
Virtual Architectural Energetics - Paper presented at SAA 2014
Upload
khangminh22Category
view
0download
0
University of RochesterLaboratory for Laser Energetics
DOE/NA/3856-1601July 2021
LLE 2020 Annual ReportOctober 2019 – September 2020

This report was prepared as an account of work conducted by the Laboratory for Laser Energetics and sponsored by New York State Energy Research and Development Authority, the University of Rochester, the U.S. Department of Energy, and other agencies. Neither the above-named sponsors nor any of their employees makes any warranty, expressed or implied, or assumes any legal liability or responsibility for the accuracy, completeness, or usefulness of any information, apparatus, product, or process disclosed, or represents that its use would not infringe privately owned rights. Reference herein to any specific commercial product, process, or service by trade name, mark, manufacturer, or otherwise, does not necessarily constitute or imply its endorsement, rec-ommendation, or favoring by the United States Government or any agency thereof or any other sponsor. Results reported in the LLE Review should not be taken as necessarily final results as they represent active research. The views and opinions of authors expressed herein do not necessarily state or reflect those of any of the above sponsoring entities.
The work described in this volume includes current research at the Laboratory for Laser Energetics, which is supported by New York State Energy Research and Development Authority, the University of Rochester, the U.S. Department of Energy Office of Inertial Confinement Fusion under Cooperative Agree-ment No. DE-FC52-08NA28302, and other agencies.
About the Cover:
Top left: LLE developed a spatially resolved electron tempera-ture (SR-Te) diagnostic to measure the temperature profiles within the hot spot of cryogenic implosions on OMEGA. Shown in the image is the SR-Te instrument and the diagnostic team led by R. Shah.
Top center: LLE deployed a new microscope to measure sub-micron features in cryogenic DT capsule targets. The micro-scope was installed in Fill and Transfer Station #2 (FTS#2) where targets, traveling in the Moving Cryostat Transport Carts (MCTC’s), are imaged without the MC shroud. Shown here are the MCTC operator M. Coffey, microscope operator D. Bredesen, and FTS#2 operator B. Ruth working together toperform the measurements.
Top right: The Multi-Terawatt (MTW) Laser at LLE delivered its 10,000th laser shot on 26 May 2020. The milestone shot was taken in support of an external campaign for L3Harris Technologies (L3H). The image shows the experimental lead C. Stillman, L3H Scientist and LLE Ph.D. graduate, standingnext to the MTW compression chamber, overlooking the targetchamber. The inset image is the interferometry data acquiredduring this shot.
Middle left: OMEGA experiments study thermal transport in laser-heated gas-jet plasmas across high magnetic fields gen-erated by the recently upgraded dual magneto-inertial fusion electrical discharge system (MIFEDS). Thomson scattering was used to diagnose the plasma conditions.
Middle right: To adapt to social distancing, travel restrictions, and other COVID-19 preventive measures, LLE has implemented a new remote-PI operation protocol that brings the Omega Laser Facility to users. LLE researchers and our external users around the globe have been participating in the remote-PI operation to safely and effectively conduct experiments remotely. Shown here are the control rooms of OMEGA (top) and OMEGA EP (bot-tom) Laser Systems. The shot director in each case is in touch with the Principal Investigator via the ShotStream Zoom meeting during the entire campaign. Details of the remotePI operation were published in G. Pien et al., ICUIL News 11, 10 (2020).
Bottom left: LLE scientists developed a novel dephasingless laser-wakefield accelerator (DLWFA) concept based on flying-focus technology that combines special optics to shape an ultrashort, high-intensity laser pulse. The DLWFA concept would produce an accelerator that uses laser light to acceler-ate particles to very high energy levels in meters. This exciting work was published in the journal Physical Review Letters [J. P. Palastro et al., 124, 134802-3 (2020)] and also highlighted by the DOE Office of Science.
Bottom right: The femtosecond damage-test system employs a 20- to 30-fs pulse duration laser with a central wavelength tun-able between 820 nm and 970 nm. The system is also designed to study dynamics with femtosecond resolution. Shown here is K. Kafka, scientist in the Optical Materials group, working inthe dynamics chamber. With the lid open, optics showcasingthe system are partially visible.
For questions or comments, Laboratory for Laser Energetics, 250 East River Road, Rochester, NY 14623-1299, (585) 275-5286. www.lle.rochester.edu
Prepared forU.S. Department of EnergyAlbuquerque Service CenterDOE/NA/3856-1601
Distribution CategoryOctober 2019–September 2020
Printed in the United States of AmericaAvailable from
National Technical Information ServicesU.S. Department of Commerce5285 Port Royal RoadSpringfield, VA 22161
www.ntis.gov

University of RochesterLaboratory for Laser Energetics
DOE/NA/3856-1601July 2021
LLE 2020 Annual ReportOctober 2019 – September 2020
Inertial Fusion Program andNational Laser Users’ Facility Program


Contents
FY20 Annual Report iii
Contents
Executive Summary .................................................................................................................................. ix
LLE REVIEW 161 (OCTOBER–DECEMBER 2019)
Inertial Confinement Fusion
Inferring Thermal Ion Temperature and Residual Kinetic Energy from Nuclear Measurements in Inertial Confinement Fusion Implosions .......................................... 1
Azimuthal Drive Asymmetry in Inertial Confinement Fusion Implosions at the National Ignition Facility .......................................................................................................... 3
Revisiting the Late-Time Growth of Single-Mode Rayleigh–Taylor Instability and the Role of Vorticity ..................................................................................................................... 7
Plasma and Ultrafast Physics
Dephasingless Laser Wakefield Acceleration ..................................................................................... 10
Multibeam Absolute Stimulated Raman Scattering ........................................................................... 13
Hot Raman Amplification ................................................................................................................... 16
Implementing a Microphysics Model in Hydrodynamic Simulations to Study the Initial Plasma Formation in Dielectric Ablator Materials for Direct-Drive Implosions ............................... 19
Extreme Atomic Physics: Interspecies Radiative Transition in Warm and Superdense Plasma Mixtures .................................................................................................................................. 23
Stimulated Raman Scattering Mechanisms and Scaling Behavior in Planar Direct-Drive Experiments at the National Ignition Facility ................................................. 25
Modeling Magnetic Confinement of a Laser-Generated Plasma in Cylindrical Geometry Leading to Disk-Shaped Structures ............................................................. 28
High-Energy-Density Physics
Axial Proton Probing of Magnetic and Electric Fields Inside Laser-Driven Coils ............................ 31
Different Mechanisms of Phase Transformation for Boron in Equilibrium and Under Shock Indicated by Equation-of-State Comparisons ........................................................ 37
Contents
FY20 Annual Reportiv
Diagnostic Science and Detectors
A Suite of Neutron Time-of-Flight Detectors to Measure Hot-Spot Motion in Direct-Drive Inertial Confinement Fusion Experiments on OMEGA ........................................... 40
Design of a Free-Space, Image-Relay Optical Time Domain Reflectometer to Measure Fiber-Optic Time Delays at Inertial Confinement Fusion-Relevant Wavelengths ............................. 43
Laser Facility Report
FY20 Q1 Laser Facility Report .......................................................................................................... 45
LLE REVIEW 162 (JANUARY–MARCH 2020)
Inertial Confinement Fusion
Novel Hot-Spot–Ignition Designs for Inertial Confinement Fusion with Liquid Deuterium–Tritium Spheres ........................................................................................... 47
First Observation of Hot-Spot Mix in Laser-Direct-Drive Inertial Confinement Fusion ................... 50
Plasma and Ultrafast Physics
Anomalous Absorption by the Two-Plasmon–Decay Instability ....................................................... 53
High-Energy-Density Physics
X-Ray Diffraction at the National Ignition Facility ........................................................................... 56
Optimizing Deuterated Metal Foils to Generate a Quasi-Monoenergetic Deuteron Beam on the Multi-Terawatt Laser ............................................................................................................... 59
Fully Consistent Density Functional Theory Determination of the Insulator-to-Metal Transition Boundary in Warm Dense Hydrogen ................................................................................ 62
Thermal Hybrid Exchange-Correlation Density Functional for Improving the Description of Warm Dense Matter ....................................................................................................................... 64
Diagnostic Science and Detectors
Soft X-Ray Spectrum Unfold of K-Edge–Filtered X-Ray Diode Arrays Using Cubic Splines ........................................................................................................................... 67
Laser System Science
Optical Characterization of the OMEGA Beam Profile at High Energy Using the Full-Beam-In-Tank Diagnostic .......................................................................................... 71
Materials Science
Deposition of a Discontinuous Coated Surface to Form a Phase-Stepped Reflected Wavefront ........................................................................................................................... 74
Damage Mechanisms in Multilayer Dielectric Gratings at Different Pulse Durations ............................................................................................................... 77

Contents
FY20 Annual Report v
Laser-Induced–Damage Behavior of Novel Glassy Liquid Crystal Materials at 1 ns and Multiple Wavelengths ....................................................................................................... 81
Morphologies and Underlying Mechanisms of Laser-Induced Damage by Model Contamination Particles on a High Reflector .................................................................... 84
Determination of the Raman Polarizability Tensor in the Optically Anistropic Crystal in Potassium Dihydrogen Phosphate and Its Deuterated Analog .......................................... 87
Long-Term Monitoring of the Damage Performance of Multilayer Dielectric Grating Samples Residing Inside the Compressor Chamber of the OMEGA EP Laser ................................. 91
Laser Facility Report
FY20 Q2 Laser Facility Report .......................................................................................................... 95
LLE REVIEW 163 (APRIL–JUNE 2020)
Inertial Confinement Fusion
Probing In-Flight Shell Breakup in DT Cryogenic Implosions on OMEGA ...................................... 97
First Temperature and Velocity Measurements of the Dense Fuel Layer in Inertial Confinement Fusion Experiments ...................................................................................... 100
Self-Radiography of Imploded Shells on OMEGA Based on Additive-Free Multi-Monochromatic Continuum Spectral Analysis ......................................................................... 103
Principal Factors in the Performance of Indirect-Drive Laser-Fusion Experiments ........................... 106
Experiments to Explore the Influence of Pulse Shaping at the National Ignition Facility .................. 112
Deficiencies in Compression and Yield in X-Ray–Driven Implosions ............................................... 118
Azimuthal Uniformity of Cylindrical Implosions on OMEGA .......................................................... 124
Characterizing Laser Preheat for Laser-Driven Magnetized Liner Inertial Fusion Using Soft X-Ray Emission ................................................................................................................ 130
Constraining Physical Models at Gigabar Pressures ........................................................................... 138
Molecular Dynamics Simulations Reveal Hydrogen Streaming upon Release from Polystyrene Shocked to Inertial Confinement Fusion Conditions .............................................. 141
Plasma and Ultrafast Physics
Impact of Spatiotemporal Smoothing on the Two-Plasmon–Decay Instability ................................. 143
Vacuum Acceleration of Electrons in a Dynamic Laser Pulse ............................................................ 146
High-Energy-Density Physics
Equation of State of CO2 Shock Compressed to 1 TPa ..................................................................... 149
Shock-Compressed Silicon: Hugoniot and Sound Speed to 2100 GPa ............................................. 153
Thermal Effects on the Electronic Properties of Sodium Electride Under High Pressures ................ 156
Contents
FY20 Annual Reportvi
Diagnostic Science and Detectors
Optimization of a Short-Pulse–Driven Si Hea Soft X-Ray Backlighter ............................................. 159
High-Resolution X-Ray Radiography with Fresnel Zone Plates on the OMEGA and OMEGA EP Laser Systems .............................................................................. 161
Laser Technology and Development
Overcoming Gas Ionization Limitations with Divided-Pulse Nonlinear Compression ...................... 163
Laser Facility Report
FY20 Q3 Laser Facility Report .......................................................................................................... 166
LLE REVIEW 164 (JULY–SEPTEMBER 2020)
Inertial Confinement Fusion
Direct-Drive Laser Fusion: Status, Plans, and Future ......................................................................... 169
Direct Measurements of DT Fuel Preheat from Hot Electrons in Direct-Drive Inertial Confinement Fusion ................................................................................................................ 172
Validating Heat-Transport Models Using Directly Driven Spheres on OMEGA ............................... 174
Magnetic-Field Generation and Its Effect on Ablative Rayleigh–Taylor Instability in Diffusive Ablation Fronts ................................................................................................................ 177
Self-Consistent Theory of the Darrieus–Landau and Rayleigh–Taylor Instabilities with Self-Generated Magnetic Fields .................................................................................................. 180
Transport Coefficients for Magnetic-Field Evolution in Inviscid Magnetohydrodynamics .................................................................................................... 183
Plasma and Ultrafast Physics
Kinetic Inflation of Convective Raman Scattering Driven by a Broadband, Frequency-Modulated Laser Pulse ...................................................................................................... 186
Measurements of Non-Maxwellian Electron Distribution Functions and Their Effect on Laser Heating ................................................................................................................................ 189
Nonlinear Spatiotemporal Control of Laser Intensity ........................................................................ 192
Laser-Plasma Acceleration Beyond Wave Breaking .......................................................................... 195
High-Energy-Density Physics
Wide-Ranging Equations of State for B4C Constrained by Theoretical Calculations and Shock Experiments ...................................................................................................................... 198

Contents
FY20 Annual Report vii
Diagnostic Science and Detectors
A Novel Photomultiplier Tube Neutron Time-of-Flight Detector ...................................................... 201
A Generalized Forward Fit for Neutron Detectors with Energy-Dependent Response Functions ............................................................................................................................ 205
Laser Technology and Development
Parametric Amplification of Spectrally Incoherent Signals ................................................................ 208
Comparison of the Laser-Induced–Damage Threshold in Single-Layer Optical Films Measured at Different Facilities .......................................................................................................... 211
Users Report
The 12th Omega Laser Facility Users Group Workshop .................................................................... 214
Laser Facility Report
FY20 Q4 Laser Facility Report .......................................................................................................... 216
NATIONAL LASER USERS’ FACILITY AND EXTERNAL USERS’ PROGRAMS
YEAR-END REPORTS
National Laser Users’ Facility and External Users’ Programs ................................................................. 219
FY20 National Laser Users’ Facility Program ......................................................................................... 220
FY20 Laboratory Basic Science Program ................................................................................................. 263
FY20 LaserNetUS ..................................................................................................................................... 287
FY20 Lawrence Livermore National Laboratory Experimental Programs at the Omega Laser Facility ...................................................................................................................... 298
FY20 Los Alamos National Laboratory Experimental Campaigns at the Omega Laser Facility ............. 332
FY20 Sandia National Laboratories Progress Report on Omega Laser Facility Experiments ................. 352
FY20 Naval Research Laboratory Report on Omega Laser Facility Experiments ................................... 354
FY20 Rutherford Appleton Laboratory Report on Omega Laser Facility Experiments ........................... 355
PUBLICATIONS AND CONFERENCE PRESENTATIONS
Publications and Conference Presentations .............................................................................................. 357


ExEcutivE Summary
FY20 Annual Report ix
Executive Summary
E. M. Campbell
Director, Laboratory for Laser Energetics
The Laboratory for Laser Energetics (LLE) is primarily funded by the U.S. Department of Energy (DOE) National Nuclear Secu-rity Administration’s (NNSA’s) Office of Experimental Sciences Inertial Confinement Fusion (ICF) Program through a five-year Cooperative Agreement. The fiscal year ending September 2020 (FY20) comprised the second year of LLE work under DOE/NNSA Cooperative Agreement No. DE-NA0003856. The Laboratory’s work is also sponsored by the New York State Energy Research Development Authority (NYSERDA) and other federal agencies such as DOE’s Office of Science (Fusion Energy Sci-ences and High Energy Physics) and the National Science Foundation (NSF). This annual report summarizes work conducted at LLE during FY20, including research on the ICF and High-Energy-Density (HED) science campaigns; laser, optical materials, and advanced technology development; operation of the Omega Laser Facility for the ICF and HED Campaigns, the National Laser Users’ Facility (NLUF), the Laboratory Basic Science (LBS) Program, and other external users including the newly established LaserNetUS supported by the DOE Office of Fusion Energy Sciences (FES); and programs focusing on the education of high school, undergraduate, and graduate students. Much of the work conducted during FY20 was adapted including virtual partici-pations and remote shot operation for users of the Omega Laser Facility to overcome the challenge of the COVID-19 pandemic.
Inertial Confinement Fusion ResearchOne of the principal missions of LLE is to conduct research in ICF with an emphasis on supporting the goal of achieving fusion
ignition or determining what is needed for this goal at the National Ignition Facility (NIF). This program uses the Omega Laser Facility, the NIF, and the full experimental, theoretical, computational, and engineering resources of the Laboratory. During FY20, despite the challenges brought on by the pandemic (including a two-month shutdown of the Laboratory), 1825 target shots were taken at the Omega Laser Facility (comprised of the 60-beam OMEGA UV laser and the four-beam, high-energy petawatt OMEGA EP laser). The ICF and HED Campaigns accounted for approximately 63% of the facility shots. LLE is the lead labora-tory worldwide for the laser-direct-drive approach with research focused on cryogenic implosions on the 60-beam OMEGA laser and on laser–plasma interaction physics of importance to all laser-driven concepts at both the Omega and NIF facilities. LLE has also developed, tested, and constructed a number of diagnostics currently being used at both the Omega Laser Facility and on the NIF. During this past year, progress in the ICF Program continued in three principal areas: ICF cryogenic DT implosion experiments on OMEGA and physics experiments in support of ICF on OMEGA, OMEGA EP, and the NIF; theoretical analysis and design efforts aimed at improving direct-drive–ignition capsule designs and advanced ignition concepts such as magnetized implosion; and the development of diagnostics for experiments on the NIF, OMEGA, and OMEGA EP Laser Systems. This annual report includes the summaries published in the LLE Review (Quarterly Reports) on the LLE research performed during FY20 in these areas.
Twenty-one of the summaries highlighted in the report concern research on various aspects of ICF by LLE scientists and external Omega users including:
• inferring thermal ion temperature and residual kinetic energy from nuclear measurements in ICF implosions;
• understanding low-mode azimuthal drive asymmetry in ICF implosions on the NIF;
ExEcutivE Summary
FY20 Annual Reportx
• revisiting the late-time growth of single-mode Rayleigh–Taylor instability and the role of vorticity;
• novel hot-spot–ignition designs for ICF with liquid deuterium–tritium (DT) spheres;
• first observation of hot-spot mix in laser-direct-drive ICF;
• probing in-flight shell breakup in DT cryogenic implosions on OMEGA;
• first temperature and velocity measurements of the dense fuel layer in ICF experiments;
• self-radiography of imploded shells on OMEGA based on multi-monochromatic continuum spectral analysis;
• in collaboration with LLNL, principal factors in the performance of indirect-drive laser-fusion experiments;
• in collaboration with LLNL, experiments to explore the influence of pulse shaping on the NIF;
• in collaboration with LLNL, deficiencies in compression and yield in x-ray–driven implosions;
• azimuthal uniformity of cylindrical implosions on OMEGA;
• characterizing laser preheat for laser-driven magnetized liner inertial fusion (MagLIF) using soft x-ray emission;
• constraining physical models at gigabar pressures;
• molecular dynamics simulations revealing hydrogen streaming upon release from polystyrene shocked to ICF conditions;
• direct-drive laser fusion: status, plans, and future;
• direct measurements of DT fuel preheat from hot electrons in direct-drive ICF;
• validating heat-transport models using directly driven spheres on OMEGA;
• magnetic-field generation and its effect on ablative Rayleigh–Taylor instability in diffusive ablation fronts;
• self-consistent theory of the Darrieus–Landau and Rayleigh–Taylor instabilities with self-generated magnetic fields;
• transport coefficients for magnetic-field evolution in inviscid magnetohydrodynamics; and
• hydrodynamic simulations with an improved microphysics model to study the initial plasma formation and laser imprint in dielectric ablator materials for direct-drive implosions.
Plasma and Ultrafast ScienceThe development of a strong, fundamental, both theory and experimental plasma physics and ultrafast science capability,
including generation of more powerful, efficient, and compact sources of high-energy photons and directed particle beams as advanced probes, underlies much of ICF and HED science. In this report we present 14 articles that highlight the FY20 labora-tory efforts in these areas including:
• dephasingless laser wakefield acceleration enabled by a novel optical technique for spatiotemporal pulse shaping that has potential to accelerate electrons to TeV in a meter-scale plasma;

ExEcutivE Summary
FY20 Annual Report xi
• three-dimensional calculations of multibeam absolute stimulated Raman scattering (SRS) thresholds that provide explana-tions for experiments on OMEGA and the NIF;
• a novel high-temperature, efficient Raman amplification scheme for generating high-peak-power laser pulses;
• study of SRS mechanisms and plasma scaling behavior in planar direct-drive experiments on the NIF;
• modeling magnetic confinement of a laser-generated plasma in cylindrical geometry leading to disk-shaped structures;
• anomalous absorption by the two-plasmon–decay (TPD) instability at the quarter-critical density in laser-produced under-dense coronas;
• experimental study of the impact of spatiotemporal smoothing on the TPD instability and comparison with simulations;
• a novel vacuum laser acceleration (VLA) of electrons in a dynamic laser pulse utilizing LLE’s “flying focus” technique;
• a study of the convective gain and kinetic inflation threshold from SRS driven by a broadband, frequency-modulated laser pulse in an inhomogeneous plasma;
• first measurements of complete electron distribution functions without any assumptions on their shape or the underlying physics that produced them and the resulting non-Maxwellian electron distribution on laser heating;
• nonlinear spatiotemporal control of laser intensity producing an arbitrary trajectory of the intensity peak that can be sustained for large distances compared to the Rayleigh range of the focusing system and its application to generate long plasma channels;
• the discovery of a novel regime of plasma wave excitation and wakefield acceleration that removes the wave-breaking limit, allowing arbitrarily high electric fields; and
• demonstration of axial proton probing of magnetic and electric fields inside laser-driven coils in OMEGA EP experiments that clearly distinguish deflection contributions from electric and magnetic fields.
High-Energy-Density PhysicsHigh-energy-density physics (HEDP) is the study of matter at extreme conditions. The HED condition, often defined by an
energy density (in pressure units) in excess of 1 Mbar, not only is foundational for ICF research and national nuclear security, but is also common in the universe, including at the interior of stars, giant planets, and exoplanets, as well as the atmospheres and the vicinity of compact objects such as white dwarfs, neutron stars, and black holes. HED regimes also enable the study of new realms of quantum mater behavior, properties, and phenomena including room-temperature superconductivity at 2.67 Mbar recently dem-onstrated in laboratory experiments led by UR researchers. HED plasma created by high-power lasers also enables the exploration of new regimes of plasmas mediated by extreme fields and the generation of intense beams of high-energy photons and particles.
LLE plays a major role in the nation’s HEDP Program not only through the numerous users’ experiments conducted at the Omega Laser Facility but also by HED physics research (experiments, theory, and modeling) carried out by LLE scientists and graduate students. This volume contains summaries of ten of these efforts including:
• first-principles molecular dynamics (MD) calculations of the equation of state (EOS) and shock Hugoniot of various boron phases, strongly indicating differences in the mechanisms of phase transitions in equilibrium and under shock;
• application of thermal density function theory (DFT) to investigate the spectra of a Fe–Zn plasma mixture at extreme densi-ties (250 to 2000 g/cm3) and temperatures of 50 to 100 eV, accessible by imploding double-shell targets, revealing two new

ExEcutivE Summary
FY20 Annual Reportxii
and uniquely extreme atomic physics phenomena: interspecies radiative transition and the breakdown of the dipole-selection rule for radiative transitions in isolated atoms;
• an overview of the x-ray diffraction (XRD) platforms on the NIF and the measurements of the density-pressure EOS andcrystal structure of a variety type of materials compressed up to 2 TPa, leading to the discovery of several new phases;
• optimizing deuterated metal foils for the production of a quasi-monoenergetic MeV deuteron beam using the Multi-Terawatt (MTW) laser;
• DFT-based quantum molecular dynamics (QMD) simulations to determine the insulator-to-metal transition boundary inwarm dense hydrogen that shows a good agreement with experimental measurements across a wide range of pressureand temperatures;
• implementation of thermal hybrid exchange-correlation density functional providing significant improvements for thedescription of warm dense matter;
• first-time experimental measurements of the EOS of CO2 shock compressed to 1 TPa on OMEGA, revealing a rich andcomplex phase diagram that cannot be described by current models;
• measurements of the principal Hugoniot and sound speed of shock-compressed silicon to 2100 GPa, showing changes inphysical properties of HED materials coincident with an increase in ionic coordination and ionization of the 3s2 electronspredicted by the DFT-based QMD simulations;
• systematic studies of effects of thermal excitations on the electronic properties of sodium electride under high pressureusing the DFT-based molecular dynamics and electro-optical calculations; and
• a comprehensive study of the EOS of boron carbide constrained by theoretical calculations and shock experiments resultingin new EOS models available for use in hydrodynamic simulations.
Diagnostic DevelopmentThe continued development of state-of-the-art diagnostic instrumentation is required to conduct experiments in support of
the national ICF and HED Programs. In this volume, we present seven summaries on research and development projects in this area including:
• a report on a suite of six neutron time-of-flight (nTOF) detectors on OMEGA to measure the primary DT neutron energyspectrum along multiple quasi-orthogonal lines-of-sight in direct-drive ICF cryogenic target implosion experiments provid-ing critical information of hot-spot flow velocity for the first time;
• a design for a free-space, image-relay optical time domain reflectometer to measure fiber-optic time delays at ICF-relevantwavelengths to within 2 ps;
• a report describing soft x-ray spectrum unfold of K-edge–filtered x-ray diode arrays using cubic-spline interpolation thatprovides an analytical way of solving for the temporally and spectrally resolved x-ray flux with no free parameters orassumptions about the geometry or material of the emitting plasma;
• a joint study optimizing a short-pulse, laser-driven silicon Hea soft x-ray backlighter for radiography of ICF layered DTimplosions at the Omega Laser Facility led by LLE in collaboration with the Technical University of Darmstadt;

ExEcutivE Summary
FY20 Annual Report xiii
• a report on the development of, along with the results from, the use of Fresnel zone plates (FZP’s) for high-resolution (micron-scale) x-ray radiography experiments on the OMEGA and OMEGA EP Laser Systems;
• development of a novel photomultiplier tube (PMT) nTOF detector without use of a scintillator for accurate measurement of the neutron energy and hot-spot flow velocity in high-yield DT implosions on OMEGA; and
• a report describing a generalized forward-fit analysis method for neutron detectors with energy-dependent instrument response functions (IRF’s), which are most essential for the analysis of nuclear states with smaller widths.
Laser System ScienceSafe, efficient, and effective operation of the Omega Laser Facility requires a dedicated team of scientists and engineers with
a high level of expertise in solving the various challenges presented by the operation of ultrahigh-power laser systems at their performance limits. In this volume we present a summary of research and development work carried out at LLE reporting on the optical characterization of the OMEGA beam profile at full energy at target chamber center using the new full-beam-in-tank diagnostic that is capable of accurate measurements of the beam-to-beam focal-spot variation in target-plane fluence. Results show the ability of the OMEGA Laser System to provide uniform fluence profiles that are consistent across all 60 beams in the laser, critical for high-performance ICF implosions.
Laser Technology and DevelopmentIn addition to advanced diagnostic development, the ICF and HED experimental programs require continuous laser technology
development. This annual report contains three articles on work in this area including:
• a study examining the limits on the gas-filled hollow-core fiber (HCF) energy scaling and the new method to overcome gas ionization limitations with divided-pulse nonlinear compression, which is important for the development of ultrafast (+10-fs) high-average power lasers;
• a report describing the framework to support optical parametric amplifier (OPA) simulations using normalized equations and the modeling study of OPA operation with spectrally incoherent signals for the development of high-energy broadband UV lasers; and
• a series of investigations and comparisons of the laser-induced–damage threshold in single-layer optical films measured at different testing facilities.
Optical Materials ScienceA strong materials science effort is required to realize the required laser and instrumentation objectives for ICF and HED
research. This report includes the following six summaries of materials science efforts at LLE:
• a report on the development of an optical component such as a reflective radial echelon via electron-beam vapor deposi-tion of a silicon-dioxide thin film onto a substrate through a mask to form a phase-stepped reflected wavefront for use in a chromatic flying focus;
• a study of damage mechanisms in multilayer dielectric gratings at different laser pulse durations (0.6 and 10 ps at 1053 nm) to inform the design and fabrication of the next-generation gratings with a significantly higher damage threshold;
• development of high laser-induced–damage threshold glassy liquid crystal materials for large-aperture polarization control and beam-smoothing optics that could replace current low-molar-mass liquid crystal devices on the OMEGA Laser System as well as offering the potential for use in other ICF-class laser systems in future upgrades;

ExEcutivE Summary
FY20 Annual Reportxiv
• a study of morphologies and underlying mechanisms of laser-induced damage (LID) by model contamination particles on a high reflector showing that the contamination microparticles can be a potent precursor for optical damage with short pulses, causing damage initiation far below the pristine LID threshold, and thereby exposing optics to the potential for damage growth;
• a novel experimental design that enabled the determination of the Raman polarizability tensor in the optically anisotropic crystal potassium dihydrogen phosphate (KDP) and its deuterated analog (DKDP); and
• a report on the results of a long-term monitoring of the damage performance of multilayer dielectric grating samples posi-tioned inside the OMEGA EP grating compressor vacuum chamber during normal operation with various pulse durations (0.7 to 100 ps).
Omega Laser Facility OperationsUnder the facility governance plan implemented in FY08 to formalize the scheduling of the Omega Laser Facility as an
NNSA User Facility in support of the science-based Stockpile Stewardship Program, Omega Laser Facility shots are allocated by programs (ICF, HED, NLUF, LBS) following NNSA guidance.
During FY20, the Omega Laser Facility conducted 1033 target shots on OMEGA and 792 target shots on OMEGA EP for a total of 1825 target shots (see Fig. 1 below for the use by various programs). OMEGA had an experimental effectiveness of 95.7%, while OMEGA EP recorded an experimental effectiveness of 95.8%. The ICF and HED Programs received 63% of the facility shots in FY20 conducted by scientists from Lawrence Livermore National Laboratory (LLNL), Los Alamos National Laboratory (LANL), Sandia National Laboratories (SNL), the Naval Research Laboratory (NRL), and LLE. About 9% of the facility shots were for the laser system calibration led by LLE. The NLUF and LBS Programs described below conducted +23% of the facility shots. The facility also delivered 70 shots (+4% of the total) for the newly established LaserNetUS Program and 21 shots (1% of the total) for the joint Rutherford Appleton Laboratory/York University (RAL/York) team and the LANL Laboratory Directed Research & Development (LDRD) Program. Approximately 52% of the facility time was used for experiments led by external users.
It should be noted as mentioned above that during the third quarter of FY20, the Omega Laser Facility was in safe stand-down for eight weeks, with additional weeks of recovery activities due to the COVID-19 pandemic and associated state regulations. As a result, almost a quarter of the FY20 approved shot days were delayed into FY21. One highlight was the implementation of the Omega remote PI shot operation developed by LLE during the safe stand-down period, which is a new protocol enabling users
Figure 1Omega Laser Facility use by program in FY20.
I3016JR
LaserNetUS, 3.8%LDRD, 0.5%
RAL, 0.7%
HED28.4%
ICF34.8%
Calibration8.9%
LBS 10.2%
NLUF/AIBS 12.7%

ExEcutivE Summary
FY20 Annual Report xv
to safely and effectively conduct Omega experiments via remote access. The remote PI system has been used on all production OMEGA and OMEGA EP target shots since 3 June 2020. Neither the effectiveness nor the availability of these target shots have been compromised by remote PI operations. Description of the “remotePI” protocol and the shot operation statistics can be found in a feature article on the LLE website under “LLE Today/Around the Lab.”
National Laser Users’ Facility and External Users’ ProgramsThe NNSA-supported Fundamental Science Program at the Omega Laser Facility is also allotted target shots, with projects
selected through open-call and peer-reviewed processes. The program has two distinct components: (1) the NLUF Program awarded to individual principal investigators (PI’s) on a two-year cycle with the associated Omega Laser Facility time for experiments led by U.S. academia and business [note: a special one-time Academic and Industrial Basic Science (AIBS) program was created to provide shot opportunities in FY20–FY21 with beam time from the unassigned NLUF allocation]; and (2) the LBS Program with annual beam-time awards for basic science experiments conducted by the NNSA laboratories and Office of Science laboratories.
FY20 was the first year of a two-year period of performance for 11 NLUF grant projects and 10 AIBS beam-time awards with Omega shot allocations (see Table I on p. 221). A total of 232 target shots were delivered for 15 NLUF/AIBS projects that accounted +13% of the 1825 overall Omega Laser Facility shots.
A critical part of the NLUF and LaserNetUS programs is the education and training of graduate students in plasma and HED physics. In addition, graduate students can also access the Omega Laser Facility for shots through their collaborations with national laboratories and LLE. There were about 60 graduate students from 18 universities involved in the external user-led research programs with experiments conducted at the Omega Laser Facility (see Table II on p. 222).
In FY20, 21 LBS projects were allocated a total of 21.5 shot days for experiments at the Omega Laser Facility. A total of 186 target shots (+10% of the total) were conducted for 16 LBS projects led by scientists from LLNL, LANL, LLE, Lawrence Berkeley National Laboratory, SLAC, and Princeton Plasma Physics Laboratory (PPPL) (see Table I, p. 263). Six FY20 LBS projects are postponed with shots to be conducted in FY21.
During FY20, LLE issued a solicitation for LBS proposal for beam time in FY21. A total of 36 proposals were submitted, requesting a total of 56 shot days, exceeding the LBS allocation by 260%. After review, 22 projects were selected and allocated a total of 22.5 shot days (including one additional day from the contingency pool) for experiments at the Omega Laser Facility in FY21 as shown in Table II on p. 264.
Since 2019, the Omega Laser Facility, specifically the OMEGA EP Laser, has been part of the FES-supported LaserNetUS network consisting of nine high-intensity laser facilities in the U.S. and one in Canada. Through a coordinated call for propos-als and an independent Proposal Review Panel (PRP) process, the LaserNetUS network makes available a variety of ultrafast, high-peak-power and high-energy petawatt-class lasers including LLE’s four-beam high-energy and high-intensity OMEGA EP laser to users who do not have regular access to ultrahigh-intensity lasers. During FY20, seven LaserNetUS projects (see Table I on p. 288) were awarded a total of eight shot days on OMEGA EP for experiments in FY20 and FY21. A total of 70 target shots were successfully conducted in FY20 for six LaserNetUS projects led by scientists from Johns Hopkins University, LLNL, PPPL, Princeton University, and the University of California, San Diego.
In FY20, the Omega Laser Facility was also used for two campaigns (a total of 21 target shots), one for the joint RAL/University of York of the United Kingdom and one for the LANL LDRD program. These externally funded experiments were conducted at the facility on the basis of special agreements put in place by UR/LLE and participating institutions with the endorsement of NNSA.
Omega Laser Facility Users GroupLLE hosted a virtual meeting for the Omega Laser Facility Users Group (OLUG) focusing on the development of Findings
and Recommendations (F&R’s) from 23–25 September 2020 (two hours each day). It was attended by more than 90 participants

ExEcutivE Summary
FY20 Annual Reportxvi
including scientists, postdoctoral fellows (postdocs), and students from 27 institutions (Fig. 1 on p. 215). The virtual meeting program included the NNSA perspective presented by A. Satsangi from NNSA’s Office of Experimental Sciences; two facility presentations: “Omega Facility Updates” presented by S. F. B. Morse and “Omega RemotePI Operation,” presented by G. Pien; and the “Omega Basic Science User Program Update” by M. S. Wei. Over three days of the meeting, OLUG members discussed and developed a list of 23 new F&R’s to further improve facility capabilities and user experiences.
EducationAs a major university participant in the National ICF Program as part of the NNSA’s science-based Stockpile Stewardship
Program, education continues to be an important mission for LLE. The Laboratory’s education programs cover the range from high school to graduate education. This report provides a summary of LLE’s main activities on education in FY20 including:
1. Summer High School Research Program Since 1989, LLE has held an annual Summer High School Research Program for Rochester-area high school students who have
just completed their junior year. The eight-week program provides an exceptional opportunity for highly motivated students to experience scientific research in a realistic environment. Unfortunately, the 2020 full program was cancelled due to the COVID-19 pandemic. Although there were no new high school students, several prior year program participants returned to work (virtually) in the summer of 2020 and continued their research projects under the guidance of their LLE advisors.
Three hundred and ninety-one students from 55 high schools have participated in the program to date, among which 137 are female. A total of 39 students, including S. Narang from the 2019 summer program, have become Scholars in the prestigious Regeneron Science Talent Search for the research projects they carried out at LLE. H. Berger and S. Narang from the 2019 summer program won gold and bronze medals, respectively, in the InspoScience Research and Innovation Competition (North America’s Continental Science Fair) in 2020.
2. Undergraduate Student ProgramDuring FY20, LLE employed 36 undergraduate students from the University of Rochester and 12 co-op college students from
Rochester Institute of Technology, Monroe Community College, and Finger Lakes Community College. The research activities carried out by the undergraduate and co-op students at LLE in 2020 were performed virtually. LLE also funded 20 students (and their six faculty advisors) from SUNY Geneseo and Houghton College to conduct research in Physics and Engineering.
3. Broad Exposure to Science and Technology Student and Teacher Research ProgramDuring FY20, LLE initiated a new research and education program called BEST (Broad Exposure to Science and Technol-
ogy), which was formed and led by T. J. Kessler, LLE’s Diversity Officer. This program aims to involve high school teachers and undergraduate and high school students from underrepresented groups in various aspects of science and technology that support LLE’s laser science and applications research. This broad exposure to science and technology will help inspire and guide students from underrepresented groups in their pursuit of STEM fields and encourage them to explore the next generation of related jobs and careers. Teacher participation will equip them with knowledge and experience that can be brought back to their schools to enhance science and technology curricula. The research experience for this new pilot BEST program will start in summer 2021.
4. Graduate Student ProgramsGraduate students are using the Omega Laser Facility as well as other LLE facilities for ICF and HEDP research and technol-
ogy development activities. These students are making significant contributions to LLE’s research program. Twenty-five faculty members with primary appointments with eight of the University of Rochester’s academic departments collaborate with LLE scientists and engineers. In addition, 17 scientists and engineers at LLE hold secondary faculty appointments with the Univer-sity at five different academic departments. In FY20, a total of 80 UR graduate students were involved in research projects at LLE. LLE directly sponsored 60 students pursuing Ph.D. degrees via the NNSA-supported Frank Horton Fellowship Program, among which 13 are new Horton Fellows starting from September 2020 (see Table I). Their research includes theoretical and experimental plasma physics, HED physics, x-ray and atomic physics, nuclear fusion, material properties under extreme pressure, ultrafast optoelectronics, high-power laser development and applications, nonlinear optics, optical materials and optical fabrica-

ExEcutivE Summary
FY20 Annual Report xvii
Table I: University of Rochester Frank Horton Fellowship Program at LLE in FY20.
Student Name Dept. Faculty Advisor LLE Advisor Research Area Notes
M. V. Ambat ME D. H. Froula Dephasing laser wakefield accelerator
New
V. Anand PA J. Carroll- Nellenback
The role of exoplanetary magnetic fields in atmospheric evolution and habitability
New
D. Bassler CH W. U. Schroeder W. T. Shmayda The effect of surface chemistry and electronic structure of atomic layer deposition deposits on the tritium inventory of stainless steel
J. Baltazar ME S. P. Regan R. C. Shah ICF implosion physics
Z. Barfield PA D. H. Froula Lateral transport with and without magnetic fields
D. Bishel PA G. W. Collins P. M. Nilson Mapping the atomic physics of complex ions with detailed nonlocal thermodynamic equilibrium (NLTE) spectroscopy
G. Bruhaug ME G. W. Collins J. R. Rygg/ H. G. Rinderknecht/ M. S. Wei
Advanced x-ray particle sources for HED and ICF diagnostic applications
S. Cao ME C. Ren Large-scale fluid and kinetic simulation study of laser–plasma instabilities and hot-electron generation in shock ignition
A. R. Christopherson ME R. Betti Theory of alpha heating, burning plasmas, and ignition in inertially confined plasmas
Defended Ph.D. Thesis in Aug. 2020 (now Staff Scientist at LLNL)
K. Churnetski ME S. P. Regan W. Theobald Three-dimensional analysis of the time-gated x-ray emission from the hot spot of DT cryogenic implosions in the polar-direct-drive configuration on OMEGA
New
L. Crandall PA G. W. Collins J. R. Rygg Equation of state of planetary fluids

ExEcutivE Summary
FY20 Annual Reportxviii
Table I: University of Rochester Frank Horton Fellowship Program at LLE in FY20 (continued).
Student Name Dept. Faculty Advisor LLE Advisor Research Area Notes
A. Davies PA D. H. Froula D. Haberberger Investigation of collisional electron plasma waves and picosecond thermodynamics in a laser-produced plasma using Thomson-scattering spectroscopy
Defended Ph.D. thesis in Nov. 2019 (now a Sr. Optical/Laser Engineer at Spectra-Physics)
A. Debrecht PA A. Frank Radiation MHD of exoplanet winds and evaporation
R. Dent CH A. Shestopalov S. Demos Optimization of coating properties and processing steps in optical grating manufacturing for high-intensity laser applications
New
Y. Ding ME R. Betti First-principles investigations on the transport properties of high-energy-density plasmas
Defended Ph.D. the-sis in Dec. 2020 (now at Amazon Web Services)
M. Evans PA P.-A. Gourdain Experimental studies of ablation in magnetic anvil cells
C. Fagan CH W. U. Schroder W. T. Shmayda The role of surface chemistry and microstructure on the retention of tritium in structural metals
P. Franke PAS D. H. Froula Measuring the dynamics of electron plasma waves with Thomson scattering
J. M. García-Figueroa CHE D. R. Harding Controlling the hydrogen content, surface roughness, and other properties of plastic targets using an electron-cyclotron-resonance microwave chemical-vapor–deposition process
M. Ghosh CH P. Huo S. X. Hu Understanding the chemistry of hydrocarbons and other materials under high pressure
M. K. Ginnane ME G. W. Collins J. R. Rygg Study behavior of materials at high pressure
X. Gong ME G. W. Collins J. R. Rygg Structure and electronic properties of sodium and potassium at high pressure

ExEcutivE Summary
FY20 Annual Report xix
Table I: University of Rochester Frank Horton Fellowship Program at LLE in FY20 (continued).
Student Name Dept. Faculty Advisor LLE Advisor Research Area Notes
V. Gopalaswamy ME R. Betti Statistical analysis of OMEGA direct-drive cryogenic DT implosions
S. Gupta OPT P. S. Carney M. D. Wittman Quantitative confocal phase imaging for the inspection of target capsules
New
A. M. Hansen PA D. H. Froula Electron plasma wave dynamics
B. J. Henderson PA G. W. Collins J. R. Rygg Broadband reflectivity of shock compressed materials
J. Hinz PA G. Ghoshal V. V. Karasiev Developing accurate free-energy density functionals via machine learning for warm dense matter simulations
R. Holcomb OPT J. Bromage Machine-learning optimization of nonlinear compression for high-average-power femto-second lasers
New
M. Huff PA G. W. Collins J. R. Rygg Sound-speed measurements on shocked material
G. W. Jenkins OPT J. Bromage Broadband seed generation and amplification at high average power
M. Jeske CH M. Anthamatten D. R. Harding Direct laser writing of high-resolution shape memory networks for mechanical interlocking
New
R. Jia CH A. Shestopalov S. G. Demos Laser damage and chemical passivation of optical surfaces modified with organic molecules
A. Kish PA A. B. Sefkow Computational plasma physics, development of hybrid methods
M. Lavell ME A. B. Sefkow The physics of magnetic-flux compression and electron thermal transport in converging magnetized plasma
New
L. S. Leal PA R. Betti A. V. Maximov Modeling laser-generated plasmas in megagauss external magnetic fields
A. Lees PA H. Aluie R. Betti Hydrodynamic instability control in a converging geometry
O. M. Mannion PA S. P. Regan C. J. Forrest Measurements of the bulk fluid motion in direct-drive experiments

ExEcutivE Summary
FY20 Annual Reportxx
Table I: University of Rochester Frank Horton Fellowship Program at LLE in FY20 (continued).
Student Name Dept. Faculty Advisor LLE Advisor Research Area Notes
M. McKie PA D. H. Froula Wave breaking of electron plasma waves as it applies to hot-electron generation and laser-plasma amplifiers
New
B. McLellan PA P. W. Milonni S. Zhang Theoretical study of structural transformation, transition pathways, and optical properties of crystals and amorphous solids under pressure
New
A. L. Milder PA D. H. Froula Measurement of electron distribution function using collective Thomson scattering
S. C. Miller ME V. N. Goncharov P. B. Radha Fine Atwood number effects on deceleration phase instability in room-temperature direct-drive implosions
Z. L. Mohamed PA D. H. Froula J. P. Knauer Gamma emission from fusion reactions
K. L. Nguyen PA D. H. Froula J. P. Palastro Application of the flying focus to nonlinear optical and plasma-based applications using a combination of theoretical and computational techniques
H. Pantell PA G. W. Collins M. Zaghoo Thermodynamic and mass transport properties of silicate at extreme conditions
H. Pasan PA R. Dias G. W. Collins Novel hydrogen rich materials at HED conditions: route to “hot” superconductivity
New
D. Patel ME R. Betti V. N. Goncharov Hybrid direct–indirect drive for ICF
R. Paul ME S. X. Hu Ab-initio construction of high-pressure phase diagrams of materials
D. Ramsey PA D. H. Froula J. P. Palastro Acceleration and radiation from a flying focus
J. J. Ruby PA G. W. Collins J. R. Rygg Understanding the thermo- dynamics of spherically imploding shocks
A. Schwemmlein PA W. U. Schroeder J. P. Knauer Thermonuclear fusion and breakup reaction between light nuclei

ExEcutivE Summary
FY20 Annual Report xxi
Table I: University of Rochester Frank Horton Fellowship Program at LLE in FY20 (continued).
Student Name Dept. Faculty Advisor LLE Advisor Research Area Notes
T. Simpson PA D. H. Froula J. P. Palastro Predicting and understanding performance of cryogenic implosions and their extrapolation to NIF energies
New
Z. Sprowal PA G. W. Collins EOS of hydrogen and hydrogen-helium for planetary interior models
G. Tabak PA G. W. Collins/ J. R. Rygg
M. Zaghoo Study of pre-compressed materials using shock compression
M. Wang CHE D. R. Harding Use of two-photon polymerization to “write” millimeter-size structures with micron resolution
C. Williams PA J. Davies R. Betti The formation of magnetized collisionless shocks
New
J.-C. Yang CHE M. Anthamatten D. R. Harding Crystallization in shape-memory polymer networks
J. Young PA P.-A. Gourdain Laser-triggered X pinches on MTW
D. Zhao ME H. Aluie R. Betti Multi-scale energy pathways in Rayleigh–Taylor instability flows
Defended Ph.D. thesis in Apr. 2020 (postdoc at Shanghai Jiao Tong Univ.)
H. Zhou PA E. Blackman New perspectives on mean-field theories of astrophysical dynamos and accretion disks
Defended Ph.D. thesis in Aug. 2020 (postdoc at Nordic Institute of Theoretical Physics)
Y. Zou PA A. Frank Common envelope evolution: HEDP studies of gravitational wave merger properties. the role of EOS and radiation transport
ME: Mechanical Engineering; PA: Physics and Astronomy; CH: Chemistry; CHE: Chemical Engineering;
OPT: Institute of Optics.

ExEcutivE Summary
FY20 Annual Reportxxii
tion technology, and target fabrication. A total of about 300 UR graduate students have completed their Ph.D. thesis research work supported by LLE since 1970. Many of LLE’s alumni now fill responsible positions at the national laboratories, industry, academia, and government.
In FY20, LLE also directly funded research programs that involve graduate students and postdoctoral researchers within the Massachusetts Institute of Technology Plasma Science and Fusion Center, the University of Michigan, the University of Nebraska-Lincoln, the University of Nevada at Reno, and Oxford University. These programs involve a total of approximately 15 graduate students, 5 postdoctoral researchers, and 10 faculty members.
In addition, the Omega Laser Facility has significantly facilitated the education and training of more than 200 graduate stu-dents and postdoctoral researchers in the HEDP and ICF science areas from other universities through their participation in the NLUF, LBS, and/or LaserNetUS experiments, or through their collaborations with LLE and national labs. Sixty graduate students (including these 15 mentioned above) from 18 universities were involved in these external user-led research programs with the experiments conducted at the Omega Laser Facility in FY20.
Thirteen graduate students, including five from the University of Rochester (see Table I) and eight from other academic institu-tions [see Table II of the National Laser Users’ Facility Program (p. 222)] have successfully completed their thesis research and obtained Ph.D. degrees during the last 15 months (from October 2019 to December 2020). Table II lists their name, university, and destination after graduation. Five of them (+40% of the total) have joined national laboratories, four have stayed in universities, and four work in the private sector. We expect that six UR/LLE Horton Ph.D. students will be graduating over the next six to nine months and all are pursuing employment at the NNSA National Laboratories including J. J. Ruby who received the prestigious Lawrence Fellowship from LLNL. He is the first University of Rochester graduate to receive this fellowship.
Table II: Thirteen students completed their Ph.D. theses from October 2019 to December 2020.
Name Institution Destination After Obtaining Ph.D. Degree
A. R. Christopherson University of Rochester LLNL (Scientist)
A. S. Davies University of Rochester Topcon Healthcare Solution (Sr. Scientist)
D. Zhao University of Rochester Shanghai Jiao Tong University (postdoc)
H. Zhou University of Rochester Nordic Institute of Theoretical Physics (postdoc)
Y. H. Ding University of Rochester Amazon Web Services
J. Matteucci Princeton University Freelancer
K. D. Meaney University of New Mexico LANL (Scientist)
J. Levesque University of Michigan LANL (postdoc)
G. Perez-Callejo Oxford University CELIA, University of Bordeaux (postdoc)
Y. Lu Rice University University of Rochester (postdoc in Tzeferacos’ Group)
S. Zhang University of California, San Diego Princeton University (postdoc in Ji’s Group)
D. T. Cliche University of Nevada, Reno LLNL (postdoc)
D. Mayes University of Nevada, Reno NNSA’s Center of Excellence for Astrophysical Plasma Properties (stationed at SNL)

InertIal ConfInement fusIon
LLE Review, Volume 161 1
K. M. Woo,1,2 R. Betti,1,2,3 O. M. Mannion,1,2 C. J. Forrest,1 J. P. Knauer,1 V. N. Goncharov,1 P. B. Radha,1 D. Patel,1,3
V. Gopalaswamy,1,3 and V. Yu. Glebov1
1Laboratory for Laser Energetics, University of Rochester2Department of Physics & Astronomy, University of Rochester
3Department of Mechanical Engineering, University of Rochester
In inertial confinement fusion (ICF) implosion experiments, the presence of residual anisotropic fluid motion within the stagnating hot spot leads to significant variations in ion-temperature measurements using neutron time-of-flight detectors along different lines of sight (LOS’s). The minimum of measured ion temperatures is typically used as representative of the thermal temperature. In the presence of isotropic flows, however, even the minimum DT neutron-inferred ion temperature can be well above the plasma thermal temperature. Consequently, apparent ion temperatures, which are inferred from the width of neutron energy spectra,1 are larger than the real thermal ion temperature. This leads to underestimating the inferred hot-spot pressures used as a metric to measure ICF implosion performance.
The influence of 3-D flow effects on apparent ion temperatures is governed by the properties of velocity variance, contributed by both isotropic and anisotropic flows. To describe this phenomenon, the method of velocity variance decomposition2 is applied. The fluid velocity vector and the LOS unit vector are substituted into the velocity variance, followed by an expansion into six components. The resulting apparent ion temperatures can be rewritten as
.T T M g giinferred
ithermal
DT,
i j iji j 1
3v= +
=/ (1)
Here MDT is the DT total reactant mass. The indices 1, 2, and 3 correspond to Cartesian coordinates x, y, and z, respectively; eiTis an orthonormal unit vector. Three geometrical factors—g1 = sinicosz, g2 = sinisinz, and g3 = cosi—specify the polar i and azimuthal z angles for a given LOS. The six components of the fluid velocity variance vij = GDviDvjH measure the flow structurewithin the hot spot, where Dvi = vi – GviH is the velocity fluctuation along the ith direction with respect to the mean velocity GviH.The covariances v12, v23, and v31 measure the degree of azimuthal asymmetry. The directional variances v11, v22, and v33 are proportional to the nontranslational component of the hot-spot fluid kinetic energy, i.e., v .ii i
2v D=
Equation (1) describes the nonrelativistic, 3-D hot-spot flow asymmetry on neutron-inferred ion-temperature measurements. The variation in ion-temperature measurements along different LOS’s is uniquely governed by the content of the fluid (residual) kinetic energy (RKE) and the properties of the hot-spot flow structure. For turbulent flows, the vanishing covariances lead to apparent ion temperatures inflated uniformly in 4r caused by the isotropic hot-spot fluid kinetic energies from the radial compo-nent of the flows. The 4r minimum of the velocity variance is the fundamental isotropic source contributed by fluid properties that causes the minimum apparent ion temperatures above the real thermal ion temperatures. Equation (1) reveals that the solu-tion for the real thermal ion temperature can be derived by performing DD and DT ion-temperature measurements at a given set of LOS’s to form an invertible matrix.
Inferring Thermal Ion Temperature and Residual Kinetic Energy from Nuclear Measurements
in Inertial Confinement Fusion Implosions

InferrIng Thermal Ion TemperaTure and resIdual KIneTIc energy from nuclear measuremenTs
LLE Review, Volume 1612
Figure 1(a) shows the strong correlation between the D–T experimental yields and the derived DD minimum ion temperatures in the OMEGA implosion database. The strong dependence on the DD minimum ion temperatures leads to yields that scale with ion temperatures +T 3.96 close to the power of 4. The minimum of DD ion temperature is closer to the real thermal ion tempera-ture because the DD total fusion reactant mass MDD - 0.8MDT is smaller than that of DT’s, resulting in a smaller contribution of isotropic flows in min
DD .T Consider a simultaneous ion-temperature measurement for DD and DT along the same single LOS:
DTT T MLOS anisomin v= +DT DT DT and ;T T MLOS min DD anisov= +DD DD DD the minimum DD ion temperature can be derived by removing the common part of the anisotropic velocity variance vaniso.
Figure 1(a) Comparison between the experimental D–T yields with the derived DD minimum ion temperatures. (b) Comparison between the simulated YOC with the ratio of the inferred maximum to the inferred minimum ion temperatures for single modes = 1 to 10.
Figure 1(b) compares the yield-over-clean (YOC) with the ratio of the inferred maximum to the inferred minimum ion temperatures for single modes = 1 to 10. The YOC is shown to be less sensitive with increasing Legendre mode numbers. A good agreement is observed between the yield degradation and the analytic curve: YOC ,T T .
max min1 53–- ` j derived
using Eq. (1). This result explains the effect of mode-1 ion-temperature asymmetries in terms of residual kinetic energies:
min 1= RKE RKE ,T T 1 4 1–max = +_ ^i h where RKE is given by the ratio of the difference of fluid kinetic energies at stagnations between 3-D and 1-D to the maximum 1-D in-flight fluid kinetic energy.
This material is based upon work supported by the Department of Energy National Nuclear Security Administration under Award Number DE-NA0003856, the University of Rochester, and the New York State Energy Research and Development Authority.
1. H. Brysk, Plasma Phys. 15, 611 (1973).
2. K. M. Woo et al., Phys. Plasmas 25, 102710 (2018).
TC15322JR
1.0 1.2 1.4 1.6 1.8 2.0 2.2 2.4
0.3
0.5
0.7
0.9
Yie
ld o
ver c
lean
Tmaxinferred Tmin
inferred/
Y = 3m = 0
Y = 2m = 0
Y = 4m = 2, > 4
Y = 4m = 0
Y = 1m = 0
YOC = (Tmax/Tmin)–1.53
Y DT
× 10
14
0.0
1.6
1.2
0.8
0.4
(a) Minimum DD Ti (b)
1.5 2.0
SD = 0.237
3.02.5 5.04.54.03.5
Yfit = aT b, b = 3.96
Derived Tmin (keV)DD
InertIal ConfInement fusIon
LLE Review, Volume 161 3
H. G. Rinderknecht,1 D. T. Casey,2 R. Hatarik,2 R. M. Bionta,2 B. J. MacGowan,2 P. Patel,2 O. L. Landen,2 E. P. Hartouni,2 and O. A. Hurricane2
1Laboratory for Laser Energetics, University of Rochester2Lawrence Livermore National Laboratory
The large radial convergence required for hot-spot ignition places demanding requirements on the symmetry of implosions. Asym-metric convergence of an inertial confinement fusion (ICF) implosion is predicted to generate unstagnated flows in the converged fuel and hot spot, which limits the maximum hot-spot pressure and reduces confinement time.1 An offset drive illuminating one side of a capsule more brightly than the opposite can produce a net velocity in the fusing hot spot and significant asymmetry in fuel assembly.2 Hot-spot flows have been measured using time-resolved x-ray pinhole cameras,3 but the accuracy of this tech-nique is limited by the small number of diagnostic views. Asymmetry in the assembled fuel has been suggested by trends in hot-spot areal density, ion temperature, and pressure,4 and from significant variations of scattered neutron flux with line of sight observed on some implosions.5 In this work, nuclear diagnostics were found to present a strong signature of a systematic mode-1 drive asymmetry in the cryogenic implosion campaigns performed at the National Ignition Facility (NIF) from 2016–2018. The observed asymmetry limits the performance of the present ICF implosions and must be corrected if ignition is to be achieved.
Flows in the hot-spot plasma are diagnosed by measuring the Doppler shift of the fusion neutrons. A neutron-averaged flow velocity projected along each of four neutron time-of-flight detector lines of sight is obtained by measuring the shift in mean neutron energy relative to the expected value.6 The mean hot-spot velocity magnitude and direction are obtained from these measurements, as shown in Fig. 1(a) for 44 shots performed during 2016–2018. For implosions in which significant velocity was inferred (v > 30 km/s, a typical value for the measurement uncertainty), the hot spots are observed to flow toward one hemisphere (approximately –20° < z < 160°). This data set includes experiments that use a variety of laser pulse shapes and ablators, including shots from the high-density carbon (HDC), “Bigfoot” (high-adiabat HDC), and CH campaigns.7 It is worth noting the magnitude of the velocities observed: many of the implosions presented velocities in excess of 20% of the implosion velocity (typically 350 to 420 km/s), representing significant perturbations to the implosions’ uniformity.
The areal density (tR) of the assembled fuel is diagnosed by a suite of neutron activation diagnostics on over 20 lines of sight. Activation of Zr-90 atoms records the fluence of unscattered neutrons above 12 MeV, which is inversely proportional to tR after correcting for the effects of the Doppler shift on the measurement.8 If scattered neutrons are assumed to be lost from detection, the variation in areal density (DtR) can be calculated from the variation in activation A relative to the mean value GAH as
– . g/cm .ln lnRM
AA
AA 4 64–
DT
DT 2. +t vD e eo o (1)
Performing the activation analysis for the 2016–2018 NIF cryogenic experiments produces a similar pattern to that observed in the velocity data. The inferred areal-density asymmetry [from Eq. (1)] normalized to the average areal density is plotted in Fig. 1(b) compared with the measured hot-spot velocity. The magnitudes of the two signatures are observed to scale linearly across the entire data set: a best-fit slope of 39% tR mode-1 asymmetry per 100-km/s hot-spot velocity matches the data with a reduced
Azimuthal Drive Asymmetry in Inertial Confinement Fusion Implosions at the National Ignition Facility

AzimuthAl Drive Asymmetry in inertiAl Confinement fusion implosions At the nAtionAl ignition fACility
LLE Review, Volume 1614
|2 metric of 0.3. Moreover, the direction of high activation (low areal density) was found to match the direction of the hot-spot velocity, as shown in Figs. 1(c) and 1(d). The hypothesis that the (i, z) directions of the hot-spot velocity and activation mode-1 are the same is supported with reduced |2 values of 0.7 and 0.6, respectively. (These low values of the reduced |2 metric suggest that the measurement uncertainties are likely overestimated.) The comparison of the azimuthal angle in Fig. 1(d) clearly shows the clustering of data points into the range –20° K z K 160°. The implosions used hohlraums with diagnostic windows (regions of the hohlraum wall with thinner gold layers) toward z = 78° and 99° [“two-window” (red)] and with an additional window toward z = 314° [“three-window” (blue)], which cluster toward different directions. The two-window hohlraums are observed to produce hot-spot velocities on average in the direction z = 94°!35°, whereas three-window hohlraums produce velocities toward z = 58°!53°. These values are consistent with the average of the window directions in each design, suggesting the windows contribute to the observed trend.
These observations together strongly indicate the presence of an unexpected systematic implosion asymmetry in NIF cryogenic implosions over the past three years. Spears et al.2 performed 2-D simulations of indirectly driven implosions with an imposed mode-1 asymmetry in the radiation intensity that produced a trend consistent with our observations. While this work was moti-vated by the possibility of pole-to-pole asymmetry, the result does not consider hohlraum geometry and is generally applicable
Figure 1(a) The measured hot-spot velocity for 43 implosions performed on the NIF from 2016–2018. Most shots in the data set (32) present significant hot-spot velocity (v > 30 km/s) clustering in one hemisphere. (b) Mode-1 variation in areal density (DtR/tR) compared with measured hot-spot velocity (km/s). Areal-density variation scales linearly with velocity, in agreement with a 2-D HYDRA model including mode-1 drive asymmetry (black line). [(c),(d)] The inferred (i, z) direction of maximum activation (minimum tR) compared with hot-spot velocity. Implosions with two-window hohlraums (red symbols) cluster toward z = 94°!35°, whereas those with three-window hohlraums (blue symbols) cluster toward z = 58°!53°.
E28960JR
(a)0
30
60
90
120
150
180
i (°
)
0
20
40
60
80
100
km/s
0.8
180
0
60
30
90
120
150
0.6
0.4
0.2
0.0
0
0
90
90
180
180
270
270
0
0 60 120 180
50Velocity (km/s)
Dt
R/Gt
RHA
ctiv
atio
n z
(°)
Act
ivat
ion i
(°)
Velocity z (°)Velocity i (°)
100 150
(b)
(c)
BFCHHDC
Two windowThree window
0 60 120 180 240 300z (°)
(d)
2-D HYDRA

InertIal ConfInement fusIon
LLE Review, Volume 161 5
to radiation asymmetry in arbitrary directions. The drive asymmetry accelerated the capsule away from the direction with higher radiation flux, producing a neutron-weighted hot-spot velocity in that direction that scaled with the flux asymmetry and covered the range we observed (#120 km/s). Areal density also increased in the direction of peak intensity and decreased in the opposite direction. A prediction of the scaling between neutron-inferred hot-spot velocity and areal-density asymmetry magnitude [black line in Fig. 1(b)] agrees with the data.
The hohlraum windows can plausibly create such a mode-1 radiation asymmetry. Figure 2 shows a calculation of the reduction in radiation flux onto a capsule inside a three-window hohlraum, assuming complete radiation loss at the windows, performed using the view factor code VisRAD.9 Up to 6.2% radiation deficit toward the windows is predicted in this limiting case: signifi-cantly larger than the asymmetry needed to explain the most extreme velocities. In experiments, thinner gold layers and gaps approaching half the window area will reduce local radiation power by some fraction of this amount, inducing velocity and higher activation in the average direction of the windows. This hypothesis matches the observed data trends with hohlraum window design. Together, these observations provide strong evidence that a systematic, azimuthally directed mode-1 drive asymmetry of up to !2% in radiation intensity is present in this series of implosions. Detailed models are in development to more quantitatively assess window radiation losses, including the effects of window architecture and ablation dynamics.10,11
E29017JR
(a) (b)
300 0 60 120 180 240 300z (°)
–1
–5
–3
Redu
ctio
n in
inci
dent
flux
(%)
Figure 2(a) Model of the capsule in a laser-irradiated hohlraum from view angle (65°, 120°). Size and position of diagnostic windows are shown in blue. (b) Calculated reduction of radiation flux on the capsule in a three-window hohlraum, assuming complete radiation loss through windows.
Such an asymmetry represents a dominant degradation mechanism for the implosions: a 3-D model predicts that the implo-sion asymmetry reduced the yield by 5# for a representative shot in this data set.1 Investigation of asymmetry sources, including hohlraum windows, laser delivery, capsule and ice-thickness variations, and target alignment is ongoing to improve implosion symmetry control and performance.
This material is based upon work supported by the Department of Energy National Nuclear Security Administration under Award Number DE-NA0003856, the University of Rochester, and the New York State Energy Research and Development Authority.
1. P. T. Springer et al., Nucl. Fusion 59, 032009 (2019).
2. B. K. Spears et al., Phys. Plasmas 21, 042702 (2014).
3. J. J. Ruby et al., Phys. Plasmas 23, 072701 (2016).
4. O. A. Hurricane et al., Nat. Phys. 12, 800 (2016).
5. C. B. Yeamans and N. Gharibyan, Rev. Sci. Instrum. 87, 11D702 (2016).

AzimuthAl Drive Asymmetry in inertiAl Confinement fusion implosions At the nAtionAl ignition fACility
LLE Review, Volume 1616
6. R. Hatarik et al., Rev. Sci. Instrum. 89, 10I138 (2018).
7. L. Berzak Hopkins et al., Plasma Phys. Control. Fusion 61, 014023 (2018); D. T. Casey et al., Phys. Plasmas 25, 056308 (2018); O. A. Hurricane et al., Phys. Plasmas 26, 052704 (2019).
8. H. G. Rinderknecht et al., Rev. Sci. Instrum. 89, 10I125 (2018).
9. J. J. MacFarlane, J. Quant. Spectrosc. Radiat. Transf. 81, 287 (2003).
10. B. J. McGowan et al., “Trending Low Mode Asymmetries in NIF Capsule Drive Using a Simple Viewfactor Metric,” submitted to High Energy Density Physics.
11. J. Milovich et al., Bull. Am. Phys. Soc. 64, JO7.00005 (2019).
InertIal ConfInement fusIon
LLE Review, Volume 161 7
X. Bian,1 H. Aluie,1,2 D. Zhao,1,2 H. Zhang,1,2 and D. Livescu3
1Department of Mechanical Engineering, University of Rochester2Laboratory for Laser Energetics, University of Rochester
3Los Alamos National Laboratory
The Rayleigh–Taylor instability (RTI) appears at a perturbed interface when a light fluid (tl) is accelerated against a heavy fluid (th). It can significantly degrade a target’s performance in inertial confinement fusion. In Ref. 1 Layzer predicted the nonlinear stage development on assuming a potential flow with Atwood number .A 1–h hl l/ t t t t+ =_ _i i Later, in Ref. 2, Goncharov generalized Layzer’s theory to arbitrary Atwood numbers. The model predicts a terminal bubble velocity of U Ag A Ck2 1b = + ,_ i8 B where C = 3 in 2-D and C = 1 in 3-D; k is the perturbation wave number.
Recent studies have shown the limitation of potential flow models in both ablative3,4 and classical RTI.5–7 In this study, we perform high-resolution, fully compressible simulations with the highest resolution (1024 # 8192 in 2-D and 256 # 256 # 2048 in 3-D). The late-time behavior of bubbles and spikes is studied systemically at both low and high Atwood numbers at different perturbation Reynolds numbers:
ReA
A g1p I/ m m n t
+,` j
where m is the perturbation wavelength, g is gravity, and tI is the interfacial density. A comparison between 2-D and 3-D RTI is also conducted.
As shown in Fig. 1(a), the analysis of Rep suggests that (1) at sufficiently large Rep, the enhancement in bubble velocity beyond the “terminal” value is sustained and does not decrease at later times, as had been previously observed in lower-resolution simula-tions,6 and (2) even at lower Rep, when the re-acceleration fails or is not achieved altogether, the bubble velocity does not maintain a constant value but decays instead at late times.
Figure 1(b) shows that increasing A makes it more difficult for bubble speed to increase and persist above the “terminal velocity” value of potential flow theory. This is consistent with the findings of Ramaprabhu et al.6 However, Ramaprabhu et al.6 showed an eventual deceleration back to the terminal velocity after a transient re-acceleration stage for all Atwood numbers. In contrast, our results indicate that the bubble speed enhancement above the terminal value can be sustained regardless of A if the Rep is sufficiently large. The differing results are most probably caused by the difference in resolution and our code guaranteeing momentum conservation. The results reported here maintain symmetry, which is necessary for momentum conservation, and are at a significantly higher resolution than what was possible several years ago when the study by Ramaprabhu et al.6 was conducted. Compared to the simulations in Ref. 6, our simulations show a clear and sustained bubble-speed enhancement at A = 0.04 and 0.25. At A > 0.25, the bubble velocity exhibits intermittent oscillations above the terminal value with an intensity that increases with increasing Rep, suggesting that a clear sustained bubble-speed enhancement is possible if Rep is sufficiently large.
Revisiting the Late-Time Growth of Single-Mode Rayleigh–Taylor Instability and the Role of Vorticity

Revisiting the Late-time gRowth of singLe-mode RayLeigh–tayLoR instabiLity and the RoLe of voRticity
LLE Review, Volume 1618
Three-dimensional density visualizations are shown in Fig. 2. The effects of A and Rep on RTI are qualitatively similar in 2-D and 3-D; however, 3-D bubbles are easier to re-accelerate, having a lower Rep threshold for any A.
The strong correlation between vorticity and bubble velocity suggests that re-acceleration and deceleration of the bubble front is determined by vorticity accumulation inside the bubble, consistent with the previous findings.3,7 Here, we quantitatively show that the vortices that propel the bubble front are not generated inside the bubble but are instead generated far below the bubble tip. The vortices then propagate toward the bubble tip. Note that the vortices need to move faster than the bubble tip, which implies that the induced vortical velocity should enhance the advection velocity.
E28995JR
Frb
1.0
0.5
0.0
Rep = 100Rep = 400Rep = 1,000Rep = 8,000Rep = 20,000
A = 0.04A = 0.25A = 0.60A = 0.80
0 2 4x
6 8
Frb
0.8
0.6
0.4
0.2
0.00 2 4
x
6 8
(a) (b)1.5
1.0
Figure 1(a) The effects of Rep on the bubble velocity in 2-D RTI at A = 0.04; (b) effects of A on the bubble velocity in 2-D RTI at Rep = 20,000. The dashed lines in (a) and (b) show the potential model prediction. Frb is the nondimensional bubble velocity; x is the nondimensional time.
Figure 2Three-dimensional density visualization at x = 5. [(a),(b)] Results at A = 0.04 for Rep = 1000 and 8000, respectively; [(c),(d)] results at A = 0.8 for Rep = 1000 and 8000, respectively.
E28996JR
(a) (b) (c) (d)

InertIal ConfInement fusIon
LLE Review, Volume 161 9
This research was funded by the LANL LDRD program through project number 20150568ER and DOE FES grant number DE-SC0014318. D. Zhao and H. Aluie were also supported by DOE NNSA award DE-NA0003856. H. Aluie was also supported by NASA grant 80NSSC18K0772 and DOE grant DE-SC0019329. Computing time was provided by the National Energy Research Scientific Computing Center (NERSC) under Contract No. DE-AC02-05CH11231.
1. D. Layzer, Astrophys. J. 122, 1 (1955).
2. V. N. Goncharov, Phys. Rev. Lett. 88, 134502 (2002).
3. R. Betti and J. Sanz, Phys. Rev. Lett. 97, 205002 (2006).
4. R. Yan et al., Phys. Plasmas 23, 022701 (2016).
5. P. Ramaprabhu et al., Phys. Rev. E 74, 066308 (2006).
6. P. Ramaprabhu et al., Phys. Fluids 24, 074107 (2012).
7. T. Wei and D. Livescu, Phys. Rev. E 86, 046405 (2012).
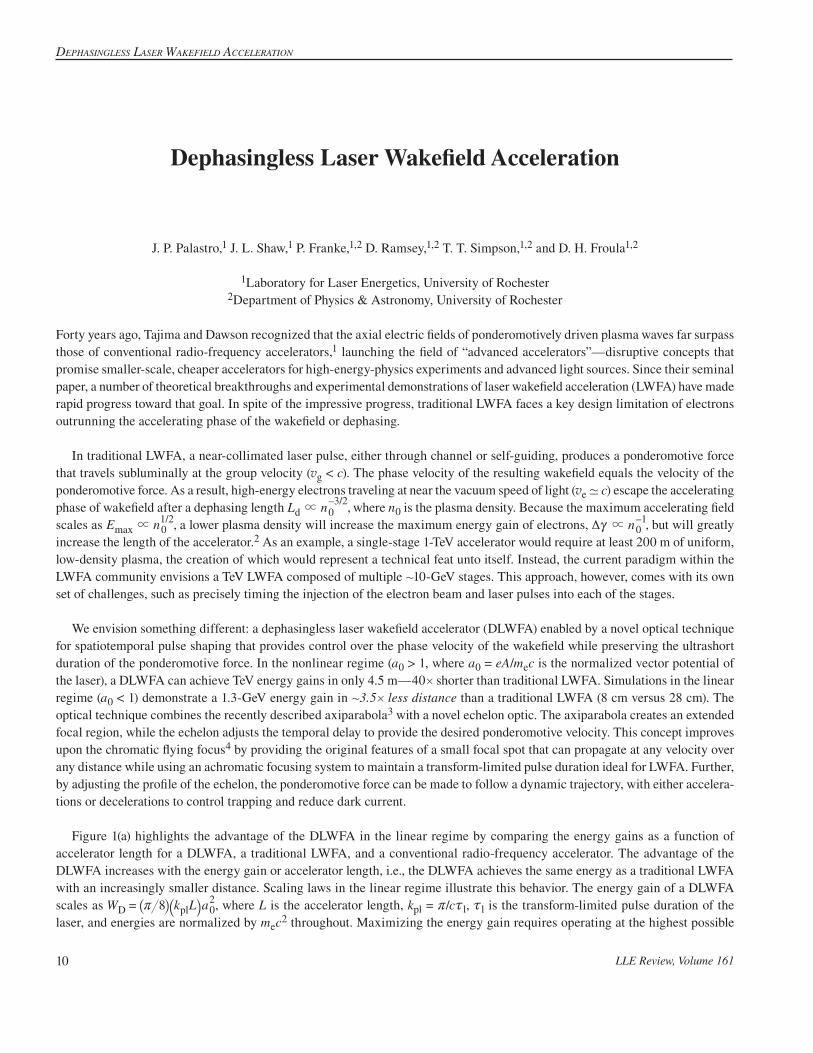
Dephasingless laser WakefielD acceleration
LLE Review, Volume 16110
J. P. Palastro,1 J. L. Shaw,1 P. Franke,1,2 D. Ramsey,1,2 T. T. Simpson,1,2 and D. H. Froula1,2
1Laboratory for Laser Energetics, University of Rochester2Department of Physics & Astronomy, University of Rochester
Forty years ago, Tajima and Dawson recognized that the axial electric fields of ponderomotively driven plasma waves far surpass those of conventional radio-frequency accelerators,1 launching the field of “advanced accelerators”—disruptive concepts that promise smaller-scale, cheaper accelerators for high-energy-physics experiments and advanced light sources. Since their seminal paper, a number of theoretical breakthroughs and experimental demonstrations of laser wakefield acceleration (LWFA) have made rapid progress toward that goal. In spite of the impressive progress, traditional LWFA faces a key design limitation of electrons outrunning the accelerating phase of the wakefield or dephasing.
In traditional LWFA, a near-collimated laser pulse, either through channel or self-guiding, produces a ponderomotive force that travels subluminally at the group velocity (vg < c). The phase velocity of the resulting wakefield equals the velocity of the ponderomotive force. As a result, high-energy electrons traveling at near the vacuum speed of light (ve - c) escape the accelerating phase of wakefield after a dephasing length ,L nd 0
/3 2–? where n0 is the plasma density. Because the maximum accelerating field
scales as ,E n /max 0
1 2? a lower plasma density will increase the maximum energy gain of electrons, ,n01–?cD but will greatly
increase the length of the accelerator.2 As an example, a single-stage 1-TeV accelerator would require at least 200 m of uniform, low-density plasma, the creation of which would represent a technical feat unto itself. Instead, the current paradigm within the LWFA community envisions a TeV LWFA composed of multiple +10-GeV stages. This approach, however, comes with its own set of challenges, such as precisely timing the injection of the electron beam and laser pulses into each of the stages.
We envision something different: a dephasingless laser wakefield accelerator (DLWFA) enabled by a novel optical technique for spatiotemporal pulse shaping that provides control over the phase velocity of the wakefield while preserving the ultrashort duration of the ponderomotive force. In the nonlinear regime (a0 > 1, where a0 = eA/mec is the normalized vector potential of the laser), a DLWFA can achieve TeV energy gains in only 4.5 m—40# shorter than traditional LWFA. Simulations in the linear regime (a0 < 1) demonstrate a 1.3-GeV energy gain in +3.5# less distance than a traditional LWFA (8 cm versus 28 cm). The optical technique combines the recently described axiparabola3 with a novel echelon optic. The axiparabola creates an extended focal region, while the echelon adjusts the temporal delay to provide the desired ponderomotive velocity. This concept improves upon the chromatic flying focus4 by providing the original features of a small focal spot that can propagate at any velocity over any distance while using an achromatic focusing system to maintain a transform-limited pulse duration ideal for LWFA. Further, by adjusting the profile of the echelon, the ponderomotive force can be made to follow a dynamic trajectory, with either accelera-tions or decelerations to control trapping and reduce dark current.
Figure 1(a) highlights the advantage of the DLWFA in the linear regime by comparing the energy gains as a function of accelerator length for a DLWFA, a traditional LWFA, and a conventional radio-frequency accelerator. The advantage of the DLWFA increases with the energy gain or accelerator length, i.e., the DLWFA achieves the same energy as a traditional LWFA with an increasingly smaller distance. Scaling laws in the linear regime illustrate this behavior. The energy gain of a DLWFA scales as ,W k L a8D pl 0
2r= _ `i j where L is the accelerator length, kpl = r/cxl, xl is the transform-limited pulse duration of the
laser, and energies are normalized by mec2 throughout. Maximizing the energy gain requires operating at the highest possible
Dephasingless Laser Wakefield Acceleration

Plasma and Ultrafast Physics
LLE Review, Volume 161 11
density, ,n m eemax2
02
12
r a x= and increasing the length of the plasma as much as possible. The promise of extending DLWFA to the nonlinear bubble regime—a TeV accelerator in 4.5 m—is illustrated by Fig. 1(b). For a nonlinear DLWFA, ,W k L a1 2D pl
/01 2= ` j
where now k a cpl/
01 2
1+ x in order to match (roughly) half the bubble radius to the transform-limited pulse duration. As before, operating at the highest possible density and increasing the plasma length maximize the energy gain.
The dephasingless wakefield can be excited by a ponderomotive force that travels through the plasma at the speed of light in vacuum over a distance greater than the dephasing length. The novel spatiotemporal technique employed here and depicted in Fig. 2 accomplishes this by using two optics: an axiparabola3 and a cylindrically symmetric echelon. The axiparabola creates an extended focal region by focusing different radial locations in the near field to different axial locations in the far field. The echelon adjusts the temporal delay of radial locations in the near field to produce the desired ponderomotive or “focal” velocity.
Figure 2A schematic of the optical configuration enabling the DLWFA. [(a),(b)] The laser pulse first reflects off of a stepped echelon, which imparts the temporal delay required for a focal velocity equal to the speed of light in vacuum without introducing angular dispersion or aberrated focusing. [(c),(d)] After reflecting from the echelon, the pulse encounters the axiparabola, which focuses different rings in the near field to different axial locations in the far field, stretching the region over which the pulse can sustain a high intensity from the initial focus at f0 to f0 + L. (e) The pulse drives a wakefield at the speed of light in vacuum.
Figure 1Energy gain of a DLWFA and traditional LWFA in the (a) linear (a0 = 0.5) and (b) nonlinear (a0 = 4) regimes as a function of accelerator length compared with a conventional radio-frequency accelerator. Simulations (green circles) show excellent agreement with the theoretical scaling. The nonlinear DLWFA reaches a TeV energy gain in 4.5 m—40# less distance than a traditional LWFA. The energy gain for the conventional accelerator is determined by the electric-field threshold for material damage, Wc = EthrL, where Ethr = 100 MeV/m. The linear and nonlinear wakefields were driven by a 1-nm laser with xl = 30 fs and xl = 15 fs, respectively.
(a) (b)
Accelerator length (m)Accelerator length (m)
Ener
gy g
ain
(GeV
) 101
100
10–110–2 100 10210–2 100 102 104
103
102
101
100
Depha
single
ssTrad
itiona
l
Conv
entio
nal Dep
hasin
gless
Traditio
nal
Conv
entio
nal
TC15151JR
abc
de
Lf0
f0 + L
TC15152JR

Dephasingless laser WakefielD acceleration
LLE Review, Volume 16112
The combined axiparabola/echelon system delivers an ultrashort pulse to each axial location in the focal region without unwanted focusing aberrations and a duration equal to that of the incident pulse.
This material is based upon work supported by the Department of Energy National Nuclear Security Administration under Award Number DE-NA0003856, the University of Rochester, and the New York State Energy Research and Development Authority.
1. T. Tajima and J. M. Dawson, Phys. Rev. Lett. 43, 267 (1979).
2. E. Esarey, C. B. Schroeder, and W. P. Leemans, Rev. Mod. Phys. 81, 1229 (2009).
3. S. Smartsev et al., Opt. Lett. 44, 3414 (2019).
4. D. H. Froula et al., Nat. Photonics 12, 262 (2018).

Plasma and Ultrafast Physics
LLE Review, Volume 161 13
R. K. Follett,1 J. G. Shaw,1 J. F. Myatt,2 D. H. Froula,1 and J. P. Palastro1
1Laboratory for Laser Energetics, University of Rochester2Department of Electrical and Computer Engineering, University of Alberta
Direct-drive inertial confinement fusion (ICF) uses multiple overlapping laser beams to symmetrically implode a millimeter-scale cryogenic capsule of deuterium–tritium fuel. The on-target laser intensity is limited by laser–plasma instabilities that can scatter the incident laser light away from the target and produce high-energy electrons that preheat and degrade the implosion. The two primary instabilities that generate hot electrons in direct-drive ICF experiments are stimulated Raman scattering (SRS), which is the decay of an electromagnetic wave (EMW) into another EMW and an electron plasma wave (EPW), and two-plasmon decay (TPD), which is the decay of an EMW into two EPW’s. Understanding the thresholds for these instabilities is critical for design-ing ICF implosions and developing mitigation strategies.
In most direct-drive ICF experiments, the intensity of a single laser beam is below the instability threshold for either SRS or TPD. For the case of TPD, numerous experimental and theoretical papers have shown that multiple laser beams can interact with shared EPW’s, resulting in the instability being driven with single-beam laser intensities well below the instability threshold.1–4 In particular, experiments on the OMEGA laser have demonstrated that using the overlapped laser intensity in the threshold formula for a monochromatic plane wave provides a reasonable approximation to the multibeam threshold. In contrast, relatively little work has been done on multibeam SRS because SRS is not typically observed in implosion experiments on the OMEGA laser.
This summary presents 3-D calculations of multibeam absolute SRS thresholds. The results provide an explanation for a number of experimental observations on OMEGA and the National Ignition Facility (NIF) that cannot be understood in terms of single-beam thresholds or shared daughter-wave theories. The multibeam coupling is shown to be weaker for SRS than for TPD, which results in thresholds that are consistent with both the NIF and OMEGA experiments. Additionally, the simulations show that it is generally not a good approximation to use the overlapped intensity in the single-beam threshold formulas to predict multibeam instability thresholds for SRS or TPD because the multibeam coupling is sensitive to the density scale length. Finally, in contrast to the single-beam SRS results, the shared EMW mode driven near the quarter-critical density is found to have a lower threshold than the absolute sidescatter mode that occurs at lower densities.
In inhomogeneous plasmas, TPD and SRS can have both convectively and absolutely unstable modes. Convectively unstable modes undergo finite spatial amplification when propagating across a resonant region.5 Absolute instability corresponds to one of the daughter waves growing more rapidly than energy is convected out of the resonant region, resulting in temporal growth at a fixed point in space.6,7 Here we will focus on the absolute form of the instabilities because, for conditions relevant to direct-drive ICF, SRS and TPD typically become absolutely unstable at laser intensities where the convective gains are still modest. There are two situations where energy advects slowly out of the resonant region and the absolute thresholds are minimized: (1) one of the daughter waves propagates nearly perpendicular to the density gradient, and (2) one of the daughter waves has a group velocity near zero, which occurs only near n 4c for TPD and SRS.
The calculations presented here were performed using the laser-plasma simulation environment (LPSE) code.8 LPSE solves the time-enveloped wave equations for the electrostatic and electromagnetic plasma response. The individual evolution equations
Multibeam Absolute Stimulated Raman Scattering

MultibeaM absolute stiMulated RaMan scatteRing
LLE Review, Volume 16114
in LPSE are linearized, but the coupling between the electrostatic and electromagnetic response leads to nonlinearity. Thresh-olds are determined by initially bounding the threshold and then iteratively running LPSE to narrow the threshold bounds until acceptable accuracy is achieved. The equations that were solved and the technique used to calculate thresholds are discussed in detail in Ref. 9. Unless otherwise specified, the simulations used a linear density gradient from . to . ,n n 0 22 0 27e c = Te = 2 keV, and m0 = 2rc/~0 = 0.351 nm, and cubic grid cells with a side length of 0.074 nm. The grids were 10 nm wide in the transverse directions (perpendicular to the density gradient) with transverse periodic boundary conditions and absorbing longitudinal bound-ary conditions. All 3-D simulations used six beams with f/6.7 phase plates and polarization smoothing incident at 23° relative to and distributed uniformly about a common axis (similar to an OMEGA “hex”). Error bars correspond to the standard deviation from ensembles of calculations with random realizations of beam polarization, phase, and noise seed.
The primary result presented here is the 3-D multibeam absolute instability thresholds for TPD and SRS shown in Fig. 1. The thresholds are normalized to the single-beam thresholds (Ithr,SB) (Refs. 6 and 7). The fact that I I 1thr thr,SB. for OMEGA-like conditions (Ln = 200 nm, Te = 2 keV) is consistent with the empirical observation that the TPD threshold can be predicted by using the overlapped intensity in the single-beam threshold formula. However, this is not true in general for TPD or SRS because the multibeam coupling becomes weaker with increasing scale length. Additionally, the multibeam coupling for SRS is weaker than for TPD, which explains why TPD is the predominant instability observed in OMEGA experiments despite the fact that Ithr,TPD > Ithr,SRS.
Figure 1Absolute instability thresholds (normalized to the single-beam thresholds) for SRS (blue circles) and TPD (red squares) near cn 4 as a function of density scale length using six beams with phase plates and polarization smoothing at Te = 2 keV. The error bars were obtained from an ensemble of four calculations with random realizations of polarization and phase.
E28937JR
I thr/
I thr,S
B
3.0
2.5
2.0
1.5
1.0
0.5100 150 200 250
Density scale length (nm)300 350 400
SRSTPD
This material is based upon work supported by the Department of Energy National Nuclear Security Administration under Award Number DE-NA0003856, the University of Rochester, and the New York State Energy Research and Development Authority.
1. C. Stoeckl et al., Phys. Rev. Lett. 90, 235002 (2003).
2. D. T. Michel et al., Phys. Rev. Lett. 109, 155007 (2012).
3. J. Zhang et al., Phys. Rev. Lett. 113, 105001 (2014).
4. R. K. Follett et al., Phys. Rev. E 91, 031104(R) (2015).
5. M. N. Rosenbluth, Phys. Rev. Lett. 29, 565 (1972).

Plasma and Ultrafast Physics
LLE Review, Volume 161 15
6. B. B. Afeyan and E. A. Williams, Phys. Fluids 28, 3397 (1985).
7. A. Simon et al., Phys. Fluids 26, 3107 (1983).
8. J. F. Myatt et al., J. Comp. Phys. 399, 108916 (2019).
9. R. K. Follett et al., Phys. Plasmas 26, 062111 (2019).

Hot Raman amplification
LLE Review, Volume 16116
D. Haberberger, A. Davies, J. L. Shaw, R. K. Follett, J. P. Palastro, and D. H. Froula
Laboratory for Laser Energetics, University of Rochester
From its conception at the turn of the 21st century,1,2 Raman amplification in a plasma has attracted attention from the laser-plasma community for its application to the production of extremely high power laser pulses. While optical parametric chirped-pulse–amplification (OPCPA) technologies have revolutionized high-power laser physics by allowing for a many-orders-of-magnitude increase to the maximum achievable power, another plateau has slowly emerged around the 30-PW level for single beams. Increasing the energy or decreasing the pulse width of these ultrahigh-power lasers requires unfeasibly large compression gratings to avoid damage.3 As a result, many envisioned applications of high-power lasers remain beyond the intensity frontier.4 A laser-plasma power amplifier can sustain orders-of-magnitude higher fluences and intensities than solid-state compressor gratings and could provide the technology to expand this frontier. While this promise has sustained interest over the past two decades, experiments have failed to produce a proof-of-principle amplifier scalable to its main application.
The Raman amplification process utilizes a three-wave instability, stimulated Raman scattering (SRS), whereby a short seed pulse at a frequency ~s counter-propagates with respect to a long energetic pump pulse at a frequency ~0 in a plasma. The pon-deromotive beat wave created by the pump and seed pulses drives an electron plasma wave (EPW) at approximately the plasma frequency ~pe = ~0–~s, where ,n e mpe e e2 0~ f= ne is the electron plasma density, e is the electron charge, me is the electron mass, and f0 is the permittivity of free space. Under optimal conditions, the pump can transfer a large fraction of its energy to the seed (up to the Manley–Rowe limit s 0~ ~ ), thereby amplifying it; however, several phenomena can interrupt this process, depending on where one operates in the vast parameter space that spans pump and seed pulse intensities, seed pulse width, pump wavelength, plasma temperature, and plasma density. Navigating this parameter space is complicated by the lack of a defining metric for scaling a proof-of-principle amplifier to the multi-PW level.
While the signatures of many limiting phenomena have been studied in simulations, the complexities of Raman amplification experiments have inhibited reaching a consensus on how many of, and the extent to which, these phenomena are limiting the performance. This is evidenced by the modest advancement in experiments over two decades, despite many detailed theoretical and simulation studies. Much of the simulation work and all past experiments have focused on amplification in a cold plasma (#100 eV), where low damping of the SRS instability allows for exponential growth of a weak seed pulse to rapidly reach the efficient pump-depletion regime (Fig. 1, gray-shaded region). In this regime, SRS growing from thermal noise ahead of the seed is often identified as a limiting mechanism,5,6 but it is typically assumed that it can be detuned with an appropriate amount of pump chirp or plasma density gradient. However, experiments with highly chirped pumps (Dtstretch = Dtcompressed > 100) have yet to surpass an +3.5% single-stage efficiency.7 Furthermore, thermal filamentation of the pump has a high gain rate in cold plasmas.8 While a discussion on filamentation is mostly absent from Raman amplification literature,9 it can deplete the pump-beam intensity through diffraction and create density perturbations that refract the seed beam, detune the resonant interaction, and imprint modulations on the amplified seed phase front, thereby limiting its focusability.10
Here we present a novel high-temperature, efficient Raman amplifier, where deleterious laser instabilities are mitigated. The high temperature increases the intensity threshold for thermal filamentation and generates strong Landau damping of the EPW’s,
Hot Raman Amplification

Plasma and Ultrafast Physics
LLE Review, Volume 161 17
which suppresses SRS growth from thermal noise. The regime takes advantage of quasi-transient amplification,11 where a suf-ficiently intense seed pulse allows for amplification, even in conditions where Landau damping exceeds the linear SRS gain. Vlasov simulations were used to demonstrate and define a new regime for proof-of-principle experiments scalable to PW-class amplifiers, where the (1) intensity gains are $10, (2) energy transfer efficiencies are $30%, and (3) amplified output intensities are $100# the pump intensity (Fig. 1, blue-shaded area).
At a plasma density of 2 # 1019 cm–3, 1-D Vlasov simulations (ARGOS12) at temperatures below 200 eV (black circles in Fig. 1) show strong growth of SRS from noise that depletes the pump pulse before crossing the seed, leaving behind a turbulent EPW spectrum. The square indicates efficient amplification with sufficient gain. Increasing the temperature to 320 eV damps SRS growth from noise driving the interaction into the kinetic regime [kmDe $ 0.3 (Ref. 13), where k is the EPW wave vector and mDe is the Debye length], where a peak efficiency of 55% and intensity amplification factor of 13 were obtained, which is nearly ideal for a next-generation power amplifier. Further increase in the temperature to 650 eV showed a decrease in performance as strong Landau damping and particle trapping inhibit EPW growth. The optimal regime is also shown to be at a plasma temperature above the threshold for thermal filamentation8 for a pump intensity of 1014 W/cm2. The plasma density resides above the cold wave-breaking limit but not too high so as to not partition a large fraction of the pump energy into the driven EPW. The previous experimental studies on Raman amplification are shown to be plagued with all three limitations described here: wave breaking, SRS growth from noise, and filamentation.
The ultimate goal of Raman amplification is to provide an amplifier for petawatt-scale laser systems; therefore, modest inten-sity gains $10, far below what is often the objective in experiments,14 are sufficient. Presumably, the seed pulse is created by a state-of-the-art OPCPA system and has a compressed power of the order of 10 PW (Ref. 3) with a pulse width of the order of 10 to 100 fs. The pump pulse, which is of the order of tens of picoseconds, would necessarily have an intensity less than that of the input seed; therefore, a plasma amplifier should require that the amplified seed intensity be a factor of $100# larger than the pump intensity. Limiting the energy in the pump to a level attainable in state-of-the-art, solid-state picosecond chirped-pulse–amplifica-tion systems requires an energy transfer efficiency of $30%. This final criterion is potentially the most difficult to satisfy since it relies on uninhibited pump-beam propagation, no pre-seed depletion of the pump from thermal SRS, and the seed entering the amplifier being intense enough to achieve high-energy transfer—all of which detrimentally affect high-gain amplifiers relying on exponential gain at low temperatures. Here, we have shown through calculations and kinetic simulations that at high temperatures it is expected that all fluid-like limitations are suppressed, while amplification continues in the presence of kinetic limitations such as Landau damping, particle trapping, and warm wave breaking, which are modeled accurately in the Vlasov simulations. The high-power amplifier metrics were satisfied in a 2-mm plasma preheated to 320 eV and seeded strongly at 1015 W/cm2—all experimentally achievable parameters.
E28909JR
Fila
men
tatio
n
00
200
Previousstudies
Electron temperature (eV)
Plas
ma
dens
ity (#
1019
cm
–3)
400 600
3
2
1
kmDe = 0.3
Cold wave breaking (#1014 W/cm2)
Figure 1The optimal parameter regime for Raman amplification is shown to be at high temperatures.

Hot Raman amplification
LLE Review, Volume 16118
This material is based upon work supported by the Department of Energy Office of Science under Award Number DE-FOA-0001820, the Department of Energy National Nuclear Security Administration under Award Number DE-NA0003856, the University of Rochester, and the New York State Energy Research and Development Authority.
1. G. Shvets et al., Phys. Rev. Lett. 81, 4879 (1998).
2. V. M. Malkin, G. Shvets, and N. J. Fisch, Phys. Rev. Lett. 82, 4448 (1999).
3. C. N. Danson et al., High Power Laser Sci. Eng. 7, e54 (2019).
4. G. Mourou, Rev. Mod. Phys. 91, 030501 (2019).
5. V. M. Malkin, G. Shvets, and N. J. Fisch, Phys. Rev. Lett. 84, 1208 (2000).
6. D. S. Clark and N. J. Fisch, Phys. Plasmas 10, 3363 (2003).
7. J. Ren et al., Nat. Phys. 3, 732 (2007).
8. W. L. Kruer, Comments Plasma Phys. Control. Fusion 9, 63 (1985).
9. D. Turnbull et al., Phys. Plasmas 19, 073103 (2012).
10. A. A. Solodov, V. M. Malkin, and N. J. Fisch, Phys. Plasmas 10, 2540 (2003).
11. V. M. Malkin and N. J. Fisch, Phys. Rev. E 80, 046409 (2009).
12. R. K. Follett et al., Phys. Plasmas 26, 062111 (2019).
13. J. L. Kline et al., Phys. Rev. Lett. 94, 175003 (2005).
14. G. Vieux et al., Sci. Rep. 7, 2399 (2017).

Plasma and Ultrafast Physics
LLE Review, Volume 161 19
A. Kar,1 S. X. Hu,1 G. Duchateau,2 J. Carroll-Nellenback,1 and P. B. Radha1
1Laboratory for Laser Energetics, University of Rochester2Université de Bordeaux-CNRS-CEA, Centre Lasers Intenses et Applications
In direct-drive inertial confinement fusion (ICF), a spherical target is irradiated by laser beams to create the necessary conditions for fusion reactions. These targets contain the fusion fuel [deuterium (D) and tritium (T)] inside a plastic (CH) shell. The laser energy on the target causes the plastic to ablate outward like the exhaust of a rocket. This ablation creates a reaction force on the remaining part of the capsule. Ideally, one hopes that this should create a spherically symmetric implosion. However, single-beam speckle (laser imprint) can introduce perturbations that can compromise performance.1 In fact, the laser energy deposited from a single-beam speckle penetrates through the target nonuniformly. This nonuniformity is intensified by the filamentation of the laser energy that leaves a damage track due to the self-focused laser radiation. These variations act as seeds to Rayleigh–Taylor instability, which grows exponentially. To create a uniform symmetric implosion for ignition, understanding and mitigating this laser-imprint process is important. As the laser beams irradiate the target, the target is ionized and a plasma is created around it. This coronal plasma determines the laser-energy deposition on the target until a critical surface is established and the target becomes opaque to the laser. After this, the subcritical underdense plasma absorbs the laser energy and transfers this energy through the electrons inside the critical surface to the ablation region.
Recently, it has been shown that the initial solid state of the target with specific electronic and optical properties has a notable impact on the subsequent plasma dynamics. It is important to implement a detailed model to understand the solid-to-plasma transition. Therefore, a microphysics model describing the response of the ablator material to the laser-irradiation process on the target has been developed.2 The microphysics model incorporates a photoionization and impact ionization scheme that describes the transition of the solid ablator into plasma due to laser irradiation. Traditionally, hydrodynamic codes have ignored this detailed transition mechanism from the solid-to-plasma state for the target. The hydrodynamic codes either assume that the material is ionized to start with, and a critical electron density exists initially, or they adopt the “cold-start” method where the laser energy is deposited on the surface of the target to generate a critical surface in an ad hoc manner. Both of these strategies are incorrect from a physics perspective. Since radiation-hydrodynamic simulations form an essential component of our understanding of the direct-drive ICF process, it is important to incorporate the microphysics model into the hydrodynamic codes to model the seeds of Rayleigh–Taylor growth including the initial solid state of the target.
In this project, a revised version of the above-mentioned microphysics model2 has been implemented into the 1-D hydro-dynamic code LILAC. We demonstrate the implications of the microphysics model in ICF through hydrodynamic simulations for both spherical and planar targets. Unlike the ad hoc model, the microphysics model shows laser-energy absorption inside the target over time. Additionally, the energy absorption causes the electron temperature inside the target to rise; subsequently, the pressure inside the target increases. This is consistent with previous observations that the laser beam penetrates through the plastic and deposits energy inside the target since plastic on the outermost layer of the target is transparent to UV laser light of 351-nm wavelength.3 This phenomenon had not been captured in previous hydrodynamic simulations since the incident laser intensity was restricted to the target surface by creating a critical surface in an ad hoc fashion.
Implementing a Microphysics Model in Hydrodynamic Simulations to Study the Initial Plasma Formation in Dielectric
Ablator Materials for Direct-Drive Implosions

ImplementIng a mIcrophysIcs model In hydrodynamIc sImulatIons to study the InItIal plasma FormatIon
LLE Review, Volume 16120
This work focuses mainly on plastic or polystyrene ablators since they are commonly used ablator materials for direct-drive ICF targets. CH is a dielectric material with a band gap of 4.05 eV. This makes solid plastic transparent to UV laser light of 351-nm wavelength (or 3.53 eV), the wavelength of TW facilities like OMEGA. Therefore, the laser energy shines through the target in the early stage of laser irradiation. At present, hydrodynamic codes ignore the transparency of plastic to UV light, which is incorrect. To overcome these inaccuracies and develop a physics-based model, a rate equation governing the free-electron den-sity of the electrons in the conduction band has been derived recently.2 This rate equation as shown in Fig. 1(a) is coupled with a laser-energy–deposition scheme. Based on the laser-energy deposition, the plasma profile and the various physical quantities are determined. This model governs the dynamics of the initial plasma formation from the solid throughout the target during the early stage of the irradiation, until a critical surface is created. During this stage, the laser-energy deposition is mediated by the joule heating mechanism of the electrons in the corona. Once the critical surface forms, the material is ionized and assumed to be in the plasma state. After this time, the microphysics model dominates the plasma profile ahead of the shock front, while the normal LILAC method for inverse bremsstrahlung absorption dominates the physics behind the shock front as demonstrated in Fig. 1(b).
TC15135JR
Laser pulseIntensity: I(t) and
electric field: EL(t)
Update electrondensity
WPI
h
xrRate equation
dnfedt
= f pnn
1 –vbfe WPI + hnfe –
xrnfe
2U2t
nfe (t + Dt)0
1
2
Mas
s den
sity
415 430Position (nm)
445
Lase
r ene
rgy
depo
sited
10–9
10–11
10–13
10–15
Microphysicsmodel
NormalLILAC method
Shockfront
Criticalsurface
Keldyshmultiphotonization
Impact ionization
Recombination rate
Laser-energy deposition joule heating: = j.EL
2U2t
Temperature model
Multiphysics shock-timingmass densityMultiphysics shock-timinglaser energy deposited
(a) (b)
10–7
Figure 1(a) A flowchart with detailed equations, different physical processes, and their implementation sequence inside LILAC. (b) An outline of the regions where the microphysics model and the normal LILAC method are implemented after the critical surface is formed.
After we implemented this microphysics model into LILAC, we examined how it affects hydrodynamic simulations in ICF. The effect of irradiating a solid plastic sphere [Fig. 2(a)] with a picket pulse [Fig. 2(b)] is discussed here. The solid CH sphere is initially transparent to the UV light before the critical surface formation occurs around 81 ps according to simulation. The microphysics model dominates the plasma profile for the entire sphere until the critical surface forms. Beyond that, the micro-physics model controls the plasma profile ahead of the shock front. Figure 2(d) shows the plasma profiles in the radially outward direction, 300 nm from the center of the sphere. The plasma profiles are plotted at 75 ps, i.e., before the critical surface forms, at the peak of the picket pulse (200 ps) and at 400 ps, which is the end of the picket pulse. The microphysics model predicts a rise in the electron temperature and pressure before the shock wave travels through the target due to the shinethrough mechanism of the laser light inside the CH.

Plasma and Ultrafast Physics
LLE Review, Volume 161 21
Figure 2(a) A solid plastic sphere of 430-nm radius is irradiated with (b) a laser pulse of 250 J of energy; (c) the fraction of the incident laser energy absorbed over time. The absorption fraction between the microphysics model and the ad hoc model is initially different since the energy deposition is initially restricted to the surface of the target for the ad hoc model. Beyond the critical surface formation, the absorption profiles are the same since the plasma profile in the ablation region is controlled by the ad hoc model. (d) The plasma profiles from the microphysics model and the ad hoc model are plotted in red and blue, respectively. The top row shows the laser intensity deposition profiles (dashed red lines for the microphysics model and solid blue circles for the ad hoc model) and the corresponding free-electron density (solid lines). The critical surface formation occurs when the free-electron density rises to 9 # 1021 cm–3 for UV light. The middle row shows the rise in the electron temperature (solid lines) predicted by the microphysics model and the ion temperatures (dashed lines). The mass density profile (solid lines) and the difference in the pressure profiles (dashed lines) is evident in the lower row.
TC15136JR
Laser beams
CH target
430 nm Pow
er (T
W)
Time (ps)
0
1
2
1000 200 300 400
(a) (b) (c)
0.0
0.2
0.4
0.6
0.8
1.0
Abs
orpt
ion
frac
tion
Time (ps)1000 200 300 400
0.0
0.5
1.0
1.5
2.0
2.5
Lase
r pow
er (×
1012
W)
(d)
Microphysics modelad hoc model
Elec
tron
dens
ity (/
cm3 ) 1024 1015
1010
1011
1012
1013
10141022
1020
1018
10–4
10–2
100
10–4
10–2
100
101
100
10–1
10–2
Time = 75 ps
Distance (nm)300 350 450400 500
Distance (nm)300 350 450400 500
Distance (nm)300 350 450400 500
Lase
r int
ensi
ty (W
/cm
2 )
Time = 200 ps Time = 400 ps
Elec
tron
tem
pera
ture
(keV
)
Ion
tem
pera
ture
(keV
)Pr
essu
re (M
bar)
Mas
s den
sity
(g/c
m3 )
0
1
2
3
4
Microphysics modelad hoc model

ImplementIng a mIcrophysIcs model In hydrodynamIc sImulatIons to study the InItIal plasma FormatIon
LLE Review, Volume 16122
The next step is to implement the microphysics model into the 2-D hydrodynamic code DRACO for laser-imprint simula-tions. Perturbations to the ablation pressure as a function of angle due to the target response to laser imprint will be modeled with DRACO. Efforts to study the consequences of the microphysics model for a cryogenic implosion are also underway as the material properties of DT gas and DT ice are being investigated. It is necessary to know the band gap, collisional frequency, and recombination rates for these materials to accurately implement the microphysics model.
This material is based upon work supported by the Department of Energy National Nuclear Security Administration under Award Number DE-NA0003856, the University of Rochester, and the New York State Energy Research and Development Authority.
1. R. Ishizaki and K. Nishihara, Phys. Rev. Lett. 78, 1920 (1997).
2. G. Duchateau et al., Phys. Rev. E 100, 033201 (2019).
3. D. H. Edgell et al., Phys. Plasmas 15, 092704 (2008).

Plasma and Ultrafast Physics
LLE Review, Volume 161 23
S. X. Hu,1 V. V. Karasiev,1 V. Recoules,2 P. M. Nilson,1 N. Brouwer,2 and M. Torrent2
1Laboratory for Laser Energetics, University of Rochester2CEA, DAM, DIF
Superdense plasmas, having mass densities ranging from tens to over millions of grams per cubic centimeter, widely exist in planetary interiors and astrophysical objects such as brown-dwarf cores and white dwarfs. How atoms, the fundamental “building blocks” of matter, behave under such extreme density conditions is not yet well understood, even in single-species plasmas. Seek-ing a deeper understanding of atomic physics in superdense plasmas is now becoming possible because these extreme states of matter can be created and probed in the laboratory by using powerful lasers or pulsed-power machines. Here, we have applied the thermal density functional theory (DFT) to investigate the radiation spectra of superdense iron–zinc (Fe–Zn) plasma mixtures at mass densities of t = 250 to 2000 g/cm3 and temperatures of kT = 50 to 100 eV, accessible by imploding double-shell targets. Our ab initio calculations reveal two new and uniquely extreme atomic physics phenomena—firstly, an interspecies radiative transition (IRT); and, secondly, the breaking down of the dipole-selection rule for radiative transitions in isolated atoms. Our first-principles DFT calculations predict that for superdense plasma mixtures, both interatomic radiative transitions and dipole-forbidden intra-atomic transitions can become comparable to the normal intra-atomic Ka-emission signal because of the superdense environment.
For a warm and superdense Fe–Zn plasma of t = 1000 g/cm3 and kT = 50 eV with 1s vacancies of both Fe and Zn ions, the calculated emission coefficient as a function of photon energy is shown by the solid red line in Fig. 1. To identify the IRT fea-
Extreme Atomic Physics: Interspecies Radiative Transition in Warm and Superdense Plasma Mixtures
Figure 1The emission spectra of superdense plasmas of Fe only, Zn only, and a Fe–Zn mixture having 1s vacancy at t = 1000 g/cm3 and kT = 50 eV, calculated by DFT using ABINIT.
Continuum 1s (Fe)
Continuum
1s (Zn)
Ka (Fe)Ka (Zn)
2s (F
e)
1s (
Zn)
2s (Z
n)
1s (
Zn)
2s (F
e)
1s (
Fe)
2p (Z
n)
1s (
Fe)
2s (Z
n)
1s (F
e)
2p (F
e)
1s (
Zn)
TC15116JR
Emis
sion
coe
ffic
ient
(pho
ton.
s–1 .
Sr –
1 .m
–3)
1025
1030
1029
1028
1027
1026
6000 7000 8000 9000ho (eV)
Fe onlyZn onlyFe–Zn mixture
ExtrEmE Atomic Physics: Interspecies Radiative Transition in WArm And suPErdEnsE PlAsmA mixturEs
LLE Review, Volume 16124
tures, we also plotted the spectra of single-species Fe (dashed–dotted green line) and Zn (dashed blue line) plasmas in Fig. 1, respectively. Again, these pure plasmas have the same density and temperature conditions as those of the Fe–Zn mixture. From Fig. 1, one can clearly see that four new spectral peaks appear in the superdense Fe–Zn plasma mixtures (highlighted by the dashed ellipse): the two new emission lines located at ho . 8666 eV and ho . 8816 eV correspond to transitions from the 2s and 2p states of the Fe ion to the 1s hole of the Zn ion, while the other two new peaks at ho . 5838 eV and ho . 6012 eV belong to radiative transitions of 2s/2p electrons of the Zn ion to the 1s vacancy of Fe. Besides these new interatomic Ka emissions, the dominant intra-atomic Ka lines for each species are, of course, present in the emission spectra in Fig. 1. The vertical dotted black lines mark the normal intra-atomic Ka locations of ambient Fe and Zn, respectively. The red shift of the intra-atomic Ka line is caused by the increased electron screening resulting from the dense plasma environment. In addition, the intra-atomic 2s $ 1s transitions for each species, although being about three orders of magnitude weaker than the normal intra-atomic Ka lines, also appear as a consequence of the breaking down of the dipole-selection rule due to the density-induced distortion of 2s states. Finally, the continuum emissions from free electrons filling 1s holes of Fe and Zn ions are also present in the emission spectra, as expected (shown by Fig. 1).
Interspecies and dipole-forbidden radiative transitions were not previously considered for emissivity/opacity calculations in extremely dense plasma mixtures, directly impacting our understanding of astrophysical objects and, more generally, of the extreme atomic physics that can occur in plasma mixtures at very high energy densities.
This material is based upon work supported by the Department of Energy National Nuclear Security Administration under Award Number DE-NA0003856, the University of Rochester, and the New York State Energy Research and Development Authority.

Plasma and Ultrafast Physics
LLE Review, Volume 161 25
M. J. Rosenberg,1 A. A. Solodov,1 W. Seka,1 R. K. Follett,1 J. F. Myatt,2 A. V. Maximov,1 C, Ren,3 S. Cao,3 P. Michel,4 M. Hohenberger,4 J. P. Palastro,1 C. Goyon,4 T. Chapman,4 J. E. Ralph,4 J. D. Moody,4 R. H. H. Scott,5 K. Glize,5
and S. P. Regan1
1Laboratory for Laser Energetics, University of Rochester2Department of Electrical and Computer Engineering, University of Alberta
3Department of Mechanical Engineering, University of Rochester4Lawrence Livermore National Laboratory
5Central Laser Facility, STFC Rutherford Appleton Laboratory
Direct-drive inertial confinement fusion implosions may be susceptible to preheat by hot electrons generated by laser–plasma instabilities. Stimulated Raman scattering (SRS), which occurs at densities around and below the quarter-critical density of the laser ,n n 4e c=8 where ne is the electron density and nc is the critical density for the laser wavelength m0 (in nm), with
. cm ,n 1 1 10c 0#. m21 32 –– B has been observed to be a prominent hot-electron–generating instability in direct-drive experiments at the National Ignition Facility (NIF).1
Planar-geometry experiments were conducted on the NIF to elucidate the SRS mechanisms present in direct-drive ignition-scale plasmas, intensity thresholds for SRS, and the scaling of SRS with laser intensity for different laser beam angles of incidence. These experiments were designed to achieve plasma conditions relevant to direct-drive–ignition designs, with density scale lengths Ln + 600 nm, electron temperatures Te + 4.5 keV, and laser intensities at n 4c between
cnI 4 10414
#+ and 1.3 # 1015 W/cm2.
Figure 1 shows the experimental setup, simulated quarter-critical plasma conditions by the 2-D radiation-hydrodynamic code DRACO, and time-resolved SRS spectral data collected along the target normal. As shown in Fig. 1(a), the experiment used 32 beams (eight “quads”) at incidence angles <35° on a CH ablator and a linearly ramped laser pulse to reach simulated conditions at n 4c of up to n . W/cm ,I 8 5 104
14 2#+
c Ln + 580 nm, and Te + 4.0 keV [Fig. 1(b)]. The scattered-light spectrum [Fig. 1(c)]
shows two features: a narrow feature at around 710 nm corresponding to half-harmonic 20~` j emission and a broader feature between 600 and 660 nm. The 0 2~ feature corresponds to an absolute SRS instability at ,n 4c while the lower-wavelength feature is generated by SRS in the underdense n 4< c` j region.1 Lineouts of each feature reveal differences in the time histories of the underlying instabilities. While the 20~ feature increases nearly linearly with laser intensity [Fig. 1(d)], signifying a saturated absolute SRS instability, the underdense SRS feature increases exponentially with laser intensity [Fig. 1(e)], suggesting that this instability is observed in its linear convective stage.
Additional experiments were conducted with the planar target oriented normal to the NIF polar axis. In these experiments, the target was irradiated in cylindrical symmetry by laser beams at well-defined angles of incidence, either 23° and 30° (“inner beams”) or 45° and 50° (“outer beams”). SRS was diagnosed by optical streaked spectrometers at viewing angles of 23° and 50°, revealing different SRS mechanisms, all from the underdense region. As previously observed,1 SRS was detected at each viewing angle for each of the inner-beam and outer-beam laser drives. The observations at 50°, whether generated by inner or outer beams, are interpreted as tangential sidescatter, with the SRS-scattered light propagating parallel to density contours before refracting and propagating out of the plasma.2 The observations at 23° correspond to either backscattered or sidescattered SRS light.
Stimulated Raman Scattering Mechanisms and Scaling Behavior in Planar Direct-Drive Experiments
at the National Ignition Facility

Stimulated Raman ScatteRing mechaniSmS and Scaling BehavioR in PlanaR diRect-dRive exPeRimentS
LLE Review, Volume 16126
Within this configuration, several experiments were conducted in which particular “quads” (groupings of four NIF beams) were toggled on or off to elucidate single-quad or multi-quad contributions to the SRS signal. A strong correlation was observed between quads at 50° and the SRS observation at that location, strongly indicating a single-quad tangential sidescatter of outer beams. A moderate correlation was observed between quads at 23° and SRS observations at 50° along the same azimuthal angle, while a stronger correlation was observed between two neighboring inner quads and the 50° SRS measurement. The latter may indicate a multiple-quad effect.3 Other SRS observations at 23°, as well as along the target normal, did not show strong single-quad contributions and therefore are inferred to be generated by many beams.
Notably, in addition to the underdense SRS observed along target normal, the underdense SRS at other viewing locations, corresponding to sidescatter as well as backscatter, all appear to have a near-exponential dependence on laser intensity in experi-ments with a linear-ramp laser pulse.
Hard x-ray (HXR) measurements were also obtained in order to relate the SRS observations to hot-electron production. Fig-ure 2 shows HXR and SRS data obtained on experiments with either linear-ramp laser pulses or flattop laser pulses driven by inner beams [Fig. 2(c)]. The linear-ramp pulse experiments show a correlation of time-resolved HXR signal and SRS signal from several viewing locations representing scattered light from the underdense region [Fig. 2(a)]. The HXR emission scales nearly exponentially with time—or with laser intensity—on ramp-pulse experiments [Figs. 2(a) and 2(b)], similar to what was observed for the underdense SRS-scattered light as shown in Fig. 1(e) and at other viewing angles. In addition, a time-integrated SRS signal
Figure 1(a) Experimental geometry and SRS observations along the target normal using a ramped laser pulse. The (b) simulated total overlapped laser intensity (black line), density scale length (blue line), and electron temperature (red line) at cn 4 increased continuously with time, corresponding to (c) the time-resolved optical spectrum. The power in each spectral component [(d) ~/2 and (e) csub n 4- SRS, with the various colored lines representing the signal integrated over different 5-nm-wide wavelength bands] as a function of the single-quad intensity at cn 4 shows scaling behavior and intensity thresholds.
(e)
10–30.5 1.0 1.5
10–1
Single quad intensity(×1014 W/cm2)
SRS
(<n c/4
) po
wer
(a
rbitr
ary
units
) 100
10–2
0.5 1.0 1.4
Single quad intensity(×1014 W/cm2)
~/2
pow
er
(arb
itrar
y un
its)
0
0.8
0.4
(d)
E29003JR
(a)
Optical streaked spectrometers 0 4 8
Time (ns)I,
Ln,
Te
0
10
5
I (×1014 W/cm2)Ln (×100 nm)Te (keV)
(b)
0 5Time (ns)
10
600m (
nm)
log10
500
~/2
SRS(<nc/4)
2.2
2.6
1.8
1.4
(c)
700

Plasma and Ultrafast Physics
LLE Review, Volume 161 27
Figure 2SRS and HXR data from [(a),(b)] ramp pulse and (c) flattop-pulse experiments driven by inner beams. (a) The normalized time-resolved SRS signals from various viewing angles have a time history similar to 160-keV HXR’s. (b) Another ramp-pulse experiment produced a HXR signal that is nearly exponential with time (or with laser intensity). (c) Time-integrated SRS signals at 50° and 30° viewing angles, representing SRS from the underdense region, are directly proportional to the fraction of laser energy converted to hot electrons, indicating a correlation.
measured at 30° and 50° from target normal is directly proportional to the measured fraction of laser energy converted to hot electrons ( fhot) [Fig. 2(c)]. The correlation of HXR measurements and these SRS observations suggests a connection between SRS in the underdense region and hot-electron production.
Although further modeling is needed to explain the precise SRS mechanism by which hot electrons are generated, these results can be used to guide direct-drive–ignition designs in which hot-electron preheat coupled to the inner layer of the imploding target must be kept below +0.1%.
This material is based upon work supported by the Department of Energy National Nuclear Security Administration under Award Number DE-NA0003856, the University of Rochester, and the New York State Energy Research and Development Authority.
1. M. J. Rosenberg et al., Phys. Rev. Lett. 120, 055001 (2018).
2. P. Michel et al., Phys. Rev. E 99, 033203 (2019).
3. S. Depierreux et al., Phys. Rev. Lett. 117, 235002 (2016).
E29004JR
0 2 4 6Time (ns)
8 10 120 2 4 6Time (ns)
8 10 12
Dec
onvo
lved
trac
e (a
rbitr
ary
units
) 100
10–1
(b) Shot N180628-001 (inner beams), HXR ~160 keV
(c)
0.01
(a) Shot N171012-002 Time-resolved SRS and hard x-ray signal
1.00
Nor
mal
ized
sign
alLaser pulse totalSRS 30°SRS 50°
SRS 23°HXR ~160 keV
0.10
0 2 4fhot (%)
60
1
2
3
SRS
signa
l/las
er e
nerg
y(a
rbitr
ary
units
)
30°
50°

Modeling Magnetic confineMent of a laser-generated PlasMa in cylindrical geoMetry leading to disk-shaPed structures
LLE Review, Volume 16128
L. S. Leal,1,2 A. V. Maximov,1,3 R. Betti,1,2,3 A. B. Sefkow,1,2,3 and V. V. Ivanov4
1Laboratory for Laser Energetics, University of Rochester2Department of Physics & Astronomy, University of Rochester
3Department of Mechanical Engineering, University of Rochester4Department of Physics, University of Nevada, Reno
Strong magnetic fields can play a pivotal role in the dynamics of a plasma.1,2 Understanding the interactions in plasmas in strong fields is important for many areas of plasma physics, ranging from basic and applied plasma physics to astrophysics, controlled fusion, and Z-pinch experiments.3–8 Understanding plasma dynamics and transport in laser-produced plasmas in strong external fields has become an important area of research in inertial confinement fusion after the demonstration of fusion yield enhance-ment in laser-driven implosions9 and the most recent demonstrations of the magnetized liner inertial fusion concepts at Sandia National Laboratories.10,11 Recent work from Lawrence Livermore National Laboratory12 showed that by increasing the initial seed field to 60 T or 0.6 MG, the compressed field in National Ignition Facility implosions can reach hundreds of megagauss, reduce heat losses, and even confine the alpha particles. For an effective alpha-particle confinement, the compressed B field must be large enough that the thermal and magnetic pressures become comparable, as is the case in experiments of laser-generated plasmas in strong external magnetic fields.13,14 Modeling of these experiments can lead to a broader understanding of plasma dynamics and transport. Recent experiments at the University of Nevada, Reno13,14 have shown that laser-produced plasmas in strong magnetic fields generated by pulsed-power machines form localized structures that have unique plasma characteristics and exist for many nanoseconds after the end of the laser pulse. The experiments produced a plasma by shining a laser with a 1.056-nm wavelength and 0.8-ns pulse duration at an intensity of +3 # 1015 W/cm2 with a 30-nm spot size on an Al rod. The rod had a 1-mm diameter and 0.8 to 1 MA of current driven by the Zebra pulsed-power machine. A low-density, cold plasma was initially formed on the rod surface from the current and generated a magnetic field that was measured through Faraday probes to be 200 to 300 T. The laser ablated plasma of the rod surface and within nanoseconds after the laser pulse, the plasma formed a disk-shaped structure that expanded in the radial direction. Measured values using laser probing and x-ray spectroscopy showed the plasma had electron densities of the order of ne + 1018 cm–3, average electron temperatures Te + 400 eV, and an expansion velocity of v + 250 km/s. In modeling this interaction, further insight can be gained of the magnetohydrodynamic effects in laser-generated plasmas in strong magnetic fields.
A series of HYDRA simulations are discussed here with parameters similar to the conditions of experiments at the Zebra facility.13 Current driven through an Al rod generates azimuthal Bi + 3 MG at the surface of the rod. In experiments the current pulse time is hundreds of nanoseconds—much longer than the laser pulse and interactions leading to the generation of the disk. In the simulations, the external magnetic field is set by the boundary conditions generating the current in the rod and the 3-MG field at the surface of the rod is similar to what was detected in experiments. A laser with wavelength m = 1.057 nm illuminates the rod surface once the magnetic field has been initialized, ablating plasma with a pulse duration of 0.8 ns. The laser is injected through the HYDRA laser ray-trace package and enters from the large radius boundary in simulations. The simulations are 2-D with symmetry around the vertical axis. Without an external magnetic field, the ablated plasma is ejected in all directions away from the target rod. The presence of the MG magnetic field greatly affects the dynamics of the ablated plasma. The structure formed by the ablated plasma is well confined in the axial direction but continues to move in the radial direction at velocities of 300 to 600 km/s. Figure 1 compares simulation results at 3 ns after the end of the laser pulse for the plasma generated by
Modeling Magnetic Confinement of a Laser-Generated Plasma in Cylindrical Geometry Leading to Disk-Shaped Structures

Plasma and Ultrafast Physics
LLE Review, Volume 161 29
the laser for two cases: with current flowing through the rod (generating the 3-MG field) and without current flowing through the rod. The electron density and temperature in Fig. 1 illustrate the overall structure of the expanding plasma. For the plot of electron temperature, only the area of the ablated plasma is shown, not the “vacuum” region, which in simulations is a very low density plasma that does not affect the overall expansion of the disk plasma but can exhibit numerical noise. It can be seen from Fig. 1(a) that the plasma in the disk is underdense to the laser in the range of ne + 1018 to 1019 cm–3 but more dense and much more extended than in the unmagnetized case [Fig. 1(b)]. The plasma is fully ionized and is contained within the width of 0.1 to 0.2 mm. This collimated plasma structure, when rotated around the axis, would resemble a disk. The plasma of the disk is also much hotter than the plasma without an applied external B field. A feature seen in experiments is the presence of rings in the disk similar to Fig. 1(a) if it is rotated azimuthally.
The 2-D modeling is an important step in comparing with experimental results. The motion of the plasma following the field lines around the rod appears to be a 3-D effect of the plasma being pinched in the axial direction and leading to spreading in the azimuthal direction. The external magnetic field in the MG regime is strong enough to apply magnetic pressure that reshapes the structure of the ablated plasma, as seen in both experiment and simulation. Simulations are able to demonstrate that the strong external magnetic field outside the formed plasma provides plasma confinement in the axial direction. Interaction of laser-generated fields with the external magnetic fields leads to asymmetry of the magnetic field inside the disk. As we have shown, applying strong external fields to laser-generated plasmas leads to complex plasma structures that can be used to study fundamental plasma physics and astrophysical phenomena. The large variation in the Hall parameter also allows one to study how plasma transport properties vary as weakly magnetized plasmas transition into strongly magnetized plasmas.
This material is based upon work supported by the Department of Energy under award number DOE Grant DE-SC0016500, Department of Energy National Nuclear Security Administration under Award Number DE-NA0003856, the University of Roch-ester, and the New York State Energy Research and Development Authority.
Figure 1Electron density and temperature of laser-ablated plasma in the case [(a) and (c)] with and [(b) and (d)] without the external magnetic field, respectively, at 3 ns after the end of the laser pulse.
(#10
19 c
m–3
)
TC15266JRR (mm)
0 1 32 4 5–1.5–1.0–0.5
0.00.51.01.5
z (m
m)
z (m
m)
4.50
20.00
0.20
0.95
100.00
50
75
0
25
(eV)
(c)–1.5–1.0–0.5
0.00.51.01.5
(a) (b)
R (mm)0 1 32 4 5
(d)100
0.50
0.75
0.00
0.25
(keV
)
1.00
4.50
20.00
0.20
0.95
100.00
Modeling Magnetic confineMent of a laser-generated PlasMa in cylindrical geoMetry leading to disk-shaPed structures
LLE Review, Volume 16130
1. H. Alfvén, Nature 150, 405 (1942).
2. J. P. Knauer et al., Phys. Plasmas 17, 056318 (2010).
3. O. V. Gotchev et al., Phys. Rev. Lett. 103, 215004 (2009).
4. D. B. Sinars et al., Phys. Rev. Lett. 105, 185001 (2010).
5. A. Arefiev, T. Toncian, and G. Fiksel, New J. Phys. 18, 105011 (2016).
6. A. B. Sefkow et al., Phys. Plasmas 21, 072711 (2014).
7. M. Hohenberger et al., Phys. Plasmas 19, 056306 (2012).
8. Y. Sentoku et al., J. Phys. IV France 133, 521 (2006).
9. P. Y. Chang et al., Phys. Rev. Lett. 107, 035006 (2011).
10. S. A. Slutz and R. A. Vesey, Phys. Rev. Lett. 108, 025003 (2012).
11. M. R. Gomez et al., Phys. Rev. Lett. 113, 155003 (2014).
12. L. J. Perkins et al., Phys. Plasmas 24, 062708 (2017).
13. V. V. Ivanov et al., Plasma Phys. Control. Fusion 59, 085008 (2017).
14. V. V. Ivanov et al., Phys. Plasmas 26, 062707 (2019).

HigH-EnErgy-DEnsity PHysics
LLE Review, Volume 161 31
J. L. Peebles, J. R. Davies, D. H. Barnak, T. Cracium, M. J. Bonino, and R. Betti
Laboratory for Laser Energetics, University of Rochester
The capability of generating strong, localized, and applicable magnetic fields provides an excellent opportunity in high-energy-density (HED) research environments. Such a tool would have applications in magnetizing HED plasmas,1,2 field compression leading to fusion yield enhancement,3–7 particle collimation,8,9 and magnetized shock physics.10–14 The laser-driven coil (LDC) has been proposed several times in previous decades15–27 as a method to generate kilotesla (kT) magnitude fields in a small volume, with the precision of a laser system. Fields ranging from 0.001 T (Ref. 20) to over 1 kT (Ref. 15) have been inferred from previous experiments. Since the generation of these fields can be precisely tuned using the geometry of a thin metal target, LDC’s can potentially provide a substantial benefit over traditional pulsed-power, magnetic-field–generation mechanisms28,29
because they are easier to place in close proximity to experiments and are “triggered” precisely by a laser. LDC’s usually consist of two parallel plates connected with a wire loop advantageously shaped to generate a field. A laser passes through a hole in one of the plates and ejects hot electrons from one plate to the other. The charge displacement then draws a return current through the loop from the source plate on the other side, which may also become negatively charged after capturing some electrons from the interaction.15–27
Axial Proton Probing and MotivationThe method for diagnosing fields inside the region of interest of an LDC in this summary is “axial proton probing.” High-
energy protons travel axially through the loop rather than transversely. Since magnetic-field lines must always form a closed loop, a significant axial field will generate a radial field. This radial field will induce a deflection of protons traveling in the axial direction. Upon initial inspection, it would appear that the protons should not see any net deflection at all from a radial field; any deflection of a proton incurred by the radial field will be reversed upon encountering the opposing radial field when leaving the coil. This approximation only holds true, however, in the paraxial approximation. In reality, a proton will be deflected significantly by the initial field, leading to a rotation as it passes through the coil. It will then be returned (approximately) to its original velocity vector after leaving, resulting in a measurable rotational shift as seen in the synthetic radiograph in Fig. 1(a). There are also two second-order effects: the field encountered by the exiting proton is not necessarily the opposite of the field it encountered when it entered and the velocity vector of the proton leaving is not identical to when it entered. Therefore, in theory, a magnetic field generated by a current traveling in the loop will induce a rotation in the proton image when using a spatial fiducial. The estimated mesh rotation, calculated from multiple simulated loops with only a magnetic field, is described by Eq. (1):
rot.
,E
I r0 23
p
loop.0 27–
c .i (1)
where r is the radius of the loop, Iloop is the current, and the deflection depends inversely on the square root of the proton energy Ep, as expected. The anticipated deflection of protons due to the expected electric field is shown in Fig. 1(b), which shows a clear focusing and stretching effect on the mesh fiducial. The clear difference in the deflection effect demonstrates that this method of proton radiography is able to distinguish deflection contributions from radial electric and magnetic fields.
Axial Proton Probing of Magnetic and Electric Fields Inside Laser-Driven Coils
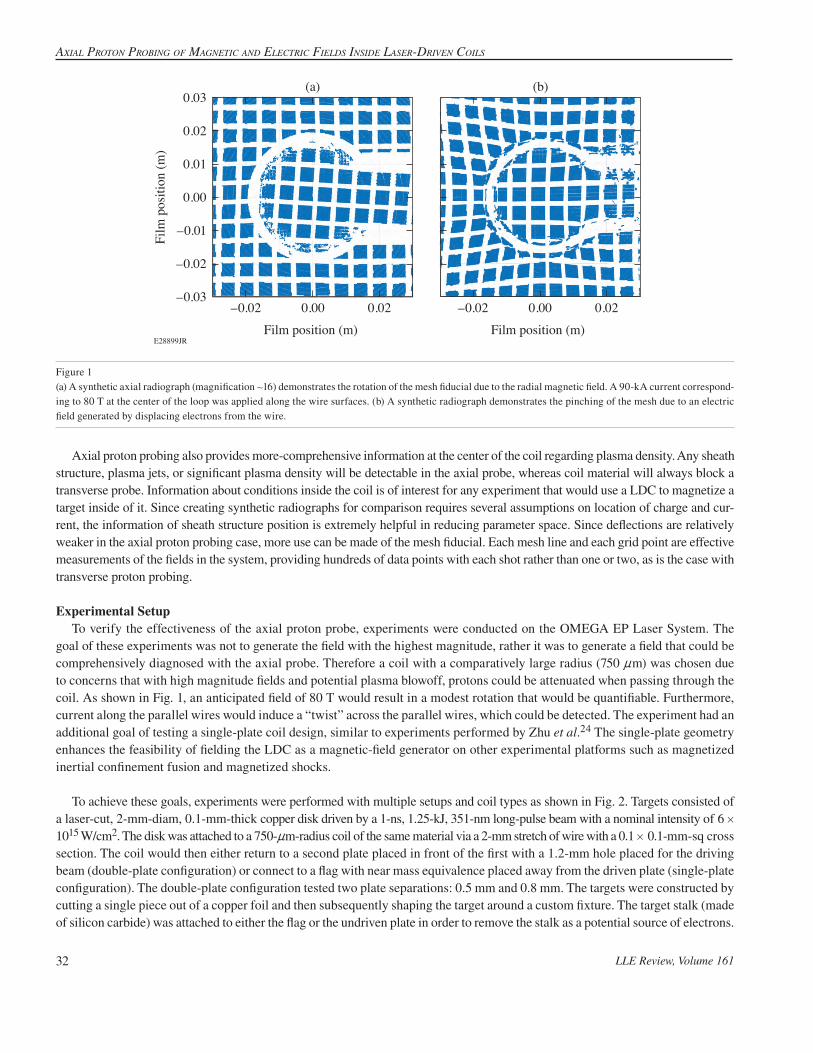
AxiAl Proton Probing of MAgnetic And electric fields inside lAser-driven coils
LLE Review, Volume 16132
Axial proton probing also provides more-comprehensive information at the center of the coil regarding plasma density. Any sheath structure, plasma jets, or significant plasma density will be detectable in the axial probe, whereas coil material will always block a transverse probe. Information about conditions inside the coil is of interest for any experiment that would use a LDC to magnetize a target inside of it. Since creating synthetic radiographs for comparison requires several assumptions on location of charge and cur-rent, the information of sheath structure position is extremely helpful in reducing parameter space. Since deflections are relatively weaker in the axial proton probing case, more use can be made of the mesh fiducial. Each mesh line and each grid point are effective measurements of the fields in the system, providing hundreds of data points with each shot rather than one or two, as is the case with transverse proton probing.
Experimental SetupTo verify the effectiveness of the axial proton probe, experiments were conducted on the OMEGA EP Laser System. The
goal of these experiments was not to generate the field with the highest magnitude, rather it was to generate a field that could be comprehensively diagnosed with the axial probe. Therefore a coil with a comparatively large radius (750 nm) was chosen due to concerns that with high magnitude fields and potential plasma blowoff, protons could be attenuated when passing through the coil. As shown in Fig. 1, an anticipated field of 80 T would result in a modest rotation that would be quantifiable. Furthermore, current along the parallel wires would induce a “twist” across the parallel wires, which could be detected. The experiment had an additional goal of testing a single-plate coil design, similar to experiments performed by Zhu et al.24 The single-plate geometry enhances the feasibility of fielding the LDC as a magnetic-field generator on other experimental platforms such as magnetized inertial confinement fusion and magnetized shocks.
To achieve these goals, experiments were performed with multiple setups and coil types as shown in Fig. 2. Targets consisted of a laser-cut, 2-mm-diam, 0.1-mm-thick copper disk driven by a 1-ns, 1.25-kJ, 351-nm long-pulse beam with a nominal intensity of 6 # 1015 W/cm2. The disk was attached to a 750-nm-radius coil of the same material via a 2-mm stretch of wire with a 0.1 # 0.1-mm-sq cross section. The coil would then either return to a second plate placed in front of the first with a 1.2-mm hole placed for the driving beam (double-plate configuration) or connect to a flag with near mass equivalence placed away from the driven plate (single-plate configuration). The double-plate configuration tested two plate separations: 0.5 mm and 0.8 mm. The targets were constructed by cutting a single piece out of a copper foil and then subsequently shaping the target around a custom fixture. The target stalk (made of silicon carbide) was attached to either the flag or the undriven plate in order to remove the stalk as a potential source of electrons.
Figure 1(a) A synthetic axial radiograph (magnification +16) demonstrates the rotation of the mesh fiducial due to the radial magnetic field. A 90-kA current correspond-ing to 80 T at the center of the loop was applied along the wire surfaces. (b) A synthetic radiograph demonstrates the pinching of the mesh due to an electric field generated by displacing electrons from the wire.
E28899JR
Film
pos
ition
(m)
Film position (m) Film position (m)
0.02
0.01
0.00
–0.01
–0.02
–0.030.020.00–0.020.020.00–0.02
0.03(a) (b)

HigH-EnErgy-DEnsity PHysics
LLE Review, Volume 161 33
Figure 2Experimental setup for the double-plate experiments. An OMEGA EP long-pulse beam passes through a front plate and hits the driving plate, which induces a current in the loop. The loop is probed with protons generated by a proton radiography target with a mesh fiducial placed halfway between the source and target.
The coil was probed using a short-pulse–based, proton radiography setup. A 0.7-ps, 300- to 500-J beam, with a nominal intensity of 0.6 to 1 # 1020 W/cm2, was incident on a copper foil placed in a shielded tube 5 mm from the coil. A tantalum shield protected the foil from any potential debris. A copper–rhodium mesh fiducial (100 # 100-nm mesh spacing with 30-nm-thick wire) was placed halfway between the coil and the proton source. Protons with energy up to 40 MeV were accelerated and detected by a radiochromic film stack placed 8 cm away from the coil.
Experimental Results and Comparison to Synthetic RadiographsFigure 3 shows experimental radiographs using two different proton energies, taken at 1.1 ns, just after the driving laser has
turned off. Overlayed in color are synthetic radiographs, which used a combination of electric charge and current distributions to best recreate the experimental image. The double-plate configuration [Figs. 3(a) and 3(b)] with 0.5-mm spacing shows limited twisting distortion of the mesh. Distortions take two primary forms: a general “pull” on the mesh toward the driven plate to the right on the radiograph and radial “spray” emanating from the wire in all directions in the loop. The general pull is most notice-able when comparing the size of mesh grids on the right and the left of each radiograph, where grids on the right are shrunk and focused compared with those on the left. This is consistent with a large electric field that surrounds all target surfaces and increases with proximity to the driven plate. The radiographs also indicate multiple populations of electrons ejected from the wire material. To recreate the features in the synthetic radiographs, no current distribution is required in the system. The energy present in the electrostatic field used to create the synthetic radiographs over the entire simulation box was 36 J, or a conversion rate of nearly 3% from the full laser energy.
The single-plate case shows a significant departure in terms of distortion type. The sheath becomes significantly detached from the coil and does not conform to the shape of the wire. An asymmetric distortion can be seen near the parallel wires, where mesh on top of the loop is expanded and mesh on the bottom is squeezed. This indicates that a current is present that would preferentially flow along the sheath on the inside of the loop since the sheath plasma is a good conductor and the shortest path contains the least inductance for the system. Another indication that a significant current is present in the single-plate case is the twisting of the reference mesh near the parallel wires. A simple rotation of the mesh, as was anticipated in Fig. 1, is not obvious, indicating that a significant electrostatic charge is present in the single-plate case as well. The current used in generating the synthetic radiographs is initially 170 kA at the driven wire and decays as it traverses the loop. The total energy in the magnetic field is approximately 37 J, or a conversion efficiency from the laser of 3.0%. The total energy in the electrostatic field for the
E28900JR
Double-platelaser-driven coil
Proton radiographytarget
Long
pulse
CoilShort pulse
Mesh�ducial
2 mm
2 mm
1.2 mm
1.5 mm

AxiAl Proton Probing of MAgnetic And electric fields inside lAser-driven coils
LLE Review, Volume 16134
simulation box is 20 J, or 1.6% of the incident laser energy. The field is approximately 65 T in the center of the loop; if the current were even throughout the loop, the field would have been much higher at around 140 T.
The proton radiographs from the single-plate experiment indicate that while a current is present, it is in a transient regime for our target design. Angular filter refractometry data and 2-D radiation-hydrodynamic simulations show that radiation ejects elec-trons from the loop before the current can propagate from the laser-heated region through the connecting solid wire. Therefore, photoelectrons will provide the return current, which allows faster propagation of current than is possible in the unheated cop-per, consistent with the proton-probing data. Indeed, photoelectrons would be expected to carry the majority of the current since they offer the lowest resistance and lowest inductance path for the current. For our parameters, current propagation in 1.1 ns is observed to be limited to around 3 mm, which is part way around the loop. For most of the other published designs, this would be far enough to drive a current around the entire loop but not far enough to draw any significant current from a second plate. Although current may be present around the entire loop in smaller coils, it could still be nonuniform.
These findings indicate the need to reduce the size of the loop and length of the wire to be as small as possible for LDC’s. Doing so creates problems, however, in regard to fielding LDC’s in order to magnetize experiments. Reducing the parallel wire length would result in the loop being placed even closer to the driving plate interaction, which would cause more x-ray interference in both the loop and the experiment being magnetized. Placing a shield between the driven plate and magnetized experiment would also prove to be problematic since any x rays will expand material off the shield and cause current to bypass the loop entirely, through the plasma off the shield surface. Reducing the gap between the parallel wires poses a similar problem to the parallel disks, where plasma expansion may simply cause a short circuit. Reducing the loop size removes much of the magnetizing capa-bility of LDC’s since loop size determines the size of the system being magnetized. For example, any magnetized inertial fusion concept would require a loop larger, not smaller, than the one fielded in our experiments in order to magnetize targets that are typically 1 mm or larger in size.
The data show more potential difficulties for the double-plate–type LDC in addition to those seen with the single plate. First, the driving interaction for the LDC bathes the entire target in x rays, causing significant plasma to form over the entire surface of the LDC. This may be initially beneficial since it will allow current to be drawn more readily, rather than from a cold, solid
E28999JR
(a) 28 MeV
(c) 28 MeV
(b) 40 MeV
(d) 40 MeV
Figure 3[(a),(b)] Synthetic radiographs created by passing 28- and 40-MeV protons through the fields generated by an electric charge distribution for double-plate experiments. The resulting synthetic radiographs are overlayed on top of the experimental data for comparison. [(c),(d)] A similar treatment for single-plate experiments. A current distribution was required in addition to the charge distribution to reproduce the experimental data in the synthetic radiographs.

HigH-EnErgy-DEnsity PHysics
LLE Review, Volume 161 35
material. However, the undriven plate is expanded significantly by these x rays due to its proximity to the interaction. The coil is therefore short circuited very quickly before any meaningful magnetic field is generated. This means that the second plate places an upper limitation on energy and intensity of the driving laser, which depends on the spacing between the plates and material. As plate spacing is increased, the coil’s inductance is increased to account for the larger gap. It becomes apparent that increasing the plate spacing to address these issues sufficiently will result in a system that tends toward a single-plate design anyway. Add-ing the additional plate provides benefit only if electrons can be captured by the second plate and the LDC size is small enough that the charge can meaningfully contribute to the current traveling through the loop. Creating an LDC small enough to benefit from the second plate, however, introduces all of the risks of a small LDC system: short circuiting, x-ray interference, and small magnetized volume.
These findings indicate some design considerations for consistent laser-driven coils. First, a single-plate design should be used with minimal distance between the driving plate and coil; in our experiments current appears to propagate significantly for only 3 mm of coil length. The double-plate design appears to offer little benefit for substantial risk and target complexity. Corners should be removed from the loop; even though, in theory, this would result in a less symmetric field, the corners are prime posi-tions for electric-field enhancement, electron emission, and abnormal sheath formation. The laser driver’s pulse length should be increased and intensity decreased in order to provide time for the system to respond.
This material is based upon work supported by U.S. Deparment of Energy (DOE) grant DE-SC0016258 from the Office of Fusion Energy Sciences and by the DOE National Nuclear Security Administration under Award Number DE-NA0003856, the University of Rochester, and the New York State Energy Research and Development Authority.
1. G. Fiksel et al., Phys. Rev. Lett. 113, 105003 (2014).
2. W. Fox, A. Bhattacharjee, and K. Germaschewski, Phys. Rev. Lett. 106, 215003 (2011).
3. S. A. Slutz et al., Phys. Plasmas 17, 056303 (2010).
4. D. H. Barnak et al., Phys. Plasmas 24, 056310 (2017).
5. J. R. Davies et al., Phys. Plasmas 24, 062701 (2017).
6. H. Nagatomo et al., Nucl. Fusion 53, 063018 (2013).
7. H. Cai, S. Zhu, and X. T. He, Phys. Plasmas 20, 072701 (2013).
8. A. Arefiev, T. Toncian, and G. Fiksel, New J. Phys. 18, 105011 (2016).
9. T. Johzaki et al., Plasma Phys. Control. Fusion 59, 014045 (2016).
10. G. Gregori et al., Nature 481, 480 (2012).
11. J. Meinecke et al., Nat. Phys. 10, 520 (2014).
12. N. C. Woolsey et al., Phys. Plasmas 8, 2439 (2001).
13. D. B. Schaeffer et al., Phys. Plasmas 19, 070702 (2012).
14. D. B. Schaeffer et al., Phys. Plasmas 24, 041405 (2017).

AxiAl Proton Probing of MAgnetic And electric fields inside lAser-driven coils
LLE Review, Volume 16136
15. H. Daido et al., Phys. Rev. Lett. 56, 846 (1986).
16. J. J. Santos et al., New J. Phys. 17, 083051 (2015).
17. S. Fujioka et al., Sci. Rep. 3, 1170 (2013).
18. K. F. F. Law et al., Appl. Phys. Lett. 108, 091104 (2016).
19. C. Courtois et al., J. Appl. Phys. 98, 054913 (2005).
20. A. Tarifeño, C. Pavez, and L. Soto, J. Phys.: Conf. Ser. 134, 012048 (2008).
21. L. Gao et al., Phys. Plasmas 23, 043106 (2016).
22. C. Goyon et al., Phys. Rev. E 95, 033208 (2017).
23. W. W. Wang et al., Plasma Physics Archive, available at https://arxiv.org/abs/1411.5933v1 (2017).
24. B. J. Zhu et al., Appl. Phys. Lett. 107, 261903 (2015).
25. K. Matsuo et al., Phys. Rev. E 95, 053204 (2017).
26. V. V. Korobkin and S. L. Motylev, Sov. Tech. Phys. Lett. 5, 474 (1979).
27. V. Ivanov et al., Bull. Am. Phys. Soc. 64, CO8.00008 (2019).
28. G. Fiksel et al., Rev. Sci. Instrum. 86, 016105 (2015).
29. B. B. Pollock et al., Rev. Sci. Instrum. 77, 114703 (2006).

HigH-EnErgy-DEnsity PHysics
LLE Review, Volume 161 37
S. Zhang,1 H. D. Whitley,2 and T. Ogitsu2
1Laboratory for Laser Energetics, University of Rochester2Lawrence Livermore National Laboratory
Boron is a prototype for low-Z and superhard materials and a candidate for making ablators for high-energy-density and inertial confinement fusion experiments. Clarifying the structure, stability relation, and melting of the various boron polymorphs at high pressure has long been a subject of interest in materials sciences. Density functional theory (DFT) calculations and diamond-anvil cell (DAC) experiments1–3 were performed at pressures up to +200 GPa. Based on these, equilibrium phase diagrams of boron were constructed, which showed high melting temperatures (>4500 K) and a nonicosahedral, metallic a-Ga phase at above 80 to 90 GPa. Dynamic compression experiments were conducted on boron up to 5608 GPa, which measured the pressure–den-sity equation of state (EOS),4,5 diffraction and electrical conductivity,6,7 or liquid structure factor8 along the shock Hugoniot.
In this work, we use first-principles molecular dynamics (MD) to calculate the EOS and shock Hugoniot of various boron phases (a-B12, b, c-B28, a-Ga, and liquid using different cell shapes), following similar procedures as in Ref. 5. We use a 2000-eV plane-wave basis cutoff, C point for Brillouin zone sampling, and simulation cells with 96 to 144 atoms, and generate canonical (NVT) ensembles that consist of 5000 to 10,000 snapshots in each MD simulation.
Our results show that if phase transitions occur in shock-compressed boron at the same pressure–temperature conditions as those expected based on the equilibrium phase diagram, the Hugoniot would have two major discontinuities at 15 and 80 GPa, respectively (Fig. 1). Moreover, melting along the Hugoniot occurs at 1500 to 3500 K and 150 to 250 GPa unless some unknown structure stabilizes over a-Ga at 100 GPa and 2000 K. Discontinuities in Hugoniot density are also expected but are clearly not observed according to the experimental data. Instead, the experimental data appear smooth and follow the trend of our predicted Hugoniot for the a-B12 and b-B106 phases at up to 80 GPa and follow that of a-B12 as well as c-B28 and probably also b-B106, but definitely not a-Ga, at 80 to 112 GPa. These indicate that, instead of transforming into the c-B28 phase, boron under shock compression may remain in the same b or a-B12 phase as its initial state up to at least 80 GPa.
In addition, our simulations show that c-B28 melts when temperature increases from 1400 to 1500 K. Therefore, the transforma-tion to c-B28, if occurring above 80 GPa, would be associated with a jump in temperature and immediately followed by melting or transformation into some other solid structures. Moreover, our DFT-MD simulations show that b-B106 remains stable at +115 GPa and 600 K, and large atomistic displacement or structural instability occurs when temperature exceeds 800 to 1000 K or pres-sure exceeds 130 GPa. We also find that a-B12 remains stable at +133 GPa and instability occurs at above 150 GPa, for 1000 K or lower temperatures. These data set the upper bounds for b-B106 or a-B12 samples to remain stable when boron is shocked to above 80 GPa. With stronger shocks above 200 GPa and 3500 K, liquid boron is obtained. Temperatures along the shock Hugoniot are increasingly higher than cold compression along an ambient-temperature isotherm. The transformation kinetics is therefore expected to be slower in room-temperature, static-compression experiments.
Our findings on the phase transitions in shocked boron based on the EOS point of view are supported remarkably well by DAC9 and explosive-shock7 experiments with diffraction, which found that b-boron was the stable structure up to +100 GPa, at which amorphization occurred. It is interesting to note that the Hugoniot temperature of b-B106 at 90 GPa is +600 K according
Different Mechanisms of Phase Transformation for Boron in Equilibrium and Under Shock Indicated
by Equation-of-State Comparisons
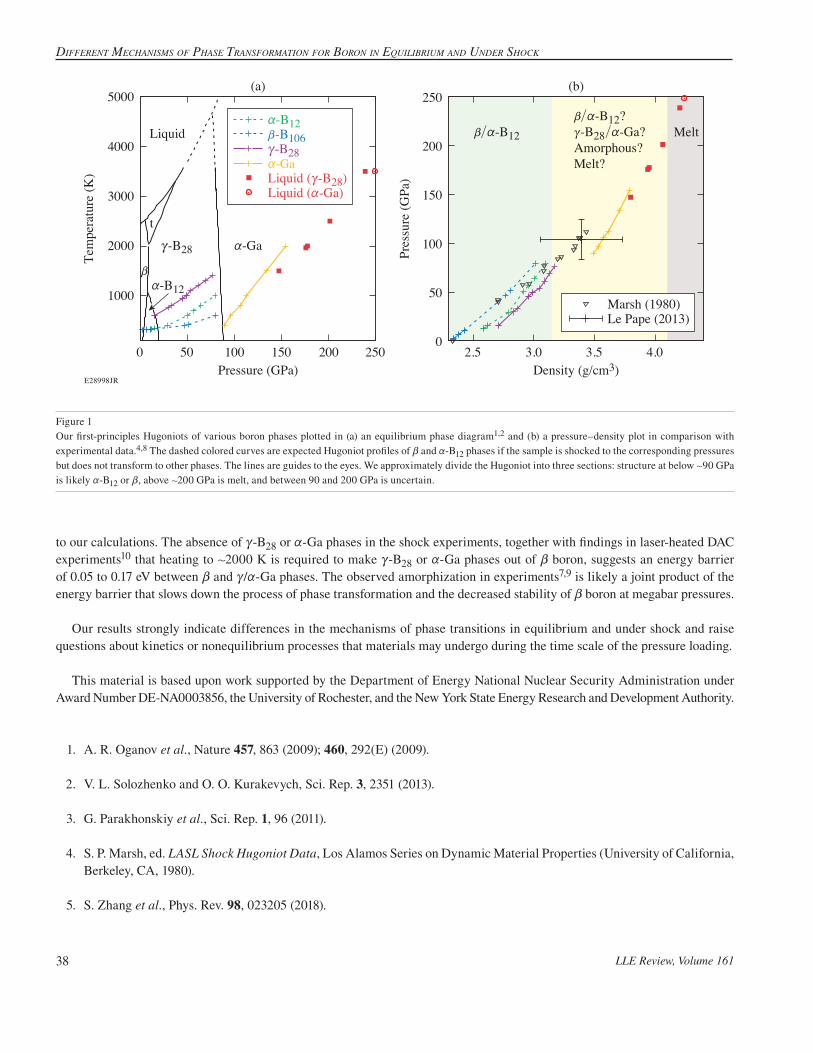
Different MechanisMs of Phase transforMation for Boron in equiliBriuM anD unDer shock
LLE Review, Volume 16138
to our calculations. The absence of c-B28 or a-Ga phases in the shock experiments, together with findings in laser-heated DAC experiments10 that heating to +2000 K is required to make c-B28 or a-Ga phases out of b boron, suggests an energy barrier of 0.05 to 0.17 eV between b and c/a-Ga phases. The observed amorphization in experiments7,9 is likely a joint product of the energy barrier that slows down the process of phase transformation and the decreased stability of b boron at megabar pressures.
Our results strongly indicate differences in the mechanisms of phase transitions in equilibrium and under shock and raise questions about kinetics or nonequilibrium processes that materials may undergo during the time scale of the pressure loading.
This material is based upon work supported by the Department of Energy National Nuclear Security Administration under Award Number DE-NA0003856, the University of Rochester, and the New York State Energy Research and Development Authority.
1. A. R. Oganov et al., Nature 457, 863 (2009); 460, 292(E) (2009).
2. V. L. Solozhenko and O. O. Kurakevych, Sci. Rep. 3, 2351 (2013).
3. G. Parakhonskiy et al., Sci. Rep. 1, 96 (2011).
4. S. P. Marsh, ed. LASL Shock Hugoniot Data, Los Alamos Series on Dynamic Material Properties (University of California, Berkeley, CA, 1980).
5. S. Zhang et al., Phys. Rev. 98, 023205 (2018).
E28998JR
1000
2000
3000
4000
5000
0 50 100 150 200 250
a-B12
a-Gac-B28
b
t
Liquid
Tem
pera
ture
(K)
Pressure (GPa)
0
50
100
150
200
250
2.5 3.0 3.5 4.0
Melt
Pres
sure
(GPa
)
Density (g/cm3)
b/a-B12
b/a-B12?c-B28/a-Ga?Amorphous?Melt?
a-B12b-B106c-B28a-GaLiquid (c-B28)Liquid (a-Ga)
(a) (b)
Marsh (1980)Le Pape (2013)
Figure 1Our first-principles Hugoniots of various boron phases plotted in (a) an equilibrium phase diagram1,2 and (b) a pressure–density plot in comparison with experimental data.4,8 The dashed colored curves are expected Hugoniot profiles of b and a-B12 phases if the sample is shocked to the corresponding pressures but does not transform to other phases. The lines are guides to the eyes. We approximately divide the Hugoniot into three sections: structure at below +90 GPa is likely a-B12 or b, above +200 GPa is melt, and between 90 and 200 GPa is uncertain.

HigH-EnErgy-DEnsity PHysics
LLE Review, Volume 161 39
6. A. M. Molodets et al., Phys. Solid State 59, 1406 (2017).
7. A. M. Molodets and A. A. Golyshev, JETP Lett. 108, 409 (2018).
8. S. Le Pape et al., New J. Phys. 15, 085011 (2013).
9. D. N. Sanz, P. Loubeyre, and M. Mezouar, Phys. Rev. Lett. 89, 245501 (2002).
10. I. Chuvashova et al., Phys. Rev. B 95, 180102(R) (2017).

A Suite of NeutroN time-of-flight DetectorS to meASure hot-Spot motioN iN Direct-Drive
LLE Review, Volume 16140
O. M. Mannion, J. P. Knauer, V. Yu. Glebov, C. J. Forrest, A. Liu, Z. L. Mohamed, M. H. Romanofsky, T. C. Sangster, C. Stoeckl, and S. P. Regan
Laboratory for Laser Energetics, University of Rochester
In direct-drive inertial confinement fusion (ICF) experiments, a capsule filled with a deuterium–tritium (DT) gas surrounded by a cryogenic DT fuel layer is illuminated by high-power lasers designed to symmetrically compress the target to generate a hot fusing plasma. In experiments where 3-D perturbations exist due to sources such as laser beam pointing errors, laser beam power imbalance, target nonuniformities, or target offsets, the capsule will be compressed asymmetrically. Asymmetric com-pression of ICF targets reduces the implosion performance by generating residual kinetic energy (RKE) in the target that could have otherwise been used to generate a hotter and denser plasma.1 Signatures of RKE include a complex flow structure within the fusing hot spot and an asymmetric dense fuel layer. Measuring these signatures of RKE can provide insights into the sources of asymmetries and strategies to improve implosion performance.
Neutron spectroscopy is a particularly useful tool for diagnosing asymmetric compression of ICF targets because neutrons are generated within the fusing plasma and scatter while exiting through the dense fuel layer. This results in the primary unscattered neutron energy spectrum containing information on the state of the fusing hot spot from which they were generated, while the scattered neutron spectrum contains information about the dense fuel layer. In particular, if a collective motion of the hot spot is present in an ICF hot spot, the primary neutron energy spectrum will be Doppler shifted by the hot-spot velocity and will affect measurements the neutron energy spectrum made along various lines of sight differently.2
If the neutron velocity is measured along a direction ,dt the neutron velocity measured along that line of sight (LOS) is given by
v v ,u diso $= + v t (1)
where viso is the isotropic neutron velocity, uv is the hot-spot velocity, and a bracket indicates a neutron-averaged quantity. The isotropic neutron velocity is the sum of the zero-temperature neutron velocity (51,233 km/s for DT neutrons) and the Gamow velocity shift,3 which is a function of ion temperature and can be written as viso = v0 + vth (Ti). By combining multiple measure-ments of the neutron velocity along different LOS’s, the hot-spot velocity uv and Gamow velocity shift can be determined directly.
To make this measurement, a suite of six neutron time-of-flight detectors has been built and calibrated to measure the primary DT neutron energy spectrum along multiple quasi-orthogonal LOS’s on the OMEGA laser. The six detectors, positioned along five LOS’s on OMEGA, are shown in Fig. 1 and use either a single detector or a dual collinear or antipodal configuration. The detectors use different technologies including a scintillator coupled to a photomultiplier tube (PMT) detector, a chemical-vapor–deposition diamond-based detector, or a PMT-based detector. By combining the neutron velocity measurements made by each of these detectors, the neutron-averaged hot-spot velocity present in a cryogenic laser-direct-drive implosion has been measured for the first time on OMEGA.
A Suite of Neutron Time-of-Flight Detectors to Measure Hot-Spot Motion in Direct-Drive Inertial Confinement Fusion Experiments
on OMEGA
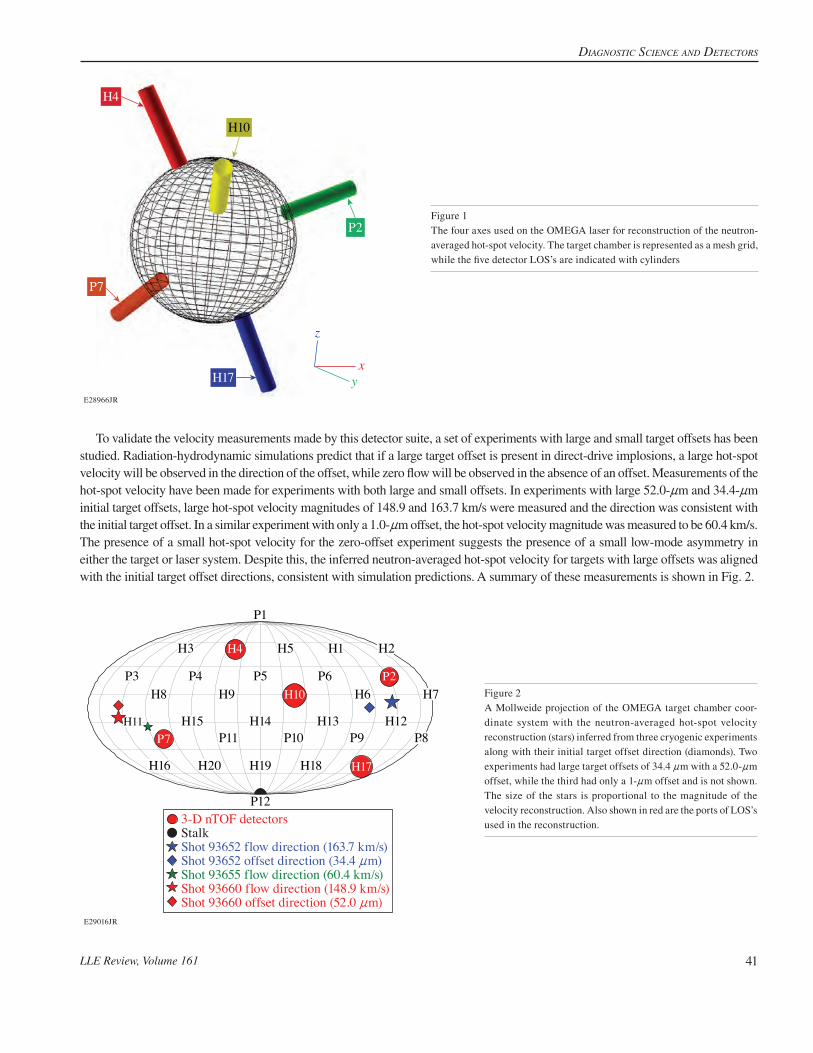
Diagnostic science anD Detectors
LLE Review, Volume 161 41
To validate the velocity measurements made by this detector suite, a set of experiments with large and small target offsets has been studied. Radiation-hydrodynamic simulations predict that if a large target offset is present in direct-drive implosions, a large hot-spot velocity will be observed in the direction of the offset, while zero flow will be observed in the absence of an offset. Measurements of the hot-spot velocity have been made for experiments with both large and small offsets. In experiments with large 52.0-nm and 34.4-nm initial target offsets, large hot-spot velocity magnitudes of 148.9 and 163.7 km/s were measured and the direction was consistent with the initial target offset. In a similar experiment with only a 1.0-nm offset, the hot-spot velocity magnitude was measured to be 60.4 km/s. The presence of a small hot-spot velocity for the zero-offset experiment suggests the presence of a small low-mode asymmetry in either the target or laser system. Despite this, the inferred neutron-averaged hot-spot velocity for targets with large offsets was aligned with the initial target offset directions, consistent with simulation predictions. A summary of these measurements is shown in Fig. 2.
P2
P7
H4
H10
H17
z
xy
E28966JR
Figure 1The four axes used on the OMEGA laser for reconstruction of the neutron-averaged hot-spot velocity. The target chamber is represented as a mesh grid, while the five detector LOS’s are indicated with cylinders
Figure 2A Mollweide projection of the OMEGA target chamber coor-dinate system with the neutron-averaged hot-spot velocity reconstruction (stars) inferred from three cryogenic experiments along with their initial target offset direction (diamonds). Two experiments had large target offsets of 34.4 nm with a 52.0-nm offset, while the third had only a 1-nm offset and is not shown. The size of the stars is proportional to the magnitude of the velocity reconstruction. Also shown in red are the ports of LOS’s used in the reconstruction.
E29016JR
H18H19H20H16 H17
H14
H10 H6 H7
P8P9P10P11P7
H9H8P5P4P3 P6 P2
P1
P12
H15H11 H13 H12
H2H1H5H4H3
3-D nTOF detectorsStalkShot 93652 flow direction (163.7 km/s)Shot 93652 offset direction (34.4 nm)Shot 93655 flow direction (60.4 km/s)Shot 93660 flow direction (148.9 km/s)Shot 93660 offset direction (52.0 nm)

A Suite of NeutroN time-of-flight DetectorS to meASure hot-Spot motioN iN Direct-Drive
LLE Review, Volume 16142
With the completion of this new diagnostic suite, greater insights into the 3-D behavior of cryogenic experiments will be gained. In particular, the hot-spot velocity measurement will be the primary diagnostic signature of mode-1 asymmetries pres-ent in our experiments. These measurements can be used to constrain simulation results and will guide the search for unknown sources of mode-1 asymmetries. Future work will extend this detector suite to include the two measurements of the D–D fusion neutron spectrum that are available on OMEGA.
This material is based upon work supported by the Department of Energy National Nuclear Security Administration under Award Number DE-NA0003856, the University of Rochester, and the New York State Energy Research and Development Authority.
1. B. K. Spears et al., Phys. Plasmas 21, 042702 (2014).
2. B. Appelbe and J. Chittenden, Plasma Phys. Control. Fusion 53, 045002 (2011).
3. L. Ballabio, J. Källne, and G. Gorini, Nucl. Fusion 38, 1723 (1998).

Diagnostic science anD Detectors
LLE Review, Volume 161 43
T. Filkins and J. Katz
Laboratory for Laser Energetics, University of Rochester
Fiber optics are used extensively at LLE and other research laboratories to transport critical timing and experimental data. In inertial confinement fusion (ICF) experiments, fibers are used to transport light in the UV, visible, and IR ranges. When a fiber is replaced, a change in the optical path length will introduce a change in the absolute timing of the associated diagnostic. To maintain absolute timing, the change in the fiber-optic time delay (FOTD) must be measured. A commercial optical time domain reflectometer (OTDR) can be used, but only to measure the FOTD at telecom wavelengths, typically in the 800-, 1300-, or 1500-nm range; therefore, it would not provide the relevant FOTD. A simple free-space, image-relay OTDR was designed at LLE that can measure the FOTD at the relevant wavelengths to within 2 ps.
The OTDR requires a short-pulse laser source, simple optics and optomechanics, a photodetector, and a fast oscilloscope. For this setup, the OMEGA 60 2~ fiducial and Diagnostic Support and Development Laboratory (DSDL) 3~ laser pulses were used as the laser source to measure the FOTD of an +16-m-long, large-core Russian graded-index fiber at two wavelengths relevant to ICF experiments (see Fig. 1). The fiber-launched laser light was collimated with a Thorlabs aspheric fiber-coupled collimator. The light was then coupled into the test fiber using a second collimator. The Fresnel reflections off the input and output surfaces of the test fiber were then transported to a large-core step-index collection fiber with a broadband pellicle beam splitter and coupled with a third collimator. The collection fiber was coupled with a fast (less than 100 ps) photodetector that was coupled to a fast-oscilloscope sampling at 40 GSa/s.
Design of a Free-Space, Image-Relay Optical Time Domain Reflectometer to Measure Fiber-Optic Time Delays
at Inertial Confinement Fusion-Relevant Wavelengths
G12809JR
Oscilloscope
Photodetector
Collection fiber
Collimator
Collimator
Collimator
Beam splitter
Source fiber
Test fiber
Cable
Figure 1A short-pulse laser with a width of 10 ps from the DSDL or a 2-GHz comb from the OMEGA fiducial is used to measure the FOTD of the test fiber. Two different photodetectors were used to digitize the signals: a Hamamatsu biplanar phototube (R1328U-53) or a Hamamatsu GaAs photodiode (G4176-01). The phototube had better signal-to-noise ratio, which led to smaller uncertainties.
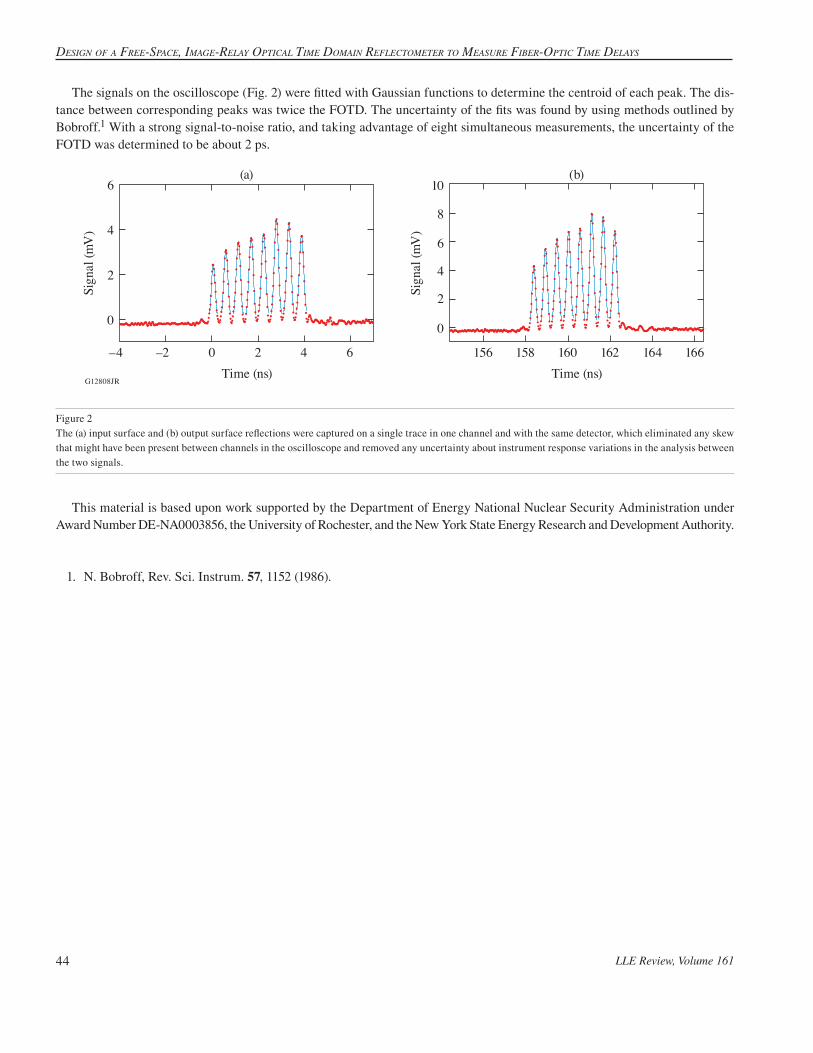
Design of a free-space, image-relay optical time Domain reflectometer to measure fiber-optic time Delays
LLE Review, Volume 16144
This material is based upon work supported by the Department of Energy National Nuclear Security Administration under Award Number DE-NA0003856, the University of Rochester, and the New York State Energy Research and Development Authority.
1. N. Bobroff, Rev. Sci. Instrum. 57, 1152 (1986).
The signals on the oscilloscope (Fig. 2) were fitted with Gaussian functions to determine the centroid of each peak. The dis-tance between corresponding peaks was twice the FOTD. The uncertainty of the fits was found by using methods outlined by Bobroff.1 With a strong signal-to-noise ratio, and taking advantage of eight simultaneous measurements, the uncertainty of the FOTD was determined to be about 2 ps.
Figure 2 The (a) input surface and (b) output surface reflections were captured on a single trace in one channel and with the same detector, which eliminated any skew that might have been present between channels in the oscilloscope and removed any uncertainty about instrument response variations in the analysis between the two signals.
G12808JR
Sign
al (m
V)
6
4
2
0
–4 –2 0Time (ns)
2 4 6
Sign
al (m
V)
10
8
6
4
2
0
Time (ns)166164162160158156
(a) (b)

Laser FaciLity report
LLE Review, Volume 161 45
J. Puth, M. Labuzeta, D. Canning, and R. T. Janezic
Laboratory for Laser Energetics, University of Rochester
During the first quarter of FY20, the Omega Laser Facility conducted 301 target shots on OMEGA and 242 target shots on OMEGA EP for a total of 543 target shots (see Tables I and II). OMEGA averaged 11.0 target shots per operating day, averaging 93.0% Availability and 94.7% Experimental Effectiveness.
OMEGA EP was operated extensively in the first quarter of FY20 for a variety of user experiments. OMEGA EP averaged 9.7 target shots per operating day averaging 95.2% Availability and 96.5% Experimental Effectiveness.
FY20 Q1 Laser Facility Report
Table I: OMEGA Laser System target shot summary for Q1 FY20.
Program LaboratoryPlanned Number of Target Shots
Actual Number of Target Shots
ICFLLE 99 98
LLNL 5.5 6
ICF Subtotal 104.5 104
HED
LLE 22 21
LANL 22 25
LLNL 27.5 31
SNL 11 9
HED Subtotal 82.5 86
LBS
LLE 11 13
LLNL 16.5 19
Princeton University 11 11
LBS Subtotal 38.5 43
NLUF 22 24
LLE Calibration LLE 0 44
Grand Total 247.5 301

FY20 Q1 Laser FaciLitY report
LLE Review, Volume 16146
Accomplishments During Q1 FY20A novel cryogenic microscope was deployed in the Cryogenic and Tritium Facility to image a cryogenic DT target for submi-
cron features. The key finding was that a filled DT target could be nondestructively imaged at a 0.6-nm resolution. Three 180 # 280-nm areas were carefully sampled, and new features resulting from the filling operations were counted and analyzed. Based on these three areas, it is estimated that approximately 670 new features appeared from the fill operations. The limb of the target was imaged, and across the entire target, ten new features of 1 to 3 nm in size were discovered on the outside of the shell. The system was unable to determine if the estimated 670 features are predominantly on the outside or inside of the shell. Further work with this new microscope will continue.
The final layer of shielding has been installed between the OMEGA Target Bay and LaCave with measured reduction in the noise level by as much as 50% (depending on location).
Table II: OMEGA EP Laser System target shot summary for Q1 FY20.
Program LaboratoryPlanned Number of Target Shots
Actual Number of Target Shots
ICF LLE 28 53
LLNL 21 31
ICF Subtotal 49 84
HED
LLE 14 24
LLNL 21 28
SNL 7 15
HED Subtotal 42 67
LBSLANL 7 1
LLNL 14 27
LBS Subtotal 21 28
NLUF 28 31
LaserNetUS 14 23
LLE Calibration LLE 0 9
Grand Total 154 242

InertIal ConfInement fusIon
LLE Review, Volume 162 47
V. N. Goncharov, I. V. Igumenshchev, D. R. Harding, S. F. B. Morse, S. X. Hu, P. B. Radha, D. H. Froula, S. P. Regan,T. C. Sangster, and E. M. Campbell
Laboratory for Laser Energetics, University of Rochester
A new class of ignition designs is proposed for inertial confinement fusion (ICF) experiments. These designs are based on the hot-spot–ignition approach, but instead of conventional targets that are comprised of spherical shells with thin frozen deuterium–tritium (DT) layers, a liquid DT sphere inside a wetted-foam shell is used, and the lower-density central region and higher-density shell are created dynamically by appropriately shaping the laser pulse. These offer several advantages, including simplicity in target production (suitable for mass production for inertial fusion energy), absence of the fill tube (leading to a more-symmetric implosion), and lower sensitivity to both laser imprint and physics uncertainty in shock interaction with the ice–vapor interface. The design evolution starts by launching an +1-Mbar shock into a homogeneous DT sphere. After bouncing from the center, the reflected shock reaches the outer surface of the sphere and the shocked material starts to expand outward until its pressure drops below the ablation pressure. At this point, an adjustment shock is launched inward by supporting ablation pressure.
This shock compresses the ablator and fuel, forming a shell. The shell is then accelerated and compressed by appropriately shaping the drive laser pulse, similar to the conventional thin-shell, hot-spot designs. This summary demonstrates the feasibility of the new concept using hydrodynamic simulations and discusses the advantages and disadvantages of the concept compared with more-traditional ICF designs.
The thin-shell cryogenic targets currently used in ICF ignition experiments have several disadvantages: First, fabrication of highly uniform frozen DT layers is time consuming and, in some cases, not reproducible. The layer must be sufficiently uniform to prevent seeding the Rayleigh–Taylor (RT) instability1 developed during shell acceleration.2 Even though the beta-layering tech-nique3 optimized over the last decade has produced smoothness that meets the uniformity specification, the layering process is still time consuming, and different engineering features (such as fill tubes, stalks, and characterization windows in the hohlraum) affect the ice-layer uniformity and lead to degradation in target performance. Second, the physics of relatively strong shocks (a few megabars) interacting with solid material (ablator and DT ice) is not well known. For example, the material phase transition behind the shock could lead to chunks of different phases being present in the shocked ablator and fuel, which contributes to the nonuniformity seeding at the ablator–ice interface and the inner surface of the shell as the first shock breaks out of the shell and material starts to accelerate, forming rarefaction or release. In addition, the physics of spallation or jetting of material from the inner ice surface after shock breakout of the shell is also not well understood and its effect on target performance remains uncertain. Third, laser imprint plays a critical role in determining the nonuniformity seeding in the laser-direct-drive designs.4,5
Prior to establishing a conduction zone (a region between where the laser energy is deposited and the ablation front) sufficiently large to smooth out the most-damaging modes (typically, these include mode numbers > 10), the nonuniformities seeded by laser beam speckles imprint on the target surface.6 These amplify due to RT instability during acceleration that starts soon after the first shock breaks out of the shell.
Most of these shortcomings can be addressed by imploding liquid DT spheres. These spheres do not require fuel layering, do not have solid–gas interfaces, and have low acceleration during shock propagation through the sphere, preventing significant amplification of early laser imprint. Homogeneous DT spheres have been considered in the past for the volume-ignition approach.7
Novel Hot-Spot–Ignition Designs for Inertial Confinement Fusion with Liquid Deuterium–Tritium Spheres

Novel Hot-Spot–IgNItIoN DeSIgNS for INertIal CoNfINemeNt fuSIoN wItH lIquID DeuterIum–trItIum SpHereS
LLE Review, Volume 16248
Volume ignition relies mainly on minimizing radiation losses. Such designs require either high-Z shells to trap radiation in the fuel or a large, optically thick fuel mass. The radiation trapping scheme has received a lot of attention in recent publications,8–10 but the neutron yields predicted in the volume-ignition ICF approach do not significantly exceed gain +1 (see Ref. 11). In addi-tion, such designs require complex targets with multiple shells and buffer layers to mitigate hydrodynamic instability growth.
To illustrate the concept of dynamic shell formation, we consider a 100-nm-thick, 2400-nm-OD CH shell filled with DT fuel at the triple point with a mass density of t = 0.25 g/cm3. This target is driven by a laser pulse with a constant-in-time power of PL = 1 TW, which corresponds to an on-target overlap incident intensity of I - 5.5 # 1012 W/cm2. Although the laser wavelength mL = 351 nm is used in this example, any other laser frequencies will work for the dynamic shell formation since no significant laser–plasma interaction issues are expected at such low overlap intensities. According to 1-D simulations using the hydrody-namic code LILAC,12 the ablation pressure corresponding to these drive conditions is Pa = 2 Mbar. A sequence of hydrodynamic profiles is shown in Figs. 1(a)–1(c). A snapshot of the shell prior to being accelerated is shown in Fig. 2. Next, shell acceleration and fuel compression proceed similarly to the conventional hot-spot designs. An example of the ignition pulse shape is shown in Fig. 3: the total pulse energy is 1.15 MJ. The acceleration part of the pulse has a continuous, 25-ns rise from 0.3 TW to 250 TW. The design reaches vimp = 3.5 # 107 cm/s, and, when alpha deposition is not included in the calculation, the peak areal density reaches tRpeak - 2 g/cm2 and the peak neutron-average pressure is 220 Gbar. When alpha deposition is included, the target ignites and gives a 1-D gain = 75.
Figure 1Snapshots of density (solid lines) and pressure (dashed lines) profiles at (a) t = 35 ns, (b) t = 51 ns, and (c) t = 61 ns.
TC15281JR
(a)3
2
1
0
2
1
0
Den
sity
(g/c
m3 )
0 4Distance (#102 nm)
82 6 10
4
6
2
0
20
10
0
Pres
sure
(Mba
r)
0 4Distance (#102 nm)
82 6 10
(c)
Leadingshock
4
6
2
0
20
60
40
00 4
Distance (#102 nm)82 6 10
(b)
Reflected shock
Figure 2 Dynamically formed shell profiles [(a) linear and (b) logarithmic density scales, respectively] at t = 180 ns for the pulse shown in Fig. 3.
TC15283JR
(a)101
100
10–1
10–2
10–3
Den
sity
(g/c
m3 )
0 8Distance (#102 nm)
164 12 20
1.2
0.8
0.4
0.012 14
Distance (#102 nm)16 18
(b)
4
16
12
8
0 Pres
sure
(#10
–2 M
bar)

InertIal ConfInement fusIon
LLE Review, Volume 162 49
This material is based upon work supported by the Department of Energy National Nuclear Security Administration under Award Number DE-NA0003856, the University of Rochester, and the New York State Energy Research and Development Authority.
1. S. Chandrasekhar, Hydrodynamic and Hydromagnetic Stability, International Series of Monographs on Physics (Dover Publications, New York, 1981), Chap. X, p. 428.
2. S. W. Haan et al., Phys. Plasmas 18, 051001 (2011).
3. J. K. Hoffer and L. R. Foreman, Phys. Rev. Lett. 60, 1310 (1988).
4. P. W. McKenty et al., Phys. Plasmas 8, 2315 (2001).
5. S. X. Hu et al., Phys. Plasmas 17, 102706 (2010).
6. V. N. Goncharov et al., Phys. Plasmas 7, 2062 (2000).
7. S. Atzeni and J. Meyer-ter-Vehn, The Physics of Inertial Fusion: Beam Plasma Interaction, Hydrodynamics, Hot Dense Matter, 1st ed., International Series of Monographs on Physics, Vol. 125 (Oxford University Press, Oxford, 2004).
8. D. S. Montgomery et al., Phys. Plasmas 25, 092706 (2018).
9. S. X. Hu et al., Phys. Rev. E 100, 063204 (2019).
10. K. Molvig et al., Phys. Rev. Lett. 116, 255003 (2016).
11. M. D. Rosen, Phys. Plasmas 6, 1690 (1999).
12. J. Delettrez et al., Phys. Rev. A 36, 3926 (1987).
TC15284JR
Pow
er (T
W)
Time (ns)0 50 100 150 200
1
10
100
180 190 200
1
10
100
210
Figure 3 Pulse shape for the EL = 1.15-MJ ignition dynamic-shell design. The inset shows the main drive pulse.

First ObservatiOn OF HOt-spOt Mix in Laser-Direct-Drive inertiaL cOnFineMent FusiOn
LLE Review, Volume 16250
S. P. Regan,1 V. N. Goncharov,1 D. Cao,1 S. X. Hu,1 I. V. Igumenshchev,1 R. Epstein,1 R. Betti,1 M. J. Bonino,1 T. J. B. Collins,1 M. Farrell,2 C. J. Forrest,1 V. Gopalaswamy,1 V. Yu. Glebov,1 D. R. Harding,1 R. T. Janezic,1 J. P. Knauer,1
R. W. Luo,2 O. M. Mannion,1 J. A. Marozas,1 F. J. Marshall,1 D. Patel,1 P. B. Radha,1 M. E. Schoff,2 C. Stoeckl,1 T. C. Sangster,1 W. Theobald,1 and E. M. Campbell1
1Laboratory for Laser Energetics, University of Rochester2General Atomics
A laser-direct-drive (LDD) inertial confinement fusion (ICF) target1 has spherical concentric layers consisting of a central region of deuterium (D) and tritium (T) vapor surrounded by a cryogenic DT fuel layer and a thin plastic (CH or CD) ablator material. A spherical implosion driven via the rocket effect from laser ablation of the outer target surface by temporally shaped, high-intensity, overlapping laser beams results in the formation of central hot-spot plasma surrounded by a cold, dense DT shell. Thermonuclear fusion (D + T " 4He + n) initially occurs in the central hot spot at stagnation, liberating 17.6 MeV per reaction. A long-term goal of ICF is to capture the energy of the alpha particle in the hot spot (i.e., alpha heating) to trigger an ignition instability (i.e., launch a radially outward propagating thermonuclear wave through the surrounding high-density, compressed DT shell), where the fusion energy output is greater than or equal to the laser energy incident on the target. Ignition is predicted to occur when the hot-spot temperature exceeds 5 keV and that compressed areal density exceeds 0.3 g/cm2 (Refs. 2–4). Perturbations from the target and laser are amplified by the Richtmyer–Meshkov instability (RMI)5–7 and the Rayleigh–Taylor instability (RTI),8–10 which could mix the target layers, degrading the implosion compression, enhancing radiative cooling of the hot spot, and reduc-ing the fusion yield and the compressed areal density. Understanding the physical mechanisms and the seeds of hydrodynamic mixing is of great importance to future LDD ICF targets.11–15
The amount of hot-spot mix mass in LDD ICF implosions of a plastic spherical shell surrounding a layer of cryogenic DT has been diagnosed for the first time. Layered DT cryogenic implosion experiments were conducted on the 60-beam, 351-nm, 30-kJ OMEGA laser16 to determine the dependence of hot-spot mix17–21 on the design adiabat. For the given target dimensions and com-position, the adiabat is determined by the time history of the absorbed laser power and the levels of target preheat by either x rays or energetic electrons. The adiabat is defined as the pressure in the compressed shell divided by the Fermi-degenerate pressure at shell density .P Pshell Fermia =` j Evolution of instability seeds due to laser imprint22 and shell and DT-ice nonuniformities, as well as RTI growth factors during shell acceleration23 depend on the adiabat; therefore, changing the adiabat varies the hydrodynamic stability of the implosion. Although the OMEGA laser is not energetic enough to ignite a target, it is used to study hydrodynami-cally scaled ignition target designs.11–14 The implosion adiabat was varied from 2.5 to 12.5 by adjusting the temporal shape of the laser-drive pulse and the Atwood number at the CH/DT material interface AT CH DT CH DT- -t t t t= _ _i i8 B was varied from –0.14 to +0.04 by changing the amount of x-ray preheat of the ablator from the coronal plasma emission. Hot-spot mix can be seeded by debris or imperfections on the target surface,17–21,24 engineering features [such as the stalk having a 17-nm outer diameter (OD) or a fill tube with a 10-nm OD],24 and laser imprint.22 These seeds are amplified by the RMI during the shock transit of the shell and are subsequently amplified by the RTI of the ablation front and possibly at the CH/DT material interface during the acceleration phase. Additional mixing of the target layers could occur as the converging shell decelerates and forms a central hot spot.
The amount of hot-spot mix mass in LDD ICF implosions of a plastic spherical shell surrounding a layer of cryogenic DT has been quantitatively measured for the first time. Perturbations from the laser and target are amplified by the RMI during the
First Observation of Hot-Spot Mix in Laser-Direct-Drive Inertial Confinement Fusion

InertIal ConfInement fusIon
LLE Review, Volume 162 51
shock transit of the shell and by the RTI at the ablation surface and the CH/DT material interface during the acceleration phase and the subsequent deceleration phase. The hydrodynamic mixing of material from the plastic ablator, having trace amounts of Ge for diagnosis, into the hot spot at stagnation was observed and quantified using x-ray spectroscopy on the OMEGA laser and was shown to depend on the implosion adiabat and the Atwood number at the CH/DT material interface, consistent with 2-D radiation-hydrodynamic simulations. Hot-spot mix could degrade implosion compression, enhance radiative cooling of the hot spot, and reduce fusion yield and the compressed areal density in future LDD ignition targets.
The inferred hot-spot mix mass versus calculated adiabat is presented in Fig. 1 with (a) showing the case where the RTI at the ablation front and the DT/CH material interface contribute to the hot-spot mix mass, and (b) showing the case where the RTI at the ablation surface is primarily responsible for the hot-spot mix mass. As can be seen in both of these figures, comparable values of mix mass were inferred on each implosion for the two x-ray spectrometers (XRS) used in the experiment: XRS1 (red symbols) and XRS2 (blue symbols). The reduction in the inferred mix mass with increasing adiabat shown in Fig. 1(b) is consistent with the expectation of a decreased level of mixing as the adiabat is increased and the implosion becomes more stable. The weaker depen-dence of the inferred mix mass on the adiabat and the higher level of inferred mix mass for the highest-adiabat implosion observed in Fig. 1(a) are attributed to additional mixing from instability growth at the unstable DT-ice/plastic ablator interface. The enhanced level of x-ray preheat for the uniformly doped plastic ablator preheats the plastic ablator and causes the DT-ice/plastic ablator interface to become unstable. The trends observed in the experiment are consistent with 2-D radiation-hydrodynamics simulations.
Figure 1The inferred mix mass for OMEGA DT cryogenic implosions using (a) targets with the 8-nm-thick plastic ablator uniformly doped with Ge, and (b) targets with the inner 3 nm of the 8-nm-thick plastic ablator doped with Ge versus the calculated adiabat. For comparison, the initial CH mass in the shell is 21 ng and the calcu-lated DT mass in the hot spot at stagnation is 1.5 ng.
0 5 10 15Calculated adiabat
0 5 10 15Calculated adiabat
1.0
10.0
100.0
Infe
rred
mix
mas
s (n
g)
0.1
1000.0Ablation-front instability
(b)(a)
XRS1XRS2Detectionthreshold
Ablation-front instability +DT/CH interface instability
TC14591JR
This material is based upon work supported by the Department of Energy National Nuclear Security Administration under Award Number DE-NA0003856, the University of Rochester, and the New York State Energy Research and Development Authority.
1. J. Nuckolls et al., Nature 239, 139 (1972).
2. J. D. Lindl et al., Phys. Plasmas 11, 339 (2004).
3. S. Atzeni and J. Meyer-ter-Vehn, The Physics of Inertial Fusion: Beam Plasma Interaction, Hydrodynamics, Hot Dense Matter, 1st ed., International Series of Monographs on Physics, Vol. 125 (Oxford University Press, Oxford, 2004).
4. R. Betti et al., Phys. Plasmas 9, 2277 (2002).
5. R. D. Richtmyer, Commun. Pure. Appl. Math. 13, 297 (1960).
First ObservatiOn OF HOt-spOt Mix in Laser-Direct-Drive inertiaL cOnFineMent FusiOn
LLE Review, Volume 16252
6. E. E. Meshkov, Fluid Dyn. 4, 101 (1969).
7. V. N. Goncharov, Phys. Rev. Lett. 82, 2091 (1999).
8. J. W. S. Rayleigh, The Theory of Sound, 2nd ed., Vol. 2 (Dover, New York, 1945).
9. G. Taylor, Proc. R. Soc. London Ser. A 201, 192 (1950).
10. A. J. Cole et al., Nature 299, 329 (1982).
11. V. N. Goncharov et al., Plasma Phys. Control. Fusion 59, 014008 (2017).
12. E. M. Campbell et al., Matter Radiat. Extremes 2, 37 (2017).
13. S. P. Regan et al., Nucl. Fusion 59, 032007 (2019).
14. V. Gopalaswamy et al., Nature 565, 581 (2019).
15. T. J. B. Collins and J. A. Marozas, Phys. Plasmas 25, 072706 (2018).
16. T. R. Boehly et al., Opt. Commun. 133, 495 (1997).
17. B. A. Hammel et al., Phys. Plasmas 18, 056310 (2011).
18. I. V. Igumenshchev et al., Phys. Plasmas 20, 082703 (2013).
19. S. P. Regan et al., Phys. Plasmas 19, 056307 (2012).
20. S. P. Regan et al., Phys. Rev. Lett. 111, 045001 (2013).
21. R. Epstein et al., AIP Conf. Proc. 1811, 190004 (2017).
22. V. A. Smalyuk et al., Phys. Rev. Lett. 81, 5342 (1998).
23. R. Betti et al., Phys. Plasmas 5, 1446 (1998).
24. T. Ma et al., Phys. Rev. Lett. 111, 085004 (2013).

Plasma and Ultrafast Physics
LLE Review, Volume 162 53
D. Turnbull,1 A. V. Maximov,1,2 D. H. Edgell,1 W. Seka,1 R. K. Follett,1 J. P. Palastro,1 D. Cao,1 V. N. Goncharov,1,2 C. Stoeckl,1 and D. H. Froula1,3
1Laboratory for Laser Energetics, University of Rochester2Department of Mechanical Engineering, University of Rochester
3Department of Physics & Astronomy, University of Rochester
Radiation-hydrodynamic simulations of directly driven fusion experiments at the Omega Laser Facility accurately predict absorption when targets are driven at low overlapped laser intensity. Discrepancies appear at increased intensity, however, with higher-than-expected laser absorption on target. Strong correlations with signatures of the two-plasmon–decay (TPD) instability—including half-harmonic and hard x-ray emission—indicate that TPD is responsible for this anomalous absorption. Scattered-light data suggest that up to +30% of the laser power reaching quarter-critical density can be absorbed locally when the TPD threshold is exceeded. A scaling of absorption versus TPD threshold parameter was empirically determined and validated using the laser-plasma simulation environment (LPSE) code.
The coupling of the laser to directly driven inertial confinement fusion targets is arguably the most fundamental ingredient of such implosions, necessitating accurate models that capture all of the primary laser-absorption processes. In radiation-hydrody-namic simulations (i.e., using the LILAC code), the recent transition from a flux-limited thermal transport model to a more-physical nonlocal model revealed significant errors in predicted laser absorption, with more light scattered from the target than expected. This led to the realization that resonant amplification of unabsorbed light leaving the target (i.e., cross-beam energy transfer, or CBET) significantly degrades the laser coupling. Simulation fidelity was improved by the addition of an in-line model describing the instability. This model, however, ostensibly overcompensates—increasing scattered light and reducing shell velocity beyond the level suggested by measurements.
One of the critically important laser–plasma instabilities in OMEGA-scale direct-drive implosions is the TPD instability,1 in which an incident photon decays into two electron plasma waves near the quarter-critical density surface .n 4c Here, we show that the discrepancy between predicted and observed scattered light is a signature of anomalous absorption of laser light due to the excitation of TPD. Over a wide range of laser intensities spanning the typical design space of implosions on OMEGA, the time-dependent absorption difference is shown to be strongly correlated with the time history of TPD activity, which was diag-nosed using half-harmonic emission. The data suggest that +15% to 20% of the laser light reaching n 4c is typically absorbed when TPD is active, which significantly modifies the coronal plasma energetics of implosions on OMEGA.
The basic mechanism is as follows: The incident lasers transfer energy to the coronal plasma through electron–ion collisions. Between approximately 10% and 50% of the critical density, the incident light is also coupled to the outgoing light by CBET. When the ingoing rays reach their turning point, the photons that have not yet been absorbed get reflected. Upon re-entering the CBET-active region, this outgoing light becomes the seed that is amplified by CBET. When some fraction of the incident laser light is absorbed near n 4c due to TPD, the power at every point thereafter will be reduced by approximately that fraction, including the net power out.
Figure 1(a) shows the total incident laser power for six different implosions along with the scattered light predicted by LILAC (using the nonlocal and CBET models) and the measured scattered light. The time-integrated coupling percentage is included
Anomalous Absorption by the Two-Plasmon–Decay Instability

AnomAlous Absorption by the two-plAsmon–DecAy instAbility
LLE Review, Volume 16254
for both the simulations and the experiments, with differences as large as 8% (shot 76824). Also noted is the average quarter-critical overlapped intensity during the peak according to LILAC (ranging from I14 = 2.5 to 4.1 in units of 1014 W/cm2) and the associated vacuum hard-sphere intensities (6.0 to 10.7). The examples shown are emblematic of the systematic trends evident in the broader absorption database. At low overlapped intensity (e.g., shot 75043), there is excellent agreement between predicted and observed scattered light. At higher quarter-critical intensity, however, they tend to diverge at some point during peak power.
In search of qualitative correlation between the apparent error in scattered light and TPD, the time-resolved difference between the predicted and observed scattered light was plotted [see Fig. 1(b)] against the time history of half-harmonic emission—a spectral doublet centered around 702 nm that is known to be a signature of TPD.1 The agreement in terms of onset, timing, and overall shape is generally remarkable.
Assuming the decrease in total scattered power is dominated by the reduction of the unabsorbed light seed, the ratio of scattered power with TPD (i.e., the experimental result) to scattered power without TPD (i.e., the simulated result) is a direct measurement of the transmission T past ,n 4c and absorption is simply 1 TAn 4c
-= [Fig. 1(c)]. Typical incident power levels yield absorption in the range of 10% to 25%. Such levels are consistent with the conclusions drawn from electron-temperature measurements of the quarter-critical region based on half-harmonic emission.2
Figure 1Use of scattered light data to infer anomalous absorption due to TPD. (a) From left to right, peak power increases along with overlapped intensity at quarter-critical density. During peak power, scattered-light data are increasingly divergent from the simulated predictions as quarter-critical intensity increases. (b) The difference between predicted and observed scattered light correlates extremely well with half-harmonic emission, indicating the discrepancy is asso-ciated with TPD. (c) Assuming that anomalous absorption by TPD primarily reduces the unabsorbed light seed for CBET, absorption at n 4c due to TPD is typically found to be in the range of +10% to 25%. The absorption time dependence can be predicted inline using parameters in LILAC along with Eq. (1).
E28914JRTime (ns)
10 2Time (ns)
10 2Time (ns)
10 2Time (ns)
10 2Time (ns)
10 2Time (ns)
10 2
0.2
0.1
Abs
orpt
ion
at n
c/4
0
4
21
3
Pow
er (T
W)
(b) Pl0 – P0 ~/2 (arbitrary units)
(c)Inferred from data Simulated prediction using Eq. (1)
20
105
15
Pow
er (T
W)
(a)75043 77335 75009 7558776601 76824
Incident Predicted scatter Pl0Measured scatter P0
3.7 (9.6)
73%73%
52%
54%58%
61%
61%
65%
59%
63%
55%
63%
I14 = 2.5 (6.0) 3.4 (9.9) 3.6 (8.9) 3.7 (8.4) 4.1 (10.7)
5
0
25
0.3
0.0

Plasma and Ultrafast Physics
LLE Review, Volume 162 55
It would be useful to have an in-line model for enhanced TPD absorption that does not rely on experimental measurements a posteriori; inferring an appropriate scaling for such a reduced model is a main goal of this work. TPD activity has previously been shown to scale with the Simon threshold parameter h = I14L/(233 Te), with the density gradient scale length L in nm, elec-tron temperature Te in keV, and laser intensity specified at .n 4c For each of the shots in Fig. 1 (highlighted in blue) as well as 11 other shots from the same 2014–2015 time period, h(t) was extracted from the LILAC simulations and plotted against the inferred absorption. Figure 2 shows the inferred scaling of anomalous TPD absorption versus TPD threshold parameter. Above a threshold at h = 0.71, the data are well fit by the power law
. . .A 0 248 0 061 4n 4c
- h= - (1)
Convolving the simulated Simon threshold parameter with an appropriate response function and then applying the above scaling yields an estimated absorption using the code parameters for direct comparison to the data on an individual shot. The results, included in Fig. 1(c), generally track the data well. This should, therefore, be a good starting point for a reduced model that can be included inline in radiation-hydrodynamic simulations.
To validate the empirical scaling, 2-D simulations were run using LPSE. Notably, a new pump-depletion model was used that self-consistently evolves the electromagnetic field of the laser as power is pumped into electron plasma waves. Figure 2 shows that LPSE’s predictions for TPD absorption are in very good agreement with the data. The use of a speckled beam was found to be essential in reproducing both the threshold and the scaling above threshold because individual intense speckles become unstable below h = 1, while other parts of the beam remain below threshold. Critically, the simulations found that 5# to 8.3# more power is dissipated by collisional (rather than Landau) damping, which explains why such large laser absorption does not result in undue levels of hot electrons—most of the power is thermalized around .n 4c
This material is based upon work supported by the Department of Energy National Nuclear Security Administration under Award Number DE-NA0003856, the University of Rochester, and the New York State Energy Research and Development Authority.
1. W. Seka et al., Phys. Plasmas 16, 052701 (2009).
2. W. Seka et al., Phys. Rev. Lett. 112, 145001 (2014).
Figure 2A trend of inferred absorption versus the Simon threshold parameter extracted from simulations is found using the average values from a wide range of shots with differing drive conditions. Typically, conditions during peak power are +20% to 30% above the TPD threshold, resulting in +15% to 20% local absorption at n 4c . Two-dimensional LPSE simulations accurately reproduce both the threshold and the scaling above threshold.
E28916JR
1.10.7 0.8 0.9 1.0
0.25
0.00
0.05
0.10
0.20
0.15
TPD threshold (Simon) parameter h
TPD
abs
orpt
ion
at n
c/4 Data
Data fitLPSE
Anc/4 = 0.248 – 0.061h–4

X-Ray DiffRaction at the national ignition facility
LLE Review, Volume 16256
J. R. Rygg,1,2,3,4 R. F. Smith,4 A. E. Lazicki,4 D. G. Braun,4 D. E. Fratanduono,4 R. G. Kraus,4 J. M. McNaney,4 D. C. Swift,4 C. E. Wehrenberg,4 F. Coppari,4 M. F. Ahmed,4 M. A. Barrios,4 K. J. M. Blobaum,4 G. W. Collins,1,2,3,4 A. L. Cook,4 P. Di Nicola,4 E. G. Dzenitis,4 S. Gonzales,4 B. F. Heidl,4 M. Hohenberger,4 A. House,4 N. Izumi,4 D. H. Kalantar,4 S. F. Khan,4 T. R. Kohut,4 C. Kumar,4 N. D. Masters,4 D. N. Polsin,1 S. P. Regan,1,2 C. A. Smith,4 R. M. Vignes,4
M. A. Wall,4 J. Ward,4 J. S. Wark,5 T. L. Zobrist,4 A. Arsenlis,4 and J. H. Eggert4
1Laboratory for Laser Energetics, University of Rochester2Department of Mechanical Engineering, University of Rochester
3Department of Physics & Astronomy, University of Rochester4Lawrence Livermore National Laboratory
5Department of Physics, Clarendon Laboratory, University of Oxford
The behavior of matter depends strongly on the particular structure or arrangement of the constituent atoms, which provides a fundamental basis for understanding the mechanical, electronic, magnetic, and thermodynamic properties. For over a century, x-ray diffraction (XRD) has been a workhorse technique to measure the atomic arrangement of matter, leading to numerous scientific discoveries and materials understanding. The powder x-ray diffraction image plate (PXRDIP) platform1—first deployed at the Omega Laser Facility in 2009—brought XRD to the frontier of high-pressure research at large laser facilities. It has been used on over 100 OMEGA and OMEGA EP campaigns to record x-ray diffraction from matter compressed to extreme pressures and discover new phases in a variety of materials.2–7
A variant of the OMEGA XRD platform, now implemented at the National Ignition Facility (NIF) [Fig. 1(a), Ref. 8], takes advantage of the additional energy and longer pulse durations to compress samples to even more extreme conditions up to 2 TPa (1 TPa = 10 Mbar . 10 million atm), and to flash even brighter x-ray sources for x-ray diffraction on thicker samples and with shorter wavelengths.
Common to the XRD platforms at both the Omega Laser Facility and the NIF, a sample of interest is sandwiched between tamper layers and compressed to a uniform, high-pressure state by direct laser drive of the sample assembly. The pressure history in the sample is measured using high-precision velocimetry [velocity interferometer system for any reflector (VISAR)]. The sample is then irradiated while at peak pressure by up to two bursts of K-shell emission from separate laser-driven foils. The angular distribution of x rays scattered from a portion of the sample restricted by a pinhole aperture is recorded on x-ray–sensitive detectors covering approximately 1.5r steradians [Fig. 1(b)].
Several improvements to the platform setup and data analysis have been implemented, many of which are applicable to both the OMEGA and NIF diffraction platforms. Pressure uniformity better than 3% (1v) in both the longitudinal and transverse dimensions has been demonstrated for compressed samples at the time of exposure to x rays. The mean sample pressure during exposure can be determined in some cases with 1% precision, depending mostly on the velocimeter sensitivity, and 3% accuracy, depending mostly on the high-pressure characterization of the VISAR-side tamper layer. The diffracted signal is determined with a typical 2i x-ray scattering angle precision of about 0.2° and resolution of about 1°. Analytic expressions have been derived for systematic corrections to 2i due to finite pinhole size and sample offset. A density accuracy of better than six parts per thousand has been demonstrated on the NIF using an undriven lead sample.
X-Ray Diffraction at the National Ignition Facility

HigH-EnErgy-DEnsity PHysics
LLE Review, Volume 162 57
E29082JR
Powder sample diffraction
Wireshadow
Fiducialwire
99-mm diameter
(a) (b)
Direct image
Diffraction arcs
Sample assembly
VISAR
XS2 direct image XS1 direct image
Fiducial wire shadow
Single-crystal diamond diffraction
VISAR
100
PSL
101
XSF2(optional)
XSF1Drive laserXS laser
The high laser energy (up to 200 kJ) used on the NIF for driving the target and the x-ray sources leads to an extremely high background on the image-plate detectors, particularly for drive pressures exceeding 1 TPa. Significant shielding improvements were implemented on the NIF, some of which were adapted to Omega’s PXRDIP platform. In addition, a recently developed variant of a nonlinear 2-D background subtraction algorithm has been used to isolate and detect diffraction lines at signal-to-background ratios as low as a few percent. This background subtraction method may be useful for other diagnostics that have a high and nonuniform background.
An improved model for the system response over the detector area has been constructed to permit compensation of the data signal based on local sensitivity in order to obtain accurate diffraction line intensities. This system response calculation includes a new analytic approximation for image-plate sensitivity as a function of photon energy (up to 100 keV) and incident angle that can be directly applied to other diagnostics using image plates at non-normal incidence angle.
These x-ray diffraction platforms have been used to (1) measure the density-pressure equation of state and determine the crystal structure of a variety of materials, including discovery of several new phases; (2) evaluate the strain-induced texturing or de-texturing after some phase transitions; and (3) verify solidity and observe liquid phases, thereby examining the melt line at high pressure. Dual x-ray probes unlock new exploration of the kinetics of phase transitions at nanosecond time scales, including hysteresis and the strain-rate dependence of phase boundaries. Manuscripts describing new diffraction results on several materials compressed up to 2 TPa are currently in preparation. Over the last century, x-ray diffraction has been an invaluable tool for prob-ing and understanding materials, and we are pleased to push this capability toward the current frontier of high-pressure science.
This work was largely performed under the auspices of the U.S. Department of Energy by Lawrence Livermore National Laboratory under Contract No. DE-AC52-07NA27344. A portion of this material is based upon work supported by the Depart-ment of Energy National Nuclear Security Administration under Award Number DE-NA0003856, the University of Rochester, and the New York State Energy Research and Development Authority.
Figure 1(a) The NIF x-ray diffraction platform involves ramp compression of the sample assembly using temporally shaped NIF laser drive beams. One, or optionally two, x-ray source foils (XSF’s) are driven by additional (XS) beams to generate an x-ray pulse that diffracts from the compressed sample and is recorded on image plates lining the inside of a 99-mm-diam cylinder. A hole-in-one image plate allows for simultaneous velocimetry of the sample assembly using the VISAR diagnostic, and fiducial wires are used to cross-register the location of the image plates for improved precision. (b) Image plate scans for N160517-003, a dual-XS exposure of platinum compressed to 200 GPa.

X-Ray DiffRaction at the national ignition facility
LLE Review, Volume 16258
1. J. R. Rygg et al., Rev. Sci. Instrum. 83, 113904 (2012).
2. F. Coppari et al., Nat. Geosci. 6, 926 (2013).
3. A. Lazicki et al., Phys. Rev. Lett. 115, 075502 (2015).
4. J. Wang et al., Phys. Rev. B 94, 104102 (2016).
5. D. N. Polsin et al., Phys. Rev. Lett. 119, 175702 (2017).
6. J. K. Wicks et al., Sci. Adv. 4, eaao5864 (2018).
7. M. Millot et al., Nature 569, 251 (2019).
8. J. R. Rygg et al., Rev. Sci. Instrum. 91, 043902 (2020).

HigH-EnErgy-DEnsity PHysics
LLE Review, Volume 162 59
A. K. Schwemmlein,1,2 C. Stoeckl,1 W. T. Shmayda,1 and W. U. Schröder1,2,3
1Laboratory for Laser Energetics, University of Rochester2Department of Physics and Astronomy, University of Rochester
3Department of Chemistry, University of Rochester
The Multi-Terawatt (MTW) Laser System at LLE was used to study the target normal sheath acceleration (TNSA) mechanism in deuterated metal foils at intensities close to 1019 W/cm2. Deuteron beams were previously generated with this mechanism using either plastic1 or heavy-water2,3 targets. While plastic targets promise simple handling, they offer poor beam quality; on the other hand, heavy-water targets yield higher beam quality but require careful handling. Deuterated metal foils provide a reasonable compromise between ease of handling and beam quality. In addition, certain metals such as titanium have a high capacity for storing hydrogen in the form of hydrides.4
A first batch of targets was prepared by exposing 500 # 500 # 25-nm3 titanium foils to 1 mTorr of atomic deuterium (D0) generated by a glowing tungsten filament in a deuterium atmosphere for varying amounts of time. The second batch was formed by depositing titanium onto titanium substrates in a deuterium atmosphere.
A total of 50 deuterated metal targets were shot to create a survey of deuteron beam characteristics as a function of surface loading. The spectra of all emitted ions were measured using the Thomson parabola ion spectrometer.5 Remarkably, the deuterons had a quasi-monoenergetic spectrum well approximated by a Gaussian (see Fig. 1). This unusual TNSA spectrum was predicted in literature6 for heavy target substrates. Heavy atoms remain almost stationary during the TNSA process, generating a nearly static electric field that uniformly accelerates light ions. All fielded targets produced this Gaussian energy spectrum, regardless of loading type, with a very consistent mean beam energy and width of 0.8!0.6 MeV.
Total yields ranged from low-1010 to mid-1011 deuterons per shot, depending critically on the surface loading. Figure 2 shows that there is an increase in deuterium yield with titanium thickness for targets onto which titanium was evaporated under a D0 atmosphere. On the other hand, there was no increase in yield with D0 exposure time for targets that were simply exposed to D0. Comparing yields across the batches, simple D0 exposure for 22 h proved more effective than condensing 1 nm of titanium on titanium in the presence of D0. Consequently, the total deuterium yield of an evaporatively loaded target increases with TiD thickness, but diffusively loaded targets always produce higher yields within the parameter space evaluated. However, this higher yield cannot be increased further by longer exposure times. In future experiments, titanium targets will be exposed to atomic tritium (T0) for 24 h to produce a tritium beam that will be used to study nuclear reaction rates relevant for stellar nucleosynthesis.
Optimizing Deuterated Metal Foils to Generate a Quasi-Monoenergetic Deuteron Beam
on the Multi-Terawatt Laser

Optimizing DeuterateD metal FOils tO generate a Quasi-mOnOenergetic DeuterOn Beam On the multi-terawatt laser
LLE Review, Volume 16260
Figure 2The absolute deuteron yields for the two different batches. (a) Targets onto which Ti was evaporated under a D0 atmosphere. An increase of yield with thick-ness is evident. (b) Targets exposed to a D0 atmosphere. Since there is no increase in yield with exposure time, it is concluded that saturation occurs quickly. Atomic deuterium exposure is clearly the more-effective loading method.
Figure 1Data for one shot using a Ti-backed target exposed to D0 for 98 h: (a) the digitized image plate and (b) the corresponding Thomson parabola spectra for each trace. Note the peaked deuteron spectrum.
E28997JRTiD2 thickness (nm) D0 exposure time (h)0 0 22 46 98 193470 890 1000
Abs
olut
e de
uter
on y
ield
(#10
11)
0
1
2
3
4
5
6
7(a) (b)
E28769JR
Thomson Parabola Spectra
00 200100 300
Electric deflection in pixels Energy (MeV)
(b)
Mag
netic
def
lect
ion
in p
ixel
s
400
600
800
400
200
1000
00 21 3 4
Parti
cles
/MeV
/sr (#
1011
)
4
6
2
H+
D+
C5+
C4+
C3+
C2+
C1+
H+
D+ or C6+
Cn+
(a)
8

HigH-EnErgy-DEnsity PHysics
LLE Review, Volume 162 61
This material is based upon work supported by the Department of Energy National Nuclear Security Administration under Award Number DE-NA0003856, the University of Rochester, and the New York State Energy Research and Development Authority.
1. L. Torrisi et al., Phys. Scr. T161, 014026 (2014).
2. J. T. Morrison et al., Phys. Plasmas 19, 030707 (2012).
3. S. Karsch et al., Phys. Rev. Lett. 91, 015001 (2003).
4. W. M. Mueller, J. P. Blackledge, and G. G. Libowitz, Metal Hydrides (Academic Press, New York, 1968).
5. C. C. Freeman et al., Rev. Sci. Instrum. 82, 073301 (2011).
6. T. Zh. Esirkepov et al., Phys. Rev. Lett. 89, 175003 (2002).

Fully Consistent Density FunCtional theory Determination oF the insulator-to-metal transition BounDary
LLE Review, Volume 16262
J. Hinz,1 V. V. Karasiev,1 S. X. Hu,1 M. Zaghoo,1 D. Mejía-Rodríguez,2 S. B. Trickey,2 and L. Calderín3
1Laboratory for Laser Energetics, University of Rochester2Quantum Theory Project, Department of Physics, University of Florida
3Department of Materials Science and Engineering, University of Arizona
The liquid–liquid insulator-to-metal transition (IMT) of warm dense hydrogen isotopes is a crucial phenomenon for giant planet structure and dynamics. Because hydrogen has the highest relative abundance in the universe, accurate determination of the IMT is key to modeling the interior dynamics and evolution of these Jovian-like planets.1 An essential prerequisite for quantitative models is an accurate equation of state (EOS) that correctly describes both the onset and character of the IMT.2 Independent of planetary physics, an accurate EOS for hydrogen and its isotopes is also essential for progress in inertial confinement fusion research.3
Despite its importance, accurate determination of the IMT boundary remains an experimental and theoretical/computational challenge. In this work we make a major step forward on the theory/computation side by providing a single, conceptually consistent density functional theory (DFT) treatment, with the best-balanced modern approximate exchange-correlation (XC) functional, namely SCAN-L with the nonlocal correlation correction rVV10. We provide results both with and without nuclear quantum effects (NQE’s) that are mostly consistent with experimental findings and with best-available combinations of DFT and stochastic methods.
With the use of quantum molecular dynamic simulations, we probe warm dense fluid hydrogen from 60 to 320 GPa across a temperature range of 600 to 3000 K. Both classical nuclei, within the Born–Oppenheimer approximation, and quantum nuclei, as treated within the path integral formalism, are considered. In all cases the electrons are treated quantum mechanically within the finite temperature extension of DFT. The bulk system of fluid hydrogen is approximated with the use of a 256-atom system in a periodic cubic supercell maintained in a canonical ensemble with fixed particle number, temperature, and volume.
Analysis of the dc conductivity and reflectivity, calculated via the Kubo–Greenwood formalism, along with the extraction of the indirect band gap and ionic pair correlation function, shows concurrent abrupt changes at the onset of a minimum metallic behavior of 2000 S/cm. With the inclusion of nuclear quantum effects, the molecular character of the system is significantly diminished prior to the onset of metallization. This in turn sharpens the abrupt changes in the aforementioned properties and produces a shift in excess of 250 K in the IMT boundary location. Furthermore, the inclusion of NQE’s produces an explicit isotope effect in the form of clear splitting in the hydrogen and deuterium IMT boundaries (see Fig. 1).
In summary, we have re-examined the problem of determining the IMT boundary of warm dense fluid hydrogen with consistent use of what is arguably the best approximate XC functional currently available for treating both molecular and condensed phase systems evenhandedly. The resulting hydrogen IMT boundary is in good agreement with experimental measurements across a wide range of pressures and temperatures. Our analysis supports the notion of a metallic transition driven by an abrupt band-gap closure associated with the dissociation of molecular to atom hydrogen.
This work was supported by the Department of Energy National Nuclear Security Administration Award Number DE-NA0003856 and U.S. National Science Foundation PHY Grant No. 1802964. D. Mejía-Rodriguez and S. B. Trickey acknowledge support by U.S. Department of Energy grant DE-SC 0002139. All computations were performed on the LLE high-performance computing systems.
Fully Consistent Density Functional Theory Determination of the Insulator-to-Metal Transition Boundary
in Warm Dense Hydrogen
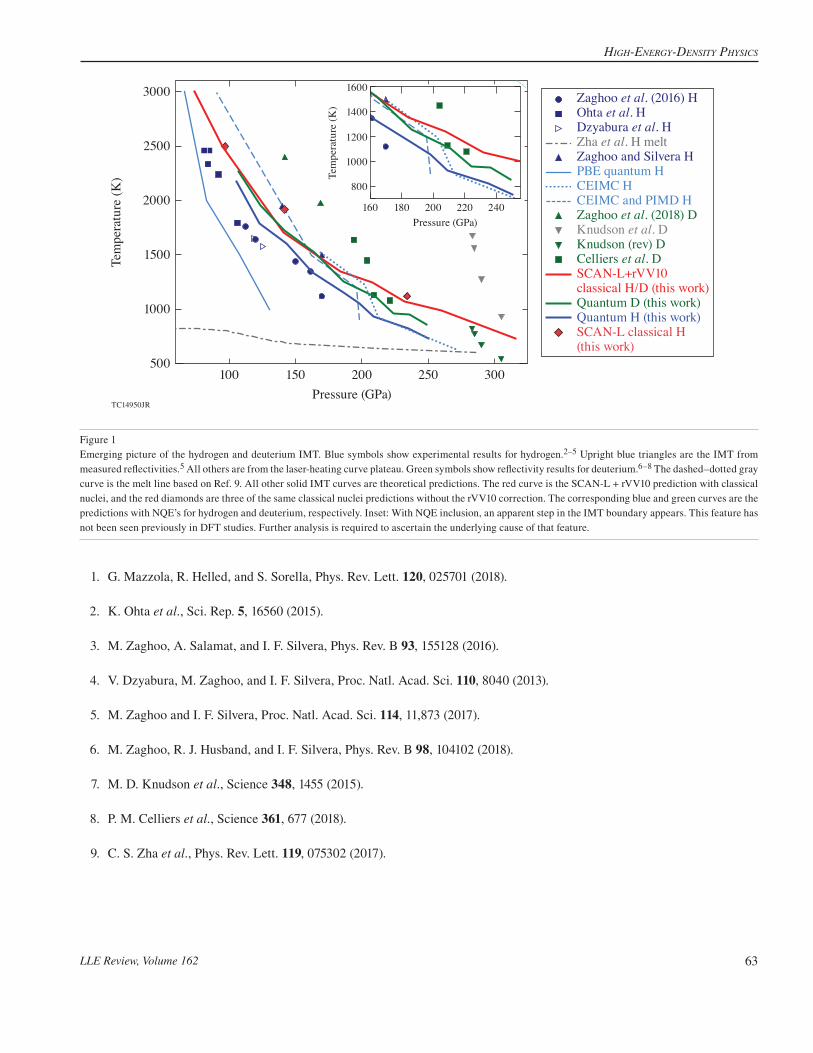
HigH-EnErgy-DEnsity PHysics
LLE Review, Volume 162 63
1. G. Mazzola, R. Helled, and S. Sorella, Phys. Rev. Lett. 120, 025701 (2018).
2. K. Ohta et al., Sci. Rep. 5, 16560 (2015).
3. M. Zaghoo, A. Salamat, and I. F. Silvera, Phys. Rev. B 93, 155128 (2016).
4. V. Dzyabura, M. Zaghoo, and I. F. Silvera, Proc. Natl. Acad. Sci. 110, 8040 (2013).
5. M. Zaghoo and I. F. Silvera, Proc. Natl. Acad. Sci. 114, 11,873 (2017).
6. M. Zaghoo, R. J. Husband, and I. F. Silvera, Phys. Rev. B 98, 104102 (2018).
7. M. D. Knudson et al., Science 348, 1455 (2015).
8. P. M. Celliers et al., Science 361, 677 (2018).
9. C. S. Zha et al., Phys. Rev. Lett. 119, 075302 (2017).
Figure 1 Emerging picture of the hydrogen and deuterium IMT. Blue symbols show experimental results for hydrogen.2–5 Upright blue triangles are the IMT from measured reflectivities.5 All others are from the laser-heating curve plateau. Green symbols show reflectivity results for deuterium.6–8 The dashed–dotted gray curve is the melt line based on Ref. 9. All other solid IMT curves are theoretical predictions. The red curve is the SCAN-L + rVV10 prediction with classical nuclei, and the red diamonds are three of the same classical nuclei predictions without the rVV10 correction. The corresponding blue and green curves are the predictions with NQE’s for hydrogen and deuterium, respectively. Inset: With NQE inclusion, an apparent step in the IMT boundary appears. This feature has not been seen previously in DFT studies. Further analysis is required to ascertain the underlying cause of that feature.
Tem
pera
ture
(K)
Pressure (GPa)
2500
2000
1500
1000
500
3000
100 150 200 250 300
Pressure (GPa)
Tem
pera
ture
(K)
200180160
800
1000
1200
1400
1600
240220
TC14950JR
Zaghoo et al. (2016) HOhta et al. HDzyabura et al. HZha et al. H meltZaghoo and Silvera HPBE quantum HCEIMC HCEIMC and PIMD HZaghoo et al. (2018) DKnudson et al. DKnudson (rev) DCelliers et al. DSCAN-L+rVV10 classical H/D (this work)Quantum D (this work)Quantum H (this work)SCAN-L classical H (this work)

Thermal hybrid exchange-correlaTion densiTy FuncTional For improving The descripTion oF Warm dense maTTer
LLE Review, Volume 16264
D. I. Mihaylov, V. V. Karasiev, and S. X. Hu
Laboratory for Laser Energetics, University of Rochester
The warm-dense-matter (WDM) regime is too hot for standard condensed-matter approaches; however, quantum many-body effects are strong and classical plasma physics are not applicable. An established standard approach for accurate treatment of WDM is ab initio molecular dynamics (AIMD), when classical treatment for ions is combined with finite-temperature density functional theory (FT-DFT) for electronic degrees of freedom. Currently, all available exchange-correlation (XC) functionals in commonly used DFT software packages are ground-state functionals that do not explicitly depend on T but are evaluated at the T-dependent self-consistent density, i.e., FXC[n(T),T] . EXC[n(T)]—an approach known as the ground-state approximation (GSA). Previously developed thermal functionals belong to the local density approximation (LDA) and generalized gradient approximation (GGA) level of refinement. At the LDA level, Karasiev et al. developed the nonempirical, thermal functional KSDT1 (and its corrected version, corrKSDT; see Ref. 2), which is based on parameterized path-integral Monte Carlo data for the homogeneous electron gas at finite T and, in the zero-T limit, reduces to the ground-state Perdew–Zunger (PZ) functional. Subsequently, driven by the need to incorporate density-gradient effects and thereby account for the nonhomogeneity of the system, Karasiev et al. developed the GGA-level thermal functional KDT16 (Ref. 2) by analyzing the gradient expansion of weakly inhomogeneous electrons at finite T and defining appropriate T-dependent reduced variables for X and C. KDT16 is, by construction, nonempirical and reduces to the popular Perdew–Burke–Ernzerhof (PBE) functional in the zero-T limit. An example of the improved accuracy provided by the KDT16 functional was recently reported in Ref. 3, where KDT16-based AIMD studies of shocked deuterium showed improved agreement with experimental measurements of Hugoniot, reflectivity, and dc conductivity at elevated T. While it is clear that corrKSDT and KDT16 provide an apparent improvement over their ground-state counterparts PZ and PBE, they suffer from an inherent fundamental drawback—underestimating the electronic band gap. Hybrid XC functionals such as PBE04 are constructed by mixing DFT XC functionals with Hartree–Fock (HF) exact exchange (EXX) and are known to be superior to GGA’s in predicting quantities such as Egap, atomization energy, bond length, and vibrational frequency. In this work we present the KDT0 thermal hybrid model, which is based on a mixture of finite-T HF X and thermal KDT16 GGA XC:
n,T n,T n,T n,T ,F F a F Fhyb DFA
XHF
XDFA
XC XC -= + _ i6 6 6 6@ @ @ @where n,TFDFA
X C 77 AA is the KDT16 X[C] free-energy density functional, n,TFHFX 7 A is HF EXX free energy, and a = 1/4 is a parameter
that is rationalized in Ref. 4 and gives a zero-T limit consistent with the PBE0 model. To compare performance between KDT0 and PBE0, we perform static calculations of the band gap as a function of electronic temperature Egap(T) when the positions of ions are fixed at near-ambient conditions. This corresponds to a two-temperature model, cold ions Ti . 0 K, and T is temperature of electrons Te = T. The systems of choice are Si, C, CH4, polystyrene (CH), and H2O. The choice of Si and C was motivated by the need to compare the KDT0 functional to the highly accurate finite-T GW (Ref. 5) (FT GW) calculations, which is a high-precision, first-principles, many-body perturbation theory approach but is prohibitively expensive for AIMD. CH, CH4, and H2O calculations were performed so that our choice of model systems spans a wide range of densities and magnitudes for the zero-T gaps and also due to their relevance to high-energy-density physics (HEDP) and planetary science.
Figure 1 shows Egap(T) results for Si and diamond, which are two of the systems addressed in Ref. 5. Let us first compare the GSA functionals PBE and PBE0 in the case of Si. At low T, they both give an approximately equally wrong value for the
Thermal Hybrid Exchange-Correlation Density Functional for Improving the Description of Warm Dense Matter

HigH-EnErgy-DEnsity PHysics
LLE Review, Volume 162 65
Egap(T), with PBE underestimating it and PBE0 overestimating it. At higher T, PBE0 predicts the same qualitative behavior as FT GW, monotonically decreasing Egap(T), while PBE predicts a monotonically increasing Egap(T), which is in direct contrast with FT GW predictions. The correct qualitative trend for Egap(T) predicted by PBE0 is a direct result of including T effects in XC through the T-dependent HF X and serves as an indication of the importance of thermal effects in XC. The same improvement in the qualitative behavior of Egap(T) provided by PBE0 is seen in diamond [Fig. 1(a) right]. Next, we turn our attention to results obtained with the thermal functionals KDT16 and KDT0. Most importantly, in both systems thermal XC effects lower the Egap(T) curve toward the more-accurate FT GW results, thereby improving qualitative behavior for all temperatures considered. We stress, however, two important observations: (1) the thermal corrections are strongly system dependent, with the relative difference in the gaps predicted by PBE0 and KDT0 reaching a maximum of 12.7% in Si and only 1.5% in diamond at T = 45 kK [see Fig. 1(c)]; (2) DEgap(T) for hybrid-level functionals is larger than that for GGA’s, which is a result of the different treatment of thermal effects in the X interaction between the hybrid and GGA levels of approximation. Motivated by these observations, we apply KDT0 and KDT16 to other systems of drastically different properties, such as density t and Egap at near-ambient conditions. Results for Egap(T) in CH, CH4, and H2O for T up to 30 kK are shown in Fig. 1(b). In CH, t = 1.06 g/cm3, relative differences in Egap(T) predicted by PBE0 and KDT0 [see Fig. 1(b)] are small (<2.5%) and comparable to those in diamond. For CH4, t = 0.43 g/cm3, and for H2O, t = 0.96 g/cm3; DEgap(T) reaches values comparable to those in Si at 45 kK, although the peaks occur at much lower T.
In conclusion, we have presented a thermal hybrid XC functional based on the KDT16 GGA XC free-energy density as density functional approximation for X and C free-energy terms and thermal HF X free energy, which leads to a finite-T extension of the PBE0 model, named here KDT0. Results for Egap(T) in various systems of interest to HEDP show that KDT16 could provide significant improvement to calculations of electronic properties for T within the WDM regime. We also see significant thermal
T (kK) T (kK)
(a)
00
20 40 0 20 40
Band
gap
(eV
) 3
2
1
3
5
4
6
PBE0 PBEKDT0 KDT16
FT GW
Si (GGA)
C (GGA)C (hybrid)
Si (hybrid)CH4 (GGA)CH (hybrid)
CH4 (hybrid)
CH (GGA)
H2O (GGA) H2O (hybrid)
10
10 20 30 40
DE g
ap (%
)
5
T (kK)
10
TC15407JR
Band
gap
(eV
)
(b)
0 203
4
5
0 20
67
0 206
8
T (kK) T (kK) T (kK)
106
PBE0 PBEKDT0 KDT16
5
8
(c)
Figure 1(a) Band gaps of Si (left) and diamond (right) as a function of electronic temperature calculated with ground-state PBE and PBE0 and thermal KDT16 and KDT0 functionals. The green curve (FT GW) was extracted from Ref. 5. (b) Band gaps as a function of electronic temperature calculated with thermal (KDT0 and KDT16) and ground-state (PBE0 and PBE) functionals. (c) Relative difference between Egap(T) predicted by GSA and thermal XC. Dotted lines correspond to GGA-level, and solid lines correspond to hybrid-level thermal corrections. Colors correspond to different systems, the absolute values of the gaps for which are shown in (a) and (b).

Thermal hybrid exchange-correlaTion densiTy FuncTional For improving The descripTion oF Warm dense maTTer
LLE Review, Volume 16266
XC effects on the entire band structure of studied systems, meaning that the accuracy of optic properties calculated via the Kubo–Greenwood formalism depends on accounting for those effects via thermal hybrid XC functionals. Also, we show that the importance of XC thermal effects depends strongly on the type of system and T range and that taking XC thermal effects into account at the hybrid level of approximation can lead to larger corrections compared to those at the GGA level, which further warrants the need for the development of advanced thermal free-energy density functionals.
This material is based upon work supported by the U.S. Department of Energy National Nuclear Security Administration under Award Number DE-NA0003856 and U.S. National Science Foundation PHY Grant No. 1802964. This research used resources of the National Energy Research Scientific Computing Center, a DOE Office of the Science User Facility supported by the Office of Science of the U.S. Department of Energy under Contract No. DE-AC02-05CH11231.
1. V. V. Karasiev et al., Phys. Rev. Lett. 112, 076403 (2014).
2. V. V. Karasiev, J. W. Dufty, and S. B. Trickey, Phys. Rev. Lett. 120, 076401 (2018).
3. V. V. Karasiev et al., Phys. Rev. B 99, 214110 (2019).
4. J. P. Perdew, M. Ernzerhof, and K. Burke, J. Chem. Phys. 105, 9982 (1996).
5. S. V. Faleev et al., Phys. Rev. B 74, 033101 (2006).

Diagnostic science anD Detectors
LLE Review, Volume 162 67
D. H. Barnak,1 J. R. Davies,1 J. P. Knauer,1 and P. M. Kozlowski2
1Laboratory for Laser Energetics, University of Rochester2Los Alamos National Laboratory
Spectrally integrated x-ray diagnostics1–3 such as the ones fielded at the Omega Laser Facility and the National Ignition Facility make it possible to estimate radiation temperatures and spectral power without the need for crystal spectrometers. An array of x-ray diodes with different K-edge filters samples finite areas of the spectrum in question to determine the radiated power in that band. X-ray mirrors are also used as filters for high-energy photons for K-edge filters at lower-photon-energy bands. The filter components, x-ray diode, cable chain, attenuators, and digitizing oscilloscope form what is commonly referred to as a channel of the array. A typical array of diodes is capable of spanning the soft spectral range from 60 to 3000 eV.
Many methods4 have been employed in the past to recover the x-ray spectrum from the channel signal traces, some of which require assumptions or measurements for the spectral shape5,6 or considerations about the geometry7 of the source. These methods are accurate but can suffer from complications such as insufficient signal-to-noise ratios or lack of signal due to overattenuation, or if the method is used outside of its intended purpose. Several methods have been previously published utilizing B splines8 for spectral deconvolution,9,10 along with proposed improvements on such methods utilizing intervals weighted with the relative intensity.11 Cubic-spline interpolation was also used to obtain unfolded x-ray flux using a priori knowledge and several itera-tions to refine the interpolation.12 Cubic-spline interpolation provides an alternative analytical way of solving for the temporally and spectrally resolved x-ray flux with no free parameters, assumptions about the geometry, or material of the emitting plasma.
The cubic spline is well known, and several derivations and codes are available as resources.13–15 Much of the derivation fol-lows the same notation found in Ref. 13 and a brief look at the derivation can be found in Ref. 12. The x-ray flux is interpolated across the entire spectral range with a series of piecewise cubic functions. The boundary of each cubic function lies between the K edges of each channel’s response function. The voltages of each diode is then related to the interpolated x-ray flux by
d ,M M yV R E E3yi D i i1 21
| | X= +3 -
0a _k i# (1)
where M M3y D 1 21
| |+-
a k represents the framework of the cubic function which depends on photon energy, E; y is the vector of unknown values of the cubic function at the knot points, which are the independent variables for which to solve, and Ri(E)Xi are the response functions and solid angle of the detector of the ith channel. The piecewise function is represented as a matrix to illustrate the linear system of equations that need to be solved in order to complete the reconstruction of the x-ray flux. The unknown values of the spline, y, do not depend on photon energy and therefore do not contribute to the integral. Each row of the matrix is integrated over photon energy, and the matrix is then inverted to find the values of y. Each row of the matrix refers to a channel of the x-ray diode array, and each column represents an interval of the spline. For n channels, there are n + 1 unknowns for which to solve; therefore, either the initial value y1 or the final value yn+1 must be arbitrarily specified for the system to be solvable. For the specific implementation shown in this summary, y1 is calculated by solving for the flat channel contributions similar to previous methods and then using linear interpolation to find the value of y1. Ultimately, the cubic spline solution is insensitive to the value chosen for y1 as shown in Fig. 1.
Soft X-Ray Spectrum Unfold of K-Edge–Filtered X-Ray Diode Arrays Using Cubic Splines

Soft X-Ray SpectRum unfold of K-edge–filteRed X-Ray diode aRRayS uSing cubic SplineS
LLE Review, Volume 16268
Figure 1The initial estimate of the first knot point value of the spline is the only part of the spline that is arbitrary. However, a linear spline calculation that can be solved with no free parameters can provide a good estimate of the initial value of the spline and thereby eliminate this free parameter. In the case where y1 = 10–9, even a slight overestimation of the spectral power can have a drastic impact and can even break the spline by giving non-physical results. The case inspired by the linear spline solution, y1 = 10–10, is equivalent to a gross underestimation of the initial value, y1 = 10–13.Sp
ectra
l pow
er (W
/eV)
Photon energy (eV)
10–9
10–10
10–11
10–12
10–13
10–14
200 400 600 800 1200 14001000
Linear spliney1 = 10–10y1 = 10–9y1 = 10–13
TC15289JR
Two sources of possible error propagate from measurement uncertainty: (1) measurement and calibration of the response functions16 of each channel in the array; and (2) uncertainty and variation in the signal voltages digitized on the oscilloscope. Since the cubic spline is solved exactly from these quantities, an analytical expression for the uncertainty of the spline can be obtained. Each element of the matrix M M dR E E3y D i i1
12| | X+ -3
0a _k i# has an associated error from the response functions.
Matrix inversion operations compound these error covariances enough to make even small covariances matter in the calcula-tion. Finding an analytical solution in simple cases like a 2 # 2 matrix is easy, but it still differs from the results calculated via Monte Carlo when errors cause the matrix to be close to singular.17 Therefore, error propagation for matrix inversion must be done via Monte Carlo.
After the Monte Carlo error propagation, all of the error analysis can be done analytically. The error for all yi values can be calculated from the matrix inverse S:
,S VS V,
,
/
y j i j ji j
S
j
V2
2 2 1 2
,
i
i j jv
v v= +` f fj p p> H* 4/ (2)
where Si,j is an element of the matrix inverse, S ,i jv is the associated error of that matrix element calculated via Monte Carlo, and
V jv is the random error associated with the measured voltage Vj of the jth channel. From here the rest of the cubic spline error can be calculated analytically.
A simple blackbody model and a detailed atomic model demonstrate how accurately cubic-spline interpolation recovers the temporally and spectrally resolved x-ray flux. A sample radiation temperature curve was used to generate synthetic diode voltage traces by convolving the blackbody spectrum with the channel response functions. These synthetic voltage traces were then used as input to the cubic-spline interpolation, and the solutions are then compared to the inputs as in Fig. 2. The cubic spline is able to solve for the blackbody spectrum and the radiation temperature accurately.
A detailed atomic model of a CNOFNe plasma was also used as an input to the cubic-spline interpolation to test the capability of the method to resolve an x-ray flux that is dominated by line emission (see Fig. 3). The input x-ray spectrum is compared visu-ally to the output of the cubic-spline interpolation, and the spectral power in three different sections of the spectrum is compared numerically. The worst part of the spectrum overestimates the spectral power by a factor of 2, whereas the other two parts of the spectrum recover the spectral power exactly. Overall, the systematic error in the spectral power from the entire unfold is 20% from the cubic spline’s inability to resolve the line structure, which corresponds to a 5% error in the radiation temperature. The systematic error is much smaller than the error that stems from the combination of the random error in the voltage trace and the error in measuring the response function in this case, so the conclusion is that the cubic-spline method can adequately recover line-dominated spectra.

Diagnostic science anD Detectors
LLE Review, Volume 162 69
This material is based upon work supported by the Department of Energy National Nuclear Security Administration under Award Number DE-NA0003856, the University of Rochester, and the New York State Energy Research and Development Authority.
1. J. L. Bourgade et al., Rev. Sci. Instrum. 72, 1173 (2001).
2. E. L. Dewald et al., Rev. Sci. Instrum. 75, 3759 (2004).
Figure 2(a) The cubic spline is able to accurately reconstruct the blackbody spectrum at peak radiation flux. The shaded region around the spline solution represents a typical error associated with calibrated response functions. (b) The input radiation temperature curve used to generate the blackbody spectra and synthetic voltage traces plotted with the radiation temperature solution of the cubic spline at every nanosecond.
Figure 3An atomic model of a CNOFNe plasma is convolved with the channel response functions. The resulting numbers are then used as signal inputs to the cubic-spline unfold algorithm. (a) The recovered cubic-spline spectrum is compared graphically to the atomic model. (b) The spectrum is divided into three line groups, and the integrated intensity of each line group is compared between the atomic model and the cubic spline. The cubic spline is able to conserve spectral power to within a factor of 2 or better in cases where the emission is extremely line dominated.
TC15396JR
80
60
40
20
0 2 4 6Time (ns)
T rad
(eV
)
8 10
Spec
tral p
ower
(W/eV
)
2000 400 600 800Photon energy (eV)
1000 1200
1 × 10¹⁰
1 × 1095 × 108
5 × 10⁹
1 × 10⁸
5 × 10⁷
1 × 10⁷
(a) (b)
Cubic splineBlackbody
Cubic splineBlackbody
0
100Sp
ectra
l flu
x (e
rg/s/
cm2 /
eV)
1010
1015
1014
1013
1012
1011
Photon energy (eV)
(a)
5000 15001000
Atomic modelCubic spline
TC15291JR
Inte
nsity
(#10
15 e
rg/c
m2 /
eV)
3
2
1
00 to 300 eV 300 to 800 eV 800 to 1500 eV
(b)
Line-resolved powerCubic-spline power
4

Soft X-Ray SpectRum unfold of K-edge–filteRed X-Ray diode aRRayS uSing cubic SplineS
LLE Review, Volume 16270
3. C. Sorce et al., Rev. Sci. Instrum. 77, 10E518 (2006).
4. A. Seifter and G. A. Kyrala, Rev. Sci. Instrum. 79, 10F323 (2008).
5. R. E. Marrs et al., Rev. Sci. Instrum. 86, 103511 (2015).
6. M. J. May et al., Rev. Sci. Instrum. 87, 11E330 (2016).
7. M. J. May et al., Rev. Sci. Instrum. 83, 10E117 (2012).
8. R. Goldman, Pyramid Algorithms: A Dynamic Programming Approach to Curves and Surfaces for Geometric Modeling, 1st ed. (Elsevier, Paris, 2003), pp. 347–443.
9. J. Li et al., Rev. Sci. Instrum. 80, 063106 (2009).
10. D. L. Fehl et al., Rev. Sci. Instrum. 71, 3072 (2000).
11. S. Tianming, Y. Jiamin, and Y. Rongqing, Rev. Sci. Instrum. 83, 113102 (2012).
12 J. P. Knauer and N. C. Gindele, Rev. Sci. Instrum. 75, 3714 (2004).
13. R. H. Bartels, J. C. Beatty, and B. A. Barsky, An Introduction to Splines for Use in Computer Graphics and Geometric Modeling, 1st ed. (Morgan Kaufmann Publishers, San Mateo, CA, 1987), pp. 9–17.
14. R. L. Burden and J. D. Faires, Numerical Analysis, 6th ed. (Brooks/Cole, Pacific Grove, CA, 1998), pp. 120–121.
15. W. H. Press et al., Numerical Recipes in FORTRAN: The Art of Scientific Computing, 2nd ed. (Cambridge University Press, Cambridge, England, 1992), pp. 107–110.
16. K. M. Campbell et al., Rev. Sci. Instrum. 75, 3768 (2004).
17. M. Lefebvre et al., Nucl. Instrum. Methods Phys. Res. A 451, 520 (2000).

Laser system science
LLE Review, Volume 162 71
K. A. Bauer, M. Heimbueger, J. Kwiatkowski, S. Sampat, L. J. Waxer, E. C. Cost, J. H. Kelly, V. Kobilansky, S. F. B. Morse, D. Nelson, D. Weiner, G. Weselak, and J. Zou
Laboratory for Laser Energetics, University of Rochester
The OMEGA Laser System performs direct-drive inertial confinement fusion implosion experiments by using 60 ultraviolet (UV) beams focused onto a target in the center of a spherical target chamber.1 Target-physics simulations suggest that the total on-target intensity (power per unit area) nonuniformity, with all 60 beams overlapped, must be less than 1% rms for optimum performance. The laser diagnostics used to assess on-target uniformity are located upstream of the target chamber and comprise a spatially integrated energy diagnostic (the harmonic energy diagnostic) and a temporal pulse-shape diagnostic (a P510 UV streak camera), both of which provide measurements of all 60 beams on each OMEGA shot. Experiments that independently estimate the on-target uniformity using measurements of x-ray production on metal targets suggest, however, that the balance is worse than the laser diagnostics indicate.2 There is a limited capability for measuring the fluence distributions in the far field on OMEGA—the UV equivalent target plane (UV-ETP) diagnostic.3 The ETP measurement does not include the full-energy effects of the final optics in the system, and beam-to-beam variations in target-plane fluence distributions cannot be effectively investi-gated using this setup. A new diagnostic, known as the full-beam-in-tank (FBIT) diagnostic4–6 has therefore been developed to more accurately characterize the beam-to-beam variation in target-plane fluence.
The FBIT diagnostic is capable of measuring the on-shot, on-target focal spot of multiple beams inside the OMEGA target chamber. A direct measurement of a full-energy OMEGA beam (+500 J/beam) at target chamber center (TCC) presents a signifi-cant challenge. To overcome this, a small sample (+0.9 mJ) of the full-energy beam (Fig. 1) is collected by the FBIT diagnostic in the target chamber. To obtain the attenuated beam for characterization, the vacuum window and debris shield are altered. The standard vacuum window is replaced by one with a 7.5-arcmin wedge. This uncoated optic allows the light to undergo multiple Fresnel reflections, each emerging at a slightly different angle. The fourth-order reflection (with +0.0003% of the incident beam energy) is the one that enters the FBIT diagnostic. The debris shield, placed after the vacuum window, serves as a compensating wedge to address the aberrations introduced by the propagation of a focusing beam through the wedged vacuum window. Two
Optical Characterization of the OMEGA Beam Profile at High Energy Using the Full-Beam-In-Tank Diagnostic
FBIT diagnosticPickoff mirrorsand collimator
OMEGAfocus lens
Targetchamber
Calorimeter
Wedged vacuumwindow
Wedged debrisshield
Target chambercenter (TCC)
Camera
G11656JR
Figure 1A schematic of the FBIT diagnostic. The main OMEGA beam is shown in red; the light blue rays indicate the fourth-order reflection from the wedged vacuum window that enters the FBIT diagnostic.

Optical characterizatiOn Of the OMeGa BeaM prOfile at hiGh enerGy UsinG the fUll-BeaM-in-tank DiaGnOstic
LLE Review, Volume 16272
small mirrors at the front end of the FBIT diagnostic, aligned close to TCC, are designed to receive the Fresnel reflection of the main OMEGA beam for imaging onto a scientific-grade charge-coupled–device (CCD) camera, which is housed in a bubble since the target chamber is at vacuum. The remainder of the main beam propagates through TCC and is terminated at a calorimeter mounted in the opposing port, which measures the on-target energy. In addition to providing a direct measurement of a beam’s fluence in the target chamber, the front end of the FBIT system rotates to characterize multiple beamlines within a single shot day.4
Initial experiments using the fourth-order reflection from the vacuum window had significant background light that made detailed characterization of a smoothed OMEGA focal spot difficult. Through modeling and laboratory measurements, it became clear that the source of the background light is scatter from the main beam. An upgrade was proposed for the FBIT diagnostic, referred to as FBIT 2.0, to address the background light issues. The primary design change was to utilize the second-order reflection from the wedged vacuum window, instead of the fourth-order reflection. Use of the second-order reflection increases the signal-to-background ratio since the increase in signal is much greater than the increase in background light as a result of collecting a solid angle that is in closer proximity to the main beam.
To maintain consistent intensities within FBIT for the upgrade, the first two mirrors in the diagnostic are replaced by uncoated NG-9 filter glass. There is a Fresnel reflection off of the first surface of the filter glass, and the remaining energy is absorbed by the filter. The attenuated second-order reflection from the wedged vacuum window then travels down the same path as the original FBIT diagnostic to the CCD.
Initial measurements taken with the FBIT 2.0 diagnostic indicate that the dynamic range of the smoothed far-field focal spots has been improved from the original design. Figure 2 shows an azimuthal average fit of one of the smoothed focal-spot images from the FBIT 2.0 diagnostic. The red vertical line indicates the R1/e point on the azimuthal average fit curve, which is 364 nm for this beam. The fitting is much improved compared to the original FBIT diagnostic.6 The fit, as expected, trends toward zero at the tail, whereas the data do not, even though a threshold is applied to the data at 0.5%. Some residual background light present in the images is currently being investigated.
Figure 2(a) A smoothed focal spot image taken with the FBIT 2.0 diagnostic; (b) The black curve is the azimuthal average (AA) of the smoothed focal spot data shown in (a), and the red curve is the super-Gaussian (SG) fit to the azimuthal average of the data. A threshold is applied to the image at 0.5% of maximum. The R80 of the AA of the data is shown by a blue vertical line; the R95 of the AA of the data is shown by a green vertical line.
R80: 343 nm
R95: 427 nm
Threshold
R1/e: 364 nm
G12997JRr (nm)x (nm)
Nor
mal
ized
uni
ts
y (n
m)
0 100 200 300 400 50010–3
10–2
10–1
(b) Azimuthal average witha SG fit for shot 95613
(Cou
nts ◊
104 )
0.0
0.8
0.4
(a) Shot 95613
1.6
1.2
–10001000500–1000 –500 0
500
0
–500
1001000
AA of dataSG fit
2.0
The FBIT diagnostic was developed to measure the on-target beam-to-beam focal-spot variation on the OMEGA Laser System. With the FBIT 2.0 upgrade, signal-to-background levels were significantly increased, allowing for precise characterization of

Laser system science
LLE Review, Volume 162 73
on-shot OMEGA focal spots. Further aberration correction and background light mitigation will further improve measurement fidelity as the FBIT is used to characterize up to 31 of OMEGA’s 60 beams.
This material is based upon work supported by the Department of Energy National Nuclear Security Administration under Award Number DE-NA0003856, the University of Rochester, and the New York State Energy Research and Development Authority.
1. T. R. Boehly et al., Opt. Commun. 133, 495 (1997).
2. F. J. Marshall et al., Phys. Plasmas 11, 251 (2004).
3. S. P. Regan et al., J. Opt. Soc. Am. B 17, 1483 (2000).
4. L. J. Waxer et al., Proc. SPIE 10898, 108980F (2019).
5. K. A. Bauer et al., Proc. SPIE 10898, 108980G (2019).
6. K. A. Bauer et al., “Optical Characterization of the On-Target OMEGA Focal Spot at High Energy Using the Full-Beam In-Tank Diagnostic,” to be published in Applied Optics.

Deposition of a Discontinuous coateD surface to form a phase-steppeD reflecteD Wavefront
LLE Review, Volume 16274
J. B. Oliver, J. Spaulding, B. Charles, D. Coates, and D. H. Froula
Laboratory for Laser Energetics, University of Rochester
Advancements in spatiotemporal control of laser intensity have enabled new approaches to manipulating laser–plasma interac-tions and applying these developments in unique ways.1–4 The “flying focus” scheme uses a chromatic focusing system together with chirped laser pulses to create a laser focus that can propagate at a speed that is decoupled from the group velocity of the laser light.5,6 The spectral separation of this system extends, however, the minimum pulse duration and limits its usefulness for applications that require ultrashort laser pulses.7 Recently, a novel achromatic concept was proposed to overcome this limita-tion.8 This “achromatic flying focus” uses a radial echelon together with an axiparabola9 to generate a small focal spot that can propagate over extended distances while maintaining an ultrashort temporal duration.
The goal of this effort is to develop an optical component with a wavelength-scale stepped-surface relief; the axiparabola and the reflective echelon together can produce a focal spot that propagates at the speed of light over a distance of 1 cm without tem-porally stretching a 15-fs laser pulse. Deposition of a silicon-dioxide thin film via electron-beam evaporation through a mask10 was used to form the surface structure shown in Fig. 1(a), followed by dc magnetron sputtering of a reflective aluminum layer. The deposited surface structure was formed on a 100-mm-diam # 9-mm-thick glass substrate rotating behind the mask shown in Fig. 1(b) to create an azimuthally uniform thickness.
The mask design uses 23 concentric annular rings with progressively larger angular widths as a function of the radial position on the optic to achieve the profile shown in Fig. 1(a). This required a deposited thickness of 24.2 nm since the maximum open
Deposition of a Discontinuous Coated Surface to Form a Phase-Stepped Reflected Wavefront
Figure 1(a) Desired deposition profile to achieve discrete steps of 0.53 nm over the surface of the component. Such a physical step on the surface yields a phase step of r or 2r in reflection. (b) The mask placed in front of the rotating optic has a series of discrete, discontinuous steps to yield the specified profile, with thinner layers near the optic center and thicker layers near the periphery.
G13004JR
0 20 3010 40 50Radius (mm)
Step
hei
ght (
nm
)
4
12
8
Echelon step height
0
Stationarymask
Substrate
(a) (b)

Materials science
LLE Review, Volume 162 75
space in the mask design is 50%. Each successive mask opening was designed to provide a stepped surface with 0.526 nm less height, using a mask-design scheme similar to the design for continuous surface profiles.11 The optic center, which is coincident with the substrate-rotation axis, has no deposited thickness. The aluminum layer deposited over the structured surface was limited to approximately 20-nm thickness to minimize degradation of the surface profile while achieving >90% reflectance.
The substrate surface relief was measured using stitching white-light interferometry as shown in Fig. 2. The flatness and transitions of the steps indicate that an accurate duplication of the desired surface profile was achieved with minimal blurring between steps in a manner that should quickly diverge light incident on the transitions out of the optical system. The transitions are of the order of 150 nm in width, representing 5% to 10% of the total substrate area.
0 1 2 3
(nm
)
y (m
m)
y (m
m)
1
11.8
12.0
12.2
12.4
2
(b)
10 30 50 70 90
30
50
70
12.6
11.6
0.2 1.0 1.8 2.6x (mm)x (mm)
y (n
m)
(a)
90
G13006JR
11.6
12.4
(c)
3
010
This work showed it is possible to vapor deposit a reflective echelon component for use in an achromatic flying focus. The resulting film structure provides accurate steps to yield the desired discontinuous reflected-wavefront phase profile. Future work may focus on reducing the lateral extent of the transitions by increasing the source-to-substrate distance and further shrinking the mask/substrate separation. Alternative deposition materials may potentially be explored, as well as collimation of the vapor source.12
This material is based upon work supported by the U.S. Department of Energy Office of Fusion Energy Sciences under Contract No. DE-SC0016253 and the U.S. Department of Energy National Nuclear Security Administration under Award Number DE-NA0003856, the University of Rochester, and the New York State Energy Research and Development Authority.
1. D. Turnbull et al., Phys. Rev. Lett. 120, 024801 (2018).
2. D. Turnbull et al., Phys. Rev. Lett. 120, 225001 (2018).
3. P. Franke et al., Opt. Express 27, 31,978 (2019).
Figure 2The surface profile of the echelon component as measured with a Zygo NexView white-light interferometer. (a) The overall optic surface is based on a series of stitched measurements. The (b) higher-magnification image and (c) corresponding lineout provide greater detail on the step shape and linear extent of the transition between steps. The step heights differ from nominal by <3%, while the transitions between steps are of the order of 0.15 mm.

Deposition of a Discontinuous coateD surface to form a phase-steppeD reflecteD Wavefront
LLE Review, Volume 16276
4. D. H. Froula et al., Nat. Photonics 12, 262 (2018).
5. A. Howard et al., Phys. Rev. Lett. 123, 124801 (2019).
6. A. Sainte-Marie, O. Gobert, and F. Quéré, Optica 4, 1298 (2017).
7. D. H. Froula et al., Phys. Plasmas 26, 032109 (2019).
8. J. P. Palastro et al., Phys. Rev. Lett. 124, 134802 (2020).
9. S. Smartsev et al., Opt. Lett. 44, 3414 (2019).
10. J. B. Oliver and D. Talbot, Appl. Opt. 45, 3097 (2006).
11. J. B. Oliver, J. Spaulding, and B. Charles, Appl. Opt. 59, A54 (2020).
12. J. B. Oliver et al., presented at SVC Techcon 2014, Chicago, IL, 3–8 May 2014.

Materials science
LLE Review, Volume 162 77
B. N. Hoffman,1 A. A. Kozlov,1 N. Liu,2 H. Huang,1 J. B. Oliver,1 A. L. Rigatti,1 T. J. Kessler,1 A. Shestopalov,1,2 and S. G. Demos1
1Laboratory for Laser Energetics, University of Rochester2Department of Chemical Engineering, University of Rochester
Multilayer dielectric (MLD) diffraction gratings typically consist of an etched layer of SiO2 that resides on top of a multilayer dielectric high-reflector stack composed of alternating layers of SiO2 and HfO2 to form a periodic structure of lines and trenches with a predetermined line density and line width. This design allows for higher laser-induced–damage thresholds (LIDT’s) compared to their metal grating predecessors.1,2 The LIDT of optical components incorporated in high-power, short-pulse laser systems is of critical importance since it affects the maximum laser output and/or the operational cost. The current generation of MLD gratings has a LIDT that is limited by defects embedded in the coating, which can be separated into two general categories. The first category is atomic defects and nanoscale defect structures introduced during coating that cause localized absorption. The second category is the defects introduced during the photolithographic and etching stages of grating manufacturing.3,4 Determin-ing the laser-damage–initiation mechanisms in MLD gratings has been elusive mainly because it is associated with the removal of grating pillars, thereby erasing any characteristic signatures. To study the laser-damage signatures, we created 5-mm grating-like structures that simulate the magnitude of the electric-field–intensity (EFI) enhancement observed in MLD gratings. The macroscopic lateral scale of the pillars in the structure allow for spatially targeted damage testing, while the inherent mechanical stability of the structure enables the preservation of damage signatures for postmortem study. The results from the grating-like structures can subsequently elucidate the damage morphology and associated laser-damage mechanisms in actual MLD gratings.
The grating-like structures were etched into a SiO2 coating using processes similar to those used for MLD gratings. The grating-like structures are 700 nm in height, which is of the order of the MLD grating pillar height [see Fig. 1(a)]. The pillar height of the grating-like structures results in a 3# internal EFI enhancement factor, which is similar to that observed near the
Damage Mechanisms in Multilayer Dielectric Gratings at Different Pulse Durations
Figure 1The EFI enhancement (a) near the millimeter-pitch pillar wall region and (b) for the MLD grating design used in this work. The laser excitation is incident on the samples at a 61° angle from the left side.
G12938JR
570
nm
2
EFI
3
1
(a) (b)
380 nm
700
nm
~225 to 790 nm
2
EFI
3
1
61°

Damage mechanisms in multilayer Dielectric gratings at Different Pulse Durations
LLE Review, Volume 16278
right side of the MLD grating pillars [see Fig. 1(b)]. The grating-like structure and the MLD grating samples were damage tested in vacuum at 0.6 ps and 10 ps.
Previous work by Kozlov et al.5 demonstrated that there are three types of laser-induced–damage mechanisms in multilayer dielectric coatings. Type-I damage is driven by the EFI enhancements within the most vulnerable material layer and involves removal of the overlying material over the area of peak laser intensity. Type-I damage occurs with pulse widths shorter than 2.5 ps. The damage mechanisms of the pillar wall of the grating-like structure for 0.6-ps laser pulses showed distinct signatures of the type-I damage mechanisms, such as a removal of coating sections within the area of the peak laser-beam intensity [see Fig. 2(a)] and a damage crater depth similar to the depth of the EFI enhancement [see Fig. 2(b)]. The morphology of the crater involves melted nanoscale projections from the explosive boiling process and the sharp crater edges, which are reminiscent of type-I craters observed with MLD high-reflector coatings [see Fig. 2(a), right inset image].
Figure 2(a) Scanning electron microscope (SEM) images of the wall region in millimeter-pitch grating-like structures containing a damage site generated with a 0.6-ps pulse. The left inset shows in higher magnification the undamaged part of the wall region, and the right inset shows a section of the damage region. The laser beam impinges from the top at 61°. (b) A cross-sectional lineout of the damage region obtained with atomic force microscopy imaging reveals the depth and exact position of the damage site.
The type-II and type-III damage initiation processes in MLD coatings occur with laser pulses longer than 2.5 ps and are defect driven, resulting in the formation of micrometer-size craters. It was previously discussed that the temperature and pres-sure relaxation pathways following plasma formation at the defect location govern the morphology of the type-II damage.5 The damage mechanisms observed on the grating-like pillar wall irradiated by 10-ps laser pulses (see characteristic examples in Fig. 3) are consistent with defect-driven damage near the EFI maximum enhancement, which is analogous to the type-II damage observed with MLD coatings.
Although damage in MLD gratings includes pillar removal, thereby concealing the primary signatures of the damage mechanisms, the use of grating-like structures helped us to recognize fingerprint signatures on which to draw correlations. MLD grating damage sites generated with 0.6-ps pulses exhibit modification on the pillar wall, primarily on the right side where the EFI enhancement is known to be maximum [see Figs. 1(b) and 4] along with melted nanoparticles between damage pillars [see Fig. 4(b)]. These observations are consistent with the mechanisms and signatures observed with the grating-like structures seen in Fig. 2. Specifically, damage causes removal of sections of the pillar at the locations of maximum EFI while melted nanoparticles are observed between the pillars, which correspond to the nanoscale projections observed at the bottom of the type-I crater for the grating-like structures (separation of nanodroplets from the superheated material).
G12910JR
Peak intensity
4 nmPillar
Base(b) AFM lineout
10
0
200
400
600
2x (nm)
y (n
m)
3
~389 nm
Peak EFI
Wall
(a)
200 nm

Materials science
LLE Review, Volume 162 79
Figure 4SEM images of areas of an MLD grating where (a) laser-induced damage was initiated under a single 0.6-ps laser pulse and (b) the image of the central region at a higher magnification shows nanoparticle distribution. The laser excitation impinges on the samples at a 61° angle of incidence from the left side.
1 nm1 nm
714 nm828 nm
(b)(a)
G12987JR
Figure 3SEM images of damage sites generated under 10-ps pulses in the wall region in a millimeter-pitch grating.
The primary morphology of laser damage in MLD gratings under 10-ps irradiation also involves removal of pillars, but there are characteristic differences from the pillar damage observed with 0.6-ps pulses. First, pillar removal often involves the entire pillar, not just the side. Second, the 10-ps damage consists of isolated sites that often span multiple pillars [see Fig. 5(a)]. Lastly, a larger number of melted nanoparticles [see Fig. 5(b)] as well as fragments [see Fig. 5(a)] are present within or near damage sites. This type of damage is suggestive of the type-II damage as also observed with the grating-like structures. However, the boundary conditions due to the small size of the grating pillars must be considered. Specifically, since the depth of the damage-initiating defect can vary, damage can initiate at different locations within the pillars. This gives rise to a variability on the damage mor-phology, including the height of the removed sections of the pillars as well as the number of pillars involved for each individual damage site. However, the distribution of generated nanoparticles within the trenches provides a fingerprint of the exact locations of the pillar involving the explosive boiling (damage).
G12985JR
1 nm 200 nm
(b)(a)

Damage mechanisms in multilayer Dielectric gratings at Different Pulse Durations
LLE Review, Volume 16280
In summary, by studying the damage mechanisms and signatures of grating-like structures, we were able to better understand the damage mechanisms for MLD gratings. This information will help advance our ability to design and fabricate the next-generation gratings that will exhibit a significantly higher damage threshold.
This material is based upon work supported by the Department of Energy National Nuclear Security Administration under Award Number DE-NA0003856, the University of Rochester, and the New York State Energy Research and Development Authority.
1. B. W. Shore et al., J. Opt. Soc. Am. A 14, 1124 (1997).
2. J. A. Britten et al., Proc. SPIE 2714, 511 (1996).
3. H. P. Howard et al., Appl. Opt. 52, 1682 (2013).
4. W.-J. Kong et al., Chin. Phys. Lett. 22, 1757 (2005).
5. A. A. Kozlov et al., Sci. Rep. 9, 607 (2019).
G12986JR
1 nm 300 nm
(b)(a)
Figure 5SEM images of areas of an MLD grating where (a) laser-induced damage was initiated under a single 0.6-ps laser pulse and (b) the image of the central region at a higher magnification shows nanoparticle distribution. The laser irradiation impinges on the samples at a 61° angle of incidence from the left side.

Materials science
LLE Review, Volume 162 81
J. U. Wallace, K. L. Marshall, T. Z. Kosc, D. J. Batesky, B. N. Hoffman, S. Papernov, L. Garrett, J. Shojaie, and S. G. Demos
Laboratory for Laser Energetics, University of Rochester
Low-molar-mass (LMM) liquid crystal (LC) fluids have demonstrated a proven track record of high-peak-power performance on the OMEGA Nd:glass laser at LLE since 1985. Over 320 large-aperture LC circular polarizers (LCP’s) and wave plates were installed during OMEGA’s upgrade to 351-nm, 60-beam, 40-TW capability in 1994. Notably, a few LCP devices installed at that time are still functional after 25 years of service. Such LC devices offer large-aperture scalability (200 mm), high optical quality and contrast with low insertion loss, precision retardance (tune by blending), broad angular tolerance, and excellent laser-damage resistance (>30 J/cm2, 1 ns, 1053 nm). In certain operational environments (e.g., such as in vacuum or where accidental fluid leakage can have additional adverse consequences), liquid materials are generally deemed unsuitable. Glassy liquid crystals (GLC’s) offer the unique optical properties of LMM LC fluids, but the anisotropic ordering of LC phases is frozen into the solid state through vitrification. As a result, GLC’s offer significant additional advantages such as resistance to mechanical disturbance, elimination of fluid leakage risk, and alleviation or reduction in the need for thick substrates.
To explore the potential benefits of GLC materials, this work is focused on designing high laser-induced–damage threshold (LIDT) GLC materials for large-aperture polarization control/beam-smoothing optics that could replace current LMM LC devices on OMEGA as well as offering the potential for use in other inertial confinement fusion (ICF)-class laser systems in future upgrades. A recent detailed study of LIDT in LC’s performed at LLE indicated that reducing the absorption edge of LC materials significantly improves their damage thresholds for high-peak-power laser applications.1 Based on that effort, a series of increasingly saturated (less aromatic) GLC’s was synthesized with the goal of preserving their desirable optical and morpho-logical properties while improving their endurance under irradiation by UV laser pulses and continuous-wave (cw), broadband UV light. This study explores an array of materials, ranging from an unsaturated aromatic GLC to highly saturated GLC’s. The highly saturated GLC’s show promising damage resistance under both irradiation conditions and offer considerable potential for application in both high-peak-power laser systems and aerospace optical systems.
The GLC material synthesis effort was complemented by examining the LIDT of these materials using both classical 1-on-1 and N-on-1 tests (yielding the 1-on-1 LIDT and the N-on-1 LIDT) as well as a 100-shot protocol. The latter was introduced in order to probe the long-term behavior and stability of the materials under continued exposure. Each site was shot at a given flu-ence at 0.1 Hz (once every 10 s) for either 100 shots or until damage was observed. The highest fluence at which a site survives 100 shots was defined as the 100-shot LIDT for the sample. A series of GLC’s with progressively lower unsaturation and lower UV absorbance were synthesized, in which a stable cholesteric GLC phase can be generated by quench-cooling on substrates coated with rubbed alignment layers. Table I provides details on the materials synthesized and their characteristic properties. Purification by semi-automated flash chromatography was employed to remove trace contaminants and significantly improve LIDT’s as compared to conventional purification methods (e.g., crystallization or precipitation from organic solvents).
The robustness of these materials to high-peak-power laser pulses as a function of unsaturation is evidenced by the LIDT data shown in Table I for three GLC materials tested at the three Nd:glass laser harmonic wavelengths and 1- to 1.5-ns pulse lengths. Test samples of 22-nm-thick GLC films, which are within the useful thickness regime for LC polarization control devices, were melt processed on fused-silica substrates and quenched into unaligned, nearly isotropic states to examine the intrinsic damage
Laser-Induced–Damage Behavior of Novel Glassy Liquid Crystal Materials at 1 ns and Multiple Wavelengths
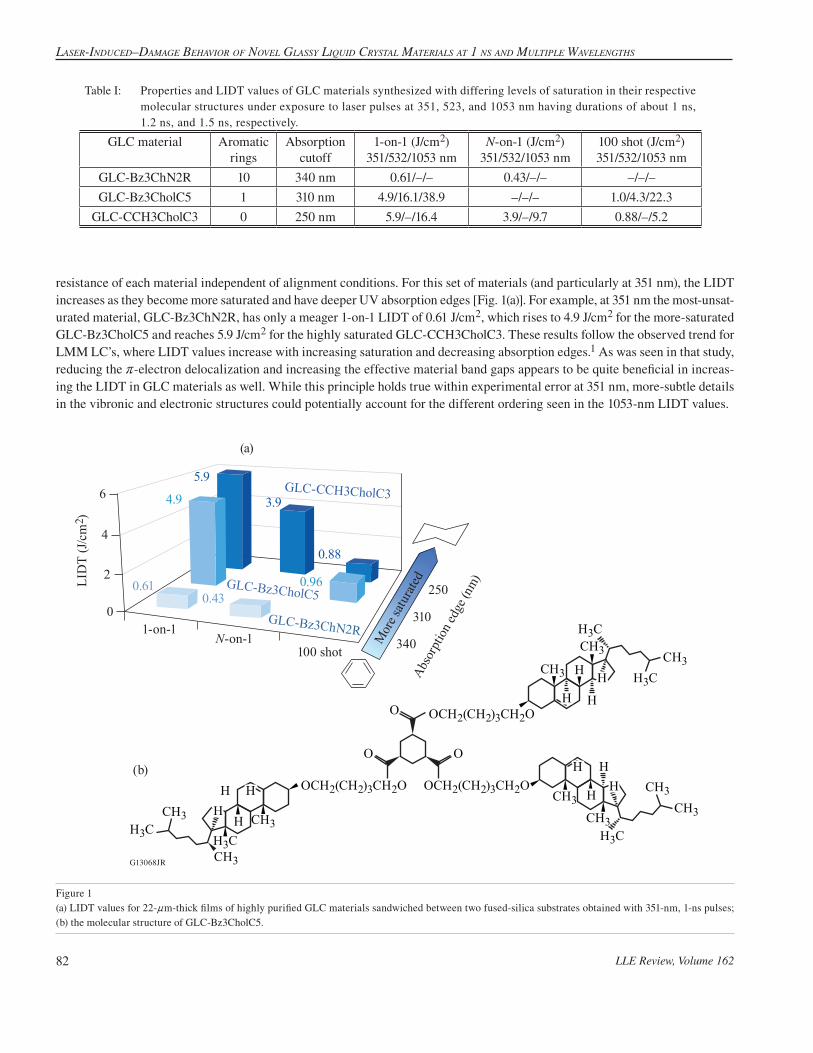
Laser-Induced–damage BehavIor of noveL gLassy LIquId crystaL materIaLs at 1 ns and muLtIpLe WaveLengths
LLE Review, Volume 16282
resistance of each material independent of alignment conditions. For this set of materials (and particularly at 351 nm), the LIDT increases as they become more saturated and have deeper UV absorption edges [Fig. 1(a)]. For example, at 351 nm the most-unsat-urated material, GLC-Bz3ChN2R, has only a meager 1-on-1 LIDT of 0.61 J/cm2, which rises to 4.9 J/cm2 for the more-saturated GLC-Bz3CholC5 and reaches 5.9 J/cm2 for the highly saturated GLC-CCH3CholC3. These results follow the observed trend for LMM LC’s, where LIDT values increase with increasing saturation and decreasing absorption edges.1 As was seen in that study, reducing the r-electron delocalization and increasing the effective material band gaps appears to be quite beneficial in increas-ing the LIDT in GLC materials as well. While this principle holds true within experimental error at 351 nm, more-subtle details in the vibronic and electronic structures could potentially account for the different ordering seen in the 1053-nm LIDT values.
Table I: Properties and LIDT values of GLC materials synthesized with differing levels of saturation in their respective molecular structures under exposure to laser pulses at 351, 523, and 1053 nm having durations of about 1 ns, 1.2 ns, and 1.5 ns, respectively.
GLC material Aromatic rings
Absorption cutoff
1-on-1 (J/cm2) 351/532/1053 nm
N-on-1 (J/cm2) 351/532/1053 nm
100 shot (J/cm2) 351/532/1053 nm
GLC-Bz3ChN2R 10 340 nm 0.61/–/– 0.43/–/– –/–/–
GLC-Bz3CholC5 1 310 nm 4.9/16.1/38.9 –/–/– 1.0/4.3/22.3
GLC-CCH3CholC3 0 250 nm 5.9/–/16.4 3.9/–/9.7 0.88/–/5.2
Figure 1(a) LIDT values for 22-nm-thick films of highly purified GLC materials sandwiched between two fused-silica substrates obtained with 351-nm, 1-ns pulses; (b) the molecular structure of GLC-Bz3CholC5.
G13068JR
1-on-1
LID
T (J
/cm
2 )
(a)
Abso
rptio
n edg
e (nm
)
Mor
e satu
rated
N-on-1100 shot
0
2250
340
310
4
65.9
3.94.9
0.610.43
GLC-CCH3CholC3
GLC-Bz3CholC5
GLC-Bz3ChN2R
0.96
0.88
(b)
H
H
H
H
H
H
H3C
H3C
CH3
H3CH3C
H3C
CH3
CH3
CH3 CH3
CH3
CH3
CH3
OCH2(CH2)3CH2O OCH2(CH2)3CH2O
OCH2(CH2)3CH2OO
O O
CH3
CH3
H
HH H
H
H

Materials science
LLE Review, Volume 162 83
Among this set of GLC materials, GLC-Bz3CholC5 shows the best overall performance for high-peak-power laser applications, particularly in the infrared (IR) spectral region, where its 100-shot LIDT was over 20 J/cm2. These results make GLC-Bz3CholC5 a promising candidate for use in polarization control or isolation elements for near-IR (NIR) lasers. A key behavior that remains of issue in all GLC materials synthesized to date is the degradation of the LIDT with continued exposure to laser pulses. This effect is observed for all damage-testing wavelengths, but it is more prominent for UV pulses. Specifically, the reduction of the 100-shot LIDT at 1053 nm in the best-performing GLC-Bz3CholC5 is approximately twofold compared to the 1-on-1 LIDT at the same wavelength, but it is about fivefold at 351 nm. To further understand the cumulative effects in the laser-damage behavior of these GLC’s and explore them for use in cw UV environments, such as in aerospace applications as optical elements,2 GLC films were subjected to broadband UV irradiation at 250 to 400 nm and their absorbance spectra were monitored as a function of exposure time. These exposure conditions increased the absorption coefficient in the UV region, which in turn contributes to lowering the LIDT values. Further understanding and development of mitigation strategies for this effect will be the subject of future work.
In conclusion, a series of increasingly saturated GLC’s synthesized in multigram quantities and evaluated for their laser-induced–damage behavior at wavelengths relevant to OMEGA operations (1053 nm, 532 nm, and 351 nm) demonstrated promising performance. Reducing the r-electron delocalization in GLC molecules by employing saturated pendants, along with uncon-ventional materials purification techniques, results in GLC’s with improved LIDT’s with 1-on-1 thresholds as high as 5.8 J/cm2 at 351 nm, 16.1 J/cm2 at 532 nm, and 38.9 J/cm2 at 1053 nm. The results also demonstrate the potential for fabricating single-substrate GLC optical elements, especially for NIR laser applications where the 100-shot LIDT exceeds the current operational fluence of major ICF-class laser systems.
This material is based upon work supported by the Department of Energy National Nuclear Security Administration under Award Number DE-NA0003856, the University of Rochester, and the New York State Energy Research and Development Authority.
1. T. Z. Kosc et al., Sci. Rep. 9, 16435 (2019).
2. E. Otón et al., IEEE Photonics J. 7, 6900909 (2015).

Morphologies and Underlying MechanisMs of laser-indUced daMage by Model contaMination particles
LLE Review, Volume 16284
K. R. P. Kafka, B. N. Hoffman, H. Huang, and S. G. Demos
Laboratory for Laser Energetics, University of Rochester
Due to the significant cost to replace optics that have sustained laser-induced damage in large-aperture laser systems, management strategies aim to maintain laser-damage performance over long time durations by (a) preventing the generation of new damage sites and (b) arresting the growth of existing damage sites. Contamination of optical elements during installation and from the operational environment has been recognized for nanosecond-class lasers as an important contributor toward these problems.1–6
Specifically, contamination particles can become the source of damage initiation via a number of mechanisms, depending on the contamination material (such as metal or dielectric) and optical substrate properties (such as reflective or transmissive). Further-more, the laser-induced–damage process with nanosecond pulses has been shown to eject particles from the affected optics that can transport onto adjacent optics and become the source of additional damage initiation.7
The potential for analogous processes occurring in short-pulse laser systems has received much less attention, although there have been reports of degradation of laser-induced–damage thresholds (LIDT’s). The LIDT-degradation of the LFEX (laser for fast ignition experiment) laser pulse compressor was attributed to organic contamination,8 and the cause of degradation of OMEGA EP compression gratings is not yet resolved.9 We recently demonstrated, using model contamination particles (including metal, glass, and plastic spherical particles) dispersed on the surface of a multilayer dielectric mirror, that exposure to 0.6-ps and 10-ps pulses at 1053 nm can introduce damage and spread secondary contamination at fluences that are significantly lower than that of the pristine surface.10 Here we expand on that work, with a primary objective to investigate the laser–particle interactions that lead to these damage initiations and/or secondary contamination depositions. Several interaction mechanisms leading to material modification and damage are identified, including localized field intensification by multibeam interference and particle-induced microlensing, plasma-induced scalding, and secondary contamination via nanoparticle generation and particle melting. The secondary objective of this work is to investigate the impact of additional pulses irradiating these sites. A second pulse irradiat-ing damaged sites caused damage growth at fluences significantly below the initiation threshold, and a second pulse irradiating secondarily contaminated sites could not significantly remove that contamination without initiating additional damage.
The reduction of LIDT in the presence of the particles was caused by intensification of the electric field locally, as shown in Fig. 1. For reflective particles (steel in this work), a multibeam interference pattern between the particle and mirror is generated, leading to sickle-shaped ripples of intensification on the laser-incident side of the microsphere. The peak value of intensity or flu-ence enhancement (4.3 # the incident value) calculated by coherent ray-tracing simulation is consistent with the LIDT reduction factor measured in experiments (4.6 and 4.0 for 0.6-ps and 10-ps pulses, respectively). On the other hand, transparent particles act as a microlens, focusing the laser onto the optic surface and leading to an ablation crater of a few-nm diameter. Due to the symmetry of the microspheres, a strong local fluence enhancement factor of approximately 200 was observed for glass micro-spheres. This damage can occur even without removal of the particle, as demonstrated by Fig. 1(e).
These intensification mechanisms were also responsible for energy deposition and ablation from the surface of the particle itself, leading to dispersal of secondary contamination onto the optic. The multibeam interference mechanism occurring for the steel particles produced fringes of similar amplitude on the particle as well and generated nanoparticles that could be deposited over a large area of the optic [Fig. 2(a)]. Although the peak intensification of the microlensing mechanism occurs outside the particle,
Morphologies and Underlying Mechanisms of Laser-Induced Damage by Model Contamination Particles on a High Reflector

Materials science
LLE Review, Volume 162 85
Figure 2Morphological effects compared between one and two laser pulses incident on a microparticle. Parameters: [(a)–(c)] steel microsphere, 10 ps, 1.4 J/cm2; [(e)–(g)] polyethylene microsphere, 0.6 ps, 0.8 J/cm2; [(d),(h)] glass microsphere, 0.6 ps, 0.9 J/cm2. For comparison, pristine LIDT was 1.4 J/cm2 and 6.7 J/cm2 for 0.6-ps and 10-ps pulses, respectively.
Figure 1Mechanisms of laser intensification that lead to damage initiation. Optical interference from a steel microsphere: (a) damage morphology for 0.6 ps, 1.1 J/cm2, with initial particle location shown (dashed line), (b) corresponding calculated intensity pattern with (c) central horizontal lineout. Microlensing by a glass microsphere: (d) ray-tracing diagram and (e) damage morphology for 0.6 ps, 32 mJ/cm2, with damage indicated by an arrow. Laser is incident at 45° incidence from the right.
G13079JR
1 pulse 2 pulses 2 pulses
10 nm
(b)(a) (c)
200 nm
10 nm 1 nm
(d)
(f)(e) (g) (h)
20 nm
1 pulse
1 pulse 2 pulses 2 pulses2 pulses
the partial beam convergence inside the bulk of the particle leads to intensification of up to one order of magnitude. This causes absorption in the bulk, leading to localized ablation accompanied by secondary contamination by liquefied jets and fragments [shown for polyethylene in Fig. 2(e)].
An additional pulse irradiating these sites did not cause favorable results. For steel particles [Figs. 2(b) and 2(c)], the nanopar-ticle contamination was partially removed (“laser cleaning”), but that process created plasma scalds (permanently modifying the surface). For polyethylene particles [Figs. 2(f) and 2(g)], the contamination removal process generated ablation sites in the coat-ing. For all particle types, the second pulse could also cause the growth of any existing damage, as shown in Figs. 2(d) and 2(h) with glass particle morphology as an example. In this case, the fluence was high enough with the first pulse to generate damage by both interference and microlensing mechanisms. The second laser pulse caused all craters to grow in area and additionally generated new ripples of damage.
G13072JR
10 nm
(a) (b) (c)
Position (nm)
Inte
nsity
enh
ance
men
t
20 30100 40
4
23
10
5
40 nm
4
20
(e) Top view(d) Side view
3 nm

Morphologies and Underlying MechanisMs of laser-indUced daMage by Model contaMination particles
LLE Review, Volume 16286
This work demonstrates that the contamination microparticles can be a potent precursor for optical damage with short pulses, causing damage initiation far below the pristine LIDT, and thereby exposing optics to the potential for damage growth. It is therefore important to better understand the role of such mechanisms in the operation of laser systems such as OMEGA EP and to devise proper management or mitigation strategies.
This material is based upon work supported by the Department of Energy National Nuclear Security Administration under Award Number DE-NA0003856, the University of Rochester, and the New York State Energy Research and Development Authority.
1 C. J. Stolz et al., Proc. SPIE 10691, 106910W (2018).
2. M. J. Matthews et al., J. Opt. Soc. Am. B 30, 3233 (2013).
3. R. N. Raman et al., Opt. Express 24, 2634 (2016).
4. S. G. Demos et al., Opt. Express 24, 7792 (2016).
5. S. R. Qiu et al., Appl. Opt. 54, 8607 (2015).
6. S. G. Demos et al., Opt. Express 27, 23,515 (2019).
7. S. G. Demos and R. A. Negres, Opt. Eng. 56, 011016 (2017).
8. T. Jitsuno et al., Proc. SPIE 8786, 87860B (2013).
9. A. A. Kozlov et al., “Long-Term Monitoring the Damage Performance of Multilayer Dielectric Grating Samples Residing Inside the Compressor Chamber of the OMEGA EP Laser,” submitted to Optical Engineering, Special Section on Laser Damage V.
10. K. R. P. Kafka and S. G. Demos, Opt. Lett. 44, 1844 (2019).

Materials science
LLE Review, Volume 162 87
T. Z. Kosc,1 H. Huang,1 T. J. Kessler,1 R. A. Negres,2 and S. G. Demos1
1Laboratory for Laser Energetics, University of Rochester2Lawrence Livermore National Laboratory
Potassium dihydrogen phosphate (KDP) and its deuterated analog (DKDP) crystals are widely used nonlinear optical materials in laser applications. They exhibit excellent UV transmission, high damage thresholds and birefringence, and can be grown to large sizes. These properties make them uniquely suited for use in large-aperture inertial confinement fusion (ICF)–class laser systems such as the OMEGA and OMEGA EP lasers and the National Ignition Facility,1,2 where they are currently used for frequency conversion,3 polarization control, and beam smoothing.4 In large-aperture plates, however, the relatively high Raman scattering cross-section of KDP/DKDP supports the generation and transfer of energy to parasitic beams arising from transverse stimulated Raman scattering (TSRS). This effect is of concern in ICF-class lasers due to the high incident laser intensities and long pulse durations that support the exponential increase of the TSRS signal as it traverses the aperture of the crystal plate5,6 and ultimately leads, if not properly managed, to damage to the optic and the surrounding hardware during laser operation.7 The TSRS Raman-gain coefficient can be calculated from the propagation length (optic size), the laser intensity and pulse duration, and a complete description of the spontaneous Raman scattering cross section (Raman polarizability tensor).8,9 The latter is of critical importance to enable one to model TSRS for suitable crystal-cut configurations to help optimize designs. Theory mandates that the Raman tensor is diagonal,10 but extensive previous efforts yielded results suggesting contributions by off-axis elements.11,12 This issue has hindered an accurate modeling of TSRS.
In this work, we determine the form of the Raman tensor and identify artifacts that have interfered in previous studies. A unique experimental system developed at LLE employs spherical samples, which enable one to “directly” measure tensor elements through rotation of the sphere to the required scattering geometries.13 Data were acquired by rotating the sphere through 360° in the azimuthal plane, which is defined as the laboratory x–z plane and contains both the pump-beam propagation and the Raman signal observation directions (Fig. 1). The azimuthal angle z = 0° is defined along the laboratory z axis. Laboratory coordinates are defined by lower-case italicized letters x, y, and z, while upper-case letters X, Y, and Z designate crystallographic axes. The experimental notation kp [ep es] ks, designates the propagation direction of the pump kp, and scattered light ks as well as the unit electric polarization vectors of the pump ep and scattered light es. For clarity, we define the notation for each trace, or set of measurements while the sample is rotated (z = 0° to 360°), based on the initial orientation of the sample for z = 0° in reference to the crystal axes. Square brackets are omitted in the trace labels in order to differentiate the notation of a data set and specific Raman scattering configurations within that data set.
Three data sets acquired with the crystallographic Z axis, or the optic axis (OA), found in the azimuthal laboratory x–z plane are shown in Fig. 1. The trace labeled ZYYX provides data for scattering in the Z[YY]X configuration at azimuthal angles z = 0° and 180°, while scattering data for the X[YY]Z configuration are collected at z = 90° or 270°. The polarization orientations of both the pump laser and the Raman scattering signal (and analyzer) for trace ZYYX are perpendicular to the azimuthal plane. A corresponding trace acquired when (a) the analyzer is rotated by 90° (in the azimuthal plane) is shown as ZYZX, and (b) the pump polarization rotated 90° is shown as ZXYX. The signal of the A1 mode of KDP,11 centered at 915 cm–1, is integrated between 860 and 960 cm–1. Unexpected features such as double peaks and valleys are detected at the specific angles of importance for determining the matrix elements.
Determination of the Raman Polarizability Tensor in the Optically Anistropic Crystal Potassium Dihydrogen
Phosphate and Its Deuterated Analog
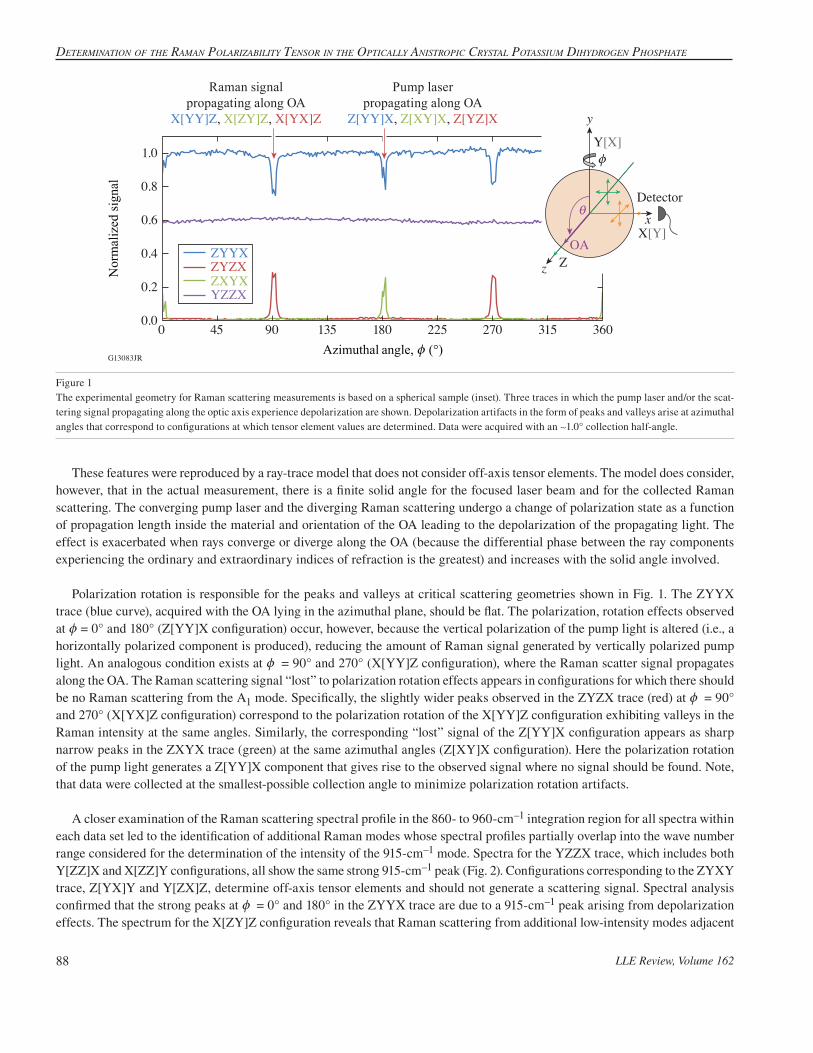
Determination of the raman Polarizability tensor in the oPtically anistroPic crystal Potassium DihyDrogen PhosPhate
LLE Review, Volume 16288
These features were reproduced by a ray-trace model that does not consider off-axis tensor elements. The model does consider, however, that in the actual measurement, there is a finite solid angle for the focused laser beam and for the collected Raman scattering. The converging pump laser and the diverging Raman scattering undergo a change of polarization state as a function of propagation length inside the material and orientation of the OA leading to the depolarization of the propagating light. The effect is exacerbated when rays converge or diverge along the OA (because the differential phase between the ray components experiencing the ordinary and extraordinary indices of refraction is the greatest) and increases with the solid angle involved.
Polarization rotation is responsible for the peaks and valleys at critical scattering geometries shown in Fig. 1. The ZYYX trace (blue curve), acquired with the OA lying in the azimuthal plane, should be flat. The polarization, rotation effects observed at z = 0° and 180° (Z[YY]X configuration) occur, however, because the vertical polarization of the pump light is altered (i.e., a horizontally polarized component is produced), reducing the amount of Raman signal generated by vertically polarized pump light. An analogous condition exists at z = 90° and 270° (X[YY]Z configuration), where the Raman scatter signal propagates along the OA. The Raman scattering signal “lost” to polarization rotation effects appears in configurations for which there should be no Raman scattering from the A1 mode. Specifically, the slightly wider peaks observed in the ZYZX trace (red) at z = 90° and 270° (X[YX]Z configuration) correspond to the polarization rotation of the X[YY]Z configuration exhibiting valleys in the Raman intensity at the same angles. Similarly, the corresponding “lost” signal of the Z[YY]X configuration appears as sharp narrow peaks in the ZXYX trace (green) at the same azimuthal angles (Z[XY]X configuration). Here the polarization rotation of the pump light generates a Z[YY]X component that gives rise to the observed signal where no signal should be found. Note, that data were collected at the smallest-possible collection angle to minimize polarization rotation artifacts.
A closer examination of the Raman scattering spectral profile in the 860- to 960-cm–1 integration region for all spectra within each data set led to the identification of additional Raman modes whose spectral profiles partially overlap into the wave number range considered for the determination of the intensity of the 915-cm–1 mode. Spectra for the YZZX trace, which includes both Y[ZZ]X and X[ZZ]Y configurations, all show the same strong 915-cm–1 peak (Fig. 2). Configurations corresponding to the ZYXY trace, Z[YX]Y and Y[ZX]Z, determine off-axis tensor elements and should not generate a scattering signal. Spectral analysis confirmed that the strong peaks at z = 0° and 180° in the ZYYX trace are due to a 915-cm–1 peak arising from depolarization effects. The spectrum for the X[ZY]Z configuration reveals that Raman scattering from additional low-intensity modes adjacent
Figure 1The experimental geometry for Raman scattering measurements is based on a spherical sample (inset). Three traces in which the pump laser and/or the scat-tering signal propagating along the optic axis experience depolarization are shown. Depolarization artifacts in the form of peaks and valleys arise at azimuthal angles that correspond to configurations at which tensor element values are determined. Data were acquired with an +1.0° collection half-angle.
G13083JR
ZYYXZYZXZXYXYZZX
360315270225180Azimuthal angle, z (°)
Nor
mal
ized
sign
al
135904500.0
0.8
0.6
0.4
0.2
1.0
Raman signalpropagating along OA
X[YY]Z, X[ZY]Z, X[YX]Z
Pump laserpropagating along OA
Z[YY]X, Z[XY]X, Z[YZ]X
z
y
iDetector
Zz
xX[Y]
Y[X]
OA

Materials science
LLE Review, Volume 162 89
Figure 2Selected spectra at 0° and 90° demonstrate the presence of Raman scattering from the dominant A1 mode of KDP (trace YZZX) and the depolarization and the overlap of neighboring modes (trace ZXYX). Data acquired with an +0.5° focusing half-angle and 1.0° collection half-angle.
to the 915-cm–1 mode overlap with the integration region and give rise to erroneous signals that can be misinterpreted as arising from nondiagonal matrix elements.
The theoretical description of the Raman tensor R for the A1 mode is represented by a diagonal matrix.13 In the following analysis, all other tensor elements are normalized to the value of A, which is assigned the maximum value of trace ZYYX (or ZXXY). The matrix element B is determined solely by averaging of the entire trace YZZX. The examination of spectra for all experimental configurations confirmed that the Raman tensor for the dominant A1 mode contains no off-axis terms. The same analysis was performed for both KDP and 70% DKDP samples tested in an experimental setup using a 1.0° collection half-angle. Future work will explore the dependence of the collection aperture on the tensor element values more carefully.
A. . . .
.RA
AB
R R00
0
0
00
100
010
00
0 79 0 01
100
010
00
0 76 0 02KDP 70% DKDP1
! !
= = =_ f f fi p p p
This material is based upon work supported by the Department of Energy National Nuclear Security Administration under Award Number DE-NA0003856, the University of Rochester, and the New York State Energy Research and Development Authority.
1. J. D. Lindl et al., Phys. Plasmas 11, 339 (2004).
2. N. Fleurot, C. Cavailler, and J. L. Bourgade, Fusion Eng. Des. 74, 147 (2005).
3. W. Seka et al., Opt. Commun. 34, 469 (1980).
4. T. R. Boehly et al., J. Appl. Phys. 85, 3444 (1999).
5. C. E. Barker et al., Proc. SPIE 2633, 501 (1995).
6. S. N. Dixit et al., J. Phys. IV France 133, 717 (2005).
7. K. R. Manes et al., Fusion Sci. Technol. 69, 146 (2016).
G13084JR
0° Z[XY]Xz Configuration
ZXYX trace
YZZX trace
90° X[ZY]Z0° Y[ZZ]X90° X[ZZ]Y
120011001000900Wave number (cm–1)
Cou
nts
8007001
100
10
1000

Determination of the raman Polarizability tensor in the oPtically anistroPic crystal Potassium DihyDrogen PhosPhate
LLE Review, Volume 16290
8. Y. R. Shen and N. Bloembergen, Phys. Rev. 137, A1787 (1965).
9. A. Z. Grasiuk and I. G. Zubarev, Appl. Phys. 17, 211 (1978).
10. R. Loudon, Adv. Phys. 13, 423 (1964).
11. W. L. Smith, M. A. Henesian, and F. P. Milanovich, Laser Program Annual Report 1983, 6-61, Lawrence Livermore National Laboratory, Livermore, CA, Report UCRL-50021-83 (1984).
12. S. G. Demos et al., Opt. Express 19, 21050 (2011).
13. T. Z. Kosc et al., Rev. Sci. Instrum. 91, 015101 (2020).
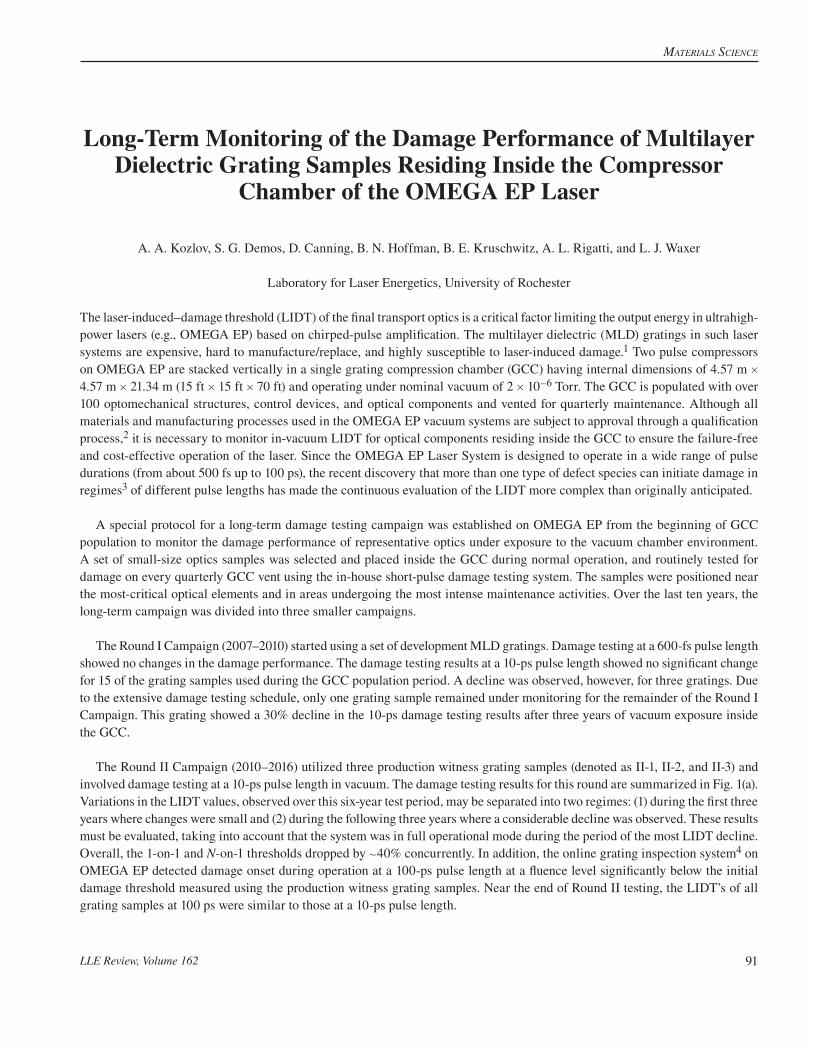
Materials science
LLE Review, Volume 162 91
A. A. Kozlov, S. G. Demos, D. Canning, B. N. Hoffman, B. E. Kruschwitz, A. L. Rigatti, and L. J. Waxer
Laboratory for Laser Energetics, University of Rochester
The laser-induced–damage threshold (LIDT) of the final transport optics is a critical factor limiting the output energy in ultrahigh-power lasers (e.g., OMEGA EP) based on chirped-pulse amplification. The multilayer dielectric (MLD) gratings in such laser systems are expensive, hard to manufacture/replace, and highly susceptible to laser-induced damage.1 Two pulse compressors on OMEGA EP are stacked vertically in a single grating compression chamber (GCC) having internal dimensions of 4.57 m # 4.57 m # 21.34 m (15 ft # 15 ft # 70 ft) and operating under nominal vacuum of 2 # 10–6 Torr. The GCC is populated with over 100 optomechanical structures, control devices, and optical components and vented for quarterly maintenance. Although all materials and manufacturing processes used in the OMEGA EP vacuum systems are subject to approval through a qualification process,2 it is necessary to monitor in-vacuum LIDT for optical components residing inside the GCC to ensure the failure-free and cost-effective operation of the laser. Since the OMEGA EP Laser System is designed to operate in a wide range of pulse durations (from about 500 fs up to 100 ps), the recent discovery that more than one type of defect species can initiate damage in regimes3 of different pulse lengths has made the continuous evaluation of the LIDT more complex than originally anticipated.
A special protocol for a long-term damage testing campaign was established on OMEGA EP from the beginning of GCC population to monitor the damage performance of representative optics under exposure to the vacuum chamber environment. A set of small-size optics samples was selected and placed inside the GCC during normal operation, and routinely tested for damage on every quarterly GCC vent using the in-house short-pulse damage testing system. The samples were positioned near the most-critical optical elements and in areas undergoing the most intense maintenance activities. Over the last ten years, the long-term campaign was divided into three smaller campaigns.
The Round I Campaign (2007–2010) started using a set of development MLD gratings. Damage testing at a 600-fs pulse length showed no changes in the damage performance. The damage testing results at a 10-ps pulse length showed no significant change for 15 of the grating samples used during the GCC population period. A decline was observed, however, for three gratings. Due to the extensive damage testing schedule, only one grating sample remained under monitoring for the remainder of the Round I Campaign. This grating showed a 30% decline in the 10-ps damage testing results after three years of vacuum exposure inside the GCC.
The Round II Campaign (2010–2016) utilized three production witness grating samples (denoted as II-1, II-2, and II-3) and involved damage testing at a 10-ps pulse length in vacuum. The damage testing results for this round are summarized in Fig. 1(a). Variations in the LIDT values, observed over this six-year test period, may be separated into two regimes: (1) during the first three years where changes were small and (2) during the following three years where a considerable decline was observed. These results must be evaluated, taking into account that the system was in full operational mode during the period of the most LIDT decline. Overall, the 1-on-1 and N-on-1 thresholds dropped by +40% concurrently. In addition, the online grating inspection system4 on OMEGA EP detected damage onset during operation at a 100-ps pulse length at a fluence level significantly below the initial damage threshold measured using the production witness grating samples. Near the end of Round II testing, the LIDT’s of all grating samples at 100 ps were similar to those at a 10-ps pulse length.
Long-Term Monitoring of the Damage Performance of Multilayer Dielectric Grating Samples Residing Inside the Compressor
Chamber of the OMEGA EP Laser

Long-Term moniToring of The Damage Performance of muLTiLayer DieLecTric graTing SamPLeS
LLE Review, Volume 16292
G12915JR
Flue
nce
(J/c
m2 )
(a)
May 10
Jan 11
Sep 11
May 12
Jan 13
Jun 14
Oct 13
Feb 15
Jun 16
Oct 15
0.0
0.5
1.0
1.5
2.0
2.5
II-1II-2II-3
(b)
Mar 10
Jul 11
Dec 12
Sep 15
Apr 14
Jan 17
Oct 19
May 18
II-1II-2GR-III-1
The Round III Campaign (2016–2019) encompassed an expanded protocol to monitor damage testing at a 100-ps pulse length. A “fresh” grating sample (GR-III-1) and the representative grating high-reflector (GHR) coating (HR-III-1) were included in the experiment to study potential differences in the vacuum performance between the MLD gratings and regular coatings. The representative grating high reflector is identical to the regular grating MLD coating with the exception of the top silica layer, which has a reduced thickness (609 nm to 440 nm) and no etched grating structure. To separate the vacuum effects from the aging-related changes in the optics performance, the fresh grating and coating samples had an equivalent twin (GR-III-2 and HR-III-2, respectively) that was stored in air throughout the campaign. Furthermore, one sample (II-3) from the Round II Campaign was removed from the study and stored in air.
Figure 1(b) summarizes the 10-ps-pulse-length damage testing results obtained during the Round III campaign combined (to enable direct comparison) with the data from Round II. Both 1-on-1 and N-on-1 damage thresholds for the fresh grating sample GR-III-1 were reduced by 40% over three years. This decline is exactly the same as the reduction of the damage threshold experienced by the gratings II-1 and II-2 during Round II, but it occurred twice as fast. The 10-ps damage thresholds for these two remaining Round II grating samples continued to decline during Round III with the 1-on-1 and N-on-1 LIDT reduced by 20% and 10%, respectively. However, the damage thresholds for the Round II gratings II-1 and II-2 showed no further measur-able decline at the 100-ps pulse length.
Damage testing results at a 100-ps pulse length of Round III, GCC-stored fresh grating GR-III-1 are presented in Fig. 2, com-bined for comparison with the 10-ps data for the same sample. The damage testing results at a 100-ps pulse length for the fresh grating GR-III-1 declined significantly faster in comparison with the 10-ps data. Specifically, the 100-ps 1-on-1 and N-on-1 damage thresholds dropped by +50% and +70%, respectively. As a result, the damage threshold at 10 ps and 100 ps converged. On the other hand, no convergence between 10-ps and 100-ps damage thresholds was observed for grating GR-III-2, which was stored in air.
The GHR coating sample HR-III-1, stored inside the GCC, showed no change in damage thresholds at 10 ps, but the damage behavior changed significantly at a 100-ps pulse length. The 1-on-1 damage threshold at 100 ps dropped by +50% after three years in vacuum, while the N-on-1 remained unchanged.
The overall percentage decline in the damage thresholds in all, GCC and in-air stored, samples (Fig. 3) depicts a clear difference in the vacuum damage performance between the MLD gratings and GHR coatings. The damage thresholds of the MLD’s grating were reduced in vacuum by up to 70%, depending on the pulse length. For the GHR coatings, only the 1-on-1 damage threshold at a 100-ps pulse length was affected by the environment inside the GCC. Both grating and GHR-coating samples revealed no change in the damage performance after three years of aging in ambient air.
Figure 1(a) The Round II and (b) Round III, N-on-1 damage testing results.

Materials science
LLE Review, Volume 162 93
Figure 2Round III, “fresh” grating GR-III-1: The 10-ps and 100-ps damage thresholds converged under vacuum exposure inside the GCC.
G12921JR
Flue
nce
(J/c
m2 )
6
0
Jun 16
Dec 16
Jun 17
Sep 17
Jan 18
Jun 18
Sep 18
Dec 18
Mar 19
Jun 19
2
4
10 ps, 1-on-110 ps, N-on-1100 ps, 1-on-1100 ps, N-on-1
Surface plasma cleaning was used on grating sample II-3 to target potential organic volatile contaminants, presumably accu-mulated on the grating surface under vacuum inside the GCC.5 The results indicated that the air–plasma cleaning method did not improve the damage performance of the grating. This suggests that the degradation of the grating damage performance under vacuum conditions inside the GCC is not related to volatile organic contamination.
Particles that attach to the surface of optics (contaminants) can be precursors for damage initiation on these optics at signifi-cantly lower fluences than the corresponding pristine optical elements. Offline studies have shown that particles on the surface can significantly lower the damage thresholds.6 It is currently unclear, however, what types of particles may be present inside
Figure 3The evolution of the damage performance of the MLD-grating and GHR-coating samples during Round III.
G12842JR
LID
T de
clin
e (%
)
HR-III-2
10 ps/1-on-110 ps/N-on-1
100 ps/1-on-1100 ps/N-on-1
GR-III-2
Gratings
HR-III-1
GR-III-10
20
40
60
Coatings
N-on-1
1-on-1Vacuum GCC samplesIn-air stored samples
Vacuum GCC samplesIn-air stored samples

Long-Term moniToring of The Damage Performance of muLTiLayer DieLecTric graTing SamPLeS
LLE Review, Volume 16294
the GCC and if they correlate with the reduced damage performance of the compression gratings discussed in this work. In an effort to perform a preliminary analysis of the contamination load inside the OMEGA EP GCC, particles were collected from seven locations near optical elements during the December 2019 vent period. The initial analysis was focused on determining the particle composition and was limited to the larger particles (>50 nm diameter). Particles were found at every collection loca-tion with the most frequently observed type being metallic particles and fibers, for the subset of particles that were chemically characterized. Several different metal particles were identified, including aluminum, stainless steel, silver, and copper. Plastic (PVC) particles were also found near the compressor grating and the lower compressor deformable mirror. Glass particles were less commonly observed.
Differences in damage degradation behavior between the MLD grating and corresponding GHR coating may arise from the different damage initiation mechanisms. As reported in Ref. 3, the damage of HfO SiO based2 2- HR’s by laser pulses longer than 10 ps is defect-driven Type II or Type III, originating at depths around 600 nm and >100 nm, respectively. Conversely, damage initiation in gratings with picosecond pulses originates in the pillars (the location of peak electric-field intensity enhancement) and is associated with defect-induced localized absorption.7 Therefore, damage in the MLD grating and the GHR coating occurs at different locations. The damage-initiation mechanisms described above apply for the case of the “pristine” optic (grating or GHR coating). Assuming there is contamination involved, the problem becomes more complex and would require additional studies to resolve. However, the existing results may help obtain insight into the possible processes.
Recent work that considered the interaction of model contamination particles (metal, plastic, and glass) located on the surface on an MLD mirror with pulses at 0.6 and 10 ps revealed that the threshold for metal particle ejection and secondary contamination (via nanodroplets) is largely dependent on only the fluence.6 These processes take place at fluences below the particle-induced LIDT of the mirror. If we further consider that damage is initiated by the generated (secondary contamination) nanoparticles, due to their small size, heat diffusion would be limited and damage would be only a function of total fluence. This would explain the convergence of the 100-ps 1-on-1 LIDT toward the 10-ps 1-on-1 LIDT (as depicted in Fig. 2). Regarding the behavior of the grating samples, the introduction of metal contamination particles would alter the localized electric-field distribution near the pillars creating “hot” spots with higher electric-field intensity. This in turn would facilitate a reduction of the LIDT. Additional work would be required to validate the above hypothetical.
This material is based upon work supported by the Department of Energy National Nuclear Security Administration under Award Number DE-NA0003856, the University of Rochester, and the New York State Energy Research and Development Authority.
1. N. Bonod and J. Neauport, Adv. Opt. Photon. 8, 156 (2016).
2. B. Ashe et al., Proc. SPIE 7069, 706902 (2008).
3. A. A. Kozlov et al., Sci. Rep. 9, 607 (2019).
4. J. Qiao et al., Opt. Express 18, 10,423 (2010).
5. H. P. Howard et al., Appl. Opt. 52, 1682 (2013).
6. K. R. P. Kafka and S. G. Demos, Opt. Lett. 44, 1844 (2019).
7. B. N. Hoffman et al., “Mechanisms of Picosecond Laser-Induced Damage in Common Multilayer Dielectric Gratings,” to be published in Optics Express, see also, this issue of LLE Review Quarterly Report 162, 77.

Laser FaciLity report
LLE Review, Volume 162 95
J. Puth, M. Labuzeta, D. Canning, and R. T. Janezic
Laboratory for Laser Energetics, University of Rochester
During the second quarter of FY20, the Omega Laser Facility conducted 285 target shots on OMEGA and 218 target shots on OMEGA EP for a total of 503 target shots (see Tables I and II). OMEGA averaged 11.4 target shots per operating day, averaging 93.2% Availability and 94.4% Experimental Effectiveness.
OMEGA EP was operated extensively in Q2 FY20 for a variety of user experiments. OMEGA EP averaged 9.1 target shots per operating day, averaging 98.2% Availability and 95.6% Experimental Effectiveness.
FY20 Q2 Laser Facility Report
Table I: OMEGA Laser System target shot summary for Q2 FY20.
Program LaboratoryPlanned Number of Target Shots
Actual Number of Target Shots
ICFLLE 93.5 92
LLNL 22 21
ICF Subtotal 115.5 113
HED
LLE 11 8
LANL 22 23
LLNL 38.5 41
HED Subtotal 71.5 72
LBS LLNL 16.5 19
LBS Subtotal 16.5 19
NLUF 44 49
LLE Calibration LLE 0 32
Grand Total 247.5 285

FY20 Q2 Laser FaciLitY report
LLE Review, Volume 16296
Table II: OMEGA EP Laser System target shot summary for Q2 FY20.
Program LaboratoryPlanned Number of Target Shots
Actual Number of Target Shots
ICF
LLE 31.5 44
LLNL 7 11
NRL 7 10
ICF Subtotal 45.5 65
HED
LLE 28 41
LANL 14 15
LLNL 28 38
HED Subtotal 70 94
LBS
LLE 7 14
LANL 7 5
Princeton University 7 7
LBS Subtotal 21 26
NLUF 7 7
LaserNetUS 7 14
LLE Calibration LLE 0 12
Grand Total 150.5 218

InertIal ConfInement fusIon
LLE Review, Volume 163 97
R. C. Shah,1 S. X. Hu,1 I. V. Igumenshchev,1 J. Baltazar,1 D. Cao,1 C. J. Forrest,1 V. N. Goncharov,1 V. Gopalaswamy,1 D. Patel,1 F. Philippe,2 W. Theobald,1 and S. P. Regan1
1Laboratory for Laser Energetics, University of Rochester2Commissariat à l’énergie atomique et aux énergies alternatives, France
On the 30-kJ OMEGA laser, experiments are conducted on spherical implosions to create conditions relevant to inertial confine-ment fusion. Plastic capsules (+1 mm in diameter) containing a cryogenic shell of solid hydrogen fuel are directly imploded by +20 TW of laser power arriving via 60 beams. The dense shell acts as a piston to create a fusion-relevant pressure (+100 Gbar) and temperature (+3 to 5 keV) in DT plasma termed the “hot spot.” The OMEGA experiments are interpreted by hydrodynamic scaling to the +2-MJ National Ignition Facility for which the implosion dimensions would be large enough for hot-spot fusion reactions to cause runaway self-heating. Substantial progress has occurred1 but the hot-spot conditions are not yet sufficient to trigger a self-sustained fusion reaction.2
Hot-spot performance is sensitive to the in-flight shell density tsh, which, along with the shell velocity vsh, determines the dynamic pressure of the imploding shell v .Pd sh sh
2t= The dynamic pressure determines the compressive work done to create the hot-spot pressure P Phs d
5 3+ (Ref. 3). A fundamental limit on the shell density arises from entropy, which is determined in
direct-drive implosions mainly by laser pulse shape and resulting shocks. It is characterized by adiabat a defined as the ratio of the pressure to the Fermi-degenerate pressure at the shell density. However, the ablation surface is hydrodynamically unstable to perturbations,4 and implosions having a higher adiabat tend to be more robust due to reduced instability growth rates and a lower-density, thicker shell. A dominant source of perturbations in direct-drive implosions is expected to be laser speckle or laser imprinting.5–7
The instability growth that breaks up the high-density shell leads to a relaxed density profile. A signature of the additional mass entering the hot-spot region is an increase of the early production of hot-spot soft x-ray emission. In this summary we interpret the onset of hot-spot x-ray self-emission from gated images of DT cryogenic implosions. Whereas the advance in onset of emission is well matched by imprint as calculated by the 3-D radiation-hydrodynamic code ASTER8,9 for a low-adiabat implosion, this is not the case for more-stable, higher-adiabat implosions. The results suggest that other perturbations, not included in models, cause decompression of more-stable implosions.
We first consider three DT cryogenic implosions with a of 1.7, 3.0, and 5.5 (also referred herein as low-, mid-, and high-stability). For the highest-adiabat implosion the cryogenic layer was 30% thicker, thereby further augmenting its stability. The implosions were pinhole imaged at magnification M = 6 onto an x-ray framing camera and recorded on film with filtration to record soft (+800-eV) x rays. In these images the ablation front is identified with an outer emission limb. To quantify the advance of the turn-on, we have tracked the increase of the core emission as a function of ablation-front position. The relative core emission is calculated from each framed image as ,drI rR r2 2 2
pk` _j i# where I(r) is the angle averaged signal normalized to the peak at the emission limb and Rpk is the peak position of the limb. These results are plotted for the low-, mid-, and high-stability implosions in Figs. 1(a)–1(c), respectively. The solid black circles and blue line correspond to the experimental measurements and fit; the dotted black line is the uniform ASTER calculation; and the dashed red line is the ASTER model including imprint. The data and simulation are fit using a delayed exponential with constant offset. A slight difference can be present in the offsets, which likely
Probing In-Flight Shell Breakup in DT Cryogenic Implosions on OMEGA
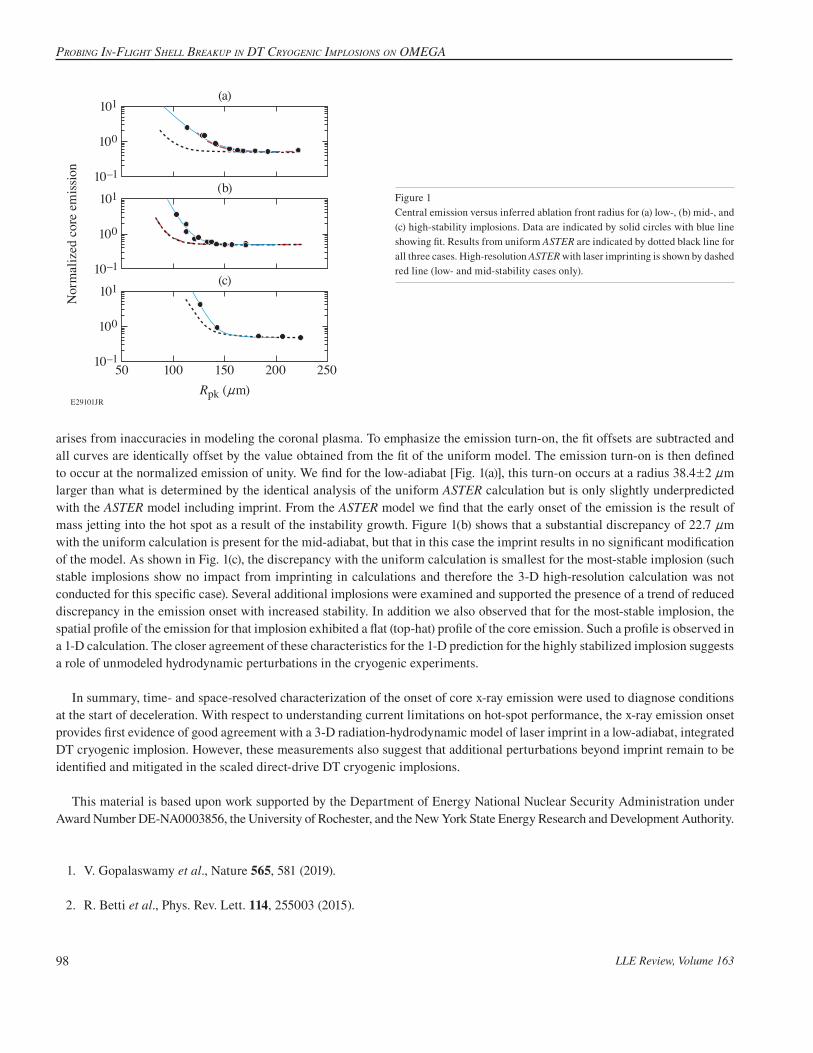
Probing in-Flight Shell breakuP in Dt CryogeniC imPloSionS on omega
LLE Review, Volume 16398
arises from inaccuracies in modeling the coronal plasma. To emphasize the emission turn-on, the fit offsets are subtracted and all curves are identically offset by the value obtained from the fit of the uniform model. The emission turn-on is then defined to occur at the normalized emission of unity. We find for the low-adiabat [Fig. 1(a)], this turn-on occurs at a radius 38.4!2 nm larger than what is determined by the identical analysis of the uniform ASTER calculation but is only slightly underpredicted with the ASTER model including imprint. From the ASTER model we find that the early onset of the emission is the result of mass jetting into the hot spot as a result of the instability growth. Figure 1(b) shows that a substantial discrepancy of 22.7 nm with the uniform calculation is present for the mid-adiabat, but that in this case the imprint results in no significant modification of the model. As shown in Fig. 1(c), the discrepancy with the uniform calculation is smallest for the most-stable implosion (such stable implosions show no impact from imprinting in calculations and therefore the 3-D high-resolution calculation was not conducted for this specific case). Several additional implosions were examined and supported the presence of a trend of reduced discrepancy in the emission onset with increased stability. In addition we also observed that for the most-stable implosion, the spatial profile of the emission for that implosion exhibited a flat (top-hat) profile of the core emission. Such a profile is observed in a 1-D calculation. The closer agreement of these characteristics for the 1-D prediction for the highly stabilized implosion suggests a role of unmodeled hydrodynamic perturbations in the cryogenic experiments.
In summary, time- and space-resolved characterization of the onset of core x-ray emission were used to diagnose conditions at the start of deceleration. With respect to understanding current limitations on hot-spot performance, the x-ray emission onset provides first evidence of good agreement with a 3-D radiation-hydrodynamic model of laser imprint in a low-adiabat, integrated DT cryogenic implosion. However, these measurements also suggest that additional perturbations beyond imprint remain to be identified and mitigated in the scaled direct-drive DT cryogenic implosions.
This material is based upon work supported by the Department of Energy National Nuclear Security Administration under Award Number DE-NA0003856, the University of Rochester, and the New York State Energy Research and Development Authority.
1. V. Gopalaswamy et al., Nature 565, 581 (2019).
2. R. Betti et al., Phys. Rev. Lett. 114, 255003 (2015).
Nor
mal
ized
cor
e em
issio
n
100
101(a)
(b)
E29101JR
150Rpk (nm)
25020050 100
(c)
10–1
100
101
10–1
100
101
10–1
Figure 1Central emission versus inferred ablation front radius for (a) low-, (b) mid-, and (c) high-stability implosions. Data are indicated by solid circles with blue line showing fit. Results from uniform ASTER are indicated by dotted black line for all three cases. High-resolution ASTER with laser imprinting is shown by dashed red line (low- and mid-stability cases only).

InertIal ConfInement fusIon
LLE Review, Volume 163 99
3. V. N. Goncharov et al., Phys. Plasmas 21, 056315 (2014).
4. S. Atzeni and J. Meyer-ter-Vehn, The Physics of Inertial Fusion: Beam Plasma Interaction, Hydrodynamics, Hot Dense Matter, 1st ed., International Series of Monographs on Physics, Vol. 125 (Oxford University Press, Oxford, 2004).
5. P. B. Radha et al., Phys. Plasmas 12, 032702 (2005).
6. V. A. Smalyuk et al., Phys. Rev. Lett. 103, 105001 (2009).
7. S. X. Hu et al., Phys. Rev. Lett. 108, 195003 (2012).
8. D. T. Michel et al., High Power Laser Sci. Eng. 3, e19 (2015).
9. I. V. Igumenshchev et al., Phys. Plasmas 23, 052702 (2016).

First temperature and Velocity measurements oF the dense Fuel layer in inertial conFinement Fusion experiments
LLE Review, Volume 163100
First Temperature and Velocity Measurements of the Dense Fuel Layer in Inertial Confinement Fusion Experiments
O. M. Mannion,1 A. J. Crilly,2 C. J. Forrest,1 B. D. Appelbe,2 Z. L. Mohamed,1 V. Yu. Glebov,1 V. Gopalaswamy,1 V. N. Goncharov,1 J. P. Knauer,1 T. C. Sangster,1 C. Stoeckl,1 J. P. Chittenden,2 and S. P. Regan1
1Laboratory for Laser Energetics, University of Rochester2Centre for Inertial Fusion Studies, The Blackett Laboratory, Imperial College, London
The hydrodynamic properties of the shell in cryogenic inertial confinement fusion (ICF) experiments are of vital importance but have yet to be measured experimentally. Recent theoretical work1 has demonstrated how the spectral shape of the kinematic edges in the neutron energy spectrum emitted from an ICF target could be used to infer the hydrodynamic properties of the dense DT fuel layer. When an incident neutron of energy En,i elastically scatters off a stationary ion, the neutron will exit the scattering event at an energy ,cosE E A A A1 2 1n,f n,i cm
2 2i= + + +_ _i i8 B where A is the ion-to-neutron mass ratio and icm is the neutron scatter-ing angle in the center-of-mass frame. The minimum energy at which a neutron can exit an elastic-scattering event is called the kinematic limit and occurs when the neutron undergoes a backscatter event (icm = r), resulting in an outgoing neutron at energy
.E E A A1 1bs n,i -= +_ _i i Since no neutron can reach energies lower than Ebs through a single elastic-scattering event, the neutron energy spectrum will have a sharp edge feature located at Ebs. This feature is referred to as the kinematic (or backscatter) edge.
The kinematic limit is shifted if the scattering ion is moving (see Fig. 1). The magnitude of this shift is dependent on the rela-tive velocity between the ion and neutron.1 When neutrons scatter off a population of ions with a given ion-velocity distribution, the resulting edge feature is the superposition of the kinematic edge produced from many neutron–ion scattering events. This results in the measured kinematic edge containing information on the ion-velocity distribution. In particular, the mean v of the ion-velocity distribution will cause an energy shift in the resulting edge location, while the variance v
2D of the ion-velocity distri-
E29040JR
n
i
TDetector
(a)
(b)
T n
En,f = 3.6 MeV
En,f = 3.4 MeV
En,i = 14.0 MeV
ET = 1.0 keV(ii) (i)
Figure 1(a) A schematic of neutron scattering in a compressed ICF target, which consists of a low-density, high-temperature hot spot (red), surrounded by a low-temperature, high-density shell (blue). (b) Backscatter kinematics for a 1-keV triton moving (i) toward and (ii) away from an incident DT neutron.

InertIal ConfInement fusIon
LLE Review, Volume 163 101
Figure 2(a) The measured nTOF signal (shaded) and forward fit (solid and dashed lines) in the nT-edge region for two experiments. The primary DT neutron yields and areal density for these two experiments were different, resulting in the measured nT edges having different amplitudes. The data have been plotted as two separate signal axes to facilitate comparison of the nT spectral shape. The inset shows the nTOF signals plotted on the same signal axis for reference. (b) The measured (circles) and LILAC calculated (lines) values for Dv and v as functions of calculated implosion velocity. (c) The measured nT edge (blue circles) and primary DT (orange circles) temperatures as functions of implosion velocity. Also shown are the LILAC-inferred temperature from the nT edge (blue dashed line), the LILAC scatter-averaged triton temperature (purple dashed–dotted line), and the temperature of the shocked material as calculated by strong shock Rankine–Hugoniot (RH) conditions (black dashed line). The statistical uncertainties are shown as error bars on the points and the systematic uncertainties are shown as gray bars on the points. The results for the experiments in (a) are indicated as stars for shots 87653 (yellow) and 91312 (purple).
E29041JR
0.3
0.4
0.2
0.8
1.0
1.2
1.4
0.6
Sign
al (V
)
500 520510 530 550540490Time of flight (ns)
500 520 540Time of flight (ns)
Shot 87653Shot 91312
0.2
0.6
1.0
1.4
Sign
al (V
)
(b)
(a)
LILAC DvLILAC v̄
OMEGA DvOMEGA v̄
100
0
200
300
400
Fit p
aram
eter
s (km
/s)
5
3
4
2
0
1Tem
pera
ture
(keV
)
400350 450 550500300vimp (km/s)
(c)LILAC TnTLILAC GTHRH TnT
OMEGA TnTOMEGA TDT
bution will cause a change in the slope of the edge. Therefore, the spectral shape of the kinematic edge produced when neutrons scatter off a material can be used to diagnose the moments of the ion-velocity distribution within the material.
Neutron scattering occurs throughout the compressed ICF target, which results in the kinematic edges sampling the ion-velocity distributions in many regions of the capsule. The ion-velocity distribution being measured by the kinematic edges from an ICF target is the scatter-weighted, ion-velocity distribution. The shape of this distribution has been studied1 using the 1-D radiation-hydrodynamic code LILAC and found to be well described by a normal distribution with a mean v and variance .v
2D The mean v is the scatter-weighted velocity of the shell, while the variance v
2D is related to the scatter-weighted temperature and velocity variance of the shell.
The nT kinematic edge has been measured for an ensemble of direct-drive DT cryogenic implosions on OMEGA using a neutron time-of-flight (nTOF) detector, and a forward-fit analysis has been applied to infer the moments of the triton velocity distribution. Example nT-edge measurements along with the forward fit are shown in Fig. 2. To minimize the effect of implosion asymmetries on the nT-edge measurements, only experiments with apparent ion temperature asymmetry <1.0 keV and hot-spot flow velocities <80 km/s were considered.

First temperature and Velocity measurements oF the dense Fuel layer in inertial conFinement Fusion experiments
LLE Review, Volume 163102
The inferred v and v2D values from the ensemble of experiments are shown in Fig. 2 as a function of the implosion velocity vimp
as calculated by LILAC. Calculations of v2D and v from post-shot LILAC simulations are in good agreement with the measured
values. The inferred shell velocities v are uniform across the experiments on OMEGA with an average velocity of 79 km/s and standard deviation of 16 km/s. The measured velocities are small in comparison to the implosion velocity due to the measure-ment sampling the shell velocity near peak compression [see Fig. 2(b)]. The v measurements indicate there is little variability in the shell residual kinetic energy for these implosions, which is expected since these implosions were chosen for their symmetry.
The nT- and DT-inferred temperatures are shown in Fig. 2(c) as functions of implosion velocity. The nT measured tempera-tures are lower than the DT temperatures. This is a result of the DT-inferred temperature being a neutron-averaged quantity, which results in the inferred value being weighted toward the region in which fusion reactions are occurring (i.e., the hot spot), whereas the nT-inferred temperature is a scatter-averaged quantity, which results in the inferred value being weighted toward the denser and colder regions (i.e., the shell). The increase in the nT-edge temperature with implosion velocity is due to an increase of the thermal conduction from the hot spot into the shell. The thermal conduction of a fully ionized ideal gas2 has a temperature dependence of T 5/2. The higher initial hot-spot temperatures achieved with higher implosion velocities [see Fig. 2(b)] result in an increased thermal conduction of heat from the hot spot into the shell. This increases the temperature of the shell while also increasing the ablation rate of cold material into the hot spot. Consequently, the fraction of neutron scattering in shocked mate-rial >1 keV increases linearly with implosion velocity while the contribution from material <1 keV decreases. Since the nT edge temperature is scatter weighted, the increasing contribution from material >1 keV is the dominant contribution to the increased nT inferred temperature.
The temperature and velocity measurements presented here, along with areal-density measurements of the shell, now provide a complete set of hydrodynamic properties of the dense fuel layer near peak compression. The temperature measurements provide a key piece of information required to measure the shell adiabat in cryogenic ICF experiment. The shell-velocity measurements provide the first experimental evidence of residual motion of the shell near peak compression and provide the first insights into the conversion efficiency of shell kinetic energy to thermal energy of the hot spot. Future work will extend this analysis to multiple lines of sight and investigate asymmetric implosions. Additionally, this technique can be applied to other backscatter edges that occur in ICF experiments such as the deuterium backscatter edge at 1.5 MeV in DT cryogenic implosions or the beryllium edge that exists in magnetized liner fusion experiments. Finally, this technique can be applied to a more general set of high-energy-density experiments that require measurements of the hydrodynamic properties of dense shocked materials.
This material is based upon work supported by the Department of Energy National Nuclear Security Administration under Award Number DE-NA0003856, the University of Rochester, and the New York State Energy Research and Development Authority.
1. A. J. Crilly et al., Phys. Plasmas 27, 012701 (2020).
2. L. Spitzer, Physics of Fully Ionized Gases, 2nd rev. ed., Interscience Tracts on Physics and Astronomy (Wiley Interscience, New York, 1962).

InertIal ConfInement fusIon
LLE Review, Volume 163 103
Self-Radiography of Imploded Shells on OMEGA Based on Additive-Free Multi-Monochromatic Continuum
Spectral Analysis
R. Epstein,1 R. C. Mancini,2 D. T. Cliche,2 R. C. Shah,1 T. J. B. Collins,1 C. Stoeckl,1 P. W. McKenty,1 P. B. Radha,1
S. P. Regan,1 and V. N. Goncharov1
1Laboratory for Laser Energetics, University of Rochester2University of Nevada, Reno
Cryogenic implosions on the OMEGA Laser System1 can be self-radiographed by their own core spectral emission near .2 keV. Utilizing the distinct spectral dependences of continuum emissivity and opacity, the projected optical thickness distribution of imploded shells can be distinguished from the structure of the core emission in images. This can be done without relying on spectral additives (shell dopants), as in previous applications of implosion self-radiography.2 Demonstrations with simulated data show that this technique is remarkably well-suited to cryogenic implosions. Imploded room-temperature CH shells can also be self-radiographed at higher spectral energy (ho . 3 to 5 keV) based on the very similar continuum spectrum of carbon. Experi-mental demonstration of additive-free self-radiography with warm CH shell implosions on OMEGA will provide an important proof of principle for future applications to cryogenic DT implosions.
Externally backlit radiography3 is primarily sensitive to the shape of the limb of the shell as projected onto an image plane and requires spectral filtering and/or temporal gating techniques4 to keep the core from outshining the external backlighter as the implosion approaches peak conditions. Self-radiography sidesteps this limitation by using core self-emission as the backlighter to project the structure of the near face of the shell onto an image plane.
We formulate continuum radiography as a spectral analysis of the imaged intensity at each image pixel, based on the free–free and bound–free emissivity and opacity of hydrogen-like ions as described by the Kramer’s5 semi-classical expressions with power-law Gaunt factor corrections6,7 based on Karzas and Latter,8 of the form go ? (o/o0)–q. For the anticipated spectral range for CH shell implosions, 3.6 < ho0 < 5.4 keV, the likely index value at the spectral midpoint is q . 0.11. The index rises slowly to q . 0.5 in the limit that the spectral energy greatly exceeds the electron binding energy, which applies to hydrogen.
The shell optical thickness at a nominal spectral frequency o0 can be expressed in terms of the power law xo ? (o/o0)–(3+q). In local thermodynamic equilibrium, the emissivity spectral form is obtained from the opacity by the Kirchhoff relationship9 using the Planck function. The result is a phenomenological expression of the intensity spectrum for a thermal continuum emit-ter surrounded by a non-emitting layer
,I A eq t0
1 q0 0 0 3o o= - - -
oo o x o o +
`` `
jj j (1)
where A represents the unabsorbed emission, x0 is the optical thickness of the foreground absorber, and t = kT/ho0 is a local continuum slope parameter that can be interpreted as an emission-weighted, harmonic mean of the source electron temperature. These three parameters are estimated at each pixel.
The three spectral parameter estimates will be sensitive to signal noise. With three images covering a bandwidth Do and with pixel intensities precise to a standard deviation equal to a fraction vI, the resulting formal uncertainty of the x estimates, for example, in the small-Do limit is .2 3 I 0
2,dx v o oD` j It is clear from the strong Do scaling of this expression that broad bandwidth is essential.

Self-RadiogRaphy of imploded ShellS on omega BaSed on additive-fRee multi-monochRomatic continuum SpectRal analySiS
LLE Review, Volume 163104
We apply our proposed analysis to synthetic data based on radiation-hydrodynamic simulations to show that the emission and absorption separation expressed in Eq. (1) is valid and that radiographs can be successfully inferred. The example selected here is based on a 2-D DRACO10 simulation of the implosion experiment shot 81590 (Ref. 4). Figure 1 shows three simulated images at spectral energies ho = 1.6, 1.8, and 2.0 keV, obtained from this simulation at a time near peak neutron production with the radiation-transport postprocessor Spect3D.11 The view direction is 30° above the equatorial plane. The DRACO simulation includes the effects of nonuniform laser irradiation, including the ideal single-beam intensity profile, OMEGA’s 60-beam pattern, and fine-scale beam speckle. The image structure in any one image is the net result of emission followed by absorption. Separat-ing the absorption structure from the emission structure by spectral analysis is the basis of self-radiography.
Figure 1 Three simulated monochromatic images of the OMEGA implosion experiment shot 81590 at spectral energies (a) ho = 1.6, (b) 1.8, and (c) 2.0 keV at a time near peak neutron production.
TC14514JR
(c)(b)(a)5
0
1
2
3
4
100 nm 100 nm
t = 3.515 ns
Inte
nsity
(#10
18 e
rg/c
m2 /
s/eV/
ster
)
100 nm
ho = 2.0 keVho = 1.8 keVho = 1.6 keV
Pixel-by-pixel spectral analysis based on Eq. (1) produces the unabsorbed emission distribution shown in Fig. 2(a) and the radiograph in Fig. 2(b), both at ho = 1.8 keV. The radiograph shows the optical thickness increasing from just below unity at the center to about double that at the edge. This absorption profile changes the roughly uniform appearance of the bare emission distribution in Fig. 2(a) into the centrally bright appearance of the simulated images in Fig. 1.
The radiograph in Fig. 2(b) is most useful within a circular area whose diameter is approximately the length of the red spatial reference arrow. The analysis produces optical thicknesses further out from the center, but this is beyond the outer edge of the emitting core, where the fitting model may be misapplied and where the image signal may be too weak to use, relative to instru-mental noise, etc. To show that the radiograph is quantitative where the image signal is reasonably strong, we compare the inferred optical thickness at 20 points on the image plane along the spatial reference arrow with the optical thickness calculated directly from the image simulation model. These are shown as the “inferred” and “actual” points in the plot in Fig. 2(c), respectively. The agreement is very good. The inferred values are all slightly lower than the actual values because a small part of the actual total optical thickness exists in the emitting core where it is only partially effective in attenuating the core emission.
We anticipate a proof-of-principle demonstration of continuum-based self-radiography of OMEGA implosions using imploded CH polymer shells imaged with the multiframe monochromatic imager (MMI) instrument.12 The MMI combines Bragg reflection with a pinhole array to provide time-gated images of inertial confinement fusion implosions. The quantitative capabilities of the MMI have been most recently characterized quantitatively by Cliche et al.13 The current configuration operates with a broad 3.5- to 5.5-keV spectral range and independent electro-optic time gating along four strips on a multichannel photoelectron-multiplying detector plate at the image plane. The MMI could be also be used for self-radiography of cryogenic implosions at lower spectral

InertIal ConfInement fusIon
LLE Review, Volume 163 105
Figure 2Analysis results showing the (a) unabsorbed emission distribution, (b) inferred radiograph, and (c) a vertical lineout of the radiograph optical thickness showing agreement between inferred and simulated “actual” optical thickness. (a) and (b) represent the spectral energy ho = 1.8 keV.
(c) x polar lineout
nm250
x “actual”x analysis
–25
2
0
1
2
0
1
Opt
ical
thic
knes
s
Infe
rred
opt
ical
thic
knes
s
TC14516JR
(b)(a)ho = 2 keVho = 2 keV
100 nm 100 nm
12
0
8
4
Inte
grat
ed e
miss
ivity
(#
1018
erg
/cm
2 /s/e
V)
ranges near ho . 2 keV. A theoretical basis for analyzing MMI images of continuum emission in terms of an ideal spherically symmetric source model has already been described.14 Successful self-radiography of room-temperature CH implosions would be an important and encouraging prelude to continuum-based self-radiography of cryogenic DT shell implosions.
This material is based upon work supported by the Department of Energy National Nuclear Security Administration under Award Number DE-NA0003856, the University of Rochester, and the New York State Energy Research and Development Authority.
1. T. R. Boehly et al., Opt. Commun. 133, 495 (1997).
2. V. A. Smalyuk et al., Phys. Rev. Lett. 87, 155002 (2001); L. A Pickworth et al., Phys. Rev. Lett. 117, 035001 (2016).
3. R. Epstein et al., High Energy Density Phys. 23, 167 (2017).
4. C. Stoeckl et al., Phys. Plasmas 24, 056304 (2017).
5. H. A. Kramers, Philos. Mag. 46, 836 (1923).
6. J. A. Gaunt, Proc. R. Soc. Lond. A 126, 654 (1930).
7. H. R. Griem, Principles of Plasma Spectroscopy (Cambridge University Press, Cambridge, England, 1997).
8. W. J. Karzas and R. Latter, Astrophys. J. Suppl. Ser. 6, 167 (1961).
9. S. Chandrasekhar, Radiative Transfer (Dover Publications, New York, 1960).
10. P. B. Radha et al., Phys. Plasmas 12, 032702 (2005); J. A. Marozas et al., Phys. Plasmas 25, 056314 (2018).
11. J. J. MacFarlane et al., High Energy Density Phys. 3, 181 (2007); Prism Computational Sciences Inc., Madison, WI 53711.
12. J. A. Koch et al., Rev. Sci. Instrum. 76, 073708 (2005).
13. D. T. Cliche and R. C. Mancini, Appl. Opt. 58, 4753 (2019).
14. J. A. Koch, S. W. Haan, and R. C. Mancini, J. Quant. Spectrosc. Radiat. Transf. 88, 433 (2004).
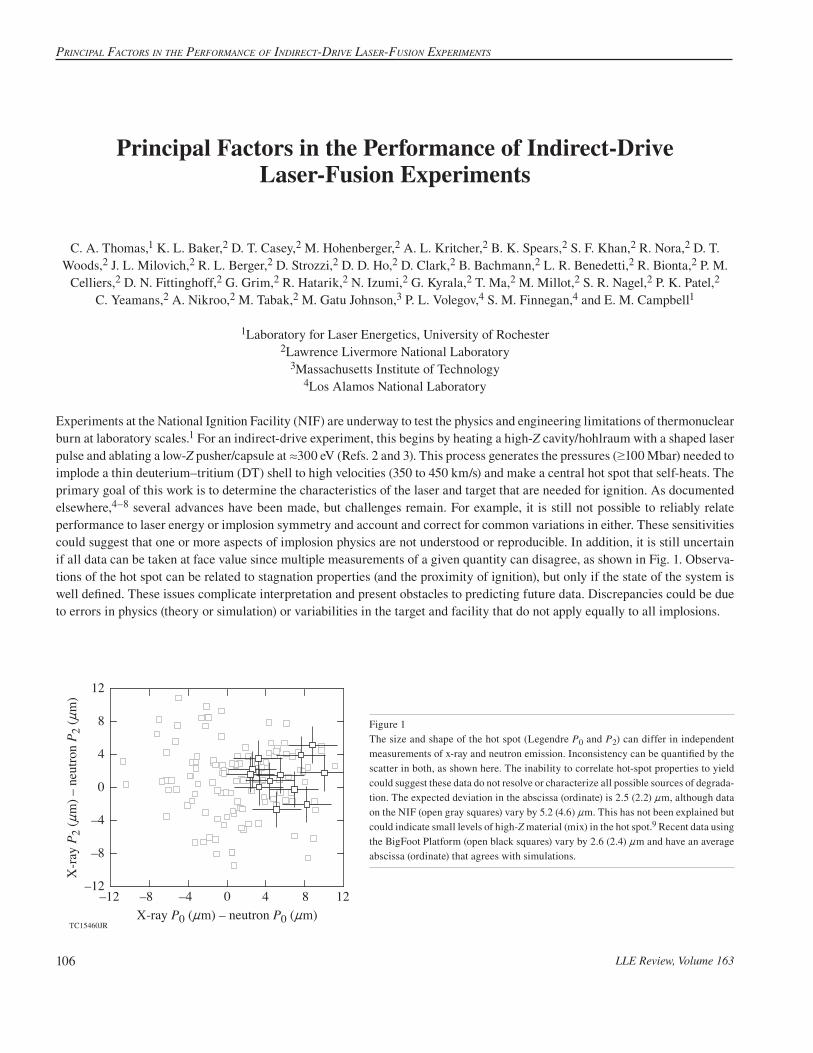
PrinciPal Factors in the PerFormance oF indirect-drive laser-Fusion exPeriments
LLE Review, Volume 163106
Principal Factors in the Performance of Indirect-Drive Laser-Fusion Experiments
C. A. Thomas,1 K. L. Baker,2 D. T. Casey,2 M. Hohenberger,2 A. L. Kritcher,2 B. K. Spears,2 S. F. Khan,2 R. Nora,2 D. T. Woods,2 J. L. Milovich,2 R. L. Berger,2 D. Strozzi,2 D. D. Ho,2 D. Clark,2 B. Bachmann,2 L. R. Benedetti,2 R. Bionta,2 P. M.
Celliers,2 D. N. Fittinghoff,2 G. Grim,2 R. Hatarik,2 N. Izumi,2 G. Kyrala,2 T. Ma,2 M. Millot,2 S. R. Nagel,2 P. K. Patel,2 C. Yeamans,2 A. Nikroo,2 M. Tabak,2 M. Gatu Johnson,3 P. L. Volegov,4 S. M. Finnegan,4 and E. M. Campbell1
1Laboratory for Laser Energetics, University of Rochester2Lawrence Livermore National Laboratory
3Massachusetts Institute of Technology4Los Alamos National Laboratory
Experiments at the National Ignition Facility (NIF) are underway to test the physics and engineering limitations of thermonuclear burn at laboratory scales.1 For an indirect-drive experiment, this begins by heating a high-Z cavity/hohlraum with a shaped laser pulse and ablating a low-Z pusher/capsule at .300 eV (Refs. 2 and 3). This process generates the pressures ($100 Mbar) needed to implode a thin deuterium–tritium (DT) shell to high velocities (350 to 450 km/s) and make a central hot spot that self-heats. The primary goal of this work is to determine the characteristics of the laser and target that are needed for ignition. As documented elsewhere,4–8 several advances have been made, but challenges remain. For example, it is still not possible to reliably relate performance to laser energy or implosion symmetry and account and correct for common variations in either. These sensitivities could suggest that one or more aspects of implosion physics are not understood or reproducible. In addition, it is still uncertain if all data can be taken at face value since multiple measurements of a given quantity can disagree, as shown in Fig. 1. Observa-tions of the hot spot can be related to stagnation properties (and the proximity of ignition), but only if the state of the system is well defined. These issues complicate interpretation and present obstacles to predicting future data. Discrepancies could be due to errors in physics (theory or simulation) or variabilities in the target and facility that do not apply equally to all implosions.
Figure 1The size and shape of the hot spot (Legendre P0 and P2) can differ in independent measurements of x-ray and neutron emission. Inconsistency can be quantified by the scatter in both, as shown here. The inability to correlate hot-spot properties to yield could suggest these data do not resolve or characterize all possible sources of degrada-tion. The expected deviation in the abscissa (ordinate) is 2.5 (2.2) nm, although data on the NIF (open gray squares) vary by 5.2 (4.6) nm. This has not been explained but could indicate small levels of high-Z material (mix) in the hot spot.9 Recent data using the BigFoot Platform (open black squares) vary by 2.6 (2.4) nm and have an average abscissa (ordinate) that agrees with simulations.
TC15460JRX-ray P0 (nm) – neutron P0 (nm)
X-r
ay P
2 (n
m) –
neu
tron
P 2 (n
m)
–12 –8 8–4 4 12–12
–8
–4
0
0
4
8
12

InertIal ConfInement fusIon
LLE Review, Volume 163 107
In this summary, we focus our analyses on experiments using the so-called “BigFoot” platform (see Fig. 2) as described in Ref. 10. These experiments have been designed to reduce complex interactions in the laser, hohlraum, and capsule with the goal of simplifying the integrated system. This required new features in design (discussed below) that do not try to maximize performance. The result has been implosions that are relatively predictable and data that are more self-consistent. Performance compares favorably with theory and, as we show, is a simple function of laser energy per unit target mass (E/M), target scale (S), and low-mode implosion symmetry (hot-spot P2). Neutron yield Y (measured at 13 to 15 MeV) is found to increase as
.E M S P S1 0 05.7 6 42-_ _ ai i k to !8.7%. This analysis suggests that small target flaws and imperfections do not determine the
yield, and we can account for small changes in E/M, P2, etc. while testing other aspects of inertial confinement fusion (ICF). (Typically, yield can be explained only by detailed calculations in 3-D including flaws unique to each target.11,12) These results provide a useful perspective on data on the NIF and a new baseline for testing the physics of indirect drive.
Figure 2(a) The BigFoot target and laser pulse from shot 180128 at S = 1.125. (b) Yield versus hot-spot symmetry for data (open black squares) and simulations (solid line) after normalizing for small differences in target scale. (c) Hot-spot symmetry versus inner cone power at constant total power.
TC15461JR
50 60 70 80 90 100 110–10
0
10
20
30
40
50
–12 –8 –4 0 4 8 120.4
0.6
0.8
1.0
1.2
0
500
ns Neutron P2/S (nm) Inner cone power (TW)
X-r
ay P
2 (n
m)
Neu
tron
yiel
d Y/
S4 (×
1016
)
0 4 62 8
TW
(a) (c)
Y/S4 ~ 1 – 0.05|P2/S|
A
C
D
B
(b)13 to 15 MeV
10 to 12 MeV
We begin by summarizing the BigFoot design and experimental campaign. The primary features and rationale are as follows: (1) a high-density carbon (HDC) ablator to substantially shorten the laser pulse; (2) a low-gas-fill (LGF) density hohlraum (0.3 mg/cm3) to reduce laser–plasma instabilities at high power, tamp hohlraum-wall motion, and provide a well-understood radiation source; and (3) a $12-Mbar first shock to reduce phase coexistence in the ablator (liquid and solid) and increase hydrodynamic stability. This work also introduced changes in laser pointing, the geometry of the hohlraum, and the pulse shape, which are designed to produce a relatively high-adiabat implosion (av = 4) as defined in Ref. 10. This shock-timing scheme was characteristic of early experiments in the National Ignition Campaign that gave unexpectedly high yield (e.g., shot 110212) and could reduce perturbations at the fuel–ablator interface. With these choices, the radiation-hydrodynamic code LASNEX13 is able to predict key aspects of hohlraum performance, such as the time of peak capsule emission (!100 ps), with the measured laser pulse. This has allowed us to perform symmetric implosions near the power and energy limits of the NIF without employing cross-beam energy transfer.14 The platform has also allowed us to collect data over a large range in laser energy (0.8 to 1.8 MJ) and primary yield (1.7 # 1014 to 1.7 # 1016) as needed to study performance.
The first experiments used HDC capsules with an inner radius R of 844 nm and a total thickness of 64 nm that we define as target scale S = R/844 = 1. The equimolar DT layer was 40 nm thick to enable high implosion velocities and accurate character-ization. The hohlraum was made of Au to avoid concerns with reproducibility (other materials oxidize) and simplify fabrication. The diameter of the hohlraum was 5400 nm and its length was 10,130 nm [see Fig. 2(a)]. The hohlraum is small so it can reach high radiation temperatures ($330 eV) without using the maximum energy available on the NIF. This limits the damage to optics and maximizes the potential shot rate. Laser backscatter was limited for all experiments (#1%), and the yield was found to increase monotonically with laser energy E (Ref. 10). Including recent data, the laser energy was increased from 0.8 to 1.3 MJ, and the primary yield from 1.7 # 1014 to 1.0 # 1016 at approximately E8. To make a comparison with theory, we assume the mass

PrinciPal Factors in the PerFormance oF indirect-drive laser-Fusion exPeriments
LLE Review, Volume 163108
forming the hot spot (1) has an initial energy +v2 before compression by the cold fuel (it reaches the same implosion velocity as the shell prior to stagnation), (2) is compressed adiabatically with c = 5/3 (losses relative to peak compression are small), and (3) achieves a radial compression ratio +(v2/av)
1/2, where the design adiabat av is a measure of compressibility.15 The energy in the hot spot Eh + v4 without accounting for alpha heating. If self-heating is included, then we expect Eh + v4f with a feedback f greater than 1. If we also assume yield ,Y Eh
2+ consistent with GvvH at 5 keV (Ref. 16), then we expect Y + v8f. Scalings of this
type are commonly used to explain performance in ICF,2 but are difficult to apply to data since the uncertainty in velocity can be 4% to 5%. Alpha heating is not measured and must be inferred. To make more-precise comparisons, this summary uses a sur-rogate for velocity based on the laser energy E and the initial ablator mass M, which are both known to <1%. If the kinetic energy of the implosion is assumed to scale with E and its mass is proportional to M, then v2 + E/M and Y + (E/M)4f. Calculations have been used to validate this approach and predict f + 2 for current experiments. Since implosions could be subject to additional instability or preheat, we will assume Y + (E/M)N.
Experiments have also been done with HDC capsules having an inner radius of 950 nm at target scale S = 950/844 = 1.125. All dimensions of the capsule and hohlraum (and laser pulse) were increased by the same ratio. Peak laser power was increased by S2 and laser energy by S3. The first data of this type (shot number 170524) was compared to experiments at S = 1 and the yield was found to increase by a factor of .S4 as expected;17,18 including prior results, we expect Y + (E/M)N (S)4.
The data can also be used to address low-mode implosion symmetry, i.e., hot-spot P2. This is the primary asymmetry on the NIF (laser-irradiation geometry) and two-sided cylindrical hohlraums. Calculations expect the primary loss mechanism to be conduction, and a small P2 suggests a hot spot with more surface area. This should reduce the time-averaged number density and temperature of the burning plasma. To first order, the change in yield can be captured by an expansion in P P2 0 or .P S2 Small changes in the system can cause asymmetry in P2 (shot to shot) even for implosions that are designed to be symmetric. In Fig. 2(b) we report the primary neutron yield versus hot-spot P2, in microns, for four experiments with the same E/M. The range is !8 nm in P2 and a factor of 1.6 in yield. The experiments were done in the order shown: A through D. Small changes in the laser, target fabrica-tion, and target alignment could cause this variation. Data and simulation are consistent, and both suggest . .Y P S1 0 05 2-+ To show the laser pulse can be adjusted to improve symmetry, we provide Fig. 2(c) in which !8 mm in P2 is equivalent to !10% on the inner cone energy (64 beams) or "5% on the outer cone (128 beams). In net, . .Y E M S P S1 0 05N 4
2-+_ _ ai i k
We determine N with a least squares fit to all data accounting for changes in laser energy, ablator mass, target scale, and implosion symmetry. This analysis can use the x-ray or neutron P2 since they are well correlated (see Fig. 1), but we choose the latter since neutron data are more directly related to the DT hot spot. In Fig. 3 we assume .Y E M S P S1 0 05N 4
2-+_ _ ai i k and find N = 7.6!0.3 with a .1 22
| =o normalized per degree of freedom. Given the measurement uncertainty in laser energy is !0.5% and neutron P2 is !1.8 nm, then we should only fit data to .8.9%. Throughout this summary, we also fit data with subsets of this model and report the residuals. Data are consistent with high levels of alpha heating (E7.6 > E4) and require all terms for a good fit. Two experiments are excluded from this process due to known problems with each target: E and F. In one of these experiments the capsule was found to have a defect/hole that would normally disqualify it from use; in the other, the capsule was found to be displaced from target chamber center by 200 nm (from one perspective). Most targets are centered to 25 nm. These issues were identified before each shot and could not be corrected. Both experiments are below trend and demonstrate that our analysis can identify outliers. Anomalies of this type should not be allowed to impact interpretations. All of the other targets met specifications and were not subject to selection effects. These targets used different capsule supports (30- and 45-nm plastic tents) and fill tubes (5- to 10-nm outer radius). Since the data are fit with a simple formula that follows expected sensitivities, it would appear these data can also provide constraints on other factors. Given that sensitivities in laser energy, target scale, and implosion symmetry have now been characterized, this platform can be used to study aspects of implosion physics with high precision. We have started a scan in pulse length that will look at adiabat (av = 2 to 6) (Ref. 19) and other features in design. These tests will search for unexpected sensitivities and may help explain performance relative to prior data and expectations of ignition.20
To motivate additional work, we briefly discuss the terms in the fit and the physics mechanisms that could play a role. (1) The sensitivity of yield to laser energy reported here is fast relative to prior results7 and simple theory with no alpha heating (+E4).

InertIal ConfInement fusIon
LLE Review, Volume 163 109
TC15462JR
0.0 0.5 1.0 1.5 2.00.0
0.5
1.0
1.5
2.0M
easu
red
neut
ron
yiel
d Y
(#10
16)
Predicted neutron yield Yp (#1016)
|2 = 1.2E
F
Yp ~ (E/M)7.6 (S)4 (1 – 0.05|P2/S|)
Figure 3The best fit to data assuming yield is a function of laser energy per unit mass, target scale, and hot-spot symmetry. The residual excluding experiments E and F is 8.7%.
The accuracy of a power law (and its ability to extrapolate) should relate to the range over which it applies. If data are inconsistent with a single value of N or can only be fit over a small range in energy (for a few data points), this could suggest results that are variable (or stochastic). The sensitivity to E/M is a central aspect of performance and the interpretation of other physics. (2) Yield should increase with target scale. BigFoot experiments are intended to be robust and provide the requisite control (shot to shot) to interpret changes in target size. The required level of control is challenging since our analysis shows 6% in E/M can change the yield by a factor of 1.6, similar to a 12% change in S (or !8 nm in P2). Understanding could be improved by performing experi-ments with more capsule radii and by making the sensitivity to scale a free variable in the fit to all data. (3) Performance should depend on low-mode symmetry and other observations of the hot spot. This is easy to demonstrate in BigFoot experiments since (a) P2 is linear in the inner cone power [see Fig. 2(c)] and (b) the impact of target flaws and imperfections are reduced. A small amount of high-Z material can increase x-ray emission (locally), reduce neutron emission, and decorrelate these measurements from each other, and the yield.9 Issues of this type would be expected to confuse interpretations of P0 and P2 as well as other integrated metrics, such as the burn-averaged pressure. Observations of the hot spot in BigFoot data are self-consistent (as shown in Figs. 1 and 2) and strongly correlate with yield. The uncertainty in subsequent inferences should be reduced. Experiments that make (large) intentional changes in implosion symmetry and stability could be used to extend this work and establish the experimental signature(s) for different failure modes.
Our results can also be used to suggest methods for increasing the yield and alpha heating. As shown in Fig. 4, a straightforward approach would be to increase laser energy by 10% to 20%. If we assume that laser–plasma instabilities do not grow significantly, this will increase the temperature in the hohlraum, the ablation pressure, and the energy coupled to the capsule. Experiments at scale 1 (1.125) have been designed to use 1.5 MJ at 400 TW (2.0 MJ at 500 TW). Using the scalings presented here, this could increase yield by as much as a factor of (1.5/1.35)7.6 = (2.0/1.8)7.6 = 2.2. We have also proposed targets that would use thicker capsules at higher power and energy to further increase E/M (Ref. 10). To determine the expected change in alpha heating, we calculate |a (a common metric for ignition16) and estimate yield amplification as .exp .1 2
|a` j For experiment 180128 (the highest
point overall), the measured areal density is 0.620!0.030 g/cm2 and primary yield is 1.7 # 1016. We estimate a total yield of 2.0 # 1016, |a = 1.13!0.06, and a yield amplification of 3.2!0.2. Since |a + Y0.34, a factor of 2.2 in yield would increase |a by 30%. This implies that existing targets could demonstrate yield amplifications as high as a factor of exp(1.471.2) = 4.9. To put this in perspective, the yield amplification in a burning plasma is commonly defined to be 3 to 3.5 (Ref. 16), and for ignition, a factor of 15 to 30. These implosions meet the criteria for an alpha-dominated plasma but are still far from ignition. Nonetheless, we rec-ommend caution with respect to both extrapolations. The measured yield and areal density are consistently below integrated 2-D calculations by a factor of 4 and 1.3, respectively. Also, BigFoot implosions appear to have higher compression ratios than prior data despite having a higher design adiabat (av = 4). This is inconsistent with theory and may indicate degradation mechanisms that are still unknown21 that can be corrected.

PrinciPal Factors in the PerFormance oF indirect-drive laser-Fusion exPeriments
LLE Review, Volume 163110
To conclude, we have analyzed implosions that simplify aspects of hohlraum and capsule physics and find that performance can be described by a simple function of laser energy per unit mass (E/M), target scale (S), and implosion symmetry (hot-spot P2). Neutron yield Y is found to be expressible as .E M S P S1 0 05.7 6 4
2-_ _ ai i k with a residual error that can be accounted for using measurements of E/M and P2. This should improve the interpretation of future data and increase confidence in its extrapolation. To build on these results, we have started a scan in design adiabat that will use the same approach and make small changes in the pulse shape (only). We also propose experiments at greater energy per unit mass and will use both studies to address performance limits in indirect drive and criteria for ignition.
This work was made possible by the operations team at the NIF, target fabrication efforts at General Atomics and LLNL, and the encouragement and support of J. H. Nuckolls, J. D. Lindl, W. L. Kruer, and G. B. Zimmerman. We also thank the Senior Leadership Team at the NIF and note that future communications with the first author should be addressed to the Laboratory for Laser Energetics at the University of Rochester. The data that support the findings of this study are available from the cor-responding author upon request. This work was performed under the auspices of the U.S. Department of Energy by Lawrence Livermore National Laboratory under Contract DE-AC52-07NA27344, the Department of Energy National Nuclear Security Administration under Award Number DE-NA0003856, the University of Rochester, and the New York State Energy Research and Development Authority.
1. J. Nuckolls et al., Nature 239, 139 (1972).
2. J. D. Lindl, Inertial Confinement Fusion: The Quest for Ignition and Energy Gain Using Indirect Drive (Springer-Verlag, New York, 1998).
3. S. Atzeni and J. Meyer-ter-Vehn, The Physics of Inertial Fusion: Beam Plasma Interaction, Hydrodynamics, Hot Dense Matter, International Series of Monographs on Physics, Vol. 125 (Oxford University Press, Canada, 2009).
4. O. L. Landen et al., Plasma Phys. Control. Fusion 54, 124026 (2012).
5. M. J. Edwards et al., Phys. Plasmas 20, 070501 (2013).
6. O. A. Hurricane et al., Nature 506, 343 (2014); 510, 432(E) (2014).
7. D. A. Callahan et al., Phys. Plasmas 22, 056314 (2015).
Figure 4Yield versus laser energy for BigFoot implosions (open black squares) having a capsule inner radius of 844 and 950 nm. For context we show the fit from Fig. 3(a) at each scale [the solid line(s)] in the limit that P2 = 0.
TC15463JR
0.8 1.0 1.2Laser energy E (MJ)
1.4 1.6 1.8 2.00.0
0.5
1.0
1.5
2.0
Neu
tron
yiel
d Y
(#10
16)
844 nm 950 nm

InertIal ConfInement fusIon
LLE Review, Volume 163 111
8. L. F. Berzak Hopkins et al., Phys. Rev. Lett. 114, 175001 (2015).
9. T. Ma et al., Phys. Plasmas 24, 056311 (2017).
10. K. L. Baker et al., Phys. Rev. Lett. 121, 135001 (2018).
11. D. S. Clark et al., Phys. Plasmas 23, 056302 (2016).
12. C. R. Weber et al., Phys. Plasmas 24, 056302 (2017).
13. G. B. Zimmerman and W. L. Kruer, Comments Plasma Phys. Control. Fusion 2, 51 (1975).
14. P. Michel et al., Phys. Plasmas 17, 056305 (2010).
15. R. Betti et al., Phys. Plasmas 8, 5257 (2001).
16. R. Betti et al., Phys. Rev. Lett. 114, 255003 (2015).
17. D. T. Casey et al., Phys. Plasmas 25, 056308 (2018).
18. R. L. Berger et al., Phys. Plasmas 26, 012709 (2019).
19. C. A. Thomas et al., “Experiments to Explore the Influence of Pulse Shaping at the National Ignition Facility,” to be submit-ted to Physics of Plasmas.
20. M. C. Herrmann, M. Tabak, and J. D. Lindl, Nucl. Fusion 41, 99 (2001).
21. B. Cheng et al., Plasma Phys. Control. Fusion 60, 074011 (2018).

ExpErimEnts to ExplorE thE influEncE of pulsE shaping at thE national ignition facility
LLE Review, Volume 163112
Experiments to Explore the Influence of Pulse Shaping at the National Ignition Facility
C. A. Thomas,1 K. L. Baker,2 D. T. Casey,2 M. Hohenberger,2 A. L. Kritcher,2 B. K. Spears,2 S. F. Khan,2 R. Nora,2 D. T. Woods,2 J. L. Milovich,2 R. L. Berger,2 D. Strozzi,2 D. D. Ho,2 D. Clark,2 B. Bachmann,2 L. R. Benedetti,2 R. Bionta,2 P. M. Celliers,2 D. N. Fittinghoff,2 G. Grim,2 R. Hatarik,2 N. Izumi,2 G. Kyrala,2 T. Ma,2 M. Millot,2 S. R. Nagel,2 C. Yeamans,2
A. Nikroo,2 M. Tabak,2 M. Gatu Johnson,3 P. L. Volegov,4 S. M. Finnegan,4 and E. M. Campbell1
1Laboratory for Laser Energetics, University of Rochester2Lawrence Livermore National Laboratory
3Massachusetts Institute of Technology4Los Alamos National Laboratory
A primary goal of the National Ignition Facility (NIF) is to determine the laser and target requirements for thermonuclear igni-tion and propagating burn.1 From detailed numerical simulations and theory, implosion performance should depend on the shape of the laser pulse and the design adiabat av of the DT fusion fuel.2,3 By convention, av is the pressure in the cold fuel relative to Fermi-degenerate DT at the maximum velocity of the implosion.4 In the absence of mechanisms that disturb the fuel, such as preheat, the laser pulse should determine compressibility, and the terms “pulse shaping” and adiabat can be interchangeable. So far, experiments on the NIF have primarily reported tests at av = 1.5 (Refs. 5 and 6) and av = 2 to 2.5 (Refs. 7-9) using indirect drive. The integrated performance has improved as issues with hot-spot mix,10 and target engineering features11,12 have been identified and mitigated. Changes in the pulse shape may also have played a role but have not been as easy to study. In part, this is because uncertainties in hohlraum and capsule physics complicate the interpretation of simple tests.13 Existing pulse shapes are also calculated to be at (or near) local optima, making it difficult to motivate new concepts.
To provide new insight, this summary takes advantage of the “BigFoot” platform that was developed to facilitate single-variable studies.14 This design uses conservative features that are to reduce the number of mechanisms that impact data. As shown in prior work,15 the yield is a simple and expected function of laser energy per unit target mass, size/scale, and implosion symmetry and shows little to no sensitivity to target quality. These properties simplify the interpretation of data and reduce the number of experiments needed to study changes in pulse shape. As a consequence, we have used this platform to do implosions at two different design adiabats (av = 4 and 3!0.1) for comparison to calculations, finding that yield and areal density can decrease when adiabat is reduced. Our findings suggest that the optimum design adiabat is presently above 3 and one or more aspects of simulation are incomplete. We have not been able to explain these results in high-resolution calculations using known details of the targets or facility. This study also provides the first direct evidence that performance can increase with compression, although it may be necessary to correct physics that are still unknown to make significant progress.
For background, we briefly explain features of the BigFoot design that make it useful for this work [see Fig. 1(a)]. First, the length of the laser pulse is shorter (and the radius of the hohlraum entrance hole is larger) than calculations suggest is needed for a higher-performing implosion. This reduces the energy coupled to the target (and the expected yield) but makes it easier to control implosion symmetry if changes are made to the laser pulse. Second, BigFoot experiments have minimal laser–plasma instabilities and show no evidence of energetic electrons. This remains true even when changes are made in the length, power, or energy of the laser pulse.16 Third, the first shock in the ablator/DT is also considerably stronger ($12 Mbar) than should be necessary for hydrodynamic stability. This reduces the maximum-possible compression of the DT fuel in calculations, but it also limits instabilities seeded by target flaws and imperfections (e.g., the capsule support and fill tube). Fourth, calculations in

InertIal ConfInement fusIon
LLE Review, Volume 163 113
TC15464JR
4.54.0
(–1.9)(+9.5)(–6.9)(+0.6)
(+1.8) (+0.4)
(–1.9)
(+9.5)(–6.9)
(+0.6)
(+1.8) (+0.4)
3.5DT fuel adiabat av
(c)(b)(a)
Dow
n-sc
atte
r rat
io D
SR/S
(%)
3.02.54.54.03.5DT fuel adiabat av
3.02.52.2
3.0
2.8
2.6
2.4
Neu
tron
yiel
d Y/
S4 (#
1016
)
TW
0.4
1.2
0
1.0
0.8
0.6
864ns
20
500
Figure 1(a) The BigFoot target and laser pulse at av = 4 (3) are shown by the solid (dashed) line. We also show (b) yield and (c) neutron down-scatter ratio (DSR) normal-izing for small changes in target size/scale for six experiments that can be directly compared. The implosion velocity for each is 430!10 km/s. For reference we provide the shape of the hot spot in Legendre P2 in microns (in parentheses). The yield is correlated to the amplitude of P2; DSR is not.
LASNEX17 are able to predict the time of peak emission (!100 ps) and implosion symmetry (!5 nm in P2) using the measured laser pulse.18,19 Together, these features make it possible to quickly demonstrate symmetric implosions at different conditions20
with changes to the laser pulse21 and to study performance as a function of adiabat.
This summary reports the result of two experiments where the length of the foot (the lower-power section of the laser pulse) is increased by approximately 400 ps, as shown in Fig. 1(a). According to 2-D integrated calculations in LASNEX, this should lower the mass-average adiabat of the cold DT fuel from av = 4 to 3!0.1, increase the DT density at peak implosion velocity, and increase the final neutron yield and DT areal density by factors of 2.9 and 1.15, respectively. We also increased the laser cone fraction (the power on the inner laser cones of the NIF divided by the total) by 3%. Consistent with calculations and prior experiments, these changes reduce the adiabat of the DT but keep other important variables constant, such as the implosion velocity and symmetry.21 (The shocks launched at each rise in the laser pulse are made to overtake closer to the inner radius of DT ice rather than the DT–ablator interface.) In Fig. 1(b), we show the primary neutron yield Y, as measured at 13 to 15 MeV, and in Fig. 1(c), the neutron–down-scatter ratio (DSR) averaged across multiple measurements. The DSR is a function of neutron emission at 10 to 12 MeV and can be related to the burn-averaged DT areal density (in g/cm2) as tRb = 20 DSR (Ref. 6). [The DSR is averaged over all lines of sight since (1) most implosions are close to symmetric (consistent with imaging data), and (2) diagnostics with a similar line of sight can vary by more than the uncertainty in each.] In contrast to calculations, we find the yield and DSR are reduced at a lower adiabat. Figure 2 addresses the statistical significance of these results. Here, we show a fit to prior BigFoot data at av = 4 that agrees with the measured yield to !9% (Ref. 15) and predict the new data in the same way. We find the experiments at lower adiabat are below trend by 40% to 50%, or 4 to 5v (40% to 9% . 4). It is not possible to explain these results by normal shot-to-shot variations. The yield and DSR at av = 3 are even below prior data at av = 4 using smaller capsules at reduced laser energy.
We can illustrate the principles involved with simple models. It is necessary to only assume that the mass forming the hot spot (1) has an initial energy +v2 before compression by the cold fuel (it reaches the same implosion velocity as the shell prior to stagnation), (2) is compressed adiabatically with c = 5/3 (losses relative to peak compression are small), and (3) achieves a peak radial compression ratio Cp + (v2/av)
1/2 (Ref. 22). If so, the energy in the hot spot v v .E C vh p2 2 4 1
+ + a- If we also assume that
,Y Eh2
+ consistent with GvvH at 5 keV (Ref. 23), then vY v8 2
+ a- without accounting for details in hot-spot physics that are uncer-
tain. Since the kinetic energy of the shell is roughly proportional to laser energy E, when the coupling between the hohlraum and capsule is fixed, this is roughly comparable to Y + (E/M)4(av)
-2, where M is the initial mass of the ablator. This derivation has few assumptions, and it clearly outlines the expected relationship between adiabat, compression, and yield. Since areal density
,Cp2
+ it follows that DSR + (E/M)(av)-1. We can increase the sophistication of these models and derive exponents that are slightly

ExpErimEnts to ExplorE thE influEncE of pulsE shaping at thE national ignition facility
LLE Review, Volume 163114
TC15466JR
3.23.02.8Predicted DSRp (%)
(b)(a)
Mea
sure
d D
SR (%
)
2.62.42.4
3.2
3.0
2.8
2.6
Mea
sure
d ne
utro
n yi
eld
Y (#
1016
)
0.0
2.0
1.5
1.0
0.5
2.01.51.0Predicted neutron yield Yp (#1016)
0.50.0
|2 = 1.1|2 = 1.2
DSRp ~ (E/M)0.9(S)(av)0.6Yp ~ (E/M)7.5(S)4(1 – 0.05;P2/S;)(av)2.0
Figure 3The best model(s) for yield and areal density versus laser energy per unit mass, target scale, hot-spot symmetry, and design adiabat. The residuals are 8.6% and 3.9%, respectively. For reference, we differentiate data at av = 4 (open black squares) and 3 (solid black squares).
TC15465JR
2.01.51.0Predicted neutron yield Yp (#1016)
Yp ~ (E/M)7.6(S)4(1 – 0.05;P2/S;)
|2 = 20.3Mea
sure
d ne
utro
n yi
eld
Y (#
1016
)
0.50.00.0
2.0
1.5
1.0
0.5
Figure 2The measured and predicted yield for BigFoot implosions using the analysis in Ref. 15. This model appears to predict data at a design adiabat of 4 (open black squares) but not 3 (solid black squares).
changed (e.g., by including alpha heating, which increases the sensitivity to all terms), but this is not important to interpretation. The yield and DSR should increase together (as shown in Fig. 1) but not by increasing the design adiabat.
To quantify experimental results in the same way, we fit all data to a power law including adiabat and determine the expo-nents in a least squares sense. For greater accuracy we account for understood changes in laser energy per unit mass (E/M), target size/scale (S), and implosion symmetry (P2) as in Ref. 15. This exercise is then repeated for DSR with no dependence on P2 since the data in Fig. 1(c) show no sensitivity. In Fig. 3(a) we assume .Y E M S P S1 0 05 vN N4
21 2-+ a^ ] ^ ^h g h h and find N1 = 7.5!0.3 and N2 = 2.0!0.1, for o .1 2| =2 (per degree of freedom). In Fig. 3(b) we assume DSR E M S v3 4+ aN N^ ] ^h g h and find N3 = 0.9!0.2 and N4 = 0.6!0.1, for . .1 1| =o
2 These fits are a good representation of data since ,12+|o and they behave as
expected with the exception of adiabat. In this summary we demonstrate the significance of these findings by fitting the data to subsets of the full model (with no dependence on adiabat) and show that all terms are needed for a good fit. We have proposed to extend this work to a larger range in design adiabat, from 2 to 6. Since these results were unexpected, it is possible that we will find a more-complicated relationship than shown here, with a peak in yield and DSR at a design adiabat other than 4. The value for testing individual aspects of implosion physics is evident, and here, we also discuss the importance of shot-to-shot variability (or reproducibility) to the interpretation of these scalings.

InertIal ConfInement fusIon
LLE Review, Volume 163 115
We now examine the peak compression ratio Cp in BigFoot data to check for self-consistency. This quantity is estimated using measurements of the cold fuel since observations of the hot spot (neutron and x-ray imaging) do not have to correlate with pdV work. We begin by defining the areal density at peak compression (without alpha heating) as tRp,c + tRp,h and at peak burn (with alpha heating) as tRb,c + tRb,h with contributions from the cold shell and hot spot, respectively. We measure only the latter tR (typically) but note that alpha heating and electron conduction tend to add energy and mass to the hot spot and reduce the total areal density; as a consequence, tRp,c ≥ tRb,c + tRb,h. If we then assume that the cold fuel at peak compression has the same mass as the initial DT layer (with areal density t0t0) and has a relatively thin shell (corrections for a finite hot spot and cold shell are only 1% to 3%), we can put a lower bound on .DSRC R R t t20p b,c b,h
20 0 0 0t t t t= + =_ i This formula can be used to compare
implosions of different sizes and types when alpha heating is modest R R Rp,h b,c b,h%t t t+` j even if hot-spot properties change shot to shot (e.g., due to mix). Figure 4 shows Cp as a function of the mass-averaged first shock velocity in the fusion fuel, u1, in km/s. This shock is a reasonable surrogate for the design adiabat as described in Ref. 24. Energy deposition should scale as ,u1
2 and in simulations we find . .u u1 1 4 10 1 4 10v
312 7
14-# #.a + - - for u1 # 60 km/s. The goal of pulse shaping is to maximize
compression, so we focus on the upper envelope of data. BigFoot implosions with a mass average av = 4 (u1 . 55 km/s) have a compression ratio of 22 to 23. When BigFoot implosions are performed at a lower adiabat (av = 3 and u1 . 40 km/s) with the same implosion velocity and symmetry, they have a compression ratio of 20 and are more consistent with prior results. We find this analysis can also be used to study compression (relative to expectations) independent of calculations. It is only necessary to decide which data can serve as a reference and project .C vp
/1 2+ a If we assume data at a high adiabat are closer to theory, then
this type of extrapolation is given by the solid line in Fig. 4. BigFoot data at av = 3 appear to be deficient in compression and DSR by 25% and 50%, respectively. Offsets at this level are significant since the laser energy needed to ignite a
6-vE vign2
+ (Ref. 25). If Cp + (v2/av)
1/2, this is equivalent to v v .DSRE C t20ign p2 4 2
0 02+ + t
- - - -` j We expect these discrepancies to
have an impact on performance and the probability of ignition.
Given these results, we will briefly discuss the mechanisms that could play a role. These could include errors in the strength or timing of shocks.24 We do not suspect issues of this type because (1) these inferences have been validated using VISAR (velocity interferometer system for any reflector)26 and (2) we have not identified a systematic error that would cause a U-shaped sensitiv-ity in u1 (see Fig. 4). It is also possible that we have made an error in the DT equation of state, the stagnation adiabat, or both. Although not presented here, we find that simulations can match the measured yield, temperature, and DSR of BigFoot implosions if they use a higher adiabat than intended by a factor $1.4. For capsules that absorb 200 to 250 kJ of x rays, this is equivalent to adding 80 J to the cold DT shell. Simulations would have to underestimate sources of instability, mix at the fuel–ablator interface, or vorticity at small scales.27 An increase in the effective adiabat could result from residual motion in the cold DT proportional to u1, which would increase internal energy as u1
2 after hydrodynamic growth (compression and thermalization). If the ablator were to mix with the DT fuel, this would also increase its absorption of hard x rays. For insight, we will continue to quantify sensitivities in pulse shaping and work to characterize the state of the DT fuel.28 We also propose to test aspects of stability and,
TC15467JR
605040Velocity of first shock in
fusion fuel u1 (km/s)
Com
pres
sion
ratio
Cp
= (2
0 D
SR/t
0t0)
1/2
30201015
35
30
25
20
Figure 4BigFoot data (open black squares) are compared to previous results (open gray squares) on aspects of pulse shaping. Experiments at u1 of 18, 32, 40, and 55 km/s correspond to av of 1.5, 2.3, 3.0, and 4.0, respectively. The solid line is the expected value for a BigFoot-type implosion assuming C vp + a
/1 2- at a given velocity and DT mass.

ExpErimEnts to ExplorE thE influEncE of pulsE shaping at thE national ignition facility
LLE Review, Volume 163116
as a start, have made capsules with different levels of high-Z dopant and crystallinity to address hypotheses regarding preheat and microscopic sources of turbulence.29
In summary, we have used a platform that is well-suited to single-variable studies to test implosions with different pulse shapes and find .Y E M S P S1 0 5 v
. .7 5 42
2 0-+ a_ _ a _i i k i and DSR + (E/M)0.9(S)(av)0.6. All terms behave as we expect with
the exception of adiabat. These sensitivities will be used to help interpret future work, particularly in circumstances where small or inadvertent changes are made in the laser pulse. If we consider Fig. 4, this could have important implications to compression, and the proximity of ignition. If we only consider the data shown here, a deficit in compression of 25% would be expected to increase the energy needed to ignite by a factor of 1.254 . 2.4 relative to expectations.
This work was made possible by the Operations Team at the NIF, target fabrication efforts at General Atomics and LLNL, and the encouragement and support of J. H. Nuckolls, J. D. Lindl, W. L. Kruer, and G. B. Zimmerman. We also thank the Senior Leadership Team at the NIF and note that future communications with the first author should be addressed to the Laboratory for Laser Energetics at the University of Rochester. The data that support the findings of this study are available from the cor-responding author upon request. This work was performed under the auspices of the U.S. Department of Energy by Lawrence Livermore National Laboratory under Contract DE-AC52-07NA27344, the Department of Energy National Nuclear Security Administration under Award Number DE-NA0003856, the University of Rochester, and the New York State Energy Research and Development Authority.
1. J. Nuckolls et al., Nature 239, 139 (1972).
2. J. D. Lindl, Inertial Confinement Fusion: The Quest for Ignition and Energy Gain Using Indirect Drive (Springer-Verlag, New York, 1998).
3. S. Atzeni and J. Meyer-ter-Vehn, The Physics of Inertial Fusion: Beam Plasma Interaction, Hydrodynamics, Hot Dense Matter, 1st ed., International Series of Monographs on Physics, Vol. 125 (Oxford University Press, Oxford, 2004).
4. J. Meyer-ter-Vehn, Nucl. Fusion 22, 561 (1982).
5. O. L. Landen et al., Plasma Phys. Control. Fusion 54, 124026 (2012).
6. M. J. Edwards et al., Phys. Plasmas 20, 070501 (2013).
7. O. A. Hurricane et al., Nature 506, 343 (2014).
8. D. A. Callahan et al., Phys. Plasmas 22, 056314 (2015).
9. L. F. Berzak Hopkins et al., Phys. Rev. Lett. 114, 175001 (2015).
10. T. Ma et al., Phys. Plasmas 24, 056311 (2017).
11. D. S. Clark et al., Phys. Plasmas 23, 056302 (2016).
12. C. R. Weber et al., Phys. Plasmas 24, 056302 (2017).
13. O. L. Landen et al., High Energy Density Phys. 36, 100755 (2020).
14. K. L. Baker et al., Phys. Rev. Lett. 121, 135001 (2018).
15. C. A. Thomas et al., “Principal Factors to Performance in Indirect-Drive Laser Fusion,” to be submitted to Physics of Plasmas.
16. R. L. Berger et al., Phys. Plasmas 26, 012709 (2019).

InertIal ConfInement fusIon
LLE Review, Volume 163 117
17. G. B. Zimmerman and W. L. Kruer, Comments Plasma Phys. Control. Fusion 2, 51 (1975).
18. O. S. Jones et al., J. Phys.: Conf. Ser. 717, 012026 (2016).
19. O. S. Jones et al., Phys. Plasmas 24, 056312 (2017).
20. D. T. Casey et al., Phys. Plasmas 25, 056308 (2018).
21. M. Hohenberger et al., Phys. Plasmas 26, 112707 (2019).
22. R. Betti et al., Phys. Plasmas 8, 5257 (2001).
23. R. Betti et al., Phys. Rev. Lett. 114, 255003 (2015).
24. H. F. Robey et al., Phys. Plasmas 19, 042706 (2012).
25. M. C. Herrmann, M. Tabak, and J. D. Lindl, Nucl. Fusion 41, 99 (2001).
26. H. F. Robey et al., Phys. Plasmas 21, 022703 (2014).
27. B. Cheng et al., Plasma Phys. Control. Fusion 60, 074011 (2018).
28. A. L. Kritcher et al., Phys. Rev. Lett. 107, 015002 (2011).
29. D. D. M. Ho et al., J. Phys.: Conf. Ser. 717, 012023 (2016).

Deficiencies in compression anD YielD in X-raY–Driven implosions
LLE Review, Volume 163118
Deficiencies in Compression and Yield in X-Ray–Driven Implosions
C. A. Thomas,1 K. L. Baker,2 D. T. Casey,2 M. Hohenberger,2 A. L. Kritcher,2 B. K. Spears,2 S. F. Khan,2 R. Nora,2 T. Woods,2 J. L. Milovich,2 R. L. Berger,2 D. Strozzi,2 D. D. Ho,2 D. Clark,2 B. Bachmann,2 R. Benedetti,2 R. Bionta,2 P. M.
Celliers,2 D. N. Fittinghoff,2 G. Grim,2 R. Hatarik,2 N. Izumi,2 G. Kyrala,2 T. Ma,2 M. Millot,2 S. R. Nagel,2 P. K. Patel,2 C. Yeamans,2 A. Nikroo,2 M. Tabak,2 M. Gatu Johnson,3 P. L. Volegov,4 S. M. Finnegan,4 and E. M. Campbell1
1Laboratory for Laser Energetics, University of Rochester2Lawrence Livermore National Laboratory
3Massachusetts Institute of Technology4Los Alamos National Laboratory
Implosion performance in inertial confinement fusion (ICF) is generally considered to be a function of hot-spot mix, x-ray sym-metry, velocity, and pulse shaping, which is a factor in the adiabat (compressibility) of deuterium–tritium (DT) fusion fuel.1,2 We define the design adiabat av by the pressure in the fuel relative to Fermi-degenerate DT at the peak velocity of the implosion (as calculated by simulations). To maximize compression it is important to avoid mechanisms that disturb or (pre)heat the fuel and thereby minimize the effective adiabat. Relative to the first experiments at the National Ignition Facility (NIF),3,4 improvements in stability have led to increased yield and self-heating as detailed in prior work.5–7 Still, it is relatively difficult to explain and project performance since these advances have convolved improvements in target quality, the power and energy delivered by the laser, and a reduction in compression that are not fully understood (individually). Most experiments can be reconciled only with 3-D calculations that include features unique to each target8,9 that may not capture (or be aware of) other important aspects in target physics. In addition, it is not easy to control or maintain implosion symmetry, or velocity, at the level necessary to interpret other factors.10 The primary limitations to temperature, areal density, and self-heating are not yet known, nor are the changes needed to increase fusion yield.
This summary uses results from the so-called “BigFoot” Campaign, which was designed to simplify aspects of hohlraum and capsule physics.11 Calculations were not used to optimize yield but, instead, to select a parameter space that would reduce reliance on 3-D simulations to interpret and extrapolate data. Nonetheless, these implosions have not performed as expected, but in the first half of this summary, we show that measurements are in good agreement with calculations at a higher design adiabat (av = 5.6) than intended (av = 4.0). These results are important because they demonstrate a persistent and significant deficit in compression relative to modeling. At the same time these data achieve areal densities (and yields) representing some of the highest-performing experiments on the NIF. To understand the importance of compression more generally, we use the second half of this summary to develop a simple model for interpreting data and find that even small improvements in compression ($10%) could present a pathway to ignition.
Details of the BigFoot target, laser pulse, and strategy can be found in prior work.11–13 The platform has been used to test hypotheses in physics since implosions (1) behave as expected with respect to laser energy, target scale, and implosion symmetry, and (2) show little to no sensitivity to target quality and engineering features (within standard specifications).14 These data are also unusual in that no changes were made in design (shot-to-shot), even though experiments were performed over a large range in laser energy. This makes it possible to study individual data in a manner that is statistically significant, as well as trends. Figures 1 and 2 show the burn-averaged ion temperature T, hot-spot areal density tRh, neutron yield Y, and ignition metric |a (Ref. 15) versus the laser energy per unit ablator mass (E/M) and neutron down-scatter ratio (DSR) as the open black squares. E/M is a surrogate

InertIal ConfInement fusIon
LLE Review, Volume 163 119
T (k
eV)
6.0
7.0
5.0
tR h/S
(g/c
m2 )
0.3
0.4
0.2
0.1
Y/S4
(#10
17) 0.4
0.8
0.2
0.1 |a
/S
(N/A
)
1.2
1.6
2.0
0.8
DSR/S (%)DSR/S (%)2.6 2.8 3.0 3.2 3.63.4 2.6 2.8 3.0 3.2 3.63.4
4.0
4.4
4.85.2
4.0
4.44.8
5.25.6
5.6
4.0
4.4
4.85.2
5.6
4.0
4.4
4.8
5.25.6
13 to 15 MeV10 to 12 MeV
TC15456JR
(a) (b)
(c) (d)
Figure 2
The four highest-performing BigFoot experiments
(open black squares) are compared to calculations
in LASNEX at a design adiabat of 5.6 (solid black
squares) and 5.2 to 4.0 (solid gray squares) on
(a) burn-averaged ion temperature, (b) hot-spot areal
density, (c) neutron yield, and (d) |a as a function
of neutron down-scatter ratio (DSR). The disconti-
nuity coincides with common criteria for ignition
(T + 5 keV and tRh $ 0.3 g/cm2).
TC15455JR
T (k
eV)
4.0
5.0
3.0 tR h
/S
(g/c
m2 )
0.2
0.3
0.1
Y/S4
(#10
16) 0.8
3.2
0.20.4
1.6
0.1
|a
/S
(N/A
)
0.4
0.8
1.2
0.00.3 0.4 0.5
E/M (GJ/g)0.6 0.70.3 0.4 0.5
E/M (GJ/g)0.6 0.7
(a) (b)
(c) (d)
5.65.6
5.6 5.6
Figure 1
The (a) burn-averaged ion temperature, (b) hot-spot
areal density, (c) neutron yield, and (d) |a for Big-
Foot implosions (open black squares) as a function of
laser energy per unit ablator mass E/M normalizing
for small differences in target size/scale S. Measure-
ments are a close match to calculations in LASNEX
(solid black squares) having a design adiabat av =
5.6. The nominal design adiabat is 4.0.
for velocity (and energy density) that is measured on all experiments, and DSR is a common measure of compression proportional to neutron scattering at 10 to 12 MeV. The burn-averaged areal density (in g/cm2) is given by tRb = 20 DSR (Ref. 4). Experiments used a capsule inner radius R of 844 (950) nm, which we define as target scale S = R/844 = 1 (1.125). All implosions were designed

Deficiencies in compression anD YielD in X-raY–Driven implosions
LLE Review, Volume 163120
to be self-similar except for the change in scale,16 so we normalize all of these metrics as appropriate. This simplifies visualization but does not adjust interpretation. The burn-averaged ion temperature is derived from time-of-flight measurements and averaged across multiple lines of sight. Most implosions are symmetric, or nearly so [time-integrated neutron emission data are shown inset to Fig. 2(a)], so measurements of yield and DSR are averaged in the same way. No data stand out from the series, even though we have inferred asymmetries in the ion temperature of 200 to 300 eV and residual motion(s) in the hot spot of 40 to 120 km/s. The areal density of the hot spot is inferred from the ion temperature, neutron yield, neutron burnwidth, and time-integrated neutron hot-spot radius (defined by the 17% intensity contour in emission at 13 to 15 MeV) as outlined in Cerjan et al.17 This approach avoids ambiguities with respect to x-ray emission that cause uncertainty in the volume of the hot spot and can lead to unphysical values for the inferred hot-spot density, pressure, etc. |a is a simple function of the burn-averaged areal density, yield, and DT mass and can be used to estimate the distance to ignition with the formula in Ref. 15. Consistent with these interpretations, these data include the highest-performing implosions done on the NIF and have a yield amplification from alpha heating that agrees with |a . 1. (Separate experiments confirm this result and will be published separately.18) The experiments shown here have used capsules from different batches, thick and thin capsule supports (30- versus 45-nm tents), and capsule fill tubes (10 nm versus 5 nm) as available. Despite these variations, the data are highly monotonic in E/M, which suggests that engineering details do not dominate performance. This summary will consider other factors, including the DT adiabat.
We note that fitting an ensemble of data with few assumptions provides more confidence in any interpretation. It is difficult to make predictions if each implosion has a unique source of degradation, particularly if multiple mechanisms play a role. This is common in ICF because (1) implosions tend to be complicated and (2) high-resolution calculations must make approximations in physics (e.g., in transport) to study the importance of microscopic imperfections. When simulations reach a certain level of complexity, and/or computational expense, they can be validated only by experiments. Since the metrics in Figs. 1 and 2 are very regular, our efforts have focused on finding a methodology that is insensitive to small details. For the experiments reported here, we find the best fit to data is achieved in simulations that increase the DT fuel adiabat by a factor of 1.4 relative to expectations. This “effective adiabat” lets us reduce the compressibility of all simulations in the same way and serves as the functional replacement for a physics mechanisms that may not be known. We are unable to attribute this change to errors in the x-ray drive,19 instabili-ties,20 or mix/preheat21 as currently understood. This is accomplished by adding 80 J of internal energy to capsules that absorb 200 to 250 kJ of x rays. To make the best comparisons with data, we use integrated calculations in LASNEX22 that reproduce the x-ray drive inferred by VISAR data23 and the times of peak neutron and x-ray emission (!100 ps) using the measured laser pulse.24,25 Calculations of this type also reproduce the measured implosion velocity, the burn-averaged ion temperature, and the neutron yield in experiments that lack a cryogenic DT layer and have fewer sources of uncertainty. We forward-simulate all diagnostics (as discussed above) and interpret them in the same way. Results are also provided in Figs. 1 and 2. Simulations with a design adiabat of 5.6 are given by the solid black squares and provide a good match to data, even though the expected design adiabat is 4.0. To address requirements for ignition (and standard expectations), we also show the result of calculations at av = 5.2 to 4.0 by the solid gray squares. Simulations predict the burn-averaged ion temperature to exceed 5 keV along with the onset of ignition when the hot spot has sufficient areal density to rapidly self-heat (.0.3 g/cm2) (Refs. 1 and 2). The neutron DSR is directly related to the burn-averaged compression of the DT fuel. Per prior work,26 a lower bound for the no-burn compression ratio is Cp . (20 DSR/t0t0)1/2, where t0t0 is the initial areal density of the cryogenic layer. Typical values for t0 and t0 are 0.25 g/cm3 and 40 to 75 nm, respectively. BigFoot experiments are consistent with a deficit in DSR of 20% (or a deficit in compression of 10%) and are otherwise predicted to ignite. Once ignition is achieved in simulation, all performance metrics are discontinuous in DSR, so it is no longer an accurate measure of peak compression.
To understand these results, this summary provides simple models for compression as a function of velocity, DT adiabat, and other details of a given implosion. It also develops simple estimates for the areal density, yield, and |a as functions of the same. These derivations are not included in this summary to reserve space for data and will be provided upon request. To make comparisons with data, we note that BigFoot (NIF) implosions are meant to have velocities of 430 (380) km/s and have typi-cally been characterized by a DT mass of 140 (200) ng. The design adiabat is not measured, but it is predicted to depend on the velocity of the first shock in the fusion fuel, u1, which is measured in km/s (Ref. 19). If we fit published literature,3,5,11 then
.. . u1 2 1 0 10v3
12
#.a + - Figure 3(a) provides Cp as a function of u1 for BigFoot (NIF) implosions as the solid black (gray) line, whereas data are the open black (gray) squares. BigFoot implosions have relatively high compression ratios (Cp . 22 to 23) but are

InertIal ConfInement fusIon
LLE Review, Volume 163 121
Figure 3(a) The peak compression ratio Cp as a function of first shock velocity u1 (a surrogate for adiabat) in BigFoot implosions (open black squares) and prior NIF data (open gray squares). Theoretical expectations are given by the black (gray) line assuming an implosion velocity of 430 (380) km/s and a DT mass of 140 (200) ng. These estimates imply a deficit in (b) DSR, (c) yield, and (d) |a that is strongly correlated to adiabat.
Cp
= 20
DSR/t
0t0)
1/2
25
35
15
Mea
sure
d D
SR/P
redi
cted
DSR 1.0
0.6
0.0
Mea
sure
d Y/
Pred
icte
d Y 0.8
0.4
0.0 Mea
sure
d |a
/Pr
edic
ted |a
0.5
0.1
0.9
u1 (km/s) u1 (km/s)20 40 60 20 40 60
TC15457JR
(a) (b)
(c) (d)
below theory by at least 10%, consistent with the calculations in Fig. 2. The estimated impacts on areal density, yield, and |a is given in Figs. 3(b)–3(d) as ,Cp
2 ,Cp5 and ,Cp
3 respectively. The minimum deficit relative to expectations is –15%, –30%, and –20%, respectively. (The maximum deficit is considerably larger.) If we extrapolate using the upper envelope of all data (which appears to be continuous), it seems that measurements would approach theory at u1 $ 60 km/s. Many experiments are below the upper envelope of data and could be sensitive to details that are not known, or not included (e.g., reduced implosion velocity). We note that 3-D calculations tend to result in higher DSR since cold fuel can approach the center of the hot spot and increase the mass-average tRb. If so, the formula used here could overestimate the compression ratio in experiments that are unstable. If we consider Fig. 2, BigFoot implosions are designed to approach ignition if compression were to agree with theory. According to Ref. 27, the laser energy needed to ignite Eign should scale as v .v
6 2. a- Since we expect x 1& and v ,C vp
2 2+ a then v .E Cign p
2 4+
- - It is clear that (1) errors in compression are critical to understanding and (2) even small improvements could enable ignition. A 10% deficit in compression (as shown here) is equivalent to 20% in PdV work on the hot spot. If future efforts are not able to find and correct this discrepancy, the data in this paper can also be used to motivate other changes in target physics. High-performing experiments already achieve 5 keV, so it is only necessary to find an increase in energy per unit mass (or target scale) that allow a hot-spot areal density of 0.3 g/cm2 or higher. Above this threshold we expect fusion alpha particles to strongly couple to the hot spot and the DT burnup fraction to depend on the total areal density of the fuel (primarily). If we extrapolate linearly using Fig. 1(b), this would require an increase in E/M of 20% to overcome the deficit in Cp
2a k or an increase in S of 30% (equivalent to
a factor of 2.2 in additional laser energy or laser-capsule coupling). Both of these changes can be made in design calculations and are the subject of existing proposal(s).11,14

Deficiencies in compression anD YielD in X-raY–Driven implosions
LLE Review, Volume 163122
In conclusion, we have analyzed x-ray-driven implosions using the BigFoot platform on the NIF and find that performance metrics including ion temperature, hot-spot areal density, and neutron yield are monotonic in laser energy, and calculations are a good match to the data if the adiabat is increased by a factor of 1.4 relative to expectations (av = 5.6 versus 4.0). Even so, these experiments achieve relatively high compression and yield, and we have developed a simple model to interpret observations. We have proposed implosions at higher laser energy per unit mass, some of which would include larger targets, to provide more insight into potential performance limitations on the NIF. We also plan to test the sensitivities reported here and will make small/iterative changes to the laser pulse in an attempt to improve compression.26
This work was made possible by the operations team at the NIF, target fabrication efforts at General Atomics and LLNL, and the encouragement and support of J. H. Nuckolls, J. D. Lindl, W. L. Kruer, and G. B. Zimmerman. We also thank the Senior Leadership Team at the NIF and note that future communications with the first author should be addressed to the Laboratory for Laser Energetics at the University of Rochester. The data that support the findings of this study are available from the cor-responding author upon request. This work was performed under the auspices of the U.S. Department of Energy by Lawrence Livermore National Laboratory under Contract DE-AC52-07NA27344, the Department of Energy National Nuclear Security Administration under Award Number DE-NA0003856, the University of Rochester, and the New York State Energy Research and Development Authority.
1. J. D. Lindl, Inertial Confinement Fusion: The Quest for Ignition and Energy Gain Using Indirect Drive (Springer-Verlag, New York, 1998).
2. S. Atzeni and J. Meyer-ter-Vehn, The Physics of Inertial Fusion: Beam Plasma Interaction, Hydrodynamics, Hot Dense Matter, 1st ed., International Series of Monographs on Physics, Vol. 125 (Oxford University Press, Oxford, 2004).
3. O. L. Landen et al., Plasma Phys. Control. Fusion 54, 124026 (2012).
4. M. J. Edwards et al., Phys. Plasmas 20, 070501 (2013).
5. O. A. Hurricane et al., Nature 506, 343 (2014).
6. D. A. Callahan et al., Phys. Plasmas 22, 056314 (2015).
7. L. F. Berzak Hopkins et al., Phys. Rev. Lett. 114, 175001 (2015).
8. D. S. Clark et al., Phys. Plasmas 23, 056302 (2016).
9. C. R. Weber et al., Phys. Plasmas 24, 056302 (2017).
10. O. L. Landen et al., High Energy Density Phys. 36, 100755 (2020).
11. K. L. Baker et al., Phys. Rev. Lett. 121, 135001 (2018).
12. R. L. Berger et al., Phys. Plasmas 26, 012709 (2019).
13. M. Hohenberger et al., Phys. Plasmas 26, 112707 (2019).
14. C. A. Thomas et al., “Principal Factors to Performance in Indirect-Drive Laser Fusion,” to be submitted to Physics of Plasmas.
15. R. Betti et al., Phys. Rev. Lett. 114, 255003 (2015).
16. D. T. Casey et al., Phys. Plasmas 25, 056308 (2018).
17. C. Cerjan, P. T. Springer, and S. M. Sepke, Phys. Plasmas 20, 056319 (2013).
InertIal ConfInement fusIon
LLE Review, Volume 163 123
18. K. L. Baker et al., “Alpha Heating of Indirect-Drive Implosions on the National Ignition Facility,” to be submitted to Physics of Plasmas.
19. H. F. Robey et al., Phys. Plasmas 19, 042706 (2012).
20. D. D. M. Ho et al., J. Phys.: Conf. Ser. 717, 012023 (2016).
21. B. Cheng et al., Plasma Phys. Control. Fusion 60, 074011 (2018).
22. G. B. Zimmerman and W. L. Kruer, Comments Plasma Phys. Control. Fusion 2, 51 (1975).
23. H. F. Robey et al., Phys. Plasmas 21, 022703 (2014).
24. O. S. Jones et al., J. Phys.: Conf. Ser. 717, 012026 (2016).
25. O. S. Jones et al., Phys. Plasmas 24, 056312 (2017).
26. C. A. Thomas et al., “Experiments to Explore the Influence of Pulse Shaping at the National Ignition Facility,” to be submit-ted to Physics of Plasmas.
27. M. C. Herrmann, M. Tabak, and J. D. Lindl, Nucl. Fusion 41, 99 (2001).

AzimuthAl uniformity of CylindriCAl implosions on omEGA
LLE Review, Volume 163124
Azimuthal Uniformity of Cylindrical Implosions on OMEGA
D. H. Barnak,1 M. J. Bonino,1 P.-Y. Chang,2 J. R. Davies,1 E. C. Hansen,3 D. R. Harding,1 J. D. Moody,4 J. L. Peebles,1 B. B. Pollock,4 and R. Betti1
1Laboratory for Laser Energetics, University of Rochester2Institute of Space and Plasma Sciences, National Cheng Kung University, Taiwan
3Department of Physics and Astronomy, University of Rochester4Lawrence Livermore National Laboratory
IntroductionMagnetized liner inertial fusion (MagLIF) employs a cylindrical implosion to compress magnetized preheated fuel to fusion-relevant conditions. The MagLIF concept was originally designed around a Z-pinch compression,1,2 which is naturally uniform barring instabilities that form at the inner and outer surfaces.3–5 To adapt the MagLIF concept to a laser-driven platform, a beam-pointing scheme that achieves a uniform cylindrical implosion must be established. Direct-drive cylindrical implosion platforms have been developed using the OMEGA laser6 with the interest of studying Rayleigh–Taylor instability growth7,8 and magnetic-flux compression9 in cylindrical geometry. Such designs employed in the past have demonstrated axial and azimuthal uniformity with measurements and simulations.10 Unfortunately, the aspect ratio of the laser-driven MagLIF targets and available distributed phase plates prohibit using these experimental designs.
The axial pointing is empirically derived11,12 since many effects, such as cross-beam energy transfer13,14 and angle of incidence dependence on laser absorption, complicate finding an analytic solution; an axially uniform illumination does not result in an axially uniform implosion. Calculating azimuthal uniformity has no such complications; an azimuthally uniform illumination gives an azimuthally uniform implosion. Using a finite number of beams will always have some nonuniformity in the illumina-tion of a cylinder, so it is important to quantify how these perturbations affect the drive symmetry. The geometry of the OMEGA laser15 has four rings of ten beams available to use for a cylindrical implosion, which means at the very least there will be some mode-10 perturbation imposed by the illumination pattern.
Experimental SetupThe standard pointing experiments used parylene-N plastic cylinders that were coated on machined and polished stainless-steel
mandrels to 20-, 24-, and 30-nm thicknesses and an 11- to 14-atm fill of D2 gas. Outer diameters ranged from as low as 550 nm to as high as 610 nm. The shell shape was determined from end-on self-emission x-ray images of the shell in flight. Given the view of the camera and opacity effects from the target, the self-emission images represent the drive uniformity from the ten beams closest to the camera. The laser energy in that group of beams was raised and lowered accordingly to achieve axial uniformity on the cylinder, but the azimuthal uniformity measured by the x-ray images depends only on the distribution and relative intensities of individual beams. The relative imbalance between adjacent beams in the group is no more than 5% rms and does not affect the azimuthal illumination pattern on the cylinder.
The uniform pointing experiments utilized Rexolite tubes with no gas fill, an outer diameter of 640 nm, and 30-nm thickness. Shell shape was determined by x-ray self-emission as before, but in these recent experiments, used the uniform pointing calculated from illuminating the 600-nm-diam hard cylinder. The energy in all of the beams was fixed to ensure axial uniformity, and the imbalance between subsequent beams was, at most, 2% rms. The difference in the imposed perturbation between the 600-nm

InertIal ConfInement fusIon
LLE Review, Volume 163 125
and 640-nm cylinders is small enough to be insignificant, but since it is larger, it can infer that smaller-diameter targets will have the same degree of uniformity or better.
The differences between the standard and uniform pointing used and the outer diameters of the target are highlighted by calculating the hard cylinder illumination profile, as shown in Fig. 1. A lineout of each illumination pattern is taken through the beam centers from the ring of beams that drives the end of the cylinder imaged in the radiographs. The lineout is then decomposed into cylindrical modes using Fourier’s trick. The amplitude of the nth mode, An, is
,dA F e1 inn
2
r i i= -r i
0_ i# (1)
where F(i) is the lineout in angular space. Note that to have only positive modes, the mode amplitudes must be normalized to 1/r. From this analysis we can compare the mode-5 and mode-10 amplitudes for the standard beam pointing on the nominal 600-nm cylinder, the uniform pointing on the same outer diameter, and the adjusted pointing on the 640-nm cylinder in Fig. 2. All other cylinder mode amplitudes are a fraction of a percent comparatively in these cases.
TC15422JR
(b) Standard beam distribution
(c) Uniform beam distribution
(a) Direct laser power deposited (TW/cm2)
z (cm)
Azi
mut
hal a
ngle
(°)
300
200
100
00.0 0.1–0.1
Directed laser power
300
200
100
0
Figure 1Pointing configuration of the standard and adjusted uniform pointing. (a) The total laser power deposited on the surface of a 600-nm-outer-diam hard cylin-der. [(b),(c)] The beams that drive the end of the cylinder closest to the observer, with the cylinder axis coming out of the page. This view of the cylinder is congruent with the view of the framing camera that captured the images of the cylindrical shell in flight. The difference between the two pointings is visually imperceptible; however, this small shift reduces the overall mode-5 perturbation.
TC15423JR
A 5/A
0 (#
10–2
)
10
0
2
6
4
8
(a)
A 10/
A 0 (#
10–3
)
0
1
2(b)
StandardUniform 600Uniform 640
Figure 2Initial cylindrical mode amplitudes for (a) mode 5 and (b) mode 10 for the stan-dard pointing and the uniform pointing for a 600-nm-outer-diam cylinder and a 640-nm-outer-diam cylinder. The total sum difference between the uniform and standard pointing is a decrease in the mode-5 amplitude by a factor of 6 and an increase in the mode-10 amplitude by a factor of 4. Mode 5 still remains the dominant perturbation.

AzimuthAl uniformity of CylindriCAl implosions on omEGA
LLE Review, Volume 163126
Standard Pointing ResultsMeasurements taken with the x-ray framing camera provide time-resolved measurements of the cylindrical mode amplitude
growth. Representative images for the three different shell thicknesses used in the standard pointing experiment are shown in Fig. 3. The mode amplitudes are then calculated from the average azimuthal lineout using Fourier’s trick, as seen for the irradia-tion profile in Eq. (1). The modes calculated from the integral are normalized by the mode-0 amplitude, which is
dA F21
0 0
2
ri i=
r_ i# (2)
and is dependent on the camera settings and other hard-to-quantify values such as charge-coupled-device response and gain droop across the strip. Mode 5 is the dominant mode seen growing over time for almost all cases, except for a few cases where there instead appears to be a mode 6. It is difficult to reason why a mode-6 growth would be preferred, given the shape of the initial nonuniformity imposed by the laser, but it is not unreasonable to assume that a target defect or some other feature in the target is responsible.
Figure 3Representative sample images of the cylindrical shell in flight for the standard pointing for (a) 30 nm, (b) 24 nm, and (c) 20 nm. A pentagon structure is visible an all three images. The image sizes are twice the size of the centering circle’s diameter, so the image is averaged radially over 70% of the image presented. The 24-nm shell in (b) shows a slight deformation on the left side of the pentagon, which is reflected in the analysis as a growing mode-6 amplitude. (d) A sample x-ray radiograph of a 30-nm-thick, 635-nm-OD cylinder driven by the uniform pointing shows the shell shape staying round to within !10 nm.
TC15424JR
(a) (b) (c) (d)
The briefest and most-complete summary of the results from the standard pointing is that regardless of cylinder diameter and shell thickness, if a mode-5 perturbation of sufficient amplitude is imposed by the laser drive, a mode-5 perturbation will grow. The question of what constitutes a sufficient amplitude will be covered in Uniform Pointing Results (p. 127). The amplitude of the perturbation is 6.7% for the smallest outer diameters and 9.3% for the largest outer diameters. The modes grow linearly in time since the acceleration of the ablation surface against the denser shell is stable. The shape of the implosion imposed by the laser likely seeds deceleration-phase Rayleigh–Taylor perturbations after the drive has been turned off. The reduction in mode amplitude from smaller-OD targets does not affect the amplitude growth rate of mode 5 to within the error bars as shown in Fig. 4. Mode-5 growth is also uncorrelated with shell thickness and initial gas pressure.
Three-Dimensional HYDRA SimulationsSimulations using the radiation-hydrodynamic code HYDRA were used to produce synthetic radiographs of four configura-
tions: (1) a 30-nm-thick, 600-nm-OD shell driven with a 2.0-ns-long pulse using the standard beam pointing; (2) a 20-nm-thick, 580-nm-OD shell with the same laser drive as case 1; (3) a 30-nm-thick, 640-nm-OD shell driven by a 1.5-ns-long pulse using the uniform pointing; and (4) a 20-nm-thick, 580-nm-OD shell with the same laser drive as case 3.
Self-emission x-ray images from the end of the cylinder are generated in a post-processing routine using the Yorick interpreted language.16 The simulated radiographs for both pointing cases for 30-nm and 20-nm shells are shown in Fig. 5. Each image is calculated from opacity and emissivity tables along the cylindrical axis line of sight using 0.01- to 10-keV x rays and including the transmission of a 25.4-nm-thick Be filter to match the filters used in the experiment. The image has a field of view of 600 #

InertIal ConfInement fusIon
LLE Review, Volume 163 127
TC15427JR
(a) (b) (c) (d)
Figure 5Images of HYDRA simulated x-ray radiographs of the standard pointing for (a) a 30-nm and (b) a 20-nm shell and the uniform pointing for (c) a 30-nm and (d) a 20-nm shell. The radiographs for the standard pointing exhibit the same pentagonal structure as the experimental radiographs. The uniform pointing radiographs are round to !1 pixel, which is the same as the experiment.
Figure 4Plots of mode-5 growth for (a) 20-nm and (b) 30-nm-thick cylinders. Between the two thicknesses, different outer diameters do not have a statistically relevant trend of having higher or lower mode-5 perturbation growth over time. HYDRA simulations predict a faster mode growth and larger mode amplitude close to the peak x-ray emission of the core. (c) Plots for mode-5 amplitude plotted as a function of time normalized to the x-ray bang time of the 20-nm-thick shells demonstrate that the mode-5 amplitude does not depend on shell thickness.
600 nm resolved by 200 # 200 pixels. Each image is convolved with the same point-spread function associated with the framing cameras and is processed identically to the experimental images, which is described in the previous sections. Since the images are free of noise, no error bars are reported for the mode amplitudes recovered from simulations. Residuals from the fit of Fourier decomposition to the simulated azimuthal profile are too small to represent graphically.
Uniform Pointing ResultsThe simulations are plotted with the experimental results for the uniform pointing in Fig. 6. Unfortunately, there are no experi-
mental data for the 20-nm shells in this case. The briefest and most-complete summary of the uniform pointing shots is that there is no longer a mode-5 growth shown in Fig. 6 or a mode 10 imposed from the adjustments as shown in Fig. 6. The degree of uniformity of the implosion is best shown by the radiograph in Fig. 3(d).
ConclusionsAzimuthal uniformity was calculated analytically by shifting the beams to minimize the mode-5 perturbation from the standard
pointing of the OMEGA laser. Data taken using the standard pointing show that, independent of cylinder outer diameter and shell thickness, a mode-5 perturbation grows as a result of the mode-5 asymmetry from the drive. The lowest-possible amplitude that gives a pentagonal-shaped shell is 6.7%, which is inferred from the different cylinder outer diameters used in the experiment.
TC15425JR
0.0
0.1
0.2
0.3
A 5/A
0
Time (ns)Time (ns)1.66 1.68 1.70
(a) (b) (c)
1.72 1.74 1.76 1.6 1.8 2.0 2.2 2.4
0.4
0.0
0.1
0.2
0.3
592.0 nm580.8 nm566.0 nmHYDRA
606.8 nm600.0 nm599.2 nm578.0 nmHYDRA
0.00.85 0.90 0.95 1.00 1.05
0.1
0.2
0.3
tbang 20 nm
30 nm24 nm20 nm

AzimuthAl uniformity of CylindriCAl implosions on omEGA
LLE Review, Volume 163128
Figure 6(a) Mode-5 and (b) mode-10 amplitudes for 30-nm-thick shells for the uniform laser drive. The HYDRA predictions of the mode-5 and mode-10 amplitudes for the 30-nm shells are well below the measurements later in time. The 20-nm-thick shells (not shown) have similar results from HYDRA.
TC15428JR
0.2
0.0
0.1
(a)
1.0 1.1 1.2 1.3 1.4 1.5 1.6
Shot 92376Shot 92378Shot 92379HYDRA
|A5/
A 0|
Time (ns) Time (ns)
0.2
0.0
0.1
(b)
1.0 1.1 1.2 1.3 1.4 1.5 1.6
|A10/A
0|
Shot 92376Shot 92378Shot 92379HYDRA
The adjustment made to the standard pointing reduces this initial perturbation to 2.2%, which completely eliminates the observed mode 5. The increase of mode 10 as a result of this adjustment is less than the mode-5 amplitude at 2%, and no mode-10 growth on the shell is observed. The experiments are reproduced using 3-D HYDRA simulations, although the perturbation amplitude is overestimated for the standard pointing case. Both simulations and experiments show that the uniform pointing gives a circular implosion to within a 10-nm resolution.
The information, data, or work presented herein was funded in part by the Advanced Research Projects Agency-Energy (ARPA-E), U.S. Department of Energy, under Award No. DE-AR0000568, the Department of Energy National Nuclear Security Administration under Award No. DE-NA0001944, DE-NA0003856, and in part under contract 89233218CNA000001, the U.S. Department of Energy Office of Inertial Confinement Fusion under Cooperative Agreement No. DE-FC52-08NA28302, the University of Rochester, and the New York State Research and Development Authority. Los Alamos National Laboratory, an affirmative action/equal opportunity employer, is operated by Triad National Security, LLC for the National Nuclear Security Administration of U.S. Department of Energy under contract 89233218CNA000001.
1. S. A. Slutz et al., Phys. Plasmas 17, 056303 (2010).
2. S. A. Slutz and R. A. Vesey, Phys. Rev. Lett. 108, 025003 (2012).
3. K. J. Peterson et al., Phys. Plasmas 20, 056305 (2013).
4. K. J. Peterson et al., Phys. Rev. Lett. 112, 135002 (2014).
5. K. J. Peterson et al., Phys. Plasmas 19, 092701 (2012).
6. C. W. Barnes et al., Rev. Sci. Instrum. 70, 471 (1999).
7. D. Tubbs et al., Laser Part. Beams 17, 437 (1999).
8. J. P. Sauppe et al., Matter Radiat. Extremes 4, 065403 (2019).
9. O. V. Gotchev et al., Phys.Rev. Lett. 103, 215004 (2009).
10. J. P. Sauppe et al., Phys. Plasmas 26, 042701 (2019).
11. E. C. Hansen et al., Plasma Phys. Control. Fusion 60, 054014 (2018).

InertIal ConfInement fusIon
LLE Review, Volume 163 129
12. E. C. Hansen et al., Phys. Plasmas 25, 122701 (2018).
13. A. K. Davis et al., Phys. Plasmas 23, 056306 (2016).
14. V. N. Goncharov et al., Plasma Phys. Control. Fusion 59, 014008 (2016).
15. R. S. Craxton, Laboratory for Laser Energetics Report No. DOE/DP 40200-101, University of Rochester (1989).
16. D. H. Munro and P. F. Dubois, Comp. Phys. 9, 609 (1995).

CharaCterizing Laser Preheat for Laser-Driven MagnetizeD Liner inertiaL fusion using soft X-ray eMission
LLE Review, Volume 163130
Characterizing Laser Preheat for Laser-Driven Magnetized Liner Inertial Fusion Using Soft X-Ray Emission
D. H. Barnak,1 M. J. Bonino,1 P.-Y. Chang,2 J. R. Davies,1 E. C. Hansen,3 D. R. Harding,1 J. L. Peebles,1 and R. Betti1
1Laboratory for Laser Energetics, University of Rochester2Institute of Space and Plasma Sciences, National Cheng Kung University
3Department of Physics and Astronomy, University of Rochester
IntroductionMagLIF (magnetized liner inertial fusion) is a magnetized target fusion scheme utilizing a cylindrical implosion with an axial magnetic field to compress preheated deuterium–tritium fuel to fusion-relevant densities and temperatures. The magnetic field mitigates the radial conduction losses and allows these implosions to happen +3# slower than direct or indirect laser fusion spherical implosions. The lower volume decrease with equal convergence ratios for cylinders versus spheres requires that the fuel start at a much higher temperature than in traditional inertial confinement fusion schemes. This is accomplished by using an axial laser to heat the fuel via inverse bremsstrahlung absorption prior to the implosion. In both the laser-driven and pulsed-power versions of MagLIF, the gas in the cylinder is held in by a thin window at the top that the laser must burn through to heat the gas. The most important aspects about preheat to quantify are the gas temperature as a function of time, mix due to the window being pushed into the implosion region by the preheat beam, mix due to wall ablation into the gas, and how the initial axial magnetic field affects the preheat. Characterizing the preheat process is critical to the success of MagLIF as described in several publications.1–4
For the laser-driven MagLIF design, a 1.84-nm polyimide foil window was used to cover the laser entrance hole (LEH) and contain the +10 atm of 2%at Ne-doped D2 gas inside a parylene-AF4 (C8H4F4) cylinder. To study the LEH window disassembly in terms of laser transmission, backscatter, sidescatter, and x-ray emission, a series of LEH foil-only shots was performed along the axis of a single beam of the OMEGA laser. LEH window shots were performed in two configurations: one to measure backscatter, sidescatter, and transmission using Beamline 25 and the other to measure transmission and forward scatter using Beamline 46. The Beamline 25 configuration was then used to heat the gas cylinders. Dante, an array of K-edge–filtered x-ray diodes, was used to measure the total x-ray flux from the LEH window disassembly, which is proportional to the laser energy absorbed by the window. The temperature of the gas in the front 1 mm of the cylinder was also measured by Dante after the window had expanded and cooled. The temperature of the wall and the gas in the implosion region was measured using a three-channel K-edge–filtered soft x-ray imager (SXR). Each configuration is illustrated in Fig. 1. Six cylinders in total were shot: two with an initial 15-T magnetic field and an initial gas density of 1.5 mg/cm3; two without a magnetic field at the same gas density; one at 1/2 the initial gas density; and one at 3/2 the initial gas density. The transmission, backscatter, and sidescatter data from the LEH window and cylinder shots are summarized in another publication,5 whereas the x-ray emission and radiation temperature are presented in this summary alongside plasma temperature measurements of the gas and the wall of the cylinder as a function of time.
Analysis of LEH Window Disassembly Using DanteAn array of filtered x-ray diodes called Dante6 was used to characterize the x-ray spectrum and total energy of x rays emit-
ted by the exploding window during the laser pulse. Each diode in the array has its own aperture, filter, signal cable, electrical attenuator, power tee, and transient digitizer. The combination of all of these components is referred to as a channel. Traditionally, 11 channels are employed to diagnose radiation temperatures for hohlraums. This makes Dante ideal to use for diagnosing both the LEH window-only shots and the full-cylinder preheat shots. Voltage signals from Dante are used to recover both time-resolved and time-integrated spectra of an emitting plasma.
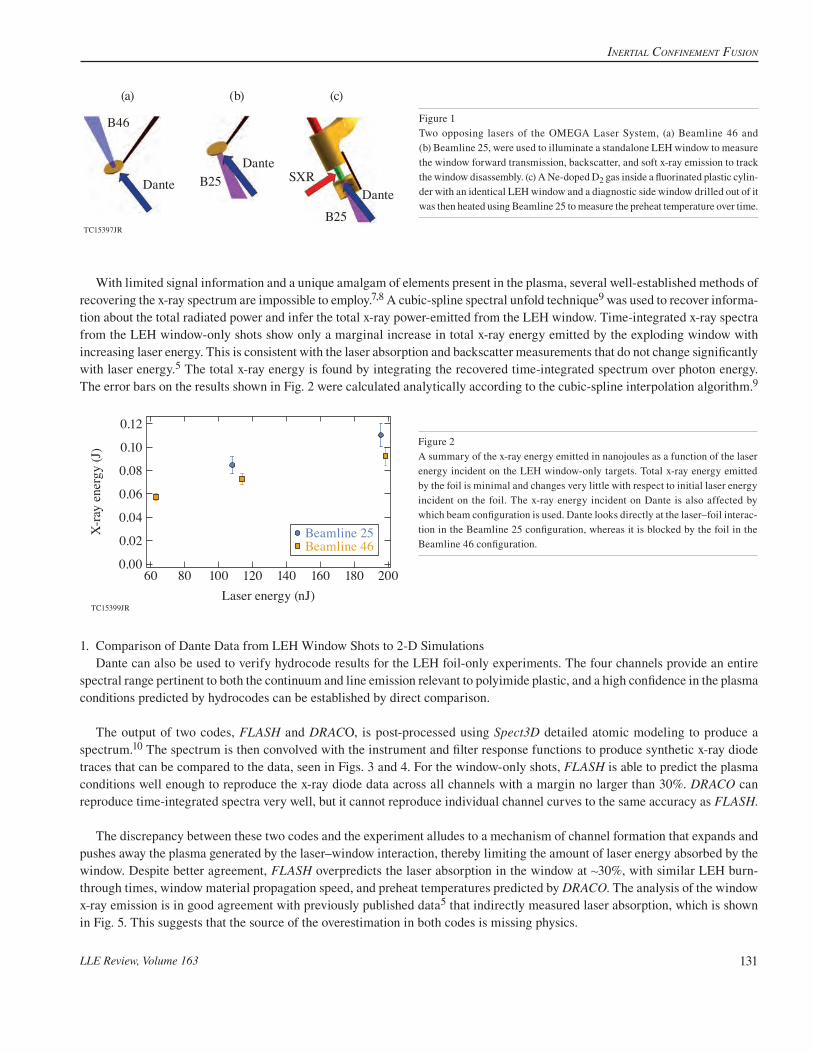
InertIal ConfInement fusIon
LLE Review, Volume 163 131
Figure 1Two opposing lasers of the OMEGA Laser System, (a) Beamline 46 and (b) Beamline 25, were used to illuminate a standalone LEH window to measure the window forward transmission, backscatter, and soft x-ray emission to track the window disassembly. (c) A Ne-doped D2 gas inside a fluorinated plastic cylin-der with an identical LEH window and a diagnostic side window drilled out of it was then heated using Beamline 25 to measure the preheat temperature over time.
TC15397JR
(a) (b) (c)
B46
B25 SXR
B25
DanteDante
Dante
Figure 2A summary of the x-ray energy emitted in nanojoules as a function of the laser energy incident on the LEH window-only targets. Total x-ray energy emitted by the foil is minimal and changes very little with respect to initial laser energy incident on the foil. The x-ray energy incident on Dante is also affected by which beam configuration is used. Dante looks directly at the laser–foil interac-tion in the Beamline 25 configuration, whereas it is blocked by the foil in the Beamline 46 configuration.
TC15399JR
0.10
0.08
0.06
0.04
0.02
0.00
X-r
ay e
nerg
y (J
)
Beamline 25Beamline 46
60 80 100 120Laser energy (nJ)
140 160 180 200
0.12
With limited signal information and a unique amalgam of elements present in the plasma, several well-established methods of recovering the x-ray spectrum are impossible to employ.7,8 A cubic-spline spectral unfold technique9 was used to recover informa-tion about the total radiated power and infer the total x-ray power-emitted from the LEH window. Time-integrated x-ray spectra from the LEH window-only shots show only a marginal increase in total x-ray energy emitted by the exploding window with increasing laser energy. This is consistent with the laser absorption and backscatter measurements that do not change significantly with laser energy.5 The total x-ray energy is found by integrating the recovered time-integrated spectrum over photon energy. The error bars on the results shown in Fig. 2 were calculated analytically according to the cubic-spline interpolation algorithm.9
1. Comparison of Dante Data from LEH Window Shots to 2-D SimulationsDante can also be used to verify hydrocode results for the LEH foil-only experiments. The four channels provide an entire
spectral range pertinent to both the continuum and line emission relevant to polyimide plastic, and a high confidence in the plasma conditions predicted by hydrocodes can be established by direct comparison.
The output of two codes, FLASH and DRACO, is post-processed using Spect3D detailed atomic modeling to produce a spectrum.10 The spectrum is then convolved with the instrument and filter response functions to produce synthetic x-ray diode traces that can be compared to the data, seen in Figs. 3 and 4. For the window-only shots, FLASH is able to predict the plasma conditions well enough to reproduce the x-ray diode data across all channels with a margin no larger than 30%. DRACO can reproduce time-integrated spectra very well, but it cannot reproduce individual channel curves to the same accuracy as FLASH.
The discrepancy between these two codes and the experiment alludes to a mechanism of channel formation that expands and pushes away the plasma generated by the laser–window interaction, thereby limiting the amount of laser energy absorbed by the window. Despite better agreement, FLASH overpredicts the laser absorption in the window at +30%, with similar LEH burn-through times, window material propagation speed, and preheat temperatures predicted by DRACO. The analysis of the window x-ray emission is in good agreement with previously published data5 that indirectly measured laser absorption, which is shown in Fig. 5. This suggests that the source of the overestimation in both codes is missing physics.

CharaCterizing Laser Preheat for Laser-Driven MagnetizeD Liner inertiaL fusion using soft X-ray eMission
LLE Review, Volume 163132
Figure 3X-ray diode data compared to results from post-processing the 2-D hydrocode FLASH using Spect3D detailed atomic physics. The agreement between data and simulation across all x-ray diode channels is within a margin no larger than 30%.
TC12576JR
0.08
0.04
0.00
Sign
al (V
) 0.2
0.1
0.01.0 1.5 2.0 3.02.5
Time (ns)
Channel 6E = 198.4 JE = 195.6 J FLASH E = 200 J
1.0 1.5 2.0 3.02.5Time (ns)
Channel 2
TC15400JR
0 1 2 3
0.00 0.00
0.02
0.04
0.06
0.08
Time (ns)0 1 2 3
Time (ns)
Sign
al (V
)Si
gnal
(V)
Sign
al (V
)Si
gnal
(V)
0.05
0.10
0.15
0.20Channel 5
0.0
0.2
0.4
0.6Channel 6
0.00
0.02
0.04
0.06
Channel 9
Channel 2
Shot 76676Shot 76678DRACO
Figure 4DRACO simulation results compared to Dante experimental data. The laser energy used in the simulation is 200 J, 195.6 J for shot 76676, and 198.4 J for shot 76678.
2. Inferring Gas Temperature from Dante Measurements of CylindersThe viewing angle of Dante to the cylinder targets suggests that the first 1 mm of the target, which includes a region of gas
outside of the implosion region, can be seen by Dante. A schematic view of the Dante line of sight is shown in Fig. 6. The neon doping in the gas should contribute to the x-ray spectrum in a region easily measurable by Dante, so that a gas temperature can be recovered from Dante from specific channels. Simulations from DRACO are used to decompose each channel into fractional contributions to the signal in each channel from the window, wall, and gas.

InertIal ConfInement fusIon
LLE Review, Volume 163 133
Laser shot 76679 (189.7 J)Measured shot 76679 (189.7 J)Simulated shot 76676 (185.6 J)
Measured shot 76680 (108.8 J)Simulated shot 76677 (102.6 J)Measured shot 76681 (60.3 J)Simulated shot 76681 (60.3 J)
E27093JR
0.0 0.2 0.4 0.6 0.8 1.0Time (ns)
2
4
6
Frac
tion
of m
ean
lase
r pow
er ( #
10–3
)
(b)
0.0 0.5 1.0 1.5 2.0 2.5Time (ns)
0.0
0.2
0.4
0.6
0.8
1.0
1.2Fr
actio
n of
mea
n la
ser p
ower
(a)
0
8
Figure 5The laser transmission as a function of time is shown for (a) the entirety of the laser pulse and (b) at the start of the pulse in better detail. The laser absorption in the window early in time is overestimated in the simulation, but the simulations and experiments show that laser absorption is independent of the incident laser power. The experiments show the transmitted laser light quickly growing to the full power of the laser pulse, whereas the simulations reach full power only toward the end of the pulse.5
Volume that Dante “sees”
1 mmB52
Danteview
0.54 mm
TC12575JR
Figure 6Schematic view of the Dante view down the cylinder. Dante is able to see emis-sion from the gas as far as 1 mm into the cylinder.
To avoid issues concerning opacity, a series of three simulations from DRACO was post-processed in Spect3D considering x-ray emission from the wall only; the wall and the window; and the wall, window, and gas. A self-consistent decomposition of the percent contribution from wall, window, and gas of the signal in each channel is made. Select channels are shown decomposed into the three possible contributors along with the raw data of the corresponding channel in Fig. 7.
Based on the signal decomposition of Channel 9 from Fig. 7, times between 1.1 and 2.2 ns were considered to be the best times to compare spectra for gas emission. Instead of comparing signals convolved with instrument response functions, the adap-tive cubic spline unfold method can be used to compare spectra recovered from Dante directly with Spect3D simulation results from DRACO. The spectral power emitted must be a function of electron temperature in the gas, and the data from the DRACO simulation are used to construct a conversion function of the form
,k b P TeT T 9e e+ = (1)
which takes the spectral power in the Channel 9 region, P9, and calculates the electron temperature Te. Both kTe and bTe
are free-fitting parameters with associated errors vk and vb. The spectral power over the Channel 9 region for the cubic-spline unfold is

CharaCterizing Laser Preheat for Laser-Driven MagnetizeD Liner inertiaL fusion using soft X-ray eMission
LLE Review, Volume 163134
TC15401JR
0.00.20.40.60.81.0
0.00.20.40.60.81.0
0.00.20.40.60.81.0
Sign
al (%
)Channel 2 Channel 5 Channel 9
0 1 2 3 4 5
0 1 2 3 4 5 0 1 2 3 4 5 0 1 2 3 4 5
0.00.20.40.60.8
Sign
al (V
)
Cylinder shots Channel 2
0 1 2 3 4 50.000.020.040.060.080.10
Time (ns) Time (ns)Time (ns)
Cylinder shots Channel 5
0 1 2 3 4 50.00
0.05
0.10
0.15
0.20Cylinder shots Channel 9
7667376674766757667876682
GasWindowWall
Figure 7Decomposed signals from Channels 2, 5, and 9 are shown in percent contributions from the window, wall, and gas using results from DRACO post-processed in Spect3D. This is compared to the raw signals from the respective channels to determine the composition of the signal at different times. Lower-photon-energy channels show only window and wall emission, whereas higher-energy channels have most of their signal contributed by the gas in the front 1 mm of the cylinder. This allows Dante to be used to estimate a time-resolved gas temperature measurement.
then plugged into Eq. (1) to recover a measurement of electron temperature. The resulting error of the total calculation takes into account the error propagation of the cubic spline and the standard error of the linear model fit
,bb P
PT TT
bk
P29
22
9
22
e ee
9v
v vv= + +` f fj p p> H (2)
where P9v is the associated error in spectral power calculated analytically from the cubic spline.9 The comparisons between
experimentally inferred gas electron temperature and predictions by DRACO between 1.0 and 2.1 ns are shown in Fig. 8. The temperature from DRACO is calculated as a volumetric average over the front 0.5 mm of the cylinder for the full cylinder radius. The electron temperature quickly saturates at +200 eV due to a drop in inverse bremsstrahlung absorption and cooling due to expansion. The ion temperature slowly thermalizes with the electron population. By the end of the laser pulse, the entirety of the cylinder including the implosion region reaches an ion temperature of 200 eV. This confirms the ability of a single OMEGA beam to reach adequate preheating conditions for a MagLIF implosion.
3. Proof of Thermal Conduction Wall Heating Suppression with Magnetic FieldsAnother useful result of the signal decomposition technique is the demonstration of the reduction in wall emission and wall
heating due to magnetic-field suppression of thermal conduction from the window and the gas. One of the six cylinder shots that was initially magnetized with an +15-T magnetic field prior to the start of the laser pulse has enough signal in Dante to make a comparison to the two other unmagnetized shots at equal initial gas pressure.
Looking at the signal composition for each channel from Fig. 7, the magnetic field provides an +20% to 40% reduction in signal for the regions in each channel that correspond to wall emission. Since the portion of the spectrum that contributes to these channels is heavily line dominated, a 20% reduction in signal infers a significant decrease in the temperature of the wall blow-off plasma. The main mechanism in the formation of the wall blowoff is thermal conduction from the hot window plasma and gas into the wall according to 2-D simulations. This implies that the magnetic field limits the amount of thermal energy transfer from

InertIal ConfInement fusIon
LLE Review, Volume 163 135
Figure 8Preheat curves for all six cylinder shots where the squares represent results from DRACO. In general, the electron temperature follows the predicted DRACO electron temperatures fairly closely, within shot-to-shot variations. Comparisons between [(a), (b)] shots with and [(c), (d)] shots without an initial axial mag-netic field show no appreciable difference between electron temperatures. A shot with (e) 5-atm initial pressure shows less preheating than the 10-atm DRACO prediction and (f) a shot with a higher initial pressure shows greater preheating than the 10-atm prediction. It can even be implied that (d) has roughly the same initial pressure as (f), although no direct measurement of the gas pressure exists for these two cases.
Figure 9Raw Dante signals for Channels 2, 5, and 6 for the cases of 15 T and 0 T. In every channel where wall emission comprises >50% of the signal (shaded region), the case with 15-T initial field has an +20% to 40% decrease in signal.
TC15404JR
0
100
200
300
0.5 1.0 1.5 2.00
100
200
300
0.5 1.0 1.5 2.0 0.5 1.0 1.5 2.0
T e (e
V)
Time (ns)Time (ns) Time (ns)
(b) (c)
(d) (e) (f)
(a)
TC15405JR
0 1 2 3 4 50.0
0.2
0.4
0.6
0.8
Time (ns)0 1 2 3 4 5
Time (ns)0 1 2 3 4 5
Time (ns)
Sign
al (V
)
Channel 2
Wallemission
0.000.020.040.060.080.10
Channel 5
0.0
0.1
0.2
0.3
0.4Channel 6
Wallemission
15 T0 T0 T
Wallemission
the window and gas to the wall. Looking at Dante signal traces for Channels 2, 5, and 6, where wall emission comprises >50% of the signal in Fig. 9, the case of 15-T initial field sees a reduction in signal by about a factor of 2.
Measuring Gas Temperature in the Implosion Region Using Ne Soft X RaysThe cylinder experiments used a diagnostic window drilled into the side and resealed with a 1.84-nm polyimide film to look
at soft x-ray emission from the gas and the wall. Spatially and temporally resolved images of the side diagnostic window are measured using SXR, which is a three-channel differentially filtered imager. The spectral responses of each filtered channel are shown in Fig. 10.

CharaCterizing Laser Preheat for Laser-Driven MagnetizeD Liner inertiaL fusion using soft X-ray eMission
LLE Review, Volume 163136
Figure 10Response functions for the three channels of SXR used to measure preheat temperature.
TC12574JRPhoton energy (keV)
0.5 1.0 1.5 2.0 2.5
Channel 2
Channel 1Channel 3
Tran
smis
sion
0.4
0.2
0.0
0.6
Figure 11The lower-bound solution for the temperature of the preheated D2 gas. Other channel ratios give a solution higher than 100 eV. The solutions always find the case where Tgas = Twall given the constraint of Tgas $ Twall as shown in the plot.
Tgas = 107 eV
Tgas = 100 eV
Shot 1
Shot 3
Shot 2
0 100 200 300 400
TC13143JR2
Wall temperature (eV)
0.0
0.2Cha
nnel
2/C
hann
el 3
0.4
0.6
0.8
1.0
1.2
Tgas = 50 eV
Lower-boundsolution
There is no possible way to recover the spectrum of the plasma from these three channels. Furthermore, SXR is not an absolutely calibrated diagnostic, so each channel signal must be compared with another for any useful information to be extracted. Using results from 2-D hydrocodes as a guide, a set of possible 2-D plasma profiles was constructed. The spectrum for each possible combination of temperature and density is calculated using Spect3D detailed atomic modeling and then convolved with response functions of SXR to generate a grid of possible solutions. The channel ratios from the data are then converted to temperature and density by using the solution grid under the condition that Tgas > Twall. Since the system is highly degenerate, the main result from this analysis establishes a lower bound on the possible gas temperature of 100 eV at 1.3 ns into the laser pulse, which is shown in Fig. 11. This result is consistent with the Dante-inferred temperatures toward the front of the cylinder and confirms that the goal of at least a 100-eV preheat is achieved with a single OMEGA laser beam.
ConclusionsMeasurements of the LEH window disassembly in terms of total emitted x-ray energy demonstrate that there is a small varia-
tion of laser light absorbed by the window as a function of the intensity of the laser. This is consistent with results obtained from analysis of the backscatter and sidescatter measurements. Furthermore, both DRACO and FLASH overpredict the amount of laser energy absorbed by the window during disassembly, and the difference between the two codes suggests that the reason for this may be related to instabilities such as laser self-focusing and ponderomotive pressure applied by the laser field that causes the window to form a channel into the gas. Despite overpredicting the window absorption, the plasma temperature evolution is the same between the simulation predictions and experiment as expected for inverse bremsstrahlung heating. Lower initial gas density is shown to lower the preheat, and higher initial density is shown to raise the total preheat relative to the simulation predictions

InertIal ConfInement fusIon
LLE Review, Volume 163 137
for the nominal case. There is no discernible difference between magnetized and unmagnetized preheat in terms of the electron temperature within the shot-to-shot variation and calculated error bars. The plasma temperature in the implosion region has been shown to meet the 100-eV requirement set in the point design specifications, although measuring the time evolution of the laser heating in the implosion region proved to be impossible. Implosion-region measurements are consistent with the measurements made of the front 1 mm of the cylinder and simulation results. The comparisons between the experimental results and simulations indicate that using DRACO as a prediction for the design of future preheating schemes is adequate.
The information, data, or work presented herein was funded in part by the Advanced Research Projects Agency-Energy (ARPA-E), U.S. Department of Energy, under Award No. DE-AR0000568, the Department of Energy National Nuclear Security Administration under Award No. DE-NA0003856, and in part under contract 89233218CNA000001, the U.S. Department of Energy Office of Fusion Energy Sciences under award No. DE-SC0016258, the U.S. Department of Energy Office of Inertial Confinement Fusion under Cooperative Agreement No. DE-FC52-08NA28302, the University of Rochester, and the New York State Research and Development Authority. Los Alamos National Laboratory, an affirmative action/equal opportunity employer, is operated by Triad National Security, LLC for the National Nuclear Security Administration of U.S. Department of Energy under contract 89233218CNA000001.
1. A. J. Harvey-Thompson et al., Phys. Plasmas 22, 122708 (2015).
2. M. Geissel et al., Phys. Plasmas 25, 022706 (2018).
3. A. J. Harvey-Thompson et al., Phys. Plasmas 26, 032707 (2019).
4. A. J. Harvey-Thompson et al., Phys. Plasmas 25, 112705 (2018).
5. J. R. Davies et al., Phys. Plasmas 25, 062704 (2018).
6. C. Sorce et al., Rev. Sci. Instrum. 77, 10E518 (2006).
7. R. E. Marrs et al., Rev. Sci. Instrum. 86, 103511 (2015).
8. A. Seifter and G. A. Kyrala, Rev. Sci. Instrum. 79, 10F323 (2008).
9. D. H. Barnak et al., Rev. Sci. Instrum. 91, 073102 (2020).
10. J. J. MacFarlane et al., in Inertial Fusion and Sciences Applications 2003, edited by B. A. Hammel et al. (American Nuclear Society, La Grange Park, IL, 2003), pp. 457–460.

Constraining PhysiCal Models at gigabar Pressures
LLE Review, Volume 163138
Constraining Physical Models at Gigabar Pressures
J. J. Ruby,1,2 J. R. Rygg,1,2,3 D. A. Chin,1,2 J. A. Gaffney,4 P. Adrian,5 D. Bishel,1,2 C. J. Forrest,2 V. Yu. Glebov,2 N. V. Kabadi,5 P. M. Nilson,2 Y. Ping,4 C. Stoeckl,2 and G. W. Collins1,2,3
1Department of Physics & Astronomy, University of Rochester2Laboratory for Laser Energetics, University of Rochester
3Department of Mechanical Engineering, University of Rochester4Lawrence Livermore National Laboratory
5Plasma Science and Fusion Center, Massachusetts Institute of Technology
Large-scale, high-energy-density (HED) experimental facilities are able to generate states of matter that push beyond the limits of where most physical models were developed. This necessitates quantitative experiments to guide theories and techniques at such conditions. Convergent geometries, either spherical or cylindrical, amplify the pressure generated from HED drivers, such as lasers or pulsed-power machines, and create the most-extreme thermodynamic states currently achievable in the laboratory. These convergent experiments complicate measurements, however, making it difficult to directly measure the state of variables and transport properties. Often, measurements are the result of an integrated system, where many properties of the system are responsible for observations, rather than a small number of key physical quantities. Such integrated system analysis requires a new way of approaching how experimental data are interpreted.
This work proposes using the well-established methodology of Bayesian inference1,2 to derive quantitative physical information from integrated HED experiments. This process includes the synthesis of a model that contains the essential physics from the experiment and is used in a forward analysis, generating synthetic experimental data to directly compare to the measurements. Given the proper parameterization and set of measurements the model can be constrained, giving a quantitative assessment of the input parameters.
This process is demonstrated using a direct-drive exploding-pusher experiment carried out on the 60-beam OMEGA Laser System, where the trajectory of an exploding shell is measured via x-ray self-emission on an x-ray framing camera. Synthetic data generated using the 1-D hydrodynamics code LILAC is also analyzed, confirming that the parameterization accurately represents the physical quantities of interest. The process is used to infer the temporal pressure profile felt by an in-flight shell and the subsequent trajectory from experimental measurements, demonstrating how a large amount of physical insight can be gained by using integrated measurements.
The model used to describe the experimental data is a thin-shell subject to force pushing in to greater convergence due to mass ablation and an outward force resisting convergences due to pressure from the compressed fuel. The equation of motion
,d t
d R a2
2= (1)
is solved, where R is the trajectory of the shell and a is the acceleration given by

InertIal ConfInement fusIon
LLE Review, Volume 163 139
v
,a tMR P
M
M
MR P
t t
t t t
t t
0
4
4
<
<e
a
a
2
2
1
1
- #
$
r
r
=o
_ i
Z
[
\
]]]]]
]]]]
(2)
where P is pressure at the fuel–shell interface given by
P t
P e t t
P e t t
rs
rs
t ts
t ts
g s
d s
#
$
=
- -
- -
c
c_
_
_
_
_
i
i
i
i
i
Z
[
\
]]
]] (3)
and M is the shell mass given by
,
,
,min
min
minM t
M M t t
M M t t t
t t t
t t t>min
a
s M
s M
s M
0 - -
-
#
=+
o
o_
_
_
i
i
i8 77
B AAZ
[
\
]]
]] (4)
Figure 1The highest posterior density (HPD) confidence intervals for the (a) shell trajec-tory and (b) pressure profile at the fuel–shell interface determined from fitting the shell model described here. The trajectory measurements of the outgoing shell and initial conditions of the shell are sufficient to constrain the trajectory and pressure at all times.
1.2
Hig
hest
post
erio
r den
sity
1.0
0.0
0.2
0.4
0.6
0.8
(a)
(b)
E29020JR
0.0 0.4 0.8Time (ns)
Pres
sure
(Gba
r)R
adiu
s (n
m)
2
0
200
400
0
468% HPD contourExperimental data
with Mo and all subscripted variables parameters in the model.
The resulting trajectory and pressure profile that follow from the Bayesian inference process are shown in Figs. 1(a) and 1(b), respectively. The framing-camera measurements of the outgoing shell trajectory, in conjunction with conservation laws and initial conditions, are sufficient to constrain the shell trajectory at all times, from laser on to shell decompression, and also to constrain the pressure profile at the fuel–shell interface.
The methods presented here showed how a seemingly isolated, integrated measurement of an evolving system can be used to reconstruct a model of the entire system with enough fidelity to gain quantifiable physical insight. This methodology has a strong

Constraining PhysiCal Models at gigabar Pressures
LLE Review, Volume 163140
history of being used in other fields of physics and has the potential to greatly impact HED physics by making possible quantified measurements in conditions otherwise inaccessible.
The combination of high-quality experimental methods and facilities that already exist in HED physics are able to create conditions otherwise impossible on Earth, and new analysis techniques for integrated measurements promise to provide new insight into our understanding of physics at extreme conditions.
This material is based upon work supported by the Department of Energy National Nuclear Security Administration under Award Number DE-NA0003856, the U.S. Department of Energy, Office of Science, Office of Acquisition and Assistance under Award No. DE-SC001926, the University of Rochester, and the New York State Energy Research and Development Authority.
1. J. A. Gaffney et al., Nucl. Fusion 53, 073032 (2013).
2. M. F. Kasim et al., Phys. Plasmas 26, 112706 (2019).

InertIal ConfInement fusIon
LLE Review, Volume 163 141
Molecular Dynamics Simulations Reveal Hydrogen Streaming upon Release from Polystyrene Shocked
to Inertial Confinement Fusion ConditionsS. Zhang and S. X. Hu
Laboratory for Laser Energetics, University of Rochester
Shock release from inertial confinement fusion (ICF) shells poses a great challenge to radiation-hydrodynamic simulations because the kinetic effects and large Knudson numbers are beyond the regular single-fluid approximation and cannot be included in standard equation-of-state (EOS) models. This has been evidenced by a recent experiment1 on polystyrene (CH), in which low-density plasmas (1019 to 1020 cm–3) released from a laser-shocked CH shell were observed to travel significantly ahead of what regular hydro-simulations predict. Further hydro-simulations were rendered to agree with experiments by assuming excessive pre-expansion at the rear surface of the CH shell before arrival of the shock. In this work, we take a novel route to elucidate the microscopic shock-release physics of CH by large-scale nonequilibrium molecular dynamics (MD) at the experimental conditions. Our results revealed species separation and hydrogen streaming out of CH upon shock release and provided excellent explanation to experimental observations. Such kinetic effect of species separation as revealed by our simulations is currently missing in single-fluid radiation-hydrodynamic simulations, which could have profound implications to ICF target designs.
CH is an important ablator material in ICF and high-energy-density experiments. In experiments, it can be shocked to warm-dense-matter states with multimegabar pressures and tens-of-electron-volt temperatures, while the unshocked regime remains under ambient conditions; after shock breakout, electron–ion recombination occurs and chemical bonding may be expected while the system is cooling down. The various pressures and temperatures and distinction between up- and downstream of the shock front challenge regular hydro-simulations that are based on the single-fluid approximation and MD simulations that use empiri-cal potentials. Previous MD studies of hydrocarbons are limited to pressures up to +200 GPa (Refs. 2–4). Recently, we have developed an approach that uses many-body reactive force fields, combines with first-principles ionization models, and greatly extends the regime of fidelity of the MD simulations to +2100 GPa (associated shock velocity +55 km/s, temperature +1.5 # 105 K), which is more than 10# the maximum previous record. This approach is justified according to benchmark calculations of various atomistic models with up to several million atoms, which uniformly show small differences (3%–20%) in the Hugoniot EOS in comparison with those predicted by accurate first-principles calculations.5
By studying the time evolution of spatial and velocity distributions of hydrogen and carbon after shock breakout, we find that hydrogen atoms stream far ahead of carbon. In addition, the motion of both species is linear throughout the simulation, whereas hydrogen travels much faster than carbon, more so at the lower density of 1019 than at 1020 cm–3 [Fig. 1(a)]. In comparison with the experiment, the hydrogen velocities calculated from our MD simulations at both densities of 1019 and 1020 cm–3 compare favorably well with the measured values, while the carbon velocity along with its dependence on density is clearly off trend [Fig. 1(b)]. Furthermore, by exponentially fitting the hydrogen distribution profile at 1019 to 1020 cm–3, we estimated the plasma scale length and found that it increases tenfold from 2 to 10 ps [Fig. 1(c)].
We note that the above comparisons to experimentally measured plasma properties are based on the assumption that G ZH = 1. While this provides a reasonable estimation for the upper bound of hydrogen ionization, we notice that the temperature remains above 10,000 to 30,000 K until after 10 ps. We have, therefore, performed average-atom model calculations6 using density functional theory for carbon and hydrogen plasmas at the temperature of 20,000 K and densities between 1019 to 1020 cm–3 to estimate a lower bound for the ionization. From these calculations, we have found G ZH to be approximately 0.5. Therefore, we have

Molecular DynaMics siMulations reveal HyDrogen streaMing upon release froM polystyrene
LLE Review, Volume 163142
TC15378JRTime (ps)40 8 12
2000
1500
1000
500
0
Posit
ion
(nm
)
(a)
Plasma electron density (cm–3)1019 1020
250
200
150
100
Velo
city
(km
/s)t/t0
31 5 7 9
2.0
1.5
1.0
0.5
0.0
s/z 0
(c)
(1.0)
(1.0) (0.5)(1.0)
(0.5)
(b)2500 300 2.5
(1.0)(0.5)
Experiment
This work (hydrogen)This work (carbon)
Hydro-simulation Experiment
This workHydro-simulation
nC = 1020 cm–3
nC = 1019 cm–3
nH = 1020 cm–3
nH = 1019 cm–3
(1.0)
considered the range of G ZH = 0.5 to 1 to directly compare with the experimental results. For the lower bound of G ZH = 0.5, the re-evaluated plasma velocity decreases slightly by 7 km/s at 1019 cm–3 and by 24 km/s at 1020 cm–3, while scale length remains constant at 2 ps but increases by the amount of sample thickness (z0) at 10 ps. Giving these ionization estimates, the hydrogen plasma velocities and scale lengths all match the experimental values very well (Fig. 1).
These results provide a clear microscopic picture of post-shock-release hydrogen streaming that offers an important factor to be considered in improving radiation-hydrodynamic simulations. We expect similar species-separation processes can occur during shock release of deuterium–tritium (DT) fuel in ICF implosions, especially for strong shocks. The other implication to ICF is the likely hydrogen streaming into the DT layer upon shock transits through DT/CH interfaces, which might induce atomic mixing, thereby reducing the final compression areal density.
This material is based upon work supported by the Department of Energy National Nuclear Security Administration under Award Number DE-NA0003856, the University of Rochester, and the New York State Energy Research and Development Authority.
1. D. Haberberger et al., Phys. Rev. Lett. 123, 235001 (2019).
2. S. Root et al., J. Appl. Phys. 114, 103502 (2013).
3. T. R. Mattsson et al., Phys. Rev. B 81, 054103 (2010).
4. T. C. O’Connor et al., Phys. Rev. Mater. 2, 035601 (2018).
5. S. Zhang et al., J. Chem. Phys. 148, 102318 (2018).
6. S. X. Hu et al., Phys. Plasmas 23, 042704 (2016).
Figure 1(a) Drifting of carbon and hydrogen, (b) plasma velocities, and (c) scale lengths (normalized by sample thickness z0) as a function of time (normalized by shock duration t0) at 1019 and 1020 cm−3 according to our simulations of shock-released CH and in comparison with experiment and regular single-fluid hydro-simulations from Ref. 1. The solid lines in (a) and (c) are guides to the eyes and the dashed lines in (a) are linear fits to the data. In (b) and (c), error bars denote the fit error; the labels of “1.0” and “0.5” indicate the estimated charge state G ZH for carbon or hydrogen.
Plasma and Ultrafast Physics
LLE Review, Volume 163 143
Impact of Spatiotemporal Smoothing on the Two-Plasmon–Decay Instability
D. Turnbull, A. V. Maximov, D. Cao, A. R. Christopherson, D. H. Edgell, R. K. Follett, V. Gopalaswamy, J. P. Knauer, J. P. Palastro, A. Shvydky, C. Stoeckl, H. Wen, and D. H. Froula
Laboratory for Laser Energetics, University of Rochester
Higher levels of hot electrons from the two-plasmon–decay (TPD) instability are observed when smoothing by spectral disper-sion (SSD)1 is turned off in directly driven inertial confinement fusion experiments at the Omega Laser Facility. This finding is explained using a hot-spot model based on speckle statistics and simulation results from LPSE. The model accurately reproduces the relative increase in hot-electron activity at two different drive intensities, although it slightly overestimates the absolute number of hot electrons in all cases. Extrapolating from the current .360-GHz system while adhering to the logic of the hot-spot model suggests that larger SSD bandwidth should significantly mitigate hot-electron generation; legacy 1-THz OMEGA experiments appear to support this conclusion. These results demonstrate that it is essential to account for laser speckles and spatiotemporal smoothing to obtain quantitative agreement with experiments.
The TPD instability—in which an electromagnetic pump decays into two electron plasma waves near the quarter-critical density n 4c —has long been a concern for directly driven inertial confinement fusion. This stems primarily from its tendency to generate hot electrons2 that can preheat the fuel and decrease the areal density of the compressed shell.3 Although there has been extensive effort to understand many aspects of TPD, little consideration has been given to the impact of laser beam speckles and spatiotemporal smoothing schemes, despite the fact that they are ubiquitous features of modern experiments.
In this summary, we present experimental evidence that SSD does partially mitigate TPD (conversely, turning off SSD enhances TPD) in implosions at the Omega Laser Facility. The experiments used 860-nm-diam, 27-nm-thick, vacuum-filled spherical CH targets illuminated by all 60 OMEGA beams. On every shot, the beams were conditioned with distributed polariza-tion rotators (i.e., polarization smoothing) and “SG5” phase plates. Both high- and low-power versions of a similar pulse shape [cf. Fig. 1(a)] were used in order to see how the impact of SSD on TPD activity varied with proximity to the TPD threshold. For each pulse shape, the SSD bandwidth was also tuned between shots from 100% (of the current .360 GHz) down to 50% and, ultimately, to zero. While varying the SSD bandwidth, laser amplifier settings were adjusted to reproduce the same delivered pulse shape. Radiation-hydrodynamic simulations using the LILAC code, including nonlocal and cross-beam energy transfer models, give the following quarter-critical conditions during the period of TPD activity: overlapped intensity I14 = 3.5 (in units of 1014 W/cm2), electron temperature Te = 2.4 keV, and density scale length L = 160 nm for the high-power case (respectively, I14 = 2.8, Te = 2.25 keV, and L = 160 nm for the low-power case).
The time-resolved hot-electron power for both the full-SSD and no-SSD shots of the two different pulse shapes are shown in Fig. 1(a), which shows that turning SSD off increased hot electrons in both cases. The total energy in hot electrons for each shot is shown in Fig. 1(b), with high power giving a more-than-twofold increase over the low-power pulse shape. The impact of SSD on TPD activity is most clearly seen in Fig. 1(c), which shows the change in hot electrons for each of the reduced-SSD shots relative to their full-SSD companions. There is a modest increase in TPD activity at 50% SSD and a much larger increase when SSD is turned off completely. It also shows that the relative effect of SSD on TPD is consistently larger at low power, closer to the TPD threshold. These measurements were obtained using the hard x-ray detector (HXRD). Note that the data have small relative error (.1%, comparable to the marker width) dominated by noise, but the systematic error could be as large as .50%.

Impact of SpatIotemporal SmoothIng on the two-plaSmon–Decay InStabIlIty
LLE Review, Volume 163144
It has long been recognized that in many situations laser–plasma instability growth is primarily determined by high-intensity speckles.4 If intense speckles dominate instability growth, the speckle motion induced by spatiotemporal smoothing schemes can potentially mitigate instability growth. The lowest-order effect is the elimination of filamentation. Absent filamentation, it was found that speckle motion can reduce stimulated Brillouin scattering (SBS) directly if the laser coherence time is less than the time it takes the instability to reach steady state.5–7 Stimulated Raman scattering (SRS), on the other hand, was thought to grow too quickly for speckle motion to provide direct mitigation. Like SRS, TPD produces electron plasma waves as primary daughter waves, so one might naively assume that TPD also grows too quickly for direct mitigation. It is important to recognize, however, that absolute instability plays a key role in OMEGA-scale TPD,8 which implies that growth is unbounded until nonlinear satura-tion mechanisms set in. Since the strongest such mechanism is mode coupling to low-frequency ion-acoustic waves, saturation actually occurs on ion time scales more similar to SBS or filamentation, thereby facilitating direct mitigation by speckle motion.
Simulations with LPSE show that the speckles resulting from beam smoothing reduce the absolute TPD threshold by about a factor of 3 compared to the single-beam plane-wave9 threshold h = I14L/(233Te), where I14 is the intensity in units of 1014 W/cm2, L is the scale length in nm, and Te is the electron temperature in keV (all specified at the quarter-critical density). This is due to the fact that a significant fraction of the laser power is carried by speckles with a maximum intensity of more than 3# the aver-age, and such speckles can therefore exceed the threshold locally. The region in parameter space in between the speckled-beam threshold and the plane-wave threshold (which is also where OMEGA experiments are situated) is exactly where spatiotemporal smoothing can have a big impact.
The LPSE simulations provided the following information to guide a hot-spot model: (1) the single-speckle TPD threshold is h . 1.31, where the speckle’s peak intensity is used in the Simon threshold formula; (2) speckles in the range 1.31 < h < 2 take .20 ps to reach saturation (much longer than the laser coherence time with SSD: .360 GHz-1 . 3 ps) and are therefore likely to
Figure 1(a) For each pulse shape (high and low power), the SSD-off delivered laser pulse is shown alongside the hot-electron power for both the SSD-on and SSD-off cases. (b) The total energy in hot electrons for each shot is plotted as a function of the percentage of the current maximum SSD bandwidth. Reducing SSD increases the number of hot electrons. (c) The same hot-electron energies are shown normalized by their full-SSD companions, which shows that SSD has a relatively larger effect at low power. [(d),(e)] The hot-spot model. TPD activity, with (dashed) and without (solid) current OMEGA SSD, predicted as a function of average TPD threshold parameter, both in terms of (d) laser absorption, and (e) hot-electron generation. The data from the experiments (symbols) are in reasonably good agreement but all lie .20% below their respective curves.
Frac
tion
of la
ser p
ower
0.04
0.00
0.08
Hot electrons
0.2
0.0
0.4
Laser absorption
Experimental hot-electron generation Hot-spot model results
E29115JR
0 0 0.3 0.4 0.5 0.6 0.750 1001360-GHz SSD (%)Time (ns)
(e)(d)
2
0
10
Pow
er (T
W)
1.0
1.2
Frac
tiona
l cha
nge
40
80
Ener
gy (J
)1.4
12020
0
10
Pow
er (T
W) 20
(b)(a)
High
Low
TPD threshold parameter 〈h〉
SSD-on speckle modelSSD-off speckle model
SSD-off dataSSD-on data
SSD-off speckle modelSSD-on speckle modelLow power
High powerHot electron, no SSD (#50)Incident laser
Hot electron, SSD (#50)
(f)
(c)

Plasma and Ultrafast Physics
LLE Review, Volume 163 145
be stabilized by SSD, whereas speckles with h > 2 take less than 3 ps to reach saturation; (3) the scaling for laser absorption versus speckle intensity is A = 0.66[(h–1.31)/h]0.5; and (4) the scaling for hot-electron generation is fhot = 0.07[(h–1.31)0.09. Applied to a power-weighted speckle probability distribution derived from Garnier,10 the scalings can be used to determine total TPD laser absorption and hot-electron generation, for any average laser intensity, with SSD on (integrating only the activity in speckles with h > 2) or off (integrating all activity in speckles with h > 1.31). The results are shown in Figs. 1(d) and 1(e).
The experimental data included in Fig. 1(e) show that the fraction of laser power into hot electrons is as high as 3% for the case of high intensity without SSD. Definitions are very important here, and these values were obtained by comparing the average hot-electron power over 200 ps of the maximum TPD activity shown in Figs. 1(a) and 1(c) to the average laser power reaching n 4c according to the LILAC simulations over that same duration. The data lie below the speckle model by .20%. It is apparent, however, that the speckle model accurately reproduces the expected changes in TPD activity going both from low to high power, as well as from SSD on to SSD off. There are many possible explanations for the small remaining discrepancy, the most likely being the large systematic errors in quantifying the hot-electron activity (.50%), as well as the fact that the hot-spot model is trained on 2-D rather than 3-D simulations.
This material is based upon work supported by the Department of Energy National Nuclear Security Administration under Award Number DE-NA0003856, the University of Rochester, and the New York State Energy Research and Development Authority.
1. S. Skupsky et al., J. Appl. Phys. 66, 3456 (1989).
2. C. Stoeckl et al., Phys. Rev. Lett. 90, 235002 (2003).
3. V. A. Smalyuk et al., Phys. Rev. Lett. 100, 185005 (2008).
4. H. A. Rose and D. F. DuBois, Phys. Rev. Lett. 72, 2883 (1994).
5. R. L. Berger et al., Phys. Rev. Lett. 75, 1078 (1995).
6. P. Mounaix et al., Phys. Rev. Lett. 85, 4526 (2000).
7. L. Divol, Phys. Rev. Lett. 99, 155003 (2007).
8. J. Zhang et al., Phys. Rev. Lett. 113, 105001 (2014).
9. A. Simon et al., Phys. Fluids 26, 3107 (1983).
10. J. Garnier, Phys. Plasmas 6, 1601 (1999).

Vacuum acceleration of electrons in a Dynamic laser Pulse
LLE Review, Volume 163146
Vacuum Acceleration of Electrons in a Dynamic Laser Pulse
D. Ramsey,1,2 P. Franke,1,2 T. T. Simpson,1,2 D. H. Froula,1,2 and J. P. Palastro1
1Laboratory for Laser Energetics, University of Rochester2Department of Physics & Astronomy, University of Rochester
Vacuum laser acceleration (VLA) exploits the large electromagnetic fields of high-intensity laser pulses to accelerate electrons to relativistic energies over short distances.1 The field of an intense pulse can far surpass that in conventional radio-frequency (rf) or advanced plasma-based accelerators, and the underlying interaction—involving only an electron and the electromagnetic field—has an appealing simplicity.
In the strong electromagnetic fields characteristic of pulses delivered by modern laser systems, nonlinear forces become a predominant driver of electron motion. Accordingly, many VLA schemes utilize the ponderomotive force, which pushes elec-trons against the gradient of the local intensity. For planar pulses, however, the ponderomotive force is insufficient to achieve net energy gains: The rising edge of an intensity peak that travels at the vacuum speed of light (c) will accelerate an electron in the direction of propagation, but the falling edge will eventually overtake and decelerate the electron back to rest [Fig. 1(a)]. To overcome this symmetry and impart net energy to an electron, the speed of the intensity peak must be subluminal, i.e., vI < c.
Figure 1(a) A typical luminal intensity peak in vacuum. The electron, shown as a red dot, experiences equal and opposite ponderomotive accelerations on the leading and falling edges of the pulse, respectively, and gains no net energy. (b) A positively chirped flying focus with a subluminal intensity peak. After forward acceleration in the leading edge of the intensity peak, the electron outruns the peak and retains the energy it gained. (c) A negatively chirped flying focus with a subluminal intensity peak that travels in the opposite direction of the pulse. After backward acceleration in the leading edge, the electron outruns the intensity peak and retains the energy it gained.
TC15113JR
t
z
(a) t
z
(c)(b)t
z
We have demonstrated the first vacuum acceleration of electrons in a single planar-like laser pulse in either the forward or the backward direction. This novel mechanism for VLA utilizes the “flying focus”—a recently realized spatiotemporal pulse-shaping technique in which a chirped pulse focused by a hyperchromatic diffractive optic produces an intensity peak that can propagate at any velocity, including vI < c, over distances much longer than the Rayleigh range.2,3 When the peak normalized vector potential

Plasma and Ultrafast Physics
LLE Review, Volume 163 147
of the flying-focus pulse a eA m ce0 0=` j exceeds a critical value v, ,where anda c2 /c I I I I I I
1 2 2b c b c b= = = /1 2-
` j8 B it can accelerate electrons from rest to a final axial momentum that depends only on the velocity of the intensity peak: .p m c2f e I Ib c= 2
In principle, the spectral phase and power spectrum of a pulse can be adjusted to create an intensity peak with an arbitrary tra-jectory. Using this principle, we also show that matching the trajectory of an intensity peak to that of an electron enhances the momentum gain beyond .m c2 e I I
2b c
Figures 1(b) and 1(c) illustrate the ponderomotive acceleration of an electron in either a subluminal forward or backward flying-focus intensity peak. In both cases, when a0 > ac, the electron can reach a velocity sufficient to outrun the intensity peak and retain its axial momentum, .m c2 e I I
2b c The laser pulse propagates from left to right at the vacuum speed of light, while the
flying-focus intensity peak moves independently at a velocity determined by the chirp and chromaticity of the diffractive optic (not shown). The chromatic aberration and chirp control the location and time at which each frequency comes to focus, respectively. Specifically, the intensity peak travels a distance zI = (D~/~)f at a velocity bI = (1!cT/zI)
-1, where ~ is the central frequency of the pulse, D~/~ is its fractional bandwidth, f is the focal length of the diffractive optic at ~, T is the stretched pulse duration, and ! takes the sign of the chirp.
Figure 2 displays the final momentum as a function of the maximum vector potential and velocity of the intensity peak. The final momentum increases with the velocity of the intensity peak and diverges as bI $ 1, but the required vector potential increases as well. Operating at the lowest-possible vector potential (a0 = ac) provides the scaling .p m ca a2 /
f e 0 01 2= + 2a k
Figure 2Final momentum of an electron accelerated in a backward propagating fly-ing focus intensity peak. Below the cutoff vector potential (ac), an electron acquires a velocity insufficient to outrun the intensity peak. Above the cutoff, an accelerated electron can outrun the intensity peak, and the final momentum is independent of a0.
TC15105JRbI
–0.95–1.00 –0.90 –0.85 –0.80
Fina
l mom
entu
m lo
g 10
(KP zK)
0.6
1.0
1.4
1.8
2.2
a 0
15
10
5
0
ac
Accelerating the intensity peak to match the ponderomotive acceleration of an electron, i.e., “trajectory locking,” can substan-tially increase the momentum gain. Constant velocity intensity peaks limit the interaction distance and the momentum gain to a value determined by the maximum vector potential. By limiting the interaction distance, the constant velocity scheme wastes any length that the intensity peak has yet to travel. Trajectory locking, on the other hand, keeps the electron in the ponderomotive potential and can utilize the entire distance, zI, to increase the final momentum.
In the trajectory-locked scheme, the intensity peak initially moves at a constant velocity, bI0. Once the electron has acceler-ated from rest to the velocity of the intensity peak, which occurs at the location a = ac, the intensity peak accelerates to keep the electron at this location (i.e., at a = ac). In the trajectory locked peak, the cycle-averaged axial momentum of the electron evolves according to
,p t t m c t t az2
1> c e I I cza
0 02 2 2
c
-22
. b c +=a
_ ` _i j i (1)

Vacuum acceleration of electrons in a Dynamic laser Pulse
LLE Review, Volume 163148
where I I0 02
b c is the cycle-averaged electron momentum upon reaching ac at time tc. Equation (1) predicts that optimizing the momentum gain requires co-locating ac with the maximum intensity gradient of the peak. Asymptotically, the momentum gain has a relatively weak scaling with time, GPzH ? t1/2. This results from the diminished ponderomotive force as GcH increases. Achieving a momentum gain greater than the constant velocity peak requires that the peak remains trajectory locked for a time
.t a2> c I I2
03
04
x b cD-
This material is based upon work supported by the Department of Energy National Nuclear Security Administration under Award Number DE-NA0003856, the University of Rochester, and the New York State Energy Research and Development Authority.
1. E. Esarey, P. Sprangle, and J. Krall, Phys. Rev. E 52, 5443 (1995).
2. D. H. Froula et al., Nat. Photonics 12, 262 (2018).
3. J. P. Palastro et al., Phys. Rev. A 97, 033835 (2018).
HigH-EnErgy-DEnsity PHysics
LLE Review, Volume 163 149
Equation of State of CO2 Shock Compressed to 1 TPa
L. E. Crandall,1,2 J. R. Rygg,1,2,3 D. K. Spaulding,4 T. R. Boehly,1 S. Brygoo,5 P. M. Celliers,6 J. H. Eggert,6 D. E. Fratanduono,6 B. J. Henderson,1,2 M. F. Huff,1,2 R. Jeanloz,7 A. Lazicki,6 P. Loubeyre,5 M. C. Marshall,1 D. N. Polsin,1
M. Zaghoo,1 M. Millot,6 and G. W. Collins1,2,3
1Laboratory for Laser Energetics, University of Rochester2Department of Mechanical Engineering, University of Rochester3Department of Physics and Astronomy, University of Rochester
4University of California, Davis5Commissariat à l’énergie atomique et aux énergies alternatives
6Lawrence Livermore National Laboratory7University of California, Berkeley
At terapascal pressures (10M atm), forces on atoms and molecules are comparable to their intrinsic quantum forces. Carbon dioxide is a simple molecular species with strong and stable chemical bonds at ambient conditions that exhibits complex phase transition behavior under increasing pressure and temperature. The physical, chemical, and thermodynamic behaviors of simple molecules comprising H, C, O, and N at hundreds of GPa and thousands of kelvin are vital to unraveling the dynamo, convec-tive flow, and evolution of giant planets.1-3 Additionally, CO2 is an important by-product of reacted chemical explosives, and its polarity, conductivity, and diffusivity at high pressure dictate the reactive dynamics of these explosives.4,5 The phase diagram of solid carbon dioxide has been extensively studied with heated diamond-anvil cells (DAC’s) to 120 GPa (Refs. 6-11). This work demonstrates that the warm-dense-fluid regime of CO2 is equally complex up to TPa pressures.
This work uses precompression and laser-driven shocks to explore the CO2 equation of state (EOS) over a wide range of pres-sures and temperatures, extending to 1 TPa (10 Mbar) and 93,000 K (8 eV). CO2 was precompressed to pressures up to 1.16 GPa in DAC’s, attaining both liquid and solid initial states, and was then shock compressed. The temperature–pressure–density internal energy (T, P, t, E) EOS and optical reflectance (R) at 532 nm for these shocks were obtained with a velocity interferometer and an optical pyrometer. These data map a broad range of states from which thermodynamic derivatives were inferred, including the specific heat and the Grüneisen coefficient.
Combining these new data with previous results12-16 and theoretical calculations17 reveals a rich and complex phase diagram for CO2. The shocked fluid exhibits at least three linear slopes in the shock velocity versus particle velocity plane; this may indicate three distinct phases or two phases with a transition region. Optical reflectivity measurements reveal an insulator-to-conductor transition between 100 and 200 GPa with a carrier density of roughly 0.3 electrons/atom. The observed trend in specific heat suggests a complex bonded fluid with increasing molecular degrees of freedom up to 1 TPa as opposed to an atomic fluid. We find that state-of-the-art modeling needs refinement to match the observed reflectivity and compressibility behavior of CO2. High-pressure chemistry was once believed to be rather simple; this work reveals multiform behavior that is potentially quite general, as most of the known matter of the universe exists at high energy density (P > 100 GPa).
These shocked CO2 experiments were performed at the Omega Laser Facility.18 CO2 samples were precompressed to various initial pressures19 using DAC’s20,21 to explore a family of Hugoniots. The velocity of the reflecting shock wave was measured throughout the shock transit of the entire experiment with a dual-channel velocity interferometer system for any reflector (VISAR).22
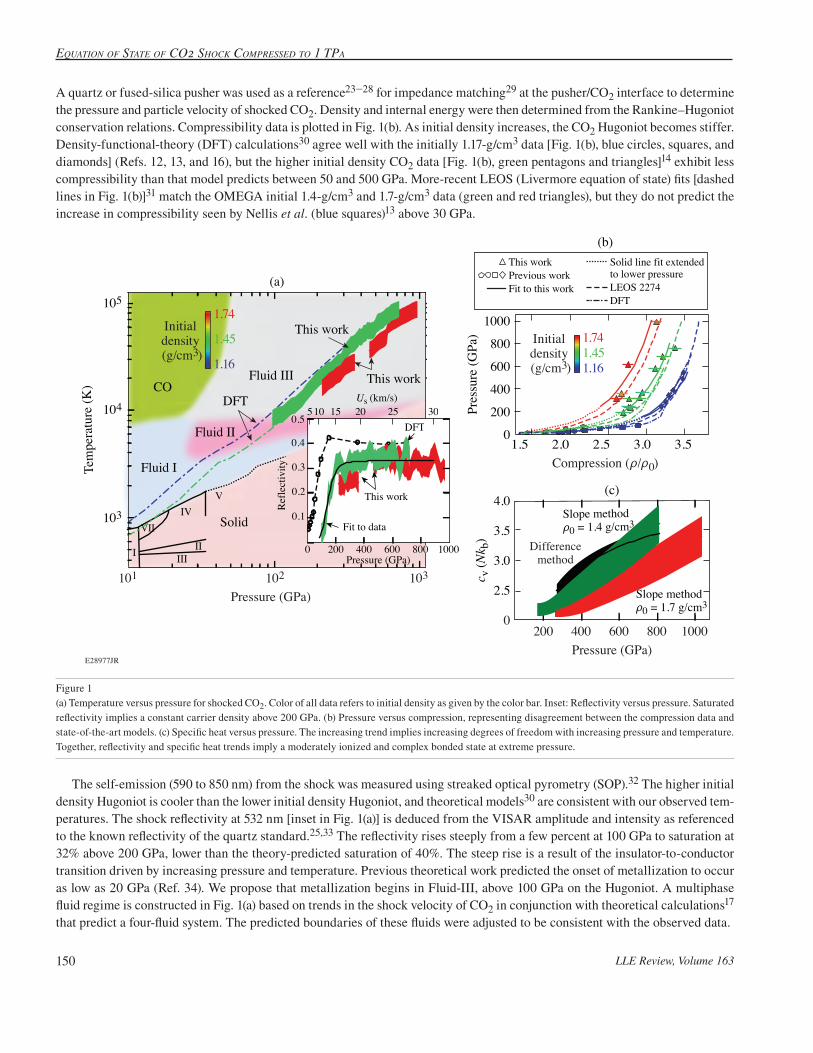
Equation of StatE of Co2 ShoCk ComprESSEd to 1 tpa
LLE Review, Volume 163150
A quartz or fused-silica pusher was used as a reference23-28 for impedance matching29 at the pusher/CO2 interface to determine the pressure and particle velocity of shocked CO2. Density and internal energy were then determined from the Rankine–Hugoniot conservation relations. Compressibility data is plotted in Fig. 1(b). As initial density increases, the CO2 Hugoniot becomes stiffer. Density-functional-theory (DFT) calculations30 agree well with the initially 1.17-g/cm3 data [Fig. 1(b), blue circles, squares, and diamonds] (Refs. 12, 13, and 16), but the higher initial density CO2 data [Fig. 1(b), green pentagons and triangles]14 exhibit less compressibility than that model predicts between 50 and 500 GPa. More-recent LEOS (Livermore equation of state) fits [dashed lines in Fig. 1(b)]31 match the OMEGA initial 1.4-g/cm3 and 1.7-g/cm3 data (green and red triangles), but they do not predict the increase in compressibility seen by Nellis et al. (blue squares)13 above 30 GPa.
E28977JR
Slope methodt0 = 1.7 g/cm3
Slope methodt0 = 1.4 g/cm3
Pressure (GPa)1000800600400200
4.0
3.5
0
3.0
2.5
c v (N
k b)
(b)
(c)
1000
30
Differencemethod
Compression (t/t0)
1.741.451.16
Initial density (g/cm3)
1.5 2.0 2.5 3.0 3.50
200
400
600
800
1000
Pres
sure
(GPa
)
102
Pressure (GPa)
IV
IIIII
VII
I
V
Solid
Fluid I
CO
Fluid II
Fluid III
This work
This work
DFT
Tem
pera
ture
(K)
103101
103
104
105(a)
1.74
1.45
1.16
Initial density (g/cm3)
This work
600400200
0.1
0.2
0.3
0.4
0.5252015105
Us (km/s)
Ref
lect
ivity
0Pressure (GPa)
DFT
Fit to data
This workPrevious workFit to this work
Solid line fit extendedto lower pressure LEOS 2274DFT
800
The self-emission (590 to 850 nm) from the shock was measured using streaked optical pyrometry (SOP).32 The higher initial density Hugoniot is cooler than the lower initial density Hugoniot, and theoretical models30 are consistent with our observed tem-peratures. The shock reflectivity at 532 nm [inset in Fig. 1(a)] is deduced from the VISAR amplitude and intensity as referenced to the known reflectivity of the quartz standard.25,33 The reflectivity rises steeply from a few percent at 100 GPa to saturation at 32% above 200 GPa, lower than the theory-predicted saturation of 40%. The steep rise is a result of the insulator-to-conductor transition driven by increasing pressure and temperature. Previous theoretical work predicted the onset of metallization to occur as low as 20 GPa (Ref. 34). We propose that metallization begins in Fluid-III, above 100 GPa on the Hugoniot. A multiphase fluid regime is constructed in Fig. 1(a) based on trends in the shock velocity of CO2 in conjunction with theoretical calculations17
that predict a four-fluid system. The predicted boundaries of these fluids were adjusted to be consistent with the observed data.
Figure 1(a) Temperature versus pressure for shocked CO2. Color of all data refers to initial density as given by the color bar. Inset: Reflectivity versus pressure. Saturated reflectivity implies a constant carrier density above 200 GPa. (b) Pressure versus compression, representing disagreement between the compression data and state-of-the-art models. (c) Specific heat versus pressure. The increasing trend implies increasing degrees of freedom with increasing pressure and temperature. Together, reflectivity and specific heat trends imply a moderately ionized and complex bonded state at extreme pressure.

HigH-EnErgy-DEnsity PHysics
LLE Review, Volume 163 151
Simultaneous temperature measurements allow one to calculate the isochoric specific heat [Fig. 1(c)]. The slope method33
allows one to calculate the specific heat along the Hugoniot of initially liquid (1.4-g/cm3) and initially solid (1.7-g/cm3) CO2. The specific heat steadily increases from 200 GPa to 1 TPa for both initially liquid and solid CO2. The difference method, independent from the slope method, corroborates the trend of increasing specific heat. Increasing specific heat indicates increasing degrees of freedom (DOF’s) in the fluid; because reflectivity is constant above 200 GPa, the increase in DOF’s is not due to a rising car-rier density. We conclude that the electrically conducting Fluid-III phase consists of a moderately ionized and bonded species of increasing chemical complexity, rather than a simple atomic fluid undergoing increasing ionization.
In summary, this work extends pressure and density measurements of the initially liquid and initially solid CO2 Hugoniot to 1 TPa and provides the first temperature measurements of shocked CO2 to 93,000 K. We propose a fluid phase diagram compris-ing at least three regimes to describe all existing shocked CO2 data. Reflectivity and specific heat trends indicate that at pressures reaching 1 TPa, CO2 is not likely a simple atomic fluid but instead a complex bonded and partially ionized species. Current models do not predict the observed compressibility and metallization behavior of high-pressure CO2. This work demonstrates the rich behavior of nominally simple materials at high energy density and invites further inquiry into the chemistry of warm dense matter.
This material is based upon work supported by the Department of Energy National Nuclear Security Administration under Award Number DE-NA0003856, the University of Rochester, and the New York State Energy Research and Development Authority. A portion of this work was conducted at Lawrence Livermore National Laboratory under Contract Number DE-AC52-07NA27344.
1. T. Guillot, Science 286, 72 (1999).
2. C. Cavazzoni et al., Science 283, 44 (1999).
3. S. Stanley and J. Bloxham, Nature 428, 151 (2004).
4. M. van Thiel and F. H. Ree, J. Appl. Phys. 62, 1761 (1987).
5. V. V. Chaban, E. E. Fileti, and O. V. Prezhdo, J. Phys. Chem. Lett. 6, 913 (2015).
6. K. F. Dziubek et al., Nat. Commun. 9, 3148 (2018).
7. F. Datchi and G. Weck, Z. Kristallogr. 229, 135 (2014).
8. C.-S. Yoo, Phys. Chem. Chem. Phys. 15, 7949 (2013).
9. K. D. Litasov, A. F. Goncharov, and R. J. Hemley, Earth Planet. Sci. Lett. 309, 318 (2011).
10. V. M. Giordano et al., J. Chem. Phys. 133, 144501 (2010).
11. V. M. Giordano, F. Datchi, and A. Dewaele, J. Chem. Phys. 125, 054504 (2006).
12. G. L. Schott, High Press. Res. 6, 187 (1991).
13. W. J. Nellis et al., J. Chem. Phys. 95, 5268 (1991).
14. V. N. Zubarev and G. S. Telegin, Sov. Phys.-Dokl. 7, 34 (1962).
15. Zubarev and Telegin14 report two different initial densities for their solid CO2: 1.45 and 1.54 g/cm3. Cited in Schott12 are “verbal inquires and replies conveyed through C. L. Mader and A. N. Dremin, ca. 1983” that confirm that 1.54 g/cm3 is a misprint, and the initial density of the data published by Zubarev and Telegin is 1.45 g/cm3.
16. S. Root et al., Phys. Rev. B 87, 224102 (2013).
17. B. Boates, A. M. Teweldeberhan, and S. A. Bonev, Proc. Natl. Acad. Sci. 109, 14808 (2012).

Equation of StatE of Co2 ShoCk ComprESSEd to 1 tpa
LLE Review, Volume 163152
18. T. R. Boehly et al., Opt. Commun. 133, 495 (1997).
19. G. J. Piermarini et al., J. Appl. Phys. 46, 2774 (1975).
20. J. Eggert et al., Phys. Rev. Lett. 100, 124503 (2008).
21. P. M. Celliers et al., Phys. Rev. Lett. 104, 184503 (2010).
22. P. M. Celliers et al., Rev. Sci. Instrum. 75, 4916 (2004).
23. M. D. Knudson and M. P. Desjarlais, Phys. Rev. B 88, 184107 (2013).
24. M. P. Desjarlais, M. D. Knudson, and K. R. Cochrane, J. Appl. Phys. 122, 035903 (2017).
25. S. Brygoo et al., J. Appl. Phys. 118, 195901 (2015).
26. C. A. McCoy et al., J. Appl. Phys. 119, 215901 (2016).
27. C. Meade and R. Jeanloz, Phys. Rev. B 35, 236 (1987).
28. R. G. Kraus et al., J. Geophys. Res. Planets 117, E09009 (2012).
29. Ya. B. Zel’dovich and Yu. P. Raizer, in Physics of Shock Waves and High-Temperature Hydrodynamic Phenomena, edited by W. D. Hayes and R. F. Probstein (Dover Publications, Mineola, NY, 2002).
30. B. Boates et al., J. Chem. Phys. 134, 064504 (2011).
31. C. J. Wu et al., J. Chem. Phys. 151, 224505 (2019).
32. J. E. Miller et al., Rev. Sci. Instrum. 78, 034903 (2007).
33. D. G. Hicks et al., Phys. Rev. Lett. 97, 025502 (2006).
34. C. Wang and P. Zhang, J. Chem. Phys. 133, 134503 (2010).

HigH-EnErgy-DEnsity PHysics
LLE Review, Volume 163 153
Shock-Compressed Silicon: Hugoniot and Sound Speed to 2100 GPa
B. Henderson,1,2 M. C. Marshall,1 T. R. Boehly,1 R. Paul,1,3 C. McCoy,4 S. X. Hu,1 D. N. Polsin,1 L. E. Crandall1,2 M. F. Huff,1,2 D. Chin,1,2 J. J. Ruby,1,2 X. Gong,1,3 D. E. Fratanduono,5 J. H. Eggert,5 J. R. Rygg,1,2,3 and G. W. Collins1,2,3
1Laboratory for Laser Energetics, University of Rochester2Department of Physics & Astronomy, University of Rochester
3Department of Mechanical Engineering, University of Rochester4Sandia National Laboratories
5Lawrence Livermore National Laboratory
The behavior of silicon (Si) above millions of atmospheres >100 GPa is important to understand the structure and evolution of terrestrial planets,1–4 as well as the performance of inertial confinement fusion (ICF) capsule designs.5–8 In rocky planets, Si is thought to be intrinsically paired to oxygen and, to a lesser extent, metals since they are prevalent on Earth’s surface. However, it is likely that atomic bonding and compound formation are quite different at the extreme pressures expected in super-Earth-like planets.9 In direct-drive ICF target designs, materials are selected based on a variety of properties at pressures exceeding several TPa (Ref. 5). Si has been proposed as a dopant for plastic shells8 to mitigate laser imprint and Rayleigh–Taylor instabilities. While there has been significant work understanding the behavior of carbon10–13 at TPa pressures, very little is understood about its group-14 analog, Si, at these extreme conditions.
Principal Hugoniot and sound-speed data are presented for silicon shocked to 320 to 2100 GPa. These Hugoniot data exhibit a different us–up slope (S = 1.26!0.06) from the measurements of Ref. 14 (S = 1.80!0.10) at lower pressures (80 to 200 GPa). A change in Hugoniot slope can point to a significant structural change in the material, e.g., solid–solid phase transitions or melt-ing,15,16 dissociation,17 or ionization.18,19 Quantum molecular dynamics (QMD) simulations performed at various points along silicon’s principal Hugoniot predict an increase in ionic coordination and ionization of the 3s2 electron that is concurrent with the observed change in slope. Sound speeds were determined by time correlating the arrival of imposed acoustic perturbations at the shock front. The isentropic sound speed cs of shock-compressed silicon was determined to be 15 to 23 km/s in the 5.7- to 7.6-g/cm3 density range.
Experiments were conducted on the OMEGA EP Laser System.20 Targets were irradiated by one to four 351-nm laser beams directly onto a parylene-n (CH) ablator, producing strong shock waves that compress the planar samples. These experiments used laser intensities of 30 to 305 TW/cm2 produced by 4- and 5-ns temporally square and ramp-top laser pulses with spot sizes of approximately 1100 or 1800 nm. A portion of these experiments had preimposed acoustic perturbations on adjacent sides of the target stack, enabling a sound-speed determination.
The Hugoniot results are plotted in Fig. 1. Shock and particle velocity data from this work and four data points from Ref. 14 are fit separately using a weighted linear regression (method described in Ref. 21). This study is restricted to the high-pressure, single-wave regime, where shocked silicon does not form elastic and inelastic precursors; only Hugoniot data with pressure greater than 80 GPa are included in the fit. Functional forms were compared through a general linear F-test criterion, evaluated at the 1v probability cutoff. An additional Bayesian statistical inference method was used for model selection, comparing a bilinear model against global linear and quadratic models through the Bayes factor. Accordingly, the bilinear model best represents silicon’s

Shock-compreSSed Silicon: hugoniot and Sound Speed to 2100 gpa
LLE Review, Volume 163154
E29059JR
5 410 15 20 25Particle velocity (km/s)
10
103
102
15
20
25
30
35
40Sh
ock
velo
city
(km
/s)
Pres
sure
(GPa
)
5 6 7 8 9Density, t (g/cm3)
(a) (b)
–100
10 D
iffer
ence
(%)
5 10 15 20 25
Breakpoint inbilinear fit
Breakpoint in bilinear
fit
This workBilinear us – up fit Single-crystal [100]14 SESAME 381022DFT-based FPEOS23LEOS 14124,25XEOS 14024,25
response to shock compression for shock pressures greater than 80 GPa. Using a |2 minimization, the breakpoint between the two linear regions was found at up,break = 6.5 km/s.
Theoretical calculations have played an important role in explaining observed changes in physical properties of high-energy-density materials.26-34 Changes in the Hugoniot slope are typically associated with ionic or electronic rearrangement. To better understand the physical mechanisms driving the change in Hugoniot slope for liquid silicon, density functional theory (DFT)-based QMD simulations were performed to examine changes in ionic coordination under shock compression. DFT-based QMD simulations suggest that the experimentally observed change in Hugoniot slope is coincident with an increase in ionic coordina-tion and ionization of the 3s2 electron.
This material is based upon work supported by the Department of Energy National Nuclear Security Administration under Award Number DE-NA0003856, the University of Rochester, and the New York State Energy Research and Development Authority.A portion of this work was performed under the auspices of the U.S. Department of Energy by Lawrence Livermore National Laboratory under Contract No. DE-AC52-07NA27344 and Sandia National Laboratories under Contract No. DE-NA0003525.
1. E. J. Davies et al., J. Geophys. Res.: Planets 125, e2019JE006227 (2020).
2. J. E. Chambers, Icarus 152, 205 (2001).
3. A. Benuzzi-Mounaix et al., Phys. Scr. 2014, 014060 (2014).
4. Y. Zhang et al., Geophys. Res. Lett. 41, 4554 (2014).
5. R. S. Craxton et al., Phys. Plasmas 22, 110501 (2015).
6. V. N. Goncharov et al., Phys. Plasmas 21, 056315 (2014).
7. G. Fiksel et al., Phys. Plasmas 19, 062704 (2012).
Figure 1Silicon principal Hugoniot in (a) shock velocity us versus particle velocity up space and (b) pressure P versus density t space. Only dynamic compression data above 80 GPa, the single-wave compression regime in shocked silicon, are shown. Experimental data from this work (blue squares) and Ref. 14 (black circles) are fit with a bilinear functional form (dashed blue line) with a breakpoint at up = 6.5 km/s (solid blue line). A 1v functional prediction band is shown as the shaded region surrounding the fit. Data is compared with Hugoniots from SESAME 3810 (red dotted curve),22 DFT-based FPEOS (pink curve),23 LEOS 141 (dashed–dotted green curve) and XEOS 140 (dashed–dotted yellow curve).24,25 Inset in (a): Percent difference in shock velocity with respect to this work’s us–up fit. FPEOS shows the best agreement with the experimental Hugoniot. The legend in (b) also corresponds to (a).

HigH-EnErgy-DEnsity PHysics
LLE Review, Volume 163 155
8. S. X. Hu et al., Phys. Rev. Lett. 108, 195003 (2012).
9. H. Niu et al., Sci. Rep. 5, 18347 (2015).
10. R. F. Smith et al., Nature 511, 330 (2014).
11. D. G. Hicks et al., Phys. Rev. B 78, 174102 (2008).
12. D. K. Bradley et al., Phys. Rev. Lett. 93, 195506 (2004).
13. M. C. Gregor et al., Phys. Rev. B 95, 144114 (2017).
14. M. N. Pavlovskii, Sov. Phys.-Solid State 9, 2514 (1968).
15. O. Strickson and E. Artacho, Phys. Rev. B 93, 094107 (2016).
16. R. Paul, S. X. Hu, and V. V. Karasiev, Phys. Rev. Lett. 122, 125701 (2019).
17. W. J. Nellis et al., J. Chem. Phys. 94, 2244 (1991).
18. J. Eggert et al., Phys. Rev. Lett. 100, 124503 (2008).
19. R. F. Trunin, Phys.-Usp. 37, 1123 (1994).
20. D. D. Meyerhofer et al., J. Phys.: Conf. Ser. 244, 032010 (2010).
21. P. M. Celliers et al., J. Appl. Phys. 98, 113529 (2005).
22. D. E. Fratanduono et al., Phys. Rev. B 94, 184107 (2016).
23. B. Boates et al., J. Chem. Phys. 134, 064504 (2011).
24. J. Zhang et al., J. Appl. Phys. 114, 173509 (2013).
25. Y. Zhang et al., J. Chem. Phys. 135, 064501 (2011).
26. Y. Zhang, C. Wang, and P. Zhang, Phys. Plasmas 19, 112701 (2012).
27. S. Root et al., Phys. Rev. B 87, 224102 (2013).
28. R. J. Magyar, S. Root, and T. R. Mattsson, J. Phys.: Conf. Ser. 500, 162004 (2014).
29. T. R. Mattsson et al., Phys. Rev. B 90, 184105 (2014).
30. D. Li, P. Zhang, and J. Yan, J. Chem. Phys. 139, 134505 (2013).
31. G. I. Kerley, Kerley Publishing Services, Albuquerque, NM, Report KPS96-8 (September 1996).
32. S. X. Hu et al., Phys. Rev. E 95, 043210 (2017).
33. D. A. Young and E. M. Corey, J. Appl. Phys. 78, 3748 (1995).
34. R. M. More et al., Phys. Fluids 31, 3059 (1988).
Thermal effecTs on The elecTronic ProPerTies of sodium elecTride under high Pressures
LLE Review, Volume 163156
Thermal Effects on the Electronic Properties of Sodium Electride Under High Pressures
R. Paul,1,2 S. X. Hu,1 V. V. Karasiev,1 D. N. Polsin,1 and S. A. Bonev3
1Laboratory for Laser Energetics, University of Rochester2Department of Mechanical Engineering, University of Rochester
3Lawrence Livermore National Laboratory
Despite being one of the simplest alkali metals at ambient pressure and temperature conditions, sodium exhibits a remarkably complex behavior under compression. The transition from lower-pressure metallic phases to the electride hP4 phase commences at approximately 160 GPa. This phase is structurally similar to a double hexagonal close-packed (dhcp) structure but has a higher compression along the c axis (c/a = 1.391) compared to the ideal dhcp (c/a = 3.266) at 320 GPa (Ref. 1). Due to the existence of a band gap, this phase has been described as a transparent insulator, deviating from the reflective metallic behavior observed at lower pressures. However, all diamond-anvil-cell (DAC) experiments performed on sodium at such pressures have been along the T . 300 K isotherm, while accompanying calculations were performed for static, nonthermalized crystals. To address the lack of systematic studies on the effects of thermal excitations on the electronic properties of electride sodium, we used density functional theory (DFT) to perform molecular dynamics (MD) and electro-optical calculations.
Canonical ensemble MD simulations were performed along different isochores while gradually increasing the ensemble temperature. This is termed as the “heat-until-melt” method, and the temperature regulation was attained using a Nosé–Hoover thermostat. The resulting melt curve for the tI19- and hP4-to-liquid transition demonstrates a monotonically increasing behavior as pressure increases, as can be seen in Fig. 1(a). Formerly, in order to establish the insulator nature of the phase, the orthonormalized single-particle Kohn–Sham orbitals nW
KS were used to construct the one-particle density operator, which in turn was used to create the real-space, one-particle density matrix , .expr r r r- -+t cl l^ _h i For normal insulators c ? E1/2 and for semiconductors c ? E, where E is the band-gap energy.2 Along the t = 5.872-g/cm3 isochore, our analyses indicate that t(r,rl) varies with a band-gap exponent c of 0.460, 0.438, 0.421, and 0.414 at T = 300 K, 700 K, 1200 K, and 1800 K, respectively. Therefore, the hP4 phase of sodium behaves like an insulator and not a semiconductor, when quantitatively analyzed using the nearsightedness of the density matrix as a criterion.
The band gaps obtained from the electronic density-of-state (DOS) calculations show a gradual decrease with increasing temperatures along the t = 5.872-g/cm3 isochore until it abruptly decreases to zero upon melting, as shown in Fig. 1(b) for vari-ous exchange-correlation functionals. At T = 300 K, the calculated band gap was in the range of 1.54 eV (SCAN-L) to 1.84 eV Perdew–Burke–Ernzerhof (PBE), which corresponds to a photon wavelength of 673.83 nm (PBE) to 805.09 nm (SCAN-L). For wavelengths shorter than this threshold, hP4 sodium would exhibit reflectivity resembling that of an optical insulator.
Taking a closer look into the electronic charge distributions, it can be seen that one exceptional feature of high-pressure electrides is the localization of electrons in the interstices between ions, which leads to the formation of pockets with an electron localiza-tion function (ELF) value of near unity existing as pseudoanions. The hP4 phase of sodium exhibits such features, resulting in an insulating behavior owing to the band gap that develops from such an electronic distribution. This is true all the way up to the melt point, beyond which, using a priori knowledge from the band gap, one would expect these localization features to almost completely disappear and the system to transform into a near free electron (NFE)-type metallic liquid with ELF . 0.5. This is not seen to be the case, however, and even though the liquid phase is metallic, electron bubbles with paired localization exist in

HigH-EnErgy-DEnsity PHysics
LLE Review, Volume 163 157
TC15323JR
100 200 500Pressure (GPa)
0
1000
2000
3000
4000Te
mpe
ratu
re (K
)
bcc hP4
Liquid
tI19tI19
Gregoryanz et al.3PBE: discrete dataPBEsol: discrete dataSCAN-L: discrete dataSCAN-L: Kechin fitPBE + QHA:solid–solid phase boundary
oP8oP8 0.0
0.5
1.0
1.5
2.0
Ban
d ga
p (e
V)
0Temperature (K)
(b)(a)
2000 4000
SCANSCAN-LPBEPBEsolTmelt, SCAN-LTmelt, PBE
fcccI16
T = 300 K T = 1800 K T = 2500 K > Tm,P = 357.8 GPa
T = 5000 K > Tm
(c)
1
0
IonsElectron bubbles
Figure 1(a) The T–P phase diagram of sodium from literature3 combined with our work, with the existing melt curve data plotted. The tI19–hP4 phase boundary was constructed by comparing the Gibbs free energy computed by combining DFT and quasiharmonic approximated (QHA) phonon calculations. The uncertainty for the six isochoric melt data points, calculated using SCAN-L, are 20, 35, 90, 115, 145, and 140 K, respectively, calculated using five separate sets of MD calculations, with differing starting solid geometry, for each isochore. (b) The evolution of the band gap with temperature during heating along the t = 5.872-g/m3 isochore demonstrates the abrupt closing of the band gap on melting at Tm + 2100 to 2200 K, corresponding to an insulator-to-metal transition. Four sets of data corresponding to different exchange-correlation functionals: PBE, PBEsol, SCAN, and SCAN-L have been shown. (c) Planar static ELF on the (001) plane along the t = 5.872-g/cm3 isochore, which shows the existence of paired interstitial electron bubbles (red) even beyond the melt point (Tm + 2100 to 2200 K).
tandem with a NFE distribution. The (001) planar ELF along the t = 5.872-g/cm3 isochore clearly exhibits localized clusters of paired electrons, in the form of electron bubbles with 0.8 < ELF < 1.0, that persist even beyond the melt point, as can be seen in Fig. 1(c). Rough estimation of the total number of electrons in certain pseudoanionic attractor regions yields a value of 1.91 to 2.0 in the solid phase and 1.77 to 1.94 in the liquid phase. This implies that the ELF attractors in the liquid phase are paired as well. Since planar cross-sectional representation of volumetric data can be misleading, we also calculated the all-volume, charge-weighted ELF histograms. Such an analysis also showed an abundant existence of regions with ELF > 0.8 in the liquid phase. However, increased temperatures along any isochore gradually dissipates these electron bubbles and the liquid ultimately reverts back to a NFE liquid beyond 5000 K.
Whereas in the solid state, interstitial electrons are predominantly p–d hybridized, two separate phenomena take place upon melting: (a) the thermal disorder in the ionic configuration in liquids, vis-à-vis solids, leads to delocalization of the p electrons from the p–d hybridized ELF attractors, alongside drastically increasing the s character and (b) delayed plasmon onset for the d electrons, compared to s and p electrons, due to higher effective mass caused by more localization. The combination of these

Thermal effecTs on The elecTronic ProPerTies of sodium elecTride under high Pressures
LLE Review, Volume 163158
two effects reduces the contribution of the localized d electrons in the liquid-phase electron bubbles, despite being coalescent, to electro-optical properties and prevents such electrons from hybridizing. This also results in a change in hybridization from p–d to s–p upon melting. Electro-optical properties calculated using the Kubo–Greenwood formula also show this insulator-to-metal transition upon melting. In essence, the hP4 phase of sodium exhibits a decrease in band gap with thermalization, culminating in an insulator-to-metal transition upon melting, accompanied by the formation of residual electron bubbles and a change in electronic hybridization.
This material is based upon work supported by the Department of Energy National Nuclear Security Administration under Award Number DE-NA0003856, the University of Rochester, and the New York State Energy Research and Development Authority.
1. Y. Ma et al., Nature 458, 182 (2009).
2. S. Ismail-Beigi and T. A. Arias, Phys. Rev. Lett. 82, 2127 (1999).
3. E. Gregoryanz et al., Phys. Rev. Lett. 94, 185502 (2005).

Diagnostic science anD Detectors
LLE Review, Volume 163 159
Optimization of a Short-Pulse–Driven Si Hea Soft X-Ray Backlighter
C. Stoeckl,1 M. J. Bonino,1 C. Mileham,1 S. P. Regan,1 W. Theobald,1 T. Ebert,2 and S. Sander2
1Laboratory for Laser Energetics, University of Rochester2Technical University of Darmstadt
Backlighting is a powerful method to interrogate the plasma density distribution in high-energy-density plasma experiments. A high backlighter brightness is not only important to maximize the photon-counting statistics, but it also helps to minimize the background from the self-emission of the plasma object. Backlighting high-performance layered cryogenic DT implosions1 is especially challenging because of the strong self-emission from the hot core of the stagnated assembly and the low opacity of DT. This requires a soft x-ray backlighter with a photon energy of less than 2 keV, which is close to the maximum of the self-emission spectrum for cryogenic implosions on OMEGA.1
A number of approaches are described in literature to increase the brightness of laser-driven x-ray backlighters. Some experi-ments have used low-density foams;2,3 others employed prepulses to increase the plasma density scale length.3,4 Some groups used V-shaped or cylindrical targets to create a cavity to absorb reflected laser light.3,5 These ideas were tested on the OMEGA EP laser6 at energies of the order of +1 kJ and +20-ps pulse length. Figure 1 shows the illumination geometry of the backlighter targets used for these experiments.
An extensive suite of diagnostics was used to evaluate the improvements from each of these three approaches. The time-inte-grated x-ray emission spectrum from the backlighter target was measured using a flat crystal x-ray spectrometer.7 The temporal history of the x-ray emission from the backlighter targets was recorded using an ultrafast x-ray streak camera.8 To observe the effect of the different backlighter configurations on the number of photons that can be used for imaging, the shaped crystal imager (SCI) on OMEGA EP was run in the Si Hea configuration9 for some of the backlighter tests. The best backlighter configuration was fielded on OMEGA to radiograph cryogenic DT implosions. In these experiments the data are recorded on a fast (+40-ps) time-gated x-ray framing camera.10
The data from the low-density (20-mg/cm3 and 100-mg/cm3) SiO2 foam targets showed some changes in the shape of the hot K-shell spectrum but no significant increase in x-ray emission. In its optimum configuration (50 J of UV laser energy, 100-ps
Si target
Stalk
CH shield(optional)
E29084JR
Figure 1Illumination geometry for the backlighter targets.

OptimizatiOn Of a ShOrt-pulSe–Driven Si hea SOft X-ray Backlighter
LLE Review, Volume 163160
pulse duration, 1 ns before the short pulse, 400-nm distributed phase plate defocus) the prepulse experiment showed an +5# improvement in time-integrated emission. However, time-resolved measurement showed a large tail in the x-ray emission lasting more than 300 ps, making this setup not suitable for the 40-ps, time-gated cryo backlighting application. The targets with the CH shield showed the best performance, with a 5 to 10# improvement in time-integrated emission of the Si Hea line compared to a simple solid target (see Fig. 2). The duration of +25 ps for the main x-ray emission pulse was only marginally longer than the emission from the flat target (20 ps). In addition a low-level “afterglow” that lasted for a few 100 ps was observed. Tests with the time-integrated narrowband (+10 eV) SCI system showed an improvement consistent with the time-integrated spectral measure-ment. To evaluate the effect of the afterglow, one experiment was performed with the 40-ps time-gated SCI system, which as expected showed a small reduction of the benefit of the “shield” target to +6# over a flat target.
To help guide future experiments, the conversion efficiency from laser light into Si Hea photons was inferred from the time-integrated spectra and the time-integrated SCI measurements. Both instruments gave similar values of the order of 1 # 10-5.
This material is based upon work supported by the Department of Energy National Nuclear Security Administration under Award Number DE-NA0003856, the University of Rochester, and the New York State Energy Research and Development Authority.
1. C. Stoeckl et al., Phys. Plasmas 24, 056304 (2017).
2. C. M. Huntington et al., Rev. Sci. Instrum. 83, 10E114 (2012).
3. F. Girard, Phys. Plasmas 23, 040501 (2016).
4. M. Afshari et al., Struct. Dynam. 7, 014301 (2020).
5. H.-S. Park et al., Phys. Plasmas 13, 056309 (2006).
6. C. Stoeckl et al., Fusion Sci. Technol. 49, 367 (2006).
7. D. B. Thorn et al., Rev. Sci. Instrum. 89, 10F119 (2019).
8. C. Stoeckl et al., Bull. Am. Phys. Soc. 52, BAPS.2007.DPP.CO6.2 (2007).
9. C. Stoeckl et al., Rev. Sci. Instrum. 83, 033107 (2012); C. Stoeckl et al., Rev. Sci. Instrum. 83, 10E501 (2012).
10. C. Stoeckl et al., Rev. Sci. Instrum. 85, 11E501 (2014).
E29092JR
24002200Energy (eV)
Sign
al (P
SL)
20001800
80
60
20
40
0
Solid (shot 25684)Solid + 50 J UV (shot 25686)Solid + shield (shot 25690)
Hea
Figure 2K-shell spectra from targets with and without shield compared to data from experiments with a 50-J UV prepulse.
Diagnostic science anD Development
LLE Review, Volume 163 161
High-Resolution X-Ray Radiography with Fresnel Zone Plates on the OMEGA and OMEGA EP Laser Systems
F. J. Marshall,1 S. T. Ivancic,1 C. Mileham,1 P. M. Nilson,1 J. J. Ruby,1 C. Stoeckl,1 B. S. Scheiner,2 and M. J. Schmitt2
1Laboratory for Laser Energetics, University of Rochester2Los Alamos National Laboratory
In this summary we report on the development of, along with the results from, the use of Fresnel zone plates (FZP’s) to image x rays emitted by laser-generated plasmas on the OMEGA and OMEGA EP Laser Systems.1,2 An FZP manufactured by Applied Nanotools3 was used in this work. The FZP specifications are a 284.9 nm outer diameter, 512 zones, a 140-nm outermost zone width, and a resulting focal length of 151.86 mm for an energy of 4.750 keV (Ti Hea resonance line). The FZP zone bars con-sisted of 1.3-nm-thick Au bars on a 1.0-nm-thick Si3N4 support membrane. For an example distance from object to image of L = 3708.4 mm, calculated values are then p = 158.65 mm, q = 3549.75 mm, and M = 22.37. At best focus, for a single-line energy, the FZP resolution is given by the diffraction limit d = 1.22Drn, where Drn is the width of the outermost zone.4 For the above example FZP, this implies a best single-line resolution of 171 nm. A range of possible resolutions is obtainable, limited not by the FZP, but by the detector. As an example, for a magnification of +20, the best obtainable resolution with a CCD (charge-coupled device) having 13.5-nm pixels is when the feature can be discerned by only two pixels (Nyquist limit), yielding a resolution limit of d(CCD) . 27 nm/20 = 1.35 nm. Other example detector resolutions of those used on OMEGA and OMEGA EP are d(film) . 10 to 20 nm, d(image plate) . 90 nm, and d(framing camera) . 50 to 60 nm. The higher the magnification, the better for these cases since all can severely compromise the resolution obtained at low magnification.
A resolution grid test was performed on the OMEGA EP target chamber using the same FZP assembly. The FZP was positioned to be focused on a grid placed at target chamber center, with a Ti foil 5 mm behind the grid. A pulsed OMEGA EP beam with 1 kJ of UV (351-nm) light in a 0.5-ns pulse was used to generate Ti Hea x rays. The magnification of the arrangement was M = 22.37, with L = 3708.4 mm, p = 158.65 mm, q = 3549.8 mm, and f = 151.86 mm, respectively, corresponding to the focus for Ti Hea x rays. The grid, which consisted of 6-nm-wide by 20-nm-thick Au bars, spaced by 25 nm, was covered by a 25-nm-thick Ta foil into which a 100-nm-diam aperture (mask) was laser cut. Figure 1(a) shows the grid image obtained with an SI800 CCD. A lineout through the image is shown in Fig. 1(b); Fig. 1(c) shows the line spread function (LSF) calculated by taking the derivative of the lineout. When averaging over eight edges, the width of the features implies an LSF full width at half maximum (FWHM) of 1.62!0.31 nm. In this case the Nyquist limit is 27 nm/22.39 = 1.19 nm, implying that the resolution obtained is partly detector limited and partly by spectral content, provided that the focus positioning was otherwise effectively perfect.
A series of experiments known as the Revolver experiments,5 whose principal investigators are the Los Alamos National Laboratory co-authors of this summary, were performed on the OMEGA target chamber. Fe backlighters were used to radiograph a set of concentric, double-shell implosions, where the outer shell was +1200 nm in diameter and the inner shell was +400 nm in diameter. The inner shell consisted of a 15- to 2-nm-thick Cr shell, held in place by a two-photon polymerization, 3-D–printed lattice with a volume-averaged density of 50 to 200 mg/cm3. The outer 25-nm-thick CH shell was driven by 40 beams with 11.4 kJ of UV light in a 1-ns pulse. Two backlighter foils were used per double-shell implosion. One foil backlit a pinhole array in front of a framing camera, and the other backlit the single FZP in front of a framing camera. The Fe-foil backlighters had principal line emission of the He-like line at 6.701 keV. Six beams were used to illuminate the pinhole-imaged framing camera backlighter and eight beams for the FZP-imaged framing camera backlighter. All backlighter beams were +423 J/beam in a 1-ns pulse. Figure 2 shows a qualitative comparison between an Fe backlit image obtained with the pinhole arrays and an image

HigH-Resolution X-Ray RadiogRapHy witH FResnel Zone plates on tHe oMega and oMega ep laseR systeMs
LLE Review, Volume 163162
Figure 1FZP image of a backlit grid obtained on OMEGA EP shot 30382 using a Ti-foil backlighter (4.75 keV). (a) CCD image of the grid with a 100-nm-diam mask over the grid; (b) lineout through the grid showing the grid bar shadows; (c) LSF (derivative) from which the resolution of 1.62!0.31 nm is inferred.
Figure 2Comparison of a framed FZP image and pinhole image of a Revolver double-shell implosion on OMEGA, each backlit by Fe-foil emission (6.70 keV) at t = 4.5 ns. (a) The FZP image, (b) the pinhole image, and (c) the FZP image blurred to the resolution of the pinhole image.
Dx = 1.62!0.31 nm (average over eight edges)
(c)
0
50 100 150 200
E29054JR
0Distance (nm)
–1
Sign
al d
eriv
ativ
e(a
rbitr
ary
units
)
1
kAD
U
(a)75 nm
10
20
0
Distance (nm)1000 200
(b)
E29058JR
(a) XRFC1 in TIM-4 with FZP(b) SFC4 TIM-3
with 15-nm pinholes(c) FZP image degraded
to pinhole resolution
400 nm 400 nm400 nm
This material is based upon work supported by the Department of Energy National Nuclear Security Administration under Award Number DE-NA0003856, the University of Rochester, and the New York State Energy Research and Development Authority.
1. T. R. Boehly et al., Opt. Commun. 133, 495 (1997).
2. L. J. Waxer et al., Opt. Photonics News 16, 30 (2005).
3. Applied Nanotools Inc., NRC-NANO Building, Edmonton, Alberta T6G 2M9, Canada.
4. A. G. Michette, Optical Systems for Soft X Rays (Plenum Press, New York, 1986).
5. B. Scheiner et al., Phys. Plasmas 26, 072707 (2019).
obtained with the FZP. The image from the FZP is shown in Fig. 2(a) and the pinhole image in Fig. 2(b) (both at t = 4.5 ns). Whereas the expected resolution of the framed FZP image is +3.3 to 4.0 nm, the pinhole image was acquired with a 15-nm-diam pinhole dph at a magnification of 4. The two ten-inch–manipulator (TIM)-based framing cameras were nearly orthogonal to each other on the target chamber sphere, so only a qualitative comparison between the resolution of features is possible. The pinhole image was geometrically limited to a resolution of . .mM d M1 18 75ph n+ =_ i The framing camera increases that to +22.5 to 27.0 nm when taken in quadrature. Figure 2(c) shows the FZP image blurred to the approximate resolution of the pinhole image dramatically illustrating the loss of detail in the pinhole image as compared to the FZP image.

Laser TechnoLogy and deveLopmenT
LLE Review, Volume 163 163
Overcoming Gas Ionization Limitations with Divided-Pulse Nonlinear Compression
G. W. Jenkins, C. Feng, and J. Bromage
Laboratory for Laser Energetics, University of Rochester
Nonlinear compression in gas-filled hollow-core fiber (HCF) has been very successful for the spectral broadening and subse-quent temporal compression of high-average-power Yb systems to +10-fs pulses. Pulse energy in an HCF is limited, however, by self-focusing and ionization.1 In this summary, we examine the limits on HCF energy scaling and simulate a method to overcome those limits: divided-pulse nonlinear compression.
In HCF nonlinear compression, a glass cladding guides light within a gas-filled hollow core. The gas provides the nonlinear-ity to broaden the pulse’s spectrum through self-phase modulation, and after the fiber, the pulse can be compressed to a shorter duration with devices such as chirped mirrors and prisms.2 Self-focusing can be controlled by reducing the nonlinear index of the gas as the peak power of the pulse is increased.3,4 The gas pressure is a convenient variable to tune the nonlinear index and can be set to keep >90% of the power in the fundamental mode. Ionization is controlled with fiber diameter. At small diameters, the peak intensity is high enough to ionize gas and give rise to plasma effects. A small-diameter fiber is optimal for maximum spectral broadening, as long as plasma effects remain small.
To overcome ionization limits, we have simulated divided-pulse nonlinear compression (DPNLC), as depicted in Fig. 1(a). The intensity of the divided pulses will be lower than the intensity of the single pulse so smaller fibers can be used without ionizing the gas. We simulated a 10-mJ, 1-ps (FWHM) pulse centered at a 1030-nm wavelength, propagating through a 1.8-m, xenon-filled HCF with a model adapted from Horak and Poletti.5 We set the gas pressure to half the value given by Tempea and Brabec3 and varied the fiber radius to vary the strength of plasma effects.
Simulations with one pulse show significant energy loss from plasma effects, as shown in Fig. 1(b). Due to intrinsic fiber losses, some energy loss is unavoidable, and the ideal pulse would only lose energy to the intrinsic loss of the fundamental mode. The ideal energy is plotted as a black dotted line for reference. The output energy tracks the ideal energy line well for large fiber diameters, but with the onset of ionization around 550 nm, there is a sharp loss of energy. Using two pulses shifts the onset of ionization to a diameter of around 400 nm, and using four pulses shifts the onset to around 300 nm. Figure 1(c) plots all loss channels for the two-pulse simulation and shows that energy losses are dominated by linear fiber losses and recombination losses. The linear fiber losses increase after the onset of ionization because the generated plasma defocuses the pulse.6 The HCF lacks total internal reflection, so it fails to confine the defocused pulse. Recombination losses increase because the trailing pulses pass through a gas–plasma mixture ionized by the first pulse and acquire phase artifacts from the index difference. Those phase artifacts appear as interference between the pulses when they are recombined and are removed by the polarizer. By shifting the onset of ionization to smaller fiber diameters, these losses can be avoided and the spectral broadening can be increased.
The ultimate figure of merit that demonstrates improvements from DPNLC is the peak power of the compressed pulse. We assumed we could compensate Kerr and plasma effects with up to second-order spectral phase during compression and plotted the peak power in Fig. 2. Because smaller-diameter fibers provide more spectral broadening, the general trend is that the smaller

OvercOming gas iOnizatiOn LimitatiOns with DiviDeD-PuLse nOnLinear cOmPressiOn
LLE Review, Volume 163164
Figure 1(a) Schematic of DPNLC with four pulses. Birefringent plates with extraordinary axis “e” and ordinary axis “o” can be used to separate the pulses temporally, and identical birefringent plates and a polarizer recombine the pulses. Red arrows indicate the pulse’s polarization. (b) Simulated output energy after HCF and recombination for a range of fiber diameters. Onset of ionization is clearly visible and results in large energy losses. (c) Simulated energy losses for two divided pulses. The majority of energy loss is due to plasma-defocusing-induced linear and recombination losses.
G13097JR
HCF
PolarizerBirefringent plates Birefringent plates
eo e
o oe e o
0 100 200 300 400 500 600 700Fiber diameter (nm)
0 0
2
4
6
8
10
Rec
ombi
ned
ener
gy (m
J)
0 100 200 300 400 500 600 700Fiber diameter (nm)
2
4
6
8
10
Ener
gy lo
sses
(mJ)
(c)(b)
(a)
Fundamental mode lossLinear lossesIonization lossesRecombination losses
Intrinsic lossesOne pulseTwo pulsesFour pulses
Figure 2Peak power after recombination and compression with up to second-order spec-tral phase. Energy improvements from DPNLC give a significant improvement in peak power, with 60 GW achievable with one pulse improved to 90 GW with four pulses.
G13102JR
0 100 200 300 400 500 600 700Fiber diameter (nm)
0
20
40
60
80
100
Peak
pow
er (G
W)
One pulseTwo pulsesFour pulses
fibers give a higher peak power as long as plasma effects are avoided. Plasma effects decrease the energy more than a small diameter and increase the bandwidth, so the peak power falls after the onset of ionization. DPNLC improves the optimum peak power achievable from 60 GW with one pulse to about 90 GW with four pulses.

FY20 Q3 Laser FaciLitY report
LLE Review, Volume 163166
FY20 Q3 Laser Facility Report
J. Puth, M. Labuzeta, D. Canning, and R. T. Janezic
Laboratory for Laser Energetics, University of Rochester
During the third quarter of FY20, the Omega Laser Facility was in safe stand-down for eight weeks, with additional weeks of recovery activities due to the COVID-19 pandemic and associated state regulations. During the remaining weeks of the quarter, the facility conducted 89 target shots on OMEGA and 69 target shots on OMEGA EP for a total of 158 target shots (see Tables I and II). OMEGA averaged 9.3 target shots per operating day, averaging 84.9% Availability and 99.4% Experimental Effectiveness. OMEGA EP averaged 8.3 target shots per operating day, averaging 92.5% Availability and 99.2% Experimental Effectiveness.
During this quarter, the system was fitted with additional computer resources and audio/video equipment to facilitate remote principal investigator collaboration with the shot crew, enabling experiments to proceed during social distancing. The Control Rooms were rearranged to maximize operator separation, and protocol was enhanced to minimize the passing of paper and equipment. At this time, LLE continues to operate with a decreased personnel density by maximizing work from home.
Table I: OMEGA Laser System target shot summary for Q3 FY20.
Program LaboratoryPlanned Number of Target Shots
Actual Number of Target Shots
ICF LLE 38.5 36
ICF Subtotal 38.5 36
HED LLE 11 13
LLNL 22 23
HED Subtotal 33 36
NLUF 11 14
Calibration LLE 0 3
Grand Total 82.5 89
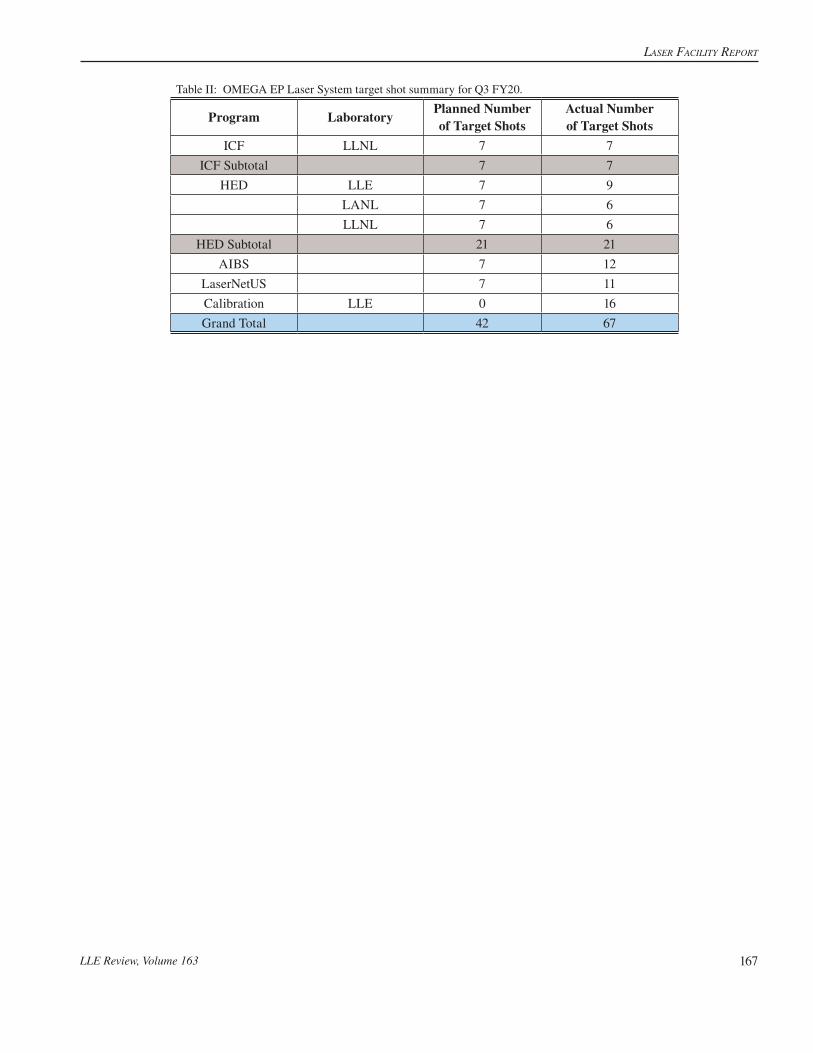
Laser FaciLity report
LLE Review, Volume 163 167
Table II: OMEGA EP Laser System target shot summary for Q3 FY20.
Program LaboratoryPlanned Number of Target Shots
Actual Number of Target Shots
ICF LLNL 7 7
ICF Subtotal 7 7
HED LLE 7 9
LANL 7 6
LLNL 7 6
HED Subtotal 21 21
AIBS 7 12
LaserNetUS 7 11
Calibration LLE 0 16
Grand Total 42 67

InertIal ConfInement fusIon
LLE Review, Volume 164 169
Direct-Drive Laser Fusion: Status, Plans, and Future
E. M. Campbell,1 T. C. Sangster,1 V. N. Goncharov,1 J. D. Zuegel,1 S. F. B. Morse,1 C. Sorce,1 G. W. Collins,1 M. S. Wei,1 R. Betti,1 S. P. Regan,1 D. H. Froula,1 C. Dorrer,1 D. R. Harding,1 V. Gopalaswamy,1 J. P. Knauer,1 R. C. Shah,1 O. M.
Mannion,1 J. A. Marozas,1 P. B. Radha,1 M. J. Rosenberg,1 T. J. B. Collins,1 A. R. Christopherson,1 A. A. Solodov,1 D. Cao,1 J. P. Palastro,1 R. K. Follett,1 and M. Farrell2
1Laboratory for Laser Energetics, University of Rochester2General Atomics
Laser direct drive (LDD), along with laser indirect (x-ray) drive (LID) and magnetic drive with pulsed power, is one of the three viable approaches to achieving fusion ignition and gain in inertial confinement fusion (ICF). Here we summarize the present status and future plans for laser direct drive. The program is being executed on both the OMEGA laser at LLE and the National Ignition Facility (NIF) at Lawrence Livermore National Laboratory (LLNL). LDD research on OMEGA includes cryogenic implosions, fundamental physics including material properties, hydrodynamics, and laser-plasma interaction physics. LDD research on the NIF is focused on energy coupling and laser-plasma interaction physics at ignition-scale plasmas. Limited implosions on the NIF in the “polar-drive” configuration, where the irradiation geometry is optimized for LID, are also a feature of LDD research.
LDD implosions on OMEGA, developed by a data-based statistical model that employs machine learning, have achieved record performance and when hydrodynamically scaled to NIF energies would be predicted to produce fusion yields approaching a megajoule. Systematic experiments enabled by the high shot rate of OMEGA and advanced diagnostics to explore 3-D implosion performance are routinely fielded to understand degradation mechanisms that limit the fusion performance and to develop mitigation strategies.
Figures 1 and 2 show a comparison of the predicted D–T fusion yields compared to the data-based statistical model and the hydro-scaled performance assuming spherical irradiation conditions similar to OMEGA.
E29139JR
Measured versus predictedyield for 160 shots
Yield predicted (#1014)
Yie
ld m
easu
red
(#10
14)
1.0 1.50.5
1.5
1.0
0.5
0.00.0
Figure 1Comparison of a data-driven statistical model with actual experimental fusion yields. Over 160 experiments are well described by this predictive model with a wide range of parameters as described in the text.

Direct-Drive Laser Fusion: status, PLans, anD Future
LLE Review, Volume 164170
I2987JR
Fusio
n yi
eld
(kJ) 1500
1000
500
0 500 1000 1500Laser energy (kJ)
2000
Yielda
Yieldno a
2500 30000
2000
Figure 2Fusion yield scaling with energy with and without alpha amplification.
Laser-plasma interaction (LPI) physics continues to be a major focus of LDD research. Innovative diagnostics, for example, that measure electron distribution functions (EDF’s) on a single shot and increased laser/facility capabilities that enable a quantitative understanding of LPI over a range of plasma conditions created on both OMEGA and the NIF have advanced our understanding of LPI. The present state of research and future plans to eventually determine acceptable operating parameters and laser requirements for LDD ignition are summarized. Figure 3 shows an advanced optical Thomson-scattering diagnostic that enables one to determine the electron distribution function and the distortions in the EDF that occur with increasing laser intensity.
I2998JR
0 0 54321
100 3.2
10–2
10–4
432vz/vte Intensity (#1015 W/cm2)
(c)
(b)(a)
(d)
f e
P s (n
orm
aliz
ed u
nits
)
10.0 2.0
2.4
2.8
0.5
Supe
r-Gau
ssia
n or
der
Langdon modelData
1.0
500
–60
700Wavelength (nm)
60
0C
olle
ctio
n an
gle
(°)
Figure 3(a) Schematic and (b) Thomson-scattered light measured over 120°. (c) Scattered light from different angle select different regions of the electron distribution function. (d) Gaussian order of the electron distribution function’s dependence on laser intensity compared to the simulations.
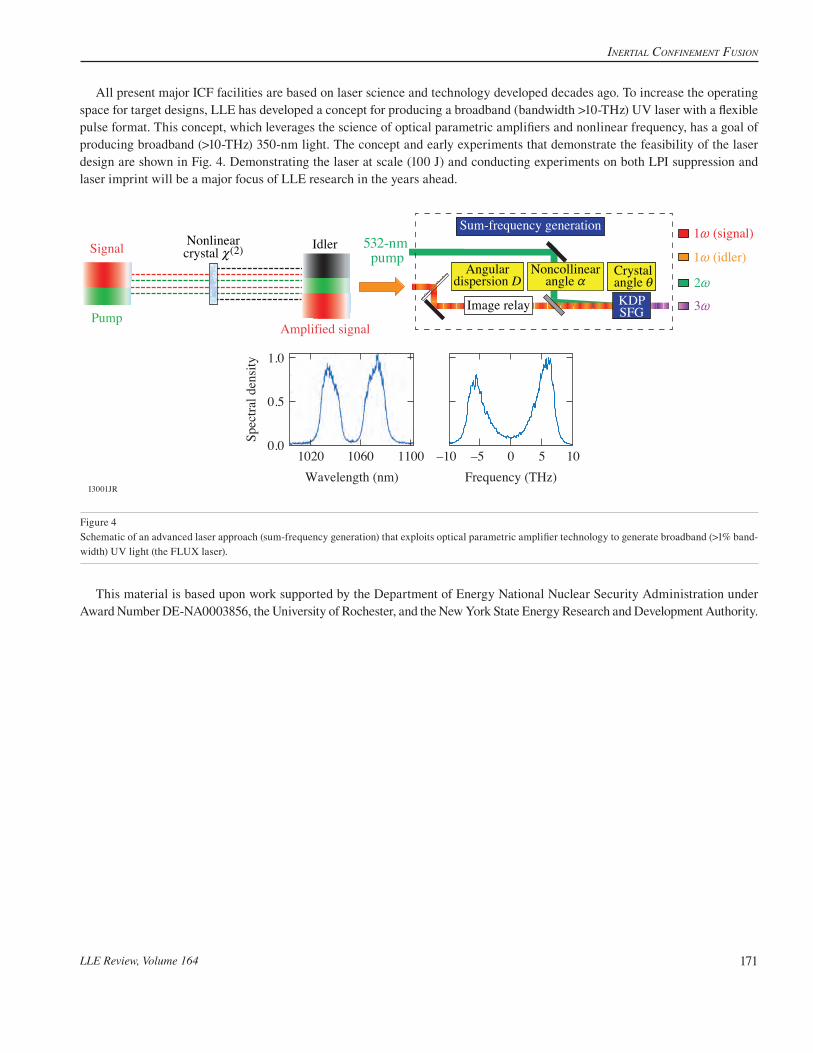
InertIal ConfInement fusIon
LLE Review, Volume 164 171
Figure 4Schematic of an advanced laser approach (sum-frequency generation) that exploits optical parametric amplifier technology to generate broadband (>1% band-width) UV light (the FLUX laser).
All present major ICF facilities are based on laser science and technology developed decades ago. To increase the operating space for target designs, LLE has developed a concept for producing a broadband (bandwidth >10-THz) UV laser with a flexible pulse format. This concept, which leverages the science of optical parametric amplifiers and nonlinear frequency, has a goal of producing broadband (>10-THz) 350-nm light. The concept and early experiments that demonstrate the feasibility of the laser design are shown in Fig. 4. Demonstrating the laser at scale (100 J) and conducting experiments on both LPI suppression and laser imprint will be a major focus of LLE research in the years ahead.
I3001JR
Sum-frequency generation 1~ (signal)
1~ (idler)
2~
3~
Angulardispersion D
Crystalangle i
Noncollinearangle a
KDPSFG
Nonlinearcrystal |(2) IdlerSignal
PumpAmplified signal
1020 1060 1100Wavelength (nm)
0.0
0.5
1.0
Spec
tral d
ensi
ty
–10 –5 0 5 10Frequency (THz)
532-nmpump
Image relay
This material is based upon work supported by the Department of Energy National Nuclear Security Administration under Award Number DE-NA0003856, the University of Rochester, and the New York State Energy Research and Development Authority.
Direct MeasureMents of Dt fuel Preheat froM hot electrons in Direct-Drive inertial confineMent fusion
LLE Review, Volume 164172
Direct Measurements of DT Fuel Preheat from Hot Electrons in Direct-Drive Inertial Confinement Fusion
A. R. Christopherson,1,2 R. Betti,1,2,3 C. J. Forrest,1 J. Howard,1,2 W. Theobald,1 J. A. Delettrez,1 M. J. Rosenberg,1 A. A. Solodov,1 C. Stoeckl,1 D. Patel,1,2 V. Gopalaswamy,1,2 D. Cao,1 J. L. Peebles,1 D. H. Edgell,1 W. Seka,1 R. Epstein,1 M. S.
Wei,1 M. Gatu Johnson,4 R. Simpson,4 S. P. Regan,1 and E. M. Campbell1
1Laboratory for Laser Energetics, University of Rochester2Department of Mechanical Engineering, University of Rochester3Department of Physics and Astronomy, University of Rochester
4Massachusetts Institute of Technology
The generation of hot electrons from laser-plasma interactions has been a longstanding issue for inertial confinement fusion experiments since the early days of the field. Hot-electron preheat increases the entropy (adiabat) of the imploding shell, thereby degrading the final compression and quenching the ignition process. It is one of the major obstacles to ignition via laser direct drive. This summary describes the first direct measurement of the energy deposited by hot electrons into the DT fuel and its spatial distribution within the fuel. All previous attempts to measure preheat assessed only the conversion of laser energy into hot electrons. Since only a small fraction of the total hot-electron energy is deposited into the fuel, previous measurements could not be used to assess fuel preheat and areal-density degradation. This measurement is essential to understanding the effective adiabat (increased by preheat) of the imploding DT shell and the implosion performance. This important issue is addressed by presenting a new technique that can be used to quantify the hot-electron preheat energy deposited into the dense DT fuel for all laser-fusion schemes.
It is shown that, in direct-drive experiments, the hot-electron energy deposited in the DT fuel can be inferred by comparing the hard x-ray signals between a layered DT implosion and its mass-equivalent all-CH implosion irradiated with the same pulse shape. Since the hot-electron source is the same between the two implosions, the difference in hard x-ray signals is proportional to the preheat energy deposited in the DT layer. However, since a significant fraction of the ice layer is ablated during the implosion, it is important to also assess the preheat energy into the unablated fuel, which determines the final areal density. In Fig. 1, the relationship between the degradation in areal density due to preheat is plotted as a function of the preheat energy into the stagnated shell E stag
preheata k normalized to its internal energy (IEshell) for a simulation ensemble of LILAC simulations of different targets.
Estimating the areal-density degradation due to preheat therefore requires an additional model to describe the spatial distribution of the preheat energy within the fuel.
The spatial distribution of preheat energy was inferred in two experimental campaigns on OMEGA using warm CH targets with Cu-doped plastic payloads of varying thicknesses. The hard x rays from the Cu-doped plastic implosions were used to infer the hot-electron energy deposited in each layer. Post-shot analysis of the hard x-ray signals from these experiments confirmed that the electrons deposit their energy uniformly throughout the unablated mass. Therefore, the energy deposited into the unablated DT can be determined simply by calculating the energy deposited into all of the DT and multiplying by the unablated DT mass ratio. The final results, reported in Table I, show that the preheat analysis presented here explains the observed degradations in areal density with respect to their 1-D simulated values.

InertIal ConfInement fusIon
LLE Review, Volume 164 173
TC15340JR
1.0
0.6
0.2
0.0
0.8
0.4
tR/
tR n
o ho
t
0.0 0.5 1.0 1.5 2.0preheat/IEshellEstag
Figure 1Areal-density degradation versus preheat energy into the stagnated shell preheat Estag
preheat` j normalized to the shell internal energy at peak velocity
(IEshell) for a large ensemble of LILAC simulations with preheat energies ranging from 0 to 100 J and design adiabats between 2 and 5.5. The red curve is the best fit to the simulation data.
Table I: Areal-density (tR) degradation for OMEGA DT-layered a . 4 implosions.
Shot number 77064 85784 91830 91834
( )JEDTpreheat 13.0!4.8 21.5!7.1 48.!11.5 40.5!13.7
( )JE stagpreheat 4.9!2.1 7.5!2.5 15.0!4.7 11.6!3.9
IEshell (J) 43.0 43.0 48.1 48.0
tRexp (mg/cm2) 201!17 154!13 120!9 127!11
tR1-D (mg/cm2) 225 186 184 188
tRhs (mg/cm2) 190!16 156!13 124!15 135!155
The same technique is now being implemented at the National Ignition Facility (NIF) to measure preheat at megajoule laser energies and will be used to assess the viability of direct-drive designs, which may convert more laser energy into hot electrons as the size of the laser facility scales up. Quantifying how preheat scales from OMEGA to the NIF will have important implications for the design of direct-drive implosions on the NIF and the assessment of the next-generation inertial fusion facility. This technique also opens up new research avenues with respect to the design of direct-drive targets on OMEGA and, more specifically, the effects of different pulse shapes, ablator materials, and beam spot sizes on DT fuel preheat.
The authors thank Prof. D. Shvarts for many useful discussions. This material is based upon work supported by the Depart-ment of Energy National Nuclear Security Administration under Award Number DE-NA0003856, the University of Rochester, and the New York State Energy Research and Development Authority.

Validating Heat-transport Models Using directly driVen spHeres on oMega
LLE Review, Volume 164174
Validating Heat-Transport Models Using Directly Driven Spheres on OMEGA
W. Farmer,1 G. Swadling,1 J. Katz,2 D. H. Edgell,2 C. Bruulsema,3 M. Sherlock,1 M. Rosen,1 and W. Rozmus3
1Lawrence Livermore National Laboratory2Laboratory for Laser Energetics, University of Rochester
3University of Alberta
The indirect-drive approach to inertial confinement fusion (ICF) uses lasers to heat a radiation oven, or hohlraum. The radiation drive ablatively implodes a capsule filled with deuterium and tritium. Hohlraums are notoriously difficult to simulate due to the complex interplay of difficult-to-model physical processes. These processes include radiation and atomic physics, which gener-ate the x-ray drive; laser-plasma interactions, which govern how the laser couples to the hohlraum; and heat transport, which determines how energy is partitioned. Further, integrated simulations of both a hohlraum and a capsule almost universally predict a capsule “bang time” earlier than observed, colloquially referred to as the “drive deficit.”1,2
The hohlraum modeling framework has been developed over the years through simpler experiments, e.g., gold disk emission experiments,3 vacuum hohlraums,4 and gold sphere experiments.5 As a natural development of this effort, recent experiment and simulation work has been performed to isolate the effect of heat transport using a directly driven, solid beryllium sphere.6 These experiments were fielded on the OMEGA Laser System and utilized the state-of-the-art optical Thomson-scattering (OTS) and laser-coupling diagnostics. The OTS diagnostic precisely measured plasma conditions, and the laser coupling gave an accurate assessment of scattered laser energy, which is important for understanding the energy partition within the system. Comparisons to 2-D LASNEX simulations showed striking agreement with the data as long as certain heat-transport models were chosen.
The OTS measurements rely on the state-of-the-art fourth-harmonic Thomson-scattering diagnostic developed at LLE. Use of a 263-nm probe beam expands the range of accessible plasma conditions, enabling the study of high-density plasmas. This introduces technical challenges, however, because it places the spectrum in the ultraviolet range. Broadband imaging in this spectrum is notoriously difficult due to the limited number of transparent glass types available and their rapidly varying index of refraction. To overcome these issues, the Thomson-scattering diagnostic on OMEGA was upgraded in 2012 to a fully reflective optical system that delivers achromatic, diffraction-limited imaging performance across a broad spectral range.7 Two streak-camera-coupled spectrometers simultaneously record scattered light from fluctuations within the plasma, providing a highly resolved measurement of the complete Thomson-scattered spectrum. Improved spatial resolution allows one to precisely define the volume of plasma sampled, enabling the proper treatment of spatial gradients in the data analysis.
The Thomson-scattering technique allows experimenters to measure key parameters characterizing the experimental plasma, such as the density and temperature. Figure 1 shows the spectrum of scattered light that is determined by the underlying, thermally excited plasma fluctuations. To extract measurement of the plasma parameters, the recorded spectrum must be fitted using a theoretical model that describes the relative amplitudes and phase velocities of these fluctuations. Analysis is complicated by the presence of strong plasma emission and spatial gradients within the plasma. To produce accurate and consistent results, an improved fitting framework was developed that properly accounted for these effects. This resulted in precise, quantitative measurements of the temporal evolution of the plasma temperature and density, which can be directly compared to simulations.

InertIal ConfInement fusIon
LLE Review, Volume 164 175
U2599JR
(a) (b)
t (ns) t (ns)–1 0 1 2 3 4 –1 0 1 2 3 4
190
200
210
220
230
m (n
m)
The uncoupled laser light was measured using the scattered-light calorimeters and spectrometers on OMEGA. The offline absolutely calibrated calorimeters give the total time-integrated uncoupled light, while the time-varying history of the unabsorbed light is recorded by the spectrometer streak camera. Multiple channels are averaged for each measurement. Two drive intensities were used (1014 W/cm2 and 2.5 # 1014 W/cm2), and the diagnostics measured 3% and 10% scattered light for the low and high drive intensities, respectively.
Two-dimensional simulations that included the Thomson probe beam were performed in LASNEX using three commonly used heat-transport models as shown in Fig. 2. Remarkable agreement with the measurement is obtained with the nonlocal model (dashed curve in the plots), which agrees so well in panel (b) that the dashed curve is obscured by the measured data. Simulations
Figure 1Scattered light observed by the OTS measurement. The vertical and horizontal axes correspond to time and wavelength, respectively: (a) with background and (b) with background subtracted. The bright spectral feature can be used to determine plasma conditions within the probe volume.
U2600JR
(a) (b)
1.6
0.0
0.4
0.8
1.2
1.6
0.0
0.4
0.8
1.2
t (ns)
T (k
eV)
1.0 1.5 2.0 2.5 3.0t (ns)
1.0 1.5 2.0 2.5 3.0
Figure 2Comparisons of measured and simulated temperatures with nominal intensity of 2.5 # 1014 W/cm2. (a) and (b) correspond to two different probe positions. Mea-surement is given by the circles, and the three models—(a local heat-flux model, a nonlocal heat-transport model, and a restricted heat-flux model)—are given by the solid, dashed, and dashed-dotted curves, respectively.

Validating Heat-transport Models Using directly driVen spHeres on oMega
LLE Review, Volume 164176
predicted that the scattered light was typically only 1% of the incident power, which does not match the measurement. The agreement with the plasma conditions suggests that heat transport is being modeled correctly and that deficiencies in modeling are in other processes. The understanding developed here is being applied to gold sphere experiments and will ultimately feed into progress toward a more-predictive hohlraum model.
This work was performed under the auspices of the U.S. Department of Energy by Lawrence Livermore National Laboratory under Contract DE-AC52-07NA27344.
1. R. P. J. Town et al., Phys. Plasmas 18, 056302 (2011).
2. O. S. Jones et al., Phys. Plasmas 19, 056315 (2012).
3. M. D. Rosen et al., Phys. Fluids 22, 2020 (1979).
4. R. E. Olson et al., Phys. Plasmas 19, 053301 (2012).
5. E. L. Dewald et al., Phys. Plasmas 15, 072706 (2008).
6. W. A. Farmer et al., Phys. Plasmas 27, 082701 (2020).
7. J. Katz et al., Rev. Sci. Instrum. 83, 10E349 (2012).

InertIal ConfInement fusIon
LLE Review, Volume 164 177
Magnetic-Field Generation and Its Effect on Ablative Rayleigh–Taylor Instability
in Diffusive Ablation Fronts
TC15614JR
y
xSpike
Bubble
Dense cold fluid
Light hot fluid
Heat flux lines
Bubble
AblationAblation
front
g
Bj
Figure 1Sketch of the effect of the self-generated B fields on the RT instability. The magnetic field is generated by the Biermann battery effect and is perpendicular to the hydrodynamic motion. If the Righi–Leduc term causes the heat-flux lines to diverge from the spikes, then ablation is reduced and enhances the ablative RT instability (solid green lines with current jv and B-field sense as depicted). If the heat-flux lines converge, ablation increases, which contributes to stabilizing the RT instability (dotted lines and current jv and B-field sense opposite to the one depicted).
F. García-Rubio,1,2 R. Betti,1,2,3 J. Sanz,4 and H. Aluie1,2
1Laboratory for Laser Energetics, University of Rochester 2Department of Mechanical Engineering, University of Rochester 3Department of Physics and Astronomy, University of Rochester
4Escuela Técnica Superior de Ingeniería Aeronáutica y del Espacio, Universidad Politécnica de Madrid
During the acceleration phase in direct-drive inertial confinement fusion (ICF), the Rayleigh–Taylor (RT) instability1–3 grows at the ablation front, degrading the integrity of the imploding shell. During the development of the RT instability, magnetic (B) fields are generated due to the misalignment of gradients of density and pressure, known as the baroclinic or Biermann battery effect.4 In the linear regime, the B field is coupled to the hydrodynamics mainly through the Righi–Leduc term. In essence, this term deflects the heat-flux lines, which in turn has a direct effect on the dynamics of these two instabilities (Fig. 1).
In this summary, the effects of self-generated magnetic fields on the ablative RT instability are investigated in the linear regime. The main governing parameters are the Froude number (Fr), which stands for the ratio between ablative convection and acceleration of the target, and the Mach number at the ablation front (Ma), assumed to be small (isobaricity). When normalized, the Righi–Leduc term is proportional to cRMa2, with cR being a constant of order unity.
The results for the hydrodynamics coupled to the magnetic field are compared to the uncoupled case in Fig. 2. For small wave numbers, the dispersion relation is similar to the RT instability of immiscible fluids with Atwood number equal to unity, .kgc
Ablation stabilization becomes effective for larger wave numbers until the RT instability is suppressed at a certain cutoff kc. The cutoff wavelength decreases at larger Froude numbers.
The self-generated B field significantly modifies the dispersion relation even for small Mach numbers. Its effect becomes impor-tant when ablation stabilization takes place (near the maximum of the spectrum). It is not monotonic and can either enhance or stabilize the RT instability depending on the Froude number. For Fr = 1, the self-generated B field plays a destabilizing role and

Magnetic-Field generation and its eFFect on ablative rayleigh–taylor instability in diFFusive ablation Fronts
LLE Review, Volume 164178
enlarges the region of unstable modes. This effect is greatly amplified by the Nernst term, notably close to the cutoff. For Fr = 10, however, the stabilizing character of the B field switches when the Nernst term is considered, shortening the range of unstable modes k. This transition in the stabilizing character is completed in the case Fr = 100, where the self-generated B field shortens the range of unstable modes in cases both with and without Nernst. In the former case, this effect is especially pronounced since the cutoff is reduced by almost 40%.
An interesting feature observed is that, when the Nernst term is considered, the stabilizing character of the B field is maintained for a given Froude number. Therefore, a Fr threshold exists that depends exclusively on Z for which the stabilizing character of the B field switches. This is shown in Fig. 3, where the difference in growth ratio is shown for the most-unstable mode for every Froude number. The dependence of threshold Fr on Z is rather weak since we obtained Fr = 6, 5, and 3.4 for Z = 1, 4, and 3, respectively. Although this figure is shown for Ma + 10–1, the same threshold Fr is obtained when varying the Mach number.
The effect of magnetic diffusivity is shown in Table I, where the computed coefficient measures the similarity of the growth rate to the pure hydrodynamic case (close to 0) or to the perfectly conductive case (close to 1). It can be seen that for Fr = 1 the
TC15615JR
10–5 10–4 10–3
kLa
Fr/u
acL a
10–2 10–1
Fr = 1
Fr = 10
Fr = 100 Z " 3cRMa2 = 10–2
Coupled, NernstCoupled, no NernstUncoupled
kLa
0.005
0.010
0.100
0.050 Figure 2Dispersion relation for different Froude numbers. Light blue curves: hydrodynamics uncoupled from induction; dark blue curves: hydrodynamics and induction coupled, cRMa2 = 10–2, without Nernst; red curves: hydrodynamics and induction cou-pled, cRMa2 = 10–2, with Nernst. The large atomic number Z " 3 is considered, and the magnetic Reynolds number is infinite.
TC15616JR
2 5Fr
10–8
–4
0
cN
erns
t – c
hydr
oc
hydr
o10
0
Destabilizing
Z = 3Z = 4
Z = 1
Transition Stabilizing
With NernstcRMa2 = 10–2
4
Figure 3Difference in growth rate (computed as a percentage) between the uncoupled (chydro) and coupled with Nernst (cNernst) cases. For every Froude number, the most-unstable mode, maximum chydro is chosen.

InertIal ConfInement fusIon
LLE Review, Volume 164 179
system is very sensitive to the magnetic Reynolds number. Ablation fronts in ICF tend to be very diffusive, and Rem is usually low. Therefore, the effect of the B field on perturbations whose wavelengths are comparable to the ablation front length scale is suppressed by resistivity. Contrary to this behavior, long-wavelength perturbations are insensitive to Rem, as can be seen for the case Fr = 10. At this Froude number, unstable perturbations penetrate deep into the hot conductive plasma, and the effect of the B field (which, for these perturbations is stabilizing) is unaltered by diffusion.
This work is supported by the Department of Energy Office of Science, Fusion Energy Sciences program grants DE-SC0016258 and DE-SC0014318. H. Aluie was also supported by DOE grants DE-SC0020229 and DE-SC0019329; NASA grant 80NSSC18K0772; and NNSA grants DE-NA0003856 and DE-NA0003914. This material is based upon work supported by the Department of Energy National Nuclear Security Administration under Award Number DE-NA0003856, the University of Rochester, and the New York State Energy Research and Development Authority.
1. S. E. Bodner, Phys. Rev. Lett. 33, 761 (1974).
2. H. J. Kull, Phys. Fluids B 1, 170 (1989).
3. H. Takabe et al., Phys. Fluids 28, 3676 (1985).
4. K. Mima, T. Tajima, and J. N. Leboeuf, Phys. Rev. Lett. 41, 1715 (1978).
Table I: Coefficient .Nerst hydrohydro- -c c c c Case considered: Z " 3 and Ma = 0.1.
Rem = 10–2 Rem = 10–1 Rem = 1 Rem = 10
Fr = 1, k = 10–1 0.076 0.28 0.62 0.97
Fr = 10, k = 5 # 10–3 1.16 1.19 1.18 1.13

Self-ConSiStent theory of the DarrieuS–lanDau anD rayleigh–taylor inStabilitieS with Self-generateD MagnetiC fielDS
LLE Review, Volume 164180
Self-Consistent Theory of the Darrieus–Landau and Rayleigh–Taylor Instabilities
with Self-Generated Magnetic Fields
F. García-Rubio,1,2 R. Betti,1,2,3 J. Sanz,4 and H. Aluie1,2
1Laboratory for Laser Energetics, University of Rochester2Department of Mechanical Engineering, University of Rochester3Department of Physics and Astronomy, University of Rochester
4Escuela Técnica Superior de Ingeniería Aeronáutica y del Espacio, Universidad Politécnica de Madrid
The Rayleigh–Taylor instability (RT) has been thoroughly studied in the context of inertial confinement fusion (ICF).1,2 In the weak acceleration regime, the cutoff wavelength is large compared to the ablation-front scale length, ,k L 1c a0 % and the dispersion relation can be analytically derived by exploiting the sharp-boundary model (SBM).3,4 In the limit of zero acceleration, sufficiently long wavelengths undergo another type of instability known as Darrieus–Landau (DL). This instability is generic for fronts where a dense fluid expands into a lighter one, as typically occurs in flames.5,6 During the development of these instabilities, magnetic (B) fields are generated due to the misalignment of gradients of density and pressure, known as baroclinic or the Biermann battery effect.7 In the linear regime, the B field is coupled to the hydrodynamics mainly through the Righi–Leduc term. In essence, this term deflects the heat-flux lines, which in turn has a direct effect on the dynamics of these two instabilities.
In this summary, the Rayleigh–Taylor and Darrieus–Landau instabilities are studied in an ICF context within the framework of a small critical-to-shell density ratio DR and a weak acceleration regime, i.e., large Froude number .Fr 1& This number stands for the ratio between ablative convection and the acceleration of the capsule. The two main novelties in this study are the inclusion of non-isobaric effects and the self-generated magnetic fields. The use of an SBM leads to a single analytical expression of the dispersion relation encompassing both instabilities:
,FrL
u kLq kL
f qku
1
2convective stabilization
/
a
a
RT
aa
perturbed pressure
a18 5 1 2- -c =
+ +_ i
1 2 344 44 1 2 3444 4445
(1)
where ua is the ablation velocity at the ablation front. The eigenvalues {fi,qi} correspond to the perturbed mass and momentum fluxes through the ablation front, and i = 1,2 refers to its quasi-steady and nonstationary values, respectively. They depend only on the perturbation wavelength normalized with the conduction layer width, . ,kx kL n n0 0117 2 /
c0 a a c5 2= ` j and are shown in Fig. 1.
For kxc0 > 0.5, the overpressure generated at the spikes q1 is positive and becomes the main damping mechanism. For kxc0 < 0.5, q1 is negative (underpressure) and destabilizing, becoming the driving mechanism of the DL instability. Asymptotic analysis allows one to derive the scaling laws of the underpressure for a small wave number. The non-isobaric effects play an important role for these perturbations, making q1 scale as q1 = –5.8 (kxc0)11/15, compared to the isobaric case studied in Ref. 6, where .q kx5 2 /
c012 5-= ` j
Under the assumptions of the sharp boundary model, the effect of the self-generated magnetic field is always stabilizing. It increases both the momentum and mass fluxes. The Nernst convection enhances the stabilizing effect of the B field. For perturbation wavelengths longer than the distance between ablation front and critical surface, kxc0 < 1, the B field is less effective, becoming

InertIal ConfInement fusIon
LLE Review, Volume 164 181
totally negligible in the DL instability region. The B-field effect is significantly stronger on the unsteady momentum flux q2. This has an important effect on the convective stabilization term in Eq. (1), which is enhanced from “–2kua” to “–4kua.”
The analysis of the dispersion relation reveals that the combination
.
/
/D Fr
m ns eV
m ns cm
g T
u n
0 015
100 10
1 10R
a
a a
2
/
/ /
/
2 3
2 3 8 3
4
24 3
2 3
n
n=
-
f
e e
d
o
p
o
n (2)
dictates the behavior of the spectrum. For ,D Fr 1/R
2 3% it is well described by the ablative RT instability in the isobaric regime,
and the cutoff takes place for kLa . Fr–5/3. In the opposite limit, ,D Fr 1/R
2 3& two regions can be defined. The long perturbations
with D FrkL < / /a R
11 8 3 4 undergo RT instability, while the part of the spectrum with D FrkL < / /a R
11 8 3 4 is DL dominated. In this limit, the cutoff becomes independent of the Froude number: . .DkL 7 6 /
a R5 2
. The regime of application for ICF corresponds to DRFr2/3 K 1. When this parameter is close to unity, the DL effect operates by reducing the restoring overpressure and increasing the wave number at which ablation comes into play. It is precisely in this range, DRFr2/3 + 1, where the effect of the self-generated B fields becomes more important. They enhance the stabilizing effect of ablation and can significantly reduce the cutoff. A configuration of interest for ICF is shown in Fig. 2.
Figure 1Eigenvalues (a) q1 and (b) q2 (quasi-steady and nonsteady perturbed momentum flux). Black solid curve: coupled with Nernst; maroon solid curve: coupled without Nernst; red solid curve: B field decoupled; red dashed curve: results from the isobaric model in Ref. 6.
TC15611JR
q 1
kxc0
1.5
1.0
0.5
–0.5
0.0
Coupled with NernstCoupled without NernstDecoupledIsobaric
1 2 3 4 5 6 7
q 2
kxc0
(a) (b)
65
210
43
2 4 6 7 10
Coupled with NernstDecoupledIsobaric
TC15612JR
cL a/u
a (#10
–4)
kLa (#10–4)
2
5
10
1
CoupledDecoupledIsobaric
1.0 5.00.50.10.05
c = kg
kq1LaFigure 2Dispersion relation for ua = 1.2 nm/ns, Ta = 7.5 eV, na = 1024 cm–3, and g = 50 nm/ns2, which gives Fr = 50 and DRFr2/3 = 0.11. Black curve: magnetic fields and non-isobaric effects are included; maroon curve: non-isobaric effects are included, but the hydrodynamic is decoupled from induction; red curve: RT instability under the isobaricity assumption. The wave number where the perturbed pressure q1 becomes positive is . .k L 4 4 10aq
51
#= -
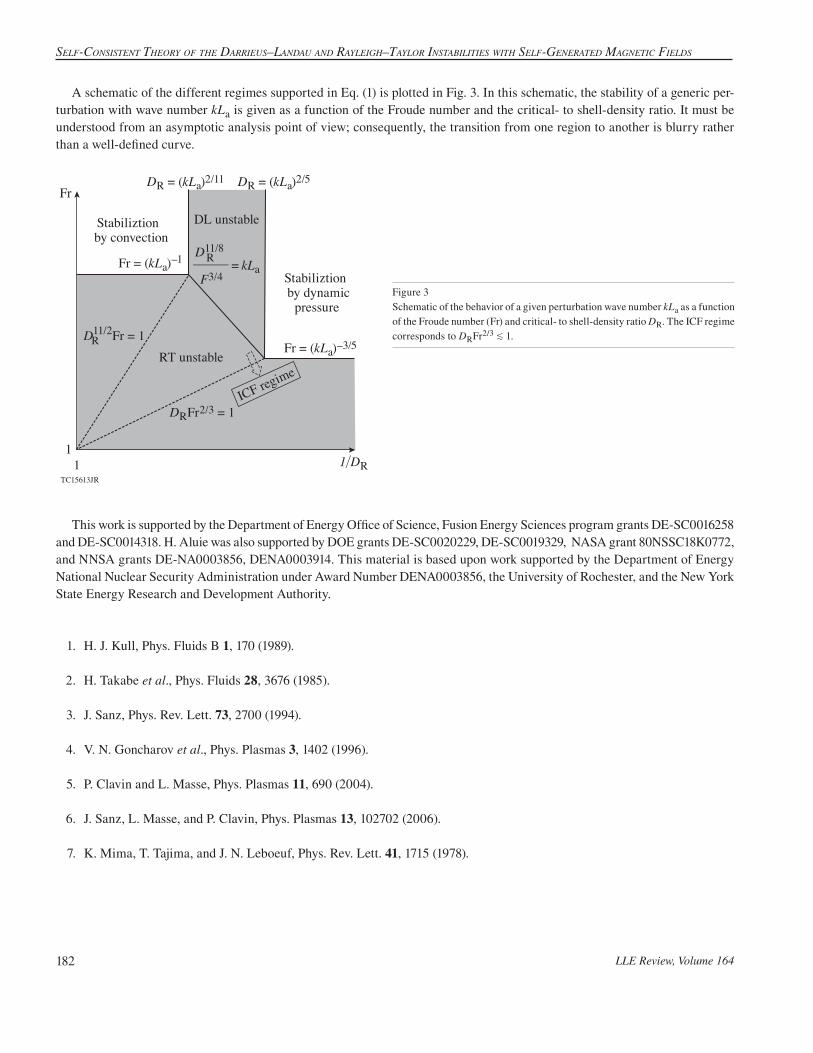
Self-ConSiStent theory of the DarrieuS–lanDau anD rayleigh–taylor inStabilitieS with Self-generateD MagnetiC fielDS
LLE Review, Volume 164182
Stabiliztion by convection
Stabiliztion by dynamic
pressure
DL unstable
ICF regimeRT unstable
Fr = (kLa)–1
Fr = (kLa)–3/5
1/DR
Fr
11
DR = (kLa)2/11
DRFr2/3 = 1
DR = (kLa)2/5
D11/2Fr = 1R
D11/8kLa
R
F3/4=
TC15613JR
Figure 3Schematic of the behavior of a given perturbation wave number kLa as a function of the Froude number (Fr) and critical- to shell-density ratio DR. The ICF regime corresponds to DRFr2/3 K 1.
A schematic of the different regimes supported in Eq. (1) is plotted in Fig. 3. In this schematic, the stability of a generic per-turbation with wave number kLa is given as a function of the Froude number and the critical- to shell-density ratio. It must be understood from an asymptotic analysis point of view; consequently, the transition from one region to another is blurry rather than a well-defined curve.
This work is supported by the Department of Energy Office of Science, Fusion Energy Sciences program grants DE-SC0016258 and DE-SC0014318. H. Aluie was also supported by DOE grants DE-SC0020229, DE-SC0019329, NASA grant 80NSSC18K0772, and NNSA grants DE-NA0003856, DENA0003914. This material is based upon work supported by the Department of Energy National Nuclear Security Administration under Award Number DENA0003856, the University of Rochester, and the New York State Energy Research and Development Authority.
1. H. J. Kull, Phys. Fluids B 1, 170 (1989).
2. H. Takabe et al., Phys. Fluids 28, 3676 (1985).
3. J. Sanz, Phys. Rev. Lett. 73, 2700 (1994).
4. V. N. Goncharov et al., Phys. Plasmas 3, 1402 (1996).
5. P. Clavin and L. Masse, Phys. Plasmas 11, 690 (2004).
6. J. Sanz, L. Masse, and P. Clavin, Phys. Plasmas 13, 102702 (2006).
7. K. Mima, T. Tajima, and J. N. Leboeuf, Phys. Rev. Lett. 41, 1715 (1978).

InertIal ConfInement fusIon
LLE Review, Volume 164 183
Transport Coefficients for Magnetic-Field Evolution in Inviscid Magnetohydrodynamics
J. R. Davies,1 H. Wen,1 J.-Y. Ji,2 and E. Held2
1Laboratory for Laser Energetics, University of Rochester2Department of Physics, Utah State University
In a magnetized plasma, the resistivity and electrothermal coefficient become tensors. Transport differs parallel and perpendicular to the magnetic field; when transport perpendicular to both the conventional direction of transport and the magnetic field occurs, it is called “cross-field transport.” Braginskii1 expressed the resulting Ohm’s law in the form
vE B n e
jB n e
P
b j b b j
b T T b T
j
b
e e
e
pe ei pe ei pe ei
e e e
02
02
02
- -
$
$
# #
# #
# #
d
d d d
f ~ x
h
f ~ x
h
f ~ x
h
= +
/
/
=
=
<
<
b b -#+
b- - -#b b b
+
,
v v vv
v
v v v v v v v v
v v v v`
`
`
_
`
`
j
j
j
i
j
j
(1)
where v is ion velocity (m s-1), B is magnetic field (T), j is current density (A m-2), ne is electron density (m-3), e is electron charge (C), Pe is electron pressure (Pa), f0 is the permittivity of free space (F m-1), ~pe is electron plasma frequency (s-1), xei is electron–ion collision time (s), b is a unit vector in the direction of the magnetic field, Te is electron temperature (eV), h is a dimensionless resistivity coefficient, b is a dimensionless electrothermal coefficient, < indicates parallel, 9 indicates perpendicu-lar, and / indicates cross. Electron viscosity has been neglected for simplicity. The only contributions the magnetized transport coefficients make to magnetohydrodynamics (MHD) are to modify magnetic-field evolution, given by d # E, and Ohmic heating, given by .j E: The resulting expression for magnetic-field evolution is long and obscures the physical significance of the transport terms. Using vector identities, the equation can be rearranged into several different forms that are more compact and have terms with a clear physical interpretation.2 The most compact form is
2v
v v
v
v ,
,
,
tB T
n e
P nB B
n ej
n eb j
me
T me
T b
c
B
1
ee
e e
ei
e
eff e e e e e e
eie e e
eie
ei
ee pe
eff2
2
2
- --
--
-
## # # # #
##
d dd d
d d d
d d
d
22
b h x
d
|h
|
h h
|b x
|
b b x
h x
dd ~
= + + + +
= + +
= =
/ /= =
< <
< <
<
h
h ,
vv v v v v
v vv v v
v
v f
d
` _
p
n
j i
(2)
where eB me ei e| x= is the electron Hall parameter, a dimensionless measure of the strength of magnetization compared to collisions. In this form, the transport coefficients are seen to lead to a magnetic-field source term ,T#d db< advection of mag-

TransporT CoeffiCienTs for MagneTiC-field evoluTion in invisCid MagneTohydrodynaMiCs
LLE Review, Volume 164184
netic field with electron transport, seen in the terms dependent on j and dTe in the effective velocity veff, advection of magnetic field to regions of lower resistivity from vh, and magnetic diffusion. These physical effects are present in whatever mathematical form is chosen. Haines3 attributes the advection terms to electron heat flux, which has terms in j as well as dTe, describing the magnetic field as being frozen to the electrons responsible for thermal transport, not the bulk fluid, due to their lower collision frequency. In this analogy, the eh |/ term arises from perpendicular electrothermal heat flux, the e-h h |= <_ i term from cross-field electron heat flux, the eb |/ term from perpendicular thermal conduction, and the e-b b |=<` j term from cross-field thermal conduction.
The advection terms in the effective velocity depend on modified transport coefficients that have not been explicitly considered in determining fits for the transport coefficients, motivating a reconsideration of these fits. We examined the fits given by Bragin-skii,1 Epperlein and Haines,4 and Ji and Held.5 The transport coefficients are obtained by solving the Fokker–Planck equation in the limit of small mean free path and collision time. Braginskii used a third-order expansion in Laguerre polynomials and gives fits in |e for effective atomic numbers Z = 1, 2, 3, 4, and Z " 3 (no electron–electron collisions) stated to be within 20% of the approximate solutions. Braginskii’s fits have incorrect limiting forms for h/ and b9 as |e " 3 and do not adequately constrain the values for Z > 4, but are still widely used. Epperlein and Haines used a direct numerical solution and give fits in |e for Z = 1, 2, 3, 4, 5, 6, 7, 8, 10, 12, 14, 20, 30, 60, and Z " 3 accurate to within 15%. While Epperlein and Haines’ results do allow a more-accurate interpolation of the coefficients for arbitrary Z than Braginskii’s, their fitting parameters for ,h= ,h/ and b9 are discontinuous in Z, so they can give physically incorrect gradients in these coefficients due to variations in Z, which will affect magnetic-field advection. Epperlein and Haines’ fits are perhaps the most widely used in MHD codes. Ji and Held used the expansion in Laguerre polynomials, increasing the number of terms until the coefficients changed by less than 1%, which required up to 160 terms. They give fits in |e and Z, valid for any Z from 0 to 100, accurate to better than 1%, making them the most convenient and accurate set of fits of which we are aware. It is important to note that the stated fitting accuracies do not apply to the modified coefficients appearing in the effective velocity.
For the modified transport coefficients, Braginskii’s incorrect limiting forms for h/ and b9 as |e " 3 are irrelevant. All three fits give 1 1e"h |+ / and e e- "b b | b |=< <` j as .e"3| There is good agreement on b< and .h< The fits for 1 eh |+ / agree to better than 5%. There is also good agreement on ,eb |/ which determines the Nernst velocity, except at small Hall parameters (<2) where Braginskii underestimates this term by up to 10%, which can be physically significant. Serious issues arise with the e-h h |= <_ i and e-b b |=<` j terms, where both Epperlein and Haines and Ji and Held give physically incorrect results for |e " 0, as can be seen in Fig. 1. These modified transport coefficients represent cross-field transport of the magnetic field so they should be proportional to |e as |e " 0. Epperlein and Haines give quite the opposite behavior with a peak in both coefficients at |e < 1, which increases with Z. Ji and Held’s fits fail to go to zero as |e " 0, the error being most significant for
,e-b b |=<` j which goes negative and becomes increasingly negative as Z increases. Only Braginskii gives physically accurate results. Since Epperlein and Haines and Ji and Held are accurate for sufficiently large Hall parameters, we can see that Braginskii’s
e-h h |= <_ i is a significant overestimate for moderate Hall parameters; it also has a nonphysical double hump.
To evaluate the accuracy of the fits for these modified coefficients, we obtained e-b b |= <` j from a direct numerical solution of the Fokker–Planck equation using the code OSHUN,6 which is shown as squares in Fig. 1(a). Braginskii is the most accurate for Hall parameters close to zero, but Ji and Held rapidly give the most-accurate fit as the Hall parameter increases. We also compared the fits for the Nernst term eb |/ to the OSHUN results and found that Ji and Held’s fit is the most accurate. For the e-h h |= <_ i term, we used the results directly from Ji and Held’s 320-term solution, shown as squares in Fig. 1(b), which again shows that Braginskii is the most accurate for Hall parameters close to zero, but Ji and Held rapidly give the most-accurate fit as the Hall parameter increases. Since none of the fits are accurate for e-h h |= <_ i and ,e-b b |=<` j we tried fitting the direct calculations of these coefficients shown in Fig. 1 with a function of |e and Z based on those used by Ji and Held. The fits are too long to be included in this summary but can be found elsewhere.2
In conclusion, we have found that there are multiple magnetic-field advection terms that arise from the resistivity and electro-thermal tensors in a magnetized plasma. These advection terms depend on significantly modified transport coefficients, which
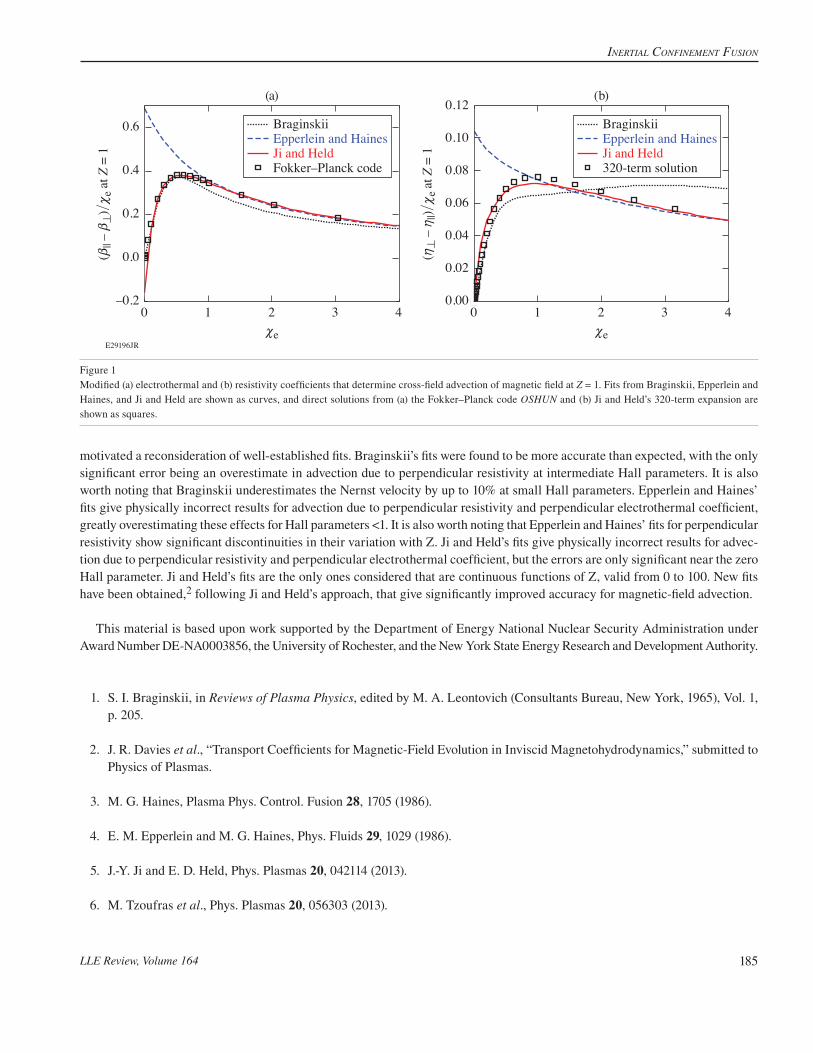
InertIal ConfInement fusIon
LLE Review, Volume 164 185
E29196JR
–0.2
0.0
0.2
0.4
0.6
0 1 2 3 4|e
(b|| –
b9
)/|
e at
Z =
1BraginskiiEpperlein and HainesJi and HeldFokker–Planck code
0.00
0.04
0.02
0.06
0.08
0.10
0.12
0 1 2 3 4|e
(h9
– h
||)/|
e at
Z =
1
BraginskiiEpperlein and HainesJi and Held320-term solution
(a) (b)
Figure 1Modified (a) electrothermal and (b) resistivity coefficients that determine cross-field advection of magnetic field at Z = 1. Fits from Braginskii, Epperlein and Haines, and Ji and Held are shown as curves, and direct solutions from (a) the Fokker–Planck code OSHUN and (b) Ji and Held’s 320-term expansion are shown as squares.
motivated a reconsideration of well-established fits. Braginskii’s fits were found to be more accurate than expected, with the only significant error being an overestimate in advection due to perpendicular resistivity at intermediate Hall parameters. It is also worth noting that Braginskii underestimates the Nernst velocity by up to 10% at small Hall parameters. Epperlein and Haines’ fits give physically incorrect results for advection due to perpendicular resistivity and perpendicular electrothermal coefficient, greatly overestimating these effects for Hall parameters <1. It is also worth noting that Epperlein and Haines’ fits for perpendicular resistivity show significant discontinuities in their variation with Z. Ji and Held’s fits give physically incorrect results for advec-tion due to perpendicular resistivity and perpendicular electrothermal coefficient, but the errors are only significant near the zero Hall parameter. Ji and Held’s fits are the only ones considered that are continuous functions of Z, valid from 0 to 100. New fits have been obtained,2 following Ji and Held’s approach, that give significantly improved accuracy for magnetic-field advection.
This material is based upon work supported by the Department of Energy National Nuclear Security Administration under Award Number DE-NA0003856, the University of Rochester, and the New York State Energy Research and Development Authority.
1. S. I. Braginskii, in Reviews of Plasma Physics, edited by M. A. Leontovich (Consultants Bureau, New York, 1965), Vol. 1, p. 205.
2. J. R. Davies et al., “Transport Coefficients for Magnetic-Field Evolution in Inviscid Magnetohydrodynamics,” submitted to Physics of Plasmas.
3. M. G. Haines, Plasma Phys. Control. Fusion 28, 1705 (1986).
4. E. M. Epperlein and M. G. Haines, Phys. Fluids 29, 1029 (1986).
5. J.-Y. Ji and E. D. Held, Phys. Plasmas 20, 042114 (2013).
6. M. Tzoufras et al., Phys. Plasmas 20, 056303 (2013).

Kinetic inflation of convective Raman ScatteRing
LLE Review, Volume 164186
Kinetic Inflation of Convective Raman Scattering Driven by a Broadband, Frequency-Modulated Laser Pulse
H. Wen,1 R. K. Follett,1 A. V. Maximov,1 D. H. Froula,1 F. S. Tsung,2 and J. P. Palastro1
1Laboratory for Laser Energetics, University of Rochester2Department of Physics and Astronomy, University of California, Los Angeles
Stimulated Raman scattering (SRS), a process in which a light wave decays into a plasma wave and another light wave, can reduce laser absorption by scattering light away from the target. SRS can also generate hot electrons that preheat the fusion fuel in the direct-drive inertial confinement fusion (ICF) scheme, making fuel compression more difficult. Inflationary SRS (iSRS) occurs in the kinetic regime when the electron velocity distribution is flattened due to electron trapping. The flattening of the electron distribution not only reduces the Landau damping rate but also decreases the plasma wave frequency, leading to an SRS reflectivity much higher than what is predicted by the convective SRS gain model1 for a Maxwellian velocity distribution. In this work, we study the convective gain and the kinetic inflation threshold for SRS driven by a broadband laser in an inhomogeneous plasma using the particle-in-cell (PIC) code OSIRIS. Based on the cancellation of the bandwidth effect and the spatial detuning effect, we derived a simple formula that can predict when the convective SRS gain is enhanced and when the iSRS threshold reaches a minimum. The analytic formula is consistent with the PIC simulation results over a broad range of parameter space.
The frequency of a pump with a sinusoidal phase modulation can be written as , sinx t t x cm m m0 0 -~ ~ ~ d ~ ~= + ,r_ `i j where 0~r is the central frequency of the pump and ~m(d) is the phase modulation frequency (depth). The bandwidth of this broadband pump is defined as D~ = 2~md/r. If SRS is driven by a broadband laser in an inhomogeneous plasma, SRS resonance (the location where the frequency mismatch is close to zero) moves in time. When the SRS resonance follows the trajectory of the SRS scattered light, i.e.,
,k L8
m p
n02 0 0
/p~
~~
~
~D=
r r (1)
where ~p is the local plasma frequency, k0 is the laser wave vector, and Ln is the density scale length, the SRS amplification is greatly enhanced.
Figure 1 shows that the condition for achieving the peak convective amplification depends on neither the temperature Te nor the laser bandwidth D~ (or the modulation frequency ~m) alone. The convective gains in the fluid (open symbols) and kinetic (solid symbols) regimes for various bandwidths are normalized to the respective Rosenbluth gains,1 1.67 (fluid regime) and 1.14 (kinetic regime). As a reference, two runs with zero bandwidth (denoted as “D~ = 0”) were carried out and their convective gains are shown as stars in Fig. 1. The Rosenbluth theory is well recovered by the zero-bandwidth simulation in the fluid regime. In both the fluid (Te = 0.1 keV) and kinetic (Te = 2 keV) regimes and for all bandwidths, the convective gains increase as p increases, peaking near the value of p predicted by Eq. (1), and then decreasing back to the level at p = 0.
Because iSRS depends on the plasma wave amplitude, one would expect the iSRS threshold to decrease when the maximum convective gain is enhanced. Accordingly, the iSRS threshold is expected to reach its minimum value when the maximum-gain condition [Eq. (1)] is satisfied. We carried out 1-D PIC simulations of self-seeded SRS in the kinetic regime to examine this hypothesis.

Plasma and Ultrafast Physics
LLE Review, Volume 164 187
Figure 2(a) shows the time-averaged reflectivity as a function of pump intensity for three different bandwidths (D~ = 0, 4 and 15 THz). The sharp rise of the SRS reflectivity is a characteristic feature of kinetic inflation. The iSRS thresholds were obtained by fitting the reflectivity curve and then solving for the intensity corresponding to the steepest slope of the fitted function. The fitting function was f(I) = tanh[g(I – Ip) + a] (pI + q) for the free parameters g, Ip, a, p, and q. The iSRS threshold is defined as the pump intensity corresponding to the inflection point of the fitted curve.
Figure 2(b) shows that the iSRS threshold as a function of the normalized maximum chirp p reaches its minimum when the maximum-gain condition is satisfied somewhere in the simulation region (between the vertical black dashed lines) regardless of the electron temperature. The horizontal dashed blue (dashed–dotted orange) line corresponds to the iSRS threshold at zero bandwidth for the 2-keV (4-keV) simulations. The iSRS threshold initially decreases as the maximum convective SRS gain is enhanced (D~~m # ~pc/8Ln) and then increases when the maximum local chirp rate of the pump exceeds the spatial detuning due to the density gradient / .c L8p nm&~~ ~D_ i The thresholds for the two temperatures are quantitatively close to each other
TC15499JR
87654321
0.0 0.2 0.4 0.6 0.8 1.0 1.2
p (#10–5)
Gm
ax/G
theo
Figure 1The maximum convective SRS gains in the fluid regime (open symbols) and kinetic regime (solid symbols) as functions of the normalized maximum chirp p. Four sets of simulations with bandwidth D~ = 0 (stars), 2 THz (circles), 6 THz (triangles), and 12 THz (squares) were performed in both the fluid and kinetic regimes. The vertical dashed line was obtained by evaluating Eq. (1).
TC15501JR
(a)
Mea
n re
flec
tivity
(%)
0 4020
10–4
10–3
10–2
10–1
Pump intensity (#1014 W/cm2)
15 THz4 THzD~ = 0
p
(b)
18
14
10
6Thre
shol
d in
tens
ity (#
1014
W/c
m2 )
10–6 10–5 10–4
2 keV4 keV
Figure 2 (a) The fractional reflectivity as a function of the laser pump intensity for laser bandwidth, overlaid with the fits of the reflectivity data. (b) The iSRS threshold in terms of pump intensity as a function of the normalized maximum chirp p for two sets of simulations with different electron temperatures. The dotted blue (dashed–dotted orange) line corresponds to the iSRS threshold at zero bandwidth for 2-keV (4-keV) electron temperature. The two dashed vertical lines correspond to the maximum-gain condition at the minimum and maximum plasma densities.

Kinetic inflation of convective Raman ScatteRing
LLE Review, Volume 164188
for all p values. The fact that the iSRS threshold depends only weakly on the laser bandwidth alone is encouraging for ICF target design: for a given finite bandwidth, one can mitigate iSRS by tuning the maximum chirp away from the maximum-gain condition.
This material is based upon work supported by the Department of Energy National Nuclear Security Administration under Award Number DE-NA0003856, the University of Rochester, and the New York State Energy Research and Development Authority.
1. M. N. Rosenbluth, Phys. Rev. Lett. 29, 565 (1972).

Plasma and Ultrafast Physics
LLE Review, Volume 164 189
Measurements of Non-Maxwellian Electron Distribution Functions and Their Effect on Laser Heating
A. L. Milder,1,2 J. Katz,1 R. Boni,1 J. P. Palastro,1 M. Sherlock,3 W. Rozmus,4 and D. H. Froula1,2
1Laboratory for Laser Energetics, University of Rochester2Department of Physics and Astronomy, University of Rochester
3Lawrence Livermore National Laboratory4Department of Physics, University of Alberta
Statistical mechanics governs the fundamental properties of many-body systems, and the corresponding velocity distributions dictate most material properties. In plasmas, a description through statistical mechanics is challenged by the fact that the move-ment of one electron effects many others through their Coulomb interactions, leading to collective motion. Although most of the research in plasma physics assumes equilibrium electron distribution functions, or small departures from a Maxwell–Boltzmann (Maxwellian) distribution, this is not a valid assumption in many situations. Deviations from a Maxwellian can have significant ramifications on the interpretation of diagnostic signatures and, more importantly, in our ability to understand the basic nature of plasmas. Uncertainties in the distribution function have implications across many areas of plasma physics including magnetic and inertial confinement fusion, astrophysics, and space sciences. The uncertainty in modeling of high-velocity electrons, including their nonlocal behavior, combined with the lack of experimental constraints has led to fundamental questions about the shape of electron velocity distributions.
In this summary, we present the first measurements of complete electron distributions without any assumptions on their shape or the underlying physics that produced them. A corresponding reduction in laser absorption, compared to classical absorption, of up to 37% was measured when the electron distributions were determined to be super-Gaussian. At these conditions the inverse bremsstrahlung heating dominated over thermalization by electron–electron collisions, and the measured absorption was in reasonable agreement with analytic predictions1 that are commonly used in hydrodynamic modeling. To enable single-shot temporally and spatially resolved measurements of the electron distribution function over several orders of magnitude, an optical diagnostic was invented that uses the angular dependence of scattering to simultaneously access the noncollective and collective nature of plasmas. This first-principles measurement showed that during significant heating by the laser beams, the distributions had a super-Gaussian shape in the bulk (v < 3 vth) with a Maxwellian tail (v > 3 vth). The super-Gaussian bulk is associated directly with the inverse bremsstrahlung heating and is well reproduced by the previous computational work.2 The departure from super-Gaussian at high velocities was predicted by Fourkal et al.,3 but these measurements show this deviation at a higher velocity. Particle simulations show improved agreement and demonstrate the importance of isotropic heating in accu-rately predicting the high-velocity tail.
Figure 1 shows the electron distribution function that was measured while five ultraviolet laser beams, with an overlapped intensity of . / ,W cmI 2 8 10UV
total 15 2#= uniformly heated an +1-mm3 volume of gas through inverse bremsstrahlung absorption.
As predicted by theory,1 the measurements show that slow electrons are preferentially heated to form a super-Gaussian electron distribution [Fig. 1(b)]. The measured electron distribution functions are well reproduced in the bulk by the heuristic scaling determined from early Fokker–Plank simulations,2 where the electron distribution functions were parameterized by
v vvexpf C am m thm
m-=_ bi l< F (1)

MeasureMents of non-Maxwellian electron Distribution functions anD their effect on laser heating
LLE Review, Volume 164190
E29109JR
0.4
10–1
100
10–2
10–3
10–5
10–4
10–2
10–1
10–3
10–4
10–610–6
10–5
0.2
0.3
0.1
0.04.53.52.5 4.03.02.043 11 00 22 3
v/vthv/vthv/vth
(a) (b) (c)
f e
Figure 1Electron distributions on (a) linear and logarithmic scales where (b) shows the complete velocity range, while (c) reduces the range to highlight the differ-ences in the tails of the electron distribution functions. While the laser beams are heating the krypton plasma, the measured distribution (black points) is well reproduced in the bulk by a super-Gaussian function (orange curve) consistent with Matte et al.2 [Eq. (2), m = 3.9]. A formalism describing the Maxwellian tail from Fourkal et al.3 (purple curve), a Maxwellian distribution (blue curve), and results from particle simulation (green curve) are shown. The 90% confidence interval on the measured distribution function (gray region) is shown.
with super-Gaussian order
.
,m 21 1 66
3.0 724
aa
= ++
^ h (2)
where v vZ osc2
th2
a = is the ratio of the inverse bremsstrahlung heating rate to the electron–electron collision rate and Z is the ionization state. Normalization constants (Cm, am) maintain the standard definitions of the first three moments of the distribution function. For the results shown in Fig. 1, the calculated electron distribution function [Eq. (1)] is in excellent agreement with the measurements for velocities less than +3vth when using the overlapped intensity and the measured plasma conditions. The plasma conditions (Te = 1.16 keV, Z = 25) were obtained from the simultaneous measurement of the angularly resolved electron plasma wave features and collective ion-acoustic wave features.
Figure 1(c) shows that the measured electron distribution transitions from a super-Gaussian to a Maxwellian shape at +3vth, whereas the theory from Fourkal et al.3 predicts an earlier transition around +2.5vth and more electrons in the tail. This departure of Fourkal from a super-Gaussian distribution was calculated considering a single plane-wave electromagnetic source, where electrons oscillating in the laser field collide with electrons in the tail, modifying the distribution function at high energies. By introducing five overlapped beams, consistent with the experimental configuration, particle simulations using the code Quartz show that the number of electrons in the tail exceeds the super-Gaussian for velocities in the range 3.5vth < v < 4.5vth, qualitatively consistent with the enhancement above super-Gaussian observed in the data. These results suggest that the increased uniformity due to multiple overlapped beams reduced the energy transferred to the high-velocity electrons.
Figure 2 shows that the measured laser absorption was significantly less than the absorption calculated assuming a plasma with a Maxwellian electron distribution. The absorption rapidly drops to +60% of the Maxwellian expectation as the relative heating rate increases v v .large Z osc th
2 2b l When the inverse bremsstrahlung heating rate dominates over the electron–electron collision
rate, the reduction in absorption is in reasonable agreement with the original predictions.1

Plasma and Ultrafast Physics
LLE Review, Volume 164 191
Figure 2The measured (red circles) and calculated (blue circles) absorption, normalized to the absorp-tion calculated assuming a Maxwellian electron distribution function, is plotted as a function of the ratio of the inverse bremsstrahlung heating rate to the electron–electron collision rate determined from the measured plasma conditions at the center of the plasma. Error bars repre-sent one standard deviation propagated from uncertainties in the measured plasma conditions.
E29351JR
2.00.0 0.5 1.51.00.0
0.5
1.0
1.5
Zv2osc/v2
th
A/A
max
This material is based upon work supported by the Department of Energy National Nuclear Security Administration under Award Number DE-NA0003856, the University of Rochester, and the New York State Energy Research and Development Authority.
1. A. B. Langdon, Phys. Rev. Lett. 44, 575 (1980).
2. J. P. Matte et al., Plasma Phys. Control. Fusion 30, 1665 (1988).
3. E. Fourkal et al., Phys. Plasmas 8, 550 (2001).

NoNliNear Spatiotemporal CoNtrol of laSer iNteNSity
LLE Review, Volume 164192
Nonlinear Spatiotemporal Control of Laser Intensity
T. T. Simpson,1,2 D. Ramsey,1,2 P. Franke,1,2 N. Vafaei-Najafabadi,3 D. Turnbull,1 D. H. Froula,1,2 and J. P. Palastro1
1Laboratory for Laser Energetics, University of Rochester2Department of Physics and Astronomy, University of Rochester3Department of Physics and Astronomy, Stony Brook University
Spatiotemporal control over the intensity of a laser pulse has the potential to enable or revolutionize a wide range of laser-based applications that currently suffer from the poor flexibility offered by conventional optics. Specifically, these optics limit the region of high intensity to the Rayleigh range and provide little to no control over the trajectory of the peak intensity. In this summary, we introduce a nonlinear technique for spatiotemporal control—the “self-flying focus”—that produces an arbitrary trajectory intensity peak that can be sustained for distances comparable to the focal length.1 The technique combines temporal pulse shap-ing and the inherent nonlinearity of a medium to customize the time and location at which each temporal slice within the pulse comes to its focus. As an example of its utility, simulations show that the self-flying focus can form a highly uniform, meter-scale plasma suitable for advanced plasma-based accelerators.
A wide range of laser-based applications share two requirements: (1) that the driving laser pulse maintain a high intensity over an extended distance, and (2) that the velocity of the peak intensity conform to some underlying process. Examples from across the fields of optics and plasma physics (such as THz and high-harmonic generation, photon acceleration, laser-wakefield and vacuum electron acceleration, Raman amplification, and plasma channel or filament formation) illustrate the ubiquity of these requirements. By providing unprecedented control over the trajectory of an intensity peak and the distance over which it can be sustained, spatiotemporal pulse shaping promises to expand the design space for these applications.2,3
Existing methods utilize linear optical elements in the near field to structure a pulse with advantageous space–time correlations, but nonlinear processes, such as self-focusing, can also give rise to these correlations. Self-focusing occurs when the nonlinear optical response of a medium, quantified by the nonlinear refractive index reduces the phase velocity in regions of high intensity. The ratio of the instantaneous pulse power P to the critical power Pc parameterizes the effect. For temporal slices within a pulse with P > Pc, self-focusing overcomes diffraction. These slices undergo transverse collapse until their intensity reaches a threshold for activating a mechanism that can arrest the collapse. Because the distance over which a slice collapses depends on its value of P/Pc, the temporal profile of the power correlates time within the pulse to a collapse location [Fig. 1(a)].
The self-flying focus technique combines temporal pulse shaping with the inherent nonlinearity of a medium to control the velocity of an intensity peak over distances comparable to the focal length. Specifically, the instantaneous power determines the collapse location for each temporal slice, with the minimum and maximum powers setting the collapse range, while the pulse shape determines the time at which the intensity peak moves through these locations. A self-focusing arrest mechanism with an intensity threshold, such as ionization refraction, ensures that the maximum intensity of the peak remains nearly constant throughout the collapse range.
Figure 1 illustrates that the trajectory of self-focusing collapse can be controlled with temporal pulse shaping. A Gaussian pulse with P > Pc focused into a nonlinear medium by an ideal lens exhibits a U-shaped collapse trajectory over the collapse

Plasma and Ultrafast Physics
LLE Review, Volume 164 193
TC15381JR
zc(t)
Gaussianprofile
z = 0 z = f
Tim
e
Nonlinearmedium
(a)
Lcz = 0 z = f
Nonlinearmedium
Shapedprofile
(b)
Lc
zc(t)1
z (m
)
0
ct – z (m)
(c)
0 1 2
vc = –c
Pow
er (M
W)
0 2 4Time (ns)
6060
120180
04 P/
P c
8
Inte
nsity
(#10
11 W
/cm
2 )
1.8
1.0
Ne/N
g
0.9
0.5
2
0.2 0.1
Figure 1 (a) Focusing a laser pulse with a Gaussian temporal profile with P > Pc into a nonlinear medium creates a collapse point that traces out a U-shaped trajectory zc(t) over a distance Lc at a velocity vc that is decoupled from the group velocity. (b) Focusing a temporally shaped pulse with P > Pc can create a collapse point and intensity peak that follows any arbitrary trajectory—in this case, a constant, positive velocity—over a distance Lc. (c) On-axis intensity and electron density profiles from simulations of an Lc = 1 m self-flying focus pulse with vc = -c propagating through a lithium gas of density N = 1019/cm3 are shown. The incident power profile is plotted in the inset, with 20-ps exponential rise and fall times added to better represent a realistic shaped pulse. The intensity peak resulting from the collapse moves exactly at the desired trajectory and creates a smooth ionization front along that trajectory.
range (Lc) [Fig. 1(a)]. The lower-power temporal slices collapse closer to the linear focal point ( f ), while the higher-power slices collapse closer to the lens (z = 0). By shaping the pulse, the collapse point can move at a constant velocity through the collapse region [Fig. 1(b)]. In this example, the power decreases with time, ensuring that the higher-power temporal slices collapse earlier and closer to the lens, while the lower-power slices collapse later and farther from the lens. In both cases, the collapse velocity is decoupled from the group velocity of the pulse. Notably, because each temporal slice collapses to a different location, the duration of the resulting intensity peak can be substantially less than the overall pulse duration.
The ability to control the intensity trajectory over long distances makes the self-flying focus ideal for creating long plasma channels—a critical component in a number of applications, such as advanced laser-based accelerators and directed energy. Current techniques for creating long plasmas rely on filamentation through a dynamic balancing of self-focusing and plasma refraction, axicon focusing, variable wave front distortion, or the use of short wavelengths. Axicon focusing, for example, can suffer from significant pump depletion and ionization refraction by the end of the medium due to the forward propagation of the intensity peak. The self-flying focus has elements in common with filamentation but offers velocity control and does not necessarily require a short-pulse laser. Further, the ability to counter-propagate the intensity peak with respect to the pulse avoids ionization refraction, allowing for a wider range of focal geometries.
Here the self-flying focus is applied to the formation of a plasma channel necessary for the recently described “dephasingless” laser-wakefield accelerator.3 Figure 1(c) displays simulation results of a self-flying focus pulse with vc = –c propagating through lithium gas and triggering a sharp ionization front that travels at the same velocity (i.e., vf = -c) over a meter. The negative collapse velocity allows the intensity peak to propagate through the background gas rather than the ionized plasma, thereby mitigating ionization refraction. The specific velocity of -c was chosen such that an injected, relativistic electron bunch would be velocity matched to the plasma creation and therefore experience constant plasma conditions throughout its acceleration.
The self-flying focus can accommodate a wide range of parameters facilitating their use on various laser systems and in diverse applications. Notably, the self-flying focus could take advantage of long-pulse, high-energy laser systems, such as the National Ignition Facility or the OMEGA laser, to create intensity peaks with durations comparable to short-pulse lasers. Further, the self-flying focus could improve the formation of long, uniform plasma channels in other media for filamentation and directed energy-based applications.

NoNliNear Spatiotemporal CoNtrol of laSer iNteNSity
LLE Review, Volume 164194
This material is based upon work supported by the Department of Energy National Nuclear Security Administration under Award Number DE-NA0003856, the University of Rochester, and the New York State Energy Research and Development Authority.
1. T. T. Simpson et al., Opt. Express 28, 38,516 (2020).
2. D. H. Froula et al., Nat. Photonics 12, 262 (2018).
3. J. P. Palastro et al., Phys. Rev. Lett. 124, 134802 (2020).

Plasma and Ultrafast Physics
LLE Review, Volume 164 195
Laser-Plasma Acceleration Beyond Wave Breaking
J. P. Palastro,1 B. Malaca,2 J. Vieira,2 D. Ramsey,1 T. T. Simpson,1 P. Franke,1 J. L. Shaw,1 and D. H. Froula1
1Laboratory for Laser Energetics, University of Rochester2Instituto de Plasmas e Fusão Nuclear, Instituto Superior Técnico, Universidade de Lisboa
Laser wakefield accelerators rely on the extremely high electric fields of nonlinear plasma waves to trap and accelerate electrons to relativistic energies over short distances. When driven strongly enough, plasma waves break, trapping a large population of the background electrons that support their motion. This limits the maximum electric field. We have discovered a novel regime of plasma wave excitation and wakefield acceleration that removes this limit, allowing for arbitrarily high electric fields. The regime, enabled by spatiotemporal shaping of laser pulses, exploits the property that nonlinear plasma waves with superluminal phase velocities cannot trap charged particles and are therefore immune to wave breaking. A laser wakefield accelerator operat-ing in this regime provides energy tunability independent of the plasma density and can accommodate the large laser amplitudes delivered by modern and planned high-power, short-pulse laser systems.
Armed with a vision of smaller-scale, less-expensive accelerators and empowered by advances in laser technology, the field of “advanced accelerators” has achieved rapid breakthroughs in both electron and ion acceleration.1 In laser wakefield acceleration (LWFA), in particular, a high-intensity laser pulse drives a plasma wave that can trap and accelerate electrons with a field nearly 1000# larger than the damage-limited field of a conventional radio-frequency accelerator.2 Progress in the field of LWFA exploded with the advent of high-power, broadband amplifiers, which delivered ultrashort pulses with durations less than the plasma period. While advances in laser technology continue to deliver ever-shorter and more-powerful pulses, the current path to higher electron energies calls for longer pulses to match the plasma period at lower densities.
The substantial bandwidth provided by modern laser systems offers an alternative approach to designing LWFA’s and increasing the maximum electron energy—spatiotemporal pulse shaping.3,4 Spatiotemporal pulse shaping provides the flexibility to structure the pulse with advantageous space–time correlations that can be tailored to an application. As an example, stretching the region over which a laser pulse focuses and adjusting the relative timing at which those foci occur provides control over the velocity of an intensity peak independent of the group velocity.5 In LWFA, because the phase velocity of the plasma wave (vp) equals the velocity of the ponderomotive potential, a typical pulse, with an intensity peak that travels at the group velocity (vg), will drive a subluminal wake (vp = vg < c). The intensity peak of a shaped pulse, on the other hand, can travel at or faster than the vacuum speed of light, such that vp $ c (Ref. 5).
The phase velocity of a subluminal plasma wave determines the maximum electric field that the plasma wave can support. A laser pulse propagating in a plasma with a peak normalized vector potential a eA m ce0 0= expels electrons from its path and leaves behind a region of net positive charge. The resulting electrostatic field accelerates the expelled electrons back into this region in an attempt to neutralize that charge. When driven by a pulse with a sufficiently large peak amplitude (a0 = awb), the electrostatic field will accelerate the electrons up to the phase velocity of the wave. At this point, the wave breaks, trapping a significant fraction of the electrons that supported its motion. For a 1-D, cold plasma wave, the wave-breaking field depends only on the phase velocity, Ewb = [2(cp-1)]1/2, where ,1
/p p
2 1 2-c b=
-a k v ,cp pb = the field has been normalized by emec/~p,
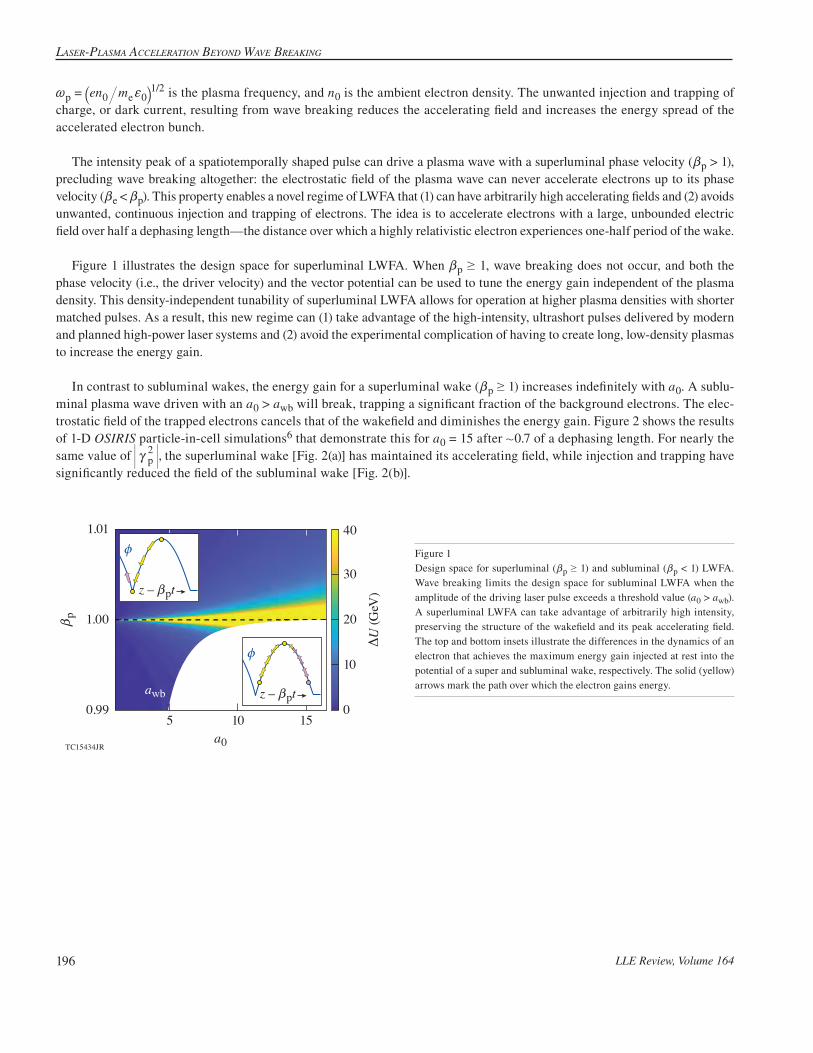
Laser-PLasma acceLeration Beyond Wave Breaking
LLE Review, Volume 164196
en m /p e0 0
1 2~ f= ` j is the plasma frequency, and n0 is the ambient electron density. The unwanted injection and trapping of charge, or dark current, resulting from wave breaking reduces the accelerating field and increases the energy spread of the accelerated electron bunch.
The intensity peak of a spatiotemporally shaped pulse can drive a plasma wave with a superluminal phase velocity (bp > 1), precluding wave breaking altogether: the electrostatic field of the plasma wave can never accelerate electrons up to its phase velocity (be < bp). This property enables a novel regime of LWFA that (1) can have arbitrarily high accelerating fields and (2) avoids unwanted, continuous injection and trapping of electrons. The idea is to accelerate electrons with a large, unbounded electric field over half a dephasing length—the distance over which a highly relativistic electron experiences one-half period of the wake.
Figure 1 illustrates the design space for superluminal LWFA. When bp $ 1, wave breaking does not occur, and both the phase velocity (i.e., the driver velocity) and the vector potential can be used to tune the energy gain independent of the plasma density. This density-independent tunability of superluminal LWFA allows for operation at higher plasma densities with shorter matched pulses. As a result, this new regime can (1) take advantage of the high-intensity, ultrashort pulses delivered by modern and planned high-power laser systems and (2) avoid the experimental complication of having to create long, low-density plasmas to increase the energy gain.
In contrast to subluminal wakes, the energy gain for a superluminal wake (bp $ 1) increases indefinitely with a0. A sublu-minal plasma wave driven with an a0 > awb will break, trapping a significant fraction of the background electrons. The elec-trostatic field of the trapped electrons cancels that of the wakefield and diminishes the energy gain. Figure 2 shows the results of 1-D OSIRIS particle-in-cell simulations6 that demonstrate this for a0 = 15 after +0.7 of a dephasing length. For nearly the same value of ,p
2c the superluminal wake [Fig. 2(a)] has maintained its accelerating field, while injection and trapping have
significantly reduced the field of the subluminal wake [Fig. 2(b)].
TC15434JR
DU
(GeV
)
50.99
10a0
15
bp
1.01
1.00
0
40
20
30
10z
z – bpt
z
z – bpt
awb
Figure 1Design space for superluminal (bp $ 1) and subluminal (bp < 1) LWFA. Wave breaking limits the design space for subluminal LWFA when the amplitude of the driving laser pulse exceeds a threshold value (a0 > awb). A superluminal LWFA can take advantage of arbitrarily high intensity, preserving the structure of the wakefield and its peak accelerating field. The top and bottom insets illustrate the differences in the dynamics of an electron that achieves the maximum energy gain injected at rest into the potential of a super and subluminal wake, respectively. The solid (yellow) arrows mark the path over which the electron gains energy.

Plasma and Ultrafast Physics
LLE Review, Volume 164 197
Figure 2A comparison of the electric field of the wake and electron phase space for [(a),(c)] a superluminal and [(b),(d)] a subluminal wake with bp = 1.01 and bp = 0.99, respectively. The phase velocities were chosen to make the distinction between the two cases clear throughout the summary. The driver intensity, shown in black for reference, has a0 = 15 and a square pulse shape with duration x = r. The superluminal wake maintains its structure and maximum electric field. Wave breaking of the subluminal wake leads to the injection and trapping of a large population of electrons, which load the wake and diminish its maximum field.
TC15454JR
–30 –10–40 –20z – t
0 –30 –10–40 –20 0
p zE
10
0
0
40
z – t
(c) (d)
–10
–40
(a) (b)
bp = 0.99bp = 1.01
The work published here was supported by the U.S. Department of Energy Office of Fusion Energy Sciences under contract Nos. DE-SC0016253 and DE-SC0021057, the Department of Energy under cooperative agreement no. DE-NA0003856, the University of Rochester, and the New York State Energy Research and Development Authority.
1. C. Joshi, S. Corde, and W. B. Mori, Phys. Plasmas 27, 070602 (2020).
2. E. Esarey, C. B. Schroeder, and W. P. Leemans, Rev. Mod. Phys. 81, 1229 (2009).
3. A. Sainte-Marie, O. Gobert, and F. Quéré, Optica 4, 1298 (2017).
4. D. H. Froula et al., Nat. Photonics 12, 262 (2018).
5. J. P. Palastro et al., Phys. Rev. Lett. 124, 134802 (2020).
6. R. A. Fonseca et al., in Computational Science – ICCS 2002, edited by P. M. A. Sloot et al., Lecture Notes in Computer Science, Vol. 2331 (Springer, Berlin, 2002), pp. 342-351.

Wide-Ranging equations of state foR B4C ConstRained By theoRetiCal CalCulations and shoCk expeRiments
LLE Review, Volume 164198
Wide-Ranging Equations of State for B4C Constrained by Theoretical Calculations and Shock Experiments
S. Zhang,1,2 M. C. Marshall,1,2 L. H. Yang,2 P. A. Sterne,2 B. Militzer,3 M. Däne,2 J. A. Gaffney,2 A. Shamp,2 T. Ogitsu,2 K. Caspersen,2 A. E. Lazicki,2 D. Erskine,2 R. A. London,2 P. M. Celliers,2 J. Nilsen,2 and H. D. Whitley2
1Laboratory for Laser Energetics, University of Rochester2Lawrence Livermore National Laboratory
3Departments of Earth and Planetary Science and Astronomy, University of California, Berkeley
The design of high-energy-density (HED) and inertial confinement fusion (ICF) experiments requires a good description of the ablator equation of state (EOS). Currently, CH plastics are typically used as ablators, and their EOS has been extensively studied (see Fig. 1). However, the formation of condensed phase microstructures, species separation, and mixing with the DT fuel dur-ing an implosion could affect the performance of the ICF target or interpretation of HED experiments.1–3 Other materials with higher densities and hardness, such as boron, have been explored as alternative ablators. In the past three years, we have com-bined various theoretical approaches with planar shock experiments and benchmarked the EOS of boron (B)4 and boron nitride (BN)5 over wide ranges of density–temperature conditions. Under constraints provided by these data, new Purgatorio-based EOS models (LEOS 50 for B and X52 for BN) have been constructed and made available for use in hydrodynamic simulations. As a follow-up, this work presents a comprehensive study of the EOS of boron carbide (B4C), another important member in the family of boron materials.
Figure 1The Hugoniot of CH polystyrene from first-principles computations is consistent with planar shock experiments and verified by the latest spherically converging shock data at the National Ignition Facility (NIF). In comparison, the Thomas–Fermi-based SESAME 7593 model predicts the Hugoniot to be much smoother around the compression maximum and is invalidated by the NIF data. The initial sample density t0 = 1.05 g/cm3.
TC15617JRCompression ratio
4.0 4.53.52.5 3.0
103
104
105
106
102
Pres
sure
(GPa
)
NIF laser, Kritcher et al.11NIF laser, Doeppner et al.10Nova laser, Cauble et al.9OMEGA laser, Barrios et al.8Gecko laser, Ozaki et al.7SESAME 7593PIMC + DFT-MD, Zhang et al.6

HigH-EnErgy-DEnsity PHysics
LLE Review, Volume 164 199
The computational methods that we have employed include path-integral Monte Carlo (PIMC) and density functional theory molecular dynamics (DFT-MD), which provide a wide-ranging, internally coherent first-principles EOS for B4C in hot plasma, warm dense matter, and condensed liquid states. The calculations are jointly benchmarked by computations using an all-electron Green’s function Korringa–Kohn–Rostoker (MECCA) and an activity expansion (ACTEX) approach. The theoretical predictions of the Hugoniot EOS are cross validated by comparisons with Hugoniot measurements up to 6100 GPa from planar shock experiments performed on the NIF.
Figure 2 summarizes the major findings of this research, including EOS comparisons between PIMC and DFT-MD, as well as Hugoniot comparisons between predictions by various computational methods or semi-empirical models and shock experiments. Note that our DFT-MD calculations have been performed in multiple ways, including one that uses projector augmented wave (PAW) potentials with plane-wave basis (PAWpw) and another one that uses optimized norm-conserving Vanderbilt (ONCV) potentials combined with pw basis or a Fermi-operator expansion. The PAW potentials have a frozen 1s core, which limits the PAWpw computations to temperatures below 5 # 105 K and moderately high densities (we considered up to 20.07 g/cm3). We used all-electron ONCV potentials for calculations at temperatures up to 1.35 # 106 K and densities up to 50.18 g/cm3. The EOS produced by the ONCV calculations matches both the PAWpw data at low temperatures and the PIMC data at high temperatures very well, as shown with overlapping isotherms in Fig. 2(a).
Figure 2The (a) pressure–compression and (b) temperature–compression Hugoniot of B4C from various computational methods (PIMC, PAWpw, ONCV, MECCA, and ACTEX) in comparison with predictions by different EOS models (L2122/2120: LEOS models; S7082: a SESAME model) and measurements by two separate laser shock experiments (OMEGA, by Fratanduono et al.,6 and the NIF, this work). The initial sample density t0 = 2.51 g/cm3. The shaded area around the lower end of the PIMC Hugoniot curve represent 1v uncertainty in the corresponding Hugoniot density due to EOS errors. In (a), EOS data along selective isotherms from three approaches are also shown with dashed lines and points (PIMC in red circles, ONCV in cyan diamonds, and PAWpw in small black diamonds). The lowest two isotherms for ONCV (and PAWpw) correspond to temperatures of 104 and 1.26 # 105 K, respectively. The highest two isotherms for ONCV (and the lowest two by PIMC) correspond to 1.01 # 106 and 1.35 # 106 K, respectively. The deviation between PIMC/L2120 (and MECCA) and ACTEX/L2122 Hugoniot curves above 106 GPa and 2 # 107 K is due to the electron relativistic effect, which is considered in ACTEX and L2122 but not in PIMC/L2120 (and not fully in MECCA).
Our calculated Hugoniot curves using the different theoretical approaches show good consistency with each other and overall agreement with two independent sets of experimental measurements at 200 to 6100 GPa. At the highest pressure of the OMEGA data12 and the lowest pressure of the NIF data, our DFT-MD predictions of the Hugoniot are slightly stiffer than the experiment,
(b)
TC15618JRCompression ratio (t/t0)
(a)
103
104
105
107
106
Pres
sure
(GPa
)
6 7 851 2 3 4102
Experiment OMEGAExperiment NIF
6 7 851 2 3 4Compression ratio (t/t0)
105
104
106
107
108Te
mpe
ratu
re (K
)PIMCPAWpwMECCAONCVACTEXL2122L2120S7082

Wide-Ranging equations of state foR B4C ConstRained By theoRetiCal CalCulations and shoCk expeRiments
LLE Review, Volume 164200
which could be worthwhile to study in the future. Assisted by the theoretical predictions, we estimate the corresponding Hugoniot temperatures for the NIF data to be in the range of 1 to 5 # 105 K. Our Hugoniot results also show overall good consistency with the L2122 model and predict B4C to have a maximum compression ratio of 4.55 at 9 # 104 GPa and 2 # 106 K, below which L2122 predicts B4C to be slightly softer. In comparison, Thomas–Fermi model L2120 predicts B4C at the compression maximum to be stiffer by +6% and SESAME 7082 predicts B4C to be much softer at pressures of 800 to 3 # 104 GPa.
We compared the EOS of B4C between our first-principles predictions and L2122 and found a maximum pressure discrepancy of +18% occurring at 6 # 103 to 2 # 105 K. We have therefore constructed three new EOS models (L2123 to 2125) by variations of the cold curve and the ion thermal EOS model to span the range of experimental error bars. We then performed a series of 1-D hydrodynamic simulations of direct-drive implosions with a B4C ablator described by the four EOS models (L2122 to 2125) based on a polar-direct-drive exploding-pusher platform.13–15 The results showed that the performance is insensitive to the EOS variations.
This material is based upon work supported by the Department of Energy National Nuclear Security Administration under Award Number DE-NA0003856, the University of Rochester, and the New York State Energy Research and Development Author-ity. This work was in part performed under the auspices of the U.S. Department of Energy by Lawrence Livermore National Laboratory under Contract No. DE-AC52-07NA27344.
1. D. S. Clark et al., Phys. Plasmas 23, 056302 (2016).
2. S. Yu Gus’kov et al., J. Russ. Laser Res. 38, 173 (2017).
3. S. Zhang and S. X Hu, Phys. Rev. Lett. 125, 105001 (2020).
4. S. Zhang et al., Phys. Rev. E 98, 023205 (2018).
5. S. Zhang et al., Phys. Rev. B 99, 165103 (2019).
6. S. Zhang et al., J. Chem. Phys. 148, 102318 (2018).
7. N. Ozaki et al., Phys. Plasmas 16, 062702 (2009).
8. M. A. Barrios et al., Phys. Plasmas 17, 056307 (2010).
9. R. Cauble et al., Phys. Plasmas 4, 1857 (1997); R. Cauble et al., Phys. Rev. Lett. 80, 1248 (1998).
10. T. Döppner et al., Phys. Rev. Lett. 121, 025001 (2018).
11. A. L. Kritcher et al., Nature 584, 51 (2020).
12. D. E. Fratanduono et al., Phys. Rev. B 94, 184107 (2016).
13. C. L. Ellison et al., Phys. Plasmas 25, 072710 (2018).
14. H. D. Whitley et al., “Comparison of Ablators for the Polar Direct Drive Exploding Pusher Platform,” Physics Archive, https://arxiv.org/abs/2006.15635 (2020).
15. C. B. Yeamans et al., “High Yield Polar Direct Drive Fusion Neutron Sources at the National Ignition Facility,” submitted to Nuclear Fusion.

Diagnostic science anD Detectors
LLE Review, Volume 164 201
A Novel Photomultiplier Tube Neutron Time-of-Flight Detector
V. Yu. Glebov, C. Stoeckl, C. J. Forrest, J. P. Knauer, O. M. Mannion, M. H. Romanofsky, T. C. Sangster, and S. P. Regan
Laboratory for Laser Energetics, University of Rochester
A traditional neutron time-of-flight (nTOF) detector used in inertial confinement fusion1 usually consists of a scintillator optically coupled to a photomultiplier tube (PMT). For accurate ion-temperature measurements in DT implosions, a scintillator- and PMT-based detector must use a fast scintillator and fast microchannel plate (MCP) PMT. Even with the fastest scintillators, the scintillator light decay significantly contributes to the instrument response function (IRF) of the nTOF detector. A novel PMT nTOF detector developed at LLE has a MCP photomultiplier tube in a housing without a scintillator. This PMT nTOF detector is less sensitive than a traditional nTOF detector with a scintillator and can be used only in high-yield (typically larger than 1013 DT) implosions. Eliminating the scintillator removes the scintillator decay from the IRF and makes the detector faster. The PMT nTOF is the fastest nTOF detector currently in use on OMEGA.
The PMT nTOF detector made of Photek2—a PMT110 gated photomultiplier with a 10-mm-diam photocathode and a single-stage MCP—was tested at 5.6 m from the target in the P2 open line of sight (LOS) on OMEGA. The nTOF signal was recorded on a 2.5-GHz, 10-GS/s Keysight DSOS254A oscilloscope. The measured neutron temporal trace signal was fit with a convolution of a Gaussian and an exponential decay function, as described in detail in Ref. 3. The fit was performed at up to 50% of the falling slope of the signal.
To determine if the measured neutron signal originates in the window or in the MCP, a comparison test was performed of the PMT nTOF with no gate and with a gate (see Fig. 1). The electronic gate energizes the PMT at select times to discriminate unwanted signals. During the shot with the gate, the Photek gate unit produces a 250-V pulse that prevents photoelectrons from the photocathode from reaching the MCP. If a neutron signal is produced by direct interaction of neutrons with the MCP, the gate will have no effect.
20 4 6 0 10 20
Cha
rge
(pC
)
Shot numberCu DT neutron yield (#1013)
0
0.8
0.0
(a)
Yie
ld ra
tio
(b)1.6
1000
2000
E25284JR
YPMT/YCu
Average = 0.998rms = 1.3%
PMT nTOFLinear fit
Figure 1(a) The neutron signal in shot 91551 with a yield of 3.7 # 1013 recorded by a PMT nTOF with no gate; (b) the neutron signal in shot 91547 with a yield of 4.1 # 1013 recorded by a PMT nTOF with a gate.
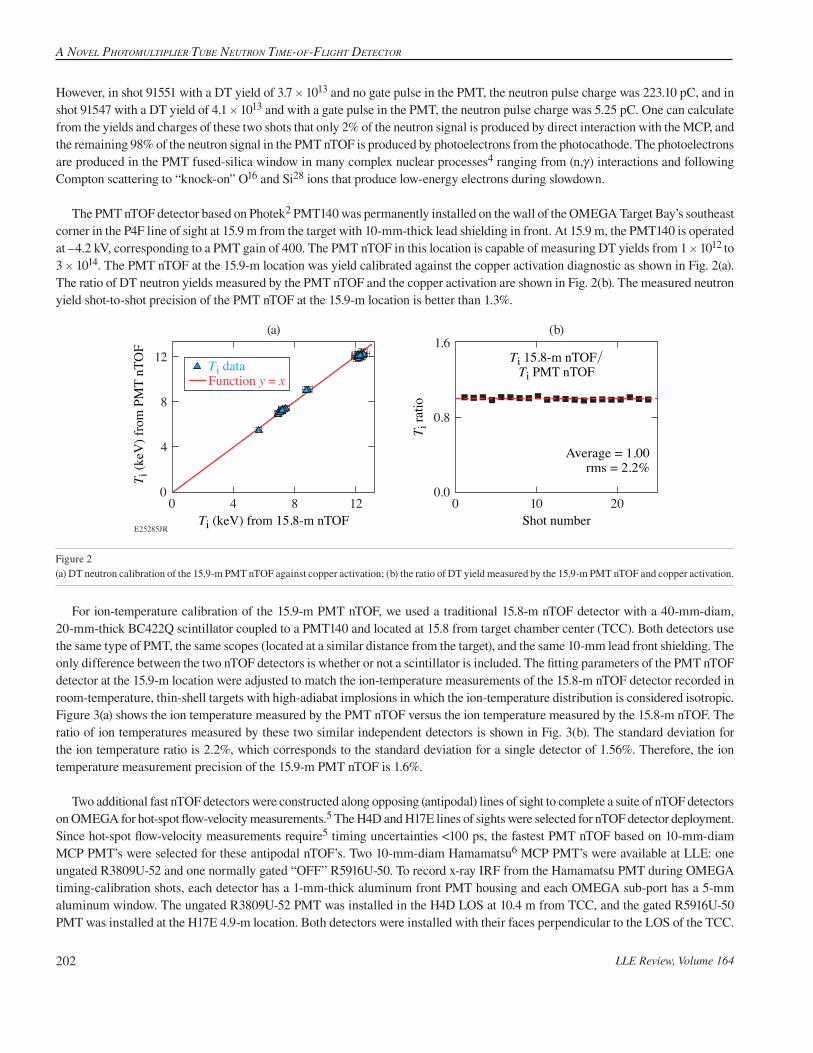
A Novel PhotomultiPlier tube NeutroN time-of-flight Detector
LLE Review, Volume 164202
40 8 12 0 10 20
T i (k
eV) f
rom
PM
T nT
OF
Shot numberTi (keV) from 15.8-m nTOF
0
0.8
0.0
(a)
T i ra
tio
(b)1.6
4
8
E25285JR
Average = 1.00rms = 2.2%
Ti 15.8-m nTOF/Ti PMT nTOF
12Ti dataFunction y = x
Figure 2(a) DT neutron calibration of the 15.9-m PMT nTOF against copper activation; (b) the ratio of DT yield measured by the 15.9-m PMT nTOF and copper activation.
However, in shot 91551 with a DT yield of 3.7 # 1013 and no gate pulse in the PMT, the neutron pulse charge was 223.10 pC, and in shot 91547 with a DT yield of 4.1 # 1013 and with a gate pulse in the PMT, the neutron pulse charge was 5.25 pC. One can calculate from the yields and charges of these two shots that only 2% of the neutron signal is produced by direct interaction with the MCP, and the remaining 98% of the neutron signal in the PMT nTOF is produced by photoelectrons from the photocathode. The photoelectrons are produced in the PMT fused-silica window in many complex nuclear processes4 ranging from (n,c) interactions and following Compton scattering to “knock-on” O16 and Si28 ions that produce low-energy electrons during slowdown.
The PMT nTOF detector based on Photek2 PMT140 was permanently installed on the wall of the OMEGA Target Bay’s southeast corner in the P4F line of sight at 15.9 m from the target with 10-mm-thick lead shielding in front. At 15.9 m, the PMT140 is operated at –4.2 kV, corresponding to a PMT gain of 400. The PMT nTOF in this location is capable of measuring DT yields from 1 # 1012 to 3 # 1014. The PMT nTOF at the 15.9-m location was yield calibrated against the copper activation diagnostic as shown in Fig. 2(a). The ratio of DT neutron yields measured by the PMT nTOF and the copper activation are shown in Fig. 2(b). The measured neutron yield shot-to-shot precision of the PMT nTOF at the 15.9-m location is better than 1.3%.
For ion-temperature calibration of the 15.9-m PMT nTOF, we used a traditional 15.8-m nTOF detector with a 40-mm-diam, 20-mm-thick BC422Q scintillator coupled to a PMT140 and located at 15.8 from target chamber center (TCC). Both detectors use the same type of PMT, the same scopes (located at a similar distance from the target), and the same 10-mm lead front shielding. The only difference between the two nTOF detectors is whether or not a scintillator is included. The fitting parameters of the PMT nTOF detector at the 15.9-m location were adjusted to match the ion-temperature measurements of the 15.8-m nTOF detector recorded in room-temperature, thin-shell targets with high-adiabat implosions in which the ion-temperature distribution is considered isotropic. Figure 3(a) shows the ion temperature measured by the PMT nTOF versus the ion temperature measured by the 15.8-m nTOF. The ratio of ion temperatures measured by these two similar independent detectors is shown in Fig. 3(b). The standard deviation for the ion temperature ratio is 2.2%, which corresponds to the standard deviation for a single detector of 1.56%. Therefore, the ion temperature measurement precision of the 15.9-m PMT nTOF is 1.6%.
Two additional fast nTOF detectors were constructed along opposing (antipodal) lines of sight to complete a suite of nTOF detectors on OMEGA for hot-spot flow-velocity measurements.5 The H4D and H17E lines of sights were selected for nTOF detector deployment. Since hot-spot flow-velocity measurements require5 timing uncertainties <100 ps, the fastest PMT nTOF based on 10-mm-diam MCP PMT’s were selected for these antipodal nTOF’s. Two 10-mm-diam Hamamatsu6 MCP PMT’s were available at LLE: one ungated R3809U-52 and one normally gated “OFF” R5916U-50. To record x-ray IRF from the Hamamatsu PMT during OMEGA timing-calibration shots, each detector has a 1-mm-thick aluminum front PMT housing and each OMEGA sub-port has a 5-mm aluminum window. The ungated R3809U-52 PMT was installed in the H4D LOS at 10.4 m from TCC, and the gated R5916U-50 PMT was installed at the H17E 4.9-m location. Both detectors were installed with their faces perpendicular to the LOS of the TCC.

Diagnostic science anD Detectors
LLE Review, Volume 164 203
90 100 100110 120 120Time (ns) Time (ns)
(a) Without gate (b) With gate
Sign
al (V
)–0.04
–0.08
E29161JR
–4
0
–2
–6
0.00
–0.12
Charge223.10 pC
Charge5.25 pC
90 110
Figure 3(a) Ion temperature from the 15.9-m PMT nTOF versus ion temperature from the 15.8-m nTOF; (b) the ratio of ion temperatures from the 15.8m nTOF and 15.9-m PMT nTOF detectors.
Figure 4The forward fits of neutron signals from (a) H4D and (b) H17E nTOF detectors.
190 92210 230Time of flight (ns)
(a)
Sign
al (V
)
TC15230JR
2
3
1
096 100 104
Time of flight (ns) Time of flight (ns)
(b)
8
4
0
Shot 95201BackgrounddNdEFit
The neutron IRF is very important for accurate measurement of the neutron energy and hot-spot flow velocity5 in DT implosions. Since, in the absence of the short impulse of 14-MeV neutrons, it is impossible to measure neutron IRF directly, a two-step process described in detail in Ref. 7 was used. During the first step, an x-ray IRF was experimentally measured, and during the second step, the neutron IRF was constructed by correcting x-ray IRF for the DT neutron propagation time modeled in MCNP (Monte Carlo neutron particle code). The x-ray IRF’s for the H4D and the H17E PMT nTOF detectors were measured with a 100-ps laser pulse on a gold target. Both detectors have a subnanosecond x-ray IRF: the H4D nTOF has 540!20 ps FWHM and the H17E nTOF has 360!12 ps FWHM. The uncertainty on the IRF FWHM is taken from the standard error of the mean FWHM from the set of IRF measurements. The 14-MeV neutrons’ propagation time through a 3.2-mm-thick PMT window is very short (62 ps), and convolution of an x ray with MCNP simulation is practically the same as an x-ray IRF. Using the constructed neutron IRF, the hot-spot flow velocity in DT fusion experiments can be determined from the H4D and the H17E PMT nTOF signals using a forward-fitting method.7 The H4D and H17E forward fits for shot 95201 with a yield of 1.1 # 1014 and Ti of 4.3 keV are shown in Fig. 4. The PMT nTOF detector in the H17E location has a negligible background, and a good fit is achieved with only the IRF. The PMT nTOF detector in the H4D location has an additional gamma background from (n,c) interactions with the Target Bay wall. For proper fitting of a neutron peak, a modified Gaussian background contribution is included in the forward fit and determined on each shot [see Fig 4(a)]. The operational yield range for the H4D and H17E PMT nTOF detectors is from 1 # 1013 to 2 # 1014. The commissioning of the H4D and H17E PMT nTOF detectors completed the suite of nTOF detectors on OMEGA for hot-spot motion measurements.5

A Novel PhotomultiPlier tube NeutroN time-of-flight Detector
LLE Review, Volume 164204
This material is based upon work supported by the Department of Energy National Nuclear Security Administration under Award Number DE-NA0003856, the University of Rochester, and the New York State Energy Research and Development Authority.
1. J. D. Lindl, Inertial Confinement Fusion: The Quest for Ignition and Energy Gain Using Indirect Drive (Springer-Verlag, New York, 1998).
2. Photek Ltd., St. Leonards on Sea, East Sussex, TN38 9NS, United Kingdom, http://www.photek.com/.
3. T. J. Murphy, R. E. Chrien, and K. A. Klare, Rev. Sci. Instrum. 68, 610 (1997).
4. A. S. Moore et al., Rev. Sci. Instrum. 89, 10I120 (2018).
5. O. M. Mannion et al., Nucl. Instrum. Methods Phys. Res. A 964, 163774 (2020).
6. Hamamatsu Photonics K.K., Hamamatsu City, Shizuoka, Japan 4308587, https://www.hamamatsu.com/us/en/index.html.
7. R. Hatarik et al., J. Appl. Phys. 118, 184502 (2015).

Diagnostic science anD Detectors
LLE Review, Volume 164 205
A Generalized Forward Fit for Neutron Detectors with Energy-Dependent Response Functions
Z. L. Mohamed,1,2 O. M. Mannion,1,2 E. P. Hartouni,3 J. P. Knauer,1 and C. J. Forrest1
1Laboratory for Laser Energetics, University of Rochester2Department of Physics and Astronomy, University of Rochester
3Lawrence Livermore National Laboratory
To date, most analyses of neutron time-of-flight (nTOF) data from inertial confinement fusion experiments have focused on the relatively small range of energies corresponding to the primary neutrons from D–D and D–T fusion. These analyses have therefore employed instrument response functions (IRF’s) corresponding to monoenergetic 2.45- or 14.03-MeV neutrons. For analysis of time-of-flight signals corresponding to broader ranges of neutron energies, accurate treatment of the data requires the use of an energy-dependent IRF. This work describes interpolation of the IRF for neutrons of arbitrary energy, construction of an energy-dependent IRF, and application of this IRF in a forward fit via matrix multiplication.
The measured nTOF signal includes effects from the detector’s IRF such that the relationship between the neutron energy spectrum and the measured signal is not immediately obvious. One method of interpreting an nTOF signal is the forward-fit technique,1 which involves the convolution of a model neutron energy spectrum with the detector IRF. In the absence of bright, pulsed monoenergetic neutron sources, the total neutron IRF cannot be directly measured. The total neutron IRF is instead constructed by convolving a measured x-ray response with an energy-dependent neutron interaction response. The measured x-ray response accounts for the detector’s response to a short pulse of incident energy, while the energy-dependent neutron interaction response accounts for neutron transport through the detector and can be calculated using a particle transport code such as MCNP.2
The oscilloscope-recorded nTOF signal m(t) can be understood as the superposition of the detector’s response to a neutron of incident energy E, weighted by the number of neutrons incident on the detector at that energy. The variable t represents the time scale recorded on the oscilloscope, while tl represents the neutron’s time of arrival at the detector. If the number of neutrons detected per unit energy is given by dN/dE[E(tl)], the detector’s temporal response for a given incident neutron energy is given by R[E(tl), t–tl], the Jacobian describing the conversion from neutron energy to nTOF is ,/d dE tl and the detector’s calibration constant is C, then the measured signal can be written as a Fredholm integral of the first kind given by
, .dd
dd dm t C
EN E t
tE E t R E t t t t
t
0-= l
ll l l l
l] ] ] ]g g g g7 7 7A A A# (1)
The equation for the forward fit with an energy-dependent IRF can also be written as a sum such that Eq. (1) becomes
i 0=
, .m t P E t R E t t tk i i k i-=k
l l l_ _ _i i i8 8B B/

A GenerAlized ForwArd Fit For neutron detectors with enerGy-dependent response Functions
LLE Review, Volume 164206
This sum can be represented by the matrix multiplication ,Tm P=v v where Pv is the vector of prediction of length Np, mv is the vector of measured values of length Nm = Np + Nr–1, and T is a Toeplitz matrix of the response vector3 with shape Nm # Np given by
.T
rrr
r
r
rrr
r
r
r
r
r
r
r
r
r
r
r
r
0
0
0
0
0
0 0
0
0
0
00
,
,
,
,
,
,
,
,
,
,
,
,
,
,
,
,
,
,
,
,
N
N N
N
N
N
N N
N N
N N
N
N
N
N N
N N
N
0 0
0 1
0 2
0 1
0
1 0
1 1
1 2
1 1
1
0
1 0r
r r
r
p
p
p r
p r
p r
p
p
p r
p r
p r
1
1
1 2
1 1
1
1
1
2
f
f
f
f
f
f
f
f
f
f
f
f
f
f
f
f
f
f
=-
-
-
-
- -
- -
-
-
-
R
T
SSSSSSSSSSSSSSSSS
V
X
WWWWWWWWWWWWWWWWW
(2)
Note that the first index of each matrix element corresponds to energy ,E til# - while the second index corresponds to time tk–tli (i.e., the index of a specific entry within the array of R[E(tli), tk–tli]. Each column represents a monoenergetic IRF. It is clear that several monoenergetic IRF’s must be generated in order to construct the Toeplitz matrix since each column of the matrix repre-sents a response function of a different energy. This is best accomplished by generating a representative set of neutron interaction responses, convolving them with the measured x-ray IRF, and interpolating the total IRF.
Uncertainty in the IRF is introduced mainly by the uncertainty in the measured x-ray IRF. Minimization must be carried out in order to include both Poisson-distributed uncertainties from the number of neutrons detected as well as Gaussian-distributed uncertainties from digitization noise. Details of the error propagation that is necessary to construct the correct |2 fit metric are included in the full length paper.4
As an example of the application of this method, an analysis of synthetic data relevant to T–T fusion experiments at the Omega Laser Facility is discussed. This example is used to illustrate the differences between a forward fit that uses an energy-dependent IRF and a forward fit that uses a monoenergetic IRF. Use of the energy-dependent IRF results in an accurate inference of the fit parameters of interest. The inferred masses of the 5He ground state and first excited state are minimally affected since the mass is related to the mean neutron energy. Use of the monoenergetic 2.45-MeV (DD) IRF affects the inferred width and magnitude of the ground state significantly (>20% change). Use of the monoenergetic 14.03-MeV (DT) IRF affects the inferred magnitude of the ground state slightly, but barely affects the inferred width of this state. The inferred 5He mass distributions are shown in Fig. 1.
This conclusion concerning the 14.03-MeV IRF is, however, only applicable for this specific detector and this specific combination of nuclear states. It is not possible to know whether any monoenergetic IRF would be an acceptable approximation for the energy-dependent IRF unless the widths and mean energies of the relevant nuclear states are already relatively well known. The use of a monoenergetic IRF to approximate the energy-dependent IRF is therefore not recommended for use with experimental data that spans a wide range of energies, especially if the analysis in question attempts to infer parameters of nuclear states that are currently poorly understood or parameters related to complicated combinations of nuclear states. The use of an energy-dependent IRF is most essential for the analysis of nuclear states with smaller widths, especially if (1) there are several states of relatively narrow widths spread across a wide range of energies, (2) there are several nuclear states located at low energies, and/or (3) there are several relatively sharp features in the nTOF data. Neutron spectra related to backscattered neutrons produced in cryogenic DT experiments as well as neutron spectra produced from inelastic reactions between DT neutrons and 7Li are two such applications for which analyses of recent OMEGA data are underway.

Diagnostic science anD Detectors
LLE Review, Volume 164 207
Figure 1(a) The synthetic TT data and an example of the components of the forward fit are shown along with the inferred 5He mass distributions. (b) The total mass distribution is shown along with (c) two close views of the inferred ground state and (d) the inferred first excited state. The forward fit with the energy-depen-dent IRF infers the mean energies, width, and magnitudes of the input mass distributions to within a few percent. There is little change to the inferred first excited state regardless of the choice of IRF because it is very wide (2.5 MeV). There is >20% change to the inferred ground state width when the 2.45-MeV monoenergetic IRF is used, but little change when the 14.03-MeV IRF is used. This result is an artifact of this combination of nuclear states and this specific detector setup, as there is only a 300-ps difference between the 8.5-MeV IRF (i.e., the approximate neutron energy where the 5He ground state is located) and the 14.03-MeV IRF for this detector.
E29214JREnergy of 5He (MeV) Energy of 5He (MeV) Energy of 5He (MeV)
46664668 4669 4670 46744666 4670 4674
Brei
t–W
igne
r mag
nitu
de
(#10
10 a
rbitr
ary
units
)
2
4
0 0 0.0
0.6
0.2
0.4
0.8
6
2
4
61.0
5He GS, input to synthetic data5He ES, input to synthetic data5He GS, energy-dependent IRF5He ES, energy-dependent IRF
5He GS, 2.45-MeV IRF5He ES, 2.45-MeV IRF5He GS, 14.03-MeV IRF5He ES, 14.03-MeV IRF
600400 500Time (ns)
300
1
2
0
Volta
ge (V
)
3DataTotal fitLacina function5He ground state5He excited stateDecay of ground stateDecay of excited stateBackground
(a)
(b) (c) (d)
This material is based upon work supported by the Department of Energy National Nuclear Security Administration under Award Number DE-NA0003856, the University of Rochester, and the New York State Energy Research and Development Authority.
1. R. Hatarik et al., J. Appl. Phys. 118, 184502 (2015).
2. X-5 Monte Carlo Team, Los Alamos National Laboratory, Los Alamos, NM, Report LA-UR-03-1987 (2008).
3. E. P. Hartouni et al., Rev. Sci. Instrum. 87, 11D841 (2016).
4. Z. L. Mohamed et al., J. Appl. Phys. 128, 214501 (2020).

Parametric amPlification of SPectrally incoherent SignalS
LLE Review, Volume 164208
Parametric Amplification of Spectrally Incoherent Signals
C. Dorrer
Laboratory for Laser Energetics, University of Rochester
Optical parametric amplifiers (OPA’s) compare favorably with laser amplifiers in terms of spectral coverage and broadband operation. Their properties, and in particular the efficiency of the energy transfer between the pump and the signal, have been extensively studied for a spectrally coherent signal,1,2 but there are no complete studies of parametric amplification for spectrally incoherent pulses. These pulses are highly relevant to the mitigation of laser–plasma instabilities in high-energy laser–matter interactions.3–6 They are the basis for the fourth-generation laser for ultrabroadband experiments (FLUX) currently being built at LLE, where three stages of parametric amplifiers will amplify spectrally incoherent broadband signals. A framework supporting OPA simulations using normalized equations is developed and used to analyze OPA operation with a spectrally incoherent signal, in particular amplification performance and statistical properties of the amplified signal, showing the interplay between OPA properties and initial seeding conditions. These simulations are in agreement with an experimental demonstration of optical parametric amplification with various spectrally incoherent signals.7
A set of normalized equations is developed to describe the amplification of a spectrally incoherent signal with coherence time Dx by a monochromatic pump at a constant intensity Ip,0. The three-wave nonlinear mixing equations in the absence of group-velocity dispersion2 can be normalized into
,
,
.
z
Av t
Aj cn
dA A
Z
aja a
z
Av t
Aj cn
dA A
Z
a aja a
z
A
v t
Aj cn
dA A
Z
aja a
a
1
1
1
s
s
s
s
s effi p
si p
i
i
i
i
i effs p
i i is p
p
p
p
p
p effs i
p p ps i
- -
- -
- -
&
&
&
2
2
2
2
2
2
2
2
2
2
2
2
2
2
2
2
2
2
2
2
2
2
~
~ d
x
~ d
x
C
C
+ = =
+ = + =
+ = + =
) )
) ) (1)
The fields of the pump Ap, signal As, and idler Ai, as a function of time t and longitudinal position z, are normalized according to ,a A n c I2s s s p p,0 s0f ~ ~= ,a A Icn 2i i i p p,0 i0f ~ ~= and .a A n c I2p p p p,00f= The OPA is characterized by the temporal walk-off of the idler and pump relative to the signal, di and dp, and the commonly used nonlinear coefficient
d I c n n n2 eff p,0 s i p1 2 3 0~ ~ fC = 2 related to its small-signal gain.2
The quantities ,a I Is s s p p,0 s2
~ ~U = = ,a I Ii i i p p,0 i2
~ ~U = = and a I Ip p p p,02
U = = are the ratios of the photon flux for the signal, idler, and pump, respectively, at a given time and position to the input-pump photon flux. For a monochromatic signal, the increase in Us and Ui during amplification are equal and reach a limit value equal to 1 at full pump depletion (Manley–Rowe relations). The normalized equations allow for general simulations over the properties of the crystal and initial conditions (signal coherence time and input relative energy of the signal and pump), highlighting their impact on the amplification of a spectrally incoherent signal such as the one presented in Fig. 1, which has the expected negative exponential probability density function (pdf). Such a signal, with an initial average photon flux of 4 # 10-6, leads to pump saturation in an OPA with a small-signal gain equal to 106.

Laser TechnoLogy and deveLopmenT
LLE Review, Volume 164 209
x/Dxx/Dx Us (0, x) (#10–5)
Us (
0, x
) (#10
–5)
Us (
0, x
) (#10
–6)
1
00Pr
obab
ility
den
sity
(#10
5 )
0 0 5 10 15 20–250 250 500–500 1
G13168JR
2 3
2
2
31086420
1
0
(c)(a) (b)
Figure 1Photon flux ratio for the signal (blue curve) as a function of time normalized to the coherence time over (a) the entire pulse and (b) a time range corresponding to 20 coherence times, where the red line represents the time-averaged photon flux ratio Us,0 = 4 # 10-6. (c) Probability density function of the input signal (blue curve) and negative exponential with the same average value (red curve).
G13230JR
(a) Us,0 = 4 × 10⁻⁷
0.010
1
2
3
0.1 1 10 100 0.01 0.1 1 10 100
Us
t t
(b) Us,0 = 1.26 × 10⁻⁶
max
(Us)
10 10010.10.010
2
4
6
8
t
fs(C
L) –
fs(0
)
10 1001
(c) (d)
0.10.010.0
0.2
0.4
0.6
0.8
1.0
t
Us,04 # 10–71.26 # 10–64 # 10–6
An OPA with a small-signal gain equal to 106 and no significant idler-signal temporal walk-off (e.g., type-I phase matching close to spectral degeneracy, where the signal wavelength is approximately twice the pump wavelength) is first considered. In the undepleted-pump regime (low signal average flux, Us,0 = 4 # 10-7), the amplified signal is proportional to the input signal and maintains a negative-exponential pdf [Fig. 2(a)]. With higher pump depletion [Us,0 = 1.26 # 10-6, Fig. 2(b)], at low pump-signal temporal walk-off relative to the signal coherence time stationarity of the signal relative to the pump imposes Us < 1. In longer
Figure 2Probability density histograms of the amplified signal as a function of the pump-signal temporal walk-off normalized to the signal coherence time pt d xD= in (a) the undepleted-pump regime and (b) with some pump depletion. [(c),(d)] The highest values of the signal photon flux and energy increase as a function of t for three depletion conditions.

Parametric amPlification of SPectrally incoherent SignalS
LLE Review, Volume 164210
(b)
Rela
tive
band
wid
th
10 10010.10.010.00.20.40.60.81.0
t
(a)
fs(C
L) –
fs(0
)
10 10010.10.010.0
0.2
0.4
0.6
t
di = 0di = dp/10di = dp
G13231JR
Figure 3(a) Extracted energy as a function pt d xD= for three different ratios .i pd d (b) Bandwidth of the amplified signal relative to the initial bandwidth.
crystals (t > 1), however, the signal extracts energy from various temporal slices of the pump, allowing for Us much larger than 1 at some particular times [Figs. 2(b) and 2(c)] and a slight increase in the extracted energy [Fig. 2(d)]. While the pdf is expected to be sharply peaked below 1 at small temporal walk-off, it follows a negative exponential function at large temporal walk-off.
A nonzero idler-signal temporal walk-off limits the amplification efficiency when the signal and idler are relatively shifted by a delay larger than the coherence time Dx, i.e., when diL > Dx, where L is the crystal length, as indicated by vertical dashed lines on Fig. 3(a) for 10i pd d= and di = dp. Considering that the signal bandwidth is inversely proportional to its coherence time, the energy decrease is fundamentally linked to the OPA phase mismatch, diL/Dx, as confirmed by the calculated relative bandwidth [Fig. 3(b)]. Spectrally incoherent signals offer an intuitive time-domain picture of the OPA phase mismatch, which is most often described in the spectral domain.
Simulations performed with normalized equations are in excellent agreement with simulations that take into account the full dispersion properties of specific nonlinear crystals (BBO, LBO, DKDP). In particular, broadband operation is observed in type-I crystals at spectral degeneracy, while the idler-signal temporal walk-off limits the OPA efficiency when operating away from degeneracy or in type-II crystals.
This material is based upon work supported by the Department of Energy National Nuclear Security Administration under Award Number DE-NA0003856, the University of Rochester, and the New York State Energy Research and Development Authority.
1. R. A. Baumgartner and R. Byer, IEEE J. Quantum Electron. 15, 432 (1979).
2. G. Cerullo and S. De Silvestri, Rev. Sci. Instrum. 74, 1 (2003).
3. J. J. Thomson and J. I. Karush, Phys. Fluids 17, 1608 (1974).
4. S. P. Obenschain, N. C. Luhmann, and P. T. Greiling, Phys. Rev. Lett. 36, 1309 (1976).
5. J. P. Palastro et al., Phys. Plasmas 25, 123104 (2018).
6. R. K. Follett et al., Phys. Plasmas 26, 062111 (2019).
7. C. Dorrer, E. M. Hill, and J. D. Zuegel, Opt. Express 28, 451 (2020).

Laser TechnoLogy and deveLopmenT
LLE Review, Volume 164 211
Comparison of the Laser-Induced-Damage Threshold in Single-Layer Optical Films Measured at Different Facilities
L. Lamaignère,1 A. Ollé,1 M. Chorel,1 N. Roquin,1 A. A. Kozlov,2 B. N. Hoffman,2 J. B. Oliver,2 S. G. Demos,2 L. Gallais,3 R. A. Negres,4 and A. Melninkaitis5
1Commissariat à l’énergie atomique et aux énergies alternatives, CESTA2Laboratory for Laser Energetics, University of Rochester
3Aix-Marseille University, CNRS, Centrale Marseille, Institut Fresnel4National Ignition Facility and Photon Sciences, Lawrence Livermore National Laboratory
5Laser Research Center, Vilnius University
The laser-induced–damage thresholds (LIDT’s) of two different coatings were measured in a round-robin experiment involving five well-equipped damage-testing facilities. Investigations were conducted at a wavelength of 1 nm in the subpicosecond-pulse–duration regime with different configurations in terms of polarization, angle of incidence, and environment (air versus vacuum). The results of this round-robin damage-testing effort revealed significant differences between facilities.
The standardization and comparison of laser-damage protocols and results are essential prerequisites for development and quality control of large optical components used in high-power laser facilities. This may be critical for the development of next-generation laser systems or even to improve the operational envelope of current-generation, large-aperture laser systems such as OMEGA EP1 and PETAL.2 Although the damage-initiation process is due to defects, and therefore the damage behavior of a material is best described by a damage probability curve, the damage threshold under subpicosecond laser excitation using a small area beam for testing is characterized by a narrow range of fluences in the transition from 0% to 100% probability for laser damage. This threshold behavior allows one to measure the damage threshold with great precision (which can be considered to be “deterministic”). This in turn simplifies a direct comparison of LIDT measurements from different facilities in order to explore how systematic factors in the measurement method can affect the result, aiding in the development of standardized damage-testing protocols.
The objective of this work was to compare results of LIDT testing of two dielectric materials, HfO2 and SiO2, in the form of single layers tested at five different laser facilities. The facilities utilized very similar characteristics such as similar wavelengths (around 1 nm), pulse duration (0.8 ps), and beam size. The tests were based on the protocol described by the ISO 21254 Standard.3 The hafnia (HfO2) and silica (SiO2) single layers selected for these tests are common materials used in multilayer dielectric opti-cal components employed in short-pulse laser systems as high- and low-refractive-index materials, respectively. All test substrates for a given coating type were produced during a single coating deposition (and therefore are considered identical) and have been deposited by electron-beam evaporation with ion assistance on BK7 substrates. Testing was performed in four configurations with respect to incidence angle and beam polarization (0° p polarization, 45° p polarization, 0° s polarization, and 45° s polarization). The layer thickness of the hafnia and silica layers was 149.9 and 194.3 nm, respectively. The results reported in this summary obtained from five different facilities (see author affiliations) are presented anonymously in the form Lab A, B, C, D, E (for laboratory A, B, C, D, and E). Following the presentation of the raw results of LIDT measurements, we examine the various parameters, which are hypothesized to be the sources for the observed discrepancies between these measurements.
The values of the refractive index and thickness were used to calculate the electric-field–intensity distribution within each single layer using OptiLayer software4 and the maximum enhancement of the electric-field intensity (EFImax) in the layer was

Comparison of the Laser-induCed–damage threshoLd at singLe-Layer optiCaL fiLms measured at different faCiLities
LLE Review, Volume 164212
determined for each testing configuration. This EFImax value was used in combination with the measured LIDT (LIDTexp) in each material and testing configuration to estimate the “intrinsic” LIDT (LIDTint) for the two single layers using Eq. (1):
.LIDT LIDT EFIint exp max#= (1)
Results are given in Table I for HfO2 and SiO2 single layers. Only results obtained in an air environment are compared since only two of the five testing facilities had the capability for testing in vacuum.
Table I: Intrinsic LIDT’s (LIDTint) for HfO2 and SiO2 monolayers estimated by means of relation (1) and raw damage test experimental data. Thresholds are given in terms of energy density (fluence) in J/cm2.
HfO2 monolayer SiO2 monolayerp polarization s polarization LIDTint p polarization s polarization LIDTint
0° 45° 0° 45° mean v 0° 45° 0° 45° mean v
Lab A 1.94 2.06 ‒ 2.04 2.01 0.04 3.03 2.99 ‒ 2.93 2.99 0.03Lab B 2.13 1.87 2.17 out of
range2.06 0.09 2.96 out of
range3.09 out of
range3.02 0.07
Lab C 1.54 1.37 1.41 1.36 1.42 0.04 2.00 2.15 2.01 2.05 2.05 0.04Lab D 1.63 1.39 ‒ 1.60 1.54 0.07 2.03 2.18 ‒ 2.15 2.12 0.05Lab E 1.64 1.48 ‒ 1.48 1.53 0.09 Not tested
The round-robin LIDT measurements of two dielectric single layers showed significant differences. Deviations of the order of 21% were obtained, much greater than the absolute measurement uncertainties on the facilities estimated to be at least 10%. This is an unexpected and highly undesirable result. LIDT determination in this pulse-length regime should be straightforward, and results should be comparable. An analysis of the various contributors involved in the measurement of damage thresholds shows, however, that differences of 20% are nevertheless plausible. The hypothesized principal mechanism to explain such deviations must be explored in future work to resolve this difficulty in determining damage-threshold measurements in the short-pulse regime. We suggest that it is of fundamental importance to pay increased attention to specific metrology:
• Acquire accurate beam spatial-profile measurements with special attention to the sensor noise determination in the case of a small beam on a large sensor window.
• The problem of nonlinear beam propagation affecting the experimental measurements, mainly the beam profile, must be considered.
• Experimental conditions must be perfectly known and controlled as, for example, hygrometry and/or environment.
• Precise knowledge of the temporal intensity profile is also imperative.
This material is based in part upon work supported by the Department of Energy National Nuclear Security Administration under Award Number DE-NA0003856, the University of Rochester, and the New York State Energy Research and Development Authority. Part of this work was performed under the auspices of the U.S. Department of Energy (DOE) by Lawrence Livermore National Laboratory under Contract DE-AC52-07NA27344.

Laser TechnoLogy and deveLopmenT
LLE Review, Volume 164 213
1. L. J. Waxer et al., Opt. Photonics News 16, 30 (2005).
2. N. Blanchot et al., Opt. Express 25, 16,957 (2017).
3. ISO 21254-1:2011- 21254-4:2011(E), “Lasers and Laser-Related Equipment—Test Methods for Laser-Induced Damage Threshold”—Parts 1-4 (International Organization for Standardization, Geneva, Switzerland, 2011), pp. 1-5.
4. A. V. Tikhonravov and M. K. Trubetskov, OptiLayer Thin Film Software, Optilayer Ltd., http://www.optilayer.com.

The 12Th Omega Laser FaciLiTy Users grOUp WOrkshOp
LLE Review, Volume 164214
The 12th Omega Laser Facility Users Group Workshop
M. S. Wei and S. F. B. Morse
Laboratory for Laser Energetics, University of Rochester
LLE hosted a virtual meeting for the Omega Laser Facility User Group (OLUG) 23–25 September 2020 with more than 90 par-ticipants from 27 institutions (see Fig. 1). The objective of this meeting was the development of Findings and Recommendations (F&R’s) to improve facility capabilities and user experience/effectiveness. The first day of the meeting began with two facility presentations: “Omega Facility Updates” (including LLE responses to the 2019 OLUG F&R’s) and “Omega RemotePI Operation,” (a comprehensive description of the RemotePI capability developed during the pandemic lockdown in Q3). Over the three days (two hours each day), OLUG members discussed and developed a list of 23 new F&R’s. A few highlights include:
• Automated online access to post-processed neutronic data through the Omega operation webpage.
• A dedicated gas-jet nozzle characterization station to measure the plasma density for each specific nozzle used to create targets for experiments.
• Enhanced VISAR (velocity interferometer system for any reflector)/SOP (streaked optical pyrometer) capability, including its implementation in an additional ten-inch manipulator (TIM) on OMEGA EP to allow simultaneous shock pressure and x-ray diffraction measurements.
• A new TIM-based particle spectrometer that works in an intense x-ray background.
• Enhanced pulse-shaping capability to flexibly control/correct the as-shot laser pulse shapes on OMEGA.
• Longer pulse durations on OMEGA EP (UV beams) for studying photoionized plasmas, laboratory astrophysics, and high-energy-density hydrodynamics.
• A dedicated short-pulse beam (i.e., not sourced from OMEGA EP) on OMEGA for ultrafast diagnostics and short-pulse interaction physics in the OMEGA chamber (a longer-term development project).
On the last day of the meeting, Mingsheng Wei gave an update on the Omega Basic Science Program and Ann Satsangi described the NNSA perspectives and gave an update on Academic Programs.
The next OLUG Workshop with a full meeting agenda including poster sessions will be held virtually 27–30 April 2021.

Users report
LLE Review, Volume 164 215
U2671JR
eugene kowaluk
LLE Meeting2020-09-29eugene kowalukby eugene kowaluk
ATTENDEESOmega Laser Facility Users Group WorkshopWednesday-Friday, 23-25 September 2020
Figure 12020 OLUG virtual meeting attendees.
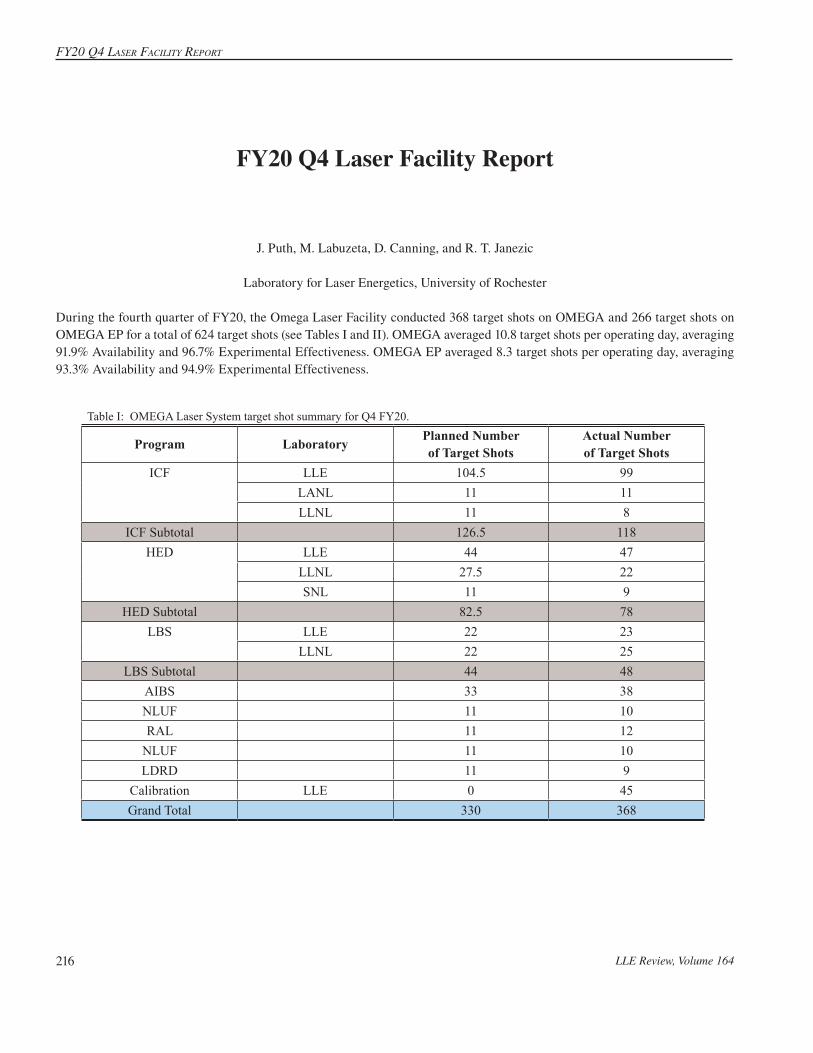
FY20 Q4 Laser FaciLitY report
LLE Review, Volume 164216
FY20 Q4 Laser Facility Report
J. Puth, M. Labuzeta, D. Canning, and R. T. Janezic
Laboratory for Laser Energetics, University of Rochester
During the fourth quarter of FY20, the Omega Laser Facility conducted 368 target shots on OMEGA and 266 target shots on OMEGA EP for a total of 624 target shots (see Tables I and II). OMEGA averaged 10.8 target shots per operating day, averaging 91.9% Availability and 96.7% Experimental Effectiveness. OMEGA EP averaged 8.3 target shots per operating day, averaging 93.3% Availability and 94.9% Experimental Effectiveness.
Table I: OMEGA Laser System target shot summary for Q4 FY20.
Program Laboratory Planned Number of Target Shots
Actual Number of Target Shots
ICF LLE 104.5 99LANL 11 11LLNL 11 8
ICF Subtotal 126.5 118HED LLE 44 47
LLNL 27.5 22SNL 11 9
HED Subtotal 82.5 78LBS LLE 22 23
LLNL 22 25LBS Subtotal 44 48
AIBS 33 38NLUF 11 10RAL 11 12
NLUF 11 10LDRD 11 9
Calibration LLE 0 45Grand Total 330 368

Laser FaciLity report
LLE Review, Volume 164 217
Table II: OMEGA EP Facility Target Shot Summary for Q4 FY20.
Program Laboratory Planned Number of Target Shots
Actual Number of Target Shots
ICF LLE 45.5 64LLNL 28 44
ICF Subtotal 73.5 108HED LANL 14 13
LLE 7 7LLNL 42 44
HED Subtotal 63 64LBS LLNL 14 22
NLUF 28 28AIBS 14 19
LaserNetUS 14 22Calibration LLE 0 3Grand Total 206.5 266
A prototype alignment package in the stage-F diagnostics area featuring a modern digital camera was installed on the OMEGA laser. This upgrade will improve the resolution of the alignment and prevent operational delays associ-ated with the aging analog components. The design has been validated, and all 60 beams will be upgraded over the upcoming six months.

NatioNal laser Users’ Facility aNd exterNal Users’ Programs
FY20 Annual Report 219
National Laser Users’ Facility and External Users’ Programs
M. S Wei
Laboratory for Laser Energetics, University of Rochester
Under the facility governance plan implemented in FY08 to formalize the scheduling of the Omega Laser Facility as a National Nuclear Security Administration (NNSA) User Facility, Omega Facility shots are allocated by programs following NNSA guid-ance. The majority (+69%) of the Omega target shots are committed to the national Inertial Confinement Fusion (ICF) Program and the High-Energy-Density (HED) Program conducted by scientists from Lawrence Livermore National Laboratory (LLNL), Los Alamos National Laboratory (LANL), Sandia National Laboratories (SNL), the Naval Research Laboratory (NRL), and LLE. In FY20, the Omega Laser Facility delivered a total of 1947 shots, among which about 72% of the total shots were conducted for the ICF and HED campaigns including calibration shots. The relative lower number of the total shots in FY20 is due to the disruption caused by the ongoing global Covid-19 pandemic. No experiments were conducted during 23 March to 15 May when the Omega Facility was on the Safe Standby mode. Nearly 25% of the approved FY20 experiments have been postponed to FY21. It is worth noting that the Omega shot operation resumed in June utilizing the new RemotePI operation protocol that enables all researchers at LLE and external users to safely and effectively conduct experiments remotely.
The Fundamental Science Program at the Omega Laser Facility, with projects selected through open-call and peer-reviewed processes, is typically allotted between 25% to 29% of the total Omega Facility shots. The NNSA-supported program has two distinct components: (1) the NLUF awards to individual principal investigator’s (PI’s) on a two-year cycle with the associated Omega Facility time (+18% of the overall facility time each year) for experiments led by U.S. academia and business; and (2) the Laboratory Basic Science (LBS) experiments approved annually (with +11% of the Omega facility time) that are led by the NNSA ICF laboratories including LLNL, LANL, SNL, NRL, and LLE and the Office of Science laboratories such as SLAC, Princeton Plasma Physics Laboratory (PPPL), and Lawrence Berkeley National Laboratory (LBNL). From FY20, a few additional shot days on OMEGA EP have been made available to users of the newly established LaserNetUS network for basic HED science research supported by the DOE Office of Fusion Sciences (FES) within the DOE Office of Science. In FY20, these peer-reviewed user programs (NLUF, LBS, and LaserNetUS) obtained a total of 500 target shots that accounted for 27% of the overall Omega Facility shots.
The Omega Laser Facility has also been used for externally funded campaigns led by teams from the Commissariat à l’énergie atomique et aux énergies (CEA) of France, the joint Rutherford Appleton Laboratory (RAL), the University of York of the United Kingdom, and others. These externally funded experiments are conducted at the facility on the basis of special agreements put in place by UR/LLE and participating institutions with the endorsement of NNSA. During FY20, the RAL/York team performed 11 target shots on OMEGA and an LANL LDRD team conducted 9 shots.
The facility users who conducted experiments during this year included 16 collaborative teams participating in the NLUF Program with the Omega Laser Facility shot allocation from the FY20–FY21 awards; 17 teams led by scientists from LLNL, LANL, LLE, SLAC, PPPL, and LBNL participating in the LBS Program; 6 project teams from academia and national labs participating in the LaserNetUS Program; many collaborative teams from the national laboratories (LLNL and NRL) and LLE conducting ICF experiments; investigators from LLNL, LANL, SNL, and LLE conducting experiments for HED campaigns; and researchers from RAL/York.

FY20 NatioNal laser Users’ FacilitY Program
FY20 Annual Report220
FY20 National Laser Users’ Facility Program
M. S. Wei
Laboratory for Laser Energetics, University of Rochester
During FY19, the National Nuclear Security Administration (NNSA) and Office of Science jointly completed a funding opportu-nity announcement (FOA), review, and selection process for National Laser Users’ Facility (NLUF) experiments to be conducted at the Omega Facility during FY20 and FY21. After peer review by an independent proposal review committee for scientific and technical merit and the feasibility review by the Omega Facility team, NNSA selected 11 proposals for funding and Omega shot allocation with a total of 22.5 and 23.5 shot days for experiments in FY20 and FY21, respectively. During the first half of the FY20, LLE completed a one-time solicitation, review, and selection process for Academic and Industrial Basic Science (AIBS) experiments to utilize the remaining NLUF shot allocation in FY20–FY21. Ten new projects were selected for AIBS shot alloca-tion (a total of 11 and 10 shot days) for experiments staring in Q3FY20 and throughout FY21.
FY20 was the first of a two-year period of performance for these 21 NLUF including AIBS projects (Table I). Fifteen NLUF and AIBS projects obtained a total of 232 target shots during FY20, which are summarized in this section.
A critical part of the NNSA-supported NLUF program and the DOE Office of Fusion Energy Sciences (FES)-supported Laser-NetUS program is the education and training of graduate students in high-energy-density (HED) physics. In addition, graduate students can also access the Omega Laser Facility to conduct their theses research through collaborations with national labora-tories and LLE. In total, about 60 graduate students from 18 universities participated in these external user-led research projects supported by NLUF/Laser Basic Science (LBS), LaserNetUS, and/or with experiments conducted at the Omega Laser Facility (see Table II), among which nine students successfully defended their Ph.D. theses in calendar year 2020 (see the highlighted names in Table II). It is worth noting that 18 of these students are new to the Omega Laser Facility.
Measurements of Ion–Electron Equilibration Utilizing Low-Velocity Ion Stopping in High-Energy-Density Plasmas on OMEGAPrincipal Investigators: P. J. Adrian, J. A. Frenje, N. Kabadi, M. Gatu Johnson, A. Bose, B. Lahmann, J. Pearcy, G. D. Sutcliffe, T. Johnson, F. H. Séguin, C. K. Li, and R. D. Petrasso (Plasma Fusion Science Center, MIT); P. E. Grabowski, B. Bachmann,F. Graziani, H. Whitley, C. Scullard, and L. X. Benedict (LLNL); J. Katz, C. Stoeckl, A. Sorce, C. Sorce, V. Yu. Glebov, and S. P.Regan (LLE); R. C. Mancini (University of Nevada, Reno); and R. Florido (Universidad de Las Palmas de Gran Canaria, Spain)
MIT graduate student P. Adrian and collaborators led an NLUF experiment to study the physics of ion–electron equilibration in high-energy-density plasmas (HEDP’s). This work was the basis for an invited talk given at the American Physical Society’s Division of Plasma Physics (APS–DPP) meeting in November 2020. In addition, the results for this day and previous NLUF days studying ion–electron equilibration will be published in the 2021 APS–DPP conference proceedings.

NatioNal laser Users’ Facility aNd exterNal Users’ Programs
FY20 Annual Report 221
Table I: Twenty-one NLUF (in blue) and AIBS (in gray) projects approved for the FY20–FY21 Omega Laser Facility shot allocations.
Principal Investigator Institution Title
F. N. Beg* University of California, San Diego
Charged-Particle Transport and Energy Deposition in Warm Dense Matter With and Without an External Magnetic Field
C. M. Krauland* General Atomics Characterization of the Nonlinear Laser–Plasma Interaction in Electron-Assisted Shock Ignition
K. Krushelnick* University of Michigan The Dynamics of Strong Magnetic Fields Generated by Relativistic Laser–Plasma Interactions Using OMEGA EP
E. Liang Rice University Collision of Two Magnetized Jets Created by Hollow Ring Lasers
R. Mancini* University of Nevada, Reno A Laboratory Photoionized Plasma Experiment on OMEGA EP
C. McGuffey University of California, San Diego
Driving Compressed Magnetic Fields to Exceed 10 kT in Cylindrical Implosions on OMEGA
R. Petrasso* Massachusetts Institute of Technology
High-Energy-Density Physics, Laboratory Astrophysics, and Student Training on OMEGA
P. Tzeferacos* University of Chicago Fundamental Astrophysical Processes in Radiative Supersonic Magnetohydrodynamic Turbulence
M. Valdivia* Johns Hopkins University Demonstration of Monochromatic Talbot–Lau X-Ray Deflectometry (TXD) Electron Density Diagnostic in Laser–Target Interactions
J. Wicks* Johns Hopkins University High Pressure and Temperature Polymorphism of a Key Super-Earth Mantle Material: MgO
L. Willingale* University of Michigan Direct Laser Acceleration of Electrons for Bright, Directional Radiation Sources
M. Cappelli* Stanford University Hydrodynamic Versus Kinetic Atomic Mix in Deflagrating Converging Plasmas
T. Duffy* Princeton University Phase Transitions in Planetary Materials at Ultrahigh Pressures
W. Fox Princeton University Magnetic Reconnection in High-Energy-Density Plasmas
R. Jeanloz* University of California, Berkeley
Multi-Compression and Chemical Physics of Planetary Interiors
H. Ji Princeton University Study of Particle Acceleration from Magnetically Driven Collisionless Reconnection at Low Plasma Beta Using Laser- Powered Capacitor Coils
C. Kuranz* University of Michigan Experimental Astrophysics on the OMEGA Laser
M. Manuel* General Atomics B-Field Effects on Laser–Plasma Instabilities
D. Schaeffer* Princeton University Particle Heating by Collisionless Shocks in Magnetized High-Energy-Density Plasmas
B. Srinivasan* Virginia Tech Investigation of Feasibility of the 11B(P,3a) Reaction in Inertial Confinement Fusion Settings
W. Theobald* University of Rochester Quantifying Turbulent Rayleigh–Taylor Mixing with X-Ray Phase-Contrast Imaging
*Experiments conducted in FY20.

FY20 NatioNal laser Users’ FacilitY Program
FY20 Annual Report222
Table II: Graduate students from other universities who have conducted research utilizing the Omega Laser Facility through NLUF, LBS, LaserNetUS, or via collaborations with national labs and LLE in FY20. Eight students successfully defended their Ph.D. theses and one student graduated with an M.S. degree during Calendar Year 2020 (see the shaded cells).
Name University Advisor(s) Notes
Elizabeth Grace Georgia Tech Trebino/Ma (LLNL) New; LLNL collaboration
Junellie Gonzalez Quiles JHU Wicks
Tylor Perez JHU Wicks
Zixuan Ye JHU Wicks
Patrick Adrian MIT Petrasso
Timothy Mark Johnson MIT Petrasso
Neel Kabadi MIT Petrasso
Justin Kunimune MIT Petrasso
Brandon Lahmann MIT Petrasso
Jacob Pearcy MIT Petrasso
Benjamin Reichelt MIT Petrasso
Graeme Sutcliffe MIT Petrasso
Raspberry Simpson MIT Winslow (MIT)/ Ma (LLNL)
LLNL collaboration
Abraham Chien Princeton Ji
Jack Matteucci Princeton Bhattacharjee/Fox Defended Ph.D. thesis in Jan. 2020 (now a freelancer)
Donghoon Kim Princeton Duffy
Sirus Han Princeton Duffy
Ian Ocampo Princeton Duffy
Yingchao Lu Rice University Liang Defended Ph.D. thesis in Oct. 2020 (now a postdoc at the FLASH Center at U. Rochester)
Kyle Perez Rice University Liang New
William Riedel Stanford Cappelli New
Megan Harwell University of California, Davis
Stewart New
Roman Lee University of California, Los Angeles
Mori New; UCSD-led CMEC GA collaboration (AIBS, M. Manuel)
Mitchell Sinclair University of California, Los Angeles
Joshi New; LLNL collaboration (LBS, F. Albert)
Krish Bhutwala University of California, San Diego
Beg New
Jacquelynne Vaughan University of California, San Diego
Beg New
Joseph Strehlow University of California, San Diego
Beg
Shu Zhang University of California, San Diego
Beg Defended Ph.D. thesis in July 2020 (now a postdoc at Princeton)
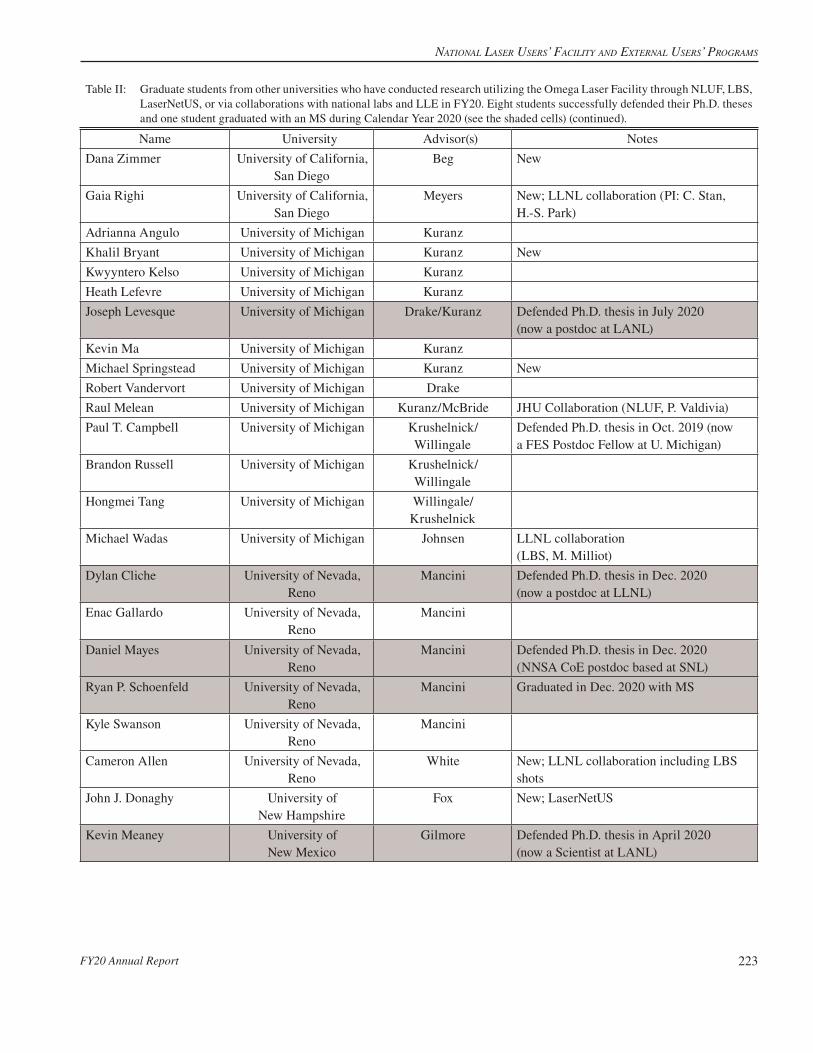
NatioNal laser Users’ Facility aNd exterNal Users’ Programs
FY20 Annual Report 223
Table II: Graduate students from other universities who have conducted research utilizing the Omega Laser Facility through NLUF, LBS, LaserNetUS, or via collaborations with national labs and LLE in FY20. Eight students successfully defended their Ph.D. theses and one student graduated with an MS during Calendar Year 2020 (see the shaded cells) (continued).
Name University Advisor(s) Notes
Dana Zimmer University of California, San Diego
Beg New
Gaia Righi University of California, San Diego
Meyers New; LLNL collaboration (PI: C. Stan, H.-S. Park)
Adrianna Angulo University of Michigan Kuranz
Khalil Bryant University of Michigan Kuranz New
Kwyyntero Kelso University of Michigan Kuranz
Heath Lefevre University of Michigan Kuranz
Joseph Levesque University of Michigan Drake/Kuranz Defended Ph.D. thesis in July 2020 (now a postdoc at LANL)
Kevin Ma University of Michigan Kuranz
Michael Springstead University of Michigan Kuranz New
Robert Vandervort University of Michigan Drake
Raul Melean University of Michigan Kuranz/McBride JHU Collaboration (NLUF, P. Valdivia)
Paul T. Campbell University of Michigan Krushelnick/Willingale
Defended Ph.D. thesis in Oct. 2019 (now a FES Postdoc Fellow at U. Michigan)
Brandon Russell University of Michigan Krushelnick/Willingale
Hongmei Tang University of Michigan Willingale/Krushelnick
Michael Wadas University of Michigan Johnsen LLNL collaboration (LBS, M. Milliot)
Dylan Cliche University of Nevada, Reno
Mancini Defended Ph.D. thesis in Dec. 2020 (now a postdoc at LLNL)
Enac Gallardo University of Nevada, Reno
Mancini
Daniel Mayes University of Nevada, Reno
Mancini Defended Ph.D. thesis in Dec. 2020 (NNSA CoE postdoc based at SNL)
Ryan P. Schoenfeld University of Nevada, Reno
Mancini Graduated in Dec. 2020 with MS
Kyle Swanson University of Nevada, Reno
Mancini
Cameron Allen University of Nevada, Reno
White New; LLNL collaboration including LBS shots
John J. Donaghy University of New Hampshire
Fox New; LaserNetUS
Kevin Meaney University of New Mexico
Gilmore Defended Ph.D. thesis in April 2020 (now a Scientist at LANL)

FY20 NatioNal laser Users’ FacilitY Program
FY20 Annual Report224
Table II: Graduate students from other universities who have conducted research utilizing the Omega Laser Facility through NLUF, LBS, LaserNetUS, or via collaborations with national labs and LLE in FY20. Eight students successfully defended their Ph.D. theses and one student graduated with an MS during Calendar Year 2020 (see the shaded cells) (continued).
Name University Advisor(s) Notes
Paul King University of Texas, Austin
Hegelich/Albert LLNL collaboration including LBS (F. Albert)
Camille Samulski Virginia Tech. Srinivasan New; GA collaboration (NLUF, M. Manuel)
Oliver Vaxirani Virginia Tech. Srinivasan Through LANL collaboration
Victorien Bouffetier University of Bordeaux Casner LLE collaboration including LBS (W. Theobald)
Thomas Campbell Oxford Gregori New; NLUF and LLE collaboration
Hannah Poole Oxford Gregori NLUF and LLE collaboration
Gabriel Perez-Callejo Oxford Rose LLNL collaboration including LBS and HED (E. Marley); Defended Ph.D. thesis in June 2020 (now a postdoc at CELIA, Bordeaux)
Adam Dearing U. York Woolsey New; LLE collaboration (W. Theobald)
Matthew Khan U. York Woolsey RAL/York (PI R. Scott) and LLE collaboration (W. Theobald)
Arun Nutter U. York Woolsey New; Through RAL/York (PI: R. Scott)
JHU: Johns Hopkins UniversityMIT: Massachusetts Institute of Technology
Many processes in HEDP experiments drive the ions and electrons out of equilibrium. When this occurs, ions and electrons are brought into thermal equilibrium through collisions; however, the equilibration rate can be significantly longer than the dynamical time scale of the plasma. Phenomena such as the structure of shock waves, laser absorption, alpha heating, and magnetic-field advection all depend on the equilibration time scale of ions and electrons. It is critically important when modeling, simulating, or interpreting experiments to have accurate theories calculating ion–electron equilibration. Theories for the equilibration rate must be tested experimentally.
Previously, measurements of ion–electron equilibration in the high-density (>1023-cm–3), high-temperature (>1-keV) regime were challenging. This work made the first experimental measurements of ion–electron equilibration in this regime by using a novel method to infer ion–electron equilibration rates through low-velocity ion-stopping power measurements. In this regime, most theories predict that the equilibration rate vie is
.lnmm Ze
T
n3
4 24v /0
2 2
3 2ie i
e
e
e% % %r
r r fK= e o (1)
The Coulomb logarithm lnK is related to the Coulomb cross section, which must be calculated theoretically. At high density and temperature, the Coulomb logarithm is expected to scale as
,Cln lnQ
De
m
mK = f p (2)

NatioNal laser Users’ Facility aNd exterNal Users’ Programs
FY20 Annual Report 225
where mDe is the Debye length, mQ is the De Broglie wavelength, and C is a correction factor that arises in the small-angle scat-tering approximation in the collision physics. All the theoretical uncertainty lies within the calculation of lnK, so we designed experiments to measure ln K.
The experiments conducted involved the implosion of thin-glass capsules filled with D3He gas on the OMEGA Laser System. At peak compression, the capsules produce high-density and high-temperature conditions of interest as well as D–D and D–3He fusion reactions. To measure lnK, our method required an accurate knowledge of the plasma conditions and measurements of the energy loss of the DD-triton and D3He-alpha particles. To measure the plasma conditions, we used x-ray penumbral imaging1 as well as x-ray spectrometers to characterize the x-ray emission from the capsule. From this data we were able to determine the electron density (ne) and temperature (Te) during the thermonuclear fusion phase of the implosion. We also used MIT’s charged-particle spectrometers2 to measure the energy loss of the DD-triton and D3He-alpha particles. From this data we were able to measure an “experimental” Coulomb logarithm lnKexp.
Figure 1 shows the main result of these experiments. Measurements of ne and Te were used to calculate mDe and mQ. The probed densities and temperature spanned 1 to 20 # 1023 cm–3 and 1.4 to 2.5 keV, respectively. The measured lnKexp was then used to constrain the correction factor C from Eq. (2). Figure 1 shows that the best fit is C = 0.45!0.14. Different theories will predict different values for C based on how they handle the small-angle scattering that occurs in ion–electron collisions. After a review of the literature, we have found that three equilibration theories best reflect our measurements. These theories are the quantum Lenard–Balescu (qLB)3 model, the quantum Fokker–Plank (qFP)4 model, and the Brown–Preston–Singleton (BPS)5 model. All three of these models incorporate quantum diffraction into the scattering physics and, according to our data, correctly account for the small-angle collision.
This work demonstrates that the qLB, qFP, and BPS equilibration theories should be used in models and simulations when describing plasma phenomena that occur at high density and high temperature.
This material is based upon work supported by the DOE/NNSA Center of Excellence (CoE) at MIT with Contract DE-NA0003868, and NLUF at Omega DE-NA0003856, DE-NA0003868 the University of Rochester, and the New York State Energy Research and Development Authority. P. J. Adrian was also supported with a DOE Stewardship Science Graduate Fel-lowship under contract DE-NA0003960.
Figure 1Measurements of the Coulomb logarithm (lnKexp), Debye length (mDe), and electron thermal De Broglie length (mQ) are used to constrain the small-angle scattering cor-rection factor (C). The best fit to the measurements is C = 0.45!0.14. This is consistent with the theoretical predictions of BPS, qLB, and qLF equilibration theories. This result highlights the importance of quantum diffraction and small-angle scattering in predicting the equilibration rate in high-density and high-temperature plasmas.
U2601JRlnKexp
C = 0.45!0.14
ln (C
mD
e/mQ
)
6 82 40
4
6
8
2
0

FY20 NatioNal laser Users’ FacilitY Program
FY20 Annual Report226
Applying Laser-Driven Coils for Magnetization of Cylindrical Implosions on OMEGAPrincipal Investigators: M. Bailly-Grandvaux, C. McGuffey, and F. N. Beg (University of California, San Diego); J. J. Santos and G. Perez-Callejo (CELIA, University of Bordeaux, France); R. Florido (Universidad de Las Palmas de Gran Canaria, Spain); C. Walsh (LLNL); F. Suzuki-Vidal (Imperial College, UK); R. C. Mancini (University of Nevada, Reno); T. Nagayama (SNL); J. L. Peebles, J. R. Davies, and S. Muller Fess (LLE); M. A Gigosos (Universidad de Valladolid, Spain); and S. Ferri and A. Calisti (Aix-Marseille Université, CNRS, PIIM, France)
Magnetization is one of the possible routes to achieving higher fusion yields in inertial confinement fusion (ICF). Magnetic fields induce anisotropic thermal-electron diffusion, improving energy confinement in the dense core and therefore implosion efficiency, and can therefore decrease the loss of fusion-produced ions, relaxing the areal density constraint of conventional ICF. Yet, demonstrating the viability of magneto-inertial fusion (MIF) requires mastering complex mechanisms such as magnetic-flux compression and nonlocal electron transport.
The experimental campaign aimed at systematically investigating magnetized cylindrical implosions with a quasi-static seed magnetic field (B field) but with a pair of laser-driven Helmholtz-like coils rather than the magneto-inertial fusion electrical discharge system’s (MIFEDS) pulsed electrical system. The laser-driven coils present fewer debris and obstruction concerns than MIFEDS, and its scaling is not yet fully explored. The goal of producing a 50-T seed would significantly extend the range of achievable magnetization levels. For the first shot day, we studied the critical issue of B-field compression under well-controlled and monitored conditions of density and temperature using an established cylindrical implosion platform.6–9 A comparison of imploded plasma has been made with and without a magnetic field. The data obtained will facilitate benchmarking of magne-tohydrodynamic modeling and consequently help one to understand the underlying physics of advanced fusion schemes such as the magnetized liner inertial fusion (MagLIF) and astrophysical systems.
The experimental setup used for the four implosion shots is illustrated in Fig. 2. Forty UV beams with a total energy of +14.5 kJ were delivered in 1.5 ns to compress a cylinder target filled with 11 atm of D2 + 0.3 at. % of Ar. Three main diagnostics were
U2602JR
(a)
TIM-2, XRSTIM-1, fill tube
TIM-3, SXS
H13F, KB microscope
TIM-5,
XRFC TTP4- CCT1 stalk
TIM-6, XRFC
TPS2-
CCT2 stalk 2.4-mm gap
(b)Laser-driven capacitor coil target (CCT)
5 UV beams/CCT,~2 kJ, 1.5 ns, I0 ~ 8 # 1015 W/cm2
40 UV beams,~14.5 kJ, 1.5 ns, SG2-600 PP
D2 at 11 atm(0.3 at % Ar)
Cylindrically imploded D2 gas tube
Figure 2(a) Experimental setup for the “implosion” configuration of the first shot day of the BCoilCompress Campaign. Forty UV beams were used to compress the cylinder target filled with 11 atm of D2 and 0.3 at. % of Ar. It used the same irradiation scheme as SmallMagLIF. (b) A pair of laser-driven coils in a quasi-Helmholtz configuration was designed for this experiment in order to apply an external magnetic field to the implosion. A total of 2 kJ is delivered in 1.5 ns to each laser-driven coil. CCT: capacitor coil target; TIM: ten-inch manipulator; TPS: Target Positioning System; KB: Kirkpatrick–Baez microscope.
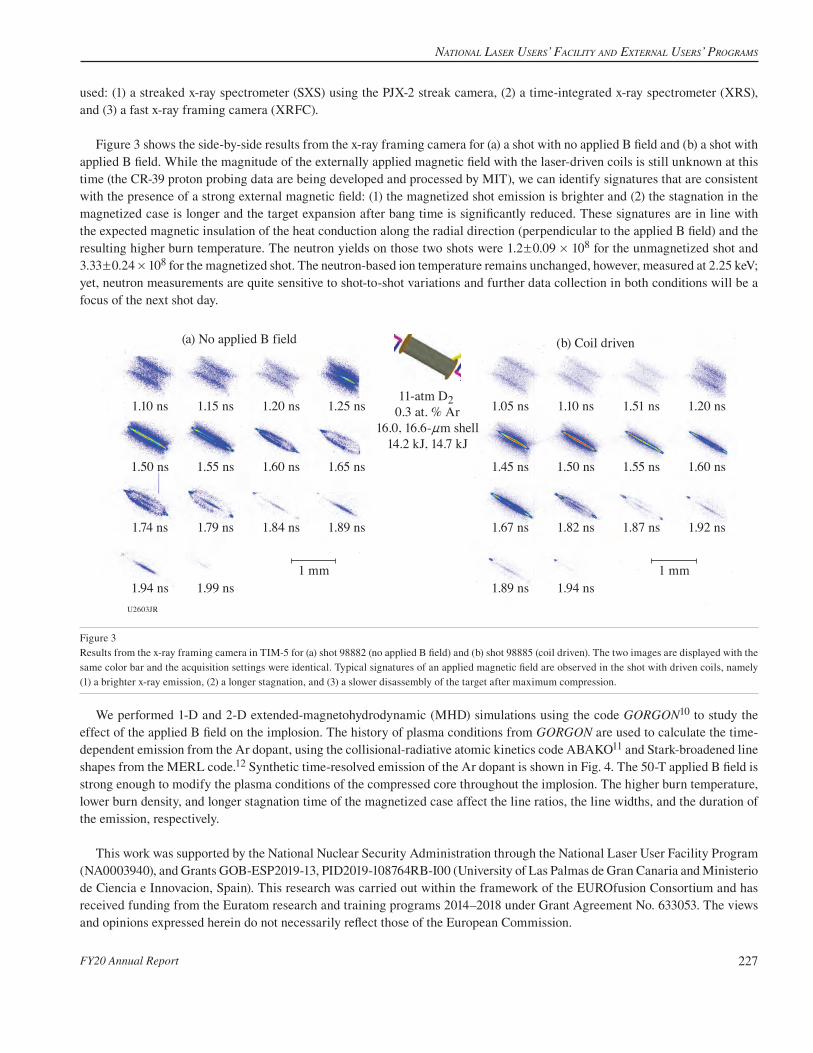
NatioNal laser Users’ Facility aNd exterNal Users’ Programs
FY20 Annual Report 227
used: (1) a streaked x-ray spectrometer (SXS) using the PJX-2 streak camera, (2) a time-integrated x-ray spectrometer (XRS), and (3) a fast x-ray framing camera (XRFC).
Figure 3 shows the side-by-side results from the x-ray framing camera for (a) a shot with no applied B field and (b) a shot with applied B field. While the magnitude of the externally applied magnetic field with the laser-driven coils is still unknown at this time (the CR-39 proton probing data are being developed and processed by MIT), we can identify signatures that are consistent with the presence of a strong external magnetic field: (1) the magnetized shot emission is brighter and (2) the stagnation in the magnetized case is longer and the target expansion after bang time is significantly reduced. These signatures are in line with the expected magnetic insulation of the heat conduction along the radial direction (perpendicular to the applied B field) and the resulting higher burn temperature. The neutron yields on those two shots were 1.2!0.09 # 108 for the unmagnetized shot and 3.33!0.24 # 108 for the magnetized shot. The neutron-based ion temperature remains unchanged, however, measured at 2.25 keV; yet, neutron measurements are quite sensitive to shot-to-shot variations and further data collection in both conditions will be a focus of the next shot day.
U2603JR
(b) Coil driven
1 mm 1 mm
11-atm D2 0.3 at. % Ar
16.0, 16.6-nm shell14.2 kJ, 14.7 kJ
(a) No applied B field
1.10 ns 1.15 ns 1.20 ns 1.25 ns
1.50 ns 1.55 ns 1.60 ns 1.65 ns
1.74 ns 1.79 ns
1.94 ns 1.99 ns
1.84 ns 1.89 ns
1.05 ns 1.10 ns 1.51 ns 1.20 ns
1.45 ns 1.50 ns 1.55 ns 1.60 ns
1.67 ns 1.82 ns
1.89 ns 1.94 ns
1.87 ns 1.92 ns
Figure 3Results from the x-ray framing camera in TIM-5 for (a) shot 98882 (no applied B field) and (b) shot 98885 (coil driven). The two images are displayed with the same color bar and the acquisition settings were identical. Typical signatures of an applied magnetic field are observed in the shot with driven coils, namely (1) a brighter x-ray emission, (2) a longer stagnation, and (3) a slower disassembly of the target after maximum compression.
We performed 1-D and 2-D extended-magnetohydrodynamic (MHD) simulations using the code GORGON10 to study the effect of the applied B field on the implosion. The history of plasma conditions from GORGON are used to calculate the time-dependent emission from the Ar dopant, using the collisional-radiative atomic kinetics code ABAKO11 and Stark-broadened line shapes from the MERL code.12 Synthetic time-resolved emission of the Ar dopant is shown in Fig. 4. The 50-T applied B field is strong enough to modify the plasma conditions of the compressed core throughout the implosion. The higher burn temperature, lower burn density, and longer stagnation time of the magnetized case affect the line ratios, the line widths, and the duration of the emission, respectively.
This work was supported by the National Nuclear Security Administration through the National Laser User Facility Program (NA0003940), and Grants GOB-ESP2019-13, PID2019-108764RB-I00 (University of Las Palmas de Gran Canaria and Ministerio de Ciencia e Innovacion, Spain). This research was carried out within the framework of the EUROfusion Consortium and has received funding from the Euratom research and training programs 2014–2018 under Grant Agreement No. 633053. The views and opinions expressed herein do not necessarily reflect those of the European Commission.
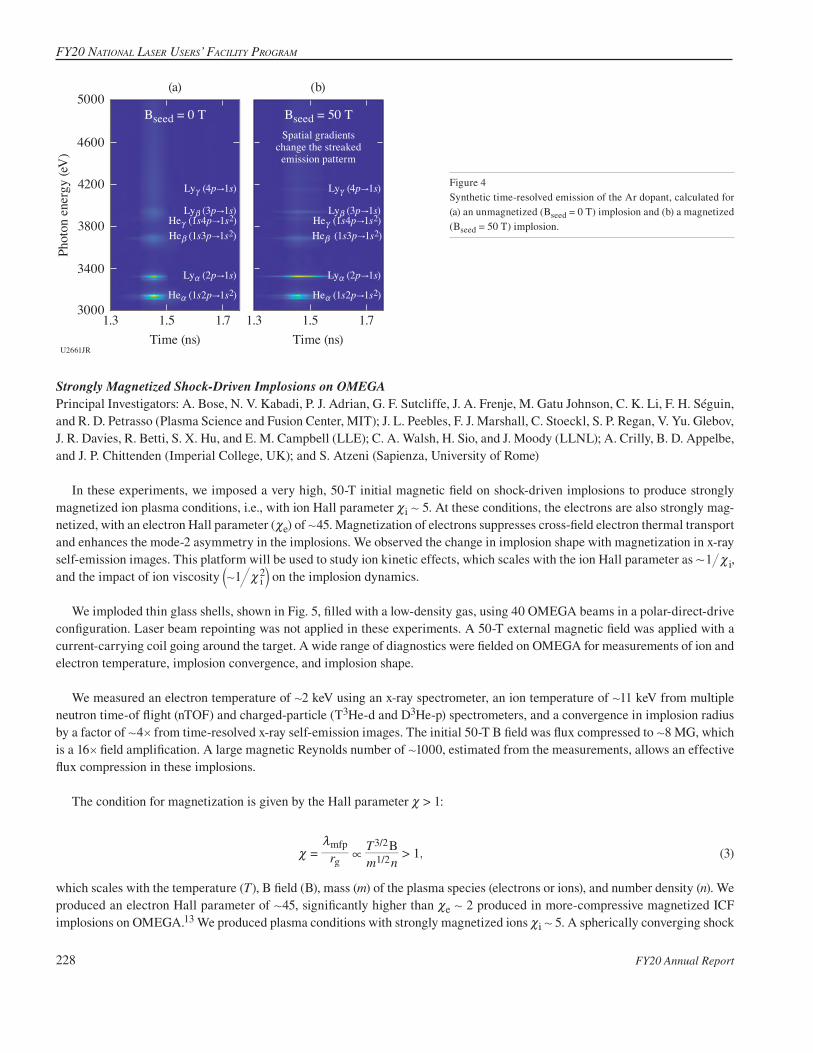
FY20 NatioNal laser Users’ FacilitY Program
FY20 Annual Report228
Strongly Magnetized Shock-Driven Implosions on OMEGAPrincipal Investigators: A. Bose, N. V. Kabadi, P. J. Adrian, G. F. Sutcliffe, J. A. Frenje, M. Gatu Johnson, C. K. Li, F. H. Séguin, and R. D. Petrasso (Plasma Science and Fusion Center, MIT); J. L. Peebles, F. J. Marshall, C. Stoeckl, S. P. Regan, V. Yu. Glebov, J. R. Davies, R. Betti, S. X. Hu, and E. M. Campbell (LLE); C. A. Walsh, H. Sio, and J. Moody (LLNL); A. Crilly, B. D. Appelbe, and J. P. Chittenden (Imperial College, UK); and S. Atzeni (Sapienza, University of Rome)
In these experiments, we imposed a very high, 50-T initial magnetic field on shock-driven implosions to produce strongly magnetized ion plasma conditions, i.e., with ion Hall parameter |i + 5. At these conditions, the electrons are also strongly mag-netized, with an electron Hall parameter (|e) of +45. Magnetization of electrons suppresses cross-field electron thermal transport and enhances the mode-2 asymmetry in the implosions. We observed the change in implosion shape with magnetization in x-ray self-emission images. This platform will be used to study ion kinetic effects, which scales with the ion Hall parameter as ,1 i+ |
and the impact of ion viscosity 1 2i+ |a k on the implosion dynamics.
We imploded thin glass shells, shown in Fig. 5, filled with a low-density gas, using 40 OMEGA beams in a polar-direct-drive configuration. Laser beam repointing was not applied in these experiments. A 50-T external magnetic field was applied with a current-carrying coil going around the target. A wide range of diagnostics were fielded on OMEGA for measurements of ion and electron temperature, implosion convergence, and implosion shape.
We measured an electron temperature of +2 keV using an x-ray spectrometer, an ion temperature of +11 keV from multiple neutron time-of flight (nTOF) and charged-particle (T3He-d and D3He-p) spectrometers, and a convergence in implosion radius by a factor of +4# from time-resolved x-ray self-emission images. The initial 50-T B field was flux compressed to +8 MG, which is a 16# field amplification. A large magnetic Reynolds number of +1000, estimated from the measurements, allows an effective flux compression in these implosions.
The condition for magnetization is given by the Hall parameter | > 1:
,r m nT
1B
>/
/
1 2
3 2
g
mfp?|
m= (3)
which scales with the temperature (T), B field (B), mass (m) of the plasma species (electrons or ions), and number density (n). We produced an electron Hall parameter of +45, significantly higher than |e + 2 produced in more-compressive magnetized ICF implosions on OMEGA.13 We produced plasma conditions with strongly magnetized ions |i + 5. A spherically converging shock
U2661JR
Phot
on e
nerg
y (eV
)
5000
4600
4200
3800
3400
3000
Time (ns)1.3 1.5 1.7
Bseed = 0 T
Time (ns)
(a) (b)
1.3 1.5 1.7
Lyc (4p"1s)
Bseed = 50 TSpatial gradients
change the streakedemission patterm
Lya (2p"1s)
Hea (1s2p"1s2)
Lyb (3p"1s)Hec (1s4p"1s2)Heb (1s3p"1s2)
Lyc (4p"1s)
Lya (2p"1s)
Hea (1s2p"1s2)
Lyb (3p"1s)Hec (1s4p"1s2)Heb (1s3p"1s2)
Figure 4Synthetic time-resolved emission of the Ar dopant, calculated for (a) an unmagnetized (Bseed = 0 T) implosion and (b) a magnetized (Bseed = 50 T) implosion.

NatioNal laser Users’ Facility aNd exterNal Users’ Programs
FY20 Annual Report 229
differentially heats up the ions of the plasma to very high temperatures (+11 keV), and since the ion Hall parameter [Eq. (3)] scales as a high power of temperature T3/2, strongly magnetized ions could be produced in these experiments. The fuel ion magnetiza-tion conditions we produced are comparable to MagLIF experiments |i + 1 (Ref. 14). Experiments on OMEGA provide a wide selection of diagnostics and a clear field of view of the implosion, allowing complementary and high-fidelity measurements of the strongly magnetized implosion properties.
It is observed for the first time that strong magnetization can enhance the mode-2 asymmetry in implosions. Figure 6 shows a comparison between a nonmagnetized shot on the left and a magnetized shot on the right. A current-carrying coil going around the target, shown in Fig. 6(b), produces the 50-T imposed B field. The B-field direction, which is along the coil axis, coincides with the laser-drive axis. It can be observed from a comparison of the x-ray self-emission images [Figs. 6(c) and 6(d)] that external magnetic fields enhance the mode-2 asymmetry, making it more elliptic in shape. The compression is sup-pressed along the waist, i.e., in the direction perpendicular to the imposed B field. This is because the B field introduces an
Figure 6A comparison between nonmagnetized (left) and magnetized (right) implosions. The [(a),(b)] experimental geometry, [(c),(d)] x-ray self-emission images, and [(e),(f)] preliminary simulation images are shown.
U2605JR
(e) (f)
Without B field With B field Without B field With B field
(a) (b)
(c) (d)B-fielddirection
Shot95293
Shot 95292
–80
80
0
–80 80
1.0 # 105 1.5 # 105 0.0 0.05.0 # 104 7.5 # 104
0Distance (nm)
Dist
ance
(nm
)
–80 800Distance (nm)
B-fielddirection
U2604JR
ThinshellGas fill
Laser
A 50-T B field(a)
Time (ns)
(c) 40-beam drive (16.9 kJ)
0.00
5
10
15
1.0 1.50.5
Pow
er (T
W)
(b) Target
DT3He gas(1:9:10)
1 mg/cm3430 nm
2.5-nm glass
Figure 5The experimental configuration on OMEGA: (a) a 50-T externally imposed initial B field was imposed on a target driven with 40 beams in a polar-direct-drive configuration. (b) Thin glass targets with a gas fill were used. (c) A 1-ns square pulse was used to drive the implosions.

FY20 NatioNal laser Users’ FacilitY Program
FY20 Annual Report230
anisotropy in transport properties between the directions parallel and perpendicular to the field. In the direction perpendicular to the B field, the thermal conduction is suppressed ,1 2
e+ |` j whereas in the direction parallel to the B field, the conductivity is unaltered. X-ray self-emission images from GORGON simulations in Figs. 6(e) and 6(f) show qualitative agreement in shape with the experiments.
Sponsored by the DOE–NNSA NLUF Program on OMEGA, these experiments are the first strongly magnetized shock driven implosions, and a part of platform development effort for future experiments to study effects of strongly magnetized ion and electrons on the plasma transport properties and effects on ICF implosion dynamics with an externally imposed B field.
This material is based upon work supported by the Laboratory for Laser Energetics, University of Rochester, and by the DOE/NNSA CoE at MIT with Contract DE-NA0003868.
High-Pressure Polymorphism of Gold Under Laser-Based Ramp Compression to 690 GPaPrincipal Investigators: S. H. Han, D. Kim, J. K. Wicks,* and T. S. Duffy (Princeton University); R. F. Smith, A. Lazicki, and J. H. Eggert (LLNL); and J. R. Rygg (LLE)*Now at Johns Hopkins University
Gold is a 5d transition metal with widespread use in high-pressure science. Recently, considerable attention has been paid to its phase behavior at multimegabar conditions. Theoretical studies have predicted 300-K transformations from the ambient face-centered cubic (fcc) structure to a hexagonal close-packed (hcp) structure at pressures ranging from 151 to 410 GPa (Refs. 15–18), followed by a second transformation to a body-centered cubic (bcc) phase16,18 from the fcc to a double-hexagonal close-packed (dhcp) phase at pressures between 232 and 250 GPa (Refs. 19 and 20), or to a series of stacking disordered phases above 390 GPa (Ref. 21).
Two of these phases have been experimentally observed: experiments in an electrically heated diamond anvil cell first observed the hcp phase at 248 GPa and 800 K (Ref. 20). Other experiments using newly developed anvil designs reported only the fcc phase up to as high as 1.06 TPa under room-temperature compression.22 Laser-based shock-compression experiments coupled with in-situ synchrotron x-ray diffraction experiments have recently shown that gold transforms to the bcc phase under shock loading, coexisting with the fcc phase and then a liquid phase along the Hugoniot.23,24
To test off-Hugoniot polymorphism, we performed laser-based ramp compression on gold. Target packages were constructed using a 2.5-nm-thick layer of gold, diamond ablators, and either diamond or LiF windows. For higher-stress experiments, a 1-nm-thick layer of gold was included in the ablator in order to shield the sample from x rays generated by the ablation plasma. The experiments used Cu backlighters and either Pt, W, or Ta pinholes. Samples were compressed on both OMEGA and OMEGA EP using laser-ablation ramp compression and characterized using the powder x-ray diffraction image plate (PXRDIP) and velocity interferometer system for any reflector (VISAR) diagnostics.
A total of eight experiments were successfully conducted: two on OMEGA EP and six on OMEGA. The gold samples were sampled at stresses between 166 and 690 GPa. Pressures were determined using either the method of characteristics or forward modeling using hydrocode simulations. Between one and three diffraction lines were observed in each experiment, consistent with diffraction from the fcc phase, the bcc phase, or a mixture of the two [see Fig. 7(a)]. Diffraction from shots between 166 and 259 GPa is consistent with just the fcc phase, while between 299 and 333 GPa, asymmetry of the most-intense diffraction peak is consistent with diffraction from both the fcc (111) and the bcc (110). Between 377 and 690 GPa, the diffraction is consistent with just the bcc phase.
Our results indicate that gold transforms to the bcc phase at thermodynamic states intermediate between the 300-K isotherm and the Hugoniot. Temperatures were not directly measured in these experiments, but were constrained from above by the melt curve due to the presence of crystalline diffraction, and from below by a modified isentrope. The lower boundaries to these tem-perature estimates are slightly higher than the theoretically calculated boundaries for the hcp phase [see Fig. 7(b)].
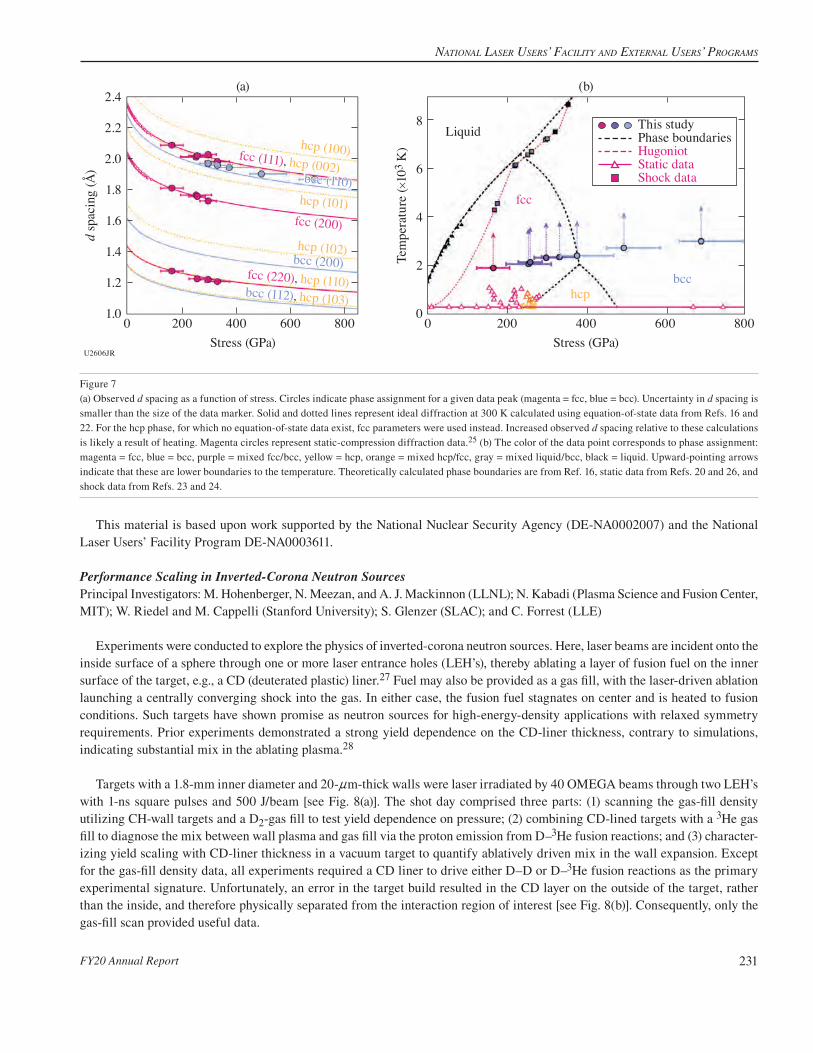
NatioNal laser Users’ Facility aNd exterNal Users’ Programs
FY20 Annual Report 231
Figure 7(a) Observed d spacing as a function of stress. Circles indicate phase assignment for a given data peak (magenta = fcc, blue = bcc). Uncertainty in d spacing is smaller than the size of the data marker. Solid and dotted lines represent ideal diffraction at 300 K calculated using equation-of-state data from Refs. 16 and 22. For the hcp phase, for which no equation-of-state data exist, fcc parameters were used instead. Increased observed d spacing relative to these calculations is likely a result of heating. Magenta circles represent static-compression diffraction data.25 (b) The color of the data point corresponds to phase assignment: magenta = fcc, blue = bcc, purple = mixed fcc/bcc, yellow = hcp, orange = mixed hcp/fcc, gray = mixed liquid/bcc, black = liquid. Upward-pointing arrows indicate that these are lower boundaries to the temperature. Theoretically calculated phase boundaries are from Ref. 16, static data from Refs. 20 and 26, and shock data from Refs. 23 and 24.
U2606JRStress (GPa)
400 8006002000
2.4
2.0
1.6
1.2
1.0
2.2
1.8
1.4
d sp
acin
g (Å
)
Stress (GPa)
(a) (b)
400 8006002000
2
0
4
8Liquid
fcc
hcpbcc
6
Tem
pera
ture
(#10
3 K
)
This studyPhase boundariesHugoniotStatic dataShock data
hcp (100)fcc (111), hcp (002)
bcc (112), hcp (103)
hcp (101)
bcc (200)hcp (102)
fcc (220), hcp (110)
fcc (200)
bcc (110)
This material is based upon work supported by the National Nuclear Security Agency (DE-NA0002007) and the National Laser Users’ Facility Program DE-NA0003611.
Performance Scaling in Inverted-Corona Neutron SourcesPrincipal Investigators: M. Hohenberger, N. Meezan, and A. J. Mackinnon (LLNL); N. Kabadi (Plasma Science and Fusion Center, MIT); W. Riedel and M. Cappelli (Stanford University); S. Glenzer (SLAC); and C. Forrest (LLE)
Experiments were conducted to explore the physics of inverted-corona neutron sources. Here, laser beams are incident onto the inside surface of a sphere through one or more laser entrance holes (LEH’s), thereby ablating a layer of fusion fuel on the inner surface of the target, e.g., a CD (deuterated plastic) liner.27 Fuel may also be provided as a gas fill, with the laser-driven ablation launching a centrally converging shock into the gas. In either case, the fusion fuel stagnates on center and is heated to fusion conditions. Such targets have shown promise as neutron sources for high-energy-density applications with relaxed symmetry requirements. Prior experiments demonstrated a strong yield dependence on the CD-liner thickness, contrary to simulations, indicating substantial mix in the ablating plasma.28
Targets with a 1.8-mm inner diameter and 20-nm-thick walls were laser irradiated by 40 OMEGA beams through two LEH’s with 1-ns square pulses and 500 J/beam [see Fig. 8(a)]. The shot day comprised three parts: (1) scanning the gas-fill density utilizing CH-wall targets and a D2-gas fill to test yield dependence on pressure; (2) combining CD-lined targets with a 3He gas fill to diagnose the mix between wall plasma and gas fill via the proton emission from D–3He fusion reactions; and (3) character-izing yield scaling with CD-liner thickness in a vacuum target to quantify ablatively driven mix in the wall expansion. Except for the gas-fill density data, all experiments required a CD liner to drive either D–D or D–3He fusion reactions as the primary experimental signature. Unfortunately, an error in the target build resulted in the CD layer on the outside of the target, rather than the inside, and therefore physically separated from the interaction region of interest [see Fig. 8(b)]. Consequently, only the gas-fill scan provided useful data.
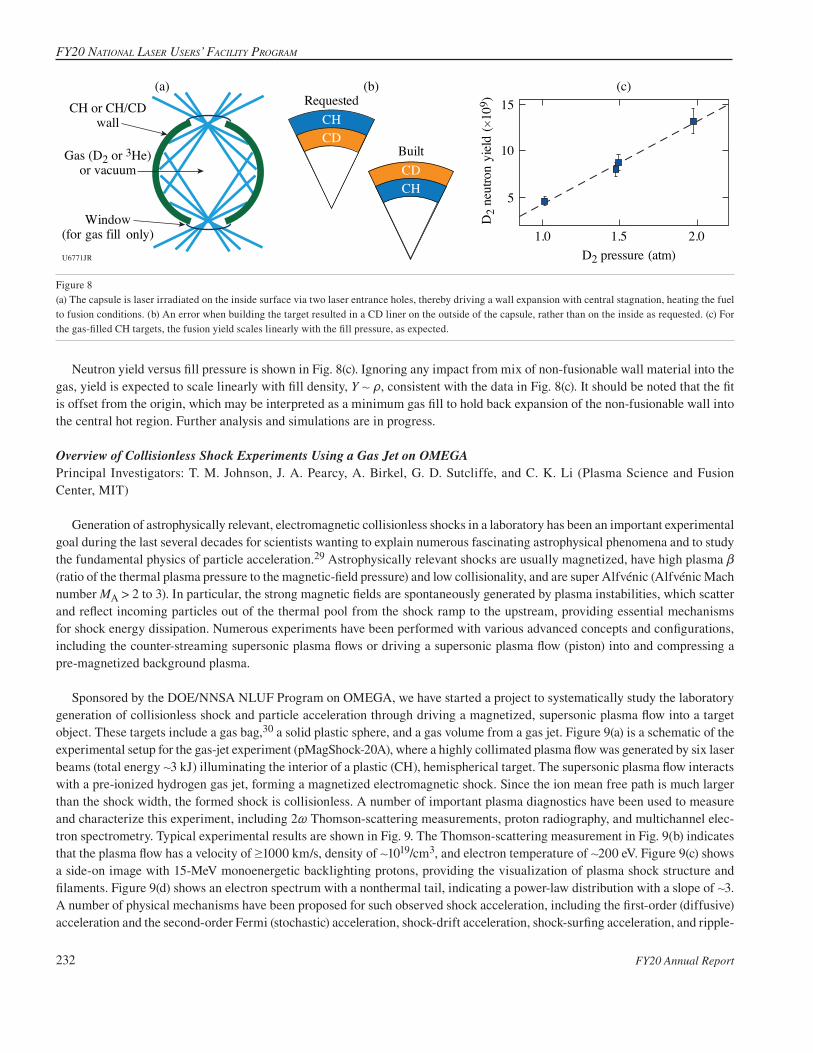
FY20 NatioNal laser Users’ FacilitY Program
FY20 Annual Report232
Neutron yield versus fill pressure is shown in Fig. 8(c). Ignoring any impact from mix of non-fusionable wall material into the gas, yield is expected to scale linearly with fill density, Y + t, consistent with the data in Fig. 8(c). It should be noted that the fit is offset from the origin, which may be interpreted as a minimum gas fill to hold back expansion of the non-fusionable wall into the central hot region. Further analysis and simulations are in progress.
Overview of Collisionless Shock Experiments Using a Gas Jet on OMEGA Principal Investigators: T. M. Johnson, J. A. Pearcy, A. Birkel, G. D. Sutcliffe, and C. K. Li (Plasma Science and Fusion Center, MIT)
Generation of astrophysically relevant, electromagnetic collisionless shocks in a laboratory has been an important experimental goal during the last several decades for scientists wanting to explain numerous fascinating astrophysical phenomena and to study the fundamental physics of particle acceleration.29 Astrophysically relevant shocks are usually magnetized, have high plasma b (ratio of the thermal plasma pressure to the magnetic-field pressure) and low collisionality, and are super Alfvénic (Alfvénic Mach number MA > 2 to 3). In particular, the strong magnetic fields are spontaneously generated by plasma instabilities, which scatter and reflect incoming particles out of the thermal pool from the shock ramp to the upstream, providing essential mechanisms for shock energy dissipation. Numerous experiments have been performed with various advanced concepts and configurations, including the counter-streaming supersonic plasma flows or driving a supersonic plasma flow (piston) into and compressing a pre-magnetized background plasma.
Sponsored by the DOE/NNSA NLUF Program on OMEGA, we have started a project to systematically study the laboratory generation of collisionless shock and particle acceleration through driving a magnetized, supersonic plasma flow into a target object. These targets include a gas bag,30 a solid plastic sphere, and a gas volume from a gas jet. Figure 9(a) is a schematic of the experimental setup for the gas-jet experiment (pMagShock-20A), where a highly collimated plasma flow was generated by six laser beams (total energy +3 kJ) illuminating the interior of a plastic (CH), hemispherical target. The supersonic plasma flow interacts with a pre-ionized hydrogen gas jet, forming a magnetized electromagnetic shock. Since the ion mean free path is much larger than the shock width, the formed shock is collisionless. A number of important plasma diagnostics have been used to measure and characterize this experiment, including 2~ Thomson-scattering measurements, proton radiography, and multichannel elec-tron spectrometry. Typical experimental results are shown in Fig. 9. The Thomson-scattering measurement in Fig. 9(b) indicates that the plasma flow has a velocity of $1000 km/s, density of +1019/cm3, and electron temperature of +200 eV. Figure 9(c) shows a side-on image with 15-MeV monoenergetic backlighting protons, providing the visualization of plasma shock structure and filaments. Figure 9(d) shows an electron spectrum with a nonthermal tail, indicating a power-law distribution with a slope of +3. A number of physical mechanisms have been proposed for such observed shock acceleration, including the first-order (diffusive) acceleration and the second-order Fermi (stochastic) acceleration, shock-drift acceleration, shock-surfing acceleration, and ripple-
U6771JR
CDCH
Requested
CHCD
Built
5
10
15(a) (b) (c)
D2
neut
ron
yiel
d (#
109 )
D2 pressure (atm)1.0 2.01.5
CH or CH/CDwall
Gas (D2 or 3He)or vacuum
Window(for gas fill only)
Figure 8(a) The capsule is laser irradiated on the inside surface via two laser entrance holes, thereby driving a wall expansion with central stagnation, heating the fuel to fusion conditions. (b) An error when building the target resulted in a CD liner on the outside of the capsule, rather than on the inside as requested. (c) For the gas-filled CH targets, the fusion yield scales linearly with the fill pressure, as expected.

NatioNal laser Users’ Facility aNd exterNal Users’ Programs
FY20 Annual Report 233
U2608JR
Lasers
Gas jet(H2)
Plasmaflow
Gas-jetnozzle
1.21.00.80.60.40.20.0
5.2 5.4 5.6 5.8 6.0
Flow
vel
ocity
(#10
8 cm
/s)
Time (ns)
Filaments indicateWeibel instability
101101
102
103
104
105
102
n = 3.61r2 = 0.976
Energy (keV)
(d)(c)
(b)(a)
dN/d
E (k
eV)–
1
Figure 9(a) Schematic of the experimental setup. (b) Thomson-scattering measurement indicating that the plasma flow has a velocity of $1000 km/s, a density of +1019/cm3, and an electron temperature of +200 eV. (c) A side-on image with 3-MeV monoenergetic backlighting protons providing the visualization of plasma shock structure and filaments. Darker areas are more protons. (d) An electron spectrum with a nonthermal tail, indicating a power law distribution with a slope of +3.
shock acceleration. On this shot day, a total of 12 shots were performed with different plasma conditions and measured with all diagnostics at different times and different locations. Currently we are focusing on systematically analyzing all experimental data. In the meantime, we are performing comprehensive numerical simulations including using FLASH hydrodynamic simulations to model the supersonic plasma flow generation and propagation and OSIRIS particle-in-cell simulations to model the generation of plasma ion Weibel filaments and formation of electromagnetic shocks. The experiments directly mimic the scenario of col-lisionless shocks in nonrelativistic astrophysical contexts, such as in the supernova remnants, and provide a roadmap for studying shock physics in relativistic regimes, such as in the afterglow of cosmological c-ray bursts.
This material is based upon work supported by the DOE/NNSA CoE at MIT with Contract DE-NA0003868, and NLUF at Omega.
High-Energy-Density Physics and Planetary Evolution Principal Investigators: Y.-J. Kim, M. Millot, P. M. Celliers, J. H. Eggert, and D. E. Fratanduono (LLNL); J. R. Rygg and G. W. Collins (LLE); S. Brygoo and P. Loubeyre (CEA, France); and R. Jeanloz (University of California, Berkeley)
Our NLUF collaboration aims at documenting the microscopic properties and new chemical physics behavior of low-Z materi-als that are the key constituents of gas giant planets and exoplanets, namely hydrogen, helium, and hydrogen–helium mixtures.31
In FY20, we conducted the DACplanetEP-20A Campaign with diamond-anvil-cell (DAC) targets in a direct-drive geometry for a total of 12 shots on OMEGA EP. New technical developments with the DAC targets were demonstrated to reach higher-pressure regimes and obtain multiple shock data from a single experiment. First, a 10-ns-long drive duration, instead of the usual 1- to 3-ns drive, was tested with a DAC having a wide aperture [Fig. 10(a)]. Next, reverberation of a shock wave was generated by a tungsten

FY20 NatioNal laser Users’ FacilitY Program
FY20 Annual Report234
U2609JR
600
560
520
480
44021201918
Time (ns)21201918
Time (ns)
Posi
tion
(nm
)800
750
700
650
600
550
(a) (b) (c)
Sam
ple
Qua
rtz
Dia
mon
d
Dia
mon
d
Quartz
Ruby
Sample
Figure 10(a) A sample chamber image of the wide-aperture DAC; (b) VISAR; and (c) SOP data obtained from a long drive experiment.
Characterization of the Nonlinear Laser–Plasma Interaction in Electron-Assisted Shock IgnitionPrincipal Investigators: C. Krauland and A. Raymond (GA); K. Matsuo, D. Kawahito, and F. N. Beg (University of California, San Diego); S. Zhang (Princeton University); and A. Hansen, J. Katz, and W. Theobald (LLE)
Shock ignition (SI) has been proposed as an alternative approach to ICF. The SI approach separates the compression and ignition processes, using a low-intensity pulse to implode the fuel capsule, followed by a high-intensity laser spike to generate a strong convergent shock to trigger ignition. The spike in the laser pulse shape is of sufficiently high irradiance to cause strong laser–plasma instabilities (LPI’s). The resultant hot electrons with moderately high temperature (<100 keV) are predicted to benefit the SI scheme by enhancing the ignition shock.34
We completed experiments on the OMEGA laser at the end of FY20 to characterize the shock propagation and plasma param-eters in our previously established SI-relevant planar geometry experimental platform. Twenty UV beams partially overlapped in space produce a large-scale-length (>300-nm) and high-temperature (>keV) coronal plasma.35 In some shot cases, with the aid of a shaped laser pulse, a high-intensity (I + 1016 W/cm2) laser interaction followed. Figure 11(a) shows a schematic of this platform with the two laser power profiles fielded [Figs. 11(b) and 11(d)]. On this shot day, a SOP and VISAR were used to measure the shock breakout time and to track shock fronts moving in the target, respectively. Figures 11(c) and 11(e) compare the SOP mea-surements with each pulse shape. In the case with the spike, the shock front reaches the rear surface of the target 1.2 ns earlier than the case without the spike pulse. Compared to our previous OMEGA EP experiments that fielded only a single UV beam to produce the high-intensity interaction, this 20 overlapped-beam setup at the same peak intensity shows better laser-shock energy coupling. Previous SOP measurements showed a delta of only 0.2 ns. Bremsstrahlung data also suggest that the overlapped UV lasers produce more hot electrons than a single UV beam of comparable intensity by a conversion efficiency increase of >2#. We performed simulations to validate experimental SOP/VISAR data using the code FLASH,36 which estimated peak ablation pressures +90 Mbar for the shots with a spike pulse in the overlapped-beam platform.
layer to provide two different shock Hugoniot states in a sample. Finally, we demonstrated that preparing thick precompressed samples allows us to carry out decaying-shock measurements, paving the way for future experiments on H–He mixtures.32
Doppler velocimetry (VISAR) and streaked optical pyrometry (SOP) were used to monitor the shock-wave propagation through the transparent, precompressed sample and to document the pressure–density–temperature shock equation of state as well as the evolution of the optical properties (reflectivity, absorption coefficient) using a quartz reference [see Figs. 10(b) and 10(c)].33 Ongoing data analysis is being used to improve our measurements, allowing us to explore a new regime of matter that will be useful for benchmarking future equation-of-state and planetary models.
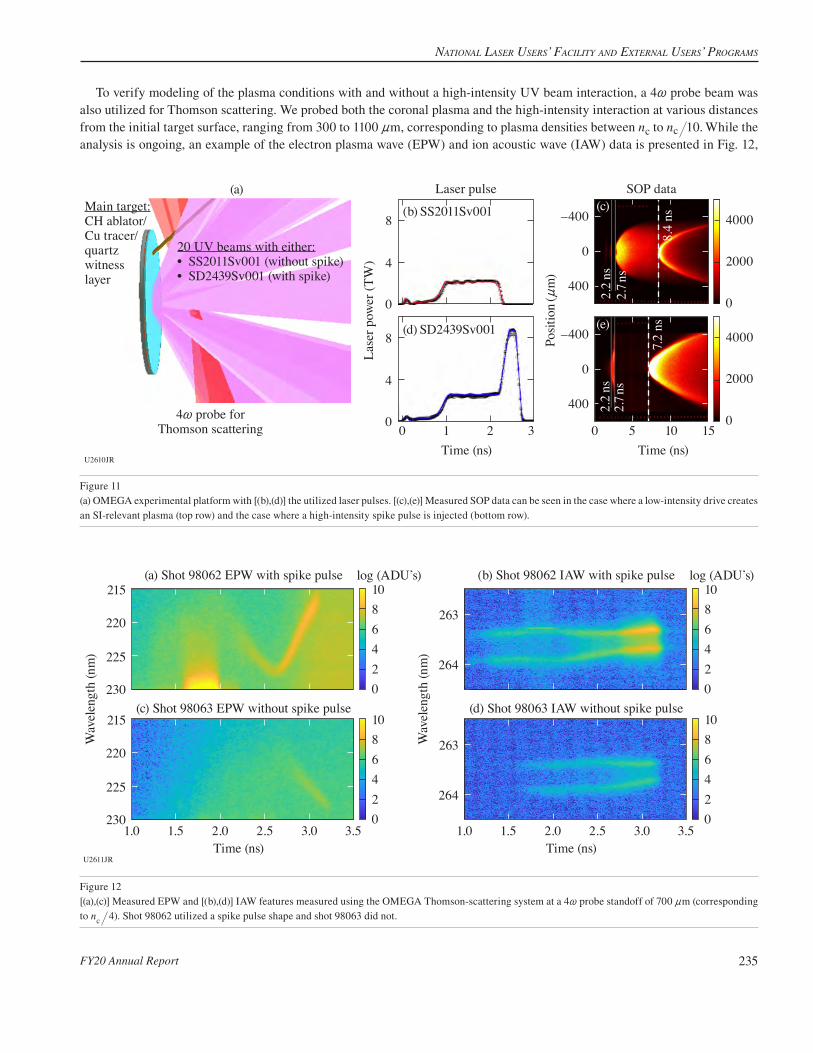
NatioNal laser Users’ Facility aNd exterNal Users’ Programs
FY20 Annual Report 235
Figure 12[(a),(c)] Measured EPW and [(b),(d)] IAW features measured using the OMEGA Thomson-scattering system at a 4~ probe standoff of 700 nm (corresponding to n 4c ). Shot 98062 utilized a spike pulse shape and shot 98063 did not.
U2611JR
215
220
225
230
(a) Shot 98062 EPW with spike pulse
1.0 2.0 3.0 3.51.5 2.5
1086420
Wav
elen
gth
(nm
)
215
220
225
230
(c) Shot 98063 EPW without spike pulse1086420
Time (ns)
log (ADU’s)
263
264
(b) Shot 98062 IAW with spike pulse
1.0 2.0 3.0 3.51.5 2.5
1086420
Wav
elen
gth
(nm
)
263
264
(d) Shot 98063 IAW without spike pulse1086420
Time (ns)
log (ADU’s)
To verify modeling of the plasma conditions with and without a high-intensity UV beam interaction, a 4~ probe beam was also utilized for Thomson scattering. We probed both the coronal plasma and the high-intensity interaction at various distances from the initial target surface, ranging from 300 to 1100 nm, corresponding to plasma densities between nc to .n 10c While the analysis is ongoing, an example of the electron plasma wave (EPW) and ion acoustic wave (IAW) data is presented in Fig. 12,
Figure 11(a) OMEGA experimental platform with [(b),(d)] the utilized laser pulses. [(c),(e)] Measured SOP data can be seen in the case where a low-intensity drive creates an SI-relevant plasma (top row) and the case where a high-intensity spike pulse is injected (bottom row).
U2610JR
Main target:CH ablator/Cu tracer/quartzwitnesslayer
20 UV beams with either:• SS2011Sv001 (without spike)• SD2439Sv001 (with spike)
4~ probe forThomson scattering
8
4
0
Lase
r pow
er (T
W)
8
4
00 1 2 3
Time (ns)
Laser pulse
0 5 10 15Time (ns)
SOP data
4000
2000
0
4000
2000
0
8.4
ns7.
2 ns
–400
0
400
Posit
ion (
nm
)
–400
0
400
2.2
ns2.
7 ns
2.2
ns2.
7 ns
(a)
(b) SS2011Sv001
(d) SD2439Sv001
(c)
(e)

FY20 NatioNal laser Users’ FacilitY Program
FY20 Annual Report236
corresponding to a focal standoff of 700 nm .n 4c` j Qualitatively, the data indicate an expected increase in plasma temperature during irradiation by the spike pulse; the measured values of the temperatures and density will be compared to expectations from FLASH modeling when analysis is complete. These direct measurements of SI-relevant plasma conditions will also serve to seed initial plasma conditions in ongoing particle-in-cell simulations aimed at investigating the LPI.
This material is based upon work supported by the DOE NNSA NLUF Program with award number DE-NA0003939, DE-NA0002730, and DE-NA0003600.
Experiments to Observe Laboratory Photoionization Fronts in N Gas CellsPrincipal Investigators: H. J. LeFevre, K. Kelso, J. S. Davis, W. J. Gray, R. P. Drake, S. R. Klein, and C. C. Kuranz (University of Michigan); and P. A. Keiter (LANL)
Ionizing radiation has been present in the universe since the age of reionization, approximately 200 million years after the Big Bang, until the present day. The emission that escaped from the first galaxies provided the photon flux to drive the reionization of the intergalactic medium in photoionization fronts.37 Additionally, in present day astrophysics, the ionizing radiation from the forward shock in type-IIn supernovae drives a photoionization front that heats the circumstellar medium, which affects the behavior of the light curve and causes the appearance of narrow lines in the emission spectrum.38 Experiments on the OMEGA laser study the formation and structure of photoionization fronts to better understand the reionization of the early universe and the evolution of supernovae.
A photoionization front is a heat front where photoionization is the dominant heating mechanism at the interface between the hot downstream and cold upstream material. The heated downstream sufficiently reduces the opacity such that the radiation transport in this region is nondiffusive, which presents an interesting challenge to many radiation-hydrodynamic codes. Drake et al.39 and Gray et al.40 explore the requirements for producing this type of heat front in a high-energy-density physics facility and provide two dimensionless ratios of atomic rate coefficients to determine the physics regime of an experiment. The first of these ratios is
,nn n R
,
,1
1
1
i
i
i i
e i ia
C=
+
+
+ (4)
where ni is the ion number density of the ith ionization state in cm–3, ne is the electron number density in cm–3, Ri+1,i is the recombination rate coefficient in cm3 s–1, and Ci,i+1 is the photoionization rate in s–1. The second dimensionless parameter is
,nn
R1,
,
1 1
1
i
i
i i
i ivb
v= +
+ +
+ (5)
where GvvH i,i+1 is the electron collisional rate coefficient in cm–3 s–1. To produce a photoionization front, an experiment needs values of 1%a and b + 1.
Ph.D. students H. LeFevre and K. Kelso designed and ran the shot days for these experiments using a 2- to 4-atm N gas cell with 1% Ar, by mass, as a spectroscopic dopant for the propagation medium and the soft x rays from the rear surface of a laser-irradiated Au foil as the ionizing radiation source. The gas cell was 3-D–printed plastic with a 3-mm # 3-mm-sq cross section and 7-mm length of gas volume. The Au foil was 500 nm thick and sat 400 nm from the front of the gas cell with an incident laser intensity of 1014 W/cm2. Windows are printed into the gas cell for diagnostic access with the center point 1350 nm from the Au foil. These rectangular windows are 0.6 mm along the propagation direction of the photoionization front and 2 mm in the other dimension with 3-nm mylar foils to seal in the gas but allow few-keV x rays to pass through. This design improved upon previous designs since it was more capable of holding gas at these pressures and allowed for a larger spectral range of the primary diagnostic.

NatioNal laser Users’ Facility aNd exterNal Users’ Programs
FY20 Annual Report 237
The primary diagnostic in this experiment is streaked x-ray absorption spectroscopy of the Ar K shell. A capsule implosion acts as a continuum source in the 2- to 4-keV range for the Ar absorption measurements. H. LeFevre recently submitted a publication to Review of Scientific Instruments detailing the characterization and performance of CH vacuum capsules as x-ray backlight-ers under anisotropic laser irradiation from previous NLUF experiments. These most-recent experiments tested a new capsule backlighter design that uses a 200-nm layer of Ni on the interior surface of an +7-nm-thick CH layer with an outer diameter of 870 nm. The intent of this design is to produce two useful spectral regions with a single source: continuum emission in the 2- to 5-keV range and line emission from the Ni K shell around 7.8 keV.
A day of experiments in August 2020 tested the new backlighter and made streaked spectral measurements through the gas cell. The Ar dopant percentage was too low to clearly distinguish any absorption features during these experiments. This further demonstrates, however, that the new gas-cell design was a success and solved the issue with collimating the absorption source in the previous shot day, even though the data were not as expected. Increasing the Ar fraction easily resolves this issue and suggests that the next shot day should produce excellent data. There were very promising results for the new backlighter design. There was strong continuum in the 2- to 4-keV range on a time-integrated spectrometer used as an unattenuated reference to compare with the streaked absorption spectra shown in Fig. 13(a). Emission in the 5- to 8-keV range on a second time-integrated spectrometer saw weak line structures from the Ni K shell. Figure 13(b) shows the contrast-enhanced raw data clearly indicating line emission. Figure 13(c) shows the detailed features of the Ni line emission. Ideally, this would be much stronger if one intends to use these lines to probe a plasma of interest, but this is a good starting point for a first shot day with a new design. Future experiments will reduce the capsule mass to allow for larger implosion velocities, which should increase the temperature of the Ni and result in stronger line emission.
(b) Contrast-enhanced raw data
Ni K-shell lines
U2612JR
2400 2800 3200 3600 4000 4400Energy (eV)
0.51.01.52.02.5
Inte
nsity
(a
rbitr
ary
units
)
(a) Time-integrated low-energy spectrum
7700 7750 7800 7850 7900Energy (eV)
0.22
0.24
0.26
0.28
Inte
nsity
(arb
itrar
y un
its) (c) Ni line emission
98007*0.198010*0.1980119801298013*0.33
9801498015*0.339801798019*0.3398020
Figure 13The performance of the Ni-lined capsule backlighters was very promising for a first experiment with this design. (a) The emission in the spectral range of the Ar K shell is flat continuum. The line emission in (a) is likely the result of mid-Z elements in the glue used to attach the capsules to the stalk. (b) The Ni line emission acts as a second diagnostic probe from a single source with three lines apparent. (c) The line structure shows a relatively bright, high-energy line with two progressively weaker lower-energy lines.
This work is funded by the U.S. Department of Energy NNSA Center of Excellence under cooperative agreement number DE-NA0003869, and the National Laser User Facility Program, grant number DE-NA0002719, and through the Laboratory for Laser Energetics, University of Rochester by the NNSA/OICF under Cooperative Agreement No. DE-NA0003856.

FY20 NatioNal laser Users’ FacilitY Program
FY20 Annual Report238
Colliding Megagauss Plasma Jets ExperimentPrincipal Investigators: E. Liang (Rice University) and L. Gao and H. Ji (Princeton University)
An important question in the study of shock waves, in both astrophysical and laboratory plasmas, is the role of the heat flux carried by electron thermal conduction. When the electron thermal conductivity is high, the conduction front runs ahead of the shock, carries energy upstream, and lowers the post-shock electron temperature. When the electron thermal conductivity is low, the post-shock electrons and ions have roughly the same temperature. Therefore, the shock structure and evolution depend strongly on the electron thermal conductivity. In magnetized shocks, the magnetic field can strongly influence the electron trans-port. Even if the magnetic field is dynamically unimportant ,B v2 2% t_ i it can still inhibit electron thermal conductivity across field lines, thereby influencing the structure and evolution of the shock. When the electron gyroradius becomes smaller than the Coulomb mean free path, thermal conduction perpendicular to the field lines becomes inhibited, even when the Coulomb mean free path is large, while thermal conduction along the field lines remains uninhibited. In such cases electron thermal conduction can become highly anisotropic, and the structure and evolution of the shock depend strongly on the orientation and strength of the local magnetic field. Our goal is therefore to develop laboratory platforms to systematically study strongly magnetized shocks in controllable settings.
In a series of OMEGA laser experiments in 2016 and 2017,41,42 we demonstrated that a hollow ring configuration of 20 OMEGA beams irradiating a flat disk can create narrowly collimated megagauss (MG) plasma jets. In such strongly magnetized jets, the electron gyroradii can become much smaller than the Coulomb mean free path. Therefore, we expect that electron thermal conduction will become highly anisotropic. When two such jets collide head on, they will create strongly magnetized high-beta shocks, which should provide a unique platform to study the effects of anisotropic electron thermal conduction on shock structure and evolution. Subsequent 3-D FLASH simulations show that the collision of two MG plasma jets, each created by 20 OMEGA beams in a hollow ring pattern, will indeed launch two expanding shocks whose structure and evolution strongly depend on the local magnetic-field geometry and electron thermal conductivity. We were awarded one OMEGA shot date in 2020 and one joint shot date in 2021 to carry out such colliding-jet experiments. At the writing of this report, we just completed our 2020 experiment but the data have not yet been analyzed. Preliminary XRFC images show, however, that expanding shocks were indeed created. We are cautiously optimistic that the data from our 2020 colliding-jets experiment will shed new light on this important question.
Figure 14 depicts the colliding-jet experimental setup. Twenty OMEGA beams from each hemisphere irradiate a flat CH target with a hollow ring pattern of 800-nm radius and 6.4-mm target separation. The Thomson-scattering diagnostic is used to measure the density, electron and ion temperatures, and flow velocity at target chamber center (TCC) and 150 nm below TCC. Protons from a D3He fusion capsule are used to map out the magnetic-field geometry and amplitude. In addition, XRFC is used to capture time-lapse x-ray images of the entire domain. Figure 15 shows 3-D FLASH simulation results of this experiment at 4 ns, based on Spitzer thermal conductivity, plus lineout plots along the jet axis. Both the expanding electron conduction fronts and shock fronts are visible, with the conduction front running ahead of the shocks. These predictions will be confronted with our 2020
U2623JR
Otherdiagnostics
Protonbacklighter
CH target
CH target
XRFC
Beam 25
Filmpack
TS
TCCTCC
ShockShock
ShockShock
JetJet
JetJet20 OMEGA beams20 OMEGA beams
20 OMEGA beams20 OMEGA beams
Figure 14Setup of the colliding MG jets experiment using 40 OMEGA beams.

NatioNal laser Users’ Facility aNd exterNal Users’ Programs
FY20 Annual Report 239
U2624JR
0.3
0.2
0.1
0.0
–0.1
–0.2
–0.3z a
xis
0.3
0.2
0.1
0.0
–0.1
–0.2
–0.3
z axi
s
–0.1 0.0 0.1x axis
–0.1 0.0 0.1x axis
4.931
0.222
0.010
5.000
0.277
0.015
0.050
0.001
0.000
4.960
2.223
0.010
0.2 5 –200
0
200
10
15
0.1 0.3Distance
0.5 0.1 0.3Distance
0.5 0.1 0.3Distance
0.5
0.60.8
0.4
Valu
e (#
10–2
1 )
Valu
e ( #
10–3
)
Valu
e (#
10–6
)Electron ElectronElectronIon
(a) (b)
(c) (d)
(e) (f) (g)
#107
#1021
#107
Figure 15Three-dimensional FLASH simulated profiles of (a) shocked electron temperature, (b) ion temperature, (c) electron density, and (d) ion density at 4 ns. The line plots are profiles along the jet axis of (e) density, (f) electron (blue) and ion (purple) temperatures, and (g) axial velocity at 4 ns.
experimental data. We anticipate the analyses of our 2020 data to be completed in early 2021. This will give us ample time to finalize and refine the design of the follow-on experiment with more-advanced diagnostics, currently scheduled for August 2021.
This material is based on work supported by the Department of Energy National Nuclear Security Administration under Award Number DE-NA0003942.
A Laboratory Photoionized Plasma Experiment on OMEGA EPPrincipal Investigator: R. C. Mancini (University of Nevada, Reno)Co-investigators: R. Heeter and D. Liedahl (LLNL) and S. P. Regan (LLE)
Basic science experiments on high-energy-density (HED) physics on OMEGA EP provide a unique opportunity to create states of matter at extreme conditions of temperature, density, and radiation flux in the laboratory relevant to astrophysics. The focus

FY20 NatioNal laser Users’ FacilitY Program
FY20 Annual Report240
of this project is to study the fundamental heating, atomic, and radiation physics properties of plasmas driven by a broadband intense flux of x rays, i.e., photoionized plasmas. Most laboratory work performed to date on HED laboratory plasmas pertains to collisional plasmas, i.e., those where electron collisional processes play a dominant role in the plasma ionization and atomic physics. Relatively little attention has been paid, however, to studying and understanding the basic properties of laboratory pho-toionized plasmas where both photoionization and photoexcitation, driven by a broadband x-ray flux, become dominant. These plasmas are important for understanding a myriad of astrophysical sources including x-ray binaries, active galactic nuclei, and the accretion disks formed in the vicinity of black holes. The quantitative information that we obtain from these objects is mainly based on the analysis of spectroscopic observations made by orbiting telescopes such as Chandra and XMM-Newton.
We have established a new experimental platform for OMEGA EP that uses a plastic-tamped silicon sample driven by the 30-ns-duration, broadband x-ray flux produced by the “Gatling-gun” radiation source. This source is comprised of three copper hohlraums that are sequentially driven by three OMEGA EP beams, each one delivering 4 kJ of UV energy in a 10-ns square pulse shape. Each copper hohlraum has a length of 2.8 mm and an inner diameter of 1.4 mm and is filled with TPX foam. The laser beams sequentially illuminate one hohlraum at a time, thereby producing an x-ray flux characteristic of 90-eV radiation temperature for a time period of 30 ns. The relatively long duration of the Gatling-gun radiation source is critical to producing an x-ray radiation-driven plasma in photoionization equilibrium.
The silicon sample has a diameter of 2 mm and is placed 7 mm from the source. It has an initial thickness of 0.2 or 0.4 nm and is coated on both sides with submicron-thick, 2.5-mm-diam layers of parylene plastic. Heated by the x-ray flux, the silicon sample expands and ionizes into the L-shell range of silicon ions, i.e., neon- to lithium-like ions, thereby producing a photoionized plasma in steady state with an atom number density of a few times 1018 atoms/cm3 and a relatively uniform spatial distribution.
The spatial extension of the blow-off TPX/copper plasma from the copper hohlraums is monitored with the 4~ probe laser to ensure that it does not reach the silicon sample. The silicon photoionized plasma is probed with L-shell self-emission spectra recorded with a grating spectrometer and K-shell line absorption spectra recorded with a KAP crystal streaked spectrometer. The latter is afforded by a 1-ns-duration, separate titanium backlight source driven by the fourth laser beam of OMEGA EP. This laser beam delivers 1 kJ of UV energy onto a titanium slab target in a 1-ns square pulse shape. The radiative recombination continuum emission photons of the titanium laser-produced plasmas backlight and probe the photoionized plasma via absorption spectroscopy. From this measurement, the charged-state distribution and electron temperature of the plasma can be extracted.
The x-ray flux starts at t = –15 ns and lasts until t = +15 ns. Figure 16 shows the synthetic spectrally resolved x-ray flux pro-duced by the Gatling-gun source and the measured transmission spectrum of the silicon photoionized plasma at t = 18 ns. The data show n = 1 to n = 2 line transitions in F-, O-, N- and C-like silicon ions as well as n = 1 to n = 3 in F-like ions. Observations recorded in nominally identical experiments but with the titanium backlighter fired at a later time show a nearly identical absorp-tion spectrum, thereby demonstrating that a plasma in steady state has been produced. The latter is critical to compare with and benchmark the astrophysical modeling codes that are employed in the analysis and interpretation of x-ray astronomy observations.
Platform Development for MagLPI and MagRT on OMEGA EPPrincipal Investigators: M. J.-E. Manuel (GA); M. Bailly-Grandvaux, A. Higginson, J. Strehlow, C. McGuffey, and F. N. Beg (University of California, San Diego); R. Lee (University of California, Los Angeles); and C. Samulski and B. Srinivsan (Virginia Polytechnic Institute and State College)
Externally applied magnetic fields have become more common place in HED plasma experiments due in large part to the advancement of pulsed-power technology and new techniques for generating large magnetic fields with laser-driven targets. External magnetic fields applied to inertial fusion experiments can relax the ignition criterion43 and reduce mix in the hot spot.44 It is of fundamental interest, then, to understand how external B fields affect laser–plasma45 and hydrodynamic instabilities in HED plasmas. To that end, the magnetized laser–plasma instability (MagLPI) and the magnetized Rayleigh–Taylor (MagRT) platforms (see Fig. 17) are being developed to answer basic science questions about how B fields affect plasma behavior in laser-driven HED systems.
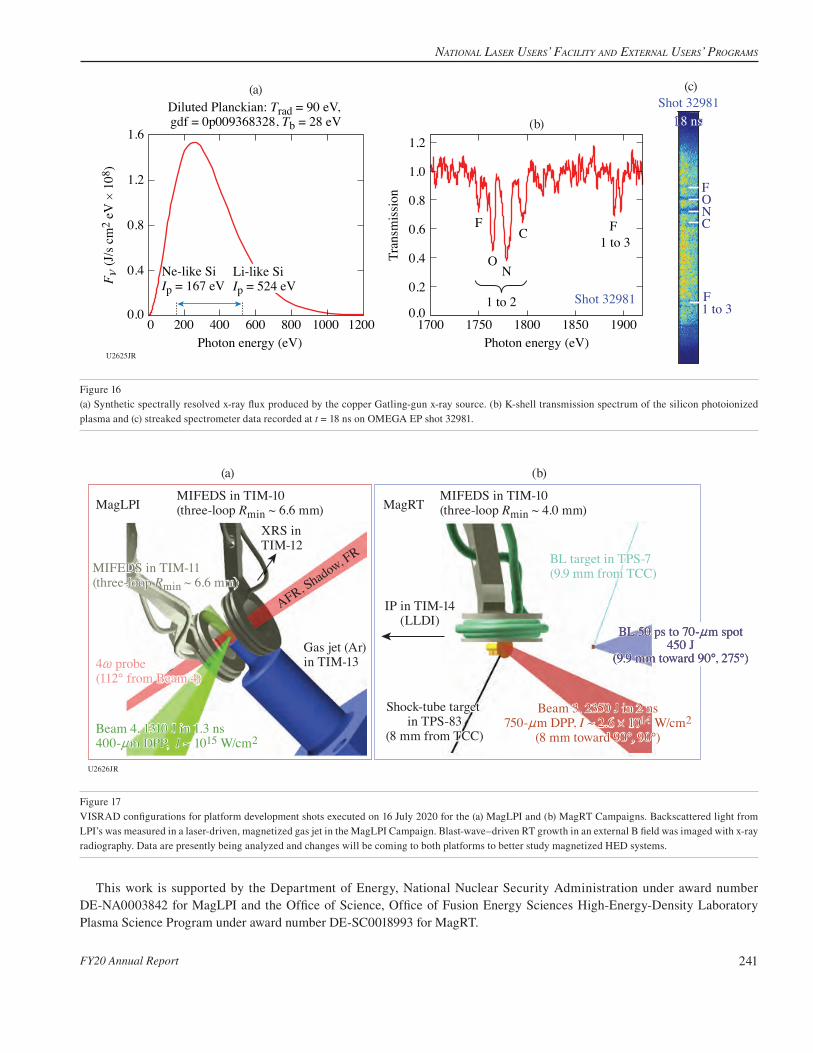
NatioNal laser Users’ Facility aNd exterNal Users’ Programs
FY20 Annual Report 241
This work is supported by the Department of Energy, National Nuclear Security Administration under award number DE-NA0003842 for MagLPI and the Office of Science, Office of Fusion Energy Sciences High-Energy-Density Laboratory Plasma Science Program under award number DE-SC0018993 for MagRT.
Figure 16(a) Synthetic spectrally resolved x-ray flux produced by the copper Gatling-gun x-ray source. (b) K-shell transmission spectrum of the silicon photoionized plasma and (c) streaked spectrometer data recorded at t = 18 ns on OMEGA EP shot 32981.
0.0
0.4
0.8
1.2
1.6
0 200 400 600 800 1000 1200
F o (J
/s c
m2
eV #
108
)
Photon energy (eV)
Diluted Planckian: Trad = 90 eV, gdf = 0p009368328, Tb = 28 eV
Ne-like SiIp = 167 eV
Li-like SiIp = 524 eV
(a)
O
Shot 32981
F
F1 to 3
NC
18 ns18 ns
(c)
U2625JR
0.0
0.2
0.4
0.6
0.8
1.0
1.2
1700 1750 1800 1850 1900
Tran
smis
sion
Photon energy (eV)
F
ON
C F1 to 3
1 to 2 Shot 32981
(b)
Figure 17VISRAD configurations for platform development shots executed on 16 July 2020 for the (a) MagLPI and (b) MagRT Campaigns. Backscattered light from LPI’s was measured in a laser-driven, magnetized gas jet in the MagLPI Campaign. Blast-wave–driven RT growth in an external B field was imaged with x-ray radiography. Data are presently being analyzed and changes will be coming to both platforms to better study magnetized HED systems.
U2626JR
MagLPI MagRTMIFEDS in TIM-10(three-loop Rmin ~ 6.6 mm)
MIFEDS in TIM-10(three-loop Rmin ~ 4.0 mm)
BL target in TPS-7(9.9 mm from TCC)BL target in TPS-7(9.9 mm from TCC)
IP in TIM-14(LLDI)
Shock-tube target in TPS-83
(8 mm from TCC)
Shock-tube target in TPS-83
(8 mm from TCC)
4~ probe(112° from Beam 4)4~ probe(112° from Beam 4)
Gas jet (Ar)in TIM-13
XRS inTIM-12
AFR, Shadow, FR
(a) (b)
MIFEDS in TIM-11(three-loop Rmin ~ 6.6 mm)
Beam 4, 1310 J in 1.3 ns400-nm DPP, I ~ 1015 W/cm2
BL 50 ps to 70-nm spot450 J
(9.9 mm toward 90°, 275°)
BL 50 ps to 70-nm spot450 J
(9.9 mm toward 90°, 275°)
BL 50 ps to 70-nm spot450 J
(9.9 mm toward 90°, 275°)
Beam 3, 2350 J in 2 ns750-nm DPP, I ~ 2.6 # 1014 W/cm2
(8 mm toward 90°, 90°)

FY20 NatioNal laser Users’ FacilitY Program
FY20 Annual Report242
Charged-Particle Transport and Energy Deposition in Warm Dense Matter With and Without an External Magnetic FieldPrincipal Investigators: C. McGuffey, M. Bailly-Grandvaux, D. Kawahito, K. Matsuo, K. Bhutwala, J. Kim, M. Dozières, A. Higginson, J. Vaughan, D. Zimmer, and F. N. Beg (University of California, San Diego); D. Mariscal, R. F. Heeter, E. Marley, and J. Emig (LLNL); J. L. Peebles, J. R. Davies, M. S. Wei, P. M. Nilson, W. Theobald, F. J. Marshall, and S. Muller-Fess* (LLE); P. Gourdain (Dept. of Physics and Astronomy, University of Rochester); J. Honrubia (Universidad Politécnica de Madrid, Spain); and J. J. Santos (CELIA, University of Bordeaux, France)*Also at GA
In this UCSD-led NLUF project, we investigated the energy deposition in dense matter by two intense-laser–driven particle beams: relativistic electrons and protons. Electron-beam energy deposition was studied in a characterized imploding cylinder with and without an external magnetic field. Understanding the role of the B field is important for advanced fusion schemes such as fast-ignition inertial confinement fusion (FI ICF) and MagLIF. Proton energy deposition was applied to a solid Si foil, turning it into warm dense matter (WDM). Tools to characterize WDM samples are a prerequisite to measurements of equation of state and the benchmarking of proton-stopping codes, which have relevance in ICF capsules and stockpile stewardship.
1. Electron Transport in Magnetized Compressed MatterThe platform used for the study of electron transport is illustrated in Fig. 18. Using a joint OMEGA/OMEGA EP configuration,
a plastic cylinder filled with Ti-doped plastic foam is imploded using 36 OMEGA long-pulse lasers;46 the OMEGA EP short-pulse laser then irradiates one end to produce relativistic electrons that travel into the compressed, magnetized material, where they deposit their energy.47 Time-resolved spectroscopy and detailed atomic physics codes are used to extract the temperature of the plasma at different levels of magnetization. Electrons reaching and escaping the target are measured via K-shell spectroscopy of tracer foils located on each end of the cylinder. The MIFEDS magnetic-field–generation device delivers 20 T, which, according to our simulations, helps the electrons to efficiently deposit their energy along the compressed channel via magnetic guiding. The experimental observations are compared with particle-in-cell (PIC), hybrid-PIC, and 2-D radiation-hydrodynamic codes to further understand the dynamics.47
In Figs. 19(a) and 19(b), we report on recent measurements of the implosion trajectories and stagnation conditions in an implosion-only shot. The results of the implosion history obtained with (a) a fast x-ray framing camera and (b) the time-integrated Ti emission spectra compares very well with our benchmarked 2-D FLASH simulation of the implosion. At stagnation, the density is +10 g/cm3 and the electron temperature is +500 eV.
2. Proton Beam Heating and Characterization of Si in Warm Dense ConditionsThis portion of the project is focused on proton heating. High-intensity proton beams driven by the 10-ps OMEGA EP laser
have been shown to be effective at rapidly heating solid targets into WDM.48 Now we are developing a reliable temperature-
Figure 18Experimental setup for RelEPlasma-J-20-A.
U2613JR
TIM-1:(blocked by
OMEGA EP)
TIM-4: SXS
TIM-5: XRS
TIM-3: TTP MIFEDSTIM-6: TTP cylinder
TIM-2: XRFC(retracted for electron transport)
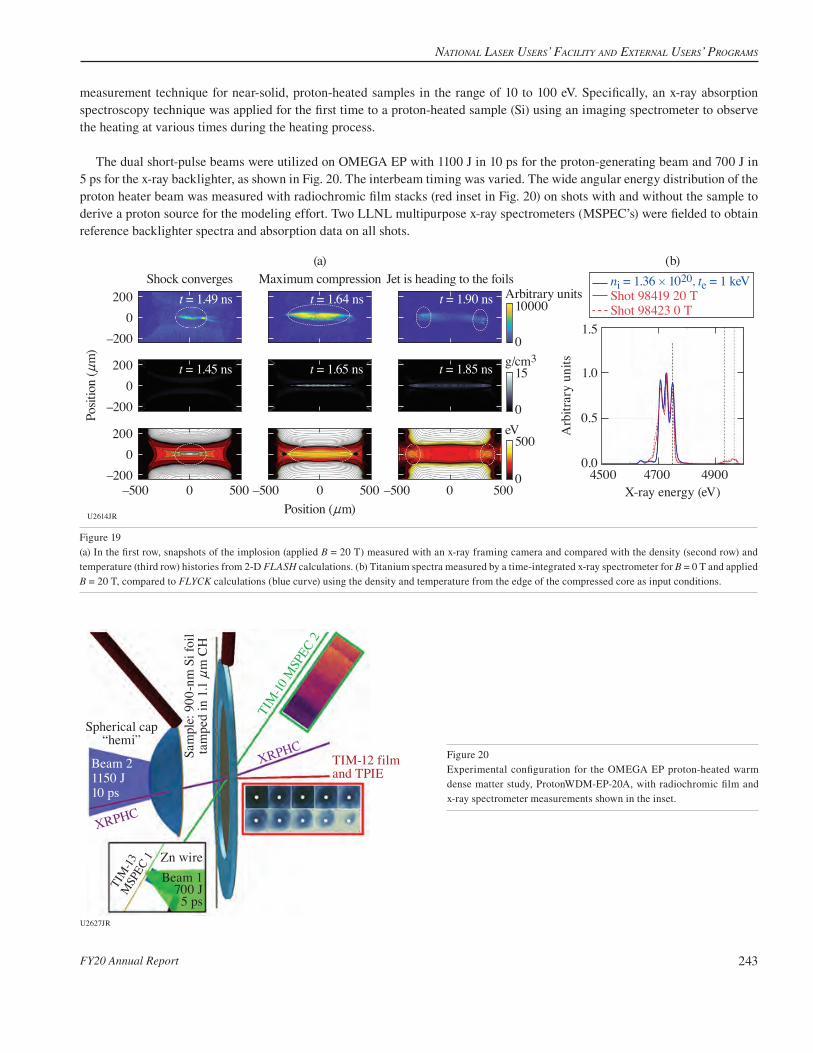
NatioNal laser Users’ Facility aNd exterNal Users’ Programs
FY20 Annual Report 243
Figure 19(a) In the first row, snapshots of the implosion (applied B = 20 T) measured with an x-ray framing camera and compared with the density (second row) and temperature (third row) histories from 2-D FLASH calculations. (b) Titanium spectra measured by a time-integrated x-ray spectrometer for B = 0 T and applied B = 20 T, compared to FLYCK calculations (blue curve) using the density and temperature from the edge of the compressed core as input conditions.
U2614JR
(b)
4500
Arb
itrar
y un
its
0.0
0.5
1.0
1.5
4700X-ray energy (eV)
4900
ni = 1.36 # 1020, te = 1 keVShot 98419 20 TShot 98423 0 T
Shock converges Maximum compression(a)
Position (nm)–500 0
Posit
ion
(nm
)
0–200
200
0–200
200
0–200
200
500 –500 0 500 –500 0 5000
500
0
15
0
10000Arbitrary units
g/cm3
eV
Jet is heading to the foilst = 1.49 ns t = 1.64 ns t = 1.90 ns
t = 1.45 ns t = 1.65 ns t = 1.85 ns
U2627JR
Spherical cap“hemi”
TIM-12 filmand TPIE
Sam
ple:
900
-nm
Si f
oil
tam
ped
in 1
.1 n
m C
H
TIM
-10 M
SPEC
2
Beam 21150 J10 ps
XRPHC
XRPHC
TIM
-13M
SPEC
1 Zn wireBeam 1
700 J5 ps
Figure 20Experimental configuration for the OMEGA EP proton-heated warm dense matter study, ProtonWDM-EP-20A, with radiochromic film and x-ray spectrometer measurements shown in the inset.
measurement technique for near-solid, proton-heated samples in the range of 10 to 100 eV. Specifically, an x-ray absorption spectroscopy technique was applied for the first time to a proton-heated sample (Si) using an imaging spectrometer to observe the heating at various times during the heating process.
The dual short-pulse beams were utilized on OMEGA EP with 1100 J in 10 ps for the proton-generating beam and 700 J in 5 ps for the x-ray backlighter, as shown in Fig. 20. The interbeam timing was varied. The wide angular energy distribution of the proton heater beam was measured with radiochromic film stacks (red inset in Fig. 20) on shots with and without the sample to derive a proton source for the modeling effort. Two LLNL multipurpose x-ray spectrometers (MSPEC’s) were fielded to obtain reference backlighter spectra and absorption data on all shots.

FY20 NatioNal laser Users’ FacilitY Program
FY20 Annual Report244
High-quality x-ray spectral data, such as the example shown in the green inset in Fig. 20 and the corresponding lineout in Fig. 21, were obtained at five probing delays. Several bound–bound absorption dips below 1850 eV and wide dips above it are, respectively, n = 1 to 2 and one to three transitions in ions of Si. Modeling was carried out with 1-D radiation-hydrodynamic simulations and non-LTE (local thermodynamic equilibrium) atomic calculations using codes from Prism Computational Sciences to produce target transmission to compare with the data as shown in Fig. 21. This demonstrates promise for bulk temperature measurements of 10- to 100-eV WDM.
U2632JR
16500.0
0.2
0.4
0.6
0.8
1.0
1850 2050Photon energy (eV)
Tran
smiss
ion
2250
OMEGA EP shot 32261Model of expanded target
Figure 21Comparison of modeled and measured transmission of the Si sample at +86 after Beam 2 irradiated the hemi. The experimental data curve is preliminary pending refined film correction.
This work was supported by the National Nuclear Security Administration through the National Laser User Facility Program (NA0003943).
Field Measurements from Reconstructions in OMEGA Hohlraum Experiments Principal Investigators: J. Pearcy, T. Johnson, G. Sutcliffe, A. Birkel, and C. K. Li (Plasma Science and Fusion Center, MIT)
Irradiated by high-power lasers or energetic ions, a high-Z enclosure, i.e., hohlraum, creates an environment filled with a nearly blackbody (Planckian) radiation field. Hohlraum-generated x-ray drive can create extreme plasma conditions and has served as an important platform for studying a wide range of basic and applied HEDP, including laboratory astrophysics, space physics, nuclear physics, and material sciences. In the indirect-drive approach to ICF, a hohlraum is used to generate uniform soft x rays for sym-metrically compressing a cryogenic deuterium–tritium (DT) spherical capsule to an extreme state of high temperature and density.
With a typical laser intensity and power irradiating on the hohlraum’s inner surface, large-scale, spontaneous electric fields are generated by the electron pressure gradient, and magnetic fields are generated by the noncollinear electron density gradient and temperature gradient (Biermann battery effect). The generation, evolution, and dissipation of such fields are described by the Faraday induction equation along with the generalized Ohm’s law. The presence of these electric and magnetic fields has important effects on the plasma transport and dynamics inside the hohlraum.49 For example, magnetic fields can affect electron thermal transport by changing thermal conductivity, while E fields play an important role in the inhibition of electron heat flux through mechanisms like the return current instability.
To quantitatively study these self-generated spontaneous electric and magnetic fields, advanced proton radiography has been used in producing detailed images of protons being deflected and scattered as they transit through hohlraums as a consequence of sensitivity of charged particles to the fields due to the Lorentz force,

NatioNal laser Users’ Facility aNd exterNal Users’ Programs
FY20 Annual Report 245
, ,w B E m cq
z Bm W
qEz z
2d d
��i i
i
i i
i#= +v v v t v v_ _i i ##
where ,w B Eivv v_ i is the deflection field. Sponsored by the DOE NNSA NLUF Program, we have recently performed experiments on
OMEGA (pProbeHohl-20A). Figure 22(a) shows a schematic of the experimental setup. The backlighter was a D3He-gas–filled, glass shell capsule with a 420-mm diameter and a 2-mm shell thickness, typically imploded by 30 laser beams. Two types of fusion protons with discrete birth energies of 14.7 and 3.0 MeV were produced in nuclear fusion reactions (D + 3He$ a + p and D + D$ T + p) + 80 ps (the nuclear burn duration). As they transited the hohlraum, the backlighting protons were either deflected by the fields or scattered in the plasma (or wall) and were recorded by CR-39 track detectors.50 The timing of the proton sampling (i.e., the time when backlighting protons start to pass through the subject target) was adjustable. Figure 22(b) shows a radiograph measured with 14.7-MeV protons.
• By using new techniques, we have been able to quantitatively reconstruct electromagnetic-field information inside laser-driven vacuum hohlraums with field strengths of +3 # 109 V/m and +0.5 MG.
• We extracted information from a 14.7-MeV image alone by imposing a systematic relationship between the deflections caused by electric fields and magnetic fields; a particularly simple example is .w w w f w f w1B Etot tot tot-= + = +v v v v_ i
• We then tested different values for the breakdown “field fraction” f by using the inferred electric and magnetic fields to predict 3-MeV proton images and compared those to our actual data.
U2615JR
Hohlraum
Protons
To detectorBacklighter
(a) (b) (c) (d)
–0.1
–0.1 0.0x (cm)
y (c
m)
Estimated electricfield (#109 V/m)
0.1
0 1 2
0.0
0.1
–0.1 0.0x (cm)
Estimated magneticfield (MG)
0.1
0.0 0.3
Figure 22(a) Schematic of the experimental setup; (b) end-on radiographs of a laser-driven “hohlraum” with 15 D3He protons; (c) reconstructed electric field; and (d) reconstructed magnetic field.
This material is based upon work supported by the DOE/NNSA CoE at MIT with Contract DE-NA0003868, and NLUF at Omega.
The Dynamics of Strong Magnetic Fields Generated by Relativistic Laser–Plasma Interactions Using OMEGA EPPrincipal Investigators: B. K. Russell, P. T. Campbell, C. A. Walsh, G. Fiksel, H. Tang, A. G. R. Thomas, L. Willingale, and K. Krushelnick (University of Michigan); J. P. Chittenden and A. Crilly (Imperial College London, UK); and P. M. Nilson (LLE)
In the interaction of lasers with solid-density targets, large magnetic fields (+MG) can be produced in the expanding plasma plumes. This mechanism has been used to generate experimental geometries relevant to magnetic reconnection, using two plasma

FY20 NatioNal laser Users’ FacilitY Program
FY20 Annual Report246
plumes that expand into each other.51 Previous experiments have been performed using long, moderate-intensity pulses51 and short, relativistic-intensity pulses.52 Proton radiography is the standard method used to study these interactions, but it can be very difficult to extract a complete physics picture of the interaction as both magnetic and electric fields are probed, and large errors can occur in calculated field magnitudes without knowledge of the initial proton beam profile.53 Therefore, we should have a complete knowledge of all parts of the interaction independently to more easily analyze the more-complex interactions.
In FY20 we used two shot days on OMEGA EP to study the fundamental magnetic-field formation mechanisms in short- and long-pulse–generated plasmas. Two 1-ns UV pulses were focused to an intensity of +1014 W/cm2 onto 25-nm-thick films. These pulses had different angles of incidence and were separated such that they would not interact. Protons produced and accelerated by target normal sheath acceleration (TNSA), in the interaction of a 300-J, 1-ps laser pulse with a Cu foil, were used to diagnose the fields produced by the UV lasers in the face-on configuration shown in Fig. 23(a). These probing protons were collected by a stack of radiochromic film (RCF), generating a time series of data on each shot. The time delays between the UV and probe lasers were varied to see the time evolution of the long-pulse magnetic fields. This was performed using Al foils with 1-nm layers of Cu or Au for comparison with data from our previous shot days where we used CH, Cu, and Al foils. A second configura-tion used a rear-projection probing geometry to study the fields produced by the UV laser at larger angles of incidence and by a second, higher-intensity 500-J, 10-ps IR pulse with an intensity >1018 W/cm2. Si, Al, and CH foils were used for these shots. The probing direction is important to the radiographs produced for the IR pulse because fields produced on the front surface of the target should be imaged as a dot, while back-surface fields should be imaged to a ring. Therefore, information of the front-surface field amplitudes may be lost in the face-on configuration.54 By probing through the back side of the target, we can reverse this imaging problem and obtain additional information about the front-surface fields.
Figure 23(b) shows the results of our material scan from the long-pulse laser at small angles of incidence. In CH, the radio-graph shows a dark ring where protons have been deflected due to azimuthal magnetic fields, similar to the results by Gao et al.55 A notable difference is seen in Al and Cu + Al, where a double-ring structure forms, suggesting the formation of two distinct regions of magnetic field in the plumes. Simulations were performed using the extended-MHD code GORGON to understand this discrepancy in the higher-Z targets. At these moderate intensities, magnetic fields are generated by the Biermann battery mechanism, ∂B/∂t ? dTe # dne, where dTe and dne are the gradients in electron temperature and density, repectively.56 The simulations showed that in the higher-Z targets, two regions with different temperature and density gradients form; therefore, by the Biermann battery, two regions of magnetic field form. This second region, not seen in CH, forms as a result of a change
U2616JR
1 mm
UV pulse
Protons
IR pulse UV pulse
6 or 8 mm
(a) (b)
80 or 78 mmto RCF stack –1
–1
0
1
0x (mm)
y (m
m)
Nor
mal
ized
flux
–1
0
1
y (m
m)
1 –1 0
0
2
4
x (mm)1
CH Al
Cu + Al Au + Al
Figure 23(a) Face-on proton probing configuration used on the first shot day. (b) Proton radiographs of the UV long pulse from FY20 and previous shot days taken for several materials 0.75 ns after the initial time of incidence on the main foil.57

NatioNal laser Users’ Facility aNd exterNal Users’ Programs
FY20 Annual Report 247
in opacity near the edge of the plasma plume from a change in ionization in this region. This charge in opacity will then cause a change in heating in this region from the x rays produced in the hottest regions of the plume. A full analysis of this data was published in 2020.57
During the second shot day we took seven shots in the rear-projection probing geometry to study both the magnitude of surface fields produced by a short IR pulse and the structure of UV long-pulse magnetic fields produced at large angles of inci-dence. Shots taken with the long pulse showed oblong rings with additional rings depending on the material used. These data are currently being analyzed and compared to data taken during the first shot day at large angles of incidence in the face-on probing geometry.
This material is based upon work supported by the Department of Energy, National Nuclear Security Administration under Awards No. DE-NA0003606 and No. DE-NA0003764. P. T. Campbell is supported by the U.S. Department of Energy Fusion Energy Sciences Postdoctoral Research Program administered by the Oak Ridge Institute for Science and Education (ORISE) for the DOE. ORISE is managed by Oak Ridge Associated Universities (ORAU) under DOE Contract No. DESC0014664. B. K. Russell acknowledges support from NSF Grant No. 175142.
Investigation of Feasibility of the 11B(p,3a) Reaction in ICF SettingsPrincipal Investigators: B. Srinivasan (Virginia Tech); G. Kagan (Imperial College London, UK); M. Gatu Johnson, N. Kabadi, and P. Adrian (MIT); and S. P. Regan, T. R. Joshi, D. Barnak, and R. C. Shah (LLE)
The p11B Campaign aimed to investigate the feasibility of the proton–boron nuclear reaction in inertial fusion settings and to clarify the role of the kinetic effects on x-ray emission from ICF hot spots. A series of exploding-pusher implosions were performed with both nuclear and x-ray diagnostics employed. The nuclear diagnostic relied on CR-39 detecting medium, which is still being processed. The x-ray diagnostic gave good data in both soft (3- to 6-keV) and hard (20- to 30-keV) ranges. In particular, the output from the novel, spatially resolved electron temperature (SR-TE) diagnostic shown in Fig. 24 indicates that the electron temperature profile is rather shallow compared to a reference implosion. Further processing of the x-ray data is ongoing.
U2617JR
00
1
2
3
4
5
6
50 100Radius (nm)
(a) Shot 98127 (b) Shot 98135
Elec
tron
tem
pera
ture
(keV
)
150 200 0 50 100Radius (nm)
150 200
Figure 24The time-averaged electron temperature obtained with the SR-TE spectrometer for two representative shots 98127 and 98135 as a function of the radial coordinate.
This material is based upon work partially supported by the Laboratory Directed Research and Development program under the auspices of the U.S. Department of Energy by the Triad National Security, LLC, Los Alamos National Laboratory under Contract No. 89233218CNA000001.

FY20 NatioNal laser Users’ FacilitY Program
FY20 Annual Report248
Filamentary Instability Observed in Expanding Laser Ablation Matches PIC Predictions of Electron Weibel InstabilityPrincipal Investigators: G. D. Sutcliffe, T. Johnson, J. Pearcy, B. Lahmann, P. Adrian, N. Kabadi, S. Haque, M. Gatu Johnson, R. D. Petrasso, and C. K. Li, (MIT); B. Pollock and J. Moody (LLNL); and J. Katz (LLE)
In plasmas, gradients in temperature and density are sources of energy available to drive various processes that generate a magnetic field. Chief among magnetic-field–generation mechanisms in plasmas is the Biermann battery, a mechanism that generates large-scale magnetic fields when there are nonparallel density and temperature gradients. This mechanism is both a dominant source of magnetic field in OMEGA laser-driven solid targets (as observed in many references and simulations) and a source of astrophysical seed magnetic fields.58 Depending on the parameters of the plasma, there is a further variety of pro-cesses that contribute to the decay and transport of magnetic fields, including convection, resistive diffusion, and the Hall effect. At long scale length (more precisely, when the magnetic Reynolds number is large), resistive and Hall effects are unimportant and the Biermann battery source term is balanced by convection. This results in a saturated magnetic field scaling ,B d LTi? where di is the ion inertial length (set by density) and LT is the temperature gradient scale length. As the scale length increases, the saturated field strength decreases.
Recent predictions in PIC simulations59 show that field amplification can proceed instead through the electron Weibel insta-bility in plasmas like that from an OMEGA laser–solid ablation and is important at long scale length .L dT i The structure of the Weibel-amplified magnetic field is necessarily different from the Biermann-generated fields: a small-scale magnetic field is generated around periodic current filaments with wavelengths of the order of the electron inertial length, de, much smaller than the macroscopic system size. The simulations predict that instead of the field decreasing with increased ,L dT i the field becomes independent of scale length and saturates with ,B 1 1 5? .b a larger value than what the Biermann battery could sustain at large .L dT i Indeed, the authors of this summary point out how this finding could change the current model of cosmic magnetic-field generation.
Charged-particle radiographs were collected during MagHohlMultiPBL-19A (a LLNL LBS campaign shared for the primary purpose of “tri-particle” DT3He backlighter development) that showed promising signatures of the Weibel instability: small-scale, filament-structured magnetic fields. BubbleTS-20A was designed to diagnose the plasma as completely as possible for the sake of direct inference of the normalized field scaling quantities b and L dT e and to compare with simulations. A time series of radiographs and Thomson-scattering measurements were collected and are under analysis. An example of the radiographs is shown in Fig. 25, where the filamentary nature of the instability is apparent in the ablated plasma above the foil. From the radio-graphs, the magnetic field can be inferred through a reconstruction technique that gives both magnitude and wavelength-space
U2618JR
100,00000
54321
–4
4
2
0
–2
0 1 2Space (cm)x (cm)
Trac
ks (#
105
cm2 )
3 4420–2–4x (cm)
(c)(b)(a)
y (c
m)
y (c
m)
420–2–4
500,000
400,000
300,000
200,000
654321Tr
acks
(#10
5 cm
2 )
Figure 25Radiographs collected as part of BubbleTS-20A; D + D proton (+3-MeV) radiographs from shots (a) 96045 and (b) 96046. Here the protons probe the plasma approximately parallel to the foil. (c) Lineouts of the particle flux, with small-scale structure encoding information about the filament-shaped magnetic field generated by (we speculate and seek to prove with further analysis) the electron Weibel instability. The large-scale displacement of particles near the foil is electric-field deflection caused by target charging.

NatioNal laser Users’ Facility aNd exterNal Users’ Programs
FY20 Annual Report 249
spectral information. These data will ultimately be a test of the PIC predictions and, depending on final results, could shape our understanding of the interplay of magnetic-field–generation mechanisms.
This material is based upon work supported by the DOE/NNSA CoE at MIT with Contract DE-NA0003868, and NLUF at Omega.
Gas-Filled Hohlraum Hydrodynamic Wall–Gas Interface StabilityPrincipal Investigators: G. D. Sutcliffe, T. Johnson, J. Pearcy, B. Lahmann, P. Adrian, N. Kabadi, S. Haque, M. Gatu Johnson, R. D. Petrasso, and C. K. Li (MIT); B. Pollock and J. Moody (LLNL); and J. Katz (LLE)
In ICF, “indirect drive” is a configuration where the fusion target capsule is suspended inside a hohlraum. The hohlraum is heated to extremely hot temperatures by laser beams, and the capsule’s surface is bathed in x rays from the hot environment. The capsule’s surface ablates and the fuel is accelerated inward. Ablated wall material expands into the cavity of the hohlraum. This can prevent laser beam access to the inner sections of the wall and result in large fractions of scattered light. A gas fill can be used to slow the expansion of the wall material. The timing of the laser deposition, and therefore capsule implosion symmetry, depends on the interaction of the ablated wall with the fill gas.60
The hydrodynamic stability of the ablated wall and fill gas interface is of interest. Previous gas-filled hohlraum experiments61 found that the Rayleigh–Taylor instability can explain the chaotic structure in the wall–gas interface. Large density and temperature gradients at this interface could be generating a small-structure, large-amplitude magnetic field that could impact transport in the hohlraum environment. This campaign, HohlraumRT-20A, was designed to systematically look at the growth rate of perturba-tions imposed in the surface of the wall interface. Gold and CH hohlraums (see Fig. 26) were shot with the laser and probed with proton radiography at staggered times to build a time-resolved understanding of the interface dynamics. Thomson scattering was planned to help connect the experiment with FLASH hydrodynamic simulations; however, this diagnostic was dropped after facility issues early in the shot day restricted the number of shots. Analysis of proton radiography data (see Fig. 27) is underway along with supporting FLASH simulations.
This material is based upon work supported by the DOE/NNSA CoE at MIT with Contract DE-NA0003868, and NLUF at Omega.
U2619JR
(a) (b)
Figure 26(a) A VISRAD view of the proton radiography line of sight, along with 6 of the 12 drive beams (6 are on the opposing side); (b) the CH hohlraum. Visible on the far side is the imposed perturbation on the inner surface of the hohlraum. The film holding in the gas fill is also visible as glare.
U2620JR
–4
4
0
x (cm)
y (c
m)
40–4
(a)
0
2
1
Trac
ks (#
104
cm2 )
x (cm)
(b)
0
4
Trac
ks (#
104
cm2 )
3
40–4
8Figure 2715-MeV (D + 3He) preliminary proton radiographs of (a) the gold hohlraum and (b) the CH hohlraum at late time. Additional etch time is required to improve the quality of the picture, but the wall–gas interface can be seen as a sharp line in the gold hohlraum case. Analysis is underway.

FY20 NatioNal laser Users’ FacilitY Program
FY20 Annual Report250
Laser Channeling and Electron Acceleration from High-Intensity Laser Interactions with an Underdense Plasma Principal Investigators: H. Tang, A. McKelvey, P. T. Campbell, B. K. Russell, Y. Ma, A. G. R. Thomas, and L. Willingale (University of Michigan); H. Chen and F. Albert (LLNL); J. L. Shaw and P. M. Nilson (LLE); and A. V. Arefiev (University of California, San Diego)
High-energy electron beams have numerous applications, including producing highly directional x-ray and gamma-ray radia-tion.62,63 This work focuses on the electron acceleration from the interaction of a relativistically intense laser pulse propagating in an underdense plasma. Previous research has used analytical and numerical methods to understand the mechanism of the energy exchange between particles and laser.64,65 If a laser pulse is intense enough, the electric field can oscillate the electrons at speeds approaching the speed of light, and an electron can be accelerated directly by the laser field and will have momentum gain twice in a laser cycle. But the energy gain is limited by dephasing with laser the pulse.64,65 Within an underdense plasma, however, global electromagnetic fields can be present. Quasi-static transverse electric fields, caused by the ponderomotive force inducing charge separation between the expelled electrons and the ion channel, and a longitudinal electric field, located near the opening of the channel, become established. These comparatively weak electric fields reduce the electron dephasing and make the transverse velocity antiparallel to the laser electric field, leading to a time extension for the electrons to be accelerated by the laser. A localized azimuthal magnetic field inside the channel is generated by the current flux and can also contribute to energy enhancement by confining the boundaries of the transverse electron motion.
Continuing from previous work that investigated laser channeling66 and electron heating,67,68 this project aims to experimentally explore the ideal conditions for generating high-energy electron beams and to observe the channeling dynamics. A picosecond-duration laser pulse was focused onto a millimeter-scale underdense plasma produced by a helium gas nozzle. Plasma densities and laser parameters like pulse duration, energy, and f number were varied to investigate the optimal conditions for electron energy gain. The channel dynamics were observed using proton radiography with RCF stacks.
Figure 28 shows the raw RCF data from a shot using a 111-J, 1-ps laser pulse and plasma density of 0.007 nc, where nc is the critical density. For a proton transit time of 117 ps, a time shortly after the main pulse arrives at the gas jet, a channel from the left side to the center of the plasma is clearly observed with a radius of 4.5 nm and a length of 202.7 nm in the interaction plane. The main channel then splits into three branches/filaments and a close-up shows the break-up region. At later times, the “prefocus” filament bundle (left side) grows, surrounding the central channel, and the filamentation structures expand to a larger area on the right side.
Figure 28The raw RCF images showing the laser channel and filamentation at t = 117 ps, 136 ps, and 149 ps, where t is the proton transit time from source.
U2620JR
(a) t = 117 ps (b) t = 136 ps (c) t = 149 ps
Laser direction
202.7 nm
Laser channel
Channelfocus
Centralchannel
splitFilamentbundle
Figure 29 demonstrates the electron energy spectra measured by (a) an on-axis (labeled “head-on”) EPPS (electron–positron proton spectrometer) and (b) a transverse (labeled “side-on”) EPPS. The blue curves are the background signal obtained from shots with no plasma and are generated by the proton probe–foil interaction. The overlap of the background with other curves in the side-on spectra implies that the majority of the high-energy electrons energized by the main interaction were directed toward the on-axis EPPS. Shots were taken using the square near-field beam profile (approximately equivalent to an f/2 focusing geometry) and a 4-mm-wide nozzle or using an f/2 or f/5 circularly apodized beam and a 2-mm-wide nozzle. The highest electron energy of 70 MeV was achieved using an f/5 circular apodizer, beam energy of 111 J, and plasma density of 0.007 nc. The mean electron

NatioNal laser Users’ Facility aNd exterNal Users’ Programs
FY20 Annual Report 251
Figure 29The electron energy spectra from (a) an on-axis (head-on) and (b) a side-on EPPS.
0 10 20 30 40 50 60 70 5 10
Num
ber/M
eV/S
r(a) (b)
15 20
109
1010
1011
1012
109
1010
1011
1012246 J, 0.064 nc493 J, 0.064 nc500 J, 0.029 nc242 J, 0.010 nc244 J, 0.007 nc250 J, 0.007 ncf/5, 111 J, 0.007 ncf/5, 2 ps, 112 J, 0.007 ncf/5 112 J, 0.004 ncBackground 250 JBackground 250 JBackground 250 J
U2621JRElectron energy (MeV) Electron energy (MeV)
energies of nine effective shots vary from 10 MeV to 16 MeV. The low plasma density, low laser energy, and large f number are beneficial to improving the electron energy and number of the accelerated electrons, likely due to improved channel stability.
This material is based upon work supported by the Department of Energy National Nuclear Security Administration under Award Number DE-NA0003944, the University of Rochester, and the New York State Energy Research and Development Authority.
Quantifying Turbulent Rayleigh–Taylor Mixing with X-Ray Phase Contrast ImagingPrincipal Investigators: W. Theobald (LLE); A. Casner, V. Bouffetier, L. Ceurvorst, and F. Barbato (CELIA, University of Bor-deaux, France); G. Rigon and M. Koenig (Ecole Polytechnique, France); L. Antonelli, M. Khan, N. Woolsey (University of York, UK); and R. Scott and K. Glize (Rutherford Appleton Laboratory, UK)
The advent of MJ-class laser facilities such as the National Ignition Facility (NIF) and Laser Mégajoule (LMJ)-PETAL makes it possible to explore states of matter in the laboratory that are relevant for astrophysics and HED plasmas under extreme condi-tions of pressure. For the case of high-Mach-number turbulent flows, NIF and LMJ-PETAL are unique energy drivers because targets are accelerated over larger areas and longer time periods than previously achieved on any other laser facilities. This enables hydrodynamic instabilities, such as the Rayleigh–Taylor instability (RTI) or the Kelvin–Helmholtz instability, to be driven into their turbulent stage of development. However, even though x-ray imaging diagnostics for hydrodynamic instability experiments have improved over the past two decades, further developments are still needed to elevate our understanding and simulations of turbulent flows in HED plasmas.69
The planar RTI platform takes advantage of OMEGA EP short-pulse beams to perform wire point-projection x-ray radiography. The platform was first developed at the LULI2000 laser facility in France70,71 and then successfully transferred to OMEGA EP (TurboHEDP-EP-19A) using classical point-projection x-ray radiography. Here we report on the efforts to apply the recently commissioned x-ray phase-contrast imaging (XPCI) technique,72 developed by a collaboration of scientists from LLE, the Uni-versity of York, RAL, and CELIA, to the planar RTI platform. This novel x-ray imager in HED physics could provide electron density gradients as well as additional simultaneous information such as attenuation. Based on the previous results acquired in the TurboHEDP-EP-19A and XPCI-EP-19A experiments, which were performed in 2019 on OMEGA EP, we merged both platforms in order to optimize the configuration and improve the spatial resolution and contrast. A long-pulse UV driver laser impinges onto a plastic ablator foil and generates a shock wave that propagates into a shock tube containing a preheat shield that protects a modulated CHBr foil (5% atomic fraction) that is in contact with a formaldehyde foam (C15H12O4) cylinder. RTI is triggered during the deceleration phase with the modulated surface embedded within the low-density foam. At a time delay of up

FY20 NatioNal laser Users’ FacilitY Program
FY20 Annual Report252
to tens of nanoseconds, a high-intensity, short-pulse beam is fired onto the tip of a wire target to provide a point-projection x-ray source, emitting predominantly resonance line emission, and to acquire snapshots of RTI during the highly nonlinear phases. The modulated package (monomode or multimode) decelerates into the lighter foam medium.
It is important to transfer the RTI platform to larger HED facilities such as to drive the modulated CH/foam targets at higher laser energies and with better beam quality. Figure 30(a) shows the VISRAD model of the experiment. Two alternating UV (m = 0.35-nm) drive laser beams (B3, B4) provided an energy of up to 2150 J/beam in a 2-ns square pulse and were focused on the CH ablator mounted onto the shock tube cylinder (1-mm internal diameter, 1 mm in length) filled with a foam with a mass den-sity of 20 mg/cm3 or 100 mg/cm3 to trigger RTI growth in the deceleration phase. The UV beams were equipped with SG8-750 distributed phase plates (DPP’s) that produced a laser spot with a diameter of 750 nm (1/e value of peak fluence) and a fluence distribution envelope that is well described by a super-Gaussian function with an order of 6.8. The UV laser intensity was 3 # 1014 W/cm2 per beam at maximum energy. The alternating IR beams (B1 or B2) were focused normal onto the tip of a Ti wire or a Cu wire with an intensity of up to 1 # 1017 W/cm2 (50 ps, 500 J). The wire was aligned along the axis to TIM-14, which contained a passive image-plate (IP) detector plate in a heavimet-shielded box. The Ti wire backlighter produced a strong emis-sion of between 4.5 and 5.5 keV predominately from the Hea and Lya resonance lines, while the Cu wire produced a strong line emission at 8.3 keV from the Hea resonance line. The distance from the backlighter to the CH/foam cylinder was 2.3 cm and the distance from the CH/foam cylinder to the IP detector was 1.4 m, providing a magnification of 60#, which is necessary to observe the phase contrast on the image-plate detector. The technique was first qualified in a shot with Au grids and a Cu back-lighter, demonstrating 15-nm spatial resolution. Subsequent shots with driven targets showed a significant background originating from the main target at maximum laser energy, which overwhelmed the radiograph on the front IP but captured a radiograph on a subsequent IP (back). This is shown in Fig. 30(b). A large Cu washer inside the main target produced significant Cu Ka line emission competing with the backlighter emission and reducing the image contrast. However, a radiograph of the RTI spikes that is visible on the back IP is presumably produced by 10- to 20-keV x rays from the backlighter. Figure 30(c) shows a radiograph of an undriven target, clearly showing the modulated front CHBr plate (in blue), the CH tube containing a 20-mg/cm3 foam with some defects in it, and the target stalk on the bottom.
E29470JR
Short-pulsebeamCu or Ti
backlighter target
TCC23 mm
Shock tube
UV nanoseconddrive beams
(a)
1.0
0.6
1000
RTIspikes
Drivelaser IP: front
600
x (nm)x (nm)
(c) Undriven targetLLDI – shot 33106
(b) 1 UV beam 2.15 kJ,20-ns probe time, shot 33098
y (n
m)
y ( n
m)
600 10002000400800Si
gnal
(PSL
)
–400
0
400
0.2200
1400
TIM-14detector1.4 m away
Figure 30(a) TurboXPCI-EP-20A-aibs VISRAD model and [(b), (c)] experimental data. (b) Radiograph of a single-mode target with initial 100-mg/cm2 foam density probed at t = 20 ns with a Ti wire backlighter. The skew of the shock front due to the non-normal incident drive laser is clearly visible along with the RTI spikes driven into the turbulent regime. (c) Radiograph of an undriven shock tube produced with a Cu wire backlighter. Fine details such as the corrugation of the drive plate (blue region) and fine cracks in the foam material are visible.
In subsequent shots, the background was mitigated by lowering the laser drive intensity producing radiographs on the front IP at various delay times and for two foam densities. The contrast of the radiographs is not, however, at a level to obtain high-quality data. On the other hand, an excellent radiograph of a shock front in a driven CH cylinder was obtained at lower UV drive energy, clearly marking the shock front and phase contrast effects at the target edge (see Fig. 31). Further development, for example by using a time-gated detector, is required to bring this platform to the point where it can be used with high-energy drivers.

NatioNal laser Users’ Facility aNd exterNal Users’ Programs
FY20 Annual Report 253
Part of this material is based upon work supported by the Agence Nationale de la Recherche under the ANR project Turbo-HEDP (ANR-15-CE30-0011).
Fundamental Astrophysical Processes in Radiative Supersonic MHD TurbulencePrincipal Investigators: P. Tzeferacos,*,† E. Hansen, and A. Reyes (Flash Center for Computational Science, Department of Physics and Astronomy, University of Rochester); D. H. Froula and J. Katz (LLE); C. Palmer,‡ A. F. A. Bott,§ T. Campbell, H. Poole, and G. Gregori (Department of Physics, University of Oxford); A. Birkel, C. K. Li, and R. D. Petrasso (Plasma Science Fusion Center, MIT); J. S. Ross and H.-S. Park (LLNL); and D. Lamb (Department of Astronomy and Astrophysics, University of Chicago)*,†Also, LLE and Department of Physics, University of Oxford‡Also, Centre for Plasma Physics, School of Mathematics and Physics, Queen’s University Belfast§Also, Department of Astrophysical Sciences, Princeton University
Magnetic fields are ubiquitous in the universe and are salient agents in numerous astrophysical processes;74 however, their origin is not fully understood. The consensus among cosmologists and astrophysicists is that cosmic magnetic fields are the result of dynamo amplification of tiny seed fields in turbulent magnetized plasmas.75 The turbulent dynamo mechanism eluded experi-mental demonstration for decades, while theoretical and numerical studies largely relied on simplified models76 that steer clear of realistic magnetized compressible turbulence, where strong density fluctuations, shocks, filamentation, and radiative effects complicate the picture and confound the analysis. Only in the last few years have theoretical and numerical efforts begun to tackle highly compressible magnetized turbulence77,78—an important step forward, given that most astrophysical systems in the interstel-lar and intergalactic mediums exhibit signs of high compressibility (i.e., large sonic Mach numbers, M). Supersonic turbulence plays a critical role in determining the star formation rate,79 the star formation efficiency,80 and the stellar mass distribution.81
Turbulent plasmas also play a fundamental role in the transport and energization of suprathermal particles that make up cosmic rays (CR’s). Originally discovered by Hess in 1912 in a series of balloon experiments, today’s measurements, based on a combination of balloon, satellite, and ground-based experiments, reveal a power-law spectral energy distribution of CR particles that extends more than ten orders of magnitude82 up to 1020 eV. The origin of these particles puzzled astrophysicists for several decades until Fermi83,84 showed that charged particles could exchange energy with the plasma by way of scattering off magnetic irregularities. The study of Fermi acceleration in realistic astrophysical turbulence is equally demanding. The kinetic nature of the process and its inherent coupling to the background turbulent plasma complicate modeling efforts. Ab initio kinetic simula-tions using PIC methods are promising,85,86 but the affordable dynamic range remains limited. Reduced models must therefore invoke simplifications that range from the geometry and properties of the flow, to the transport coefficients of the CR’s, to their
E29471JR
0 200 400 600z (nm)
R (n
m)
Tran
smiss
ion
800 1000 0 200 400 600z (nm)
(a) Shot 33105
Simulation
Experiment
(b) Shot 33105
800 1000
–4000.4
0.6
0.8
1.0
1.2400
200
0
–200
(c)
1.0 mm
UV laser beam
1.0
mm
SimulationExperiment
1.0
mm
Figure 31(a) Experimental radiograph (bottom) of a shock wave driven in a solid plastic cylinder compared to a hydro simulation with the code DUETT73 and an XPCI post-processor (top).72 The signal excursion due to phase contrast on the shock-front interface and the target’s back side are observed. (b) Lineout through the central axis of the cylinder. (c) Experimental setup.

FY20 NatioNal laser Users’ FacilitY Program
FY20 Annual Report254
interaction with the plasma or lack thereof. While such approaches can inform us on the role and importance of different factors entering the acceleration process, they cannot fully address the integrated problem of Fermi acceleration in magnetized turbulence.
This project aims to demonstrate and characterize for the first time in the laboratory (1) the turbulent dynamo in the radia-tive, supersonic regime and (2) the acceleration of charged particles via stochastic Fermi in supersonic magnetized turbulence. The experiments exploit the mature turbulent dynamo (TDYNO) experimental platform we developed87 for the Omega Laser Facility, which demonstrated turbulent dynamo in the laboratory for the first time,88 and meticulously characterize89 it in the classical subsonic, nonradiative regime. The TDYNO platform was also used to create an experimental analogue of ultrahigh-energy CR transport in turbulent magnetized plasmas.90 The experiments build on the expertise we have acquired through our previous experimental campaigns at the Omega Laser Facility and the experience we have gained in designing and interpreting these experiments using validated simulations done with FLASH,91,92 a highly capable radiation MHD code we have developed that is able to simulate a wide range of high-energy-density–physics experiments. The project establishes a basis for laboratory investigations on the nature of the saturated MHD turbulent state in radiative, supersonic turbulence, and poses the basis for understanding the acceleration of charged particles in astrophysical plasmas.
Supersonic magnetized turbulence and the onset of turbulent dynamo were the astrophysical processes we targeted on the first shot day of the TDYNO NLUF experimental campaign. The shot day was carried out on 28 January 2020. The platform deployed is shown in Fig. 32(a) and is similar to the one we fielded on OMEGA for our previous successful TDYNO campaigns. The assembly is comprised of two composite targets and two grids that are connected by a pair of cylindrical shields. The 3-mm-diam composite targets consist of a 10-nm-thick chlorine-doped polystyrene foil (6% Cl) and a 240-nm-thick polystyrene washer. The polystyrene washers were machined to have a 400-nm-diam cylindrical “well” in their centers. The two targets are mounted 8 mm apart and the pair of grids placed between them. The two grids are made of polyimide and are mounted 4 mm apart—each of them 2 mm away from the respective proximate face of the foil target. The grids have a diameter of 3 mm and a thickness of 230 nm and consist of either 300-nm-wide holes and 100-nm wires, or 100-nm-wide holes and 30-nm wires, offset with respect to each other to break the mirror symmetry of the assembly: grid A (red) has a hole in the center while grid B (blue) does not. Rectangular cones on each target shield the diagnostics from the intense x-ray emission produced when a sequence of ten 1-ns-duration laser beams coming from different angles illuminate each target. The two targets are driven for 5 ns, delivering a total of 5 kJ, 2.5 kJ, or 1 kJ on an area defined by the laser SG5 phase plates. The temporal profile of the drive is a “staircase”
E29472JR
(a) (b) (c) (f)
TS beam
Grid B Grid A
Diagnostic shields
D3He capsule
Ne (1/cm3) B (gauss)
Rm
Rm2B2
0 = 10–6
110–110–9
10–7
10–5
10–3
10–1
10
10210 103
Gu2HGdB2H
M1: Re - 450M2: Re - 840M3: Re - 1700HM: Re - 3500
1.03.2 5.04.7
2.02.1 1.05.6M (values > 1) Rm(e)(d)
Figure 32Supersonic turbulent dynamo on OMEGA. (a) VISRAD schematic of the supersonic TDYNO platform for OMEGA. (b) FLASH simulation of the CHCl plat-form we will field on OMEGA (electron number density rendering). (c) Magnetic-field strength in the FLASH simulation, indicating amplification to hundreds of kG. (d) Mach number of the plasma flows and the turbulent region, showing only values above unity. The turbulent plasma is robustly supersonic. (e) The Rm values in the FLASH simulations are above Rmc in the many hundreds. (f) The mean square induced B field versus Rm from Ref. 93 in the subcritical and supercritical regimes in the subsonic regime. Qualitatively similar behavior is expected for supersonic turbulence.

NatioNal laser Users’ Facility aNd exterNal Users’ Programs
FY20 Annual Report 255
profile, ramping up the power toward the end of the drive (e.g., for 5 kJ: 500 J/ns for 2 ns, 1000 J/ns for 1 ns, and 1500 J/ns for 2 ns). As shown in the FLASH simulation we performed for the platform design, the beams drive a pair of counter-propagating, high magnetic Reynolds number (Rm) plasma flows that carry the seed magnetic fields generated by a Biermann battery. The flows propagate through a pair of grids that destabilize the flow and define the driving scale of the turbulence (L). The flows then meet at the center of the chamber to form a hot, turbulent interaction region [Fig. 32(b)] where the magnetic fields are amplified to saturation values [Fig. 32(c)]. The chlorine dopant increases the radiative cooling efficiency of the turbulent plasma. This results in a decrease in the temperature and the sound speed of the plasma, making it supersonic [Fig. 32(d)]. However, our design enabled us to retain large enough temperatures to achieve supercritical Rm for dynamo to operate [Fig. 32(e)].
The primary goals of this shot day were to measure the plasma properties of the supersonic radiative turbulence and the magnetic-field strength during saturation—i.e., at late times of the evolution—as a function of Rm and bracket the critical Rmc required for the dynamo to operate. We controlled the plasma properties by modifying the laser energy Edrive and the driving scale of the turbulence L (by using the finer grid). By decreasing Edrive, we decreased the turbulent kinetic energy reservoir of the plasma, thereby reducing Rm. Similarly, by reducing L, we directly decreased Rm since Rm ? L. The measurements will enable us to (1) demonstrate turbulent dynamo in supersonic, radiative turbulence; (2) experimentally recover the supersonic equivalent of Fig. 32(f), i.e., the Rm dependence of the magnetic field93 induced by tangling (in the subcritical regime) or dynamo (in the supercritical regime); (3) validate the critical value Rmc that recent FLASH resistive-MHD–driven turbulence simulations place at Rmc + 100 to 170 for supersonic turbulent dynamo;94 and (4) measure the density, kinetic energy, and magnetic energy power spectra.
The shots yielded a wealth of experimental data: preliminary analysis indicates that we were, in fact, able to generate compress-ible magnetized turbulence, characterize the plasma state, capture the transition from magnetic tangling to dynamo, and measure the magnetic-field amplification using the suite of diagnostics we previously fielded. More specifically, we used x-ray imaging [Fig. 33(a)] to visualize the formation and evolution of the magnetized turbulence, from which we can reconstruct the density power
E29473JR
(d)0.1
–0.1–0.2 0.0 0.2
0.0
y (c
m)
x (cm)
3
0
(B.L
) (kG
cm
)
1
2
(e)
(a)XRFC shot 96436 PV PV
x (mm)
y (m
m)
500200
200
600
5
0
–5
–10
1000
1000
1800
1500x (mm)
200 600 1000x (mm)
200 600 10000
4000
8000
12,000
(b)log IAW 96433
(c)EPW 96433
Figure 33Experimental results. (a) X-ray image of supersonic radiative turbulence on OMEGA. (b) IAW 4~ Thomson-scattering signal. (c) EPW 4~ Thomson-scattering signal. (d) Proton radiograph of the magnetized turbulence. (e) Reconstructed path integrated magnetic field95,96 from the proton radiograph in (d).

FY20 NatioNal laser Users’ FacilitY Program
FY20 Annual Report256
spectrum from the x-ray intensity fluctuations and recover temperature maps. Moreover, the 4~ Thomson-scattering diagnostic [Figs. 33(b) and 33(c)] yielded detailed information on the plasma state (ion and electron temperatures, bulk flow velocity, turbulent velocity, and electron density) for different drive/grid combinations. Finally, we employed proton radiography [Fig. 33(d)] on all shots and reconstructed the path-integrated magnetic fields95,96 [Fig. 33(e)], thereby measuring the magnetic-field amplification and demonstrating weaker fields for smaller values of Edrive and L. Despite the complexity of the experimental platform, with the help of LLE personnel we were able to perform 12 shots during our first shot day. The experimental data are currently being analyzed and promise to further our understanding of magnetized astrophysical turbulence in the supersonic regime.
The research leading to these results has received funding from the European Research Council under the European Com-munity’s Seventh Framework Programme (FP7/2007-2013)/ERC grant agreements no. 256973 and 247039, the U.S. Department of Energy (DOE) National Nuclear Security Administration (NNSA) under Contract No. B591485 to Lawrence Livermore National Laboratory (LLNL), Field Work Proposal No. 57789 to Argonne National Laboratory (ANL), Subcontract No. 536203 with Los Alamos National Laboratory, Subcontract B632670 with LLNL, and grants No. DE-NA0002724, DE-NA0003605, and DE-NA0003934 to the University of Chicago, DE-NA0003868 to the Massachusetts Institute of Technology, and Cooperative Agreement DE-NA0003856 to the Laboratory for Laser Energetics University of Rochester. We acknowledge support from the U.S. DOE Office of Science Fusion Energy Sciences under grant No. DE-SC0016566 and the National Science Foundation under grants No. PHY-1619573, PHY-2033925, and AST-1908551. Awards of computer time were provided by the U.S. DOE ASCR Leadership Computing Challenge (ALCC) program, using resources at ANL, which is supported by the U.S. DOE Office of Science under contract No. DE-AC02-06CH11357. We acknowledge funding from grants 2016R1A5A1013277 and 2017R1A2A1A05071429 of the National Research Foundation of Korea. Support from AWE plc., the Engineering and Physical Sciences Research Council (grant numbers EP/M022331/1, EP/N014472/1, and EP/R034737/1) and the U.K. Science and Technology Facilities Council is also acknowledged.
High-Pressure and High-Temperature Polymorphism of a Key Super-Earth Mantle Material: MgOPrincipal Investigator: J. Wicks (Johns Hopkins University)
As one of the most important building blocks of the earth and other rocky planets, MgO is a relevant material to character-ize at extreme conditions. It serves as a high-pressure analogue for most other diatomic ionic solids, where the B1–B2 transition pressure and mechanism have been studied for decades.97 The equation of state, phase diagram, and rheology of MgO at the extreme pressures of the B1–B2 transition (300 to 500 GPa) likely play an important role in the mantle convection dynamics of super-Earth interiors.98
The high-pressure and high-temperature phase diagram of MgO has been beyond experimental reach until recent years, when groundbreaking research carried out at the Omega Laser Facility identified the B1–B2 transition using streaked optical pyrom-etry in decaying-shock experiments99 and then again using x-ray diffraction in laser-driven, ramp-compression experiments.100 Discrepancies between experimental measurements and theoretically predicted shock Hugoniot(s) (and implied phase diagrams) have been attributed to both kinetics and anharmonicity, exacerbated by the extreme temperatures associated with melting (+10 to 15 kK along the Hugoniot).101
The goal of this NLUF project is to explore the kinetic barriers to MgO phase transitions along the shock Hugoniot. FY20 marked our inaugural campaign on OMEGA EP, where our primary objective was to carry out temperature measurements of the shock Hugoniot of MgO as a function of shock-propagation direction. Bringing a large team enabled training and experimental support from other lab members from both JHU and Princeton (Fig. 34). This work is part of a continued collaboration between the PI and scientists at LLNL and Princeton, where our common goal is to measure crystal structure and compressibility of minerals under dynamic compression.
In these decaying-shock experiments, 1-ns laser drives are used to drive a strong but unsupported shock wave through the sample assembly. The propagating shock front is monitored using the line-imaging velocimetry (VISAR) and SOP diagnostics, where the properties of quartz windows before and after the MgO served as in-situ calibrants102,103 [Fig. 35(a)]. Discontinuities

NatioNal laser Users’ Facility aNd exterNal Users’ Programs
FY20 Annual Report 257
U2665JR
MgOXRD-20A MgOXRD-20B
Figure 34(a) The science team for this NLUF program’s inaugural campaign on OMEGA EP. J. Wicks’s laboratory members supported by our colleagues from LLNL, Princeton University, and LLE. (b) Rescheduled COVID-friendly campaign science team.
Figure 35(a) Target setup on OMEGA EP for decaying-shock measurements of single-crystal MgO with quartz reference material. Line VISAR measured the shock velocity and reflectivity of the shock front, while (b) SOP simultaneously measured the thermal emission.
U2666JR
Laser drive beam
10 mmCH washer
(a) (b)
0 5 10 15Time (ns)
Solid–liquid boundary
B1–B2transition
20 25
MgOSample
SOP
VISAR
Diamondablator
a-Quartz
a-Quartz
in the VISAR and pyrometry records delineate phase changes, enabling one to identify the B2–liquid and the B1–B2 transitions, respectively [Fig. 35(b)].

FY20 NatioNal laser Users’ FacilitY Program
FY20 Annual Report258
The propagating shock front through both SiO2 and MgO liquid is a reflective, opaque surface. Below the metallization tem-perature, the reflected shock is not detectable in VISAR, and pressure is extrapolated as an exponential decay, with end-point pressure constrained by the impedance jump into the quartz window. Decaying-shock measurements of MgO conducted along different crystallographic directions revealed exciting differences in the location and shape of temperature discontinuities along the shock Hugoniot, indicating different transition energy barriers as a function of orientation. Follow-up work using in-situ x-ray diffraction will allow us to better understand the temperature trends in the second year of this program.
Another highlight of FY20 was the presentation of this project by former undergraduate researcher J. Gonzalez Quiles at the 2019 Society for Advancement of Chicanos/Hispanics and Native Americans in Science Conference, winning a best poster award. This NLUF grant provided primary support for second-year graduate student Z. Ye (Fig. 34, inset), who spent the following sum-mer studying under Dr. M. Millot (LLNL) through the virtual Livermore Scholars Program. In this internship, she developed and applied optical absorption corrections with the eventual goal to explore transition kinetics effects on optical measurements during dynamic compression experiments.
These results will provide insight into the kinetics effects on the observability of extreme-temperature phase transitions during the time scales of shock compression.
REFERENCES
1. B. Bachmann et al., Phys. Rev. E 101, 033205 (2020).
2. F. H. Séguin et al., Rev. Sci. Instrum. 74, 975 (2003).
3. L. X. Benedict et al., Phys. Rev. E 95, 043202 (2017).
4. J. Daligault, Phys. Plasmas 23, 032706 (2016).
5. C. R. Scullard et al., Phys. Rev. E 97, 013205 (2018).
6. D. H. Barnak et al., Phys. Plasmas 24, 056310 (2017).
7. J. R. Davies et al., Phys. Plasmas 24, 062701 (2017).
8. E. C. Hansen et al., Plasma Phys. Control. Fusion 60, 054014 (2018).
9. E. C. Hansen et al., Phys. Plasmas 27, 062703 (2020).
10. C. A. Walsh et al., Phys. Plasmas 27, 022103 (2020).
11. R. Florido et al., Phys. Rev. E 80, 056402 (2009).
12. R. C. Mancini et al., High Energy Density Phys. 9, 731 (2013).
13. P. Y. Chang et al., Phys. Rev. Lett. 107, 035006 (2011).
14. M. R. Gomez et al., Phys. Rev. Lett. 113, 155003 (2014).
15. J. C. Boettger, Phys. Rev. B 67, 174107 (2003).

NatioNal laser Users’ Facility aNd exterNal Users’ Programs
FY20 Annual Report 259
16. N. A. Smirnov, J. Phys.: Condens. Matter 29, 105402 (2017).
17. R. Ahuja, S. Rekhi, and B. Johansson, Phys. Rev. B 63, 212101 (2001).
18. P. Söderlind, Phys. Rev. B 66, 176201 (2002).
19. Z.-L. Liu et al., Comput. Mater. Sci. 114, 72 (2016).
20. L. Dubrovinsky et al., Phys. Rev. Lett. 98, 045503 (2007).
21. T. Ishikawa et al., Phys. Rev. B 88, 214110 (2013).
22. A. Dewaele et al., Nat. Commun. 9, 2913 (2018).
23. R. Briggs et al., Phys. Rev. Lett. 123, 045701 (2019).
24. S. M. Sharma et al., Phys. Rev. Lett. 123, 045702 (2019).
25. K. Takemura and A. Dewaele, Phys. Rev. B 78, 104119 (2008).
26. A. Dewaele, P. Loubeyre, and M. Mezouar, Phys. Rev. B 70, 094112 (2004).
27. G. Ren et al., Phys. Rev. Lett. 118, 165001 (2017).
28. W. Riedel et al., High Energy Density Phys. 37, 100861 (2020).
29. R. A. Treumann, Astron. Astrophys. Rev. 17, 409 (2009).
30. C. K. Li et al., Phys. Rev. Lett. 123, 055002 (2019).
31. P. M. Celliers et al., Science 361, 677 (2018).
32. J. H. Eggert et al., Nat. Phys. 6, 40 (2010).
33. S. Brygoo et al., J. Appl. Phys. 118, 195901 (2015).
34. R. Betti et al., Phys. Rev. Lett. 98, 155001 (2007).
35. S. Zhang et al., Phys. Plasmas 27, 023111 (2020).
36. Flash Center for Computational Science, University of Chicago, Chicago, IL 60637, Accessed 3 March 2020, http://flash.uchicago.edu/site/.
37. B. E. Robertson et al., Nature 468, 49 (2010).
38. M. Fraser, R. Soc. Open Sci. 7, 200467 (2020).
39. R. P. Drake et al., Astrophys. J. 833, 249 (2016).

FY20 NatioNal laser Users’ FacilitY Program
FY20 Annual Report260
40. W. J. Gray et al., Phys. Plasmas 26, 052901 (2019).
41. L. Gao et al., Astrophys. J. Lett. 873, L11 (2019).
42. Y. Lu et al., Phys. Plasmas 26, 022902 (2019).
43. M. M. Basko, A. J. Kemp, and J. Meyer-ter-Vehn, Nucl. Fusion 40, 59 (2000).
44. B. Srinivasan and X.-Z. Tang, Phys. Plasmas 20, 056307 (2013).
45. B. J. Winjum, F. S. Tsung, and W. B. Mori, Phys. Rev. E 98, 043208 (2018).
46. M. Dozières et al., Phys. Plasmas 27, 023302 (2020).
47. D. Kawahito et al., Phil. Trans. R. Soc. A 379, 20200052 (2021).
48. C. McGuffey et al., Sci. Rep. 10, 9415 (2020).
49. P.-E. Masson-Laborde et al., Phys. Rev. E 99, 053207 (2019).
50. C. K. Li et al., Science 327, 1231 (2010).
51. P. M. Nilson et al., Phys. Rev. Lett. 97, 255001 (2006).
52. A. E. Raymond et al., Phys. Rev. E 98, 043207 (2018).
53. N. L. Kugland et al., Rev. Sci. Instrum. 83, 101301 (2012).
54. G. Sarri et al., Phys. Rev. Lett. 109, 205002 (2012).
55. L. Gao et al., Phys. Rev. Lett. 114, 215003 (2015).
56. L. Biermann and A. Schlüter, Phys. Rev. 82, 863 (1951).
57. P. T. Campbell et al., Phys. Rev. Lett. 125, 145001 (2020).
58. R. M. Kulsrud and E. G. Zweibel, Rep. Prog. Phys. 71, 046901 (2008).
59. K. M. Schoeffler et al., Phys. Plasmas 23, 056304 (2016).
60. J. D. Lindl et al., Phys. Plasmas 11, 339 (2004).
61. C. K. Li et al., Phys. Rev. Lett. 108, 025001 (2012).
62. S. Kneip et al., Phys. Rev. Lett. 100, 105006 (2008).
63. F. Albert and A. G. R. Thomas, Plasma Phys. Control. Fusion 58, 103001 (2016).
64. A. P. L. Robinson, A. V. Arefiev, and D. Neely, Phys. Rev. Lett. 111, 065002 (2013).

NatioNal laser Users’ Facility aNd exterNal Users’ Programs
FY20 Annual Report 261
65. A. V. Arefiev et al., Phys. Plasmas 23, 056704 (2016).
66. L. Willingale et al., Phys. Rev. Lett. 106, 105002 (2011).
67. L. Willingale et al., New J. Phys. 15, 025023 (2013).
68. A. E. Hussein et al., New J. Phys. 23, 023031 (2021).
69. A. Casner et al., High Power Laser Sci. Eng. 6, e44 (2018).
70. E. Brambrink et al., High Power Laser Sci. Eng. 4, e30 (2016).
71. G. Rigon et al., Phys. Rev. E 100, 021201 (2019).
72. L. Antonelli et al., Europhys. Lett. 125, 35002 (2019).
73. S. Atzeni et al., Comput. Phys. Commun. 169, 153 (2005).
74. E. N. Parker, Cosmical Magnetic Fields: Their Origin and Their Activity, The International Series of Monographs on Physics (Clarendon Press, Oxford, 1979).
75. R. M. Kulsrud et al., Astrophys. J. 480, 481 (1997).
76. A. Brandenburg and Å. Nordlund, Rep. Prog. Phys. 74, 046901 (2011).
77. C. Federrath et al., Astrophys. J. 797, L19 (2014).
78. C. Federrath, J. Plasma Phys. 82, 535820601 (2016).
79. M. R. Krumholz and C. F. McKee, Astrophys. J. 630, 250 (2005).
80. C. Federrath and R. S. Klessen, Astrophys. J. 763, 51 (2013).
81. P. Padoan and A. Nordlund, Astrophys. J. 576, 870 (2002).
82. R. Blandford and D. Eichler, Phys. Rep. 154, 1 (1987).
83. E. Fermi, Phys. Rev. 75, 1169 (1949).
84. E. Fermi, Elementary Particles (Yale University Press, New Haven, 1951).
85. D. Caprioli and A. Spitkovsky, Astrophys. J. 794, 46 (2014).
86. L. Comisso and L. Sironi, Phys. Rev. Lett. 121, 255101 (2018).
87. P. Tzeferacos et al., Phys. Plasmas 24, 041404 (2017).
88. P. Tzeferacos et al., Nat. Commun. 9, 591 (2018).

FY20 NatioNal laser Users’ FacilitY Program
FY20 Annual Report262
89. A. F. A. Bott et al., Proc. Nat. Acad. Sci. 118, e2015729118 (2021).
90. L. E. Chen et al., Astrophys. J. 892, 114 (2020).
91. B. Fryxell et al., Astrophys. J. Suppl. Ser. 131, 273 (2000).
92. P. Tzeferacos et al., High Energy Density Phys. 17, 24 (2015).
93. C. Federrath, J. Plasma Phys. 82, 6 (2016).
94. A. A. Schekochihin et al., New J. Phys. 9, 300 (2007).
95. C. Graziani et al., Rev. Sci. Instrum. 88, 123507 (2017).
96. A. F. A. Bott et al., J. Plasma Phys. 83, 905830614 (2017).
97. Y. Syono, Y. Noguchi, and K. Kusaba, in Properties of Earth and Planetary Materials at High Pressure and Temperature, edited by M. H. Manghnani and T. Yagi, Geophysical Monograph Series (AGU, Washington, DC, 1998), Vol. 101, pp. 319–325.
98. S. Karato, Icarus 212, 14 (2011).
99. R. S. McWilliams et al., Science 338, 1330 (2012).
100. F. Coppari et al., Nat. Geosci. 6, 926 (2013).
101. J. Bouchet et al., Phys. Rev. B 99, 094113 (2019).
102. M. D. Knudson and M. P. Desjarlais, Phys. Rev. B 88, 184107 (2013).
103. D. G. Hicks et al., Phys. Rev. Lett. 97, 025502 (2006).

NatioNal laser Users’ Facility aNd exterNal Users’ Programs
FY20 Annual Report 263
M. S. Wei
Laboratory for Laser Energetics, University of Rochester
In FY20, 22 Laser Basic Science (LBS) projects were allocated a total of 21.5 shot days for experiments at the Omega Laser Facility. A total of 186 target shots were conducted for sixteen LBS projects led by scientists from Lawrence Livermore National Laboratory (LLNL), Los Alamos National Laboratory (LANL), Lawrence Berkeley National Laboratory (LBNL), Princeton Plasma Physics Laboratory (PPPL), SLAC, and LLE (see Table I). The FY20 LBS experiments are summarized here.
FY20 Laboratory Basic Science Program
Table I: LBS experiments conducted at the Omega Laser Facility in FY20.
Principal Investigator Institution Title
F. Albert LLNL X-Ray Radiation Driven by Laser Wakefield Acceleration at OMEGA EP
H. Chen LLNL Develop a Magnetic Mirror Trap for Laser-Produced Relativistic Electron–Positron Pairs
H. Chen LLNL Laboratory Model of Particle Acceleration in Supernova Shocks
F. Coppari* LLNL The Atomic Structure and Melting of New Solid and Superionic Water Ices at Multi-Megabar Pressures: Searching for Ice XIX
T. Doeppner LLNL Experimental Measurement of Mutual Diffusivity in Warm Dense Matter
K. Flippo LANL Quantifying the Path to Saturation in a Turbulent Magnetic Dynamo
W. Fox PPPL Turbulent Transport in Magnetized HED Plasmas
D. E. Fratanduono LLNL Investigating Giant Impacts Between Rocky Planets with High-Pressure Melting and Shock Equation-of-State Measurements on Complex Silicates
L. Gao PPPL Effect of Laser Parameters on Magnetic Field Generation with Laser-Powered Capacitor Coils
A. Gleason SLAC Viscosity Measurements Using Tracer Particles
S. Jiang LLNL Characterizing Pressure Ionization in High-Density with X-Ray Line Emission Spectroscopy
O. M. Mannion LLE Measuring the Gamow Energy Shift of Fusion Products in High-Temperature Plasmas
M. Millot* LLNL Peering into the Ices Giant Planets Using Shocks On Pre-Compressed Water– Ammonia Mixtures: Superionic Ammonia Hydrates
Z. L. Mohamed* LLE Study of Gamma-Ray Products from Reactions Relevant to Big Bang Nucleosynthesis
P. M. Nilson LLE Terra Incognita: Testing the Predictions of Density Functional Theory (DFT) in Warm and Extremely Dense Plasmas
A. Pak* LLNL Proton Radiography of Target Normal Sheath Acceleration Fields in the Long-Pulse Regime
H. G. Rinderknecht* LLE Measuring the Triton Breakup Reaction T(n,2n)D
R. Saha and J. R. Rygg* LLE Optical and X-Ray Scattering Measurements of Dense Lithium

FY20 LaboratorY basic science Program
FY20 Annual Report264
During FY20, LLE issued a solicitation for LBS proposal for beam time in FY21. A total of 36 proposals were submitted requesting a total of 56 shot days, 260% exceeding the LBS allocation, showing strong interest and high demand of Omega facility time for basic high-energy-density (HED) science experiments from both National Nuclear Security Administration Inertial Confinement Fusion (NNSA ICF) and Office of Science laboratories. An independent LBS Proposal Review Committee consisting of 12 experts from university, national labs, and industry reviewed and ranked the proposals. Based on the Review Committee’s recommendation, 22 proposals were selected and allocated a total of 22.5 shot days (including one additional day from the contingency pool) for experiments at the Omega Laser Facility in FY21 as shown in Table II.
Table I: LBS experiments conducted at the Omega Laser Facility in FY20 (continued).
Principal Investigator Institution Title
R. Smith LLNL The Effect of Alloying on High-Pressure Phase Transformations: Diffusion Time Scales and Kinetics
C. Stoeckl LLE Development of New Experimental Platform LIANS on OMEGA EP for Deuteron- and Triton-Induced Nuclear Reactions
S. Zhao LBNL Extreme Deformation and Failure of High-Entropy Alloys by Laser Shock-Induced Compression and Tension
A. B. Zystra LLNL Implosions for Studying Solar CNO Reactions*Six FY20 LBS projects were postponed with shots rescheduled in FY21.
Table II: LBS experiments approved for target shots at the Omega Laser Facility in FY21.
Principal Investigator
Lead Institution
Title
F. Albert LLNL X-Ray Radiography with Sources Driven by Laser Wake-Field Acceleration
H. Chen LLNL Develop a Magnetic Mirror Trap for Laser-Produced Relativistic Electron–Positron Pairs
H. Chen LLNL Measuring Particle Transport in Turbulent Plasmas
F. Coppari LLNL Melting, Polymorphism, and Kinetics of Crystallization of Superionic Ice
T. Doeppner LANL Developing Fresnel Diffractive Radiography for Mutual Diffusion Measurements
C. J. Forrest LLE Inelastic Reactions of 14-MeV Neutrons from Lithium Isotopes
D. E. Fratanduono LLNL Investigating Giant Impacts on Rocky Planets with High-Pressure Melting and Shock Equation-of-State Measurements on Complex Silicates
L. Gao PPPL Investigation of Magnetic-Field Generation with Short-Pulse Laser-Powered Capacitor Coils
Y.-J. Kim LLNL Extreme Chemistry Inside Icy Planets: Shock Compression of Precompressed Ammonia–Water Mixtures
N. Lemos LLNL Proton Radiography of a Hybrid Laser Wakefield Accelerator Driven by a Picosecond, Kilojoule-Class Laser
L. Masse LLNL Evidencing the Transition from Landau–Darrieus Instability to Ablative Richtmyer– Meshkov Using Low-Density Foam Targets on OMEGA EP
P. M. Nilson LLE Atomic Physics at Petapascal Pressures
J. L. Peebles LLE Comparison and Validation of Dynamic Magnetic-Field Diagnostics on Laser-Driven Coils and MIFEDS
H. G. Rinderknecht LLE A Plasma Rectifier for Extreme Magnetic Fields, Efficient Electron Acceleration, and Bright X-Ray Sources
S. Singh LLNL Determination of High-Pressure Phase Transformation Mechanisms at the Atomic Scale

NatioNal laser Users’ Facility aNd exterNal Users’ Programs
FY20 Annual Report 265
Table II: LBS experiments approved for target shots at the Omega Laser Facility in FY21 (continued).
Principal Investigator
Lead Institution
Title
V. A. Smalyuk LLNL The Kelvin–Helmholtz Instability with a Magnetic Twist
C. Stoeckl LLE Development of New Experimental Platform LIANS on OMEGA EP for Deuteron and Triton-Induced Nuclear Reactions
G. Tabak LLE Extreme Physics of Hydrogen and Water in Planetary Interiors
W. Theobald LLE X-Ray Phase-Contrast Imaging of Imploding Strong Shock Waves
T. J. Weber LANL Understanding Collisional Interpenetration of Ion Species with Talbot–Lau Interferometry
S. Zhao LBNL Extreme Deformation of High-Entropy Alloys
A. B. Zylstra LLNL Big-Bang Nucleosynthesis Relevant to the Primordial 7Li Problem
Development of Self-Modulated Laser Wakefield Acceleration on OMEGA EPPrinciple Investigators: F. Albert, P. M. King,* N. Lemos, J. Williams, and H. Chen (LLNL); J. L. Shaw and D. H. Froula (LLE); and M. Sainclair and C. Joshi (University of California, Los Angeles)*Also University of Texas, Austin
X-ray backlighting is one of the most commonly used methods to look into the extreme temperatures, pressures, and densi-ties created during laser-driven high-energy-density science (HEDS) experiments. Over the years, much effort has gone into developing backlighting techniques to look into these states of matter, with new sources and diagnostics. The properties of an x-ray backlighter (flux, source size, spectrum, duration) required for an experiment depend on the application being studied and on the quantity being measured. The goal of the Wakefield-EP shot series is to develop a new type of x-ray source that could be advantageous for applications requiring broadband spectra, small source sizes (sub-50 nm), short duration (less than 10 ps), and x rays extending beyond 100 keV. Our proposed x-ray sources are based on laser wakefield acceleration (LWFA) of electrons in the self-modulated regime (SMLWFA). Specifically, we aim to develop three different x-ray sources based on betatron radiation, Compton scattering, and bremsstrahlung emission.
The WakefieldLBS-EP-20A shot day aimed at producing and detecting betatron radiation produced by SMLWFA using a modified version of the electron–positron proton spectrometer (EPPS) diagnostic. The modified EPPS used apertures enlarged to 5 mm (instead of 1 mm) and included a hole at the back of the magnet box, as well as a stack of nine image plates at the back of the ten-inch–manipulator (TIM) cart to detect betatron radiation. Initial analysis of these experiments shows that EPPS was successful at simultaneously recording electron, spectrum, profile, and x-ray data (Fig. 1).
The wakefield platform produced robust electron beam data, recording a >100-nC charge electron beam at each shot, as well as two-temperature spectra extending up to about 200 MeV (Fig. 1). Our data show that our signal-to-noise ratio needs to be improved for more-efficient x-ray detection. With the help of Monte Carlo simulations, we are working on additional diagnostic shielding enhancements for our next shot day in February 2021.
Developing a Magnetic Mirror Trap for Laser-Produced Relativistic Electron–Positron PairsPrinciple Investigators: H. Chen, J. von der Linden, M. Edwards, and A. Link (LLNL); G. Fiksel and L. Willingale (University of Michigan); and J. L. Peebles (LLE)
Creating a relativistic electron–positron pair plasma in a laboratory is of great interest to basic plasma science and to labora-tory astrophysics experiments that explore particle acceleration through collisionless shocks. The difficulties of such an endeavor are caused by the limited number of pairs that can be created and the limited strength of magnetic field that is necessary for the pair confinement.1,2 Using the award under the Laboratory Basic Science program, we designed and tested a mirror trap for laser-produced relativistic pairs.

FY20 LaboratorY basic science Program
FY20 Annual Report266
U2672JR
160 mrad
0
1010
1012
50 100Energy (MeV)
Parti
cles
/sr/M
eV
150 200
6 7 8 9
1 2
Betatron signal
3 4 5
Unfolded dataDetection limitFit1: A1 = 1.7 # 1013 (particles/sr/MeV), T1 = 19.1 (MeV)Fit2: A2 = 2.2 # 1012 (particles/sr/MeV), T2 = 50.1 (MeV)
(a)
(b)
Figure 1Results obtained during the Wakefield LBS-EP-20A shot day using the modified EPPS diagnostic. (a) An electron beam profile for each of our nine shots; (b) representative electron beam spectrum; (c) betatron x-ray signal measured on the rear image-plate stack of EPPS.
A schematic of the magnetic trap [shown in Fig. 2(a)] consists of the LLE’s magneto-inertial fusion electrical discharge sys-tem (MIFEDS) and a pair-generating target placed inside the magnetic mirrors. The target is irradiated by a high-intensity laser beam; the positrons and electrons are generated and, depending on their energy, will be either confined by the mirror magnetic field or allowed to escape. With the magnetic field at the mirror center at about 7 T, the simulations show that the trap can confine
15 mm 10 mm
e+
e–
–10 00
108
109
1010
1011
1012
1013
5 10 15 20 25 300
4
8
12
z coordinate (mm)Energy (MeV)
dNe/d
E (sr
–1 M
eV–1
)
(a) (b)
B (T
)
10
B = 0B = 13 T, shot averageB = 13 T, shot 32285
U2673JR
Figure 2(a) A magnetic mirror formed by MIFEDS can trap the low-energy (<3-MeV) pairs according to simulation. (b) Experimental data show that E < 3 MeV have indeed been well confined and only escape axially, the axial flux of 3 MeV < E < 15 < MeV is increased, and 15-MeV particles are focused by the magnetic field in this configuration.

NatioNal laser Users’ Facility aNd exterNal Users’ Programs
FY20 Annual Report 267
particles with a kinetic energy of less than 3 MeV, while particles with higher energies will partially or totally escape after one or more gyrations.
The experimental results appear to confirm these simulations, as shown in Fig. 2(b). The confinement studies were performed on electrons in this first experiment due to their higher numbers and easier detection. In principle, the positrons should behave the same as the electrons at the same energies, albeit having the opposite direction of rotation. Figure 2(b) shows clearly that with the magnetic field on, the axial flux of the low-energy electrons generated inside the trap is greatly increased, indicating that they are well confined in the radial direction and eventually only escape axially, as predicted.3
Investigating Giant Impacts Between Rocky Planets with Shock Equation-of-State Measurements on Natural SilicatesPrinciple Investigators: B. A. Chidester and S. T. Stewart (University of California, Davis); M. Millot and D. E. Fratanduono (LLNL); J. P. Townsend (SNL); and J. Li (University of Michigan)
The Earth and other rocky planets likely formed after a series of energetic collisions in the early solar system. Simulations of these impacts rely on accurate equations of state and phase diagrams of natural materials to determine the amount of melting, vaporization, and mixing that occurs in the aftermath of a giant impact. Combined with data collected at the Sandia Z Machine, this study is the first to measure the principal pressure–density–temperature (PtT) Hugoniot of the most-abundant minerals in Earth’s upper mantle—olivine [(Mg0.9,Fe0.1)2SiO4] and orthopyroxene [(Mg0.9,Fe0.1)SiO3]—to conditions relevant to giant impacts. Additionally, we collected the first shock-temperature measurements on wadsleyite, a high-pressure polymorph of olivine that exists in Earth’s transition zone.
We completed 15 shots on OMEGA EP in the one-day allocation, using alternating beams to increase the shot rate. Those data are combined with data collected in a previous shot allocation (FY19-SilicateEOS). As shown in Fig. 3(a), the olivine shock temperatures measured on OMEGA EP match those measured on the Sandia Z Machine and quantum molecular dynamics calculations. In Fig. 3(b), we show that natural olivine is very similar to synthetic forsterite, the magnesium endmember of this material (Mg2SiO4) (Ref. 4). PtT data on wadsleyite will provide a wealth of thermodynamic information for the olivine series, including the Grüneisen parameter that describes thermal pressure. The data collected on natural orthopyroxene will comple-ment our previous work on enstatite (MgSiO3) (Ref. 5). All of these data will be incorporated into analytical equations of state (ANEOS) for use in planetary impact simulations [dashed orange curve, Fig. 3(b)].6
Figure 3(a) T–Us data for natural olivine. Fit to OMEGA EP data in blue; data collected at the Sandia Z machine, on a gas gun (purple triangle);7 and quantum molecular dynamics simulations (#’s) included for comparison. (b) T–P curve on the olivine Hugoniot. Forsterite Hugoniot from Root et al. (2018);4 new forsterite ANEOS from Stewart (2019)6 included for comparison.
U2674JR
100
10
20
30
40
50
60
12 14 16 18Shock velocity, Us (km/s)
20 22 24 26 0 200 400 600 800Pressure, P (km/s)
Tem
pera
ture
, T (#
1000
K)
1000 1200 1400
(a) (b)
OMEGA EP dataFit, this studyThis study, Z machine
This study, QMDLuo et al.4
Forsterite, Root et al.1Forsterite ANEOS, Stewart3

FY20 LaboratorY basic science Program
FY20 Annual Report268
Fresnel Diffractive–Refractive Radiography for Measurements of Mutual Diffusivity in Warm Dense MatterPrincipal Investigators: T. Döppner, O. L. Landen, Y. Ping, L. Divol, and A. Saunders (LLNL); T. G. White, C. H. Allen, and M. Oliver (University of Nevada, Reno); and W. Theobald (LLE)
The experimental measurement of concentration-driven diffusion between two species in warm dense matter (WDM) is impor-tant for benchmarking instability growth simulations in ICF experiments.8 The scale length of this mutual diffusion is of the order of 1 nm, necessitating a diagnostic tool that can resolve density-gradient changes with sub-1-nm resolution. With two half-day campaigns on OMEGA-60 this year, we have developed a reliable x-ray radiography technique that is sensitive to Fresnel diffrac-tion signatures by using novel 1-nm-wide slits, which we have termed Fresnel diffractive–refractive radiography (FDR) [Fig. 4(a)].
Over two half-days, our experiments—MutualDiffusion-20A&B on OMEGA-60—progressed from imaging cold wire targets to sampling driven dynamic WDM systems, looking at the interface of isochorically heated Al and CH [(Figs. 4(b) and 4(c)]. Our preliminary analysis indicates that we captured changes in the CH as it expands, but further analysis is required to determine the change in the Al–CH interface. With an upcoming campaign on OMEGA-60 in February 2021, we plan to further refine the platform before converting it for use at the National Ignition Facility (NIF) for campaigns in FY22 and beyond.
U2675JR
(a) (b)4 nm W
10 nm Al in CH
10 nm Al
CH edge
(c)
00
1000
2000
Cou
nts (
arbi
trary
uni
ts)
3000
4000
100 200Distance in target plane (nm)300 400
1.0 nm
30.0
nm
1.0 nm
30.0
nm
1.0 nm
30.0
nm
0
0
1000
2000
3000
4000
100 200 300
W
CH
Al in CHAl
Ross pair strip 1Ross pair strip 2
Figure 4(a) Driven target configuration in a monolithic frame. The two detailed images are (left) a SEM image of a 1-nm-wide slit and (right) the driven target in the frame. (b) Radiographs and lineouts from a cold wire target, showing features from a variety of wires including strong refraction contrast at the CH surface. (c) Radiographs and lineouts of a driven target. The change of the CH signal across the strips is the rarefaction wave from expansion and can be used to cali-brate the x-ray drive by comparing to simulation.
Viscosity Measurements Using Tracer ParticlesPrincipal Investigators: A. E. Gleason (SLAC); D. N. Polsin, J. J. Ruby,* R. Rygg,*,† G. W. Collins,*,† P. M. Nilson, and R. Betti*,† (LLE); and J. K. Shang, H. A. Aluie, N. Acharya, and D. H. Kelley (Dept. of Mechanical Engineering, University of Rochester)*Also Dept. of Physics and Astronomy, University of Rochester†Also Dept. of Mechanical Engineering, University of Rochester
Viscosity has an important role in the evolution of hydrodynamic instabilities and the mixing between materials, especially at early times at scales smaller than of the order of 100 nm (Refs. 9 and 10). Our objective was to measure viscosity in a hydrocar-

NatioNal laser Users’ Facility aNd exterNal Users’ Programs
FY20 Annual Report 269
bon plastic (CH) at HED conditions, which is commonly employed in target fabrication for ICF and basic science experiments. In this experiment, we shock compressed the CH and imaged the deformation and movement of small, high-Z particles embed-ded in the target over time. The viscosity plays a role in how well a particle tracks the surrounding fluid and can be inferred by comparing trajectories of particles of different sizes and/or densities after a shock has passed. The experiment was a continuation of the pilot FY19 campaign and is part of a broader effort to develop an x-ray particle image velocimetry (XPIV) platform as a technique to measure more-complex flows.
Experimental ConfigurationThe target bulk was composed of particle-seeded epoxy (Stycast 1266, 1.12 g/cm3). Layers of epoxy were drilled with small
holes at the desired positions in which the high-Z particles were placed, backfilled, and assembled with adhesive. Each target contained three particle pairs, where each pair consisted of a large (60-nm) and small (40- or 50-nm) spherical particle aligned collinearly center-to-center, such that the impinging shock should pass through the center of both particles approximately simul-taneously. Particles were Ti or stainless steel (Cospheric). Particle pairs were 100 nm apart. A Kapton ablator and Au heat shield were placed on the drive side of the target. Targets were fabricated by Gryphon Technologies.
Drive beams (0.8 kJ, 7.4 ns) irradiated the Kapton ablator at the front of the target using 760-nm distributed phase plates, driving a shock through the target. Additional beams irradiated a copper backlighter with a 1-ns square pulse; a pinhole array (20 nm) and a gated x-ray framing camera were positioned on the P6–P7 axis opposite the backlighter [Fig. 5(a)]. Framing-camera strip-time delays were varied to obtain particle-shock interactions at different times. The 0.1-ns gate duration of the framing camera provided sufficient temporal resolution to locate the particle locations, with 20-km/s particle speeds (estimated from hydrodynamics simulations with FLASH) blurring location by only 2 nm. Shock speeds as a function of time were measured by VISAR (velocity interferometer system for any reflector).
ResultsParticles were clearly imaged with area backlighting at various times during target compression, as shown in Fig. 5(b). The
shock interface and deformation of the shocked particles were evident and agree well with a previous experiment at NOVA conducted by Klein et al.11 As part of this campaign, our team is concurrently developing a method to approximate the defor-mation resistance of the solid particles at early times with a modified ideal-gas equation of state in radiation-hydrodynamics code (FLASH). In Fig. 5(b), we show that particle shapes simulated by this equation-of-state (EOS) method agree well with the
Figure 5(a) Target configuration. (b) Stainless-steel particles at two times during CH target compression, obtained with an x-ray framing camera on OMEGA (Sept. 2020). The particle deformation (dark bodies, top) agrees well with FLASH simulations (particle outlines shown in white, bottom).
U2716JR
P6
TIM-1H2
(a) (b)
Drivebeams
ToXRFC
To VISAROATEL
18.3 ns
Rad
iogr
aph
Sim
ulat
ion
23.5 ns100 nm
P7
Shock front

FY20 LaboratorY basic science Program
FY20 Annual Report270
experimental images. Excellent VISAR data were obtained, and the timing of the radiography data will be correlated with the measured shock velocity. We estimate that a 480-GPa shock front in epoxy was achieved.
Image analysis to determine particle displacement is in progress.
Dissemination, Training, and Professional DevelopmentResults related to this effort were presented at the 2020 Stewardship Science Academic Programs (SSAP) Symposium
(February 2020) and Division of Plasma Physics Meeting (November 2020) by senior personnel and graduate students.
This work was performed under the auspices of the U.S. Department of Energy and NNSA under Grant DE-SC0019329 within the joint HEDLP program and the Stewardship Science Academic Alliances under Grant DE-NA003914.
LBS Campaign FY20—Magnetic-Field Generation with Laser-Powered Capacitor CoilsPrincipal Investigators: H. Ji, L. Gao, A. Chien, and S. Zhang (PPPL); E. G. Blackman (Dept. of Physics and Astronomy, Uni-versity of Rochester); P. M. Nilson (LLE); G. Fiksel (University of Michigan); and H. Chen (LLNL)
The LBS Campaign in FY20 focused on two main goals: (1) to optimize laser-powered capacitor coils12 as an external magnetic-field source generator and (2) to build a comprehensive lumped-circuit model for the capacitor coil platform, including important physics processes such as the laser–solid interaction, plasma effects, and electron distribution.
These goals were achieved in two major laser-drive regimes: UV long-pulse drive and IR short-pulse drive. In the UV case, the capacitor-coil target is driven by OMEGA EP Beamlines 3 and 4, while in the IR case, Beamline 1 in sidelighter mode is used to energize the target. In both cases, the capacitor-coil design consists of two parallel copper plates connected by a thin copper wire folded into a U-shaped coil. Experimental setups for UV and IR drives are shown in Figs. 6(a) and 6(b), respectively. Hot electrons are generated as the laser beam hits the back plate, building up a voltage difference between the plates and driving a large current through the connecting coil. This results in strong magnetic-field generation around the coil. The magnetic-field strength and coil current are inferred using TNSA (target normal sheath acceleration) proton radiography: measurement of the prolate void feature generated by the magnetic-field structure can be compared with synthetic radiographs from ray tracing.
Figure 6(a) OMEGA EP experimental setup for long-pulse drive of the capacitor coil. Beamlines 3 and 4 drive the main target, and the coil magnetic fields are diagnosed with TNSA protons driven by the backlighter. (b) OMEGA EP experimental setup for short-pulse drive of the capacitor coil. The sidelighter beam drives the main target at a 45° incidence angle, and the coil magnetic fields are diagnosed with TNSA proton radiography.
U2717JR
Target stalkTarget stalkTarget stalkTarget stalk
Main targetMain targetRCF pack
OU-ESMOU-ESM
RCF pack
TNSA targetTNSA target
LP beam 4
LP beam 3
(b)(a)
BacklighterBacklighter
Sidelighter

NatioNal laser Users’ Facility aNd exterNal Users’ Programs
FY20 Annual Report 271
In UV drive, a fixed intensity of 1.7 # 1016 W/cm2 was used for all shots. A laser pulse duration scan was conducted with square pulse widths of tL = 2, 3, 4, and 9.9 ns. Accounting for proton time-of-flight from the TNSA interaction, the radiographs represent field measurements taken at roughly the end of the square laser pulse. Prolate voids of varying sizes were formed for all long-pulse shots (Fig. 7). Comparing the voids with synthetic radiographs, coil currents were inferred for the laser pulse widths to be 17!1, 13!1, 11!1, and 10!1 kA for pulse widths of 2, 3, 4, and 9.9 ns, respectively. A clear decreasing trend is established in generated coil current with increasing laser pulse duration at constant intensity.
U2718JRtL = 2 ns tL = 3 ns tL = 4 ns tL = 9.9 ns
(a) (b) (c) (d)
Figure 7Experimental proton radiographs for laser pulse widths of (a) 2, (b) 3, (c) 4, and (d) 9.9 ns. Laser intensity is the same for all shots at 1.7 # 1016 W/cm2. The experimental data are overlaid with synthetic radiographs of coil-generated magnetic fields, corresponding to inferred currents of !17, !13, !11, and !10 kA, respectively. The overlays indicate close agreement in structure and size of the primary feature.
A lumped circuit model13 was developed to characterize the effects of an intense laser pulse on such a capacitor-coil target. The current through the coil is modeled by characterizing the target as an RLC series circuit. Voltage between the plates, U, is described by a combination of ion and electron currents, as well as the coil current. The electron current can be described as the sum of two Boltzmann distributions at different temperatures. The ion current is assumed to follow a self-similar expansion model. Combining the expressions for the current sources and including the other components of the RLC circuit to describe the behavior of the voltage between the plates, the model becomes a set of coupled differential equations:
.
exp exp exp
exp exp exp exp exptU
I d c t K I U T K I U T I t
I d c t t K I U T K I U T t I t
U RI LtI
1 0
1dd
dd
<
>
, ,
, , ,
h h h l
d i h h h d
0 0 0
0 1 0 0 1 1
i s e e e e c c
i s e e e e,c e c
cc
- - - -
- - - - - - -
-
# x
x x x x x
+
+ +
= +
C
`
` _
` _
`
`
_ ` _
j
j i
j i
j
j
i j i8 9 8B C B
Z
[
\
]]]]]]]]]]]]
The lumped-circuit model indicates a rise and subsequent saturation of coil current with increasing laser pulse duration. By varying the model, it can be seen that this is due to the arrival of ions reaching the front plate, which effectively “shorts” out the circuit. The phenomenon occurs on a time scale similar to the ion transit time xi + d/cs. A comparison of experimental data and the lumped-circuit model is shown in Fig. 8.
The short-pulse–drive experiments were conducted at varying intensities and pulse widths. The varied parameters allow us to build a comprehensive “phase diagram” of achievable currents and magnetic fields based on the laser parameters of intensity and pulse width. At constant laser pulse width of 5 ps, a laser intensity scan was performed, ranging from 2.8 # 1018 W/cm2 to 2.0 # 1019 W/cm2. On the other axis, a pulse width scan was performed at a constant intensity of 2.8 # 1018 W/cm2, ranging from 5 ps to 50 ps. Additionally, a maximum intensity shot of 6.7 # 1019 W/cm2 was performed, using 300 J over 0.7 ps.

FY20 LaboratorY basic science Program
FY20 Annual Report272
Figure 8Lumped-circuit model simulations of coil current as a function of laser pulse duration, compared with experimental measurements. In the model, resistance is assumed constant for each run, but varied as a free parameter to account for temperature effects. R = 0.5 X provides the best match to experimental measurements but diverges at late time. R = 0.23 X matches the data point at t = 9.9 ns. In all cases, coil current is observed to eventually decay with increasing laser pulse width due to ion shorting.
U2719JR
00
5
10
15
20
25
30
35
2 4Time (ns)
Coi
l cur
rent
(kA
)
6 8 10
ExperimentR = 0.1 XR = 0.23 X
R = 0.5 XR = 1.0 X
Data analysis is ongoing, but preliminary results demonstrate great promise for short-pulse–driven capacitor coils as a platform for external magnetic field generation. TNSA proton radiographs for an intensity scan at constant laser energy are shown in Fig. 9. The radiographs demonstrate coil currents of 90!10, 85!10, and 75!10 kA for laser pulse widths of 100 ps, 50 ps, and 15 ps, respectively. For all shots, laser energy on target was 1 kJ. Despite the lower energy on target than the long-pulse drivers, higher coil currents were achieved. This represents a conversion efficiency of up to 11# larger than achievable with the long-pulse drive on OMEGA EP. With further data analysis, we hope to gain insight into hot-electron physics, as well as the mechanisms behind current generation to produce a self-consistent lumped-circuit model for short-pulse–driven capacitor coils.
U2720JRxL = 100 ps xL = 50 ps xL = 15 ps
(a) (b) (c)
Figure 9(a) 100-ps, (b) 50-ps, and (c) 15-ps pulse widths. Proton radiographs of the magnetic field generated by a short-pulse–driven interaction for various pulse widths. For all shots, laser energy on target was 1 kJ at best focus. The radiographs represent coil currents of 90!10, 85!10, and 75!10 kA, respectively.
This material is based upon work supported by the Department of Energy National Nuclear Security Administration under LBS Award Number L2034.
Characterizing Pressure Ionization in High-Density Mid-Z Materials with X-Ray Fluorescence SpectroscopyPrincipal Investigators: S. Jiang, Y. Ping, A. Lazicki Jenei, P. Sterne, P. Grabowski, H. Scott, R. Smith, R. Shepherd, B. Bachmann, and J. H. Eggert (LLNL); and S. B. Hansen (SNL)
This campaign comprised one day on OMEGA EP during FY20. In our previous campaigns, we had for the first time provided a direct benchmark between various isolated-atom and average-atom ionization models by measuring K-shell emission of Co. During the FY20 campaign, we have extended the method to L-shell emissions of mid-Z materials Tb and Dy.

NatioNal laser Users’ Facility aNd exterNal Users’ Programs
FY20 Annual Report 273
U2721JR
(a)
0.15
0.10
0.05
0.006960 7160
Lb3
Lb1
Lb2
PSLS
7360E (eV)
(b)
Short-pulselaser
Fluorescencelayer
IXTS 100 nm Al2
mm
Long-pulselaser driver
20 nmdiamond
3 nm Co 25 nm Tb or Dy
80 nmdiamond
Diamond
Secondary Altarget
e–
UndrivenDriven, 3300 JDriven, 6950 J
0.6
0.4
0.2
0.07150 7230
Lb3
Lb1
Lb4
PSLS
7350E (eV)
Tb Dy
UndrivenDriven, 6950 J
Figure 10(a) A schematic diagram of the experimental configuration. (b) Measured IXTS spectra of Tb and Dy L-line emissions. The spectra under different conditions are aligned with the Co Ka emission line.
A schematic of the experimental setup is displayed in Fig. 10(a). The fluorescence line emissions were induced by hot elec-trons generated through short-pulse, laser–solid interactions. A large, thick Al target was used to avoid heating from the short pulse. The high pressure was achieved by ramp compression using the long-pulse drivers, so that the temperature was kept low during the compression process. During the experiment, the pressure history was characterized with VISAR measurements. We have varied the driver energies to reach different densities. The target structure is also shown in Fig. 10(a). Despite the Tb or Dy layer under study, we have also included a thin Co layer as an energy reference. The main diagnostic used in this cam-paign was a high-resolution imaging x-ray Thomson spectrometer (IXTS) with a user-provided Ge crystal to accommodate the required energy range.
We have successfully measured the Co Ka fluorescence line and multiple Tb/Dy Lb lines with high signal-to-noise ratio as can be seen in Fig. 10(b). According to our previous Co study, the Co Ka line has negligible energy shift under the designed experi-mental conditions since the inner K, L shells are not greatly affected by pressure ionization; therefore, the measured spectra under various conditions can be aligned with the Co Ka peak. The M, N shells that are responsible for the multiple Lb emissions of Tb and Dy are much more prone to both the ionization pressure depression effect and the density-dependent plasma polarization effect. Under maximum compression, we have observed a +1-eV blue shift in Tb Lb1, a –3-eV red shift in Tb Lb2, and no shift in Tb Lb3. For Dy, a small +1-eV blue shift was observed in both its Lb1 and Lb3. While further analysis is still in progress, we have seen evidence of various competing effects in the measured line shifts, which can be used to directly benchmark various ionization models for mid-Z materials.

FY20 LaboratorY basic science Program
FY20 Annual Report274
Measurements of Shock Equation of State and Melting Temperature on Water–Ammonia MixturesPrincipal Investigators: Y.-J. Kim, S. Hamel, and M. Millot (LLNL); M. Bethkenhagen (Rostock University, Germany); M. Wadas (University of Michigan); and S. Stanley (Johns Hopkins University)
This SuperionicMix-20 Campaign aims at investigating the optical and thermodynamic properties of water–ammonia mixtures at the extreme pressure–temperature conditions that we expect in the deep interior of icy giant planets such as Uranus and Neptune. This work at the Omega Laser Facility expands on our recent discovery of superionic water ice (or ice XVIII)14,15 to reveal the possible existence of the superionic phase in the icy planet constituents (H:C:N:O) as well as its melting temperature.
We used a diamond-anvil cell (DAC) to increase the initial sample density at room temperature, achieve lower temperatures but higher compression under dynamic loading, and finally reach planetary interior conditions. With excellent laser performance and support, we collected 14 system shots in the two half-day allocations. Doppler velocimetry (VISAR) [Figs. 11(a) and 11(b)] and streaked optical pyrometry (SOP) [Fig. 11(c)] were used to track the shock-wave propagation through the precompressed sample and to document the pressure–density–temperature shock equation of state as well as the evolution of the optical proper-ties (reflectivity and absorption coefficient) along the shock Hugoniot curves using quartz.16
The ongoing data analysis will be used to improve our understanding of how the icy planet constituent of H:C:N:O mixtures behave at the extreme pressure–temperature condition inside the planets.
Figure 11Examples of [(a),(b)] VISAR and (c) SOP data showing the decaying shock along the 150-nm-thick water–ammonia mixture on OMEGA 60.
Experimental Study of the Dynamics of Expanding Magnetized Laser-Produced Plasma Principal Investigators: S. Malko,* W. Fox,† and A. Bhattacharjee† (PPPL); D. B. Schaeffer and A. Spitkovsky (Princeton Uni-versity); C. Johnson (Rowan University); G. Fiksel (University of Michigan); P. Knapp (SNL); A. Ciardi (Observatoire de Paris, Sorbonne Université and CNRS, France); and J. R. Davies (LLE)*Also Centro de Laseres Pulsados, Spain†Also Princeton University
The interaction of an expanding plasma with a magnetic field plays a key role in magnetized fusion schemes such as mag-netized liner inertial fusion (MagLIF),17 laboratory astrophysics experiments such as magnetic reconnection18 and magnetized collisionless shocks,19 and space-plasma experiments such as Active Magnetospheric Particle Tracer Explorers.20
U2722JR
10350
400
450
500
550
600
400
450
500
550
650
600
300
350
400
450
550
600
500
15 20Time (ns)
(c) SOP(b) VISAR (Channel 2)(a) VISAR (Channel 1)
25 3010 15 20Time (ns)
25 3010 15 20Time (ns)
25 30
Dia
mon
dQ
uartz
Sam
ple
Dia
mon
d
Posit
ion
(nm
)

NatioNal laser Users’ Facility aNd exterNal Users’ Programs
FY20 Annual Report 275
These topics motivate an understanding of magnetic-field transport properties in laser-produced HED; another aspect of interest is anomalous fast diffusion of plasma caused by strong plasma gradients, causing particles and field to mix and diffuse with respect to one another. These processes can determine the time and space scales over which plasma heat can be effectively confined by the magnetic field. Under certain conditions, the magnetic-field diffusion is enhanced by plasma instabilities, of either the lower-hybrid type, which have a short wavelength and result from the coupling of gradient-driven modes to the lower-hybrid range modes ~ + ~LH = (~ce~ci)
1/2, or the large-Larmor-radius Raleigh–Taylor (RT) instabilities, in which the magnetic field acts like a “light fluid” to decelerate an expanding “heavy” plasma (by its pressure force). Such instabilities may also be present in the MagLIF scheme, and by scaling using dimensionless parameters,21 we can study a set of common physics at smaller-scale facilities. Here we report on an experiment on OMEGA that focused on the study of the magnetic-field dynamics in HED plasma in a relevant regime (b > 1), covering the magnetic-field evolution time along with its diffusion and potential anomalous transport processes.
The schematic experimental setup on OMEGA is shown in Fig. 12. The magnetized laser-produced plasma is generated by ablating a CH plasma into a quasi-static magnetic field produced by the MIFEDS pulsed-power system. The evolution of the 2-D global topology of the magnetic fields was imaged with proton radiography by 3-MeV and 15-MeV protons, acquired at different plasma expansion times. A novel technique of the proton radiography was developed to obtain an absolute reference of undeflected beamlets for each shot. The corresponding local plasma parameters—electron temperature and density—were measured with 2~ Thomson scattering.
U2723JR
D3He backlighterp+ (3 MeV, 15 MeV)
CR-39(p+ 3 MeV)
Protonradiography
Plasmaplume
CH target
CR-39(p+ 15 MeV) IP (x rays)
Magneticfield ~ 4 T
z
y
Figure 12Schematic of the experimental setup showing the raw images obtained with a novel proton radiography technique. The CR-39 stack was composed of CR-39 for 3-MeV and 15-MeV protons and an image plate (IP) in the back of the stack for an x-ray image of the nickel mesh.
The magnetic-field dynamics in plasma has been explored for different laser energies and target orientations relative to field. Here we show the preliminary experimental results for one of the experimental configurations as shown in Fig. 12. In the experi-ment we observe the expanding plasma expelling the magnetic field out of its volume and forming a diamagnetic cavity. A clear magnetic-field temporal evolution in plasma can be seen in Fig. 13(a), which shows the path-integrated magnetic field #Bdl at different plasma expansion times, compared to the vacuum magnetic-field profile with no plasma, as calculated by a COMSOL model of the MIFEDS coil windings. The magnetic field is observed to be mostly expelled by the plasma between 20 ns (red curve) and 30 ns (green curve) and then gradually returns. The experimental radii of the diamagnetic cavity are estimated by fitting data with the synthetic magnetic field with artificial cavities of various sizes. These are compared with the radii obtained from GORGON 3-D magnetohydrodynamic (MHD) simulations in Fig. 13(b). GORGON 3-D MHD simulations were employed to qualitatively observe the effect in similar conditions. The preliminary analysis shows a rapid diamagnetic expansion followed by collapse, in qualitative agreement with GORGON 3-D MHD simulations.

FY20 LaboratorY basic science Program
FY20 Annual Report276
In summary, we have developed a novel technique of proton radiography with a reference x-ray image of the mesh for precise measurement of the magnetic field. Using this method, we have performed a characterization of the diamagnetic cavity formation and time evolution in b > 1 expanding plasma. The results, which were compared to the simulated magnetic-field dynamics in similar conditions with GORGON 3-D MHD, suggested a faster diffusion than predicted classically of 1 ns.
Measurements of the DT and DD Neutron Energy Spectrum in High-Temperature PlasmasPrincipal Investigators: O. M. Mannion, C. J. Forrest, V. Yu. Glebov, J. P. Knauer, P. W. McKenty, Z. L. Mohamed, S. P. Regan, and C. Stoeckl (LLE); P. Adrian, J. A. Frenje, M. Gatu Johnson, and N. Kabadi (Plasma Science and Fusion Center, MIT); B. D. Appelbe and A. J. Crilly (Imperial College London, UK); and W. Taitano (LANL)
The goal of ICF experiments is to generate a hot dense thermonuclear plasma that releases more energy from thermonuclear fusion than was required to initially assemble the plasma. A key parameter required to understand the performance of these experiments is the temperature of the hot fusing plasma. Traditionally, the temperature of the hot fusing plasma is determined from measuring the variance (second moment) of the DT and DD neutron energy spectra emitted from the target. The second moment of the neutron energy spectrum is altered if nonthermal motion of the fusing plasma exists within the hot spot and can result in the inferred temperature being higher than the true thermal temperature. Therefore, alternative techniques to infer the hot-spot temperature, such as electron–ion temperature measurements, are being pursued in the ICF community.
Motivated by this pursuit, we have executed a set of experiments that investigated a new method to infer the thermal ion tem-perature. In this method the Gamow velocity shift (first moment) of the neutron spectrum emitted from the hot fusing plasma22 is used to infer the plasma ion temperature. The Gamow velocity shift is not susceptible to nonthermal motion of the hot spot like the second moment is, so provides an alternative and robust method to infer the temperature of the plasma. In this work we have experimentally demonstrated this technique and have inferred the ion temperature from the Gamow velocity shift for plasmas between 2 to 18 keV. We found that good agreement exists between the first- and second-moment temperatures until the Knudsen number23,24 K Ln iim=` j approaches unity. For a Knudsen number that exceeds unity we see discrepancies between the two differ-ent temperature measurements, which is likely a sign that the ion velocity distribution within the fusing plasma is non-Maxwellian.
U2724JR Time (ns)
R b (m
m)
(b) Radius of diagmagnetic cavity
20 40301000
1
2
4
3
5
x position (mm)
yBdl
(T-m
m)
(a) Magnetic-field evolution
–1.0 0.0 0.5–0.5 1.0 1.5–1.50
10
20
30
40
50
60
70
80 Simulation (GORGON)COMSOL fit to experiment
COMSOL10 ns20 ns30 ns40 ns
Figure 13(a) The path-integrated magnetic field at each expansion time. (b) The radius of the diamagnetic cavity at each expansion time obtained in experiment (blue circles) and in GORGON 3-D MHD simulations (black circles).

NatioNal laser Users’ Facility aNd exterNal Users’ Programs
FY20 Annual Report 277
The goal of this work was to compare the first- and second-moment ion temperatures over a large range of ion temperatures. Therefore, a series of thin glass DT-filled targets were imploded on OMEGA using 1-ns and 600-ps square pulses with fill pres-sures of 5 and 10 atm. In these implosions a strong shock that is sent through the fuel heats the DT fuel. By varying the laser energy and fill pressure, ion temperatures were varied between 2 to 18 keV. The DT and DD neutron energy spectra produced from these plasmas were then measured using a suite of neutron time-of-flight (nTOF) detectors, and the first and second moments were inferred. A semi-relativistic neutron spectrum model22 was used to infer the plasma ion temperature from the first and second moments independently.
In these high-temperature experiments, kinetic effects have been observed in past experiments, indicating that the ion velocity distribution may not be Maxwellian in these plasmas. Therefore, a suite of secondary diagnostics were used to fully characterize the hot plasma conditions. This included charged-particle spectrometers such as the magnetic recoil spectrometer (MRS) and the charged-particle spectrometer (CPS), which measured the knock of the deuteron spectrum and were used to infer the hot spot’s areal density. The proton core imaging spectrometer diagnostic was run in x-ray imager mode and measured the morphology of the hot spot at different photon energies, which enable us to infer the hot-spot radius and the electron temperature. Finally, the neutron temporal diagnostic was used to measure the fusion reaction history. Using all of these measurements, along with the ion temperatures measured using the nTOF’s, the ion mean free paths in these experiments were determined. Finally, using the ion mean free path and hot-spot radius measurements, the plasma Knudsen number was inferred.
The ion temperatures inferred from the first and second moments are shown in Fig. 14 for both the DT and DD neutron spectra. Good agreement is observed between the inferred ion temperatures for all but the high-ion-temperature cases. In these high-temperature experiments, the Knudsen number exceeded unity as indicated in Fig. 15, which shows the ratio of the first- and second-moment inferred ion temperatures as a function of the Knudsen number. It is observed that for Knudsen numbers below 1, there is good agreement between the temperatures inferred using both methods. As the Knudsen number exceeds unity, a discrepancy is observed. In particular for the DT spectrum’s inferred temperature, the first-moment temperature appears to plateau, while the second-moment ion temperature continues to increase (see Fig. 14). Conversely for the DD inferred tempera-tures, the second-moment inferred ion temperature appears to plateau at high Knudsen number, while the first-moment inferred ion temperature continues to increase (see Fig. 14).
These experiments are currently being simulated using a Vlasov–Fokker–Plank (VFP) code25 developed at LANL, which should accurately capture the non-Maxwellian nature of these shock-drive implosions. A fully kinetic neutron spectrum calculation
Figure 14The inferred ion temperature from the first moment of the neutron spectrum as a function of the second moment of the neutron spectrum for the (a) DT and (b) DD neutron energy spectra.
E29534JR
(b)
Second moment temperature (keV)
Firs
t mom
ent t
empe
ratu
re (k
eV)
105 15 200Second moment temperature (keV)
105 15 2000
5
10
15
20(a)

FY20 LaboratorY basic science Program
FY20 Annual Report278
E29535JR
(b)
Nk
Rat
io
1.00.5 1.50.0Nk
1.00.5 1.50.0
0.6
0.8
1.0
1.2
1.4(a)
Figure 15The ratio of the inferred ion temperature from the first and second moments of the (a) DT and (b) DD neutron energy spectra as a function of the Knudsen number.
package has been developed to post-process the VFP simulation results and will be used to study the effect of non-Maxwellian distributions on the neutron energy spectrum. These experimental results will be used as key benchmarks of these fully kinetic simulations and will provide insights into the physics occurring in high-temperature fusing plasmas.
This material is based upon work supported by the Department of Energy National Nuclear Security Administration under Award Number DE-NA0003856, the University of Rochester, and the New York State Energy Research and Development Authority.
Extreme Atomic Physics: Changes in the Electronic Structure of Compressed MaterialsPrincipal Investigators: P. M. Nilson and S. X. Hu (LLE); and S. B. Hansen (SNL)
Understanding how atomic physics may be altered in HED conditions is important to the study of stellar interiors, planetary cores, and inertial fusion. Warm dense matter is just one type of system that is intrinsically challenging because the system’s thermal energy, Fermi energy, and Coulomb energy are all comparable, thereby causing traditional plasma approximations to no longer be valid. The goal of this campaign is to test the atomic-scale models that are used to estimate changes in the electronic structure of compressed materials and understand how atomic physics may be altered in these conditions.
To measure detailed x-ray spectroscopic features from dense, high-temperature matter, a self-backlit, spherical-implosion plat-form is being developed on the OMEGA Laser System. The target design uses a spherical shell with a CH ablator, a central CH layer doped with 4 at. % Cu, and an inner CH layer. The target contains a 20-atm D2Ar (1 at. %) fill and is assembled by direct laser ablation using a 27-kJ, 1-ns drive. Continuum emission generated in the core at bang time backlights the assembled shell. By actively manipulating the sample compression and heating, experiments are underway to study how the K-shell emission and absorption are altered in the imploding Cu-doped layer.
Figure 16 shows time-integrated x-ray emission and absorption spectra from two different targets. Figure 16(a) shows data from a 30-nm-thick shell containing a 10-nm CHCu (4 at. %) layer and a 3-nm inner CH layer. The measured spectrum shows the Cu K-shell emission and resonant self-absorption. Figure 16(b) shows data from a 30-nm-thick shell containing a 5-nm CHCu (4 at. %) layer and a 10-nm inner CH layer. The thicker inner layer protects the compressed Cu-doped layer from core heating, showing a clear absence of 1s–2p absorption. In addition to the development of high-resolution x-ray imaging of the buried layer, analyses of simultaneous time-integrated and time-resolved x-ray emission and absorption spectra are underway for comparison with model predictions. These data will be used to test modern density functional theory calculations and the atomic-scale models that are used to estimate changes in the electronic structure of highly compressed materials.

NatioNal laser Users’ Facility aNd exterNal Users’ Programs
FY20 Annual Report 279
This material is based upon work supported by the Department of Energy National Nuclear Security Administration under Award Number DE-NA0003856, the University of Rochester, and the New York State Energy Research and Development Authority.
Development of a New Experimental Platform LIANS on OMEGA EP for Deuteron- and Triton-Induced Nuclear ReactionsPrincipal Investigators: A. K. Schwemmlein,* C. Stoeckl, W. T. Shmayda, and W. U. Schröder* (LLE)*Also Dept. of Physics and Astronomy, University of Rochester
The OMEGA EP Laser System was used create a deuteron beam through TNSA with deuterated metal foils at intensities close to 1019 W/cm2. In previous experiments, deuteron beams were generated with this mechanism using either plastic26 or heavy water27,28 targets. Deuterium-doped titanium substrates were extensively studied29 previously on the Multi-Terawatt (MTW) laser to produce a controllable deuterium beam with yields exceeding 1011 deuterons per shot. Separate studies using deuterated plastic targets demonstrated the feasibility of nuclear science experiments on OMEGA EP.30
Using the deuteration technique successfully applied to MTW targets, a set of metal targets was prepared for the LBS cam-paign in February 2020. The unique beamline layout on OMEGA EP was exploited to obtain deuteron beam spectra with a single deuterated target in the sidelighter configuration and to perform nuclear reaction experiments with two deuterated targets in the backlighter configuration.
The OMEGA EP Thomson parabola ion energy (TPIE)31 analyzer was used as the main deuteron beam diagnostic for the single-target configuration, whereas the three existing nTOF scintillators were used to detect the reaction products of nuclear processes.
A striking difference between OMEGA EP deuteron beams and MTW beams is the much higher abundance of q/m = 1/2 spe-cies in the OMEGA EP beams. These high abundances are most likely caused by the contamination species carbon, oxygen, and nitrogen, which are pushed into their highest ionization states in the OMEGA EP experiments at laser energies >1 kJ. Titanium targets loaded with hydrogen and untreated targets were used to obtain a reliable background spectrum to be subtracted from the signal of a deuterated target. The background-corrected deuterium spectrum shown in Fig. 17 resembles the asymmetric Gauss-ian shape previously observed on MTW, except for increased noise due to the background. It is evident that higher laser energy predominantly increases the per deuteron energy, from below about 0.5 to +5 MeV, whereas the overall yields remain similar, in the low 1011 deuterons per shot regime.
E29536JR
(b)
Photon energy (eV)
Ambient Cu K edge
1s–2
p ab
sorp
tion
Cu Ka
Ambient Cu K edgeCu Ka
Nor
mal
ized
sign
al(a)
85008000 9000 9500Photon energy (eV)
85008000 9000 95000.0
0.2
0.4
0.8
0.6
1.0
20 atm D2 Ar(1 at. %)
10 nm CH with 4 at. % Cu3 nm CH
17 nm CH5 nm CH with 4 at. % Cu
10 nm CH
15 nm CH
20 atm D2 Ar(1 at. %)
Figure 16Example time-integrated x-ray absorption features and fluorescent line emission from a laser-driven implosion containing a Cu-doped layer. The target designs are shown in the insets.

FY20 LaboratorY basic science Program
FY20 Annual Report280
In addition, faint neutron signals were observed during experiments in the double-target configuration. Previous campaigns with deuterated plastic targets30 have demonstrated that the laser parameters must be carefully adjusted for a given target to sup-press the low-energy neutron background caused by (p, n) reactions in the target chamber while preserving the reaction neutrons. Further studies are planned to address this background. Figure 18 shows the neutron spectra from two different detectors at 90° and 150° for the same shot, together with Gaussian fits for the peaks that are kinematically consistent with DD fusion neutrons. While this neutron signal is quite small, just above the average noise level, the consistent observation of this signal in independent detectors indicates that these signals are real and not artifacts.
E29538JR Neutron energy (MeV)
0.4
0.3
0.2
0.1
Coefficient values!one standard deviation
= 0.1418!0.0161= 0.1067!0.0166= 2.7054!0.022= 0.259!0.0587
y0A
x0 width
Coefficient values!one standard deviation
5 10 15 Neutron energy (MeV)
5 10 15Neu
tron
signa
l (ar
bitra
ryun
its)
2.5
2.0
1.0
1.5
0.5
= 0.38367!0.0306= 0.29254!0.0293= 2.5903!0.0164= 0.39165!0.0524
y0A
x0width
(a) (b)
Figure 18Neutron spectrum of shot 33407 as recorded by the nTOF at (a) 90° from the laser direction and (b) 150°. The fitted peaks are consistent with a DD fusion neutron signal assuming an effective beam energy of 1 MeV.
The experience in target preparation and laser tuning obtained in this and another planned LBS campaign will be used to produce an equivalent tritium beam in a joint shot configuration in the future.
This material is based upon work supported by the Department of Energy National Nuclear Security Administration under Award Number DE-NA0003856, the University of Rochester, and the New York State Energy Research and Development Authority.
Figure 17Deuteron spectra obtained on MTW (red circles) and OMEGA EP (blue circles) with identical targets. The corresponding Gaussian fits are represented by the solid line.
E29537JR
OM
EGA
EP
deut
eron
s/sr (#10
11)
MTW
deu
tero
ns/sr
(#10
9 )
Deuteron energy (MeV)
0
2
4
6
8
10
12
14
0
2
4
6
8
10
12
14
20 4 6 8 10 12 14

NatioNal laser Users’ Facility aNd exterNal Users’ Programs
FY20 Annual Report 281
Measurement of High-Pressure Phase-Transformation Pressures in Fe-(11 wt%)Si and MgOPrincipal Investigators: R. Smith (LLNL); J. Wicks, M. Sim, and V. Rastogi (Johns Hopkins University); and X. Gong and J. R. Rygg (LLE)
The XRD-Alloy experiments on OMEGA-60 used six beams focused to 800-nm spots to dynamically compress 30-nm-thick samples of single-crystal MgO or 10-nm-thick powder samples of Fe-(11 wt%)Si over 8 ns, to pressures up to 800 GPa. Temporal laser pulse shaping delivered progressively stronger pressure to the sample over time. This ramp compression keeps the sample temperature relatively low and maintains the solid state to extreme levels of compression, avoiding the issue with shock compres-sion where large increases in entropy increase temperatures too high to constrain exoplanet interior conditions.
The MgO or Fe-(11 wt%)Si sample was sandwiched between two single-crystal diamond foils. Diamond served as an ideal material to couple laser energy into ramp-compression waves. The diamond/MgO/diamond target was positioned on a Ta pinhole placed over the front of the PXRDIP box (power x-ray diffraction with image plates), which contains x-ray–sensitive image-plate detectors along the inner five walls (Fig. 19). The pressure history of the sample and the time of peak compression are determined by VISAR view-ing the back of the sample through an aperture in the PXRDIP box. Pressure (P) and temperature (T) within the MgO sample can be simulated using the 1-D hydrocode HYADES, which models the coupling of the OMEGA 527-nm laser into our target geometry and calculates the 1-D hydrodynamic flow of P–T waves through the target assembly using equation-of-state descriptions of each layer.
Figure 19The PXRDIP setup on OMEGA-60. (Figure adapted from Ref. 32).
U2725JR
Direct x rays
ImageplatesImageplates
PXRDIP
Diffractedx rays
75 mm
VISAR2iTarget
package
50 mm
Laser beam
X-raysource(Cu foil)
At the time of peak compression, another 35 laser beams irradiate a Cu foil to produce a hot dense plasma of mainly He-like ions. This results in a strong quasi-monochromatic Hea x-ray source over 1 ns at x-ray energies of 8.3 keV. The x rays incident onto the compressed sample scatter in a transmission-diffraction pattern, which is recorded by the image-plate detectors. Peaks from the uncompressed Ta pinhole are also recorded, providing fiducial data that allow us to plot the image-plate data as diffraction angle versus azimuthal angle around the x-ray beam axis (Fig. 20).32 The angular position of diffracted sample peaks provide direct information of the atomic lattice spacing and crystal structure at a pressure determined through VISAR. By increasing the laser intensity on target the sample pressure increases, so a systematic series of these ramp-compression x-ray diffraction shots determines the onset pressure of phase transformations.
Investigating Magnetic Fields Generated in Collisionless Plasma-Flow Interactions Using Thomson ScatteringPrincipal Investigators: G. F. Swadling, H. S. Park, J. S. Ross, B. Pollock, and D. Higginson (LLNL); F. Fiuza and A. Grassi (SLAC); W. Rozmus and C. Bruulsema (Dept. of Physics, University of Alberta); and H. G. Rinderknecht (LLE)
The experiments conducted for the BFieldOTS-20A OMEGA Campaign focused on investigating the generation and amplifica-tion of spontaneous magnetic fields via the Weibel filamentation instability in collisionless, interpenetrating plasmas, extending previous work recently published.33 High-velocity (+1000-km/s) streams of plasma were generated by laser heating the surfaces

FY20 LaboratorY basic science Program
FY20 Annual Report282
of counter-facing beryllium disk targets. The parameters of the two counterpropagating streams of plasma imply that their inter-actions must be collisionless: the experimental scale length is substantially smaller than the collisional mean free path expected between the two streams. For this campaign, the experiment was modified so that the targets could be driven using only the Leg 1 and 3 beams. A long-pulse Thomson-scattering probe beam driven by Leg 2 could then be used to probe the interaction for 3.7 ns, substantially longer than has previously been explored. This configuration also allowed us to carry out spatially resolved Thomson-scattering measurements using a short-pulse (100-ps) probe beam. The experiments were highly successful, data quality was excellent, and analysis is ongoing. An example of the time-resolved data is shown in Fig. 21.
U2726JR
100
–100
0
50
–50
2i (°)70605040 80 90 100
MgO peaksB2 100 B2 110
z (°
)
Ta reference peaks
Figure 20MgO diffraction pattern as captured on the PXRDIP image plates. The image-plate planes are projected into a linear 2i–z angular space with respect to the x-ray beam axis.32
U2727JR
200
400
600
1000
800
200 400 600 1000800
Wav
elen
gth
(pix
el)
Time (pixel) Time (pixel)
(a) IAW
Red-shifted flow
Blue-shifted flow
Asymmetry is filamentation signature
200 400 600 1000800
(b) EPW
Figure 21Example of Thomson-scattering data captured over 3.7 ns in an (a) ion-acoustic wave (IAW) and (b) electron plasma wave (EPW). The development of an asymmetry in the IAW feature is indicative of the onset of filamentation in the interpenetrating plasma.

NatioNal laser Users’ Facility aNd exterNal Users’ Programs
FY20 Annual Report 283
Extreme Deformation and Failure of High Entropy Alloys by Laser Shock-Induced Compression and TensionPrincipal Investigators: S. Zhao and A. Minor (LBNL); and C. Stan, C. E. Wehrenberg, and H.-S. Park (LLNL)
High-entropy alloys (HEA’s) are a class of metallic alloys containing three or more elements in significant atomic proportion. They exhibit generally high-yield strength and fracture toughness and are good candidates for engineering applications such as the aerospace industry. We are interested in the spall strength behavior of these materials and studied them under shock impact to several tens of GPa. The setup consisted of three independent targets that were shot individually, one of which was a spall velocimetry target and two of which were recovery tube spall targets (Fig. 22). Recovered samples were analyzed using electron microscopy (Fig. 23).
U2728JR
Velocimetrytarget
Recovery targets
(a)
Velo
city
(km
/s)Time (ns)
0.8
1.0
0.4
0.6
0.0
0.2
0 20 40 60
Leg ALeg B
(b)
Figure 22(a) Schematic of the experimental setup. Laser shocks were independently timed. (b) Typical spall velocimetry measurement. The beats are indicative of “ring-ing” in the sample, which is a marker of spall strength in samples.
U2729JR
Lase
r sho
ck
Com
pres
sion
crat
er
Tens
ile sp
all
Spal
l pla
ne
Grain boundary
Crack tip
VoidsVoid 1
Void 2
In the vicinity of thecrack tip
In the vicinity of thecrack tip
TBTBTBTB TBTB
(a) (b) (c) (d)
(e)
Twins
1 mm 100 nm 10 nm 5 nm
100 nm
Figure 23(a) Diagram of a spall event in a laser-driven sample. (b) Scanning electron microscopy (SEM) at the spall boundary, showing the formation of cracks and voids due to tension generated by shock unloading against vacuum. (c) Grain mapping of the crack tip, showing multiple grain boundaries. (d) Transmission electron microscopy (TEM) analysis of the grains near the crack tip, showing extensive twin formation and multiple stacking faults.

FY20 LaboratorY basic science Program
FY20 Annual Report284
Figure 24D–D ion temperatures versus fuel type and shell thickness as determined from the neutronics diagnostics. The deuterated methane targets achieve a larger ion temperature. For each fuel type, the smaller shell thickness results in a larger ion temperature.
U2730JR
9834
298
34398
34998
35398
35598
34698
34798
35098
35498
35698
34598
35198
34898
352
Shot number
1
2
3
4
DD
neu
tron
yiel
d (#
1011
)
CNO-20 shot yields
13 CD 4 to 5.7 nm13 CD 4 to 7.1 nmDD 5.7 nmDD 7.1 nm
Initial analysis of the recovered samples shows that stronger shocks lead to a larger degree of plasticity. We observe stacking faults, nano twins, hexagonal-close-packed lamellae, and their interactions, with TEM. Velocimetry measurements give us an approximate spall strength of 10 GPa, which is higher than those of Ta (+8 GPa), Al (+3 GPa), or Cu (+8 GPa). Molecular dynamics simulations suggest that the strength is partially due to void pinning by twin boundaries induced during shock compression.
Implosions for Studying Solar CNO ReactionsPrincipal Investigators: A. B. Zylstra and J. Jeet (LLNL); Y. H. Kim (LANL); and M. Gatu Johnson (MIT)
Utilization of inertial fusion implosions to study nuclear astrophysics is a new technique popularized within the last few years.34,35 A particular reaction of interest is the “CNO process”36 occurring in heavier stars with finite metallicity, in which hydrogen burning is catalyzed in the presence of 12C. These reactions are more strongly dependent on temperature, however, than the pp cycle reactions; therefore the CNO cycle dominates only in massive stars. For these types of reactions to be studied using ICF facilities, an implosion platform using heavier nuclei in the fuel and capable of creating ion temperatures of the order of at least 30 keV is required. One potential route to reach these conditions is to take advantage of kinetic effects in low-convergence, shock-driven “exploding-pusher” implosions. Ion thermal decoupling was observed in such implosions.37 While the exact mecha-nism for shock heating is not clear (collisional versus electrostatic), a significant boost in ion temperature, up to a factor of 6 to 12# versus a hydrogen ion, is expected for carbon or heavier ions (Fig. 24). In this experiment, shots using the surrogate reaction 13C + D were conducted for which the cross section is substantially higher than the actual astrophysical CNO reactions. These shots were made possible by utilizing a deuterated methane gas fill. For comparison, D2 gas fills were also used. For the implo-sions, 60 beams were used at 300 J per beam and a 600-ps square pulse. The targets consisted of 860-nm-diam shells (CH) at thicknesses of 5.7 and 7.1 nm.
The 13C + D neutron yield was expected to be low (as shown in Fig. 25), and the nTOF data show no clear signature of the 5-MeV neutrons. The DAD data do show a gamma-ray signal, but it is unclear if this is due to carbon gammas. The primary diagnostics include the CPS, wedge-range filters (WRF’s), and SRF’s to measure the 13C + D protons. The CR-39 is currently being processed to determine the proton yield and energy spectrum. The results will inform whether kinetic effects can boost high-Z reaction yields and will provide a basis for designing future CNO experiments.

NatioNal laser Users’ Facility aNd exterNal Users’ Programs
FY20 Annual Report 285
Figure 25D–D neutron yields versus fuel type and shell thickness as determined from the neutronics diagnostics. The deuterated methane targets have a lower D–D neutron yield. For each target gas-fill type (D2 and 13C + D), the smaller shell thickness results in a lower D–D neutron yield.
REFERENCES
1. H. Chen et al., Phys. Rev. Lett. 114, 215001 (2015).
2. H. Chen et al., Phys. Plasmas 21, 040703 (2014).
3. G. Fiksel et al., Bull. Am. Phys. Soc. 64, NO08.00010 (2020).
4. S. Root et al., Geophys. Res. Lett. 45, 3865 (2018).
5. D. E. Fratanduono et al., Phys. Rev. B 97, 214105 (2018).
6. S. Stewart et al., AIP Conf. Proc. 2272, 080003 (2020).
7. S.-N. Luo et al., J. Geophys. Res. Solid Earth 109, B05205 (2004).
8. C. Wang et al., Phys. Plasmas 22, 102702 (2015).
9. V. A. Thomas and R. J. Kares, Phys. Rev. Lett. 109, 075004 (2012).
10. D. S. Clark et al., Phys. Plasmas 23, 056302 (2016).
11. R. I. Klein et al., Astrophys. J. 583, 245 (2003).
12. V. V. Korobkin and S. L. Motylev, Sov. Tech. Phys. Lett. 5, 474 (1979).
13. G. Fiksel et al., Appl. Phys. Lett. 109, 134103 (2016).
14. M. Millot et al., Nat. Phys. 14, 297 (2018).
9834
298
34398
34998
35398
35598
34698
34798
35098
35498
35698
34598
35198
34898
352
Shot number
9
10
11
12
13
14
15
16
17
18D
D io
n te
mpe
ratu
re (k
eV)
CNO-20 ion temperatures
U2731JR
13 CD 4 to 5.7 nm13 CD 4 to 7.1 nmDD 5.7 nmDD 7.1 nm

FY20 LaboratorY basic science Program
FY20 Annual Report286
15. M. Millot et al., Nature 569, 251 (2019).
16. S. Brygoo et al., J. Appl. Phys. 118, 195901 (2015).
17. S. A. Slutz et al., Phys. Plasmas 17, 056303 (2010).
18. D. B. Schaeffer et al., Phys. Rev. Lett. 119, 025001 (2017).
19. W. Fox et al., Physics Archive, https://arxiv.org/abs/2003.06351 (2020).
20. A. Valenzuela et al., Nature 320, 700 (1986).
21. D. D. Ryutov et al., Phys. Plasmas 19, 062706 (2012).
22. L. Ballabio, J. Källne, and G. Gorini, Nucl. Fusion 38, 1723 (1998).
23. K. Molvig et al., Phys. Rev. Lett. 109, 095001 (2012).
24. J. D. Huba, NRL Plasma Formulary, Naval Research Laboratory, Washington, DC, D 210.2:P 69/4/2009 (2009).
25. W. T. Taitano et al., Phys. Plasmas 25, 056310 (2018).
26. L. Torrisi et al., Phys. Scr. T161, 014026 (2014).
27. J. T. Morrison et al., Phys. Plasmas 19, 030707 (2012).
28. S. Karsch et al., Phys. Rev. Lett. 91, 015001 (2003).
29. A. Schwemmlein et al., “Optimizing Deuterated Metal Foils to Generate a High-Yield, Quasi-Monoenergetic Deuteron Beam Employing Target Normal Sheath Acceleration on the Multi-Terawatt Laser System at the Laboratory for Laser Energetics,” to be submitted to Nuclear Instruments and Methods A.
30. C. Stoeckl et al., Nucl. Instrum. Methods Phys. Res. B 453, 41 (2019).
31. C. C. Freeman et al., Rev. Sci. Instrum. 82, 073301 (2011).
32. J. K. Wicks et al., Sci. Adv. 4, eaao5864 (2018).
33. G. F. Swadling et al., Phys. Rev. Lett. 124, 215001 (2020).
34. A. B. Zylstra et al., Phys. Rev. Lett. 117, 035002 (2016).
35. A. B. Zylstra et al., Phys. Rev. C 101, 042802(R) (2020).
36. H. A. Bethe, Phys. Rev. 55, 434 (1939).
37. H. G. Rinderknecht et al., Phys. Rev. Lett. 114, 025001 (2015).

NatioNal laser Users’ Facility aNd exterNal Users’ Programs
FY20 Annual Report 287
M. S. Wei
Laboratory for Laser Energetics, University of Rochester
In 2018, the Department of Energy (DOE) Fusion Energy Sciences (FES) within the Office of Science established a network of high-power laser user facilities, LaserNetUS, to invigorate the U.S. high-energy-density (HED) plasma physics and high-field laser community by supporting a new mechanism for scientific discovery and technical innovation. This DOE FES initiative was a direct response to a 2017 report of the National Academy of Sciences that assessed the physics potential in laser-driven high-field science in the U.S., recommending the creation of a broad national network that includes mid-scale laser infrastructure. LaserNetUS started in August 2018 with seven participating mid-scale high-peak-power laser facilities. LLE joined the Laser-NetUS in early 2019. In about a year, the network has grown to ten institutions including Colorado State University, Lawrence Berkeley National Laboratory (LBNL), Lawrence Livermore National Laboratory (LLNL), SLAC, The Ohio State University, the University of Michigan, University of Nebraska-Lincoln, Institut National de la Recherche Scientifique, the University of Rochester, and the University of Texas at Austin. Through a coordinated call for proposals and an independent proposal review panel (PRP) process, the LaserNetUS network makes available a variety of ultrafast, high-peak-power and high-energy, petawatt-class lasers including LLE’s four-beam high-energy and high-intensity OMEGA EP laser to users who do not have regular access to ultrahigh-intensity lasers.
In its first year of operation, LaserNetUS issued two solicitations for beam time in 2019 and 2020, and awarded beam time for 49 user experiments to researchers from 25 different institutions. As one of the most-requested facilities in the LaserNetUS network, OMEGA EP accepted seven projects (see Table I) with a total of eight shot days for experiments in FY20 and FY21. A total of 70 target shots were successfully conducted for six LaserNetUS projects led by scientists from Johns Hopkins University, LLNL, Princeton Plasma Physics Laboratory (PPPL), Princeton University, and University of California, San Diego (see Table I). FY20 LaserNetUS experiments are summarized below.
Exploring Novel Target Designs for High-Yield Laser-Created Relativistic PairsPrincipal Investigator: H. Chen (LLNL)Co-investigators: S. Kerr and A. Link (LLNL); J. Kim and F. N. Beg (University of California, San Diego); and M. J. Manuel (General Atomics)
Despite the progress made in the last ten years or so in using lasers to create relativistic electron–positron pair-plasma jets, low pair density has been the key issue preventing the application of laser-produced pairs in laboratory experiments.1,2 Our prior experimental work2 showed that while it would be easy to reach orders of magnitude higher pair yield on future lasers that have much higher laser energy and intensities (ex., EP-OPAL), currently the only effective way to increase the positron beam density is to extract more positrons out of solid targets because simulations suggest that only 1% of the positrons created in conventional, solid high-Z targets escape. We have designed two types of novel targets from which the simulation predicts up to a factor-of-10 higher yield. LaserNetUS facility time offered a perfect opportunity for us to test these targets.
A schematic of the target design rationale,3 together with the target shape for two designs and their respective experimental results, is shown in Fig. 1.
FY20 LaserNetUS

FY20 LaserNetUs
FY20 Annual Report288
The experimental data showed that although the nested target seemed to alter the positron energy spectrum, no significant enhancement in positron yield was observed on the 10-ps laser pulse, contrary to that in the simulation. Preliminary interpretation is that the resistive magnetic fields are guiding low-energy positrons later in the interaction and/or, the electromagnetic fields are too weak or grow too slowly to collimate early, high-energy positrons. The layer targets showed a trend that matched expectation in positron yield enhancement with a larger number of cavities in the layer targets [Fig. 1(f)]. Here, since positron yield depends on the target material mass with which relativistic electrons interact, the total measured positron numbers were normalized by target (Au) mass. These experimental results demonstrate a part of the effects of self-generated fields inside the target, but a more systematic study with varying cavity gap and numbers will optimize the electron transport and positron generation.3 Future work includes a detailed understanding of the discrepancy for the nested targets and optimized design for the layer targets to further increase the positron yield.
The team is grateful for the support of LaserNetUS shot time on the OMEGA EP laser. This work was performed under the auspices of the U.S. DOE by LLNL under Contract DE-AC52-07NA27344 and funded by LDRD (17-ERD-010).
Particle Energization During Magnetic Reconnection in Colliding High-Beta Magnetized Plasmas on OMEGA EPPrincipal Investigators: W. Fox* and A. Bhattacharjee* (PPPL); G. Fiksel and D. B. Schaeffer* (University of Michigan); M. J. Rosenberg (LLE); and K. Germaschewski (University of New Hampshire)*Also, Princeton University
Understanding the physics of magnetized plasmas is key to unlocking a number of important problems in space and astrophysics. A key feature of explosive processes in astrophysical plasmas is the acceleration of particles to form populations of superthermal, energized particles, such as cosmic rays. Magnetic reconnection is a fundamental mechanism behind these processes, which can explosively release stored magnetic energy, convert it to plasma heat and flows, and accelerate particles.4,5 Recent experiments using magnetized laser-produced plasmas have opened opportunities to study particle acceleration by magnetic reconnection in the laboratory.6–8 The experiments collide pairs of plasma plumes that have self-generated strong (+10-T) magnetic fields by the Biermann battery process.6
Table I: Seven LaserNetUS projects were awarded beam time on OMEGA EP for target shots in 2019 and 2020. The first six experiments (shaded cells) were successfully conducted during FY20 and the seventh experiment with two approved shot days has been scheduled for FY21.
Principal Investigator Lead Institution Title
H. Chen LLNL Exploring Novel Target Designs for High-Yield Laser-Created Relativistic Pairs
T. Duffy Princeton University Ultrahigh-Pressure Phase Transition in (Mg,Fe)O: Implications for Exoplanet Structure and Dynamics
W. Fox PPPL Particle Energization During Magnetic Reconnection in Colliding Magnetized Plasmas on OMEGA EP
H. Ji Princeton University Plasma Beta Dependence of Particle Acceleration from Magnetically Driven Collisionless Reconnection Using Laser-Powered Capacitor Coils
J. Kim University of California, San Diego
Ion Acceleration from Multipicosecond Short-Pulse Lasers Interacting with Underdense Plasmas
Y.-J. Kim LLNL Extreme Chemistry of Synthetic Uranus
M. P. Valdivia Johns Hopkins Electron Density Imaging of Irradiated Foils Through Talbot–Lau X-Ray Deflectometry
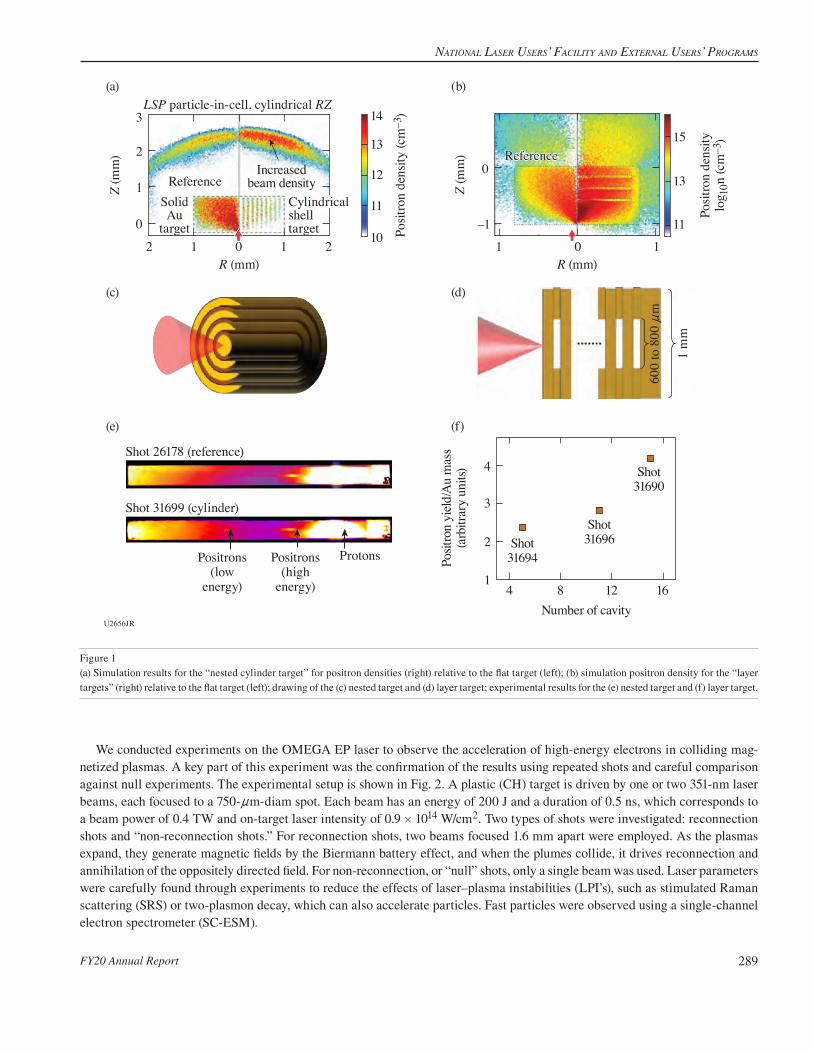
NatioNal laser Users’ Facility aNd exterNal Users’ Programs
FY20 Annual Report 289
Figure 1(a) Simulation results for the “nested cylinder target” for positron densities (right) relative to the flat target (left); (b) simulation positron density for the “layer targets” (right) relative to the flat target (left); drawing of the (c) nested target and (d) layer target; experimental results for the (e) nested target and (f) layer target.
We conducted experiments on the OMEGA EP laser to observe the acceleration of high-energy electrons in colliding mag-netized plasmas. A key part of this experiment was the confirmation of the results using repeated shots and careful comparison against null experiments. The experimental setup is shown in Fig. 2. A plastic (CH) target is driven by one or two 351-nm laser beams, each focused to a 750-nm-diam spot. Each beam has an energy of 200 J and a duration of 0.5 ns, which corresponds to a beam power of 0.4 TW and on-target laser intensity of 0.9 # 1014 W/cm2. Two types of shots were investigated: reconnection shots and “non-reconnection shots.” For reconnection shots, two beams focused 1.6 mm apart were employed. As the plasmas expand, they generate magnetic fields by the Biermann battery effect, and when the plumes collide, it drives reconnection and annihilation of the oppositely directed field. For non-reconnection, or “null” shots, only a single beam was used. Laser parameters were carefully found through experiments to reduce the effects of laser–plasma instabilities (LPI’s), such as stimulated Raman scattering (SRS) or two-plasmon decay, which can also accelerate particles. Fast particles were observed using a single-channel electron spectrometer (SC-ESM).
U2656JR
(a)
(c)
(e)
Shot 26178 (reference)
Shot 31699 (cylinder)
Positrons(low
energy)
Positrons(high
energy)
Protons
(f)
3
2
1
0
2 1 0
ReferenceSolidAu
target
Increasedbeam density
LSP particle-in-cell, cylindrical RZ
1 2
Posit
ron
dens
ity (c
m–3
)
Posit
ron
dens
itylo
g 10n
(cm
–3)
1011
13
15
11
12
–1
0
13
14
(b)
R (mm)0 11
R (mm)
Z (m
m)
Z (m
m)
Cylindricalshelltarget
ReferenceReference
1
2
3
4
4 8Number of cavity
Shot31694
Shot31696
Shot31690
12 16
Posit
ron
yield
/Au
mas
s(a
rbitr
ary
units
)
600
to 8
00 n
m
1 m
m
(d)
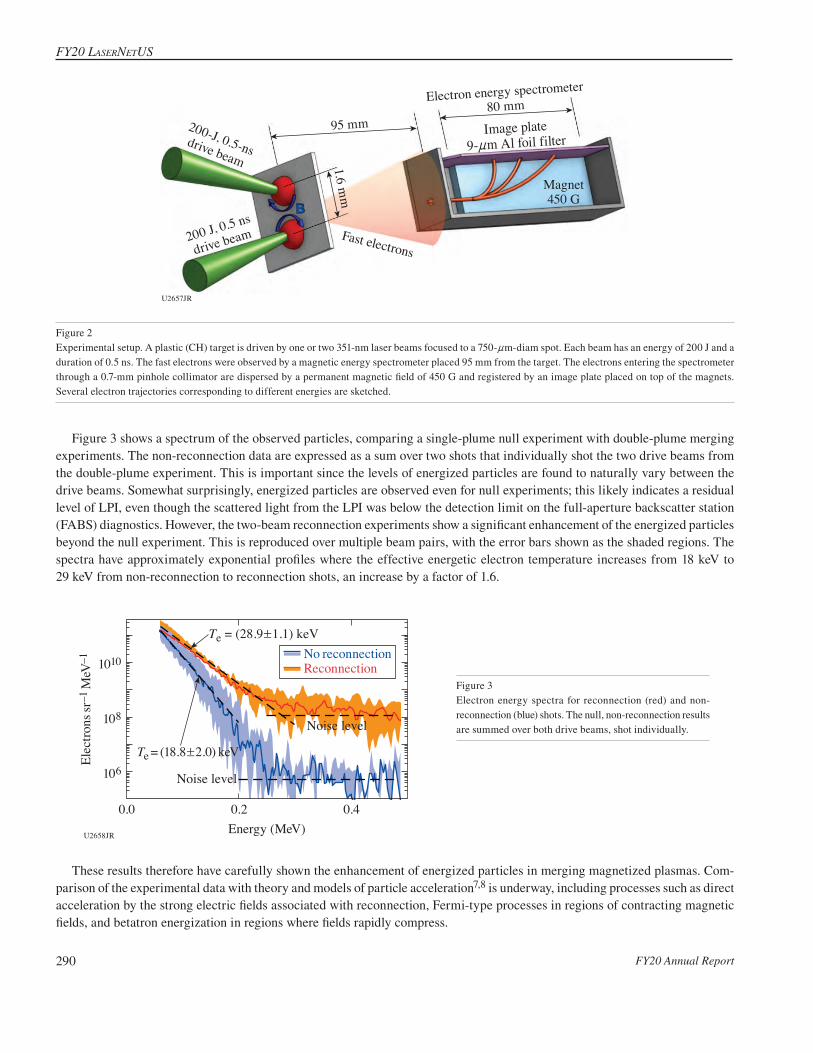
FY20 LaserNetUs
FY20 Annual Report290
U2657JR
95 mm200-J, 0.5-nsdrive beam
200 J, 0.5 ns
drive beam
Electron energy spectrometer80 mm
Image plate9-nm Al foil filter
Magnet450 G
Fast electrons
1.6 mm
B
Figure 2Experimental setup. A plastic (CH) target is driven by one or two 351-nm laser beams focused to a 750-nm-diam spot. Each beam has an energy of 200 J and a duration of 0.5 ns. The fast electrons were observed by a magnetic energy spectrometer placed 95 mm from the target. The electrons entering the spectrometer through a 0.7-mm pinhole collimator are dispersed by a permanent magnetic field of 450 G and registered by an image plate placed on top of the magnets. Several electron trajectories corresponding to different energies are sketched.
Figure 3 shows a spectrum of the observed particles, comparing a single-plume null experiment with double-plume merging experiments. The non-reconnection data are expressed as a sum over two shots that individually shot the two drive beams from the double-plume experiment. This is important since the levels of energized particles are found to naturally vary between the drive beams. Somewhat surprisingly, energized particles are observed even for null experiments; this likely indicates a residual level of LPI, even though the scattered light from the LPI was below the detection limit on the full-aperture backscatter station (FABS) diagnostics. However, the two-beam reconnection experiments show a significant enhancement of the energized particles beyond the null experiment. This is reproduced over multiple beam pairs, with the error bars shown as the shaded regions. The spectra have approximately exponential profiles where the effective energetic electron temperature increases from 18 keV to 29 keV from non-reconnection to reconnection shots, an increase by a factor of 1.6.
U2658JR
0.0
106
108
1010
0.2Energy (MeV)
Noise level
Noise level
Te = (18.8!2.0) keV
Te = (28.9!1.1) keV
Elec
trons
sr–1
MeV
–1
0.4
No reconnectionReconnection
Figure 3Electron energy spectra for reconnection (red) and non-reconnection (blue) shots. The null, non-reconnection results are summed over both drive beams, shot individually.
These results therefore have carefully shown the enhancement of energized particles in merging magnetized plasmas. Com-parison of the experimental data with theory and models of particle acceleration7,8 is underway, including processes such as direct acceleration by the strong electric fields associated with reconnection, Fermi-type processes in regions of contracting magnetic fields, and betatron energization in regions where fields rapidly compress.

NatioNal laser Users’ Facility aNd exterNal Users’ Programs
FY20 Annual Report 291
This material is based upon work supported by the Department of Energy National Nuclear Security Administration under Award Number DE-NA0003856, the University of Rochester, and the New York State Energy Research and Development Authority.
Magnetic Reconnection at Low-Beta Plasmas in Laser-Driven Capacitor Coil ExperimentPrincipal Investigators: H. Ji, S. Zhang, A. Chien, and L. Gao (Princeton University); E. Blackman (Department of Physics and Astronomy, University of Rochester), P. M. Nilson (LLE); G. Fiksel (University of Michigan); and H. Chen (LLNL)
Magnetic reconnection is a ubiquitous astrophysical phenomenon at low-b plasmas that rapidly converts magnetic energy into plasma flow energy, thermal energy, and nonthermal energetic particles. The nonthermal particles are often an observational signature of magnetic reconnection since it is considered an efficient acceleration mechanism in astrophysical and space plasmas. The diagnosis of the reconnection-accelerated nonthermal particles was limited, however, in magnetically driven devices due to the relatively small mean free path compared with the system size. To overcome this limitation, we have developed a platform using laser-driven capacitor coils, creating a magnetized plasma with low b similar to the astrophysical conditions. In this platform, the reconnection-accelerated electrons can escape the mm-scale plasma and be diagnosed by spectrometers.
In FY20, to study the particle acceleration in the magnetic reconnection at low-b plasmas, we performed one day of experiments on OMEGA EP under the support of the LaserNetUS program. As shown in Fig. 4(a), two 1-ns, 1.25-kJ UV beams irradiate the capacitor’s backplate, producing hot electrons via laser–plasma instabilities. When these hot electrons escape, they create 10s to +100-kV high voltages driving an +56-kA peak current in the coils.9 This current can generate an +90-T magnetic field in the coil center and +30 T in the reconnection region. The magnetic field and the magnetic reconnection features were diagnosed in the previous experiments.9,10
To diagnose the accelerated electrons, we used Osaka University’s electron spectrometer (OU-ESM) and two SC-ESM’s placed in different directions. As shown in Fig. 4(b), the channel 5 of OU-ESM facing the front of the target captured the 20- to 70-keV electrons accelerated by the electric field in the reconnection. The SC-ESM facing the back of the target captured lower-temperature spectra in the reconnection experiments than in the reference experiment, indicating particle deceleration due to the electric field. The measured electron spectra and the angular dependence will be compared with the particle-in-cell simulations.
U2659JR
B3 B4
(a) (b) Shot 33337 right coilShot 33341 left coilShot 33343Shot 33339Shot 33335
10–1103
104
105
106
107
E (MeV)
dN/d
E (1
/MeV
)
100
Figure 4(a) OU-ESM channel 5 view in the reconnection experiment with UV lasers irradiating the capacitor coil target. (b) The OU-ESM-measured electron spectra. Dashed lines are from two reference experiments that used a target with one coil. The solid lines are from reconnection experiments using two-coil targets. Accelerated electrons around 20 keV to 70 keV are seen in the reconnection experiments.

FY20 LaserNetUs
FY20 Annual Report292
Figure 5Comparison of the proton radiography images between (a) the capacitor coil driven by a 0.7-ps, 300-J laser and (b) the capacitor coil driven by a 15-ps laser. The void diameter in the 0.7-ps laser experiment is 20% smaller than that in the 15-ps experiment, which indicates an +40% lower current and magnetic field.
During this shot day, besides the particle acceleration measurement, we tested a new platform that uses a short-pulse IR laser to drive a capacitor-coil target. We varied the IR pulse duration and energy to study the magnetic field’s dependence on the laser parameters. As shown in the proton radiography images (Fig. 5), even though the 0.7-ps, 300-J laser has a 20# higher intensity than the 15-ps, 300-J laser, the magnetic field generated by the 0.7-ps laser is +40% lower than that driven by the 15-ps laser. This pulse-duration dependence will aid in validating our lump-circuit model.
This material is based upon work supported by DOE Office of Science, Fusion Energy Sciences under Contract No. DE-SC0020005: the LaserNetUS initiative at the Omega Laser Facility and under Contract No. DE-SC0020103 (HEDLP).
High-Energy Protons from OMEGA EP Multipicosecond Pulses Using Submicron TargetsPrincipal Investigators: J. Kim, C. McGuffey, K. Bhutwala, and F. N. Beg (University of California, San Diego); G. Cochran, T. Ma, D. Mariscal, G. G. Scott, and S. Wilks (LLNL); S. R. Klein (University of Michigan); and R. Simpson (MIT)
We have investigated the acceleration of protons and ions using the OMEGA EP short-pulse laser with submicron-thick targets while exploring the pulse duration. Ion acceleration driven by short-pulse lasers has been an active research area in high-energy-density physics because it is appealing for its potential broad range of applications including neutron sources, exotic isotope creation, novel inertial confinement fusion (ICF) ignition schemes, proton probing, and ion therapy.
For two decades, numerous acceleration mechanisms, leading to tens of MeV/nucleon ion acceleration, have been described in simulations and reported experimentally, many of which benefit from a submicron target or even rely on the target becoming transparent before or during the main pulse interaction. Laser prepulse—light that precedes the main pulse—sets the conditions of the target interaction and is thought to have thwarted many attempts to pass the 58-MeV mark set in 1999.11 With the well-characterized OMEGA EP prepulse12 and ongoing work into a plasma mirror configuration that would further reduce prepulse energy, it is an excellent time to re-evaluate the ion acceleration performance that can be achieved.
Furthermore, recent findings have shown promise in using multipicosecond laser pulse duration for increasing the maximum proton energy, in spite of conventional wisdom that higher intensity is always better. It has been predicted through simulations by our group13 and shown in recent experiments on the National Ignition Facility (NIF) Advanced Radiographic Capability (ARC) laser14 that 1- to 10-ps lasers outperform subpicosecond lasers in terms of proton energy for mildly relativistic intensities. In those works, we showed that multipicosecond pulse duration leads to a time-evolving (increasing) temperature of the hot electrons being directed into the target that in turn accelerates protons longer and to higher maximum energy. We also hypothesized, before this project, that multipicosecond pulses would provide synergistic effects in combination with submicron targets due to the higher likelihood of transparency during the main pulse.
U2660JR
(a) (b)

NatioNal laser Users’ Facility aNd exterNal Users’ Programs
FY20 Annual Report 293
U2733JR
Target normalLaser axis
13+ MeVHD-v2
(b)
(a)
70+ MeV layer(EBT3-type film)
17+ MeVMD-v2
70+ MeVEBT3
C8H8300 nm
C8H8200 nm
C8H8100 nm
Figure 6(a) The last layer of a radiochromic film stack, corresponding to 70-MeV proton energy, is shown for three target thicknesses and fixed laser conditions: 500 J in 2 ps. (b) The beam profile and directionality can be seen in three select layers of a single shot.
During a recent OMEGA EP shot day, we measured proton beams from the short-pulse beams with laser durations from 0.7 to 10 ps and targets of parylene (CH) or aluminum with thickness from 100 nm to 3 nm. We also fielded a special target consisting of two 100-nm CH foils separated by 300 nm to test the concept of a fast shutter. The primary diagnostic was a stack of radio-chromic films and filters designed to have a proton punch-through energy of 70 MeV for the last layer. The target was rotated to a 10° angle of incidence such that the target normal and laser propagation directions could be distinguished on the films.
For a control shot using the best compressed-pulse duration (nominally 0.7 ps) and 3-nm-thick parylene, protons reached the 45+-MeV film layer but not the 58+-MeV layer, an unsurprising result. However, all the shots with 2- to 3-ps duration and full energy produced a signal all the way to the last layer of the film (70+ MeV). Figure 6 shows the last layer of film for three targets, with the 300 nm of CH producing the strongest signal on that layer. We believe these are the most energetic protons measured from the facility to date, and the result begs for the design of a film holder to accommodate higher energy.
We are investigating other interesting results from the shot day including 4~ probe images that may inform us about transpar-ency of the different targets. An example interferogram is shown in Fig. 7 for the shot with the fast shutter test target (2 # 100 nm of CH). The interferogram shows plasma in line with the laser axis on the front and back layers of both foils, suggesting that the front foil became transparent during or before the main pulse.
This material is based upon work supported by the Department of Energy Fusion Energy Sciences LaserNetUS.
Figure 7Interferogram from the 4~ probe side-on to a double-foil target. Plasma, indicated by bent fringes, is apparent on both sides of both targets at the probing time, 30 ps after the 3-ps main pulse arrives from the top of the image. This suggests the 100-nm parylene became transparent before the end of the main pulse.
U2662JR
First foil
Second foil

FY20 LaserNetUs
FY20 Annual Report294
High-Pressure Polymorphism of ZnO Under Laser-Driven Ramp CompressionPrincipal Investigators: I. K. Ocampo, D. Kim, and T. S. Duffy (Department of Geosciences, Princeton University); and F. Coppari and R. F. Smith (LLNL)
A goal of the XRDEOSEP Campaign was to investigate the phase diagram of ZnO, a wide-bandgap semi-conductor (3.37 eV) well suited for use in electronic and optoelectronic devices.15 There has long been interest in high-pressure polymorphism in ZnO from both theory and experiment as a test case for the B1–B2 phase transition. Static compression experiments have shown that under relatively low pressures (+10 GPa), ZnO undergoes a phase transition from a wurtzite-type structure (P63mc) to a B1-type structure (Fm-3m).16 No further phase transitions have been observed in ZnO experimentally up to +209 GPa, but density func-tional theory calculations predict that the B2 phase (Pm–3m) will become stable at high pressures.17,18 The calculated B1–B2 transition pressures vary considerably from one study to another (243.5 to 316 GPa). By combining the unique pulse-shaping capabilities of OMEGA EP with nanosecond x-ray diffraction, we sought to observe the crystal structure of ZnO across the pre-dicted B1–B2 transition. Furthermore, constraining the transition pressures and equations of state for ZnO allows us to test the efficacy of the theoretical calculations.
ZnO powders were compressed in a short piston diamond anvil cell with 800-nm culets to +1.7 GPa, resulting in +10-nm-thick foils. These foils were sandwiched between a single-crystal diamond ablator and a LiF window. A 10-ns ramp-shaped pulse was used to ablate the surface of the target sandwich and quasi-isentropically compress the sample. When the target was at approximately peak stress, a 1-ns, 500-J laser pulse was used to irradiate a Cu backlighter foil, generating quasi-monochromatic x rays that were diffracted and recorded using the powder x-ray diffraction image plate (PXRDIP) diagnostic. The active shock breakout diagnostic monitored the particle velocity at the ZnO–LiF interface, which was then used to infer the stress history in the sample.
We conducted four experiments and collected high-quality diffraction data from 253 to 448 GPa. At 253 GPa, four reflections from the sample were observed, all corresponding to the B1 phase. Two intermediate stress experiments (351 and 396 GPa) show diffraction from the B1 phase as well as the B2-type structure (Fig. 8). This is the first experimental observation of the post-B1 phase in ZnO. At our highest achieved stress (448 GPa), diffraction from the B1 phase is still observed but is highly textured. Under the nanosecond time scales of these experiments, ZnO exhibits a wide B1–B2 mixed phase region (+100 GPa). This work is ongoing and further experiments will be conducted to better constrain the EOS of the B2 phase.
This work was supported by DOE Office of Science, Fusion Energy Sciences under Contract No. DE-SC0020005: the Laser-NetUS initiative at the Omega Laser Facility.
U2663JR
35 40 45 50 552i (º)
(b)(a) 396 GPa
Inte
nsity
(arb
itrar
y un
its)
60 65 70
351 GPa
253 GPa
396 GPa
448 GPa
Ta 0
02
B2 0
11
Ta 0
02
B1 0
02
B1 1
11
B2 0
01
B1
B2
Ta 0
11 Figure 8(a) Recorded raw diffraction data from shot 32575. Red arrows highlight the presence of reflections corresponding to the high-pressure phase (B2 type), whereas the blue arrows indicate diffraction from the low-pressure phase (B1 type). (b) Integrated dif-fraction patterns display the two highest-intensity peaks from both the B1 and B2 structures. Only the B1 phase is observed in the lowest stress experiment, whereas the B1 and B2 phases are observed in all other experiments.

NatioNal laser Users’ Facility aNd exterNal Users’ Programs
FY20 Annual Report 295
Talbot–Lau X-Ray Deflectometry (TXD) Electron Density Diagnostic in Laser–Target InteractionsPrincipal Investigators: M. P. Valdivia, D. Stutman, and M. Schneider (Physics and Astronomy Department, Johns Hopkins University)
X-ray refraction-based imaging diagnostics for high-energy-density laboratory plasmas have been developed by the Johns Hopkins University X-ray Imaging and Plasma Spectroscopy group. Experiments have been conducted at LLE to benchmark a Talbot–Lau19–21 x-ray deflectometer for the OMEGA EP laser (EP-TXD).22 The imaging diagnostic uses standard laser-based x-ray backlighters to directly measure electron density gradients and can simultaneously measure refraction, attenuation, elemental composition, and small-angle scatter.23 Differential phase-contrast imaging offers a stronger contrast mechanism since refrac-tion signatures are much larger than attenuation when probing low-Z matter with 1- to 100-keV x rays.24 For this reason, x-ray refraction imaging techniques based on Talbot–Lau interferometry have been developed to characterize fusion-relevant dense plasmas. The EP-TXD rail detects x-ray refraction angles caused by refraction index changes within an object placed along its line of sight.25,26 This angle (a) is proportional to the probed object electron density gradient, enabling 2-D electron density mapping through moiré imaging by following
( , ) ( , ),a x y x y2m rDU= (1)
where m is the probing x-ray beam wavelength and U is the phase. In the deflectometry configuration, one fringe shift is equivalent to the system’s effective angular sensitivity. From Eq. (1), considering a critical density of nc = 4.56 # 1028 cm−3 at 8 keV, the EP-TXD platform can measure electron densities of +1023 to 1024 cm−3.
Sponsored by the National Laser Users Facility grant, the EP-TXD diagnostic platform has been established in collaboration with researchers at LLE. An experimental platform was designed to probe the ablation front of an irradiated foil to obtain electron density through TXD. Electron density mapping above 1023 cm−3 will help benchmark standard magnetohydrodynamic (MHD) codes that fail to accurately model ablating plasma properties. The results obtained can help validate codes in the longstand-ing problem of ablation dynamics in laser-produced coronal plasmas and aid in two-plasmon decay and general laser–plasma interaction studies, for example.27,28
Preliminary experiments were performed using the Multi-Terawatt laser to evaluate x-ray backlighter source spectra quality, size, and flux. Detector performance was also studied in context of moiré fringe contrast and spatial resolution in order to opti-mize TXD diagnostic capabilities.29 These experiments established backlighter target, detector, and laser parameters for a new Irradiated Foil LaserNetUS Campaign on OMEGA EP, where an x-ray backlighter evaluation was performed followed by ablation profile imaging. Driving beam laser parameters were adjusted, in similarity to x-ray backlighter target and laser parameters, to obtain a moiré image of the ablation profile with a measured spatial resolution <10 nm. The experiment imaged—for the first time—plasma targets using laser-produced x-ray backlighters.
A refraction-angle map [Fig. 9(c)] was retrieved from recorded fringe shifts [Fig. 9(b)], showing that x-ray phase contrast can diagnose high-energy-density physics (HEDP) experiments through x-ray refraction imaging. Figure 9(b) also shows a highly dense ablation front close to the foil target (left side), well above the 1025 cm−3 detection limit of EP-TXD. TXD was success-fully implemented on OMEGA EP, demonstrating it can obtain moiré images with high x-ray refraction angle sensitivity and spatial resolution. Moiré deflectometry will allow us to accurately measure density gradients in HED plasmas with high spatial resolution. Further analysis and measurements are underway as well as the extension of TXD diagnostic capabilities through monochromatic x-ray backlighting.
This material is based on work supported by DoE NNSA under Award Number DE-NA0003882 and DE-NA0003941. DOE Office of Science FES: DE-SC0020005 LaserNetUS at the Omega Laser Facility.

FY20 LaserNetUs
FY20 Annual Report296
Figure 9(a) Visible camera image of the EP-TXD diagnostic in the Irradiated Foil Campaign. (b) Raw moiré image of the 125-nm CH irradiated foil (150 J, 1 ns) obtained through TXD at 5 ns. (c) Refraction-angle 2-D map retrieved through TXD methods.
U2664JR
125 nm
Ablation front
(a) (b) (c)
Refraction angle (nrad)CH foil0 270
REFERENCES
1. H. Chen et al., Phys. Plasmas 22, 056705 (2015).
2. H. Chen et al., Phys. Rev. Lett. 114, 215001 (2015).
3. J. Kim et al., “Efficient Positron Generation by Control of Laser-Driven Electrons in Novel Targets,” to be submitted to Physics of Plasmas.
4. M. Yamada, R. M. Kulsrud, and H. Ji, Rev. Mod. Phys. 82, 603 (2010).
5. J. F. Drake et al., Nature 443, 553 (2006).
6. M. J. Rosenberg et al., Phys. Rev. Lett. 114, 205004 (2015).
7. W. Fox et al., Phys. Plasmas 24, 092901 (2017).
8. S. R. Totorica, T. Abel, and F. Fiuza, Phys. Rev. Lett. 116, 095003 (2016).
9. A. Chien et al., Phys. Plasmas 26, 062113 (2019).
10. L. Gao et al., Phys. Plasmas 23, 043106 (2016).
11. R. A. Snavely et al., Phys. Rev. Lett. 85, 2945 (2000).
12. C. Dorrer, A. Consentino, and D. Irwin, Appl. Phys. B 122, 156 (2016).
13. J. Kim et al., Phys. Plasmas 25, 083109 (2018).
14. D. Mariscal et al., Phys. Plasmas 26, 043110 (2019).
15. X. Sha et al., Sci. Rep. 5, 11003 (2015).

NatioNal laser Users’ Facility aNd exterNal Users’ Programs
FY20 Annual Report 297
16. H. Liu, J. S. Tse, and H. Mao, J. Appl. Phys. 100, 093509 (2006).
17. J. E. Jaffe et al., Phys. Rev. B 62, 1660 (2000).
18. Z. Li et al., Phys. Rev. B 79, 193201 (2009).
19. H. F. Talbot, Lond. & Edin. Phil. Mag. & J. of Sci., Third Series 9, 401 (1836).
20. A. Momose et al., Jpn. J. Appl. Phys. 42, L866 (2003).
21. F. Pfeiffer et al., Nat. Phys. 2, 258 (2006).
22. M. P. Valdivia et al., Rev. Sci. Instrum. 91, 023511 (2020).
23. N. Bevins et al., Med. Phys. 39, 424 (2012).
24. D. Stutman and M. Finkenthal, Rev. Sci. Instrum. 82, 113508 (2011).
25. M. P. Valdivia, D. Stutman, and M. Finkenthal, Rev. Sci. Instrum. 85, 073702 (2014).
26. M. P. Valdivia et al., Rev. Sci. Instrum. 87, 11D501 (2016).
27. J. R. Fein et al., Phys. Plasmas 24, 032707 (2017).
28. R. P. Drake et al., Phys. Fluids B 1, 1089 (1989).
29. M. P. Valdivia et al., Rev. Sci. Instrum. 89, 10G127 (2018).

FY20 Annual Report298
FY20 Lawrence Livermore nationaL LaboratorY experimentaL programs at the omega Laser FaciLitY
R. F. Heeter,1 F. Albert,1 S. J. Ali,1 P. M. Celliers,1 H. Chen,1 B.A. Chidester,2 A. L. Coleman,1 F. Coppari,1 T. Döppner,1 M. Gorman,1 M. Hohenberger,1 J. Jeet,1 A. Lazicki Jenei,1 S. Jiang,1 S. F. Khan,1 Y.-J. Kim,1 N. Candeias Lemos,1 M. J.
MacDonald,1 D. Mariscal,1 E. V. Marley,1 M. C. Marshall,1,3 M. J. May,1 M. Millot,1 B. B. Pollock,1 P. L. Poole,1 D. Rusby,1 A. M. Saunders,1 R. Smith,1 C. Stan,1 G. F. Swadling,1 S. Zhao,4 and A. Zylstra1
1Lawrence Livermore National Laboratory2University of California, Davis
3Laboratory for Laser Energetics, University of Rochester4Lawrence Berkeley National Laboratory
In fiscal year 2020 (FY20), Lawrence Livermore National Laboratory’s (LLNL’s) High-Energy-Density (HED) Physics and Indirect-Drive Inertial Confinement Fusion (ICF-ID) Programs conducted numerous campaigns on the OMEGA and OMEGA EP Laser Systems. This was the 22nd year of national laboratory collaborative experiments at the Omega Laser Facility since the Nova Laser at LLNL shut down in 1999 (Ref. 1), building upon prior collaborations. In FY20 overall, these LLNL programs led 375 target shots, with 166 shots using only the OMEGA Laser System and 209 shots using only the OMEGA EP Laser System. Approximately 34% of the total number of shots (35 OMEGA shots and 93 OMEGA EP shots) supported the Indirect-Drive Inertial Confinement Fusion Campaign. The remaining 66% (131 OMEGA-only shots and 116 OMEGA EP-only shots) were dedicated to experiments for high-energy-density physics. Highlights of the various HED and ICF-ID campaigns are summarized in the following reports.
In addition to these experiments, LLNL Principal Investigators (PI’s) led a variety of Laboratory Basic Science Campaigns using OMEGA and OMEGA EP, including 63 target shots using OMEGA and 49 shots using OMEGA EP. An additional 14 OMEGA EP shots were led by LLNL through a new national fundamental science shot allocation, LaserNetUS.
Overall, LLNL PI’s led a total of 501 shots at LLE in FY20. In addition, LLNL PI’s supported 71 basic science shots in col-laboration with the academic community, including 26 National Laser User’s Facility (NLUF) shots, 24 Academic/Industrial Basic Science (AIBS) shots, and 21 LaserNetUS shots led by university collaborators.
This work performed was under the auspices of the U.S. Department of Energy by Lawrence Livermore National Laboratory under Contract DE-AC52-07NA27344.
Indirect-Drive Inertial Confinement Fusion Experiments
Investigating the Behavior of Diamond Under Shock Compression to Its Melting Line with PyrometryPrincipal Investigator: M. Millot Co-investigators: Y.-J. Kim and P. M. Celliers
High-density carbon (HDC)—diamond—ablators are used in many ICF designs at the National Ignition Facility (NIF). Understanding the microphysics behavior of this material along the multishock compression path typical for ICF implosions is fundamental. Here we focus on elucidating the behavior of diamond under shock compression to its melting line near 10 Mbar.
FY20 Lawrence Livermore National Laboratory Experimental Programs at the Omega Laser Facility

NatioNal laser Users’ Facility aNd exterNal Users’ Programs
FY20 Annual Report 299
The specific goal for this study is to provide more-accurate data than the previous study by Eggert et al.2 more than a decade ago and inform the possibility of lowering the adiabat in HDC implosions on the NIF by tightly benchmarking equation-of-state (EOS) models near the first shock state.
To document the melting temperature of diamond near 10 Mbar, we launched strong unsupported shocks in a planar pack-age containing a diamond plate [Fig. 1(a)]. Using line-imaging Doppler velocimetry (VISAR) and streaked optical pyrometry (SOP), we were able to record high-quality data [Fig. 1(b)] in the 5- to 30-Mbar range. Analysis is ongoing. In addition, using quartz as an impedance-matching standard allowed us to collect high-precision shock pressure–density data along the Hugoniot as described in (Ref. 3).
U2676JR
0 10Time (ns)
(b)(a)
20 30
Figure 1(a) VisRad model of the experiment: six beams of the OMEGA laser were used to launch strong shock waves in a diamond sample. (b) Example of a high-quality SOP image exhibiting sharp temporal and spatial resolution.
X-Ray Diffraction of Diamond Under Shock Compression and Shock and Release Near the Melting Line Principal Investigator: M. Millot Co-investigators: F. Coppari, D. Braun, A. Jenei, Y.-J. Kim, P. M. Celliers, and J. H. Eggert
Using HDC—diamond—ablators in ICF implosions on the NIF has enabled important advances thanks to its efficiency as an ablator and the possibility of using shorter laser pulses.4,5 However, the unique thermodynamic properties of carbon present multiple challenges toward reaching higher fusion yield on the NIF. Among these challenges is whether rapid resolidification could occur after the first shock is transmitted to the hydrogen fuel and a release wave propagates backward toward the ablation front. Such a phenomenon would likely be a large source of implosion-quality degradation since the second shock would be launched into a slurry of nano/microcrystalline diamond with a metallic fluid carbon.
Here we focus on elucidating the behavior of diamond under shock compression to completion of the melting line near 12 Mbar [Fig. 2(a)] as well as under shock and subsequent decompression by an impedance-mismatch–generated release wave. The specific goal for this study is to characterize the atomic structure with in-situ nanosecond x-ray diffraction.6
We launched strong steady shocks in a planar package containing a diamond plate mounted on the powder x-ray diffraction image plate (PXRDIP) diagnostic box [Fig. 2(c)] and collected high-quality x-ray diffraction data [Fig. 2(b)] at unprecedented conditions in the 6- to 15-Mbar range. Ongoing analysis will make it possible to reveal the atomic structure of carbon at those conditions and document the transition from the compressed solid to the metallic warm dense fluid.
Hydrodynamic Response from Nonuniformities in High-Density CarbonPrincipal Investigator: S. J. Ali Co-investigators: P. M. Celliers, R. Briggs, A. Fernandez-Panella, C. Weber, S. W. Haan, and V. A. Smalyuk
Performance and yield from fusion capsules on the NIF are highly dependent on the uniformity of the capsule implosion, and hydrodynamic instabilities are a significant source of performance degradation during the implosion. These instabilities can arise due to, among other reasons, intrinsic heterogeneity within the capsule material. HDC is a polycrystalline diamond material that
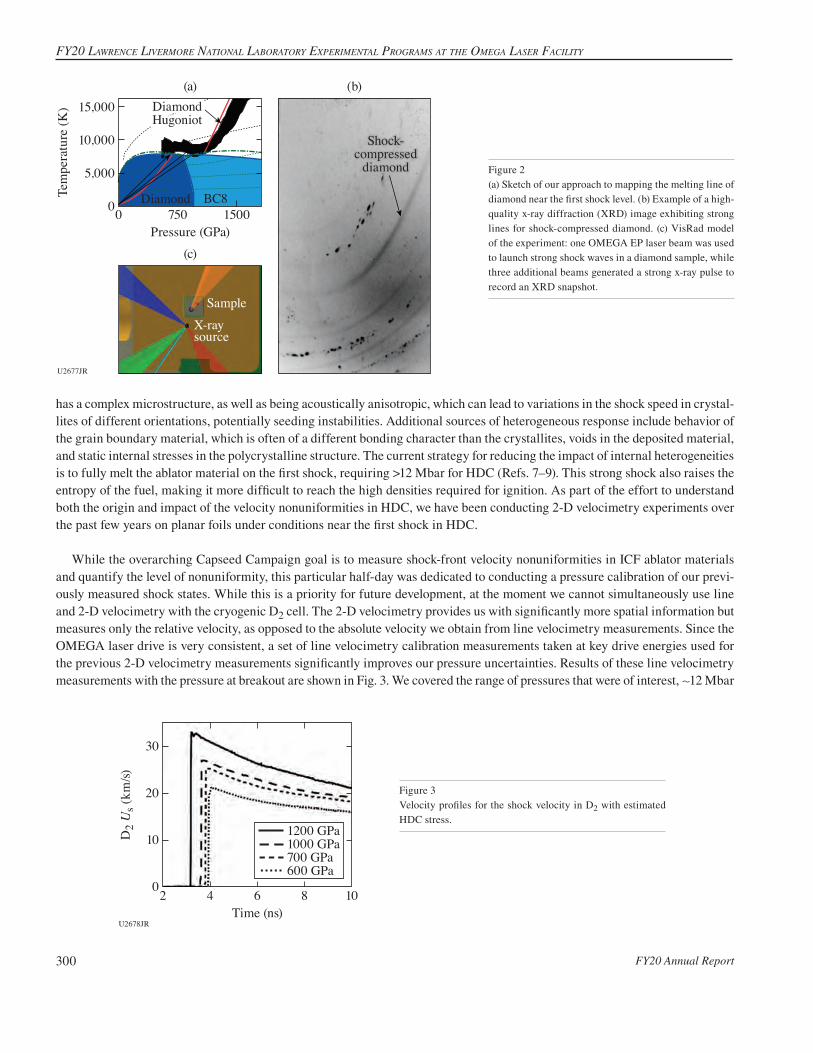
FY20 Annual Report300
FY20 Lawrence Livermore nationaL LaboratorY experimentaL programs at the omega Laser FaciLitY
U2677JR
15,000
10,000
5,000
0 750 1500Pressure (GPa)
Sample
X-raysource
Tem
pera
ture
(K)
(a) (b)
(c)
0
DiamondHugoniot
BC8Diamond
Shock-compressed
diamond Figure 2(a) Sketch of our approach to mapping the melting line of diamond near the first shock level. (b) Example of a high-quality x-ray diffraction (XRD) image exhibiting strong lines for shock-compressed diamond. (c) VisRad model of the experiment: one OMEGA EP laser beam was used to launch strong shock waves in a diamond sample, while three additional beams generated a strong x-ray pulse to record an XRD snapshot.
has a complex microstructure, as well as being acoustically anisotropic, which can lead to variations in the shock speed in crystal-lites of different orientations, potentially seeding instabilities. Additional sources of heterogeneous response include behavior of the grain boundary material, which is often of a different bonding character than the crystallites, voids in the deposited material, and static internal stresses in the polycrystalline structure. The current strategy for reducing the impact of internal heterogeneities is to fully melt the ablator material on the first shock, requiring >12 Mbar for HDC (Refs. 7–9). This strong shock also raises the entropy of the fuel, making it more difficult to reach the high densities required for ignition. As part of the effort to understand both the origin and impact of the velocity nonuniformities in HDC, we have been conducting 2-D velocimetry experiments over the past few years on planar foils under conditions near the first shock in HDC.
While the overarching Capseed Campaign goal is to measure shock-front velocity nonuniformities in ICF ablator materials and quantify the level of nonuniformity, this particular half-day was dedicated to conducting a pressure calibration of our previ-ously measured shock states. While this is a priority for future development, at the moment we cannot simultaneously use line and 2-D velocimetry with the cryogenic D2 cell. The 2-D velocimetry provides us with significantly more spatial information but measures only the relative velocity, as opposed to the absolute velocity we obtain from line velocimetry measurements. Since the OMEGA laser drive is very consistent, a set of line velocimetry calibration measurements taken at key drive energies used for the previous 2-D velocimetry measurements significantly improves our pressure uncertainties. Results of these line velocimetry measurements with the pressure at breakout are shown in Fig. 3. We covered the range of pressures that were of interest, +12 Mbar
U2678JR
20
30
20
10
4Time (ns)
D2
Us (
km/s)
6 8 10
1200 GPa1000 GPa700 GPa600 GPa
Figure 3Velocity profiles for the shock velocity in D2 with estimated HDC stress.

NatioNal laser Users’ Facility aNd exterNal Users’ Programs
FY20 Annual Report 301
to +6 Mbar, and by following a more-detailed impedance-matching analysis with uncertainty propagation, we will apply these measurements to constrain the pressure of previously acquired Capseed data.
Investigating Gold Wall/Gas Fill Interactions in an Open GeometryPrincipal Investigator: G. F. Swadling Co-investigators: J. S. Ross, W. A. Farmer, and M. D. Rosen
The AuGasJet Campaign aims to develop a new experimental platform to study the interaction of ablated gold plasma with a He gas fill. The overall purpose of this work is to benchmark simulations and therefore drive progress toward a predictive hohlraum performance model. The experiments use an open geometry that provides excellent diagnostic access to the gold plasma, allow-ing us to make detailed measurements of the plasma parameters of the gold and helium as they interact using the OMEGA 4~ Thomson-Scattering System. To achieve these goals, the experiments use a supersonic gas nozzle to inject a 0.3-mg/cm3 plume of gas over the surface of a gold foil (see Fig. 4). The surface of the foil is then heated with the OMEGA 3~ heater beams, and the cloud of plasma that results is probed with Thomson scattering 300 nm from the foil surface. Use of the gas jet removes the need for a “gas bag”; previous experiments using gas bags have shown that the shocks launched by the explosion bag wall significantly perturb the experimental measurements. Using a gas jet also allows us to achieve ICF-relevant gas densities without resorting to a surrogate gas species or a cryogenic target design.
The initial half-day executed in FY20 scoped out the approach and collected some initial data. Four target shots were completed before the gas jet hardware failed. We believe that the hardware failure was due to damage inflicted by the x-ray flux emitted by the gold foil. The design of the gas nozzle has been modified for the follow-up campaign to try to mitigate this failure mode.
Figure 4Experimental setup: a gas jet produces a “gas fill” over the surface of a gold foil. TS: Thomson scattering.
U2679JR
Gas jet
4~ TS
3~ heater
Hea
ter b
eam
Gas nozzle
TS measurement volume
Measurements of Biermann-Battery Magnetic Fields Using Three-Particle Backlighting, Plus Au-Ta Foil X-Ray Conversion StudyPrincipal Investigator: B. B. Pollock (LLNL)Co-investigators: G. Sutcliffe and C. K. Li (MIT) and J. D. Moody (LLNL)
The MagHohlMultiPBL experiments are attempting to characterize Biermann-battery magnetic-field structures using a new tri-particle backlighter being developed at MIT. The backlighter source is a capsule containing a mixture of DT3He gas, which on implosion produces two populations of protons characteristic of the D–D and D–3He reactions, plus an additional 9.5-MeV deuteron burst from T–3He reactions. The deuteron has different energy and charge-to-mass ratio than either of the proton populations; these three particle groups then each respond differently to electric and magnetic fields. The experimental setup is

FY20 Annual Report302
FY20 Lawrence Livermore nationaL LaboratorY experimentaL programs at the omega Laser FaciLitY
Figure 5Experimental configuration showing the backlighter capsule at target chamber center (TCC) and both Au foils (each 1 cm from the capsule). The foil toward TIM-5 is actually concave into the page so that protons and deuterons pass tangential to the surface.
U2680JR
TIM-3 52-beam drive backlighter
TIM-5:PRAD
TIM-2:PRAD
shown in Fig. 5, where the capsule is irradiated at the center of the OMEGA target chamber. Two foils, one flat and one curved, are placed 1 cm from the capsule toward ten-inch manipulators (TIM’s) containing CR-39 detectors, and the foils themselves are irradiated with one to five beams each. On the surface of each foil, orthogonal density and temperature gradients are produced that give rise to magnetic-field generation through the Biermann-battery mechanism. Protons and deuterons from the backlighter pass tangentially to each foil and are deflected by the fields at the foil surfaces. The CR-39 is in process at MIT, where the three particle signatures are anticipated to reduce degeneracy between electric- and magnetic-field effects and provide information about the field strengths and structures.
In addition to the magnetic-field measurements, several shots were performed on this day to measure x-ray conversion efficiency of AuTa foils of varying composition. This information is being used to inform the choice of material for a new hohlraum design under development on the NIF capable of supporting pre-imposed magnetic fields, as part of a Laboratory-Directed Research and Development Strategic Initiative project. The results in Fig. 6 show that for all conditions tested, the total x-ray flux produced from a five-beam drive on a planar foil varies by only +5%, which is within the design space tolerance for this new hohlraum material. Based on electrical properties, an alloy with 80% Ta is currently being produced at LLNL for magnetized hohlraum experiments later this year.
U2681JR
0.0 0.20
200
250
100
150
50
0.4Ta fraction
Total x-ray flux and M band
Total x-ray flux
E. Kemp
M band
Hohlraum material
Missinginformationon Dante filters
Flue
nce
(J/sr
)
0.6 0.8 1.0
300
0 to 5 keV (v1)1.5 to 5 keV (v1)0 to 5 keV (v2)1.5 to 5 keV (v2)1-D HYDRA 0 to 5 keV1-D HYDRA 1.5 to 5 keV
Figure 6Dante measurements of x-ray flux from a driven foil at varying Au:Ta fractions.
Magnetic-Field Amplification in Imploding Cylindrical TargetsPrincipal Investigator: B. B. Pollock (LLNL)Co-investigators: J. R. Davies and J. L. Peebles (LLE) and J. D. Moody (LLNL)
The BFieldAmp Campaign seeks to demonstrate high magnetic-field generation (+kT) by compressing a modest seed field (tens of T) in a converging cylindrical target. The experimental configuration is shown in Fig. 7, where a D2-filled cylinder sits coaxially within a magneto-inertial fusion electrical discharge system (MIFEDS) coil near the center of the OMEGA target

NatioNal laser Users’ Facility aNd exterNal Users’ Programs
FY20 Annual Report 303
U2682JR
Target
TIM-6
TIM-5
TIM-3
CH
MIFEDS
TIM-4
Figure 7Experimental configuration showing the plastic cylindrical target inside of a MIFEDS coil and the D3He-filled capsule. The target is aligned along the TIM-4–TIM-6 axis, while the primary proton radiography axis is from TIM-3 to TIM-2.
chamber. The MIFEDS produces the seed magnetic field, and at peak field, 40 OMEGA beams uniformly compress a 500-nm-long region of the cylinder, similar to the work of Knauer et al.10 With a modest convergence ratio of 10, the tube is compressed from a 560-nm diameter to a 50- to 60-nm diameter, resulting in an expected +100# amplification of the magnetic field. The primary measurement of the field is proton radiography, where the protons are supplied by the implosion of a D3He-filled capsule 1 cm from the tube center. Protons are collected on CR-39 detectors 30 cm from the target, and the changes in proton trajectory with and without an applied magnetic field can be determined and then used to infer the magnetic-field strength. Before the CR-39 can be analyzed, it undergoes a chemical-etching process to reveal pits left by the impacts of the arriving protons; that process is still underway for these experiments. Following a successful demonstration of field amplification, this target platform will be used for additional high magnetic-field physics studies, where 1- to 10-kT fields are required but unattainable through conventional pulsed-power schemes.
Shock-Propagation Measurements in Magnetized Quartz Samples with Laser-Driven Magnetic FieldsPrincipal Investigator: B. B. Pollock (LLNL)Co-investigators: J. R. Davies and D. N. Polsin (LLE) and J. D. Moody (LLNL)
The BFieldLoopEP Campaign has previously investigated the dynamics of high current and magnetic-field generation in capacitor-coil–style targets.11,12 The FY20 shot days in this campaign transitioned the focus to observing the effects of these large (hundreds of T) magnetic fields on external systems and developing platforms for using them as seed fields in related physics studies. In particular, these experiments measured shock propagation through quartz samples with and without pre-imposed magnetic fields using the active shock breakout (ASBO) system on OMEGA EP in various shock-drive and magnetic-field–drive configurations.
The experimental configuration is shown in Fig. 8, where the capacitor-coil target is comprised of Au foil folded to produce a half-loop region with a radius of 250 nm. A 0.6- to 1-mm-wide region is removed in the curved section, leaving behind 300-nm-wide strips on each end of the target. One to three long-pulse beams are focused to the front side of the target, which drives a blow-off plasma, sourcing a current through the strips and producing a magnetic field along the loop axis (here aligned with the 4~ probe axis). The magnetic field rises rapidly to +100 T in the first 1 ns of the 10-ns drive, then more slowly to 300 to 400 T by the end of the drive. An additional long-pulse beam is used to drive the surface of a quartz sample embedded between the Au strips, where the magnetic field is the strongest. This launches a shock into the quartz, propagating perpendicular to the magnetic field. The primary measurement is the shock propagation, recorded by the OMEGA EP ASBO system with a line of sight normal to the rear surface of the quartz, to record the shock breakout time and other features.
Figure 9 shows a calculation of breakout times as a function of applied magnetic-field strength for a variety of shock pressures, as well as the change in breakout between magnetized and unmagnetized propagation conditions. For 5- to 10-Mbar shocks

FY20 Annual Report304
FY20 Lawrence Livermore nationaL LaboratorY experimentaL programs at the omega Laser FaciLitY
U2683JR
Shock drive
Gold sheet
4~ probe axis
B-field drive
Laser capacitor coil
ASBO washer
Awning
SiO2
Awning
SiO2
Ta washer
U2684JR
0 200B (T)
BO
4000
20
10
0 200B (T)
(a) (b)
DBO
4000
8
4
BO 2 nsBO 5 ns
BO 10 nsBO 20 ns
DBO 2 MbarDBO 5 MbarDBO 10 MbarDBO 20 Mbar
Figure 8Experimental configuration showing the capacitor-coil target, the quartz sample, and nominal laser pointing for the B field and shock drive beams. The target structure is mounted onto a light-tight Ta washer and backed by a standard ASBO washer.
Figure 9(a) Calculated shock breakout times as a function of shock pres-sure and applied magnetic field. (b) Change in breakout between magnetized and unmagnetized propagation conditions.
(which is the range probed here), the magnetic field should reduce the breakout time by roughly a few hundred ps for the 100- to 300-T range of applied fields sampled during the shock drive and propagation. Initial analysis of the ASBO data suggests that the magnetic field reduces the breakout time by 100 to 200 ps across the conditions investigated, but further analysis is needed to quantify the uncertainties. Future experiments will increase the temporal sensitivity of the instrument configuration and seek to increase the strength of the applied magnetic field.
Increasing Laser-Accelerated Particle Energies with “Shaped” Short PulsesPrincipal Investigator: D. Mariscal (LLNL)Co-investigators: G. G. Scott and T. Ma (LLNL) and R. Simpson (MIT)
Newer kJ-class short-pulse (ps) lasers such as the NIF’s Advanced Radiographic Capability (ARC) laser have recently been shown to be able to accelerate protons to energies that far exceed conventional scalings. While these results are encouraging, the proton energies necessary for probing indirectly driven ICF experiments remain 2# higher than currently achievable with ARC. A new concept, inspired by ARC’s capability to deliver multiple short-pulse beams to the same location with specified delays, was tested on OMEGA EP by delivering both short-pulse beams to a single target in order to create pseudo-shaped short laser pulses.
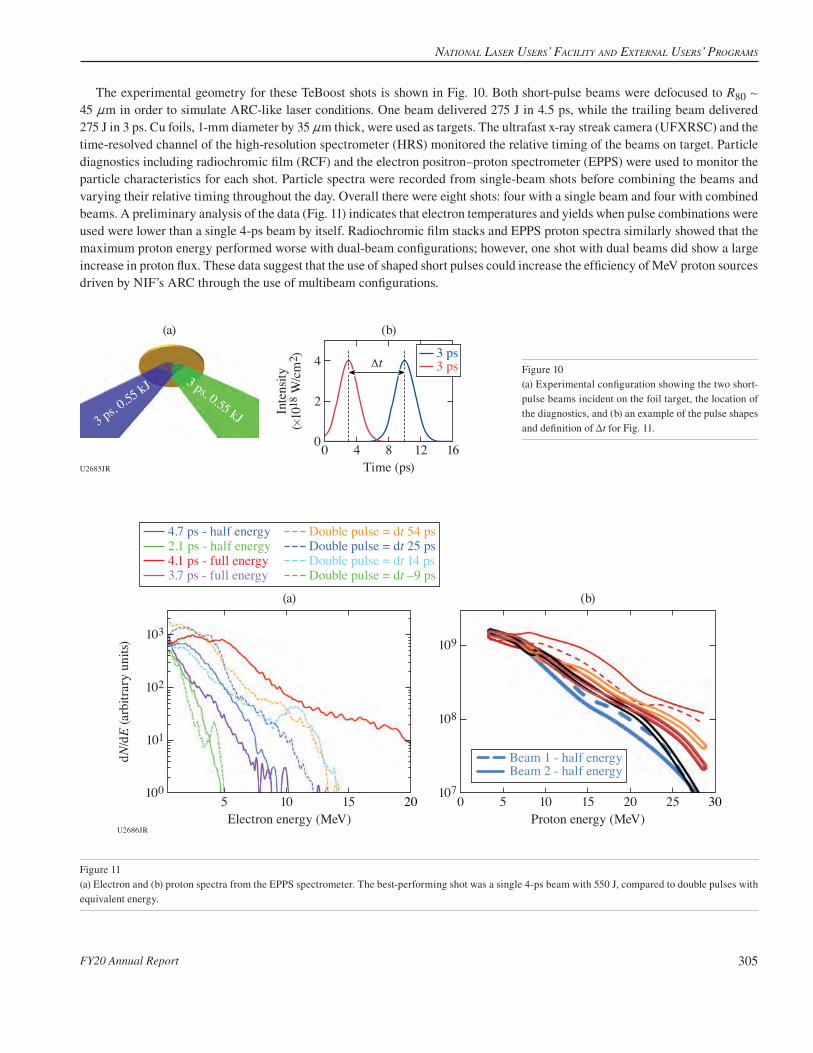
NatioNal laser Users’ Facility aNd exterNal Users’ Programs
FY20 Annual Report 305
The experimental geometry for these TeBoost shots is shown in Fig. 10. Both short-pulse beams were defocused to R80 + 45 nm in order to simulate ARC-like laser conditions. One beam delivered 275 J in 4.5 ps, while the trailing beam delivered 275 J in 3 ps. Cu foils, 1-mm diameter by 35 nm thick, were used as targets. The ultrafast x-ray streak camera (UFXRSC) and the time-resolved channel of the high-resolution spectrometer (HRS) monitored the relative timing of the beams on target. Particle diagnostics including radiochromic film (RCF) and the electron positron–proton spectrometer (EPPS) were used to monitor the particle characteristics for each shot. Particle spectra were recorded from single-beam shots before combining the beams and varying their relative timing throughout the day. Overall there were eight shots: four with a single beam and four with combined beams. A preliminary analysis of the data (Fig. 11) indicates that electron temperatures and yields when pulse combinations were used were lower than a single 4-ps beam by itself. Radiochromic film stacks and EPPS proton spectra similarly showed that the maximum proton energy performed worse with dual-beam configurations; however, one shot with dual beams did show a large increase in proton flux. These data suggest that the use of shaped short pulses could increase the efficiency of MeV proton sources driven by NIF’s ARC through the use of multibeam configurations.
U2686JR
5100
102
101
10Electron energy (MeV)
dN/d
E (a
rbitr
ary
units
)
15 20 0 5107
108
10Proton energy (MeV)
(b)(a)
15 20 25 30
109103
4.7 ps - half energy2.1 ps - half energy4.1 ps - full energy3.7 ps - full energy
Double pulse = dt 54 psDouble pulse = dt 25 psDouble pulse = dt 14 psDouble pulse = dt –9 ps
Beam 1 - half energyBeam 2 - half energy
U2685JR
0 4
Dt
8Time (ps)
(a) (b)
Inte
nsity
(#10
18 W
/cm
2 )
12 160
2
4 3 ps3 ps
3 ps, 0.55 kJ 3 ps, 0.55 kJ
Figure 10(a) Experimental configuration showing the two short-pulse beams incident on the foil target, the location of the diagnostics, and (b) an example of the pulse shapes and definition of Dt for Fig. 11.
Figure 11(a) Electron and (b) proton spectra from the EPPS spectrometer. The best-performing shot was a single 4-ps beam with 550 J, compared to double pulses with equivalent energy.
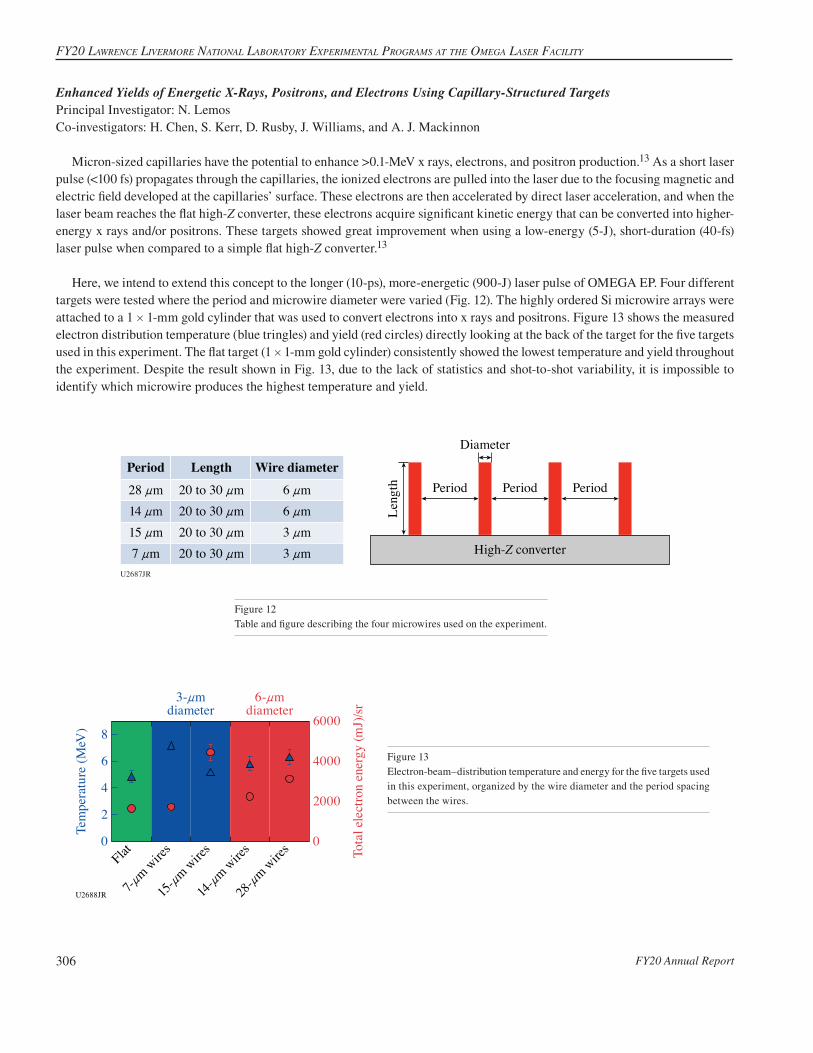
FY20 Annual Report306
FY20 Lawrence Livermore nationaL LaboratorY experimentaL programs at the omega Laser FaciLitY
Enhanced Yields of Energetic X-Rays, Positrons, and Electrons Using Capillary-Structured TargetsPrincipal Investigator: N. LemosCo-investigators: H. Chen, S. Kerr, D. Rusby, J. Williams, and A. J. Mackinnon
Micron-sized capillaries have the potential to enhance >0.1-MeV x rays, electrons, and positron production.13 As a short laser pulse (<100 fs) propagates through the capillaries, the ionized electrons are pulled into the laser due to the focusing magnetic and electric field developed at the capillaries’ surface. These electrons are then accelerated by direct laser acceleration, and when the laser beam reaches the flat high-Z converter, these electrons acquire significant kinetic energy that can be converted into higher-energy x rays and/or positrons. These targets showed great improvement when using a low-energy (5-J), short-duration (40-fs) laser pulse when compared to a simple flat high-Z converter.13
Here, we intend to extend this concept to the longer (10-ps), more-energetic (900-J) laser pulse of OMEGA EP. Four different targets were tested where the period and microwire diameter were varied (Fig. 12). The highly ordered Si microwire arrays were attached to a 1 # 1-mm gold cylinder that was used to convert electrons into x rays and positrons. Figure 13 shows the measured electron distribution temperature (blue tringles) and yield (red circles) directly looking at the back of the target for the five targets used in this experiment. The flat target (1 # 1-mm gold cylinder) consistently showed the lowest temperature and yield throughout the experiment. Despite the result shown in Fig. 13, due to the lack of statistics and shot-to-shot variability, it is impossible to identify which microwire produces the highest temperature and yield.
Leng
th Period
Diameter
Period
High-Z converter
PeriodWire diameterLengthPeriod
6 nm20 to 30 nm28 nm6 nm20 to 30 nm14 nm3 nm20 to 30 nm15 nm3 nm20 to 30 nm7 nm
U2687JR
Figure 12Table and figure describing the four microwires used on the experiment.
3-nmdiameter
Tem
pera
ture
(MeV
)
Tota
l ele
ctro
n en
ergy
(mJ)
/sr
00
60008
6
4
2
4000
2000
Flat
7-nm w
ires
15-nm
wire
s
14-nm
wire
s
28-nm
wire
s
6-nmdiameter
U2688JR
Figure 13Electron-beam–distribution temperature and energy for the five targets used in this experiment, organized by the wire diameter and the period spacing between the wires.
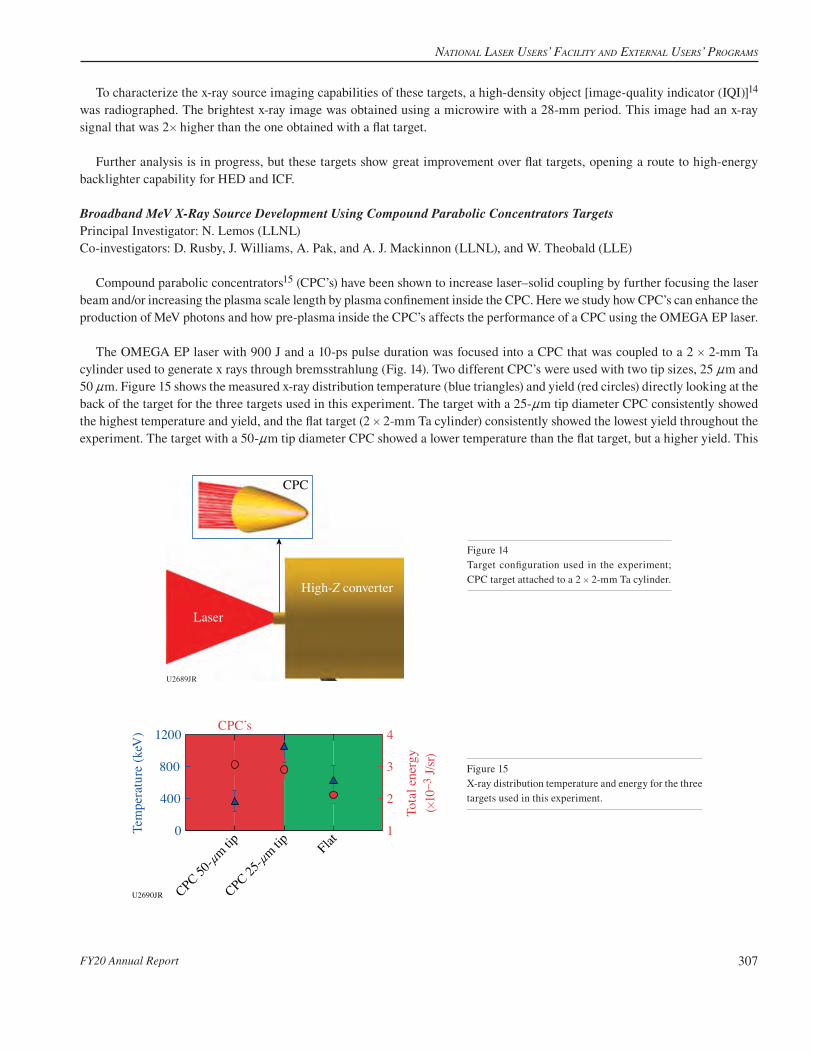
NatioNal laser Users’ Facility aNd exterNal Users’ Programs
FY20 Annual Report 307
To characterize the x-ray source imaging capabilities of these targets, a high-density object [image-quality indicator (IQI)]14 was radiographed. The brightest x-ray image was obtained using a microwire with a 28-mm period. This image had an x-ray signal that was 2# higher than the one obtained with a flat target.
Further analysis is in progress, but these targets show great improvement over flat targets, opening a route to high-energy backlighter capability for HED and ICF.
Broadband MeV X-Ray Source Development Using Compound Parabolic Concentrators TargetsPrincipal Investigator: N. Lemos (LLNL)Co-investigators: D. Rusby, J. Williams, A. Pak, and A. J. Mackinnon (LLNL), and W. Theobald (LLE)
Compound parabolic concentrators15 (CPC’s) have been shown to increase laser–solid coupling by further focusing the laser beam and/or increasing the plasma scale length by plasma confinement inside the CPC. Here we study how CPC’s can enhance the production of MeV photons and how pre-plasma inside the CPC’s affects the performance of a CPC using the OMEGA EP laser.
The OMEGA EP laser with 900 J and a 10-ps pulse duration was focused into a CPC that was coupled to a 2 # 2-mm Ta cylinder used to generate x rays through bremsstrahlung (Fig. 14). Two different CPC’s were used with two tip sizes, 25 nm and 50 nm. Figure 15 shows the measured x-ray distribution temperature (blue triangles) and yield (red circles) directly looking at the back of the target for the three targets used in this experiment. The target with a 25-nm tip diameter CPC consistently showed the highest temperature and yield, and the flat target (2 # 2-mm Ta cylinder) consistently showed the lowest yield throughout the experiment. The target with a 50-nm tip diameter CPC showed a lower temperature than the flat target, but a higher yield. This
U2689JR
Laser
CPC
High-Z converter
Figure 14Target configuration used in the experiment; CPC target attached to a 2 # 2-mm Ta cylinder.
Flat
CPC 50-nm
tip
CPC 25-nm
tip
U2690JR
Tem
pera
ture
(keV
)
Tota
l ene
rgy
(#10
–3 J/
sr)
CPC’s4
1
2
3
1200
0
400
800
Total electron energyTemperature
Figure 15X-ray distribution temperature and energy for the three targets used in this experiment.

FY20 Annual Report308
FY20 Lawrence Livermore nationaL LaboratorY experimentaL programs at the omega Laser FaciLitY
is possibly an indication that the CPC is collecting and focusing the energy on the wings of the laser spot (36-nm diameter at 1/e2) into the CPC tip (larger than the spot size), increasing coupling. To understand how pre-plasma inside a CPC affects the performance of a CPC, a UV beam with 0.7 J was used to create a pre-plasma inside the CPC. This beam was fired before the main pulse with a controlled time delay from 0.25 ns to 3 ns. To evaluate if the CPC performance was degrading over time, x-ray images of an IQI were taken. Time delays over 0.5 ns showed a reduction of the x-ray signal reaching a maximum of 2# for a delay of 3 ns. Figure 16 shows the shadowgraph of the target before the main pulse hits it when a UV beam with delays of –3 ns, –0.5 ns, and –0.25 ns is used. At –0.25 ns [Fig. 16(c)] there is no apparent external CPC expansion, but from 0.5 ns to 3 ns the external CPC expansion is visible, justifying the reduction on the x-ray signal on the radiographs. Further analysis is in progress, but these targets show a great improvement over flat targets, opening a route to high-energy backlighter capability for HED and ICF.
(a) (b) (c)
U2691JR
Figure 16Shadowgraph of the target 100 ps before the main pulse arrives when a UV beam is fired (a) 3 ns, (b) 0.5 ns, and (c) 0.25 ns before the main pulse.
High-Energy-Density Campaigns1. Material Equation-of-State and Strength Measured Using Diffraction
High-Pressure Chemistry in Shocked TATBPrincipal Investigators: M. C. Marshall,* M. G. Gorman, A. Fernandez-Pañella, S. M. Clarke, J. H. Eggert, and L. D. Leininger (LLNL); and D. N. Polsin (LLE) *Currently at LLE
TATB (1-3-5-triamino-2,4,6-trinitrobenzene) is a high explosive known for its insensitivity to external stimuli like high tem-peratures and impacts. When shocked to a sufficiently high pressure, TATB (C6H6N6O6) chemically reacts into solid carbon condensates and gaseous products including N2, CO, CO2, and H2O. In previous OMEGA EP campaigns, we measured the Hugoniot of single-crystal TATB to 83 GPa (Ref. 16) and began searching for the solid carbon reaction products using in-situ x-ray diffraction. We found that TATB single crystals remain highly textured (single crystal-like) when shocked to +50 GPa. At +50 to +90 GPa, there was no longer evidence of the compressed single crystals. Instead, a powder diffraction line was detected that was consistent with compressed diamond. The goal of the FY20 campaign is to confirm the diamond product formation at high pressure.
The targets comprised an epoxy or Be ablator, a TATB sample, and a LiF window. In some shots, there was no “ablator” and the TATB was irradiated directly. Two OMEGA EP beams were stacked in time to produce an +20-ns drive that supported a nearly steady shock through the TATB. The remaining two OMEGA EP beams were incident on an Fe or Cu backlighter foil, generating the x-ray source for the diffraction measurements. Diffraction patterns of the target shortly before the shock exited the TATB were recorded using the PXRDIP diagnostic. VISAR was used to measure interface velocities needed to determine the TATB pressure during the x-ray probe time.
A diffraction line consistent with the (111) reflection of compressed diamond was again observed above 45 GPa (example in Fig. 17) for all shots with an epoxy ablator and one shot using the TATB itself as the ablator. An additional second line consistent with the (220) reflection in diamond was observed in two shots above 100 GPa. Work is ongoing to decouple diffraction from diamond produced in the shocked TATB from possible diamond produced in the reshocked epoxy ablator.

NatioNal laser Users’ Facility aNd exterNal Users’ Programs
FY20 Annual Report 309
U2692JR
220
131
131220
111
111Figure 17Stereographic projection of diffraction data for shot 31374 showing diffraction consistent with the (111) reflection of compressed diamond. Unlabeled powder diffraction rings are from the W pinhole.
Resolidification Kinetics of Tin Along a Shock Ramp PathPrincipal Investigators: M. Gorman and R. Smith
The goal of these experiments was to study the solidification kinetics of shock-melted tin. Tin samples were first shock com-pressed to 90 GPa to ensure the sample had completely melted. Using the pulse-shaping capability of OMEGA EP, the sample was then ramp compressed to 200 GPa back into the solid phase. The crystal structure of the Sn sample was then investigated using the PXRDIP diagnostic.
Samples consisted of a 130-nm Be ablator with a 1-nm Au preheat shield deposited on it. The ablator was bonded to a 35-nm Al pusher and a 12-nm Sn sample. A 150-nm LiF window was then bonded to the sample.
Our VISAR data show good agreement with our designs from hydrodynamic simulations (Fig. 18). The Sn sample was initially shocked to 90 GPa, where shock melting is known to occur, before it was ramp compressed to 200 GPa. The Ge backlighter was timed to probe the sample at peak pressure, and the collected diffraction data are consistent with the bcc phase (Fig. 19).
Our results clearly show that the bcc phase of Sn can nucleate from the melt on nanosecond time scales and also help to constrain the high-pressure melt curve of Sn. These lattice-level measurements support the equation-of-state effort on the NIF, which has studied Sn along various shock ramp paths.
U2693JR
01010 20 30 20
Time (ns)Time (ns)
(b)XRS
timing
(a)
Parti
cle
velo
city
(km
/s)
30
6
4
2
LASNEX
VISAR
Figure 18(a) Raw VISAR data and (b) analyzed velocity data of shot 32953 that show Sn shocked to 90 GPa and then ramped to 200 GPa. The analyzed velocity data (red curve) are in very good agreement with the outputs of our hydrodynamic simulations (dashed black curve). The red-shaded bar indicates the timing and duration of the Ge backlighter source.

FY20 Annual Report310
FY20 Lawrence Livermore nationaL LaboratorY experimentaL programs at the omega Laser FaciLitY
U2694JR
0
16
14
30 402i (º)
z (º
)
Inte
nsity
(arb
itrar
y un
its)
50 807060
10
12
8
6
4
2
–40
0
40
i (º)7030 50
bcc
Figure 19Image-plate diffraction data of shot 32953 with integrated diffraction profile. Several diffraction peaks were observed with at least three found to be consistent with bcc Sn. Other weak diffraction features were found to originate from the Al pusher (not shown).
2. Material Equation-of-State Using Other Techniques
The Metastability Limit of Liquid Water Under Compressive Freezing into Ice VIIPrincipal Investigators: M. C. Marshall, M. Millot, D. E. Fratanduono, Y.-J. Kim, F. Coppari, P. C. Myint, J. L. Belof, J. H. Eggert, R. F. Smith, and J. M. McNaney (LLNL) and D. M. Sterbentz (University of California, Davis)
Kinetics can play an important role in the transformation of matter to different high-pressure phases over the short time scales associated with dynamic-compression experiments. Many theoretical and experimental works have investigated the effects of kinetics on the rapid freezing of water into the ice VII phase. We are studying the metastability limit of ramp-compressed liquid water undergoing freezing into ice VII at the fastest compression rates to date (+1 GPa/ns).
Experiments were done on the OMEGA EP laser. One laser beam was used to shock the 12%Br-CH reservoir that released across a vacuum gap and isentropically loaded the water cell shown in Fig. 20(a). A thin water layer (+15 nm), created using a diving board configuration inside the water cell, was ramp compressed to +15 GPa over +15 ns. Since ice VII is more dense than liquid water, there is a volume collapse in the thin water layer upon freezing. This causes a stress release on the rear sapphire or quartz window, observed experimentally as a dip in the water/window interface velocity using VISAR [Fig. 20(b)]. A sapphire witness is used to record the shot-to-shot variation in the shape of the ramp compression wave and to determine the pressure drive on the front surface of the baseplate17 needed to simulate the half of the target containing the thin water layer.
Preliminary analysis suggests that the freezing pressure increases from 7 to 9 GPa over compression rates of 0.2 to 2 GPa/ns. Data are being compared to the results of previous experiments on the liquid–ice VII phase transition at 10# lower compression rates and to predictions using SAMSA, an LLNL kinetics code.
Development of a Focusing Spectrometer for L-Edge EXAFS Principal Investigator: F. CoppariCo-investigators: A. Coleman, A. Krygier, and Y. Ping (LLNL); and L. Gao, K. W. Hill, P. Efthimion, and M. Bitter (Princeton Plasma Physics Laboratory)
EXAFS (extended x-ray absorption fine structure) spectroscopy is a powerful x-ray probe to determine the local structure and disorder of materials at extreme conditions, including those generated by laser-driven compression.18,19 To collect high-quality EXAFS data, a bright x-ray source and a high spectral resolution spectrometer are needed, especially when studying the material L edge, where the absorption cross section is significantly lower than the K edge. To enable collection of L-edge EXAFS data at the Omega Laser Facility, we developed a new platform for EXAFS measurements based on the use of a Ti-foil backlighter coupled with a focusing spectrometer. Previous backlighter development campaigns demonstrated that Ti foils can generate continuum

NatioNal laser Users’ Facility aNd exterNal Users’ Programs
FY20 Annual Report 311
emission brighter than capsule implosions20 especially at x-ray energies >10 keV. The x-ray source size is also bigger (+300 nm), requiring instruments insensitive to source-size broadening, such as a spectrometer with focusing geometry. The imaging x-ray Thomson spectrometer (IXTS) spectrometer21 was therefore modified to enable EXAFS measurements around 7 keV. A Ge(220) curved crystal was designed to fit the existing spectrometer body [Fig. 21(a)] and used in two half-days on the OMEGA laser to collect EXAFS data at the Gd L3 edge, for a total of 12 target shots. Preliminary characterization of the performance of the new configuration is necessary, including off-line laboratory tests aimed at verifying the dispersion and focusing geometry, plus dedicated flat-field shots to check potential crystal defects that may interfere with the data [Fig. 21(b)].
Good-quality EXAFS data at the Gd L3 edge were collected [Fig. 21(c)], demonstrating enhanced performance of this new configuration in measuring L-edge EXAFS data with respect to the previous attempts based on capsule implosion and a flat
U2695JR
0.5
0.4
0.3
0.2
0.1
0.01301201101009080
Freezing
(b)
Inte
rface
vel
ocity
(km
/s)
Time (ns)
Baseplate/witness
Water/window Water cell
OMEGA EPlaser
4-ns square550 J
Vacu
um g
ap (3
00 n
m)
Br-
CH
rese
rvoi
r (17
0 n
m)
Sapphire baseplate (150 nm) (a)
Kaptonablator
(30 nm)
1.8
mm
Witness
Window
Water layer of interest(10 to 25 nm)
Al coatVISAR
VISAR
Figure 20(a) Schematic of water target and (b) velocities of the baseplate/witness interface (red curve) and water/window interface (blue curve) measured using VISAR for shot 31422. The dip in the water/window interface velocity near 110 ns corresponds to freezing in the thin water layer.
U2696JR
Abs
orpt
ion
(arb
itrar
y un
its)
7300 7400Energy (eV)
7500
Gd L3-edge(a) (c)
(b)
Defects
Figure 21(a) Photograph of the new Ge(220) crystal used in the IXTS spectrometer to collect EXAFS data. (b) Image of the crystal showing some defects that may interfere with the EXAFS measure-ment. (c) Absorption spectrum of Gd (L3 edge at 7243 eV) at ambient conditions before flat-field correction. The feature around 7500 eV may be due to a crystal defect.

FY20 Annual Report312
FY20 Lawrence Livermore nationaL LaboratorY experimentaL programs at the omega Laser FaciLitY
crystal spectrometer, where a good signal-to-noise ratio was obtained by averaging over multiple shots.22 This is a key result in support of the ongoing effort of developing the EXAFS platform on the NIF.
EXAFS Measurements of Shock- and Ramp-Compressed Fe Using the IXTS Spectrometer for Temperature DeterminationPrincipal Investigator: A. L. ColemanCo-investigators: F. Coppari, Y. Ping, and J. McNaney
Temperature determination is one of the greatest challenges in modern laser-driven, dynamic compression experiments. The nanosecond time scales and extreme pressure and temperature conditions at which these experiments are conducted mean that the successful implementation of a temperature diagnostic is challenging and frequently not possible at all. A potential means of obtaining temperature information about a shock- or ramp-compressed sample lies in the analysis of EXAFS data. As a mate-rial becomes hotter, thermal motion of the atoms becomes important and reduces the amplitude of the EXAFS oscillations in a manner that is proportional to the temperature increase [Fig. 22(a)].
The purpose of this campaign was to optimize the IXTS23 spectrometer [Fig. 22(b)] to obtain high-quality EXAFS data from Fe at a series of either shock- or ramp-compressed states, with the intention of determining the sample’s temperature through the analysis of the EXAFS spectra. As well as running IXTS as the primary diagnostic, VISAR data were also obtained to establish the pressure in the Fe sample. Over the course of the two half-day campaigns, 12 shots were taken. Shock-compressed, ramp-compressed, and ambient data sets were obtained along with a flat-field shot (taken once every campaign), which are used to correct the effects of the IXTS crystal defects on the EXAFS data. This experimental configuration made use of a Ti foil back-lighter x-ray source, driven by a 1-ns laser pulse.24 While the ramp target package comprised a diamond/Fe/diamond sandwich structure, a tamper layer was implemented in the shock target, consisting of a material that was closely impedance matched to the Fe layer of interest; the purpose of this additional layer was to hold a steady shock pressure state in the Fe layer for the entire 1-ns duration of the backlighter x-ray source.
U2697JR
71407500740073007200–0.6
–0.2
0.2
Crystal
TCC
CCD
Insertiondirection
Abs
orpt
ion
(arb
itrar
y un
its)
|
7260Energy (eV)Energy (eV)
(b) (c)(a)
Synthetic data
7380 7500
Fe EXAFS at 20 Mbar bcc at 6000 K bcc at 10,000 K hcp at 6000 K hcp at 10,000 K
(c)
Ramp-compressed FeIXTS flat fieldAmbient Fe
Figure 22(a) Simulated Fe EXAFS data are shown at various temperatures, exemplifying the reduction in oscillation amplitude due to increased heat. (b) The IXTS spectrometer schematic is shown.23 A curved Ge(220) crystal is used to observe the energy range around the Fe absorption edge (7.1 keV). (c) Ambient (black curve) and compressed (red curve) absorption spectra of Fe collected during these campaigns are shown along with the flat-field signature of the crystal (blue curve). Bumps in the flat-field data occur as a consequence of crystal defects.
During these campaigns several shielding materials were used to reduce the effect of preheating of the target from the x-ray source. The quality of the data obtained during this experiment was very high, and while the temperature determination analysis

NatioNal laser Users’ Facility aNd exterNal Users’ Programs
FY20 Annual Report 313
U2698JR
5 10Time (ns)
15 20Time (ns)
Pow
er (T
W)
864200.0
0.2
0.4
0.6
0.8
1.0
1.2
1.4
(a) (b)
20 30 300 1003
Vacuumgap
Diamond
OMEGA EPlaser
Auheat shield
Figure 23(a) Target design and experimental laser pulse shape. The OMEGA EP laser is focused onto the diamond flyer (consisting of a diamond ablator, Au heat shield, and diamond pusher), separated by a vacuum gap from the diamond window. The laser pulse was specifically designed to slowly accelerate the diamond flyer plate, avoiding shock formation. (b) VISAR data were collected to measure the flyer velocity prior to the impact and the shock velocity in the window after the impact.
is an ongoing effort, the implementation of this target to access shock- and ramp-compressed states in Fe can be considered to be successful.
Laser-Driven Acceleration of Diamond Flyer Plates Principal Investigator: F. Coppari Co-investigators: A. Lazicki, M. Millot, R. London, H. Whitley, and D. Braun
We are developing a platform for performing reference-free equation-of-state measurements of materials in the multi-Mbar regime to be used as an absolutely calibrated pressure standard in future equation-of-state measurements.
We used the OMEGA EP laser to accelerate diamond flyer plates to hypervelocities across a vacuum gap of known thick-ness and used the VISAR diagnostic to observe the impact of the flyer onto a diamond window (symmetric impact). VISAR provided a measure of the flyer velocity (from which the particle velocity can be obtained) and the shock velocity, before and after the impact, respectively. From these two observables the pressure–density relation of diamond can be obtained by solving the Rankine–Hugoniot equations.25
A tailored, ramped pulse shape was used to slowly accelerate the flyer up to peak velocity [Fig. 23(a)], avoiding melting and keeping its density close to ambient density. The impact generates a reflecting shock in the diamond window when the propagated shock is strong enough to melt the window.
Previous data collected at the Omega Laser Facility reached Us = 24 to 26 km/s. The goal of the OMEGA EP campaign was to take advantage of the higher laser energy to generate stronger shocks and characterize the diamond Hugoniot equation of state above 20 Mbar. Our goal was achieved in five target shots on a day shared with another campaign.
Hydrodynamic simulations were run to optimize pulse shape and target design, and the VISAR data analysis suggests good predictive capabilities. Loss of reflectivity over a couple of nanoseconds was observed [Fig. 23(b)]; the cause is still under inves-tigation. Data analysis will allow us to establish the diamond EOS in an unprecedented pressure range.

FY20 Annual Report314
FY20 Lawrence Livermore nationaL LaboratorY experimentaL programs at the omega Laser FaciLitY
Measuring the Effect of Phase-Plate Speckle Imprint on Plastic Ablators Using 2-D VISAR (OHRV)Principal Investigator: M. GormanCo-investigators: R. Smith, S. Ali, and P. M. Celliers
The goals of these experiments were to investigate (1) the laser imprinting from phase-plate speckle onto plastic (CH) ablators and (2) how these instabilities are smoothed, as a function of the CH thickness. The effect of smoothing by spectral dispersion (SSD) on shock roughness was also investigated. At Omega, the 1-D VISAR provides a record of the compression history within the CH sample, and the 2-D VISAR [known as the OMEGA high-resolution velocimeter (OHRV)] provides a high-resolution spatial map of the CH interface velocity and reflectivity at effective single-time “snapshots” during the compression.
As the laser-produced plasma expands, the incident laser radiation gets absorbed up to the critical density (Fig. 24). Absorp-tion of the laser light couples energy into the CH ablator at or below the critical electron density, and electron heat conduction carries some of this energy from the absorption zone to the ablation front. The phase-plate intensity structure becomes smoothed by lateral transport through the plasma and during shock transit within the CH ablator. The target design for shock roughness measurements consists of different thicknesses of polyimide in the 13- to 75-nm range and a LiF [100] window. To enhance reflectivity, the inner surface of the LiF is coated with 0.2 nm of Al. An +1-nm glue layer is used to adhere the LiF and CH layers. The velocity of the CH/LiF interface is measured by 1-D VISAR and OHRV systems.
U2699JR
Laser
CH ablator
Criticaldensity
Distance (nm)
0.2 nm AlPres
sure
(GPa
)
–400 00
40
80
120
400
LiF
2-D VISAR: Us (x, y)tUs
1-D VISAR: Us (x, t)
Figure 24Experimental design. Laser speckle due to phase-plate uniformities impart insta-bilites in the shock front onto the CH ablator, which are transmitted through to the sample layer. Our experiments use the OHRV system on OMEGA to quantify the shock roughness as a function of CH ablator thickness.
Our results show a clear trend of decreasing shock roughness with CH ablator thickness (Fig. 25). Interestingly, our results also show that the use of SSD is effective in dramatically reducing shock roughness, even in relatively thin CH ablators. These results have important implications for future target designs of laser-driven compression experiments at x-ray free-electron facilities where small-scale laser systems necessitate the need for thinner ablators to reach high sample pressures.
Measurements of Release Isentropes of Proton-Heated Warm Dense Matter with Streaked X-Ray RadiographyPrincipal Investigators: S. Jiang, Y. Ping, and A. LazickiCo-investigators: M. P. Hill (AWE); and A. Saunders, A. Do, D. Swift, J. Nilsen, P. A. Sterne, H. Whitley, and J. H. Eggert (LLNL)
This campaign comprised one day on OMEGA EP during FY20. Following our previous FY19 campaign, which demonstrated the platform to measure the release isentrope of materials heated isochorically using proton heating, the FY20 campaign further used specially designed targets to measure the initial bulk temperature with SOP, and a Thomson parabola along with RCF films to record the spectrum and angular distribution of the proton source.

NatioNal laser Users’ Facility aNd exterNal Users’ Programs
FY20 Annual Report 315
U2700JR Spatial frequency (nm–1)
Velo
city
spec
tral d
ensit
y (m
/s-n
m)
0.10
200
400
600
800
1.0
36 nm (no SSD)50 nm (no SSD)75 nm (no SSD)
36 nm (2-D SSD)50 nm (2-D SSD)75 nm (2-D SSD)
Figure 25Smoothing of particle velocity map is evident as ablator thickness increases. SSD has little relative effect on the roughness of a 75-nm CH ablator but is found to dramatically reduce the roughness in the thinner ablators.
The experiment used the OMEGA EP short pulse to generate a beam of protons, which heated a 500-nm # 50-nm # 50-nm Al ribbon offset from the proton source. Three long-pulse beams were used to heat a V backlighter to provide an x-ray source for streaked x-ray radiography. The time-dependent density profiles calculated from the radiography data were then integrated to obtain pressure–density isentropes [Fig. 26(a)]. The initial bulk temperature was difficult to measure on-shot, however, because the SOP on TIM-12 can be pointed only to the side of the target that was scraped directly by the proton beam. The initial surface temperature on the target side was therefore around 20 to 30 eV—much higher than the bulk temperature. The FY20 campaign used a target that involves a Si mirror on the backside of the 50-nm-thick Al foil. The mirror reflected the emission from the back surface to the SOP, and we were able to derive both the spatial and the temporal temperature distribution of the proton-heated bulk Al. Figure 26(b) shows an initial temperature of around 1.3 eV, which is much lower than the previously measured surface temperature on the side of the Al ribbon.
To account for shot-to-shot variability, the on-shot proton spectrum was also recorded, and we have performed Monte Carlo simulations to calculate the total proton energy deposition inside the target. Preliminary analysis indicates that the energy deposition from an earlier shot shown in Fig. 26(a) is about 3# higher than that from the shot in Fig. 26(b); therefore, the initial bulk tempera-ture for the isentrope in Fig. 26(a) is estimated to be around 4 to 6eV, which is relatively consistent with model predictions. Further analysis is in progress, and future experiments have been planned over a wider temperature range to benchmark different EOS models.
Measuring Off-Hugoniot Equation of State by Shocking Porous MetalsPrincipal Investigator: A. Lazicki-JeneiCo-investigator: S. Jiang, F. Coppari, D. Erskine, R. London, J. Nilsen, and H. Whitley (LLNL); and M. C. Marshall (LLE)
This campaign was designed to use the crushing of pores in an initially porous sample to achieve a hot, solid-density state ahead of the shock front to experimentally access a hotter shock adiabat. Data off of the principal Hugoniot have the potential to provide a more-discriminating test of theoretical models.
The campaign was allocated one half-day and one full day of shots in FY20, for a total of a total of 19 shots (Fig. 27). The first half-day was meant to measure principal and off-Hugoniot states of copper by shocking samples of full-density and +80% porous material. Targets with diamond ablators and quartz impedance-matching standard were mounted on a halfraum that was driven with 21 beams along the H7–H14 axis; shock velocity and/or transit time in adjacent samples of quartz and porous metal were measured using the VISAR and SOP diagnostics.

FY20 Annual Report316
FY20 Lawrence Livermore nationaL LaboratorY experimentaL programs at the omega Laser FaciLitY
U2701JR
1012
1010
2.0
108
0.5
T = 6 eV T = 2 eV
Density (g/cm3)
Pres
sure
(Pa)
T (eV
)
Time
Streaked x-ray radiograph
Ribbon expandingover time
Edge ofprotonsource
Spac
e
1.5 2.5
0.0
0.5
1.0
1.5
200
1000
600
0 2Time (ns)
x (n
m)
4
SOP
Si mirror
Al t
arge
t
SESAME 3718SESAME 3720LEOS 130Experiment
T = 10 eV
(a)
(b)
Figure 26(a) Streaked radiography data and the extracted pressure–density isentrope curve. Isentrope curves from various EOS models at different initial temperatures were also plotted for comparison. (b) Target designed for bulk temperature measurement and SOP data from a 50-nm-thick Al foil.
U2702JRTime
Quartz
PorousAu
VISAR
Posit
ion
SOP
Figure 27(a) Target configuration with VISAR and SOP data from one shot in the porous EOS-20B Campaign, designed to measure principal- and off-Hugoniot states of Au. (b) The VISAR diagnostic registers the in-situ velocity in the quartz impedance-matching standard, and VISAR and SOP record the shock transit time through the Au sample.
The porous Cu material was made by alloying Cu with Zn and then removing the Zn component, leaving a uniformly distributed network of submicron pores, and giving the material a bulk density of 1.40(!0.05) g/cm3. The porous samples were very difficult to machine and suffered from high surface roughness and thickness nonuniformity, which was very evident in the VISAR and

NatioNal laser Users’ Facility aNd exterNal Users’ Programs
FY20 Annual Report 317
SOP data. The sample quality was not adequate for a high-accuracy measurement, but the results were nevertheless important for testing the target and laser drive design. The first half-day was followed by extensive work on target-fabrication methods, and the second full day of shots aimed to measure Hugoniot and off-Hugoniot states of Au. The +70% porous Au samples were made from an Au–Ag alloy with the Ag removed, and the quality was significantly improved. On the second day we successfully shot four full-density Au samples and seven porous samples, varying the drive energy to span a range of shock pressures. We also shot two samples of Cu to complete work from the first half-day and to test the use of fluorescence spectroscopy to measure temperature information. Previous work with smaller hohlraums had successfully pumped Cu fluorescence using the hohlraum radiation. We did not register a spectroscopic signature on either shot, suggesting that the Cu samples were too thick and the radiation from the hohlraum was likely too low in energy.
3. Material Dynamics, Strength, and Ejecta Physics
Characterizing Laser-Driven Tin Ejecta Microjet Interactions with X-Ray RadiographyPrincipal Investigator: A. M. Saunders Co-investigators: C. Stan, S. Ali, K. Mackay, T. Haxhimali, Y. Ping, F. Najjar, B. Morgan, J. H. Eggert, and H.-S. Park (LLNL); and H. G. Rinderknecht (LLE)
The OMEGA and OMEGA EP Ejecta Campaigns seek to develop platforms that investigate ejecta microjet interactions. The microjetting process occurs when a shock wave travels through a sample and interacts with surface defects, such as scratches, dents, or grooves, on the back surface of a sample. The features invert as a limiting case of the Richtmyer–Meshkov instability to form micro-jets.26,27 Many experiments have been performed to understand the effect of experimental parameters like drive pressure, drive-time dependence, and material type on the jetting process and the resulting jet mass and velocity distributions, but very few examples in the literature seek to understand the effects of microjet interactions.28,29 To that end, the ejecta campaigns seek to characterize ejecta microjet interactions with x-ray radiography as a way to understand the physical properties governing microjet interaction behavior.
A schematic of the platform can be seen in Fig. 28(a). Two tin foils are situated opposite from each other and are connected to each other by a thin stalk. Each foil has an angular trench carved across the inside of the foil, as seen in Fig. 28(b). The main drive lasers (on OMEGA) or laser (on OMEGA EP) impinge upon the outsides of the tin samples, and ejecta microjets are driven toward each other into the center of the sample as depicted. We then use a point x-ray source in conjunction with an image plate to take
Main drive
(a) (b)
Main drive
Jet view
Sheet view Groove
Diamond-turned Snsurface
TrenchMicrojet
X-ray sourceTinfoil
Image plateU2703JR
Figure 28(a) A schematic of the interacting microjet platform and the primary imaging diagnostic. The two tin foils are oriented toward each other, and lasers incident on the back sides of the samples drive ejecta microjets into the center. An x-ray source and image plate serve to take time-resolved radiographs of the system. (b) A photo of the bottom of a piece of tin. The groove is clearly visible carved into the diamond-turned tin surface.

FY20 Annual Report318
FY20 Lawrence Livermore nationaL LaboratorY experimentaL programs at the omega Laser FaciLitY
x-ray radiographs of the sample. On OMEGA, the x-ray source consists of a Ti foil offset from a pinhole in order to create a Ti Hea x-ray point source; on OMEGA EP, the x-ray source is a Ti microwire driven by the OMEGA EP short-pulse beam to gener-ate a broadband x-ray source. The primary difference between the OMEGA EP and the OMEGA platforms is the angle at which the microjets interact; due to the nature of the OMEGA laser, the microjets can interact nearly head-on, whereas the OMEGA EP geometry is limited to oblique interactions.
Data from both OMEGA EP and OMEGA platforms show promise with resolving microjet interaction behavior. Figure 29 shows schematics and sample data from both platforms.
Shot 32363, 700 nsWithout maskJet view
Shot 32365, 700 nsWith maskJet view
Without mask With mask
Tin TinEjecta
Laserdrive
(b)
Ejecta-OMEGA-20 B: tin releasing at 1.0 Mbar (liquid phase)
Ejecta-EP-20 A: tin releasing at 0.16 Mbar (solid phase)
(a)
Tin foils Shot 32365, 700 nswith Mask
Shot 96940, 180 ns Side view
Side view
Tin foils
Drive
Drive
Drive
Drive
U2704JR
Figure 29(a) Example data from both the OMEGA and the OMEGA EP platforms. The data on OMEGA EP were taken with a tin release pressure at 0.16 Mbar, which is assumed in the solid phase. The interaction behavior looks markedly different from that observed on the OMEGA platform at 1.0 Mbar, which is believed to be liquid on shock. The side view of the images is shown in both cases, demonstrating the increased planarity with the larger phase plates on OMEGA EP. (b) VisRad models from the OMEGA EP platform showing the addition of masks to reduce the region of microjet that reaches the interaction point. As observed in the data, the masks improve data quality and our ability to resolve absolute density.

NatioNal laser Users’ Facility aNd exterNal Users’ Programs
FY20 Annual Report 319
Data from both OMEGA EP and OMEGA platforms show promise to resolve microjet interaction behavior. Figure 29(a) shows schematics of the interactions, as well as data looking down the region of interaction for the interacting jets and from the side view for a single jet. We see that the microjets from tin releasing into solid at 0.16 Mbar appear to pass through each other unaffected, while the microjets from tin releasing into liquid at 1.0 Mbar form a cloud at the interaction point. More studies remain to be done to determine if the difference in interaction behavior is due to the difference in densities of the microjets or from other materials properties.
Figure 29(b) compares radiographs of the nominal target design taken at the same time after the laser drive was turned on versus a target with the addition of Ta masks on the bottom side. The Ta masks restrict the region of microjetting material that is able to reach the center and allows for better resolution of jet characteristics and interaction behavior. The masks are one such improvement that has been implemented over the course of these campaigns.
Overall, the radiographs show great promise in their ability to study microjet interactions. Further work involves measuring interactions at more drive pressures and on different materials, as well as performing quantitative analyses on the x-ray spectrum so that we can measure the density of microjetting material to a high accuracy. The results will allow for refinement of models used in laboratory hydrocodes that have been described in several publications.30,31
Understanding the Strength of Diamond Under Shock CompressionPrincipal Investigator: C. StanCo-investigators: H.-S. Park, C. Wehrenberg, and A. Krygier (LLNL); and M. Hill (AWE)
Diamond, or HDC, is a critical material for ultrahigh dynamic-compression experiments, in both materials strength and ICF. It possesses extremely high hardness, thermal conductivity, and optical transparency and is therefore used as either a window or capsule material across a wide variety of experiments. Its behavior above the Hugoniot elastic limit is poorly understood. Recent diffraction work shows that it may retain strength up to 20 GPa when compressed to 150 to 300 GPa (Ref. 32). Here, we shock-compress diamond and measure velocimetry and Laue diffraction. Two backlighter types were used: a capsule and a Ge foil.
Both backlighter types show elongated single-crystal diffraction spots (Fig. 30). These are indicative of a single crystal under longitudinal deformation, where deformation is occurring on the unit cell level. In the Ge backlighter shots, the diffraction pat-terns are stronger, and powder diffraction from the pinhole and an Au powder layer can also be seen. These lines should aid in positional calibration of the image plates during diffraction analysis. Overall, the Ge backlighter provided better experimental data.
U2705JR
(a)
(b)
Figure 30(a) Image plates from a capsule backlighter shot; (b) image plates from a Ge backlighter shot.

FY20 Annual Report320
FY20 Lawrence Livermore nationaL LaboratorY experimentaL programs at the omega Laser FaciLitY
2000
1750
1500
1250
250
500
750
1000
25002000150010005000
60
50
40
30
25
35
45
55
PSL
504030Time (ns)
(b)(a)
Space (pixel)
Gro
wth
fact
or
Spac
e (p
ixel
)
20100
1
2
3
4
00
1# SteinbergGuinan09/20 shot day02/20 shot day
U2706JR
Figure 31(a) Typical radiography image, collected at 37.5 ns after the laser is turned off. Fiducial steps and a gold knife edge can be seen at the top of the image; to the right are fiducial rippled steps. The imprint of the directly driven laser can be seen in the center. (b) Growth factor derived from ripple amplitude analysis using the gold knife edge and fiducial steps; values for the two shot days are represented, as well as growth predicted by the Steinberg–Guinan model.33
Measuring Tin Strength Using the Rayleigh–Taylor InstabilityPrincipal Investigators: C. Stan, H.-S. Park, T. Lockard, and D. Swift (LLNL): M. Hill (AWE); G. Righi (University of California, San Diego); and D N. Polsin (LLE)
We measure plastic deformation in tin using directly driven targets with seeded sinusoidal perturbations. The targets consist of a Be ablator (20 nm), a brominated plastic layer (20 nm), epoxy (5 to 7 nm), rippled tin (40 nm), a LiF window (500 nm), and fiducials. Radiography data were collected at varying points in time (20 to 50 ns from laser start time) to determine ripple growth [Fig. 31(a)]. Growth factor was determined from the images using two different methods. In the first method, which we refer to as direct amplitude analysis,
,AA
GFundriven
driven= (1)
where GF is the growth factor and A is the amplitude of the driven and undriven ripples in units of photostimulated luminescence (PSL). In the second method, the modulation transfer function (MTF) method,
,z
zGF MTFundriven
driven
t
t
D
D= (2)
where tDz is the areal density determined from fiducial wedge steps and MTF is determined from a Fourier transform across the knife edge. The MTF provides a measure of the x-ray beam spot size for the measurement and therefore determines the instrumental resolution.
Initial analysis using the MTF analysis method [Fig. 31(b)] shows that the growth was lower than anticipated by Steinberg–Guinan strength modeling.33
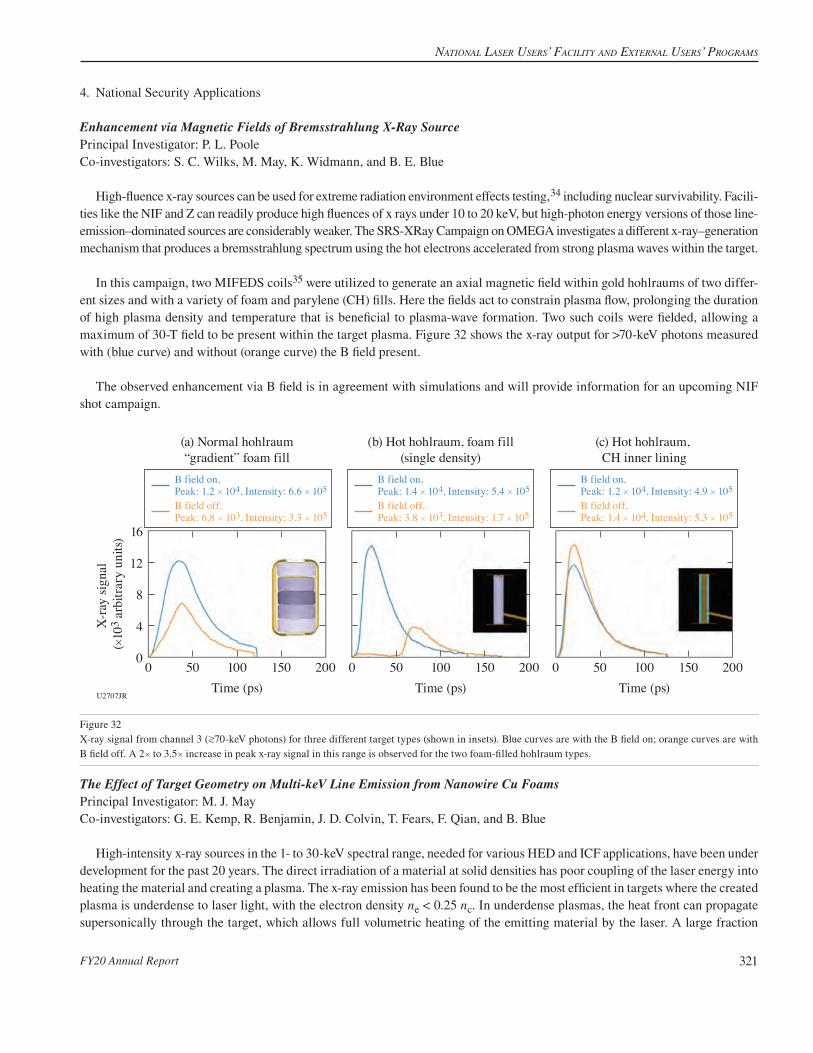
NatioNal laser Users’ Facility aNd exterNal Users’ Programs
FY20 Annual Report 321
4. National Security Applications
Enhancement via Magnetic Fields of Bremsstrahlung X-Ray SourcePrincipal Investigator: P. L. Poole Co-investigators: S. C. Wilks, M. May, K. Widmann, and B. E. Blue
High-fluence x-ray sources can be used for extreme radiation environment effects testing,34 including nuclear survivability. Facili-ties like the NIF and Z can readily produce high fluences of x rays under 10 to 20 keV, but high-photon energy versions of those line-emission–dominated sources are considerably weaker. The SRS-XRay Campaign on OMEGA investigates a different x-ray–generation mechanism that produces a bremsstrahlung spectrum using the hot electrons accelerated from strong plasma waves within the target.
In this campaign, two MIFEDS coils35 were utilized to generate an axial magnetic field within gold hohlraums of two differ-ent sizes and with a variety of foam and parylene (CH) fills. Here the fields act to constrain plasma flow, prolonging the duration of high plasma density and temperature that is beneficial to plasma-wave formation. Two such coils were fielded, allowing a maximum of 30-T field to be present within the target plasma. Figure 32 shows the x-ray output for >70-keV photons measured with (blue curve) and without (orange curve) the B field present.
The observed enhancement via B field is in agreement with simulations and will provide information for an upcoming NIF shot campaign.
U2707JR
(a) Normal hohlraum“gradient” foam fill
(b) Hot hohlraum, foam fill(single density)
(c) Hot hohlraum, CH inner lining
16
0
4
8
12
X-r
ay si
gnal
(#
103
arbi
trary
uni
ts)
Time (ps)500 100 150 200
Time (ps)500 100 150 200
Time (ps)500 100 150 200
B field on, Peak: 1.2 # 104, Intensity: 6.6 # 105
B field off, Peak: 6.8 # 103, Intensity: 3.3 # 105
B field on, Peak: 1.4 # 104, Intensity: 5.4 # 105
B field off, Peak: 3.8 # 103, Intensity: 1.7 # 105
B field on, Peak: 1.2 # 104, Intensity: 4.9 # 105
B field off, Peak: 1.4 # 104, Intensity: 5.3 # 105
Figure 32X-ray signal from channel 3 (L70-keV photons) for three different target types (shown in insets). Blue curves are with the B field on; orange curves are with B field off. A 2# to 3.5# increase in peak x-ray signal in this range is observed for the two foam-filled hohlraum types.
The Effect of Target Geometry on Multi-keV Line Emission from Nanowire Cu FoamsPrincipal Investigator: M. J. MayCo-investigators: G. E. Kemp, R. Benjamin, J. D. Colvin, T. Fears, F. Qian, and B. Blue
High-intensity x-ray sources in the 1- to 30-keV spectral range, needed for various HED and ICF applications, have been under development for the past 20 years. The direct irradiation of a material at solid densities has poor coupling of the laser energy into heating the material and creating a plasma. The x-ray emission has been found to be the most efficient in targets where the created plasma is underdense to laser light, with the electron density ne < 0.25 nc. In underdense plasmas, the heat front can propagate supersonically through the target, which allows full volumetric heating of the emitting material by the laser. A large fraction
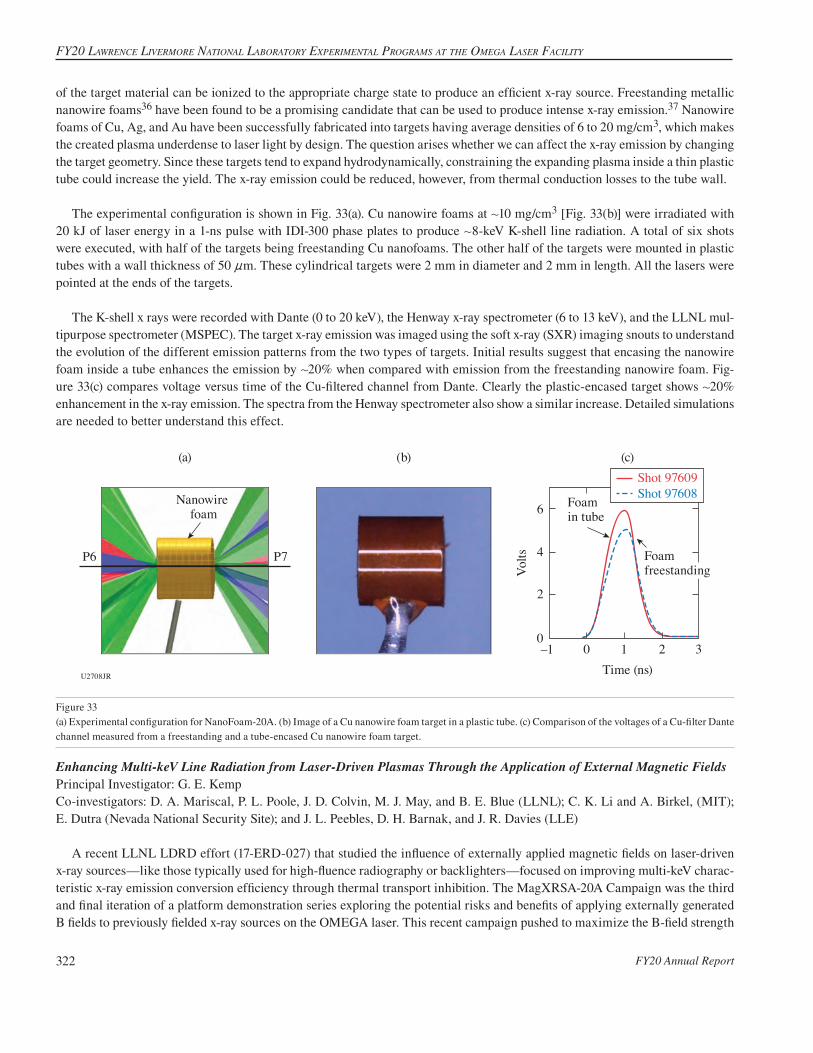
FY20 Annual Report322
FY20 Lawrence Livermore nationaL LaboratorY experimentaL programs at the omega Laser FaciLitY
of the target material can be ionized to the appropriate charge state to produce an efficient x-ray source. Freestanding metallic nanowire foams36 have been found to be a promising candidate that can be used to produce intense x-ray emission.37 Nanowire foams of Cu, Ag, and Au have been successfully fabricated into targets having average densities of 6 to 20 mg/cm3, which makes the created plasma underdense to laser light by design. The question arises whether we can affect the x-ray emission by changing the target geometry. Since these targets tend to expand hydrodynamically, constraining the expanding plasma inside a thin plastic tube could increase the yield. The x-ray emission could be reduced, however, from thermal conduction losses to the tube wall.
The experimental configuration is shown in Fig. 33(a). Cu nanowire foams at +10 mg/cm3 [Fig. 33(b)] were irradiated with 20 kJ of laser energy in a 1-ns pulse with IDI-300 phase plates to produce +8-keV K-shell line radiation. A total of six shots were executed, with half of the targets being freestanding Cu nanofoams. The other half of the targets were mounted in plastic tubes with a wall thickness of 50 nm. These cylindrical targets were 2 mm in diameter and 2 mm in length. All the lasers were pointed at the ends of the targets.
The K-shell x rays were recorded with Dante (0 to 20 keV), the Henway x-ray spectrometer (6 to 13 keV), and the LLNL mul-tipurpose spectrometer (MSPEC). The target x-ray emission was imaged using the soft x-ray (SXR) imaging snouts to understand the evolution of the different emission patterns from the two types of targets. Initial results suggest that encasing the nanowire foam inside a tube enhances the emission by +20% when compared with emission from the freestanding nanowire foam. Fig-ure 33(c) compares voltage versus time of the Cu-filtered channel from Dante. Clearly the plastic-encased target shows +20% enhancement in the x-ray emission. The spectra from the Henway spectrometer also show a similar increase. Detailed simulations are needed to better understand this effect.
U2708JR
Nanowire foam
(a)
P6 P7
320
2
4
6
10–1Time (ns)
(c)
Volts
Foam in tube
Shot 97609Shot 97608
(b)
Foam freestanding
Figure 33 (a) Experimental configuration for NanoFoam-20A. (b) Image of a Cu nanowire foam target in a plastic tube. (c) Comparison of the voltages of a Cu-filter Dante channel measured from a freestanding and a tube-encased Cu nanowire foam target.
Enhancing Multi-keV Line Radiation from Laser-Driven Plasmas Through the Application of External Magnetic FieldsPrincipal Investigator: G. E. Kemp Co-investigators: D. A. Mariscal, P. L. Poole, J. D. Colvin, M. J. May, and B. E. Blue (LLNL); C. K. Li and A. Birkel, (MIT); E. Dutra (Nevada National Security Site); and J. L. Peebles, D. H. Barnak, and J. R. Davies (LLE)
A recent LLNL LDRD effort (17-ERD-027) that studied the influence of externally applied magnetic fields on laser-driven x-ray sources—like those typically used for high-fluence radiography or backlighters—focused on improving multi-keV charac-teristic x-ray emission conversion efficiency through thermal transport inhibition. The MagXRSA-20A Campaign was the third and final iteration of a platform demonstration series exploring the potential risks and benefits of applying externally generated B fields to previously fielded x-ray sources on the OMEGA laser. This recent campaign pushed to maximize the B-field strength

NatioNal laser Users’ Facility aNd exterNal Users’ Programs
FY20 Annual Report 323
to 40 T (versus 20 T from MagXRSA-19A), into a regime where little to no data currently exist for such high-Z, non-LTE (local thermodynamic equilibrium), magnetized plasma conditions. The data from this platform will be used to constrain thermal transport inhibition and MHD models currently used in the multi-physics radiation-hydrodynamic code HYDRA.38
The experimental configuration is illustrated in Fig. 34(a). Thin-walled, cylindrical Kr gas pipes (1.5 atm) were irradiated with 20 kJ of laser energy in a 1-ns pulse—a typical source of +13-keV K-shell line radiation. A total of six shots were taken, half of which had externally imposed B fields. A dual-MIFEDS design was adopted to reach +40-T axial B-field strengths. The primary goal of the shots was quantifying changes in x-ray emission with increasing external B-field strength, recorded with Dante (0 to 20 keV), hard x-ray detectors (20 to 500 keV), pinhole cameras [>2 keV, Fig. 34(b)], and the dual-channel spectrometer (11 to 45 keV). Secondary diagnostics included stimulated Raman/Brillouin laser backscatter and proton radiography using a D3He backlighter capsule as a source of 3- and 15-MeV protons. Analysis is ongoing, but initial results suggest +1.5# enhancements in >8-keV Kr K-shell emission and +3.3# improvement in >80-keV continuum emission with a 40-T field; the enhancement effect appears to saturate at around 20 to 30 T, which is consistent with pre-shot modeling.39
The successful demonstration of this platform has motivated the development of a magnetized x-ray source platform on NIF—dubbed MAGNETO—where +1.5 to 2# improvements in Ag K-shell (+23-keV) emission from nanowire foam sources have already been observed with a 25-T field (shot N200609-002) provided by the new MAGNIF pulser.40
P6
U2709JR
D3He target19 drive beams(3 and 15 MeV p+)
Kr gas-pipe target1.5 atm
40 drive beams
Fill tubeP7
Proton radiography:B-field generation and evolution
SRS and SBS laser backscatter:Changes in plasma conditions
X-ray diagnostics:DANTEHXRDXRPHCDCSHXRSP
(b)(a)
H13C XRPHC(>2 keV)
(View)
2000
1500
1000
500
0
0 T
30 T
40 T
MIFEDS
MIFEDS
p+
Figure 34 (a) Experimental configuration for MagXRSA-20A. X-ray emission, laser backscatter, and proton radiography data were simultaneously obtained to quantify the influence of external B fields on laser-driven Kr plasmas. (b) Representative time-integrated x-ray pinhole data illustrating the saturation of the B-field effect; roughly 30% higher >2-keV integrated signals were observed for fields 20 T and above.
Improving Exploding-Pusher Performance with Optimized Pulse ShapesPrincipal Investigator: M. HohenbergerCo-investigators: T. J. B. Collins and M. J. Rosenberg (LLE); and L. Divol, C. Yeamans, B. E. Blue, and W. W. Hsing (LLNL)
Experiments were conducted to study the performance of exploding-pusher (XP) target implosions using computationally optimized pulse shapes to maximize the neutron yield. The yield from XP’s primarily stems from shock heating of the fusionable fill gas, and these implosions exhibit low convergence, low areal densities, and high ion temperatures. XP’s are typically driven by single shock pulse shapes, e.g., Gaussian, flattop, or ramped pulses, and, by virtue of their shock-driven nature, are insensitive to degradation mechanisms that affect high-convergence implosions, such as electron preheat or Rayleigh–Taylor instabilities. While neither yield amplification nor a propagating burn is accessible at these conditions, significant neutron yields in excess of 1016 have been demonstrated on the NIF, making XP’s a robust source for, e.g., nuclear effects studies and other applications.
Glow-discharge plasma (GDP) targets with an 860-nm outer diameter and 8-nm-thick walls and filled with 10 atm of room-temperature D2 gas were symmetrically imploded using all 60 OMEGA beams with +250 J/beam. As shown in Figs. 35(a)–35(c) as

FY20 Annual Report324
FY20 Lawrence Livermore nationaL LaboratorY experimentaL programs at the omega Laser FaciLitY
dashed lines, three different pulse shapes were compared: a simple flattop as a baseline reference [Fig. 35(a)] and two multi-shock pulse shapes based on computational optimization using the hydrodynamic code Telios,41 which in simulations improved both the free-fall and total yield by >40% compared to the baseline. The experimental pulse shapes [dashed lines in Figs. 35(a)–35(c)] qualitatively reproduced the optimized pulses, but difficulties in the pulse shaping resulted in reduced energy by as much as 25%.
Experimental yields are shown in Fig. 35(d) for the three designs as a function of total laser energy. Notably, while the yield appears to roughly scale with incident energy, an assessment of performance with respect to pulse shape is difficult given the differences in total energy and shock timing compared to the optimized requests. Post-shot simulations are currently in progress, but preliminary results indicate that (1) the experimental performance trends are captured well by simulations42 and (2) that experimental yield increase of the order of 30% beyond the baseline may be feasible with improved pulse shaping of the multi-shock designs.
5. Plasma Properties
Measurement of Au M-Shell Emission Using a Buried-Layer PlatformPrincipal Investigator: E. V. MarleyCo-investigators: R. F. Heeter, M. B. Schneider, G. E. Kemp, M. E. Foord, D. A. Liedahl, and J. Emig (LLNL); and D. Bishel (LLE)
This campaign was designed to measure emitted M-shell gold spectra from a well-characterized and uniform plasma to bench-mark atomic kinetic models. The buried-layer target geometry used for this experiment is capable of generating plasmas with an electron temperature of +2 keV at electron densities of 1021 electrons per cubic centimeter. Similar plasmas have also been found inside gold hohlraums during ICF experiments on the NIF. The OMEGA laser–target configuration provides a stable platform to create uniform plasmas for radiation transport and atomic kinetic studies at relevant conditions.
Planar, buried-layer targets were illuminated equally on both sides (Fig. 36) to heat the sample. The sample used in the cam-paign was a 1300-Å-thick Au/V mixture (0.27/0.73 by atoms) designed to burn through completely before the end of the laser pulse, resulting in highly uniform plasma conditions to measure the M-shell emission of the gold. The samples were buried between two 5-nm-thick layers of Be, which acted as an inertial tamp, slowing the expansion of the sample. This campaign was a repeat of the FY19 campaign, correcting for a target-fabrication issue, which had previously compromised the hydrodynamic behavior of the expanding plasma.
Time-resolved 2-D images of the target’s x-ray emission, viewed both face on and side on, were recorded using pinhole cameras coupled to framing cameras. The 4~ probe beam and Thomson spectrometer were also used to measure scattering, including both
U2710JR Time (ns) Time (ns)Time (ns)
Tota
l pow
er (T
W)
Neu
tron
yiel
d ( #
1011
)
0.5 1.01.0 0.00.0 0.5 1.00.00.5Laser energy (kJ)
(b) Two peak (c) Flat with foot(a) Square-pulse/baseline (d)
17161514130
10
20
2
3
4
SquareTwo-peakFlat with foot
Figure 35Exploding-pusher performance was tested with three pulse shape designs: (a) square pulse as a reference, (b) a two-peak design, and (c) a flattop with foot. Experimental pulse shapes (solid lines) suffered from pulse-shaping difficulties, and both shaped pulses in (b) and (c) underperformed in energy compared to the requests (dashed lines). (d) Experimental neutron yields scaled with incident laser energy, but differences between requested and delivered pulse shapes make a correlation between performance and pulse shape difficult.

NatioNal laser Users’ Facility aNd exterNal Users’ Programs
FY20 Annual Report 325
U2711JR
Target
Laser
Laser Laser
Laser
Figure 36Experimental configuration and Thomson-scattering data of shot 96710.
the electron and ion-acoustic features (see Fig. 36). A new optical filter package was used during the campaign to filter out the self-emission and unconverted light, which has been an issue in the past with high-Z targets, and good-quality data were obtained. The K-shell spectra from the V were used to determine the electron temperature of the plasma. The time-resolved spectra were recorded using a crystal spectrometer coupled to a framing camera. Two crystal spectrometers were used to record the full range of the Au M-shell emission, also time resolved. All of the framing cameras, those used for imaging as well as those used for spectroscopy, were co-timed so the plasma conditions could be determined for the measured Au M-shell emission.
A single pulse shape was used during the campaign, a 3.0-ns square pulse with a 100-ps picket arriving 1 ns before the main pulse. A complete set of data from all six diagnostics, fully cross-timed, was recorded during the campaign at temperatures +2 keV.
Developing a Robust Temperature Diagnostic for High-Energy-Density Experiments Using X-Ray Fluorescence SpectroscopyPrincipal Investigator: M. J. MacDonaldCo-investigators: T. Döppner, A. M. Saunders, H. A. Scott, and T. Baumann, (LLNL); S. R. Klein, M. P. Springstead, H. J. LeFevre, K. Ma, C. C. Kuranz, and E. Johnsen (University of Michigan); and R. W. Falcone (University of California, Berkeley)
Although temperature is a fundamental parameter in plasma physics, a limited number of experimental diagnostics exist to measure temperature in HED experiments. In particular, measurements of temperatures relevant to HED hydrodynamic experi-ments (tens of eV) are typically limited to surface measurements or very low densities where absorption spectroscopy can be used with soft x rays. The FoamXRFTS Campaign aims to develop x-ray fluorescence (XRF) spectroscopy as an in-situ diagnostic for temperatures as low as 10 eV using K-shell fluorescence of mid-Z elements in combination with time-resolved x-ray Thomson scattering (XRTS).
In these experiments, planar shocks were driven into Co-doped carbon foams and probed using a Zn Hea x-ray source as shown in Fig. 37(a). The Zn Hea probe both excites Co K-shell XRF and serves as the source for the XRTS measurements to independently measure the plasma temperature. An example of the XRF data collected using the IXTS is shown in Fig. 37(b), where the spatially resolved measurement separates emission from the shock-heated foam and the unshocked foam. The change
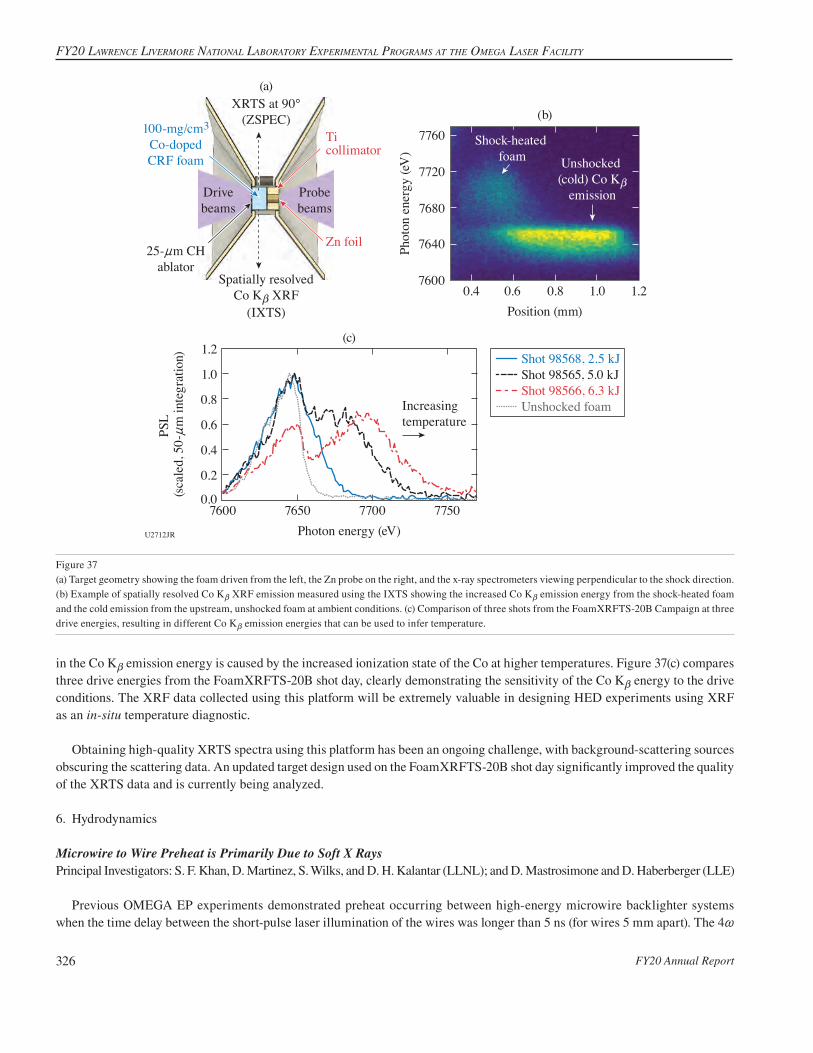
FY20 Annual Report326
FY20 Lawrence Livermore nationaL LaboratorY experimentaL programs at the omega Laser FaciLitY
U2712JR
XRTS at 90°(ZSPEC)
(a)
(b)
(c)
Spatially resolvedCo Kb XRF
(IXTS)
Ticollimator
Probebeams
Zn foil
100-mg/cm3
Co-dopedCRF foam
25-nm CHablator
Drivebeams
7760
7720
7640
7680
7600
Phot
on e
nerg
y (eV
)
1.21.00.8Position (mm)0.60.4
Unshocked (cold) Co Kb
emission
Shock-heated foam
1.0
1.2
0.0
0.2
0.6
0.8
0.4
PSL
(sca
led,
50-n
m in
tegr
atio
n)
77507700Photon energy (eV)
76507600
Shot 98568, 2.5 kJShot 98565, 5.0 kJShot 98566, 6.3 kJUnshocked foamIncreasing
temperature
Figure 37(a) Target geometry showing the foam driven from the left, the Zn probe on the right, and the x-ray spectrometers viewing perpendicular to the shock direction. (b) Example of spatially resolved Co Kb XRF emission measured using the IXTS showing the increased Co Kb emission energy from the shock-heated foam and the cold emission from the upstream, unshocked foam at ambient conditions. (c) Comparison of three shots from the FoamXRFTS-20B Campaign at three drive energies, resulting in different Co Kb emission energies that can be used to infer temperature.
in the Co Kb emission energy is caused by the increased ionization state of the Co at higher temperatures. Figure 37(c) compares three drive energies from the FoamXRFTS-20B shot day, clearly demonstrating the sensitivity of the Co Kb energy to the drive conditions. The XRF data collected using this platform will be extremely valuable in designing HED experiments using XRF as an in-situ temperature diagnostic.
Obtaining high-quality XRTS spectra using this platform has been an ongoing challenge, with background-scattering sources obscuring the scattering data. An updated target design used on the FoamXRFTS-20B shot day significantly improved the quality of the XRTS data and is currently being analyzed.
6. Hydrodynamics
Microwire to Wire Preheat is Primarily Due to Soft X RaysPrincipal Investigators: S. F. Khan, D. Martinez, S. Wilks, and D. H. Kalantar (LLNL); and D. Mastrosimone and D. Haberberger (LLE)
Previous OMEGA EP experiments demonstrated preheat occurring between high-energy microwire backlighter systems when the time delay between the short-pulse laser illumination of the wires was longer than 5 ns (for wires 5 mm apart). The 4~

NatioNal laser Users’ Facility aNd exterNal Users’ Programs
FY20 Annual Report 327
probe shadowgraphs (Fig. 38) of one of the tungsten wires show a material expansion of +5# after 15 ns, resulting from local absorption of the other wire’s emission.
In the FY20 DoubleHEBL (high-energy backlighter) experiments, we concluded that the hot electrons emitted from the first wire are not a substantial contributor to the preheat experienced by the other wire by using an +8-T magnetic field (generated by MIFEDS) to divert electrons (<5 MeV) from impacting the second wire. We took a shot with the B field off, and both shots show the same amount of wire preheat, indicating that the primary mechanism of preheat is not affected by a magnetic field. In a separate configuration, we used a 25-nm-thick polyimide shielding between the two microwires, which successfully prevented preheat expansion. Using transmission attenuation tables, x rays less than 1.5 keV are +99% blocked by this shielding. In addi-tion to the 4~ probe shadowgraphy data, the relative wire sizes in these experiments were tracked by inferring the resolution (Fig. 39) from the potentially preheated wires by radiographing a solid tungsten-carbide sphere. Simulations are in progress to better understand the mechanisms involved in microwire preheat.
U2714JR
35
10
15
20
25
30
Effective radiography source size
Shot number
50 ps0 T
50 ps8 T
10 ps8 T
10 ps75 poly
50 ps75 poly
50 ps25 poly
3329
333
295
3329
733
299
33303
33301
Min
or F
WH
M (n
m) Second wire
First wire Figure 39Plot of the inferred source size (resolution) from the microwires. The 50 ps/10 ps indicate the laser pulse duration (with 1 kJ/0.9 kJ). The higher-intensity short pulse clearly generates more preheat expansion (shot 33297 versus 33295). In addition, there is an indication of self-generated preheat (shot 33299 versus 33301) where both wires have a better resolution with the shorter pulse. Shot 33293 versus 33295 shows the same expansion with and without B field. Finally, comparing shot 33297 to 33299 shows the benefit of the polyimide for shielding the second wire.
U2713JR
1000800600400 1000800
(a) (b)
Space (pixel)
Spac
e (p
ixel
)
Space (pixel)600400
1400
1600
1800
1200
1000
Figure 38The 4~ probe shadowgraphs of a 12.5-nm tungsten wire (a) before and (b) after being exposed for 15 ns to the radiation from another nominally identical wire. Both the wire holder and the wire show an expanded size after the exposure. The bright spot in the left image is the emission when the short pulse hits the wire after the 4~ probe laser pulse. Images from shot numbers 33296 and 33297 (10 September 2020).

FY20 Annual Report328
FY20 Lawrence Livermore nationaL LaboratorY experimentaL programs at the omega Laser FaciLitY
Wakefield X-Ray Source for Radiography Above 100 keVPrincipal Investigator: F. AlbertCo-investigators: M. King (LLNL and University of Texas, Austin); N. Lemos, J. Williams, and H. Chen (LLNL); J. L. Shaw and D. H. Froula (LLE); and M. Sainclair and C. Joshi (University of California, Los Angeles)
X-ray backlighting is one of the most commonly used methods to look into the extreme temperatures, pressures, and densities created during laser-driven HED science experiments. Over the years, much effort has gone into developing backlighting tech-niques to look into these states of matter with new sources and diagnostics. The properties of an x-ray backlighter (flux, source size, spectrum, duration) required for an experiment depend on the application being studied and the quantity being measured. The goal of the Wakefield-EP shot series is to develop a new type of x-ray backlighter, which could be advantageous for applica-tions requiring broadband spectra, small source sizes (sub-50 nm), short duration (less than 10 ps), and x rays extending beyond 100 keV. Our proposed x-ray sources are based on laser wakefield acceleration (LWFA) of electrons in the self-modulated regime (SMLWFA). Specifically, we aim to develop three different x-ray sources based on betatron radiation, Compton scattering, and bremsstrahlung emission.
The Wakefield-EP-20A shot day aimed at producing and detecting betatron radiation produced by SMLWFA using a modified version of the EPPS diagnostic. We enlarged apertures to 5 mm (instead of 1 mm) and included a hole at the back of the magnet box, as well as a stack of nine image plates at the back of the TIM boat to detect betatron radiation. Initial analysis of our experi-ments shows that EPPS was successful at simultaneously recording electron, spectrum, profile, and x-ray data.
The wakefield platform produced robust electron beam data, recording a >100-nC charge electron beam at each shot, as well as two-temperature spectra extending up to about 200 MeV. The signal-to-noise ratio must be further improved for more-efficient x-ray detection. Monte Carlo simulations are providing additional diagnostic shielding enhancements for the next shot day in February 2021.
Supersonic-to-Subsonic Transition of Radiation Transport in Silica AerogelPrincipal Investigators: D. Rusby, F. Albert, R. A. Colón Quiñones, C. Harris, S. Murray, S. Prisbrey, and H. K. Widmann (LLNL); and H. G. Rinderknecht (LLE)
In laser-driven ramp-compression experiments aimed at measuring the equation of state of various materials, an incident shock can reflect at the interface between low and high impedance layers and the reflected shock subsequently interacts with the incident shock. Within this context, it is critical to understand how well radiation-hydrodynamic codes capture the physics of colliding shocks or pressure fronts. The ESPADA platform was designed for this purpose. ESPADA-20A, the first campaign on OMEGA, observed the shock front induced by the supersonic-to-subsonic transition of a Marshak wave in silica aerogel and compared the results with the radiation-hydrodynamic code KULL. Supersonic-to-subsonic radiation transition induces a diagnosable shock wave that can be observed with x-ray radiography.
During this initial half-day of shots, a halfraum was driven to temperatures +120 eV by 21 OMEGA beams (3-ns flattop pulse with 273 J/beam). This x-ray drive launched a Marshak wave through a 2-mm-diam, 2-mm-long, 30-nm-thick gold tube filled with SiO2 foam (33 mg/cm3) attached on the other side of the halfraum. A 12-nm-thick Ti foil was driven with 21 additional beams to provide a near-monochromatic 4.7-keV x-ray backlighter source oriented quasi-perpendicular to the gold tube’s axis. A 200-nm-wide slit on each side of the tube allowed the x rays to pass through the foam, and the x-ray images of the target were recorded on a four-strip x-ray framing camera at different times (Fig. 40).
Our initial results (Fig. 40) show reasonable agreement between the experiment and simulations.43 The larger discrepancy observed at early times is possibly due to a smaller contrast ratio—a consequence of the lower number of photons of the back-lighter in the region corresponding to earlier times. For our next experiment in January 2021 we expect closer comparison with an improved backlighter source, and we will image shock/shock interactions by launching a strong shock (few Mbar) by direct laser ablation from the other side of the target.

NatioNal laser Users’ Facility aNd exterNal Users’ Programs
FY20 Annual Report 329
REFERENCES
1. LLE 1999 Annual Report, October 1998–September 1999, 222, Rochester, NY, LLE Document No. DOE/SF/19460-332 (2000).
2. J. H. Eggert et al., Nat. Phys. 6, 40 (2010).
3. M. Millot et al., Phys. Plasmas 27, 102711 (2020).
4. S. Le Pape et al., Phys. Rev. Lett. 120, 245003 (2018).
5. M. Millot et al., Phys. Rev. B 97, 144108 (2018).
6. M. Millot et al., Nature 569, 251 (2019).
7. D. K. Bradley et al., Phys. Plasmas 16, 042703 (2009).
8. D. K. Bradley et al., Phys. Rev. Lett. 102, 075503 (2009).
9. S. W. Haan et al., Phys. Plasmas 18, 051001 (2011).
10. J. P. Knauer et al., Phys. Plasmas 17, 056318 (2010).
11. C. Goyon et al., Phys. Rev. E 95, 033208 (2017).
12. H. Morita et al., Phys. Rev. E 103, 033201 (2021).
13. S. Jiang et al., Phys. Rev. Lett. 116, 085002 (2016).
14. C. Courtois et al., Phys. Plasmas 18, 023101 (2011).
U2715JR
Experimental radiographs (4.7 keV)
4.6 ns
5.1 ns
5.6 ns
Induced shock
Distance (cm)
(b)(a)
Nor
mal
ized
tran
smiss
ion
0.04 0.05 0.06 0.07
0.4
0.8
1.4
1.2
1.0
0.6
0.2
0.0
4.6 ns (experiment)4.6 ns (simulation)5.1 ns (experiment)5.1 ns (simulation)5.6 ns (experiment)5.6 ns (simulation)
Figure 40Experimental data with (a) images for the induced shock recorded with x-ray radiography and (b) comparison between experimental and simulated shock location (using the code KULL) for different timings.

FY20 Annual Report330
FY20 Lawrence Livermore nationaL LaboratorY experimentaL programs at the omega Laser FaciLitY
15. A. G. MacPhee et al., Optica 7, 129 (2020).
16. M. C. Marshall et al., J. Appl. Phys. 127, 185901 (2020)
17. D. M. Sterbentz et al., J. Appl. Phys. 128, 195903 (2020).
18. B. Yaakobi et al., Phys. Rev. Lett. 95, 075501 (2005).
19. Y. Ping et al., Phys. Rev. Lett. 111, 065501 (2013).
20. A. Do et al., Rev. Sci. Instrum. 91, 086101 (2020).
21. E. J. Gamboa et al., Rev. Sci. Instrum. 83, 10E108 (2012).
22. Y. Ping et al., Rev. Sci. Instrum. 84, 123105 (2013).
23. E. J. Gamboa et al., Rev. Sci. Instrum. 83, 10E108 (2012).
24. A. Do et al., Rev. Sci. Instrum. 91, 086101 (2020).
25. Ya. B. Zel’dovich and Yu. P. Raizer, Physics of Shock Waves and High-Temperature Hydrodynamic Phenomena, edited by W. D. Hayes and R. F. Probstein (Dover, Mineola, NY, 2002).
26. R. D. Richtmyer, Commun. Pure. Appl. Math. 13, 297 (1960).
27. E. E. Meshkov, Izv. Akad. Nauk SSSR, Mekh. Zhidk. Gaza 334, 151 (1969).
28. W. T. Buttler et al., J. Fluid Mech. 703, 60 (2012).
29. T. de Rességuier et al., J. Appl. Phys. 124, 065106 (2018).
30. A. M. Saunders et al., AIP Conf. Proc. 2272, 120025 (2020).
31. K. K. Mackay et al., J. Appl. Phys. 128, 215904 (2020).
32. M. J. MacDonald et al., Appl. Phys. Lett. 116, 234104 (2020).
33. D. J. Steinberg, S. G. Cochran, and M. W. Guinan, J. Appl. Phys. 51, 1498 (1980).
34. M. J. May et al., Phys. Plasmas 25, 056302 (2018).
35. O. V. Gotchev et al., Rev. Sci. Instrum. 80, 043504 (2009).
36. F. Qian et al., Nano Lett. 17, 7171 (2017).
37. M. J. May et al., Phys. Plasmas 25, 056302 (2018).
38. M. M. Marinak et al., Phys. Plasmas 8, 2275 (2001).

NatioNal laser Users’ Facility aNd exterNal Users’ Programs
FY20 Annual Report 331
39. G. E. Kemp et al., Phys. Plasmas 23, 101204 (2016).
40. B. Pollock et al., Bull. Am. Phys. Soc. 64, TO6.00007 (2019).
41. J. A. Delettrez, T. J. B. Collins, and C. Ye, Phys. Plasmas 26, 062705 (2019).
42. T. J. B. Collins et al., “Optimized Pulse Shapes for Improved Exploding-Pusher Peformance,” presented at the 62nd Annual Meeting of the American Physical Society Division of Plasmas Physics, Memphis, TN, 9–13 November 2020.
43. R. Colon Quinones et al., “Shock Wave Formation Induced by the Supersonic-to-Subsonic Transition of Radiation Transport in Silica Aerogel,” presented at the 62nd Annual Meeting of the American Physical Society Division of Plasmas Physics, Memphis, TN, 9–13 November 2020.

FY20 Annual Report332
FY20 Los ALAmos NAtioNAL LAborAtorY ExpErimENtAL CAmpAigNs At thE omEgA LAsEr FACiLitY
P. A. Keiter, E. Loomis, S. Palaniyappan, B. Scheiner, A. Rasmus, H. Johns, K. Flippo, and Y. Kim
Los Alamos National Laboratory
Evaluating the Shock Behavior of Be to W Metal Gradient Foils on OMEGA EPPrincipal Investigators: E. Loomis, D. Stark, A. Strickland, S. Palaniyappan, P. A. Keiter, T. Cardenas, and J. Sauppe (LANL); and M. Huff* (Dept. of Physics & Astronomy, University of Rochester)*Also LLE
Los Alamos National Laboratory (LANL) is currently assessing double-shell implosions as a potential platform for reaching volumetric thermonuclear burn at the National Ignition Facility (NIF). In double-shell capsules, an outer low-Z ablator is accel-erated inward with x rays or lasers toward a high-Z, dense inner shell containing liquid-fill DT fuel. One of the major sources of degradation in these capsules is the growth of hydrodynamic instabilities on the surface of the high-Z shell. One mitigation strategy for controlling this instability growth is the use of a graded-density shell between the high-density metal and a lower-density metal, which provides a gradient scale length to suppress instability growth during shell collision. Our current design uses tungsten graded into beryllium; however, when shocked to hundreds of Mbar, the behavior of this graded-density and composition material is unknown.
We are therefore studying the planar behavior of graded metal targets on OMEGA and OMEGA EP. During our first shot day in FY20 we studied the 1-D shock compression of Be/W graded targets on OMEGA EP. These experiments used a similar target design as that described in Ref. 1; our target design is detailed in Fig. 1(a). Here, a bilayer target was placed side-by-side with a
FY20 Los Alamos National Laboratory Experimental Campaigns at the Omega Laser Facility
Figure 1(a) Planar DSMATGRAD target driven by fourOMEGA EP long-pulse beams of 6-ns duration.Details of the target include Be ablator, side-by-side Be/W bilayer and gradient-layer specimens, andquartz window for shock-wave measurement using the ASBO diagnostic. (b) LANL xRAGE simula-tions show the difference in shock velocity through the bilayer versus the gradient-layer sample.
(a) (b)
U2628JR
ASBO
Bi layer/gradient target package details
OMEGA EP
Be/W graded layer
Ablator Quartz
t (x)
Be/W bi-layer
100% W
100% Be
QuartzBe
Be Quartz
Bi la
yer
Shockdirection
Grad
ient
0 50 100 150Distance (nm)
200 250
70
60
50
40
Shoc
k ve
loci
ty (n
m/n
s)
70
60
50
40

NatioNal laser Users’ Facility aNd exterNal Users’ Programs
FY20 Annual Report 333
gradient-layer target on a Be ablator. Placed on the high-Z side of both the bilayer and gradient layer was a quartz window that allowed us to view the shock front directly with the active shock breakout (ASBO) diagnostic. Simulations of both the bilayer and graded layer using the LANL xRAGE code are shown in Fig. 1(b), where a decelerating shock is seen as the shock propagates up the density gradient. This is starkly different from the bilayer target, where a simple discrete jump occurs at the sharp Be/W interface.
Figure 2 shows representative data from the DSMATGRAD-EP shot day where on shot 32630 we removed the bilayer and gradient-layer targets to simply have a quartz window against the Be ablator. This was done to characterize the ablator drive prior to entering the metal specimens. Here we measured a shock velocity entering the quartz from the ablator of 55 km/s [Fig. 2(b)]. In shot 32632 we used a bilayer/gradient-layer target that was roughly 30 nm thick. The ASBO image in Fig. 2(c) shows fringe motion on both the bilayer and gradient-layer sides. The data analysis is still in progress for this shot, but the fringe motion does appear to be different in the bilayer side relative to the gradient side.
U2629JR
(a) Shot 32630 (b) Shot 32632 (c)
800
600
400
200
Bare Be ablator Be/W bilayer
Time (ns)Time (ns)0 4 8 122 4 6 8 10
800
600
400
200
800
1000
600
400
200
Be ablator +quartz
Be/W gradient
Shoc
k ve
loci
ty in
qua
rtz (k
m/s)
60
40
20
00 4000
Time from laser t0 (ps)8000
Shock in quartz
ASBO 1ASBO 2
Figure 2ASBO interferometry data from two shots. (a) Data from the Be ablator/quartz target from shot 32630 where the shock becomes reflecting inside the quartz window and (b) the measured shock velocity entering the quartz from the ablator of 55 km/s; (c) Shot 32632, which used a bilayer/gradient-layer target. Dif-ferences in fringe motion (and shock velocity) are seen on either side of the Be/W target once the shock enters the quartz.
This material is based upon work supported by the Department of Energy National Nuclear Security Administration, Los Alamos National Laboratory Campaign 10 (J. Kline, C-10 Program Manager).
Laser-Driven X-Ray Radiography of Shocked Chromium FoilsPrincipal Investigators: S. Palaniyappan, D. Broughton, C. Huang, A. Favalli, M. Iliev, A. Junghans, P. Singh, and R. Reinovsky (LANL); N. Lemos, A. Mckinnon, and A. Pak (LLNL); and S. Klein (University of Michigan)
1. Multi-Probe 20A (13 February 2020)The experimental setup for radiographing static objects on OMEGA EP is shown in Fig. 3. A 50-J (2-ps) laser pulse, called
a “sidelighter,” impinges on a 0.5-mm3 tantalum cube from the left. The tantalum cube is held by the Target Positioning System (TPS-7). The laser interacts with the front surface of the tantalum cube and drives an intense multi-MeV electron beam along the direction of the laser beam. The rest of the tantalum cube acts as a converter and generates x rays via bremsstrahlung. A filter stack spectrometer sitting nearly perpendicular to the laser beam is used to measure the x-ray spectrum. The tantalum cube stops electrons up to an energy of 1 MeV, and electrons with higher energies lose some of their energy as they transmit through the converter. The transmitted electrons can contribute to a large background signal on the image-plate (IP) detector. To partially mitigate this issue, a 2-mm-thick aluminum block was placed 5 mm away from the tantalum cube to block some of the high-energy electrons. The x rays transmit through the physics package and are then recorded using an IP stack. The IP stack has five IP’s (each 2 ft # 2 ft square) with copper filters of varying thickness sandwiched in between.

FY20 Annual Report334
FY20 Los ALAmos NAtioNAL LAborAtorY ExpErimENtAL CAmpAigNs At thE omEgA LAsEr FACiLitY
U2630JR
5 mm
5 mm190 mm
Image-plate stack
Physics package
Aluminumfilter TPS-7
Beam 2: Short pulsethrough UC to BL
Tantalum foilTPS-83
TIM-13 TPS
Figure 3Experimental setup on the OMEGA EP laser for static radiography.
Figure 4 shows the x-ray spectrum measured using the filter stack x-ray spectrometer. The first image plate on the IP stack has a 200-mm-thick copper filter, while the subsequent IP’s had a 50-nm-thick copper filter. In this setup, the image plates were seeing the x ray with energies 35 keV and above.
Figure 5(a) above shows a sketch of the static layers that were radiographed [Fig. 5 (b)] with laser-driven x rays. The static object contained three layers: a 500-nm-thick CH foil, a 100-nm-thick tantalum foil, and a 500-nm-thick chromium foil stacked together. In the x-ray line of sight, these layers were 2 mm long. The x-ray radiographs were taken at x-ray energies of 30 keV and
U2631JR
Phot
ons (
MeV
)
Energy (MeV)
101
100
102
103
10–1
10–2
10110010–110–210–3
Shot 32250 x-ray spectrum
Figure 4Measured x-ray spectrum for a typical shot (32250).
U2632JR
(a) Static physics package (b) Static x-ray radiograph shot 32250
Dual x-ray sources showing two Ta foil images
500-nm CH foil
100-nm Ta foil
500-nm Cr foil
Figure 5X-ray radiograph of static layers.

NatioNal laser Users’ Facility aNd exterNal Users’ Programs
FY20 Annual Report 335
above. The x-ray radiograph [Fig. 5 (b)] shows a dual image of the tantalum layer. We believe that the dual x-ray source most likely comes from the driving laser filamenting in the pre-plasma in front of the tantalum target with which the short-pulse laser interacts.
Figure 6 shows the x-ray radiograph of a chromium foil that was driven by three long-pulse laser beams (4.5 KJ each, 10 ns long) that were stacked in a line to create a 1.5-mm long line focus onto the chromium foil. The shocked chromium was expected to double its density. This would lead to shocked chromium with an areal density of 1.1 g/cm2. It is very unlikely that the darker region in Fig. 6 is the shocked chromium because we do not see the edges of the chromium foil. At the end of this campaign, we identified several issues that prevented us from obtaining a high-resolution and high-quality radiograph: (1) We observed a dual x-ray source that most likely came from laser filamentation on the front side of the tantalum foil interacting with the short-pulse laser. (2) We observed relatively high background counts of +30 K on the image-plate detector. This background was the same whether the long-pulse beam was on or off. This implied that the background signal on the image plate was due to the short pulse. We suspect it was mostly the electrons that were not stopped within the tantalum converter impinging on the image plate. (3) We also noticed that some stray x-ray light was coming into the image-plate pack from the side.
U2633JR
Shocked chromium?
Expected chromiumfoil position
Figure 6X-ray radiograph of the chromium foil driven by three long-pulse beams.
2. Multi-Probe 20B (3 September 2020)During the first campaign of the experiment, we realized that several issues were preventing us from getting a good x-ray
radiograph (as was discussed above). For the second experimental campaign, several improvements were made to mitigate the issues that were present during the first shot day.
Figure 7 shows the improved experimental setup for the second shot day. The improvements included using a compound parabolic concentrator (CPC) cone with a tantalum wire, using a magneto-inertial fusion electrical discharge system (MIFEDS) magnetic-field coil, and covering the sides of the image-plate pack with 500-nm-thick copper.
Figure 7Experimental setup for the second shot day. NTA: near-target arm.
U2634JR
TIM-13 TPS
MIFEDS
CPC cone/Ta wireTPS-7
Sidelighter
Beam 1: Short pulsethrough LC to SL Physics
package
TPS-83 NTA with image-plate stack
TIM-14

FY20 Annual Report336
FY20 Los ALAmos NAtioNAL LAborAtorY ExpErimENtAL CAmpAigNs At thE omEgA LAsEr FACiLitY
Figure 9CPC cone with a tantalum wire attached to the cone tip.
3. Compound Parabolic Concentrator A sketch of the CPC is shown in Fig. 8(a).2 The parabolic surface of the CPC ensures that rays coming in with an incident
angle less than a certain value are focused at the tip of the cone. Figure 8(c) shows a 3-D–printed CPC cone with a handling tab that we used in the OMEGA EP experiment pictured on a grain of rice. The CPC cone focuses the laser beam to a single focal spot at the tip of the cone.
U2635JR
Rays within 2i cone pass through a disk defined by the resolved focus
Handling tab CPC cone
imaxi < imax
Resolved parabolic surface
(a) (b)
r = 25 nm
r = 275 nm1.1 mm
(c)
Figure 8(a) A sketch of the CPC, (b) a CAD model of a CPC cone, and (c) an actual 3-D–printed CPC cone with a handling tab on a grain of rice that we used in our OMEGA EP experiment.
A 25-nm-thick, 500-nm-long tantalum wire is attached at the tip of the CPC cone as shown in Fig. 9. The CPC cone/wire combination ensures that we get a single source of x rays. This setup is also expected to provide x rays with a source size of the order of the wire thickness for high-resolution radiography.
Figure 10 shows the expected field distribution from the 50-T MIFEDS coil used in our experiment.3 The center of the coil was placed 2 mm away from the target chamber center (TCC), where we still expect magnetic fields strong enough to deflect the electrons escaping the tantalum wire away from the IP pack detector, thereby significantly reducing the background count.
Figure 11 shows the 500-nm-thick copper plate, shaped like a box lid, in which the IP pack sits. This prevents any stray light from entering the IP pack from the side and increasing the background on the IP. The improvements (CPC cone/wire, MIFEDS coil, and the IP pack cover) are expected to mitigate the issues we experienced in the first shot day that prevented us from getting high-resolution and high-quality radiographs.
Figure 12 shows static x-ray radiographs of the CH/Ta/Cr layers. The plastic layer is not visible in the radiograph. The fourth and fifth layers had 350 nm and 400 nm of copper in front of them, respectively. With these filters, the image plates see x rays above 35 keV. The x-ray radiograph from shot 32254 had an edge blur of +40 nm, which is of the order of the wire thickness. In
U2636JR
27.43°

NatioNal laser Users’ Facility aNd exterNal Users’ Programs
FY20 Annual Report 337
U2637JR
x (#
10–3
m)
z (#10–3 m)
5
0
–5 50–5
100
50
0
–50
Figure 10Magnetic-field distribution from a 50-T MIFEDS coil.
Figure 11A 500-nm-thick copper dip that covers the sides of the IP pack, except the front, to help reduce the background on the IP.
U2639JR
(a) Static physics package (b) X-ray static image shot 32251(fourth layer)
(c) X-ray static image shot 32254(fifth layer)
500-nm CH foil
100-nm Ta foil
500-nm Cr foil
Ta foil Cr foil Ta foil Cr foil
Figure 12Static x-ray radiograph of the CH/Ta/Cr layers stack.
U2638JR

FY20 Annual Report338
FY20 Los ALAmos NAtioNAL LAborAtorY ExpErimENtAL CAmpAigNs At thE omEgA LAsEr FACiLitY
U2640JR
0 250 500 750
1400
1600
1800
2000
2200
Distance (nm)0 250 500 750
1000
1500
2000
2500
Sign
al (a
rbitr
ary
units
)
Distance (nm)
Shock Shock
(a) (b)
Figure 13X-ray radiograph of shocked chromium foil at 16 ns (shot 32255) and 26 ns (shot 32256).
Table I: Shots performed with the parameters.
Number Shot # SRFShort-pulse
energyShort-pulse
durationShort-pulse turn on (ns)
Long-pulse beams on/off
Long-pulse turn on (ns)
Total delay (ns)
Static/ Dynamic
1 33250 78050 200 J 5 ps 0 Off Static
2 33252 79156 50 J 5 ps 0 Off Static
3 33253 79157 20 J 10 ps 0 Off Static
4 33254 79158 20 J 5 ps 0 Off Static
5 33255 78051 20 J 5 ps 16 On 0 16 Dynamic
6 33256 79161 20 J 5 ps 16 On –10 26 Dynamic
comparison, shot 32251 had a larger edge blur. We believe this difference is associated with variation in the intensity on the Ta wire due to variation from the focusing capability of the CPC cone. We are still trying to understand this effect.
Table I lists the shots and the corresponding laser parameters used on the second shot day.
Figure 13 shows the dynamic radiography of the chromium foil that was shocked by the three long-pulse beams stacked to focus as a line. The position of the shock is consistent with the HELIOS 1-D radiation-hydrodynamic predictions. We see that the x-ray source size is larger in these radiographs. We are still trying to understand this effect as we discussed above.
Radishock 2020 Annual Report on OMEGAPrincipal Investigators: H. M. Johns, P. Kozlowski, S. Wood, H. Robey, C. Fryer, A. Liao, T. S. Perry, C. J. Fontes, J. Cowan, T. Urbatsch, and M. Douglas (LANL); and J. W. Morton and C. R. D. Brown (AWE)
The Radishock experiment uses point-projection backlighting for both radiography and spectroscopy, as shown in Fig. 14. The Kr-filled capsule generates 4- to 5.5-keV photons that are absorbed by L-shell Ti ions in the driven Radishock target. These

NatioNal laser Users’ Facility aNd exterNal Users’ Programs
FY20 Annual Report 339
U2641JR
V foilbacklighter
(TIM-4)
Hohlraum drive
View from TIM-1
CIPs 6 # 6 mm(TIM-6)
Physics target(TIM-5)
Kr capsule(TPS-2)
Spec
trosc
opy
LOS
(NIF
-5 in
TIM
-3)
Radiography
LOS TCC
Figure 14VisRad model for the Radishock experiment.
spectra are measured by a 1-D space-resolving spectrometer, giving us a spectrum that evolves with distance from the halfraum. The V-foil backlighter uses a 25-nm pinhole to backlight the target with V K lines, dominated by the V K-b line, to backlight the target for radiography using the 6 # 6-mm close-in ported snout (CIPS). We fielded additional diagnostics not shown in the VisRad. Dante was fielded to obtain the temperature of the halfraum drive. A 12# imager in TIM-1 (ten-inch manipulator) was used to image the imploded capsule, obtain the duration of the flash, and determine the size of the imploded capsule at that time. X-ray streak camera A was fielded in TIM-2 to verify the flash duration and ensure that each flash remained continuous and repeatable.
The last shot day for the Radishock Campaign was 12 March 2020. The motivation for Radishock is to study the interaction between a supersonic flow (driven by a halfraum) and a counter-propagating shock (driven by an ablator) in order to provide constraining data on radiation transport for radiation-hydrodynamic codes. The interaction is predicted to result in a Zel’dovich-like temperature spike when the foam warmed by the shock interacts with the higher-temperature plasma caused by the radiation flow. The Radishock-20A shot day was used to collect additional data on mid- and late-time spectra and radiography to improve quality. The original intended goal was to use lower-density foams to probe differences that would occur in the spike if the radia-tion flow were driven by reduced power (400 J/beam) versus nominal (500 J/beam). The lower-density foams needed for this objective were not of sufficient quality, however, so we instead built targets with higher-density foams and opted to prioritize our secondary goal of filling in our data set.
Our Radishock-20A shot day yielded very high quality radiography data, including the best first-shot radiograph collected for the campaign (Table II). We used the radiography data to obtain the position of the shock.
Table II: FY20 Radishock shot day.
Date Shot day Number of shots
12 March 2020 Radishock 20A 11

FY20 Annual Report340
FY20 Los ALAmos NAtioNAL LAborAtorY ExpErimENtAL CAmpAigNs At thE omEgA LAsEr FACiLitY
Figure 15Radiographs from Radishock-20A: (a) 6.7 ns and (b) 8.2 ns after the ablator was fired.
Figure 15 shows six radiographs from Radishock-20A. We treat the ablator start time as “0” in simulations. Radiographs taken during the Radishock interaction are on the left, ablator-only shots are in the center, and radiation flow-only shots (halfraum only) are on the right. The ablator-only shots were used to benchmark the ablator drive in simulations to assist with modeling interac-tion shots. The radflow-only radiographs verify that the flow remains supersonic at the time of interaction. In the data in Fig. 15, the ablator is toward the left and the halfraum is toward the right. The foam is visible in the center of the target, especially for ablator-only shots. An Al filter was placed over the halfraum edge to prevent early time emission near the re-entrant hole from contaminating the radiograph.
Spectroscopic data collected on film in Radishock-20A were more problematic for a couple of reasons. First, issues with the timing systems in TIM-1 and TIM-3 made it difficult to both co-time the capsule flash with recording the spectroscopic data and co-time the frames for the spectroscopic data. The issue with co-timing frames had never previously occurred but occurred for essentially every shot on this particular day. An additional issue was uncovered when we worked toward processing this data: we noticed unusual features in the wedge. Figure 16 provides an example comparison between wedge-corrected data from two different shot days.
In Fig. 16(a) and (c), Frame 1 is on the bottom and Frame 2 on the top; the halfraum is on the Frame 2 side. The interaction is visible in the raw data [see Fig. 16(c)] in 20A in Frame 1, but not visible on the top. This means that for Radishock-20A, none of our interaction shots actually captured useful spectra at the location of the interaction. The reason why these data seem to be visible in the flat field is explained in Fig. 17, which compares the curves for the wedge corrections from 19A (which is fairly normal) with the unusual wedge correction we obtained for Radishock-20A. For the shot from Radishock-19A, the intensity for the continuum is largely the same for both frames, and the intensity drops in the same position (because for early times this particular shot was not aligned with the backlighter flash).
U2642JR
(a)
Interaction (shot 96972) Ablator only (shot 96981) Radflow only (shot 97978)
(b)
Interaction (shot 96991) Ablator only (shot 96990) Radflow only (shot 96988)

NatioNal laser Users’ Facility aNd exterNal Users’ Programs
FY20 Annual Report 341
U2644JR
Opt
ical
den
sity
3
0
1
2
D log H
Lesssensitive
Moresensitive
Nonlinear response
We want to be here
Shot 92555 XRFCWShot 96974 XRFCW
5 10 15Step
20 25
Figure 17The wedge calibration curves for two shots from Radishock-20A (orange curve, shot 96974) and Radishock-19A (blue curve, shot 92555). This comparison was done as part of a study by J. Cowan, the resident film expert for P-24.
U2643JR
Ener
gy a
xis (
pixe
ls)
2000
1500
1000
500
0200015001000
Spatial axis (pixels)5000 200015001000
Spatial axis (pixels)5000
Ener
gy a
xis (
pixe
ls)
2000
2000
1000
4000
30001200
800
400
2000
16001500
1000
500
0
(a) Shot 96974 wedge-corrected data (b) Shot 92554 wedge-corrected data
(c) Shot 96974 flat scan (raw) (d) Shot 92554 flat scan (raw)
Figure 16A comparison between [(a),(b)] wedge corrected and [(c),(d)] raw data for a shot from [(a),(c)] Radishock-20A and [(b),(d)] Radishock-19A.
The shot from 19A in Fig. 17 has a nominal wedge correction for that day and indeed is very similar to wedges for all previ-ous days from the Radishock Campaign. The shot (96974) selected for Radishock-20A has the same shape as the others for that

FY20 Annual Report342
FY20 Los ALAmos NAtioNAL LAborAtorY ExpErimENtAL CAmpAigNs At thE omEgA LAsEr FACiLitY
shot day, so it is a representative example. These calibration curves are the center points for the wedge steps. In both cases, the P-24 LANL delta wedge was used.
The 20A shot was taken with new film, so it is more sensitive at low signal. This is why the data from Frame 1 appears in the raw data, but the value is insignificant once the wedge correction is made. The film is more sensitive and will record intensity values that are much smaller than are “useful.” The 19A shots were recorded with older film, which had significantly more fog. The points on the calibration curve corresponding to that increased sensitivity are in the box on the lower left, or points 1 to 5 on the 20A wedge. Additionally, the film development is overdriven (too hot or too long for the developer used), resulting in a much steeper intensity curve and a loss of sensitivity and nonlinear behavior at the top of the curve (steps 21 to 27). Unfortunately, this region of the wedge overlaps with intensities for our bright continuum (usually 20 to 24), which means that the peak signal we have in 20A is nonlinear. J. Cowan from P-24 is currently working with personnel at LLE to help investigate this issue in hopes that later campaigns do not see a recurrence.
The remainder of this report discusses an analysis of data of the Radishock Campaign that illustrates the current state of investigation of the results of this series of experiments.
Figure 18 shows example analyzed spectra from a set of ten shots that are being compared with synthetic spectra post-processed from radiation-hydrodynamic simulations4 using a ray-trace model.5 The data processing strategy is consistent with a recently submitted publication on COAX5 spectra.
U2645JR
600 nm560 nm
520 nm479 nm439 nm399 nm
262 nm217 nm172 nm127 nm83 nm38 nm
(a) Radishock target
Halfraum
2.5 mm
0.9 mm
0.9 mm
1.6 mm1.2
mm 0.
3 m
m
0.67
5 m
mFoam
670
–40
Dist
ance
(nm
)
Halfraum edge
(b) Shot 92554 corrected data
1s-2p 1s-3p
1s–2p 1s–3p
6543210
6543210
Tran
smis
sion
(+of
fset
)Tr
ansm
issio
n (+
offs
et)
4400 4600 4800 5000 5200Energy (eV) Energy (eV)
5400
Frame 1
Frame 2
(c) Select lineout tranmissions,offset for clarity
Photon energy (eV)4.3 keV 5.4 keV
Figure 18(a) Spectroscopic data collected from Radishock targets have been (b) corrected and (c) transmission lineouts have been extracted. Every second lineout above the halfraum edge is shown, each with an offset of 1.0 for clarity.
Figure 19 shows an example of post-shot simulations performed in Cassio using the as-shot laser power history and measured foam densities for each shot. The simulated shock position and shock curvature are in very reasonable agreement with the mea-sured data for all shots simulated. Cutoff models are being augmented with laser ray tracing on halfraum models that allow one to set the actual laser beam parameters (number of beams, timing, pointing, energy, defocus, etc.). Cassio simulations’ laser ray tracing includes cross-beam energy transfer and have no laser power multipliers and no shot-to-shot changes.

NatioNal laser Users’ Facility aNd exterNal Users’ Programs
FY20 Annual Report 343
U2646JR
2000
1500
1000
500
–500
0
–1000
–1500
–2000200010000
r (nm)–1000–2000 4002000
Radial distance (nm)–200–400
Measured shock
Simulated shock
Shot 96990, t = 8.2 ns
DataSimulation
(a) (b)
Figure 19(a) Post-shot simulation of shot 96990 in (b) Cassio.
We have begun interrogating the processed Radishock spectra to locate the temperature spike, as seen in Fig. 20. Normally, the temperature of the radiation flow is decreased with distance from the halfraum, resulting in reduced absorption in higher-photon-energy spectral features. If instead we see a spectrum with increased absorption in these features relative to the one behind it, it means that the temperature has increased locally and we have evidence in the spectrum consistent with a temperature spike. We expect the temperature increase to be small early in time compared to later-time shots after the interaction is well established. Early uncertainty assessments imply this early-time spike is indeed measurable, but further work is needed. Figures 18–20 are intended to be part of upcoming publications to be drafted in early FY21.
U2647JR
Ti+17
Ti+16
Ti+15Ti+14Ti+13
353 nm329 nmUncertainties
Ti+17
Ti+16
Ti+15Ti+14Ti+13
353 nm377 nmUncertainties
Tran
smiss
ion
1.2
1.0
0.8
0.6
0.4
0.2
0.0
Photon energy (eV)
4500 4600 4700 4800
Photon energy (eV)
4500 4600 4700 4800
(a) (b)
Figure 20(a) Shot 90740 lineouts at 329 nm, 353 nm, and (b) 377 mm from the halfraum edge show increased absorption in Ti+17 at 353 nm, consistent with higher temperature. Reduced absorption in Ti+16 at 377 nm is consistent with lower temperature. This behavior signifies a temperature spike at 353 nm.

FY20 Annual Report344
FY20 Los ALAmos NAtioNAL LAborAtorY ExpErimENtAL CAmpAigNs At thE omEgA LAsEr FACiLitY
This work was performed under the auspices of the U.S. Department of Energy at Los Alamos National Laboratory under Contract No. 8923318CNA000001.
Discrete Vortex Model and ModCons ExperimentsPrincipal Investigators: A. Rasmus, C. Di Stefano, K. Flippo, E. Merritt, F. Doss, N. Christiansen, A. Strickland, and D. Schmidt (LANL)
In FY20, the Discrete Vortex Model (DVM) and ModCons EP Campaigns did a combination of data collection and diagnostic development. DVM and ModCons used a shared experimental platform to study different aspects of hydrodynamic instability growth on interfaces. Three long-pulse beams were used to create a semi-sustained shock that drove instability growth. These campaigns utilized a Mn Hea (6.2-keV) backlighter in conjunction with the spherical crystal imager (SCI) or Fresnel zone plate (FZP) to create x-ray radiographs of interface evolution.
ModCons 20A measured the instability evolution of Richtmyer–Meshkov (RM), with delayed-onset Rayleigh–Taylor (RT), for a broadband perturbation. The experiments were built on data taken in FY19, using the same bulk platform, SCI diagnostic, and timings, but perturbation was used to seed instability growth. In particular, we kept the wavelengths in the perturbation the same but weighted the amplitudes so that either short or wavelength modes dominated (see Fig. 21). These data will inform models that use sub-grid models of instability evolution to initialize turbulence models.
U2648JR
(a) “Left” (b) “Right”
y (n
m)
Wave number (450 nm/m)
10
–10
0
y (n
m)
100
10–1100 101 100 101
y (n
m)
100
10–1
0 100 200 300 400
y (n
m)
x (nm)x (nm)
Wave number (450 nm/m)
10
–10
0
0 100 200 300 400
Figure 21(a) The “left” and “right” perturbations which seeded instability growth in the ModCons 20A experiments. (b) Experimental radiographs showing the interface for each perturbation after 18 ns of instability evolution.
ModCons 20B used the same physics package as ModCons 20A but used the new FZP diagnostic instead of the SCI. The FZP diagnostic has the potential for greatly improved imaging resolution when compared to the SCI. We obtained a data set that will

NatioNal laser Users’ Facility aNd exterNal Users’ Programs
FY20 Annual Report 345
U2649JR
Figure 22A radiograph of point vortex evolution taken in the DVM 20A experiments .
allow us to think through the trade-offs between photon count, motion blur, and field of view for future ModCons experiments that use the FZP.
DVMEP 20A measured the evolution of a single strong point vortex quickly compared to the sound speed. This was achieved by shocking a single height discontinuity, or step, machined onto an interface. We successfully radiographed the point vortex evolution (see Fig. 22), and further analysis should yield insights into how the finite sound speed altered the flow surrounding the vortex.
U2650JR
(b)(a) (c)0
2000
1500
1000
500
0 200015001000500 0 200015001000500
Shock ShockShock
Gas-filled voidGas fill/spool
0.70
8 m
m
0.00
0 m
m0.
075
mm
0.10
0 m
m0.
200
mm
0.59
0 m
m0.
840
mm
1.14
0 m
m1.
440
mm
Void Void
Figure 23(a) An improved shock tube holding a gas pressure up to 6 atm. (b) A pure Kr-filled target (5.7 atm) taken 9.29 ns after the shock drive). (c) A mixture of Kr and H2 target (5.6 atm) taken 9.31 ns after the shock drive.
Observations of Dynamics of Void CollapsePrincipal Investigators: P. M. Kozlowski, Y. Kim, B. M. Haines, A. Strickland, T. H. Day, L. Green, T. J. Murphy, and B. Albright
On 6 February 2020, the Marble team executed a series of experiments on OMEGA designed to understand how shocks inter-act with features such as voids. The goal of these experiment was to create a gas-filled void within a shock tube, similar to those encountered in Marble experiments on the NIF,6,7 which would preheat and interact with a laser-driven shock. The Marble team made great improvements on a shock-tube design and was able to hold gas pressures up to 6 atm (Fig. 23). X-ray radiography diagnostics obtained data at 7-, 8.5-, 9.5-, 10.5-, and 11-ns delays after the shock drive, which enabled a study of the evolution

FY20 Annual Report346
FY20 Los ALAmos NAtioNAL LAborAtorY ExpErimENtAL CAmpAigNs At thE omEgA LAsEr FACiLitY
of the gas-filled void. Throughout the shot day, we encountered a few technical issues such as losing two shot radiographs due to a charge-coupled–device (CCD) software issue (i.e., serial number issues on XRFC4), which forced the switch from CCD to film. In addition, a few shot radiographs voids were either not visible or difficult to see due to possible contrast issues. Despite such technical issues, the Marble team was able to compare dynamics with both pure krypton gas and a mixture of krypton and hydrogen gas fills to test how a void collapses and deforms under different plasma pressure conditions (Fig. 23). These experi-ments help us understand Marble experiments on the NIF as well as validate our computer models of the interaction of shocks in high-energy-density media with features.8
This work was performed by the Los Alamos National Laboratory, operated by Triad National Security, LLC for the National Nuclear Security Administration (NNSA) of U.S. Department of Energy (DOE) under contract 89233218CNA000001. Marble is supported by the DOE NNSA Office of Experimental Sciences (NA-113) SAT and PAT Programs.
Evaluation of Two-Photon Polymerization Printed Structures as Low-Density Supports in Multi-Shell TargetsPrincipal Investigators: B. S. Scheiner, M. J. Schmitt, D. W. Schmidt, and L. Goodwin (LANL); and F. J. Marshall, P. M. Nilson, and R. S. Craxton (LLE)
The Revolver 20 A/B/C Campaigns evaluated the use of low-density (5- to 20-mg/cm3) two-photon polymerization (2PP) printed structures as a support for the inner shell of a direct-drive double-shell target. The 2PP hemispherical structures, shown in Fig. 24(a), were printed in a stochastic lattice geometry and were composed of CH1.72N0.086O0.37. From 1-D and 2-D simulations, it is expected that the lattices will disassemble by absorbing the radiation from the ablator’s hot corona. The extent to which it can do so before bulk motion of the ablator depends on the lattice strut size and potentially on the lattices ability to absorb x-ray radiation. In experiments, the extent of the lattice disassembly is determined by measuring the perturbations imparted to the second shell, measured at a resolution of +3 nm using the FZP imager. These experiments evaluated the per-formance of different lattice designs by varying the lattice strut size and average density and by adding a high-Z Au coating to assist in the absorption of x-ray radiation. Each lattice design is shown in Fig. 24(a). The corresponding FZP images are
U2651JR
Revolver 20B5 nm, 7 mg/cm3
Revolver 20B3 nm, 5 mg/cm3
Revolver 20C3 nm, 5 mg/cm3,
gold coatedRevolver 20B
5 nm, 20 mg/cm3Revolver 20C
3 nm, 20 mg/cm3
(a)
(b)
Figure 24(a) The five different 2PP lattice designs used during the Revolver 20B/C shot days had differing lattice strut sizes and mass averaged densities. The first image shows a 2PP hemi attached to the Cr inner shell of the direct-drive double-shell targets. The center image shows the gold-coated lattice as viewed through the ablator of the assembled target. (b) The corresponding FZP image for each target type. The black bar in the fourth image is due to clipping by the edge of the framing camera strip.

NatioNal laser Users’ Facility aNd exterNal Users’ Programs
FY20 Annual Report 347
shown in Fig. 24(b). While detailed analysis is underway, the general trend that is observed is that lattices with thinner struts result in a more-uniform inner shell for both +5-mg/cm3 and 20-mg/cm3 lattices. The uniformity does not depend only on the strut size; an effect of the lattice void size is also at play. This effect is indicated by the superior uniformity of the 20-mg/cm3 targets, regardless of strut size.
This research was supported by the Laboratory Directed Research and Development Program of Los Alamos National Labora-tory under project number 20180051DR.
HEDB 20A High Energy Density with B FieldsPrincipal Investigators: K. A. Flippo, H. Li, Y.-C. Lu, S-.T. Li, A. Rasmus, C. Fiedler Kawaguchi,* and K. Kelso* (LANL); and D. Barnak (LLE)*Also University of Michigan
The goals of this project were to test our understanding of a specific process in plasmas, namely self-generated magnetic fields, by creating them and measuring them experimentally in the laboratory, in conditions relevant to inertial confinement fusion (ICF) and high-energy-density (HED) physics. The design and modeling of the experiments were carried out mainly in FLASH, and FLAG was used for several comparisons of energy partition. In addition, hydro comparisons to FLASH were made using LANL’s xRAGE to verify that the hydrodynamic behavior of FLASH was accurate for the resolutions used for 3-D simulations.
The existence of self-generated B fields in ICF plasmas has long been considered, but its impact has rarely been quantified in such environments. A popular misconception is that the likely B-field strength produces an energy density eB that is small compared to the dominant energy density (often the thermal energy density eth of the plasma) so that it is not “dynamically” important. But in reality, the self-generated and amplified (by turbulence) B fields need to affect only the turbulent energy density eturb of the flow in order to dramatically impact how an experiment might evolve. Given the fact that eturb can often be much smaller than eth, B fields can indeed significantly affect the turbulence properties of ICF/HED plasmas without noticeably alter-ing the overall global dynamics. For example, by altering the turbulence and mix evolution in the ICF implosion dynamics, the ignition performance can greatly degrade, as revealed by numerous NIF and OMEGA experiments.9–14 Currently, B-field effects in ICF are typically not included and could be the reason simulations must alter the heat conduction by a factor of 2 to match ion temperatures.9,14 Indeed, we have discovered another mechanism based on the concentration of ion species, which can play a role in ICF implosion that could be beneficial to hot-spot ignition. We have designed, executed, redesigned, and executed several experiments to get a meaningful measurement to quantify the self-generated fields and compare them with predictions using the latest ideas on plasma conductivity and extended magnetohydrodynamics (MHD).
This project used an extremely large amount of 3-D simulations to design our experimental platforms. This would not have been possible using the LANL advanced simulation and computing codes due to the time cost incurred in running these calcula-tions. The reduced set of physics in the FLASH code, an adaptive mesh refinement Eularian code, allowed us to make use of the MHD in the FLASH code and the relatively good hydrodynamics (which were compared to xRAGE and many experiments) to carry out a large number of 2-D and 3-D simulations at 2- to 20-nm resolution.
In the end we tested two designs on the first shot day in 2019, which resulted in down-selecting to the counter-shear platform (Shock/Shear) with a modified internal layer to maximize B-field self-generation due to the so-called Biermann battery term found in extended MHD formulations. This is shown in Fig. 25(a). On the second shot day in 2019 we improved on the pRad diagnostic used to quantify the B field by adding a pepper-pot shield (PPS) to reduce the proton source to a pencil beam, which helped us find a simple shift in that source as a measurement of the B fields; the concept is shown in Fig. 25(b). That second 2019 day showed that we need to improve our signal levels of the proton source. The shot day in 2020 was the culmination of those improvements. Preliminary results are shown in Fig. 26. We significantly improved the signal level of the pRad source and are currently analyzing the collected data.

FY20 Annual Report348
FY20 Los ALAmos NAtioNAL LAborAtorY ExpErimENtAL CAmpAigNs At thE omEgA LAsEr FACiLitY
Figure 25Setup of HEDB with (a) window only and (b) with the PPS showing the pRad axis and interior geometry and synthetic pRad images.
Figure 26(a) pRad image from 2019 with (b) the accompanying x-ray image using the D3He implosion as the x-ray source; (c) the improved signal-to-noise pRad from 2020.
U2653JR
(a) (b) (c)
U2652JR
(a) Window only (b) With PPS
Target
Interior
pRadprojected
pRad image(CR-39)
ShockShock
Proton source(D3He implosion)
PPS
Shock
Shock

NatioNal laser Users’ Facility aNd exterNal Users’ Programs
FY20 Annual Report 349
Figure 27(a) The OMEGA heating setup with two orthogonal x-ray backlighters imaged via (b) PPBL and CIPS tips.
U2654JR
(a) (b)
CH heaters
MShock 2020Principal Investigators: K. A. Flippo, F. W. Doss, C. Di Stefano, E. Merritt, and A. Rasmus (LANL)
The LANL HED Hydro team has adapted our OMEGA RM/RT instability platform to study the effects of heating on a shocked interface similar to what might occur in the inner shell of a double-shell–type ICF design. In our platform the interface can be heated before, after, or during shock and reshock using OMEGA and can easily be adapted and scaled to larger facilities such as the NIF as well. The current design allows for heating of one or two high-density interfaces separated by low-density foam. The material can be chosen with any density and/or composition typically 50 nm thick and can be heated from several eV up to around 100 eV, depending on material, thickness, and laser power. Strong shocks (from the drive beams) can then interact with these layers from either end of the shock tube. We are also testing the ability for the strongly heated layers to produce shocks themselves.
The platform is motivated by simulations presented in Haines et al.15 The target design and laser setup are shown in Fig. 27. We use a point-projection backlighting (PPBL) scheme and the LANL CIPS tips on the cameras for imaging using vanadium, titanium, or chromium. The tube is a Be tube of 100-nm-thick walls and a 500-nm ID. The heaters are thin 10-nm-thick CH foils that span the two gold-cone shine-shields. Eight to nine beams can easily be used to heat the target before and during shock with the backlighter driver, which offers about 4 kJ of laser energy of which about 50% to 25% can be converted into hot elec-trons and x rays for heating the target.
On a previous shot day we measured the flux of hot electrons, which can extend to several hundred keV and are mainly respon-sible for the heating.16 Of the 4 kJ, several hundred if not more can make it to the target to heat, depending on geometry. The data obtained on the last FY20 shot day show the heating of a 50-nm Ta layer expanding from heating to approximately 230 nm in width in 2 ns of time (see Fig. 28). Several issues affect the measurement of Ta since the layer is very opaque: just a small
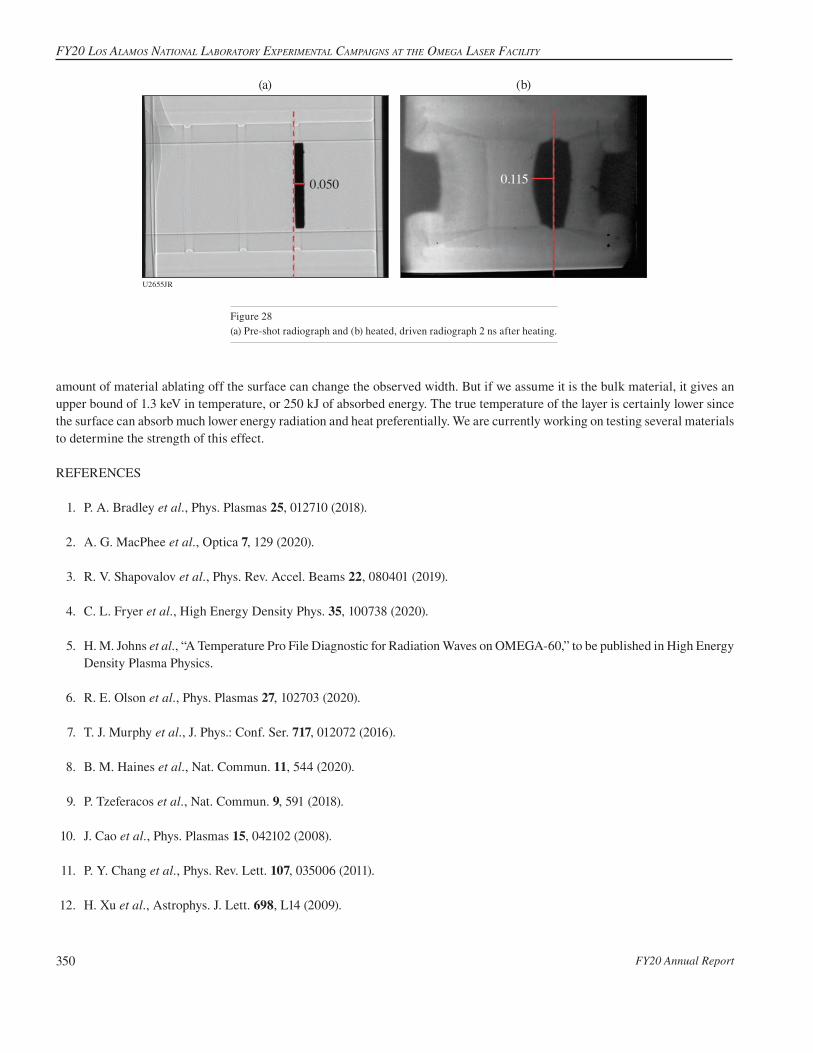
FY20 Annual Report350
FY20 Los ALAmos NAtioNAL LAborAtorY ExpErimENtAL CAmpAigNs At thE omEgA LAsEr FACiLitY
amount of material ablating off the surface can change the observed width. But if we assume it is the bulk material, it gives an upper bound of 1.3 keV in temperature, or 250 kJ of absorbed energy. The true temperature of the layer is certainly lower since the surface can absorb much lower energy radiation and heat preferentially. We are currently working on testing several materials to determine the strength of this effect.
REFERENCES
1. P. A. Bradley et al., Phys. Plasmas 25, 012710 (2018).
2. A. G. MacPhee et al., Optica 7, 129 (2020).
3. R. V. Shapovalov et al., Phys. Rev. Accel. Beams 22, 080401 (2019).
4. C. L. Fryer et al., High Energy Density Phys. 35, 100738 (2020).
5. H. M. Johns et al., “A Temperature Pro File Diagnostic for Radiation Waves on OMEGA-60,” to be published in High Energy Density Plasma Physics.
6. R. E. Olson et al., Phys. Plasmas 27, 102703 (2020).
7. T. J. Murphy et al., J. Phys.: Conf. Ser. 717, 012072 (2016).
8. B. M. Haines et al., Nat. Commun. 11, 544 (2020).
9. P. Tzeferacos et al., Nat. Commun. 9, 591 (2018).
10. J. Cao et al., Phys. Plasmas 15, 042102 (2008).
11. P. Y. Chang et al., Phys. Rev. Lett. 107, 035006 (2011).
12. H. Xu et al., Astrophys. J. Lett. 698, L14 (2009).
Figure 28(a) Pre-shot radiograph and (b) heated, driven radiograph 2 ns after heating.
U2655JR
(a) (b)
0.050 0.115

NatioNal laser Users’ Facility aNd exterNal Users’ Programs
FY20 Annual Report 351
13. S. Li, Lawrence Livermore National Laboratory, Livermore, CA, Report LA-UR-03-8925 (2003).
14. S. Li et al., “Implementation of Magneto-Hydrodynamic Solver for RAGE,” Los Alamos National Laboratory, Los Alamos, NM (2007).
15. B. M. Haines et al., Phys. Plasmas 20, 022309 (2013).
16. T. R. Desjardins et al., High Energy Density Phys. 39, 100937 (2021).

FY20 Sandia national laboratorieS ProgreSS rePort on omega laSer FacilitY exPerimentS
FY20 Annual Report352
Energetic Neutrons Experiments on OMEGA-60Principle Investigators: B. A. Aguirre and W. J. Martin
The Energetic Neutrons Campaign led by Sandia National Laboratories (SNL) had a successful year testing electronic devices and printed circuit boards (PCB’s) under 14-MeV neutron irradiation at the Omega Laser Facility. During FY20 the Energetic Neutrons Campaign increased the number and complexity of experiments, continued collaborations with external organizations, and generated knowledge that supports SNL’s national security mission.
During FY20 the Energetic Neutrons Campaign was executed by an early career team led by a new principal investigator (PI). The SNL team members were trained to take over new responsibilities during the shot day to increase the number and complex-ity of experiments in the campaigns. Also, in FY20 for the first time the Energetic Neutrons Campaign had a graduate student at SNL contributing with pre- and post-irradiation characterizations of the semiconductor devices irradiated on OMEGA.
In FY20 SNL collaborated with the Air Force Nuclear Weapons Center and supported experiments related to radiation effects in semiconductor devices. SNL also gave the opportunity to multiple scientists from Los Alamos National Laboratory, MIT, and LLE for the ride-along diagnostics tests.
SNL continued to use the last two generations of the neutron effects diagnostics (NED’s) to field active and passive experi-ments but also redesigned the latest generation of the NED’s to accommodate larger components and improve the vacuum seal-ing as shown in Fig. 1(a). The redesigned NED’s allowed SNL to perform active tests of a high-voltage (HV) PCB for the first
FY20 Sandia National Laboratories Progress Report on Omega Laser Facility Experiments
U2670JR
(a) (b) (c)
50 100 150 200 250 300T (K)
0
2
4
6
8
DC
/C (#
10–4
)
2.4 # 10127.4 # 10113.9 # 1011
Fluence (n/cm2)0.4
0.2
0.00 1 2
Fluence(#1012 n/cm2)
Leak
age
curr
ent (
nA)
Figure 1(a) The redesigned Gen 3 NED used on OMEGA; (b) a HV PCB mounted in one of the redesigned Gen 3 NED’s; and (c) the radiation-induced defects andleakage current for different 14-MeV neutron fluences.
NatioNal laser Users’ Facility aNd exterNal Users’ Programs
FY20 Annual Report 353
time on OMEGA, where signals before, during, and after the irradiation were recorded. The HV PCB installed in one of the SNL NED’s is shown in Fig. 1(b), where a 3-D–printed nose cone was used to check for mechanical and electrical interference. Passive irradiations of multiple components were followed up with leakage current, gain measurements, and radiation-induced defect characterization at SNL as shown in Fig. 1(c).
This work was performed at Sandia National Laboratories, a multimission laboratory managed and operated by National Technology and Engineering Solutions of Sandia LLC, a wholly owned subsidiary of Honeywell International, Inc. for the U.S. Department of Energy’s National Nuclear Security Administration under contract DE-NA0003525. The views expressed in the article do not necessarily represent the views of the U.S. Department of Energy or the United States Government. SAND2020-12842 R.
Dynamic Materials Experiments at the Omega Laser FacilityPrinciple Investigator: C. A. McCoy
Two dynamic materials campaigns were carried out by SNL scientists during FY20. In addition, a third campaign scheduled for FY20 was postponed to early FY21 due to COVID-related shutdowns. The completed campaigns provided data to support ongoing experiments at the Sandia Z Pulsed-Power Facility geared toward constraining the reshock Hugoniot of a-quartz and the sapphire release isentrope. In addition, data from FY19 OMEGA and OMEGA EP experiments were included in a manuscript detailing the Hugoniot of TiO2 rutile, which was published in Physical Review B.1
The QuartzSapphireEP Campaign on OMEGA EP in FY20Q1 successfully completed 15 shots to meet two experimental objec-tives: measurement of the reshock Hugoniot of quartz into sapphire and the release of sapphire into quartz, TPX, and 200-mg/cm3 silica aerogel. The results have been paired with sapphire Hugoniot data from the Z facility to generate an independent constraint of the quartz reshock from initial states ranging between 350 and 1200 GPa. Sapphire release data were taken from 600 to 1500 GPa and will be used to support ongoing experiments on the Z precompression platform.
A combination of two half-day campaigns was completed on OMEGA in FY20Q4: SapphireCryo and HiZEOS. The Sap-phireCryo Campaign was a companion campaign to QuartzSapphireEP, where the primary measurement was the sapphire release isentrope. Liquid deuterium was used as the release standard to provide a deep release measurement into a well-constrained standard. Four planar cryogenic experiments were completed as part of this campaign. As interleaved experiments during warm-ing and cooldown of targets in the cryogenic targets, the HiZEOS Campaign investigated the Hugoniot and release of hafnium. As a high-Z material, hafnium has higher shock impedance than most standards and limited data exist above 500 GPa. This campaign provided the first measurement of the Hugoniot above 1000 GPa and provides initial results to develop hafnium as a high-impedance shock standard.
Sandia National Laboratories is a multimission laboratory managed and operated by National Technology & Engineering Solu-tions of Sandia, LLC, a wholly owned subsidiary of Honeywell International, Inc., for the U.S. Department of Energy’s National Nuclear Security Administration under contract DE-NA0003525. Any subjective views or opinions that might be expressed in the paper do not necessarily represent the views of the U.S. Department of Energy or the United States Government. SAND2020-12838 R.
REFERENCES
1. S. Duwal et al., Phys. Rev. B 102, 024105 (2020).

FY20 Naval ReseaRch laboRatoRY RepoRt oN omega laseR FacilitY expeRimeNts
FY20 Annual Report354
Focused Experiments on High-Z Coating Dynamics on OMEGA EPPrincipal Investigators: M. Karasik, J. Weaver, J. Oh, A. J. Schmitt, and S. P. Obenschain (Plasma Physics Division, U.S. Naval Research Laboratory); and D. N. Polsin and D. Mastrosimone (LLE)
During FY20, the Naval Research Laboratory (NRL) in collaboration with LLE executed two shot days on OMEGA EP. The experiments were designed to study the detailed physics of high-Z coatings that are highly effective for imprint mitigation. Soft x-ray spectra of the indirect-direct hybrid drive with high-Z coatings were obtained using the NRL transmission grating spec-trometer (NRL TGS) installed on OMEGA EP. Measurement of coating pre-expansion (Fig. 1) needed to maximize the effect ofthe coating was obtained using the 4~ probe. High-Z coating dynamics were monitored using streaked soft x-ray self-emission.VISAR (velocity interferometer system for any reflector) and SOP (streaked optical pyrometer) images of the shocks generatedin the coated and uncoated foils provide data on shock velocity and uniformity.
FY20 Naval Research Laboratory Report on Omega Laser Facility Experiments
Figure 1(a) 4~ probe measurement of coating pre-expansion; (b) streaked soft x-ray emission showing coating dynamics; (c) time-resolved soft x-ray spectrum fromNRL TGS measurement; and (d) VISAR streak of a high-uniformity shock from a coated target.
U2667JR
Undriven Expanded using prepulse 1 ns
prior to laser pulse
400 Å Au on 40 nm CH(a) (c) (d)
400 Å Au on CH
Brea
kout
Reflection offrear surface
300-Å Au coating
Wavelength (Å)5 10 15 20 25 30 35 40 45 50
–13
0
17
Tim
e (n
s)
Time (ns)0 1 2
(b)300 Å Au on CH
2800 3600Space (nm)
1
2
4
5
3
Tim
e (n
s)
Laser

NatioNal laser Users’ Facility aNd exterNal Users’ Programs
FY20 Annual Report 355
Shock Augmented IgnitionPrincipal Investigators: R. H. H. Scott, K. Glize, and A. Ruocco (Central Laser Facility, STFC Rutherford Appleton Laboratory); D. Barlow (Department of Physics, University of Warwick); M. Khan, L. Antonelli, A. Nutter, and N. Woolsey (York Plasma Insti-tute, University of York); W. Theobald (LLE); J. A. Frenje (MIT); and R. C. Mancini (Physics Department, University of Nevada)
Shock ignition1 is a laser-direct-drive approach to inertial confinement fusion that seeks to reduce the implosion velocity required for ignition by adding a strong shock toward the end of the implosion. The strong shock heats the hot-spot ions and fur-ther compresses the DT fuel. In the standard approach to shock ignition, the strong shock is launched by a spike in laser power, and therefore intensity, toward the end of the drive pulse. Research indicates that shock ignition may have various advantageous characteristics in comparison to central hot-spot ignition, in particular reduced implosion velocity and the potential to achieve high fusion energy gain. Questions do remain, however, regarding the requirement for high laser intensity. These high laser intsensities can cause significant laser backscatter (due to stimulated Raman and Brillouin scatter) and accelerate hot electrons toward the cold fuel (due to stimulated Raman scatter and/or two-plasmon decay).
In this work we have performed the initial experimental evaluation of a concept that seeks to retain the advantages of shock ignition without the requirement for high laser power and/or intensity. Shock-augmented ignition uses a dip in power prior to a rise in power (see Fig. 1). The dip in power reduces the ion sound speed in the ablation plasma, aiding shock generation, while the subsequent rise in power is, according to radiation-hydrodynamic simulations, able to launch a very strong shock as per the shock-ignition concept, but with a peak intensity of around 1015 W/cm2—significantly lower than that required for shock ignition.
U2668JR
0 1 2 3 0 1 2 3 0 1Time (ns)
Pow
er (T
W)
Time (ns) Time (ns)
(a) Shock slighty early (b) Optimum timing (c) Shock late
2 30.0
0.6
0.4
0.2
UltravioletInfrared
Figure 1Three shock-augmented ignition pulse shapes used on this OMEGA-60 campaign. Each pulse shape has a slightly different timing of the dip and power spike combination in order to launch the shock at different times. The shock launching time was varied in order to find the optimum experimental shock-launch timing.
The OMEGA laser was used to perform spherical direct-drive implosions of 860-nm-outer-diam, 27-nm wall, deuterium-filled and D2 + 0.25% Ar (by atomic number)-filled capsules. The argon dopant was used for spectroscopic purposes. Three direct-drive monochromatic imager2 instruments were fielded along quasi-orthogonal lines of sight to measure time, space, and spectrally resolved images of the hot-spot x-ray emission. These will be used to reconstruct 3-D tomographic spatial distribu-tions3 of the hot-spot electron density and temperature. Two wedge-range filter4 diagnostics were used to record down-scattered proton spectra in order to measure the shell areal density. A Sydor framing camera was also used to image the ablation front.5
FY20 Rutherford Appleton Laboratory Report on Omega Laser Facility Experiments

FY20 RutheRFoRd Appleton lAboRAtoRY RepoRt on omegA lAseR FAcilitY expeRiments
FY20 Annual Report356
Figure 2The variation in D–D neutron yield as a function of (a) shock launching time and (b) the associated variation in ion temperature.
U2669JR
1.7 1.8 1.9 2.0Shock timing (ns)
Ion
tem
pera
ture
(keV
)1.5
2.3
1.9
2.7
1.7 1.8 1.9 2.0
DD
neu
tron
yiel
d(#
1010
)
Shock timing (ns)
Shockslightlyearly
Optimum
Shock late4
16128
(b)(a)20
The single-line-of-sight time resolved x-ray imager6 and Kirkpatrick–Baez microscope (KBframed)7 diagnostics were used to record time-resolved images of the hot-spot x-ray emission.
Figure 1 depicts three of the five pulse shapes employed to find the optimum experimental shock-launching time. Figure 2 depicts (a) the change in D–D neutron yield and (b) ion temperature as functions of the timing of the dip in laser power. An optimum timing of 1.8 ns was found; the yield was more than 2# greater than an equivalent shot with a later shock-launching time. Initial analysis indicates that the shocks propagate more slowly than predicted by radiation-hydrodynamic simulations. This is tentatively attributed to stimulated Brillouin scatter, which was measured at the +10% level during the spike’s rise in power. Post-shot simulations that accurately reproduce the trends and yields indicate that a shock pressure of +0.6 GBar was attained prior to merging with the rebound shock at the shell’s inner surface.
This work was supported by EPSRC grants EP/P023460/1, EP/P026486/1, and EP/P026796/1.
REFERENCES
1. R. Betti et al., Phys. Rev. Lett. 98, 155001 (2007).
2. D. T. Cliche and R. C. Mancini, Appl. Opt. 58, 4753 (2019).
3. T. Nagayama et al., Phys. Plasmas 19, 082705 (2012).
4. F. H. Séguin et al., Phys. Plasmas 9, 2725 (2002).
5. D. T. Michel et al., Phys. Rev. Lett. 120, 125001 (2018).
6. W. Theobald et al., Rev. Sci. Instrum. 89, 10G117 (2018).
7. F. J. Marshall et al., Rev. Sci. Instrum. 88, 093702 (2017).

Publications and conference Presentations
FY20 Annual Report 357
Publications and Conference Presentations
Publications
A. Antikainen and G. P. Agrawal, “Supercontinuum Generation in Seven-Core Fibers,” J. Opt. Soc. Am. B 36, 2927 (2019).
Y. Arikawa, M. Ota, M. Nakajima, T. Shimizu, S. Segawa,T. N. K. Phan, Y. Sakawa, Y. Abe, A. Morace, S. R. Mirfayzi,A. Yogo, S. Fujioka, M. Nakai, H. Shiraga, H. Azechi,R. Kodama, K. Kan, J. Frenje, M. Gatu Johnson, A. Bose,N. V. Kabadi, G. D. Sutcliffe, P. Adrian, C. Li, F. H. Séguin,and R. Petrasso, “The Conceptual Design of 1-ps TimeResolution Neutron Detector for Fusion Reaction HistoryMeasurement at OMEGA and the National Ignition Facility,”Rev. Sci. Instrum. 91, 063304 (2020).
M. Bailly-Grandvaux, D. Kawahito, C. McGuffey, J. Strehlow,B. Edghill, M. S. Wei, N. Alexander, A. Haid, C. Brabetz, V. Bagnoud, R. Hollinger, M. G. Capeluto, J. J. Rocca, and F. N. Beg, “IonAcceleration from Microstructured Targets Irradiated by High-Inten-sity Picosecond Laser Pulses,” Phys. Rev. E 102, 021201(R) (2020).
M. Bailly-Grandvaux, J. Kim, C. M. Krauland, S. Zhang,M. Dozières, M. S. Wei, W. Theobald, P. E. Grabowski, S. S.Santos, Ph. Nicolaï, P. McKenna, M. P. Desjarlais, and F. N.Beg, “Transport of kJ-Laser-Driven Relativistic ElectronBeams in Cold and Shock-Heated Vitreous Carbon andDiamond,” New J. Phys. 22, 033031 (2020).
K. L. Baker, C. A. Thomas, D. T. Casey, M. Hohenberger,S. Khan, B. K. Spears, O. L. Landen, R. Nora, D. T. Woods, J. L. Milovich, R. L. Berger, D. Strozzi, C. Weber, D. Clark, O. A.Hurricane, D. A. Callahan, A. L. Kritcher, B. Bachmann, L. R.Benedetti, R. Bionta, P. M. Celliers, D. Fittinghoff, C. Goyon,R. Hatarik, N. Izumi, M. Gatu Johnson, G. Kyrala, T. Ma,K. Meaney, M. Millot, S. R. Nagel, P. K. Patel, D. Turnbull, P. L. Volegov, C. Yeamans, and C. Wilde, “Hotspot Parameter Scaling with Velocity and Yield for High-Adiabat Layered Implosions at the National Ignition Facility,” Phys. Rev. E 102, 023210 (2020).
D. H. Barnak, J. R. Davies, J. P. Knauer, and P. M. Kozlowski,“Soft X-Ray Spectrum Unfold of K-Edge Filtered X-Ray DiodeArrays Using Cubic Splines,” Rev. Sci. Instrum. 91, 073102 (2020).
K. A. Bauer, M. Heimbueger, J. Kwiatkowski, S. Sampat, L. J. Waxer, E. C. Cost, J. H. Kelly, V. Kobilansky, S. F. B.Morse, D. Nelson, D. Weiner, G. Weselak, and J. Zou, “Optical Characterization of the On-Target OMEGA Focal Spot at High Energy Using the Full-Beam In-Tank Diagnostic,” Appl. Opt.59, 7994 (2020).
X. Bian, H. Aluie, D. Zhao, H. Zhang, and D. Livescu,“Revisiting the Late-Time Growth of Single-Mode Rayleigh–Taylor Instability and the Role of Vorticity,” Physica D 403,132250 (2020).
P. T. Campbell, D. Canning, A. E. Hussein, K. D. W. Ratnayaka, A. G. R. Thomas, K. Krushelnick, and L. Willingale, “Proton Beam Emittance Growth in Multipicosecond Laser-Solid Interactions,” New J. Phys. 21, 103021 (2019).
P. T. Campbell, C. A. Walsh, B. K. Russell, J. P. Chittenden, A. Crilly, G. Fiksel, P. M. Nilson, A. G. R. Thomas, K. Krushelnick, and L. Willingale, “Magnetic Signatures of Radiation-DrivenDouble Ablation Fronts,” Phys. Rev. Lett. 125, 145001 (2020).
S. H. Cao, R. Yan, H. Wen, J. Li, and C. Ren, “Cogeneration of Hot Electrons from Multiple Laser-Plasma Instabilities,” Phys. Rev. E 101, 053205 (2020).
L. Ceurvorst, R. Betti, A. Casner, V. Gopalaswamy, A. Bose,S. X. Hu, E. M. Campbell, S. P. Regan, C. A. McCoy,M. Karasik, J. L. Peebles, M. Tabak, and W. Theobald, “Hybrid Target Design for Imprint Mitigation in Direct-Drive InertialConfinement Fusion,” Phys. Rev. E 101, 063207 (2020).
L. E. Chen, A. F. A. Bott, P. Tzeferacos, A. Rigby, A. Bell,R. Bingham, C. Graziani, J. Katz, M. Koenig, C. K. Li,R. Petrasso, H.-S. Park, J. S. Ross, D. Ryu, T. G. White,B. Reville, J. Matthews, J. Meinecke, F. Miniati, E. G. Zweibel,S. Sarkar, A. A. Schekochihin, D. Q. Lamb, D. H. Froula, andG. Gregori, “Transport of High-Energy Charged ParticlesThrough Spatially Intermittent Turbulent Magnetic Fields,”Astrophys. J. 892, 114 (2020).

Publications and conference Presentations
FY20 Annual Report358
Y.-H. Chen, J. R. Peterson, L. A. Johnson, T. G. Jones, B. Hafizi, A. B. Stamm, A. C. Ting, J. P. Palastro, M. H. Helle, and D. Kaganovich, “Nonlinear Underwater Propagation of Picosecond Ultraviolet Laser Beams,” Opt. Lett. 45, 4344 (2020).
A. R. Christopherson, R. Betti, S. Miller, V. Gopalaswamy, O. M. Mannion, and D. Cao, “Theory of Ignition and Burn Propagation in Inertial Fusion Implosions,” Phys. Plasmas 27, 052708 (2020).
A. S. Davies, D. Haberberger, J. Katz, S. Bucht, J. P. Palastro, R. K. Follett, and D. H. Froula, “Investigation of Picosecond Thermodynamics in a Laser-Produced Plasma Using Thomson Scattering,” Plasma Phys. Control. Fusion 62, 014012 (2020).
S. Depierreux, C. Neuville, V. Tassin, M.-C. Monteil, P.-E. Masson-Laborde, C. Baccou, P. Fremerye, F. Philippe, P. Seytor, D. Teychenne, J. Katz, R. Bahr, M. Casanova,
N. Borisenko, L. Borisenko, A. Orekhov, A. Colaïtis, A. Debayle, G. Duchateau, A. Heron, S. Huller, P. Loiseau, P. Nicolai, C. Riconda, G. Tran, C. Stoeckl, W. Seka, V. Tikhonchuk, D. Pesme, and C. Labaune, “Experimental Investigation of the Collective Stimulated Brillouin and Raman Scattering of Multiple Laser Beams in Inertial Confinement Fusion Experiments,” Plasma Phys. Control. Fusion 62, 014024 (2020).
C. Dorrer, E. M. Hill, and J. D. Zuegel, “High-Energy Parametric Amplification of Spectrally Incoherent Broadband Pulses,” Opt. Express 28, 451 (2020).
M. Dozières, S. Hansen, P. Forestier-Colleoni, C. McGuffey, D. Kawahito, M. Bailly-Grandvaux, K. Bhutwala, C. M. Krauland, M. S. Wei, P. Gourdain, J. R. Davies, K. Matsuo, S. Fujioka, E. M. Campbell, J. L. Peebles, J. J. Santos, D. Batani, S. Zhang, and F. N. Beg, “Characterization of an Imploding Cylindrical Plasma for Electron Transport Studies Using X-Ray Emission Spectroscopy,” Phys. Plasmas 27, 023302 (2020).
D. J. Erskine, “Forward Modeling of Doppler Velocity Inter-ferometer System for Improved Shockwave Measurements,” Rev. Sci. Instrum. 91, 043103 (2020).
C. Fagan, M. Sharpe, W. T. Shmayda, and W. U. Schröder, “A Thin Alumina Film as a Tritium Adsorption Inhibitor for Stainless Steel 316,” Fusion Sci. Technol. 76, 424 (2020).
C. Fagan, M. Sharpe, W. T. Shmayda, and W. U. Schröder, “Tritium Retention in Hexavalent Chromate-Conversion–Coated Aluminum Alloy,” Fusion Sci. Technol. 75, 1058 (2019).
S. R. Fairchild, Y. Liu, J. Palastro, and J. Peñano, “Laser Filamentation and Applications: Introduction,” J. Opt. Soc. Am. B 36, LFA1 (2019).
K. Falk, C. J. Fontes, C. L. Fryer, C. W. Greeff, M. Holec, H. M. Johns, D. S. Montgomery, D. W. Schmidt, and M. M. Šmíd, “Experimental Observation of Elevated Heating in Dynamically Compressed CH Foam,” Plasma Phys. Control. Fusion 62, 074001 (2020).
W. A. Farmer, C. Bruulsema, G. F. Swadling, M. W. Sherlock, M. D. Rosen, W. Rozmus, D. H. Edgell, J. Katz, B. B. Pollock, and J. S. Ross, “Validation of Heat Transport Modeling Using Directly Driven Beryllium Spheres,” Phys. Plasmas 27, 082701 (2020).
F. Fiuza, G. F. Swadling, A. Grassi, H. G. Rinderknecht, D. P. Higginson, D. D. Ryutov, C. Bruulsema, R. P. Drake, S. Funk, S. Glenzer, G. Gregori, C. K. Li, B. B. Pollock, B. A. Remington, J. S. Ross, W. Rozmus, Y. Sakawa, A. Spitkovsky, S. Wilks, and H.-S. Park, “Electron Acceleration in Laboratory-Produced Turbulent Collisionless Shocks,” Nat. Phys. 16, 916 (2020).
R. K. Follett, J. G. Shaw, J. F. Myatt, D. H. Froula, and J. P. Palastro, “Multibeam Absolute Stimulated Raman Scattering and Two-Plasmon Decay,” Phys. Rev. E 101, 043214 (2020).
Y. Frank, G. E. Kemp, E. V. Marley, G. P. Callejo, M. E. Foord, M. B. Schneider, Y. Ehrlich, and M. Fraenkel, “Hydrodynamic Conditions in Laser Irradiated Buried Layer Experiments,” Phys. Plasmas 27, 063301 (2020).
P. Franke, D. Turnbull, J. Katz, J. P. Palastro, I. A. Begishev, J. Bromage, J. L. Shaw, R. Boni, and D. H. Froula, “Measure-ment and Control of Large Diameter Ionization Waves of Arbitrary Velocity,” Opt. Express 27, 31978 (2019).
M. Gatu Johnson, P. J. Adrian, K. S. Anderson, B. D. Appelbe, J. P. Chittenden, A. J. Crilly, D. Edgell, C. J. Forrest, J. A. Frenje, V. Yu. Glebov, B. M. Haines, I. Igumenshchev, D. Jacobs-Perkins, R. Janezic, N. V. Kabadi, J. P. Knauer, B. Lahmann, O. M. Mannion, F. J. Marshall, T. Michel, F. H. Séguin, R. Shah, C. Stoeckl, C. A. Walsh, and R. D. Petrasso, “Impact of Stalk on Directly Driven Inertial Confinement Fusion Implosions,” Phys. Plasmas 27, 032704 (2020).
M. Gatu Johnson, B. M. Haines, P. J. Adrian, C. Forrest, J. A. Frenje, V. Yu. Glebov, W. Grimble, R. Janezic, J. P. Knauer, B. Lahmann, F. J. Marshall, T. Michel, F. H. Séguin, C. Stoeckl,

Publications and conference Presentations
FY20 Annual Report 359
and R. D. Petrasso “3D xRAGE Simulation of Inertial Con-finement Fusion Implosion with Imposed Mode 2 Laser Drive Asymmetry,” High Energy Density Phys. 36, 100825 (2020).
V. N. Goncharov, I. V. Igumenshchev, D. R. Harding, S. F. B. Morse, S. X. Hu, P. B. Radha, D. H. Froula, S. P. Regan, T. C. Sangster, and E. M. Campbell, “Novel Hot-Spot Igni-tion Designs for Inertial Confinement Fusion with Liquid-Deuterium-Tritium Spheres,” Phys. Rev. Lett. 125, 065001 (2020).
T. Gong, H. Habara, K. Sumioka, M. Yoshimoto, Y. Hayashi, S. Kawazu, T. Otsuki, T. Matsumoto, T. Minami, K. Abe, K. Aizawa, Y. Enmei, Y. Fujita, A. Ikegami, H. Makiyama, K. Okazaki, K. Okida, T. Tsukamoto, Y. Arikawa, S. Fujioka, Y. Iwasa, S. Lee, H. Nagatomo, H. Shiraga, K. Yamanoi, M. S. Wei, and K. A. Tanaka, “Direct Observation of Imploded Core Heating via Fast Electrons with Super-Penetration Scheme,” Nat. Commun. 10, 5614 (2019).
M. J. Guardalben, M. Barczys, B. E. Kruschwitz, M. Spilatro, L. J. Waxer, and E. M. Hill, “Laser-System Model for Enhanced Operational Performance and Flexibility on OMEGA EP,” High Power Laser Sci. Eng. 8, e8 (2020).
G. Guidarelli, J. Nordhaus, L. Chamandy, Z. Chen, E. G. Blackman, A. Frank, J. Carroll-Nellenback, and B. Liu, “Hydrodynamic Simulations of Disrupted Planetary Accretion Discs Inside the Core of an AGB Star,” Mon. Not. R. Astron. Soc. 490, 1179 (2019).
D. Haberberger, A. Shvydky, V. N. Goncharov, D. Cao, J. Carroll-Nellenback, S. X. Hu, S. T. Ivancic, V. V. Karasiev, J. P. Knauer, A. V. Maximov, and D. H. Froula, “Plasma Density Measurements of the Inner Shell Release,” Phys. Rev. Lett. 123, 235001 (2019).
B. M. Haines, D. E. Keller, J. A. Marozas, P. W. McKenty, K. S. Anderson, T. J. B. Collins, W. W. Dai, M. L. Hall, S. Jones, M. D. McKay Jr., R. M. Rauenzahn, and D. N. Woods, “Coupling Laser Physics to Radiation-Hydrodynamics,” Comput. Fluids 201, 104478 (2020).
B. M. Haines, R. C. Shah, J. M. Smidt, B. J. Albright, T. Cardenas, M. R. Douglas, C. Forrest, V. Yu. Glebov, M. A. Gunderson, C. E. Hamilton, K. C. Henderson, Y. Kim, M. N. Lee, T. J. Murphy, J. A. Oertel, R. E. Olson, B. M. Patterson, R. B. Randolph, and D. W. Schmidt, “Observation of Persistent Species Temperature Separation in Inertial Confinement Fusion Mixtures,” Nat. Commun. 11, 544 (2020).
A. M. Hansen, D. Turnbull, J. Katz, and D. H. Froula, “Miti-gation of Self-Focusing in Thomson Scattering Experiments,” Phys. Plasmas 26, 103110 (2019).
E. C. Hansen, J. R. Davies, D. H. Barnak, R. Betti, E. M. Campbell, V. Yu. Glebov, J. P. Knauer, L. S. Leal, J. L. Peebles, A. B. Sefkow, and K. M. Woo, “Neutron Yield Enhancement and Suppression by Magnetization in Laser-Driven Cylindrical Implosions,” Phys. Plasmas 27, 062703 (2020) (invited).
M. H. Helle, G. DiComo, S. Gregory, A. Mamonau, D. Kaganovich, R. Fischer, J. Palastro, S. Melis, and J. Peñano, “Beating Optical-Turbulence Limits Using High-Peak-Power Lasers,” Phys. Rev. Appl. 12, 054043 (2019).
J. Hinz, V. V. Karasiev, S. X. Hu, M. Zaghoo, D. Mejía-Rodríguez, S. B. Trickey, and L. Calderín, “Fully Consistent Density Functional Theory Determination of the Insulator-Metal Transition Boundary in Warm Dense Hydrogen,” Phys. Rev. Res. 2, 032065(R) (2020).
B. N. Hoffman, A. A. Kozlov, N. Liu, H. Huang, J. B. Oliver, A. L. Rigatti, T. J. Kessler, A. A. Shestopalov, and S. G. Demos, “Mechanisms of Picosecond Laser-Induced Damage in Common Multilayer Dielectric Gratings,” Opt. Express 28, 24,928 (2020).
S. X. Hu, R. Epstein, W. Theobald, H. Xu, H. Huang, V. N. Goncharov, S. P. Regan, P. W. McKenty, R. Betti, E. M. Campbell, and D. S. Montgomery, “Direct-Drive Double-Shell Implosion: A Platform for Burning-Plasma Physics Studies,” Phys. Rev. E 100, 063204 (2019).
S. X. Hu, V. V. Karasiev, V. Recoules, P. M. Nilson, N. Brouwer, and M. Torrent, “Interspecies Radiative Transition in Warm and Superdense Plasma Mixtures,” Nat. Commun. 11, 1989 (2020).
K. D. Humbird, J. L. Peterson, B. K. Spears, and R. G. McClarren, “Transfer Learning to Model Inertial Confinement Fusion Experiments,” IEEE Trans. Plasma Sci. 48, 61 (2020).
V. V. Ivanov, A. V. Maximov, A. L. Astanovitskiy, I. A. Begishev, R. Betti, J. R. Davies, C. Mileham, J. D. Moody, C. Stoeckl, K. J. Swanson, N. L. Wong, and J. Bromage, “Study of Laser-Driven Magnetic Fields with a Continuous Wave Faraday Rotation Diagnostic,” Phys. Plasmas 27, 033102 (2020).
A. Kar, S. X. Hu, G. Duchateau, J. Carroll-Nellenback, and P. B. Radha, “Implementing a Microphysics Model in Hydro-

Publications and conference Presentations
FY20 Annual Report360
dynamic Simulations to Study the Initial Plasma Formation in Dielectric Ablator Materials for Direct-Drive Implosions,” Phys. Rev. E 101, 063202 (2020).
P. R. C. Kent, A. Annaberdiyev, A. Benali, M. C. Bennett, E. J. L. Borda, P. Doak, H. Hao, K. D. Jordan, J. T. Krogel, I. Kylänpää, J. Lee, Y. Luo, F. D. Malone, C. A. Melton, L. Mitas, M. A. Morales, E. Neuscamman, F. A. Reboredo, B. Rubenstein, K. Saritas, S. Upadhyay, G. Wang, S. Zhang, and L. Zhao, “QMCPACK: Advances in the Development, Efficiency, and Application of Auxiliary Field and Real-Space Variational and Diffusion Quantum Monte Carlo,” J. Chem. Phys. 152, 174105 (2020).
T. Z. Kosc, H. Huang, T. J. Kessler, A. Maltsev, and S. G. Demos, “Measurement of the Angular Dependence of the Spon-taneous Raman Scattering in Anisotropic Crystalline Materials Using Spherical Samples: Potassium Dihydrogen Phosphate as a Case Example,” Rev. Sci. Instrum. 91, 015101 (2020).
T. Z. Kosc, A. A. Kozlov, S. Papernov, K. R. P. Kafka, K. L. Marshall, and S. G. Demos, “Investigation of Parameters Governing Damage Resistance of Nematic Liquid Crystals for High-Power or Peak-Intensity Laser Applications,” Sci. Rep. 9, 16435 (2019).
N. S. Krasheninnikova, M. J. Schmitt, K. Molvig, S. C. Hsu, B. S. Scheiner, D. W. Schmidt, V. Geppert-Kleinrath, P. W. McKenty, D. T. Michel, D. H. Edgell, F. J. Marshall, and H. Huang, “Development of a Directly Driven Multi-Shell Platform: Laser Drive Energetics,” Phys. Plasmas 27, 022706 (2020).
A. L. Kritcher, D. C. Swift, T. Döppner, B. Bachmann, L. X. Benedict, G. W. Collins, J. L. DuBois, F. Elsner, G. Fontaine, J. A. Gaffney, S. Hamel, A. Lazicki, W. R. Johnson, N. Kostinski, D. Kraus, M. J. MacDonald, B. Maddox, M. E. Martin, P. Neumayer, A. Nikroo, J. Nilsen, B. A. Remington, D. Saumon, P. A. Sterne, W. Sweet, A. A. Correa, H. D. Whitley, R. W. Falcone, and S. H. Glenzer, “A Measurement of the Equation of State of Carbon Envelopes of White Dwarfs,” Nature 584, 51 (2020).
B. Lahmann, M. Gatu Johnson, J. A. Frenje, V. Yu. Glebov, H. G. Rinderknecht, F. H. Séguin, G. Sutcliffe, and R. D. Petrasso, “CR-39 Nuclear Track Detector Response to Inertial Confinement Fusion Relevant Ions,” Rev. Sci. Instrum. 91, 053502 (2020).
L. S. Leal, A. V. Maximov, R. Betti, A. B. Sefkow, and V. V. Ivanov, “Modeling Magnetic Confinement of Laser-Generated
Plasma in Cylindrical Geometry Leading to Disk-Shaped Structures,” Phys. Plasmas 27, 022116 (2020).
J. Levesque, C. Kuranz, T. Handy, M. Manuel, and F. Fiuza, “Characterizing Filamentary Magnetic Structures in Counter-Streaming Plasmas by Fourier Analysis of Proton Images,” Phys. Plasmas 26, 102303 (2019).
J. Li, S. Zhang, C. M. Krauland, H. Wen, F. N. Beg, C. Ren, and M. S. Wei, “Pump Depletion and Hot-Electron Generation in Long-Density-Scale-Length Plasma with Shock-Ignition High-Intensity Laser,” Phys. Rev. E 101, 033206 (2020).
Y. Lu, S. Li, H. Li, K. A. Flippo, D. Barnak, A. Birkel, B. Lahmann, C. K. Li, A. M. Rasmus, K. Kelso, A. Zylstra, E. Liang, P. Tzeferacos, and D. Lamb, “Modeling Hydrodynamics, Magnetic Fields, and Synthetic Radiographs for High-Energy-Density Plasma Flows in Shock-Shear Targets,” Phys. Plasmas 27, 012303 (2020).
K. Luo, V. V. Karasiev, and S. B. Trickey, “Towards Accurate Orbital-Free Simulations: A Generalized Gradient Approximation for the Noninteracting Free Energy Density Functional,” Phys. Rev. B 101, 075116 (2020).
S. MacNally, C. Smith, J. Spaulding, J. Foster, and J. B. Oliver, “Glancing-Angle-Deposited Silica Films for Ultraviolet Wave Plates,” Appl. Opt. 59, A155 (2020).
O. M. Mannion, J. P. Knauer, V. Yu. Glebov, C. J. Forrest, A. Liu, Z. L. Mohamed, M. H. Romanofsky, T. C. Sangster, C. Stoeckl, and S. P. Regan, “A Suite of Neutron Time-of-Flight Detectors to Measure Hot-Spot Motion in Direct-Drive Inertial Confinement Fusion Experiments on OMEGA,” Nucl. Instrum. Methods Phys. Res. A 964, 163774 (2020).
A. V. Maximov, J. G. Shaw, and J. P. Palastro, “Nonlinear Transmission of Laser Light Through Coronal Plasma Due to Self-Induced Incoherence,” Phys. Rev. E 102, 023205 (2020).
D. I. Mihaylov, V. V. Karasiev, and S. X. Hu, “Thermal Hybrid Exchange-Correlation Density Functional for Improving the Description of Warm Dense Matter,” Phys. Rev. B 101, 245141 (2020).
A. L. Milder, H. P. Le, M. Sherlock, P. Franke, J. Katz, S. T. Ivancic, J. L. Shaw, J. P. Palastro, A. M. Hansen, I. A. Begishev, W. Rozmus, and D. H. Froula, “Evolution of the Electron Dis-tribution Function in the Presence of Inverse Bremsstrahlung

Publications and conference Presentations
FY20 Annual Report 361
Heating and Collisional Ionization,” Phys. Rev. Lett. 124, 025001 (2020).
M. Millot, S. Zhang, D. E. Fratanduono, F. Coppari, S. Hamel, B. Militzer, D. Simonova, S. Shcheka, N. Dubrovinskaia, L. Dubrovinsky, and J. H. Eggert, “Recreating Giants Impacts in the Laboratory: Shock Compression of MgSiO3 Bridgmanite to 14 Mbar,” Geophys. Res. Lett. 47, e2019GL085476 (2020).
J. F. Myatt, J. G. Shaw, R. K. Follett, D. H. Edgell, D. H. Froula, J. P. Palastro, and V. N. Goncharov, “LPSE: A 3-D Based Model of Cross-Beam Energy Transfer in Laser-Irradiated Plasmas,” J. Comp. Phys. 399, 108916 (2019).
J. M. Ngoko Djiokap, A. V. Meremianin, N. L. Manakov, L. B. Madsen, S. X. Hu, and A. F. Starace, “Molecular Symmetry-Mixed Dichroism in Double Photoionization of H2,” Phys. Rev. Lett. 123, 143202 (2019).
J. Nilsen, A. L. Kritcher, M. E. Martin, R. E. Tipton, H. D. Whitley, D. C. Swift, T. DÖppner, B. L. Bachmann, A. E. Lazicki, N. B. Kostinski, B. R. Maddox, G. W. Collins, S. H. Glenzer, and R. W. Falcone, “Understanding the Effects of Radiative Preheat and Self-Emission from Shock Heating on Equation of State Measurement at 100s of Mbar Using Spherically Converging Shock Waves in a NIF Hohlraum,” Matter Radiat. Extremes 5, 018401 (2020).
J. B. Oliver, A. L. Rigatti, T. Noll, J. Spaulding, J. Hettrick, V. Gruschow, G. Mitchell, D. Sadowski, C. Smith, and B. Charles, “Large-Aperture Coatings for Fusion-Class Laser Systems,” Appl. Opt. 59, A7 (2020).
J. B. Oliver, J. Spaulding, and B. Charles, “Stress Compensation by Deposition of a Nonuniform Corrective Coating,” Appl. Opt. 59, A54 (2020).
J. P. Palastro, J. L. Shaw, P. Franke, D. Ramsey, T. T. Simpson, and D. H. Froula, “Dephasingless Laser Wakefield Acceleration,” Phys. Rev. Lett. 124, 134802 (2020).
C. E. Parker, J. A. Frenje, O. H. W. Siegmund, C. J. Forrest, V. Yu. Glebov, J. D. Kendrick, C. W. Wink, M. Gatu Johnson, T. J. Hilsabeck, S. T. Ivancic, J. Katz, J. D. Kilkenny, B. Lahmann, C. K. Li, F. H. Séguin, C. M. Sorce, C. Trosseille, and R. D. Petrasso, “Response of a Lead-Free Borosilicate-Glass Microchannel Plate to 14-MeV Neutrons and c-Rays,” Rev. Sci. Instrum. 90, 103306 (2019).
P. K. Patel, P. T. Springer, C. R. Weber, L. C. Jarrott, O. A. Hurricane, B. Bachmann, K. L. Baker, L. F. Berzak Hopkins, D. A. Callahan, D. T. Casey, C. J. Cerjan, D. S. Clark, E. L. Dewald, L. Divol, T. Döppner, J. E. Field, D. Fittinghoff, J. Gaffney, V. Geppert-Kleinrath, G. P. Grim, E. P. Hartouni, R. Hatarik, D. E. Hinkel, M. Hohenberger, K. Humbird, N. Izumi, O. S. Jones, S. F. Khan, A. L. Kritcher, M. Kruse, O. L. Landen, S. Le Pape, T. Ma, S. A. MacLaren, A. G. MacPhee, L. P. Masse, N. B. Meezan, J. L. Milovich, R. Nora, A. Pak, J. L. Peterson, J. Ralph, H. F. Robey, J. D. Salmonson, V. A. Smalyuk, B. K. Spears, C. A. Thomas, P. L. Volegov, A. Zylstra, and M. J. Edwards, “Hotspot Conditions Achieved in Inertial Confinement Fusion Experiments on the National Ignition Facility,” Phys. Plasmas 27, 050901 (2020).
R. Paul, S. X. Hu, and V. V. Karasiev, “Crystalline Phase Tran-sitions and Vibrational Spectra of Silicon up to Multiterapascal Pressures,” Phys. Rev. B 100, 144101 (2019).
R. Paul, S. X. Hu, V. V. Karasiev, S. A. Bonev, and D. N. Polsin, “Thermal Effects on the Electronic Properties of Sodium Elec-tride Under High Pressures,” Phys. Rev. B 102, 094103 (2020).
J. L. Peebles, J. R. Davies, D. H. Barnak, T. Cracium, M. J. Bonino, and R. Betti, “Axial Proton Probing of Magnetic and Electric Fields Inside Laser-Driven Coils,” Phys. Plasmas 27, 063109 (2020).
A. Pineau, B. Chimier, S. X. Hu, and G. Duchateau, “Modeling the Electron Collision Frequency During Solid-to-Plasma Transition of Polystyrene Ablator for Direct-Drive Inertial Confinement Fusion Applications,” Phys. Plasmas 27, 092703 (2020).
H. G. Rinderknecht, D. T. Casey, R. Hatarik, R. M. Bionta, B. J. MacGowan, P. Patel, O. L. Landen, E. P. Hartouni, and O. A. Hurricane, “Azimuthal Drive Asymmetry in Inertial Confinement Fusion Implosions on the National Ignition Facility,” Phys. Rev. Lett. 124, 145002 (2020).
M. J. Rosenberg, A. A. Solodov, W. Seka, R. K. Follett, J. F. Myatt, A. V. Maximov, C. Ren, S. Cao, P. Michel, M. Hohenberger, J. P. Palastro, C. Goyon, T. Chapman, J. E. Ralph, J. D. Moody, R. H. H. Scott, K. Glize, and S. P. Regan, “Stimulated Raman Scattering Mechanisms and Scaling Behavior in Planar Direct-Drive Experiments at the National Ignition Facility,” Phys. Plasmas 27, 042705 (2020).
J. J. Ruby, J. R. Rygg, J. A. Gaffney, B. Bachmann, and G. W. Collins, “A Boundary Condition for Guderley’s Converging Shock Problem,” Phys. Fluids 31, 126104 (2019).

Publications and conference Presentations
FY20 Annual Report362
J. R. Rygg, R. F. Smith, A. E. Lazicki, D. G. Braun, D. E. Fratanduono, R. G. Kraus, J. M. McNaney, D. C. Swift, C. E. Wehrenberg, F. Coppari, M. F. Ahmed, M. A. Barrios, K. J. M. Blobaum, G. W. Collins, A. L. Cook, P. Di Nicola, E. G. Dzenitis, S. Gonzales, B. F. Heidl, M. Hohenberger, A. House, N. Izumi, D. H. Kalantar, S. F. Khan, T. R. Kohut, C. Kumar, N. D. Masters, D. N. Polsin, S. P. Regan, C. A. Smith, R. M. Vignes, M. A. Wall, J. Ward, J. S. Wark, T. L. Zobrist, A. Arsenlis, and J. H. Eggert, “X-Ray Diffraction at the National Ignition Facility,” Rev. Sci. Instrum. 91, 043902 (2020).
E. M. Schiesser, S.-W. Bahk, J. Bromage, and J. P. Rolland, “Design and Alignment of an All-Spherical Unobscured Four-Mirror Image Relay for an Ultra-Broadband Sub-Petawatt Laser,” Appl. Opt. 58, 9514 (2019).
E. M. Schiesser, A. Bauer, and J. P. Rolland, “Effect of Freeform Surfaces on the Volume and Performance of Unobscured Three Mirror Imagers in Comparison with Off-Axis Rotationally Symmetric Polynomials,” Opt. Express 27, 21,750 (2019).
E. M. Schiesser, A. Bauer, and J. P. Rolland “Estimating Field-Dependent Nodal Aberration Theory Coefficients from Zernike Full-Field Displays by Utilizing Eight-Order Astigmatism,” J. Opt. Soc. Am. A 36, 2115 (2019).
M. Sharpe, C. Fagan, and W. T. Shmayda, “Distribution of Tritium in the Near Surface of Type 316 Stainless Steel,” Fusion Sci. Technol. 75, 1053 (2019).
M. Sharpe, W. T. Shmayda, and K. Glance, “Measurement of Palladium Hydride and Palladium Deuteride Isotherms Between 130 K and 393 K,” Fusion Sci. Technol. 76, 642 (2002).
W. T. Shmayda, C. R. Shmayda, and G. Torres, “Tritium Extraction from Water,” Fusion Sci. Technol. 75, 1030 (2019).
R. W. Short, “Absolute Stimulated Raman Side Scatter in Direct-Drive Laser-Produced Plasmas,” Phys. Plasmas 27, 042703 (2020).
D. B. Sinars, M. A. Sweeney, C. S. Alexander, D. J. Ampleford, T. Ao, J. P. Apruzese, C. Aragon, D. J. Armstrong, K. N. Austin, T. J. Awe, A. D. Baczewski, J. E. Bailey, K. L. Baker, C. R. Ball, H. T. Barclay, S. Beatty, K. Beckwith, K. S. Bell, J. F. Benage, Jr., N. L. Bennett, K. Blaha, D. E. Bliss, J. J. Boerner, C. J. Bourdon, B. A. Branch, J. L. Brown, E. M. Campbell, R. B. Campbell, D. G. Chacon, G. A. Chandler, K. Chandler, P. J. Christenson, M. D. Christison, E. B. Christner, R. C.
Clay III, K. R. Cochrane, A. P. Colombo, B. M. Cook, C. A. Coverdale, M. E. Cuneo, J. S. Custer, A. Dasgupta, J.-P. Davis, M. P. Desjarlais, D. H. Dolan III, J. D. Douglass, G. S. Dunham, S. Duwal, A. D. Edens, M. J. Edwards, E. G. Evstatiev, B. G. Farfan, J. R. Fein, E. S. Field, J. A. Fisher, T. M. Flanagan, D. G. Flicker, M. D. Furnish, B. R. Galloway, P. D. Gard, T. A. Gardiner, M. Geissel, J. L. Giuliani, M. E. Glinksy, M. R. Gomez, G. P. Grim, K. D. Hahn, T. A. Haill, N. D. Hamlin, J. H. Hammer, S. B. Hansen, H. L. Hanshaw, E. C. Harding, A. J. Harvey-Thompson, D. Headley, M. C. Herrmann, M. H. Hess, C. Highstrete, O. A. Hurricane, B. T. Hutsel, C. A. Jennings, O. M. Johns, D. Johnson, M. D. Johnston, B. M. Jones, M. C. Jones, P. A. Jones, P. E. Kalita, R. J. Kamm, J. W. Kellogg, M. L. Kiefer, M. W. Kimmel, P. F. Knapp, M. D. Knudson, A. Kreft, G. R. Laity, P. W. Lake, D. C. Lamppa, W. L. Langston, J. S. Lash, K. R. LeChien, J. J. Leckbee, R. J. Leeper, G. T. Leifeste, R. W. Lemke, W. Lewis, S. A. Lewis, G. P. Loisel, Q. M. Looker, A. J. Lopez, D. J. Lucero, S. A. MacLaren, R. J. Magyar, M. A. Mangan, M. R. Martin, T. R. Mattsson, M. K. Matzen, A. J. Maurer, M. G. Mazarakis, R. D. McBride, H. S. McLean, C. A. McCoy, G. R. McKee, J. L. McKenney, A. R. Miles, J. A. Mills, M. D. Mitchell, N. W. Moore, C. E. Myers, T. Nagayama, G. Natoni, A. C. Owen, S. Patel, K. J. Peterson, T. D. Pointon, J. L. Porter, A. J. Porwitzky, S. Radovich, K. S. Raman, P. K. Rambo, W. D. Reinhart, G. K. Robertson, G. A. Rochau, S. Root, D. V. Rose, D. C. Rovang, C. L. Ruiz, D. E. Ruiz, D. Sandoval, M. E. Savage, M. E. Sceiford, M. A. Schaeuble, P. F. Schmit, M. S. Schollmeier, J. Schwarz, C. T. Seagle, A. B. Sefkow, D. B. Seidel, G. A. Shipley, J. Shores, L. Shulenburger, S. C. Simpson, S. A. Slutz, I. C. Smith, C. S. Speas, P. E. Specht, M. J. Speir, D. C. Spencer, P. T. Springer, A. M. Steiner, B. S. Stolzfus, W. A. Stygar, J. Ward Thornhill, J. A. Torres, J. P. Townsend, C. Tyler, R. A. Vesey, P. E. Wakeland, T. J. Webb, E. A. Weinbrecht, M. R. Weis, D. R. Welch, J. L. Wise, M. Wu, D. A. Yager-Elorriaga, A. Yu, and E. P. Yu, “Review of Pulsed Power-Driven High Energy Density Physics Research on Z at Sandia,” Phys. Plasmas 27, 070501 (2020).
V. A. Smalyuk, C. R. Weber, O. L. Landen, S. Ali, B. Bachmann, P. M. Celliers, E. L. Dewald, A. Fernandez, B. A. Hammel, G. Hall, A. G. MacPhee, L. Pickworth, H. F. Robey, N. Alfonso, K. L. Baker, L. F. Berzak Hopkins, L. Carlson, D. T. Casey, D. S. Clark, J. Crippen, L. Divol, T. Döppner, M. J. Edwards, M. Farrell, S. Felker, J. E. Field, S. W. Haan, A. V. Hamza, M. Havre, M. C. Herrmann, W. W. Hsing, S. Khan, J. Kline, J. J. Kroll, S. LePape, E. Loomis, B. J. MacGowan, D. Martinez, L. Masse, M. Mauldin, J. L. Milovich, A. S. Moore, A. Nikroo, A. Pak, P. K. Patel, J. L. Peterson, K. Raman, B. A. Remington,

Publications and conference Presentations
FY20 Annual Report 363
N. Rice, M. Schoff, and M. Stadermann, “Review of Hydrodynamic Instability Experiments in Inertially Confined Fusion Implosions on National Ignition Facility,” Plasma Phys. Control. Fusion 62, 014007 (2020).
C. Smith, S. MacNally, and J. B. Oliver, “Ellipsometric Modeling of Serially Bi-Deposited Glancing-Angle-Deposition Coatings,” Appl. Opt. 59, A26 (2020).
A. A. Solodov, M. J. Rosenberg, W. Seka, J. F. Myatt, M. Hohenberger, R. Epstein, C. Stoeckl, R. W. Short, S. P. Regan, P. Michel, T. Chapman, R. K. Follett, J. P. Palastro, D. H. Froula, P. B. Radha, J. D. Moody, and V. N. Goncharov, “Hot-Electron Generation at Direct-Drive Ignition-Relevant Plasma Conditions at the National Ignition Facility,” Phys. Plasmas 27, 052706 (2020).
F. Soubiran, F. González-Cataldo, K. P. Driver, S. Zhang, and B. Militzer, “Magnesium Oxide at Extreme Temperatures and Pressures Studied with First-Principles Simulations,” J. Chem. Phys. 151, 214104 (2019).
R. B. Spielman and A. B. Sefkow, “Modeling Variable-Impedance, Magnetically Insulated, Transmission Lines,” in 2019 IEEE Pulsed Power & Plasma Science (PPPS) (IEEE, Piscataway, NJ, 2020).
G. F. Swadling, C. Bruulsema, F. Fiuza, D. P. Higginson, C. M. Huntington, H.S. Park, B. B. Pollock, W. Rozmus, H. G. Rinderknecht, J. Katz, A. Birkel, and J. S. Ross, “Measurement of Kinetic-Scale Current Filamentation Dynamics and Associated Magnetic Fields in Interpenetrating Plasmas,” Phys. Rev. Lett. 124, 215001 (2020).
L. L. Taylor, J. Xu, M. Pomerantz, T. R. Smith, J. C. Lambropoulos, and J. Qiao, “Femtosecond Laser Polishing of Germanium,” Opt. Mater. Express 9, 4165 (2019) (invited).
W. Theobald, C. Sorce, W. R. Donaldson, R. Epstein, R. L. Keck, C. Kellogg, T. J. Kessler, J. Kwiatkowski, F. J. Marshall, S. Sampat, W. Seka, R. C. Shah, A. Shvydky, C. Stoeckl, L. J. Waxer, and S. P. Regan, “Inferred UV Fluence Focal-Spot Profiles from Soft X-Ray Pinhole-Camera Measurements on OMEGA,” Rev. Sci. Instrum. 91, 023505 (2020).
S. Tochitsky, A. Pak, F. Fiuza, D. Haberberger, N. Lemos, A. Link, D. H. Froula, and C. Joshi, “Laser-Driven Collisionless Shock Acceleration of Ions from Near-Critical Plasmas,” Phys. Plasmas 27, 083102 (2020).
D. Turnbull, A. Colaïtis, A. M. Hansen, A. L. Milder, J. P. Palastro, J. Katz, C. Dorrer, B. E. Kruschwitz, D. J. Strozzi, and D. H. Froula, “Impact of the Langdon Effect on Crossed-Beam Energy Transfer,” Nat. Phys. 16, 181 (2020).
D. Turnbull, A. V. Maximov, D. H. Edgell, W. Seka, R. K. Follett, J. P. Palastro, D. Cao, V. N. Goncharov, C. Stoeckl, and D. H. Froula, “Anomalous Absorption by the Two-Plasmon Decay Instability,” Phys. Rev. Lett. 124, 185001 (2020).
M. P. Valdivia, D. Stutman, C. Stoeckl, C. Mileham, J. Zou, S. Muller, K. Kaiser, C. Sorce, P. A. Keitner, J. R. Fein, M. Trantham, R. P. Drake, and S. P. Regan, “Implementation of a Talbot–Lau X-Ray Deflectometer Diagnostic Platform for the OMEGA EP Laser,” Rev. Sci. Instrum. 91, 023511 (2020).
T. Walton, J. L. Sebald, I. E. Golovkin, J. J. MacFarlane, V. N. Golovkina, A. A. Solodov, P. M. Nilson, and R. Epstein, “Parameterizing Hot Electron Energy Distributions for Tabular Emissivities and Opacities,” High Energy Density Phys. 35, 100730 (2020).
H. Wen, A. V. Maximov, R. Yan, J. Li, C. Ren, and F. S. Tsung, “Three-Dimensional Particle-in-Cell Modeling of Parametric Instabilities Near the Quarter-Critical Density in Plasmas,” Phys. Rev. E 100, 041201(R) (2019).
K. Werner, V. Gruzdev, N. Talisa, K. Kafka, D. Austin, C. M. Liebig, and E. Chowdhury, “Single-Shot Multi-Stage Damage and Ablation of Silicon by Femtosecond Mid-infrared Laser Pulses,” Sci. Rep. 9, 19993 (2019).
K. M. Woo, R. Betti, O. M. Mannion, C. J. Forrest, J. P. Knauer, V. N. Goncharov, P. B. Radha, D. Patel, V. Gopalaswamy, and V. Yu. Glebov, “Inferring Thermal Ion Temperature and Residual Kinetic Energy from Nuclear Measurements in Inertial Confinement Fusion Implosions,” Phys. Plasmas 27, 062702 (2020) (invited).
J. Zhang, R. Wei, M. ElKabbash, E. M. Campbell, and C. Guo, “Thin-Film Perfect Infrared Absorbers over Single- and Dual-Band Atmospheric Windows,” Opt. Lett. 45, 2800 (2020).
S. Zhang and S. X. Hu, “Species Separation and Hydrogen Stream-ing upon Shock Release from Polystyrene Under Inertial Confine-ment Fusion Conditions,” Phys. Rev. Lett. 125, 105001 (2020).
S. Zhang, C. M. Krauland, J. Peebles, J. Li, F. N. Beg, N. Alexander, W. Theobald, R. Betti, D. Haberberger, E. M.

Publications and conference Presentations
FY20 Annual Report364
Campbell, R. Yan, E. Borwick, C. Ren, and M. S. Wei, “Experimental Study of Hot Electron Generation in Shock Ignition Relevant High-Intensity Regime with Large Scale Hot Plasmas,” Phys. Plasmas 27, 023111 (2020).
Y. Zhao and W. R. Donaldson, “Ultrafast UV AlGaN Metal–Semiconductor–Metal Photodetector with a Response Time Below 25 ps,” IEEE J. Quantum Electron. 56, 4000607 (2020).
A. B. Zylstra, R. S. Craxton, J. R. Rygg, C.-K. Li, L. Carlson, M. J.-E. Manuel, E. L. Alfonso, M. Mauldin, L. Gonzalez, K. Youngblood, E. M. Garcia, L. T. Browning, S. Le Pape, N. Candeias Lemos, B. Lahmann, M. Gatu Johson, H. Sio, and N. Kabadi, “Saturn-Ring Proton Backlighters for the National Ignition Facility,” Rev. Sci. Instrum. 91, 093505 (2020).
A. B. Zylstra, H. W. Herrmann, Y. H. Kim, A. McEvoy, J. A. Frenje, M. Gatu Johnson, R. D. Petrasso, V. Yu. Glebov,
C. Forrest, J. Delettrez, S. Gales, and M. Rubery, “2H(p,c)3He Cross Section Measurement Using High-Energy-Density Plasmas,” Phys. Rev. C 101, 042802(R) (2020).
A. B. Zylstra, H. W. Herrmann, Y. H. Kim, A. McEvoy, K. Meaney, V. Yu. Glebov, C. Forrest, and M. Rubery, “Improved Calibration of the OMEGA Gas Cherenkov Detector,” Rev. Sci. Instrum. 90, 123504 (2019).
A. B. Zylstra, H. G. Rinderknecht, J. A. Frenje, C. K. Li, and R. D. Petrasso, “Modified Parameterization of the Li-Petrasso Charged-Particle Stopping Power Theory,” Phys. Plasmas 26, 122703 (2019).
A. B. Zylstra, J. R. Rygg, G. W. Collins, C. K. Li, J. A. Frenje, R. D. Petrasso, S. R. Nagel, P. Fitzsimmons, and H. Reynolds, “Platform Development for dE/dx Measurements on Short-Pulse Laser Facilities,” High Energy Density Phys. 35, 100731 (2020).
Conference Presentations
W. Theobald, “Review of the LLE-CELIA Shock-Ignition Collaboration over the Last Ten Years,” presented at the CELIA Anniversary, Talence, France, 1 October 2019.
C. Dorrer and S.-W. Bahk, “Characterization of Spatiotemporal Coupling with Multispectral Hartmann Wavefront Sensor,” presented at Ultrafast Optics XII, Bol, Croatia, 6–11 October 2019.
M. S. Wei, J. D. Zuegel, H. G. Rinderknecht, J. Bromage, P. M. Nilson, S. X. Hu, D. H. Froula, F. Albert, B. M. Hegelich, M. Roth, and E. M. Campbell, “EP OPAL: A Multibeam Ultrahigh-Intensity Laser User Facility for New Frontiers in High-Energy-Density and Relativistic Physics,” presented at the First ELI-NP User Workshop, Magurele, Romania, 7–11 October 2019.
M. S. Wei, “LaserNetUS,” presented at Laserlab Conference, Florence, Italy, 11 October 2019.
C. J. Forrest, V. Yu. Glebov, J. P. Knauer, O. M. Mannion, Z. Mohamed, P. B. Radha, S. P. Regan, T. C. Sangster, A. Schwemmlein, C. Stoeckl, W. U. Schröder, and G. M. Hale, “Inelastic Reaction of 14-MeV Neutrons with 7Li,” presented at APS Division of Nuclear Physics Fall Meeting, Arlington, VA, 14–17 October 2019.
The following presentations were made at the 61st Meeting of the American Physical Society Division of Plasma Physics, Fort Lauderdale, FL, 21–25 October 2019:
K. S. Anderson, J. A. Marozas, D. Cao, C. J. Forrest, O. M. Mannion, R. C. Shah, P. B. Radha, F. J. Marshall, T. J. B. Collins, J. P. Knauer, V. N. Goncharov, and M. Gatu Johnson, “Cross-Beam Energy Transfer in Offset Implosions on OMEGA.”
Z. Barfield, D. H. Froula, and J. L. Peebles, “The Study of Thermal Transport in Magnetized Laser-Produced Plasmas.”
D. Barnak, K. Flippo, C. Kawaguchi, K. Kelso, H. Li, S. Li, E. Loomis, Y. Lu, N. Vazirani, A. Birkel, B. Lahmann, and C. K. Li, “Impact of Self-Generated B-Fields on High-Energy-Density Experiments.”

Publications and conference Presentations
FY20 Annual Report 365
G. Bruhaug, H. G. Rinderknecht, M. S. Wei, G. W. Collins, J. R. Rygg, and J. L. Shaw, “An Investigation of Monoenergetic Electron Beams for High-Energy-Density and Inertial Confinement Fusion Diagnostics.”
D. Cao, D. Patel, M. J. Rosenberg, W. Theobald, C. Stoeckl, A. R. Christopherson, I. V. Igumenshchev, V. Gopalaswamy, S. P. Regan, C. Thomas, P. B. Radha, R. Betti, and V. N. Goncharov, “Implosion Designs Varying Hot-Electron Production for Direct-Drive Inertial Confinement Fusion Implosions on OMEGA.”
A. R. Christopherson, R. Betti, W. Theobald, C. J. Forrest, M. Wei, E. M. Campbell, J. Howard, M. J. Rosenberg, A. A. Solodov, D. Patel, J. A. Delettrez, C. Stoeckl, D. Edgell, W. Seka, V. Yu. Glebov, A. K. Davis, J. L. Peebles, A. V. Maximov, R. Simpson, M. Gatu Johnson, W. Scullin, V. Gopalaswamy, D. Cao, V. N. Goncharov, P. B. Radha, S. P. Regan, and R. Epstein, “Direct Measurements of Hot-Electron Preheat in the Dense Fuel of Inertial Confinement Fusion Implosions” (invited).
T. J. B. Collins, C. Stoeckl, R. Epstein, S. Miller, J. A. Marozas, K. S. Anderson, D. Cao, O. M. Mannion, R. Betti, J. A. Delettrez, W. A. Bittle, C. J. Forrest, V. Yu. Glebov, V. N. Goncharov, D. R. Harding, I. V. Igumenshchev, D. W. Jacobs-Perkins, R. T. Janezic, J. H. Kelly, T. Z. Kosc, C. Mileham, D. T. Michel, R. L. McCrory, P. W. McKenty, F. J. Marshall, S. F. B. Morse, P. B. Radha, S. P. Regan, B. Rice, T. C. Sangster, M. J. Shoup III, W. T. Shmayda, C. Sorce, W. Theobald, J. Ulreich, M. D. Wittman, J. A. Frenje, M. Gatu Johnson, and R. D. Petrasso, “Mixing at the Fuel-Ablator Interface in Backlit OMEGA Cryogenic Implosions.”
R. S. Craxton, A. Sharma, Y. Yang, R. F. Heeter, Y. P. Opachich, T. Cardenas, H. M. Johns, and T. S. Perry, “Simulations of Double Cone-in-Shell Implosions for an X-Ray Backlighting Source at the National Ignition Facility.”
J. R. Davies, D. H. Barnak, R. Betti, T. Cracium, and J. L. Peebles, “Current Transients in Laser-Driven Coils.”
D. H. Edgell, R. E. Bahr, J. Katz, and D. H. Froula, “Absorption and Scattered-Light Asymmetry in OMEGA Implosions.”
R. Epstein, C. Stoeckl, P. B. Radha, T. J. B. Collins, D. Cao, R. C. Shah, D. Cliche, and R. C. Mancini, “Self-Radiography of Imploded Shells on OMEGA Based on Additive-Free Multi-Monochromatic Continuum Spectral Analysis.”
R. K. Follett, J. G. Shaw, D. H. Edgell, D. H. Froula, C. Dorrer, J. Bromage, E. M. Hill, T. J. Kessler, A. V. Maximov, A. A. Solodov, E. M. Campbell, J. P. Palastro, J. F. Myatt, J. W. Bates, and J. L. Weaver, “Broadband Mitigation of Laser-Plasma Instabilities.”
P. Franke, J. P. Palastro, D. Turnbull, and D. H. Froula, “Frequency Conversion of Laser Pulses Reflected from Ionization Waves of Arbitrary Velocity.”
D. H. Froula, C. Dorrer, E. M. Hill, J. Bromage, T. J. Kessler, J. D. Zuegel, R. K. Follett, L. Nguyen, A. A. Solodov, J. P. Palastro, D. Turnbull, D. H. Edgell, J. G. Shaw, A. M. Hansen, A. L. Milder, J. Katz, R. Boni, V. N. Goncharov, M. Sherlock, H. Le, D. Strozzi, P. Michel, L. Divol, J. F. Myatt, W. Rozmus, J. W. Bates, A. Schmitt, J. Weaver, A. Colaïtis, L. Yin, and B. Albright, “Fourth-Generation Laser for Ultra-Broadband Experiments—Expanding the ICF Design Space Through Mitigation of Laser Plasma Instabilities.”
F. Garcia-Rubio, R. Betti, H. Aluie, and J. Sanz, “The Effect of Self-Generated Magnetic Fields on Ablative Rayleigh–Taylor Instability Dynamics.”
V. Yu. Glebov, C. J. Forrest, J. P. Knauer, O. M. Mannion, S. P. Regan, M. H. Romanofsky, T. C. Sangster, and C. Stoeckl, “New Fast Neutron Time-of-Flight Detectors with Subnanosecond Instrument Response Function for DT Implosions on OMEGA.”
V. N. Goncharov, S. C. Miller, and P. B. Radha, “A Survey of Different Perturbation Amplification Mechanisms in the Early Stages of Inertial Confinement Fusion Implosions.”
V. Gopalaswamy, R. Betti, J. P. Knauer, A. Lees, D. Patel, A. R. Christopherson, K. M. Woo, O. M. Mannion, Z. L. Mohamed, F. J. Marshall, C. Stoeckl, V. Yu. Glebov, S. P. Regan, R. C. Shah, D. H. Edgell, D. Cao, V. N. Goncharov, I. V. Igumenshchev, P. B. Radha, T. J. B. Collins, T. C. Sangster, E. M. Campbell, M. Gatu Johnson, R. D. Petrasso, C. K. Li, and J. A. Frenje, “Improved Predictive Models and Further Progress in the Cryogenic Optimization Campaign on OMEGA.”
D. Haberberger, A. Shvydky, V. N. Goncharov, D. Cao, J. Carroll-Nellenback, S. X. Hu, S. T. Ivancic, V. V. Karasiev, J. P. Knauer, A. V. Maximov, and D. H. Froula, “Density Measurements of the Inner Shell Release.”
A. M. Hansen, D. Turnbull, R. K. Follett, J. Katz, A. L. Milder, J. P. Palastro, K. L. Nguyen, D. Mastrosimone, D. H.

Publications and conference Presentations
FY20 Annual Report366
Froula, L. Yin, and B. Albright, “Cross-Beam Energy Transfer Experiments at High Ion-Acoustic Wave Amplitudes.”
E. C. Hansen, J. R. Davies, D. H. Barnak, R. Betti, E. M. Campbell, V. Yu. Glebov, J. P. Knauer, J. L. Peebles, A. B. Sefkow, and K. M. Woo, “Neutron Yield Enhancement and Suppression by Magnetization in Laser-Driven Cylindrical Implosions” (invited).
J. Hinz, V. V. Karasiev, S. X. Hu, M. Zaghoo, and D. Mejia-Rodriguez, “First Principles Investigation of the Insulator–Metal Transition in Liquid Hydrogen with a Recently Developed Deorbitalized meta-GGA Exchange-Correlation Functional.”
S. X. Hu, R. C. Shah, J. Baltazar, D. Cao, S. P. Regan, V. N. Goncharov, P. B. Radha, J. L. Peebles, W. Theobald, R. Betti, E. M. Campbell, G. Duchateau, A. Casner, and V. T. Tikhonchuk, “Understanding Laser-Imprint Effects on Cryogenic DT Implosions on OMEGA.”
I. V. Igumenshchev, R. Betti, E. M. Campbell, D. Cao, C. J. Forrest, V. N. Goncharov, V. Gopalaswamy, J. P. Knauer, O. M. Mannion, D. Patel, S. P. Regan, R. C. Shah, and A. Shvydky, “Three-Dimensional Hydrodynamic Modeling of OMEGA Direct-Drive Cryogenic Implosions with the Highest Fusion Yield.”
S. T. Ivancic, F. J. Marshall, W. Theobald, C. Sorce, D. Cao, I. V. Igumenshchev, S. P. Regan, R. C. Shah, J. P. Knauer, V. N. Goncharov, R. Betti, and T. C. Sangster, “Three Dimensional Gated Hot-Spot X-Ray Imaging on OMEGA.”
V. V. Ivanov, A. L. Astanovitskiy, N. L. Wong, K. J. Swanson, I. A. Begishev, J. Bromage, J. R. Davies, A. V. Maximov, C. Mileham, and C. Stoeckl, “Study of Laser Driven Magnetic Fields in the Coil Target.”
V. V. Karasiev, S. X. Hu, and L. Calderin, “Systematic Ab Initio Calculations of Optical Properties of Silicon for Inertial Confinement Fusion Applications.”
A. Kish, A. B. Sefkow, J. Giuliani, A. Velikovich, S. Zalesak, and A. Schmitt, “Toward Advanced Modeling of Transport in Magnetized Inertial Confinement Fusion Targets.”
J. P. Knauer, R. Betti, V. Gopalaswamy, D. Cao, I. V. Igumenshchev, A. Shvydky, D. Patel, A. Lees, M. J. Bonino, E. M. Campbell, T. J. B. Collins, C. J. Forrest, V. Yu. Glebov, V. N. Goncharov, D. R. Harding, J. A. Marozas, F. J. Marshall,
P. W. McKenty, P. B. Radha, S. P. Regan, T. C. Sangster, C. Stoeckl, M. Gatu Johnson, J. A. Frenje, and R. D. Petrasso, “The Effect of Laser Bandwidth on High-Performance Cryogenic Implosions.”
L. S. Leal, A. V. Maximov, A. B. Sefkow, R. Betti, and V. V. Ivanov, “Three-Dimensional Modeling of Laser–Plasma Confinement in a Strong Magnetic Field.”
A. Lees, R. Betti, J. P. Knauer, V. Gopalaswamy, D. Patel, A. R. Christopherson, K. M. Woo, O. M. Mannion, Z. L. Mohamed, F. J. Marshall, C. Stoekl, V. Yu. Glebov, S. P. Regan, R. C. Shah, D. H. Edgell, C. Cao, V. N. Goncharov, I. V. Igumenshchev, P. B. Radha, T. J. B. Collins, T. C. Sangster, E. M. Campbell, M. Gatu Johnson, R. D. Petrasso, C. K. Li, and J. A. Frenje, “Toward Optimizing Cryogenic Inertial Confinement Fusion Implosions.”
O. M. Mannion, C. J. Forrest, D. Cao, V. Yu. Glebov, V. N. Goncharov, V. Gopalaswamy, J. P. Knauer, Z. L. Mohamed, S. P. Regan, T. C. Sangster, C. Stoeckl, A. J. Crilly, B. D. Appelbe, and J. P. Chittenden, “Experimental Analysis of nT Kinematic Edge Data on OMEGA.”
J. A. Marozas, P. W. McKenty, T. J. B. Collins, M. J. Rosenberg, P. B. Radha, S. P. Regan, S. Miller, E. M. Campbell, B. E. Blue, L. Divol, W. W. Hsing, G. E. Kemp, C. B. Yeamans, and H. D. Whitley, “NIF Polar-Drive High DT-Yield Exploder-Pusher Designs Modeled Using Pump-Depletion in DRACO.”
F. J. Marshall, S. T. Ivancic, C. Mileham, P. M. Nilson, J. J. Ruby, B. S. Schiener, M. J. Schmitt, and C. A. Wilde, “High-Resolution X-Ray Imaging with Fesnel Zone Plates on the University of Rochester’s OMEGA and OMEGA EP Laser Systems.”
A. V. Maximov, D. Turnbull, J. G. Shaw, R. K, Follett, and J. P. Palastro, “Effect of Multi-Beam Two-Plasmon Decay Instability on Cross-Beam Energy Transfer in Plasmas.”
P. W. McKenty, F. J. Marshall, D. R. Harding, R. S. Craxton, M. J. Rosenberg, J. A. Marozas, T. J. B. Collins, P. B. Radha, E. M. Campbell, B. E. Blue, C. B. Yeamans, W. W. Hsing, and M. Farrell, “Evaluation of Ablator-Shell Contouring to Enhance the Performance of NIF Polar-Drive High Yield Source Experiments.”
A. L. Milder, J. Katz, R. Boni, D. Nelson, J. P. Palastro, K. Daub, R. K. Follett, and D. H. Froula, “Measurements of Arbitrary Electron Distribution Functions Using Angularly Resolved Thomson Scattering.”

Publications and conference Presentations
FY20 Annual Report 367
S. C. Miller, P. B. Radha, V. N. Goncharov, T. J. B. Collins, J. A. Marozas, and A. Shvydky, “A Study of Internal Perturbation Evolution in Inertial Confinement Fusion Implosions.”
Z. L. Mohamed, C. J. Forrest, J. P. Knauer, R. Simpson, and M. Gatu Johnson, “Observed Variations in Areal Densities as Measured by Detectors Along Multiple Lines of Sight.”
K. L. Nguyen, L. Lin, B. J. Albright, A. M. Hansen, D. H. Froula, D. Turnbull, and J. P. Palastro, “Simulation Study of Nonlinear Saturation of Cross-Beam Energy Transfer in TOP9 Experiments at the Omega Laser Facility.”
P. M. Nilson, I. V. Igumenshchev, R. Betti, D. H. Froula, L. Gao, J. Matteucci, W. Fox, M. G. Haines, and D. D. Meyerhofer, “Magnetic Reconnection in the High-Energy-Density Regime” (invited).
J. P. Palastro, J. L. Shaw, D. Ramsey, T. T. Simpson, P. Franke, S. T. Ivancic, K. Daub, and D. H. Froula, “Dephasingless Laser Wakefield Acceleration.”
D. Patel, R. Betti, K. M. Woo, V. Gopalaswamy, J. P. Knauer, R. C. Shah, and A. Bose, “Analysis and Reconstruction of Highest-Performing OMEGA DT Layered Implosion Shot 90288.”
R. Paul, S. X. Hu, V. V. Karasiev, and S. A. Bonev, “Tem-perature-Induced Changes in hP4-Sodium Electride: An Ab Initio Study.”
J. L. Peebles, S. X. Hu, W. Theobald, V. N. Goncharov, N. Whiting, E. M. Campbell, T. R. Boehly, S. P. Regan, P. M. Celliers, S. J. Ali, and G. Duchateau, “Measurements of Laser-Imprint-Induced Shock-Velocity Nonuniformities and Laser-Imprint Mitigation.”
D. N. Polsin, G. W. Collins, L. Crandall, X. Gong, R. Saha, M. Huff, G. Tabak, Z. K. Sprowal, T. R. Boehly, M. Zaghoo, J. R. Rygg, P. M. Celliers, D. E. Fratanduono, Y. Ping, J. H. Eggert, D. H. Munro, A. Lazicki, and D. G. Hicks, “X-Ray Diffraction of Double-Shocked Diamond.”
P. B. Radha, M. J. Rosenberg, A. Shvydky, W. Theobald, D. Turnbull, F. J. Marshall, K. S. Anderson, R. Betti, E. M. Campbell, V. N. Goncharov, T. J. B. Collins, R. S. Craxton, J. A. Marozas, P. W. McKenty, S. P. Regan, T. C. Sangster, C. B. Yeamans, B. E. Blue, W. W. Hsing, and R. Scott, “Validating Direct-Drive Implosion Energetics Based on OMEGA and NIF Experiments.”
D. W. Ramsey, D. H. Froula, and J. P. Palastro, “Vacuum Acceleration in a Flying Focus.”
S. P. Regan, O. M. Mannion, C. J. Forrest, J. P. Knauer, R. Betti, E. M. Campbell, D. Cao, V. Yu. Glebov, V. N. Goncharov, S. T. Ivancic, F. J. Marshall, P. B. Radha, T. C. Sangster, R. C. Shah, C. Sorce, C. Stoeckl, and W. Theobald, “Hot-Spot Flow Velocity in Laser-Direct-Drive Inertial Confinement Fusion Implosions.”
H. G. Rinderknecht, C. J. Forrest, J. P. Knauer, W. Theobald, S. P. Regan, R. Simpson, M. Gatu Johnson, and J. A. Frenje, “Hot Spot and Fuel Imaging Using Nuclear Diagnostics on Direct-Drive Cryogenic Implosions at OMEGA.”
M. J. Rosenberg, A. A. Solodov, W. Seka, R. K. Follett, A. V. Maximov, C. Ren, S. Cao, S. P. Regan, P. B. Radha, T. J. B. Collins, D. H. Froula, J. P. Palastro, V. N. Goncharov, J. F. Myatt, P. A. Michel, M. Hohenberger, G. Swadling, J. S. Ross, R. Scott, and K. Glize, “Hot Electron Generation Mechanisms in Ignition-Scale Direct-Drive Coronal Plasmas on the NIF.”
J. J. Ruby, J. R. Rygg, D. A. Chin, C. J. Forrest, V. Yu. Glebov, C. Stoeckl, G. W. Collins, B. Bachmann, J. A. Gaffney, Y. Ping, N. V. Kabadi, and P. Adrian, “Analysis of Self-Emission from Spherical Shock Experiments.”
A. B. Sefkow, J. G. Shaw, J. Carroll-Nellenback, S. Pai, E. G. Blackman, D. Cao, J. R. Davies, R. K. Follett, A. Frank, J. L. Giuliani, M. Haddad, E. C. Hansen, S. B. Hansen, S. X. Hu, A. Kish, M. Lavell, R. L. McCrory, P. W. McKenty, P. M. Nilson, A. Shvydky, R. B. Spielman, A. Tu, A. Velberg, and A. L. Velikovich, “Introduction to TriForce: A Multi-Physics Code for Hybrid Fluid-Kinetic Simulations.”
R. C. Shah, I. V. Igumenshchev, C. J. Forrest, K. A. Bauer, E. M. Campbell, D. Cao, V. N. Goncharov, S. Sampat, and S. P. Regan, “Influence of In-Flight Shape on Stagnation Performance in Direct-Drive Laser Implosion Experiments.”
J. L. Shaw, M. A. Romo-Gonzales, M. M. McKie, J. P. Palastro, D. H. Froula, P. M. King, N. Lemos, G. J. Williams, H. Chen, and F. Albert, “Microcoulomb-Class Self-Modulated Laser Wakefield Accelerator on OMEGA EP” (invited).
A. Shvydky, D. Haberberger, J. P. Knauer, S. X. Hu, S. T. Ivancic, J. Carroll-Nellenback, D. Cao, I. V. Igumenshchev, V. V. Karasiev, A. V. Maximov, S. P. Regan, P. B. Radha, T. C. Sangster, B. Boni, P. Nilson, V. N. Goncharov, D. H.

Publications and conference Presentations
FY20 Annual Report368
Froula, and V. A. Smalyuk, “Analysis of Shock-Release OMEGA EP Experiments.”
T. T. Simpson, D. H. Froula, and J. P. Palastro, “Nonlinear Self-Focusing of Flying Focus Pulses.”
A. A. Solodov, M. J. Rosenberg, A. R. Christopherson, R. Betti, M. Stoeckl, W. Seka, R. Epstein, R. K. Follett, P. B. Radha, S. P. Regan, D. H. Froula, J. P. Palastro, V. N. Goncharov, J. F. Myatt, M. Hohenberger, B. Bachmann, and P. Michel, “Hot-Electron Preheat and Energy Deposition in Direct-Drive Implosion Experiments at the National Ignition Facility.”
C. Stoeckl, T. J. B. Collins, R. Epstein, V. N. Goncharov, R. K. Jungquist, C. Mileham, P. B. Radha, S. P. Regan, T. C. Sangster, and W. Theobald, “Investigating Small-Scale Mix in Direct-Drive Cryogenic DT Implosions with Radiography on OMEGA.”
W. Theobald, D. Cao, R. C. Shah, K. A. Bauer, R. Betti, M. J. Bonino, E. M. Campbell, A. R. Christopherson, T. J. B. Collins, R. S. Craxton, D. H. Edgell, R. Epstein, C. J. Forrest, R. K. Follett, D. H. Froula, V. Yu. Glebov, V. N. Goncharov, V. Gopalaswamy, D. R. Harding, S. X. Hu, I. V. Igumenshchev, S. T. Ivancic, D. W. Jacobs-Perkins, R. T. Janezic, J. H. Kelly, T. J. Kessler, J. P. Knauer, T. Z. Kosc, O. M. Mannion, J. A. Marozas, F. J. Marshall, P. W. McKenty, Z. L. Mohamed, S. F. B. Morse, P. M. Nilson, J. P. Palastro, D. Patel, J. L. Peebles, P. B. Radha, H. G. Rinderknecht, M. J. Rosenberg, S. Sampat, T. C. Sangster, W. Seka, M. J. Shoup III, W. T. Shmayda, A. Shvydky, C. Sorce, C. Stoeckl, C. Thomas, J. Ulreich, M. D. Wittman, S. P. Regan, B. Rice, M. Gatu Johnson, J. A. Frenje, and R. D. Petrasso, “Enhanced Laser Energy Coupling with Small-Spot Distributed Phase Plates (SG5-650) in OMEGA Cryogenic Implosions.”
C. A. Thomas, K. L. Baker, D. T. Casey, M. Hohenberger, A. L. Kritcher, B. K. Spears, S. Khan, R. Nora, T. Woods, J. L. Milovich, R. L. Berger, D. Strozzi, D. D. Ho, D. Clark, B. Bachmann, R. Benedetti, R. Bionta, P. M. Celliers, D. Fittinghoff, G. Grim, R. Hatarik, N. Izumi, G. Kyrala, T. Ma, M. Millot, S. R. Nagel, P. K. Patel, C. B. Yeamans, M. Tabak, M. Gatu Johnson, P. L. Volegov, and E. M. Campbell, “Review of BigFoot Implosion Data at NIF.”
D. Turnbull, D. Cao, D. H. Edgell, R. K. Follett, D. H. Froula, V. N. Goncharov, A. V. Maximov, J. P. Palastro, W. Seka, C. Stoeckl, and H. Wen, “Anomalous Absorption by the Two-Plasmon-Decay Instability in Directly Driven Inertial Confinement Fusion Experiments.”
D. Turnbull, C. Dorrer, D. H. Edgell, R. K. Follett, D. H. Froula, A. M. Hansen, J. Katz, B. E. Kruschwitz, A. L. Milder, J. P. Palastro, A. Colaïtis, T. Chapman, L. Divol, C. S. Goyon, P. Michel, J. D. Moody, B. B. Pollock, J. S. Ross, and D. J. Strozzi, “Impact of Non-Maxwellian Electron Distribution Functions on Crossed-Beam Energy Transfer” (invited).
H. Wen, B. J. Winjum, F. S. Tsung, and W. B. Mori, “Mitigation of Stimulated Raman Scattering with Laser Bandwidth and an External Magnetic Field.”
J. Wilson, V. N. Goncharov, T. Simpson, D. Ramsey, C. Dorrer, A. Shvydky, D. H. Froula, and J. P. Palastro, “Broadband Smoothing of Laser Pulses for Imprint Reduction in Direct-Drive Inertial Confinement Fusion.”
K. M. Woo, R. Betti, O. M. Mannion, D. Patel, C. J. Forrest, J. P. Knauer, V. N. Goncharov, P. B. Radha, K. S. Anderson, R. Epstein, J. A. Delettrez, M. Charissis, A. Shvydky, I. V. Igumenshchev, V. Gopalaswamy, A. R. Christopherson, Z. L. Mohamed, D. Cao, H. Aluie, E. M. Campbell, R. Yan, P.-Y. Chang, A. Bose, D. Shvarts, and J. Sanz, “Inferring the Thermal Ion Temperature and Residual Kinetic Energy from Nuclear Measurements in Inertial Confinement Fusion” (invited).
S. Zhang, H. Whitley, L. Benedict, L. Yang, K. Caspersen, J. Gaffney, M. Däne, J. Pask, P. Sterne, T. Ogitsu, A. Lazicki, M. Marshall, D. Swift, M. Martin, R. London, A. Kritcher, J. Nilsen, N. Kostinski, B. Maddox, B. Militzer, K. Driver, F. Soubiran, A. Sharma, P. Suryanarayana, D. D. Johnson, A. V. Smirnov, S. X. Hu, and W. Johnson, “Wide-Range EOS of C– and B– Materials from First Principles.”
M. S. Wei, “Status FY19 OLUG Findings and Recommenda-tions,” presented at APS DPP OLUG Update; Fort Lauderdale, FL, 22 October 2019.
S. G. Demos, “Optical Materials Research at LLE,” presented at the CEA Seminar, Bordeaux, France, 23 October 2019.
S. G. Demos, “Relocation of the SPIE Laser Damage Conference to Rochester and Opportunities for Industrial

Publications and conference Presentations
FY20 Annual Report 369
Partners,” presented at the Institute of Optics 2019 Fall Industrial Associates Symposium, Rochester, NY, 1 November 2019.
The following presentations were made at the 2nd American Physical Society Division of Plasma Physics Community Planning Process Workshop for High Energy Density Physics (HEDP), Palo Alto, CA, 11–14 November 2019:
J. P. Palastro, D. H. Froula, J. L. Shaw, T. M. Antonsen, J. Vieira, N. Vafaei-Najafabadi, W. Mori, P. Franke, D. Ramsey, T. T. Simpson, K. Daub, M. S. Wei, J. D. Zuegel, and E. M. Campbell, “Spatiotemporally Structured Light for Advanced Accelerators and Radiation Sources.”
J. D. Zuegel, J. Bromage, D. H. Froula, M. S. Wei, H. G. Rinderknecht, P. M. Nilson, S. X. Hu, F. Albert, B. M. Hegelich, M. Roth, and E. M. Campbell, “Frontiers in High-Energy-Density and Relativistic Plasma Physics Enabled by EP OPAL: A Multibeam Ultrahigh-Intensity Laser User Facility.”
K. L. Marshall, T. Z. Kosc, B. N. Hoffman, S. Papernov, A. A. Kozlov, S. G. Demos, J. Shojaie, C. Dorrer, D. Batesky, J. Wallace, S. Jacobs, A. Schmid, K. Richardson, J. Starowitz, S. H. Chen, T. Brown, and N. Tabiryan, “Liquid Crystal Research at LLE: A 35-Year Journey from Information Displays to Laser Fusion and Beyond,” presented at the Rochester OSA/SPIE Student Chapter Lecture Series, Rochester, NY, 12 November 2019.
M. S. Wei, “Overview of Fundamental Science Programs at the Omega Laser Facility,” presented at SUNY Geneseo Colloquium, Geneseo, NY, 21 November 2019.
The following presentations were made at the Materials Research Society Fall Meeting, Boston, MA, 1–6 December 2019:
J. M. Garcia Figueroa and D. R. Harding, “The Relationship Between the Processing Conditions for an Electron Cyclotron Resonance-(ECR) Microwave-(MW) CVD System and the Properties of Vapor Deposited Hydrocarbon Films.”
M. Wang and D. R. Harding, “Mechanical Properties of Micrometer-Size Cellular Foam-Like Auxetic Structures.”
The following presentations were made at the Conference on High Intensity Laser and Attosecond Science in Israel, Tel Aviv, Israel, 9–11 December 2019:
R. Betti, V. Gopalaswamy, J. P. Knauer, A. R. Christopherson, D. Patel, K. M. Woo, A. Bose, K. S. Anderson, T. J. B. Collins, S. X. Hu, D. T. Michel, C. J. Forrest, R. C. Shah, P. B. Radha, V. N. Goncharov, V. Yu. Glebov, A. V. Maximov, C. Stoeckl, F. J. Marshall, M. J. Bonino, D. R. Harding, R. T. Janezic, J. H. Kelly, S. Sampat, T. C. Sangster, S. P. Regan, E. M. Campbell, M. Gatu Johnson, J. A. Frenje, C. K. Li, and R. D. Petrasso, “Overview of the Cryogenic Implosion Campaign on the OMEGA Laser.”
S. P. Regan, V. N. Goncharov, T. C. Sangster, R. Betti, E. M. Campbell, K. A. Bauer, M. J. Bonino, D. Cao, G. W. Collins, T. J. B. Collins, R. S. Craxton, D. H. Edgell, R. Epstein, C. J. Forrest, J. A. Frenje, D. H. Froula, M. Gatu Johnson, V. Yu. Glebov, V. Gopalaswamy, D. R. Harding, S. X. Hu, I. V. Igumenshchev, S. T. Ivancic, D. W. Jacobs-Perkins, R. T. Janezic, T. J. Kessler, J. P. Knauer, T. Z. Kosc, J. Kwiatkowski, O. M. Mannion, J. A. Marozas, F. J. Marshall, P. W. McKenty, Z. L. Mohamed, S. F. B. Morse, P. M. Nilson, J. P. Palastro, D. Patel, J. L. Peebles, R. D. Petrasso, P. B. Radha, H. G. Rinderknecht, M. J. Rosenberg, S. Sampat, W. Seka, R. C. Shah, J. R. Rygg, W. T. Shmayda, M. J. Shoup III, A. Shvydky, A. A. Solodov, C. Sorce, C. Stoeckl, W. Theobald, D. Turnbull, J. Ulreich, M. D. Wittman, and K. M. Woo, “Three-Dimensional Diagnostics for Inertial Confinement Fusion Research on OMEGA” (invited).
T. Z. Kosc, T. J. Kessler, H. Huang, and S. G. Demos, “Raman Polarizability Tensor in Potassium Dihydrogen Phosphate and Deuterated Potassium Dihydrogen Phosphate Crystals,” presented at Photonics West 2020, San Francisco, CA, 1–6 February 2020.
M. K. Ginnane, D. N. Polsin, X. Gong, L. Crandall, T. R. Boehly, J. R. Rygg, G. W. Collins, A. Lazicki, R. Kraus, J. H. Eggert, M. C. Marshall, D. E. Fratanduono, J.-P. Davis,
Publications and conference Presentations
FY20 Annual Report370
C. A. McCoy, C. Seagle, and S. Root, “X-Ray Diffraction of Platinum,” presented at NIF User Group, Livermore, CA, 3–5 February 2020.
The following presentations were made at the 60th Sanibel Symposium, St. Simons Island GA, 16–21 February 2020:
M. Ghosh, S. Zhang, and S. X. Hu, “Nanodiamond Formation In Hydrocarbons Under Extreme Pressure-Temperature Conditions-Evidence from First Principles.”
V. V. Karasiev, J. Hinz, and S. X. Hu, “Characterization of the Liquid-Liquid Phase Transition in Dense Hydrogen: The Role of Accurate Exchange-Correlation and Nuclear Quantum Effects.”
D. H. Froula, “Plasma Physics at the University of Rochester Laboratory for Laser Energetics,” presented at the Office of Science, Rochester, NY, 24 February 2020.
J. L. Peebles, J. R. Davies, D. H. Barnak, T. Cracium, M. J. Bonino, and R. Betti, “Axial Proton Probing of Single and Double Plate Laser-Driven Coils,” presented at the 2020 Stewardship Science Academic Programs Symposium, Washington, DC, 26–27 February 2020.
M. S. Wei, “OMEGA EP Experimental Capability: First-Year LaserNetUS Experiments and Future Plans,” presented at the LaserNetUS SAB and PI Meeting, Washington, DC, 3–4 March 2020.
The following presentations were made at the APS April Meeting, virtual, 18–21 April 2020:
C. J. Forrest, G. Hale, W. U. Schröder, J. P. Knauer, P. B. Radha, V. Yu. Glebov, O. M. Mannion, Z. L. Mohamed, S. P. Regan, T. C. Sangster, A. Schwemmlein, and C. Stoeckl, “Evidence for a 7Li State at Ex = 10.2 MeV from Inelastic Neutron Scattering at 14 MeV.”
A. K. Schwemmlein, W. U. Schröder, C. Stoeckl, C. J. Forrest, J. P. Knauer, and S. P. Regan, “Using the Multi-Terawatt Laser at the Laboratory for Laser Energetics to Generate a High-Yield, 0.5-MeV Deuteron Beam.”
The following presentations were made at Technology of Fusion Energy (TOFE) 2020, virtual, 20–23 April 2020:
C. Fagan, M. Sharpe, W. T. Shmayda, and W. U. Schröder, “Tritium Concentration Profiles in Stainless-Steel 316 Samples.”
M. Sharpe, W. T. Shmayda, J. Wermer, and C. A. Bond, “Permeation Rate of Deuterium and Tritium Through Iron-Chromium-Aluminum Alloys.”
The following presentations were made at High Energy Density Science, virtual, 20–24 April 2020:
S. P. Regan, V. N. Goncharov, T. C. Sangster, R. Betti, E. M. Campbell, K. A. Bauer, M. J. Bonino, D. Cao, A. R. Christopherson, G. W. Collins, T. J. B. Collins, R. S. Craxton, D. H. Edgell, R. Epstein, P. Fan, M. Farrell, P. Fitzsimmons, C. J. Forrest, R. K. Follett, J. A. Frenje, D. H. Froula, M. Gatu Johnson, V. Yu. Glebov, V. Gopalaswamy, D. R. Harding, S. X. Hu, H. Huang, I. V. Igumenshchev, Y. Lu, R. Luo, D. W. Jacobs-Perkins, R. T. Janezic, M. Karasik, T. J. Kessler, J. P. Knauer, T. Z. Kosc, A. Lees, O. M. Mannion, J. A. Marozas, F. J. Marshall, P. W. McKenty, Z. L. Mohamed, S. F. B. Morse, P. M. Nilson, S. P. Obenschain, J. P. Palastro, D. Patel, J. L. Peebles, R. D. Petrasso, P. B. Radha, H. G. Rinderknecht, M. J. Rosenberg, S. Sampat, A. J. Schmitt, W. Seka, R. C. Shah, J. R. Rygg, J. G. Shaw, W. T. Shmayda, M. J. Shoup III, C. Shuldberg, A. Shvydky, A. A. Solodov, C. Sorce, C. Stoeckl, W. Sweet, W. Theobald, D. Turnbull, J. Ulreich, L. J. Waxer, M. D. Wittman, K. M. Woo, and J. D. Zuegel, “Laser-Direct-Drive Inertial Confinement Fusion Research on OMEGA: Current Status.”
J. J. Ruby, J. R. Rygg, D. A. Chin, C. J. Forrest, V. Yu. Glebov, C. Stoeckl, N. V. Kabadi, P. Adrian, B. Bachmann, Y. Ping, J. A. Gaffney, and G. W. Collins, “Spherical Shock Wave Experiments on the OMEGA Laser.”

Publications and conference Presentations
FY20 Annual Report 371
G. W. Collins, “Laboratory for Laser Energetics Contributions to the Stockpile Stewardship Mission,” presented at the HEDP Briefing to DOE, virtual, 29 April 2019.
The following presentations were made at CLEO 2020, virtual, 10–15 May 2020:
I. A. Begishev, V. V. Ivanov, S. Patankar, P. S. Datte, S. T. Yang, J. D. Zuegel, and J. Bromage, “Nonlinear Crystals for Efficient High-Energy Fifth-Harmonic Generation of Near-IR Lasers.”
C. Dorrer, I. A. Begishev, S.-W. Bahk, and J. Bromage, “Broadband Parametric-Gain Optimization of Partially Deuterated KDP with Two-Wavelength Tuning Curves.”
C. Dorrer, E. M. Hill, and T. Borger, “Record-Bandwidth Spectrally Incoherent UV Laser Pulses.”
C. Dorrer, E. M. Hill, and J. D. Zuegel, “High-Efficiency Para-metric Amplification of Broadband Spectrally Incoherent Pulses.”
D. H. Froula, S.-W. Bahk, I. A. Begishev, R. Boni, J. Bromage, A. Davies, P. Franke, R. K. Follett, D. Haberberger, A. Howard, G. W. Jenkins, J. Katz, T. J. Kessler, J. P. Palastro, J. B. Oliver, D. Ramsey, T. Simpson, J. L. Shaw, D. Turnbull, N. Vafaei-Najafabadi, and J. Vieira, “From Chromatic to Achromatic Flying Foci.”
V. Gruzdev and K. R. P. Kafka, “Ultrafast Multiphoton Absorption in Optical-Coating Materials at Near-Damage-Threshold Fluence.”
E. P. Power, J. Bromage, and J. D. Zuegel, “Integrated-Flow Active Cooling for Thermal Management of Reflective Optics Under High-Average-Power Load.”
E. M. Campbell, “Direct-Drive Laser Fusion, Status, Plans, and the Future,” presented at the Cornell University Talk, virtual, 11 May 2020.
D. H. Froula, J. P. Palastro, S.-W. Bahk, I. V. Begishev, R. Boni, J. Bromage, A. Davies, P. Franke, R. K. Follett, D. Haberberger, A. Howard, G. W. Jenkins, J. Katz, T. J. Kessler, J. B.
Oliver, D. Ramsey, T. Simpson, J. L. Shaw, D. Turnbull, N. Vafaei-Najafabadi, and J. Vieira, “Progress in Flying Focus for Plasma-Based Applications: From Chromatic to Achromatic Flying Foci,” presented at UR Colloquia, virtual, 17 June 2020.
E. M. Campbell, “Laboratory for Laser Energetics (LLE) Contributions to the Stockpile Stewardship Mission,” presented at OES Executives Meeting, virtual, 23 June 2020.
D. R. Harding, S. M. Fess, M. J. Bonino, R. F. Earley, T. C. Sangster, E. M. Campbell, V. N. Goncharov, J. L. Peebles, M. D. Wittman, C. Stoeckl, Y.-F. Lu, P. Fan, and X. Huang, “Laser-Based Microfabrication and Metrology of Laser-Driven Inertial Fusion Targets,” presented at the 21st International Symposium on Laser Precision Microfabrication, virtual, 23–26 June 2020.
G. W. Collins, “High Energy Density (HED) Quantum Matter,” presented at the Office of Science Meeting, virtual, 29 June 2020.
E. M. Campbell, “NIF: An Unexpected Journey and Lessons Learned to Secure ‘Projects of Scale,’” presented at the LLNL Seminar, virtual, 9 July 2020.
S.-W. Bahk, I. A. Begishev, R Roides, D. H. Froula, J. Bromage, and J. D. Zuegel, “Application of Near-Field and Far-Field Beam Shaping Techniques for High-Power Lasers,” presented at Advanced Photonics Congress, virtual, 13–16 July 2020.
The following presentations were made at the BETHE Kickoff Workshop, virtual, 11–12 August 2020:
V. N. Goncharov, I. V. Igumenshchev, R. K. Follett, and T. J. B. Collins, “Advanced IFE Target Designs with Next-Generation Laser Technologies.”

Publications and conference Presentations
FY20 Annual Report372
P. Tzeferacos, A. B. Sefkow, C. Ren, R. Betti, J. R. Davies, and H. Wen, “A Simulation Resource Team for Innovative Fusion Concepts.”
K. L. Marshall, B. E. Ugur, and J. Travis, “Computational Modeling and Design of Liquid Crystal Materials for Applications in the Terahertz Regime” presented at SPIE Optics and Photonics, Liquid Crystals XXIV, virtual, 24–28 August 2020 (invited).
T. T. Simpson, D. Ramsey, P. Franke, N. Vafaei-Najafabadi, D. H. Froula, and J. P. Palastro, “The Self-Flying Focus: Nonlinear Spatiotemporal Control of Laser Intensity,” presented at ELI Summer School, virtual, 26–28 August 2020.
The following presentations were made at 9th EPS-QEOD Europhoton Conference, virtual, 30 August–4 September 2020:
G. W. Jenkins, C. Feng, and J. Bromage, “Overcoming Gas-Ionization Limits with Divided-Pulse Nonlinear Compression.”
B. Webb, S.-W. Bahk, I. A. Begishev, C. Dorrer, C. Feng, C. Jeon, M. Spilatro, R. Roides, J. D. Zuegel, and J. Bromage, “Full-Energy, Vacuum-Compatible, Single-Shot Pulse Characterization Method for Petawatt-Level Ultra-Broad Bandwidth Lasers Using Spatial Sampling.”
The following presentations were made at Laser Damage 2020, virtual, 13–16 September 2020:
E. M. Campbell, “A Vision of the Future for High-Power Lasers.”
V. Gruzdev and K. R. P. Kafka, “Multiphoton Absorption of Ultrashort Laser Pulses in Optical Materials of Multilayer Coatings at Near-Damage-Threshold Fluence.”
H. Huang, K. R. P. Kafka, and S. G. Demos, “Study of Electric-Field Enhancement Caused by Debris on Laser Optics.”
K. R. P. Kafka, B. N. Hoffman, A. A. Kozlov, and S. G. Demos, “Investigation of Excitation Dynamics in HfO2 and SiO2 Monolayers Using Subpicosecond Pump-and-Probe Damage Testing.”
M. S. Wei, “Omega Basic Science User Program Update,” Omega Laser Facility Users Group, virtual, 23–25 September 2020.
M. Zaghoo, H. Pantell, G. Tabak, L. Crandall, M. Huff, J. R. Rygg, G. W. Collins, S. X. Hu, V. V. Karasiev, D. N. Polsin, M. C. Marshall, R. Dias, E. Blackman, H. Aluie, P. M. Celliers, J. H. Eggert, D. E. Fratanduono, and S. Bonev, “Constraints from Mineral Physics on Thermal and Magnetic States of Exoplanets,” presented at Carnegie Earth and Planets Laboratory, virtual, 24 September 2020.

Copyright © 2022 FDOKUMEN