
Physics Laboratory WorkBook
234
Physics Laboratory Workbook Francisco Glover, S.J . Engr. Reyman Zamora, E.C.E. [Revised Edition] Ateneo de Davao University Davao City 2008
Transcript of Physics Laboratory WorkBook
Physics Laboratory Workbook
Francisco Glover, S.J .
Engr. Reyman Zamora, E.C.E.
[Revised Edition]
Ateneo de Davao University Davao City
2008
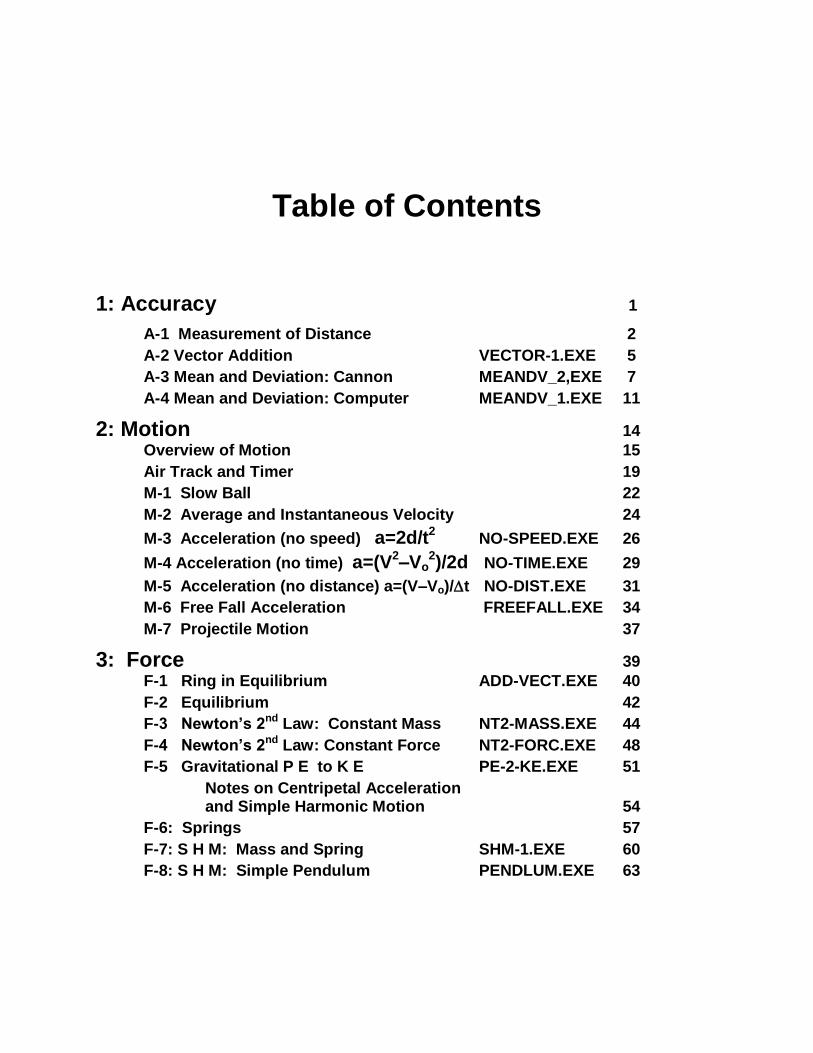
Table of Contents
1: Accuracy 1
A-1 Measurement of Distance 2
A-2 Vector Addition VECTOR-1.EXE 5
A-3 Mean and Deviation: Cannon MEANDV_2,EXE 7
A-4 Mean and Deviation: Computer MEANDV_1.EXE 11
2: Motion 14 Overview of Motion 15
Air Track and Timer 19
M-1 Slow Ball 22
M-2 Average and Instantaneous Velocity 24
M-3 Acceleration (no speed) a=2d/t2
NO-SPEED.EXE
26
M-4 Acceleration (no time) a=(V2–Vo
2)/2d NO-TIME.EXE 29
M-5 Acceleration (no distance) a=(V–Vo)/t NO-DIST.EXE 31
M-6 Free Fall Acceleration FREEFALL.EXE 34
M-7 Projectile Motion 37
3: Force 39 F-1 Ring in Equilibrium ADD-VECT.EXE 40
F-2 Equilibrium 42
F-3 Newton‟s 2nd Law: Constant Mass NT2-MASS.EXE 44
F-4 Newton‟s 2nd Law: Constant Force NT2-FORC.EXE 48
F-5 Gravitational P E to K E PE-2-KE.EXE 51
Notes on Centripetal Acceleration and Simple Harmonic Motion 54
F-6: Springs 57
F-7: S H M: Mass and Spring SHM-1.EXE 60
F-8: S H M: Simple Pendulum PENDLUM.EXE 63
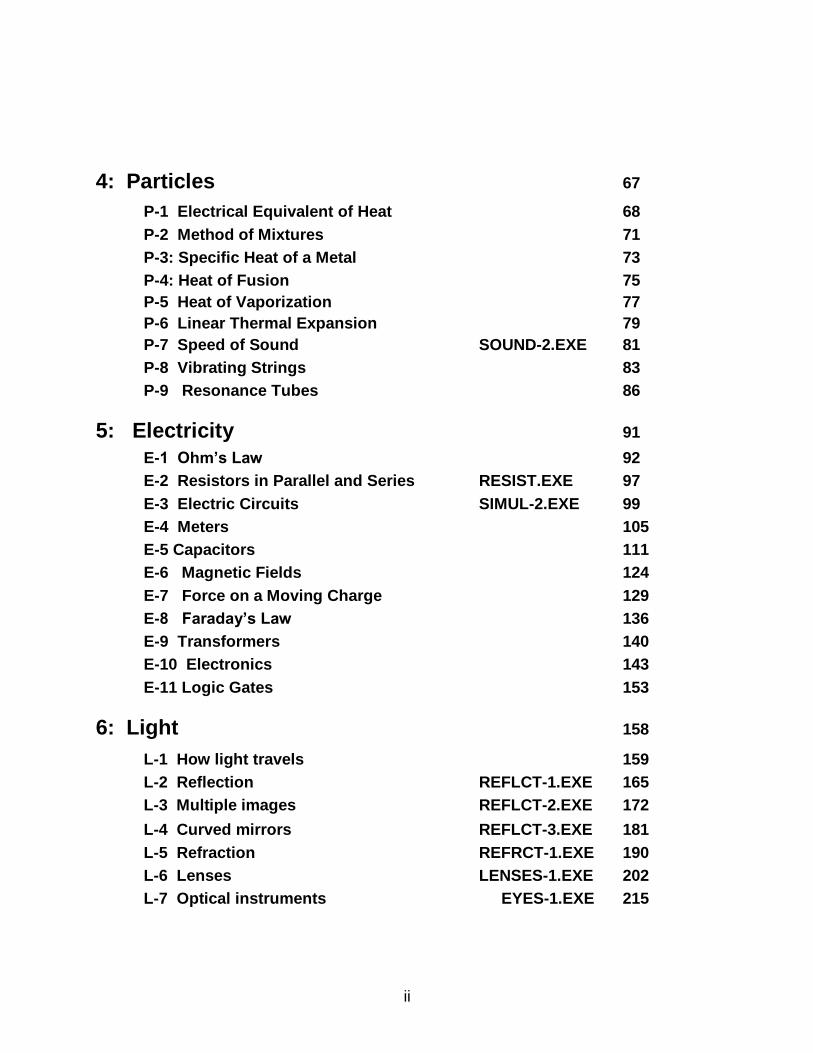
ii
4: Particles 67
P-1 Electrical Equivalent of Heat 68
P-2 Method of Mixtures 71
P-3: Specific Heat of a Metal 73
P-4: Heat of Fusion 75
P-5 Heat of Vaporization 77
P-6 Linear Thermal Expansion 79
P-7 Speed of Sound SOUND-2.EXE 81
P-8 Vibrating Strings 83
P-9 Resonance Tubes 86
5: Electricity 91
E-1 Ohm‟s Law 92
E-2 Resistors in Parallel and Series RESIST.EXE 97
E-3 Electric Circuits SIMUL-2.EXE 99
E-4 Meters 105
E-5 Capacitors 111
E-6 Magnetic Fields 124
E-7 Force on a Moving Charge 129
E-8 Faraday‟s Law 136
E-9 Transformers 140
E-10 Electronics 143
E-11 Logic Gates 153
6: Light 158
L-1 How light travels 159
L-2 Reflection REFLCT-1.EXE 165
L-3 Multiple images REFLCT-2.EXE 172
L-4 Curved mirrors REFLCT-3.EXE 181
L-5 Refraction REFRCT-1.EXE 190
L-6 Lenses LENSES-1.EXE 202
L-7 Optical instruments EYES-1.EXE 215
iii
Preface
The present text is a response to a felt need. As Physics teachers we are aware of the advantages of presenting our subject not by chalkboard alone. The syllabus of our various level courses allocate up to one-third the contact hours to laboratory activities but by and large the available apparatus had been inadequate and laboratory guides, where available, were not always relevant to the materials at hand. True, our institutions possess the items requisite for government recognition, but generally such precious materials nestled safely in our laboratory cabinets awaiting the next visit of inspectors or accreditors. We dreamed of having in quantity complete sets of student laboratory experiments covering the traditional general Physics areas from Mechanics to Light. The Physics should be solid, the construction durable and the pricing affordable. This would entail thoughtful design, local manufacture, and strict quality control.. And at the Ateneo de Davao we decided to make this dream a reality. The text you are reading is a part of this dream come true. The Physics topics presented in both high school and college are basically the same but differ markedly in depth of coverage. Accordingly with careful design the same equipment can be suitable for both levels. Yet for student benefit the laboratory workbook .must be specific to the actual materials used. For this reason most of the forty-five experiments presented here involve a progressive series of activities with the same equipment, permitting further investigation in accord with the level of the course and the judgment of the instructor. By incorporating electronic technology in many of the experiments significant amounts of numerical data are easily obtained. To facilitate its processing and interpretation more than twenty stand-alone computer programs have been prepared which run on even the oldest IBM clone computers since Windows® is not required. The source code of these programs is available for those hardy souls who may wish to modify or extend them. All the equipment referred to in this guide ( with the exception of the digital multimeter ) has been designed, developed and tested at the Ateneo. Much of it is original and novel, yet none is patented. The design has been placed in the Public Domain as our institution‟s offering of community extension. To provide for the construction needs in Southern Mindanao we have arrangements with a reliable local group, capable of quality workmanship and reasonable pricing. All construction materials are locally available. For reasons of economy some items are used in a number of different experiments, for example 14 experiments use the millisecond timer, eight use the linear air track.
iv
This Physics Laboratory Workbook is not a textbook, yet is suitable to accompany most locally available secondary and tertiary level Physics textbooks. But neither books nor apparatus teach Physics. Only the living teacher is capable of opening the minds of students and enkindling in them the enthusiasm to learn, The authors present this work as a tool and as a tribute to such teachers and their fortunate students. Our nation‟s greatest natural resources reside not in plants or rocks but it the talents of our young people, and for their growth and development this Physics project attempts to offer them the assistance they deserve. Francisco Glover, S.J.
Engr Reyman Zamora, E.C.E. Ateneo de Davao University April 2008 .
1: Accuracy
All sciences make measurements expressed in terms of numbers and Physics in no exception. We live in a world of motion and change. To measure motion, we deal with position, before and after. Vectors, telling how much and in which direction, are useful here. Yet every measurement is only our best approximation, and repeated measurements of the same quantity often differ slightly, so averages and the spread of values are means to improve the accuracy of such measurements
A-1 Measurement of Distance A-2 Vector Addition A-3 Mean and Deviation: Cannon A-4 Mean and Deviation: Computer
A-1 Measurement of Distance
2
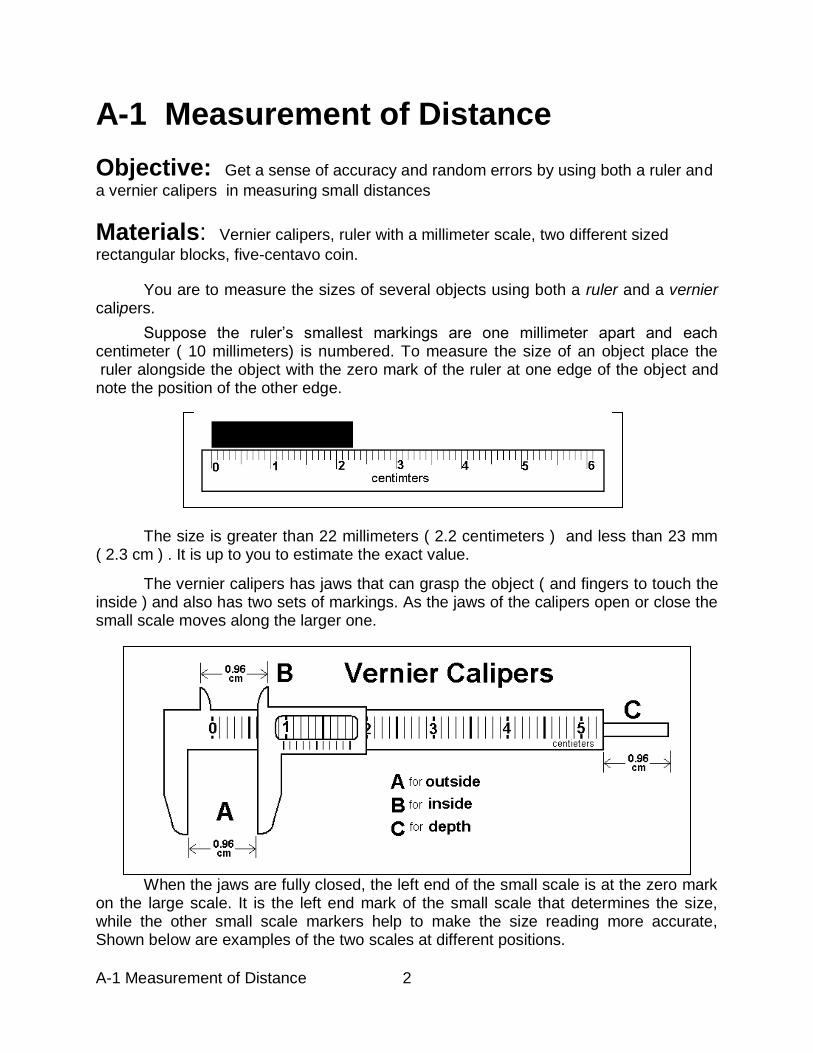
A-1 Measurement of Distance
Objective: Get a sense of accuracy and random errors by using both a ruler and
a vernier calipers in measuring small distances
Materials: Vernier calipers, ruler with a millimeter scale, two different sized
rectangular blocks, five-centavo coin.
You are to measure the sizes of several objects using both a ruler and a vernier calipers.
Suppose the ruler‟s smallest markings are one millimeter apart and each centimeter ( 10 millimeters) is numbered. To measure the size of an object place the ruler alongside the object with the zero mark of the ruler at one edge of the object and note the position of the other edge.
The size is greater than 22 millimeters ( 2.2 centimeters ) and less than 23 mm ( 2.3 cm ) . It is up to you to estimate the exact value.
The vernier calipers has jaws that can grasp the object ( and fingers to touch the inside ) and also has two sets of markings. As the jaws of the calipers open or close the small scale moves along the larger one.
When the jaws are fully closed, the left end of the small scale is at the zero mark on the large scale. It is the left end mark of the small scale that determines the size, while the other small scale markers help to make the size reading more accurate, Shown below are examples of the two scales at different positions.
A-1 Measurement of Distance
3
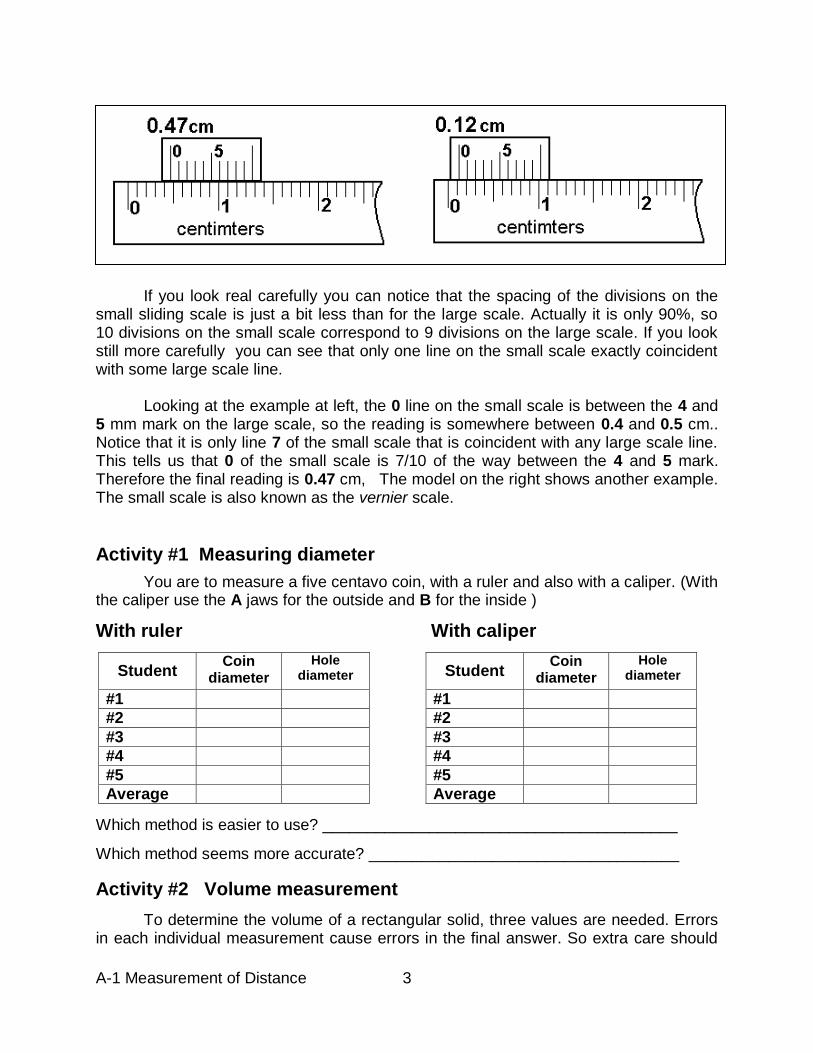
If you look real carefully you can notice that the spacing of the divisions on the small sliding scale is just a bit less than for the large scale. Actually it is only 90%, so 10 divisions on the small scale correspond to 9 divisions on the large scale. If you look still more carefully you can see that only one line on the small scale exactly coincident with some large scale line. Looking at the example at left, the 0 line on the small scale is between the 4 and 5 mm mark on the large scale, so the reading is somewhere between 0.4 and 0.5 cm.. Notice that it is only line 7 of the small scale that is coincident with any large scale line. This tells us that 0 of the small scale is 7/10 of the way between the 4 and 5 mark. Therefore the final reading is 0.47 cm, The model on the right shows another example. The small scale is also known as the vernier scale.
Activity #1 Measuring diameter
You are to measure a five centavo coin, with a ruler and also with a caliper. (With the caliper use the A jaws for the outside and B for the inside )
With ruler With caliper
Which method is easier to use? ________________________________________
Which method seems more accurate? ___________________________________
Activity #2 Volume measurement
To determine the volume of a rectangular solid, three values are needed. Errors in each individual measurement cause errors in the final answer. So extra care should
Student Coin
diameter Hole
diameter
#1 #2
#3 #4
#5 Average
Student Coin
diameter Hole
diameter
#1 #2
#3 #4
#5 Average

A-1 Measurement of Distance
4
be taken in making the individual measurements.
Your group will be given two rectangular blocks. You are to measure for each the length, width and height and then compute the volume. (you decide which is the length and width)
Block A With ruler With Calipers
Block B With ruler With Calipers
Looking Backwards:
Which method do you find easier to use? _____________________________
In your view, is the extra trouble in learning to read the vernier balanced by its increased accuracy? _____________________________________________________________ ____________________________________________________________________
How does averaging together values improve the final accuracy?_________________ ____________________________________________________________________
Do you really understand how a vernier scale gives increased accuracy? __________
Could you explain this to a classmate not quite as bright as yourself? ___________
Student length width height volume
#1 #2 #3
#4 #5 Average
Student length width height volume
#1 #2
#3 #4
#5 Average
Student length width height volume
#1 #2
#3 #4
#5 Average
Student length width height volume
#1 #2
#3 #4
#5 Average
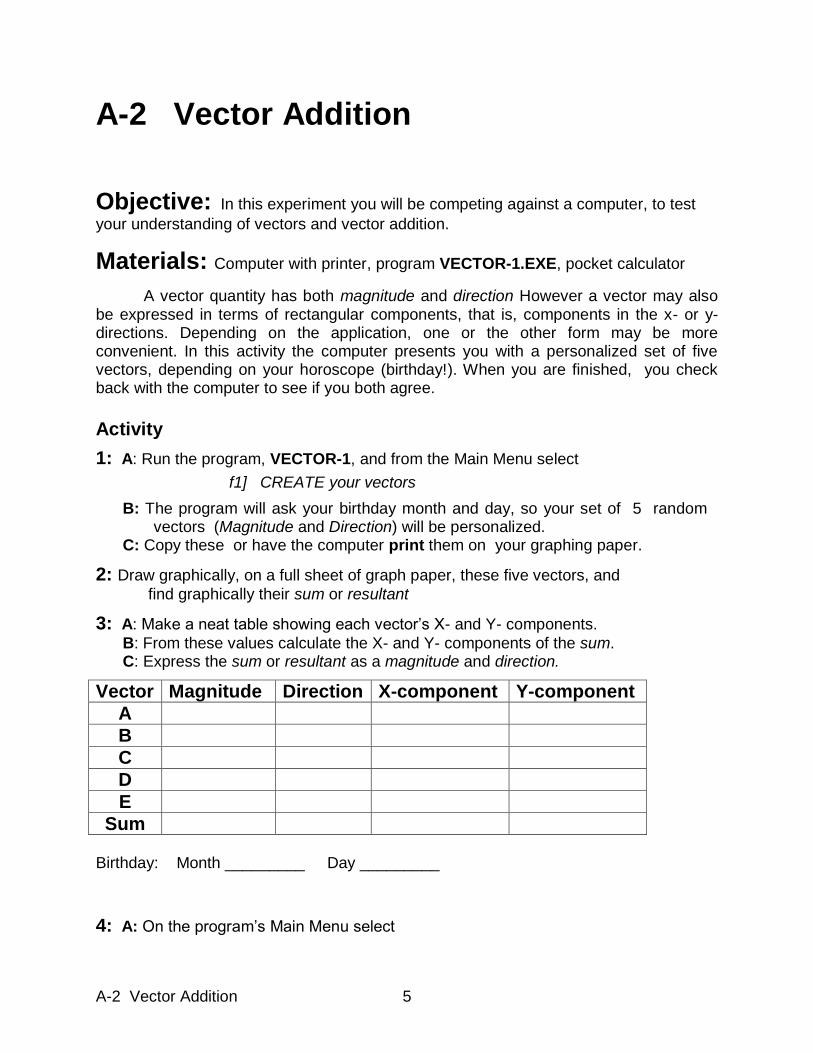
A-2 Vector Addition 5
A-2 Vector Addition
Objective: In this experiment you will be competing against a computer, to test
your understanding of vectors and vector addition.
Materials: Computer with printer, program VECTOR-1.EXE, pocket calculator
A vector quantity has both magnitude and direction However a vector may also be expressed in terms of rectangular components, that is, components in the x- or y-directions. Depending on the application, one or the other form may be more convenient. In this activity the computer presents you with a personalized set of five vectors, depending on your horoscope (birthday!). When you are finished, you check back with the computer to see if you both agree. Activity
1: A: Run the program, VECTOR-1, and from the Main Menu select
f1] CREATE your vectors
B: The program will ask your birthday month and day, so your set of 5 random vectors (Magnitude and Direction) will be personalized. C: Copy these or have the computer print them on your graphing paper.
2: Draw graphically, on a full sheet of graph paper, these five vectors, and
find graphically their sum or resultant
3: A: Make a neat table showing each vector‟s X- and Y- components.
B: From these values calculate the X- and Y- components of the sum. C: Express the sum or resultant as a magnitude and direction.
Vector Magnitude Direction X-component Y-component
A
B
C
D
E
Sum Birthday: Month _________ Day _________ 4: A: On the program‟s Main Menu select

A-2 Vector Addition 6
f2] Display CALCULATIONS
B: Enter again your birthday information to identify your vectors. C: The computer then displays your original vectors and their sum, in both polar and rectangular form. You may view the computer‟s vector plot, and also print this plot along with the data. D: Compare your own graph and calculations with that of the computer. Submit both sets as your final report.
Looking Backwards:
When adding the vectors graphically, which form did you find easier to use, the X-Y or the distance-angle form ?_________________________
Which form seems to give the greater accuracy? ______________________________
Is your calculator sharper than your pencil? ______________________________
Is it possible for the angle part of a vector to be greater than 360o ? ___________
What meaning could you assign to such a value? __________________________
If you walked ¾ the way around a mango tree, or 5 ¾ the way around it, would you still end up at the same position? ____________________________________
Could you walk backwards around that tree?_____________________________ Do you like mangoes ? __________________________________________
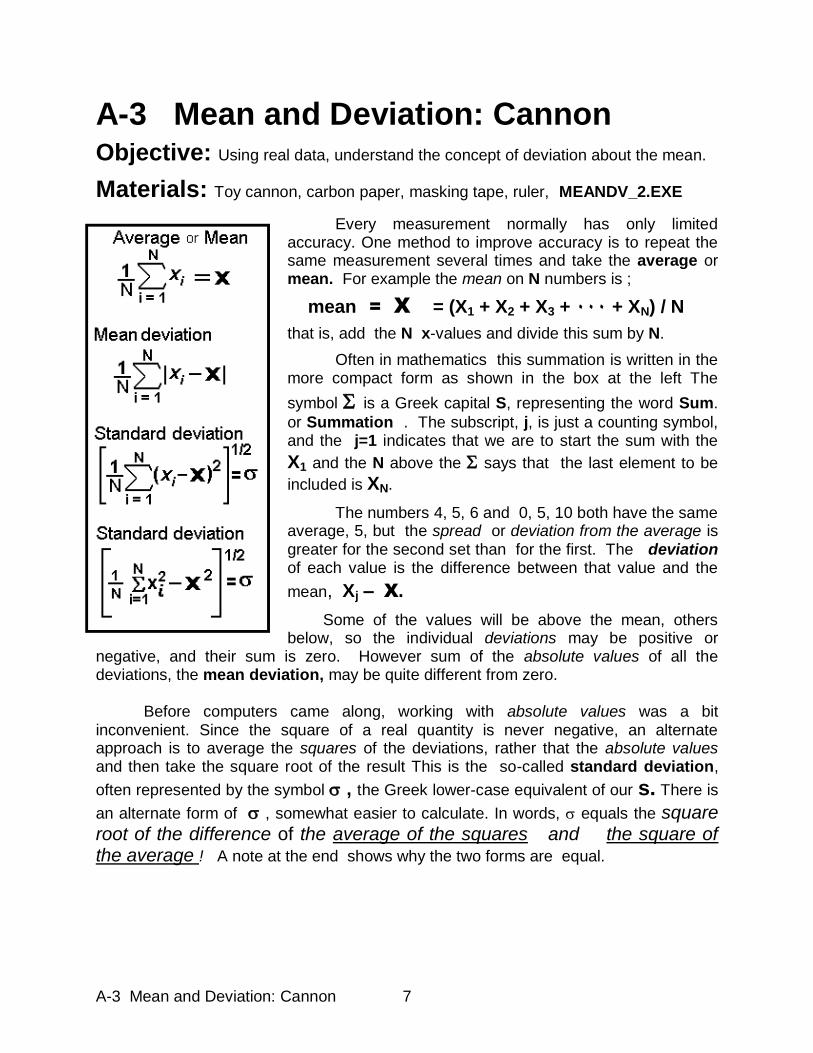
A-3 Mean and Deviation: Cannon 7
A-3 Mean and Deviation: Cannon
Objective: Using real data, understand the concept of deviation about the mean.
Materials: Toy cannon, carbon paper, masking tape, ruler, MEANDV_2.EXE
Every measurement normally has only limited accuracy. One method to improve accuracy is to repeat the same measurement several times and take the average or mean. For example the mean on N numbers is ;
mean = X = (X1 + X2 + X3 + ۰۰۰ + XN) / N
that is, add the N x-values and divide this sum by N.
Often in mathematics this summation is written in the more compact form as shown in the box at the left The
symbol is a Greek capital S, representing the word Sum.
or Summation . The subscript, j, is just a counting symbol, and the j=1 indicates that we are to start the sum with the
X1 and the N above the says that the last element to be
included is XN.
The numbers 4, 5, 6 and 0, 5, 10 both have the same average, 5, but the spread or deviation from the average is greater for the second set than for the first. The deviation of each value is the difference between that value and the
mean, Xj – X.
Some of the values will be above the mean, others below, so the individual deviations may be positive or
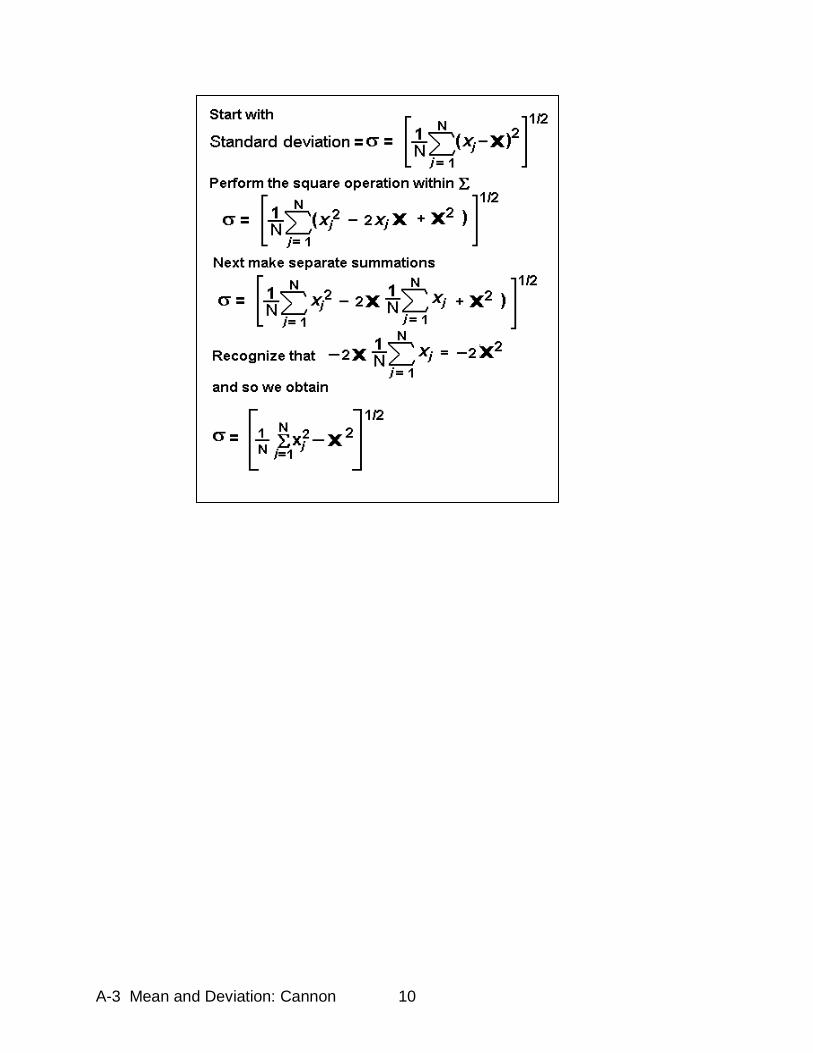
negative, and their sum is zero. However sum of the absolute values of all the deviations, the mean deviation, may be quite different from zero. Before computers came along, working with absolute values was a bit inconvenient. Since the square of a real quantity is never negative, an alternate approach is to average the squares of the deviations, rather that the absolute values and then take the square root of the result This is the so-called standard deviation,
often represented by the symbol , the Greek lower-case equivalent of our s. There is
an alternate form of , somewhat easier to calculate. In words, equals the square root of the difference of the average of the squares and the square of the average ! A note at the end shows why the two forms are equal.
A-3 Mean and Deviation: Cannon 8
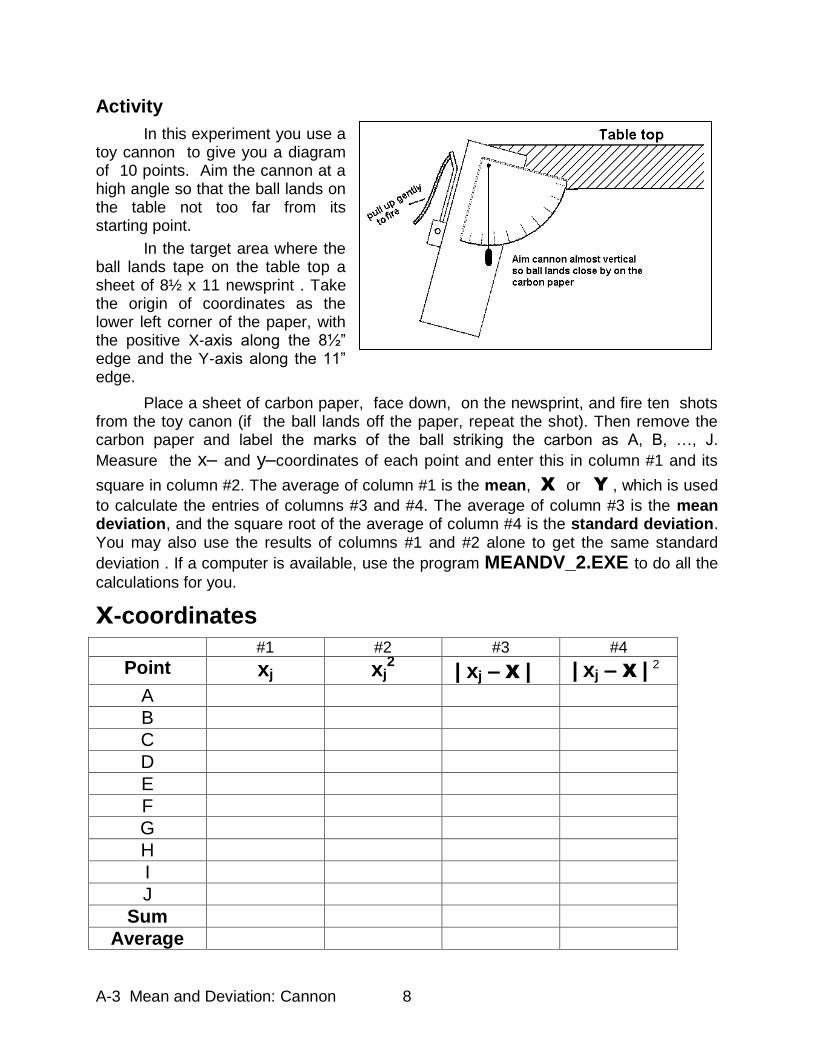
Activity
In this experiment you use a toy cannon to give you a diagram of 10 points. Aim the cannon at a high angle so that the ball lands on the table not too far from its starting point.
In the target area where the ball lands tape on the table top a sheet of 8½ x 11 newsprint . Take the origin of coordinates as the lower left corner of the paper, with the positive X-axis along the 8½” edge and the Y-axis along the 11” edge.
Place a sheet of carbon paper, face down, on the newsprint, and fire ten shots from the toy canon (if the ball lands off the paper, repeat the shot). Then remove the carbon paper and label the marks of the ball striking the carbon as A, B, …, J.
Measure the x– and y–coordinates of each point and enter this in column #1 and its
square in column #2. The average of column #1 is the mean, X or Y, which is used
to calculate the entries of columns #3 and #4. The average of column #3 is the mean deviation, and the square root of the average of column #4 is the standard deviation. You may also use the results of columns #1 and #2 alone to get the same standard
deviation . If a computer is available, use the program MEANDV_2.EXE to do all the
calculations for you.
x-coordinates
#1 #2 #3 #4
Point xj xj2 | xj –X| | xj – X |2
A
B
C
D
E
F
G
H
I
J
Sum
Average
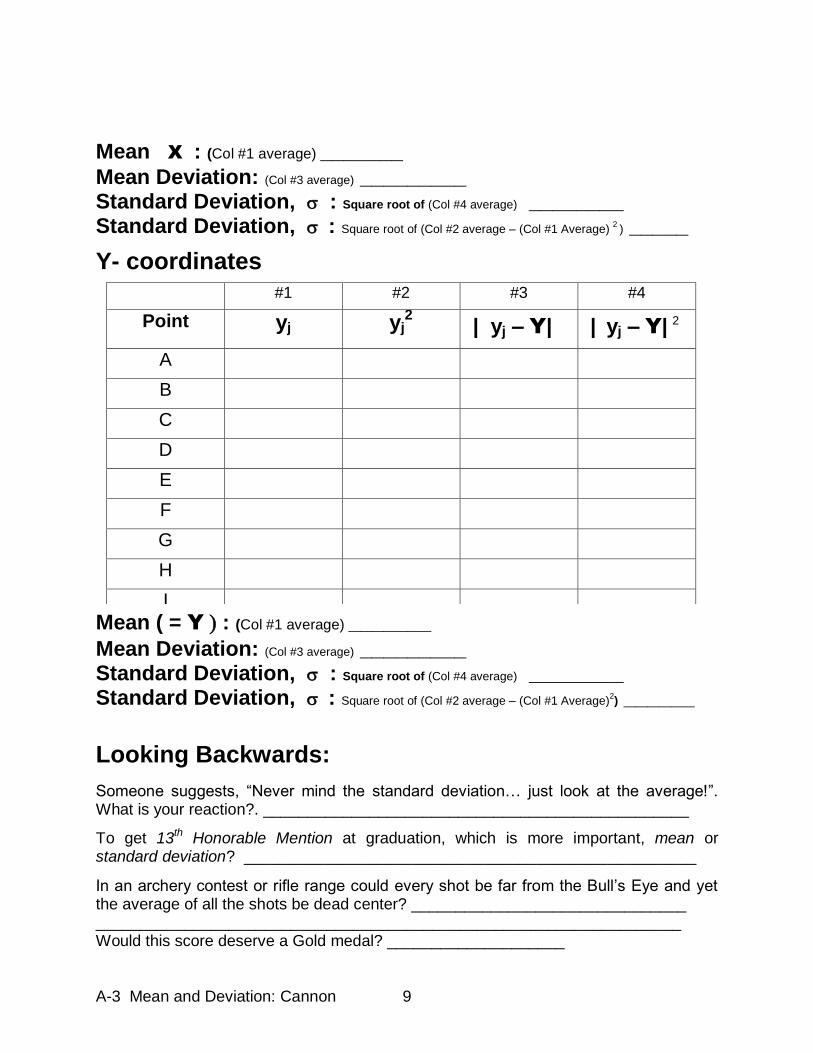
A-3 Mean and Deviation: Cannon 9
Mean X : (Col #1 average) _______
Mean Deviation: (Col #3 average) _________ Standard Deviation, : Square root of (Col #4 average) ________ Standard Deviation, : Square root of (Col #2 average – (Col #1 Average)
2 ) _____
Y- coordinates
Mean ( = Y : (Col #1 average) _______
Mean Deviation: (Col #3 average) _________ Standard Deviation, : Square root of (Col #4 average) ________ Standard Deviation, : Square root of (Col #2 average – (Col #1 Average)
2) ______
Looking Backwards:
Someone suggests, “Never mind the standard deviation… just look at the average!”. What is your reaction?. ________________________________________________
To get 13th Honorable Mention at graduation, which is more important, mean or standard deviation? ___________________________________________________
In an archery contest or rifle range could every shot be far from the Bull‟s Eye and yet the average of all the shots be dead center? _______________________________ __________________________________________________________________ Would this score deserve a Gold medal? ____________________
#1 #2 #3 #4
Point yj yj2 | yj – Y| | yj – Y|2
A
B
C
D
E
F
G
H
I
J
Sum
Average
A-3 Mean and Deviation: Cannon 10
A-4 Mean and Deviation: Computer 11
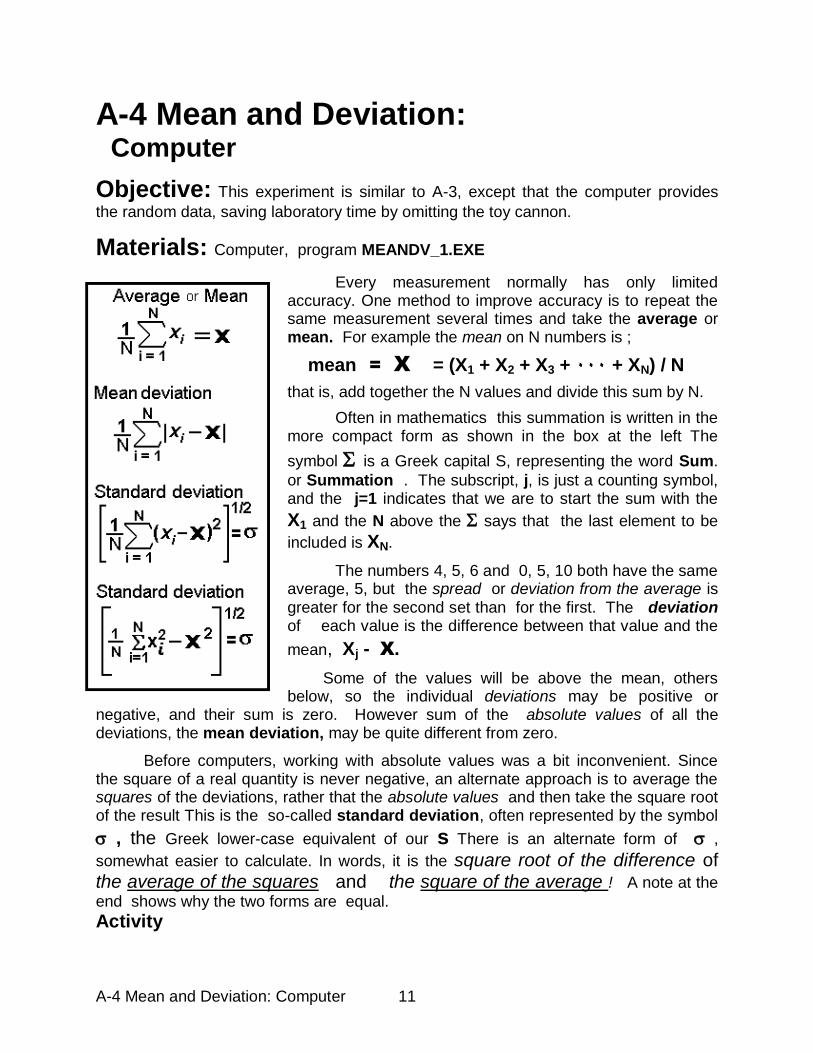
A-4 Mean and Deviation: Computer
Objective: This experiment is similar to A-3, except that the computer provides
the random data, saving laboratory time by omitting the toy cannon.
Materials: Computer, program MEANDV_1.EXE
Every measurement normally has only limited accuracy. One method to improve accuracy is to repeat the same measurement several times and take the average or mean. For example the mean on N numbers is ;
mean = X = (X1 + X2 + X3 + ۰۰۰ + XN) / N
that is, add together the N values and divide this sum by N.
Often in mathematics this summation is written in the more compact form as shown in the box at the left The
symbol is a Greek capital S, representing the word Sum.
or Summation . The subscript, j, is just a counting symbol, and the j=1 indicates that we are to start the sum with the
X1 and the N above the says that the last element to be
included is XN.
The numbers 4, 5, 6 and 0, 5, 10 both have the same average, 5, but the spread or deviation from the average is greater for the second set than for the first. The deviation of each value is the difference between that value and the
mean, Xj - X.
Some of the values will be above the mean, others below, so the individual deviations may be positive or
negative, and their sum is zero. However sum of the absolute values of all the deviations, the mean deviation, may be quite different from zero.
Before computers, working with absolute values was a bit inconvenient. Since the square of a real quantity is never negative, an alternate approach is to average the squares of the deviations, rather that the absolute values and then take the square root of the result This is the so-called standard deviation, often represented by the symbol
, the Greek lower-case equivalent of our s There is an alternate form of ,
somewhat easier to calculate. In words, it is the square root of the difference of the average of the squares and the square of the average ! A note at the
end shows why the two forms are equal.
Activity
A-4 Mean and Deviation: Computer 12
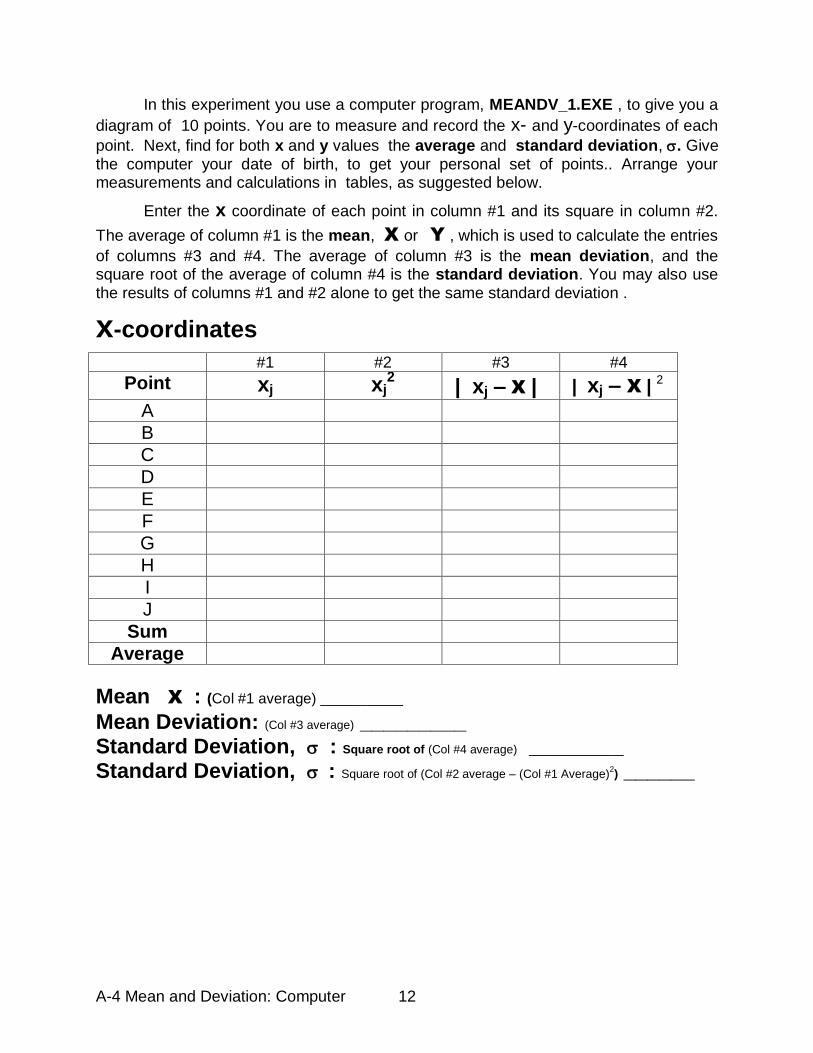
In this experiment you use a computer program, MEANDV_1.EXE , to give you a
diagram of 10 points. You are to measure and record the x- and y-coordinates of each
point. Next, find for both x and y values the average and standard deviation, . Give the computer your date of birth, to get your personal set of points.. Arrange your measurements and calculations in tables, as suggested below.
Enter the x coordinate of each point in column #1 and its square in column #2.
The average of column #1 is the mean, X or Y, which is used to calculate the entries
of columns #3 and #4. The average of column #3 is the mean deviation, and the square root of the average of column #4 is the standard deviation. You may also use the results of columns #1 and #2 alone to get the same standard deviation .
x-coordinates
#1 #2 #3 #4
Point xj xj2 | xj –X| | xj – X |
2
A
B
C
D
E
F
G
H
I
J
Sum
Average
Mean X : (Col #1 average) _______
Mean Deviation: (Col #3 average) _________ Standard Deviation, : Square root of (Col #4 average) ________ Standard Deviation, : Square root of (Col #2 average – (Col #1 Average)
2) ______
A-4 Mean and Deviation: Computer 13
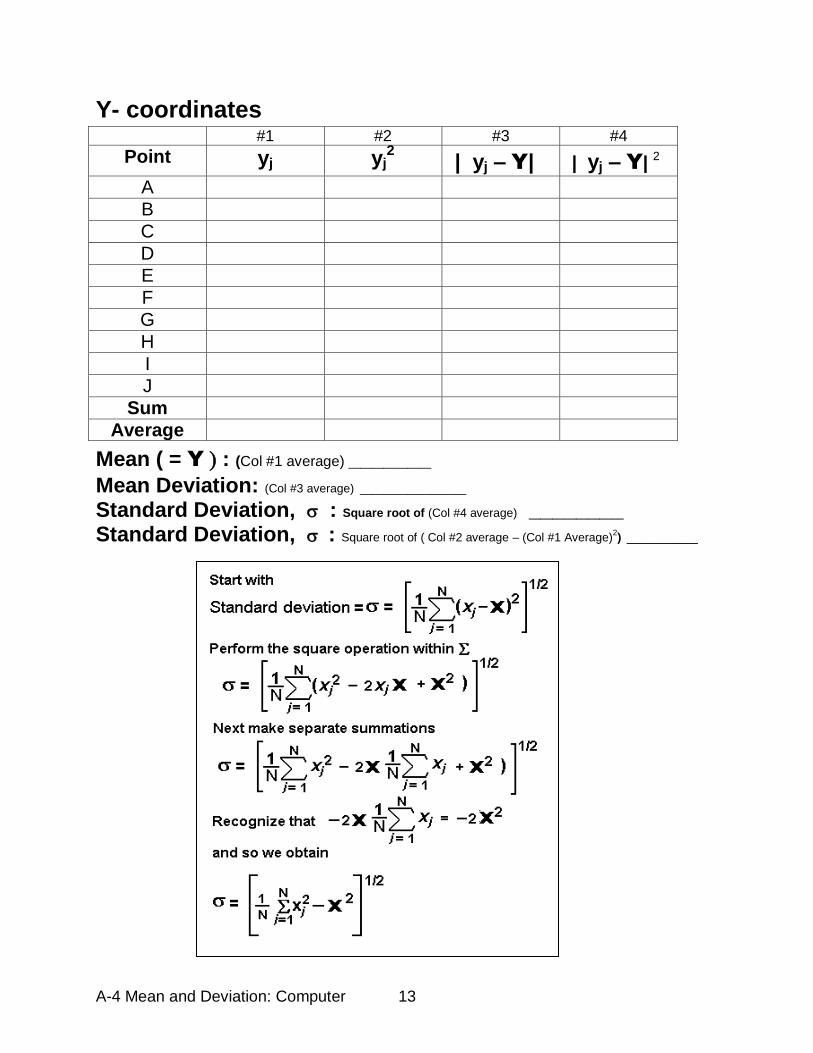
Y- coordinates
#1 #2 #3 #4
Point yj yj2 | yj – Y| | yj – Y|
2
A
B
C
D
E
F
G
H
I
J
Sum
Average
Mean ( = Y : (Col #1 average) _______
Mean Deviation: (Col #3 average) _________ Standard Deviation, : Square root of (Col #4 average) ________ Standard Deviation, : Square root of ( Col #2 average – (Col #1 Average)
2) ______
14
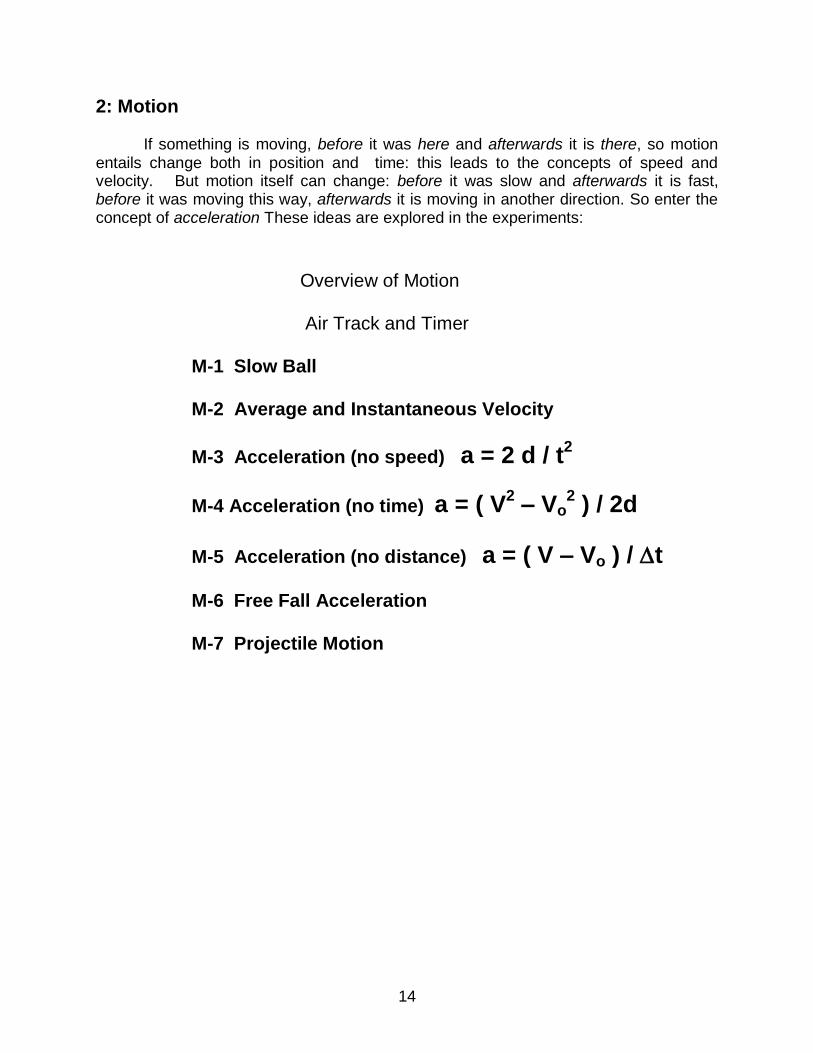
2: Motion If something is moving, before it was here and afterwards it is there, so motion entails change both in position and time: this leads to the concepts of speed and velocity. But motion itself can change: before it was slow and afterwards it is fast, before it was moving this way, afterwards it is moving in another direction. So enter the concept of acceleration These ideas are explored in the experiments: Overview of Motion Air Track and Timer
M-1 Slow Ball M-2 Average and Instantaneous Velocity
M-3 Acceleration (no speed) a = 2 d / t2
M-4 Acceleration (no time) a = ( V2 – Vo
2 ) / 2d
M-5 Acceleration (no distance) a = ( V – Vo ) / t M-6 Free Fall Acceleration M-7 Projectile Motion
15
Overview of Motion
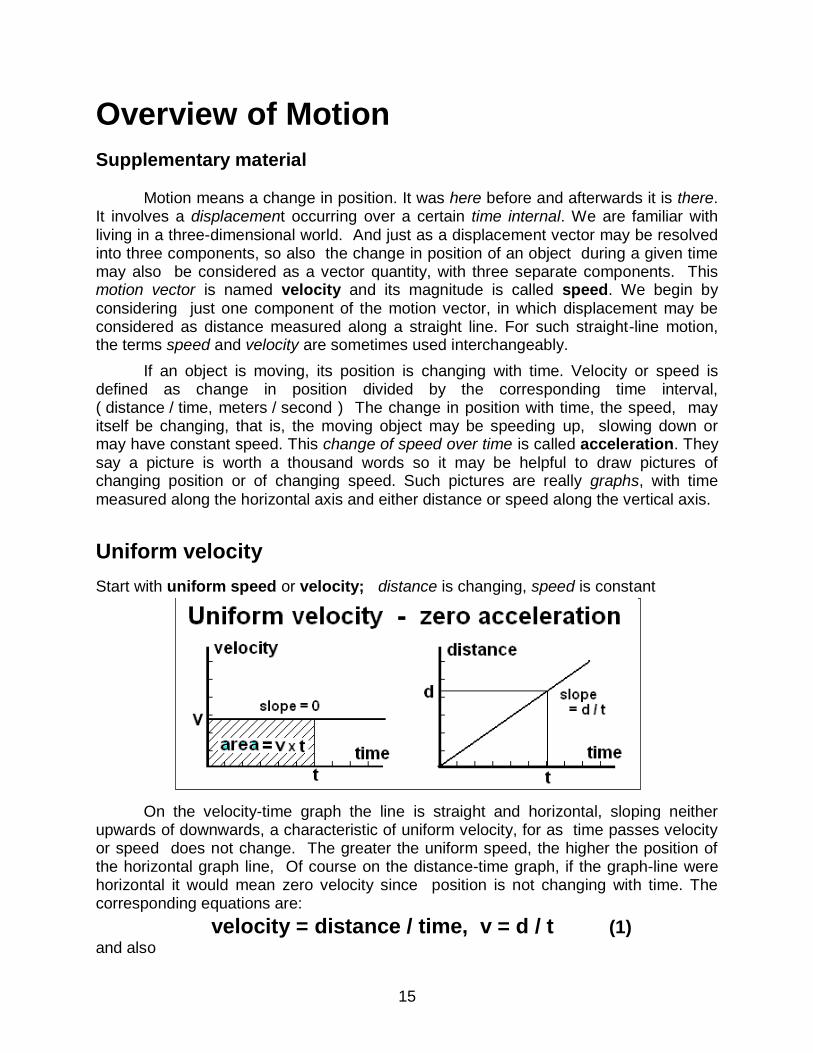
Supplementary material Motion means a change in position. It was here before and afterwards it is there. It involves a displacement occurring over a certain time internal. We are familiar with living in a three-dimensional world. And just as a displacement vector may be resolved into three components, so also the change in position of an object during a given time may also be considered as a vector quantity, with three separate components. This motion vector is named velocity and its magnitude is called speed. We begin by considering just one component of the motion vector, in which displacement may be considered as distance measured along a straight line. For such straight-line motion, the terms speed and velocity are sometimes used interchangeably.
If an object is moving, its position is changing with time. Velocity or speed is defined as change in position divided by the corresponding time interval, ( distance / time, meters / second ) The change in position with time, the speed, may itself be changing, that is, the moving object may be speeding up, slowing down or may have constant speed. This change of speed over time is called acceleration. They say a picture is worth a thousand words so it may be helpful to draw pictures of changing position or of changing speed. Such pictures are really graphs, with time measured along the horizontal axis and either distance or speed along the vertical axis.
Uniform velocity
Start with uniform speed or velocity; distance is changing, speed is constant
On the velocity-time graph the line is straight and horizontal, sloping neither upwards of downwards, a characteristic of uniform velocity, for as time passes velocity or speed does not change. The greater the uniform speed, the higher the position of the horizontal graph line, Of course on the distance-time graph, if the graph-line were horizontal it would mean zero velocity since position is not changing with time. The corresponding equations are:
velocity = distance / time, v = d / t (1) and also
16
distance = velocity x time, d = v t (2)
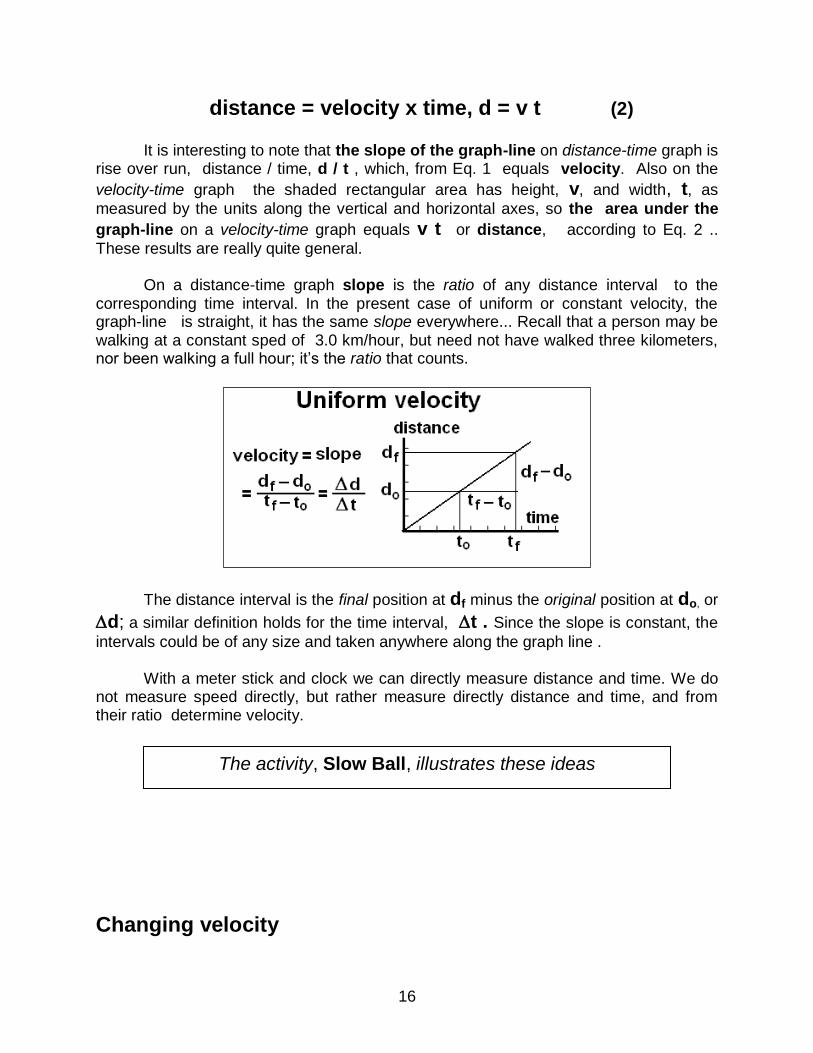
It is interesting to note that the slope of the graph-line on distance-time graph is rise over run, distance / time, d / t , which, from Eq. 1 equals velocity. Also on the
velocity-time graph the shaded rectangular area has height, v, and width, t, as
measured by the units along the vertical and horizontal axes, so the area under the
graph-line on a velocity-time graph equals v t or distance, according to Eq. 2 ..
These results are really quite general. On a distance-time graph slope is the ratio of any distance interval to the corresponding time interval. In the present case of uniform or constant velocity, the graph-line is straight, it has the same slope everywhere... Recall that a person may be walking at a constant sped of 3.0 km/hour, but need not have walked three kilometers, nor been walking a full hour; it‟s the ratio that counts.
The distance interval is the final position at df minus the original position at do, or
d; a similar definition holds for the time interval, t . Since the slope is constant, the
intervals could be of any size and taken anywhere along the graph line . With a meter stick and clock we can directly measure distance and time. We do not measure speed directly, but rather measure directly distance and time, and from their ratio determine velocity.
Changing velocity
The activity, Slow Ball, illustrates these ideas
17
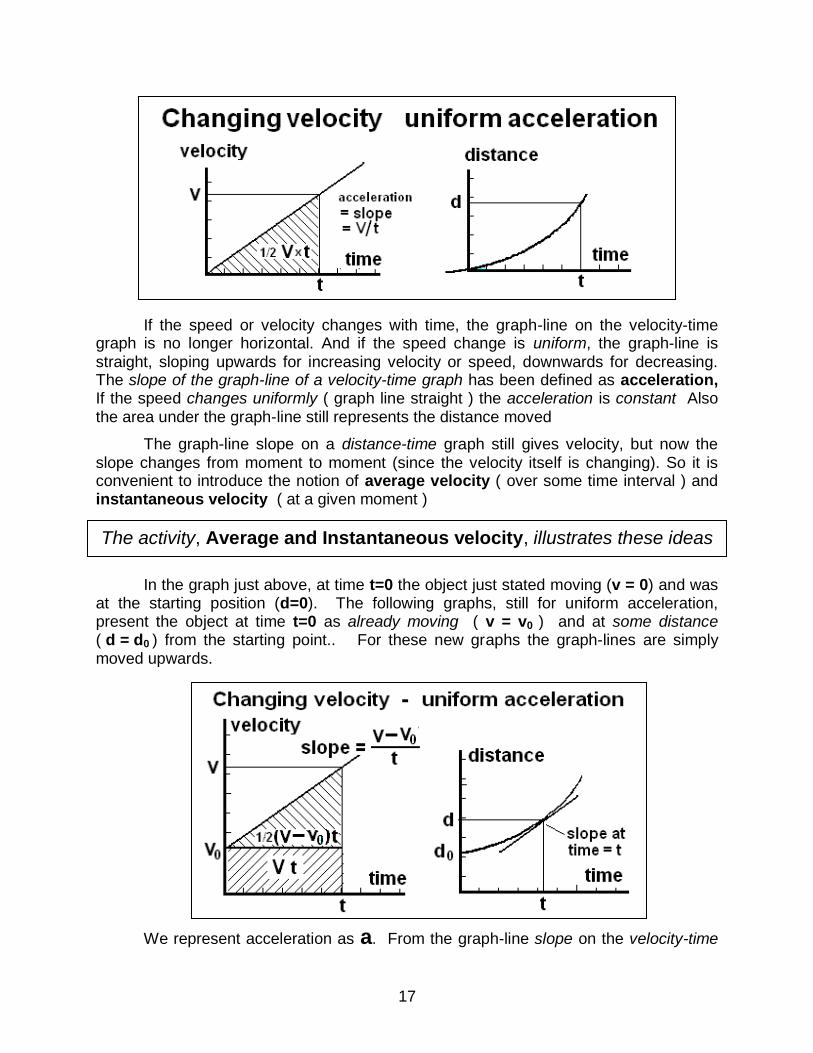
If the speed or velocity changes with time, the graph-line on the velocity-time graph is no longer horizontal. And if the speed change is uniform, the graph-line is straight, sloping upwards for increasing velocity or speed, downwards for decreasing. The slope of the graph-line of a velocity-time graph has been defined as acceleration, If the speed changes uniformly ( graph line straight ) the acceleration is constant Also the area under the graph-line still represents the distance moved
The graph-line slope on a distance-time graph still gives velocity, but now the slope changes from moment to moment (since the velocity itself is changing). So it is convenient to introduce the notion of average velocity ( over some time interval ) and instantaneous velocity ( at a given moment )
In the graph just above, at time t=0 the object just stated moving (v = 0) and was at the starting position (d=0). The following graphs, still for uniform acceleration, present the object at time t=0 as already moving ( v = v0 ) and at some distance ( d = d0 ) from the starting point.. For these new graphs the graph-lines are simply moved upwards.
We represent acceleration as a. From the graph-line slope on the velocity-time
The activity, Average and Instantaneous velocity, illustrates these ideas
18
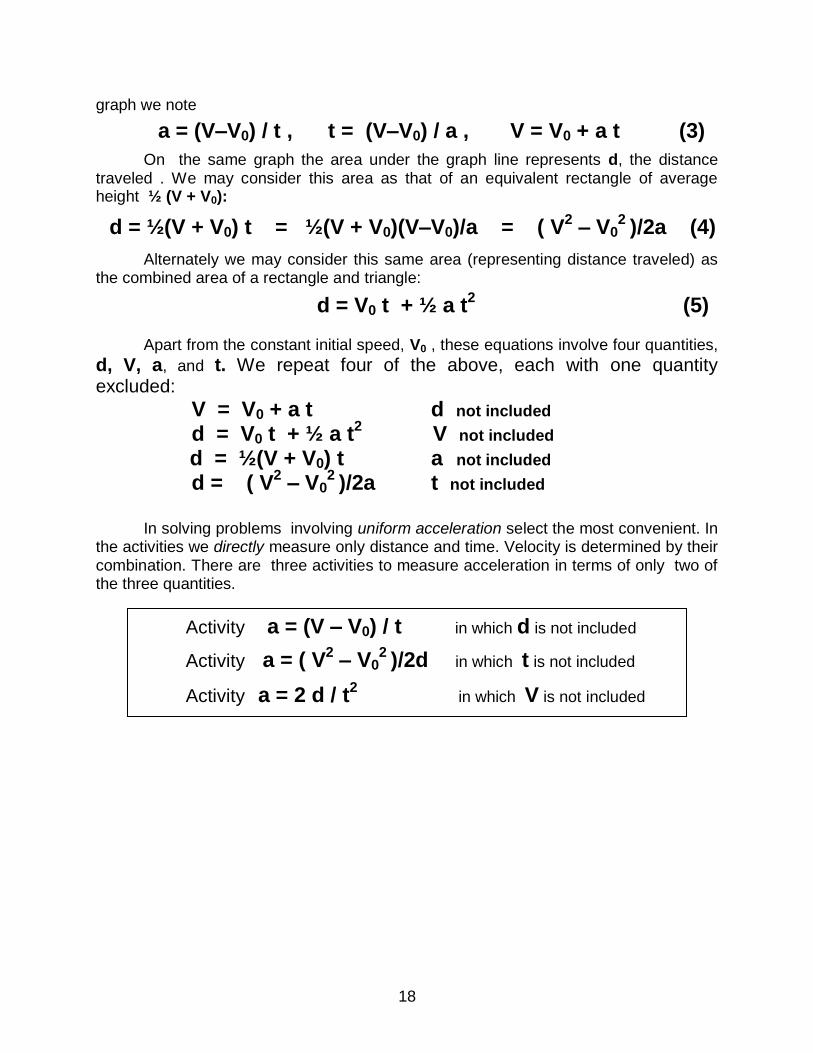
graph we note
a = (V–V0) / t , t = (V–V0) / a , V = V0 + a t (3)
On the same graph the area under the graph line represents d, the distance traveled . We may consider this area as that of an equivalent rectangle of average height ½ (V + V0):
d = ½(V + V0) t = ½(V + V0)(V–V0)/a = ( V2 – V0
2 )/2a (4)
Alternately we may consider this same area (representing distance traveled) as the combined area of a rectangle and triangle:
d = V0 t + ½ a t2 (5)
Apart from the constant initial speed, V0 , these equations involve four quantities,
d, V, a, and t. We repeat four of the above, each with one quantity excluded:
V = V0 + a t d not included d = V0 t + ½ a t
2 V not included
d = ½(V + V0) t a not included
d = ( V2 – V0
2 )/2a t not included
In solving problems involving uniform acceleration select the most convenient. In the activities we directly measure only distance and time. Velocity is determined by their combination. There are three activities to measure acceleration in terms of only two of the three quantities.
Activity a = (V – V0) / t in which d is not included
Activity a = ( V2 – V0
2 )/2d in which t is not included
Activity a = 2 d / t2
in which V is not included
19
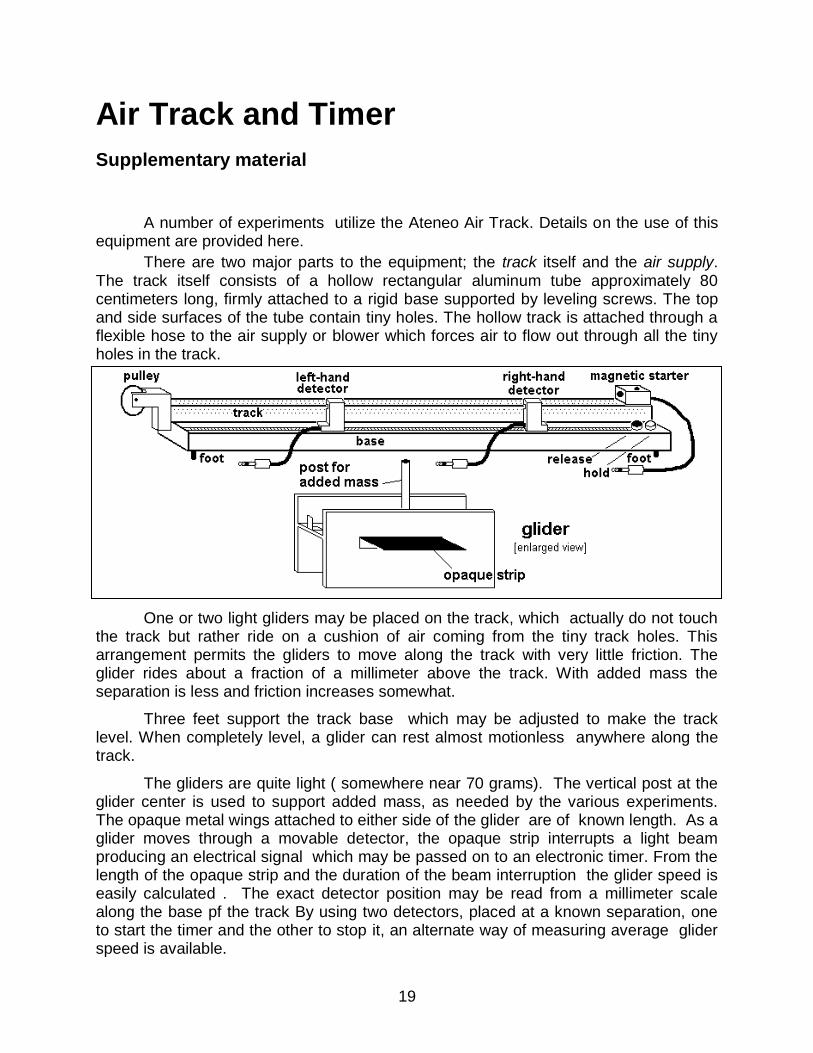
Air Track and Timer
Supplementary material A number of experiments utilize the Ateneo Air Track. Details on the use of this equipment are provided here.
There are two major parts to the equipment; the track itself and the air supply. The track itself consists of a hollow rectangular aluminum tube approximately 80 centimeters long, firmly attached to a rigid base supported by leveling screws. The top and side surfaces of the tube contain tiny holes. The hollow track is attached through a flexible hose to the air supply or blower which forces air to flow out through all the tiny holes in the track.
One or two light gliders may be placed on the track, which actually do not touch the track but rather ride on a cushion of air coming from the tiny track holes. This arrangement permits the gliders to move along the track with very little friction. The glider rides about a fraction of a millimeter above the track. With added mass the separation is less and friction increases somewhat.
Three feet support the track base which may be adjusted to make the track level. When completely level, a glider can rest almost motionless anywhere along the track.
The gliders are quite light ( somewhere near 70 grams). The vertical post at the glider center is used to support added mass, as needed by the various experiments. The opaque metal wings attached to either side of the glider are of known length. As a glider moves through a movable detector, the opaque strip interrupts a light beam producing an electrical signal which may be passed on to an electronic timer. From the length of the opaque strip and the duration of the beam interruption the glider speed is easily calculated . The exact detector position may be read from a millimeter scale along the base pf the track By using two detectors, placed at a known separation, one to start the timer and the other to stop it, an alternate way of measuring average glider speed is available.
20
At one end of the track is a small electromagnet starter which, when energized, holds a glider positioned against it. A red hold and black release button govern the magnetic action, which is also monitored by a red warning light on the starter When the track is inclined at a definite angle (place an object of known height under one end of an already leveled track), the magnetic starter holds the glider until the release button is pressed. At this moment the starter also produces an electrical signal useful to start an attached timer. A low-friction pulley is placed at the far end of the track opposite the starter For experiments involving Newton‟s second law, a light thread may placed over this pulley, one end looped around the glider center post and a known mass suspended from the other. For convenience of storage, this pulley is detachable. A single 220 volt input line is available to provide power for the three electrical outlets placed along the track base for timers and the air supply. .
The timer is started and stopped automatically by the detectors, and so provides great precision. The precision of the detector position is much less ( position, precise to one-thousandth of a meter; time, precise to one-millionth of a second) To attain improved experimental accuracy make sure that the detector is always carefully positioned and is never tilted. Try not to touch or tilt the detector during any series of time measurement.
Timer
For all air track time measurements a timer is required. The Ateneo Millisecond Timer provides a four digit time display, with four switch selectable ranges, one for seconds and three for milliseconds. The display decimal point shifts according to the selected range, from full-scale 9.999 sec to 9.999 msec. In making measurements it is desirable to select the range that shows the maximum number of significant digits. The display is set to 0000 whenever the reset button is pressed. If the display rolls over to 0000 after passing 9999 a small carry light appears at the left of the display. The timer also provides six switch-selectable functions.
1: A Start Stop ∏ In this mode the timer starts counting when a low electrical signal ( < 1.0 volt ) is applied to the A input on the rear of the timer and continues to count until the A input signal returns to high ( > 3.5 volts ) Further changes at the A input are ignored until the reset button is pressed. This changes the display to 0000 and the timer is ready for a new cycle
2: A Start Stop. ∏∏ This is an alternate of #1 above. The timer counts for as long as the signal at the A input is active ( < 1.0 volt ) . The counts accumulate until Reset is pressed.
21
3: A Start – B Stop. In this mode the timer starts as soon as the A input first becomes active, and continues counting (even after A may be released) until the B input first becomes active. This is the only timer mode that responds to a signal at the B input. 4: Pendulum This mode is designed to measure conveniently the period of simple harmonic motion such as a pendulum. Once reset is pressed counting is started only after A is activated ( voltage at A < 1.0V ) for the second time. The third time A is activated nothing happens. The counter stops the moment A is activated for the fourth time. The display does not change again until reset is pressed, after which a new cycle begins. The display gives the time for one complete cycle of periodic motion. 5 Two Times This mode provides two successive A Start Stop operations. After the first operation the display value is stored in internal memory, the display is set to 0000 and the prior indicator is lit, indicating a meaningful value stored in memory. The timer awaits the second A Start Stop interval. The first timing interval may be recalled by holding down the Prior button. Pressing Reset sets both displays to 0000. 6: Period This mode continuously displays the period of any periodic signal applied to the Period input. on the rear panel.( for some models the A input may be used for this purpose ).
M-1 Slow Ball
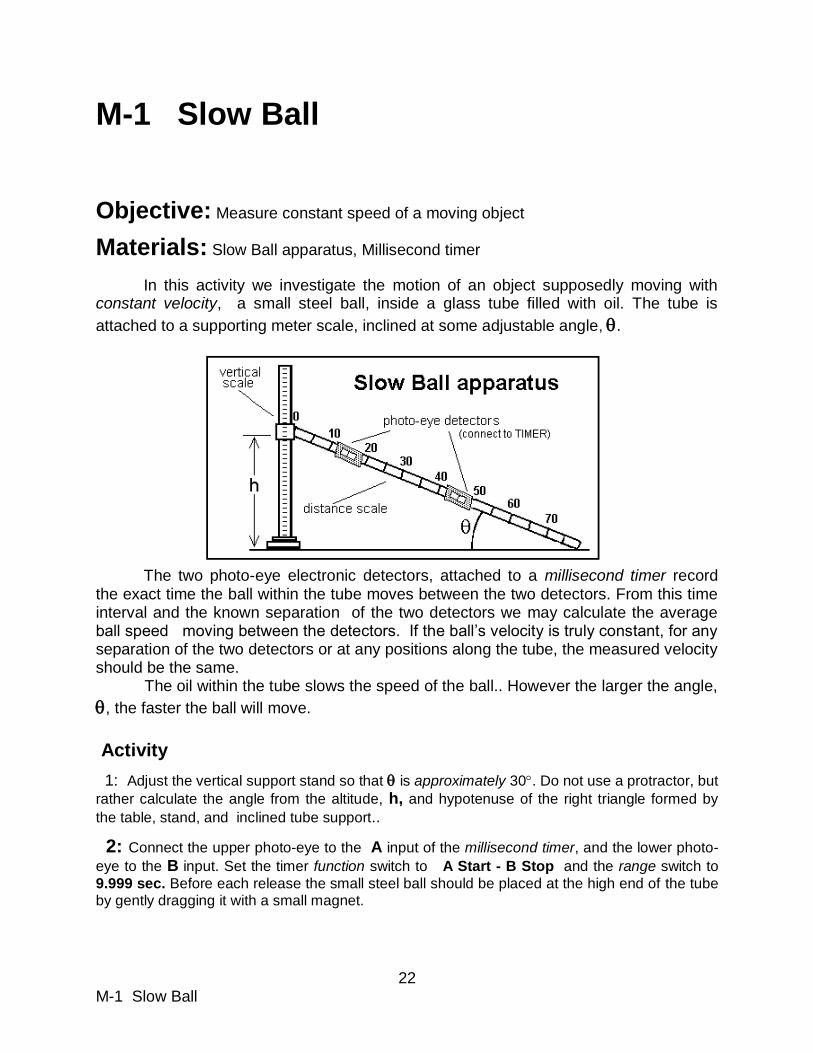
22
M-1 Slow Ball
Objective: Measure constant speed of a moving object
Materials: Slow Ball apparatus, Millisecond timer
In this activity we investigate the motion of an object supposedly moving with constant velocity, a small steel ball, inside a glass tube filled with oil. The tube is
attached to a supporting meter scale, inclined at some adjustable angle, .
The two photo-eye electronic detectors, attached to a millisecond timer record the exact time the ball within the tube moves between the two detectors. From this time interval and the known separation of the two detectors we may calculate the average ball speed moving between the detectors. If the ball‟s velocity is truly constant, for any separation of the two detectors or at any positions along the tube, the measured velocity should be the same. The oil within the tube slows the speed of the ball.. However the larger the angle,
, the faster the ball will move.
Activity
1: Adjust the vertical support stand so that is approximately 30. Do not use a protractor, but
rather calculate the angle from the altitude, h, and hypotenuse of the right triangle formed by
the table, stand, and inclined tube support..
2: Connect the upper photo-eye to the A input of the millisecond timer, and the lower photo-
eye to the B input. Set the timer function switch to A Start - B Stop and the range switch to
9.999 sec. Before each release the small steel ball should be placed at the high end of the tube by gently dragging it with a small magnet.
M-1 Slow Ball
23
3: In Trial #1 you are to change the separation of the photo-detectors. Measure and
record the time for the ball to move from the position A to position B as indicated in the
table.. Repeat the time measurement 3 times and calculate the average of the 3 measurements. Use this average in computing the average speed in the interval. The time measurements are quite accurate. Therefore position the two photo-detectors as accurately as possible to improve the accuracy of the calculated speed.
4: In Trial #2 you are to change the positions of the photo-detectors along the tube,
keeping their separation constant.
h: ____ angle : _____
Measure TIME in seconds, DISTANCE in centimeters
Trial #1 Changing length of the distance interval
A B time #1 time #2 time #3 average
time average speed
15.0 65.0
20.0 60.0 25.0 55.0
30.0 50.0 35.0 45.0
Trial #2 Changing position of a constant distance interval
A B time #1 time #2 time #3 average
time average speed
15.0 25.0 25.0 35.0
35.0 45.0 45.0 55.0
55.0 65.0
Looking Back:
With a different inclination angle, , the speed seems to change. How can you explain this?_______________________________________________________________ __________________________________________________________________
A fighter pilot ejects from his damaged plane. The plane nose-dives to earth at a terrific speed, while the pilot floats down gracefully with a parachute. Why the difference in speed? ___________________________________________________________ _________________________________________________________________
If there is trouble in a space capsule, could the astronaut eject with a parachute? _________________________________________________________________
M-2 Average and Instantaneous Velocity
24
M-2 Average and Instantaneous Velocity
Objective: Analyze the velocity of an object moving with increasing speed
Materials: Linear air track, millisecond timer
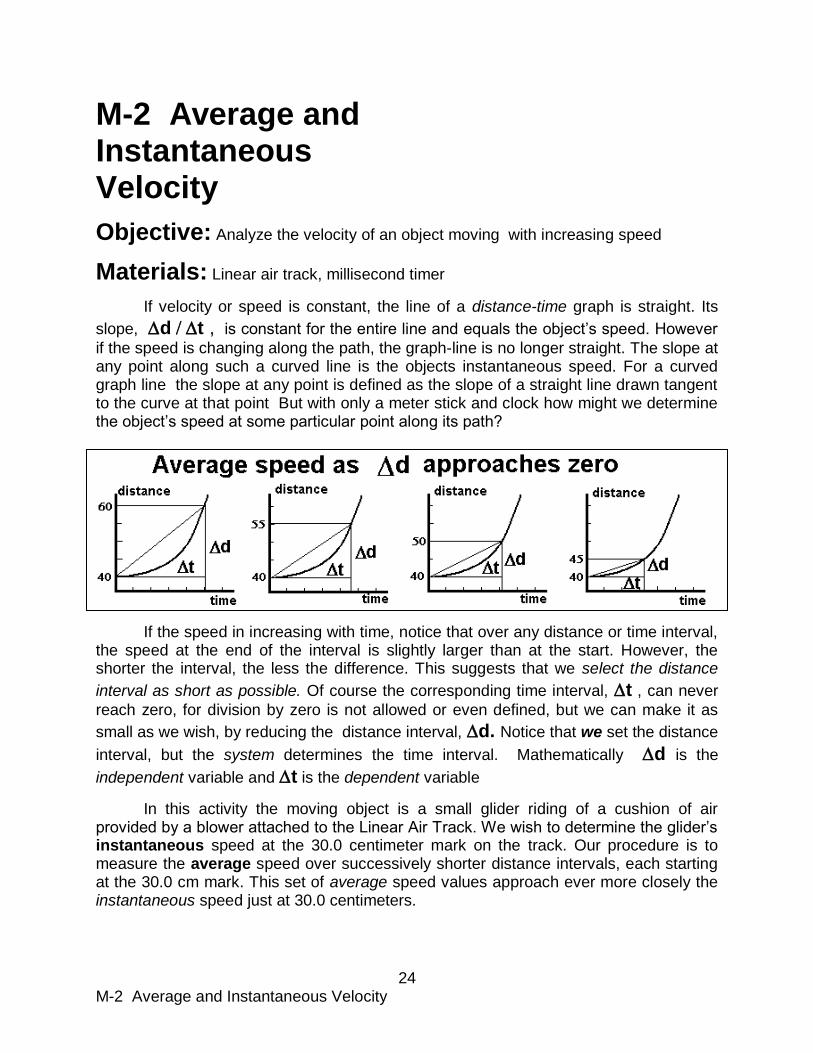
If velocity or speed is constant, the line of a distance-time graph is straight. Its
slope, dt , is constant for the entire line and equals the object‟s speed. However
if the speed is changing along the path, the graph-line is no longer straight. The slope at any point along such a curved line is the objects instantaneous speed. For a curved graph line the slope at any point is defined as the slope of a straight line drawn tangent to the curve at that point But with only a meter stick and clock how might we determine the object‟s speed at some particular point along its path?
If the speed in increasing with time, notice that over any distance or time interval, the speed at the end of the interval is slightly larger than at the start. However, the shorter the interval, the less the difference. This suggests that we select the distance
interval as short as possible. Of course the corresponding time interval, t , can never
reach zero, for division by zero is not allowed or even defined, but we can make it as
small as we wish, by reducing the distance interval, d. Notice that we set the distance
interval, but the system determines the time interval. Mathematically d is the
independent variable and t is the dependent variable
In this activity the moving object is a small glider riding of a cushion of air provided by a blower attached to the Linear Air Track. We wish to determine the glider‟s instantaneous speed at the 30.0 centimeter mark on the track. Our procedure is to measure the average speed over successively shorter distance intervals, each starting at the 30.0 cm mark. This set of average speed values approach ever more closely the instantaneous speed just at 30.0 centimeters.
M-2 Average and Instantaneous Velocity
25
Activity
1: Set up and level the air track
2: Position the right-hand detector at the 30.0 centimeter mark, and connect it to the A input at
the back of the timer. Position the left-hand detector at the 55.0 centimeter mark and connect it
to the timer B input. Set the timer Function to A start - B stop and Range to 999.9 ms
3: Place the small aluminum block under the track feet at the right end so that the track is
inclined. Place the glider against the starter at the right end of the track and press the red button to hold the glider against the magnetic starter.
4: Place a 20.0 mass on the vertical pin of the glider, to give it added stability. Hold down the
button on the air supply to run the blower. Allow the blower to come to full speed (one or two seconds). Then press the black button near the magnetic starter to release the glider. Once the glider has passed the B detector, release the blower button. Record the time.
5: Make three trials, recording exactly the time, in milliseconds, and then average the three
values. After each trial press the Reset switch on the timer to clear the display. To determine the average velocity over this 25.0 cm interval, divide the interval length by the average of the three time measurements. The result is in units of centimeters per millisecond. Convert this to units of meters / second.
6 Move the left-hand B detector to the 50.0 cm mark. Do not move the right-hand A detector
from its 30.0 position, and repeat the time measurements. Repeat this for all the position values shown in the table
7: From this set of average velocity calculations, estimate the instantaneous velocity at the
30.0 cm position.
NOTE: The time measurements are quite precise. Therefore it is important that you position the
photo-detectors as accurately as possible !
Express TIME in milliseconds, POSITION in centimeters
A cm
B cm
time #1 milli-sec
time #2 milli-sec
time #3 milli-sec
average time
velocity cm / milli-sec
velocity m / sec
40.0 65.0 40.0 60.0
40.0 55.0 40.0 50.0
40.0 45.0
Estimated instantaneous velocity at the 30.0 cm position __________________
Looking Back: Is there a minimum allowed size for d ?_____________________________
Would it be possible to let t equal zero? ____________________________
In our world is there any minimum speed for an object not at rest? ________
In our world is there any maximum speed for a moving object? ___________
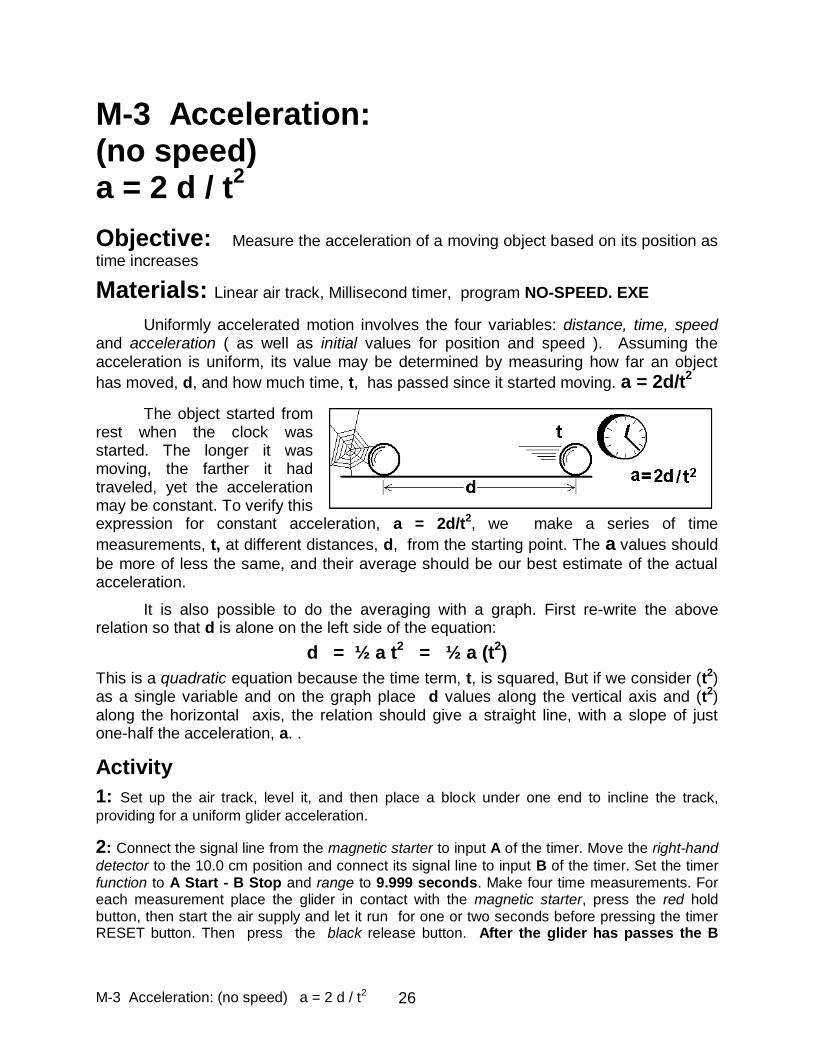
M-3 Acceleration: (no speed) a = 2 d / t2 26
M-3 Acceleration: (no speed) a = 2 d / t
2
Objective: Measure the acceleration of a moving object based on its position as
time increases
Materials: Linear air track, Millisecond timer, program NO-SPEED. EXE
Uniformly accelerated motion involves the four variables: distance, time, speed and acceleration ( as well as initial values for position and speed ). Assuming the acceleration is uniform, its value may be determined by measuring how far an object
has moved, d, and how much time, t, has passed since it started moving. a = 2d/t2
The object started from rest when the clock was started. The longer it was moving, the farther it had traveled, yet the acceleration may be constant. To verify this expression for constant acceleration, a = 2d/t2, we make a series of time
measurements, t, at different distances, d, from the starting point. The a values should
be more of less the same, and their average should be our best estimate of the actual acceleration.
It is also possible to do the averaging with a graph. First re-write the above relation so that d is alone on the left side of the equation:
d = ½ a t2 = ½ a (t
2)
This is a quadratic equation because the time term, t, is squared, But if we consider (t2) as a single variable and on the graph place d values along the vertical axis and (t2) along the horizontal axis, the relation should give a straight line, with a slope of just one-half the acceleration, a. .
Activity
1: Set up the air track, level it, and then place a block under one end to incline the track,
providing for a uniform glider acceleration.
2: Connect the signal line from the magnetic starter to input A of the timer. Move the right-hand
detector to the 10.0 cm position and connect its signal line to input B of the timer. Set the timer function to A Start - B Stop and range to 9.999 seconds. Make four time measurements. For each measurement place the glider in contact with the magnetic starter, press the red hold button, then start the air supply and let it run for one or two seconds before pressing the timer RESET button. Then press the black release button. After the glider has passes the B
M-3 Acceleration: (no speed) a = 2 d / t2 27
input detector, turn off the air supply.. Read and record the time. Make four measurements.
3: Move the detector at the 15.00 centimeter mark. Do this as carefully as possible, and make
sure the detector is not tilted to either side or can touch the glider as it passes through.. Make four time measurements. Repeat, each time moving the detector in 5.00 centimeter increments
until 0.55 meters.
4: Draw a neat graph of the gathered data. Place (t2) along the horizontal axis and d along the
vertical axis. Then draw a straight line that comes closest to the most number of graph points.
Measure the slope of this line. It should equal ½ a .If a computer is available, use the program
NO-SPEED. EXE to process the data and draw the graph
5: The graph line probably does not pass through the origin of coordinates! The reason is that
at time t=0 the glider was not at position d=0. The glider position is measured from the front
edge of the opaque strip on the glider. To determine the real d0 value at t=0, hold the glider
against the magnetic starter, and then move the detector back toward the magnetic starter until
the detector indicator just lights. The detector‟s position gives the Ivalue of d0. Compare this
with the value on your graph.
d0, on the track ____________ d0, on the graph ___________________
Looking Back:
You were measuring both distance and time. Which measurement seemed to be more precise? _______________________________________________________________
For each position measurement you made four time measurements and took the average. Would it help to take four position measurements for each time value? _____ _____________________________________________________________________
You moved the photo-detector and then read the timer. Could you select a time value and then find the corresponding position? Why or why not? ____________________ _______________________________________________________________________________
d meters T1 sec T2 sec T3 sec T4 sec Taverage (Taverage)
2
0.10
0.15
0.20
0.25
0.30
0.35
0.40
0.45
0.50
0.55
M-3 Acceleration: (no speed) a = 2 d / t2 28
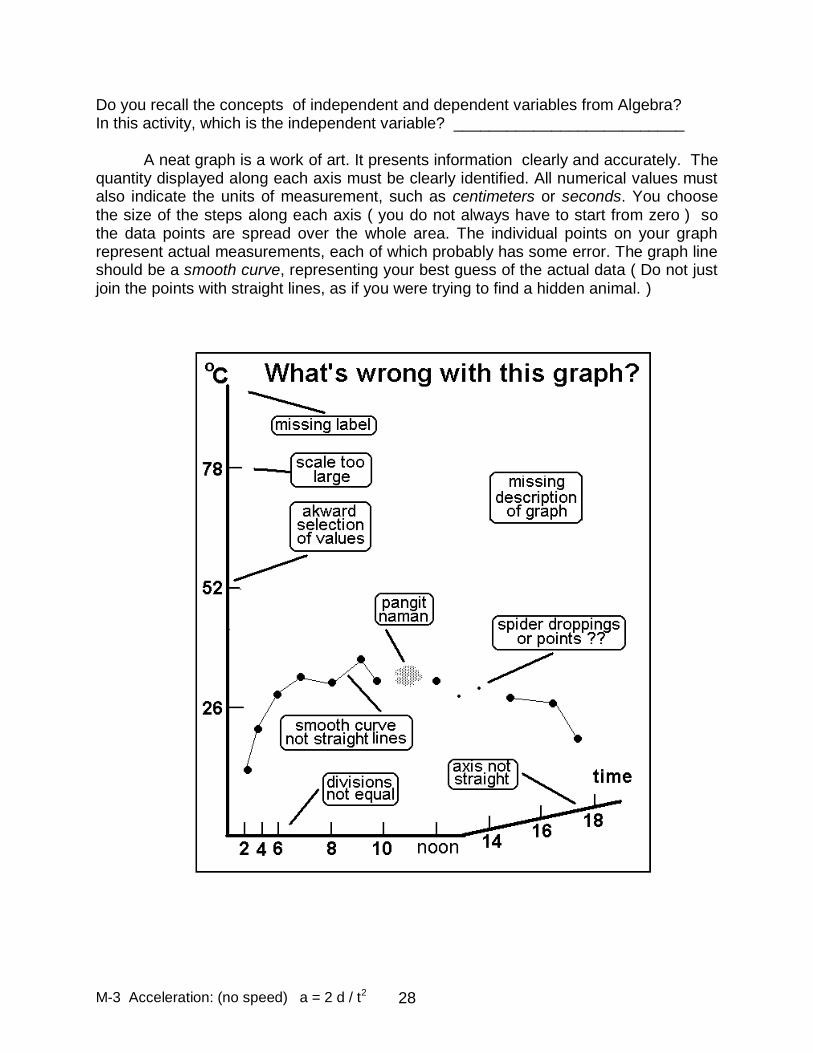
Do you recall the concepts of independent and dependent variables from Algebra? In this activity, which is the independent variable? __________________________ A neat graph is a work of art. It presents information clearly and accurately. The quantity displayed along each axis must be clearly identified. All numerical values must also indicate the units of measurement, such as centimeters or seconds. You choose the size of the steps along each axis ( you do not always have to start from zero ) so the data points are spread over the whole area. The individual points on your graph represent actual measurements, each of which probably has some error. The graph line should be a smooth curve, representing your best guess of the actual data ( Do not just join the points with straight lines, as if you were trying to find a hidden animal. )
M-4 Acceleration: a = ( V2 – V02 ) / 2d
29
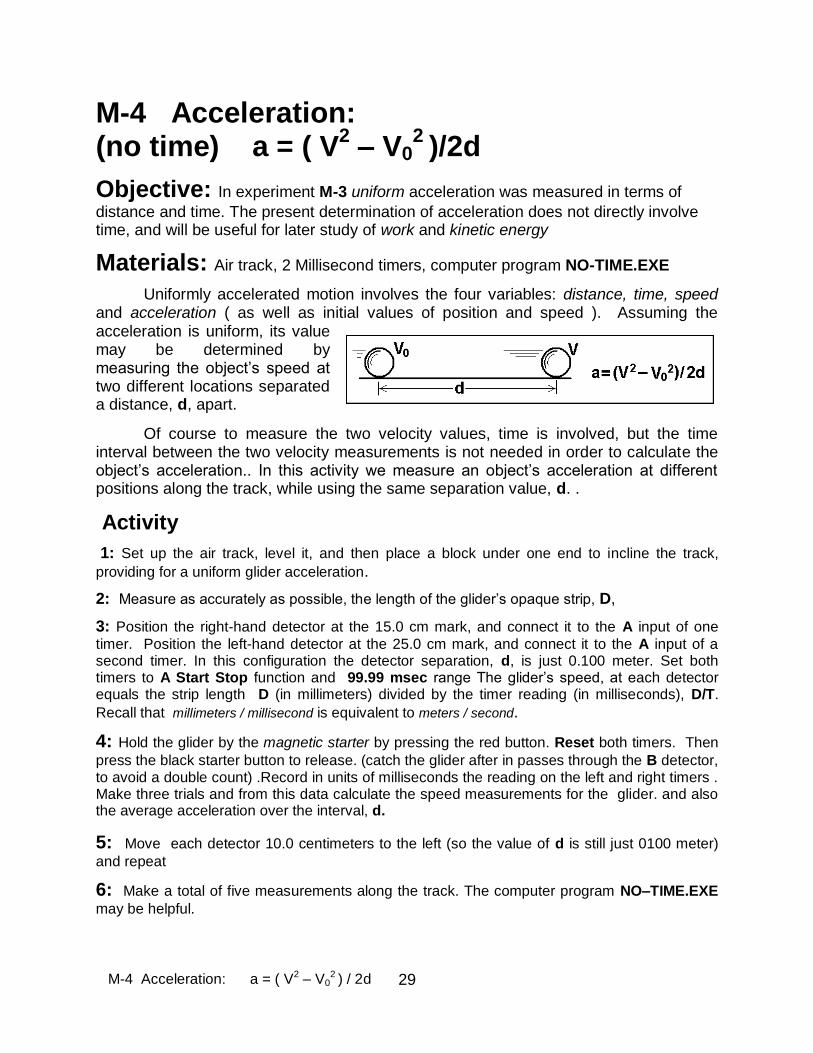
M-4 Acceleration: (no time) a = ( V
2 – V0
2 )/2d
Objective: In experiment M-3 uniform acceleration was measured in terms of
distance and time. The present determination of acceleration does not directly involve time, and will be useful for later study of work and kinetic energy
Materials: Air track, 2 Millisecond timers, computer program NO-TIME.EXE
Uniformly accelerated motion involves the four variables: distance, time, speed and acceleration ( as well as initial values of position and speed ). Assuming the acceleration is uniform, its value may be determined by measuring the object‟s speed at two different locations separated a distance, d, apart.
Of course to measure the two velocity values, time is involved, but the time interval between the two velocity measurements is not needed in order to calculate the object‟s acceleration.. In this activity we measure an object‟s acceleration at different positions along the track, while using the same separation value, d. .
Activity
1: Set up the air track, level it, and then place a block under one end to incline the track,
providing for a uniform glider acceleration.
2: Measure as accurately as possible, the length of the glider‟s opaque strip, D,
3: Position the right-hand detector at the 15.0 cm mark, and connect it to the A input of one
timer. Position the left-hand detector at the 25.0 cm mark, and connect it to the A input of a second timer. In this configuration the detector separation, d, is just 0.100 meter. Set both timers to A Start Stop function and 99.99 msec range The glider‟s speed, at each detector equals the strip length D (in millimeters) divided by the timer reading (in milliseconds), D/T.
Recall that millimeters / millisecond is equivalent to meters / second.
4: Hold the glider by the magnetic starter by pressing the red button. Reset both timers. Then
press the black starter button to release. (catch the glider after in passes through the B detector, to avoid a double count) .Record in units of milliseconds the reading on the left and right timers . Make three trials and from this data calculate the speed measurements for the glider. and also the average acceleration over the interval, d.
5: Move each detector 10.0 centimeters to the left (so the value of d is still just 0100 meter)
and repeat
6: Make a total of five measurements along the track. The computer program NO–TIME.EXE
may be helpful.
M-4 Acceleration: a = ( V2 – V02 ) / 2d
30
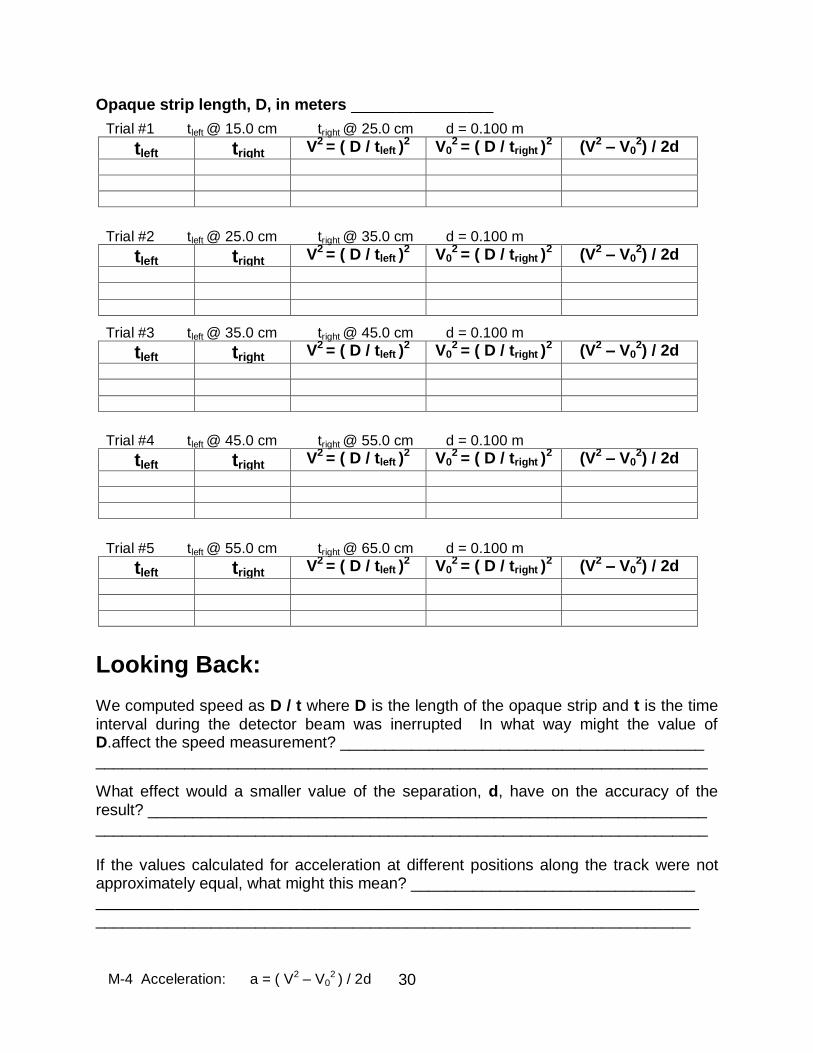
Opaque strip length, D, in meters ________________
Looking Back:
We computed speed as D / t where D is the length of the opaque strip and t is the time interval during the detector beam was inerrupted In what way might the value of D.affect the speed measurement? _________________________________________ _____________________________________________________________________
What effect would a smaller value of the separation, d, have on the accuracy of the result? _______________________________________________________________ _____________________________________________________________________ If the values calculated for acceleration at different positions along the track were not approximately equal, what might this mean? ________________________________ ____________________________________________________________________ ___________________________________________________________________
Trial #1 tleft @ 15.0 cm tright @ 25.0 cm d = 0.100 m
tleft tright V2 = ( D / tleft )2 V0
2 = ( D / tright )2 (V2 – V0
2) / 2d
Trial #2 tleft @ 25.0 cm tright @ 35.0 cm d = 0.100 m
tleft tright V2 = ( D / tleft )2 V0
2 = ( D / tright )2 (V2 – V0
2) / 2d
Trial #3 tleft @ 35.0 cm tright @ 45.0 cm d = 0.100 m
tleft tright V2 = ( D / tleft )2 V0
2 = ( D / tright )2 (V2 – V0
2) / 2d
Trial #4 tleft @ 45.0 cm tright @ 55.0 cm d = 0.100 m
tleft tright V2 = ( D / tleft )2 V0
2 = ( D / tright )2 (V2 – V0
2) / 2d
Trial #5 tleft @ 55.0 cm tright @ 65.0 cm d = 0.100 m
tleft tright V2 = ( D / tleft )2 V0
2 = ( D / tright )2 (V2 – V0
2) / 2d
M-5 Acceleration: a = (V–V0) / t 31
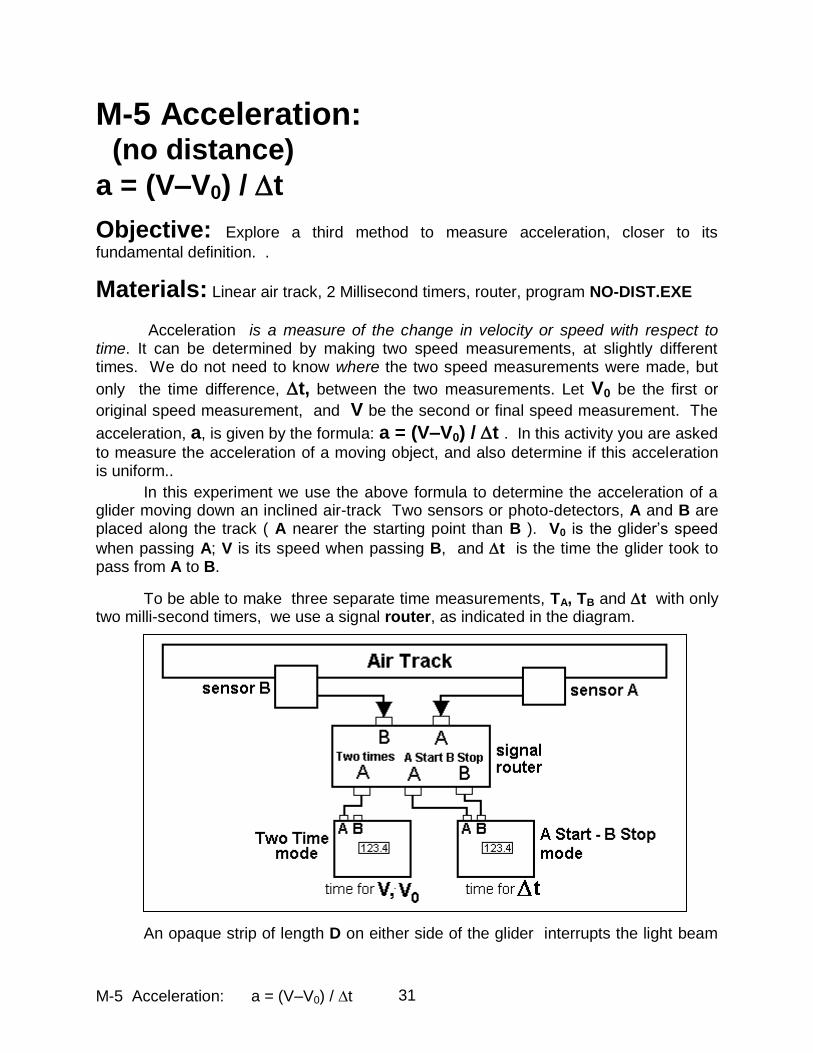
M-5 Acceleration: (no distance)
a = (V–V0) / t
Objective: Explore a third method to measure acceleration, closer to its
fundamental definition. .
Materials: Linear air track, 2 Millisecond timers, router, program NO-DIST.EXE
Acceleration is a measure of the change in velocity or speed with respect to time. It can be determined by making two speed measurements, at slightly different times. We do not need to know where the two speed measurements were made, but
only the time difference, t, between the two measurements. Let V0 be the first or
original speed measurement, and V be the second or final speed measurement. The
acceleration, a, is given by the formula: a = (V–V0) / t . In this activity you are asked
to measure the acceleration of a moving object, and also determine if this acceleration is uniform..
In this experiment we use the above formula to determine the acceleration of a glider moving down an inclined air-track Two sensors or photo-detectors, A and B are placed along the track ( A nearer the starting point than B ). V0 is the glider‟s speed
when passing A; V is its speed when passing B, and t is the time the glider took to pass from A to B.
To be able to make three separate time measurements, TA, TB and t with only two milli-second timers, we use a signal router, as indicated in the diagram.
An opaque strip of length D on either side of the glider interrupts the light beam
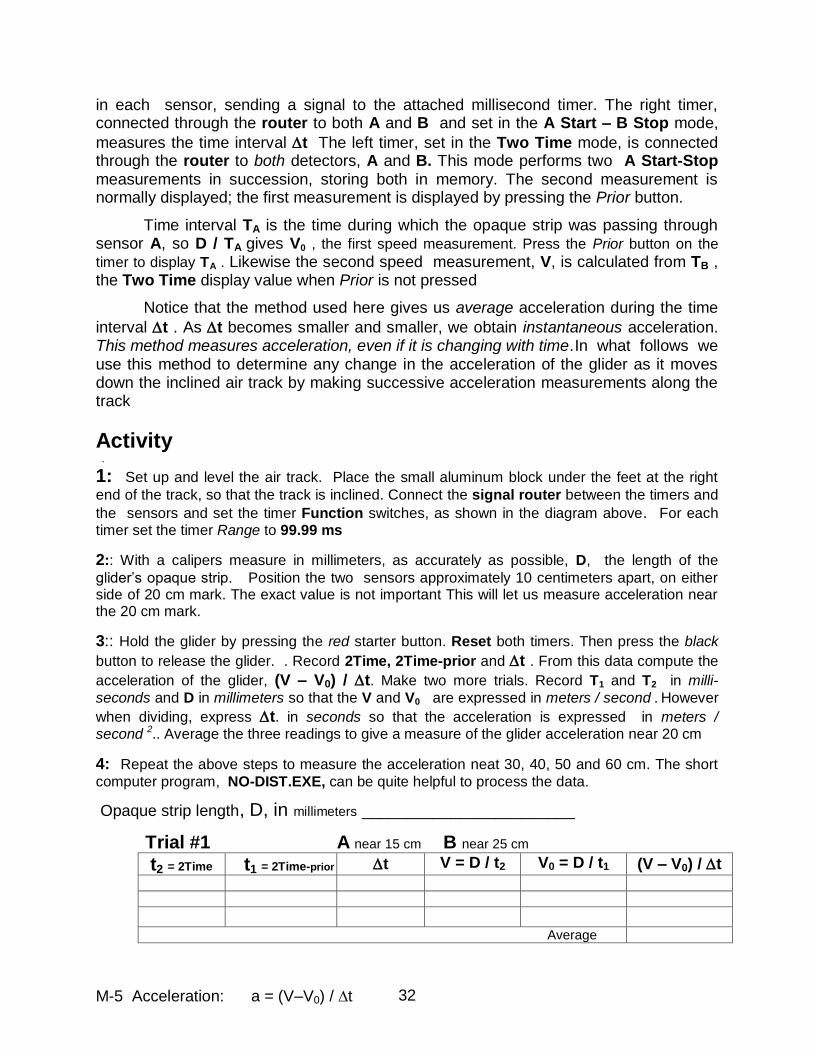
M-5 Acceleration: a = (V–V0) / t 32
in each sensor, sending a signal to the attached millisecond timer. The right timer, connected through the router to both A and B and set in the A Start – B Stop mode,
measures the time interval t The left timer, set in the Two Time mode, is connected through the router to both detectors, A and B. This mode performs two A Start-Stop measurements in succession, storing both in memory. The second measurement is normally displayed; the first measurement is displayed by pressing the Prior button.
Time interval TA is the time during which the opaque strip was passing through sensor A, so D / TA gives V0 , the first speed measurement. Press the Prior button on the
timer to display TA . Likewise the second speed measurement, V, is calculated from TB , the Two Time display value when Prior is not pressed
Notice that the method used here gives us average acceleration during the time
interval t . As t becomes smaller and smaller, we obtain instantaneous acceleration. This method measures acceleration, even if it is changing with time. In what follows we use this method to determine any change in the acceleration of the glider as it moves down the inclined air track by making successive acceleration measurements along the track
Activity .
1: Set up and level the air track. Place the small aluminum block under the feet at the right
end of the track, so that the track is inclined. Connect the signal router between the timers and
the sensors and set the timer Function switches, as shown in the diagram above. For each timer set the timer Range to 99.99 ms
2:: With a calipers measure in millimeters, as accurately as possible, D, the length of the
glider‟s opaque strip. Position the two sensors approximately 10 centimeters apart, on either side of 20 cm mark. The exact value is not important This will let us measure acceleration near the 20 cm mark.
3:: Hold the glider by pressing the red starter button. Reset both timers. Then press the black
button to release the glider. . Record 2Time, 2Time-prior and t . From this data compute the
acceleration of the glider, (V – V0) / t. Make two more trials. Record T1 and T2 in milli-
seconds and D in millimeters so that the V and V0 are expressed in meters / second . However
when dividing, express t. in seconds so that the acceleration is expressed in meters / second 2.. Average the three readings to give a measure of the glider acceleration near 20 cm
4: Repeat the above steps to measure the acceleration neat 30, 40, 50 and 60 cm. The short
computer program, NO-DIST.EXE, can be quite helpful to process the data.
Opaque strip length, D, in millimeters ________________________
Trial #1 A near 15 cm B near 25 cm
t2 = 2Time t1 = 2Time-prior t V = D / t2 V0 = D / t1 (V – V0) / t
Average
M-5 Acceleration: a = (V–V0) / t 33
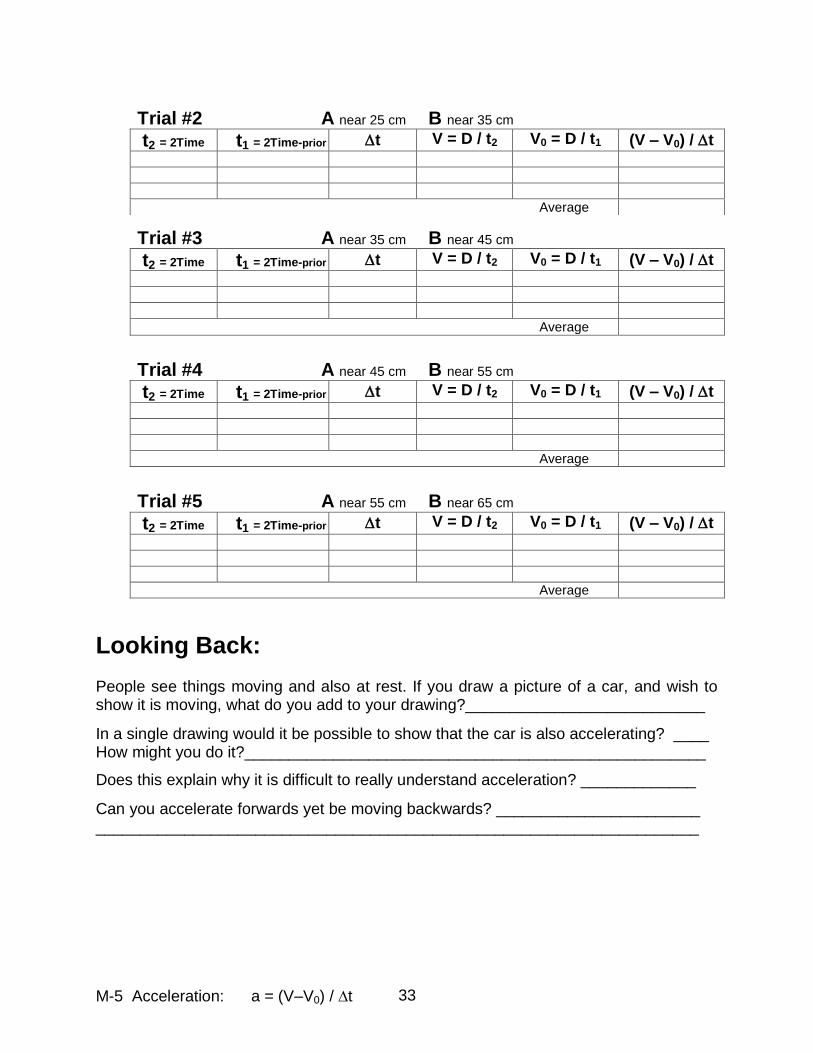
Looking Back: People see things moving and also at rest. If you draw a picture of a car, and wish to show it is moving, what do you add to your drawing?___________________________
In a single drawing would it be possible to show that the car is also accelerating? ____ How might you do it?____________________________________________________
Does this explain why it is difficult to really understand acceleration? _____________
Can you accelerate forwards yet be moving backwards? _______________________ ____________________________________________________________________
Trial #2 A near 25 cm B near 35 cm
t2 = 2Time t1 = 2Time-prior t V = D / t2 V0 = D / t1 (V – V0) / t
Average
Trial #3 A near 35 cm B near 45 cm
t2 = 2Time t1 = 2Time-prior t V = D / t2 V0 = D / t1 (V – V0) / t
Average
Trial #4 A near 45 cm B near 55 cm
t2 = 2Time t1 = 2Time-prior t V = D / t2 V0 = D / t1 (V – V0) / t
Average
Trial #5 A near 55 cm B near 65 cm
t2 = 2Time t1 = 2Time-prior t V = D / t2 V0 = D / t1 (V – V0) / t
Average
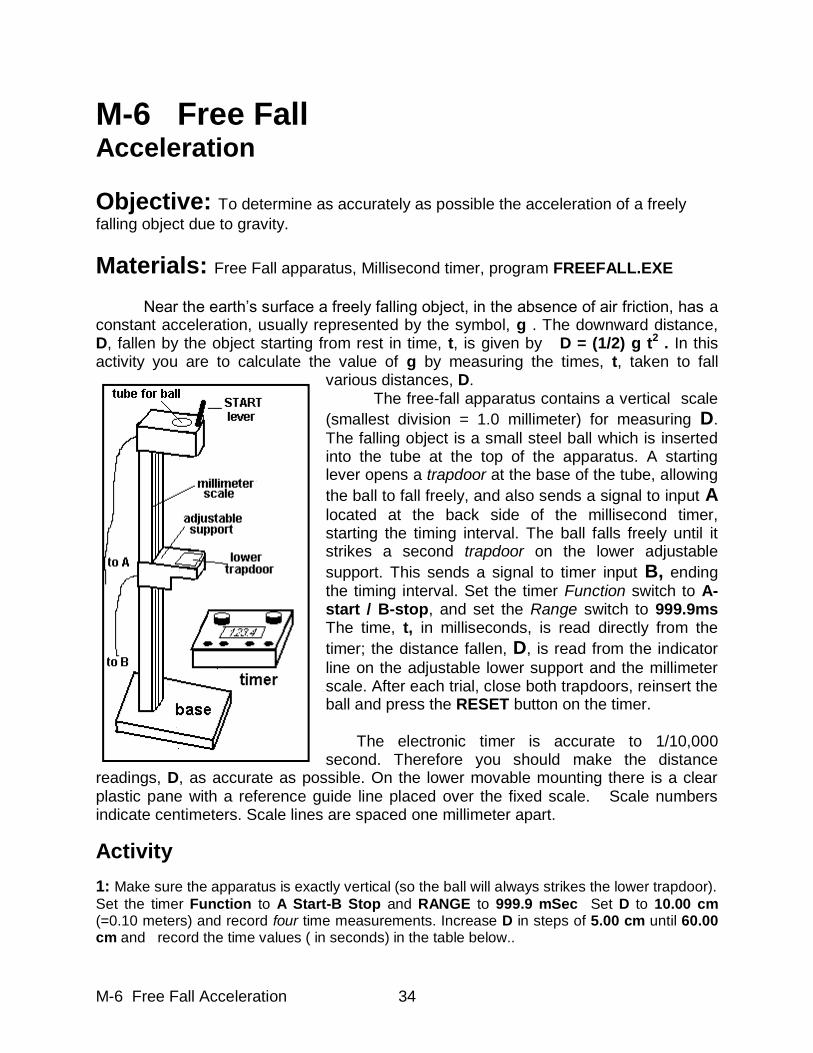
M-6 Free Fall Acceleration 34
M-6 Free Fall
Acceleration
Objective: To determine as accurately as possible the acceleration of a freely
falling object due to gravity.
Materials: Free Fall apparatus, Millisecond timer, program FREEFALL.EXE
Near the earth‟s surface a freely falling object, in the absence of air friction, has a constant acceleration, usually represented by the symbol, g . The downward distance, D, fallen by the object starting from rest in time, t, is given by D = (1/2) g t2 . In this activity you are to calculate the value of g by measuring the times, t, taken to fall
various distances, D. The free-fall apparatus contains a vertical scale
(smallest division = 1.0 millimeter) for measuring D.
The falling object is a small steel ball which is inserted into the tube at the top of the apparatus. A starting lever opens a trapdoor at the base of the tube, allowing
the ball to fall freely, and also sends a signal to input A
located at the back side of the millisecond timer, starting the timing interval. The ball falls freely until it strikes a second trapdoor on the lower adjustable
support. This sends a signal to timer input B, ending the timing interval. Set the timer Function switch to A-start / B-stop, and set the Range switch to 999.9ms The time, t, in milliseconds, is read directly from the
timer; the distance fallen, D, is read from the indicator
line on the adjustable lower support and the millimeter scale. After each trial, close both trapdoors, reinsert the ball and press the RESET button on the timer. The electronic timer is accurate to 1/10,000 second. Therefore you should make the distance
readings, D, as accurate as possible. On the lower movable mounting there is a clear plastic pane with a reference guide line placed over the fixed scale. Scale numbers indicate centimeters. Scale lines are spaced one millimeter apart.
Activity 1: Make sure the apparatus is exactly vertical (so the ball will always strikes the lower trapdoor).
Set the timer Function to A Start-B Stop and RANGE to 999.9 mSec Set D to 10.00 cm (=0.10 meters) and record four time measurements. Increase D in steps of 5.00 cm until 60.00 cm and record the time values ( in seconds) in the table below..
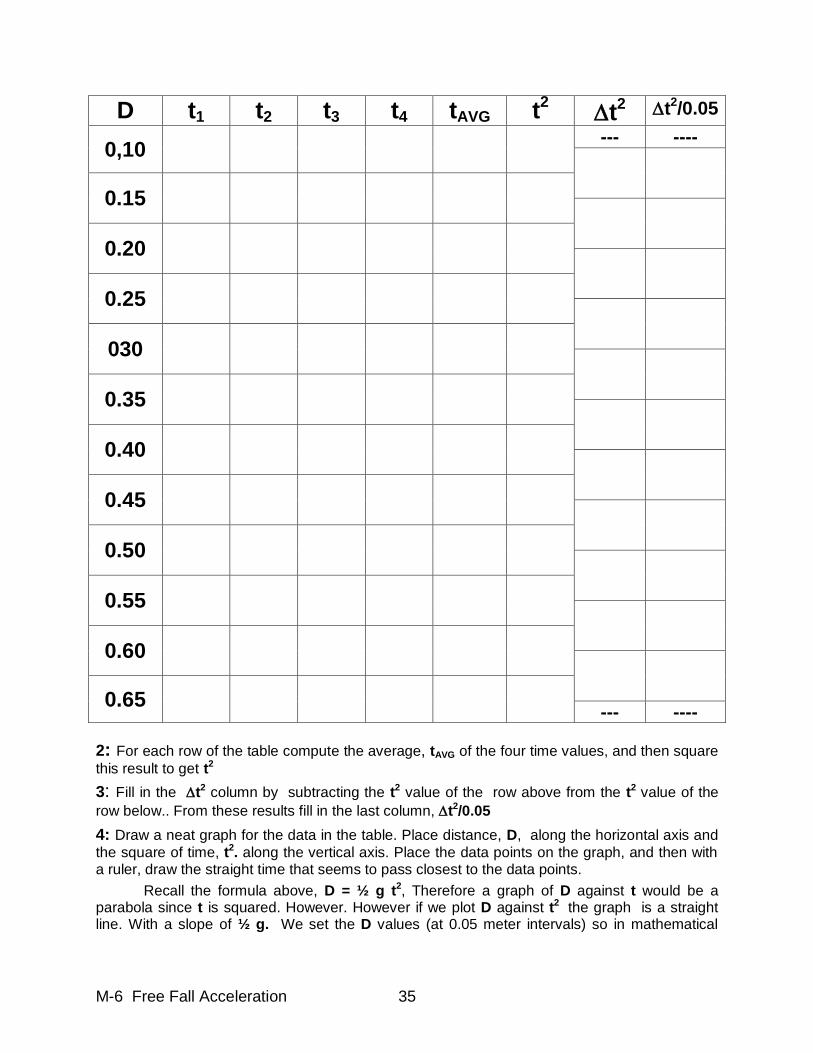
M-6 Free Fall Acceleration 35
D t1 t2 t3 t4 tAVG t2
t2 t
2/0.05
0,10 --- ----
0.15
0.20
0.25
030
0.35
0.40
0.45
0.50
0.55
0.60
0.65
--- ----
2: For each row of the table compute the average, tAVG of the four time values, and then square
this result to get t2
3: Fill in the t2 column by subtracting the t2 value of the row above from the t2 value of the
row below.. From these results fill in the last column, t2/0.05
4: Draw a neat graph for the data in the table. Place distance, D, along the horizontal axis and
the square of time, t2. along the vertical axis. Place the data points on the graph, and then with a ruler, draw the straight time that seems to pass closest to the data points.
Recall the formula above, D = ½ g t2, Therefore a graph of D against t would be a parabola since t is squared. However. However if we plot D against t2 the graph is a straight line. With a slope of ½ g. We set the D values (at 0.05 meter intervals) so in mathematical
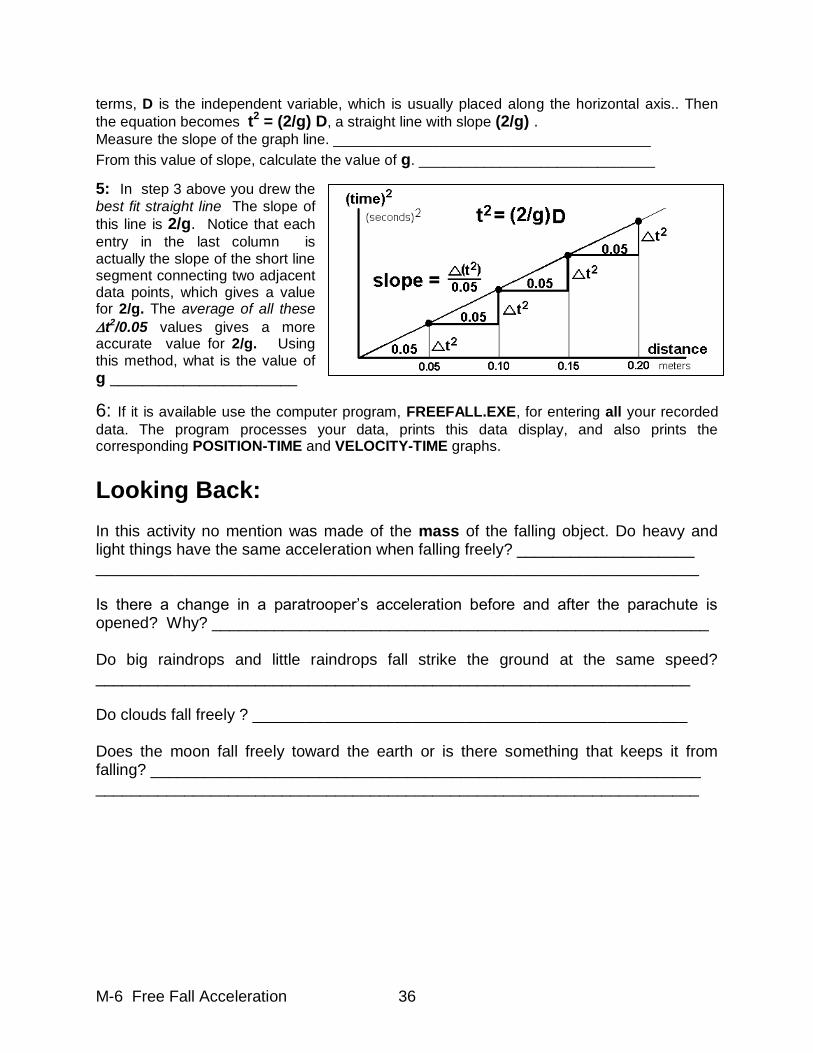
M-6 Free Fall Acceleration 36
terms, D is the independent variable, which is usually placed along the horizontal axis.. Then
the equation becomes t2 = (2/g) D, a straight line with slope (2/g) . Measure the slope of the graph line. _______________________________________
From this value of slope, calculate the value of g. _____________________________
5: In step 3 above you drew the
best fit straight line The slope of
this line is 2/g. Notice that each
entry in the last column is actually the slope of the short line segment connecting two adjacent data points, which gives a value for 2/g. The average of all these
t2/0.05 values gives a more accurate value for 2/g. Using this method, what is the value of
g _______________________
6: If it is available use the computer program, FREEFALL.EXE, for entering all your recorded
data. The program processes your data, prints this data display, and also prints the corresponding POSITION-TIME and VELOCITY-TIME graphs.
Looking Back:
In this activity no mention was made of the mass of the falling object. Do heavy and light things have the same acceleration when falling freely? ____________________ ____________________________________________________________________ Is there a change in a paratrooper‟s acceleration before and after the parachute is opened? Why? ________________________________________________________ Do big raindrops and little raindrops fall strike the ground at the same speed? ___________________________________________________________________ Do clouds fall freely ? _________________________________________________ Does the moon fall freely toward the earth or is there something that keeps it from falling? ______________________________________________________________ ____________________________________________________________________
M-7 Projectile Motion 37
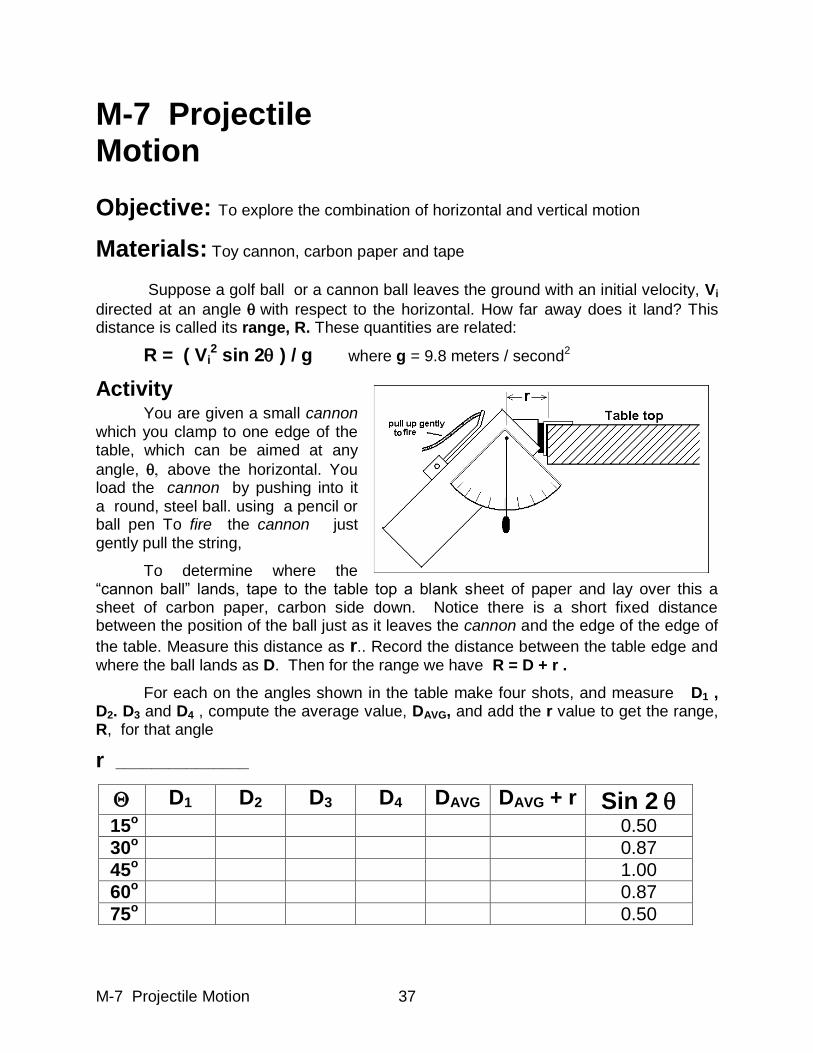
M-7 Projectile
Motion
Objective: To explore the combination of horizontal and vertical motion
Materials: Toy cannon, carbon paper and tape
Suppose a golf ball or a cannon ball leaves the ground with an initial velocity, Vi
directed at an angle with respect to the horizontal. How far away does it land? This distance is called its range, R. These quantities are related:
R = ( Vi2 sin 2 ) / g where g = 9.8 meters / second2
Activity
You are given a small cannon which you clamp to one edge of the table, which can be aimed at any
angle, above the horizontal. You load the cannon by pushing into it a round, steel ball. using a pencil or ball pen To fire the cannon just gently pull the string,
To determine where the “cannon ball” lands, tape to the table top a blank sheet of paper and lay over this a sheet of carbon paper, carbon side down. Notice there is a short fixed distance between the position of the ball just as it leaves the cannon and the edge of the edge of
the table. Measure this distance as r.. Record the distance between the table edge and where the ball lands as D. Then for the range we have R = D + r .
For each on the angles shown in the table make four shots, and measure D1 , D2. D3 and D4 , compute the average value, DAVG, and add the r value to get the range, R, for that angle
r _______________
D1 D2 D3 D4 DAVG DAVG + r Sin 2 15
o 0.50
30o
0.87
45o
1.00
60o
0.87
75o
0.50
M-7 Projectile Motion 38
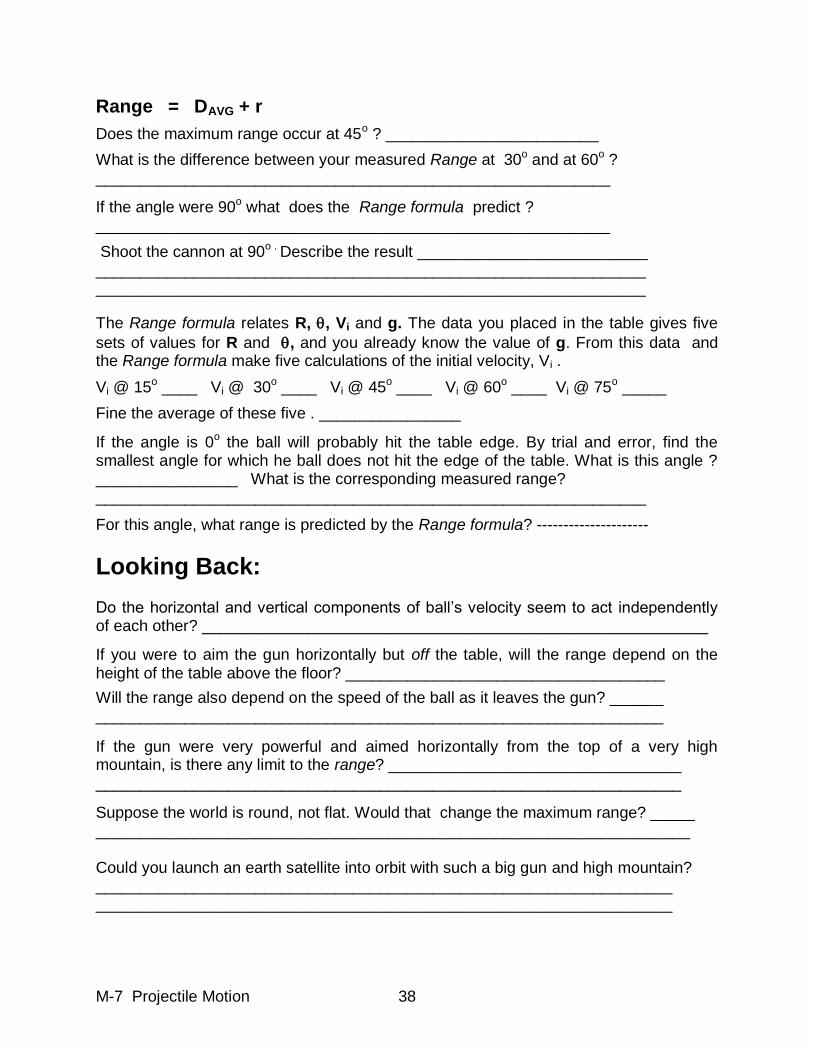
Range = DAVG + r
Does the maximum range occur at 45o ? ________________________
What is the difference between your measured Range at 30o and at 60o ? __________________________________________________________
If the angle were 90o what does the Range formula predict ?
__________________________________________________________
Shoot the cannon at 90o . Describe the result __________________________ ______________________________________________________________ ______________________________________________________________
The Range formula relates R, , Vi and g. The data you placed in the table gives five
sets of values for R and , and you already know the value of g. From this data and the Range formula make five calculations of the initial velocity, Vi .
Vi @ 15o ____ Vi @ 30o ____ Vi @ 45o ____ Vi @ 60o ____ Vi @ 75o _____
Fine the average of these five . ________________
If the angle is 0o the ball will probably hit the table edge. By trial and error, find the smallest angle for which he ball does not hit the edge of the table. What is this angle ? ________________ What is the corresponding measured range? ______________________________________________________________
For this angle, what range is predicted by the Range formula? ---------------------
Looking Back: Do the horizontal and vertical components of ball‟s velocity seem to act independently of each other? _________________________________________________________
If you were to aim the gun horizontally but off the table, will the range depend on the height of the table above the floor? ____________________________________
Will the range also depend on the speed of the ball as it leaves the gun? ______ ________________________________________________________________
If the gun were very powerful and aimed horizontally from the top of a very high mountain, is there any limit to the range? _________________________________ __________________________________________________________________
Suppose the world is round, not flat. Would that change the maximum range? _____ ___________________________________________________________________ Could you launch an earth satellite into orbit with such a big gun and high mountain? _________________________________________________________________ _________________________________________________________________
39
3: Force What causes a moving object to go faster or slower, this way or that? Must we push or pull an object to change the way it moves? Will the same push on a moving ping-pong ball or bowling ball produce the same change in motion? Trying to answer such questions leads to the concepts of force and the related concepts of mass and energy. These ideas are explored in the following experiments:
F-1 Ring in Equilibrium F-2 Equilibrium F-3 Newton‟s 2
nd Law: Constant Mass
F-4 Newton‟s 2
nd Law: Constant Force
F-5 Gravitational Potential Energy to Kinetic Energy Notes on Centripetal Acceleration and Simple Harmonic Motion F-6: Springs F-7: Simple Harmonic Motion: Mass and Spring F-8: Simple Harmonic Motion: Simple Pendulum
F1 Ring in Equilibrium 40
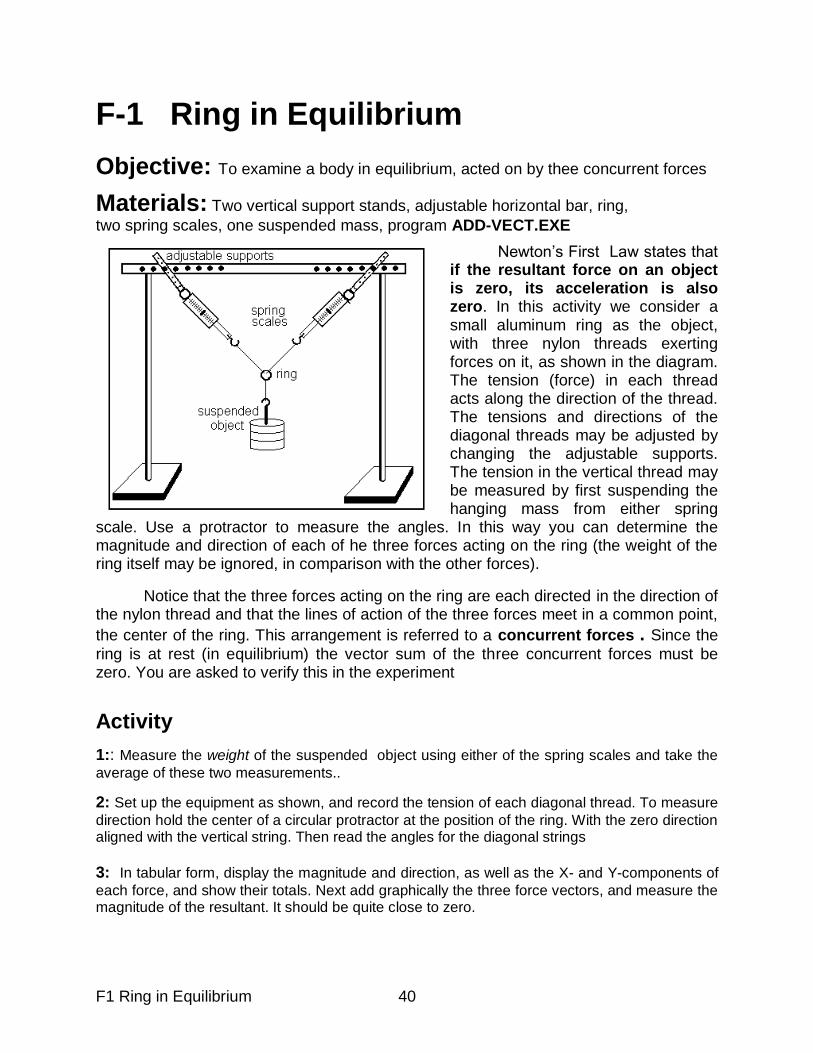
F-1 Ring in Equilibrium
Objective: To examine a body in equilibrium, acted on by thee concurrent forces
Materials: Two vertical support stands, adjustable horizontal bar, ring,
two spring scales, one suspended mass, program ADD-VECT.EXE
Newton‟s First Law states that if the resultant force on an object is zero, its acceleration is also zero. In this activity we consider a small aluminum ring as the object, with three nylon threads exerting forces on it, as shown in the diagram. The tension (force) in each thread acts along the direction of the thread. The tensions and directions of the diagonal threads may be adjusted by changing the adjustable supports. The tension in the vertical thread may be measured by first suspending the hanging mass from either spring
scale. Use a protractor to measure the angles. In this way you can determine the magnitude and direction of each of he three forces acting on the ring (the weight of the ring itself may be ignored, in comparison with the other forces).
Notice that the three forces acting on the ring are each directed in the direction of the nylon thread and that the lines of action of the three forces meet in a common point,
the center of the ring. This arrangement is referred to a concurrent forces . Since the
ring is at rest (in equilibrium) the vector sum of the three concurrent forces must be zero. You are asked to verify this in the experiment
Activity
1:: Measure the weight of the suspended object using either of the spring scales and take the
average of these two measurements..
2: Set up the equipment as shown, and record the tension of each diagonal thread. To measure
direction hold the center of a circular protractor at the position of the ring. With the zero direction aligned with the vertical string. Then read the angles for the diagonal strings
3: In tabular form, display the magnitude and direction, as well as the X- and Y-components of
each force, and show their totals. Next add graphically the three force vectors, and measure the magnitude of the resultant. It should be quite close to zero.
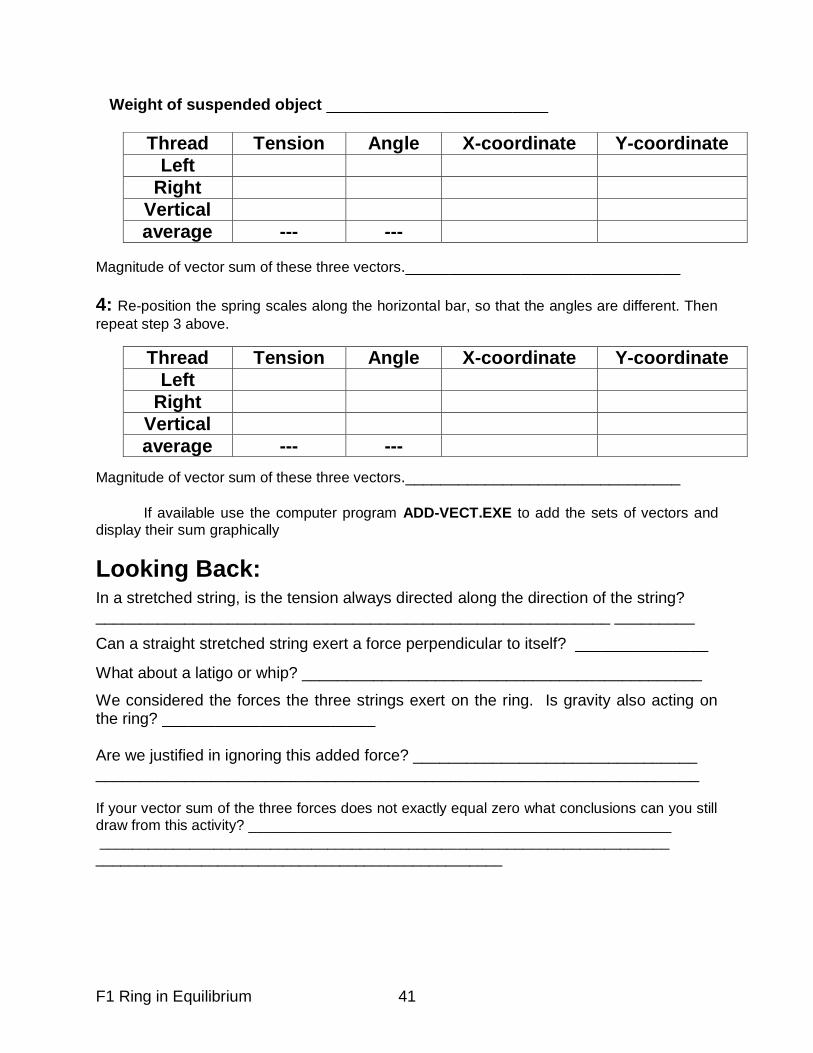
F1 Ring in Equilibrium 41
Weight of suspended object _________________________
Magnitude of vector sum of these three vectors._______________________________
4: Re-position the spring scales along the horizontal bar, so that the angles are different. Then
repeat step 3 above.
Magnitude of vector sum of these three vectors._______________________________ If available use the computer program ADD-VECT.EXE to add the sets of vectors and display their sum graphically
Looking Back:
In a stretched string, is the tension always directed along the direction of the string? __________________________________________________________ _________
Can a straight stretched string exert a force perpendicular to itself? _______________
What about a latigo or whip? _____________________________________________
We considered the forces the three strings exert on the ring. Is gravity also acting on the ring? ________________________ Are we justified in ignoring this added force? ________________________________ ____________________________________________________________________ If your vector sum of the three forces does not exactly equal zero what conclusions can you still draw from this activity? ____________________________________________________ ______________________________________________________________________ __________________________________________________
Thread Tension Angle X-coordinate Y-coordinate
Left
Right
Vertical
average --- ---
Thread Tension Angle X-coordinate Y-coordinate
Left
Right
Vertical
average --- ---
F-2 Equilibrium 42
F-2 Equilibrium
Objective: To explore with real objects the conditions for equilibrium
Materials: Vertical iron stands, horizontal cross bar, 2 spring scales,
2 suspended masses, equilibrium bar For an object to be in equilibrium, two conditions must be satisfied:
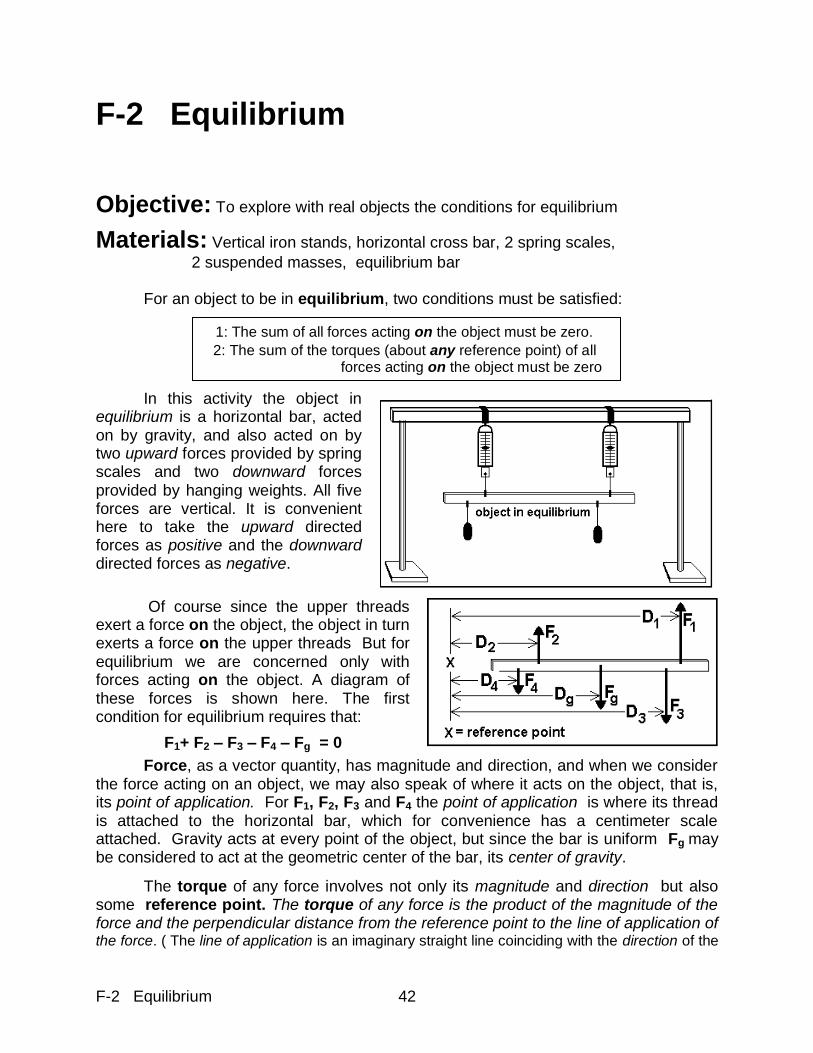
In this activity the object in equilibrium is a horizontal bar, acted on by gravity, and also acted on by two upward forces provided by spring scales and two downward forces provided by hanging weights. All five forces are vertical. It is convenient here to take the upward directed forces as positive and the downward directed forces as negative.
Of course since the upper threads exert a force on the object, the object in turn exerts a force on the upper threads But for equilibrium we are concerned only with forces acting on the object. A diagram of these forces is shown here. The first condition for equilibrium requires that:
F1+ F2 – F3 – F4 – Fg = 0
Force, as a vector quantity, has magnitude and direction, and when we consider the force acting on an object, we may also speak of where it acts on the object, that is, its point of application. For F1, F2, F3 and F4 the point of application is where its thread is attached to the horizontal bar, which for convenience has a centimeter scale attached. Gravity acts at every point of the object, but since the bar is uniform Fg may be considered to act at the geometric center of the bar, its center of gravity.
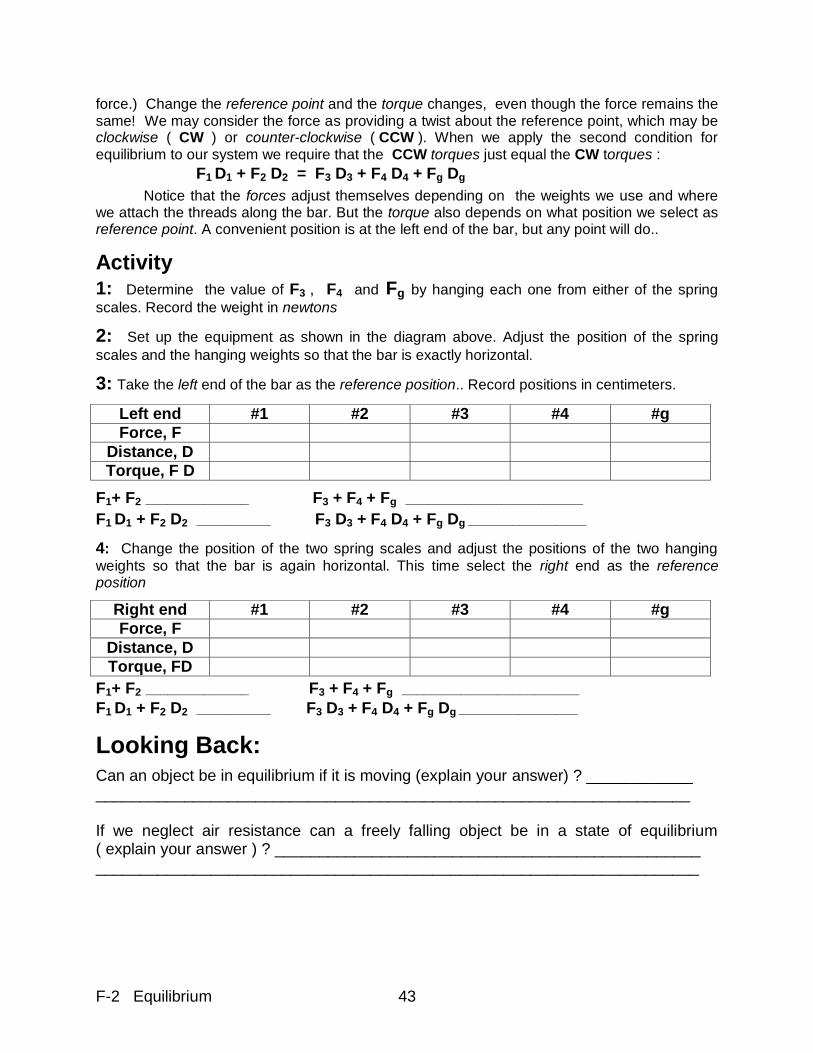
The torque of any force involves not only its magnitude and direction but also some reference point. The torque of any force is the product of the magnitude of the force and the perpendicular distance from the reference point to the line of application of the force. ( The line of application is an imaginary straight line coinciding with the direction of the
1: The sum of all forces acting on the object must be zero.
2: The sum of the torques (about any reference point) of all forces acting on the object must be zero
F-2 Equilibrium 43
force.) Change the reference point and the torque changes, even though the force remains the same! We may consider the force as providing a twist about the reference point, which may be clockwise ( CW ) or counter-clockwise ( CCW ). When we apply the second condition for equilibrium to our system we require that the CCW torques just equal the CW torques :
F1 D1 + F2 D2 = F3 D3 + F4 D4 + Fg Dg
Notice that the forces adjust themselves depending on the weights we use and where we attach the threads along the bar. But the torque also depends on what position we select as reference point. A convenient position is at the left end of the bar, but any point will do..
Activity
1: Determine the value of F3 , F4 and Fg by hanging each one from either of the spring
scales. Record the weight in newtons
2: Set up the equipment as shown in the diagram above. Adjust the position of the spring
scales and the hanging weights so that the bar is exactly horizontal.
3: Take the left end of the bar as the reference position.. Record positions in centimeters.
F1+ F2 ______________ F3 + F4 + Fg ________________________
F1 D1 + F2 D2 __________ F3 D3 + F4 D4 + Fg Dg ________________
4: Change the position of the two spring scales and adjust the positions of the two hanging
weights so that the bar is again horizontal. This time select the right end as the reference position
F1+ F2 ______________ F3 + F4 + Fg ________________________
F1 D1 + F2 D2 __________ F3 D3 + F4 D4 + Fg Dg ________________
Looking Back:
Can an object be in equilibrium if it is moving (explain your answer) ? ____________ ___________________________________________________________________ If we neglect air resistance can a freely falling object be in a state of equilibrium ( explain your answer ) ? ________________________________________________ ____________________________________________________________________
Left end #1 #2 #3 #4 #g
Force, F
Distance, D
Torque, F D
Right end #1 #2 #3 #4 #g
Force, F
Distance, D
Torque, FD
44 F-3 Newton‟s 2nd Law: Constant Mass
F-3 Newton‟s 2nd
Law: Constant Mass
Objective: Newton‟s 2nd Law relates resultant force, mass and acceleration. In
this activity we hold mass constant. and verify the linear relation between resultant force and acceleration
Materials: Linear air track, Millisecond timer, program NT2-MASS.EXE .
Newton‟s second law may be stated as The resultant force, F, acting on an object of mass M produces an acceleration, A, such that F = M A . This relation is fundamental to the understanding of all dynamics. In this activity we consider the case of constant mass, so the acceleration should be directly proportional to the resultant force, F. In another activity we consider the case of constant resultant force, in which we expect the acceleration to be inversely proportional to the total mass
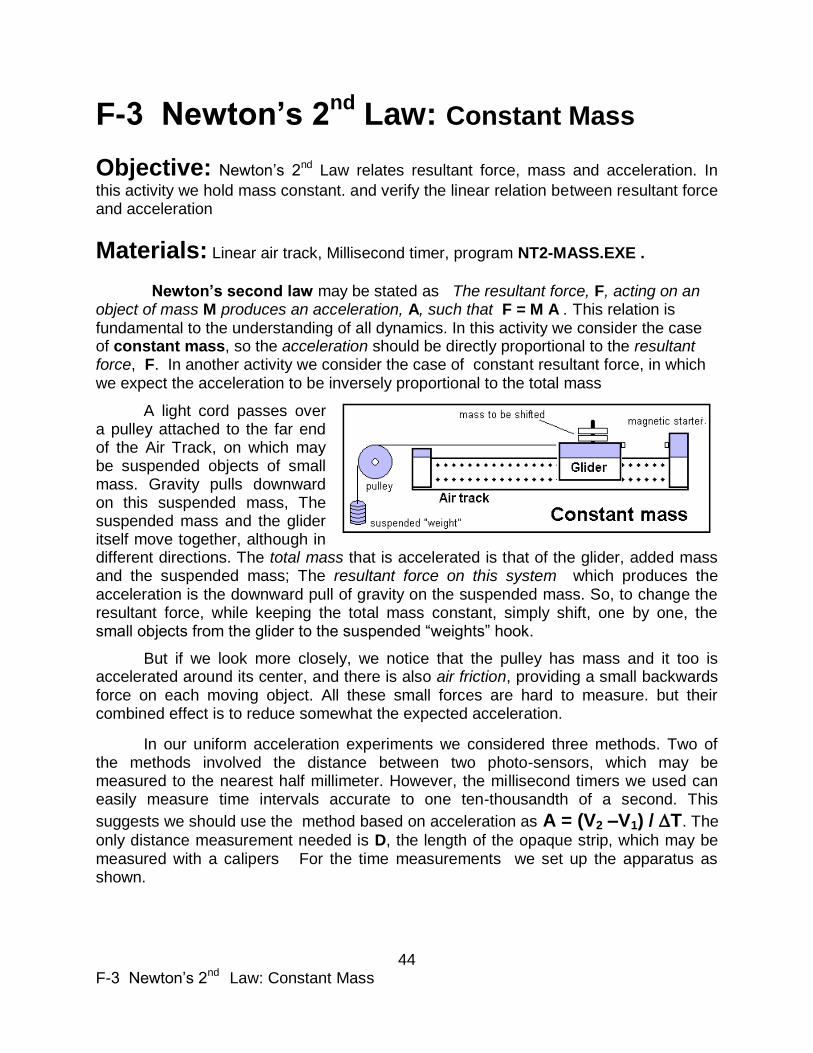
A light cord passes over a pulley attached to the far end of the Air Track, on which may be suspended objects of small mass. Gravity pulls downward on this suspended mass, The suspended mass and the glider itself move together, although in different directions. The total mass that is accelerated is that of the glider, added mass and the suspended mass; The resultant force on this system which produces the acceleration is the downward pull of gravity on the suspended mass. So, to change the resultant force, while keeping the total mass constant, simply shift, one by one, the small objects from the glider to the suspended “weights” hook.
But if we look more closely, we notice that the pulley has mass and it too is accelerated around its center, and there is also air friction, providing a small backwards force on each moving object. All these small forces are hard to measure. but their combined effect is to reduce somewhat the expected acceleration.
In our uniform acceleration experiments we considered three methods. Two of the methods involved the distance between two photo-sensors, which may be measured to the nearest half millimeter. However, the millisecond timers we used can easily measure time intervals accurate to one ten-thousandth of a second. This
suggests we should use the method based on acceleration as A = (V2 –V1) / T. The
only distance measurement needed is D, the length of the opaque strip, which may be measured with a calipers For the time measurements we set up the apparatus as shown.
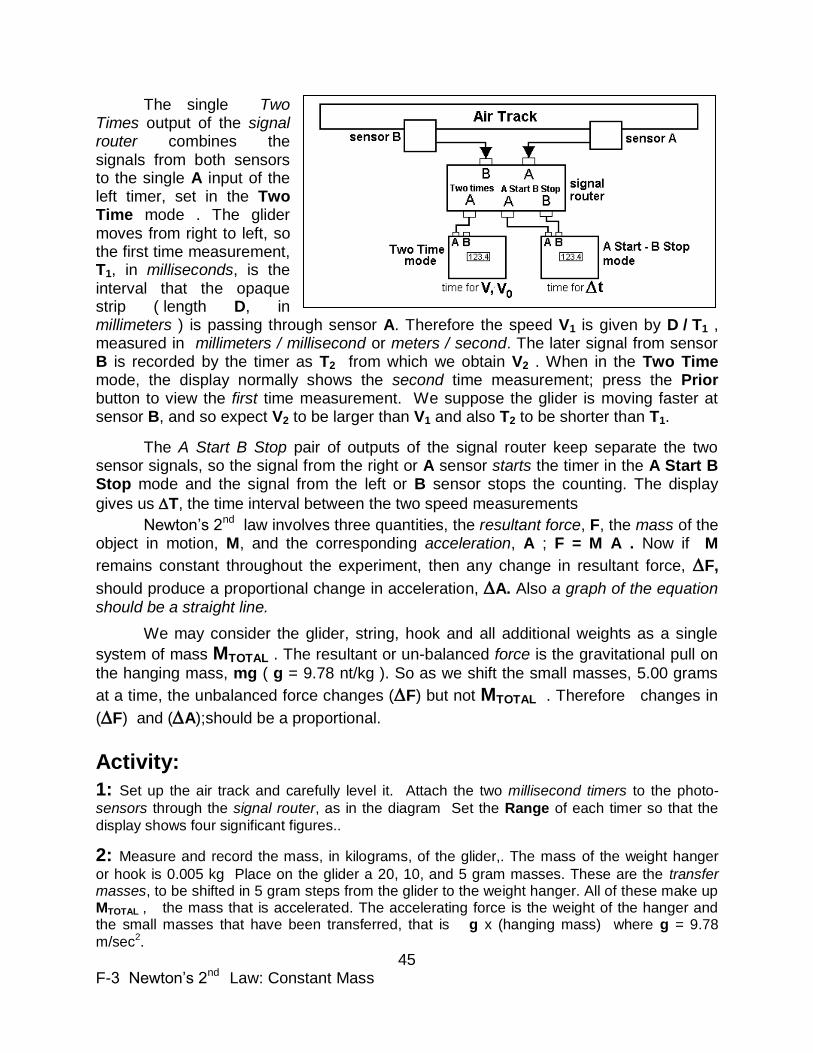
45 F-3 Newton‟s 2nd Law: Constant Mass
The single Two Times output of the signal router combines the signals from both sensors to the single A input of the left timer, set in the Two Time mode . The glider moves from right to left, so the first time measurement, T1, in milliseconds, is the interval that the opaque strip ( length D, in millimeters ) is passing through sensor A. Therefore the speed V1 is given by D / T1 , measured in millimeters / millisecond or meters / second. The later signal from sensor B is recorded by the timer as T2 from which we obtain V2 . When in the Two Time mode, the display normally shows the second time measurement; press the Prior button to view the first time measurement. We suppose the glider is moving faster at sensor B, and so expect V2 to be larger than V1 and also T2 to be shorter than T1.
The A Start B Stop pair of outputs of the signal router keep separate the two sensor signals, so the signal from the right or A sensor starts the timer in the A Start B Stop mode and the signal from the left or B sensor stops the counting. The display
gives us T, the time interval between the two speed measurements
Newton‟s 2nd law involves three quantities, the resultant force, F, the mass of the object in motion, M, and the corresponding acceleration, A ; F = M A . Now if M
remains constant throughout the experiment, then any change in resultant force, F,
should produce a proportional change in acceleration, A. Also a graph of the equation should be a straight line.
We may consider the glider, string, hook and all additional weights as a single
system of mass MTOTAL . The resultant or un-balanced force is the gravitational pull on
the hanging mass, mg ( g = 9.78 nt/kg ). So as we shift the small masses, 5.00 grams
at a time, the unbalanced force changes (F) but not MTOTAL . Therefore changes in
(F) and (A);should be a proportional.
Activity:
1: Set up the air track and carefully level it. Attach the two millisecond timers to the photo-
sensors through the signal router, as in the diagram Set the Range of each timer so that the
display shows four significant figures..
2: Measure and record the mass, in kilograms, of the glider,. The mass of the weight hanger
or hook is 0.005 kg Place on the glider a 20, 10, and 5 gram masses. These are the transfer masses, to be shifted in 5 gram steps from the glider to the weight hanger. All of these make up MTOTAL , the mass that is accelerated. The accelerating force is the weight of the hanger and the small masses that have been transferred, that is g x (hanging mass) where g = 9.78
m/sec2.
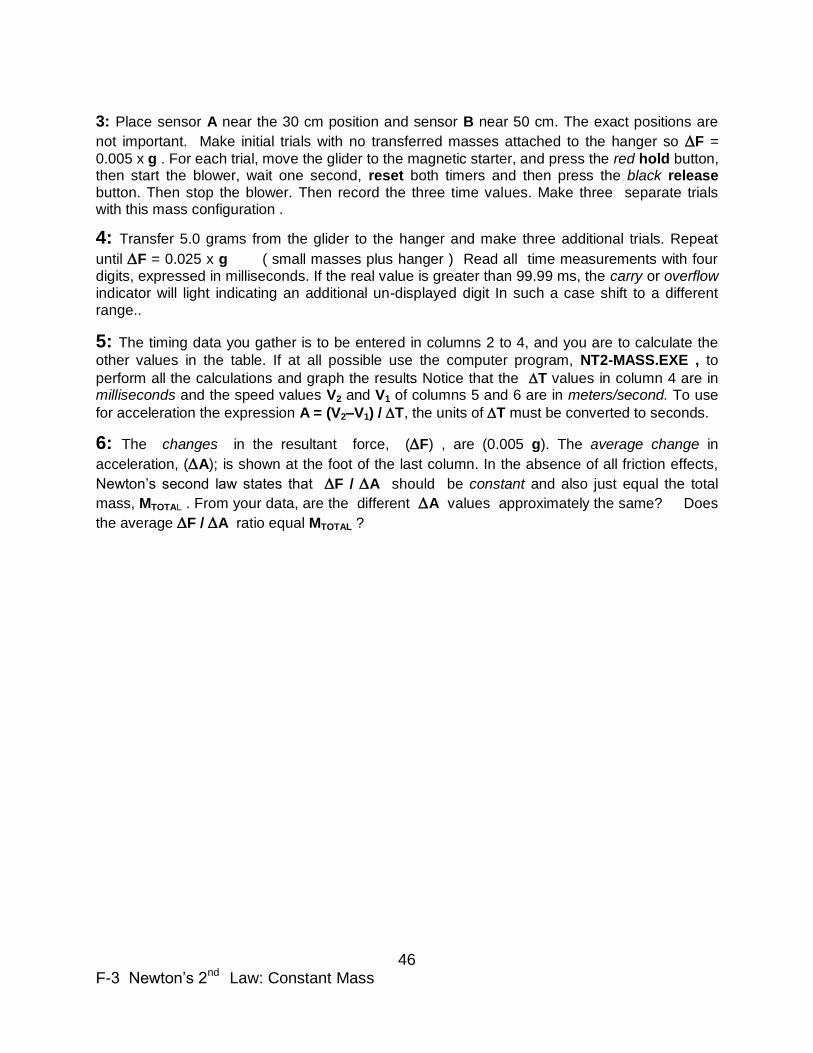
46 F-3 Newton‟s 2nd Law: Constant Mass
3: Place sensor A near the 30 cm position and sensor B near 50 cm. The exact positions are
not important. Make initial trials with no transferred masses attached to the hanger so F =
0.005 x g . For each trial, move the glider to the magnetic starter, and press the red hold button, then start the blower, wait one second, reset both timers and then press the black release button. Then stop the blower. Then record the three time values. Make three separate trials with this mass configuration .
4: Transfer 5.0 grams from the glider to the hanger and make three additional trials. Repeat
until F = 0.025 x g ( small masses plus hanger ) Read all time measurements with four digits, expressed in milliseconds. If the real value is greater than 99.99 ms, the carry or overflow indicator will light indicating an additional un-displayed digit In such a case shift to a different range..
5: The timing data you gather is to be entered in columns 2 to 4, and you are to calculate the
other values in the table. If at all possible use the computer program, NT2-MASS.EXE , to
perform all the calculations and graph the results Notice that the T values in column 4 are in milliseconds and the speed values V2 and V1 of columns 5 and 6 are in meters/second. To use
for acceleration the expression A = (V2–V1) /T, the units of T must be converted to seconds.
6: The changes in the resultant force, (F) , are (0.005 g). The average change in
acceleration, (A); is shown at the foot of the last column. In the absence of all friction effects,
Newton‟s second law states that F / A should be constant and also just equal the total
mass, MTOTAL . From your data, are the different A values approximately the same? Does
the average F / A ratio equal MTOTAL ?

47 F-3 Newton‟s 2nd Law: Constant Mass
F=(0.005 g) ______________ Average A ________________
MTOTAL ________________ F / A _____________________
Looking Back: Do your results indicate that acceleration is proportional to resultant force? _____
Is the motion of the glider on the air track completely frictionless? _______________ ___________________________________________________________________
If there were no friction would a moving glider ever come to rest? _______________ ___________________________________________________________________
Does planet Earth experience any friction forces as it moves along its orbit about the sun, or spins on its axis? ________________________________________________ ____________________________________________________________________
grams
T2 millisec
T1
millisec
T millisec
V2 m/sec
V1 m/sec Accel
m/sec2
Average Accel
Avg Accel
5
5
5
10
10
10
15
15
15
20
20
20
25
25
25
Average change in acceleration
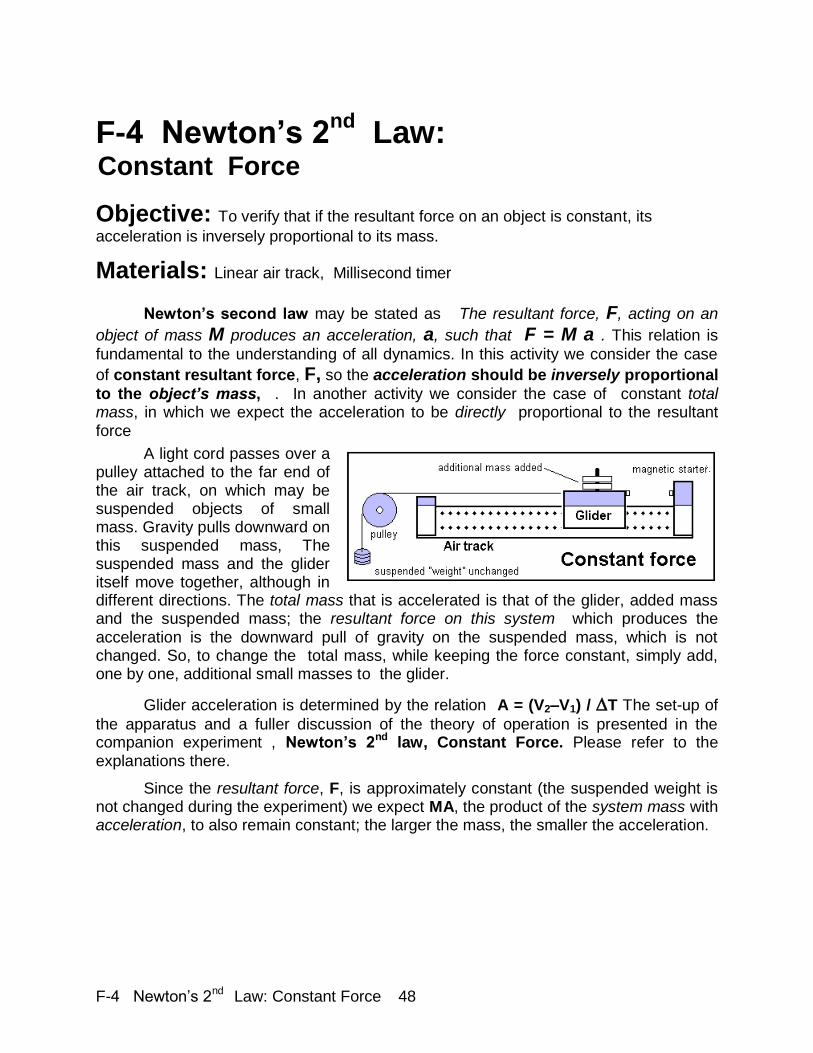
F-4 Newton‟s 2nd Law: Constant Force 48
F-4 Newton‟s 2nd
Law:
Constant Force
Objective: To verify that if the resultant force on an object is constant, its
acceleration is inversely proportional to its mass.
Materials: Linear air track, Millisecond timer
Newton‟s second law may be stated as The resultant force, F, acting on an
object of mass M produces an acceleration, a, such that F = M a . This relation is
fundamental to the understanding of all dynamics. In this activity we consider the case
of constant resultant force, F, so the acceleration should be inversely proportional
to the object’s mass, . In another activity we consider the case of constant total mass, in which we expect the acceleration to be directly proportional to the resultant force
A light cord passes over a pulley attached to the far end of the air track, on which may be suspended objects of small mass. Gravity pulls downward on this suspended mass, The suspended mass and the glider itself move together, although in different directions. The total mass that is accelerated is that of the glider, added mass and the suspended mass; the resultant force on this system which produces the acceleration is the downward pull of gravity on the suspended mass, which is not changed. So, to change the total mass, while keeping the force constant, simply add, one by one, additional small masses to the glider.
Glider acceleration is determined by the relation A = (V2–V1) / T The set-up of
the apparatus and a fuller discussion of the theory of operation is presented in the companion experiment , Newton‟s 2nd law, Constant Force. Please refer to the explanations there.
Since the resultant force, F, is approximately constant (the suspended weight is not changed during the experiment) we expect MA, the product of the system mass with acceleration, to also remain constant; the larger the mass, the smaller the acceleration.
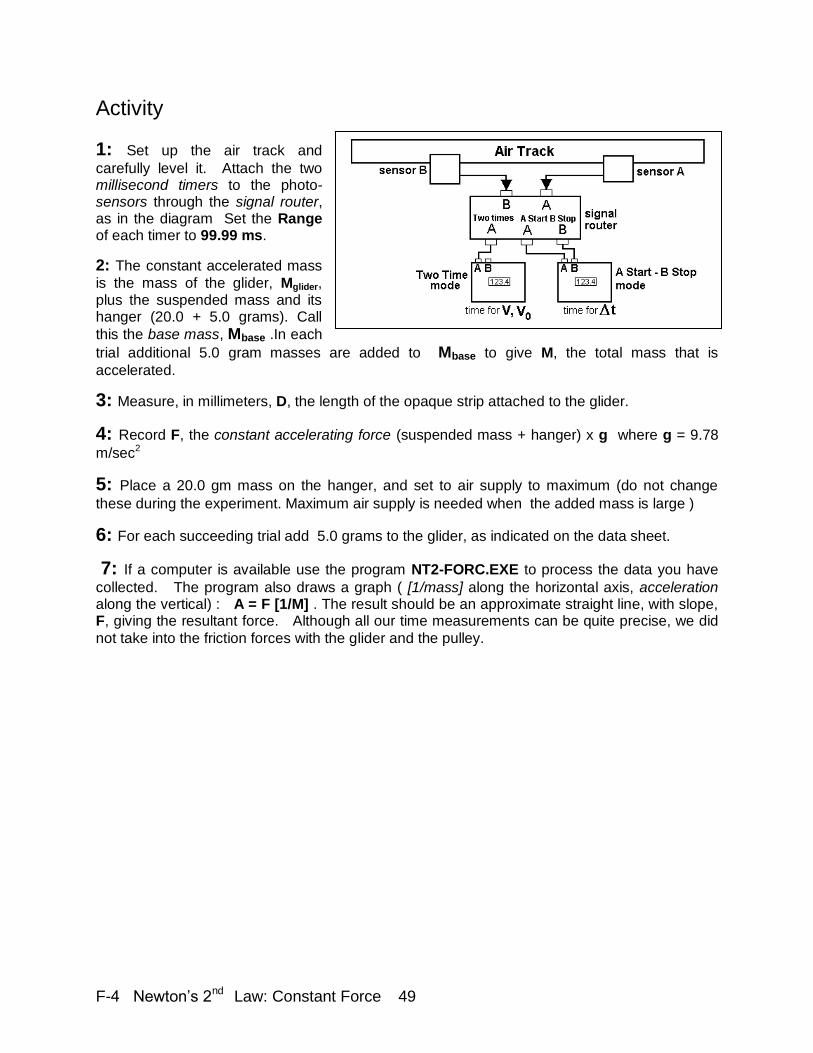
F-4 Newton‟s 2nd Law: Constant Force 49
Activity
1: Set up the air track and
carefully level it. Attach the two millisecond timers to the photo-sensors through the signal router, as in the diagram Set the Range of each timer to 99.99 ms.
2: The constant accelerated mass
is the mass of the glider, Mglider, plus the suspended mass and its hanger (20.0 + 5.0 grams). Call
this the base mass, Mbase .In each
trial additional 5.0 gram masses are added to Mbase to give M, the total mass that is
accelerated.
3: Measure, in millimeters, D, the length of the opaque strip attached to the glider.
4: Record F, the constant accelerating force (suspended mass + hanger) x g where g = 9.78
m/sec2
5: Place a 20.0 gm mass on the hanger, and set to air supply to maximum (do not change
these during the experiment. Maximum air supply is needed when the added mass is large )
6: For each succeeding trial add 5.0 grams to the glider, as indicated on the data sheet.
7: If a computer is available use the program NT2-FORC.EXE to process the data you have
collected. The program also draws a graph ( [1/mass] along the horizontal axis, acceleration along the vertical) : A = F [1/M] . The result should be an approximate straight line, with slope, F, giving the resultant force. Although all our time measurements can be quite precise, we did
not take into the friction forces with the glider and the pulley.
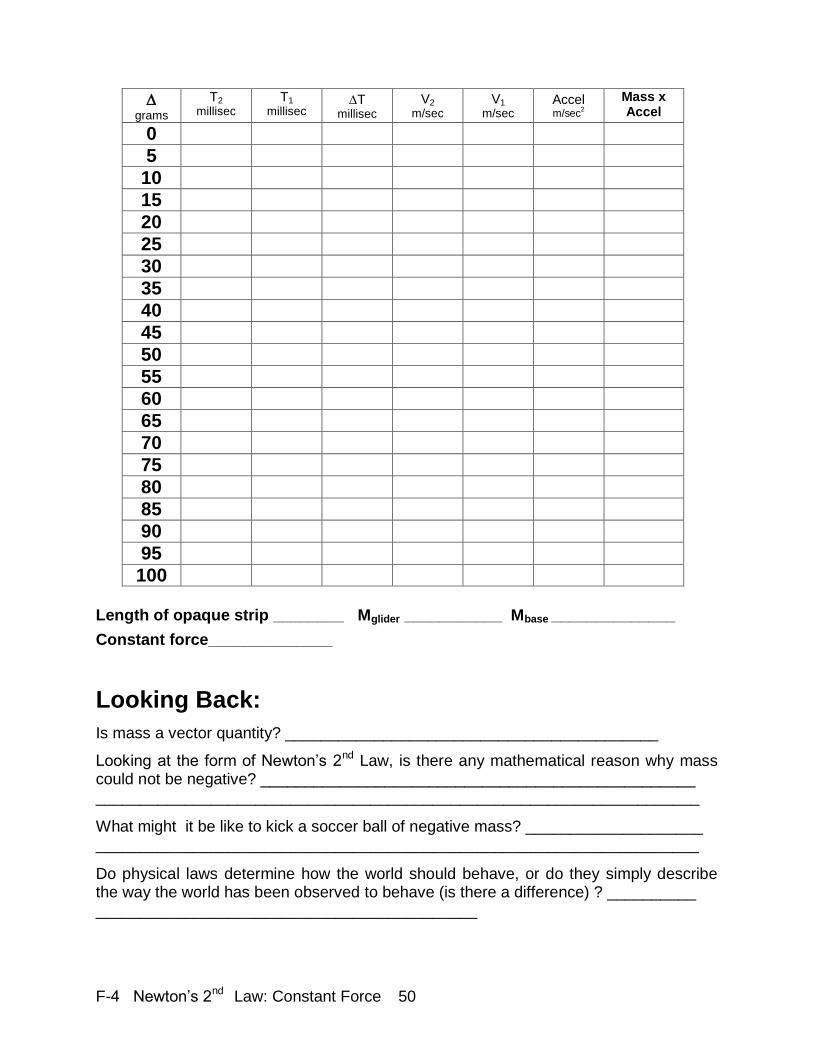
F-4 Newton‟s 2nd Law: Constant Force 50
Length of opaque strip ________ Mglider ___________ Mbase ______________
Constant force______________
Looking Back:
Is mass a vector quantity? __________________________________________
Looking at the form of Newton‟s 2nd Law, is there any mathematical reason why mass could not be negative? _________________________________________________ ____________________________________________________________________
What might it be like to kick a soccer ball of negative mass? ____________________ ____________________________________________________________________
Do physical laws determine how the world should behave, or do they simply describe the way the world has been observed to behave (is there a difference) ? __________ ___________________________________________
grams
T2 millisec
T1
millisec
T millisec
V2 m/sec
V1 m/sec
Accel m/sec
2
Mass x
Accel
0
5
10
15
20
25
30
35
40
45
50
55
60
65
70
75
80
85
90
95
100
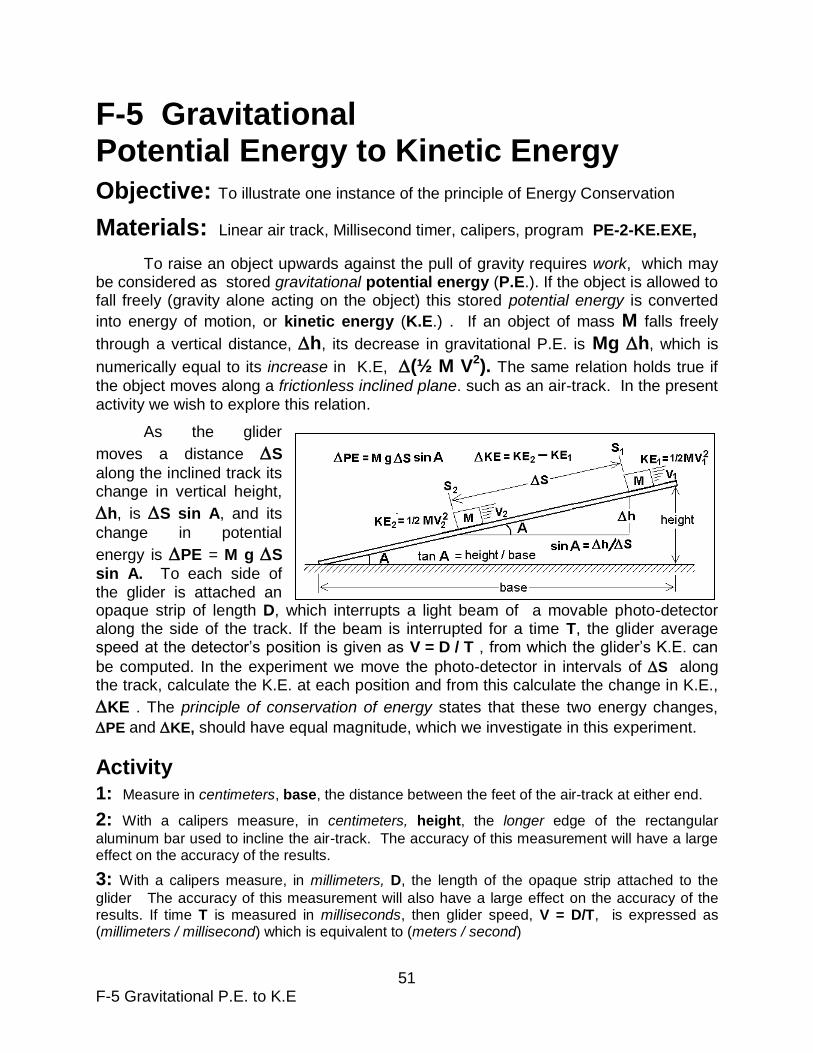
51 F-5 Gravitational P.E. to K.E
F-5 Gravitational Potential Energy to Kinetic Energy
Objective: To illustrate one instance of the principle of Energy Conservation
Materials: Linear air track, Millisecond timer, calipers, program PE-2-KE.EXE,
To raise an object upwards against the pull of gravity requires work, which may be considered as stored gravitational potential energy (P.E.). If the object is allowed to fall freely (gravity alone acting on the object) this stored potential energy is converted
into energy of motion, or kinetic energy (K.E.) . If an object of mass M falls freely
through a vertical distance, h, its decrease in gravitational P.E. is Mg h, which is
numerically equal to its increase in K.E, (½ M V2). The same relation holds true if
the object moves along a frictionless inclined plane. such as an air-track. In the present activity we wish to explore this relation.
As the glider
moves a distance S
along the inclined track its change in vertical height,
h, is S sin A, and its
change in potential
energy is PE = M g S
sin A. To each side of the glider is attached an opaque strip of length D, which interrupts a light beam of a movable photo-detector along the side of the track. If the beam is interrupted for a time T, the glider average speed at the detector‟s position is given as V = D / T , from which the glider‟s K.E. can
be computed. In the experiment we move the photo-detector in intervals of S along the track, calculate the K.E. at each position and from this calculate the change in K.E.,
KE . The principle of conservation of energy states that these two energy changes,
PE and KE, should have equal magnitude, which we investigate in this experiment.
Activity
1: Measure in centimeters, base, the distance between the feet of the air-track at either end.
2: With a calipers measure, in centimeters, height, the longer edge of the rectangular
aluminum bar used to incline the air-track. The accuracy of this measurement will have a large effect on the accuracy of the results.
3: With a calipers measure, in millimeters, D, the length of the opaque strip attached to the
glider The accuracy of this measurement will also have a large effect on the accuracy of the results. If time T is measured in milliseconds, then glider speed, V = D/T, is expressed as (millimeters / millisecond) which is equivalent to (meters / second)
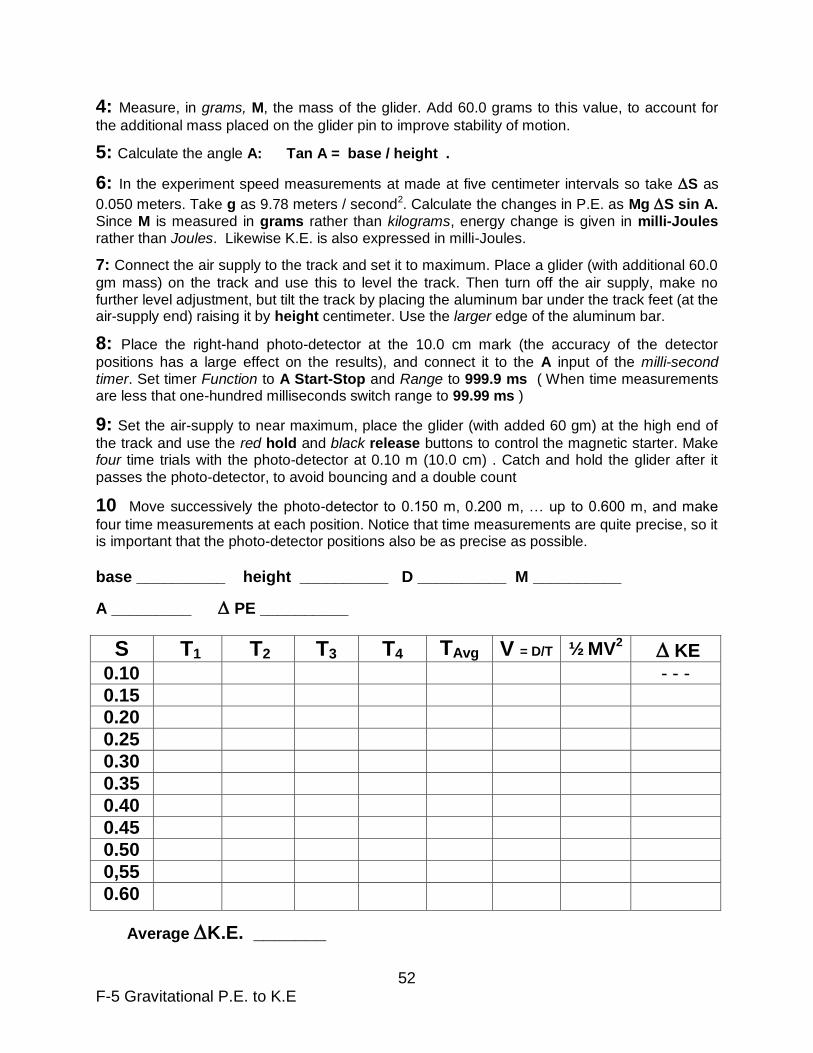
52 F-5 Gravitational P.E. to K.E
4: Measure, in grams, M, the mass of the glider. Add 60.0 grams to this value, to account for
the additional mass placed on the glider pin to improve stability of motion.
5: Calculate the angle A: Tan A = base / height .
6: In the experiment speed measurements at made at five centimeter intervals so take S as
0.050 meters. Take g as 9.78 meters / second2. Calculate the changes in P.E. as Mg S sin A. Since M is measured in grams rather than kilograms, energy change is given in milli-Joules rather than Joules. Likewise K.E. is also expressed in milli-Joules.
7: Connect the air supply to the track and set it to maximum. Place a glider (with additional 60.0
gm mass) on the track and use this to level the track. Then turn off the air supply, make no further level adjustment, but tilt the track by placing the aluminum bar under the track feet (at the air-supply end) raising it by height centimeter. Use the larger edge of the aluminum bar.
8: Place the right-hand photo-detector at the 10.0 cm mark (the accuracy of the detector
positions has a large effect on the results), and connect it to the A input of the milli-second timer. Set timer Function to A Start-Stop and Range to 999.9 ms ( When time measurements are less that one-hundred milliseconds switch range to 99.99 ms )
9: Set the air-supply to near maximum, place the glider (with added 60 gm) at the high end of
the track and use the red hold and black release buttons to control the magnetic starter. Make four time trials with the photo-detector at 0.10 m (10.0 cm) . Catch and hold the glider after it
passes the photo-detector, to avoid bouncing and a double count
10 Move successively the photo-detector to 0.150 m, 0.200 m, … up to 0.600 m, and make
four time measurements at each position. Notice that time measurements are quite precise, so it is important that the photo-detector positions also be as precise as possible.
base __________ height __________ D __________ M __________
A _________ PE __________
Average K.E. _______
S T1 T2 T3 T4 TAvg V = D/T ½ MV2
KE
0.10 - - -
0.15 0.20
0.25
0.30
0.35
0.40
0.45
0.50
0,55
0.60
53 F-5 Gravitational P.E. to K.E
NOTE: To calculate the values in the KE column, from the K.E. value in each row
subtract from the K.E. in the preceding row. However, if you have access to a computer it is much easier to use the short program, PE-2-KE.EXE, which does for you all the calculations.
Looking Back:
If you extend your hand out the window of a moving vehicle, can you feel air pressure similar to that of the wind. Should something like this also occur for the moving glider on the air track.? _________________________________________________________ _____________________________________________________________________
On the surface of the earth, the pull of gravity is directed toward the center of the earth. At the center of the earth is there any pull of gravity on an object? ________________ ____________________________________________________________________
At the earth‟s center would an object be weightless? __________________________ ____________________________________________________________________
Can gravitational potential energy be zero at a position where there is still a pull of gravity______________________________________________________________
Is Newton‟s 2nd law, F = M A, sill valid at the center of the earth or inside a space capsule in orbit _______________________________________________________
If an object is said to be weightless, does this mean it has no mass? ______________ ____________________________________________________________________ If an object is said to be weightless, does this mean it has no gravitational energy? ____________________________________________________________________ ____________________________________________________________________
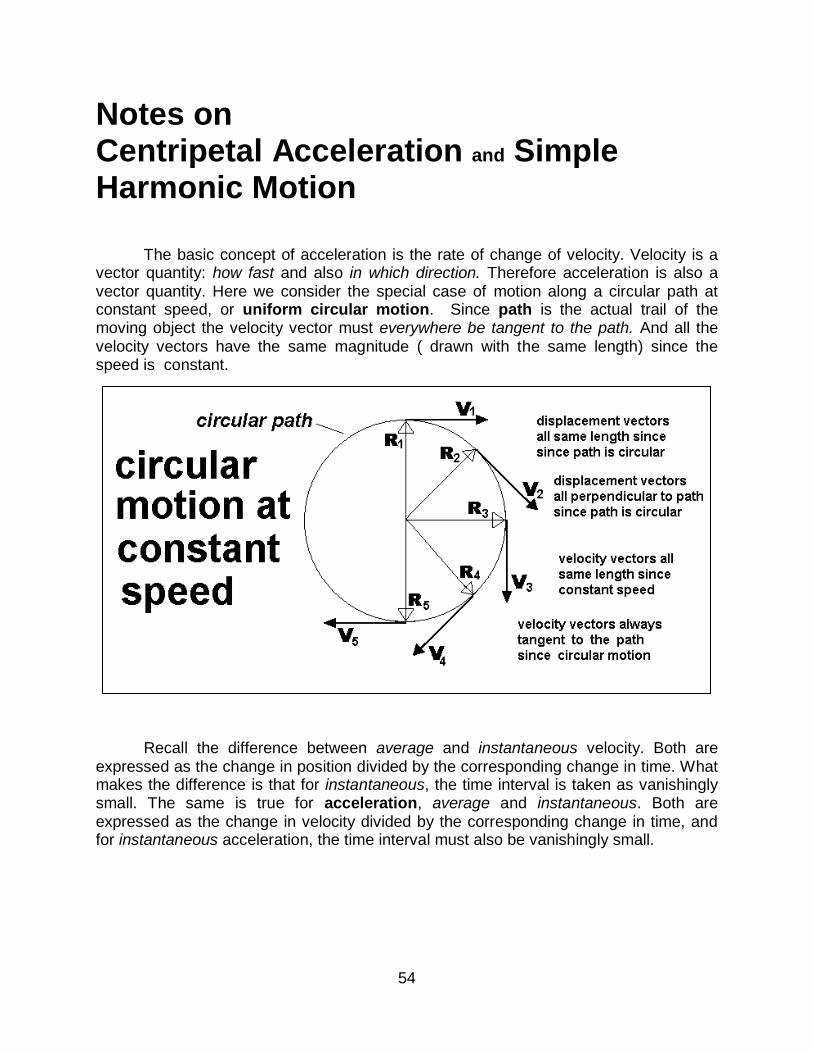
54
Notes on Centripetal Acceleration and Simple Harmonic Motion
The basic concept of acceleration is the rate of change of velocity. Velocity is a vector quantity: how fast and also in which direction. Therefore acceleration is also a vector quantity. Here we consider the special case of motion along a circular path at constant speed, or uniform circular motion. Since path is the actual trail of the moving object the velocity vector must everywhere be tangent to the path. And all the velocity vectors have the same magnitude ( drawn with the same length) since the speed is constant.
Recall the difference between average and instantaneous velocity. Both are expressed as the change in position divided by the corresponding change in time. What makes the difference is that for instantaneous, the time interval is taken as vanishingly small. The same is true for acceleration, average and instantaneous. Both are expressed as the change in velocity divided by the corresponding change in time, and for instantaneous acceleration, the time interval must also be vanishingly small.
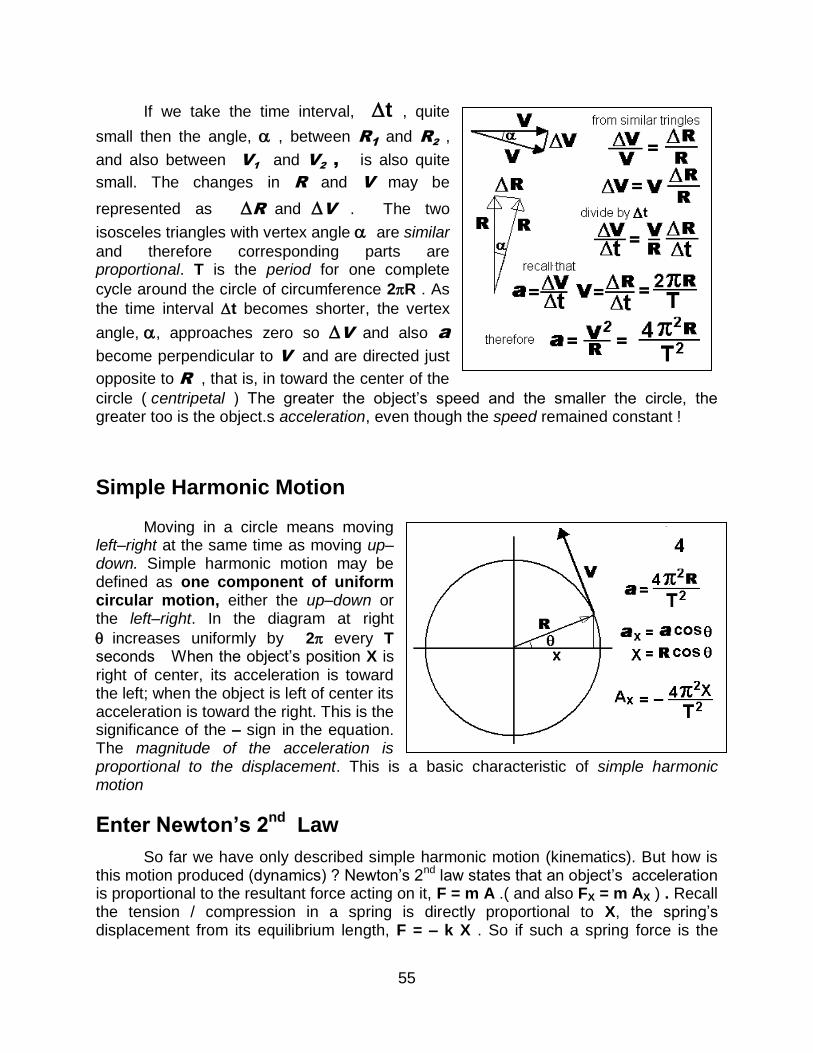
55
If we take the time interval, t , quite
small then the angle, , between R1 and R
2 ,
and also between V1 and V
2 , is also quite
small. The changes in R and V may be
represented as RandV . The two
isosceles triangles with vertex angle are similar
and therefore corresponding parts are proportional. T is the period for one complete
cycle around the circle of circumference 2R . As
the time interval t becomes shorter, the vertex
angle,, approaches zero so V and also a
become perpendicular to V and are directed just
opposite to R , that is, in toward the center of the
circle ( centripetal ) The greater the object‟s speed and the smaller the circle, the greater too is the object.s acceleration, even though the speed remained constant !
Simple Harmonic Motion
Moving in a circle means moving left–right at the same time as moving up–down. Simple harmonic motion may be defined as one component of uniform circular motion, either the up–down or the left–right. In the diagram at right
increases uniformly by 2 every T seconds When the object‟s position X is right of center, its acceleration is toward the left; when the object is left of center its acceleration is toward the right. This is the significance of the – sign in the equation. The magnitude of the acceleration is proportional to the displacement. This is a basic characteristic of simple harmonic motion
Enter Newton‟s 2nd
Law
So far we have only described simple harmonic motion (kinematics). But how is this motion produced (dynamics) ? Newton‟s 2nd law states that an object‟s acceleration is proportional to the resultant force acting on it, F = m A .( and also FX = m AX ) . Recall the tension / compression in a spring is directly proportional to X, the spring‟s displacement from its equilibrium length, F = – k X . So if such a spring force is the
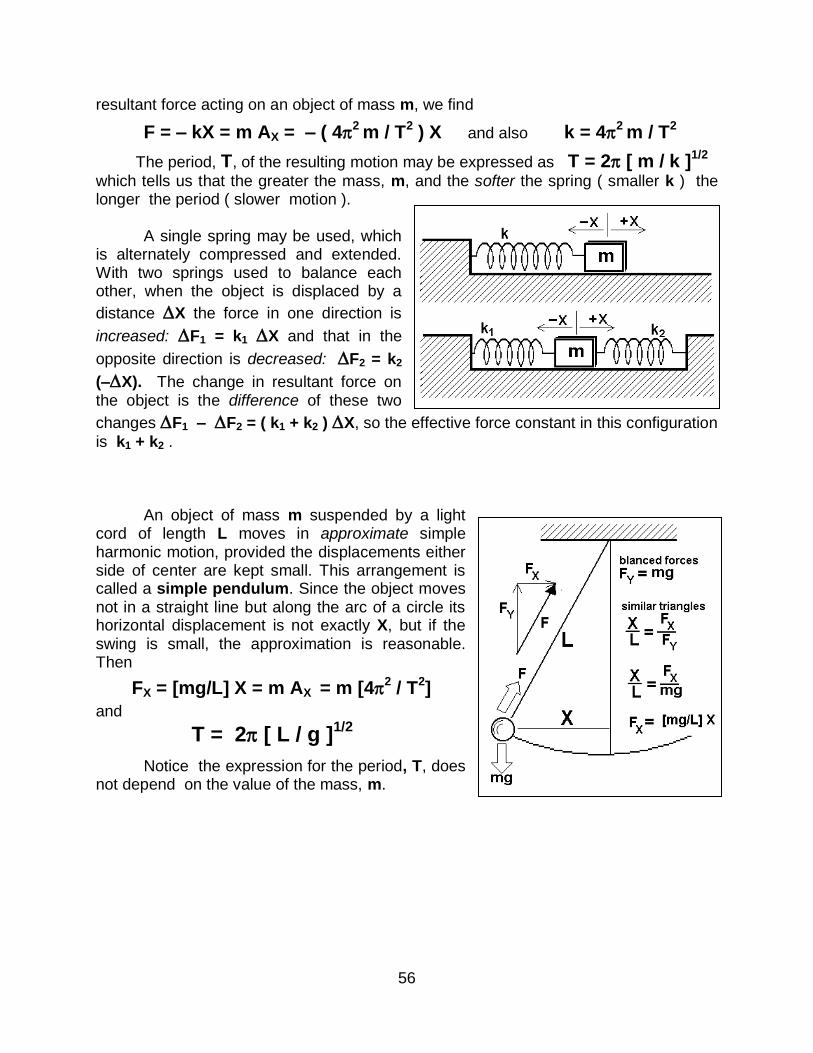
56
resultant force acting on an object of mass m, we find
F = – kX = m AX = – ( 42 m / T
2 ) X and also k = 4
2 m / T
2
The period, T, of the resulting motion may be expressed as T = 2 [ m / k ]1/2
which tells us that the greater the mass, m, and the softer the spring ( smaller k ) the longer the period ( slower motion ). A single spring may be used, which is alternately compressed and extended. With two springs used to balance each other, when the object is displaced by a
distance X the force in one direction is
increased: F1 = k1 X and that in the
opposite direction is decreased: F2 = k2
(–X). The change in resultant force on the object is the difference of these two
changes F1 – F2 = ( k1 + k2 ) X, so the effective force constant in this configuration
is k1 + k2 . An object of mass m suspended by a light cord of length L moves in approximate simple harmonic motion, provided the displacements either side of center are kept small. This arrangement is called a simple pendulum. Since the object moves not in a straight line but along the arc of a circle its horizontal displacement is not exactly X, but if the swing is small, the approximation is reasonable. Then
FX = [mg/L] X = m AX = m [42 / T
2]
and
T = 2[ L / g ]1/2
Notice the expression for the period, T, does not depend on the value of the mass, m.
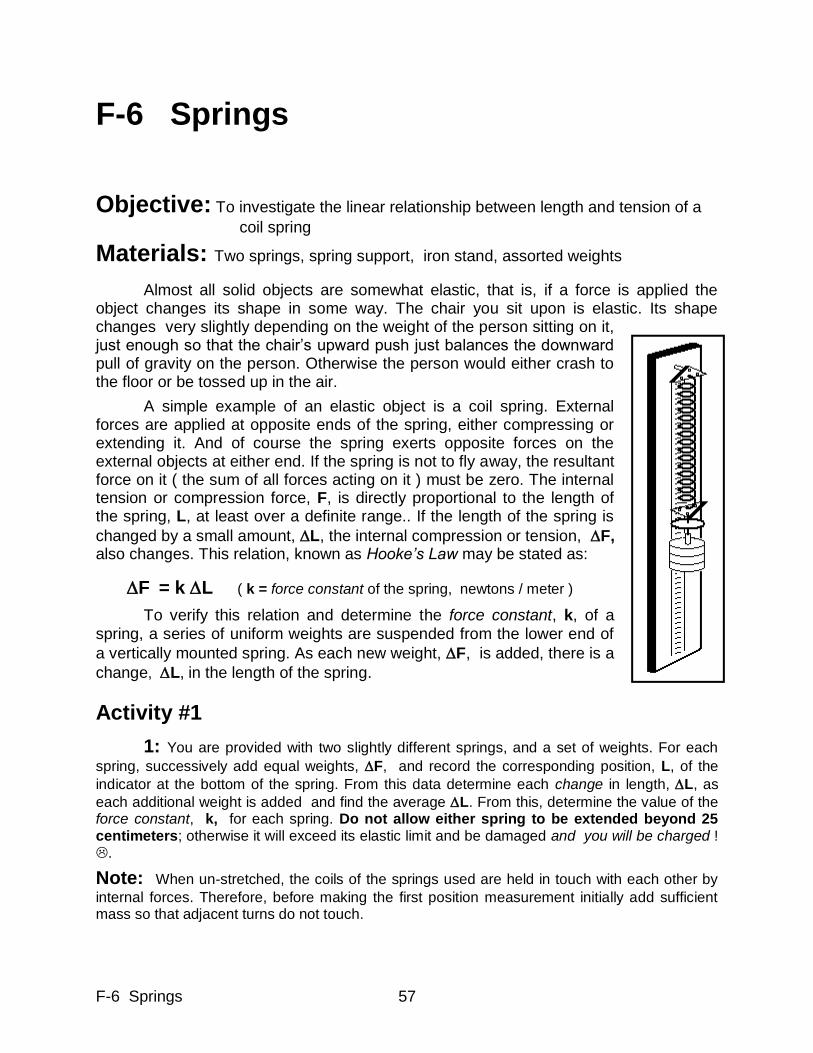
F-6 Springs 57
F-6 Springs
Objective: To investigate the linear relationship between length and tension of a
coil spring
Materials: Two springs, spring support, iron stand, assorted weights
Almost all solid objects are somewhat elastic, that is, if a force is applied the object changes its shape in some way. The chair you sit upon is elastic. Its shape changes very slightly depending on the weight of the person sitting on it, just enough so that the chair‟s upward push just balances the downward pull of gravity on the person. Otherwise the person would either crash to the floor or be tossed up in the air.
A simple example of an elastic object is a coil spring. External forces are applied at opposite ends of the spring, either compressing or extending it. And of course the spring exerts opposite forces on the external objects at either end. If the spring is not to fly away, the resultant force on it ( the sum of all forces acting on it ) must be zero. The internal tension or compression force, F, is directly proportional to the length of the spring, L, at least over a definite range.. If the length of the spring is
changed by a small amount, L, the internal compression or tension, F, also changes. This relation, known as Hooke’s Law may be stated as:
F = k L ( k = force constant of the spring, newtons / meter )
To verify this relation and determine the force constant, k, of a spring, a series of uniform weights are suspended from the lower end of
a vertically mounted spring. As each new weight, F, is added, there is a
change, L, in the length of the spring.
Activity #1
1: You are provided with two slightly different springs, and a set of weights. For each
spring, successively add equal weights, F, and record the corresponding position, L, of the
indicator at the bottom of the spring. From this data determine each change in length, L, as
each additional weight is added and find the average L. From this, determine the value of the force constant, k, for each spring. Do not allow either spring to be extended beyond 25 centimeters; otherwise it will exceed its elastic limit and be damaged and you will be charged ! .
Note: When un-stretched, the coils of the springs used are held in touch with each other by
internal forces. Therefore, before making the first position measurement initially add sufficient mass so that adjacent turns do not touch.
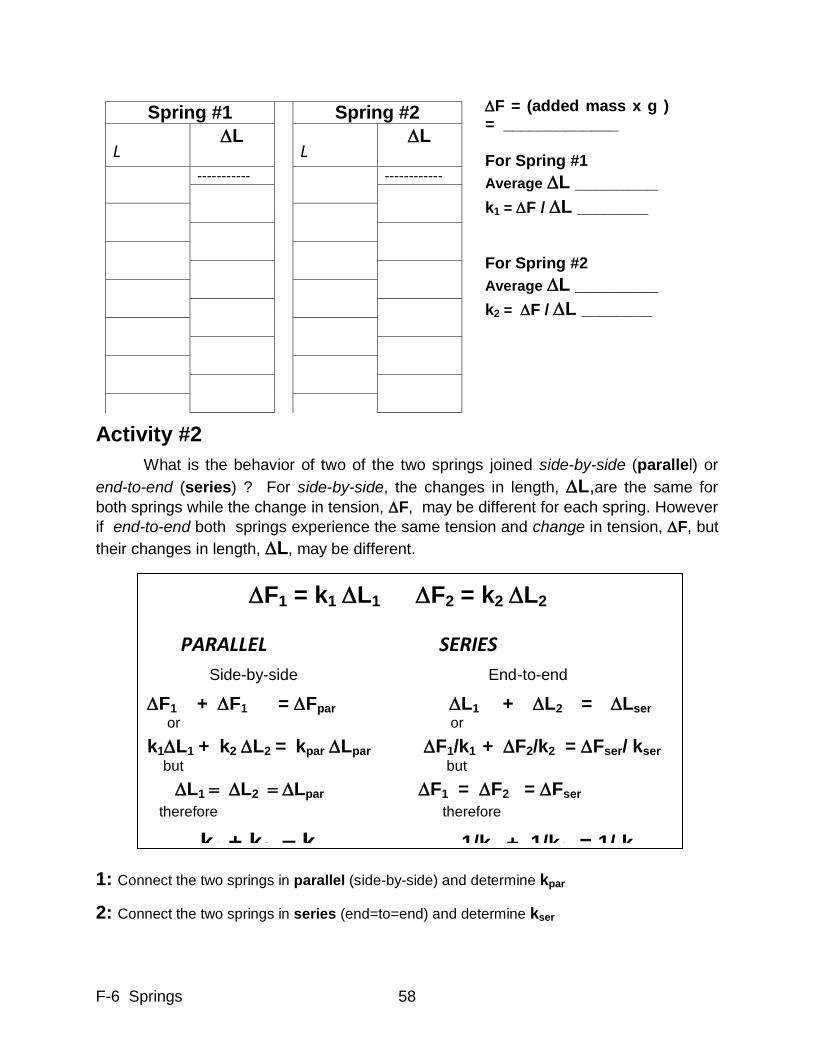
F-6 Springs 58
F = (added mass x g ) = _____________ For Spring #1
Average L ________
k1 = F / L ________
For Spring #2
Average L ________
k2 = F / L ________
Activity #2
What is the behavior of two of the two springs joined side-by-side (parallel) or
end-to-end (series) ? For side-by-side, the changes in length, L,are the same for
both springs while the change in tension, F, may be different for each spring. However
if end-to-end both springs experience the same tension and change in tension, F, but
their changes in length, L, may be different.
1: Connect the two springs in parallel (side-by-side) and determine kpar
2: Connect the two springs in series (end=to=end) and determine kser
Spring #1 Spring #2
L L
L L
----------- ------------
-------- -------------
F1 = k1L1F2 = k2L2
PARALLEL SERIES
Side-by-side End-to-end
F1 + F1 = Fpar L1+ L2=Lser or or k1L1+ k2L2=kparLparF1/k1 + F2/k2 = Fser/ kser but but L1L2Lpar F1 = F2 = Fser
therefore therefore
k1+ k2kpar 1/k1 + 1/k2 = 1/ kser
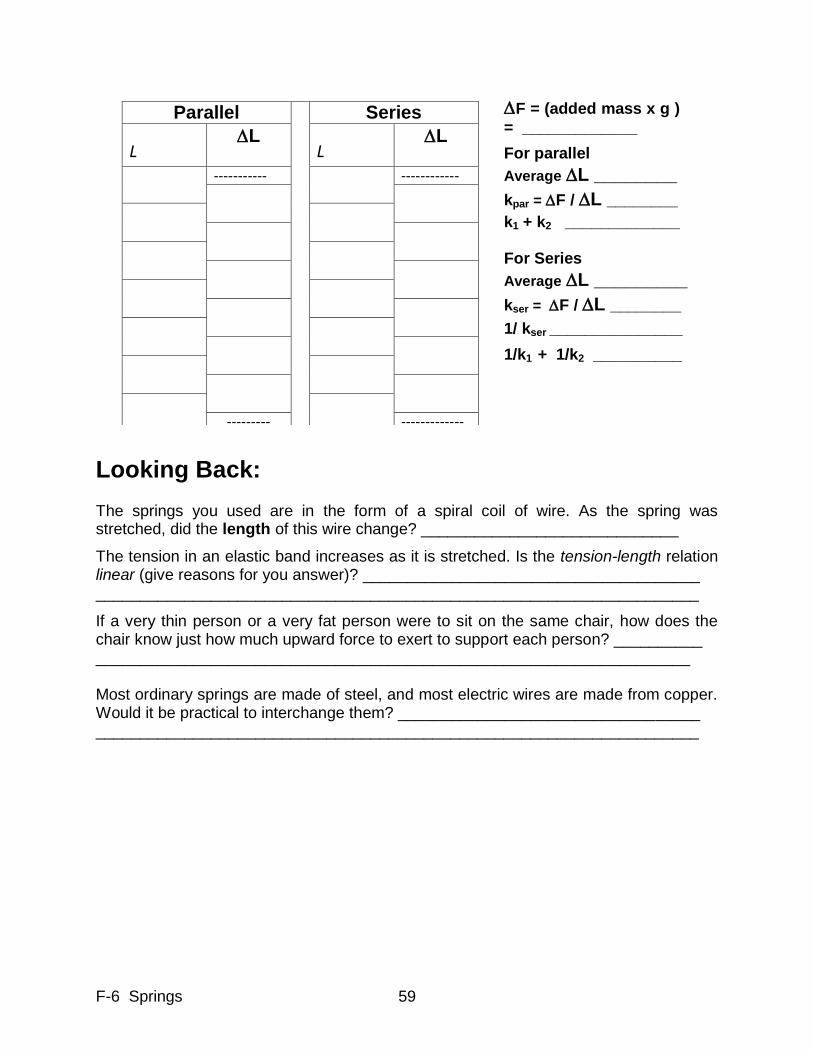
F-6 Springs 59
F = (added mass x g )
= _____________
For parallel
Average L ________
kpar = F / L ________
k1+ k2 _____________ For Series
Average L _________
kser = F / L ________
1/ kser _______________
1/k1 + 1/k2 __________
Looking Back: The springs you used are in the form of a spiral coil of wire. As the spring was stretched, did the length of this wire change? _____________________________
The tension in an elastic band increases as it is stretched. Is the tension-length relation linear (give reasons for you answer)? ______________________________________ ____________________________________________________________________
If a very thin person or a very fat person were to sit on the same chair, how does the chair know just how much upward force to exert to support each person? __________ ___________________________________________________________________ Most ordinary springs are made of steel, and most electric wires are made from copper. Would it be practical to interchange them? __________________________________ ____________________________________________________________________
Parallel Series
L L
L L
----------- ------------
--------- -------------
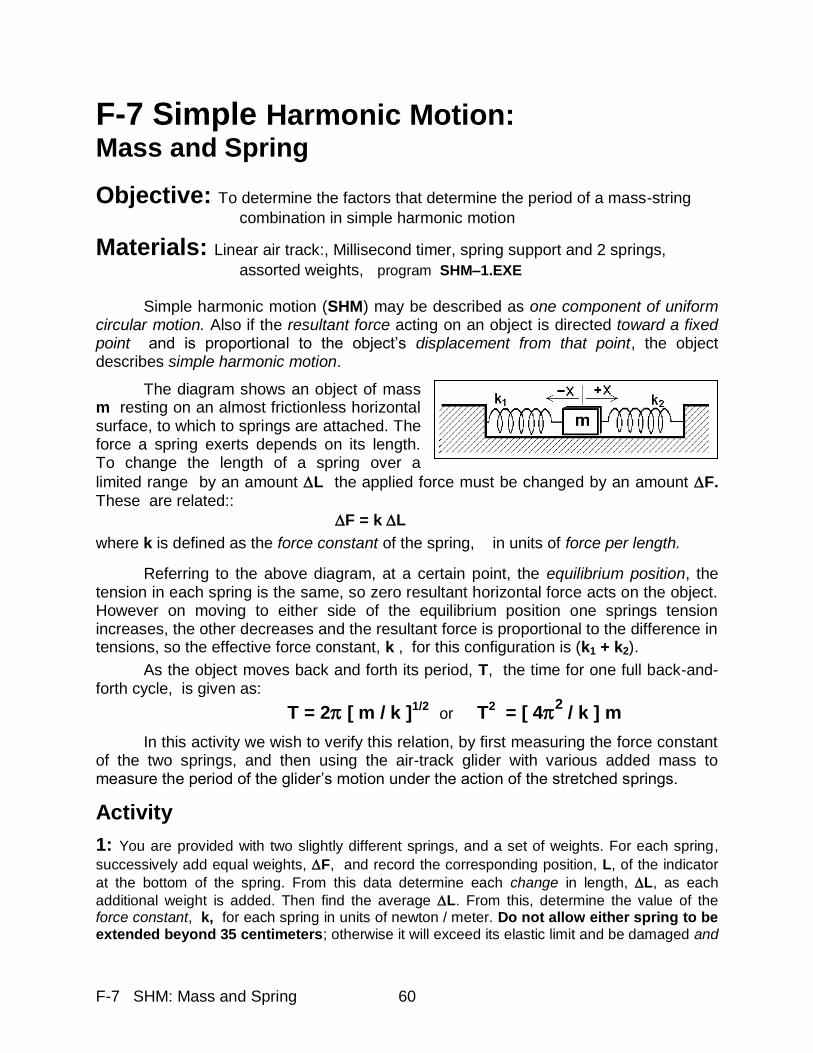
F-7 SHM: Mass and Spring 60
F-7 Simple Harmonic Motion:
Mass and Spring
Objective: To determine the factors that determine the period of a mass-string
combination in simple harmonic motion
Materials: Linear air track:, Millisecond timer, spring support and 2 springs,
assorted weights, program SHM–1.EXE Simple harmonic motion (SHM) may be described as one component of uniform circular motion. Also if the resultant force acting on an object is directed toward a fixed point and is proportional to the object‟s displacement from that point, the object describes simple harmonic motion.
The diagram shows an object of mass m resting on an almost frictionless horizontal surface, to which to springs are attached. The force a spring exerts depends on its length. To change the length of a spring over a
limited range by an amount L the applied force must be changed by an amount F. These are related::
F = k L
where k is defined as the force constant of the spring, in units of force per length.
Referring to the above diagram, at a certain point, the equilibrium position, the tension in each spring is the same, so zero resultant horizontal force acts on the object. However on moving to either side of the equilibrium position one springs tension increases, the other decreases and the resultant force is proportional to the difference in tensions, so the effective force constant, k , for this configuration is (k1 + k2).
As the object moves back and forth its period, T, the time for one full back-and-forth cycle, is given as:
T = 2 [ m / k ]1/2
or T2 = [ 4
2 / k ] m
In this activity we wish to verify this relation, by first measuring the force constant of the two springs, and then using the air-track glider with various added mass to measure the period of the glider‟s motion under the action of the stretched springs.
Activity
1: You are provided with two slightly different springs, and a set of weights. For each spring,
successively add equal weights, F, and record the corresponding position, L, of the indicator
at the bottom of the spring. From this data determine each change in length, L, as each
additional weight is added. Then find the average L. From this, determine the value of the force constant, k, for each spring in units of newton / meter. Do not allow either spring to be extended beyond 35 centimeters; otherwise it will exceed its elastic limit and be damaged and
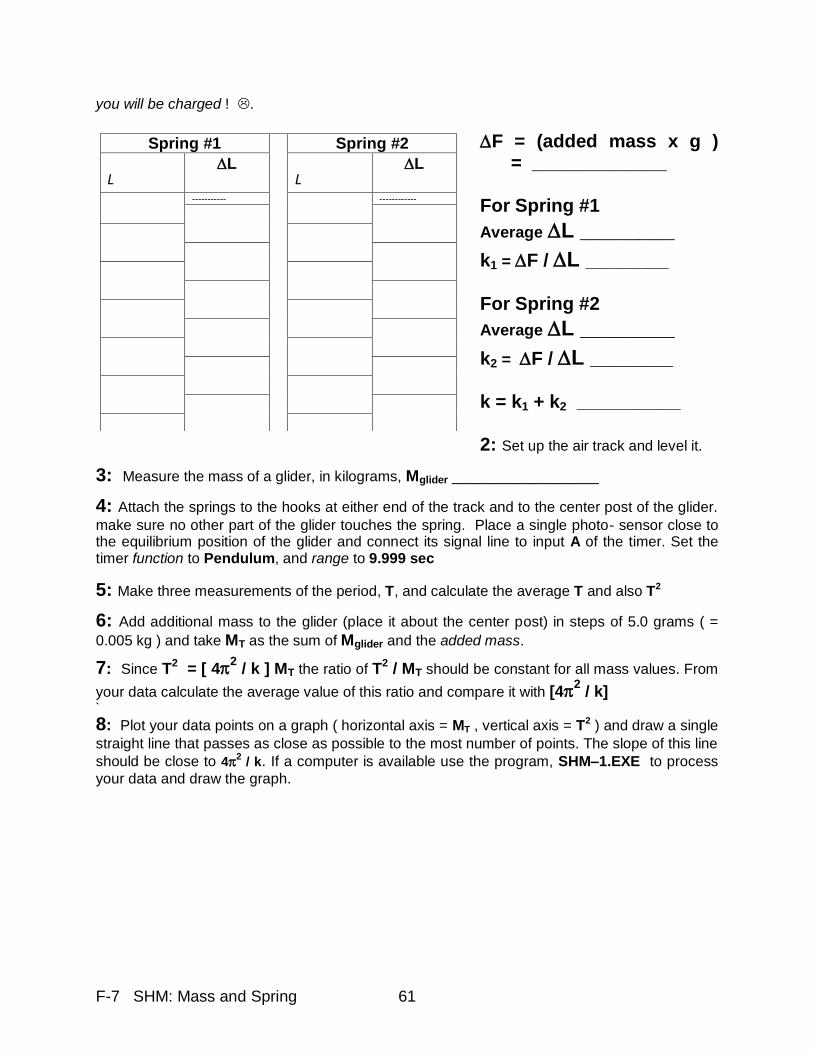
F-7 SHM: Mass and Spring 61
you will be charged ! .
F = (added mass x g ) = _____________ For Spring #1
Average L ________
k1 = F / L ________ For Spring #2
Average L ________
k2 = F / L ________ k = k1 + k2 __________ 2: Set up the air track and level it.
3: Measure the mass of a glider, in kilograms, Mglider __________________
4: Attach the springs to the hooks at either end of the track and to the center post of the glider.
make sure no other part of the glider touches the spring. Place a single photo- sensor close to the equilibrium position of the glider and connect its signal line to input A of the timer. Set the timer function to Pendulum, and range to 9.999 sec
5: Make three measurements of the period, T, and calculate the average T and also T2
6: Add additional mass to the glider (place it about the center post) in steps of 5.0 grams ( =
0.005 kg ) and take MT as the sum of Mglider and the added mass.
7: Since T2 = [ 42 / k ] MT the ratio of T2 / MT should be constant for all mass values. From
your data calculate the average value of this ratio and compare it with [42 / k]
`
8: Plot your data points on a graph ( horizontal axis = MT , vertical axis = T2 ) and draw a single
straight line that passes as close as possible to the most number of points. The slope of this line
should be close to 42 / k. If a computer is available use the program, SHM–1.EXE to process
your data and draw the graph.
Spring #1 Spring #2
L L
L L
----------- ------------
-------- -------------
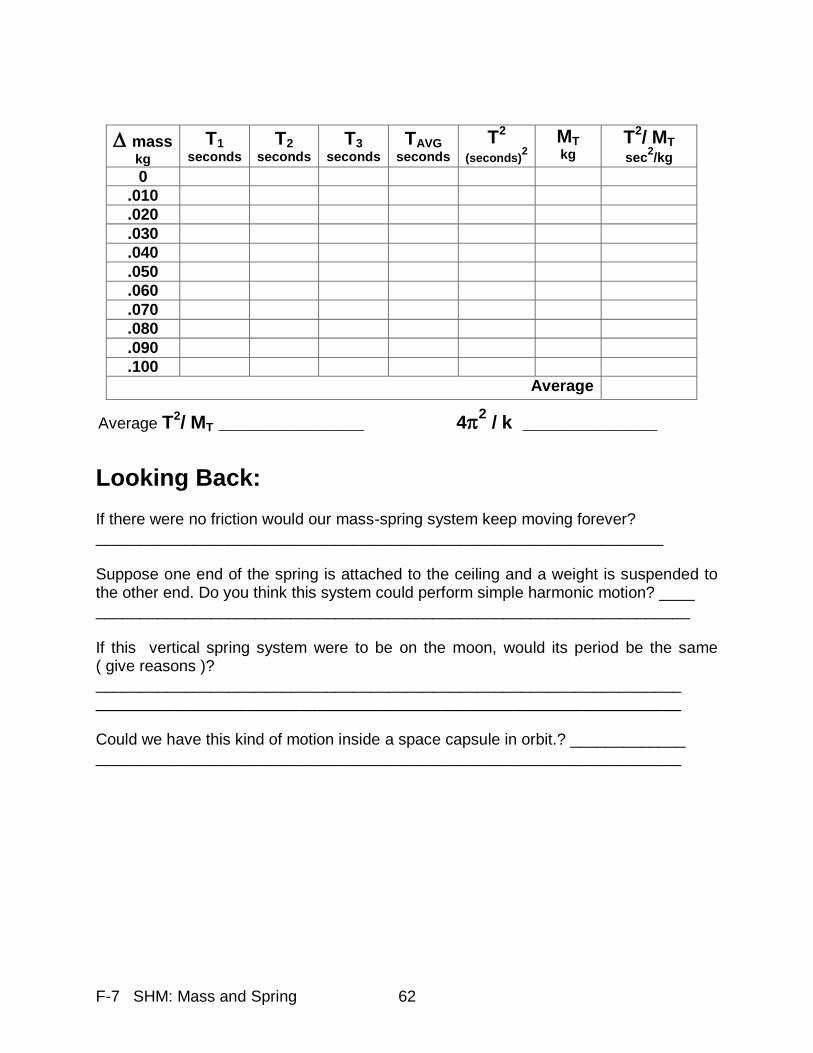
F-7 SHM: Mass and Spring 62
Looking Back: If there were no friction would our mass-spring system keep moving forever? ________________________________________________________________ Suppose one end of the spring is attached to the ceiling and a weight is suspended to the other end. Do you think this system could perform simple harmonic motion? ____ ___________________________________________________________________ If this vertical spring system were to be on the moon, would its period be the same ( give reasons )? __________________________________________________________________ __________________________________________________________________ Could we have this kind of motion inside a space capsule in orbit.? _____________ __________________________________________________________________
mass kg
T1 seconds
T2 seconds
T3 seconds
TAVG seconds
T2
(seconds)2
MT kg
T2/ MT
sec2/kg
0 .010 .020
.030
.040
.050
.060
.070
.080
.090
.100
Average
Average T2/ MT ______________ 4
2 / k _____________
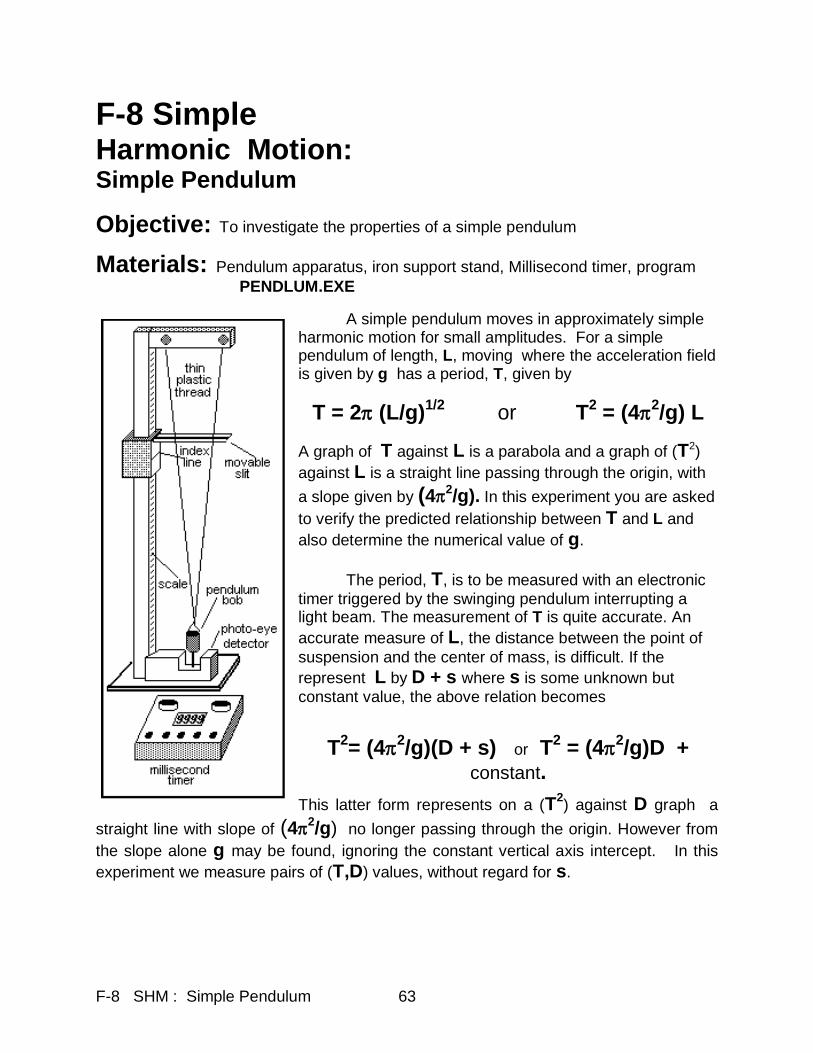
F-8 SHM : Simple Pendulum 63
F-8 Simple Harmonic Motion: Simple Pendulum
Objective: To investigate the properties of a simple pendulum
Materials: Pendulum apparatus, iron support stand, Millisecond timer, program
PENDLUM.EXE
A simple pendulum moves in approximately simple harmonic motion for small amplitudes. For a simple pendulum of length, L, moving where the acceleration field is given by g has a period, T, given by
T = 2 (L/g)1/2
or T2 = (4
2/g) L
A graph of T against L is a parabola and a graph of (T2)
against L is a straight line passing through the origin, with
a slope given by (42/g). In this experiment you are asked
to verify the predicted relationship between T and L and
also determine the numerical value of g.
The period, T, is to be measured with an electronic
timer triggered by the swinging pendulum interrupting a light beam. The measurement of T is quite accurate. An
accurate measure of L, the distance between the point of
suspension and the center of mass, is difficult. If the
represent L by D + s where s is some unknown but
constant value, the above relation becomes
T2= (4
2/g)(D + s) or T
2 = (4
2/g)D +
constant.
This latter form represents on a (T2) against D graph a
straight line with slope of (42/g) no longer passing through the origin. However from
the slope alone g may be found, ignoring the constant vertical axis intercept. In this
experiment we measure pairs of (T,D) values, without regard for s.
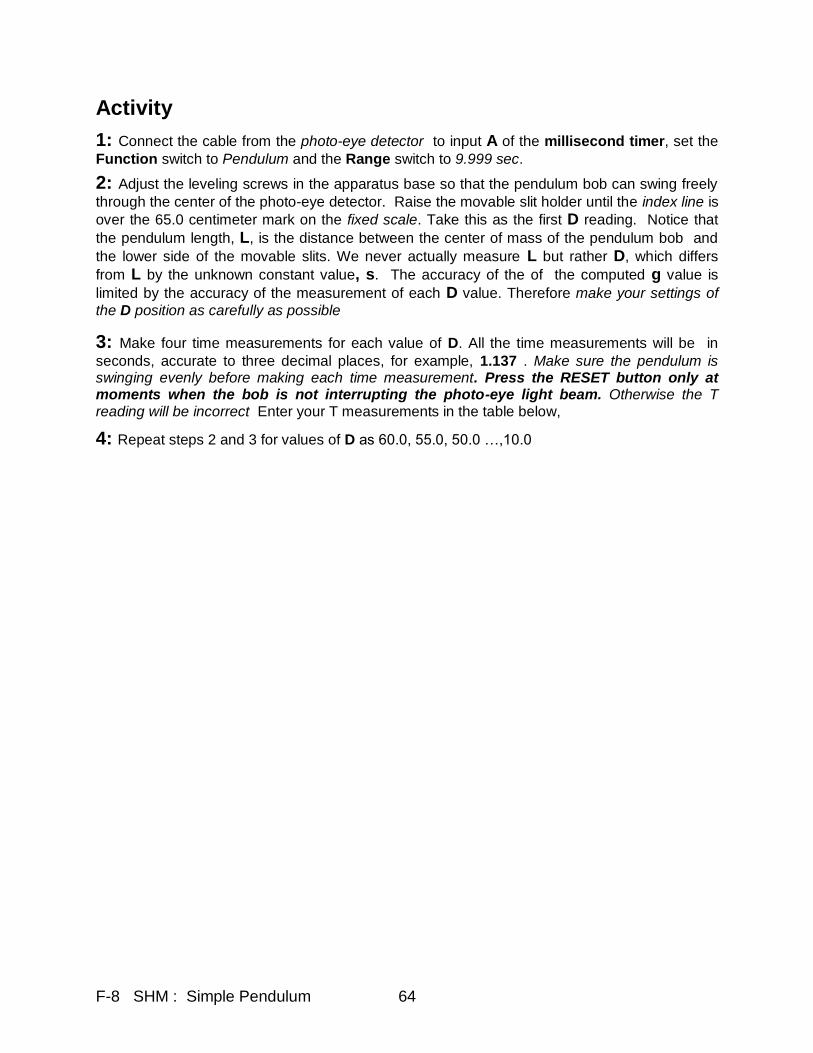
F-8 SHM : Simple Pendulum 64
Activity
1: Connect the cable from the photo-eye detector to input A of the millisecond timer, set the
Function switch to Pendulum and the Range switch to 9.999 sec.
2: Adjust the leveling screws in the apparatus base so that the pendulum bob can swing freely
through the center of the photo-eye detector. Raise the movable slit holder until the index line is
over the 65.0 centimeter mark on the fixed scale. Take this as the first D reading. Notice that
the pendulum length, L, is the distance between the center of mass of the pendulum bob and
the lower side of the movable slits. We never actually measure L but rather D, which differs
from L by the unknown constant value, s. The accuracy of the of the computed g value is
limited by the accuracy of the measurement of each D value. Therefore make your settings of
the D position as carefully as possible
3: Make four time measurements for each value of D. All the time measurements will be in
seconds, accurate to three decimal places, for example, 1.137 . Make sure the pendulum is swinging evenly before making each time measurement. Press the RESET button only at moments when the bob is not interrupting the photo-eye light beam. Otherwise the T reading will be incorrect Enter your T measurements in the table below,
4: Repeat steps 2 and 3 for values of D as 60.0, 55.0, 50.0 …,10.0
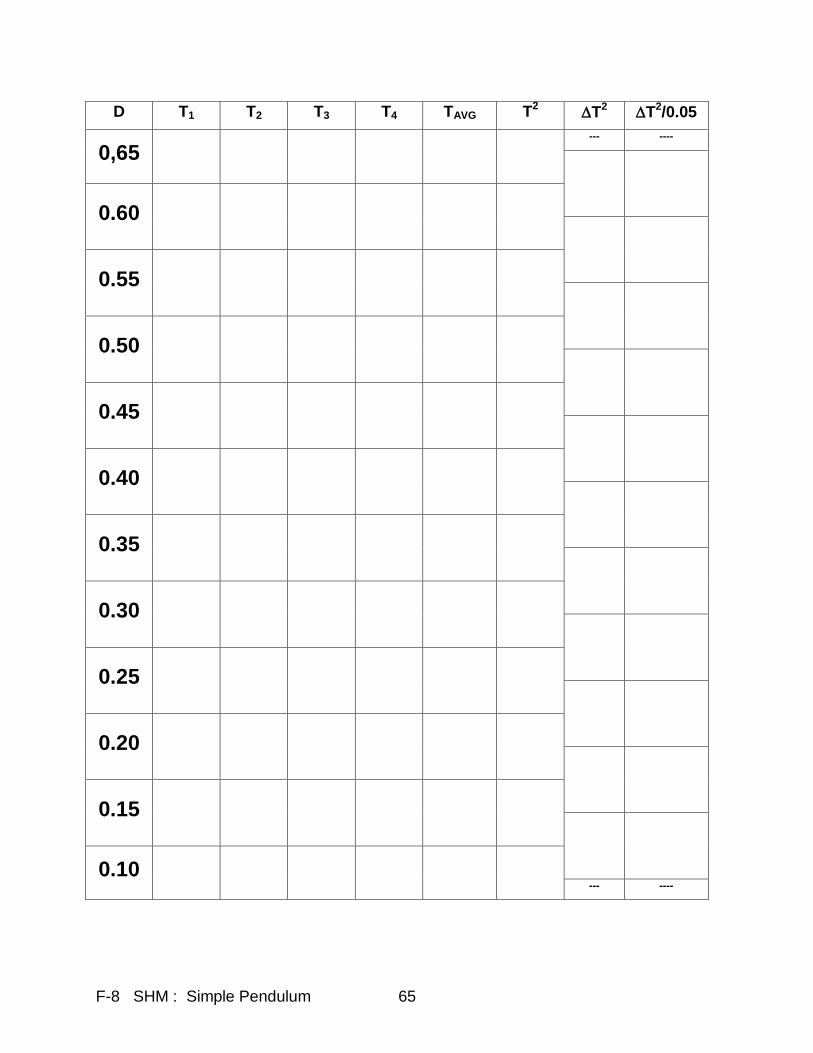
F-8 SHM : Simple Pendulum 65
D T1 T2 T3 T4 TAVG T2 T2
T2/0.05
0,65 --- ----
0.60
0.55
0.50
0.45
0.40
0.35
0.30
0.25
0.20
0.15
0.10
--- ----
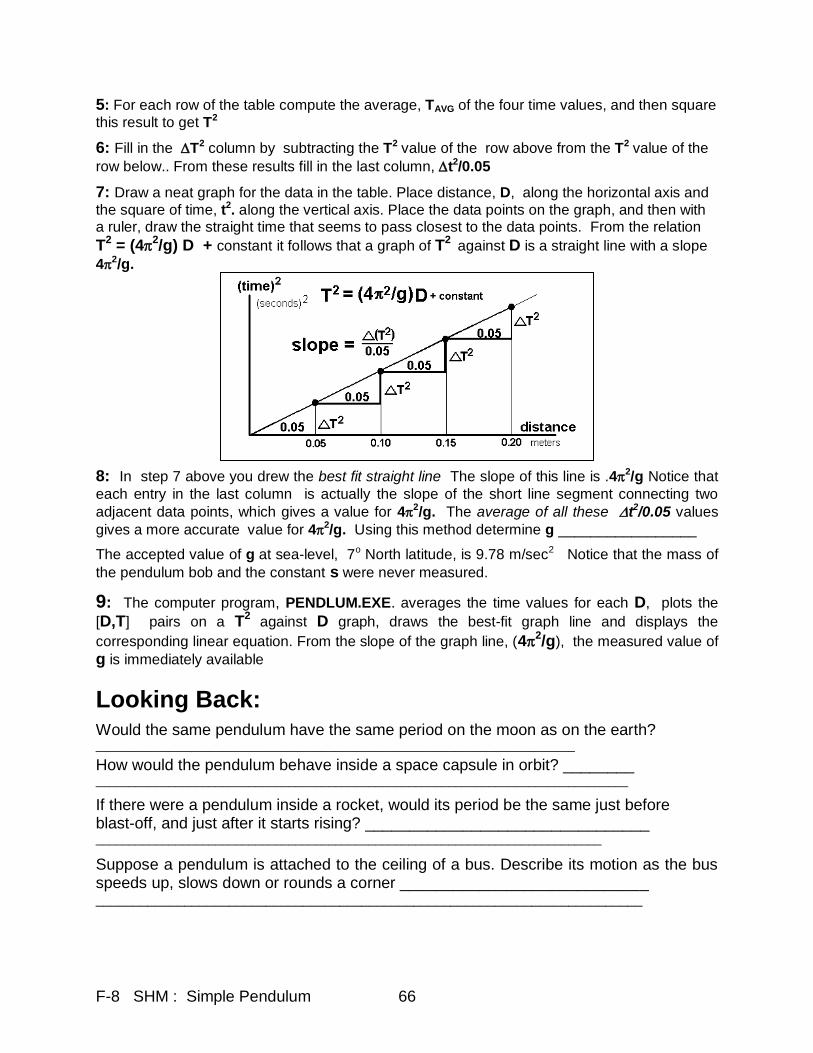
F-8 SHM : Simple Pendulum 66
5: For each row of the table compute the average, TAVG of the four time values, and then square
this result to get T2
6: Fill in the T2 column by subtracting the T2 value of the row above from the T2 value of the
row below.. From these results fill in the last column, t2/0.05
7: Draw a neat graph for the data in the table. Place distance, D, along the horizontal axis and
the square of time, t2. along the vertical axis. Place the data points on the graph, and then with a ruler, draw the straight time that seems to pass closest to the data points. From the relation
T2 = (42/g) D + constant it follows that a graph of T2 against D is a straight line with a slope
42/g.
8: In step 7 above you drew the best fit straight line The slope of this line is .42/g Notice that
each entry in the last column is actually the slope of the short line segment connecting two
adjacent data points, which gives a value for 42/g. The average of all these t2/0.05 values
gives a more accurate value for 42/g. Using this method determine g _________________
The accepted value of g at sea-level, 7o North latitude, is 9.78 m/sec2 Notice that the mass of
the pendulum bob and the constant s were never measured.
9: The computer program, PENDLUM.EXE. averages the time values for each D, plots the
[D,T] pairs on a T2 against D graph, draws the best-fit graph line and displays the
corresponding linear equation. From the slope of the graph line, (42/g), the measured value of
g is immediately available
Looking Back:
Would the same pendulum have the same period on the moon as on the earth? ________________________________________________________________________
How would the pendulum behave inside a space capsule in orbit? ________ ________________________________________________________________________________
If there were a pendulum inside a rocket, would its period be the same just before blast-off, and just after it starts rising? ________________________________ ____________________________________________________________________________
Suppose a pendulum is attached to the ceiling of a bus. Describe its motion as the bus speeds up, slows down or rounds a corner ____________________________ __________________________________________________________________________
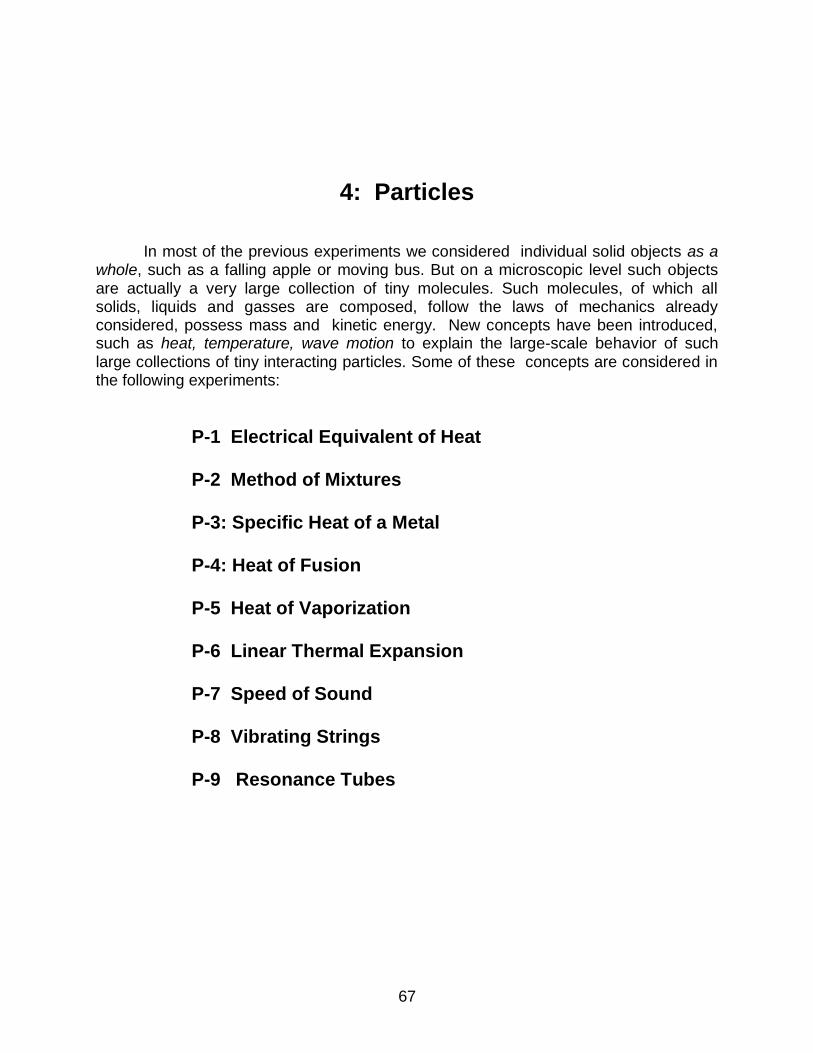
67
4: Particles
In most of the previous experiments we considered individual solid objects as a whole, such as a falling apple or moving bus. But on a microscopic level such objects are actually a very large collection of tiny molecules. Such molecules, of which all solids, liquids and gasses are composed, follow the laws of mechanics already considered, possess mass and kinetic energy. New concepts have been introduced, such as heat, temperature, wave motion to explain the large-scale behavior of such large collections of tiny interacting particles. Some of these concepts are considered in the following experiments:
P-1 Electrical Equivalent of Heat P-2 Method of Mixtures P-3: Specific Heat of a Metal P-4: Heat of Fusion P-5 Heat of Vaporization P-6 Linear Thermal Expansion P-7 Speed of Sound P-8 Vibrating Strings P-9 Resonance Tubes
P-1 Electrical Equivalent of Heat 68
P-1 Electrical Equivalent of Heat Objective: Make an actual determination of the electrical equivalent of heat
Materials: Calorimeter with heater, thermometer, transformer & AC voltmeter,
stopwatch or equivalent Mechanical energy is expressed in terms joules, equivalent to a force of one newton acting through one meter. Heat, a manifestation of random molecular kinetic energy, traditionally has been measured in the calorie, the energy needed to rise the temperature of one gram of pure water through one degree Celsius. It was James Joule who first determined the relation between the calorie and joule, 1.00 calorie = 4.19 joule, which is known as the mechanical equivalent of heat.
Electrical energy is also measured in joules, or watt-seconds; for example a 50–watt light bulb converts into heat and light 50 joules of energy each second. Perhaps you already know that a one–ampere current flowing through a one–volt difference in potential provides one joule of electrical energy each second. More on electrical quantities in later activities. The principle of conservation of energy states that in all observed processes energy may be transformed from one form to another but the total energy is neither gained or lost. In this activity we explore the transformation of electrical energy into heat. The electrical equivalent of heat relates 4.19 watt-second or joules of electrical energy to 1.00 calorie of thermal energy or heat..
A matter of accuracy
In principle the measurement is quite straightforward; the electrical energy supplied is calculated from a known voltage applied across a known resistance for a known amount of time. The thermal energy developed is calculated from a measured increase in temperature of known mass of pure water. These measurements are made with varying degrees of accuracy. But this is not the whole picture. A cold soft drink warms up and a cup of hot coffee cools down, both approaching the temperature of their surroundings as heat energy seeps in or out. In our activity not all the electrically generated heat is absorbed by the water, for some is retained in the heating element itself, some absorbed by the thermometer and the water container. And as the temperature increases heat already
Quantity Accuracy % error
time 1 second in about 500 seconds 0.2% voltage 0.1 volt in about 25 volts 0.4%
resistance 0.5 in 33 1.5%
mass 0.5 gram in about 50 grams 1.0% temperature ½ degree in about 25 degrees 2.0%
total percent error ≈ 5%
P-1 Electrical Equivalent of Heat 69
given to the water leaks away into the surroundings. All these factors affect the accuracy of our results. This points out the difference between the idealized situation presented in the text book and the actual real world situation.
Activity
1: Measure the mass of the empty styrofoam cup. Mcup
2: Fill the styrofoam cup approximately 1/3 full with tap water and measure the mass of cup
and water, Mcup+water, and from this calculate the mass of the water alone, Mwater.
3: Measure the initial temperature of the water, Tinitial . In all temperature measurements, first
gently stir the water with the thermometer, for the warmer water tends to rise and the cooler water tends to sink.
4: Place the styrofoam cup into the cup-holder, and insert the heater into the cup. Connect the
heater to the transformer, and attach a voltmeter (AC VOLTS range)
5: Turn on the power switch and start the stop-watch at the same moment. Record the AC
voltage, VAC.
6: Record the voltage after each minute, until exactly 10 minutes or 600 seconds. Record the
final temperature as Tfinal . calculate the average voltage.
7: Calculate total electrical energy ( time x Voltage2 / Resistance = 600 x VAC2 / 33 ), Welectric
8: Calculate the temperature change, T = Tfinal – Tinitial
9: Calculate total thermal energy added to the water, Wthermal = Mwater x T.
10: Calculate the electrical equivalent of heat, Welectric / Wthermal
11: Calculate the “lost” energy, W lost = Welectric – Wthermal
12: Calculate the percentage error, ( W lost / Welectric ) x 100%
Mass of Styrofoam cup, Mcup ____________________
Time Temperature Time Temperature
0:00 = Tinitial 8:00
1:00 7:00
2:00 8:00
3:00 9:00
4:00 10:00 = Tfinal
5:00 – – – –
P-1 Electrical Equivalent of Heat 70
Mass of water + cup, Mwater+cup ____________________
Mass of water Mwater ( = Mwater + cup – Mcup ) ____________________
Initial water temperature, Twater ____________________
Initial voltage, VAC ____________________
Electric power, P ( = VAC2
/ 33 ) ____________________
time ____________________
Electrical energy, Welectric ( = P x time ) ____________________
Final temperature, Tfinal ____________________
Change in temperature, T ( Tfinal – Tinitial ) ____________________
Thermal energy into water W thermal ( = Mwater x T ) ____________________
Electrical equivalent of heat (Welectric / Wthermal ) ____________________
Energy “lost” , W lost ( = Welectric – W thermal ) ____________________
Percentage error = ( W lost / Welectric) x 100% ____________________
Looking Back: Why is it necessary to stir the water prior to each temperature measurement? _____________________________________________________________ _____________________________________________________________
What might be the advantages / disadvantages of starting with water about ten degrees below room temperature? __________________________________________ _______________________________________________________________
We used a double styrofoam cup to keep heat from leaking away. Can you think of a method of perfect heat insulation? __________________________________________ ______________________________________________________________________
Historically the mechanical equivalent was determined long before the electrical equivalent. Can you think of reasons why it happened this way? _________________ ____________________________________________________________________
Empty space, as between earth and sun, is thought to be really empty. If heat were to be transferred from the sun to the earth can the space in between really be cold? ___________________________________________________________________________________
Could you use ideas of the electrical equivalent of heat to measure the electrical power of a microwave oven? __________________________________________________ ___________________________________________________________________
P-2 Method of Mixtures 71
P-2 Method of Mixtures Objective: Objects in thermal contact but originally at different temperatures tend
toward a common temperature through heat transfer. We explore this.
Materials: Styrofoam calorimeter, steam generator, thermometer, accurate
balance scale If you add some cold milk to a cup of steaming hot coffee, the temperature of the mixture is less than the initial coffee temperature and more than the initial milk temperature. The total thermal energy or heat remains the same even as the two temperatures change. Of course the hot coffee – cold milk system is not isolated so thermal energy continually seeps in or out of the system.
In this activity we use hot water and water at room temperature in place of coffee and milk. It is important to remember that water, except close to freezing, expands with increasing temperature. The warmer, less dense water rises while the cooler more dense water sinks. Therefore before making a temperature measurement the water should be gently stirred..
You are to mix Mcool grams of cool water, initially at a temperature Tcool with
Mhot grams of hot water initially at a temperature Thot and measure the final
temperature of the mixture, Tmix. . Recall that one calorie is the heat involved in
changing the temperature of one gram of water by one degree Celsius. In our mixing, the calories leaving the hot water should equal the calories entering the cool water if there no outside heat entering or leaving during the measurements:
Mhot x ( Thot – Tmix ) = heat leaving hot water
Mcool x ( Tmix – Tcool ) = heat entering cold water
Activity
1: Weigh the styrofoam cup, fill it about 1/3 full of cool water, and weigh the combined cup and
water Determine the mass of the cool water. and place the cup with cool water in the holder.
Measure its temperature, Tcool..
2: Fill a second cup, 1/3 full of with hot water, and measure its temperature. Thot. A convenient
way to warm the water is to pass live steam through it
3: Add the hot water to the cool, stir, and measure at once the temperature of the mixture, Tmix
4: Measure the mass of the cup and mixture, and from this determine the mass of the hot water, Mhot . Notice that the mass of the hot water is not determined until after the mixing. This is to avoid the cooling of the hot water while weighing.
5; Determine the heat leaving the hot water and the heat entering the cool water, and the
difference of these values.
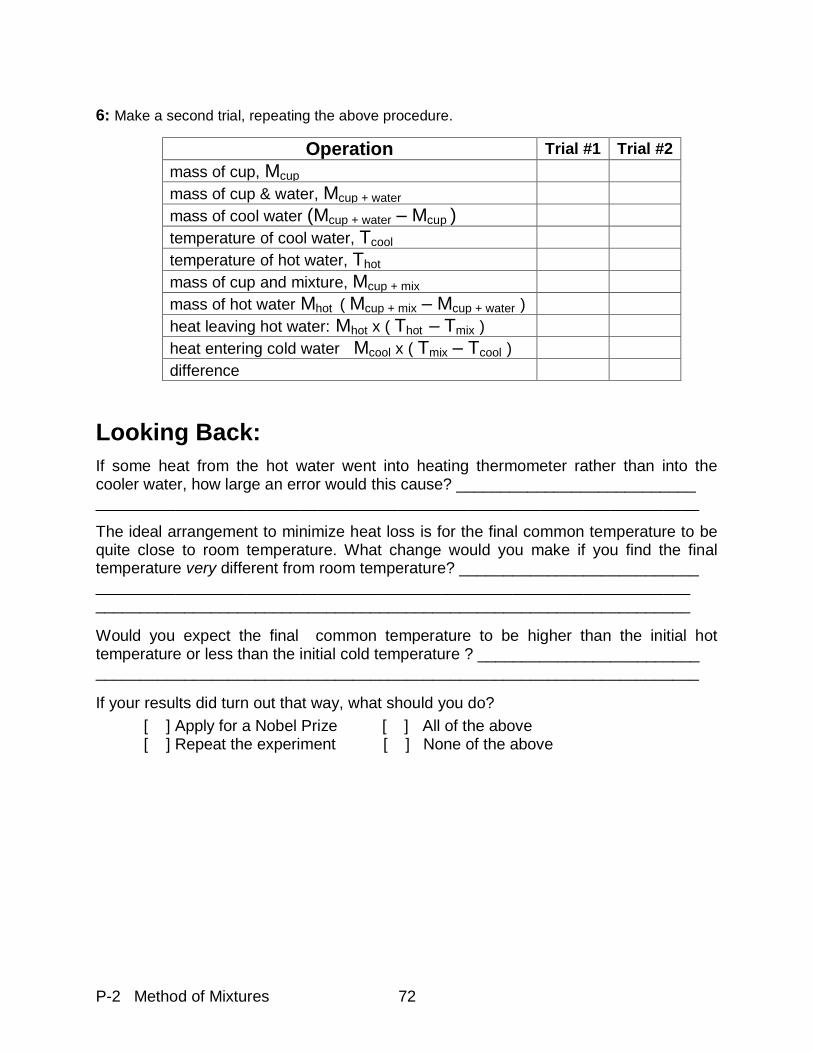
P-2 Method of Mixtures 72
6: Make a second trial, repeating the above procedure.
Looking Back:
If some heat from the hot water went into heating thermometer rather than into the cooler water, how large an error would this cause? ___________________________ ____________________________________________________________________
The ideal arrangement to minimize heat loss is for the final common temperature to be quite close to room temperature. What change would you make if you find the final temperature very different from room temperature? ___________________________ ___________________________________________________________________ ___________________________________________________________________
Would you expect the final common temperature to be higher than the initial hot temperature or less than the initial cold temperature ? _________________________ ____________________________________________________________________
If your results did turn out that way, what should you do?
[ ] Apply for a Nobel Prize [ ] All of the above [ ] Repeat the experiment [ ] None of the above
Operation Trial #1 Trial #2
mass of cup, Mcup
mass of cup & water, Mcup + water
mass of cool water (Mcup + water – Mcup )
temperature of cool water, Tcool
temperature of hot water, Thot
mass of cup and mixture, Mcup + mix
mass of hot water Mhot ( Mcup + mix – Mcup + water )
heat leaving hot water: Mhot x ( Thot – Tmix )
heat entering cold water Mcool x ( Tmix – Tcool )
difference
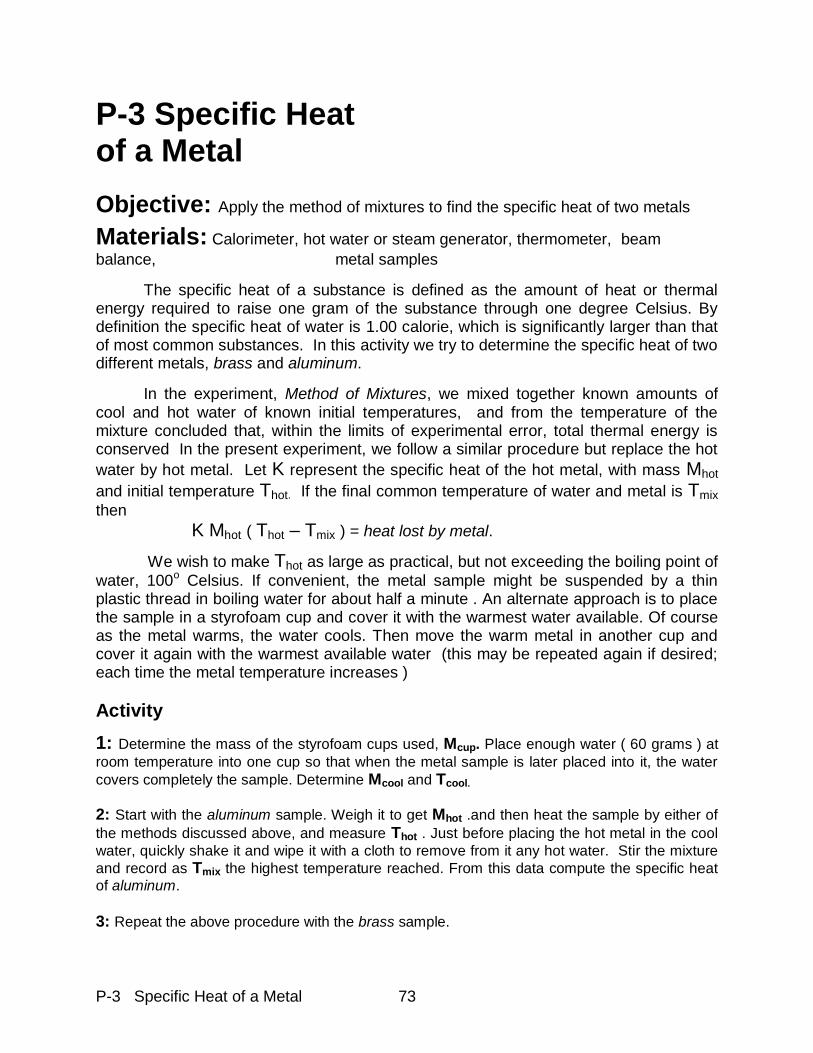
P-3 Specific Heat of a Metal 73
P-3 Specific Heat of a Metal
Objective: Apply the method of mixtures to find the specific heat of two metals
Materials: Calorimeter, hot water or steam generator, thermometer, beam
balance, metal samples
The specific heat of a substance is defined as the amount of heat or thermal energy required to raise one gram of the substance through one degree Celsius. By definition the specific heat of water is 1.00 calorie, which is significantly larger than that of most common substances. In this activity we try to determine the specific heat of two different metals, brass and aluminum.
In the experiment, Method of Mixtures, we mixed together known amounts of cool and hot water of known initial temperatures, and from the temperature of the mixture concluded that, within the limits of experimental error, total thermal energy is conserved In the present experiment, we follow a similar procedure but replace the hot
water by hot metal. Let K represent the specific heat of the hot metal, with mass Mhot and initial temperature Thot. If the final common temperature of water and metal is Tmix
then
K Mhot ( Thot – Tmix ) = heat lost by metal.
We wish to make Thot as large as practical, but not exceeding the boiling point of
water, 100o Celsius. If convenient, the metal sample might be suspended by a thin plastic thread in boiling water for about half a minute . An alternate approach is to place the sample in a styrofoam cup and cover it with the warmest water available. Of course as the metal warms, the water cools. Then move the warm metal in another cup and cover it again with the warmest available water (this may be repeated again if desired; each time the metal temperature increases )
Activity
1: Determine the mass of the styrofoam cups used, Mcup. Place enough water ( 60 grams ) at
room temperature into one cup so that when the metal sample is later placed into it, the water
covers completely the sample. Determine Mcool and Tcool.
2: Start with the aluminum sample. Weigh it to get Mhot .and then heat the sample by either of
the methods discussed above, and measure Thot . Just before placing the hot metal in the cool
water, quickly shake it and wipe it with a cloth to remove from it any hot water. Stir the mixture
and record as Tmix the highest temperature reached. From this data compute the specific heat
of aluminum.
3: Repeat the above procedure with the brass sample.
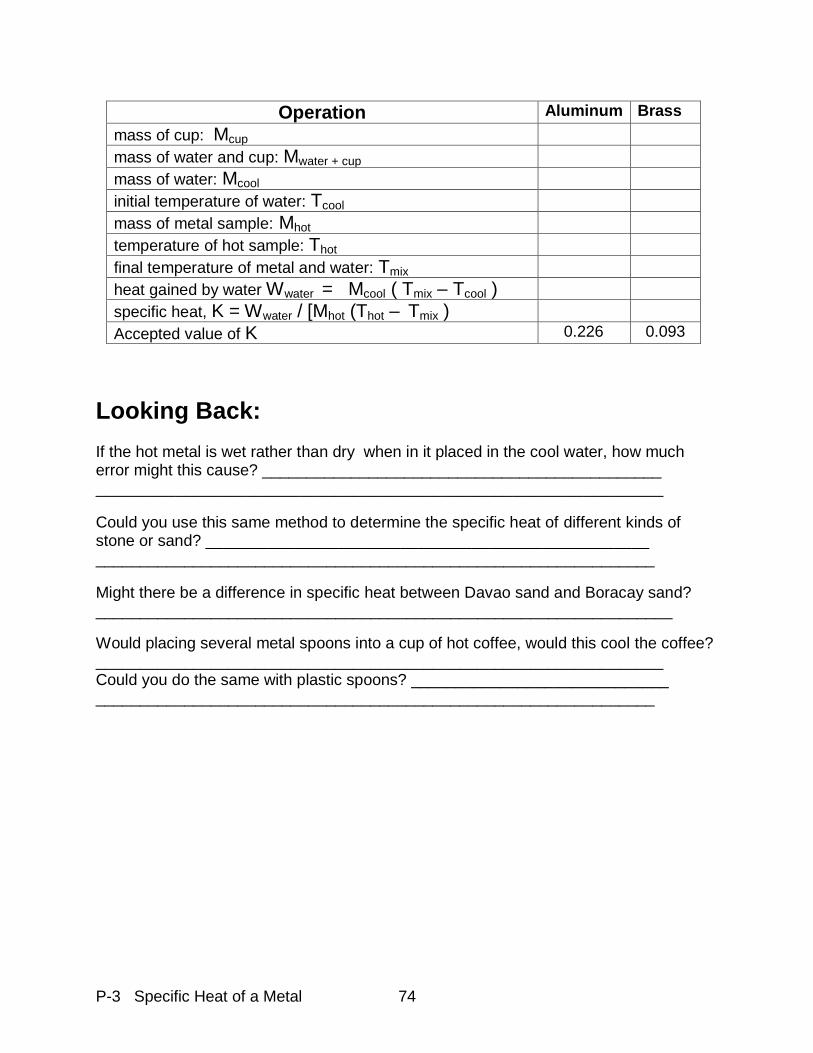
P-3 Specific Heat of a Metal 74
Looking Back:
If the hot metal is wet rather than dry when in it placed in the cool water, how much error might this cause? _____________________________________________ ________________________________________________________________
Could you use this same method to determine the specific heat of different kinds of stone or sand? __________________________________________________ _______________________________________________________________
Might there be a difference in specific heat between Davao sand and Boracay sand? _________________________________________________________________
Would placing several metal spoons into a cup of hot coffee, would this cool the coffee? ________________________________________________________________ Could you do the same with plastic spoons? _____________________________ _______________________________________________________________
Operation Aluminum Brass
mass of cup: Mcup
mass of water and cup: Mwater + cup
mass of water: Mcool
initial temperature of water: Tcool
mass of metal sample: Mhot
temperature of hot sample: Thot
final temperature of metal and water: Tmix
heat gained by water Wwater = Mcool ( Tmix – Tcool )
specific heat, K = Wwater / [Mhot (Thot – Tmix )
Accepted value of K 0.226 0.093
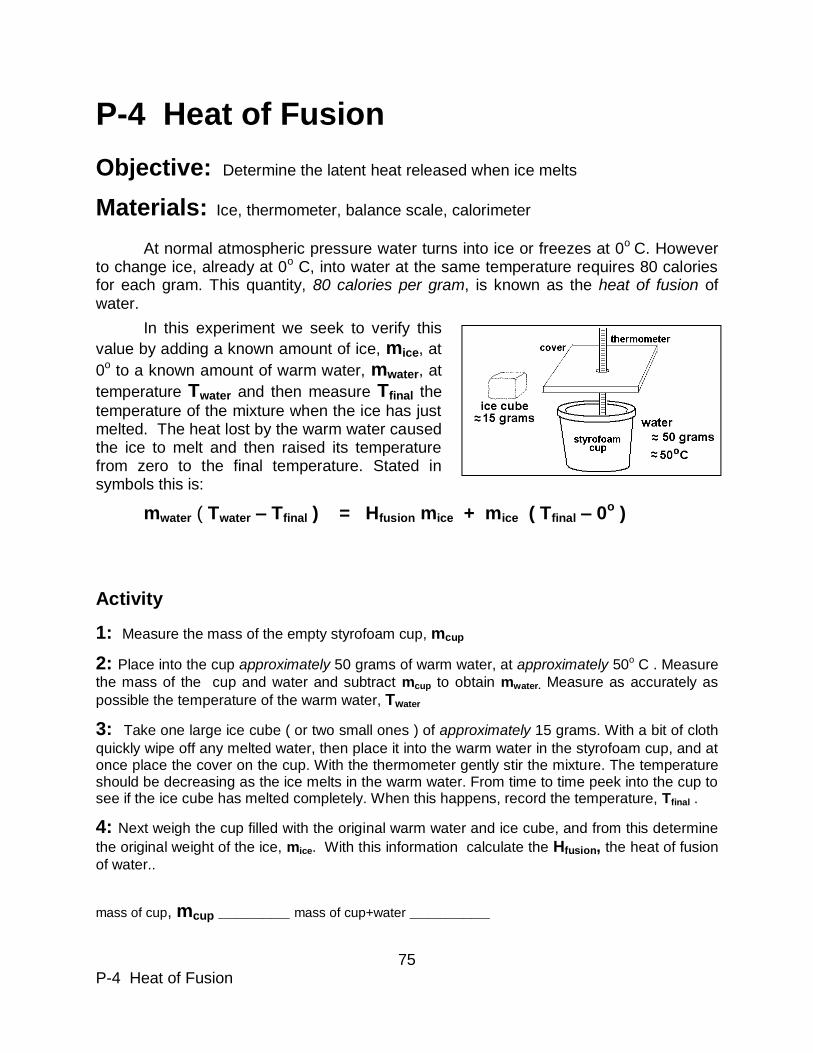
75 P-4 Heat of Fusion
P-4 Heat of Fusion
Objective: Determine the latent heat released when ice melts
Materials: Ice, thermometer, balance scale, calorimeter
At normal atmospheric pressure water turns into ice or freezes at 0o C. However
to change ice, already at 0o C, into water at the same temperature requires 80 calories for each gram. This quantity, 80 calories per gram, is known as the heat of fusion of water.
In this experiment we seek to verify this
value by adding a known amount of ice, mice, at
0o to a known amount of warm water, mwater, at
temperature Twater and then measure Tfinal the
temperature of the mixture when the ice has just melted. The heat lost by the warm water caused the ice to melt and then raised its temperature from zero to the final temperature. Stated in symbols this is:
mwater ( Twater – Tfinal ) = Hfusion mice + mice ( Tfinal – 0o )
Activity
1: Measure the mass of the empty styrofoam cup, mcup
2: Place into the cup approximately 50 grams of warm water, at approximately 50o C . Measure
the mass of the cup and water and subtract mcup to obtain mwater. Measure as accurately as
possible the temperature of the warm water, Twater
3: Take one large ice cube ( or two small ones ) of approximately 15 grams. With a bit of cloth
quickly wipe off any melted water, then place it into the warm water in the styrofoam cup, and at once place the cover on the cup. With the thermometer gently stir the mixture. The temperature should be decreasing as the ice melts in the warm water. From time to time peek into the cup to see if the ice cube has melted completely. When this happens, record the temperature, Tfinal .
4: Next weigh the cup filled with the original warm water and ice cube, and from this determine
the original weight of the ice, mice. With this information calculate the Hfusion, the heat of fusion
of water..
mass of cup, mcup ________ mass of cup+water _________
76 P-4 Heat of Fusion
mass of water, mwater _______
temperature of warm water Twater ________
final temperature Tfinal ____________
mass of ice, mice ____________
Heat of fusion of water, Hfusion _____________
Looking Back:
Is all ice at the same temperature of 0o C ___________________________________
Does this mean that ice itself might have its own specific heat, different from that of water ? ____________________________________________________________ __________________________________________________________________
As water turns into ice does it expand? ___________________________________
When you fill an ice-cube tray with water, the water level is flat, but when you remove the tray from the freezer, the ice seems to have formed a tiny hill.? In expanding on freezing did the water-to-ice do work on its surroundings ? _____________________ ____________________________________________________________________
If work was done on freezing, from where did the energy come ?
Water, on freezing, expands. When hot candle wax turn from liquid to solid, does the volume expand, contract or stay the same On freezing and melting is there any chemical change, that is, new chemicals formed? _____________________________________________________________ Does this mean that melting-freezing is all a matter of energy and structure? ______ _________________________________________________________________
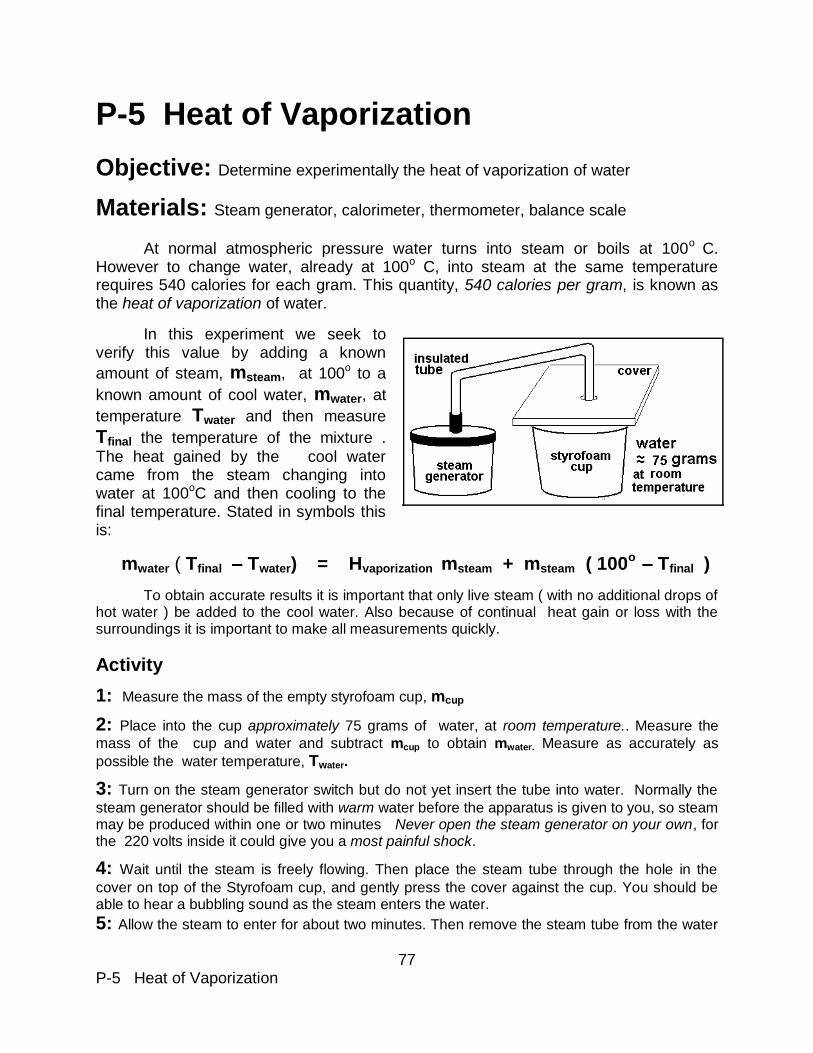
77 P-5 Heat of Vaporization
P-5 Heat of Vaporization
Objective: Determine experimentally the heat of vaporization of water
Materials: Steam generator, calorimeter, thermometer, balance scale
At normal atmospheric pressure water turns into steam or boils at 100o C.
However to change water, already at 100o C, into steam at the same temperature requires 540 calories for each gram. This quantity, 540 calories per gram, is known as the heat of vaporization of water.
In this experiment we seek to verify this value by adding a known
amount of steam, msteam, at 100o to a
known amount of cool water, mwater, at
temperature Twater and then measure
Tfinal the temperature of the mixture .
The heat gained by the cool water came from the steam changing into water at 100oC and then cooling to the final temperature. Stated in symbols this is:
mwater ( Tfinal – Twater) = Hvaporization msteam + msteam ( 100o
– Tfinal )
To obtain accurate results it is important that only live steam ( with no additional drops of hot water ) be added to the cool water. Also because of continual heat gain or loss with the surroundings it is important to make all measurements quickly.
Activity
1: Measure the mass of the empty styrofoam cup, mcup
2: Place into the cup approximately 75 grams of water, at room temperature.. Measure the
mass of the cup and water and subtract mcup to obtain mwater. Measure as accurately as
possible the water temperature, Twater.
3: Turn on the steam generator switch but do not yet insert the tube into water. Normally the
steam generator should be filled with warm water before the apparatus is given to you, so steam may be produced within one or two minutes Never open the steam generator on your own, for the 220 volts inside it could give you a most painful shock.
4: Wait until the steam is freely flowing. Then place the steam tube through the hole in the
cover on top of the Styrofoam cup, and gently press the cover against the cup. You should be able to hear a bubbling sound as the steam enters the water.
5: Allow the steam to enter for about two minutes. Then remove the steam tube from the water
78 P-5 Heat of Vaporization
and after it is removed, turn off the electricity to the steam generator. Measure accurately and
quickly the final temperature of the mixture, Tfinal .If Tfinal. is greater than 90o you probably
added too much steam. If so, start all over. Measure the mass of the cup with the original
water and condensed steam. From this data determine the mass of the steam added, msteam .
Calculate the heat of vaporization, Hvaporization. and compare your results to the expected value
of 540 calories per gram.
6: Now that you have developed your cooking skills make a second trial.
Trial #1
mass of cup, mcup _______ mass of cup + water _________ mass of water, mwater _______
temperature of water Twater ________ final temperature Tfinal ____________
mass of cup + water + steam _________ mass of steam, msteam ________
Heat of vaporization of water, Hvaporization __________
Trial #2
mass of cup, mcup _______ mass of cup + water _________ mass of water, mwater _______
temperature of water Twater ________ final temperature Tfinal ____________
mass of cup + water + steam _________ mass of steam, msteam ________
Heat of vaporization of water, Hvaporization __________
Looking Back:
As each gram of liquid turns to vapor, it must do work against its surroundings. Does this suggest that the amount of needed energy might depend on the surrounding pressure? Explain _______________________________________________ ______________________________________________________________ On top of a high mountain (where atmospheric pressure is less than at sea level ) water boils at less than 100o C. Do you think the heat of vaporization might also change on the high mountain? _________________________________________________ _________________________________________________________________ Can liquid water change into water vapor at room temperature ? ______________
For wet clothes to dry is it necessary to heat them to 100o C _________________ _________________________________________________________________
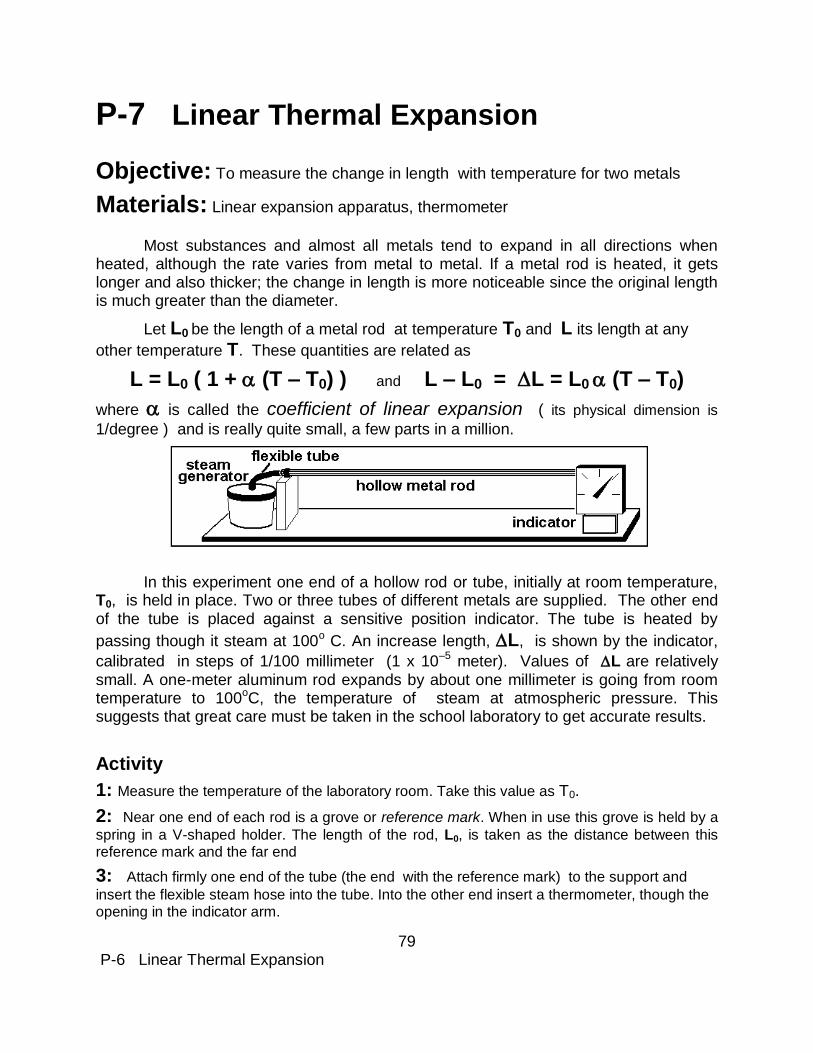
79 P-6 Linear Thermal Expansion
P-7 Linear Thermal Expansion
Objective: To measure the change in length with temperature for two metals
Materials: Linear expansion apparatus, thermometer
Most substances and almost all metals tend to expand in all directions when heated, although the rate varies from metal to metal. If a metal rod is heated, it gets longer and also thicker; the change in length is more noticeable since the original length is much greater than the diameter.
Let L0 be the length of a metal rod at temperature T0 and L its length at any
other temperature T. These quantities are related as
L = L0 ( 1 + (T – T0) ) and L – L0 = L = L0 (T – T0)
where is called the coefficient of linear expansion ( its physical dimension is
1/degree ) and is really quite small, a few parts in a million.
In this experiment one end of a hollow rod or tube, initially at room temperature, T0, is held in place. Two or three tubes of different metals are supplied. The other end of the tube is placed against a sensitive position indicator. The tube is heated by
passing though it steam at 100o C. An increase length, L, is shown by the indicator,
calibrated in steps of 1/100 millimeter (1 x 10⁻⁵ meter). Values of L are relatively small. A one-meter aluminum rod expands by about one millimeter is going from room temperature to 100oC, the temperature of steam at atmospheric pressure. This suggests that great care must be taken in the school laboratory to get accurate results.
Activity
1: Measure the temperature of the laboratory room. Take this value as T0.
2: Near one end of each rod is a grove or reference mark. When in use this grove is held by a
spring in a V-shaped holder. The length of the rod, L0, is taken as the distance between this reference mark and the far end
3: Attach firmly one end of the tube (the end with the reference mark) to the support and
insert the flexible steam hose into the tube. Into the other end insert a thermometer, though the opening in the indicator arm.
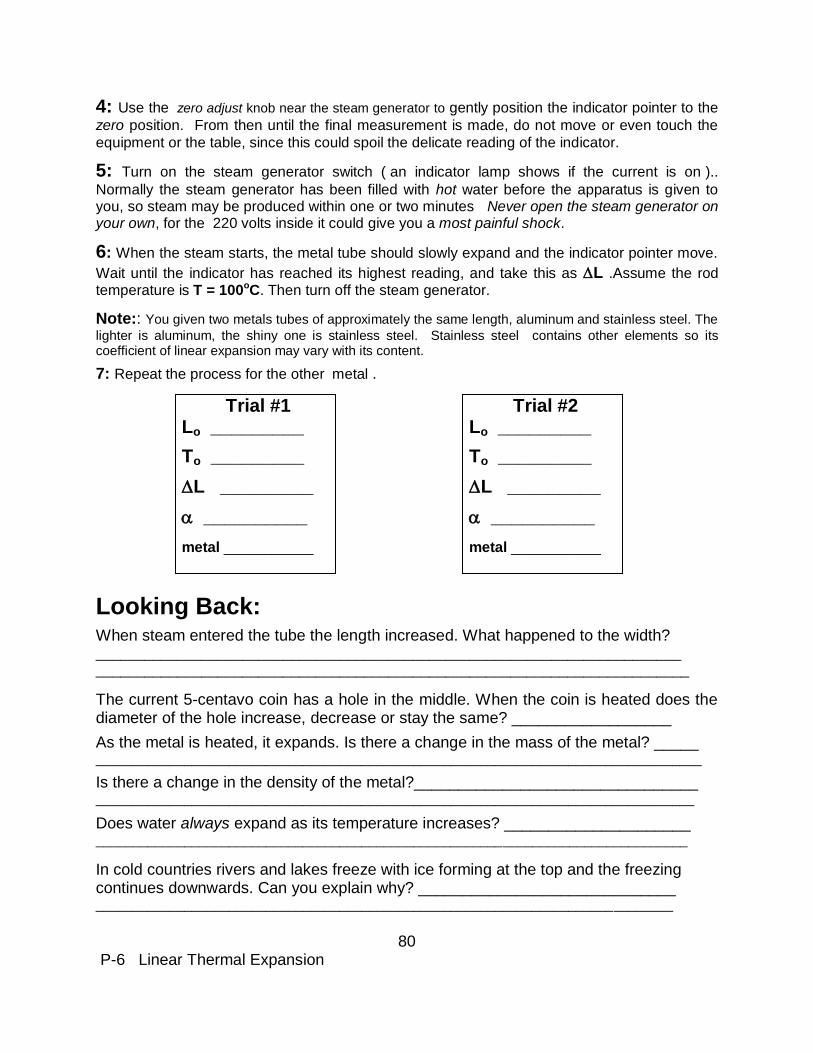
80 P-6 Linear Thermal Expansion
4: Use the zero adjust knob near the steam generator to gently position the indicator pointer to the
zero position. From then until the final measurement is made, do not move or even touch the
equipment or the table, since this could spoil the delicate reading of the indicator.
5: Turn on the steam generator switch ( an indicator lamp shows if the current is on )..
Normally the steam generator has been filled with hot water before the apparatus is given to you, so steam may be produced within one or two minutes Never open the steam generator on your own, for the 220 volts inside it could give you a most painful shock.
6: When the steam starts, the metal tube should slowly expand and the indicator pointer move.
Wait until the indicator has reached its highest reading, and take this as L .Assume the rod temperature is T = 100oC. Then turn off the steam generator.
Note:: You given two metals tubes of approximately the same length, aluminum and stainless steel. The
lighter is aluminum, the shiny one is stainless steel. Stainless steel contains other elements so its coefficient of linear expansion may vary with its content.
7: Repeat the process for the other metal .
Looking Back:
When steam entered the tube the length increased. What happened to the width? ________________________________________________________________________ _________________________________________________________________________
The current 5-centavo coin has a hole in the middle. When the coin is heated does the diameter of the hole increase, decrease or stay the same? __________________
As the metal is heated, it expands. Is there a change in the mass of the metal? _____ __________________________________________________________________________________
Is there a change in the density of the metal?________________________________ _________________________________________________________________________________
Does water always expand as its temperature increases? _____________________ ________________________________________________________________________________
In cold countries rivers and lakes freeze with ice forming at the top and the freezing continues downwards. Can you explain why? _____________________________
______________________________________________________________________________
Trial #1
Lo _________
To _________
L _________
__________
metal ___________
Trial #2
Lo _________
To _________
L _________
__________
metal ___________
79 P-6 Linear Thermal Expansion
zero position. From then until the final measurement is made, do not move or even touch the equipment or the table, since this could spoil the delicate reading of the indicator.
5: Turn on the steam generator switch ( an indicator lamp shows if the current is on )..
Normally the steam generator has been filled with hot water before the apparatus is given to you, so steam may be produced within one or two minutes Never open the steam generator on your own, for the 220 volts inside it could give you a most painful shock.
6: When the steam starts, the metal tube should slowly expand and the indicator pointer move.
Wait until the indicator has reached its highest reading, and take this as L .Assume the rod
temperature is T = 100oC. Then turn off the steam generator.
Note:: You given two metals tubes of approximately the same length, aluminum and stainless steel. The
lighter is aluminum, the shiny one is stainless steel. Stainless steel contains other elements so its coefficient of linear expansion may vary with its content.
7: Repeat the process for the other metal .
Looking Back:
When steam entered the tube the length increased. What happened to the width? ________________________________________________________________________ _________________________________________________________________________
The current 5-centavo coin has a hole in the middle. When the coin is heated does the diameter of the hole increase, decrease or stay the same? __________________
As the metal is heated, it expands. Is there a change in the mass of the metal? _____ __________________________________________________________________________________
Is there a change in the density of the metal?________________________________ _________________________________________________________________________________
Does water always expand as its temperature increases? _____________________ ________________________________________________________________________________
In cold countries rivers and lakes freeze with ice forming at the top and the freezing continues downwards. Can you explain why? _____________________________
______________________________________________________________________________
Trial #1
Lo _________
To _________
L _________
__________
metal ___________
Trial #2
Lo _________
To _________
L _________
__________
metal ___________
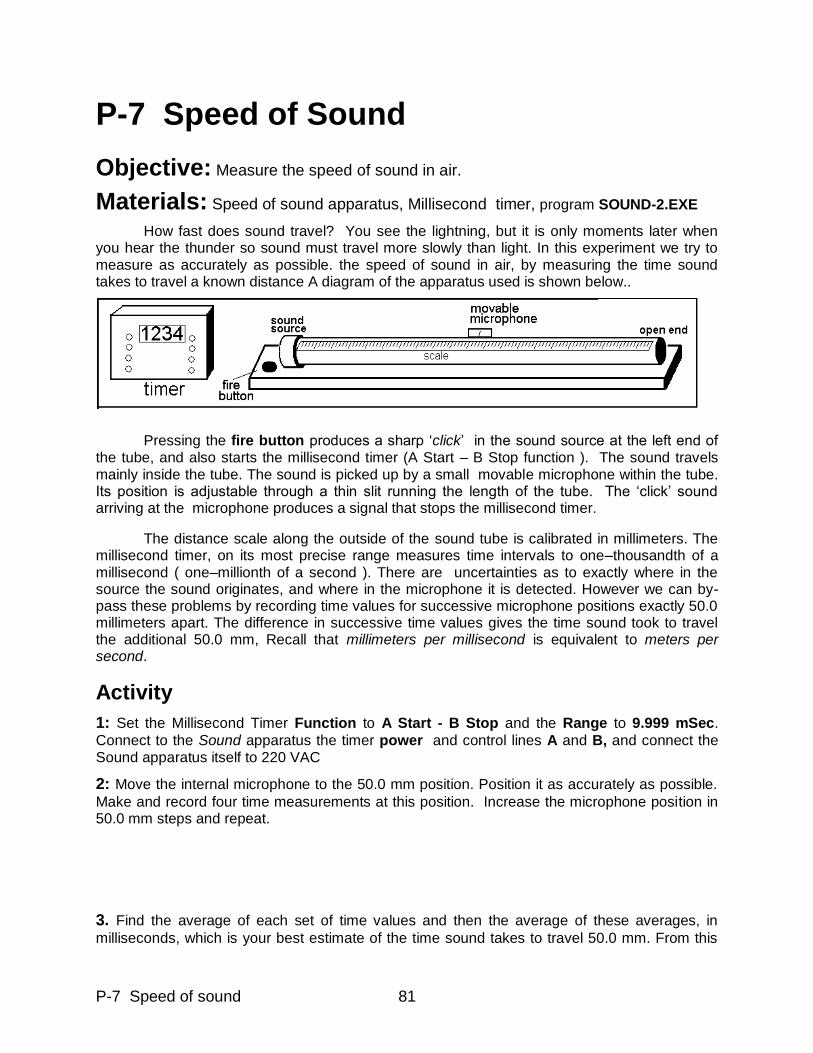
P-7 Speed of sound 81
P-7 Speed of Sound
Objective: Measure the speed of sound in air.
Materials: Speed of sound apparatus, Millisecond timer, program SOUND-2.EXE
How fast does sound travel? You see the lightning, but it is only moments later when you hear the thunder so sound must travel more slowly than light. In this experiment we try to measure as accurately as possible. the speed of sound in air, by measuring the time sound takes to travel a known distance A diagram of the apparatus used is shown below..
Pressing the fire button produces a sharp „click‟ in the sound source at the left end of the tube, and also starts the millisecond timer (A Start – B Stop function ). The sound travels mainly inside the tube. The sound is picked up by a small movable microphone within the tube. Its position is adjustable through a thin slit running the length of the tube. The „click‟ sound arriving at the microphone produces a signal that stops the millisecond timer.
The distance scale along the outside of the sound tube is calibrated in millimeters. The millisecond timer, on its most precise range measures time intervals to one–thousandth of a millisecond ( one–millionth of a second ). There are uncertainties as to exactly where in the source the sound originates, and where in the microphone it is detected. However we can by-pass these problems by recording time values for successive microphone positions exactly 50.0 millimeters apart. The difference in successive time values gives the time sound took to travel the additional 50.0 mm, Recall that millimeters per millisecond is equivalent to meters per second.
Activity
1: Set the Millisecond Timer Function to A Start - B Stop and the Range to 9.999 mSec.
Connect to the Sound apparatus the timer power and control lines A and B, and connect the Sound apparatus itself to 220 VAC
2: Move the internal microphone to the 50.0 mm position. Position it as accurately as possible.
Make and record four time measurements at this position. Increase the microphone position in 50.0 mm steps and repeat.
3. Find the average of each set of time values and then the average of these averages, in
milliseconds, which is your best estimate of the time sound takes to travel 50.0 mm. From this
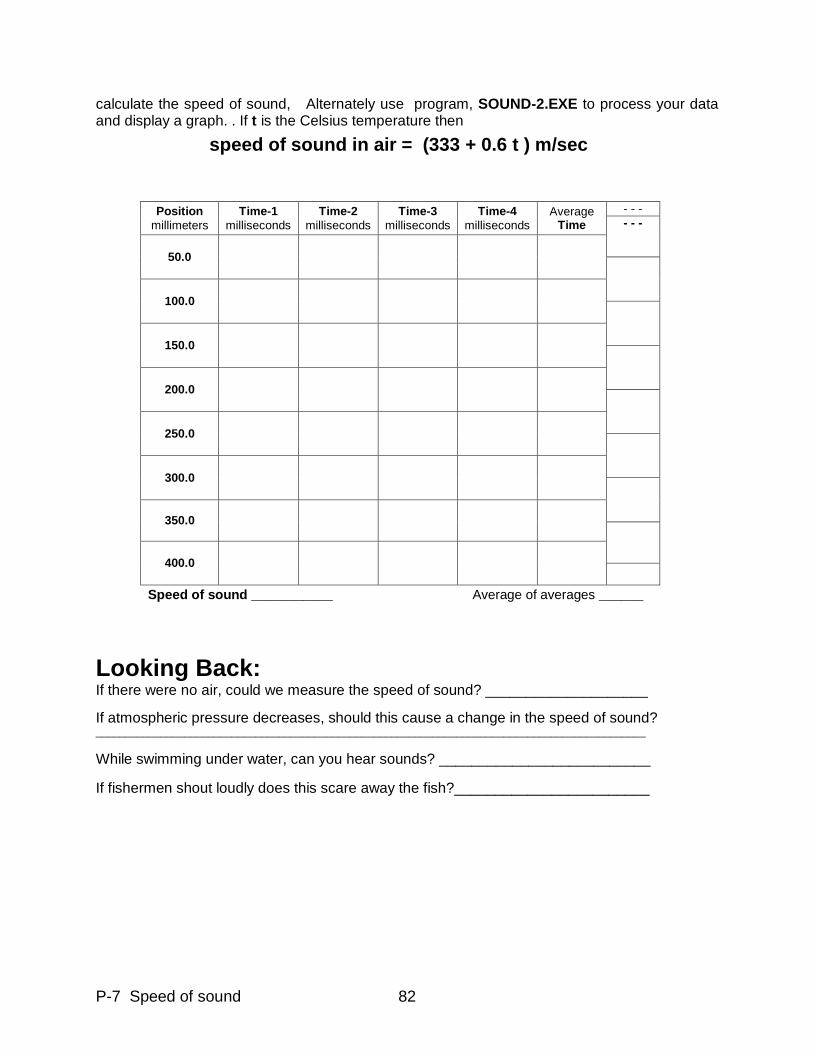
P-7 Speed of sound 82
calculate the speed of sound, Alternately use program, SOUND-2.EXE to process your data and display a graph. . If t is the Celsius temperature then
speed of sound in air = (333 + 0.6 t ) m/sec
Looking Back: If there were no air, could we measure the speed of sound? ____________________
If atmospheric pressure decreases, should this cause a change in the speed of sound? _____________________________________________________________________________________________
While swimming under water, can you hear sounds? __________________________
If fishermen shout loudly does this scare away the fish?________________________
Position
millimeters
Time-1
milliseconds
Time-2
milliseconds
Time-3
milliseconds
Time-4
milliseconds Average
Time
- - -
- - -
50.0
100.0
150.0
200.0
250.0
300.0
350.0
400.0
Speed of sound ___________ Average of averages ______
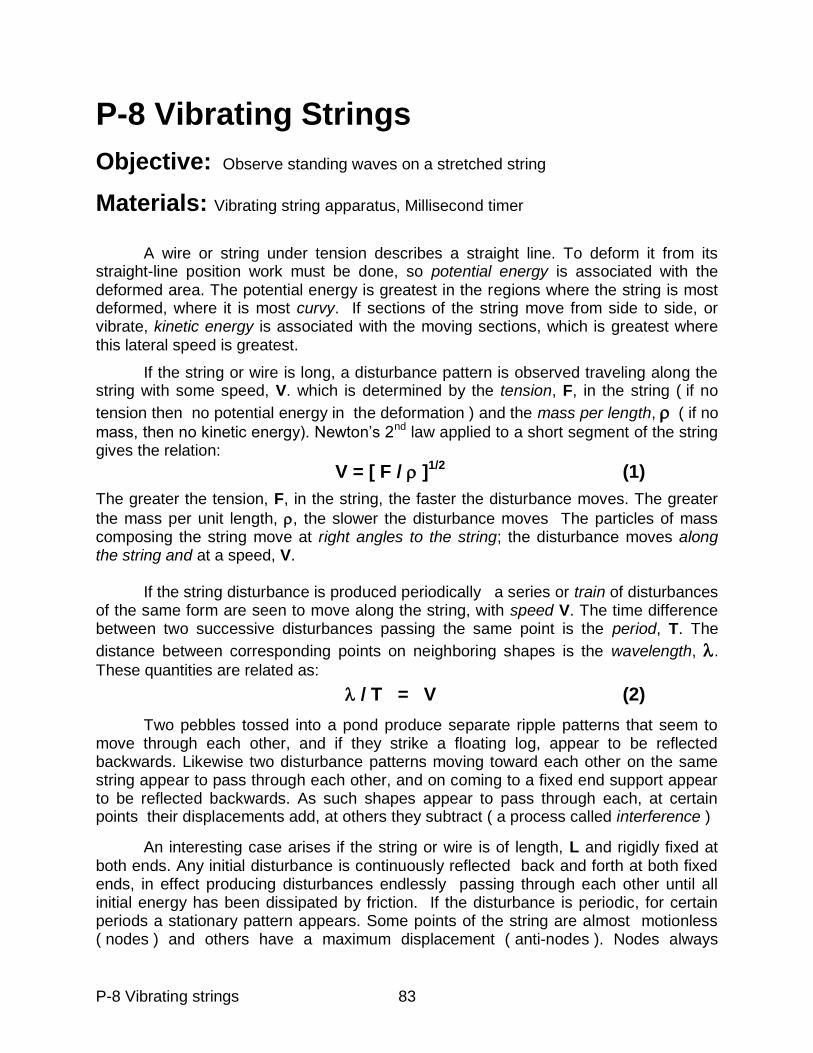
P-8 Vibrating strings 83
P-8 Vibrating Strings
Objective: Observe standing waves on a stretched string
Materials: Vibrating string apparatus, Millisecond timer
A wire or string under tension describes a straight line. To deform it from its straight-line position work must be done, so potential energy is associated with the deformed area. The potential energy is greatest in the regions where the string is most deformed, where it is most curvy. If sections of the string move from side to side, or vibrate, kinetic energy is associated with the moving sections, which is greatest where this lateral speed is greatest.
If the string or wire is long, a disturbance pattern is observed traveling along the string with some speed, V. which is determined by the tension, F, in the string ( if no
tension then no potential energy in the deformation ) and the mass per length, ( if no
mass, then no kinetic energy). Newton‟s 2nd law applied to a short segment of the string gives the relation:
V = [ F / ]1/2
(1)
The greater the tension, F, in the string, the faster the disturbance moves. The greater
the mass per unit length, , the slower the disturbance moves The particles of mass composing the string move at right angles to the string; the disturbance moves along the string and at a speed, V. If the string disturbance is produced periodically a series or train of disturbances of the same form are seen to move along the string, with speed V. The time difference between two successive disturbances passing the same point is the period, T. The
distance between corresponding points on neighboring shapes is the wavelength, .
These quantities are related as:
/ T = V (2)
Two pebbles tossed into a pond produce separate ripple patterns that seem to move through each other, and if they strike a floating log, appear to be reflected backwards. Likewise two disturbance patterns moving toward each other on the same string appear to pass through each other, and on coming to a fixed end support appear to be reflected backwards. As such shapes appear to pass through each, at certain points their displacements add, at others they subtract ( a process called interference )
An interesting case arises if the string or wire is of length, L and rigidly fixed at both ends. Any initial disturbance is continuously reflected back and forth at both fixed ends, in effect producing disturbances endlessly passing through each other until all initial energy has been dissipated by friction. If the disturbance is periodic, for certain periods a stationary pattern appears. Some points of the string are almost motionless ( nodes ) and others have a maximum displacement ( anti-nodes ). Nodes always
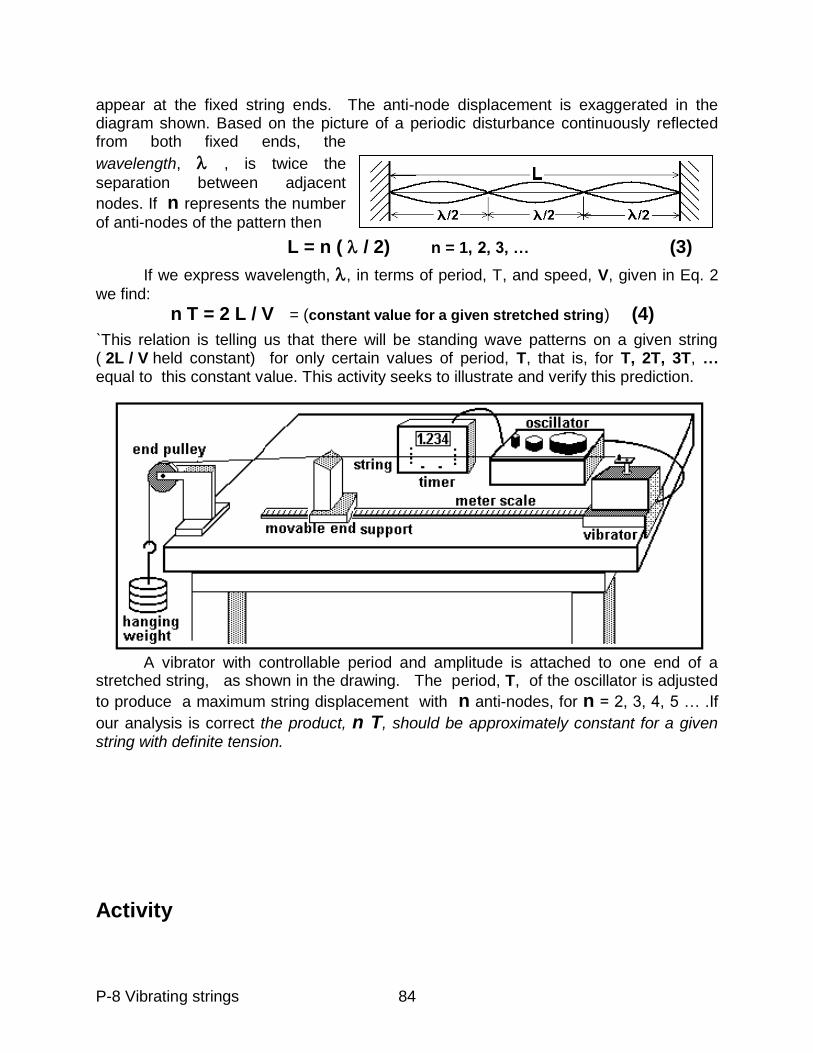
P-8 Vibrating strings 84
appear at the fixed string ends. The anti-node displacement is exaggerated in the diagram shown. Based on the picture of a periodic disturbance continuously reflected from both fixed ends, the
wavelength, , is twice the
separation between adjacent
nodes. If n represents the number
of anti-nodes of the pattern then
L = n ( / 2) n = 1, 2, 3, … (3)
If we express wavelength, , in terms of period, T, and speed, V, given in Eq. 2
we find:
n T = 2 L / V = (constant value for a given stretched string) (4)
`This relation is telling us that there will be standing wave patterns on a given string ( 2L / V held constant) for only certain values of period, T, that is, for T, 2T, 3T, … equal to this constant value. This activity seeks to illustrate and verify this prediction.
A vibrator with controllable period and amplitude is attached to one end of a stretched string, as shown in the drawing. The period, T, of the oscillator is adjusted
to produce a maximum string displacement with n anti-nodes, for n = 2, 3, 4, 5 … .If
our analysis is correct the product, n T, should be approximately constant for a given string with definite tension.
Activity
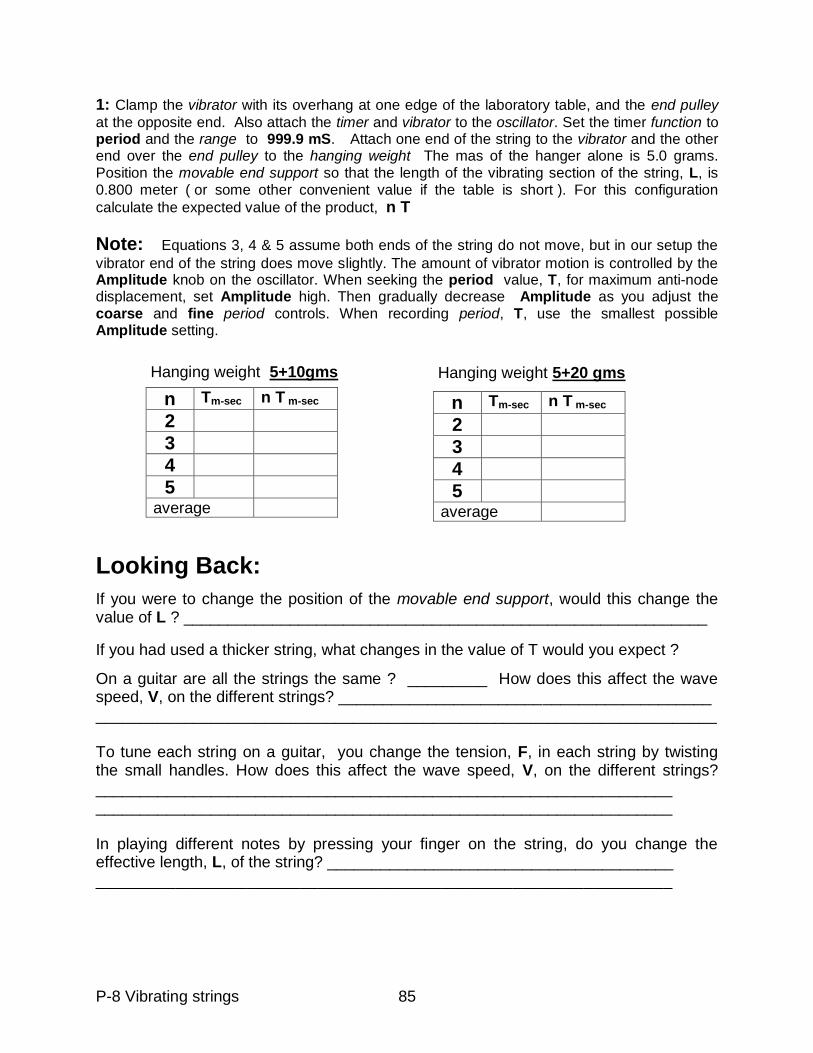
P-8 Vibrating strings 85
1: Clamp the vibrator with its overhang at one edge of the laboratory table, and the end pulley
at the opposite end. Also attach the timer and vibrator to the oscillator. Set the timer function to period and the range to 999.9 mS. Attach one end of the string to the vibrator and the other end over the end pulley to the hanging weight The mas of the hanger alone is 5.0 grams. Position the movable end support so that the length of the vibrating section of the string, L, is 0.800 meter ( or some other convenient value if the table is short ). For this configuration
calculate the expected value of the product, n T
Note: Equations 3, 4 & 5 assume both ends of the string do not move, but in our setup the
vibrator end of the string does move slightly. The amount of vibrator motion is controlled by the Amplitude knob on the oscillator. When seeking the period value, T, for maximum anti-node displacement, set Amplitude high. Then gradually decrease Amplitude as you adjust the coarse and fine period controls. When recording period, T, use the smallest possible Amplitude setting.
Looking Back:
If you were to change the position of the movable end support, would this change the value of L ? ___________________________________________________________
If you had used a thicker string, what changes in the value of T would you expect ?
On a guitar are all the strings the same ? _________ How does this affect the wave speed, V, on the different strings? __________________________________________ ______________________________________________________________________ To tune each string on a guitar, you change the tension, F, in each string by twisting the small handles. How does this affect the wave speed, V, on the different strings? _________________________________________________________________ _________________________________________________________________ In playing different notes by pressing your finger on the string, do you change the effective length, L, of the string? _______________________________________ _________________________________________________________________
Hanging weight 5+10gms
n Tm-sec n T m-sec
2
3
4
5
average
Hanging weight 5+20 gms
n Tm-sec n T m-sec
2
3
4
5
average
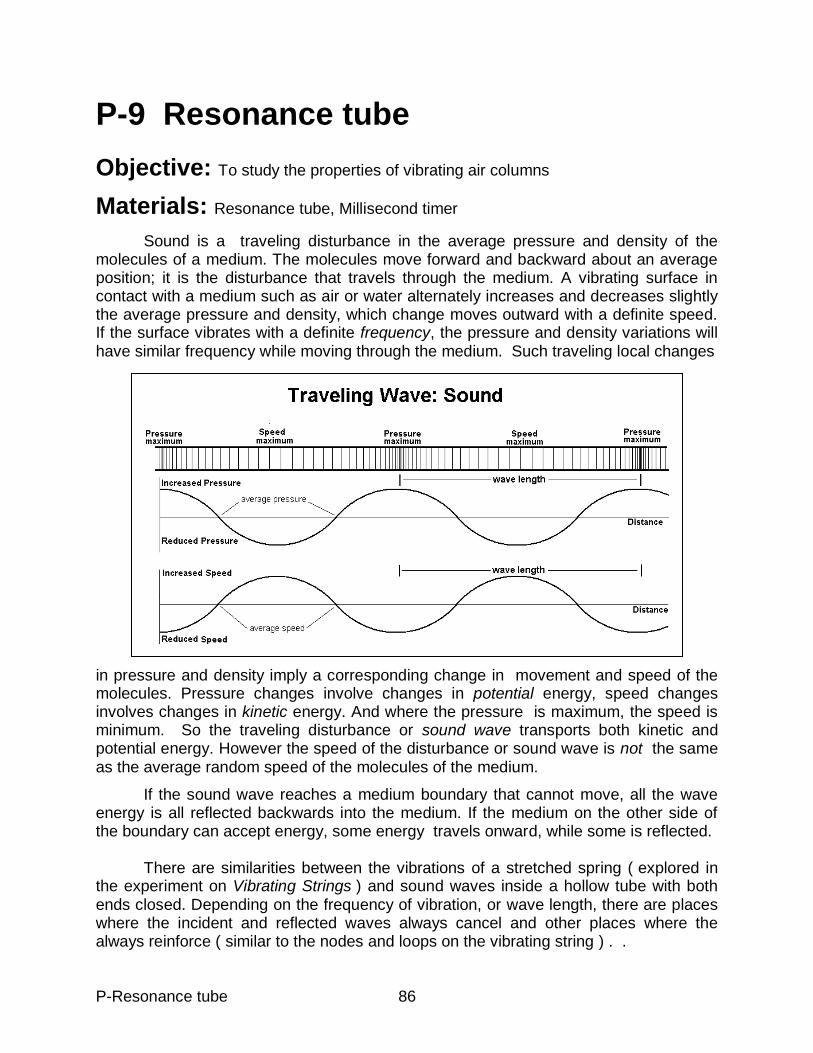
P-Resonance tube 86
P-9 Resonance tube
Objective: To study the properties of vibrating air columns
Materials: Resonance tube, Millisecond timer
Sound is a traveling disturbance in the average pressure and density of the molecules of a medium. The molecules move forward and backward about an average position; it is the disturbance that travels through the medium. A vibrating surface in contact with a medium such as air or water alternately increases and decreases slightly the average pressure and density, which change moves outward with a definite speed. If the surface vibrates with a definite frequency, the pressure and density variations will have similar frequency while moving through the medium. Such traveling local changes
in pressure and density imply a corresponding change in movement and speed of the molecules. Pressure changes involve changes in potential energy, speed changes involves changes in kinetic energy. And where the pressure is maximum, the speed is minimum. So the traveling disturbance or sound wave transports both kinetic and potential energy. However the speed of the disturbance or sound wave is not the same as the average random speed of the molecules of the medium.
If the sound wave reaches a medium boundary that cannot move, all the wave energy is all reflected backwards into the medium. If the medium on the other side of the boundary can accept energy, some energy travels onward, while some is reflected. There are similarities between the vibrations of a stretched spring ( explored in the experiment on Vibrating Strings ) and sound waves inside a hollow tube with both ends closed. Depending on the frequency of vibration, or wave length, there are places where the incident and reflected waves always cancel and other places where the always reinforce ( similar to the nodes and loops on the vibrating string ) . .
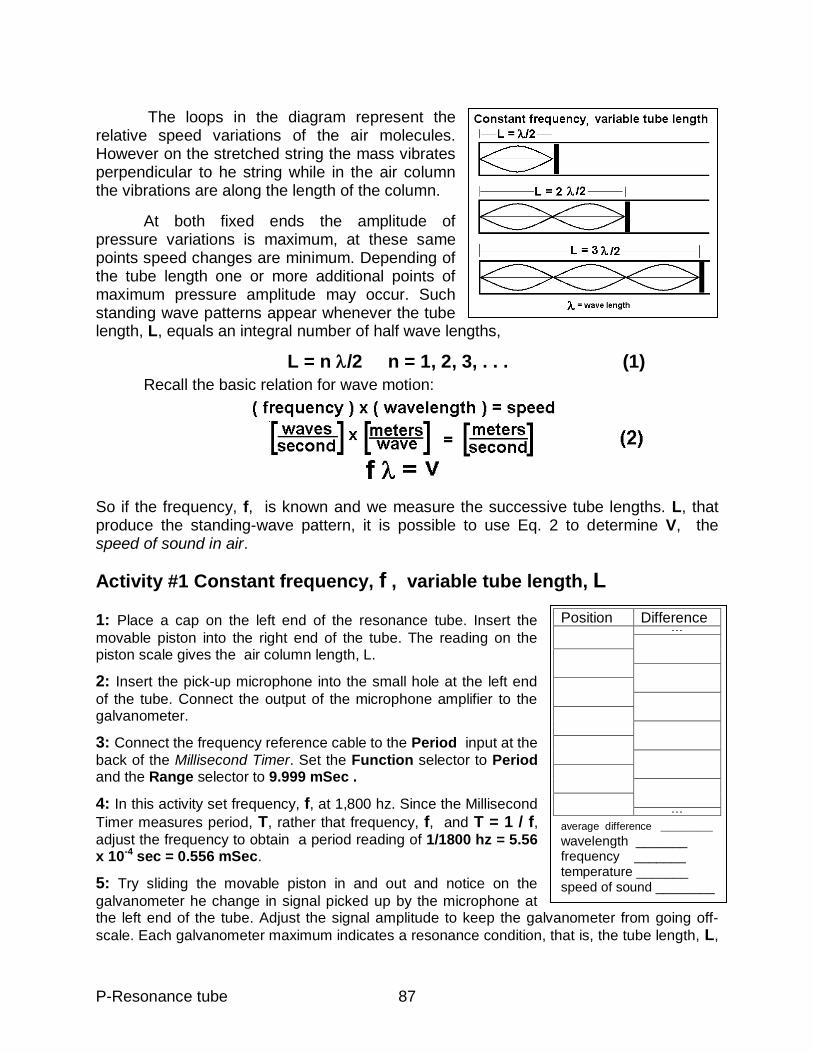
P-Resonance tube 87
The loops in the diagram represent the relative speed variations of the air molecules. However on the stretched string the mass vibrates perpendicular to he string while in the air column the vibrations are along the length of the column.
At both fixed ends the amplitude of pressure variations is maximum, at these same points speed changes are minimum. Depending of the tube length one or more additional points of maximum pressure amplitude may occur. Such standing wave patterns appear whenever the tube length, L, equals an integral number of half wave lengths,
L = n /2 n = 1, 2, 3, . . . (1)
Recall the basic relation for wave motion:
So if the frequency, f, is known and we measure the successive tube lengths. L, that produce the standing-wave pattern, it is possible to use Eq. 2 to determine V, the speed of sound in air.
Activity #1 Constant frequency, f , variable tube length, L
1: Place a cap on the left end of the resonance tube. Insert the
movable piston into the right end of the tube. The reading on the piston scale gives the air column length, L.
2: Insert the pick-up microphone into the small hole at the left end
of the tube. Connect the output of the microphone amplifier to the galvanometer.
3: Connect the frequency reference cable to the Period input at the
back of the Millisecond Timer. Set the Function selector to Period and the Range selector to 9.999 mSec .
4: In this activity set frequency, f, at 1,800 hz. Since the Millisecond
Timer measures period, T, rather that frequency, f, and T = 1 / f, adjust the frequency to obtain a period reading of 1/1800 hz = 5.56 x 10⁻⁴ sec = 0.556 mSec.
5: Try sliding the movable piston in and out and notice on the
galvanometer he change in signal picked up by the microphone at the left end of the tube. Adjust the signal amplitude to keep the galvanometer from going off-
scale. Each galvanometer maximum indicates a resonance condition, that is, the tube length, L,
Position Difference - - -
- - -
average difference _______ wavelength _______
frequency _______ temperature _______ speed of sound ________
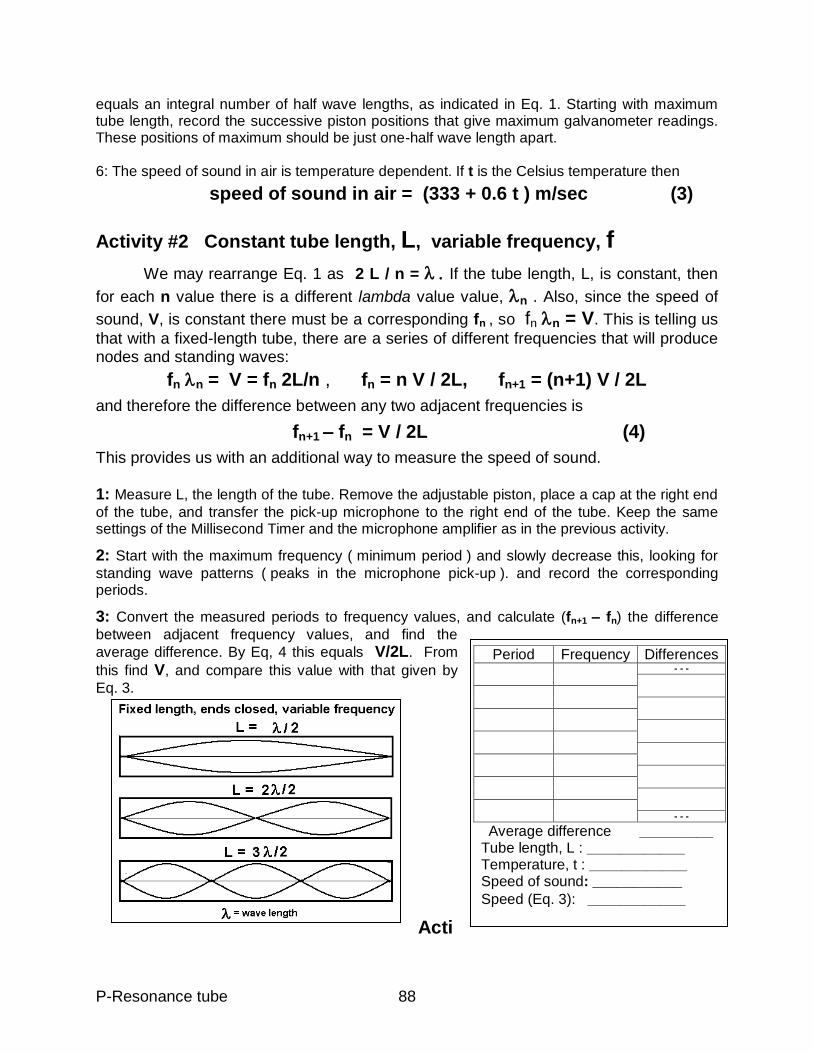
P-Resonance tube 88
equals an integral number of half wave lengths, as indicated in Eq. 1. Starting with maximum tube length, record the successive piston positions that give maximum galvanometer readings. These positions of maximum should be just one-half wave length apart. 6: The speed of sound in air is temperature dependent. If t is the Celsius temperature then
speed of sound in air = (333 + 0.6 t ) m/sec (3)
Activity #2 Constant tube length, L, variable frequency, f
We may rearrange Eq. 1 as 2 L / n = If the tube length, L, is constant, then
for each n value there is a different lambda value value, n . Also, since the speed of
sound, V, is constant there must be a corresponding fn , so fn n = V. This is telling us
that with a fixed-length tube, there are a series of different frequencies that will produce nodes and standing waves:
fn n = V = fn 2L/n , fn = n V / 2L, fn+1 = (n+1) V / 2L
and therefore the difference between any two adjacent frequencies is
fn+1 – fn = V / 2L (4)
This provides us with an additional way to measure the speed of sound. 1: Measure L, the length of the tube. Remove the adjustable piston, place a cap at the right end
of the tube, and transfer the pick-up microphone to the right end of the tube. Keep the same settings of the Millisecond Timer and the microphone amplifier as in the previous activity.
2: Start with the maximum frequency ( minimum period ) and slowly decrease this, looking for
standing wave patterns ( peaks in the microphone pick-up ). and record the corresponding periods.
3: Convert the measured periods to frequency values, and calculate (fn+1 – fn) the difference
between adjacent frequency values, and find the
average difference. By Eq, 4 this equals V/2L. From
this find V, and compare this value with that given by
Eq. 3.
Acti
Period Frequency Differences - - -
- - -
Average difference _________ Tube length, L : ____________ Temperature, t : ____________ Speed of sound: ___________
Speed (Eq. 3): ____________

P-Resonance tube 89
vity #3 Constant length, L; variable frequency, f ; one end open
In the two previous activities, both ends of the tube were closed, the sound was introduced into the tube by a small speaker at the left end, and the resonant frequencies were determined. The sound remained mainly within the tube. But with musical instruments we want the sound to come out so in the present activity, we leave the tube open at one end. At the closed end the pressure amplitude is maximum, speed amplitude minimum and all the wave energy is reflected back. At the open end there is an energy adjustment, so part of the energy is reflected back, to produce nodes at certain frequencies, and the remaining energy leaves the tube at the open end. Here the pressure amplitude is zero and speed amplitude is maximum.. From the diagram we may form a general expression,
L = (2n + 1) n/4 or n = 4 L / (2n + 1) n = 0, 1,2, . . .
fn = (2n + 1) V / 4L , fn+1 = (2n + 3) V / 4L
fn+1 – fn = V / 2L
Notice that this expression for the difference of adjacent resonant frequencies for one end open is the same as Eq. 4 for both ends closed although the individual frequencies differ. NOTE: There is an end effect for the wave reflection at the open end
of the tube effectively increasing the L value by an amount of 0.85 times the radius of the tube.
1: Use the same set-up as in the previous activity except
remove the cap from the right end of the tube..
2: Starting from the maximum frequency ( minimum period
) determine the resonant frequencies ( maximum signal from the pick-up amplifier output ) and the average of their difference. and from this data compute the speed of sound in air.
3: Compare the frequencies here with those for the tube
with both ends closed in Activity #2
Period Frequency Differences - - -
- - -
Average difference _________ Effective tube length, L : _________ Temperature, t : ____________ Speed of sound: ___________
Speed (Eq. 3): ____________
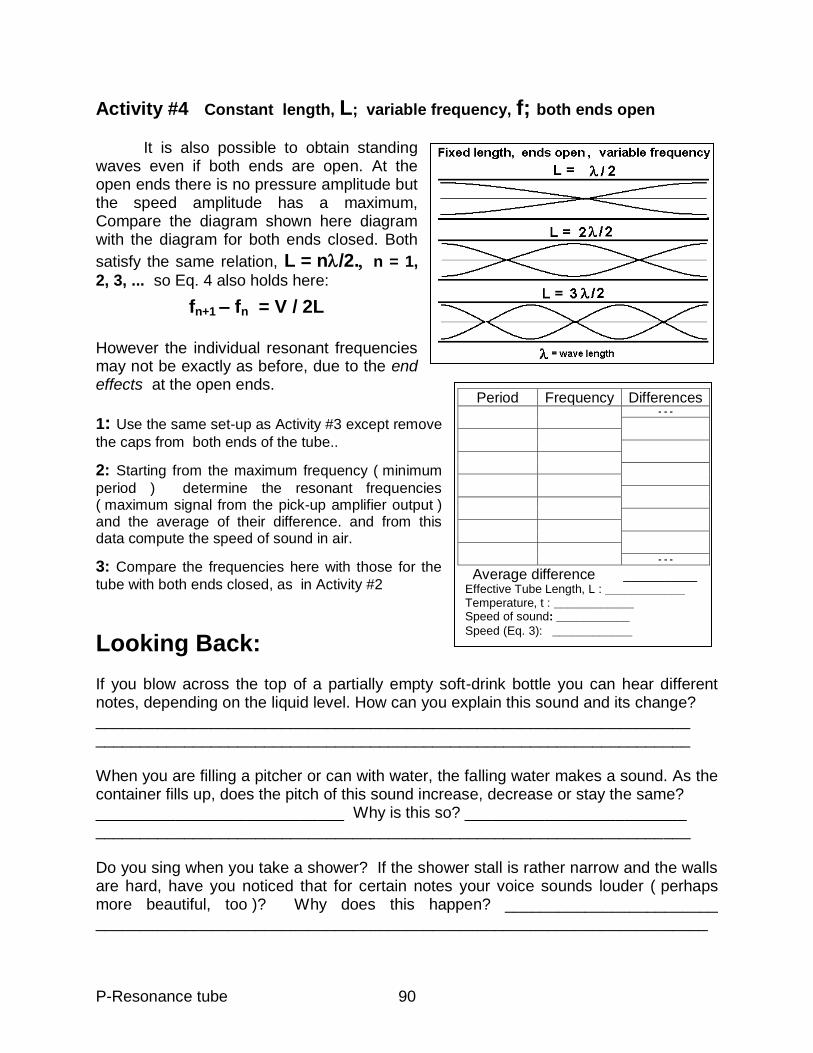
P-Resonance tube 90
Activity #4 Constant length, L; variable frequency, f; both ends open
It is also possible to obtain standing waves even if both ends are open. At the open ends there is no pressure amplitude but the speed amplitude has a maximum, Compare the diagram shown here diagram with the diagram for both ends closed. Both
satisfy the same relation, L = n/2.n = 1,
2, 3, ... so Eq. 4 also holds here:
fn+1 – fn = V / 2L
However the individual resonant frequencies may not be exactly as before, due to the end effects at the open ends.
1: Use the same set-up as Activity #3 except remove
the caps from both ends of the tube..
2: Starting from the maximum frequency ( minimum
period ) determine the resonant frequencies ( maximum signal from the pick-up amplifier output ) and the average of their difference. and from this data compute the speed of sound in air.
3: Compare the frequencies here with those for the
tube with both ends closed, as in Activity #2
Looking Back:
If you blow across the top of a partially empty soft-drink bottle you can hear different notes, depending on the liquid level. How can you explain this sound and its change? ___________________________________________________________________ ___________________________________________________________________ When you are filling a pitcher or can with water, the falling water makes a sound. As the container fills up, does the pitch of this sound increase, decrease or stay the same? ____________________________ Why is this so? _________________________ ___________________________________________________________________ Do you sing when you take a shower? If the shower stall is rather narrow and the walls are hard, have you noticed that for certain notes your voice sounds louder ( perhaps more beautiful, too )? Why does this happen? ________________________ _____________________________________________________________________
Period Frequency Differences - - -
- - -
Average difference _________ Effective Tube Length, L : ____________ Temperature, t : ____________ Speed of sound: ___________
Speed (Eq. 3): ____________
91
5: Electricity
The molecules of which solids, liquids and gases are composed are themselves made of smaller pieces ( fundamental particles ), which possess mass and also an additional property called charge. As the gravitational force depends on the masses and separation of the interacting objects, an additional electric force exists between these fundamental particles, depending on charge and separation. In the following experiments we do not see these fundamental particles but do observe some of the large-scale effects of their charge;
E-1 Ohm‟s Law E-2 Resistors in Parallel and Series E-3 Electric Circuits E-4 Meters E-5 Capacitors E-6 Magnetic Fields E-7 Force on a Moving Charge E-8 Faraday‟s Law E-9 Transformers E-10 Electronics E-11 Logic Gates
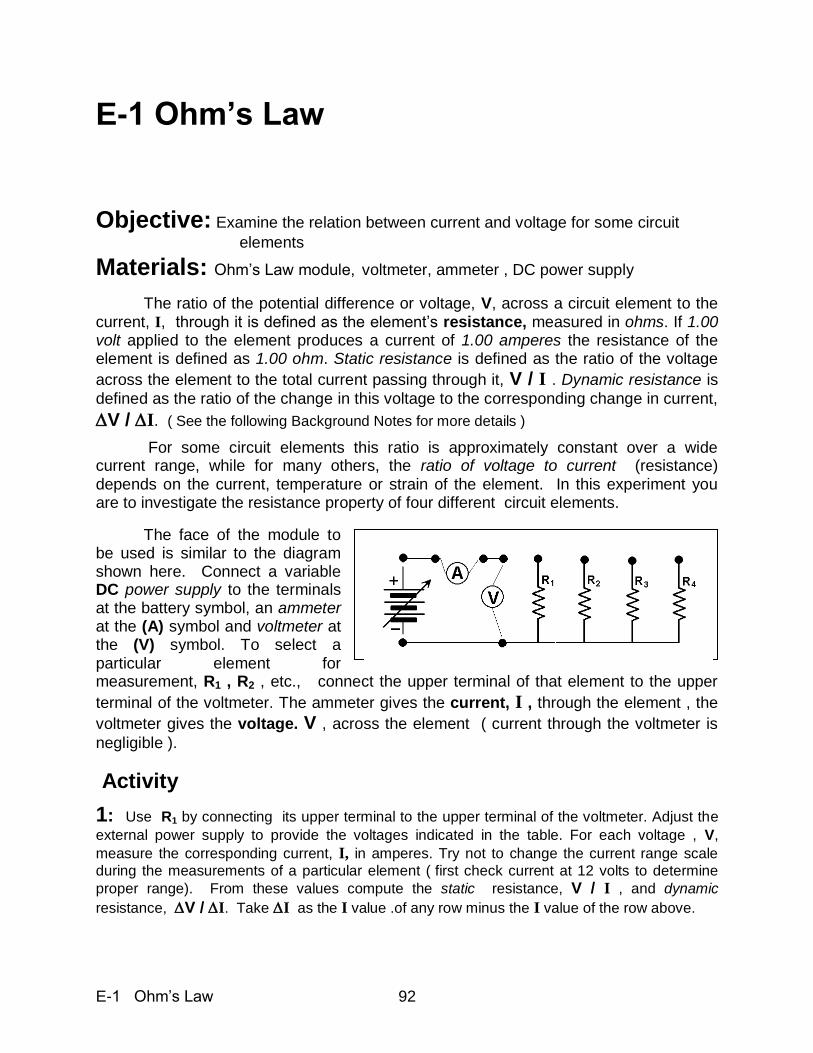
E-1 Ohm‟s Law 92
E-1 Ohm‟s Law Objective: Examine the relation between current and voltage for some circuit
elements
Materials: Ohm‟s Law module, voltmeter, ammeter , DC power supply
The ratio of the potential difference or voltage, V, across a circuit element to the current, I, through it is defined as the element‟s resistance, measured in ohms. If 1.00 volt applied to the element produces a current of 1.00 amperes the resistance of the element is defined as 1.00 ohm. Static resistance is defined as the ratio of the voltage
across the element to the total current passing through it, V / I . Dynamic resistance is
defined as the ratio of the change in this voltage to the corresponding change in current,
V / I. ( See the following Background Notes for more details )
For some circuit elements this ratio is approximately constant over a wide current range, while for many others, the ratio of voltage to current (resistance) depends on the current, temperature or strain of the element. In this experiment you are to investigate the resistance property of four different circuit elements.
The face of the module to be used is similar to the diagram shown here. Connect a variable DC power supply to the terminals at the battery symbol, an ammeter at the (A) symbol and voltmeter at the (V) symbol. To select a particular element for measurement, R1 , R2 , etc., connect the upper terminal of that element to the upper
terminal of the voltmeter. The ammeter gives the current, I , through the element , the
voltmeter gives the voltage. V , across the element ( current through the voltmeter is
negligible ).
Activity
1: Use R1 by connecting its upper terminal to the upper terminal of the voltmeter. Adjust the
external power supply to provide the voltages indicated in the table. For each voltage , V,
measure the corresponding current, I, in amperes. Try not to change the current range scale
during the measurements of a particular element ( first check current at 12 volts to determine
proper range). From these values compute the static resistance, V / I , and dynamic
resistance, V / I. Take I as the I value .of any row minus the I value of the row above.
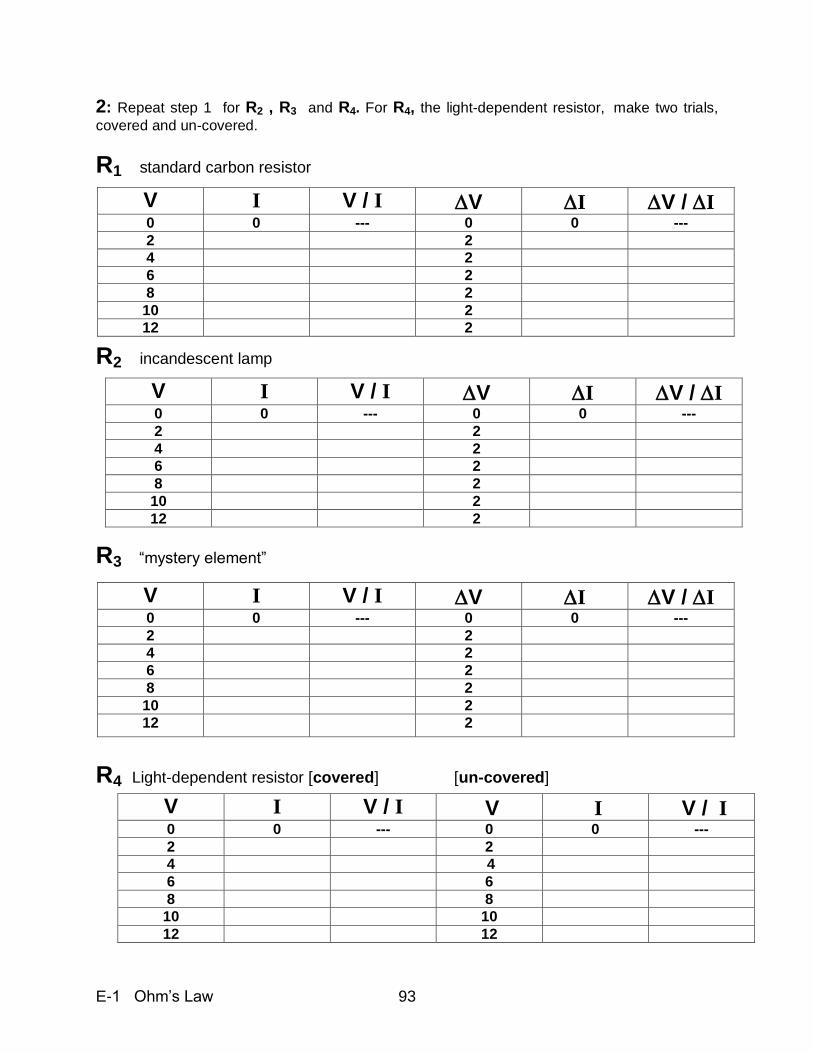
E-1 Ohm‟s Law 93
2: Repeat step 1 for R2 , R3 and R4. For R4, the light-dependent resistor, make two trials,
covered and un-covered.
R1 standard carbon resistor
R2 incandescent lamp
R3 “mystery element”
R4 Light-dependent resistor [covered] [un-covered]
V I V / I V I V / I 0 0 --- 0 0 ---
2 2
4 2
6 2
8 2
10 2
12 2
V I V / I V I V / I 0 0 --- 0 0 ---
2 2
4 2
6 2
8 2
10 2
12 2
V I V / I V I V / I 0 0 --- 0 0 ---
2 2
4 2
6 2
8 2
10 2
12 2
V I V / I V I V / I 0 0 --- 0 0 ---
2 2
4 4
6 6
8 8
10 10
12 12
E-1 Ohm‟s Law 94
Background Notes on Resistance
All known matter, sand, stars, our own bodies, are made from tiny building blocks called atoms. Two fundamental properties ( there are others as well ) of all atoms are mass and charge. These names really don‟t tell us much, but then the nature of mass and charge is not yet well understood, although their effects are obvious everywhere. Inertia, momentum, kinetic energy and gravity are based on mass. All chemical interactions, the functions of all living things flow from charge. Charge comes in two flavors, positive and negative, mass in only one flavor. Charge is measured in coulombs, mass in kilograms.
All atoms ( there are some one-hundred species ) are composed of an extremely small central core or nucleus, which contains some 99.9% of the mass of the atom. The heaviest atoms are about 300 times that of the lightest. If we picture the atom as somewhat spherical, the diameter of the central nucleus is 1/100,000 that of the atom., so most of the space occupied by an atom seems to be empty. In size the largest atom is no more than 10 times the diameter of the smallest.
The nucleus itself is thought to be composed to two kinds particles, protons and neutrons, of approximately equal mass, but differing in charge; the proton has positive charge, while the neutron is uncharged. The nucleus of the lightest atom, hydrogen, contains only a single proton while heavier atoms may contain up to 300 of these basic particles, with about twice as many neutrons as protons. The remaining space of the atom, outside the extremely tiny nucleus, is the region of the electrons. An electron has only ½,000 the mass of a proton, but its charge is equal in magnitude to that of the proton but of opposite sign. The electron’s charge is negative In a neutral atom, the positive proton charge of the nucleus just balances the negative electron’s charge outside. However, this electrical balance is changed if the atom gains or loses one or more electrons.
Any two objects, simply because they possess mass, attract:. two grains of sand, or an apple and the whole earth. This gravitational attraction is extremely weak, and cannot be felt or observed unless at least one of the objects has appreciable mass. On the other hand the electrical attraction / repulsion interaction is relatively strong. The electrical attractive force between a proton and electron is more than a million million million times stronger than their gravitational attraction. It is this force that holds atoms together. Since most atoms are electrically neutral ( electron and proton charges balancing ), we do not directly experience such tremendous forces. Perhaps you have directly experienced the electric force when rubbing a plastic object.
Any object with mass or net charge (unbalanced positive and negative) is considered to set up a field about itself, decreasing with distance. Such fields ( g, in
units of newtons per kilogram for mass or E, in units of newtons per coulomb for charge )
are considered to exert a force on any other object with charge or mass, a force proportion to the object‟s charge or mass and the strength of the field at its position.
Recall work is done by a force acting through a distance. If the force is either gravitational or electric, the work done is stored as potential energy which depends on
the field strength ( g or E ), the mass or charge ( m or q ) and the displacement along
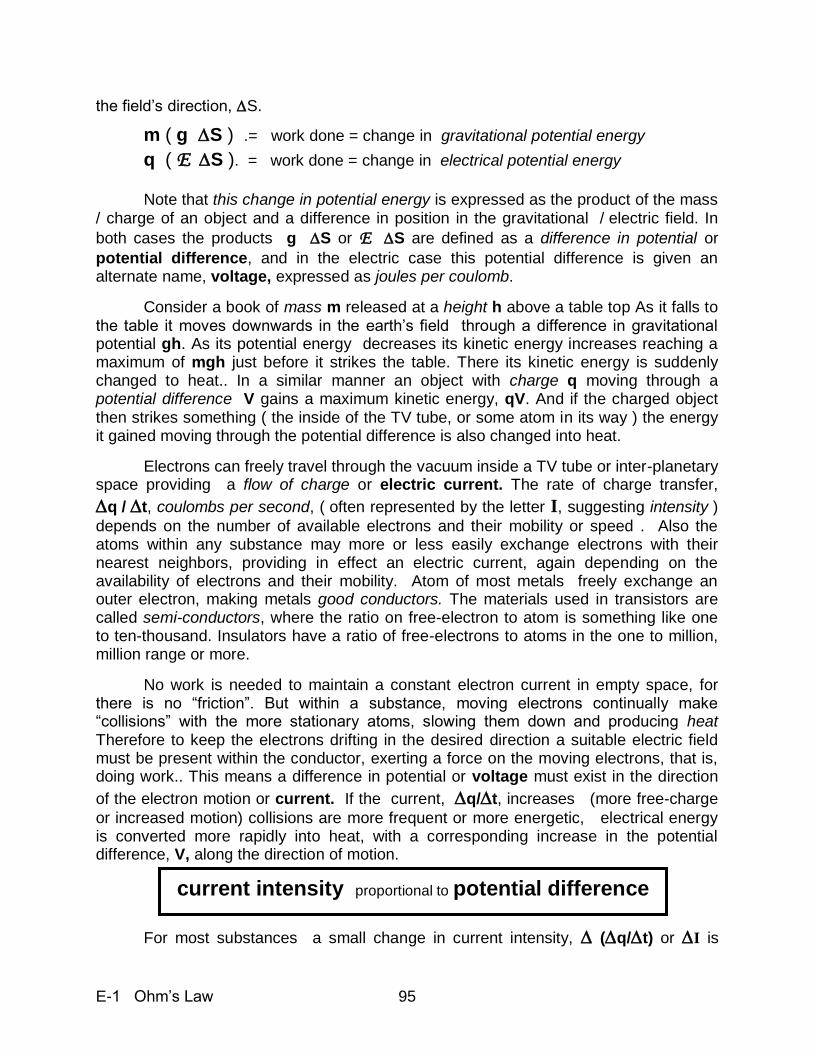
E-1 Ohm‟s Law 95
the field‟s direction, S.
m ( g S ) .= work done = change in gravitational potential energy
q ( E S ). = work done = change in electrical potential energy
Note that this change in potential energy is expressed as the product of the mass / charge of an object and a difference in position in the gravitational / electric field. In
both cases the products g S or E S are defined as a difference in potential or
potential difference, and in the electric case this potential difference is given an alternate name, voltage, expressed as joules per coulomb.
Consider a book of mass m released at a height h above a table top As it falls to the table it moves downwards in the earth‟s field through a difference in gravitational potential gh. As its potential energy decreases its kinetic energy increases reaching a maximum of mgh just before it strikes the table. There its kinetic energy is suddenly changed to heat.. In a similar manner an object with charge q moving through a potential difference V gains a maximum kinetic energy, qV. And if the charged object then strikes something ( the inside of the TV tube, or some atom in its way ) the energy it gained moving through the potential difference is also changed into heat.
Electrons can freely travel through the vacuum inside a TV tube or inter-planetary space providing a flow of charge or electric current. The rate of charge transfer,
q / t, coulombs per second, ( often represented by the letter I, suggesting intensity )
depends on the number of available electrons and their mobility or speed . Also the atoms within any substance may more or less easily exchange electrons with their nearest neighbors, providing in effect an electric current, again depending on the availability of electrons and their mobility. Atom of most metals freely exchange an outer electron, making metals good conductors. The materials used in transistors are called semi-conductors, where the ratio on free-electron to atom is something like one to ten-thousand. Insulators have a ratio of free-electrons to atoms in the one to million, million range or more.
No work is needed to maintain a constant electron current in empty space, for there is no “friction”. But within a substance, moving electrons continually make “collisions” with the more stationary atoms, slowing them down and producing heat Therefore to keep the electrons drifting in the desired direction a suitable electric field must be present within the conductor, exerting a force on the moving electrons, that is, doing work.. This means a difference in potential or voltage must exist in the direction
of the electron motion or current. If the current, q/t, increases (more free-charge
or increased motion) collisions are more frequent or more energetic, electrical energy is converted more rapidly into heat, with a corresponding increase in the potential difference, V, along the direction of motion.
For most substances a small change in current intensity, (q/t) or I is
current intensity proportional to potential difference
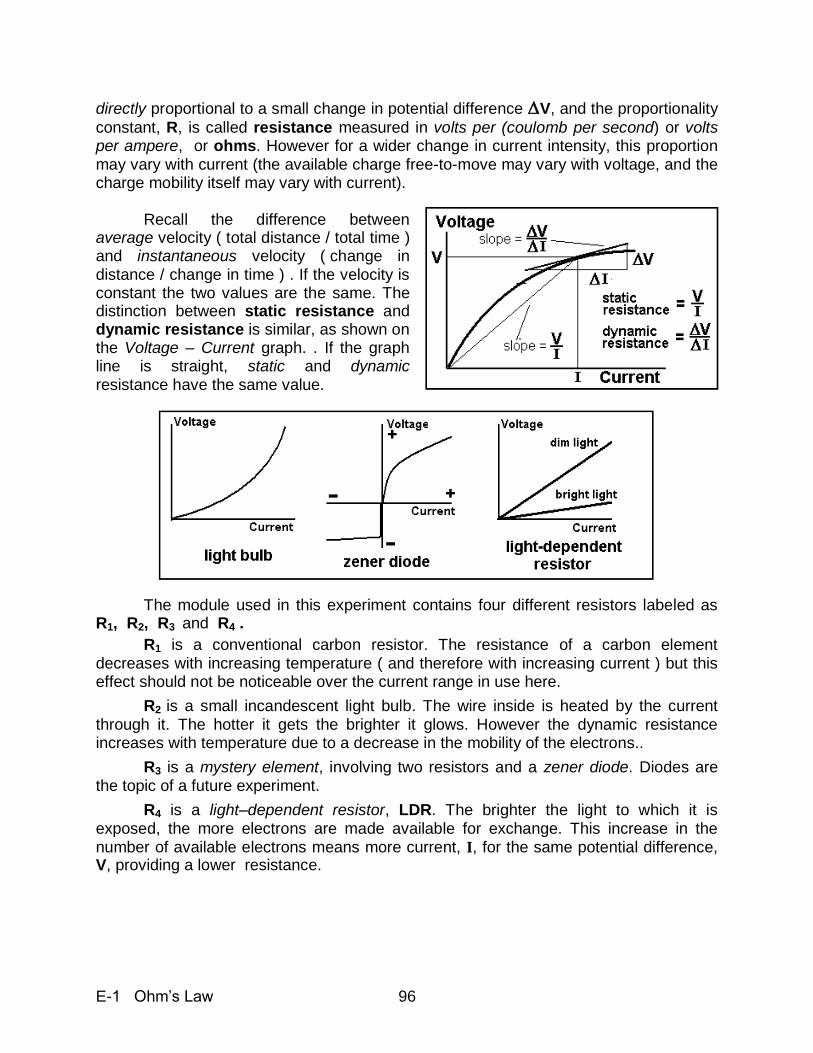
E-1 Ohm‟s Law 96
directly proportional to a small change in potential difference V, and the proportionality
constant, R, is called resistance measured in volts per (coulomb per second) or volts per ampere, or ohms. However for a wider change in current intensity, this proportion may vary with current (the available charge free-to-move may vary with voltage, and the charge mobility itself may vary with current). Recall the difference between average velocity ( total distance / total time ) and instantaneous velocity ( change in distance / change in time ) . If the velocity is constant the two values are the same. The distinction between static resistance and dynamic resistance is similar, as shown on the Voltage – Current graph. . If the graph line is straight, static and dynamic resistance have the same value. The module used in this experiment contains four different resistors labeled as R1, R2, R3 and R4 .
R1 is a conventional carbon resistor. The resistance of a carbon element decreases with increasing temperature ( and therefore with increasing current ) but this effect should not be noticeable over the current range in use here.
R2 is a small incandescent light bulb. The wire inside is heated by the current through it. The hotter it gets the brighter it glows. However the dynamic resistance increases with temperature due to a decrease in the mobility of the electrons..
R3 is a mystery element, involving two resistors and a zener diode. Diodes are the topic of a future experiment.
R4 is a light–dependent resistor, LDR. The brighter the light to which it is exposed, the more electrons are made available for exchange. This increase in the number of available electrons means more current, I, for the same potential difference, V, providing a lower resistance.
E-2 Resistors in Parallel and Series 97
E-2 Resistors in Parallel and Series
Objective: Verify experimentally the relations for combining resistances in parallel
or series
Materials: Resistor terminal board, digital multimeter, program RESIST.EXE
Ohm‟s law relates the current, I, passing through a resistor of resistance, R, to the potential difference or voltage, V, between the end terminals: V = I R. Given two resistors, #1 and #2, which obey Ohm‟s law: V1 = I1 R1 and V2 = I2 R2 . We may connect them together either in parallel ( side-by-side ) or in series ( end-to-end )
When connected end-to-end, series, the same current flows through each, so Iseries = I1 = I2, while the potential difference is the sum of that across each individual resistor, Vseries = V1 + V2 . Therefore
Iseries RSeries = Vseries = I1 R1 + I2 R2 = Iseries ( R1 + R2 ).
Rseries = R1 + R2
When connected side-by-side, parallel, the same potential difference appears across each, Vparallel = V1 = V2 while the current divides between them, Iparallel = I1 + I2.
Vparallel / Rparallel = Iparallel = V1 / R1 + V2 / R2 .
1 / Rparallel = 1 / R1 + 1 / R2
These relations may be extended to more than two resistors in the same configuration. In this experiment you are given five resistors, R1 , R2 , R3 , R4 and R5
which you are to connect in various configurations. You are to use the above equations to determine the resistance of the configuration, and then check your answer both by direct measurement and also by using the short computer program, RESIST.EXE .
Activity:
1: Measure with a digital multimeter and record the values of the five resistors.
2: For each of the configurations shown, connect the resistors on the module. Make sure the
connections are reasonably tight. With the meter measure the resistance between the end terminals ( marked with a diamond ) Then calculate the expected result.
3: Use the computer program, RESIST.EXE to verify your results. Include the computer print-
out with your report.
R1 _______ R2 _______ R3 _______ R4 ________ R5 _______
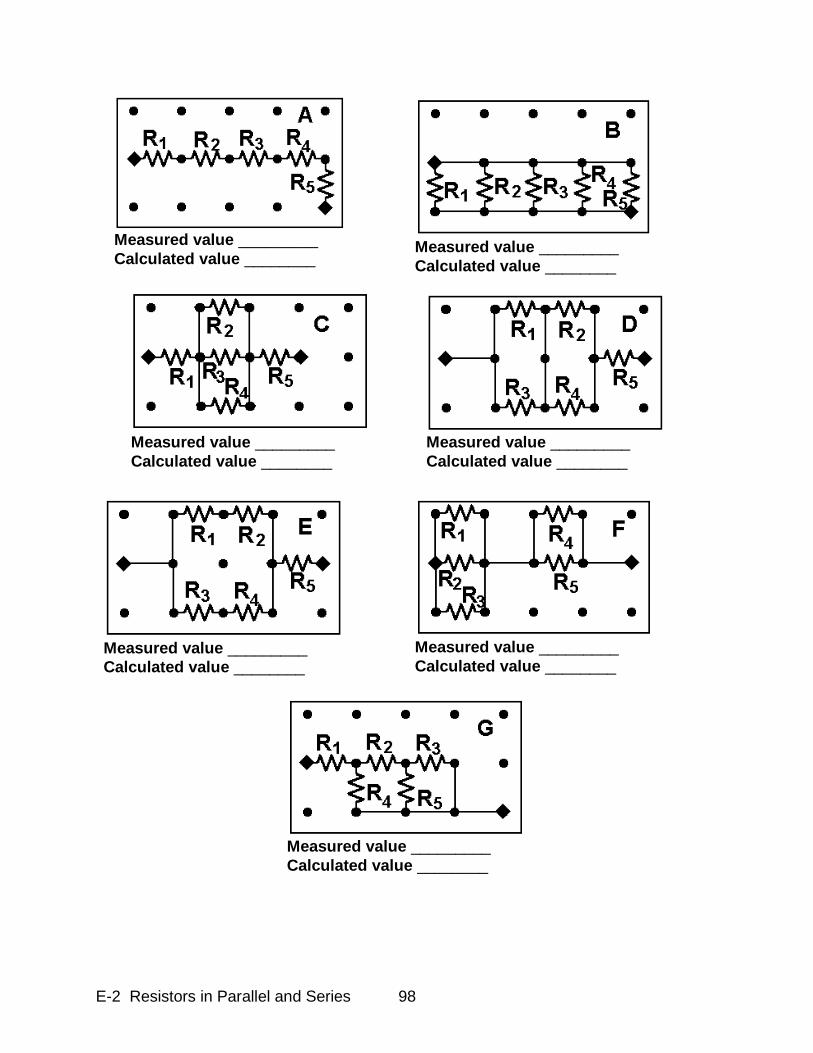
E-2 Resistors in Parallel and Series 98
Measured value _________
Calculated value ________
Measured value _________
Calculated value ________
Measured value _________
Calculated value ________
Measured value _________
Calculated value ________
Measured value _________
Calculated value ________
Measured value _________
Calculated value ________
Measured value _________
Calculated value ________
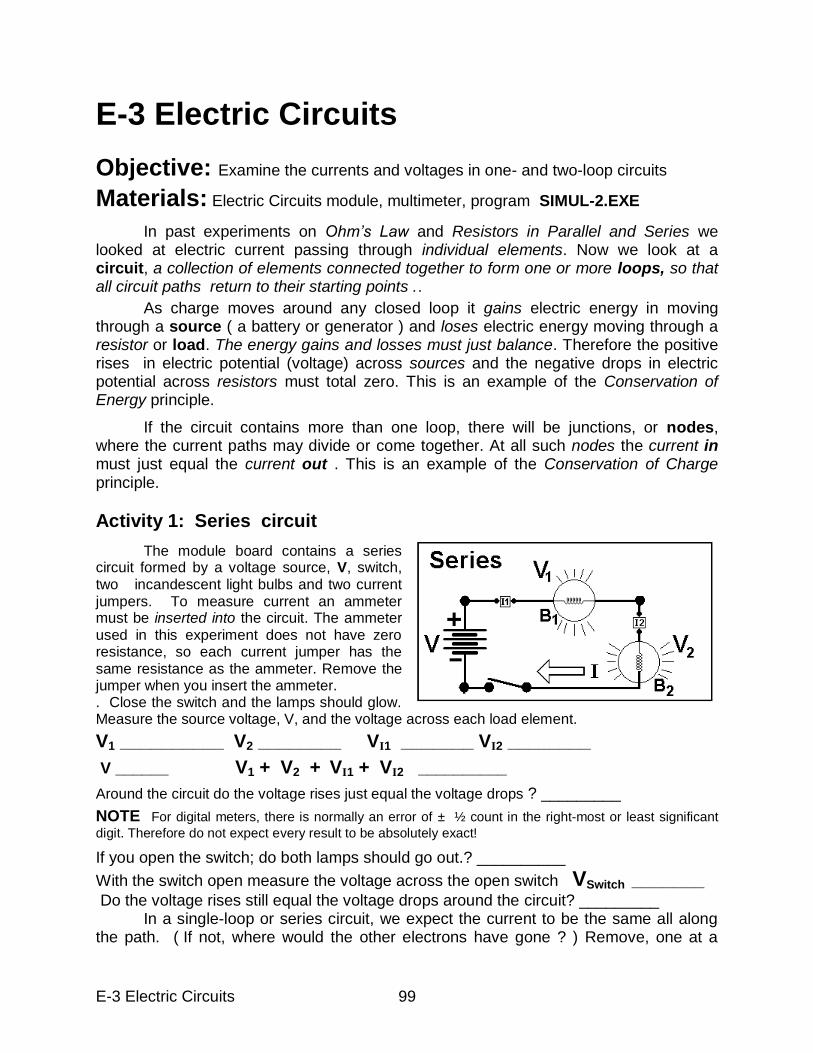
E-3 Electric Circuits 99
E-3 Electric Circuits
Objective: Examine the currents and voltages in one- and two-loop circuits
Materials: Electric Circuits module, multimeter, program SIMUL-2.EXE
In past experiments on Ohm’s Law and Resistors in Parallel and Series we looked at electric current passing through individual elements. Now we look at a circuit, a collection of elements connected together to form one or more loops, so that all circuit paths return to their starting points ..
As charge moves around any closed loop it gains electric energy in moving through a source ( a battery or generator ) and loses electric energy moving through a resistor or load. The energy gains and losses must just balance. Therefore the positive rises in electric potential (voltage) across sources and the negative drops in electric potential across resistors must total zero. This is an example of the Conservation of Energy principle.
If the circuit contains more than one loop, there will be junctions, or nodes, where the current paths may divide or come together. At all such nodes the current in must just equal the current out . This is an example of the Conservation of Charge principle.
Activity 1: Series circuit
The module board contains a series circuit formed by a voltage source, V, switch, two incandescent light bulbs and two current jumpers. To measure current an ammeter must be inserted into the circuit. The ammeter used in this experiment does not have zero resistance, so each current jumper has the same resistance as the ammeter. Remove the jumper when you insert the ammeter. . Close the switch and the lamps should glow. Measure the source voltage, V, and the voltage across each load element.
V1 __________ V2 ________ VI1 _______ VI2 ________
V ______ V1 + V2 + VI1 + VI2 __________
Around the circuit do the voltage rises just equal the voltage drops ? _________
NOTE For digital meters, there is normally an error of ± ½ count in the right-most or least significant
digit. Therefore do not expect every result to be absolutely exact!
If you open the switch; do both lamps should go out.? __________
With the switch open measure the voltage across the open switch VSwitch _______ Do the voltage rises still equal the voltage drops around the circuit? _________ In a single-loop or series circuit, we expect the current to be the same all along the path. ( If not, where would the other electrons have gone ? ) Remove, one at a
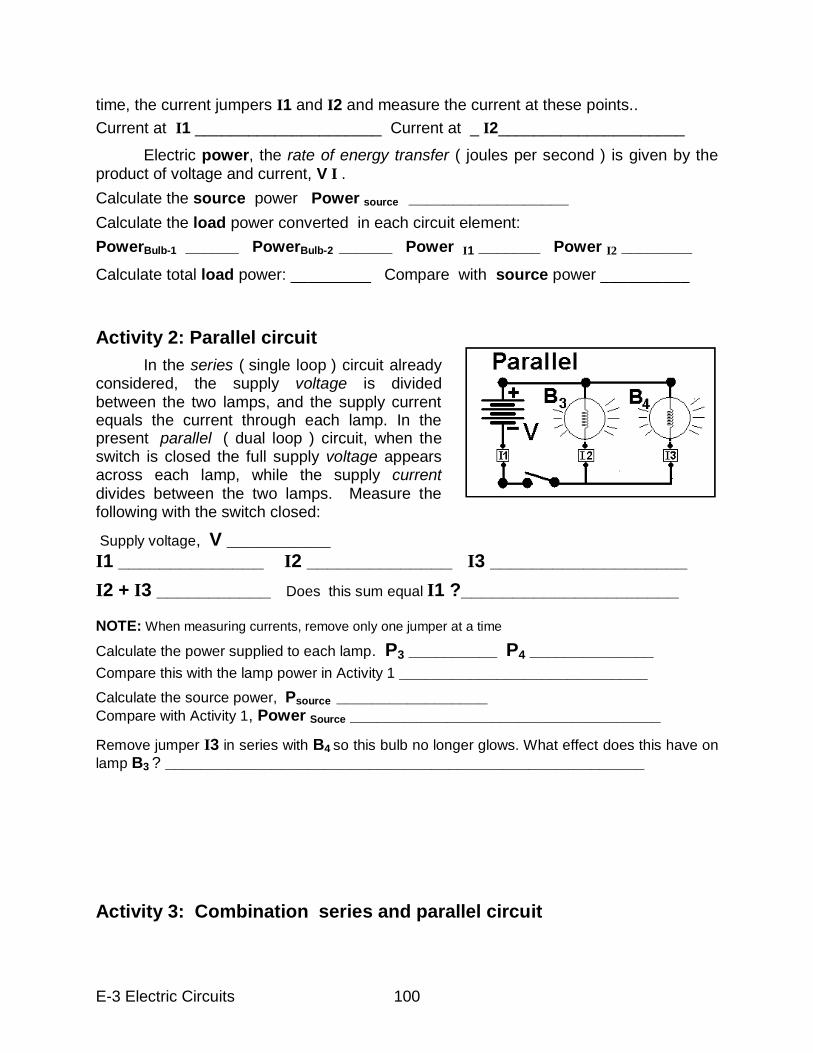
E-3 Electric Circuits 100
time, the current jumpers I1 and I2 and measure the current at these points..
Current at I1 _____________________ Current at _ I2_____________________
Electric power, the rate of energy transfer ( joules per second ) is given by the product of voltage and current, V I .
Calculate the source power Power source __________________
Calculate the load power converted in each circuit element:
PowerBulb-1 ______ PowerBulb-2 ______ Power I1 _______ Power I2 ________
Calculate total load power: _________ Compare with source power __________ Activity 2: Parallel circuit
In the series ( single loop ) circuit already considered, the supply voltage is divided between the two lamps, and the supply current equals the current through each lamp. In the present parallel ( dual loop ) circuit, when the switch is closed the full supply voltage appears across each lamp, while the supply current divides between the two lamps. Measure the following with the switch closed:
Supply voltage, V __________ I1 ______________ I2 ______________ I3 ___________________
I2 + I3 ___________ Does this sum equal I1 ?_____________________ NOTE: When measuring currents, remove only one jumper at a time
Calculate the power supplied to each lamp. P3 __________ P4 ______________
Compare this with the lamp power in Activity 1 ____________________________
Calculate the source power, Psource _________________ Compare with Activity 1, Power Source ___________________________________
Remove jumper I3 in series with B4 so this bulb no longer glows. What effect does this have on
lamp B3 ? ______________________________________________________
Activity 3: Combination series and parallel circuit
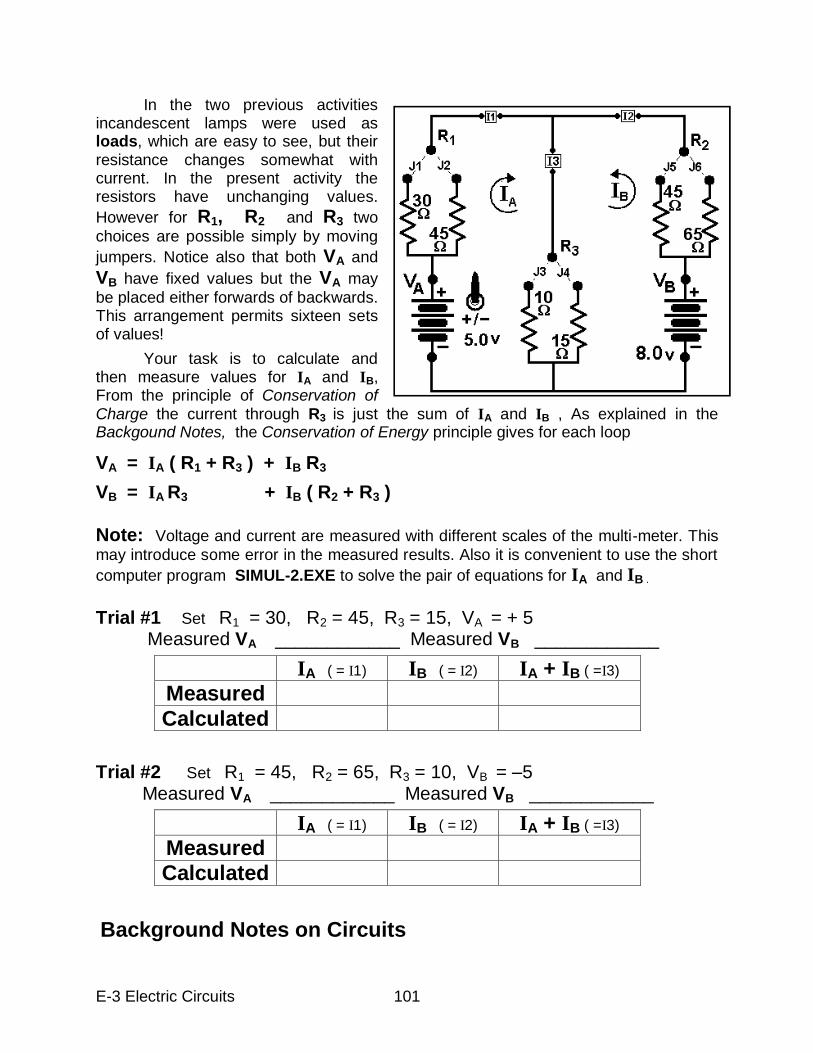
E-3 Electric Circuits 101
In the two previous activities incandescent lamps were used as loads, which are easy to see, but their resistance changes somewhat with current. In the present activity the resistors have unchanging values.
However for R1, R2 and R3 two
choices are possible simply by moving
jumpers. Notice also that both VA and
VB have fixed values but the VA may
be placed either forwards of backwards. This arrangement permits sixteen sets of values!
Your task is to calculate and then measure values for IA and IB, From the principle of Conservation of Charge the current through R3 is just the sum of IA and IB , As explained in the Backgound Notes, the Conservation of Energy principle gives for each loop
VA = IA ( R1 + R3 ) + IB R3
VB = IA R3 + IB ( R2 + R3 ) Note: Voltage and current are measured with different scales of the multi-meter. This
may introduce some error in the measured results. Also it is convenient to use the short
computer program SIMUL-2.EXE to solve the pair of equations for IA and IB .
Trial #1 Set R1 = 30, R2 = 45, R3 = 15, VA = + 5 Measured VA ____________ Measured VB ____________
Trial #2 Set R1 = 45, R2 = 65, R3 = 10, VB = –5 Measured VA ____________ Measured VB ____________
Background Notes on Circuits
IA ( = I1) IB ( = I2) IA + IB ( =I3)
Measured
Calculated
IA ( = I1) IB ( = I2) IA + IB ( =I3)
Measured
Calculated
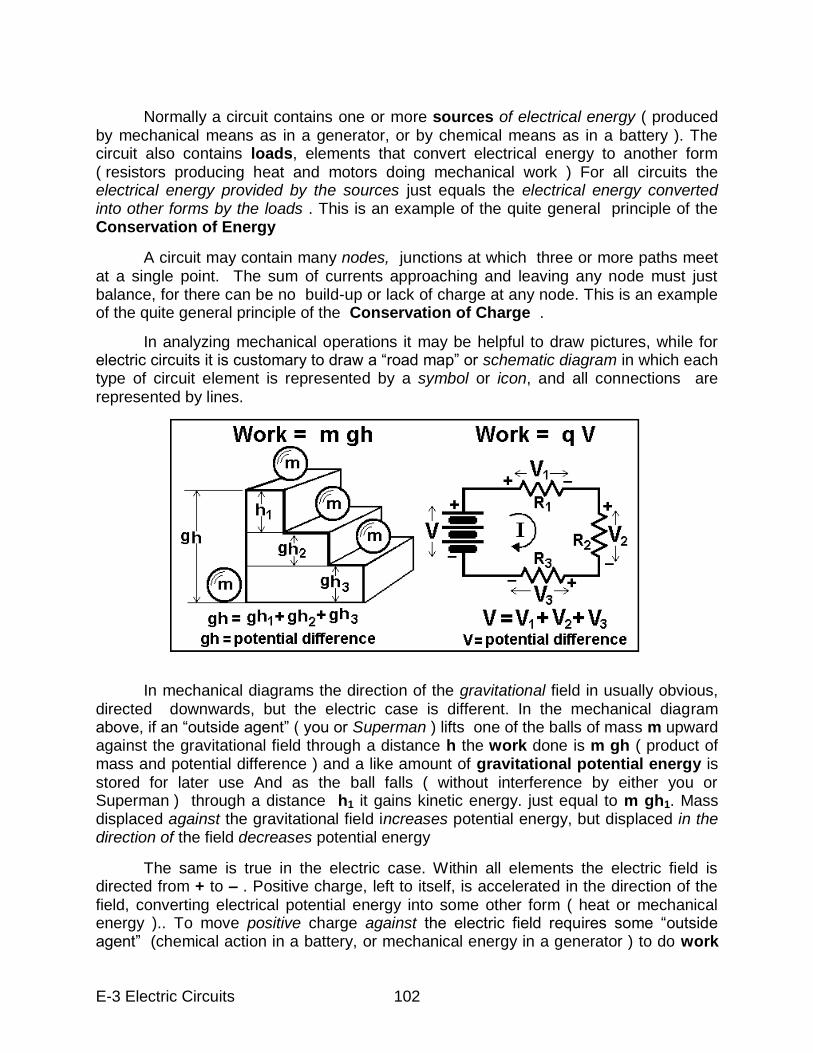
E-3 Electric Circuits 102
Normally a circuit contains one or more sources of electrical energy ( produced by mechanical means as in a generator, or by chemical means as in a battery ). The circuit also contains loads, elements that convert electrical energy to another form ( resistors producing heat and motors doing mechanical work ) For all circuits the electrical energy provided by the sources just equals the electrical energy converted into other forms by the loads . This is an example of the quite general principle of the Conservation of Energy
A circuit may contain many nodes, junctions at which three or more paths meet at a single point. The sum of currents approaching and leaving any node must just balance, for there can be no build-up or lack of charge at any node. This is an example of the quite general principle of the Conservation of Charge .
In analyzing mechanical operations it may be helpful to draw pictures, while for electric circuits it is customary to draw a “road map” or schematic diagram in which each type of circuit element is represented by a symbol or icon, and all connections are represented by lines. In mechanical diagrams the direction of the gravitational field in usually obvious, directed downwards, but the electric case is different. In the mechanical diagram above, if an “outside agent” ( you or Superman ) lifts one of the balls of mass m upward against the gravitational field through a distance h the work done is m gh ( product of mass and potential difference ) and a like amount of gravitational potential energy is stored for later use And as the ball falls ( without interference by either you or Superman ) through a distance h1 it gains kinetic energy. just equal to m gh1. Mass displaced against the gravitational field increases potential energy, but displaced in the direction of the field decreases potential energy
The same is true in the electric case. Within all elements the electric field is directed from + to – . Positive charge, left to itself, is accelerated in the direction of the field, converting electrical potential energy into some other form ( heat or mechanical energy ).. To move positive charge against the electric field requires some “outside agent” (chemical action in a battery, or mechanical energy in a generator ) to do work
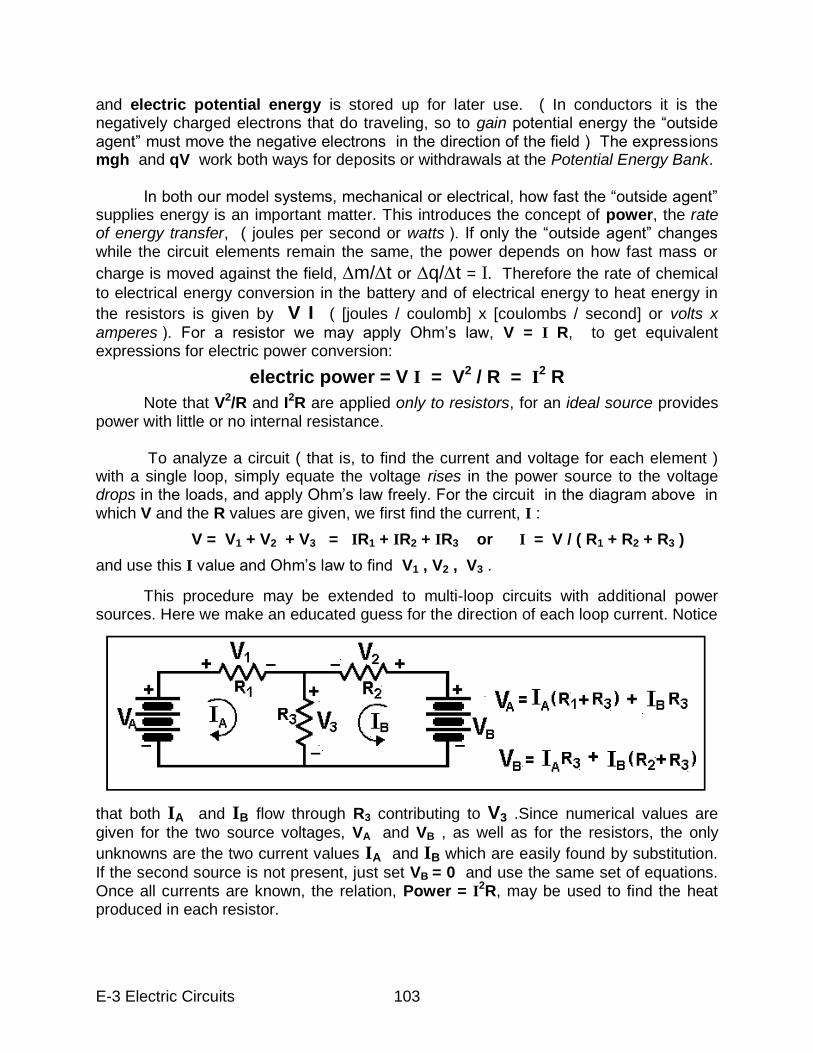
E-3 Electric Circuits 103
and electric potential energy is stored up for later use. ( In conductors it is the negatively charged electrons that do traveling, so to gain potential energy the “outside agent” must move the negative electrons in the direction of the field ) The expressions mgh and qV work both ways for deposits or withdrawals at the Potential Energy Bank. In both our model systems, mechanical or electrical, how fast the “outside agent” supplies energy is an important matter. This introduces the concept of power, the rate of energy transfer, ( joules per second or watts ). If only the “outside agent” changes while the circuit elements remain the same, the power depends on how fast mass or
charge is moved against the field, m/t or q/t = I. Therefore the rate of chemical
to electrical energy conversion in the battery and of electrical energy to heat energy in
the resistors is given by V I ( [joules / coulomb] x [coulombs / second] or volts x
amperes ). For a resistor we may apply Ohm‟s law, V = I R, to get equivalent expressions for electric power conversion:
electric power = V I = V2 / R = I
2 R
Note that V2/R and I2R are applied only to resistors, for an ideal source provides power with little or no internal resistance. To analyze a circuit ( that is, to find the current and voltage for each element ) with a single loop, simply equate the voltage rises in the power source to the voltage drops in the loads, and apply Ohm‟s law freely. For the circuit in the diagram above in which V and the R values are given, we first find the current, I :
V = V1 + V2 + V3 = IR1 + IR2 + IR3 or I = V / ( R1 + R2 + R3 )
and use this I value and Ohm‟s law to find V1 , V2 , V3 .
This procedure may be extended to multi-loop circuits with additional power sources. Here we make an educated guess for the direction of each loop current. Notice
that both IA and IB flow through R3 contributing to V3 .Since numerical values are
given for the two source voltages, VA and VB , as well as for the resistors, the only
unknowns are the two current values IA and IB which are easily found by substitution.
If the second source is not present, just set VB = 0 and use the same set of equations. Once all currents are known, the relation, Power = I
2R, may be used to find the heat produced in each resistor.
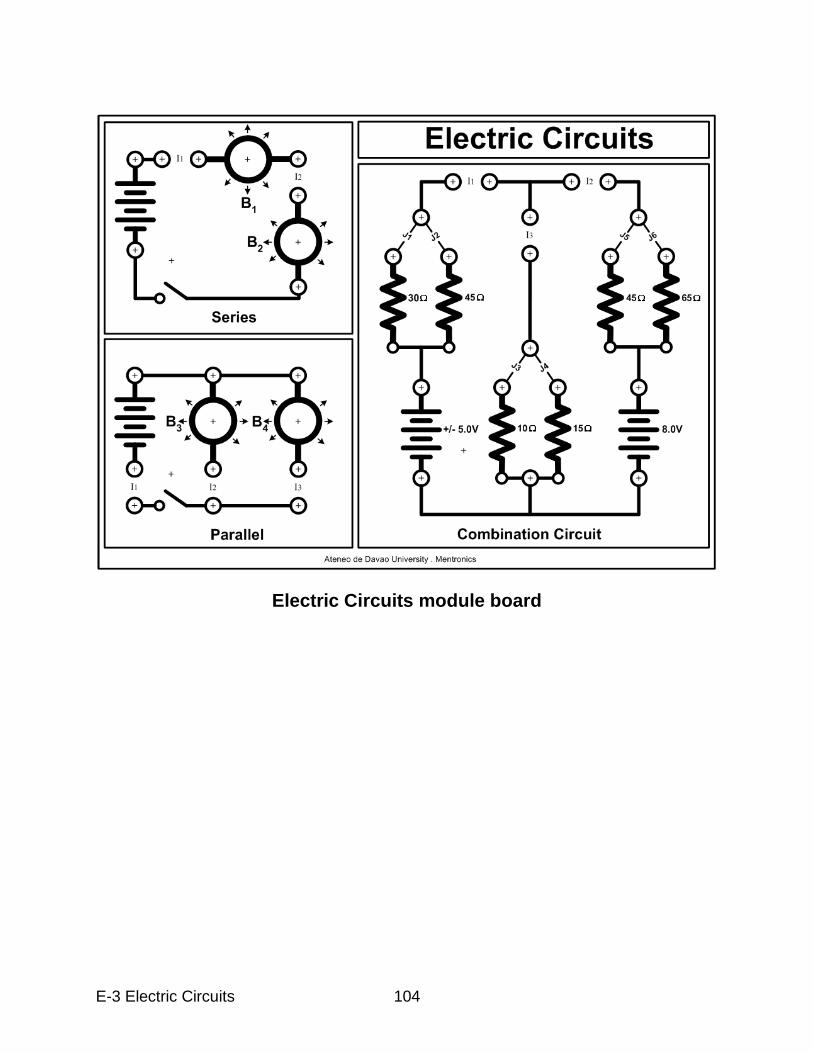
E-3 Electric Circuits 104
Electric Circuits module board
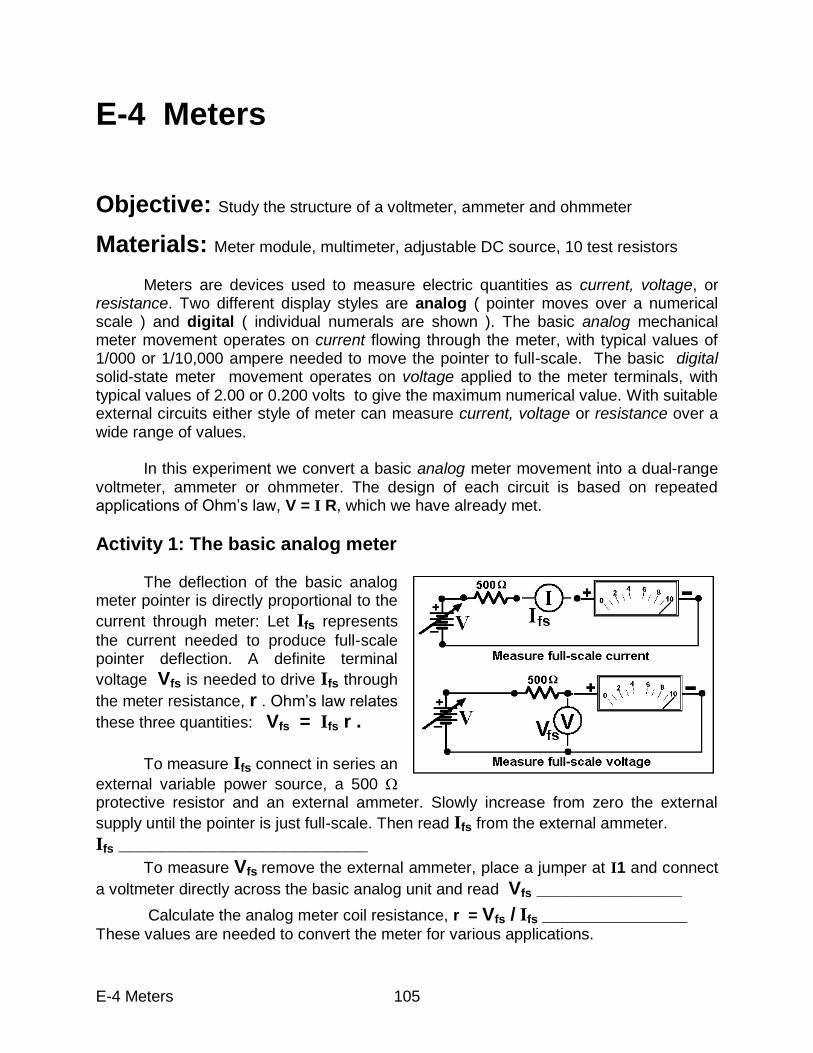
E-4 Meters 105
E-4 Meters
Objective: Study the structure of a voltmeter, ammeter and ohmmeter
Materials: Meter module, multimeter, adjustable DC source, 10 test resistors
Meters are devices used to measure electric quantities as current, voltage, or resistance. Two different display styles are analog ( pointer moves over a numerical scale ) and digital ( individual numerals are shown ). The basic analog mechanical meter movement operates on current flowing through the meter, with typical values of 1/000 or 1/10,000 ampere needed to move the pointer to full-scale. The basic digital solid-state meter movement operates on voltage applied to the meter terminals, with typical values of 2.00 or 0.200 volts to give the maximum numerical value. With suitable external circuits either style of meter can measure current, voltage or resistance over a wide range of values. In this experiment we convert a basic analog meter movement into a dual-range voltmeter, ammeter or ohmmeter. The design of each circuit is based on repeated applications of Ohm‟s law, V = I R, which we have already met.
Activity 1: The basic analog meter The deflection of the basic analog meter pointer is directly proportional to the
current through meter: Let Ifs represents
the current needed to produce full-scale pointer deflection. A definite terminal
voltage Vfs is needed to drive Ifs through
the meter resistance, r . Ohm‟s law relates
these three quantities: Vfs = Ifs r .
To measure Ifs connect in series an
external variable power source, a 500 protective resistor and an external ammeter. Slowly increase from zero the external
supply until the pointer is just full-scale. Then read Ifs from the external ammeter.
Ifs ________________________
To measure Vfs remove the external ammeter, place a jumper at I1 and connect
a voltmeter directly across the basic analog unit and read Vfs ______________
Calculate the analog meter coil resistance, r = Vfs / Ifs ______________
These values are needed to convert the meter for various applications.
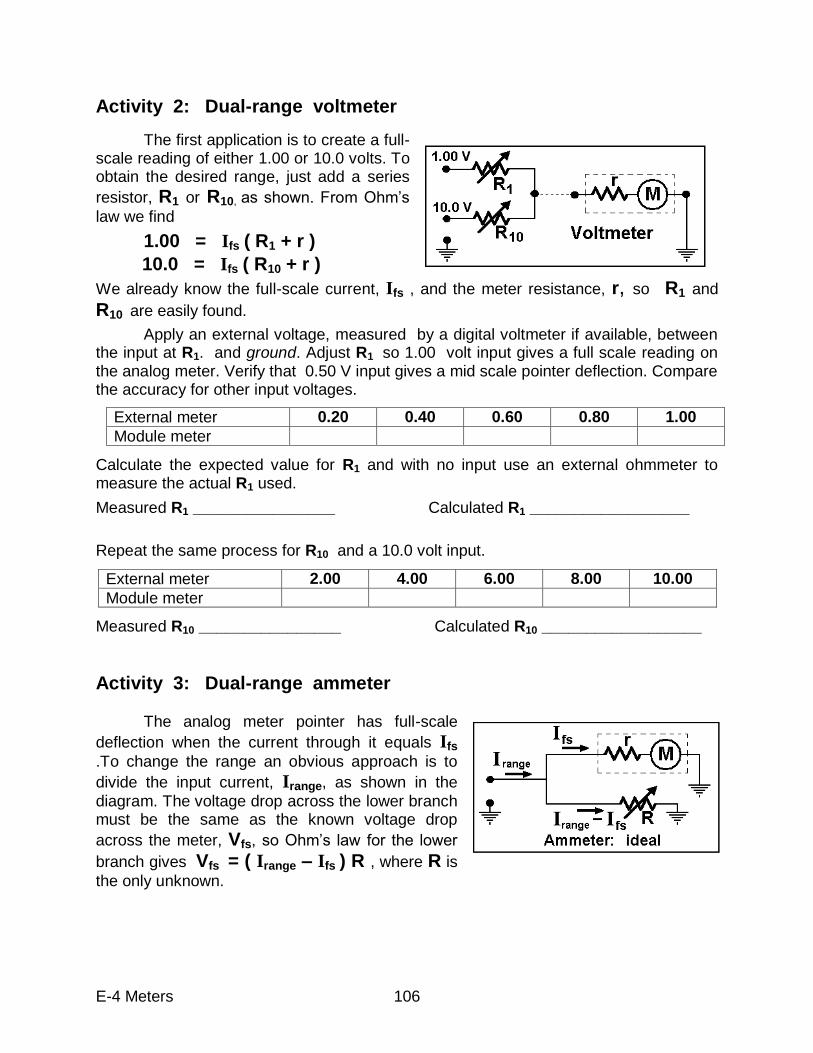
E-4 Meters 106
Activity 2: Dual-range voltmeter
The first application is to create a full-scale reading of either 1.00 or 10.0 volts. To obtain the desired range, just add a series
resistor, R1 or R10, as shown. From Ohm‟s
law we find
1.00 = Ifs ( R1 + r )
10.0 = Ifs ( R10 + r )
We already know the full-scale current, Ifs , and the meter resistance, r, so R1 and R10 are easily found.
Apply an external voltage, measured by a digital voltmeter if available, between the input at R1. and ground. Adjust R1 so 1.00 volt input gives a full scale reading on the analog meter. Verify that 0.50 V input gives a mid scale pointer deflection. Compare the accuracy for other input voltages.
Calculate the expected value for R1 and with no input use an external ohmmeter to measure the actual R1 used.
Measured R1 ________________ Calculated R1 __________________
Repeat the same process for R10 and a 10.0 volt input.
Measured R10 ________________ Calculated R10 __________________
Activity 3: Dual-range ammeter The analog meter pointer has full-scale
deflection when the current through it equals Ifs
.To change the range an obvious approach is to
divide the input current, Irange, as shown in the
diagram. The voltage drop across the lower branch must be the same as the known voltage drop
across the meter, Vfs, so Ohm‟s law for the lower
branch gives Vfs = ( Irange – Ifs ) R , where R is
the only unknown.
External meter 0.20 0.40 0.60 0.80 1.00
Module meter
External meter 2.00 4.00 6.00 8.00 10.00
Module meter
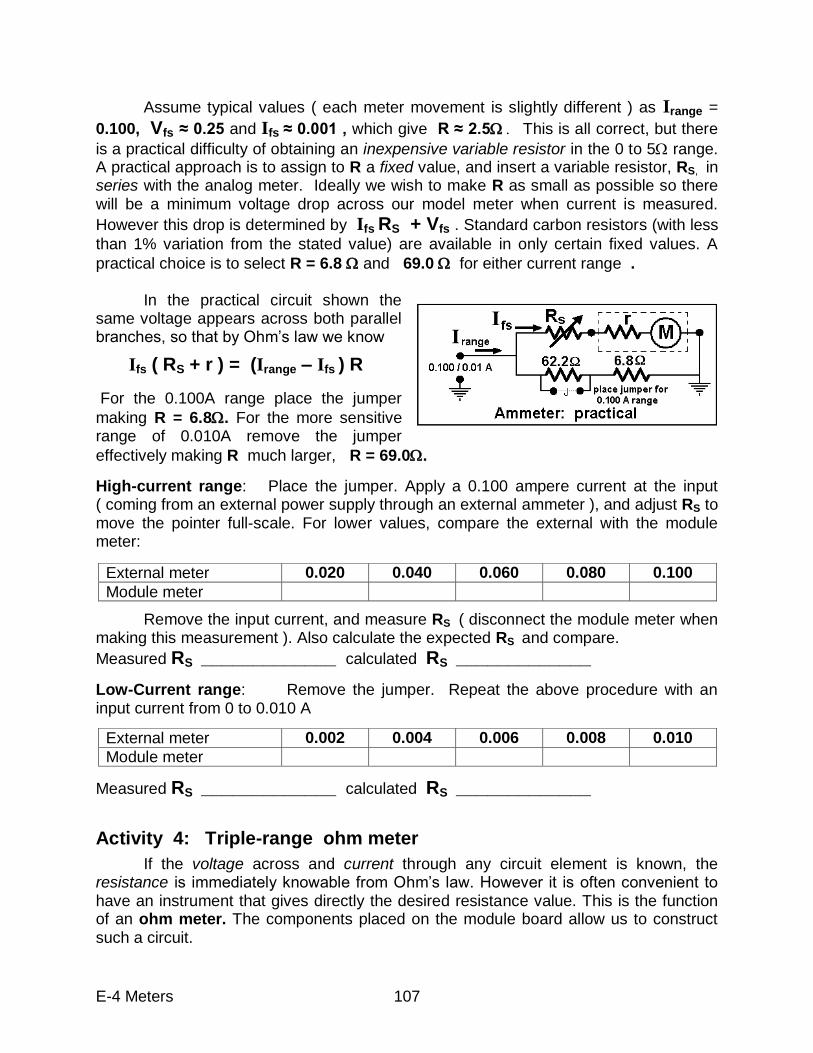
E-4 Meters 107
Assume typical values ( each meter movement is slightly different ) as Irange =
0.100, Vfs ≈ 0.25 and Ifs ≈ 0.001 , which give R ≈ 2.5This is all correct, but there
is a practical difficulty of obtaining an inexpensive variable resistor in the 0 to 5 range. A practical approach is to assign to R a fixed value, and insert a variable resistor, RS, in series with the analog meter. Ideally we wish to make R as small as possible so there will be a minimum voltage drop across our model meter when current is measured.
However this drop is determined by Ifs RS + Vfs . Standard carbon resistors (with less
than 1% variation from the stated value) are available in only certain fixed values. A
practical choice is to select R = 6.8 and 69.0 for either current range . In the practical circuit shown the same voltage appears across both parallel branches, so that by Ohm‟s law we know
Ifs ( RS + r ) = (Irange – Ifs ) R
For the 0.100A range place the jumper
making R = 6.8. For the more sensitive range of 0.010A remove the jumper
effectively making R much larger, R = 69.0.
High-current range: Place the jumper. Apply a 0.100 ampere current at the input ( coming from an external power supply through an external ammeter ), and adjust RS to move the pointer full-scale. For lower values, compare the external with the module meter:
Remove the input current, and measure RS ( disconnect the module meter when making this measurement ). Also calculate the expected RS and compare.
Measured RS _____________ calculated RS _____________ Low-Current range: Remove the jumper. Repeat the above procedure with an input current from 0 to 0.010 A
Measured RS _____________ calculated RS _____________
Activity 4: Triple-range ohm meter
If the voltage across and current through any circuit element is known, the resistance is immediately knowable from Ohm‟s law. However it is often convenient to have an instrument that gives directly the desired resistance value. This is the function of an ohm meter. The components placed on the module board allow us to construct such a circuit.
External meter 0.020 0.040 0.060 0.080 0.100
Module meter
External meter 0.002 0.004 0.006 0.008 0.010
Module meter
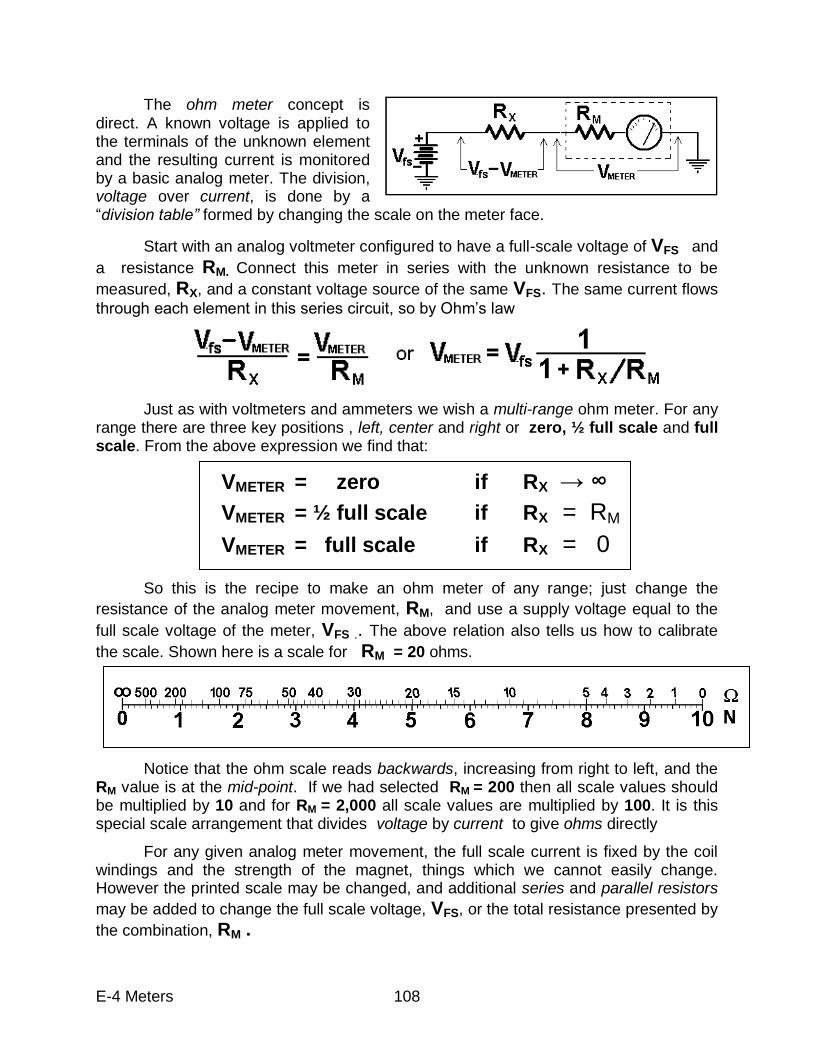
E-4 Meters 108
The ohm meter concept is direct. A known voltage is applied to the terminals of the unknown element and the resulting current is monitored by a basic analog meter. The division, voltage over current, is done by a “division table” formed by changing the scale on the meter face.
Start with an analog voltmeter configured to have a full-scale voltage of VFS and
a resistance RM. Connect this meter in series with the unknown resistance to be
measured, RX, and a constant voltage source of the same VFS. The same current flows
through each element in this series circuit, so by Ohm‟s law
Just as with voltmeters and ammeters we wish a multi-range ohm meter. For any range there are three key positions , left, center and right or zero, ½ full scale and full scale. From the above expression we find that:
So this is the recipe to make an ohm meter of any range; just change the
resistance of the analog meter movement, RM, and use a supply voltage equal to the
full scale voltage of the meter, VFS .. The above relation also tells us how to calibrate
the scale. Shown here is a scale for RM = 20 ohms.
Notice that the ohm scale reads backwards, increasing from right to left, and the RM value is at the mid-point. If we had selected RM = 200 then all scale values should be multiplied by 10 and for RM = 2,000 all scale values are multiplied by 100. It is this special scale arrangement that divides voltage by current to give ohms directly
For any given analog meter movement, the full scale current is fixed by the coil windings and the strength of the magnet, things which we cannot easily change. However the printed scale may be changed, and additional series and parallel resistors
may be added to change the full scale voltage, VFS, or the total resistance presented by
the combination, RM .
VMETER = zero if RX → ∞
VMETER = ½ full scale if RX = RM
VMETER = full scale if RX = 0
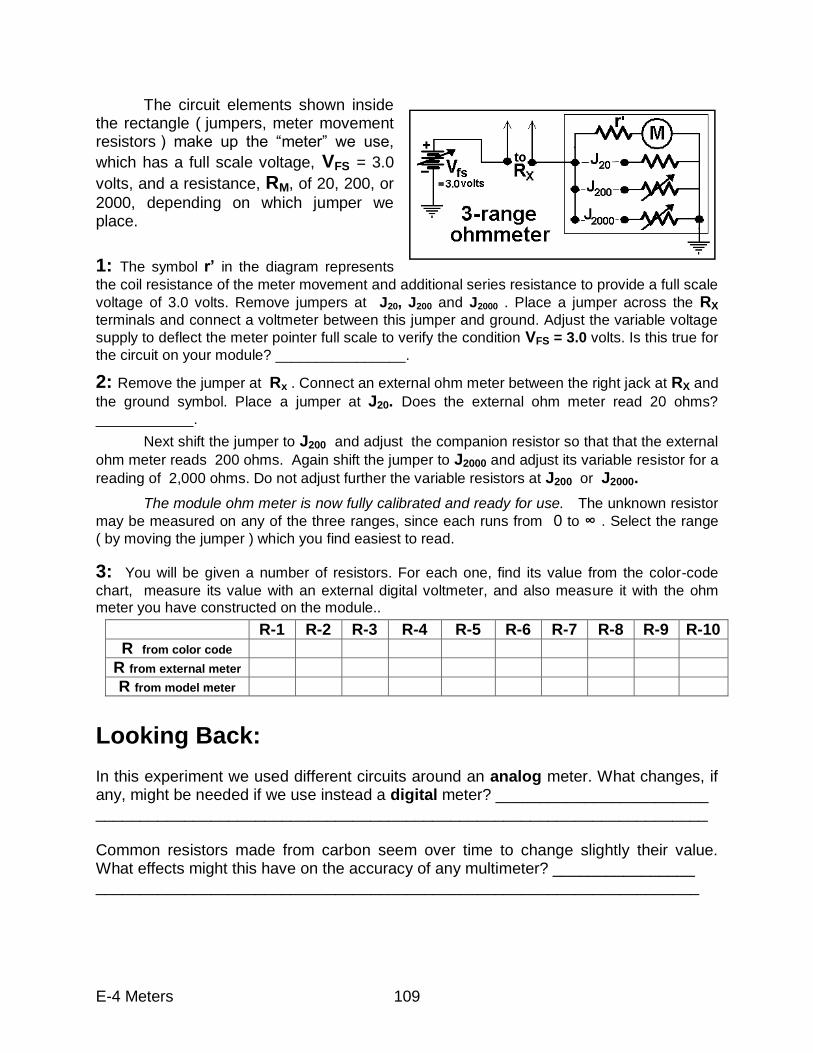
E-4 Meters 109
The circuit elements shown inside the rectangle ( jumpers, meter movement resistors ) make up the “meter” we use,
which has a full scale voltage, VFS = 3.0
volts, and a resistance, RM, of 20, 200, or
2000, depending on which jumper we place.
1: The symbol r‟ in the diagram represents
the coil resistance of the meter movement and additional series resistance to provide a full scale
voltage of 3.0 volts. Remove jumpers at J20, J200 and J2000 . Place a jumper across the RX
terminals and connect a voltmeter between this jumper and ground. Adjust the variable voltage
supply to deflect the meter pointer full scale to verify the condition VFS = 3.0 volts. Is this true for
the circuit on your module? ________________.
2: Remove the jumper at Rx . Connect an external ohm meter between the right jack at RX and
the ground symbol. Place a jumper at J20. Does the external ohm meter read 20 ohms?
____________.
Next shift the jumper to J200 and adjust the companion resistor so that that the external
ohm meter reads 200 ohms. Again shift the jumper to J2000 and adjust its variable resistor for a
reading of 2,000 ohms. Do not adjust further the variable resistors at J200 or J2000.
The module ohm meter is now fully calibrated and ready for use. The unknown resistor
may be measured on any of the three ranges, since each runs from 0 to ∞ . Select the range
( by moving the jumper ) which you find easiest to read.
3: You will be given a number of resistors. For each one, find its value from the color-code
chart, measure its value with an external digital voltmeter, and also measure it with the ohm meter you have constructed on the module..
Looking Back:
In this experiment we used different circuits around an analog meter. What changes, if any, might be needed if we use instead a digital meter? ________________________ _____________________________________________________________________ Common resistors made from carbon seem over time to change slightly their value. What effects might this have on the accuracy of any multimeter? ________________ ____________________________________________________________________
R-1 R-2 R-3 R-4 R-5 R-6 R-7 R-8 R-9 R-10
R from color code
R from external meter R from model meter
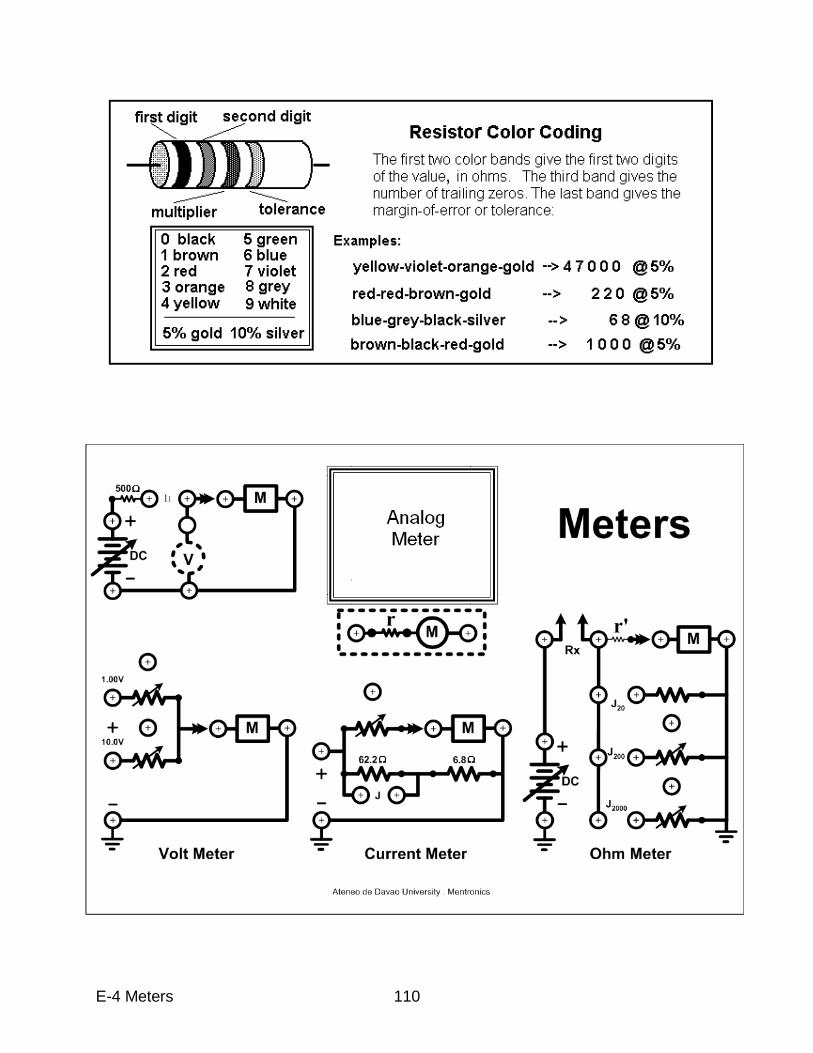
E-4 Meters 110
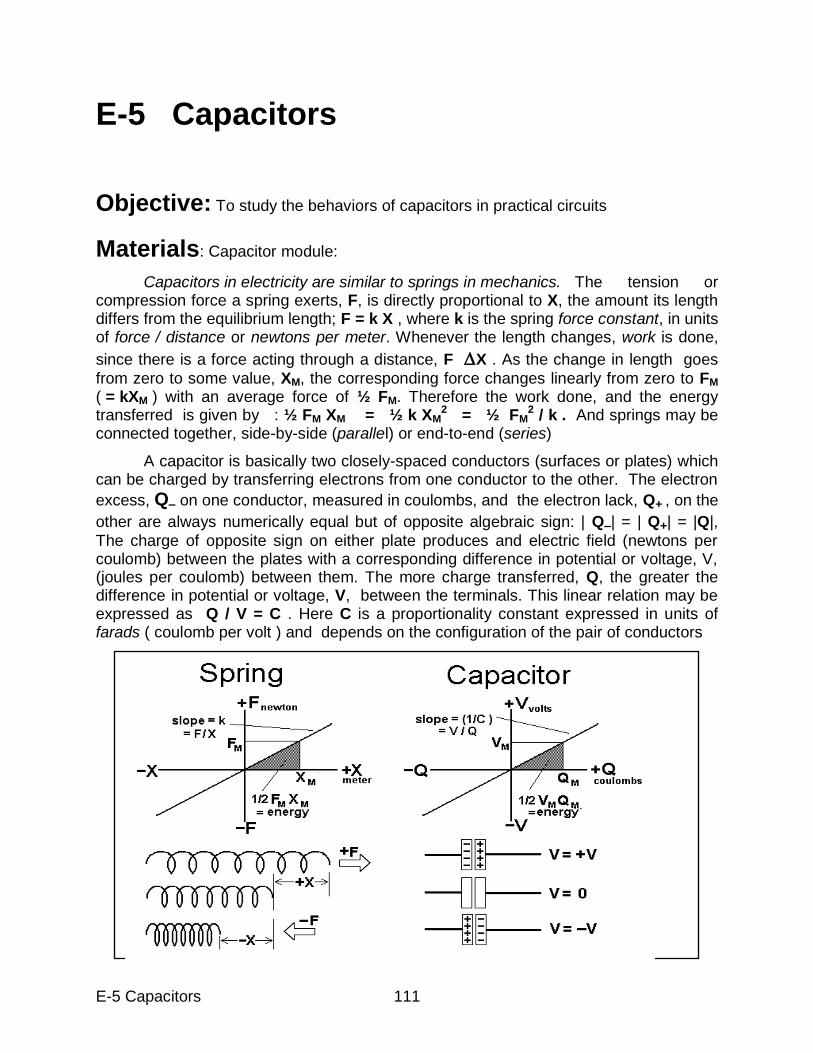
E-5 Capacitors 111
E-5 Capacitors
Objective: To study the behaviors of capacitors in practical circuits
Materials: Capacitor module:
Capacitors in electricity are similar to springs in mechanics. The tension or compression force a spring exerts, F, is directly proportional to X, the amount its length differs from the equilibrium length; F = k X , where k is the spring force constant, in units of force / distance or newtons per meter. Whenever the length changes, work is done,
since there is a force acting through a distance, F X . As the change in length goes
from zero to some value, XM, the corresponding force changes linearly from zero to FM ( = kXM ) with an average force of ½ FM. Therefore the work done, and the energy transferred is given by : ½ FM XM = ½ k XM
2 = ½ FM2 / k . And springs may be
connected together, side-by-side (parallel) or end-to-end (series)
A capacitor is basically two closely-spaced conductors (surfaces or plates) which can be charged by transferring electrons from one conductor to the other. The electron
excess, Q– on one conductor, measured in coulombs, and the electron lack, Q+ , on the
other are always numerically equal but of opposite algebraic sign: | Q–| = | Q+| = |Q|,
The charge of opposite sign on either plate produces and electric field (newtons per coulomb) between the plates with a corresponding difference in potential or voltage, V, (joules per coulomb) between them. The more charge transferred, Q, the greater the difference in potential or voltage, V, between the terminals. This linear relation may be expressed as Q / V = C . Here C is a proportionality constant expressed in units of farads ( coulomb per volt ) and depends on the configuration of the pair of conductors
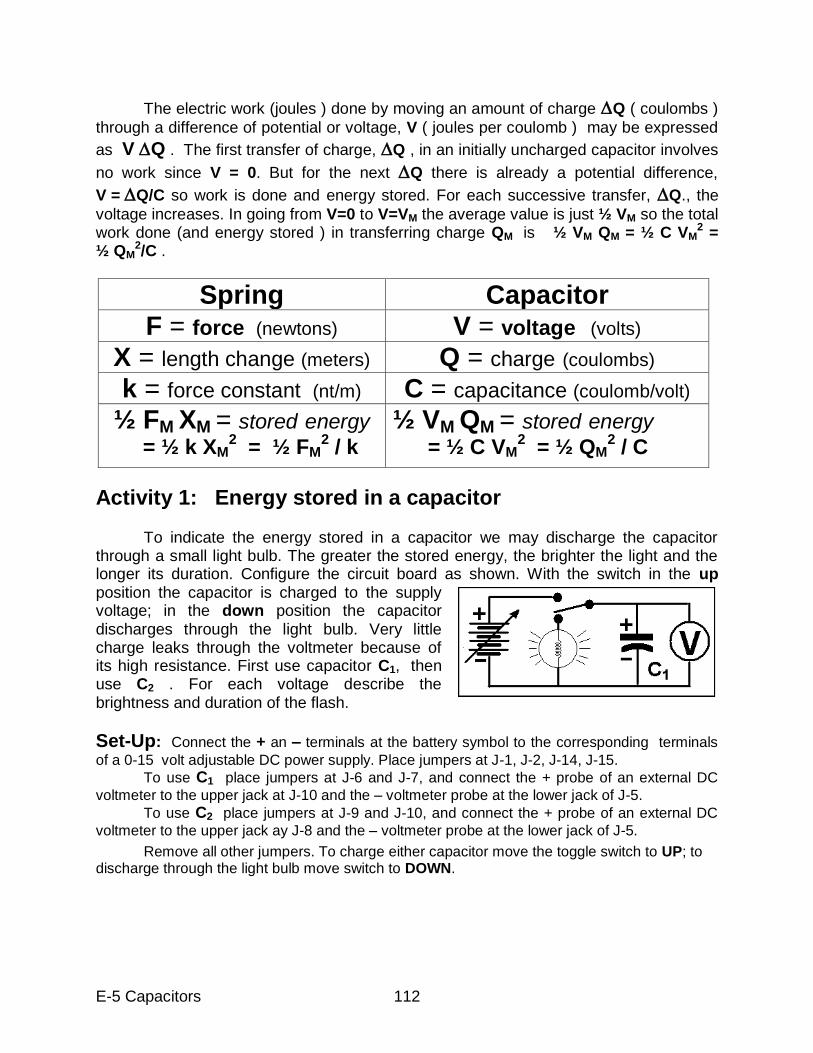
E-5 Capacitors 112
The electric work (joules ) done by moving an amount of charge Q ( coulombs )
through a difference of potential or voltage, V ( joules per coulomb ) may be expressed
as V Q . The first transfer of charge, Q , in an initially uncharged capacitor involves
no work since V = 0. But for the next Q there is already a potential difference,
V = Q/C so work is done and energy stored. For each successive transfer, Q., the
voltage increases. In going from V=0 to V=VM the average value is just ½ VM so the total work done (and energy stored ) in transferring charge QM is ½ VM QM = ½ C VM
2 = ½ QM
2/C .
Activity 1: Energy stored in a capacitor
To indicate the energy stored in a capacitor we may discharge the capacitor through a small light bulb. The greater the stored energy, the brighter the light and the longer its duration. Configure the circuit board as shown. With the switch in the up position the capacitor is charged to the supply voltage; in the down position the capacitor discharges through the light bulb. Very little charge leaks through the voltmeter because of its high resistance. First use capacitor C1, then use C2 . For each voltage describe the brightness and duration of the flash.
Set-Up: Connect the + an – terminals at the battery symbol to the corresponding terminals
of a 0-15 volt adjustable DC power supply. Place jumpers at J-1, J-2, J-14, J-15.
To use C1 place jumpers at J-6 and J-7, and connect the + probe of an external DC
voltmeter to the upper jack at J-10 and the – voltmeter probe at the lower jack of J-5.
To use C2 place jumpers at J-9 and J-10, and connect the + probe of an external DC
voltmeter to the upper jack ay J-8 and the – voltmeter probe at the lower jack of J-5.
Remove all other jumpers. To charge either capacitor move the toggle switch to UP; to discharge through the light bulb move switch to DOWN.
Spring Capacitor F = force (newtons) V = voltage (volts)
X = length change (meters) Q = charge (coulombs)
k = force constant (nt/m) C = capacitance (coulomb/volt)
½ FM XM = stored energy
= ½ k XM2 = ½ FM
2 / k
½ VM QM = stored energy
= ½ C VM2 = ½ QM
2 / C
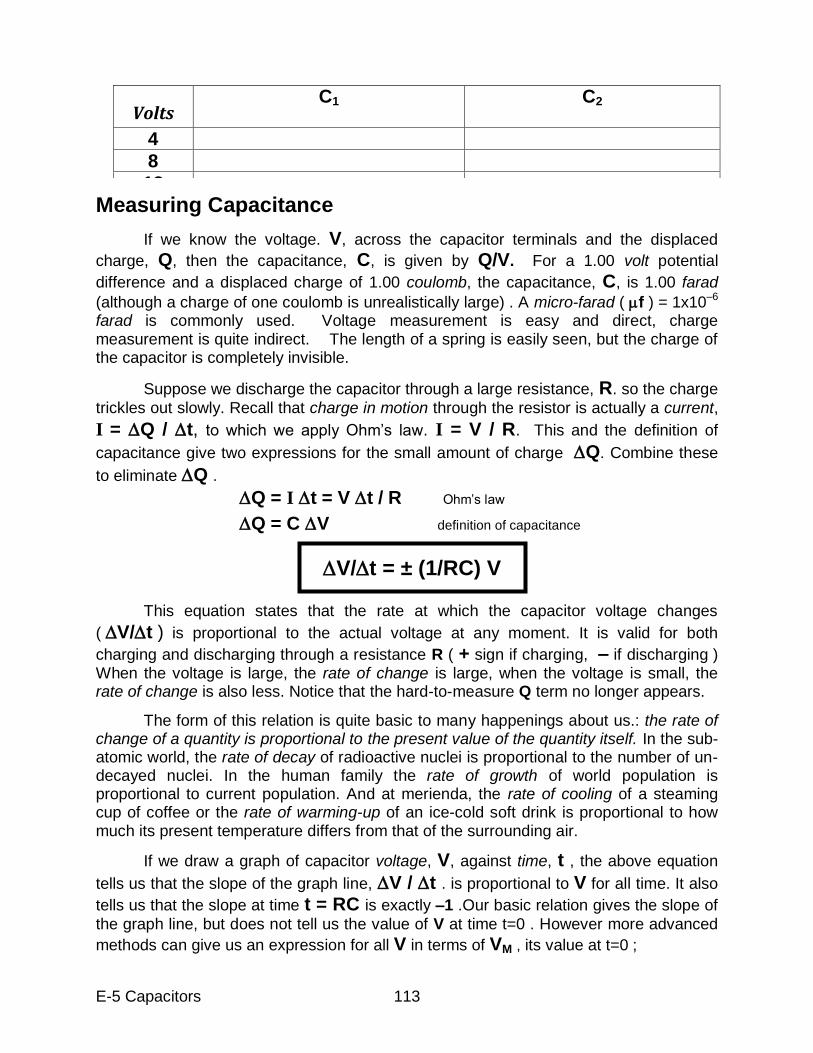
E-5 Capacitors 113
Measuring Capacitance
If we know the voltage. V, across the capacitor terminals and the displaced
charge, Q, then the capacitance, C, is given by Q/V. For a 1.00 volt potential
difference and a displaced charge of 1.00 coulomb, the capacitance, C, is 1.00 farad
(although a charge of one coulomb is unrealistically large) . A micro-farad ( f ) = 1x10⁻⁶ farad is commonly used. Voltage measurement is easy and direct, charge measurement is quite indirect. The length of a spring is easily seen, but the charge of the capacitor is completely invisible.
Suppose we discharge the capacitor through a large resistance, R. so the charge
trickles out slowly. Recall that charge in motion through the resistor is actually a current,
I = Q / t, to which we apply Ohm‟s law. I = V / R. This and the definition of
capacitance give two expressions for the small amount of charge Q. Combine these
to eliminate Q .
Q = I t = V t / R Ohm‟s law
Q = C V definition of capacitance
This equation states that the rate at which the capacitor voltage changes
( V/t ) is proportional to the actual voltage at any moment. It is valid for both
charging and discharging through a resistance R ( + sign if charging, – if discharging ) When the voltage is large, the rate of change is large, when the voltage is small, the rate of change is also less. Notice that the hard-to-measure Q term no longer appears.
The form of this relation is quite basic to many happenings about us.: the rate of change of a quantity is proportional to the present value of the quantity itself. In the sub-atomic world, the rate of decay of radioactive nuclei is proportional to the number of un-decayed nuclei. In the human family the rate of growth of world population is proportional to current population. And at merienda, the rate of cooling of a steaming cup of coffee or the rate of warming-up of an ice-cold soft drink is proportional to how much its present temperature differs from that of the surrounding air.
If we draw a graph of capacitor voltage, V, against time, t , the above equation
tells us that the slope of the graph line, V / t . is proportional to V for all time. It also
tells us that the slope at time t = RC is exactly –1 .Our basic relation gives the slope of
the graph line, but does not tell us the value of V at time t=0 . However more advanced
methods can give us an expression for all V in terms of VM , its value at t=0 ;
V/t = ± (1/RC) V
Volts C1 C2
4
8
12
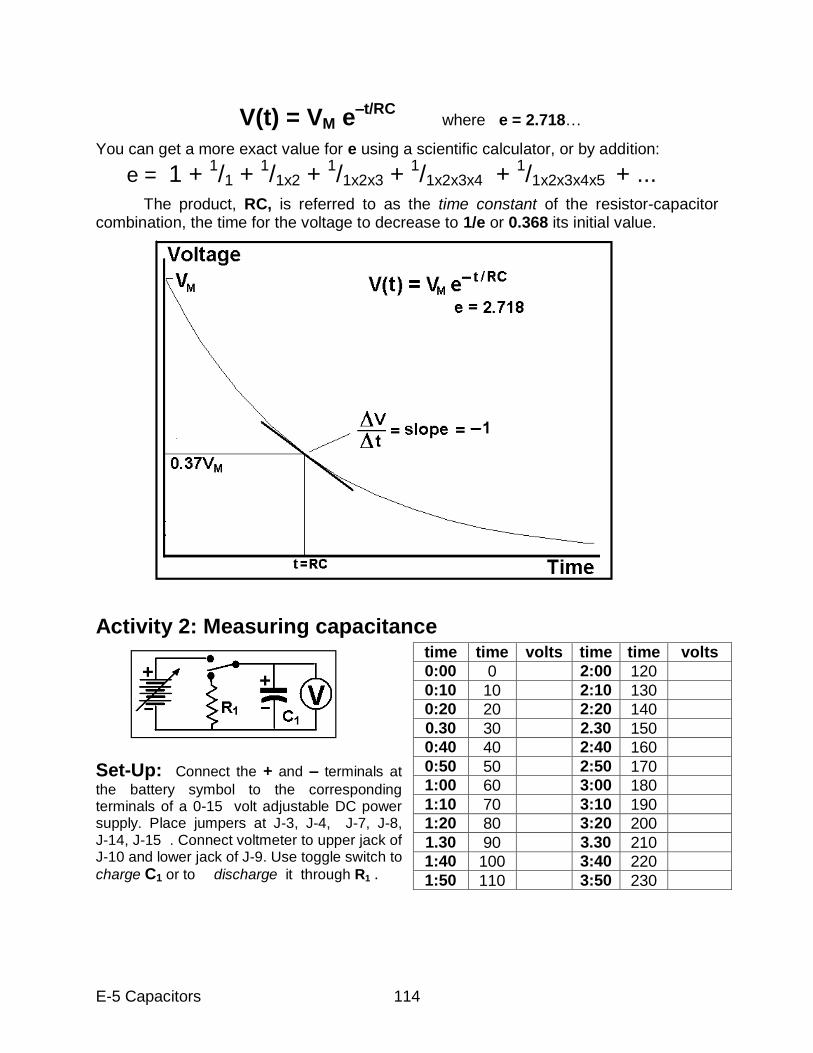
E-5 Capacitors 114
V(t) = VM e–t/RC
where e = 2.718…
You can get a more exact value for e using a scientific calculator, or by addition:
e = 1 + 1/1 +
1/1x2 +
1/1x2x3 +
1/1x2x3x4 +
1/1x2x3x4x5 + ...
The product, RC, is referred to as the time constant of the resistor-capacitor combination, the time for the voltage to decrease to 1/e or 0.368 its initial value.
Activity 2: Measuring capacitance
Set-Up: Connect the + and – terminals at
the battery symbol to the corresponding terminals of a 0-15 volt adjustable DC power supply. Place jumpers at J-3, J-4, J-7, J-8, J-14, J-15 . Connect voltmeter to upper jack of J-10 and lower jack of J-9. Use toggle switch to
charge C1 or to discharge it through R1 .
time time volts time time volts
0:00 0 2:00 120
0:10 10 2:10 130
0:20 20 2:20 140
0.30 30 2.30 150
0:40 40 2:40 160
0:50 50 2:50 170
1:00 60 3:00 180
1:10 70 3:10 190
1:20 80 3:20 200
1.30 90 3.30 210
1:40 100 3:40 220
1:50 110 3:50 230
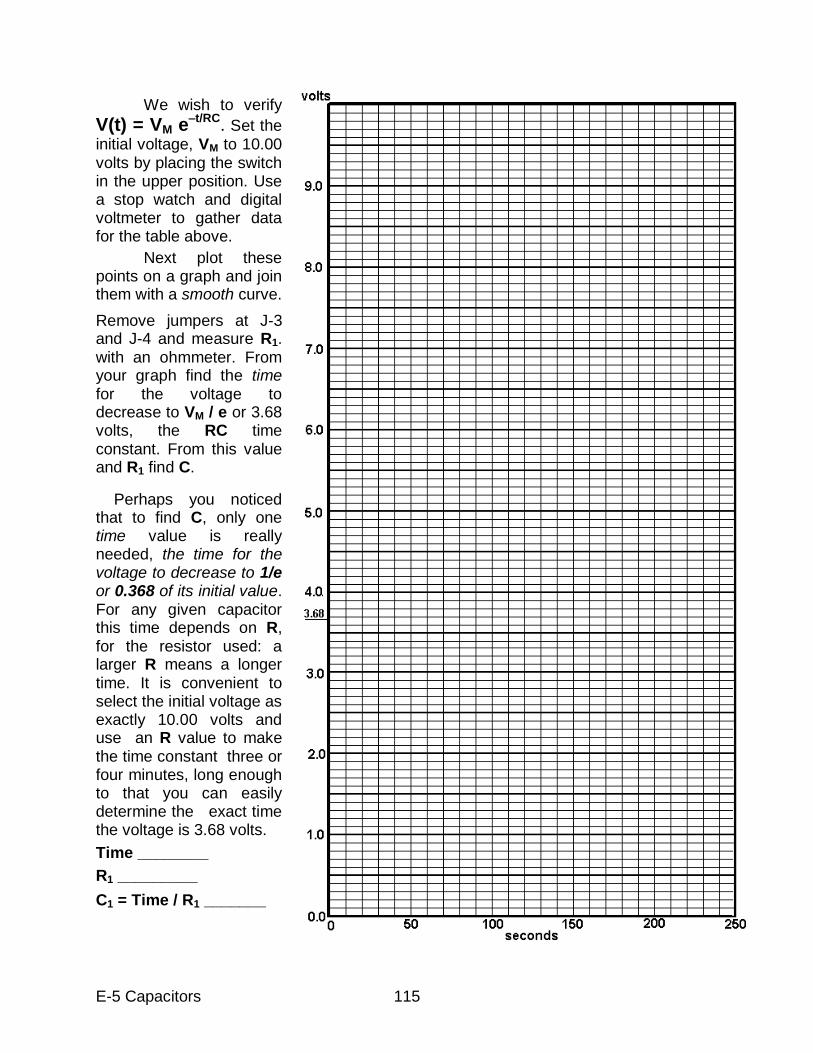
E-5 Capacitors 115
We wish to verify
V(t) = VM e–t/RC
. Set the initial voltage, VM to 10.00 volts by placing the switch in the upper position. Use a stop watch and digital voltmeter to gather data for the table above.
Next plot these points on a graph and join them with a smooth curve.
Remove jumpers at J-3 and J-4 and measure R1. with an ohmmeter. From your graph find the time for the voltage to decrease to VM / e or 3.68 volts, the RC time constant. From this value and R1 find C.
Perhaps you noticed that to find C, only one time value is really needed, the time for the voltage to decrease to 1/e or 0.368 of its initial value. For any given capacitor this time depends on R, for the resistor used: a larger R means a longer time. It is convenient to select the initial voltage as exactly 10.00 volts and use an R value to make the time constant three or four minutes, long enough to that you can easily determine the exact time the voltage is 3.68 volts.
Time ________
R1 _________
C1 = Time / R1 _______
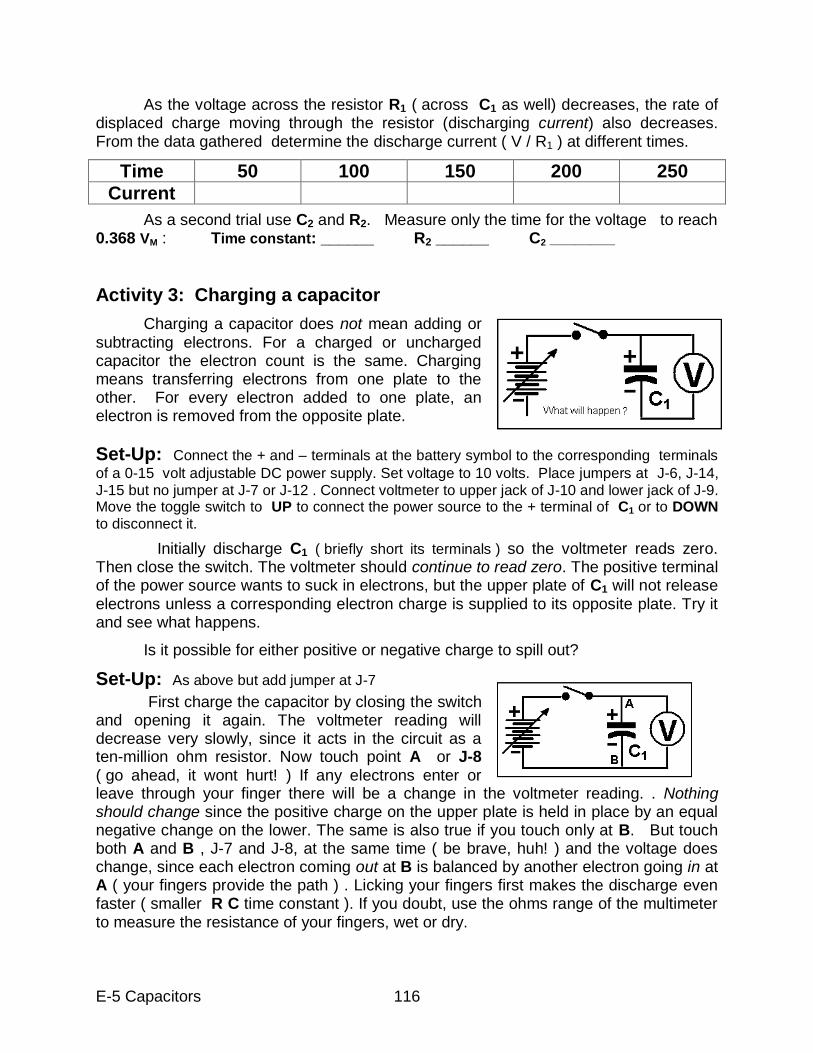
E-5 Capacitors 116
As the voltage across the resistor R1 ( across C1 as well) decreases, the rate of displaced charge moving through the resistor (discharging current) also decreases. From the data gathered determine the discharge current ( V / R1 ) at different times.
Time 50 100 150 200 250
Current
As a second trial use C2 and R2. Measure only the time for the voltage to reach 0.368 VM : Time constant: ______ R2 ______ C2 ________
Activity 3: Charging a capacitor
Charging a capacitor does not mean adding or subtracting electrons. For a charged or uncharged capacitor the electron count is the same. Charging means transferring electrons from one plate to the other. For every electron added to one plate, an electron is removed from the opposite plate.
Set-Up: Connect the + and – terminals at the battery symbol to the corresponding terminals
of a 0-15 volt adjustable DC power supply. Set voltage to 10 volts. Place jumpers at J-6, J-14, J-15 but no jumper at J-7 or J-12 . Connect voltmeter to upper jack of J-10 and lower jack of J-9. Move the toggle switch to UP to connect the power source to the + terminal of C1 or to DOWN to disconnect it.
Initially discharge C1 ( briefly short its terminals ) so the voltmeter reads zero. Then close the switch. The voltmeter should continue to read zero. The positive terminal of the power source wants to suck in electrons, but the upper plate of C1 will not release electrons unless a corresponding electron charge is supplied to its opposite plate. Try it and see what happens.
Is it possible for either positive or negative charge to spill out?
Set-Up: As above but add jumper at J-7
First charge the capacitor by closing the switch and opening it again. The voltmeter reading will decrease very slowly, since it acts in the circuit as a ten-million ohm resistor. Now touch point A or J-8 ( go ahead, it wont hurt! ) If any electrons enter or leave through your finger there will be a change in the voltmeter reading. . Nothing should change since the positive charge on the upper plate is held in place by an equal negative change on the lower. The same is also true if you touch only at B. But touch both A and B , J-7 and J-8, at the same time ( be brave, huh! ) and the voltage does change, since each electron coming out at B is balanced by another electron going in at A ( your fingers provide the path ) . Licking your fingers first makes the discharge even faster ( smaller R C time constant ). If you doubt, use the ohms range of the multimeter to measure the resistance of your fingers, wet or dry.
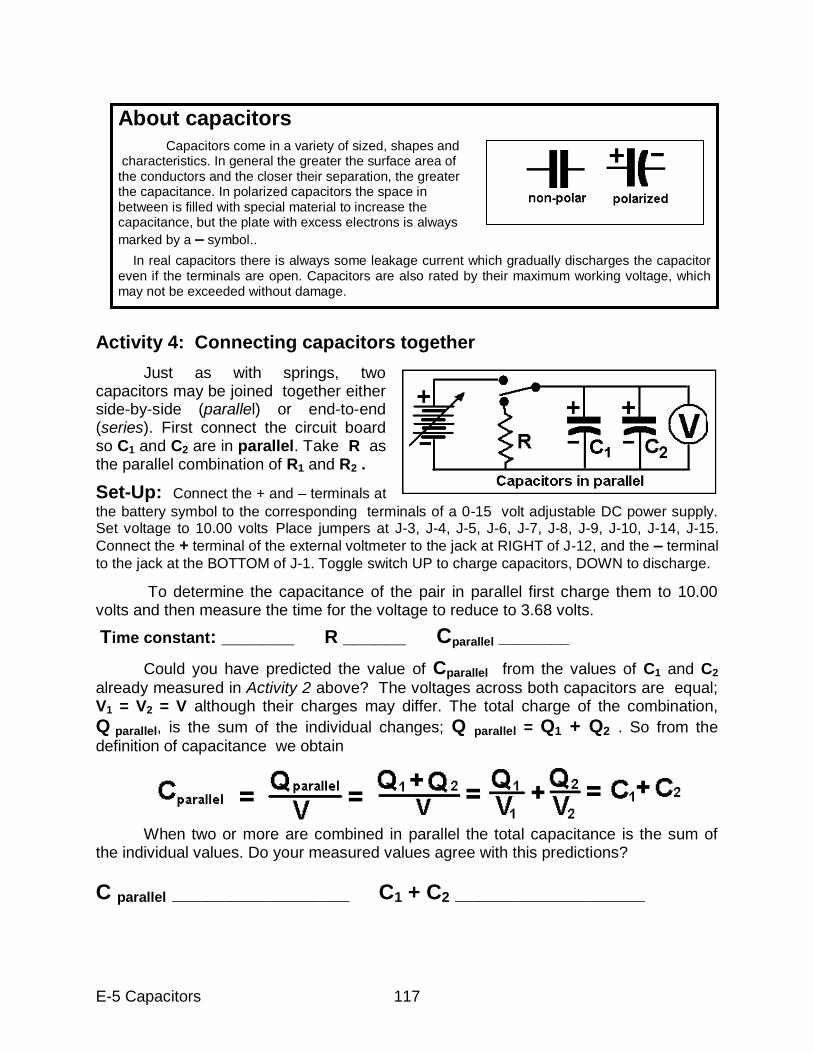
E-5 Capacitors 117
Activity 4: Connecting capacitors together
Just as with springs, two capacitors may be joined together either side-by-side (parallel) or end-to-end (series). First connect the circuit board so C1 and C2 are in parallel. Take R as the parallel combination of R1 and R2 .
Set-Up: Connect the + and – terminals at
the battery symbol to the corresponding terminals of a 0-15 volt adjustable DC power supply. Set voltage to 10.00 volts Place jumpers at J-3, J-4, J-5, J-6, J-7, J-8, J-9, J-10, J-14, J-15.
Connect the + terminal of the external voltmeter to the jack at RIGHT of J-12, and the – terminal
to the jack at the BOTTOM of J-1. Toggle switch UP to charge capacitors, DOWN to discharge.
To determine the capacitance of the pair in parallel first charge them to 10.00 volts and then measure the time for the voltage to reduce to 3.68 volts.
Time constant: _______ R ______ Cparallel ________
Could you have predicted the value of Cparallel from the values of C1 and C2
already measured in Activity 2 above? The voltages across both capacitors are equal; V1 = V2 = V although their charges may differ. The total charge of the combination,
Q parallel, is the sum of the individual changes; Q parallel = Q1 + Q2 . So from the
definition of capacitance we obtain
When two or more are combined in parallel the total capacitance is the sum of the individual values. Do your measured values agree with this predictions?
C parallel _______________ C1 + C2 ________________
About capacitors
Capacitors come in a variety of sized, shapes and characteristics. In general the greater the surface area of the conductors and the closer their separation, the greater the capacitance. In polarized capacitors the space in between is filled with special material to increase the capacitance, but the plate with excess electrons is always
marked by a – symbol..
In real capacitors there is always some leakage current which gradually discharges the capacitor even if the terminals are open. Capacitors are also rated by their maximum working voltage, which may not be exceeded without damage.
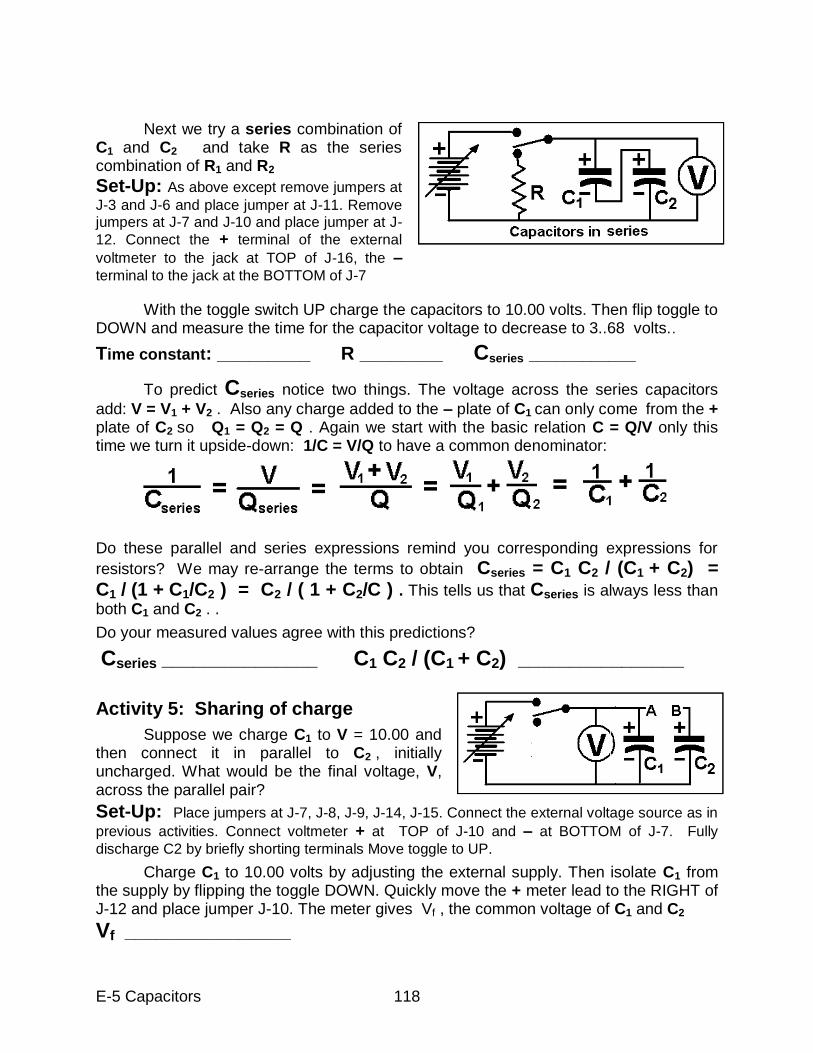
E-5 Capacitors 118
Next we try a series combination of C1 and C2 and take R as the series combination of R1 and R2
Set-Up: As above except remove jumpers at
J-3 and J-6 and place jumper at J-11. Remove jumpers at J-7 and J-10 and place jumper at J-
12. Connect the + terminal of the external
voltmeter to the jack at TOP of J-16, the –
terminal to the jack at the BOTTOM of J-7
With the toggle switch UP charge the capacitors to 10.00 volts. Then flip toggle to DOWN and measure the time for the capacitor voltage to decrease to 3..68 volts..
Time constant: _________ R ________ Cseries ____________
To predict Cseries notice two things. The voltage across the series capacitors
add: V = V1 + V2 . Also any charge added to the – plate of C1 can only come from the + plate of C2 so Q1 = Q2 = Q . Again we start with the basic relation C = Q/V only this time we turn it upside-down: 1/C = V/Q to have a common denominator:
Do these parallel and series expressions remind you corresponding expressions for
resistors? We may re-arrange the terms to obtain Cseries = C1 C2 / (C1 + C2) = C1 / (1 + C1/C2 ) = C2 / ( 1 + C2/C ) . This tells us that Cseries is always less than both C1 and C2 . .
Do your measured values agree with this predictions?
Cseries _______________ C1 C2 / (C1 + C2) ________________
Activity 5: Sharing of charge
Suppose we charge C1 to V = 10.00 and then connect it in parallel to C2 , initially uncharged. What would be the final voltage, V, across the parallel pair?
Set-Up: Place jumpers at J-7, J-8, J-9, J-14, J-15. Connect the external voltage source as in
previous activities. Connect voltmeter + at TOP of J-10 and – at BOTTOM of J-7. Fully
discharge C2 by briefly shorting terminals Move toggle to UP.
Charge C1 to 10.00 volts by adjusting the external supply. Then isolate C1 from the supply by flipping the toggle DOWN. Quickly move the + meter lead to the RIGHT of J-12 and place jumper J-10. The meter gives Vf , the common voltage of C1 and C2
Vf ________________
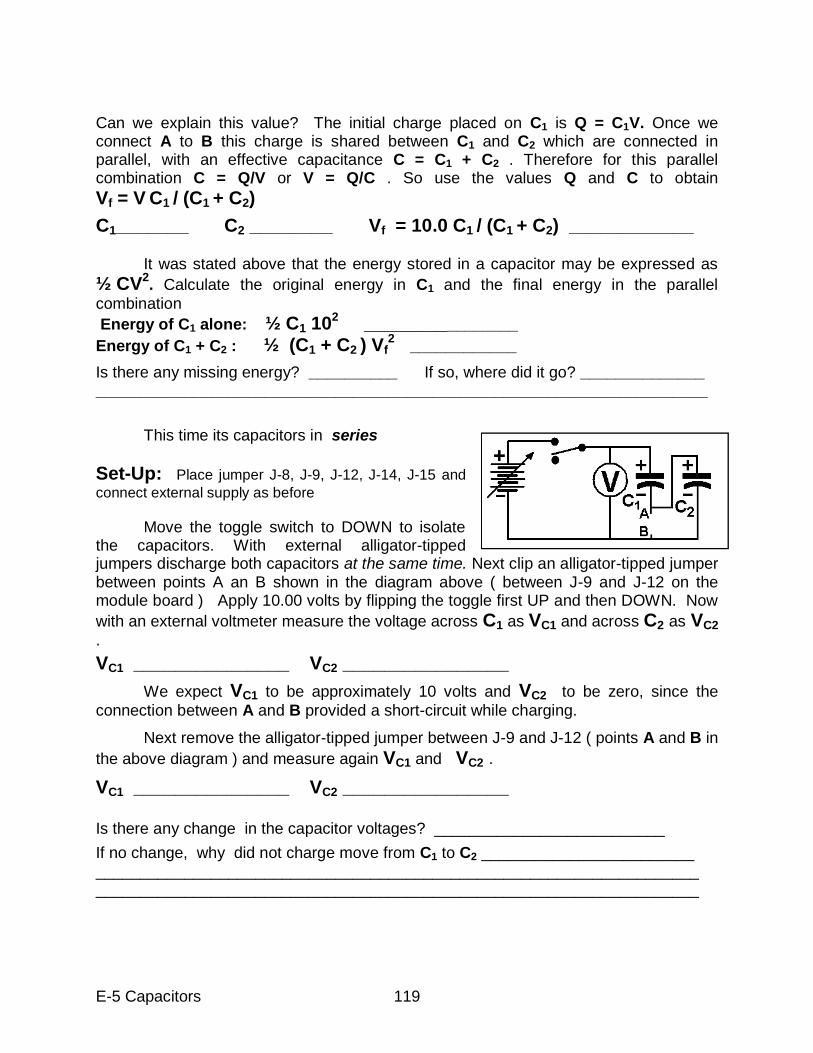
E-5 Capacitors 119
Can we explain this value? The initial charge placed on C1 is Q = C1V. Once we connect A to B this charge is shared between C1 and C2 which are connected in parallel, with an effective capacitance C = C1 + C2 . Therefore for this parallel combination C = Q/V or V = Q/C . So use the values Q and C to obtain Vf = V C1 / (C1 + C2)
C1_______ C2 ________ Vf = 10.0 C1 / (C1 + C2) ____________ It was stated above that the energy stored in a capacitor may be expressed as
½ CV2. Calculate the original energy in C1 and the final energy in the parallel
combination
Energy of C1 alone: ½ C1 102 ________________
Energy of C1 + C2 : ½ (C1 + C2 ) Vf2 ____________
Is there any missing energy? __________ If so, where did it go? ______________ _____________________________________________________________________
This time its capacitors in series
Set-Up: Place jumper J-8, J-9, J-12, J-14, J-15 and
connect external supply as before
Move the toggle switch to DOWN to isolate the capacitors. With external alligator-tipped jumpers discharge both capacitors at the same time. Next clip an alligator-tipped jumper between points A an B shown in the diagram above ( between J-9 and J-12 on the module board ) Apply 10.00 volts by flipping the toggle first UP and then DOWN. Now
with an external voltmeter measure the voltage across C1 as VC1 and across C2 as VC2 .
VC1 _______________ VC2 ________________
We expect VC1 to be approximately 10 volts and VC2 to be zero, since the
connection between A and B provided a short-circuit while charging.
Next remove the alligator-tipped jumper between J-9 and J-12 ( points A and B in
the above diagram ) and measure again VC1 and VC2 .
VC1 _______________ VC2 ________________ Is there any change in the capacitor voltages? __________________________
If no change, why did not charge move from C1 to C2 ________________________ ____________________________________________________________________ ____________________________________________________________________
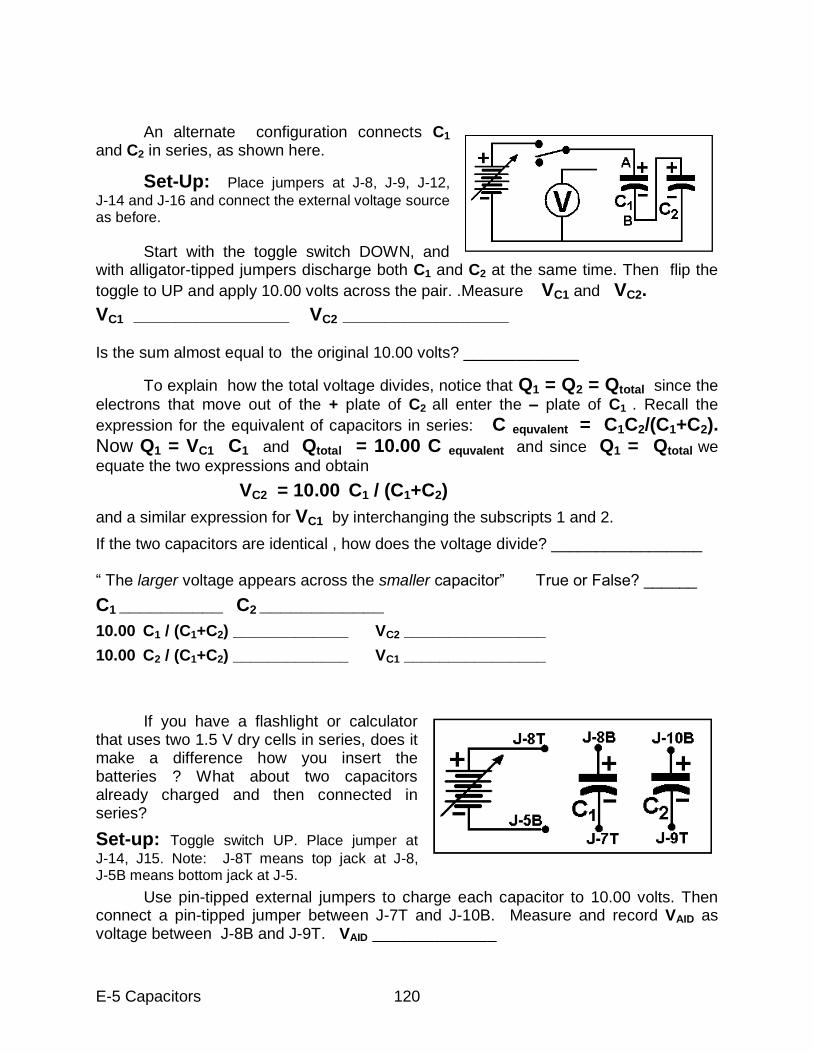
E-5 Capacitors 120
An alternate configuration connects C1 and C2 in series, as shown here.
Set-Up: Place jumpers at J-8, J-9, J-12,
J-14 and J-16 and connect the external voltage source as before.
Start with the toggle switch DOWN, and with alligator-tipped jumpers discharge both C1 and C2 at the same time. Then flip the
toggle to UP and apply 10.00 volts across the pair. .Measure VC1 and VC2.
VC1 _______________ VC2 ________________ Is the sum almost equal to the original 10.00 volts? _____________
To explain how the total voltage divides, notice that Q1 = Q2 = Qtotal since the
electrons that move out of the + plate of C2 all enter the – plate of C1 . Recall the
expression for the equivalent of capacitors in series: C equvalent = C1C2/(C1+C2). Now Q1 = VC1 C1 and Qtotal = 10.00 C equvalent and since Q1 = Qtotal we
equate the two expressions and obtain
VC2 = 10.00 C1 / (C1+C2)
and a similar expression for VC1 by interchanging the subscripts 1 and 2.
If the two capacitors are identical , how does the voltage divide? _________________ “ The larger voltage appears across the smaller capacitor” True or False? ______
C1 __________ C2 ____________
10.00 C1 / (C1+C2) _____________ VC2 ________________
10.00 C2 / (C1+C2) _____________ VC1 ________________
If you have a flashlight or calculator that uses two 1.5 V dry cells in series, does it make a difference how you insert the batteries ? What about two capacitors already charged and then connected in series?
Set-up: Toggle switch UP. Place jumper at
J-14, J15. Note: J-8T means top jack at J-8, J-5B means bottom jack at J-5.
Use pin-tipped external jumpers to charge each capacitor to 10.00 volts. Then connect a pin-tipped jumper between J-7T and J-10B. Measure and record VAID as voltage between J-8B and J-9T. VAID ______________
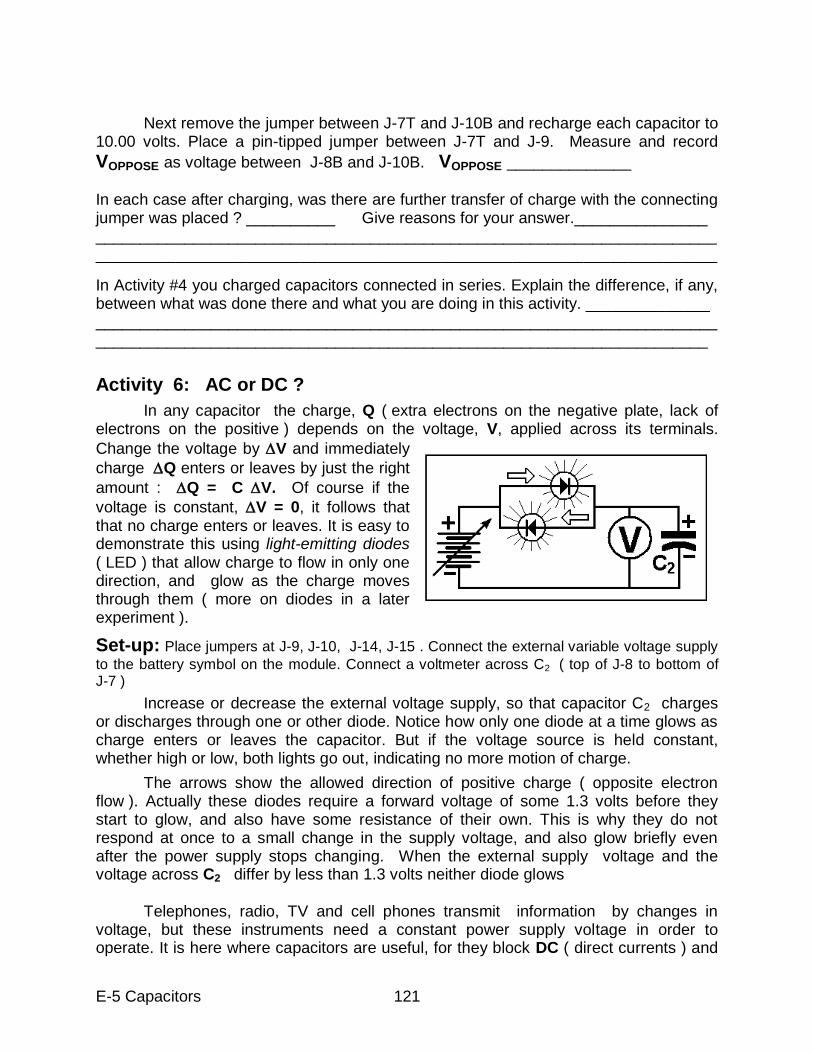
E-5 Capacitors 121
Next remove the jumper between J-7T and J-10B and recharge each capacitor to 10.00 volts. Place a pin-tipped jumper between J-7T and J-9. Measure and record
VOPPOSE as voltage between J-8B and J-10B. VOPPOSE ______________
In each case after charging, was there are further transfer of charge with the connecting jumper was placed ? __________ Give reasons for your answer._______________ ______________________________________________________________________ ______________________________________________________________________
In Activity #4 you charged capacitors connected in series. Explain the difference, if any, between what was done there and what you are doing in this activity. ______________ ______________________________________________________________________ _____________________________________________________________________
Activity 6: AC or DC ?
In any capacitor the charge, Q ( extra electrons on the negative plate, lack of electrons on the positive ) depends on the voltage, V, applied across its terminals.
Change the voltage by V and immediately
charge Q enters or leaves by just the right
amount : Q = C V. Of course if the
voltage is constant, V = 0, it follows that that no charge enters or leaves. It is easy to demonstrate this using light-emitting diodes ( LED ) that allow charge to flow in only one direction, and glow as the charge moves through them ( more on diodes in a later experiment ).
Set-up: Place jumpers at J-9, J-10, J-14, J-15 . Connect the external variable voltage supply
to the battery symbol on the module. Connect a voltmeter across C2 ( top of J-8 to bottom of J-7 )
Increase or decrease the external voltage supply, so that capacitor C2 charges or discharges through one or other diode. Notice how only one diode at a time glows as charge enters or leaves the capacitor. But if the voltage source is held constant, whether high or low, both lights go out, indicating no more motion of charge.
The arrows show the allowed direction of positive charge ( opposite electron flow ). Actually these diodes require a forward voltage of some 1.3 volts before they start to glow, and also have some resistance of their own. This is why they do not respond at once to a small change in the supply voltage, and also glow briefly even after the power supply stops changing. When the external supply voltage and the voltage across C2 differ by less than 1.3 volts neither diode glows Telephones, radio, TV and cell phones transmit information by changes in voltage, but these instruments need a constant power supply voltage in order to operate. It is here where capacitors are useful, for they block DC ( direct currents ) and
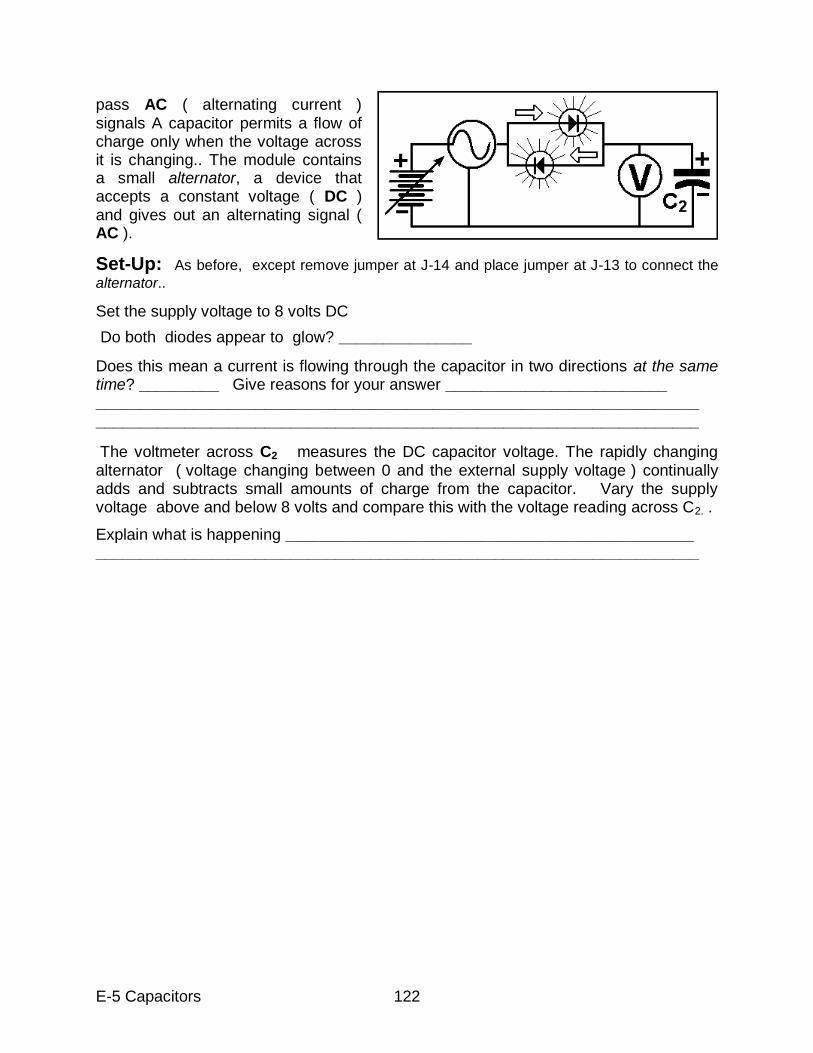
E-5 Capacitors 122
pass AC ( alternating current ) signals A capacitor permits a flow of charge only when the voltage across it is changing.. The module contains a small alternator, a device that accepts a constant voltage ( DC ) and gives out an alternating signal ( AC ).
Set-Up: As before, except remove jumper at J-14 and place jumper at J-13 to connect the
alternator..
Set the supply voltage to 8 volts DC
Do both diodes appear to glow? _______________
Does this mean a current is flowing through the capacitor in two directions at the same time? _________ Give reasons for your answer _________________________ ____________________________________________________________________ ____________________________________________________________________
The voltmeter across C2 measures the DC capacitor voltage. The rapidly changing alternator ( voltage changing between 0 and the external supply voltage ) continually adds and subtracts small amounts of charge from the capacitor. Vary the supply voltage above and below 8 volts and compare this with the voltage reading across C2. .
Explain what is happening ______________________________________________ ____________________________________________________________________
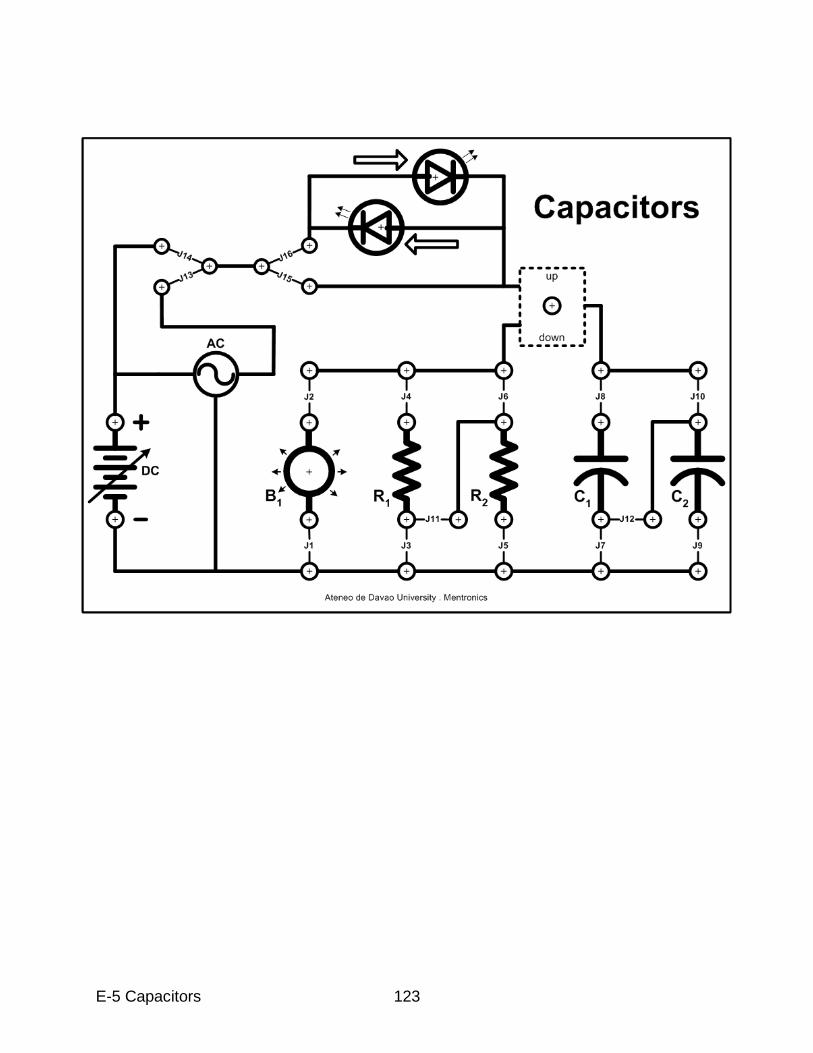
E-5 Capacitors 123
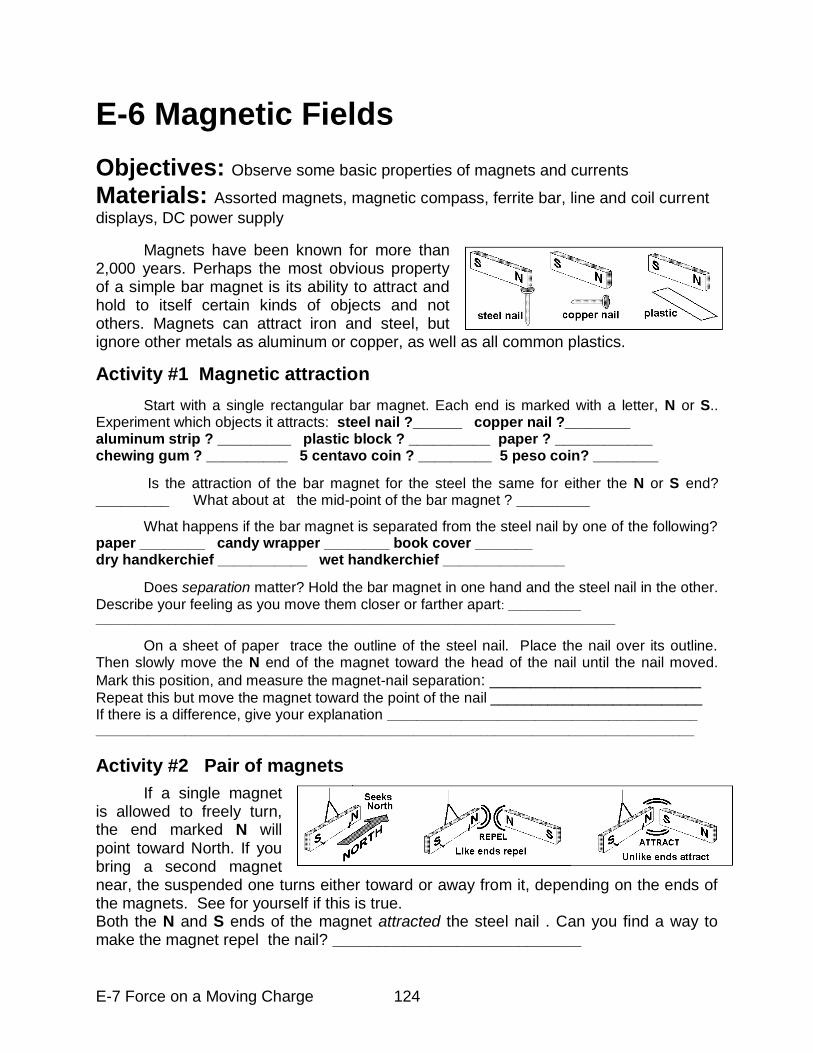
E-7 Force on a Moving Charge 124
E-6 Magnetic Fields
Objectives: Observe some basic properties of magnets and currents Materials: Assorted magnets, magnetic compass, ferrite bar, line and coil current
displays, DC power supply
Magnets have been known for more than 2,000 years. Perhaps the most obvious property of a simple bar magnet is its ability to attract and hold to itself certain kinds of objects and not others. Magnets can attract iron and steel, but ignore other metals as aluminum or copper, as well as all common plastics.
Activity #1 Magnetic attraction
Start with a single rectangular bar magnet. Each end is marked with a letter, N or S.. Experiment which objects it attracts: steel nail ?______ copper nail ?________ aluminum strip ? _________ plastic block ? __________ paper ? ____________ chewing gum ? __________ 5 centavo coin ? _________ 5 peso coin? ________
Is the attraction of the bar magnet for the steel the same for either the N or S end? _________ What about at the mid-point of the bar magnet ? _________
What happens if the bar magnet is separated from the steel nail by one of the following? paper ________ candy wrapper ________ book cover _______ dry handkerchief ___________ wet handkerchief _______________
Does separation matter? Hold the bar magnet in one hand and the steel nail in the other. Describe your feeling as you move them closer or farther apart: ___________ ______________________________________________________________________________
On a sheet of paper trace the outline of the steel nail. Place the nail over its outline. Then slowly move the N end of the magnet toward the head of the nail until the nail moved.
Mark this position, and measure the magnet-nail separation: __________________________
Repeat this but move the magnet toward the point of the nail __________________________ If there is a difference, give your explanation __________________________________________ _________________________________________________________________________________
Activity #2 Pair of magnets
If a single magnet is allowed to freely turn, the end marked N will point toward North. If you bring a second magnet near, the suspended one turns either toward or away from it, depending on the ends of the magnets. See for yourself if this is true. Both the N and S ends of the magnet attracted the steel nail . Can you find a way to make the magnet repel the nail? ____________________________
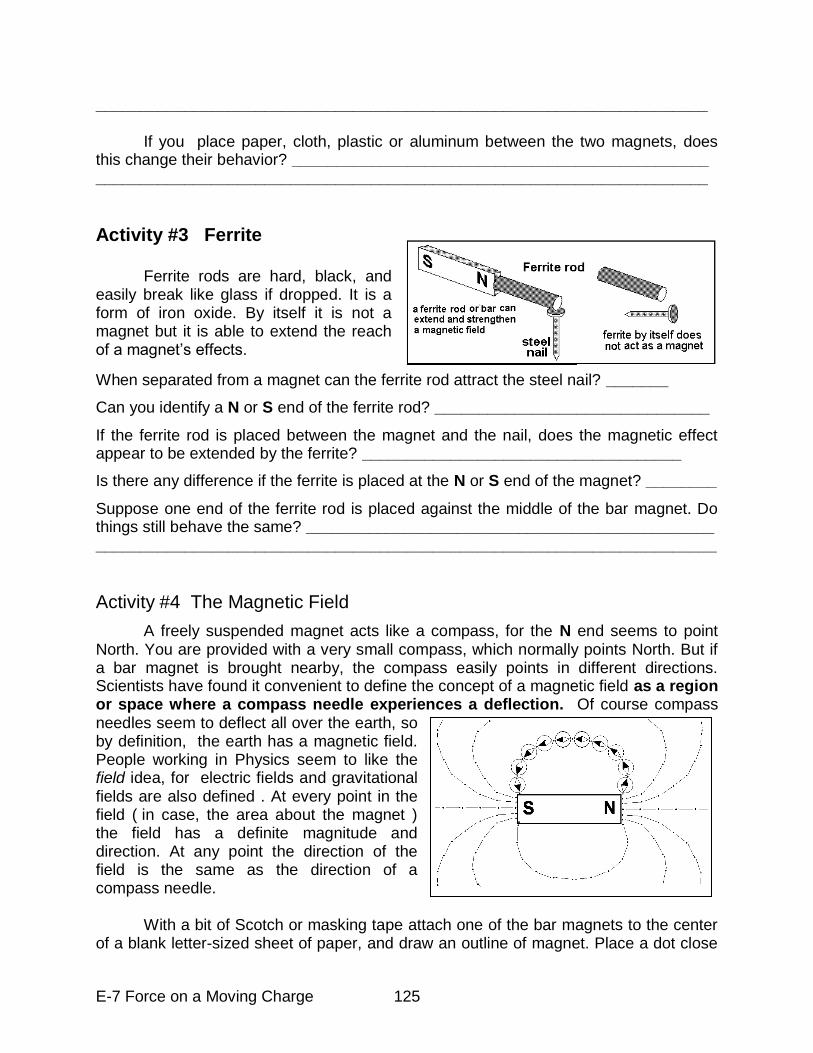
E-7 Force on a Moving Charge 125
_____________________________________________________________________ If you place paper, cloth, plastic or aluminum between the two magnets, does this change their behavior? _______________________________________________ _____________________________________________________________________
Activity #3 Ferrite Ferrite rods are hard, black, and easily break like glass if dropped. It is a form of iron oxide. By itself it is not a magnet but it is able to extend the reach of a magnet‟s effects.
When separated from a magnet can the ferrite rod attract the steel nail? _______
Can you identify a N or S end of the ferrite rod? _______________________________
If the ferrite rod is placed between the magnet and the nail, does the magnetic effect appear to be extended by the ferrite? ____________________________________
Is there any difference if the ferrite is placed at the N or S end of the magnet? ________
Suppose one end of the ferrite rod is placed against the middle of the bar magnet. Do things still behave the same? ______________________________________________ ______________________________________________________________________
Activity #4 The Magnetic Field
A freely suspended magnet acts like a compass, for the N end seems to point North. You are provided with a very small compass, which normally points North. But if a bar magnet is brought nearby, the compass easily points in different directions. Scientists have found it convenient to define the concept of a magnetic field as a region or space where a compass needle experiences a deflection. Of course compass needles seem to deflect all over the earth, so by definition, the earth has a magnetic field. People working in Physics seem to like the field idea, for electric fields and gravitational fields are also defined . At every point in the field ( in case, the area about the magnet ) the field has a definite magnitude and direction. At any point the direction of the field is the same as the direction of a compass needle. With a bit of Scotch or masking tape attach one of the bar magnets to the center of a blank letter-sized sheet of paper, and draw an outline of magnet. Place a dot close
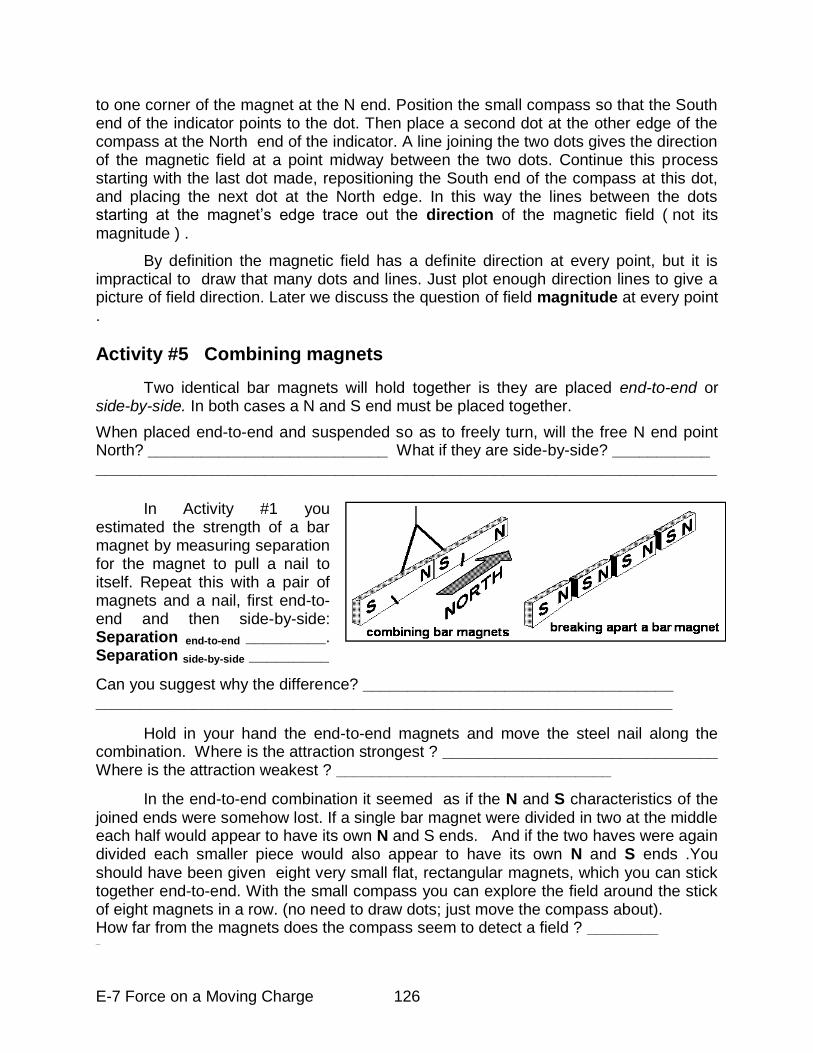
E-7 Force on a Moving Charge 126
to one corner of the magnet at the N end. Position the small compass so that the South end of the indicator points to the dot. Then place a second dot at the other edge of the compass at the North end of the indicator. A line joining the two dots gives the direction of the magnetic field at a point midway between the two dots. Continue this process starting with the last dot made, repositioning the South end of the compass at this dot, and placing the next dot at the North edge. In this way the lines between the dots starting at the magnet‟s edge trace out the direction of the magnetic field ( not its magnitude ) .
By definition the magnetic field has a definite direction at every point, but it is impractical to draw that many dots and lines. Just plot enough direction lines to give a picture of field direction. Later we discuss the question of field magnitude at every point .
Activity #5 Combining magnets
Two identical bar magnets will hold together is they are placed end-to-end or side-by-side. In both cases a N and S end must be placed together.
When placed end-to-end and suspended so as to freely turn, will the free N end point North? ___________________________ What if they are side-by-side? ___________ ______________________________________________________________________
In Activity #1 you estimated the strength of a bar magnet by measuring separation for the magnet to pull a nail to itself. Repeat this with a pair of magnets and a nail, first end-to-end and then side-by-side: Separation end-to-end _________. Separation side-by-side _________
Can you suggest why the difference? ___________________________________ _________________________________________________________________
Hold in your hand the end-to-end magnets and move the steel nail along the combination. Where is the attraction strongest ? _______________________________ Where is the attraction weakest ? _______________________________
In the end-to-end combination it seemed as if the N and S characteristics of the joined ends were somehow lost. If a single bar magnet were divided in two at the middle each half would appear to have its own N and S ends. And if the two haves were again divided each smaller piece would also appear to have its own N and S ends .You should have been given eight very small flat, rectangular magnets, which you can stick together end-to-end. With the small compass you can explore the field around the stick of eight magnets in a row. (no need to draw dots; just move the compass about). How far from the magnets does the compass seem to detect a field ? ________ _
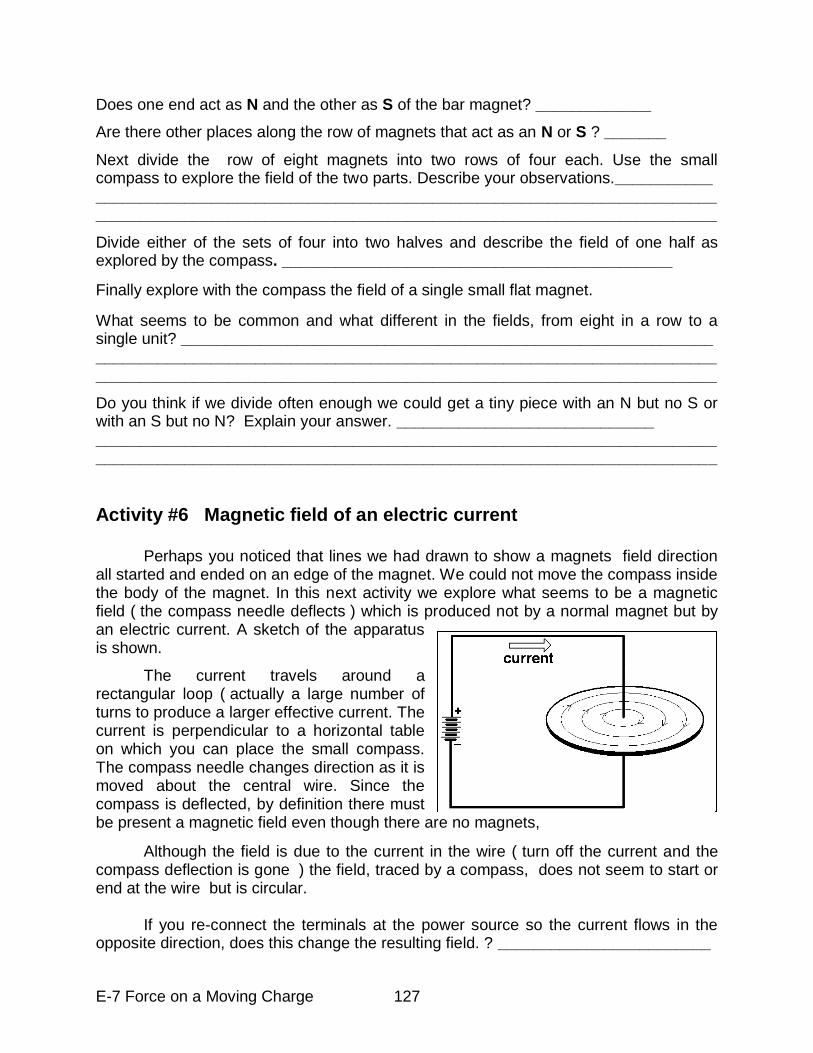
E-7 Force on a Moving Charge 127
Does one end act as N and the other as S of the bar magnet? _____________
Are there other places along the row of magnets that act as an N or S ? _______
Next divide the row of eight magnets into two rows of four each. Use the small compass to explore the field of the two parts. Describe your observations.___________ ______________________________________________________________________ ______________________________________________________________________
Divide either of the sets of four into two halves and describe the field of one half as explored by the compass. ____________________________________________
Finally explore with the compass the field of a single small flat magnet.
What seems to be common and what different in the fields, from eight in a row to a single unit? ____________________________________________________________ ______________________________________________________________________ ______________________________________________________________________
Do you think if we divide often enough we could get a tiny piece with an N but no S or with an S but no N? Explain your answer. _____________________________ ______________________________________________________________________ ______________________________________________________________________
Activity #6 Magnetic field of an electric current Perhaps you noticed that lines we had drawn to show a magnets field direction all started and ended on an edge of the magnet. We could not move the compass inside the body of the magnet. In this next activity we explore what seems to be a magnetic field ( the compass needle deflects ) which is produced not by a normal magnet but by an electric current. A sketch of the apparatus is shown.
The current travels around a rectangular loop ( actually a large number of turns to produce a larger effective current. The current is perpendicular to a horizontal table on which you can place the small compass. The compass needle changes direction as it is moved about the central wire. Since the compass is deflected, by definition there must be present a magnetic field even though there are no magnets,
Although the field is due to the current in the wire ( turn off the current and the compass deflection is gone ) the field, traced by a compass, does not seem to start or end at the wire but is circular. If you re-connect the terminals at the power source so the current flows in the opposite direction, does this change the resulting field. ? ________________________
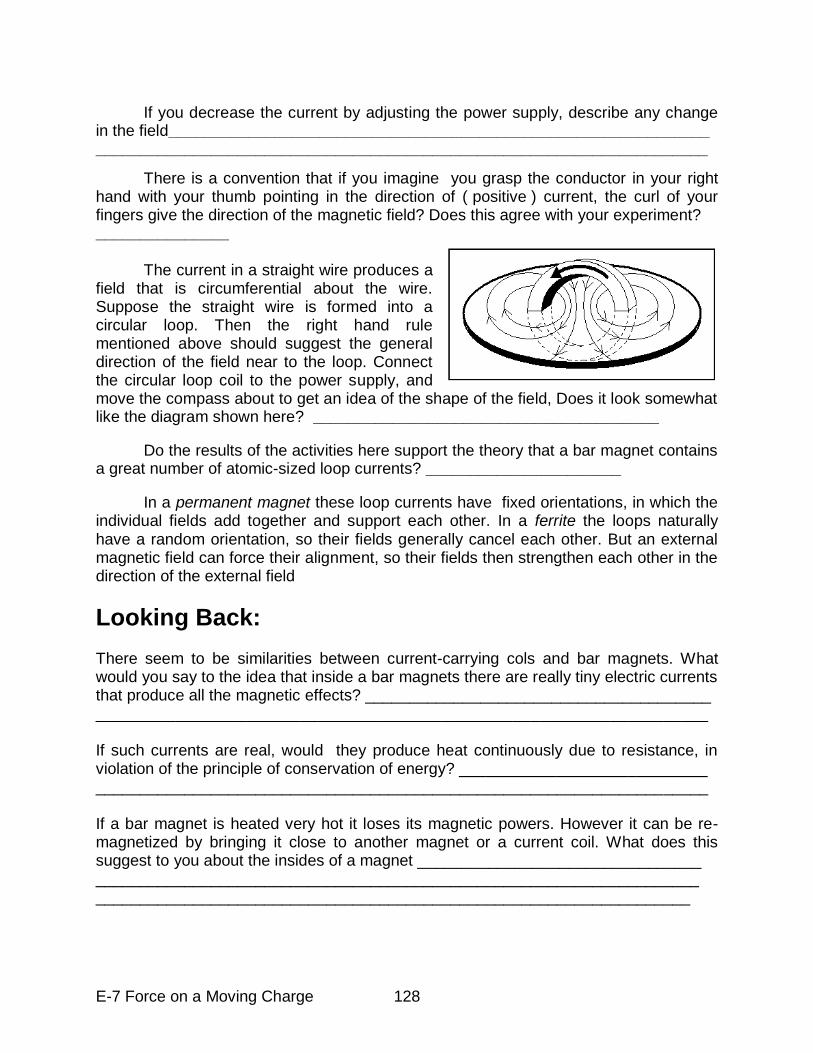
E-7 Force on a Moving Charge 128
If you decrease the current by adjusting the power supply, describe any change in the field_____________________________________________________________ _____________________________________________________________________
There is a convention that if you imagine you grasp the conductor in your right hand with your thumb pointing in the direction of ( positive ) current, the curl of your fingers give the direction of the magnetic field? Does this agree with your experiment? _______________ The current in a straight wire produces a field that is circumferential about the wire. Suppose the straight wire is formed into a circular loop. Then the right hand rule mentioned above should suggest the general direction of the field near to the loop. Connect the circular loop coil to the power supply, and move the compass about to get an idea of the shape of the field, Does it look somewhat like the diagram shown here? _______________________________________
Do the results of the activities here support the theory that a bar magnet contains a great number of atomic-sized loop currents? ______________________
In a permanent magnet these loop currents have fixed orientations, in which the individual fields add together and support each other. In a ferrite the loops naturally have a random orientation, so their fields generally cancel each other. But an external magnetic field can force their alignment, so their fields then strengthen each other in the direction of the external field
Looking Back: There seem to be similarities between current-carrying cols and bar magnets. What would you say to the idea that inside a bar magnets there are really tiny electric currents that produce all the magnetic effects? _______________________________________ _____________________________________________________________________ If such currents are real, would they produce heat continuously due to resistance, in violation of the principle of conservation of energy? ____________________________ _____________________________________________________________________ If a bar magnet is heated very hot it loses its magnetic powers. However it can be re-magnetized by bringing it close to another magnet or a current coil. What does this suggest to you about the insides of a magnet ________________________________ ____________________________________________________________________ ___________________________________________________________________
E-7 Force on a Moving Charge 129
E-7 Force on a Moving Charge
Objective: To observe and measure magnetic force on a current
Materials: Magnetic balance, DC power source, Multimeter, galvanometer, loop
Background
Atoms are the building blocks of every material object from sand to stars, and us included. Some 100 chemical elements ( different kinds of atoms ) have been identified which are themselves made from combinations of only three particles, the proton, neutron and electron. Each of these three fundamental particles has its own mass and magnetic moment ( the particle acts as a very tiny bar magnet ) and two of the three have an electric charge: the proton is positive, the electron negative. The particles with charge exert a force on each other: positive protons repel other protons, negative electrons repel other negative electrons, but a
proton and electron pair attract. Likes repel , unlikes attract. These forces can be measured,
but why there are such forces has yet to be discovered.
The various chemical elements differ in the number of their protons, ranging from one to about a hundred. If the number of its protons is matched by a like number of electrons the atom as a whole is electrically neutral . However all atoms can gain or lose one or more electrons ( some more readily, like metals, others more reluctantly ) so they may possess a net positive or negative charge. Such charged atoms interact electrically with each other; likes repel, unlikes attract. The whole science of Chemistry is based on these force interactions.
The extended objects we see and touch are composed of a vast number of atoms. If only a tiny fraction of these atoms have gained or lost an electron the entire object appears as charged, Certain plastics, when rubbed, appear to be charged for they can attract other objects, even though only one out of every million, million atoms has gained or lost an electron . So when a Physics book speaks of “a charge”, this can refer equally to a single proton or electron, an atom that has gained or lost one or more electrons, or to an extended object in which the one-in-a-million positively or negatively charged atoms do not exactly balance.
Coulomb‟s law states that the electric force ( attractive or repulsive ) between two charged objects depends on the charge of each, and decreases as the square of their separation. However there is an additional interaction present, less than a hundred millionth the strength of the first, if the charged objects are moving with respect to each other. Since it is so
weak, it becomes significant only with large amounts of charge or high speeds.
We have seen in a previous activity how an electric current ( charge in motion ) produces a magnetic field. We now examine how any other moving charge or current within this field experiences a force, the magnetic interaction..
(1)
.
Notice that force, velocity and magnetic field are all vector quantities. We can directly control the direction of the magnetic field and the velocity ( speed and direction )
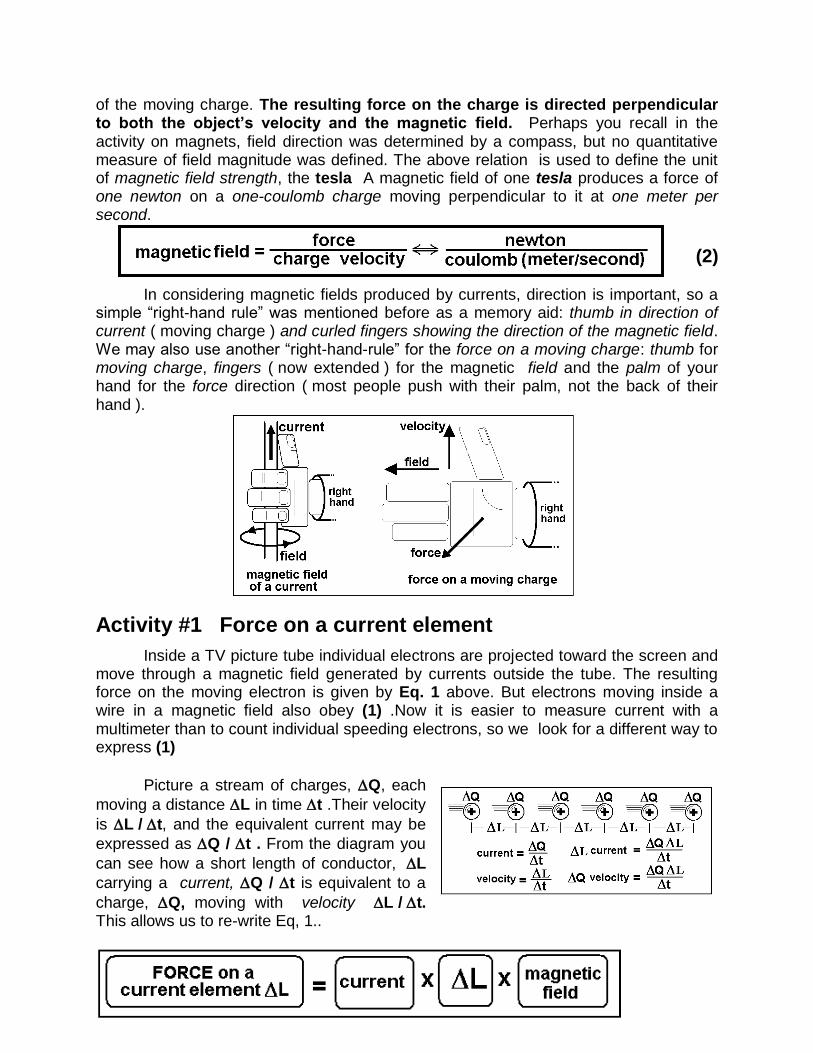
E-7 Force on a Moving Charge 130
of the moving charge. The resulting force on the charge is directed perpendicular to both the object‟s velocity and the magnetic field. Perhaps you recall in the activity on magnets, field direction was determined by a compass, but no quantitative measure of field magnitude was defined. The above relation is used to define the unit of magnetic field strength, the tesla A magnetic field of one tesla produces a force of one newton on a one-coulomb charge moving perpendicular to it at one meter per second.
(2)
In considering magnetic fields produced by currents, direction is important, so a simple “right-hand rule” was mentioned before as a memory aid: thumb in direction of current ( moving charge ) and curled fingers showing the direction of the magnetic field. We may also use another “right-hand-rule” for the force on a moving charge: thumb for moving charge, fingers ( now extended ) for the magnetic field and the palm of your hand for the force direction ( most people push with their palm, not the back of their hand ).
Activity #1 Force on a current element
Inside a TV picture tube individual electrons are projected toward the screen and move through a magnetic field generated by currents outside the tube. The resulting force on the moving electron is given by Eq. 1 above. But electrons moving inside a wire in a magnetic field also obey (1) .Now it is easier to measure current with a multimeter than to count individual speeding electrons, so we look for a different way to express (1)
Picture a stream of charges, Q, each
moving a distance L in time t .Their velocity
is L / t, and the equivalent current may be
expressed as Q / t . From the diagram you
can see how a short length of conductor, L
carrying a current, Q / t is equivalent to a
charge, Q, moving with velocity L / t. This allows us to re-write Eq, 1..
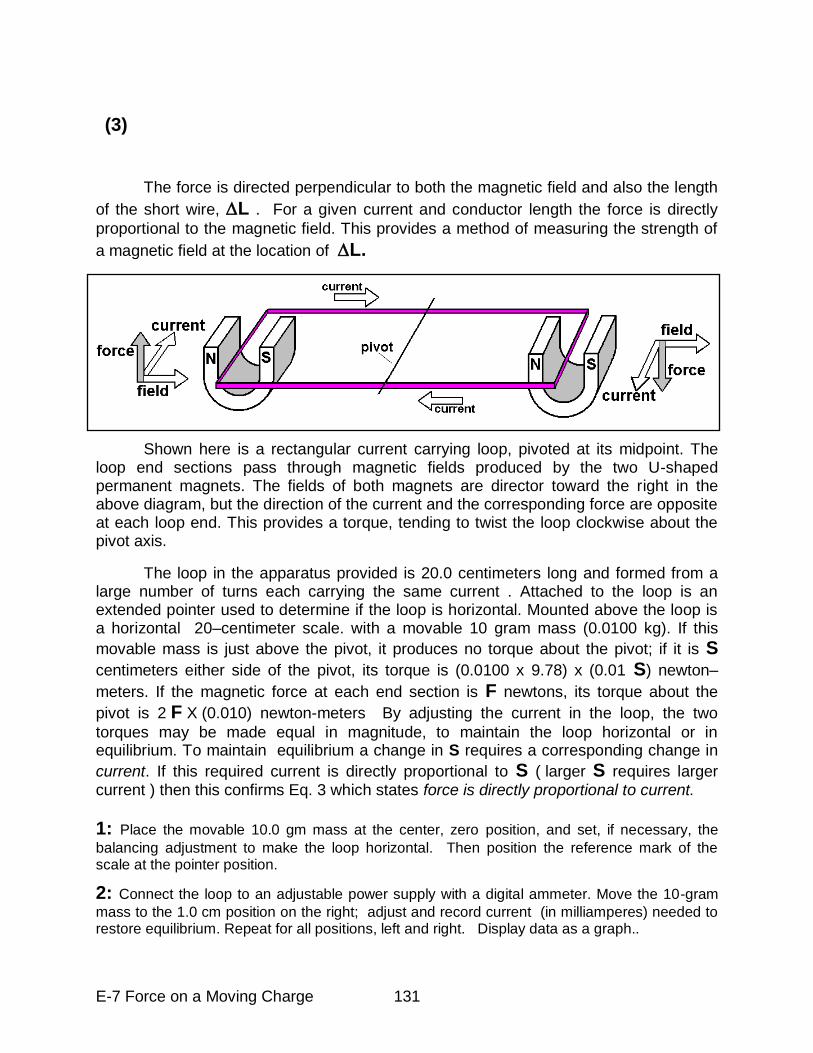
E-7 Force on a Moving Charge 131
(3) The force is directed perpendicular to both the magnetic field and also the length
of the short wire, L . For a given current and conductor length the force is directly
proportional to the magnetic field. This provides a method of measuring the strength of
a magnetic field at the location of L.
Shown here is a rectangular current carrying loop, pivoted at its midpoint. The loop end sections pass through magnetic fields produced by the two U-shaped permanent magnets. The fields of both magnets are director toward the right in the above diagram, but the direction of the current and the corresponding force are opposite at each loop end. This provides a torque, tending to twist the loop clockwise about the pivot axis.
The loop in the apparatus provided is 20.0 centimeters long and formed from a large number of turns each carrying the same current . Attached to the loop is an extended pointer used to determine if the loop is horizontal. Mounted above the loop is a horizontal 20–centimeter scale. with a movable 10 gram mass (0.0100 kg). If this
movable mass is just above the pivot, it produces no torque about the pivot; if it is S
centimeters either side of the pivot, its torque is (0.0100 x 9.78) x (0.01 S) newton–
meters. If the magnetic force at each end section is F newtons, its torque about the
pivot is 2 F X (0.010) newton-meters By adjusting the current in the loop, the two
torques may be made equal in magnitude, to maintain the loop horizontal or in equilibrium. To maintain equilibrium a change in S requires a corresponding change in
current. If this required current is directly proportional to S ( larger S requires larger current ) then this confirms Eq. 3 which states force is directly proportional to current.
1: Place the movable 10.0 gm mass at the center, zero position, and set, if necessary, the
balancing adjustment to make the loop horizontal. Then position the reference mark of the scale at the pointer position.
2: Connect the loop to an adjustable power supply with a digital ammeter. Move the 10-gram
mass to the 1.0 cm position on the right; adjust and record current (in milliamperes) needed to restore equilibrium. Repeat for all positions, left and right. Display data as a graph..
E-7 Force on a Moving Charge 132
S 1 2 3 4 5 9 7 8 9 10
Right
Left
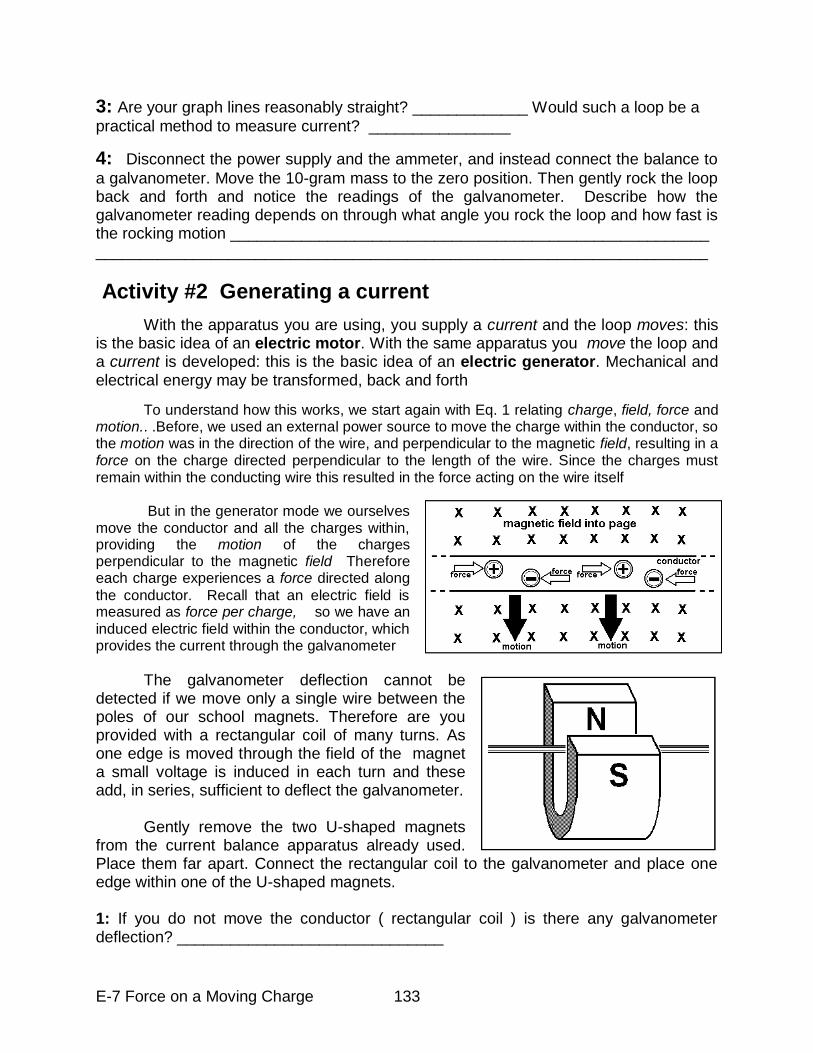
E-7 Force on a Moving Charge 133
3: Are your graph lines reasonably straight? _____________ Would such a loop be a
practical method to measure current? ________________
4: Disconnect the power supply and the ammeter, and instead connect the balance to
a galvanometer. Move the 10-gram mass to the zero position. Then gently rock the loop back and forth and notice the readings of the galvanometer. Describe how the galvanometer reading depends on through what angle you rock the loop and how fast is the rocking motion ______________________________________________________ _____________________________________________________________________
Activity #2 Generating a current
With the apparatus you are using, you supply a current and the loop moves: this is the basic idea of an electric motor. With the same apparatus you move the loop and a current is developed: this is the basic idea of an electric generator. Mechanical and electrical energy may be transformed, back and forth
To understand how this works, we start again with Eq. 1 relating charge, field, force and motion.. .Before, we used an external power source to move the charge within the conductor, so the motion was in the direction of the wire, and perpendicular to the magnetic field, resulting in a force on the charge directed perpendicular to the length of the wire. Since the charges must remain within the conducting wire this resulted in the force acting on the wire itself But in the generator mode we ourselves move the conductor and all the charges within, providing the motion of the charges perpendicular to the magnetic field Therefore each charge experiences a force directed along
the conductor. Recall that an electric field is measured as force per charge, so we have an induced electric field within the conductor, which provides the current through the galvanometer
The galvanometer deflection cannot be detected if we move only a single wire between the poles of our school magnets. Therefore are you provided with a rectangular coil of many turns. As one edge is moved through the field of the magnet a small voltage is induced in each turn and these add, in series, sufficient to deflect the galvanometer. Gently remove the two U-shaped magnets from the current balance apparatus already used. Place them far apart. Connect the rectangular coil to the galvanometer and place one edge within one of the U-shaped magnets. 1: If you do not move the conductor ( rectangular coil ) is there any galvanometer deflection? ______________________________
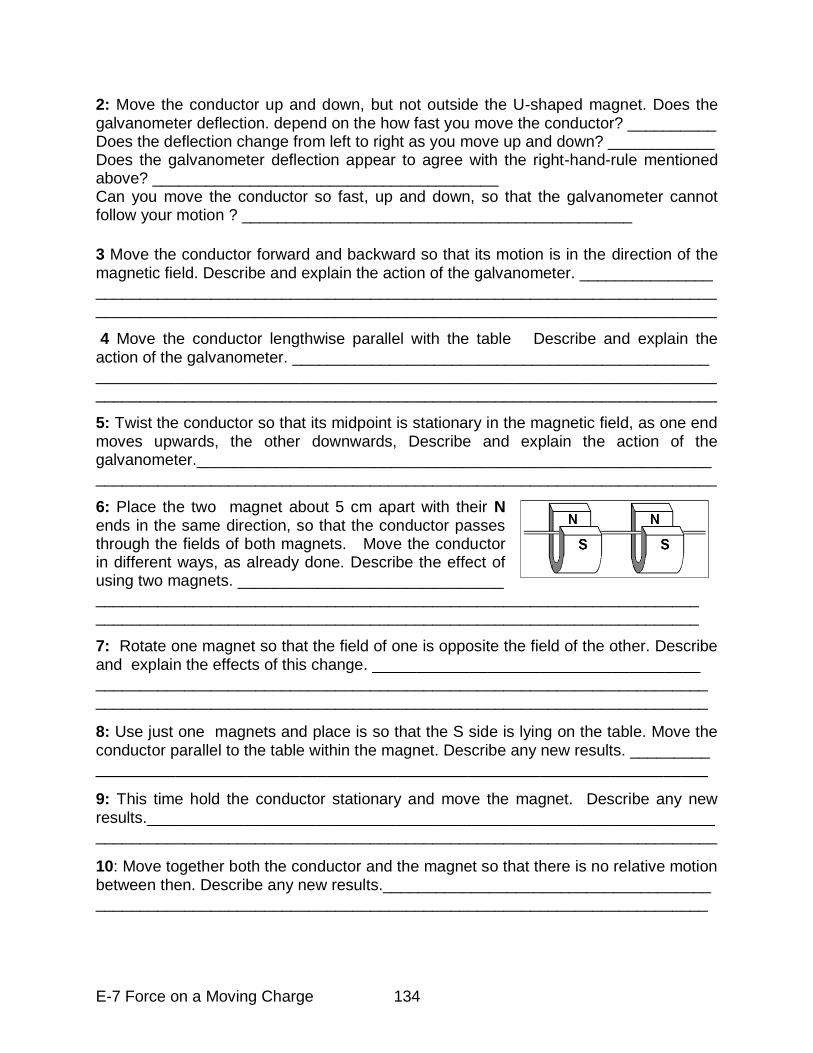
E-7 Force on a Moving Charge 134
2: Move the conductor up and down, but not outside the U-shaped magnet. Does the galvanometer deflection. depend on the how fast you move the conductor? __________ Does the deflection change from left to right as you move up and down? ____________ Does the galvanometer deflection appear to agree with the right-hand-rule mentioned above? _______________________________________ Can you move the conductor so fast, up and down, so that the galvanometer cannot follow your motion ? ____________________________________________
3 Move the conductor forward and backward so that its motion is in the direction of the magnetic field. Describe and explain the action of the galvanometer. _______________ ______________________________________________________________________ ______________________________________________________________________
4 Move the conductor lengthwise parallel with the table Describe and explain the action of the galvanometer. _______________________________________________ ______________________________________________________________________ ______________________________________________________________________
5: Twist the conductor so that its midpoint is stationary in the magnetic field, as one end moves upwards, the other downwards, Describe and explain the action of the galvanometer.__________________________________________________________ ______________________________________________________________________
6: Place the two magnet about 5 cm apart with their N ends in the same direction, so that the conductor passes through the fields of both magnets. Move the conductor in different ways, as already done. Describe the effect of using two magnets. ______________________________ ____________________________________________________________________ ____________________________________________________________________
7: Rotate one magnet so that the field of one is opposite the field of the other. Describe and explain the effects of this change. _____________________________________ _____________________________________________________________________ _____________________________________________________________________
8: Use just one magnets and place is so that the S side is lying on the table. Move the conductor parallel to the table within the magnet. Describe any new results. _________ _____________________________________________________________________
9: This time hold the conductor stationary and move the magnet. Describe any new results.________________________________________________________________ ______________________________________________________________________
10: Move together both the conductor and the magnet so that there is no relative motion between then. Describe any new results._____________________________________ _____________________________________________________________________
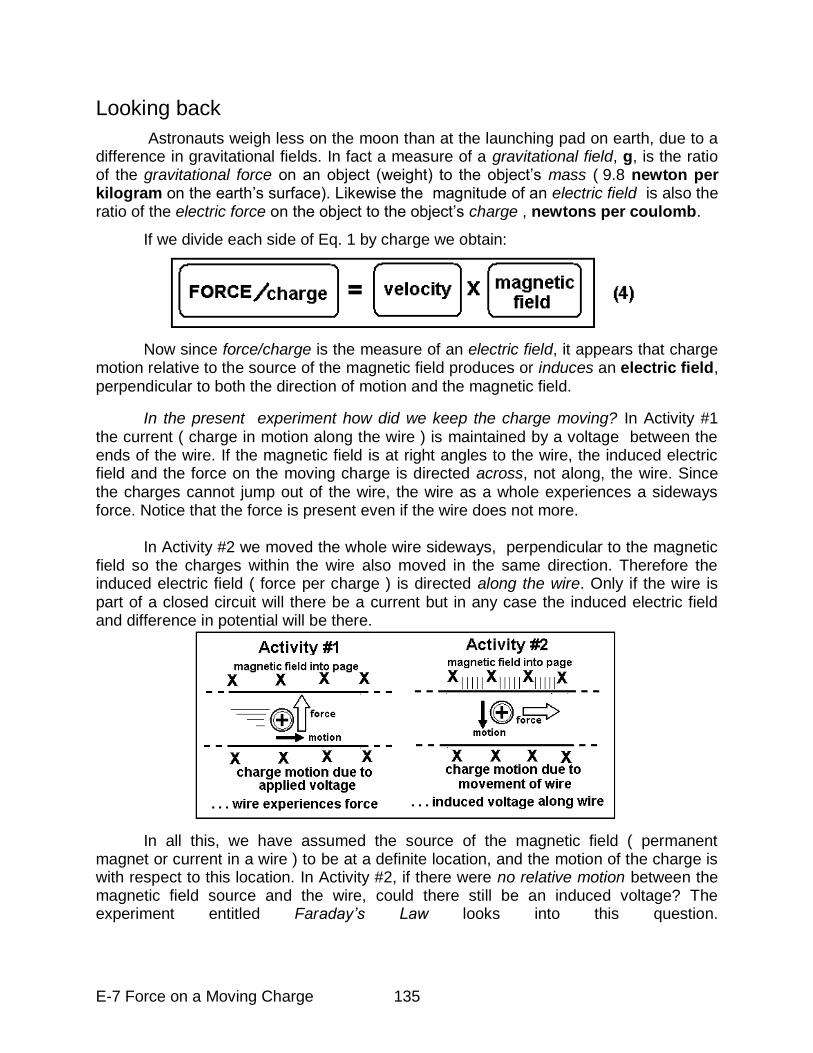
E-7 Force on a Moving Charge 135
Looking back
Astronauts weigh less on the moon than at the launching pad on earth, due to a difference in gravitational fields. In fact a measure of a gravitational field, g, is the ratio of the gravitational force on an object (weight) to the object‟s mass ( 9.8 newton per kilogram on the earth‟s surface). Likewise the magnitude of an electric field is also the ratio of the electric force on the object to the object‟s charge , newtons per coulomb.
If we divide each side of Eq. 1 by charge we obtain: Now since force/charge is the measure of an electric field, it appears that charge motion relative to the source of the magnetic field produces or induces an electric field, perpendicular to both the direction of motion and the magnetic field.
In the present experiment how did we keep the charge moving? In Activity #1 the current ( charge in motion along the wire ) is maintained by a voltage between the ends of the wire. If the magnetic field is at right angles to the wire, the induced electric field and the force on the moving charge is directed across, not along, the wire. Since the charges cannot jump out of the wire, the wire as a whole experiences a sideways force. Notice that the force is present even if the wire does not more. In Activity #2 we moved the whole wire sideways, perpendicular to the magnetic field so the charges within the wire also moved in the same direction. Therefore the induced electric field ( force per charge ) is directed along the wire. Only if the wire is part of a closed circuit will there be a current but in any case the induced electric field and difference in potential will be there. In all this, we have assumed the source of the magnetic field ( permanent magnet or current in a wire ) to be at a definite location, and the motion of the charge is with respect to this location. In Activity #2, if there were no relative motion between the magnetic field source and the wire, could there still be an induced voltage? The experiment entitled Faraday’s Law looks into this question.
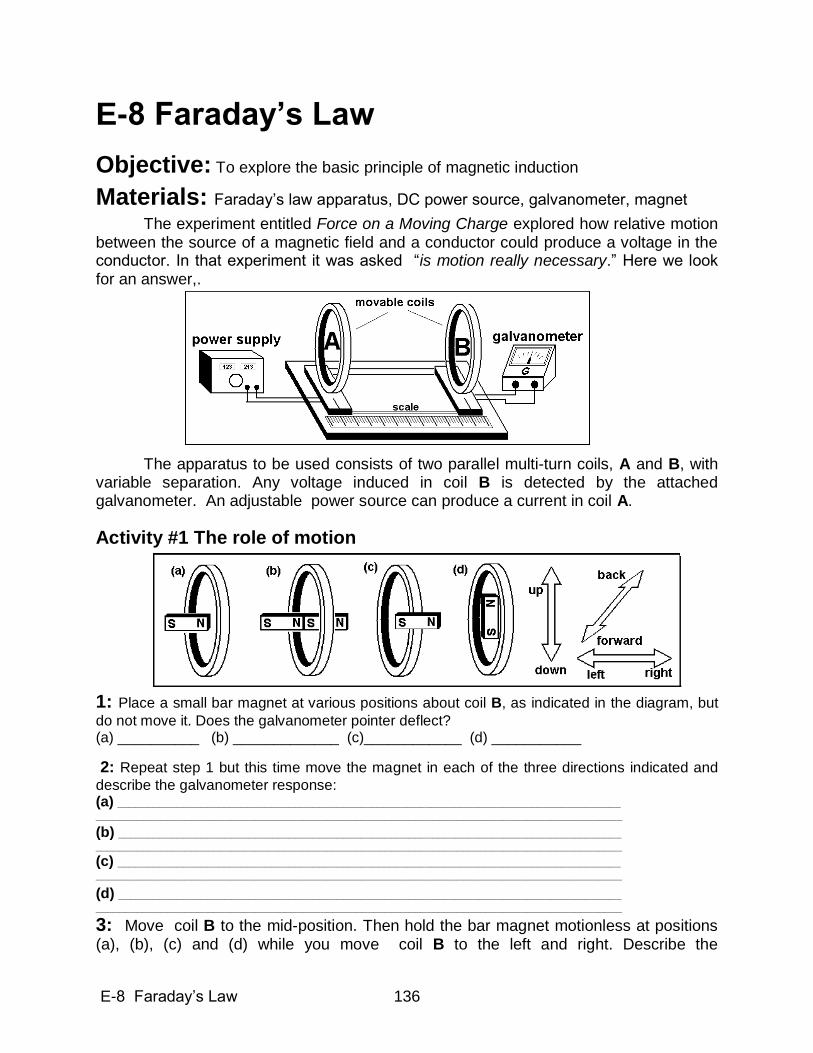
E-8 Faraday‟s Law 136
E-8 Faraday‟s Law
Objective: To explore the basic principle of magnetic induction
Materials: Faraday‟s law apparatus, DC power source, galvanometer, magnet
The experiment entitled Force on a Moving Charge explored how relative motion between the source of a magnetic field and a conductor could produce a voltage in the conductor. In that experiment it was asked “is motion really necessary.” Here we look for an answer,.
The apparatus to be used consists of two parallel multi-turn coils, A and B, with variable separation. Any voltage induced in coil B is detected by the attached galvanometer. An adjustable power source can produce a current in coil A.
Activity #1 The role of motion
1: Place a small bar magnet at various positions about coil B, as indicated in the diagram, but
do not move it. Does the galvanometer pointer deflect? (a) __________ (b) _____________ (c)____________ (d) ___________
2: Repeat step 1 but this time move the magnet in each of the three directions indicated and
describe the galvanometer response: (a) _____________________________________________________________________________________ _________________________________________________________________________________________
(b) _____________________________________________________________________________________ _________________________________________________________________________________________
(c) _____________________________________________________________________________________ _________________________________________________________________________________________
(d) _____________________________________________________________________________________ _________________________________________________________________________________________
3: Move coil B to the mid-position. Then hold the bar magnet motionless at positions (a), (b), (c) and (d) while you move coil B to the left and right. Describe the
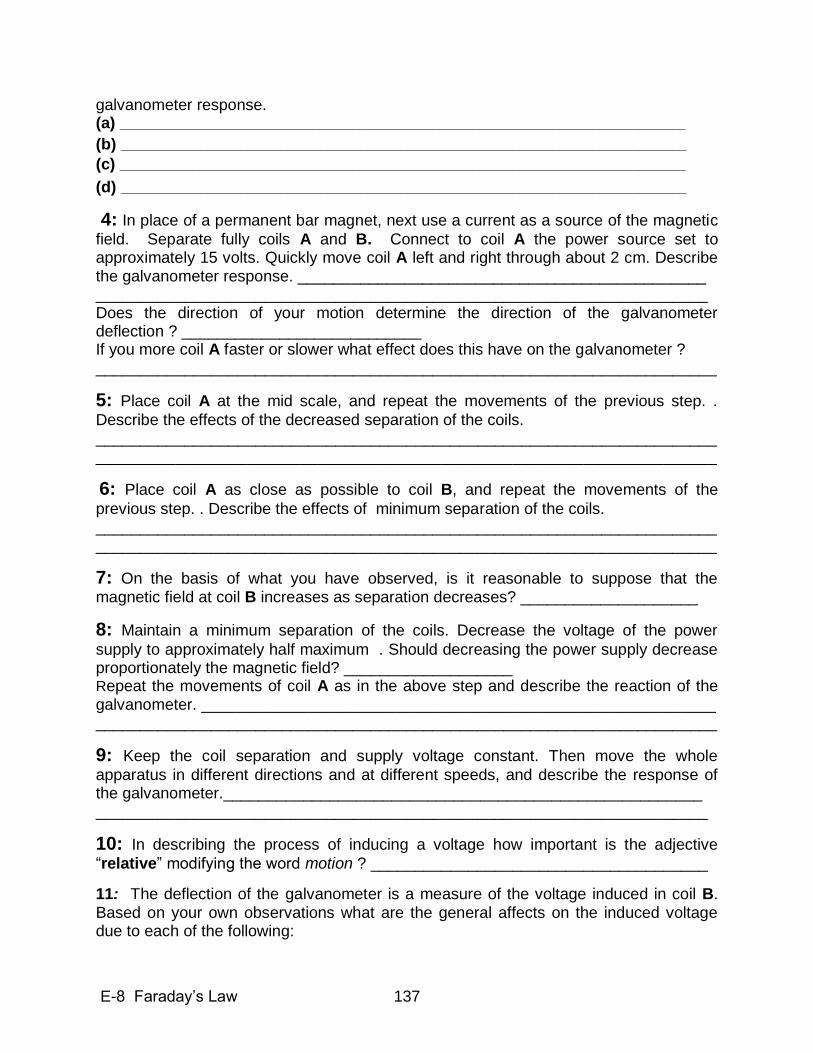
E-8 Faraday‟s Law 137
galvanometer response. (a) _____________________________________________________________________________________
(b) _____________________________________________________________________________________
(c) _____________________________________________________________________________________
(d) _____________________________________________________________________________________
4: In place of a permanent bar magnet, next use a current as a source of the magnetic
field. Separate fully coils A and B. Connect to coil A the power source set to approximately 15 volts. Quickly move coil A left and right through about 2 cm. Describe the galvanometer response. ______________________________________________ _____________________________________________________________________ Does the direction of your motion determine the direction of the galvanometer deflection ? ___________________________ If you more coil A faster or slower what effect does this have on the galvanometer ? ______________________________________________________________________
5: Place coil A at the mid scale, and repeat the movements of the previous step. .
Describe the effects of the decreased separation of the coils. ______________________________________________________________________ ______________________________________________________________________
6: Place coil A as close as possible to coil B, and repeat the movements of the
previous step. . Describe the effects of minimum separation of the coils. ______________________________________________________________________ ______________________________________________________________________
7: On the basis of what you have observed, is it reasonable to suppose that the magnetic field at coil B increases as separation decreases? ____________________
8: Maintain a minimum separation of the coils. Decrease the voltage of the power
supply to approximately half maximum . Should decreasing the power supply decrease proportionately the magnetic field? ___________________ Repeat the movements of coil A as in the above step and describe the reaction of the galvanometer. __________________________________________________________ ______________________________________________________________________
9: Keep the coil separation and supply voltage constant. Then move the whole
apparatus in different directions and at different speeds, and describe the response of the galvanometer.______________________________________________________ _____________________________________________________________________
10: In describing the process of inducing a voltage how important is the adjective
“relative” modifying the word motion ? ______________________________________
11: The deflection of the galvanometer is a measure of the voltage induced in coil B. Based on your own observations what are the general affects on the induced voltage due to each of the following:
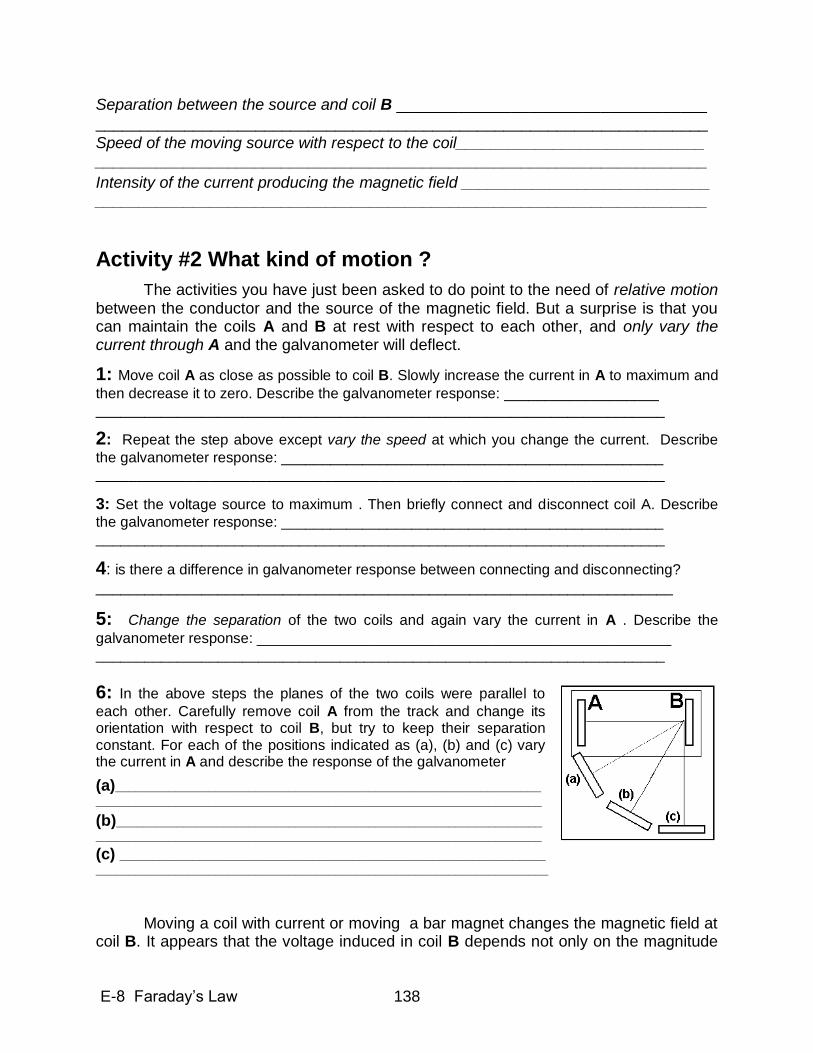
E-8 Faraday‟s Law 138
Separation between the source and coil B ___________________________________ _____________________________________________________________________
Speed of the moving source with respect to the coil____________________________ _____________________________________________________________________
Intensity of the current producing the magnetic field ____________________________ _____________________________________________________________________
Activity #2 What kind of motion ?
The activities you have just been asked to do point to the need of relative motion between the conductor and the source of the magnetic field. But a surprise is that you can maintain the coils A and B at rest with respect to each other, and only vary the current through A and the galvanometer will deflect.
1: Move coil A as close as possible to coil B. Slowly increase the current in A to maximum and
then decrease it to zero. Describe the galvanometer response: ___________________ ______________________________________________________________________
2: Repeat the step above except vary the speed at which you change the current. Describe
the galvanometer response: _______________________________________________ ______________________________________________________________________
3: Set the voltage source to maximum . Then briefly connect and disconnect coil A. Describe
the galvanometer response: _______________________________________________ ______________________________________________________________________
4: is there a difference in galvanometer response between connecting and disconnecting?
_______________________________________________________________________
5: Change the separation of the two coils and again vary the current in A . Describe the
galvanometer response: ___________________________________________________ ______________________________________________________________________
6: In the above steps the planes of the two coils were parallel to
each other. Carefully remove coil A from the track and change its orientation with respect to coil B, but try to keep their separation constant. For each of the positions indicated as (a), (b) and (c) vary the current in A and describe the response of the galvanometer
(a)________________________________________________________________
___________________________________________________________________
(b)________________________________________________________________
___________________________________________________________________
(c) ________________________________________________________________
____________________________________________________________________
Moving a coil with current or moving a bar magnet changes the magnetic field at coil B. It appears that the voltage induced in coil B depends not only on the magnitude
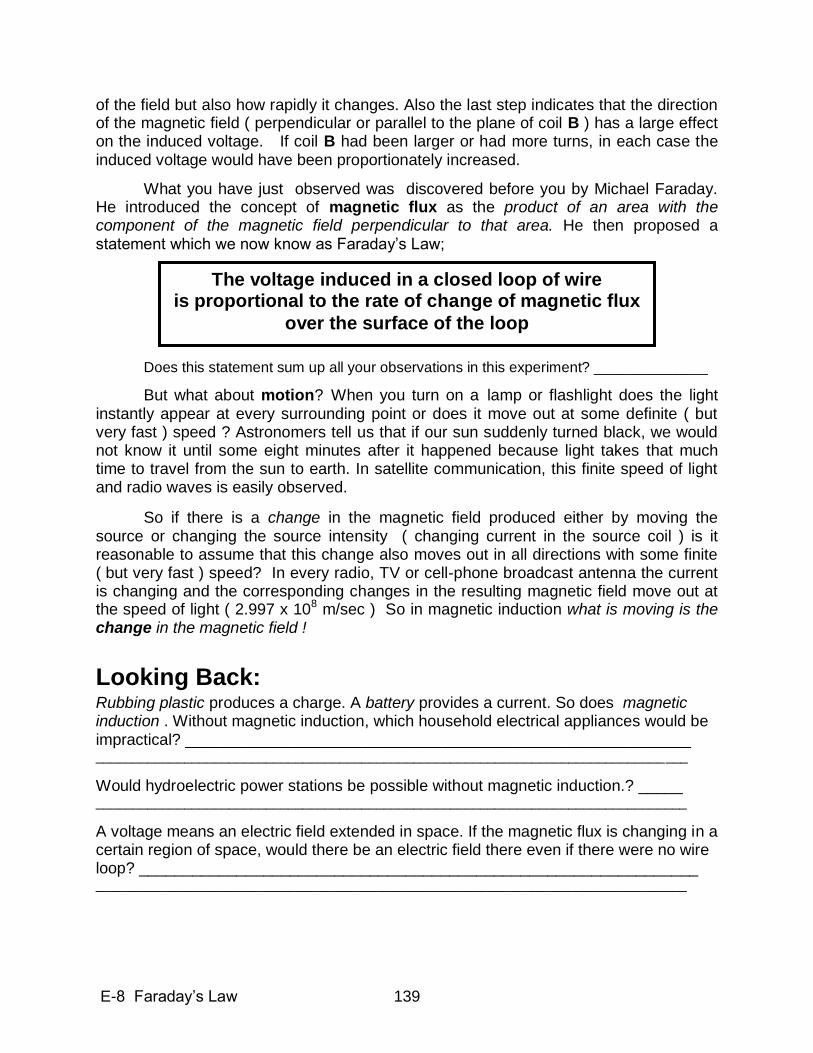
E-8 Faraday‟s Law 139
of the field but also how rapidly it changes. Also the last step indicates that the direction of the magnetic field ( perpendicular or parallel to the plane of coil B ) has a large effect on the induced voltage. If coil B had been larger or had more turns, in each case the induced voltage would have been proportionately increased.
What you have just observed was discovered before you by Michael Faraday. He introduced the concept of magnetic flux as the product of an area with the component of the magnetic field perpendicular to that area. He then proposed a statement which we now know as Faraday‟s Law;
Does this statement sum up all your observations in this experiment? ______________
But what about motion? When you turn on a lamp or flashlight does the light instantly appear at every surrounding point or does it move out at some definite ( but very fast ) speed ? Astronomers tell us that if our sun suddenly turned black, we would not know it until some eight minutes after it happened because light takes that much time to travel from the sun to earth. In satellite communication, this finite speed of light and radio waves is easily observed.
So if there is a change in the magnetic field produced either by moving the source or changing the source intensity ( changing current in the source coil ) is it reasonable to assume that this change also moves out in all directions with some finite ( but very fast ) speed? In every radio, TV or cell-phone broadcast antenna the current is changing and the corresponding changes in the resulting magnetic field move out at the speed of light ( 2.997 x 10⁸ m/sec ) So in magnetic induction what is moving is the change in the magnetic field !
Looking Back:
Rubbing plastic produces a charge. A battery provides a current. So does magnetic induction . Without magnetic induction, which household electrical appliances would be impractical? _________________________________________________________ ________________________________________________________________________________
Would hydroelectric power stations be possible without magnetic induction.? _____ ________________________________________________________________________________
A voltage means an electric field extended in space. If the magnetic flux is changing in a certain region of space, would there be an electric field there even if there were no wire loop? _______________________________________________________________ ________________________________________________________________________________
The voltage induced in a closed loop of wire is proportional to the rate of change of magnetic flux
over the surface of the loop
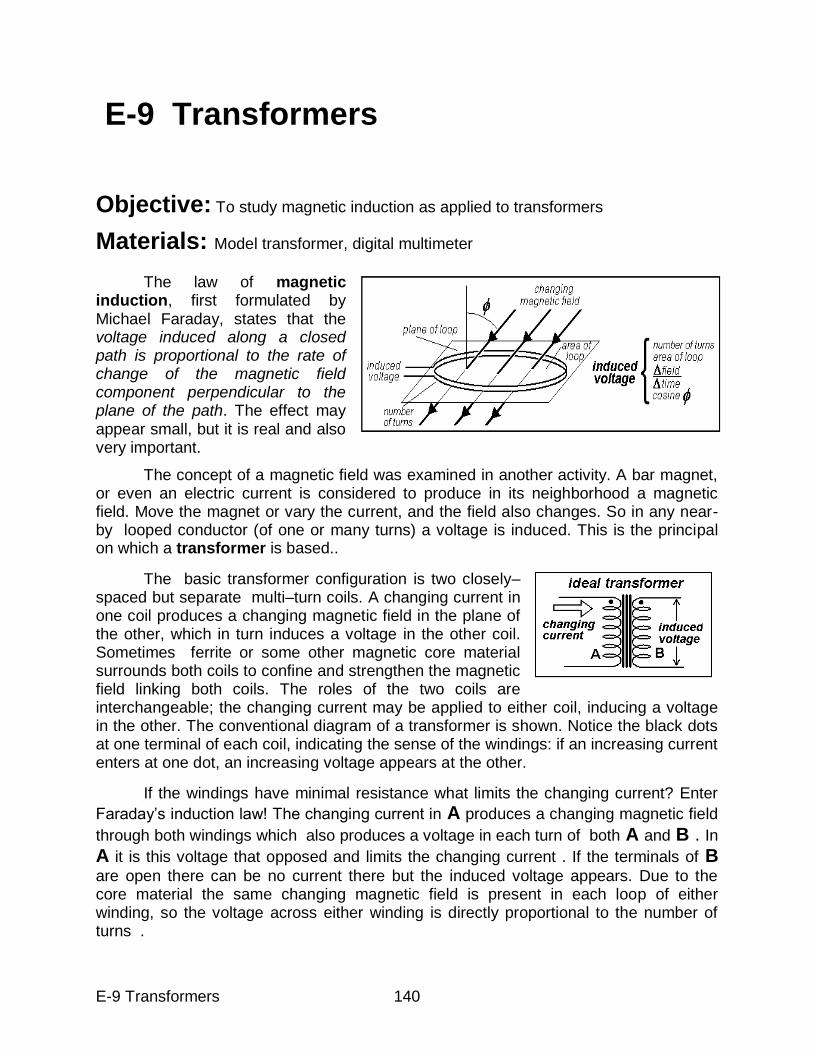
E-9 Transformers 140
E-9 Transformers
Objective: To study magnetic induction as applied to transformers
Materials: Model transformer, digital multimeter
The law of magnetic induction, first formulated by Michael Faraday, states that the voltage induced along a closed path is proportional to the rate of change of the magnetic field component perpendicular to the plane of the path. The effect may appear small, but it is real and also very important.
The concept of a magnetic field was examined in another activity. A bar magnet, or even an electric current is considered to produce in its neighborhood a magnetic field. Move the magnet or vary the current, and the field also changes. So in any near-by looped conductor (of one or many turns) a voltage is induced. This is the principal on which a transformer is based..
The basic transformer configuration is two closely–spaced but separate multi–turn coils. A changing current in one coil produces a changing magnetic field in the plane of the other, which in turn induces a voltage in the other coil. Sometimes ferrite or some other magnetic core material surrounds both coils to confine and strengthen the magnetic field linking both coils. The roles of the two coils are interchangeable; the changing current may be applied to either coil, inducing a voltage in the other. The conventional diagram of a transformer is shown. Notice the black dots at one terminal of each coil, indicating the sense of the windings: if an increasing current enters at one dot, an increasing voltage appears at the other.
If the windings have minimal resistance what limits the changing current? Enter
Faraday‟s induction law! The changing current in A produces a changing magnetic field
through both windings which also produces a voltage in each turn of both A and B . In A it is this voltage that opposed and limits the changing current . If the terminals of B
are open there can be no current there but the induced voltage appears. Due to the core material the same changing magnetic field is present in each loop of either winding, so the voltage across either winding is directly proportional to the number of turns .
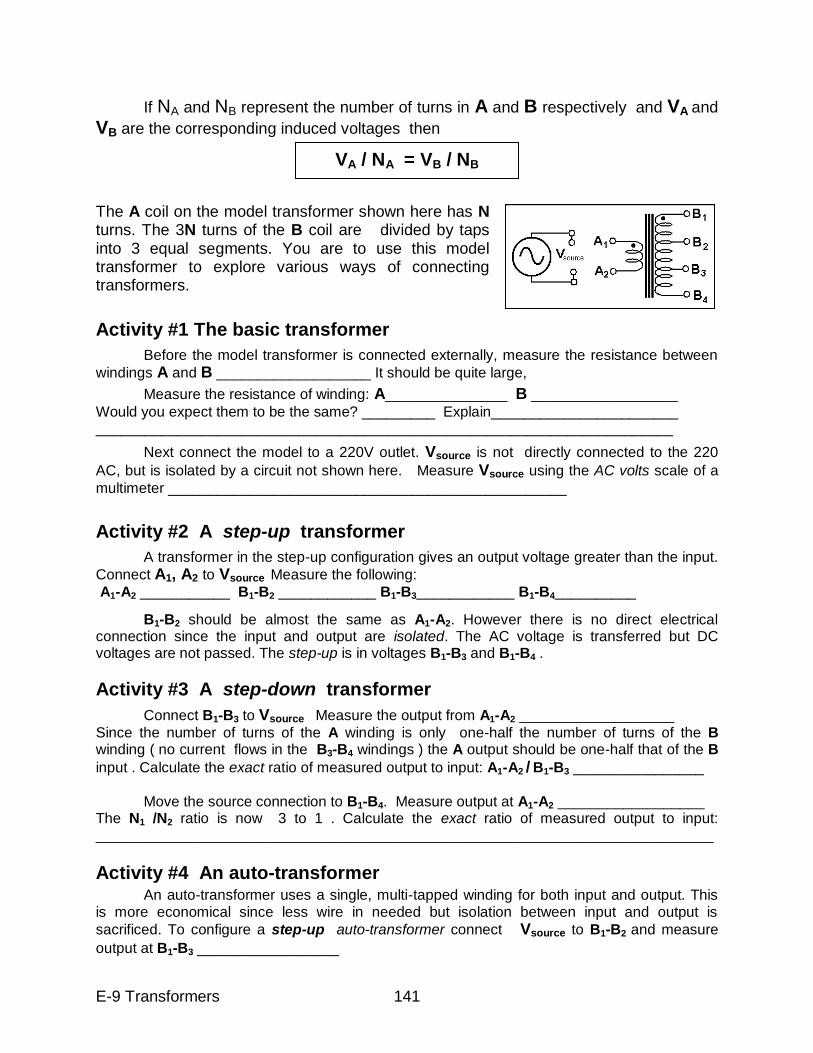
E-9 Transformers 141
If NA and NB represent the number of turns in A and B respectively and VA and
VB are the corresponding induced voltages then
The A coil on the model transformer shown here has N turns. The 3N turns of the B coil are divided by taps into 3 equal segments. You are to use this model transformer to explore various ways of connecting transformers.
Activity #1 The basic transformer
Before the model transformer is connected externally, measure the resistance between
windings A and B ___________________ It should be quite large,
Measure the resistance of winding: A_______________ B __________________
Would you expect them to be the same? _________ Explain_______________________ _______________________________________________________________________
Next connect the model to a 220V outlet. Vsource is not directly connected to the 220
AC, but is isolated by a circuit not shown here. Measure Vsource using the AC volts scale of a
multimeter _________________________________________________
Activity #2 A step-up transformer
A transformer in the step-up configuration gives an output voltage greater than the input.
Connect A1, A2 to Vsource Measure the following: A1-A2 ___________ B1-B2 ____________ B1-B3____________ B1-B4__________
B1-B2 should be almost the same as A1-A2. However there is no direct electrical connection since the input and output are isolated. The AC voltage is transferred but DC voltages are not passed. The step-up is in voltages B1-B3 and B1-B4 .
Activity #3 A step-down transformer
Connect B1-B3 to Vsource Measure the output from A1-A2 ___________________
Since the number of turns of the A winding is only one-half the number of turns of the B winding ( no current flows in the B3-B4 windings ) the A output should be one-half that of the B
input . Calculate the exact ratio of measured output to input: A1-A2 / B1-B3 ________________
Move the source connection to B1-B4. Measure output at A1-A2 __________________ The N1 /N2 ratio is now 3 to 1 . Calculate the exact ratio of measured output to input: ____________________________________________________________________________
Activity #4 An auto-transformer
An auto-transformer uses a single, multi-tapped winding for both input and output. This is more economical since less wire in needed but isolation between input and output is
sacrificed. To configure a step-up auto-transformer connect Vsource to B1-B2 and measure
output at B1-B3 ________________
VA / NA = VB / NB
E-9 Transformers 142
Also measure output at B1-B4 ____________________________________________
Is there a difference between taking the output at B1-B3 and at B2-B4 ? _____________ Explain the reason for your measured result _________________________________ _____________________________________________________________________
To configure a step-down auto-transformer connect Vsource to B1-B4 and measure output at
B1-B2 _______________________________________________________________________
Also measure other possible outputs at B2-B3 ____________ and at B3-B4 _______________
Activity #5 Buck or boost ?
As explained an auto-transformer uses a single multi-tap winding for both input and output. But could we also include the A winding in series with the B winding to make a single
continuous coil of 4N turns? Connect Vsource to B1-B2 and also connect B4 to A1 and
measure the output between B1 and A2 ______________________________________ Explain why this output voltage: ________________________________________________ __________________________________________________________________________
The way the A winding is connected to B is quite important. Try connecting B4 to A2 and taking the output between B1 and A1 _______________________________
Here is where the dots on the winding diagram become important. Depending on the connection, the magnetic field produced by the changing current in A either opposes or aids ( bucks or boosts ) the field produced by the current in the B windings. If a small current came from a separate source were to be fed to the isolated A winding, a corresponding small voltage change would appear on the B side, configured as an auto-transformer. This method is used in some commercial voltage regulators.
Looking Back:
The change in voltage between the primary and secondary coils depends on the ratio of turns. Is there any practical maximum value for the output voltage.? ________ ___________________________________________________________________ A hydroelectric station can generate one megawatt of power ( = 1,000,000 watts ) and send this to a distant city over a 10.0 ohm transmission line. Recall electric power is volts x amperes. If the input voltage to the transmission line is 1,000 volts, what must be the current? _______________________________________________________
How much power is dissipated by the ten-ohm line resistance? __________________ If the input voltage to the transmission line is 100,000 volts, what must be the current? _____________________________________________ . How much power is dissipated by the ten-ohm line resistance? __________________ Does this explain why transformers are used when sending electric power over long distances? ___________________________________________________________
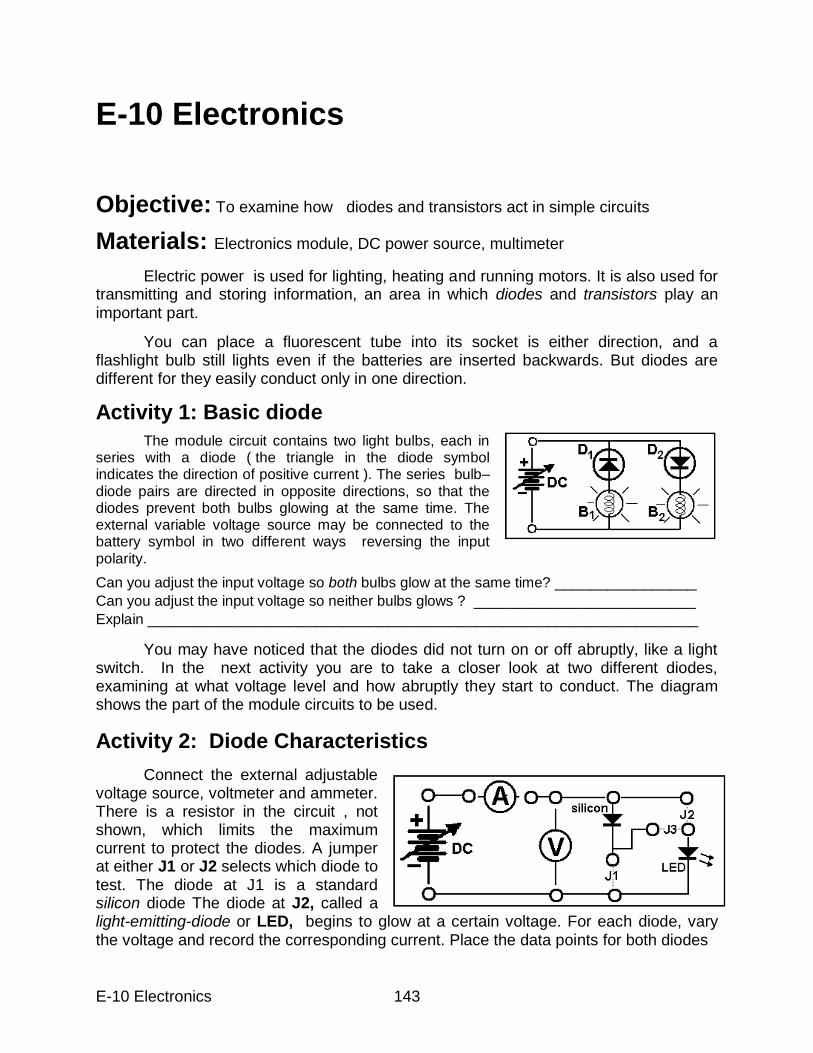
E-10 Electronics 143
E-10 Electronics
Objective: To examine how diodes and transistors act in simple circuits
Materials: Electronics module, DC power source, multimeter
Electric power is used for lighting, heating and running motors. It is also used for transmitting and storing information, an area in which diodes and transistors play an important part.
You can place a fluorescent tube into its socket is either direction, and a flashlight bulb still lights even if the batteries are inserted backwards. But diodes are different for they easily conduct only in one direction.
Activity 1: Basic diode
The module circuit contains two light bulbs, each in series with a diode ( the triangle in the diode symbol indicates the direction of positive current ). The series bulb–diode pairs are directed in opposite directions, so that the diodes prevent both bulbs glowing at the same time. The external variable voltage source may be connected to the battery symbol in two different ways reversing the input polarity.
Can you adjust the input voltage so both bulbs glow at the same time? ________________ Can you adjust the input voltage so neither bulbs glows ? _________________________ Explain ______________________________________________________________
You may have noticed that the diodes did not turn on or off abruptly, like a light switch. In the next activity you are to take a closer look at two different diodes, examining at what voltage level and how abruptly they start to conduct. The diagram shows the part of the module circuits to be used.
Activity 2: Diode Characteristics
Connect the external adjustable voltage source, voltmeter and ammeter. There is a resistor in the circuit , not shown, which limits the maximum current to protect the diodes. A jumper at either J1 or J2 selects which diode to test. The diode at J1 is a standard silicon diode The diode at J2, called a light-emitting-diode or LED, begins to glow at a certain voltage. For each diode, vary the voltage and record the corresponding current. Place the data points for both diodes
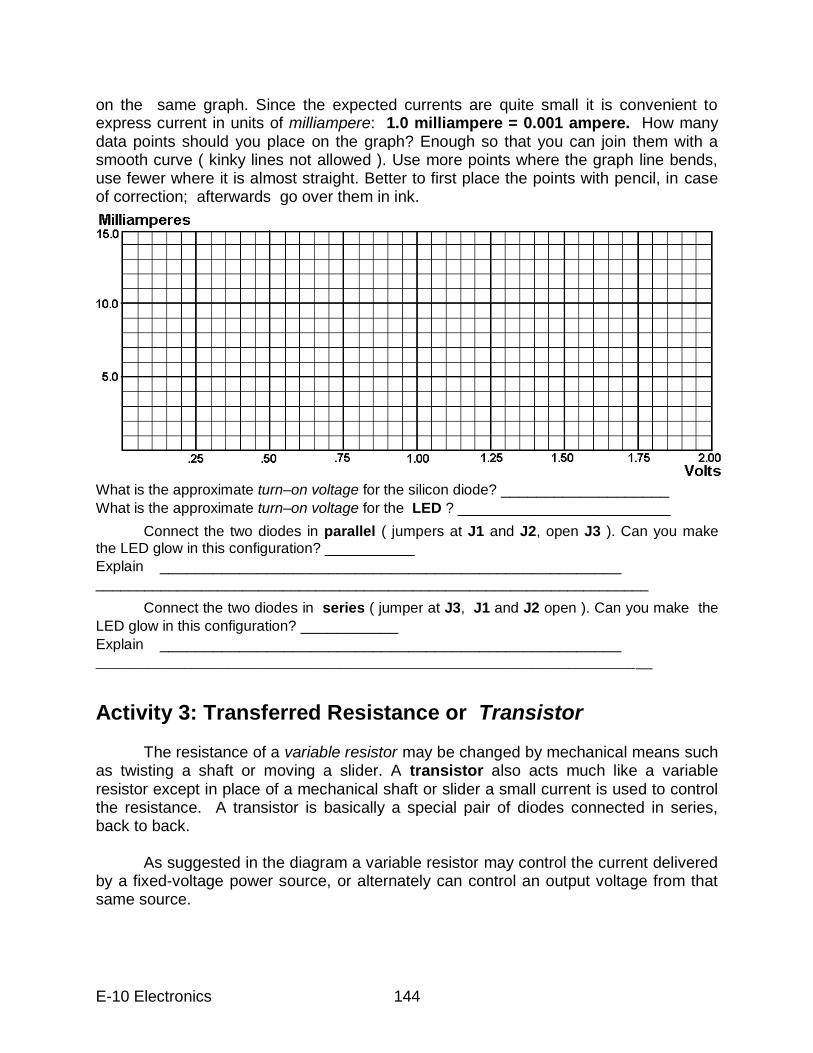
E-10 Electronics 144
on the same graph. Since the expected currents are quite small it is convenient to express current in units of milliampere: 1.0 milliampere = 0.001 ampere. How many data points should you place on the graph? Enough so that you can join them with a smooth curve ( kinky lines not allowed ). Use more points where the graph line bends, use fewer where it is almost straight. Better to first place the points with pencil, in case of correction; afterwards go over them in ink.
What is the approximate turn–on voltage for the silicon diode? ___________________
What is the approximate turn–on voltage for the LED ? ________________________
Connect the two diodes in parallel ( jumpers at J1 and J2, open J3 ). Can you make the LED glow in this configuration? ___________
Explain ____________________________________________________ ____________________________________________________________________
Connect the two diodes in series ( jumper at J3, J1 and J2 open ). Can you make the
LED glow in this configuration? ___________
Explain ____________________________________________________ ___________________________________________________________________________
Activity 3: Transferred Resistance or Transistor The resistance of a variable resistor may be changed by mechanical means such as twisting a shaft or moving a slider. A transistor also acts much like a variable resistor except in place of a mechanical shaft or slider a small current is used to control the resistance. A transistor is basically a special pair of diodes connected in series, back to back. As suggested in the diagram a variable resistor may control the current delivered by a fixed-voltage power source, or alternately can control an output voltage from that same source.
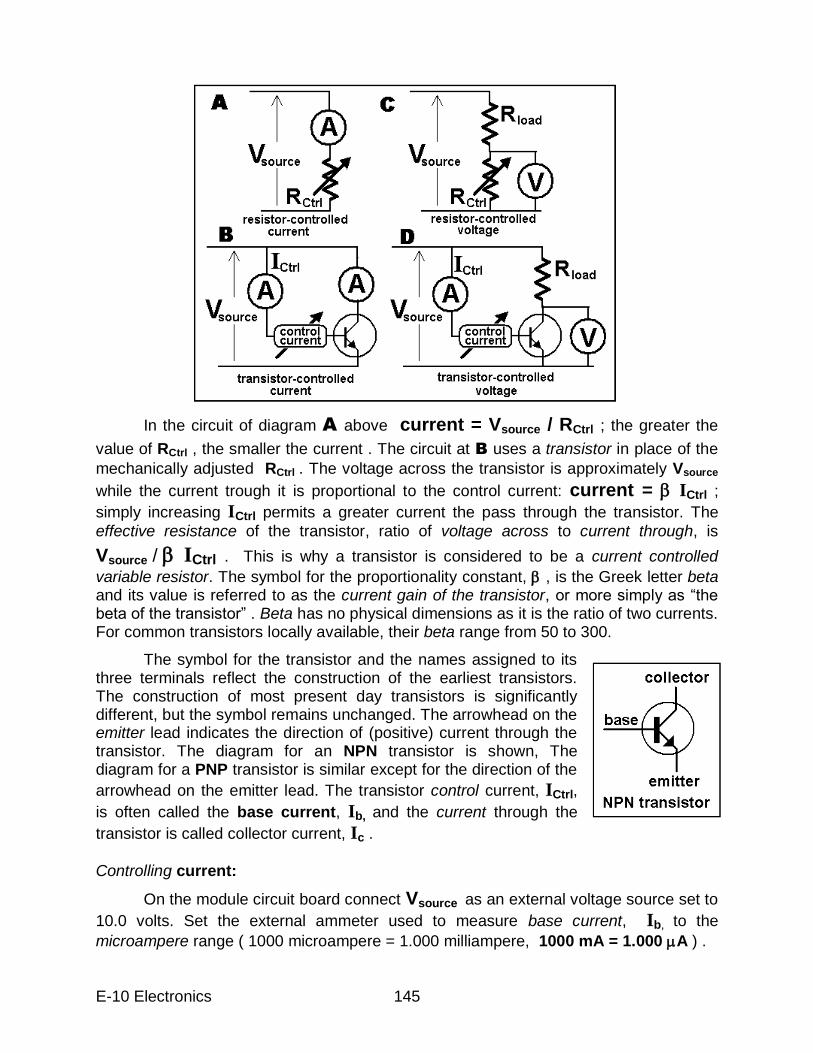
E-10 Electronics 145
In the circuit of diagram A above current = Vsource / RCtrl ; the greater the
value of RCtrl , the smaller the current . The circuit at B uses a transistor in place of the
mechanically adjusted RCtrl . The voltage across the transistor is approximately Vsource
while the current trough it is proportional to the control current: current = ICtrl ;
simply increasing ICtrl permits a greater current the pass through the transistor. The
effective resistance of the transistor, ratio of voltage across to current through, is
Vsource / ICtrl . This is why a transistor is considered to be a current controlled
variable resistor. The symbol for the proportionality constant, , is the Greek letter beta and its value is referred to as the current gain of the transistor, or more simply as “the beta of the transistor” . Beta has no physical dimensions as it is the ratio of two currents. For common transistors locally available, their beta range from 50 to 300.
The symbol for the transistor and the names assigned to its three terminals reflect the construction of the earliest transistors. The construction of most present day transistors is significantly different, but the symbol remains unchanged. The arrowhead on the emitter lead indicates the direction of (positive) current through the transistor. The diagram for an NPN transistor is shown, The diagram for a PNP transistor is similar except for the direction of the
arrowhead on the emitter lead. The transistor control current, ICtrl,
is often called the base current, Ib, and the current through the
transistor is called collector current, Ic .
Controlling current:
On the module circuit board connect Vsource as an external voltage source set to
10.0 volts. Set the external ammeter used to measure base current, Ib, to the
microampere range ( 1000 microampere = 1.000 milliampere, 1000 mA = 1.000 A ) .
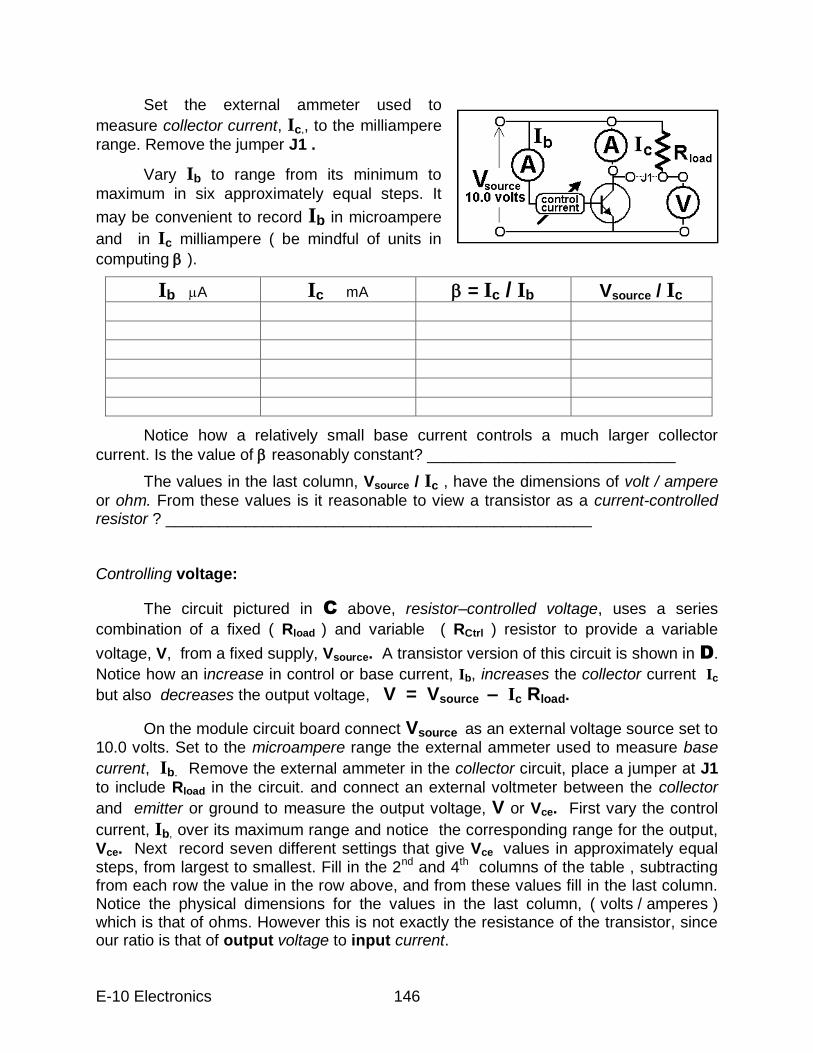
E-10 Electronics 146
Set the external ammeter used to
measure collector current, Ic,, to the milliampere
range. Remove the jumper J1 .
Vary Ib to range from its minimum to
maximum in six approximately equal steps. It
may be convenient to record Ib in microampere
and in Ic milliampere ( be mindful of units in
computing ).
Notice how a relatively small base current controls a much larger collector
current. Is the value of reasonably constant? ____________________________
The values in the last column, Vsource / Ic , have the dimensions of volt / ampere
or ohm. From these values is it reasonable to view a transistor as a current-controlled resistor ? ________________________________________________
Controlling voltage:
The circuit pictured in C above, resistor–controlled voltage, uses a series
combination of a fixed ( Rload ) and variable ( RCtrl ) resistor to provide a variable
voltage, V, from a fixed supply, Vsource. A transistor version of this circuit is shown in D.
Notice how an increase in control or base current, Ib, increases the collector current Ic
but also decreases the output voltage, V = Vsource – Ic Rload.
On the module circuit board connect Vsource as an external voltage source set to 10.0 volts. Set to the microampere range the external ammeter used to measure base
current, Ib. Remove the external ammeter in the collector circuit, place a jumper at J1
to include Rload in the circuit. and connect an external voltmeter between the collector
and emitter or ground to measure the output voltage, V or Vce. First vary the control
current, Ib, over its maximum range and notice the corresponding range for the output, Vce. Next record seven different settings that give Vce values in approximately equal steps, from largest to smallest. Fill in the 2nd and 4th columns of the table , subtracting from each row the value in the row above, and from these values fill in the last column. Notice the physical dimensions for the values in the last column, ( volts / amperes ) which is that of ohms. However this is not exactly the resistance of the transistor, since our ratio is that of output voltage to input current.
Ib A Ic mA = Ic / Ib Vsource / Ic
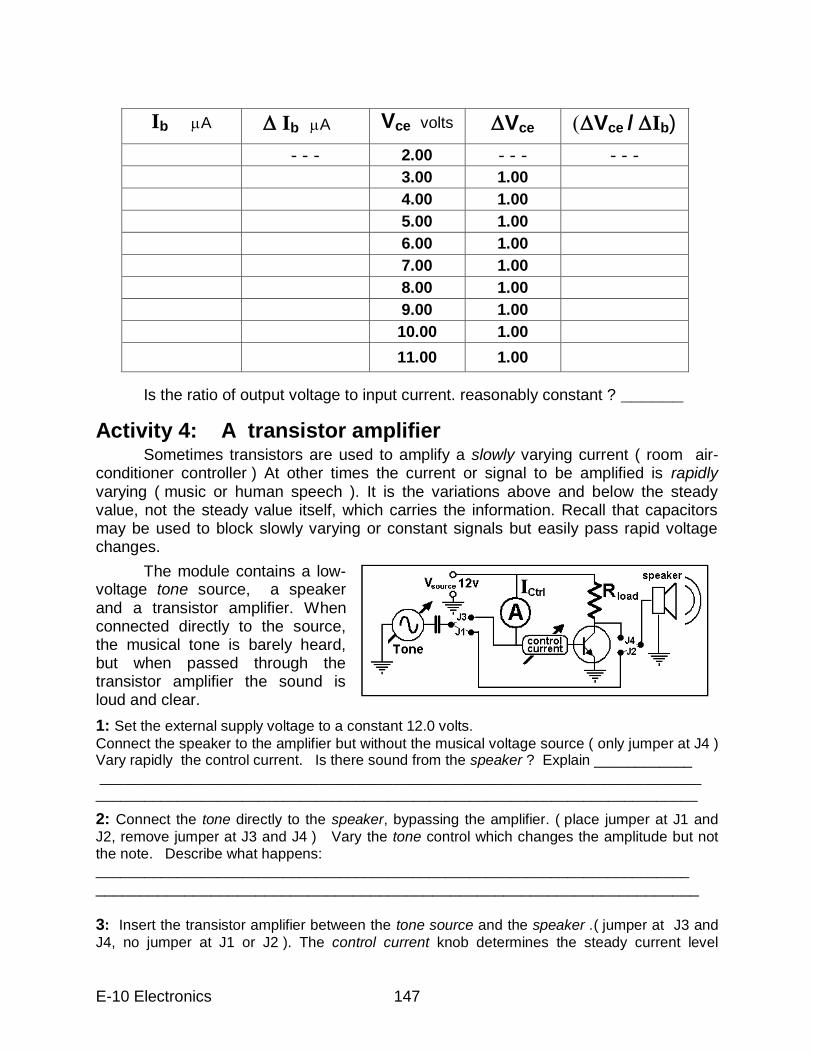
E-10 Electronics 147
Is the ratio of output voltage to input current. reasonably constant ? ______
Activity 4: A transistor amplifier
Sometimes transistors are used to amplify a slowly varying current ( room air-conditioner controller ) At other times the current or signal to be amplified is rapidly varying ( music or human speech ). It is the variations above and below the steady value, not the steady value itself, which carries the information. Recall that capacitors may be used to block slowly varying or constant signals but easily pass rapid voltage changes.
The module contains a low-voltage tone source, a speaker and a transistor amplifier. When connected directly to the source, the musical tone is barely heard, but when passed through the transistor amplifier the sound is loud and clear.
1: Set the external supply voltage to a constant 12.0 volts.
Connect the speaker to the amplifier but without the musical voltage source ( only jumper at J4 ) Vary rapidly the control current. Is there sound from the speaker ? Explain ____________
__________________________________________________________________________ __________________________________________________________________________
2: Connect the tone directly to the speaker, bypassing the amplifier. ( place jumper at J1 and
J2, remove jumper at J3 and J4 ) Vary the tone control which changes the amplitude but not the note. Describe what happens: _________________________________________________________________________
____________________________________________________________________ 3: Insert the transistor amplifier between the tone source and the speaker .( jumper at J3 and
J4, no jumper at J1 or J2 ). The control current knob determines the steady current level
Ib A Ib A Vce volts Vce Vce / Ib)
- - - 2.00 - - - - - -
3.00 1.00
4.00 1.00
5.00 1.00
6.00 1.00
7.00 1.00
8.00 1.00
9.00 1.00
10.00 1.00
11.00 1.00
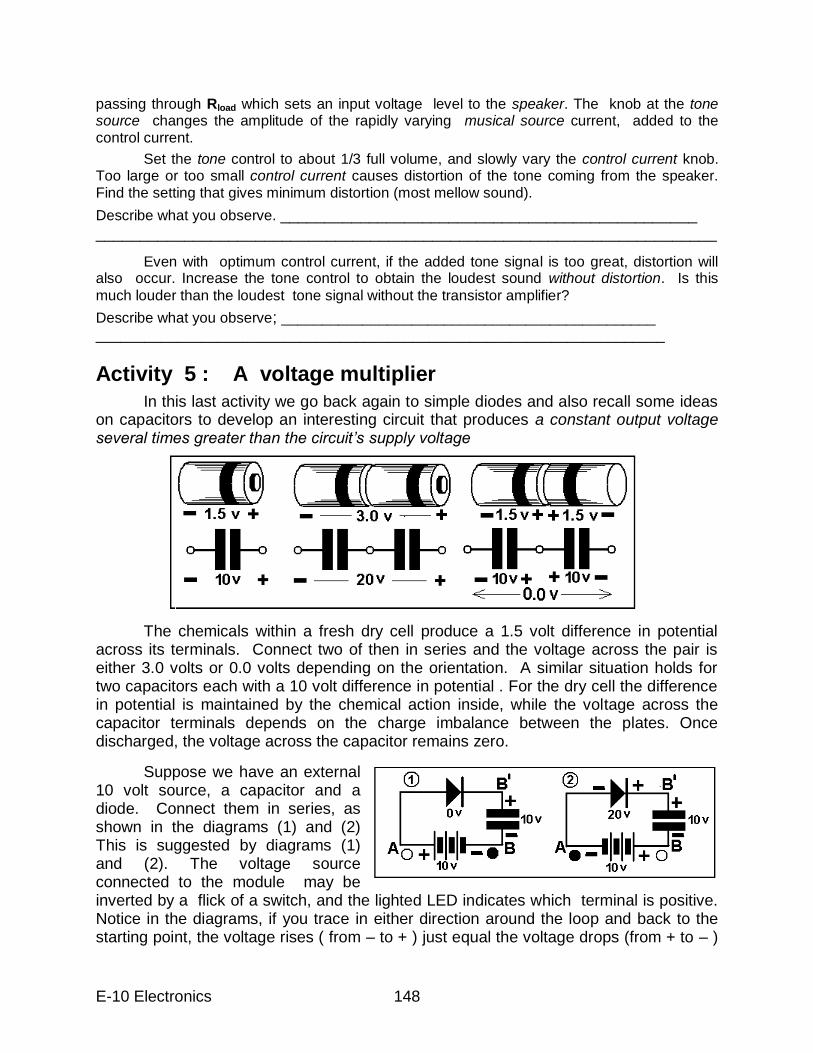
E-10 Electronics 148
passing through Rload which sets an input voltage level to the speaker. The knob at the tone source changes the amplitude of the rapidly varying musical source current, added to the control current.
Set the tone control to about 1/3 full volume, and slowly vary the control current knob. Too large or too small control current causes distortion of the tone coming from the speaker. Find the setting that gives minimum distortion (most mellow sound).
Describe what you observe. _______________________________________________ ______________________________________________________________________
Even with optimum control current, if the added tone signal is too great, distortion will also occur. Increase the tone control to obtain the loudest sound without distortion. Is this
much louder than the loudest tone signal without the transistor amplifier?
Describe what you observe; ______________________________________________
______________________________________________________________________
Activity 5 : A voltage multiplier
In this last activity we go back again to simple diodes and also recall some ideas on capacitors to develop an interesting circuit that produces a constant output voltage several times greater than the circuit’s supply voltage
The chemicals within a fresh dry cell produce a 1.5 volt difference in potential across its terminals. Connect two of then in series and the voltage across the pair is either 3.0 volts or 0.0 volts depending on the orientation. A similar situation holds for two capacitors each with a 10 volt difference in potential . For the dry cell the difference in potential is maintained by the chemical action inside, while the voltage across the capacitor terminals depends on the charge imbalance between the plates. Once discharged, the voltage across the capacitor remains zero.
Suppose we have an external 10 volt source, a capacitor and a diode. Connect them in series, as shown in the diagrams (1) and (2) This is suggested by diagrams (1) and (2). The voltage source connected to the module may be inverted by a flick of a switch, and the lighted LED indicates which terminal is positive. Notice in the diagrams, if you trace in either direction around the loop and back to the starting point, the voltage rises ( from – to + ) just equal the voltage drops (from + to – )
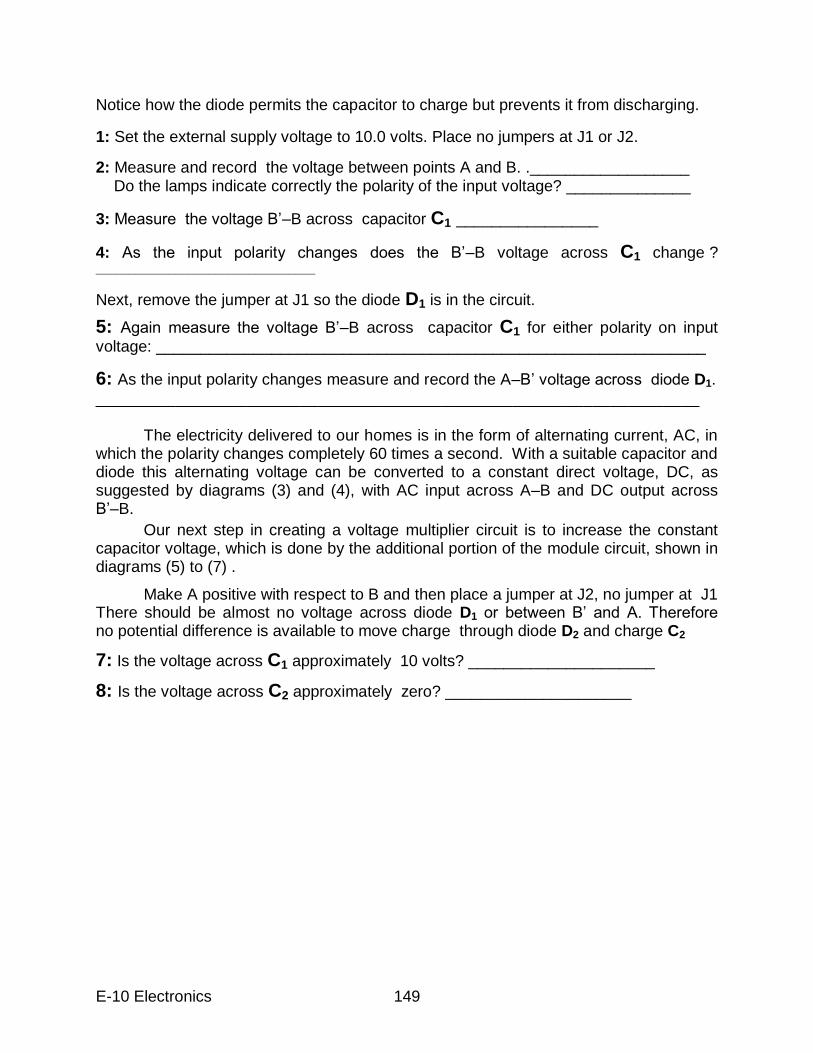
E-10 Electronics 149
Notice how the diode permits the capacitor to charge but prevents it from discharging.
1: Set the external supply voltage to 10.0 volts. Place no jumpers at J1 or J2.
2: Measure and record the voltage between points A and B. .__________________ Do the lamps indicate correctly the polarity of the input voltage? ______________
3: Measure the voltage B‟–B across capacitor C1 ________________
4: As the input polarity changes does the B‟–B voltage across C1 change ? _________________________________
Next, remove the jumper at J1 so the diode D1 is in the circuit.
5: Again measure the voltage B‟–B across capacitor C1 for either polarity on input
voltage: ______________________________________________________________
6: As the input polarity changes measure and record the A–B‟ voltage across diode D1.
____________________________________________________________________ The electricity delivered to our homes is in the form of alternating current, AC, in which the polarity changes completely 60 times a second. With a suitable capacitor and diode this alternating voltage can be converted to a constant direct voltage, DC, as suggested by diagrams (3) and (4), with AC input across A–B and DC output across B‟–B.
Our next step in creating a voltage multiplier circuit is to increase the constant capacitor voltage, which is done by the additional portion of the module circuit, shown in diagrams (5) to (7) .
Make A positive with respect to B and then place a jumper at J2, no jumper at J1 There should be almost no voltage across diode D1 or between B‟ and A. Therefore no potential difference is available to move charge through diode D2 and charge C2
7: Is the voltage across C1 approximately 10 volts? _____________________
8: Is the voltage across C2 approximately zero? _____________________
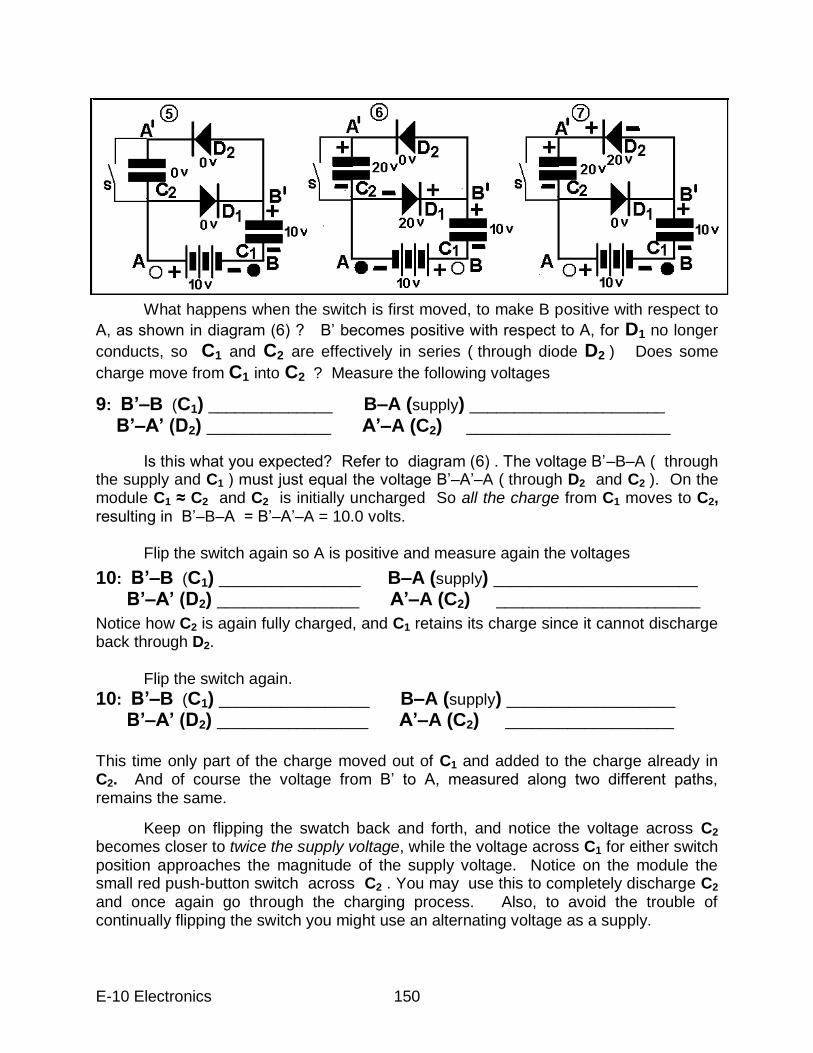
E-10 Electronics 150
What happens when the switch is first moved, to make B positive with respect to
A, as shown in diagram (6) ? B‟ becomes positive with respect to A, for D1 no longer
conducts, so C1 and C2 are effectively in series ( through diode D2 ) Does some
charge move from C1 into C2 ? Measure the following voltages
9: B‟–B (C1) ______________ B–A (supply) ______________________ B‟–A‟ (D2) ______________ A‟–A (C2) _______________________
Is this what you expected? Refer to diagram (6) . The voltage B‟–B–A ( through the supply and C1 ) must just equal the voltage B‟–A‟–A ( through D2 and C2 ). On the module C1 ≈ C2 and C2 is initially uncharged So all the charge from C1 moves to C2, resulting in B‟–B–A = B‟–A‟–A = 10.0 volts. Flip the switch again so A is positive and measure again the voltages
10: B‟–B (C1) ________________ B–A (supply) _______________________
B‟–A‟ (D2) ________________ A‟–A (C2) _______________________
Notice how C2 is again fully charged, and C1 retains its charge since it cannot discharge back through D2.
Flip the switch again.
10: B‟–B (C1) _________________ B–A (supply) ___________________ B‟–A‟ (D2) _________________ A‟–A (C2) ___________________ This time only part of the charge moved out of C1 and added to the charge already in C2. And of course the voltage from B‟ to A, measured along two different paths, remains the same.
Keep on flipping the swatch back and forth, and notice the voltage across C2
becomes closer to twice the supply voltage, while the voltage across C1 for either switch position approaches the magnitude of the supply voltage. Notice on the module the small red push-button switch across C2 . You may use this to completely discharge C2
and once again go through the charging process. Also, to avoid the trouble of continually flipping the switch you might use an alternating voltage as a supply.

E-10 Electronics 151
So we have succeeded in making a voltage multiplier using only capacitors and diodes, for the voltage across C2 is approximately twice the supply voltage. It would be possible to add additional diode–capacitor pairs and get still higher output voltages. In principle there is no limit to the final voltage we may obtain by using more and more such diode–capacitor pairs. This method is used commercially for generating quite high constant output voltages from small alternating input voltages. But be careful, for voltages above 30 volts become painful to the touch. While very high voltages may be obtained there is a practical limit to the size of the output current, since all the charging currents must pass through C1 ;
Looking Back
What are the differences between the transformer considered in a previous experiment and the voltage multiplier circuit considered here? ____________________________ ____________________________________________________________________ Can we speak of the resistance of a diode ? _________________________________ ____________________________________________________________________ What about dynamic resistance?__________________________________________ Explain how you can use an ohmmeter to determine which end is which of a diode? _________________________________________________________________ _________________________________________________________________
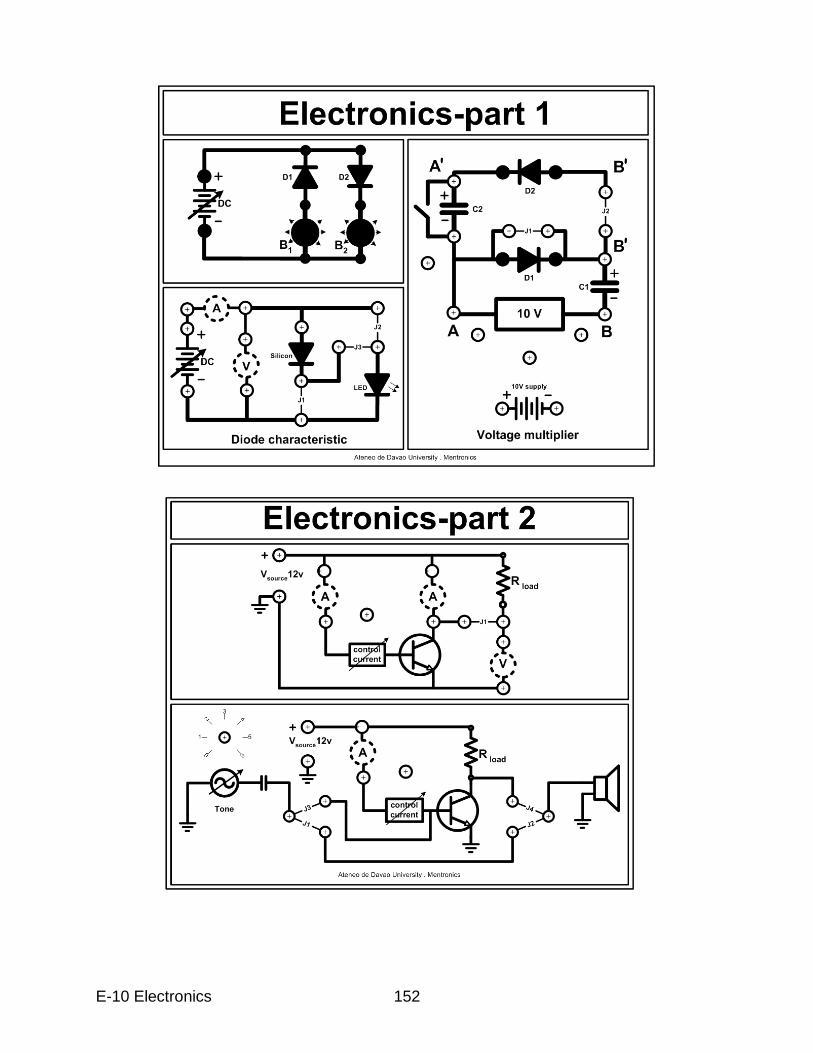
E-10 Electronics 152
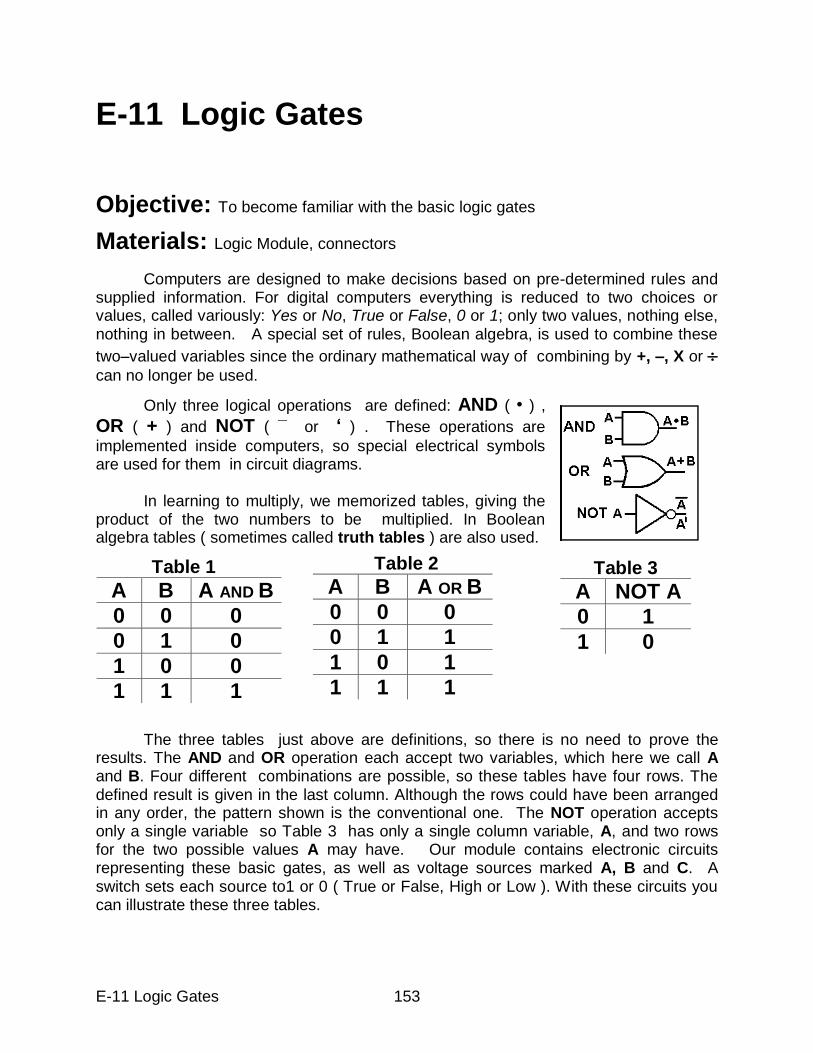
E-11 Logic Gates 153
E-11 Logic Gates
Objective: To become familiar with the basic logic gates
Materials: Logic Module, connectors
Computers are designed to make decisions based on pre-determined rules and supplied information. For digital computers everything is reduced to two choices or values, called variously: Yes or No, True or False, 0 or 1; only two values, nothing else, nothing in between. A special set of rules, Boolean algebra, is used to combine these
two–valued variables since the ordinary mathematical way of combining by +, –, X or
can no longer be used.
Only three logical operations are defined: AND ( • ) , OR ( + ) and NOT ( ¯ or „ ) . These operations are
implemented inside computers, so special electrical symbols are used for them in circuit diagrams. In learning to multiply, we memorized tables, giving the product of the two numbers to be multiplied. In Boolean algebra tables ( sometimes called truth tables ) are also used.
The three tables just above are definitions, so there is no need to prove the results. The AND and OR operation each accept two variables, which here we call A and B. Four different combinations are possible, so these tables have four rows. The defined result is given in the last column. Although the rows could have been arranged in any order, the pattern shown is the conventional one. The NOT operation accepts only a single variable so Table 3 has only a single column variable, A, and two rows for the two possible values A may have. Our module contains electronic circuits representing these basic gates, as well as voltage sources marked A, B and C. A switch sets each source to1 or 0 ( True or False, High or Low ). With these circuits you can illustrate these three tables.
Table 1 A B A AND B
0 0 0
0 1 0
1 0 0
1 1 1
Table 2 A B A OR B
0 0 0
0 1 1
1 0 1
1 1 1
Table 3 A NOT A
0 1
1 0
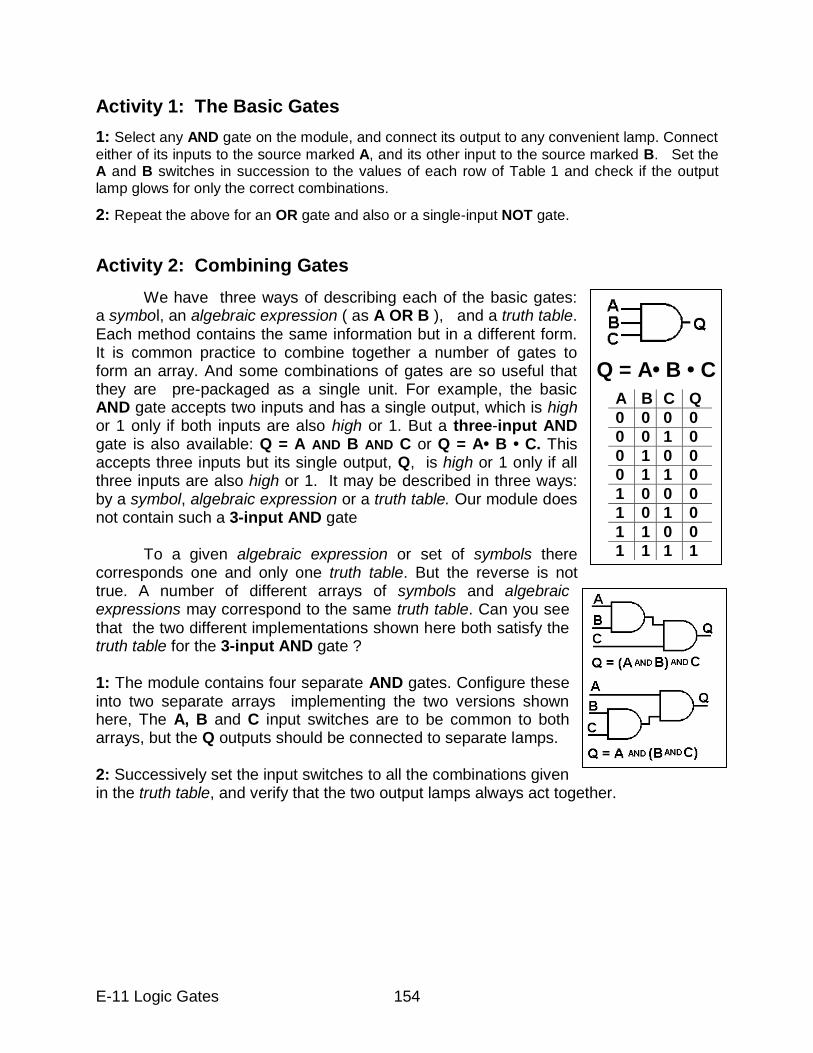
E-11 Logic Gates 154
Activity 1: The Basic Gates
1: Select any AND gate on the module, and connect its output to any convenient lamp. Connect
either of its inputs to the source marked A, and its other input to the source marked B. Set the A and B switches in succession to the values of each row of Table 1 and check if the output lamp glows for only the correct combinations.
2: Repeat the above for an OR gate and also or a single-input NOT gate.
Activity 2: Combining Gates
We have three ways of describing each of the basic gates: a symbol, an algebraic expression ( as A OR B ), and a truth table. Each method contains the same information but in a different form. It is common practice to combine together a number of gates to form an array. And some combinations of gates are so useful that they are pre-packaged as a single unit. For example, the basic AND gate accepts two inputs and has a single output, which is high or 1 only if both inputs are also high or 1. But a three-input AND gate is also available: Q = A AND B AND C or Q = A• B • C. This accepts three inputs but its single output, Q, is high or 1 only if all three inputs are also high or 1. It may be described in three ways: by a symbol, algebraic expression or a truth table. Our module does not contain such a 3-input AND gate To a given algebraic expression or set of symbols there corresponds one and only one truth table. But the reverse is not true. A number of different arrays of symbols and algebraic expressions may correspond to the same truth table. Can you see that the two different implementations shown here both satisfy the truth table for the 3-input AND gate ? 1: The module contains four separate AND gates. Configure these into two separate arrays implementing the two versions shown here, The A, B and C input switches are to be common to both arrays, but the Q outputs should be connected to separate lamps. 2: Successively set the input switches to all the combinations given in the truth table, and verify that the two output lamps always act together.
Q = A• B • C
A B C Q
0 0 0 0
0 0 1 0
0 1 0 0
0 1 1 0
1 0 0 0
1 0 1 0
1 1 0 0
1 1 1 1
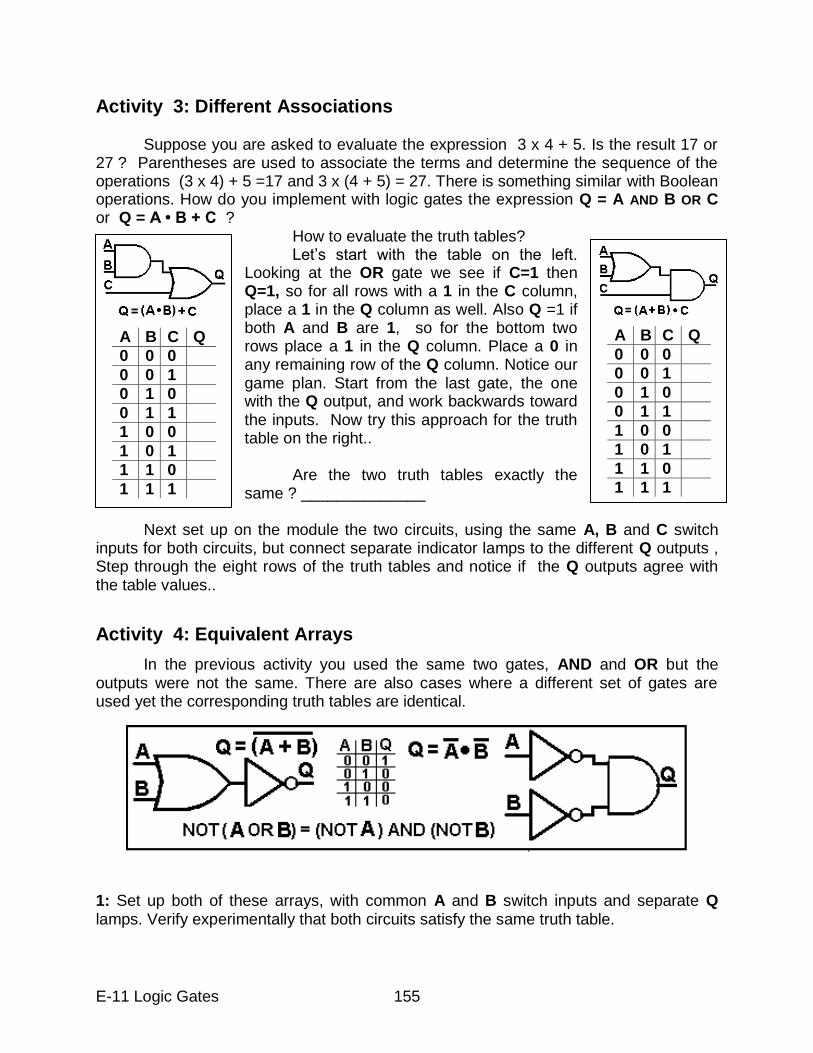
E-11 Logic Gates 155
Activity 3: Different Associations
Suppose you are asked to evaluate the expression 3 x 4 + 5. Is the result 17 or 27 ? Parentheses are used to associate the terms and determine the sequence of the operations (3 x 4) + 5 =17 and 3 x (4 + 5) = 27. There is something similar with Boolean operations. How do you implement with logic gates the expression Q = A AND B OR C or Q = A • B + C ?
How to evaluate the truth tables? Let‟s start with the table on the left. Looking at the OR gate we see if C=1 then Q=1, so for all rows with a 1 in the C column, place a 1 in the Q column as well. Also Q =1 if both A and B are 1, so for the bottom two rows place a 1 in the Q column. Place a 0 in any remaining row of the Q column. Notice our game plan. Start from the last gate, the one with the Q output, and work backwards toward the inputs. Now try this approach for the truth table on the right.. Are the two truth tables exactly the same ? ______________
Next set up on the module the two circuits, using the same A, B and C switch inputs for both circuits, but connect separate indicator lamps to the different Q outputs , Step through the eight rows of the truth tables and notice if the Q outputs agree with the table values..
Activity 4: Equivalent Arrays
In the previous activity you used the same two gates, AND and OR but the outputs were not the same. There are also cases where a different set of gates are used yet the corresponding truth tables are identical.
1: Set up both of these arrays, with common A and B switch inputs and separate Q lamps. Verify experimentally that both circuits satisfy the same truth table.
A B C Q
0 0 0
0 0 1
0 1 0
0 1 1
1 0 0
1 0 1
1 1 0
1 1 1
A B C Q
0 0 0
0 0 1
0 1 0
0 1 1
1 0 0
1 0 1
1 1 0
1 1 1
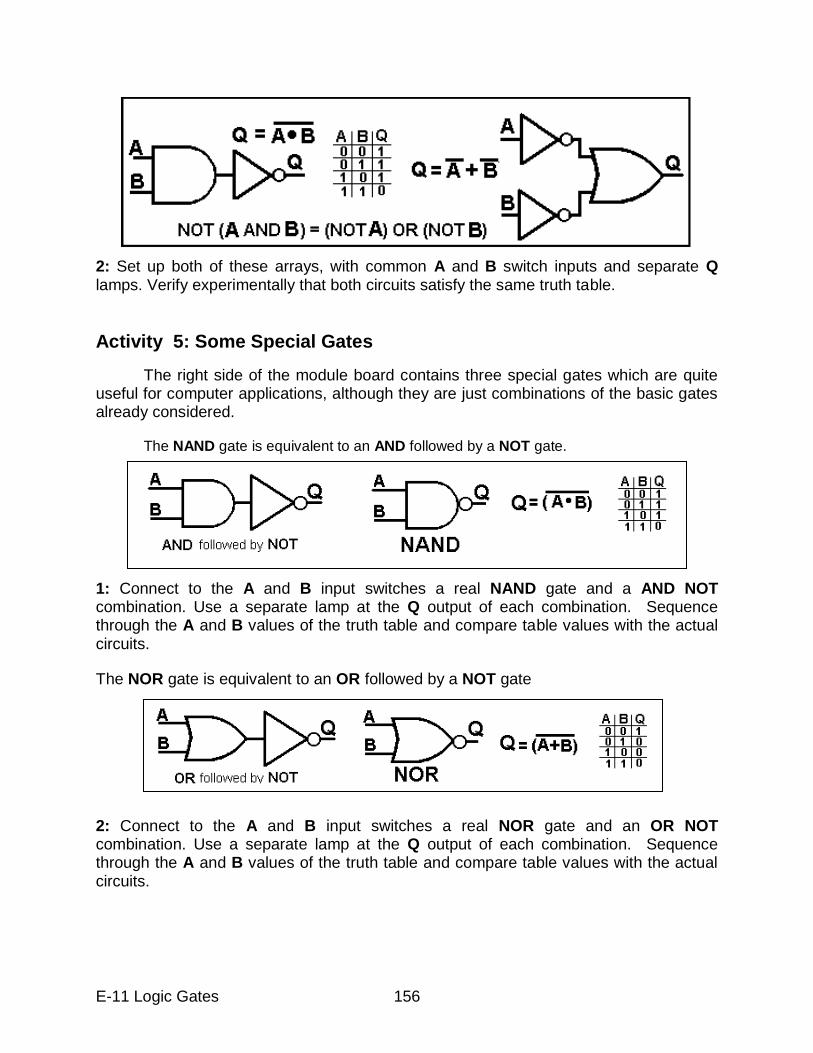
E-11 Logic Gates 156
2: Set up both of these arrays, with common A and B switch inputs and separate Q lamps. Verify experimentally that both circuits satisfy the same truth table.
Activity 5: Some Special Gates
The right side of the module board contains three special gates which are quite useful for computer applications, although they are just combinations of the basic gates already considered. The NAND gate is equivalent to an AND followed by a NOT gate.
1: Connect to the A and B input switches a real NAND gate and a AND NOT combination. Use a separate lamp at the Q output of each combination. Sequence through the A and B values of the truth table and compare table values with the actual circuits.
The NOR gate is equivalent to an OR followed by a NOT gate
2: Connect to the A and B input switches a real NOR gate and an OR NOT combination. Use a separate lamp at the Q output of each combination. Sequence through the A and B values of the truth table and compare table values with the actual circuits.
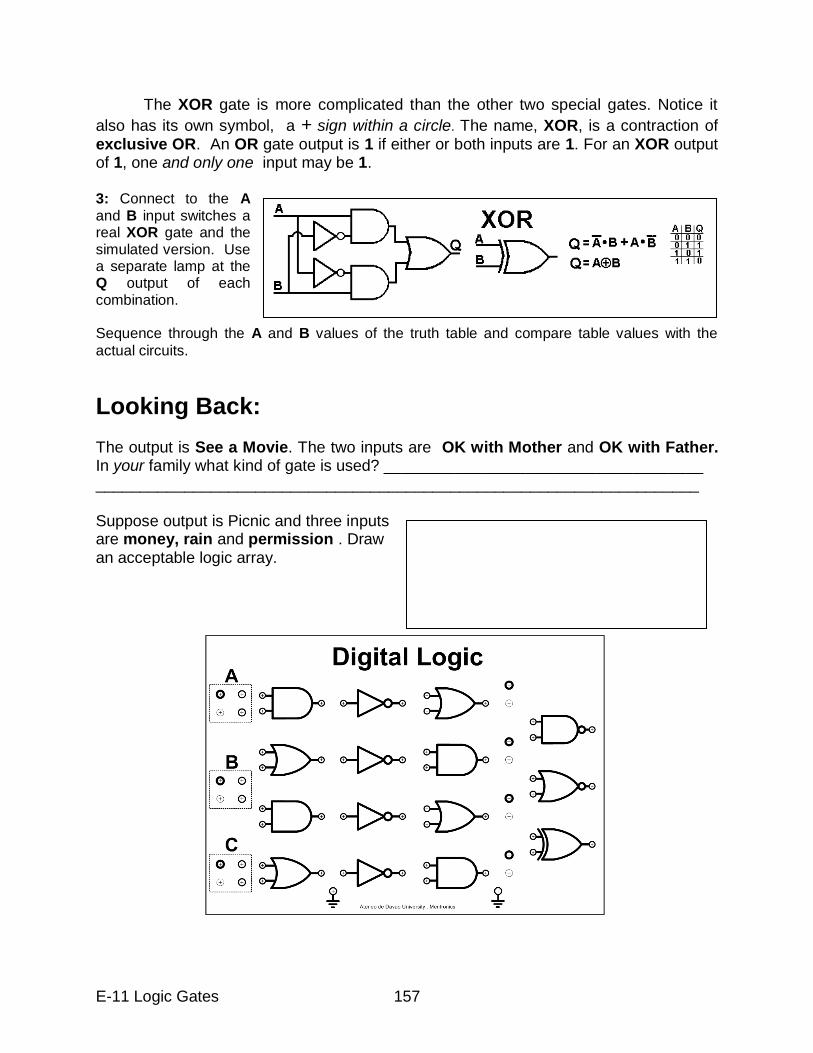
E-11 Logic Gates 157
The XOR gate is more complicated than the other two special gates. Notice it
also has its own symbol, a + sign within a circle. The name, XOR, is a contraction of exclusive OR. An OR gate output is 1 if either or both inputs are 1. For an XOR output of 1, one and only one input may be 1. 3: Connect to the A and B input switches a real XOR gate and the simulated version. Use a separate lamp at the Q output of each combination. Sequence through the A and B values of the truth table and compare table values with the
actual circuits.
Looking Back:
The output is See a Movie. The two inputs are OK with Mother and OK with Father. In your family what kind of gate is used? ____________________________________ ____________________________________________________________________ Suppose output is Picnic and three inputs are money, rain and permission . Draw an acceptable logic array.
158
6: Light Without electric charge there would be no light although humans have been seeing things long before electricity was ever dreamed of. Light has both mass and energy. In the experiments presented here we try to describe in a logical manner the observed behavior of light, without raising the question of the real nature of light..
L-1 How light travels L-2 Reflection L-3 Multiple images L-4 Curved mirrors L-5 Refraction L-6 Lenses L-7 Optical instruments
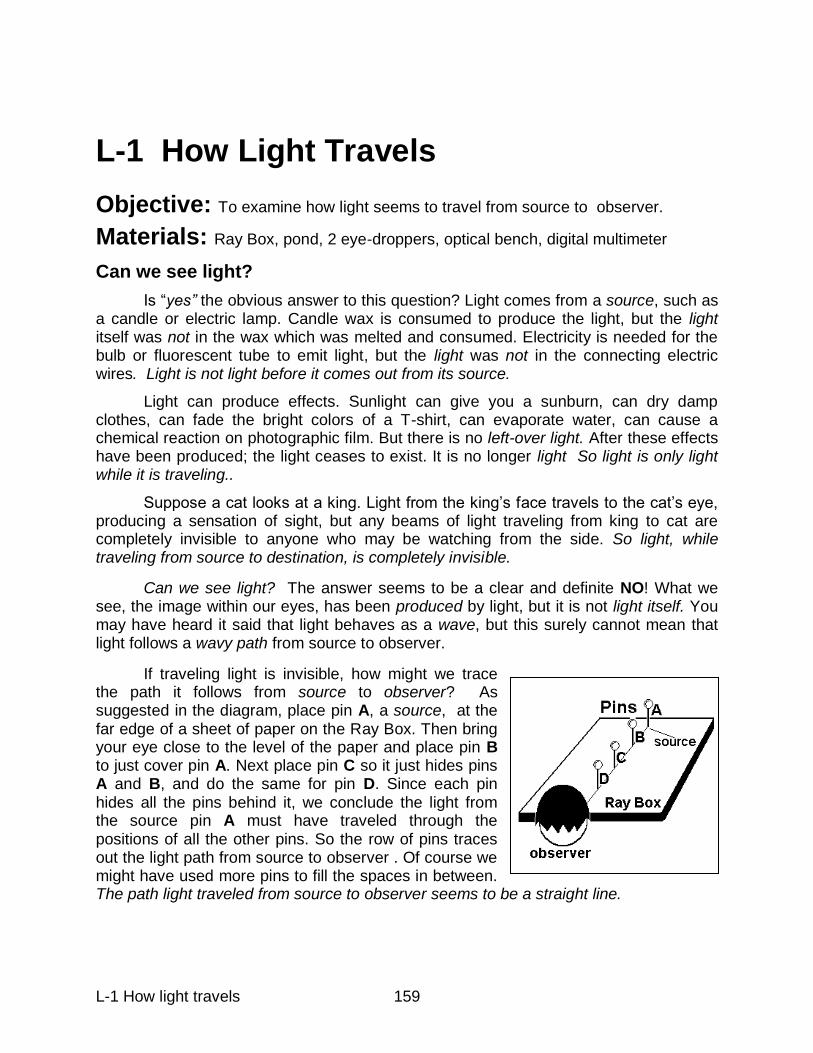
L-1 How light travels 159
L-1 How Light Travels
Objective: To examine how light seems to travel from source to observer.
Materials: Ray Box, pond, 2 eye-droppers, optical bench, digital multimeter
Can we see light?
Is “yes” the obvious answer to this question? Light comes from a source, such as a candle or electric lamp. Candle wax is consumed to produce the light, but the light itself was not in the wax which was melted and consumed. Electricity is needed for the bulb or fluorescent tube to emit light, but the light was not in the connecting electric wires. Light is not light before it comes out from its source.
Light can produce effects. Sunlight can give you a sunburn, can dry damp clothes, can fade the bright colors of a T-shirt, can evaporate water, can cause a chemical reaction on photographic film. But there is no left-over light. After these effects have been produced; the light ceases to exist. It is no longer light So light is only light while it is traveling..
Suppose a cat looks at a king. Light from the king‟s face travels to the cat‟s eye, producing a sensation of sight, but any beams of light traveling from king to cat are completely invisible to anyone who may be watching from the side. So light, while traveling from source to destination, is completely invisible.
Can we see light? The answer seems to be a clear and definite NO! What we see, the image within our eyes, has been produced by light, but it is not light itself. You may have heard it said that light behaves as a wave, but this surely cannot mean that light follows a wavy path from source to observer.
If traveling light is invisible, how might we trace the path it follows from source to observer? As suggested in the diagram, place pin A, a source, at the far edge of a sheet of paper on the Ray Box. Then bring your eye close to the level of the paper and place pin B to just cover pin A. Next place pin C so it just hides pins A and B, and do the same for pin D. Since each pin hides all the pins behind it, we conclude the light from the source pin A must have traveled through the positions of all the other pins. So the row of pins traces out the light path from source to observer . Of course we might have used more pins to fill the spaces in between. The path light traveled from source to observer seems to be a straight line.
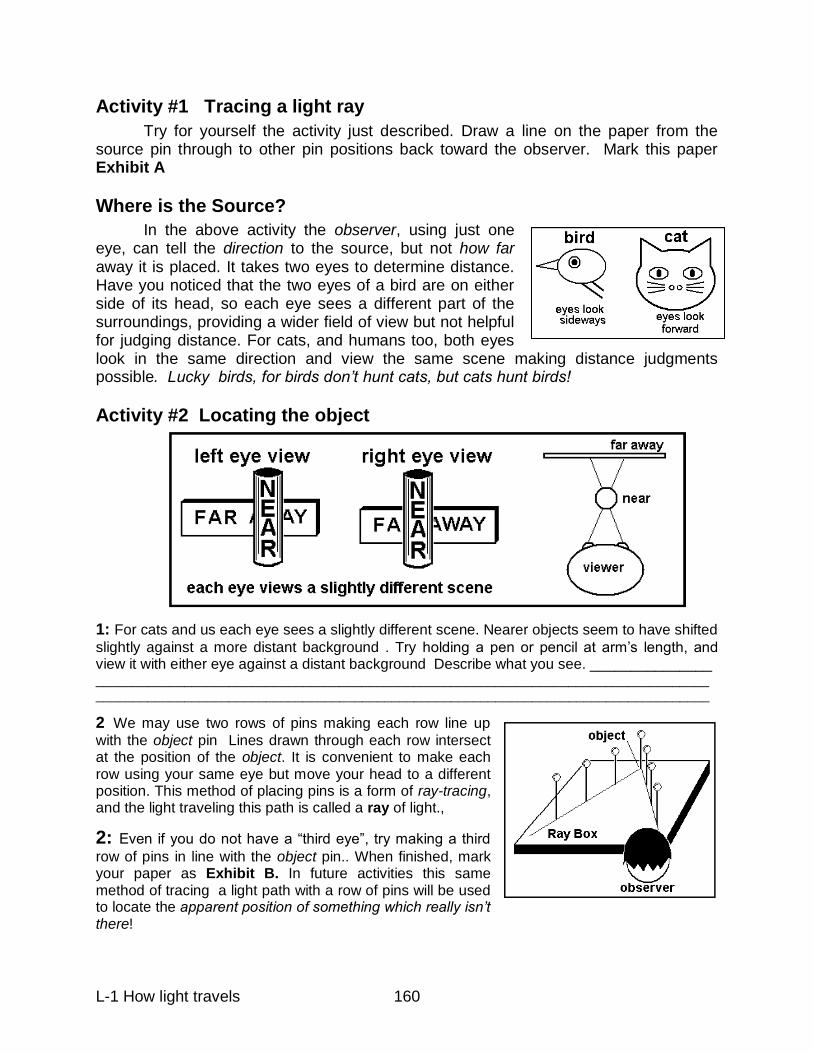
L-1 How light travels 160
Activity #1 Tracing a light ray
Try for yourself the activity just described. Draw a line on the paper from the source pin through to other pin positions back toward the observer. Mark this paper Exhibit A
Where is the Source?
In the above activity the observer, using just one eye, can tell the direction to the source, but not how far away it is placed. It takes two eyes to determine distance. Have you noticed that the two eyes of a bird are on either side of its head, so each eye sees a different part of the surroundings, providing a wider field of view but not helpful for judging distance. For cats, and humans too, both eyes look in the same direction and view the same scene making distance judgments possible. Lucky birds, for birds don’t hunt cats, but cats hunt birds!
Activity #2 Locating the object
1: For cats and us each eye sees a slightly different scene. Nearer objects seem to have shifted
slightly against a more distant background . Try holding a pen or pencil at arm‟s length, and view it with either eye against a distant background Describe what you see. _______________ ___________________________________________________________________________________ ___________________________________________________________________________________
2 We may use two rows of pins making each row line up
with the object pin Lines drawn through each row intersect at the position of the object. It is convenient to make each row using your same eye but move your head to a different position. This method of placing pins is a form of ray-tracing, and the light traveling this path is called a ray of light.,
2: Even if you do not have a “third eye”, try making a third
row of pins in line with the object pin.. When finished, mark your paper as Exhibit B. In future activities this same method of tracing a light path with a row of pins will be used to locate the apparent position of something which really isn’t there!
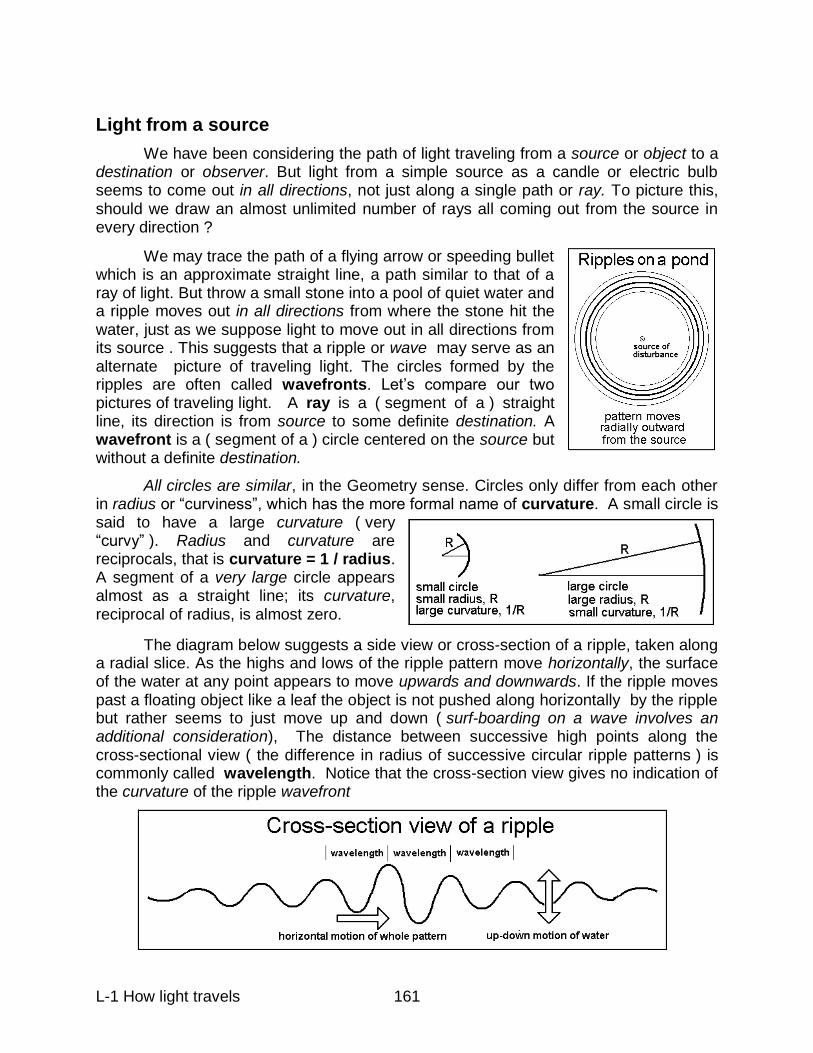
L-1 How light travels 161
Light from a source
We have been considering the path of light traveling from a source or object to a destination or observer. But light from a simple source as a candle or electric bulb seems to come out in all directions, not just along a single path or ray. To picture this, should we draw an almost unlimited number of rays all coming out from the source in every direction ?
We may trace the path of a flying arrow or speeding bullet which is an approximate straight line, a path similar to that of a ray of light. But throw a small stone into a pool of quiet water and a ripple moves out in all directions from where the stone hit the water, just as we suppose light to move out in all directions from its source . This suggests that a ripple or wave may serve as an alternate picture of traveling light. The circles formed by the ripples are often called wavefronts. Let‟s compare our two pictures of traveling light. A ray is a ( segment of a ) straight line, its direction is from source to some definite destination. A wavefront is a ( segment of a ) circle centered on the source but without a definite destination.
All circles are similar, in the Geometry sense. Circles only differ from each other in radius or “curviness”, which has the more formal name of curvature. A small circle is said to have a large curvature ( very “curvy” ). Radius and curvature are reciprocals, that is curvature = 1 / radius. A segment of a very large circle appears almost as a straight line; its curvature, reciprocal of radius, is almost zero.
The diagram below suggests a side view or cross-section of a ripple, taken along a radial slice. As the highs and lows of the ripple pattern move horizontally, the surface of the water at any point appears to move upwards and downwards. If the ripple moves past a floating object like a leaf the object is not pushed along horizontally by the ripple but rather seems to just move up and down ( surf-boarding on a wave involves an additional consideration), The distance between successive high points along the cross-sectional view ( the difference in radius of successive circular ripple patterns ) is commonly called wavelength. Notice that the cross-section view gives no indication of the curvature of the ripple wavefront
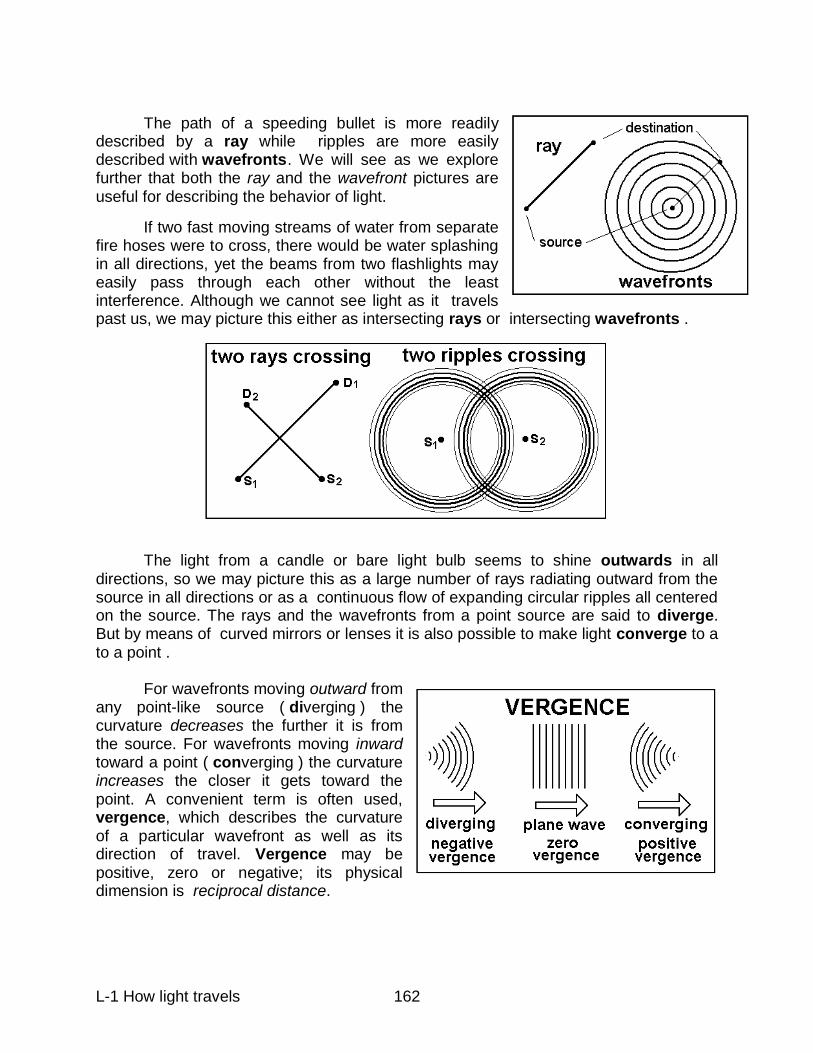
L-1 How light travels 162
The path of a speeding bullet is more readily described by a ray while ripples are more easily described with wavefronts . We will see as we explore further that both the ray and the wavefront pictures are useful for describing the behavior of light.
If two fast moving streams of water from separate fire hoses were to cross, there would be water splashing in all directions, yet the beams from two flashlights may easily pass through each other without the least interference. Although we cannot see light as it travels past us, we may picture this either as intersecting rays or intersecting wavefronts .
The light from a candle or bare light bulb seems to shine outwards in all directions, so we may picture this as a large number of rays radiating outward from the source in all directions or as a continuous flow of expanding circular ripples all centered on the source. The rays and the wavefronts from a point source are said to diverge. But by means of curved mirrors or lenses it is also possible to make light converge to a to a point . For wavefronts moving outward from any point-like source ( diverging ) the curvature decreases the further it is from the source. For wavefronts moving inward toward a point ( converging ) the curvature increases the closer it gets toward the point. A convenient term is often used, vergence, which describes the curvature of a particular wavefront as well as its direction of travel. Vergence may be positive, zero or negative; its physical dimension is reciprocal distance.
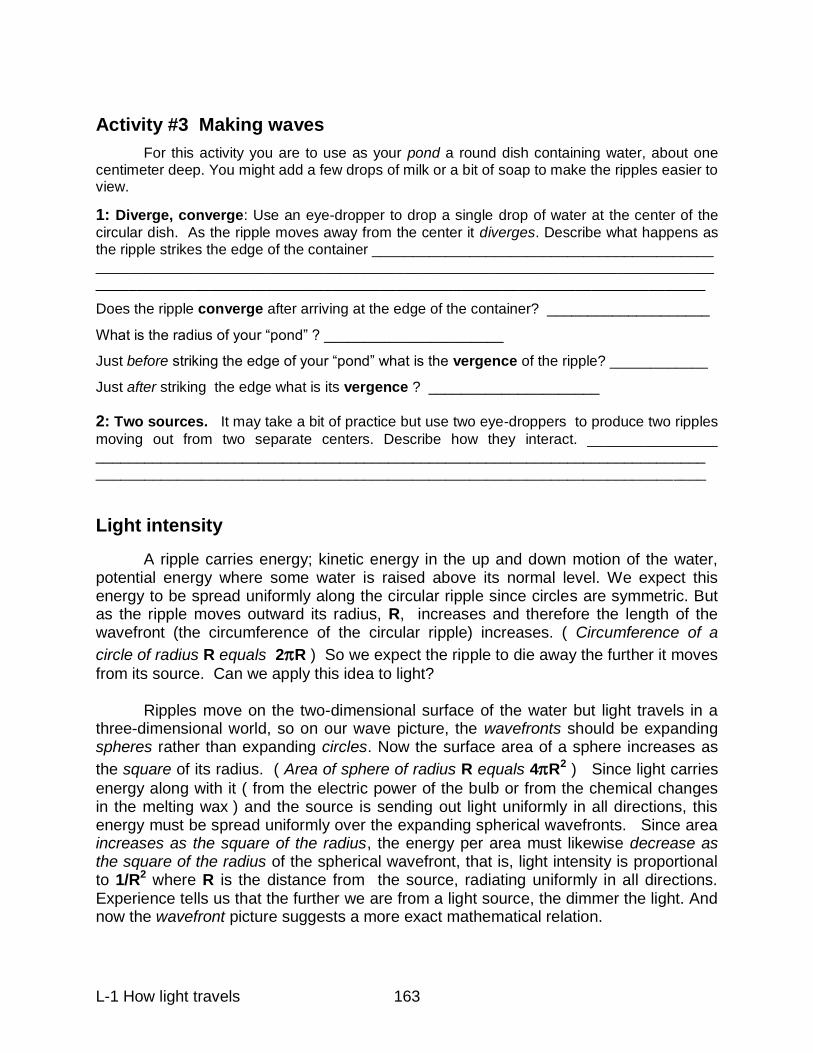
L-1 How light travels 163
Activity #3 Making waves
For this activity you are to use as your pond a round dish containing water, about one centimeter deep. You might add a few drops of milk or a bit of soap to make the ripples easier to view.
1: Diverge, converge: Use an eye-dropper to drop a single drop of water at the center of the
circular dish. As the ripple moves away from the center it diverges. Describe what happens as the ripple strikes the edge of the container __________________________________________ ____________________________________________________________________________ ___________________________________________________________________________
Does the ripple converge after arriving at the edge of the container? ____________________
What is the radius of your “pond” ? ______________________
Just before striking the edge of your “pond” what is the vergence of the ripple? ____________
Just after striking the edge what is its vergence ? _____________________
2: Two sources. It may take a bit of practice but use two eye-droppers to produce two ripples
moving out from two separate centers. Describe how they interact. ________________ ___________________________________________________________________________ ___________________________________________________________________________
Light intensity
A ripple carries energy; kinetic energy in the up and down motion of the water, potential energy where some water is raised above its normal level. We expect this energy to be spread uniformly along the circular ripple since circles are symmetric. But as the ripple moves outward its radius, R, increases and therefore the length of the wavefront (the circumference of the circular ripple) increases. ( Circumference of a
circle of radius R equals 2R ) So we expect the ripple to die away the further it moves
from its source. Can we apply this idea to light? Ripples move on the two-dimensional surface of the water but light travels in a three-dimensional world, so on our wave picture, the wavefronts should be expanding spheres rather than expanding circles. Now the surface area of a sphere increases as
the square of its radius. ( Area of sphere of radius R equals 4R2 ) Since light carries
energy along with it ( from the electric power of the bulb or from the chemical changes in the melting wax ) and the source is sending out light uniformly in all directions, this energy must be spread uniformly over the expanding spherical wavefronts. Since area increases as the square of the radius, the energy per area must likewise decrease as the square of the radius of the spherical wavefront, that is, light intensity is proportional to 1/R2 where R is the distance from the source, radiating uniformly in all directions. Experience tells us that the further we are from a light source, the dimmer the light. And now the wavefront picture suggests a more exact mathematical relation.
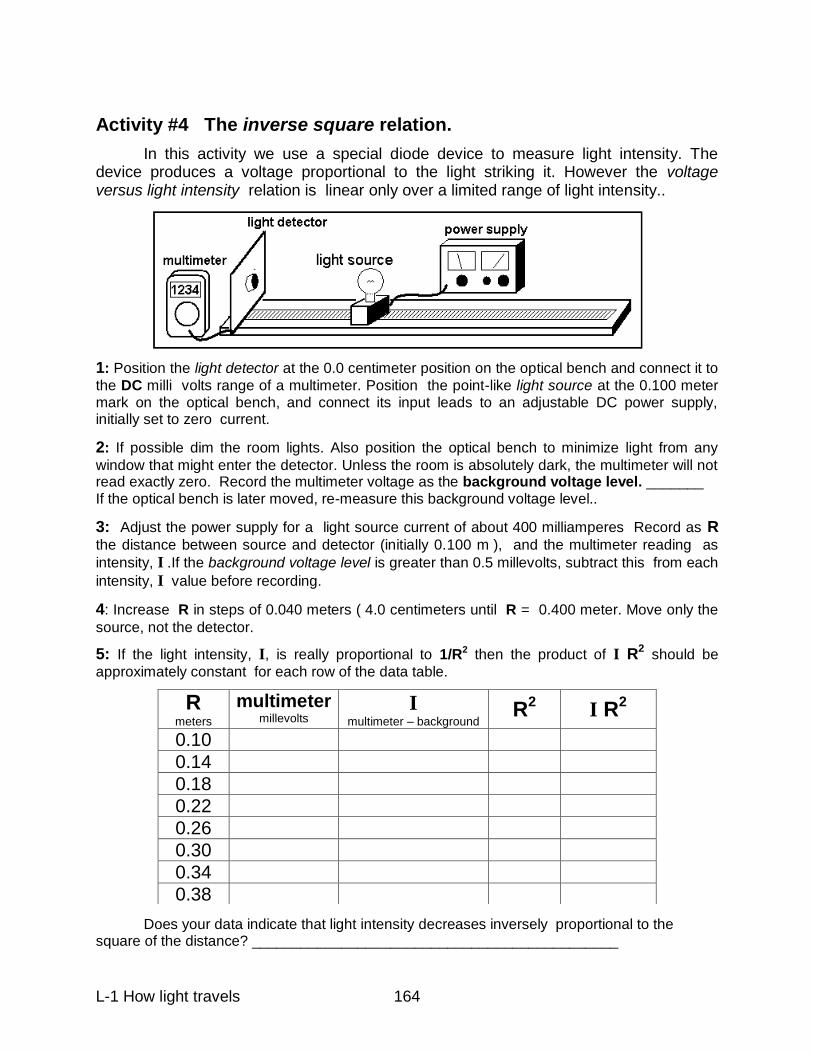
L-1 How light travels 164
Activity #4 The inverse square relation.
In this activity we use a special diode device to measure light intensity. The device produces a voltage proportional to the light striking it. However the voltage versus light intensity relation is linear only over a limited range of light intensity..
1: Position the light detector at the 0.0 centimeter position on the optical bench and connect it to
the DC milli volts range of a multimeter. Position the point-like light source at the 0.100 meter mark on the optical bench, and connect its input leads to an adjustable DC power supply, initially set to zero current.
2: If possible dim the room lights. Also position the optical bench to minimize light from any
window that might enter the detector. Unless the room is absolutely dark, the multimeter will not read exactly zero. Record the multimeter voltage as the background voltage level. _______ If the optical bench is later moved, re-measure this background voltage level..
3: Adjust the power supply for a light source current of about 400 milliamperes Record as R
the distance between source and detector (initially 0.100 m ), and the multimeter reading as
intensity, I .If the background voltage level is greater than 0.5 millevolts, subtract this from each
intensity, I value before recording.
4: Increase R in steps of 0.040 meters ( 4.0 centimeters until R = 0.400 meter. Move only the
source, not the detector.
5: If the light intensity, I, is really proportional to 1/R2 then the product of I R2 should be
approximately constant for each row of the data table. Does your data indicate that light intensity decreases inversely proportional to the square of the distance? _____________________________________________
R meters
multimeter millevolts
I multimeter – background
R2 I R
2
0.10
0.14
0.18
0.22
0.26
0.30
0.34
0.38
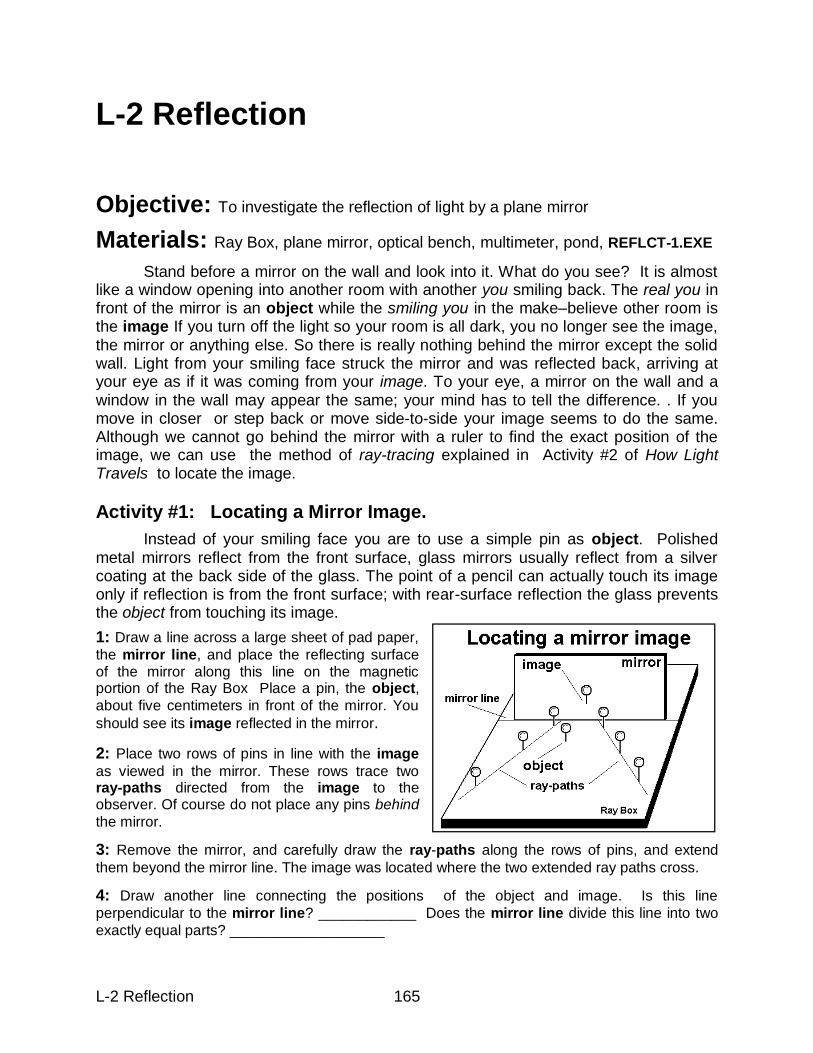
L-2 Reflection 165
L-2 Reflection
Objective: To investigate the reflection of light by a plane mirror
Materials: Ray Box, plane mirror, optical bench, multimeter, pond, REFLCT-1.EXE
Stand before a mirror on the wall and look into it. What do you see? It is almost like a window opening into another room with another you smiling back. The real you in front of the mirror is an object while the smiling you in the make–believe other room is the image If you turn off the light so your room is all dark, you no longer see the image, the mirror or anything else. So there is really nothing behind the mirror except the solid wall. Light from your smiling face struck the mirror and was reflected back, arriving at your eye as if it was coming from your image. To your eye, a mirror on the wall and a window in the wall may appear the same; your mind has to tell the difference. . If you move in closer or step back or move side-to-side your image seems to do the same. Although we cannot go behind the mirror with a ruler to find the exact position of the image, we can use the method of ray-tracing explained in Activity #2 of How Light Travels to locate the image.
Activity #1: Locating a Mirror Image.
Instead of your smiling face you are to use a simple pin as object. Polished metal mirrors reflect from the front surface, glass mirrors usually reflect from a silver coating at the back side of the glass. The point of a pencil can actually touch its image only if reflection is from the front surface; with rear-surface reflection the glass prevents the object from touching its image.
1: Draw a line across a large sheet of pad paper,
the mirror line, and place the reflecting surface of the mirror along this line on the magnetic portion of the Ray Box Place a pin, the object,
about five centimeters in front of the mirror. You
should see its image reflected in the mirror.
2: Place two rows of pins in line with the image
as viewed in the mirror. These rows trace two ray-paths directed from the image to the observer. Of course do not place any pins behind
the mirror.
3: Remove the mirror, and carefully draw the ray-paths along the rows of pins, and extend
them beyond the mirror line. The image was located where the two extended ray paths cross.
4: Draw another line connecting the positions of the object and image. Is this line
perpendicular to the mirror line? ____________ Does the mirror line divide this line into two
exactly equal parts? ___________________
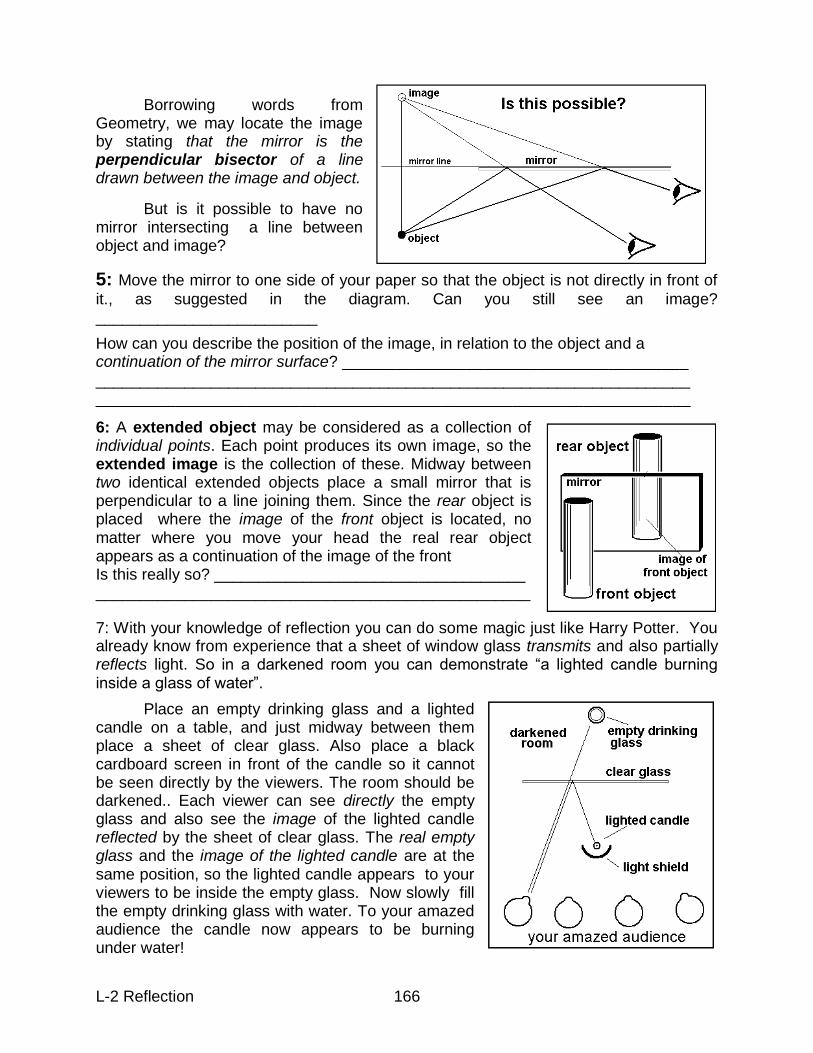
L-2 Reflection 166
Borrowing words from Geometry, we may locate the image by stating that the mirror is the perpendicular bisector of a line drawn between the image and object.
But is it possible to have no mirror intersecting a line between object and image?
5: Move the mirror to one side of your paper so that the object is not directly in front of
it., as suggested in the diagram. Can you still see an image? _________________________
How can you describe the position of the image, in relation to the object and a continuation of the mirror surface? _______________________________________ ___________________________________________________________________ ___________________________________________________________________
6: A extended object may be considered as a collection of individual points. Each point produces its own image, so the extended image is the collection of these. Midway between two identical extended objects place a small mirror that is perpendicular to a line joining them. Since the rear object is placed where the image of the front object is located, no matter where you move your head the real rear object appears as a continuation of the image of the front Is this really so? ___________________________________ _________________________________________________
7: With your knowledge of reflection you can do some magic just like Harry Potter. You already know from experience that a sheet of window glass transmits and also partially reflects light. So in a darkened room you can demonstrate “a lighted candle burning inside a glass of water”.
Place an empty drinking glass and a lighted candle on a table, and just midway between them place a sheet of clear glass. Also place a black cardboard screen in front of the candle so it cannot be seen directly by the viewers. The room should be darkened.. Each viewer can see directly the empty glass and also see the image of the lighted candle reflected by the sheet of clear glass. The real empty glass and the image of the lighted candle are at the same position, so the lighted candle appears to your viewers to be inside the empty glass. Now slowly fill the empty drinking glass with water. To your amazed audience the candle now appears to be burning under water!
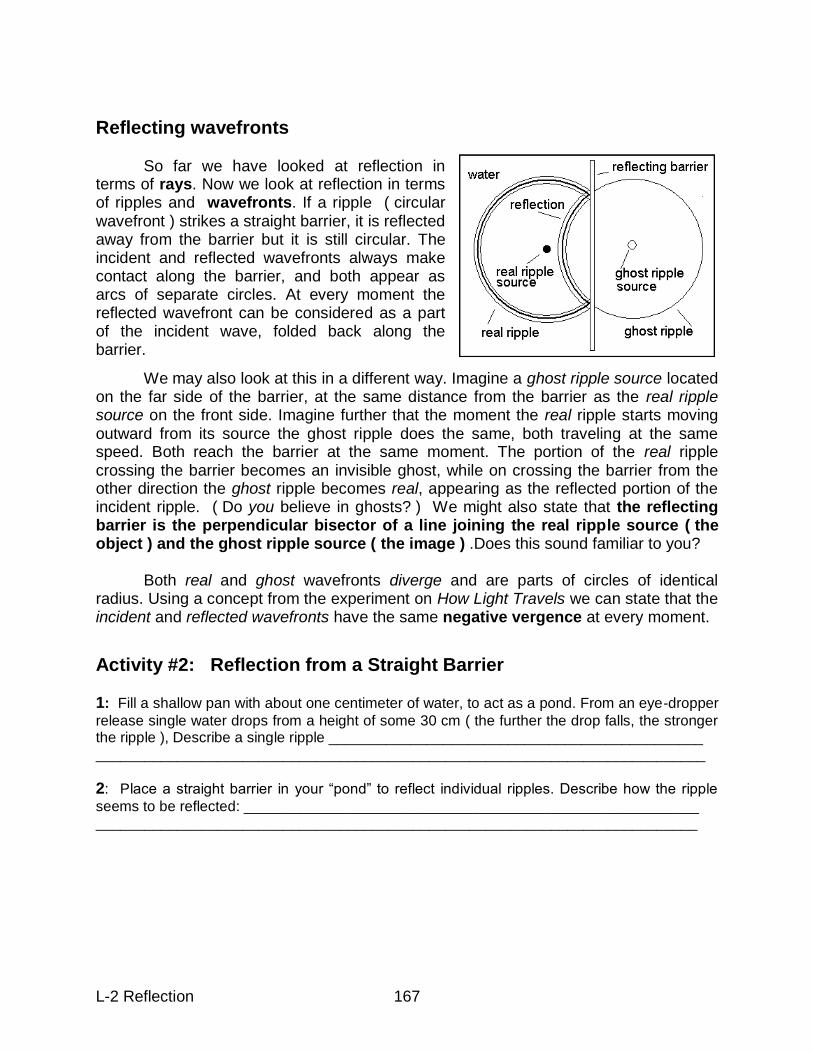
L-2 Reflection 167
Reflecting wavefronts
So far we have looked at reflection in terms of rays. Now we look at reflection in terms of ripples and wavefronts. If a ripple ( circular wavefront ) strikes a straight barrier, it is reflected away from the barrier but it is still circular. The incident and reflected wavefronts always make contact along the barrier, and both appear as arcs of separate circles. At every moment the reflected wavefront can be considered as a part of the incident wave, folded back along the barrier.
We may also look at this in a different way. Imagine a ghost ripple source located on the far side of the barrier, at the same distance from the barrier as the real ripple source on the front side. Imagine further that the moment the real ripple starts moving outward from its source the ghost ripple does the same, both traveling at the same speed. Both reach the barrier at the same moment. The portion of the real ripple crossing the barrier becomes an invisible ghost, while on crossing the barrier from the other direction the ghost ripple becomes real, appearing as the reflected portion of the incident ripple. ( Do you believe in ghosts? ) We might also state that the reflecting barrier is the perpendicular bisector of a line joining the real ripple source ( the object ) and the ghost ripple source ( the image ) .Does this sound familiar to you? Both real and ghost wavefronts diverge and are parts of circles of identical radius. Using a concept from the experiment on How Light Travels we can state that the incident and reflected wavefronts have the same negative vergence at every moment.
Activity #2: Reflection from a Straight Barrier 1: Fill a shallow pan with about one centimeter of water, to act as a pond. From an eye-dropper
release single water drops from a height of some 30 cm ( the further the drop falls, the stronger the ripple ), Describe a single ripple ______________________________________________ ___________________________________________________________________________
2: Place a straight barrier in your “pond” to reflect individual ripples. Describe how the ripple
seems to be reflected: ________________________________________________________ __________________________________________________________________________
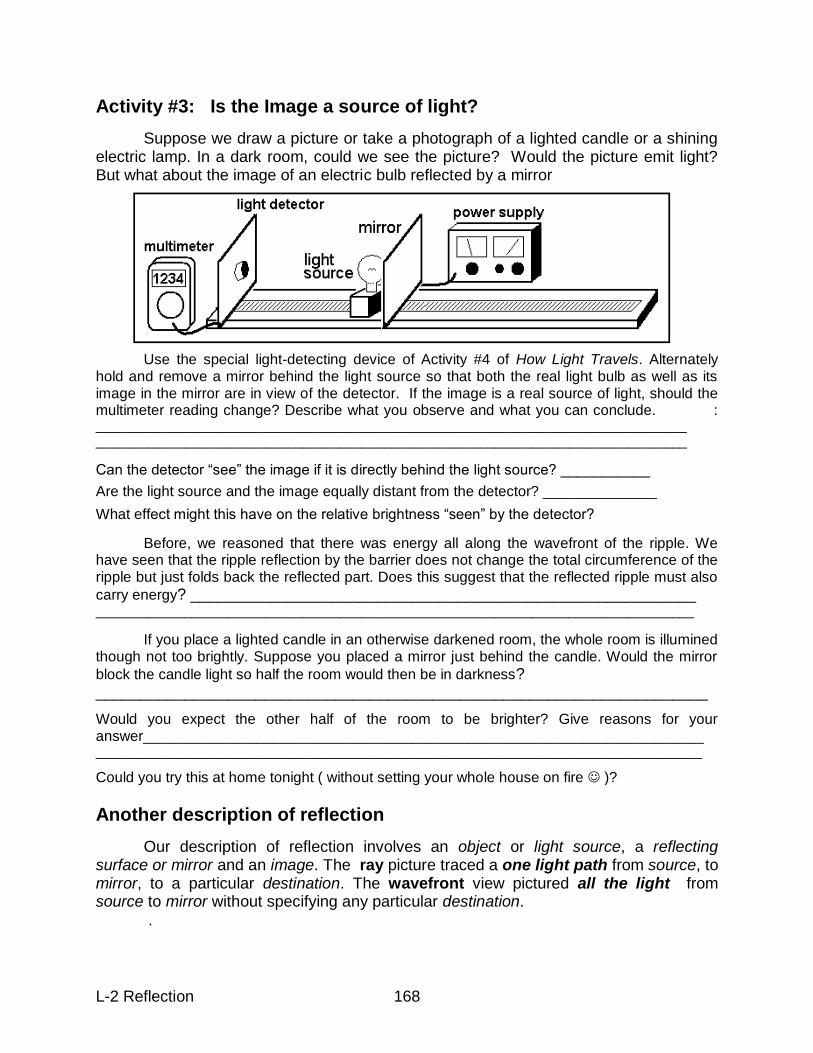
L-2 Reflection 168
Activity #3: Is the Image a source of light?
Suppose we draw a picture or take a photograph of a lighted candle or a shining electric lamp. In a dark room, could we see the picture? Would the picture emit light? But what about the image of an electric bulb reflected by a mirror
Use the special light-detecting device of Activity #4 of How Light Travels. Alternately hold and remove a mirror behind the light source so that both the real light bulb as well as its image in the mirror are in view of the detector. If the image is a real source of light, should the multimeter reading change? Describe what you observe and what you can conclude. : ________________________________________________________________________________ ________________________________________________________________________________ Can the detector “see” the image if it is directly behind the light source? ___________
Are the light source and the image equally distant from the detector? ______________
What effect might this have on the relative brightness “seen” by the detector?
Before, we reasoned that there was energy all along the wavefront of the ripple. We have seen that the ripple reflection by the barrier does not change the total circumference of the ripple but just folds back the reflected part. Does this suggest that the reflected ripple must also
carry energy? _________________________________________________________ _________________________________________________________________________________ If you place a lighted candle in an otherwise darkened room, the whole room is illumined though not too brightly. Suppose you placed a mirror just behind the candle. Would the mirror
block the candle light so half the room would then be in darkness? _____________________________________________________________________
Would you expect the other half of the room to be brighter? Give reasons for your answer_____________________________________________________________________ __________________________________________________________________________________
Could you try this at home tonight ( without setting your whole house on fire )?
Another description of reflection
Our description of reflection involves an object or light source, a reflecting surface or mirror and an image. The ray picture traced a one light path from source, to mirror, to a particular destination. The wavefront view pictured all the light from source to mirror without specifying any particular destination.
.
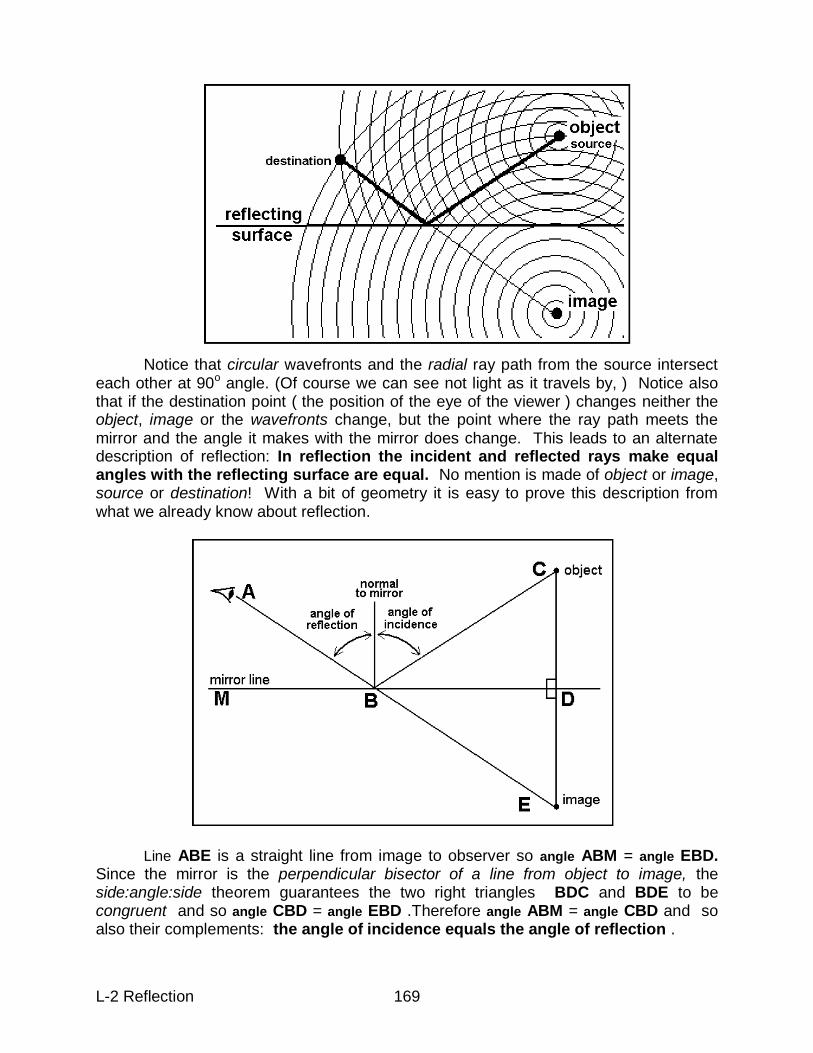
L-2 Reflection 169
Notice that circular wavefronts and the radial ray path from the source intersect each other at 90o angle. (Of course we can see not light as it travels by, ) Notice also that if the destination point ( the position of the eye of the viewer ) changes neither the object, image or the wavefronts change, but the point where the ray path meets the mirror and the angle it makes with the mirror does change. This leads to an alternate description of reflection: In reflection the incident and reflected rays make equal angles with the reflecting surface are equal. No mention is made of object or image, source or destination! With a bit of geometry it is easy to prove this description from what we already know about reflection.
Line ABE is a straight line from image to observer so angle ABM = angle EBD. Since the mirror is the perpendicular bisector of a line from object to image, the side:angle:side theorem guarantees the two right triangles BDC and BDE to be congruent and so angle CBD = angle EBD .Therefore angle ABM = angle CBD and so also their complements: the angle of incidence equals the angle of reflection .
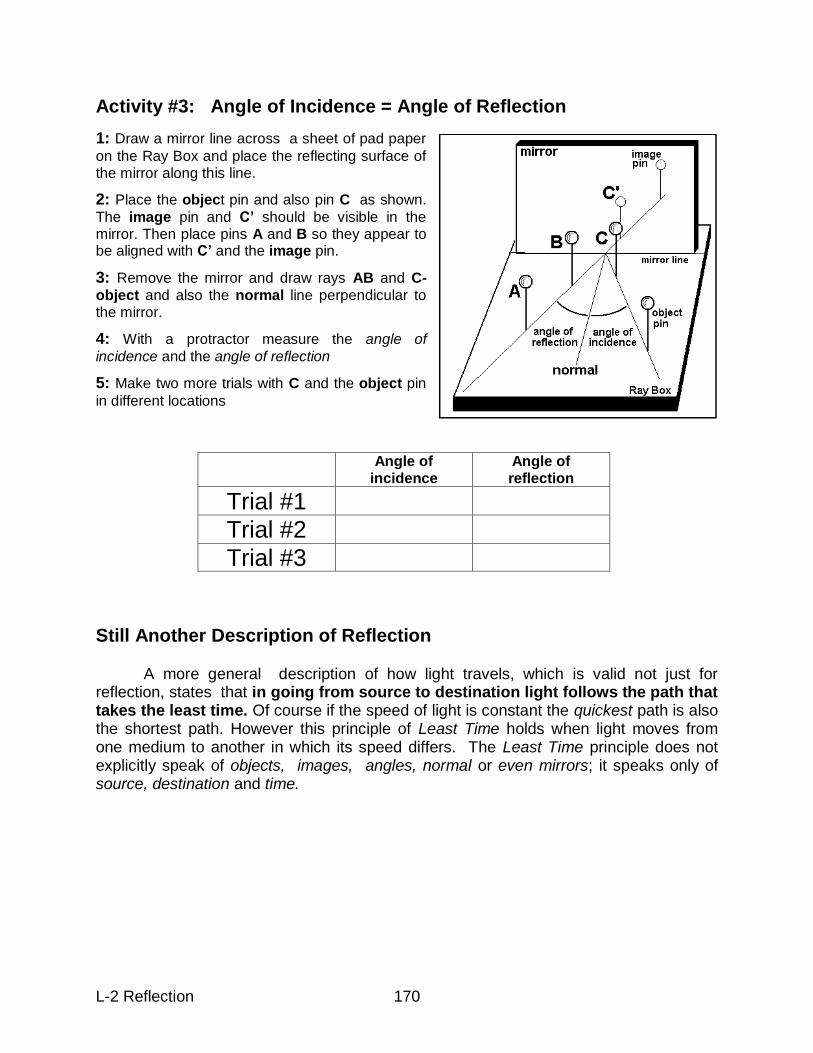
L-2 Reflection 170
Activity #3: Angle of Incidence = Angle of Reflection
1: Draw a mirror line across a sheet of pad paper
on the Ray Box and place the reflecting surface of the mirror along this line.
2: Place the object pin and also pin C as shown.
The image pin and C‟ should be visible in the mirror. Then place pins A and B so they appear to be aligned with C‟ and the image pin.
3: Remove the mirror and draw rays AB and C-
object and also the normal line perpendicular to the mirror.
4: With a protractor measure the angle of
incidence and the angle of reflection
5: Make two more trials with C and the object pin
in different locations
Still Another Description of Reflection
A more general description of how light travels, which is valid not just for reflection, states that in going from source to destination light follows the path that takes the least time. Of course if the speed of light is constant the quickest path is also the shortest path. However this principle of Least Time holds when light moves from one medium to another in which its speed differs. The Least Time principle does not explicitly speak of objects, images, angles, normal or even mirrors; it speaks only of source, destination and time.
Angle of incidence
Angle of reflection
Trial #1
Trial #2
Trial #3
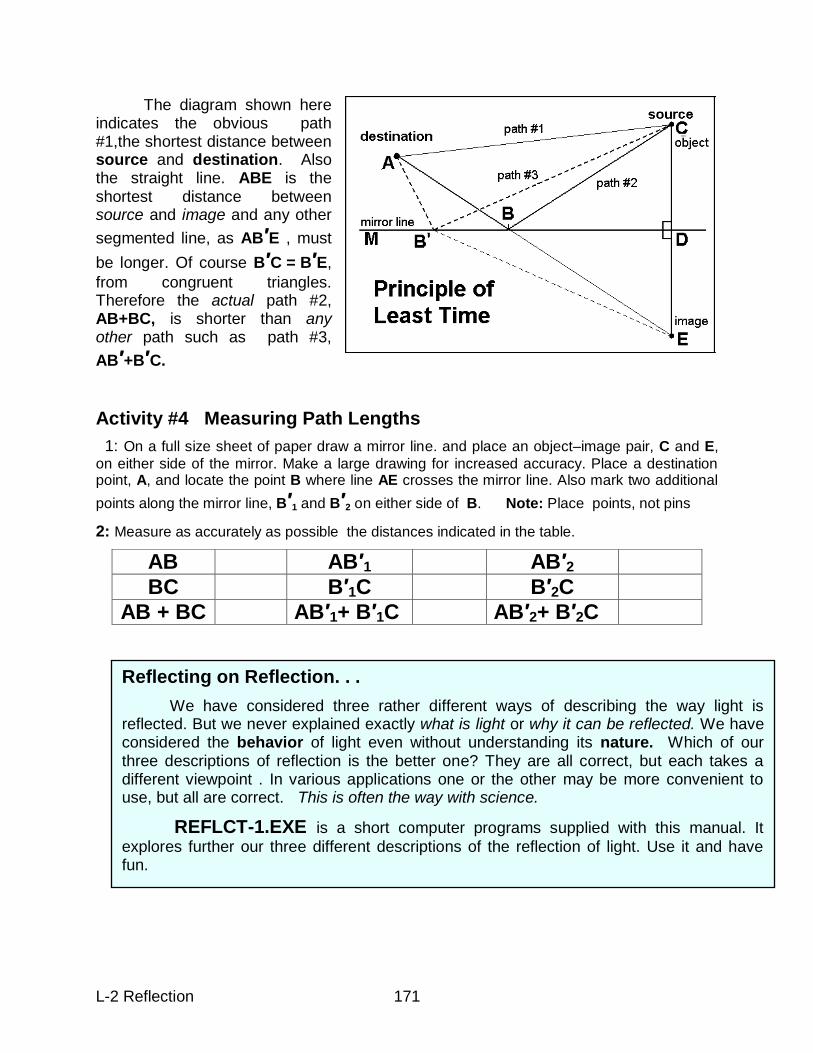
L-2 Reflection 171
The diagram shown here indicates the obvious path #1,the shortest distance between source and destination. Also the straight line. ABE is the shortest distance between source and image and any other
segmented line, as AB′E , must
be longer. Of course B′C = B′E,
from congruent triangles. Therefore the actual path #2, AB+BC, is shorter than any other path such as path #3,
AB′+B′C.
Activity #4 Measuring Path Lengths
1: On a full size sheet of paper draw a mirror line. and place an object–image pair, C and E,
on either side of the mirror. Make a large drawing for increased accuracy. Place a destination point, A, and locate the point B where line AE crosses the mirror line. Also mark two additional
points along the mirror line, B′1 and B′2 on either side of B. Note: Place points, not pins
2: Measure as accurately as possible the distances indicated in the table.
AB AB′1 AB′2
BC B′1C B′2C
AB + BC AB′1+ B′1C AB′2+ B′2C
Reflecting on Reflection. . .
We have considered three rather different ways of describing the way light is reflected. But we never explained exactly what is light or why it can be reflected. We have considered the behavior of light even without understanding its nature. Which of our three descriptions of reflection is the better one? They are all correct, but each takes a different viewpoint . In various applications one or the other may be more convenient to use, but all are correct. This is often the way with science.
REFLCT-1.EXE is a short computer programs supplied with this manual. It
explores further our three different descriptions of the reflection of light. Use it and have fun.
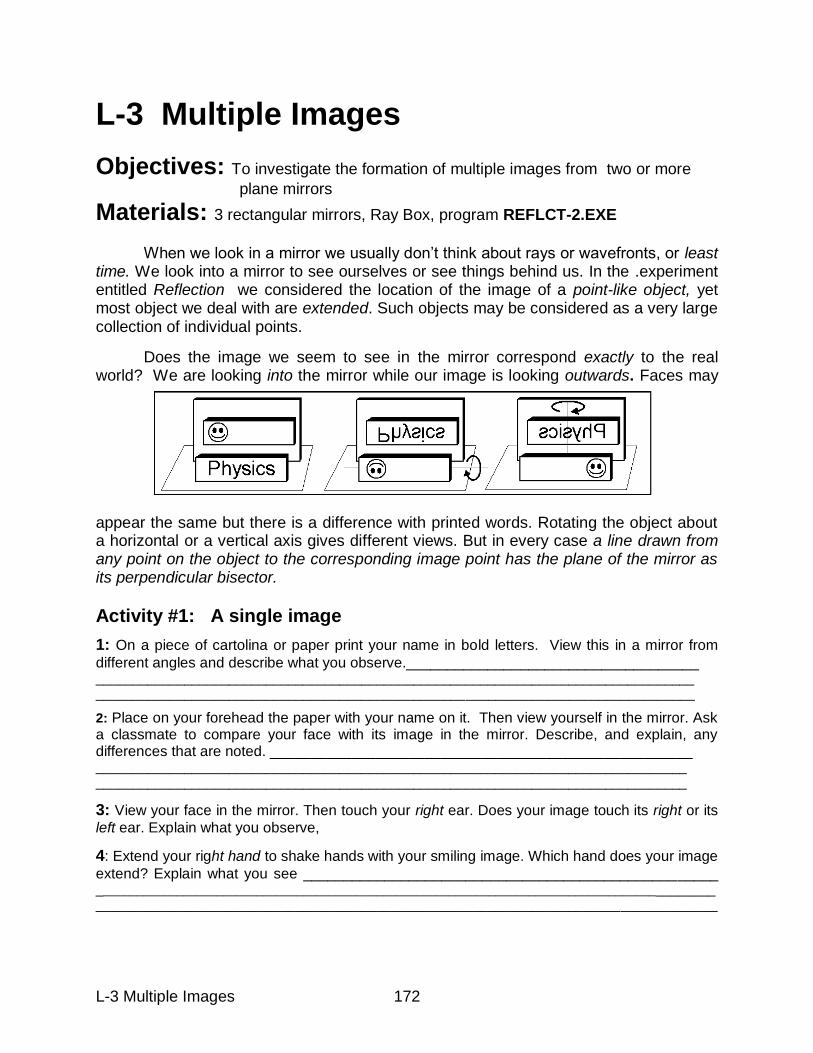
L-3 Multiple Images 172
L-3 Multiple Images
Objectives: To investigate the formation of multiple images from two or more
plane mirrors
Materials: 3 rectangular mirrors, Ray Box, program REFLCT-2.EXE When we look in a mirror we usually don‟t think about rays or wavefronts, or least time. We look into a mirror to see ourselves or see things behind us. In the .experiment entitled Reflection we considered the location of the image of a point-like object, yet most object we deal with are extended. Such objects may be considered as a very large collection of individual points.
Does the image we seem to see in the mirror correspond exactly to the real world? We are looking into the mirror while our image is looking outwards. Faces may
appear the same but there is a difference with printed words. Rotating the object about a horizontal or a vertical axis gives different views. But in every case a line drawn from any point on the object to the corresponding image point has the plane of the mirror as its perpendicular bisector.
Activity #1: A single image
1: On a piece of cartolina or paper print your name in bold letters. View this in a mirror from
different angles and describe what you observe.____________________________________ _________________________________________________________________________________ _________________________________________________________________________________
2: Place on your forehead the paper with your name on it. Then view yourself in the mirror. Ask a classmate to compare your face with its image in the mirror. Describe, and explain, any differences that are noted. ____________________________________________________ ________________________________________________________________________________ ________________________________________________________________________________
3: View your face in the mirror. Then touch your right ear. Does your image touch its right or its
left ear. Explain what you observe,
4: Extend your right hand to shake hands with your smiling image. Which hand does your image
extend? Explain what you see ___________________________________________________ ________________________________________________________________________________________________________________________________________________________________________________
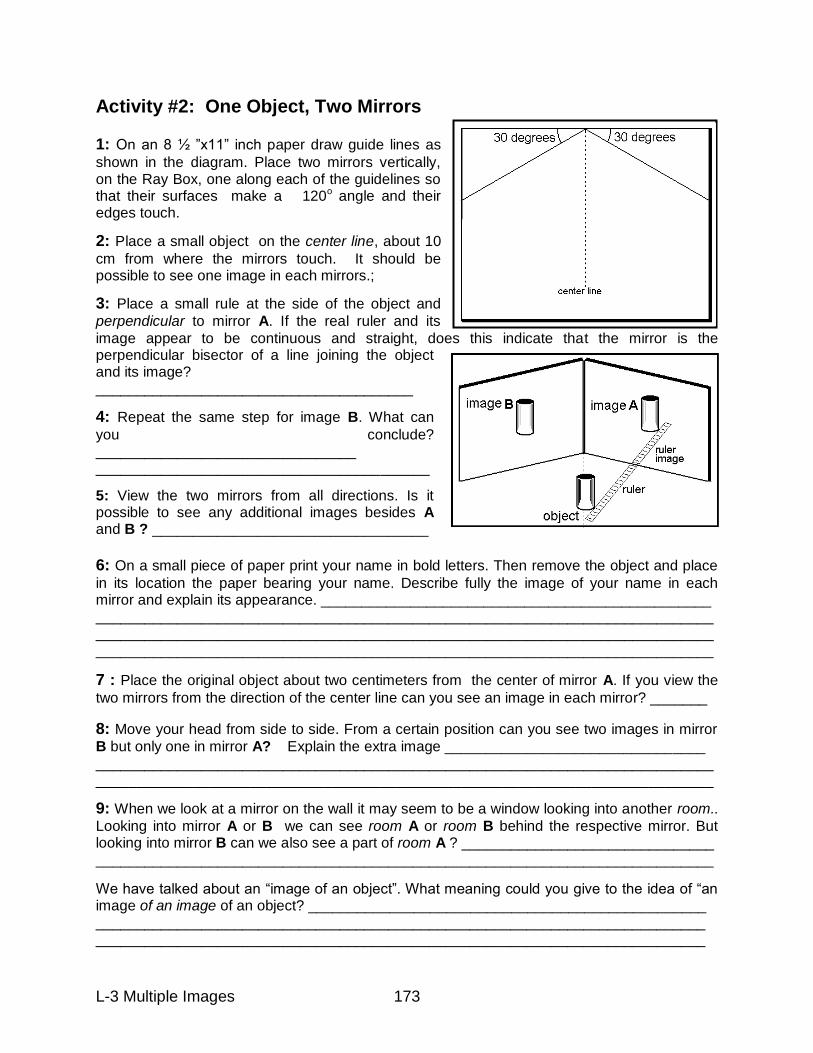
L-3 Multiple Images 173
Activity #2: One Object, Two Mirrors
1: On an 8 ½ ”x11” inch paper draw guide lines as
shown in the diagram. Place two mirrors vertically, on the Ray Box, one along each of the guidelines so that their surfaces make a 120o angle and their edges touch.
2: Place a small object on the center line, about 10
cm from where the mirrors touch. It should be possible to see one image in each mirrors.;
3: Place a small rule at the side of the object and
perpendicular to mirror A. If the real ruler and its
image appear to be continuous and straight, does this indicate that the mirror is the perpendicular bisector of a line joining the object and its image? _______________________________________
4: Repeat the same step for image B. What can
you conclude? ________________________________ _________________________________________
5: View the two mirrors from all directions. Is it possible to see any additional images besides A and B ? __________________________________ 6: On a small piece of paper print your name in bold letters. Then remove the object and place
in its location the paper bearing your name. Describe fully the image of your name in each mirror and explain its appearance. ________________________________________________ ____________________________________________________________________________ ____________________________________________________________________________ ____________________________________________________________________________
7 : Place the original object about two centimeters from the center of mirror A. If you view the
two mirrors from the direction of the center line can you see an image in each mirror? _______
8: Move your head from side to side. From a certain position can you see two images in mirror
B but only one in mirror A? Explain the extra image ________________________________ ____________________________________________________________________________ ____________________________________________________________________________
9: When we look at a mirror on the wall it may seem to be a window looking into another room..
Looking into mirror A or B we can see room A or room B behind the respective mirror. But looking into mirror B can we also see a part of room A ? _______________________________ ____________________________________________________________________________
We have talked about an “image of an object”. What meaning could you give to the idea of “an image of an image of an object? _________________________________________________ ___________________________________________________________________________ ___________________________________________________________________________
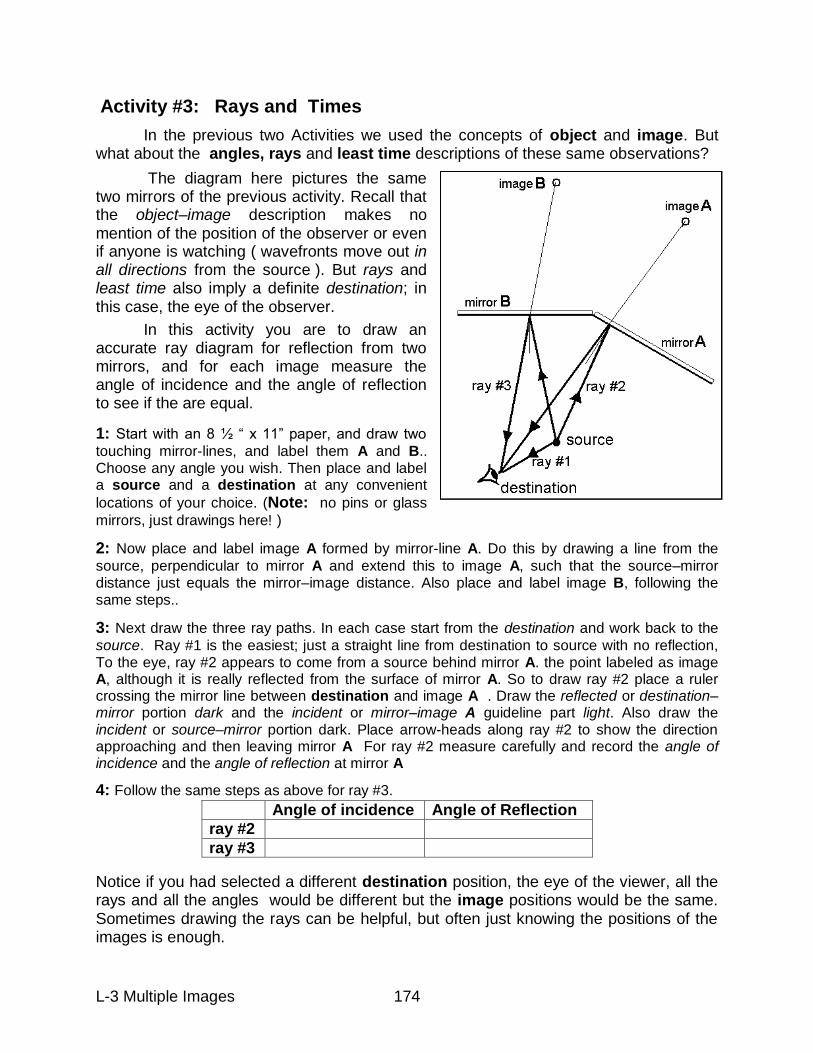
L-3 Multiple Images 174
Activity #3: Rays and Times
In the previous two Activities we used the concepts of object and image. But what about the angles, rays and least time descriptions of these same observations?
The diagram here pictures the same two mirrors of the previous activity. Recall that the object–image description makes no mention of the position of the observer or even if anyone is watching ( wavefronts move out in all directions from the source ). But rays and least time also imply a definite destination; in this case, the eye of the observer.
In this activity you are to draw an accurate ray diagram for reflection from two mirrors, and for each image measure the angle of incidence and the angle of reflection to see if the are equal.
1: Start with an 8 ½ “ x 11” paper, and draw two
touching mirror-lines, and label them A and B.. Choose any angle you wish. Then place and label a source and a destination at any convenient
locations of your choice. (Note: no pins or glass
mirrors, just drawings here! )
2: Now place and label image A formed by mirror-line A. Do this by drawing a line from the
source, perpendicular to mirror A and extend this to image A, such that the source–mirror distance just equals the mirror–image distance. Also place and label image B, following the same steps..
3: Next draw the three ray paths. In each case start from the destination and work back to the
source. Ray #1 is the easiest; just a straight line from destination to source with no reflection, To the eye, ray #2 appears to come from a source behind mirror A. the point labeled as image A, although it is really reflected from the surface of mirror A. So to draw ray #2 place a ruler crossing the mirror line between destination and image A . Draw the reflected or destination–mirror portion dark and the incident or mirror–image A guideline part light. Also draw the incident or source–mirror portion dark. Place arrow-heads along ray #2 to show the direction approaching and then leaving mirror A For ray #2 measure carefully and record the angle of incidence and the angle of reflection at mirror A
4: Follow the same steps as above for ray #3.
Notice if you had selected a different destination position, the eye of the viewer, all the rays and all the angles would be different but the image positions would be the same. Sometimes drawing the rays can be helpful, but often just knowing the positions of the images is enough.
Angle of incidence Angle of Reflection
ray #2
ray #3
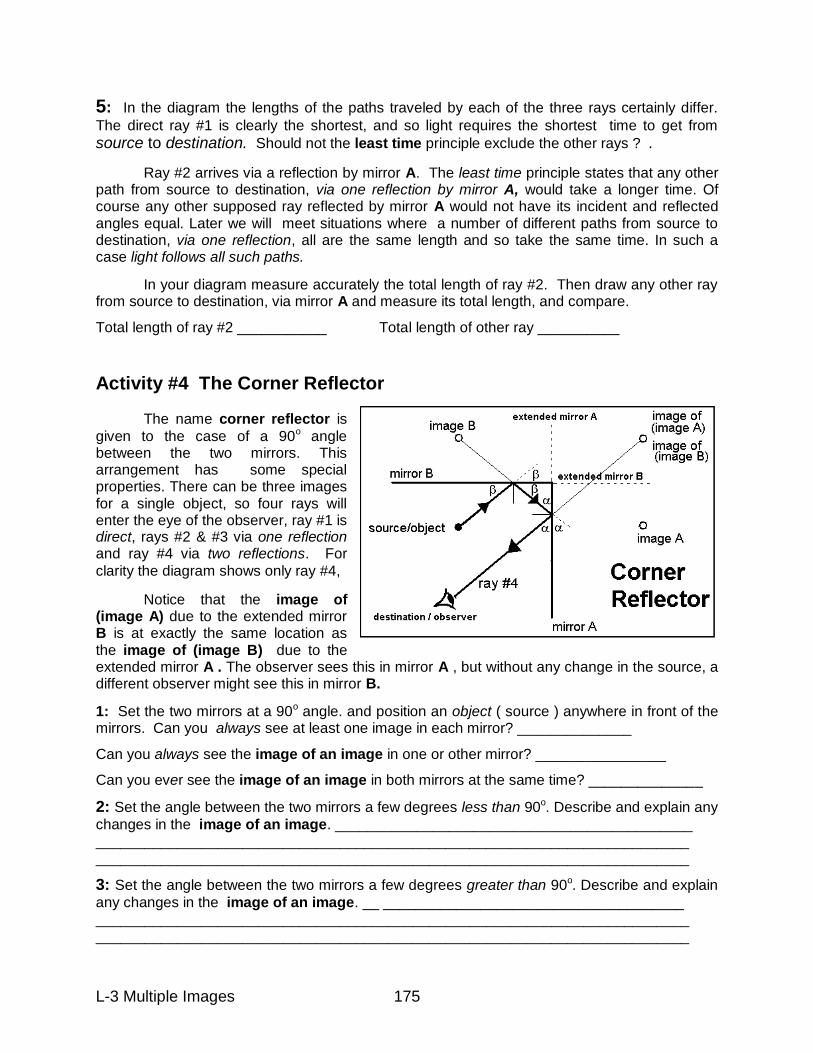
L-3 Multiple Images 175
5: In the diagram the lengths of the paths traveled by each of the three rays certainly differ.
The direct ray #1 is clearly the shortest, and so light requires the shortest time to get from
source to destination. Should not the least time principle exclude the other rays ? .
Ray #2 arrives via a reflection by mirror A. The least time principle states that any other path from source to destination, via one reflection by mirror A, would take a longer time. Of course any other supposed ray reflected by mirror A would not have its incident and reflected angles equal. Later we will meet situations where a number of different paths from source to destination, via one reflection, all are the same length and so take the same time. In such a case light follows all such paths.
In your diagram measure accurately the total length of ray #2. Then draw any other ray from source to destination, via mirror A and measure its total length, and compare.
Total length of ray #2 ___________ Total length of other ray __________
Activity #4 The Corner Reflector The name corner reflector is
given to the case of a 90o angle between the two mirrors. This arrangement has some special properties. There can be three images for a single object, so four rays will enter the eye of the observer, ray #1 is direct, rays #2 & #3 via one reflection and ray #4 via two reflections. For
clarity the diagram shows only ray #4,
Notice that the image of (image A) due to the extended mirror B is at exactly the same location as the image of (image B) due to the extended mirror A . The observer sees this in mirror A , but without any change in the source, a different observer might see this in mirror B.
1: Set the two mirrors at a 90o angle. and position an object ( source ) anywhere in front of the mirrors. Can you always see at least one image in each mirror? ______________
Can you always see the image of an image in one or other mirror? ________________
Can you ever see the image of an image in both mirrors at the same time? ______________
2: Set the angle between the two mirrors a few degrees less than 90o. Describe and explain any
changes in the image of an image. ____________________________________________ _________________________________________________________________________ _________________________________________________________________________
3: Set the angle between the two mirrors a few degrees greater than 90o. Describe and explain
any changes in the image of an image. __ _____________________________________ _________________________________________________________________________ _________________________________________________________________________
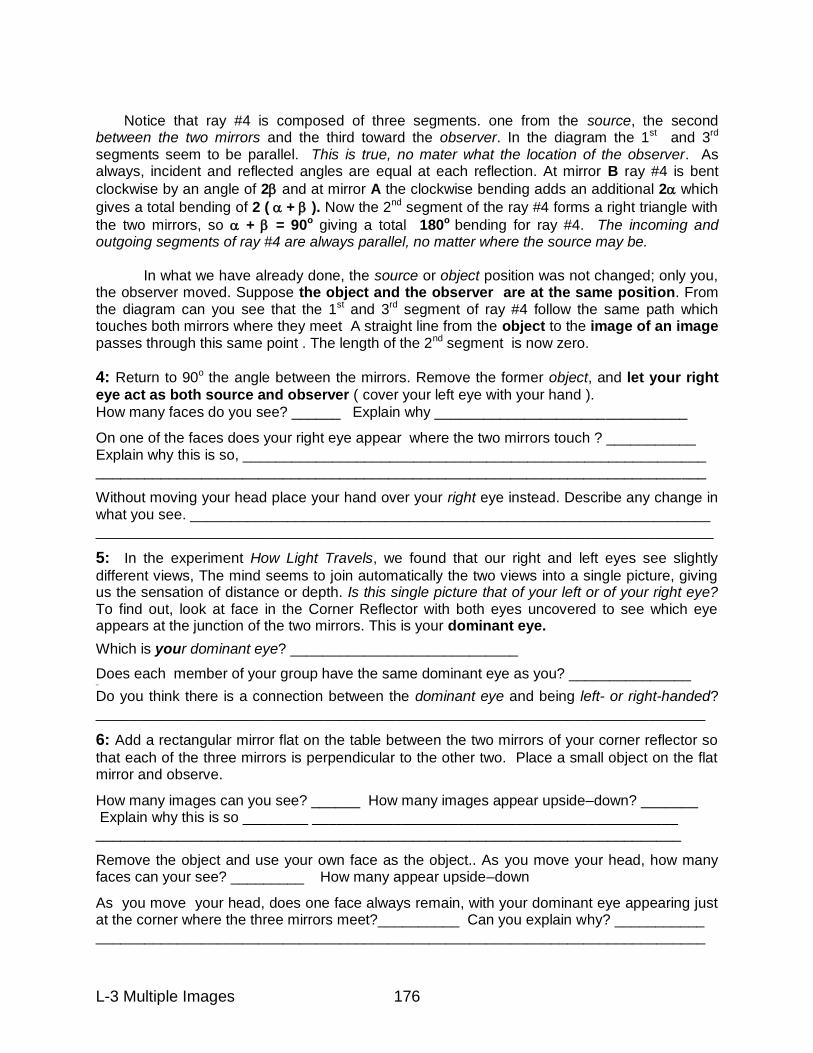
L-3 Multiple Images 176
Notice that ray #4 is composed of three segments. one from the source, the second between the two mirrors and the third toward the observer. In the diagram the 1st and 3rd segments seem to be parallel. This is true, no mater what the location of the observer. As always, incident and reflected angles are equal at each reflection. At mirror B ray #4 is bent
clockwise by an angle of 2 and at mirror A the clockwise bending adds an additional 2 which
gives a total bending of 2 ( + ). Now the 2nd segment of the ray #4 forms a right triangle with
the two mirrors, so + = 90o giving a total 180o bending for ray #4. The incoming and outgoing segments of ray #4 are always parallel, no matter where the source may be.
In what we have already done, the source or object position was not changed; only you, the observer moved. Suppose the object and the observer are at the same position. From the diagram can you see that the 1st and 3rd segment of ray #4 follow the same path which touches both mirrors where they meet A straight line from the object to the image of an image passes through this same point . The length of the 2nd segment is now zero.
4: Return to 90o the angle between the mirrors. Remove the former object, and let your right
eye act as both source and observer ( cover your left eye with your hand ).
How many faces do you see? ______ Explain why _______________________________
On one of the faces does your right eye appear where the two mirrors touch ? ___________ Explain why this is so, _________________________________________________________ ___________________________________________________________________________
Without moving your head place your hand over your right eye instead. Describe any change in what you see. ________________________________________________________________ ____________________________________________________________________________
5: In the experiment How Light Travels, we found that our right and left eyes see slightly
different views, The mind seems to join automatically the two views into a single picture, giving us the sensation of distance or depth. Is this single picture that of your left or of your right eye? To find out, look at face in the Corner Reflector with both eyes uncovered to see which eye appears at the junction of the two mirrors. This is your dominant eye.
Which is your dominant eye? ____________________________
Does each member of your group have the same dominant eye as you? _______________ –
Do you think there is a connection between the dominant eye and being left- or right-handed? ___________________________________________________________________________
6: Add a rectangular mirror flat on the table between the two mirrors of your corner reflector so
that each of the three mirrors is perpendicular to the other two. Place a small object on the flat mirror and observe.
How many images can you see? ______ How many images appear upside–down? _______ Explain why this is so ________ _____________________________________________ ________________________________________________________________________
Remove the object and use your own face as the object.. As you move your head, how many faces can your see? _________ How many appear upside–down
As you move your head, does one face always remain, with your dominant eye appearing just at the corner where the three mirrors meet?__________ Can you explain why? ___________ ___________________________________________________________________________
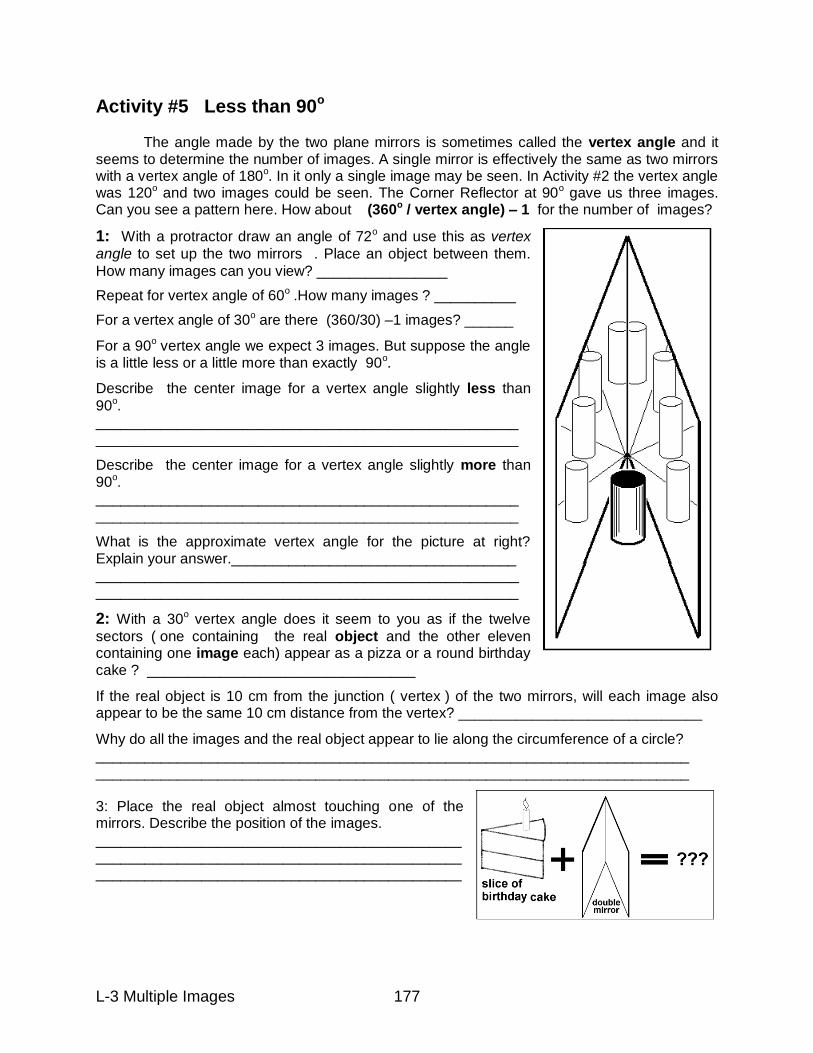
L-3 Multiple Images 177
Activity #5 Less than 90o
The angle made by the two plane mirrors is sometimes called the vertex angle and it seems to determine the number of images. A single mirror is effectively the same as two mirrors with a vertex angle of 180o. In it only a single image may be seen. In Activity #2 the vertex angle was 120o and two images could be seen. The Corner Reflector at 90o gave us three images. Can you see a pattern here. How about (360o / vertex angle) – 1 for the number of images?
1: With a protractor draw an angle of 72o and use this as vertex
angle to set up the two mirrors . Place an object between them.
How many images can you view? ________________
Repeat for vertex angle of 60o .How many images ? __________
For a vertex angle of 30o are there (360/30) –1 images? ______
For a 90o vertex angle we expect 3 images. But suppose the angle is a little less or a little more than exactly 90o.
Describe the center image for a vertex angle slightly less than
90o. ____________________________________________________ ____________________________________________________
Describe the center image for a vertex angle slightly more than 90o. ____________________________________________________ ____________________________________________________
What is the approximate vertex angle for the picture at right? Explain your answer.___________________________________ ____________________________________________________ ____________________________________________________
2: With a 30o vertex angle does it seem to you as if the twelve
sectors ( one containing the real object and the other eleven containing one image each) appear as a pizza or a round birthday cake ? _________________________________
If the real object is 10 cm from the junction ( vertex ) of the two mirrors, will each image also appear to be the same 10 cm distance from the vertex? ______________________________
Why do all the images and the real object appear to lie along the circumference of a circle? _________________________________________________________________________ _________________________________________________________________________ 3: Place the real object almost touching one of the mirrors. Describe the position of the images. _____________________________________________ _____________________________________________ _____________________________________________
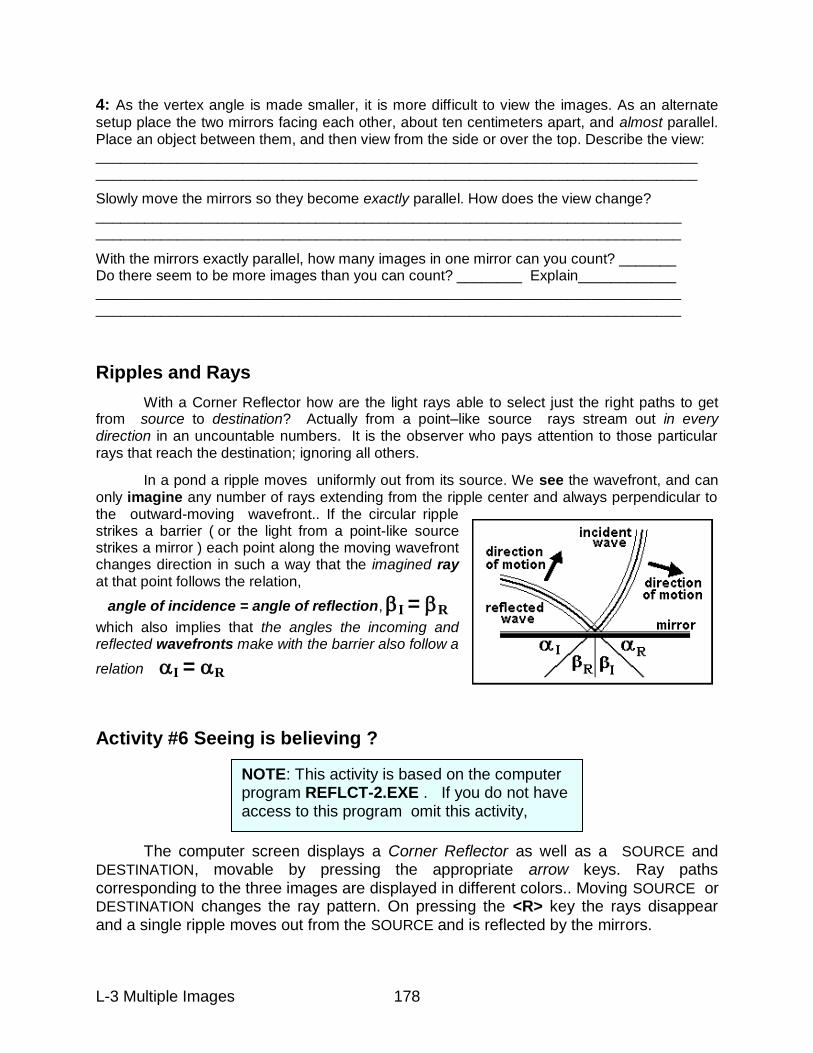
L-3 Multiple Images 178
4: As the vertex angle is made smaller, it is more difficult to view the images. As an alternate
setup place the two mirrors facing each other, about ten centimeters apart, and almost parallel. Place an object between them, and then view from the side or over the top. Describe the view: __________________________________________________________________________ __________________________________________________________________________
Slowly move the mirrors so they become exactly parallel. How does the view change?
________________________________________________________________________ ________________________________________________________________________
With the mirrors exactly parallel, how many images in one mirror can you count? _______ Do there seem to be more images than you can count? ________ Explain____________ ________________________________________________________________________ ________________________________________________________________________
Ripples and Rays
With a Corner Reflector how are the light rays able to select just the right paths to get from source to destination? Actually from a point–like source rays stream out in every direction in an uncountable numbers. It is the observer who pays attention to those particular rays that reach the destination; ignoring all others.
In a pond a ripple moves uniformly out from its source. We see the wavefront, and can only imagine any number of rays extending from the ripple center and always perpendicular to the outward-moving wavefront.. If the circular ripple strikes a barrier ( or the light from a point-like source strikes a mirror ) each point along the moving wavefront changes direction in such a way that the imagined ray at that point follows the relation,
angle of incidence = angle of reflection, I = R
which also implies that the angles the incoming and reflected wavefronts make with the barrier also follow a
relation I = R
Activity #6 Seeing is believing ?
The computer screen displays a Corner Reflector as well as a SOURCE and DESTINATION, movable by pressing the appropriate arrow keys. Ray paths corresponding to the three images are displayed in different colors.. Moving SOURCE or DESTINATION changes the ray pattern. On pressing the <R> key the rays disappear and a single ripple moves out from the SOURCE and is reflected by the mirrors.
NOTE: This activity is based on the computer program REFLCT-2.EXE . If you do not have access to this program omit this activity,
L-3 Multiple Images 179
1: Four rays come from the source; one never touches a mirror, one touches both mirrors, and
two touch a mirror only once. Identify these rays by their color and in terms of images. _______ ____________________________________________________________________________ ____________________________________________________________________________
2: For each of the three rays at the points where they touch the mirror does the angle of
incidence appear to equal the angle of reflection ? _________________________________
3: Set SOURCE = [300, 100] and DESTINATION = [300, 300] . Describe the red ray ________
___________________________________________________________________________
What is its angle of incidence? ___________________________
4: Move the source and destination to the same location. ( your select the location ) Describe
the ray pattern? ______________________________________________________________ ___________________________________________________________________________
What physical situation would correspond to the source and destination being at the same location? ___________________________________________________________________ ___________________________________________________________________________
5: Set SOURCE = [300,200] . Find five different DESTINATION positions that cause the yellow
ray to touch both mirrors at the corner.____________________________________________ ___________________________________________________________________________
Do these five positions all lie along a straight line? _________________________________
6: The yellow ray from the SOURCE sometimes strikes the horizontal mirror first, sometimes
the vertical mirror Can you find a general rule (based on SOURCE and DESTINATION ) to
predict which mirror it strikes first? ___ ____________________________________________ ___________________________________________________________________________ ___________________________________________________________________________
7: Interchange the position of SOURCE and DESTINATION, and describe what changes occur
in the ray pattern. ____________________________________________________________ ___________________________________________________________________________ ___________________________________________________________________________
8: For different SOURCE positions the ripple patterns vary. Does the ripple pattern change if
only the DESTINATION position is changed? _____________________________________
NOTE: If the ripple moving out from the source is not a perfect circle, you may have to adjust the vertical or horizontal
controls of your computer monitor to improve its appearance
9: For rays, the pattern appeared unchanged if SOURCE and DESTINATION are interchanged.
Is this also true for the ripple pattern? _________________________________________
10: After pressing the <R> key how many ripples pass through the SOURCE? ____________
How many pass through the DESTINATION? ___________________ If these two numbers differ, explain why? _____________________________________________________
11: Place your finger on the screen. at any point in front of both mirrors. Will at least one ripple pass through that point? ____________ What is the total number of ripples that pass through that point.? __________ Does a lighted candle at the center of an room provide light to every point of the room?____________ Will mirrors on the walls make a difference? ____________ ______________________________________________________________________
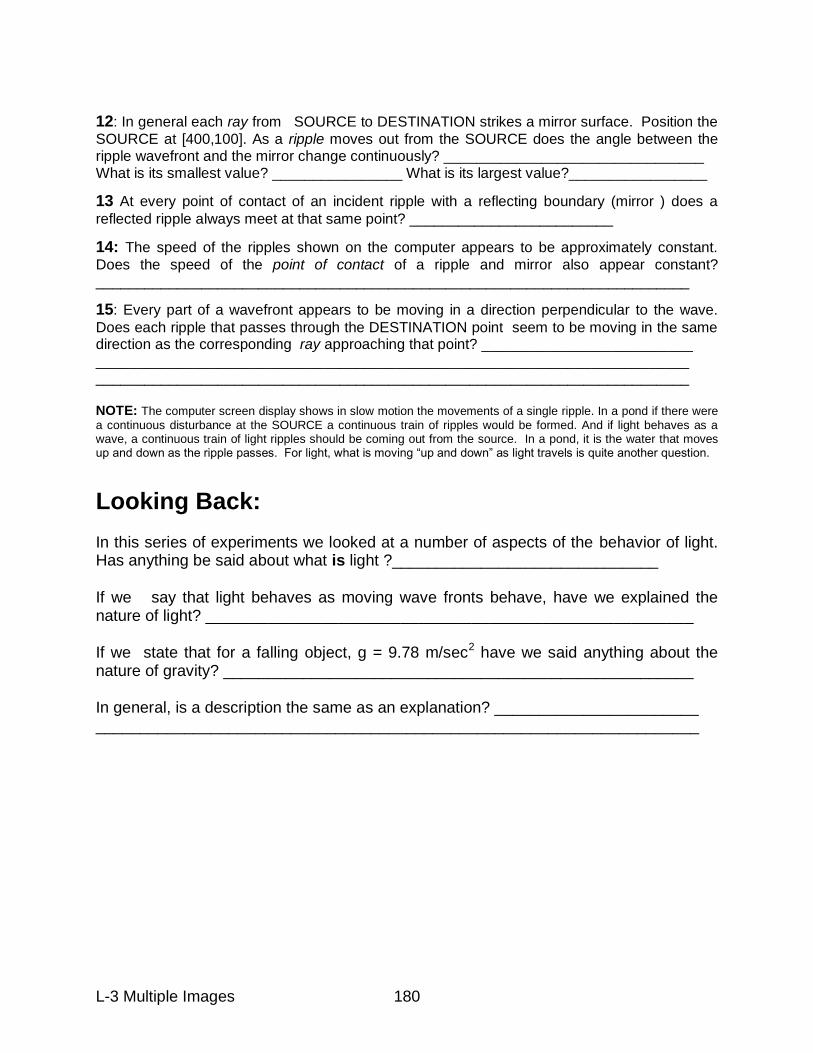
L-3 Multiple Images 180
12: In general each ray from SOURCE to DESTINATION strikes a mirror surface. Position the
SOURCE at [400,100]. As a ripple moves out from the SOURCE does the angle between the ripple wavefront and the mirror change continuously? ________________________________ What is its smallest value? ________________ What is its largest value?_________________
13 At every point of contact of an incident ripple with a reflecting boundary (mirror ) does a
reflected ripple always meet at that same point? _________________________
14: The speed of the ripples shown on the computer appears to be approximately constant.
Does the speed of the point of contact of a ripple and mirror also appear constant? _________________________________________________________________________
15: Every part of a wavefront appears to be moving in a direction perpendicular to the wave.
Does each ripple that passes through the DESTINATION point seem to be moving in the same direction as the corresponding ray approaching that point? __________________________ _________________________________________________________________________ _________________________________________________________________________ NOTE: The computer screen display shows in slow motion the movements of a single ripple. In a pond if there were
a continuous disturbance at the SOURCE a continuous train of ripples would be formed. And if light behaves as a wave, a continuous train of light ripples should be coming out from the source. In a pond, it is the water that moves up and down as the ripple passes. For light, what is moving “up and down” as light travels is quite another question.
Looking Back:
In this series of experiments we looked at a number of aspects of the behavior of light. Has anything be said about what is light ?______________________________ If we say that light behaves as moving wave fronts behave, have we explained the nature of light? _______________________________________________________ If we state that for a falling object, g = 9.78 m/sec2 have we said anything about the nature of gravity? _____________________________________________________ In general, is a description the same as an explanation? _______________________ ____________________________________________________________________
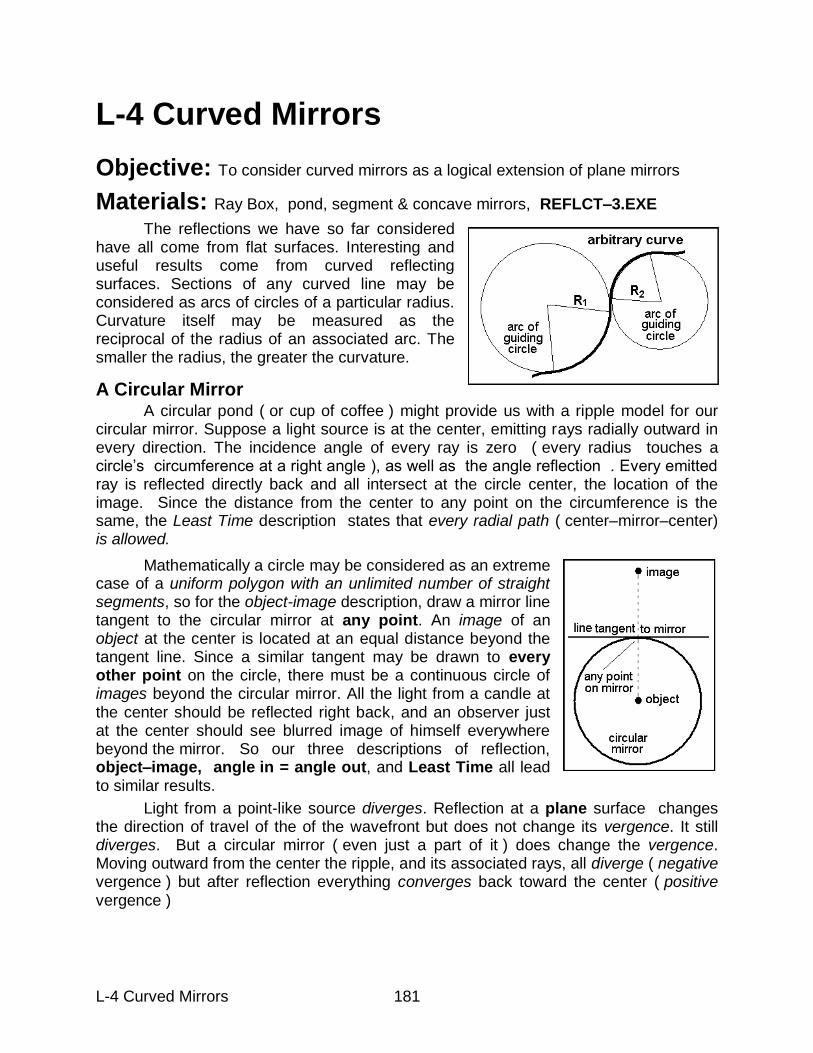
L-4 Curved Mirrors 181
L-4 Curved Mirrors
Objective: To consider curved mirrors as a logical extension of plane mirrors
Materials: Ray Box, pond, segment & concave mirrors, REFLCT–3.EXE
The reflections we have so far considered have all come from flat surfaces. Interesting and useful results come from curved reflecting surfaces. Sections of any curved line may be considered as arcs of circles of a particular radius. Curvature itself may be measured as the reciprocal of the radius of an associated arc. The smaller the radius, the greater the curvature.
A Circular Mirror
A circular pond ( or cup of coffee ) might provide us with a ripple model for our circular mirror. Suppose a light source is at the center, emitting rays radially outward in every direction. The incidence angle of every ray is zero ( every radius touches a circle‟s circumference at a right angle ), as well as the angle reflection . Every emitted ray is reflected directly back and all intersect at the circle center, the location of the image. Since the distance from the center to any point on the circumference is the same, the Least Time description states that every radial path ( center–mirror–center) is allowed.
Mathematically a circle may be considered as an extreme case of a uniform polygon with an unlimited number of straight segments, so for the object-image description, draw a mirror line tangent to the circular mirror at any point. An image of an object at the center is located at an equal distance beyond the tangent line. Since a similar tangent may be drawn to every other point on the circle, there must be a continuous circle of images beyond the circular mirror. All the light from a candle at the center should be reflected right back, and an observer just at the center should see blurred image of himself everywhere beyond the mirror. So our three descriptions of reflection, object–image, angle in = angle out, and Least Time all lead to similar results.
Light from a point-like source diverges. Reflection at a plane surface changes the direction of travel of the of the wavefront but does not change its vergence. It still diverges. But a circular mirror ( even just a part of it ) does change the vergence. Moving outward from the center the ripple, and its associated rays, all diverge ( negative vergence ) but after reflection everything converges back toward the center ( positive vergence )
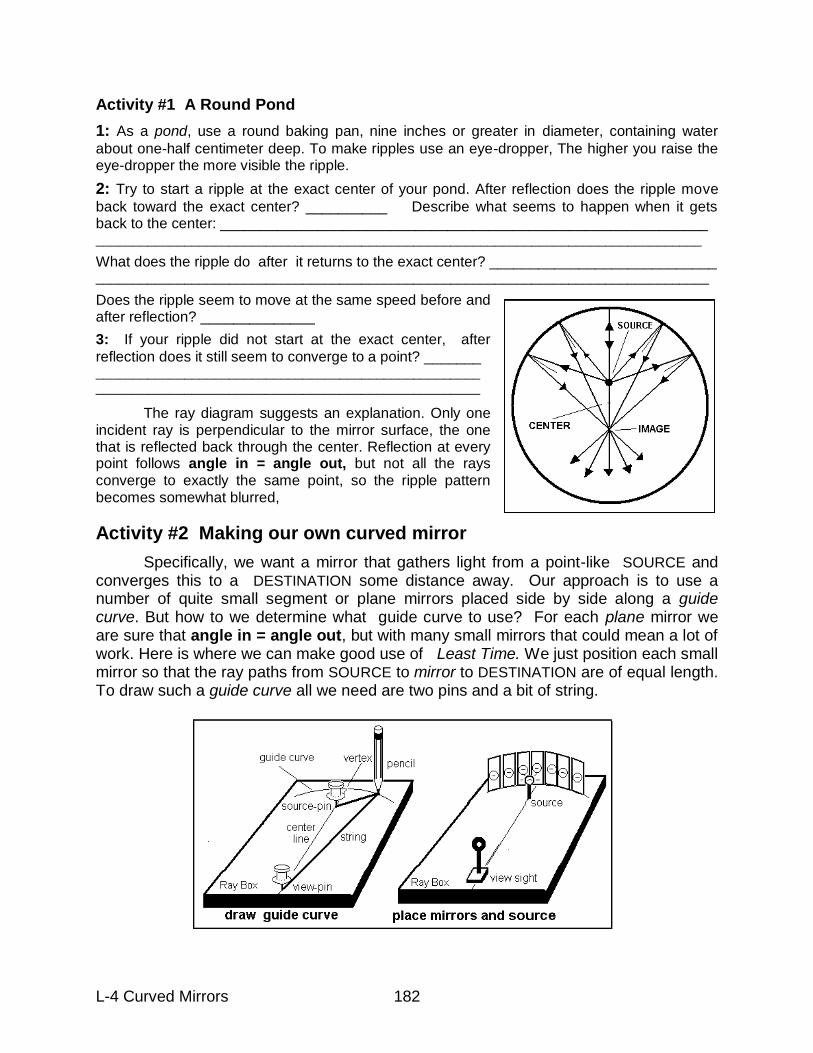
L-4 Curved Mirrors 182
Activity #1 A Round Pond
1: As a pond, use a round baking pan, nine inches or greater in diameter, containing water
about one-half centimeter deep. To make ripples use an eye-dropper, The higher you raise the eye-dropper the more visible the ripple.
2: Try to start a ripple at the exact center of your pond. After reflection does the ripple move
back toward the exact center? __________ Describe what seems to happen when it gets back to the center: ____________________________________________________________ __________________________________________________________________________________
What does the ripple do after it returns to the exact center? ____________________________ ___________________________________________________________________________________
Does the ripple seem to move at the same speed before and after reflection? ______________
3: If your ripple did not start at the exact center, after
reflection does it still seem to converge to a point? _______ ____________________________________________________ ____________________________________________________
The ray diagram suggests an explanation. Only one incident ray is perpendicular to the mirror surface, the one that is reflected back through the center. Reflection at every point follows angle in = angle out, but not all the rays converge to exactly the same point, so the ripple pattern becomes somewhat blurred,
Activity #2 Making our own curved mirror
Specifically, we want a mirror that gathers light from a point-like SOURCE and converges this to a DESTINATION some distance away. Our approach is to use a number of quite small segment or plane mirrors placed side by side along a guide curve. But how to we determine what guide curve to use? For each plane mirror we are sure that angle in = angle out, but with many small mirrors that could mean a lot of work. Here is where we can make good use of Least Time. We just position each small mirror so that the ray paths from SOURCE to mirror to DESTINATION are of equal length. To draw such a guide curve all we need are two pins and a bit of string.
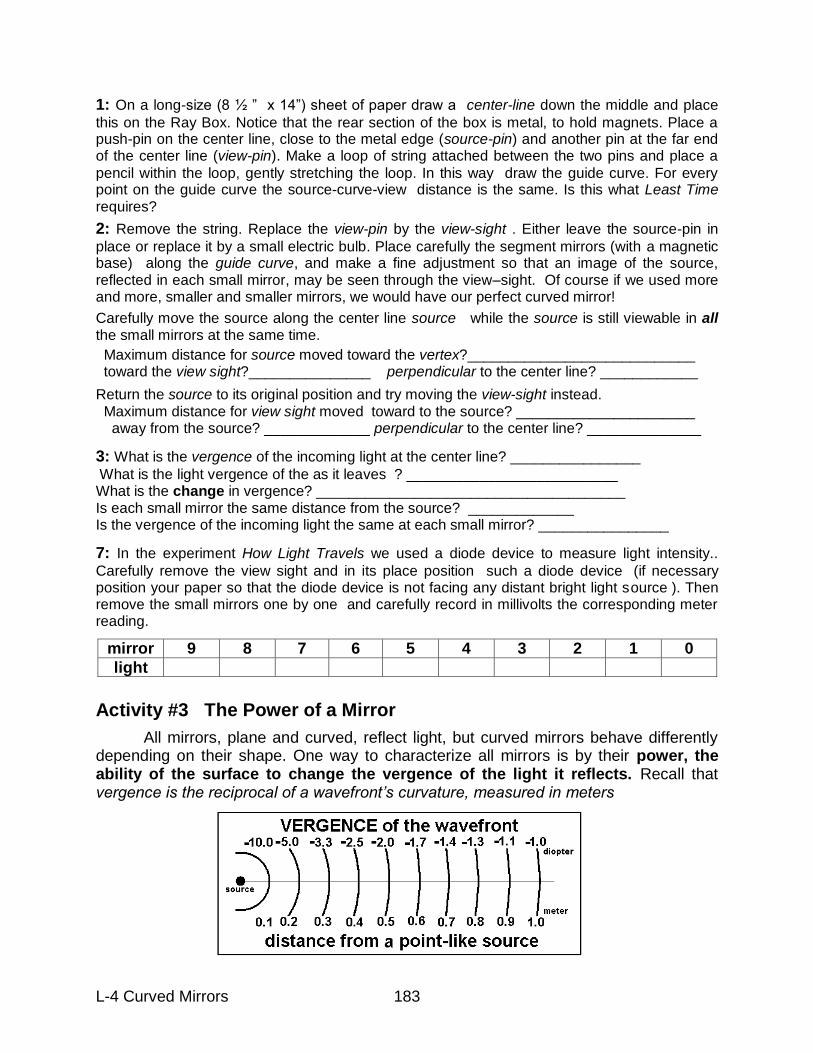
L-4 Curved Mirrors 183
1: On a long-size (8 ½ ” x 14”) sheet of paper draw a center-line down the middle and place
this on the Ray Box. Notice that the rear section of the box is metal, to hold magnets. Place a push-pin on the center line, close to the metal edge (source-pin) and another pin at the far end of the center line (view-pin). Make a loop of string attached between the two pins and place a
pencil within the loop, gently stretching the loop. In this way draw the guide curve. For every point on the guide curve the source-curve-view distance is the same. Is this what Least Time requires?
2: Remove the string. Replace the view-pin by the view-sight . Either leave the source-pin in
place or replace it by a small electric bulb. Place carefully the segment mirrors (with a magnetic base) along the guide curve, and make a fine adjustment so that an image of the source, reflected in each small mirror, may be seen through the view–sight. Of course if we used more and more, smaller and smaller mirrors, we would have our perfect curved mirror!
Carefully move the source along the center line source while the source is still viewable in all the small mirrors at the same time.
Maximum distance for source moved toward the vertex?____________________________ toward the view sight?_______________ perpendicular to the center line? ____________
Return the source to its original position and try moving the view-sight instead. Maximum distance for view sight moved toward to the source? ______________________ away from the source? _____________ perpendicular to the center line? ______________
3: What is the vergence of the incoming light at the center line? ________________
What is the light vergence of the as it leaves ? __________________________ What is the change in vergence? ______________________________________ Is each small mirror the same distance from the source? _____________ Is the vergence of the incoming light the same at each small mirror? ________________
7: In the experiment How Light Travels we used a diode device to measure light intensity..
Carefully remove the view sight and in its place position such a diode device (if necessary position your paper so that the diode device is not facing any distant bright light source ). Then remove the small mirrors one by one and carefully record in millivolts the corresponding meter reading.
Activity #3 The Power of a Mirror
All mirrors, plane and curved, reflect light, but curved mirrors behave differently depending on their shape. One way to characterize all mirrors is by their power, the ability of the surface to change the vergence of the light it reflects. Recall that vergence is the reciprocal of a wavefront’s curvature, measured in meters
mirror 9 8 7 6 5 4 3 2 1 0
light
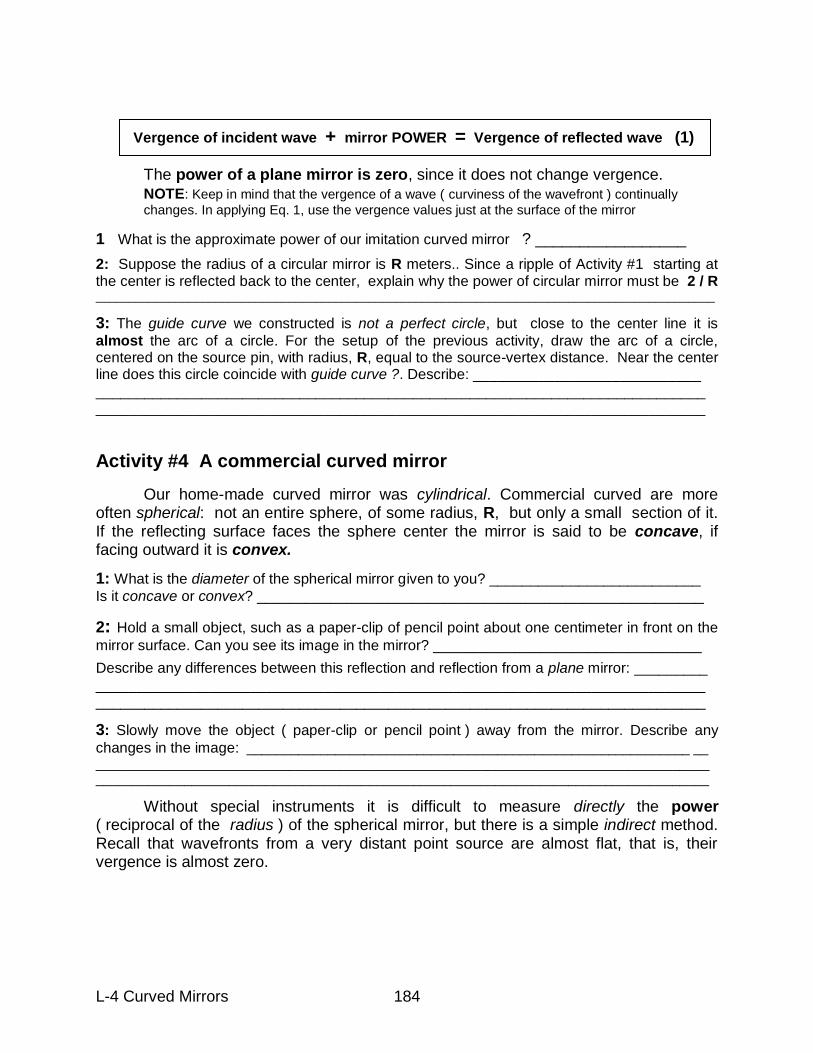
L-4 Curved Mirrors 184
The power of a plane mirror is zero, since it does not change vergence.
NOTE: Keep in mind that the vergence of a wave ( curviness of the wavefront ) continually
changes. In applying Eq. 1, use the vergence values just at the surface of the mirror
1 What is the approximate power of our imitation curved mirror ? _________________
2: Suppose the radius of a circular mirror is R meters.. Since a ripple of Activity #1 starting at the center is reflected back to the center, explain why the power of circular mirror must be 2 / R _____________________________________________________________________________________________
3: The guide curve we constructed is not a perfect circle, but close to the center line it is
almost the arc of a circle. For the setup of the previous activity, draw the arc of a circle, centered on the source pin, with radius, R, equal to the source-vertex distance. Near the center line does this circle coincide with guide curve ?. Describe: ____________________________
___________________________________________________________________________ ___________________________________________________________________________
Activity #4 A commercial curved mirror
Our home-made curved mirror was cylindrical. Commercial curved are more often spherical: not an entire sphere, of some radius, R, but only a small section of it. If the reflecting surface faces the sphere center the mirror is said to be concave, if facing outward it is convex.
1: What is the diameter of the spherical mirror given to you? __________________________
Is it concave or convex? _______________________________________________________
2: Hold a small object, such as a paper-clip of pencil point about one centimeter in front on the
mirror surface. Can you see its image in the mirror? _________________________________
Describe any differences between this reflection and reflection from a plane mirror: _________
___________________________________________________________________________ ___________________________________________________________________________
3: Slowly move the object ( paper-clip or pencil point ) away from the mirror. Describe any
changes in the image: ____________________________________________________________ __
___________________________________________________________________________________ ___________________________________________________________________________________
Without special instruments it is difficult to measure directly the power ( reciprocal of the radius ) of the spherical mirror, but there is a simple indirect method. Recall that wavefronts from a very distant point source are almost flat, that is, their vergence is almost zero.
Vergence of incident wave + mirror POWER = Vergence of reflected wave (1)
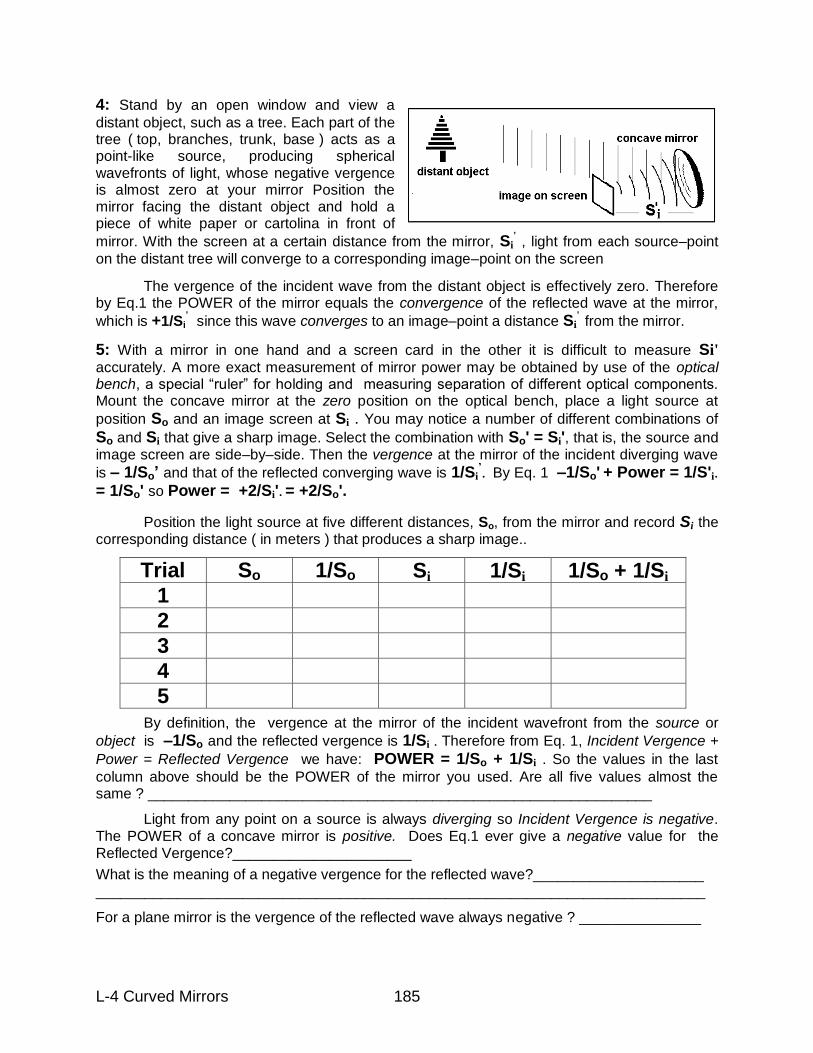
L-4 Curved Mirrors 185
4: Stand by an open window and view a
distant object, such as a tree. Each part of the tree ( top, branches, trunk, base ) acts as a point-like source, producing spherical wavefronts of light, whose negative vergence is almost zero at your mirror Position the mirror facing the distant object and hold a piece of white paper or cartolina in front of
mirror. With the screen at a certain distance from the mirror, Si' , light from each source–point
on the distant tree will converge to a corresponding image–point on the screen
The vergence of the incident wave from the distant object is effectively zero. Therefore by Eq.1 the POWER of the mirror equals the convergence of the reflected wave at the mirror,
which is +1/Si' since this wave converges to an image–point a distance Si
' from the mirror.
5: With a mirror in one hand and a screen card in the other it is difficult to measure Si' accurately. A more exact measurement of mirror power may be obtained by use of the optical bench, a special “ruler” for holding and measuring separation of different optical components. Mount the concave mirror at the zero position on the optical bench, place a light source at
position So and an image screen at Si . You may notice a number of different combinations of
So and Si that give a sharp image. Select the combination with So' = Si', that is, the source and image screen are side–by–side. Then the vergence at the mirror of the incident diverging wave
is – 1/So‟ and that of the reflected converging wave is 1/Si’. By Eq. 1 –1/So' + Power = 1/S'i.
= 1/So' so Power = +2/Si'. = +2/So'.
Position the light source at five different distances, So, from the mirror and record Si the corresponding distance ( in meters ) that produces a sharp image..
By definition, the vergence at the mirror of the incident wavefront from the source or
object is –1/So and the reflected vergence is 1/Si . Therefore from Eq. 1, Incident Vergence +
Power = Reflected Vergence we have: POWER = 1/So + 1/Si . So the values in the last
column above should be the POWER of the mirror you used. Are all five values almost the same ? ______________________________________________________________
Light from any point on a source is always diverging so Incident Vergence is negative. The POWER of a concave mirror is positive. Does Eq.1 ever give a negative value for the Reflected Vergence?______________________
What is the meaning of a negative vergence for the reflected wave?_____________________ ___________________________________________________________________________
For a plane mirror is the vergence of the reflected wave always negative ? _______________
Trial So 1/So Si 1/Si 1/So + 1/Si
1
2
3
4
5
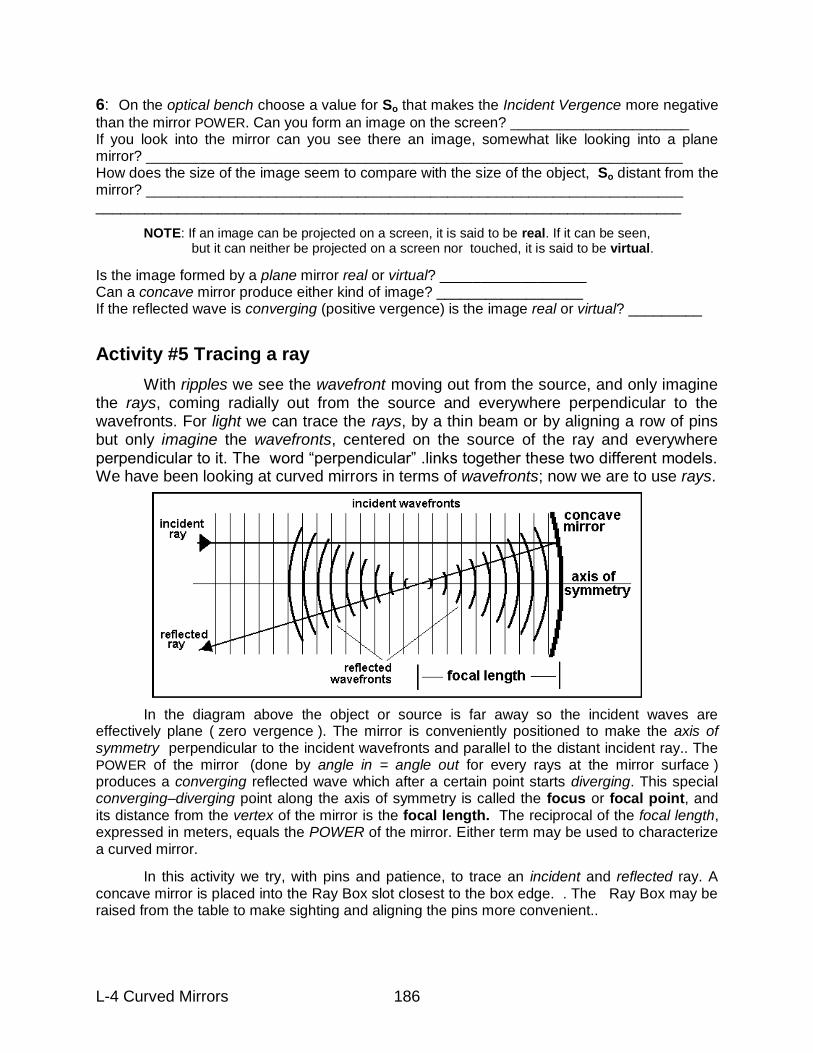
L-4 Curved Mirrors 186
6: On the optical bench choose a value for So that makes the Incident Vergence more negative
than the mirror POWER. Can you form an image on the screen? ______________________ If you look into the mirror can you see there an image, somewhat like looking into a plane mirror? __________________________________________________________________ How does the size of the image seem to compare with the size of the object, So distant from the mirror? __________________________________________________________________ ________________________________________________________________________
NOTE: If an image can be projected on a screen, it is said to be real. If it can be seen, but it can neither be projected on a screen nor touched, it is said to be virtual.
Is the image formed by a plane mirror real or virtual? __________________ Can a concave mirror produce either kind of image? __________________ If the reflected wave is converging (positive vergence) is the image real or virtual? _________
Activity #5 Tracing a ray
With ripples we see the wavefront moving out from the source, and only imagine the rays, coming radially out from the source and everywhere perpendicular to the wavefronts. For light we can trace the rays, by a thin beam or by aligning a row of pins but only imagine the wavefronts, centered on the source of the ray and everywhere perpendicular to it. The word “perpendicular” .links together these two different models. We have been looking at curved mirrors in terms of wavefronts; now we are to use rays.
In the diagram above the object or source is far away so the incident waves are effectively plane ( zero vergence ). The mirror is conveniently positioned to make the axis of symmetry perpendicular to the incident wavefronts and parallel to the distant incident ray.. The POWER of the mirror (done by angle in = angle out for every rays at the mirror surface ) produces a converging reflected wave which after a certain point starts diverging. This special converging–diverging point along the axis of symmetry is called the focus or focal point, and its distance from the vertex of the mirror is the focal length. The reciprocal of the focal length, expressed in meters, equals the POWER of the mirror. Either term may be used to characterize a curved mirror.
In this activity we try, with pins and patience, to trace an incident and reflected ray. A concave mirror is placed into the Ray Box slot closest to the box edge. . The Ray Box may be raised from the table to make sighting and aligning the pins more convenient..
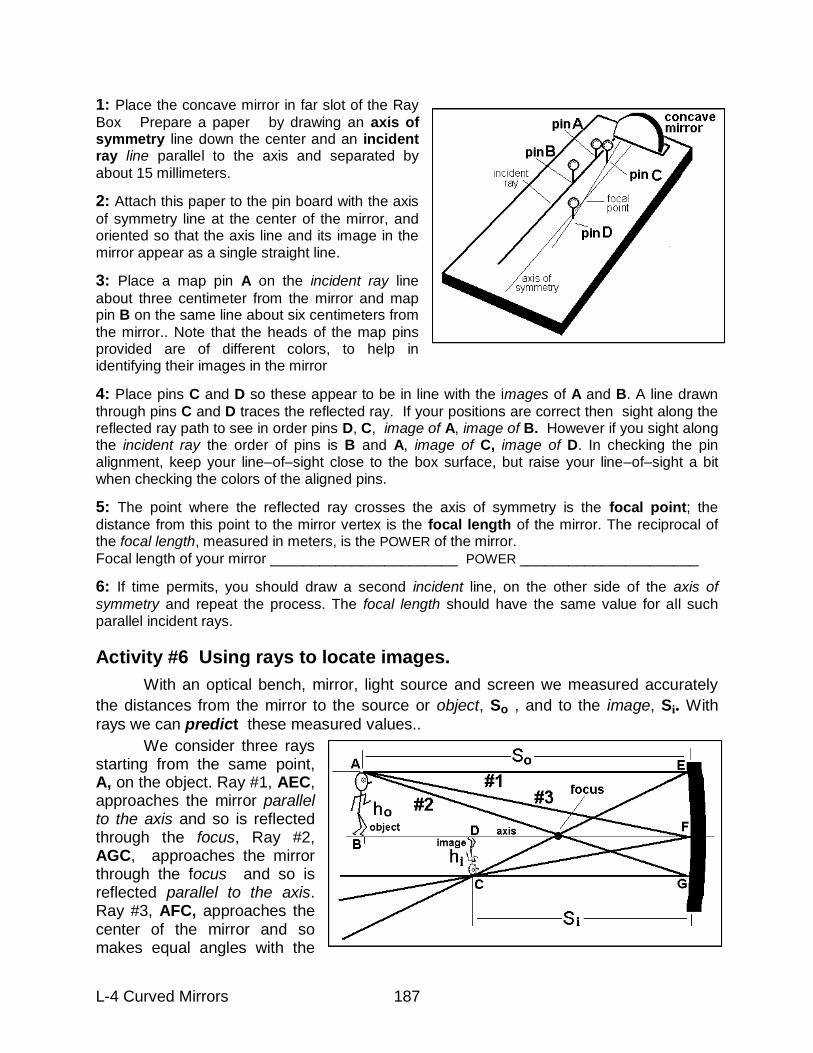
L-4 Curved Mirrors 187
1: Place the concave mirror in far slot of the Ray
Box Prepare a paper by drawing an axis of symmetry line down the center and an incident ray line parallel to the axis and separated by
about 15 millimeters.
2: Attach this paper to the pin board with the axis
of symmetry line at the center of the mirror, and oriented so that the axis line and its image in the mirror appear as a single straight line.
3: Place a map pin A on the incident ray line
about three centimeter from the mirror and map pin B on the same line about six centimeters from
the mirror.. Note that the heads of the map pins provided are of different colors, to help in identifying their images in the mirror
4: Place pins C and D so these appear to be in line with the images of A and B. A line drawn
through pins C and D traces the reflected ray. If your positions are correct then sight along the reflected ray path to see in order pins D, C, image of A, image of B. However if you sight along the incident ray the order of pins is B and A, image of C, image of D. In checking the pin alignment, keep your line–of–sight close to the box surface, but raise your line–of–sight a bit when checking the colors of the aligned pins.
5: The point where the reflected ray crosses the axis of symmetry is the focal point; the
distance from this point to the mirror vertex is the focal length of the mirror. The reciprocal of the focal length, measured in meters, is the POWER of the mirror.
Focal length of your mirror _______________________ POWER ______________________
6: If time permits, you should draw a second incident line, on the other side of the axis of
symmetry and repeat the process. The focal length should have the same value for all such parallel incident rays. Activity #6 Using rays to locate images.
With an optical bench, mirror, light source and screen we measured accurately
the distances from the mirror to the source or object, So , and to the image, Si. With
rays we can predict these measured values..
We consider three rays starting from the same point, A, on the object. Ray #1, AEC, approaches the mirror parallel to the axis and so is reflected through the focus, Ray #2, AGC, approaches the mirror through the focus and so is reflected parallel to the axis. Ray #3, AFC, approaches the center of the mirror and so makes equal angles with the
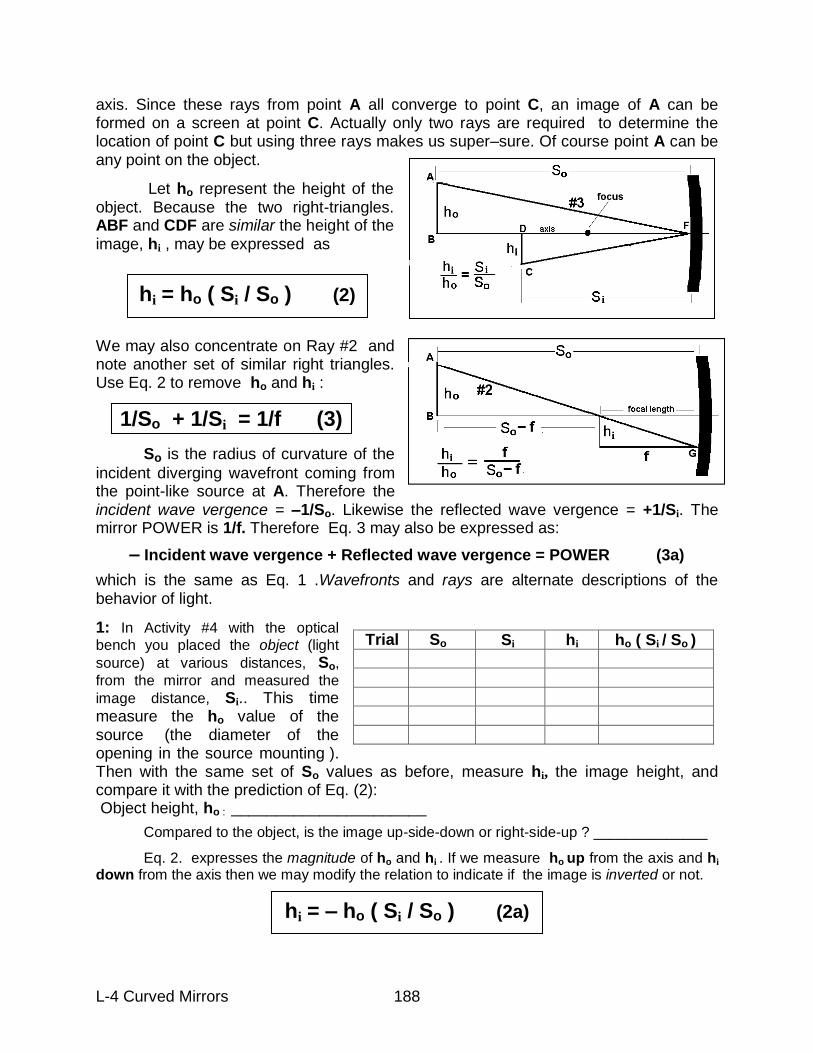
L-4 Curved Mirrors 188
axis. Since these rays from point A all converge to point C, an image of A can be formed on a screen at point C. Actually only two rays are required to determine the location of point C but using three rays makes us super–sure. Of course point A can be any point on the object.
Let ho represent the height of the object. Because the two right-triangles. ABF and CDF are similar the height of the image, hi , may be expressed as
We may also concentrate on Ray #2 and note another set of similar right triangles. Use Eq. 2 to remove ho and hi :
So is the radius of curvature of the
incident diverging wavefront coming from the point-like source at A. Therefore the incident wave vergence = –1/So. Likewise the reflected wave vergence = +1/Si. The mirror POWER is 1/f. Therefore Eq. 3 may also be expressed as:
– Incident wave vergence + Reflected wave vergence = POWER (3a)
which is the same as Eq. 1 .Wavefronts and rays are alternate descriptions of the behavior of light.
1: In Activity #4 with the optical
bench you placed the object (light
source) at various distances, So,
from the mirror and measured the
image distance, Si.. This time measure the ho value of the source (the diameter of the opening in the source mounting ). Then with the same set of So values as before, measure hi, the image height, and compare it with the prediction of Eq. (2): Object height, ho : ______________________
Compared to the object, is the image up-side-down or right-side-up ? ______________
Eq. 2. expresses the magnitude of ho and hi . If we measure ho up from the axis and hi down from the axis then we may modify the relation to indicate if the image is inverted or not.
hi = ho ( Si / So ) (2)
1/So + 1/Si = 1/f (3)
Trial So Si hi ho ( Si / So )
hi = – ho ( Si / So ) (2a)
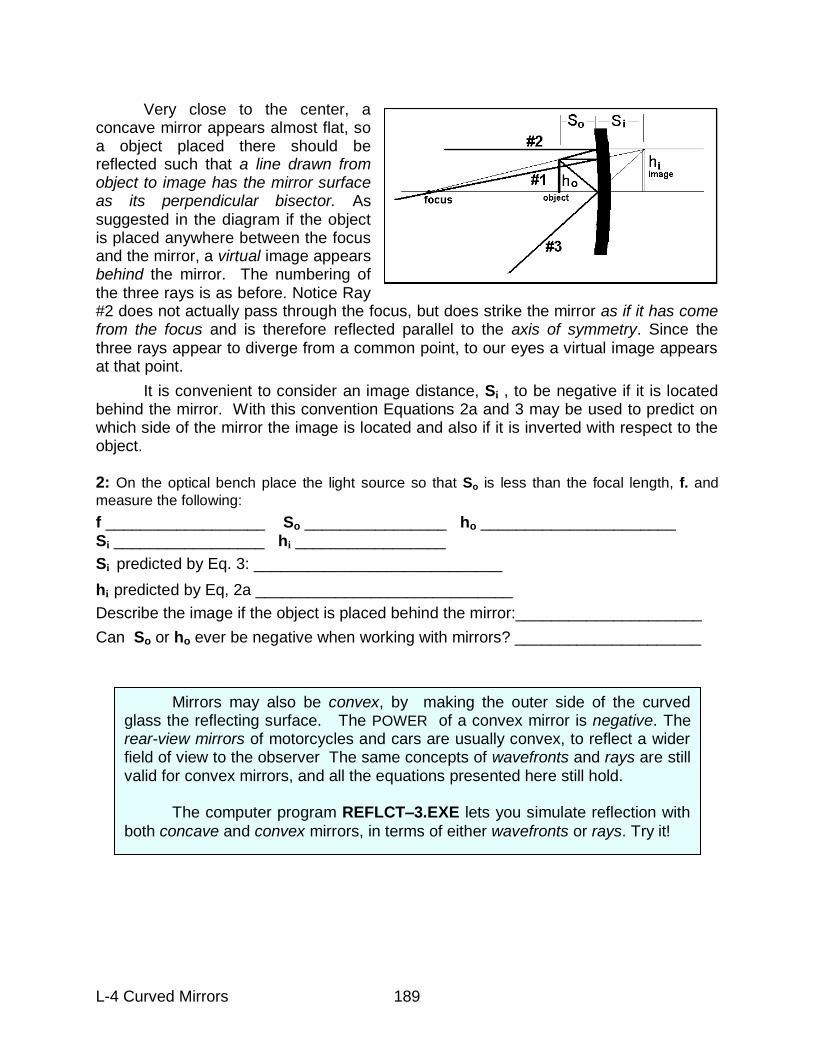
L-4 Curved Mirrors 189
Very close to the center, a concave mirror appears almost flat, so a object placed there should be reflected such that a line drawn from object to image has the mirror surface as its perpendicular bisector. As suggested in the diagram if the object is placed anywhere between the focus and the mirror, a virtual image appears behind the mirror. The numbering of the three rays is as before. Notice Ray #2 does not actually pass through the focus, but does strike the mirror as if it has come from the focus and is therefore reflected parallel to the axis of symmetry. Since the three rays appear to diverge from a common point, to our eyes a virtual image appears at that point.
It is convenient to consider an image distance, Si , to be negative if it is located behind the mirror. With this convention Equations 2a and 3 may be used to predict on which side of the mirror the image is located and also if it is inverted with respect to the object. 2: On the optical bench place the light source so that So is less than the focal length, f. and
measure the following:
f __________________ So ________________ ho ______________________ Si _________________ hi _________________
Si predicted by Eq. 3: ____________________________
hi predicted by Eq, 2a _____________________________
Describe the image if the object is placed behind the mirror:_____________________
Can So or ho ever be negative when working with mirrors? _____________________
Mirrors may also be convex, by making the outer side of the curved glass the reflecting surface. The POWER of a convex mirror is negative. The rear-view mirrors of motorcycles and cars are usually convex, to reflect a wider field of view to the observer The same concepts of wavefronts and rays are still valid for convex mirrors, and all the equations presented here still hold. The computer program REFLCT–3.EXE lets you simulate reflection with
both concave and convex mirrors, in terms of either wavefronts or rays. Try it!
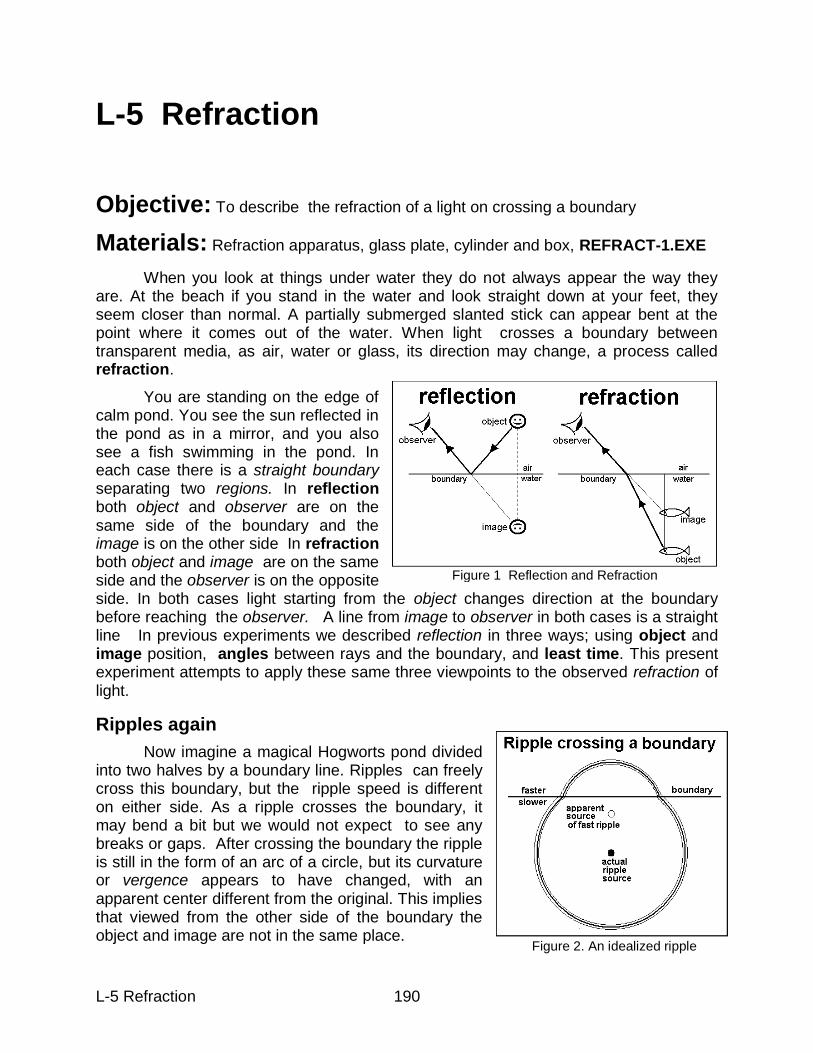
L-5 Refraction 190
L-5 Refraction
Objective: To describe the refraction of a light on crossing a boundary
Materials: Refraction apparatus, glass plate, cylinder and box, REFRACT-1.EXE
When you look at things under water they do not always appear the way they are. At the beach if you stand in the water and look straight down at your feet, they seem closer than normal. A partially submerged slanted stick can appear bent at the point where it comes out of the water. When light crosses a boundary between transparent media, as air, water or glass, its direction may change, a process called refraction.
You are standing on the edge of calm pond. You see the sun reflected in the pond as in a mirror, and you also see a fish swimming in the pond. In each case there is a straight boundary separating two regions. In reflection both object and observer are on the same side of the boundary and the image is on the other side In refraction both object and image are on the same side and the observer is on the opposite side. In both cases light starting from the object changes direction at the boundary before reaching the observer. A line from image to observer in both cases is a straight line In previous experiments we described reflection in three ways; using object and image position, angles between rays and the boundary, and least time. This present experiment attempts to apply these same three viewpoints to the observed refraction of light.
Ripples again
Now imagine a magical Hogworts pond divided into two halves by a boundary line. Ripples can freely cross this boundary, but the ripple speed is different on either side. As a ripple crosses the boundary, it may bend a bit but we would not expect to see any breaks or gaps. After crossing the boundary the ripple is still in the form of an arc of a circle, but its curvature or vergence appears to have changed, with an apparent center different from the original. This implies that viewed from the other side of the boundary the object and image are not in the same place.
Figure 1 Reflection and Refraction
Figure 2. An idealized ripple
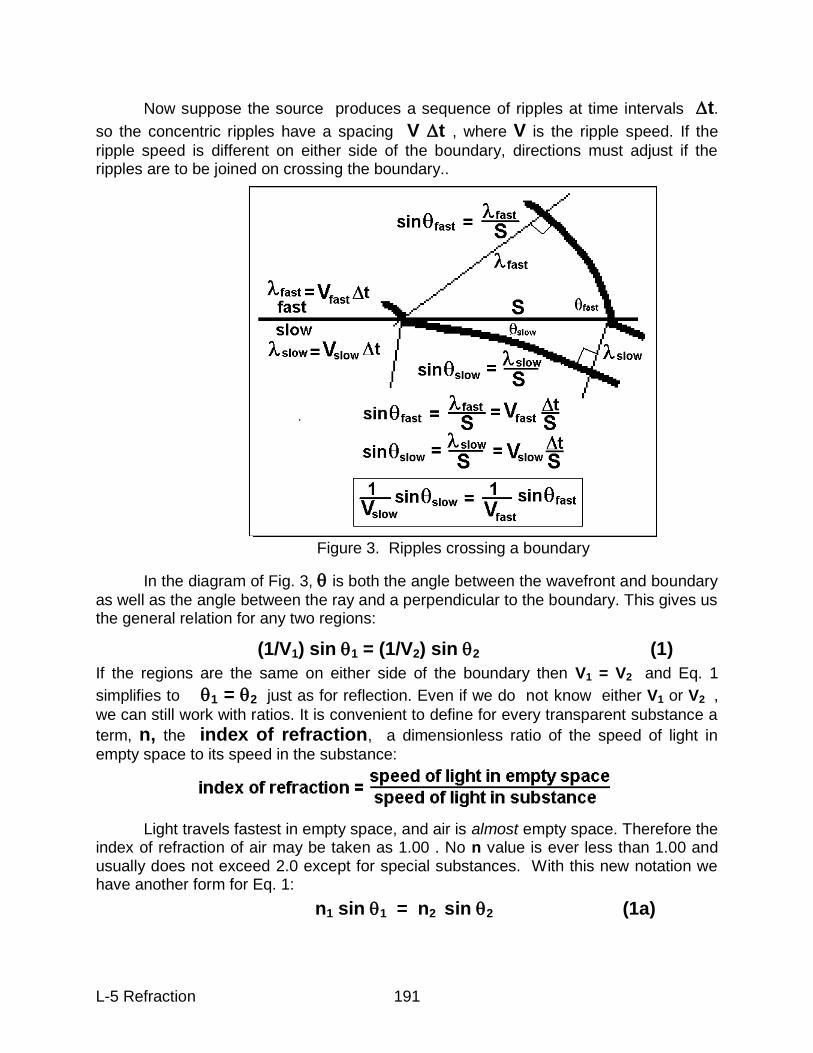
L-5 Refraction 191
Now suppose the source produces a sequence of ripples at time intervals t.
so the concentric ripples have a spacing V t , where V is the ripple speed. If the
ripple speed is different on either side of the boundary, directions must adjust if the ripples are to be joined on crossing the boundary..
In the diagram of Fig. 3, is both the angle between the wavefront and boundary
as well as the angle between the ray and a perpendicular to the boundary. This gives us the general relation for any two regions:
(1/V1) sin 1 = (1/V2) sin 2 (1)
If the regions are the same on either side of the boundary then V1 = V2 and Eq. 1
simplifies to 1 = 2 just as for reflection. Even if we do not know either V1 or V2 ,
we can still work with ratios. It is convenient to define for every transparent substance a
term, n, the index of refraction, a dimensionless ratio of the speed of light in
empty space to its speed in the substance:
Light travels fastest in empty space, and air is almost empty space. Therefore the index of refraction of air may be taken as 1.00 . No n value is ever less than 1.00 and usually does not exceed 2.0 except for special substances. With this new notation we have another form for Eq. 1:
n1 sin 1 = n2 sin 2 (1a)
Figure 3. Ripples crossing a boundary
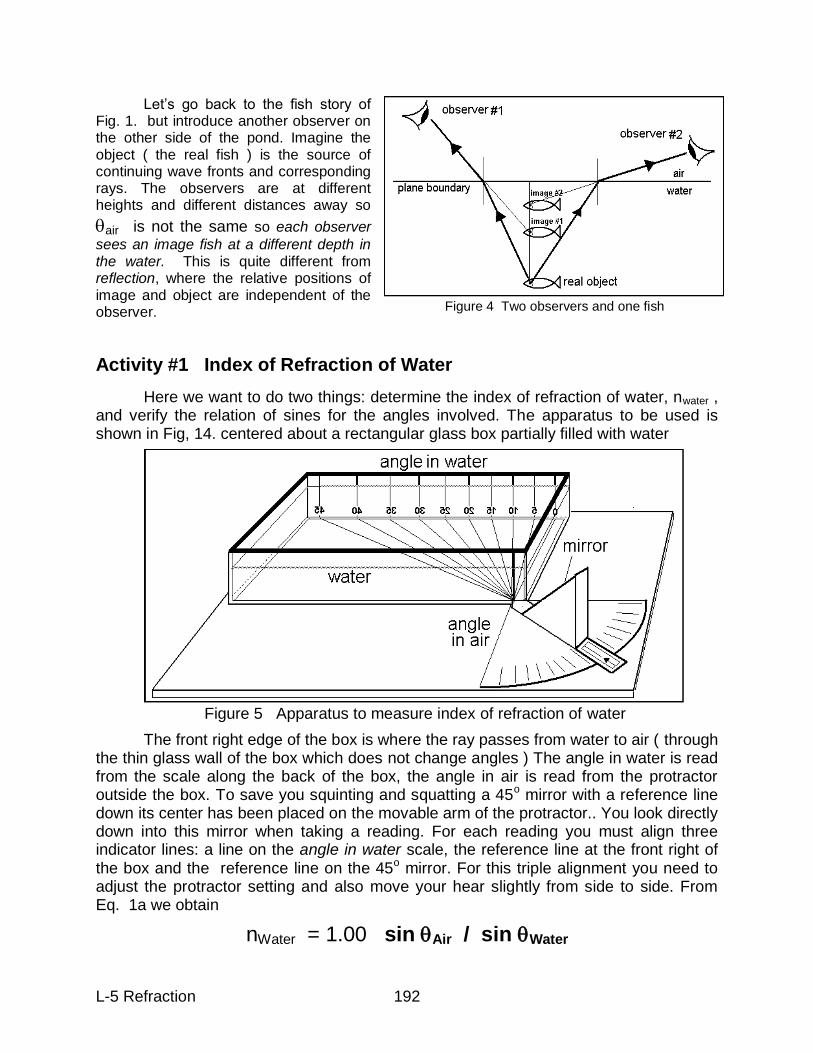
L-5 Refraction 192
Let‟s go back to the fish story of Fig. 1. but introduce another observer on the other side of the pond. Imagine the object ( the real fish ) is the source of continuing wave fronts and corresponding rays. The observers are at different heights and different distances away so
air is not the same so each observer
sees an image fish at a different depth in the water. This is quite different from reflection, where the relative positions of image and object are independent of the observer.
Activity #1 Index of Refraction of Water
Here we want to do two things: determine the index of refraction of water, nwater , and verify the relation of sines for the angles involved. The apparatus to be used is shown in Fig, 14. centered about a rectangular glass box partially filled with water
The front right edge of the box is where the ray passes from water to air ( through the thin glass wall of the box which does not change angles ) The angle in water is read from the scale along the back of the box, the angle in air is read from the protractor outside the box. To save you squinting and squatting a 45o mirror with a reference line down its center has been placed on the movable arm of the protractor.. You look directly down into this mirror when taking a reading. For each reading you must align three indicator lines: a line on the angle in water scale, the reference line at the front right of the box and the reference line on the 45o mirror. For this triple alignment you need to adjust the protractor setting and also move your hear slightly from side to side. From Eq. 1a we obtain
nWater = 1.00 sin Air / sin Water
Figure 4 Two observers and one fish
Figure 5 Apparatus to measure index of refraction of water
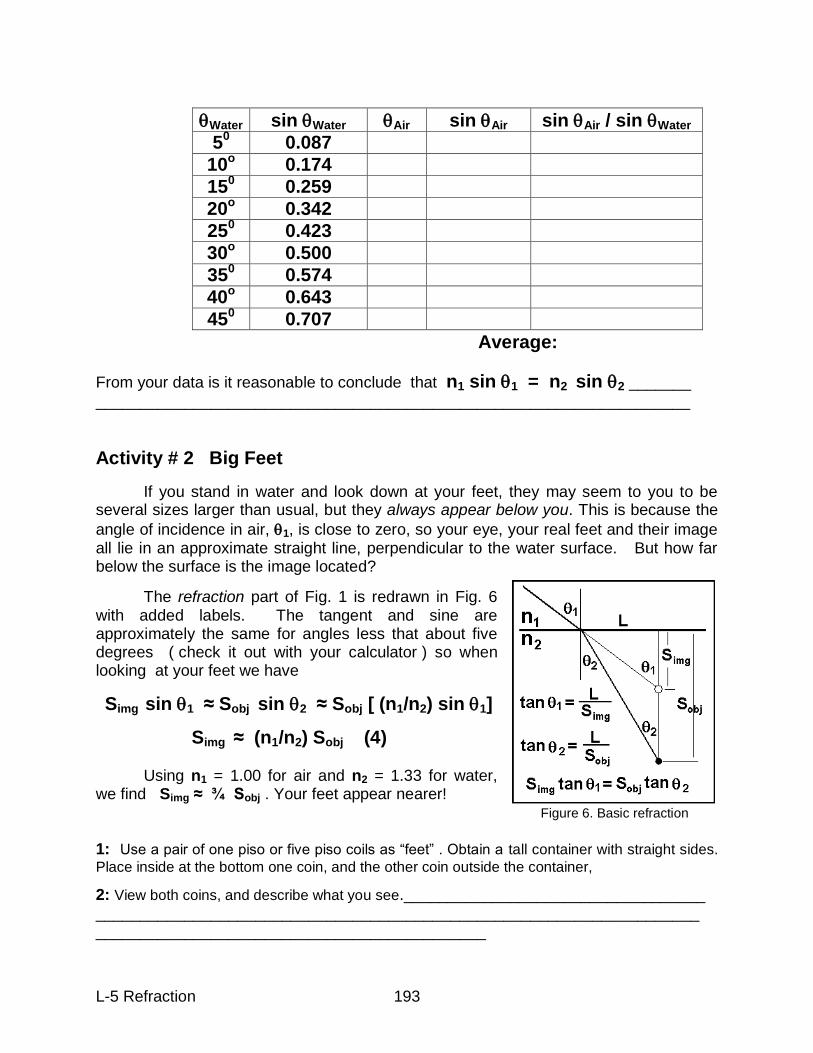
L-5 Refraction 193
From your data is it reasonable to conclude that n1 sin 1 = n2 sin 2 _______
___________________________________________________________________
Activity # 2 Big Feet
If you stand in water and look down at your feet, they may seem to you to be several sizes larger than usual, but they always appear below you. This is because the
angle of incidence in air, 1, is close to zero, so your eye, your real feet and their image all lie in an approximate straight line, perpendicular to the water surface. But how far below the surface is the image located?
The refraction part of Fig. 1 is redrawn in Fig. 6 with added labels. The tangent and sine are approximately the same for angles less that about five degrees ( check it out with your calculator ) so when looking at your feet we have
Simg sin 1 ≈ Sobj sin 2 ≈ Sobj [ (n1/n2) sin1]
Simg ≈ (n1/n2) Sobj (4) Using n1 = 1.00 for air and n2 = 1.33 for water, we find Simg ≈ ¾ Sobj . Your feet appear nearer! 1: Use a pair of one piso or five piso coils as “feet” . Obtain a tall container with straight sides.
Place inside at the bottom one coin, and the other coin outside the container,
2: View both coins, and describe what you see.__________________________________ ____________________________________________________________________ ____________________________________________
Figure 6. Basic refraction
Water sin Water Air sin Air sin Air / sin Water
50
0.087
10o
0.174
150 0.259
20o 0.342
250 0.423
30o 0.500
350 0.574
40o 0.643
450 0.707
Average:
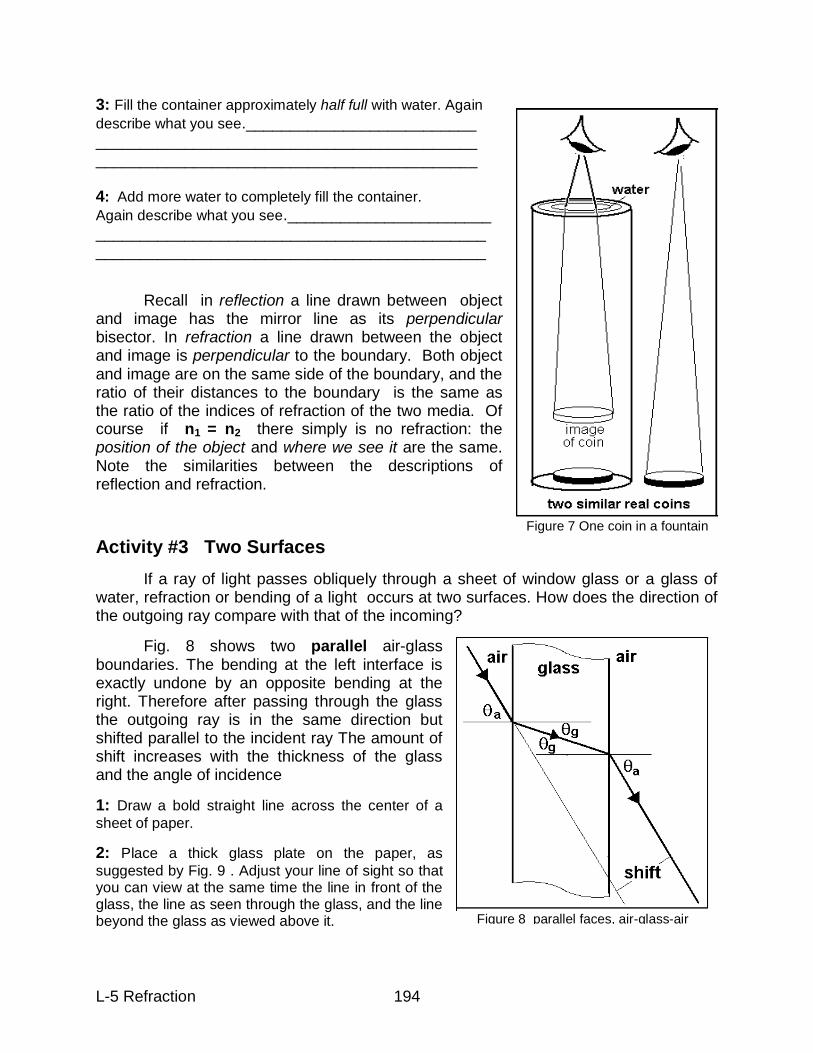
L-5 Refraction 194
3: Fill the container approximately half full with water. Again
describe what you see.__________________________ ___________________________________________ ___________________________________________ 4: Add more water to completely fill the container.
Again describe what you see._______________________ ____________________________________________ ____________________________________________
Recall in reflection a line drawn between object and image has the mirror line as its perpendicular bisector. In refraction a line drawn between the object and image is perpendicular to the boundary. Both object and image are on the same side of the boundary, and the ratio of their distances to the boundary is the same as the ratio of the indices of refraction of the two media. Of course if n1 = n2 there simply is no refraction: the position of the object and where we see it are the same. Note the similarities between the descriptions of reflection and refraction. Activity #3 Two Surfaces
If a ray of light passes obliquely through a sheet of window glass or a glass of water, refraction or bending of a light occurs at two surfaces. How does the direction of the outgoing ray compare with that of the incoming?
Fig. 8 shows two parallel air-glass boundaries. The bending at the left interface is exactly undone by an opposite bending at the right. Therefore after passing through the glass the outgoing ray is in the same direction but shifted parallel to the incident ray The amount of shift increases with the thickness of the glass and the angle of incidence
1: Draw a bold straight line across the center of a
sheet of paper.
2: Place a thick glass plate on the paper, as
suggested by Fig. 9 . Adjust your line of sight so that you can view at the same time the line in front of the glass, the line as seen through the glass, and the line beyond the glass as viewed above it.
Figure 7 One coin in a fountain
Figure 8 parallel faces, air-glass-air
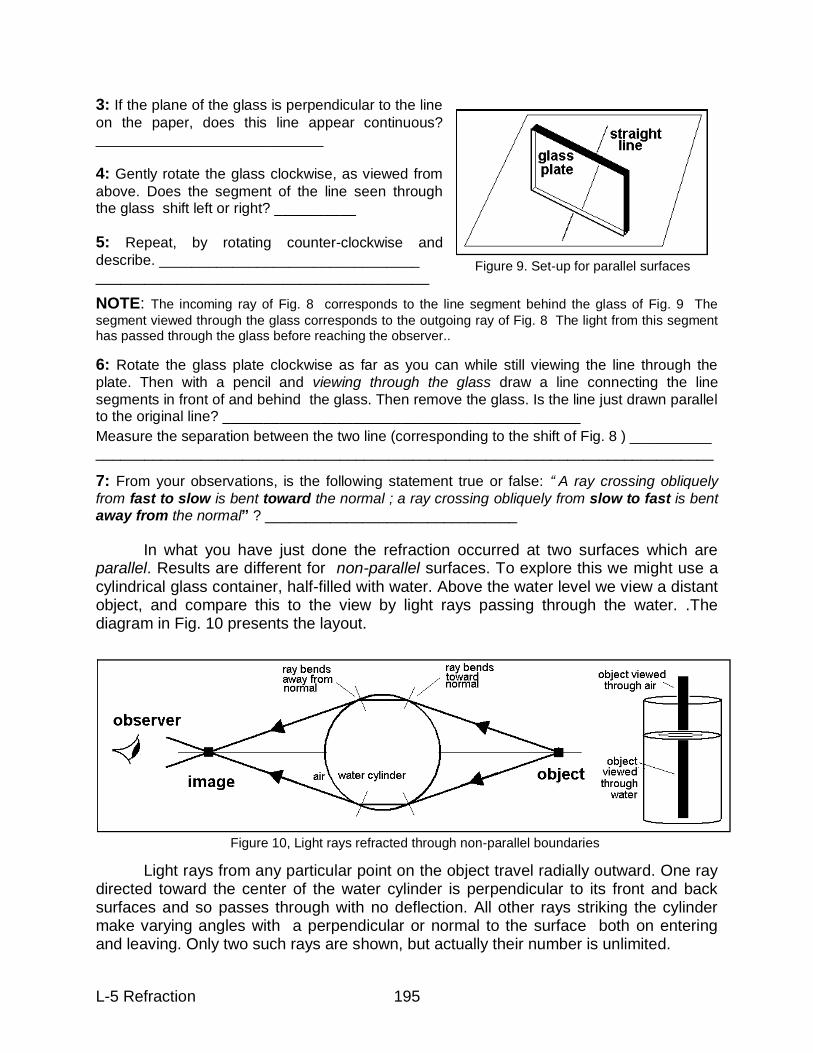
L-5 Refraction 195
3: If the plane of the glass is perpendicular to the line
on the paper, does this line appear continuous? ____________________________
4: Gently rotate the glass clockwise, as viewed from
above. Does the segment of the line seen through the glass shift left or right? __________
5: Repeat, by rotating counter-clockwise and
describe. ________________________________ _________________________________________
NOTE: The incoming ray of Fig. 8 corresponds to the line segment behind the glass of Fig. 9 The
segment viewed through the glass corresponds to the outgoing ray of Fig. 8 The light from this segment has passed through the glass before reaching the observer..
6: Rotate the glass plate clockwise as far as you can while still viewing the line through the
plate. Then with a pencil and viewing through the glass draw a line connecting the line
segments in front of and behind the glass. Then remove the glass. Is the line just drawn parallel to the original line? ____________________________________________
Measure the separation between the two line (corresponding to the shift of Fig. 8 ) __________ ____________________________________________________________________________
7: From your observations, is the following statement true or false: “ A ray crossing obliquely
from fast to slow is bent toward the normal ; a ray crossing obliquely from slow to fast is bent away from the normal” ? _______________________________
In what you have just done the refraction occurred at two surfaces which are parallel. Results are different for non-parallel surfaces. To explore this we might use a cylindrical glass container, half-filled with water. Above the water level we view a distant object, and compare this to the view by light rays passing through the water. .The diagram in Fig. 10 presents the layout.
Light rays from any particular point on the object travel radially outward. One ray directed toward the center of the water cylinder is perpendicular to its front and back surfaces and so passes through with no deflection. All other rays striking the cylinder make varying angles with a perpendicular or normal to the surface both on entering and leaving. Only two such rays are shown, but actually their number is unlimited.
Figure 9. Set-up for parallel surfaces
Figure 10, Light rays refracted through non-parallel boundaries
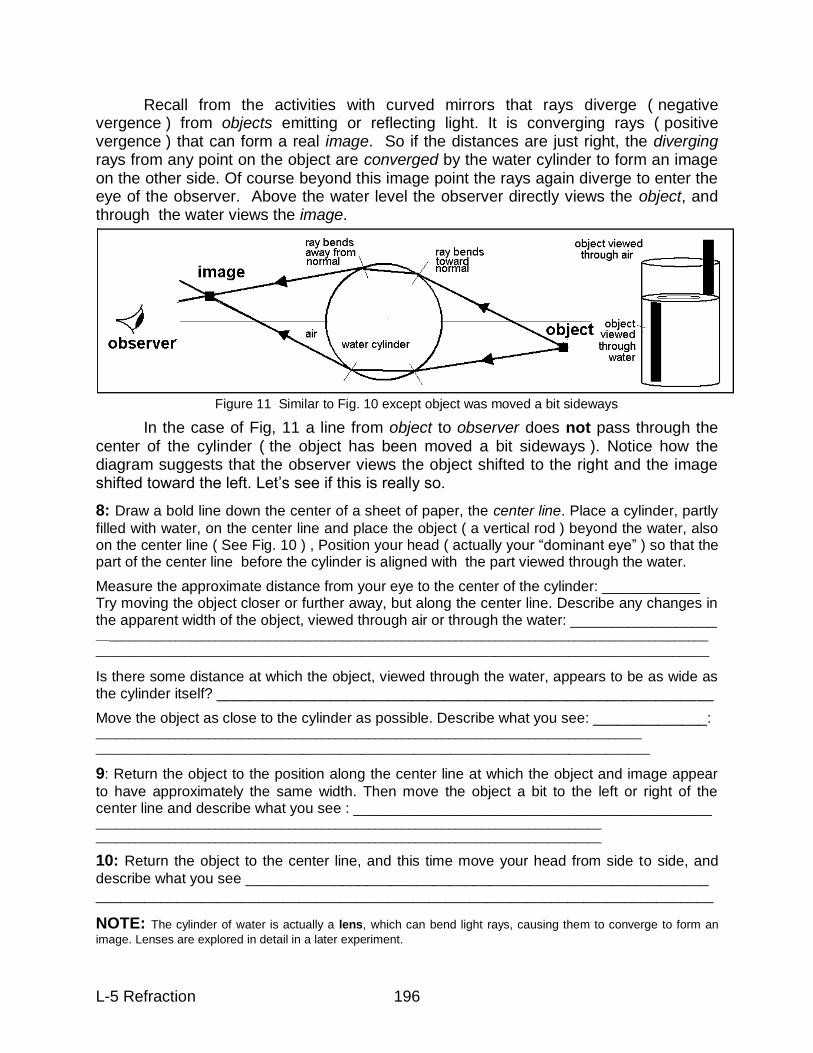
L-5 Refraction 196
Recall from the activities with curved mirrors that rays diverge ( negative vergence ) from objects emitting or reflecting light. It is converging rays ( positive vergence ) that can form a real image. So if the distances are just right, the diverging rays from any point on the object are converged by the water cylinder to form an image on the other side. Of course beyond this image point the rays again diverge to enter the eye of the observer. Above the water level the observer directly views the object, and through the water views the image.
In the case of Fig, 11 a line from object to observer does not pass through the center of the cylinder ( the object has been moved a bit sideways ). Notice how the diagram suggests that the observer views the object shifted to the right and the image shifted toward the left. Let‟s see if this is really so.
8: Draw a bold line down the center of a sheet of paper, the center line. Place a cylinder, partly
filled with water, on the center line and place the object ( a vertical rod ) beyond the water, also on the center line ( See Fig. 10 ) , Position your head ( actually your “dominant eye” ) so that the part of the center line before the cylinder is aligned with the part viewed through the water.
Measure the approximate distance from your eye to the center of the cylinder: ____________ Try moving the object closer or further away, but along the center line. Describe any changes in the apparent width of the object, viewed through air or through the water: __________________ _____________________________________________________________________________________________
___________________________________________________________________________________
Is there some distance at which the object, viewed through the water, appears to be as wide as the cylinder itself? _____________________________________________________________
Move the object as close to the cylinder as possible. Describe what you see: ______________: __________________________________________________________________________________
___________________________________________________________________________
9: Return the object to the position along the center line at which the object and image appear
to have approximately the same width. Then move the object a bit to the left or right of the center line and describe what you see : ____________________________________________ ____________________________________________________________________________ ____________________________________________________________________________
10: Return the object to the center line, and this time move your head from side to side, and
describe what you see _________________________________________________________ ____________________________________________________________________________
NOTE: The cylinder of water is actually a lens, which can bend light rays, causing them to converge to form an
image. Lenses are explored in detail in a later experiment.
Figure 11 Similar to Fig. 10 except object was moved a bit sideways
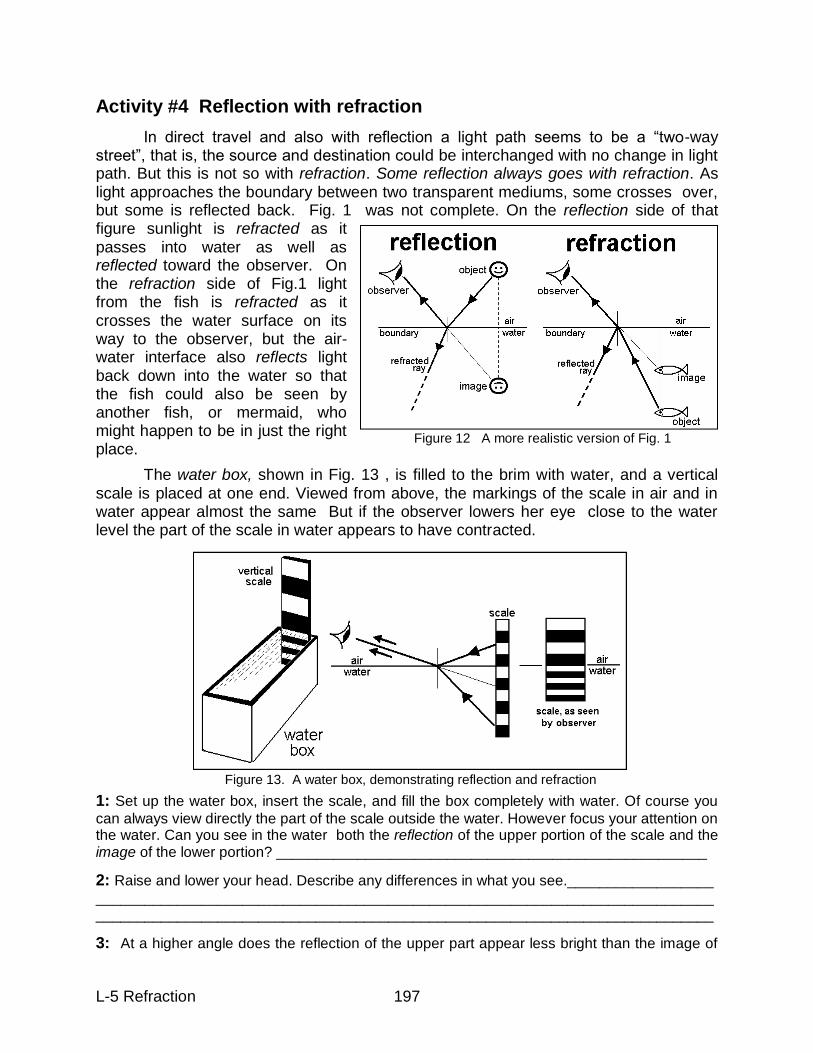
L-5 Refraction 197
Activity #4 Reflection with refraction
In direct travel and also with reflection a light path seems to be a “two-way street”, that is, the source and destination could be interchanged with no change in light path. But this is not so with refraction. Some reflection always goes with refraction. As light approaches the boundary between two transparent mediums, some crosses over, but some is reflected back. Fig. 1 was not complete. On the reflection side of that figure sunlight is refracted as it passes into water as well as reflected toward the observer. On the refraction side of Fig.1 light from the fish is refracted as it crosses the water surface on its way to the observer, but the air-water interface also reflects light back down into the water so that the fish could also be seen by another fish, or mermaid, who might happen to be in just the right place.
The water box, shown in Fig. 13 , is filled to the brim with water, and a vertical scale is placed at one end. Viewed from above, the markings of the scale in air and in water appear almost the same But if the observer lowers her eye close to the water level the part of the scale in water appears to have contracted.
1: Set up the water box, insert the scale, and fill the box completely with water. Of course you
can always view directly the part of the scale outside the water. However focus your attention on the water. Can you see in the water both the reflection of the upper portion of the scale and the image of the lower portion? _____________________________________________________
2: Raise and lower your head. Describe any differences in what you see.__________________
____________________________________________________________________________ ____________________________________________________________________________
3: At a higher angle does the reflection of the upper part appear less bright than the image of
Figure 12 A more realistic version of Fig. 1
Figure 13. A water box, demonstrating reflection and refraction
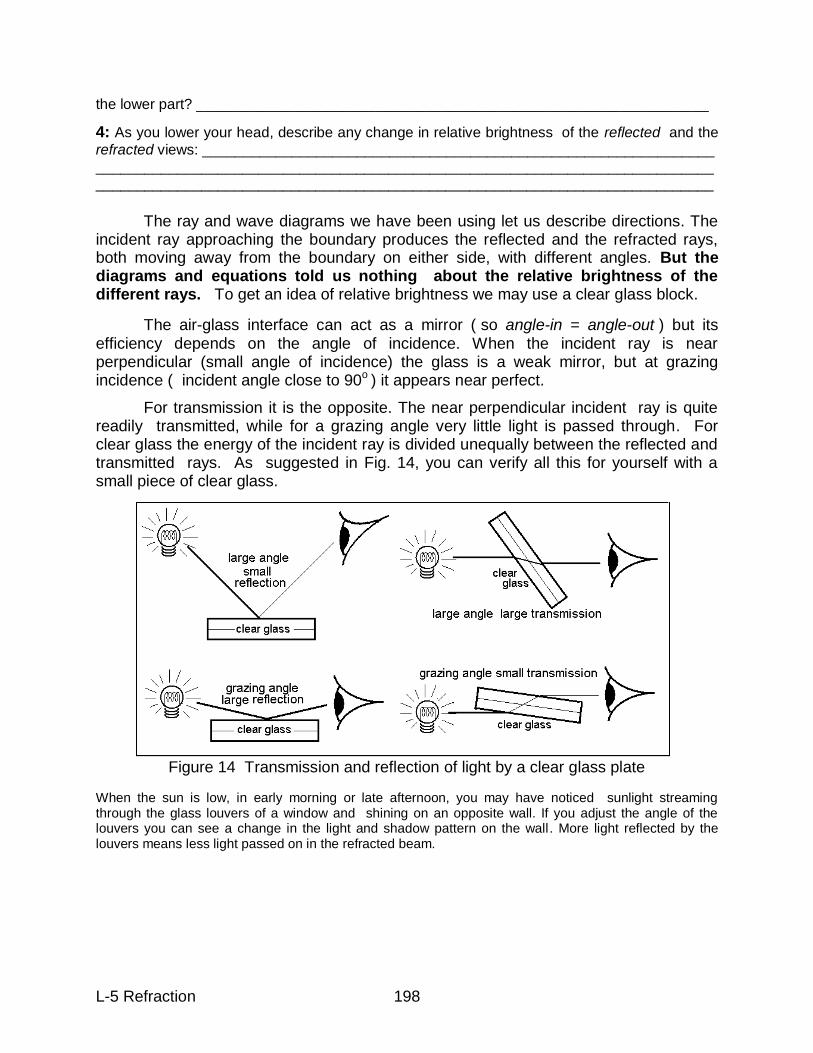
L-5 Refraction 198
the lower part? _______________________________________________________________
4: As you lower your head, describe any change in relative brightness of the reflected and the
refracted views: _______________________________________________________________
____________________________________________________________________________ ____________________________________________________________________________
The ray and wave diagrams we have been using let us describe directions. The incident ray approaching the boundary produces the reflected and the refracted rays, both moving away from the boundary on either side, with different angles. But the diagrams and equations told us nothing about the relative brightness of the different rays. To get an idea of relative brightness we may use a clear glass block.
The air-glass interface can act as a mirror ( so angle-in = angle-out ) but its efficiency depends on the angle of incidence. When the incident ray is near perpendicular (small angle of incidence) the glass is a weak mirror, but at grazing incidence ( incident angle close to 90o ) it appears near perfect.
For transmission it is the opposite. The near perpendicular incident ray is quite readily transmitted, while for a grazing angle very little light is passed through. For clear glass the energy of the incident ray is divided unequally between the reflected and transmitted rays. As suggested in Fig. 14, you can verify all this for yourself with a small piece of clear glass.
When the sun is low, in early morning or late afternoon, you may have noticed sunlight streaming through the glass louvers of a window and shining on an opposite wall. If you adjust the angle of the louvers you can see a change in the light and shadow pattern on the wall. More light reflected by the louvers means less light passed on in the refracted beam.
Figure 14 Transmission and reflection of light by a clear glass plate
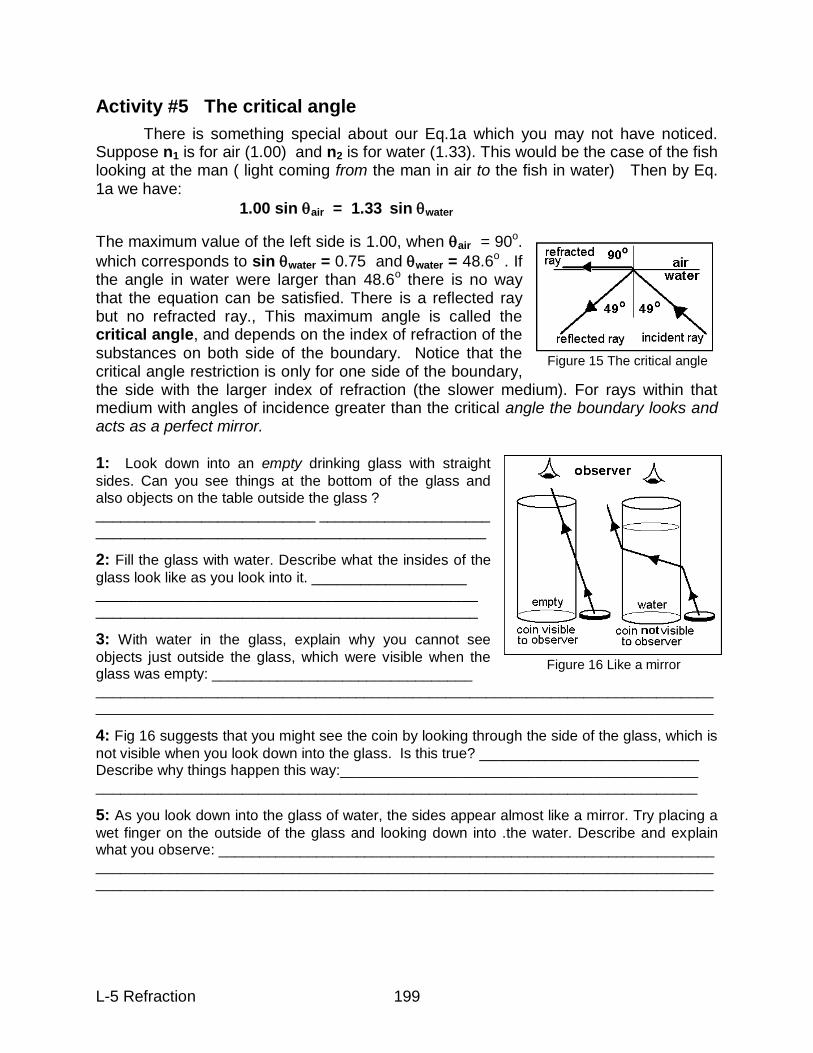
L-5 Refraction 199
Activity #5 The critical angle
There is something special about our Eq.1a which you may not have noticed. Suppose n1 is for air (1.00) and n2 is for water (1.33). This would be the case of the fish looking at the man ( light coming from the man in air to the fish in water) Then by Eq. 1a we have:
1.00 sin air = 1.33 sin water
The maximum value of the left side is 1.00, when air = 90o.
which corresponds to sin water = 0.75 and water = 48.6o . If the angle in water were larger than 48.6o there is no way that the equation can be satisfied. There is a reflected ray but no refracted ray., This maximum angle is called the critical angle, and depends on the index of refraction of the substances on both side of the boundary. Notice that the critical angle restriction is only for one side of the boundary, the side with the larger index of refraction (the slower medium). For rays within that medium with angles of incidence greater than the critical angle the boundary looks and acts as a perfect mirror. 1: Look down into an empty drinking glass with straight
sides. Can you see things at the bottom of the glass and also objects on the table outside the glass ? ___________________________ _____________________ ________________________________________________
2: Fill the glass with water. Describe what the insides of the
glass look like as you look into it. ___________________ _______________________________________________ _______________________________________________
3: With water in the glass, explain why you cannot see
objects just outside the glass, which were visible when the glass was empty: ________________________________ ____________________________________________________________________________ ____________________________________________________________________________
4: Fig 16 suggests that you might see the coin by looking through the side of the glass, which is
not visible when you look down into the glass. Is this true? ___________________________ Describe why things happen this way:____________________________________________ __________________________________________________________________________
5: As you look down into the glass of water, the sides appear almost like a mirror. Try placing a
wet finger on the outside of the glass and looking down into .the water. Describe and explain what you observe: _____________________________________________________________ ____________________________________________________________________________ ____________________________________________________________________________
Figure 15 The critical angle
Figure 16 Like a mirror
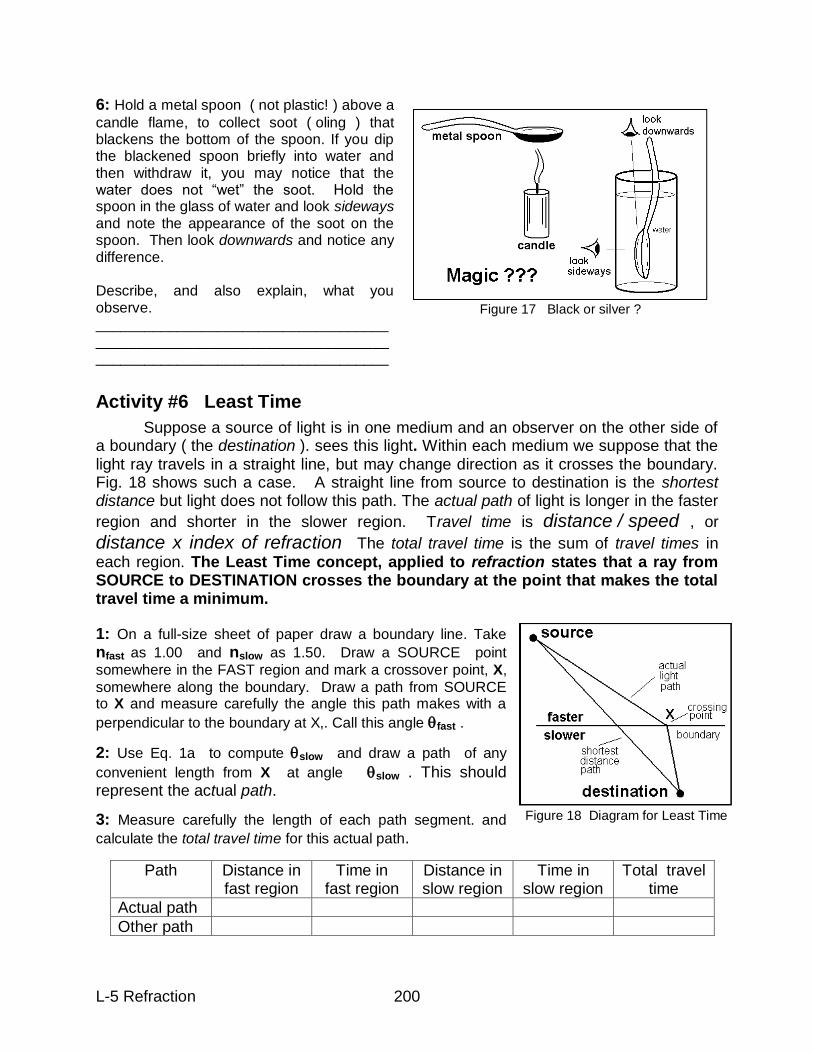
L-5 Refraction 200
6: Hold a metal spoon ( not plastic! ) above a
candle flame, to collect soot ( oling ) that blackens the bottom of the spoon. If you dip the blackened spoon briefly into water and then withdraw it, you may notice that the water does not “wet” the soot. Hold the spoon in the glass of water and look sideways and note the appearance of the soot on the spoon. Then look downwards and notice any difference. Describe, and also explain, what you observe. ____________________________________ ____________________________________ ____________________________________
Activity #6 Least Time
Suppose a source of light is in one medium and an observer on the other side of a boundary ( the destination ). sees this light. Within each medium we suppose that the light ray travels in a straight line, but may change direction as it crosses the boundary. Fig. 18 shows such a case. A straight line from source to destination is the shortest distance but light does not follow this path. The actual path of light is longer in the faster
region and shorter in the slower region. Travel time is distance / speed , or
distance x index of refraction The total travel time is the sum of travel times in each region. The Least Time concept, applied to refraction states that a ray from SOURCE to DESTINATION crosses the boundary at the point that makes the total travel time a minimum.
1: On a full-size sheet of paper draw a boundary line. Take
nfast as 1.00 and nslow as 1.50. Draw a SOURCE point
somewhere in the FAST region and mark a crossover point, X,
somewhere along the boundary. Draw a path from SOURCE to X and measure carefully the angle this path makes with a
perpendicular to the boundary at X,. Call this angle fast .
2: Use Eq. 1a to compute slow and draw a path of any
convenient length from X at angle slow . This should represent the actual path.
3: Measure carefully the length of each path segment. and
calculate the total travel time for this actual path.
Figure 17 Black or silver ?
Figure 18 Diagram for Least Time
Path Distance in fast region
Time in fast region
Distance in slow region
Time in slow region
Total travel time
Actual path
Other path
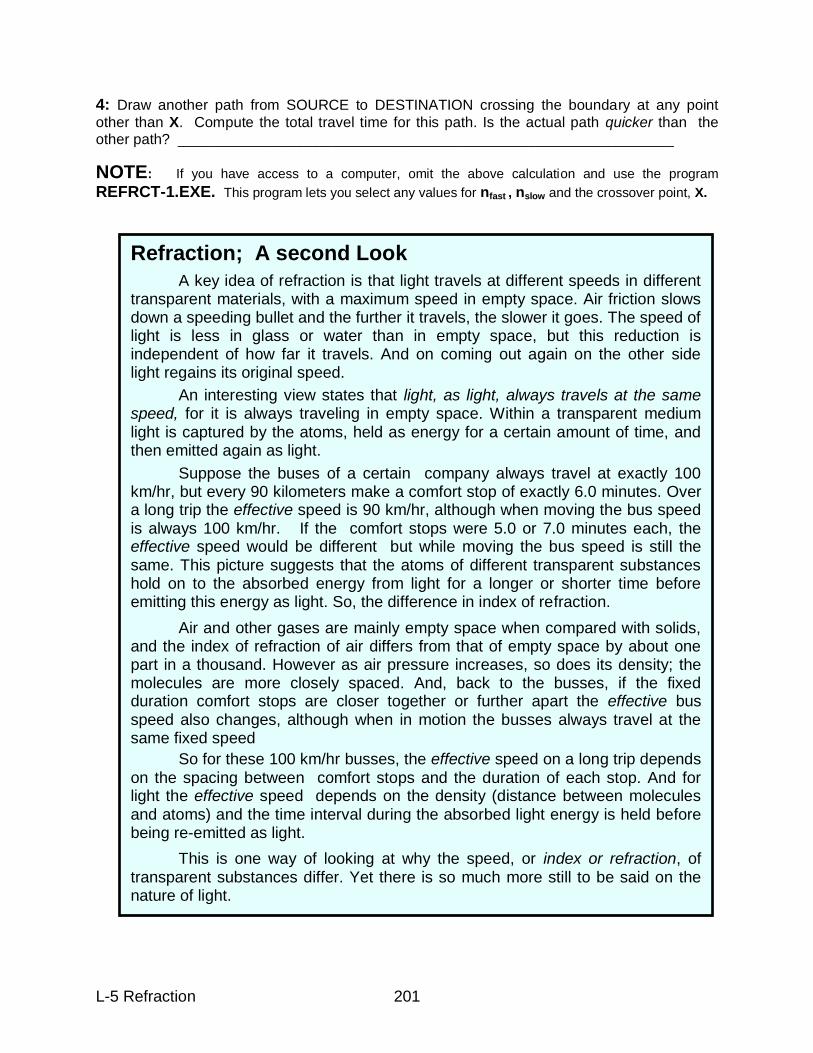
L-5 Refraction 201
4: Draw another path from SOURCE to DESTINATION crossing the boundary at any point
other than X. Compute the total travel time for this path. Is the actual path quicker than the other path? _____________________________________________________________
NOTE: If you have access to a computer, omit the above calculation and use the program
REFRCT-1.EXE. This program lets you select any values for nfast , nslow and the crossover point, X.
Refraction; A second Look
A key idea of refraction is that light travels at different speeds in different transparent materials, with a maximum speed in empty space. Air friction slows down a speeding bullet and the further it travels, the slower it goes. The speed of light is less in glass or water than in empty space, but this reduction is independent of how far it travels. And on coming out again on the other side light regains its original speed.
An interesting view states that light, as light, always travels at the same speed, for it is always traveling in empty space. Within a transparent medium light is captured by the atoms, held as energy for a certain amount of time, and then emitted again as light.
Suppose the buses of a certain company always travel at exactly 100 km/hr, but every 90 kilometers make a comfort stop of exactly 6.0 minutes. Over a long trip the effective speed is 90 km/hr, although when moving the bus speed is always 100 km/hr. If the comfort stops were 5.0 or 7.0 minutes each, the effective speed would be different but while moving the bus speed is still the same. This picture suggests that the atoms of different transparent substances hold on to the absorbed energy from light for a longer or shorter time before emitting this energy as light. So, the difference in index of refraction.
Air and other gases are mainly empty space when compared with solids, and the index of refraction of air differs from that of empty space by about one part in a thousand. However as air pressure increases, so does its density; the molecules are more closely spaced. And, back to the busses, if the fixed duration comfort stops are closer together or further apart the effective bus speed also changes, although when in motion the busses always travel at the same fixed speed
So for these 100 km/hr busses, the effective speed on a long trip depends on the spacing between comfort stops and the duration of each stop. And for light the effective speed depends on the density (distance between molecules and atoms) and the time interval during the absorbed light energy is held before being re-emitted as light.
This is one way of looking at why the speed, or index or refraction, of transparent substances differ. Yet there is so much more still to be said on the nature of light.
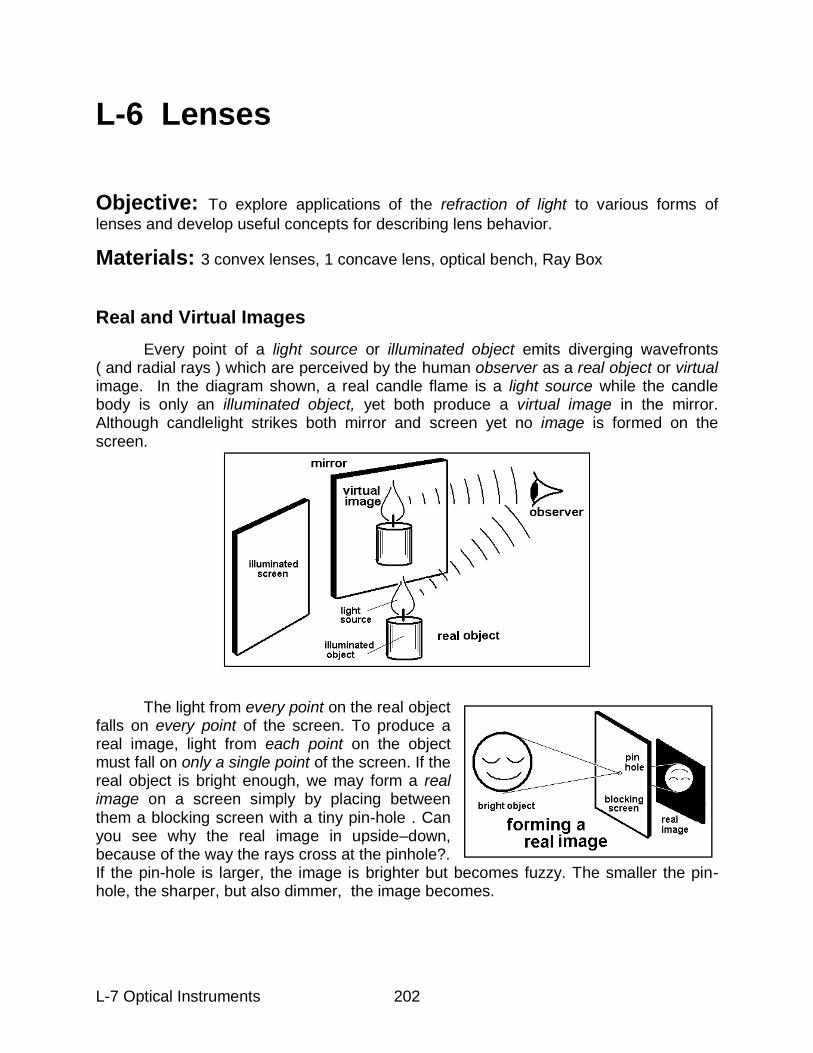
L-7 Optical Instruments 202
L-6 Lenses
Objective: To explore applications of the refraction of light to various forms of
lenses and develop useful concepts for describing lens behavior.
Materials: 3 convex lenses, 1 concave lens, optical bench, Ray Box
Real and Virtual Images
Every point of a light source or illuminated object emits diverging wavefronts ( and radial rays ) which are perceived by the human observer as a real object or virtual image. In the diagram shown, a real candle flame is a light source while the candle body is only an illuminated object, yet both produce a virtual image in the mirror. Although candlelight strikes both mirror and screen yet no image is formed on the screen.
The light from every point on the real object falls on every point of the screen. To produce a real image, light from each point on the object must fall on only a single point of the screen. If the real object is bright enough, we may form a real image on a screen simply by placing between them a blocking screen with a tiny pin-hole . Can you see why the real image in upside–down, because of the way the rays cross at the pinhole?. If the pin-hole is larger, the image is brighter but becomes fuzzy. The smaller the pin-hole, the sharper, but also dimmer, the image becomes.
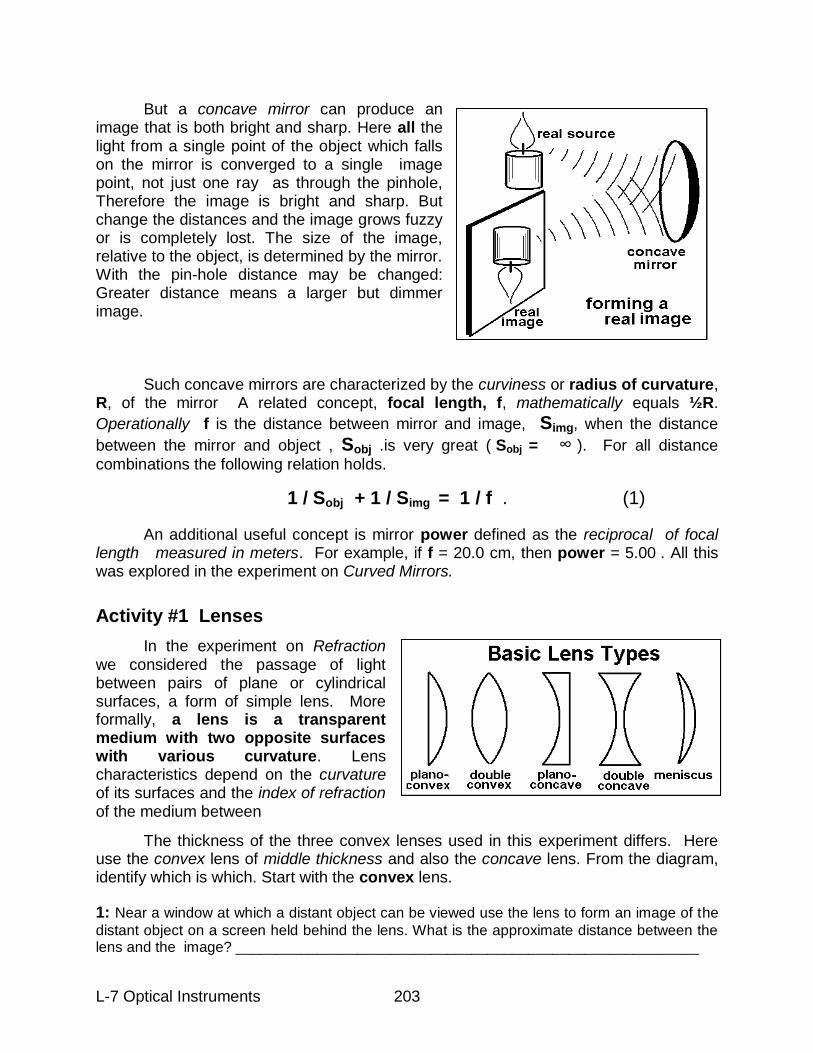
L-7 Optical Instruments 203
But a concave mirror can produce an image that is both bright and sharp. Here all the light from a single point of the object which falls on the mirror is converged to a single image point, not just one ray as through the pinhole, Therefore the image is bright and sharp. But change the distances and the image grows fuzzy or is completely lost. The size of the image, relative to the object, is determined by the mirror. With the pin-hole distance may be changed: Greater distance means a larger but dimmer image. Such concave mirrors are characterized by the curviness or radius of curvature, R, of the mirror A related concept, focal length, f, mathematically equals ½R.
Operationally f is the distance between mirror and image, Simg, when the distance
between the mirror and object , Sobj .is very great ( Sobj = ∞ ). For all distance
combinations the following relation holds.
1 / Sobj + 1 / Simg = 1 / f . (1)
An additional useful concept is mirror power defined as the reciprocal of focal length measured in meters. For example, if f = 20.0 cm, then power = 5.00 . All this was explored in the experiment on Curved Mirrors.
Activity #1 Lenses
In the experiment on Refraction we considered the passage of light between pairs of plane or cylindrical surfaces, a form of simple lens. More formally, a lens is a transparent medium with two opposite surfaces with various curvature. Lens characteristics depend on the curvature of its surfaces and the index of refraction of the medium between
The thickness of the three convex lenses used in this experiment differs. Here use the convex lens of middle thickness and also the concave lens. From the diagram, identify which is which. Start with the convex lens.
1: Near a window at which a distant object can be viewed use the lens to form an image of the
distant object on a screen held behind the lens. What is the approximate distance between the lens and the image? _________________________________________________________
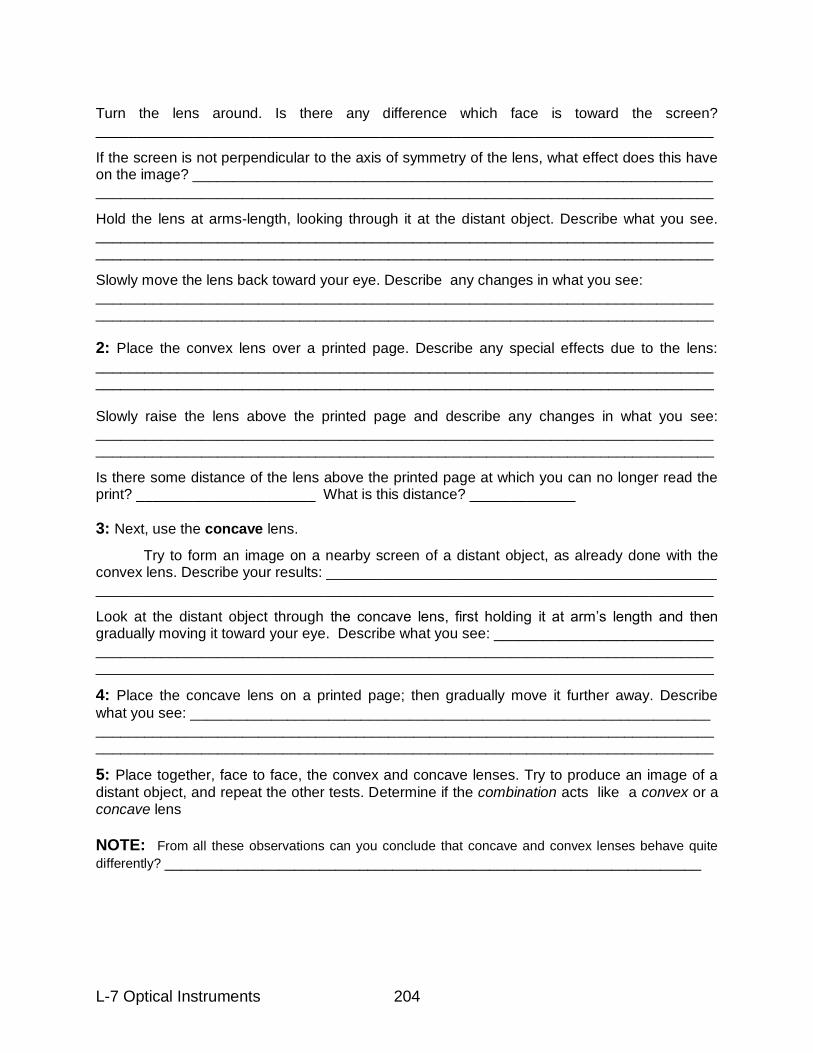
L-7 Optical Instruments 204
Turn the lens around. Is there any difference which face is toward the screen? ____________________________________________________________________________
If the screen is not perpendicular to the axis of symmetry of the lens, what effect does this have on the image? ________________________________________________________________ ____________________________________________________________________________
Hold the lens at arms-length, looking through it at the distant object. Describe what you see. ____________________________________________________________________________ ____________________________________________________________________________
Slowly move the lens back toward your eye. Describe any changes in what you see: ____________________________________________________________________________ ____________________________________________________________________________
2: Place the convex lens over a printed page. Describe any special effects due to the lens:
____________________________________________________________________________ ____________________________________________________________________________ Slowly raise the lens above the printed page and describe any changes in what you see: ____________________________________________________________________________ ____________________________________________________________________________
Is there some distance of the lens above the printed page at which you can no longer read the print? ______________________ What is this distance? _____________
3: Next, use the concave lens.
Try to form an image on a nearby screen of a distant object, as already done with the convex lens. Describe your results: ________________________________________________ ____________________________________________________________________________
Look at the distant object through the concave lens, first holding it at arm‟s length and then gradually moving it toward your eye. Describe what you see: ___________________________ ____________________________________________________________________________ ____________________________________________________________________________
4: Place the concave lens on a printed page; then gradually move it further away. Describe
what you see: ________________________________________________________________ ____________________________________________________________________________ ____________________________________________________________________________
5: Place together, face to face, the convex and concave lenses. Try to produce an image of a
distant object, and repeat the other tests. Determine if the combination acts like a convex or a concave lens
NOTE: From all these observations can you conclude that concave and convex lenses behave quite
differently? __________________________________________________________________
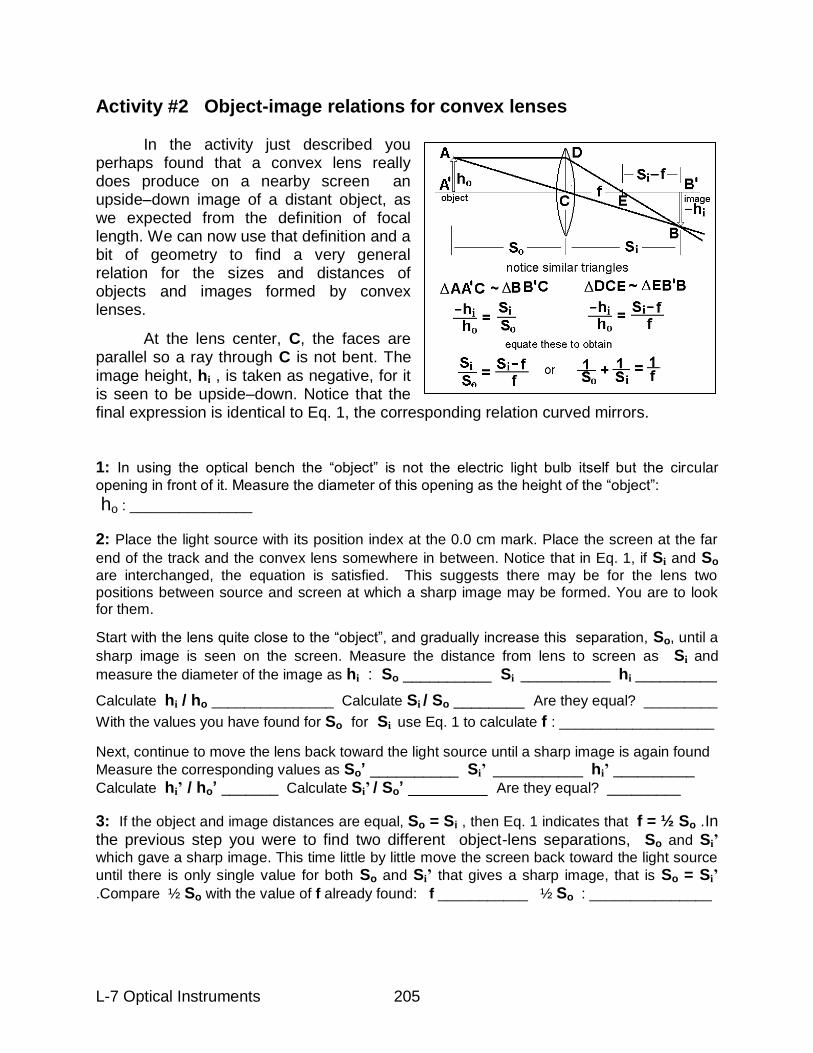
L-7 Optical Instruments 205
Activity #2 Object-image relations for convex lenses
In the activity just described you perhaps found that a convex lens really does produce on a nearby screen an upside–down image of a distant object, as we expected from the definition of focal length. We can now use that definition and a bit of geometry to find a very general relation for the sizes and distances of objects and images formed by convex lenses.
At the lens center, C, the faces are parallel so a ray through C is not bent. The image height, hi , is taken as negative, for it is seen to be upside–down. Notice that the final expression is identical to Eq. 1, the corresponding relation curved mirrors. 1: In using the optical bench the “object” is not the electric light bulb itself but the circular
opening in front of it. Measure the diameter of this opening as the height of the “object”:
ho : _______________
2: Place the light source with its position index at the 0.0 cm mark. Place the screen at the far
end of the track and the convex lens somewhere in between. Notice that in Eq. 1, if Si and So are interchanged, the equation is satisfied. This suggests there may be for the lens two positions between source and screen at which a sharp image may be formed. You are to look for them.
Start with the lens quite close to the “object”, and gradually increase this separation, So, until a
sharp image is seen on the screen. Measure the distance from lens to screen as Si and
measure the diameter of the image as hi : So __________ Si ___________ hi __________
Calculate hi / ho _______________ Calculate Si / So ________ Are they equal? _________
With the values you have found for So for Si use Eq. 1 to calculate f : ___________________
Next, continue to move the lens back toward the light source until a sharp image is again found
Measure the corresponding values as So‟ __________ Si’ ___________ hi’ __________
Calculate hi’ / ho‟ _______ Calculate Si’ / So‟ _________ Are they equal? _________
3: If the object and image distances are equal, So = Si , then Eq. 1 indicates that f = ½ So .In the previous step you were to find two different object-lens separations, So and Si’ which gave a sharp image. This time little by little move the screen back toward the light source
until there is only single value for both So and Si’ that gives a sharp image, that is So = Si’
.Compare ½ So with the value of f already found: f ___________ ½ So : _______________
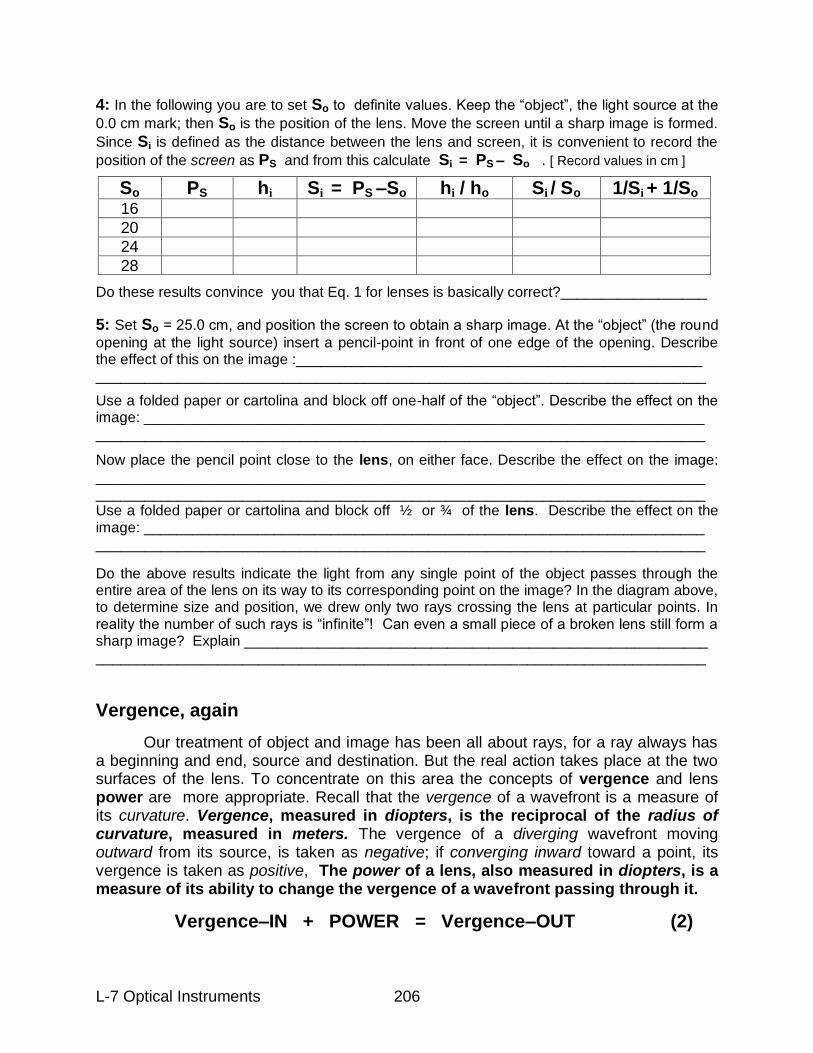
L-7 Optical Instruments 206
4: In the following you are to set So to definite values. Keep the “object”, the light source at the
0.0 cm mark; then So is the position of the lens. Move the screen until a sharp image is formed.
Since Si is defined as the distance between the lens and screen, it is convenient to record the
position of the screen as PS and from this calculate Si = PS – So . [ Record values in cm ]
Do these results convince you that Eq. 1 for lenses is basically correct?__________________
5: Set So = 25.0 cm, and position the screen to obtain a sharp image. At the “object” (the round
opening at the light source) insert a pencil-point in front of one edge of the opening. Describe the effect of this on the image :__________________________________________________ ___________________________________________________________________________
Use a folded paper or cartolina and block off one-half of the “object”. Describe the effect on the image: _____________________________________________________________________ ___________________________________________________________________________
Now place the pencil point close to the lens, on either face. Describe the effect on the image:
___________________________________________________________________________ ___________________________________________________________________________ Use a folded paper or cartolina and block off ½ or ¾ of the lens. Describe the effect on the image: _____________________________________________________________________ ___________________________________________________________________________
Do the above results indicate the light from any single point of the object passes through the entire area of the lens on its way to its corresponding point on the image? In the diagram above, to determine size and position, we drew only two rays crossing the lens at particular points. In reality the number of such rays is “infinite”! Can even a small piece of a broken lens still form a sharp image? Explain _________________________________________________________ ___________________________________________________________________________
Vergence, again
Our treatment of object and image has been all about rays, for a ray always has a beginning and end, source and destination. But the real action takes place at the two surfaces of the lens. To concentrate on this area the concepts of vergence and lens power are more appropriate. Recall that the vergence of a wavefront is a measure of its curvature. Vergence, measured in diopters, is the reciprocal of the radius of curvature, measured in meters. The vergence of a diverging wavefront moving outward from its source, is taken as negative; if converging inward toward a point, its vergence is taken as positive, The power of a lens, also measured in diopters, is a measure of its ability to change the vergence of a wavefront passing through it.
Vergence–IN + POWER = Vergence–OUT (2)
So PS hi Si = PS –So hi / ho Si / So 1/Si + 1/So 16
20
24
28
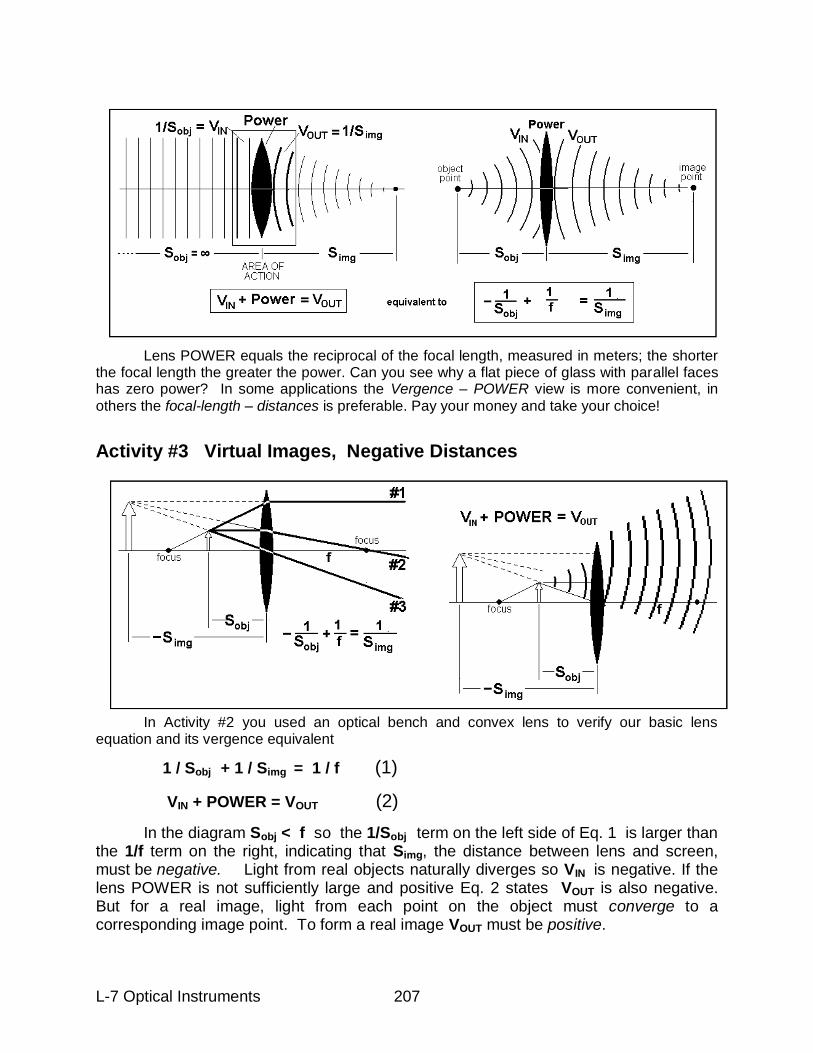
L-7 Optical Instruments 207
Lens POWER equals the reciprocal of the focal length, measured in meters; the shorter the focal length the greater the power. Can you see why a flat piece of glass with parallel faces has zero power? In some applications the Vergence – POWER view is more convenient, in others the focal-length – distances is preferable. Pay your money and take your choice!
Activity #3 Virtual Images, Negative Distances
In Activity #2 you used an optical bench and convex lens to verify our basic lens equation and its vergence equivalent
1 / Sobj + 1 / Simg = 1 / f (1)
VIN + POWER = VOUT (2)
In the diagram Sobj < f so the 1/Sobj term on the left side of Eq. 1 is larger than the 1/f term on the right, indicating that Simg, the distance between lens and screen, must be negative. Light from real objects naturally diverges so VIN is negative. If the lens POWER is not sufficiently large and positive Eq. 2 states VOUT is also negative. But for a real image, light from each point on the object must converge to a corresponding image point. To form a real image VOUT must be positive.
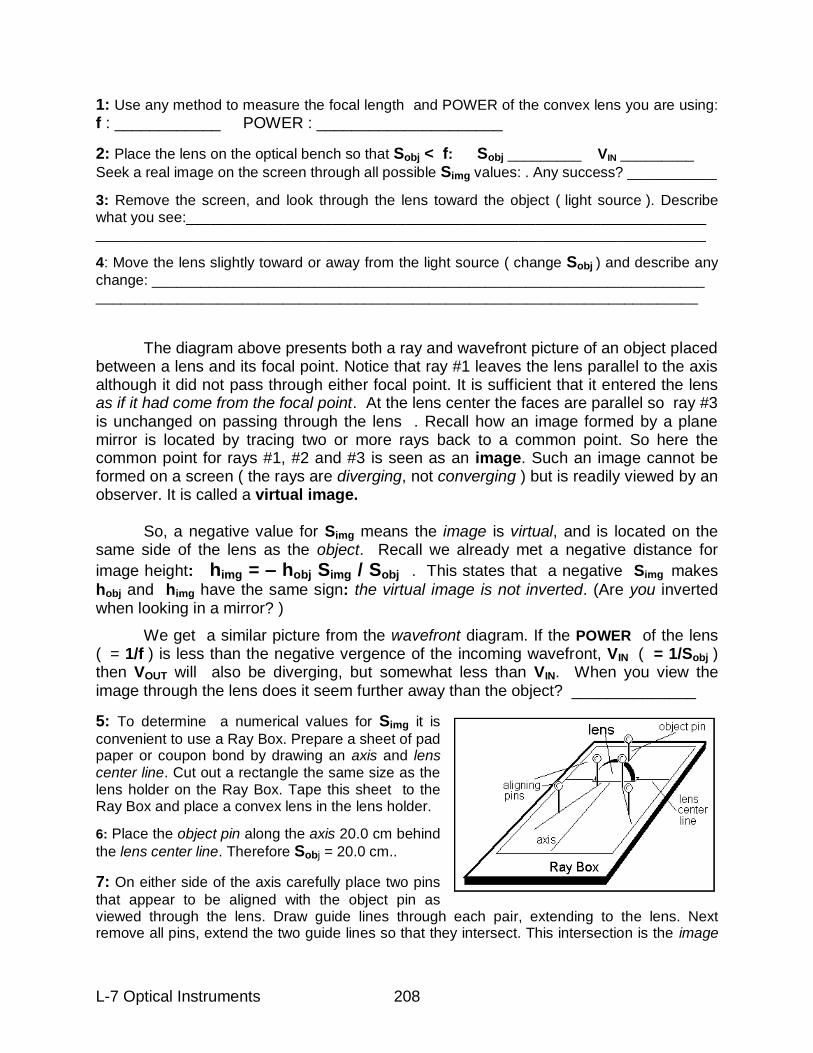
L-7 Optical Instruments 208
1: Use any method to measure the focal length and POWER of the convex lens you are using: f : ____________ POWER : _____________________
2: Place the lens on the optical bench so that Sobj < f: Sobj _________ VIN _________
Seek a real image on the screen through all possible Simg values: . Any success? ___________
3: Remove the screen, and look through the lens toward the object ( light source ). Describe what you see:________________________________________________________________ ___________________________________________________________________________
4: Move the lens slightly toward or away from the light source ( change Sobj ) and describe any
change: ____________________________________________________________________ __________________________________________________________________________
The diagram above presents both a ray and wavefront picture of an object placed between a lens and its focal point. Notice that ray #1 leaves the lens parallel to the axis although it did not pass through either focal point. It is sufficient that it entered the lens as if it had come from the focal point. At the lens center the faces are parallel so ray #3 is unchanged on passing through the lens . Recall how an image formed by a plane mirror is located by tracing two or more rays back to a common point. So here the common point for rays #1, #2 and #3 is seen as an image. Such an image cannot be formed on a screen ( the rays are diverging, not converging ) but is readily viewed by an observer. It is called a virtual image. So, a negative value for Simg means the image is virtual, and is located on the same side of the lens as the object. Recall we already met a negative distance for
image height: himg = – hobj Simg / Sobj . This states that a negative Simg makes
hobj and himg have the same sign: the virtual image is not inverted. (Are you inverted when looking in a mirror? )
We get a similar picture from the wavefront diagram. If the POWER of the lens ( = 1/f ) is less than the negative vergence of the incoming wavefront, VIN ( = 1/Sobj ) then VOUT will also be diverging, but somewhat less than VIN. When you view the image through the lens does it seem further away than the object? ______________
5: To determine a numerical values for Simg it is
convenient to use a Ray Box. Prepare a sheet of pad paper or coupon bond by drawing an axis and lens center line. Cut out a rectangle the same size as the lens holder on the Ray Box. Tape this sheet to the Ray Box and place a convex lens in the lens holder.
6: Place the object pin along the axis 20.0 cm behind
the lens center line. Therefore Sobj = 20.0 cm..
7: On either side of the axis carefully place two pins
that appear to be aligned with the object pin as viewed through the lens. Draw guide lines through each pair, extending to the lens. Next remove all pins, extend the two guide lines so that they intersect. This intersection is the image
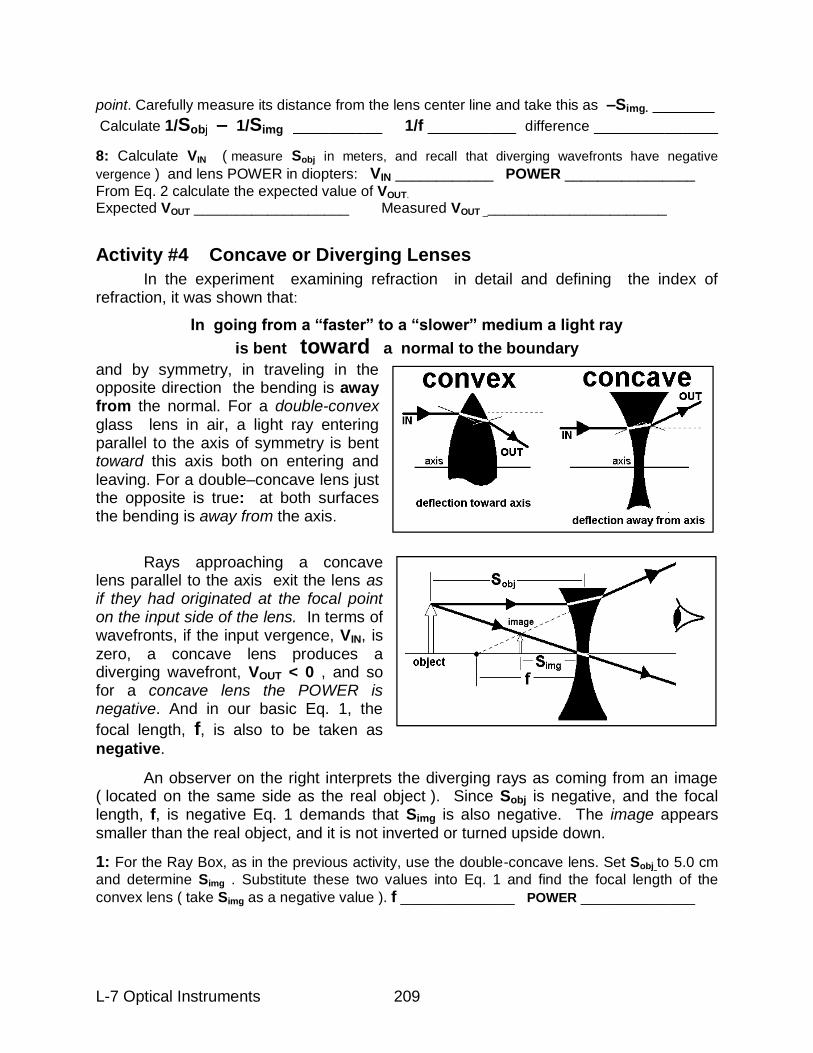
L-7 Optical Instruments 209
point. Carefully measure its distance from the lens center line and take this as –Simg. _______
Calculate 1/Sobj – 1/Simg __________ 1/f __________ difference ______________
8: Calculate VIN ( measure Sobj in meters, and recall that diverging wavefronts have negative
vergence ) and lens POWER in diopters: VIN ____________ POWER ________________
From Eq. 2 calculate the expected value of VOUT.
Expected VOUT ___________________ Measured VOUT _______________________
Activity #4 Concave or Diverging Lenses
In the experiment examining refraction in detail and defining the index of refraction, it was shown that:
In going from a “faster” to a “slower” medium a light ray
is bent toward a normal to the boundary
and by symmetry, in traveling in the opposite direction the bending is away from the normal. For a double-convex glass lens in air, a light ray entering parallel to the axis of symmetry is bent toward this axis both on entering and leaving. For a double–concave lens just the opposite is true: at both surfaces the bending is away from the axis.
Rays approaching a concave lens parallel to the axis exit the lens as if they had originated at the focal point on the input side of the lens. In terms of wavefronts, if the input vergence, VIN, is zero, a concave lens produces a diverging wavefront, VOUT < 0 , and so for a concave lens the POWER is negative. And in our basic Eq. 1, the
focal length, f, is also to be taken as
negative.
An observer on the right interprets the diverging rays as coming from an image ( located on the same side as the real object ). Since Sobj is negative, and the focal length, f, is negative Eq. 1 demands that Simg is also negative. The image appears smaller than the real object, and it is not inverted or turned upside down.
1: For the Ray Box, as in the previous activity, use the double-concave lens. Set Sobj to 5.0 cm
and determine Simg . Substitute these two values into Eq. 1 and find the focal length of the
convex lens ( take Simg as a negative value ). f ______________ POWER ______________
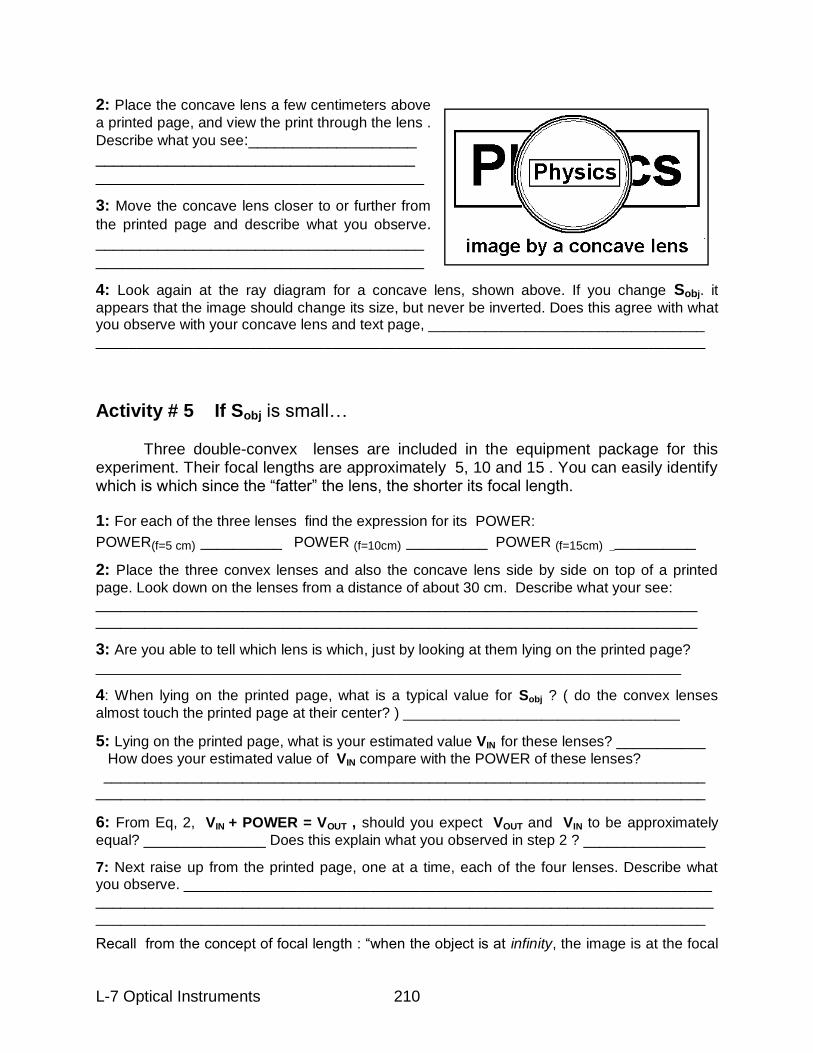
L-7 Optical Instruments 210
2: Place the concave lens a few centimeters above
a printed page, and view the print through the lens .
Describe what you see:___________________ ____________________________________ _____________________________________
3: Move the concave lens closer to or further from
the printed page and describe what you observe. _____________________________________ _____________________________________
4: Look again at the ray diagram for a concave lens, shown above. If you change Sobj. it
appears that the image should change its size, but never be inverted. Does this agree with what you observe with your concave lens and text page, __________________________________ ___________________________________________________________________________
Activity # 5 If Sobj is small… Three double-convex lenses are included in the equipment package for this experiment. Their focal lengths are approximately 5, 10 and 15 . You can easily identify which is which since the “fatter” the lens, the shorter its focal length.
1: For each of the three lenses find the expression for its POWER:
POWER(f=5 cm) __________ POWER (f=10cm) __________ POWER (f=15cm) ___________
2: Place the three convex lenses and also the concave lens side by side on top of a printed
page. Look down on the lenses from a distance of about 30 cm. Describe what your see: __________________________________________________________________________ __________________________________________________________________________
3: Are you able to tell which lens is which, just by looking at them lying on the printed page?
________________________________________________________________________
4: When lying on the printed page, what is a typical value for Sobj ? ( do the convex lenses
almost touch the printed page at their center? ) __________________________________
5: Lying on the printed page, what is your estimated value VIN for these lenses? ___________
How does your estimated value of VIN compare with the POWER of these lenses? __________________________________________________________________________ ___________________________________________________________________________
6: From Eq, 2, VIN + POWER = VOUT , should you expect VOUT and VIN to be approximately
equal? _______________ Does this explain what you observed in step 2 ? _______________
7: Next raise up from the printed page, one at a time, each of the four lenses. Describe what you observe. _________________________________________________________________ ____________________________________________________________________________ ___________________________________________________________________________
Recall from the concept of focal length : “when the object is at infinity, the image is at the focal
L-7 Optical Instruments 211
point, and when the object is at the focal point, the image is at infinity”. Is this idea related to what you see here? Explain: _____________________________________________________ ____________________________________________________________________________ ____________________________________________________________________________
8: Place face-to-face the concave lens and the 10 cm focal length convex lens. View the printed
page through this combination, close-up and at a distance. Describe what you see._________ ___________________________________________________________________________ ___________________________________________________________________________ What is the sum of the POWER of these two lenses? ________________________________ Does the diverging property of one just cancel the converging property of the other? ________
9:. What is the POWER of the 5 cm focal length convex lens __________________
What is the sum of the POWER of the concave and the 5 cm focal length convex __________ Place face to face the concave and 5 cm convex and view the printed page through this combination, and compare this view with that of the10 cm convex alone. Describe and also explain what you see. __________________________________________________________ ____________________________________________________________________________ ____________________________________________________________________________ NOTE 1: Notice that for the 5 cm convex lens there is significant distortion (the lines of text appear
twisted if viewed near the edge of the lens) . A requirement for the validity of our Eq. 1 (as shown in the Appendix to this experiment) is that the thickness of the lens should be small compared to its diameter,
that is, the lens must be “thin”. Since our 5 cm convex lens is somewhat “fat”, the distortion follows.
NOTE 2: If you have access to a computer, use the program LENSES-1.EXE to simulate wavefront and
ray descriptions
Appendix A: The Focal Length of a Lens
In common speech an “appendix” is an odd part of the body, which, if it begins to give you great pain, can be removed and you may still live happily ever after. This present “appendix” is something like that. For math freaks and nerds it may be just the thing, but if it‟s going to give you pain, just skip it. and move on. The concept of focal length comes up again and again in discussing mirrors and lenses. For mirrors, focal length depended only on the shape of the reflecting surface. When the boundary is between regions with different properties as in a lens, focal length depends not only on the shape of the boundary but also on the properties of the mediums on either side.
The focal length, f, of a lens is the distance between the lens center and the focal point or focus. All rays entering the lens parallel to the axis of symmetry leave the lens directed toward this focus. Since lenses are characterized by radius of curvature, R, and by the index of refraction, n, of the material of which they are made, it follows that f must be expressible in terms of R and n. To find this relation we may use either
of two approaches; Principle of Least Time or n1 sin 1 = n2 sin 2 , also known
as Snell’s Law.
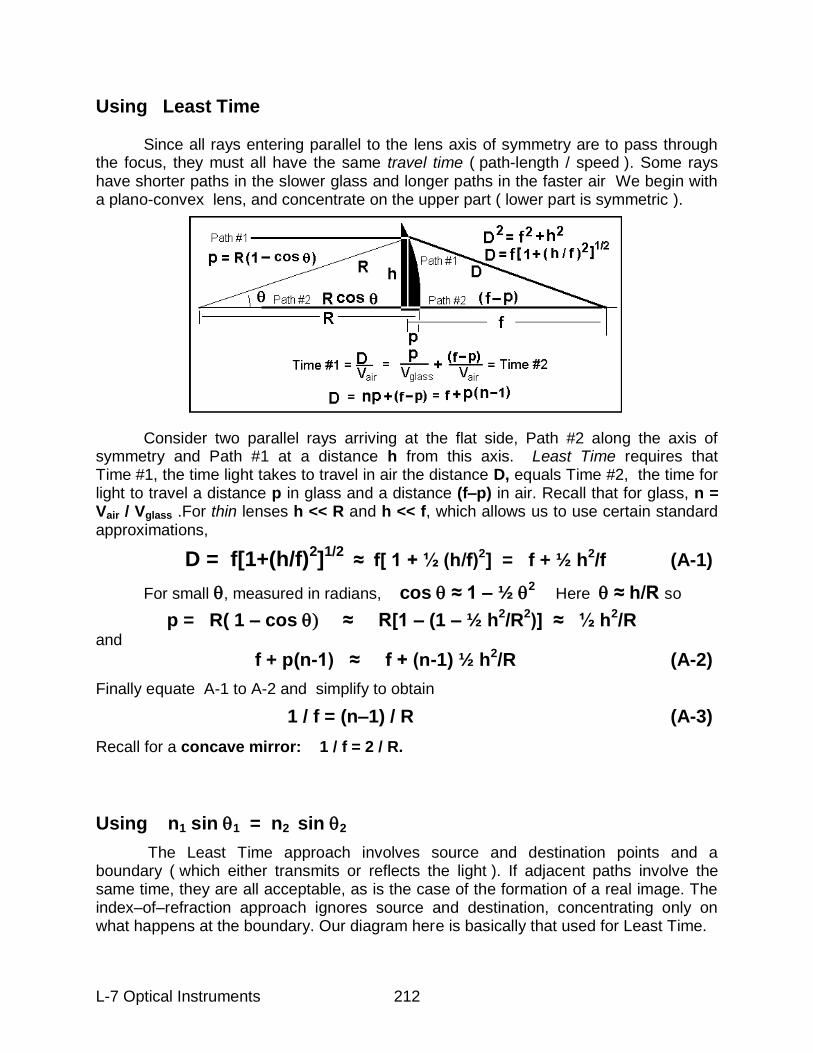
L-7 Optical Instruments 212
Using Least Time Since all rays entering parallel to the lens axis of symmetry are to pass through the focus, they must all have the same travel time ( path-length / speed ). Some rays have shorter paths in the slower glass and longer paths in the faster air We begin with a plano-convex lens, and concentrate on the upper part ( lower part is symmetric ). Consider two parallel rays arriving at the flat side, Path #2 along the axis of symmetry and Path #1 at a distance h from this axis. Least Time requires that Time #1, the time light takes to travel in air the distance D, equals Time #2, the time for light to travel a distance p in glass and a distance (f–p) in air. Recall that for glass, n = Vair / Vglass .For thin lenses h << R and h << f, which allows us to use certain standard approximations,
D = f[1+(h/f)2]1/2
≈ f[ 1 + ½ (h/f)2] = f + ½ h
2/f (A-1)
For small, measured in radians, cos ≈ 1 – ½ 2 Here ≈ h/R so
p = R( 1 – cos ≈ R[1 – (1 – ½ h2/R
2)] ≈ ½ h
2/R
and f + p(n-1) ≈ f + (n-1) ½ h
2/R (A-2)
Finally equate A-1 to A-2 and simplify to obtain
1 / f = (n–1) / R (A-3)
Recall for a concave mirror: 1 / f = 2 / R.
Using n1 sin 1 = n2 sin 2
The Least Time approach involves source and destination points and a boundary ( which either transmits or reflects the light ). If adjacent paths involve the same time, they are all acceptable, as is the case of the formation of a real image. The index–of–refraction approach ignores source and destination, concentrating only on what happens at the boundary. Our diagram here is basically that used for Least Time.
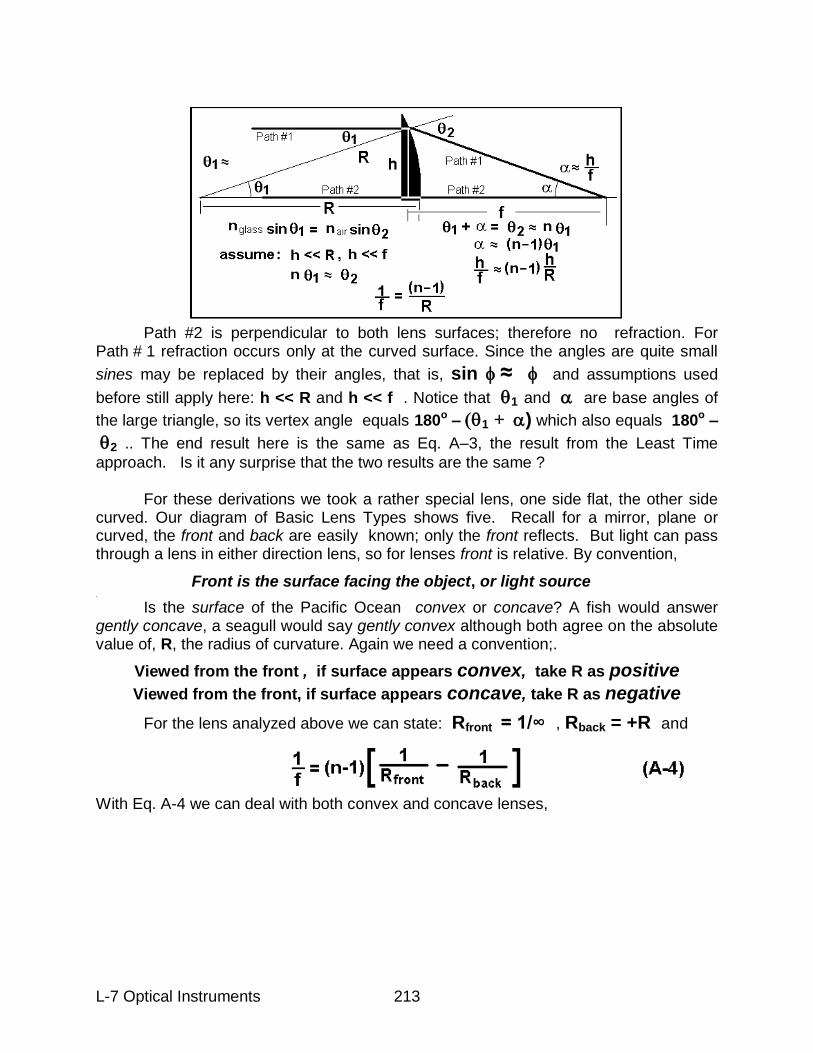
L-7 Optical Instruments 213
Path #2 is perpendicular to both lens surfaces; therefore no refraction. For Path # 1 refraction occurs only at the curved surface. Since the angles are quite small
sines may be replaced by their angles, that is, sin ≈ and assumptions used
before still apply here: h << R and h << f . Notice that 1 and are base angles of
the large triangle, so its vertex angle equals 180o –1 + ) which also equals 180o –
2 .. The end result here is the same as Eq. A–3, the result from the Least Time
approach. Is it any surprise that the two results are the same ? For these derivations we took a rather special lens, one side flat, the other side curved. Our diagram of Basic Lens Types shows five. Recall for a mirror, plane or curved, the front and back are easily known; only the front reflects. But light can pass through a lens in either direction lens, so for lenses front is relative. By convention,
Front is the surface facing the object, or light source .
Is the surface of the Pacific Ocean convex or concave? A fish would answer gently concave, a seagull would say gently convex although both agree on the absolute value of, R, the radius of curvature. Again we need a convention;.
Viewed from the front , if surface appears convex, take R as positive
Viewed from the front, if surface appears concave, take R as negative
For the lens analyzed above we can state: Rfront = 1/∞ , Rback = +R and
With Eq. A-4 we can deal with both convex and concave lenses,
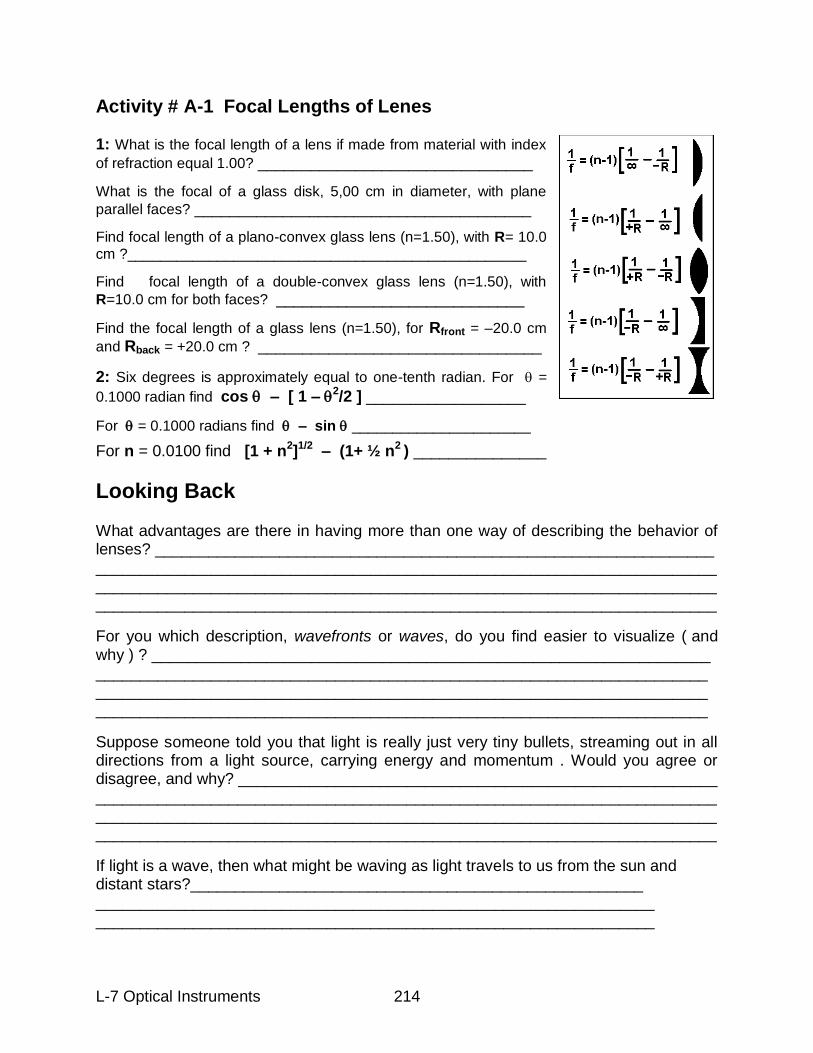
L-7 Optical Instruments 214
Activity # A-1 Focal Lengths of Lenes 1: What is the focal length of a lens if made from material with index
of refraction equal 1.00? _______________________________
What is the focal of a glass disk, 5,00 cm in diameter, with plane
parallel faces? ______________________________________
Find focal length of a plano-convex glass lens (n=1.50), with R= 10.0 cm ?_________________________________________________
Find focal length of a double-convex glass lens (n=1.50), with
R=10.0 cm for both faces? ____________________________
Find the focal length of a glass lens (n=1.50), for Rfront = –20.0 cm
and Rback = +20.0 cm ? ________________________________
2: Six degrees is approximately equal to one-tenth radian. For =
0.1000 radian find cos – [ 1 – 2/2 ] __________________
For = 0.1000 radians find – sin ______________________
For n = 0.0100 find [1 + n2]1/2 – (1+ ½ n2 ) _______________
Looking Back
What advantages are there in having more than one way of describing the behavior of lenses? _______________________________________________________________ ______________________________________________________________________ ______________________________________________________________________ ______________________________________________________________________
For you which description, wavefronts or waves, do you find easier to visualize ( and why ) ? _______________________________________________________________ _____________________________________________________________________ _____________________________________________________________________ _____________________________________________________________________
Suppose someone told you that light is really just very tiny bullets, streaming out in all directions from a light source, carrying energy and momentum . Would you agree or disagree, and why? ______________________________________________________ ______________________________________________________________________ ______________________________________________________________________ ______________________________________________________________________
If light is a wave, then what might be waving as light travels to us from the sun and distant stars?___________________________________________________ _______________________________________________________________ _______________________________________________________________
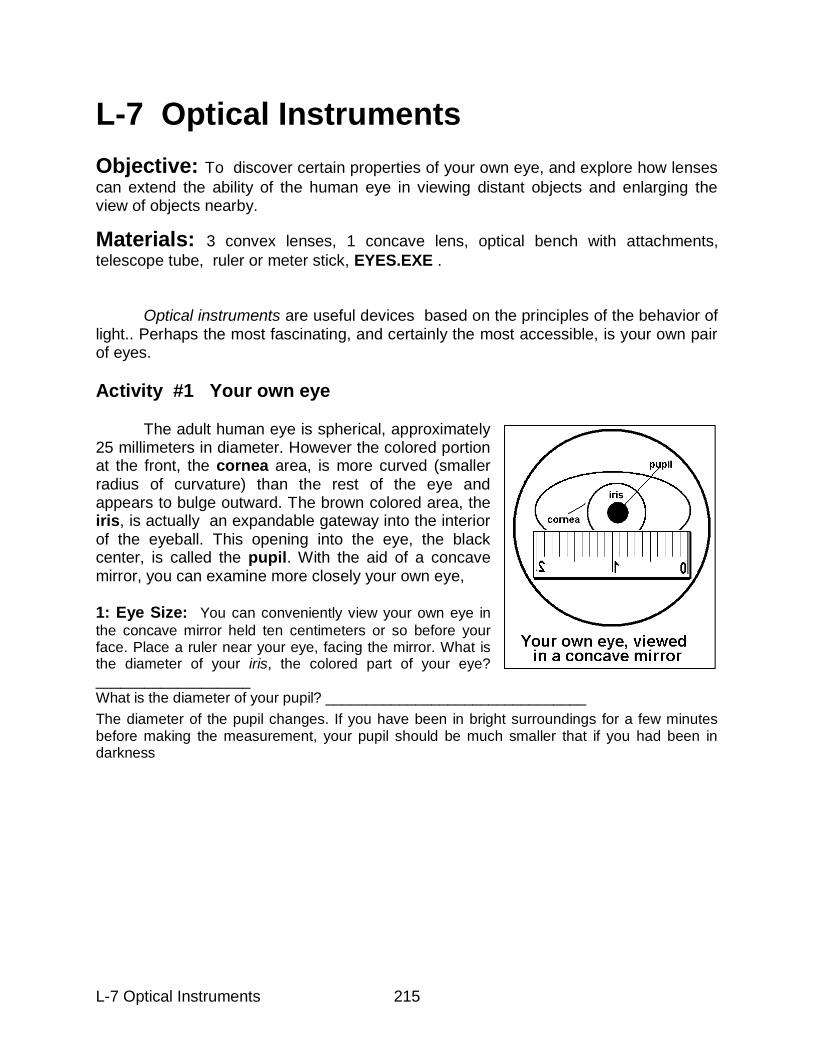
L-7 Optical Instruments 215
L-7 Optical Instruments
Objective: To discover certain properties of your own eye, and explore how lenses
can extend the ability of the human eye in viewing distant objects and enlarging the view of objects nearby.
Materials: 3 convex lenses, 1 concave lens, optical bench with attachments,
telescope tube, ruler or meter stick, EYES.EXE . Optical instruments are useful devices based on the principles of the behavior of light.. Perhaps the most fascinating, and certainly the most accessible, is your own pair of eyes.
Activity #1 Your own eye
The adult human eye is spherical, approximately 25 millimeters in diameter. However the colored portion at the front, the cornea area, is more curved (smaller radius of curvature) than the rest of the eye and appears to bulge outward. The brown colored area, the iris, is actually an expandable gateway into the interior of the eyeball. This opening into the eye, the black center, is called the pupil. With the aid of a concave mirror, you can examine more closely your own eye, 1: Eye Size: You can conveniently view your own eye in
the concave mirror held ten centimeters or so before your face. Place a ruler near your eye, facing the mirror. What is the diameter of your iris, the colored part of your eye?
___________________ What is the diameter of your pupil? ________________________________
The diameter of the pupil changes. If you have been in bright surroundings for a few minutes before making the measurement, your pupil should be much smaller that if you had been in darkness
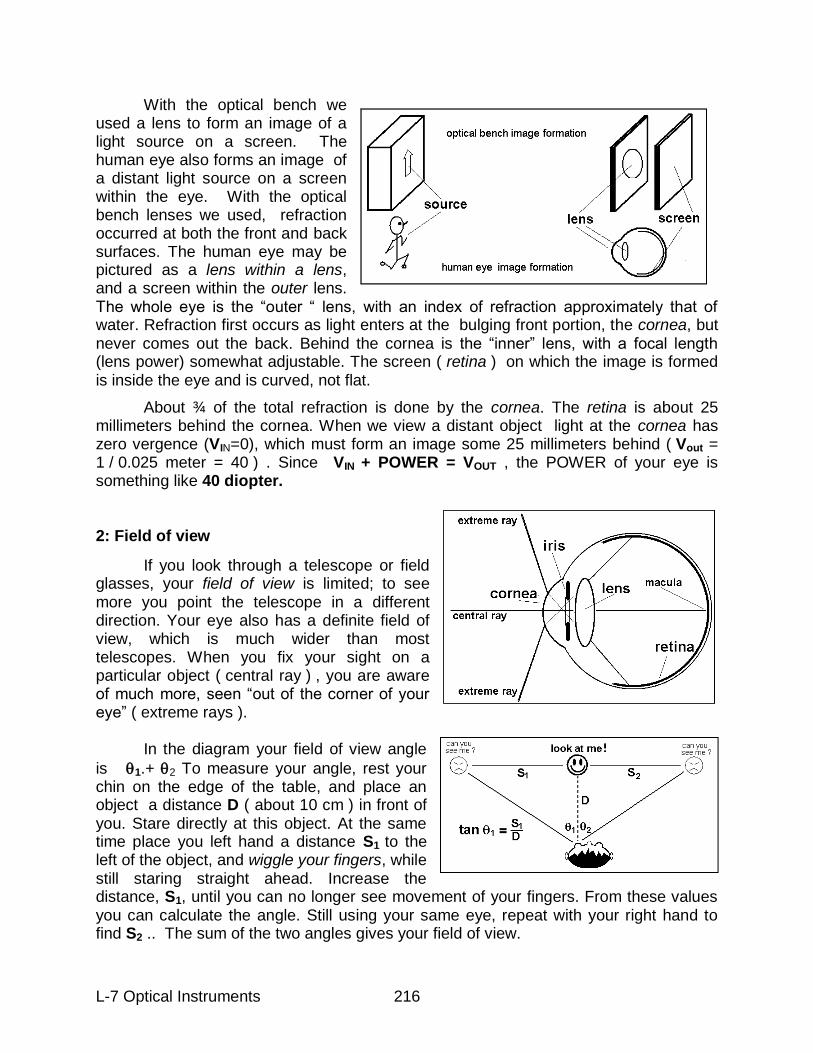
L-7 Optical Instruments 216
With the optical bench we used a lens to form an image of a light source on a screen. The human eye also forms an image of a distant light source on a screen within the eye. With the optical bench lenses we used, refraction occurred at both the front and back surfaces. The human eye may be pictured as a lens within a lens, and a screen within the outer lens. The whole eye is the “outer “ lens, with an index of refraction approximately that of water. Refraction first occurs as light enters at the bulging front portion, the cornea, but never comes out the back. Behind the cornea is the “inner” lens, with a focal length (lens power) somewhat adjustable. The screen ( retina ) on which the image is formed is inside the eye and is curved, not flat.
About ¾ of the total refraction is done by the cornea. The retina is about 25 millimeters behind the cornea. When we view a distant object light at the cornea has zero vergence (VIN=0), which must form an image some 25 millimeters behind ( Vout = 1 / 0.025 meter = 40 ) . Since VIN + POWER = VOUT , the POWER of your eye is something like 40 diopter. 2: Field of view
If you look through a telescope or field glasses, your field of view is limited; to see more you point the telescope in a different direction. Your eye also has a definite field of view, which is much wider than most telescopes. When you fix your sight on a particular object ( central ray ) , you are aware of much more, seen “out of the corner of your eye” ( extreme rays ). In the diagram your field of view angle
is 1.+ 2 To measure your angle, rest your chin on the edge of the table, and place an object a distance D ( about 10 cm ) in front of you. Stare directly at this object. At the same time place you left hand a distance S1 to the left of the object, and wiggle your fingers, while still staring straight ahead. Increase the distance, S1, until you can no longer see movement of your fingers. From these values you can calculate the angle. Still using your same eye, repeat with your right hand to find S2 .. The sum of the two angles gives your field of view.
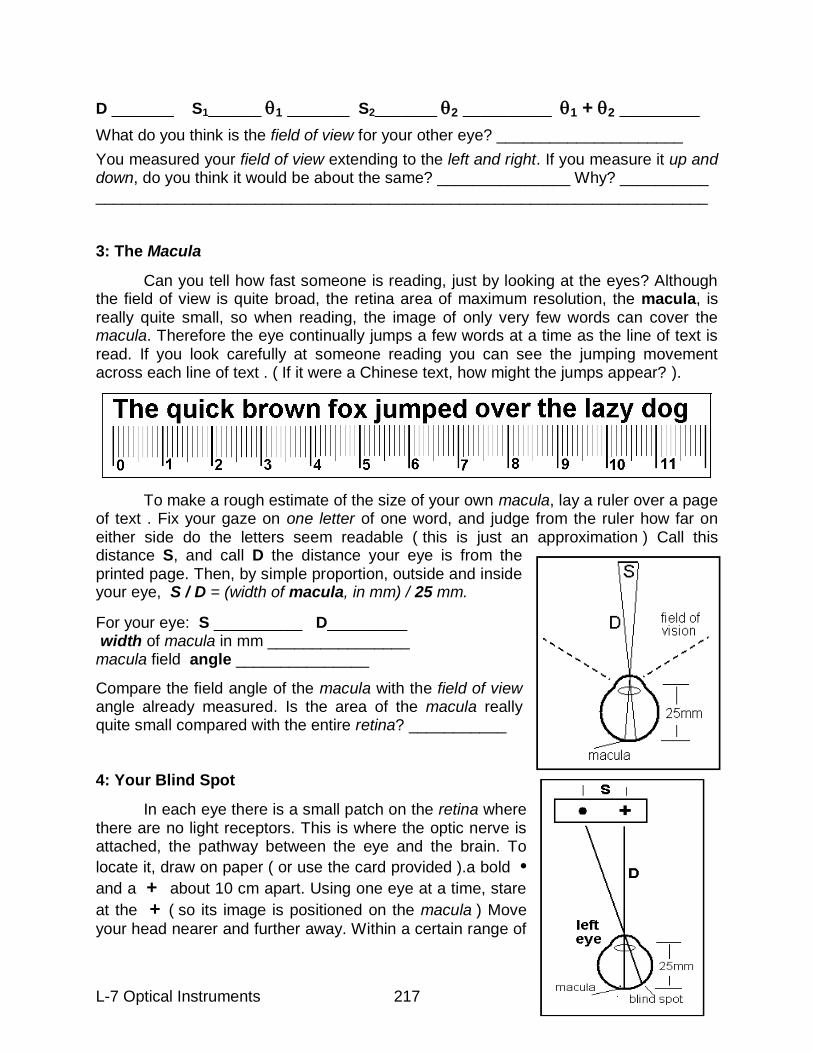
L-7 Optical Instruments 217
D _______ S1______ 1 _______ S2_______ 2 __________ 1 + 2 _________
What do you think is the field of view for your other eye? _____________________
You measured your field of view extending to the left and right. If you measure it up and down, do you think it would be about the same? _______________ Why? __________ _____________________________________________________________________ 3: The Macula
Can you tell how fast someone is reading, just by looking at the eyes? Although the field of view is quite broad, the retina area of maximum resolution, the macula, is really quite small, so when reading, the image of only very few words can cover the macula. Therefore the eye continually jumps a few words at a time as the line of text is read. If you look carefully at someone reading you can see the jumping movement across each line of text . ( If it were a Chinese text, how might the jumps appear? ).
To make a rough estimate of the size of your own macula, lay a ruler over a page of text . Fix your gaze on one letter of one word, and judge from the ruler how far on either side do the letters seem readable ( this is just an approximation ) Call this distance S, and call D the distance your eye is from the printed page. Then, by simple proportion, outside and inside your eye, S / D = (width of macula, in mm) / 25 mm. For your eye: S __________ D_________ width of macula in mm ________________ macula field angle _______________
Compare the field angle of the macula with the field of view angle already measured. Is the area of the macula really quite small compared with the entire retina? ___________ 4: Your Blind Spot
In each eye there is a small patch on the retina where there are no light receptors. This is where the optic nerve is attached, the pathway between the eye and the brain. To
locate it, draw on paper ( or use the card provided ).a bold • and a + about 10 cm apart. Using one eye at a time, stare
at the + ( so its image is positioned on the macula ) Move
your head nearer and further away. Within a certain range of
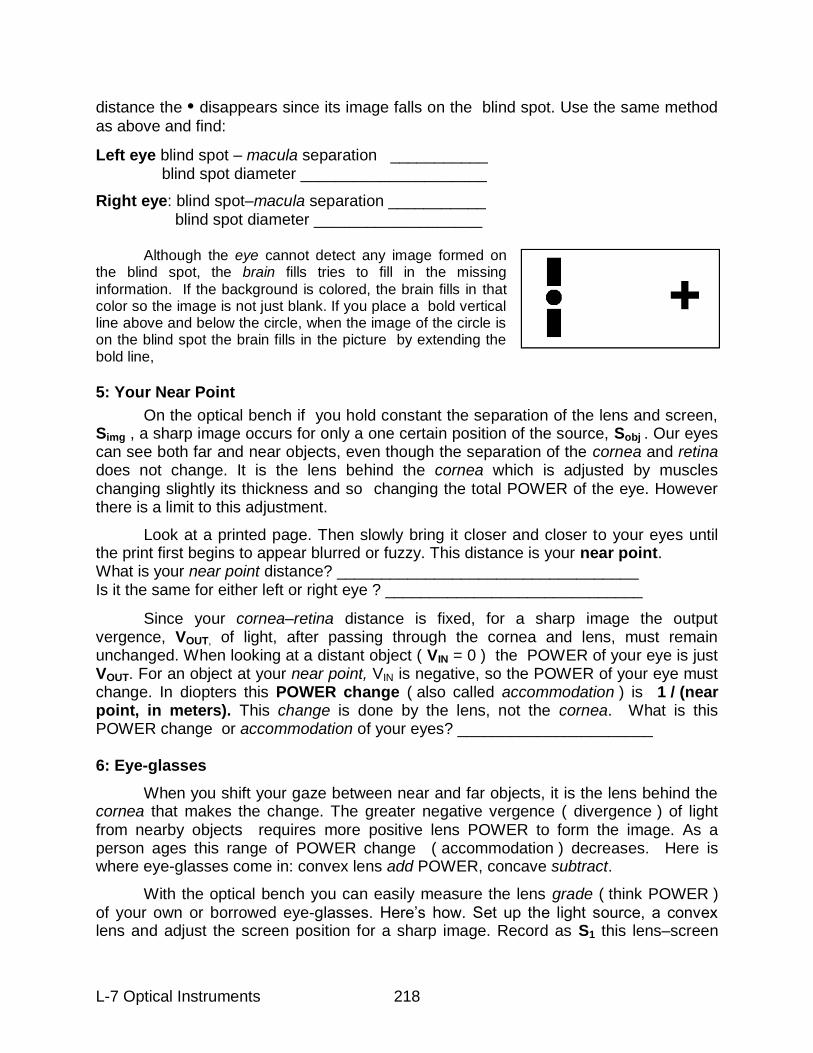
L-7 Optical Instruments 218
distance the • disappears since its image falls on the blind spot. Use the same method
as above and find:
Left eye blind spot – macula separation ___________ blind spot diameter _____________________
Right eye: blind spot–macula separation ___________ blind spot diameter ___________________ Although the eye cannot detect any image formed on the blind spot, the brain fills tries to fill in the missing
information. If the background is colored, the brain fills in that color so the image is not just blank. If you place a bold vertical line above and below the circle, when the image of the circle is on the blind spot the brain fills in the picture by extending the bold line,
5: Your Near Point
On the optical bench if you hold constant the separation of the lens and screen, Simg , a sharp image occurs for only a one certain position of the source, Sobj . Our eyes can see both far and near objects, even though the separation of the cornea and retina does not change. It is the lens behind the cornea which is adjusted by muscles changing slightly its thickness and so changing the total POWER of the eye. However there is a limit to this adjustment.
Look at a printed page. Then slowly bring it closer and closer to your eyes until the print first begins to appear blurred or fuzzy. This distance is your near point. What is your near point distance? __________________________________ Is it the same for either left or right eye ? _____________________________
Since your cornea–retina distance is fixed, for a sharp image the output vergence, VOUT, of light, after passing through the cornea and lens, must remain unchanged. When looking at a distant object ( VIN = 0 ) the POWER of your eye is just VOUT. For an object at your near point, VIN is negative, so the POWER of your eye must change. In diopters this POWER change ( also called accommodation ) is 1 / (near point, in meters). This change is done by the lens, not the cornea. What is this POWER change or accommodation of your eyes? ______________________ 6: Eye-glasses
When you shift your gaze between near and far objects, it is the lens behind the cornea that makes the change. The greater negative vergence ( divergence ) of light from nearby objects requires more positive lens POWER to form the image. As a person ages this range of POWER change ( accommodation ) decreases. Here is where eye-glasses come in: convex lens add POWER, concave subtract.
With the optical bench you can easily measure the lens grade ( think POWER ) of your own or borrowed eye-glasses. Here‟s how. Set up the light source, a convex lens and adjust the screen position for a sharp image. Record as S1 this lens–screen
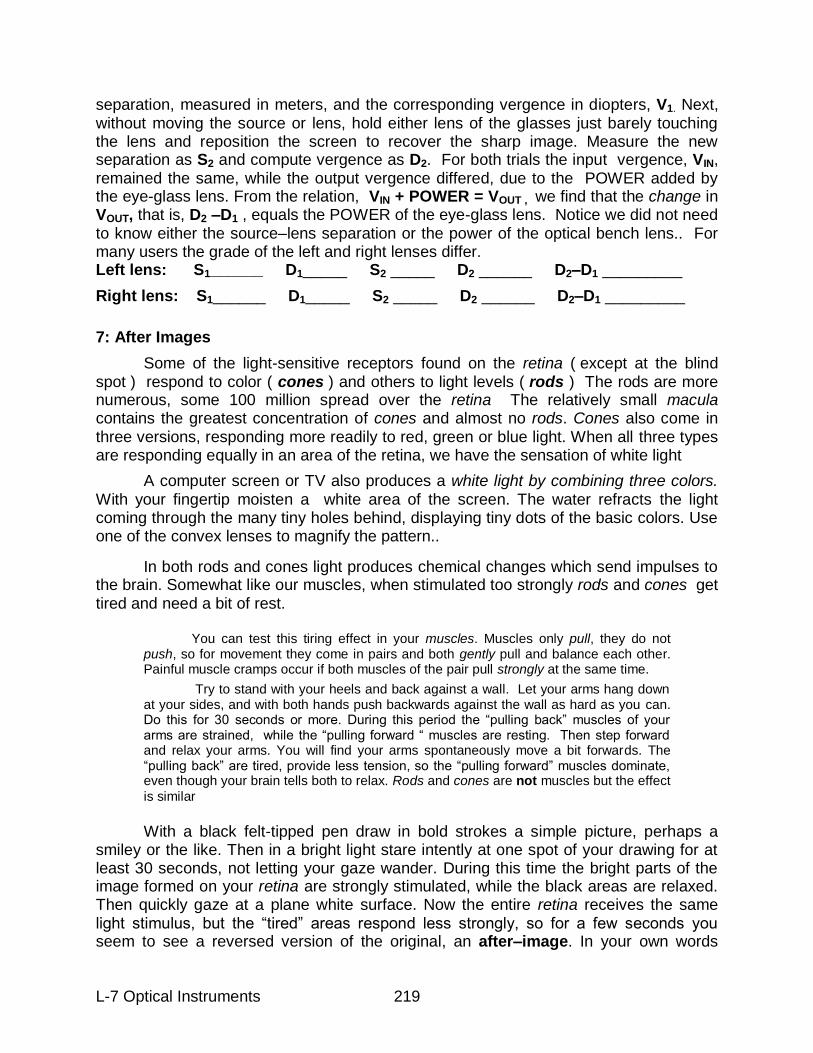
L-7 Optical Instruments 219
separation, measured in meters, and the corresponding vergence in diopters, V1. Next, without moving the source or lens, hold either lens of the glasses just barely touching the lens and reposition the screen to recover the sharp image. Measure the new separation as S2 and compute vergence as D2. For both trials the input vergence, VIN, remained the same, while the output vergence differed, due to the POWER added by the eye-glass lens. From the relation, VIN + POWER = VOUT , we find that the change in VOUT, that is, D2 –D1 , equals the POWER of the eye-glass lens. Notice we did not need to know either the source–lens separation or the power of the optical bench lens.. For many users the grade of the left and right lenses differ. Left lens: S1______ D1_____ S2 _____ D2 ______ D2–D1 _________
Right lens: S1______ D1_____ S2 _____ D2 ______ D2–D1 _________
7: After Images
Some of the light-sensitive receptors found on the retina ( except at the blind spot ) respond to color ( cones ) and others to light levels ( rods ) The rods are more numerous, some 100 million spread over the retina The relatively small macula contains the greatest concentration of cones and almost no rods. Cones also come in three versions, responding more readily to red, green or blue light. When all three types are responding equally in an area of the retina, we have the sensation of white light
A computer screen or TV also produces a white light by combining three colors. With your fingertip moisten a white area of the screen. The water refracts the light coming through the many tiny holes behind, displaying tiny dots of the basic colors. Use one of the convex lenses to magnify the pattern..
In both rods and cones light produces chemical changes which send impulses to the brain. Somewhat like our muscles, when stimulated too strongly rods and cones get tired and need a bit of rest.
You can test this tiring effect in your muscles. Muscles only pull, they do not push, so for movement they come in pairs and both gently pull and balance each other. Painful muscle cramps occur if both muscles of the pair pull strongly at the same time.
Try to stand with your heels and back against a wall. Let your arms hang down at your sides, and with both hands push backwards against the wall as hard as you can. Do this for 30 seconds or more. During this period the “pulling back” muscles of your arms are strained, while the “pulling forward “ muscles are resting. Then step forward and relax your arms. You will find your arms spontaneously move a bit forwards. The “pulling back” are tired, provide less tension, so the “pulling forward” muscles dominate, even though your brain tells both to relax. Rods and cones are not muscles but the effect
is similar
With a black felt-tipped pen draw in bold strokes a simple picture, perhaps a smiley or the like. Then in a bright light stare intently at one spot of your drawing for at least 30 seconds, not letting your gaze wander. During this time the bright parts of the image formed on your retina are strongly stimulated, while the black areas are relaxed. Then quickly gaze at a plane white surface. Now the entire retina receives the same light stimulus, but the “tired” areas respond less strongly, so for a few seconds you seem to see a reversed version of the original, an after–image. In your own words

L-7 Optical Instruments 220
describe what you see. ________________________________________________ ___________________________________________________________________ ___________________________________________________________________
The equipment kit for this experiment contains a prepared color sheet, which you can use just like the black and white drawing described above. The different color receptors tire depending on the color and intensity of the light falling on them. If you use this color sheet,
describe your sensations. __________________________________________________ _____________________________________________________________________ _____________________________________________________________________
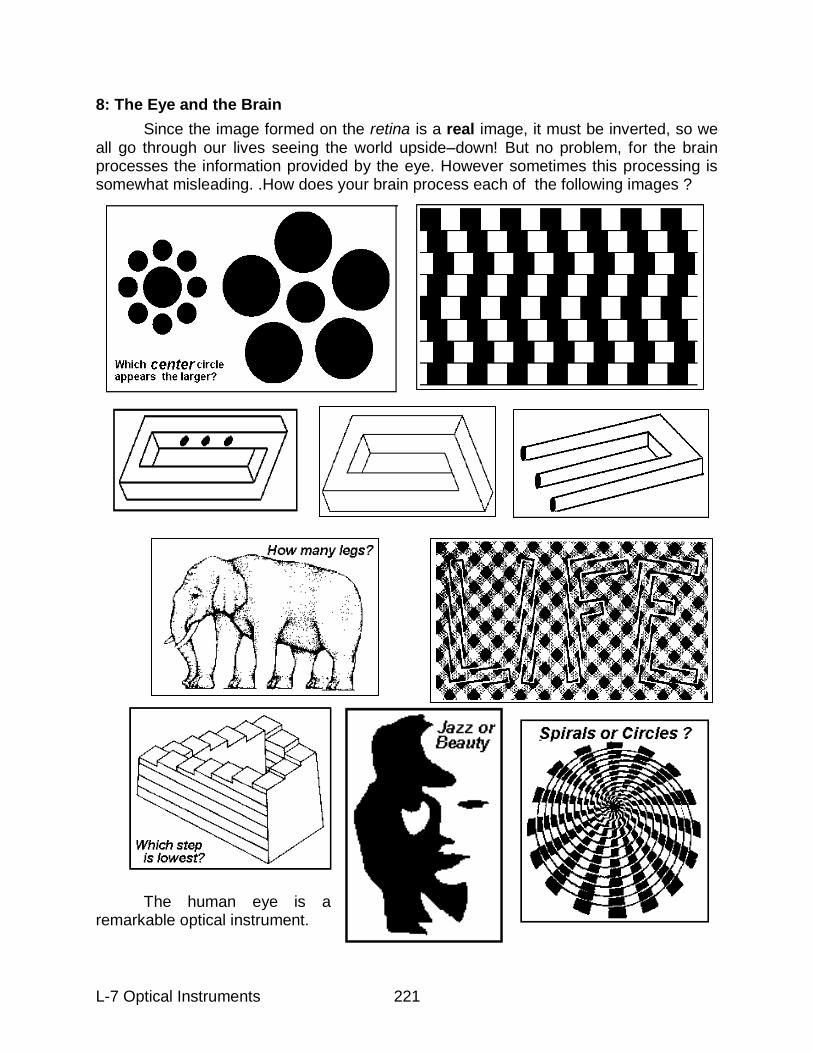
L-7 Optical Instruments 221
8: The Eye and the Brain
Since the image formed on the retina is a real image, it must be inverted, so we all go through our lives seeing the world upside–down! But no problem, for the brain processes the information provided by the eye. However sometimes this processing is somewhat misleading. .How does your brain process each of the following images ?
The human eye is a remarkable optical instrument.

L-7 Optical Instruments 222
Activity #2 The Magnifying Glass
Seeing is about producing a real image on the retina of the eye. About that image two questions arise: How sharp? and How large?
For sharpness, as we have already seen, light entering the eye must have a vergence between zero ( object very far away ) and about –5 ( object at near point of 20 centimeters ). The eye lens provides the proper POWER level ( accommodation ), sometimes with a little help for eye-glasses. All the light that enters the eye from any point on the object must be brought to a corresponding single point on the retina.
How large depends on the size of retina image.. The image of a nearby mouse may be larger on the retina than that of a distant elephant. In the diagram h represents the ( inverted ) height of the image on the retina
and the angle between the two extreme rays, which determine the image size for the human eye. For an object of
given Height increases as Distance is made smaller But there is a minimum Distance, the near point value, for less than this the image is no longer sharp. By using a single well-placed convex lens,
a magnifying glass, we can increase and also keep the vergence of the light entering the eye within an comfortable range, without changing the Distance. Of course we will not use a magnifying glass for the distant elephant; that‟s a job for telescopes.
:
The diagram shows the object located between the lens and the focal point or focus, Sobj < f and 1/Sobj > 1/f . To satisfy our basic equation 1/Simg as well as Simg must be negative, indicating a virtual image. The closer the object is to the focus, the larger the value of Simg .and the more distant from the observer
Relative image size follows the relation himg / hobj = Simg / Sobj . You may object that we don‟t gain anything here for as the virtual image grows larger, it also moves further away. True, but with a large Simg there is no longer a problem with the near point. You can move your eye as close as you wish to the lens and the image on your
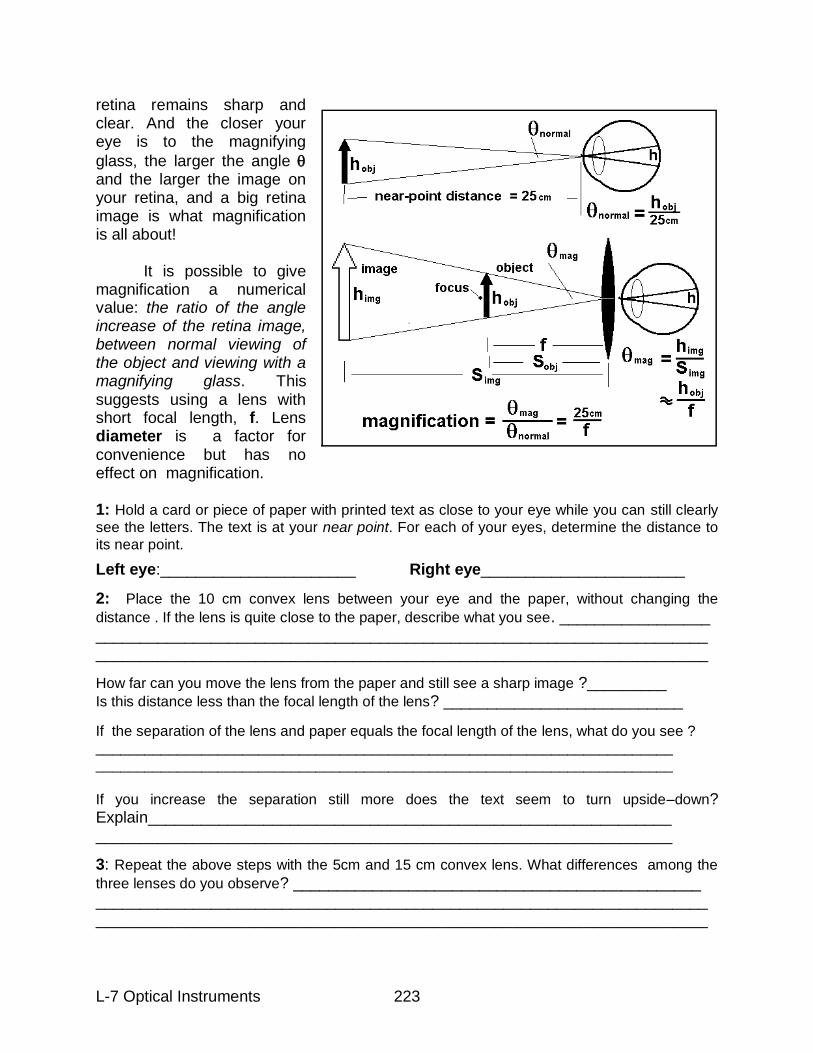
L-7 Optical Instruments 223
retina remains sharp and clear. And the closer your eye is to the magnifying
glass, the larger the angle and the larger the image on your retina, and a big retina image is what magnification is all about! It is possible to give magnification a numerical value: the ratio of the angle increase of the retina image, between normal viewing of the object and viewing with a magnifying glass. This suggests using a lens with short focal length, f. Lens diameter is a factor for convenience but has no effect on magnification. 1: Hold a card or piece of paper with printed text as close to your eye while you can still clearly
see the letters. The text is at your near point. For each of your eyes, determine the distance to
its near point.
Left eye:______________________ Right eye_______________________
2: Place the 10 cm convex lens between your eye and the paper, without changing the
distance . If the lens is quite close to the paper, describe what you see. _________________ _____________________________________________________________________ _____________________________________________________________________
How far can you move the lens from the paper and still see a sharp image ?_________ Is this distance less than the focal length of the lens? ___________________________
If the separation of the lens and paper equals the focal length of the lens, what do you see ? _______________________________________________________________________ _______________________________________________________________________
If you increase the separation still more does the text seem to turn upside–down? Explain___________________________________________________________ _________________________________________________________________
3: Repeat the above steps with the 5cm and 15 cm convex lens. What differences among the
three lenses do you observe? ______________________________________________ _____________________________________________________________________ _____________________________________________________________________
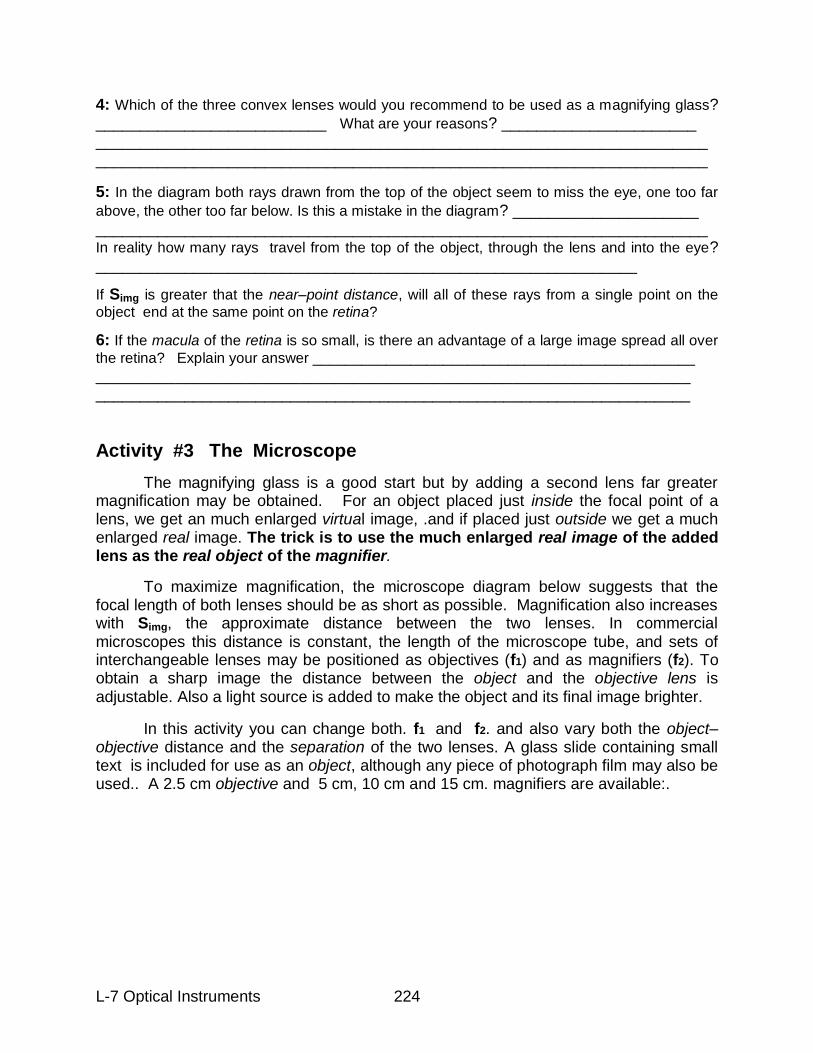
L-7 Optical Instruments 224
4: Which of the three convex lenses would you recommend to be used as a magnifying glass? __________________________ What are your reasons? ______________________ _____________________________________________________________________ _____________________________________________________________________
5: In the diagram both rays drawn from the top of the object seem to miss the eye, one too far
above, the other too far below. Is this a mistake in the diagram? _____________________ _____________________________________________________________________ In reality how many rays travel from the top of the object, through the lens and into the eye? _____________________________________________________________
If Simg is greater that the near–point distance, will all of these rays from a single point on the
object end at the same point on the retina?
6: If the macula of the retina is so small, is there an advantage of a large image spread all over
the retina? Explain your answer _______________________________________________
___________________________________________________________________ ___________________________________________________________________
Activity #3 The Microscope
The magnifying glass is a good start but by adding a second lens far greater magnification may be obtained. For an object placed just inside the focal point of a lens, we get an much enlarged virtual image, .and if placed just outside we get a much enlarged real image. The trick is to use the much enlarged real image of the added lens as the real object of the magnifier.
To maximize magnification, the microscope diagram below suggests that the focal length of both lenses should be as short as possible. Magnification also increases with Simg, the approximate distance between the two lenses. In commercial microscopes this distance is constant, the length of the microscope tube, and sets of interchangeable lenses may be positioned as objectives (f1) and as magnifiers (f2). To obtain a sharp image the distance between the object and the objective lens is adjustable. Also a light source is added to make the object and its final image brighter.
In this activity you can change both. f1 and f2. and also vary both the object–objective distance and the separation of the two lenses. A glass slide containing small text is included for use as an object, although any piece of photograph film may also be used.. A 2.5 cm objective and 5 cm, 10 cm and 15 cm. magnifiers are available:.
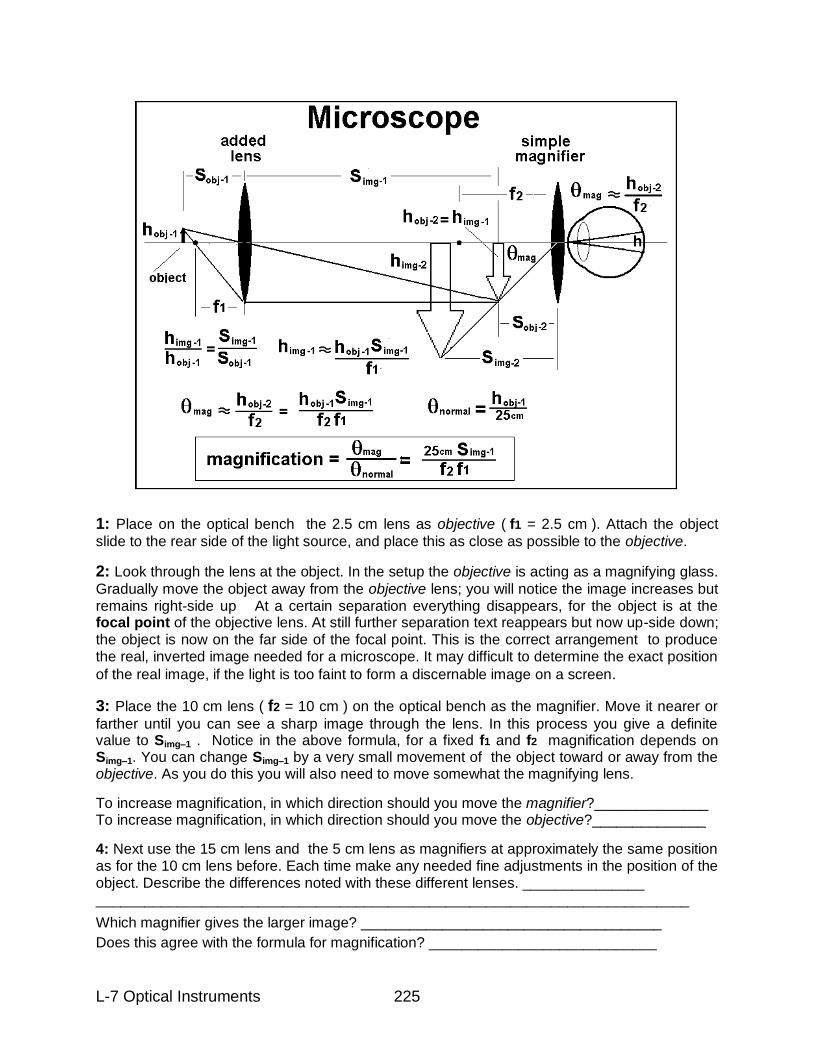
L-7 Optical Instruments 225
1: Place on the optical bench the 2.5 cm lens as objective ( f1 = 2.5 cm ). Attach the object
slide to the rear side of the light source, and place this as close as possible to the objective.
2: Look through the lens at the object. In the setup the objective is acting as a magnifying glass.
Gradually move the object away from the objective lens; you will notice the image increases but remains right-side up At a certain separation everything disappears, for the object is at the focal point of the objective lens. At still further separation text reappears but now up-side down; the object is now on the far side of the focal point. This is the correct arrangement to produce the real, inverted image needed for a microscope. It may difficult to determine the exact position
of the real image, if the light is too faint to form a discernable image on a screen.
3: Place the 10 cm lens ( f2 = 10 cm ) on the optical bench as the magnifier. Move it nearer or
farther until you can see a sharp image through the lens. In this process you give a definite value to Simg–1 . Notice in the above formula, for a fixed f1 and f2 magnification depends on Simg–1. You can change Simg–1 by a very small movement of the object toward or away from the objective. As you do this you will also need to move somewhat the magnifying lens.
To increase magnification, in which direction should you move the magnifier?______________ To increase magnification, in which direction should you move the objective?______________
4: Next use the 15 cm lens and the 5 cm lens as magnifiers at approximately the same position as for the 10 cm lens before. Each time make any needed fine adjustments in the position of the object. Describe the differences noted with these different lenses. _______________ _________________________________________________________________________
Which magnifier gives the larger image? _____________________________________
Does this agree with the formula for magnification? ____________________________
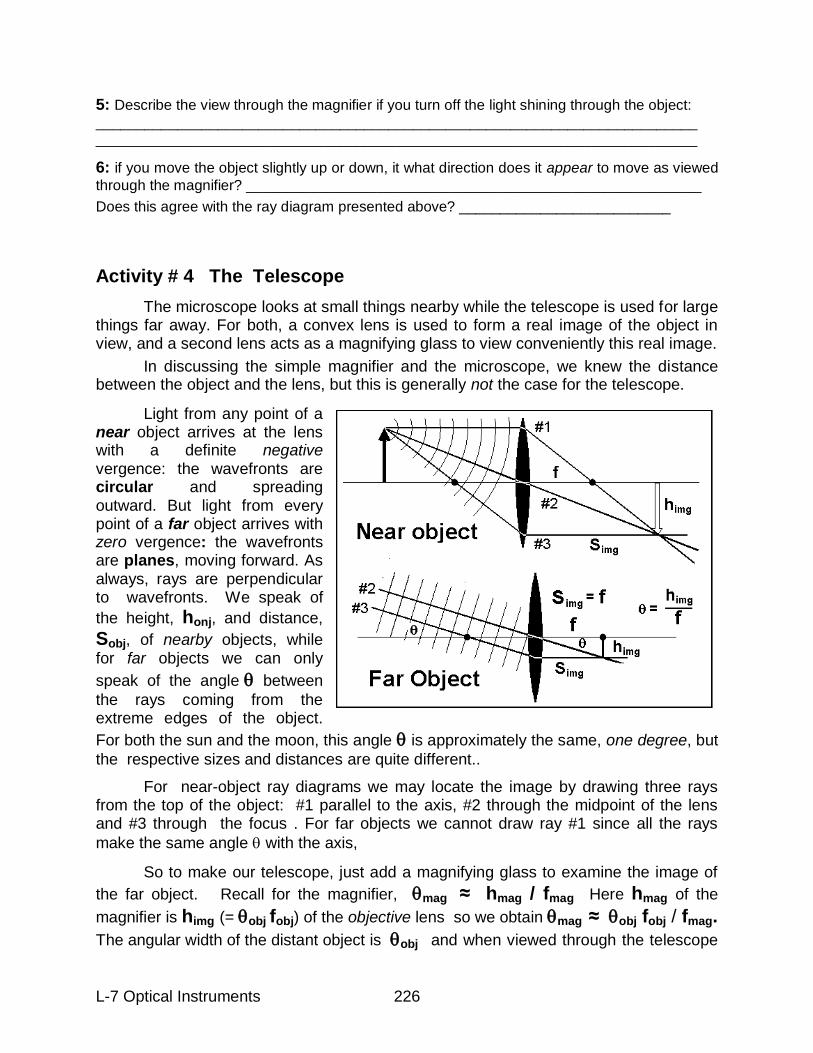
L-7 Optical Instruments 226
5: Describe the view through the magnifier if you turn off the light shining through the object:
__________________________________________________________________________ __________________________________________________________________________
6: if you move the object slightly up or down, it what direction does it appear to move as viewed
through the magnifier? ________________________________________________________
Does this agree with the ray diagram presented above? __________________________
Activity # 4 The Telescope
The microscope looks at small things nearby while the telescope is used for large things far away. For both, a convex lens is used to form a real image of the object in view, and a second lens acts as a magnifying glass to view conveniently this real image.
In discussing the simple magnifier and the microscope, we knew the distance between the object and the lens, but this is generally not the case for the telescope.
Light from any point of a near object arrives at the lens with a definite negative vergence: the wavefronts are circular and spreading outward. But light from every point of a far object arrives with zero vergence: the wavefronts are planes, moving forward. As always, rays are perpendicular to wavefronts. We speak of
the height, honj, and distance,
Sobj, of nearby objects, while for far objects we can only
speak of the angle between
the rays coming from the extreme edges of the object.
For both the sun and the moon, this angle is approximately the same, one degree, but
the respective sizes and distances are quite different..
For near-object ray diagrams we may locate the image by drawing three rays from the top of the object: #1 parallel to the axis, #2 through the midpoint of the lens and #3 through the focus . For far objects we cannot draw ray #1 since all the rays
make the same angle with the axis,
So to make our telescope, just add a magnifying glass to examine the image of
the far object. Recall for the magnifier, mag ≈ hmag / fmag Here hmag of the
magnifier is himg (= obj fobj) of the objective lens so we obtain mag ≈ obj fobj / fmag.
The angular width of the distant object is obj and when viewed through the telescope
L-7 Optical Instruments 227
it is mag .Therefore the magnification of the telescope is the ratio of these two angles:
telescope magnification = mag / obj ≈ fobj / fmag
For greatest magnification, make the focal length of the objective, fobj , as large
as possible and that of the magnifier or eye-piece, fmag, as small as possible. Notice
the difference from the microscope, where both objective and magnifier should have minimum focal lengths.
Recall that for lenses and curved mirrors, the same equation is valid, 1/Sobj + 1/Simg = 1/f . This suggests that we might design a telescope using a concave mirror
in place of a convex lens . Such instruments are called reflecting telescopes, and those with a lens as objective are called refracting telescopes. The same expression for magnification is applied to both. 1: In this activity use the magnetic portion of the Ray Box in place of the optical bench, to make
it easier to look out the window.. Start with a 10 cm objective lens and a 5 cm magnifier or eyepiece. What is the predicted magnification ?_____________________ What is the measured distance between objective and eyepiece for sharpest image? _______ By how much can you change the objective–eyepiece and still get a reasonable image? ___________________________________________________ Is the image upside–down? __________________________
2: Change the magnifier from 5 cm to 2.5 cm. What is the measured distance between
objective and eyepiece for sharpest image? _______________ What difference do you notice in the magnification? ________________________________ _________________________________________________________________________
Describe any change in he “field of view” ________________________________________ _________________________________________________________________________
3 Change the objective to 15 cm and use the 2,5 cm eye-piece, . What is the measured
distance between objective and eyepiece for sharpest image? _______________
Is the image sharp over the entire “field of view” or only near the center? _________________..
4: To make a reflecting telescope replace the objective lens with the concave mirror, and use
the 2.5 cm eyepiece Notice that the reflecting surface of the mirror must face the object. The eyepiece is placed a little to the side of the axis of the mirror. When observing with this configuration, your back is facing the object viewed in the mirror
For sharpest image what is the objective –eyepiece separation? _____________________ Is the image upside-down? ____________________________________________ Describe any distortion around the edges of the field of view. ______________________ ____________________________________________________________________________
What differences do you notice between the refracting and the reflecting telescope? ______________________________________________________________________ ______________________________________________________________________
Which telescope do you prefer, and why? ____________________________________ ______________________________________________________________________ ______________________________________________________________________

L-7 Optical Instruments 228
Looking Back A camera is also an optical instrument. Which parts of a camera imitate a corresponding part of the human eye? ________________________________________________ _____________________________________________________________________ _____________________________________________________________________ On a clear day you can use a single convex lens to form an image of the sun on a piece of paper. Why are you able to use this image to start a fire? _________________________________ ___________________________________ ____________________________________________________________________ Light passing from air to the cornea of the human eye is refracted. If you are swimming under water in what ways is your vision changed, and why? ______________________ ______________________________________________________________________ ______________________________________________________________________
NOTE: If you have access to a computer, use the program EYES.EXE that lets you act as an eye-
doctor to fit the proper eye-glasses to different patients.