Soil properties, crop productivity and energetics under ...
16
Full Terms & Conditions of access and use can be found at http://www.tandfonline.com/action/journalInformation?journalCode=gags20 Archives of Agronomy and Soil Science ISSN: 0365-0340 (Print) 1476-3567 (Online) Journal homepage: http://www.tandfonline.com/loi/gags20 Soil properties, crop productivity and energetics under different tillage practices in fodder sorghum + cowpea – wheat cropping system Anoop Kumar Dixit, Rajiv Kumar Agrawal, Sanjoy Kumar Das, Chandra Shekhar Sahay, Mukesh Choudhary, Arvind Kumar Rai, Sunil Kumar, Sita Ram Kantwa & Dana Ram Palsaniya To cite this article: Anoop Kumar Dixit, Rajiv Kumar Agrawal, Sanjoy Kumar Das, Chandra Shekhar Sahay, Mukesh Choudhary, Arvind Kumar Rai, Sunil Kumar, Sita Ram Kantwa & Dana Ram Palsaniya (2018): Soil properties, crop productivity and energetics under different tillage practices in fodder sorghum + cowpea – wheat cropping system, Archives of Agronomy and Soil Science, DOI: 10.1080/03650340.2018.1507024 To link to this article: https://doi.org/10.1080/03650340.2018.1507024 View supplementary material Accepted author version posted online: 30 Jul 2018. Published online: 14 Aug 2018. Submit your article to this journal Article views: 47 View Crossmark data Citing articles: 1 View citing articles
-
Upload
khangminh22 -
Category
Documents
-
view
3 -
download
0
Transcript of Soil properties, crop productivity and energetics under ...

Full Terms & Conditions of access and use can be found athttp://www.tandfonline.com/action/journalInformation?journalCode=gags20
Archives of Agronomy and Soil Science
ISSN: 0365-0340 (Print) 1476-3567 (Online) Journal homepage: http://www.tandfonline.com/loi/gags20
Soil properties, crop productivity and energeticsunder different tillage practices in fodder sorghum+ cowpea – wheat cropping system
Anoop Kumar Dixit, Rajiv Kumar Agrawal, Sanjoy Kumar Das, ChandraShekhar Sahay, Mukesh Choudhary, Arvind Kumar Rai, Sunil Kumar, SitaRam Kantwa & Dana Ram Palsaniya
To cite this article: Anoop Kumar Dixit, Rajiv Kumar Agrawal, Sanjoy Kumar Das, ChandraShekhar Sahay, Mukesh Choudhary, Arvind Kumar Rai, Sunil Kumar, Sita Ram Kantwa & DanaRam Palsaniya (2018): Soil properties, crop productivity and energetics under different tillagepractices in fodder sorghum + cowpea – wheat cropping system, Archives of Agronomy and SoilScience, DOI: 10.1080/03650340.2018.1507024
To link to this article: https://doi.org/10.1080/03650340.2018.1507024
View supplementary material Accepted author version posted online: 30Jul 2018.Published online: 14 Aug 2018.
Submit your article to this journal Article views: 47
View Crossmark data Citing articles: 1 View citing articles

Soil properties, crop productivity and energetics under differenttillage practices in fodder sorghum + cowpea – wheat croppingsystemAnoop Kumar Dixita, Rajiv Kumar Agrawala, Sanjoy Kumar Dasb, Chandra Shekhar Sahaya,Mukesh Choudhary a, Arvind Kumar Raic, Sunil Kumara, Sita Ram Kantwaa
and Dana Ram Palsaniyaa
aDivision of Crop Production, ICAR–Indian Grassland and Fodder Research Institute, Jhansi, India; bDivision ofRiverine Ecology and Fisheries, ICAR–Central Inland Fisheries Research Institute, Kolkata, India; cDivision of Soiland Crop Management, ICAR–Central Soil Salinity Research Institute, Karnal, India
ABSTRACTTillage is an important agricultural operation which influences soil proper-ties, crop yield and environment. Nine combinations of three tillage prac-tices including conventional tillage (CT), minimum tillage (MT) and zerotillage (ZT) were evaluated in fodder sorghum (Sorghum bicolor) + cowpea(Vigna unguiculata) – wheat (Triticum durum) cropping system for 5 years(2009–2014) on clay loam soil under limited irrigation. Continuous ZTpractices significantly improved surface soil organic carbon, bulk density,infiltration rate andmaximumwater holding capacity. Carbon sequestrationrate, soil organic carbon stock and soil enzymatic activities were relativelymore under ZT than CT-CT practice. Higher fodder yield of sorghum + cow-pea was recorded with CT (kharif) while wheat grain yield with ZT (rabi).However, the system productivity was statistically similar in all the tillagetreatments on pooled data basis. The economic benefits were also max-imum under ZT-ZT practice. The ZT-ZT practice recorded significantly low-est energy input (17.1 GJ ha−1) which resulted in highest energy useefficiency (13.6) and energy productivity (518 kg GJ−1). Thus, adoption ofZT significantly improved soil health, stabilized crop yield, increased profit-ability and energy use efficiency in the semi-arid agro-ecosystem.
ARTICLE HISTORYReceived 22 February 2018Accepted 29 July 2018
KEYWORDSCrop yields; economics;energy use efficiency; soilhealth; tillage
Introduction
Soil tillage is one of the fundamental agriculture operations because of its influence on soilproperties (physical, chemical and biological), crop growth, profitability and environment.Conventional agriculture has largely been characterized by intensive tillage. The objectives oftillage include, soil loosening and levelling for seed bed preparation, mixing fertilizer into soil,weed control, and crop residue management (Busari et al. 2015). The conventional agriculture,based on tillage and being highly mechanized, has been responsible for soil erosion, waterpollution, more water consumption, biodiversity reduction, low energy efficiency and contributionto global warming (Jat et al. 2012). Continuous soil tillage strongly influences the soil properties.Hence, it is important to follow appropriate tillage practices that avoid soil structure degradation,maintain crop yield as well as ecosystem stability (Sharma et al. 2011). The conventional agriculture
CONTACT Mukesh Choudhary [email protected] ICAR–Indian Grassland and Fodder Research Institute, Jhansi,India
Supplementary data for this article can be accessed here.
ARCHIVES OF AGRONOMY AND SOIL SCIENCEhttps://doi.org/10.1080/03650340.2018.1507024
© 2018 Informa UK Limited, trading as Taylor & Francis Group
largely characterized by heavy tillage which results in higher cost, energy use and reduced profit-ability. Therefore, in recent years, interest of farmers has increased in the conservation tillage. Theminimum soil disturbance through reduced or zero tillage improves soil biological activity, pro-duces stable soil aggregates, maintains optimum proportions of respiration gases in the rooting-zone, moderates organic matter oxidation, porosity for water movement and limits the re-exposureof weed seeds and their germination (Bhan and Behera 2014). Various on-farm participatory trialshave revealed little or no difference in yields of crops under zero-till system compared withconventional tillage (Krishna and Veettil 2014). However, yield variability with zero-tillage stillremains a major concern among farmers. Different workers reported ecologically and economicallypositive effect of direct seeding (Parihar et al. 2016a; Jakhar et al. 2017, 2018a; Kumar et al. 2018)whereas based on 610 studies around the globe, Pittelkow et al. (2015) found negative impact ofzero tillage on crop yields. In general, reduced tillage systems required lower operation costs andgave greater economic returns compared with conventional tillage (Sharma et al. 2011).
Energy and economics are mutually dependent (Pimentel et al. 1994). There is a close relationshipbetweenagriculture andenergy.While agriculture uses energy, it also supplies it in the formofbio-energy.The energy crisis of early seventies forced scientists to conserve energy in all sectors including agriculture.Energy is used for carrying out various operations like tillage, irrigation, sowing, weeding, harvesting andthreshing. Since tillage consumes maximum energy (Choudhary et al. 2017) hence, efforts were startedworld-wide to reduce the energy use by reducing the number of tillage operations to bare minimum forseed bed preparation to get higher or equivalent yield. As the energy and labour are becoming expensivewith the passage of time, need is being felt to study the energy budget of production systems.
The benefits of zero tillage are variable over region, season and crop (Derpsch et al. 2010). Manystudies in India showed that zero tillage technology is successful in rice-wheat cropping systemonly and confined to Indo-Gangetic Plains (Derpsch et al. 2010; Jat et al. 2012). Other regions andcropping systems, particularly in rainfed areas are yet to get the benefit of conservation tillage. Theadvantage of zero tillage is more pronounced in rabi (winter) season due to lesser weed growthand assured irrigation (Choudhary et al. 2017). Keeping these facts in view, the present study wasundertaken to evaluate the effect of nine different tillage practices on soil properties, cropproductivity, profitability and energetics in a prominent fodder – food production system (sorghum+ cowpea – wheat) under limited irrigation conditions of semi-arid Central India.
Materials and methods
Study site and soil
A field experiment was carried out at Central Research Farm of Indian Grassland and Fodder ResearchInstitute Jhansi, India (25° 27ʹ N latitude, 78° 33ʹ E longitude and 270 m above mean sea level) during2009–2014. The area has a continental monsoon climate with an average (1939–2015) annual rainfall of908 mm received mostly during June to September (Rai et al. 2018). The study area was characterized bysemi-arid climate with extreme temperature during summer (43 to 46°C) and winter (as low as 2°C). Therainfall and temperature pattern observed during the study period is shown in Table 1. The soil of theexperimental site was deep, moderately well drained, brown to dark grayish brown (Typic Haplustept)with clay loam in texture (372 g sand, 345 g silt and 283 g clay kg–1 soil). It had pH 7.1, electricalconductivity (EC) 0.12 dS m−1, soil organic carbon 6.7 g kg−1, KMnO4 oxidizable N 257 kg ha−1, 0.5 MNaHCO3 extractable P 22 kg ha−1 and 1 N NH4OAc extractable K 280 kg ha−1 in the top 15 cm soil.Saturation water holding capacity of soil was 59.5% (v/v).
Treatment details
Treatments included nine combinations of conventional tillage (CT), minimum tillage (MT) and zerotillage (ZT) practiced in kharif and rabi season and were evaluated in randomized block design with
2 A. K. DIXIT ET AL.

3 replications. The tillage combinations were CT-CT, CT-MT, CT-ZT, MT-CT, MT-MT, MT-ZT, ZT-CT,ZT-MT and ZT-ZT. Here, CT-MT means conventional tillage in kharif season (sorghum + cowpea)and minimum tillage in rabi season (wheat). In CT plots, two passes of disc harrow, two passes ofspring-tyne cultivator followed by one planking operations performed for field preparation. MTcomprised of one harrowing with disc harrow and one pass of spring-tyne cultivator followed byplanking. In ZT plots, different crops were drilled directly using zero till planter without preparatorytillage. Details of tillage operation performed under different treatments is given in SupplementaryTable 1. The plot size was 15 m × 4.8 m.
Crop management
Fodder sorghum variety ‘PC-6ʹ was sown with seed rate of 20 kg ha−1 in paired row during firstfortnight of July every year. Two rows of fodder cowpea (cv ‘BL 2ʹ) were sown between pairedrows of sorghum as intercrop. The distance between each row was 30 cm. Sorghum + cowpeacrops were harvested 70–80 days after sowing (50% flowering stage) for green fodder.Glyphosate (N-phosphonomethyl glycine) 41 SL was sprayed at 1.0 kg a.i. ha−1 in the ZTplots about 10–12 days before sowing of crops while one hand weeding was done in all theCT plots at 25–30 days after sowing of sorghum + cowpea. After harvesting of kharif crops,durum wheat (cv ‘HD 4672ʹ) was sown using 100 kg seeds ha−1 at 20 cm row to row distance inthe second fortnight of November each year in same plots. The crops were sown by zero-tillseed cum ferti drill in ZT and seed cum ferti drill in CT and MT plots. Sorghum + cowpeareceived a common fertilizer dose of 60 kg N + 40 kg P2O5 + 30 kg K2O ha−1 while wheat wasfertilized with 100 kg N + 60 kg P2O5 + 40 kg K2O ha−1. Two third N and whole P and K wereapplied as basal at the time of sowing, while remaining 1/3rd N was top dressed bybroadcasting urea at 25–30 days after sowing. To control broad leaf weeds in wheat, 2–4 Dat 0.75 kg a.i. ha−1 was sprayed at 28–32 days after seeding in all the plo. Wheat was harvestedin the month of April. Sorghum + cowpea was grown as rainfed crops while 3 irrigationincluding one pre sowing irrigation was applied in wheat.
Table 1. Monthly total rainfall, mean monthly maximum and minimum temperature prevailed during the experimental period.
Year June July Aug Sept Oct Nov Dec Jan Feb Mar April May
Mean maximum temperature (°C)2009–10 42.7 34.5 33.9 34.4 32.9 29.2 24.6 19.9 26.5 36.1 41.8 43.72010–11 42.1 35.6 33.0 32.9 34.4 28.1 24.5 20.0 24.8 32.3 37.4 42.52011–12 37.0 33.2 32.7 33.1 34.8 30.6 26.1 19.5 24.2 31.8 38.2 42.22012–13 41.9 34.0 31.3 33.0 34.3 29.4 25.0 22.5 24.9 32.2 37.1 43.22013–14 37.6 32.2 31.3 34.1 31.2 28.0 24.1 18.4 22.5 30.0 37.4 41.0
Mean minimum temperature (°C)2009–10 26.7 26.1 25.4 23.2 16.9 11.6 8.7 5.4 11.0 15.1 22.3 25.82010–11 26.7 26.4 25.3 23.4 18.4 15.4 6.5 4.9 9.9 30.3 17.9 26.02011–12 24.7 24.9 25.5 23.9 17.2 13.4 9.7 6.8 7.6 11.8 19.3 24.12012–13 29.4 26.1 25.2 30.5 16.0 9.8 6.8 4.6 10.8 13.6 18.8 24.52013–14 26.2 25.0 24.7 24.1 20.2 10.9 8.6 8.4 8.7 12.9 17.1 22.7
Rainfall (mm)2009–10 15.4 192.2 139.8 110.6 54.8 10.6 13.8 1.8 13.8 0 1.4 1.62010–11 13.0 246.5 166.4 193.4 0 17.2 1.8 0 1.8 0 0 18.42011–12 466.0 264.0 175.0 158.2 0 0 0 43.8 2.2 0 15.2 1.22012–13 18.5 390.0 217.6 100.8 0 0 0 0 102.6 2.2 5.2 1.22013–14 149.2 437.2 527.6 43.4 107.6 2.8 22.9 53.0 66.6 6.2 16.6 10
Source: Agromet Observatory, Division of Crop Production, ICAR-IGFRI, Jhansi, India.
ARCHIVES OF AGRONOMY AND SOIL SCIENCE 3

Soil sampling and analysis
Soil samples (0–15 cm) were collected at randomly distributed points prior to the experiment in2009 and after wheat harvesting in 2013 from each plot for physical and chemical analysis. Thesamples were air dried, ground and passed through 2 mm mesh sieve. Soil pH was measured inaqueous soil extract in de-ionized water (1:2.5 soil:water). Soil salinity was measured as theelectrical conductivity of the aqueous soil extract in de-ionized water. Soil organic carbon (SOC)was determined by the Walkley–Black method (Walkley and Black 1934). The available Nwas estimated by alkaline KMnO4 method suggested by Subbiah and Asija (1956) and expressedin kg ha−1. The available P content in soil was estimated by Olsen’s method (Olsen et al. 1954).Available K was determined using neutral normal ammonium acetate extraction (flame photo-meter) method as described by Jackson (1973) and expressed in kg ha−1. Bulk density wasmeasured by the core sampler method (Piper 1950). Particle density (PD) was determined by thepycnometer method (Blake and Hartge 1986) and water infiltration rate (IR) by double-ringinfiltrometer (Bouwer 1986). Maximum water holding capacity (WHC) was determined by equili-brating the soil with water through capillary action in a Keen Raczkowald (KR) box (Baruah andBarthakur 1999). KR box is a circular brass box having an internal diameter of 5 cm and a height of1.6 cm with perforated bottom having numerous holes of 0.75 mm diameter spaced at 4 mm. TheSOC stock for a layer of thickness was calculated as given by Lal et al. (1999):
SOC Stock Mg ha�1� � ¼ SOC %ð Þ � Bulk density Mg M�3ð Þ � Soil depth mð Þ � 10000100
Soil C sequestration rate (Mg C ha−1 year−1) was calculated as change in the SOC stock (Mg ha−1)divided by duration of experiment (year).
Soil microbial biomass carbon (SMBC) was estimated by chloroform fumigation extractionmethod as described by Nunan et al. (1998). Soil dehydrogenase activity was estimated bymeasuring the rate of triphenylformazan (TPF) from triphenyl tetrazolium chloride (Casida et al.1964) and β-glucosidase by determining the amount of p-nitrophenol released after 1 h ofincubation with p-nitrophenyl- β -D-glucopyranoside (Eivazi and Tabatabai 1988). Alkaline phos-phatase activities were measured by using p-nitrophenyl (PNP) as per method described byTabatabai and Bremner (1969).
Crop yield and nutrient uptake
Sorghum + cowpea were harvested at 70–80 days after sowing and weighed for green fodder yield.Random chopped samples of green fodder were sun dried and placed in the oven at 65°C for72 hours to estimate dry matter percentage and then it was multiplied with respective green fodderyield to calculate dry matter yield. At maturity, wheat crop was harvested manually with the help ofsickle from the net plot area after discarding the border area (0.6 m from all the sides of each plot).The grain and straw yields of wheat were estimated from each plot using plot thresher after sundrying. The sorghum + cowpea fodder yield was converted to wheat equivalent yield (WEY) bymultiplying green fodder yield with its respective price and divided by the market price of wheat.
The plant samples were collected at harvest, oven dried (70°C), processed and analyzed fornutrient content. The N, P and K were estimated by Kjeldahl, vanado-molybdate yellow color andflame-photometric method, respectively as per procedure described by Jackson (1973). The uptakeof nutrients was calculated by multiplying concentration with their respective yield.
Economic analysis
The economic analysis was done by considering the variable production costs only. The variablecosts included human labour, use of machinery (tractor, plough, planter, etc.), input cost (seed,
4 A. K. DIXIT ET AL.

fertilizer, and pesticide), irrigation, harvesting and threshing. Net returns (NR) were calculated bydeducting the production cost from gross returns. Benefit to cost ratio was calculated by dividingthe net returns value to the production cost in order to determine the economic efficiency. Forbetter comparisons, all the economics data (cost of cultivation and returns) were converted fromIndian Rupees (INR) to US$ using an exchange rate (INR/US$) of 60.
Energy input-output relationship
Agricultural inputs like labour, machinery, diesel, fertilizers, pesticides, seed etc. were used forcomputation of energy consumption on the basis of energy equivalent. Energy output from theproduct (grain, straw and fodder) was calculated by multiplying the amount of production and itscorresponding energy equivalent (Choudhary et al. 2017). The energy use efficiency (EUE) andenergy productivity were calculated as given by Devasenapathy et al. (2009).
Energy use efficiency = Energy output (GJ ha−1)/Energy input (GJ ha−1)Energy productivity (kg GJ−1) = Wheat equivalent yield (kg ha−1)/Energy input (GJ ha−1)
Statistical analysis
Statistical analyses were performed using software SAS version 9.3 (Cary, USA). Analysis of variance(PROC MIXED) was performed and means were separated by least significant differences (LSD),when the F-test indicated factorial effects on the significance level of p < 0.05.
Results
Weather
The rainfall during kharif season (July–October) was the highest (1116 mm) in 2013 followed by708 mm in 2012 and 606 mm in 2010, whereas 2009 and 2011 seasons received the lowest rainfall(470 and 597 mm, respectively). The rainfall received in three months (July to September) amount-ing more than 85% of total yearly rainfall during all the study years (Table 1). The rainfall in rabiseason (November to April) was very low (20–41 mm) during first two years (2009–10 and2010–11), whereas 61, 110 and 168 mm of rainfall was received during 2011–12, 2012–13 and2013–14, respectively. In kharif 2012, plant population of sorghum + cowpea was not uniform dueto continuous rains in the month of July. July, 2013 received the highest monthly rainfall (437 mm)but sowing was possible due to dry spells. The mean monthly maximum and minimum tempera-tures were almost similar in all the years of study (Table 1).
Soil properties
The tillage practices had significant (p < 0.05) effect on bulk density (BD) of 0–15 cm soil depth, whilein deeper soil layers (15–30 and 30–45 cm) it was non-significant (data not given) (Table 2). The BDunder CT-CT was lowered by 3.4% in 0–15 cm soil profile than ZT-ZT plots after completion of 4cropping cycle. Tillage practices had no significant effect on particle density of soil. Maximum waterholding capacity (WHC) of soil was found in MT-MT (0.67 m3 m−3) which was statistically at par withZT-ZT, ZT-MT, MT-ZT and CT-ZT practices. The WHC of soil was improved by 11.9% in ZT-ZT over CT-CT at the end of 4th year. Infiltration rate (IR) was the lowest (6.5 mm h−1) under ZT-ZT and thehighest (10.6 mm h−1) under CT-CT plots (Table 2). Omission of tillage reduced IR by 63%. The IR wasinversely related to BD (r = – 0.56).
The different tillage practices had significant (p < 0.05) effect on SOC content, SOC stock andcarbon sequestration rate (Table 3). The SOC content in ZT-ZT plots were significantly (p < 0.05)highest for the soil depths 0–15 and 15–30 cm. The SOC content in all the tillage practices significantly
ARCHIVES OF AGRONOMY AND SOIL SCIENCE 5

increased over CT-CT at 0–15 cm soil depth. However, the SOC content of all the treatments werestatistically at par for the soil depth 30–45 cm. Furthermore, SOC stock in 0–15 cm soil depth wasmaximum in ZT-ZT and lowest under CT-CT. The increase in SOC stock in ZT-ZT was 21% higher overCT-CT. After 4 years of study, carbon sequestration rate varied between 0.05 to 0.69 Mg ha–1 year–1
and the maximum value (0.69 Mg ha–1 year–1) was observed in ZT-ZT followed by ZT-MT.Soil pH, EC and available nutrients (N, P and K) did not differ significantly between treatments
after 4 years of study (Table 3). A marginal decline in the EC was observed in all the treatments incomparison to initial EC (0.11 dS m–1). However, pH value was almost same as initial pH (7.05)across treatment. The initial available N, P and K status in soil was 257, 22 and 280 kg ha−1. After4 years, available N in soil was marginally increased in all the treatments in comparison to theirinitial value. Similarly, available P was also increased in all the treatments except in CT-CT. However,soil available K was decreased.
Tillage practices significantly influenced the biological properties of soil (Table 3). Soil microbialbiomass carbon (SMBC) varied from 366.9 to 530.4 mg g–1. Likewise, dehydrogenase (DHA) andalkaline phosphatase activities ranged from 62.3 to 86.1 mg TPF kg−1 soil day−1 and 73.2 to 99.5 mgþ- nitrophenol kg–1 h–1, respectively. Continuous ZT caused an increase of 44.5, 38.2 and 35.9% inSMBC, DHA and alkaline phosphatase activities, respectively, over CT-CT plots. Similarly, highest βglucosidase activity (48.1 µg PNP g−1 soil h−1) was observed in ZT-ZT plots.
Different tillage practices significantly influenced the correlation matrix of different soil micro-bial and enzyme activities (Table 4). The SOC content had a positive and significant (p < 0.05)correlation with MBC (r = 0.87), DHA (r = 0.87), alkaline phosphatase (r = 0.75) and β glucosidase(r = 0.84). Similarly, MBC had a positive and significant (p < 0.05) correlation with DHA, alkalinephosphatase and β glucosidase.
Crop productivity
The tillage practices had significant (p < 0.05) effect on green fodder yield (GFY) and dry matteryield (DMY) of sorghum + cowpea except first year (2009) of study (Table 5). In general, CT practicein kharif season produced higher GFY and DMY than MT and ZT irrespective of type of tillage insucceeding season. However, any practice of tillage in rabi season (within same tillage operationsin kharif season) did not influence GFY and DMY of sorghum + cowpea in any year. During secondyear, the green and dry matter yield was the highest in CT-MT followed by CT-CT planting.However, the highest GFY and DMY were found in MT-ZT during third year and in ZT-ZT duringlast year. The data pooled over four years showed that green and dry matter yield of sorghum+ cowpea was significantly (p < 0.05) higher by 7.5% and 8.1% in CT-MT compared to ZT-ZTplanting, respectively. However, crops planted under CT-CT and CT-ZT yielded at par with CT-MT.
Table 2. Density and water holding capacity of soil under different tillage practices at the end of four cropping cycle (0–15 cm).
Tillage practicesBulk density(Mg m−3)
Particle density(Mg m−3)
Maximum WHC(m3 m−3) Infiltration rate (mm h−1)
CT – CT 1.17c 2.20 0.59d 10.6a
CT – MT 1.17c 2.20 0.63bcd 9.9ab
CT – ZT 1.17c 2.19 0.64abc 8.2cde
MT – CT 1.19b 2.19 0.62bcd 9.0abc
MT – MT 1.18bc 2.21 0.67a 8.3bcd
MT – ZT 1.18bc 2.19 0.65abc 7.0de
ZT – CT 1.18bc 2.21 0.61cd 7.9cde
ZT – MT 1.21a 2.21 0.66ab 8.2cde
ZT – ZT 1.21a 2.20 0.66ab 6.5e
Means followed by a superscripted similar lowercase letter within a column are not significantly different (at p < 0.05)according to LSD test. Means without any letter indicate no significant difference (at p < 0.05). CT-conventional tillage; MT-minimum tillage; ZT- zero tillage; WHC- water holding capacity.
6 A. K. DIXIT ET AL.
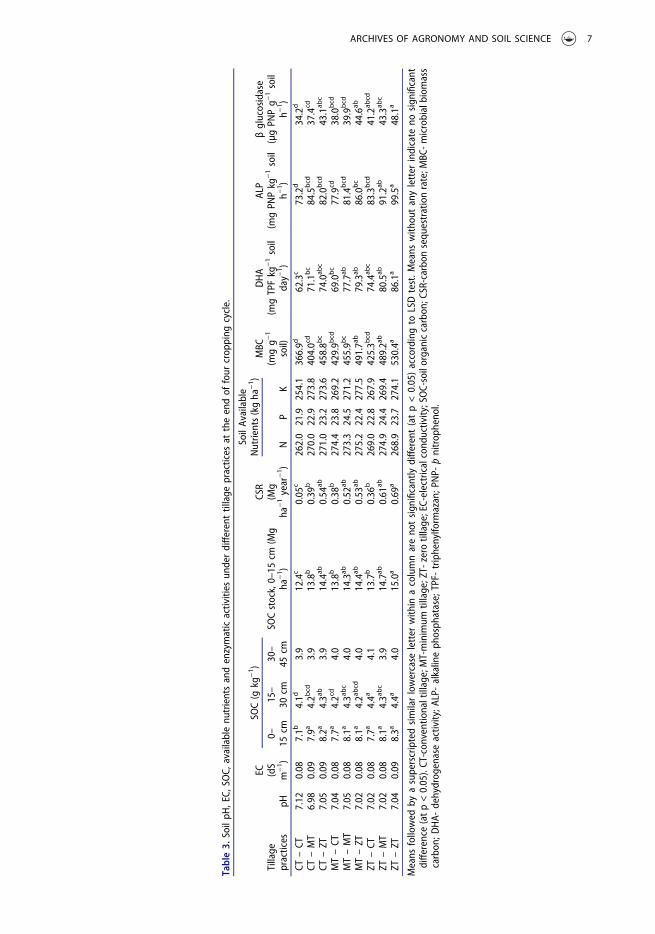
Table3.
SoilpH
,EC,
SOC,
availablenu
trientsandenzymaticactivities
underdifferenttillage
practices
attheendof
four
crop
ping
cycle.
Tillage
practices
pH
EC (dS
m−1 )
SOC(g
kg−1 )
SOCstock,0–15
cm(M
gha
−1 )
CSR
(Mg
ha−1year
−1 )
SoilAvailable
Nutrients(kgha
−1 )
MBC
(mgg−
1
soil)
DHA
(mgTPFkg
−1soil
day−
1 )
ALP
(mgPN
Pkg
−1soil
h−1 )
βglucosidase
(µgPN
Pg−
1soil
h−1 )
0–15
cm15–
30cm
30–
45cm
NP
K
CT–CT
7.12
0.08
7.1b
4.1d
3.9
12.4c
0.05
c262.0
21.9
254.1
366.9d
62.3c
73.2d
34.2d
CT–MT
6.98
0.09
7.9a
4.2b
cd3.9
13.8b
0.39
b270.0
22.9
273.8
404.0c
d71.1bc
84.5bcd
37.4cd
CT–ZT
7.05
0.09
8.2a
4.3a
b3.9
14.4ab
0.54
ab271.0
23.2
273.6
458.8b
c74.0abc
82.0bcd
43.1abc
MT–CT
7.04
0.08
7.7a
4.2c
d4.0
13.8b
0.38
b274.4
23.8
269.2
429.9b
cd69.0bc
77.9cd
38.0bcd
MT–MT
7.05
0.08
8.1a
4.3a
bc
4.0
14.3ab
0.52
ab273.3
24.5
271.2
455.9b
c77.7ab
81.4bcd
39.9bcd
MT–ZT
7.02
0.08
8.1a
4.2a
bcd
4.0
14.4ab
0.53
ab275.2
22.4
277.5
491.7a
b79.3ab
86.0bc
44.6ab
ZT–CT
7.02
0.08
7.7a
4.4a
4.1
13.7b
0.36
b269.0
22.8
267.9
425.3b
cd74.4abc
83.3bcd
41.2abcd
ZT–MT
7.02
0.08
8.1a
4.3a
bc
3.9
14.7ab
0.61
ab274.9
24.4
269.4
489.2a
b80.5ab
91.2ab
43.3abc
ZT–ZT
7.04
0.09
8.3a
4.4a
4.0
15.0a
0.69
a268.9
23.7
274.1
530.4a
86.1a
99.5a
48.1a
Means
followed
byasuperscriptedsimilarlowercase
letter
with
inacolumnareno
tsign
ificantlydifferent(atp<0.05)accordingto
LSDtest.M
eans
with
outanyletter
indicate
nosign
ificant
difference
(atp<0.05).CT-con
ventionaltillage;MT-minimum
tillage;ZT-
zero
tillage;EC-electricalcond
uctivity;SOC-soilorganiccarbon
;CSR-carbo
nsequ
estrationrate;M
BC-m
icrobialbiom
ass
carbon
;DHA-
dehydrog
enaseactivity;A
LP-alkalineph
osph
atase;TPF-
triphenylform
azan;P
NP-
þnitrop
heno
l.
ARCHIVES OF AGRONOMY AND SOIL SCIENCE 7

The tillage practices had significant effect on mean (pooled over 5 years) wheat grain yieldwhich was highest in MT-MT plots (4.80 Mg ha−1) compared to CT-CT (4.48 Mg ha−1) and was foundat par with all MT and ZT in rabi season (Figure 1). However, straw yield of wheat was not affectedsignificantly with different tillage practices.
The tillage practices had significant (p < 0.05) effect on system productivity (wheat equivalentyield, WEY) in 2010–11 and 2014–15 (Table 6). In second year (2010–11), the system productivitywas the highest in CT-CT and CT-ZT followed by CT-MT. Thereafter (2014–15), WEY was significantlyhigher (8.6–22.5%) in ZT (rabi) compared to CT (rabi). The system productivity in first two years ofstudy was higher in CT (kharif). Thereafter, it increased in ZT and in fifth year ZT-ZT turned out to bethe highest yielder (11.42 Mg ha−1). However, pooled system productivity over 5 years was notsignificant.
Nutrients uptake
The uptake of N, P and K, as calculated by multiplying the nutrient concentration in the crop withthe respective yield, are shown in Figure 2. Differences in N, P and K uptake over the various yearswere mainly due to the differences in yield (data was not shown). The tillage system did notsignificantly affect N, P and K uptake. Similar results were reported by Vogeler et al. (2009) whofound that tillage did not affect uptake of N or P by maize and field bean. In general, nutrientsuptake by sorghum + cowpea and wheat were almost similar. In this cropping system, N, P and Kuptake ranged from 216–230, 47–53 and 196–217 kg ha−1 in various tillage practices, respectively.
Economics and energetics
The production cost and economic returns of sorghum + cowpea – wheat cropping system underdifferent tillage practices are presented in Table 7. The production cost varied from minimum with
Table 4. Pearson correlation matrix of soil microbial activities with soil organic carbon (n = 9) .
Parameters SOC MBC DHA ALP
MBC 0.87**DHA 0.87** 0.95**ALP 0.75* 0.86** 0.91**BG 0.84** 0.96** 0.93** 0.87**
* and ** indicate significance at 5 and 1% level of probability.SOC- soil organic carbon; MBC- microbial biomass carbon; DHA- dehydrogenase activity; ALP- alkaline phosphatase;BG – β glucosidase.
Table 5. Green fodder and dry matter yield of sorghum + cowpea under different tillage practices.a.
Kharif tillage Rabi tillage
Green fodder yield (Mg ha−1) Dry matter yield (Mg ha−1)
2009 2010 2011 2013 Pooled 2009 2010 2011 2013 Pooled
CT CT 32.4 49.6ab 19.6abc 31.8d 33.4ab 7.5 12.4ab 3.9abc 7.3 7.8ab
MT 32.9 51.6a 19.7abc 33.1cd 34.3a 7.6 12.9a 3.9abc 7.8 8.0a
ZT 32.7 48.5b 19.3abcd 34.6bcd 33.8a 7.5 12.1b 3.8abcd 8.1 7.9a
MT CT 30.9 41.2c 18.1d 35.5abc 31.5c 7.0 10.0cde 3.6d 8.2 7.2c
MT 29.9 42.6c 20.4ab 35.7abc 32.2bc 6.8 10.4c 4.0ab 8.3 7.4c
ZT 30.0 40.2cd 20.6a 36.2abc 31.7c 6.8 9.8cde 4.0a 8.5 7.3c
ZT CT 32.0 41.0c 19.0bcd 36.8ab 32.2bc 7.3 10.1cd 3.7bcd 8.7 7.5bc
MT 32.1 38.2d 19.1bcd 37.4ab 31.7c 7.4 9.4e 3.8bcd 8.8 7.3c
ZT 32.3 38.3d 18.3cd 38.5a 31.9c 7.4 9.4de 3.7cd 9.0 7.4c
Means followed by a superscripted similar lowercase letter within a column are not significantly different (at p < 0.05)according to LSD test. Means without any letter indicate no significant difference (at p < 0.05). CT-conventional tillage; MT-minimum tillage; ZT- zero tillage.
a In 2012, plant population was not uniform due to continuous rains. Therefore, yield data was not included in the table.
8 A. K. DIXIT ET AL.

ZT-ZT (601 US$ ha−1) to maximum under CT-CT (665 US$ ha−1). Pooled data of 5 years showed thatZT-ZT gave significantly the highest net monetary returns (1209 US$ ha−1) and the lowest in CT-CT(1069 US$ ha−1). Similar to net returns, the highest benefit to cost ratio was calculated in MT-MT(2.06) followed by ZT-ZT (2.05) and the lowest in CT-CT (1.67). ZT-ZT practices recorded 13.1 and22.7% increase in net returns and B:C ratio, respectively over CT-CT.
Among various tillage practices, total energy requirement of the system was the highest in CT-CT (20.4 GJ ha−1) followed by CT-MT (19.6 GJ ha−1) and the lowest in ZT-ZT (17.1 GJ ha−1). Theoutput bio-energy of cropping system was statistically similar across treatments and ranged from229.2 GJ ha−1 (CT- CT) to 235.8 GJ ha−1 (CT-MT). However, energy use efficiency and energyproductivity differed significantly (p < 0.05) among treatments. The highest energy-use efficiency(13.6) and energy productivity (518 kg WEY GJ−1) were computed in ZT-ZT and the least in CT-CT.
Discussion
Soil properties
The higher bulk density in ZT-ZT was attributed primarily to the lack of annual loosening fromploughing in absence of crop residues on the soil surface. The lower bulk density found in CT-CT
Figure 1. Wheat yield under different tillage practices (Pooled over 5 years). Bar with a similar lowercase letter are notsignificantly different (at p < 0.05) according to LSD test. CT-conventional tillage; MT-minimum tillage; ZT- zero tillage.
Table 6. System productivity in terms of wheat equivalent yield (Mg ha−1) under different tillage practices.
Kharif tillage Rabi tillage 2009–10 2010–11 2011–12 2012–13 2013–14 Pooled
CT CT 9.30 9.49a 8.45 6.23 9.32e 8.56MT 9.16 9.48a 9.23 6.51 9.59de 8.80ZT 9.12 9.49a 9.09 6.40 10.04cd 8.83
MT CT 8.74 8.52bc 8.37 6.31 10.40bc 8.47MT 8.95 8.88b 9.46 6.65 10.55bc 8.90ZT 8.56 8.52bc 9.42 6.72 10.66bc 8.78
ZT CT 9.12 8.55bc 8.85 6.41 10.91ab 8.77MT 9.09 8.36c 9.02 6.73 11.08ab 8.86ZT 8.75 8.48bc 8.92 6.72 11.42a 8.86
Means followed by a superscripted similar lowercase letter within a column are not significantly different (at p < 0.05)according to LSD test. Means without any letter indicate no significant difference (at p < 0.05). CT-conventional tillage; MT-minimum tillage; ZT- zero tillage.
ARCHIVES OF AGRONOMY AND SOIL SCIENCE 9

Figure 2. Nutrient uptake under different tillage practices. Error bars represent standard error of the mean.CT-conventional tillage; MT-minimum tillage; ZT- zero tillage.
10 A. K. DIXIT ET AL.

was likely due to seasonal ploughing which helped in maintaining a fairly loose structure. Ourresults were in consistent with those of other studies that showed differences in bulk density dueto tillage practices. For example, Dam et al. (2005) found that CT had a significantly lower bulkdensity (1.21 Mg m−3) than ZT (1.36 Mg m−3) on sandy loam soil of Canada in an 11-year study. Thelowest infiltration rate observed in ZT-ZT plots might be due to compaction of the soil and top soilsealing in absence of crop residue (Govaerts et al. 2009).
Different tillage practices for four years had no significant effect on soil pH and EC (Table 3). Thesoil has buffering capacity to resist changes in pH. Our findings are consistent with those reportedby Neugschwandtner et al. (2014) in silty loam soil after 7 year of different tillage practices.However, SOC and soil carbon sequestration increased in ZT-ZT systems. The soil tilling increasesorganic matter decomposition and decreases carbon content by increasing organic matter oxida-tion (Thomas et al. 2007). The crop roots remain intact in the root zone due to non-disturbance ofthe soil under ZT, which might facilitate enhancement of organic carbon input in deeper rootzones (up to 30 cm) through their decay. This improvement might not cause significant effect inmuch deeper soil layers (30–45 cm) due to absence of sufficient root biomass. Parihar et al. (2016b)had observed that ZT enhanced the SOC by 23–35% in maize based cropping system over CT.Differences in bulk density of soils among treatments also had an influence on SOC stock. Thelower bulk density in CT than ZT practices resulted in lower SOC stock in CT-CT besides lower SOCcontent. The initial (2009) SOC stock at 0–15 cm soil depth was 12.2 Mg C ha−1 and it changed by0.2 to 2.8 Mg C ha−1 in different tillage practices in 4 years (Table 3). This resulted in C sequestra-tion rates of 0.05 to 0.69 Mg C ha−1 yr−1.
Soil microbial activity in terms of soil microbial biomass carbon, dehydrogenase activity, alkalinephosphatase and β glucosidase were significantly influenced by the tillage practices (Table 3).These parameters can be used as an indicator of soil quality for assessing the sustainability ofagricultural ecosystem. These soil enzymes were maximum in ZT–ZT plots and the lowest in CT-CT.The higher microbial and enzymatic activities under ZT practices was due to less disturbance ofsoil, better aeration and more organic matter content. Water stable aggregates increases under ZT,and help in increasing soil enzymes, SOC and MBC (Roldan et al. 2003). Positive and significantcorrelation between SOC and soil microbial and enzymatic activities were evident from our study(Table 4) and SOC was the probable force for enhancing microbial and enzymatic activities. Theseresults are in conformity with the findings of Parihar et al. (2016b).
Table 7. Economics and energetics of (sorghum + cowpea) – wheat cropping system under different tillage practices (pooleddata over 5 years).
Khariftillage
Rabitillage
Cost ofproductiona
(US$ ha−1)
Grossreturns(US$ha−1)
Netreturns(US$ha−1) B:C
Input energy(GJ ha−1)
Outputenergy(GJ ha−1) EUE
Energy productivity (kgWEY GJ−1)
CT CT 665 1735bc 1069c 1.67e 20.4 229.2 11.2f 418f
MT 626 1786abc 1160a 1.92bc 19.6 235.8 12.0e 448de
ZT 626 1794ab 1168a 1.93bc 18.7 234.6 12.5bcd 472bc
MT CT 634 1726c 1092bc 1.75de 19.6 223.9 11.4f 432ef
MT 605 1813a 1208a 2.06a 18.7 234.4 12.5cd 474bc
ZT 600 1790ab 1190a 2.02ab 17.8 230.6 12.9bc 491b
ZT CT 636 1787abc 1152ab 1.83cd 18.8 232.6 12.3de 465cd
MT 602 1807a 1205a 2.04a 18.0 233.1 12.9b 492b
ZT 601 1810a 1209a 2.05a 17.1 233.0 13.6a 518a
Means followed by a superscripted similar lowercase letter within a column are not significantly different (at p < 0.05)according to LSD test. Means without any letter indicate no significant difference (at p < 0.05). CT-conventional tillage; MT-minimum tillage; ZT- zero tillage; EUE-energy use efficiency; WEY-wheat equivalent yield; B:C- benefit to cost ratio.
a 1 US$ = 60 INR
ARCHIVES OF AGRONOMY AND SOIL SCIENCE 11

Crop and system productivity
Green and dry matter yields of sorghum + cowpea were comparable in 2009. The higher yields in2010 in all treatments were attributed to even distribution of rainfall over crop growing period.However, year 2011 was lower yielder in spite of heavy rainfall (Table 5). In 2013, reverse yield trendof sorghum + cowpea was observed than previous years. In this year, higher yield was obtained inZT (kharif) plots than CT (kharif). Heavy rainfall created excessive wet situation for longer period inCT plots than ZT plot which caused yield reduction in CT plots. On the basis of pooled data of5 years, CT (kharif) recorded significantly higher yield of sorghum + cowpea than ZT while vice-versa in wheat. This might be due to more weed infestation in kharif season under ZT which causedreduction in yield (Choudhary et al. 2017).
The pooled data over five years clearly showed the positive effects of ZT on grain yield of wheat(Figure 1). The present study results are in consistent with earlier studies which showed higher cropyields under ZT compared to CT in wheat systems (Jat et al. 2013; Singh et al. 2016). The higheryield of wheat in ZT and MT systems could be due to the compound effects of additional nutrients(Blanco-Canqui and Lal 2009; Kaschuk et al. 2010), lesser weed population (Ozpinar 2006; Chauhanet al. 2007), improved soil physical health (Jat et al. 2013; Singh et al. 2016), better water regimes(Govaerts et al. 2009) and improved nutrient use efficiency (Unger and Jones 1998) compared toCT. In initial years of experiment, the system productivity was higher in CT (kharif) than ZT practices(Table 6). This relative yield increase in ZT over time and transition period has been attributed toimproved soil quality such as organic carbon, soil enzymatic activity, microbial biomass, porosityand structural stability (So et al. 2009). These results indicate the importance of long termexperiments.
Economics and energy
The positive effects of ZT on system productivity were reflected in economic benefits (Table 7). Thehigher net returns in MT-MT and ZT-ZT were attributed mainly to reduced production cost andincreased yield particularly of wheat. Lower production cost in MT and ZT practices was mainly dueto non- requirement of preparatory tillage unlike in CT where 4 passes of tillage operations wereperformed before sowing of crops. CT-CT also maintained lower benefit to cost ratio (1.67) due tothe higher cost of production and lower yields. Consistent to our results, higher net returns and B:Cratio with ZT were reported by many workers (Gathala et al. 2011; Jat et al. 2013; Choudhary et al.2016, 2017; Singh et al. 2016; Jakhar et al. 2018b).
Total energy input used in CT-CT was 20.4 GJ ha−1, which is about 19.3% more than that of ZT-ZT (Table 7). Tillage and weeding operations were main factor resulting in excessive energy use inCT-CT. Conventional tillage practices were regarded to be energy intensive and poor in resourceutilization. About 25–30% of energy was required for field preparation and crop establishment(Choudhary et al. 2017). Zero tillage practices reduced the energy requirement due to saving ofenergy in land preparation and weeding operations. Energy-use efficiency and energy productivitywas higher in ZT-ZT because of lowest energy input and higher system productivity.
Conclusion
The following conclusions were drawn from this study:
● Bulk density was affected by tillage practices, but only within the top 15 cm soil. ContinuousZT practice increased bulk density relative to CT. None of tillage systems was able to affectsoil pH, EC and available nutrients.
12 A. K. DIXIT ET AL.
● In ZT-ZT practice, SOC concentration and stock were higher as compared to CT-CT plotswhich ultimately helped to maintain higher carbon sequestration rate. Soil enzymatic activ-ities were also higher in ZT-ZT plots.
● There was no significant tillage effect on system productivity over the 5 years. As with the wheatequivalent yield, the differences in yield between tillage practices over 5 years was minimal (8.47to 8.90 Mg ha−1) and year-to-year differences were attributed to climatic variation.
● Energy use efficiency and economic benefits were greater in ZT-ZT among all tillagetreatments.
● Conventional tillage in kharif (sorghum + cowpea) and zero tillage (wheat) in rabi season wasfound to be a better option in terms of crop productivity in semi-arid climate. However, fromthe point of energy saving, economic benefits and soil health, zero tillage in both the seasonsmay be considered depending on farm resources.
Disclosure statement
No potential conflict of interest was reported by the authors.
ORCID
Mukesh Choudhary http://orcid.org/0000-0001-5277-2780
References
Baruah TC, Barthakur HP. 1999. A text book of soil analysis. New Delhi: Vikas Publishing House Pvt. Ltd.Bhan S, Behera UK. 2014. Conservation agriculture in India – problems, prospects and policy issues. Int Soil Water
Conserv Res. 2:1–12.Blake GR, Hartge KH. 1986. Bulk density. In: Klute A, editor. Methods of soil analysis. part 1. physical and minerological
methods. Madison: SSSA; p. 363–382.Blanco-Canqui H, Lal R. 2009. Crop residue removal impacts on soil productivity and environmental quality. Crit Rev
Plant Sci. 28:139–163.Bouwer H. 1986. Intake rate: cylinder infiltrometer. In: Klute A, editor. Methods of soil analysis, physical and miner-
alogical methods. 2nd ed. Madison: Agronomy Mono- graph No. 9, ASA & SSSA; p. 825–844.Busari MA, Kukal SS, Kaur A, Bhatt R, Dulazi AA. 2015. Conservation tillage impacts on soil, crop and the environment.
Int Soil Water Conserv Res. 3:119–129.Casida LEJ, Klein DA, Santaro T. 1964. Soil dehydrogenase activity. Soil Sci. 98:371–376.Chauhan BS, Gill GS, Preston C. 2007. Effect of seeding systems and dinitroaniline herbicides on emergence and
control of rigid ryegrass (Lolium rigidum) in wheat. Weed Technol. 21:53–58.Choudhary M, Rana KS, Bana RS, Ghasal PC, Choudhary GL, Jakhar P, Verma RK. 2017. Energy budgeting and carbon
footprint of pearl millet – mustard cropping system under conventional and conservation agriculture in rainfedsemi-arid agro-ecosystem. Energy. 141:1052–1058.
Choudhary M, Rana KS, Rana DS, Bana RS. 2016. Tillage and crop residue effects in rainfed pearl millet (Pennisetumglaucum) in conjunction with sulphur fertilization under pearl millet – indian mustard (Brassica juncea) croppingsystem. Indian J Agron. 61:15–19.
Dam RF, Mehdi BB, Burgess MSE, Madramootoo CA, Mehuys GR, Callum IR. 2005. Soil bulk density and crop yieldunder eleven consecutive years of corn with different tillage and residue practices in a sandy loam soil in centralCanada. Soil Till Res. 84:41–53.
Derpsch R, Friedrich T, Kassam A, Li HW. 2010. Current status of adoption of no- till farming in the world and some ofits main benefits. Int J Agric Biol Eng. 3:1–25.
Devasenapathy P, Senthilkumar G, Shanmugam PM. 2009. Energy management in crop production. Indian J Agron.54:80–90.
Eivazi F, Tabatabai MA. 1988. Glucosidases and galactosidases in soils. Soil Biol Biochem. 20:601–606.Gathala MK, Ladha JK, Saharawat YS, Kumar V, Kumar V, Sharma PK. 2011. Effect of tillage and crop establishment
methods on physical properties of a medium-textured soil under a seven-year rice–wheat rotation. Soil Sci Soc AmJ. 75:1851–1862.
Govaerts B, Sayre KD, Goudeseune B, De Corte P, Lichter K, Dendooven L, Deckers J. 2009. Conservation agriculture asa sustainable option for the central Mexican highlands. Soil Till Res. 103:222–230.
ARCHIVES OF AGRONOMY AND SOIL SCIENCE 13

Jackson ML. 1973. Soil chemical analysis. New Delhi: Prentice Hall of India Pvt Ltd.; p. 205–226.Jakhar P, Rana KS, Dass A, Choudhary AK, Choudhary M, Adhikary PP, Maharana J. 2017. Moisture conservation
practices in maize-mustard cropping system : effects on productivity, water use and soil fertility. Indian J SoilConserv. 45:288–295.
Jakhar P, Rana KS, Dass A, Choudhary AK, Choudhary M, Adhikary PP, Maharana J. 2018a. Resource conservationpractices in maize-mustard cropping system: impact on energy, soil carbon and nutrient dynamics. J Environ Biol.39:440–446.
Jakhar P, Rana KS, Dass A, Choudhary AK, Kumar P, Meena MC, Choudhary M. 2018b. Tillage and residue retentioneffect on crop and water productivity of Indian mustard (Brassica juncea) under rainfed conditions. Indian J AgricSci. 88:47–53.
Jat ML, Gathala MK, Saharawat YS, Tetarwal JP, Gupta R, Singh Y. 2013. Double no-till and permanent raised beds inmaize–wheat rotation of north-western indo-gangetic plains of India: effects on crop yields, water productivity,profitability and soil physical properties. Field Crops Res. 149:291–299.
Jat RA, Wani SP, Sahrawat KL. 2012. Conservation agriculture in the semi-arid tropics: prospects and problems. AdvAgron. 117:191–273.
Kaschuk G, Alberton O, Hungria M. 2010. Three decades of soil microbial biomass studies in Brazilian ecosystems:lessons learned about soil quality and indications for improving sustainability. Soil Bio Biochem. 42:1–13.
Krishna VV, Veettil PC. 2014. Productivity and efficiency impacts of conservation tillage in northwest indo-gangeticplains. Agric Syst. 127:126–138.
Kumar V, Jat HS, Sharma PC, Singh B, Gathala MK, Malik RK, Kamboj BR, Yadav AK, Ladha JK, Raman A, et al. 2018. Canproductivity and profitability be enhanced in intensively managed cereal systems while reducing the environ-mental footprint of production? Assessing sustainable intensification options in the breadbasket of India. AgricEcosyst Environ. 252:132–147.
Lal R, Follett RF, Kimble J, Cole CV. 1999. Managing US cropland to sequester carbon in soil. J Soil Water Conserv.54:374–381.
Neugschwandtner RW, Liebhard P, Kaul H, Wagentristl H. 2014. Soil chemical properties as affected by tillage and croprotation in a long-term field experiment. Plant Soil Environment. 60:57–62.
Nunan N, Morgan MA, Herlihy M. 1998. Ultraviolet absorbance (280 nm) of compounds released from soil duringchloroform fumigation as an estimate of the microbial biomass. Soil Biol Biochem. 30:1599–1603.
Olsen BC, Cole CV, Watenabe FS, Dean LA. 1954. Estimation of available phosphorus by extraction with sodiumcarbonate. Washington: USDA.
Ozpinar S. 2006. Effects of tillage systems on weed population and economics for winter wheat production under themediterranean dryland conditions. Soil Till Res. 87:1–8.
Parihar CM, Jat SL, Singh AK, Kumar B, Pradhan S. 2016a. Conservation agriculture in irrigated intensive maize-basedsystems of north-western India: effects on crop yields, water productivity and economic profitability. F Crop Res.193:104–116.
Parihar CM, Yadav MR, Jat SL, Singh AK, Kumar B, Pradhan S, Chakraborty D, Jat ML, Jat RK, Saharawat YS, et al. 2016b.Long term effect of conservation agriculture in maize rotations on total organic carbon, physical and biologicalproperties of a sandy loam soil in north-western indo-gangetic plains. Soil Till Res. 161:116–128.
Pimentel D, Herdendorf M, Eisenfeld S, Olander L, Carroquino M, Corson C, McDade J, Chung Y, Cannon W, Roberts J,Bluman L. 1994. Achieving a secure energy future: environmental and economic issues. Ecol Econ. 9:201–219.
Piper CS. 1950. Soil and plant analysis. Australia: The University of Adelaide; p. 286–287.Pittelkow CM, Liang X, Linquist BA, Van GKJ, Lee J, Lundy ME, Van GN, Six J, Venterea RT, Van KC. 2015. Productivity
limits and potentials of the principles of conservation agriculture. Nature. 517:365–368.Rai SK, Dixit AK, Choudhary M, Kumar S. 2018. Climatic variability and prediction of annual rainfall using stochastic
time series model at Jhansi in central India. Mausam. 69:73–80.Roldan A, Caravaca F, Hernandez MT, Garcia C, Sanchez-Brito C, Velasquez M, Tiscareno M. 2003. No-tillage, crop
residue additions, and legume cover cropping effects on soil quality characteristics under maize in Patzcuarowatershed (Mexico). Soil Till Res. 72:65–73.
Sharma P, Abrol V, Sharma RK. 2011. Impact of tillage and mulch management on economics, energy requirementand crop performance in maize-wheat rotation in rainfed subhumid inceptisols, India. Eur J Agron. 34:46–51.
Singh VK, Singh Y, Dwivedi BS, Singh KS, Majumdar K, Jat ML, Mishra RP, Rani M. 2016. Soil physical properties: yieldtrends and economics after five years of conservation agriculture based rice-maize system in north-western India.Soil Till Res. 155:133–148.
So HB, Grabski A, Desborough P. 2009. The impact of 14 years of conventional and no-till cultivation on the physicalproperties and crop yields of a loam soil at Grafton NSW, Australia. Soil Till Res. 104:180–184.
Subbiah BV, Asija GL. 1956. A rapid procedure for the estimation of available nitrogen in soils. Cur Sci. 25:259–260.Tabatabai MA, Bremner JM. 1969. Use of p-nitrophenyl phosphate for assay of soil phosphatase activity. Soil Biol
Biochem. 1:301–307.Thomas GA, Dalal RC, Standley J. 2007. No-till effects on organic matter, pH, cation exchange capacity and nutrient
distribution in a Luvisol in the semi-arid subtropics. Soil Till Res. 94:295–304.
14 A. K. DIXIT ET AL.

Unger PW, Jones OR. 1998. Long-term tillage and cropping systems affect bulk density and penetration resistance ofsoil cropped to dryland wheat and grain sorghum. Soil Till Res. 45:39–57.
Vogeler I, Rogasik J, Funder U, Panten K, Schnug E. 2009. Effect of tillage systems and P - fertilization on soil physicaland chemical properties, crop yield and nutrient uptake. Soil Till Res. 103:137–143.
Walkley A, Black IA. 1934. An examination of the degtjareff method for determining soil organic matter and aproposed modification of chromic acid titration method. Soil Sci. 37:29–38.
ARCHIVES OF AGRONOMY AND SOIL SCIENCE 15