BIOMASS CROP ASSISTANCE PROGRAM
228
B B I I O O M M A A S S S S C C R R O O P P A A S S S S I I S S T T A A N N C C E E P P R R O O G G R R A A M M 1 Environmental Assessment 2 Proposed BCAP Giant Miscanthus (Miscanthus X giganteus) Establishment 3 and Production in Georgia, North Carolina, and South Carolina 4 5 Sponsored by REPREVE SM Renewables LLC 6 7 United States Department of Agriculture 8 Farm Service Agency 9 10 October 2011 11 DRAFT 12
-
Upload
khangminh22 -
Category
Documents
-
view
5 -
download
0
Transcript of BIOMASS CROP ASSISTANCE PROGRAM

BBIIOOMMAASSSS CCRROOPP AASSSSIISSTTAANNCCEE PPRROOGGRRAAMM 1
Environmental Assessment 2
Proposed BCAP Giant Miscanthus (Miscanthus X giganteus) Establishment 3 and Production in Georgia, North Carolina, and South Carolina 4
5
Sponsored by REPREVESM Renewables LLC 6
7
United States Department of Agriculture 8 Farm Service Agency 9
10
October 2011 11
DRAFT 12

1
2

NOTICE OF AVAILABILITY
DRAFT - Environmental Assessment SE Giant Miscanthus Establishment and Production i
NOTICE OF AVAILABILITY 1
DRAFT ENVIRONMENTAL ASSESSMENT 2
Proposed BCAP Giant Miscanthus Establishment and 3 Production in Georgia, North Carolina, and South Carolina 4
Farm Service Agency 5
U.S. Department of Agriculture 6
This notice announces the availability of a Draft Environmental Assessment (EA) for the 7
proposed establishment and production of Freedom giant miscanthus (Miscanthus X 8
giganteus) as a dedicated energy crop for energy production to be grown in the REPREVE 9
Renewables LLC (Project Sponsor) proposed project areas in Georgia, North Carolina, and 10
South Carolina under the Biomass Crop Assistance Program (BCAP). This EA is being 11
prepared in accordance with the National Environmental Policy Act (NEPA) (Public Law [PL] 12
91-190, 42 U.S. Code [USC] 4321 et seq.); implementing regulations adopted by the 13
Council on Environmental Quality (CEQ) (40 Code of Federal Regulations [CFR] 1500-14
1508); and FSA implementing regulations, Environmental Quality and Related 15
Environmental Concerns – Compliance with NEPA (7 CFR 799). According to CEQ 16
guidance, an EA is a “concise document for which a Federal agency is responsible that 17
serves to (1) briefly provide sufficient evidence and analysis for determining whether to 18
prepare an environmental impact statement (EIS) or a finding of no significant impact 19
(FONSI) (40 CFR 1508.9).” Additionally, since this document falls under the guidance of the 20
BCAP Final Programmatic EIS (PEIS), which was a broad national-level program document, 21
CEQ guidance allows for “tiering.” CEQ guidance defines tiering as, “the coverage of 22
general matters in broader EIS with subsequent narrower statements or environmental 23
analyses incorporating by reference the general discussions and concentrating solely on the 24
issues specific to the statement subsequently prepared (40 CFR 1508.28). The Draft EA 25
provides a means for the public to voice any concerns they may have about the proposed 26
BCAP project area. 27
The Farm Service Agency (FSA), on behalf of the Commodity Credit Corporation (CCC), 28
invites comments on the Draft EA. We will consider comments that we receive by 22 29
November 2011. Comments submitted after this date will be considered to the extent 30
possible. 31
32

NOTICE OF AVAILABILITY
DRAFT - Environmental Assessment SE Giant Miscanthus Establishment and Production ii
To comment on this Draft EA, please use one of the following methods: 1
· Federal eRulemaking Portal: Go to http://www.regulations.gov. Follow the online 2
instructions for submitting comments. 3
· E-Mail: [email protected]. 4
· Fax: 972-562-7673 ATTN: SE Giant Miscanthus EA Comments. 5
· Mail: SE Giant Miscanthus EA Comments 6 Integrated Environmental Solutions, LLC 7 2150 S Central Expy Ste 110 8 McKinney, TX 75070 9
· Hand Delivery or Courier: Deliver comments to the above address. 10
Comments may be inspected in the Office of the Director, CEPD, FSA, USDA, Room 4709 11
South Building, Washington, D.C., between 8:00 a.m. and 4:30 p.m., Monday through 12
Friday, except holidays. A copy of this notice is available through the FSA home page at 13
http://www.fsa.usda.gov/. 14
For additional information, please contact: 15
USDA/FSA/CEPD 16 Matthew T. Ponish 17 National Environmental Compliance Manager 18 1400 Independence Ave. SW 19 Mail Stop 0513 20 Washington, D.C. 20250 21 (202) 720-6853 22 [email protected] 23 24

EXECUTIVE SUMMARY
DRAFT - Environmental Assessment SE Giant Miscanthus Establishment and Production ES-1
EXECUTIVE SUMMARY 1
INTRODUCTION AND BACKGROUND 2
The U.S. Department of Agriculture (USDA) Commodity Credit Corporation (CCC) 3
implements the Biomass Crop Assistance Program (BCAP) authorized by the Food, 4
Conservation, and Energy Act of 2008 (the 2008 Farm Bill). On October 27, 2010, the CCC 5
published the Record of Decision (ROD) for the BCAP Final Programmatic Environmental 6
Impact Statement (PEIS) and the BCAP Final Rule (7 Code of Federal Regulations [CFR] 7
Part 1450) in the Federal Register (FR 75:207, 65995-66007; 66202-66243). As part of the 8
mitigation measures detailed in the ROD, each project proposal is subject to a National 9
Environmental Policy Act (NEPA) (Public Law [PL] 91-190, 42 U.S. Code [USC] 4321 et 10
seq.) analysis prior to approval of the project area proposal. The initial environmental 11
evaluation (pre-NEPA documentation) of a project area proposal is developed through the 12
completion of Forms BCAP-19, BCAP-20, BCAP-21, and BCAP-22 and supporting 13
information. After this initial evaluation of the project area proposal FSA can conclude that 14
(1) no additional environmental analyses are applicable due to (a) the activity being 15
specifically addressed and analyzed within the BCAP Final PEIS, and/or (b) no potential for 16
the proposed BCAP activity to significantly impact the environment or (2) that additional 17
environmental analyses in the form of an environmental assessment (EA) or environmental 18
impact statement (EIS) are necessary, depending upon the potential level of significance. 19
All project area proposals undergoing NEPA documentation, subsequent to the BCAP Final 20
PEIS, must adhere to the findings and conditions established in the BCAP Final PEIS. The 21
BCAP Final PEIS was a broad national-level program document; therefore, according to the 22
Council on Environmental Quality (CEQ) NEPA guidance (40 CFR 1508.28) “tiering” from 23
the BCAP Final PEIS is allowable. CEQ guidance defines tiering as, “the coverage of 24
general matters in broader EIS with subsequent narrower statements or environmental 25
analyses incorporating by reference the general discussions and concentrating solely on the 26
issues specific to the statement subsequently prepared (40 CFR 1508.28). CEQ identifies 27
tiering as appropriate to assist the lead agency on focusing on the issues of importance and 28
exclude from consideration those issues, which have been previously decided or “not yet 29
ripe” for a decision. 30
If a project area proposal is approved by FSA, then producers can apply to FSA to become 31
BCAP contract producers with acreage within the approved project area(s). As part of the 32
process for approving contract acreage, the producer must provide an on-site environmental 33

EXECUTIVE SUMMARY
DRAFT - Environmental Assessment SE Giant Miscanthus Establishment and Production ES-2
evaluation for the proposed acreage. The initial environmental evaluation will require the 1
completion of the Natural Resources Conservation Service (NRCS) environmental 2
evaluation worksheet, CPA-52. If through the completion of CPA-52, there is an indication 3
for the potential for environmental impacts additional environmental evaluation would be 4
required following the FSA NEPA guidance for an EA or EIS. However, FSA could 5
determine after the completion of CPA-52 not to enroll those acres into the BCAP project 6
area due to the potential level of significant effects. If acreage is approved, then all contract 7
producers must develop a BCAP Conservation Plan or Forest Stewardship Plan for their 8
contract acreage, in addition to any project area specific mitigation and monitoring measures 9
(Section 6 of this document), which would be included within the BCAP contract details or 10
incorporated into the BCAP Conservation Plan or Forest Stewardship Plan. 11
In Fiscal Year (FY) 2011, the FSA approved nine BCAP project areas with the following 12
species: native prairie grass (two project areas totaling 70,000 acres); giant miscanthus, 13
Illinois clone (four project areas totaling 19,182 acres, which underwent an EA and received 14
a mitigated finding of no significant impact [FONSI] in May 2011); camelina (two project 15
areas totaling 51,000 acres); and hybrid poplar (one project area totaling 7,002 acres). 16
This EA analyzes the proposed establishment of BCAP project areas supporting the 17
proposed establishment and production of giant miscanthus hybrid (Miscanthus X 18
giganteus) by REPREVE Renewables LLC (Project Sponsor) in Georgia, North Carolina, 19
and South Carolina. The information developed from this EA and from public comments 20
received on the Draft EA will provide the FSA decisionmakers the information necessary to 21
determine if this project area proposal would meet the requirements of the NEPA 22
environmental evaluation of the BCAP or would require further environmental evaluations 23
under an EIS. 24
PURPOSE AND NEED 25
The primary purpose of BCAP is to promote the cultivation of perennial bioenergy crops and 26
annual bioenergy crops that show exceptional promise for producing bioenergy or biofuels 27
that preserve natural resources and that are not primarily grown for food or animal feed, 28
which would help alleviate dependence on foreign oil for energy production. 29
As such, the FSA accepts project area proposals from potential sponsors of BCAP project 30
areas and then determines whether to accept and establish those project areas, which then 31
creates opportunities for producers to receive funding for crop establishment and production 32

EXECUTIVE SUMMARY
DRAFT - Environmental Assessment SE Giant Miscanthus Establishment and Production ES-3
under BCAP. Project area proposals are submitted by proposed sponsors and include a 1
specific dedicated bioenergy crop or crops and the proposed location for the project area or 2
areas. FSA does not determine which crop(s) or methods would be the most economically 3
viable or most environmentally suited for an area(s), but rather is tasked with determining 4
that a project area proposal fully meets the requirements set forth in the BCAP Final Rule 5
and the appropriate environmental evaluation for the proposal is completed and enough 6
information is available for the decisionmakers to make an informed decision. 7
The FSA would determine from the initial environmental evaluation of a project area 8
proposal whether that proposed project area should (1) be granted approval as a BCAP 9
project area (e.g,, a species analyzed within the Final BCAP EIS or an existing non-Title I 10
crop species) or (2) that further environmental evaluation would be required. This EA 11
provides the initial step for the further environmental evaluation of the proposed project area 12
proposal by FSA. At the conclusion of this EA process, FSA will determine based on the 13
finding of the EA to provide a FONSI or mitigated FONSI or that more environmental 14
evaluation in the form of an EIS is necessary to determine the extent of environmental 15
effects. 16
The purpose of the Proposed Action is to support the establishment and production of giant 17
miscanthus as a crop for energy production to be grown by BCAP participants in the project 18
areas proposed in Georgia, North Carolina, and South Carolina. The need for the Proposed 19
Action is to provide renewable biomass feedstock to a Biomass Conversion Facility (BCF) 20
for use in energy production within and potentially outside the immediate region(s). 21
ALTERNATIVES 22
As part of the BCAP Project Area Selection Process, the Project Sponsor develops a 23
proposal application for submittal to FSA. Prior to this submittal, the Project Sponsor has 24
likely determined the economic feasibility of their proposal, including developing alternatives 25
for location and crop species. The Project Sponsor developed selection criteria to meet the 26
overall purpose and need for the Proposed Action, the establishment and production of giant 27
miscanthus as a dedicated energy crop for energy production under the incentives of the 28
BCAP. As part of the alternatives development process, the Project Sponsor analyzed both 29
alternative locations and alternative crops for the proposed project areas; however, each of 30
these was determined not to be feasible. As such, this EA is analyzing the implementation 31
of the Proposed Action or the selection of the No Action Alternative, that FSA would not 32

EXECUTIVE SUMMARY
DRAFT - Environmental Assessment SE Giant Miscanthus Establishment and Production ES-4
establish the proposed project areas supporting the establishment and production of giant 1
miscanthus. 2
PROPOSED ACTION 3
REPREVESM Renewables LLC (Project Sponsor) are proposing that FSA establish BCAP 4
project areas that support the establishment and production of Freedom™ giant miscanthus 5
on up to 58,000 total acres by 2013, with crop longevity of up to 20+ years. The acreage 6
expected to be enrolled within the proposed project areas are marginal croplands, 7
pasturelands, and abandoned or previously cleared timberlands. The proposed project 8
areas are located in three states in four distinct proposed project areas, East Georgia 9
(15,000 acres); Middle Georgia (20,000 acres), Lowcountry (5,000 acres) in Georgia and 10
South Carolina, and North Carolina (18,000 acres). This proposed action differs, from the 11
MFA Oil Biomass LLC and Aloterra Energy LLC giant miscanthus projects, approved by 12
FSA in May 2011, in that (1) Freedom would be the variety of giant miscanthus planted 13
within the proposed project areas, and (2) there would not be the development of 14
propagation acres at the individual contract producer level. 15
Each proposed project area contains at least one BCF that would accept giant miscanthus 16
for a direct bioenergy feedstock or conversion into an intermediary product for bioenergy 17
production. Additionally, there are other BCFs in varying stages of development for various 18
end products that could use giant miscanthus as a feedstock in the proposed project areas. 19
Each proposed project area was developed in proximity to the foundation acreage located in 20
Soperton, Georgia and to sub-licensed registered acreage for efficient transportation of the 21
certified rhizome stock to the participating producers and efficient transportation alternatives 22
to the BCF(s) within each proposed project area. All rhizome stock planted on contract 23
acreage within the proposed project areas would be certified rhizomes from the foundation 24
acreage or from the sub-licensed registered acreage. All rhizomes would be pre-processed 25
following the methods developed by the Project Sponsor prior to planting and establishment 26
on contract acreage. 27
Equipment to be used to establish giant miscanthus would be modified equipment from 28
existing agricultural industries located in the Southeastern United States, such as tobacco 29
and forage/hay. Equipment used to harvest and bale giant miscanthus would be similar to 30
existing types of agricultural machinery used for hay crops to produce large square bales. 31

EXECUTIVE SUMMARY
DRAFT - Environmental Assessment SE Giant Miscanthus Establishment and Production ES-5
ENVIRONMENTAL CONSEQUENCES 1
Table ES-1 provides a tabular summary of the potential effects from both the Proposed 2
Action and No Action Alternative. Implementing the Proposed Action would result in minor 3
positive and negative effects to the local and regional area; however, many of these effects 4
would be minimized through the use of the Mitigation and Monitoring Plan. FSA has a 5
framework for defining the components of the Mitigation and Monitoring Plan. The 6
Mitigation and Monitoring Plan is included in Section 6.0 of this document. 7
Table ES-1. Comparison of the Alternatives 8 Resource Area Proposed Action No Action Alternative Cumulative Effects Socioeconomics Minor +/0 0 Minor +/0 Land Use 0/Minor - 0 0/Minor - Coastal Zone Management Consistency
0 0 0
Biological Resources Vegetation 0/Minor - 0 0/Minor - Wildlife 0/Minor- 0 0/Minor- Protected Species 0 0 0
Soil Resources +/Minor - 0/Minor - +/Minor- Water Quality/Quantity
Water Quality Minor +/0 0/Minor - Minor +/Minor- Water Quantity Minor +/0 0/Minor - Minor +/Minor-
Air Quality 0/Minor - 0 0/Minor- Outdoor Recreation Minor +/Minor - 0 Minor +/Minor- Environmental Justice Minor +/0 0/Minor - Minor +/Minor- Note: (+)=positive (-)=negative (0)=neutral 9
The Proposed Action would result in additional diversified income for participating 10
producers, as well as technical assistance from the Project Sponsor in the production and 11
harvesting of giant miscanthus. The Project Sponsor has located at least one BCF in each 12
of the proposed project areas ensuring that producers will have a demand for their products. 13
Also, ancillary agricultural services should expect an increase due to the Project Sponsor 14
goal of primarily contracting economically marginal, idle acres, or abandoned acres. The 15
Proposed Action would result in a changed local landscape with the addition of the giant 16
miscanthus fields. 17
The Mitigation and Monitoring Plan (see Section 6), which would be a mandatory 18
component of the producer contract with FSA, would be used to ensure that adverse effects 19
from this new crop are minimized or avoided. Similarly, minor negative effects would be 20
anticipated for biological diversity as pastureland is converted into giant miscanthus 21
croplands. The Mitigation and Monitoring Plan would be essential to provide mechanisms 22

EXECUTIVE SUMMARY
DRAFT - Environmental Assessment SE Giant Miscanthus Establishment and Production ES-6
such as reasonable and economically feasible buffers and field edges to provide for 1
continued wildlife and vegetative diversity in these areas. Recent research has indicated 2
that giant miscanthus is susceptible to some plant pests; the Mitigation and Monitoring Plan 3
monitoring and buffer efforts would be essential to ensure that any occurrence is identified 4
and treated early to avoid transmission to local croplands, such as corn. 5
Giant miscanthus, which has an extensive perennial root system, would be anticipated to 6
have beneficial effects on soil retention, soil organic matter, and soil carbon sequestration. 7
Water quality should improve relative to other crops typically grown in the project areas due 8
to improved nutrient uptake, low fertilizer requirements, and reduced sediment transport. 9
Also, due to its growth patterns, giant miscanthus would be anticipated to require more 10
water than corn grown for grain, but less water than grass hay and improved pasture. The 11
majority of the acres that enroll in the program are expected to be economically marginal 12
cropland, pastureland, idle cropland, and previously harvested/abandoned 13
forestland/timberland. The project may also see some conversion of irrigated lands to the 14
non-irrigated miscanthus, which will reduce regional water use from those irrigated acres, 15
though this would be expected to be on limited acreage. The plant has much higher water 16
use efficiency, generating high amounts of biomass per volume of water consumed, 17
indicating it uses rainfall efficiently. 18
The No Action Alternative would result in no adverse effects to the local and regional area 19
since there would be no giant miscanthus planted in any of the proposed project areas as 20
described in this BCAP Project Proposal. However, the No Action Alternative would not 21
assist in meeting the overall goal of BCAP, which is to develop dedicated energy crops for 22
conversion to bioenergy. 23
Cumulatively, within the proposed project areas, cumulative effects would be minor and 24
dependent upon the site specific acreage potentially enrolled within the proposed project 25
areas. Under the proposed project, up to 58,000 acres could be enrolled under BCAP to 26
establish and produce Freedom giant miscanthus. The cumulative effects analysis was 27
defined as activities related to existing cropland production, projected future cropland 28
production, existing Conservation Reserve Program acreage, and the potential for additional 29
BCAP project areas with the proposed project areas for this action. 30
· Cumulatively, socioeconomic effects could be minor and beneficial or neutral to 31
existing conditions. Direct and indirect socioeconomics effects from the proposed 32
action would account for an increase in employment numbers of less than 0.05 33

EXECUTIVE SUMMARY
DRAFT - Environmental Assessment SE Giant Miscanthus Establishment and Production ES-7
percent across all proposed project areas. Producers are anticipated to derive a 1
positive cash flow by the harvest date in Year 3 after initial plantings with the BCAP 2
assistance rather than in Year 8 or later compared to without BCAP. More than likely 3
woody biomass would be the primary bioenergy feedstock developed in the 4
Southeastern United States given the large amount of land use currently in 5
timberland and forest cover and the relative value of timber in relation to livestock 6
production. The addition of smaller acreages of Freedom giant miscanthus could 7
diversify the producer portfolio and provide an annual revenue stream to supplement 8
the production of other traditional row crops or the longer term production of timber. 9
· Conversion of traditional row crops into Freedom giant miscanthus would be 10
anticipated to be a small percentage of the proposed acreage due to the current 11
commodity prices, large acreage in forestland and timber production, and the 12
relatively small amount of acreage to be potentially converted into Freedom giant 13
miscanthus under this proposed project, which would limit the cumulative effects 14
associated with the proposed action. 15
· Cumulative effects to biological resources would be minimized through the use of the 16
mandatory contract level Conservation Plans or Forest Stewardship Plans in 17
combination with the Mitigation and Monitoring Plan developed as part of the 18
Proposed Action. Like traditional row crops, a monoculture establishment of 19
Freedom giant miscanthus would reduce local level biodiversity; however, field 20
buffers and wildlife corridors in association with mandatory site-specific Conservation 21
Practices including in the Conservation Plan would provide mechanisms for 22
continued wildlife movement and use. Overall anticipated land use conversion to 23
Freedom giant miscanthus would be limited in any of the proposed project areas, 24
which when combined with other on-going agricultural and forestry activities would 25
produce changes to biodiversity, but the effects would be highly dependent upon the 26
site-specific conditions. 27
· Reduced soil erosion would be anticipated from the establishment and production of 28
a perennial herbaceous species. Soil erosion could increase in some site-specific 29
areas dependent upon soil type and texture; however, the mandatory Conservation 30
Plan or Forest Stewardship Plan in association with the Mitigation and Monitoring 31
Plan would develop appropriate erosion control methods to minimize soil loss during 32
the establishment phase of this dedicated bioenergy crop. Also a large perennial 33

EXECUTIVE SUMMARY
DRAFT - Environmental Assessment SE Giant Miscanthus Establishment and Production ES-8
herbaceous species would likely increase soil organic matter and below-ground 1
carbon sequestration due to the high volume of root mass. However, these 2
cumulative effects would be minimized from the small amount of acreage proposed 3
for Freedom giant miscanthus establishment within the proposed project areas 4
associated with all other agricultural and forestry activities. 5
· Freedom giant miscanthus has a greater water use efficiency (amount of biomass 6
produced per volume of water consumed) than annual crops, but would be 7
anticipated to require more water than permanent pasture, rangeland, or annual 8
crops grown for grain production. However, for most acreage water would be 9
anticipated to come from precipitation, rather than irrigation. Water quality would be 10
anticipated to improve in watersheds with high soil erosion potential and existing 11
nutrient leaching or runoff from traditional crops once Freedom giant miscanthus 12
becomes established. Cumulatively, the water quantity and quality effects from the 13
production of Freedom giant miscanthus, in association with other agricultural and 14
forestry activities, would be minimal given the relatively low amount of acreage to be 15
converted. 16
· Cumulative effects to air quality would be avoided due the limited use of agricultural 17
machinery for the establishment and production of giant miscanthus. Even at the 18
maximum amount of acreage tilled at one point in time, the amount of small airborne 19
particulate matter (PM2.5) would be less than 0.1 percent of the projected total 20
emissions in 2012. Tillage would only occur during the establishment year, with the 21
addition of harvesting equipment included in the on-farm mobile sources each year 22
thereafter. Overall, emissions from agricultural equipment and tractor trailers for 23
transportation of products would be limited and only create minor, temporary 24
increases in emissions during initial establishment, periodic crop maintenance, and 25
annual harvest across all proposed project areas. 26
· The potential cumulative effects of establishment of a biomass crop would impact 27
wildlife as habitats are fragmented, degraded, or destroyed from dedicated energy 28
crop establishment; however, the amount of acreage within any of the proposed 29
project areas would be minor when compared to existing agricultural and forestry 30
activities. Overall, effects to biodiversity would be minimized, to the extent, possible 31
through the use of the mandatory contract producer Conservation Plan or Forest 32
Stewardship Plan in association with the Mitigation and Monitoring Plan, which 33

EXECUTIVE SUMMARY
DRAFT - Environmental Assessment SE Giant Miscanthus Establishment and Production ES-9
should provide on-going opportunities for both consumptive and non-consumptive 1
outdoor recreation. 2
DATA GAPS IN CURRENT UNITED STATES ESTABLISHMENT AND PRODUCTION 3
Giant miscanthus is a new agronomic crop species in the United States, and also still 4
relatively new in Europe, where the oldest cultivation areas are approximately 30 years old 5
or less. The Miscanthus genus was introduced to the United States over 100 years ago in 6
ornamental plantings and was first described by Beal in 1896 in the Grasses of North 7
America. Several universities (i.e., University of Illinois, Mississippi State University [MSU], 8
University of Wisconsin, Michigan State University [MSU2], and the University of Georgia 9
[UGA]) in the United States are currently cultivating giant miscanthus on a trial basis or 10
conducting research on giant miscanthus or the Miscanthus genus. Additionally, large-scale 11
acreages of giant miscanthus have not been cultivated in the United States; although 12
commercial production of giant miscanthus for bioenergy production in co-fired systems 13
have been established within the last few years in the United Kingdom. Given, that giant 14
miscanthus has only been grown in large-scale trials in Europe; the data on giant 15
miscanthus planting in the United States is limited. As mentioned previously, FSA approved 16
four BCAP project areas for the production of giant miscanthus totaling 19,182 acres in the 17
Midwestern United States in FY 2011. 18
In light of the lack of data applicable to the proposed project areas, an adaptive Mitigation 19
and Monitoring Plan has been developed, which includes best management practices 20
(BMPs) for the establishment and production of giant miscanthus. These BMPs are 21
designed to ensure avoidance and/or minimization of potential effects to the immediate 22
environment and the larger landscape. The Mitigation and Monitoring Plan is a living 23
document that is highly dependent on routine monitoring of the fields to determine the 24
success of giant miscanthus plantings, its overall effects to the immediate environment, and 25
any potential effects to the larger landscape based on observation and measurement. This 26
document contains information on appropriate and effective eradication methods that would 27
be updated over time as new data become available. Likewise, other metrics or observable 28
measurements will be adapted over time based on past observations, new research 29
findings, and new regulations. 30
The following information related to the growth and production of giant miscanthus in the 31
United States has been found to be lacking complete detail. . 32

EXECUTIVE SUMMARY
DRAFT - Environmental Assessment SE Giant Miscanthus Establishment and Production ES-10
· Potential effects to socioeconomics are focused on the information provided in the 1
pro forma analyses of the Project Sponsor. Data from Europe indicates a high cost 2
of establishment due to the vegetative propagation of the species; however, the 3
BCAP combined with the production methods undertaken by the Project Sponsor 4
and technical assistance to be provided to producers addresses most of these 5
concerns. 6
· Landscape scale analyses of giant miscanthus are generally lacking since there 7
have not been any commercial-scale field trials in the United States. 8
· Literature documenting the potential for invasiveness of the fertile species of the 9
Miscanthus genus has been discussed along with documentation supporting that 10
giant miscanthus should not be considered invasive due to its sterility and slow 11
rhizome spread within the United States. The growth and management of giant 12
miscanthus has been studied extensively by the University of Illinois and 13
commercial-scale production has been implemented and monitored in the United 14
Kingdom, but commercial-scale production of the plant has not yet been 15
implemented in the United States. Although the preponderance of evidence 16
indicates that the plant is sterile and slow spreading, documentation of sterility and 17
spread is needed for commercial-scale operations in United States’ environments. 18
· Literature discussing potential plant pests has been recently published relating to the 19
western corn root worm, several species, of aphids, and rust; those studies along 20
with recommendations have been included. 21
· There is little peer-reviewed literature concerning the effects of giant miscanthus 22
plantings on biological diversity in the United States; however, some specific studies 23
have been published in Europe. These studies are primarily focused on bird species 24
with some small mammal observations. These studies also looked at young-aged 25
giant miscanthus stands, so there was little information available on biodiversity 26
found in mature stands. 27
· Information concerning the nutrient uptake, nutrient addition trials, and root structure 28
has been included to discuss the potential for soil erosion, soil organic matter, and 29
soil carbon sequestration based on the available literature. 30
Literature concerning nutrient uptake, water use efficiency, and irrigation needs during 31
establishment has been discussed based on the available literature. 32

TABLE OF CONTENTS
DRAFT - Environmental Assessment SE Giant Miscanthus Establishment and Production I
TABLE OF CONTENTS 1
NOTICE OF AVAILABILITY ............................................................................................................................ I 2
EXECUTIVE SUMMARY .......................................................................................................................... ES-1 3
INTRODUCTION AND BACKGROUND ........................................................................................................ES-1 4
PURPOSE AND NEED ..............................................................................................................................ES-2 5
ALTERNATIVES ........................................................................................................................................ES-3 6
PROPOSED ACTION .................................................................................................................................ES-4 7
ENVIRONMENTAL CONSEQUENCES .........................................................................................................ES-5 8
DATA GAPS IN CURRENT UNITED STATES ESTABLISHMENT AND PRODUCTION .........................................ES-9 9
1 PURPOSE AND NEED FOR THE PROPOSED ACTION ................................................................. 1-1 10
1.1 INTRODUCTION AND BACKGROUND ............................................................................................ 1-1 11
1.2 USDA NEPA GUIDANCE/AUTHORITY ............................................................................................. 1-3 12
1.3 PURPOSE AND NEED FOR THE PROPOSED ACTION ....................................................................... 1-3 13
1.4 ORGANIZATION OF THE DOCUMENT ............................................................................................. 1-5 14
2 ALTERNATIVES INCLUDING THE PROPOSED ACTION ............................................................... 2-1 15
2.1 ALTERNATIVES DEVELOPMENT ..................................................................................................... 2-1 16
2.1.1 Proposed Project Area Locations – Alternatives Analyzed and Eliminated ............................. 2-1 17
2.1.2 Proposed Crop Alternatives – Alternatives Analyzed and Eliminated ..................................... 2-2 18
2.2 ALTERNATIVES TO BE ANALYZED .................................................................................................. 2-3 19
2.2.1 No Action Alternative ........................................................................................................... 2-3 20
2.2.2 Proposed Action.................................................................................................................. 2-4 21
2.2.2.1 Methods for Establishment and Production of Giant Miscanthus ...................................... 2-8 22
2.2.2.2 East Georgia Proposed Project Area .............................................................................. 2-13 23
2.2.2.3 Middle Georgia Proposed Project Area .......................................................................... 2-15 24
2.2.2.4 Lowcountry Proposed Project Area ................................................................................. 2-15 25
2.2.2.5 North Carolina Project Area ........................................................................................... 2-15 26
2.3 RESOURCES CONSIDERED BUT ELIMINATED FROM DETAILED ANALYSIS .................................... 2-19 27
2.4 COMPARISONS OF THE ALTERNATIVES ...................................................................................... 2-20 28
3 AFFECTED ENVIRONMENT (BY RESOURCE AREA) ..................................................................... 3-1 29
3.1 SOCIOECONOMICS ..................................................................................................................... 3-1 30
3.1.1 Definition of the Resource ................................................................................................... 3-1 31
3.1.2 Existing Conditions – General Population Characteristics ..................................................... 3-1 32
3.1.2.1 Population and Demographics ........................................................................................ 3-1 33
3.1.2.2 Income ........................................................................................................................... 3-3 34

TABLE OF CONTENTS
DRAFT - Environmental Assessment SE Giant Miscanthus Establishment and Production II
3.1.2.3 Employment .................................................................................................................... 3-7 1
3.1.2.4 Poverty Levels ............................................................................................................... 3-10 2
3.1.3 Existing Conditions – Agricultural Enterprises .................................................................... 3-16 3
3.1.3.1 Rural Population Trends ................................................................................................ 3-16 4
3.1.3.2 Number of Farms and Land in Farms ............................................................................. 3-16 5
3.1.3.3 Minority Operators ........................................................................................................ 3-16 6
3.1.3.4 Primary Field Crops ....................................................................................................... 3-19 7
3.1.3.5 Primary Livestock Industries .......................................................................................... 3-19 8
3.1.3.6 Farm Income and Cost .................................................................................................. 3-21 9
3.2 LAND USE ................................................................................................................................. 3-22 10
3.2.1 Definition of the Resource ................................................................................................. 3-22 11
3.2.2 Existing Conditions ........................................................................................................... 3-22 12
3.2.2.1 Agricultural Land Uses .................................................................................................. 3-22 13
3.2.2.2 Conservation Acreage ................................................................................................... 3-28 14
3.2.2.3 Forestlands .................................................................................................................. 3-30 15
3.3 MANAGED COASTAL ZONE......................................................................................................... 3-32 16
3.3.1 Definition of the Resource ................................................................................................. 3-32 17
3.3.2 Existing Conditions ........................................................................................................... 3-32 18
3.4 BIOLOGICAL RESOURCES.......................................................................................................... 3-35 19
3.4.1 Vegetation ........................................................................................................................ 3-35 20
3.4.1.1 Definition of the Resource ............................................................................................. 3-35 21
3.4.1.2 Existing Conditions ....................................................................................................... 3-35 22
3.4.2 Wildlife ............................................................................................................................. 3-39 23
3.4.2.1 Definition of the Resource ............................................................................................. 3-39 24
3.4.2.2 Existing Conditions ....................................................................................................... 3-39 25
3.4.3 Protected Species ............................................................................................................. 3-40 26
3.4.3.1 Definition of the Resource ............................................................................................. 3-40 27
3.4.3.2 Existing Conditions ....................................................................................................... 3-40 28
3.5 SOIL RESOURCES ..................................................................................................................... 3-51 29
3.5.1 Definition of the Resource ................................................................................................. 3-51 30
3.5.2 Existing Conditions ........................................................................................................... 3-53 31
3.5.2.1 Existing Conditions ....................................................................................................... 3-53 32
3.5.2.2 Soil Erosion .................................................................................................................. 3-53 33
3.6 WATER QUALITY AND QUANTITY ................................................................................................. 3-55 34
3.6.1 Water Quality .................................................................................................................... 3-55 35

TABLE OF CONTENTS
DRAFT - Environmental Assessment SE Giant Miscanthus Establishment and Production III
3.6.1.1 Definition of the Resource ............................................................................................. 3-55 1
3.6.1.2 Existing Conditions ....................................................................................................... 3-56 2
3.6.2 Water Quantity .................................................................................................................. 3-58 3
3.6.2.1 Definition of the Resource ............................................................................................. 3-58 4
3.6.2.2 Existing Conditions ....................................................................................................... 3-58 5
3.7 AIR QUALITY .............................................................................................................................. 3-60 6
3.7.1 Definition of the Resource ................................................................................................. 3-60 7
3.7.2 Existing Conditions ........................................................................................................... 3-61 8
3.7.2.1 Georgia ........................................................................................................................ 3-61 9
3.7.2.2 North Carolina .............................................................................................................. 3-61 10
3.7.2.3 South Carolina .............................................................................................................. 3-63 11
3.8 OUTDOOR RECREATION ............................................................................................................. 3-63 12
3.8.1 Definition of the Resource ................................................................................................. 3-63 13
3.8.2 Existing Conditions ........................................................................................................... 3-63 14
3.8.2.1 Georgia ........................................................................................................................ 3-63 15
3.8.2.2 North Carolina .............................................................................................................. 3-65 16
3.8.2.3 South Carolina .............................................................................................................. 3-65 17
4 ENVIRONMENTAL CONSEQUENCES ............................................................................................. 4-1 18
4.1 DATA GAPS ................................................................................................................................. 4-1 19
4.2 SOCIOECONOMICS ..................................................................................................................... 4-3 20
4.2.1 Significance Threshold ........................................................................................................ 4-3 21
4.2.2 Proposed Action.................................................................................................................. 4-3 22
4.2.3 No Action Alternative ........................................................................................................... 4-6 23
4.3 LAND USE ................................................................................................................................... 4-6 24
4.3.1 Significance Threshold ........................................................................................................ 4-6 25
4.3.2 Proposed Action.................................................................................................................. 4-6 26
4.3.3 No Action Alternative ........................................................................................................... 4-8 27
4.4 MANAGED COASTAL ZONES ......................................................................................................... 4-8 28
4.4.1 Significance Threshold ........................................................................................................ 4-8 29
4.4.2 Proposed Action.................................................................................................................. 4-9 30
4.4.3 No Action Alternative ........................................................................................................... 4-9 31
4.5 BIOLOGICAL RESOURCES ............................................................................................................ 4-9 32
4.5.1 Vegetation .......................................................................................................................... 4-9 33
4.5.1.1 Significance Threshold .................................................................................................... 4-9 34
4.5.1.2 Proposed Action ............................................................................................................. 4-9 35

TABLE OF CONTENTS
DRAFT - Environmental Assessment SE Giant Miscanthus Establishment and Production IV
4.5.1.3 No Action Alternative .................................................................................................... 4-13 1
4.5.2 Wildlife ............................................................................................................................. 4-14 2
4.5.2.1 Significance Threshold .................................................................................................. 4-14 3
4.5.2.2 Proposed Action ........................................................................................................... 4-14 4
4.5.2.3 No Action Alternative .................................................................................................... 4-18 5
4.5.3 Protected Species ............................................................................................................. 4-18 6
4.5.3.1 Significance Threshold .................................................................................................. 4-18 7
4.5.3.2 Proposed Action ........................................................................................................... 4-18 8
4.5.3.3 No Action Alternative .................................................................................................... 4-18 9
4.6 SOIL RESOURCES ..................................................................................................................... 4-19 10
4.6.1 Significance Threshold ...................................................................................................... 4-19 11
4.6.2 Proposed Action ............................................................................................................... 4-19 12
4.6.3 No Action Alternative ........................................................................................................ 4-20 13
4.7 WATER QUALITY AND QUANTITY ................................................................................................. 4-21 14
4.7.1 Water Quality .................................................................................................................... 4-21 15
4.7.1.1 Significance Threshold .................................................................................................. 4-21 16
4.7.1.2 Proposed Action ........................................................................................................... 4-21 17
4.7.1.3 No Action Alternative .................................................................................................... 4-22 18
4.7.2 Water Quantity .................................................................................................................. 4-23 19
4.7.2.1 Significance Threshold .................................................................................................. 4-23 20
4.7.2.2 Proposed Action ........................................................................................................... 4-23 21
4.7.2.3 No Action Alternative .................................................................................................... 4-26 22
4.8 AIR QUALITY .............................................................................................................................. 4-27 23
4.8.1 Significance Thresholds .................................................................................................... 4-27 24
4.8.2 Proposed Action ............................................................................................................... 4-27 25
4.8.3 No Action Alternative ........................................................................................................ 4-28 26
4.9 OUTDOOR RECREATION ............................................................................................................. 4-28 27
4.9.1 Significance Thresholds .................................................................................................... 4-28 28
4.9.2 Proposed Action ............................................................................................................... 4-28 29
4.9.3 No Action Alternative ........................................................................................................ 4-29 30
4.10 ENVIRONMENTAL JUSTICE ANALYSIS ......................................................................................... 4-29 31
4.10.1 Significance Thresholds .................................................................................................... 4-31 32
4.10.2 Proposed Action ............................................................................................................... 4-32 33
4.10.2.1 Review of Minority and Low-Income Characteristics ................................................... 4-33 34
4.10.2.2 State-Level Tax Credit Programs ................................................................................ 4-34 35

TABLE OF CONTENTS
DRAFT - Environmental Assessment SE Giant Miscanthus Establishment and Production V
4.10.3 No Action Alternative ......................................................................................................... 4-37 1
4.11 ALTERNATIVES COMPARISON .................................................................................................... 4-37 2
4.11.1 Proposed Action................................................................................................................ 4-37 3
4.11.2 No Action .......................................................................................................................... 4-38 4
5 CUMULATIVE IMPACTS ASSESSMENT ......................................................................................... 5-1 5
5.1 DEFINITION ................................................................................................................................. 5-1 6
5.2 CUMULATIVE IMPACTS ANALYSIS BY RESOURCE AREA................................................................. 5-1 7
5.2.1 Socioeconomics ................................................................................................................. 5-1 8
5.2.2 Land Use ............................................................................................................................ 5-2 9
5.2.3 Managed Coastal Zones ...................................................................................................... 5-3 10
5.2.4 Biological Resources ........................................................................................................... 5-3 11
5.2.5 Soil Resources .................................................................................................................... 5-4 12
5.2.6 Water Quality and Quantity .................................................................................................. 5-4 13
5.2.7 Air Quality ........................................................................................................................... 5-5 14
5.2.8 Outdoor Recreation ............................................................................................................. 5-5 15
6 MITIGATION AND MONITORING .................................................................................................... 6-1 16
6.1 INTRODUCTION ........................................................................................................................... 6-1 17
6.2 ROLES AND RESPONSIBILITIES ................................................................................................... 6-1 18
6.3 MITIGATION AND MONITORING RECOMMENDATIONS .................................................................. 6-4 19
6.3.1 Purpose and Overview ......................................................................................................... 6-4 20
6.3.2 Meetings with Contract Producers ....................................................................................... 6-5 21
6.3.3 Socioeconomics ................................................................................................................. 6-6 22
6.3.4 Land Use ............................................................................................................................ 6-6 23
6.3.5 Biological Resources ........................................................................................................... 6-7 24
6.3.5.1 Vegetation ...................................................................................................................... 6-7 25
6.3.5.2 Wildlife ......................................................................................................................... 6-12 26
6.3.5.3 Protected Species ......................................................................................................... 6-13 27
6.3.6 Soil Resources .................................................................................................................. 6-14 28
6.3.7 Water Quality and Quantity ................................................................................................ 6-15 29
6.3.7.1 Water Quality ................................................................................................................ 6-15 30
6.3.7.2 Water Quantity .............................................................................................................. 6-16 31
7 REFERENCES ................................................................................................................................... 7-1 32
8 PREPARERS ..................................................................................................................................... 8-1 33
9 PERSONS AND AGENCIES CONTACTED ...................................................................................... 9-1 34
9.1 TRIBAL CONSULTATION ............................................................................................................... 9-1 35

TABLE OF CONTENTS
DRAFT - Environmental Assessment SE Giant Miscanthus Establishment and Production VI
9.2 AGENCIES AND PERSONS CONTACTED ......................................................................................... 9-3 1
APPENDICES 2
APPENDIX A – STATE-LISTED SPECIES THAT COULD POTENTIALLY OCCUR IN THE PROPOSED 3 PROJECT AREAS 4
APPENDIX B – COMMENTS ON THE DRAFT ENVIRONMENTAL ASSESSMENT 5
6
7

TABLE OF CONTENTS
DRAFT - Environmental Assessment SE Giant Miscanthus Establishment and Production VII
LIST OF TABLES 1
Table ES-1. Comparison of the Alternatives 2 ........................................................................................... ES-5
Table 2-1. Definitions of Marginal Lands 3 ............................................................................................... 2-4
Table 2-2. Proposed Establishment and Production Methods for Giant Miscanthus 4 ............................. 2-10
Table 2-3. Counties and Proposed Acreage within Each Proposed Project Area 5 ................................... 2-13
Table 2-4. Comparison of the Alternatives 6 .......................................................................................... 2-20
Table 3-1. 2010 Select Minority Populations within the States 7 .............................................................. 3-2
Table 3-2. 2010 Select Minority Populations within the Proposed Project Areas 8 ..................................... 3-2
Table 3-3. 2009 Total Personal Income and Earnings by Select Industries by State 9 ................................ 3-6
Table 3-4. 2009 Total Personal Income and Earnings by Select Industries by Proposed Project Area 10 ...... 3-7
Table 3-5. 2009 Employment by State by Select Categories 11 .................................................................. 3-8
Table 3-6. 2009 Employment by Proposed Project Areas by Select Categories 12 ....................................... 3-9
Table 3-7. Labor Force, Employed, and Unemployment Rate by State and Proposed Project Area, 13 2001 and 2010 ............................................................................................................... 3-11 14
Table 3-8. Poverty Rate and Median Household Income by State and by Proposed Project Areas, 2000 15 and 2010 ......................................................................................................................... 3-13 16
Table 3-9. Farm Typology by State and Proposed Project Area 17 ............................................................. 3-17
Table 3-10. 2007 Minority Operators by State and by Proposed Project Areas 18 ....................................... 3-17
Table 3-11. Planted Acres, Harvested Acres, and Production of Select Field Crops in the States and 19 Proposed Project Areas .................................................................................................... 3-20 20
Table 3-12. Primary Livestock Activities by County within the Proposed Project Areas 21 ........................... 3-21
Table 3-13. 2007 Land Use Types by State, acres 22 ................................................................................. 3-23
Table 3-14. 2007 Land Use Types by Proposed Project Areas, acres 23 ..................................................... 3-24
Table 3-15. Farmland Enrolled in CRP, Total Acres by State and by Proposed Project Area. 24 ................... 3-28
Table 3-16. Forestland and Non-Forestland Acres by State and by Proposed Project Areas 25 ................... 3-30
Table 3-17. Level III Ecoregions Descriptions by Proposed Project Areas 26 ............................................... 3-35
Table 3-18. Federally Listed Threatened and Endangered Species that Could Potentially Occur within 27 Georgia ............................................................................................................................ 3-41 28
Table 3-19. Federally Listed Threatened and Endangered Species that Could Potentially Occur within 29 North Carolina .................................................................................................................. 3-42 30
Table 3-20. Federally Listed Threatened and Endangered Species that Could Potentially Occur within 31 South Carolina ................................................................................................................. 3-43 32
Table 3-21. Major Land Resource Area Soils Information for Each Proposed Project Area 33 ...................... 3-53
Table 3-22. Acres of Irrigated Land and Water Withdrawals by County within Each Proposed Project 34 Area ................................................................................................................................. 3-58 35
Table 4-1. Cost Comparison for Participating Versus Non-Participating Producers for the 36 Establishment and Production of Giant Miscanthus .............................................................. 4-4 37

TABLE OF CONTENTS
DRAFT - Environmental Assessment SE Giant Miscanthus Establishment and Production VIII
Table 4-2. Estimated Acres to be Planted by 2014 to Giant Miscanthus by Proposed Project Area and 1 Percent of Land Use Type. .................................................................................................... 4-7 2
Table 4-3. Characteristics of Ideal Biomass Crop/Weeds 3 .................................................................... 4-11
Table 4-4. Species Identified In and Around Foundation Acreage, 16 August 2011 4 .............................. 4-16
Table 4-5. Comparison of Average Fertilizer Applications, pounds per acre 5 .......................................... 4-21
Table 4-6. Summary of Reported Water Use Values (mm) for Miscanthus and Other Crops 6 ................... 4-24
Table 4-7. Summary of Reported ET Values (mm/day) for Miscanthus and Other Crops 7 ....................... 4-26
Table 4-8. Comparison of the Alternatives 8 ........................................................................................... 4-37
Table 6-1. Roles and Responsibilities for the Mitigation and Monitoring Plan 9 ........................................ 6-3
10

TABLE OF CONTENTS
DRAFT - Environmental Assessment SE Giant Miscanthus Establishment and Production IX
LIST OF FIGURES 1
Figure 2-1. Proposed Project Area Locations. 2 ......................................................................................... 2-6
Figure 2-2. Freedom Giant Miscanthus, April 2011 Planting, Soperton Georgia. 3 ..................................... 2-8
Figure 2-3. Freedom Giant Miscanthus, Rhizomes on Plant Root Ball. 4 ..................................................... 2-9
Figure 2-4. Field Preparation and Planting of Rhizome Harvest Foundation Acreage, Freedom Giant 5 Miscanthus. ..................................................................................................................... 2-11 6
Figure 2-5. Mechanical Planting of Freedom Giant Miscanthus Rhizomes on Foundation Acreage. 7 ........ 2-12
Figure 2-6. Baling of Freedom Giant Miscanthus. 8 ................................................................................ 2-12
Figure 2-7. Biomass Conversion Facilities of Varying Stages of Operation within the East Georgia 9 Proposed Project Area. ..................................................................................................... 2-14 10
Figure 2-8. Biomass Conversion Facilities of Varying Stages of Operation within the Middle Georgia 11 Proposed Project Area. ..................................................................................................... 2-16 12
Figure 2-9. Biomass Conversion Facilities of Varying Stages of Operation within the Lowcountry 13 Proposed Project Area. ..................................................................................................... 2-17 14
Figure 2-10. Biomass Conversion Facilities of Varying Stages of Operation within the North Carolina 15 Proposed Project Area. ..................................................................................................... 2-18 16
Figure 3-1. Percent Minority by County for Proposed Project Areas in Georgia and South Carolina. 17 ........... 3-4
Figure 3-2. Percent Minority by County for the North Carolina Proposed Project Area. 18 .............................. 3-5
Figure 3-3. Annual Changes in the Unemployment Rate for the Combined Counties within Each 19 Proposed Project Area, 2001 through 2010. ..................................................................... 3-11 20
Figure 3-4. June 2011 Unemployment Rates by County within Each Proposed Project Area 21 ................... 3-12
Figure 3-5. Percent of the Population Below the Poverty Threshold by County for Proposed Project Areas 22 in Georgia and South Carolina. ......................................................................................... 3-14 23
Figure 3-6. Percent of the Population Below the Poverty Threshold by County for the North Carolina 24 Proposed Project Area. ..................................................................................................... 3-15 25
Figure 3-7. Minority Operators within the Proposed Project Areas 26 ........................................................ 3-18
Figure 3-8. Percent of Farmland Acres by County in the Proposed Project Areas. 27 ................................... 3-25
Figure 3-9. Comparison of the Percentage of Harvested Cropland and Total Pastureland in the Georgia 28 and South Carolina Proposed Project Areas. ..................................................................... 3-26 29
Figure 3-10 Comparison of the Percentage of Harvested Cropland and Total Pastureland in the North 30 Carolina Proposed Project Area......................................................................................... 3-27 31
Figure 3-11. Percent of Total Acres Enrolled in the Conservation Reserve Program, Total Acres, July 32 2011. .............................................................................................................................. 3-29 33
Figure 3-12. Forestland as a Percentage of Total Land Areas by Proposed Project Areas 34 ......................... 3-31
Figure 3-13. Coastal Zone Management Areas by Proposed Project Areas 35 .............................................. 3-33
Figure 3-14. Level III Ecoregions within and adjacent to the Proposed Project Areas. 36 .............................. 3-36
Figure 3-15. Potential Ranges of Federally-listed Threatened and/or Endangered Birds, Insects and 37 Mammals within and adjacent to the Proposed Project Areas. ........................................... 3-44 38
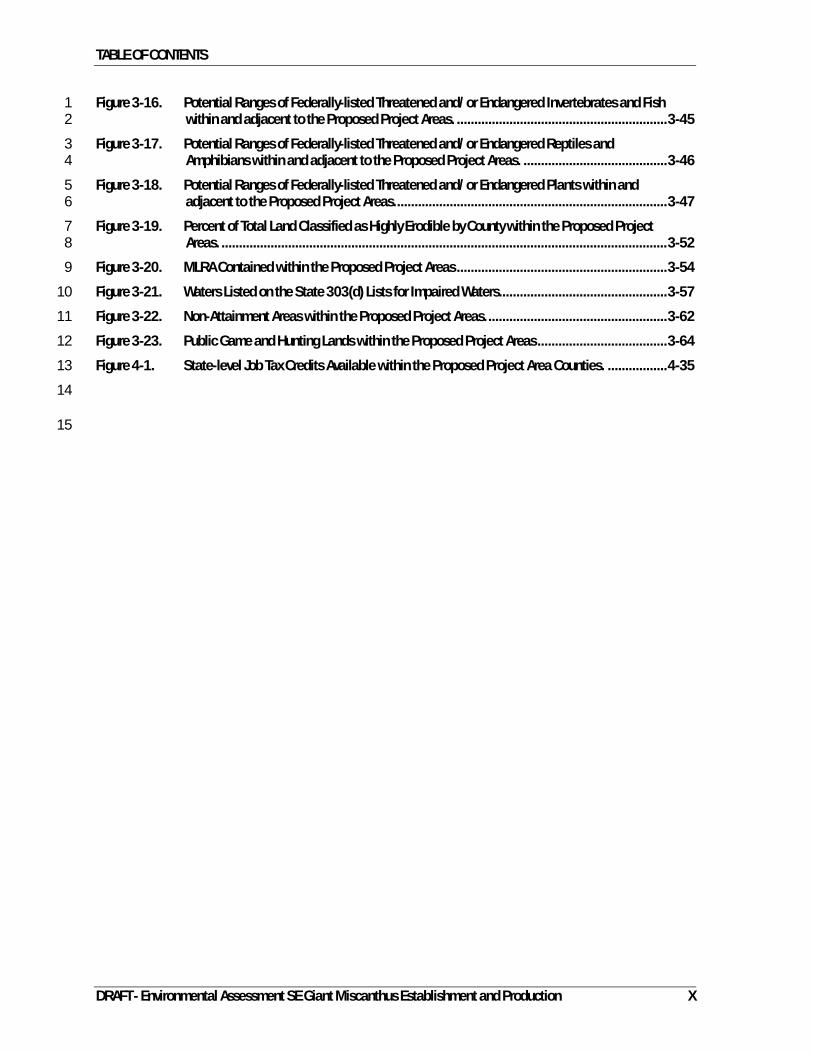
TABLE OF CONTENTS
DRAFT - Environmental Assessment SE Giant Miscanthus Establishment and Production X
Figure 3-16. Potential Ranges of Federally-listed Threatened and/or Endangered Invertebrates and Fish 1 within and adjacent to the Proposed Project Areas. ............................................................ 3-45 2
Figure 3-17. Potential Ranges of Federally-listed Threatened and/or Endangered Reptiles and 3 Amphibians within and adjacent to the Proposed Project Areas. ......................................... 3-46 4
Figure 3-18. Potential Ranges of Federally-listed Threatened and/or Endangered Plants within and 5 adjacent to the Proposed Project Areas. ............................................................................. 3-47 6
Figure 3-19. Percent of Total Land Classified as Highly Erodible by County within the Proposed Project 7 Areas. ............................................................................................................................... 3-52 8
Figure 3-20. MLRA Contained within the Proposed Project Areas 9 ............................................................ 3-54
Figure 3-21. Waters Listed on the State 303(d) Lists for Impaired Waters 10 ................................................ 3-57
Figure 3-22. Non-Attainment Areas within the Proposed Project Areas. 11 ................................................... 3-62
Figure 3-23. Public Game and Hunting Lands within the Proposed Project Areas 12 ..................................... 3-64
Figure 4-1. State-level Job Tax Credits Available within the Proposed Project Area Counties. 13 ................. 4-35
14
15
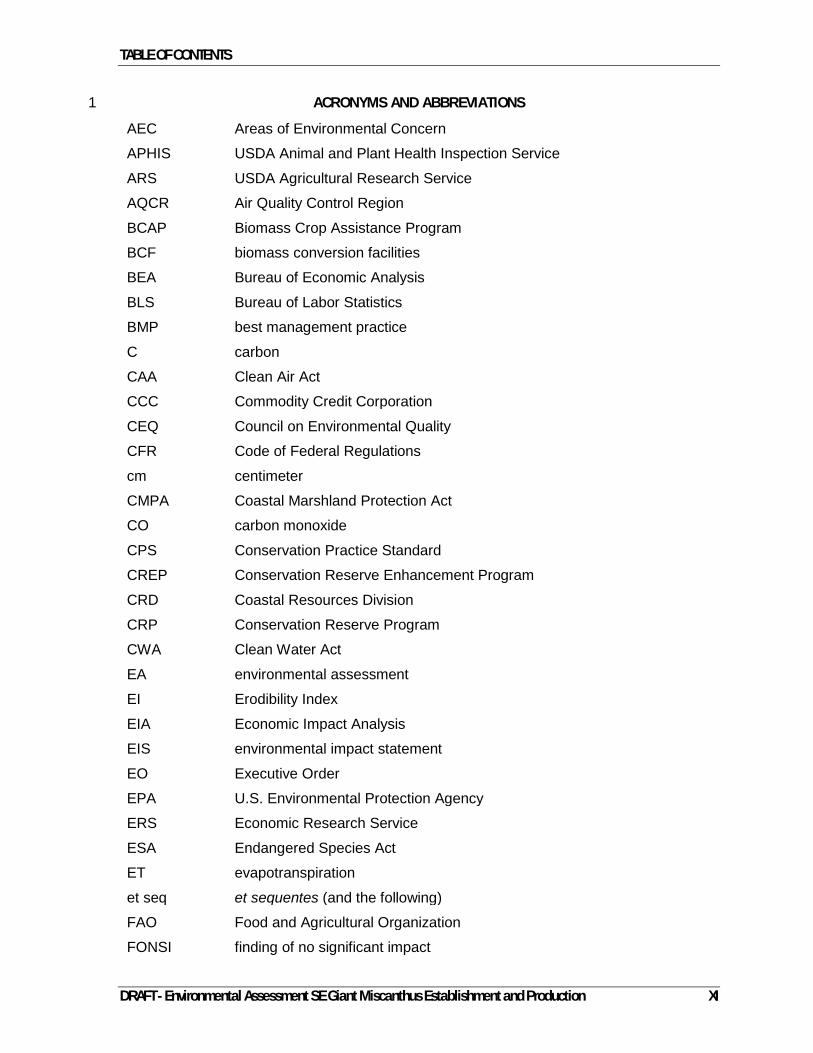
TABLE OF CONTENTS
DRAFT - Environmental Assessment SE Giant Miscanthus Establishment and Production XI
ACRONYMS AND ABBREVIATIONS 1
AEC Areas of Environmental Concern
APHIS USDA Animal and Plant Health Inspection Service
ARS USDA Agricultural Research Service
AQCR Air Quality Control Region
BCAP Biomass Crop Assistance Program
BCF biomass conversion facilities
BEA Bureau of Economic Analysis
BLS Bureau of Labor Statistics
BMP best management practice
C carbon
CAA Clean Air Act
CCC Commodity Credit Corporation
CEQ Council on Environmental Quality
CFR Code of Federal Regulations
cm centimeter
CMPA Coastal Marshland Protection Act
CO carbon monoxide
CPS Conservation Practice Standard
CREP Conservation Reserve Enhancement Program
CRD Coastal Resources Division
CRP Conservation Reserve Program
CWA Clean Water Act
EA environmental assessment
EI Erodibility Index
EIA Economic Impact Analysis
EIS environmental impact statement
EO Executive Order
EPA U.S. Environmental Protection Agency
ERS Economic Research Service
ESA Endangered Species Act
ET evapotranspiration
et seq et sequentes (and the following)
FAO Food and Agricultural Organization
FONSI finding of no significant impact

TABLE OF CONTENTS
DRAFT - Environmental Assessment SE Giant Miscanthus Establishment and Production XII
FR Federal Register
FS USDA Forest Service
FSA USDA Farm Service Agency
g gram
GCIA Georgia Crop Improvement Association
GDNR Georgia Department of Natural Resources
GHG greenhouse gases
HEL highly erodible lands
HILD high-input low diversity
HUC hydrologic unit
Ibid. Ibidem (the same place)
IPM integrated pest management
ISO International Standards Organization
kg kilograms
kPA kilo Pascal
LIHD low-input high diversity
µg/m3 micrograms per cubic meter
m meter
m2 square meter
MSU Mississippi State University
MSU2 Michigan State University
MW megawatt
NAAQS National Ambient Air Quality Standards
NASS National Agricultural Statistics Service
NCDENR North Carolina Department of Environmental and Natural Resources
NCNHP North Carolina Natural Heritage Program
NEPA National Environmental Policy Act
NISC National Invasive Species Council
NOX nitrous oxides
NOAA National Oceanic and Atmospheric Administration
NRCS USDA Natural Resources Conservation Service
NZERMA New Zealand Environmental Risk Management Authority
O3 ozone
Pb lead

TABLE OF CONTENTS
DRAFT - Environmental Assessment SE Giant Miscanthus Establishment and Production XIII
PEIS Programmatic Environmental Impact Statement
PL Public Law
PM2.5 particulate matter of less than 2.5 microns
PM10 particulate matter of less than 10 microns
PPA Plant Protection Act
QAP Quality Assurance Program
RES Renewable Energy Standard
ROD Record of Decision
ROI Region of Influence
SCDHEC South Carolina Department of Health and Environmental
SCDNR South Carolina Department of Natural Resources
SHPO State Historical Preservation Offices
SIP State Implementation Plan
SO2 sulfur dioxide
SPA Shore Protection Act
SWAT Soil Water Assessment Tool
tpy tons per year
TSP Technical Service Providers
UGA University of Georgia
USACE U.S. Army Corp of Engineers
USC U.S. Code
USCB U.S. Census Bureau
USDA U.S. Department of Agriculture
USFWS U.S. Fish and Wildlife Service
USGS U.S. Geological Survey
USLE Universal Soil Loss Equation
WRA Weed Risk Assessment
WRP Wetland Reserve Program
1
2

TABLE OF CONTENTS
DRAFT - Environmental Assessment SE Giant Miscanthus Establishment and Production XIV
1
2
3
4
5
6
7
8
9
10
11
12
This Page Intentionally Left Blank 13
14
15

PURPOSE AND NEED FOR THE PROPOSED ACTION
DRAFT - Environmental Assessment SE Giant Miscanthus Establishment and Production 1-1
1 PURPOSE AND NEED FOR THE PROPOSED ACTION 1
1.1 INTRODUCTION AND BACKGROUND 2
The U.S. Department of Agriculture (USDA) Commodity Credit Corporation (CCC) 3
implements the Biomass Crop Assistance Program (BCAP) authorized by the Food, 4
Conservation, and Energy Act of 2008 (the 2008 Farm Bill). This legislation, which was 5
passed into law on June 18, 2008, creates the BCAP and authorizes the program through 6
September 30, 2012. BCAP is intended to assist agricultural and forestland owners and 7
operators with the establishment and production of eligible crops including woody biomass 8
in selected project areas for conversion to bioenergy, and the collection, harvest, storage, 9
and transportation of eligible material to designated biomass conversion facilities (BCF) that 10
produce or intending to produce heat, power, biobased products, or advanced biofuels. The 11
BCAP is administered by the Deputy Administrator for Farm Programs of the Farm Service 12
Agency (FSA) on behalf of the CCC with the support of other Federal and local agencies. 13
On October 27, 2010, the CCC published the Record of Decision (ROD) for the BCAP Final 14
Programmatic Environmental Impact Statement (PEIS) and the BCAP Final Rule (7 Code of 15
Federal Regulations [CFR] Part 1450) in the Federal Register (FR 75:207, 65995-66007; 16
66202-66243). 17
As part of the mitigation measures detailed in the ROD, each project proposal is subject to a 18
National Environmental Policy Act (NEPA) (Public Law [PL] 91-190, 42 U.S. Code [USC] 19
4321 et seq.) analysis prior to approval of the project area proposal. The initial 20
environmental evaluation of a project area proposal is developed through the completion of 21
Forms BCAP-19, BCAP-20, BCAP-21, and BCAP-22 and supporting information. After this 22
initial evaluation of the project area proposal FSA can conclude that (1) no additional 23
environmental analyses are applicable due to (a) the activity being specifically addressed 24
and analyzed within the BCAP Final PEIS, and/or (b) no potential for the proposed BCAP 25
activity to significantly impact the environment or (2) that additional environmental analyses 26
in the form of an environmental assessment (EA) or environmental impact statement (EIS) 27
are necessary, depending upon the potential level of significance. 28
If a project area proposal is approved by FSA, then producers can apply to FSA to become 29
BCAP contract producers with acreage within the approved project area(s). As part of the 30
process for approving contract acreage, the producer must provide an on-site environmental 31
evaluation for the proposed acreage. The initial environmental evaluation will require the 32
completion of the Natural Resources Conservation Service (NRCS) environmental 33

PURPOSE AND NEED FOR THE PROPOSED ACTION
DRAFT - Environmental Assessment SE Giant Miscanthus Establishment and Production 1-2
evaluation worksheet, CPA-52. If through the completion of CPA-52, there is an indication 1
for the potential for environmental impacts additional environmental evaluation would be 2
required following the FSA NEPA guidance for an EA or EIS. However, FSA could 3
determine after the completion of CPA-52 not to enroll those acres into the BCAP project 4
area due to the potential level of significant effects. If acreage is approved, then all contract 5
producers must develop a BCAP Conservation Plan or Forest Stewardship Plan for their 6
contract acreage, in addition to any project area specific mitigation and monitoring measures 7
(Section 6 of this document), which would be included within the BCAP contract details or 8
incorporated into the BCAP Conservation Plan or Forest Stewardship Plan. 9
In Fiscal Year (FY) 2011, the FSA approved nine BCAP project areas with the following 10
species: native prairie grass (two project areas totaling 70,000 acres); giant miscanthus, 11
Illinois clone (four project areas totaling 19,182 acres, which underwent an EA and received 12
a mitigated finding of no significant impact [FONSI] in May 2011); camelina (two project 13
areas totaling 51,000 acres); and hybrid poplar (one project area totaling 7,002 acres). 14
This EA analyzes the proposed establishment of BCAP project areas supporting the 15
proposed establishment and production of giant miscanthus hybrid (Miscanthus X 16
giganteus) by REPREVE Renewables LLC (Project Sponsor) in Georgia, North Carolina, 17
and South Carolina. The information developed from this EA and from public comments 18
received on the Draft EA will provide the FSA decisionmakers the information necessary to 19
determine if this project area proposal would meet the requirements of the NEPA 20
environmental evaluation of the BCAP or would require further environmental evaluations 21
under an EIS. 22
REPREVE Renewables LLC, headquartered in Soperton, Georgia, is a commercial grower 23
of Freedom™ giant miscanthus. It was founded three years ago to participate in the 24
research and commercialization of viable non-food biomass solutions. The company’s 25
variety, Freedom giant miscanthus, is superior in vigor and yield for the Southeastern United 26
States, as detailed by the experience of Mississippi State University (MSU), where the 27
variety was developed. By offering a high-yielding, low maintenance energy crop, the 28
Project Sponsor feels that growers can make a profit and contribute to America's foreign fuel 29
independence. The Project Sponsor has the exclusive license to commercialize Freedom 30
giant miscanthus, an energy crop that has the potential to significantly out-produce the 31
current sources of biomass in the Southeast. REPREVE Renewables LLC was formed in 32
2010 by a joint venture between certain affiliates of Unifi, Inc. and SunBelt Biofuels, LLC. 33

PURPOSE AND NEED FOR THE PROPOSED ACTION
DRAFT - Environmental Assessment SE Giant Miscanthus Establishment and Production 1-3
The new company was formed with capital sufficient to advance the commercialization of 1
bioenergy crops, including research and development around feedstocks, planting, and 2
harvesting and conversion technologies. The company is primarily owned and operated 3
jointly by Phillip Jennings and a subsidiary of Unifi, Inc. Phillip Jennings is the owner 4
operator of Phillip Jennings Turf Farms, LLC, as well as other related business, engaged in 5
the development and commercialization of turf grass. Unifi, Inc. is a $700 million annual 6
revenue textile company that is publicly traded company on the NYSE under the symbol 7
UFI. 8
1.2 USDA NEPA GUIDANCE/AUTHORITY 9
This EA is being prepared in accordance with the NEPA (PL 91-190, 42 USC 4321 et seq.); 10
implementing regulations adopted by the Council on Environmental Quality (CEQ) (40 CFR 11
1500-1508); and FSA implementing regulations, Environmental Quality and Related 12
Environmental Concerns – Compliance with NEPA (7 CFR 799). According to CEQ 13
guidance, an EA is a “concise document for which a Federal agency is responsible that 14
serves to (1) briefly provide sufficient evidence and analysis for determining whether to 15
prepare an EIS or a FONSI (40 CFR 1508.9).” Additionally, since this document falls under 16
the guidance of the BCAP Final PEIS, which was a broad national-level program document, 17
CEQ guidance allows for “tiering.” CEQ guidance defines tiering as, “the coverage of 18
general matters in broader EIS with subsequent narrower statements or environmental 19
analyses incorporating by reference the general discussions and concentrating solely on the 20
issues specific to the statement subsequently prepared (40 CFR 1508.28). CEQ identifies 21
tiering as appropriate to assist the lead agency on focusing on the issues of importance and 22
exclude from consideration those issues, which have been previously decided or “not yet 23
ripe”for a decision. 24
1.3 PURPOSE AND NEED FOR THE PROPOSED ACTION 25
The primary purpose of BCAP is to promote the cultivation of perennial bioenergy crops and 26
annual bioenergy crops that show exceptional promise for producing bioenergy or biofuels 27
that preserve natural resources and that are not primarily grown for food or animal feed, 28
which would help alleviate dependence on foreign oil for energy production. 29
As such, the FSA accepts project area proposals from potential sponsors of BCAP project 30
areas and then determines whether to accept and establish those project areas, which then 31
creates opportunities for producers to receive funding for crop establishment and production 32

PURPOSE AND NEED FOR THE PROPOSED ACTION
DRAFT - Environmental Assessment SE Giant Miscanthus Establishment and Production 1-4
under BCAP. Project area proposals are submitted by proposed sponsors and include a 1
specific dedicated bioenergy crop or crops and the proposed location for the project area or 2
areas. FSA does not determine which crop(s) or methods would be the most economically 3
viable or most environmentally suited for an area(s), but rather is tasked with determining 4
that a project area proposal fully meets the requirements set forth in the BCAP Final Rule 5
and the appropriate environmental evaluation for the proposal is completed and enough 6
information is available for the decisionmakers to make an informed decision. 7
The FSA would determine from the initial environmental evaluation of a project area 8
proposal whether that proposed project area should (1) be granted approval as a BCAP 9
project area (e.g,, a species analyzed within the Final BCAP EIS or an existing non-Title I 10
crop species) or (2) that further environmental evaluation would be required. This EA 11
provides the initial step for the further environmental evaluation of the proposed project area 12
proposal by FSA. At the conclusion of this EA process, FSA will determine based on the 13
finding of the EA to provide a FONSI or mitigated FONSI or that more environmental 14
evaluation in the form of an EIS is necessary to determine the extent of environmental 15
effects. 16
The purpose of the Proposed Action is to support the establishment and production of giant 17
miscanthus as a crop for energy production to be grown by BCAP participants in the project 18
areas proposed in Georgia, South Carolina, and North Carolina. The need for the Proposed 19
Action is to provide renewable biomass feedstock to a Biomass Conversion Facility (BCF) 20
for use in energy production within and potentially outside the immediate region(s). 21
22

PURPOSE AND NEED FOR THE PROPOSED ACTION
DRAFT - Environmental Assessment SE Giant Miscanthus Establishment and Production 1-5
1.4 ORGANIZATION OF THE DOCUMENT 1
This EA assesses the potential impacts of the Proposed Action and No Action Alternatives 2
on the potentially affected environmental and socioeconomic resources. 3
· Section 1 provides background information relevant to the Proposed Action, and 4 discusses its purpose and need. 5
· Section 2 describes the alternatives, including the Proposed Action, and compares 6 the alternatives. 7
· Section 3 describes the baseline conditions (i.e., the conditions against which 8 potential impacts of the Proposed Action and alternatives are measured) for each of 9 the potentially affected resources. 10
· Section 4 describes potential environmental consequences on these resources. 11
· Section 5 includes analysis of cumulative impacts and irreversible and irretrievable 12 resource commitments. 13
· Section 6 discusses mitigation measures. 14
· Section 7 is a list of references cited in the EA. 15
· Section 8 lists the preparers of this document. 16
· Section 9 contains a list of persons and agencies receiving this document and 17 contacted during the preparation of this document. 18
19

PURPOSE AND NEED FOR THE PROPOSED ACTION
DRAFT - Environmental Assessment SE Giant Miscanthus Establishment and Production 1-6
1
2
3
4
5
6
7
8
9
10
11
12
This Page Intentionally Left Blank 13
14

ALTERNATIVES INCLUDING THE PROPOSED ACTION
DRAFT - Environmental Assessment SE Giant Miscanthus Establishment and Production 2-1
2 ALTERNATIVES INCLUDING THE PROPOSED ACTION 1
2.1 ALTERNATIVES DEVELOPMENT 2
As part of the BCAP Project Area Selection Process, the Project Sponsor developed a 3
proposal application for submittal to the FSA. Prior to this submittal, the Project Sponsor 4
has determined the economic feasibility of their proposal, including developing alternatives 5
for location and crop species. The Project Sponsor developed selection criteria to meet the 6
overall purpose and need for the Proposed Action, the establishment and production of giant 7
miscanthus as a dedicated energy crop for energy production under the incentives of the 8
BCAP. As part of the alternatives development process the Project Sponsor analyzed both 9
alternative locations and alternative crops for the proposed project areas. The following 10
sections describe each of these processes that were under taken by the Project Sponsor 11
during the planning phases and why certain aspects were eliminated as unfeasible 12
alternatives. 13
2.1.1 Proposed Project Area Locations – Alternatives Analyzed and Eliminated 14
The Project Sponsor utilized several criteria to determine the proposed project locations. 15
These selection criteria included: 16
(1) Location Near the Project Sponsor - The Southeastern United States is the 17
location of the Project Sponsor’s foundation facilities, so proposed project areas 18
were developed in a regional area in reasonable proximity to Soperton, Georgia.; 19
(2) Location Near Foundation Acreage – The Project Sponsor has several hundred 20
acres of rhizome production in Soperton, Georgia which offers readily available 21
rhizome distribution from a centralized point to all proposed project areas. 22
(3) Proximity of Infrastructure for Market Transportation – Due to the heavy 23
agricultural and timber production in the Southeastern United States, multiple 24
transportation options exist for moving large-scale plant materials efficiently. The 25
proposed project areas have convenient access to Interstate highways, rail hubs, 26
inland distribution ports, and major sea ports, such as Savannah, Georgia; 27
Charleston, South Carolina; and Wilmington, North Carolina. 28
(4) Proximity to Multiple Potential BCFs – the Project Sponsor chose proposed 29
project areas that could support multiple types of BCFs from local electricity 30
generation, cellulosic ethanol, advanced biofuels, to pellet mills for export of 31

ALTERNATIVES INCLUDING THE PROPOSED ACTION
DRAFT - Environmental Assessment SE Giant Miscanthus Establishment and Production 2-2
biomass materials. This approach would provide contract producers with greater 1
options to market their feedstock and lessen the risk of only having one demand 2
source for their product. 3
(5) Amount of Available Marginal Croplands, Pasturelands, and 4
Abandoned/Previously Cleared Timberlands – The Project Sponsor 5
understands the underlying food versus fuel debate and the uncertainty over 6
indirect land uses changes, as such, the Project Sponsor is targeting marginal 7
croplands, pasturelands, and, where economically available, previously 8
cleared/abandoned timberlands. 9
(6) Need for Rural Development – The Project Sponsor being an agricultural 10
producer in Georgia, was acutely aware of the current economic conditions within 11
the rural areas of the Southeastern United States, primarily Georgia, North 12
Carolina, and South Carolina. The Project Sponsor focused the proposed project 13
areas in agricultural regions with a need for a more diversified profile of agricultural 14
products to meet the fluctuating demand shifts in the traditional agricultural crops of 15
these areas, such as loss of tobacco acreage and the increase in high cost input 16
crops such as cotton. 17
(7) Economic Feasibility of the Project – The Project Sponsor determined through 18
internal economic analyses that the production of Freedom giant miscanthus could 19
provide sufficient return on economic investment to undertake the efforts. 20
2.1.2 Proposed Crop Alternatives – Alternatives Analyzed and Eliminated 21
The Project Sponsor determined the ideal feedstock to be grown in the Southeastern United 22
States based upon their experience in agriculture and their work with university energy crop 23
experts. The following detail the selection criteria that were developed through the process 24
of selecting Freedom giant miscanthus. 25
(1) Testing of Several Herbaceous Energy Crop Species – MSU performed trials 26
of energy sorghums (Sorghum spp.), napier grass (Pennisetum purpureum), 27
switchgrass (Panicum virgatum), and giant miscanthus. Switchgrass and giant 28
miscanthus were selected for further study based on yields and their ability to 29
grow in Southeastern United States conditions and on marginal lands. 30
(2) Testing of Switchgrass versus Giant Miscanthus – MSU performed side-by-31
side trials and determined that the most efficient use of land for energy crops 32

ALTERNATIVES INCLUDING THE PROPOSED ACTION
DRAFT - Environmental Assessment SE Giant Miscanthus Establishment and Production 2-3
would be in growing giant miscanthus, based on yields that were more than 1
double that of switchgrass. 2
(3) Selection of Most Efficient Variety of Giant Miscanthus – Through repeated 3
selections of the most vigorous plants, and through serial propagation, a superior 4
variety was identified for growing in the Southeast. This variety was named 5
Freedom, tested for genetic differences, licensed as a commercial variety, and is 6
patent pending. 7
(4) Land Use Efficiency versus Existing Biomass Feedstocks – In the Southeast, 8
southern yellow pine (Pinus spp.) is the predominant biomass crop for renewable 9
energy. Freedom giant miscanthus was chosen as the ideal alternative feedstock 10
as it produces more tons per acre than plantation pine stands, can grow on similar 11
lands, and is an equally usable cellulosic feedstock for both power and liquid 12
fuels. 13
(5) Economic Feasibility for Growers – In the Southeast, the Project Sponsor 14
believes that growers can produce more cellulosic feedstock per acre, and with 15
more profit per acre, with giant miscanthus than other alternative energy crops. 16
They foresee the revitalization of rural economies based on growing energy crops 17
and producing renewable energy. With BCAP funding, growers will be able to 18
help create these economies faster and, with the growth incentivized by BCAP, 19
enjoy economies of scale making the model even more efficient. 20
2.2 ALTERNATIVES TO BE ANALYZED 21
Alternatives considered to be reasonably expected to meet the purpose and need for action 22
include the Proposed Action. Even though the No Action Alternative would not meet the 23
purpose and need for the proposed action, it is included as the baseline for which the 24
Proposed Action is compared to determine the potential effects to the human and natural 25
environment and the potential significance of those effects, both positive and negative. 26
2.2.1 No Action Alternative 27
Under the No Action Alternative, the FSA would not establish the proposed project areas 28
supporting the establishment and production of giant miscanthus. This alternative would 29
leave existing agricultural production practices in place in the proposed project areas. 30
Producers would have the ability, if market conditions exist, to convert acreage into 31
traditional crops, leave as is, or provide their acreage for non-agricultural development. This 32

ALTERNATIVES INCLUDING THE PROPOSED ACTION
DRAFT - Environmental Assessment SE Giant Miscanthus Establishment and Production 2-4
alternative would not meet the goals and objectives of the BCAP, as the Project Sponsor 1
would not enter the voluntary program for the incentive to produce dedicated bioenergy 2
crops. Also, the No Action Alternative would not meet the purpose and need for the Action 3
as described in Section 1.3. 4
2.2.2 Proposed Action 5
REPREVE Renewables LLC (Project Sponsor) is proposing that FSA establish four 6
separate BCAP project areas to establish and produce Freedom giant miscanthus on up to 7
58,000 total acres over the life of the project. The acreage targeted for enrollment into the 8
proposed project areas are economically marginal and idle croplands, current pastureland, 9
and abandoned/previously cleared timberland; however, it would not exclude producers with 10
acreage in traditional row crops from enrolling those acres. Liu et al. (2011) has 11
summarized marginal lands from the following sources with the following definitions (Table 12
2-1). 13
Table 2-1. Definitions of Marginal Lands 14 Organization Definition of Marginal Lands Committee on World Food Security (2003) In farming, poor-quality land that is likely to yield a
poor return. It is the last land to be brought into production and the first land to be abandoned.
USDA-NRCS (1995) Land is restricted by various soil physical/chemical properties, or environmental factors, for crop production. Land classes IV-VIII defined as the marginal land based on NRCS State Soil Geographic database.
European Environmental Agency Low quality land the value of whose production barely covers its cultivation costs
Organization for Economic Development Co-operation and Development (2001)
Land of poor quality with regard to agricultural use and unsuitable for housing and other uses.
Asia-Pacific Economic, Cooperation Energy Working Group (2009)
Marginal lands are characterized by poor climate, poor physical characteristics, or difficult cultivation. They include areas with limited rainfall, extreme temperatures, low quality soils, steep terrain, or other problems for agriculture. Examples include deserts, high mountains, land affected by salinity, waterlogged or marshy land, barren rocky areas, and glacial areas. Evidently not all of the areas are suitable for agriculture.
Ministry of Agriculture, the People’s Republic of China (2008)
Marginal land is winter-followed paddy land and waste land that may be used to cultivate energy crops.
Agriculture and Agri-Food Canada (2008) Classifying Land Class 4-7 as marginal based on the Canada Land Inventory.
Source: Liu et al. 2011 15
16

ALTERNATIVES INCLUDING THE PROPOSED ACTION
DRAFT - Environmental Assessment SE Giant Miscanthus Establishment and Production 2-5
As per the BCAP statute and regulatory guidance, native sod would be excluded from any 1
project area. All Federal and State-owned land are considered to be ineligible for 2
participation in the BCAP program. Other lands considered ineligible to be enrolled under 3
a BCAP contract include native sod; and land that is already enrolled in CCC’s CRP, 4
Wetlands Reserve Program, or Grassland Reserve Program. Native sod within the 5
proposed BCAP rules is land on which the plant cover is composed principally of native 6
grasses, grass like plants, forbs, or shrubs suitable for grazing and browsing; and that has 7
never been tilled for the production of an annual crops as of the date of the publication of the 8
BCAP Final Rule in the FR. 9
The proposed project areas are located in three states in four proposed project areas 10
(Figure 2-1). Three of the proposed project areas are within Georgia with one being 11
combined with counties in South Carolina, and one proposed project area in North Carolina. 12
The Project Sponsor deems the proposed project economically feasible based on 13
discussions with BCFs and projected economic models, which are part of the Project 14
Sponsor’s confidential project area proposals; however, no specific contract acreage has 15
been developed. As such, the proposed project areas have some approximate locations of 16
acreage to be included, but those acres are not committed; therefore, the level of analysis 17
for this EA is based at the combined county proposed project area level. 18
Each proposed project area contains at least one BCF that would accept giant miscanthus 19
for a direct bioenergy feedstock or conversion into an intermediary product for bioenergy 20
production. Additionally, there are other BCFs in varying stages of development for various 21
end products that could use giant miscanthus as a feedstock in the proposed project areas. 22
Each proposed project area was developed in proximity to the foundation acreage located in 23
Soperton, Georgia and to sub-licensed registered acreage for efficient transportation of the 24
certified rhizome stock to the participating producers and efficient transportation alternatives 25
to the BCF(s) within each proposed project area. All rhizome stock planted on contract 26
acreage within the proposed project areas would be certified and originate from the 27
foundation acreage or from sub-licensed registered acreage. All rhizomes would be pre-28
processed following the methods developed by the Project Sponsor prior to planting and 29
establishment on contract acreage. The specific methods for rhizomes processing are a 30
trade secret process developed by the Project Sponsor and have been described further in 31
the confidential project area proposals. 32
33

ALTERNATIVES INCLUDING THE PROPOSED ACTION
DRAFT - Environmental Assessment SE Giant Miscanthus Establishment and Production 2-6
Figure 2-1. Proposed Project Area Locations. 1 2

ALTERNATIVES INCLUDING THE PROPOSED ACTION
DRAFT - Environmental Assessment SE Giant Miscanthus Establishment and Production 2-7
The Project Sponsor reserves the right to decline any acres within the eligible project area 1
that the Project Sponsor, the FSA, or the FSA technical partners’ determine cannot produce 2
giant miscanthus effectively without substantial environmental effects. This would be 3
determined through one of the following: the Project Sponsor’s initial site evaluations, the 4
environmental screening process for each participating contract, or through the conservation 5
or forest stewardship planning processes. The environmental screening process for each 6
project proposal begins with the completion of Form BCAP-22 Environmental Screening for -7
the Project Proposal. The conservation planning process for each participating producer 8
includes the preparation of the NRCS worksheet NRCS-CPA-052 by either NRCS field 9
personnel or a certified technical service provider (TSP). The CPA-52 worksheet is provided 10
to FSA for completion and determination by FSA, as the lead Federal agency for BCAP, of 11
any need for further environmental evaluation through the development of an EA or EIS. 12
The CPA-52 provided to FSA also notes any required consultation or coordination under any 13
applicable Federal environmental law, Executive Order (EO), or agency policy that FSA 14
would need to complete for the site-specific acreage. 15
Additionally, per the BCAP Final PEIS and BCAP Final Rule, the collection, harvest, 16
storage, and transportation of biomass from the proposed project areas to the BCF are 17
included within the provisions of the BCAP Matching Payments Program; therefore, those 18
activities are not being analyzed as part of the Proposed Action (BCAP Final PEIS Chapter 19
1.3.2, page 1-6). The Matching Payment Program was determined not to be a major 20
Federal action per the NEPA definition since (1) there was no discretionary authority to 21
implement the program terms; it was implemented per the direct language of the 2008 Farm 22
Bill and (2) that the materials collected during the Matching Payment Program were currently 23
being utilized in the marketplace for a similar, if not the same, purpose. 24
25

ALTERNATIVES INCLUDING THE PROPOSED ACTION
DRAFT - Environmental Assessment SE Giant Miscanthus Establishment and Production 2-8
2.2.2.1 Methods for Establishment and Production of Giant Miscanthus 1
The establishment and production of giant 2
miscanthus (Figure 2-2) within the 3
proposed project area began with the 4
establishment of Freedom giant 5
miscanthus on the foundation acreage in 6
Soperton, Georgia. The Project Sponsor 7
has developed proven, proprietary 8
protocols based on experience with other 9
herbaceous species and with Freedom 10
giant miscanthus for the establishment and 11
production of this species within the 12
proposed project areas. These protocols 13
are shared with licensed growers to help 14
ensure the most successful growth and 15
production. The Project Sponsor will 16
target land that is well suited or easily 17
modified to become suitable for Freedom 18
giant miscanthus. All state and Federal soil conservation rules, best management practices 19
(BMPs), and other applicable conditions as developed within the mandatory site-specific 20
producer Conservation Plan or Forest Stewardship Plan will be implemented during land 21
preparation and planting. 22
Giant miscanthus is a triploid hybrid perennial warm-season grass developed through the 23
crossing of Miscanthus sinensis (diploid species) with M. sacchariflorus (tetraploid species), 24
both of which are native to Southeast Asia. One species, M. sinensis was introduced to the 25
United States, as an ornamental; other species are not frequently being used, including 26
varieties of giant miscanthus, which is currently being developed as a biofuel feedstock. 27
Freedom giant miscanthus was developed at MSU beginning in 2001. Field testing of giant 28
miscanthus from greenhouse propagated stock began in 2002 at both MSU and a replicate 29
site in Oklahoma. The Freedom giant miscanthus variety was selected in 2005 after field 30
testing. Freedom giant miscanthus has been grown and/or tested in California, Georgia, 31
Iowa, Missouri, North Carolina, Ohio, Oklahoma, South Carolina, and Texas by universities, 32
USDA, and private industry. The only visual (morphological) difference between Freedom 33
Figure 2-2. Freedom Giant Miscanthus, April 2011 Planting, Soperton Georgia.

ALTERNATIVES INCLUDING THE PROPOSED ACTION
DRAFT - Environmental Assessment SE Giant Miscanthus Establishment and Production 2-9
giant miscanthus and the other widely tested variety is in the leaf angle as measured above 1
the node, to the upper surface of the leaf; however, genetic lab testing revealed enough 2
genetic variability to allow for a pending patent. 3
Yields in North American research trials have reached a range between 15 to 23 dry tons 4
per acre per year with minimal inputs. The species is a sterile hybrid which does not 5
produce viable seed and is therefore propagated vegetatively by rhizome division 6
(Jørgensen 2011, Gordon et al 2011). Mechanical planting equipment for turfgrass or 7
specialty crops has been used to successfully establish giant miscanthus in Southeastern 8
United States. Harvesting is done in a manner similar to traditional hay crops, but the 9
equipment must be able to handle high-yield crops. Table 2-2 summarizes best practices for 10
the establishment and management of giant miscanthus. 11
Successful establishment of Freedom giant 12
miscanthus within the proposed project areas 13
begins with viable, appropriately processed 14
rhizomes (Figure 2-3). All rhizomes to be used 15
on contract acreage within the proposed project 16
areas will be harvested with proven, proprietary 17
protocols that protect rhizomes from destruction 18
with equipment designed specifically for giant 19
miscanthus. Each rhizome will be processed 20
with minimum bruising or splitting. The rhizome 21
processing methods are a proprietary process 22
that the Project Sponsor developed and are 23
further described in the confidential project area 24
proposals. This process increases rhizome 25
viability by allowing it to retain more stored 26
energy, which enables rhizomes to survive longer under stress periods after planting. 27
Rhizomes will be harvested after all energy and nutrients have been naturally translocated 28
to the root system, thus increasing viability. 29
30
Figure 2-3. Freedom Giant Miscanthus, Rhizomes on Plant
Root Ball.

ALTERNATIVES INCLUDING THE PROPOSED ACTION
DRAFT - Environmental Assessment SE Giant Miscanthus Establishment and Production 2-10
Table 2-2. Proposed Establishment and Production Methods for Giant Miscanthus 1 Former Land Use
Traditional Crops Currently Idle or Pasture Harvested Timberland Crop Establishment Year One
Deep tillage to disrupt any hard pan that may inhibit deep rooting.
A non-selective herbicide will be applied during the fall or early spring prior to land preparation to control unwanted herbaceous species that may be present.
Leftover timber harvest residue will be removed by V-blading, chopping, mulching, piling and burning, or a combination thereof. Debris will be removed to allow mechanical planters to pass over and place rhizomes at a depth of three inches at an equally distributed rate.
Protocols for the GCIA land certification of Freedom giant miscanthus will be followed.
Deep tillage to disrupt any hard pan that may inhibit deep rooting.
Deep tillage to disrupt any hard pan that may inhibit deep rooting.
Prior to planting, harrowed or finished for a prepared seedbed followed by row bedding.
Protocols for the GCIA land certification of Freedom giant miscanthus will be followed.
Protocols for the GCIA land certification of Freedom giant miscanthus will be followed.
Soils will be amended to correct any deficiencies of nutrients and/or Ph according to soil analysis recommendations.
Prior to planting, harrowed or finished for a prepared seedbed followed by row bedding.
Prior to planting, harrowed or for a prepared seedbed followed by row bedding.
Pre-emergent herbicide will be applied at the time of planting and on 45-day increments for a total of three applications.
Soils will be amended to correct any deficiencies of nutrients and/or Ph according to soil analysis recommendations.
Soils will be amended to correct any deficiencies of nutrients and/or Ph according to soil analysis recommendations.
Pre-emergent herbicide will be applied at the time of planting and on 45-day increments for a total of three applications.
Pre-emergent herbicide will be applied at the time of planting and on 45-day increments for a total of three applications.
Crop Maintenance Year Two After successful planting of rhizomes and first-year growth, soils will be amended to correct any deficiencies of nutrients and/or Ph according to soil analysis recommendations. Pre-emergent herbicides will be applied prior to plant emergence in late winter/early spring. A second application of herbicide may be necessary if weeds emerge. Crop canopy will hinder weed germination and competition during the second and succeeding years.
Crop Maintenance (Years 3+)
Soils will be amended to correct any deficiencies of nutrients and/or Ph according to soil analysis recommendations
Pre-emergent herbicides will be applied as necessary to control competition from weeds. Crop canopy will hinder weed germination and competition in succeeding years, reducing and even eliminating the need for herbicides.
Crop Removal Following final biomass harvest, till or harrow to destroy rhizome mass. Upon emergence of existing rhizomes in late winter/early spring, apply non-selective herbicide. Plant glyphosate tolerant crop and apply glyphosate during growing season when giant miscanthus shoots appear. At least two treatments are recommended, with monitoring to occur for two to three growing seasons after no additional resprouting of Freedom giant miscanthus.
2
3

ALTERNATIVES INCLUDING THE PROPOSED ACTION
DRAFT - Environmental Assessment SE Giant Miscanthus Establishment and Production 2-11
Rhizomes should be processed with proven protocols to preserve their viability from harvest 1
until planting time. Specialized equipment will be used to separate and remove the smaller 2
feeder roots from the rhizomes so that they will flow with accuracy through various types of 3
planters. Rhizomes will be stored in a controlled environment, with temperature and 4
humidity monitored daily to ensure predetermined storage parameters are met. 5
Rhizome processing would occur either in an existing Freedom giant miscanthus field where 6
the rhizomes are cleaned, sorted, cut, and then packaged for off-site transportation for field 7
planting or storage or live rhizomes would be transported without processing from an 8
existing Freedom giant miscanthus field in covered, enclosed containers and transported to 9
a processing facility. Live rhizomes would leave the processing center in a sealed container 10
under climate-controlled conditions to ensure that no live plant materials are unintentionally 11
disbursed along transportation routes following all state and local requirements, as 12
applicable. 13
Within the Southeastern United States 14
giant miscanthus would be planted in 15
early spring (majority of acreage) or 16
early fall (Figure 2-4). Climatic 17
historical ranges of soil moisture 18
balance, soil temperature, and ambient 19
temperatures will be considered when 20
determining optimum time to plant in 21
various regions. Rhizomes will be 22
planted in a prepared seedbed 23
approximately three inches deep with a 24
density of 5,000 rhizomes per acre. 25
Mechanical planters will be used to 26
precisely distribute each rhizome at a predetermined rate per area (Figure 2-5). A post-27
planting roller may be required to ensure good soil to rhizome contact. All planters and 28
other equipment that comes in contact with live plant materials will be pressure-washed and 29
inspected for residual plant materials prior to movement from one property to the next to 30
ensure that no live plant materials are unintentionally disbursed along transportation routes. 31
Figure 2-4. Field Preparation and Planting of Rhizome Harvest Foundation Acreage,
Freedom Giant Miscanthus.

ALTERNATIVES INCLUDING THE PROPOSED ACTION
DRAFT - Environmental Assessment SE Giant Miscanthus Establishment and Production 2-12
Harvest time for giant miscanthus is anytime 1
between full dormancy, which is usually mid-2
December in the Southeast to before new 3
growth in early spring, but could occur as 4
early as November, depending on climatic 5
conditions by proposed project area. Biomass 6
will be harvested prior to succeeding year’s 7
emergence with mower/conditioner type 8
equipment that cuts and swaths material into 9
a narrow row, which will then be compacted 10
and removed from field in 4’x4’x8’ large bales 11
(Figure 2-6) or more conventional small 12
bales. Other harvest methods could include 13
a smaller materials processing and then 14
blown into a transport truck for field removal. 15
The harvest and removal method selected would be dependent upon the most efficient 16
manner for the site specific conditions and the requirements of the BCF where the end 17
product would be processed. 18
Most bale storage will be within the property, thus minimizing transportation until the BCF is 19
ready for delivery. All harvesting 20
equipment and other equipment 21
that comes in contact with live 22
plant materials will be pressure-23
washed and inspected for residual 24
plant materials prior to movement 25
from one property to the next to 26
ensure that no live plant materials 27
are unintentionally disbursed along 28
transportation routes. 29
Glyphosate and traditional tillage 30
have been found to be effective 31
eradication methods for giant 32
miscanthus though it may require more than one growing season for complete eradication 33
Figure 2-5. Mechanical Planting of Freedom Giant Miscanthus Rhizomes
on Foundation Acreage.
Figure 2-6. Baling of Freedom Giant Miscanthus.

ALTERNATIVES INCLUDING THE PROPOSED ACTION
DRAFT - Environmental Assessment SE Giant Miscanthus Establishment and Production 2-13
(Caslin et al. 2010, Anderson et al. 2009, Anderson et al. 2011). Caslin et al. (2010) 1
recommend an application of glyphosate after emergence followed by tillage. Anderson et 2
al. (2009) recommend a tillage depth of at least 10 centimeters to remove any living 3
rhizomes after herbicide treatment. 4
2.2.2.2 East Georgia Proposed Project Area 5
The East Georgia proposed project area contains all or parts of 45 counties including the 6
primary population centers of Dublin, Statesboro, Tifton, Valdosta, Waycross, Vidalia, and 7
Swainsboro. There are multiple potential BCFs located within the proposed project area. 8
Figure 2-1 illustrates the proposed project areas, Table 2-3 lists the counties within each 9
proposed project area, and Figure 2-7 illustrates the existing, proposed, and under 10
construction facilities that could utilize biomass within the proposed project area. There is 11
currently over 500 acres of Freedom giant miscanthus established in the East Georgia 12
proposed project area with an anticipated planting schedule of the remaining up to 14,500 13
acres by 2012. 14
Table 2-3. Counties and Proposed Acreage within Each Proposed Project Area 15 East Georgia Middle Georgia Lowcountry North Carolina Counties Appling, Atkinson,
Bacon, Ben Hill, Berrien, Bleckley, Brantley, Bulloch, Burke, Candler, Charlton, Clinch, Coffee, Cook, Dodge, Echols, Effingham, Emanuel, Evans, Glascock, Irwin, Jeff Davis, Jefferson, Jenkins, Johnson, Lanier, Laurens, Long, Lowndes, Montgomery, Pierce, Pulaski, Screven, Tattnall, Telfair, Tift, Toombs, Treutlen, Twiggs, Ware, Washington, Wayne, Wheeler, Wilcox, Wilkinson
Baldwin, Bleckley*, Burke*, Butts, Crawford, Emanuel*, Hancock, Harris, Heard, Houston, Jasper, Jefferson*, Johnson*, Lamar, Laurens*, Macon, Meriwether, Peach, Pike, Putnam, Spalding, Talbot, Taylor, Treutlen*, Troup, Twiggs*, Upson, Washington*, Wilkinson*
Georgia: Bulloch*, Burke*, Candler*, Effingham*, Emanuel*, Evans*, Jefferson*, Jenkins*, Johnson*, Laurens*, Montgomery*, Screven*, Tattnall*, Toombs*, Treutlen*, Washington* South Carolina: Allendale, Bamberg, Barnwell, Colleton, Hampton, Jasper
Beaufort, Bladen, Brunswick, Columbus, Craven, Cumberland, Duplin, Edgecombe, Greene, Harnett, Hoke, Johnston, Jones, Lee Lenoir, Martin, Montgomery, Moore, Nash, New Hanover, Onslow, Pamlico, Pender, Pitt, Richmond, Sampson, Scotland, Wayne, Wilson
Existing Acreage 500 500 500 0 Proposed Acreage 15,000 20,000 5,000 18,000 Note: * = Counties that have occurred in a previous proposed project area 16

ALTERNATIVES INCLUDING THE PROPOSED ACTION
DRAFT - Environmental Assessment SE Giant Miscanthus Establishment and Production 2-14
1
Figure 2-7. Biomass Conversion Facilities of Varying Stages of Operation within 2 the East Georgia Proposed Project Area. 3
4

ALTERNATIVES INCLUDING THE PROPOSED ACTION
DRAFT - Environmental Assessment SE Giant Miscanthus Establishment and Production 2-15
2.2.2.3 Middle Georgia Proposed Project Area 1
The Middle Georgia proposed project area contains all or parts of 27 counties including the 2
primary population centers of LaGrange, Griffin, Dublin, and Milledgeville. There are 3
multiple potential BCFs located within the proposed project area. Figure 2-1 illustrates the 4
proposed project areas, Table 2-3 lists the counties within each proposed project area, and 5
Figure 2-8 illustrates the existing, proposed, and under construction facilities that could 6
utilize biomass within the proposed project area. There is currently over 500 acres of 7
Freedom giant miscanthus established in the Middle Georgia proposed project area with an 8
anticipated planting schedule of the remaining up to 19,500 acres by 2013 with up to 11,700 9
acres proposed for 2012 and up to 7,800 acres proposed for 2013. 10
2.2.2.4 Lowcountry Proposed Project Area 11
The Lowcountry proposed project area contains all or parts of 16 counties in Georgia and 12
six counties in South Carolina. There are multiple potential BCFs located within the 13
proposed project area. Figure 2-1 illustrates the proposed project areas, Table 2-3 lists the 14
counties within each proposed project area, and Figure 2-9 illustrates the existing, 15
proposed, and under construction facilities that could utilize biomass within the proposed 16
project area. There is currently 500 acres of Freedom giant miscanthus established in the 17
Lowcountry proposed project area with an anticipated planting schedule which includes the 18
remaining up to 4,500 acres by 2012. 19
2.2.2.5 North Carolina Project Area 20
The North Carolina proposed project area contains all or parts of 30 counties. There are 21
multiple potential BCFs located within the proposed project area. Figure 2-1 illustrates the 22
proposed project areas, Table 2-3 lists the counties within each proposed project area, and 23
Figure 2-10 illustrates the existing, proposed, and under construction facilities that could 24
utilize biomass within the proposed project area. The anticipated planting schedule includes 25
up to 18,000 acres by 2013 with up to 9,000 acres planted in both 2012 and 2013. 26
27

ALTERNATIVES INCLUDING THE PROPOSED ACTION
DRAFT - Environmental Assessment SE Giant Miscanthus Establishment and Production 2-16
1
Figure 2-8. Biomass Conversion Facilities of Varying Stages of Operation within 2 the Middle Georgia Proposed Project Area. 3
4

ALTERNATIVES INCLUDING THE PROPOSED ACTION
DRAFT - Environmental Assessment SE Giant Miscanthus Establishment and Production 2-17
Figure 2-9. Biomass Conversion Facilities of Varying Stages of Operation within 1 the Lowcountry Proposed Project Area. 2
3

ALTERNATIVES INCLUDING THE PROPOSED ACTION
DRAFT - Environmental Assessment SE Giant Miscanthus Establishment and Production 2-18
Figure 2-10. Biomass Conversion Facilities of Varying Stages of Operation within 1 the North Carolina Proposed Project Area. 2
3

ALTERNATIVES INCLUDING THE PROPOSED ACTION
DRAFT - Environmental Assessment SE Giant Miscanthus Establishment and Production 2-19
2.3 RESOURCES CONSIDERED BUT ELIMINATED FROM DETAILED ANALYSIS 1
As mentioned previously, this EA is being tiered from the BCAP Final PEIS, as such certain 2
resource areas are being excluded from this analysis consistent with the BCAP Final PEIS, 3
due to little or no affects to these resource areas due to their absence within the proposed 4
project areas or limitations on effects by program guidelines. Those resource areas being 5
excluded from this analysis include: 6
· Wetlands – were eliminated from detailed analysis in this EA since the conversion of 7
wetlands is prohibited under BCAP; 8
· Floodplains – were eliminated from detailed analysis in this EA, since there is little 9
potential for effect from traditional agricultural production practices in floodplains. 10
The Project Sponsor would also exclude or buffer certain areas, depending upon the 11
site-specific conditions associated with each individual producer contract. Giant 12
miscanthus, once established, provides a tight below ground root mass with a low 13
likelihood of floodwater movements. Additionally, practices, included as part of the 14
Mitigation and Monitoring Plan, and the individual Conservation Plan would minimize 15
the potential for vegetative transport of giant miscanthus through flooding; 16
· Prime and Unique Farmland – were eliminated from detailed analysis in this EA, 17
since they are exempt from coordination with the NRCS due to the continued 18
agricultural production of these areas rather than conversion into other land uses; 19
· Cultural Resources – was eliminated from detailed analysis in this EA due to the 20
site specific nature of this resource. No cultural resources analysis (Section 106 of 21
the National Historic Preservation Act compliance) will be required if the project area 22
will be on crop land and the planting of the giant miscanthus will not disturb below 23
the current plow zone. If disturbance will occur below the plow zone, or if the project 24
area has never been plowed, then the Section 106 process will be addressed during 25
the completion of the environmental evaluation as part of the conservation or forest 26
stewardship planning requirement for each individual producer BCAP contract; and 27
· Noise – was eliminated from detailed analysis in this EA, since the effects would be 28
minor, only temporarily occurring during activities, and would be similar to agricultural 29
activities currently taking place within the proposed project areas. 30
31

ALTERNATIVES INCLUDING THE PROPOSED ACTION
DRAFT - Environmental Assessment SE Giant Miscanthus Establishment and Production 2-20
2.4 COMPARISONS OF THE ALTERNATIVES 1
Table 2-4 provides a tabular summary of the potential effects from both the Proposed Action 2
and No Action Alternative. As described previously, the No Action Alternative would not 3
meet the purpose and need as described, but is the baseline to which the Proposed Action 4
is compared to determine effects to the analyzed environmental resource areas. 5
Table 2-4. Comparison of the Alternatives 6 Resource Area Proposed Action No Action Alternative Cumulative Effects Socioeconomics Minor +/0 0 Minor +/0 Land Use 0/Minor - 0 0/Minor - Coastal Zone Management Consistency
0 0 0
Biological Resources Vegetation 0/Minor - 0 0/Minor - Wildlife 0/Minor- 0 0/Minor- Protected Species 0 0 0
Soil Resources +/Minor - 0/Minor - +/Minor- Water Quality/Quantity
Water Quality Minor +/0 0/Minor - Minor +/Minor- Water Quantity Minor +/0 0/Minor - Minor +/Minor-
Air Quality 0/Minor - 0 0/Minor- Outdoor Recreation Minor +/Minor - 0 Minor +/Minor- Environmental Justice Minor +/0 0/Minor - Minor +/Minor- Note: (+)=positive (-)=negative (0)=neutral 7
8

AFFECTED ENVIRONMENT
DRAFT - Environmental Assessment SE Giant Miscanthus Establishment and Production 3-1
3 AFFECTED ENVIRONMENT (BY RESOURCE AREA) 1
3.1 SOCIOECONOMICS 2
3.1.1 Definition of the Resource 3
Socioeconomic analyses generally include detailed investigations of the prevailing 4
population, income, employment, and housing conditions of a community or Region of 5
Influence (ROI). The socioeconomic conditions of a ROI could be affected by changes in 6
the rate of population growth, changes in the demographic characteristics of a ROI, or 7
changes in employment within the ROI caused by the implementation of the proposed 8
action. 9
Socioeconomic resources within this document include general population characteristics; 10
general trends in income, employment, and poverty level; general agricultural characteristics 11
associated with number of farms, acres of primary field crops, and revenues generated from 12
primary field crops. Additionally, a brief analysis of rural population trends is discussed. 13
3.1.2 Existing Conditions – General Population Characteristics 14
3.1.2.1 Population and Demographics 15
3.1.2.1.1
Between 2000 and 2010, all states within the proposed project areas had population growth 17
that averaged less than two percent per year (U.S. Census Bureau [USCB], 2002; 2011). 18
Population growth within Georgia and North Carolina was slower than in the previous 19
decade when Georgia had an average annual population growth rate of 2.6 percent and 20
North Carolina had an average annual population growth rate of 2.1 percent. Overall, 21
between 2000 and 2010, the South had the largest percentage regional growth in the United 22
States at 14.3 percent with Texas and the Southeastern states (Florida, Georgia, North 23
Carolina, and South Carolina) all contributing to the rapid regional growth (Ibid.). The 24
counties within the proposed project areas generally followed a similar annual average 25
population growth rate as the state, except in South Carolina, where the combined counties 26
only had an average annual population growth of 0.2 percent with four of the six counties 27
experiencing population losses over the decade (Ibid.). 28
General Population Change 16
29

AFFECTED ENVIRONMENT
DRAFT - Environmental Assessment SE Giant Miscanthus Establishment and Production 3-2
3.1.2.1.2
Overall, minority populations accounted for 44.1 percent of the total population in Georgia, 2
33.8 percent of the population in South Carolina, and 34.7 percent of the population in North 3
Carolina (Table 3-1) (USCB 2011). The largest population increase in any group occurred 4
in the Hispanic and Latino populations across all states with Georgia having a total growth 5
rate of 96.1 percent, North Carolina a total growth rate of 111.1 percent, and South Carolina 6
a total growth rate of 147.9 percent (Ibid.). 7
Minority Population 1
Table 3-1. 2010 Select Minority Populations within the States 8
State Total
Population Percent Minority
Hispanic or Latino
Percent Hispanic or Latino
Black or African
American
Percent Black or African
American Georgia 9,687,653 44.1 853,689 8.8 2,910,800 30.0 North Carolina 9,535,483 34.7 800,120 8.4 2,019,854 21.2 South Carolina 4,625,364 33.8 235,682 5.1 1,290,684 27.9 Source: USCB 2011 9
Within the proposed project areas, minorities accounted for 36.5 percent of the total 10
population in the East Georgia proposed project area, 40.0 percent in the Middle Georgia 11
proposed project area, 42.9 percent in the Lowcountry proposed project area, and 41.1 12
percent in the North Carolina proposed project area (Table 3-2) (Ibid.). The largest minority 13
group across all counties within the proposed project areas was Black or African American. 14
As a percentage of total population, this minority group accounted for approximately 27.8 15
percent of the population within the East Georgia proposed project area, 36.0 percent of the 16
population within the Middle Georgia proposed project area, 39.3 percent of the population 17
within the Lowcountry proposed project area, and 28.0 percent of the population within the 18
North Carolina proposed project area (Ibid.). 19
Table 3-2. 2010 Select Minority Populations within the Proposed Project Areas 20
Proposed Project Area Total
Population Percent Minority
Hispanic or Latino
Percent Hispanic or Latino
Black or African
American
Percent Black or African
American East Georgia 939,584 36.5 52,667 5.6 269,274 28.7 Middle Georgia 765,943 40.0 26,718 3.5 258,824 33.8 Lowcountry 512,380 42.9 23,551 4.6 185,576 36.2 North Carolina 2,600,445 41.1 224,589 8.6 682,910 26.3 Source: USCB 2011 21
22

AFFECTED ENVIRONMENT
DRAFT - Environmental Assessment SE Giant Miscanthus Establishment and Production 3-3
Figures 3-1 and 3-2 illustrate the county minority population percentages across the 1
proposed project areas. As indicated from the figures, certain counties have a minority 2
population at or in excess of 50 percent. Overall 7 counties in the East Georgia proposed 3
project area (24.1 percent of counties), 3 counties in the Middle Georgia proposed project 4
area (6.7 percent of the counties), 7 counties in the Lowcountry proposed project area (33.4 5
percent of the counties), and 7 counties in the North Carolina proposed project area (23.4 6
percent of the counties) have a minority population percentage at or in excess of 50 percent 7
(Ibid.). 8
3.1.2.2 Income 9
The Bureau of Economic Analysis (BEA) defines personal income as the income received 10
by all persons from all sources, including net earnings by place of residence, rental income 11
of persons, personal dividend income, personal interest income, and personal current 12
transfer receipts (BEA 2011a). Net earnings, as defined by BEA, are the earnings by place 13
of work (sum of wages and salary disbursements, supplements to wages and salaries, and 14
proprietors’ income) less contributions for government social insurance, plus an adjustment 15
to convert earnings by place of work to a place-of-residence basis. 16
Total personal income increased across all states within the proposed project areas by 17
greater than 35 percent between 2001 to 2009 with values ranging from $335.5 billion in 18
Georgia to $148.3 billion in South Carolina (Table 3-3) (Ibid.). Earnings growth from 19
Government and Government Enterprises far outpaced Private earnings during the period 20
with growth more than double across all three states. Earnings from Federal, Civilian 21
employment and Local Government employment contributed the highest percentage change 22
in earnings during the period in all three states. Government and Government Enterprise 23
earnings accounted for, on average, across all three states, 15.5 percent of total personal 24
income. Private earnings accounted for, on average, across all three states, 55.6 percent of 25
total personal income. Farm earnings accounted for less than one percent of total personal 26
income across all states. Farm earnings was the only category to show a consistent decline 27
across all states. 28
29

AFFECTED ENVIRONMENT
DRAFT - Environmental Assessment SE Giant Miscanthus Establishment and Production 3-4
Figure 3-1. Percent Minority by County for Proposed Project Areas in Georgia and 1 South Carolina. 2

AFFECTED ENVIRONMENT
DRAFT - Environmental Assessment SE Giant Miscanthus Establishment and Production 3-5
Figure 3-2. Percent Minority by County for the North Carolina Proposed Project 1 Area. 2

AFFECTED ENVIRONMENT
DRAFT - Environmental Assessment SE Giant Miscanthus Establishment and Production 3-6
Table 3-3. 2009 Total Personal Income and Earnings by Select Industries by State 1
Metric
Total Personal Income
Farm Earnings
Non-Farm Earnings
Private Earnings Government and Government Enterprises
Total
Forestry &
Logging Total Federal Civilian State Local
GEORGIA Earnings ($1,000s) 335,465,861 2,104,086 250,865,903 202,390,689 383,247 48,475,214 9,938,520 8,456,148 21,150,660 Percent Change 2000 -2009 36.5% -4.9% 27.9% 22.5% 9.6% 56.7% 51.1% 37.6% 51.1%
NORTH CAROLINA Earnings ($1,000s) 327,199,075 2,440,667 232,631,116 180,605,136 228,445 52,025,980 6,148,522 10,955,931 21,892,820 Percent Change 2000 -2009 40.5% -21.7% 31.1% 23.6% -7.5% 66.3% 56.3% 57.8% 46.1%
SOUTH CAROLINA Earnings ($1,000s) 148,264,684 450,526 99,919,350 76,144,719 194,993 23,774,631 2,901,715 5,215,082 11,297,512 Percent Change 2000 -2009 42.3% -30.4% 31.1% 24.8% 6.1% 56.1% 57.5% 30.6% 57.3%
Source: BEA 2011a 2
Total personal income also increased across the combined counties within each proposed 3
project area with a range in 2009 from $84.9 billion in the North Carolina proposed project 4
area to $13.4 billion in the Lowcountry proposed project area (Table 3-4) (Ibid.). 5
Earnings from Government and Government Enterprises had the greatest percentage 6
increase across all proposed project areas, averaging over 50 percent, which was highly 7
influenced by the 85.4 percent increase in earnings in this sector within the North Carolina 8
proposed project area. Earnings from Government and Government Enterprises accounted 9
for 16.0, 20.8, 14.2, and 27.4 percent of total personal income in the proposed project areas, 10
respectively. Local Government earnings account for 52.5, 35.6, 56.3, and 27.0 percent of 11
the Government and Government Enterprises earnings, by proposed project area, 12
respectively. Only in the North Carolina proposed project area, do earnings from Military 13
account for a substantial percentage (51.3 percent) of Government and Government 14
Enterprises earnings. 15
Private earnings across all proposed project areas increased by at least 19 percent over 16
2001 earnings. Earnings from Forestry and Logging increased in all the proposed project 17
areas, except North Carolina, where earnings from this industry fell over 38 percent. Farm 18
19

AFFECTED ENVIRONMENT
DRAFT - Environmental Assessment SE Giant Miscanthus Establishment and Production 3-7
Table 3-4. 2009 Total Personal Income and 1 Earnings by Select Industries by Proposed Project Area 2
Metric
Total Personal Income
Farm Earnings
Non-Farm Earnings
Private Earnings Government & Government Enterprises
Total
Forestry &
Logging Total Federal Civilian State Local
East Georgia Earnings ($1,000s) 24,273,542 674,661 13,461,784 9,498,336 57,636 3,963,448 348,884 954,724 2,082,165 Percentage of State Earnings 7.2% 32.1% 5.4% 4.7% 15.0% 8.2% 3.5% 11.3% 9.8% Percent Change 2000 -2009 37.7% 13.2% 26.4% 19.2% 35.4% 47.9% 44.0% 25.0% 49.3%
Middle Georgia Earnings ($1,000s) 22,106,812 217,178 12,906,404 8,300,423 24,783 4,605,981 1,658,684 782,931 1,640,197 Percentage of State Earnings 6.6% 10.3% 5.1% 4.1% 6.5% 9.5% 16.7% 9.3% 7.8% Percent Change 2000 -2009 37.1% -0.8% 29.2% 21.8% 6.7% 45.0% 63.2% 22.4% 41.5%
Lowcountry Combined Georgia Counties Earnings ($1,000s) 10,086,045 286,589 5,158,753 3,715,848 25,483 1,442,905 166,318 443,079 775,337 Percentage of State Earnings 3.0% 13.6% 2.1% 1.8% 6.6% 3.0% 1.7% 5.2% 3.7% Percent Change 2000 -2009 42.1% 17.7% 30.1% 25.3% 42.0% 44.1% 52.7% 25.1% 49.3% Combined South Carolina Counties Earnings ($1,000s) 3,455,999 19,189 1,789,628 1,305,486 32,516 484,142 53,138 93,195 310,019 Percentage of State Earnings 2.3% 4.3% 1.8% 1.7% 16.7% 2.0% 1.8% 1.8% 2.7% Percent Change 2000 -2009 35.9% -39.1% 24.1% 21.3% 50.2% 32.3% 29.3% 4.8% 37.3%
North Carolina Earnings ($1,000s) 84,943,430 1,278,813 55,809,201 32,551,186 50,813 23,258,015 2,587,637 2,413,877 6,319,482 Percentage of State Earnings 26.0% 52.4% 24.0% 18.0% 22.2% 44.7% 42.1% 22.0% 28.9% Percent Change 2000 -2009 49.6% -10.9% 44.8% 25.1% -38.4% 85.4% 67.0% 55.4% 43.8%
Source: BEA 2011a 3
earnings increased or only marginally declined in the combined Georgia counties, but 4
declined in the combined South Carolina and North Carolina counties over the period. Farm 5
earnings in the North Carolina proposed project area accounted for over 52 percent of Farm 6
earnings in the state. The East Georgia proposed project area accounted for approximately 7
32.1 percent of the Farm earnings in the State of Georgia. 8
3.1.2.3 Employment 9
Following income is employment, the primary source of earnings, which depending upon the 10
metric includes both full-time and part-time positions or full-time equivalent employment. 11
The BEA employment figures use both full-time and part-time positions to account for 12
persons that may hold multiple part-time positions or a full-time and part-time position. 13

AFFECTED ENVIRONMENT
DRAFT - Environmental Assessment SE Giant Miscanthus Establishment and Production 3-8
At the state level, between 2001 and 2009 the total number of employment opportunities 1
increased less than 10 percent across all states with the employment gain primarily from 2
nonfarm proprietors (Table 3-5). Wage and salary opportunities declined by less than one 3
percent in both Georgia and South Carolina; however, both states showed substantial 4
increases in proprietors employment (66.4 and 77.6 percent increase, respectively). For 5
wage and salary opportunities in Georgia and North Carolina, positions in government 6
organizations increased at a faster rate than in private industries with an average growth of 7
13.8 percent with private industry growth averaging 7.4. In South Carolina, employment in 8
government organizations increased 6.2 percent during the period, while private industry 9
employment increased 10.3 percent. Farm proprietors and farm employment declined in all 10
states from 2001 to 2009. 11
Table 3-5. 2009 Employment by State by Select Categories 12
Metric Total Wage & Salary
Proprietors Employment
Non-Proprietors Employment Private Employment Government Employment
Farm Nonfarm Farm Nonfarm Total
Forestry, Fishing,
& Related Total
Federal Civilian State Local
GEORGIA Number Employed 5,269,998 4,093,208 39,520 1,137,270 56,779 5,213,219 4,414,957 21,742 798,262 98,755 168,900 427,789 Percentage Change 2001-2009 8.5% -0.7% -21.3% 66.4% -13.7% 8.8% 8.1% 0.0% 12.9% 5.9% 12.5% 16.4%
NORTH CAROLINA Number Employed 5,201,929 4,163,274 43,229 995,426 63,909 5,138,020 4,282,392 23,483 855,628 67,749 205,146 440,018 Percentage Change 2001-2009 7.5% 2.1% -23.2% 41.0% -22.8% 8.0% 6.7% 4.9% 14.7% 12.2% 15.9% 12.3%
SOUTH CAROLINA Number Employed 2,453,442 1,910,702 22,492 520,248 30,313 2,423,129 2,022,051 10,211 401,078 31,420 97,120 216,828 Percentage Change 2001-2009 9.4% -0.8% -10.1% 77.6% -6.6% 9.6% 10.3% -2.3% 6.2% 12.4% -4.6% 12.9%
Source: BEA 2011b 13
Within the proposed project areas, wage and salary employment opportunities declined in all 14
areas, except North Carolina (5.5 percent increase) between 2001 and 2009 (Table 3-6). 15
Proprietors’ employment increased considerably across all proposed project areas, which 16
lead to increased overall total employment. There was a decline in farm proprietors across 17
all proposed project areas and in farm employment, except in the combined South Carolina 18
counties, which had an 11.8 percent increase in farm employment. Employment in Forestry, 19
Fishing, and Related declined across all proposed project areas. 20
21

AFFECTED ENVIRONMENT
DRAFT - Environmental Assessment SE Giant Miscanthus Establishment and Production 3-9
Table 3-6. 2009 Employment by Proposed Project Areas by Select Categories 1
Metric Total Wage & Salary
Proprietors Employment
Non-Proprietors Employment Private Employment Government Employment
Farm Nonfarm Farm Nonfarm Total
Forestry Fishing, &
Related Total Federal Civilian State Local
East Georgia Total Combined Counties 406,290 307,116 11,466 87,708 16,451 389,839 307,042 5,229 82,797 4,143 21,927 48,494 Percentage of State 7.7% 7.5% 29.0% 7.7% 29.0% 7.5% 7.0% 24.1% 10.4% 4.2% 13.0% 11.3% Percentage Change 2009 -2001 4.2% -3.2% -23.3% 52.6% -16.1% 5.3% 4.2% -4.1% 9.4% 1.5% 5.8% 11.1%
Middle Georgia Total Combined Counties 341,829 255,409 7,044 79,376 9,020 332,809 253,514 1,160 79,295 17,006 18,880 37,236 Percentage of State 6.5% 6.2% 17.8% 7.0% 15.9% 6.4% 5.7% 5.3% 9.9% 17.2% 11.2% 8.7% Percentage Change 2009 -2001 6.7% -2.8% -15.9% 61.0% -12.3% 7.3% 7.5% -10.4% 6.6% 16.8% 4.9% 7.5%
Lowcountry Total Combined Georgia Counties 159,754 118,012 5,007 36,735 7,043 152,711 121,403 2,008 31,308 1,834 10,098 18,201 Percentage of State 3.0% 2.9% 12.7% 3.2% 12.4% 2.9% 2.7% 9.2% 3.9% 1.9% 6.0% 4.3% Percentage Change 2009 -2001 6.6% -1.6% -23.3% 57.2% -14.1% 7.8% 7.8% 9.2% 8.1% 9.0% 6.2% 9.4% Total Combined South Carolina Counties 56,038 39,917 1,655 14,466 2,472 53,566 43,271 663 10,295 617 2,008 7,099 Percentage of State 2.3% 2.1% 7.4% 2.8% 8.2% 2.2% 2.1% 6.5% 2.6% 2.0% 2.1% 3.3% Percentage Change 2009 -2001 5.9% -5.8% -7.6% 64.8% 11.8% 5.6% 8.8% 16.7% -5.8% -4.9% -14.1% -2.9%
North Carolina Total Combined Counties 1,306,335 1,057,949 11,576 236,810 21,839 1,284,496 950,656 3,543 333,840 30,764 49,172 130,789 Percentage of State 25.1% 25.4% 26.8% 23.8% 34.2% 25.0% 22.2% 15.1% 39.0% 45.4% 24.0% 29.7% Percentage Change 2009 -2001 9.7% 5.5% -21.9% 36.8% -23.7% 10.6% 8.6% -21.9% 16.4% 12.0% 14.4% 11.0%
Source: BEA 2011b 2
The Bureau of Labor Statistics (BLS) in the May 2010 State Occupational and Wage 3
Estimates and the National Occupational and Wage Estimates indicated that the national 4
mean hourly wage was $21.35 per hour and the mean annual salary was $44,410 (BLS 5
2010a, b). Georgia had a mean hourly wage of $20.32 (95.2 percent of national mean), 6
followed by North Carolina at $19.47 (91.2 percent), then South Carolina at $18.23 (85.4 7
percent) (Ibid.). The mean annual salary in Georgia was $42,270, in North Carolina it was 8
$40,500, and in South Carolina $37,920 (Ibid.). 9

AFFECTED ENVIRONMENT
DRAFT - Environmental Assessment SE Giant Miscanthus Establishment and Production 3-10
As indicated in Tables 3-5 and 3-6, total employment opportunities increased across all 1
states and all proposed project areas between 2001 and 2009. However, as the number of 2
opportunities increased, so did the labor force in each of these areas with the labor force 3
growing at a considerably faster rate than the number of employment opportunities 4
available. On average in the three states, the number employed between 2001 and 2010 5
increased, on average 3.3 percent; however, the labor force within these three states 6
increased, on average, 9.9 percent during the period (BLS 2011). 7
Table 3-7 illustrates the data by state and by the proposed project areas for labor force, 8
employed, and unemployment rate. In the United States, the annual average 9
unemployment rate in 2001 was 4.7 percent, while in 2010 the annual average 10
unemployment rate was 9.6 percent. Overall, the unemployment rate within these states 11
and within the proposed project areas, exceed the United States average. Figure 3-3 12
illustrates the trend for the unemployment rate within each of the proposed project areas 13
from 2001 through 2010. Figure 3-4 illustrates the unemployment rate by county within 14
each of the three states as of June 2011. As of June 2011, the United States 15
unemployment rate was 9.2 percent. 16
3.1.2.4 Poverty Levels 17
The Southern United States has a persistent history with higher than the national average 18
poverty rates and lower than the national average median household incomes (University of 19
Georgia [UGA] nd). Between 2000 and 2010, all three states had their poverty rates climb 20
to higher than 16 percent, at least two percentage point higher than the national poverty rate 21
of 14.3 percent (Table 3-8). Two of the proposed project areas had poverty rates in excess 22
of 20 percent, with the other two proposed project areas having poverty rates in excess of 23
18 percent. Within the proposed project areas, the East Georgia proposed project area had 24
41 counties out of the 45 that had poverty rates between 20 to 40 percent, one county had a 25
poverty rate greater than 40 percent, and three counties had a poverty rate less than 20 26
percent. The Middle Georgia proposed project area had 21 of the 28 counties with a 27
poverty rate greater than 20 percent; the remaining counties were below 20 percent. The 28
Lowcountry proposed project area had 21 out of 22 counties with a poverty rate greater than 29
20 percent. The North Carolina proposed project area had 16 of 30 counties with a poverty 30
rate in excess of 20 percent. Figures 3-5 and 3-6 illustrate the 2010 poverty rates by 31
county within the proposed project areas. 32
33

AFFECTED ENVIRONMENT
DRAFT - Environmental Assessment SE Giant Miscanthus Establishment and Production 3-11
Table 3-7. Labor Force, Employed, and Unemployment 1 Rate by State and Proposed Project Area, 2001 and 2010 2
Year Labor Force Employed Unemployment Rate GEORGIA
2001 4,283,156 4,112,868 4.0% 2010 4,693,711 4,213,719 10.2%
NORTH CAROLINA 2001 4,164,911 3,929,977 5.6% 2010 4,512,770 4,036,343 10.6%
SOUTH CAROLINA 2001 1,935,614 1,834,871 5.2% 2010 2,164,612 1,922,815 11.2%
PROPOSED PROJECT AREAS East Georgia
2001 374,205 355,495 5.0% 2010 402,072 356,655 11.3%
Middle Georgia 2001 300,960 286,722 4.7% 2010 322,579 286,925 11.1%
Lowcountry 2001 204,165 193,508 5.2% 2010 221,707 195,456 11.8%
North Carolina 2001 1,034,730 968,413 6.4% 2010 1,148,194 1,026,217 10.6%
Source: BLS 2011 3
4
Figure 3-3. Annual Changes in the Unemployment Rate for the Combined Counties 5 within Each Proposed Project Area, 2001 through 2010. 6
4.0%
5.0%
6.0%
7.0%
8.0%
9.0%
10.0%
11.0%
12.0%
2001 2002 2003 2004 2005 2006 2007 2008 2009 2010
Une
mpl
oym
ent R
ate
Middle Georgia Eastern Georgia Savannah River/Nimmer North Carolina

AFFECTED ENVIRONMENT
DRAFT - Environmental Assessment SE Giant Miscanthus Establishment and Production 3-12
Figure 3-4. June 2011 Unemployment Rates by County within Each Proposed 1 Project Area 2

AFFECTED ENVIRONMENT
DRAFT - Environmental Assessment SE Giant Miscanthus Establishment and Production 3-13
Table 3-8. Poverty Rate and Median Household 1 Income by State and by Proposed Project Areas, 2000 and 2010 2
Year Poverty Rate Median Household Income Percent of National Median
Household Income UNITED STATES
2001 12.4% $41,994
2010 15.1% $50,221
GEORGIA 2001 13.0% $42,433 101.0% 2010 16.6% $47,469 94.5%
NORTH CAROLINA 2001 12.3% $39,184 93.3% 2010 16.2% $43,754 87.1%
SOUTH CAROLINA 2001 14.1% $37,082 88.3% 2010 17.1% $42,580 84.8%
East Georgia 2001 18.0% $29,402 70.0% 2010 22.1% $32,833 65.4%
Middle Georgia 2001 15.1% $33,037 78.7% 2010 18.4% $37,102 73.9%
Lowcountry 2001 18.8% $28,527 67.9% 2010 23.5% $32,212 64.1%
North Carolina 2001 14.6% $33,617 80.1% 2010 18.2% $37,934 75.5%
Source: USCB 2011b 3
4

AFFECTED ENVIRONMENT
DRAFT - Environmental Assessment SE Giant Miscanthus Establishment and Production 3-14
Figure 3-5. Percent of the Population Below the Poverty Threshold by County for 1 Proposed Project Areas in Georgia and South Carolina. 2

AFFECTED ENVIRONMENT
DRAFT - Environmental Assessment SE Giant Miscanthus Establishment and Production 3-15
Figure 3-6. Percent of the Population Below the Poverty Threshold by County for 1 the North Carolina Proposed Project Area. 2

AFFECTED ENVIRONMENT
DRAFT - Environmental Assessment SE Giant Miscanthus Establishment and Production 3-16
3.1.3 Existing Conditions – Agricultural Enterprises 1
3.1.3.1 Rural Population Trends 2
The USDA Economic Research Service (ERS) found that by 2006 non-metro counties in the 3
United States accounted for a population of approximately 50.2 million persons, which is 4
approximately 16.8 percent of the total United States population (ERS 2008; USCB 2008). 5
The general trend in these counties was a decline in the population with over 51 percent of 6
the non-metro counties experiencing population declines of approximately 0.5 percent per 7
year from 2000 to 2006. 8
3.1.3.2 Number of Farms and Land in Farms 9
From 1997 to 2007, the number of farms in the United States declined 0.5 percent (USDA 10
National Agricultural Statistics Service [NASS] 2009). Most farm categories declined from 11
1997 to 2007, with the number of acres in farms declining 3.4 percent, the average size of 12
farms declining by 3.0 percent, the amount of cropland declining by 8.7 percent, and the 13
amount of harvested cropland acreage declining by 2.9 percent (Ibid.). The average market 14
value of land and buildings increased approximately 90.2 percent for the average farm and 15
approximately 95.7 for the average acre (Ibid.). Farm production expenses also showed an 16
increase of approximately 52.8 percent over the decade. When compared by type of farm, 17
the largest number of farms in the United States falls within the small family farm – 18
residential or lifestyle farm. 19
For the majority, the largest number of farms in the proposed project areas fall within the 20
small family farm – residential or lifestyle farm (Table 3-9). Small family farms comprise the 21
vast majority of farms within the three states and within the proposed project areas. 22
Residential/lifestyle farms contribute the greatest percentage across all areas. The North 23
Carolina proposed project area is the only region that has greater than 15 percent of the 24
farms being large farms. 25
3.1.3.3 Minority Operators 26
Minority operators account for approximately six percent of all operators within Georgia, 27
North Carolina, and South Carolina. North Carolina had the least minority operators as a 28
percentage of total operators (4.8 percent), while South Carolina had the most at 8.6 29
percent. Within the proposed project areas, minority operators account for 30
31

AFFECTED ENVIRONMENT
DRAFT - Environmental Assessment SE Giant Miscanthus Establishment and Production 3-17
Table 3-9. Farm Typology by State and Proposed Project Area 1
Location Total
Small Family Farms
Large family
Very large family Non-family
Limited resource Retirement
Residential/ lifestyle
Farming occupation/ lower sales
Farming occupation/
higher sales
# % # % # % # % # % # % # % # %
Georgia 47,846 7,112 14.9 11,367 23.8 17,514 36.6 4,611 9.6 1,401 2.9 1,134 2.4 3,030 6.3 1,677 3.5 North Carolina 52,913 8,622 16.3 11,712 22.1 17,917 33.9 5,704 10.8 1,236 2.3 1,751 3.3 4,114 7.8 1,857 3.5 South Carolina 25,867 4,596 17.8 6,561 25.4 9,824 38.0 2,535 9.8 329 1.3 305 1.2 865 3.3 852 3.3
Proposed Project Areas East Georgia 13,808 2,106 15.3 3,216 23.3 5,012 36.3 1,418 10.3 554 4.0 381 2.8 630 4.6 491 3.6 Middle Georgia 8,478 1,291 15.2 2,292 27.0 3,287 38.8 830 9.8 153 1.8 135 1.6 236 2.8 254 3.0
Lowcountry 7,922 1,338 16.9 1,805 22.8 3,055 38.6 731 9.2 239 3.0 161 2.0 281 3.5 312 3.9 North Carolina 14,545 1,956 13.4 2,735 18.8 3,850 26.5 1,596 11.0 489 3.4 774 5.3 2,416 16.6 729 5.0
Source: USDA NASS 2009 2
approximately eight percent of all operators. Within the proposed project areas, the East 3
Georgia and Middle Georgia proposed project areas had just over seven percent of 4
operators being a minority, while the Lowcountry proposed project area just over nine 5
percent. Table 3-10 lists the minority operator by race and/or ethnicity by state and 6
proposed project area. Figure 3-7 illustrates the number of minority operators within the 7
counties of the proposed project areas. 8
Table 3-10. 2007 Minority Operators by State and by Proposed Project Areas 9
Location Total
Operator Race or Ethnicity
Total Minority
Operators
American Indian or Alaska Native Asian African American Spanish
Farms Operators Farms Operators Farms Operators Farms Operators Farms Operators
Georgia 47,846 69,060 451 572 268 385 2,160 2,647 484 547 4,151
North Carolina 52,913 76,832 729 887 157 232 1,563 1,801 648 738 3,658 South Carolina 25,867 37,082 181 217 67 85 2,159 2,605 243 277 3,184
Proposed Project Areas
East Georgia 13,808 19,099 113 155 41 61 853 1,043 104 117 1,376 Middle Georgia 8,478 12,107 75 93 67 94 550 668 71 76 931
Lowcountry 7,922 10,849 36 41 19 21 705 850 63 77 989
North Carolina 14,993 21,217 479 597 43 61 730 855 204 232 1,745 Source: USDA NASS 2009 10

AFFECTED ENVIRONMENT
DRAFT - Environmental Assessment SE Giant Miscanthus Establishment and Production 3-18
Figure 3-7. Minority Operators within the Proposed Project Areas 1

AFFECTED ENVIRONMENT
DRAFT - Environmental Assessment SE Giant Miscanthus Establishment and Production 3-19
3.1.3.4 Primary Field Crops 1
The 2003 National Resources Inventory indicates that approximately 368 million acres 2
within the United States is cultivated cropland and 58 million acres is uncultivated cropland. 3
In 1992, those figures were 334 million acres of cultivated cropland and 47 million acres of 4
uncultivated cropland. Table 3-11 illustrates the amount of acreage planted of select 5
primary field crops in 2010, along with harvested acres of those crops, and total production 6
of the crops (USDA NASS 2009). The East Georgia proposed project area accounted for 7
25.8 percent of corn grain production, 30.1 percent of upland cotton, 36.6 percent of 8
soybeans, 20.9 percent of wheat production, and 57.1 percent of tobacco production in 9
Georgia during those periods. The Middle Georgia proposed project areas accounted for 10
less statewide production, which would be mainly attributable to fewer counties. The North 11
Carolina proposed project area accounted for greater than 50 percent of corn grain 12
production and upland cotton within the state and just under 50 percent of soybeans and 13
wheat production. The counties in the North Carolina proposed project area accounted for 14
all of the tobacco production and 28.8 percent of hay production. The following counties did 15
not have reportable or discloseable acres: Baldwin, Brantley, Butts, Charlton, Clinch, 16
Crawford, Glascock, Hancock, Harris, Heard, Jasper, Long, Lowndes, Meriwether, Pierce, 17
Putnam, Spalding, Talbot, Tift, Treutlen, Troup, Twiggs, Upson, Wilkinson, Georgia and 18
Montgomery and New Hanover, North Carolina. 19
3.1.3.5 Primary Livestock Industries 20
The primary livestock industries across the proposed project areas are cattle for all states in 21
addition to hogs and pigs in North Carolina. Table 3-12 lists the most recent data on 22
livestock numbers by type and by county. Butts, Crawford, Hancock, Harris, Heard, 23
Houston, Lamar, Macon, Meriwether, Peach, Pike, Putnam, Spalding, Talbot, Taylor, Troup 24
and Upson Counties, Georgia did not contain any reportable or discloseable level of cattle, 25
as well as New Hanover, North Carolina. The Middle Georgia proposed project area 26
contributed approximately six percent of all cattle in Georgia. The East Georgia proposed 27
project area contributed approximately 25 percent of all cattle in Georgia. The Lowcountry 28
proposed project area contributed approximately 11 percent of all cattle in Georgia and six 29
percent of all cattle in South Carolina. The North Carolina proposed project areas 30
contributed approximately 21 percent of all cattle in North Carolina and 92 percent of all 31
hogs and pigs. 32
33

AFFECTED ENVIRONMENT
DRAFT - Environmental Assessment SE Giant Miscanthus Establishment and Production 3-20
Table 3-11. Planted Acres, Harvested Acres, 1 and Production of Select Field Crops in the States and Proposed Project Areas 2
Crop Type Planted Acres Harvested Acres Production GEORGIA
Corn (Grain) (2010) 295,000 245,000 35,525,000 Cotton, Upland (2008) 940,000 920,000 1,600,000 Soybeans (2010) 270,000 260,000 6,760,000 Wheat All (2008) 480,000 400,000 22,400,000 Tobacco (2005)
16,000 27,760,000
NORTH CAROLINA Corn (Grain) (2010) 910,000 840,000 76,440,000 Cotton, Upland (2008) 550,000 545,000 951,000 Soybeans (2010) 1,580,000 1,550,000 40,300,000 Wheat All (2008) 820,000 720,000 43,200,000 Tobacco (2004)
19,400 42,680,000 Hay All, Dry (2007) 699,000 1,050,000
SOUTH CAROLINA Corn (Grain) (2010) 350,000 335,000 30,485,000 Cotton, Upland (2008) 135,000 134,000 246,000 Soybeans (2010) 465,000 455,000 10,465,000 Hay All, Dry (2007)
330,000 561,000
East Georgia Corn (Grain) (2010) 77,900 65,200 9,169,900 Cotton, Upland (2008) 281,600 276,100 482,200 Soybeans (2010) 93,900 92,340 2,473,400 Wheat All (2008) 98,300 87,800 4,684,000 Tobacco (2005)
9,070 15,858,000
Middle Georgia Corn (Grain) (2010) 35,400 24,750 3,928,600 Cotton, Upland (2008) 55,300 53,600 83,200 Soybeans (2010) 62,600 61,030 1,409,300 Wheat All (2008) 75,000 68,900 3,847,000
Lowcountry Corn (Grain) (2010) 76,300 68,600 7,746,000 Cotton, Upland (2008) 112,300 109,850 171,300 Soybeans (2010) 101,800 99,520 2,590,500 Wheat All (2008) 76,500 68,400 3,702,000 Tobacco (2005)
500 720,000 Hay All, Dry (2007) 13,500 37,000
North Carolina Corn (Grain) (2010) 485,000 474,000 39,059,500 Cotton, Upland (2008) 281,700 279,200 497,300 Soybeans (2010) 854,000 839,900 18,679,000 Wheat All (2008) 394,900 357,600 20,018,000 Tobacco (2005)
19,400 42,680,000 Hay All, Dry (2007) 161,400 302,500
Source: USDA NASS 2011 3
4

AFFECTED ENVIRONMENT
DRAFT - Environmental Assessment SE Giant Miscanthus Establishment and Production 3-21
Table 3-12. Primary Livestock Activities by 1 County within the Proposed Project Areas 2
Livestock Number of Head GEORGIA
Cattle All (2011) 1,060,000 SOUTH CAROLINA
Cattle All (2011) 385,000 NORTH CAROLINA
Cattle All (2011) 780,000 Hogs and Pigs (2009) 9,600,000
East Georgia Cattle All (2011) 259,800
Middle Georgia Cattle All (2011) 66,800
Lowcountry Cattle All (2011) 133,000
North Carolina Cattle All (2011) 161,600 Hogs and Pigs (2009) 8,799,900
Source: USDA NASS 2011 3
3.1.3.6 Farm Income and Cost 4
The ERS (USDA ERS 2011a) indicated that net farm income in 2011 is projected to be 5
above the 2010 forecast by 19.8 percent. Net farm income was estimated to be 6
approximately $94.7 billion in 2011 with net cash income of $98.6 billion (Ibid.). Total 7
expenses in the agricultural sector are anticipated to increase by $20.2 billion, exceeding 8
$300 billion for the first time. Crop receipts were estimated to increase to $24.1 billion (Ibid.). 9
At the household level, the average family farm household income for 2010 was estimated 10
to be $83,021, an increase of 7.6 percent from 2009 (USDA ERS 2011b). The ERS 11
anticipates that in 2011 approximately 12.9 percent of average family farm household 12
income was generated from on-farm sources with an average of approximately $75,178 of 13
household income generated from off-farm sources (Ibid.). 14
15
AFFECTED ENVIRONMENT
DRAFT - Environmental Assessment SE Giant Miscanthus Establishment and Production 3-22
3.2 LAND USE 1
3.2.1 Definition of the Resource 2
Land use analysis primarily details the interactions of humans and their environment, both 3
natural and human-induced. Such analyses address how different land uses currently 4
interact and if there would be conflict between new and existing land uses. In urban areas, 5
land uses are primarily controlled for public health and safety concerns through land use 6
zoning mechanisms. In rural areas, land use restrictions may be developed at a county or 7
regional scale, or land use restrictions may not exist or be limited to special public health 8
and safety concerns. Land use within this document is being described as the acreage 9
within cropland and permanent pasture since these lands uses are being proposed for 10
conversion into a dedicated energy crop land use. 11
3.2.2 Existing Conditions 12
3.2.2.1 Agricultural Land Uses 13
The 2007 Agricultural Census estimates the amount of land in agricultural land uses in the 14
United States. Tables 3-13 and 3-14 illustrate the agricultural lands defined by land use 15
categories and sub-categories in the proposed project area. At the state level, cropland 16
accounted for approximately 44.1 percent of total land in farms in Georgia, 57.8 percent in 17
North Carolina, and 44.0 percent in South Carolina. Woodland accounted for 36.6 percent 18
of total farmland in Georgia, 26.0 percent in North Carolina, and 37.4 percent in South 19
Carolina. Permanent pasture and rangeland, excluding woodland pastured and cropland 20
pastured, accounted for 13.2 percent of the total land in farms in Georgia, 11.1 percent in 21
North Carolina, and 12.6 percent in South Carolina. 22
The East Georgia proposed project area accounted for 36.6 percent of the total land in 23
farms in Georgia, with Middle Georgia accounting for 18.7 percent, and the North Carolina 24
proposed project area accounting for 40.5 percent of the total land in farms in North 25
Carolina. The East Georgia proposed project area accounted for 40.2 percent of harvested 26
cropland in the state, while the North Carolina proposed project area accounted for 50.1 27
percent. These two proposed project areas also accounted for 42.5 percent and 33.7 28
percent, respectively in marginal croplands for their states. 29
30

AFFECTED ENVIRONMENT
DRAFT - Environmental Assessment SE Giant Miscanthus Establishment and Production 3-23
Table 3-13. 2007 Land Use Types by State, acres 1
Land Use Type Georgia North
Carolina South
Carolina Land in farms 10,150,539 8,474,671 4,889,339 Approximate land area 36,798,743 31,113,828 19,255,034 Total cropland 4,478,168 4,895,204 2,151,219 Total woodland 3,712,672 2,201,609 1,827,191 Permanent pasture and rangeland, other than cropland and woodland pastured 1,341,985 941,609 617,136 Land in farmsteads, buildings, livestock facilities, ponds, roads, wasteland, etc. 617,714 436,249 293,793 Total cropland
Harvested cropland 3,390,437 4,188,658 1,551,670 Cropland used only for pasture or grazing 587,428 338,605 1,551,670 Other cropland 500,303 367,941 335,500 Cropland on which all crops failed 118,512 95,333 81,018 Cropland idle or used for cover crops or soil improvement, but not harvested and not pastured or grazed (see text) 328,998 225,038 223,039 Cropland in cultivated summer fallow 52,793 47,570 31,443 Total woodland
Woodland not pastured 3,191,085 1,914,066 1,607,555 Woodland pastured 521,587 287,543 219,636 Pastureland, all types 2,451,000 1,567,757 1,100,821 Permanent pasture and rangeland, other than cropland and woodland pastured 1,341,985 941,609 617,136 Cropland used only for pasture or grazing 587,428 338,605 1,551,670 Woodland pastured 521,587 287,543 219,636 Conservation Acres - CRP, WRP, Farmable Wetlands, and CREP 331,166 163,676 264,950
Source: USDA NASS 2009 2
Within the proposed project areas, the dominant land use type for land in farms in East 3
Georgia and North Carolina was cropland with woodland being dominant in Middle Georgia, 4
and approximately equally split in the Lowcountry proposed project area. Less than 10 5
percent of the land use was for permanent pasture or rangeland in all the proposed project 6
areas, except Middle Georgia, where permanent pasture or rangeland accounted for 13.7 7
percent. 8
Marginal croplands in the proposed project areas accounted for a relatively small 9
percentage of total land in farms. Values ranged from 3.6 percent in the North Carolina 10
proposed project area to 7.1 percent in the Lowcountry proposed project area. Figure 3-8 11
provides an illustration of percentage of total farmland in each of the proposed project areas, 12
while Figures 3-9 and 3-10 illustrate the percentage of cropland and pastureland within the 13
proposed project areas. 14
15

AFFECTED ENVIRONMENT
DRAFT - Environmental Assessment SE Giant Miscanthus Establishment and Production 3-24
Table 3-14. 2007 Land Use Types by Proposed Project Areas, acres 1
Land Use Type East Georgia
Middle Georgia Lowcountry
North Carolina
Land in farms 3,717,921 1,896,166 2,412,162 3,428,776 Approximate land area 12,547,314 7,222,217 7,229,088 11,487,711 Total cropland 1,787,113 730,236 1,049,647 2,324,025 Total woodland 1,443,765 796,852 1,048,227 771,540 Permanent pasture and rangeland, other than cropland and woodland pastured 274,858 259,064 158,477 158,512 Land in farmsteads, buildings, livestock facilities, ponds, roads, wasteland, etc. 208,521 110,014 155,811 173,457 Total cropland
Harvested cropland 1,362,838 499,353 730,712 2,098,694 Cropland used only for pasture or grazing 211,871 126,457 38,476 100,674 Other cropland 212,404 104,426 170,922 124,076 Cropland on which all crops failed 44,988 16,266 31,940 32,440
Cropland idle or used for cover crops or soil improvement, but not harvested and not pastured or grazed (see text) 141,198 77,992 120,548 73,139 Cropland in cultivated summer fallow 25,155 8,567 18,434 17,487 Total woodland
Woodland not pastured 1,287,368 690,375 982,120 718,268 Woodland pastured 120,368 106,477 66,107 53,272 Pastureland, all types 623,189 491,998 372,597 312,939 Permanent pasture and rangeland, other than cropland and woodland pastured 274,858 259,064 158,477 158,512 Cropland used only for pasture or grazing 211,871 126,457 148,013 100,674 Woodland pastured 120,368 106,477 66,107 53,272 Conservation Acres - CRP, WRP, Farmable Wetlands, and CREP 132,181 62,837 126,655 47,536
Source: USDA NASS 2009 2
When land use data from the 2002 Agricultural Census and the 2007 Agricultural Census 3
are compared by geographic area, some changes in land use become apparent across all 4
areas. The number of farms decreased in all states, except South Carolina, which had an 5
increase of less than one percent. Also, acres in farms declined in all states, except South 6
Carolina, which had a less than one percent increase in land in farms. The average size of 7
farm declined in all states, mirroring observations across the United States that the overall 8
decline in farm is leveling off and new entrants are younger than the average producer with 9
smaller farms. Average farm size within these states ranged from 160 acres in North 10
Carolina to 212 acres in Georgia. All states had a decline in cropland and an increase in 11
permanent pasture and rangeland. 12
13

AFFECTED ENVIRONMENT
DRAFT - Environmental Assessment SE Giant Miscanthus Establishment and Production 3-25
Figure 3-8. Percent of Farmland Acres by County in the Proposed Project Areas. 1

AFFECTED ENVIRONMENT
DRAFT - Environmental Assessment SE Giant Miscanthus Establishment and Production 3-26
Figure 3-9. Comparison of the Percentage of Harvested Cropland and Total 1 Pastureland in the Georgia and South Carolina Proposed Project Areas. 2

AFFECTED ENVIRONMENT
DRAFT - Environmental Assessment SE Giant Miscanthus Establishment and Production 3-27
Figure 3-10 Comparison of the Percentage of Harvested Cropland and Total 1 Pastureland in the North Carolina Proposed Project Area. 2
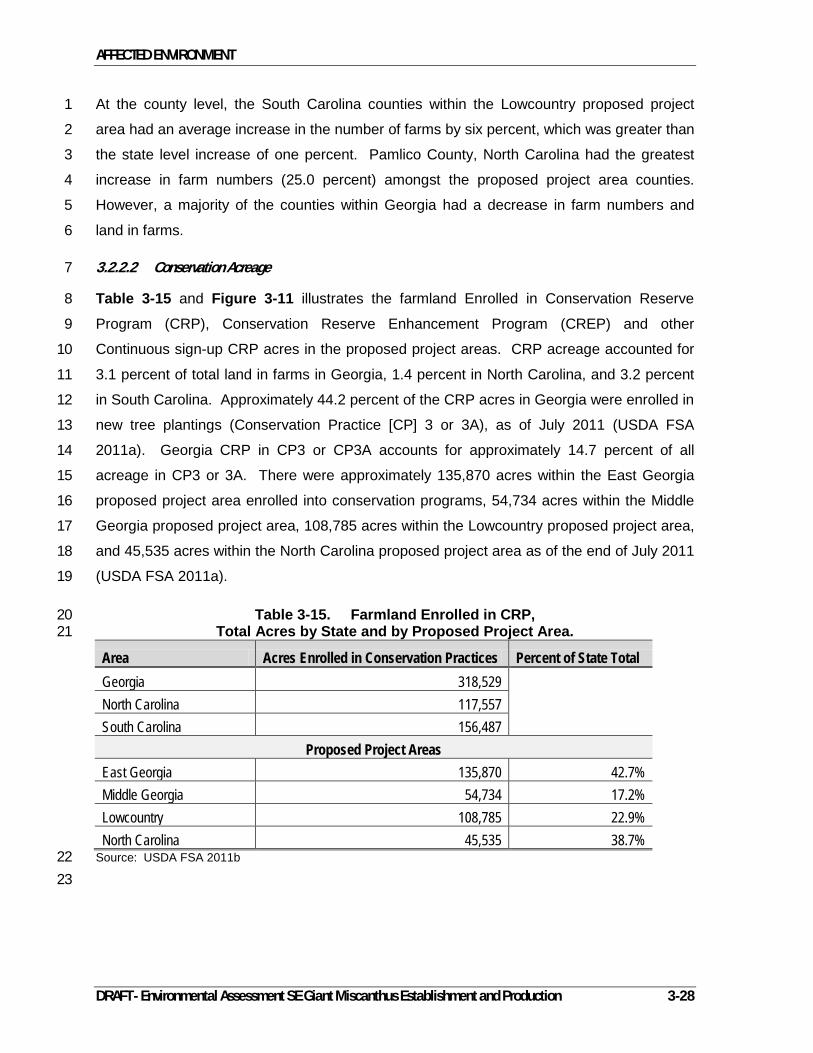
AFFECTED ENVIRONMENT
DRAFT - Environmental Assessment SE Giant Miscanthus Establishment and Production 3-28
At the county level, the South Carolina counties within the Lowcountry proposed project 1
area had an average increase in the number of farms by six percent, which was greater than 2
the state level increase of one percent. Pamlico County, North Carolina had the greatest 3
increase in farm numbers (25.0 percent) amongst the proposed project area counties. 4
However, a majority of the counties within Georgia had a decrease in farm numbers and 5
land in farms. 6
3.2.2.2 Conservation Acreage 7
Table 3-15 and Figure 3-11 illustrates the farmland Enrolled in Conservation Reserve 8
Program (CRP), Conservation Reserve Enhancement Program (CREP) and other 9
Continuous sign-up CRP acres in the proposed project areas. CRP acreage accounted for 10
3.1 percent of total land in farms in Georgia, 1.4 percent in North Carolina, and 3.2 percent 11
in South Carolina. Approximately 44.2 percent of the CRP acres in Georgia were enrolled in 12
new tree plantings (Conservation Practice [CP] 3 or 3A), as of July 2011 (USDA FSA 13
2011a). Georgia CRP in CP3 or CP3A accounts for approximately 14.7 percent of all 14
acreage in CP3 or 3A. There were approximately 135,870 acres within the East Georgia 15
proposed project area enrolled into conservation programs, 54,734 acres within the Middle 16
Georgia proposed project area, 108,785 acres within the Lowcountry proposed project area, 17
and 45,535 acres within the North Carolina proposed project area as of the end of July 2011 18
(USDA FSA 2011a). 19
Table 3-15. Farmland Enrolled in CRP, 20 Total Acres by State and by Proposed Project Area. 21
Area Acres Enrolled in Conservation Practices Percent of State Total Georgia 318,529
North Carolina 117,557 South Carolina 156,487
Proposed Project Areas East Georgia 135,870 42.7% Middle Georgia 54,734 17.2% Lowcountry 108,785 22.9% North Carolina 45,535 38.7%
Source: USDA FSA 2011b 22 23

AFFECTED ENVIRONMENT
DRAFT - Environmental Assessment SE Giant Miscanthus Establishment and Production 3-29
Figure 3-11. Percent of Total Acres Enrolled in the Conservation Reserve Program, 1 Total Acres, July 2011. 2
3

AFFECTED ENVIRONMENT
DRAFT - Environmental Assessment SE Giant Miscanthus Establishment and Production 3-30
3.2.2.3 Forestlands 1
According to the USDA Forest Service (FS), Forest Resources of the United States, in 2007 2
there were approximately 24.8 million acres of forestland in Georgia, 18.4 million acres of 3
forestland in North Carolina, and 12.7 million acres of forestland in South Carolina (USDA 4
FS 2009a, b). Of those total forest areas, the majority of the land was private forestland. 5
Georgia had 90.5 percent private forestland, North Carolina had 84.0 percent private 6
forestland, and South Carolina had 87.8 percent private forestland. Both Georgia and South 7
Carolina had a small increase in the acres of forestland from 1997 to 2007 (1.5 percent and 8
0.7 percent, respectively) while North Carolina had a small decrease in forest area (Ibid.). 9
The USDA FS and state forestry agencies complete forest inventories on cyclic basis, with 10
the last year’s data in all states from 2010 (Table 3-16 and Figure 3-12). Forestland in all 11
three states account for almost or more than 60 percent of total acreage in the state. Within 12
the proposed project areas, forestland acreage accounts for more than 70 percent of total 13
acres except for the North Carolina proposed project area. 14
Table 3-16. Forestland and Non-Forestland 15 Acres by State and by Proposed Project Areas 16
Location Total Acres Forestland Non-Forestland Percent Forestland Georgia 38,031,355 24,785,061 12,086,170 66.9% North Carolina 34,443,688 18,601,251 12,368,696 59.7% South Carolina 20,492,874 13,101,231 6,077,194 67.9%
Proposed Project Areas East Georgia 12,867,344 9,496,017 3,178,863 74.5% Middle Georgia 7,300,014 5,391,040 1,810,875 74.6% Lowcountry 7,379,934 5,236,635 1,969,738 72.2% North Carolina 12,145,887 6,946,785 4,461,489 60.5% Source: USDA, FS 2011 17
18

AFFECTED ENVIRONMENT
DRAFT - Environmental Assessment SE Giant Miscanthus Establishment and Production 3-31
Figure 3-12. Forestland as a Percentage of Total Land Areas by Proposed Project 1 Areas 2

AFFECTED ENVIRONMENT
DRAFT - Environmental Assessment SE Giant Miscanthus Establishment and Production 3-32
3.3 MANAGED COASTAL ZONE 1
3.3.1 Definition of the Resource 2
The Coastal Zone Management Act of 1972 encourages the management of coastal zones 3
areas including the protection and restoration of these areas. The act defines coastal zones 4
as the coastal waters and the adjacent shorelands, strongly influenced by each other and in 5
proximity to the shorelines of the several coastal states, and includes islands, transitional 6
and intertidal areas, salt marshes, wetlands, and beaches. Each coastal state is 7
responsible for developing a coastal zone management program and submitting the 8
program for review and approval. 9
3.3.2 Existing Conditions 10
3.3.2.1.1.1 East Georgia Proposed Project Area 11
The Georgia Coastal Management Act of 1998 authorized the creation of the Georgia 12
Coastal Program with Georgia's Department of Natural Resources (GDNR), Coastal 13
Resources Division (CRD) serving as the lead agency. Georgia’s state coastal zone 14
includes the 11 counties that border tidally-influenced water or have economies that are 15
closely tied to coastal resources. Of the coastal zones counties, there are five counties 16
within the East Georgia proposed project area; Brantley, Charleston, Effingham, Long, and 17
Wayne counties (National Oceanic and Atmospheric Administration [NOAA] 2011) (Figure 18
3-13). 19
Georgia’s Coastal Management Program addressed the economic development and natural 20
resource issues identified in Georgia. The Coastal Marshland Protection Act (CMPA) and 21
the Shore Protection Act (SPA) limits certain activities and structures in tidal wetland or 22
jurisdictional areas and requires permits for other activities and structures. Under the 23
CMPA, jurisdiction is established mainly using tidal indicator plants. Under the SPA, 24
jurisdiction is established using vegetation, structures, and the western boundary of the 25
dune field. Any agricultural or silvicultural activities that directly alter lands within the 26
jurisdictional areas of the CMPA or SPA must be permitted by the GDNR CRD. Lands 27
outside these jurisdictional areas, but within the designated counties, do not require 28
permitting. 29
30

AFFECTED ENVIRONMENT
DRAFT - Environmental Assessment SE Giant Miscanthus Establishment and Production 3-33
Figure 3-13. Coastal Zone Management Areas by Proposed Project Areas 1

AFFECTED ENVIRONMENT
DRAFT - Environmental Assessment SE Giant Miscanthus Establishment and Production 3-34
3.3.2.1.1.2 Middle Georgia Proposed Project Area 1
There are no counties within the Middle Georgia proposed project area that are within the 2
Georgia coastal zones. 3
3.3.2.1.1.3 Lowcountry Proposed Project Area 4
The South Carolina Coastal Program is lead by the South Carolina Department of Health 5
and Environmental Control (SCDHEC) and was approved by NOAA in 1979. The South 6
Carolina coastal zone includes all lands and waters in the counties of the State which 7
contain any one or more “critical areas” which are defined as coastal waters, tidelands, 8
beaches, and primary oceanfront sand dunes (NOAA 2011). Within the Lowcountry 9
proposed project area there are two counties that would be within the designated coastal 10
zone counties, Jasper and Colleton (SCDHEC 2011) (Figure 3-13). Within this proposed 11
project area, one county, Effingham, is within the Georgia coastal zone counties. 12
3.3.2.1.1.4 North Carolina Proposed Project Area 13
The North Carolina Coastal Management Program is lead by the Division of Coastal 14
Management within the North Carolina Department of Environment and Natural Resources 15
(NCDENR) and was approved by NOAA in 1978. North Carolina’s coastal zone includes the 16
20 counties that in whole or in part are adjacent to, adjoining, intersected by, or bounded by 17
the Atlantic Ocean or any coastal sounds. There are two tiers within the coastal zone 18
boundaries. The first tier is comprised of Areas of Environmental Concern (AEC). The AECs 19
includes coastal wetlands, estuarine waters, public trust areas, estuarine shorelines, ocean 20
beaches, frontal dunes, ocean erosion areas, inlet lands, small surface water supply 21
watersheds, public water supply well-fields, and fragile natural resource areas. The second 22
tier includes land uses which have potential to affect coastal waters even if they are not 23
located within the AEC (NOAA 2011). Of those 20 coastal zone counties, seven are within 24
the North Carolina proposed project area; Beaufort, Brunswick, Craven, New Hanover, 25
Onslow, Pamlico, and Pender (NCDENR 2011) (Figure 3-13). Section 103(5)(b) of the 26
Coastal Area Management Act exempts agricultural or forestry production that does not 27
involve the excavation or filling of estuarine or navigable waters or coastal marshland. 28

AFFECTED ENVIRONMENT
DRAFT - Environmental Assessment SE Giant Miscanthus Establishment and Production 3-35
3.4 BIOLOGICAL RESOURCES 1
3.4.1 Vegetation 2
3.4.1.1 Definition of the Resource 3
Vegetation refers to the plants, both native and introduced, of a specific region. 4
3.4.1.2 Existing Conditions 5
3.4.1.2.1
For this project, the Level III Ecoregions will be used to illustrate the natural vegetation of 7
each proposed project area. Table 3-17 describes each ecoregion within the proposed 8
project areas. Figure 3-14 illustrates the ecoregions within and adjacent to the proposed 9
project areas. 10
Ecoregions 6
Table 3-17. Level III Ecoregions Descriptions by Proposed Project Areas 11 Proposed Project Area Level III Ecoregion
East Georgia Lowcountry
The Southern Coastal Plains are mostly flat plains and contains barrier islands, coastal lagoons, marches, and swampy lowlands. The land cover in the region is mostly slash and loblolly pine forests with some oak-gum-cypress stands in the low lying areas.
East Georgia Middle Georgia
Lowcountry North Carolina
The Southeastern Plains ecoregion is a mosaic of cropland, pastureland, woodland, and forest. The natural vegetation is dominated by oak-hickory-pine and southern mixed forests.
Middle Georgia North Carolina
The Piedmont ecoregion is a transitional zone between the mountainous areas to the northwest and the relatively flat coastal plains to the southeast. This area that was once largely cultivated has now reverted to pine and hardwood woodlands.
Lowcountry North Carolina
The Middle Atlantic Coastal consists of low elevation, flat plains, and many swamps, marches, and estuaries. Forest cover in the region is dominated by loblolly and some shortleaf pine, with patches of oak, gum, and cypress near major streams.
Source: Adapted from Griffith et al. 2001, 2002 12
13

AFFECTED ENVIRONMENT
DRAFT - Environmental Assessment SE Giant Miscanthus Establishment and Production 3-36
Figure 3-14. Level III Ecoregions within and adjacent to the Proposed Project Areas. 1

AFFECTED ENVIRONMENT
DRAFT - Environmental Assessment SE Giant Miscanthus Establishment and Production 3-37
3.4.1.2.1
Current agricultural and conservation practices include the planting of native and introduced 2
species and control or eradication of invasive or noxious species. The Executive Order (EO) 3
13112, Invasive Species, directs Federal agencies to prevent the introduction of invasive 4
species and provide for their control and to minimize the economic, ecological, and human 5
health impacts that invasive species cause unless the benefits of the introduction or spread 6
of the invasive species clearly outweigh potential harms. In addition, the Plant Protection 7
Act (PPA), which became law in June 2000 as part of the Agricultural Risk Protection Act, 8
consolidated all or part of 10 existing laws, applicable to USDA activities, into one 9
comprehensive law, including the authority to regulate plants, plant products, certain 10
biological control organisms, noxious weeds, and plant pests (USDA Animal and Plant 11
Health Inspection Service [APHIS] 2002). EO 13112 defines native species as a species 12
that, with respect to a particular ecosystem, other than as a result of an introduction, 13
historically occurred or currently occurs in that ecosystem. An alien or non-native species is 14
any species, with respect to a particular ecosystem, including its seeds, eggs, spores, or 15
other biological material capable of propagating that species, that is not native to that 16
ecosystem; an invasive species is a nonnative “species whose introduction does or is likely 17
to cause economic or environmental harm or harm to human health” (EO 13112). The PPA 18
defines a noxious weed as any plant or plant product that can directly or indirectly bring 19
harm to agriculture, the public health, navigation, irrigation, natural resources, or the 20
environment; this Act expands the definition of noxious weed from the definition in the 1974 21
Federal Noxious Weed Act, which included only weeds that were of foreign origin, new to, or 22
not widely prevalent in the United States (APHIS 2002). Noxious weeds are identified and 23
listed on State and Federal lists. 24
Invasive and Noxious Plant Species 1
Invasive plant species can have significant negative impacts on biological resources 25
including decreases in native wildlife and plant species populations, alterations to rare plant 26
communities, or changing ecological processes that native plant species and other desirable 27
plants and wildlife depend on for survival (including impacts upon native pollinators) 28
(National Invasive Species Council [NISC] 2008). Invasive plant species could potentially 29
cause or vector decimating plant diseases, prevent native and agricultural species from 30
reproducing, suppress the growth of neighboring plants, out-compete desirable species for 31
nutrients, light, moisture or other vital resources; and adversely impact erosion rates, 32
hydrologic regimes and soil chemistry such as pH and nutrient availability. Natural wildfire 33
cycles could also be altered; invasions by fire-promoting grasses could alter entire plant 34

AFFECTED ENVIRONMENT
DRAFT - Environmental Assessment SE Giant Miscanthus Establishment and Production 3-38
communities, eliminating or sharply reducing populations of many native plant species 1
(Ibid.). 2
Eradication or control of invasive and noxious species can be an arduous task often 3
including multiple methods of treatment to be effective. The application of herbicide, 4
grazing, burning, mechanical or manual control (cutting, excavating), and mowing are all 5
methods that can be used to control and eradicate invasive species. While it may not be 6
possible to fully eradicate an invasive plant species, management activities can control 7
further spread or takeover. Some species of invasive plants require timed treatment for 8
eradication or control such as when the plant is dormant, young, or prior to 9
flowering/seeding. Additionally, vegetation may become accustomed to certain methods of 10
control and other methods may be required to aid in management (NRCS Conservation 11
Practice Standard [CPS] 595, Pest Management). 12
Giant miscanthus is not listed on any of the proposed project areas states’ (North Carolina 13
or South Carolina) list of noxious weeds as of August 2011 located through the USDA 14
PLANTS database (Georgia does not have a state noxious weed list). This may be partially 15
due to the fact that this species has not had widespread distribution in a localized or regional 16
level; however, this is the most recent listing for these states. This species is also not listed 17
on the Federal Noxious Weed List as of the 2006 list. 18
Two species of Miscanthus (M. floridulus and M. sinensis), one of which is a parent species 19
of the hybrid being proposed by the Project Sponsor, are listed on the U.S. Weeds species 20
list per the USDA PLANTS database. Additionally, the other parent species (M. 21
sacchariflorus) is listed as a noxious weed in Massachusetts. The Early Detection and 22
Distribution Mapping System (EDDMapS) developed by the UGA Center for Invasive 23
Species and Ecosystem Health has compiled distribution records for invasive and exotic 24
species down to the county level for the United States. These distribution records do not 25
indicate an infestation, rather just a record of occurrence on an exotic species known to 26
have infestations in the United States. The distribution maps indicate records for M. 27
sinensis in 16 counties in Georgia (including Echols), 12 counties in South Carolina (no 28
counties within the proposed project area), and 42 counties in North Carolina (including 29
Beaufort, Craven, Harnett, Lee, Moore, Nash, and Scotland). There were no distribution 30
records for M. sacchariflorus in any of the states within the proposed project areas. 31

AFFECTED ENVIRONMENT
DRAFT - Environmental Assessment SE Giant Miscanthus Establishment and Production 3-39
3.4.2 Wildlife 1
3.4.2.1 Definition of the Resource 2
Wildlife refers to the animal species (mammals, birds, amphibians, reptiles, invertebrates, 3
and fish/shellfish), both native and introduced, which characterize a region. 4
3.4.2.2 Existing Conditions 5
3.4.2.2.1
Major wildlife species in this area include white-tailed deer (Odocoileus virginianus), wild pig 7
(Sus scrofa), coyote (Canis latrans), striped skunk (Mephitis mephitis), northern raccoon 8
(Procyon lotor), American black bear (Ursus americanus), Virginia opossum (Didelphis 9
virginiana), western cottontail (Sylvilagus floridanus), wood duck (Aix sponsa), mallard (Anas 10
platyrhynchos), barn owl (Strix varia), snapping turtle (Chelydra serpentina), and American 11
alligator (Alligator mississipiensis) (UGA 2008). 12
East Georgia Proposed Project Area 6
3.4.2.2.2
Major wildlife species in this area include white-tailed deer, wild pig, coyotes, striped skunk, 14
northern raccoon, American black bear, Virginia opossum, western cottontail, wood duck, 15
mallard, barn owl, snapping turtle, and American alligator (UGA 2008). 16
Middle Georgia Proposed Project Area 13
3.4.2.2.3
Major wildlife species in this area include bobwhite quail (Colinus virginianus), dove 18
(Zenaida macroura), oyster catcher (Haematopus palliates), turkey (Meleagris sp.), beavers 19
(Castor canadensis), American black bear, coyote, muskrat (Ondatra zibethicus), and 20
American alligator. Freshwater fish species that are common in the area include blue catfish 21
(Ictalurus furcatus), largemouth bass (Micropterus salmoides), striped bass (Morone 22
saxatilis), and white crappie (Pomoxis annularis) (South Carolina Department of Natural 23
Resources [SCDNR] 2011). 24
Lowcountry Proposed Project Area 17
3.4.2.2.4
Major wildlife species in this area include dove, snowy egret (Egretta thula), Canada goose 26
(Branta canadensis), wild turkey, American black bear, cougar (Felis concolor), coyote, 27
white-tailed deer, gray fox (Urocyon cinereoargenteus), corn snake (Elaphe guttata), and 28
eastern box turtle (Terrapene carolina carolina). Fish species include largemouth bass, 29
striped bass, bluegill (Lepomis macrochirus), crappie, and trout (Salvelinus sp.) (NCDENR 30
2001). 31
North Carolina Proposed Project Area 25

AFFECTED ENVIRONMENT
DRAFT - Environmental Assessment SE Giant Miscanthus Establishment and Production 3-40
3.4.3 Protected Species 1
3.4.3.1 Definition of the Resource 2
Protected species are those Federally designated as threatened or endangered under the 3
Endangered Species Act of 1973 (ESA) (7 USC 136, 16 USC 1531 et seq.) or species that 4
are considered candidates for being listed as threatened or endangered. Critical habitat is 5
defined as: (1) specific areas within the geographical area occupied by the species at the 6
time of listing, if they contain physical or biological features essential to conservation, and 7
those features may require special management considerations or protection; and (2) 8
specific areas outside the geographical area occupied by the species if the agency 9
determines that the area itself is essential for conservation. 10
3.4.3.2 Existing Conditions 11
Tables 3-18 through 3-20 list the Federally-listed threatened and/or endangered species 12
that could be present in the proposed project area counties by each state. Figures 3-15 13
through 3-18 illustrate the potential ranges of Federally-listed species within the proposed 14
project areas. A table of the State-listed species that could potentially occur within the 15
proposed project areas is included in Appendix A. 16
3.4.3.2.1
A review of the Federally-listed protected (threatened and/or endangered) species based on 18
the U.S. Fish and Wildlife Service (USFWS) data indicate that 11 Federally-listed 19
endangered species and two Federally-listed threatened species have the potential to occur 20
in the counties within the East Georgia proposed project area. 21
East Georgia Proposed Project Area 17
A review of the GDNR Rare Species and Natural Community Data, indicates that there 30 22
State-listed threatened species and 21 State-listed endangered species. Of those species, 1 23
is a State-listed threatened insect, 4 are State-listed endangered fish, 1 is a State-listed 24
threatened fish, 16 are State-listed threatened plants, 10 are State-listed endangered plants, 25
4 are State-listed threatened reptiles, 1 is a State-listed threatened bird, 2 are State-listed 26
endangered birds, 2 are State-listed endangered mammals, 2 are State-listed threatened 27
mammal, 3 are State-listed threatened mollusk and crustaceans, 3 are State-listed 28
endangered mollusk and crustaceans, and 2 are State-listed threatened amphibians within 29
30

AFFECTED ENVIRONMENT
DRAFT - Environmental Assessment SE Giant Miscanthus Establishment and Production 3-41
Table 3-18. Federally Listed Threatened and 1 Endangered Species that Could Potentially Occur within Georgia 2
Category Scientific Name Common Name T/E County Amphibian Ambystoma cingulatum
Frosted Flatwoods Salamander T Evans, Lanier, Long, Screven
Bird
Mycteria americana Wood Stork E
Appling, Bacon, Ben Hill, Berrien, Bleckley, Brantley, Bulloch, Burke, Chandler, Charlton, Clinch, Coffee, Cook, Dodge, Echols, Effingham, Emanuel, Evans, Glascock, Houston, Irwin, Jeff Davis, Jefferson, Jenkins, Johnson, Lanier, Laurens, Long, Lowndes, Macon, Montgomery, Pierce, Pulaski, Screven, Tattnall, Telfair, Tift, Toombs, Treutlen, Twiggs, Ware, Washington, Wayne, Wheeler, Wilcox
Picoides borealis Red-cockaded Woodpecker E
Appling, Ben Hill, Brantley, Charlton, Effingham, Evans, Emanuel, Laurens, Long, Montgomery, Putnam, Talbot, Tattnall, Ware, Washington, Wheeler, Wilcox
Haliaeetus leucocephalus Bald Eagle DL No County Level Data Available
Fish Acipenser brevirostrum Shortnose Sturgeon E
Appling, Ben Hill, Bulloch, Burke, Coffee, Effingham, Jeff Davis, Jenkins, Long, Montgomery, Screven, Tattnall, Telfair, Toombs, Wayne, Wheeler, Wilcox
Invertebrate
Medionidus penicillatus Gulf Moccasin shell T Spalding, Pike, Meriwether, Taylor, Harris
Elliptoideus sloatianus Purple Bankclimber T Pike, Taylor, Macon, Upson, Talbot, Harris, Crawford, Peach
Hamiota subangulata Shinyrayed Pocketbook E Spalding, Pike, Meriwether, Taylor, Macon, Upson
Pleurobema pyriforme Oval Pigtoe E Spalding, Pike, Meriwether, Talbot Lampsilis altilis Finelined Pocketbook T Heard
Mammal Balaenoptera physalus Finback Whale E No County Level Data Available Megaptera novaengliae Humpback whale E No County Level Data Available Trichechus manatus Manatee E Effingham
Plant
Baptisia arachnifera Hairy Rattleweed E Brantley, Wayne, Pierce Isoetes melanospora Black-spored Quillwort E Butts, Heard, Troup Isoetes tegetiformans Mat-forming Quillwort E Hancock, Putman, Washington
Oxypolis canbyi Canby Dropwort E Burke, Emanuel, Houston, Jenkins, Pulaski, Screven
Ptilimnium nodosum Harperella E Putnam, Houston, Hancock
Silene polypetala Fringed Campion E Bleckley, Crawford, Harris, Houston, Pulaski, Talbot, Taylor, Upson, Twiggs
Trillium reliquum Relict Trillium E
Bleckley, Butts, Crawford, Harris, Houston, Jasper, Laurens, Macon, Pulaski, Talbot, Taylor, Twiggs, Upson, Wilkinson
Lindera melissifolia Pondberry/Pond Spicebush E Dodge, Effingham, Jeff Davis, Screven, Telfair, Taylor, Wheeler
Schwalbea americana American Chaffseed E Lamar, Pike, Spalding, Tift, Upson
Amphianthus pusillus Little Amphianthus/Pool Sprite T
Butts, Harris, Hancock, Heard, Meriwether, Pike, Putnam
Rhus michauxii Michaux's Sumac E
Butts, Crawford, Harris, Hancock, Heard, Lamar, Meriwether, Pike, Putnam, Spalding, Talbot, Troup, Upson
Reptile Drymarchon corais couperi Eastern Indigo Snake T
Appling, Atkinson, Bacon, Berrien, Bulloch, Charlton, Clinch, Coffee, Echols, Emanuel, Evans, Irwin, Jeff Davis, Lanier, Long, Lowndes, Tattnall, Telfair, Wayne, Wheeler
Lepidochelys kempii Kemp's Ridley Sea Turtle E No County Level Data Available Alligator mississippiensis American Alligator T (S/A) No County Level Data Available
Source: USFWS 2011 3

AFFECTED ENVIRONMENT
DRAFT - Environmental Assessment SE Giant Miscanthus Establishment and Production 3-42
Table 3-19. Federally Listed Threatened and 1 Endangered Species that Could Potentially Occur within North Carolina 2
Category Scientific Name Common Name T/E County
Birds
Mycteria americana Wood Stork E Brunswick, Columbus, Sampson, New Hanover
Picoides borealis Red-cockaded Woodpecker E
Beaufort, Bladen, Brunswick, Columbus, Craven, Duplin, Edgecombe, Green, Garnett, Hoke, Johnston, Jones, Lee, Lenoir, Montgomery, Moore, Nash, New Hanover, Onslow, Pamlico, Pender, Pitt, Richmond, Robeson, Sampson, Scotland, Wayne, Wilson
Charadrius melodus Piping Plover T Brunswick, New Hanover, Onslow, Pender Haliaeetus leucocephalus Bald Eagle DL No County Level Data
Fish
Notropis mekistocholas Cape Fear Shiner E Harnett, Lee, Moore
Acipenser brevirostrum Shortnose Sturgeon E Richmond, Brunswick, New Hanover, Onslow, Pamlico, Scotland
Menidia extensa Waccamaw Silverside T Columbus
Invertebrate
Lasmigona decorata Carolina Heelsplitter E Richmond Alasmidonta heterodon Dwarf Wedgemussel E Johnston, Nash, Wilson Neonympha mitchellii francisci Saint Francis' Satyr E Cumberland, Hoke Elliptio steinstansana Tar River Spinymussel E Edgecombe, Johnston, Nash, Pitt
Mammals
Trichechus manatus West Indian Manatee E Beaufort, Brunswick, Craven, New Hanover, Onslow, Pamlico, Pender, Pit
Canis rufus Red Wolf E, XN
E Beaufort, No Other County Level Data Available
Balaena glacialis North Atlantic Right whale E No County Level Data Available Balaenoptera physalus Finback Whale E No County Level Data Available Megaptera novaengliae Humpback whale E No County Level Data Available
Plants
Oxypolis canbyi Canby's Dropwort E Scotland
Schwalbea americana American Chaffseed E Bladen, Cumberland, Hoke, Moore, Pender, Scotland
Thalictrum cooleyi Cooley's Meadowrue E Brunswick, Columbus, New Hanover, Onslow, Pender
Carex lutea Golden Sedge E Onslow, Pender Ptilimnium nodosum Harperella E Lee
Rhus michauxii Michaux's Sumac E
Cumberland, Hoke, Johnson, Moore, Nash, Richmond, Robeson, Scotland, Wilson
Lindera melissifolia Pondberry E Bladen, Cumberland, Onslow, Sampson
Lysimachia asperulifolia Rough-leaf Loosestrife E
Beaufort, Bladen, Brunswick, Columbus, Craven, Cumberland, Harnett, Hoke, , New Hanover, Onslow, Pamlico, Pender, Richmond, Scotland
Helianthus schweinitzii Schweinitz's Sunflower E Montgomery Amaranthus pumilus Seabeach Amaranth T Brunswick, New Hanover, Onslow, Pender Aeschynomene virginica Sensitive Jointvetch T Beaufort, Craven, Lenoir Echinacea laevigata Smooth Coneflower E Montgomery
Reptile
Alligator mississippiensis American Alligator T (S/A) No county level data
Chelonia mydas Green Sea Turtle T Beaufort, Brunswick, New Hanover, Onslow, Pender, Pamlico
Lepidochelys kempii Kemp's Ridley Sea Turtle E Beaufort, Brunswick, Pamlico
Dermochelys coriacea Leatherback Sea Turtle E Beaufort, Brunswick, Craven, New Hanover, Onslow, Pamlico, Pender
Caretta caretta Loggerhead Sea Turtle T Beaufort, Brunswick, New Hanover, Onslow, Pender, Pamlico
Eretmochelys imbricata Hawksbill Sea Turtle E Beaufort, Brunswick, New Hanover, Onslow, Pamlico, Pender
Source: USFWS 2011 3

AFFECTED ENVIRONMENT
DRAFT - Environmental Assessment SE Giant Miscanthus Establishment and Production 3-43
Table 3-20. Federally Listed Threatened and 1 Endangered Species that Could Potentially Occur within South Carolina 2
Category Scientific Name Common Name T/E County Amphibian Ambystoma cingulatum
Frosted flatwoods salamander T Jasper
Birds
Charadrius melodus Piping plover T Colleton, Jasper
Haliaeetus leucocephalus Bald eagle
Delisted due to
Recover Allendale, Barnwell, Colleton, Hampton, Jasper
Mycteria americana Wood stork E Allendale, Bamberg, Barnwell, Colleton, Hampton, Jasper
Picoides borealis Red-cockaded woodpecker E Allendale, Bamberg, Barnwell, Colleton, Hampton, Jasper
Dendroica kirtlandii Kirtland’s Warbler E Colleton, Jasper
Fish Acipenser brevirostrum Shortnose sturgeon E Allendale, Barnwell, Colleton, Hampton, Jasper
Mammals
Balaena glacialis North Atlantic Right whale E No County Level Data Balaenoptera physalus Finback Whale E No County Level Data Megaptera novaengliae Humpback whale E No County Level Data Trichechus manatus West Indian manatee E Colleton, Jasper Canis rufus Red Wolf E No County Level Data
Plant
Echinacea laevigata Smooth coneflower E Allendale, Barnwell Lindera melissifolia Pondberry E Barnwell, Colleton, Jasper
Oxypolis canbyi Canby's dropwort E Allendale, Bamberg, Barnwell, Colleton, Hampton, Jasper
Schwalbea americana American chaffseed E Barnwell, Jasper Ptilimnium nodosum Harperella E Barnwell
Reptile
Caretta caretta Loggerhead sea turtle T Colleton, Jasper Chelonia mydas Green sea turtle T Colleton, Jasper Dermochelys coriacea Leatherback sea turtle E Colleton, Jasper Lepidochelys kempii Kemp's ridley sea turtle E Colleton, Jasper Eretmochelys imbricata Hawksbill Sea Turtle E Colleton, Jasper Alligator mississippiensis American Alligator T (S/A) No County Level Data
Source: USFWS 2011 3

AFFECTED ENVIRONMENT
DRAFT - Environmental Assessment SE Giant Miscanthus Establishment and Production 3-44
Figure 3-15. Potential Ranges of Federally-listed Threatened and/or Endangered 1 Birds, Insects and Mammals within and adjacent to the Proposed Project Areas. 2
3

AFFECTED ENVIRONMENT
DRAFT - Environmental Assessment SE Giant Miscanthus Establishment and Production 3-45
Figure 3-16. Potential Ranges of Federally-listed Threatened and/or Endangered 1 Invertebrates and Fish within and adjacent to the Proposed Project Areas. 2
3

AFFECTED ENVIRONMENT
DRAFT - Environmental Assessment SE Giant Miscanthus Establishment and Production 3-46
Figure 3-17. Potential Ranges of Federally-listed Threatened and/or Endangered 1 Reptiles and Amphibians within and adjacent to the Proposed Project Areas. 2

AFFECTED ENVIRONMENT
DRAFT - Environmental Assessment SE Giant Miscanthus Establishment and Production 3-47
Figure 3-18. Potential Ranges of Federally-listed Threatened and/or Endangered 1 Plants within and adjacent to the Proposed Project Areas. 2

AFFECTED ENVIRONMENT
DRAFT - Environmental Assessment SE Giant Miscanthus Establishment and Production 3-48
the Georgia counties in the East Georgia proposed project area. The search also indicates 1
that there are 25 species listed as rare (a species which may not be endangered or 2
threatened by which should be protected because of its scarcity) and five species are listed 3
as unusual and thus deserving of special consideration. 4
3.4.3.2.2
A review of the Federally-listed protected (threatened and/or endangered) species based on 6
the USFWS data indicate that 13 Federally-listed endangered species and five Federally-7
listed threatened species have the potential to occur in the Middle Georgia proposed project 8
area. 9
Middle Georgia Proposed Project Area 5
A review of the GDNR Rare Species and Natural Community Data, indicates that there 42 10
State-listed threatened species and 26 State-listed endangered species. Of those species, 1 11
is a State-listed threatened insect, 3 are State-listed endangered fish, 2 are State-listed 12
threatened fish, 23 are State-listed threatened plants, 14 are State-listed endangered plants, 13
5 are State-listed threatened reptiles, 1 is a State-listed threatened bird, 1 is a State-listed 14
endangered bird, 1 is a State-listed endangered mammal, 1 is a State-listed threatened 15
mammal, 7 are State-listed threatened mollusk and crustaceans, 8 are State-listed 16
endangered mollusk and crustaceans, and 2 are State-listed threatened amphibians within 17
the Georgia counties in the Middle Georgia proposed project area. The search also 18
indicates that there are nine species listed as rare (a species which may not be endangered 19
or threatened by which should be protected because of its scarcity) and one species is listed 20
as unusual and thus deserving of special consideration. 21
3.4.3.2.3
A review of the Federally-listed protected (threatened and/or endangered) species based on 23
the USFWS data indicate that 14 Federally-listed endangered species and five Federally-24
listed threatened species have the potential to occur in the counties within the Lowcountry 25
proposed project area. 26
Lowcountry Proposed Project Area 22
A review of the GDNR Rare Species and Natural Community Data, indicates that there 23 27
State-listed threatened species and 15 State-listed endangered species. Of those species, 1 28
is a State-listed threatened insect, 3 are State-listed endangered fish, 15 are State-listed 29
threatened plants, 6 are State-listed endangered plants, 3 are State-listed threatened 30
reptiles, 1 is a State-listed threatened bird, 2 are State-listed endangered birds, 2 are State-31
listed endangered mammals, 1 is a State-listed threatened mammal, 3 are State-listed 32

AFFECTED ENVIRONMENT
DRAFT - Environmental Assessment SE Giant Miscanthus Establishment and Production 3-49
threatened invertebrates, and 2 are State-listed endangered invertebrates, within the 1
Georgia counties in the Lowcountry proposed project area. The search also indicates that 2
there are 18 species listed as rare (a species which may not be endangered or threatened 3
by which should be protected because of its scarcity) and four species are listed as unusual 4
and thus deserving of special consideration. 5
A review of the SCDNR Rare, Threatened and Endangered Species Inventory, indicates 6
that there five State-listed threatened species and eight State-listed endangered species 7
within the South Carolina counties in the Lowcountry proposed project area. Of those 8
species, 1 is State-listed endangered fish, 2 are State-listed threatened reptiles, 1 is a State-9
listed threatened reptile, 2 are State-listed threatened birds, 3 are State-listed endangered 10
birds, 1 is a State-listed endangered mammal, 1 is State-listed threatened amphibian, and 2 11
are State-listed endangered amphibians, within the South Carolina counties in the 12
Lowcountry proposed project area. The search also indicates that there are 47 species 13
listed as S1 (Critically imperiled state-wide because of extreme rarity or because of some 14
factor(s) making it especially vulnerable to extirpation), 44 species are listed as S2 15
(Imperiled state-wide because of rarity or factor(s) making it vulnerable), and 23 species are 16
listed as S3 (Rare or uncommon in state). 17
3.4.3.2.4
A review of the Federally-listed protected (threatened and/or endangered) species based on 19
the USFWS data indicate that 26 Federally-listed endangered species and seven Federally-20
listed threatened species have the potential to occur in the North Carolina proposed project 21
area. 22
North Carolina Proposed Project Area 18
A review of the North Carolina Natural Heritage Program (NCNHP), indicates that there 96 23
State-listed threatened species and 111 State-listed endangered species. Of those species, 24
11 are State-listed endangered mollusks, 10 are State-listed threatened mollusks, 6 are 25
State-listed threatened fish, 4 are State-listed endangered fish, 70 are State-listed 26
threatened plants, 85 are State-listed endangered plants, 3 are State-listed threatened 27
reptiles, 4 are State-listed endangered reptiles, 3 are State-listed threatened birds, 3 are 28
State-listed endangered birds, 1 is a State-listed threatened mammal, 1 is a State-listed 29
endangered mammal, and 2 are State-listed threatened amphibians within the North 30
Carolina counties in the proposed project area. The search also indicates that there are 52 31
species listed as Special Concern (Any species of wild animal native or once-native to North 32
Carolina which is determined by the Wildlife Resources Commission to require monitoring 33

AFFECTED ENVIRONMENT
DRAFT - Environmental Assessment SE Giant Miscanthus Establishment and Production 3-50
but which may be taken under regulations adopted under the provisions in Article 25.), 111 1
species listed as significantly rare (Any species which has not been listed by the North 2
Carolina Wildlife Resources Commission as an Endangered, Threatened, or Special 3
Concern species, but which exists in the State in small numbers and has been determined 4
by the NCNHP to need monitoring.), 43 plant species listed as Special Concern-Vulnerable 5
(Any species or higher taxon of plant that occurred in North Carolina at one time, but for 6
which all known populations are currently considered to be either historical or extirpated ), 7
13 plant species listed as Special Concern-Historical (Any species or higher taxon of plant 8
that occurred in North Carolina at one time, but for which all known populations are currently 9
considered to be either historical or extirpated), 13 plant species listed as Limited (The 10
range of the species is limited to North Carolina and adjacent states [endemic or near 11
endemic]. These are species which may have 20 to 50 populations in North Carolina, but 12
fewer than 100 populations rangewide. The preponderance of their distribution is in North 13
Carolina and their fate depends largely on conservation here), 32 plant species listed as 14
Throughout (The species is rare throughout its range [fewer than 100 populations total].), 12 15
plant species listed as disjunct (The species is disjunct to North Carolina from a main range 16
in a different part of the country or world), 76 plant species listed as peripheral (The species 17
is at the periphery of its range in North Carolina. These species are generally more common 18
somewhere else in their ranges, occurring in North Carolina peripherally to their main 19
ranges, mostly in habitats which are unusual in North Carolina), and 17 plant species listed 20
as Other (The range of the species is sporadic or cannot be described by 21
the other Significantly Rare categories) within the North Carolina counties in the proposed 22
project area. 23

AFFECTED ENVIRONMENT
DRAFT - Environmental Assessment SE Giant Miscanthus Establishment and Production 3-51
3.5 SOIL RESOURCES 1
3.5.1 Definition of the Resource 2
Soils are a natural body made up of weathered minerals, organic matter, air and water. 3
Soils are formed mainly by the weathering of rocks, the decaying of plant matter, and the 4
deposition of materials such as chemical and biological fertilizers that are derived from other 5
origins. Soils are differentiated based on characteristics such as particle size, texture and 6
color, and classified taxonomically into soil orders based on observable properties such as 7
organic matter content and degree of soil profile development (Brady and Weil 1996). Soil 8
taxonomy was established to classify soils according to the relationship between soils and 9
the factors responsible for their character (USDA NRCS 1999). For the purpose of this 10
project, the soil resources will be discussed based on the soil classification in the particular 11
proposed project area. 12
Soil erosion is a naturally occurring event and the erosion rates are relatively slow; however, 13
human activity can greatly accelerate the rate of erosion. Poor farming practices, loss of 14
vegetation through deforestation, overgrazing and the maintenance of agricultural land are 15
some of the factors that make soils more susceptible to erosion. For the purpose of this 16
document, highly erodible lands (HEL) were used to evaluate the potential for erosion within 17
the proposed project areas (Figure 3-19). For more information about HEL, refer to the 18
BCAP Final PEIS (Chapter 3.4). 19
HEL are those lands with a soil erodibility index (EI) 8 or greater. The EI provides a value to 20
determine the potential for a soil to erode considering the physical and chemical properties 21
of the soil and the climatic conditions where it is located. The higher EI score, the more 22
investment is necessary to maintain crop production. The EI is calculated from a portion of 23
the Universal Soil Loss Equation (USLE) as the maximum of (R*K*LS)/T or from the Wind 24
Erosion Equation as (C*I)/T (from the Wind Erosion Equation). 25
R = measure of rainfall and runoff; C = windspeed and surface soil moisture characterization; K = soil erodibility (water); I = soil erodibility (wind); and L = slope length; T = soil loss tolerance. S = slope steepness;
26

AFFECTED ENVIRONMENT
DRAFT - Environmental Assessment SE Giant Miscanthus Establishment and Production 3-52
Figure 3-19. Percent of Total Land Classified as Highly Erodible by County within the 1 Proposed Project Areas. 2

AFFECTED ENVIRONMENT
DRAFT - Environmental Assessment SE Giant Miscanthus Establishment and Production 3-53
3.5.2 Existing Conditions 1
3.5.2.1 Existing Conditions 2
For this project, the Major Land Resource Area (MLRA) will be used to illustrate the soils of 3
each proposed project area. Table 3-21 describes each MLRA within the proposed project 4
areas. Figure 3-20 illustrates the MLRA within and adjacent to the proposed project areas. 5
Table 3-21. Major Land Resource Area Soils Information for Each Proposed Project 6 Area 7
Proposed Project Area MLRA Soils Middle Georgia East Georgia Lowcountry North Carolina
Southern Coastal Plain – Soils in this region are generally very deep, somewhat excessively drained to poorly drained and loamy. They are also dominated by a thermic soil temperature regime with udic or aquic soil moisture. The dominant soil orders in this region are Ultisols, Entisols, and Inceptisols.
Middle Georgia Lowcountry North Carolina
Atlantic Coast Flatwood – Soils in this region are generally very deep, well drained to very poorly drained, and loamy or clayey. They are also dominated by a thermic soil temperature regime with udic or aquic soil moisture. The dominant soil orders in this region are Spodosols and Ultisols.
East Georgia Lowcountry North Carolina
Carolina and Georgia Sand Hills – Soils in this region are very deep, well drained to excessively drained and loamy or sandy. They are also dominated by a thermic soil temperature regime with udic soil moisture. The dominant soil orders in this area are Ultisols and Entisols.
East Georgia North Carolina
Southern Piedmont – Soils in this region are shallow to very deep, generally well drained and loamy or clayey. They are also dominated by a thermic soil temperature regime with udic soil moisture. The dominant soil orders in this region are Ultisols, Inceptisols, and Alfisols.
Lowcountry North Carolina
Tidewater Area – The soils in this region area characterized by restricted drainage, a thermic soil temperature regime and an aquic soil moisture regime. The soils are very deep and loamy to clayey. The dominant soil orders in this region are Alfisols and Entisols.
Source USDA NRCS 2006 8
3.5.2.2 Soil Erosion 9
3.5.2.2.1
There was approximately 221,459 acres of HEL within the counties of the East Georgia 11
proposed project area (USDA FSA 2011c). Within this proposed project area, Coffee 12
County had the highest acres of HEL, covering 4.8 percent of the county. 13
East Georgia Proposed Project Area 10
3.5.2.2.2
There was approximately 124,668 acres of HEL within the counties of the Middle Georgia 15
proposed project area (USDA FSA 2011c). Within this proposed project area, Laurens 16
County had the highest acres of HEL, covering 2.7 percent of the county. 17
Middle Georgia Proposed Project Area 14

AFFECTED ENVIRONMENT
DRAFT - Environmental Assessment SE Giant Miscanthus Establishment and Production 3-54
Figure 3-20. MLRA Contained within the Proposed Project Areas 1

AFFECTED ENVIRONMENT
DRAFT - Environmental Assessment SE Giant Miscanthus Establishment and Production 3-55
3.5.2.2.3
There was approximately 150,327 acres of HEL within the counties of the Savannah River 2
proposed project area (USDA FSA 2011c). Within this proposed project area, Allendale 3
County had the highest acres of HEL, covering 5.6 percent of the county. 4
Lowcountry Proposed Project Area 1
3.5.2.2.4
There was approximately 144,167 acres of HEL within the counties of the North Carolina 6
proposed project area (USDA FSA 2011c). Within this proposed project area, Johnston 7
County had the highest acres of HEL, covering 7.8 percent of the county. 8
North Carolina Proposed Project Area 5
3.6 WATER QUALITY AND QUANTITY 9
3.6.1 Water Quality 10
3.6.1.1 Definition of the Resource 11
Freshwater is necessary for the survival of most terrestrial organisms, and is required by 12
humans for drinking and agriculture, among other uses; however, less than one percent of 13
Earth’s water is in the form of freshwater that is not bound in ice caps or glaciers. The 14
Water Pollution Control Act of 1972, or Clean Water Act (CWA), Safe Drinking Water Act, 15
and the Water Quality Act are the primary Federal laws that protect the nation’s waters. The 16
principal law governing pollution of the nation’s surface water resources is the CWA. The 17
Act utilizes water quality standards, permitting requirements, and monitoring to protect water 18
quality. The U.S. Environmental Protection Agency (EPA) sets the standards for water 19
pollution abatement for all waters of the United States under the programs contained in the 20
CWA but, in most cases, delegates the authority to issue and enforce permits to qualified 21
States. For this analysis, water resources include surface water quality (including lakes, 22
rivers and associated tributaries, and estuaries), groundwater quality, and water 23
use/quantity of both surface and groundwater. 24
Surface water, as defined by the EPA, are waters of the United States, such as rivers, 25
streams, creeks, lakes, and reservoirs, supporting everyday life through uses such as 26
drinking water and other public uses, irrigation, and industrial uses. Surface runoff from 27
rain, snow melt, or irrigation water, can affect surface water quality by depositing sediment, 28
minerals, or contaminants into surface water bodies. Surface runoff is influenced by 29
meteorological factors such as rainfall intensity and duration, and physical factors such as 30
vegetation, soil type, and topography. 31

AFFECTED ENVIRONMENT
DRAFT - Environmental Assessment SE Giant Miscanthus Establishment and Production 3-56
Groundwater is the water that flows underground and is stored in natural geologic 1
formations called aquifers. It is ecologically important because it sustains ecosystems by 2
releasing a constant supply of water into wetlands and contributes a sizeable amount of flow 3
to permanent streams and rivers (USDA FSA 2003). 4
3.6.1.2 Existing Conditions 5
The 303(d) List of Waters reports on streams and lakes identified as impaired for one or 6
more pollutants and do not meet one or more water quality standards. The term, "303(d) 7
list," is short for the list of impaired waters (stream segments, lakes) that the CWA requires 8
all states to submit for EPA approval every two years. The states identify all waters where 9
required pollution controls are not sufficient to attain or maintain applicable water quality 10
standards and rank the waters taking into account the uses of the water and severity of the 11
pollution problem (EPA 2008). Figure 3-21 illustrates the impaired streams and water 12
bodies within each state containing the proposed project areas. 13
3.6.1.2.1
According to the 303(d) list, there are 188 impaired stream segments within the East 15
Georgia proposed project area for a total of 291.4 miles of impaired streams. There is also a 16
total of 0.1 square miles of impaired lakes and reservoirs (EPA 2010a). 17
East Georgia Proposed Project Area 14
3.6.1.2.2
According to the 303(d) list, there are 74 impaired stream segments within the Middle 19
Georgia proposed project area for a total of 86.1 miles of impaired streams. There is also a 20
total of 0.2 square miles of impaired lakes and reservoirs (EPA 2010a). 21
Middle Georgia Proposed Project Area 18
3.6.1.2.3
According to the 303(d) list, there are 291 impaired stream segments within the Lowcountry 23
proposed project area for a total of 347.9 miles of impaired streams. There is also a total of 24
0.9 square miles of impaired lakes and reservoirs (EPA 2010a). 25
Lowcountry Proposed Project Area 22
3.6.1.2.4
According to the 303(d) list, there are 1,238 impaired stream segments within the North 27
Carolina proposed project area for a total of 886.3 miles of impaired streams. There is also a 28
total of 6.5 square miles of impaired lakes and reservoirs (EPA 2010a). 29
North Carolina Proposed Project Area 26

AFFECTED ENVIRONMENT
DRAFT - Environmental Assessment SE Giant Miscanthus Establishment and Production 3-57
Figure 3-21. Waters Listed on the State 303(d) Lists for Impaired Waters 1

AFFECTED ENVIRONMENT
DRAFT - Environmental Assessment SE Giant Miscanthus Establishment and Production 3-58
3.6.2 Water Quantity 1
3.6.2.1 Definition of the Resource 2
Water use/quantity is the specific amount of water used for a given task, such as the 3
production of dedicated bioenergy crops. Three types are distinguished: withdrawal, where 4
water is taken from a river, or surface or underground reservoir, and after use returned to a 5
natural water body; consumptive, which starts with withdrawal but without any return (e.g. 6
irrigation) and is no longer available directly for subsequent uses; non-withdrawal, the in situ 7
use of a water body for, e.g. navigation, fishing, recreation, effluent disposal and power 8
generation (Food and Agricultural Organization [FAO] 2005). 9
3.6.2.2 Existing Conditions 10
Table 3-22 summarizes acres of the irrigated cropland by state and county. The table also 11
contains a summary of the water withdrawals by source for each county within the proposed 12
project area. The EPA defines a watershed as the area of land where all of the water that is 13
under it or drains off of it goes into the same place (EPA 2009). Further, the U.S. Geological 14
Survey (USGS) defines a watershed as the divide separating one drainage basin from 15
another. The USGS has divided and sub-divided the United States using hydrologic units 16
(HUC). The hydrologic unit system has four levels of classification (USGS 2011). For this 17
project the fourth level of classification, the 8-digit HUC codes, were used to classify the 18
watersheds within the proposed project area. 19
Table 3-22. Acres of Irrigated Land and Water 20 Withdrawals by County within Each Proposed Project Area 21
Location
Total Cropland
Irrigated Land
Percent Irrigated Acres
Withdrawals (in million gallons per day)
By source Total Acres Groundwater Surface water
Georgia 4,478,168 1,017,773 22.7% 1,160 4,280 5,380 North Carolina 4,895,204 232,075 4.7% 700 12,200 11,300 South Carolina 2,151,219 132,439 6.2% 378 7,470 7,850
Proposed Project Areas East Georgia 1,787,113 373,151 20.9% 158 112 269 Middle Georgia 730,236 115,706 15.8% 58 29 87 Lowcountry 1,049,647 140,275 13.4% 74 43 116 North Carolina 2,324,025 145,620 6.3% 47 107 153
Source: USDA NASS 2009, USGS 2010b 22

AFFECTED ENVIRONMENT
DRAFT - Environmental Assessment SE Giant Miscanthus Establishment and Production 3-59
3.6.2.2.1
Within the East Georgia proposed project area, there was an average of 8,103.09 acres of 2
irrigated land within the proposed project area. Overall, the amount of irrigated acres varied 3
greatly within the proposed project area from 16 acres to 30,577 acres. There was a total of 4
276.27 million gallons of water withdrawn per day in the proposed project area, with an 5
average of 49 percent from surface water and 51 percent from groundwater sources (USGS 6
2010b). 7
East Georgia Proposed Project Area 1
Twenty-one different watersheds are located within the counties in the East Georgia 8
proposed project area. These 21 watersheds cover over 21 million acres with 60 percent 9
within the proposed project area. 10
3.6.2.2.2
Within the Middle Georgia proposed project area, there was an average of 3,976.5 acres of 12
irrigated land within the proposed project area. Overall, the amount of irrigated acres varied 13
greatly within the proposed project area from 16 acres to 17,693 acres. There was a total of 14
87.03 million gallons of water withdrawn per day in the proposed project area, with an 15
average of 50 percent from surface water and 50 percent from groundwater sources (USGS 16
2010b). 17
Middle Georgia Proposed Project Area 11
Sixteen different watersheds are located within the counties in the Middle Georgia proposed 18
project area. These 16 watersheds cover over 20 million with 37 percent within the 19
proposed project area. 20
3.6.2.2.3
Within the Lowcountry proposed project area, there was an average of 6,650 acres of 22
irrigated land within the proposed project area. There was a total of 155.99 million gallons 23
of water withdrawn per day in the proposed project area, with an average of 37 percent from 24
surface water and 63 percent from groundwater sources (USGS 2010b). 25
Lowcountry Proposed Project Area 21
Seventeen different watersheds are located within the counties in the Lowcountry proposed 26
project area. These 17 watersheds cover over 15 million acres with 49 percent within the 27
proposed project area. 28
29

AFFECTED ENVIRONMENT
DRAFT - Environmental Assessment SE Giant Miscanthus Establishment and Production 3-60
3.6.2.2.4
Within the North Carolina proposed project area, there was an average of 4,854 acres of 2
irrigated land within the proposed project area. There was a total of 153.41 million gallons 3
of water withdrawn per day in the proposed project area, with an average of 61 percent from 4
surface water and 39 percent from groundwater sources (USGS 2010b). 5
North Carolina Proposed Project Area 1
Twenty-four different watersheds are located within the counties in the North Carolina 6
proposed project area. These 24 watersheds cover over 21 million acres with 54 percent 7
within the proposed project area. 8
3.7 AIR QUALITY 9
3.7.1 Definition of the Resource 10
The Clean Air Act (CAA) (42 USC 7401-7671q), as amended, gives the EPA the 11
responsibility to establish the primary and secondary National Ambient Air Quality Standards 12
(NAAQS) (40 CFR §50) that set acceptable concentration levels for seven criteria pollutants: 13
fine particles matter (PM10), very fine particle (PM2.5), sulfur dioxide (SO2), carbon monoxide 14
(CO), nitrous oxides (NOx), ozone (O3), and lead (Pb). Short-term standards (1-, 8-, and 24-15
hour periods) have been established for pollutants contributing to acute health effects, while 16
long-term standards (annual averages) have been established for pollutants contributing to 17
chronic health effects. Each state has the authority to adopt standards stricter than those 18
established under the federal program. Federal regulations designate Air-Quality Control 19
Regions (AQCRs) in violation of the NAAQS as “nonattainment” areas. Federal regulations 20
designate AQCRs with levels below the NAAQS as “attainment” areas. 21
The CAA contains the general conformity rule, prohibiting federal agencies from conducting, 22
supporting, or approving any actions that do not conform to an EPA approved State 23
Implementation Plan (SIP); thereby, not interfering with a state’s timely attainment of the 24
NAAQS. Federal agencies must determine if increased emission associated with their 25
actions would exceed de minimis levels or be “regionally significant”. De minimis emissions 26
are emissions associated with an action at rates less than specified applicability thresholds 27
of a criteria pollutant in a nonattainment area. “Regionally significant” emissions are 28
emissions associated with an action that are greater than 10 percent of a nonattainment 29
area's total emissions for a criteria pollutant. 30

AFFECTED ENVIRONMENT
DRAFT - Environmental Assessment SE Giant Miscanthus Establishment and Production 3-61
3.7.2 Existing Conditions 1
A quick analysis of the attainment status based on the NAAQS was conducted for each 2
county within the proposed project areas through the use of the EPA’s Green Book of 3
Nonattainment Areas. 4
3.7.2.1 Georgia 5
Georgia has designations for the following criteria pollutants: PM2.5, and 8-hour O3. Heard 6
and Putnam Counties are designated as in non-attainment for PM2.5, while Spalding County 7
is designated as in non-attainment for both PM2.5 and moderate for 8-hour O3 (Figure 3-22). 8
Heard, Putnam and Spalding Counties are part of the Metropolitan Atlanta, Georgia AQCR 9
56. PM2.5 pollutants are considered fine particles being less than 2.5 micrometers in 10
diameter. Sources of fine particles include all types of combustion, including motor vehicles, 11
power plants, residential wood burning, forest fires, agricultural burning, and some industrial 12
processes (EPA 2011). The 2008 National Emissions Inventory Data (EPA 2011) indicates 13
that Putman County had 1,016 tons per year (tpy) of PM2.5 emissions (filterable and 14
condensable) with electric generating units accounting for 44 percent of the pollutant load, 15
dust emissions (e.g., dust from construction, paved roads and unpaved road) accounted for 16
approximately 16.9 percent of pollutant load. In Spalding County, 970 tpy were monitored in 17
2008, with 52.6 percent generated from dust emissions and 21.5 percent generated from 18
industrial boilers. Heard County had 2,242 tpy of PM2.5 emissions with electric generating 19
units accounting for 87.2 percent of the pollutant load and dust emissions accounted for 20
approximately 6.6 percent of pollutant load. 21
The 2009 Ambient Air Surveillance Report summarized the air quality data collected by the 22
state of Georgia during the 2009 calendar year. According to the report, there are no 23
monitoring stations in Heard, Spalding, or Putman counties but there were stations within 24
the proposed project area. The annual arithmetic mean for Wilkinson County was 12.51 25
microgram per cubic meter (µg/m3) and the annual arithmetic mean for Washington County 26
was 11.27 µg/m3. 27
3.7.2.2 North Carolina 28
North Carolina has designation for the following criteria pollutants: 8-hour O3 and PM2.5. All 29
counties in the proposed project areas are designated as in attainment for all criteria 30
pollutants. 31

AFFECTED ENVIRONMENT
DRAFT - Environmental Assessment SE Giant Miscanthus Establishment and Production 3-62
Figure 3-22. Non-Attainment Areas within the Proposed Project Areas. 1

AFFECTED ENVIRONMENT
DRAFT - Environmental Assessment SE Giant Miscanthus Establishment and Production 3-63
3.7.2.3 South Carolina 1
South Carolina has designations for the following criteria pollutants: 8-hour O3. All counties 2
in the proposed project area are designated as in attainment for all criteria pollutants. 3
3.8 OUTDOOR RECREATION 4
3.8.1 Definition of the Resource 5
Recreational resources are those activities or settings either natural or manmade that are 6
designated or available for recreational use by the public. In this analysis, recreational 7
resources include lands and waters utilized by the public for hunting and viewing wildlife, 8
fishing, hiking, birding, boating, and other water-related activities. 9
3.8.2 Existing Conditions 10
3.8.2.1 Georgia 11
According to the National Survey of Fishing, Hunting and Wildlife- Associated Recreation, 12
approximately 2.8 million people 16 years old and older fished, hunted or wildlife watched in 13
Georgia (USFWS and USCB 2008a). Of those people approximately 481,000 people spent 14
8.2 million days hunting. The largest percentage of hunting in Georgia was for big game (86 15
percent), then small game (47 percent), then migratory birds (26 percent). The total amount 16
spent on these activities, including trip-related activities, equipment, and miscellaneous 17
expenditures was over $678 million. The average total expenditures in 2006 were $1,392 18
per hunter with an average trip expenditure of $493. Of the types of land, 7 percent of 19
hunters used public land only, 71 percent used private land only, and 16 percent used both 20
public and private land. Within the proposed project areas, there is approximately 0.3 21
million acres of public hunting access lands in East Georgian, 0.2 million acres in Middle 22
Georgia, and 0.1 million acres in the Lowcountry proposed project area (Figure 3-23). 23
There were also 2.0 million people who observed or photographed wildlife in Georgia. Of 24
those wildlife watchers, 90 percent (1.8 million) participated in those activities close to home 25
and are designated “around the home” participants. Among the around the home 26
participates, approximately 1.5 million fed wildlife, 1.1 million observed wildlife, and 0.4 27
million photographed wildlife. The remaining participants maintained natural areas (0.3 28
million), maintained plantings (0.2 million), or visited public areas (0.3 million). Wildlife-29
watching expenditures in Georgia totaled $1.6 billion. 30
31

AFFECTED ENVIRONMENT
DRAFT - Environmental Assessment SE Giant Miscanthus Establishment and Production 3-64
Figure 3-23. Public Game and Hunting Lands within the Proposed Project Areas 1

AFFECTED ENVIRONMENT
DRAFT - Environmental Assessment SE Giant Miscanthus Establishment and Production 3-65
3.8.2.2 North Carolina 1
In North Carolina, approximately 3.4 million people 16 years old and older fished, hunted or 2
wildlife watched (USFWS and USCB 2008b). Of those people approximating 304,000 3
people 16 years old and older spent 4.9 million days hunting. The largest percentage of 4
hunting in North Carolina was for big game, then small game, then migratory birds. The 5
total amount spent on these activities, including trip-related activities, equipment, and 6
miscellaneous expenditures was over $431 million. The average total expenditures in 2006 7
were $1,232 per hunter with an average trip expenditure of $296. Of the types of land, 26 8
percent of hunters used public land, 87 percent used private land, and 18 percent used both 9
public and private land. There is approximately 0.5 million acres of public hunting access 10
lands in the North Carolina proposed project area. 11
There were also 2.6 million people who observed or photographed wildlife in North Carolina. 12
Of those wildlife watchers, 85 percent (2.2 million) participated in those activities close to 13
home and are designated “around the home” participants. Among the around the home 14
participates, approximately 2.1 million fed wildlife, 1.2 million observed wildlife, and 0.5 15
million photographed wildlife. The remaining participants maintained natural areas (0.4 16
million), maintained plantings (0.3 million), or visited public areas (0.3 million). Wildlife-17
watching expenditures in North Carolina totaled $917 million. 18
3.8.2.3 South Carolina 19
In South Carolina, approximately 1.7 million people 16 years old and older fished, hunted or 20
wildlife watched (USFWS and USCB 2008c). Of those people approximating 208,000 21
people spent 4.3 million days hunting. The largest percentage of hunting in South Carolina 22
was for big game (87 percent), then small game (28 percent), then migratory birds (22 23
percent). The total amount spent on these activities, including trip-related activities, 24
equipment, and miscellaneous expenditures was over $279 million. The average total 25
expenditures in 2006 were $1,336 per hunter with an average trip expenditure of $586. Of 26
the types of land, 21 percent of hunters used public land, 85 percent used private land, and 27
14 percent used both public and private land. 28
There were also 1.1 million people who observed or photographed wildlife in South Carolina. 29
Of those wildlife watchers, 83 percent (0.9 million) participated in those activities close to 30
home and are designated “around the home” participants. Among the around the home 31
participates, approximately 0.9 million fed wildlife, 0.6 million observed wildlife, and 0.2 32

AFFECTED ENVIRONMENT
DRAFT - Environmental Assessment SE Giant Miscanthus Establishment and Production 3-66
million photographed wildlife. The remaining participants maintained natural areas (0.1 1
million), maintained plantings (0.1 million), or visited public areas (0.1 million). Wildlife-2
watching expenditures in South Carolina totaled $551 million. 3
4

ENVIRONMENTAL CONSEQUENCES
DRAFT - Environmental Assessment SE Giant Miscanthus Establishment and Production 4-1
4 ENVIRONMENTAL CONSEQUENCES 1
4.1 DATA GAPS 2
Giant miscanthus is a new agronomic crop species in the United States, and also still 3
relatively new in Europe, where the oldest cultivation areas are approximately 30 years old 4
or less. The Miscanthus genus was introduced to the United States over 100 years ago in 5
ornamental plantings and was first described by Beal in 1896 in the Grasses of North 6
America. Several universities (i.e., University of Illinois, MSU, University of Wisconsin, 7
Michigan State University [MSU2], and UGA) in the United States are currently cultivating 8
giant miscanthus on a trial basis or conducting research on giant miscanthus or the 9
Miscanthus genus. Additionally, large-scale acreages of giant miscanthus have not been 10
cultivated in the United States; although commercial production of giant miscanthus for 11
bioenergy production in co-fired systems have been established within the last few years in 12
the United Kingdom. Given, that giant miscanthus has only been grown in large-scale trials 13
in Europe, the data on giant miscanthus planting in the United States is limited. As 14
mentioned previously, FSA approved four BCAP project areas for the production of giant 15
miscanthus totaling 19,182 acres in the Midwestern United States in FY 2011. 16
In light of the lack of data applicable to the proposed project areas, an adaptive Mitigation 17
and Monitoring Plan has been developed, which includes BMPs for the establishment and 18
production of giant miscanthus. These BMPs are designed to ensure avoidance and/or 19
minimization of potential effects to the immediate environment and the larger landscape. 20
The Mitigation and Monitoring Plan is a living document that is highly dependent on routine 21
monitoring of the fields to determine the success of giant miscanthus plantings, its overall 22
effects to the immediate environment, and any potential effects to the larger landscape 23
based on observation and measurement. This document contains information on 24
appropriate and effective eradication methods that would be updated over time as new data 25
become available. Likewise, other metrics or observable measurements will be adapted 26
over time based on past observations, new research findings, and new regulations. 27
The following information related to the growth and production of giant miscanthus in the 28
United States has been found to be lacking complete detail. 29
· Potential effects to socioeconomics are focused on the information provided in the 30
pro forma analyses of the Project Sponsor. Data from Europe indicates a high cost 31
of establishment due to the vegetative propagation of the species; however, the 32

ENVIRONMENTAL CONSEQUENCES
DRAFT - Environmental Assessment SE Giant Miscanthus Establishment and Production 4-2
BCAP combined with the production methods undertaken by the Project Sponsor 1
and technical assistance to be provided to producers addresses most of these 2
concerns. 3
· Landscape scale analyses of giant miscanthus are generally lacking since there 4
have not been any commercial-scale field trials in the United States. 5
· Literature documenting the potential for invasiveness of the fertile species of the 6
Miscanthus genus has been discussed along with documentation supporting that 7
giant miscanthus should not be considered invasive due to its sterility and slow 8
rhizome spread within the United States. The growth and management of giant 9
miscanthus has been studied extensively by the University of Illinois and MSU and 10
commercial-scale production has been implemented and monitored in the United 11
Kingdom, but commercial-scale production of the plant has not yet been 12
implemented in the United States. Although the preponderance of evidence 13
indicates that the plant is sterile and slow spreading, documentation of sterility and 14
spread is needed for commercial-scale operations in United States’ environments. 15
· Literature discussing potential plant pests has been recently published relating to the 16
western corn root worm, several species, of aphids, and rust. Those studies along 17
with recommendations have been included. 18
· There is little peer-reviewed literature concerning the effects of giant miscanthus 19
plantings on biological diversity in the United States; however, some specific studies 20
have been published in Europe. These studies are primarily focused on bird species 21
with some small mammal observations. These studies also looked at young-aged 22
giant miscanthus stands, so there was little information available on biodiversity 23
found in mature stands. 24
· Information concerning the nutrient uptake, nutrient addition trials, and root structure 25
has been included to discuss the potential for soil erosion, soil organic matter, and 26
soil carbon sequestration based on the available literature. 27
· Literature concerning nutrient uptake, water use efficiency, and irrigation during 28
establishment has been discussed based on the available literature and field trial 29
information obtained within the foundation acreage. 30

ENVIRONMENTAL CONSEQUENCES
DRAFT - Environmental Assessment SE Giant Miscanthus Establishment and Production 4-3
4.2 SOCIOECONOMICS 1
4.2.1 Significance Threshold 2
The significance thresholds for socioeconomics include a substantial change in farm 3
income, which could lead to wider community effects such as employment loss and 4
population declines. 5
4.2.2 Proposed Action 6
Implementing the Proposed Action would not result in significant adverse effects to the 7
socioeconomic conditions of any of the proposed project areas, but would create benefits to 8
producers through a diversified crop portfolio that spreads economic risk associated with 9
agricultural production. The Proposed Action would provide a positive cash-flow stream to 10
producers and an economically viable product through the BCF to local, regional, and 11
potentially out of region sales according to the BCAP project area application documents. 12
Giant miscanthus would require some level of inputs during the establishment phases; 13
thereby, maintaining the existing agricultural products stream, with the potential for creating 14
new markets for more species-specific agricultural chemicals. Agricultural services would 15
be maintained in the short-term, with the potential creation of new services streams for 16
heavier-duty equipment manufacture and contract farming for harvesting, baling, and 17
transportation of baled products to the BCF. Overall, the maintenance of existing higher 18
value cropland acres with the inclusion of smaller dedicated energy crop production should 19
maintain or enhance farm household and agricultural services-related household incomes. 20
BCAP was developed to provide assistance to participating producer to offset a portion of 21
the costs associated with establishing and producing dedicated energy crops. Table 4-1 22
lists the estimated establishment and production costs for giant miscanthus with a 23
comparison of the BCAP payments to participating producers. The value of BCAP to 24
participating producers was analyzed by developing a crop budget based on actual and 25
predicted costs associated with Freedom giant miscanthus in the proposed project areas. 26
MSU2 also developed crop budgets for miscanthus budgets using ‘cheap’ and market rate 27
rhizomes (James et al. 2009). Under MSU2’s analysis with “market rhizomes” after 10 years 28
the producer is still cash flow negative over $6,000 on each acre planted. If the rhizome 29
costs were reduced to only 25 percent of MSU2’s estimate, the producer would still need 10 30
31
32

ENVIRONMENTAL CONSEQUENCES
DRAFT - Environmental Assessment SE Giant Miscanthus Establishment and Production 4-4
Table 4-1. Cost Comparison for Participating Versus Non-Participating Producers 1 for the Establishment and Production of Giant Miscanthus 2
Item
Giant Miscanthus Establishment without
BCAP
Giant Miscanthus Establishment with BCAP
Per Acre (all values rounded to the next whole $) Crop Establishment
Rhizomes ($0.26 ea) $1,350 $1,350 Land Prep $425 $425 Soil Amendments $190 $190 Pest Control $110 $110 Planting Cost $250 $250 Total Establishment Cost $2,325 $2,325 BCAP Establishment Payment $0 $1,744 BCAP Annual Payment $0 $51 Revised Establishment Cost $2,325 $530
Year 2 Production Annual Costs – Year 2 $350 $350 Estimated Revenue – Year 2 (6 tons @ $50/ton)
$300 $300
BCAP Annual Payment $0 $39 BCAP Matching Payment – Year 1 $0 $270 Profit/Loss Continual ($2,375) ($271)
Year 3 Production Annual Costs – Year 3 $343 $343 Estimated Revenue – Year 3 $500 $500 BCAP Annual Payment $0 $450 BCAP Matching Payment – Year 2 $0 $39 Profit/Loss Continual ($2,218) $374
Year 4 Production Annual Costs – Year 4 $343 $343 Estimated Revenue – Year 4 $700 $700 BCAP Annual Payment $0 $39 Profit/Loss Continual ($1,860) $770
Year 5 Production Annual Costs – Year 5 $343 $343 Estimated Revenue – Year 5 $900 $900 BCAP Annual Payment $0 $39 Profit/Loss Continual ($1,303) $1,365
Notes: 3 · All cost estimates derived from actual past expenditures and predicted on-going expenses from the 4
Project Sponsor. 5 · The average rental rate for CRP as of February 2011 in each state containing proposed project areas 6
are: Georgia = $47.02/acre; North Carolina = $68.72/acre; South Carolina = $38.38/acre. The average 7 rental rate for these three states = $51.37/acre (USDA FSA 2011a) 8
· A reduction in the annual BCAP payment was estimated at 25 percent for biomass sold for heat, power, 9 or biobased products (USDA FSA 2011d). 10
11

ENVIRONMENTAL CONSEQUENCES
DRAFT - Environmental Assessment SE Giant Miscanthus Establishment and Production 4-5
years to break even. Under MSU2’s analysis, producers would have little incentive to 1
establish energy crops. 2
The Project Sponsor has set as its company’s goal the commercialization of giant 3
miscanthus as a dedicated energy crop to provide feedstock to the developing biofuel and 4
bioenergy markets. This commercialization is centered on making all aspects of energy 5
crop production enjoy economies of scale that do not currently exist. This includes providing 6
more affordable rhizomes, reducing establishment and growing costs, and providing for 7
efficient harvest, storage, and transportation of giant miscanthus. BCAP helps reduce the 8
financial risk of the company and its producers in the initial development stages; thereby, 9
making it an important catalyst in the commercialization of a large-scale energy crop. 10
As Table 4-1 shows, BCAP in combination with the Project Sponsor’s costs for Freedom 11
giant miscanthus establishment in the proposed project areas provides enough incentive 12
that a producer would begin realizing a profit in year three, rather than in year eight without 13
BCAP. 14
Under the Proposed Action, the Project Sponsor proposes to establish and produce 15
Freedom giant miscanthus in the proposed project areas with a maximum acreage of 58,000 16
acres by 2013. The Project Sponsor has a goal of minimizing the amount of arable cropland 17
to be included in the contract acreage, thereby maximizing producer incomes through 18
diversification of a small amount of economically marginal croplands or idle lands, 19
pasturelands, and abandoned/previously harvested timberlands. 20
The BCAP Final PEIS (Table 3.1-5) lists the national average farm size for different farm 21
types; overall the majority of farms within the United States are considered small family 22
farms with average farm size between 137 acres (Limited Resource) to 1,040 acres 23
(Farming Occupation/Higher Sales). Small farms comprise 89.1 percent of the total farms in 24
the East Georgia proposed project area, 92.6 percent in the Middle Georgia proposed 25
project area, 90.5 percent in the Lowcountry proposed project area, and 73.1 percent in the 26
North Carolina proposed project area. 27
The Project Sponsor estimates that within the East Georgia proposed project area, more 28
than 85 full time or full time equivalent (FTE) jobs would be created directly or indirectly 29
through this project with an estimate annualized effect of over $17 million once the 30
establishment is mature. In the Middle Georgia proposed project area, the project sponsor 31
is estimating more than 115 full time or FTE jobs would be created directly or indirectly 32

ENVIRONMENTAL CONSEQUENCES
DRAFT - Environmental Assessment SE Giant Miscanthus Establishment and Production 4-6
through this project with an estimate annualized effect of over $22 million once the 1
establishment is mature. The Lowcountry proposed project area is estimated to provide 2
more than 30 full time or FTE jobs would be created directly or indirectly through this project 3
with an estimate annualized effect of over $5.5 million once the establishment is mature. 4
For the North Carolina proposed project, the project sponsor estimates more than 85 full 5
time or FTE jobs would be created directly or indirectly through this project with an estimate 6
annualized effect of over $19 Million once the establishment is mature. Overall, the 7
increased number of jobs from the proposed action would increase employment numbers by 8
less than 0.05 percent per proposed project area. 9
4.2.3 No Action Alternative 10
The selection of the No Action Alternative would not result in significant adverse effects to 11
the socioeconomic conditions of the proposed project areas. Under this alternative, the 12
Project Sponsor would not undertake the establishment and production of giant miscanthus 13
in the proposed project areas. The agricultural conditions would remain as described in 14
Section 3.1 and would follow projected demand and production aspects. This alternative 15
would not create a small acreage diversification into dedicated energy crops, nor would a 16
new services market be developed for heavy-duty machinery associated with high-yielding 17
biomass crops, such as giant miscanthus. 18
4.3 LAND USE 19
4.3.1 Significance Threshold 20
For land use the significance thresholds include a substantial change in land use type that 21
could trigger the development of agricultural lands into other non-agricultural land use types 22
within the region or adjacent to the region. 23
4.3.2 Proposed Action 24
Implementing the Proposed Action would not result in significant changes in land use types 25
that could trigger development of agricultural lands into other non-agricultural land use types 26
nor would it create a substantial loss of arable cropland within the proposed project areas. 27
Also of concern, due to the proposed project area locations, is the amount of harvestable 28
timberland and non-industrial private forestland with the potential for conversion into a 29
dedicated energy crop. Under the Proposed Action, the Project Sponsor proposes to 30
establish and produce Freedom giant miscanthus in the proposed project areas with a 31
maximum total acreage of 58,000 acres by 2013. The Project Sponsor has a priority of 32

ENVIRONMENTAL CONSEQUENCES
DRAFT - Environmental Assessment SE Giant Miscanthus Establishment and Production 4-7
using economically marginal or idle croplands and abandoned/previously harvested 1
forestland in place of higher-value harvestable croplands, pasturelands, and timberlands. 2
Conrad et al. (2011) found through a survey of forestland owners in the Southern United 3
States that 90 percent of respondents would regenerate their stands after harvest. This 4
indicates that approximately 10 percent of private timberland would not be revegetated with 5
timber after harvest, which would leave those acres available for alternative usages. To 6
determine an approximate annual amount of available abandoned/previously harvested 7
forestland for conversion into giant miscanthus within the proposed project areas, this 10 8
percent landowner value was extrapolated from Conrad et al. (2011), which was then used 9
in combination with FS data to determine an approximately acreage value. The USDA FS 10
(2009a, b) indicates that on average, in the Southeast, 2.7 percent of timberland acreage is 11
harvested annually, with a replanting rate, as of 2003, of 0.7 percent of timberland acreage. 12
This could indicate an extended fallow period due to a change in land ownership for this 13
acreage or the loss of acreage to development into another land use. 14
Table 4-2 lists the estimated total acres that could be planted by each land use type, other 15
cropland, pastureland (pastureland, all types), and abandoned forestland by proposed 16
project area. 17
Table 4-2. Estimated Acres to be Planted by 2014 to 18 Giant Miscanthus by Proposed Project Area and Percent of Land Use Type. 19
Proposed Project Area Other
Cropland Pastureland
All Types
Estimated Annual Abandoned
Forestland After Harvest
Total Targeted Land Categories
Available
Proposed Freedom Giant
Miscanthus
Percent of Combined
Targeted Land Categories
Eastern Georgia 212,404 623,189 170,928 1,006,521 15,000 1.5% Middle Georgia 104,426 491,998 97,039 693,463 20,000 2.9% Lowcountry 170,922 372,597 94,259 640,558 5,000 0.8% North Carolina 124,076 312,939 116,706 553,721 18,000 3.3% Source: Adapted from USDA NASS 2009, USDA FS 2011 20
Based on the targeted land use types there would be at least 0.5 million acres of lower-21
economic value acreage available for the establishment and production of Freedom giant 22
miscanthus within each proposed project area. Due to the overlapping Georgia counties in 23
three of the proposed project areas, an analysis was performed on the total targeted land 24
use categories and proposed Freedom giant miscanthus acreage in Georgia and South 25
Carolina. Overall, there would be 2.3 million acres of other cropland, pastureland, and 26
estimated abandoned/previously cleared forestland within the three proposed project areas 27
in Georgia and South Carolina; the establishment of 40,000 acres of Freedom giant 28

ENVIRONMENTAL CONSEQUENCES
DRAFT - Environmental Assessment SE Giant Miscanthus Establishment and Production 4-8
miscanthus within these three proposed project areas would account for approximately 1.7 1
percent of the estimated available land uses. 2
Conversion of active agricultural lands could create short-term affects to livestock production 3
and forestland. The conversion of pastureland could negatively affect livestock production 4
within the proposed project areas, if sufficient grazing acreage was converted. The most 5
productive (i.e., highest stocking rate forage availability) pastureland would not be converted 6
into Freedom giant miscanthus, unless the individual producer determined that the net 7
return would be higher from Freedom giant miscanthus per acre than from cattle. Likewise, 8
the decision to replant forestland is based on the individual producers’ willingness to 9
produce Freedom giant miscanthus in the short-term at the opportunity cost of lost timber 10
revenue in the future. Overall, the conversion of marginal and abandoned lands into a 11
perennial herbaceous species that provides a positive rate of return for producers under 12
highly monitored conditions with BMPs to reduce environmental effects to natural resources 13
provides ecological benefits over the conversion of those lands into developed or urbanized 14
uses. 15
4.3.3 No Action Alternative 16
The selection of the No Action Alternative would not result in significant adverse effects to 17
the land use within the proposed project areas. Under this alternative, the Project Sponsor 18
would not undertake the establishment and production of giant miscanthus in the proposed 19
project areas. The agricultural conditions would remain as described in Section 3.3 and 20
would follow projected demand and production aspects. This alternative would not create a 21
small acreage diversification into dedicated energy crops and would allow for conversion of 22
lands into other higher value categories for the producers such as developed or urbanized 23
uses. 24
4.4 MANAGED COASTAL ZONES 25
4.4.1 Significance Threshold 26
A significant effect to managed coastal zones areas would be an activity that would 27
substantially alter the ecological characteristics of sensitive environments of coastal areas 28
(e.g., tidal areas) or non-tidal areas and uplands within the general watershed that 29
contribute to the ecological balance of tidal areas. The vast majority of these effects would 30
be avoided through the state-level permitting processes associated with ground disturbing 31
activities within designated coastal zone management areas. 32

ENVIRONMENTAL CONSEQUENCES
DRAFT - Environmental Assessment SE Giant Miscanthus Establishment and Production 4-9
4.4.2 Proposed Action 1
Implementing the Proposed Action, in association with the Mitigation and Monitoring Plan 2
(Section 6) would be anticipated to have no adverse impacts to managed coastal zones in 3
any of the states within the proposed project areas. The Project Sponsor would exclude all 4
acreage within any designated environmentally sensitive coastal area, such as AECs or 5
lands with the potential to affect coastal waters in North Carolina, critical areas in South 6
Carolina, or tidal wetlands and jurisdictional areas in Georgia, and upland buffer areas to 7
these sensitive coastal land types. Also, per the BCAP regulations, BMPs, and CPS to be 8
undertaken in the producer’s site specific Conservation Plan, no wetlands would be 9
converted into production lands for Freedom giant miscanthus. On the whole, agricultural 10
activities that do not cause new ground disturbing activities when compared to existing land 11
uses (e.g., existing agricultural lands) and the exclusion from the conversion of wetlands 12
would not result in changes to the ecological functioning of uplands adjacent to coastal 13
areas. 14
4.4.3 No Action Alternative 15
The selection of the No Action Alternative would not result in significant adverse effects to 16
managed coastal zones within the proposed project areas. Under this alternative, the 17
Project Sponsor would not undertake the establishment and production of giant miscanthus 18
in the proposed project areas. The agricultural conditions would remain as described in 19
Section 3.1 and would follow projected demand and production aspects. 20
4.5 BIOLOGICAL RESOURCES 21
4.5.1 Vegetation 22
4.5.1.1 Significance Threshold 23
For vegetation, a significant effect would be a finding of invasiveness for the species, that it 24
had a high likelihood of being a vector for a plant pathogen or insect harmful to native 25
species, or that it was extremely difficult to eradicate once established. 26
4.5.1.2 Proposed Action 27
Implementing the Proposed Action, in association with the Mitigation and Monitoring Plan 28
and Conservation Plan or Forest Stewardship Plan, (Section 6) would be anticipated to 29
result in minor effects to local and regional vegetation due to the change in vegetation from 30
the existing cover to Freedom giant miscanthus. These effects would be highly dependent 31

ENVIRONMENTAL CONSEQUENCES
DRAFT - Environmental Assessment SE Giant Miscanthus Establishment and Production 4-10
upon the site-specific conditions and could be either positive or negative. Land areas 1
dominated by annual species or invasive species would benefit from the conversion into a 2
perennial herbaceous species under highly monitored conditions with BMPs to reduce 3
environmental effects to natural resources. The Mitigation and Monitoring Plan addresses 4
measures to avoid and minimize effects to vegetation. Some of these measures include 5
exclusions from planting within sensitive segments of 100-year floodplains and floodways, 6
which would be determined at the site-specific level based on localized conditions and 7
regulations, to minimize the potential for vegetative spread through rhizome or active stalks 8
transported via stormwater flows or wind, and active management to provide eradication in 9
adjacent areas, if necessary. Additionally, for ephemeral systems, with a potential for high 10
velocity flows during normal precipitation events, buffering restrictions could be developed 11
as part of the producer’s mandatory Conservation Plan or Forest Stewardship Plan and 12
associated Mitigation and Monitoring Plan. 13
As mentioned previously, the Project Sponsor anticipates that most of the acreage for 14
Freedom giant miscanthus would be marginal and idle lands, including abandoned 15
timberland. Pasturelands throughout the proposed project areas could be in fallow 16
agricultural fields with annual vegetation or a mix of annual and perennial vegetation, in 17
permanent improved pasture, or rangeland. Abandoned/previously cleared forestlands 18
could be fallow acreage with naturally occurring annual vegetation, a short-term erosion 19
control cover, or the regeneration of naturally occurring woody species that have prevalence 20
after a ground disturbance. It is anticipated that economically marginal croplands which 21
could be either currently fallow or in traditional row crops. Vegetation species diversity is 22
highly site specific and part of the larger local landscape. 23
The Project Sponsor would recommend that wildlife corridors be installed between and 24
around fields of Freedom giant miscanthus, as appropriate for the site specific conditions. 25
These patches of corridors and field edges should assist in the minimization of the loss of 26
landscape level vegetation biodiversity and richness along with anticipated buffers to 27
riparian areas through the Mitigation and Monitoring Plan. 28
Jørgensen (2011) indicates a potential fire risk associated with senesced stands of giant 29
miscanthus. To reduce potential fire risk, the Mitigation and Monitoring Plan includes a 30
minimum buffer width and a more site-specific buffer width to be included in the individual 31
contract producer’s Conservation Plan, which would take into account landscape features 32
(e.g., habitable structures, farmsteads, communities within close proximity), normal fire 33
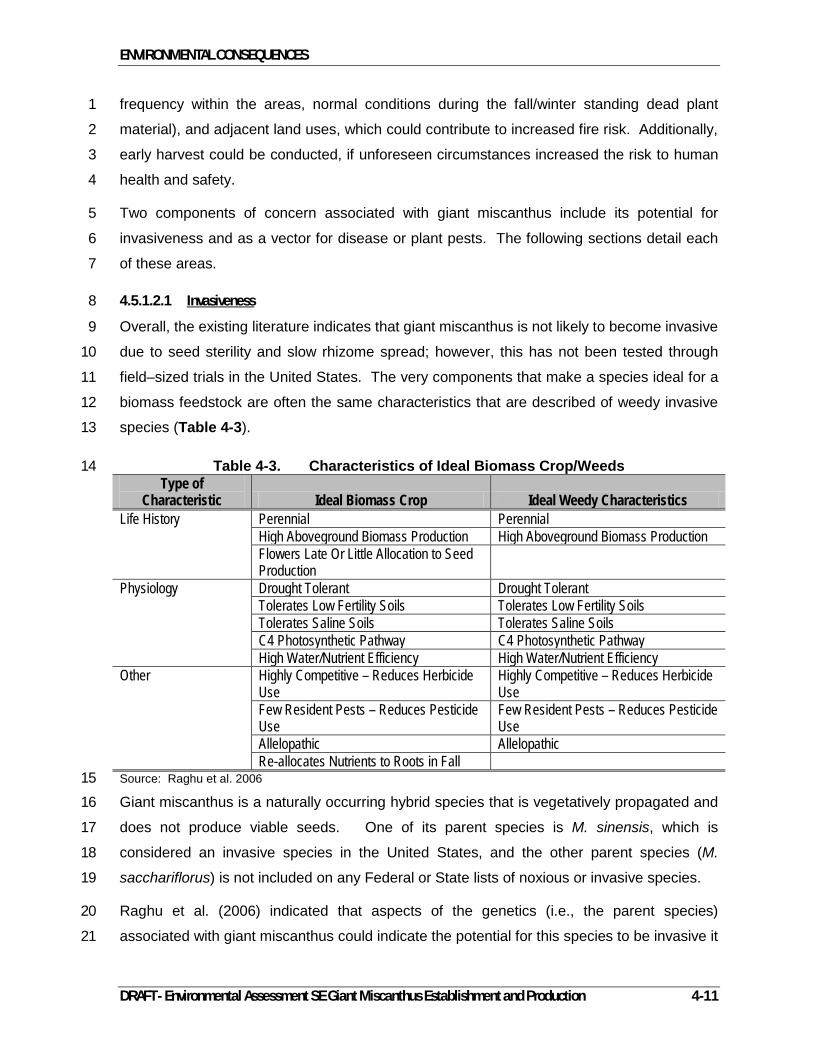
ENVIRONMENTAL CONSEQUENCES
DRAFT - Environmental Assessment SE Giant Miscanthus Establishment and Production 4-11
frequency within the areas, normal conditions during the fall/winter standing dead plant 1
material), and adjacent land uses, which could contribute to increased fire risk. Additionally, 2
early harvest could be conducted, if unforeseen circumstances increased the risk to human 3
health and safety. 4
Two components of concern associated with giant miscanthus include its potential for 5
invasiveness and as a vector for disease or plant pests. The following sections detail each 6
of these areas. 7
4.5.1.2.1
Overall, the existing literature indicates that giant miscanthus is not likely to become invasive 9
due to seed sterility and slow rhizome spread; however, this has not been tested through 10
field–sized trials in the United States. The very components that make a species ideal for a 11
biomass feedstock are often the same characteristics that are described of weedy invasive 12
species (Table 4-3). 13
Invasiveness 8
Table 4-3. Characteristics of Ideal Biomass Crop/Weeds 14 Type of
Characteristic Ideal Biomass Crop Ideal Weedy Characteristics Life History Perennial Perennial
High Aboveground Biomass Production High Aboveground Biomass Production Flowers Late Or Little Allocation to Seed Production
Physiology Drought Tolerant Drought Tolerant Tolerates Low Fertility Soils Tolerates Low Fertility Soils Tolerates Saline Soils Tolerates Saline Soils C4 Photosynthetic Pathway C4 Photosynthetic Pathway High Water/Nutrient Efficiency High Water/Nutrient Efficiency
Other Highly Competitive – Reduces Herbicide Use
Highly Competitive – Reduces Herbicide Use
Few Resident Pests – Reduces Pesticide Use
Few Resident Pests – Reduces Pesticide Use
Allelopathic Allelopathic Re-allocates Nutrients to Roots in Fall
Source: Raghu et al. 2006 15
Giant miscanthus is a naturally occurring hybrid species that is vegetatively propagated and 16
does not produce viable seeds. One of its parent species is M. sinensis, which is 17
considered an invasive species in the United States, and the other parent species (M. 18
sacchariflorus) is not included on any Federal or State lists of noxious or invasive species. 19
Raghu et al. (2006) indicated that aspects of the genetics (i.e., the parent species) 20
associated with giant miscanthus could indicate the potential for this species to be invasive it 21
ENVIRONMENTAL CONSEQUENCES
DRAFT - Environmental Assessment SE Giant Miscanthus Establishment and Production 4-12
has the ability to resprout from belowground, rapid growth, and efficient photosynthetic 1
pathways. Jørgensen (2011) indicates that rhizome spread of giant miscanthus occurs only 2
at about 10 centimeters (cm) per year from observation of intentionally planted areas, which 3
is relatively slow. There have been no documented unintentionally spreading of giant 4
miscanthus in Europe, where the species has been studied for over 30 years. In the event 5
that giant miscanthus rhizomes in intentionally planted areas spread beyond the planted 6
fields, Jørgensen (2011) indicates that rhizomes transported accidentally by man, soil 7
erosion, or flooding could be easily eradicated using commercially available herbicides. In 8
contrast, Jørgensen (2011) indicates that M. sacchariflorus (i.e., a parent species of giant 9
miscanthus) has creeping rhizomes that spread several meters (m) in a few years with high 10
adaptability to riparian areas, which has a higher potential for translocation via erosion and 11
water transport. 12
Gordon et al (2011) assessed the potential invasiveness of several potential dedicated 13
energy crop species using the Australian Weed Risk Assessment (WRA). The WRA is a 14
tool that has been used in Australia and New Zealand for over a decade to determine if plant 15
species should be considered for use in those countries. The WRA has been shown to be 16
90 percent accurate in indentifying invasive species, 70 percent accurate in non-invaders, 17
with approximately 10 percent of non-invaders incorrectly predicted to be invasive (Gordon 18
et al. 2011). Gordon et al (2011) performed the WRA on 12 potential dedicated energy 19
crops, not native to Florida, for Florida and the United States. Based on the WRA results 20
they found that only four species (giant miscanthus, plume grass, sugarcane, and sweet 21
sorghum) should be accepted as potential dedicated energy crops, one species (cabbage 22
gum) should be further evaluated, and the remainder rejected (giant reed, Red River gum, 23
rose gum, jatropha, leadtree, elephantgrass, and castor bean). Gordon et al. (2011) did 24
indicate that since both giant miscanthus and sweet sorghum had parent genetics from 25
documented invasive species, production should be carefully monitored for changes in 26
fertility or other traits. Barney and DiTomaso (2008) also performed a WRA on giant 27
miscanthus and found it to be acceptable for a dedicated energy crop. 28
Davis et al. (2010) suggests that using the WRA may not be sufficient as a stand-alone tool 29
provided that the chance of an inadvertent approval of an invasive species could be 1:10 or 30
1:20. Davis et al. (2010) suggest a nested approach where an initial screen, such as WRA, 31
is used to determine if a pre-entry evaluation of a species is warranted. The Davis et al 32
(2010) evaluation would analyze data from the species home range for its potential for 33

ENVIRONMENTAL CONSEQUENCES
DRAFT - Environmental Assessment SE Giant Miscanthus Establishment and Production 4-13
invasiveness; if approved after this step, and then a post-entry evaluation would be 1
conducted. The post-entry evaluation would include quarantined field trials to determine if 2
release of a species is appropriate. 3
4.5.1.2.2
Another potential for vegetative effects is the movement of diseases and plant pests from 5
one species to another, such as from giant miscanthus to corn. The Project Sponsor has 6
had no indication of plant pests or diseases within the foundation acreage in Georgia 7
through continual monitoring of the fields since the inception of the field establishment of 8
Freedom giant miscanthus. Recently published literature in the United States does indicate 9
that giant miscanthus could provide a refuge or reservoir for plant pests, especially for corn 10
and sorghum, depending upon location. Jørgensen (2011) indicates that the western corn 11
rootworm has been found in giant miscanthus, while Stewart and Cromey (2011) indicated 12
that reports of diseases such as barley yellow dwarf virus, rust (Puccinia emaculata) and 13
smut (Tilletia maclaganii) in miscanthus and switchgrass. Additionally, Spenser and Raghu 14
(2009) found that in greenhouse and field studies, in the Midwestern United States, there 15
was significant emergence of western corn rootworm from giant miscanthus placed near 16
corn fields. Bradshaw et al. (2010) found two species of aphids (yellow sugarcane aphid 17
and corn leaf aphid) in samples taken from giant miscanthus fields in four states with stands 18
ranging from one year to 21-years old. The yellow sugarcane aphid was located in seven 19
samples across the four states and the corn leaf aphid was located in four samples in four 20
states. According to Bradshaw et al. (2010) the presence of aphids in giant miscanthus is of 21
concern since aphids can transmit plant viruses. The research in this area is somewhat 22
lacking as these are new reports and steps should be taken to monitor for any plant 23
diseases or pests within established stands of giant miscanthus. The Mitigation and 24
Monitoring Plan includes integrated pest management (IPM) programs associated with 25
dedicated energy crops that will provide protection equal or greater than IPM programs for 26
crops within the project areas. . 27
Disease Vector, Host for Plant Pathogens, Host for Plant Pests 4
4.5.1.3 No Action Alternative 28
Selecting the No Action Alternative would not result in significant effects to the local or 29
regional vegetation within the proposed project areas, as the Project Sponsor would not 30
establish and produce giant miscanthus in those areas. Current agricultural activities would 31
remain similar or along the current projected trends for those regions. Land coverage would 32
remain similar to existing, which could include areas currently dominated by annual or 33

ENVIRONMENTAL CONSEQUENCES
DRAFT - Environmental Assessment SE Giant Miscanthus Establishment and Production 4-14
invasive species, which could result in future negative impacts to surrounding native 1
vegetation areas. 2
4.5.2 Wildlife 3
4.5.2.1 Significance Threshold 4
For wildlife, a significant effect would be a finding of substantial decline in biodiversity or 5
species richness for the local area or the region. 6
4.5.2.2 Proposed Action 7
Implementing the Proposed Action, in association with the mandatory site-specific producer 8
Conservation Plan or Forest Stewardship Plan and Mitigation and Monitoring Plan (Section 9
6), would be anticipated to result in minor negative effects to wildlife diversity; however, 10
given the lack of data associated with wildlife use of mature stands of giant miscanthus 11
wildlife effects could also be minor and beneficial for certain types of wildlife. Wildlife 12
diversity effects would be contingent upon the type of previous land use the acreage was in 13
prior to conversion into giant miscanthus stands. There could be adverse effects to larger 14
wildlife as giant miscanthus stands mature when compared to pasturelands; however, data 15
related to larger species is lacking; therefore, the implementation of appropriate BMPs, as 16
developed in the Mitigation and Monitoring Plan, would be essential to gauge short and 17
longer-term effects on local larger wildlife. 18
Additionally, wildlife that root or highly disturb (e.g. feral hogs or armadillos in the Southeast) 19
the soils could be anticipated to uproot and distribute rhizomes from the fields. However, 20
there has been no indication of these species distributing rhizomes from the foundation 21
acres, though evidence of these species is clearly observed in these fields. Also, the 22
probability of rhizomes left on the soil surface rooting and spreading giant miscanthus 23
appears to be low given the loss of viability the longer the rhizome remains on the soil 24
surface without appropriate depth of planting. 25
Fernando et al. (2010) indicates that monocultures are not generally as diverse as 26
polycultures, but that biodiversity levels depend on the crop and the environmental setting 27
(i.e., the overall landscape diversity and the lands being converted). They also indicate that 28
perennial rhizomatous grasses require less tillage, lower agrochemicals and high above- 29
and below-ground biomass, which are beneficial for soil microfauna and provide cover to 30
invertebrates and birds. Fernando et al. (2010) indicate that according to their weighted-31
model, no significant differences related to a suite of environmental impacts was observed 32

ENVIRONMENTAL CONSEQUENCES
DRAFT - Environmental Assessment SE Giant Miscanthus Establishment and Production 4-15
for the perennial species supported for dedicated energy crops. They suggested that 1
compared to cultivated fields (e.g., potato and wheat), all perennial dedicated energy crops 2
had fewer environmental impacts; however, they had greater impacts than fallow fields 3
when considered on the whole. 4
4.5.2.2.1
Field margins and wildlife buffers would provide continued access in areas where larger 6
wildlife species are known to occur. The Project Sponsor would recommend that wildlife 7
corridors be developed along field margins or through larger fields to allow continued wildlife 8
movement. Additionally, due to early harvest periods in the Southeast, there would be less 9
standing senesced material in the winter months, which would allow wildlife movement and 10
use of the fields. This earlier harvest could allow for overcropping with a cool-season crop 11
type for groundcover during the winter and early spring prior to the emergence of giant 12
miscanthus. The Project Sponsor is currently conducting field trials on this overcropping 13
method. The longer growing season in the Southeast could also provide the opportunity for 14
a dual harvest cycle, which would open the landscape for wildlife use during the regrowth 15
periods. 16
Wildlife Buffers, Corridors, and Cropping Systems 5
4.5.2.2.2
The Project Sponsor has allowed preliminary avian diversity studies to be undertaken on the 18
foundation acreage to assess the number and species of birds that utilize the existing giant 19
miscanthus stands and continue to gauge avian usage as the stands mature. Wildlife 20
biologists with the GDNR Wildlife Resources Division, Game Management Section surveyed 21
two fields to quickly indentify wildlife use of the giant miscanthus fields and associated buffer 22
areas. The quick evaluation noted the presence of the following species (Table 4-4) 23
through visual identification of the animal or evidence that the animal had been present 24
(e.g., tracks or scat). 25
Birds 17
26

ENVIRONMENTAL CONSEQUENCES
DRAFT - Environmental Assessment SE Giant Miscanthus Establishment and Production 4-16
Table 4-4. Species Identified In and Around Foundation Acreage, 16 August 2011 1 Common Name Scientific Name
BIRDS Brown Headed Cow Bird Molothrus ater Crow Corvus branchyrhynches Eastern Wild Turkey Meleagris gallopavo Mourning Dove Zenaida macroura Red Shouldered Hawk Bueto lineatus Rufous Sided Towhee Pipilo erythophalmus White Eyed Vireo Vireo griseus
MAMMALS Bobcat Lynx rufus Coyote Canus latrans Eastern Cottontail Rabbit Sylvilagus floridanus Raccoon Procyon lotor Whitetail Deer Odocoileus virginianus Source: Waters 2011 2
Studies from Europe indicate a temporary neutral to positive effect for young-aged stands of 3
giant miscanthus on bird species richness, depending upon the previous vegetation cover. 4
Bellamy et al (2009) provide some preliminary information on the abundance and diversity of 5
birds in giant miscanthus and winter wheat in the United Kingdom. They found a greater 6
abundance and diversity of birds in fields (study field size of three hectare = 7.41 acres) with 7
giant miscanthus aged between one to three years than in the control wheat fields. Bellamy 8
et al. (2009) hypothesized that the reasons for greater diversity in giant miscanthus could 9
have been the contribution to shelter provided by giant miscanthus during the winter and the 10
abundance of non-crop plants (e.g., weeds) in these early stage giant miscanthus fields. 11
Bellamy et al. (2009) surmised that on-going management for wildlife would be necessary to 12
ensure continued biodiversity as the giant miscanthus plants matured and the crop structure 13
developed. 14
Similarly, Semere and Slater (2007a) found that young giant miscanthus fields in 15
Herefordshire, England have a greater variety and abundance of open-ground bird than 16
reed canary grass fields; however, the abundance and diversity of birds and small mammals 17
was higher at the edges of both type of perennial biomass fields than in the fields 18
themselves. Semere and Slater (2007a) indicate that perennial biomass grasses could 19
provide improved wildlife habitat due to the lower input of agricultural chemicals relative to 20
traditionally managed row crops. Sage et al. (2010) found that the number of birds in 21
young-aged miscanthus grown in southwestern England was approximately equivalent to 22
the number of birds found in grasslands. They found bird use to be variable and dependent 23
on many factors such as region, weediness, crop structure, and patchiness. 24

ENVIRONMENTAL CONSEQUENCES
DRAFT - Environmental Assessment SE Giant Miscanthus Establishment and Production 4-17
Fargione (2010) in a review of literature indicated that researchers found potential for a loss 1
of bird biodiversity in high-input low diversity (HILD) bioenergy crops, such as corn and 2
soybeans, while in low-input high diversity (LIHD) bioenergy crops, such as native prairie, 3
bird species richness increased. They also found that the magnitude of changes was more 4
than double for species of concern than for generalist species. Fargione (2010) indicates a 5
lack of specific data availability for crops such as giant miscanthus, which has a different 6
structure than native prairie grass species in the United States, indicating a need for more 7
research on these species. Jørgensen (2011) indicates that very few species directly feed 8
on miscanthus so diversity indicators are due in part to the lack of continual tilling, reduced 9
pesticide levels, and provision of cover. At maturity, these stands could have a decline in 10
biodiversity if the fields become so successful that weeds are fully suppressed or large field 11
are planted which would reduce the quantity of field margin habitat (Ibid.). 12
4.5.2.2.3
In a study of invertebrates, Semere and Slater (2007b) found that more invertebrates utilized 14
miscanthus fields than areas dominated by reed canary-grass but less than field margins, in 15
large part due to the increased presence of weeds within the establishing fields. They 16
surmise that the more mature fields of reed canary-grass observed in these studies could be 17
an approximation in terms of the generalized potential for biodiversity effects from mature 18
stands of giant miscanthus in the United Kingdom since data for biodiversity is lacking for 19
the mature age class of giant miscanthus (Ibid.). As such, appropriately sized field buffers 20
would provide necessary wildlife habitat and edge to ameliorate the loss of biodiversity from 21
maturing stands of giant miscanthus. Landis and Werling (2010) provided a review of 22
relevant literature related to arthropods and biofuel production, indicating a general lack of 23
data associated with mature giant miscanthus stands and arthropod interactions. Gardiner 24
et al. (2010) analyzed arthropods in three different types of potential biofuel crops, corn 25
(planted for grain), switchgrass (planted for CRP), and mixed prairie (planted for CRP). 26
They found that insects responded more positively to greater landscape diversity, provided 27
by switchgrass and mixed prairie; however, if switchgrass was planted and managed for 28
biomass feedstock, the overall insect diversity could increase with a decline in plant 29
diversity. Felten and Emmerling (2011) observed earthworm diversity and density between 30
differing field management regimes – fallow, grassland, giant miscanthus, rapeseed, 31
cereals, and maize. They found that giant miscanthus had enhanced biodiversity when 32
compared to the more intensively cultivated crops and less than the less intensively 33
Insects 13

ENVIRONMENTAL CONSEQUENCES
DRAFT - Environmental Assessment SE Giant Miscanthus Establishment and Production 4-18
managed areas. They observed that earthworms were attracted to the rhizomatous areas of 1
the soil profile and less observed in the intersticel spaces. 2
4.5.2.3 No Action Alternative 3
Selecting the No Action Alternative would not result in significant effects to the local or 4
regional wildlife within the proposed project areas, as the Project Sponsor would not 5
establish and produce giant miscanthus in those areas. Current wildlife communities would 6
remain similar for those regions. 7
4.5.3 Protected Species 8
4.5.3.1 Significance Threshold 9
For protected species, both for vegetation and wildlife, a significant effect would be a direct 10
taking of a protected species or the finding of decline in the number or range of species for 11
the local area or the region indirectly attributable to the Proposed Action. 12
4.5.3.2 Proposed Action 13
Implementing the Proposed Action would not result in significant effects to any protected 14
species, state, Federal, or Tribally-listed as threatened and/or endangered, primarily due to 15
the lack of those species within the site-specific acreage proposed project areas. Some 16
transitory and migratory species may occur while commuting or migrating along waterways 17
that serve as corridors between roost areas and other habitats, but existing crop and idle 18
lands do not provide suitable habitat within the proposed project areas. Other concerns 19
would be for fish, clams, and invertebrates located in streams near giant miscanthus 20
plantings. The Mitigation and Monitoring Plan specifies buffers between plantings and 21
streams and riparian areas. These buffers will ensure that effects to any aquatic and 22
riparian species will be minimized or avoided. 23
4.5.3.3 No Action Alternative 24
Selecting the No Action Alternative would not result in significant effects to the local or 25
regional protected species within the proposed project areas, as the Project Sponsor would 26
not establish and produce giant miscanthus in those areas. Current agricultural activities 27
would remain similar or along the current projected trends for those regions. 28

ENVIRONMENTAL CONSEQUENCES
DRAFT - Environmental Assessment SE Giant Miscanthus Establishment and Production 4-19
4.6 SOIL RESOURCES 1
4.6.1 Significance Threshold 2
Impacts to soil resources would be considered significant if implementation of an action 3
resulted in permanently increasing erosion, altered soil characteristics that threaten the 4
viability of the cover, or affected unique soil conditions. 5
4.6.2 Proposed Action 6
Implementing the Proposed Action would result in a positive reduction in the soil erosion 7
through abundant below ground biomass with soil retaining abilities. Giant miscanthus 8
produces abundant above and below ground biomass. The top soil layer (0 to 30 9
centimeters [cm]) contains around 28 percent of the root biomass, while nearly half of the 10
total roots were present in the deeper soils layers (below 90 cm) (Neukirchen et al 1999). 11
The extensive deep root system can improve soil qualities by improving water storage, 12
microbial process, and soil organic carbon storage (Blanco-Canqui 2010). In a 10-year 13
study of giant miscanthus in Illinois, Davis et al. (2010) found that giant miscanthus 14
produced greater above ground carbon (C) (1,606 to 2,426 grams [g] C/ square meter [m2]) 15
when compared to switchgrass, native prairie, (344 to 705 g C/m2) and corn (405 to 717 g 16
C/m2). Davis et al. (2010) also indicated that giant miscanthus could produce soil C at a 17
faster rate due in part to greater litter fall and below ground plant production (root system). 18
Hansen et al. (2004) indicated that between 26 to 29 percent of accumulated C input was 19
retained in the soil in soil samples taken from 9-year old and 16-year old giant miscanthus 20
plants in Denmark. 21
Initial preparation of land for giant miscanthus establishment could result in the soil 22
disturbance similar to traditional tillage of commodity crops. The preparation process could 23
cause erosion following rainfall events until the giant miscanthus becomes established 24
(Donnelly et al 2010). Soil tillage for giant miscanthus establishment can redistribute the 25
organic matter and nutrients that accumulate at the surface of soils and create beneficial 26
effects for the soil quality by mixing the soils and organic matter (Donnelly et al 2010). The 27
eradication of the crop would result in additional tillage, similar to the establishment phase 28
and traditional row crop tillage, which would redistribute soil organic matter, but would leave 29
the soil bare until a new cover crop was established. The crop is expected to have a 20+ 30
year lifetime. Once the plant is established, the dense root and rhizome system is expected 31
to minimize the potential for soil erosion. In the long term, the potential for soil erosion will 32

ENVIRONMENTAL CONSEQUENCES
DRAFT - Environmental Assessment SE Giant Miscanthus Establishment and Production 4-20
be significantly reduced relative to other regional crops and will likely be reduced relative to 1
pasture land, which is disturbed by grazing stock. 2
Pimental and Kounang (1998) reviewed the literature to determine average soil erosion 3
rates for different land types. They found that the average soil erosion rate on U.S. 4
croplands was 13 tons per hectare per year or approximately 5.3 tons per acre per year 5
(Ibid.). Pastureland was found to have a soil erosion rate approximately half that of cropland 6
(six tons per hectare per year or 2.4 tons per acre per year) (Ibid.). They also cited that the 7
natural soil formation rate is approximately 0.5 to 1.0 tons per hectare per year (0.2 to 0.4 8
tons per acre per year) (Ibid.). Triplett and Dick (2008) found that traditional tillage, when 9
compared to a no tillage system for corn production in Ohio over 42 years, resulted in a 10
difference of over 13.4 tons of soil lost per acre per year from traditional tillage acres. 11
Overall, soil loss due to erosion greatly exceeds natural soil formation in most areas. 12
Once established, giant miscanthus fields would generate soil conservation benefits 13
associated with a large perennial root system and no tillage production. The combined root 14
system and high litter accumulation on the soil surface would reduce the wind and water soil 15
erosion. During the establishment period, traditional tillage practices would be undertaken 16
for a maximum of one year within the proposed project areas 17
Overall, there could be a positive result of soil quality and reduction of soil erosion for the 18
Proposed Action. Giant miscanthus can produce an ample amount of above and below 19
ground biomass allowing for reduction in soil loss which would reduce the potential for 20
sediment to move from fields carrying pesticides and nutrients to the surface water bodies. 21
This also is expected to reduce the sediment runoff which could be deposited off-site or 22
runoff directly into water bodies. 23
4.6.3 No Action Alternative 24
Selecting the No Action Alternative would be unlikely to change current practices. Under this 25
alternative, the Project Sponsor would not undertake the establishment and production of 26
giant miscanthus in the proposed project areas. The proposed project areas would not 27
receive the potential soil benefits that could be provided by giant miscanthus and could 28
potentially receive negative effects to soil quality through continued traditional crop 29
management. 30

ENVIRONMENTAL CONSEQUENCES
DRAFT - Environmental Assessment SE Giant Miscanthus Establishment and Production 4-21
4.7 WATER QUALITY AND QUANTITY 1
4.7.1 Water Quality 2
4.7.1.1 Significance Threshold 3
An accounting of increases or reductions in input use such as fertilizer, herbicides, and 4
pesticides is performed to evaluate potential changes in water quality. 5
4.7.1.2 Proposed Action 6
Implementing the Proposed Action would not result in a significant decline in surface water 7
quality or groundwater quality within the proposed project areas. Over the productive life of 8
the Freedom giant miscanthus acres, inputs of fertilizer, herbicides, and pesticides would be 9
anticipated to be lower when compared to inputs for traditional row crops and higher for 10
unimproved pasture, but would be site-specific based on soil type and past land use 11
activities. 12
Since giant miscanthus is expected to be an excellent nutrient scavenger and recycles 13
nutrients back to the root system, and provides excellent soil surface cover to prevent 14
erosion losses, off-site movement of nitrogen and phosphorus would be expected to be low. 15
As indicated earlier, fertilization of giant miscanthus would not occur until after soil testing 16
recommendations have been analyzed at the site-specific level. Cadoux et al. (2011) 17
indicate that biomass harvest of miscanthus removes approximately 4.9 grams per kilogram 18
(g/kg) of dry matter, 0.45 g/kg, and 7.0 g/kg of nitrogen, phosphorus, and potassium, 19
respectively, which should indicate a maximum replenishment rate for fertilizer applications. 20
Based on unpublished giant miscanthus trials at MSU, average rates were found to be 50 21
pounds of nitrogen and 60 pounds of potassium fertilizer per acre with average biomass dry 22
tonnage in the range of 15 to 23 tons. Table 4-5 lists the average fertilizer applications in 23
pounds per acre by state within the proposed project areas. In general, the field trials of 24
Freedom giant miscanthus indicated that it required less fertilization than the average 25
application in Georgia for corn or cotton and in North Carolina for corn. 26
Table 4-5. Comparison of Average Fertilizer Applications, pounds per acre 27
Nutrient
Corn Corn Cotton Soybeans Freedom Giant Miscanthus
Georgia (2010)
North Carolina (2010)
Georgia (2010)
North Carolina (2007) Mississippi
Nitrogen 177 128 95 21 50 Phosphorus 68 40 59 84 0 Potassium 78 81 105 44 60 USDA ERS 2011, unpublished field trial data MSU 28

ENVIRONMENTAL CONSEQUENCES
DRAFT - Environmental Assessment SE Giant Miscanthus Establishment and Production 4-22
Research also suggests that, once established, giant miscanthus can lead to low levels of 1
nitrate leaching and as a result improve groundwater quality relative to other crops 2
(Christian and Riche 1998). Further, Love and Nejadhashemi (2011), through modeling with 3
the Soil and Water Assessment Tool (SWAT) for scenarios of crop conversions in Michigan, 4
found that perennial grasses (e.g., miscanthus, native grasses, and switchgrass) would 5
improve water quality over traditional crops for sediment and phosphorus loading, but could 6
slightly increase nitrogen. On lands with existing high nitrogen levels within the study area, 7
that are currently cultivated with other crops (e.g., sugarbeets, potatoes, dry beans, and fruit 8
crops) or lands considered marginal for crop production, the authors determined these areas 9
would not be suitable for bioenergy production, as all herbaceous species modeled 10
increased nitrogen loading. The authors did find that on these land types with less nitrogen 11
concerns, miscanthus and native grasses would be suitable crops for bioenergy production 12
(Ibid.). Ng et al. (2010) found using SWAT that a 10 percent land use change to miscanthus 13
from a corn and soybean rotation in Illinois reduced nitrate export by 6.4 percent; while at a 14
50 percent conversion, up to a 30 percent decrease in nitrate export could be obtained. 15
The conversion of formerly cropped acres to giant miscanthus production would reduce 16
runoff, sediment loss, and nutrient loss due to the high ground cover provided by the plant 17
after it has established and the reduced need for nutrient application. This reduction in 18
sediment and nutrient loss in runoff could enhance water bodies and water quality, 19
especially in sensitive watersheds. In marginal areas, sediment runoff could be affected 20
during the establishment of giant miscanthus; however, that would be contingent upon the 21
quality of vegetation cover on the marginal lands. For lower quality vegetation, such as a 22
previously disturbed site dominated by annual or early successional species, these areas 23
would be anticipated to receive water quality benefits as giant miscanthus establishes 24
perennial groundcover on the previous short-term or spare vegetative cover. For areas with 25
improved perennial pasture, there could be short-term increases in off-site runoff, until giant 26
miscanthus becomes established. Site-specific BMPs would be incorporated into the 27
producer Conservation Plan to minimize these effects. 28
4.7.1.3 No Action Alternative 29
Selecting the No Action Alternative, would not produce a significant change in water quality, 30
unless there was a substantial increase in land use toward traditional commodity crops. 31
Based on agricultural crop production projections, planted corn acreage is anticipated to 32
increase by approximately 5.4 percent between 2008 and 2017; however, all other primary 33

ENVIRONMENTAL CONSEQUENCES
DRAFT - Environmental Assessment SE Giant Miscanthus Establishment and Production 4-23
field crop planted acreage is anticipated to decline. Overall, the change in land use through 1
the selection of the No Action Alternative would not indicate increased acreage with a need 2
for increased agricultural chemicals. 3
4.7.2 Water Quantity 4
4.7.2.1 Significance Threshold 5
Water quantity changes could result in positive or negative effects on total water use in the 6
short-term and over the life of the crop compared to other cropping systems depending on 7
the regional climate. Land use and water use changes would affect hydrology relative to 8
runoff and stream flow. 9
4.7.2.2 Proposed Action 10
Miscanthus has a higher efficiency of water use per biomass yield than corn or sorghum 11
crops. Typically, giant miscanthus requires between 100 to 300 liters of water 12
(approximately 26 to 79 gallons) to produce one kilogram (kg) (approximately 2.2 pounds) of 13
biomass depending upon location of production with average anticipated to be 14
approximately 200 liters per kg (approximately 500 millimeters [mm] equivalent precipitation 15
per year) (Heaton et al. 2010). 16
Although miscanthus uses less water per unit of biomass than traditional crops in the project 17
area, the net water use per acre may be higher. This is due to the higher biomass per acre, 18
than corn, soybeans, and switchgrass, and a longer growing season than corn and 19
soybeans 20
Annual water use and water losses associated with evapotranspiration (ET) for giant 21
miscanthus differs from those documented for annual row crops and pasturelands. Hall 22
(2003) estimated that perennial energy grasses would use between 500 to 600 mm (20 to 23
24 inches) of water annually. Hall determined that giant miscanthus had approximately a 20 24
percent interception loss, indicating that a giant miscanthus crop, to be productive would 25
need approximately 28 inches per year in precipitation. Grass hay, alfalfa, or pasture which 26
typically require between 30 and 39 inches of water annually and corn typically requires 21 27
to 29 inches of water annually (Schneekloth and Andales 2009). Table 4-6 summarizes 28
literature associated with seasonal water use by crop type. 29
30

ENVIRONMENTAL CONSEQUENCES
DRAFT - Environmental Assessment SE Giant Miscanthus Establishment and Production 4-24
Table 4-6. Summary of Reported 1 Water Use Values (mm) for Miscanthus and Other Crops 2
Crop Estimated Water Use
(mm) Location Source(s) Miscanthus 200 England Heaton et al. (2010)
500 United Kingdom Long and Beale (2001) as cited in Teoh et al. (2011)
954.6 Illinois Hickman et al. (2010) 347.9 to 391.7 Italy Consentino et al. (2006)
Alfalfa 763.0 to 999.2 Colorado Schneekloth and Andales 2009 Barley 288 to 297 – monoculture and
rotation Spain Álvaro-Fuentes et al. (2009)
Coastal Bermudagrass 680 Texas Marsalis et al. (2007) Corn 146 to 316 Colorado Nielsen et al. (2006)
551 to 584 Kansas Hattendorf et al. (1988) 255 to 422 – dry matter
293 to 448 - grain South Dakota Olson (1971)
520.4 to 681.0 Colorado Schneekloth and Andales 2009 444 to 480 Kansas Norwood (2001)
611.9 Illinois Hickman et al. (2010) Giant Amaranth 261 to 282 North Dakota Johnson and Henderson (2002) Grain Sorghum 339 to 374 Nebraska Maman et al. (2003)
451 to 523 Kansas Hattendorf et al. (1988) 453 to 477 Kansas Stone et al. (2001)
202 to 424 – dry matter 296 to 443 - grain
South Dakota Olson (1971)
406.1 to 640.1 Colorado Schneekloth and Andales 2009 Grass hay/pasture 661.4 to 880.4 Colorado Schneekloth and Andales 2009 Pearl Millet 336 to 370 Nebraska Maman et al. (2003)
70 to 266 Colorado Nielsen et al. (2006) 441 to 529 Kansas Hattendorf et al. (1988)
Soybean 441 to 596 Kansas Hattendorf et al. (1988) Sunflower 476 to 584 Kansas Hattendorf et al. (1988)
565 to 580 Kansas Stone et al. (2001) Sweet Sorghum 152 to 268 Arizona Miller and Ottman (2010)
272 to 390 South Dakota Olson (1971) Switchgrass 764.3 Illinois Hickman et al. (2010) Triticale 86 to 330 Colorado Nielsen et al. (2006) Wheat 317 to 342 Australia Angus and Herwaarden (2001)
318.3 to 499.1 Colorado Schneekloth and Andales 2009 300 to 345 – monoculture and
rotation Spain Álvaro-Fuentes et al. (2009)
Beale et al. (1999) indicated that water use efficiency for giant miscanthus, when normalized 3
by the daily maximum vapor pressure deficit, were within the range of C4 crops over several 4
environments (7.3 grams per kiloPascal per kilogram [g kPA/kg] – 9.4 g kPA/kg) and based 5
on literature would be similar to corn (8.2 to 12.0 g kPA/kg) and pearl millet (8.4 to 10.6 g 6
kPA/kg). Since some pastureland species use more water annually than miscanthus; 7
depending upon land use cover of pastureland, total water use could be reduced somewhat 8
through implementation of the project areas. 9

ENVIRONMENTAL CONSEQUENCES
DRAFT - Environmental Assessment SE Giant Miscanthus Establishment and Production 4-25
The majority of the data on ET comes from England where the plant has been grown in 1
production for over a decade. Estimated ET for miscanthus is highly variable between 2
studies (Table 4-7). In general, ET in miscanthus fields is two to three times lower than the 3
values measured in corn, similar to switchgrass, and somewhat higher than winter wheat 4
and grasslands. 5
VanLoocke et al. (2010) indicated that through their modeling giant miscanthus at 100 6
percent cover that ET increased by over 200 mm per year and drainage declined between 7
50 to 250 mm per year. The model included the entire Midwest (11 states) with over 324 8
million acres of agricultural land and average precipitation ranging from 15 to 40 inches per 9
year (west to east). At 10 percent cover (estimated more than 32 million acres) changes to 10
ET and drainage were minimal compared to existing cover (Ibid.). The project is expected to 11
enroll considerably less than 10 percent of the total agricultural lands in each of the 12
production areas, so no significant regional change in ET is expected. VanLoocke et al. 13
(2010) also indicate that past studies have shown that conversion from native grasslands to 14
annual crop dominated cover could have reduced ET in Corn Belt of the United States by 15
approximately 75 mm per year, indicating that giant miscanthus could have ET rates more in 16
line with past vegetative cover in prime farming areas than current crop cover. 17
Giant miscanthus, as a result of the deep root system and large leaf area, likely has higher 18
infiltration rates during rain events allowing for a reduced run-off and the reduced peak 19
flows, which could reduce the effects of flooding in certain areas (Smeets 2008). 20
The project is targeting use of pastureland, marginal and idle croplands, and 21
abandoned/previously cleared forestlands. Therefore, the number of acres converted from 22
irrigated crops to giant miscanthus in these project areas will likely be negligible. 23
24

ENVIRONMENTAL CONSEQUENCES
DRAFT - Environmental Assessment SE Giant Miscanthus Establishment and Production 4-26
Table 4-7. Summary of Reported 1 ET Values (mm/day) for Miscanthus and Other Crops 2
Crop Estimated ET
(mm/day) Location Source(s) Miscanthus 2.3 England Beale et al. (1999)
1.2 to 1.6 England Cranfield University (2001) as cited in Finch et al. (2009)
1.9 to 3.1 Italy Cosentino et al. (2007) 3.2 England Finch and Riche (2008) as cited in
Finch et al. (2009) 3.7 to 3.9 Illinois McIsaac et al. (2010)1
Corn 6.8 to 7.4 (43 year average)
Kansas Lamm et al. (2007)
6 to 10 Texas Howell et al. (1996) 1.8-3.0 – no till
1.7-3.1 – chisel plow Wisconsin Brye et al. (2000)
Corn – Soybean 1.4 to 2.3 Illinois McIsaac et al. (2010)1 Soybeans 4.1 to 5.1 – irrigated
3.4 to 4.6 – non-irrigated Siberia Maksimovic et al. (2005)
3.4 – irrigated 3.2 - rainfed
Nebraska Suyker and Verma (2009)
Switchgrass 2.5 to 2.6 Illinois McIsaac et al. (2010) 1 Winter Wheat 1.3 – drought crop 2.0 –
rain fed crop England Weir and Barraclough (1986) as cited
in Finch et al. (2009) 1.5 to 1.7 England Scott et al. (1994) as cited in Finch et
al. (2009) Alfalfa 7.9 to 8.1 Texas Tolk et al. (2006) Grasslands 1.4 England Calder et al. (2003) as cited in Finch et
al. (2009)3 1.1 England, riparian
areas Finch and Harding (1988) as cited in Finch et al. (2009)
Native Prairie 2.6-2.7 North Dakota Frank (2003) 2.4-2.5 Wisconsin Brye et al.(2000) 3.2-3.4 Kansas Bremer et al. (2001)
Western Wheatgrass 2.8 North Dakota Frank (2003) 1 Publication reported total annual ET; values converted to daily ET 3 2 Publication indicated corn/soybeans were 104 mm less per growing season which is equivalent to 0.9 4
mm/day less. Number in table is value for miscanthus reported by the author minus 0.9 mm/day 5 3 Grasslands in England have a longer growing season than Miscanthus 6
4.7.2.3 No Action Alternative 7
The selection of the No Action Alternative would not result in significant adverse effects to 8
the water quantity within the proposed project areas. Under this alternative, the Project 9
Sponsor would not undertake the establishment and production of giant miscanthus in the 10
proposed project areas. The change in land use through the selection of the No Action 11
Alternative would not indicate increased acreage with a need for increased agricultural 12
irrigation. 13

ENVIRONMENTAL CONSEQUENCES
DRAFT - Environmental Assessment SE Giant Miscanthus Establishment and Production 4-27
4.8 AIR QUALITY 1
4.8.1 Significance Thresholds 2
A significant effect to air quality would be sufficient emissions generation to contribute a 3
substantial amount to estimated calculated emissions to an AQCR. The percentage 4
contribution would vary by area and the amount of existing pollutant emissions. In areas in 5
nonattainment for criteria pollutants a significant effect could be an amount of emissions that 6
would require obtaining a new source permit or would create negative effects to a state’s 7
emissions goals as developed in their SIP. 8
4.8.2 Proposed Action 9
Overall, it would be anticipated that agricultural equipment necessary for the establishment, 10
harvesting, and transportation of giant miscanthus would provide a minimum amount of the 11
PM2.5 particulate load within the three counties located within the Metropolitan Atlanta AQCR 12
based on the comparison of estimated emissions from new agricultural production to the 13
emissions from electric generating units in Heard County and the proximity to the Atlanta, 14
Georgia metropolitan area. 15
A calculation of PM2.5 emissions for traditional agricultural tillage was developed following 16
the EPA’s Development of Agricultural Dust Emission Inventories for the Central State 17
Regional Air Planning Association; it indicated a range of 0.0565 pounds per acre to 0.1790 18
pounds per acre (Penfold et al nd., EPA 1998). Agricultural tillage would occur for one year 19
on each contract parcel within the proposed project areas. Based on the acres for the 20
Middle Georgia proposed project area in Table 2-3, tpy of fine dust particulates generated 21
from agricultural tillage within the entire proposed project area would range from 1.10 tpy to 22
3.49 tpy after planting. Even at the highest amount and assuming that all particulates would 23
occur within the Metropolitan Atlanta AQCR, the contribution of agricultural tillage from this 24
proposed project area would account for approximately 0.16 percent of the 2008 emissions 25
in Heard County or 0.36 percent of the 2008 emissions in Spalding County or 0.34 percent 26
of the 2008 emissions in Putman County. The Proposed SIP Revision for the Atlanta PM2.5 27
Nonattainment Area indicated that the 2012 estimated on-road mobile source emissions for 28
Georgia are 3,127 tpy. When compared to the emissions from the proposed project, it 29
would contribute 0.1 percent to this total. In the long term, PM2.5 emissions should be 30
reduced by the program since lands currently tilled annual will no longer be tilled once the 31
rhizomes are planted. 32

ENVIRONMENTAL CONSEQUENCES
DRAFT - Environmental Assessment SE Giant Miscanthus Establishment and Production 4-28
4.8.3 No Action Alternative 1
The selection of the No Action Alternative would not result in significant adverse effects to 2
the air quantity within the proposed project areas. Under this alternative, the Project 3
Sponsor would not undertake the establishment and production of giant miscanthus in the 4
proposed project areas. 5
4.9 OUTDOOR RECREATION 6
4.9.1 Significance Thresholds 7
Overall trends in outdoor recreation participation in the United States have been positive in 8
both the number of participants and the number of participant days. Based on these on-9
going trends as well as parallel data that can be derived from other USDA program-related 10
outdoor recreation effects, impacts to recreational resources would be considered significant 11
if there were long-term reductions in recreational participation or expenditures after 12
implementation of an action and establishment of a new equilibrium. 13
4.9.2 Proposed Action 14
Under the proposed action, a maximum of 58,000 acres within three states would be 15
converted to Freedom giant miscanthus. Wildlife-related outdoor recreation is highly 16
dependent upon wildlife diversity and abundance in a given area; therefore, recreational 17
opportunities are correlated with effects to wildlife habitat from this project. If wildlife buffers 18
and corridors are part of the site-specific Conservation Plans wildlife movement would still 19
occur, similar to other types of row crop usage. Land conversion into giant miscanthus 20
would be relatively small on the regional scale and would be highly dependent on producer’s 21
determination of economic values associated with their properties. All three states have 22
private hunting opportunities where properties are leased to day-hunters or longer-term 23
season leases. If a producer determines that their income from their leasehold exceed the 24
potential income from giant miscanthus production, then that producer would choose not to 25
convert the land into giant miscanthus production. High quality hunting lands with high 26
economic value to the property owner are unlikely to be converted, which would provide 27
continued opportunities for the direct consumptive use of wildlife for non-landowners. No 28
public lands would be converted into giant miscanthus providing continued opportunities for 29
the population to have non-consumptive wildlife uses (e.g., wildlife watching). Though 30
further study is needed to determine the long-term use of giant miscanthus fields by wildlife, 31

ENVIRONMENTAL CONSEQUENCES
DRAFT - Environmental Assessment SE Giant Miscanthus Establishment and Production 4-29
indications through anecdotal surveys are that wildlife in the short-term continue to use 1
fields similar to use prior to conversion into giant miscanthus. 2
4.9.3 No Action Alternative 3
The selection of the No Action Alternative would not result in significant adverse effects to 4
the outdoor recreation within the proposed project areas. Under this alternative, the Project 5
Sponsor would not undertake the establishment and production of giant miscanthus in the 6
proposed project areas. As such, land use conversion would follow existing patterns and 7
available lands for outdoor recreation would remain similar to those described or would be 8
developed according to the prevailing economic conditions of the time. 9
4.10 ENVIRONMENTAL JUSTICE ANALYSIS 10
Executive Order (EO) 12898, “Federal Actions to Address Environmental Justice in Minority 11
and Low Income Populations,” requires a federal agency to “make achieving environmental 12
justice part of its mission by identifying and addressing, as appropriate, disproportionately 13
high human health or environmental effects of its programs, policies, and activities on 14
minority populations and low income populations.” A message from the President 15
concerning EO 12898 stated that federal agencies should collect and analyze information 16
concerning a project’s effects on minorities or low-income groups, when required by NEPA. 17
If such investigations find that minority or low-income groups experience a disproportionate 18
adverse effect, then avoidance or mitigation measures are to be taken. Under NEPA, if 19
disproportionate impacts on minority or low-income populations are identified, a proposed 20
action is not precluded from going forward, nor does it compel a conclusion that the action is 21
environmentally unsatisfactory. Rather, identification of such an effect should heighten 22
agency attention to alternatives, mitigation measures, monitoring needs, and preferences 23
expressed by the affected communities or populations (Council on Environmental Quality 24
[CEQ] 1997). 25
More specifically, EO 12898 requires all Federal agencies to: 26
· Conduct their programs, policies, and activities that substantially affect health and 27
the environment so as not to exclude, deny benefits to, or discriminate against 28
persons because of race, color, or national origin. 29
· Ensure that public documents, notices, and hearings relating to human health or the 30
environment are concise, understandable, and readily accessible to the public. 31

ENVIRONMENTAL CONSEQUENCES
DRAFT - Environmental Assessment SE Giant Miscanthus Establishment and Production 4-30
· Whenever practicable and appropriate, collect, maintain, and analyze information 1
assessing and comparing environmental and human health risks borne by 2
populations identified by race, national origin, or income. To the same extent, 3
Federal agencies shall use this information to determine whether their programs, 4
policies, and activities have disproportionately high and adverse human health or 5
environmental effects on minority populations and low-income populations. Similarly, 6
Federal agencies are to collect and analyze information on race, national origin, 7
income level, and other readily accessible and appropriate information for areas 8
surrounding facilities or sites expected to have a substantial environmental, human 9
health, or economic effect on the surrounding populations, when such facilities or 10
sites become the subject of a substantial Federal environmental administrative or 11
judicial action. 12
· Collect and analyze information on the consumption patterns of populations who 13
principally rely on fish and/or wildlife for subsistence. 14
On 10 December 1997, the CEQ published Environmental Justice Guidance Under the 15
National Environmental Policy Act as a guidance document for Federal agencies to follow 16
for developing and implementing procedures to comply with EO 12898 during the NEPA 17
process. CEQ guidance made several points with regard to agency NEPA analyses 18
addressing environmental justice, these included: 19
· The importance of research, data collection, and analysis, particularly with respect to 20
multiple and cumulative exposures to environmental hazards for low-income 21
populations, minority populations, and Indian tribes. Thus, data on these exposure 22
issues should be incorporated into NEPA analyses as appropriate. 23
· The importance of ensuring effective public participation and access to information. 24
· In regards to NEPA analyses, each Federal agency should analyze the 25
environmental effects, including human health, economic, and social effects of 26
Federal actions, including effects on minority populations, low-income populations, 27
and Indian tribes. 28
· Mitigation measures identified as part of a NEPA analysis should, whenever feasible, 29
address significant and adverse environmental effects of proposed federal actions on 30
minority populations, low-income populations, and Indian tribes. 31

ENVIRONMENTAL CONSEQUENCES
DRAFT - Environmental Assessment SE Giant Miscanthus Establishment and Production 4-31
· Each Federal agency must provide opportunities for effective community 1
participation in the NEPA process, including identifying potential effects and 2
mitigation measures in consultation with affected communities and improving the 3
accessibility of public meetings, crucial documents, and notices. 4
The primary agency involved in ensuring meaningful access of minority and low-income 5
communities is the U.S. Environmental Protection Agency (USEPA) which monitors the 6
enforcement of EO 12898 nationwide to ensure that it is being enforced equally in all states 7
to protect the environment and public health. In July 2010, the USEPA published the EPA’s 8
Action Development Process (2010a), which describes its internal guidance for addressing 9
environmental justice concerns across agency rulemaking and providing a blueprint for other 10
agencies to follow. The USEPA has further refined EO 12898 to further the concepts of fair 11
treatment and meaningful involvement. 12
Fair treatment – no group of people should bear a disproportionate burden of 13
environmental harms and risks, including those resulting from negative environmental 14
consequences of industrial, governmental, and commercial operations or programs and 15
policies. 16
Meaningful involvement – (1) potentially affected community members have an 17
appropriate opportunity to participate in decisions about a proposed activity that will affect 18
their environment and/or health; (2) the public’s contribution can influence the regulatory 19
agency’s decision; (3) the concerns of all participants involved will be considered in the 20
decision-making process; and (4) the decision-makers seek out and facilitate the 21
involvement of those potentially affected. 22
4.10.1 Significance Thresholds 23
According to the CEQ (1997), a minority population can be described as being composed of 24
the following population groups: American Indian or Alaskan Native, Asian or Pacific 25
Islander, Black, not of Hispanic origin, or Hispanic, and exceeding 50 percent of the 26
population in an area or the minority population percentage of the affected area is 27
meaningfully greater than the minority population percentage in the general population. 28
Race and ethnicity are two separate categories of minority populations. A minority 29
population can be defined by race, by ethnicity, or by a combination of the two distinct 30
classifications. 31
32

ENVIRONMENTAL CONSEQUENCES
DRAFT - Environmental Assessment SE Giant Miscanthus Establishment and Production 4-32
Race as defined by the U.S. Census Bureau (2001) includes: 1
· White – A person having origins in any of the original peoples of Europe, the Middle 2
East, or North Africa; 3
· Black or African American – A person having origins in any of the Black racial groups 4
of Africa; 5
· American Indian or Alaska Native – A person having origins in any of the original 6
peoples of North and South America (including Central America) and who maintain 7
tribal affiliation or community attachment; 8
· Asian – A person having origins in any of the original peoples of the Far East, 9
Southeast Asia, or the Indian subcontinent including, for example, Cambodia, China, 10
India, Japan, Korea, Malaysia, Pakistan, or the Philippine Islands; and 11
· Native Hawaiian and Other Pacific Islanders – A person having origins in any of the 12
original peoples of Hawaii, Guam, Samoa, or other Pacific Islands. 13
The U.S. Census Bureau (USCB) defines ethnicity as either being of Hispanic origin or not 14
being of Hispanic origin. Hispanic origin is defined as “a person of Cuban, Mexican, Puerto 15
Rican, South or Central America, or other Spanish culture or origin regardless of race” 16
(USCB 2001). 17
Each year the USCB defines the national poverty thresholds, which are measured in terms 18
of household income dependent upon the number of persons within the household. 19
Individuals falling below the poverty threshold ($17,603 for a household of four in 2000; 20
$22,314 for a household of four in 2010) are considered low-income individuals. USCB 21
census tracts where at least 20 percent of the residents are considered poor are known as 22
poverty areas (USCB 1995). When the percentage of residents considered poor is greater 23
than 40 percent, the census tract becomes an extreme poverty area. 24
4.10.2 Proposed Action 25
Implementing the proposed action would not result in disproportionate adverse impacts to 26
minority or low-income populations within the proposed project areas. The Project Sponsor 27
has diligently worked to find a species of dedicated biomass energy feedstock that could be 28
competitively grown in the Southeastern United States that did not diminish acreage for food 29
or fiber production and would have minimal adverse environmental effects from the species 30
itself and/or the establishment and production methods. The Project Sponsor has 31

ENVIRONMENTAL CONSEQUENCES
DRAFT - Environmental Assessment SE Giant Miscanthus Establishment and Production 4-33
developed processes that diminish the overall cost of establishing Freedom giant 1
miscanthus within the proposed project areas, which should provide adequate opportunities 2
for eligible producers of all races, ethnicities, and sex with land appropriate for giant 3
miscanthus production to enroll in the program. Overall, this project could provide a needed 4
diversified crop mix for minority and beginning producers within the proposed project areas. 5
A short review of the sensitive populations is included below, as well as, information on the 6
job tax credits available to draw new businesses into the proposed project areas. 7
4.10.2.1 Review of Minority and Low-Income Characteristics 8
The proposed project areas contain substantial minority and low-income populations 9
throughout. As mentioned previously, 24.1 percent of the counties in the East Georgia 10
proposed project area, 6.7 percent of the counties in the Middle Georgia proposed project 11
area, 33.4 percent of the counties in the Lowcountry proposed project area, and 23.4 12
percent of the counties in the North Carolina proposed project area have a total minority 13
population in excess of 50 percent of the total population. 14
As indicated in Section 3.1.3.3, minority operators in these three states account for as many 15
as 8.6 percent of producer to as few as 4.8 percent of producers. In the proposed project 16
areas, minority operators account for 9.1 percent of total operators in the Lowcountry 17
proposed project area, 8.2 percent of operators in the North Carolina proposed project area, 18
7.7 percent in the Middle Georgia proposed project area, and 7.2 percent in the East 19
Georgia proposed project areas. In all of the proposed project areas, minority operators 20
account for a higher percentage of operators than at the state level, indicating greater 21
opportunities for minority operators to participate in this project. 22
The proposed project areas have large percentages of the population that fall below the 23
poverty threshold. Within the East Georgia proposed project area 93.3 percent of the 24
counties have a poverty rate at or greater than 20 percent of the population, the Middle 25
Georgia proposed project area has 75 percent of the counties at or greater than 20 percent 26
of the population below the poverty threshold, the Lowcountry proposed project area has 27
95.5 percent of the counties, and the North Carolina proposed project area has 53.4 percent 28
of the counties. Additionally, the 2010 annual average unemployment rate within each of 29
the proposed project areas was greater than 18 percent. 30
31

ENVIRONMENTAL CONSEQUENCES
DRAFT - Environmental Assessment SE Giant Miscanthus Establishment and Production 4-34
4.10.2.2 State-Level Tax Credit Programs 1
Each of the states within the proposed project areas have developed tax incentive programs 2
to bring new businesses and job creation into these economically depressed counties. The 3
Project Sponsor would provide feedstock for BCFs, which would bring in new jobs to many 4
of these proposed project areas. The project sponsor estimates that within the East Georgia 5
proposed project area, more than 85 full time or full time equivalent (FTE) jobs would be 6
created directly or indirectly through this project with an estimate annualized effect of over 7
$17 million once the establishment is mature. In the Middle Georgia proposed project area, 8
the project sponsor is estimating more than 115 full time or FTE jobs would be created 9
directly or indirectly through this project with an estimate annualized effect of over $22 10
million once the establishment is mature. The Lowcountry proposed project area is 11
estimated to provide more than 30 full time or FTE jobs would be created directly or 12
indirectly through this project with an estimate annualized effect of over $5.5 million once the 13
establishment is mature. For the North Carolina proposed project, the project sponsor 14
estimates more than 85 full time or FTE jobs would be created directly or indirectly through 15
this project with an estimate annualized effect of over $19 Million once the establishment is 16
mature. 17
4.10.2.2.1
The Georgia Job Tax Credit Program is a statewide job tax for any business or 19
headquarters of any such business engaged in manufacturing, warehousing and disruption, 20
processing, telecommunication, broadcasting, tourism, or research and development 21
industries that create and maintain sufficient number of new full-time jobs. Counties and 22
certain census tracts in the state are ranked and placed in economic tiers using the following 23
factors: (1) highest unemployment rate; (2) lowest per capita income; and (3) highest 24
percentage of residents whose incomes are below the poverty level. The tier ranking of a 25
county determines the amount of Job Tax Credit which as businesses located in the count 26
will be entitled to receive, the minimum number of jobs they much created to be eligible the 27
other program requirements and benefits. In Tier I counties, job tax credits are available to 28
business of any nature. In Tier I counties recognized and designated as the 40 least 29
developed counties, and certain specially designated areas, a business must create and 30
maintain at least five net new jobs to eligible for a credit of $3,500 per job. There are 25 31
counties within the proposed project areas that are ranked in the 40 least developed 32
counties for 2011 (DCA 2011) (Figure 4-1). 33
Georgia 18

ENVIRONMENTAL CONSEQUENCES
DRAFT - Environmental Assessment SE Giant Miscanthus Establishment and Production 4-35
Figure 4-1. State-level Job Tax Credits Available within the Proposed Project Area 1 Counties. 2
3
ENVIRONMENTAL CONSEQUENCES
DRAFT - Environmental Assessment SE Giant Miscanthus Establishment and Production 4-36
4.10.2.2.2
In North Carolina, Article 3J Tax Credits offer initiatives for creating jobs, investing in 2
business property, and investment in real property. The primary activity at the business 3
establishment must be an eligible type of business, which includes: 4
North Carolina 1
· aircraft maintenance and repair; 5
· air courier services hub; 6
· company headquarters that creates at least 75 new headquarters jobs; 7
· customer service call centers; 8
· electronic shopping and mail order houses; 9
· information technology and services; 10
· manufacturing; 11
· motorsports facilities and motorsports racing teams; 12
· research and development; and 13
· warehousing and wholesale trade. 14
4.10.2.2.3
The South Carolina Traditional Annual Job Tax Credit provides a tax credit against South 16
Carolina income tax, bank tax, or insurance premium tax for a qualifying business creating 17
new jobs in this state. To qualify for the job tax credit, a business must: (1) be a certain type 18
of business, and (2) create and maintain a required minimum number of “new, full time jobs” 19
at the time a new facility or expansion is initially staffed. The traditional annual job tax credit 20
is available for five years and is first claimed on the taxpayer’s tax return for the year 21
following the creation of the new jobs, provided the jobs are maintained. The amount of 22
credit that a business may receive for each job created is determined by the county where 23
the business’s facility is located. For 2011, the “basic” job tax credit amounts under the 24
traditional annual job tax credit are listed below: $8,000 per year for each new, full time job 25
created in a Tier IV county; $4,250 per year for each new, full time job created in a Tier III 26
county: $2,750 per year for each new, full time job created in a Tier II county; $1,500 per 27
year for each new, full time job created in a Tier I county. Five of the six South Carolina 28
counties within the Lowcountry proposed project area, fall within one of these tiers. 29
South Carolina 15

ENVIRONMENTAL CONSEQUENCES
DRAFT - Environmental Assessment SE Giant Miscanthus Establishment and Production 4-37
4.10.3 No Action Alternative 1
The selection of the No Action Alternative would not result in environmental justice effects 2
within the proposed project areas. Under this alternative, the Project Sponsor would not 3
undertake the establishment and production of giant miscanthus in the proposed project 4
areas. As such, agricultural conditions would remain the same as current conditions. 5
4.11 ALTERNATIVES COMPARISON 6
This section of the EA provides a brief comparison for the potential effects associated with 7
both the Proposed Action and the No Action Alternative. Table 4-7 lists the qualitative 8
comparison of the alternatives. 9
Table 4-8. Comparison of the Alternatives 10 Resource Area Proposed Action No Action Alternative Cumulative Effects Socioeconomics Minor +/0 0 Minor +/0 Land Use 0/Minor - 0 0/Minor - Coastal Zone Management Consistency
0 0 0
Biological Resources Vegetation 0/Minor - 0 0/Minor - Wildlife 0/Minor- 0 0/Minor- Protected Species 0 0 0
Soil Resources +/Minor - 0/Minor - +/Minor- Water Quality/Quantity
Water Quality Minor +/0 0/Minor - Minor +/Minor- Water Quantity Minor +/0 0/Minor - Minor +/Minor-
Air Quality 0/Minor - 0 0/Minor- Outdoor Recreation Minor +/Minor - 0 Minor +/Minor- Environmental Justice Minor +/0 0/Minor - Minor +/Minor- Note: (+)=positive (-)=negative (0)=neutral 11
4.11.1 Proposed Action 12
Implementing the Proposed Action would result in minor positive and negative effects to the 13
local and regional area; however, many of these effects would be minimized through the use 14
of the Mitigation and Monitoring Plan. The Proposed Action could result in additional 15
diversified income for the contract producer, as well as technical assistance from the Project 16
Sponsor in the production and harvesting of giant miscanthus. The Project Sponsor have a 17
proposed BCF in each of the proposed project areas ensuring that producers will have a 18
demand for their products. Also, ancillary agricultural services should expect an increase 19
due to the Project Sponsor goal of primarily contracting idle acres and not active cropland. 20
The Proposed Action would result in a changed local landscape with the addition of the giant 21

ENVIRONMENTAL CONSEQUENCES
DRAFT - Environmental Assessment SE Giant Miscanthus Establishment and Production 4-38
miscanthus fields. The Mitigation and Monitoring Plan will be used to ensure that adverse 1
effects from this new crop are minimized or avoided. 2
Minor negative effects would be anticipated for biological diversity as pastureland is 3
converted in giant miscanthus croplands. The Mitigation and Monitoring Plan will be 4
essential to provide mechanisms such as buffers and field edges to support continued 5
wildlife and vegetative diversity in these areas and control of rhizome and vegetative spread. 6
Recent research has indicated that giant miscanthus can function as a source of plant pests 7
to conventional crops; the Mitigation and Monitoring Plan monitoring and buffer will be 8
essential to ensure that any pests/diseases are identified and treated early to avoid 9
transmission to local croplands, such as corn. 10
Giant miscanthus, which has an extensive perennial root system, would be anticipated to 11
have positive effects on soil retention, soil organic matter, and conversion to soil carbon, as 12
well as increased water quality due to reduced nutrient leaching and transported sediments. 13
Giant miscanthus would be anticipated to require more water than annual crops, such as 14
corn; however, giant miscanthus has much higher water use efficiency, generating high 15
amounts of biomass per volume of water consumed. 16
4.11.2 No Action 17
The No Action Alternative would result in no adverse effects to the local and regional area 18
since there would be no giant miscanthus planted in any of the proposed project areas as 19
described in this BCAP Project Proposal. However, the No Action Alternative would not 20
assist in meeting the overall goal of BCAP, which is to develop dedicated energy crops for 21
use into the conversion of bioenergy. 22
23

CUMULATIVE IMPACTS ASSESSMENT
DRAFT - Environmental Assessment SE Giant Miscanthus Establishment and Production 5-1
5 CUMULATIVE IMPACTS ASSESSMENT 1
5.1 DEFINITION 2
The CEQ regulations stipulate that cumulative effects analysis consider the potential 3
environmental impacts resulting from “the incremental impacts of the action when added to 4
other past, present and reasonably foreseeable actions regardless of what agency or person 5
undertakes such other actions.” Cumulative effects most likely arise when a relationship 6
exists between a proposed action and other actions expected to occur in a similar location 7
or during a similar time period. Actions overlapping with or in proximity to the proposed 8
action would be expected to have more potential for a relationship than those more 9
geographically separated. Similarly, actions that coincide, even partially, in time tend to 10
have potential for cumulative effects. 11
The Proposed Action is to establish BCAP project areas supporting the establishment and 12
production of giant miscanthus as a dedicated energy crops for bioenergy production. The 13
scale of this action is regional and includes counties within Georgia, North Carolina, and 14
South Carolina. Given the action is to produce an alternative crop on existing agricultural 15
lands, identifying past, present, and reasonably foreseeable future actions is based on 16
existing cropland production, projected future cropland production, existing CRP acres 17
within each county, future expirations of CRP acres within each county, and the potential for 18
additional BCAP project acres within these proposed project areas. 19
5.2 CUMULATIVE IMPACTS ANALYSIS BY RESOURCE AREA 20
5.2.1 Socioeconomics 21
In the United States, average farm operator household income from 2007 to 2009 has been 22
consistently higher than the average United States household income; however, the 23
percentage difference has been declining from a high of 31.1 percent higher to 13.5 percent 24
higher (USDA ERS 2011b). Farming activities have contributed approximately 11.3 percent 25
to household income, with the projected average being 12.5 percent in 2010 (Ibid.). After 26
two declining years of total household income of farm operators, the forecast for 2010 and 27
2011 indicate an increase, which will be record levels (Ibid.). Traditional commodity crops 28
continue to be high-value for associated land production capabilities providing a substantial 29
proportion of farm operator household income for many areas. Combined with the 30
foreseeable high commodity prices associated with recent natural occurrences that have 31
impacted food crops globally and the driver for alternative fuels and energy sources from 32

CUMULATIVE IMPACTS ASSESSMENT
DRAFT - Environmental Assessment SE Giant Miscanthus Establishment and Production 5-2
renewable resources, traditional crops such as corn and soybean would be anticipated to 1
continue as the dominant agricultural land uses within these proposed project areas. 2
Under the Proposed Action, contract producers would be creating a diversified crop profile 3
with the inclusion of giant miscanthus on their marginal or idle lands. More than likely 4
woody biomass would be the primary bioenergy feedstock developed in the Southeastern 5
United States given the large amount of land use currently in timberland and forest cover 6
and the relative value of timber in relation to livestock production. Given the infancy of 7
industry for biomass feedstock production, large acreages are not anticipated to be 8
converted into dedicated biomass crops with the short-time frame associated with BCAP. 9
The Project Sponsor is anticipating a total combined acreage across all proposed project 10
areas to be up to 58,000 acres by 2013. The addition of smaller acreages of Freedom giant 11
miscanthus could diversify the producer portfolio and provide an annual revenue stream to 12
supplement the production of other traditional row crops or the longer term production of 13
timber. The potential for dedicated energy crops exists through many regions of the United 14
States; however, one of the primary limiting factors is accessibility to a BCF that (1) provides 15
a market to producers for their biomass feedstock and (2) has a market for sale of the 16
bioenergy product produced at that facility. Overall, the cumulative effects to 17
socioeconomics associated with the Proposed Action and No Action Alternative would be 18
minor, given the high commodity prices associated with traditional crops and the lack of 19
adequate BCF with enough demand in the region to convert more than a modest amount of 20
agricultural lands to dedicated energy crop production away from traditional crops. 21
5.2.2 Land Use 22
The combined proposed project areas include approximately 5.5 million acres of cropland 23
and pastureland with varying degrees of activity. Overall, soybeans are the most cultivated 24
crop within the proposed project areas accounting for just under 1.0 million acres. Corn 25
followed with 0.6 million planted acres in the combined proposed project areas. Projections 26
from the USDA Agricultural Projections to 2020 indicate that increased United States 27
planted acres of soybeans and corn would, on average, remain relatively flat, with some 28
short-term increase in corn (USDA 2011). 29
Of the land in farms, approximately 227,361 acres are in CRP as of July 2011 (5.0 percent 30
of total cropland) within the proposed project areas, with approximately 120,313 acres (52.9 31
percent) expiring from CRP between 30 September 2011 and 30 September 2015. 32
Currently, there are approximately 26.1 million acres enrolled in CRP practices in the United 33

CUMULATIVE IMPACTS ASSESSMENT
DRAFT - Environmental Assessment SE Giant Miscanthus Establishment and Production 5-3
States as of July 2011, with 4.4 million expiring at the end of Fiscal Year 2011 (16.9 1
percent). Overall, the cumulative effects to land use associated with the Proposed Action 2
and No Action Alternative would be minor, given the high commodity prices associated with 3
traditional crops and the lack of adequate BCF with enough demand in the region to convert 4
more than a modest amount of agricultural lands to dedicated energy crop production away 5
from traditional crops. 6
5.2.3 Managed Coastal Zones 7
This project would not be anticipated to create cumulative effects to managed coastal 8
zones, primarily through acreage exclusion of designated environmentally sensitive areas 9
and upland buffers to those designated areas. States have been granted the authority to 10
manage their coastal zone resources to protect their integrity and their high-value 11
associated with additional key resources that depend on those areas for existence. The 12
state-level permitting processes within each state require the review of ground disturbing 13
activities within the designated environmental sensitive areas. The Project Sponsor would 14
limit giant miscanthus production to existing agricultural lands in upland areas outside the 15
designated sensitive areas and upland buffers. All contract producers would be required to 16
implement all appropriate CPS and BMPs associated with their activities and their proximity 17
to coastal areas. The potential amount of available acreage within the coastal zone 18
counties would be small and adverse effects would be fully avoided. 19
5.2.4 Biological Resources 20
Cumulative effects from the Proposed Action would be minimized through the use of the 21
mandatory producer Conservation Plan or Forest Stewardship Plan in association with the 22
Mitigation and Monitoring Plan to ensure that effects to overall biodiversity would be 23
minimized and the potential for plant pests would be minimized. The potential cumulative 24
effects of establishment of a biomass crop would impact wildlife as habitats are fragmented, 25
degraded, or destroyed from dedicated energy crop establishment; however, the amount of 26
acreage within any of the proposed project areas would be minor and would be mitigated 27
through the mandatory producer Conservation Plan or Forest Stewardship Plan in 28
association with the Mitigation and Monitoring Plan. The establishment of new dedicated 29
energy crops in areas previously fallow, cropped for a different style of agriculture, or 30
previously cleared timberland could create a loss of previous habitat and may itself cause 31
some direct mortality and range shifting at the local scale of wildlife. Direct effects are likely 32
to occur during the establishment phase, but would be similar to traditional agricultural 33

CUMULATIVE IMPACTS ASSESSMENT
DRAFT - Environmental Assessment SE Giant Miscanthus Establishment and Production 5-4
cropping of fallowed or idle lands. During the short term, mobile species using pastureland, 1
fallowed areas, or previously cleared timberland could relocate to other marginal lands in the 2
vicinity or adjacent wildlife corridors. Less mobile or non-mobile species currently inhabiting 3
pastured or fallowed land could be adversely affected; however, it would be similar to a loss 4
associated with the re-introduction of a traditional crop on fallowed acreage. Overall, the 5
cumulative effects to biological resources associated with the Proposed Action and No 6
Action Alternative would be minor, given the high commodity prices associated with 7
traditional crops and the lack of adequate BCF with enough demand in the region to convert 8
more than a modest amount of agricultural lands to dedicated energy crop production away 9
from traditional crops. The use of the Mitigation and Monitoring Plan for the Proposed 10
Action would also minimize effects to biological resources and provide mechanisms for 11
adaptive management should the need arise based on crop monitoring. 12
5.2.5 Soil Resources 13
The Proposed Action would be anticipated to have positive effects on soils at multiple levels, 14
including a reduction of soil erosion, and increase in soil organic matter, and soil carbon 15
deposition, relative to traditional crops, fallowed land under annual species, or previously 16
cleared forestland that has not been revegetated. Overall, the cumulative effects to soils 17
resources associated with the Proposed Action and No Action Alternative would be minor, 18
given the high commodity prices associated with traditional crops and the lack of adequate 19
BCF with enough demand in the region to convert more than a modest amount of 20
agricultural lands to dedicated energy crop production away from traditional crops. 21
5.2.6 Water Quality and Quantity 22
The conversion to a perennial dedicated energy crop provides greater water use efficiency 23
than traditional row crops such as corn, thereby indicating a more productive choice for 24
biomass production. Giant miscanthus would be anticipated to use more water than 25
fallowed or idle lands with permanent pasture, rangeland, or annual species. Taken in 26
combination with traditional crops in the proposed project areas, there could be greater use 27
of groundwater supplies or effects on groundwater recharge. However, these effects would 28
be mitigated through monitoring and BMPs associated with the Mitigation and Monitoring 29
Plan. The conversion from traditional crops to dedicated energy crops would be anticipated 30
to limit runoff from agricultural fields and potential need for irrigation. Potential plant pests 31
newly associated with giant miscanthus could require pesticide use in larger quantities than 32
described in peer-reviewed literature or greater IPM than potentially anticipated based on 33

CUMULATIVE IMPACTS ASSESSMENT
DRAFT - Environmental Assessment SE Giant Miscanthus Establishment and Production 5-5
existing literature from Europe, but should be less than traditional row crops. Overall, the 1
cumulative effects to water quality and quantity associated with the Proposed Action and No 2
Action Alternative would be minor, given the high commodity prices associated with 3
traditional crops and the lack of adequate BCF with enough demand in the region to convert 4
more than a modest amount of agricultural lands to dedicated energy crop production away 5
from traditional crops. 6
5.2.7 Air Quality 7
Cumulative effects to air quality from the Proposed Action would be avoided due the limited 8
use of agricultural machinery for the establishment and production of giant miscanthus. As 9
indicated previously, even at the maximum amount of acreage tilled at one point in time, the 10
amount of PM2.5 would be less than 0.1 percent of the projected total emissions in 2012. 11
Tillage would only occur during the establishment year, with the addition of harvesting 12
equipment included in the on-farm mobile sources each year thereafter. Overall, emissions 13
from agricultural equipment and tractor trailers for transportation of products would be 14
limited and only create minor, temporary increases in emissions over a period of a few 15
weeks per year across all proposed project areas. 16
5.2.8 Outdoor Recreation 17
Cumulative effects from the Proposed Action would be minimized through the use of the 18
Mitigation and Monitoring Plan to ensure that overall biodiversity would be maintained thus 19
providing on-going outdoor recreational opportunities for both consumptive and non-20
consumptive users. The potential cumulative effects of establishment of a biomass crop 21
would impact wildlife as habitats are fragmented, degraded, or destroyed from dedicated 22
energy crop establishment; however, the amount of acreage within any of the proposed 23
project areas would be minor and would be mitigated through the Mitigation and Monitoring 24
Plan. Overall, the cumulative effects to outdoor recreation associated with the Proposed 25
Action and No Action Alternative would be minor, given the high commodity prices 26
associated with traditional crops and the lack of adequate BCF with enough demand in the 27
region to convert more than a modest amount of agricultural lands to dedicated energy crop 28
production away from traditional crops. The use of the Mitigation and Monitoring Plan for 29
the Proposed Action would also minimize effects to biological resources and provide 30
mechanisms for adaptive management should the need arise based on crop monitoring. 31
32

CUMULATIVE IMPACTS ASSESSMENT
DRAFT - Environmental Assessment SE Giant Miscanthus Establishment and Production 5-6
1
2
3
4
5
6
7
8
9
10
11
This page intentionally left blank 12
13
14
15

MITIGATION AND MONITORING
DRAFT - Environmental Assessment SE Giant Miscanthus Establishment and Production 6-1
6 MITIGATION AND MONITORING 1
6.1 INTRODUCTION 2
The CEQ issued revised guidance for mitigation and monitoring to be included in NEPA 3
decision documents that include three general types of scenarios including: (1) mitigation 4
incorporated into project design; (2) mitigation alternatives for NEPA decision documents 5
(i.e., EA and EIS); and (3) mitigation commitments analyzed in EAs to support a Mitigated 6
FONSI (CEQ 2011). The purpose of mitigation in this EA is the first type, which is 7
incorporation into project design following the original intent of the definition of mitigation 8
provided by CEQ that includes: 9
· Avoiding an impact by not taking a certain action or parts of an action; 10
· Minimizing the impact by limiting the degree or magnitude of the action and its 11
implementation; 12
· Rectifying an impact by repairing, rehabilitating, or restoring the affected 13
environment; 14
· Reducing or eliminating an impact over time, through preservation and maintenance 15
operations during the life of the action; and 16
· Compensating for an impact by replacing or providing substitute resources or 17
environments. 18
The recently revised CEQ guidance also explicitly specifies that adaptive management, or 19
the potential for the lead agency under NEPA to take corrective actions if the originally 20
committed mitigation measures fail to address the target potential impacts, is allowable and 21
desirable to both protect the environment and help a Federal agency meet their stated 22
goals. 23
6.2 ROLES AND RESPONSIBILITIES 24
The revised CEQ guidance on mitigation and monitoring explicitly requires each federal lead 25
agency under NEPA, or FSA in this case, to identify mitigation tracking mechanisms, 26
commitments for any mitigation proposed; responsibility for implementation particularly if 27
shared, reasonably foreseeable circumstances regarding anticipated or projected funding 28
availability to implement mitigation commitments; and the identification of any outside 29
entities that may be responsible for assisting the lead agency through financial or other 30

MITIGATION AND MONITORING
DRAFT - Environmental Assessment SE Giant Miscanthus Establishment and Production 6-2
means to implement the committed mitigations. In BCAP, the lead agency under NEPA is 1
FSA with technical support provided by the USDA Rural Development, APHIS, the Forest 2
Service (FS), and the NRCS, as described in the Final PEIS (USDA FSA 2010). FSA will 3
have primary responsibility for implementation and tracking of the mitigation and monitoring 4
program. FSA has signed a Memorandum of Understanding (MOU) with NRCS to provide 5
BCAP technical assistance for producers on an individual contract basis. FSA will ensure 6
each producer complies with existing requirements of BCAP including completion of the 7
Environmental Screening worksheet, completion of a Conservation Plan with appropriate 8
BMPs and/or NRCS CPS, as adopted by FSA for the BCAP. Based on comments received 9
on the Draft EA and to ensure the best possible results for this mitigation and monitoring 10
plan, FSA will sign a MOU with the Project Sponsor defining roles and responsibilities in 11
implementing this Mitigation and Monitoring Plan. The Project Sponsor will provide the 12
appropriate financial assistance associated with implementation of the monitoring program 13
to assess the effectiveness of mitigation and provide financial assistance for any eradication 14
efforts outside of the intentionally planted areas. The Project Sponsor will continue the 15
Mitigation and Monitoring Plan through the life of the contract between the producer and the 16
Project Sponsor, which can be renewed in perpetuity. 17
Based on the comments submitted on the Draft EA, in consultation with NRCS and ARS, 18
FSA has developed a mitigation and monitoring plan that will be applied to this BCAP 19
project. Additionally, FSA is aware of on-going research for giant miscanthus; however, 20
publication of some of those results has not yet been provided. FSA will continually review 21
and monitor newly developed and available data for inclusion into the mitigation and 22
monitoring plan within this BCAP project area annually. Table 6-1 summarizes the 23
responsible party for different mitigation and monitoring activities per this plan. 24
25

MITIGATION AND MONITORING
DRAFT - Environmental Assessment SE Giant Miscanthus Establishment and Production 6-3
Table 6-1. Roles and Responsibilities for the Mitigation and Monitoring Plan 1
Activity Responsible Party Comment
Biannual Producer meetings to discuss new developments in production, management, pest/disease treatment, and eradication.
Project Sponsor
Project Sponsor will coordinate with FSA, NRCS, ARS, and local extension as presenters as those parties are available.
New Producer orientation to discuss production methods, management activities, potential for spread of giant miscanthus, treatment methods, and responsibilities, pest/disease identification, treatment methods, and responsibilities, eradication methods, if necessary, and reporting requirements.
Project Sponsor
Project Sponsor will coordinate with FSA, NRCS, ARS, and local extension as presenters as those parties are available.
Producer Conservation Plans to include site specific best management practices (BMPs), which could included, but not be limited to, Natural Resources Conservation Services (NRCS) Conservation Practice Standards (CPS) and mitigation measures identified on the Environmental Evaluation CPA-52 for soil erosion, pesticide use and application, fertilizer use and application, and other areas for each specific site.
NRCS
Monitoring program developed to identify spread of giant miscanthus outside of planted fields with notification provided to the FSA County Office, local Weed Control Board, and Project Sponsor as soon as possible after identification of the issue. Producer will eradicate the portion of the miscanthus that has moved outside of the edge of the field.
Producer Project Sponsor will provide confirmation to FSA, ARS, and NRCS of eradication.
Once notified of spread of miscanthus referenced above, Project Sponsor will confirm with Producer that elimination has been completed. If Producer refuses or cannot treat the miscanthus growth, Project Sponsor will eliminate the portion that has spread beyond the field boundary. FSA and/or NRCS will make a site visit to ensure compliance.
Project Sponsor Project Sponsor will provide confirmation to FSA, ARS, and NRCS of eradication.
Monitoring program developed to identify diseases and pests with notification provided to the Project Sponsor as soon as possible after identification of the issue. Producer will treat the disease or pest in the BCAP contract acres.
Producer Project Sponsor will consult with FSA, NRCS, and ARS to ensure monitoring program is capturing the appropriate structured data that will facilitate accurate annual reporting.
Once notified of disease or pests referenced above, if Producer refuses or cannot treat for the disease or pest, Project Sponsor will treat the producer’s BCAP contracted acres in the field and notify FSA and/or NRCS who shall make a site visit to ensure compliance.
Project Sponsor
Monitoring program developed to monitor wildlife use or changes in use. Environmental Evaluation CPA-52 may need to be revised to capture changes and any new mitigation to be implemented.
Project Sponsor This will require coordination. Project Sponsor will handle report and consult with FSA, NRCS, and ARS to ensure appropriate structured data is being collected that will facilitate accurate annual reporting.
Project Sponsor will verify that Producers will only establish giant miscanthus that (1) is Freedom variety and (2) has been incorporated into Georgia Crop Improvement Association Quality Assurance Program for Miscanthus.
Project Sponsor
Data gathering to include (1) land use tracking (2) average and total size of enrolled fields (3) prior land use (4) rationale for land use change (4) spread of giant miscanthus outside of planted fields (5) any pests/diseases identification (6) the use of pesticides/herbicides to control unwanted spread of giant miscanthus or pests/diseases (6) BMP and CPS incorporated into field management, such as erosion control structures or materials, vegetative barriers, (7) fertilizer usage and application methods, and (8) cost data.
Project Sponsor This will require coordination. Project Sponsor will handle report, and work with NRCS, ARS, FSA and local extension to improve data collection.

MITIGATION AND MONITORING
DRAFT - Environmental Assessment SE Giant Miscanthus Establishment and Production 6-4
Activity Responsible Party Comment
Annual Report. Draft report summarizing information gathered immediately above and submit to the FSA and other agencies that would like the information such as the NRCS and ARS.
Project Sponsor
Initiation of a seed sampling program to determine the on-going sterility of seeds produced from the BCAP acres within the project areas. The seed sampling program includes recommended actions, including halting harvesting of material from the field, additional testing to verify findings, additional testing to fields in the region, and an eradication plan for that field.
Project Sponsor Project Sponsor intends to coordinate these activities with an independent third party and/or ARS
Exclusion of planting giant miscanthus on certain acreage within 400 m (approximately 1,300 feet) from any know M. sinensis or M. sacchariflorus to limit the potential for cross-pollination resulting in viable seed.
Project Sponsor Will coordinate with NRCS Conservation Plan efforts.
Exclusion of planting giant miscanthus on certain acreage within the project areas, depending upon certain site-specific conditions. This is beyond the Conservation Plan and will also consider economics and other considerations.
Project Sponsor Will coordinate with NRCS Conservation Plan efforts
6.3 MITIGATION AND MONITORING RECOMMENDATIONS 1
General mitigation and monitoring recommendations for BCAP, as a national program with 2
numerous feedstock options, were detailed in the Final PEIS including common BMPs to 3
address potential adverse impacts of energy crop establishment. Examples of the common 4
BMPs include conservation buffers strips, avoiding the primary nesting season to protect 5
grassland bird populations, and work window avoidance for energy crop establishment to 6
avoid establishment during high precipitation or rainfall events. 7
6.3.1 Purpose and Overview 8
The purpose of this mitigation and monitoring plan is to provide project-specific mitigation 9
measures that FSA is proposing to implement as part of the approval of the proposed BCAP 10
project area. An inherent part of that process includes a site-specific environmental review 11
by FSA through the use of an Environmental Screening worksheet to determine whether 12
environmentally sensitive resources such as Federally threatened or endangered species or 13
wetlands are present and could be potentially affected. Where possible, implementation of 14
appropriate BMPs and/or CPS identified during the conservation planning process would 15
mitigate or reduce any potential environmental impacts on key resources addressed within 16
the scope of this EA. In the event sensitive resources have the potential to be present, FSA 17
will be the lead agency in conducting any and all appropriate consultations with the resource 18
regulatory agencies such as the USFWS, U.S. Army Corps of Engineers (USACE), and 19
State Historic Preservation Offices (SHPO). 20

MITIGATION AND MONITORING
DRAFT - Environmental Assessment SE Giant Miscanthus Establishment and Production 6-5
In general, potential environmental impacts associated with establishment and cultivation of 1
giant miscanthus as proposed by the Project Sponsor are likely to be temporary in nature 2
and variable in scale from local to regional depending on existing characteristics of the 3
individual producer’s total land acreage being enrolled, their current land use, the 4
surrounding mix of agricultural uses in each of the four proposed project areas, and the year 5
in the growth. Potential localized impacts are more likely to be in areas where the average 6
farm size or the portion of total land holdings an individual producer is enrolling in the project 7
area is small. In areas with large farm sizes and/or large portions of total land holdings are 8
enrolled, impacts could be more regional in nature; potential impacts are also likely to vary 9
by current land use. Impacts will be less where cropped lands are currently in traditional row 10
crops and potentially greater where lands are currently idle or in pastureland then converted 11
into giant miscanthus. Potential impacts are also likely to vary depending on the 12
surrounding character of farmland; areas dominated by a single agricultural use (e.g., corn 13
or soybeans) that have a large proportion of land converted to BCAP may have greater 14
impacts than regions dominated by a variety of agricultural uses where land conversions to 15
BCAP cover a smaller area. Finally, impacts are likely to vary by phases of the growth 16
cycle. Establishment may have greater impacts than maintenance related to soil erosion 17
and loss, water quality and quantity impacts, and herbicide application for weed control. 18
All proposed site-specific mitigation measures will rely on adaptive management and 19
monitoring to ensure that proposed mitigation commitments are met, and, in the event they 20
do not prevent the intended potential impacts, that additional corrective measures are 21
implemented to rectify the situation as required by the recent CEQ guidance (CEQ 2011). 22
Adaptive management and monitoring is also useful for assessing the effectiveness of 23
particular mitigation actions and addressing any uncertainty regarding whether a proposed 24
method of mitigation is likely to address the intended potential environmental impact. 25
6.3.2 Meetings with Contract Producers 26
The Project Sponsor shall hold regional meetings with the BCAP contract producers within 27
the proposed project areas at least twice per year. These meetings will be used to 28
disseminate information of interest to the producers and will also be used to provide 29
information and resources regarding the latest recommendations and developments in the 30
use of appropriate approved fertilizer, the control of pests and disease, erosion control, 31
control options in the event of a potential spread of giant miscanthus, and other related 32
topics. Additionally, new enrollees will be required to attend an orientation meeting, which 33

MITIGATION AND MONITORING
DRAFT - Environmental Assessment SE Giant Miscanthus Establishment and Production 6-6
will include training similar to the information presented at the biannual meetings with 1
greater focus on the overall basics of establishment, maintenance, and production. The 2
implementation of the actions contained in this section would be required of the producers. 3
6.3.3 Socioeconomics 4
The proposed project has the potential to impact socioeconomics by converting land 5
currently enrolled in food crops to energy crops. Potential impacts are expected to be 6
mitigated by minimizing the land conversion of food crops to energy crops and when that 7
conversion does occur, focusing on the marginally productive lands currently in food crop 8
production. The Project Sponsor has worked with FSA, the USDA Agricultural Research 9
Service (ARS), and NRCS to develop appropriate metrics for tracking conversion of lands 10
currently enrolled in food production and tracking documentation of their productive status. 11
· Contract Producer Application Forms - The Project Sponsor will develop an 12
application form that documents the prior use of enrolled land (e.g., cropland, idle 13
cropland, pasture, hayland, or previously harvested forestland or timberland) and the 14
reason the applicant wishes to convert to giant miscanthus production. If the 15
applicant identifies current land use as cropland for food production, additional 16
questions will provide insight into the economic rationale for the desired conversion 17
(e.g., marginally productive cropland). 18
· Contract Producer Annual Report and Project Area Annual Reporting – Annual 19
reporting to FSA will include the number of producers that enrolled, average and total 20
enrolled field size, their prior land use, rationale for applying, and a summary of 21
economic rationales where appropriate. After review of the annual reporting effort, 22
FSA will determine whether an unexpectedly high proportion of food crop acres may 23
be converted, the rationale, and whether restrictions on land conversion may be 24
necessary as part of adaptive management and monitoring to mitigate potential 25
environmental impacts. 26
6.3.4 Land Use 27
Potential impacts on land use may include conversion of land use types such as the 28
conversion from traditional row crops to giant miscanthus as discussed above or the 29
conversion of idle land, pastureland, hayland, or previously harvested forestland or 30
timberland into giant miscanthus. The BCAP program does not allow conversion of native 31
sod into BCAP; therefore, areas meeting this definition were excluded from this analysis 32

MITIGATION AND MONITORING
DRAFT - Environmental Assessment SE Giant Miscanthus Establishment and Production 6-7
because they will not be eligible for enrollment. Potential mitigation measures as discussed 1
above for tracking the conversion of land types and their productive status are also expected 2
to mitigate potential adverse impacts on land change. If adaptive monitoring indicates large-3
scale or regional land use conversions are both occurring, and are having a negative effect, 4
then additional restrictions on land use conversion will be considered and implemented. 5
Annual reporting to FSA following the methods described above in Section 6.3.1 will also be 6
used to monitor any potentially unexpected changes in land use. In the event any 7
unexpected changes in land use are detected, FSA will determine whether additional 8
requirements are necessary to mitigate potential environmental impacts on land use. 9
6.3.5 Biological Resources 10
6.3.5.1 Vegetation 11
A potential impact of giant miscanthus establishment relates to the potential for fertile seed 12
production and the potential to spread beyond the intended plantation and propagation 13
acres. All published research, including detailed genetic studies of giant miscanthus, 14
indicate it is a sterile triploid (i.e., meaning three sets of genetic material) hybrid that 15
reproduces vegetatively through rhizomes and does not produce sterile seed (Linde-16
Laursen 1993, Lewandowski et al. 2000). The New Zealand Environmental Risk 17
Management Authority (NZERMA) approved giant miscanthus for use as a biomass 18
feedstock in 2007 after an extensive process of literature review, risk assessment 19
methodology, and contact with researchers (NZERMA 2007). The NZERMA concluded, 20
through literature and contact with researchers, that giant miscanthus is a triploid hybrid that 21
does not produce seed or viable pollen; however, it will produce inflorescences in warmer 22
climates (NZERMA 2007). 23
· Exclusion of Acreage Near Other Miscanthus Species - As to seed dispersal, the 24
Project Sponsor would take steps necessary to minimize the unintentional 25
development of viable seed from giant miscanthus. The Project Sponsor would be 26
willing to exclude acreage within 400 m (approximately 1,300 feet) from any known 27
M. sinensis or M. sacchariflorus to limit the potential for cross-pollination resulting in 28
viable seed. This distance is the maximum distance observed in Quinn et al. 2011. 29
· Seed Sampling Program – Based recommendations of ARS, a seed sampling 30
program will be undertaken by the Project Sponsor to determine if the Freedom giant 31
miscanthus being used within the proposed project areas could produce viable seed. 32

MITIGATION AND MONITORING
DRAFT - Environmental Assessment SE Giant Miscanthus Establishment and Production 6-8
Seed samples at a rate of 50 to 100 inflorescences from four samples in each 1
proposed project area would be provided to either a third party verification or ARS to 2
determine the viability of the seeds. Samples would be taken to represent a range of 3
environmental variability, such as land positions, slope, soil moisture, soil types, etc. 4
If viable seed are found through the seed sampling program these additional steps 5
could be undertaken, which include (1) halting any harvest of the identified field with 6
no off-site movement of any material harvested from that field, (2) immediate 7
removal of existing inflorescences in the field that was found to contain viable seeds, 8
(3) resampling of those inflorescences at a greater rate to determine an approximate 9
percent of inflorescences that produced viable seeds, (4) sampling of fields in the 10
immediate region to determine if additional viable seed is occurring, (5) a 11
commitment by the project sponsor to recommend eradication of that field, if it is 12
determined that the percentage of viability is outside a safe range. 13
· Quality Assurance Program overseen by Georgia Crop Improvement 14
Association - Participation in the Georgia Crop Improvement Association’s (GCIA) 15
Quality Assurance Program is voluntary and illustrates a company's efforts to use 16
effective quality control in rhizome production and marketing. The services and 17
records generated under this system provide quality assurance for every customer. 18
This program provides an unbiased quality control system of the items described 19
below and rhizomes carrying the purple registered tag or blue certified tag have met 20
the minimum standards set out by the GCIA for Miscanthus. This Quality Assurance 21
Plan is based on dual certification of (1) the rhizome stock and (2) the producer 22
acreage. 23
At the plant material level, the Project Sponsor has developed foundation stock per 24
the standards of the GCIA from breeder stock obtained from the original plant 25
breeder, which is a patent-pending variety of giant miscanthus. The Project Sponsor 26
follows all appropriate protocols as set forth by the GCIA, which includes on-going 27
field inspections at a rate of three to four times per year by the GCIA. From the 28
foundation stock, the Project Sponsor has the ability to supply registered stock or 29
certified stock to producers. Certified stock does not allow for the sale or movement 30
of rhizomes from the designated acreage. 31
Registered and certified stock can only be produced in fields that have been field 32
verified by the GCIA as having the ability to be registered or certified. Each producer 33

MITIGATION AND MONITORING
DRAFT - Environmental Assessment SE Giant Miscanthus Establishment and Production 6-9
must submit an application to the GCIA and receive appropriate designation of their 1
fields prior to any rhizomes being planted by the Project Sponsor. Producers are 2
subject to on-going field inspections and their field can be decertified, if field 3
conditions do not meet the standards set forth by the GCIA. Producers must be 4
under a continual maintenance plan with the GCIA to ensure that their fields remain 5
in their appropriate designation. 6
Other specific quality control items include field inspections, botanical description 7
and origin confirmation, field history, agreed distance from other miscanthus 8
varieties, the proper cleaning and storage of equipment, head sample collection to 9
test for viability, and proper record keeping of all of the above with an agreement to 10
inspections without notice. 11
Another potential impact of giant miscanthus plantings is the potential for spread or invasion 12
in areas that are not intentionally planted or propagated. Based on numerous published 13
studies, the likelihood of rapid growth in intentionally planted areas or invasion to areas 14
where giant miscanthus has not been deliberately planted appears low. For example, weed 15
risk assessments conducted on giant miscanthus compared to other potential bioenergy 16
crops such as giant reed, switchgrass, Eucalyptus species, and Jatropha (i.e., a deciduous 17
succulent plant) have concluded the risk of invasiveness in the United States is low (Barney 18
and DiTomaso 2008, Gordon et al. 2011). 19
Published research studies have shown a slow growth rate of intentionally planted giant 20
miscanthus rhizomes of approximately five cm per year (approximately two inches) in 21
Europe (Jørgensen 2011), but those studies focused on rhizome growth from deliberately 22
planted giant miscanthus, which is an expected characteristic in deliberately planted areas 23
and not consistent with an invasion. Unpublished data provided by ARS indicates giant 24
miscanthus tillers and rhizomes have a potential maximum rate of growth in Illinois from 25
established plants of 1.2 meters (m) per year (approximately four feet) (Davis, unpublished 26
data, 2011). In the event, giant miscanthus does escape, eradication studies indicate spring 27
tillage followed by glyphosate application was successful in eliminating 95 percent of 28
aboveground biomass after the first application (Anderson et al. 2011). 29
Another potential, but secondary impact, is the potential for giant miscanthus plantings to 30
provide an additional host plant for crop pests such as the western corn rootworm. Results 31
of a recent greenhouse and field study showed that planted giant miscanthus may support 32

MITIGATION AND MONITORING
DRAFT - Environmental Assessment SE Giant Miscanthus Establishment and Production 6-10
emergence of western corn rootworm eggs, although emergence on giant miscanthus was 1
reduced compared to corn in field studies (Spencer and Raghu 2009). 2
The Project Sponsor will rely on a tiered approach coupled with adaptive management to 3
monitor and manage any potential spread of giant miscanthus. 4
· Contract Producer Trainings - The Project Sponsor will coordinate biannual 5
producer community trainings and resource sessions with local extension and TSPs 6
to provide specific training on identification of western corn rootworm incidents. 7
· Equipment Sanitizing – As part of the agreement with the GCIA for quality 8
assurance the Project Sponsor and contract producer would agreed that all 9
equipment will be cleaned to ensure that no unintentional release of rhizomes would 10
occur during or after transport of live rhizomes. All rhizomes would be contained 11
within closed shipping containers for any shipments that leave a property destined 12
for any other location. 13
· Monitoring of Buffer Areas by Contract Producers- The first tier will rely on 14
individual producers to monitor and report any detections of giant miscanthus spread 15
beyond a specified monitoring buffer outside the planted areas. The Project Sponsor 16
have indicated that typical fields have an existing buffer of woody vegetation or other 17
areas that are not actively planted up to the fence or property line, so a monitoring 18
buffer of a minimum width beyond the planted areas with maximum buffer width 19
determined by site-specific conditions as determined within the Conservation Plan, 20
these buffers will be monitored every other year, at a minimum. 21
· Minimum Setback/Buffer Distance - Although published data on the maximum rate 22
of giant miscanthus rhizome spread indicates five cm per year (two inches) may be 23
expected, the FSA, in consultation with both NRCS and ARS, have elected to 24
implement the following setbacks for giant miscanthus with the purpose of the 25
setback/buffer being to manage the giant miscanthus stand to prevent unintentional 26
spread. The contract producer would follow all local, State, and/or Federal 27
regulations for containment of biomass plantings in existence at the time of the 28
development of the producer’s Conservation Plan or through an amendment of the 29
Conservation Plan initiated by the producer and approved by FSA and NRCS, if 30
determined appropriate for the site-specific conditions. If no such guidance exists, 31

MITIGATION AND MONITORING
DRAFT - Environmental Assessment SE Giant Miscanthus Establishment and Production 6-11
minimum procedures to prevent unintentional spread of giant miscanthus shall 1
include: 2
o Establish or maintain a minimum 25 feet of setback/buffer around a giant 3
miscanthus stand, unless the field is adjacent to existing cropland or actively 4
managed pasture with the same producer. 5
o Setback/buffer areas may be planted to an annual row crop such as corn or 6
soybeans; may be planted to a site-adapted, perennial cool-season or warm 7
season forage or turf grass; may be kept in existing vegetation, or kept clear 8
by disking, rotovating, or treating with a non-selective burn down herbicide at 9
least once a year. The method used may be dependent on slope and the 10
potential for erosion. 11
· Action if Unintentional Spread is Identified - In the event that giant miscanthus is 12
detected within the field monitoring buffer, each enrolled producer will be 13
contractually obligated to report this to the Project Sponsor, along with their plans for 14
control and eradication. In the event the producer is unable or unwilling to implement 15
control efforts, a second tier will be followed, whereby the Project Sponsor assume 16
responsibility for applying chemical control on the producer’s acres enrolled under 17
BCAP and will subsequently deduct the associated cost from the producer’s yield 18
payment as described in the producer’s enrollment contract. All chemical treatment 19
applications would be applied during proper environmental conditions under the 20
supervision of a licensed or trained pesticide applicator consistent with Federal and 21
State guidelines. 22
· Contract Producer Annual Report and Project Area Annual Reporting – 23
Beginning in year two after the first monitoring cycle is complete, annual monitoring 24
reports will include the number of producers where potential giant miscanthus 25
spreads were documented, the distance detected from areas planted, years since 26
planting, and any additional structured data determined appropriate by ARS as 27
continual monitoring occurs. FSA, NRCS, ARS, and the Project Sponsor will 28
evaluate data on the potential spread of giant miscanthus and determine whether 29
additional adaptive monitoring and management is required to mitigate potential 30
environmental impacts. 31

MITIGATION AND MONITORING
DRAFT - Environmental Assessment SE Giant Miscanthus Establishment and Production 6-12
· Long-Term Eradication Strategy - At the end of the project contract or at the 1
termination of the contract between the producer and the Project Sponsor, the 2
producer contracts would allow for either party, the producer or Project Sponsor, to 3
eradicate giant miscanthus within the contracted acres at the termination of the 4
contract. 5
To address potential crop pest and disease outbreaks such as the western corn rootworm, 6
an IPM Plan will be developed as part of each producer’s Conservation Plan. The biannual 7
producer community meetings will include updates on any new or emerging pests or 8
diseases to assist in early detection and reporting for effective treatment. The IPM Plan will 9
also follow a tiered approach, similar to that described above for detection of potential 10
vegetative spread. 11
· Monitoring of Buffer Areas by Contract Producers - In the first tier, producers will 12
be required to annually survey their fields for potential pest and disease outbreaks. 13
· Contract Producer Treatment of Pest and Diseases - In the event that pests or 14
diseases are detected, the producer will be contractually obligated to notify the 15
Project Sponsor and to treat or control the pest or disease on the producer’s acres 16
enrolled under BCAP. 17
· Project Sponsor Treatment of Pest and Diseases - In the event that the producer 18
is unable or unwilling to control and treat the pest or disease, the second tier 19
approach will be for the Project Sponsor to assume responsibility to treat the affected 20
producer’s acres enrolled under the BCAP program and to deduct any costs from the 21
producer’s yield payment that will be described in the producer’s contract. Courtesy 22
notification of immediately adjacent land owners would also be required. All 23
chemical treatment applications would be applied during proper environmental 24
conditions under the supervision of a licensed or trained pesticide applicator 25
consistent with Federal and State guidelines. 26
6.3.5.2 Wildlife 27
Potential impacts on wildlife and biodiversity would include habitat loss associated with 28
conversion of lands currently idle, in pasture, in hay, or from previously harvested forestland 29
or timberland to giant miscanthus; reduced winter cover and food supplies on lands currently 30
enrolled in row crops; impacts on nesting grassland bird populations; and additional habitat 31
fragmentation in areas where field sizes are larger and more contiguous. Potential impacts 32

MITIGATION AND MONITORING
DRAFT - Environmental Assessment SE Giant Miscanthus Establishment and Production 6-13
due to habitat loss are expected to be mitigated using similar measures as described above 1
to assess land use change to track and document the current status of any land converted 2
to giant miscanthus under BCAP. The relatively low residual height left after harvesting 3
giant miscanthus may reduce winter cover and affect nesting conditions for grassland birds 4
such as northern bobwhites (Colinus virginianus), eastern meadowlarks (Sturnella magna), 5
and grasshopper sparrows (Ammodramus savannarum). Finally, conversion of larger areas 6
dominated by a single land use type (i.e., idle land, pastureland, or hayland) may have 7
proportionally larger impacts on habitat fragmentation in project areas. 8
· Monitoring of Buffer Areas and Fields by Contract Producers - Mitigation 9
measures will primarily focus on monitoring the conversion of winter cover and food 10
sources for wildlife as a result of reduced residual or crop stubble height after 11
harvest. 12
· Contract Producer Annual Report and Project Area Annual Reporting – As part 13
of the enrollment process, individual producers will be asked to report any incidental 14
data (e.g., casual observation, hunting data, or supplemental feeding data) or 15
existing systematic data (i.e., agency counts or surveys) on wildlife winter cover and 16
food use. Annual reporting will include the incidental or existing systematic data on 17
wildlife use of winter cover or food use from any of the same data sources along with 18
reported residual and stubble height on each field after harvest. In the event that 19
unexpected significant changes in wildlife winter cover or winter food sources are 20
detected, FSA will work with NRCS and the Project Sponsor and appropriate State 21
fish and wildlife agencies to determine additional agreed upon mitigation measures 22
to offset potentially significant impacts and how to monitor those agreed upon 23
measures. 24
6.3.5.3 Protected Species 25
Potential impacts on protected species, such as Federally threatened or endangered 26
species are possible in those areas where Critical Habitat has been designated, suitable 27
habitat exists within the documented range of the species, or known records have been 28
documented. Additionally, state-listed, protected, or tribal-listed species will be analyzed for 29
potential impacts, as well. Compliance with existing regulations, including the Endangered 30
Species Act, will be accomplished with the assistance of NRCS through the Environmental 31
Screening worksheet and subsequent resource agency consultation, if deemed necessary, 32
with FSA being the lead agency. 33

MITIGATION AND MONITORING
DRAFT - Environmental Assessment SE Giant Miscanthus Establishment and Production 6-14
· Contract Producer Conservation Plans - Mitigation measures will follow a tiered 1
structure whereby individual producers who enroll land in close proximity to sensitive 2
habitat such as streams, wetlands, or riparian zones are required to implement 3
additional BMPs and/or NRCS CPS as part of their Conservation Plan and potentially 4
work with FSA to complete appropriate resource agency consultations, if necessary. 5
Such a tiered approach is expected to be used throughout the monitoring program to 6
ensure additional measures are taken when sensitive resources are present or in 7
close proximity. Potential examples of BMPs for these areas would include buffers 8
to maintain specific planting distances, conservation buffer strips or plantings, silt 9
fencing or other erosion control measures, potential application of no-till 10
establishment methods to address sedimentation impacts, and use of appropriately 11
labeled herbicides and/or pesticides to protect aquatic or other sensitive species. 12
6.3.6 Soil Resources 13
Potential impacts on soil resources may include soil erosion and loss as a result of field 14
preparation and planting in giant miscanthus. Compared to land currently in traditional row 15
crops, potential soil erosion and loss is expected to be temporary and short-term, primarily 16
associated with the establishment phase compared to more intensive annually tilled crops. 17
Compared to land currently idle or in pasture or hay, potential soil erosion and loss may be 18
slightly higher but still temporary and short-term associated with establishment. Regardless 19
of current land use, long-term benefits of soil retention with established rhizomes and 20
carbon soil sequestration towards the middle of the 15-year maintenance period on enrolled 21
fields are expected to off-set temporary and short-term increases in soil erosion and loss 22
that may also be associated with reduced carbon sequestration. 23
Mitigation will include a tiered structure that uses BMPs associated with no-till planting 24
methods for proposed project areas in close proximity to sensitive habitats such as streams, 25
wetlands, or other water bodies. 26
· Contract Producer Conservation Plans - Specific mitigation requirements will be 27
developed for each producer and included in the producer’s Conservation Plan in 28
conjunction with BMPs and/or existing NRCS CPS, applicable to the individual site. 29
It is expected that mitigation will be consistent with the BMPS and/or NRCS CPS on 30
management of soil erosion, including the guidelines on management within high 31
concentration flow areas and HEL. 32

MITIGATION AND MONITORING
DRAFT - Environmental Assessment SE Giant Miscanthus Establishment and Production 6-15
· Contract Producer Annual Report and Project Area Annual Reporting – The 1
Project Sponsor will collect information regarding the BMPs and/or NRCS CPS that 2
are being applied by each producer and will include that information in annual 3
reports. 4
Adaptive monitoring and management is expected to be used to track the effectiveness of 5
carbon sequestration over the life of a given giant miscanthus planting (i.e., up to 15 years). 6
In addition to the analyses performed, the Project Sponsor anticipates selling carbon credits, 7
or similar type credits, from the sequestration benefits. However, carbon credit sales would 8
not occur until such a time that the market for carbon credits becomes more wide-spread 9
and the effectiveness of carbon sequestration from Freedom giant miscanthus has been 10
documented in the proposed project areas or through other field trials. 11
6.3.7 Water Quality and Quantity 12
6.3.7.1 Water Quality 13
Potential impacts on water quality include short-term and temporary increases in nutrient 14
and fertilizer runoff during establishment and monitoring. Compared to land currently in 15
traditional row crops, conversion to giant miscanthus is expected to result in less nutrient 16
and fertilizer runoff. Compared to land currently idle or in pasture or hay, conversion to giant 17
miscanthus may result in slight but short-term and temporary increases in nutrient and 18
fertilizer runoff. In general, fertilizer application is only recommended at a site-specific level 19
based on soil testing recommendations. However, long-term declines in nutrient loss (i.e., 20
phosphorus and nitrogen) during the maintenance period (years three to 15) are likely to off-21
set temporary and short-term increases in nutrient leaching or runoff. The anticipated 22
fertilizer application rate is also expected to be substantially lower compared to traditional 23
row crops, but may be higher than idle or pasture or hay land. 24
· Contract Producer Conservation Plans - Potential impacts to water quality will be 25
mitigated through the development of the Conservation Plans for each producer 26
based on existing BMPs and/or NRCS CPS or newer variants that may be developed 27
specifically for BCAP, as adopted by FSA. The less frequent application of fertilizer 28
compared to traditional crops will further reduce potential impacts on water quality 29
due to runoff. 30

MITIGATION AND MONITORING
DRAFT - Environmental Assessment SE Giant Miscanthus Establishment and Production 6-16
· Contract Producer Trainings - The Project Sponsor will include training and 1
resources on soil testing and fertilizer amendments to minimize unnecessary 2
additions during their biannual producer community meetings. 3
· Contract Producer Annual Report and Project Area Annual Reporting – Annual 4
reporting will include the rate, type, frequency, and cost of fertilizer application on a 5
per acre basis for each field enrolled. In the event that FSA determines potential 6
water quality impacts are not being appropriately mitigated, FSA and the Project 7
Sponsor will work with the producer cooperatives to provide further training to 8
implement BMPs to minimize unnecessary inputs. 9
6.3.7.2 Water Quantity 10
Potential impacts on water quantity may arise from surface or groundwater supply depletion 11
if giant miscanthus increases the amount of water withdrawal relative to current land uses 12
(traditional row crops or idle, pasture, hayland, or previously harvested forestland or 13
timberland). Giant miscanthus is expected to be able to attain all the required water for the 14
growing season from within the rooting zone of the plant and should not require irrigation 15
Giant miscanthus plantings should have either no change to the amount irrigated acres in 16
the project areas or result in a net reduction in irrigated acres within the project areas; 17
thereby, reducing irrigation water demand, since the plantation acres would not be irrigated 18
for giant miscanthus. 19
· Contract Producer Conservation Plans - Mitigation will include BMPs and/or 20
existing NRCS CPS that minimize water use and will be incorporated into each 21
producer’s Conservation Plan. 22
· Contract Producer Annual Report and Project Area Annual Reporting – Annual 23
reporting will include the total number of producers enrolled in each project area, the 24
BMPs or existing NRCS CPS utilized, and their average and total yield per field 25
enrolled. 26

REFERENCES
DRAFT - Environmental Assessment SE Giant Miscanthus Establishment and Production 7-1
7 REFERENCES
Acroglu, M., and A.S. Aksoy, 2005. The Cultivation and Energy Balance of Miscanthus x
giganteus Production in Turkey. Biomass and Bioenergy Vol. 29, pp. 42-48.
Álvaro-Fuentes, J., J. Lampurlanés, and C. Cantero-Martínez. 2009. Alternative Crop
Rotations under Mediterranean No-Tillage Conditions: Biomass, Grain Yield, and
Water-Use Efficiency. Agronomy Journal. Vol. 101, No. 5, pp. 1227-1233.
Anderson, E.K., T.B. Voigt, G.A. Bollero, and A.G. Hager. 2011. Controlling Miscanthus x
giganteus. Miscanthus x giganteus response to tillage and glyphosate. In
Preparation for Weed Technology.
Anderson, E.K., A.G. Hager, T.B. Voigt, and G.A. Bollero, 2009. Herbicide Phytotoxicity and
Eradication Studies in Miscanthus x giganteus. University of Illinois at Urbana-
Champaign, Illinois Council on Food, and Agricultural Research Special Research
Initiative. January.
Angelini, L.G., L. Ceccarini, N.N. Di Nasso, and E. Bonari, 2009. Comparison of Arundo
donax L. and Miscanthus x giganteus in a Long-Term Field Experiment in Central
Italy: Analysis of Productive Characteristics and Energy Balance. Biomass and
Bioenergy Vol. 33, pp. 635-643.
Angus, J.F., and A.F. van Herwaarden. 2001. Increasing Water Use and Water Use
Efficiency in Dryland Wheat. Agronomy Journal. Vol. 93. Mar-Apr. pp. 290-298.
Bailey, C., J.F. Dyer, and L. Teeter. 2011. Assessing the rural development potential of
lignocellulosic biofuels in Alabama. Biomass & Bioenergy. 35 (2011) 1408-1417.
Barney, J.N., and J.M. DiTomaso, 2008. Nonnative Species and Bioenergy: Are We
Cultivating the Next Invader? BioScience Vol. 58, No. 1, pp. 64-70. January.
Barney, Jacob. nd. Identifying the invasive potential of biofuel crops. University of California
– Davis. http://www.berkeleybioeconomy.com/wp-
content/uploads//2010/07/Barney_Berkeley_2010_shorter.pdf. Accessed April 2011.
Beale, C.V., and S.P. Long, 1997. Seasonal Dynamics of Nutrient Accumulation and
Partitioning in the Perennial C4-Grasses Miscanthus x giganteus and Spartina
cynosuroides. Biomass and Bioenergy Vol. 12, No. 6, pp. 419-428.

REFERENCES
DRAFT - Environmental Assessment SE Giant Miscanthus Establishment and Production 7-2
Beale, C.V., J.I.L. Morison, and S.P. Long, 1999. Water Use Efficiency of C4 Perennial
Grasses in a Temperate Climate. Agricultural and Forest Meteorology Vol. 96, pp.
103-115.
Bellamy, P.E., P.J. Croxton, M.S. Heard, S.A. Hinsley, L. Hulmes, S. Hulmes, P. Nuttall,
R.F. Pywell, and P. Rothery, 2009. The Impact of Growing Miscanthus for Biomass
on Farmland Bird Populations. Biomass and Bioenergy Vol. 33, pp. 191-199.
Bennett, D. 2007. It takes a lot of water to grow a corn crop. Southeast Farm Press.
http://southeastfarmpress.com/print/it-takes-lot-water-grow-corn-crop. Accessed
May 2011.
Beuch, S., B. Boelcke, and L. Belau, 2000. Effect of the Organic Residues of Miscanthus x
giganteus on the Soil Organic Matter Level of Arable Soils. J. Agronomy & Crop
Science Vol. 183, pp. 111-119.
Blanco-Canqui, H., 2010. Energy Crops and Their Implications on Soil and Environment.
Agronomy Journal Vol. 102, pp.403-419. January.
Bradshaw, J.D., J.R. Prasifka, K.L. Steffey, and M.E. Gray, 2010. First report of field
populations of two potential aphid pests of the bioenergy crop miscanthus x
giganteus. Florida Entomologist Vol. 93(1), pp. 135-137.
Brady, N. and R. Weil. 1996. The Nature and Properties of Soils, 11th ed. Prentice-Hall, Inc.,
Upper Saddle River, NJ.
Bremer, D.J., L.M. Auen, J.M. Ham, and C.E. Owensby. 2001. Evapotranspiration in a
Prairie Ecosystem: Effects of Grazing by Cattle. Agronomy Journal. Vol.93. Mar-
Apr. pp. 338-348.
Brye., K.R., J.M. Norman, L.G. Bundy, and S.T. Gower. 2000. Water-Budget Evaluation of
Prairie and Maize Ecosystems. Agronomy Journal. Vol. 64. Mar-Apr. pp. 715-724.
Bureau of Economic Analysis (BEA). 2011a. Table CA05N. National Total Personal
Earnings. April 2011.
http://bea.gov/regional/reis/default.cfm?selTable=CA05N&series=NAICS. Accessed
August 2011.
Bureau of Economic Analysis (BEA). 2011b. Table CA25N. National Total Employment.
http://bea.gov/regional/reis/default.cfm?selTable=CA25N&series=NAICS. Accessed
August 2011.

REFERENCES
DRAFT - Environmental Assessment SE Giant Miscanthus Establishment and Production 7-3
Bureau of Indian Affairs. 2010. Indian Entities Recognized and Eligible to Receive Services
from the United States Bureau of Indian Affairs.
http://www.bia.gov/idc/groups/xraca/documents/text/idc011463.pdf. Accessed April
2011.
Bureau of Labor Statistics (BLS). 2011. Local Area Unemployment Statistics. All Areas.
http://data.bls.gov:8080/PDQ/outside.jsp?survey=la. Accessed August 2011.
Bureau of Labor Statistics (BLS). 2010a. May 2010 National Occupational and Wage
Estimates. http://www.bls.gov/oes/current/oes_nat.htm. Accessed August 2011.
Bureau of Labor Statistics (BLS). 2010b. May 2010 State Occupational and Wage
Estimates. http://www.bls.gov/oes/current/oessrcst.htm. Accessed August 2011.
Burner, D.M., T.L. Tew, J.J. Harvey, and D.P. Belesky, 2009. Dry Matter Partitioning and
Quality of Miscanthus, Panicum, and Saccarum genotypes in Arkansas, USA.
Biomass and Bioenergy Vol. 33, pp. 610-619.
Byrd, G.T., and P.A. May II. 2000. Physiological Comparisons of Switchgrass Cultivars
Differing in Transpiration Efficiency. Crop Science. Vol. 40 Sep-Oct. pp. 1271-1277.
Cadoux, S., A.B. Riche, N.E. Yates, and J.M. Machet, 2011. Nutrient Requirements of
Miscanthus x giganteus: Conclusions from a Review of Published Studies. Biomass
and Bioenergy pp.1-9.
Calder, I. R., Reid, I, Nisbet, T. R. and Green, J.C. (2003) Impact of lowland forests in
England on water resources: Application of the Hydrological Land Use Change
(HYLUC) model Wat. Resour. Res., 39, doi:10.1029/2003WR002042.
Caslin, B., J. Finnan, and L. Easson, 2010. Miscanthus Best Practice Guidelines.
Agriculture and Food Development Authority, Teagasc, and Agri-Food and
Bioscience Institute.
Christian, D.G., A.B. Riche, and N.E. Yates, 2008. Growth, Yield and Mineral Content of
Miscanthus x giganteus Grown as a Biofuel for 14 Successive Harvests. Industrial
Crops and Products Vol. 28, pp. 320-327.
Christian, D.G., M.J. Bullard, and C. Wilkins, 1997. The Agronomy of Some Herbaceous
Crops Grown for Energy in Southern England. Aspects of Applied Biology Vol. 49,
pp.41-51.

REFERENCES
DRAFT - Environmental Assessment SE Giant Miscanthus Establishment and Production 7-4
Christian, D.G., and A.B. Riche, 1998. Nitrate Leaching Losses Under Miscanthus Grass
Planted on a Silty Clay Loam Soil. Soil Use and Management Vol. 14, pp. 131-135.
Clifton-Brown, J.C., and I. Lewandowski, 2000. Overwintering Problems of Newly
Established Miscanthus Plantations can be Overcome by Identifying Genotypes with
Improved Rhizome Cold Tolerance. New Phytologist Vol. 148, No. 2, pp. 287-294.
November.
Clifton-Brown, J.C., and I. Lewandowski, 2002. Screening Miscanthus Genotypes in Field
Trials to Optimise Biomass Yield and Quality in Southern Germany. European
Journal of Agronomy Vol. 16, pp. 97-110.
Clifton-Brown, J.C., P.F. Stampfl, and M.B. Jones, 2004. Miscanthus Biomass Production
for Energy in Europe and its Potential Contribution to Decreasing Fossil Fuel Carbon
Emissions. Global Change Biology Vol. 10, pp. 509-518.
Clifton-Brown, J.C., J. Breuer, and M.B. Jones, 2007. Carbon Mitigation by the Energy
Crop, Miscanthus. Global Change Biology Vol. 13, pp. 2296-2307.
Clifton-Brown, J.C., and I. Lewandowski, 2002. Screening Miscanthus Genotypes in Field
Trials to Optimize Biomass Yield and Quality in Southern Germany. European
Journal of Agronomy Vol. 16, pp. 97-110.
Conrad, J.L., M. C. Bolding, R.L. Smith, and W. M. Aust. 2011. Wood-energy market
impact on competition, procurement practices, and profitability of landowners and
forest products industry in the U.S. south. Biomass & Bioenergy 35 (2011) 280-287.
Cosentino, S.L., C. Patanè, E. Sanzone, V. Copani, and S. Foti, 2007. Effects of Soil Water
Content and Nitrogen Supply on the Productivity of Miscanthus x giganteus Greef ef
Deu. In a Mediterranean Environment. Industrial Crops and Products Vol. 25, pp.
75-88.
Council on Environmental Quality (CEQ). 2011. Appropriate Use of Mitigation and
Monitoring and Clarifying the Appropriate Use of Mitigated Findings of No Significant
Impacts. Memorandum for Heads of Federal Departments and Agencies. Executive
Office of the President. January 14.
http://ceq.hss.doe.gov/current_developments/docs/Mitigation_and_Monitoring_Guida
nce_14Jan2011.pdf. Accessed March 2011.

REFERENCES
DRAFT - Environmental Assessment SE Giant Miscanthus Establishment and Production 7-5
Council on Environmental Quality (CEQ). 1997. Environmental Justice. Guidance Under
the National Environmental Policy Act. http://clinton4.nara.gov/media/pdf/EJ.pdf.
Accessed 15 November 2010.
Cranfield University (2001a) Review of the effects of energy crops on hydrology, Ministry of
Agriculture, Fisheries and Food, Final report NF0416 pp. 29.
Danalatos, N.G., S.V. Archontoulis, and I. Mitsios, 2007. Potential Growth and Biomass
Productivity of Miscanthus x giganteus as Affected by Plant Density and N-
Fertilization in Central Greece. Biomass and Bioenergy Vol. 31, pp. 145-152.
Dauber, J., M.B. Jones, and J.C. Scott. 2010. The impact of biomass crop cultivation on
temperate biodiversity. Bioenergy 2:289-309.
Davis, A.S, R.D. Cousens, J. Hill, R.N. Mack, D. Simberloff, and S. Raghu. 2010.
Screening bioenergy feedstock crops to mitigate invasion risk. Frontiers in Ecology
and the Environment; 8(10): 533-539.
Davis, S.C., W. J. Parton, F.G. Dohleman, C.M. Smith, S. Del Grosso, A.D. Kent, and E.H.
DeLucia, 2010. Comparative Biogeochemical Cycles of Bioenergy Crops Reveal
Nitrogen-Fixation and Low Greenhouse Gas Emissions in a Miscanthus x giganteus
Agro-Ecosystem. Ecosystems Vol. 13, pp. 144-156.
Davis, T. 2011. Personal Communication. Arkansas Department of Environmental Quality.
Air Division. Air Quality Planning. Telephone Interview. March 31.
DiTomaso, J.M., J.N. Barney, and A.M. Fox, 2007. Biofuel Feedstocks: The risk of future
invasions. CAST Commentary, QTA2007-1, November 2007.
Dohleman, F.G., and S.P. Long, 2009. More Productive Than Maize in the Midwest: How
Does Miscanthus Do It? Plant Physiology Vol. 150, pp. 2104-2115. August.
Donnelly, A., D. Styles, J. Fitzgerald, and J. Finnan, 2010. A Proposed Framework for
Determining the Environmental Impact of Replacing Agricultural Grassland with
Miscanthus in Ireland. Global Change Biology Bioenergy pp. 1-17.
Downs, J. 2011. Personal Communication. Missouri Department of Natural Resources.
Air Pollution Control Program. Monitoring. Telephone Interview. March 31.
Ercoli, L., M. Mariotti, A. Masoni, and E. Bonari, 1999. Effect of Irrigation and Nitrogen
Fertilization on Biomass Yield and Efficiency of Energy Use in Crop Production of
Miscanthus. Field Crops Research Vol. 63, pp.3-11.

REFERENCES
DRAFT - Environmental Assessment SE Giant Miscanthus Establishment and Production 7-6
Fargione, Joe, 2010. Is bioenergy for the birds? An evaluation of alternative future bioenergy
landscapes. PNAS Vol. 107 (44), pp. 18745-18746.
Felten, D. and C. Emmerling. 2011. Effects of bioenergy crop cultivation on earthworm
communities – A comparative study of perennial (Miscanthus) and annual crops with
consideration of graded land-use intensity. Applied Soil Ecology. In press.
Fernado, A.L, Duarte, M.P, Boleo, S. and Mendes, B., 2010. Environmental impact
assessment of energy crops cultivation in Europe. Biofuels, Bioprod. Bioref. Vol. 4,
pp. 594-604.
Fernando, A.L., V. Godovikova, and J.F.S. Oliveira, 2004. Miscanthus x giganteus:
Contribution to a Sustainable Agriculture of a Future/Present. Oriented Biomaterial
Materials Science Forum Vol. 455-456, pp. 437-441.
Finch, J.W. and Harding, R.J. (1998) A comparison between reference transpiration and
measurements of evaporation for a riparian grassland site Hydrol. Earth Syst. Sci.,
2,101-108.
Finch, J.W, A Karp, D P M McCabe, S Nixon,A B Riche and A P Whitmore. 2009.
Miscanthus, short-rotation coppice and the historic environment. Prepared by the
Centre for Ecology & Hydrology and Rothamsted Research. Prepared for English
Heritage
Finch, J. W. and Riche, A. B. (2008) Soil water deficits and evaporation rates associated
with Miscanthus in England. Aspects of Applied Biology 90, Biomass and Energy
Crops III, 295-302.
Food and Agriculture Organization of the United Nations. 2005. Water for Food and
Ecosystems Glossary. http://www.fao.org/ag/wfe2005/glossary_en.htm. Accessed
April 2011.
Frank, A.B. 2003. Evapotranspiration from Northern Semiarid Grasslands. Agronomy
Journal. Vol. 95. Nov-Dec. pp. 1504-1509.
Gardiner, M.A., J.K. Tuell, R. Isaacs, J. Gibbs, J.A. Ascher, and D.A. Landis. 2010.
Implications of Three Biofuel Crops for Beneficial Arthropods in Agricultural
Landscapes. Bioenery. Res. 3:6-19.

REFERENCES
DRAFT - Environmental Assessment SE Giant Miscanthus Establishment and Production 7-7
Georgia Department of Community Affairs (DCA). 2011. Georgia Job Tax Credit.
http://www.dca.state.ga.us/economic/taxcredits/programs/taxcredit.asp. Accessed 23
August 2011.
Georgia Department of Natural Resources. 2010. Proposed Georgia’s State Implementation
Plan for The Atlanta PM2.5 Nonattainment Area. Environmental Protection Division,
Air Protection Branch. 24 March 2010.
http://www.gaepd.org/Files_PDF/plans/sip/narr_public_notice.pdf. Accessed 17
August 2011.
Georgia Department of Natural Resources (GDNR). 2010. Georgia Rare Species and
Natural Community Data. EOs by County. May 2010.
http://www.georgiawildlife.org/node/1370. Accessed August 2011.
Gordon, D.R., K.J. Tancig, D.A. Onderdonk, and C.A. Gantz, 2011. Assessing the Invasive
Potential of biofuel Species Proposed for Florida and the United States Using the
Australian Weed Risk Assessment. Biomass and Bioenergy Vol. 35, pp. 74-79.
Griffith, G.E., Omernik, J.M., Comstock, J.A., Lawrence, S., Martin, G., Goddard, A.,
Hulcher, V.J., and Foster, T., 2001, Ecoregions of Alabama and Georgia, (color
poster with map, descriptive text, summary tables, and photographs): Reston,
Virginia, U.S. Geological Survey (map scale 1:1,700,000).
ftp://ftp.epa.gov/wed/ecoregions/al/alga_front.pdf. Accessed 12 August 2011.
Griffith, G.E., Omernik, J.M., Comstock, J.A., Schafale, M.P., McNab, W.H., Lenat, D.R.,
MacPherson, T.F., Glover, J.B., and Shelburne, V.B., 2002, Ecoregions of North
Carolina and South Carolina, (color poster with map, descriptive text, summary
tables, and photographs): Reston, Virginia, U.S. Geological Survey (map scale
1:1,500,000). ftp://ftp.epa.gov/wed/ecoregions/nc/ncsc_front.pdf. Accessed 12
August 2011.
Hall, R. 2003. Grasses for Energy Production Hydrological Guidelines. DTI New and
Renewable Energy Programme.
http://webarchive.nationalarchives.gov.uk/+/http://www.berr.gov.uk/files/file14946.pdf
. Accessed May 2011.
Hansen, E.M., B.T. Christensen, L.S. Jensen, and K. Kristensen, 2004. Carbon
Sequestration in Soil Beneath Long-Term Miscanthus Plantations as Determined by 13C Abundance. Biomass and Bioenergy Vol. 26, pp. 97-105.

REFERENCES
DRAFT - Environmental Assessment SE Giant Miscanthus Establishment and Production 7-8
Hattendorf, M.J., M.S. Redelfs, B. Amos, L.R. Stone, and R.E. Gwin, Jr. 1988.
Comparative Water Use Characteristics of Six Row Crops. Agronomy Journal. Vol.
80. Jan-Feb. pp80-85.
Heaton, E.A., F.G. Dohleman, A.F. Miguez, J.A. Juvik, V. Lozovaya, J. Widholm, O.A.
Zabotina, G.F. Mcisac, M.B. David, T.B. Voigt, N.N. Boersma, and S.P. Long, 2010.
Miscanthus: A Promising Biomass Crop. Advances in Botanical Research Vol. 56,
pp. 75-137.
Heaton, E.A., J. Clifton-Brown, B. Voigt, B. Jones, and S.P. Long, 2004. Miscanthus for
Renewable Energy Generation: European Union Experience and Projections for
Illinois. Mitigation and Adaptation Strategies for Global Change Vol. 9, pp. 433-451.
Hickman, G.C., A. VanLoocke, F.G. Dohleman, and C.J. Bernacchi. 2010. A comparison of
canopy evapotranspiration for maize and two perennial grasses identified as
potential bioenergy crops. GCB Bioenergy, 2: 157-168.
Hodkinson, T.R., and S. Renvoize, 2001. Nomenclature of Miscanthus x giganteus
(Poaceae). Kew Bulletin Vol. 56, No. 3, pp. 759-760.
Howell, T.A., J.A. Tolk, A.D. Schneider, and S.R. Evett. 1998. Evapotranspiration, Yield,
and Water Use Efficiency of Corn Hybrids Differing in Maturity. Agronomy Journal
Vol. 90 No. 1: pp 3-9, January-February.
Howell, T.A., S.R. Evett, J.A. Tolk, A.D. Schneider, and J.L. Steiner. 1996.
Evapotranspiration of Corn -- Southern High Plains. pp. 158-166, In C.R. Camp, E.J.
Sadler, and R.E. Yoder (eds.) Evapotranspiration and Irrigation Scheduling,
Proceedings of the International Conference, Nov. 3-6, 1996, San Antonio, TX,
American Society of Agricultural Engineers, St. Joseph, MI.
James, L.K., S.M. Swinton, and D. Pennington. 2009. Profitability of Converting to Biofuel
Crops. Michigan State University Extension. Extension Bulletin E-3084. December.
http://bioenergy.msu.edu/economics/E3084.pdf, and
http://bioenergy.msu.edu/economics/miscanthus.xls. Accessed March 2011.
Jansson, C., S.D. Wullschleger, U.C. Kalluri, and G.A. Tuskan. 2010. Phytosequestration:
Carbon Biosequestration by Plants and the Prospects of Genetic Engineering.
BioScience Vol. 60 No 9. 685-696.

REFERENCES
DRAFT - Environmental Assessment SE Giant Miscanthus Establishment and Production 7-9
Jezkowski, S., K. Glowacka, Z. Kaczmarek, 2011. Variation on Biomass Yield and
Morphological Traits of Energy Grasses from the Genus Miscanthus During the First
Years of Crop Establishment. Biomass and Bioenergy Vol. 35, pp. 814-821.
Jodl, S., A. Eppel-Htz, and K. Marzini, 1998. Examination of the Ecological Value of
Miscanthus Expanses-Faunistic studies. Biomass for Energy and Industry; Proc 10th
EU Bioenergy Conference, Wuzbury, Germany Carmen Publishers, Rimpar,
Germany pp. 48-53.
Johnson, B.L. and T.L. Henderson. 2002. Water Use Patterns of Grain Amaranth in the
Northern Great Plains. Agronomy Journal. Col. 94. Nov-Dec. pp. 1437-1443.
Jørgensen, U., 2011. Benefits Versus Risks of Growing Biofuel Crops: the Case of
Miscanthus. Current Opinion in Environmental Sustainability pp. 324-330.
Jørgensen, U., and H.-J. Muhs. Miscanthus Breeding and Improvement. pp. 68-85.
Jørgensen, U., and K. Schelde. 2001. Energy Crop Water and Nutrient Use Efficiency.
Danish Institute of Agricultural Sciences (DIAS) Department of Crop Physiology and
Soil Science. The International Energy Agency. IES Bioenergy Task 17, Short
Rotation Crops. http://www.p2pays.org/ref/17/16275.pdf. Accessed May 2011.
Kahle, P., S. Beuch, B. Boelcke, P. Leinweber, and H.R. Schulten, 2001. Cropping of
Miscanthus in Central Europe: Biomass Production and Influence on Nutrient and
Soil Organic Matter. European Journal of Agronomy Vol. 15, pp. 171-184.
Lamm,F.R., L. R. Stone, and D. M. O'Brien. 2007. Crop production and economics in
northwest Kansas as related to irrigation capacity. Applied Engineering in
Agriculture. Vol. 23(6): 737-745 .
Landis, D.A. and B.P. Werling. 2010. Arthropods and biofuel production systems in North
America. Insect Science. 17:220-236.
Lewandowski, I., J.C. Clifton-Brown, J.M.O. Scurlock, and W. Huisman, 2000. Miscanthus:
European Experience with a Novel Energy Crop. Biomass and Bioenergy Vol. 19,
pp. 209-227.
Lewandowski, I., and A. Heinz, 2003. Delayed Harvest of Miscanthus-Influences on
Biomass Quantity and Quality and Environmental Impacts of Energy Production.
European Journal of Agronomy Vol. 19, pp. 45-63.

REFERENCES
DRAFT - Environmental Assessment SE Giant Miscanthus Establishment and Production 7-10
Lewandowski, I., J.M.O. Scurlock, E. Lindvall, and M. Christou, 2003. The Development
and Current Status of Perennial Rhizomatous Grasses as Energy Crops in the US
and Europe. Biomass and Bioenergy Vol. 25, pp. 335-361.
Linde-Laursen, I.B., 1993. Cytogenetic Analysis of Miscanthus ‘Giganteus’, an Interspecific
Hybrid. Hereditas Vol. 119, pp. 297-300. June.
Liu, T.T., B.G. McConkey, Z.Y. Ma, Z.G. Liu, X. Li, and L.L. Cheng. 2011. Strengths,
Weaknesses, Opportunities, and Threats Analysis of Bioenergy Production on
Marginal Lands. Energy Procedia 5 (2011) 2378-2386.
Love, B.J., and A.P. Nejadhashemi, 2011. Water Quality Impact Assessment of Large-
Scale Biofuel Crops Expansion in Agricultural Regions of Michigan. Biomass and
Bioenergy pp. 1-17.
Low, T., and C. Booth, 2007. The Weedy Truth About Biofuels. Invasive Species Council.
October.
McElroy, M. 2005. Hybrid Grass May Prove to be Valuable Fuel Source. University of
Illinois News Bureau. 27 September.
http://news.illinios.edu/news/05/0927miscanthus.html. Accessed May 2011.
McIsaac, G.F., M.B. David, and C.A. Mitchell, 2010. Miscanthus and Switchgrass
Production in Central Illinois: Impacts on Hydrology and Inorganic Nitrogen Leaching.
Journal of Environmental Quality Vol. 39, pp. 1790-1799.
McKervey, Z., V.B. Woods, and D.L. Easson. 2008. Miscanthus as an energy crop and its
potential for Northern Ireland. Agri-Food and Biosciences Institute Global Research
Unit. May. http://www.afbini.gov.uk/afbi_miscanthus.pdf. Accessed May 2011.
Maman, N., D.J. Lyon, S.C. Mason, T.D. Galusha, and R. Higgins. 2003. Pearl Millet and
Grain Sorghum Yield Response to Water Supply in Nebraska. Agronomy Journal.
Vol. 95. Nov-Dec. pp. 1618-1624.
Marsalis, M.A., V.G. Allen, C.P. Brown, C.J. Green. 2007. Yield and Nutritive Value of
Forage Bermudagrass Grown Using Subsurface Drip Irrigation in the Southern High
Plains. Crop Science. Vol. 47. May-June. pp. 1246-1254.
Miller, A.N., and M.J. Ottman. 2010. Irrigation Frequency Effects on Growth and Ethanol
Yield in Sweet Sorghum. Agronomy Journal. Vol. 102, No. 1, pp. 60-70.

REFERENCES
DRAFT - Environmental Assessment SE Giant Miscanthus Establishment and Production 7-11
National Atlas. 2011. Federal and Indian Lands.
http://www.nationalatlas.com/printable/fedlands.html#bia. Accessed August 2011.
National Oceanic and Atmospheric Administration (NOAA). 2011. Ocean and Coastal
Resource Management. http://coastalmanagement.noaa.gov/mystate/ga.html.
Accessed 11 August 2011.
New Zealand Environmental Risk Management Authority (NZERMA). 2007. Taharoa C
Block Incorporation Application Decision Document. 17 September.
http://www.ermanz.govt.nz/Documents/NOR06003-decision.pdf. Accessed May
2011.
Neukirchen, D., M. Himken, J. Lammel, U. Czypionka-Krause, and H.W. Olfs, 1999. Spatial
and Temporal Distribution of the Root System and Root Nutrient Content of an
Established Miscanthus Crop. European Journal of Agronomy Vol. 11, pp. 301-309.
Ng, T.L., J.W. Eheart, X. Cai, and F. Miguez, 2010. Modeling Miscanthus in the Soil and
Water Assessment Tool 9 SWAT) to Stimulate Its Water Quality Effects As a
Bioenergy Crop. Environmental Science Technology Vol. 44, pp. 7138-7144.
Nielsen, D.C., M.F. Vigil, and J.G. Benjamin. 2006. Forage Yield Response to Water Use
for Dryland Corn, Millet, and Triticale in the Central Great Plains. Agronomy Journal.
Vol. 98. Jul-Aug. pp. 992-998.
North Carolina Department of Environment and Natural Resources. 2011. Division of
Coastal Management. http://dcm2.ehnr.state.nc.us/. Accessed 12 August 2011.
North Carolina Natural Heritage Program (NCNHP). 2011. County Record Search.
http://nhpweb.enr.state.nc.us/search/county.html. Accessed August 2011.
North Carolina Wildlife Resources Commission (NCWRC). 2010. Wildlife Species and
Conservation. http://www.ncwildlife.org/Wildlife_Species_Con/WSC_Profiles.htm.
. Accessed 11 August 2011
Norwood, C. 2001. Planting Date, Hybrid Maturity, and Plant Population Effects on Soil
Water Depletion, Water Use, and Yield of Dryland Corn. Agronomy Journal. Vol. 93.
Sep-Oct. pp. 1034-1042.
Olson, T. 1971. Yield and Water Use by Different Populations of Dryland Corn, Grain
Sorghum, and Forage Sorghum in the Western Corn Belt. Agronomy Journal. Vol.
63. Jan-Feb. pp. 104-106.
REFERENCES
DRAFT - Environmental Assessment SE Giant Miscanthus Establishment and Production 7-12
Penfold, B.M., D.C. Sullivan, S.B. Reid, and L.R. Chinkin. Nd. Development of Agricultural
Dust Emissions Inventories for the Central States Regional Air Planning Association.
http://www.epa.gov/ttn/chief/conference/ei14/session7/reid.pdf. Accessed May 2011.
Pimental, D. and N. Kounang. 1998. Ecology of Soil Erosion in Ecosystems. Ecosystems
1:416-426.
Pimentel, D., and J. Krummel, 1987. Biomass Energy and Soil Erosion: Assessment of
Resource Costs. Biomass Vol. 14, pp. 15-38.
Raghu, S., R.C. Anderson, C.C. Daehler, A.S. Davis, R.N. Wiedenmann, D. Simberloff, and
R.N. Mack, 2006. Adding Biofuels to the Invasive Species Fire? Science Vol. 313,
pp. 1742. September.
Quinn, L.D., D.P. Matlaga, J.R. Stewart, and A.S. Davis. 2011. Empirical Evidence of Long
Distance Dispersal in Miscanthus sinensis and Miscanthus X giganteus. Invasive
Plant and Science Management 4:142-150.
Ramsey, J., and D.W. Schemske, 1998. Pathways, Mechanisms, and Rates of Polyploid
Formation in Flowering Plants. Annu. Rev. Ecol. Syst. Vol. 29, pp.467-501.
Richter, G.M., A.B. Riche, A.G. Dailey, S.A. Gezan, and D.S. Powlson, 2008. Is UK Biofuel
Supply from Miscanthus Water-Limited? Soil Use Management Vol. 24, pp. 235-
245.
Sage, R., M. Cunningham, A.J. Haughton, M.D. Mallott, D. Bohan, A. Riche, and A. Karp,
2010. The environmental impacts of biomass crops: use by birds of miscanthus in
summer and winter in southwestern England. The International Journal of Avian
Science. Vol. 152, pp. 487-499.
Schneekloth, J and A. Andale. 2009 Seasonal Water Needs and Opportunities for Limited
Irrigation for Colorado Crops. Crop Series Fact Sheet, Irrigation, no. 4.718.
University of Colorado Extension Service.
Schwarz, H., P. Liebhard, K. Ehrendorfer, and P. Ruckenbauer, 1994. The Effect of
Fertilization on Yield and Quality of Miscanthus sinensis ‘Giganteus’. Industrial
Crops and Products Vol. 2, pp. 153-159.
Scott, R.K., Jaggard, K.W. and Sylvester-Bradley, R. 1994. Resource capture by arable
crops, In Resource capture by crops, (Eds, Monteith, J.L., Scott, R.K. and Unsworth,
M.) Nottingham University Press, Nottingham, pp. 279-302.

REFERENCES
DRAFT - Environmental Assessment SE Giant Miscanthus Establishment and Production 7-13
Seaber, P. R., F.P. Kapinos, and G.L. Knapp, 2007. Hydrologic Unit Maps. U.S. Geological
Survey, Water Supply Paper 2294. March. http://pubs.usgs.gov/wsp/wsp2294/.
Accessed March 2011.
Semere, T. and F.M. Slater. 2007a. Ground flora, small mammal and bird species diversity
in miscanthus (Miscanthus x giganteus) and reed canary-grass (Phalaris
arundinacea) fields. Biomass & Bioenergy 31:20-29.
Semere, T. and F.M. Slater. 2007b. Invertebrate populations in miscanthus (Miscanthus x
giganteus) and reed canary-grass (Phalaris arundinacea) fields. Biomass &
Bioenergy 31:30-39.
Smeets, E.M.W., I.M. Lewandowski, and A.P.C. Faaij, 2009. The Economical and
Environmental Performance of Miscanthus and Switchgrass Production and Supply
Chains in a European Setting. Renewable and Sustainable Energy Reviews Vol. 13,
pp. 1230-1245.
Somerville, C., H. Youngs, C. Taylor, S.C. Davis, and S.P. Long, 2010. Feedstocks for
Lignocellulosic Biofuels. Science Vol. 329, pp. 790-792. August.
South Carolina Department of Health and Environmental Control (SCDHEC). 2011. Ocean
and Coastal Resource Management. http://www.scdhec.gov/environment/ocrm/.
Accessed 11 August 2011.
South Carolina Department of Natural Resources (SCDNR). 2011. Wildlife Species.
http://www.dnr.sc.gov/wildlife/species.html. Accessed 11 August 2011.
South Carolina Department of Natural Resources (SCDNR). 2010. SC Rare, Threatened
and Endangered Species Inventory. June 2010.
http://www.dnr.sc.gov/species/index.html. Accessed August 2011.
Spencer, J.L., and S. Raghu, 2009. Refuge or Reservoir? The Potential Impacts of the
Biofuel Crop Miscanthus x giganteus on a Major Pest of Maize. PLoS One Vol. 4,
No. 12, pp. 8336.
Stewart, A. and M. Cromey. 2011. Identifying disease threats and management practices
for bio-energy crops. Current Opinion in Environmental Sustainability, 3:75-80
Stone, L.R., D.E. Goodrum, M.N. Jaafar, and A.H. Khan. 2001. Rooting Front and Water
Depletion Depths in Grain Sorghum and Sunflower. Agronomy Journal. Vol. 93.
Sep-Oct. pp. 1105-1110.

REFERENCES
DRAFT - Environmental Assessment SE Giant Miscanthus Establishment and Production 7-14
Stullu, L., S. Cadoux, M. Preughomme, M-H. Jeuffroy, and N. Beaudoin, 2011. Biomass
Production and Nitrogen Accumulation and Remobilisation by Miscanthus x
giganteus as Influenced by Nitrogen Stocks in Belowground Organs. Field Crops
Research Vol. 121, pp. 381-391.
Styles, D., and M.B. Jones, 2007. Energy Crops in Ireland: Quantifying the Potential Life-
Cycle greenhouse Gas Reductions of Energy-Crop Electricity. Biomass and
Bioenergy Vol. 31, pp. 759-772.
Teoh, K., S.P. Devaiah, D. Vicuna Requesens, and E.E. Hood. 2011. Dedicated
Herbaceous Energy Crops (Chapter 4 pp 85-108). in. Plant Biomass Conversion.
eds. E.E. Hood, P. Nelson, and R. Powell. John Wiley & Sons, Inc.
Thompson, L.J. and A.A. Hoffmann. 2011. Pest management challenges for biofuel crop
production. Current Opinion in Environmental Sustainability 3:95-99.
Tolk, J., T.A. Howell, and S.R. Evett. 2006. Nighttime Evapotranspiration from Alfalfa and
Cotton in a Semiarid Climate. Agronomy Journal. Vol. 98. May-Jun. pp. 730-736.
Triplett, G.B., and W. Dick. 2008. No-Tillage Crop Production: A Revolution in Agriculture!.
Celebrate the Centennial (A Supplement to the Agronomy Journal). S-153-S-165.
University of Georgia. nd. Dismantling Persistent Poverty in the Southeastern United
States. Carl Vinson Institute of Government.
http://www.dca.state.ga.us/communities/regionalism/programs/downloads/SE_Repor
t.pdf. Accessed August 2011.
University of Georgia. 2008. Museum of Natural History – Short List of Species.
http://naturalhistory.uga.edu/~GMNH/gawildlife/index.php?page=speciespages/list_s
pecies&class=Reptilia. Accessed August 2011.
U.S. Census Bureau (USCB). 2011a. 2010 Decennial Census. American Factfinder 2.
http://factfinder2.census.gov/faces/nav/jsf/pages/index.xhtml. Accessed August
2011.
U.S. Census Bureau (USCB). Small Area Income and Poverty Estimates.
http://www.census.gov/did/www/saipe/data/statecounty/index.html. Accessed
August 2011.
U.S. Census Bureau (USCB). 2008. National Population Estimates.
http://www.census.gov/popest/national/national.html. Accessed May 2009

REFERENCES
DRAFT - Environmental Assessment SE Giant Miscanthus Establishment and Production 7-15
U.S. Census Bureau (USCB). 2002. 2000 Decennial Census. American Factfinder 2. .
http://factfinder2.census.gov/faces/nav/jsf/pages/index.xhtml. Accessed August
2011.
U.S. Census Bureau (USCB). 2001. Overview of Race and Hispanic Origin. Census 2000
Brief. C2KBR/01-1. March. http://www.census.gov/prod/2001pubs/c2kbr01-1.pdf.
Accessed November 2010.
U.S. Census Bureau (USCB). 1995. Poverty Areas. Statistical Brief.
http://www.census.gov/population/socdemo/statbriefs/povarea.html. June.
Accessed November 2010.
U.S. Department of Agriculture (USDA). 2010. Action Plan for Tribal Consultation and
Collaboration. February 3. http://www.usda.gov/documents/ConsultationPlan.pdf.
Accessed April 2011.
U. S. Department of Agriculture (USDA). 2011. USDA Agricultural Projections to 2010.
Office of the Chief Economist, Long term-Projections Report OCE-2011-1. February
2011.
U.S. Department of Agriculture (USDA) Animal and Plant Health Inspection Service
(APHIS). 2002. Factsheet: The Plant Protection Act. U.S. Department of
Agriculture/Animal Plant Health Inspection Service.
http://www.aphis.usda.gov/publications/plant_health/content/printable_version/fs_ph
proact.pdf. Accessed July 2009.
U. S. Department of Agriculture (USDA). Economic Research Service (ERS). 2011a. Farm
Income and Costs: 2011 Farm Sector Income Forecast. February.
http://www.ers.usda.gov/Briefing/FarmIncome/nationalestimates.htm. Accessed
March 2011.
U. S. Department of Agriculture (USDA), Economic Research Service (ERS), 2011b. Farm
Household Economics and Well-Being: Farm Household Income. February.
http://www.ers.usda.gov/briefing/wellbeing/farmhouseincome.htm. Accessed March
2011.
U.S. Department of Agriculture (USDA). Economic Research Service (ERS). 2011c.
Fertilizer Use and Price dataset. http://www.ers.usda.gov/Data/FertilizerUse/.
Accessed September 2011.

REFERENCES
DRAFT - Environmental Assessment SE Giant Miscanthus Establishment and Production 7-16
U. S. Department of Agriculture (USDA) Economic Research Service (ERS). 2008. Rural
America at a Glance, 2008 edition, Economic Information Bulletin 40.
http://www.ers.usda.gov/Publications/EIB40/EIB40.pdf. Accessed July 2009.
U.S. Department of Agriculture (USDA). Farm Service Agency (FSA). 2011a.
Conservation Reserve Program Monthly Summary, July. Washington, D.C.
http://www.fsa.usda.gov/Internet/FSA_File/jul2011crpstat.pdf. Accessed August
2011.
U.S. Department of Agriculture (USDA), Farm Service Agency (FSA). 2011b. Summary of
Active and Expiring CRP Cropland Acres by County, July 2011.
https://arcticocean.sc.egov.usda.gov/CRPReport/monthly_report.do?method=select
State&report=ActiveAndExpiredCRPAcresByCounty&report_month=July-2011.
Accessed August 2011.
U.S. Department of Agriculture (USDA). Farm Service Agency (FSA). 2011c. “Re: Need
HEL data for GA, NC, SC.” 22 and 23 August. Personal communication via e-mail
correspondence with Integrated Environmental Solutions, LLC and USDA-FSA.
U.S. Department of Agriculture (USDA). Farm Service Agency (FSA). 2011d. Biomass
Crop Assistance Program (BCAP) Final Rule Provisions. Washington, D.C.
http://www.fsa.usda.gov/Internet/FSA_File/bcapoctrules.pdf. Accessed March 2011.
U.S. Department of Agriculture (USDA). Farm Service Agency (FSA). 2010. Final
Programmatic Environmental Impact Statement for the Biomass Crop Assistance
Program (BCAP). Washington, D.C.
U. S. Department of Agriculture (USDA). Farm Service Agency (FSA). 2003. Final
Programmatic Environmental Impact Statement for the Conservation Reserve
Program (CRP). Washington, D.C.
U.S. Department of Agriculture (USDA). Forest Service (FS). 2011. Personal
Communication with R.A. Harper “RE: Need Forested land acres by county for GA,
SC, and NC.” 25 August 2011. Email.
U.S. Department of Agriculture (USDA). Forest Service (FS). 2010. Northern Research
Station. 2010 Forest Inventory. EVALIDator Version 4.01.01.
http://apps.fs.fed.us/Evalidator/tmattribute.jsp. Accessed August 2011.

REFERENCES
DRAFT - Environmental Assessment SE Giant Miscanthus Establishment and Production 7-17
U.S. Department of Agriculture (USDA). Forest Service (FS). 2009a. Forest Resources of
the United States, 2007. General Technical Report WO-78.
http://nrs.fs.fed.us/pubs/7334. Accessed August 2011.
U.S. Department of Agriculture (USDA). Forest Service (FS). 2009b. Forest Resources of
the United States, 2007. Resources Planning Act Resource Tables.
http://www.fia.fs.fed.us/program-features/rpa/. Accessed August 2011.
U.S. Department of Agriculture (USDA), National Agricultural Statistics Service (NASS).
2011. Quick Stats – Crops and Livestock data by State and County.
http://www.nass.usda.gov/QuickStats/Create_County_All.jsp. Accessed August
2011.
U. S. Department of Agriculture (USDA), National Agricultural Statistics Service (NASS).
2009. 2007 Census of Agriculture. United States Summary and State Data Vol. 1,
Geographic Area Series, Part 51, pp. 1-739.
U.S. Department of Agriculture (USDA) Natural Resources Conservation Service (NRCS).
2009. Tribal Consultation. A Guide for Natural Resource Conservation Service
(NRCS) Employees. USDA. May 5.
http://www.nrcs.usda.gov/programs/tribalgov/tribal-consultation.pdf. Accessed April
2011.
U.S. Department of Agriculture (USDA). Natural Resources Conservation Service (NRCS).
2006. Land Resource Regions and Major Land Resource Areas of the United
States, the Caribbean and the Pacific Basin. USDA Handbook 296. ftp://ftp-
fc.sc.egov.usda.gov/NSSC/Ag_Handbook_296/Handbook_296_low.pdf. Accessed
August 2011.
U.S. Department of Agriculture (USDA). Natural Resources Conservation Service (NRCS).
1999. Soil Taxonomy Maps. ftp://ftp-
fc.sc.egov.usda.gov/NSSC/Soil_Taxonomy/maps.pdf. Accessed October 2009.
U.S. Fish and Wildlife Service (USFWS). 2011. Endangered Species Program. Species By
County Report. http://www.fws.gov/endangered/. Accessed September 2011.
U.S. Fish and Wildlife Service (USFWS) and U.S. Census Bureau (USCB). 2008a. 2006
National Survey of Fishing, Hunting, and Wildlife Watching. State Report for

REFERENCES
DRAFT - Environmental Assessment SE Giant Miscanthus Establishment and Production 7-18
Georgia. http://www.census.gov/prod/2008pubs/fhw06-ga.pdf. Accessed August
2011.
U.S. Fish and Wildlife Service (USFWS) and U.S. Census Bureau (USCB). 2008b. 2006
National Survey of Fishing, Hunting, and Wildlife Watching. State Report for North
Carolina. http://www.census.gov/prod/2008pubs/fhw06-nc.pdf. Accessed August
2011.
U.S. Fish and Wildlife Service (USFWS) and U.S. Census Bureau (USCB). 2008c. 2006
National Survey of Fishing, Hunting, and Wildlife Watching. State Report for South
Carolina. http://www.census.gov/prod/2008pubs/fhw06-sc.pdf. Accessed August
2011.
U.S. Environmental Protection Agency (EPA). 2011. Level III Ecoregions of the Continental
United States. National Health and Environmental Effects Research Laboratory.
January.
U.S. Environmental Protection Agency (EPA). 2011. 2008 National Emissions Inventory
Data. http://www.epa.gov/ttn/chief/net/2008inventory.html. Accessed August 2011.
U.S. Environmental Protection Agency (EPA). 2011. Currently Designated nonattainment
Areas for All Criteria Pollutants. 21 April 2011.
http://www.epa.gov/oaqps001/greenbk/ancl.html. Accessed August 2011.
U.S. Environmental Protection Agency (EPA). 2010a. EPA Office of Water: 303(d) Listed
Impaired Waters NHD Dataset.
http://www.epa.gov/waters/data/downloads.html#303(d) Listed Impaired Waters.
Accessed August 2011.
U.S. Environmental Protection Agency (EPA). 2010b. EPA’s Action Development Process:
Interim Guidance on Considering Environmental Justice During the Development of
an Action. July.
http://www.epa.gov/environmentaljustice/resources/policy/considering-ej-in-
rulemaking-guide-07-2010.pdf. Accessed November 2010.
U.S. Environmental Protection Agency (EPA). 2009. What is a Watershed? Watersheds.
http://water.epa.gov/type/watersheds/whatis.cfm. Accessed March 2011.
U.S. Environmental Protection Agency (EPA). 2008. 303(d) List.
http://www.epa.gov/reg3wapd/tmdl/303d.htm. Accessed August 2011.

REFERENCES
DRAFT - Environmental Assessment SE Giant Miscanthus Establishment and Production 7-19
U.S. Environmental Protection Agency (EPA). 1998. National Air Pollutant Emission Trends
Procedures Document, Sections 1, 4, and 6 1985-1996 Projections 1999-2010.
EPA-454/R-98-008. June. Office of Air Quality Planning and Standards.
http://nepis.epa.gov/Exe/ZyNET.exe/00003677.TXT?ZyActionD=ZyDocument&Client
=EPA&Index=1995+Thru+1999&Docs=&Query=454R98008&Time=&EndTime=&Se
archMethod=1&TocRestrict=n&Toc=&TocEntry=&QField=pubnumber%5E%22454R
98008%22&QFieldYear=&QFieldMonth=&QFieldDay=&UseQField=pubnumber&IntQ
FieldOp=1&ExtQFieldOp=1&XmlQuery=&File=D%3A%5Czyfiles%5CIndex%20Data
%5C95thru99%5CTxt%5C00000010%5C00003677.txt&User=ANONYMOUS&Pass
word=anonymous&SortMethod=h%7C-
&MaximumDocuments=10&FuzzyDegree=0&ImageQuality=r75g8/r75g8/x150y150g
16/i425&Display=p%7Cf&DefSeekPage=x&SearchBack=ZyActionL&Back=ZyAction
S&BackDesc=Results%20page&MaximumPages=1&ZyEntry=1&SeekPage=x&ZyP
URL#. Accessed May 2011.
U.S. Fish and Wildlife Service (USFWS). 2011. Endangered Species Program. Species
Profile. http://www.fws.gov/endangered/. Accessed September 2011.
U. S. Geological Survey (USGS), 2011. Hydrologic Unit Maps. Water Resources of the
United States. http://water.usgs.gov/GIS/huc.html Accessed August 2011.
U. S. Geological Survey (USGS), 2010a. National Hydrography Dataset.
ftp://nhdftp.usgs.gov/DataSets/Staged/States/. Accessed August 2011.
U. S. Geological Survey (USGS), 2010b. Estimated Use of Water in the United States, 2005.
http://water.usgs.gov/watuse/data/2005/index.html. Accessed March 2011.
VanLoocke, A., C.J. Bernacchi, and T.E. Twines, 2010. The Impacts of Miscanthus x
giganteus Production on the Midwest US Hydrologic Cycle. Global Change Biology
Bioenergy Vol. 2, pp. 180-191.
Waters, G. 2011. Personal Communication between P. Jennings, Phillip Jennings Turf
Farm. 20 August.
Williams, M.J., and J. Douglas. 2011. Planting and Managing Giant Miscanthus as a
Biomass Energy Crop. USDA NRCS Plant Materials Program. Technical Note No.
4. July. http://plant-materials.nrcs.usda.gov/pubs/NPMtechnotes/npmptn4.pdf.
Accessed August 2011.

REFERENCES
DRAFT - Environmental Assessment SE Giant Miscanthus Establishment and Production 7-20
Weir, A.H. and Barraclough, P.B. 1986. The effect of drought on the root growth of winter
wheat and its water uptake from a deep loam soil. Soil Use Mgmt, 2, 91-
96.Whitmore, A.P., Bradbury, N.J. and Johnson, P.A. (1992) The potential
contribution of ploughed grassland to nitrate leaching. Agriculture, Ecosystems and
Environment, 39, 221-233
Zub, H.W., S. Arnoult, M. Brancourt-Hulmel, 2011. Key Traits for Biomass Production
Identified in Different Miscanthus Species at Two Harvest Dates. Biomass and
Bioenergy Vol. 35, pp. 637-651.

PREPARERS
DRAFT - Environmental Assessment SE Giant Miscanthus Establishment and Production 8-1
8 PREPARERS
Name Organization Experience Project Role
Phillip Jennings, COO REPREVE Renewables, LLC
31 years Project Review and Methodology Oversight
Jay Brinson, Sales Manager REPREVE Renewables, LLC
11 years Project Review and Technical Oversight
Craig Patterson, Manager Commercial Operations
REPREVE Renewables, LLC
17 years Project Review and Technical Oversight
Rae Lynn Schneider Integrated Environmental Solutions, LLC
10 years Project Management, Project Review
M.P.P, Public Policy, Harvard University, 2001
B.S., Rangeland Ecology & Management, Texas A&M University, 1997
Katelyn Kowalczyk Integrated Environmental Solutions, LLC
2.5 years Affected Environment, Environmental Consequences
B.S., Environmental Science, Stephen F. Austin State University, 2008
Ransley Eberhart Integrated Environmental Solutions, LLC
6 years GIS Analysis and Map Generation
M.S., Geoarchaeology and GIS, University of North Texas, 2008
B.A., Anthropology, University of North Texas, 2002

PREPARERS
DRAFT - Environmental Assessment SE Giant Miscanthus Establishment and Production 8-2
This Page Intentionally Left Blank
PERSONS AND AGENCIES CONTACTED
DRAFT - Environmental Assessment SE Giant Miscanthus Establishment and Production 9-1
9 PERSONS AND AGENCIES CONTACTED 1
9.1 TRIBAL CONSULTATION 2
This section has been added to the Final EA after reviewing comments received on the Draft 3
EA concerning Tribal Consultation. FSA is committed to government-to-government 4
consultation. FSA conducts these consultations in a regular and meaningful way that takes 5
into account the comments and concerns of American Indian Tribal governments. 6
As part of this FSA’s commitment and as required by EO 13175 “Consultation and 7
Coordination with Indian Tribal Governments,“ FSA conducted two formal consultations 8
with Tribal governments on BCAP prior to the publication of the final rule. Both of the Tribal 9
consultations were conducted through teleconferences. All Federally recognized Tribes 10
were invited to the first consultation, which was held on July 21, 2010. The Forest County 11
Potawatomi Community requested a separate government-to-government consultation on 12
BCAP, which was held on July 22, 2010. All comments from the government-to-government 13
Tribal consultations were addressed in the final rule. 14
This proposed BCAP project is an action that does not have a “substantial direct effect on 15
one or more Indian tribe” (Sec.1 (a) EO 13175). As such, no separate government-to-16
government consultations were deemed necessary for this project. The proposed locations 17
that were analyzed in this Final EA do not encompass any Tribal lands as defined under 36 18
CFR 800.16(x). 19
Tribal members may own private lands which would be within the project area of this BCAP 20
project and thus may be eligible to apply. These applicants would have the same rights and 21
eligibility requirements as any private lands applicant. 22
Tribal consultation is required for any proposed federal action that may significantly affect 23
the human environment according to NEPA Implementing Regulations (40 CFR 1500). EO 24
13175, Consultation and Coordination with Indian Tribal Governments, further described the 25
obligation of federal agencies to coordinate and consult with federally recognized tribes for 26
any proposed federal action that may affect significant cultural or historic resources to that 27
tribe. The USDA released a department-wide Action Plan for Tribal Coordination and 28
Consultation on February 3, 2010 in response to a memorandum from President Obama on 29
November 5, 2009 that required effective tribal consultation in carrying out federal actions 30
(USDA 2010). Agency-specific guidance has also been developed by the NRCS within 31
USDA that provides the FSA with technical assistance in relation to environmental 32

PERSONS AND AGENCIES CONTACTED
DRAFT - Environmental Assessment SE Giant Miscanthus Establishment and Production 9-2
compliance at the field or contract level on a state basis including tribal consultation (NRCS 1
2009). 2
Tribal consultation was initiated by FSA as part of the Final BCAP PEIS using a variety of 3
teleconferences or follow up individual teleconferences if requested by individual tribes. 4
FSA also initiated tribal consultation with three tribes based on the Final BCAP PEIS 5
process, which included the Sac and Fox Nation of Oklahoma, Osage Nation of Oklahoma, 6
and the Seneca Nation of New York. Each of these three tribes was provided with a copy of 7
this Draft EA and invited to comment during the public comment period that opened on April 8
8, 2011 with the publication of the Draft EA in the Federal Register. 9
The Project Sponsor completed additional desktop reviews to support the Draft EA including 10
a review of publicly available information on Indian lands, the Bureau of Indian Affairs (BIA) 11
list of federally recognized tribes and their affiliations, and State Historic Preservation Office 12
(SHPO) web sites for the four states within the proposed project areas. Based on a review 13
of National Atlas data, there are no Indian reservations or Indian lands in any of the 14
proposed project areas (National Atlas 2011). Based on a review of the BIA list of federally 15
recognized tribes by state that was last updated on October 1, 2010, there is one federally 16
recognized tribe currently living North Carolina but there are no tribes currently living in the 17
other two states and none within the proposed project areas (BIA 2010). A review of the 18
SHPO web sites for additional tribal information provided no additional data for Georgia and 19
North Carolina, but the South Carolina State Historic Preservation Office provided a list of 20
16 tribes federally recognized tribes and seven state recognized tribes that have historical 21
affiliation to the state (SCSHPO 2011). Any specific tribal concerns raised during the public 22
comment period on the Draft EA will be further incorporated into the development of 23
conservation plans to avoid and minimize such impacts as part of the overall environmental 24
compliance program that NRCS will assist FSA with implementing for BCAP enrollees. 25
26

PERSONS AND AGENCIES CONTACTED
DRAFT - Environmental Assessment SE Giant Miscanthus Establishment and Production 9-3
9.2 AGENCIES AND PERSONS CONTACTED 1
Name Organization/Agency
Responsible Agency Officials
Juan M. Garcia Acting Deputy Administrator for Farm Programs, U.S. Department of Agriculture, Farm Service Agency, Washington D.C.
Kelly Novak Associate Director, U.S. Department of Agriculture, Farm Service Agency, Conservation and Environmental Programs Division, Washington D.C.
Matthew T. Ponish National Environmental Compliance Manager , U.S. Department of Agriculture, Farm Service Agency, Washington D.C.
Amy Braun Natural Resource Specialist, U.S. Department of Agriculture, Farm Service Agency, Washington D.C.
Todd Atkinson Senior Policy Advisor, U.S. Department of Agriculture, Farm Service Agency, Washington D.C.
Federal Agencies Contacted
USDA, Agricultural Research Service · Adam Davis, Ecologist, Global Change and Photosynthesis Research Unit, IL
· Seth Dabney · Richard Lowrance, Research Ecologist, GA · John Sadler, Research Leader,, Cropping
Systems and Water Quality Research Unit, MO USDA, Animal Plant Health Inspection Service
· Neil Hoffman, Special Assistant to the Deputy Administrator
USDA, Forest Service · Joseph Carbone, Assistant Director, Ecosystem Management Coordination - NEPA
USDA, Natural Resources Conservation Service
· Diane E. Gelbund, PhD, Special Assistant to the Chief for Strategic Natural Resource Issues
· Philip Barbour, PhD, Wildlife Biologist · Meg Bishop, Landscape Ecologist,
Environmental Compliance · Steve Brady, PhD, Team Leader, National
Wildlife Technology Development Team · John Englert, National Plants Materials Specialist · Matt Harrington, National Environmental
Coordinator · C. Wayne Honeycutt, PhD, Deputy Chief for
Science and Technology · Norm Widman, National Agronomist
USDA, Rural Development · Linda Rogers, Deputy Director, Program Support Staff

PERSONS AND AGENCIES CONTACTED
DRAFT - Environmental Assessment SE Giant Miscanthus Establishment and Production 9-4
Name Organization/Agency
U.S. Environmental Protection Agency Region 1 Region 2 Region 3 Region 4 Region 5 Region 6 Region 7 Region 8 Region 9 Region 10
Washington, D.C. Boston, MA New York, NY Philadelphia, PA Atlanta, GA Chicago, IL Dallas, TX Kansas City, KS Denver, CO San Francisco, CA Seattle, WA
U.S. Fish and Wildlife Service Region 1 Region 2 Region 3 Region 4 Region 5 Region 6 Region 7 Region 9
Portland, OR Albuquerque, NM Fort Snelling, MN Atlanta, GA Hadley, MA Denver, CO Anchorage, AK Washington, D.C.
State Agencies Contacted State of Georgia · Gary Black, Commissioner, Georgia Department
of Agriculture · Mark Williams, Commissioner, Georgia
Department of Agriculture · Jill Stuckey, Director, Center of Innovation for
Energy · Terry Hollifield, Executive director, Georgia Crop
Improvement Association State of North Carolina · Steve Troxler, Commissioner, North Carolina
Department of Agriculture and Community Services
· Sam Brake, Director of Farming, Biofuels Center for North Carolina
· Dee Freeman, North Carolina Department of Environment and Natural Resources
· Ron Gehl, Assistant Professor and Extension Specialist, North Carolina State University
State of South Carolina · John E. Frampton, Director, South Carolina Department of Natural Resources
· Hugh Weathers, Commissioner, South Carolina Department of Agriculture
· Tom French, Chairman, South Carolina Biomass Council
Political Officials State of Georgia · The Honorable Johnny Isakson, US Senator
· The Honorable Saxby Chambliss, US Senator · The Honorable John Barrow, US Representative · The Honorable Jack Kingston, US
Representative

PERSONS AND AGENCIES CONTACTED
DRAFT - Environmental Assessment SE Giant Miscanthus Establishment and Production 9-5
Name Organization/Agency
State of North Carolina · The Honorable Richard Burr, US Senator · The Honorable Kay Hagan, US Senator
State of South Carolina · The Honorable Jim DeMint, US Senator · The Honorable Lindsey Graham, US Senator
State of Mississippi · The Honorable Thad Cochran, US Senator State of Alabama · The Honorable Jeff Sessions, US Senator 1
2

PERSONS AND AGENCIES CONTACTED
DRAFT - Environmental Assessment SE Giant Miscanthus Establishment and Production 9-6
1
2
3
4
5
6
7
8
9
10
11
12
This Page Intentionally Left Blank 13
14

APPENDICES
DRAFT - Environmental Assessment SE Giant Miscanthus Establishment and Production A-1
APPENDICES

APPENDICES
DRAFT - Environmental Assessment SE Giant Miscanthus Establishment and Production A-2
This Page Intentionally Left Blank

APPENDICES
DRAFT - Environmental Assessment SE Giant Miscanthus Establishment and Production A-3
APPENDIX A – State-listed Species that Could Potentially Occur within the Proposed Project Areas

APPENDICES
DRAFT - Environmental Assessment SE Giant Miscanthus Establishment and Production A-4
This Page Intentionally Left Blank

APPENDICES
DRAFT - Environmental Assessment SE Giant Miscanthus Establishment and Production A-5
Table A-2. State-listed Threatened and Endangered Species that Could Potentially Occur in Georgia
Category Scientific Name Common Name T/E Counties
Amphibians Ambystoma cingulatum
Frosted Flatwoods Salamander T
Ben Hill, Berrien, Burke, Charlton, Effingham, Emanuel, Evans, Irwin, Jeff Davis, Lanier, Long, Lowndes, Screven, Ware
Notophthalmus perstriatus Striped Newt T
Berrien, Charlton, Emanuel, Evans, Irwin, Jenkins, Lanier, Long, Lowndes, Screven, Taylor, Ware, Wilcox
Birds
Haliaeetus leucocephalus Bald Eagle T
Appling, Baldwin, Bulloch, Coffee, Cook, Hancock, Harris, Heard, Jefferson, Lanier, Long, Lowndes, Macon, Talbot, Troup, Twiggs, Wilkinson
Picoides borealis Red-cockaded Woodpecker E
Appling, Ben Hill, Brantley, Charlton, Effingham, Emanuel, Evans, Irwin, Jefferson, Laurens, Long, Meriwether, Montgomery, Putnam, Talbot, Tattnall, Upson, Ware, Washington, Wheeler, Wilcox
Mycteria americana Wood Stork E Brantley, Charlton, Jenkins, Long, Lowndes, Screven, Ware, Wayne
Fish
Alosa alabamae Alabama Shad T Cook, Lowndes
Cyprinella xaenura Altamaha Shiner T Butts, Crawford, Jasper, Lamar, Putnam, Spalding
Enneacanthus chaetodon
Blackbanded Sunfish E Berrien, Charlton, Ware
Elassoma okatie Bluebarred Pygmy Sunfish E Jefferson
Percina crypta Halloween Darter T Crawford, Meriwether, Pike, Talbot, Tayoe, Upson
Moxostoma robustum Robust Redhorse E
Baldwin, Burke, Emanuel. Houston, Johnson, Laurens, Pulaski, Twiggs, Washington, Wilkinson
Acipenser brevirostrum
Shortnose Sturgeon E
Appling, Burke, Effingham, Jeff Davis, Long, Montgomery, Screven, Tattnall, Toombs, Wayne, Wheeler
Insect Cordulegaster sayi Say's Spiketail T Candler, Coffee, Effingham, Emanuel, Evans, Irwin, Tallnall, Toombs, Wayne
Invertebrates
Alasmidonta arcula Altamaha Arcmussel T
Appling, Ben Hill, Coffee, Jeff Davis, Laurens, Long, Montgomery, Tattnall, Telfair, Toombs, Wayne, Wheeler
Elliptio spinosa Altamaha Spinymussel E Appling, Coffee, Jeff Davis, Long, Montgomery, Tattnall, Telfair, Toombs, Wayne, Wheeler
Fusconaia masoni Atlantic Pigtoe E Bulloch, Burke, Glascock, Hancock, Jefferson, Jenkins, Screven, Washington
Elliptio arctata Delicate Spike E Crawford, Harris, Meriwether, Pike, Spalding, Talbot, Taylor, Upson, Wayne
Amblema neislerii Fat Threeridge E Macon
Medionidus penicillatus
Gulf Moccasinshell E Harris, Meriwether, Pike, Spalding, Taylor
Elliptio purpurella Inflated Spike T Spalding, Taylor
Procambarus gibbus Muckalee Crayfish T Crawford
Cambarus truncatus
Oconee Burrowing Crayfish T Laurens, Washington, Wilkinson
Pleurobema pyriforme Oval Pigtoe E Macon, Meriwether, Pike, Spalding, Taylor
Cambarus harti Piedmont Blue Burrower E Meriwether
Elliptoideus sloatianus
Purple Bankclimber T Crawford, Harris, Macon, Spalding, Talbot, Taylor, Upson
Anodontoides radiatus Rayed Creekshell T Macon, Meriwether, Pike, Spalding, Upson

APPENDICES
DRAFT - Environmental Assessment SE Giant Miscanthus Establishment and Production A-6
Category Scientific Name Common Name T/E Counties
Toxolasma pullus Savannah Lilliput T Burke, Jeff Davis, Long, Screven, Tattnall, Telfair, Wayne
Hamiota subangulata
Shinyrayed Pocketbook E Crawford, Macon, Meriwether, Pike, Spalding, Taylor
Alasmidonta triangulata Southern Elktoe E Crawford, Macon, Meriwether, Pike, Spalding, Taylor, Upson
Mammals
Puma concolor coryi Florida Panther E Bulloch, Evans, Troup
Trichechus manatus Manatee E Effingham
Neofiber alleni Round-tailed Muskrat T Brantley, Charlton, Ware
Geomys pinetis Southeastern Pocket Gopher T Emanuel, Jefferson, Jenkins, Laurens, Screven, Tattnall, Taylor, Telfair
Reptiles
Macrochelys temminckii
Alligator Snapping Turtle T Cook, Crawford, Echols, Lanier, Lowndes, Pike, Taylor, Upson
Graptemys barbouri Barbour's Map Turtle T Crawford, Macon, Meriwether, Pike, Talbot, Taylor, Upson
Drymarchon couperi Eastern Indigo Snake T
Appling, Atkinson, Bacon, Ben Hill, Berrien, Brantley, Bulloch, Candler, Charlton, Clinch, Coffee, Cook, Echols, Effingham, Emanuel, Evans, Irwin, Jeff Davis, Lanier, Long, Lowndes, Pierce, Tattnall, Telfair, Toombs, Ware, Wayne, Wheeler, Wilcox
Gopherus polyphemus Gopher Tortoise T
Appling, Atkinson, Ben Hill, Berrien, Brantley, Bulloch, Candler, Charlton, Clinch, Coffee, Cook, Dodge, Effingham, Emanuel, Evans, Glascock, Irwin, Jefferson, Jeff Davis, Lanier, Long, Lowndes, Montgomery, Pierce, Talbot, Tattnall, Taylor, Telfair, Toombs, Ware, Wayne, Washington, Wheeler, Wilcox
Heterodon simus Southern Hognose Snake T
Ben Hill, Bleckley, Bulloch, Burke, Coffee, Effingham, Glascock, Houston, Irwin, Jeff Davis, Jefferson, Jenkins, Johnson, Long, Macon, Peach, Pulaski, Screven, Talbot, Tattnall, Taylor, Wilcox
Plants
Matelea alabamensis Alabama Milkvine T Wayne
Berberis canadensis American Barberry E Harris, Meriwether
Schisandra glabra Bay Star-vine T Heard, Troup, Washington
Isoetes melanospora Black-spored Quillwort E Butts, Heard
Oxypolis canbyi Canby Dropwort E Butts, Jenkins, Screven
Kalmia carolina Carolina Bog Laurel T Taylor
Schwalbea americana Chaffseed E Pike, Upson
Pinguicula primuliflora
Clearwater Butterwort T Taylor
Pteroglossaspis ecristata
Crestless Plume Orchid T Berrien, Brantley, Charlton, Irwin, Long, Tattnall, Tift
Croomia pauciflora Croomia T Crawford, Harris, Talbot, Taylor
Eriocaulon koernickianum Dwarf Hatpins E Hancock, Meriwether
Fothergilla gardenii Dwarf Witch-alder T Brantley, Candler, Emanuel, Long, Macon, Tattnall, Taylor, Ware, Wayne
Salix floridana Florida Willow E Dodge, Pulaski, Wilcox
Silene polypetala Fringed Campion E Crawford, Houston, Talbot, Taylor, Twiggs, Upson
Symphyotrichum georgianum Georgia Aster T Houston

APPENDICES
DRAFT - Environmental Assessment SE Giant Miscanthus Establishment and Production A-7
Category Scientific Name Common Name T/E Counties
Elliottia racemosa Georgia Plume T Atkinson, Ben Hill, Bulloch, Burke, Candler, Coffee, Emanuel, Evans, Irwin, Jeff Davis, Jenkins, Long, Tattnall, Telfair, Wheeler
Arabis georgiana Georgia Rockcress T Harris
Sarracenia oreophila Green Pitcherplant E Crawford, Taylor, Upson
Baptisia arachnifera Hairy Rattleweed E Brantley, Wayne
Ptilimnium nodosum Harperella E Putnam
Cuscuta harperi Harper's Dodder E Heard, Washington
Hartwrightia floridana Hartwrightia T Brantley, Charlton, Ware
Macranthera flammea
Hummingbird Flower T Ben Hill, Emanuel, Evans, Johnson, Tattnall, Treutlen, Wilcox
Cypripedium kentuckiense
Kentucky Ladyslipper E Laurens, Wilkinson
Rudbeckia heliopsidis
Little River Black-eyed Susan T Harris
Asplenium heteroresiliens Marl Spleenwort T Bleckley
Isoetes tegetiformans
Mat-forming Quillwort E Hancock, Putnam
Sedum nevii Nevius Stonecrop T Harris
Scutellaria ocmulgee Ocmulgee Skullcap T Ben Hill, Bleckley, Burke, Houston, Laurens, Telfair, Treutlen, Twiggs, Wheeler, Wilcox
Morella inodora Odorless Bayberry T Brantley
Quercus oglethorpensis Oglethorpe Oak T Jasper, Putnam
Calamintha ashei Ohoopee Wild Basil T Candler, Tattnall
Sarracenia psittacina
Parrot Pitcherplant T
Bacon, Ben Hill, Berrien, Bulloch, Candler, Charlton, Clinch, Coffee, Cook, Emanuel, Irwin, Jeff Davis, Lanier, Telfair, Tift, Toombs, Ware, Wilcox
Stylisma pickeringii var. pickeringii
Pickering's Morning-glory T Jenkins, Talbot, Tattnall, Taylor, Toombs
Rhododendron prunifolium Plumleaf Azalea T Harris
Lindera melissifolia Pond Spicebush E Effingham, Screven, Taylor, Wheeler
Amphianthus pusillus Pool Sprite T Butts, Hancock, Harris, Heard, Meriwether, Pike, Putnam
Sarracenia purpurea Purple Pitcherplant E Evans, Tattnall, Tift, Toombs
Trillium reliquum Relict Trillium E Bleckley, Harris, Houston, Jasper, Laurens, Macon, Talbot, Taylor, Twiggs, Upson, Wilkinson
Astragalus michauxii Sandhill Milk-vetch T
Bleckley, Bulloch, Burke, Candler, Dodge, Emanuel, Jenkins, Laurens, Screven, Tattnall, Washington
Ceratiola ericoides Sandhill Rosemary T Burke, Candler, Emanuel, Tattnall, Toombs, Wheeler
Hymenocallis coronaria Shoals Spiderlily T Harris, Talbot, Upson

APPENDICES
DRAFT - Environmental Assessment SE Giant Miscanthus Establishment and Production A-8
Category Scientific Name Common Name T/E Counties
Rhynchospora solitaria Solitary Beakrush E Irwin, Tift
Sarracenia rubra Sweet Pitcherplant T
Bulloch, Burke, Candler, Crawford, Emanuel, Jefferson, Macon, Peach, Talbot, Tattnall, Taylor, Toombs, Twiggs, Wheeler
Crataegus triflora Three-flowered Hawthorn T Houston

APPENDICES
DRAFT - Environmental Assessment SE Giant Miscanthus Establishment and Production A-9
Table A-3. State-listed Threatened and Endangered Species that Could Potentially Occur in North Carolina
Category Scientific Name Common Name T/E Counties
Amphibian Rana capito
Carolina Gopher Frog ST
Belfort, Bladen, Brunswick, Hoke, Jones, New Hanover, Onslow, Pender, Robeson, Sampson, Scotland
Ambystoma tigrinum
Eastern Tiger Salamander ST Cumberland, Hoke, Richmond, Robeson, Scotland
Bird
Haliaeetus leucocephalus Bald Eagle ST
Belfort, Bladen, Brunswick, Columbus, Craven, Edgecombe, Harnett, Johnston, Jones, Lee, Lenoir, Martin, Montgomery, Nash, New Hanover, Onslow, Pamlico, Pender, Pitt, Richmond, Wayne
Gelochelidon nilotica Gull-billed Tern ST Brunswick, New Hanover, Onslow
Falco peregrinus Peregrine Falcon SE Brunswick
Charadrius melodus Piping Plover ST Brunswick, New Hanover, Onslow, Pender
Picoides borealis Red-cockaded Woodpecker SE
Beaufort, Bladen, Brunswick, Columbus, Craven, Duplin, Edgecombe, Green, Harnett, Hoke, Johnston, Jones, Lee, Lenoir, Montgomery, Moore, Nash ,New Hanover, Onslow, Pamlico, Pender, Pitt, Richmond, Robeson, Sampson, Scotland, Wayne, Wilson
Mycteria americana Wood Stork SE Brunswick, Columbus, Sampson
Fish
Notropis bifrenatus Bridle Shiner SE Craven, Jones
Notropis mekistocholas Cape Fear Shiner SE Harnett, Lee, Moore
Noturus furiosus Carolina Madtom ST Craven, Edgecombe, Greene, Johnston, Jones Lenoir, Nash, Pitt, Wayne, Wilson
Elassoma boehlkei
Carolina Pygmy Sunfish ST Brunswick, Columbus
Moxostoma sp. 3 Carolina Redhorse ST Harnett, Lee, Montgomery, Moore, Richmond
Lampetra aepyptera
Least Brook Lamprey ST Edgecombe, Johnston, Jones, Lenoir, Pitt
Moxostoma robustum Robust Redhorse SE Richmond
Etheostoma perlongum Waccamaw Darter ST Columbus
Menidia extensa Waccamaw Silverside ST Columbus
Acipenser brevirostrum
Shortnose Sturgeon SE
Beaufort, Bladen, Brunswick, Columbus, Craven, New Hanover, Onslow, Pamlico, Pender, Pitt, Richmond
Invertebrate
Anodonta implicata Alewife Floater ST Montgomery, Richmond
Fusconaia masoni Atlantic Pigtoe SE
Beaufort, Bladen, Cumberland, Edgecombe, Harnett, Johnston, Montgomery, Moore, Nash, Pender, Pitt
Triodopsis soelneri
Cape Fear Threetooth ST Brunswick, Columbus, New Hanover, Onslow
Lasmigona decorata
Carolina Heelsplitter SE Richmond
Aristida simpliciflora
Chapman's Three-awn SE Brunswick, Columbus, Onslow, Pender
Strophitus undulatus Creeper ST Edgecombe, Johnston, Jones, Lee, Montgomery, Moore, Nash, Pitt, Richmond, Wilson

APPENDICES
DRAFT - Environmental Assessment SE Giant Miscanthus Establishment and Production A-10
Category Scientific Name Common Name T/E Counties
Lampsilis radiata Eastern Lampmussel ST
Bladen, Columbus, Craven, Edgecombe, Johnston, Jones, Lee, Montgomery, Nash, Pender, Pitt, Richmond, Sampson, Wayne, Wilson
Ligumia nasuta Eastern Pondmussel ST Brunswick, Martin, Nash, Pitt, Richmond
Elliptio roanokensis Roanoke Slabshell ST
Bladen, Craven, Cumberland, Edgecombe, Harnett, Johnston, Jones, Lee, Montgomery, Moore, Nash, Onslow, Pitt, Richmond, Wayne
Leptodea ochracea Tidewater Mucket ST Columbus, Edgecombe, Martin, Pitt
Alasmidonta undulata Triangle Floater ST Edgecombe, Harnett, Johnston, Jones, Lee, Montgomery, Moore, Nash, Pitt, Wayne, Wilson
Catinella waccamawensis
Waccamaw Ambersnail ST Columbus
Lampsilis fullerkati
Waccamaw Fatmucket ST Columbus
Anodonta couperiana Barrel Floater SE Bladen, New Hanover
Alasmidonta varicosa Brook Floater SE Moore
Villosa vaughaniana Carolina Creekshell SE Montgomery, Moore, Richmond,,,
Alasmidonta heterodon
Dwarf Wedgemussel SE Johnston, Nash, Wilson
Lasmigona subviridis Green Floater SE Edgecombe, Johnston, Montgomery, Nash, Pitt,
Helisoma eucosmium
Greenfield Rams-horn SE Brunswick, New Hanover
Planorbella magnifica
Magnificent Rams-horn SE Brunswick, New Hanover
Elliptio steinstansana
Tar River Spinymussel SE Edgecombe, Johnston, Nash ,Pitt
Lampsilis cariosa Yellow Lampmussel SE
Columbus, Cumberland, Edgecombe, Harnett, Johnston, Lee, Montgomery, Moore, Nash, Pender, Pitt, Richmond, Sampson
Elliptio lanceolata Yellow Lance SE Duplin, Edgecombe, Johnston, Nash, Wayne,
Mammal Neotoma floridana floridana
Eastern Woodrat - Coastal Plain population ST Brunswick, New Hanover, Onslow, Pender
Trichechus manatus
West Indian Manatee SE Beaufort, Brunswick, Craven, Jones, Lenoir, New Hanover, Onslow, Pamlico, Pender, Pitt,
Plant
Pityopsis graminifolia var. graminifolia A Silkgrass SE Brunswick, Columbus
Chasmanthium nitidum A Spanglegrass ST Pender
Xyris serotina Acid-swamp Yellow-eyed-grass ST Columbus
Rhynchospora crinipes
Alabama Beaksedge ST Hoke, Brunswick
Buchnera americana
American Bluehearts SE Cumberland, Harnett, Sampson
Veronica American ST Craven

APPENDICES
DRAFT - Environmental Assessment SE Giant Miscanthus Establishment and Production A-11
Category Scientific Name Common Name T/E Counties americana Speedwell
Scleria baldwinii Baldwin's Nutrush ST Brunswick, Columbus, Pender
Eupatorium paludicola Bay Boneset ST Onslow, Scotland
Ipomoea imperati Beach Morning-glory ST Brunswick
Aristida condensata
Big Three-awn Grass ST Bladen, Hoke, New Hanover, Pender, Richmond, Scotland
Bacopa caroliniana Blue Water-hyssop ST Bladen, Brunswick, Columbus, New Hanover, Pender
Dichanthelium caerulescens Blue Witch Grass SE Brunswick, Pender
Andropogon mohrii Bog Bluestem ST Brunswick, Columbus, Craven, Onslow, Pender, Robeson
Agalinis virgata Branched Gerardia ST Brunswick, Craven, Duplin, New Hanover, Onslow, Pender, Scotland
Lachnocaulon minus Brown Bogbutton ST Brunswick, New Hanover, Onslow, Pender
Trifolium reflexum Buffalo Clover ST Harnett, Montgomery, Moore
Sabal palmetto Cabbage Palm ST Brunswick
Oxypolis canbyi Canby's Dropwort SE Scotland
Parnassia caroliniana
Carolina Grass-of-parnassus ST Bladen, Brunswick, Columbus, Cumberland, Harnett, Hoke, Lee, Onslow, Pender, Scotland
Crocanthemum carolinianum Carolina Sunrose SE Brunswick, Craven, Brunswick, Onslow, Pender, Cumberland
Cirsium carolinianum Carolina Thistle SE Montgomery
Tridens chapmanii Chapman's Redtop ST Bladen, Craven, Hoke, Jones, Martin, Montgomery, Moore, Pender, Richmond, Scotland
Carex cherokeensis Cherokee Sedge SE Pender
Rhynchospora pleiantha Coastal Beaksedge ST Brunswick, New Hanover, Onslow
Solidago villosicarpa Coastal Goldenrod SE Brunswick, Craven, New Hanover, Onslow, Pender,
Carex exilis Coastal Sedge SE Cumberland, Harnett, Hoke, Moore,
Hibiscus aculeatus Comfortroot ST New Hanover, Robeson
Gaylussacia nana Confederate Huckleberry SE Pender
Vaccinium macrocarpon Cranberry ST Bladen, Brunswick, Cumberland
Cardamine douglassii
Douglass's Bittercress ST Cumberland, Harnett
Scirpus lineatus Drooping Bulrush ST Brunswick, Craven, Jones, New Hanover, Onslow, Pender
Utricularia olivacea Dwarf Bladderwort ST Brunswick, Craven, Cumberland, Hoke, New Hanover, Onslow, Pender
Echinodorus tenellus Dwarf Burhead SE Brunswick, Robeson

APPENDICES
DRAFT - Environmental Assessment SE Giant Miscanthus Establishment and Production A-12
Category Scientific Name Common Name T/E Counties
Ludwigia linifolia Flaxleaf Seedbox ST Brunswick, Columbus, New Hanover, Onslow
Amphicarpum muhlenbergianum
Florida Goober Grass SE Hoke, Robeson, Scotland
Crocanthemum nashii
Florida Scrub Frostweed SE Brunswick, New Hanover
Eleocharis elongata Florida Spikerush SE Brunswick, Onslow
Helianthus floridanus Florida Sunflower ST Bladen, Brunswick, Columbus, Robeson
Xyris floridana Florida Yellow-eyed-grass ST Brunswick, Columbus, Onslow, Pender, Robeson
Symphyotrichum georgianum Georgia Aster ST Montgomery
Clinopodium georgianum Georgia Calamint SE Brunswick, Pender, Richmond, Robeson
Amorpha georgiana
Georgia Indigo-bush SE Cumberland, Harnett, Hoke, Lee, Lenoir, Moore, Pender, Richmond, Robeson, Scotland
Crocanthemum georgianum Georgia Sunrose SE Brunswick, New Hanover
Spiranthes longilabris Giant Spiral Orchid SE Bladen, Brunswick, Onslow, Pender
Ludwigia sphaerocarpa
Globe-fruit Seedbox SE Bladen, Columbus, Craven, Hoke, Johnston, Moore, New Hanover, Richmond, Wayne
Minuartia godfreyi Godfrey's Sandwort SE Craven, Jones
Carex lutea Golden Sedge SE Onslow, Pender
Epidendrum magnoliae Green Fly Orchid ST Bladen, Brunswick, Columbus, New Hanover, Pender
Eleocharis cellulosa
Gulfcoast Spikerush SE Beaufort, Onslow
Persicaria hirsuta Hairy Smartweed SE Brunswick, Onslow, Richmond, Scotland
Fimbristylis perpusilla Harper's Fimbry ST Brunswick, Columbus
Euphorbia cordifolia Heartleaf Sandmat ST Bladen Richmond, Wayne
Dichanthelium hirstii Hirsts' Panic Grass SE Onslow
Sarracenia minor Hooded Pitcher Plant SE Brunswick, Columbus, New Hanover
Utricularia cornuta
Horned Bladderwort ST Brunswick, Columbus, New Hanover
Gillenia stipulata Indian Physic ST Lee, Montgomery, Moore
Carex reniformis Kidney Sedge ST Bladen, Johnston, Pender, Sampson
Ludwigia lanceolata Lanceleaf Seedbox SE Brunswick ,New Hanover
Parnassia grandifolia
Large-leaved Grass-of-parnassus ST Brunswick, Columbus, Pender
Solidago leavenworthii
Leavenworth's Goldenrod ST Columbus, Robeson, Sampson, Scotland

APPENDICES
DRAFT - Environmental Assessment SE Giant Miscanthus Establishment and Production A-13
Category Scientific Name Common Name T/E Counties
Cyperus lecontei Leconte's Flatsedge ST Brunswick, New Hanover, Onslow
Eupatorium leptophyllum
Limesink Dog-fennel SE Brunswick, New Hanover, Robeson, Scotland
Ruellia strepens Limestone Wild-petunia SE Pender, Richmond
Helenium brevifolium
Littleleaf Sneezeweed SE Brunswick, Lenoir, Montgomery
Leptochloa fascicularis var. maritima
Long-awned Spangletop SE Brunswick
Schisandra glabra Magnolia Vine ST Martin
Rhus michauxii Michaux's Sumac SE Cumberland, Hoke, Johnston, Moore, Nash, Richmond
Paronychia herniarioides
Michaux's Whitlow-wort SE Scotland
Paspalum dissectum
Mudbank Crown Grass SE Brunswick, Columbus, Craven, Moore, Pender, Scotland
Scleria reticularis Netted Nutrush ST Brunswick, Cumberland, Hoke, New Hanover, Onslow, Sampson, Scotland
Utricularia resupinata
Northeastern Bladderwort SE Columbus
Carya myristiciformis Nutmeg Hickory SE Brunswick, Pender
Hypericum fasciculatum
Peelbark St. John's-wort SE Cumberland, Hoke, Moore, New Hanover, Robeson
Crocanthemum corymbosum
Pinebarren Sunrose ST Brunswick
Plantago sparsiflora Pineland Plantain ST Bladen, Brunswick, Columbus, Onslow, Pender
Xyris stricta Pineland Yellow-eyed-grass SE Brunswick, Pender
Fleischmannia incarnata Pink Thoroughwort ST Martin, Richmond
Sabatia kennedyana Plymouth Gentian ST Brunswick, Columbus
Lindera melissifolia Pondberry SE Bladen, Cumberland, Onslow, Sampson
Baptisia australis var. aberrans
Prairie Blue Wild Indigo SE Montgomery
Balduina atropurpurea
Purple-disk Honeycomb-head SE Bladen, Brunswick
Sagittaria isoetiformis
Quillwort Arrowhead ST Bladen, Brunswick, Columbus, Cumberland, Hoke, New Hanover, Samson, Scotland
Zephyranthes simpsonii Rain Lily SE Brunswick
Ludwigia ravenii Raven's Seedbox ST Brunswick, Columbus, Craven, Duplin, New Hanover, Pamlico, Sampson
Ptilimnium costatum
Ribbed Bishop-weed ST Brunswick, New Hanover
Crocanthemum rosmarinifolium Rosemary Sunrose ST Hoke, Richmond, Scotland

APPENDICES
DRAFT - Environmental Assessment SE Giant Miscanthus Establishment and Production A-14
Category Scientific Name Common Name T/E Counties
Cornus asperifolia
Roughleaf Dogwood SE Onslow, Pender
Sporobolus virginicus
Saltmarsh Dropseed ST Brunswick
Gaillardia aestivalis var. aestivalis
Sandhills Blanket-flower SE Cumberland, Hoke, Moore, Richmond, Scotland,
Lilium pyrophilum Sandhills Lily SE Cumberland, Harnett, Hoke, Lee, Moore, Nash
Ruellia ciliosa Sandhills Wild-petunia ST Cumberland, Hoke, Richmond, Scotland
Amorpha confusa Savanna Indigo-bush ST Bladen, Brunswick, Columbus, New Hanover
Toxolasma pullus Savannah Lilliput SE Columbus, Lee, Montgomery
Helianthus schweinitzii
Schweinitz's Sunflower SE Montgomery, Richmond
Amaranthus pumilus
Seabeach Amaranth ST Brunswick, New Hanover, Onslow, Pender
Polygonum glaucum
Seabeach Knotweed SE Beaufort, Brunswick, New Hanover
Aeschynomene virginica
Sensitive Jointvetch ST Beaufort, Craven, Lenoir
Ponthieva racemosa Shadow-witch ST Beaufort, Brunswick, Craven, Jones, Onslow, Pender
Primula meadia Shooting-star ST Montgomery
Ludwigia suffruticosa Shrubby Seedbox ST Bladen, Brunswick, New Hanover, Onslow, Robeson, Scotland
Pinguicula pumila Small Butterwort SE Onslow, Pender
Sageretia minutiflora
Small-flowered Buckthorn ST Onslow, Pender
Iva microcephala Small-headed Marsh Elder ST Robeson, Scotland
Echinacea laevigata Smooth Coneflower SE Montgomery
Platanthera nivea Snowy Orchid ST Beaufort, Bladen, Brunswick, Columbus, Craven Hoke, New Hanover, Pender, Robeson
Galactia mollis Soft Milk-pea ST Brunswick, Cumberland, Hoke, Richmond, Scotland, Wayne
Scutellaria australis Southern Skullcap SE Johnston, Lee, Richmond
Rhynchospora macra
Southern White Beaksedge ST Cumberland, Harnett, Hoke, Moore, Richmond, Scotland
Helenium vernale Spring Sneezeweed SE Brunswick, Columbus
Sagittaria macrocarpa
Streamhead Sagittaria ST Hoke, Moore
Rudbeckia heliopsidis
Sun-facing Coneflower SE Harnett, Moore
Rhynchospora decurrens
Swamp Forest Beaksedge ST Brunswick, Columbus, Onslow
Cystopteris tennesseensis
Tennessee Bladder-fern SE Craven, Jones, Onslow

APPENDICES
DRAFT - Environmental Assessment SE Giant Miscanthus Establishment and Production A-15
Category Scientific Name Common Name T/E Counties
Baptisia alba Thick-pod White Wild Indigo ST Johnston, Montgomery
Isoetes microvela Thin-wall Quillwort ST Brunswick, Jones, Onslow, Pender, Sampson
Lechea torreyi Torrey's Pinweed SE Brunswick, Moore, Pender
Sideroxylon tenax Tough Bumelia ST Brunswick, New Hanover
Rhynchospora tracyi Tracy's Beaksedge ST Brunswick, New Hanover, Onslow, Scotland
Solidago tortifolia Twisted-leaf Goldenrod SE Bladen, Brunswick, Hoke, Jones, New Hanover, Robeson, Scotland
Adiantum capillus-veneris Venus Hair Fern ST Columbus
Tradescantia virginiana Virginia Spiderwort ST Harnett, Montgomery, Moore
Hymenocallis pygmaea
Waccamaw River Spiderlily ST Brunswick, Columbus
Elliptio waccamawensis Waccamaw Spike SE Brunswick, Columbus
Stylisma aquatica Water Dawnflower SE Brunswick, Moore, Robeson, Scotland
Solidago radula Western Rough Goldenrod SE Montgomery
Carex tenax Wire Sedge SE Moore, Wayne
Sporobolus teretifolius Wireleaf Dropseed ST Brunswick, Columbus, Craven
Chrysoma pauciflosculosa Woody Goldenrod SE Columbus, Cumberland, Robeson
Solidago plumosa Yadkin River Goldenrod ST Montgomery
Linum floridanum var. chrysocarpum Yellow-fruited Flax ST Brunswick, Columbus, Onslow, Pender
Oldenlandia boscii Bosc's Bluet SE Brunswick, Columbus, Cumberland, Hoke, Scotland,
Lobelia boykinii Boykin's Lobelia SE Bladen, Cumberland, Hoke, Onslow, Robeson, Scotland
Macbridea caroliniana Carolina Bogmint SE Bladen,Brunswick,Columbus,Harnett,Johnston,Jones,Pender,Robeson,Sampson,,
Trillium pusillum var. pusillum
Carolina Least Trillium SE Onslow, Pender
Warea cuneifolia Carolina Pineland-cress SE Harnett, Hoke,,,,
Asplenium heteroresiliens
Carolina Spleenwort SE Bladen, Craven, Jones, Onslow
Schwalbea americana Chaffseed SE Bladen, Cumberland, Hoke, Moore, Pender, Scotland
Sagittaria chapmanii
Chapman's Arrowhead SE
Thalictrum cooleyi
Cooley's Meadowrue SE Brunswick, Columbus, New Hanover, Onslow, Pender,
Erythrina herbacea Coralbean SE Brunswick, New Hanover

APPENDICES
DRAFT - Environmental Assessment SE Giant Miscanthus Establishment and Production A-16
Category Scientific Name Common Name T/E Counties
Spiranthes eatonii Eaton's Ladies'-tresses SE Beaufort,Bladen,Brunswick,Craven,Cumberland,Moore,Onslow,Pamlico,Pender,,
Lophiola aurea Golden-crest SE Brunswick, Columbus, New Hanover, Onslow,,
Sagittaria weatherbiana
Grassleaf Arrowhead SE
Beaufort, Bladen, Brunswick, Columbus, Craven, Duplin, New Hanover, Onslow, Pender, Pitt, Sampson
Ptilimnium nodosum Harperella SE Lee
Myriophyllum tenellum
Leafless Water-milfoil SE Bladen
Myriophyllum laxum Loose Water-milfoil SE Brunswick, Craven, Cumberland, Hoke, Onslow
Calopogon multiflorus
Many-flower Grass-pink SE Brunswick, Onslow, Pender
Tridens ambiguus Pineland Triodia SE Scotland
Lysimachia asperulifolia
Rough-leaf Loosestrife SE
Beaufort,Bladen,Brunswick,Columbus,Craven,Cumberland,Harnett,Hoke,Montgomery,Moore,New Hanover
Arnoglossum ovatum
Savanna Indian-plantain SE Bladen, Brunswick, Columbus, Jones, Onslow, Pender
Scutellaria leonardii
Shale-barren Skullcap SE Moore
Anemone berlandieri Southern Anemone SE Montgomery
Pteroglossaspis ecristata Spiked Medusa SE Bladen, Cumberland, Hoke, New Hanover, Robeson,
Eriocaulon texense Texas Hatpins SE Cumberland, Richmond
Trillium pusillum var. virginianum
Virginia Least Trillium SE Johnston, Nash
Eleocharis vivipara
Viviparous Spikerush SE New Hanover, Onslow, Pender
Reptile
Alligator mississippiensis American Alligator ST
Beaufort, Bladen, Brunswick, Columbus, Craven, Cumberland, Duplin, Hoke, Jones, Lenoir, New Hanover, Pender, Robeson, Onslow, Pamlico, Pitt, Sampson, Scotland
Micrurus fulvius Eastern Coral Snake SE
Bladen, Brunswick, Cumberland, Harnett, Hoke, Moore, New Hanover, Onslow, Pender, Robeson, Scotland
Crotalus adamanteus
Eastern Diamondback Rattlesnake SE
Brunswick, Columbus, Craven, Cumberland, Duplin, Jones, New Hanover, Onslow, Pender, Robeson, Sampson
Chelonia mydas Green Seaturtle ST Brunswick, New Hanover, Onslow, Pender
Lepidochelys kempii
Kemp's Ridley Seaturtle SE Beaufort, Brunswick, Pamlico
Dermochelys coriacea
Leatherback Seaturtle SE Brunswick, Craven, New Hanover, Onslow
Caretta caretta Loggerhead Seaturtle ST Brunswick, New Hanover, Onslow, Pender

APPENDICES
DRAFT - Environmental Assessment SE Giant Miscanthus Establishment and Production A-17
Table A-4. State-listed Threatened and Endangered Species that Could Potentially Occur in South Carolina
Category Scientific Name Common Name T/E Counties
Amphibian
Pseudobranchus striatus Dwarf siren ST Hampton, Jasper
Ambystoma cingulatum
Frosted flatwoods salamander SE Jasper
Rana capito Gopher frog SE Barnwell, Hampton
Bird
Haliaeetus leucocephalus Bald eagle SE Allendale, Barnwell, Colleton, Hampton, Jasper
Sterna antillarum Least tern ST Colleton, Jasper
Picoides borealis Red-cockaded woodpecker SE Allendale, Barnwell, Colleton, Hampton, Jasper
Charadrius wilsonia Wilson's plover ST Colleton
Mycteria americana Wood stork SE Bamberg, Colleton, Hampton, Jasper
Fish Acipenser brevirostrum
Shortnose sturgeon SE Colleton, Hampton, Jasper
Mammal Corynorhinus rafinesquii
Rafinesque's Big-eared bat SE Allendale, Bamberg, Barnwell, Colleton, Hampton, Jasper
Reptile
Gopherus polyphemus Gopher tortoise SE Allendale, Colleton, Hampton, Jasper
Caretta caretta Loggerhead sea turtle ST Colleton, Jasper
Clemmys guttata Spotted turtle ST Allendale, Bamberg, Barnwell, Colleton, Hampton, Jasper

APPENDICES
DRAFT - Environmental Assessment SE Giant Miscanthus Establishment and Production A-18
This Page Intentionally Left Blank

APPENDICES
DRAFT - Environmental Assessment SE Giant Miscanthus Establishment and Production A-19
APPENDIX B – Comments on the Draft Environmental Assessment

APPENDICES
DRAFT - Environmental Assessment SE Giant Miscanthus Establishment and Production A-20
This Page Intentionally Left Blank