Technical Assistance for a Study on Forest Biomass Energy ...
138
1 A report on the energy demand by sector for the selected countries Output 3.1 Deliverable: A report on the energy demand by sector for the selected countries. (ENG) Technical Assistance for a Study on Forest Biomass Energy Conversion [Contract No: 3000080064]
-
Upload
khangminh22 -
Category
Documents
-
view
3 -
download
0
Transcript of Technical Assistance for a Study on Forest Biomass Energy ...

1
A report on the energy demand by sector for the selected countries
Output 3.1 Deliverable:
A report on the energy demand by sector for
the selected countries. (ENG)
Technical Assistance for a Study on
Forest Biomass Energy Conversion
[Contract No: 3000080064]
Third Progress Delivery Report Output
D3.1
Third Progress Delivery Report Output
D3.1

2
A report on the energy demand by sector for the selected countries
A report on the energy demand by sector for the selected countries Executive Summary
This output 3.1 report is part of the third deliverables (others include output 3.2 and 3.3) of the six deliverables
of the CTCN commissioned study on biomass energy conversion in 15 countries in Central, West and East Africa
whose objective is to:
• Assess the bioenergy potential from sustainable biomass sources such as wood waste from
forest harvesting operations and industry.
• Improve afforestation and forest sector residues energy conversion, and
• Identify market opportunities for the private sector that will bypass the exploitation of
traditional biomass sources.
The CTCN technical assistance is intended to promote projects that establish a sustainable industrial chain for
forest biomass energy conversion using planted forest including agroforestry as raw material and forestry
biomass and sawmill waste. It is anticipated to bring about the following impacts and co-benefits and contribute
to country obligations to the Paris agreement through the Nationally Determined Contributions (INDCs) and
Sustainable Development Goals
The main objective of output 3.1 was to identify the energy demands by sector for the selected countries in
Central, East and West Africa and propose those sectors the forest biomass energy conversion potential can
contribute, considering the current problem of traditional biomass consumption. As such output 3.1 report deals
with the energy demand by sector for seven Central African countries, two East African countries, and six West
African countries.
Chapter 1, which forms the background of the report elaborates on the current trends in the energy industry.
Energy assessment of the countries has been carried out to ascertain the future energy demand so as to design
projects that will sufficiently, and sustainably supply reliable energy in the medium to long term. This has
involved estimating the current needs based on historical trends and the future applications that may be
included as the population increases, community continues to grow economically in size and complexity. The
report used the Nationally Determined Contributions (NDCs) for each country as the main reference with regards
critical sectors of the economy that will contribute to low carbon development while ensuring community
resilience in the face of climate change. The energy sector being an enabler of sustainable development is a
critical component of the NDC as it contributes about a third of greenhouse (GHG) emissions in a country.
Chapters 2 to 4 outlines the energy demand by sector for each country in the three regions – Central, East and
West Africa. Energy resources available and potential in each country are reviewed focusing on the potential,
quantity, and installed capacity. Key economic sectors include agriculture, mining, forestry, industry, transport,
and domestic/institutional sectors, though there is some variation from one country to another. The purpose of
investigating key economic sectors as per NDCs was to assess the potential contribution of biomass energy in
mitigating GHG as part of low carbon development in most energy intensive economic sectors.
In Central Africa, Cameroon accounts for the largest biomass energy source consumed at 73%, followed by oil
and gas (20%) and electricity (7%) as per 2011 statistics. The Rural Electrification Agency identified 37 sites with
high potential for biomass energy production in the country. Cameroon’s energy potential from biomass sources
is 1 GWh. The country is the third largest biomass giant in Sub-Saharan Africa with biomass from wood waste in
the Eastern region and from rice fields in Ndop, respectively. Cameroon’s agricultural sector relies on biomass
from animal dung and compost. Very few areas convert forest biomass to energy. The domestic/institutional
sector is the greatest consumer of biomass energy. In 2010, forest biomass, mostly in the form of wood energy,
contributed 72.6% of energy used in 2010, which was estimated to be 13,163 ktoe. Since the country has large
biomass potential in its forests, biomass plants can be set up in sites which lack electricity but are areas of high
population. The biomass plant sites in this area can manufacture valorised charcoal, bioethanol, and electricity
to serve the surrounding population for their agricultural and household needs.

3
A report on the energy demand by sector for the selected countries
Democratic Republic of Congo 99% of its electricity is generated from hydropower sources, about 2410 MW
being produced. Firewood remains the dominant source of energy. Biogas, biofuel and geothermal remain to be
largely unexplored sources of energy. The largest consumers of energy in the country are the household and
light industrial sectors. Together they account for over 75% of the energy consumed in the country. Biomass
accounts for the largest share of household energy consumption at 93%, and then followed by hydroelectricity
at 4%. Oil and others account for 3% and 1% respectively. Biomass is also the major source of cooking energy in
DRC. It is mostly used in the form of charcoal and firewood. The annual demand for biomass in the country is
45million cubic metres per year. Bioenergy plants can be set up in most places in the country which can be used
to generate power for village uses, production of ethanol for the transport and for cogeneration in industries.
The sites proposed for the construction of biomass plants due to the presence of large amounts of residue are
Kinshasa, Kisangani and Mbuji-Mayi.
The Republic of Congo has forest covers about 60% of the land area. Biomass, hydropower and solar are the
energy resources with the greatest potential in Congo. Wood energy accounts for 80% usage in households.
Hydropower has the largest energy potential in the country, at 1400MW, but only 209 MW is generated. The
country also has large oil and gas reserves in its offshore fields. Biomass use accounts for over 80% of the energy
used in households. This is followed by natural gas at 11%, and petroleum products at 75%. Cogeneration of
electricity from logging is generated in Pokola, North West of the country by the Congolese Wood Industry
Company. Four megawatts of electricity are generated of which 2MW are distributed to the surrounding
population for free as part of corporate social responsibility. Biofuel, such as ethanol, is generated from the
country’s sugar cane sector, while biodiesel is manufactured from oil palm plantations. Most biomass energy
projects in the country are running on obsolete machines. On a positive note, most biomass-based factories are
transitioning to second-generation machines which are more efficient. Biomass has the potential to supply
energy to run the activities in the logging sites and domestic uses in households.
The Gabonese Republic is rich in hydropower, biomass and fossil fuel reserves and the high precipitation levels
and topography contribute to the nation’s large hydropower potential. Biomass resources are also in large
quantity, a fact attributed to the country’s extensive and dense forest cover. The country has the fifth largest oil
reserves in the continent. Hydropower potential of the country is estimated to be 10 billion kilowatts/hour per
year and contributes 51.7% of the total electricity generated. The forestry sector represents the greatest niche
where biomass can be used as an alternative energy source, especially in the running of logging machinery. The
report recommends the logging factories in the concession sites to generate electricity using cogeneration from
their wood residues.
Republic of Chad: It is estimated to have 312 million hectares in the 1970s but due to deforestation, over 20
million hectares have been lost. The country has higher potential in developing solar and wind energy
technologies compared to hydropower. Insolation intensities range from 4 to 6kWh/m2/hr per day over most of
its landscape while windspeeds range from 3 to 9m/2 with the fastest speeds in the northern region. Chad has
significant oil reserves and an oil refinery in the capital, N’djamena. This has made the country less reliant on its
neighbours for oil, but production rates have been declining in the past few years due to technical problems and
instability. In 2011, biomass accounted for 93% of the energy used in the country. The niches where biomass
can contribute are in cogeneration of electricity, and production of biofuels for the transport sector. Most of the
energy demand is situated south of the capital, N’djamena and which hosts most of the country’s industries.
This area also has the largest forest cover and is thus able to provide residue for cogeneration from logged wood.
Republic of Equatorial Guinea has one of the largest reserves of oil and gas in the continent. However, biomass
contributes over 80% of the household energy needs while petroleum products and water contribute 18% and
2%, respectively. About 58% or 1626 million hectares of the country is covered under dense rainforest. Most of
the biomass for household uses is collected from agricultural harvest (70%) while a lesser amount is collected
from standing tree canopy (30%). Only 8% of the population uses Liquified Petroleum Gas (LPG). The country
has significant potential to generate more power from hydroelectric solar and wind sources. The latter two are
due to the equatorial climate and high wind speeds south of the country. The country was estimated to have
1,100 million barrels and 36.8 billion cubic metres of recoverable oil and gas reserves, respectively. The country
generates only about 327MW of electricity as most of the households in rural areas rely on biomass. Because of

4
A report on the energy demand by sector for the selected countries
Equatorial Guinea’s conducive environment for forestry and agricultural purposes, the country has enough
potential for biomass conversion to electricity. The proposed methods for the country to use at large scale are
conventional steam cycle, gasification, and cogeneration. An area that produces significant amounts of wood
residue is the area of Bata.
Central African Republic is rich in uranium, a raw material for nuclear energy which is exploited mainly by foreign
firms. Hydropower is the only developed energy resource in the country, with an estimated potential of 2000
MW though the current installed capacity falls short of this. Despite the various natural resources that could be
harnessed for large scale electricity production, the country relies on biomass for 98% of its energy needs.
Electricity supply in the country is unreliable and therefore the few large industries in the country rely alternative
sources such as diesel and biomass. For example, the IFB Batalimo and Ngobo sugar factory use wood waste and
bagasse for cogeneration, respectively. Industries use less than 1% of the total energy produced in the country.
A large share of energy is consumed by households, but mostly from biomass (98%). The country has potential
for biomass energy from the forest and agricultural residues which can be sufficiently supplied from the Ouaka,
Laboye and Ngakobo regions.
In East Africa, Republic of Burundi, hydroelectric power is the nation’s major supplier of electricity. The installed
capacity is around 300MW but most households, which account for 94% of the energy consumption, rely on
biomass. Firewood is the main energy source for both artisanal and household use. The country, however, has
a number of sources for wood and agricultural residues. The country has potential to develop solar energy with
insolation intensities ranging between 4 to 5kWh/m2 per day while average wind speeds in the country are 4 to
6m/s. The country also has the one of the largest peat reserves in the continent. However, only 0.5% of the total
6 million peat reserves have been exploited. The industrial and domestic/institutional sector are the major users
of biomass. The tea industry is one of the largest consumers of firewood. The sawmilling sites transform wood
to various products for sale or for use by carpentry associations. Because of the existence of various forms of
biomass at varying scales in the country, there are a number of recommendations to improve contribution of
biomass energy to the economy. Some of these are:
• Use of pyrolysis to generate energy from rice and coffee husks
• Extracting biogas from palm oil substrate in the Kireka-Muzazi mini-plant in Bujumbura
• Exploitation of the country’s peat reserves to generate electricity. The existing National Peat Office
(ONATOUR) is mandated with the development of the peat industry
• Increase the capacity of industries using cogeneration so as to generate more electricity. For example,
Société Sucrière du Moso ( SOSUMO), the leading sugar company, can only generate electricity during
the sugar season because of technical inefficiencies
• Gasification of wood waste to generate electricity for large scale industries. Conversely, wood pellets
can be used to provide energy needs at the household level
Republic of Djibouti has limited power for biomass and hydropower energy but has considerable potential for
solar, geothermal and wind energy. The first two are of limited viability because of lack of sufficient forest cover,
wood and agricultural residue. Djibouti, unlike most countries discussed in the report, has limited opportunities
for biomass energy. The country’s forest cover occupies less than 1% of the total area, and the country has less
than 4% of arable land from which agricultural residues can be sourced from. The only viable source of biomass
energy is from the exploitation of Prosopis juliflora to manufacture pellets.
In West Africa, Republic of Benin, the Communauté Électrique du Bénin (CEB) is the national distributor of
electricity in Benin. It is a bi-state organ headquartered in Togo, but its management is shared by both countries
on a 50-50 basis. Apart from the Nangbéto hydroelectric dam in Togo which generates most of the electricity
(65.6 MW), each of the two countries has a 20 MW gas turbine each. To fill the deficit that CEB cannot supply,
Benin imports electricity from neighboring Ghana. Biomass is used by household and small-scale industries in
the country. As an example of biomass use in industries, the Nocibé cement factory buys agricultural residues,
especially cashew hulls to burn in its stoves. Cashew processing plants use 15% of their cashew hulls to fuel their
boilers. Biomass has a variety of uses in Benin. The domestic sector is the largest consumer at 83% (1559
ktoe/year in total), followed by the commercial sector at 17% (311 ktoe/year) and industry at 1%(32ktoe). The

5
A report on the energy demand by sector for the selected countries
main large industrial consumer of biomass is the cement industry. Biomass constitutes 15% of the energy in its
processes. Biomass in industries, however, is used because it is very cheap compared to electricity, otherwise
the latter is still the best option. The biomass reaching the cement factory arrives in a variety of forms such as
corn stems, cashew nut shells, peanut hulls etc. For Benin, cashew nut shells, according to this report, have more
potential for biomass energy compared to firewood. The cashew hulls can be transformed to briquettes or
valorised to produce electricity.
Burkina Faso is energy deficient and imports most of its supply from neighbouring Côte d’Ivoire and Ghana. The
country’s forests are a source of household energy in the form of firewood and charcoal. A total of 34MW of
hydroelectric power is produced from the country’s rivers. Only agricultural residues are viable to contribute to
the industrial sector’s energy needs while in the transport and agricultural sector there is little opportunity
available for the use of this resource. Businesses, institutions and households rely on firewood for most of their
uses. The report mentions that most cashew industries are located within a 100km zone. This means that cashew
shells can be amassed at a single collection point from where they can be transported to a single site for
valorisation. Cashew hulls have a supply potential of 17, 200 tonnes/year in Burkina Faso.
Republic of Côte d'Ivoire has large oil, gas, and additionally, large potential for solar and hydroelectric power.
In addition, it has large biomass reserves. In 2017, it produced 19,000 kilotonnes of firewood and 1500
kilotonnes of charcoal. The country’s hydroelectric potential from its rivers is estimated to be over 1600MW.
The household sector is the largest consumer of electricity in the country at 60%, transport comes second at
23%, third are commercial services at 11%, while industry and other uses trail at 4% and 1%, respectively.
Household and commercial sector are the largest consumers of biomass at 4254 ktoe/year (88%) and 790
ktoe/year (12%). Use of biomass in the industrial sector is very low. However, for those that use biomass as fuel
in their boilers, residues of palm, cocoa and cashew nuts are the main raw materials. Though the country has
many areas from where biomass can be sourced from, the areas are scattered all over the country. It is
recommended for a decentralized approach for their collection. In addition to valorisation of palm and cashew
hulls, the report also recommends for the trial of cacao residues as raw materials for biomass energy. This is
because most cacao waste in the country’s producing areas is left idle in the plantations.
Republic of Mali energy comes from biomass (66%), oil products (31%), imported electricity (2%) and
hydroelectricity (1%). Biomass comes from the country’s shrinking forests, while agricultural residues are from
rice and cotton husks, and oilseed hulls. The country also produces biofuel from Jatropha. In 2016, 740, 000
litres of biofuel were produced but this production seemed to stop. The northern areas of the country have
significant solar irradiance potential of 6 kWh/m2 per day. The northern areas also experience wind speeds of
above 5m/s which are viable for large wind infrastructure investments. Biomass is mostly used in the household,
commercial and industry sectors. The first two mostly rely on firewood and charcoal while the third, industries,
mostly use agricultural residues such as bagasse, shea cakes and cashew hulls for their energy needs. Little
biomass is used in the transport, agricultural and forestry sectors.
Republic of Senegal relies on crude oil and hydropower for most of its national energy needs. Solar and wind
energy contribute less than 1% to the overall energy production. The country experiences a solar irradiance of
5kWh/m2 per day and wind speeds of upto 6m/s at high altitudes along the coast. Senegal imports 1172
kilotonnes of crude oil, 1220 kilotonnes of oil products and 615 kilotonnes of coal every year. Fuelwood is
consumed more compared to charcoal at 1500 kilotonnes for the former and 200 kilotonnes for the latter. A
variety of agricultural residues are used for energy purposes from groundnut shells, cereal straws, and sugar
bagasse. Industries, commercial services and households are the major users of biomass. From these three
economic sectors, industries consume the least biomass at 8.94 ktoe. Households consume almost 200ktoe of
biomass annually while commercial services consume 75ktoe every year. For industries, large amounts of wood
would be needed to generate any usable form of electricity. Since this is not possible, the industries can further
develop the biomass conversion technologies of cashew hulls currently existing in the country. Non-wood and
non-forest residues such as shells and husks can be processed to briquettes and biochar. These two products
can be used as alternatives to firewood and traditional charcoal for household uses. It will not be easy for
biomass sources to replace the use of oil in the agricultural and forestry sectors unless the material is intensively
value added. Only biofuel is a promising example.

6
A report on the energy demand by sector for the selected countries
In Togolese Republic, biomass and hydroelectricity are the main energy sources. Biomass use is dominated by
wood waste and to a lesser extent plant waste. Over 3000 ktoe of biomass were used in 2017. Hydroelectric
power, at Nangbéto dam produces less than 70MW of power. Solar and wind energy systems are few in the
country. Only businesses and the household sector use biomass at large scale. Apart from the agriculture sector
which does not have any energy consumption statistics, the industry and transport sector majorly rely on refined
oil and its products for their energy needs. The report recommends that agricultural residues have the greatest
potential to contribute to biomass energy in the country.
In conclusion, the greatest energy niches that biomass energy can fill in the 15 countries are in the household,
commercial and industry sectors. For the industrial sector, however, both sophisticated technology and
sufficient biomass supply (in space and quantity) is needed to generate enough electricity or fuel for the
industrial processes. Biomass can only make inroads in the transport sector in form of biofuel. The study has
shown that most household still consume firewood in its natural form using traditional cooking devices. Wood
fuel sustainability is therefore challenged by unsustainable harvesting and inefficient methods of converting
wood into energy. The use of inefficient cook stoves contributes to wood wastage and smoke exposure
associated with severe illnesses. Using briquettes or wood pellets stoves can reduce health risks associated with
cooking fuel due to increased fuel efficiency. However, the development of these innovations will need for a
multi-disciplinary approach to increase awareness of the benefits of cooking fuel innovations, encourage further
research on product quality enhancement and standardization, to understand cultural and behavioral issues
influencing adoption, and integrate innovations into bioenergy policy frameworks. The study recommends wood
and agricultural residues to be valorised through processes such as pyrolysis and gasification to generate
electricity for community and industries where applicable. Regionally, countries with the largest potential for
biomass energy are those in Central and West Africa. This report should be read together with outputs 3.2 and
3.3 reports. Output 3.2 summarizes the most appropriate conversion technologies, including pre-treatments
and treatments of biomass to produce the final energy use for potential sectors identified in priority countries,
whereas output 3.3. gives description of identified pilot projects for each sector, and discusses site design,
logistics, biomass suppliers including budget.

7
A report on the energy demand by sector for the selected countries
Table of Contents
1 CENTRAL AFRICA COUNTRIES ................................................................................................................. 14
1.1 CAMEROON ........................................................................................................................................ 14 1.1.1 Energy resources...................................................................................................................... 14
.......................................................................................................................................................... 14 1.1.2 Keys economics sectors according to Nationally Determined Contributions (NDC) ..................... 18 1.1.3 Conclusion and Recommendation ............................................................................................ 24
1.2 DEMOCRATIC REPUBLIC OF CONGO (DRC) ................................................................................................. 25 1.2.1 Energy Resources ..................................................................................................................... 25 1.2.2 Key economic sectors as per the Nationally Determined Contributions (NDCs) .......................... 29 1.2.3 Conclusion and Recommendation ............................................................................................ 32
1.3 THE REPUBLIC OF CONGO ...................................................................................................................... 33 1.3.1 Energy Resources ..................................................................................................................... 33 2.2.3. Keys economics sectors according to Nationally Determined Contributions (NDC) ..................... 35 1.3.2 Conclusion and Recommendation ............................................................................................ 37
1.4 GABON ............................................................................................................................................. 38 1.4.1 Energy Resources ..................................................................................................................... 38 1.4.2 Keys economics sectors according to Nationally Determined Contributions (NDC) ..................... 40 1.4.3 Conclusion and Recommendation ............................................................................................ 42
1.5 CHAD................................................................................................................................................ 43 1.5.1 Energy Resources ..................................................................................................................... 43 1.5.2 Keys economics sectors according to Nationally Determined Contributions ............................... 44 1.5.3 Conclusion and Recommendation ............................................................................................ 51
1.6 EQUATORIAL GUINEA ............................................................................................................................ 52 1.6.1 Energy Resources ..................................................................................................................... 52 1.6.2 Keys economics sectors according to Nationally Determined Contributions ............................... 55 1.6.3 Conclusion and Recommendation ............................................................................................ 57
1.7 CENTRAL AFRICAN REPUBLIC .................................................................................................................. 58 2.7.1. Energy Resources ..................................................................................................................... 58 2.7.2. Keys economics sectors according to Nationally Determined Contributions ............................... 60 1.7.1 Conclusion and Recommendation ............................................................................................ 62
3.1. BURUNDI ............................................................................................................................................ 63
3.1.1. Energy resources of the country ............................................................................................... 63 3.1.2. Energy demands by economic sectors ...................................................................................... 65 3.1.3. Main economic sectors and their energy demand ..................................................................... 68 3.1.4. Sectors with high potential of bioenergy .................................................................................. 70 1.7.2 Conclusions and Recommendations ......................................................................................... 70
3.2. DJIBOUTI ............................................................................................................................................ 72
3.2.1. ENERGY RESOURCES OF THE COUNTRY ................................................................................................... 72 3.2.2. Energy demand by economic sectors ........................................................................................ 75 3.2.3. Main economic sectors and their energy demands ................................................................... 76 3.2.4. Sector with high potential of bioenergy .................................................................................... 78 1.7.3 Conclusions and Recommendations ......................................................................................... 78
2 WEST AFRICA ......................................................................................................................................... 79
4.1. BENIN ................................................................................................................................................. 79
4.1.1. Energy resources...................................................................................................................... 79 4.1.2. Key economic sectors according to NDP ................................................................................... 83

8
A report on the energy demand by sector for the selected countries
2.1.1 Conclusions and recommendations .......................................................................................... 86
4.2. BURKINA FASO ................................................................................................................................... 88
4.2.1. Energy resources...................................................................................................................... 88 4.2.2. Key economic sectors according to NDP ................................................................................... 91 2.1.2 Conclusions and recommendations .......................................................................................... 95
4.3. IVORY COAST ...................................................................................................................................... 95
4.3.1. Energy resources...................................................................................................................... 95 4.3.2. Key economic sectors according to NDP ................................................................................... 98 2.1.3 Conclusions and recommendations ........................................................................................ 101
4.4. MALI ................................................................................................................................................. 102
4.4.1. Energy resources.................................................................................................................... 102 2.1.4 4.4.2 Key economic sectors according to NDP ......................................................................... 106 2.1.5 Conclusions and recommendations ........................................................................................ 110
4.5. SENEGAL ........................................................................................................................................... 111
4.5.1. Energy resources.................................................................................................................... 111 4.5.2. Key economic sectors according to NDP ................................................................................. 115 2.1.6 Conclusions and recommendations ........................................................................................ 120
4.6. TOGO ............................................................................................................................................... 121
4.6.1. The country's energy resources .............................................................................................. 121 4.6.2. Key economic sectors according to NDP ................................................................................. 125 2.6.3 Conclusions and recommendations ........................................................................................ 131
3 REFERENCES ......................................................................................................................................... 131

9
A report on the energy demand by sector for the selected countries
List of Abbreviations
NDC Nationally Determined Contributions
GHG Greenhouse Gases
GWh Gigawatt hours
MW Megawatts
LPG Liquified Petroleum Gas
CEB Communauté Électrique du Bénin
SOSUMO Société Sucrière du Moso
UNDP United Nations Development Program
GDP Gross Domestic Product
CTCN Climate Technology Centre & Network
AFREC African Energy Commission
CERD Centre d'Etudes et de Recherche de Djibouti
SE4ALL Sustainable Energy For All
List of Figures
Figure 1: Map of biomass in Cameroon ........................................................................................................... 14
Figure 2: Map of Solar radiation in Cameroon ................................................................................................. 15
Figure 3: Map of wind speed variation in Cameroon ....................................................................................... 16
Figure 4: Distribution of wood energy production by nature ........................................................................... 24
Figure 5: Map of biomass in the Democratic Republic of Congo ...................................................................... 25
Figure 6: A hydro power plant ........................................................................................................................ 26
Figure 7: Map of solar variation in Africa with Democratic Republic of Congo at the inset ............................... 27
Figure 8: Map of wind speed variation in the Democratic Republic of Congo ................................................... 27
Figure 9: Map of the Democratic Republic of Congo ........................................................................................ 30
Figure 10: Cross evolution of GDP and energy consumption ............................................................................ 35
Figure 11: Changes in the consumption of petroleum products by sector ........................................................ 36
Figure 12: Production profile for 2014 to 2020 ................................................................................................ 36
Figure 13: Forecast according to status quo .................................................................................................... 37
Figure 14: Energy needs maps by pipeline, project and deadline (2016, 2020 and 2025) ................................. 42
Figure 15: Structure of energy production and production from renewable energy sources ............................ 42
Figure 16: Schematization of energy demand in Chad ..................................................................................... 45

10
A report on the energy demand by sector for the selected countries
Figure 17: Accumulated electricity consumption per product from 2040 ......................................................... 56
Figure 18: Forest distribution in the Republic of Equatorial Guinea ................................................................. 57
Figure 19: Sectoral distribution of total final energy consumption in 2011 ...................................................... 61
Figure 20: Nature energy production .............................................................................................................. 62
Figure 21: Statistics on total consumption of kerosene in thousand metric tonnes ......................................... 64
Figure 22: Total primary energy supply in Ktoe ............................................................................................... 66
Figure 23: Total final energy consumption in Ktoe ........................................................................................... 66
Figure 24: Electricity Generation by source (GWh) .......................................................................................... 66
Figure 25: Electricity Production and Consumption (GWh) .............................................................................. 66
Figure 26: Sources of electricity production according to REGIDOSO (2003 to 2011) ........................................ 67
Figure 27: Electricity power and consumption................................................................................................. 69
Figure 28: Total primary energy supply from 2000 to 2010.............................................................................. 73
Figure 29: Petrol product consumption over time ........................................................................................... 73
Figure 30: Total final energy consumption in Ktoe ........................................................................................... 75
Figure 31: Electricity production and consumption in GWh ............................................................................. 75
Figure 32: Total primary energy production in 2017 in Benin (in ktoe) ............................................................. 79
Figure 33: Total primary energy supply in 2017 in Benin (in Ktoe).................................................................... 80
Figure 34: Structure of electricity supply in Benin in 2017. .............................................................................. 80
Figure 35: Structure of electricity supply in Benin in 2017 ............................................................................... 83
Figure 36: Final consumption by sector in 2017 (in ktoe) ................................................................................. 83
Figure 37: Structure of energy consumption in the industrial sector in 2017.................................................... 84
Figure 38: Household energy consumption in 2017 ......................................................................................... 85
Figure 39: Distribution of energy consumption in the commercial and public service sector ............................ 85
Figure 40: Total primary energy production in 2017 in Burkina Faso (in Ktoe) .................................................. 88
Figure 41: Total primary energy supply in 2017 in Burkina Faso (in ktoe) ......................................................... 89
Figure 42: Total primary energy production in 2017 (in ktoe) .......................................................................... 90
Figure 43: Total final energy consumption by sector in 2017 in Burkina Faso (in ktoe) ..................................... 92
Figure 44: Total primary energy production in 2017 (in ktoe) .......................................................................... 96
Figure 45: Distribution of agricultural residues potentially available from local processing units. ..................... 97
Figure 46: Distribution of potentially available agricultural residues in agricultural production plots. .............. 97
Figure 47: Total final energy consumption in 2017 in Côte d'Ivoire (in ktoe) .................................................... 99
Figure 48: Final consumption by sector in 2017 (in ktoe) ................................................................................. 99
Figure 49: Total primary energy supply in 2017 in Mali (in ktoe) .................................................................... 103
Figure 50: Total primary energy production in 2017 in Mali (in ktoe) ............................................................. 103
Figure 51: Total primary energy supply in 2017 in Mali (ktoe) ....................................................................... 104
Figure 52: Total final consumption in 2017 (in ktoe) ...................................................................................... 107

11
A report on the energy demand by sector for the selected countries
Figure 53: Final consumption by sector in 2017 (in ktoe) ............................................................................... 108
Figure 54: Total primary energy production in 2017 (in Ktoe) ........................................................................ 111
Figure 55: Total primary energy supply in 2017 (in ktoe) ............................................................................... 112
Figure 56: Fuelwood and charcoal production in Senegal (Ktoe) .................................................................... 112
Figure 57: Total primary energy supply in 2017 in Senegal (in ktoe)............................................................... 113
Figure 58: Total final energy consumption in Senegal, 2017 (in Ktoe) ............................................................ 115
Figure 59: Total final energy consumption by sector in 2017 in Senegal (ktoe)............................................... 116
Figure 60: Total final energy consumption of the industry sector in 2017 in Senegal (ktoe)............................ 117
Figure 61: Total final energy consumption of the residential sector (households) in 2017 (in Ktoe) ................ 118
Figure 62: Total final energy consumption of the commercial and public services sector in 2017 in Senegal (in
ktoe) ............................................................................................................................................................ 120
Figure 63: Details of Togo's energy supply in 2016 ........................................................................................ 121
Figure 64: Total primary energy supply in 2017 in Togo (in ktoe) ................................................................... 122
Figure 65: Growth curve of Togo's supply of energy by source ...................................................................... 122
Figure 66: Production in Togo between 2000 and 2019 (Ktoe) ...................................................................... 123
Figure 67: Total final consumption between 2000 and 2019.......................................................................... 125
Figure 68: Distribution of final consumption by energy source in 2016 .......................................................... 126
Figure 69: Total final consumption in 2017 in Togo ....................................................................................... 126
Figure 70: Distribution of final energy consumption by activity sector in 2017 ............................................... 126
Figure 71: Distribution of final energy consumption by activity sector in 2017 ............................................... 126
Figure 72: Total final energy consumption by sector in 2017 in Togo (in ktoe) ............................................... 127
Figure 73: l energy consumption in industries in Togo between 2000 and 2019 ............................................. 128
Figure 74: Distribution of energy consumption in industries in Togo in 2017 ................................................. 128
Figure 75: Final consumption in transport in Togo between 2000 and 2019 .................................................. 129
Figure 76: Household energy consumption in 2016 ....................................................................................... 130
Figure 77: Household energy consumption in 2017 ....................................................................................... 130
Figure 78: Commercial and utility energy consumption in 2017 ..................................................................... 130
List of Tables

12
A report on the energy demand by sector for the selected countries
Background
This output 3.1 report is part of the third deliverables (others include output 3.2 and 3.3) of the CTCN
commissioned study on biomass energy conversion in 15 countries in Central, West and East Africa whose
objective is to:
• Assess the bioenergy potential from sustainable biomass sources such as wood waste from
forest harvesting operations and industry.
• Improve afforestation and forest sector residues energy conversion, and
• Identify market opportunities for the private sector that will bypass the exploitation of
traditional biomass sources.
The CTCN technical assistance is intended to promote projects that establish a sustainable industrial chain for
forest biomass energy conversion using planted forest as raw material and forestry biomass and sawmill waste.
It is anticipated to bring about the following impacts and co-benefits and contribute to country obligations to
the Paris agreement through the Nationally Determined Contributions (INDCs) and Sustainable Development
Goals
In output 2 reports, the sources of forest residues in the forest supply chain were identified and sites where the
largest amount of waste is generated mapped. The report also outlined in detail the process by which wood
waste is generated from both forest and agroforestry woody trees until it reaches the final customer.
In this output 3.1 report an assessment of the energy demand by sector for the selected countries has been
carried out with a view to determining sectors where biomass energy residues obtained from output 2 can be
used to supply clean energy. This is consistent with the main objective of output 3, which is to determine the
requirements for and availability of technologies for converting the identified biomass resources in Output 2.
There are three deliverables in output 3 which are described below.
• Output 3.1 whose deliverable is a report on the energy demand by sector for the selected countries
• Output 3.2 whose deliverable is a report on the most appropriate conversion technologies, including
pre-treatments and treatments of biomass to produce the final energy use for each sector identified.
• Output 3.3. whose deliverable is a report on the identified pilot projects for each sector, including
budget, site design, logistics and biomass suppliers
This report focuses on output 3.1 whose main activities entailed identification of the energy demand by sector
in the selected countries and a determination of which sectors the forest biomass potential can contribute,
considering the current problem of traditional biomass consumption. Biomass energy is becoming an
increasingly popular choice for providing an alternative fuel source to many sectors including the energy,
agriculture, infrastructure and industry sectors. This is driven by the need to steer dependency away from fossil
fuels towards a cleaner, more environmentally friendly source of energy. A sector focused assessment aimed at
identifying the actual/potential demand of energy in each of the country’s main economic sectors were carried
out using the countries NDC report as the main reference. The result of an energy demand assessment is an
important factor in deciding:
• If adequate renewable energy resources (biomass in this instance) are both available and adapted
• How much energy systems need to be able to produce?
• If other fuel sources would be needed.
In carrying out this study the characteristics that were taken into account in predicting energy demand included
macro-socio-economic factors and community energy needs.
Socio-economic factors
These factors are changing the way the energy consumer baseline and consumer preferences evolve over long
periods of time. Contextual factors include:
13
A report on the energy demand by sector for the selected countries
Demographic factors. These include projections of increased demand due to population growth and income
growth. Projections are based on historical trends and incorporate variations in the types of fuels used as
households become richer, the so-called "energy stacking."
Geographical factors. Geographical variations considering climate impacts as well as social and cultural
practices. Variations affect demand and use of different types of fuel while shaping the types of resources
available.
Economic factors. These included forecasts of expected trends in economic statistics such as GDP, consumer
price indices, national income and income distribution. These statistics are solid indicators of likely growth in
household consumption and productive use, as well as industrial energy consumption and its distribution among
segments of society.
Political factors. These considerations assessed the impact of government policy and regulation, including taxes
and subsidies. Although it is difficult to accurately assess, trends expressed through long-term government
planning show priorities to support different aspects of the energy sector.
Community energy needs
Community needs assessment will reveal the amount of energy required for productive use, as energy demand
increases. New businesses and their productive use needs will also need to be included. The energy needs of a
community were understood as referring to uses/services such as:
➢ Basic and lifestyle: home cooking, lighting, entertainment, cooling/heating, appliances and
communication). Most households have the same basic energy needs for cooking and lighting. End-use
energy needs, on the other hand, aim to improve the measured quality of life in terms of convenience,
entertainment and improved access to information and communication. Consumption levels vary by
income and affordability. Household choices about the use of energy resources provide information on
accessibility
➢ Social and productive (public lighting and electrification of schools or health centers as well as uses for
services, industry and agriculture): Public services and facilities include evening street lighting, water
pumping and energy for schools, health centers and social centers. Since the entire community uses
these public services and facilities, the associated costs are borne by all households through village
funds or local government budgets or grants. Public uses are not directly related to the income level of
each household, but to the overall income of the community. Population growth and incomes are two
macroeconomic factors that are behind the growth in demand for public energy.
➢ Productive uses. Productive uses of energy have a cumulative effect on income generation, livelihoods,
employment opportunities and subsequent energy demand. In other words, funds invested in
productive uses can create other benefits that, in turn, lead to increased use of energy services. For this
reason, programs should assess the socio-economic impacts of productive uses of energy in a
community.
Taking into consideration the above factors, this report made reference to the countries Nationally Determined
Contributions (NDCs), which are the main instruments for implementing the Paris Agreement. NDCs carries the
aspirations of the countries commitment to tackle climate change, including emissions mitigation pledges, and
adaptation through various actions and investments that align with their development priorities. The energy
sector is central to NDCs as the sector is responsible for nearly a third of global greenhouse gas (GHG) emissions.
It is for this reason that CTCN working with central and West Africa countries focused on biomass energy
conversion using forest residues as part of meeting increasing energy demand as African countries seek to
harness synergies between development strategies and NDCs (Merrill, et al., 2017).
Below is a review of the energy demand by sector for the selected countries in Central African countries that
include Cameroon, Chad, Equatorial Guinea, Central African Republic, Congo, Gabon, Democratic Republic of
Congo.

14
A report on the energy demand by sector for the selected countries
1 Central Africa Countries
1.1 Cameroon
1.1.1 Energy resources
The main source of energy used in Cameroon is biomass. For cooking and heating, the majority of Cameroonians
still depend on biomass, which is abundant and, in some cases, renewable and affordable. Electricity and gas are
still very little used, mainly due to unavailability and lack of accessibility, especially in rural areas. According to
Cameroon's Energy Situation (SEC) in 2011, the energy consumption mix was 73% biomass, 20% oil and gas
products and 7% electricity totaling about 6000 Ktoe (kilo tons oil equivalent) for the whole country and
converted to about 0.3 toe (tons of oil equivalent) per capita (Djouedjom & Zhao, 2018).
Biomass
Figure 1: Map of biomass in Cameroon Cameroon has the third largest biomass potential in Sub-Saharan Africa (Djouedjom & Zhao, 2018). Biomass
sources can be classified as woody, agricultural, forest and animal sources. Waste streams from wood mills in
the eastern region are sources that can be used to generate electricity. Rice paddies in Ndop in the Northwest
Region are potential areas that can provide straw and waste to use in a biomass plant. Tree branches in the
forest are forest sources of biomass. Cameroon's potential to generate electricity from biomass residues is
estimated at about 1 GWh. A recent study by the Rural Electrification Agency identified 37 sites in 9 regions
where energy can be produced from biomass (Djouedjom & Zhao, 2018).
Hydropower
Cameroon has the second largest hydroelectric potential in Africa after the Democratic Republic of Congo (DRC).
The gross theoretical potential of Cameroonian hydropower is 294 TWh/year. Of this value, 115 TWh/year are
considered technically feasible while 103 TWh/year are economically feasible. However, only 5.5% of the

15
A report on the energy demand by sector for the selected countries
technically feasible capacity has been developed (Djouedjom & Zhao, 2018). In terms of the number of
hydroelectric power plants, three main power plants are currently in operation in Cameroon. These are the
hydroelectric power plants of Edea, Songloulou and Lagdo. The Edea hydroelectric plant has an installed
generating capacity of 263 MW; Songloulou has an installed capacity of 387 MW while Lagdo on the Benue River
has an installed capacity of 72 MW. Three large-scale hydroelectric projects are currently in various stages of
development: Lom Pangar (30 MW), Memeve'ele (210 MW), Nachtigal (420 MW).
Solar
Figure 2: Map of Solar radiation in Cameroon
Solar radiation is important in the northern part of the country (5.8 kWh/day/m2) (Djouedjom & Zhao, 2018) and
to a lesser extent in the wet southern part of the country (4.5 kWh/day/m2). Solar technology will see growing
opportunities. In 2015, Cameroon signed a Memorandum of Understanding (MoU) with its first Independent
Power Producer (IPP), Green quest Solar Corporation, to develop a 500 MW photovoltaic solar installation. This
project will be located in the northern region of Cameroon and will be piloted with a 72 MW photovoltaic plant
(Djouedjom & Zhao, 2018).

16
A report on the energy demand by sector for the selected countries
Wind turbine
Figure 3: Map of wind speed variation in Cameroon
Wind potential exists in northern Cameroon and coastal areas with an average wind speed of 5 to 7 m/s at some
favourable sites. In most areas, the average wind speed is only about 2 to 4 m/s at a height of 100 meters.
Currently, two fast wind turbines are being installed in Douala and feasibility studies for a 42 MW wind project
(extendable to 80 MW) are underway in the Bamboutos Mountains in western Cameroon (Djouedjom & Zhao,
2018).
Geothermal
Geothermal energy is one of the areas with the least literature in Cameroon. Even in the few documents that
exist, the data is often contradictory, making it difficult to conclude about Cameroon's geothermal potential.
There is mention of existing hot points in Ngaoundere in Adamawua, Mount Cameroon and Lake Moundou in
Manengoumba (Abanda, 2012).
Oil and gas
Cameroon began producing offshore oil in 1977 (Encyclopedia of the Nations, 2020). Annual production has
gradually declined since 1985, and the decline is expected to continue with the depletion of existing reserves.
according to the Energy Information Administration (EIA) Cameroon is the sixth largest producer of crude oil in
sub-Saharan Africa, with production in 2003 at 67,000 barrels per day (10,700 m3 /d), and reserves estimated at
400 million barrels (64 × 106 m3) as of 1 January 2004. The country has large reserves of liquefied petroleum
gas, which are largely untapped. According to the EIA, Cameroon's natural gas reserves amounted to 3.9 billion
cubic feet (110 × 106 m3) as of January 1, 2004, with unknown production in 2002.
Tidal energy
Globally, ocean energy is in its infancy and knowledge about this energy resource is lacking. It is therefore
difficult to find a detailed and comprehensive study of the global potential. Recent studies by the US Department
of Energy indicate that only 40 sites in the world have tides with significant potential to generate electricity. As
far as Africa is concerned, South Africa is the only country that has previously considered tidal energy, while
Cameroon has so far hired MRS Power Cameroon, a subsidiary of MRS Holding Ltd., a fast-growing energy group
in sub-Saharan Africa, to conduct a feasibility study on tidal energy potential (Abanda, 2012).
The table below gives the statistics of total energy (production and consumption) in Cameroon.

17
A report on the energy demand by sector for the selected countries
Source: (AFREC, 2018)
Table 1: Total Energy Statistics in Kilotonnes of Oil Equivalent (Ktoe)

18
A report on the energy demand by sector for the selected countries
1.1.2 Keys economics sectors according to Nationally Determined Contributions (NDC)
Table 2: Final energy consumption in Cameroon excluding biomass
Residential
Tertiary
Agriculture
Residential Tertiary Agriculture Non-energy 2008
Mtoe % Mtoe % Mtoe % Mtoe % Mtoe % Unit
0,273 19,9 0,208 15,1 0,061 4,5 0,004 0,3 0,015 1,11 Cameroon
Source : (Gabriel, 2014)
Table 3: Cameroon's final energy consumption by production sector
2008 Population Final energy consumption Industry Transport
Unit Million Total By hab
Mtoe Tep Mtoe % Mtoe %
Cameroon 19 5,86 O.31 0,923 15,7 0,73 12,5
Source : (Gabriel, 2014)
Table 4: Final energy consumption by energy product
Coal Biomass Electricity 2008
Mtoe % Mtoe % Mtoe % 4,5 76,5 0,4 6,9 Cameroon
Source : (Gabriel, 2014)
Table 5: Cameroon's energy balance
electricity total Cameroun
for capita
Consummation 6.41 bn kWh 247.75 kWh
Production 8.11 bn kWh 313.34 kWh
Import 55.00 m kWh 2.13 kWh
Crude Barrel
Cameroun
for capita
Production 69,000.00 bbl 0.003 bbl
Import 36,480.00 bbl 0.001 bbl
Export 96,370.00 bbl 0.004 bbl
Natural gas Put cube
Cameroun
for capita
Consumption 906.10 m3 35.02 m³
Production 910.40 m3 35.18 m³
Source : (Data, n.d.)
Table 6: Structure of final energy consumption in Cameroon in 2010 (in Ktoe)
No Sector Oil product Biomass Electricity Total %

19
A report on the energy demand by sector for the selected countries
1 Industry 116,4 0,0 239,1 355,4 6,2
2 Transport 896,3 0,0 0,0 896,3 15,6
3 Other sectors 18,2 387,4 94,2 499,8 8,7
4 Residential 125,1 3785,6 84,8 3995,5 69,5
5 Total General 1155,9 4173,0 418,1 5747,0 100
6 % 20,1 72,6 7,3 100
Source : (Ngoubou, 2013)
Table 7: Liquified Petroleum Gas (LPG) production statistics for Cameroon
Designation LPG production by SNH
(associated gas)
Predictable production of
LPG by SONARA
GPL's predictable
national offer
Unit TM TM TM
2015 20 000 28 000 48 000
2020 200 000 28 000 228 000
2025 200 000 28 000 228 000
2030 200 000 28 000 228 000
2035 200 000 28 000 228 000
Source : (Gabriel, 2014)
Table 8: Energy Consumption Bill in 2010
No Energy Final Consumption in
Ktoe Bill
Million de CFA %
1
Firewood 3 981 0%
Bought 1 393 59 221 13%
Not bought 2 587 0%
2 Charcoal 87 21 416 2%
3 Sawdust and copuls 106 530 0%
4 Other biomass - - 0%
5 Total biomasse 4 173 185 167 16%
6 Oil 1 156 647 924 54%
7 AES Sonel (ancestor of ENEO) 210 143 000 12%
8 Auto production 208 215 436 18%
9 Total 5 747 1 191 527 100%
Source : (Gabriel, 2014)
Public sector electricity demand (low voltage and medium voltage consumers), which is increasing by an average
of 6% per year, is estimated at 4,700 GWh in 2015 and will grow to 7,600 GWh by 2025 (Republic of Cameroon,
2008).
Electricity demand is expected to continue to grow rapidly, with estimation of 750,000 connections by 2021. The
government's plan to add 5,000 MW of generating capacity by 2020 was on a national and regional basis in
response to demand (Ossono, 2014). But that plan has not been implemented.

20
A report on the energy demand by sector for the selected countries
Agriculture sector
The main challenges facing Cameroon's agriculture sector are the search for self-sufficiency, food security, the
development of agribusiness and improved productivity and competitiveness. In Cameroon's NDC, four
directions are well defined for developing the agricultural sector:
➢ Consistency in the planning and development of rural areas to develop agriculture while limiting
deforestation/degradation.
➢ The intensification of environmentally friendly agricultural, animal and fisheries production to limit
deforestation/degradation.
➢ Promoting practices to improve agricultural production capacity and enhance environmental resources.
➢ The energy development of rural resources with the use of waste as an energy source.
Energy demand in the sector: The use of energy in the agricultural sector has not been extensively studied,
complicating attempts to project the future energy demand in agricultural sector in Cameroon.
Percentage of biomass used in the sector: The use of biomass in agriculture relies mainly on decomposition of
dead biomass in compost and droppings in the fields. The use of energy from the conversion of biomass into
agriculture in Cameroon is still in its infancy. Few studies have been done on this area and percentage data on
bioenergy use in agriculture on this sector according to the energy demand in agriculture sector. Thereby, the
best data is not available of our knowledge.
Contribution of forest bioenergy in the sector: Farmers especially in rural areas should be informed and trained
on different energy sources, particularly renewable energy sources and energy efficiency options available to
agricultural enterprises. In addition, farmers need to explore the renewable energy sources available to them.
Thus, energy companies can outline the various options and possibilities on the exploitation of biomass as an
energy source for the development of agriculture. As mentioned in report 2.1, biomass is the most abundant
source of energy in Cameroon. In Report 2.2, several technologies can be adopted for the conversion of biomass
into clean energy. In the agricultural sector biomass power plants can provide enough energy for pumping water
for irrigating plants in arid areas, use for smart agriculture (in greenhouses), the operation of cold rooms allowing
food preservation and limiting post-harvest losses, etc. Similarly, biomass can be used for biogas production and
waste from it can be used as biofertilizer.
Mining and industry
The mining and industrial sector is one of the 12 economic sectors that were included in Cameroon's INDC. In
2012, the Ministry of Mines mentioned several mining projects under implementation in Cameroon. This
includes the five mining licenses granted to Geovic for nickel, cobalt and manganese mining in Nkamouna
(Lomié) and the five licences granted to C and K Mining Inc for the exploitation of diamonds and related
substances in Mobilong (Yokadouma). In addition, three mining permits have been granted for the exploitation
of limestone and marble. These include Cam Iron, a subsidiary of the Australian Sundance Resources for the
exploitation of Mbalam iron and Cameroon Alumina Limited, which will develop the bauxite deposits of Mini
Martap and Ngaoundal (Adamaoua). The Implementation of these projects requires an increase in the demand
for energy in the beneficiaries’ communities (MEW, 2006)
Energy demand in the mining sector: Industrial demand is highly conditioned by the energy needs of the
aluminium industry, which currently is 1,315 GWh (or 150 MW). With the implementation of the Edea aluminium
plant expansion project, this demand will grow up to around 500 MW by 2015. The implementation of the
ambitious Bauxite-Aluminium development plan envisaged by the Government with its partners through the
Greenfield project and the prospects for the development of the industrial zone of the future deep water port
of Kribi will result in additional energy needs of more than 13,000 GWh (1500 MW) by 2016 by 2025. Industrial
demand for high voltage electric energy will increase very strongly (aluminum) as well as demand for medium
voltage for industries directly dependent on large projects (Republic of Cameroon, n.d). This additional demand
will be calculated specifically and independently of the rate of GDP growth. In 2025, the electricity needs will
be in the order of 25 TWh for the whole sector.

21
A report on the energy demand by sector for the selected countries
Table 9: Electricity demand forecast for the "Bauxite-Alumina-Aluminium" sector to 2030
Source: (MEW, 2006)
Cameroon has significant potential for the production of cotton-based products with higher added value,
particularly in the spinning, weaving and clothing manufacturing segments. Based on the local processing of half
of cotton-fibre, consideration should be given to the provision of about 20 MW of electricity for industrial units
engaged in such activities.
Percentage of biomass used in the sector: The energy consumed in the industrial sector is mainly supplied by
petroleum and hydroelectric products. Biomass is not used in Cameroon as an energy source in the mining and
industrial sector (Ngoubou, 2013).
Contribution of forest bioenergy: The ratio of energy demand to energy production in Cameroon is more than
1. This reflects the fact that the amount of energy provided does not fully meet the need. This deficit is more
evident in mining industries. However, Cameroon is full of a large amount of biomass. According to the Ministry
of Water and Energy, the rational consumption of Cameroonian biomass can enable the production of 420 MW
via biomass power plants. This excess energy would fill the energy deficit in the industry and mining sector.
Table 10: Synthesis of energy demand for industrial projects other than the aluminium sector

22
A report on the energy demand by sector for the selected countries
Source : (MEW, 2006)
Forestry sector
As described in Cameroon's NDC, the forestry sector faces major challenges. The main challenge is to ensure the
sustainable management of forests and the enhancement of productive forests under management plans,
contribution to economic growth and the fight against poverty through the return of part of tax revenues to
communities, job creation, Conservation of biodiversity through the strengthening of the national network of
protected areas, consistency of the land system through zoning plans. Energy consumption in the forestry sector
is dominated by wood forest processing industries.
Energy demand in the forestry sector: The estimated energy in the forestry sector in Cameroon is that used in
the extraction and processing industries of wood and non-wood forest products. Primary energy is mainly used
for wood logging and processing activities. A study conducted by SFID shows that the transformation of one
cubic meter of wood requires about 15 liters of diesel. The exploitation of non-wood forest products in
Cameroon is limited to extraction, conservation and sale. The low processing rate is linked to low access to
energy and a lack of transportation of products from harvest sites to potential processing sites. In this context,
the functioning of all the timber industries would result in an additional need of at least 50 MW over the next
five to ten years as part of a proactive policy to promote the timber sector, based on incentives to attract private
investors to the subsector (GTZ, n.d).
Percentage of biomass used in the sector: The use of biomass in Cameroon is mainly traditional. The use of
biomass as an energy source in the forestry sector in Cameroon is almost nil. Biomass is used in the forestry
sector in Cameroon for minimal heat needs.
Contribution of forest bioenergy in the sector: With more than 2 million tons of waste produced in Cameroon
per year, several cogeneration systems can be installed and exploited. The production of heat and electricity by
these cogeneration systems will not meet the energy needs of logging companies.
Transportation sector
As mentioned in Cameroon's INDC (Intended Nationally Determined Contribution) (Republic of Cameroon,
2015), the transport sector should:
➢ Limit constrained mobility and promote low-carbon transport

23
A report on the energy demand by sector for the selected countries
➢ Promote an integrated approach to the sector and the development of low-carbon transport through
a National Transport Infrastructure Scheme
➢ Incorporate an energy/climate dimension into territorial planning documents in an attempt to limit
distances, work on functional mix and propose efficient transit policies
➢ To assist the State and local authorities in the development of low-carbon intra- and intercity public
transport development plans (formerly the Yaoundé and Douala trams)
➢ Promote the purchase of low-emission vehicles and the disposal of the most polluting vehicles through
standards, incentives or obligations
Oil is the main source of energy used in the transportation sector. The energy demand is steadily rising.
Energy demand: Cameroon's oil production in 2010 was about 3.3 million tons. TOTAL Exploration-Production
remains the largest producer with 61% of the shares. This production continues the downward trend that began
in 1985, when Cameroon peaked oil. Between 2001 and 2010, Cameroon's oil production fell by more than 40%.
However, the intensification of oil exploration, propelled in recent years by the National Hydrocarbon Company
(NHC), augurs an inflection of this downward trend. According to the study on the optimization of the supply of
petroleum products (CSPH, 2005), consumption of petroleum products would double over the next 20 years,
from 983,409 to 1,732,202 tons from 2005 to 2025. The supply situation in relation to the evolution of
consumption indicates increasing deficits on the horizon (MEW, 2006).
Percentage of biomass used in the transport sector: The use of biomass energy in Cameroon's transport sector
is in an embryonic state. The percentage of biomass used is almost null. The few cases observed concern the
production of bioethanol from biomass. The biomass produced is not enough to sufficiently serve the transport
sector.
Contribution of forest bioenergy in the transport sector: The development of an economically viable process
for producing liquid biofuels from cellulose could lead to the widespread use of forest biomass in the transport
sector. As most of the growth in demand for liquid biofuels is expected in developed countries, trade flexibility
is the main factor affecting development plans in most developing countries (FAO, 2008).
Institutional and domestic sector
According to the 2008 Ministry of Water Resources and Energy Survey on Domestic Energy Consumption, 60%
of firewood is purchased while the rest is acquired through non-commercial channels. By bringing the final
consumption and energy bills closer together, it appears that biomass, which accounts for more than 73% of the
energy consumed in Cameroon, accounts for about 16% of national energy expenditure. On the other hand,
commercial energy, which accounts for less than 27% in volume, covers 84% of the national energy bill.
Energy demand: The study's long-term consumption projections (15 years) projected a potential consumption
of between 78,000 and 166,000 tons, depending on the scenarios. These projections are based on the
continuation of the historical series observed, i.e. the continuation of consumption in urban areas, combined
with an increase in consumption in rural areas, in line with the policy of poverty reduction. We believe that the
high hypothesis is the most likely, and that the total consumption potential is probably greater. In fact, there is
considerable potential in northern Cameroon, where the development of LPG can effectively help to curb the
phenomenon of deforestation caused by the massive and harmful use of biomass (firewood and charcoal) to
meet domestic needs.
Taking the estimated ratio in the study for the specific consumption of the tertiary sector (7%), there is still about
155,000 tons left for the residential sector. Considering that the development of the LPG market will be in favour
of an increase in the number of households that have access to it, and by estimating, a doubling in 15 years of
the number of households (about 1 million in 2020), the unit consumption per household would increase to 155
kg per year, or about one bottle per month. Although well above the 2002 average, this figure remains modest
and is at the lower end of the range compared to unit consumption in other countries with similar levels of
development (between 1 and 2 bottles per household per month).

24
A report on the energy demand by sector for the selected countries
In Cameroon, where nearly 80% of energy consumption is non-domestic and more than 70% is directly related
to economic activities, it is mainly the growth of high-consumption industries that will determine future demand.
Domestic consumption, which in 2004 represented only 20% of total demand, will remain relatively unimportant
on the growth of demand in the medium term.
Percentage of biomass used: Wood-energy, both in rural and urban areas, remains the main energy resource in
Cameroon. In 2010, it accounted for 72.6% of total energy consumption, compared with 20.1% for oil and gas
products and 7.3% for electricity in households. This can be explained by the accessibility of this form of energy
and the importance of its use. The energy balance for 2010 shows that energy wood production was estimated
at 13,163 Ktoe, slightly up from 13,118 Ktoe in 2009 and distributed as shown in Figure 4 in 2010 (Gabriel, 2014).
Figure 4: Distribution of wood energy production by nature
Contribution of forest bioenergy in the sector: Implementation of various biomass technologies in Cameroon
would make it possible to better exploit biomass potential with better efficiency.
➢ The construction of isolated biomass power plants in off-grid rural areas would increase access to
electricity to households
➢ The construction of bio-digesters would allow for both domestic gas for cooking and heating and
electricity to power electronic devices and lighting in households.
1.1.3 Conclusion and Recommendation
The total energy supply in the Republic of Cameroon may in future not be able to sufficiently meet the demand
of a rapidly rising population. This is one of the reasons why the energy produced in Cameroon is directed
towards urban areas where the industrial sector is in perpetual growth, without forgetting the rate of residence
in urban areas which increases with the rural -urban migration. These arguments justify the poor access to
energy in rural areas.
Thus, the industrial sector and the residential sector are the most energy consumer sectors in Cameroon. The
demand for energy is in these sectors is very high. Cameroon in his INDC wants to reduce its GHG emissions by
-32%. To achieve this, the use of renewable sources is one of the solutions. The conversion of biomass which is
a source of renewable energy into a form of sustainable energy can help to fill the deficit observed in the
electricity grid of Cameroon and thus increase the rate of access to energy in both urban and rural areas.
The East and South Region, for example, are home to the largest forest concessions and an abundance of Wood
Processing Units (WPU). These are therefore the two regions with large forest biomass hot spots and also regions
with poor access to energy.
Combustion technology used in biomass power plants can be implemented in these regions to generate
electrical energy. This waste can be valorised by the production of ecological charcoal for cooking and heating;

25
A report on the energy demand by sector for the selected countries
the fermentation of the wood waste also can allow the production of biogas, bioethanol used in several sectors,
the resulting compost may be used in agriculture sector.
1.2 Democratic Republic of Congo (DRC)
1.2.1 Energy Resources
Electricity production in 2015 was 676 Ktoe (kilo tons oil equivalent), of which 99.7% was generated from
hydroelectric sources. The final electricity consumption in the same year was 613 Ktoe.
Biomass
Figure 5: Map of biomass in the
Democratic Republic of Congo
Source : (WWF, 2017)
The different categories of
biomass that can be used for
energy production in the DRC are
presented below.
Firewood
The DRC has about 125 million hectares of forest representing 67.9% of the country's area (Kusakana, 2016) The
biofuels used are mainly firewood and charcoal. These fuels provide most of the energy used by households,
especially for cooking. According to 1985 data, the consumption of these eco-banks amounted to 8.5 million
toes (tons of oil equivalent), or 86% of the total energy used in the DRC (Kusakana, 2016).
Biogas
It is a renewable energy source and can be used as fuel for heating, cooking and generating electricity. The raw
materials used for biogas generation are plants, animal waste and landfills (where municipal solid waste is
dumped). The list of raw materials that can be used to produce biogas is enormous. Studies have shown that
the use of landfill gas for energy production is a viable option for the DRC. Currently, biogas production in the
DRC is in an experimental phase due to the high cost of biogas plants and the lack of training of users and
maintenance technicians (Kusakana, 2016).

26
A report on the energy demand by sector for the selected countries
Biofuel
The DRC has great potential for biofuel, particularly ethanol, from the sugar industries and molasses distilleries.
The main use of ethanol is fuel for engines and fuel additives. (Kusakana, 2016).
Hydropower
Figure 6: A hydro power plant
Source: World Wind Map
The DRC has a very large
hydroelectric potential,
estimated at 774 GWh,
corresponding to nearly 65%
of the potential of Central
Africa, 35% of Africa's
potential and 8% of the
world's annual potential. This
important hydroelectric
resource is the result of the
country's geographical
location in the Congo River
watershed. Hydropower is the
main source of electricity in the DRC and there is enormous potential to develop micro-scale hydropower plants
with an estimated minimum operating capacity of 88,400 MW and an export capacity of 51.9 TWh/year (WEC,
2005). The current level of operation represents about 3% of the economically exploitable capacity. The national
electricity organization has 17 hydroelectric plants with a total nominal capacity of 2,410 MW. The two largest
are Inga 1 (351 MW) and Inga 2 (1424 MW) with new Inga 3 (4320 MW) and Inga 4 plants in the planning phase
(Kusakana, 2016; UNEP, 2017).

27
A report on the energy demand by sector for the selected countries
Solar
Figure 7: Map of solar variation in Africa with
Democratic Republic of Congo at the inset
The DRC is located in a very insolated region
with radiation levels between 3.25 and
6.0kWh/m2/day, making the
implementation of photovoltaic (PV) solar
panels viable throughout the country.
Currently, only 836 photovoltaic solar
systems with a total capacity of 83 kW are in
service. There are also 148 Caritas network
systems, with an estimated capacity of 6.31
kW. We note that the penetration of solar
PV systems is very low in relation to the size
of the country and in relation to the
availability of this energy resource
(Kusakana, 2016).
Wind turbine
Figure 8: Map of wind speed variation in the
Democratic Republic of Congo
The DRC generally has a low wind speed
potential ranging from 1.5 m/s to Matadi, 1.7
m/s to Gimbi and 1.8 m/s to Kalemie and
Goma. Ugoma makes the difference with
wind speed ranging from 6 to 6.6 m/s. Wind
energy is not commonly used in the DRC
except in a few isolated cases where it is used
for windmills to pump groundwater or for
small lighting systems. The country's
potential wind energy is estimated at about 77,380 MW. However, further studies are needed to determine how
much of this potential can be economically exploited (Kusakana, 2016).
Geothermal
The eastern regions of the DRC are part of the East African Rift System, which is one of the largest tectonic
structures in the world, where the thermal energy of the Earth's core crosses the surface. As a result, the DRC
has significant geothermal energy potential. Two suitable sites, Nyangezi and Uvira/Kinanira/Kavimvira, which
have maximum temperatures hot spots of up to 90 degrees Celsius and an average flows ranging from 11 to 162
L/s, have been identified in the eastern part of the country.
Oil and gas
The DRC has oil reserves in the western coastal basin (offshore and onshore) and two virtually unexplored
sedimentary basins. In 2009, the country's crude oil reserve of about 180 million barrels was the second largest

28
A report on the energy demand by sector for the selected countries
in southern Africa after Angola. The DRC has a significant production capacity for crude oil. However, the country
does not have refineries and must therefore export all production and import refined products for local use.
Lake Kivu (which is shared with Rwanda) contains methane gas reserves of 65 billion m3, the equivalent of 50
million tons of oil, which are at depths above 300 meters, and remain untapped. The methane reserve in Lake
Kivu is the only case of gas dissolved in water in the world. Studies on Lake Kivu have shown that the amount of
methane in the bottom of the lake has increased by 30% over the past 30 years due to volcanic activity in the
region, as well as the introduction of sardine fish into the lake (Kusakana, 2016).
Nuclear energy
The DRC has a reserve of approximately 1,800 tons of unexploited high-concentration Uranium deposits mainly
around seven sites in the southern region of Katanga province: Shinkolobwe, Kalongwe, Lwambo, Mindigi,
Kalongwe, Kasompi and Samboa. The DRC's nuclear energy is managed by the Office of the General Atomic
Energy Commissioner (CGEA), which is mandated to develop the country's Uranium sector by exploring and
exploiting uranium deposits. However, the current activities of the CGEA are limited in terms of research,
oversight and regulation. Two research reactors were built in 1958 and 1972 (Atomic Energy Centre), but both
were closed in 1998 at the request of the International Atomic Energy Agency (IAEA) for safety reasons
(Kusakana, 2016).
The table below shows energy production and energy consumption in the DRC.
Table 11: Total Energy Statistics for the Democratic Republic of Congo in Kilo tonnes of Oil Equivalent (Ktoe)
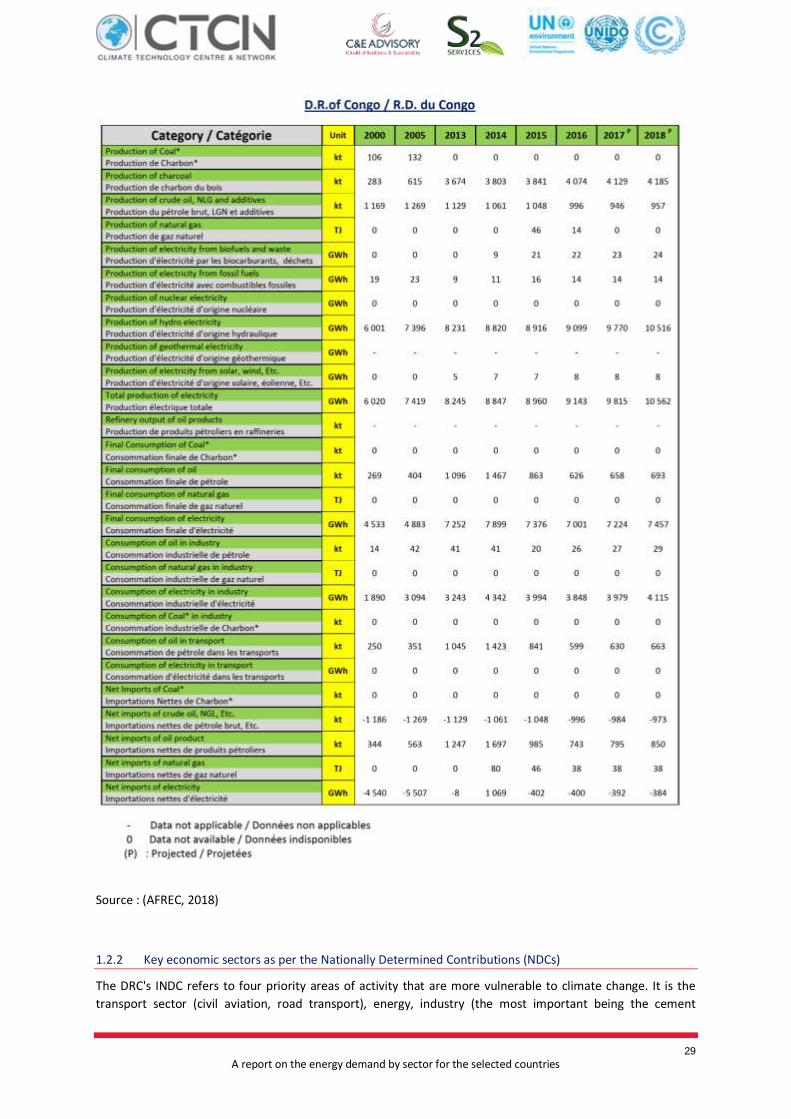
29
A report on the energy demand by sector for the selected countries
Source : (AFREC, 2018)
1.2.2 Key economic sectors as per the Nationally Determined Contributions (NDCs)
The DRC's INDC refers to four priority areas of activity that are more vulnerable to climate change. It is the
transport sector (civil aviation, road transport), energy, industry (the most important being the cement

30
A report on the energy demand by sector for the selected countries
production industry), agriculture and the waste sector. The GHG adaptation, mitigation and reduction plan
requires the implementation of new technologies in new processes that would also, to some extent, increase
the country's GDP and consequently the country's economic and social growth. However, access to energy is
one of the priorities to achieve this goal. The DRC's energy demand since 2005 has been increasing. Energy
demand is not limited to these four sectors.
2.2.2.1. Forestry
Energy demand: In the DRC, industry, transport and the residential sector together account for more than 99%
of final energy consumption, with the remainder less than one per cent coming from agricultural, livestock,
fishing and agroforestry sectors. This is an indicator of the low mechanization of Congolese agriculture in general
(agricultural machinery) and the low use of technologies for processing and conserving agricultural products in
the broadest sense (agriculture, forest, fishing and livestock).
The supply of electricity includes domestic production, which mainly makes up hydroelectric, thermal and
imports from the DRC. The significant investments made by the Congolese Government in recent years have led
to a nearly seven-fold increase in national energy production capacity from 89 MW in 2001 to 600 MW in 2011
(excluding the oil and forestry sector). The available supply covers the potential demand for the interconnected
electricity grid, which is estimated at 360 MW (Ngoubou, 2013).
In the wake of the DRC's population growth and reconstruction, there is no doubt that energy demand will be
resolutely on the rise. Table 11 below presents a simulation carried out by the Ministry of Energy following the
Energy Demand Analysis Model (MAED) developed by the International Atomic Energy Agency (IAEA). This
model assesses future energy demand on the basis of several parameters and factors such as socio-economic,
demographic and other specificities of the country (Esseqqat, 2011).
Figure 9: Map of the Democratic Republic of Congo
Table 12: Electricity demand summary following three growth scenarios

31
A report on the energy demand by sector for the selected countries
Source : (Esseqqat, 2011)
Universal access to electricity by 2030 would mean that the DRC will move to an electrification rate:
- From 9% in 2011 to 100% in 2030 at the national level,
- From 35% in 2011 to 100% in 2030 in the urban area,
- From 1% in 2011 to 100% in 2030 in the rural area.
But to achieve this goal of universal electrification in the DRC by 2030, the final electricity consumption would
then be in the order of 149,528 Gwh in 2030 (or 12,858 Ktoe), a 23.8-fold increase in the total final electricity
consumption level of 2011; or by 11.25 times the average final electricity consumption per capita increase from
0.008 toe per capita (or 1,394 kWh/year/hbt) in 2011 to 0.09 toe per capita (or 15,685 kWh/year/hbt) in 2030.
The capacity required to meet such demand, with the assumption of improvements in the energy efficiency of
the electricity subsector, would be in the order of 32,965 MW, an increase of about 23.8 times the capacity
required in 2011 (1,387 MW) or by 12.7 times the capacity already installed in 2011 (2,589 MW). These 32,965
MW will be divided between domestically produced hydropower, electricity imports within interconnected
networks through sub-regional energy cooperation, public and private thermal production, and new and
renewable power plants (solar, wind biofuels, etc.) (UNDP, 2013).
Percentage of biomass in energy production in DRC: Primary energy production in 2011 is estimated at
approximately 23,434 Ktoe, of which 22,781 Ktoe (97.2%) are 653 Ktoe in electricity (2.8%). Net supply for
national energy needs (gross primary consumption) is estimated at 24,116 ktoe in 2011, of which 94.5% is
biomass (22,781 ktoe), 3.1% of petroleum products (746.Ktoe) and 2.4% is electricity (589.Ktoe).
The DRC's energy consumption (total final consumption) in 2008 was 21.7 million Mega tons of oil equivalent,
of which about 75% for domestic use, 22% for industrial use and 1% for transport (IEA 2011). Biomass (including
wood energy) is estimated to cover 93% of the country's energy consumption, followed by hydropower with 4%,
oil with 3% and mineral coal with 1% (Ministry of Energy, 2009). More than 90% of the demand for this form of
energy is in the household sector.
Biomass remains the main source of energy for cooking for more than 93% of the DRC's population. Households
and street food vendors rely heavily on coal (or firewood) for daily cooking (77% in Kinshasa). Businesses, such

32
A report on the energy demand by sector for the selected countries
as bakeries, breweries, restaurants, bricklayers and aluminum smelters, also depend on firewood or charcoal for
their daily work (REDD+ International, 2015).
According to the latest Energy Information System 2010 report by the CNE, biomass accounts for 95% of the
DRC's overall energy balance. The DRC's demand for domestic energy biomass is 45 million cubic metres of wood
per year (UNDP, 2013).
Contribution of forest bioenergy in the sector: In the DRC, yields on the use of traditional fuels through "three-
stone fireplaces" or "metal braziers" are very low, between 5 and 7% and between 12% and 15% energy
efficiency, respectively. The biomass-energy sectors contain several important areas of application of
technologies and know-how to improve the energy efficiency of energy production and consumption methods.
Like most African countries, energy efficiency programmes are still in their infancy in the DRC, with the exception
of more than 30 years of action to promote improved fireplaces (wood and charcoal) and wood carbonization
technologies. In addition to these improved technologies, the implementation of biomass power plants with
large capacities would be all the more effective in filling the gap in the country's energy mix. The energy
produced from biomass power plants could thus be used in the agriculture and livestock sector (feeding water
pumping systems, irrigation, cold rooms, etc.), the transport sector (biofuel production), the industrial sector.
The implementation of cogeneration systems allows the production of energy that would feed not only
companies operating in the forestry sector (wood processing) but also households close to forest waste
production sites. Biogas produced from forest biomass would increase the production of gas for cooking food
and heating homes and electricity for lighting and powering electronic devices (UNDP, 2013).
1.2.3 Conclusion and Recommendation
DRC is a country marked by its richness in natural resources due to its large forest area. However, it is one of the
poorest countries in Central Africa. Like other countries in the sub-region, the population growth of the DRC
continues to increase, and the direct consequence is the rise in energy demand. Hydroelectric power is the main
source of energy that feeds the country's electricity grid. On the other hand, bioenergy is the most widely used
source of energy in rural areas. The other sources of energy like gas, charcoal, oil is used mainly in urban areas
for cooking and also in industry. The cleaner fuels, such as gas and oil are mainly used in urban areas for purposes
such as cooking, industry among others. The percentage of biomass in the DRC's energy mix justifies the
observed deforestation rate.
The residential sector and the industrial sector are the most energy intensive sectors in thecountry. However,
we see that the development of these sectors is not enough. The ratio between supply and demand shows that
there is a large energy deficit. Considering the context of the fight against climate change, reducing GHG
emissions is essential. To achieve this, the DRC in its INDC plans to look at the use of renewable energy sources
such as biomass.
Kinshasa, Kisangani, Mbuji-Mayi are the main localities which are home to the majority of logging companies.
Therefore, these are the great hot spots of biomass residues in the DRC. Wood waste in these localities are in
significant quantities and can be exploited to fill the energy deficit observed in the DRC.
Combustion and fermentation are the main technologies easily implemented for the production of bioenergy.
The combustion used in biomass power plants makes it possible to produce electricity and feed it into the
electricity grid. Biogas, biofuel and compost from the fermentation of wood waste can contribute to the
development of several activities in the DRC.

33
A report on the energy demand by sector for the selected countries
1.3 The Republic of Congo
1.3.1 Energy Resources
Congo has significant energy resources of hydropower, oil, natural gas and firewood. The total supply of primary
energy in Congo is estimated at 2637 ktoe, while the total final consumption amounts to 1769 ktoe1
2.2.2.2. Biomass
Congo is largely covered by forest (60% of the national territory) which accounts for 10% of all tropical
rainforests. They are divided into three main massifs: the Mayombe (2 million ha) the Challu (3 million ha) and
the North Congo (15 million ha). The potential biomass productivity in Congo's tropical forests is among the
highest in the world. Wood-energy is the fuel par excellence of households (more than 80% of total energy
consumption). Large consumption centers are fed by informal channels. Charcoal is produced from traditional
low-yielding millstones (10-15%) (Ngoubou, 2013).
2.2.2.3. Hydropower
The Republic of Congo has a dense water system that is organized around two main river basins: the Congo River
basin, which occupies about 72% of the country's total area, and the Kouilou-Niari basin, covering about 16%.
To these two basins it is necessary to add smaller coastal basins: the basins of the Loémé, upper Nyanga, upper
Ogooué, and Chilango. Despite the importance of Congo's water system, the hydraulic potential for electricity
generation is not yet fully exploited. Out of an estimated hydroelectric potential of 14,000 MW, the installed
capacity is 209 MW. Only the Moukoukoulou hydroelectric sites (74 MW) in the department of Bouenza, Djoué
(15 MW) in Brazzaville and Imboulou (120 MW) in the Department of the North Pool are operational (Ngoubou,
2013).
2.2.2.4. Solar
In gross terms, the average sunshine in Congo represents a potential of 4.5 kWh/m2/day, compared to only 3
kWh/m2/day in the European temperate zone. This important sunshine and the real prospect of reducing the
costs of photovoltaic technology lead to a very significant contribution of solar energy to rural people's access
to a basic energy service (Ngoubou, 2013).
2.2.2.5. Wind
The only wind measurements available come from the Agency for the Safety of Air Navigation in Africa and
Madagascar (ASECNA) synoptic stations (measures at 10-12 m). These measurements indicate that the potential
is not appreciable and wind speeds, in the order of 2 m/s, are not constant throughout the year. At such wind
speeds, wind energy is currently not viable.
2.2.2.6. Oil and gas
According to the EIA, which cites the Journal of Oil and Gas as a source (January 2016), Congo has large oil
reserves of up to 1.6 billion barrels. Indeed, the most influential oil companies operate in the country, including
the French Total and the Italian Eni, present in Congo since 1968. The Moho Bilondo offshore oil field, for
example, between the end of 2008 and 2010 was the oil reserve that contributed the most to oil production.
1 RAPPORT ANNUEL SIE-CONGO 2013

34
A report on the energy demand by sector for the selected countries
Another major offshore oil field, between Congo and Angola, whose two countries have agreed to share its
profits, is Lianzi, with reserves of about 70 million barrels (Louvel et al. 2017)
Natural gas is also present in considerable quantities, but the absence of a distribution network does not allow
for real commercial exploitation. For these reasons, much of the associated gas is re-injected into oil wells (About
Energy, n.d.).
The table below shows energy production and energy consumption in Congo.
Table 13: Total Energy Statistics for Republic of Congo in Kilo tonnes of Oil Equivalent (Ktoe)
Source : (AFREC, 2018)
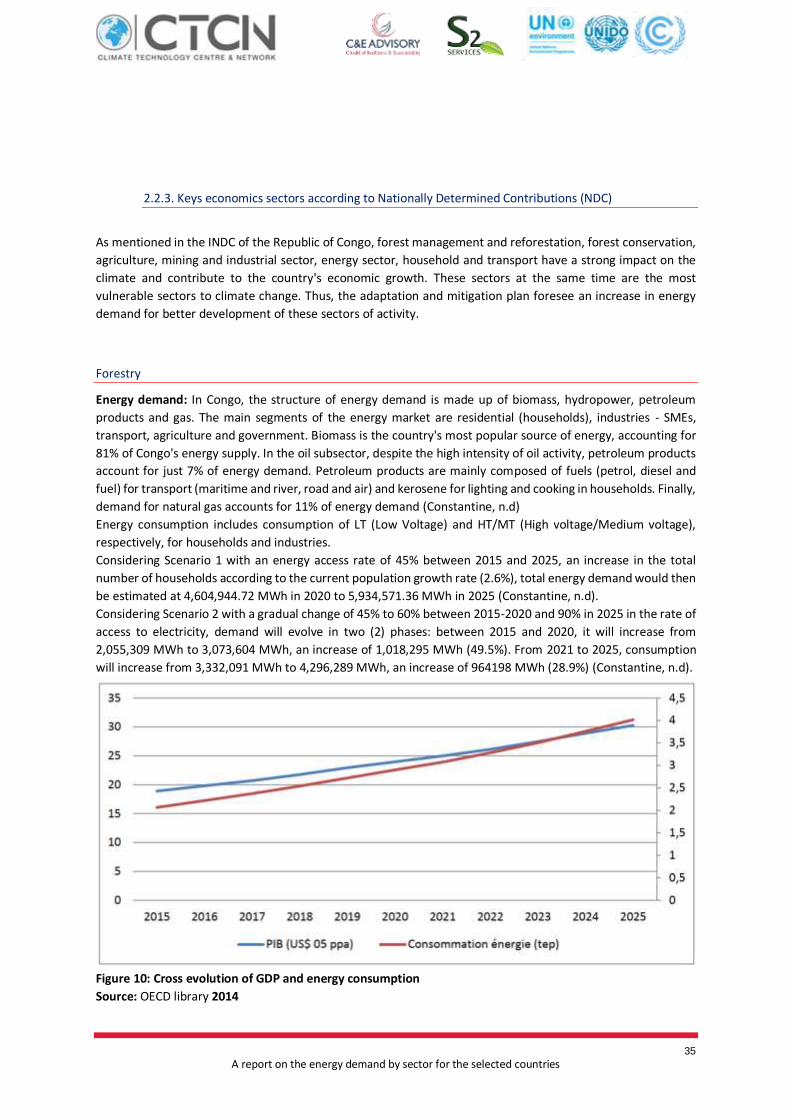
35
A report on the energy demand by sector for the selected countries
2.2.3. Keys economics sectors according to Nationally Determined Contributions (NDC)
As mentioned in the INDC of the Republic of Congo, forest management and reforestation, forest conservation,
agriculture, mining and industrial sector, energy sector, household and transport have a strong impact on the
climate and contribute to the country's economic growth. These sectors at the same time are the most
vulnerable sectors to climate change. Thus, the adaptation and mitigation plan foresee an increase in energy
demand for better development of these sectors of activity.
Forestry
Energy demand: In Congo, the structure of energy demand is made up of biomass, hydropower, petroleum
products and gas. The main segments of the energy market are residential (households), industries - SMEs,
transport, agriculture and government. Biomass is the country's most popular source of energy, accounting for
81% of Congo's energy supply. In the oil subsector, despite the high intensity of oil activity, petroleum products
account for just 7% of energy demand. Petroleum products are mainly composed of fuels (petrol, diesel and
fuel) for transport (maritime and river, road and air) and kerosene for lighting and cooking in households. Finally,
demand for natural gas accounts for 11% of energy demand (Constantine, n.d)
Energy consumption includes consumption of LT (Low Voltage) and HT/MT (High voltage/Medium voltage),
respectively, for households and industries.
Considering Scenario 1 with an energy access rate of 45% between 2015 and 2025, an increase in the total
number of households according to the current population growth rate (2.6%), total energy demand would then
be estimated at 4,604,944.72 MWh in 2020 to 5,934,571.36 MWh in 2025 (Constantine, n.d).
Considering Scenario 2 with a gradual change of 45% to 60% between 2015-2020 and 90% in 2025 in the rate of
access to electricity, demand will evolve in two (2) phases: between 2015 and 2020, it will increase from
2,055,309 MWh to 3,073,604 MWh, an increase of 1,018,295 MWh (49.5%). From 2021 to 2025, consumption
will increase from 3,332,091 MWh to 4,296,289 MWh, an increase of 964198 MWh (28.9%) (Constantine, n.d).
Figure 10: Cross evolution of GDP and energy consumption
Source: OECD library 2014

36
A report on the energy demand by sector for the selected countries
Figure 11: Changes in the consumption of petroleum products by sector
Figure 12: Production profile for 2014 to 2020
Source: MHC, 2014
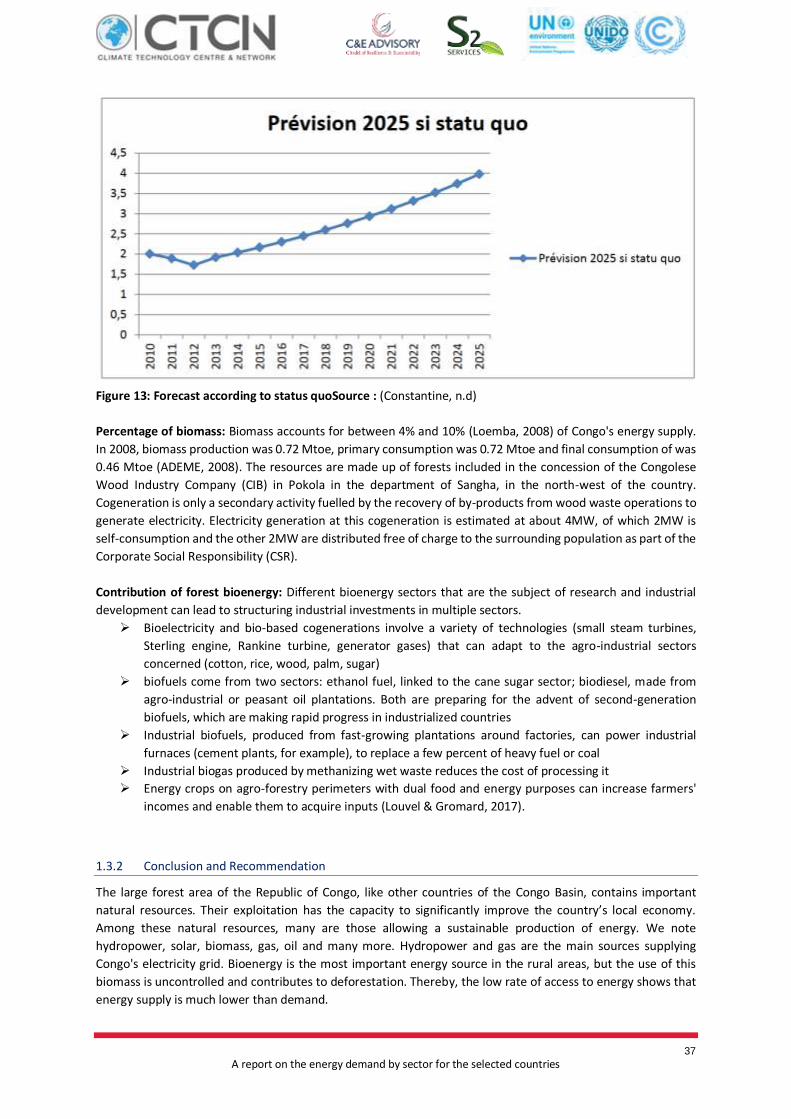
37
A report on the energy demand by sector for the selected countries
Figure 13: Forecast according to status quoSource : (Constantine, n.d)
Percentage of biomass: Biomass accounts for between 4% and 10% (Loemba, 2008) of Congo's energy supply.
In 2008, biomass production was 0.72 Mtoe, primary consumption was 0.72 Mtoe and final consumption of was
0.46 Mtoe (ADEME, 2008). The resources are made up of forests included in the concession of the Congolese
Wood Industry Company (CIB) in Pokola in the department of Sangha, in the north-west of the country.
Cogeneration is only a secondary activity fuelled by the recovery of by-products from wood waste operations to
generate electricity. Electricity generation at this cogeneration is estimated at about 4MW, of which 2MW is
self-consumption and the other 2MW are distributed free of charge to the surrounding population as part of the
Corporate Social Responsibility (CSR).
Contribution of forest bioenergy: Different bioenergy sectors that are the subject of research and industrial
development can lead to structuring industrial investments in multiple sectors.
➢ Bioelectricity and bio-based cogenerations involve a variety of technologies (small steam turbines,
Sterling engine, Rankine turbine, generator gases) that can adapt to the agro-industrial sectors
concerned (cotton, rice, wood, palm, sugar)
➢ biofuels come from two sectors: ethanol fuel, linked to the cane sugar sector; biodiesel, made from
agro-industrial or peasant oil plantations. Both are preparing for the advent of second-generation
biofuels, which are making rapid progress in industrialized countries
➢ Industrial biofuels, produced from fast-growing plantations around factories, can power industrial
furnaces (cement plants, for example), to replace a few percent of heavy fuel or coal
➢ Industrial biogas produced by methanizing wet waste reduces the cost of processing it
➢ Energy crops on agro-forestry perimeters with dual food and energy purposes can increase farmers'
incomes and enable them to acquire inputs (Louvel & Gromard, 2017).
1.3.2 Conclusion and Recommendation
The large forest area of the Republic of Congo, like other countries of the Congo Basin, contains important
natural resources. Their exploitation has the capacity to significantly improve the country’s local economy.
Among these natural resources, many are those allowing a sustainable production of energy. We note
hydropower, solar, biomass, gas, oil and many more. Hydropower and gas are the main sources supplying
Congo's electricity grid. Bioenergy is the most important energy source in the rural areas, but the use of this
biomass is uncontrolled and contributes to deforestation. Thereby, the low rate of access to energy shows that
energy supply is much lower than demand.

38
A report on the energy demand by sector for the selected countries
The areas of Bouenza, Ouesso, Pokala are the areas where the production of biomass is important. Biomass is
mainly sourced from the areas of Bounza, Ouesso, and Pokala.As mentioned in Congo’s INDC, biomass comes
from renewable energy sources. Its use as an alternative source will allow a reduction in GHG emissions. The
quantities of this biomass are sufficient in these areas for bioenergy production. This dual energy could make it
possible to fill the deficit observed in the electricity sector of the Congo.
As in other countries, fermentation and combustion are the main technologies that can be implemented for
energy production. Combustion is best exploited in biomass power plants for the production of electricity;
Ecological charcoal, briquettes, pellets (used in households for cooking and in boiler industries, for example) can
also be obtained from the combustion of biomass. At the end of fermentation, biogas, biofuel and compost can
be obtained and used for the development of several business sectors.
1.4 Gabon
1.4.1 Energy Resources
In terms of proven and recoverable oil reserves, the country is considered to be one of the richest in sub-Sharan
Africa, ranking 5th largest in the continent. It also ranks as the 3rd largest oil producer in sub-Saharan Africa,
following Nigeria & Angola. The country's two main energy sources are fossil-fuels and hydropower. 51.7% of
Gabon's total produced electricity in 2015 were generated from hydro, and 48.2% were from fossil fuels. Gabon
relies heavily on oil for both its export revenues & its domestic energy production. The other major energy
source is hydropower, from which the country's government aims to produce up to 1200 MW by 2020 (World
Bank, 2020; Nachmany, et al., 2015).
Hydropower
Gabon has high potential for hydro-electric generation due to its topography and high-precipitation conditions
(UNEP 2017). Gabon has an extremely dense and extensive hydraulic network that feeds two major rivers: the
Ogooué and the Nyanga. With the existence of powerful rapids on these rivers, the country has considerable
hydroelectric potential. Some sites are of great interest, such as those at the Okanda gates, where the Ogooué
is engulfed in a series of powerful rapids and whose productivity has been estimated at 10 billion kilowatts per
hour per year. According to the Ministry of Energy, the overall hydroelectric potential is estimated between
40,000 and 50,000 gigawatts per year. This is an important asset for its development (Lawson, n.d.).
Oil and Gas
Energy in Gabon comes from two main sources, fossil fuels and hydraulics. Gabon also relies heavily on oil for
its export earnings. In terms of oil reserves, the country is one of the richest in sub-Saharan Africa, ranking 5th
after Nigeria and Angola among others. Although Gabon's proven oil reserves have increased from 1,300 million
barrels in 1996 to 2,500 million barrels in 2004, the government is concerned about the long-term depletion of
resources. Total crude oil production increased from a peak of 371,000 barrels per day (59,000 m3/d) to about
289,700 barrels per day (46,060 m3/d) in 2003 (Energypedia, 2019) (UNEP 2017)
Gabon's total electricity production in 2015 was 199 kilotons of oil equivalent (ktoe), of which 51.7% came from
hydroelectric sources and 48.2% from fossil fuels. The country's final electricity consumption was 169 ktoe.

39
A report on the energy demand by sector for the selected countries
Solar, wind
Gabon has an average of 300 sun-shining days per year, with an average daily solar insolation of approximately
4 kWh/m2. Yet, as mentioned earlier, the country is heavily forested, which stands in the way of connecting
remote communities to the country's main grid. Therefore, with such solar conditions, stand-alone solar systems
would be the ideal solution for power generation for these communities in Gabon.
Biomass
Gabon’s forests cover a huge portion of the land area and supply an equally large proportion of the country’s
energy needs (IEA, 2016). Biomass is the predominant energy source used by 80 per cent of the domestic sector
(REEEP, 2012). The country has collaborative ventures at international and regional levels for sustainable forest
management and energy use through the Central African Forest Initiative and the International Centre for
Carbon Sequestration and Biomass Energy. As the formal wood sector grows, there is also potential to use waste
from the timber industry to produce energy (UNEP 2017).
Table 14 : Total energy statistics for Gabon

40
A report on the energy demand by sector for the selected countries
Source: (AFREC, 2018)
1.4.2 Keys economics sectors according to Nationally Determined Contributions (NDC)
The INDC of the Gabonese Republic (Government of Gabon, 2015) refers to several sectors of activity that have
a significant influence on the country's GDP. These sectors, while vulnerable to climate change, contribute to
the increase in atmospheric GHG concentration. The functioning of these sectors depends mainly on access to
energy in the country. A better development of these sectors thus requires an increase in energy demand.
41
A report on the energy demand by sector for the selected countries
Forestry sector
Energy demand: Gabon in its National Infrastructure Director Scheme plans to develop electrical infrastructure
to meet the additional needs of the forest sector, of about 100 MW by 2025 (Government of Gabon, 2013).
Percentage of bioenergy in this sector: Gabon's forest biomass is mainly represented by waste from logging.
However, the energy from the conversion of this forest biomass is used in other sectors of activity. The
contribution of bioenergy in the forestry sector is almost nil.
Contribution of forest bioenergy: The recovery of the millions of tons of biomass generated by the logging
industries can enable Gabon to implement technologies of cogeneration, biomass power plants, biofuel
production and biogas. This energy provided will have to feed forestry companies and households that are close
to the production sites of large quantities of waste. The biogas produced should allow food to be cooked and
houses to be heated. The biofuel produced will have to supply the transport machinery of forest products.
Industrial sector (wood industries, agribusiness, mining industry)
Energy demand: The estuary province, home to the capital Libreville and the SEZ (Special Economic Zone), is the
most industrialized in the country. Its energy demand alone rises to more than 115 MW. In the emerging
strategic plan document, Gabon plans to meet this demand by building the 70 MW Gas-fired Power Plant and
the Ngoulmendjim Dam (45 MW) as well as the extension and modernization of the north electricity grid of
Libreville.
The economic hub of Lastoursville-Koulamoutou with the infrastructure available and projects planned need
more than 90 MW for its development. In the emerging strategic plan Gabon has planned the Ngoulmendjim
hydroelectric dam to meet this demand. About 10.6 MW will meet the demand of the wood industry and various
agricultural and mining activities.
The economic hub of Port-Gentil through its infrastructure and projects will need a capacity of about 117 MW.
At the Belinga pole where Gabon plans to exploit iron, manganese, gotha, its energy needs are estimated at 240
MW.
Lambaréné's economic hub for the development of its activities in the wood industry needs 25.8 MW and various
agricultural, agro-industrial and mining activities need 25 MW for manganese production in Ndjolé.
The development of this energy potential will enable to meet the energy needs of industrial Gabon. Gabon, with
the support of its partners, will set up a production fleet with a capacity of 1,200 MW in 2020 and 3,000 MW in
2030. This offer will consist of 80% hydroelectric power and 20% thermal energy produced from gas
(Government of Gabon, 2013).

42
A report on the energy demand by sector for the selected countries
Figure 14: Energy needs maps by pipeline, project and deadline (2016, 2020 and 2025)
Source: (Government of Gabon, 2013)
Percentage of biomass: Gabon has a hydrocarbon-rich subsoil, which explains its choice to use mostly fossil fuel
(60.1%) to meet the growing needs of the population. The renewable sources that provide the additional share
are represented at 98.7% by the hydraulics sector and 1.3% by biomass (EDF, 2013).
Figure 15: Structure of energy production and production from
renewable energy sources
Contribution of forest bioenergy: Different bioenergy
sectors that are the subject of research and industrial
development can lead to structuring industrial investments
in multiple sectors.
➢ Bioelectricity and bio-based cogenerations involve a
variety of technologies (small steam turbines, Sterling
engine, Rankine turbine, generator gases) that can adapt to
the agro-industrial sectors concerned (cotton, rice, wood,
palm, sugar),
➢ Biofuels come from two sectors: ethanol fuel, linked to the sugarcane sector; biodiesel, made from
agro-industrial or smallholder oil plantations. Both are preparing for the advent of second-generation
biofuels, which are making rapid progress in industrialized countries,
➢ Industrial biofuels, produced from fast-growing plantations around factories, can power industrial
furnaces (cement plants, for example), to replace a few percent of heavy fuel or coal,
➢ Industrial biogas produced by methanizing wet waste reduces the cost of processing it,
➢ Energy crops on agro-forestry perimeters with dual food and energy purposes can increase farmers'
incomes and enable them to acquire inputs (Louvel & Gromard, 2017).
1.4.3 Conclusion and Recommendation
The Gabonese Republic, like other countries in Central Africa, has enormous potential in natural resources
(hydropower, solar, gas, oil, mines, biomass, etc.) offered on the one hand by its large forest area that covers
85% of its territory. The exploitation of these resources enables to rank Gabon among the most electrified
countries on the African continent with an energy access rate estimated at around 97%. However, access to
energy is not homogeneous across the country. Rural areas, mainly isolated ones, still experience electrification

43
A report on the energy demand by sector for the selected countries
issue. This is justified by the priority given to urban areas which are home to the industrial sector (energy
intensive) and SMEs. In addition, the residential sector is very important in urban areas and their energy demand
is quite high. The populations of these rural areas for basic energy needs use fuelwood and charcoal in an
uncontrolled way. As mentioned in its INDC, Gabon through many actions wants to reduce its greenhouse gas
emissions. The priority of its actions is focused on the fight against deforestation and the use of renewable
energy sources like biomass.
The Nzok Specialized Economic Zone is the area that is home to important forestry companies. This is probably
the area where forest waste is found in significant quantities. However, this waste is not ecologically recovered.
The production of electricity by combustion in a biomass power plant is one of the technically implementable
technologies to supply rural areas. Ecological charcoal, briquettes are products that can be obtained from the
combustion of wood waste. Along with combustion, fermentation enables the production of biofuel, biogas,
electricity and compost. These products can be used in various sector and industries.
1.5 Chad
1.5.1 Energy Resources
Biomass
In the case of biomass, particularly ligno-cellulosic, the country is home to important sources estimated in the
1970s at 312 million hectares, but today the area has dropped by 23 million hectares. This decline is due to its
anarchic and abusive exploitation and repeated droughts (Richard, n.d).
Hydropower
The pre-identified hydroelectric sites are: Am Dam on Batha, Goré, Baibokoum, and Gauthiot Falls. Hydroelectric
potential is unevenly distributed over the year (Richard, n.d).
Solar
From the north to the south of the country, the sun shines from 2,750 to 3,250 hours per year. This averages 4
to 6 kilowatts per hour per square meter per day (Xinhua, 2013).
Wind
Wind power, based on the results of satellite measurements, shows that Chad has a very large deposit in the
northern regions (where there are two mountain ranges), as well as in the central and southern regions (3 to 9
m/s) (Richard, n.d).
Oil and gas
The country has 7 oil basins, but only the Doba basin is in operation with several fields in production: Miandoum
and Komé (since October 2004), Bolobo (August 2004), Nya (July 2007) and Rônier and Mimosas (in April 2011).
Oil production began in 2003 and peaked in 2004 at 8.7 Mt (megatonne/million tonnes) (Republic of Chad, 2016;
Constantine, n.d). It has declined steadily since 2006 to for example 5.7 Mt in 2011, despite the starting of new
fields. This decrease is due to technical difficulties and upwellings which have caused production to stop on
several fields. Production stabilized in 2010 with 6.1 Mt. The Djermaya refinery can produce 700,000 t of gasoline
and kerosene, 20,000 t of diesel and 60,000 t of LPG per year. In 2007, Chad and China National Petroleum
signed a 60/40 partnership agreement for the construction and operation of the refinery. Until then, the country

44
A report on the energy demand by sector for the selected countries
was totally dependent on imports from neighbouring countries including Cameroon, Nigeria, Libya and Sudan
(Republic of Chad, 2016)2.
Table 15: Total energy statistics for Chad
Source: (AFREC, 2018)
1.5.2 Keys economics sectors according to Nationally Determined Contributions
The INDC of the Republic of Chad mentions agriculture, energy, livestock and waste sectors as most vulnerable
to climate change (Republic of Chad, 2015). These sectors have a strong impact on the country's GDP. Thus, the
2 EnerdataJanuary, January 2013

45
A report on the energy demand by sector for the selected countries
improvement of its business sectors to meet the needs of the rapidly growing population is conditioned by
access to energy. As a result, since 2009 the Chadian government through public-private partnerships has
evaluated the energy forecasts that are well detailed in its master plan for the energy sector. As indicated in the
master plan for energy, Forest biomass can be used for the development of several sectors of activities. It can
be operated collectively in residential sector (50 000 to 100 000 inhabitants), in agricultural sector using
fermentation to produce biofuel, biogas, electricity; industrially using various technologies as combustion,
fermentation, etc. (EU, 2012).
Forestry
Energy demand: Based on the public inquiry and data provided by the SNE, the demand for energy in Chad was
established. This request does not cover the industry sector because of their low presence in the country and
the fact that they are not connected to the urban network (EU, 2012). 3
Figure 16: Schematization of energy demand in Chad
Source : (EU, 2012)
The Ministry of Energy in March 2009 carried out a forecast of electricity demand for Chad based on the elasticity
of the country’s GDP trajectory relative to the current electricity demand (EU, 2012).
Table 16: Electric demand forecast4
3 Chad's Energy Master Plan 4 Chad’s energy master plan

46
A report on the energy demand by sector for the selected countries
Source: (EU, 2012)
The last energy demand study was conducted in 2012 with three envisaged scenarios. The basic scenario, the
high scenario and the low scenario.
Basic scenario - demand is based on the development of the number of different consumers, the realistic
development of specific consumption, and the realistic development of GDP. Technical losses remain at the
same level as today, electrification programmes will be carried out as planned, demand will increase as
population and household size increases in different regions of Chad; and the results of the survey are
considered.
Top Scenario - compared to the basic scenario, the following changes are considered: The number of subscribers
increases more strongly than for the base scenario; the elasticity of demand vis-à-vis GDP is stronger than for
the basic scenario; the electrification of the country is carried out in an expected way; the population is growing
faster than for the basic scenario.
Low Scenario - compared to the basic scenario, the following changes are considered: The number of subscribers
increases less strongly than for the base scenario; the elasticity of demand vis-à-vis GDP is less strong than for
the basic scenario; the electrification of the country is carried out in a predicted way; the population is growing
less rapidly than for the basic scenario.
The following table includes electricity demand and the rate of increase in electricity demand. The data in the
table relates to demand in Chad's 22 regional capitals (N'Djamena, Moundou, Sarh, Abeché, Bongor, Doba, Faya
Largeau, Mongo, Oum Hadjer, Biltine, Am Timan, Ati, Mao, Bol, Moussoro, Fada, Bardai, Massakory, Koumra,
Kélo, Pala, Lai).
Table 17: Forecasting demand and the rate of increase in electricity demand
Forecasting demand and rate of increase in electricity demand
2011 2015 2020 2025 2030
MW
demand
Rate of
increase
(%)
MW
dema
nd
Rate of
increase
(%)
MW
dema
nd
Rate of
increase (%)
MW
demand
Rate of
increase
(%)
MW
demand
Rate of
increase (%)
N'Djamena

47
A report on the energy demand by sector for the selected countries
Forecasting demand and rate of increase in electricity demand
2011 2015 2020 2025 2030
MW
demand
Rate of
increase
(%)
MW
dema
nd
Rate of
increase
(%)
MW
dema
nd
Rate of
increase (%)
MW
demand
Rate of
increase
(%)
MW
demand
Rate of
increase (%)
Basic
scenario 118,8 -
153,33 29% 200,78 31% 252,6 26% 308,66 22%
Top
scenario 118,8 -
163,58
9 38% 226,31 38% 296,57 31% 374,34 26%
Low
scenario 118,8 -
138,95
3 17% 167,85 21% 197,17 17% 230,23 17%
Moundou
Basic
scenario 6,697 - 8,782 31% 11,388 30% 13,995 23% 16,601 19%
Top
scenario 6,697 - 9,337 39% 12,637 35% 15,937 26% 19,237 21%
Low
scenario 6,697 - 8,225 23% 10,135 23% 12,045 19% 13,955 16%
Sarh
Basic
scenario 4,102 - 5,309 29% 6,819 28% 8,328 22% 9,837 18%
Top
scenario 4,102 - 5,65 38% 7,585 34% 9,52 26% 11,455 20%
Low
scenario 4,102 - 4,97 21% 6,055 22% 7,14 18% 8,225 15%
Abeché
Basic
scenario 3,543 - 4,751 34% 6,261 32% 7,771 24% 9,281 19%
Top
scenario 3,543 - 5,047 42% 6,927 37% 8,807 27% 10,687 21%
Low
scenario 3,543 - 4,455 26% 5,595 26% 6,735 20% 7,875 17%
Bongor
Basic
scenario 1,062 - 1,291 22% 1,577 22% 1,864 18% 2,151 15%
Top
scenario 1,062 - 1,382 30% 1,782 29% 2,182 22% 2,582 18%
Low
scenario 1,062 - 1,202 13% 1,377 15% 1,552 13% 1,727 11%
Time
Basic
scenario 2,807 - 3,766 34% 4,963 32% 6,161 24% 7,359 19%
Top
scenario 2,807 - 3,999 42% 5,489 37% 6,979 27% 8,469 21%
Low
scenario 2,807 - 3,531 26% 4,436 26% 5,341 20% 6,246 17%
Faya

48
A report on the energy demand by sector for the selected countries
Forecasting demand and rate of increase in electricity demand
2011 2015 2020 2025 2030
MW
demand
Rate of
increase
(%)
MW
dema
nd
Rate of
increase
(%)
MW
dema
nd
Rate of
increase (%)
MW
demand
Rate of
increase
(%)
MW
demand
Rate of
increase (%)
Basic
scenario 460 - 552 20% 666 21% 781 17% 895 15%
Top
scenario 460 - 588 28% 748 27% 908 21% 1,068 18%
Low
scenario 460 - 516 12% 586 14% 656 12% 726 11%
Mongo
Basic
scenario 2,105 - 2,564 22% 3,137 22% 3,71 18% 4,284 15%
Top
scenario 2,105 - 2,745 30% 3,545 29% 4,345 23% 5,145 18%
Low
scenario 2,105 - 2,385 13% 2,735 15% 3,085 13% 3,435 11%
Oum Hadjer
Basic
scenario 1,499 - 1,825 22% 2,233 22% 2,641 18% 3,049 15%
Top
scenario 1,499 - 1,954 30% 2,523 29% 3,093 23% 3,662 18%
Low
scenario 1,499 - 1,698 13% 1,947 15% 2,196 13% 2,445 11%
Biltine
Basic
scenario 856 - 1,043 22% 1,276 22% 1,509 18% 1,742 15%
Top
scenario 856 - 1,117 30% 1,442 29% 1,767 23% 2,093 18%
Low
scenario 856 - 970 13% 1,113 15% 1,255 13% 1,397 11%
Am Timan
Basic
scenario 2,105 - 2,564 22% 3,137 22% 3,71 18% 4,284 15%
Top
scenario 2,105 - 2,745 30% 3,545 29% 4,345 23% 5,145 18%
Low
scenario 2,105 - 2,385 13% 2,735 15% 3,085 13% 3,435 11%
Ati
Basic
scenario 1,872 - 2,29 22% 2,813 23% 3,335 19% 3,858 16%
Top
scenario 1,872 - 2,455 31% 3,185 30% 3,914 23% 4,644 19%
Low
scenario 1,872 - 2,127 14% 2,446 15% 2,765 13% 3,084 12%
Mao

49
A report on the energy demand by sector for the selected countries
Forecasting demand and rate of increase in electricity demand
2011 2015 2020 2025 2030
MW
demand
Rate of
increase
(%)
MW
dema
nd
Rate of
increase
(%)
MW
dema
nd
Rate of
increase (%)
MW
demand
Rate of
increase
(%)
MW
demand
Rate of
increase (%)
Basic
scenario 1,203 - 1,472 22% 1,808 23% 2,144 19% 2,48 16%
Top
scenario 1,203 - 1,578 31% 2,047 30% 2,516 23% 2,985 19%
Low
scenario 1,203 - 1,367 14% 1,572 15% 1,777 13% 1,982 12%
Bowl
Basic
scenario 821 - 1,004 22% 1,234 23% 1,463 19% 1,692 16%
Top
scenario 821 - 1,077 31% 1,397 30% 1,717 23% 2,037 19%
Low
scenario 821 - 933 14% 1,073 15% 1,213 13% 1,353 12%
Moussoro
Basic
scenario 1,132 - 1,385 22% 1,701 23% 2,018 19% 2,334 16%
Top
scenario 1,132 - 1,485 31% 1,927 30% 2,368 23% 2,809 19%
Low
scenario 1,132 - 1,287 14% 1,48 15% 1,673 13% 1,866 12%
Fairy
Basic
scenario 3,008 - 3,68 22% 4,519 23% 5,359 19% 6,199 16%
Top
scenario 3,008 - 3,945 31% 5,117 30% 6,289 23% 7,461 19%
Low
scenario 3,008 - 3,418 14% 3,931 15% 4,443 13% 4,956 12%
Bards
Basic
scenario 106 - 130 22% 160 23% 189 19% 219 16%
Top
scenario 106 - 139 31% 181 30% 222 23% 263 19%
Low
scenario 106 - 121 14% 139 15% 157 13% 175 12%
Massakory
Basic
scenario 1,353 - 1,656 22% 2,034 23% 2,412 19% 2,789 16%
Top
scenario 1,353 - 1,775 31% 2,303 30% 2,83 23% 3,358 19%
Low
scenario 1,353 - 1,538 14% 1,769 15% 2 13% 2,23 12%
Koumra

50
A report on the energy demand by sector for the selected countries
Forecasting demand and rate of increase in electricity demand
2011 2015 2020 2025 2030
MW
demand
Rate of
increase
(%)
MW
dema
nd
Rate of
increase
(%)
MW
dema
nd
Rate of
increase (%)
MW
demand
Rate of
increase
(%)
MW
demand
Rate of
increase (%)
Basic
scenario 2,557 - 3,128 22% 3,841 23% 4,555 19% 5,269 16%
Top
scenario 2,557 - 3,354 31% 4,35 30% 5,346 23% 6,342 19%
Low
scenario 2,557 - 2,905 14% 3,341 15% 3,777 13% 4,213 12%
Kélo
Basic
scenario 2,557 - 3,128 22% 3,841 23% 4,555 19% 5,269 16%
Top
scenario 2,557 - 3,354 31% 4,35 30% 5,346 23% 6,342 19%
Low
scenario 2,557 - 2,905 14% 3,341 15% 3,777 13% 4,213 12%
Shovel
Basic
scenario 1,504 - 1,84 22% 2,26 23% 2,68 19% 3,099 16%
Top
scenario 1,504 - 1,973 31% 2,559 30% 3,145 23% 3,731 19%
Low
scenario 1,504 - 1,709 14% 1,965 15% 2,222 13% 2,478 12%
Lai
Basic
scenario 1,507 - 1,844 22% 2,265 23% 2,686 19% 3,107 16%
Top
scenario 1,507 - 1,977 31% 2,565 30% 3,152 23% 3,739 19%
Low
scenario 1,507 - 1,713 14% 1,97 15% 2,227 13% 2,484 12%
Source : (EU, 2012)
In terms of demand for wood-energy, the following table gives the values for the next 20 years based on the
expected increase in population. This value is also expressed in terms of cubic metres of wood and the area
needed for products with an average rate of 0.9m3/ha corresponding to the estimated production of tree
savannas.5
Table 18: Forecasting energy wood demand6
Tonnes 2011 2015 2020 2025 2030
Basic
scenario
5.776.000 - 6.612.000 14% 7.658.000 16% 8.703.000 14% 9.748.000 12%
Top
scenario
5.776.000 - 6.946.000 20% 8.233.000 19% 9.519.000 16% 10.805.00
0
14%
Low
scenario
5.776.000 - 6.317.000 9% 7.159.000 13% 8.002.000 12% 8.845.000 11%
5 Chad's Energy Master Plan 6 Chad's Energy Master Plan

51
A report on the energy demand by sector for the selected countries
Percentage of biomass used: In 2002 wood and charcoal and other biomass (mostly rural and urban households)
amounted to 1,763,000 tons of oil equivalent (96.5%) about 5,289,000 tons of wood equivalent.
In 2010, based on consumption data from the 2005 survey, N'Djamena's theoretical domestic energy
consumption would be 137,000 t of wood, 93,000 t of charcoal and 3,000 t of gas. The 93,000 t of charcoal
represents in primary energy an amount of 652,000 t, but also a usage value of 240,000 t when one takes into
account the difference in calorific power and cooking efficiency.
Table 19: Final energy consumption by industry and energy type
Final consumption
1990 2000 2007 2008 2009 2010 2011
Total Mtoe 0,71 0,87 0,97 0,98 1 1 0,99
By energy
Oil % 4 5 6 6 6 6 6
Gas % 0 0 0 0 0 0 0
Coal, lignite % 0 0 0 0 0 0 0
Electricity % 1 1 1 1 1 1 1
Heat % 0 0 0 0 0 0 0
Biomass % 98 95 93 93 94 93 93
By sector
Industry % 13 13 13 14 15 13 13
Transport % 3 3 4 4 4 4 4
Tertiary residence % 85 84 82 82 81 83 83
Non-energy use % 0 0 0 0 0 0 0
Source : (Richard, n.d)
Contribution of forest bioenergy: Applications for biomass exploitation in Chad:
➢ Incineration for cogeneration (heat and electricity)
➢ Fermentation in biogas production for cooking in households, and other productive activities.
➢ Biofuels (with or without processing: ethanol, biodiesel and jatropha) for usetransport sector7
1.5.3 Conclusion and Recommendation
The Republic of Chad is much diversified in natural resources offered by its large forest area. It contains wood
resources, hydraulics, solar, oil, and gas. However, hydraulics, gas and oil are the main sources that supply Chad’s
electrical grid. A majority of Chad’s population has no access to electricity, especially in the rural areas. Several
studies have shown that 80% of the energy produced by Chad is used to supply the N’Djaména capital. The
demand for energy is higher in the Southern part of the capital, where most of the country’s industries are
situated. Excluding industries, energy demand is also important at household level for basic energy needs. The
ratio between supply and demand is very low, which shows a large deficit in the country's electricity network.
Chad's INDC indicates that Chad wants to fight climate change by reducing its GHGs. The use of renewable energy
sources like biomass is an action to be implemented.
7 Chad's Energy Master Plan

52
A report on the energy demand by sector for the selected countries
The southern part of Chad is the part that contains a large quantity of forestry and agricultural waste. These
wastes in Chad nowadays can be recovered. However, the sustainable use of this waste will make it possible to
fill the deficit observed in the energy mix in Chad.
Fermentation and combustion of this waste are easily applicable technologies to produce bioenergy to power
off-grid areas.
1.6 Equatorial Guinea
1.6.1 Energy Resources
Equatorial Guinea has vast energy potential, the bulk of which is oil and natural gas. Electricity consumption in
Equatorial Guinea in 2015 was 36 kilotons of oil equivalent (ktoe). The energy consumed is totally produced by
the country. In 2012, renewable energy accounted for 29.2% of the final energy mix. Most of its renewable
energy comes from hydroelectric power plants.
Equatorial Guinea's main sources of energy supply are biomass (80%), petroleum products (18%) and water
resources (2%) despite the country's strong hydroelectric potential. The country's main renewable energy
potential lies in biomass and water resources, followed by wind and solar.
Biomass, in the form of firewood and coal, is the most important renewable energy resource used in households
for cooking. In rural and suburban areas, households mainly use charcoal or wood for cooking. According to data
available for 2012, almost 100% of rural households use firewood exclusively and 20% of urban households use
firewood and/or coal for cooking (MEWF, 2019).
Biomass
Equatorial Guinea has about 1626 million hectares of dense rainforest, representing 58.0% of the country's total
area There are three main types of vegetation. The first type is composed of medium- and low-rise, moist forests,
with high-value wood species. Logging is a large-scale phenomenon, driven by international demand for timber.
61% of the population living in predominantly rural areas faces serious domestic energy problems (DGCE 2001).
A small percentage of family units (8%) uses gas to cook. Although most firewood is harvested from subsistence
crops after clearing (approximately 70%), there is a strong trend towards fallow logging and in the remaining
secondary forests (30%). Biomass consumption is less represented in Equatorial Guinea. The main source of
energy in Equatorial Guinea is natural gas. Its natural gas potential ranks it fifth in Sub-Saharan Africa8.
Table 20: Charcoal consumption in CEEAC countries (tonnes)
Country 2005 2010 2011 2012
Angola 246,612 293,494 303,601 314,056
Burundi 60,000 60,000 60,000 60,000
Cameroon 381,393 429,319 438,493 447,862
RCA 192,223 195,742 199,325
Congo 3,194 3,930 4,082 4,239
RD Congo 1, 704,243 2, 025,055 2, 095,096 2, 167,561
Gabon 17,920 20,168 20,561 20,962
Equatorial Guinea 7,836 9,062 9,297 9,539
Sao Tomé and Principle 8,152 8,836 8,966 9,099
Chad 355,052 402,534 412,871 423,473
Total CEEAC 2 805 402 3 444 621 3 548 709 3 656 116
Source: (ECCAS-CEMAC, 2014)
8 (Source: NDE (Ministère de l'agriculture, de l'élevage, Les forêts et l'environnement)

53
A report on the energy demand by sector for the selected countries
Table 21: Wood consumption in CEEAC countries (m3)
Country 2005 2010 2011 2012
Angola 3, 573,764 4, 009,338 4, 100,538 4, 194,293
Burundi 8, 541,727 9, 259,292 9, 396,845 9, 536,440
Cameroon 9, 485,004 9, 905,983 9, 992,570 10, 080,710
RCA 2, 000,000 2, 000,000 2, 000,000 2, 000,000
Congo 1, 369,000 1, 335,790 1, 357,017 1, 378,601
RD Congo 71, 066,400 76, 602,030 77, 735,602 78, 894,151
Gabon 1, 070,000 1, 070,000 1, 070,000 1, 070,000
Equatorial Guinea 447,000 447,000 447,000 447,000
Sao Tomé and Principle 102,322 107,426 108,310 109,206
Chad 6, 487,646 7, 070,029 7, 183,997 7, 300,182
Total CEEAC 104 144 868 111 808 898 113 393 890 115 012 595
Source : (ECCAS-CEMAC, 2014)
Hydropower
Hydropower has significant potential to meet the country’s energy consumption needs. The Djibloho dam on
the Wele River came online in October 2012 and increased total electricity generating capacity by 120
megawatts (MW). The Sendje River hydropower project is also expected to add 200 MW of capacity upon
completion in 2017 (EIA, 2017; UNDP, 2013). Total installed capacity in 2014 was estimated at 200 MW.
Electricity generation in 2014 was estimated at 98 million Kwh Electricity is supplied by the national electricity
company (CIA, 2020), Sociedad de Electricidad de Guinea Ecuatorial (SEGESA).
Solar
Equatorial Guinea has significant potential for solar energy. This potential required the government to carry out
a project in Annobon on solar energy as a renewable energy source, which will allow residents of the island of
Annobon to have clean energy. The solar complex on which this project is based has a capacity of 5MW, up to
10MW in the future. The project was considered to be the largest self-sustaining solar micro-grid system in the
entire African continent and is particularly optimal for the island of Annobon, which will be able to produce
sufficient electricity to source, cover the needs of the inhabitants and the future needs of tourism, industrial and
commercial activities (MMIE, 2014).
Wind
Wind speeds averaging 6 m/s at heights of 80 m have been measured in the southern area of the mainland. But
there are currently no wind power projects in the country (Campos, 2012; REEEP, 2012).
Oil and gas
The proven recoverable oil reserves by the end of 2011 were 1,100 million barrels and oil production at the end
of the same year was 91,625 thousand barrels (WEC, 2013). Oil is the country’s most important export with
exports of crude oil amounting to 318,120 barrels per day (WEC, 2013). By the end of 2011, proven recoverable
resources of natural gas were 36.8 bcm (1,299.6 bcf) and natural gas production was 36.8 bcm (WEC, 2013). The
natural gas reserves are located off Bioko Island and are mainly in the Zafiro and Alba oil and gas fields. The Alba
field was discovered in 1984 and Zafiro began production in 1996. Oil production originates almost entirely from
the Zafiro, Ceiba, and Okume fields. Condensate production comes from the Alba field (WEC, 2013).
.
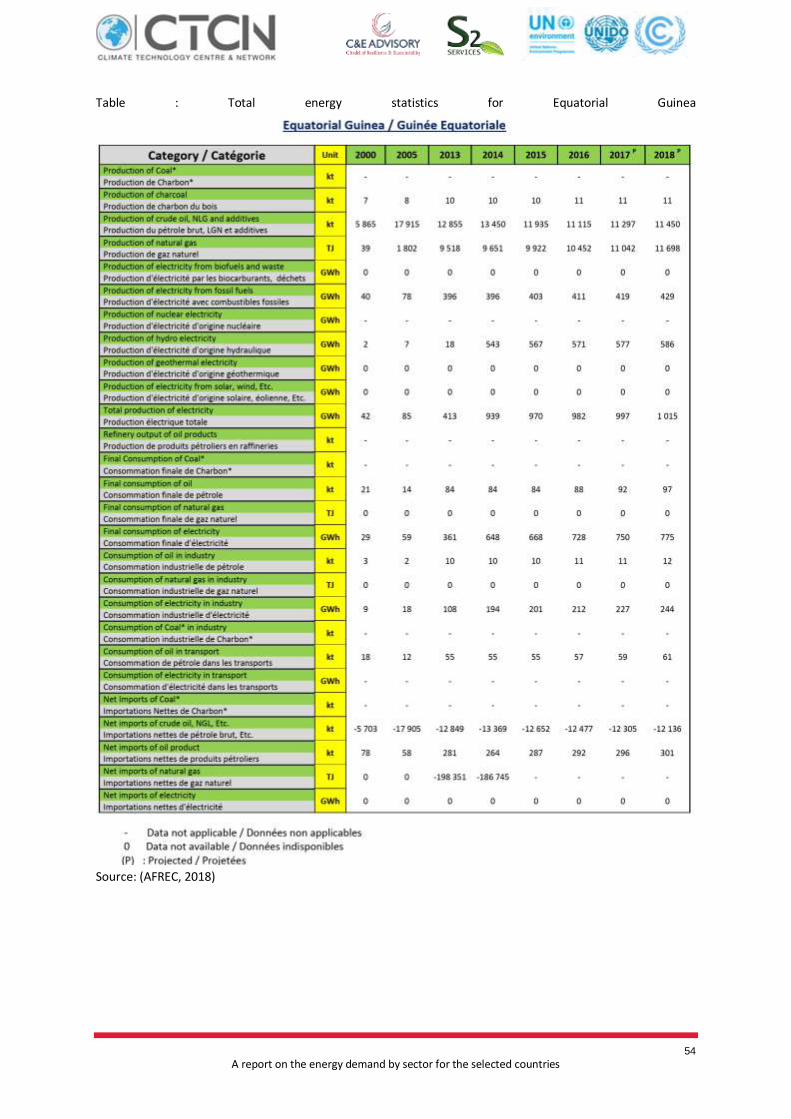
54
A report on the energy demand by sector for the selected countries
Table : Total energy statistics for Equatorial Guinea
Source: (AFREC, 2018)

55
A report on the energy demand by sector for the selected countries
1.6.2 Keys economics sectors according to Nationally Determined Contributions
2.6.2.1. Forestry
Energy demand: The main objective of the Electricity Plan of the Republic of Equatorial Guinea 2025 is to
establish general guidelines for the development of sufficient electricity infrastructure to meet domestic
demand, thus allowing all citizens to have access to electricity services, promoting the use of productive
equipment and integrating electricity nationally with the prospect of producing a surplus of energy for export.
According to Cargo Dispatch data, for the island region, currently the peak of demand is about 8.2 MW.
Currently, only the installation of the Musola 1 and 2 and Riaba hydroelectric plants, with a capacity of 0.5 MW
and 3.8 MW respectively, are underused and out of service (Government of Equatorial Guinea, 2018).
More than 20 major projects in Equatorial Guinea meet energy demand in the fields of production, transport,
distribution and marketing:
➢ Djibloho hydroelectric power plant with a capacity of 120 MW
➢ Djibloho transmission and processing line
➢ 60 KV transport network in the city of Malabo
➢ Turbo-Gas plant expands to 126 MW ISO
➢ Line 33 KV to Basil Peak and nearby villages
➢ Remodeling the Ebibeyin and Mongomo electrical facilities
➢ Adaptation of several power grids in the continental region
➢ Road lighting on the Ngolo Highway - Port of Bata
➢ Emergency and assisting generator batteries in Malabo and Bata
➢ Recovery of the mini-hydropower plants of Riaba, Musola 1 and 2.
The development of these projects should help achieve an installed capacity that will be above the national
electricity demand.
Table 22: Annual and cumulative schedule in 2025, 2030 and 2040
Annual Savings In 2025, 2030 and 2040
Residential Professional Outside
2030 2040 2030 2040 2030 2040
Electricity
(Gwh) 1,2 0,1 11 0,9 4,4 0,4
Electricity Bill
(Millions of
Us$)
0,3 0 2,4 0,2 1 0,1
Hours Accumulated In 2030 And 2040
Residential Professional Outside
2030 2040 2030 2040 2030 2040
Electricity
(Gwh) 15 19 130 170 53 69
Electricity Bill
(Millions of
Us$)
3,4 4,3 29 38 12 16
Source : U4E 2019
Scenario unchanged

56
A report on the energy demand by sector for the selected countries
Minimum scenario
Ambition
Alta Ambition Scenario
Figure 17: Accumulated electricity consumption per product from 2040
Source: U4E 2019
Percentage of biomass used: The PANDER describes the installed capacity in the country, expressed in
megawatts and classified as renewable or non-renewable. Electricity generation capacity is 394 MW, of which
127 MW corresponds to energy production from traditional renewable sources (hydroelectric power plants) and
267 MW from non-renewable sources (156 MW from natural gas thermoelectric power plants and 111 MW from
diesel). Biomass is mainly used in the residential sector. The lack of access to the electricity grid in rural areas
forces households to use biomass as an energy source for the production of heat and electricity (Republic of
Equatorial Guinea, 2019).
Contribution of forest bioenergy: Electrical energy can be obtained by processing biomass from agricultural
residues, forest biomass and agricultural industrial residues. The technology applied to obtain electrical energy
depends on the type and quantity of biomass available, as well as their physical-chemical characteristics. The
main techniques developed for biomass-based electricity generation include the conventional steam cycle based
on direct biomass combustion for steam production and turbine drive, the use of synthetic gases from biomass
gasification applied to gas turbines, and the use of piston engines that work with synthetic gases or biogas.
Biomass production can give rise to cogeneration systems, where steam and gases from biomass combustion
are used to generate electricity through combined cycles or are used in industrial processes for heating or
cooling. The product obtained from biomass is steam or synthetic gas, which is applied to a steam turbine or a
turbine or gas engine system for the production of electricity. In both cases, it is possible to apply a cogeneration
system of electrical energy and heat. The heat produced can be used in households for cooking and heating
homes, the electricity generated can be used for productive uses, lighting and many other services (Republic of
Equatorial Guinea, 2019).

57
A report on the energy demand by sector for the selected countries
Source: (INDEFOR, WRI 2016)
1.6.3 Conclusion and Recommendation
Equatorial Guinea has a large variety of natural resources like mining, hydropower, solar, wind, forestry, oil, and
gas resources. Like Gabon, the exploitation of Equatorial Guinea's resources makes it possible to classify
Equatorial Guinea among the countries with a high rate of access to energy. In addition, Equatorial Guinea is the
fifth exporter of oil in Sub-Saharan Africa. Rural areas are characterized by their poor access to electricity. The
energy produced by Equatorial Guinea is mainly intended for the industrial sector. The demand for energy by
the residential sector shows that it is a sector where the energy consumption is important. Analysis of supply
and demand shows that there is an energy deficit. Since the COP 21 summit, Equatorial Guinea has shown its
willingness to fight against climate change by drafting its INDC. On the one hand reducing GHG emissions
requires the use of renewable energy sources that contribute less GHG emissions.
In the Bata area, there is a significant number of enterprises engaged in the processing of forest products. Bata
area is one of the areas with large amounts of wood waste.
The transformation of this wood waste into bioenergy could make it possible to fill the deficit observed in the
energy mix of Equatorial Guinea. The combustion and fermentation processes are those technically applicable
and the resulting products (electricity, biogas, biofuel, ecological coal, etc.) allow the development of several
sectors of activity.
Figure 18: Forest distribution in the Republic of Equatorial Guinea

58
A report on the energy demand by sector for the selected countries
1.7 Central African Republic
2.7.1. Energy Resources
2.7.1.1. Biomass
The Central African Republic (CAR) is particularly rich in biomass because of its heavily forested area. Traditional
biomass, divided between firewood and charcoal, is the country's main energy resource. About 98% of the
energy consumed in the territory comes from traditional biomass. This energy source is intended for heating,
cooking food and lighting (Nzango, 2019).
2.7.1.2. Hydropower
CAR has a dense water system and a hydroelectric potential estimated at 2000 MW. Partial inventories have
revealed about 40 hydroelectric sites ranging from 5 to 180 MW. Only two sites have been developed: the Boali
site on the Mbali River, and the Mobaye site on the Oubangui River (Nzango, 2019).
2.7.1.3. Solar, wind and Geothermal
Due to its type of climate and geographical location, the Central African Republic is conducive to the
development of photovoltaic electricity. Its average irradiation rate is estimated at 5 kWh/m2/d. But the
exploitation of these solar potentials is still in the embryonic stage: pumping water in rural areas, health centers,
lighting etc. In addition, no studies have yet been carried out to enhance the mechanical energy of the wind in
the Central African Republic, but some sites have been identified as favourable to geothermal exploitation
(Nzango, 2019).
2.7.1.4. Oil and gas
The CAR has oil potential that is still being clarified. The Central African subsoil is rich because of its geological
diversity but has not yet been systematically prospected or seriously researched due to political instability.
2.7.1.5. Nuclear energy
Nuclear power generates electricity in nuclear power plants. CAR has a uranium deposit that was identified in
the south-east of the country in the early 1960s. Reserves have been estimated at more than 23,000 tons. Its
exploitation began timidly in 1975, then in the 2000s by AREVA, a French firm (Nzango, 2019).
2.7.1.6. Uranium
The sedimentary deposit of phosphates of Bakouma (Prefecture of Mbomou) contains known reserves of
uranium (metal) amount to approximately 20,000 tons. The production processes of commercial uranium
concentrate from ore from this deposit have been defined and the costs for treatment established (Komode,
n.d.).
2.7.1.7. Lignite
The existence of a lignite deposit has been recognized in the same region of Bakouma. The importance of this
deposit is estimated at approximately 2.9 million cubic meters. This deposit is however insufficiently evaluated
(Komode, n.d.).

59
A report on the energy demand by sector for the selected countries
Table 23: Total energy statistics for Central African Republic
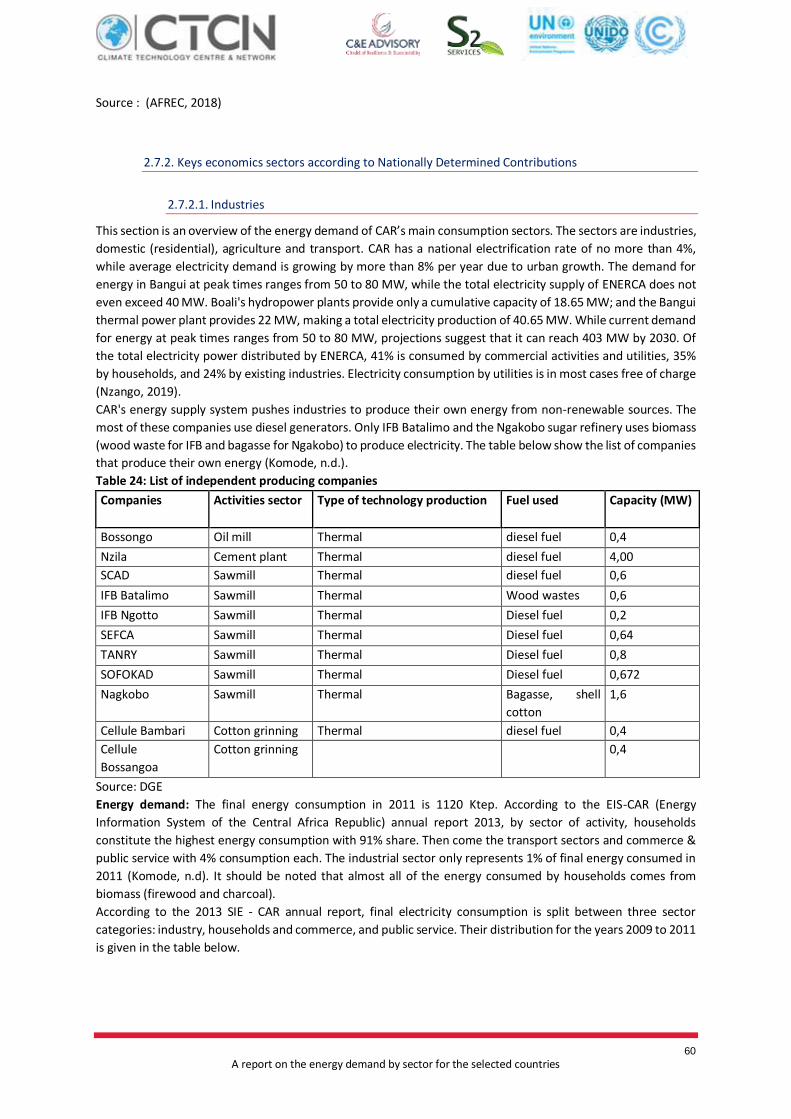
60
A report on the energy demand by sector for the selected countries
Source : (AFREC, 2018)
2.7.2. Keys economics sectors according to Nationally Determined Contributions
2.7.2.1. Industries
This section is an overview of the energy demand of CAR’s main consumption sectors. The sectors are industries,
domestic (residential), agriculture and transport. CAR has a national electrification rate of no more than 4%,
while average electricity demand is growing by more than 8% per year due to urban growth. The demand for
energy in Bangui at peak times ranges from 50 to 80 MW, while the total electricity supply of ENERCA does not
even exceed 40 MW. Boali's hydropower plants provide only a cumulative capacity of 18.65 MW; and the Bangui
thermal power plant provides 22 MW, making a total electricity production of 40.65 MW. While current demand
for energy at peak times ranges from 50 to 80 MW, projections suggest that it can reach 403 MW by 2030. Of
the total electricity power distributed by ENERCA, 41% is consumed by commercial activities and utilities, 35%
by households, and 24% by existing industries. Electricity consumption by utilities is in most cases free of charge
(Nzango, 2019).
CAR's energy supply system pushes industries to produce their own energy from non-renewable sources. The
most of these companies use diesel generators. Only IFB Batalimo and the Ngakobo sugar refinery uses biomass
(wood waste for IFB and bagasse for Ngakobo) to produce electricity. The table below show the list of companies
that produce their own energy (Komode, n.d.).
Table 24: List of independent producing companies
Companies Activities sector Type of technology production Fuel used Capacity (MW)
Bossongo Oil mill Thermal diesel fuel 0,4
Nzila Cement plant Thermal diesel fuel 4,00
SCAD Sawmill Thermal diesel fuel 0,6
IFB Batalimo Sawmill Thermal Wood wastes 0,6
IFB Ngotto Sawmill Thermal Diesel fuel 0,2
SEFCA Sawmill Thermal Diesel fuel 0,64
TANRY Sawmill Thermal Diesel fuel 0,8
SOFOKAD Sawmill Thermal Diesel fuel 0,672
Nagkobo Sawmill Thermal Bagasse, shell
cotton
1,6
Cellule Bambari Cotton grinning Thermal diesel fuel 0,4
Cellule
Bossangoa
Cotton grinning
0,4
Source: DGE
Energy demand: The final energy consumption in 2011 is 1120 Ktep. According to the EIS-CAR (Energy
Information System of the Central Africa Republic) annual report 2013, by sector of activity, households
constitute the highest energy consumption with 91% share. Then come the transport sectors and commerce &
public service with 4% consumption each. The industrial sector only represents 1% of final energy consumed in
2011 (Komode, n.d). It should be noted that almost all of the energy consumed by households comes from
biomass (firewood and charcoal).
According to the 2013 SIE ‐ CAR annual report, final electricity consumption is split between three sector
categories: industry, households and commerce, and public service. Their distribution for the years 2009 to 2011
is given in the table below.

61
A report on the energy demand by sector for the selected countries
Figure 19: Sectoral distribution of total final energy consumption in 2011
Table 25: Final electricity consumption in MWh, by sector in 2009, 2010 and 2011
Secteur /Année 2009 2010 2011
Industrie 15 131 16 843 18 622
Ménages 26 900 26 345 27 221
Commerce & service public 30 702 31 350 32 248
Source : rapport annuel 2013 SIE‐RCA
In CAR, the industrial and residential sectors are ranked at the top of the list as the most energy consumers. It
may therefore be a connection between the Central African economy and energy consumption:
Industrial energy consumption and the potential for energy savings
Household energy consumption and the potential for energy savings
The table below regroup the energy consumption in the industrial and household sector.
Table 26: Energy consumption in the industrial and household sector (toe)
Sector /year 2007 2008 2009 2010 2011
Industry 11 075 11 262 11 756 17 143 14 513
Household 926 301 952 289 968 478 990 772 1 012 216
Source : SIE‐CAR
Table 27: Energy strategy and relevant objectives (access, capacity, security of
Indicators 2011 Target
2015 Target 2020
Target
2025
Target
2030
Proportion of localities electrified
Proportion of household with access to
electricity 2,50% 10% 30% 40% 50%
Proportion of household with access to
modern cooking systems 0% 2% 5% 8% 10%
Proportion of new and renewable energy
in the national energy balance 0% 2% 5% 8% 10%
Source: (Komode, n.d.)
Cooking with charcoal only concerns a small number of wealthy households. Charcoal is also used in many
households for ironing. Table 27 below shows an evolution of the demand for wood energy, from 2008 to 2011.
Table 28: Evolution of demand for fuelwood, from 2008 to 2011

62
A report on the energy demand by sector for the selected countries
2 008 2009 2 010 2011
Firewood Wood
charcoal
Firewood Wood
charcoal
Firewood Wood
charcoal
Firewood Wood
charcoal
Production (1000
t)
2 469 5,9 2 530 6,1 2 594 6,2 2 658 6,4
Wood quantity
used for wood
charcoal
production
40
41
41,8
43
Consumption
(1000 t)
2 429 5,9 2 489 6,1 2 552,2 6,2 2 615 6,4
Exportation
(1000 t)
Source: DGE
Percentage of biomass used: In 2016, energy production reached about 2.86 million tons of oil equivalent.
Firewood represents production, electricity from the interconnected system 1%, and charcoal 1% (Bindo, 2017).
Figure 20: Nature energy production
Contribution of bioenergy: Applications for biomass
exploitation in Chad:
➢ Incineration for cogeneration (heat and electricity).
➢ Fermentation for biogas production for cooking in
households, productive use activities
Biofuels (with or without processing: ethanol, biodiesel and
jatropha) for the development of the transport sector.
1.7.1 Conclusion and Recommendation
CAR is a country whose main natural resources are provided by the forest. The CAR has potential in solar,
hydropower, wind, thermal and biomass energy. The majority of the oil and gas used in CAR is imported. The
electricity sector in CAR is characterized by a mismatch between supply and demand. In fact, the rate of access
to electricity is 2.5% nationally, around 20% at Bangui the capital, 1% in electrified secondary centres and almost
zero in rural. This situation is so precarious for the economic and social development of the country and is
explained by the low installed capacity of production infrastructure correlated with the use of unsuitable
technology, the low rate of urbanization of cities. To this is added the monopoly of the public electricity service
granted to the state company ENERCA since independence and the limited resources of the state to finance
projects electrification.
Ouaka, Lobaye, Ngakobo are home to some forestry companies. These are areas with significant amounts of
forest waste. Agricultural waste can also be found there. The recovery of this agricultural and forestry waste can
contribute to making up for the deficit observed in the CAR's electricity network.
East Africa Selected Countries

63
A report on the energy demand by sector for the selected countries
3.1. Burundi
3.1.1. Energy resources of the country
3.1.1.1. Biomass
Households are the main consumers of energy in the country, accounting for 94% of total energy consumption.
To a great extent, the consumption relies on biomass. Wood accounts for 97% of the fuel used, which inserts
strong pressure on Burundi’s limited and fragile forests. If industry and transport is included, 94% of all energy
consumption relies on biomass, which is composed by around 70% of fuel wood, 18% of agricultural residues,
6% of charcoal, and 1% of bagasse. The current forest coverage of the country is 174, 000 hectares against a
forecast consumption rate of 180, 000 ha (UNEP, 2017) which means that there is a deficit of wood supply.
Firewood is the main energy source for most artisanal or industrial activities and for cooking fuel for majority of
the population. The total sustainable firewood biomass supply from all sources was an estimated 6,400,000 m³
in 2007. One of the main challenges is to develop a sustainable firewood supply. There exist several available
sources of waste biomass and agricultural residue in different forms in Burundi, which can be sustainably
harvested and transformed into energy sources.
3.1.1.2. Hydropower
Hydro power provides the majority of the country’s electricity power supply. Burundi’s energy supply depends
on 95% hydro from 7 hydroelectricity plants, which has a combined installed power capacity of 30.6 MW
(International Business Publications, 2018). However, there is considerable potential for further development,
including micro, mini and small hydro power. Burundi’s theoretical hydropower capacity is 1,700 MW, however,
roughly 300 MW is seen as economically viable, and only 52 MW has been functionally installed (International
Business Publications, 2018). The focus of the energy policy is on rehabilitation of existing (hydropower) plants
and distribution grids, as well as the development of new hydroelectric sites. Furthermore, a rural electrification
program is planned, mainly by grid extension, and by providing information on alternative energy sources
affordable for low-income households (Se4All, 2020).
The average consumption of electricity in Burundi is 23 kWh/cap/year which is one of the lowest in the world
(Fortune of Africa, n.d). Burundi is one of the least electrified countries globally currently at 7% overall, with 49%
of the urban and only 1% of the rural population connected to electricity (Se4All, 2020). The electricity sector in
Burundi is underdeveloped and the electrification rate is 11% (World Bank). Table 1 shows the electricity status
as of 2013 according to the Burundi’s National Energy Report (2017) (Karangwa, 2017). The energy situation is
characterised by insufficient power supply to meet the demand, which inhibits economic growth.
Table 29: Electrification status in Burundi, 2013
Without electricity 95 %
With electricity 5 %
Urban electrification rate 2.8 %
Rural electrification rate 2 %
Source: (Karangwa, 2017)
3.1.1.3. Oil and Gas
Oil: In the period 2011 – 2015, 2.5% of the energy demand in Burundi was from petroleum (Burundi National
Energy Report, 2017). Most of these petroleum sources are used to run household generators. Burundi has no
known fossil fuel reserves. As a result, all of its thermal power is run from imported oil. The use of non-
renewables is predominant at the household level. As of 2017, only 9% of Burundi’s energy was sourced from

64
A report on the energy demand by sector for the selected countries
diesel generators (Hafner, Tagliapietra, Falchetta, & Occhiali, 2019). The remaining 91% was from hydroelectric
generation which makes Burundi a country heavily reliant on renewable energy. Out of the 35.5 Megawatts
(MW) of electricity generated in Burundi, about 14% or 4.97MW of electricity is generated from diesel. Most of
this diesel is imported from Kenya and Tanzania (Bazex & Antoine, 2019). Per capita consumption of energy is
219 kilogrammes (kg) of oil per year, which is the lowest in the world.
The Burundian Government has for the past 10 years leased a gas-fired power generation of 30 MW capacity
located at Bujumbura, the capital city. This lease aims at bringing an immediate emergency electricity supply,
but this solution has both an environmental and financial cost: around 160,000 litres of fuel is consumed each
day and Régie de Production et Distribution d’Eau et d’Electricité (REGIDESO), the national electricity utility
company required to pay around EUR 3.8 million per month. The lease has been entered into with Interpetrol,
a company already operating in Burundi for the quasi-monopoly of oil importation (Barba, 2018).
LPG and Kerosene: The use of LPG and kerosene as sources of cooking fuel is impaired by low purchasing power
of the citizens, poor infrastructure for delivery, and high cost of imports and transport of the product(s) (UNIDO,
n.d).Most of the households that use kerosene or LPG are mostly located in Bujumbura and its environs. There
has been an increase in the number of people using LPG and kerosene as alternatives to firewood and charcoal,
but their numbers constitute a very small percentage of the total population.
Figure 21: Statistics on total consumption of kerosene in thousand metric tonnes
Source: (United Nations Statistic Division, 2018)
3.1.1.4. Biogas
Biogas is a form of energy adapted well to the needs for Burundi. The current government’s plan is to produce
energy by means of digesters. According to the World Development Indicators, there is no data on biogas as
well as all forms of cooking fuel (Liquified Petroleum Gas (LPG), natural gas) for Burundi. This does not mean
that there are no biogas installations in Burundi, but that the statistics on the installations and capacities are not
available.
The biogas industry in Burundi flourished in the 1980s and 1990s, with 320 – 1100 units installed in 1993, but
data after this date remains scanty. In 1992, there were 206 small-scale biogas installations, and 84 institutional
plants with digester volumes of over 100m3 (Sacranie & Lausten, 2017). Ever since the beginning of the 2000’s,
biogas use has been decreasing steadily even though there is widespread knowledge and skills on the use of this
0
0.5
1
1.5
2
2.5
3
3.5
2009 2010 2011 2012 2013 2014 2015
In t
ho
usa
nd
met
ric
ton
s
Year
Quantity
Quantity

65
A report on the energy demand by sector for the selected countries
technology, which was facilitated by international organizations in the ‘80s and ‘90s such as the German
Technical Cooperation (then GTZ, but now GIZ), French Technical Cooperation (FTC), Belgian Technical
Cooperation (BTC) and others (UNIDO, n.d).
3.1.1.5. Solar, Wind & Geothermal
Solar energy: Burundi has natural conditions favourable to the sustainable use of solar energy. The average
annual power received is around 2000 kWh / m² per year, equivalent to the best European regions which are
found in the Southern Mediterranean (Se4All, 2020). Average solar insolation stands at 4-5 kWh/ m2/day (insert
ref). There is a large potential for solar PV electricity generation in rural parts of Burundi since most regions are
still yet to be connected to the main electrical grid. Solar energy is being investigated as a potential provider for
off-grid electrification in rural areas. Institutions such as the Solar Electric Light Fund have also invested in small
solar systems for public buildings, such as health centres.
Wind energy: Data on wind patterns has been recorded by the Institute for Agronomic Sciences of Burundi
(ISABU). Though primarily for agricultural purposes, the mean wind speed for the country oscillates between 4
and 6 m/s. More potential sites probably exist in the higher elevations. To date, no feasibility studies on wind
power have been carried out in Burundi.
Geothermal energy: Geothermal resources have been identified in the West Rift Valley region in the
neighbouring Democratic Republic of Congo to the east. Several geothermal indicators exist in Burundi, but there
is little available data to ascertain their commercial viability.
Peat: Peat resources in Burundi amount to about 323 km2 (WEC, 2013). Of the country’s known peatlands, the
most extensive is located beneath the Akanyaru swamp complex to the north, an area of about 123 km2 with an
estimated 1.42 billion m3 of peat in situ (Joosten, 2010). Peat production in 2008 was 20,000 tonnes which was
entirely consumed in the same year. This constituted the entire production and total consumption total for all
of Africa (WEC, 2013) (UNEP, 2017). As an alternative to wood, the use of peat would help in reducing pressure
on Burundi’s forests. Commercialisation of this resource, for use in agriculture and industry is being driven by
the National Peat Officer (ONATOUR). ONATOUR was established in 1977 and in Africa, is the only facility that
produces turf or dried-out peat sods using mechanical means. So far, only 0.5% of the 6 million tonnes peat
reserves have been processed. Most of this (90%) has been used by the military and prisons. With the
rehabilitation of the processing facilities, peat production is expected to rise (WEC, 2013).
3.1.2. Energy demands by economic sectors
The primary energy supply and consumption at household level in Burundi is dominated by biomass (biofuels
and wastes)(Figures 2a, Figure 2b, Figure 3a, Figure 3b). Most of Burundi’s energy supply is from hydroelectric
sources. As of 2017, the electricity produced outweighed the amount consumed. Ironically, part of the excess
energy supplied is imported from outside the country.

66
A report on the energy demand by sector for the selected countries
a)
Figure 22: Total primary energy supply in Ktoe
b)
Figure 23: Total final energy consumption in Ktoe
Source: ?
a)
Figure 24: Electricity Generation by source (GWh)
b)
Figure 25: Electricity Production and Consumption
(GWh)
Source: ?
Burundi’s energy sector is under-developed, which means that there exist considerable opportunities for
investors, especially in the electricity sector which is mostly handled by the national water and electricity
utility REGIDESO. REGIDESO has an installed capacity of 35.8 MW, of which 30.8MW are from hydropower
plants and 5.5MW from thermal units. Both sources constitute 97% of the national installed capacity as per
2012 statistics. Burundi’s national production is lower than consumption, hence the increasing need to
import energy. This phenomenon is a consequence of under-investment in the energy sector over the last
20 years. Thus, there clearly is a need to increase national electricity production.

67
A report on the energy demand by sector for the selected countries
Figure 26: Sources of electricity
production according to REGIDOSO
(2003 to 2011)
Source: (Ministry of Energy and
Mining, 2012)
Table 30 below shows the energy
balance for Burundi. It shows that
most of the energy consumption
in the industry and transport
sector comes from oil products.
Most households, however, rely
on biomass. The graph also shows that the agriculture and forestry sectors have limited energy consumption
as represented by their nil figures. Table 30: Energy balance for Burundi
Source: ?

68
A report on the energy demand by sector for the selected countries
3.1.3. Main economic sectors and their energy demand
3.1.3.1. Agriculture Sector
The Burundian economy is dominated by the agriculture sector, which accounts for nearly half of its gross
domestic product (GDP) and close to 80% of its export revenues (Republic of Burundi, 2015). The current
economic structure, dominated by subsistence farming, is very vulnerable and fragile due to its dependency on
climatic conditions (Republic of Burundi, 2015). There are many opportunities in the agriculture sector that could
benefit from improved energy sources such as bioenergy. For example, fisheries in Lake Tanganyika need cooling
systems to conserve the fish. Photovoltaic power generation could be a potential solution. In the agriculture
sector processing and conservation of fruits, vegetables or milk in rural areas is a way of achieving economic
development. The installation of photovoltaic generators could be a solution to the energy problems the agro-
processing sector is facing (Republic of Burundi, 2015).
3.1.3.2. Mining
The scale of the Burundian mining sector is minor compared to its neighbours. Burundi is home to an estimated
10,000 artisanal miners. Two thirds of the artisanal miners are engaged in gold mining. In 2012, mining
accounted for less than 1% of the country’s Gross Domestic Product (GDP) while subsistence agriculture
accounted for more than 40%. Fiscal revenues from the mining sector represent a mere 0.3% of national fiscal
revenues despite gold being Burundi’s largest national export. In 2013, 2.8 tonnes worth more than USD 100
million were exported, most of which ends up in Dubai in the United Arab Emirates (Matthysen, 2015).
Furthermore, extraction is often carried out with rudimentary techniques and tools such as pickaxes, hammers,
chisels, shovels and pans. Efficiency can already be increased considerably with the introduction of quite simple
techniques, such as water pumps, compressors and automatic crushing machines, some of which require
electricity. Burundi’s Vision 2025 aims at providing energy in quantities sufficient for the industrial, artisanal and
mining activities.
3.1.3.3. Forestry
Most state forest plantations were established in the 1980s. However, it is not clear how much and which forest
plantations are still standing after the long political crisis. Support for updating forest inventory in Burundi, the
last of which was carried out in 1976 and collection of accurate forest statistics in Burundi is urgently needed.
For example, the area and usable volume of wood of several different species remains unknown in Burundi. The
statistics on the energy demands from the forestry sector are not available, though a number of actors involved
in wood processing business sector mainly characterised by individual businessmen and informal groups exist.
However, there is limited industrial scale processing and hence the energy demands in the forestry sector are
low. With the exception of major towns like Bujumbura where there are few wood working machines, wood
processing is mainly carried out with hand tools. Some of the large companies and sawmillers involved in primary
and secondary processing in some of the big forest plantation estates in Burundi include: Wood perfect,
Participatory Management Group (PMG), Coopérative INEZA des menuisiers du Marché de Mutanga Nord
(INEZA), Cooperative of carpenters - Mutanga North Market and different carpenters associations working at
the artisanal training centre of Jabe (Centre de Formation Artisanal (CFA).
3.1.3.4. Industry
In Burundi, Industry and handicraft represents just 17-18% of GDP. BRARUDI brewery is one of the largest
electricity consumers in Burundi and is reported to have produced 2.8% of its own electricity consumption in
2011 and is interested in investment opportunities in alternative solutions such as renewable self-production.
According to earlier scenarios for economic growth, the energy needs in 2020 with industrial consumption

69
A report on the energy demand by sector for the selected countries
included were estimated at 100 MW. However, a number of industrial activities require additional capacity that
is estimated to be at least 100 MW. Consequently, the energy demand was estimated at around 250 MW in
2020, excluding the energy needs of the nickel mines, which would need around 280 MW in peak hours (Figure
27). There are also other mines projects, like MUSONGATI and MUREMERA nickel projects that require
electricity. The commercial and handicraft sector also has a considerable need for electricity (welding,
preservation of milk etc) (Fortune of Africa, n.d).
Figure 27: Electricity power and
consumption
Source: ?
3.1.3.5. Transport
The transport sector is one of
the most vital sectors in
Burundi as other sectors
depend on it for the movement
and delivery of their goods. The
sector in Burundi is undergoing
improvements following
destruction of infrastructure as
a result of civil wars. Because of
the landlocked nature in
Burundi road is the most
dominant mode of transport. The road transport system in Burundi comprises about 14,480kilometres
of road network and only about 7 percent of them remain open in all weather, the rest are considered
as local roads or local tracks. The sector is affected by high fuel prices since it imports most of the
petroleum products. Burundi does not possess any railway infrastructure, although there are
proposals to connect it to neighbouring countries via railway. The country’s Bujumbura International
Airport is the only airport people can use for international air travel. One of the focus areas of
Burundi’s Vision 2025 is on improvement and the development of the infrastructures of transport,
communication and energy. Concerning the infrastructures for transport, Burundi’s vision 2025 plans
to turn Burundi into a transit and a major hub for the Great Lakes subregion, and to function as a
service economy.
3.1.3.6. Domestic/Institutional Sector
Households are the main consumers of energy in the country, accounting for 94% of total consumption. Their
needs are almost exclusively met by traditional biomass (99%). Burundi’s Vision 2025 has as a principal objective
to ensure that by 2025 both the rural and urban populations have access to reliable, clean sources of energy and
at competitive prices. Given the large dependency of Burundi’s households and communities on wood fuel and
charcoal, with firewood consumption accounting for 96 % of total consumption (rural—76 %; urban—24%),
there is a severe fuel wood deficit.

70
A report on the energy demand by sector for the selected countries
3.1.3.7. Other sectors
Health, education and tourism sectors in Burundi are other sectors that have considerable demands for energy.
20% of the rural hospitals and 70% of the health centres do not have access to energy. There is a considerable
public health challenge in supplying hospitals and health centres with a minimum level of energy for lighting,
refrigeration, and sanitation services. The vast majority of schools in rural areas do not have electricity. Although
many buildings have been equipped with solar energy, a needs and resources analysis should be carried out to
increase access and identify which energy source would be most suitable. Access to solar energy or small-scale
hydropower for remote tourism destinations would improve the quality of accommodation and also promote
the development of ecological tourism in Burundi (Republic of Burundi, 2012).
3.1.4. Sectors with high potential of bioenergy
Industry and mining sectors: These two sectors have high potential. Vision 2025 requires that both the rural
and the urban population have access to reliable, clean and competitive energy sources and provide sufficient
energy for industrial and mining activities. As a result of the existing energy deficit in Burundi, Burundi’s
industries are currently internally generating their own energy either by using costly solutions or solutions that
pose a threat to the environment, such as using firewood for the processing of tea. These industries have an
interest in supporting and consuming renewable energy both for environmental purposes but also to reduce
costs (Republic of Burundi, 2015) calls for the expansion of hydroelectric power stations and investment in
renewable energy, improvement in wood-energy sector while safeguarding the environment, and promotion of
renewable energies (solar, ethanol and wind). Currently, search for new and use of existing renewable energy
sources, in particular, fuels of biological origin – biomass has now intensified in the world energy sector driven
by the rising prices for fossil fuel.
Domestic /Institutional sector: This sector is very important since more than 90% of the population of cities and
almost 100% of secondary urban centres use charcoal or firewood as a source of energy mainly for cooking food
( (Ministry of Energy and Mining, 2012). As noted above, Burundi’s Vision 2025 has as a principal objective to
ensure that by 2025 both the rural and urban populations have access to reliable, clean sources of energy and
at competitive prices, and bioenergy offers a good opportunity to realise this objective.
1.7.2 Conclusions and Recommendations
There are many opportunities and potential for bioenergy in Burundi derived from the following:
1. A growing power supply-demand gap notably due to a rapidly increasing power demand in the capital
city of Bujumbura and (ii) a huge energy resource (notably renewable, with hydro, estimated to 1,7 GW,
and solar, estimated to 2,000 kWh/m²/year).
2. Burundi is also very densely populated compared to other neighbouring countries such as Tanzania or
Kenya. The country has a population density of 350km2 and is populated by 10 million people, a figure
similar to that of Rwanda.
3. It has a huge demand for small and medium scale energy projects which may match to its agricultural
needs (mechanization and food-conservation), the global welfare of the local population (schools and
hospitals) and the potential mineral extraction in the region.
4. Burundi possesses large deposits of peat in the order to of 50 million tonnes. Household energy needs
could be met by carbonising peat with agricultural waste in small, cost-efficient, and widely distributed
stoves (GIZ, 2011).
Successful exploitation of biomass reserves in the Republic of Burundi will partially solve the country’s energy
problems. In addition to minimizing consumption of diesel fuel the use of biogas and pyrogas will improve the
thermodynamic and economic efficiency of the existing diesel-electric generators of the "REGIDESO". One
solution is the use of pyrolysis on peat, wood waste, agricultural biomass, household and industrial waste in

71
A report on the energy demand by sector for the selected countries
order to obtain from them secondary energy resources - pyrolysis and biogas, diesel fuel, coke, charcoal, heating
oil. Studies on the pyrolysis processing of both peat and solid agricultural waste from rice, sorghum, peas, beans,
maize, as well as biogas from solid and liquid waste from the Kirekura-Muzazi mini-plant in the city of Bujumbura
for the production of palm oil were carried out in 2019. The main types of biomass with promising results if
upscaled for commercial use are Burundi palm sawdust, local peat, rice and coffee straws and husks. Some of
the conclusions made from this study are:
• Fast and high-temperature pyrolysis allows one to preserve the energy capacity of rice, coffee straw
and husk, as well as Burundian palm trees, and thereby increase the yield of volatile gases for a longer
time during high-temperature conversion.
• Biogas obtained from a palm liquid substrate in the Kirekura-Muzazi mini-plant in the city of Bujumbura,
contains: CH4 - more than 70%; H2S - about 0.1%; CO2 - about 30%. This indicates that the resulting
biogas, with methane content of more than 70%, may well be used as fuel for generating electricity in
diesel generators, and for domestic purposes.
• Considering the amount of gas produced every day at the operating mini-plant that processes 6.0 tons
per day of palm raw materials, it can be concluded that with full automation and intensification of the
cooking process it becomes possible to increase productivity by several times and thus to approach the
production of biogas to the existing industrial plant in Europe, which will at least partly solve the energy
problem in the Republic of Burundi.
• The results of the reconstruction of diesel generators of the industrial group “REGIDESO” to the use of
biomethane as fuel will increase their engine life, as well as reduce the consumption of diesel fuel by
55-60%, and thereby reduce the cost of electricity supplied by 2.0-2 5 times (Manigomba, Chichirova,
Gruzdev, Ndikumana, & Lyapin, 2019).
In Burundi, the following biomass activities could be explored (Ministry of Energy and Mining, 2012):
• Electricity production based on waste by direct burning or by methanisation.
• The use of household and/or industrial waste for incineration and methanisation.
• Peat-based electricity production. Burundi possesses a peat potential estimated at 600 million tons. The
exploitable potential would be around 47 to 58 million tons. The management of the peat is the
responsibility of the National Peat Office (ONATOUR).
• The use of sugar cane residues (bagasse) to produce electricity. The country’s leading sugar company,
Société Sucrière du Moso ( SOSUMO) has a biomass power plant. The plant is a 2 x 2 MW cogeneration unit
that is fuelled with bagasse (sugar cane residues) and is operational during the entire sugar season.
Unfortunately, this turbine is linked only to the SOSUMO factory and its administrative buildings. Eventual
surplus production is not injected to the REGIDESO grid. The absence of a steam condenser prevents the
factory from being productive outside the sugar season, despite the stocks of bagasse waste. The French
cooperation is currently analysing how to help SOSUMO connect to the national grid and also to resell its
surpluses to REGIDESO.
• The use of peat in combination with forest biomass residues or agricultural waste to produce briquettes.
• Gasification of wood waste from wood industries to produce wood pellets and distribution of efficient
cookstoves.

72
A report on the energy demand by sector for the selected countries
3.2. Djibouti
3.2.1. Energy resources of the country
3.2.1.1. Biomass
Total Primary Energy Supply in Djibouti is dominated by biomass, accounting for about 67%, with the remaining
share from oil products (Singh, Nouhou, & Sokona, 2015). Biomass use has progressively decreased in urban
areas as a proportion of the total. Kerosene has replaced biomass in Djiboutian homes, and renewables account
for negligible amounts of energy consumed across the whole country. However, better data are needed to
improve the assessment of the biomass contribution to the overall energy mix. With the majority of the country
being semi desert, Djibouti’s potential for large-scale power production from biomass is expected to be of
limited feasibility since both wood waste and agricultural residues are lacking. However, no formal assessment
has yet been made into the country. Predominant use of traditional biomass resources for domestic purposes is
inefficient and potentially harmful, particularly the household use of charcoal and firewood. World Bank has
made recommendations to the government of Djibouti to promote the use of bottled LPG as an alternative,
which will likewise improve home energy efficiency.
3.2.1.2. Hydropower
Djibouti has no hydropower sources of its own. The country imports its energy from Ethiopia’s hydropower
production through a 150MW electrical transmission line (Republic of Djibouti, 2015). Prior to 2011, 100% of
Djibouti’s energy was generated from heavy fuel oil and diesel thermal power plants. From that year onwards,
however, some 65% of Djibouti’s electricity has been supplied through a 150-MW interconnection line from
Ethiopia. Local power production, which now accounts for around 35% of the energy supply, continues to be
generated through local heavy oil and diesel thermal power plants, with a total power generation capacity of
126 MW, distributed between four generation plants: Boulaos (108.2 MW), Marabout (14.4 MW), Tadjoura (2.2
MW) and Obock (1.2 MW), according to a 2013 Djibouti market brief by the Africa-EU Energy
Partnership. Djibouti vision 2035, mentions improving access to energy and energy security as a primary
strategic focus and envisaged a power sector transition from 100% fossil thermal in 2010 to 100% renewable
energy by the year 2020.The electricity sector in Djibouti has not seen much progress for several decades and
the electrification rate is 55% (Singh, Nouhou, & Sokona, 2015). Most demand is from the city of Djibouti and it
has been growing at a rate of 5% a year. Forecasts put the maximum energy demand for 2025 at 810 GWh/yr.
3.2.1.3. Oil and gas
Djibouti has no oil reserves and no refining capacity so far. Djibouti relies entirely on imported fossil fuels and
electricity to meet its energy needs and, therefore, remains exposed to fluctuating oil prices. Figure 28 shows
the Total Primary Energy Supply between 2000-2010 of oil when compared to bioenergy.

73
A report on the energy demand by sector for the selected countries
Figure 28: Total primary energy supply from 2000 to 2010
Source: (Singh, Nouhou, & Sokona, 2015)
Petroleum product consumption has been on the rise since 2005, particularly diesel and kerosene (Figure 29).
This rise in consumption is due to increased demand from the transport and household sectors. In 2012, Djibouti
imported nearly 390 000 tonnes of oil equivalent. Fuel oil consumption has reduced since 2011 as a result of the
interconnection with Ethiopia.
Figure 8. Petroleum product consumption over time
Figure 29: Petrol product consumption over time
Source: (Singh, Nouhou, & Sokona, 2015)
There is currently no available data on biogas in Djibouti or the industries that use this resource. According to a
2015 Djibouti report, the production of electricity using household waste has a potential of generating 10MW.
However, this assessment was considered a non-priority by the government since no funds were available to
finance biogas projects and further study was needed to assess the viability.
3.2.1.4. LPG and kerosene
Clean fuels for cooking are Biogas, Liquified gas, electricity, and natural gas (BLEN).Kerosene continues to be a
key source of heat energy in Djiboutian households and has been on a rising trend compared to biomass use in

74
A report on the energy demand by sector for the selected countries
the past few years. According to the World Bank ranking of 2016 (World Bank, 2020) only 11.5% of the total
Djiboutian population in 2016 had access to clean cooking fuels.
3.2.1.5. Solar, wind and geothermal
Solar: Djibouti has high potential for solar energy due to its high temperature seasons that provide Global
Horizontal Irradiance (GHI) of 4.5-7.3 kWh per square metre per day (m2/ day). Djibouti had set a target of
achieving electrification of 30% of the rural population by solar photovoltaics by 2017. A solar park of an area of
5200m2set up by the Japanese government in 2012 produced 508MWh for the entire year. The site of the solar
plant is at Centre d'Etudes et de Recherche de Djibouti (CERD). Surplus power is fed to the Djibouti Electricity
Company (Electricité de Djibouti (EdD)). The solar park has 1440 solar panels (Hassan Daher, Gaillard, Ménézo,
& Amara, 2015) that have a combined output of 304 Watt Peaks (Wp)(Ibid). Watt peak is the maximum power
output of a solar panel under ideal conditions. The government also plans to set up three more solar plants at
Petit Bara, Ali Sabieh and Goubet. The commissioning of these plants is expected to be done in 2025. These
three solar plants are expected to provide a combined output of 250MW of photovoltaic electricity (Republic of
Djibouti, 2015). The country aims to set up other solar plants that will be used to desalinize sea water for both
domestic and industrial use.
Wind: Studies conducted in the 1980s indicated that average wind speeds across Djibouti peak at 4 m/s,
indicating a moderate potential for wind energy. The potential of wind energy in Djibouti is 390MW.Djibouti is
planning to set up an onshore wind farm with an electric generation of 60MW (Republic of Djibouti, 2015). The
site of the proposed windfarm will be at Goubet. The power plants are set to be commissioned in 2025 (Republic
of Djibouti, 2015). Other places identified for the construction of wind farms in the country are:
▪ Ali Sabieh
▪ Bada wein
▪ Egralyta
▪ Djibouti city
Geothermal: Geothermal exploration in the Djibouti fields began in the 1970’s in the Assal Rift Zone (Singh,
Nouhou, & Sokona, 2015). Due to the country’s inefficient thermal plants. Out of the 120MW installed, the
country only generates 67MW of electricity (The World Bank, 2017; Republic of Djibouti, 2015). The exploitable
potential of the country’s geothermal energy is 330 – 650 Megawatts Electricity (MWe), the capable electric
output from a plant.The sites having geothermal potential in Djibouti and which exploratory drilling has already
been done are (Republic of Djibouti, 2015):
▪ Lake Asal
▪ NorthGoubhet
▪ Lake Abhe
▪ Obock
▪ SakalolAlol
▪ Gaggadé
▪ Hanlé
▪ Arta
None of these geothermal sites have been developed but the most recent available literature states that funding
of $24.73 million for development of Lake Asal geothermal site was given to the Djibouti government in 2018
(Africa Energy Portal, 2020). In addition, the government plans to build a 30MW plant on Lake Asal (UNEP, 2017).
3.2.1.6. Other sources of energy
Tidal Energy: Blue shark energy, a French firm, is planning to build a 120MW tidal farm off the coast of Djibouti.
The tidal farm will be harnessing the tidal waves off the coast to generate electricity.

75
A report on the energy demand by sector for the selected countries
3.2.2. Energy demand by economic sectors
Data for primary energy supply by Energy Africa Commission is not available but data for total energy
consumption shows that Djibouti heavily relies on oil and biomass (biofuels and wastes) (Figure 30). The
economic sectors in Djibouti especially transport and household rely on imported oil products (Figure 31).
Figure 30: Total final energy consumption in Ktoe
Source: ?
Figure 31: Electricity production and consumption in GWh
Source: ?

76
A report on the energy demand by sector for the selected countries
Table 31: Energy consumption by source and sector in 2017
Source: ?
3.2.3. Main economic sectors and their energy demands
3.2.3.1. Agriculture Sector
The primary sector (agriculture and fisheries) contributes to about 3% of the GDP. Annual estimates indicate a
growth rate of 7.7% for year 2020 (World Bank, 2019).Unreliable rainfall and less than 4% arable land limits crop
production to small quantities of fruits and vegetables, and most food must be imported. The contribution of
agriculture to the national GDP is expected to increase from 3.7% in 2012 to 4.1% in 2022 and 5% of GDP by
2035, according to government plans stated in the Djibouti Vision 2035 strategy document. The sector is
currently made up of small plots and subsistence farming techniques – which is perhaps no surprise given the
arid climate. The government is hoping to increase the amount of locally cultivated products and seafood, but
also establish agro-industrial production units to add value to production, with an eye to exports to the Gulf
states. Due to the limited agricultural production, energy demand from the agriculture sector is therefore low.

77
A report on the energy demand by sector for the selected countries
3.2.3.2. Mining
Djibouti's key natural resources include salt, petroleum, gold, clay, marble, pumice, gypsum and
diatomite. At 155 m below sea level, Lake Assal is believed to have the largest unexplored salt reserves
in the world, totalling around 100 Mt. A nationwide survey of the country’s mineral resources in 2015
found new deposits of sandstone, limestone and ornamental stones in Ali Sabieh in the south;
corallian limestone, clay and pumice in Tadjourah; and ilmenite sand, corrallin limestone and
ornamental stones in Obock in the north. These industrial minerals and rocks are necessary for the
development of sectors like construction, public works, agriculture and the ceramics industry. The
country’s first gold mining operation located near the Port of Djibouti has a huge potential. At present,
mining accounts for between 1% and 3% of Djibouti’s GDP, according to estimates from the World
Bank and the African Development Bank. Government efforts to improve the mining investment
environment are part of a concentrated effort to diversify the economy and improve the broader
investment climate – a central part of the Djibouti Vision 2035 strategy for economic development
and inclusive growth. Mining therefore has a huge energy demand potential in Djibouti and energy
assessment demands would provide more insight on the magnitude of energy needed for this
important sector.
3.2.3.3. Forestry
Djibouti has very few forest resources. The forested area of Djibouti is just 0.3% of the country’s total land area
(Butler, 2016). The Food and Agriculture statistical database (FAOSTAT) estimates the total area under forestry
in the country to be 56 km2 (FAO, 2019).Because the country does not have industrial plantations and the natural
forests are not for exploitation, the energy demand for wood products has to be substantiated from other
sources.
3.2.3.4. Industry
The industrial and manufacturing sector accounts for 17% of the GDP. There are currently just over 30 formal,
large-scale, commercial manufacturing enterprises operating in the country. The firms are largely focused on
the domestic market as opposed to exports, with a number of companies operating in the building materials,
beverage and mineral water, industrial gas, and plastic and paper production segments. A central part of
Djibouti’s government’s Vision 2035 strategy for economic development is facilitating industrial growth in the
country. The growth curve of the industrial sector’s energy demand is expected to rise in the near future and
especially from the agro-processing, shipping and processing industries.
3.2.3.5. Transport
The structure of the economy is dominated by the service sector - transport, communications, commerce, and
tourism. These contribute to more than 80% of Djibouti’s GDP, and employ about 60% of the active population
(IMF, 2013). Transport and related logistical services remain the backbone of the economy. The government
launched a programme to increase port activity in 2012 by building two ports as well as road corridors. Much of
this is intended to meet the needs of the growing Ethiopian economy. The construction of the Port of Doraleh,
expected to increase the port’s annual cargo handling capacity to 10 million tonnes by 2022. The 759km Addis
Ababa–Djibouti Railway, the first all-electric inter-country railway system in Africa, completed in 2017 and
inaugurated in 2018, is a major transport infrastructure in Djibouti. The railway has a total capacity of 24.9 million
tonnes of freight annually, although the current haulage is about 5m tonnes. However, the haulage is expected
to increase to 6 million tonnes by 2023. Meanwhile, development of the airline sector is also underway. The
national carrier, Air Djibouti, was relaunched in 2015 and there are two new airports, the Ahmed Dini Ahmed
International Airport near the Sept-Frères archipelago, and the Hassan GouledAptidon International Airport at
Bicidley. The two airports are expected to increase the country’s air transport capacity by eight times from the
78
A report on the energy demand by sector for the selected countries
current 900, 000 passengers. Investments in port infrastructure have contributed to the recorded rise in
commercial activity in Djibouti in 2019, and this is expected to increase the energy demand of the industrial
sector in Djibouti.
3.2.4. Sector with high potential of bioenergy
Like Burundi, the industry and mining sectors of Djibouti have the highest potential for bioenergy use. Growth
in these sectors is currently being driven by infrastructural development. The industrial sector for example will
also remain strong as the nascent import-substitution manufacturing industry (mainly food processing and
construction materials) develops. Annual estimates indicate a growth rate of 7.7% for the year 2020 (World
Bank, 2019).
1.7.3 Conclusions and Recommendations
There is no bioenergy that can be derived from forest biomass since there are no forests exploited for
commercial purpose in Djibouti. There is also no agricultural waste since most of the crops grown are for
consumption purposes, and little or none at all are grown as raw materials for bioenergy production. However,
there is potential of using Prosopis Juliflora, an invasive species for bioenergy which can be processed to
briquettes or used as feedstock for electricity generation. The Prosopis Juliflora tree has successfully been used
as feedstock at energy generation plants in India and there were attempts by the Cummins Cogeneration Kenya
Ltd intends to do the same in Kenya in 2014. In Kenya’s case, this was not successful because the area’s Prosopis
species had a lot of moisture hence incompatible with the gasification technology which would have been
employed to produce the biomass.

79
A report on the energy demand by sector for the selected countries
2 West Africa
4.1. Benin
4.1.1. Energy resources
From the graph below it is clear that Benin produces very little energy on its soil. Total primary energy production
in 2017 is largely dominated by biomass, mainly wood energy. Although producing hydroelectricity and having
solar photovoltaic plants, the part of these two forms of renewable energy is marginal in the total primary energy
production balance.
The data in the graph come mainly from the Energy Information System (EIS) of the Republic of Benin for 2017.
The only missing information in the EIS concerns hydropower production on the national territory9 and was
taken from the AFREC balance sheet (2019). 10This production is very low, since it only concerns the Yéripao
dam, with 0.5 kW installed in the country.
Figure 32: Total primary energy production in 2017 in Benin (in ktoe)
Source: (AFREC, 2019)
The data in the graph below are again mainly from the EIS 2017, with the addition of hydroelectricity production
from AFREC (2019).
According to this graph, Benin imports almost as much oil products as it does biomass. It also shows that the
country imports 87 ktoe of electricity. All imported natural gas (50 ktoe) as well as 40 ktoe of oil products are
transformed into electricity. Together, these two fossil fuels produce 28 ktoe of electricity, or 24% of the total
(power plants and autoproducers, see Figure 33).
9 Since the hydropower production given in the EIS includes the production of the Nangbéto dam in Togo under the CEB (see
4.1.1.2). 10 The data in these two reports largely overlap. There are a few differences, however: for example, the SIE reports 64 ktoe of industrial energy consumption, the AFREC 45.88. An error has also been found: AFREC has counted the import of natural gas
as own production in its balance sheet.
0 0.10 0.50
2711
0
500
1000
1500
2000
2500
3000
Natural gas Hydroelectricity Wind and solar power Biomass (wood-energy,biogas, biofuel, etc.)
Total production of primary energy in 2017 (in ktoe) (AFREC, 2019 and SIE, 2017)

80
A report on the energy demand by sector for the selected countries
Figure 33: Total primary energy supply in 2017 in Benin (in Ktoe)
Source: (AFREC, 2019)
Particularity of Benin: Benin-Togo bi-state electricity network and strong external dependency
Together with Togo, Benin forms the Communauté Électrique du Bénin (CEB), a bi-state body with headquarters
in Lomé (Togo). CEB makes it possible to pool energy resources, namely the Nangbéto hydroelectric dam in Togo
and two gas turbines of 20 MW each, one located in Benin and the other in Togo. The production of these
facilities is shared 50-50 between Togo and Benin. It is also CEB that imports electricity for both countries.
In 2017, 70% of the electricity distributed in Benin was imported by the CEB (56% from Nigeria, 10% from Ghana
and 4% from Côte d'Ivoire). Since 2019 and the inauguration of the Maria Gleta II power plant, imported
electricity has fallen to around 50% of national consumption. This electricity comes from Ghana, as Benin no
longer obtains its electricity from Nigeria (Benin Government, 2019).
16% of the electricity is produced by thermal power stations, including CEB's gas turbines. The 7% of
hydroelectricity in figure 1 is produced almost exclusively by the Nangbéto dam in Togo (65.6 MW). Benin has a
dam at Yéripao, but this only has an installed capacity of 0.5 MW11. Self-production is entirely based on the
production of oil products12.
Figure 34: Structure of electricity supply in Benin in 2017.
11 Personal communication of the author with Mr. Salim CHITOU, head of the EIS at the General Directorate of Energy Resources of Benin. 12 Ibid.
0.0
2,135.9
0.0 49.5 0.1 0.5
2,711.0
86.7
0500
10001500200025003000
Total primary energy supply in 2017 (in ktoe) (AFREC, 2019 and EIS, 2017)

81
A report on the energy demand by sector for the selected countries
4.1.1.1. Biomass 13
A study carried out within the framework of the Bois de Feu project (phase II) (Bois de Feu II, 2007) considered
that 90% of biomass production in Benin (excluding plantations) is potentially usable as fuelwood. The annual
production of fuelwood in 2007 was estimated at 5,700,000 tonnes (8,134,460 m3). This value is not very far
from that of the 2015 EIS report of the General Directorate of Energy of the Republic of Benin. This report
estimates that the total amount of fuelwood harvested from the forest amounts to 7,125,996.4 tonnes
(equivalent to 2,711 ktoe). This productivity is determined on the basis of values of 5 tonnes/ha for dense
forests, 1.2 tonnes/ha for open forests and wooded savannas and 0.6 tonnes/ha for wooded savannas, weighted
with the percentage represented by each type of forest formation according to CENATEL's estimates of forest
formation areas in 1998 (giving an average forest productivity of 0.81 tonnes/ha).
All of Benin's wood energy is used to meet the thermal needs of the population (cooking, water heating) and
small-scale industry. Some industrialists also use residual biomass, which they produce themselves or recover
from third party industrialists, to meet their thermal energy needs. We have the following information at our
disposal:
- The Nocibé cement plant (there are 4 cement plants in Benin) buys residues from agro-industrials,
cashew nut hulls in particular, to supply its stoves.
- The oil mills SHB and Fludor (cotton oil) use part of their waste for energy purposes.
- Cashew processing plants use a portion (about 15%) of their cashew hulls as fuel for their boilers.
The PDEHR study (2017) also cites oil palm leaves, cotton stems and rice husks as potentially energy-generating
biomass. The mobilization of these resources raises questions. While rice husks are already frequently used for
litter in poultry farms, cotton stems are left on the field and then burnt, while palm leaves are left at the foot of
the palm trees in the case of peasant plantations, and burnt in the case of industrial plantations. The collection
of this biomass should be organised in order to envisage a valorisation of the biomass.
Finally, there are recent initiatives to convert residual agricultural biomass into electricity (for cashew nut
processing units in particular). However, these projects have not yet taking shape and are at various stages of
implementation.
4.1.1.2. Hydropower
Under CEB, the country benefits from about 50% of the electricity generated by the Nangbéto hydroelectric dam
in Togo. It has an installed capacity of 65.6 MW. Benin has a hydroelectric power plant in Yéripao, but this has
an installed capacity of only 0.5 MW. In 2017, the cumulative supply of these two dams reached 7% of final
electricity consumption, or 101 GWh (9 ktoe, compared with the 0.1 ktoe that the Yéripao dam alone would
have produced in 2017 according to AFREC). (AFREC, 2017).
13 This part is taken from the report of Outcome 2 for Benin of this study.

82
A report on the energy demand by sector for the selected countries
Table 32: Potential for hydropower generation
The following table summarises the
potential for hydropower generation
in Benin, as estimated by the Off-Grid
Electrification Master Plan (PDEHR,
2017).
Source :(PDEHR, 2017)
4.1.1.3. Solar
While the EIS for 2015 did not mention solar energy, the EIS for 2017 reports 0.4% of electricity produced by
solar energy (6 GWh).
The Off-Grid Electrification Master Plan document (PDEHR, 2017) states that photovoltaic solar energy is central
to off-grid electrification (OGE) policies. It mentions that in 2017, "5% of localities in Benin [had] been the subject
of an EHR project, part of which only electrified community centres (schools, health centres, etc.), without
deploying the service to the population. In detail:
-2% (83) of the localities [had] mini-grids and a 100% PV power plant.
-3% (101) of localities [were] receiving individual PV kits
-1% (30) of localities [were] benefiting from community PV kits.
77 micro-solar power plants (each with a capacity of around 50 kW) have been built across Benin to supply off-
grid locations. Only 4 (financed by UEMOA) are now connected, as contracts for the management of the plants
have not yet been awarded for the 73 others (financed by the government). The solar energy given in the 2017
EIS also takes into account the savings in electricity consumption for public lighting induced by the installation
of solar streetlamps.
The PDEHR (2017) estimates the solar potential for electricity production in Benin depending on the regions in:
-North: 1560 kWh/kWp installed per year
-Central part: 1460 kWh/kWp installed per year
-South: 1400 kWh/kWp installed per year in wetlands.
4.1.1.4. Oil and derivatives
Benin imports 100% of the hydrocarbons it consumes. The country's situation is marked by informal importation
of petrol and diesel from Nigeria, where oil products, which are heavily subsidised, are much cheaper. In 2017,
uncontrolled imports have been estimated at 56% of total hydrocarbon supplies (EIS, 2017).
75% of this hydrocarbon supply concerns petrol and diesel. The remainder is made up of 14% paraffin, 7% fuel
oil (heavy gas oil), and 3% butane gas.
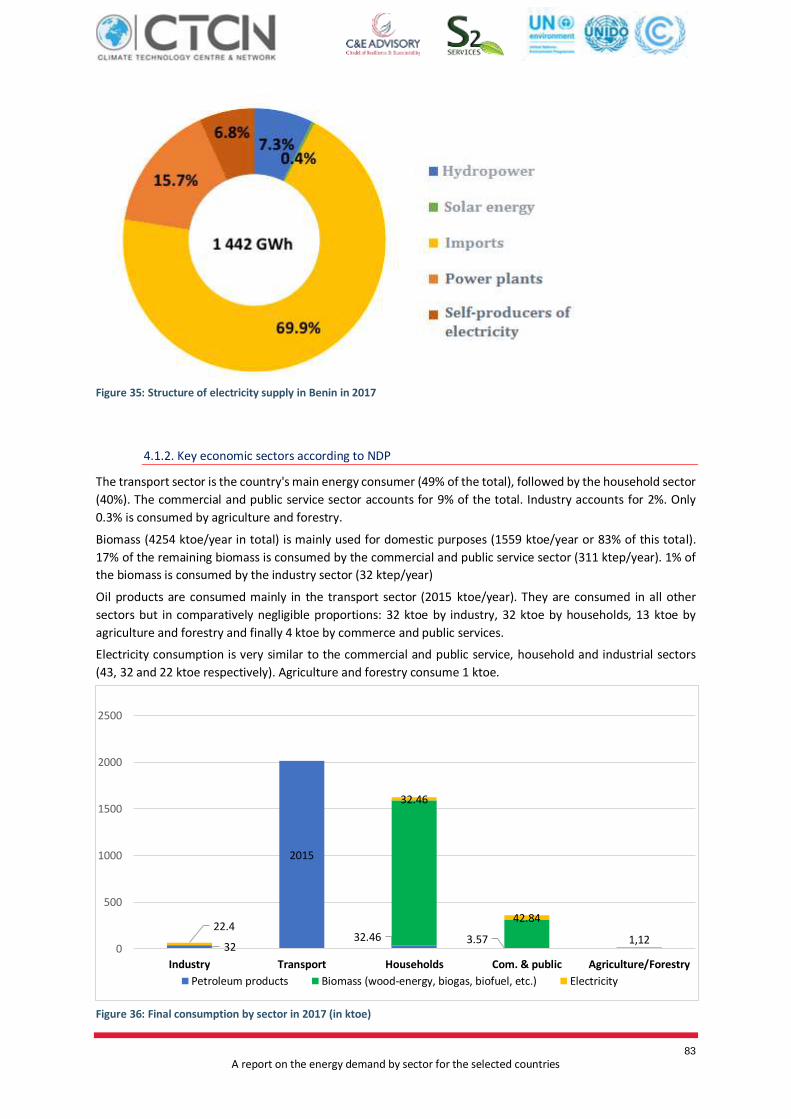
83
A report on the energy demand by sector for the selected countries
Figure 35: Structure of electricity supply in Benin in 2017
4.1.2. Key economic sectors according to NDP
The transport sector is the country's main energy consumer (49% of the total), followed by the household sector
(40%). The commercial and public service sector accounts for 9% of the total. Industry accounts for 2%. Only
0.3% is consumed by agriculture and forestry.
Biomass (4254 ktoe/year in total) is mainly used for domestic purposes (1559 ktoe/year or 83% of this total).
17% of the remaining biomass is consumed by the commercial and public service sector (311 ktep/year). 1% of
the biomass is consumed by the industry sector (32 ktep/year)
Oil products are consumed mainly in the transport sector (2015 ktoe/year). They are consumed in all other
sectors but in comparatively negligible proportions: 32 ktoe by industry, 32 ktoe by households, 13 ktoe by
agriculture and forestry and finally 4 ktoe by commerce and public services.
Electricity consumption is very similar to the commercial and public service, household and industrial sectors
(43, 32 and 22 ktoe respectively). Agriculture and forestry consume 1 ktoe.
Figure 36: Final consumption by sector in 2017 (in ktoe)
32
2015
32.46 3.5722.4
32.46
42.84
1,120
500
1000
1500
2000
2500
Industry Transport Households Com. & public Agriculture/Forestry
Petroleum products Biomass (wood-energy, biogas, biofuel, etc.) Electricity

84
A report on the energy demand by sector for the selected countries
Source: (SIE, 2017)
4.1.2.1. Industry
Energy demand: In 2017, the energy consumption of industry was 64 ktoe, i.e. less than 2% of the total final
consumption, which reflects the weakness of the country's industrial fabric.
The two forms of energy mainly consumed by industry are electricity (35%) and oil coke (32%, used in cement
industries). The part of biomass energy in industrial consumption is also quite significant, accounting for almost
15% of the total final energy consumption (Figure 36, see Section 4.1.2 above).
Figure 37: Structure of energy consumption in the industrial sector in 2017
Percentage of biomass used in the sector: As stated, oil coke (mineral coal) is used mainly for thermal purposes.
But agricultural residues can also be used. This is particularly the case with cashew nut Shells. Some cashew nut
processors in Benin already sell their cashew nuts (for very modest sums) to cement factories.
Other processing industries have thermal needs: cotton oil mills and cashew nut processors in particular. Oil
mills and cashew nut processors already use their waste to meet their thermal energy needs Error! Reference
source not found.). The part of recovered agro-industrial waste could be increased through the promotion of
appropriate technologies (Error! Reference source not found.).
Contribution of forest bioenergy in the sector: Benin's cement factories (there are 4 in 2020), consumed 71%
of the total energy in 2017. This energy is in the form of electricity and heat. As an energy-consuming activity,
cement plants producing clinker have significant heat requirements in their stoves. This may explain the 15%
part of biomass use. Indeed, these cement plants are supplied with solid biomass from different sources: corn
stems, cashew nut shells, peanut hulls, etc., in order to supply their process with cheaper energy (compared to
oil coke or fuel oil, which would be the alternatives).
.
4.1.2.2. Transport
Energy demand: Transport mobilised 2015 ktoe of oil products in 2017, at a rate of 64% petrol and 36% diesel14.
Since the end of rail transport in 2018, all of this consumption is destined for road transport.
14 Paraffin is not counted in the domestic consumption of the transport sector, as this product is consumed by aircraft whose
destination is outside Benin's borders. It is taken into account under the heading "international air bunkers".

85
A report on the energy demand by sector for the selected countries
Percentage of biomass used in the sector: There is no realistic scenario today to envisage a contribution of
forest biomass to the transport sector. However, CNSL (Cashew Nutshell Liquid), the oil contained in cashew nut
shells, has been considered as a natural source of fuel for aviation (similarities with paraffin). After distillation,
cardanol is obtained, which is used in the chemical industry as a raw material for various polymers and
composites.
Contribution of forest bioenergy in the sector: There are no biofuels consumed in Benin.
4.1.2.3. Residential (households)
Energy demand: As elsewhere in the West African sub-region, the vast majority of Benin's household energy
consumption is in the form of wood energy consumption (Figure 3). Broadly speaking, in rural areas it is mainly
firewood that is consumed, since the resource is within easy reach, whereas the larger the town and the further
away the population is from rural areas, the greater is the consumption of charcoal.
From the 2017 EIS figures presented in Figure 3, the relative part of consumption
of coal seems undervalued while that of firewood seems overvalued. Indeed, these data are based on a 2012
study (SIEP, 2012). The population of urban centres has increased over the last 10 years in favour of rural areas,
and the part of charcoal today should be higher. If we take the proportions indicated by the EIS of 2017, the
energy delivered by firewood at the national level was about 4 times the energy equivalent of charcoal.
Together, energy from wood accounts for 93% of total household final energy consumption. To this must be
added 3% corresponding to various biomasses such as coconut husks or corn stems that are occasionally used
as fuel; and an additional 1% to count the contribution of butane gas (LPG) to the household energy mix. In total,
97% of domestic energy consumption meets the thermal energy needs of households.
Only 3% would be used for lighting and other miscellaneous uses: through paraffin and electricity. The low
participation of the electricity component in the energy balance of families is a sign of the poor access to
electricity in this sector (national electrification rate 29% in 2018).
Figure 38: Household energy consumption in 2017
Contribution of forest bioenergy in the sector:
Green coal briquettes (or clean coal), produced from
the carbonisation of agricultural residues, could
replace a proportion of commercial coal
consumption. In the case of forest biomass,
briquettes can for example be produced from
carbonised cashew nut hulls. Other resources can be
used more systematically, such as corn stems, for
example
4.1.2.4. Businesses and public services
Energy demand: Energy consumption in the
commercial and public service sector in 2017
reached 357 ktoe, of which 68% was firewood, 16%
charcoal, 12% electricity, 3% other biomass and 1%
butane gas (Figure 4). Most of this energy is consumed by small units such as shops, supermarkets, bakeries and
small food processing units ("other tertiary" in the graph).
Restaurants, school canteens and bakeries, for example, use firewood because of the large amounts of thermal
energy they require. Some sectors have a special need for coal, such as ironmongery, dyeing or the dry-cleaning
trade (irons). (Espace_réservé29).

86
A report on the energy demand by sector for the selected countries
Contribution of forest bioenergy in the sector: Green coal briquettes (or clean coal), produced from the
carbonisation of agricultural residues, could replace a proportion of commercial coal consumption. In the case
of forest biomass, briquettes can for example be produced from carbonised cashew nut shells. Other resources
can be used, such as corn stems, for example.
4.1.2.5. Agriculture/Forestry
Energy demand: Consumption in the agricultural and forestry sector represents only a marginal part of the total
final energy consumption: 14 ktoe in 2017, i.e. 0.3% of the total. 88% of this energy is in the form of diesel, 8%
in the form of electricity and 4% in the form of paraffin.
It should be noted that "as of 2017, the consumption of cotton ginning plants has been transferred to the
agricultural sector, in order to comply with the INSAE nomenclature, which now classifies these industries in this
sector, since they are an integral part of the agricultural process" (SIE, 2017). The ginning plants would have a
marginal consumption of diesel compared to the consumption of the sector (0.62 ktoe for a total of 13), but
would be the main consumers of electricity among the consumers listed in this balance sheet (1.02 ktoe out of
a total of 1.04).
Contribution of forest bioenergy in the sector: The agriculture and forestry sector can contribute to making the
wood energy sector more sustainable through reforestation programmes of fast-growing species for wood
energy. Until now, reforestation policies in Benin have mainly concerned species used for timber (teak and
melina). However, some reforested species can also be exploited for fuelwood (Eucalyptus, Acacia and Khaya).
The Khaya species is an indigenous species used for energy wood.
2.1.1 Conclusions and recommendations
As indicated in Result 2.1, the main residual forest biomass that can be mobilized in Benin is cashew nut shells,
a waste product from processing plants. This potential has been estimated at 17,640 tonnes of cashew nuts
(corresponding to the volumes transformed in 2018), or 1,270 GWh annually, to be potentially converted into
various energy products.
Indeed, hulls can be valorised in the following ways:
• Thermal energy: to supply boilers on site (direct combustion with gas washing or use of H2CP pyrolysis
stoves developed by Nitidæ15 ) or for the needs of other industries (cement factories for example, as is
already done today).
• Electrical energy: with {gasification unit + gas turbines/motors} or {boiler + steam turbines} systems.
The first option is more profitable for units below 5 MW and is promoted by Nitidæ. A first project for
the installation of a power generation system with gasification is underway in Benin (GAZEL project). A
second project to convert hull residues into electricity has recently been developed in the country but
its implementation has not yet started.
15 H2CP (High Calorific Cashew Pyrolyser) ovens, degrade the shells into gas. It is then the gas and not the raw cashew that is burnt in the boiler furnace. This eliminates much of the pollution associated with the direct combustion of the hulls in cashew
processing plants. About 15% of the initial mass of the hulls is recovered as coal.

87
A report on the energy demand by sector for the selected countries
• Coal: after carbonisation of the hulls, obtained either as a by-product of a pyrolysis or gasification
operation for energy purposes or in a dedicated carbonisation stove.
The thermal and electrical energy resulting from the valorisation of cashew nut shells would supply the industrial
sector, and hulls charcoal could be used by households as a substitute for charcoal.
Recommendations
As noted in the report on Outcome 2.1, in terms of access to energy from residual biomass, the most promising
sectors would be cashew nuts and shea butter.
As far as cashew nuts are concerned, for factories with sufficient processing capacity (> 5000 tons of nuts
processed per year), the self-production of electricity from cashew nut shells can be a very interesting operation.
The GAZEL project in which Nitidæ is involved in consortium with the IED group and CIRAD should demonstrate
its relevance. The country has two industrial units that meet the minimum capacity requirements.
For low capacity factories (< 5000 tonnes of nuts processed per year), H2CP pyrolysis stoves are indicated to
reduce pollution linked to the combustion of the hulls and improve the working conditions of the workers. Both
options can be combined with the marketing of biofuel briquettes from residual cashew nut hulls coal. Stoves
specifically designed for the carbonisation of cashew hulls could also be envisaged, the main product sought
would then be coal (with an efficiency of 20 to 25% against 15% for H2CP stoves and 10% for gasification units).
Alternative fuels to charcoal could then be placed on the local market.
In the case of shea, the crab produced at the end of the process has an interesting energy potential. It is
moreover commonly used by artisanal processors themselves as a source of fuel. The main obstacle to its use
by a wider public is the non-centralised nature of this waste. Solutions adapted to the scale of production of this
waste could be put in place, in order to make this biomass more accessible to potential buyers (households,
small businesses, industry). Indeed, shea crab can be packaged in the form of balls or even logs and has fuel
characteristics very similar to wood.

88
A report on the energy demand by sector for the selected countries
4.2. Burkina Faso
4.2.1. Energy resources
The country's energy resources
Burkina Faso is a landlocked country with very limited energy resources. The country produces neither oil and
gas nor coal and uranium. Its main natural energy source is the sun. Indeed, like most Sahelian countries, Burkina
Faso benefits from an average daily sunshine of 5.5 kWh/m2 , which is very favourable for the operation of solar
systems (Burkina Faso Government, 2016). However, like its neighbours, in Burkina Faso, biomass is the
country's most widely used energy resource.
For a long time, hydropower has been the most exploited renewable resource to produce electricity. It is only
recently that solar photovoltaic electricity has surpassed the contribution of hydropower. By 2017, solar PV had
produced 62 ktoe, while domestic hydropower contributed only 11 ktoe (Error! Reference source not found.).
Source: (AFREC, 2019) Table 33: Burkina Faso's energy resource production between 2000 and 2019.
Years 2000 2005 2014 2015 2016 2017 2018* 2019*
Charcoal production (kt) 196 404 795 490 884 410 932 984
Natural gas production (TJ) - - - - - - - -
Electricity production from biofuels,
waste (GWh) 6 0 0 0 0 0 0 0
Electricity generation with fossil fuels
(GWh) 302 390 722 1710 1801 1448 1542 1643
Hydropower generation (GWh) 98 99 64 93 102 124 136 149
Electricity production from solar,
wind, etc. (GWh) 0 0 5 0 0 725 755 814
Total electricity production (GWh) 406 489 791 1804 1903 2297 2433 2606
Imports of oil products (ktoe) 313 507 889 1046 1110 1549 1656 1170
0 11 62
4783
0
1000
2000
3000
4000
5000
6000
Natural gas Hydroelectricity Wind and solar power Biomass (wood-energy,biogas, biofuel, etc.)
Total production of primary energy in 2017 (in ktoe) (AFREC, 20&9 and SIE, 2017)
Figure 40: Total primary energy production in 2017 in Burkina Faso (in Ktoe)

89
A report on the energy demand by sector for the selected countries
Source: (AFREC 2019) *projection
Despite all this, Burkina Faso is far from being an energy-sovereign country, and imports much of its primary
energy. Error! Reference source not found. shows the total primary energy supply, where Burkina Faso has to
procure 1328 ktoe of oil products and 56 ktoe of electricity (from its neighbours Côte d'Ivoire and Ghana).
Figure 41: Total primary energy supply in 2017 in Burkina Faso (in ktoe) Source: (AFREC, 2019)
4.2.1.1. Biomass
Forest biomass, which is a limited resource, is mainly used for the wood-energy sector. On the other hand,
biomass, particularly agricultural biomass, is abundant and is the subject of energy interest in certain areas.
However, the current level of recovery remains modest in view of the quantity of potentially exploitable
residues.
While wood and charcoal are mainly used in households, agricultural residues such as rice husks and bagasse,
cotton stems are also an interesting source of potentially valuable energy. Apart from these residues, others are
currently of interest to industry as an important source of energy. This is the case of sugar cane bagasse, cashew
nuts or cotton seed husks, which can be used to produce heat or even electricity. This is the case of the larger
agro-industries, which produce their electrical energy for self-consumption. Only one biomass cogeneration unit
is connected to the grid, the Faso biogas plant in Ouagadougou. It produces biogas from the waste from the
refrigerated slaughterhouse in the capital of Burkina Faso. The gas turns an electric generator which exports to
the grid, and the refrigeration circuit removes heat which is then recovered by the neighbouring brewery.
0
1328
0 0 11 62
4783
560
1000
2000
3000
4000
5000
6000
Total primary energy supply in 2017 (in ktoe) (AFREC, 2019 and EIS, 2017)

90
A report on the energy demand by sector for the selected countries
Figure 42: Total primary energy production in 2017 (in ktoe) Source : (SIE, 2017; AFREC, 2019)
4.2.1.2. Hydropower
The power of Burkina Faso's rivers is exploited in electricity production at the Bagré (16 MW), Kompienga (14
MW), Niofila (1.5 MW), Tourni (0.5 MW) and Samandéni (2.56 MW) power stations.
The total hydroelectric power (34.56 MW) contributes 10% of the total installed capacity and the contribution
of the hydroelectric production of the National Interconnected Network (RNI) averaged 100 GWh per year.
Unfortunately, the guaranteed hydropower capacity during the peak period represents only 38% of the total
installed capacity.
Table 34: Burkina Faso's energy resource production between 2000 and 2019.
Years 2000 2005 2014 2015 2016 2017 2018* 2019*
Charcoal production (kt) 196 404 795 490 884 410 932 984
Natural gas production (TJ) - - - - - - - -
Electricity production from biofuels,
waste (GWh) 6 0 0 0 0 0 0 0
Electricity generation with fossil fuels
(GWh) 302 390 722 1710 1801 1448 1542 1643
Hydroelectricity generation (GWh) 98 99 64 93 102 124 136 149
Electricity production from solar,
wind, etc. (GWh) 0 0 5 0 0 725 755 814
Total electricity production (GWh) 406 489 791 1804 1903 2297 2433 2606
Imports of oil products (ktoe) 313 507 889 1046 1110 1549 1656 1170
*projection
Source : (AFREC, 2019)
0 11 62
4783
Natural gas Hydroelectricity Wind and solar power Biomass (wood-energy,biogas, biofuel, etc.)

91
A report on the energy demand by sector for the selected countries
4.2.1.3. Solar
Burkina Faso has significant solar energy potential. The solar deposit, although evenly distributed throughout
the country, provides an average daily sunshine of 5.5 kWh/m2, for 3,000 to 3,500 hours/year. However, this
resource remains very little or not enough exploited. The incentive policy of exemption from customs duties and
VAT on solar equipment aims to change this trend and make this resource more economically attractive.
Nevertheless, there is a growing number of installations of solar kits (individual or collective), small photovoltaic
or hybrid power plants (photovoltaic coupling and generators).
In 2015, autonomous solar systems were the most widespread with an installed capacity of around 4 MWp.
From 2019, the Zagtouli power plant will be the first solar power plant connected to the grid with 50 MWp. Since
then, several other power plant projects have been under development and, together with the recent
inauguration of a solar panel manufacturing plant, demonstrate the country's commitment to transforming itself
into solar power.
4.2.1.4. Oil and derivatives
Burkina Faso has neither deposits nor refining facilities. And for this, the country is totally dependent on imports.
Three types of actors are involved in the import, storage and distribution of oil products: the state playing its
regalian role in regulation and regulation through its involved ministries, specialised state bodies supporting the
implementation of government policy, and private operators involved in marketing. The volume of imports
tripled between 2005 and 2017.
Table 35: Burkina Faso's energy resource production between 2000 and 2019.
Years 2000 2005 2014 2015 2016 2017 2018* 2019*
Charcoal production (kt) 196 404 795 490 884 410 932 984
Natural gas production (TJ) - - - - - - - -
Electricity production from biofuels,
waste (GWh) 6 0 0 0 0 0 0 0
Electricity generation with fossil fuels
(GWh) 302 390 722 1710 1801 1448 1542 1643
Hydroelectricity generation (GWh) 98 99 64 93 102 124 136 149
Electricity production from solar, wind,
etc. (GWh) 0 0 5 0 0 725 755 814
Total electricity production (GWh) 406 489 791 1804 1903 2297 2433 2606
Imports of oil products (ktoe) 313 507 889 1046 1110 1549 1656 1170
*projection Source : (AFREC, 2019)
4.2.2. Key economic sectors according to NDP
The country does not consume coal or natural gas. On the other hand, although it does not also produce oil, it
does consume it. This consumption is mainly due to the transport sector and, to a lesser extent, to the power
generation and industrial sectors, as can be seen in Error! Reference source not found..

92
A report on the energy demand by sector for the selected countries
Figure 43: Total final energy consumption by sector in 2017 in Burkina Faso (in ktoe)
Source: (AFREC, 2019)
4.2.2.1. Industry
Energy demand: The following Error! Reference source not found. presents the energy consumption in industry
in Burkina Faso. Table 36: Evolution of energy consumption in the industry sector from 2000 to 2019
Years 2000 2005 2014 2015 2016 2017 2018* 2019*
Industrial oil consumption
(ktoe) 2 4 6 11 11 14 17 20
Industrial electricity
consumption (ktoe) 12 17 61 38 39 23 24 24
*projection
Source : (AFREC, 2019)
An analysis of the table shows a tenfold increase in oil consumption over 15 years (between 2005 and 2019).
Indeed, from 2014 Burkina Faso will start to export gold from its industrial mines. It is this emerging sector which
is driving the growth in the consumption of oil and derivatives. By generating their own electricity from their
own generators, the first mines that initially (2014) relied on the national electricity grid have gradually gained
independence from the unreliable and pressurised grid. However, the overall consumption of energy resources
remains very low compared to the country's total consumption of oil products (1050 ktoe in 2017 against 14
ktoe of industrial consumption, i.e. 1.3% of final consumption).
Electricity consumption in industry, on the other hand, rose significantly between 2005 and 2014 before falling
from 2015 onwards. This is, in part, the phenomenon just mentioned: the mining sector consumed electricity
from the grid in its early days, and more recently it has decided to supply itself with its own facilities.
Percentage of biomass used in the sector: Faced with the national problem of an energy deficit, the industrial
sector, which is highly dependent on energy, is beginning to explore or even exploit other energy sources.
Bioenergy in the form of agro-industrial residues is increasingly attracting industries, especially those of the agro-
food industry, which can access this resource quickly and at lower cost. Indeed, for certain industrial units
installed in areas with high agricultural potential or those which transform agricultural products into commercial
products, agricultural residues represent valuable energy sources. Some industries such as SN SOSUCO and SN
14936
7620 4
4009
3022
152
25
200
500
1000
1500
2000
2500
3000
3500
4000
4500
Industry Transport Households Com. & public Agriculture/ForestryPetroleum products Natural gas Biomass (wood-energy, biogas, biofuel, etc.) Electricity

93
A report on the energy demand by sector for the selected countries
CITEC are already active in the production of combined heat and electricity (cogeneration) from the daily use of
about 1,200 tonnes of sugar cane bagasse and cotton seed cake respectively.
Other residues such as cashew nut hulls or shea cakes are real energy sources that are intensively exploited in
the industrial sector, but only for thermal purposes at the moment.
Contribution of forest bioenergy in the sector: Forest biomass, considered as waste from the wood-energy
sector, cannot contribute to this sector. The country itself is not forested and the exploitation of wood for energy
purposes is largely dominated by domestic consumption. Although the use of wood by small and medium sized
industries is observed in the field, such uses should be prohibited or at least accompanied by energy efficiency
measures in order to minimize the contribution of this fuel, which is currently overexploited in the country.
On the other hand, the forest biomass from non-timber forest products currently exploited in Burkina Faso has
a real potential to contribute to this reduction or even disappearance of the use of wood energy in the sector.
The two main forest products processed by the industry are cashew nuts and shea butter. It has been estimated
that the current potential for cashew nut hull waste is 17,200 tonnes/year at present, with a forecast of around
50,000 tonnes/year by 2030. The shea industry also offers an interesting potential (around 30,000 t of potentially
recoverable oilcake). However, for the latter, prior negotiations will be necessary to dispose of this cake, a large
quantity of which is sent to Ghana.
The cashew nut hull is emerging as an untapped source of biomass, widely available in industrial centres. Some
links are beginning to develop between cashew nut processing plants and consumers of these shells for energy
purposes (mostly small and medium industry). It would be interesting to build on this dynamic to initiate a real
transition towards the full conversion of the cashew nutshell, which would benefit the industrial sector by being
a source of renewable energy.
4.2.2.2. Transport
Energy demand of the sector: The following table shows energy consumption in transport in Burkina Faso. Table 37: Evolution of energy consumption in the transport sector from 2000 to 2019
Years 2000 2005 2014 2015 2016 2017 2018* 2019*
Oil consumption in transport
(kt) 142 230 403 685 705 992 1027 1067
Electricity consumption in
transport (GWh) - - - - - - - -
Source : (AFREC, 2019) *projections
The table shows that energy consumption in transport is entirely dominated by oil. The country is therefore not
yet in the era of electric vehicles. The railway sector does not run on electricity either, but on fossil fuels.
Conventional energies therefore dominate this sector entirely.
Percentage of biomass used in the sector: No contribution of biomass energy to the transport sector has been
identified.
Contribution of forest bioenergy in the sector: Bioenergy can help reduce dependence on conventional energy.
To this end, the bioenergy path that can be explored is that of biofuels. Indeed, within the framework of the
Sustainable Energy For All (SE4ALL) initiative, two options have been retained in the biofuels action plan: the
production of bioethanol allowing the use of E10 fuel (10% incorporation into petrol) and the production of
vegetable oil to be incorporated into diesel up to 30%. (Gouvernement Burkina Faso, 2015).
4.2.2.3. Residential (households)
Energy demand of the sector: Household energy consumption in Burkina Faso, as in most sub-Saharan countries,
is still dominated by wood energy. About 90% of households use wood as their main source of energy according
to a 2015 report. According to this report, existing validated statistical data dates back to 2002 with an estimated

94
A report on the energy demand by sector for the selected countries
consumption of 4,280,941 tonnes of fuelwood and 217,137 tonnes of charcoal. However, the report indicates
that an extrapolation of the growth rate of charcoal consumption (5.4%/year) resulted in the following values in
2012: 7,243,448 tonnes of fuelwood and 367,401 tonnes of charcoal. Charcoal consumption therefore
represented 2,296,254 tonnes of wood in 2012, taking into account average carbonisation yields estimated at
16%, i.e. approximately 6 kg of wood for 1 kg of charcoal.
But as can be seen in Table 37, the general trend in charcoal production is upward.
Since 2009, a major programme of bio-digester construction has been implemented by the National Bio-digester
Programme with a target of 100,000 units by 2030. According to this programme, 13,000 biodigesters have been
built for households throughout the country. The beneficiaries of this programme are families with one to
several heads of livestock. A realistic scenario of 38,000 units of biodigesters by 2030 would have been adopted
(PNB, 2020).
However, the promotion of butane gas (LPG) is a priority action in the promotion of modern alternative fuels for
cooking. Butane gas, whose total consumption remains marginal, is nevertheless steadily increasing. In 2002,
butane gas represented less than 1% of the country's energy balance. (MEPRED, 2008) . But with the State's
exemptions to encourage its use, this rate has risen to 1.4%. Urban households are the ones that use this
resource more.
Percentage of biomass used in the sector: Biomass accounts for 96% of the final energy consumed in the
residential sector. It is mainly firewood, charcoal and, to a lesser extent, other biomasses (cow dung, peanut
hulls, rice husks, etc.), mainly used for cooking.
Although not very widespread at the national level, it should be noted that biogas, produced from cow dung or
slaughterhouse waste, also provides cooking energy for a few thousand households (domestic biodigesters
produced as part of the National Biogas Programme), as well as electricity at the Faso biogas plant.
Contribution of forest bioenergy in the sector: It was found during the work felled for result 2.1 that the
exploitation of forest biomass in the strict sense leaves little residue from which a value chain would make sense.
Thus, the main possibility for the sustainable energy use of forest biomass, including residues of non-wood forest
products, would be the creation of schemes to integrate them into the commercial supply of biofuels (fresh or
carbonised).
Agricultural (non-forest) biomass should also be taken into account as the potential is still untapped.
4.2.2.4. Businesses and public services
Energy demand of the sector: Consumption in the commercial sector in Burkina Faso is dominated by wood
energy, particularly for heating and cooking. In public services, electricity consumption remains predominant
with the use of lighting, air conditioning, lifts and the supply of electronic equipment.
Percentage of biomass used in the sector: Biomass contributes 87% of the final energy consumed in this sector.
This is mainly firewood and charcoal used in the country's many restaurants and hotels. Professional uses
(ironing, dyeing, traditional metallurgy, pottery) also need biomass, as well as small-scale agro-food processing
activities, which are often confused in the service sector and therefore the commercial group (fish smoking,
manufacture of shea butter...).
Contribution of forest bioenergy in the sector: With an energy consumption profile quite similar to that of
households, the conclusions that can be applied are the same as in section 2.3 above.
4.2.2.5. Agriculture
Energy demand of the sector: Agriculture in Burkina Faso is still traditional. Production techniques and tools
remain basic. Mechanisation exists in some places, but motorised equipment mainly uses oil.
Percentage of biomass used in the sector: No biomass has been identified as being used in this sector.

95
A report on the energy demand by sector for the selected countries
Contribution of forest bioenergy in the sector: Biomass is not an energy source that can replace the energy
resources currently used in agriculture: electricity and fossil fuels, as the latter provide mechanical energy most
often (tractors, pumping, etc.).
On the other hand, it is the sector that produces the largest amount of biomass (cereal stems, hulls, ears, raffles,
etc.). This biomass from agricultural residues is an important untapped bioenergy potential.
2.1.2 Conclusions and recommendations
From the above, it can be noted that the country lacks conventional energy resources (oil, gas, coal, etc.). On
the other hand, it has abundant biomass from agriculture and the agro-food industry (cashew nut hulls, shea,
mango, cotton, rice waste, etc.). Today, some industries operate 100% from their own biomass for energy needs,
which is already commendable. But efforts remain to be made to encourage all industries to move in this
direction. And to do this, a better organisation of the actors could facilitate the supply of biomass to those who
do not have it locally, so that the industrial sector is energy self-sufficient, if only for steam production. For at
present, industry still consumes firewood (although this resource has not been identified), whereas in most cases
this wood can be replaced by agro-industrial biomass waste.
As mentioned above, the agriculture sector has a high potential for residues that can be used for bioenergy. The
real problem here is the dispersal of this biomass on the field and often far away from use areas such as cities.
Also, the problem of storing this potentially valuable biomass remains a challenge, to which must be added the
mentality of the populations who immediately think of selling it as soon as their residue becomes a source of
covetousness.
As noted in the report on Outcome 2.1, in terms of access to energy from residual biomass, the most promising
sectors would be cashew nuts and shea butter.
As far as cashew nuts are concerned, for plants with sufficient processing capacity (> 5000 tonnes of nuts
processed per year), self-production of electricity from cashew nut hulls can be envisaged. The country has at
least one industrial unit that meets the minimum capacity requirements and is interested in the option with a
view to becoming a fully sustainable factory.
Given the relative proximity of different cashew processing units in Burkina Faso (most of them are located along
a 100 km long axis), it would be conceivable to implement a system of centralisation of the cashew hulls in a
single site, for their energy conversion. The conversion method can take several forms:
- Extraction of the oil from the hull then valorisation of the two materials (oil and scrab) separately.
- Energy recovery without separation,
- As a direct fuel in industrial uses (and using the h2cp pyrolysis stove).
- In carbonization and then briquetting, to be used in the residential and commercial sector.
It is interesting to note that Burkina Faso is a pioneer in the conversion of cashew nut hull by means of pyrolysis
stoves, and it has been demonstrated that several industrial sectors other than cashew nuts can benefit from
this technology and thus eliminate the consumption of conventional fuels or firewood. This is the case of several
cotton oil mills, using cashew nut hulls, or mango drying units.
4.3. Ivory Coast
4.3.1. Energy resources
Côte d'ivoire, a West African country rich in resources, has been experiencing years of remarkable economic
growth since 2010. On the energy front, the government has set itself the objective of achieving 95%
electrification on a national level by 2020 and 98% by 2030, with a part of renewable energy in the production
mix of 42% of electrical energy by 2030 (including 26% from hydroelectricity), and 57% of the installed capacity
of the park.

96
A report on the energy demand by sector for the selected countries
Total primary energy production in Côte d'Ivoire was about 11,000 ktoe in 2017. 65% of this energy is biomass,
notably wood energy (firewood and charcoal). Côte d'Ivoire is an oil and natural gas producing country, with
1648 and 1881 ktoe respectively (16 and 18 per cent of total supply). The country also produces hydroelectricity
(2050 GWh, or 1.7%).
Figure 44: Total primary energy production in 2017 (in ktoe)
Source: (AFREC, 2019)
4.3.1.1. Biomass
In 2017, the country produced 19,000 kt of firewood against 1,500 kt of charcoal. Agricultural and agro-industrial
residues represent the other biomass deposit of the country, a deposit particularly interesting for the industrial
sector and the production of electricity. The National Action Plan for Renewable Energies (CEDEAO / République
Côte d'ivoire, 2016) estimates the national biomass potential at more than 12,000,000 t/year. According to the
BEFS-RA report (FAO, 2018), which announces volumes of the same order of magnitude, vegetable waste16 falls
into the following categories:
- Agricultural residues potentially available from processing industries: about 2,000,000 tonnes
- Agricultural residues in the fields: around 11,500,000 tonnes (of which around 1,500,000 t/year of
cocoa waste)
- Logging residues in the logging plots: around 400,000 t/year
- Wood processing residues (sawdust, slabs and chips): approx. 130,000 t/year
16 Excluding therefore the waste produced by the livestock sectors, also listed in the BAFS-RA.
1648.31 1881.88
176.03
6672.74
0
1000
2000
3000
4000
5000
6000
7000
8000
Crude oil Natural gas Hydroelectricity Biomass (wood-energy,biogas, biofuel, etc.)

97
A report on the energy demand by sector for the selected countries
Figure 45: Distribution of agricultural residues potentially available from local processing units.
Source: (RA, 2016)
Figure 46: Distribution of potentially available agricultural residues in agricultural production plots.
Source: (RA, 2016)
There are several biomass-based combined heat and power (CHP) plants. These are the Sucrivoire (bagasse) and
Sania (palm oil) plants. These plants are managed for self-consumption by industrialists, who use their waste. In
2017, 46 ktoe of biomass were used in the production of electricity.
At least five other projects are in the pipeline, all aiming to be connected to the electricity grid. Power ratings
range from 1MW to 123MW, bringing the projected total to 241MW. All these plants will start up at the earliest
in 2023. All of the power plants are based on the biomass resources of the major agricultural sectors in Côte
d'Ivoire: cocoa, rubber, palm, cotton and cashew nuts (the first three of which can be considered as forest
resources).
Côte d'Ivoire's energy strategy is ambitious in terms of using bioenergy as a source of electricity. It was
announced in 2016 (PANER, 2016) 225 MW installed biomass capacity for 2020, a capacity reaching up to 485
MW until 2030. The capacity installed on the grid in biomass should therefore slightly exceed the capacity in
solar PV.

98
A report on the energy demand by sector for the selected countries
4.3.1.2. Hydroelectricity
Hydroelectricity is a priority in Côte d'Ivoire in the promotion of renewable energies. The country intends to
increase the part of medium and large hydropower to 26% of the energy mix by 2030. The objective is for small
hydropower to reach 16% of the energy mix by the same date. The national potential of hydroelectric production
is estimated at 1680 MW (PANER, 2016). For the time being, in 2017 hydroelectricity contributed to 9.5% of the
resources invested in the country's electricity production.
4.3.1.3. Solar
The duration of sunshine varies between 2,000 and 2,700 hours per year depending on the region of the country
(the north of the country is sunnier than the south, which has a humid climate). The average annual sunshine
on a horizontal plane is estimated at 5.25 kWh/m2/day. (PANER, 2016).
However, solar is not the preferred renewable resource for access to electricity given its intermittent nature,
and the mismatch between the solar irradiation profile and the load profile of Côte d'Ivoire (which has a peak
load in the evening) does not favour a massive development of solar PV. However, the NREAP notes that both
biomass and solar PV have the advantage that they can be deployed in a decentralised manner, particularly in
the north of the country, and will thus make it possible to supply electricity demand locally and avoid major
losses on the transmission grid. Indeed, 6 IPP projects in solar PV have been approved to date, for
implementation in the northern half of the country.
Here again, the objectives of the NAPER 2016 are slightly behind schedule, as the country was forecasting an
installed capacity of 25 MW in 2020 and an increase to 424 MWp by 2030. However, the first grid-connected
solar power plant, 37.5MW, is expected in 2021 (PANER, 2016).
4.3.1.4. Natural gas
The country consumes all of its natural gas production for electricity generation. Electricity production from
natural gas reached 515 ktoe in 2017. The efficiency is therefore 32%. Côte d'Ivoire does not import natural gas.
4.3.1.5. Oil
Côte d’ivoire is an oil producer, with a production of 1648 ktoe in 2017. However, in 2017, the country exported
practically the same amount (1500 ktoe) and imported twice as much (3000 ktoe). This perpetuates its
dependence on oil prices.
Only 2.30 ktoe of oil products are burned in thermal power plants. The remaining 3150 ktoe are refined for
export (1240 ktoe) and for domestic consumption excluding electricity production. 335 ktoe of imported refined
oil products are also imported for the needs of the same national consumption excluding electricity production.
4.3.2. Key economic sectors according to NDP
A small part of the oil products leaving Ivorian refineries, corresponding to 157 ktoe of oil products, is consumed
in various sectors for non-energy uses, such as the manufacturing sector (paints, surface coatings, polymers,
cosmetics...).
The predominant energy source in the total final energy consumption in 2017 (7069 ktoe/year) is biomass,
accounting for 60% of the total. This is followed by the consumption of oil products, which accounts for 31%.
This is followed by the consumption of electricity and natural gas, accounting for 8% and 1% of total consumption
respectively. It should be noted that the natural gas supply has been entirely transformed into electricity: 515
ktoe, which is added to the 176 ktoe of hydroelectricity. The total of 570 ktoe of electricity is obtained after
subtracting 180 ktoe of losses.

99
A report on the energy demand by sector for the selected countries
Figure 47: Total final energy consumption in 2017 in Côte d'Ivoire (in ktoe)
Source: (AFREC, 2019)
As shown in Error! Reference source not found. below, the household sector is the country's main pole of energy
consumption (60% of the total), followed by transport (23%). The commercial and public service sector accounts
for 11% of the total. Industry accounts for 4%. Finally, 2% are consumed for non-energy use.
Biomass (4254 ktoe/year in total) is mainly used for domestic purposes (3754 ktoe/year, or 88% of this total).
The remaining biomass (12%) is consumed by the commercial and public service sector (790 ktep/year).
Oil products are consumed mainly in the transport sector (1623 ktoe/year), to a lesser extent by households
(294 ktoe/year). 157 ktoe are consumed for non-energy use, 90 ktoe for trade and public services and 20 ktoe
in industry.
Natural gas, on the other hand, is used almost exclusively in the industrial sector (60 ktoe/year). It should be
remembered that most of the natural gas in Côte d'Ivoire is transformed into electricity.
Electricity consumption is almost equally distributed between the commercial and public service, household and
industrial sectors (194, 191 and 183 ktoe respectively).
Figure 48: Final consumption by sector in 2017 (in ktoe) Source: (AFREC, 2019)
2184.7
59.98
4253.72
570.35
0
500
1000
1500
2000
2500
3000
3500
4000
4500
Petroleum products Natural gas Biomass (wood-energy,biogas, biofuel, etc.)
Electricity
20.16
1623.48
294.15 90.2359.98
3763.5
490.22183.25
191.45
194.38
1.27 156,…0
500
1000
1500
2000
2500
3000
3500
4000
4500(AFREC, 2019)
Petroleum products Natural gas Biomass (wood-energy, biogas, biofuel, etc.) Electricity

100
A report on the energy demand by sector for the selected countries
4.3.2.1. Industry
Energy demand: Industry is the fourth most energy-consuming sector in the country, accounting for 4% of the
country's final energy consumption. The Ivorian industrial sector is very much centred on consumer goods and
more specifically the agro-food industry: production and refining of palm oil (Côte d'Ivoire is the leading
producer in West Africa), grinding and production of cocoa paste (leading world producer), cashew nut
processing (leading cashew nut producer in the world, and growing capacities for processing)... Not forgetting
non-food products: fabric manufacturing, materials and polymer industry, cosmetics.
There is also a mining sector, but its part in the energy balance is not the largest.
Large industries have important thermal needs and therefore consume natural gas. This is the only sector in the
country to use this resource, which is produced domestically and is also converted into electricity (as mentioned
above). The rest of the sector's consumption would be in the form of electricity.
Percentage of biomass used in the sector: Biomass seems to have been neglected in this balance sheet, as the
industrial sector does use biomass for its own energy needs. More and more factories are adopting biomass to
power their boilers. This biomass comes from the remains of crops, whether perennial or annual: hevea, palm,
cocoa, cashew nuts are the main crops.
The few plants that produce their own electricity have been mentioned in the balance sheet at the level of the
electricity transformation line, i.e. upstream of industrial use, so that biomass has not been considered as a final
energy resource.
Contribution of forest bioenergy in the sector: The trend has begun, but the use of biomass for industrial
purposes is not yet systematic. Residual biomass should first benefit each of the sectors from which it originates.
Starting with the wood industry, where it would be possible to convert the waste generated by the largest
sawmills into electricity, which would be self-consumed in order to power the processing equipment. Then, the
other sectors (not only cocoa, palm, cashew nuts, but also breweries and other non-food production) could
benefit more systematically from this waste, primarily for thermal purposes, by adapting existing boilers and
stoves to use biomass, replacing natural gas or oil derivatives. Some plants could also produce their own
electricity, in cases where the available biomass deposit is large enough (and the current situation of access to
the network is rather unfavorable.
4.3.2.2. Transport
Energy demand: Transport mobilized 1623 ktoe of oil products in 2017. At present, bioenergy does not
contribute to the energy supply of the transport sector at the national level.
Contribution of forest bioenergy in the sector: There is no realistic scenario today to envisage a contribution of
forest biomass to the transport sector. However, CNSL (Cashew Nutshell Liquid), the oil contained in cashew nut
shells, has been considered as a natural source of fuel for aviation (similarities with paraffin). After distillation,
cardanol is obtained, which is used as a solvent in the chemical industry.
4.3.2.3. Residential (households)
Energy demand: As elsewhere in the West African sub-region, the vast majority of energy consumption by
Ivorian households is in the form of wood energy (88% of consumption). 7% of oil products and 5% of electricity
complete the energy consumption of Ivorian households.
The country aims to achieve 100% access to modern cooking energy by 2030, through the promotion of coal
produced with efficient techniques (16% of the coal produced in the country by 2030), and the promotion of
improved stoves, but above all the promotion of butane gas as an energy source (reaching 90% of the population
by 2030, according to the NREAP). Several awareness-raising actions on the use of improved stoves and butane
gas (LPG) have been undertaken for several years and will continue to be undertaken in Côte d'Ivoire.

101
A report on the energy demand by sector for the selected countries
Contribution of forest bioenergy in the sector: As indicated above, the country envisages that 16% of coal will
eventually be produced using efficient techniques, and this includes biochar (or green coal, from agricultural
biomass or waste). The production of green coal and biogas is listed in the objectives of the National Renewable
Energy Action Plan (NREAP, 2016). Green charcoal can indeed be produced from residues from agriculture in
forests, such as those from cocoa fields. Cocoa waste, which is abundant and under-exploited in the form of
pods and old plants, could contribute to the energy balance in both carbonised and fresh form.
4.3.2.4. Businesses and public services
Energy demand: Energy consumption in the trade and public service sector in 2017 reached 775 ktoe, of which
63% is biomass, 25% electricity and 12% oil products. Most of the biomass energy is consumed by small and
large shops, restaurants, hotels, dry cleaners, supermarkets, bakeries and small food processing units
(production of gari and attiéké, fish smoking, transformation of shea butter, etc.).
Contribution of forest bioenergy in the sector: The measures proposed for the household sector (section
4.3.2.3) apply.
4.3.2.5. Agriculture/Forestry
Energy demand: The energy demand of the agricultural and forestry sector is not given in the AFREC reports.
The agricultural and forestry sector, itself, requires energy sources that can meet the needs for mechanical work
(cutting, ploughing, water pumping, transport of inputs and products) but also thermal (cold chambers, drying
for conservation). The fact that these consumptions have not been recorded in the national energy balance
sheets shows the low part they represent in the national total. The second handicap of this sector as regards the
quantification of energy-consuming activities is its fairly widespread degree of informality, at least on the
producers' side. Thus, energy consumption by organised actors (cooperatives, packaging units, sawing units,
etc.) has been classified in the industrial sector.
Percentage of biomass used in the sector: Without available data, the part of bioenergy in this sector could not
be ascertained. The case of Côte d'Ivoire could be extrapolated from that of neighbouring Ghana, which has a
similar agricultural and climatic profile. More than two-thirds of final energy in Côte d'Ivoire is derived from oil
products, with the rest coming mainly from electricity and a small part from mineral coal and natural gas.
Bioenergy does not appear to contribute to the balance sheet of this sector.
It is certain that in any case Côte d'Ivoire does not use mineral coal or natural gas for any agricultural activity.
So, this consumption profile, in which oil derivatives are the most used, ahead of electricity, can be maintained.
Bioenergy is therefore not a source used by the sector.
Contribution of forest bioenergy in the sector: Reforestation policies with fast-growing species (teak in
particular) are carried out. Like neighbouring Ghana, Côte d'Ivoire is increasingly covered with teak forests,
which is a wood appreciated as a fuel, but also a material in demand on the international timber market. Thus,
felling during thinning applied to teak plantations often ends up in the fuelwood market and is consumed by the
productive sector (bakeries and others) and by households.
A holistic planning of agricultural sectors could find ways of achieving synergies between several sectors, where
the residual biomass of some could be used by others to meet heat needs for product conservation reasons
(drying, smoking, pasteurisation). Post-harvest losses of cassava, yam and cereals could be reduced by making
intelligent use of wood waste from other neighbouring agricultural or forestry sectors.
2.1.3 Conclusions and recommendations
Main sectors with potential for bioenergy

102
A report on the energy demand by sector for the selected countries
Due to the consumption profile described above, the residential (household), commercial and public sectors and
the industrial sector are important consumers of biomass and/or heat, and the volumes consumed are only
increasing, due to an increasing population, the standard of living and the industrialisation of the country.
Recommendations
One form of residual forest biomass that can be mobilised in Côte d'Ivoire and which is very abundant is cocoa
waste, a waste left at the edge of the plantations.
In particular, the cocoa pod can be valorised in the following forms:
- Thermal energy: as a non-carbonised fuel, after drying of the pod. This fuel can then be used to power
industrial sites but can also be used for household applications. The pod can also be carbonized. This is
being implemented by the APNFP in Afféry.
- Electrical energy: with small- or large-scale systems. Large scale would seem to be more profitable and
there are already some projects developed in this direction.
The great difficulty of this biomass is that it is very scattered in the territory and its access is difficult because it
is located in the forests. Decentralised conversion techniques should be recommended.
Although wood waste is present in sawmills, the sustainability of the sector is not assured today and therefore
it cannot be said that it is a good idea to consider this deposit, for the time being. Moreover, it is not the largest
residual biomass deposit in the country.
4.4. Mali
4.4.1. Energy resources
Like many African countries, Mali's energy situation is characterised by:
- Abusive exploitation of forest resources
- Dependence on oil products imported from abroad
- The high cost of developing the country's abundant renewable energy potential.
The energy sector comprises four main sub-sectors which are (i) hydrocarbons, (ii) traditional energies, (iii)
renewable energies and (iv) electricity. Mali's 2014 energy balance sheet reveals that biomass (wood and
charcoal) accounts for about 78% of national energy consumption, oil products 17%, electricity and renewable
energies (other than hydroelectricity) 5%. The implementation of the various projects and programmes has led
to the following main indicators17 for the energy sector (situation in 2014):
Table 38: Energy Sector Indicators 2012 - 2016
Variables 2012 2013 2014 2015 2016 2017
Electricity production EDM
(GWh)
1 276 1 420 1 574 1 594 1768
Part of non-hydropower RE
in Electricity Generation
- - 7% 7% N/A*
Consumption of oil products
per year (TOE)
911 839 972 298 1 024 000 1 056 864 1 373 533
Butane gas consumption (in
tonnes)
13 279 12 010 12 228 12 982 14 530 ND
17 EIS Report, PDIO-2015

103
A report on the energy demand by sector for the selected countries
Biomass consumption 78% of the national energy balance 2014 71,6% 73,2%
Import of all Hydrocarbon
consumption
17% of the balance sheet 2014 24,9% 22,3%
Electricity consumption 5% of the balance sheet 2014 3,5% 4,6%
(EIS Report, PDIO-2015 and AFREC 2019) (*ND= not available)
Mali imports all of its fossil fuel needs. Oil products represent 26% of all imports in 2010 and 22% in 2015, making
it very sensitive to price volatility. It should be noted that despite this decrease in the part of oil product imports
in total imports, the consumption of oil products per year has steadily increased in recent years, as shown in the
following graph:
Figure 49: Total primary energy supply in 2017 in Mali (in ktoe) Source: (AFREC, 2019)
The country has no internal fossil or geothermal resources for energy production. Energy production comes
mainly from biomass (bioenergy/biofuel); hydroelectricity and imported fossil fuels. The balance of energy
production in Mali in 2017 reveals that biomass (wood energy, biofuel...) represents about 97.9% of national
energy production, hydroelectricity 2.1% and a small contribution for other renewable energies (solar) (Cf.
following graph).
Figure 50: Total primary energy production in 2017 in Mali (in ktoe)
72.05 0.62
3354.27
0
500
1000
1500
2000
2500
3000
3500
4000
Hydropower Wind and solar Biomass (wood-energy,biofuel...)
Total production of primary energy in 2017 (in ktoe) (AFREC, 2019)

104
A report on the energy demand by sector for the selected countries
Source: (AFREC, 2019)
Total primary energy supply
Energy supply in Mali concerns four main sub-sectors which are (i) hydrocarbons, (ii) traditional energy, (iii)
renewable energy and (iv) electricity. The balance of supply in 2017 in Mali reveals that biomass (wood energy,
biofuel, etc.) represents about 66% of the total supply, oil products 31%, imported electricity 2%, hydroelectricity
1% and a low supply for renewable energy (solar and wind) (see Figure 51).
Figure 51: Total primary energy supply in 2017 in Mali (ktoe)
4.4.1.1. Biomass
Forest bioenergy: Wood energy, the main source of energy for Malian households, comes from the country's
forests, whose surface area is estimated at nearly 33 million hectares, i.e. about 25% of the country's surface
area, with a standing volume of about 520 million m3 . As explained in the previous report 2.1, although these
forests cover large areas, they are not very productive (weighted productivity for the country as a whole of about
0.86 m3/ha/year) and have been overexploited since the beginning of the decade 2010. Year after year, Malian
forests are experiencing a decline in their wood stocks, due to the growing demand for fuel and the clearing of
surrounding areas for agricultural purposes. All this has been brought about by a very significant population
growth.
In a country exposed to climate change and where land and natural resource degradation is a real problem,
wood energy is not an adequate response to growing energy needs.
Agricultural and vegetal waste: Mali has significant potential for energy production from agricultural waste Error!
Bookmark not defined.Error! Bookmark not defined.:
- 1.5 million tonnes of rice and cotton waste (husks, stems, etc.) in 2010.
- Nearly 3.5 million tonnes in 2018, following an annual growth of 10% in cereal production, mainly
around Sikasso (cotton) and Ségou/Mopti (rice).
- Mali is a large regional producer of oilseeds: more than 500,000 tonnes of groundnuts, 370,000 tonnes
of cotton seeds and 200,000 tonnes of shea nuts, which leads to the production of large quantities of
crabs and hulls.
- As the leading regional producer of livestock, with more than 30% of the total livestock in uemoa and
annual growth of around 5%, Mali offers untapped opportunities for the recovery of animal waste.
- In addition, there are aquatic invasive species and household waste estimated at nearly 600,000 tonnes
per year.
1587.39
72.05 0.62
3354.27
104.87
0
500
1000
1500
2000
2500
3000
3500
4000
Petroleum products Hydroelectricity Wind and solarpower
Biomass (wood-energy, biogas,
biofuel, etc.)
Electricity (import)
Total primary energy supply in 2017 (in ktoe) (AFREC, 2019)

105
A report on the energy demand by sector for the selected countries
Energy crops: The conditions are optimal for sugar cane production with abundant sunshine and water for
irrigation. Production is concentrated in the Office du Niger area in existing sugar factories (Sukala and Nsukala).
The 20,000 hectares cultivated produce 140,000 tonnes of sugar and 11 million litres of ethanol, which are
successfully exported.
Jatropha (jatropha) cultivation has long been used in Mali as a traditional fence. Mainly concentrated in the
regions of Sikasso, Koulikoro, Kayes and Ségou, 65,000 ha of jatropha allow an estimated production of 5,500
tonnes of seeds in 2016. Four presses and a refinery are currently in operation, and 740,000 litres of jatropha-
based biofuel were produced in 2016, with annual growth of 35% since 2010. However, it is noted that this unit
has been idle since at least 2018.
4.4.1.2. Hydroelectricity
The electricity sector is dominated by the national company EDM-SA. It also includes a few isolated private
systems and several dozen multifunctional platforms managed by local communities. The electricity company
EDM-SA, the main and historic operator in the electricity sector, has had a concession since 200018 for the
production, transmission, distribution, import, export and marketing of electrical energy throughout its
perimeter covering 99 localities (including mainly the District of Bamako and the 10 regional capitals).
The identified exploitable hydropower potential is 1,150 MW on some twenty sites with a corresponding average
annual production of approximately 5,600 GWh. In 2019 (SEforALL), May), 2019, nearly 840 MW of this potential
remains available, undeveloped and divided into 3 major groups: sites at the feasibility study stage (150 MW);
sites at the pre-feasibility stage (342 MW); and sites at the reconnaissance stage (150 MW)Error! Bookmark not defined..
The main rivers and their tributaries are the following sites:
- Sites at the feasibility study stage: Taoussa (20 MW; 100 GWh); Sotuba II (6 MW; 30-40 GWh); Kénié
(42 MW; 188 GWh); Markala (13 MW; 45 GWh); Félou II (60 MW; 320 GWh); Gouina (140 MW; 560
GWh).
- Sites at the pre-feasibility stage: Labezanga (14-84 MW; 67 GWh); Gourbassi (13 MW; 104 GWh);
Moussala (30 MW; 160 GWh); Galougo (285 MW; 1520 GWh); Badoumbé; Dioumbéla; Boudofara;
Maréla; Bindougou.
- Sites at the reconnaissance stage: Toubani (35 MW; 134 GWh); Baoulé II (30 MW; 124 GWh); Bakoye II
(45 MW; 193 GWh); Salambougou (10 MW; 40 GWh); Kourouba; Banifing.
- Micro hydroelectric power plant sites (feasibility studies): Farako (50 kW); Kéniéba (180 -250 kW);
Nimbougou (8 -12 kW); Papara (50-60 kW).
4.4.1.3. Oil and derivatives
The hydrocarbons sector is characterised by a net import of all oil products. The country is therefore totally
dependent on oil resources. This should not be interpreted as if the country does not have any hydrocarbon
deposits. Oil exploration, undertaken since independence, did not lead to the discovery of hydrocarbon deposits
until 2003. However, Mali has five sedimentary basins totalling 750,000 km2, all located in the northern half of
the country, on which hope is based. To date, only four hydrocarbon exploration drillings have been carried out
in Mali. All of them have proved negative. As for the gas indices observed during some hydraulic drilling, they
are of little interest for a significant energy exploitation.
To date, Mali does not have any significant hydrocarbon resources of its own. Its supply has been ensured almost
exclusively by the subsidiaries of large multinationals19, from Côte d'Ivoire and Senegal. But since then, the
country has undertaken to liberalise the sub-sector and diversify its sources of supply. National operators have
appeared and occupy a growing part of the market, and new supply centres have been added to the existing
ones: Ghana, Togo, Nigeria, Benin, etc.
The country's energy supply depends mainly on oil products (31%), being exclusively imported.
18 Decree No. 00-580/P-RM of 22 November 2000 approving the Public Electricity Service Concession Contract. 19 Mobil Oil, Shell - Texaco, Elf, Esso, Total

106
A report on the energy demand by sector for the selected countries
4.4.1.4. Solar
The inventory of renewable energies reveals a quantitatively very significant potential throughout the country
(with disparities, however, depending on the renewable energy sources). Apart from hydropower, solar energy
is the most abundant renewable resource in Mali. Even if they have never been accounted for in energy balances,
they could be close to 3% of the conventional electricity produced (about 12 MW). (Duarte, 2012) . This falls
short of the National Energy Policy's quantified objectives, which indicate that the part of renewable energies in
national electricity production should reach 6% in 2010 and 10% in 2015.
Solar irradiation is very high and is spread throughout the country. It reaches an average of 6 kWh/m2/day for a
daily sunshine duration of 7 to 10 hours. Solar radiation in the country is stronger in the desert areas of the
North.
According to the country's energy balance, in 2017 0.62 ktoe of primary energy from solar, geothermal and solar
power were produced, or 7.21 GWh. This corresponds entirely to the contribution of solar energy, since the
installed wind power capacity is limited to a few individual installations (as shown below) and was certainly not
included in this balance sheet.
4.4.1.5. Wind turbine
Wind resources, especially in the South, are not as promising as solar energy. The lower wind speed limit is
generally defined at 5 metres/second for an economically reasonable exploitation of wind resources. Wind
speeds above 5 metres/second prevail in the part of the country above 16 degrees north latitude, which includes
the cities of Timbuktu and Gao. This band is sufficient for pumping applications for irrigation and the supply of
drinking water to small localities. However, due to the low population density in these areas, demand will also
be low. In addition, the critical political and security context affecting northern Mali will play a determining role
in the development of wind projects. For the time being, apart from a few pilot projects and small water pumping
stations, wind energy has not yet really taken off. Feasibility studies have been carried out on a 1.1-3 MW wind
farm in Timbuktu and a 0.9-2 MW wind farm in Gao (AER-Mali, n.d.)20.
4.4.1.6. Others
Unlike other neighbours in the sub-region, Mali does not rely on natural gas or mineral coal. The supply figures
are 0 for these raw materials.
2.1.4 4.4.2 Key economic sectors according to NDP
Final energy consumption refers to energy products consumed for activities other than conversion or
transformation into other energy products. Error! Reference source not found. and the following graphs show
the final energy consumption of Mali's total and of each economic sector in 2017. Table 39: Final energy consumption in Mali by source
Oil products
(ktoe)
Biomass (wood-energy,
biofuel, etc.)
(ktoe)
Electricity (ktep) Total (ktoe) % by sector
TOTAL
1084,98 2426,84 247,82 3759,64 100%
29% 65% 7% 100%
Industry 192,37 - 104,18 296,55 8%
20 Information obtained from EAR-Mali experts

107
A report on the energy demand by sector for the selected countries
65% - 35% 100%
Transport
794,96 - - 794,96 21%
100% - - 100%
Households
16,48 2190,07 93,28 2299,83 61%
1% 95% 4% 100%
Com. & public
236,77 38,67 275,44 7%
86% 14% 100%
Agriculture/Forestry
42,33 - - 42,33 1,1%
100% - - 100%
Others
38,84 - 11,69 50,53 1%
77% - 23% 100%
Figure 52: Total final consumption in 2017 (in ktoe)
Source: (AFREC, 2019)
Biomass represents 65% of total final energy consumption in 2017, 29% of consumption is derived from oil
products and less than 7% of consumption is from electricity.
1084.98
2426.84
247.82
0
500
1000
1500
2000
2500
3000
Oil products Biomass (wood-energy, biofuel...) Electricity

108
A report on the energy demand by sector for the selected countries
Figure 53: Final consumption by sector in 2017 (in ktoe)
Source: (AFREC, 2019)
4.4.2.1. Industry
Industry in Mali is relatively undeveloped. This industry is essentially composed of agro-industry, spinning mills
and food processing industries, SMEs and SMIs. They are mainly concentrated in Bamako and only slightly in the
interior, with the exception of the CMDT factories. The mining industry is fairly developed, especially in the field
of gold production.
Energy demand: Total energy consumption by the industrial sector accounts for 8% of Mali's total final
consumption in 2017 (see Table 39). The main energy consumed in this sector comes from oil products (65%)
and electricity, itself produced with fuel oil by EDM (35%) (see Table 39). The extractive industry is by far the
largest consumer of these resources. However, most of the factories are not connected to the network, hence
the large part of oil products in the balance sheet of this sector.
Percentage of biomass used in the sector: Error! Reference source not found. shows that bioenergy does not
participate in the energy consumption of the industrial sector, although there are agro-food industries in the
country that consume the waste produced by themselves for energy purposes. This shows the undervaluation
of this sector. Some agro-processing plants can use their own waste or other agricultural or agro-industrial waste
to produce bioenergy. This is the case of the Sukala sugar factory (bagasse), the MaliShi shea butter factory,
which uses part of the crabs in its boiler, and the cashew nut processing agro-industrial platform, which uses
cashew nut shells. The jatropha processing plants also use their product (biofuel) and by-products (shells,
capsules and cake) to produce their own energy.
Contribution of forest bioenergy to the sector: Given that Mali is exposed to climate change and where land
and natural resource degradation is a real problem, conventional forest biomass (wood and derivatives) cannot
provide an adequate response to the energy needs of the industrial sector.
On the other hand, non-timber forest products such as shea and cashew nuts are emerging as potential sources
of biomass waste. The shea industry counts with the salient example of MaliShi, which should eventually reach
30,000 tonnes of shea kernels processed per year, and thus generate waste crab after extraction of 15,000
tonnes. This waste has the advantage of being concentrated on a single site, which facilitates the supply of
192.37
794.9616.48 42.33
38.84
2190.07
236.77104.18
93.28
38.67 11.69
0
500
1000
1500
2000
2500
Petroleum products Biomass (wood-energy, biogas, biofuel, etc.) Electricity

109
A report on the energy demand by sector for the selected countries
biomass waste. The plant is planning to use its crab, in addition to fuel for its boiler, as a raw material for the
manufacture of combustible briquettes that could benefit the population by replacing firewood.
4.4.2.2. Transport
Consumption in the transport sector covers all transport activities, regardless of the economic sector concerned:
road transport; air transport; rail transport and inland waterway transport.
Energy demand: Energy demand in the transport sector accounts for 21% of Mali's total final energy
consumption in 2017 and is 100% dominated by oil products (see Table 39).
Percentage of biomass used in the sector: Oil dominates 100% of consumption in the transport sector. No
initiatives to introduce renewable sources in the sector have been identified.
Contribution of forest bioenergy in the sector: Forest biomass at the moment cannot provide a solution to
Mali's transport sector. The production of biofuel from jatropha and ethanol from sugar cane would be an
alternative to substitute part of the oil consumption in this sector.
4.4.2.3. Residential
Energy consumption in the residential (household) sector concerns three sources of energy: oil products,
biomass and electricity.
Energy demand of the sector: Energy demand in the residential sector accounts for 61% of Mali's total final
energy consumption in 2017, ranking it as the leading consumer sector. Demand is dominated by biomass
(mainly wood energy) which accounts for 95%. Biomass is used for cooking needs and some artisanal activities.
Oil products which represent 1% (essentially butane gas and paraffin, at 16.48 ktoe) are used for lighting (in rural
areas) and also for cooking (in urban areas). Electricity accounts for 4% of household final consumption and is
used for lighting and household appliances (see Table 39).
Percentage of biomass used in the sector: The participation of bioenergy in the residential sector is low. The
promotion of domestic bio-digesters to produce biogas could be the solution to the valorisation of household
biomass waste, especially among the population with livestock.
Contribution of forest bioenergy in the sector: With the results of the Report 2 of the same study, Mali has no
wood processing residues, but the use of charcoal dust for the production of charcoal briquettes would be a
solution to substitute part of the consumption of charcoal in the residential sector.
Also, agricultural residues (rice, cotton waste, etc.) and agro-industrial residues (shea, cashew, groundnut waste,
etc.) could be compacted into briquettes to replace wood, given its high calorific value; or carbonised to produce
biochar and could be used to replace wood energy.
4.4.2.4. Trade and public service
Energy demand of the sector: The energy demand of the commercial and public service sector represents 7%
of Mali's total final energy consumption in 2017. The demand is dominated by two energy sources: biomass
(mainly wood energy) which accounts for 86% of the energy consumption of this sector and electricity accounts
for 14% of the final consumption of the sector (see Table 39).
Percentage of biomass used in the sector: The participation of bioenergy in the commercial sector is notably
provided by wood-energy, at the level of the numerous catering and craft or small food-processing businesses,
which also carry out processing activities of these products.
It is interesting to note the use of shea tree residues (crab) in bakeries, especially in rural and peri-urban areas,
as a substitute for wood.
Contribution of forest bioenergy in the sector: The recovery of charcoal dust for the production of dust
briquettes would be a solution for substituting a part of the charcoal consumption and wood in the commercial
and public service sector.

110
A report on the energy demand by sector for the selected countries
The promotion of biodigesters for productive purposes to produce biogas could be the solution to recover
organic waste from markets, restaurants, canteens....
Also, agricultural residues (rice, cotton, groundnut waste, etc.) and agro-industrial residues (shea, cashew, etc.)
could be carbonised to produce biochar and could be used to replace wood energy.
4.4.2.5. Agriculture and forestry
Consumption in the agriculture and forestry sector concerns exclusively oil products.
Energy demand of the sector: Energy demand in the agriculture and forestry sector accounts for 1.1% of Mali's
total final energy consumption in 2017 and is 100% dominated by oil products (see Table 39). This consumption
is related to agricultural and forestry machinery.
Percentage of biomass used in the sector: Although oil dominates 100% of consumption in the agriculture and
forestry sector.
Contribution of forest bioenergy in the sector: Forest biomass at the moment cannot provide a solution to
Mali's agriculture and forestry sector.
Apart from forest biomass, the production of biofuel from jatropha and ethanol from sugar cane would be an
alternative to substitute part of the consumption of diesel and petrol in this sector.
4.4.2.6. Other sectors
Consumption in the other sectors concerned is related to oil products and electricity. This consumption
represents 1% of Mali's total final energy consumption in 2017. In this consumption, oil products represent 77%
and electricity 23% (see Table 39).
2.1.5 Conclusions and recommendations
Main sectors with potential for bioenergy
- The country's energy consumption is dominated by biomass (65%) of total final consumption in 2017,
90% of which is in the residential sector and 10% in the commercial and public service sector. In a
country exposed to climate change and where land and natural resource degradation is a real problem,
the wood-energy resource cannot provide an adequate response to the growing energy needs.
- Residues in wood-energy supply chain are minimal, and only charcoal dust could be identified in 2.1 as
a potentially interesting material for recovery and use as fuel.
- The country's second source of consumption is related to oil products (29%) of total final consumption
in 2017 and is dominated by the transport sector (73% of total oil products), industrial (18%); and 9%
for other sectors.
In view of the above, the main sectors with potential for bioenergy are grouped in order of priority:
1- Residential and Commercial and utilities.
2- The industrial sector.
3- The transport sector; and agriculture and forestry.
Recommendations
The consumption of wood energy dominates total final energy consumption, particularly in the residential
sector, which leads to worrying deforestation and justifies the use of bioenergy and modern/improved means
of cooking.
The recommendations for bioenergy here concern the residential sector but also the commercial and public
service sector. These recommendations are :
- Recovery of charcoal dust for the production of dust briquettes to substitute a part of charcoal and
wood consumption in these two sectors.

111
A report on the energy demand by sector for the selected countries
- Improved carbonisation to reduce deforestation.
- To produce biochar and biogas from agricultural and agro-industrial residues to replace wood energy
in these two sectors.
❖ In the industrial sector, the consumption of oil products must be reduced by using alternative fuels
(biomass):
- The agro-food industries can valorise their waste to produce thermal energy necessary for their process
by using H2CP technology developed by Nitidæ and which has already proved its worth on the agro-
industrial platform in Kita.
- If the quantity of waste is large (as in the case of cashew nut or shea factories: MaliShi), the production
of electricity can be envisaged.
❖ Concerning the transport & agriculture and forestry sector, the production of biofuel from jatropha and
ethanol from sugar cane would be an alternative to substitute part of the consumption of diesel and
petrol in these two sectors.
4.5. Senegal
4.5.1. Energy resources
Primary energy production
Figure 54: Total primary energy production in 2017 (in Ktoe)
Total primary energy production in Senegal was about 600 ktoe in 2017 and is mainly (over 90%) based on
biomass, especially wood energy (fuelwood and charcoal). The country also produces, but to a much lesser
extent, hydropower, gas and electricity.
Natural resources (solar and wind energy), representing respectively nearly 0.6% and less than 1% of total
primary energy production (see Figure 54).
Unlike some countries on the African continent (Nigeria, Angola, Algeria...), Senegal does not produce crude oil
or mineral coal.
Total primary energy supply
20.21 30.69
542.53
0.530
100
200
300
400
500
600
Natural gas Hydroelectricity Biomass (wood-energy,biogas, biofuel, etc.)
Wind and solar power

112
A report on the energy demand by sector for the selected countries
Figure 55: Total primary energy supply in 2017 (in ktoe)
Source: (AFREC, 2019)
To meet all its energy needs, the country imports large quantities of energy based on fossil fuels such as crude
oil (1172 kt/year), oil products (1220 kt/year) but also mineral coal (615 kt/year). In 2017, these accounted for
more than 75% of the country's total primary energy supply, being estimated at nearly 2600 ktoe, and more
precisely 49%, 19% and 12% respectively of this total (see Figure 55).
Biomass, also including biogas and biofuel in addition to wood energy, still accounts for about 20% of this total
supply. It should be noted that biomass flows (import and export, especially wood energy with neighbouring
countries such as Gambia and Mali) are not taken into account since they are equal to zero in AFREC's energy
balance sheet, which suggests an undervaluation of biomass volumes in terms of both supply and consumption.
Also, although minimal, it should be noted that the country imports electricity (equivalent to 26 ktoe) at a rate
of only 1% of its total primary energy supply.
4.5.1.1. Biomass
Forest bioenergy: In 2017, the country produced more than 1500 kilotonnes (kt) of firewood compared to more
than 200 kt of charcoal (see Figure 56).
Figure 56: Fuelwood and charcoal production in Senegal (Ktoe)
Source: (AFREC, 2019)
1172.24
484.71313.18
20.21 30.69
542.53
0.53 26.230
200
400
600
800
1000
1200
1400
(AFREC, 2019)

113
A report on the energy demand by sector for the selected countries
Although charcoal production appears to have been broadly stable between 2000 and 2015, there has been a
significant decline in fuelwood production since 2012 (substantially offset by an increase in charcoal production
in 2013 and 2014), but especially since 2015, when charcoal production slightly diminished. This decrease is to
be understood in the context of measures to ban logging in much of the country, as reported in the previous
report 2.1.
Therefore, it is likely that the considerable decline in the production of wood fuels since 2015 has been offset
by the increase in the use of LPG (butane gas).
Agricultural and vegetable waste: The country also produces residual agricultural biomass, including residues
of groundnuts (shells), cereals (straw), cotton (stems) and sugar (bagasse). Groundnut shells and sugar cane
bagasse are now being exploited for various energy purposes. At least bagasse has been accounted in this
balance sheet.
There have also been initiatives to produce bio-coal from straw (NEBEDAY, n.d) since 2015.
4.5.1.2. Hydroelectricity
Hydropower is the best established and most commonly used renewable energy technology in West Africa and
is the only technology used on a commercial scale in most ECOWAS member states.
According to AFREC, installed hydroelectric capacity in Senegal would have reached 357 GWh in 2017.
The country has six hydroelectric power stations managed by independent power producers according to the
Senegalese CRSE (Comission de Régulation du Service Electrique), which publishes a compendium of the
different profiles of power producers on its website (CRSE, n.d.). The installed capacity of the two power stations
already commissioned since 2002 and 2013 is respectively 66 MW for the Manantali power station (which also
supplies Mali with 144 MW) against 15 MW for the Felou power station. That of the four power stations under
construction varies from 35 MW to 128 MW, for a total cumulated power of 333 MW.
4.5.1.3. Oil and derivatives
Figure 57: Total primary energy supply in 2017 in Senegal (in ktoe)
Source: (AFREC, 2019)
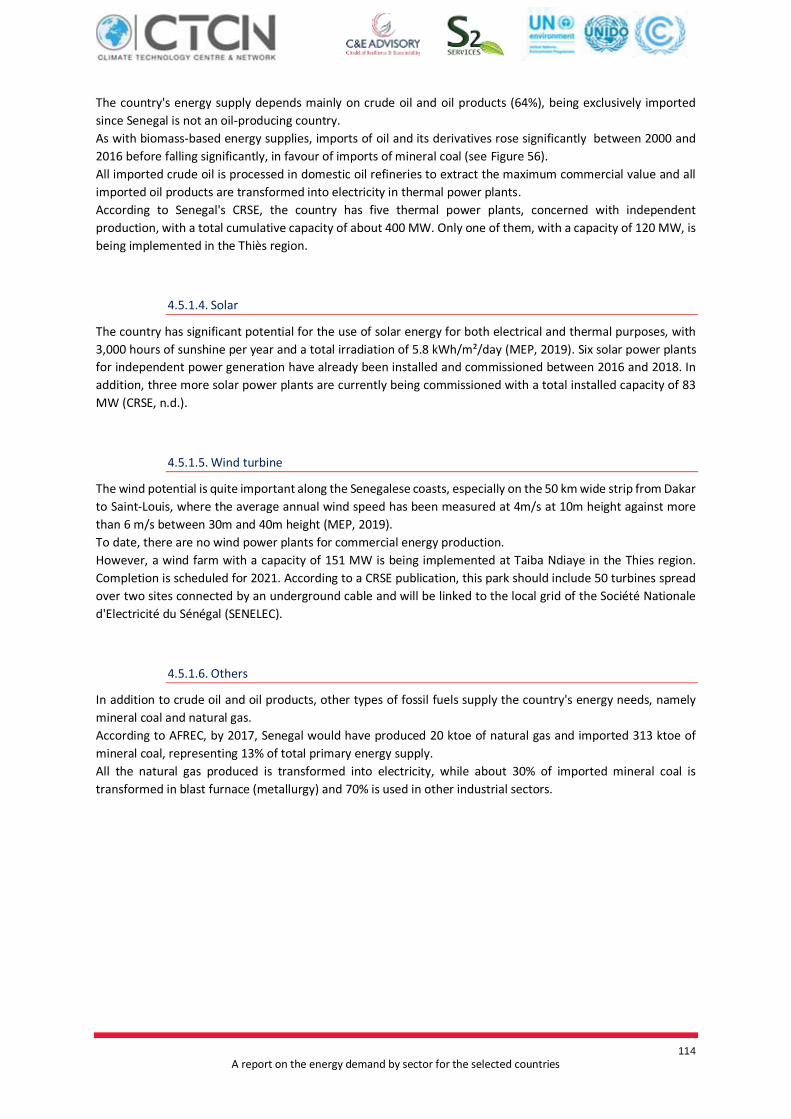
114
A report on the energy demand by sector for the selected countries
The country's energy supply depends mainly on crude oil and oil products (64%), being exclusively imported
since Senegal is not an oil-producing country.
As with biomass-based energy supplies, imports of oil and its derivatives rose significantly between 2000 and
2016 before falling significantly, in favour of imports of mineral coal (see Figure 56).
All imported crude oil is processed in domestic oil refineries to extract the maximum commercial value and all
imported oil products are transformed into electricity in thermal power plants.
According to Senegal's CRSE, the country has five thermal power plants, concerned with independent
production, with a total cumulative capacity of about 400 MW. Only one of them, with a capacity of 120 MW, is
being implemented in the Thiès region.
4.5.1.4. Solar
The country has significant potential for the use of solar energy for both electrical and thermal purposes, with
3,000 hours of sunshine per year and a total irradiation of 5.8 kWh/m²/day (MEP, 2019). Six solar power plants
for independent power generation have already been installed and commissioned between 2016 and 2018. In
addition, three more solar power plants are currently being commissioned with a total installed capacity of 83
MW (CRSE, n.d.).
4.5.1.5. Wind turbine
The wind potential is quite important along the Senegalese coasts, especially on the 50 km wide strip from Dakar
to Saint-Louis, where the average annual wind speed has been measured at 4m/s at 10m height against more
than 6 m/s between 30m and 40m height (MEP, 2019).
To date, there are no wind power plants for commercial energy production.
However, a wind farm with a capacity of 151 MW is being implemented at Taiba Ndiaye in the Thies region.
Completion is scheduled for 2021. According to a CRSE publication, this park should include 50 turbines spread
over two sites connected by an underground cable and will be linked to the local grid of the Société Nationale
d'Electricité du Sénégal (SENELEC).
4.5.1.6. Others
In addition to crude oil and oil products, other types of fossil fuels supply the country's energy needs, namely
mineral coal and natural gas.
According to AFREC, by 2017, Senegal would have produced 20 ktoe of natural gas and imported 313 ktoe of
mineral coal, representing 13% of total primary energy supply.
All the natural gas produced is transformed into electricity, while about 30% of imported mineral coal is
transformed in blast furnace (metallurgy) and 70% is used in other industrial sectors.

115
A report on the energy demand by sector for the selected countries
4.5.2. Key economic sectors according to NDP
Figure 58: Total final energy consumption in Senegal, 2017 (in Ktoe)
Source: (AFREC, 2019)
The total final energy consumption in 2017 (1906 ktoe/year) of the country's various economic sectors comes
mainly from the use of oil products (59% of the total) but also from electricity (18%), biomass (15%) in a broad
sense (firewood, charcoal, biogas, biofuel...) and mineral coal (12%) (see Figure 58).
It should be noted that:
(i) All imported and refined crude oil is used to power thermal power plants to produce electricity.
(ii) hydropower, natural gas, solar and wind energy produced at national level, equivalent to about 30
and 20 and 0.5 ktoe/year respectively, are fully transformed into electricity.
The transport sector is the country's main energy-consuming sector (45% of the total), followed by industry and
households (23% and 21% respectively), while trade and public services represent only 9% of the total against
2% for other unspecified sectors and less than 1% for agriculture & forestry (see Figure 59).
1069.24
219.68276.68
340.24
0
200
400
600
800
1000
1200
Petroleum products Coal (mineral)Biomass (wood-energy, biogas, biofuel, etc.)Electricity
Total final consumption in 2017 (in ktoe) (AFREC, 2019)
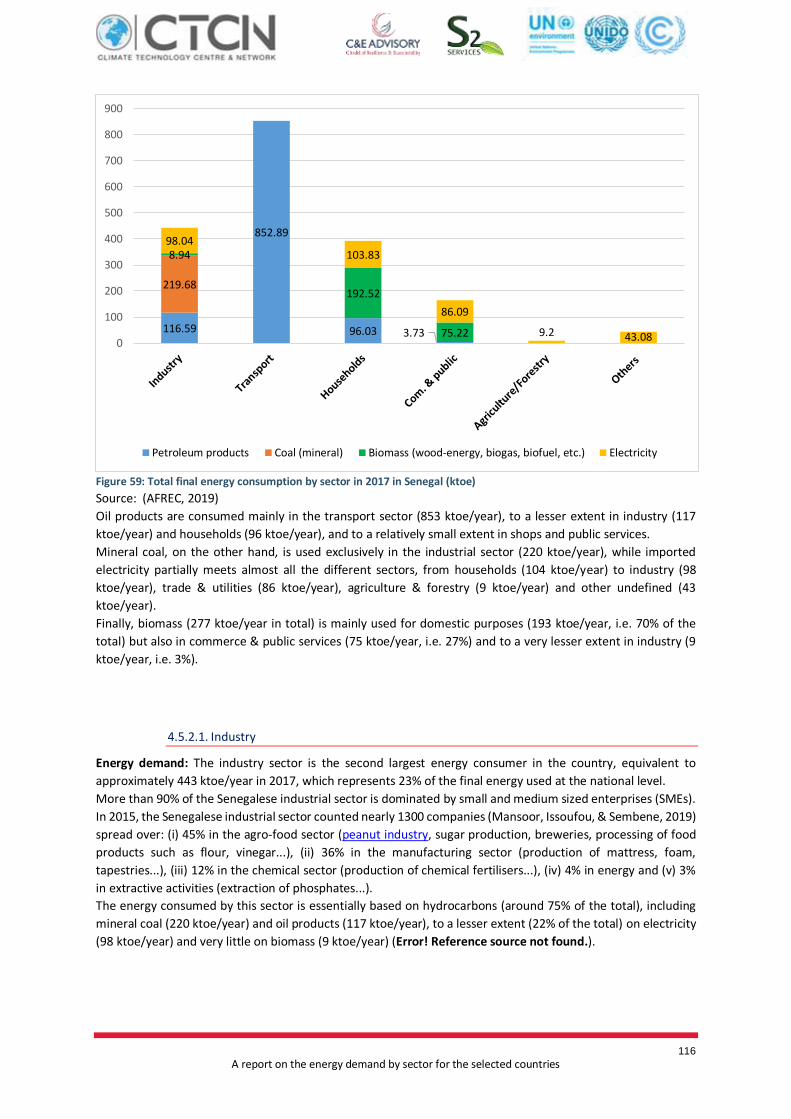
116
A report on the energy demand by sector for the selected countries
Figure 59: Total final energy consumption by sector in 2017 in Senegal (ktoe)
Source: (AFREC, 2019)
Oil products are consumed mainly in the transport sector (853 ktoe/year), to a lesser extent in industry (117
ktoe/year) and households (96 ktoe/year), and to a relatively small extent in shops and public services.
Mineral coal, on the other hand, is used exclusively in the industrial sector (220 ktoe/year), while imported
electricity partially meets almost all the different sectors, from households (104 ktoe/year) to industry (98
ktoe/year), trade & utilities (86 ktoe/year), agriculture & forestry (9 ktoe/year) and other undefined (43
ktoe/year).
Finally, biomass (277 ktoe/year in total) is mainly used for domestic purposes (193 ktoe/year, i.e. 70% of the
total) but also in commerce & public services (75 ktoe/year, i.e. 27%) and to a very lesser extent in industry (9
ktoe/year, i.e. 3%).
4.5.2.1. Industry
Energy demand: The industry sector is the second largest energy consumer in the country, equivalent to
approximately 443 ktoe/year in 2017, which represents 23% of the final energy used at the national level.
More than 90% of the Senegalese industrial sector is dominated by small and medium sized enterprises (SMEs).
In 2015, the Senegalese industrial sector counted nearly 1300 companies (Mansoor, Issoufou, & Sembene, 2019)
spread over: (i) 45% in the agro-food sector (peanut industry, sugar production, breweries, processing of food
products such as flour, vinegar...), (ii) 36% in the manufacturing sector (production of mattress, foam,
tapestries...), (iii) 12% in the chemical sector (production of chemical fertilisers...), (iv) 4% in energy and (v) 3%
in extractive activities (extraction of phosphates...).
The energy consumed by this sector is essentially based on hydrocarbons (around 75% of the total), including
mineral coal (220 ktoe/year) and oil products (117 ktoe/year), to a lesser extent (22% of the total) on electricity
(98 ktoe/year) and very little on biomass (9 ktoe/year) (Error! Reference source not found.).
116.59
852.89
96.03 3.73
219.68
8.94
192.52
75.22
98.04103.83
86.09
9.2 43.080
100
200
300
400
500
600
700
800
900
Petroleum products Coal (mineral) Biomass (wood-energy, biogas, biofuel, etc.) Electricity

117
A report on the energy demand by sector for the selected countries
Figure 60: Total final energy consumption of the industry sector in 2017 in Senegal (ktoe)
Source: (AFREC, 2019)
Percentage of biomass used in the sector: The part of biomass consumed in the energy balance of the industrial
sector is very low, at 2% of the total.
Among the different experiences in the field of biomass energy recovery for industrial purposes, it can be
mentioned the energy autonomy achieved by the Compagnie Sucrière Sénégalaise (CSS). Indeed, this company
uses bagasse (cane residues) as fuel in a steam boiler coupled to a tube to provide the energy required to operate
machinery and other equipment such as irrigation pumps.
In addition, it should be noted that this company has a distillery, with a capacity of 12 million litres per year, for
the production of alcohol for export.
Contribution of forest bioenergy in the sector: Forest biomass could contribute to the supply of thermal energy
first, by taking forest residues such as sawdust or wood chips. These would have to be collected from wood
processing sites, although, as reported in Report 2.1, the sawnwood sector is difficult to characterize and is
currently in decline.
Forest biomass, used on a large scale, would make it possible to supply part of the electricity needs of the
industrial sector through the installation of biomass power plants, producing electricity from the water vapour
released by burning wood. The resource should, however, come from reforestation, in order to reduce the
pressure on the national forest heritage, which is currently protected against this type of exploitation.
Also, it may be envisaged to develop energy self-sufficiency projects in certain factories using non-timber forest
products, such as, for example, the pyrolysis of cashew nut shells to produce the thermal energy needed to
process cashew nuts and, on a larger scale, the production of electricity from these materials.
4.5.2.2. Transport
Energy demand of the sector: Transport is the most energy-consuming sector in terms of the country's total
final energy consumption, with a total of approximately 853 ktoe consumed annually, or 45% of the total.
Oil products provide all the energy consumed by this sector (petrol, diesel, paraffin, etc.). The latter absorbs
about 80% of the oil products consumed by the various economic sectors of the country.
Percentage of biomass used in the sector: At present, bioenergy does not contribute to the energy supply of
the transport sector at the national level.
116.59
219.68
8.94
98.04
Consumption total final energy consumption of the industry sector in 2017 (in ktoe) (AFREC, 2019)
Petroleum products
Coal (mineral)
Biomass (wood-energy,biogas, biofuel, etc.)
Electricity
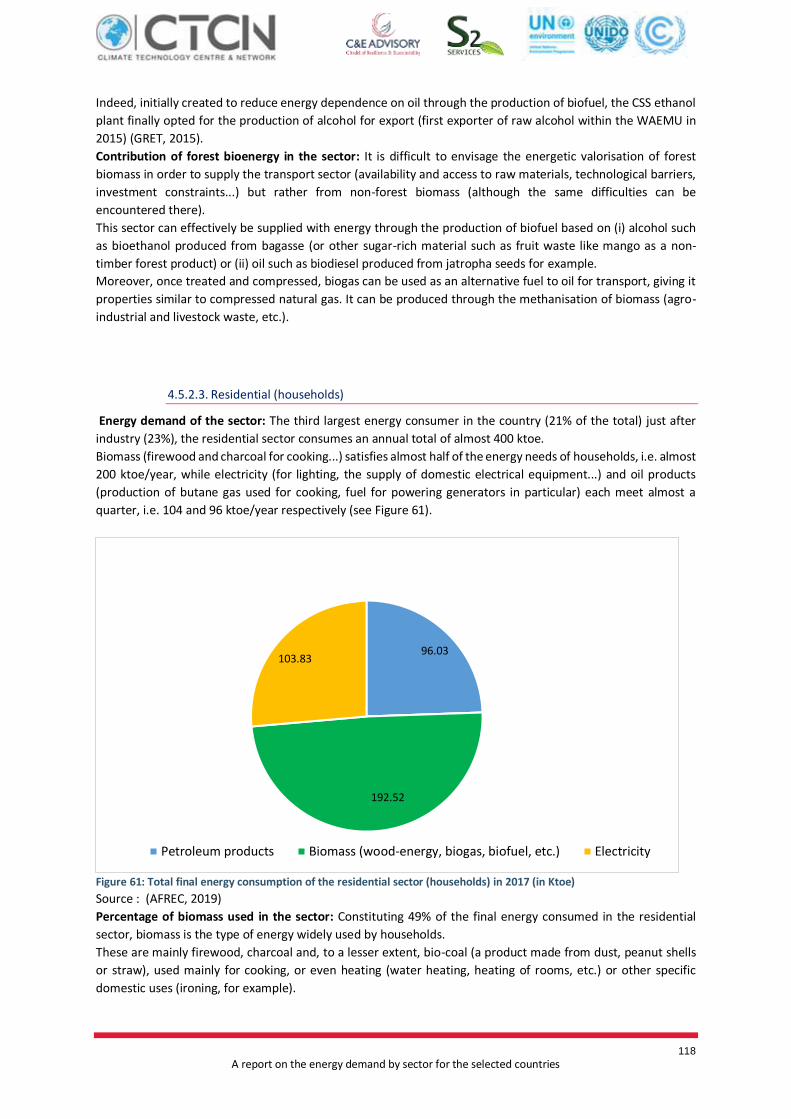
118
A report on the energy demand by sector for the selected countries
Indeed, initially created to reduce energy dependence on oil through the production of biofuel, the CSS ethanol
plant finally opted for the production of alcohol for export (first exporter of raw alcohol within the WAEMU in
2015) (GRET, 2015).
Contribution of forest bioenergy in the sector: It is difficult to envisage the energetic valorisation of forest
biomass in order to supply the transport sector (availability and access to raw materials, technological barriers,
investment constraints...) but rather from non-forest biomass (although the same difficulties can be
encountered there).
This sector can effectively be supplied with energy through the production of biofuel based on (i) alcohol such
as bioethanol produced from bagasse (or other sugar-rich material such as fruit waste like mango as a non-
timber forest product) or (ii) oil such as biodiesel produced from jatropha seeds for example.
Moreover, once treated and compressed, biogas can be used as an alternative fuel to oil for transport, giving it
properties similar to compressed natural gas. It can be produced through the methanisation of biomass (agro-
industrial and livestock waste, etc.).
4.5.2.3. Residential (households)
Energy demand of the sector: The third largest energy consumer in the country (21% of the total) just after
industry (23%), the residential sector consumes an annual total of almost 400 ktoe.
Biomass (firewood and charcoal for cooking...) satisfies almost half of the energy needs of households, i.e. almost
200 ktoe/year, while electricity (for lighting, the supply of domestic electrical equipment...) and oil products
(production of butane gas used for cooking, fuel for powering generators in particular) each meet almost a
quarter, i.e. 104 and 96 ktoe/year respectively (see Figure 61).
Figure 61: Total final energy consumption of the residential sector (households) in 2017 (in Ktoe)
Source : (AFREC, 2019)
Percentage of biomass used in the sector: Constituting 49% of the final energy consumed in the residential
sector, biomass is the type of energy widely used by households.
These are mainly firewood, charcoal and, to a lesser extent, bio-coal (a product made from dust, peanut shells
or straw), used mainly for cooking, or even heating (water heating, heating of rooms, etc.) or other specific
domestic uses (ironing, for example).
96.03
192.52
103.83
Petroleum products Biomass (wood-energy, biogas, biofuel, etc.) Electricity

119
A report on the energy demand by sector for the selected countries
Although not widespread at the national level, it should be noted that biogas, produced from cow dung or
slaughterhouse waste, also provides cooking energy for more than 1,300 households (domestic biodigesters
produced as part of Senegal's National Biogas Programme and biodigesters from the St-Louis slaughterhouse
with a production capacity of 10,000 m3 per year to supply 12 households with biogas).
Contribution of forest bioenergy in the sector: Beyond the use of firewood and charcoal, in particular as fuel
for domestic cooking, there seem to be relatively many possibilities for the use of forest biomass (including
residues of non-wood forest products) or non-forest biomass (agro-industrial biomass from non-forest sources)
for household energy supply:
➢ Production of alternative charcoal (biochar) from forest residues (wood dust available in charcoal
distribution points in large cities, sawdust and wood chips in sawmills, cashew nut shell or cashew nut
shell dust in cashew nut processing plants, etc.) and/or agricultural residues (peanut shell, rice husk,
cotton stem... available in the production areas of these crops);
➢ Production of biogas, from cow dung or other fermentable biomasses (slaughterhouse waste, fruit
waste, especially mangoes, etc.) for cooking and lighting purposes, or even for decentralized
electrification.
➢ Electricity production in biomass power plants (wood from reforestation and sustainable management,
sawdust and wood chips, agricultural residues, etc.).
➢ Production of biofuel as an alternative to oil to power household generators (bioethanol from bagasse
or other sugar-rich waste, biodiesel from jatropha oil, etc.).
4.5.2.4. Businesses and public services
Energy demand of the sector: The commercial and public services sector represents only a small part of the
country's energy consumption, i.e. less than 10% of the total (165 ktoe/year out of the total of 1906 ktoe
consumed annually).
Nearly 98% of the energy used by this sector comes from electricity (89 ktoe/year; street lighting, power supply
of public buildings, shops and restaurants...) and biomass (75 ktoe/year; firewood and coal used in
restaurants...); and only 2% from oil products (butane gas used in restaurants, fuel for generators...) (see Figure
62).
Percentage of biomass used in the sector: Almost half of the energy needs of this sector are derived from
biomass (46% of the total) and, more particularly, mainly from the use of firewood and charcoal as cooking fuel
for catering. Due to the fact that the informal economy is widespread in the country, especially street catering,
it is likely that this energy consumption has been underestimated.
In spite of its very small part in the total electricity consumption of this sector, it is worth highlighting two
experiences in the production of biogas for the purpose of "clean" electricity production.
In the field of trade (meat), the Société de Gestion des Abattoirs du Sénégal (SOGAS) in Dakar produces annually
517,000 m3 of biogas which is energetically recovered thanks to a cogeneration unit (production of 800
MWh/year of electrical energy and 1700 MWh/year of thermal energy (ReCube, 2016).
In the field of public services (sanitation), the Cambérène wastewater treatment plant produces 51,100 m3 of
biogas annually, which is converted into electrical and thermal energy via a cogeneration system. This self-
produced clean energy on site reduces the conventional energy used in the plant by 50% (Incatema, 2019).

120
A report on the energy demand by sector for the selected countries
Figure 62: Total final energy consumption of the commercial and public services sector in 2017 in Senegal (in ktoe)
Source: (AFREC, 2019)
Contribution of forest bioenergy in the sector: The proposals made above in chapter "4.5.2.3" concerning
households are applicable here, particularly for businesses (restaurants, slaughterhouses, etc.).
4.5.2.5. Agriculture and forestry
Energy demand of the sector: The agriculture and forestry sector consumes less than 1% of the country's total
final energy, i.e. only 9 ktoe/year solely from electricity (power supply of cold rooms for the conservation of
agricultural products, and possibly also of machinery in wood processing plants).
Percentage of biomass used in the sector: No biomass is used to meet the energy needs of this sector.
Contribution of forest bioenergy in the sector: As mentioned in chapters "1.1.1" relating to the industrial sector
and "4.5.2.3" relating to the residential sector, electricity generation in forest biomass plants (wood, sawmill
waste, non-timber forest product residues, etc.) could be considered.
2.1.6 Conclusions and recommendations
Main sectors with potential for bioenergy
In a country that is highly dependent on imported fossil fuels to meet its energy needs, but at the same time is
seeing its forest resources dwindle due to the ever-increasing demand of wood energy, it is essential to act with
measures that will reduce this trend in two ways: firstly, to reduce the consumption of primary resources (energy
efficiency), and finally to make the exploitation of the resource sustainable (among other things, by increasing
the supply of modern biomass, such as charcoal from managed sources, bio-coal or biogas).
The economic sector with the best potential to act on this use of biomass for energy purposes seems to be
households since 70% of biomass is consumed by them. This biomass is used for thermal purposes (mainly
cooking) which is the most appropriate use for the type of biomass used (wood fuels from small trees, crop
residues and small-scale biogas).
Also, the commercial & public services and industry sectors present a significant potential for biomass use as
these sectors (i) consume the remaining 30% of biomass and (ii) depend on the use of electricity to meet their
energy needs, respectively up to 52% and 22%.
Recommendations
The fact that :
3.73
75.2286.09
Petroleum products Biomass (wood-energy, biogas, biofuel, etc.) Electricity

121
A report on the energy demand by sector for the selected countries
(i) Biomass satisfies almost half of households' energy needs (around 50%), thus leaving considerable
room for improvement (especially since 26% of households' energy needs are met by importing
electricity, compared with 24% for importing oil products),
and
(ii) Senegal is characterised by a very young population (average age of the population is 19 years,
with an estimated projection in 2020 of 16.7 million) and is experiencing very significant population
growth (population growth rate of around 3% between 2017 and 2018) (Ansd, 2012), households
a priori represent the most promising sector in terms of access to modern biomass-based energy
services.
4.6. Togo
4.6.1. The country's energy resources
Primary energy supply
Figure 63: Details of Togo's energy supply in 2016 Source: (SIE, 2016)
Togo's Energy Information System, in its 2016 report (SIE 2016) 21 oil products and electricity.
Data from the African Energy Commission (AFREC) confirms this trend. Indeed, in 2017, biomass, oil products
and electricity also constituted the essential of the total primary energy supply (AFREC 2019).
21 Where no additional sources are mentioned, the 2016 energy data correspond to the EIS 2016 data.

122
A report on the energy demand by sector for the selected countries
Figure 64: Total primary energy supply in 2017 in Togo (in ktoe)
Source: (AFREC, 2019)
Figure 65: Growth curve of Togo's supply of energy by source
Source: (AFREC, 2019)
Error! Reference source not found. presents the evolution of energy production in Togo between 2000 and
2017 (with projections for 2018 and 2019).
At the level of national energy production, as shown in Error! Reference source not found. below, is by far the
most important locally produced energy source in Togo. Since 2016, production has been increasing to meet the
cooking energy needs of the population. It can also be seen that since 2017, almost 90% of the electricity
produced by Togo is dominated by fossil fuels, specifically oil products, 100% of which are imported. On the
other hand, the contribution of renewable energies (especially hydraulic) to this electricity production has
decreased. The part of other renewable energies (solar, wind, etc.) is marginal (around 3% since 2017).
0466.13
0 31.84 8.86 2.18
3421.23
72.740
500
1000
1500
2000
2500
3000
3500
4000
Total primary energy supply in 2017 (in ktoe) (AFREC, 2019)

123
A report on the energy demand by sector for the selected countries
Figure 66: Production in Togo between 2000 and 2019 (Ktoe)
Source: (AFREC 2019)
*the years 2018 and 2019 are projections
Table 40: Trends in energy production in Togo between 2000 and 2019
Years
2000 2005 2014 2015 2016 2017 2018 * 2019*
Coal Production (ktoe) - - - - - - - -
Charcoal production (ktoe) 330 374 493 369 513 542 542 542
Production of crude oil, NGL and
additives (ktoe) - - - - - - - -
Natural gas production (ktoe) - - - - - - - -
Electricity production from biofuels,
waste (ktoe) 0 0 0 0 0 0 0 0
Electricity generation with fossil fuels
(ktoe) 6 10 2 2 2 51 56 56
Hydroelectric power generation (ktoe) 9 6 10 5 20 9 10 10
Electricity production from solar,
wind, etc. (ktoe) 0 0 2 2 2 2 2 2
Total electricity production (ktoe) 15 16 14 9 24 63 68 68
Production of oil products in
refineries(ktoe) - - - - - - - -
Source: (AFREC 2019) *projection
0
100
200
300
400
500
600
2000 2005 2014 2015 2016 2017 2018 2019
Production between 2000 and 2019* (ktoe)
Charcoal production (ktoe) Electricity generation with fossil fuels (ktoe)
Hydroelectric power generation (ktoe) Electricity production from solar, wind, etc. (ktoe)
Total electricity production (ktoe)

124
A report on the energy demand by sector for the selected countries
Biomass
Biomass is an important source of energy in Togo. It is dominated by wood energy (firewood and charcoal) and
is mainly used by households, and to a certain extent by businesses.
Biomass consumption comes entirely from domestic resources. Total production in 2016 was 2,735 ktoe in
primary energy, with 99% (2,711 ktoe) of wood energy and the rest of plant waste (24 ktoe). More than a third
(35%) of the wood is used as is, mainly by households (i.e. a consumption of 965 ktoe), and almost all the rest is
transformed into charcoal with a mass yield of 15% (i.e. an energy yield of 29.5%), allowing a final consumption
of 514 ktoe. In 2017, total biomass production was 3 421 ktoe, an increase of 25% compared to 2016.
Hydroelectricity
Togo's hydroelectric potential is very important thanks to the river network. About forty sites have been
prospected on the Mono, Oti and Sio rivers, of which nearly half (23) have a potential of more than 2 MW. Thus,
according to the EIS 2016 report, the expected production of all the sites is estimated at about 850 GWh for a
power to be installed of about 224 MW.
In 2017, the production of hydroelectric power was 8.86 ktoe, or 103,042 MWh. The best-known dam is that of
Nangbéto, a few kilometres from the town of Atakpamè. This dam is operated by the Communauté Électrique
du Bénin (CEB) for a total power of 64 MW.
Oil and derivatives
Togo is 100% dependent on imports for its supply of oil products. Since 2009, supplies of oil products have surged
and its consumption remains sustained until a decline in 2017 of 13.5% compared to the previous year. In 2016,
supply amounted to 539 ktoe. A large majority (72% or 387 ktoe) is consumed as is, mainly by the transport
sector, and the rest (152 ktoe) is used for electricity production with an efficiency of 23% for public power plants.
Solar
According to a SE4all (2012) report, new and renewable energies (solar, wind, biofuels, etc.) are marginal (or
even insignificant) in Togo's energy balance (SE4all, 2012).
Thus, in 2012, according to this report, the total installed solar power capacity at the national level was 301.92
kWp. It is often used for the electrification of social infrastructures: schools, dispensaries, drinking water
pumping, etc. in rural areas.
Togo's 2017 energy balance reports 2.18 ktoe (25,353 MWh) of solar, wind and geothermal energy production.
It is legitimate to blame everything on solar energy, as wind power is not yet developed in the country, and the
potential for geothermal energy is nil. This energy would come in particular from off-grid solar systems, as the
first solar power plant connected to the electricity system is expected in 2021 in Blitta (50MW).
Wind turbine
According to the SE4all report, the installed capacity in 2012 was 5.7 kW. It is used for pumping drinking water
in rural areas, precisely in the locality of Ataloté (Prefecture of Kéran) by the Sisters for water pumping. However,
these sources have not been referenced in the WIS 2016, which is why the production of primary renewable
wind energy has been estimated at 0.
The report points out that a project for the construction of wind power plants (24 MW) was announced and
could see the first connections to the grid.

125
A report on the energy demand by sector for the selected countries
4.6.2. Key economic sectors according to NDP
Togo's national final consumption of energy resources is presented in Error! Reference source not found..
Table 41: National final energy consumption of Togo's energy resources between 2000 and 2019
Years 2000 2005 2014 2015 2016 2017 2018* 2019*
Final Coal Consumption (ktoe) 0 0 0 0 0 0 0 0
Final oil consumption(ktoe) 271 286 544 594 617 364 376 376
Final consumption of natural gas (ktoe) - - - - - - - -
Final electricity consumption (ktoe) 40 52 99 107 107 155 161 161
(*2018 and 2019: projections)
Oil consumption increased significantly between 2005 and 2016. However, since 2017, this consumption has
fallen.
On the other hand, electricity consumption is on the rise. In two decades, electricity consumption has
quadrupled from 40 ktoe in 2000 to 161 ktoe in 2019. This could be explained by the increase in the coverage
rate and the rise in the number of households with access to electricity.
A comparison of oil and electricity consumption reveals a reversed trend in both since 2016. This could be
reflected in the fact that oil consumption is gradually being reduced in favour of electricity.
Figure 67: Total final consumption between 2000 and 2019
Even if this is not shown in the above table, it should be noted that the final consumption of energy sources in
Togo is dominated by biomass. In fact, in 2016, it accounted for 76% of the country's final energy consumption,
mainly wood fuels (wood and charcoal) and some agricultural residues. In 2017, biomass consumption was
1919.15 or 79% of the country's total final consumption.
0
100
200
300
400
500
600
700
2000 2005 2014 2015 2016 2017 2018 2019
Total final consumption between 2000 and 2019 (ktoe)
Final Coal Consumption Final oil consumption Final electricity consumption

126
A report on the energy demand by sector for the selected countries
Figure 68: Distribution of final consumption by energy source
in 2016
Figure 69: Total final consumption in 2017 in Togo
Source: (SIE, 2016) Source: (AFREC 2019)
According to the figures above, final energy consumption would have increased by 22% compared to 2016.
Indeed, final energy consumption in Togo has jumped since 2015 as reported by the statistics collected by AFREC;
biomass taking an increasingly important part in the total energy consumption. Thus, according to EIS 2016,
1499 ktoe of biomass would have been consumed in 2016 against 1919 ktoe in 2017. This may not necessarily
correspond to a real leap in biomass consumption, but rather to an increasingly comprehensive energy
intelligence system, which the 2017 EIS was able to identify more sources than in previous editions.
The distribution of this consumption in 2017 by sector of activity is as shown in Figure 71.
Figure 70: Distribution of final energy consumption by activity sector in 2017
Figure 71: Distribution of final energy consumption by activity sector in 2017
Source: (AFREC 2019)
According to the most recent balance sheet available (2017), households account for the largest part of the final
energy consumption (59%), followed by the commercial and public sector (24%) and then transport (14%).
Industry would represent only 3% of the total.
Petroleum products, 16%
Biomass, 79%
Electricity, 5%
2415 ktep
3%
14%
59%
24%
Breakdown of final consumption of energy by sector of activity in 2017
Industry
Transport
Households
Com. & public
2415 ktep

127
A report on the energy demand by sector for the selected countries
Figure 72: Total final energy consumption by sector in 2017 in Togo (in ktoe)
Source: (AFREC, 2019)
4.6.2.1. Industry
Energy demand: The country is weakly industrialised and the part of this sector in energy consumption is proof
of this. The industrial fabric is represented above all by agro-food processing, followed by extractive and mining
processing activities (WTO, 2012). The latter weigh heavily in the energy balance of the industry, because they
are very energy-consuming activities: extraction of phosphates, production and grinding of clinker, iron ore and
marble. In 2016, mining products accounted for around 60% of the country's exports. Among the major food
processing industries there is at least one oil mill producing cotton oil and shea butter, based in Lomé.
The following table presents energy consumption in industry in Togo according to AFREC sources. Table 42: Energy consumption in industry in Togo
Years 2000 2005 2014 2015 2016 2017 2018* 2019*
Industrial oil consumption
(ktoe) 85 30 52 57 60 9 10 10
Industrial consumption of
natural gas (ktoe) - - - - - - - -
Industrial electricity
consumption (ktoe) 11 16 28 34 35 54 56 56
Industrial Coal Consumption
(ktoe) - - - - - - - -
Source: (AFREC 2019) (*projections)
After 2016, the consumption of oil in industries in Togo decreased, unlike that of electricity, which increased
more significantly from that date.
8.74
351.72
19.882.03
1346.07
573.08
54.17
50.64
8.86
9.243.080
200
400
600
800
1000
1200
1400
1600
Final consumption according to sectors in 2017 (in ktoe) (AFREC, 2019)
Petroleum products Coal (mineral) Biomass (wood-energy, biogas, biofuel, etc.) Electricity

128
A report on the energy demand by sector for the selected countries
Figure 73: l energy consumption in industries in Togo between 2000 and 2019
Source: (AFREC 2019)
Percentage of biomass used in the sector: Available data show an insignificant or even non-existent part of
biomass in industrial energy consumption. Oil and electricity would remain the only sources of energy used in
industries in Togo as illustrated in the following figure.
Nevertheless, it has been reported from a good source that the Nioto oil mill in Lomé uses its residual biomass
to provide itself with thermal energy (Icilome, 2019). The omission of this contribution suggests that other uses
of biomass in industry have also not been identified in the EISs for the moment. The balance sheet would
therefore give partial information, although certainly the part of biomass in the final energy is expected to be
minimal compared to other energy sources (oil products and electricity).
Figure 74: Distribution of energy consumption in industries in Togo in 2017
Source: (AFREC 2019)
Contribution of forest bioenergy in the sector: The low part of industrial energy consumption in total energy
consumption (3% in 2016 and 2017 for example) reflects the country's low level of industrialization. In addition,
the large part of electricity in this consumption could indicate that these industries use much less calorific energy
(heat). Indeed, the processing of the various products of the subsoil requires large quantities of electricity.
Grinding, cutting, etc. units require power in the order of MW in order to be able to operate.
0
20
40
60
80
100
2000 2005 2014 2015 2016 2017 2018 2019
Final energy consumption in industries in Togo between 2000 and 2019 (ktoe)
Industrial Coal Consumption (ktoe) Industrial electricity consumption (ktoe)
Industrial oil consumption (ktoe)
14%
86%
Distribution of energy consumption in industries in Togo in 2017
Petroleumproducts
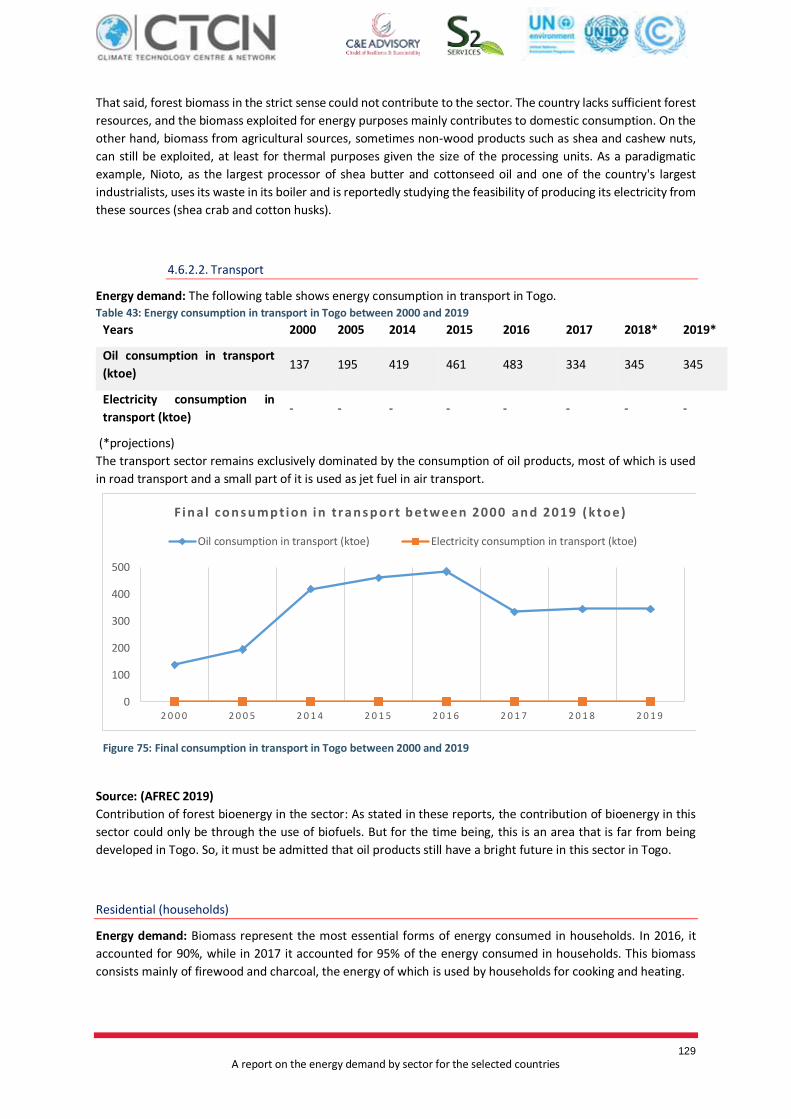
129
A report on the energy demand by sector for the selected countries
That said, forest biomass in the strict sense could not contribute to the sector. The country lacks sufficient forest
resources, and the biomass exploited for energy purposes mainly contributes to domestic consumption. On the
other hand, biomass from agricultural sources, sometimes non-wood products such as shea and cashew nuts,
can still be exploited, at least for thermal purposes given the size of the processing units. As a paradigmatic
example, Nioto, as the largest processor of shea butter and cottonseed oil and one of the country's largest
industrialists, uses its waste in its boiler and is reportedly studying the feasibility of producing its electricity from
these sources (shea crab and cotton husks).
4.6.2.2. Transport
Energy demand: The following table shows energy consumption in transport in Togo. Table 43: Energy consumption in transport in Togo between 2000 and 2019
Years 2000 2005 2014 2015 2016 2017 2018* 2019*
Oil consumption in transport
(ktoe) 137 195 419 461 483 334 345 345
Electricity consumption in
transport (ktoe) - - - - - - - -
(*projections)
The transport sector remains exclusively dominated by the consumption of oil products, most of which is used
in road transport and a small part of it is used as jet fuel in air transport.
Figure 75: Final consumption in transport in Togo between 2000 and 2019
Source: (AFREC 2019)
Contribution of forest bioenergy in the sector: As stated in these reports, the contribution of bioenergy in this
sector could only be through the use of biofuels. But for the time being, this is an area that is far from being
developed in Togo. So, it must be admitted that oil products still have a bright future in this sector in Togo.
Residential (households)
Energy demand: Biomass represent the most essential forms of energy consumed in households. In 2016, it
accounted for 90%, while in 2017 it accounted for 95% of the energy consumed in households. This biomass
consists mainly of firewood and charcoal, the energy of which is used by households for cooking and heating.
0
100
200
300
400
500
2 0 0 0 2 0 0 5 2 0 1 4 2 0 1 5 2 0 1 6 2 0 1 7 2 0 1 8 2 0 1 9
F i n a l co n s u m p ti on i n t r a n s p o r t b etw een 2000 a n d 2019 ( kto e)
Oil consumption in transport (ktoe) Electricity consumption in transport (ktoe)

130
A report on the energy demand by sector for the selected countries
Figure 76: Household energy consumption in 2016
Figure 77: Household energy consumption in 2017
Source: (EIS 2016)
Source: (AFREC 2019)
Businesses and public services
Energy demand: As seen above, the part of shops and public services in consumption is 24%.
According to AFREC data, in 2017, consumption in this sector was dominated by biomass consumption of about
573 ktoe or 98%.
Figure 78: Commercial and utility energy consumption in 2017
Source: (AFREC 2019)
Agriculture
Energy demand: There is very little or no information on energy consumption in this sector. The energy balances
drawn up between 2000 and 2016 in Togo's EIS (2016) report do not provide any data on energy consumption
in the agriculture sector, either on the consumption of oil products or on the consumption of biomass or
1
95
4
Energy consumption in households in 2017(%)
Petroleum products
Biomass (wood-energy,biogas, biofuel, etc.)
Electricity
98%
2%
Energy consumption in shops and public services in 2017
Biomass (wood-energy, biogas,biofuel, etc.)
Electricity
1416 ktep
584 ktep

131
A report on the energy demand by sector for the selected countries
electricity. Unless it is assumed that the sector does not consume energy (which seems unlikely), this could be
explained by the unavailability of this information. Especially since it is a quasi-informal sector, and occupies a
majority of the rural population, which is not always aware of the need for energy data. However, and as the EIS
(2016) reminds us, the absence of consumption of oil products and electricity in agriculture could be an indicator
of the low level of mechanization in Togolese agriculture (agricultural machinery) and the low use of
technologies for processing and conserving agricultural products in the broad sense (agriculture, forestry, fishing
and livestock).
However, as in most countries of the sub-region, it is a sector that provides residual biomass (cereal stems, hulls,
ears, raffles, etc.) available both in the fields and in processing sites. The latter remain, with a few exceptions,
very small in size, so the waste is scattered. This biomass could be an important source of energy but
unfortunately not yet sufficiently exploited.
2.6.3 Conclusions and recommendations
Main sectors with potential for bioenergy
In view of the above situation, the main sectors with bioenergy consumption potential are households and
commercial and public services, where energy is mainly used for cooking.
Recommendations
The large part of biomass, especially woody biomass (firewood and charcoal) in total household energy
consumption could be replaced by bioenergy in the form of biofuel. As noted in Report 2.1, some potential for
the valorization of charcoal dust in Lomé can be foreseen. However, the biomass that can be valorized into
bioenergy is mainly found in agricultural residues, which are not the subject of this study.
3 References
Abanda, F. (2012). Renewable energy sources in Cameroon: Potentials, benefits and enabling environment.
Renewable and Sustainable Energy Reviews, 16(7), 4557-4562.
doi:https://doi.org/10.1016/j.rser.2012.04.011
About Energy. (n.d.). Energy Overview. About energy.com. Retrieved 10 22, 2020, from Aboutenergy.com:
https://www.aboutenergy.com/en_IT/reportages/congo_eng/energy-overview.html?lnkfrm=All
ADEME. (2008). Les CONSOMMATIONSd’ÉNERGIE des PAYS de la CEDEAO et de la CEDEMAC. Agence de
l'Environment et de la Maítrise de l'Energie. Retrieved from
https://www.scribd.com/document/434688551/77908-Conso-Cedeao-Et-Cemac-
fr?language_settings_changed=English
AER-Mali. (n.d.).
AFREC. (2017).
AFREC. (2018). Africa Energy Database. African Union. Retrieved from https://afrec-
energy.org/Docs/En/PDF/2018/statistics_2018_afrec.pdf
AFREC. (2019).
AFREC. (2019).
AFREC. (2019).
AFREC. (2019).
Africa Energy Portal. (2020, 5 14). Djibouti: Geothermal project to boost green energy production capacity.
Retrieved 10 28, 2020, from Africa Energy Portal: https://africa-energy-portal.org/news/djibouti-
geothermal-project-boost-green-energy-production-capacity
Ansd. (2012). Retrieved 11 19, 2020, from Annuaire Statistique du Senegal: http://www.ansd.sn/

132
A report on the energy demand by sector for the selected countries
Barba, J. (2018, 1 18). The electricity sector in Burundi: a place for renewable energy in the great lakes region?
Retrieved 10 27, 2020, from Lexology.com:
https://www.lexology.com/library/detail.aspx?g=8a686f01-c89c-4db6-b973-164b5abda114
Bazex, K., & Antoine, R. L. (2019). Burundi Off-grid Access Project. The World Bank.
Benin Government. (2019, 8 30). Implementation of the PAG: The Maria-Gléta II power station now a reality.
Retrieved 11 19, 2020, from Government of the Republic of Benin:
https://www.gouv.bj/actualite/332/mise-en-%C5%93uvre-du-pag-la-centrale-electrique-de-maria-
gleta-ii-desormais-une-realite/
Bindo, M. (2017). Diagnosis of the Energy Sector of the Central African Republic. United Nations Development
Programme (UNDP. Retrieved from https://info.undp.org/docs/pdc/Documents/CAF/Rapport de
diagnostic du secteur %C3%A9nergie RCA VF.pdf
Burkina Faso Government. (2016). DECREE N ° 20161063 / PRES / PM / MEMC / MINEFID adopting the Energy
Sector Policy Letter (LPSE) N ° 52 OF DECEMBER 29, 2016. Retrieved from
https://translate.googleusercontent.com/translate_f
Burundi National Energy Report. (2017). Fostering cooperation in energy-efficiency and accessibility in East
Africa (pp. 1-22). Dr. Pierre-Cèlestine Karwanga.
Butler, R. (2016). Djibouti Forest Information and Data. Retrieved 7 1, 2020, from Mongabay.com:
https://rainforests.mongabay.com/deforestation/2000/Djibouti.htm
Campos, A. (2012). Equatorial Guinea. In A. Mehler, H. Melber, & K. v. Walraven (Eds.), Africa Yearbook Volume
9: Politics, Economy and Society South of the Sahara in 2012 (Vol. 9). doi:10.1163/1872-
9037_ayb_ayb2012_COM_0027
CEDEAO / République Côte d'ivoire. (2016). Plan d'Actions National des Energies Renouvelables.
CIA. (2020). The World Factbook: Equatorial Guinea. Retrieved 11 4, 2020, from The World Factbook:
https://www.cia.gov/library/publications/the-world-factbook/geos/ek.html
Constantine, T. (n.d). Energy for the emergence of the Congo: Energy strategies of the Congo 2015-2025.
Project Paper for Diploma in Energy Management. Retrieved from https://www.hec.ca/formations-
internationales/dess-congo/cohorte-1/DESS_CONGO_Strategie_rapport.pdf
CRSE. (n.d.). Commission de Régulation du Secteur de l’Electricité: Producteurs-independants. Retrieved 11 19,
2020, from Commission de Régulation du Secteur de l’Electricité: https://www.crse.sn/producteurs-
independants
Data, W. (n.d.). Energy consumption in Cameroon. Retrieved 10 22, 2020, from WorldData.info:
https://www.worlddata.info/africa/cameroon/energy-consumption.php
Djouedjom, G. T., & Zhao, X. (2018). Current Status of Renewable Energy in Cameroon. North American
Academic Research, 1(2), 71-80. Retrieved from
https://www.researchgate.net/publication/326635559_Current_Status_of_Renewable_Energy_in_Ca
meroon
Djoyum, B.-O. (2012, 9 19). Gold, diamonds, iron and bauxite buried in Cameroon. Retrieved 10 23, 2020, from
AgenceeCofin: https://www.agenceecofin.com/mines/1909-6733-de-l-or-du-diamant-du-fer-et-de-la-
bauxite-enterres-au-cameroun
Duarte, M. (2012). Renewable Energy in Mali: Achievements, Challenges and Opportunities. Retrieved from
https://www.afdb.org/fileadmin/uploads/afdb/Documents/Project-and-
Operations/RE%20Mali%20exec%20summary%20final.pdf
ECCAS-CEMAC. (2014). ECCAS White Paper of CEMAC: Regional policy for universal access modern energy
services andeconomic and social development (2014-2030). Economic Community of Central African

133
A report on the energy demand by sector for the selected countries
States (ECOWAS) and Central African Economic and Monetary Community (CEMAC). Retrieved from
https://www.se4all-
africa.org/fileadmin/uploads/se4all/Documents/News___Partners_Docs/ECCAS_CEMAC_livre_blanc_
energie_2014.pdf
ECREEE. (2012). Renewable Energy in West Africa: Status, experiences and trends. (Vilar, Ed.) ECOWAS Centre
for Renewable Energy and Energy Effeciency (ECREEE). Retrieved from
http://www.ecreee.org/sites/default/files/renewable_energy_in_west_africa_0.pdf
EDF. (2013). Renewable origin electricity production: details by region and by country: Gabon. Observ'ER.
Retrieved from http://www.energies-renouvelables.org/observ-er/html/inventaire/pdf/15e-
inventaire-Chap03-3.10.5-Gabon.pdf
EIA. (2017, 12). Equatorial Guinea. Retrieved 12 2020, from EIA: US Energy Information Administration:
https://www.eia.gov/international/analysis/country/GNQ
Encyclopedia of the Nations. (2020). Cameroon-Energy and Power. Retrieved 11 4, 2020, from Nations.
Encyclopedia: https://www.nationsencyclopedia.com/Africa/Cameroon-ENERGY-AND-
POWER.html#:~:text=Cameroon%20began%20offshore%20oil%20production,barrels%20per%20day%
20in%201999
Energypedia. (2019, 8 5). Gabon Energy Situation. Retrieved 11 4, 2020, from Energypedia.info:
https://energypedia.info/wiki/Gabon_Energy_Situation#Solar
Esseqqat, H. (2011). Renewable Energies in the Democratic Republic of Congo. Retrieved from
https://postconflict.unep.ch/publications/UNEP_DRC_renewable_energy_FR.pdf
EU. (2012). Schéma Directeur Du Secteur de l’Energie Au Tchad. European Union. Retrieved from
https://www.scribd.com/document/248020539/Schema-Directeur-Tchad-Final-Definitif-2
FAO. (1995). Future energy requirements for Africa's agriculture. Rome: FOOD AND AGRICULTURE
ORGANIZATION OF THE UNITED NATIONS. Retrieved from
http://www.fao.org/3/v9766E/v9766e00.htm#Contents
FAO. (2008). Forest and Energy: Key issues. Rome: Food and Agriculture Organization of the United Nations
(FAO). Retrieved from http://www.fao.org/3/i0139e/i0139e00.pdf
FAO. (2017). Forest and Climate Change Working Paper 16: Analysis Forests and Climate Change in East Africa.
Rome: Food and Agriculture Organization of the United Nations. Retrieved from
http://www.fao.org/3/a-i7757e.pdf
FAO. (2018). Off-grid rural electrification options using crop and woody residues in Côte d'Ivoire: Bioenergy and
Food Security case study. Rome: Food and Agriculture Organization of the United Nations. Retrieved
from http://www.fao.org/3/ca2213en/CA2213EN.pdf
FAO. (2019). FAOSTAT. Retrieved 7 2, 2020, from FAOSTAT: http://www.fao.org/faostat/en/#data/GF
Fortune of Africa. (n.d). Energy sector profile in Burundi. Retrieved from Fortune of Africa:
https://fortuneofafrica.com/burundi/energy-sector-profile-in-burundi/
Gabriel, T. (2014). Cameroon - Contribution to the preparation of the national report for the formulation of the
regional white paper on universal access to energy services, integrating energy development
renewables and energy effeciency. United Nations Environmental Programme. Retrieved from
https://www.seforall.org/sites/default/files/Cameroon_RAGA_FR_Released.pdf
GIZ. (2011). Energy Strategy and Action Plan for Burundi. Deutsche Gesellschaft für Internationale
Zusammenarbeit (GIZ) GmbH. Retrieved from http://www.euei-
pdf.org/sites/default/files/field_publication_file/FF_EUEI_PDF_Burundi_Energy_strategy_Nov2009_E
N.pdf

134
A report on the energy demand by sector for the selected countries
Gouvernement Burkina Faso, C. (2015).
Government of Cameroon. (2015). National Intended Determined Contribution. Republic of Cameroon.
Retrieved from
https://www4.unfccc.int/sites/ndcstaging/PublishedDocuments/Cameroon%20First/CPDN%20CMR%
20Final.pdf
Government of Equatorial Guinea. (2018). National Plan for the Development of Renewable Energies in
Equatorial Guinea. Malabo. Retrieved from
https://info.undp.org/docs/pdc/Documents/GNQ/PANDER Final1.pdf
Government of Gabon. (2013). Gabon Strategic Plan: National Strategy for Industrialization. Retrieved from
http://www.mines.gouv.ga/object.getObject.do?id=1148
Government of Gabon. (2015). The Republic of Gabon - Intended Nationally Determined Contribution (INDC).
Retrieved from https://www4.unfccc.int/sites/ndcstaging/PublishedDocuments/Gabon
First/20150331 INDC Gabon.pdf
GRET. (2015, 10 30). Senegal leader in the export of raw alcohol within the UEMOA. Retrieved 11 19, 2020,
from Senegal Agri-food Portal: https://www.agroalimentaire.sn/le-senegal-leader-dans-lexportation-
dalcool-brut-au-sein-de-luemoa/
GTZ. (n.d). Technical note on wood energy in Cameroon. Yaoundè: GTZ‐ProPSFE/Antenne de l’Est. Retrieved
from http://www.doc-developpement-durable.org/file/Energie/biomasse-
bois/Note%20tech%20sur%20bois-energie%20au%20Cameroun.pdf
Hafner, M., Tagliapietra, S., Falchetta, G., & Occhiali, G. (2019). Country Level Analysis: Power sector, Energy
resources, and Policy Context. In Renewables for Energy Access and Sustainable Development in East
Africa. Springer, Cham. doi:https://doi.org/10.1007/978-3-030-11735-1_3
Hafner, M., Tagliapietra, S., Occhiali, G., & Falchetta, G. (2019). Renewables for Energy Access and Sustainable
Development in East Africa. Springer International Publishing. doi:10.1007/978-3-030-11735-1_2
Hassan Daher, D., Gaillard, L., Ménézo, C., & Amara, M. (2015). Impact of Environmental Conditions on the
Performance of a 300 kWp Solar PV Plant in Djibouti.
Heegde, F. t., & Sonder, K. (2007). Biogas for a Better Life:. International Institute of Tropical Agriculture.
Retrieved from http://www.bibalex.org/Search4Dev/files/283934/116037.pdf
Icilome. (2019, 11 26). Marie-Ségolène Royal visited the NIOTO factory. Retrieved 11 19, 2020, from Icilome:
https://www.icilome.com/actualites/878574/marie-segolene-royal-a-visite-l-usine-nioto
Incatema. (2019, 3 5). Energy effeciency with Cambéréne WWTP. Retrieved 11 19, 2020, from Incatema
consulting and engineering: https://incatemaconsulting.es/fr/noticias/lefficacite-energetique-avec-la-
step-de-camberene-3/
Karangwa, P. C. (2017). Burundi National Energy Report. Retrieved from http://www.enrich-
project.eu/sites/default/files/field_files/D2.09_Burundi_National%20Energy%20Report_PK%20UB.pd
f
Komode, E. N. (n.d). Universal Access to Energy Services Integrating Energy Development Renewables and
Energy Efficiency: Case of the Central African Republic. An initiative of CEMAC and ECCAS with the
support of UNDP. Retrieved from https://www.se4all-
africa.org/fileadmin/uploads/se4all/Documents/Country_RAGAs/Central_African_Republic_RAGA_FR
_Released.pdf
Kusakana, K. (2016). A Review of Energy in the Democratic Republic of Congo. Retrieved from
https://www.researchgate.net/publication/306380971_A_Review_of_Energy_in_the_Democratic_Re
public_of_Congo

135
A report on the energy demand by sector for the selected countries
Lago, C., Caldés, N., & Lechón, Y. (2019). Chapter Seven - Key Challenges and Opportunities. In The Role of
Bioenergy in the Bioeconomy (pp. 297-398). Academic Press. doi:https://doi.org/10.1016/B978-0-12-
813056-8.00007-8
Lawson, A. (n.d.). ENERGIE-GABON: An enormous energy potential, but little developed. Retrieved 10 22, 2020,
from Inter Press Service News Agency - French: http://ipsnews.net/francais/2003/02/26/energie-
gabon-un-potentiel-energetique-enorme-mais-peu-valorise/
Loemba, D. B. (2008, 6 28). The contribution of biomass to sustainable development in Congo. Retrieved 11 4,
2020, from Congopage: http://www.congopage.com/La-contribution-de-la-biomasse-au
Louvel, R., & Gromard, C. d. (2017). From biomass to bioeconomy, an energy strategy for Africa?
Contemporary Africa. doi:10.3917 / afco.261.0223
Manigomba, J., Chichirova, N., Gruzdev, V., Ndikumana, E., & Lyapin, A. (2019). Prospects for biomass energy
use in the Republic of Burundi. International Journal of Mechanical Engineering and Technology, 10,
1371-1382. Retrieved from
https://www.researchgate.net/publication/331112718_Prospects_for_biomass_energy_use_in_the_
Republic_of_Burundi
Mansoor, A., Issoufou, S., & Sembene, D. (2019). Chapter 3. Review of the industrial structure of Senegal. In
Race to the Next Income Frontier: How Senegal and Other Low Income Countries can Reach the Finish
Line. International Monetary Fund. Retrieved from https://www.elibrary.imf.org/doc/IMF071/24349-
9781484373606/24349-9781484373606/Other_formats/Source_PDF/24349-9781498314763.pdf
Matthysen, K. (2015). Review of the Artisanal Burundian Gold Mining Sector. International Peace Information
Service (IPIS). Retrieved from
https://www.bgr.bund.de/EN/Themen/Min_rohstoffe/CTC/Downloads/burundi_ASM_gold.pdf?__blo
b=publicationFile&v=2
MEP. (2019). Solar Photovoltaic. Retrieved 11 19, 2020, from Ministry of Energy and Petroleum:
http://www.energie.gouv.sn/solaire-photovoltaique/
MEP. (2019). Wind Power. Retrieved 11 19, 2020, from Ministry of Energy and Petroleum:
http://www.energie.gouv.sn/filiere-eolienne/
MEPRED. (2008). De l’accès aux services énergétiques.
Merrill, L., Bridle, R., Klimscheffskij, M., Tommila, P., Lontoh, L., Sharma, S., . . . Gerasimchuk, I. (2017). Making
the Switch: From fossil fuel subsidies to sustainable energy. Nordic Council of Ministers.
doi:10.6027/TN2017-537
MEW. (2006). Assistance to the Ministry of Energy and Water inthe preparation of the long-term development
plan of the Horizon 2030 Electricity Sector (PDSE 2030). Ministry of Environment and Water (MEW).
Retrieved from
https://www.commissiemer.nl/docs/cms/O83_008_detb_PDSE_2030_Rapport_Vol.2_Demande_VerF
in_Juillet_06.pdf
MEW. (2006). Assistance to the Ministry of Energy and Water inthe preparation of the long-term development
plan of theHorizon 2030 Electricity Sector (PDSE 2030). Yaoundè: Government of Cameroon. Retrieved
from
https://www.commissiemer.nl/docs/cms/O83_008_detb_PDSE_2030_Rapport_Vol.2_Demande_VerF
in_Juillet_06.pdf
MEWF. (2019). Biogas in Guinea. Retrieved 10 22, 2020, from meef-guinee.org: http://meef-
guinee.org/biogaz-en-guinee/#

136
A report on the energy demand by sector for the selected countries
Ministry of Energy and Mining. (2012). Investment Opportunities in Renewable Energy Burundi. Ministry of
Energy and Mining. Retrieved from http://proreds.eu/wp-content/uploads/2014/02/Investment-
opportunities-in-renewable-energy-Burundi.pdf
MMIE. (2014, 6 11). Solar energy macro-energy project for Annobon. Retrieved from Guinea Equatorial Press:
https://www.guineaecuatorialpress.com/noticia.php?id=5277&lang=fr
Nachmany, M., Fankhauser, S., Davidová, J., Kingsmill, N., Landesman, T., Roppongi, H., . . . Townshend, T.
(2015). The 2015 Global Climate Legislation Study: A Review of Climate Change Legislation in 99
Countries. Seacourt Ltd. Retrieved from https://www.lse.ac.uk/GranthamInstitute/wp-
content/uploads/2015/05/Global_climate_legislation_study_20151.pdf
NEBEDAY. (n.d). Association Nébéday. Retrieved 11 19, 2020, from nebeday.org:
http://www.nebeday.org/p/charbon-de-paille.html
Ngoubou, L. (2013). National Report for the formulation and drafting of the White Paper on Regional Policy for
"Access to energy services in ECCAS-CEMAC countries integrating renewable energies and energy
efficiency andcontributing to the fight against poverty". United Nations Environmental Programme
(UNEP). Retrieved from
https://www.seforall.org/sites/default/files/Republic_of_Congo_RAGA_FR_Released.pdf
Nzango, C. (2019). Central Africa Republic Energy Syndrome: Why so much load shedding in Bangui. Retrieved
from https://hal.archives-ouvertes.fr/hal-01971335/document
Ossono, E. N. (2014). Electricity in Cameroon: What is the way forward? Denis and Lenora Loretia Foundation.
Retrieved from https://foretiafoundation.org/wp-content/uploads/2014/01/ELECTRICITY-IN-
CAMEROON.pdf
PANER. (2016).
PANER. (2016).
PDEHR. (2017).
PNB. (2020). Retrieved 11 19, 2020, from National Biodigesters Programme: https://www.pnb-
bf.org/index.php/en/decouvrez-le-pnb-bf/connaitre-le-programme
RA, B. (2016).
RA, B. (2016).
ReCube. (2016). SOGAS: Biogas with solar waste. ReCube. Retrieved from http://www.recube.fr/wp-
content/uploads/2016/08/Sogas-Dakar-ReCube-.pdf
REDD+ International. (2015). Democratic Republic of Congo: REDD+ Investment Plan (2015-2020). Retrieved
from https://redd.unfccc.int/uploads/3262_4_redd_investment_plan_eng.pdf
REEEP. (2012). Equatorial Guinea. Retrieved from https://www.reeep.org/equatorial-guinea-2012
Republic of Burundi. (2015). Intended Nationally Determined Contribution (INDC)/Burundi. Retrieved from
https://www4.unfccc.int/sites/ndcstaging/PublishedDocuments/Burundi%20First/Burundi_INDC-
english%20version.pdf
Republic of Cameroon. (2008). Strategic Document for Growth and Development: Republic of Cameroon.
Republic of Cameroon. Retrieved from https://www.undp.org/content/dam/cameroon/docs-one-un-
cameroun/2017/dsce.pdf
Republic of Cameroon. (2015). Intended Nationally Determined Contribution (INDC). Retrieved from
https://www4.unfccc.int/sites/ndcstaging/PublishedDocuments/Cameroon%20First/CPDN%20CMR%
20Final.pdf

137
A report on the energy demand by sector for the selected countries
Republic of Cameroon. (n.d). Cameroon - Growth and Employment Strategies Paper (2010/2020). Republic of
Cameroon. Retrieved from
https://www.cameroonembassyusa.org/images/documents_folder/quick_links/Cameroon_DSCE_Eng
lish_Version_Growth_and_Employment_Strategy_Paper_MONITORING.pdf
Republic of Chad. (2015). Intended Nationally Determined Contribution (INDC) for the Republic of Chad.
Retrieved from https://www.ctc-n.org/sites/www.ctc-
n.org/files/UNFCCC_docs/indc_chad_official_version_english.pdf
Republic of Chad. (2016). 2016-2020 Priority Action Plan rom 2nd Diagnostic Study on Trade Integration in
Chad. Le Commerce pour le développement des PMA. Retrieved from
https://www.enhancedif.org/en/system/files/uploads/tchad_rapport_final_pap-
edic2_01_02_2016_vf_3.pdf
Republic of Djibouti. (2015). Intended Nationally Determined Contribution for the Republic of Djibouti.
Retrieved from
https://www4.unfccc.int/sites/ndcstaging/PublishedDocuments/Djibouti%20First/INDC-
Djibouti_ENG.pdf
Republic of Equatorial Guinea. (2019). Equatorial Guinea Country Programme for the Green Climate Fund.
Retrieved from https://fvcguineaecuatorial.org/archivos/ProgramaPais.pdf
Richard, M. P. (n.d). National Report of Chad. Retrieved from
https://www.seforall.org/sites/default/files/Chad_RAGA_FR_Released.pdf
Sacranie, A., & Lausten, A. (2017). Renewable Energy Market Landscape Study covering 15 countries in
Southern and Eastern Africa. Danish Energy Management & Esbensen. Retrieved from
https://eepafrica.org/wp-content/uploads/2019/11/Volume_I_Market_Landscape_Study_EEP-
SEA_Report.pdf
SE4all. (2012). Togo: Rapid Assessment and Gaps Analysis. Sustainable Energy for All (SE4all). Retrieved from
https://www.se4all-
africa.org/fileadmin/uploads/se4all/Documents/Country_RAGAs/TOGO_RAGA_FR_Released.pdf
Se4All. (2020). se4all-africa: Burundi. Retrieved 10 27, 2020, from se4all-africa.org: https://www.se4all-
africa.org/seforall-in-africa/country-data/burundi/
SIE. (2016).
SIE. (2016).
SIE. (2017).
Singh, G., Nouhou, S. A., & Sokona, M. Y. (2015). Djibouti: Renewables Readiness Assessment. International
Renewable Energy Agency (IRENA). Retrieved from https://www.irena.org/-
/media/Files/IRENA/Agency/Publication/2015/IRENA_RRA_Djibout_2015_EN.pdf
Smart Villages. (n.d). Energy Situation Report - West Africa. Smart Villages. Retrieved from
https://e4sv.org/wp-content/uploads/2016/10/West-Africa-Energy-Report-AW-Draft-3-200516-
V3_MT.pdf
The World Bank. (2017). Djibouti: Sustainable Electrification Program. Retrieved from
http://documents1.worldbank.org/curated/fr/791041521039921148/pdf/Disclosable-Version-of-the-
ISR-Djibouti-Sustainable-Electrification-Program-P158505-Sequence-No-02.pdf
UNDP. (2013). National Report for Sustainable Energy for All on the Horizon 2030: National Program and
Strategy for the Democratic Republic of Congo. United Nations Development Programme (UNDP).
Retrieved from http://www.undp.org/content/dam/dem_rep_congo/docs/eenv/UNDP-CD-RAPPORT-
ENERGIE-DURBALE-POUR-TOUS-HORIZON-2030.pdf

138
A report on the energy demand by sector for the selected countries
UNDP. (2013). Sustainable Energy for All: Promoting small-scale hydropower in Bioko and other clean energy
solutions for remote islands. United Nations Development Programme (UNDP).
UNEP. (2017). Energy Profile: Democratic Republic of Congo. In UNEP, Atlas of Africa Energy Resources (pp.
142-145). United Nations Environmental Programme. Retrieved from
https://wedocs.unep.org/bitstream/handle/20.500.11822/20492/Energy_profile_DemocraticRepCon
go.pdf?sequence=1&isAllowed=y
UNEP. (2017). Energy Profile: Djibouti. In Atlas of Africa Energy Resources (pp. 114-117). Retrieved from
https://wedocs.unep.org/bitstream/handle/20.500.11822/20486/Energy_profile_Burundi.pdf?seque
nce=1&isAllowed=y
UNEP. (2017). Energy Profile:Burundi. In UNEP, Atlas of Africa Energy Resources. United Nations Environmental
Programme (UNEP) and African Development Bank (AfDB). Retrieved from
https://wedocs.unep.org/bitstream/handle/20.500.11822/20476/Atlas_Africa_Energy_Resources.pdf
?sequence=1&%3BisAllowed=
UNEP. (2017). Enery Profile: Cameroon. In UNEP, Atlas of Africa Energy Resources (pp. 118-121). United
Nations Environmental Programme (UNEP). Retrieved from
https://wedocs.unep.org/bitstream/handle/20.500.11822/20487/Energy_profile_Cameroon.pdf?seq
uence=1&isAllowed=y
UNIDO. (n.d). Baseline Report of Clean Cooking fuels in the East African Community (EAC) Region. United
Nations Development Organization (UNIDO). Retrieved from
https://cdn2.b2match.io/event/2901/assets/8478585412-9cc8c37a39.pdf
United Nations Statistic Division. (2018). UNData. Retrieved 7 8, 2020, from
http://data.un.org/Data.aspx?d=EDATA&f=cmID%3aKR%3btrID%3a123
WEC. (2005). Regional Energy Integration in Africa: A Report of the World Energy Council. London: World
Energy Council. Retrieved from https://www.worldenergy.org/assets/downloads/PUB_Regiona_-
Energy_Integration_in_Africa_2005_WEC.pdf
WEC. (2013). World Energy Resources 2013 Survey. London: World Energy Council (WEC). Retrieved from
https://www.worldenergy.org/assets/images/imported/2013/09/Complete_WER_2013_Survey.pdf
World Bank. (2019, 4 1). Djibouti's Economic Update - April 2019. Retrieved 10 28, 2020, from WorldBank.Org:
https://www.worldbank.org/en/country/djibouti/publication/economic-update-april-
2019#:~:text=Djibouti's%20small%20economy%20is%20resuming%20acceleration.&text=The%20med
ium%2Dterm%20economic%20outlook,8.0%20percent%20in%2020120%2D2023.
World Bank. (2020). Data Bank: World Development Indicators. Retrieved 10 28, 2020, from The World Bank:
https://databank.worldbank.org/source/world-development-indicators
World Bank. (2020). The World Bank In Gabon. Retrieved 11 4, 2020, from The World Bank:
https://www.worldbank.org/en/country/gabon/overview
WTO. (2012). Trade Policy Review Report by the Secretariat: Côte d’Ivoire, Guinea Bissau and Togo. World
Trade Organization. Retrieved from https://www.wto.org/english/tratop_e/tpr_e/s266_e.zip
WWF. (2017, 5 19). A National Forest Carbon Map for the DRC. Retrieved 11 4, 2020, from Congo-basin:
https://www.wwf-congobasin.org/news/?300412/A-National-Forest-Carbon-Map-for-the-DRC#
Xinhua. (2013, 10 30). Chad: The capital goes solar. Retrieved 10 22, 2020, from Tchadinfos.com:
https://tchadinfos.com/environnement-societes/tchad-capitale-se-met-solaire/