Variation in wood density determines spatial patterns inAmazonian forest biomass
18
Global Change Biology (2004) 10, 545-562, doi: 10.1111/j.l529-8817.2003.00751.x Variation in wood density determines spatial patterns in Amazonian forest biomass TIMOTHY R. BAKER*t, OLIVER L. PHILLIPSf, YADVINDER MALHIJ, SAMUEL ALME1DA§, LUZMILA ARROYO^, ANTHONY Dl FIORE|| , TERRY ERWIN**, TIMOTHY J. KILLEENtt, SUSAN G. LAURANCEJi, WILLIAM F. LAURANCEH, SIMON L. LEWISt, JON LLOYD*, ABEL MONTEAGUDO§§,§§§, DAVID A. NEILLHt. SANDRA PATIÑO*||||, NIGEL C. A. PITMAN***, J. NATALINO M. SILVA 111 tíí and RODOLFO VÁSQUEZ MARTÍNEZ§§§ *Max Planck Institut für Biogeochemie, ]ena, Germany, ^Earth and Biosphere Institute, School of Geography, University of Leeds, Leeds, UK, ^School of GeoSciences, University of Edinburgh, Edinburgh, UK, §Museu Paraense Emilio Goeldi, BeUm, Brazil, *\Museo Noel Kempff Mercado, Santa Cruz, Bolivia, \\Department of Anthropology, New York University, New York, USA, **Smithsonian Institution, Washington, DC, USA, i^Center for Applied Biodiversity Science, Conservation International, Washington, DC, USA, WSmithsonian Tropical Research Institute, Balboa, Panama, §%Herbario Vargas, Universidad Nacional San Antonio Abad del Cusco, Cusco, Peru, '¡'¡¡Missouri Botanical Garden, c/o Herbario Nacional del Ecuador, Quito, Ecuador, IIII Alexander von Humboldt Biological Research Institute, Bogota, Colombia, ***Center for Tropical Conservation, Duke University, Durham, USA, tttC7f OR, Tapajos, Brazil, I'^^EMBRAPA Amazonia Oriental, Belém, Brazil, %%%Proyecto Flora del Perú, jardin Botánico de Missouri, Oxapampa, Peru Abstract Uncertainty in biomass estimates is one of the greatest limitations to models of carbon flux in tropical forests. Previous comparisons of field-based estimates of the above- ground biomass (AGB) of trees greater than 10 cm diameter within Amazonia have been limited by the paucity of data for western Amazon forests, and the use of site-specific methods to estimate biomass from inventory data. In addition, the role of regional variation in stand-level wood specific gravity has not previously been considered. Using data from 56 mature forest plots across Amazonia, we consider the relative roles of species composition (wood specific gravity) and forest structure (basal area) in determining variation in AGB. Mean stand-level wood specific gravity, on a per stem basis, is 15.8% higher in forests in central and eastern, compared with northwestern Amazonia. This pattern is due to the higher diversity and abundance of taxa with high specific gravity values in central and eastern Amazonia, and the greater diversity and abundance of taxa with low specific gravity values in western Amazonia. For two estimates of AGB derived using different allometric equations, basal area explains 51.7% and 63.4%, and stand-level specific gravity 45.4% and 29.7%, of the total variation in AGB. The variation in specific gravity is important because it determines the regional scale, spatial pattern of AGB. When weighting by specific gravity is included, central and eastern Amazon forests have significantly higher AGB than stands in northwest or southwest Amazonia. The regional-scale pattern of species composition therefore defines a broad gradient of AGB across Amazonia. Keywords: AGB, Amazonia, carbon, permanent plot, tropical forests, wood specific gravity Received 13 December 2002; revised version received and accepted 28 March 2003 Introduction Correspondence: T. R. Baker, Earth and Biosphere Institute, School Accurately quantifying the role of tropical forests in the of Geography, University of Leeds, Leeds LS2 9JT, UK, tel. +44113 global carbon cycle is one of the key requirements to 343 3361, fax + 44 113 343 3308, e-mail: [email protected] improve our understanding of current patterns of © 2004 Blackwell Publishing Ltd 545
-
Upload
independent -
Category
Documents
-
view
0 -
download
0
Transcript of Variation in wood density determines spatial patterns inAmazonian forest biomass

Global Change Biology (2004) 10, 545-562, doi: 10.1111/j.l529-8817.2003.00751.x
Variation in wood density determines spatial patterns in Amazonian forest biomass
TIMOTHY R. BAKER*t, OLIVER L. PHILLIPSf, YADVINDER MALHIJ, SAMUEL ALME1DA§, LUZMILA ARROYO^, ANTHONY Dl FIORE|| , TERRY ERWIN**, TIMOTHY J. KILLEENtt, SUSAN G. LAURANCEJi, WILLIAM F. LAURANCEH, SIMON L. LEWISt, JON LLOYD*, ABEL MONTEAGUDO§§,§§§, DAVID A. NEILLHt. SANDRA PATIÑO*||||, NIGEL C. A. PITMAN***, J. NATALINO M. SILVA 111 tíí and RODOLFO VÁSQUEZ MARTÍNEZ§§§ *Max Planck Institut für Biogeochemie, ]ena, Germany, ^Earth and Biosphere Institute, School of Geography, University of Leeds, Leeds, UK, ^School of GeoSciences, University of Edinburgh, Edinburgh, UK, §Museu Paraense Emilio Goeldi, BeUm, Brazil, *\Museo Noel Kempff Mercado, Santa Cruz, Bolivia, \\Department of Anthropology, New York University, New York, USA, **Smithsonian Institution, Washington, DC, USA, i^Center for Applied Biodiversity Science, Conservation International, Washington, DC, USA, WSmithsonian Tropical Research Institute, Balboa, Panama, §%Herbario Vargas, Universidad Nacional San Antonio Abad del Cusco, Cusco, Peru, '¡'¡¡Missouri Botanical Garden, c/o Herbario Nacional del Ecuador, Quito, Ecuador, IIII Alexander von Humboldt Biological Research Institute, Bogota, Colombia, ***Center for Tropical Conservation, Duke University, Durham, USA, tttC7f OR, Tapajos, Brazil, I'^^EMBRAPA Amazonia Oriental, Belém, Brazil, %%%Proyecto Flora del Perú, jardin Botánico de Missouri, Oxapampa, Peru
Abstract
Uncertainty in biomass estimates is one of the greatest limitations to models of carbon flux in tropical forests. Previous comparisons of field-based estimates of the above- ground biomass (AGB) of trees greater than 10 cm diameter within Amazonia have been limited by the paucity of data for western Amazon forests, and the use of site-specific methods to estimate biomass from inventory data. In addition, the role of regional variation in stand-level wood specific gravity has not previously been considered. Using data from 56 mature forest plots across Amazonia, we consider the relative roles of species composition (wood specific gravity) and forest structure (basal area) in determining variation in AGB.
Mean stand-level wood specific gravity, on a per stem basis, is 15.8% higher in forests in central and eastern, compared with northwestern Amazonia. This pattern is due to the higher diversity and abundance of taxa with high specific gravity values in central and eastern Amazonia, and the greater diversity and abundance of taxa with low specific gravity values in western Amazonia. For two estimates of AGB derived using different allometric equations, basal area explains 51.7% and 63.4%, and stand-level specific gravity 45.4% and 29.7%, of the total variation in AGB. The variation in specific gravity is important because it determines the regional scale, spatial pattern of AGB. When weighting by specific gravity is included, central and eastern Amazon forests have significantly higher AGB than stands in northwest or southwest Amazonia. The regional-scale pattern of species composition therefore defines a broad gradient of AGB across Amazonia.
Keywords: AGB, Amazonia, carbon, permanent plot, tropical forests, wood specific gravity
Received 13 December 2002; revised version received and accepted 28 March 2003
Introduction
Correspondence: T. R. Baker, Earth and Biosphere Institute, School Accurately quantifying the role of tropical forests in the of Geography, University of Leeds, Leeds LS2 9JT, UK, tel. +44113 global carbon cycle is one of the key requirements to 343 3361, fax + 44 113 343 3308, e-mail: [email protected] improve our understanding of current patterns of
© 2004 Blackwell Publishing Ltd 545

546 T. R. BAKER et al.
terrestrial carbon exchange (Prentice et al., 2001). In particular, in models of carbon flux in tropical regions, the estimates of forest biomass are an important source of uncertainty (Houghton et al., 2000). For the Brazilian Amazon, for example, different approaches have yielded widely varying estimates of aboveground biomass (AGB) (Brown & Lugo, 1992; Fearnside, 1992, 1997a). As a result, estimates of total carbon storage vary between 39 and 93 Pg C, and different models also disagree on the spatial distribution of biomass (Hought- on et al., 2001). Improved estimates on a basin wide scale will therefore rely on extended studies of regional-scale variation of below and aboveground forest biomass. In this paper, we examine regional variation across Amazonia of one of the most important components of ecosystem carbon density: the AGB of trees greater than 10 cm diameter.
In studies of Amazon forests, trees greater than 10 cm diameter typically comprise more than 80% of total AGB (Brown et al, 1995; Nascimento & Laurance, 2002). The biomass of such trees is usually calculated by applying an equation that relates nondestructive measurements of tree structure to tree dry weight. Such equations are typically developed from allometric relationships de- termined from measurements of the dimensions and mass of only a few selectively harvested trees. Many biomass equations have been developed, variously including tree diameter, height, wood density, and tree form factor as explanatory variables (e.g. Brown et al., 1989, 1995). The choice in any particular study is important, as different equations can give rise to very different AGB estimates when applied to the same forest inventory data (Araújo et al., 1999). Equation choice therefore poses a significant problem for regional-scale comparisons of AGB estimates, because variation caused by environmental, structural, and compositional gradients (e.g. ter Steege et al., 2000; Malhi et al., 2002), may be confounded with variation resulting from the use of different regression equations. Ideally, therefore, comparisons of AGB estimates over large spatial scales need to be based on a consistent regression approach.
In equations developed at a single site, diameter can usually explain the majority of variation in the AGB of individual trees (Chave et al., 2001). However, for regionally comparable estimates of AGB, an equation that incorporates terms for those aspects of forest structure that vary significantly at regional scales is required. For this type of comparison other factors, in addition to tree diameter, may also be important. In this study, the importance of including variation in wood specific gravity is considered. Wood specific gravity varies widely between tropical forest tree species, and is closely related to differences in diameter growth rates
and life history strategies (Whitmore, 1998; Suzuki, 1999). In addition, wood specific gravity is recognized as an important determinant of differences in AGB over successional gradients (Ketterings et al., 2001; Nebel et al., 2001). Given the existence of large variation in species composition and dynamics in tropical forests (Phillips et al, 1994, in press; ter Steege et al, 2000), this study evaluates the importance of including specific gravity in regional-scale comparisons of AGB within mature Amazonian forests.
Using inventory data from forest plots across Amazonia and a consistent regression approach to estimate AGB, this paper therefore addresses the following questions:
1. Are there significant gradients in stand-level wood specific gravity across mature forest sites in Amazo- nia?
2. How much of the variation in AGB between plots is due to variation in forest structure (basal area) and how much to differences in forest composition (wood specific gravity)?
3. What are the relative roles of basal area and wood specific gravity in determining spatial variation in AGB across Amazonia?
Methods
Inventory data
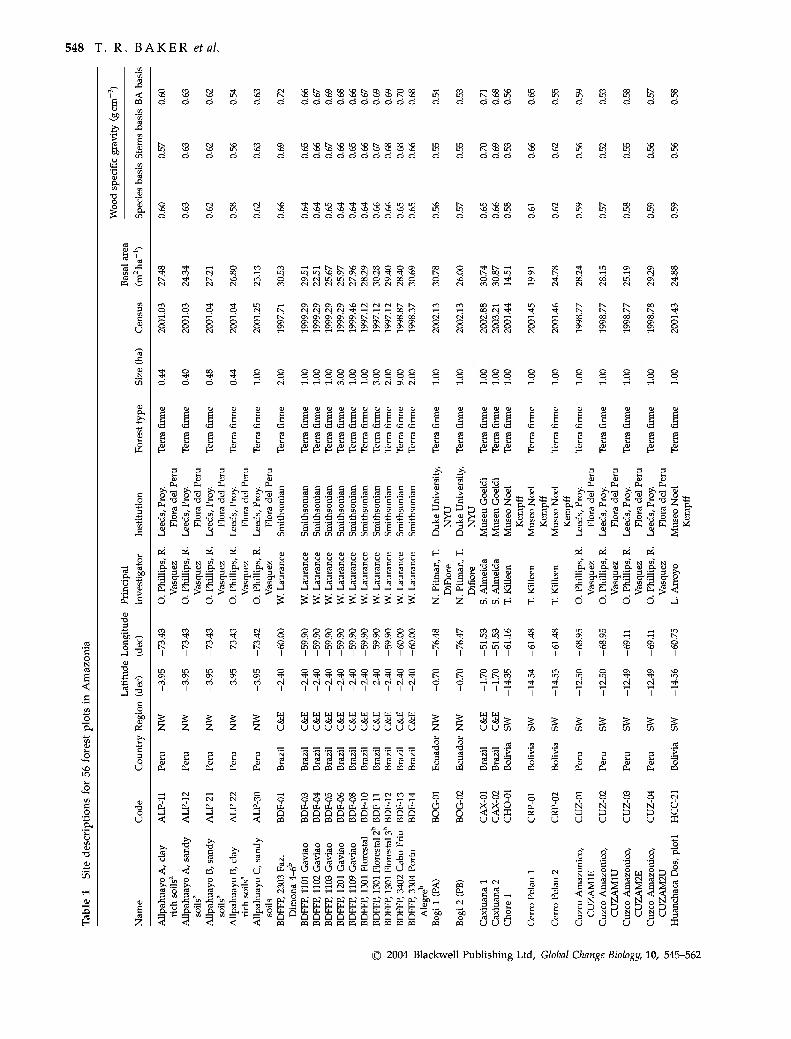
This study used data collected and collated by the RAINFOR project (Malhi et al, 2002). Fifty-six forest plots were used from across the range of local and regional environmental gradients that occur in Amazo- nia, including term firme forest on both clay-rich and white-sand substrates, and seasonally flooded forest (Fig. 1, Table 1). All plots examined were in lowland sites (<500ma.m.s.l.) consisting of an apparently mature forest with a canopy dominated by nonpioneer species. None of the plots are believed to have experienced any recent, major, direct human impact. The plots range in size from 0.4 to 9.0 ha (median 1.0 ha, mean 1.2 ha), contain 40077 stems greater than 10 cm diameter, and in total encompass 67.9 ha of forest (Table 1). To attempt to control for any systematic, long-term changes in forest structure (Phillips et al, 1998), variation in census dates was minimized and encom- passes less than 7 years for all 56 plots (Table 1). To allow regional comparisons of forest structure and biomass estimates, these plots were divided into three geographical categories: southwestern Amazonia (south of 10°S; Bolivia and southern Peru), north- western Amazonia (north of 10°S, west of 70°W; northern Peru and Ecuador), and central and eastern
¡g) 2004 Blackwell Publishing Ltd, Global Change Biology, 10, 545-562

WOOD SPECIFIC GRAVITY AND AMAZONIAN BIOMASS ESTIMATES 547
Fig. 1 Location of forest sites in northwest (black), southwest (hatched) and central and eastern (grey) Amazonia. 1. Jatun Sacha, 2. Bogi, Tiputini, 3. AUpahuayo, 4. Yanamono, 5. Sucusari, 6. Tambopata, 7. Cusco Amazónico, 8. Huanchaca, Las Londras, Chore, Cerro Pelao, Los Fierros, 9. BDFFP, 10. Tapajos, 11. Jari, 12. Caxuiana.
Amazonia (north of 10°S, east of 70°W; Brazil). These three regions are represented by 19, 20, and 17 plots, respectively (Fig. 1, Table 1).
A key objective of the RAINFOR project is to employ standard measurement and data management protocols at every site (details available at http://www.geog. leeds/projects/rainfor). In summary, the diameters of all trees greater than 10 cm at 1.3 m ( = diameter at breast height, dbh) are measured, with buttressed trees being measured 50 cm above the top of the buttress. Forty-one of the plots forming the basis of this study were remeasured during RAINFOR field campaigns in 2000-2003. For the other 15 plots, the principal investi- gators have ensured that all diameter measurements were made above buttresses.
Comparable species identifications at all sites are required for calculating stand-level wood specific gravity values. For most plots, all trees were identified to species, where possible, either in the field, or by collecting voucher specimens, usually leaves, for comparison with herbarium samples. At Jari and Tapajos, field identifications of common species were made using local names, which were later converted to their botanical equivalent. Detailed studies of the species composition of some of these plots have been published elsewhere (BDF, Rankin de Mérona et al., 1992; ALP, Martinez & PhiUips, 2000; BOG & TIP, Pitman et al., 2001). In this study, in order to standardize nomenclature across all the plots, order- and family-
level taxonomy follows the Angiosperm Phylogeny Group (1998). For example, Bombacaceae, Tiliaceae, and Sterculiaceae are treated as Malvaceae, Fabaceae are treated as a single family, Cecropiaceae is split from Moraceae, and Memecylaceae is treated separately from Melastomataceae. Spelling of generic- and species-level names has been standardized using the Missouri Botanical Garden VAST database (http://mobot.mobot. org/W3TSearch/vast.htmI). In addition, an attempt has been made to resolve generic-level synonyms (e.g. Pithecellobiuni/Zygia, Greuter et al., 2000). Identifications with any degree of uncertainty (cf., aff. etc) and morphospecies are treated as indeterminate in these analyses, and subspecies are not distinguished. Overall, for the current compilation, positive species-level identifications have been made for 74.3% of stems, a further 14.1% have been identified to genus, and 9.7% solely to family. 1.9% of stems are unidentified. Plots where local names were initially used for the identifica- tion of common species have similar levels of resolu- tion. For the Jari and Tapajos plots, 2.3% of stems are unidentified, 10.0% are identified to family, 10.0% to genus, and 77.7% to species.
Wood specific gravity
Wood specific gravity data for 583 South American forest tree taxa were compiled from published sources (Rich, 1987; data from Détienne et al, 1982, cited in
© 2004 Blackwell Pubhshing Ltd, Global Change Biology, 10, 545-562
548 T. R. BAKER et al.
O
^
"S 0 T3 f ) N ce B 'n < ra Tl
00 T-H
oooooooooo
\Û >£) sO
ÖÖÖÖÖÖÖÖÖÖ
oooooooooo
1-HT•iI>slN.-.OCrsGOOOas
cK(Nir)Lnt<oöÖCTioöö CM(NCN|(N(NCN|cr)(N(NrD
00 ro oÑoÑcT^aÑCT^KKKoóco
O^C3^0^C3^0^0^C3^0^0^C3^
OOOOOOOOOO OOOOOOOOOO
o o o
o o o
CT) 0-) T-H
o o o o o o Csl fN| Csl T-H T-H Csl
o T-H T-H ,-H CT) T-H CT) (N CTs (N
QJQJ(DQJ(1¡(DQJ(1¡(DQJ
Ësassassas O) O) O)
SES
0*03 0*03 c'a; o'öj o'ôî
c¿ c¿ Cä
DHOJ CL, 'Ú CL, fÚ DHOJ CIHO) m , 3 3 3 3 3 3 tr 3 a^3
3 3 IT'S
dCfCiCfCiCiCfCiCiCfC
cccceccccc oooooooooo
ËSSSSSSSSS
QJQJiUQJQJQJQJQJQJQJ uuuuuuuuuu
>i -H 0) ïï ïï 2 S ^ ^ -^ ¥ ^ 'QJ "QJ 'QJ % "ÔJ
-ÎH .ÎH OOOIJ_,OVJ• 0.J_,UI'UU^<J'
I•'31•'rj-33Qc:oCoñ ^S -2 -S ^SoC a)>Haj^Qja)Qjgajgajgjqo^o42o^oajg j^ uZ jj CZ <Ji <Ji fi cH fi J, tn.'^T3-5T3J=l'l3-='T3-5 i/i.S "^Z^Z 3 13 3Ä 3^ 7^ ^ "^ U^ OJfc 1>I-1H «HÜH 3ä
OS Ci eá OS
Ó Ó
OOOOOOOOOO O^0^0^0^!3^0^0^!3^00
OOOOOOOOOO
c 0) QJ
ce fi
1 0 s ,0 01
s QJ Q¿
I/) Csj 1/) tsl t/3 Ö
Û < <c ^
-p T-H ^ ,-1
D- ií P-i QJ DH QJ
r-; "J^ ,r1 "^ .'"1 "^ .'^ f tí
ó o ó ó J
hh > Dá ^ fî C 3 3 u U tn
2 u wcaracaMracaMraca uuuuuuuuuu 2
=a =a g u u S
(N ^
11^ 11^
<
OH
OH
"Ö 33 3
fflp3CÛP3p2CÛP3p2CÛP3
cn^m^ooo^rjro^ 00000 íL íL U, íL d, D D Q D D CÛ CÛ CÛ CÛ CÛ
ÜH PH b Q D D CO Da CQ
Q D CO CQ
o o O
X X O < <x u u u u os u
OH
N N
U U
oj o OH CQ
N N D D U U
-^ ro OOOOoSraffl
> > > > > ce (Q (Ö (Q (ti
o o
u u X
o 'S,
^00 tt< E E
r^ro^o>'^^T^cN^ >, -3 >^
al CQ -rt CQ .1-1 (Ö 'Ti (Q .,-1 0,0 ci,o Dn.y ao
r^ ^ ? ^-~. ^ rl ^f^ rf) 0 n, r. n^ pi Pi Pi c_r a; Pi r. t*^ (N CQ CQ
QJ UH Li- UH Li- UH UH I-L- fc UH Li-
Û UH Li- UH Li- UH UH I-L- fc UH Li- < bo ^ n f1 0 f1 n ri fi n ri f1 CQ CQ
CÛ CÛ m CÛ CÛ m CÛ CÛ m CÛ CÛ m U u u
N tÜ N I•' N
S S E § S <; < < < < o N o N o
U U U
g O w g D D (N rt (N • 2 S S S < < < ^
u I
© 2004 Blackwell Publishing Ltd, Global Change Biology, 10, 545-562

WOOD SPECIFIC GRAVITY AND AMAZONIAN BIOMASS ESTIMATES 549
u
tí ^ j 3
(N T-H ro T-H
(N ^
2 ií 2 y [H ro y te y fH 0) o 01 o Qj
u^ qil u^ q3 H
g -0 •
•Z.-U. ° Ë "' .5 •£ >5 •£ >5 •£ _ HM QJ ^ QJ ^ QJ
S I I •
K*^ 1•1 ^^ ^H ^^ ^H ^^ 1•1
O s o
_ Pu "ôj "ôj 'QJ 'QJ
2 2 2 J J J J
o oj ^ "0
o'ôj 0*03 0*03 o'ôj o OJ
u
>1 ^ ^ ^ _^
> QJ OJ
< QJ QJ QJ
<¿ <¿ ¿: 2 c/1 ^ ^ J D D D D z H H
t¿ c¿ < "§ < uí bc [ß 5b 3 iH
MKOi t^'w CIHÎH PKJÎ (TQJ ^ .,H 3 •• 3 •-" QJ -.H QJ y^ ^ ••
g > CO S ci H
î N ï N CiK QJ ex QJ 3 3 3 3 • IT'S tr .-
^ a. ^ a. Ó Ó Ö
o T3 3 . bo N
« Cä
1/) Csj U3 N '^ N JJ ^*JJ •-' l• JJ '-'*-' ¿(^ Î-H VJ [NI J-J
cxs ?« Q-s s^.&|.a- o X
3 3 3 W O^ 33 3^ 3 CT"
î N SE? N CiK QJ DH QJ 3 3 3 3 3 IT'S CT*
^ 3 ^ ^ ^ ^
00 ^ ^ Ö r-i r-i
u
QJ OH
2
QJ OH
2
QJ QJ OH
QJ OH
^ (N ^
U V
X s. ( ) u u U U 2 ;> ;> ^ >. o D D P D < <: <: < < cß C/Í C/Í cß C/Í H H H H H
o j: 33 ^
2 3 5 S-0 E
© 2004 Blackwell Publishing Ltd, Global Change Biology, 10, 545-562

550 T. R. BAKER et al.
^
u
K 00
Ö Ö
ON 00
Ö Ö
ON S IN. ?? IN CM ?; CM
en
O LD
0-) m g ID ON ON
s s o
S a s s Es-SE s 1-1 l-l ^ 1-1 t-l ^^ UJ 1-1 ;-! 'S 'ïï -S 'S -ÎH ^ »T-Î -ÎH 'ÏÏ
-b^
o D MHI-MI-MI-I-IM-(M-( ¡3 -3
?= ^ Í fe r" "^
< < ta ^
£ 4S es n
ta os n
CD Ci eu
[0 Si ^ li w li W ü w D û
ce ro E S
o OJ o OJ
Í N Í N
3 3 3 3 3 a^3 CT*
"^ ;g ^ ^ Ö ó
^ ^ QO
•a u
^ en Tf
u 5 2
s a s "O "O
OH 11^ 2 Í
2
00 T-H
V^ T•I
Cu CH Cl- ÇA Ci c¿ CM m
C fi
R R DH CL- Ct-
H p p P P
2, Ä .2, -S s Ë
0)
0)
o G O -a
^ 1« yD tí 0) s " o >, o
is o
" •z O OJ
OJ
g ° bC O
••5 2 CO
o N
tu Ë a o
yD ;j
0) o S -^
t^ '3 H •' ^ y]
yi O tu 7; yD PH
^ ce (S -C C^ LD a 04 0) tzi yD
s s tu -a
0)
tu
o •3.
CO
I 'S X CO
yD
o, b
O O
-Ö B O) « ye <u tí .S
o 5
•3 'S > o
o
pa 2 "tí ^
X
< S
^ >-.ä CO a¡
E^ tu
o, s tí
íg) 2004 Blackwell Publishing Ltd, Global Change Biology, 10, 545-562

WOOD SPECIFIC GRAVITY AND AMAZONIAN BIOMASS ESTIMATES 551
Favrichon, 1994; Fearnside, 1997b; ter Steege, 2000 (additional taxa not included in Favrichon, 1994); Woodcock, 2000) and a search of local publications in Peru (Appendix). Difficulties can arise in combining data from a range of sources due to differences in sampling methods. Here, wood specific gravity is defined as the oven dry weight divided by the fresh volume (Fearnside, 1997b). Therefore, values calculated at 12% moisture content (Favrichon, 1994; ter Steege, 2000) were corrected using a calibration equation (Reyes et al, 1992; cited by Brown, 1997). In addition, field protocols also vary: Woodcock (2000) used cores from the outer sapwood, whereas the other studies obtained samples from the trunks of harvested trees. Radial gradients in wood specific gravity are related to successional status, with increasing specific gravity towards the stem periphery in early successional species, and decreases in late successional taxa (Wood- cock & Shier, 2002). Ideally, this trend needs to be quantified by developing calibration equations that relate inner to outer wood specific gravity. In this study, where values were available for species sampled using both methods (32% of all species measured by Wood- cock, 2000), there was a significant relationship between inner (/) and outer (O) wood specific gravity {O = a + hi, coefficients ± SE a = 0.24 ± 0.14, fe = 0.63 ± 0.26, r^ = 24.7%, P<0.05). However, as this regression is not significantly different from a 1:1 relationship passing through the origin, the data in Woodcock (2000) was included without any alteration. Wood specific gravity values for palms are problematic due to very large radial and longitudinal gradients in tissue density (Rich, 1987). Here, mean values for six species were calculated from minimum and maximum values extracted from Rich (1987). The mean palm species specific gravity (0.31 g cm^^) was also used for stems of Strelitziaceae. Taxonomic consistency was achieved within the entire wood density dataset as described for the inventory data above.
An exploratory analysis showed that wood specific gravity is closely dependent on phylogeny, with differences between genera accounting for the largest proportion of the total variation (Fig. 2). Therefore, in the absence of species-level data for individual stems, specific gravity values were allocated generic- or family-level mean values. The overall species-level mean (0.62 g cm^'') was used for stems with no taxonomic information and for families where no specific gravity information was available. From the total of 40 077 stems making up the dataset examined here, 23.0% have corresponding specific gravity values at the species level, and a further 46.8% and 24.0% match at the generic and family levels, respectively. The average wood specific gravity of each plot was
Species 29.0% Order 12.1%
Faiiil)y13.3%
Genus 43.6%
Fig. 2 Percentage of variation in wood density contributed by successive taxonomic levels. Nested ANOVA, with reduced dataset (n = 229) to ensure replication within each order, family and genus: order and family, not significant, genus, F = 7.27, df = 36, P< 0.001.
calculated by averaging values on a per species, per stem, and basal area weighted basis.
AGB estimation
AGB was estimated from the inventory data using two different equations that are derived from two indepen- dent dataseis (Chambers et al, 2001; Chave et al, 2001). The equation in Chambers et al (2001) was obtained from data for 315 trees harvested as part of the BIONTE project, near Manaus, Brazil. In contrast. Chave et al (2001) compiled previously published, pan-tropical, diameter, and mass data for 378 trees, principally from Araújo et al. (1999) and Brown (1997). The Chave et al (2001) equation has the same form as the moist forest equation described in Brown (1997, Eqn (3.2.4), p. 11). Although the parameter estimates are slightly different, the equations are very similar, as much of the under- lying tree mass data (197 trees) is the same.
Both equations express AGB as a function of tree diameter. Here, variation in wood specific gravity (p) is incorporated as a simple multiplication factor, p/pm/ where Pm is the mean wood specific gravity of the trees harvested to create the biomass equation. For the equation in Chambers et al (2001), Pm was estimated as 0.67, the mean stand-level value (stems basis) for the central Amazon plots in this study (plots BDF-01-BDF- 13, Table 1). For the equation in Chave et al (2001), Pm was estimated as the pan-tropical, species-level mean of 0.58 g cm^^ (Brown, 1997), which reflects the wide geographic range of the sources of data used to create the Chave model.
© 2004 Blackwell Pubhshing Ltd, Global Change Biology, 10, 545-562

552 T. R. BAKER et al.
For each tree greater than 10 cm diameter, of diameter D (cm), including palms, AGB (kg DW), was calculated as:
(1) based on the Chambers et al. (2001) equation:
AGB =-^exp(0.33[lnD] + 0.933[lnD]^
-0.122[lnD]^-0.37),
(2) based on the Chave et al. (2001) equation:
AGB = -^exp(2.42[lnD] - 2.00). 0.58
Results
Basal area shows a weakly significant difference between regions (ANOVA, n = 56, F = 3.22, P<0.05, Fig. 3a). This pattern is caused by particularly low basal area values for a number of plots in southwestern Amazonia, whereas the range of basal area in north-
(a)
!»
in
m
(b)
35 -
30
25 -
20 -
15
* *
0.70 H o O)
i^ 0.65 '35 c a •a
0.60 -
0.55 -
•a o o i > 0)
•a TO 0.50
NW Amazonia
1
C&E Amazonia
\
SW Amazonia
Fig. 3 (a) Basal area (m^ ha^^) and (b) stand-level wood specific gravity, on a per stems basis (gcm^^) for forest plots in northwest, central and southeastern Amazonia. Box plots show 25% quartile, median and 75% quartile of the distributions (horizontal lines); vertical lines extend a further 1.5 times the interquartile (25-75%) range; asterisks denote outliers.
western, and central and eastern Amazonia is almost identical (Fig. 3a, Table 1).
Mean stand-level wood density differs significantly between forest plots in different regions of Amazonia when calculated on a species, stem or basal area basis (ANOVA, n = 56, species basis, F = 61.5, P< 0.001, stems basis, f = 45.3, P< 0.001; basal area basis, f = 50.0, P< 0.001, Fig. 3b). This regional difference in wood density is not a result of including varying proportions of different landscape units within each region, as the significance is enhanced if only terra firme forests on clay-rich soils are considered (ANOVA, n = 56, species basis, f = 100.6, P< 0.001, stems basis, f = 65.4, P< 0.001; basal area basis, P = 82.6, P< 0.001). Although stand-level means calculated using all three methods are closely correlated (r^ = 91.4-95.1%), regional differ- ences are greatest on a basal area basis. For example, mean stand-level wood density is 9.1% (species basis), 15.8% (stems basis), and 19.7% (basal area basis) higher in central and eastern, compared with northwestern Amazonia. Stand-level means calculated using only generic-level, or family-level, specific wood gravity data are highly correlated with the overall mean values (r^ = 93.5%, P< 0.001 and r^ = 91.5%, P< 0.001).
A similar overall range of wood specific gravity values is found within each region (Fig. 4). The difference between western and eastern Amazonia arises because of the high relative abundance of stems with a specific gravity of 0.2-0.5 g cm^"' in western Amazonia and of stems 0.7-0.9 g cm^ in central and eastern Amazon (Fig. 4). These patterns are also reflected in the trends in relative diversity in different specific gravity classes. For example, 22.6% of species in northwestern Amazo- nia have a specific wood gravity between 0.2 and 0.5 g cm^^ compared with only 16.7% of central and eastern Amazon species. In contrast, in northwestern
NW Amazonia
C&E Amazonia
SW Amazonia
0.15 0.25 0.35 0.45 0.55 0.65 0.75 0.85 0.95 1.05
Midpoint of specific gravity class (g cm"')
Fig. 4 Percentage of stems in successive wood specific gravity classes in forest plots in (a) northwest Amazonia, (b) southwest Amazonia, and (c) central and eastern Amazonia.
¡g) 2004 Blackwell Publishing Ltd, Global Change Biology, 10, 545-562

WOOD SPECIFIC GRAVITY AND AMAZONIAN BIOMASS ESTIMATES 553
Amazonia 20.6% species have a wood specific gravity between 0.7 and 0.9 g cm^^, compared with 33.6% in central and eastern Amazonia. Taxa that contribute to these regional-scale patterns include Virola (mean 0.43 g cm^''), which comprises 3.7% of stems in north- west Amazonia, but only 1.1% in central and eastern Amazonia, palms (mean 0.31 g cm^''), 6.8% and 1.3%, respectively, and Eschweilera (mean 0.84 g cm^^), which is very common in central and eastern Amazonia (11.1% of stems), but less abundant in northwest Amazonia (3.2% of stems). There is no significant trend in wood specific gravity with tree size within any region, when mean wood specific gravity is calculated for successive lOcmdbh classes (up to 70cmdbh, and combining all trees >70cm).
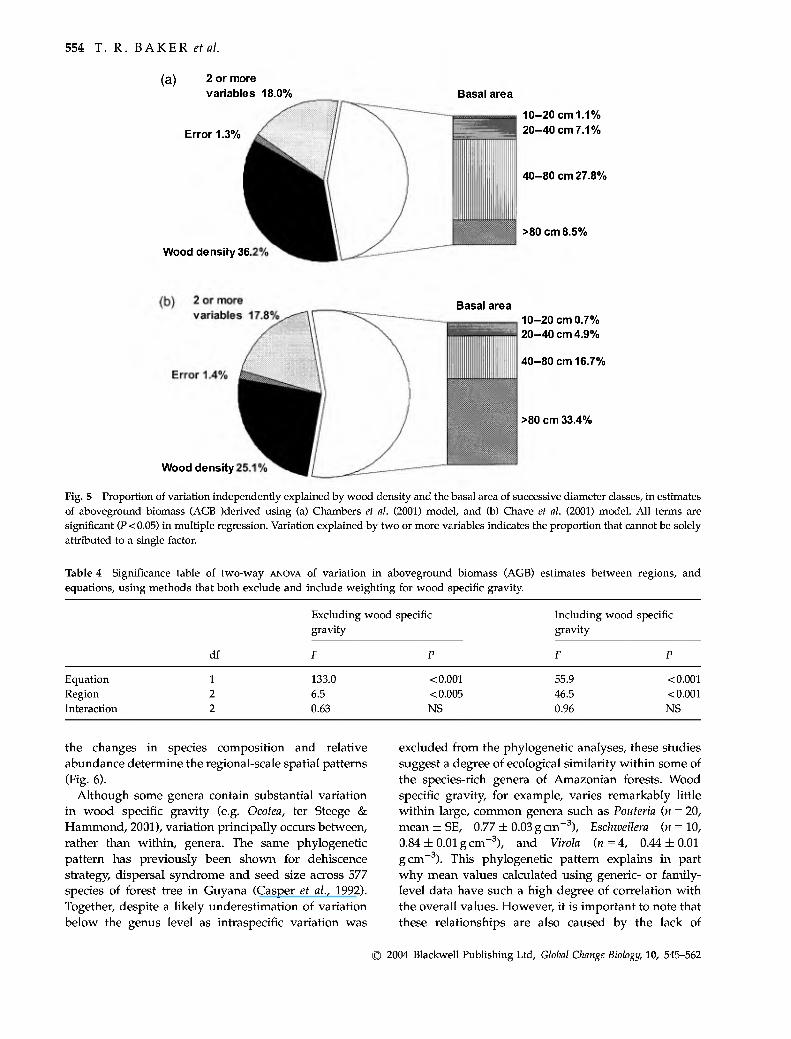
Together, the two stand-level parameters, basal area and wood specific gravity (calculated on a basal area basis) account for a large proportion of the variation in AGB estimates derived using both regression models (Tables 2 and 3, Fig. 5). Across Amazonia, basal area accounts for 51.7% and 63.4%, and wood specific gravity an additional 45.4% and 29.7% of the variation in AGB estimates derived from the Chambers and Chave models, respectively. Within regions, variation in wood specific gravity is generally less important than at the basinwide scale, and for AGB estimates derived using the Chave model, wood specific gravity is not significant for plots in central and eastern Amazonia (Table 3). Variation in the basal area of the largest trees is particularly important for determining variation in AGB between plots (Fig. 5). The basal area of trees greater than 40 cm diameter independently explains
36.3% and 50.1% of the variation in AGB estimates in all plots for the two different regression models (Fig. 5), respectively.
Although the models give similar results regarding the relative importance of the factors determining variation in biomass, they differ significantly in their predictions of the absolute magnitudes (Tables 4 and 5, Fig. 6); the Chambers model consistently predicts AGB values 50-100 Mgha^^ greater than the Chave model. The two models do, however, exhibit similar spatial patterns, because regional differences in AGB are largely a consequence of variations in specific gravity rather than basal area (Table 5, Fig. 6). When specific gravity is excluded, the only regional difference in AGB is between central and eastern, and south- western Amazonia, using the Chambers model esti- mates (Fig. 6a). By contrast, when wood specific gravity is included in the regression models, both approaches show significantly higher AGB in the central and eastern Amazon, compared with the other two regions (Fig. 6b).
Discussion
This study demonstrates significant differences in stand-level wood specific gravity for mature forests within Amazonia - the forests of eastern Amazonia typically contain trees that have higher values than their western counterparts (Fig. 3). This pattern is important to incorporate in regional-scale comparisons of AGB estimates. Although differences in forest basal area explain much of the site-to-site variation in AGB,
Table 2 Multiple regression of aboveground biomass (AGB) estimates on basal area and wood specific gravity; n = = 56
Chambers et al. (2001) model Chave et al. (2001) model
Coefficient Í P Coefficient f P
Basal area 10.0 Wood density 546
33.3 29.2
< 0.001 < 0.001
10.1 410.7
23.2 15.1
< 0.001 < 0.001
Overall r values are 97.2% (Chambers model) and 93.1% (Chave model).
Table 3 Coefficients from stepwise multiple regression of aboveground biomass (AGB) estimates on basal area and wood specific gravity for each region, using backward elimination with a threshold significance of P < 0.05
Chambers et al. (2001) model Chave et al. (2001) model
C&E NW SW C&E NW SW
M 17 20 19 17 20 19 Basal area 11.10 9.48 9.42 14.30 8.69 10.22
Specific gravity 551 523 510 ns 399 325
r^(%) 96.9 93.5 93.4 92.9 82.4 96.1
© 2004 Blackwell Publishing Ltd, Global Change Biology, 10, 545-562
554 T. R. BAKER et al.
(a) 2 or more variables 18.0% Basai area
Error 1.3%
Wood density 36.
10-20 cm 1.1% 20-40 cm 7.1%
40-80 cm 27.8%
>80 cm 8.5%
Basal area 10-20 cm 0.7% 20-40 cm 4.9%
40-80 cm 16.7%
>80 cm 33.4%
Wood density
Fig. 5 Proportion of variation independently explained by wood density and the basal area of successive diameter classes, in estimates of aboveground biomass (AGB )derived using (a) Chambers et al. (2001) model, and (b) Chave et al. (2001) model. AU terms are significant (P < 0.05) in multiple regression. Variation explained by two or more variables indicates the proportion that cannot be solely attributed to a single factor.
Table 4 Significance table of two-way ANOVA of variation in aboveground biomass (AGB) estimates between regions, and equations, using methods that both exclude and include weighting for wood specific gravity.
Excluding wood specific gravity
Including wood specific gravity
df
Equation 1 133.0 < 0.001 55.9 < 0.001 Region 2 6.5 < 0.005 46.5 < 0.001 Interaction 2 0.63 NS 0.96 NS
the changes in species composition and relative abundance determine the regional-scale spatial patterns (Fig. 6).
Although some genera contain substantial variation in wood specific gravity (e.g. Ocotea, ter Steege & Hammond, 2001), variation principally occurs between, rather than within, genera. The same phylogenetic pattern has previously been shown for dehiscence strategy, dispersal syndrome and seed size across 577 species of forest tree in Guyana (Casper et al, 1992). Together, despite a likely underestimation of variation below the genus level as intraspecific variation was
excluded from the phylogenetic analyses, these studies suggest a degree of ecological similarity within some of the species-rich genera of Amazonian forests. Wood specific gravity, for example, varies remarkably little within large, common genera such as Pouteria (n = 20, mean ± SE, 0.77 ± 0.03gcm"\ Eschweilera (n = 10, 0.84 ±0.01 g cm"^), and Virola (n = i, 0.44 ± 0.01 gcm^^). This phylogenetic pattern explains in part why mean values calculated using generic- or family- level data have such a high degree of correlation with the overall values. However, it is important to note that these relationships are also caused by the lack of
© 2004 Blackwell Publishing Ltd, Global Change Biology, 10, 545-562

WOOD SPECIFIC GRAVITY AND AMAZONIAN BIOMASS ESTIMATES 555
-Ö
to
x¡
> I/]
c o to 3 cr 0)
t/3
a o
•rH
-Q
O o ö 'Q
-ij
0) > j^ U T3 C to
T•t O o ö "^ ^ tn ^ 0)
Xi B to
U 60 C
•rH I/]
S
_to r^ O N
g «< c
•rH
I/]
^ "B.
o •^
VD LT)
ÏH O
•-^
^^ to
.15 60 .b S •> « 1 & to U
^ 'u <D
I/] 0) OH
pa •^ O i 5 tß ÏH t/3 O ••ií g 60 O s X
-ö 60 c 'OJ
o 5 60 0) •S^ > -Ö ¿ ^
<; TJ
in S 01 O
3 ¡2
•rH
5
I g
CD
01
O
0) Ci.
60 C
"3 >^
11 W 60
0)
1/3
60 C
M > &
60 g
11 W 60
0)
60
.3 V
0) Ci.
60
.3 >
U
,J5 U
,J5 U
,J5 U
,J5
U
,J5 U
U QJ 0)
T3 Ci. t/3
60 ïï g 0)
1 •3 1 to
01 u S 60
,J5 u
,J5 U
,J5 U
0) > to
,J5 u
,J5 u
s ^ ^ CO iç o ^ gs S fe S 5^ se CO 8 S »
os CTs g K
a S so
os K s K
8 IN o<
CM CM
K a IN
Ö T•1
'^Goom'^om^ro'^ro iT) ro ro -^ o
CM GO 00 GO CM GO 1-H o CM CM CO ro CM CO CM ro CM ro
•^ 0^ O '^ '^
OV ^ -^ O LO T-H •^ CM CM CM a> l>> CM ro ro ro CM ro
l>s. ro 00 CM ITN ro tTNTfT-Hcocoo^cocMCMT•lLn^^N
IT) '^ ITN l>> GO
(N CM
GO '-O 0^ ro -^ ^ O T•t tN. ro ro ^ 0>
CM CM T-" CM CM CM o-^rom^-jcMLOcMooro
CM CM CM CM CM CM
cM^^O'^^^o^a^GOl^)0^cMl^)T-^I^> 00 ^ GO CO ^ CM GO Ov 0^ ro IT)
ro CO o o 00 ^ INO^^OO^GOLO CMCMCMCMCMCMCMCMCMCMï-HCMCMCMCMCMCMCM
O p:, P^ N N N N K c^ f¿ ;D ^ ^ ;D u u u u u u u
IN iT) LT) in \o 00 rj O^GO^O'^0^0'.OOGOC^
T^^ in 00 iT) CO ON ^ o
o ro ^ CO ro IN (N CM T-H
^ t>> O T-H ro T-H .,. -..,., . IT) ITi (^s ^ \0 '^ CMCMCMCMCMCMCMCMCMfMcMCO
os 00 8 ^ (N §; O fe S S Î-H
rs| Os S ° îo g gR o6 o SO
(N
Os 00 IN
d Cs| ro
ro (N ro
LT) 00 ro ro (N ro
LT) ro
SO SO
S ro
ro
o so
LT) 00
OS ro os
ro 00
rsi sO
LT) os SO
00 00 O ^ ro
IN ro IN FC OS 00 (N
fe IN Cs|
sO (N (N
LT) ro IN Cs| (N IN
95 SO Cs|
SO (N
00 IN
Csi
ro 8 ro
IN LT) ro Cs|
LO
ro so ro
fe g S OS (N S g §8 K SS OS
os ;z; R SO g -* S 00 04
ro
00 ro ro
o i LT) OS 04
o6 ro
SO (N ro
LT) ro
o6 (N SO LT) ro ro
•* S
K S
SO os Cs| ro ^
O ro O s o
SO O
00 o O î-H
;^ Cs| CO î-H o 9 o 9 8
pa pa pa g pa pa pa pa pa
i pa
g pa
g pa
X < U
X S fi
§ S Cs| 00 fe ^ S ^
ro S os SO s S rsi 00
SO IN ^ S
t=3 00
Cs¡ (N 8 g csi ï•1
8 Os
cÑi a 00 (N
00
ro SO lO
î-H (N
SO os ^ T-H
IN
Os T-H
04
SO ro os CN
ro t^ SO O^
Ol
SO ro "!f 0Ö
00 LT) SO l^^ T-H lo ro lO) l^^ t^ rJ •* 00 os 00 o 00 o os SO ro 04 ro 04 04
00 04 04 SO t^ Tf o ro 00 00 04 04 04 T-H T-H
00 fv t^ os C3S -if csi K t< lO f^ ro ro 04 ro
04 00 Os os ro CM rn' Ö Ö lO) (N 00 ro Tf ro
00 (N t^ T-H cs| •* CM 00 t^ 04 Cs| SO Ö t=3 Osi Ö -* K 04 (N o "îf CM o ro ro ro ro ro ro
o os lO 04 ^ T-H CN 04 CM 04 CM 04
lO) T-H ir^ SO Ir^ os t^ -* 04 T-H CM CM 04
00 SO os CM ro lO •*•*!>. SO lO SO CM lO QÓ 00 Ir^ LO 04 04 ro ro ro
T-H LO ro o o -* -* CM 04 CM CM CM
T-H SO ,_H 04 OS 04 00 SO 00 00 ro 04 os 04 ,_H ro -í" lO o [>. 00 Osl lO 'S« SO p os -* os OS I^N lO 00 lO Tf 00 -* os 00 04 T-H so t^ os SD K T-H Ö OS T-H K csi oó so OÓ K Osi ró oi Ö lO O^ Ö so LO SO SO 00 Tf LO 00 (N 'S« so 00 I^N 00 o OS so lO OS o I^N (N 04 04 (N 04 04 (N 04 04 ro 04 04 (N ro ro 04 04 04 04 ro 04
CM (N O ^_^
ÍÍ 04 ro •Tf LO T-H 04 Í•1 04 oi ro O O £á G s; LO O O O o o 04 ro 9 9
< < < 88 pa pa
o
< o
< o o ú ú
CD
Ü en
Ó en
9 9 g m CD
© 2004 Blackwell Publishing Ltd, Global Change Biology, 10, 545-562

556 T. R. BAKER et al.
(a) 400
350 -
300
\ 250
=> 200
ço 150 - <
100 -
50
0
bc c b
(b)
00
<
400
350
300 \
250
200
150
100
50
0
c d bc
ab
0 NW Amazonia
D C & E Amazonia
DSW Amazonia
Chambers étal. (2001) Chave et ai. (2001)
Fig. 6 Biomass estimates for three regions of Amazonia, using two regression equations (a) excluding, and (b) including weighting for wood density. Different letters indicate significantly different values, using Tukey's multiple comparison procedure, following two-way ANO VA. Error bars are ± 95% CIs.
species-level wood specific gravity data for many stems. On-going compilations of wood specific gravity data for a wider range of taxa (J. Chave eí al., unpublished data) will provide greater resolution and understanding of species-level variability. Increasing the proportion of species-level identifications within the plots will also enable more accurate determination of stand-level specific gravity values. However, as more than 70% of stems are already identified to species, the wood specific gravity database is a greater limitation to current stand-level estimates.
Even with the limitations of the current wood specific gravity data, the finding that stand-level values calculated using family-level data capture the regio- nal-scale variability is important, because it coincides with the level of detail in current studies of regional- scale floristic composition (ter Steege ei a\., 2000). Forests in eastern and central Amazonia, for example, are rich in families such as Lecythidaceae (mean wood specific gravity 0.70 g cm"'') and Sapotaceae (0.76 g cm"^), while western Amazon forests are richer in Arecaceae (0.31 g cm"''), Moraceae (0.61 g cm"'') and Myristicaceae (0.51 g cm"''). As these patterns of family- level forest composition have been determined from a far larger number of plots than studied here, it suggests that the regional-scale patterns in specific gravity
derived in the current study will prove to be spatially consistent and robust. In contrast, the lack of a relationship between tree diameter and specific gravity indicates that this gradient will not be greatly influ- enced by the variation in mean tree size that occurs across Amazonia (Malhi et al., 2002). Overall, the regional-scale patterns of species composition and abundance appear to determine the regional-scale gradient in wood specific gravity.
Just as simple parameters such as diameter can explain variation in biomass at the level of individual trees, simple parameters describing forest structure and composition can be used to predict the stand biomass of all trees greater than 10 cm diameter. Stand basal area, and specifically, variation in the basal area of trees greater than 40cmdbh, is important, in comparisons both within and between regions (Table 4, Fig. 5). The importance of large trees for estimates of total stand biomass has previously been shown for the Brazilian Amazon, where the relative abundance of tree stems greater than 70 cm diameter correlated positively with total AGB estimates across six studies (Brown & Lugo, 1992). This pattern is not surprising given that trees greater than 70 cm diameter contribute up to 30% of biomass of trees >10cmdbh in some tropical forests (Brown & Lugo, 1992; Clark & Clark, 2000). However, variation in the biomass of medium-sized trees is also important (Fig. 5). Although individually smaller, their typically far greater abundance means that trees 35- 45 cm diameter may contribute the greatest biomass of any 10 cm diameter class (Keller et al., 2001).
In contrast to the regional pattern in specific gravity, basal area varies little across Amazonia (Fig. 2). The lower basal area in southwestern Amazonia is caused by one plot (CHO-01) in evergreen liana forest (Killeen, 1998). Liana forest is common in Parque Nacional Noel Kempff in northeast Bolivia, and its formation may be related to periodic fire, or an interaction between low soil fertility and seasonal drought (Killeen, 1998). When this site is removed, there is no significant difference in basal area between regions. As a result, the gradient in specific gravity is more important for regional-scale AGB estimates, and the highest AGB values are found in central and eastern Amazon forests (Fig. 6b).
Previous estimates of AGB in western Amazonia are sparse, making it difficult to compare the regional contrasts shown here with other studies. However, Houghton et al. (2001) compiled biomass estimates for 44 neotropical sites, of which 27 comprise lowland Amazonian terra firme forest. Using the regional demarcation followed here, these data show no difference in AGB estimates between central and eas- tern, and southwestern Amazon forests, and the single site from northwestern Amazonia has comparatively
¡g) 2004 Blackwell Publishing Ltd, Global Change Biology, 10, 545-562

WOOD SPECIFIC GRAVITY AND AMAZONIAN BIOMASS ESTIMATES 557
high biomass (C&E Amazonia, n = 22, mean AGB = 289.6 ±15.9 Mg ha"^; SW Amazonia, w = 4, AGB = 260.5 ±45.3 Mg ha"^; NW Amazonia, w = 1, AGB = 343Mgha^^). The lack of agreement between these data and the spatial patterns reported in this study are a result of such little previous information on the biomass of western Amazon forests, and the frequent omission of wood specific gravity from AGB estimates. However, the lower AGB of aseasonal, northwestern Amazon forests compared with central and eastern sites in this study is consistent with the different results given by biomass equations developed using trees from different climatic zones (Brown, 1997). Equations developed for moist forest based solely on tree diameter, give higher AGB estimates than equivalent equations developed in wet forest, when they are applied to the same inventory data (Clark & Clark, 2000; Chambers et al, 2001). This pattern may reflect the small number of trees used to develop the equations, or their different mathematical forms (a power-law vs. quadratic model). Alternatively, there may be factors, such as lower wood specific gravity, that result in lower AGB for a given tree diameter in wet forests. However, the difference in AGB between southwestern, and central and eastern forests, which share a broadly similar, seasonal, climate, indicates that even within a given climatic zone, there may be substantial variation in the life history characteristics of the species.
The different regression equations give rather differ- ent AGB values, despite the agreement between methods on the patterns of spatial variation, as the Chambers model consistently gives the highest predic- tions of AGB (Fig. 6). Also, trees >80cmdbh are far less important in determining variation in overall biomass in estimates derived using the Chambers equation (Fig. 5). This difference may be because the Chambers equation is based on randomly selected trees, and incorporates terms that empirically model tree damage, preventing overestimation of AGB of the largest individuals. In addition, this equation has the advantage for estimating AGB in Amazonian forests that it is based solely on Amazonian trees that may be more likely to reflect the architecture and height/ diameter relationships of the region.
It is important to note that the methods used to estimate AGB in this study have a number of potential limitations. Firstly, the Chambers et al. (2001) equation used in this study was constructed using stems greater than 5 cm diameter, but applied here to stems >10cmdbh. However, Chambers et al. (2001) also provide a similar equation based solely on trees greater than lOcmdbh, and results obtained using this equa- tion are almost identical. AGB estimates are marginally higher (1.4 ± 0.31%), but highly correlated with the
values reported here (r^ = 99.6%). Secondly, a small number of trees were larger than the maximum size of tree used to create the biomass equations. For the Chambers et al. (2001) and Chave et al. (2001) equations, the largest trees were 120 and 148 cm. In this study, a small number of trees, 27 and nine stems, respectively, exceeded these values, and we assume that the allometric equations can be extrapolated to larger sizes for these trees. However, clearly, tree mass data for more large diameter trees is required to extend the range of the allometric equations. Overall, improve- ments to the methods for estimating AGB will come from constructing regression equations involving all available tree mass data and incorporating the greatest number of key structural variables, including wood specific gravity. Such efforts are currently underway (J. Chave et al., unpublished manuscript).
Variation in wood specific gravity is closely related to variation in species' light demand: fast growing, light- demanding species typically have lower specific gravity than more shade tolerant species (Whitmore, 1998). Therefore, the regional-scale pattern described in this study represents an east-west gradient in the types of species that dominate Amazonian forests. Similar varia- tion in the functional composition of tropical forests has been described at a range of scales in other regions and has been related to variation in diversity and forest dynamics (e.g. Condit et al., 1999; ter Steege & Hammond, 2001; Baker et al, 2003). What are the ecological processes that control these patterns? For Amazonia, the similar range of wood specific gravity across regions suggests that the differences in stand- level specific gravity are caused by ecological factors that regulate the abundance of groups of taxa that share similar values. One possibility is that the higher specific gravity in central and eastern Amazon forests is related to the regular seasonal water shortage, or the more severe El Niño related droughts that occur in this region (Malhi & Wright, in press). For example, amongst 36 North American temperate angiosperm species, encom- passing a wide range of life forms including desert shrubs, higher wood specific gravity is related to greater resistance to cavitation (Hacke et al, 2001). In addition, in dry forest in Costa Rica, high wood specific gravity is associated with a group of deciduous species that grow on well-drained hilltops and develop very low dry season leaf and stem water potentials (Borchert, 1994). However, it is unclear whether these results can be extrapolated to Amazonia, which is much wetter than many of the habitats in these studies. For example, southwestern Amazonia has a seasonal climate similar to central and eastern Amazonia, but stand-level wood specific gravity similar to the aseasonal forests in northwest Amazonia. In addition, some semi-deciduous
© 2004 Blackwell Publishing Ltd, Global Change Biology, 10, 545-562

558 T. R. BAKER et al.
tropical forests that experience strong seasonal, and severe El Niño droughts, such as in Panama (Chave et al., in press) and Ghana (Hawthorne, 1996), have a comparatively light-demanding species composition, with low stand-level wood specific gravity. Therefore, water shortage is unlikely to be the primary selective pressure determining the functional composition of moist and wet tropical forests in relation to wood specific gravity.
Given the relationship between specific gravity and species light demand, variation in disturbance may be more important. For example, regions associated with lighter wooded species in Guyana, and increased pioneer abundance in Ghana have historically higher rates of human activity (Hawthorne, 1996; ter Steege & Hammond, 2001). In addition, across Amazonia, the lower stand-level values in western Amazon forests are associated with higher mortality and recruitment rates (Phillips et al, in press), which may be driven by higher abiotic disturbance rates by wind and storms in these forests. Variation in soil fertility may also be an impor- tant factor (MuUer-Landau, in press), as light-demand- ing species show greater increases in growth rate to increased soil fertility than more shade tolerant species (Baker et al., 2003). However, it is difficult to distinguish the effects of soil fertility on growth rates from the effects of variation in abiotic disturbance rates. In both Guyana and Ghana, for example, the areas with the highest rates of anthropogenic disturbance also have the richest soils (Fairhead and Leach, 1998; ter Steege & Hammond, 2001). Equally, western Amazonian forests tend to be associated with more fertile soils than the oxisols that characterize the central and eastern Amazon plots in this study (Sombroek, 2000). Further studies aimed at eluci- dating the relationships between the functional compo- sition, structure, and dynamics of these forests and the environmental factors that correlate with these patterns are needed to improve our understanding of the patterns and dynamics of forest biomass in Amazonia.
Acknowledgements
Development of the RAINFOR network, 2000-2002, has been funded by the European Union Fifth Framework Programme, as part of CARBONSINK, part of the European contribution to the Large-Scale Biosphere-Atmosphere Experiment in Amazonia (LBA). RAINFOR field campaigns were funded by the Royal Geographic Society (Peru 2001), CARBONSINK-LBA (BoUvia 2001) and the Max Planck Institut für Biogeochemie (Peru, Bolivia 2001, Ecuador 2002, Brazil 2003). We gratefully acknowl- edge the support and funding of numerous organizations who have contributed to the establishment and maintenance of individual sites: in Bolivia (T. J. K., L. A.), US National Science Foundation, the Nature Conservancy/Mellon Foundation (Eco- system Function Program), FONAMA (Fondo Mundial del Medio Ambiente) and USAiD through the Missouri Botanical
Garden; in Brazil, (S. A.) Conselho Nacional de Desenvolvi- mento Científico e Tecnológico (CNPq), Museu Goeldi, Estacao Científica Ferreira Penna; (S. G. L., W. F. L.) Andrew W. Mellon Foundation, NASA-LBA Program, Conservation, Food and Health Foundation, MacArthur Foundation; (J. N. M. S.) Jari Celulose SA, EMBRAPA/Jari; in Ecuador, (D. N.), Liz Claiborne & Art Ortenberg Foundation, National Geographic Society, Fundación Jatun Sacha; (N. P., A. D.) Estación Científica Yasuni de la Pontificia Universidad Católica del Ecuador, Estación de Biodiversidad Tiputini; in Peru, (O. P., R. V.) Natural Environ- ment Research Council, US National Geographic Society, National Science Foundation, WWF-US/Garden Club of Amer- ica, Conservation International, MacArthur Foundation, An- drew W. Mellon Foundation, ACEER, Albergue Cuzco Amazónico, Explorama Tours S.A., Explorers Inn, IIAP, IN- RENA, UNAP and UNSAAC. T R. B. gratefully acknowledges financial support from the Max Planck Institut für Biogeochem- ie, and thanks Roosevelt Garcia for help in the compilation of Peruvian wood specific gravity data during March 2001.
References
Angiosperm Phylogeny Group (1998) An ordinal classification for the families of flowering plants. Annals of the Missouri Botanical Garden, 85, 531-553.
Araújo TM, Higuchi N, Carvalho JA (1999) Comparison of formulae for biomass content determination in a tropical rain forest site in the state of Para, Brazil. Forest Ecology and Management, 117, 43-52.
Aróstegui A (1982) Recopilación y análisis de estudios tecnológicos de
maderas peruanas. Documento de trabajo No. 2. Proyecto PNUD/FAO/PER/81/002 Fortalecimiento de los programas de desarrollo forestal en selva central, Lima.
Aróstegui A, Sobral Filho M (1986) Usos de las maderas del bosque
húmedo tropical Colonia Angamos Río Yavarí y Jenaro Herrera.
Investigaciones Tecnológicas 2, Universidad Nacional de la Amazonia Peruana, Iquitos.
Aróstegui A, Valderrama H (1986) Usos de las maderas del
bosque húmedo tropical Allpahuayo-Iquitos. Investigaciones
Tecnológicas 5, Universidad Nacional de la Amazonia Peruana, Iquitos.
Baker TR, Swaine MD, Burslem DFRP (2003) Variation in
tropical forest growth rates: combined effects of functional group composition and resource availability. Perspectives in
Plant Ecology, Evolution and Systeniatics, 6, 37-49. Borchert R (1994) Soil and stem water storage determine
phenology and distribution of tropical dry forest trees. Ecology, 75, 1437-1449.
Brown S (1997) Estimating biomass and biomass change of tropical forests. FAO Forestry Paper 134, FAO, Rome.
Brown S, Gillespie AJR, Lugo AE (1989) Biomass estimation methods for tropical forests with applications to forest inventory data. Forest Science, 35, 881-902.
Brown S, Lugo AE (1992) Aboveground biomass estimates for tropical moist forests of the Brazilian Amazon. Interciencia, 17,
8-18. Brown IF, Martinelli LA, Thomas WW et al. (1995) Uncertainty in
the biomass of Amazonian forests: an example from Rónde- nla, Brazil. Forest Ecology and Management, 75, 175-189.
© 2004 Blackwell Publishing Ltd, Global Change Biology, 10, 545-562

WOOD SPECIFIC GRAVITY AND AMAZONIAN BIOMASS ESTIMATES 559
Casper BB, Heard SB, Apanius V (1992) Ecological correlates of single-seededness in a woody tropical flora. Oecologia, 90, 212- 217.
Chambers JQ, dos Santos J, Ribeiro R] et al. (2001 ) Tree damage, allometric relationships, and above-ground net primary production in central Amazon forest. Forest Ecology and
Management, 152, 73-84. Chave J, Condit R, Aguñar S et al. (in press) Error propogation
and scaling for tropical forest biomass estimates. Philosophical
Transactions of the Royal Society of London (Series B), 359, 409^20.
Chave J, Riera B, Dubois MA (2001) Estimation of biomass in a neotropical forest of French Guiana: spatial and temporal variability. Journal of Tropical Ecology, 17, 79-96.
Clark DB, Clark DA (2000) Landscape-scale variation in forest structure and biomass in a tropical rain forest. Forest Ecology and Management, 137, 185-198.
Condit R, Ashton PS, Manokaran N et al. (1999) Dynamics of the forest communities at Pasoh and Barro Colorado: comparing two 50-ha plots. Philosophical Transactions of the Royal Society of
London (Series B), 354, 1739-1748. Détienne P, Jacquet P, Mariaux A (1982) Manuel d'Identification
des Bois Tropicaux, Tome 3, Guyane Française, Centre Technique
Forestier Tropical, Nogent-sur-Marne, France. Fairhead J, Leach M (1998) Reframing Deforestation: Global Analyses
and Local Realities: Studies in West Africa. Routledge, London. Favrichon V (1994) Classification des espèces arborées en
groupes fonctionnels en vue de la réalisation d'un modèle de dynamique de peuplement en forêt Guyanaise. Revue Ecologie (Terre et Vie), 49, 379-403.
Fearnside PM (1992) Forest biomass in Brazilian Amazonia: comments on the estimate by Brown and Lugo. Interciencia, 17, 19-27.
Fearnside PM (1997a) Greenhouse gases from deforestation in Brazilian Amazonia: net committed emissions. Climatic
Change, 35, 321-360. Fearnside PM (1997b) Wood density for estimating forest
biomass in Brazilian Amazonia. Forest Ecology and Manage-
ment, 90, 59-87. Greuter W, McNeill J, Barrie FR et al. (2000) International Code of
Botanical 'Nomenclature (Saint Louis Code). Koeltz Scientific Books, Königstein.
Hacke UG, Sperry JS, Pockman WTet al. (2001) Trends in wood density and structure are linked to prevention of xylem implosion by negative pressure. Oecologia, 126, 457-461.
Hawthorne WD (1996) Holes and sums of parts in Ghanaian forest: regeneration, scale and sustainable use. Proceedings of the Royal Society of Edinburgh, 104, 75-176.
Houghton RA, Lawrence KT, Hackler JL et al. (2001) The spatial distribution of forest biomass in the Brazilian Amazon: a comparison of estimates. Global Change Biology, 7, 731-746.
Houghton RA, Skole DL, Nobre CA et al. (2000) Annual fluxes of carbon from deforestation and regrowth in the Brazilian Amazon. Nature, 403, 301-304.
Inga PR, Castillo MU (1987) Características fisico-quimicas de la madera y carbon de once especies forestales de la Amazonia Peruana. Revista Forestal del Peru, 14, 62-73.
Keller M, Palace M, Hurtt G (2001) Biomass estimation in the Tapajos National Forest, Brazil. Examination of sampling and
allometric uncertainties. Forest Ecology and Management, 154, 371-382.
Ketterings QM, Coe R, van Noordwijk M et al. (2001) Reducing
uncertainty in the use of allometric biomass equations for predicting above-ground tree biomass in mixed secondary forests. Forest Ecology and Management, 146, 199-209.
Killeen T (1998) Vegetation and flora of Parque Nacional Noel Kempff Mercado. In: A Biological Assessment of Parque Nacional
Noel Kempff Mercado, Bolivia (ed. Killeen T), pp. 61-85. Conservation International, Washington, DC.
Malhi Y, PhiUips OL, Lloyd J et al. (2002) An international
network to understand the biomass and dynamics of Amazonian forests (RAINFOR). journal of Vegetation Science,
13, 439-450. Malhi Y, Wright J (in press) Spatial patterns and recent trends in
the climate of tropical forest regions. Philosophical Transactions of the Royal Society of London (Series B), 359, 311-329.
Mallque MA, Yoza LY, Garcia AQ (1991) Determinación de las propiedades eléctricas en seis maderas tropicales. Revista Forestal de Peru, 18, 5-21.
Martinez RV, Phillips OL (2000) AUpahuayo: floristics, structure and dynamics of a high diversity forest in Amazonian Peru. Annals of the Missouri Botanical Garden, 87, 499-527.
MuUer-Landau HC (2004) Interspecific and inter-site variation in wood-specific gravity of tropical trees. Biotropica (in press).
Nascimento HEM, Laurance WL (2002) Total aboveground biomass in central Amazonian rainforests: a landscape-scale study. Forest Ecology and Management, 168, 311-321.
Nebel G, Dragsted J, Vegas AS (2001) Litter fall, biomass and net primary production in flood plain forest in the Peruvian Amazon. Forest Ecology and Management, 150, 93-102.
Phillips OL, Baker TR, Arroyo L et al. (in press) Pattern and process in Amazon tree turnover, 1976-2001. Philosophical
Transactions of the Royal Society of London (Series B), 359, 381-407.
Phillips OL, Hall P, Gentry AH et al. (1994) Dynamics and
species richness of tropical rain forests. Proceedings of the National Academy of Sciences, USA, 91, 2895-2809.
Phillips OL, Malhi Y, Higuchi N et al. (1998) Changes in the carbon balance of tropical forests: evidence from long-term plots. Science, 282, 439-442.
Pitman NCA, Terborgh JW, Silman MR et al. (2001) Dominance and distribution of tree species in upper Amazonian terra firme forests. Ecology, 82, 2102-2117.
Prentice IC, Farquhar GD, Fasham ML et al. (2001) The carbon cycle and atmospheric carbon dioxide. In: Climate Change 2001: The Scientific Basis (ed. IPCC), pp. 183-197. Cambridge
University Press, Cambridge. Proyectos Andinos de Desarrollo Technologico en el area de los
recursos forestales tropicales (PADT-REFORT) (1981) Tablas de propiedades físicas y mecánicas de la madera de 20 especies del Peru, PADT-REFORT, Lima.
Rankin de Mérona J, Prance GT, Hutchings RW et al. (1992) Preliminary results of a large-scale tree inventory of upland rain forest in the Central Amazon. Acta Amazónica, 22, 493-534.
Reyes GS, Brown S, Chapman J et al. (1992) Wood densities of
tropical tree species. Report no. SO-88, Southern Forest Experi- ment Station, New Orleans, USA.
© 2004 BlackweU Pubhshing Ltd, Global Change Biology, 10, 545-562

560 T. R. BAKER et al.
Rich PM (1987) Mechanical structure of the stem of arborescent palms. Botanical Gazette, 148, 42-50.
Sombroek WG (2000) Amazon land forms and soils in relation to biological diversity. Acta Amazónica, 30, 81-100.
Suzuki E (1999) Diversity in specific gravity and water content of wood among Bornean tropical rainforest trees. Ecological
Research, 14, 211-224. ter Steege H (2000) Plant diversity in Guyana, with recommen-
dations for a National Protected Area Strategy. Tropenbos Series 18, Tropenbos Foundation, Wageningen.
ter Steege H, Hammond DS (2001) Character convergence, diversity and disturbance in tropical rain forest in Guyana. Ecology, 82, 3197-3212.
ter Steege H, Sabatier D, Castellanos H et al. (2000) An analysis of the floristic composition and diversity of Amazonian forests
including those of the Guiana Shield, journal of Tropical Ecology,
16, 801-828. Whitmore TC (1998) An Introduction to Tropical Rain Forests.
Oxford University Press, Oxford.
Woodcock D (2000) Wood specific gravity of trees and forest types in the southern Peruvian Amazon. Acta Amazónica, 30,
589-599. Woodcock D, Shier AD (2002) Wood specific gravity and its
radial variations: the many ways to make a tree. Trees - Structure and Function, 16, 437-^43.
Appendix
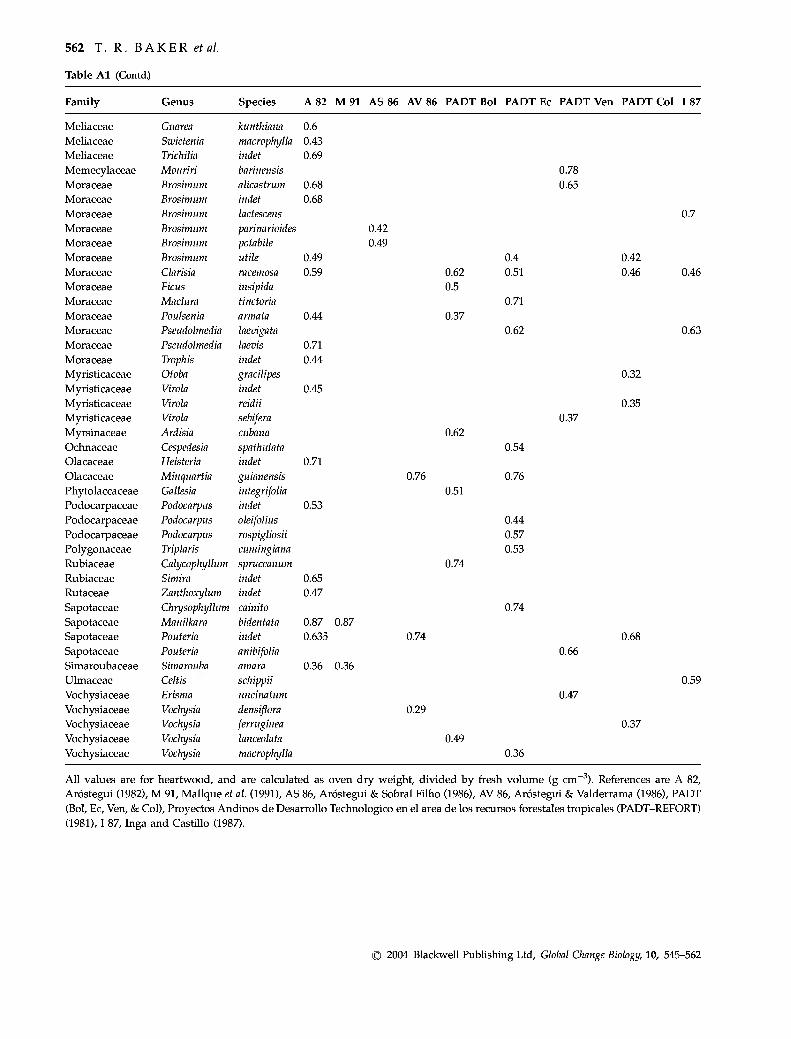
Wood specific gravity values are given in Table Al.
Table Al Wood specific gravity values from a variety of studies in western Amazonia
Family Genus Species A 82 M 91 AS 86 AV 86 PADT Bol PADT Ec PADT Ven PADT Col I 87
Anacardiaceae Anacardium excelsum
Anacardiaceae Campnosperma panamensis
Anacardiaceae Mauria indet
Anacardiaceae Spondias mombin 0.35 Annonaceae Guatteria decurrens 0.52 Annonaceae Xylopia indet
Apocynaceae Aspidosperma macrocarpon 0.67 0.67
Araliaceae Schefflera morototoni
Bignoniaceae Tabebuia rosea
Bignoniaceae Tabebuia serratifolia 0.92
Burseraceae Protium indet
Caryocaraceae Caryocar glabrum 0.65 Celastraceae Goupia glabra
Chrysobalanaceae Licania indet
Chrysobalanaceae Licania unguiculata
Clusiaceae Calophyllum brasiliense 0.51 Clusiaceae Calophyllum indet
Clusiaceae Rheedia indet 0.6 Clusiaceae Symphonia globulifera
Combretaceae Buchenavia indet
Combretaceae Buchenavia viridiflora
Combretaceae Terminalia amazonia
Combretaceae Terminalia indet
Combretaceae Terminalia oblonga 0.73 Ebenaceae Diospyros indet
Euphorbiaceae Hevea indet 0.53 Euphorbiaceae Hieronyma chocoensis
Euphorbiaceae Hieronyma laxiflora
Euphorbiaceae Hura crepitans 0.41 Euphorbiaceae Nealchornea yapurensis
Euphorbiaceae Pausandra trianae
Euphorbiaceae Sapium marmieri 0.4 Fabaceae Albizia indet 0.45 Fabaceae Amburana cearensis 0.43 Fabaceae Apuleia leiocarpa
Fabaceae Bocoa indet
0.35 0.34 0.37
0.31 0.31
0.5
0.36 0.54
0.55
0.88 0.56
0.55
0.77
0.65
0.47
0.42
0.68 0.59
0.46
0.58
0.61
0.59
0.65 0.64
0.55 0.62
0.61 0.59
0.7 0.42
(^continued)
¡g) 2004 Blackwell Publishing Ltd, Global Change Biology, 10, 545-562

WOOD SPECIFIC GRAVITY AND AMAZONIAN BIOMASS ESTIMATES 561
Table Al (Contd.)
Family Genus Species A 82 M 91 AS 86 AV 1
Fabaceae Cedrelinga cateniformis 0.45 0.45 Fabaceae Copaifera indet
Fabaceae Copaifera officinalis 0.61 Fabaceae Copaifera pubiflora
Fabaceae Diplotropis martiusii 0.74 Fabaceae Hymenaea courbaril
Fabaceae Hymenaea oblongifolia 0.62
Fabaceae Inga edulis
Fabaceae Mora gonggrijpii
Fabaceae Mora megistosperma
Fabaceae Myroxylon balsamum
Fabaceae Myroxylon peruiferum 0.78 Fabaceae Ormosia coccinea 0.61 Fabaceae Ormosia schunkei 0.57 Fabaceae Parkia indet
Fabaceae Peltogyne porphyrocard 'ia
Fabaceae Pentadethra macroloba
Fabaceae Piptadenia grata
Fabaceae Pithecellobium latifoUum
Fabaceae Pithecellobium saman
Fabaceae Pterocarpus indet 0.703 Fabaceae Pterocarpus vernalis
Fabaceae Schizolobium parahyba
Fabaceae Sclerolobium indet 0.39 Fabaceae Swartzia laevicarpa 0.61 Fabaceae Taralea oppositifolia
Flacourtiaceae Laetia procera
Humiriaceae Humiria balsamifera 0.82
Humiriaceae Humiriastrum procerum
Lauraceae Aniba amazónica 0.56 0.52
Lauraceae Endlicheria indet
Lauraceae Nectandra indet 0.42 Lauraceae Ocotea indet 0.53 Lauraceae Persea caerulea
Lecythidaceae Cariniana decandra 0.51 Lecythidaceae Cariniana domestica 0.59 Lecythidaceae Cariniana estrellensis
Lecythidaceae Eschweilera indet 0.72 Lecythidaceae Gustavia speciosa
Malvaceae Apeiba áspera 0.28 Malvaceae Bombacopsis quinata
Malvaceae Bombax paraense 0.39 Malvaceae Catostemma commune
Malvaceae Ceiba pentandra
Malvaceae Ceiba samauma 0.57
Malvaceae Chorisia integrifolia 0.28 Malvaceae Huberodendron patinoi
Malvaceae Pterygota indet 0.62
Malvaceae Quararibea asterolepis
Malvaceae Quararibea bicolor 0.52 Malvaceae Quararibea cordata 0.43 Meliaceae Carapa guianensis
Meliaceae Cedrela odorata 0.42 Meliaceae Guarea indet
0.37
0.51
0.56
0.77
0.78
0.86
0.4
0.8
0.33
0.36 0.49
0.57
0.66
0.42
0.57
0.39
0.5 0.52
0.55
0.43
0.48
0.63 0.78
0.43
0.68 0.69
0.63
0.5
0.34
0.21
0.5
0.45
0.49
0.53
(continued)
© 2004 Blackwell PubUshing Ltd, Global Change Biology, 10, 545-562
562 T. R. BAKER et al.
Table Al (Contd.)
Family Genus Species A 82
Meliaceae Guarea kunthiana 0.6 Meliaceae Swietenia macrophylla 0.43 Meliaceae Trichilia indet 0.69 Memecylaceae Mouriri barinensis
Moraceae Brosimum alicastrum 0.68 Moraceae Brosimum indet 0.68 Moraceae Brosimum lactescens
Moraceae Brosimum parinarioides
Moraceae Brosimum potahile
Moraceae Brosimum utile 0.49 Moraceae Clarisia racemosa 0.59 Moraceae Ficus insipida
Moraceae Madura tinctoria
Moraceae Poulsenia armata 0.44 Moraceae Pseudolmedia laevigata
Moraceae Pseudolmedia laevis 0.71
Moraceae Trophis indet 0.44 Myristicaceae Otoba gracilipes
Myristicaceae Virola indet 0.45 Myristicaceae Virola reidii
Myristicaceae Virola setífera
Myrsinaceae Ardisia cubana
Ochnaceae Cespedesia spathulata
Olacaceae Heisteria indet 0.71
Olacaceae Minquartia guianensis
Pliytolaccaceae Gallesia integrifolia
Podocarpaceae Podocarpus indet 0.53 Podocarpaceae Podocarpus oleifolius
Podocarpaceae Podocarpus rospigliosii
Polygonaceae Triplaris cumingiana
Rubiaceae Calycophyllum spruceanum
Rubiaceae Simira indet 0.65 Rutaceae Zanthoxylum indet 0.47
Sapotaceae Chrysophyllum cainita
Sapotaceae Manilkara bidentata 0.87 Sapotaceae Pouteria indet 0.635 Sapotaceae Pouteria anibifolia
Simaroubaceae Simarouba amara 0.36 Ulmaceae Celtis schippii
Vochysiaceae Erisma uncinatum
Vochysiaceae Vochysia densiflora
Vochysiaceae Vochysia ferruginea
Vochysiaceae Vochysia lanceolata
Vochysiaceae Vochysia macrophylla
M 91 AS 86 AV 86 PADT Bol PADT Ec PADT Yen PADT Col I 87
0.78 0.65
0.42 0.49
0.62 0.5
0.37
0.4 0.51
0.71
0.62
0.42 0.46
0.7
0.46
0.63
0.32
0.35 0.37
0.76
0.62
0.51
0.74
0.54
0.76
0.44 0.57 0.53
0.74 0.87
0.36
0.74
0.29
0.68 0.66
0.47 0.59
0.37 0.49
0.36
AU values are for heartwood, and are calculated as oven dry weight, divided by fresh volume (g cm ^). References are A 82, Aróstegui (1982), M 91, Mallque et al. (1991), AS 86, Aróstegui & Sobral Filho (1986), AV 86, Aróstegui & Valderrama (1986), PADT (Bol, Ec, Ven, & Col), Proyectos Andinos de Desarrollo Technologico en el area de los recursos forestales tropicales (PADT-REFORT) (1981), I 87, Inga and Castillo (1987).
íg) 2004 Blackwell Publishing Ltd, Global Change Biology, 10, 545-562