Energy Sector Management Assistance Programme
100
:9w -:0ESMAP Energy Sector Management Assistance Programme bec. 129? Philippines Commercial Potential for Power Production from Agricultural Residues Report No. 157193 Results of a Joint Study by ESMAPand the Philippines Department of Energy Public Disclosure Authorized Public Disclosure Authorized Public Disclosure Authorized Public Disclosure Authorized
-
Upload
khangminh22 -
Category
Documents
-
view
3 -
download
0
Transcript of Energy Sector Management Assistance Programme

:9w -:0ESMAPEnergy Sector Management Assistance Programme
bec. 129?
PhilippinesCommercial Potential for Power Production from
Agricultural ResiduesReport No. 157193
Results of a Joint Study by ESMAP and thePhilippines Department of Energy
Pub
lic D
iscl
osur
e A
utho
rized
Pub
lic D
iscl
osur
e A
utho
rized
Pub
lic D
iscl
osur
e A
utho
rized
Pub
lic D
iscl
osur
e A
utho
rized

JOINT UNDP / WORLD BANKENERGY SECTOR MANAGEMENT ASSISTANCE PROGRAMME (ESMAP)
PURPOSE
The Joint UNDP/World Bank Energy Sector Management Assistance Programme (ESMAP) waslaunched in 1983 to complement the Energy Assessment Programme, established three yearsearlier. ESMAP's original purpose was to implement key recommendations of the EnergyAssessment reports and ensure that proposed investments in the energy sector represented the mostefficient use of scarce domestic and external resources. In 1990, an international Commissionaddressed ESMAP's role for the 1990s and, noting the vital role of adequate and affordable energyin economic growth, concluded that the Programme should intensify its efforts to assist developingcountries to manage their energy sectors more effectively. The Commission also recommendedthat ESMAP concentrate on making long-term efforts in a smaller number of countries. TheCommission's report was endorsed at ESMAP's November 1990 Annual Meeting and promptedan extensive reorganization and reorientation of the Programme. Today, ESMAP is conductingEnergy Assessments, performing preinvestment and prefeasibility work, and providing institutionaland policy advice in selected developing countries. Through these efforts, ESMAP aims to assistgovermnents, donors, and potential investors in identifying, funding, and implementingeconomically and environmentally sound energy strategies.
GOVERNANCE AND OPERATIONS
ESMAP is governed by a Consultative Group (ESMAP CG), composed of representatives of theUNDP and World Bank, the governments and institutions providing financial support, andrepresentatives of the recipients of ESMAP's assistance. The ESMAP CG is chaired by the WorldBank's Vice President, Finance and Private Sector Development, and advised by a TechnicalAdvisory Group (TAG) of independent energy experts that reviews the Programme's strategicagenda, its work program, and other issues. ESMAP is staffed by a cadre of engineers, energyplanners and economists from the Industry and Energy Department of the World Bank. TheDirector of this Department is also the Manager of ESMAP, responsible for administering theProgramme.
FUNDING
ESMAP is a cooperative effort supported by the World Bank, UNDP and other United Nationsagencies, the European Community, Organization of American States (OAS), Latin AmericanEnergy Organization (OLADE), and countries including Australia, Belgium, Canada, Denmark,Germany, Finland, France, Iceland, Ireland, Italy, Japan, the Netherlands, New Zealand, Norway,Portugal, Sweden, Switzerland, the United Kingdom, and the United States.
FURTHER INFORMATION
For further information or copies of completed ESMAP reports, contact:
ESMAPc/o Industry and Energy Department
The World Bank1818 H Street N.W.
Washington, D.C. 20433U.S.A.

Philippines:
Commercial Potential for Power Production fromAgricultural Residues
Results of a Joint Study by ESMAP and the PhilippinesDepartment of Energy
December 1993
Abbreviations and Acronyms
ANECs Affiliated Nonconventional Energy CentersBED Bureau of Energy DevelopmentBEU Bureau of Utilization1301 Board of InvestmentsCARP Comprehensive Agrarian Reform ProgramCNED Center for Nonconventional Energy DevelopmentDOE Departnent of EnergyDOST Departnent of Science and TechnologyDSM Demand side managementECC Energy Coordinating CouncilEDB Energy Development BoardERDC Energy Research and Development CenterESMAP Energy Sector Management ProgrammeGEF Global Environment FacilityGOP Government of the PhilippinesMOE Ministry of EnergyNASUTRA National Sugar Trading CorporationNCRD Nonconventional Resources DivisionNEA National Electrification AdministrationNCED Nonconventional Energy DivisionNEDP Nonconventional Energy Development ProgramNFA National Food AuthorityNPC National Power CorporationOEA Office of Energy AffairsP Philippine PesoPCA Philippine Coconut AuthorityPCIERD Philippine Council for Industry and Energy
Research and DevelopmentPNOC Philipine National Oil CompanyREC Rural Electric CooperativeSRA Sugar Regulatory AdministrationUNDP United Nations Development Program

Currency Equivalents
The Philippine currency is the peso (P). The exchange race used in this report is US$1 .00 = P 25.00
Weights and Measures
bbl - barrelbcf - billion cubic feetbcm - billion cubic metersbfoe - barrels of fuel oil equivalentha - hectareGWh - gigawatt-hour (I million kilowatt-hours)kcal - kilocalorie (3.97 British thermal units)kg - kilogram (2.2 pounds)km - kilometer (0.62 miles)kW - kilowattkWh - kilowatt-hourmcf - million cubic feetmloe - million litres of oil equivalent
immb - million barrelsmmbfoe - million barrels of fuel oil equivalentr - metric tonty - metric tons per yearMW - megawatttcd - tons of cane per daytcpy - tons of cane per yeartoe - tons of oil equivalent
Converlon Facton
I million tons of oil equivalent is
= 1.5 million tons of coal= 3 million tons of lignite= 1.l Ibcm of natural gas= 39.2bcf of natural gas= 12.WOOGWh of electricity

TABLE OF CONTENTS Page
FOREWORD ...........................
EXECUTIVE SUMMARY ....................... i
L.BACKGROUND......................... IIntroduction .. 1........................Energy Sector Overview .......................Current Power Situation.......................2The Case For Biomass Cogeneration.................. 3Objectives and Methodology of the Study ................. s
IL. THlE SUGAR SECTOR.......................6Sector Profile......................... 8Mill Operation......................... 8Cane Residue Availability .. 1...................iSector Segmentation .11..................... Investment Scenarios ....................... 12Results of the Economic and Financial Analysis...............13Implementation Issues.......................15
M. THE RICE SECTOR.......................17Sector Profile..........................17Biomiass Residue Availability.....................18
Potential Availability of Rice Hulls ................. 19Present Uses of Rice Hulls....................20
Sector Segmnentation ....................... 20Investment Scenarios ....................... 20Results of the Economic and Financial Analysis ............... 23Other Inplementation Constraints ................... 23
IV. THE COCONUT SECTOR.....................25Sector Profile..........................25
Area Planted and Production ................... 28Coconut Processing and Consumption.................28
Biomass Residue Availability.....................29Present Uses as Fuel......................30Non-Fuel Uses........................30
Sector Segmentation ....................... 31Coconut Oil Mills.......................31Coconut Desiccators......................31Coconut Production Sites .................... 32
Investment Scenarios ....................... 33Results of the Analysis.......................34Implernentation Issues.......................35

V. CONCLUSIONS AND RECOMMENDATIONS .......................... 36General Conclusions.36Sector Conclusions ............................................. 37Recommendations.39
ANNEXES
A. The Nonconventional Energy Development Program: An Evaluation ............... 41
B. Training on Economic Appraisal of Nonconventional Energy Projects ............... 48
C. Guidelines for Technology Selection ................................... 52
D. Data Tables ................................................... 56
E. Selected Spreadsheets ............................................. 71

FOREWORD
This report is one of the outputs of a technical assistance project to the Philippines Officeof Energy Affairs (OEA), now the Department of Energy (DOE), executed by the joint WorldBank/UNDP Energy Sector Management Programme (ESMAP) and financed by the NetherlandsGovernment. The activity entitled "Nonconventitnnal Energy Planning Technical Assistance" hadthree components: (a) an evaluation of OEA's nonconventional energy development program, (b)a training course on project economic appraisal and (c) a study of the potential for powerproduction using biomass residues. The study effectively commenced in November 1991.
The first component, a brief evaluation of program achievements, constraints and directions,was conducted by Dan Fallen-Bailey, Gregorio Kilayko and Nonnan Brown (consultants). Theoutput of this component was written by Ernesto Terrado and is presented as Annex A.
The results of the second cnmponent, a training program for staff of the NonconventionalResources Division of OEA and of the Affiliated Nonconventional Energy Centers of variousprovinces, are described in Annex B. The main resource person for this task was DonaldHertzmark (consultant).
The main body of this report comprises the bulk of the work done overall. Its purpose wastwofold. First, it aimed to determine the realistic potential for energy utilization of keyagricultural wastes in the country, namely residues of the sugar, rice and coconut processingindustries, given the prolonged power crisis. Second, and more importantly, it aimed to use theprocess of investigation as a hands-on training tool for OEA staff who previously have nevercarried out a study of similar complexity. Thus a local team consisting of OEA staff and localconsultants was forned in 1992 and interacted closely with the ESMAP team during the courseof the work. The local team, led by Conrado Heruela, Marites Cabrera and Eloida Balaniiento,conducted all field surveys, analyzed the data and performed most of the economic and financialcalculations. The local consultants were Fernando Corpuz (sugar sector), Levy Trinidad (coconutsector), Mauricio Valdez (rice sector) and Alberto Dalusong (power sector). Technicalsupervision was provided by Richard Stevenson, a Manila-based consultant.
Overall task managernent and technical backstopping were provided by Emesto Terrado andRobert Chronowski (consultant). The final report, based on a draft prepared by the Philippinesbased team, was written by Ernesto Terrado, Robert Chronowski and Gabriela Martin(consultant).

i
EXECUTIVE SUMMARY
Overview
Other than in the sugar industry, biomass has not received adequate attention as a potentialenergy resource by either the Government of the Philippines (GOP) or by major lenders mainlybecause of the relatively small energy production potential at any given project site. While thisis a legitimate issue froni the stand-point of regular project lending criteria, the aggregatepotential for economic energy production from this indigenous and renewable resource is clearlylarge enough to warrant more serious consideration.
The Philippines has an abundant supply of biomass resources in the form of agricultural cropresidues, forest residues, animal wastes, agro-industrial wastes, and aquatic biomass. Some oftherse resources are already being exploited. In 1992, biomass, principally bagasse burned in thesugar industry and coconut huskishell used by other industries, contributed about 11 percent ofthe total national energy supply mix, makling it the country's largest indigenous energy source.However, considerable biomass energy resources remain untapped and are treated as wastes.While the theoretical potential has always been recognized as considerable, the economic potentialfor energy production was, at the inception of the study, an unknown quantity. The Departmentof Energy requested assistance to determine the realistic potential for power production fromprocess residues in three major agro-industrial sectors: sugar, rice and coconut. One reason forthe interest is the the country's power sector situation, characterized by poor reliability,insufficient capacity to meet demand, rising electricity prices, and heavy reliance on importedfuels. Despite the already massive efforts to address the crisis by a variety of conventional powerprojects, it was thought important to also explore additional possibilities in less conventionalenergy production. The sugar, rice and coconut sectors examined in this report all haveagricultural waste byproducts that in most cases have minimal or even negative cost (factoriessometimes pay for waste disposal). Agro-industrial facilities in the country are generally agedand require replacement of equipment. There is tremendous renewed interest worldwide incogeneration projects that provide additional revenues to key industries.
At an estimated power purchase floor price of P1.80 per kWh, or an avoided electricity costfrom P2.00 (purchased electricity cost) to P2.50 per kWh (small diesel based captive electricityproduction with a commercial, heavily taxed diesel oil price) and possibly higher, there aresufficient revenues or savings potential to seriously consider investments in biomass-derivedpower generation in all three biomass residue sectors in the country. Also, along with the intentand provisions of recent private power legislation, there appears to be a real opportunity now forbiomass power project development that has not been possible in the past.
As finally determined by the study. however, the total potential for power production frombiomass residues in the three agro-industrial sectors is nowhere near the level required to fullyaddress the current power crisis in the country. Furthermore, because of the relatively largenumber of individual plants involved, only a small fraction of the potential can be developed inthe short-term to help alleviate the power shortage. Nevertheless, many of the biomass projectsthat were examined are cost-effective and present attractive investment opportunities. They mustbe viewed as energy efficiency investments that are in themselves worth doing because they areeconomically viable and environmentally beneficial.

ii
Objectives and Methodology of the Study
The principal objective of the study is to develop realistic estimates of lhe commercialpotential for power generation in thie Philippines from major bionlass residue in the sugar. riceand coconut processing/production industries. Based on techniical and statistical profiles preparedfor each sector by a Department of Energy (DOE) team, the industries were segmented into"clusters" or groupings by common characteristics such as size. and several sites were selectedfrom each cluster for the field surveys. The selections represent the ranges of sizes. types ofmills and sites in a particular cluster. The study teams from DOE surveyed the selected sites infield visits. Data sets of operational parameters were developed for a prototype mill or site thatwould most closely represent the particular cluster and enable a broader application of the resultsof the analyses. Economic and financial analyses were then conducted on each prototype millto screen the most promising cases.
The Sugar Sector
The processing se_tor of the sugar industry is composed of 39 mills (exclusive of 2inoperational mills) spread over 16 provinces. The bulk of the mills is concentrated in Negros,the "Sugar Bowl of the Philippines", which provides about 56 percent of the country's annualsugar production. The mills process from 500 tcd (tonnes of cane per day) to 10,800 tcd, for anaverage of 4,600 tcd. Bagasse, a by-product of sugarcane processing, is used as the principal fuelfor steam production in the sugar mills. Steam is utilized for power production and sugarprocessing. Investments to improve the efficiency of mill operations can result in excess bagassethat can be utilized to generate electricity for export to the grid.
Three investment scenarios were considered for each representative prototype mill. The firstscenario eliminates the current boiler makt-up steam and injection water input to the sugarprocessing steam header, and passes an equivalent amount of steam through a new or existingsteam turbine. The second scenario involves the replacement of old plant equipment with new,higher pressure and temperature boilers, and the corresponding topping cycle turbo generatorsets. The third scenario would add a new higher pressure boiler with a condensing-extractionsteam turbine-generator, allowing year round operation with the use of cane trash as asupplementary fuel. This scenario, for all intents and purposes, means putting up a stand-alonepower plant beside the sugar mill. The first two scenarios were limited in the analysis togeneration of surplus electricity only during the milling season. It is important to point out thatthe milling season does coincide with the dry season, such that surplus power is available whenthe hydro potential is at its lowest.
Some of the major conclusions drawn from the analysis are as follows:
a) The cases in the first or "bypass steam" scenario obtained the best rates of return, withfinancial IRRs ranging from 22 to 65 percent. The economics in actual cases may even bebetter, as the analysis uniformly assumed the purchase of additional turbo-generator capacityand associated equipment to utilize the excess bagasse.
b) The "topping cycle" approach of the second scenario, which involves high investments,does not appear to be viable for all mill sizes with electricity production during theprocessing season only.
iii
c) T'he stand-alone condenising cycle plant of the third scenario shows good potential formills of at least 700,000 tcpy capacity, with financial IRRs betweeni 26 and 31 percent. Onereason is the capability to operate year-round using a supplemential fuel such as cane trashor coal in lhe olT-season. The resuli of the analysis Illust be viewed as merely indicative.Only a plant-specific study can confirmii the feasibility of the complex assignment of benefitsand inputs between the stand-alone power plant and the sugar mill. 'he feasibility evaluationwould consider the bagasse and water as inputs from the mill, with electricity and steam asreturns to the mill. The benefiLs arising from use of thesc inputs and returns, the accountingof changes in personnel assignments, and possibly land lease clharges can be accounted forin multiple ways, depending on specific ownership/partnership arrangements.
d) Based on the results of this study, the sugar sector can be very conservatively describedas having the potential to contribute from 60-90 MW to grid supply from several individualprojects in the immediate term. The largest 15 sugar mills (each processing over 500,000tons of cane annually) would be the most likely contributors to this capacity goal. The totalinvestment requirement for financially viable projects would be at least US$ 112 million.
e) The above astimate of MW potential is very likely on the low side as the analysisassumed full investment costs in each case. In reality, many mills will already have thesurplus turbine-generator capacity required for Scenario l. and the investment will besignificantly below the assumed unit cost of capacity installed. Also, in a situation where anew bagasse boiler needs to be purchased anyway for sugar processing purposes when a millmodernizes, only the incremental cost for achieving the topping cycle pressure rating (andnot the total boiler cost) should be charged to electricity production. In that case, the toppingcycle will likely become a viable investment scenario because the boiler comprises the majorcost element in the total price for the topping cycle equipment. For example, if about halfof the mills that were screened out by the financial analysis in Scenario II are assumed torequire only half of the regular capital costs for the reasons cited, the total power potentialcould increase by an additional 25 MW.
f) There are few technical risks associated with the use of bagasse for surplus powerproduction. However, the need to employ higher steam pressures and temperatures does addsome O&M considerations not normally experienced by the sugar sector in the Philippines.This suggests that some type of improved skills will be required of the steam plant operatorsemployed for these projects.
g) The major barrier to cogeneration projects in Philippine sugar mills at this time, besidesthe presently poor financial condition of many mill companies, would appear to be the canesharing issue between the farmers and the mill owners. In general, the present system doesnot provide an incentive for the mills to invest in mill modernization projects, includingbagasse cogeneration projects for power export.
Rice Sector
In 1991, 3.42 million hectares of agricultural land were planted with rice, producing 9.67million tons, at an average yield of 2.82 tons per hectare. Rice husk or hull constitutes about 20percent of paddy. About 14,000 rice mills nationwide, most of them small, produce about 1.9million tons of rice husks annually. The Cono and Rubber Roll types of rice mills that were

iv
selected for the analysis constitute about 95 percent of total milling capacity. The cases selectedfor analysis involve the installation of a rice-hull fired power plant in a mill, ranging from a 75kW system for the smallest grouping (less than 11.000 tons paddy milled annually) to an 800 kWsystem for the largest mills (over 41,000 tois). In addition, it was determined from the surveyresults that it may be possible also to group rice mills under two types 01' schemes, such that themills in a cluster would contribute rice hulls to a common power plant. The schemes wouldproduce I and 3 MW, respectively. Only the systems above 500 kW are assumed lo generateenough surplus electricity for grid export. The rest would use the clectricity produced internally,displacing diesel-generated electricity. Specific conclusions concerning the rice sector analysisare:
a) Most of the potential projects with capacity of 350 kW and above (especially the high-tech option) have economic internal rates of return exceeding the discount rate of 15 percent.even with no revenues from ashl sales. These results indicate rice sector projects involvingat least 350 kW would warrant further investigation. Ash sales significantly improve theeconomics of all cases, raising the financial IRRs by 11-24 percent. This suggests the needto examine more closely the possibilities for marketing rice hull ash in the domestic andexport markets.
b) For simplicity in the analysis, the cogeneration option was not considered for the ricesector in this study, but the economics would be further improved if steam could be used forrice drying.
c) The economics of the investments depend strongly on the utilization of the electricityproduced. The locations of many of the rice mills are normally in areas with low powerdemand where the assumed 85 percent load factor will be difficult to attain.
d) Compared to bagasse, there is more technical risk with the use of rice hulls as boilerfuel because of the erosive nature of the rice hulls caused by their high silica content.Unless the equipment is properly specified and carefully operated and maintained, technicaldifficulties could lead to project failures. There would clearly be a need for more skilledmanpower in the rice mills to operate and mnaintain the power plant equipment.
e) Based on the results of the present study, the realistic potential aggregate contributionof rice hull-fired capacity is not likely to exceed 40 MW. Because of the large number ofinstaliations needed to achieve this amount, a progrum in the inmmediate term should targetno more than 10 MW total. Unless a significant rice hull ash market can be developed, itis not likely that off-shore entrepreneurs would participate in ventures to exploit this sector'sbiomass residue resource for energy production.
Coconut Sector
The coconut sector was the most difficult to deal with in the study because of theuncertainties regarding the structure of the Philippine coconut growing and processing industryand its markets. Although the original intent was to incorporate a cogenerating plant within anindividual coconut oil mill or a coconut desiccating plant, this was found to be not feasible forvarious technical reasons. It was decided instead to investigate two investnent scenarios: (a)installation of a power generating facility within a 7,500 ha. coconut plantation area, and (b)

v
installation of a power generating facility integrated with a 7,500 metric tons per year (tfyr)coconut oil mill. Based on biomass-fired power plant designs currently available in the market.two sizes, 500 kW and 1000 kWY, were examined for each of the two scenarios. Specificconclusions drawn from the analysis are:
a) The financial IRRs for the four cases range from 10 to 45 percent. which indicatespotential for proceeding to site specific analysis. The power plant integrated with an oil millhas a better return than the stand alone case because of a probable higher load factor, andthe higher value of the avoided purchase of eectr-city by the oil mill for self use. All of thecases assumed the implementation of the Philippine Coconut Authority (PCA) "nucleusestate" concept. However, any organizational or business arrangement giving the mill accessto 7500 ha of coconut production will yield the same result.
b) The analysis suggests that the power plants will have to be heavily base loaded toachieve sufficient IRRs. This appears unlikely in most rural areas. Integration of the powerplant with a coconut oil mill will only partially solve the load problem.
c) On the positive side, the remoteness of the potential power plant sites does suggest thatit may be possible on a site specific basis to negotiate a higher power sales rate than the P1.80 assumed for the analysis. Also, there are very few technical risks with implementingcoconut husk fired power projects, even in remote areas.
d) The concept of coconut husk-fired power stations is valid, but more analysis is neededto accurately define the potential of this sector. Unless the appropriate resources/load matchcan be made for the 500 kW and 1,000 kW cases, the aggregate power contribution fromthis sector will be minm=al. No doubt some viable sites can be identified, but it is likely thatthe aggregate potential contribution from this sector will be only about 20 MW.
Recommendations
The biomass power investments discussed in this report are expected to be undertaken mainlyby the private sector, once confirmed to be viable in specific situations. However, theGovernment has an important role to play in promoting the concept and facilitating theidentification and implementation of actual projects. Through its line agencies the DOE has beenimplementing a program for developing onconventional energy resources (see evaluation inArmex A). Given the urgency of the power crisis, it is recommended that grid-connected powergeneration opportunities using agricultural wastes be given priority attention in that program. Avariety of fiscal and other incentives for renewable energy projects already exist. The applicationof these incentives to the type of biornass projects discussed in this report should be clearlydefined and widely publicized. Information dissemination efforts are crucial in order to developawareness of investment opportunities in the three sectors.
It is recommended that the sugar industry, with its relatively better defined potential fordevelopment of surplus electricity generation capacity, should be targeted as the top sector forimmediate attention. The DOE, along with the Sugar Regulatory Administration (SRA), shouldhelp define the type of actions required to resolve the mill/farmer cane sharing issue in anequitable manner that provides the mill owners and their potential off-shore partners withsufficient incentive to make the substantial investments needed to develop the surplus power

vi
capacity. An arrangement is needed with all cane suppliers that will allow the millers to investin a surplus power project with some acceptable minimum revenue sharing liability. The marketleaders in the sugar industry are already involved in trying to define viable surplus powerprojects, and these activities should be fully supported as precedent setting projects. One usefularea of assistance would be in the pre-qualification of potential off-shore joint venture partnersto avoid wasting time and efforts of the mill owners.
For the rice sector, the market leaders should be identified and educational and awarenessbuilding activities should be directed toward them. This effort should be coordinated with theNational Food Authority (NFA) and its allied industry associations. As an immediate action, itis recommended that suitable demonstration projects involving selected mill sizes and types beidentified. Despite the failure of an earlier pilot project on rice-husk fired power production bythe NFA, technology advances and operational experience acquired in recent years, combinedwith a more favorable local climate for private power generation, warrant a re-investigation ofthis option. To the extent possible, DOE, through its line agencies should serve as a brokerbetween the market leaders with viable sites, the qualified equipment vendors, and the appropriatefinancing organizations to accelerate implementation of these pilot projects.
For the coconut sector, the potential for project investments is closely linked to theimplementation of the proposed sector decentralization program. The remoteness of the areaswhere the coconut husk resource is normally located implies low load factors and suggests thatthe most promising projects will be those integrated with an oil mill. Identification of precedent-setting projects in this sector must involve close cooperation between the DOE and the PhilippineCoconut Authority (PCA). It is recommended that one or two demonstration projects in carefullyselected sites be designed and assisted with financing arrangements, perhaps from bilateraldonors.
It is recommnended that the legal and contractual framework needed to facilitateimplementation of relatively small agricultural residue-fired power projects be clearly defined byDOE, starting with the adoption and publication of an appropriate standard power purchaseagreement for these types of projects. This should also include a clear delineation ofresponsibilities between the mills and the utility for interconnection and fault protectionrequirements.
In summary, given that the current national power supply deficit is in the order of 1,000MW, the total power potential of about 150 MW from agricultural biomass estimated by thisstudy is clearly not going to be a major solution to the energy problems of the Philippines, ineither the short or long term. It should be correctly viewed as a small but strategic part of thesolution, having good potential for economically and environmentally beneficial capacitycontributions. The present study has identified the specific mill situations and investmentconfigurations that will likely result in cost effective projects. Even in situations whereincremental power production from biomass projects are just sufficient for internal mill use, theycontribute to easing the power crisis by reducing total demand for grid supply. In addition, theprojects have the potential to contribute to the economic upliftment of the agro industries byproviding an additional revenue-generating activity and new opportunities for rural employment.

-1-
I. BACKGROUNDIntroduction
1.1 The Philippines has an abundant supply of biomass resources in the form of agriculturalcrop residues, forest residues, animal wastes, agro-industrial wastes, and aquatic biomass. Someof these resources are already being exploited. In 1992, biomass, principally bagasse burned inthe sugar industry, contributed about 11 percent to the total national energy supply mix, makingit the country's largest indigenous energy source. The bagasse, however, is not fully utilized,nor is its efficiency of use at an optimum level. Considerable biomass energy resources remainuntapped and are treated as wastes. The purpose of the present study is to examine the potentialfor new investment opportunities in the utilization of biomass residues for energy in thePhilippines. This study focusses on power generation potential from process residues in threemajor agro-industrial sectors: sugar, rice and coconut. From the perspective of industry, plantinvestments in power production from waste biomass would appear to be economically attractive,particularly when they coincide with a modernization program to replace aging equipment andimprove overall production efficiency.
1.2 Investigation of the energy potential of biomass resources is important given the currentpower situation in the country. The Philippines is in the midst of a worsening power crisis thathas affected local industries, the commercial sector and residential areas nationwide. Thegovernment is accelerating energy projects in a massive effort to solve the power crisis. Althoughsome have predicted that this effort, ironically, may result in surplus capacity in 3-5 years, thegovernment wishes to identify all possible options for power generation, including the use ofnonconventional sources of energy. The Department of Energy (DOE) has an ongoing programfor nonconventional energy development and, under that program, a priority is determiningwhether the economic potential of power production from biomass resources is significant.
Enerev Sector Overview
1.3 The Philippines remains highly dependent on foreign oil for its energy needs. In 1973,all oil was imported and accounted for 92 percent of the country's energy mix. At that time,national energy consumption was about 70 million barrels of fuel oil equivalent (MMBFOE). By1991, energy imports (oil and coal) had been reduced substantially but still accounted for 67percent of the total energy supply. Indigenous conventional energy accounted for about 21 percentof the energy mix, while approximately 13 percent came from nonconventional energy sources.
1.4 In 1991, 37 percent of total energy consumption was used for power generation.Oil-based generation provided 50 percent of total power produced in 1991. With respect to finalend-uses. the industrial and transport sectors accounted for the bulk of energy consumption, withshares of 37 percent and 47 percent, respectively, in 1991.
1.5 The Philippine energy outlook will be largely influenced by current energy patterns andthe course of future economic expansion. While the growth target for the gross domestic productwas scaled down in 1991, there is optimism that the economic recovery efforts will gain strengthin succeeding years. By the year 2000, national energy demand is projected to reach226.73 MMBFOE. almost double the 1991 volume. As noted in Figure 1. 1, oil will remain theleading energy source for the country, although its share is expected to decline.

-2-
Figure 1.1
Philippine Energy Mix
0. 7-
09
19.2
0 011 & G
EC.I m Hto a G.thkwr.l1 Nflonr.ntIon I
Source: Office of Encrgy Affairs (1993)
1.6 The government has embarked on an energy program calling for "sustained efforts inthe development of indigenous energy sources and the reduction of oil import dependence." Thekey institutions involved in the formulation and implementation of the energy program originallyconsisted of the Energy Coordinating Council (ECC) and its member agencies, namely: the Officeof Energy Affairs (OEA), the Philippine National Oil Company (PNOC), the National PowerCorporation (NPC), and the National Electrification Administration (NEA). Recently, OEA's coregave rise to the Department of Energy (DOE) and the ECC was abolished. DOE's mandateincludes formulation of the nation's energy policy and coordination of all energy programs.Promoting the use of biomass and other nonconventional energy sources also falls under theresponsibilities of the DOE, with programs in this area managed by the DOE's Non-ConventionalEnergy Division.
Current Power Situation
1.7 Power demand in the Philippines has grown sharply since 1987 (see Annex D, Figure 1)after the economy emerged from the recession of 1984-1985. Power demand continued toincrease until 1989 when the power infrastructure could no longer keep pace with economicgrowth. There has been no new baseload capacity commissioned since 1985.

-3-
1.8 Consequently, grid power supply has largely stagnated during the last four years. Theprivate sector has resorted to self generation using diesel- and bunker-fired diesel generator sets.Various estimates place this private capacity between 1,500 and 2,500 MW, much of it broughton-line under the tax- and duty-free importation incentive granted by the Board of Investments(BOI). In addition to industrial and commercial self-generation, there has been a significant risein household generation as seen in the brisk sales of small gasoline and diesel generator sets.
1.9 The power situation in the Philippines worsened further in 1992. Both the number andlength of power intermptions increased, particularly in the Luzon grid which represents abouttwo-thirds of total power consumption in the country. The MERALCO franchise area, whichaccounts for about half the total electricity sales in the country, faced brownouts in 1992 nearlyten times the 1991 level. Unserved energy due to brownouts was approximately 5 percent in1992.
1.10 In Mindanao, the power situation is even more severe. Heavy dependence on hydroresources and prolonged droughts have led to grid-wide load curtailmnents of 20 to more than 30percent. Only the Visayan sub-grids (i.e. Leyte-Samar and Negros-Panay) with access togeothemal energy have been spared these levels of brownouts. Cebu, which relies on coal anddiesel power plants, suffers fewer power interruptions than Manila.
1.11 To address the energy crisis, the Govermnent's power development program calls forregular baseload capacity projects and several "fast track" projects (essentially oil-based plants)designed to meet shortfalls in the immediate term. The total additional capacity from the fast tractprojects alone is about 800 MW, with a target commissioning date of summer 1993. The poweroutlook in the near future varies from grid to grid but overall - due to various technical,financial, institutional and political factors - there is a general lack of optimism that the officialtargets will be met. It is also widely recognized that the enormity of the power problem can onlybe addressed with private sector involvement.
The Case For Biomass Cogeneration
1.12 Cogeneration projects are an additional way to allow mobilization of private sectorresources to assist the government's power development program. Biomass cogeneration,involving residues generated from the processing of agricultural crops, seems particularlypromising with significant potential for excess power sales to the grid. The sugar industry, forexample, has been cogenerating since its earliest days, but mainly to meet in-plant power needs.Much of the sugarcane waste that remains after the milling season and is disposed throughincineration could be used to generate additional power.
1.13 There are several key factors that make cogeneration investments, using biomass orconventional fuels, attractive to the private sector in the Philippines.
0 Unreiable Power Supply. The discussion in the previous section on the current difficultiesof supplying power and the major fossil fuel response provide a strong argument for privatecompanies to venture into cogeneration. Meeting the large unserved demand and reversingthe debilitating effects of the shortage on both residential and productive sectors withimported fuel electricity generation, imply a high economic value for supply of additionalpower generated from an indigenous renewable energy resource.

-4-
o High Electriciy Costs. NAPOCOR is scheduled to install over eight hundred megawatts ofoil-fired gas turbines and diesel engines in 1993 to augment power capacities in Luzon andMindanao. These pealing units will in practice be operated as baseload power plants. Powertariff increases to recover the very high running costs of these systems have already beenimplemented. Furthermore, the Energy Regulatory Board has allowed MERALCO to recoveradditional costs related to system losses. Finally, NAPOCOR power tariffs are alreadyscheduled for restructuring towards long-run marginal costs. All of these measures willimprove the economics of alternative power supply.
a Proven Tecwology. Cogeneration has been used worldwide for nore than a hundred years.The current renewed interest in cogeneration has resulted not from technologicaldevelopments but from new perspectives taken by utilities in sourcing their power supplyfrom outside producers- Private power generation in the industrial setting has proven to betechnically and economically feasible.
1.14 Potential cogenerators with access to agricultural andlor by-product wastes have thefollowing additional motivating factors:
o Abwzdant low-cost fuel. The sugar, rice and coconut sectors considered in this report allhave access to agriwastes which are in most cases by-products of their production processes.These agriwastes have costs that are practically zero or even negaive as factories may payfor waste disposal.
o Aging Equipment. Many local applications of cogeneration and agriwaste utilization do notbegin to approach the efficiencies of late model equipment. For example, the average agefor boilers in the domestic sugar industry is 34 years. In several sugar mills steam generatingequipment has been in service for over 70 years. This equipment is ready for replacement,having been operated well beyond its expected economic life.
c Source of Process Heat/Steam. The establishment of a cogeneration power plant usingbiomass residues could provide a source of excess steam for ancillary process heating or saleto nearby steam users. The rice sector, in particular, could benefit from the availability ofa heat source for drying purposes. Paddy drying in the countryside remains dependent onsundying practices. This limits the capacity of the mills to process paddy during the rainyseason.
o Rual Employment Generaion. Many agricultural processing industries have close ties withthe community where they operate. Social objectives such as employment generation affectbusiness decisions of such industries. In the Hacienda Luisita project, for example, thecompany paid for costs to bale and transport field trash at equivalent to fuel oil on an energybasis. Aside from providing the cormmunity with an additional income opportunity, itdiscouraged the practice of burning the sugarcane in the fields for easier harvesting. Burntcane loses sucrose content very quickly and therefore has to be processed soon after beingbrought into the mill.

-5s-
Objectives and Methodologv of the Study
1.15 The principal objective of the study is to develop realistic estimates of the commercialpotential for power generation in the Philippines from major biomass residues in the sugar, riceand coconut processing/production industries. Whereas most previous studies of power potentialfrom agriwastes have examined the aggregate total of biomass residues available and theirtheoretical power potential, the present study aims to determine the conditions under whichbiomass cogeneration investments would be economically and commercially viable.
1.16 The study is a joint effort by ESMAP and the Philippine DOE. Selected staff of DOE-NCED were formed into three project teams. A chief technical adviser and several sectorconsultants provided guidance and technical support. One team each was assigned to study thesugar, coconut and rice production sectors. Technical and statistical profiles for each sector wereprepared. Based on these profiles, the industries were segmented into "rlusters" by commoncharacteristics such as size, and several sites were selected from each cluster for the field surveys.The selections represent a range of sizes, types of mills and sites in a particular cluster.
1.17 Detailed questionnaires were designed in order to gather a wide range of technical,operational and economic information for each sector. The questionnaires were pre-tested inselected plants and modified as needed. The project teams surveyed the selected sites in fieldvisits. After data review and random verification of the responses, data sets of operationalparameters were developed for a prototype mill or site that would most closely represent theparticular cluster. Economic and financial analyses were conducted on each prototype mill usingthe data sets as base conditions. Sensitivity analyses were subsequently carried out to detenminethe impact of changes in some key variables.
1.18 The study was a basic screening exercise for quantifying the potential contribution tothe power sector from 3 indigenous biomass resources. That a demand for the Kwh producedfrom the biomass resources will exist was assumed. No attempt was made to so any load flowstudies for the various electricity grids, and the boundary for the study analysis was set at thesubstation for transmission to the grid. The next logical steps would include the use of thisstudy's results to identify opportunities for site specific feasibility evaluation. These follow-upstudies would examine load flow implications, and the cost of transmnission in determining finalviability.

II. THE SUGAR SECTOR
Sector Profile
2.1 The Philippine sugarcane industry existed long before the Canlubang and San Carlosmills began producing centrifugal sugar in 1914. Chinese traders engaged in sugar barter salesduring the Spanish era with produce sourced from small animal-drawn mills scattered in Northemand Central Luzon, Panay, Mindoro and Negros Islands. In the 1960's the industry was bustlingwith activity as smaller mills merged, older ones were phased out, while larger, modeminstallations were established. Up to the middle 1970's around 15 factories were built. Raw sugarhas been the country's strongest export commodity.
2.2 After the 1974 termination of the Laurel-Langley Agreement which guaranteedPhilippine sugar a lucrative preferential US market, sugar's contribution to the national economygradually declined. In the 1930's, 55 percent of the Philippines' total foreign exchange earningscame from sugar. This fell to a mere 1.5 percent of GNP, averaged from 1980 to 1990. The mostsevere blows to the industry occurred in the mid- 1980's, as the mismanagement of NASUTRA(National Sugar Trading Corporation, the government's monopoly sugar trading entity) resultedin capital flight and a contraction in agricultural land allotted to cane. Coupled with low sugarprices in both domestic and export markets, this period almost spelled the end of the industry.
2.3 Since then, however, investor confidence has been restored and a consistent thoughgradual increase in production has become apparent during the past cropping seasons. Sugar isslowly regaining its importance in the national economy. As the annual U.S. sugar quota for thePhilippines has dwindled from 1.2 million tons to only about 0.2 million tons today, the industryis preparing for the eventual disappearance of this preferential market. About 80 percent ofproduction is now consumed in the domestic market. It is recognized that to improvecompetitiveness in the intemational free market, production costs have to be reduced by anindustry-wide modernization program. Replacement of aging inefficient boilers and powerequipment provide opportunities for cogeneration projects that would realize additional revenuesthrough the sale of excess power to the grid. Many sugar millers are keenly interested in thispossibility and some have initiated feasibility studies.
2.4 The sector currently supports about 5 million people, providing direct employment toover 530,000 workers in 39 milling districts. Already offering comparatively high wages to itsworkers, the industry also voluntarily contributes about P105 million annually for socio-economicimprovements directed at sugar workers. Furthermore, the industry also pays over P1 billion intaxes annually and provides a yearly subsidy amounting to about P60 million to the governmentregulatory agency, the Sugar Regulatory Administration (SRA).
2.5 The processing sector of the sugar industry is composed of 39 mills (exclusive of 2inoperational mills) spread over 16 provinces (see Fig. 2.1). The bulk of the mills isconcentrated in Negros, the "Sugar Bowl of the Philippines", which provides about 56 percentof the country's annual sugar production. The mills process from 500 tcd (tonnes of cane per day)to 10,800 tcd, for an average of 4,600 tcd. About 20 million tonnes of cane are ground annually,producing around 1.7 million metric tonnes of sugar. There are ten sugar refineries with acombined capacity rated at 87,000 50-kg bags refined per day or an annual throughput of roughly15 million 50-kg bags.

-7-
Figure 2.1IPRO3,
PHIUPPINES
LUNN LOCATION OF SUGAR MILLS AND.._.n REFINERIES
7 cEma'mammu* ^4~3~q a * 5SUGA I?EEI Sm.^CA.i mmMnwa V wm"
, .00-o"Wr oC e2 PmOI?NcAMIS
81~~~~ ~ - ouoe.
Ir C.E3.Wxcmim~.1_is .4a___c_a * r **t -SUe" e.. n
272 J~twm -A / DZ0 1x1
23Nw _._C - -
glRl- ~ ~ ~ ~ ~ ~ ~ ~~~4 _1 0 N -ls
CM CAAM NES a 0 a l: :fD2ve ~1 5 N| r-- -s . ~.
7 *.Zrrn._: cm J
24 SnwIEas&~~~~~~~~~~~~~~~~~~~~~~ Pf£1M E
hr NMw NrKa
U >4~SEEC sR A
-- ; C mw c
d ,J o lmc_ w
241 B ~"
I?USEtsN j :UUAItS
Su ~ ~ SE
- b-'p b g- VISAYrR >
~deda>;* rr f x ,,{ CDC9, .t
m.o CIi b-t ' ''"
C HE )IAQ
'It ," o Caeepm.X -

-8-
2.6 Approximately 30,000 sugarcane planters supply the mills with cane from a cultivatedarea of 371,000 hectares. Average yield per hectare is placed at 54 tonnes of cane, with atypical recovery of 4.58 tonnes of sugar.
Mill ODeration
2.7 Sugar Processing is a 24 hour per day, 7 day per week continous process during thecane season. The mills process cane at full rated capacity as long as sufficient cane can beobtained. Bagasse, a by-product of sugarcane processing, is used as fuel for steam productionin the sugar mills. Steam is utilized for power production and sugar processing. High pressuresteam from the boilers powers the mill's juice extractors, turbine-drives and prime movers forpower-generators and pumps. The exhaust steam from the equipment is then fed to the plant'sboiling house for use in juice heating, evaporation, vacuum pans, etc. It is difficult, however, toattain a satisfactory balance of power and process steam requirements in the system, mainly dueto the batch type operation of the boiling house. Hence, make-up steam is supplied through apressure reducing valve (automatically operated) which expands the steam isothermally from thehigh pressure main to the low pressure main. The condensate from the sugar processing cycleis pumped back to the boilers and the cycle is repeated. Figure 2.2 illustrates the standard steamcycle of a sugar rmill.
2.8 Philippine sugar mills, as anywhere in the global sugar industry, are not relied upontraditionally to supply electricity beyond their own processing needs. Electricity is generated formill use and the sugar plant operators are familiar with parallel operations of generators plusfiequency and voltage control and the skills needed for such operations are already present.Boiler and turbogenerator installed capacities are based tn rated cane input, with only the nonnalallowances for surplus. It is therefore typical to find mountains of bagasse accumulating outsidethe boiler house at the end of the week, and even more so at the close of the season. Because ofthis, the early steam boilers used by the industry also serve as incinerators to remove the bagasseand avoid costly disposal.
2.9 In recent years, the availability of excess bagasse worldwide has been increasinglyexploited by sugar producing countries to produce electricity for sale to the public grid, thusproviding an additional source of income for the mills and adding to the country's electricitysupply. For cc'untries like the Philippines which are plagued by power shortages, this opportunityis particularly important. Investment opportunities are further enhanced by the fact that much ofthe major equipment in local sugar mills has been in operation well beyond its economic life andis ready for replacement. The average age for boilers is 34 years and some steam generatingequipment has over 70 years of service (see Annex D, Table 1).
Cane Residue Availability
2.10 Biomass waste from the sugar industry is derived from two principal sources, the fieldand the factory. Bagasse, the main biomass waste used, is the residue remaining after juice isextrcted from the prepared sugarcane by the milling tandem. Bagasse comes out of the lasttwo-roller squeeze of the last mill, and is composed of particles averaging approximately 25 mm.Typically, bagasse contains 45-49 percent fiber, 49-52 percent moisture and 2-3 percent solublesolids (sucrose). Bagasse with 3 percent sucrose and 50 percent moisture has a calorific value of1789 kcal/kg.

STANDARD STEAM CYCLE OF PHILIPPINE SUGAR MILLS
Uve steam High pressure stoam Inornaily superteated)
Make.UPSteam
Boiler Boile;Fans GenoraTors PressureFeedwater GoeaosReducingPump Valve
(PAVI)
Make-up Water
I 12 *14 psig Low pressure sleam
t e -,UPRV2 '0
Evaporaltrs (11 st. 2nd, and 3rd effecl) 6 psgi (Vapor) +
___ __ t < 1 -
I I I I I I I ~~~~~~~~~~~~~~~~~Juice IvacuumIDeaeralorl L vp. Evap. EI ap I va EvaeaerpPns Other
aatorsI Ea.I .II Ea
Condensate---Pump
ExcessCondensate

-10-
2.11 Annual bagasse production by the sugar industry during the last ten years is given inTable 2.1. Most of this production ends up as boiler fuel in the mills, accounting for about 87percent of the sugar industry's total fuel mix in 1992, nr 851 million liters oil equivalent(MLOE). Supplementary fuels (bunker oil, wood, etc.) are also used, especially by mills withauxiliary processing plants (refinery, distillery) where the bagasse produced is not sufficient tosustain the additional steam and power requirements. Although there are alternative uses forbagasse, such as the production of particle board, activated carbon, newsprint, commercial andindustrial fuel etc., these have not been significant in the Philippines. Tnis is mainly due toeconomic reasons and the fact that the role of bagasse as fuel in sugar mills is viewed as the mostimportant. The bagasse does have a low density and low calorific value limiting its viabletransport distance.
Table 2.1: Ten-Year Summiary of Bagasse Production Data
Crop Year Gross Cane Milled Approximate Field Bagasse Fuel Oil EquivalentOt Area (Hat.) X (BBL)
1982-83 24,962,736 421,931 6,915,205 9,957,8951983-84 25,969,151 455,359 7,214,885 10,389,4351984-85 18,719,339 328,237 5,269,813 7,588,5301985-86 16,124,014 282,729 4,718,943 6,795,2771986-87 13,751,502 241,128 3,949,806 5687,7211987-88 15,663.605 274,656 4,500,687 6,480,9891988-89 19,375,44?. 339,741 5,522,816 7,952,8551989-90 19,352,218 339,334 5,660,011 8,150,4161990-91 20,499,044 359,443 5,801,407 8,354,0261991-92 22,815.603 370,718 6,539,043 9,416,222
Source: Annual Report, Production and Performance Report 1991-92, Sugar Regulatory Adniinisaion, Pbilippines.
2.12 In the Philippines, where harvesting is still far from being mechanized, cane is manuallycut and loaded. A good part of the cane's vegetative part remains in the field while a smallpercentage, about 2.5-3.0 percent, goes with the millable cane delivery. This field trash,popularly known as "barbojo" in Puerto Rico and "canciaja" in some districts in the NegrosIsland, is normally left on the land and then needs to be cleared in preparation for the nextcropping operation, ratoon or planting. Burning is used as the easiest and most economical modeof disposal.
2.13 This cane residue has been estimated at 11 to 21 tonnes per hectare, depending on thevariety and quality of growth. In Tarlac, where a cane trash utilization program documents fieldand cane handling operations, it has been established that on the average one hectare of plantedsugar yields 12 tonnes of residue, of which about 8 tonnes are recovered. Extrapolating thisamount to the present cane hectarage, there are potentially 3 million metric tonnes of trashavailable for use ir power generation. The available volume of cane trash far outweighs what isnormally obtained as excess bagasse in the mills. Moreover, the trash more nearly meets thecriteria set for ideal biomass fuel, namely low moisture content and high calorific value,availability and combustion characteristics. Available bagasse and field trash and their total fuel

-I 1-
equivalent in BFOE from the various mills during the 1991-92 crop year are shown in Annex D,Table 2. In Tarlac, it was established that the moisture content of a bale of trash comes from twoconstituents: the leaves of the tops and the young or dried stalks. While the percentage volumeof the latter is minimal (12-20%), the moisture content of the former is quite high (65-70%). Theresultant average moisture content is 26 percent as the trash arrives at the mill site. It is possibleto lower the moisture content through winnowing and sun drying. A tonne of field trash canprovide 2.938 million kcal or about 295 liters oil equivalent.
2.14 The main obstacle to economic utilization of cane trash is the collection process.Another is the need to transform the trash, which arrives at the mill site in bales, into a form orparticle size approximating that of bagasse in order to require little or no modification in theinstalled conveying and boiler feeding systems. Unlike the canciaia system in at least two millsin Negros, where whole trash bundles are manually fed to the boiler furnaces for efficientcombustion, the trash needs to pass through shredders or bale breakers.
Sector Segmentation
2.15 For the field surveys, the 39 sugar mills in the Philippines were ranked in terms of tonsof cane milled annually. This was selected as the principal variable for segmentation, rather thanthe theoretical capacity of the mill, because it determines the amount of bagasse available as fuelfor power generation. Figures for the last three milling years were averaged and the results wereused for ranking. The mills were then listed from the smallest (Barotac Sugar Mill), with anannual average throughput of 15 thousand metric tons of cane, to the largest sugar central(Victorias), milling an average of 2.3 million tons per year for the last three years (see AnnexD, Table "3 for the complete listing of sugar mills). The 39 mills were grouped into clusters A-E according to the ranges listed in Figure 2.3.
2-16 Of the total number of sugar mills in the Philippines, 10 mills (nearly 25%) are locatedin Luzon, of which 6 are sited in the north and 4 are in the south. Twenty-seven mills (70%)are from the Visayas Region with 18 (46%) situated in Negros, 5 (13%) in Panay and two eachin Cebu and Leyte (10%). Only 2 mills (5%) are on the island of Mindanao, at Davao andBukidnon. Both were included in the survey, one falling into Cluster A and the other into ClusterE.
2.17 Four representative mills were included in the smple selected for Cluster A, three eachfor samples from Clusters B, C and D, and two for a sample from Cluster E, for a total of 15representative respondents (see Annex D. Table 3). The samples within a size cluster were chosenfor their variety in geographical location. Although almost half of the total mill population islocated in Negros Island. the analysis did not confine itself to that area and reflects a diversesampling.
2.18 The field survey included four Luzon mills (27%). nine Visayas sugar centrals (60%)and the two Mindanao plants (13%). Cluster A includes two Luzon mills, and one each fromVisayas and Mindanao. Clusters B and C include two Visayas sugar centrals and one each fromLuzon. For D. which is composed of a total population of five plants, all in Negros. the analysisselected three. One Mindanao and one Visayas mill were selected from Cluster E.

-12-
Figure 2.3
Sugar Mil IsQ'.upd by AnnumI RloIe spse CepaIty
14 Cluster A: 10,000 -
12- 199,999i12-ii- Cluster B: 200,000 -_0 499,9991
* ~~~~~~~~~~~~~~~~~Cluster C: 500,000 -699,999it
* Cluster D: 700,OO
2 101 l l l ClusterE: > I1.0000 t
2
A c n 9iam m I I C lUotre
Investment Scenarios
2.19 After analysis of the collected data, a representative mill for each cluster was identifiedfor use in the economic and financial analyses. The initial the intent was to average the operatingdata from the surveyed samples for each cluster. However, several runs of the model developedby the team revealed that this method of averaging did not create a realistic set of characteristics.Therefore, it was decided that one prototvDe mill would be used to represent the whole cluster.This was done for all five clusters.
2.20 Three investment scenarios were considered for each representative prototype mill. Thefirst scenario eliminates the current boiler make-up steam and injection water input to the sugarprocessing steam header, and passes an equivalent amount of steam through a new or existingsteam turbine. In effect, this system uses the grid as a flywheel to absorb the surplus electricity,thereby generating additional revenues from the marginal power sales. This scheme will not applyto all mills, but could be an option for many, requiring no more than $500 capital investmentper kW installed if a new TG set is needed. This figure includes the necessary fault protectionand sub-station upgrade but not the cost of any new transmission lines.
2.21 The second scenario involves the replacement of some old plant equipment with new,more efficient machinery such as higher pressure and temperature boilers and the correspondingtopping-cycle turbo-generator sets. Back-pressure turbines are used and the existing turbo-generators are kept in service. Bagasse consumption is more efficient. The total cost is assumedto be $1500 per kW installed, including the substation but no transmission line costs.Alsoincluded in this amount are soft costs representing start-up capital, interest during constructionand financing fees at a maximum of 10 percent of project cost.

-13-
2.22 The third scenario adds a new higher pressure boiler with a condensing-extraction steamturbine-generator, allowing year round operation with the use of supplementary fuel. Bagasseconsumption is assumed to be even more efficient in this case. The scenario assumes thecollection and use of cane trash as a supplemental fuel to bagasse. This scenario, for all intentsand purposes, means putting up a stand-alone power plant beside the sugar mill. The costassumed for the installed new equipment is $2000 per kW, inclusive of soft costs and step uptransformer (substation). It does not include the cost of any new transmission lines.
2.23 Except for cases under the Third Scenario which allow year-round operation, all othercases are conservatively assumed to generate and export surplus electricity only during the millingseason as a base condition. Most sugar mills have back-pressure turbo-generator equipment andthere is no normal off-season operation of such equipment, whether or not surplus bagasse orcane trash may be available. The first case (Cluster A, Scenario I) is that of a small mill, usingthe by-pass steam approach with no investment in additional generating capacity. With theimposition of no off-milling season generation-, the case becomes irrelevant and is not includedin the analyses. All other cases have investments that result in the generation of surpluselectricity that is then exported to the grid at an assumed buyback price of P1.80/kWh. Todetermine an appropriate average buy back price, the ProjecL Team looked at both the contractualprice for the existing and proposed private power facilities, and at the reported energy chargecomponents of the the NPC bulk electricity sales tariffs for the Luzon, Cebu, Negros, Panay,Bohol and Leyte grids'. While the contractually agreed or proposed private power rates to bepaid by NPC during the contract period vary from P.1.252 to P.2.135 per KWH, the morerelevant current NPC energy charge components of their own tariffs range from P1.7193 toP1.9535 per K-WH, a much tighter range which results in an average energy charge of aboveP1.80 per KWH for each grid. The private power contracts, other than for the 2 hydra andgeothermal projects will include fuel adjustment and currency devaluation escalators that suggestan inevitable rising trend. The biomass projects will produce direct energy cost savings for NPCand, for screening purposes, the average NPC energy cost component should be considered asthe floor value per KWH produced from indigenous biomass resources. In specific cogenerationprojects in remote areas, buyback prices could be significantly higher. Project viability in allcases depends on how incremenital investment and 0 & M costs compare with the revenuesrealized from the sale of electricity.
Results of the Economic and Fir.-ncial Analysis
2.24 Operating data (including derived data) for each prototype mill as well as financial andeconomic data that were used in the analysis are shown in Annex D, Tables 4 and 5. In general,the number of operating days of the prototype mill increased with the size of the cluster to whichit belongs (i.e., from 114 days for Cluster A to 243 days for Cluster E), exet in the case ofthe prototype mill for Cluster C which had even fewer operating days than that for Cluster B.As mentiDoned earlier, the data used represent actual operating conditions of real mills. Theassumed capital investments range from acquisition of 500 kW additional turbo-generator capacityin the simplest cases to the installation of a 17.7 MW of new boiler! T-G system (Third Scenario,Cluster E) or investment costs of between $240,000 to $37.3 million. These costs compare with1992 equipment quotations for similar projects internationally.
' Staff Appraisal Report, Philippine Power Transmission and Rehabilitation Project, June 1993.

-14-
2.25 The results of the economic analysis are summarized in Table 2.2 below. The discountrate used was 15 percent. Foreign exchange costs and labor Losts were shadow priced usingcoefficients normally used by NEDA and IBRD in similar studies in the Philippines (see AnnexD). The results show that all cases under Scenario I (smallest capital investments) plus the casesfor Scenario lll, Clusters B, C, D and E (large capital investments but also large exportcapacity) provide acceptable economic rates of return. Note that mills in these clusters are locatedin regions with the longest milling seasons. All cases under Scenario 11 are uniformlyuneconomic, no doubt because of the much higher incremental capital investment compared toScenario I, coupled with the imposition of the condition of no electricity export during the off-milling season.
Table 2.2: Results of Economic and Financial AnalysisInternal Rates of Return (in percent)
Cluster A Cluster B Cluster C Cluster D Cluster E
Scenario IEconomic 24% 18% 24% 33%
Financial -- 37% 22% 37% 65%
Scenario 11Econormic -.2% 8% 5% 8% 12%Financial -10% 4% .9% 4% 12%
Scenario IIIEconomic 14% 17% 16% 19% 24%Financial 16% 22% 18% 26% 31%
2.26 The base case for financial analysis assumed project financing with 70:30 debt-equityratio, an 18 perc_nt interest rate and 10 years repayment term. An inflation rate of 5.8 percentwas assumed, as well as a tax holiday on the first 5 years of operation. These correspond topresent borrowing conditions for sugar industry projects in t.he country. The results of thefinancial analysis are sumnarized in Table 2.2. If the minimum acceptable financial rate of returnon investment is taken to be 25 percent in the Philippines, the cases that appear viable are allthose under Scenario 1, except cluster C, with an FIRR range of 37-65 percent, and Cluster Dand E under Scenario III, with FIRR between 26 and 30 percent. As in the economic analysisresults, all cases under Scenario II are not financially viable. Sensitivity analysis indicates thatthe viability of the above investments are strongly dependent on the length of the milling season,the capital investment costs and the buyback price for electricity. Cluster C mills that have anaverage size greater than Cluster B mills are shown to have lower rates of return because theprototype mill is in a region where the milling season is shorter (150 days as opposed to 180days for Cluster B). The stand-alone condensing system approach with year-round generation(Scenario III) has the best economics but relies on the use of cane trash for off-season fuel andon additional revenues from steam sales to the sugar mill. These factors are obviously highlysite-specific.
2.27 The above analyses indicate that the sugar sector has the potential to economicallycontribute up to 60-90 MW to grid supply, with about 85 percent due to mills employing thethird investment scenario. The investment requirement for financially viable projects would beat least US$ 112 million. About 15 large individual mills, each processing over 500,000 tonscane annually would be the most likely contributors. This number was obtained by considering

-15-
the "position" of the prototype mill in the size range of its cluster and then making ajudgernentas to the realistic number of mills that could implement the envisioned investment. Thisprocedure was also employed for the rice and coconut sectors and the resulting tables are includedin Annex D. The potential would be substantially larger if the topping-cycle scenario can haveextended operations beyond the cane processing season. This can only be defined by site-specificstudies, including approaches to bagasse storage, that would identify situations where idle sugarprocessing equipment could utilize excess bagasse for off-season operation at reduced load.
2.28 Even without off-season operation. the potential is likely to be larger than what theabove conservative analysis indicates. In the bypass steam approach (Scenario 1), it isconservatively assumed that each mill will purchase a new back-pressure turbine generator plusfault protection and control at about $500/kW of capacity. In reality, many mills already havesurplus turbine-generator capacity and the required investment will be significantly less. Theeconomics will be even better than the above results. The topping-cycle approach (Scenario 11)could become viable if the mill needs to purchase a new boiler for sugar processing purposes.In that case, only the incremental cost of achieving the topping-cycle pressure rating needs tobe charged to electricity production, not the full cost of the boiler. For example, if about halfof the mills that were screened out by the financial analysis in Scenario It are assumed to requireonly half of the regular capital costs for the reasons cited, the total power potential wouldincrease by about 25 MW (see Annex D).
Implementation Issues
2.29 An important issue which must be resolved before initiatives for grid power supply bythe sugar industry can make any substantial progress is the present sharing system between caneplanters and sugar mnill owners in the Philippines. Under this legislated arrangement, all producefrom cane consignment sent fir milling - sugar, molasses, bagasse and press cake - have to be"shared' by the planter and the miller, with the former getting 60 to 70 percent. Therefore, underthe existing law, 60-70 percent of any surplus bagasse produced at the sugar mill is still ownedby the planters. The planters could make a claim to a portion according to this formula of anyrevenues realized from electricity production using surplus bagasse, regardless of the incrementalinvestments made by the miller on power generation equipment.
2.30 For the time being, it is possible for an individual sugar mill to negotiate with theindividual farmers for an equitable sharing scheme for investments in bagasse cogeneration withsales of surplus power to the grid, because of the relative novelty of this type of venture and thelack of precedent. As the practice becomes more widespread, there are bound to be conflicts onthe sharing issue. It is clear that the solution must be institutionalized and not proceed on a millby mill basis. Congressional action may be required if sugar sector cogeneration projects are tobecome a widespread reality.
2.31 Sugar processing is seasonal in the Philippines with the season lasting from 3 to 8months. The sugar is harvested during the dry season which is important in any country that hashydroelectric capacity because the surplus power from the sugar industry would be available whenthe hydro potential is at its minimum. WhIe the sugar mill cogeneration facilities can be designedfor year round operation with a supplementary fuel, as in Scenario 3, it also has viable seasonalsupply options. The installation of any new equipment would be during the off-season, with littleor no impact on sugar production.

-16-
Environmental Issues
2.32 It is understood that new biomass combustion and power generation facilities must becapable of meeting much stricter emission limits than do existing industrial processing facilities.While biomass combustion does provide certain global greenhouse gas emissions benefits, thelocal environmental impact, especially for particulates can be significant. The installed cost perKW chosen for scenarios 2 and 3, and for the high tech options for rice and coconut residues thatare discussed later, are at the high end of the average cost for similar projects implementedrecently throughout the world. The high-end was deliberately used to allow for sufficientenviromnental control hardware to meet any new standards and to cover other such contingencies.

-17-
III. THE RICE SECTOR
Sector Profile
3.1 Rice is the main staple food of the Philippines and accounts for about 25 percent of bothtotal crop area total value of crop production in the country.
3.2 In 1991, 3.42 million hectares of agricultural land were planted with rice, producing9.67 million tons, at an average yield of 2.82 tons per hectare (see Table 3.1). The largestproduction areas harvested and highest yields per hectare are located in Central Luzon (Region3), Western Visayas (Region 6), Southern Tagalog (Region 4) and Cagayan Valley (Region 2).
3.3 Some 60 percent of the rice grain produced is grown in the wetter half of the year, fromJuly to December, while the remainder (40%) is grown during the drier months, from Januaryto June. About 55 percent of the planted area is classified as irrigated, 40 percent as lowlandrainfed and 5 percent as upland. Rice milling is a full year business, but all mills do notnecessarily have access to sufficient paddy to operate year round. This factor has been includedin the analysis done to support this study. Irrigated land can produce 5 crops of rice in 2 years.Yields per cropping season in the Philippines currently average about 2.8 tons per hectare. Thiscompares with about 2.0 tons per hectare in Thailand, 2.6 tons per hectare in Malaysia and 4.1tons per hectare in Indonesia.
Table 3.1: Rice Production. Area Harvested and Yield per Hectare
eion Rice Production Area Harvested Yield('000 metrico tans) ('0 ectares) itonslhetare)
CAR 152.56 59.33 2.57I 898.58 312.25 2.882 1,033.62 325.29 3.183 1,748.49 499.87 3-504 1,118.09 411.88 2.715 744.22 295.53 2.526 1,183.89 456.16 2.607 207.70 124.38 1.678 382.95 221.71 1.739 399.04 142.78 2.7910 531.78 170.11 3.1311 688.30 205.63 3.3512 584.05 200.04 2.92
Total 9,673.26 3.424.96 2.82
Source: National Food Authority
3.4 In the short term, the Philippine Agricultural Development Plan for 1991-1995 proposesan annual average growth rate target for rice production of 4.12 percent. This target growth rateis required in order to enable the Philippines to become self-sufficient in rice production by 1995,

-18-
taking into account population growth and expected increases in the per capita consumption rate.Irrigation development is expected to play a key role in raising rice production in the next 10years. However, actual attainment of these targets may well depend more on political andsocio-economic factors than on agronomic considerations.
Biomass Residue Availability
Potential Availability of Rice Hulls
3.5 Table 3.2 below shows the potentially available rice hulls by region. The percentage ofhusk (hull) in paddy varies widely, but 20 percent is a fair average. Using this figure, total ricehull production is about 1.9 million tons annually.
Table 3.2: Potntial Availability of Rice Hull
Region Rice Producdon Potential Rice Haul('000 metric tons) Available
('000 nmetric ons)
CAR 152.56 30.511 898.58 179.72
2 1,033.62 206.723 1,748.09 349.62
4 1,118.09 223.62
5 744.22 148.84
6 1,183.89 236.78
7 207.70 41.548 382.95 76.59
9 399.04 79.8110 531.78 106.36
11 688.30 137.6612 584.05 116.81
Total 9.673.26 1,934.65
Source: National Food Authority
3.6 Out of the potential rice hull available, only that produced by certain types of rice millscan be used in practice. In 1991, 13,704 rice mills were registered and licensed by the NationalFood Authority, representing an aggregate total capacity of 27,208 tons per hour. (See Figure3.1 for milling capacity by Province.)
3.7 In the kiskisan rice mill, hulling and bran polishing are done in a single operation withthe resulting mixture of rice hull and bran used as livestock feed. The cono and rubber rollmills. on the other hand, perform the hulling and polishing as individual operations, producingthe rice hull separately from the bran. While the bran is fed to livestock, the rice hull is usuallydisposed as waste. It is the rice hull from the cono and rubber roll rice mills which can beconsidered as potential fuel for biomass-fired power plants. Although cono and rubber roll ricemills represent just over 60 percent of rice mills, they make up 95 percent of rice milling capacity(see Figure 3.2).

-19-
Figure 3.2
Pice Mi I IsWotv.d Dy Procnni re hathod
6
4
3
0
- § X~~EScsh
K:lskl-nn Camob~P
Source: National Food Authority
3.8 While rice hull is easily available, some of its fuel related characteristic represent certaindrawbacks. These include the fuel's low density, low calorific value, erosive characteristics anda high amount of ash residue (up to 50% in normal furnace burning). (See Annex D, Table 6for rice fuel-related characteristics.)
Present Ulses of Rice Hulls
3.9 In certain parts of the Philippines, rice hulls are used as fuel in households and ruralindustries. Households use rice hulls for cooking in special stoves. Some older rice mills use ricehulls to generate steam and electricity for in-plant use. Rice hulls are also a common fuel forpaddy drying and brick making. Non-fuel uses include utilization as raw material for themanufacture of particle board, as livestock feed (along with rice bran), as mulching material infarms and as insulating material, especially in rural ice plants.
3.10 The ash or char produced whenever rice hulls are burned (about 17-35% of initialweight) consists of carbon-silica or silica with many potential conmnercial applications. Theseinclude its use as: absorbent material, carrier (catalyst), filter media, hydroponic media, pigmentmaterial, silica source for manufacture of chemicals, and refractory material. As demonstratedin Malaysia, there are export opportunities for this combustion residue. If revenues from this by-product can be realized it will improve the economics of power generation using rice hulls.

-20-
Sector Segmentation
3.11 A survey was conducted to determine the milling characteristics and the status ofproduction units in the rice milling industry. A total of 85 respondents, all cono and rubber rollrice mills, were interviewed in the provinces of Nueva Ecija, Isabela, Cagayan, Iloilo, Leyte,North Cotabato, South Cotabato, and Sultan Kudarat. The respondent mills were classified intofive groups, according to the annual quantity of paddy milled, as shown in Table 3.3.
Table 3.3: Respondent Grouping According to the Quantity of Paddy Milled per Year
Quantity of Paddy Milled per Year Number of Respondenas
Group 1 2.000 - 10,999 t 56Group if IlOWO-20,999t 12Group I11 21.O0O - 30,999 t 9Group IV 31,000 - 40,999 t 4Group V over 41,000 t 4
Total 85
Investment Scenarios
3.12 The cases selected for analysis involve the installation of a rice hull-fired power plantin a mill, ranging from a 75 kW system for Group I to an 800 kW system for Group V mills.These capacities were detennined based on the rice-hull production capabilities of the variousmills and on considerations of equipment availability. In addition, it was determined from thesurvey results that it may be possible to group rice mills such that the mills in a cluster wouldcontribute rice hulls to a comnon power plant. For the analysis, two representative groups werechosen in Leyte (Cluster A) and Isabela (Cluster B) and are included in Table 3.4.
Table 3.4: Rice Hull Power Grouping/Power Rating
Group Power Razing
Group I 75 kWGroup 1H 200 kWGroup m 350 kWGroup IV 500 kWGroup V 800 kWCluster A 1 MWCluster B 3 MW
3.13 The proposed installations are based on two technology approaches: a low-efficiency,low-cost approach employing a simple low pressure steam system and a high efficiency, higher-cost approach that uses a more efficient thermal conversion system. For very small systemsproducing only electricity (75 to 200 kW) the fire-tube boilerfsteam engine-generator approachmakes sense, at a cost generally less than $1,000 per kW installed. For larger systems with andwithout cogeneration, multi-stage condensing steam turbine-generators are the choice with fire-tube boilers in the less than 2,000 kW capacity range, and with water-tube boilers for largercapacities. The cost per kW can be estimated at an average of about $1.500 plus 10 percent for

-21-
soft costs, although the cost will vary depending on the country of origin of the equipment. Oneproblem with rice hull or rice straw combustion equipment is the small number of qualifiedvendors.
3.14 In all the investment prototypes, the electricity produced is first used to supply powerto the rice mill that otherwise is assumed to be self-generated at P2.5/kWh. The excessproduction, where available in sizes above 350 kW, is sold to the grid.
3.15 The two cluster schemes assume high-efficiency, high-cost designs. Cluster A consistsof 7 rice mills within a kilometer area, a physical configuration very common in most riceproducing provinces. Minimally, there must be 3 to 4 rice mills in less than a kilometer radius.Cluster B differs in physical arrangement, in that the mills are located within a 5 kilometerradius. This cluster also mills a much larger amount of paddy in a year, with longer operatingdays and maximum power use.
3.16 The average rate of recovery of a rice milling plant is approximately 65 percent, the restof which becomes wasre. Annual rice hull yield (with a heating value of 6200 Btu) is assumedto be 20 percent of the total inputs. Ash is about 20 percent of the hull. Technical and operatingparameters for all the cases are shown in Table 3.5 below. Other data on the power balance ofthe mills as well as financial and economic data are shown in Tables 7 and 8, Annex D.
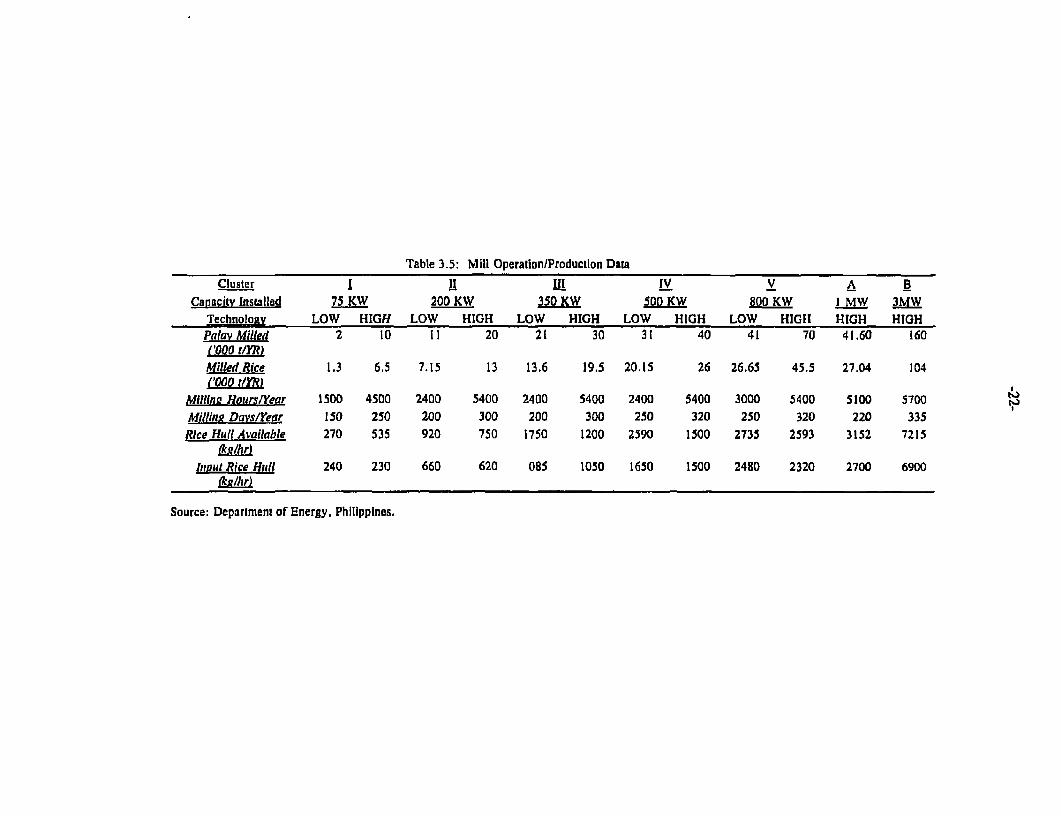
Table 3.5: Mill Operation/Production Data
Cluster 11 III IV V A BCanacily Installed 75 KW 200 KW 350 KW 500 KW 800 KW I MW 3MN
Technoloav LOW HIGH LOW HIGH LOW HIGH LOW HIGH LOW HIGH HIGH HIGHPalav Milled 2 10 I 1 20 21 30 31 40 41 70 41.60 160('000 t/YR)
Milled Rice 1.3 6.5 7.15 13 13.6 19.5 20.15 26 26.65 45.5 27.04 104(f000 t/YR)
Milline Hours/Year 1500 4500 2400 5400 2400 5400 2400 5400 3000 5400 5100 5700Milling Days/Year 150 250 200 300 200 300 250 320 250 320 220 335
Rice Hull Available 270 535 920 750 1750 1200 2590 1500 2735 2593 3152 7215
Inwut Rice Hull 240 230 660 620 085 1050 1650 1500 2480 2320 2700 6900
Source: Department of Energy, Philippines.

-23-
3.17 The high-tech option for the smallest capacity mill, 75 kW, was excluded from analysisas the cost for such small steam turbines would certainly exceed the assumed installed cost perkWh of $1800 for the high-tech cases.
Results of the Economic and Financial Analysis
3.18 Results of the economic and financial analyses are summarized in Tables 3.6 and 3.7below. Each case was analyzed under both conditions of "no ash sales" and "with ash sales".The export value of ash was assumed to be $40 per metric ton, based on the Malaysianprecedent.
3.19 Most projects with capacity of 350 kW and above (except the 500 kW low-tech case)have economic internal rates of return exceeding the discount rate of 15 percent, even with noash sales. Excluding plants under 500 kW, ihe financial rates of return generally exceed 25percent without ash sales. These results indicate rice sector projects involving at least 500 kWwould be worth further investigation. Ash sales improve the economics of all cases significantly,raising the financial IRRs 11-24 percent, enough to warrant a closer examination of the potentialdomestic and export market for rice hull ash. The viability of each project is strongly dependenton the cost of energy to the mill, generally provided by diesel gensets, that was avoided by theproject. If the price of diesel generated electricity drops from the assumed P 2.5/kWh to P2.10/kWh or less, all low-tech cases considered become uneconomic, and only high-tech casesof 500 KW or more are economically viable. For simplicity, the cogeneration option was notanalyzed in this study, but the economics would clearly be improved if steam could be used forrice drying. Considering the results of the above analysis, the potential aggregate contribution ofrice hull-fired capacity to the overall power supply could be up to 40 MW at this time.
Other Implementation Constraints
3.20 The major impediments specific to power projects in the rice sector are essentiallytechnical in nature. First, the majority of rice mills in the Philippines are rather small (kWpotential rather than MW potential) and any significant contribution to grid power requires manysmall incremental inputs. The only real possibility for grid-supply projects would be in a few"clustering" opportunities. A previous study made by the San Miguel Corporation for a verylarge power plant (> 15,000 MW) concluded that the logistical problems of collecting andtransporting the required amount of rice hulls were insurmountable. Second, unlike bagasse orcoconut husks, rice hulls have very high silica content and pose special handling and combustionproblems. As a result, there are much fewer qualified vendors for combustion equipmentinternationally. Tenders for equipment for rice hull-fired power projects must require hardwarebidders to provide proof of units in successful commercial operation. All equipment will mostlikely need to be imported as there is as yet no local production capability. Third, the mills arenormally located in areas with low load demand and the economics of the investments dependstrongly on the utilization of the surplus electricity produced.
3.21 The surveys conducted in this study indicate interest in the sector to install at leastcaptive power or cogeneration because power outages have been hurting production, captivediesel generation is expensive and many rice mills have associated energy demands for adjacentcaptive activities, such as palay drying.

Table 3.6: Results of Economic and Financial AnalysisInternal Rates of Retum (in percent)
75 kW 200 kW 350 kW S00 kW 800 kW Cluster A Cluster BLow Low High Low Hight Low High Lowv High
Economic 0% 11% 13% 13% 19% 13% 21% 18% 20% 20% 21%Financial -17% 2% 5% 8% 21% 11% 28% 21% 25% 29% 21%
Table 3.7: Results of Economic and Financial AnalysisWith Ash Sales
Intemal Rates of Return (in percent)
75 kW 200kW 350 kW 500 kW 800 kW Cluster A Clruster BLow Low High Low High Low High Lowv High
Econzompic 06% 20% 20% 22% 26% 23% 28% 26% 28% 27% 26%Financial 4% 22% 21% 30% 41% 35% 49% 43% 48% 40% 34%

-25-
IV. THE COCONUT SECTOR
Sector Profile
4.1 Historically, the coconut industry has contributed significantly to the country's exportearnings and has provided employment for millions of people. Coconut lands supportapproximately one-third of the Philippine population, numbering about 20 million Filipinos orroughly 2.5 million families. To design effective investments in this sector, it is important tounderstand the roles of the farm sector and the non-farm sector. The farm sector includes: thecoconut fanner who provides the actual labor in coconut production, the coconut landlord whoowns the land but does not participate in the farm work, the owner-farmer who owns the landand does the farming, the tenant farmer who works for a share of the produce, and the wagefarm-worker who works for wages. The non-farm sector players are the coconut trader who buysand sells coconut/coconut products, and the industrial worker who works for wages in thecoconut product factories and processing plants.
4.2 The socio-economic structure of the industry indicates that the landless but activeparticipants in the industry's economic activities constitute the major part of the industrypopulation, i.e. 2.0 million families. Land-owning families number 0.5 million families of whichonly 0.4 million families are involved in coconut production. Of the 0.5 million families, it isestimated that only 10 percent (50,000 families) own 80 percent of the total 2.6 million hectaresplanted to coconut, corresponding to an average per household landholding of 52 hectares. Theremaining 0.45 million land owning families, on the other hand, own 0.52 million hectares ofcoconut lands. For these families the average amount of land owned is 1.16 hectares.
Area Planted and Production
4.3 Over the last ten years, the total area planted to coconut averaged 3.21 million hectares.During that period the hectarage declined at an annual rate of approximately 0.35 percent, exceptfor a slight increase in 1989-1990. The general decline may be attributed to the implementationof the Comprehensive Agrarian Reform Program (CARP), which values coconut lands lowercompared with lands planted to most other commercial crops. This has led some coconutfarnerslowners to cut down their coconut trees and replace them with higher value crops.
4.4 The area dedicated to coconut increased slightly to 3.112 million hectares in 1990. Ofthis area, the Southern Mindanao and Southern Tagalog regions accounted for the biggest sharesof 24.61 percent (766,000 hectares) and 17.42 percent (542,000 hectares), respectively.
4.5 The number of coconut bearing trees decreased during the ten year period at a rate ofdecline of about 15 percent. Southern Mindanao was greatly affected by the drought, the CARP,and the development of technology for coco-lumber utilization, and registered the highest declinein number of bearing trees. Figure 4.1 represents the geographical population of coconut treesfor 1990. Nut productivity has also declined, averaging 54 nuts per tree per year in 1981 andonly 49 nuts per tree per year in 1990. With the exception of Southern Mindanao, which showedimproved nut productivity, most regions have registered a deteriorating trend while the othershave remained unchanged. To some extent the decline in hectarage in Southern Mindanao wascompensated in increased nut productivity per tree.

:26-
Figure 4.1ISRO 25041
PHILIPPINESIAMMAMOnN OP OMHMNW IEO COCONUT TREE POPULATION
BY REGIONI Itocas rir.1 I,. A 000
:W cocMURA ADsIJfIlR1W - I u
REOION A C 100
It CAOAtAN VAUD BATANESmcnA CAuTA a 100. 1.000
RGON ecAl 1,001 - 3,000
I IV 5OUTmcUtI 3.001 - 8m,0I V BCOUt f A
VIl wE1eUvUAIM 5.001 - 7,000VII WIPE1ALYASVll ctmaLrA t 1 011 WA3S3 7.001 - 10.000
Vill WIMNSVfAO
IX wOEMINNIMuo I6 0R-B lo l.0 -UPX WOMe wmJn I II * NATIONAL C^PITAL
XI BCJI)fl4mNfq4AO
XII CaNtMN.W,o - PROVINCI! BOUNDARIDIS
. - INTERNAOION BOUNAORIE5UA1_4WRN^10O4L GOLINDAES
L U ~~0 NI mtcecu 9,lpo:ao:oo30
MLEU 0 so ICc 1S0 23
/DCATANDLIANES
>¾ 8 V.%. sp IPHILIPPINE SEA
MI IV
SO:)UTH CHINASEA
1I.b ~~~~~PAoLA
IF. tIW brl nmS
Is i"Fo Cwu S :d.
had ha .5 by'?'?t
Ih!N4 IN. 7nsnww o
w.d V. bKdwi. I.
CHINA Q _
A LJUSourcu: pIC.
L 1~~~~~~~~2 2r11
JULY 1992
nhiThI1l IMA 7ORI9fl

-27-
Figure 4.2
IRRO 7504
PHILIPPINES
- LOCATION OF COCONUT OIL MILLSAND CRUSHING CAPACITIES AS OF JUNE 1991
- - ~~~~~~~GKNCARffAL
edi-lacf e.aqa Cqw en l'CC faVmcTtA aovOUNmmz
.eeenena a mews - o -~~~~~~~ajoro nwaama± owsr
"ccIm.aanhjme Sw 13 2i
n.ca -~ ~ ~ ~~~~~~~~~~~~~~~~wo.-w -M
a POW& QW'a
.14-cmmoum .- Ow. - -0L -* NOTE GUSHING ~~~4.cCA.mOTYINmEC 0'
a 'm-. .e C a RO
n, h- b-w.ne.. H.-- -!i
co --- rw ~ ~ ~ ~ ~ ~ ~ anm.
_Z '1 . -h-- a-na I
P.,, SO.aDCUCpin n tcc.mac -i 1nJe,e.m &SC am.a ia.ae -c
~~'mZmcr : ~ ~ ~ 'LU- Z ONmoeflm. ,eq3~ iw ma - in.aPmqa SC U C UP.Yaak.
.n cemic.e O2n~ u aa.ao em
ecineceain-a 'a SSbm neea -.
esm.o us eta wdasin..mo, -. ~A'a suata aLOL
em- 'a n - CAANUANS. p
a ean was me~~~~~~~~~~cvobs e
a ca-mac m~~~~~~~~~~~~~~~~~~SuLe C
19 a-COatS ii OCaCO SC 19.~~~~~~~~~uwl

-28-
Table 4.1: Basic Statisdcs of die Coconut Industry
Region Area Rearing Trees Nuts Harvested Nut Productivity Copra('100 Has.) ('000) (million) per Tree Production
(71000 t)
Ilocos 14.00 2,065.00 100.90 49.00 192.72Cagayan Vally 6.00 610.00 23.58 39.00 45.04Central Luzon 2.00 115.00 2.43 21.00 4.64South ragalog 542.00 62,201.00 2,349.10 38.00 4,486.78BicoI 367.00 21.241.00 894.19 42.00 1,707.90Western Visayas 114.00 8,177.00 358.85 44.00 685.40Central Visayas 137.00 13,491.00 501.01 37.00 956.93Eastern Visayas 334.00 34,427.00 1,163.64 34.00 2,222.55Western Mindanao 460.00 42,433.00 1,753.08 41.00 3,348.38Nonherz 370.00 29,153.00 1,190.24 41.00 2,273.36Mindanao'Southern Mindanaod 766.00 76,260.00 5,991.42 79.00 11,443.61PHIPPINES 3,112.00 290,173.00 14.328.44 49.00 27,367.32
'Includes Eastern Mindanao (former regional classification, Northern-Eastern Mindanao)2lncludes Central MindanaoSource: Philippine Coconut Statistics, 1990
4.6 In the years 1981 to 1990 the highest number of nuts, 17.2 billion, was gathered in1986, while the lowest was in 1984 with a total of 14.085 billion nuts harvested. For the year1990, the total number of nuts harvested reached 14.328 billion, indicating a 1.1 percent increasefrom 1989's harvest of 14.172 billion nuts. In general, however, the pattern has been declining.One reason is that the majority of the trees are more than 60 years old and will require someform of rejuvenation through an aggressive fertilization program. The crop suitability evaluationof existing coconut areas in the Philippines prepared by the Department of Soils of the Universityof the Philippines at Los Batios in 1989 predicted that the deteriorating trends will continue if noprogram of development is pursued :jy the government. However, aside from the soil andtechnology utilized, the most critical factor in overall coconut production is the weather. Severedroughts and strong typhoons have been the main reasons for the decline in production.
Coconut Processing and Consumption
4.7 The major coconut p± inary product, the coconut meat, is generally processed into copraand used as an input for oil processing and for desiccated coconut. As of October 1991, thecountry's aggregate oil mill copra crushing capacity indicated a cumulative daily production of16,535.87 tons (copra terms). Based on a 300-day operation, the combined annual capacity wascomputed at 4,960,761 tons -ig. 4.2 shows the geographical distribution of the oil mills in thecountry.
4.8 The Philippine coconut and vegetable oil industry involves the production of vegetableoil from coconut, which is the largest single raw material source, and from other minority seedsand nuts. The current uses of energy in the industry are for (1) process heating, (2) mechanicalpower drive, (3) transportation, and (4) other miscellaneous applications such as lighting and airconditioning. As shown in Table 4.2, fuel oil accounts for the majority of consumption and iswholly utilized for process heating.

-29-
4.9 Biomass waste is loosely defined in this study as any portion of the coconut tree thatmay be used as combustion fuel. In general, this consists of the coconut shell (if carbonized intococonut shell charcoal), husk, and fronds. The last is derived from the leaves which are notnormally cut and thus an estimate of supply is difficult. The analysis will therefore be limited tococoshell and husk.
Table 4.2: Coconut Industry Petroleum Fuel ProducLs Consumption(in BBULYear)
Fuel 1988 1989 1990 1991Product
Fuel Oil 236,517.00 249.985.00 307,519.00 214,913.00Premium 2.370.00 2,238.00 2.746.00 2,639.00
GasRegular 1,866.00 1,126.00 1,115.00 1,492.00
GasKerosene 73.00 126.00 136.00 0.00Diesel Oil 37,356.00 33,544.00 47,210.00 45,395.00
LPG 0.00 0.00 0.00 0.00Avturbo 564.00 513.00 402.00 306.00Asphalt 13.00 129.00 59.00 4.00
Lubes/Grea 2,321.00 2,828.00 3,684.00 3,104.00ses
Others 35-00 20.00 20.00 33.00
Source: OEA-Planning Service Report
Biomas Residue Availability
4.10 The outer covering of the coconut is called the husk. The coconut shell is the thin hardportion between the husk and the meat of the coconut fruit. It weighs about 180 grams per nutand accounts for roughly 15 percent of the whole coconut or 25 percent of the husked nut. Fieldobservations indicate that these two resources are accumulated at (1) plantation sites, (2) centraldehuskdng sites, (3) copra drying sites, and (4) coco processing plant sites. However, the bulkof the resources, both husk and cocoshell, are normally amassed near the copra drying site. Themost common practice is to gather the harvested nuts at the coprakan. Dehusklng of whole nutsand the partial carbonization of cocoshells are done at the site.
4.11 Indicators of potential cocoshell supply for energy purposes are: (1) the gross cocoshellavailable and (2) the net cocoshell accumulated in the desiccating plants after use for fuel.Cocoshell supply statistics are provided in Annex D, Table 9. Since gross cocoshell supply hasa direct relationship with coconut production, areas with a large supply of cocoshells are RegionsIV-A, V, and XI, in ascending order. Region XI, consisting of Davao Sur, Davao Norte, DavaoOriental, Davao City and Surigao Sur, generate approximately 42,225 tons of cocoshellannually. This constitutes about 19.5 percent of the gross cocoshell available nationally. Theprovince of Davao Oriental has registered the highest supply of cocoshell as validated by fieldobservations. Davao has successfully cultivated a high-yielding coconut variety which at age 80years still produces roughly 80 to 100 nuts per tree per year.
4.12 Based on the nature of uperations of desiccating plants, about 4 percent of cocoshellreaches the plant sites. Desiccators procure dehusked nuts as raw materials and, as they normallyuse the cocoshell as fuel for process heat, these cocoshells should be deducted from the gross

-30-
supply of cocoshell. The geographical distribution of the operational desiccated coconut plantsin the country is shown in the Table 4.3. For fuel related characteristics and chemicalcomposition of cocoshell, see Annex D. Tables 10 and I l.
Table 4.3: Location of Cocoprut Desiccatinig Plants
Province/Area Nutinber of Plants Dailv Production Capacirv Yearly Production Capacity(I) n)
Metro Manila 1 13.61 4.083Quezon 3 166.66 50.000San Pablo City 2 84.74 25,422Lucena City 1 180.00 54.000Laguna 1 53.33 16.000Misamis 1 41.67 12.500OccidentalMisamis 1 21.77 6.532OrientalDavao del Sur 1 42.33 12.700
Present Uses as Fuel
4.13 Cocoshells and cocohusks are largely utilized as domestic and industrial fuel.Households commonly convert cocoshell into charcoal for cooking, ironing, and water heating.As an industriai fuel, the desiccator facilities are practically the only users of cocoshells. Arecent survey indicated that national consumption of cocoshell charcoal is about 520,000 tons peryear and consumption of raw cocoshells is about 139.000 tons per year. This translates to aboutP 1.4 billion annually, at current market prices for these items.
4.14 The major use of cocohusk for fuel is by copra drying facilities and, to a much lesserextent, by households in rural areas for cooking. The national consumption of cocohusk isestimated to be about 450,000 tons per year. This residue is not traded and is viewed as a freeconunodity.
Non-Fuel Uses
4.15 The main non-fuel use of cocoshell in its raw forrn is for ornamental purposes. It isoften carved, used in jewelry, decorated with lacquer and inlaid with silver and/or other metalsto enhance its attractiveness. When pulverized, it is used as a grinding agent and when furtherground to 100-325 mesh produces cocoshell flour, a clear, light brown, free-flowing powder.This is generally used as a filler for the plastics industry, a coating for electric arc-weldingelectrodes, and as soft-blast to clean piston engines.
4.16 Most cocoshell is converted to charcoal for local use or export, mainly to Japan, Europeand the United States. The activated carbon derived from cocoshell charcoal commands a highprice in the international market. In 1990 trading in activated carbon reached 9,579 metric tons,with foreign exchange earnings valued at US $ 9,756,151 (FOB).
4.17 The main non-fuel use of coconut husk is as a source of coir. Compared to othernatural fibers, coconut coir is very buoyant and resistant to bacteria and salt water. The fibersfrom matured nuts are used for carpet underlays, gym mats, upholstery cushioning, brushes, coir

-31-
tuffed carpet. filtration pads, and caulking material for boats. The fibc rs from green nuts. on theother hand, are mainly used as yarn material for Larpets. rugs, and mats. The PCA is seriouslysupporting the development of the coir industry, and recent bans on use of urethane foam forupholstery in some countries have substantially increased world demand for the product.
Sector Segmentation
Coconut Oil Mills
4.18 The original plan of the study was to look into the prospects of using cogenerationtechnology in coconut oil mills. Coconut oil is not only the major output of the industry, but itis one of the main products of the country and has significant energy requirements.
4.19 Initial investigations were done to determine the possibility of incorporating acogenerating plant within an existing coconut oil mill facility, using coco husk and/or coco shellas the boiler fuel. Upon review of available literature and discussions with PCA and oil millpersonnel, it became apparent that this would not be a practical undertaking for the followingreasons:
a) The oil mill purchases copra at the millgate, not whole nuts. This means that thecoco husk and shell remain at the farm site where the copra was produced. Setting upa coco husk/shell-fired generation system would force the oil mill to depend on thecopra producers for its fuel requirements. As the supply is often unreliable, this optionwould not be attractive to the mills which now use grid electricity.
b) The coconut oil industry does not have an established market structure for rawmaterial distribution. An oil mill can purchase its raw materials from any sourceanywhere in the country. Consequently, an oil mill is not assured of securing the supplyof copra (and its residues) in its locality since any other oil mill can attract the rawmaterial with the right purchase price. Though the residues would not leave the regionwith the copra, purchase of the copra would imply greater access to the residues atminimal additional cost.
c) Coconut oil has a very dynamic price which depends on the international market.The fluctuation of coconut oil prices abroad is immediately translated down to the priceof copra at the farmers' level. Since coconut oil is only one of many products derivedfrom the coconut meat, a drop in coconut oil price could cause farmers or middlemento sell the nuts to other manufacturers (e.g. desiccators, oleo-chemical producers, etc.).
4.20 It was decided on the basis of the above points to drop the coconut oil mill as a potentialbiomass cogenerator.
Coconut Desiccators
4.21 The desiccating plants were the second option investigated for cogeneration technologyapplication. This type of production is more energy intensive ffian oil milling. However, onlyeleven (11) desiccators operate in the country, representing a very small market. Unlike the oilmills, the desiccators purchase husked nuts (husk already removed) which means that cocoshellis available at the plant site. Husked nuts are purchased rather than whole nuts primarily due to
-32-
the significant difference in bulk density. Some of the desiccators are reportedly usingbiomass-fired boilers, relying solely on the coco shells available at the plant. However, shortagesin biomass fuel are experienced from time to time, making it necessary to use the biomass-firedboilers in tandem with conventional oil-fired systems.
4.22 The field visits of the study team in selected coconut producing areas confirmed theabove supply problem. It was further learned that due to the higher market value of coconut shellcharcoal as household fuel or activated carbon material, many desiccators opted to use thecocoshells for these purposes rather than for boiler fuel. Shifting to coco husk for supplementaryfuel was not a practical option due to the supply problem described earlier under the coconut oilmills scenario. Moreover, a biomass-fired boiler designed for coco shell may not have theflexibility to use coco husk, considering the significant difference in physical characteristics.
4.23 Given the above conditions, it was decided to exclude the desiccators from the study.
Coconut Production Sites
4.24 The exclusion of the coconut oil mills meant that no actual industrial plant sites, suchas sugar centrals and rice mills, could be used for the case studies. It was decided to study thecoconut producing areas and to use their production levels as the basis for sector segmentation.
4.25 The relative intensity of production per province (i.e. productivity) was not used as abasis for segmentation for two reasons. First, the density of coconut trees is similar in mostareas, primarily due to the 10-meter standard distance between trees as determined by PCA tobe the ideal spacing. This means that most areas would have the same productivity, given thesame yield per tree per year. Second, in areas where coconut is not the only major crop, it wouldbe difficult to determine the configuration within the province (e.g. if the plantations are locatedin only one side of the province or dispersed throughout the area).
4.26 To identify the cases for analysis, all coconut producing provinces were ranked on thebasis of their 1991 copra production, as provided by the PCA. From this list, the provinces wereranked among three groups: high, medium and low production. These major groups were againdivided into high, medium and low classifications, so that the high production areas in thecountry would still have three classes of provinces based on relative output. The same would betrue with the medium and low production areas. One representative province was then selectedfor each classification, leading to the selection of nine (9) sites. Time constraints limnited the fieldvisits and investigations to the following provinces-
o Quezon I and H (division of the province is a PCA classification)o Negros Orientalo Albayo Zamboanga del Sur (with Zamboanga City treated separately)o Davao del Norte and Sur (with Davao City treated separately)
4.27 The analysis pinpointed plantation sites where the coconut wastes (husk and shell)accumulated. These "resource" sites were considered to be prospective areas for potentialbiomass-fired power generating plant installations. It was then necessary to look into thepractices prevalent in each locality (i.e. harvesting, de-husking, copra drying) and the currentuses of the waste itself. The production of copra outside the oil mills made it possible to consider

-33-
copra drying as an independent process, which in itself has specific energy requirements. Sincethe separation of fresh meat from the coco shell is done prior to drying, it is quite evident thatthe shells accumulate near the copra drying facility. Consequently, the capacity of the dryer willdetermine the relative amount of coco shells and husks generated. Examination of various typesof dryers in the areas was undertaken.
Investment Scenarios
4.28 Based on the current structure of the industry and the information generated from thefield visits, only two distinct scenarios are evaluated as feasible for power generation andcogeneration applications. These are:
Scenario I
4.29 Installation of a stand-alone power generating facility within a 7.500 ha. coconutplantation area. Electricity generated will be sold to the grid through a rural electric cooperative(REC). The power plant will utilize a coconut husk-fired boiler, relying solely on the husksgenerated within the plantation. It is assumed that all coconut shells are converted to and sold ascharcoal for either household or activated carbon applications. The total utilization of the cocohusks as boiler fuel displaces their current use for traditional copra dryers. However, copradrying will still be done locally through waste heat utilization, making use of the flue gas gener-ated by biomass-fired boiler. The viability of this case is therefore based on the profitability ofsupplying electricity to the local grid.
Scenario IT
4.30 Installation of a power generating facility integrated with a 7.500 t/yr coconut oil mill.Conditions pertaining to physical characteristics of the coconut area covered are essentiallysimilar to that of the preceding prototype. The main difference lies in the establishment of an oilmill manufacturing crude coconut oil and coconut flour utilizing the raw materials harvested inthe locality. The energy requirements of the mill will be supplied by the power plant and theexcess electricity will be sold to the REC as in the first case study. The viability of thisprototype depends on the combined income of the power plant sales to the grid and the electricitycosts avoided by the coconut oil mill.
4.31 The size of plantation selected is the estimated area necessary to produce the rawmaterial (copra) requirements for a 7,500 tlyr coconut oil mill (at about 1 ton/ha. average yield).The type of coconut area considered is a strip of coastal land extending 2-km from the shorelinewith an approximate area length of 35 kin. Land ownership is not an issue since the collectiveoutput of the area will be utilized and raw material acquisition will be valued at the currentmarket price.
4.32 For the second scenario it is assumed that the total nut production will be supplied tothe oil mill in accordance with the "zoning scheme" being proposed by the PCA. The oilmilling capacity is based on the standard size of the Anderson Supcrduo Expeller, which is theequipment primarily used in the coconut oil milling industry since the 1950's. Even for oil millsusing the solvent extraction process, most if not all are using the Anderson expeller initially.Increasing plant capacity could be attained by simply multiplying the number of expeller units,giving flexibility in adjusting the suitable size for a given condition. For the two scenarios, the
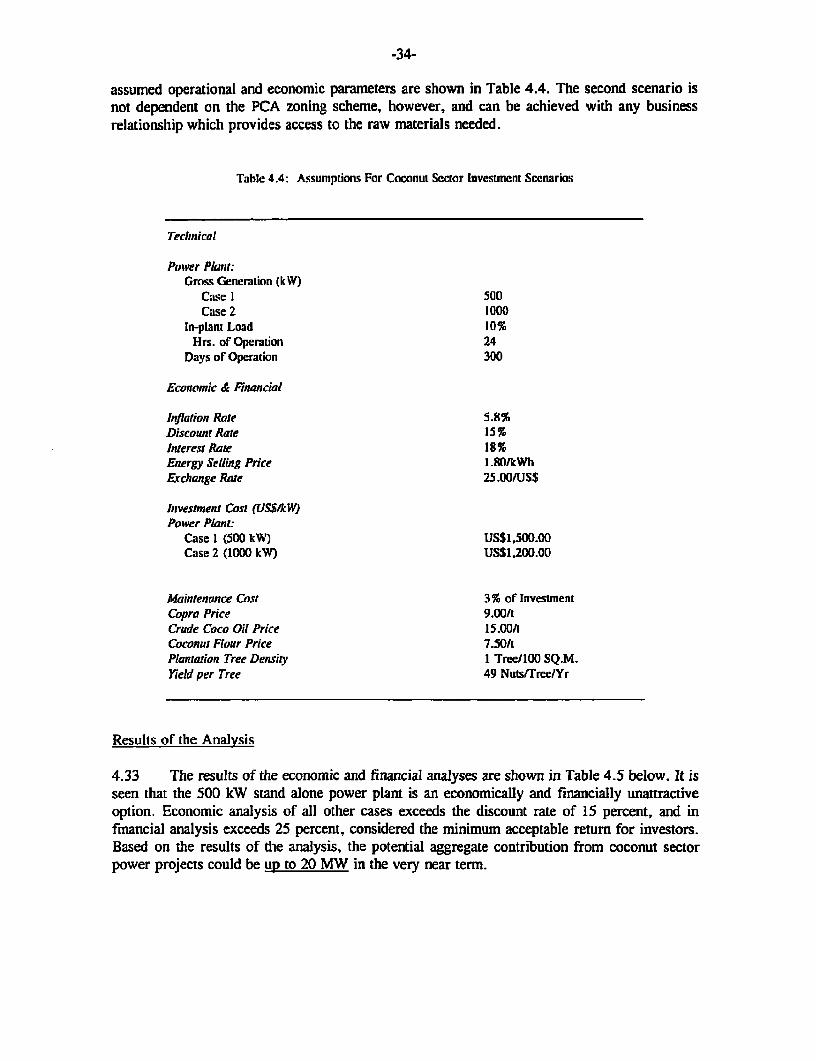
-34-
assumed operational and economic parameters are shown in Table 4.4. The second scenario isnot dependent on the PCA zoning scheme, however, and can be achieved with any businessrelationship which provides access to the raw materials needed.
Table 4.4: Assumptions For Coconut Sector Investment Scenarios
Technical
Powver Plmant:Gross Generation (kW)
Case 1 500Case 2 1000
In-plant Load 10%Hrs. of Operation 24
Days or Operation 300
Economic & Financial
inflation Rate 5.8%Discount Rate 15%Interest Rate 18%Energy Selling Price 1.80/kWhExchange Rate 25.00/US$
Investment Cost (USSH449Poower Plant:
Case 1 (500 kW) US$1,500.00Case 2 (1000 kW) US$1,200.00
Maintenance Cost 3% of InvestmentCopra Price 9.00/tCrude Coco Oil Price 15.00/tCoconut Flour Price 7.50/tPlantadion Tree Density I Tree/100 SQ.M.rield per Tree 49 Nuts/Trre/Yr
Results of the Analysis
4.33 The results of the economic and financial analyses are shown in Table 4.5 below. It isseen that the 500 kW stand alone power plant is an economically and financially unattractiveoption. Economic analysis of all other cases exceeds the discount rate of 15 percent, and infinancial analysis exceeds 25 percent, considered the minimum acceptable return for investors.Based on the results of the analysis, the potential aggregate contribution from coconut sectorpower projects could be up to 20 MW in the very near term.

-35-
Table 4.5: Results of Economic and Financial Analysis: Coconut ScCtor InvestmentsIntemal Rates of Returm (in percent)
500 kW Stand 500 kW 1000 kW Stand 1000 kWAlone Integrated Alone Integrated
Economic 13% 17% 23% 26%Financial 10% 18% 35% 45%
Implementation Issues
4.34 Care must be exercised when interpreting these results. On the positive side, the ratesof return may be better in certain site-specific cases where, due to the remoteness of the area, abuyback price higher than the assumed P 1 .80/kWh could be negotiated. The negative aspects aremore numerous. Although the calculated returns appear attractive, the projects assume thatappropriate matches between resource availability and electricity demand can be identified. Theload factor, however, is likely to be low in the coconut growing areas in remote rural locations.Integration of the power plant with a coconut oil mill will only partly solve the load problem.Viability of the power operation will also be critically dependemt on the profitability of the oilMill.
4.35 Perhaps the main problem faced by any initiative for power production in the coconutsector is the general pessimism about thc future of the industry. This stems from technical andeconomic inefficiencies in local coconut production and processing that has affectedcompetitiveness in the international markets. The situation is attributed by many to what isperceived as a highly inequitable sharing arrangement between the producers of the raw materialson the one hand, and the processors, traders and exporters, on the other. Farmers claim that thetraders benefit solely during periods of high international prices for coconut products, but thatthe farmers bear the brunt during the lean periods through reduced prices dictated for their crops.These issues took root in the colonial period and continued despite later attempts to rationalizethe coconut industry. However, the recently formulated Coconut Industry Medium Term Planthat calls for a "nucleus estate" program seems to have general support and it is hoped will resultin a positive restructuring of the industry. Under the zoning scheme of the program, existing oilmills will be assigned specific 'resource' areas so that the prevalent price-dictated copra-sourcingcan be eliminated, assuring each mill of steady supply of raw material. Farmers will also benefitfrom such arrangement with the elimination of middlemen. The goal is to increase overallproduction and establish equitable distribution of gains.

-36-
V. CONCLUSIONS AND RECOMMENDATIONS
General Conclusions
5.1 Other than in the sugar industry, biomass has not received adequate attention as apotential energy resource by either the Government of the Philippines (GOP) or by major lendersmainly because of the relatively small energy production potential at any given project site.While this is a legitimate issue from the stand-point of regular project lending criteria, theaggregate potential for economic energy production from this indigenous and renewable resourceis clearly large enough to warrant more serious consideration.
5.2 The Philippines has an abundant supply of biomass resources in the form of agriculturalcrop residues, forest residues, animal wastes, agro-industrial wastes, and aquatic biomass. Someof these resources are already being exploited. In 1992, biomass, principally bagasse burned inthe sugar industry and coconut husk/shell used by other industries, contributed about 11 percentof the total national energy supply mix, making it the country's largest indigenous energy source.However, considerable biomass energy resources remain untapped and are treated as wastes.While the theoretical potential has always been recognized as considerable, the economic potentialfor energy production was, at the inception of the study, an unknown quantity. The Departmentof Energy requested assistance to determine the realistic potential for power production fromprocess residues in three major agro-industrial sectors: sugar, rice and coconut. One reason forthe interest is the the country's power sector situation, characterized by poor reliability,insufficient capacity to meet demand, rising electricity prices, and heavy reliance on importedfuels. Despite the already massive efforts to address the crisis by a variety of conventional powerprojects, it was thought important to also explore additional possibilities in less conventionalenergy production. The sugar, rice and coconut sectors examined in this report all haveagricultural waste byproducts that in most cases have minimal or even negative cost (factoriessometimes pay for waste disposal). Agro-industrial facilities in the country are generally agedand require replacement of equipment. There is tremendous renewed interest worldwide incogeneration projects that provide additional revenues to key industries.
5.3 At an estimated power purchase floor price of P1.80 per kWh, or an avoided electricitycost from P2.00 (purchased electricity cost) to P2.50 per kWh (small diesel based captiveelectricity production with a conmmercial, heavily taxed diesel oil price) and possibly higher, thereare sufficient revenues or savings potential to seriously consider investments in biomass-derivedpower generation in all three biomass waste sectors in the country. Also, along with the intentand provisions of recent private power legislation, there appears to be a real opportunity now forbiomass power project development that has not been possible in the past.
5.4 However, given that the current national power supply deficit is in the order of 1,000MW, the potential power contribution from agricultural biomass estimated in this report is clearlynot going to be a major solution to the energy problems of the Philippines in either the short orlong term. It should be correctly viewed as a small but strategic part of the solution, having goodpotential for economically and environmentally beneficial capacity contributions. While there aresome negative environmental impacts associated with biomass combustion (such as increase inparticulate emissions), they are manageable and are considerably much less than the impacts offossil-fuel combustion on both local and global environments. The present study has identifiedthe specific mill situations and investment configurations that will likely result in cost effectiveprojects. Even in situations where incremental power production from biomass projects are just

-37-
sufficient for internal mill use, they contribute to easing the power crisis by reducing totaldemand for grid supply. In addition, the projects have the potential to contribute to the economicupliftnent of the agro-industrial industries by providing an additional revenue-generating activityand new opportunities for rural employment.
Sector Conclusions
5.5 Sugar Sector: The sugar sector shows promise of providing significant capacityadditions to electricity supply in the Philippines. Examination of data on the historic use ofbagasse shows clearly that the resource is neither fully used nor used at optimum efficiency. Theseasonal nature of sugar cane processing impacts its potential for exploitation, as the revenuegenerating potential from bagasse produced kWh sales is directly proportional to the number ofcane processing days. For the sugar industry, no off-season power generation, and hence off-season revenues, were considered appropriate for prefeasibility level analysis of the base casesfor by-pass steam and topping-cycle scenarios. It is possible, however, that site specificexamination may reveal opportunities for using idle sugar processing equipment as defacrocondensers for reduced load off-season operation with surplus bagasse. For the stand-alonecondensing system scenario, the use of cane trash or other supplemental fuels to achieve yearround power production was considered as the base case for analysis. Conclusions from theanalysis specific to the sugar sector include:
a) The cases in the "bypass steam" scenario obtained the best rates of return, with FIRRranging from 22 to 65 percent. The economics in actual cases may even be better, as theanalysis assumed the purchase of additional turbo-generator capacity and associatedequipment to utilize the excess bagasse. In reality, many mills will already have the surplusturbine-generator capacity, and the investment will be significantly below the assumed unitinstalled cost of capacity.
b) The "topping-cycle" approach of the second scenario, which involves high investments,does not appear to be viable at all mill sizes for electricity production during the processingseason only. However, in a situation where a new bagasse boiler needs to be purchasedanyway for sugar processing purposes, only the incremental cost for achieving the topping-cycle pressure rating (and not the total boiler cost) should be charged to electricityproduction. In that case, the topping-cycle may become viable, since the boiler comprisesthe major cost element in the total price for the topping-cycle equipment.
c) The stand-alone condensing cycle plant of the third scenario shows good potential formills of at least 700,000 tcpy capacity, with financial IRRs from 26 to 31 percent. Onereason is the capability to operate year-round using a supplemental fuel such as cane trashin the off-season. The result of the analysis must be viewed as merely indicative. Only aplant specific study can confinm the feasibility of the complex assignment of benefits andinputs between the stand-alone power plant and the sugar mill. The feasibility evaluation willconsider the bagasse and water as inputs from the mill, with electricity and steamn as returnsto the mill. The benefits sharing from use of these inputsand returns, the accounting of changes in personnel assignments, and possibly land leasecharges can be accounted for in multiple ways, depending on specificownership/partnership arrangements.

-38-
d) There are few technical risks associated with the use of bagasse for surplus powerproduction. However, the need to employ higher steam pressures and temperatures does addsome O&M considerations not normally experienced by the sugar sector in the Philippines.This suggests that some improved skills will be required of the steam plant operatorsemployed for these projects.
e) Based on the results of this study, the sugar sector can be conservatively described ashaving the potential to contribute up to 90 MW to grid supply from several individualprojects. The largest 15 sugar mills (each processing over 500,000 tons of cane annually)would be the most likely to contribute to reaching this capacity goal.f) The major barrier to cogeneration projects in Philippine sugar mills at this time, besidesthe presently poor financial condition of most mill companies, appears to be the cane sharingissue between the farmers and the mill owners. In general, the present system does notprovide an incentive for the mills to invest in projects using bagasse for power export.
5.6 Rice Sector: The great majority of rice mills in the Philippines are small, with paddymilling capacities of less than 20,000 tons per year. These sizes do not warrant seriousconsideration as sources of capacity for grid supply. The only real grid supply option is in a few'clustering" opportunities and possibly in the 500 and 800 kW cases. Nevertheless, the smallprojects do have a role to play in reducing the existing burden on the grid from capacity shortageand continuing demand growth by simply eliminating their own demands on the grid. Theanalysis shows that energy cost savings and improvement in supply reliability can provideadequate incentives for the rice mill owners/operators to implement rice mill power projects.Although the National Food Authority (NFA) has tried similar projects in the past with minimalsuccess, the conditions have changed sufficiently (energy price escalation, deregulation of riceprices, etc.) to justify a reexamination of their feasibility. Specific conclusions concerning therice sector analysis are:
a) Most of the potential projects with capacity of 350 kW and above (especially the high-tech option) have economic internal rates of return exceeding the discount rate of 15 percent,even when no revenues from ash sales are included. These results indicate rice sectorprojects involving at least 350 kW would be worth further investigation. Ash salessignificantly improve the economics of all cases, raising the FIRR by 11-24 percent. Thissuggests the need to examine more closely the possibilities for marketing rice hull ash in thedomestic and export markets.
b) For simplicity in the analysis, the cogeneration option was not considered for the ricesector in this study, but the economics would be further improved if steam could be used forrice drying.
c) The economics of the investments depend strongly on the utilization of the electricityproduced. The locations of many of the rice mills are normally in areas with low powerdemand where the assumed 85 percent load factor will be difficult to attain.
d) Compared to bagasse, there is more technical risk with the use of rice hulls as boiler fuelbecause of the erosive nature of the rice hulls caused by their high silica content. Unlessthe equipment is properly specified, and carefully operated and maintained, technicaldifficulties could lead to project failures There would clearly be a need for more skilledmanpower in the rice mills to operate and maintain the power plant equipment.

-39-
e) Based on the results of the present study, the realistic potential aggregate contribution ofrice hull-fired capacity is not likely exceed 40 MW at this time because of the large numberof installations needed to achieve this amount. Unless a significant rice hull ash market canbe developed, it is not likely that off-shore entrepreneurs would participate in ventures toexploit this sector's biomass waste resource for energy production.
5.7 Coconut Sector: The coconut sector was the most difficult to deal witl in the studybecause of the uncertainties regarding the structure of the Philippine coconut growing andprocessing industry and its mfarkets. Regardless of the status of the industry, the condition existswhere abundant husk resources, potentially exploitable for energy purposes, remain unused inthe areas of harvest (the shell normally goes with the coconut meat for processing). The technicalissues regarding potential use of the coconut husk for power production revolve around theremoteness of the potential power plant sites and the low demand for electricity in these areas.There is momentum in the industry for decentralizing the production of coconut oil and movingthe milling out to where the resource is harvested. This development would provide anopportunity for investments in husk-fired power plants coupled to an oil mill, assuring bothresource supply and demand for the power produced. Specific conclusions regarding the coconutsector analysis are:
a) The financial IRR for the four cases range from 10 to 45 percent which indicatespotential for proceeding to site specific analysis. The power plant integrated with an oil millhas better returns than the stand-alone case because of the potential for a higher load factor.
b) The analysis suggests that the power plants will have to be heavily base loaded to achievesufficient IRR's. This appears unlikely to be realized in most rural area locations. Integrationof the power plant with a coconut oil mill will only partially solve the load problem.
c) On the positive side, the remoteness of the potential power plant sites does suggest thatit may be possible on a site specific basis to negotiate a higher power sales rate than the P.1.80 assumed for the analysis. Also, there are very few technical risks with implementingcoconut husk fired power projects, even in remote areas.
d) The concept of coconut husk-fired power stations is valid, but more analysis is neededto accurately define the potential of this sector. Unless the appropriate resources/load matchcan be made for the 500 kW and 1,000 kW cases, the aggregate power contribution fromthis sector will be minimal. No doubt some viable sites can be identified, but to targetanything over 20 MW as the potential contribution from this sector is premature at this time.That capacity potential could grow, but the increment is far from certain with the knowledgebase in-hand.
Recoinunendations
5.8 The bioniass power investments discussed in this report are expected to be undertakenmainly by the private sector, once confirmed to be viable in specific situations. However, theGovernment has an important role to play in promoting the concept and facilitating theimplementation of actual projects. Experience has shown (e.g., in energy conservation work) thatmerely demonstrating the financial feasibility of certain investments does not necessarily translateto their implementation. Where such activities clearly offer national benefits by way of advantages

-40-
to the economy and to the environmnent, Government must play a more active role. Through itsline agencies, the DOE has been implementing a program for developing nonconventional energyresources (see evaluation in Annex A). It is recommended that grid-connected power generationopportunities using agricultural wastes be given priority attention in that program. A variety offiscal and other incentives for renewable energy projects arc already in existing laws. Theapplication of these incentives to the type of biomass projects discussed in this repon should beclearly defined and widely publicized. Informiation dissemination efforts are crucial to developawareness in the three sectors of the opportunities for investment.
5.9 It is recommended that the sugar industry, with its relatively better defined potential fordevelopment of surplus electricity generation capacity, be targeted as the top sector for immediateattention. The DOE, along with the SRA, should help define the type of legislative actionrequired to resolve the mill/farmer cane sharing issue in an equitable manner that provides themill owners and potential off-shore partners with sufficient incentive to make the substantialinvestments needed to develop the surplus power capacity. What is needed is a specialarrangement with all cane suppliers that will allow the millers to invest in a surplus power projectwith no farmer liability, or with an acceptable minimum revenue sharing liability. The marketleaders in the sugar industry are already involved in trying to define viable surplus powerprojects, and these activities should be fully supported as precedent setting projects. One area ofassistance should be in the prequalification of potential off-shore joint venture partners to avoidwasting the time and efforts of the mill owners.
5.10 For the rice sector, the market leaders should be identified and educational andawareness building activities should be directed toward them. This effort should be coordinatedwith the NFA and its allied industry associations. As immediate action it is recommended thatsuitable demonstration projects involving several mill sizes and types be identified. Despite thefailure of an earlier pilot project on rice-husk fired power by the NFA, technology advances andoperational experience acquired in recent years, combined with a more favorable local climatefor private power generation, warrant a re-investigation of this option. To the extent possible,DOE, through its line agencies should serve as a broker between the market leaders with viablesites, the qualified equipment vendors, and the appropriate financing organizations to accelerateimplementation of these pilot projects.
5.11 For the coconut sector, the potential for project investments is only partially linkedto the implementation of the proposed sector decentralizing program. The remoteness of theareas where the coconut husk resource is normally located implies low load factors and suggeststhat the more promising projectS wiil be those integrated with an oil mill. Identification ofprecedent-setting projects in this sector must involve close cooperation between DOE and PCA.It is recommended that one or two demonstration projects in carefully selected sites be designedand assisted with financing arrangements, perhaps from bilateral donors.
5.12 Finally, it is recommended that the legal and contractual framework needed to facilitateimplementation of relatively small agricultural residue fired power projects be clearly defined,starting with the adoption and publication of an appropriate standard power purchase agreementfor these types of projects. This should include also a clear delineation of responsibility betweenthe mills and the utility for interconnection and fault protection requirements.

Annex APage 1 of 7
THE NONCONVENTIONAL ENERGY DEVELOPMENT PROGRAM: ANEVALUATION
Introduction
1. The Nonconventional Energy Development Program (NEDP) of the Philippines waspart of the initial responsz of the govenunent to ihe international oil crisis of 1973. At thetine of the first oil crisis, 92 per cent of the country's total energy supply was based on oil,95 per cent of which came from the Middle East. The creation of the Mhiistry of Energy(MOE) in 1977 was hitended to provide coherence among the ensuing energy activities of thevarious agencies. The MOE served as an umbrella organization, under which were placed anew Bureau of Energy Utilization (BEU) and the former Energy Development Board (EDB),now reorganized into the Bureau of Energy Development (BED). The two major energyparasttals, the Philippine National Oil Company (PNOC) and the National PowerCorporation (NPC) were also put under the overall control of the Energy Minister whobecame de officio chairman of both corporations.
2. Aside from immediate moves to diversify forign sources of oil, acceleratedprograms were launched to explore for indigenous oil deposits and to develop geothermal,coal and hydro resources. Coincident with (and inspired by) then strong worldwide initiativesto develop solar and other renewable energy forms, the govermnent decreed the launching in1977 of the nonconventional energy development program (Presidential Decree 1068),providing an intial budget allocation of PesosIO million. The fumds were to be used forgants-in-aid financing of research and development projects in the areas of solar, wind andbiomass energy. The GIA program was to be administered by the NonconentionalResources Division (NCRD) of the Bureau of Energy Development.
Historical Backeround: Mixed Experiences
3. In the first year of the progam (1977), NCRD identified a number of technologiesthat it considered either already well-developed or required minimal R & D to enableprctical applications. Included under technologies widt relatively large-scale energy outputwere: power and fuels from agricultural wastes;"Alcogas" for motor fuel; energy platationsand industrial solar water heating. Those with smaller scale output were: biogas from ruraland urban wastes; windmills for water pumping and low-power electricity; solar crop dryers;surface gas utilization; solar stills and utilization of hot springs Although these applicationswere intemationally well developed at the time, their suitability to specific local conditionswas generally unknown. For this reason, during its first five years (1977-1982), the programconcentrted on the generation of baseline information by mounting a series ofdemonstration/pilot projects. NCRD's strategy was to limit itself to "adaptive" resarch anddevelopment, focussing on materials substitution to reduce costs and deternining socialacceptance of the pilot instllations. This period was characterized by substantialintenational support for the program, reflecting the considerable resources allocated bybilateral and multilateral agencies at that time to renewable energy and the growinginternational recognition of the Philippines' program.

- 42 -
Annex APage 2 ot 7
4. On the basis of the information gathered during tiis initial period, and coincidentwith the advent of a new program manager, the focus of the program shifted in 1982 tocommercialization of some of the tcchnologies shown to be most promising. These included:biomass-fired boiler systems; gasifier systcms for power and process-heat production; biogassystems; biomass-derived liquid fiel (ethanol and coconut oil); and solar water heaters.
5. NCRD saw its role in the commercialization program as initiating market studies anddisseminating tcchnical information on results of previous R&D projects, e.g., identificationof appropriate fuel sources for biomass-fired boilers. The objectives of this program phase,however, wvere hardly achieved. A major reason was the decidedly urban focus of the chosentechnologies. On the one band, it seemed an appropriate way to increase the energycontribution of rcnewabic energy to the national energy nix by promoting technologiescapable of delivering erergy on a larger scale and by targetting consumers with the ability topay for them. On the other hand, this urban focus did not coincide with funding priorities ofinternational donors at that time, who were more interested in decentralized ruralapplications.
Past Programs of Other Agencies
6. Starting somewhat prior to and encornpassing this period, other goversnent agecieslaunched their own nonconventional energy programs, often with little or no coordinationwith NCRD. MOE did not formally oppose these programs as they were billed to becommercializafion efforts, i.e., the step subsequent to NCRD's research, development anddemonstration program. The largest budgeted programs were those of the Ministry ofHuman Settements and its affiliated agencies. WiLh much fanfare, the NationalElectrification Administration launched its Dendrothermal Power Development Program in1979 with the ambitious goal of constructing 100 MW of capacity by the early 90s, usingplantation wood from over 70-000 hectares of tree fanns. At about tfhis time, NEA alsoembarked on a large minihydro deployment program. The Farm Systems DevelopmentCorporation started large-scale manufacturing of biomass gasifier units for use in vehicles,boats and water pumping systems. These prograns were mainly politically-inspired andfiled to attain most of their objectives. Aside from problems inherent to renewable energydevelopment that will be discussed later, these programs failed iT fthe local context largelybecause they tried to do "too much, too soon". The basis for commercializing the chosenapplications were supposed to have been drawn from the results of NCRD's R&D program.However, the flaw was in misinterpreting these results and assuming that the technologieswere commercially ready.
7. Later, a World Bank project that the Government requested to revitalize the NEA notedthat a contributing factor to the weakened status of the agency was its past extensive and ill-fated involvement in the above renewable energy progams. NEA was advised to focus itsefforts in the immediate term to fulfilling its principal mandate of managing the problem-ridden conventional ruml electrification program.
Later Developments
8. The third disfinct phase of the NEDP may be said to be the period betweem 1987-1992. At about the beginming of this period, the Ministry of Energy was abolished, in effct

- 43 -Annex APage 3 of 7
severing the coordinative links betwcen the energy parastatals and agencies with purelyGovermnent functions. Before this, the NCRD head was also the head of the Centcr forNonconventional Energy Dcvelopment (CNED), a research ficility built wiith PNOC fimnds.When MOE was abolished, NCRD became part of the Office of Energy Affairs (OEA) andCNED reverted to PNOC. The facility was renamed the Energy Research and DevelopmentCenter (ERDC) whose new role was mainly to serve conventional oil-related research needsof PNOC (although for sorne tirne it continued to execute foreign finded renewable energywork started with CNED). NCRD's official mandate became program management. There isno doubt that, at that time, the split had an ov-rall negative effect in tens of the country'sattractiveness to donors as an effective executor ot renewable energy projects.
9. NCRD adapted as well as it could to the situation and revised the scale anddirections of the program. In the years 1987-1992, the program's primary attention saw areturn to mecting specialized energy needs of rural areas. The rationale was the generalrecognition that there were strong social, political and environmental justifications fordevoting some public resources to improving the quality of life of people in rural and remoteareas ofthe country.
10. To carry out this mral-focussed program, OEA-NCRD gradually cstablished 15Affiliated Nonconventional Energy Centers (ANECs) in 11 regions. The ANECs wereessially small units based in provincial universities and staffed by faculty ;nembers withbackgrounds relevant to renewable energy. These ANECs were intended to serve as NCRDcxtensions to the provinces in the hope that the nonconventional energy progam will have alonger reach to the remote users, where nonconventional sources of energy are often the leastcost options. The actual effectiveness of this networldng concept, although sfill to befonnally assessed may have been less than desired due mainly to wide variations in thecompetence of the individual ANECs.
11. In early 1993 a reorganization of the entire energy sector was implemented by theGovernment. The NCRD became a unit of the Energy Utilization and Management Bureauin the newly created (1993) Department of Energy. Its name was changed to theNonconventional Energy Division (NED) but it retained its role as manager of the nationalprogram. NED is presently composed of 13 professional staff, ten with engineering ortechnical degrees and three with economic degrees. By special waining or advancededucation, one staff has expertise in biomass energy, one in solar energy, one in energyengineering, one in marketing and three in economics. Through various training programsand participation in international conferences, many staff have gained exposure to rmalenergy planning and managemnent, economnic appraisal of projects and infonnationdissemination methods.
Present Problems
12. The NEDP's progress has been seriously hampered by a combination of factors.International developments in energy supply and prices starting in the late 80s had negativeimpacts on renewable energy work worldwide. After the fivefold increase in oil pricesbetween 1972-83, they dropped steeply so that by 1987 they were again at about the samelevel, in real tersw, as in 1972. The softening of oil prices had two major effects onrenewables. Firstly, it made uneconomic various renewable energy options that compete

- 44 -Annex APage 4 of 7
direcdy in the modem sector as petroleum substitutes, such as fuel alcohol and industrialsolar water heating. Secondly, it gave a new perception that oil was again cheap andplentiful and dtat there was no need to examine less fimiliar fuel options. There was thus asignificant drop in intemational funding for renewable energy work.
13. The above exogenous developments and a weakening local economy caused aserious decline in Government funding of NEDP. For 1992, the gross appropriation for thispurpose was only P2.5 million, or about 40% of the aveage yearly budget for the NEDPsgrants-in-aid pmgram from 1980-86. This budget is clearly inadequate to pursue even aminimal program.
14. This lack of progran resources has weakened NED's position and led to someinstitutional coordination problems. An example is the apparent overiap in the past ofprogram functions with the Philippine Council for Industry and Energy Research andDevelopment (PCIERD) of the Department of Science and Technology ((DOSf) in thisspecific area. Despite its broader coverage, PCIERD's grants in aid research program hasbeen financing a substantial number of renewable energ technology work, with little or noformal coordination with NED that officially is in charge of the national program in thisspecific area. Coordination of the governments technology research efforts is supposed tobe the role of the Science and Teelmology Coordinating Council headed by DOST in whichOEA, ERDC and UP are members.
Cantribution to the Energy Mix
15. Judged solely by its contribution to the national energy supply, it may be concludedthat the noncon-s-stional energy program has not been effctive at all. Based on officialfigures, the ccntribution of nonconventional energy did not increase very much since thelaunching of the energy program, from 13.2m BFOE in 1978 to 15.05m BFOE in 1991. Ofthe 1991 figure, at least 97% was due to biomass resources; namely, bagasse, coconuthusk/shell, rice husk and wood/woodwaste. Bagasse accounts for most of this number. It isdifficult to deteumine whether even this small increase is real or the result of inconsistency incalculational methods. For instance, small variations on assumptions of bioanss moisturecontent can have substantial impact on the final estmates. Since there has been litdeexpansion of acreage in the sugar industry during the period, the indication is that actubagasse utilization may have hardly changed.
16. In tenns of physical installations, the nonconventional energy program has by end of1991 directly or indirectly caused the following installations: (1) a total capacity of 14.6 KWof photovoltaics, (2) 259 windmills, (3) 789 biogas systems, and (4) hundreds of domesticsolar water heaters. The aggregate energy contribution of these instaUations are clearlymargnal when compared to conventional power sources. What cannot be quantified are thesocial and environmental benefits that very likely accrued from these applicztions. Therewere likely benefits as well in terms of future trmnsaction costs and technology cosu resulfingfrom the implementation of the program, but these again are difficult to quantify.
Conclusions and Recommendations
17. Despite the setbacks that renewable energy programs have suffered in the last

- 45 -
Arnnex APage 5 of 7
decade, there are new powerful reasons for persisting in their development. The currentinternational concern for the envirornent, formalized in last year's UNCED conference inBrazil, direcdy impacts rcnewable energy development in the sense that environmental costsand benefits have now taken a more prominent weight in the consideration of energy projects.Where a biogas project, for example, may not pass muster in the past on its energyproduction benefits, its high environmental value for reducing toxicity of effluents fromdisaillieries, meat processing plants and other highly polluting industries is now being moreseriously re-examined and quantified. Many conventional energy projects are now requiredby lenders to incorporate energy conservation, demand side management (DSM) andrenewable energy components in the overall project. The creation of the Global EnvironmentFacility (GEF) has made available billions of dollars of funding for environmentally benignprojects, including renewable energy. The World Bank, which administers this facility, hasalready financed several renewable energy projects in many countries, most of themuneconomic by conventional project evaluation criteria. The successful implementation ofthese GEF-financed projects in developing countries require the presence of strong localcapabilities in this field, capabilities normally acquired through ongoing nationalnonconventional energy progrms.
is. It is advantageous for the Philippines to participate in these worldwide efforts bycontinuing its nonconventional energy program. The program, howeer, must be providednot only with a reasonable budget but stronger political commitment The prsent budget isclearly inadequate to pursue even a modest program. As to commitmt, it is important forDOE officials who oversee NED's activities to understand the limitations of a program ofthis type and to stop judging its achievements by the same yardstick as conventional powerdevelopment or oil exploration or coal development The fict is that unless there are majortechnology breakthroughs at the global level, large-scale energy generation will continue tobe done primarily with conventional fuels and technologies; the contribution of renewableenergy sources to national energy supplies in the foreseeable futu will therefore beinimal
19. In the context of countries like the Philippines, ihe main value of present-dayrenewable energy applications is not in tems of their energy outputs but rather in thedelivery of essential services, particularly to users in rual and remote areas. The essentialservices include potable water (solar pumps, windpumps), health services (PV poweredvaccine refrigerators, sterilizers heated by biogas or solar energy), education (PY poweredcommnunity TV) and so on. There are good social justifications for continued use of publicfunds for delivering these types of services.
20. Renewable energy does have practical large-scale applications today but these tendto be very site-specific and are more sensitive to availability and prices of conventionalaltenatives. Where there are clear economic and financial benefits, renewable energyprogrms must be alert to exploit opporunities for such applications. An example is biomasscogeneration for power export to the grid that, in light of the prolonged power shortage in thePhilippines, would seem to have high economic value and should be given priority in NED'sprogram. On the other hand, it may be wise to put low priority on program resources fordeveloping power alcohol (alcogas) or cocomnt oilldiesel mixes (cocodiesel), due to thelikelihood that low oil prices and high coconut oil market prices may persist in the mediumterm.
-- 46 -
Annex APage 6 of 7
21. NCRD has already acquired years of experience in this specialized field and, ingeneral, has demonstratd its competence. What is needed is a periodic reassessment of itsgoals and priorities in light of rapid changes in the energy sector. The staff complement isprobably adequate for the near temi, even if a larger program is made possible by anincrease in the GIA budget. However, it should focus its attention tc ..ogram management,policy research and coordination of intermational technical assistat.-e in this field. Thepresent staff composition is heavy on the technical side. It will be advantageous to strike aproper balance by gradually including more staff with degrees in economics. NED wouldneed to be continuously strengthened, through short and long-term training and joint studiesand projects with foreign agencies.
22. While the ANECs concept is a good one, their exact practical role should be re-examined and more clearly defined. The present description of responsibilities seem to beinappropriate to both typical skills in these units and the opportunities provided by verylimited NCRD resources. Most of present ANEC staff appear to be knowledgeabletechnically but often have little idea of the process by which the worth of renewable enegyprojects should be judged. The training of ANEC staff on important skills such as economicand financial analysis of projects is already a high priority by NCRD and more resourcesshould be made arailable for this purpose.
23. With the creation of the DOE and the reumr of PNOC under its umbrella, thcre maybe interesting possibilities for a renewed partnership between NCRD and ERDC. Theenvisioned relationship would be over and above the nomal functional relationship betweenNCED-as official program manager- and individual agency executors of renewable energyprojects, such as NPC, NEA and others. The partnership may be unofficial and govemedonly by informal agreements on specific roles. What it would achieve, in the author's view, isa stronger image to intemational donors of NCED's capability to implement all types ofrenwable energy work expeditiously .
24. There is a need to fonmally delineate instittional responsibiliies with regards to theimplementation of a nonconventional energy development program, partcularly the roles ofDOE vis-a-vis DOST. While there is no evidence that past overlaps in the grants-in-aidprograms in this specific area between these two institionsof have led to the wasteful use ofGovernment resources, it is clear that there must be closer coordination in the fature. Theexisting Science and Technology Coordinating Council headed by DOS, in which ERDC, UPand fte former OEA were members, appear to be a usefil vehicle for this purpose andshould be more fully utilized.
25. Finally, the nonconventional energy program must always be fonnulated within thecontext of overall energy sector planning. One way to achieve this is to link up NEDPactivities with broader, more immediate development issues, such as rural energy planning or"household energy". Most of these issues deal with fuelwood, a renewable energy source thatstill dominates overall energy end-use in the Philippines and most developing countries. Theproblems related to massive fuelwood use, deforestation and interfuel substitution trends inhouseholds are complicated and the responsibility for tackling thm often falls between thecracks of line agencies. The problems straddle both energy and forestry (and perhaps othersectors, as well) but, typically, neither energy planning agency or forestry agency have the

- 47 -Annex APage 7 of 7
expertise to deal with them. Through a previous joint study with World Bank/ESMAP andparticipation in other studies by FAO, etc, NCRD has acquired the basic staff skills as wellas the initial baseline data on national household energy supply and demand. Efforts on thisimportant topic should be continued in the nonconventional energy program.

- 4t,8
Annex BPage I of 4
TRAINING ON ECONOMIC APPRAISAL OF NONCONVENTIONAL ENERGYPROJECTS
Description of the Training Program
1. The training program conducted under the ESMAP technical assistance project wascomposed of three workshops. The first was the -training the trainers" workshop on economicappraisal of noncon energy projects and the other two were "echo seminars" . The detailedcourse program for the first module is shown in the attachment. The schedules and venues ofeach workshop are shown below:
Training I Echo I Echo 2
Venue Talisay. Batangas CLSU, Munoz USC. Cebu CityDate October 19-23,1992 November 9-13 November 16-20Participants
ANECs ANECS 14 11 12NGOs- IGOs I 1
NCRD6 2 2OEAI - -
Total 22 15 14
Participants/Trainers
2. A total of 51 were trained under the training program. Most of the participants camefrom the ANECs and OEA, while a number were from selected government organizations andNGOs. Provisions were made for the participation of representatives from local government units(LGUs) which assist the ANECs in the promotion and dissemination of noncon energy systemsin their own localities. However, most of the ANECs were not able to nominate participantsfrom LGUs.
3. The chief trainer for the first workshop was Don Hertzmark, consultant,with Ernesto N.Terrado from the World Bank and Ms. Eufemia Mendoza from DBP as special lecturers. In thesucceeding workshops, 5 of the participants from the Talisay workshop were tapped as lecturers.Ms. Mendoza and Mr. Herminigildo Bautista, also from DBP, were on hand to elaborate onDBP's lending procedures. Ms. Maria Theresa Arce, a lecturer from the Economics Departmentof the University of San Carlos, discussed an introductory topic.
4. At the end of the training workshop, each participant was expected to be capable of executingindependent basic economic analysis and appraisal of energy-related investment plans and alsobe equipped with background information on acceptable local bankirng terms on financing energyprojects.

- 49 -
Annex BPage 2 of 4
Structure and Oreanization of the Workshop
5. The workshops consisted of lectures and hands-on exercises aimed at maximizing appreciationand understanding of basic economic project theories and concepts, general procedures forconduct of project analysis and appraisal and understanding of the implications or interpretationsof the results, and provided sample calculations using pertinent data on renewable energysystems.
6. The OEA-NCRD took the lead role in designing and preparing the course contents of thetraining workshop in consultation with the ESMAP personnel. The course content for theTalisay workshop is shown in the attachment. A review of this workshop by NCRD and takinginto consideration the available expertise from NCRD and the ANECs resulted in a revised courseprogram for the succeeding echo-workshops.
7. The training materials used included those developed by ESMAP for Chinese energy plannersemphasizing integrated local energy system planning techniques and financialleconomic analysis.
lnstidtional Arrangements
8. NCRD handled the overall management and supervision of the training workshops. NCRDalso coordinated with different agencies to effectively pursue feasible arrangements, such assubcontracting local institutions and resource persons, preparation of workshop course contentand identification of participants. In addition, NCRD prepared and supplied the trainingworkshop paraphernalia, handled the compilation of proceedings and identification of localresource speaker/s.
9. The different agencies and organizations involved in the preparatory arrangements includedtwo ANECs, namely: Central Luzon State University (CLSU) and University of San Carlos(USC). They provided the technical secretariat support services, such as the organization andpreparation of venue for the training workshop and arrangements for food, accommodation, andtransportation, confirmation of attendance of participants, travel arrangements of participants, etc.
Participants Assessment of the Training Program
Training Workshop
10. The first workshop was adjudged to be very satisfactory by most of the participants.The workshop content was deemed very sufficient, and topic sequencing and presentations werefound adequate. Also, most of the participants found the theoretical and practical discussionsvery satisfactory. In addition, most found the workshop to be highly relevant to their line ofwork. The duration, schedule and training method used were also very satisfactory. The venueand other facilities were considered excellent.
11. Although the workshop content was deemed very satisfactory. some participants felt theneed for further discussions in the following aspects:

- 50 -
Annex BPage 3 of 4
a. shadow pricingb. economic analysis of reference energy systemsc. market studiesd. banking gauge of project worthinesse. introduction to electronic spreadsheetsf. introduction to the use of financial consultant (specialized calculators/instruments)g. derivation of long-hand equations for given formulae
12. Some participants also gave the following suggestions to improve future workshops:
a. more examples on energy projects, especially under local conditionsb. exercises based on actual procedures of banking institutionsc. more hands-on time with hardware (calculator and computer)d. more computers for use of participants specially for case preparatione. site visit to energy projects and subsequent analysis
Echo Workshops
13. The two echo workshops conducted were deemed very satisfactory by most of theparticipants. The workshop content and presentation were found to be very adequate. Topicsequencing was also considered satisfactory. The mix of theoretical and practical discussion, andthe relevance of the workshop to their line of work were found to be very satisfactory. Theworkshop duration, scheduling and methods used were also deemed very acceptable. Therevenue and other facilities were considered very good although there were suggestions for someentertainment and sports facilities in the Cebu venue.
14. The first two days of the echo workshops dealt with the basic concepts of financial andeconomic evaluation, such as the terms and variables used in the analysis, and the long-handcalculation of these parameters. The participants appreciated the lectures and general discussionsthey evoked. However, some participants recommnended the following topics for furtherdiscussion:
a. development impact assessment of the DBPb. demand analysisc. growth and development theoryd. computer operations (hands-on) before application
15. All the topics discussed were deemed important. The participants also felt that there weresufficient exercises to familiarize themselves with the process of evaluation. However, a fewvoiced the need for more realistic and simple examples.
16. The case studies were also found to be very helpful. However, some felt that they shouldhave been told to bring relevant materials and information for their case studies. In this manner,they would have done studies which were realistic and applicable to their own localities. In bothecho seminars, the lecturers presented the Dendrothermal Case prior to the preparation of groupcase studies. The case studies undertaken included the following:

- 51 -
Annex BPage 4 of 4
a. rehabilitation of 60 kW wind turbine generator in Batac. llocos Norteb. small PV systems for a remote communityc. PV for incubatord. solar crop dryere. microhydro system for corn millingf. windmill for water pumping
17. Final examinations were administered during the echo workshops to gauge the proficiencyof the participants. About 75 % of the participants passed the two exams.
18. Other problems encountered during the conduct of the workshops were as follows:
a. learning to operate the calculators tended to distract the participants in doing the long-hand calculationb. lack of computers for use during the case studiesc. need for more proficient lecturer/s on economic analysis

Annex C
Page 1 of 4
GUIDELINES FOR TECHNOLOGY SELECTION
Available Technologv
1. There exists a wide range of technological options to pursue for biomass energycogeneration projects, depending on the value of the energy produced and the scale of theapplication. For this report, only electricity producing options--mainly in the cogenerationmode-- are considered.
The range of technology choices is as follows:
Combustion System
* Grate Type - Stationary or Moving with Gasifying or Direct Combustion
* Fluidized bed - Gasifying or Direct Combustion with Bubbling or CirculatingBeds
Steamn Generator (Boiler)
• Fire-tube - Less than 20 Bar with Saturated Steam or Limited Superheatand Limited to Less than 20 tph Steam
* Water-tube - All Pressures with High Superheat Potential and all Sizes
• Hybrids - Fire-tube Boilers with Interconnected Water-tube RadiantFurnaces, Still Limited to Less than 20 Bar but in LargerCapacities
Electrical Generator Drive
* Reciprocating Steam Engine - 20kW to about 2,000kW with Condensing ornon-condensing Application with ThermodynamicEfficiency Limitations
* Steam Turbine - 200kW and Larger with Condensing and Non-condensingApplications and Higher Efficiency Potential
* Gas Turbine - Potential but not considered commercial
Technological Concerns
2. Technology selection begins with a determination of the specific fuel or fuels available.A combustion or gasification system is designed around a fuel specification. Without an accuratefuel analysis, the performance of the combustion/gasification system simply cannot be guaranteed.

Annex CPage 2 of 4
3. Mixing of fuels causes even more design problems unless the exact mixture of tbe fuelscan be predicted and the combustion system designer can be given an envelope of fuel mixconditions within which the system will always operate. For example, the use of conventionalfuels like distillate or residual oil with biomass will inevitably cause superheat temperature controlproblems, if superheat is being used because of the necessary air/fuel ratio requirementdifferences between the biomass and oil. A constituent in the ash of one fuel might not be aproblem by itself, but when mixed with a constituent from the ash of a second fuel, a horribleboiler tube slagging potential may rise. Fuels like rice hulls and/or rice straw give problemsbecause of the basic physical characteristics they possess of being a silica matrix holding the othercomponents within. The silica does not burn and if the velocity anywhere in the combustionlgasification and heat exchange systems (boiler) gets too high, the erosion damage is inevitable.If the moisture content of the fuel turns out to be higher than that given to the system designer,the equipment will likely never meet performance requirements, if it can be made to operatesatisfactorily at all. The point of this discussion is that the biomass fuel situation must beaccurately portrayed, and good constituent analysis provided to the hardware supplier. Ifpossible, samples of the fuel should be sent to the equipment supplier for his analysis and testuse. There are only a handful of hardware suppliers in the world than can claim to havesuccessful commercial systems in operation using rice hulls. For other biomass fuels, morechoices are available.
4. Whether to go combustion or gasification (staged-combustion, i.e., a gasifierclose-coupled to the furnace of a boiler) should not be an issue in the Philippines. In the U.S.gasification is an attractive option because the federal Govermnent allows a tax credit when abiomass resource is converted into a liquid and gaseous form, and the energy derived is sold toanother party for some productive use that would ostensibly obviate the use of a fossil fuel.Because of this, many close-coupled gasifiers are being installed to fire steam boilers. Anothersituation when gasifier-fired steam boilers could make sense is when retrofits of old conventionalbiomnass combustion systems are made. These old systems were designed for grate or pileburning of the biomass and the heat was transferred to the boiler tubes through essentiallyconvection heat transfer. The use of a gasifier allows a radiant flame to be ignited with the gasproduced, and the flame can be directed to allow more of the efficient radiant heat transferproducing more steam output per unit of heat transfer surface. Some hardware suppliers arealready i.ncorporating this principle in the design of new lines of biomass steam generators. Forthe purposes of this report, direct combustion systems are to be considered as the approach ofchoice. Hardware suppliers proposing staged-combustion systems should only be considered ifthay can successfully operating commercial facilities.
5. The choice between fire-tube and water-tube boilers is more a function of size andefficiency desired. Water-tube boilers allow much higher pressures to be considered and muchhigher superheat to be employed. Technically, they also demand much more sophisticated watertreatment to avoid disastrous scaling problems inside the boiler tubes which lead to tube burn-out.For all installations, the water quality is an issue, and the boiler supplier needs to have acomplete water analysis to be able to specify what water treatment system and procedures willhave to be used to guarantee reliable and efficient water/steam side performance.
6. To produce electricity in the 20,000 kW range with biomass, the vast majority ofapplications would specify steam turbines as the comnmercially proven more efficient, and
Annex CPage 3 of 4
preferred hardware choice. At the small end of the range. from 20kW to 2,000 kW. it can beargued that other choices exist. However, it must be remembered that there have been many pastattempts to use biomass gasiriers to produce fuel ,as to drive reciprocating spark ignition orcompression ignition engines. The vast majority of these attempts have been clear commercialfailures, and it would be prudent for cogeneration projects in the Philippines to avoid this option.
7. [n Brazil and other Latin American countries, reciprocating steam engines are still beingsuccessfully used to generate electricity and provide shaft power in remote areas with largebiomass resources. There is no question of the technical viability of these reciprocating steamengines, and their potential applicability to the Philippines. They are a legitimate option. Themajor technical impediment with these steam engincs is that to improve the efficiency somewhat,a limited amount of superheat is added to the steam. Without the superheat, the cylinder wallsare lubricated by the moisture (condensation) in the cylinder, but with superheat lubricating oilmust be used in the cylinder which contaminates the steam for further use, and inhibits its usein a condenser (although oil separators can be installed at a cost). The newest small cogenerationoption to consider is a small gas turbine driven by hot air produced by a biomass combustionsystem. This system can ordy be considered to be at the demonstration mode at this time.
Technoloev Costs
8. There are some basic financial considerations related to choosing the right technology.Conventional fuel fire-tube boilers are significantly cheaper than water-tube boilers in the sizerange they are both available in. Packaged boilers (shop assembled) are always cheaper than fieldassembled boilers. Solid fuel designed fire-tube and water-tube boilers are more expensive thanthose designed for oil and/or gas (larger furnaces and lower gas pass velocity design limits). Forall boilers, the higher the operating pressure, the thicker the metal used, the higher the price.Adding superheat always increases the price as it is a non-water cooled heat transfer devicerequiring more careful design, and normally more exotic metals. The higher the boiler pressure,the more costly is the water treatment needed to protect the boiler. FBC systems do not appearto have any significant price advantages over traditional solid fuel systems. Ssngle stage steamturbines can be almost as cheap as steam engines, but the efficiency of the steam engine canpossibly be higher in that case than that of the steam turbine. When deciding whatto specify in small applications (2,000kW and less), the steam rate -- pounds or kilograms ofsteam required to produce a kWh - is the guiding factor. Multi-stage steam turbines can obtainefficiencies way above that of a steam engine, but at an additional capital cost. Condensingcompared to non-condensing operation is another factor to examine. If the steam has value forthermal processing, this could be an excellent investment trade-off but project specific analysisis required to make the right decision. Finally, it is important to avoid new technologies that,on paper, are seemingly cost-effective and highly efficient but do not yet have a commercial trackrecord.
9. For the investment scenarios discussed in this study, the technology strategy follows oneof two basic approaches: a) the low-tech/low efficiency/low cost approach, using fire-tube boilersand atmospheric exhaust steam engine-generators, and b) the high-tech/high efficiency/higher costapproach of higher pressure water-tube boilers with superheats driving condensing multi-stage

- 55 -
Annex CPage 4 of 4
steam turbine-generators (except for the sugar industry where a back-pressure turbine-generatoroption is also included). Obviously, in-between approaches can be engineered for specificprojects in the next phase, but to determine the potential on an industry wide basis, this genericapproach is more than adequate.

Figure 1
Philippine Power Demand30,000-
15, 000
£2 10,000 ---
5,000 ---- .
<r +A
1973 1975 1977 1979 1981 1983 1985 1987 1989 1991
LIII Total Demand Own Use -+-Losses

- 57 -
Table 1: Steam Generating Plants of Philippine Sugar Mitts Pae of 15
SUGAR MILL BOILER BOILER NO.OF CAPACITY PRESSURE, KG/CN2 AGETYPE RAKE UNITS CKG/HR) DESIGN OPERT'G
CASUCO WT TAKUMA 1 25,000 24.0 20.0 12
WT TAKUMA 2 60,000 24.0 20.0 12
HIND FT HIW 2 3,855 10.5 7.0 40
WT KEEPER 1 7,711 10.5 7.0 40
PANIOUI UT B 8 W 1 34,000 10.5 8.8 24
WT HEINE 2 10.5 8.8
UT KEEPER 1 10.5 8.8TARLAC BIGELOW 1 136,080 21.1 17.6 6
RILEY 1 45,360 21.1 17.6 20
8 & W 2 34,020 21.1 10.6 30
ARCAN B & W 10 10,500 10.6 8.8 71
B & U 1 60,000 12.? 8.8 27
PASLJDECO EDGEMOORE 1 18,678 11.3 10.6 578 & W 3 13,883 11.3 10.6 628 & W 5 11,681 11.3 10.6 70a & U 1 54,595 11.3 10.6 26
CANLUBANG J. THOMPSON 1 54,420 16.9 11.3 25WT E. CITY 1 20,410 13.7 9.2
U1 E. KEEPER 2 18,140 13.7 9.2
wT STERLING 2 12,240 13.7 9.2
UT E. KEEPER 2 11,340 13.7 9.2
WIT E. KEEPER 1 31,750 16.9 11.3 33
DON PEDRO WT F. WHEELER 1 136,000 36.2 33.4 10
WT J. THOMPSON 1 91,000 17.6 10.5 20WT PS. MACHINER 1 20,000 17.6 10.5 41
BALAYAN WT TSUNEKICHI 2 55,000 24.0 20.0 21
BISUDECO WT J. THOMPSON 2 21.1 17.7 16B & U 1 9.5 31
BOGO-MEDELLIN BIGELOW 1 5.0 9.5 22
DURANO MITSUBISHI 2 60,000 23.0 18.0 19
HIDECO 2D B. A. 2 70,000 20.5 21.5 17
ORMOC WT B & U 1 52,163 17.6 16.4 24
WT E. KECLOS 2
PILAR WT KAWASAKI 2 36,287 21.1 18.3 14WT KELLER 1 27,215 8.8 8.4 60
WT B & W 1 15,144 8.8 8.4 34PASSI JT 2 60,900 24.7 19
B & U 1 4,000 42.0 9GOLDEN FONTIER CONNELY 1 13,000 10.5 20
8 & U 2 75,440 10.5 20AZUCAR WT S B & W 1 7,892 10.5 69
UT S B & W 1 7,892 10.5 69
UT S B 1 w t 7,892 10.5 65
UT S B e W 1 7,892 10.5 65
UT S 8 & 1 1 7,892 10.5 65
HEINE 10,160 10.5 65EDGEMOORE 1 25,401 10.5 36
B & U 2 31,751 17.6 25
DAESUMICO UT S B & U 4 7,500 10.5 9.1 59
UT S B & W 2 7,500 10.5 9.1 31
UT S B S W 4 10,000 10.5 9.1 59
FIRST FARMERS FT RILEY 1 29,030 12.7 10.5 30
FT RILEY 1 20,412 11.2 9.1 30
FT RILEY 1 29,030 12.7 10.5 30FT RILEY 1 29,030 12.7 10.5 30FT ALPHA 1 56,699 19.7 17.6 7

- 58 - Annex T)Page 3 of 15
SUGAR MILL BOILER BOILER NO.OF CAPACITY PRESSURE, KG/CM2 AGETYPE MAKE UNITS CKG/HR) DESIGN OPERT'G
CASUCO UT TAKUMA 1 25,000 24.0 20.0 12HAWAIIAN-PHILIPPINE S B & W 6 15,250 11.0 9.1 40
S B & U 1 34,750 11.0 9.1 33S B & W 1 110,000 18.3 16.5 12
JOHN 2 41,000 24.0 20.0 21THOMPSON
AIDSISA UT TSUNIKICHI 1 41,000 24.0 20.0 15UT TSUMIKICHI
VICTORIAS UT RILEY 4 120,000 28.1 2
UT STERLING 3 17,270 8.8 70
UT B & W 1 10,000 8.8 70WT B 6 U 1 21,000 8.8 70
WT B & U 3 35,000 17.6 70
UT STERLING 1 50,000 17.6 70
UT B & L 1 150,000 28.1 13
LOPEZ UT JT 1 90,700 17.6 17.6 18
UT JT 1 45,500 10.5 10.5 24
WT KEELER 4 13,100 8.B 8.8 62
UT STERLING 2 12,500 8.8 8.8 62
WT SEMI-STERLIN 2 9,400 8.8 8.8 62
UT B & W 2 15,600 8.8 8.8 62
SAGAT TAKUMA 2 45,000 24.0 20.0 20
DANAO KEELER 1 7,711 8.8
STERLING 1 8,618 8.8
WALSH 1 19,604 8.8KEELER 1 7,111 8.8
BABCOCK 1 34,019 8.8
FOSTER & WHE 1 18,144 10.5
SAN CARLOS WT B & U 1 25,000 11.2 10.5 37
YT BIL U 1 25,000 11.2 10.5 37
UT B & I 1 25,000 11.2 9.8 61
WT B & U 1 25,000 11.2 9.8 61YT FOSTER & UHE 1 40,823 14.5 11.2 25
KA-AO S a & W 1 10,800 10.5 8.4 30
S B & W 3 10,800 10.5 8.4 30
S B & W 1 10,800 10.5 S.4 30
51 B BW 1 10,800 10.5 6.4 30
KEELER 1 13,390 10.5 6.4 25
S 8 & W 2 15,600 10.5 B.4 25
W & 3 e W ¶ 17,500 20.0 17.5 17
LA CARLOTA KAWASAKI 2 55,000 23.5 21.0 20
S B B U 2 35,000 14.0 10.5 26
B & U 2 25.000 14.0 10.5 40
STERLING; ER 1 10,000 14.0 9.5 40
S a & W 4 5,000 14.0 9.5 64
CLEAVER 25,000 15.0 10.5 18BROOKS
SONEDRO WT TSENOKECHI 2 55,000 24.0 21.0 20
DACONG-COGON RILEY 1 34,000 21.5 17.6 18
HEINE 2 13,630 10.0 8.8 18
URSUMCO UT YOSHIMINE 2 60,000 24.0 20.0 13
BAIS UT ALPHA 1 90,700 23.2 19.3 15
WT B B L 4 13,600 9.8 8.8 71
WT B & W 2 11,340 9.8 8.8 71
WT B B U 4 18,140 9.8 8.8 71
WT WALSH WEIDER 2 18,140 9.1 8.8 52
TOLONG UT F & C & B 2 43,000 25.0 21.5 19
BUSMO WT YOSHIMINE 3 60,000 24.0 20.0 13
DASUCECO WT B & U 2 70,000 21.5 17.3 18
LEGEND:WT - Water tube; FT - Fire tube; 2D - 2 drum bent tube type; B & U Babcock & Witcox; S B & W -Sterling, Babcock & Wilcox; B. A. Babcock AtLantiave.

- 59- Annex T2Page 4 of 15
TabLe 2: Fuet PotentiaL of Sugar Mitt Wastes(1991-92 Crop Year)
Gross Cane Area Bagasse Field Trash Fuel OIlThroughput HarvestedChas.) (Metric Tons) (Metric Tons) Equiva-Lent
(Metric Tons)
LUZON 4,720,689 82,903 1,356,238 663,224 1,952,986CARSUNCO 56,548 2,256 16,236 18,048 23,383HIND 28,401 5,296 8,526 42,368 12,281PANIOUI 137,714 44,479 64,053TARLAC 1,142,634 11,522 321,405 92,176 462,826ARCAN 340,675 6,619 89,866 52,952 129,410PASUDECO 540,679 13,466 129,072 107,728 185,867CANLUBANG 566,953 12,311 15,706 98,488 22,620DON PEDRO 1,329,068 12,114 384,497 96,912 553,679BATAIIGAS 406,890 15,619 154,944 124,952 223,123BISWUECO 171,123 3,700 48,773 29,600 70,236
EAST VISATAS 1,439,993 24,047 94,968 192,376 136,757BOGO-MEDELLIN 502,454 10,409 118,835 83,272 171,126DURANO 205,233 58,286 83,935HIDECO 502,804 13,636 135,868 109,088 195,653ORMOC 229,501 58,522 84,275
PANAY 1,828,953 27,832 496,791 222,656 715,382PILAR 389,157 4,357 106,582 34,856 153,481ASTURIAS 270,247 4,196 77,614 33,568 111,767PASSI 711,581 19,279 184.264 154.232 265.343G. FRONTIER 443,027 130,114 187,367BAROTAC 14,942 4,388 6,322
NEGROS 13,502,350 197,184 3,997,364 1,577,472 5,756,207AZUCAR 297,182 21,301 85,685 170,408 123,390DAESUMICO 114,923 34,167 49,204FIRST FARMERS 918,170 25,360 36,522HAWAIIAN-PHIL 1,108,872 11,189 270,453 89,512 389,456AIDSISA 744,872 196,020 282,272VICHICO 2,467,952 26,269 881,946 210,152 1,270,005LOPEZ 1,031,539 10,924 289,243 87,392 416,513SAGAY 633,106 13,902 183,593 111,216 264.377DANAO 229,478 64,971 93,561SAN CARLOS 348,605 8,381 95,587 67,048 137,649MA-AO 399,081 10.168 99,992 81,344 143,992LA CARLOTA 1,433,152 17,328 405,636 138,624 584,119BISCom 1,136,075 27,338 324,058 218,704 466,647SONEDCO 594,871 10,645 169,479 85.160 244,053DACONGCOGON 209,481 8,630 59,485 69,040 85,662URSUMCO 672,528 23,121 232,158 184,968 334,311BAIS 756,864 237,308 341,727H. TEVES 405,056 7,988 116,905 63,904 168,346
MINDANAO 1,323,617 38,752 429,535 310,016 618,534BUSCO 1,162,732 31,138 375,933 249,104 541,347DASUCECO 160,886 7,614 53,720 60,912 77,360NOCOSII
PHILIPPINES 22,815,602 370,718 6,374,896 2,965,744 9,179,867

- 60- Annex-DPage 5 of 15
Table 3: Sector Segmentation of Sugar Mills in the Philippines
Sugar Mill Island Tans of Cane Cluster SurveyedPer Year
Barotac Sugar MiLL, Inc. Panay 14,941 AHind Sugar Co. LuZOn 37,005 ACagayan Robina Sugar Milling Co. Luzon 60,289 ABicotandia Sugar Dev. Corp. Luzon 101,102 ACana Sugar Corp. Negros 122,978 APaniqui Sugar Corp. Luzon 144,476 ADurano III & Sons, Inc. Cebu 175,109 ADavao Sugar Central Co. Mindanao 183,267 ADanao Dev. Corp. Negros 193,392 AMonomer Sugar Central Panay 205,449 BDacongcogon Sugar & Rice Milling Co. Negros 219,057 8Ormoc Sugar Co-, Inc. Leyte 240,361 BNew Frontier Sugar Corp. Panay 302,294 aCapiz Sugar Central Inc. Panay 306,460 aIndustrial Sugar Resources Co., Inc. Negros 321,218 8Herminio Teves & Co., Inc. Negros 322,317 BArcam & Co., Inc. Luzon 338,251 BHa-ao Sugar Central Co. Negros 378,937 BSan Cartos Mitling Co., Inc. Negros 390,460 BBatangas Sugar Central Negros 420,345 BBogo-Medettin miLting Co., Inc. Cebu 457,697 BHideco Sugar Milling Co., Inc. Leyte 488,782 BSagay Centrat, Inc. Negros 534,080 CSouthern Negros Dev. Corp. Negros 546,666 Ccanlubang Sugar Estate Luzon 555,275 CPampanga sugar Dev. Co. Luzon 599,168 CPassi Sugar Central, Inc. Panay 606,972 C Universal Robina Sugar Milling Co. Negros 628,599 CCanelarid Sugar Corp. Negros 628,907 CCentral Azucarera de Dais Negros 701,983 DFirst Farmers Holding Corp. Negros 831,082 DBinalbagan IsabeLa Sugar Co. Negros 865,702 DHaWaiian-Philippine Co. Negros 923,903 DLopez Sugar Corp. Negros 949,538 0Central Azucarera Don Pedro Luzon 1,068,020 ECentral Azucarera de Tarlac Luzon 1,090,347 EBusco Sugar MilLing Co. Miridanao 1,220,078 ECentral Azucarera de La Carlota Negros 1,409,060 EVictorias Milling co., Inc. Negros 2,307,118 ETOTAL: 20,890,684 15
Note: Tons cane per year based on three-year average productionSource: Sugar regulatory Acdministration

Table 4: Sugar MilL Operation Data
Scenario I A: 10,000-199,000 8: 200,000-499,999 C: 500,000-699,000 D: 700,000-999,000 E: Over 1 Milliont/yr t/yr t/yr t/yr t/yr
Tons Cane MiLied/Day 1,200 3,500 6,500 7,500 8,000
Operating Hours/Day 24 24 24 24 24
Operating Days 114 180 150 204 243Off-Milling Days 251 155 215 161 122
Downtime (Crop) 19.62% 35.68% 34.09X 36.65% 29.84%
X lagasse on Cane 32.36% 28.93% 24.98X 27.80X 31.43%
X Cane Utilized 89.97X 89.60% 88.47% 76.185 85.00X
SoiLer T-G Capacity 0 0 0 0 0Purchased (WU)Additional capaeity 0 480 799 605 639Purchased tkU)Demand -- Milling (kW) 194 600 1,043 2,231 2,333
Grid Export -- Milling (kW) 0 40B 678 514 537
Total Revenues, '000 P/yr 0 2,041.8 2,609.3 2,584.0 3,564.1
Total Investment ('000 P) 0 6,003.4 9,982.8 7,562.9 7,992.4Operating Costs, '000 P/yr 160.1 381.0 511.8 485.2 595.2
Scenario 11 A: 10,000-199,000 8: 200,000-499,999 C: 500,000-699,000 D: 700,000-999,000 E: Over 1 Milliont/yr t/yr /tyr t/Yr t/yr
Tons Cane Milled/Day 1,200 3,500 6,500 7,500 8,000
Operating Hours/Day 24 24 24 24 24Operating Days 114 180 150 204 243
Off-MiLLing Days 251 185 215 161 12?
Downtime (Crop) 19.62% 35.68% 34.09% 36.65% 29.84%
X Zagasse on Cane 32.36% 28.93% 24.98X 27.80% 31.431
X Cane utiLized 89.97% 89.60X 88.47% 76.18X 85.00%
oalter r-a capacfty 500 800 1,228 2,625 2,744Purchased tkU)Additional Capacity 0 480 799 605 639Purchased (kw)Demand -- Milling (kW) 194 600 1,043 2,231 2,333
Grid Export -- Milling (kU) 425 1,088 1,722 2,836 2,896
TotaL Revenues, '000 P/yr 1,682.4 5,442,3 7,355.5 15,834.4 21,326.3Total Investment ('000 P) 18,755.0 36,007.0 56,027.0 106,024.2 112,045.1
Operating Costs, '000 P/yr 722.7 1,281.1 1,893.1 3,852.6 3,716.8
LA

Table 4 Ccont): Sugar Mitt Operation Data
Scenario III A: 10,000-199,000 B: 200,000-499,999 C: 500,000-699,000 0: 700,oo0-999,000 E: Over 1 Miltiont/yr tlyr t/yr t/yr t/yr
Tons Cane Milled/Day 1,200 3,500 6,500 7,500 8,000
Operating Hours/Day 24 24 24 24 24
Operating Days 114 1B0 150 204 243
Off-Milling Days 251 185 215 161 122
Downtime (crop) 19.62X 35.68X 34.09X 36.65X 29.84XX Bagasse on Cane 32.362 28.93X 24.98X 27.80X 31.431X Cane UtiLized 89.97% B9.60X 88.47% 76.18X 85.00XBoiler T-C Capacity 3,315 7,767 13,485 14,350 17,683Purchased (kW)Additional Capacity 0 0 0 0 0Purchased (kW)Demnd -- Milling (kW) 194 600 1,043 2,231 2,333Grfd Export -- Mtiling (kW) 0 408 678 514 537Demand -- Off-MiLling (kW) 257 102 757 733 900Grid Export -- Off-MiLling 2,361 6,100 10,978 11,820 14,015(kW)TotaL Revenues, p000 P/yr 49,030.6 118,397.4 210,052.7 247,392.4 315,297.1Total Investment (1000 P) 181,428.8 406,466.4 729,213.1 765,935.2 932,569.3Operating Costs, '0oo PJyr 16,414.0 33,247.8 69,076.7 70,829.3 78,523.5
1IA

- 63 - nnexT
Page 8 of 15
TabLe 5: Economic and Financial Assumptionsfor the Sugar Sector
Inflation Rate 5.81Interest Rate 18XDiscount Rate 151Exchange Rate 25.00/USSEnergy Sale to Grid P 1.80/kWhInvestment Costs (US$/kW)
Scenario 1 S500Scenario 2 51,500Scenario 3 S2,000
Maintenance cost
Scenario 1 & 2 3XScenario 3 41
Conversion factor of 1.2 used in economic adjustment of equipment costs.Conversion factor of 0.7 used in economic adjustment of unskilled labor costs.
Table 6: Rice Fuel-ReLated Characteristics and Range of Values
Fuel-Related Characteristics Range of Values
Heating Value 2,900 - 3,619 kcatlkgAsh 16.50 - 24.9? X by weightMoisture 1.1 - 9.02 % by weightCarbon 2.2 - 42.12 % by weightSiLica 37.05 - 95.8 1 by weightHydrogen 4.67 - 5.31 X by weightNitrogen 0.30 - 2.17 Z by weightSulfur 0.07 - 0.12 1 by weightOxygen 29.90 - 31.72 Z by weightVolatile Matter 56.4 - 69.3 % by weightFixed Carbon 12.7 - 17.4 1 by weight

Table 7: Rice Milt Operation Data
75 kW 200 kw 200 kW 350 kW 350 kW 500kW 500 kW 800kW 00 kw 1 w 3 wLow Low High Low High Low High Low High
S/kW Instatled 1,500 1,000 1,800 1,000 1,800 1,000 1,700 1,000 1,700 1,650 1,650
Operating Hours/Year 1,500 2,400 5,400 2,400 5,400 2,400 5,400 3,000 5,400 5,100 5,700
Operating Days/Year 150 200 300 200 300 250 320 250 320 220 335
Electricity Buyback 1.8 1.8 1.8 1.8 1.8 1.8 1.8 1.8 1.8 1.8 1.8
Price, P/kWhAvoided Diesel, P/kWh 2.5 2.5 2.5 2.5 2.5 2.5 2.5 2.5 2.5 2.5 2.5
Rlce Ash, MT 80 440 BOO 840 1,200 1,240 1,600 1,640 2,800 2,880 6,400
Rice Ash Price, S5t 40 40 40 40 40 40 40 40 40 40 40
Parasitic Load Boiler 3 4 6 25 25 40 40 50 SO 50 70
CkW)Parasitic Load 18 25 25 30 30 30 30 80 80 80 80
Turbine (kW)Average Power Demand 60 150 150 300 300 400 400 600 600 820 1000
(kW)In-plant Use (kW) 60 150 150 300 300 400 400 600 600 820 1000
Residential/Office 5 10 10 12 12 15 15 20 20 150 300
Use CkWMExport (kW) 0 0 0 0 0 65 65 130 130 none 1,400
Electricity 97,500 432,000 972,000 792,000 1,782,000 1,140,000 2,565,000 2,250,000 4,050,000 2,560,800 14,280,000 c3
Production, kWh/YrTotaL Revenues, No 288.8 1,030 2,265 1,952 4,332 2,883 6,738 5,477 9,793 12,537.5 33,099
Ash Sales ('000 P/Yr)Total Revenues, With 368.8 1,470 2,563 2,792 5,532 4,123 7,978 7,177 12,593 14,201.5 39,499
Ash Sales ('000 P/Yr)Investment 1,875 5,000 11,000 8,750 15,750 12,500 21,250 20,000 34,000 41,250 123,750
Requirements ('000 P)operating costs 138.2 287.3 501.6 436.2 689.6 548.7 854.6 853.0 1,317.7 1,712.5 4,662.5
('000 P/Yr)
PIIa

-65 - AM-Page 10 of 15
Table 8: Economic and Financial Data Assumptions for the Rice Sector
Economic Financial
Interest Rate, X 18.00Inflation Rate, X 5.8Discount Rate, X 15.00Exchange Rate, Peso/USS 25.00 25.00Avoided DieseL Cost, USS/kUh 0.10 0.10Buyback Price, USS/kUh .072 .072Cost of RH disposalltonlyear USS variable variabteOperating & Maintenance Costs/Yr, % 3.00 3.00Manpower RequirementslO hrs Operation
S skilled Manpower (Engineer) 1-2 1-2* Semi-skitLed Manpower (Technician) 2-3 2-3
Labor CostSkilled Marpower CEngr) US$1mo 18D1248 1801248Unskilled Manpower USSlmo 84/98 120/140
Project Lifetime (Years) 15.00 15.00
- Conversion factor of 1.2 used in economic adjustment of equipment costs.- Conversion factor of 0.7 used in economic adjustment of unskilted Labor costs.

- 66 - AnnSx DPage 11 of 15
TabLe 9: PhiLippine Coconunt Industry Basic Statistics
Reg- Province Coconut Copra Coconut Gross Desic- Coco- met Cross In-ion Area (MT) (mr) Cocoshelt cator shalL Cocashell Cocotusk ten-
(Ha.) (NT) Capa- In-plant (NT) (MT) sitycity Avatt-
(MT/Yr) ableIn Farm(MT)
I Pangasinan 8,300 1,220 7,673 1,151 0 0 1,151 2,555 0.92La Union 788 94 591 89 0 0 89 197 0.75ILOcOs 1,705 36 226 34 0 0 34 75 0.13Norte/Sur
10,793 1,350 8,491 1,274 a 0 1,274 2,827 0.79
1I Cagayan 2,574 521 3,277 492 a 0 492 1,091 1.27Isabela 465 16 101 15 a a 15 34 0.22
3,039 537 3,377 507 0 0 507 1,125 1.11
III ZaWmblesl 2,153 0 0 0 0 0 0 0 0.00Bataan
IV-A Batangas 42,158 33,365 209,842 31,476 0 0 31,476 69,878 4.98Laguna 86,751 16,591 104,346 15,652 11,000 8,010 7,642 34,747 1.20Marinduque 35,159 9,006 56,641 8,496 0 0 8,496 18,862 1.61Cavite 15,667 1,566 9,849 1,477 0 0 1,477 3,280 0.63Quezon 1 191,537 70,045 146,973 22,046 55,000 40,049 (C1,003) 48,942 0.77Ouezon II 211,510 102,753 646,244 96,937 0 0 96,937 215,199 3.06
582,782 233,326 1,173,896 176,084 66,000 48,058 128,026 390,907 2.01
tv-B Occ. 3,474 1,413 8,887 1,333 0 0 1,333 2,959 2.56MindoroOr. Mindoro 44,526 21,300 133,962 20,094 0 0 20,094 44,609 3.01Aurora 21,595 829 5,214 782 0 0 782 1,736 0.24PaLawan 38,589 22,575 141,981 21,297 0 0 21,297 47,280 3.68Rombton 56,590 14,147 8a,975 13,346 0 0 13,346 29,629 1.57
164,774 60,264 379,018 56,853 0 0 56,853 126,213 2.30
V Atbay 84,159 55,067 346,333 51,950 0 0 51,950 115,329 4.12Camarines 94,070 57,284 360,276 54,041 0 54,041 119,972 3.83NorteCamarines 75,228 47,691 299,943 44,991 0 0 44,991 99,881 3.99Sur ICaamarines 132,724 60,343 379,515 56,927 0 0 56,927 126,379 2.86Sur IICatanduanes 17,472 3,014 18,956 2,843 0 0 2,843 6,312 1.08Masbate 133,928 35,695 224,497 33,674 a 0 33,674 74,757 1.68Sorsogon 104,493 42,969 270,245 40,537 0 0 40,537 89,992 2.59
642,074 302,063 1,899,765 284,965 0 0 284,965 632,622 2.96
VI Aktan 35,417 16,338 102,755 15,413 0 0 15,413 34,217 2.90Antique 54,625 3,810 23,962 3,594 0 0 3,594 7,979 0.44
Capiz 10,716 4,284 26,943 4,042 0 0 4,042 8,972 2.51Itoilo 26,415 4,802 30,201 4,530 a 0 4,530 10,057 1.14Negros Occ. 15,150 13,077 82,245 12,337 0 0 12,337 27,388 5.43
142,323 42,311 266,107 39,916 0 0 39,916 88,613 1.87
VII Bohol 221,908 18,036 113,434 17,015 0 0 17,015 37,773 0.51Cebu 63.458 14,229 89,490 13,424 a 0 13,424 29,800 1.41Negros Or. 82,071 32,273 202,975 30,446 0 0 30,446 67,591 2.47Siquijor 8,900 2,747 17,277 2,592 0 0 2,592 5,753 1.94
376,337 67,285 423,176 63,476 0 0 63,476 140,917 1.12

- 67 - Ananx DPage 12 of 15
RN- Province Coconut Capra Coconut Gross Desic- Coc Net Craes In-ien Area (MT) (MN) CocoshetL cator shalt Cocoshalt Cocohusk ten-
(Ha.) CRT) Cape- In-plant (Nr) (MT) sitycity Avail-
(NT/Yr) abteIn Farm(NT)
:ItI Leyte t 58,297 30,975 194,511 29,222 0 0 29,222 64,572 2.21NW Leyte 110,412 25,479 160,245 24,037 0 0 24,037 53,362 1.455. Leyte 103,157 48,764 306,691 46,004 0 a 46,004 102,128 2.97E. Sar 173,881 30,s98 194,327 29,149 0 a 29,149 64,711 1.12N. Sar 66,816 41,224 259,270 38,891 0 0 38,891 86,337 3.M8V. Sanr 76,711 28,970 182,201 27,330 0 e 27,330 60,673 2.38
619,304 206,310 1,297,545 194,632 0 0 194,632 432,083 2.10
IX Uasilan 56,807 44,95 22,861 42,429 0 0 42,429 94,193 4.98Zambo. 172,596 84,984 534,490 80,173 0 0 80,173 177,985 3.10NorteZanbo. Sur 127,245 52,412 329,635 49,445 0 0 49,445 109,768 2.59Zambo. City 36,299 15,496 97,459 14,619 0 0 14,619 32,454 2.68
392,947 197,867 1,244,44s 186,667 o a 186,667 414,400 3.17
X Agusmn 37,378 28,226 177,522 26,628 0 0 26,628 59,115 4.75NorteAgusan Sur 51,572 21,036 132,302 19,845 0 0 19,845 44,056 2.57Lukidnon 9,770 562 3,535 530 0 0 530 1,177 0.36Camiguin 19,513 13,722 56,302 12,945 0 0 12,945 28,738 4.42misamis 99,194 48,493 304,98T 45,748 12,500 9,102 36,646 101,561 3.070cc.Misamis ar. 118,992 57,97t 364,597 54.690 8,700 6,335 48,355 121,411 3.06Surigao 97,471 42,009 264,207 39,631 0 0 39,631 B757,9 2.71Norte
433,890 212,019 1,333,451 200,018 21,200 15,437 184,551 444,039 3.07
xi Surigao Sur 78,2t6 36,195 227,641 34,146 0 0 34,146 75.805 2.91Davao Norte 101,541 89,712 564,226 84.634 0 0 84,634 187,887 5.56Davao Or. 160,708 126,033 792,659 1l18,89 0 0 118,599 263,956 4.93Davao Sur 107,151 47,555 299,088 44,863 15,000 10,922 33,941 99,596 2.79Davao City 51,004 45,887 258,597 43,290 0 0 43,290 96,103 5.66
498,621 345,382 2,172,211 325,832 15,000 10,922 314,909 723,346 4.36
xii N. Cotabato 26,150 15,659 98,484 14,773 0 0 14,773 32,795 3.77S. Cotabato 125,578 81,590 513,144 76,972 0 0 76,972 170,877 4.09Lanao Norte 72,956 48,567 305,452 45,818 0 0 45,818 101,716 4.19SuLtan 20,250 9,760 61,384 9,208 0 0 9,208 20,441 3.03Kudarat
244,934 155,576 975,464 146,770 0 0 146,770 325,829 3."9
ARM Lanao Sur 29,463 69,539 437,352 65,603 0 0 65,603 145,638 14.84Maguindanao 87,986 62,675 394,182 59,127 0 0 59,127 131,263 4.48SuLu 362,590 37,432 235,421 35,313 0 0 35,313 78,395 0.65Tawu-Tawi 29,340 10,075 63,365 9,505 0 0 9,505 21,100 2.16
509.379 179,721 1,130,319 169,548 0 0 169,548 376,396 2.22PHILIPPINES 4,623,349 2,004,011 12,310,265 1,846,540 102,200 74,417 1,772,122 4,099,318 2.66
Source: PhiLippinre Coconut Authority

- 68 - Annex aPage 13 of 15
TabLe 10: Proximste Analysis of CocoshelL
Moisture 8.0 percentAsh 0.6 percentLignin 29.4 percentCeLLuLose 26.6 percentPentosans 27.7 percentSolvent Extractives 4.2 percentUronic Anhydrides 3.5 percent
Source: DOE Fuel and AppLicance Testing Laboratory
TabLe 11: ChemicaL Composition of Cocohusk (in percent)
Water SoLubLe Matters Soluber Hemi-CelluLose Lignin CelluloseSubstance in Boiling
Water
Old Nut 5.25 3.0 0.25 45.84 43.44
Young Nut 16.00 2.7 0.50 40.30 32.86
Very Young Nut 15.00 4.0 0.25 40.02 36.11
Source: Sepctrum of Coronut Products, PCA Report.

Table 12: Coconut Power Generating Facility Operation Data
Project Capacity 500 kW Stand Alone 500 kW Integrated 1000 kW Stand Alone 1000 kW Integreted
S/kWh Installed 1500 1500 1Z00 1200
Operating Hours/Day 24 24 24 24
Operating Days/Year 300 300 300 300
Electricity Buyback P-ice, P/kWh 1.B 1.8 I.8 1.8
Avoided Diesel Cost, P/kWh 2.5 2.5 2.5 2.5
Electricity SaLes (kWh) 3,060,000 2,700,000 6,120,000 5,94n.0oo
Displaced Electricity (kWh) 0 540,000 C 540,000
Total Revenues '000 P/Yr 5,832 7,020 11,664 12,852
Investment Requirements, '000 P 18,750 18,750 30,000 30,000
Operating Costs, '000 P/Yr 2,089.5 2,089.5 2,427 2,427
C.
lII.4>
iA

70 - Annex DPage 15 of 15
Table 13: Capacity Potential in the Sugar Sector
Avg. Unit Nurber Capacity Potential (MU) Capacity Potential (RW)Size (MW) of Units CEconomic) (Financial)
Scenario IB 1 5 5 5
C 1 3 3D 1 2 2 2
E 1 2 2 2TotaL 12 12 9
Scenario IIIG 5 2 10C 7.5 2 15 -D 10 2 20 20E 15 2 30 30TotaL 8 75 50SUBTOTAL 87 59
* Cluster A is never a viable option and therefore not included here.
Table 14: Additional Capacity Potential from Scenario II
Scenario 11 Average Unit Size Nurber of Units PotentiaL Capacity (MU)(MU)
8 1.5 6 9D 2.5 2 5E 3.5 3 10.5Total 11 24.5
- Assumption of a 502 capitaL cost reduction for the financialty viabLe cases, only.
Table 15: Capacity Potential in the Rice Sector
Unit Number Capacity Potential (MU) Capacity Potential (MU)Size of Units (Economic) (Financial)
No Ash Sales With Ash Sales No Ash Sates With Ash Sales200 kW 40 -- B --350 kW 20- 7 7 -- 7
500 kW 15 7.5 7.5 7.5 7.5800 kW 10 8 8 8 81 MW 4 4 4 4 43 NW 2 6 6 -- 6
Total 91 32.5 40.5 19.5 32.5
Table 16: Capacity Potential in the Coconut Sector
Unit Number Potentiat Capacity (NW) PotentiaL Capacity (CW)Size of Units (Economic) (Financial)500 kW 1 9 _
1000 kW 10 10 10Total 28 19 10

Annex E. SELECTED SPREADSHEETS: ECONOMIC AND FINANCIAL ANALYSES(Refer to Annex D, Tables 4,5 and 6 for Assumptions)
Table 1. SUGAR SECTOR- ECONOMIC COMPUTATIONS - THIRD SCENARIO - CWSTER Dx 1000 P
Oper. Total Gross Net CashYear Capital * Costs Cost Revenues Flow (ATI)
0 : (861688.8) : 0 : (861.688.8) 0.0 : (861,688.8)1 0.0 : (74,564.0) : (74,564.0) 47,392.4 : 172,828.42 :0.0 : (74,564.0) : (74,564.0): 247,392.4 : 172,828.43 :0.0 (74,564.0) :(74,564.0): 247,392.4 : 172,828.44 :0.0 : (74,564.0) : (74.564.0): 247,392.4 : 172,828.45 :0.0 : (74,564.0) :(74.564.0): 247,392.4 : 172,828.46 :0.0 : (74,564.0) : (74,564.0): 247,392.4 : 172,828.47 :0.0 (74,564.0) : (74,564.0): 247,392.4 : 172,828.48 :0.0 : (74,564.0) : (74,564.0): 247,392.4 : 172,828.49 0.0 : (74,564.0) : (74,564.0) 247,392.4 : 172,828.4
10 - 0.0: (74,564.0) : (74,564.0) 247,392.4 : 172,828.41 1 0.0 : (74,564.0) (74,564.0) 247,392.4 O 172,828.41 2 0.0 (74,564.0) :(74,564.0) :247,392.4 :172,828.413 :0.0 : (74,564.0) : (74,564.0) :247,392.4 :172,828.414 :0.0 : (74,564.0) :(74,564.0) :247,392.4 :172,828.415 :0.0 : (74,564.0) : (74,564.0) :247,392.4 :172,828.416 :0.0 : (74,564.0) : (74,564.0) 247,392.4 : 172,828.417 :0.0 : (74,564.0) : (74,564.0) :247,392.4 :172,828.418 0.0 (74,564.0) : (74,564.0) 247,392.4 : 172,828.419 :0.0 : (74,564.0) : (74,564.0) :247,392.4 : 172,828.420 :0.0 : (74,564.0) : (74,564.0) :247,392.4 : 172,828.4
NPVs= 0 IRR- 0.00%

TabIB 2. SUGARSECTOR- FINANCIALCOMPUTATIONS- THIRDSCENARIO CWSTERD
With Loan to amortize Debt: 536,154.6 Depreciation, Years 20(x 1000 P) Equity: 229,780.6 Tax Rate 0.30
......... .. .................. .. ................. ................................ .......... ......................... .. . .............. ... ................... ....... ................... .. ...................................... .......,... ..........
Wlth Lc: Loan . Oper. Depre- : Total Gross : Profit Taxes Not CashYear : Repaym. : Costs : ciation Cost Revenues before lax . : Flow (ATI)
+.......... .................. +. ................. .+ -................ .+....... .......... + . ............... . ............ . .----- - . .- - .+ ...... . .....................
0 (229,781) 0 : 0 (229,780.6) : 0.0 : (229,780.6) 0.0 : (229.780.6)1 : (119,302): (70,829): (38,297): (228,428.4) : 247,392 : 18,964.0 0.0 18,964.02 (119,302): (74,937) : (38,297) (232,536.5): 261,741 : 29,204.7 : 0.0 : 29,204.73 (119,302): (79,284): (38,297): (236,882.8): 276,922 40,039.3 : 0.0 : 40,039.34 : (119,302): (83,882) : (38,297): (241,481.3) : 292,984 : 51,502.3 0.0 51,502.35 : (119,302): (88,747) : (38,297) (246,346.5) : 309,977 : 63,63u.2 0.0 63,630.26 : (119,302): (93,895) : (38,297): (251,493.8) : 327,955 : 76,461.5 : 22,938.5 53,523.17: (119,302) (99,341) : (38,297) : (256,939.7) ; 346,977: 90,037.0 27,011.1 63,025.98a (119,302): (105,102) : (38,297) : (262,701.5) : 367,101: 104,399.9 31,320.0 73,079.99 : (119,302) : (111,198) (38,297): (268,797.4) : 388,393 119,595.9 : 35,878.8 : 63,717.1
10 : (119,302) : (117,648): (38,297) (275,246.9): 410,920 135,673.2 : 40,701.9 94,971.211 : 0.0 : (124,471): (38,297): (162,768.3) : 434,753 : 271,985.2 : 81,595.6 190,389.612 : 0.0 : (131,691) (38,297) (169,987.6) : 459,969 : 289,981.5 : 86,994.5 202,987.113 0.0 : (139,329): (38,297): (177,625.7) : 486,647 : 309,021.7 : 92,706.5 : 216,315.214 : 0.0 : (147,410): (38,297): (185,706.7) : 514,873 : 329,166.2 98,749.8 : 230,416.315 : 0.0 : (155,960) : (38,297) (194,256.5) : 544,736 : 350,479.0 105,143.7 245,335.316 : 0.0 : (165,005) : (38,297): (203,302.2) : 576,330 : 373,028.0 111,908.4 : 261,119.617 : 0.0 : (174,576): (38,297): (212,872.5) : 609,757 : 396,884.8 119,065.5 277,819.418 0.0 : (184,701): (38,297) (222,997.9) : 645,123 422,125.4 : 126,637.6 : 295,487.819 : 0.0 : (195,414) : (38,297): (233,710.6) : 682,540 : 448,829.9 : 134,649.0 : 314,180.920 0.0 : (200,748): (38,297): (245,044.6): 722,128 : 477,083.2 : 143,125.0 : 333,958.2
....-.....-.................... + ................. . ............... . ................. I. . ............... . ................... . ........................................
PMT-> : (119,302):NPVs- : 185,009 :IRR ; 26.02% :
*4>

Table 3. RICE SECTOR - ECONOMIC ANALYSIS - 500 kW HIGH TECH CASE
WITHOUT ASH SALES WITH ASH SALESYear Investment Operating Gross Net Cash Gross Net Cash
Costs Revenues Flow Revenues Flow0 (25,500,000) 0 0 (25,500,000) 0 (25,500,000)1 0 (941,137) 6,556,500 5,615,363 8,156,500 7,215,3632 0 (941,137) 6,556,500 5,615,363 8,156,500 7,215,3633 0 (941,137) 6,556,500 5,615,363 8,156,500 7,215,3634 0 (941,137) 6,558,500 5,615,363 8,156,500 7,215,3635 0 (941,137) 6,556,500 5,615,363 8,156,500 7,215,3636 0 (941,137) 6,556,500 5,615,363 8,156,500 7,215,3637 0 (941,137) 6,556,500 5,615,363 8,156,500 7,215,3638 0 (941,137) 6,556,500 5,615,363 8,156,500 7,215,3639 0 (941,137) 6,556,500 5,615,363 8,156,500 7,215,363
10 0 (941,137) 6,556,500 5,615,363 8,156,500 7,215,36311 0 (941,137) 6,556,500 5,615,363 8,156,500 7,215,36312 0 (941,137) 6,556,500 5,615,363 8,156,500 7,215,36313 0 (941,137) 6,556,500 5,615,363 8,156,500 7,215,36314 0 (941,137) 6,556,500 5,615,363 8,156,500 7,215,36315 0 (941,137) 6,556,500 5,615,363 8,156,500 7,215,363
Total (25,500,000) (14,117,055) 98,347,500 58,730,445 122,347,500 82,730,445
NPV 7,335,106 NPV 16,690,898IRR 0.21 IRR 0.28Payback 4.54 Payback 3.53
to.0s

Table 4. RICE SECTOR - FINANCIAL ANALYSIS - 500 kW, HIGH TECH CASE
WITHOUT ASH SALES WITH ASH SALESYear Investment Operating Gross Net Cash Gross Net Cash
Costs Revenues Flow Revenues Flow0 (21,250,000) 0 0 (21,250,000) 0 (21,250,000)1 0 (854,587) 6,378,300 5,523,713 7,978,300 7,123,7132 0 (904,153) 6,748,241 5,844,088 8,441,041 7,536,8883 0 (956,594) 7,139,639 6,183,045 8,930,622 7,974,0284 0 (1,012,076) 7,553,738 6,541,662 9,448,598 8,436,5215 0 (1,070,777) 7,991,855 6,921,079 9,996,617 8,925,8406 0 (1,132,882) 8,455,383 7,322,501 10,576,420 9,443,5387 0 (1,198,589) 8,945,795 7,747,206 11,189,853 9,991,2648 0 (1,268,107) 9,464,651 8,196,544 11,838,864 10,570,7579 0 (1,341,657) 10,013,601 8,671,944 12,525,518 11,183,861
10 0 (1,419,474) 10,594,390 9,174,916 13,251,998 11,832,52511 0 (1,501,803) 11,208,865 9,707,062 14,020,614 12,518,81112 0 (1,588,908) 11,858,979 10,270,071 14,833,810 13,244,90213 0 (1,681,064) 12,546,799 10,885,735 15.694,171 14,013,10714 0 (1,778,566) 13,274,514 11,495,948 16,604,433 14,825,86715 0 (1,881,723) 14,044,436 12,162,713 17,567,490 15,685,767
Total (21,250,000) (19,590,959) 146,219,187 105,378,227 182,898,349 142,057,389NPV 15,217,345 NPV 25,780,484IRR 0.31 IRR 0.39
2

75 - Page S of 6
Table 5. COCONUT SECTOR - ECONOMIC ANALYSIS - 1000 kW STAND ALONE
Operating Gross Net CashYear Investment Costs Revenues Flow
0 (36,000,000) 0 0 (36,000,000)1 0 (2,421,900) 11,016,000 8,594,1002 0 (2,421,900) 11,016,000 8,594,1003 0 (2,421,900) 11,016,000 8,594,1004 0 (2,421,900) 11,016,000 8,594,1005 0 (2,421,900) 11,016,000 8,594,1006 0 (2,421,900) 11,016,000 8,594,1007 0 (2,421,900) 11,016,000 8,594,1008 0 (2,421,900) 11,016,000 8,594,1009 0 (2,421,900) 11,016,000 8,594,100
10 0 (2,421,900) 11,016,000 8,594,10011 0 (2,421,900) 11,016,000 8,594,10012 0 (2,421,900) 11,016,000 8,594,10013 0 (2,421,900) 11,016,000 8,594,10014 0 (2,421,900) 11,016,000 8,594,10015 0 (2,421,900) 11,016,000 8,594,100
Total (36,000,000) (36,328,500) 165,240,000 92,911,500NPV 14,252,883IRR 0.22Payback 4-19

Table 6. COCONUT SECTOR - 1000 kW STAND ALONE - FINANCIAL ANALYSIS WITH LOAN AMORTIZATION
Debt: 21,000,000 Inflation: 0.058 Depreciation: 15Equity: 9,000,o00 Interest: 0.18 Tax Rate: 0.3
Year Loan Repayment Oper.Costs Total Cost Depreciation Gross Revs Profit pre Taxes Taxes Net Cash Flow0 (9,000,OO) 0 (9,000,000) 0 0 (9,000,000) 0 (9,000,000)1 (4,672,807) (2,427,000) (7,099,807) (2,000,000) 11,016,000 1,916,193 0 1,916,1932 (4,672,807) (2,567,766) (7,240,573) (2,000,000) 11,654,928 2,414,355 0 2,414,3553 (4,672,807) (2,716,696) (7,389,504) (2,000,000) 12,330,914 2,941,410 0 2,941,4104 (4,672,807) (2,874,265) (7,547,072) (2,000,000) 13,046,107 3,499,035 0 3.499,0355 (4,672,807) (3,040,972) (7,713,780) (2,000,000) 13,802,781 4,089,001 0 4,089,0016 (4,672,807) (3,217,349) (7,890,156) (2,000,000) 14,603,342 4,713,186 1,413,956 3,299,2307 (4,672,807) (3,403,955) (8,076,762) (2,000,000) 15,450,336 5,373,574 1,612,072 3,761,5028 (4,672.fr 7) (3,601,384) (8,274,192) (2,000,000) 16,346,456 6,072,264 1,821,679 4,250,5859 (4,672,807) (3,810,264) (8,483,072) (2,000,000) 17,294,550 6,811,478 2,043,443 4,768,03510 (4,672,807) (4,031,260) (8,704,067) (2,000,000) 18,297,634 7,593,567 2,278,070 5,315,49711 0 (4,265,073) (4,265,073) (2,000,000) 19,358,897 13,093,824 3,928,147 9,165,67712 0 (4,512,447) (4,512,447) (2,000,000) 20,481,713 13,969,266 4,190,780 9,778,48613 a (4,774,169) (4,774,169) (2,000,000) 21,689.852 14,895,483 4,468,645 10,426,83814 0 (5,051,071) (5,051,071) (2,000,000) 22,926,492 15,875,421 4,762,628 11,112,795'15 0 (5,344,033) (5,344,033) (2,000,000) 24,256,228 16,912,196 5,073,659 11,838,537
PMT (4,672,807)NPV 16,521,099IRR 0.34PBP 10 years
Ca0o

Joint UNDP/World BankENERGY SECTOR MANAGEMENT ASSISTANCE PROGRAMME (ESMIAP)
LIST OF REPORTS ON COMPLETED ACTIVITIES
Region/Country Aniviry/Reporn 7flue Dale Number
SUB-SAHARAN AFRICA (AFR)
Africa Regional Anglophone Africa Household Energy Workshop (English) 07188 085/88Regional Power Seminar on Reducing Electric Power System
Losses in Africa (English) 08188 087/88Institutional Evaluation of EGL (English) 02189 098/89Biomass Mapping Regional Workshops (English - Out of Print) 05/89 -
Francophone Household Energy Workshop (French) 08189 103189Interafrican Electrical Engineering College: Proposals for Short-
and Long-Term Development (English) 03/90 112190Biomass Assessment and Mapping (English - Out of Print) 03/90 -
Angola Energy Assessment (English and Portuguese) 05/89 4708-ANGPower Rehabilitation and Technical Assistance (English) 10/91 142191
Benin Energy Assessment (English and French) 06/85 5222-BENBotswana Energy Assessment (English) 09/84 4998-ET
Pump Electrification Prefeasibility Study (English) 01/86 047/86Review of Electricity Service Connection Policy (English) 07/87 071/87Tuli Block Farms Electrification Study (English) 07/87 072187Household Energy Issues Study (English - Out of Print) 02/88 -
Urban Household Energy Strategy Study (English) 05/91 132191Burkina Faso Energy Assessment (English and French) 01/86 5730-BUR
Technical Assistance Program (English) 03/86 052/86Urban Household Energy Strategy Study (English and French) 06191 134191
Burundi Energy Assessment (English) 06/82 3778-BUPetroleum Supply Management (English) 01/84 012184Status Report (English and French) 02/84 011184Presentation of Energy Projects for the Fourth Five-Year Plan
(1983-1987) (English and French) 05/85 036185Improved Charcoal Cookstove Strategy (English and French) 09/85 042185Peat Utilization Project (English) 11/85 046/85Energy Assessment (English and French) 01/92 9215-BU
Cape Verde Energy Assessment (English and Portuguese) 08J84 5073-CVHousehold Energy Strategy Study (English) 02/90 110/90
Cenral AfricanRepublic Energy Assessement (French) 08/92 9898-CAR
Comoros Energy Assessment (English and French) 01/88 7104-COMCongo Energy Assessment (English) 01/88 6420-COB
Power Development Plan (English and French) 03/90 106/90Cote d'Ivoire Energy Assessment (English and French) 04/85 5250-IVC
Improved Biomnass Utilization (English and French) 04/87 069/87Power System Efficiency Study (Out of Print) 12/87 -
Power Sector Efficiency Study (French) 02/92 140!91Ethiopia Energy Assessment (English) 07/84 4741-fT
Power System Efficiency Study (English) 10/85 045/85

Region/Country ActivitlyReporn Vlk Date Number
Ethiopia Agricultural Residue Briquetting Pilot Project (English) 12/86 062/86Bagasse Study (English) 12186 063/86Cooking Efficiency Project (English) 12/87 -
Gabon Energy Assessment (English) 07/88 6915-GAThe Gambia Energy Assessment (English) 11/83 4743-GM
Solar Water Heating Retrofit Project (English) 02/85 030/85Solar Photovoltaic Applications (English) 03/85 032185Petroleum Supply Management Assistance (English) 04/85 035/85
Ghana Energy Assessment (English) 11/86 6234-OHEnergy Rationalization in the Industrial Sector (English) 06/88 084/88Sawmill Residues Utilization Study (English) 11/83 074/87
Guinea Energy Assessment (Out of Print) 11/86 6137-GUIGuinea-Bissau Energy Assessment (English and Portuguese) 08/84 5083-OUB
Recommended Technical Assistance Projects (English &Portuguese) 04/85 033/85
Management Options for the Electric Power and Water SupplySubsecors (English) 02/90 100/90
Power and Water Institutional Restructuring (French) 04/91 118/91Kenya Energy Assessment (English) 05182 3800-KE
Power System Efficiency Study (English) 03/84 014/84Status Report (English) 05/34 016184Coal Conversion Action Plan (English - Out of Print) 02/37 -
Solar Water Heating Study (English) 02/87 066/87Peri-Urban Woodfuel Development (English) 10187 076/87Power Master Plan (English - Out of Print) 11/87 -
Lesotho Energy Assessment (English) 01/84 4676-LSOLiberia Energy Assessment (English) 12/84 5279-LBR
Reconmmended Technical Assistance Projects (English) 06/85 038/85Power System Efficiency Study (English) 12/87 081/87
Madagascar Energy Assessment (English) 01/87 5700-MAGPower System Efficiency Study (English and French) 12/87 075/87
Malawi Energy Assessment (English) 08182 3903-MALTechnical Assistance to Improve the Efficiency of Fuelwood
Use in the Tobacco Industry (English) 11183 009/83Status Report (English) 01/84 013184
Mali Energy Assessment (English and French) 11/91 8423-MLIHousehold Energy Strategy (English and French) 03/92 147/92
Islamic Republicof Mauritania Energy Assessment (English and French) 04185 5224-MAU
Household Energy Strategy Study (English and French) 07/90 123/9OMauritius Energy Assssment (English) 12181 3510-MAS
Status Report (English) 10/83 008/83Power System Efficiency Audit (English) 05/87 070/87Bagase Power Potential (English) 10/87 077187
Mozambique Energy Asement (English) 01/87 6128-MOZHousehold Electricity Utilization Study (English) 03/90 113190
Namibia Energy Assessment (English) 03/93 11320-NAM

- 3 -
Region/Count Actvity/Report flts Date Number
Niger Energy Assessment (French) 05184 4642-NIRStatus Report (English and French) 02186 051186Improved Stoves Project (English and French) 12187 080187Household Energy Consevation and Substitution (English
and French) 01188 082/88Nieaia Energy Assessment (English) 08183 4440-UNI
Energy Assessment (English) 07193 11672-UNIRwanda Energy Assessment (English) 06182 3779-RW
Energy Assessment (English and French) 07(91 8017-RWStatus Report (English and French) 05184 017184Improved Charcoal Cookstove Strategy (English and French) 08186 059/86Improved Charcoal Production Techniques (English and French) 02187 065/87Commercialization of Improved Charcoal Stoves and Carbonization
Techniques Mid-Term Progress Report (English and French) 12(91 141/91SADCC SA1)CC Regional Sector. Regional Capacity-Building Progmrm
for Energy Surveys and Policy Analysis (English) 11/91 -
Sao Tomeand Principe Energy Assessment (English) 10/85 5803-STP
Senegal Energy Assessment (English) 07183 4182-SEStatus Report (English and French) 10184 025184Industrial Energy Conservation Study (English) 05(85 037/85Preparatory Assistnce for Donor Meeting (English and French) 04/86 056/86Urban Household Energy Strategy (English) O/89 096/89
Seychelles Energy Assessment (English) 01/84 4693-SEYElectric Power Systm Efficiency Study (English) 08184 021/84
Sierra Leon. Energy Assesment (English) 10/87 6597-SLSomalia Energy Assessment (English) 12(85 5796SOSudan Management Assistance to the Ministry of Energy and Mining 05/83 003183
Energy Assessment (English) 07/83 451 I-SUPower System Efficiency Study (English) 06/84 018/84Status Report (English) 11/84 026184Wood Energy/Forety Feasibility (English - Out of Print) 07/87 073187
Swaziland Energy Assessment (English) 02187 6262-SWTanzania Energy Assessment (English) 11/84 4969-TA
Peri-Urban Woodfiuls Feasibility Study (English) 08/88 086188Tobacco Curing Efficiency Study (English) 05/89 102189Remote Sensing and Mapping of Woodlands (English) 06/90 -
Industrial Energy Efficiency Technical Assistance(English - Out of Print) 08/90 122/90
Togo Energy Assessment (English) 06/85 5221-TOWood Recovery in the Nangbeto Lake (English and French) 04186 055/86Power Efficiency Improvement (English and French) 12187 078187
Uganda Energy Asesment (English) 07/83 4453-UGStatus Report (English) 08/84 020184nstitutional Review of the Energy Sector (Englisb) O1IPi 029185
Energy Efficiency in Tobacco Curing Industry (English) 086 049/86Fuelwood/Forestry Fessibility Study (English) 03/86 053/86

-4 -
Region/Country Acdivily/Repon hEte Date Number
Uganda Power System Efficiency Study (English) 12/88 092/88Energy Efficiency Improvement in the Brick and
Tile Industry (English) 02189 097189Tobacco Curing Pilot Project (English - Out of Print) 03/89 UNDP Terminal
ReportZaire Energy Assessment (Englisb) 05/86 5837-ZRZambia Energy Assessment (English) 01/83 4110-ZA
Status Report (English) 08/85 039/85Energy Sector Institutional Review (English) 11/86 060/86Power Subsector Efficiency Study (English) 02189 093/88Energy Strategy Study (English) 02/89 o94/88Urban HousehoId Energy Strategy Study (English) 08190 121/90
Zimbabwe Energy Assessment (English) 06/82 3765-ZIMPower System Efficiency Study (English) 06/83 005/83Status Report (English) 08/84 019184Power Sector Management Assistance Project (English) 04/85 034/85Petroleum Management Assistance (English) 12/89 109/89Power Sector Management Institution Building
(English - Out of Print) 09/89 -
Charcoal Utilization Prefeasibility Study (English) 06/90 119/90Integrated Energy Strategy Evaluation (English) 01/92 8768-ZIM
EAST ASIA AND PACIFC (EAP)
Asia Regional Pacific Household and Rural Energy Semina (English) 11190 -
China County-Level Rural Energy Assessments (English) 05/89 101/89Fuelwood Forestry Preinvestment Study (English) 12/89 105/89
Fiji Energy Assessment (English) 06/83 4462-FI1Indonesia Energy Assessment (English) 11/Si 3543-IND
Status Report (English) 09/84 022/84Power Generation Efficiency Study (English) 02/86 050/86Energy Efficiency in the Brick, Tile and
Lime Industries (English) 04187 067/87Diesel Generating Plant Efficiency Study (English) 12/88 095/88Urban Household Energy Strategy Study (English) 02/90 107/90Biomass Gasifier Preinvestment Study Vols. I & U (English) 12/90 124/90
Lao PDR Urban Electricity Demand Assessment Study (English) 03/93 154/93Malaysia Sabah Power System Efficiency Study (English) 03/87 068/87
Gas Utilization Study (English) 09/91 9645-MAMyanmnar Energy Assessment (English) 06/85 5416-BAPapua New
Guinea Energy Assessment (English) 06/82 3882-PNGStats Report (English) 07/83 006/83Energy Strategy Paper (English - Out of Print) - -Institutional Review in the Energy Sectcr English) 10/84 023/84Power Tariff Study (English) 10/84 024184

RegionlCouw Acd*y/Report Tle Date Number
Philippines Commercial Potential for Power Production fromAgricultural Residues (English) 12193 157/93
Solomon Islands Energy Assessment (English) 06183 4404-SOLEnergy Assessment (English) 01(92 979/SOL
South Pacific Petroleum Transport in the South Pacific (English-Out of Print) 05/86 -
Thailand Energy Assessment (English) 09(85 5793-fTHRural Energy Issues and Options (English - Out of Print) 09(85 044/85Accelerated Dissemination of Improved Stoves and
Charcoal Kilns (English - Out of Print) 09(17 079/87Northeast Region Village Forestry and Woodfuels
Preinvestment Study (English) 02/88 083/88Impact of Lower Oil Prices (English) 08/88 -
Coal Development and Utilization Study (English) 10/89 -
Tonga Energy Assessment (English) 06/85 5498-TONVanuatu Energy Assessment (English) 06185 5577-VAWestemu Samoa Energy Assessment (English) 06(85 5497-WSO
SOUTH ASIA (SAS)
Bangladesh Energy Asseswment (English) 10182 3873-BDPriority Investment Program 05/83 002/83Status Report (English) 04/84 015/84Power System Efficiency Study (English) 02/85 031/85Small Scale Uses of Gas Prefeasibility Study (English -
(Out of Print) 12/88 -
India Opportunities for Commercialization of Nonconventional-nergy Systems (English) 11188 091/88
Maharashtra Bagasse Energy Efficiency Project (English) 05191 120/91Mini-Hydro Development on Irrigation Dams and
Canal Drops Vols. I, 11 and II (English) 07/91 139/91WindFarm Pre-Investment Study (English) 12/92 150/92
Nepal Energy Assessment (English) 08/83 4474-NEP.Status Report (English) 01/85 028/84
Pakdstan Household Energy Assessment (English - Out of Print) 05/8 -
Assessment of Photovoltaic Programs, Applications, andMarkets (English) 10/89 103/89
Sri Lanka Energy Assessment (English) 05/82 3792-CEPower System Loss Reduction Study (English) 07/83 007/83Status Report (English) 01/84 010/84Industrial Energy Conservation Study (English) 03/86 054/86

-6 -
Reglon/Cowurry Acdvky/Reporn Thrk Dae Number
EUROPE AND CENTRAL ASIA (ECA)
Eastern Europe The Future of Natural Gas in Eastern Europe (English) 08192 149192Poland Energy Sector Restructuring Program Vols. I-V (English) 01/93 153193Portugal Energy Assessment (English) 04184 4824-POTurkey Energy Assessment (English) 03/83 3877-TU
MIDDLE EAST AND NORTH AFRICA (MNA)
Morocco Energy Assessment (English and French) 03/84 4157-MORStatus Report (English and French) 01/86 048186
Syria Energy Assessment (Englisb) 05186 5822-SYRElectric Power Efficiency Study (English) 09/88 089188Energy Efficiency Improvement in the Cement Sector (English) 04/89 099/89Energy Efficiency Improvement in the Fertilizer SectorCEnglish) 06/90 115/90
Tunisia Fuel Substitution (English and French) 03/90 -
Power Efficiency Study (English and French) 02/92 136/91Energy Management Strategy in the Residential and
Tertiary Sectors (English) 04/92 146/92Yemen Energy Assement (English) 12/84 4892-YAR
Energy Investment Priorities (English - Out of Print) 02/87 6376-YARHousehold Energy Strategy Study Phase I (English) 03/91 126191
LATIN AMERICA AND THE CARIBBEAN (LAC)
LAC Regional Regional Seminar on Electric Power System Loss Reductionin the Caribbean (English) 07/89 -
Bolivia Energy Assessment (English) 04/83 4213-BONational Energy Plan (English) 12187 -
National Energy Plan (Spanish) 08/91 131/91La Paz Private Power Technical Assistance (English) 11/90 111/90Natural Gas Distribution: Economics and Regulation (English) 03/92 125/92Prefeasibility Evaluation Rural Electrification and Demand
Assessment (English and Spanish) 04191 129/91Private Power Generation and Transmission (English) 01/l92 137/91
Chile Energy Sector Review (English - Out of Print) 08/88 7129-CHIColombia Energy Strategy Paper (English) 12/86 -
Costa Rica Energy Assessment (English and Spanish) 01/84 4655-CRRecommended Technical Assistance Projects (English) 11184 027/84Forest Residues Utilization Study (English and Spanish) 0X90 108190
DominicanRepublic Energy Assessment (English) 05/91 8234-DO

-7-
Rtegfw/Ccwuify Actwifrlt/epofl 71ll Dale NwnbeF
Ecuador Energy Assessment (Spanish) 12/85 5865-ECEnergy Stategy Phae I (Spanish) 07/83 -Energy Strategy TEnglish) 04(91 -
Private Minihydropower Development Study (English) 11/92 -
Guatemala Issues and Options in the Energy Sector (English) 09/93 12160-GUHaiti Energy Assessment (English and French) 06/R2 3672-HA
Status Report (Engish ad French) 08185 041185Household Energ Stat.,gy (Enish and French) 12191 143/91
Hondurs Ergy Asssment (English) 08187 6476-HOPetroleum Supply Management (English) 0391 12891
Jamaica Energy Asssment (English) 04fBS 5466-3MPetroleum Pocument, Refing, and
Distnbution Study (English) 11/86 061/86EneWr Efficiency Building Code Phase I (English-Out of Pit) 03188 -
Energy Efficiency Standards andLabels Phase I (English - Out of Print) 03f88 -
Mmnagement Information System Phase I (English - Out of Print) 03188 -
Charcoal Production Project (English) 09188 090188FIDCO Sawmill Residues Utilization Study (English) 09(88 088/88Eergy Sector Strategy and Investmt Planning Study (English) 07192 135192
Mexico Improved Charcoal Production Within Fosest Mnagemet forthe State of Vemacuz (English and Spanish) 08191 138/91
Panam Power System Efficiecy Study (English - Out of Print) 06/83 004183Parguay Energy Asement (English) 10/84 5145-PA
Recommended Technical Asstane Projects (English-(Out of Print) 09/85 -
Status Report (English and Spanish) 09/85 043/85Peu Energy Assessment (English) 01184 4677-PE
Status Report (English - Out of Print) 08(85 040185Proposal for a Stove Dissemination Program in
the Sierra (English and Spaish) 02187 064/87Energy Strategy (English and Spanis) 12190 -
Saint Lucia Energy Assessment (English) 09/84 5111-SLUSt Vmcent andthe Grenadines Energy Assssent (English) 09/84 5103-STV
Trinidad andTobago Energy Asement (English - Out of Print) 12(85 5930-TR

-8 -
Reieon/countuy AclMvsyRepor* 7ltk Date Nunber
GLOBAL
Energy End Use Efficiency: Research and Strategy(English - Out of Print) 11/89
Guidelines for Utility Customer Management andMetering (English and Spnish) 07/91
Women and Enery-A Resource GuidoThe Internationd Network: Policies and Experience (Eglish) 04/90
Assessment of Personal Computer Models for EnergyPlaning in Developing Countries (English) 10/91
Long-Term Gas Contracts Principles and Applications (English) 02/93 152/93Comparafive Behavior of Firms Under Public and Privae
Ownersbip (English) 05/93 155/93
120993

* , -x ii' v!.
-. =- _~
0~~~~~~~~~~~ _3 I
__ __ WA.@ '~~~~~