Social Vulnerability Analysis of the Health Sector Reform Program Assistance in Egypt
58
Technical Report No. 5 Volume III Social Vulnerability Analysis of the Health Sector Reform Program Assistance in Egypt July 1996 Prepared by: Denise DeRoeck, M.P.H. Abt Associates Inc. Heba Nassar, Ph.D. American University David Hotchkiss, Ph.D. Tulane University School of Public Health and Tropical Medicine James Knowles, Ph.D. Abt Associates Inc. Partnerships for Health Reform Abt Associates Inc. # 4800 Montgomery Lane, Suite 600 Bethesda, Maryland 20814 # Tel: 301/913-0500 # Fax: 301/652-3916 In collaboration with: Development Associates, Inc. # Harvard School of Public Health # Howard University International Affairs Center # University Research Corporation
-
Upload
independent -
Category
Documents
-
view
1 -
download
0
Transcript of Social Vulnerability Analysis of the Health Sector Reform Program Assistance in Egypt

Technical Report No. 5
Volume III
Social VulnerabilityAnalysis of the HealthSector ReformProgram Assistance in Egypt
July 1996
Prepared by:
Denise DeRoeck, M.P.H.Abt Associates Inc.
Heba Nassar, Ph.D.American University
David Hotchkiss, Ph.D.Tulane University School of Public Health and Tropical Medicine
James Knowles, Ph.D.Abt Associates Inc.
Partnershipsfor HealthReform
Abt Associates Inc. # 4800 Montgomery Lane, Suite 600Bethesda, Maryland 20814 # Tel: 301/913-0500 # Fax: 301/652-3916
In collaboration with:
Development Associates, Inc. # Harvard School of Public Health #Howard University International Affairs Center # University Research Corporation

Recommended Citation
Denise DeRoeck, Heba Nassar, David Hotchkiss and James Knowles. 1996. Social Vulnerability Analysis of the Health SectorReform Program Assistance in Egypt. Technical Report No. 5., Volume III. Bethesda, MD: Partnerships for Health ReformProject (PHR), Abt Associates Inc.
Partnerships for HealthReform
Mission
The Partnerships for Health Reform Project (PHR) seeks to improve people’s health in low- andmiddle-income countries by supporting health sector reforms that ensure equitable access to efficient,sustainable, quality health care services. In partnership with local stakeholders, PHR promotes anintegrated approach to health reform and builds capacity in the following key areas:
> policy formulation and implementation
> health economics and financing
> organization and management of health systems
PHR advances knowledge and methodologies to develop, implement, and monitor health reforms andtheir impact, and informs and guides the exchange of knowledge on critical health reform issues.
July 1996
For additional copies of this report, contact the PHR Resource Center at [email protected] orvisit our website at www.phrproject.com.
Contract No.: HRN-5974-C-00-5024-00Project No.: 936-5974.13
Submitted to: Mellen TanamlyUSAID/Cairo
and: Robert Emrey, COTRHealth Policy and Sector Reform DivisionOffice of Health and NutritionCenter for Population, Health and NutritionBureau for Global Programs, Field Support and ResearchUnited States Agency for International Development

Abstract
This report, written for the United States Agency for International Development-fundedPartnerships for Health Reform Project, examines the likely impact on socially vulnerable groupsof the various health policy reform strategies proposed for the government of Egypt’s NationalHealth Sector Policy Reform Agenda. The report also identifies steps to maximize the policyreform benefits and minimize disadvantages for the socially vulnerable that the report identifies asthe poor, residents of disadvantaged rural areas, and female-headed households, with a specificfocus on women and children. The analysis concentrates on four primary effects in the governmentof Egypt’s draft policy reform agenda: (1) cost recovery in Ministry of Health and Populationfacilities, (2) redirecting ministry resources from hospital-based curative care to primary andpreventive health, (3) reallocating ministry personnel and other resources from geographic areas ofunderutilization and excess supply to needy areas, and (4) improving and expanding nationalhealth insurance.

Table of Contents i
Table of Contents
List of Tables . . . . . . . . . . . . . . . . . . . . . . . . . . . . . . . . . . . . . . . . . . . . . . . . . . . . . . . . . . . . . . . . . . . . . . . . . . iii
Acronyms . . . . . . . . . . . . . . . . . . . . . . . . . . . . . . . . . . . . . . . . . . . . . . . . . . . . . . . . . . . . . . . . . . . . . . . . . . . . . v
Preface . . . . . . . . . . . . . . . . . . . . . . . . . . . . . . . . . . . . . . . . . . . . . . . . . . . . . . . . . . . . . . . . . . . . . . . . . . . . . . vii
Acknowledgments . . . . . . . . . . . . . . . . . . . . . . . . . . . . . . . . . . . . . . . . . . . . . . . . . . . . . . . . . . . . . . . . . . . . . . xi
Executive Summary . . . . . . . . . . . . . . . . . . . . . . . . . . . . . . . . . . . . . . . . . . . . . . . . . . . . . . . . . . . . . . . . . . . xiii
1.0 Purpose . . . . . . . . . . . . . . . . . . . . . . . . . . . . . . . . . . . . . . . . . . . . . . . . . . . . . . . . . . . . . . . . . . . . . . . . 1
2.0 Methodology and Data Sources . . . . . . . . . . . . . . . . . . . . . . . . . . . . . . . . . . . . . . . . . . . . . . . . . . . . 3
3.0 Background on Socially Vulnerable Groups in Egypt . . . . . . . . . . . . . . . . . . . . . . . . . . . . . . . . . 53.1 Who Are the Socially Vulnerable? . . . . . . . . . . . . . . . . . . . . . . . . . . . . . . . . . . . . . . . . . . . . . 5
3.1.1 The Poor in Egypt . . . . . . . . . . . . . . . . . . . . . . . . . . . . . . . . . . . . . . . . . . . . . . . . . . . 53.1.2 Women in Egypt . . . . . . . . . . . . . . . . . . . . . . . . . . . . . . . . . . . . . . . . . . . . . . . . . . . . 73.1.3 Health Status and Use of Health Services by the Socially Vulnerable . . . . . . . . . . 7
4.0 Analysis of the Impact of the Suggested Health Reform Strategies on the Socially Vulnerable . . . . . . . . . . . . . . . . . . . . . . . . . . . . . . . . . . . . . . . . . . . . . . . . . . . . . . . . 94.1 Expanding Cost Recovery and Rationalizing the MOHP’s Role
in Financing Curative Care . . . . . . . . . . . . . . . . . . . . . . . . . . . . . . . . . . . . . . . . . . . . . . . . . . . 94.1.1 Current Utilization of MOHP Care by Socially Vulnerable Groups . . . . . . . . . . . . 9
4.1.1.1 Inpatient Care Utilization . . . . . . . . . . . . . . . . . . . . . . . . . . . . . . . . . . . . . . 94.1.1.2 Outpatient Care Utilization . . . . . . . . . . . . . . . . . . . . . . . . . . . . . . . . . . . 12
4.1.2 Health Care Expenditures by the Socially Vulnerable . . . . . . . . . . . . . . . . . . . . . . 124.1.2.1 Inpatient Care Expenditures . . . . . . . . . . . . . . . . . . . . . . . . . . . . . . . . . . . 144.1.2.2 Outpatient Care Expenditures . . . . . . . . . . . . . . . . . . . . . . . . . . . . . . . . . 14
4.1.3 The Potential Impact of Cost Recovery Mechanisms on the Socially Vulnerable . . . . . . . . . . . . . . . . . . . . . . . . . . . . . . . . . . . . . . . . . . . . . . . . . . . . . . . 14
4.1.4 Conditions Necessary to Help Ensure the Success of Cost Recovery Efforts . . . . 164.1.4.1 Targeting . . . . . . . . . . . . . . . . . . . . . . . . . . . . . . . . . . . . . . . . . . . . . . . . . . 164.1.4.2 Phasing-in Cost Recovery Implementation . . . . . . . . . . . . . . . . . . . . . . . . 174.1.4.3 Awareness of Institutional Factors That May Thwart Success . . . . . . . . . . . . . . . . . . . . . . . . . . . . . . . . . . . . . . . . . . . . . . . . . . . . . . . . . . 174.1.4.4 Monitoring and Evaluation of Cost Recovery Efforts . . . . . . . . . . . . . . . 18
4.1.5 Conclusions . . . . . . . . . . . . . . . . . . . . . . . . . . . . . . . . . . . . . . . . . . . . . . . . . . . . . . . 184.2 Strengthening the MOHP’s Role in the Provision of PHC and
Redirecting MOHP Resources from Curative Care to PHC . . . . . . . . . . . . . . . . . . . . . . . . 184.2.1 The Health Needs of the Socially Vulnerable in Relation to the Current Allocation
of Government Health Resources in Egypt . . . . . . . . . . . . . . . . . . . . . . . . . . . . . . 194.2.1.1 The Socially Vulnerable’s Health Status and Health Service
Utilization . . . . . . . . . . . . . . . . . . . . . . . . . . . . . . . . . . . . . . . . . . . . . . . . . 19

ii Table of Contents
4.2.1.2 Where Government Funds are Going for Health Care . . . . . . . . . . . . . . . 204.2.2 The Potential Impact of Strengthening the MOHP’s Role in PHC and in
Redirecting Resources from Curative to PHC on Utilization of Health Services by Socially Vulnerable Groups: Will They Seek Out and Receive More Health Care, Including PHC? . . . . . . . . . . . . . . . . . . . . . . . . . . . . . . . . . . . . . . . . . 21
4.2.3 Conditions or Interventions Necessary to Help Ensure a Positive Impact on theSocially Vulnerable of Efforts to Focus MOHP Resources on PHC/MHC . . . . . . 23
4.3 Reallocate MOHP Resources, Including Personnel and Facilities, to Where They Are Most Needed and Reduce Overall Number of MOHP Personnel . . . . . . . . . . . . 244.3.1 Resource Reallocation . . . . . . . . . . . . . . . . . . . . . . . . . . . . . . . . . . . . . . . . . . . . . . 244.3.2 Reducing the Number of MOHP Personnel . . . . . . . . . . . . . . . . . . . . . . . . . . . . . . 264.3.3 Conclusions . . . . . . . . . . . . . . . . . . . . . . . . . . . . . . . . . . . . . . . . . . . . . . . . . . . . . . . 27
4.4 Improving the HIO and Extending Social Health Insurance to Universal Coverage . . . . . 274.4.1 Current HIO Enrollment and Use by Socially Vulnerable Groups . . . . . . . . . . . . 284.4.2 Are the Socially Vulnerable Not Receiving Needed Hospital (Inpatient)
Care? . . . . . . . . . . . . . . . . . . . . . . . . . . . . . . . . . . . . . . . . . . . . . . . . . . . . . . . . . . . . 294.4.3 Conclusions: Would Expanding Social Health Insurance Really Help
the Socially Vulnerable? . . . . . . . . . . . . . . . . . . . . . . . . . . . . . . . . . . . . . . . . . . . . . 30
5.0 Summary of the Impact of Proposed Health Sector Reforms on the Socially Vulnerable . . . 33
6.0 Further Analysis to Conduct from Existing Data . . . . . . . . . . . . . . . . . . . . . . . . . . . . . . . . . . . . 37
Bibliography . . . . . . . . . . . . . . . . . . . . . . . . . . . . . . . . . . . . . . . . . . . . . . . . . . . . . . . . . . . . . . . . . . . . . . . . . . 39

List of Tables iii
List of Tables
Table 1 Demographic Characteristics of Respondents from the 1994 Health Expenditure Survey by Income Group and by Gender . . . . . . . . . . . . . . . 6
Table 2 Percent Receiving Inpatient Care among Respondents 16 Years of Age and Older Who Reported a Need for Hospitalization during the Past Year, by Income Group . . . . . . . . . . . . . . . . . . . . . . . . . . . . . . . . . . . . . . . . . . . 10
Table 3 Distribution of Respondents Hospitalized by Source of Most Recent Inpatient Care, by Income Group, and by Gender . . . . . . . . . . . . . . . . . . 11
Table 4 Distribution of Respondents Seeking Outpatient Care by Source of Care, Income Group, and Gender . . . . . . . . . . . . . . . . . . . . . . . . . . . . . . . . . . . 13
Table 5 Percentage of Per Capita Income Spent on Health Care, by Income Quintiles . . . . . . . . . . . . . . . . . . . . . . . . . . . . . . . . . . . . . . . . . . . . . . . . . . 15
Table 6 Total Mean Hospital Expenditure Per Inpatient Stay by Type of Facility and by Income Group . . . . . . . . . . . . . . . . . . . . . . . . . . . . . . . . . . . . . . . . 15
Table 7 Indicators of Health Status and Health Service Utilization by Region . . 21
Table 8 Comparison of MOHP Resources Between Regions in Egypt . . . . . . . . 25
Table 9 HIO Coverage Rates and Hospital Beds per Beneficiary by HIO Branch . . . . . . . . . . . . . . . . . . . . . . . . . . . . . . . . . . . . . . . . . . . . . . . . . . . . 29
Table 10 Summary of Impact of Suggested National Health Sector Reform Strategies on the Socially Vulnerable . . . . . . . . . . . . . . . . . . . . . . . . . . . . 34

Acronyms v
Acronyms
ARI Acute Respiratory InfectionCAPMAS Central Agency for Public Mobilization and StatisticsCCO Curative Care OrganizationDDM Data for Decision Making ProjectDHS Demographic and Health SurveyGIS Geographic Information Survey GOE Government of EgyptIMR Infant Mortality RateHIO Health Insurance OrganizationLE Egyptian poundsMCH Maternal and Child Health CareMOHP Ministry of Health and Population ORT Oral Rehydration TherapyPM Preventive MedicinePHC Primary Health CarePHR Partnerships for Health Reform ProjectSHIP Student’s Health Insurance ProgramUSAID United States Agency for International Development


Preface vii
Preface
This report is one in a series of six analyses conducted by the Partnerships forHealth Reform Project for the Health Office of the United States Agency for InternationalDevelopment/Cairo between June and September 1996. The Partnerships for Health Reformwas requested by the United States Agency for International Development/Cairo Mission toconduct these analyses to support and inform the design of its upcoming Health SectorReform Program Assistance, which is intended to provide technical and financial assistanceto the government of Egypt in planning and implementing health sector reform. Theanalyses examine the feasibility and/or impact of a set of health sector reform strategies thatwere proposed jointly by the Ministry of Health and Population and the United StatesAgency for International Development. These proposed strategies are shown in thefollowing table.
Technical Report No. 5 contains all six analyses. The analyses and theircorresponding volume numbers are as follows:
Volume I Suggested National Health Sector Reform Strategies, Benchmarks, andIndicators for Egypt
Volume II Economic Analysis of the Health Sector Policy Reform ProgramAssistance in Egypt
Volume III Social Vulnerability Analysis of the Health Sector Policy Reform ProgramAssistance in Egypt
Volume IV Legal Analysis of the Health Sector Policy Reform Program Assistance inEgypt
Volume V Analysis of the Political Environment for Health Policy Reform in Egypt
Volume VI Analysis of the Institutional Capacity for Health Policy Reform in Egypt
Volume VII Summary of Analyses

viii Preface
Proposed Health Sector Policy Reforms
Specific Strategy Generic Strategy
1. ROLE OF THE MINISTRY OF HEALTH AND POPULATION (MOHP)
1.1 Rationalize the role of the MOHP in financing curative care
1.1.1 Stop the construction of unnecessary hospitals Improve the allocation of the MOHPand set strict guidelines for the completion of investment budgetfacilities under construction
1.1.2 Transfer existing hospitals to other parastatal Allow hospital autonomyorganizations
1.1.3 Expand cost recovery in government facilities Expand cost recovery
1.1.4 Allow private practitioners to use the MOHP Allow private practitioners to usefacilities government facilities
1.1.5 Allow hospital autonomy Allow hospital autonomy
1.1.6 Support hospitals based on efficiency indicators Use alternative budget allocation formula such as on a per capita, per bed basis, etc. for MOHP hospitals
1.1.7 Examine the cost recovery of curative services at Expand cost recoverythe primary health care (PHC) level
1.2 Strengthen the role of the MOHP in the provision and increased share of financingpreventive medicine (PM) and primary health care
1.2.1 Use cost-effectiveness analysis to identify a Increase the cost effectiveness of thepackage of PM and PHC services to be MOHP’s program supported by the MOHP to which every Egyptianis entitled
1.2.2 Increase emphasis on Maternal and Child Increase emphasis on MCH programsHealth Care (MCH) programs
1.2.3 Provide incentives for the health care providers Increase the cost effectiveness of theto specialize in PM, PHC, and family medicine MOHP’s program
1.2.4 Do not separate curative services at the PHC Continue to provide curative services inlevel PHC facilities
1.2.5 Ensure adequate allocation of resources, e.g., Improve the allocation of the MOHPpersonnel recurrent budget
1.3 Reform the MOHP personnel policy
1.3.1 There should be no guaranteed employment Reduce the overall number of the MOHPpersonnel
1.3.2 Develop guidelines for the MOHP personnel, Improve the allocation of the MOHPand apply them to redistribute personnel based recurrent budgeton needs assessment
1.3.3 Reduce the overall number of the MOHP Reduce the overall number of the MOHPpersonnel personnel

Proposed Health Sector Policy Reforms
Specific Strategy Generic Strategy
Preface ix
1.3.4 Provide incentives for the MOHP personnel to Improve the allocation of the MOHPserve in underserved and remote areas recurrent budget
1.4 Develop the MOHP capacity for national health needs assessment, sectoral strategicplanning, and policy development
1.4.1 Adapt the national health information systems, Improve the allocation of the MOHPincluding Geographic Information Survey (GIS) investment budget for planning and policy decision making
Improve the allocation of the MOHPrecurrent budget
1.4.2 Prioritize the allocation of the MOHP resources Improve the allocation of the MOHPbased on needs using health status indicators investment budget
Improve the allocation of the MOHPrecurrent budget
1.4.3 Create incentives for other health care providers Provide incentives to private healthto function in underserved areas providers to function in underserved areas
1.4.4 Target government of Egypt (GOE) subsidy to Improve the equity of the MOHP subsidiespoor and indigent populations
1.4.5 Use cost-effectiveness analyses in determining Increase the cost effectiveness of thethe essential health services MOHP’s program
1.5 Develop the MOHP role in regulation, accreditation, and quality assurance of healthservices
1.5.1 Develop and adopt National Health Standards of Develop and adopt national healthPractice and health facility accreditation standards and accreditation
1.5.2 Establish a policy of continued physician Establish CME and physician licensinglicensing and continuing medical education(CME)
2. NATIONAL SOCIAL HEALTH INSURANCE PROGRAM
2.1 Ensure the viability of the Health Insurance Organization (HIO)
2.1.1 Do not add any new groups of beneficiaries to Eliminate the HIO’s deficitthe HIO
2.1.2 Eliminate the current HIO deficit Eliminate the HIO’s deficit
2.1.3 Reduce the proportion of the pharmaceutical Redefine HIO's benefitscosts
2.1.4 Unify the existing health insurance laws into one Unify existing health insurance lawslaw
2.1.5 Change the HIO’s legal and legislative Ensure the HIO’s autonomyframework to ensure its autonomy
Proposed Health Sector Policy Reforms
Specific Strategy Generic Strategy
x Preface
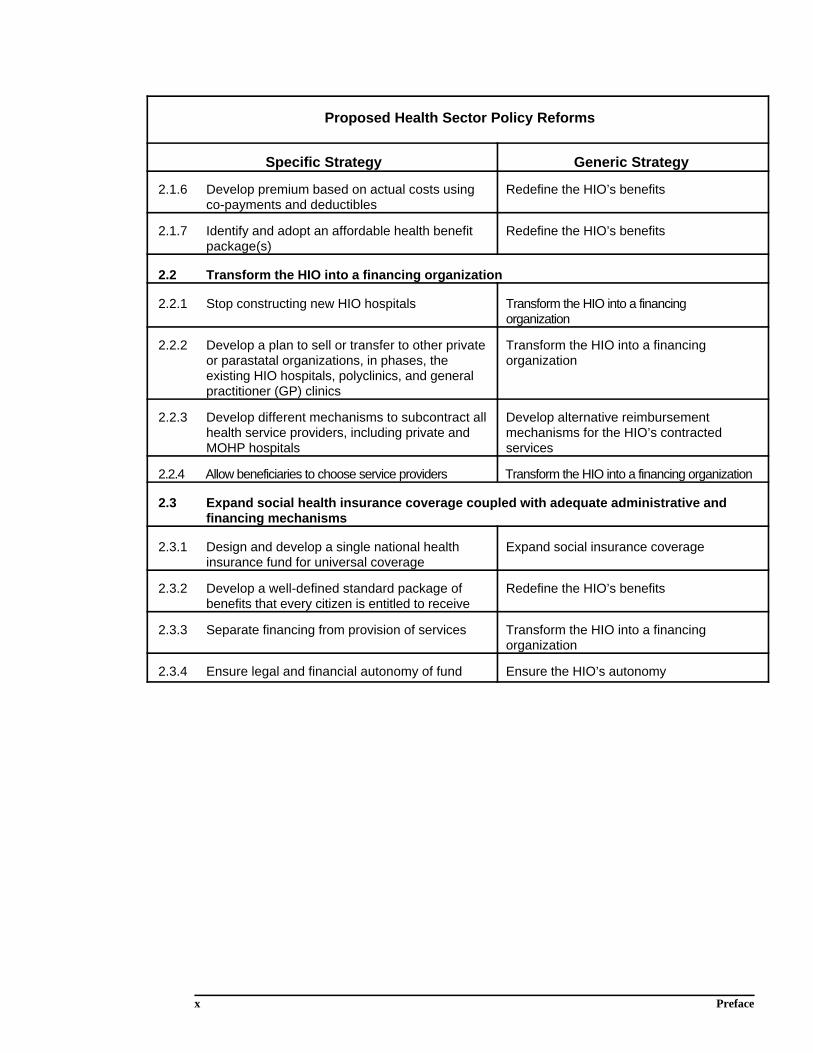
2.1.6 Develop premium based on actual costs using Redefine the HIO’s benefitsco-payments and deductibles
2.1.7 Identify and adopt an affordable health benefit Redefine the HIO’s benefitspackage(s)
2.2 Transform the HIO into a financing organization
2.2.1 Stop constructing new HIO hospitals Transform the HIO into a financingorganization
2.2.2 Develop a plan to sell or transfer to other private Transform the HIO into a financingor parastatal organizations, in phases, the organizationexisting HIO hospitals, polyclinics, and generalpractitioner (GP) clinics
2.2.3 Develop different mechanisms to subcontract all Develop alternative reimbursementhealth service providers, including private and mechanisms for the HIO’s contractedMOHP hospitals services
2.2.4 Allow beneficiaries to choose service providers Transform the HIO into a financing organization
2.3 Expand social health insurance coverage coupled with adequate administrative andfinancing mechanisms
2.3.1 Design and develop a single national health Expand social insurance coverageinsurance fund for universal coverage
2.3.2 Develop a well-defined standard package of Redefine the HIO’s benefitsbenefits that every citizen is entitled to receive
2.3.3 Separate financing from provision of services Transform the HIO into a financingorganization
2.3.4 Ensure legal and financial autonomy of fund Ensure the HIO’s autonomy

Acknowledgments xi
Acknowledgments
The authors would like to thank the staff members of the Health and PopulationOffice of the United States Agency for International Development/Cairo, especially Mr.Carl Abdou Rahmann, Dr. Sameh El-Saharty, Ms. Aziza Helmy, and Ms. Jennifer Notkin,for their valuable guidance on the analyses and comments on the draft report. The authorsalso greatly appreciate the technical guidance provided by Dr. A.K. Nandakumar, Ph.D.,resident adviser of the Data for Decision Making Project, and by several staff members ofthe Cost Recovery Programs for Health project, including Jim Jeffers, whose untimely deathoccurred during the team’s visit.


Executive Summary xiii
Executive Summary
The purpose of the social vulnerability analysis is to examine the likely impact onsocially vulnerable groups of the various health policy reform strategies proposed for theNational Health Sector Policy Reform Agenda. Socially vulnerable groups include the poor,residents of disadvantaged rural areas, and female-headed households. Within these groups,the analysis focuses on women and children. Another objective of the analysis is to identifythe steps that should be taken to maximize the positive and minimize the negative effects ofpolicy reform on the socially vulnerable.
The analysis focuses on four primary effects of the 38 individual reform strategiescontained in the draft policy reform matrix, Suggested National Health Sector ReformStrategies. These are (1) cost recovery in Ministry of Health and Population (MOHP)facilities, (2) redirecting MOHP resources from hospital-based curative care to primary andpreventive health, (3) reallocating MOHP personnel and other resources from geographicareas of underutilization and excess supply to areas of need (e.g., rural Upper Egypt), and(4) improving and expanding national health insurance.
The conclusion of the social vulnerability analysis is that most aspects of the policyreform would have unambiguously positive effects on the socially vulnerable. In the case ofcost recovery, however, the effect on the socially vulnerable would depend on how it wasimplemented, as discussed below.
The analysis indicates that MOHP health facilities and services are used moreheavily by the socially vulnerable than by other population groups. Under thesecircumstances, charging user fees for MOHP services would have a disproportionatelynegative effect on the socially vulnerable, either by disproportionately increasing the cost oftheir health care or disproportionately lowering their utilization of health services (or somecombination thereof). However, if suitable mechanisms for identifying and exempting thepoor from paying user fees (e.g., means testing, geographic targeting) are developed,implemented, and carefully evaluated, the potentially adverse effects of user fees can beminimized.
In addition, if the revenue from user fees is used to improve the quality of care infacilities used by the socially vulnerable (being careful, in the case of hospitals, to ensurethat the quality improvements are focused on actual services used by the socially vulnerableand not those used by physicians’ private patients) and to increase the share of MOHPresources used for primary and preventive care, both the economic and health status effectsof cost recovery can be strongly positive for the socially vulnerable. Obtaining such positiveeffects from cost recovery would require that the MOHP gradually reduce its budgetallocations to hospitals (at least relatively, if not absolutely) as user-fee revenue expands.
An additional finding of the social vulnerability analysis relative to cost recovery isthat the socially vulnerable tend to use MOHP ambulatory facilities rather than hospitals foroutpatient services, suggesting that fees could be raised for hospital outpatient serviceswithout having significant adverse effects on the socially vulnerable (even in the absence ofmeans testing). When effective MOHP means-testing procedures have been implementedand/or as social insurance is improved and expanded, user fees for inpatient care can beraised to a level where they recover a substantial share of, if not total, cost. Last, with

xiv Executive Summary
respect to cost recovery, the analysis emphasizes the need for a strong research andevaluation component to measure the effect of cost recovery on health care utilization andspending of the socially vulnerable, as well as to monitor the effectiveness of MOHP’smeans testing and targeting efforts.
The analysis clearly shows that, between the socially vulnerable and other groups inEgypt, substantial differentials remain in health status, as well as in access to and utilizationof primary and preventive health care. There is no question but that the socially vulnerable’shealth status would be much enhanced by policy reform that succeeds in shifting MOHPbudget priorities from the current emphasis on urban, hospital-based, technology-intensivecurative care to primary and preventive health care (particularly maternal and child healthservices in rural areas). The only qualification to this strong conclusion is that femalephysicians may be disadvantaged relatively by policies that gradually reduce MOHPemployment of physicians in urban areas and that provide financial incentives to physicianswho move to underserved rural areas.
The analysis establishes that the current social insurance program Health InsuranceOrganization (HIO) disproportionately benefits population groups other than the sociallyvulnerable (i.e., predominantly the urban middle classes). Eliminating the HIO deficit,particularly if the savings accruing to the government of Egypt (GOE) is used to expandprimary and preventive health services, would unambiguously help the socially vulnerable,few of whom are currently HIO members. The expansion of a suitably redesigned andrestructured social insurance program oriented to the financing of catastrophic illness (i.e.,with greatly reduced benefits for hospital outpatient care and drugs) would alsounambiguously help the socially vulnerable, who now must either do without neededinpatient care or incur expenditures that result in severe financial hardship.
The social vulnerability analysis concludes by identifying a need for continuedsupport of research with newly available data sets (e.g., the 1996 Central Agency for PublicMobilization and Statistics [CAPMAS] budget survey, the 1995 Demographic and HealthSurvey, the 1995 Poverty Study) to sharpen our understanding of the likely effect of healthpolicy reform on the socially vulnerable. It also calls for continued support of research onthe demand for health services, particularly on the factors that affect the choice of publicversus private providers and on the trade-offs between price and quality in patient demand.Continued research on the cost effectiveness of alternative health interventions in Egypt isalso needed to guide MOHP supply and pricing of health services and use in developing asuitable minimum benefits package for a redesigned social insurance program. The analysisconcludes by recommending a study of the net health benefits (subsidies less taxes)currently received by different income groups from the GOE budget. A better understandingof the system’s current redistributive effects would be useful in focusing policy reforms toproduce the greatest net gains for the socially vulnerable.
A summary of the conclusions reached by the analysis concerning the likely effecton socially vulnerable groups of the proposed reform strategies is shown in Table 10.

1.0 Purpose 1
1.0 Purpose
The purpose of this analysis is to examine the impact on socially vulnerable groupsof the various health policy reform strategies proposed for the National Health Sector PolicyReform Agenda. For the purposes of this analysis, socially vulnerable groups consist of thepoor, rural residents—especially those of Upper Egypt—and female-headed households.Within all these groups, the analysis focuses on women and children.


This survey is the first round of the Egyptian Household Health Care Utilization and Expenditure Survey and was funded by1
the United States Agency for International Development (Berman et al., 1995). It involves a stratified random sample ofhouseholds selected from 546 segments in 21 governorates. Two types of questionnaires were used in data collection: ahousehold questionnaire and an individual questionnaire. The survey was conducted in two rounds to adjust for seasonalvariations in utilization. The first round was conducted from November 1994 to early February 1995, and included 5,299households, 4,973 of which were successfully interviewed (i.e,. a response rate of 96.7 percent). Of the 27,242 individualsin the surveyed households, 25,513 were interviewed (i.e., a response rate of 93.7 percent).
2.0 Methodology and Data Sources 3
2.0 Methodology and Data Sources
This social vulnerability analysis involves both secondary and primary analysis.Secondary data sources include reports prepared by the Data for Decision Making (DDM)Project and the Cost Recovery for Health project, the 1992 Demographic and Health Survey(DHS), various Ministry of Health and Population (MOHP) documents, and a number ofspecific studies on the conditions (including health) of women, the poor, and children inEgypt. The primary analysis is based on the 1994 Health Expenditure Survey conductedjointly by the MOHP, the DDM, and the Cairo Demographic Center. These data were used1
to compare utilization of health services, household expenditures, health status, and othervariables among income groups, men and women, and urban and rural residents, to makeinferences about the likely effect of these reforms on the socially vulnerable.
Households were divided into three income groups, based on reported monthlyhousehold expenditures (used as a proxy for the household’s long-run income): the lowest35 percent of households, the middle 55 percent, and the top 10 percent. These divisionswere used in the analysis because they more accurately reflect the socioeconomic classes inEgypt than do other income groupings, such as quintiles. The lowest 35 percent wasselected to represent the poor since this is close to the estimated proportion of thepopulation that is below the poverty line. Since there is a considerable gap between theupper and middle classes in Egypt, and only a small proportion of the population can beconsidered upper class, it was decided to use only the top 10 percent of households torepresent the rich. The remaining 55 percent of households represents the middle class.
Since many of the 38 reform strategies listed in the draft policy reform matrix,Suggested National Health Sector Reform Strategies, have similar or related effects, it wasdecided to analyze the impact on the socially vulnerable of these common effects instead ofanalyzing the effect of each reform strategy separately.
The common effects analyzed are: (1) cost recovery, (2) redirecting MOHPresources from curative care to primary health care (PHC) (including maternal and childhealth care [MCH] and preventive care), (3) reallocating MOHP resources according towhere they are most needed (e.g., to rural areas and Upper Egypt), and (4) improving andexpanding national health insurance. Table 10 (see pp. 36–38) shows the relationshipbetween each of these common effects and the individual strategies listed in the matrix andsummarizes the conclusions reached by the analysis about measures needed to ensure thatthe reform has a positive impact on the socially vulnerable.


3.0 Background on Socially Vulnerable Groups in Egypt 5
3.0 Background on Socially VulnerableGroups in Egypt
3.1 Who Are the Socially Vulnerable?
We define the socially vulnerable as those who have very limited choices andlimited decision-making ability in their lives as a result of poverty, low social status, and/ora lack of political power. In Egypt, as in most other countries, the socially vulnerable tend tobe the poor and women, in particular, poor women living in areas where the traditionsconcerning the role of women remain very strong.
3.1.1 The Poor in Egypt
According to one study (Nassar, 1995), 38 percent of the Egyptian population in1990/91 was living below the poverty line (defined as a monthly per capita expenditurelevel of Egyptian pounds (LE) 61 or less in 1991). According to this study, an estimated 21to 25 percent of the population lives in “absolute poverty,” including street children,landless agriculture workers, many disabled and chronically unemployed people, as well as asubstantial proportion of female-headed households. Poverty is most common in rural areas.Among regions, Upper Egypt has the highest poverty rate, followed by the Delta Region(UNDP, 1995).
Table 1 provides a percentage breakdown by place of residence for each incomegroup (and within each income group by gender) of respondents from the 1994 HealthExpenditure Survey, a sample that is representative of the Egyptian population as a whole.Those in the low-income group (the lowest 35 percent of the sample in terms of incomelevel) are more concentrated in the rural areas and in Upper Egypt than those from themiddle- and high-income groups. This table also shows that low-income families spend onlyan average of LE 68 per person per month, compared with LE 125 for the middle-incomegroup and more than six times as much for the high-income group (LE 428). Since mosthousehold income among the poor is used to purchase food—55 to 70 percent according tosome estimates (Nassar, 1995)—little is available for such “extras” as health care,schooling, and transportation. Many rural poor are landless agricultural workers andsubsistence farmers, while the urban poor tend to be casual laborers, peddlers, and workersin small manufacturing enterprises.
Given the dire situation of poor families in Egypt, many children from thesefamilies are forced to drop out of school and enter the labor force to help make ends meet.An estimated 27 percent of children ages 6 to 14 in rural areas in 1992 were working andnot attending school, compared with only 11 percent of urban children (DHS 1992 cited inNassar, 1995). These child laborers take jobs as agricultural workers, street traders, garbagecollectors, servants, and other menial laborers and contribute up to 30 percent of the totalhousehold income of poor families.

6 Social Vulnerability Analysis of the Health Sector Reform Program Assistance in Egypt
Table 1Demographic Characteristics of Respondents from the 1994 Health
Expenditure Survey by Income Group and by Gender
Characteristic
Income Group
Total
Lowest 35% Middle 55% Highest 10%
Male Female Total Male Female Total Male Female Total
Place of Residence(percent): 33.9 35.0 34.5 46.3 46.0 46.2 49.8 51.1 50.4 43.4 Urban Areas
Rural Areas 66.1 65.0 65.5 53.7 54.0 53.8 50.2 48.9 49.6 56.6
Total 100.0 100.0 100.0 100.0 100.0 100.0 100.0 100.0 100.0 100.0
Region ofResidence(percent)
Urban 12.6 13.0 12.8 20.9 21.4 21.2 27.3 28.3 27.8 19.6Governorates
Lower Egypt 36.8 36.5 36.7 43.8 45.1 44.4 43.6 43.7 43.6 42.2
Upper Egypt 50.6 50.4 50.5 35.3 33.5 34.4 29.0 28.0 28.6 38.2
Total 100.0 100.0 100.0 100.0 100.0 100.0 100.0 100.0 100.0 100.0
Mean MonthlyExpenditures per 68.3 125.4 428.7 135.8Capita (fromhousehold data)(LE)
Education: No Education 45.7 61.8 54.1 30.5 44.9 37.7 25.5 36.9 31.2 41.5
Completed Primary 16.4 11.2 13.7 25.1 20.0 22.6 25.4 21.5 23.4 20.2Schooland SomeSecondary School
Completed 11.6 6.4 8.9 18.1 11.7 14.9 25.7 20.2 23.0 14.2Secondary School
Total 100.0 100.0 100.0 100.0 100.0 100.0 100.0 100.0 100.0 100.0
Source: 1994 Health Expenditure Survey

3.0 Background on Socially Vulnerable Groups in Egypt 7
Female-headed households are also disproportionately poor and increasinglycommon, accounting for 18 to 22 percent of all households in Egypt. These households arethe product of widowhood (in 60 percent of the cases), divorce, or the husband’s absencedue to emigration or military service (Moghadam, 1995). Many female household heads areilliterate and unskilled and work mainly in the informal sector as servants, peddlers, or inother menial jobs, or in the rural areas as subsistence farmers. The mean income of female-headed households is 37 percent lower than that of male-headed households (Moghadam,1995). Working children are especially common in female-headed households. A study ofworking children in Alexandria found that 60 percent of working children were living infemale-headed households (UNICEF, 1994, cited in Nassar, 1995). In addition, it isestimated that 40,000 children are living in the streets in Egypt.
3.1.2 Women in Egypt
Despite gains in the status of women over the past few decades in Egypt, womenstill suffer disproportionately from poverty (particularly if they head households), illiteracy,job insecurity, and poor working conditions. According to one set of estimates prepared for1991 (Nassar, 1996), 62 percent of women over the age of 15 in Egypt are illiteratecompared with 37 percent of men, while only 41 percent of girls have completed primaryschool compared with 75 percent of boys. At the same time, however, school enrollmentamong girls continues to increase and a woman’s right to an education is becoming moreand more accepted, even among lower socioeconomic groups (Kader, undated).
Women also suffer disproportionately in the work place, facing job insecurity,harsh working conditions, and job discrimination. Poor women, who tend to work moreoften than middle-income women out of need, work mainly in agriculture and in the informalsector (i.e., micro- and small enterprises). In these jobs they face poor working conditions,including long hours (50 or more per week), no social insurance, and poor sanitary andsafety conditions. Most of these jobs pay very poorly, and job security is totally lacking.Even in the formal sector, including the government sector where women fare better, manypositions are gender-defined, with women working mainly in low-level jobs as unskilled,production workers, secretaries, and clerks. When layoffs occur, women are the first to losetheir jobs, given their low job positions generally and the prevailing view that a woman’sprincipal role is that of wife and mother and that men are more deserving of the remainingjobs.
3.1.3 Health Status and Use of Health Services by the SociallyVulnerable
As in most countries, the poor in Egypt suffer from worse health compared with therest of the population. Infectious diseases still predominate among poor children; infant andchild mortality rates in the poor rural areas of the country remain substantially higher than inthe urban wealthier parts of the country. For example, the infant mortality rate (IMR)among rural inhabitants of Upper Egypt is 72 per 1,000 live births, more than double therate in the urban governorates (33) and 60 percent higher than the overall rate in Egypt (45).Similarly, malnutrition is relatively common among children less than five years of age inthe poorer rural areas of the country.
The health of poor rural women is affected both by their poverty and by their lowstatus within society. When food is scarce in a family, it is the mother who is most likely to

8 Social Vulnerability Analysis of the Health Sector Reform Program Assistance in Egypt
receive an insufficient intake of calories rather than her husband or children (Nassar, 1996).Rates of anemia among pregnant women have been reported to be around 22 percent(Nassar, 1996). Cultural norms still dictate against women seeking health care outside of thehome in many places, and women must obtain permission from their husbands or mothers-in-law to go to a clinic or doctor. Consequently, most childbirths still take place at home,and only around one-quarter of them occur in a health facility (the rate is only 12 percent inrural Upper Egypt). Maternal mortality rates are quite high, reaching 240 per 100,000 livebirths in Upper Egypt as a whole.
Given the poor health status and low utilization of health services of poor womenand children, especially those in disadvantaged rural areas, it is critical that the proposedhealth sector reforms be examined for their potential effect on these groups. This analysis isprovided in the following section.

4.0 Analysis of the Impact of the Suggested Health Reform Strategies on the Socially Vulnerable 9
4.0 Analysis of the Impact of theSuggested Health ReformStrategies on the SociallyVulnerable
4.1 Expanding Cost Recovery and Rationalizing theMOHP’s Role in Financing Curative Care
One common effect of a number of the suggested health sector reform strategies(under 1.1) is cost recovery in MOHP facilities or shifting part of the burden of financingboth inpatient and outpatient services from the government sector to private households. Toanalyze the potential impact of cost recovery on the socially vulnerable, the followingquestions are addressed:
> To what extent do the socially vulnerable use MOHP inpatient andoutpatient services as compared to services from other types of providers?
> How much do the socially vulnerable currently pay for health care?
> What is the likely impact of cost recovery on both health care utilizationand health status of the socially vulnerable? and
> How can cost recovery be implemented in such a way as to enhance itspositive impact on the socially vulnerable?
4.1.1 Current Utilization of MOHP Care by Socially VulnerableGroups
In this section, we describe patterns of health care utilization among the sociallyvulnerable. Because our interest is on modern heath care’s accessibility to both the poor andfemale populations, the focus is on which sources of health care are used most often ratherthan on how much care is used.
4.1.1.1 Inpatient Care Utilization
Table 2 presents a percentage breakdown—by income group and according towhether or not they received inpatient services—for respondents 16 years of age and olderwho claimed they needed hospitalization within the last 12 months. The data source is the1994 Health Expenditure Survey. These data indicate that the poor are less likely when ill tobe hospitalized compared with those in either middle- or higher-income groups (28 percentversus 34 percent). These data also suggest that access to inpatient services may be less for

10 Social Vulnerability Analysis of the Health Sector Reform Program Assistance in Egypt
the poor population. Indeed, the percent of individuals who cited “cost” as the reason for notentering a hospital was higher among the poor (62 percent) than for either the middle-income group (52 percent) or the upper-income group (40 percent). However, these datashould be viewed cautiously for at least two reasons. First, the 1994 Health ExpenditureSurvey did not collect information on why respondents believed hospitalization was needed(e.g., information on symptoms), so there is no way to evaluate how severe the illnesseswere in each group. Second, the percent of individuals who claimed they needed inpatientcare appears to be quite large (about 15 percent).
Table 2
Percent Receiving Inpatient Care among Respondents 16 Years ofAge and Older Who Reported a Need for Hospitalization during the
Past Year, by Income Group
Income Level
Low Middle High Total
Inpatient (percent) 28 34 34 32
Not inpatient, but claimedneed of hospitalization 72 66 66 68(percent)
Total 100 100 100 100
Sample Size (N) 1,132 2,236 452 3,820
Source: 1994 Health Expenditure Survey
Nandakumar and Yip point out that for inpatient care, all income groups relyheavily on MOHP facilities despite their poor reputation for quality of care (Nandakumarand Yip, 1995). The low level of fees in the MOHP was the most frequently cited reason forchoosing an MOHP facility by those who used them (67 percent). However, the absence ofother providers in many parts of Egypt may also be a contributing factor, as government andpublic facilities account for more than 90 percent of hospital beds in Egypt.
The 1994 Health Expenditure Survey data indicate that for those who use inpatientcare, the government sector is by far the most important source of inpatient care for allexpenditure groups. However, poor individuals rely more on the government sector than dothose who are better off. Table 3 presents a percentage breakdown of persons who usedinpatient care in the last 12 months by the type of facility where hospitalized, by incomegroup, and by gender. According to these data, more than 63 percent of the poor receivedcare in MOHP facilities, compared with 50 percent of the middle-income group and 41percent of the higher-income group. Moreover, within all income groups,

4.0 Analysis of the Impact of the Suggested Health Reform Strategies on the Socially Vulnerable 11
Table 3
Distribution of Respondents Hospitalized by Source of Most Recent Inpatient Care, by Income Group, and by Gender (Percent)
Income Group Female-HeadedHouse-Holds Total
Lowest 35% Middle 55% Highest 10%
Type of Male Female Total Male Femal Total Male Femal TotalHospital e e
MOHP 57.1 68.7 63.1 42.9 55.4 49.5 39.9 43.1 41.3 57.5 52.0
Health 17.5 6.6 11.9 18.3 9.5 13.7 16.9 4.2 11.0 8.2 12.9InsuranceOrganization
Curative Care 1.3 0.6 0.9 1.4 0.8 1.1 1.2 1.4 1.3 0.8 1.1Organizations
Other Ministries 13.6 15.7 14.7 22.4 19.5 20.9 13.3 16.7 14.8 18.2 18.51
Company 0.6 0.00 0.3 1.9 1.0 1.4 3.6 1.4 2.6 0.8 1.3
Private 5.8 5.4 5.6 10.2 10.8 10.5 21.7 26.4 23.9 11.1 10.9
Community 1.3 1.8 1.6 1.4 1.3 1.3 0.00 2.8 1.3 1.6 1.4
Syndicates 0.6 0.00 0.3 0.6 0.5 0.5 0.00 0.00 0.00 0.3 0.4
Other 1.9 1.2 1.6 0.8 1.3 1.1 3.6 4.2 3.9 1.6 1.5
Total 100.0 100.0 100.0 100.0 100.0 100.0 100.0 100.0 100.0 100.0 100.0
Source: 1994 Health Expenditure Survey
Includes University Hospitals operated by the Ministry of Education1
women used the MOHP facilities more frequently than men. For example, among the poor, 69 percentof women received care at MOHP facilities compared with 57 percent of men.
The data on inpatient care utilization patterns in Table 3 suggest that the incidence of feescharged for MOHP inpatient services would be greatest on the poor and women (including members offemale-headed households) because these groups tend to use MOHP inpatient services more than otherpopulation groups. This means that if fees are charged, and utilization patterns remain as they are, thepoor and women would pay a disproportionately large share of the fees collected. In economic terms,one might in this case characterize user fees for inpatient services as a regressive tax. Alternately, as anumber of econometric studies in other countries suggest is likely (see, for example, the review inGertler and van der Gaag, 1990), if the price elasticity of demand is higher among the poor (i.e., if theeffect of a price increase on their utilization of services is larger), an additional effect of introducinguser fees for inpatient services in the MOHP facilities would be to reduce disproportionately the use ofthese services by vulnerable groups. Reduced access to MOHP inpatient services would in this case bemanifested in the form of poorer health status (i.e., increased morbidity and mortality) among thesocially vulnerable.
If the price elasticity of demand among the poor were greater than one, their total level of spending would2
decline if prices were raised. Although reduced spending by the poor might appear to make spendingpatterns more equitable, the effect would almost certainly be to worsen the health status of the poor relativeto the nonpoor (since the reduction in spending would reflect a reduced quantity of health care consumedrather than lower prices paid).
12 Social Vulnerability Analysis of the Health Sector Reform Program Assistance in Egypt
The preceding analysis underlines the importance of minimizing the effect of fees on healthservices utilization by the poor. One possibility is to refine means testing in order to identify andexempt the poor from paying fees.
4.1.1.2 Outpatient Care Utilization
Table 4 shows that the poor rely substantially more on the MOHP and public sector facilitiesfor outpatient care than do better-off Egyptians. For example, more than 30 percent of persons fromlow-income households used the MOHP facilities compared with 20 percent of persons from middle-income households and 15 percent of persons from high-income households. Although the poor choosegovernment facilities more frequently than other individuals, private alternatives are still the mostfrequently utilized source of outpatient care (i.e., for both the poor and nonpoor). For example, Table 4shows that 41 percent of the poor obtained outpatient care from either private doctors or private healthfacilities. In addition, an additional 4 percent of the poor treated themselves by purchasing drugs from(predominantly private) pharmacies.
Women more than men rely on the government health sector and on private providers foroutpatient care. For example, 32 percent of poor women used MOHP facilities and 54 percent usedprivate providers compared with 29 percent and 49 percent, respectively, of poor men. This pattern ofrelying more on MOHP facilities and private providers also holds true for female-headed households.One reason for this is that more men are covered by social insurance, which provides them access toHealth Insurance Organization (HIO) facilities.
In urban areas, most persons seeking outpatient care use MOHP hospitals rather than lowerlevels of the referral system. Among the poor, for example, 15 percent utilized urban MOHP hospitalsand only 2.4 percent utilized urban MOHP health units. In rural areas, MOHP clinics are the dominantsource of outpatient care. While 11 percent of the poor utilized rural MOHP clinics, only 1.5 percentutilized rural MOHP hospitals.
The data in Table 4 suggest that the effects of cost recovery for MOHP outpatient services would againimpact disproportionately on poor women.
4.1.2 Health Care Expenditures by the Socially Vulnerable
Table 5 presents household-level data from the 1994 Health Expenditure Survey on thepercent of per capita income spent on health care (both outpatient and inpatient) by income quintile.These data indicate that the percent of income spent on health care declines as income increases. Thepoor spend 14 percent of their total income on health care expenditures, compared with 8.7 percent forthe highest income quintile and 11 percent for the total sample. This pattern would be even morestriking if the poor were to consume as much health care as the rich, which is not the case (refer, forexample, to Table 2). Since cost recovery in MOHP facilities would be likely to impactdisproportionately on the poor, it is possible that the pattern of health spending presented in Table 5would become even more inequitable.2

4.0 Analysis of the Impact of the Suggested Health Reform Strategies on the Socially Vulnerable 13
Table 4
Distribution of Respondents Seeking Outpatient Care by Source of Care, Income Group, and Gender (percent)
Source ofOutpatient Care
Income GroupFemale-HeadedHouse-holds Total
Lowest 35% Middle 55% Highest 10%
Male Female Total Male Female Total Male Female Total
MOHP Facilities: Urban Hospitals 14.7 15.6 15.2 8.7 10.8 9.8 6.2 10.7 8.6 12.0 11.0
Urban Clinics/Units 1.7 2.9 2.4 1.9 2.7 2.3 1.3 0.9 1.1 2.5 2.2
Rural Hospitals 1.9 1.1 1.5 0.9 1.4 1.2 0.7 0.3 0.5 1.2 1.1
Rural Clinics/Units 9.9 11.6 10.8 7.0 4.8 5.8 2.9 5.4 4.2 6.5 6.8
MHC Centers (mostlyin urban areas)
0.6 0.8 0.7 0.3 0.7 0.5 0.3 0.3 0.3 0.7 0.5
Total MOHP Facilities 28.8 32.0 30.6 18.8 20.4 19.6 11.4 17.6 14.7 22.9 21.6
TeachingHospitals/Other Govt.Facilities
11.6 8.9 10.2 13.5 9.4 11.3 13.7 7.2 10.3 9.0 10.9
Health InsuranceProviders (includingHIO)
10.9 5.5 8.0 11.6 5.5 8.3 9.4 4.8 7.0 5.4 8.1
Total OtherGovernment andPublic Facilities
22.5 14.4 18.2 25.1 14.9 19.6 23.1 12.0 17.3 14.4 19.0
PrivateDoctors/Clinics/Hospitals
38.4 43.4 41.1 45.2 53.8 49.8 58.9 59.1 59.1 51.9 48.9
Pharmacies 4.6 3.5 4.0 3.3 2.1 2.7 2.3 3.0 2.6 2.6 3.0
Other privateproviders, includingNGOs, traditionalhealers, etc.
5.6 6.6 6.1 7.6 8.9 8.3 4.2 8.4 6.5 8.2 7.3
Total PrivateProviders
48.6 53.5 51.2 56.1 64.8 60.8 65.4 70.5 68.2 62.7 59.2
Total 100 100 100 100 100.0 100 100 100 100 100 100
Source: 1994 Health Expenditure Survey

14 Social Vulnerability Analysis of the Health Sector Reform Program Assistance in Egypt
4.1.2.1 Inpatient Care Expenditures
Table 6 shows for each income group the mean total out-of-pocket expenditure for aninpatient stay among persons who were hospitalized during the past 12 months. The mean chargefor the poor in MOHP hospitals (LE 66) is equal to about one month’s minimum wage (LE 60). Itis slightly below what a poor person pays at a Curative Care Organization (CCO) hospital (LE 70)and substantially above the amount paid at an HIO hospital (LE 22). It is interesting to note thatexpenditure on drugs accounts for most of the total charges incurred in connection with aninpatient stay at MOHP hospitals, whereas the physician’s bill accounts for most of the totalcharge in connection with a private hospital stay.
4.1.2.2 Outpatient Care Expenditures
Table 5 shows that poor households spend substantially more on outpatient care as apercent of their income than do other households. If drugs purchased from sources other thanhealth facilities are included as a cost of outpatient care, households in the lowest quintile spend13.8 percent of their income on outpatient care, compared with 8.1 percent of income spent byhouseholds in the highest income quintile and 10.3 percent of income spent by the entire sample.The data in Table 5 also show that out-of-pocket expenditures on outpatient care are substantiallyhigher than expenditures on inpatient care for all income groups. For households in the lowestincome quintile, for example, only 1 percent of household income was spent on inpatient carecompared with 7.8 percent spent on outpatient care (excluding drugs). For the total sample, thepercent spent on inpatient care was only 0.5 percent compared with 6.6 percent of income spent onoutpatient care.
It is possible that cost recovery in MOHP facilities, particularly if the revenue is used toimprove the quality of services, may encourage significant numbers of the socially vulnerable toswitch from private providers to the MOHP. Since it is likely that MOHP services are lessexpensive than private services, cost recovery may serve to lower the total expenditures of thesocially vulnerable for outpatient care (even though the cost per visit to an MOHP facility may behigher).
4.1.3 The Potential Impact of Cost Recovery Mechanisms on theSocially Vulnerable
Implementing cost recovery as a way to improve the financial viability and the efficiencyof public health care provision has sparked heated discussions among government officials andpolicymakers, and for good reason. Potentially, increases in user fees can decrease health careaccessibility and, as a result, decrease both modern health care utilization and the health outcomesof the poor and other socially vulnerable populations. However, these discussions often neglect thefact that current financing policies in Egypt may have an adverse equity effect, as these policiesare most often to the advantage of the rich, the urban, and the old at the expense of the poor, therural, and the young. Evidence of such adverse equity effects in Egypt includes the following:
> The number of beds per 1,000 population in urban areas, 2.3, is almost 8 times thenumber in rural areas, 0.3. This is an important reason why the number of inpatient

4.0 Analysis of the Impact of the Suggested Health Reform Strategies on the Socially Vulnerable 15
Table 5
Percentage of Per Capita Income Spent on Health Care, by Income Quintiles
Income Quintiles Outpatient Inpatient Care Purchased Total (%) Income (LE)Care (%) (%) Drugs (%)
Self- Mean
Lowest 7.8 1.0 5.0 14.0 362
Second 7.1 0.5 3.9 11.5 629
Third 7.4 0.3 3.3 11.0 906
Fourth 5.5 0.2 3.3 9.0 1,308
Highest 5.2 0.5 2.9 8.7 3,456
Total 6.6 0.5 3.7 10.8 1,332
Source: Berman et al., 1995
Table 6
Total Mean Hospital Expenditure Per Inpatient Stay by Type of Facility and by Income Group
Type of Hospital
Income Group
Lowest 35% Middle 55% Highest 10%
Ministry of Health 66 99 324
Health Insurance Organization 22 26 24
Curative Care 70 257 1,705
Private 496 567 1,553
Community 481 115 1,600
Source: Berman et al., 1995
visits among urban residents, who tend to be wealthier and more educated than their ruralcounterparts, is more than three times that of residents of Upper Egypt. > MOHP hospitals are the preferred provider not only among the poor, but also among
those in the middle and upper classes in Egypt. Moreover, the middle and upper classesalso rely substantially on government facilities for outpatient care. The consumption ofheavily subsidized curative health services by middle- and upper-income groups lessensthe equity of Egypt’s health system.
> Household out-of-pocket expenditures in Egypt already account for most (55 percent) ofthe financing sources for the entire health care system (Department of Planning, MOHP,1995). In addition, poor Egyptians incur large out-of-pocket expenditures for outpatientcare despite the fact that government care is nominally priced. This is a result of higherprivate care utilization and high private drug purchases.

16 Social Vulnerability Analysis of the Health Sector Reform Program Assistance in Egypt
Given the current utilization and expenditure patterns, we believe that implementing costrecovery has the potential to improve health care accessibility for the socially vulnerable. Thisimprovement in the equity of health care delivery can result through a number of mechanisms.First, if higher user fees are successful in collecting funds from those who are both willing andable to pay for curative services, the MOHP can use funds that are freed up to further subsidizethe poor’s utilization of primary health care (including MHC services). Second, if funds collectedthrough user fees can be used to improve the quality of MOHP services, modern health careutilization by socially vulnerable groups may actually increase, outweighing any negative effectson demand caused by higher user fees. And third, cost recovery strategies based on price increasesand quality improvements may actually decrease total household health expenditures of thesocially vulnerable if the reliance on drugs purchased outside the facility declines, if they switchfrom more expensive private to less expensive MOHP providers, and/or if the impact of healthcare services on health status improves.
Not surprisingly, international experience and recent research studies demonstrate thatincreasing user fees alone can have a greater negative effect on the poor than the non-poor (Gertlerand van der Gaag, 1990). However, an increasing amount of research based on econometricmodeling techniques indicates that the responsiveness of the poor to changes in the price of healthcare is not very large (i.e., demand is inelastic, so that a given percentage change in price isaccompanied by a smaller percentage change in the quantity of health care consumed). Moreover,cost recovery implementation can actually increase health care utilization by the poor and othersocially vulnerable groups if MOHP officials package the “right” mix of quality improvementsand price increases. Such a positive net effect on utilization from simultaneous price increases andquality improvements is evident from experiments carried out in Cameroon and Niger (see thenext sections for more information on the Niger experience), as well as from an increasing amountof empirical research on health care demand in developing countries. Similar preliminary findingshave also been obtained by the DDM project (discussed below in section 6).
4.1.4 Conditions Necessary to Help Ensure the Success of CostRecovery Efforts
In addition to improvements in the quality of services delivered at MOHP facilities (whichis discussed in the next section of this report), there are a number of steps that we believe arenecessary to ensure the success of cost recovery efforts.
4.1.4.1 Targeting
Protecting the poor population from the potentially deleterious effects of user fees shouldbe an essential part of cost recovery implementation. The analysis reported in this section makes itclear that the incidence of user fees in MOHP facilities would fall disproportionately on the poor,particularly on poor women. With higher user fees, these groups will have to pay proportionatelymore than other groups (because they use MOHP services more than other groups) and/or,depending on their response to increased fees, they may reduce their consumption of servicesdisproportionately more than those of other groups. The data presented on actual expenditures, asdistinct from utilization, show that the poor are not exempted from paying fees, even in MOHPfacilities. If fees are to be raised, it is important that more effective means be used to identify andexempt the poor and other socially vulnerable groups from the adverse effects of these feeincreases. As fees are increased in MOHP hospitals (and possibly in other types of facilities aswell), it will be important to develop effective procedures to “target” remaining subsidies to thosewho need them the most, i.e., the poor and other socially vulnerable groups.

4.0 Analysis of the Impact of the Suggested Health Reform Strategies on the Socially Vulnerable 17
In selecting targeting mechanisms to protect the poor, planners must weigh the tradeoffbetween the administrative costs of identifying those who are in need of subsidies and themagnitude of the “leakage” (i.e., providing subsidies to those who do not need them). To provideexamples of this tradeoff, consider a geographic targeting plan that waives user fees for an entirecommunity and another plan (means testing) that uses social workers to obtain information on theincome status of patients who enter the health care facility. The former plan is characterized bylow administrative costs and a high level of leakage, while the latter plan is characterized by highadministrative costs and a low level of leakage. Although there are many options besides thosementioned that can be used to target subsidies, the “correct” targeting scheme will be selectedkeeping in mind this tradeoff as well as recognizing that the socially vulnerable are aheterogeneous population. Accordingly, the most effective scheme for targeting MOHP subsidiesto the poor and other socially vulnerable groups may be to combine geographic targeting in ruralareas of Upper Egypt with individual means testing in Cairo and other urban areas, where formalsector employment is more common and thus there is a greater ability to verify income levels.
4.1.4.2 Phasing-in Cost Recovery Implementation
In implementing cost recovery programs, health planners should carefully consider thefees charged for different types of health services. Cost recovery is most effective when applied tocurative health services. These are the services for which the willingness to pay is highest on thepart of consumers (i.e., the services with the lowest price elasticities of demand) and for whichprivate and social benefits tend to be equal (in most cases). Planners should be extremely cautiousabout implementing user fees for preventative services, where willingness to pay is low,particularly among the socially vulnerable. These services should continue to receive substantialsubsidies to encourage their continued utilization by the poor and other socially vulnerable groups.Given these considerations, it probably makes the most sense to introduce fees first in hospitals,particularly for outpatient services (which the analysis above showed are mainly consumed by theurban non-poor). As social insurance coverage increases, cost recovery should be extended toinpatient services, particularly in those categories of hospitals that are used predominantly byhigher-income urban households (e.g., university hospitals). In so doing, MOHP officials will bein a position to concentrate their limited resources on PHC services, which the analysis shows aremost often used by the rural poor.
4.1.4.3 Awareness of Institutional Factors That May Thwart Success
When designing reform strategies that involve cost recovery, planners should be aware ofthe economic interests of practitioners and administrators within the MOHP system, and thepotential for these interests to thwart the goals of improved financial sustainability, efficiency, andequity in the government health care system. For example, if the economic objective ofgovernment practitioners is to maximize their net incomes (as described by the model of physicianbehavior included in the economic analysis), there is a danger that the resources provided by costrecovery (and by the Program Assistance itself) may be used to make inappropriate qualityimprovements. An example of this phenomenon can be seen from the experience of the CostRecovery Programs for Health project, where project funds designated to improve the quality ofservices generally have been used instead to purchase diagnostic equipment appropriate only forthe provision of very specialized services that will most likely be used by a small number of high-income clients. Although such specialized quality improvements may enhance the willingness ofhigh-income patients to pay fees to physicians practicing in these facilities, the opportunity is lostto use cost recovery to improve the quality of services received by the poor and other sociallyvulnerable groups.

18 Social Vulnerability Analysis of the Health Sector Reform Program Assistance in Egypt
4.1.4.4 Monitoring and Evaluation of Cost Recovery Efforts
To monitor how well cost recovery is working and whether the poor and women areadversely affected, planners should implement monitoring and evaluating systems that can be usedto inform program management, strategic planning, and program design. A careful cost recoveryevaluation includes both program monitoring and impact assessment. Monitoring is used todetermine how well the program is carried out at different levels and at what level of efficiency.Impact assessment measures the extent to which changes in health care utilization, healthoutcomes, and costs are attributable to the program or to other factors, such as changes in themacroeconomic environment.
In particular, it is very important that the targeting mechanisms used in Egypt be carefullyevaluated for their effectiveness by using household surveys to collect data on income and actualhealth expenditures. Such surveys often find that there is little correspondence between the feesthat the poor actually pay to receive government health services and those that they are officiallyexpected to pay. If carefully designed, surveys can also be used to estimate the effect of fees on theutilization of health services by the poor and other socially vulnerable groups. Careful evaluationat the household level is an important element in cost recovery design and implementation.
4.1.5 Conclusions
The effect of cost recovery on the socially vulnerable can not be predicted a priori. Toquantify the impact on health care utilization and health status, one needs estimates of therelationships between utilization and a number of factors that determine the demand for healthcare, including user fees, travel time, and quality of care. Such relationships are currently beingestimated by the DDM project using data from the 1994 Health Expenditure Survey (discussedbelow in section 6). Cost recovery’s impact on the poor also clearly depends on the effectivenessof targeting strategies (e.g., means testing) and on how the resources recovered are used toimprove the quality and cost effectiveness of health services. Nevertheless, internationalexperience suggests that cost recovery has the potential not only to increase the health caresystem’s efficiency and financial viability, but also to improve the quality and accessibility ofhealth care services, resulting in greater health care utilization and improved health outcomesamong the poor and other socially vulnerable groups.
4.2 Strengthening the MOHP’s Role in the Provisionof PHC and Redirecting MOHP Resources fromCurative Care to Primary Health Care
We will analyze the potential impact of these sets of reform strategies on the sociallyvulnerable by trying to answer the following questions:
> Are the current patterns of resource allocation and provision of health careservices (e.g., between curative versus primary health care) not meeting the needsof the socially vulnerable as compared to other groups?

4.0 Analysis of the Impact of the Suggested Health Reform Strategies on the Socially Vulnerable 19
> If these reforms are enacted, would the socially vulnerable actually increase theirutilization of primary health care/preventive services provided by the MOHP,leading to improvements in their health status?
> What conditions or interventions are required to ensure that these reforms willactually lead to an increase in the utilization of MHC and other cost-effectivehealth services by the socially vulnerable?
4.2.1 The Health Needs of the Socially Vulnerable in Relation to theCurrent Allocation of Government Health Resources in Egypt
4.2.1.1 The Socially Vulnerable’s Health Status and Health Service Utilization
Since it is very difficult to obtain data on health status and unmet health needs fordifferent socioeconomic groups in Egypt, we will examine available health statistics pertaining tothe rural population compared with the urban population and to residents of Upper Egyptcompared with those of Lower Egypt and of the urban governorates, since the poor, especiallywomen and children, are heavily concentrated in these areas. These observed differences should beviewed against the background of the general improvements in health status that have beenachieved in Egypt in the past 20 years. For example, the overall IMR has been cut nearly in halfduring this period, from nearly 90 per 1,000 live births in 1976 to around 45 in 1988 (Nassar etal., 1992).
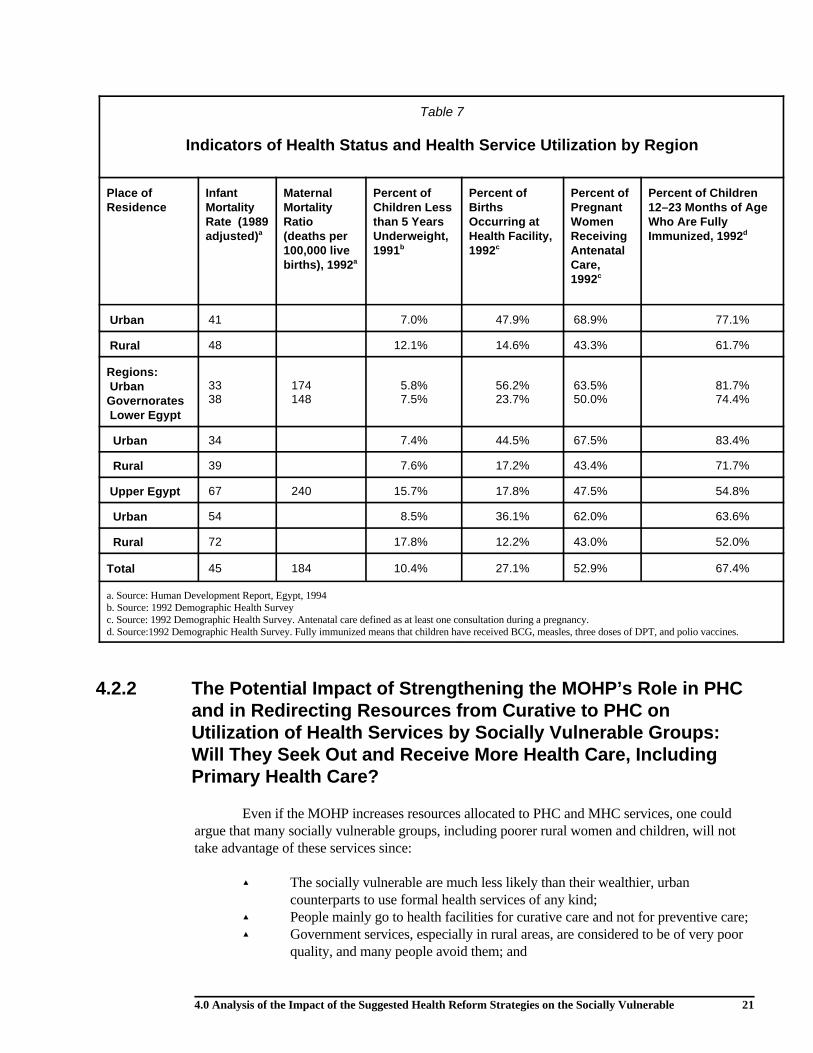
Indicators of health status and health service utilization by place of residence arepresented in Table 7. They show that residents in the country’s poor rural areas sufferdisproportionately from higher rates of mortality and morbidity—rates that are comparable tothose in countries considerably less developed than Egypt—compared with residents of thewealthier urban areas and governorates. According to the 1994 Human Development Report forEgypt, the IMR for rural Upper Egypt in 1989 was 72 per 1,000 live births—118 percent higherthan the rate in the urban governorates (33) and nearly double the overall rate for Lower Egypt(38). Mortality from diarrheal diseases and acute respiratory diseases (ARI) account for more thanhalf of infant deaths. The proportion of children under 5 that are malnourished is nearly 18 percentin rural Upper Egypt and almost 16 percent in Upper Egypt as a whole, more than twice theproportion in the urban governorates or in Lower Egypt.
Maternal mortality related to complications of pregnancy and childbirth is the leadingcause of death among women of reproductive age in Egypt. Maternal mortality in the poor ruralareas of the country is quite high by international standards, revealing a large need for improvedhealth services among poor rural women. The estimated maternal mortality ratio in 1992 forUpper Egypt was 240 per 100,000 live births, which is 62 percent higher than the estimate forLower Egypt (148) and 30 percent higher than the estimate for Egypt as a whole (184).
The use of primary and preventive health services by women and children in the poorerand rural areas of the country is also quite low and considerably lower than in the wealthier andurban areas. According to 1992 DHS data reported in Table 7, only about 12 percent of reportedbirths in rural Upper Egypt took place in a health facility, compared with 64 percent of births inthe urban governorates and 48 percent of births in urban areas as a whole. Only 43 percent of ruralwomen who were pregnant during the 5 years preceding the 1992 DHS made at least one prenatalcare visit, compared with nearly 70 percent of those living in the urban areas. Both prenatal visits

20 Social Vulnerability Analysis of the Health Sector Reform Program Assistance in Egypt
and deliveries at health facilities are critical to lowering maternal and infant mortality, and thesesharp differentials in utilization rates between urban and rural areas further indicate a large unmetneed among socially vulnerable women in Egypt. In addition, despite the fact that immunizationcoverage rates have improved markedly in recent years, nearly 50 percent of children ages 12 to 23months in rural Upper Egypt were not fully immunized in 1992, compared with less than 20percent of children living in the urban governorates.
The preceding analysis points to a large need in Egypt for effective primary health careand maternal and child health care services, especially among those living in rural areas (where thelargest concentration of socially vulnerable people live).
4.2.1.2 Where Government Funds Are Going for Health Care
Although there are clearly needs for improved and expanded primary and preventivehealth services, the allocation of government resources for health in Egypt is heavily weighedtowards curative, hospital-, and urban-based care. In 1990/91, the MOHP budget was almostevenly split between the hospital and non-hospital sectors; however, of the total government healthbudget (including the university hospitals, facilities of other ministries, and the HIO), 63 percentwas consumed by hospital services and only 37 percent was allocated to non-hospital services.The MOHP’s decline in health spending in recent years has been matched by an increase infunding for university hospitals and the HIO, both of which provide mainly inpatient services tourban populations. Expenditure data assembled by the MOHP’s Department of Planning for 3governorates show an average of only 7 percent of total expenditures being used for direct primaryhealth care and MHC services (including family planning).
A large part of the inefficiency in Egypt’s use of health resources is probably due to the heavyspending by the government on relatively expensive but cost-ineffective, hospital-based curativehealth care at the expense of relatively inexpensive but cost-effective primary health andpreventive care, which has a far greater impact on health status. According to Berman et al., 1995,“the perception is widely held that government spends too little on the services that could have alarge impact on the population’s health status, and too much on those that are less cost-effective inimproving health” (p. 11, Annex 2). For instance, Egypt has around 800 kidney dialysis units inthe country, 463 of them in the government sector. However, according to estimates prepared bythe DDM project, the money spent to gain one “healthy year of life” through renal dialysis (up toLE 36,000) would gain 174 healthy years if spent on immunizations, a highly cost-effective wayto prevent illness and save lives (LE 200 per healthy year of life gained). This shows that, even ifthe government’s health spending does not increase from current levels, just reallocating itscurrent budget away from technology-intensive hospital-based services toward cost-effectiveprimary and preventive health care services could have a tremendous effect on the health ofsocially vulnerable children and women.
4.0 Analysis of the Impact of the Suggested Health Reform Strategies on the Socially Vulnerable 21
Table 7
Indicators of Health Status and Health Service Utilization by Region
Place of Infant Maternal Percent of Percent of Percent of Percent of ChildrenResidence Mortality Mortality Children Less Births Pregnant 12–23 Months of Age
Rate (1989 Ratio than 5 Years Occurring at Women Who Are Fullyadjusted) (deaths per Underweight, Health Facility, Receiving Immunized, 1992a
100,000 live 1991 1992 Antenatalbirths), 1992 Care,a
b c
1992c
d
Urban 41 7.0% 47.9% 68.9% 77.1%
Rural 48 12.1% 14.6% 43.3% 61.7%
Regions: UrbanGovernorates Lower Egypt
33 174 5.8% 56.2% 63.5% 81.7%38 148 7.5% 23.7% 50.0% 74.4%
Urban 34 7.4% 44.5% 67.5% 83.4%
Rural 39 7.6% 17.2% 43.4% 71.7%
Upper Egypt 67 240 15.7% 17.8% 47.5% 54.8%
Urban 54 8.5% 36.1% 62.0% 63.6%
Rural 72 17.8% 12.2% 43.0% 52.0%
Total 45 184 10.4% 27.1% 52.9% 67.4%
a. Source: Human Development Report, Egypt, 1994b. Source: 1992 Demographic Health Surveyc. Source: 1992 Demographic Health Survey. Antenatal care defined as at least one consultation during a pregnancy.d. Source:1992 Demographic Health Survey. Fully immunized means that children have received BCG, measles, three doses of DPT, and polio vaccines.
4.2.2 The Potential Impact of Strengthening the MOHP’s Role in PHC and in Redirecting Resources from Curative to PHC onUtilization of Health Services by Socially Vulnerable Groups:Will They Seek Out and Receive More Health Care, IncludingPrimary Health Care?
Even if the MOHP increases resources allocated to PHC and MHC services, one couldargue that many socially vulnerable groups, including poorer rural women and children, will nottake advantage of these services since:
> The socially vulnerable are much less likely than their wealthier, urbancounterparts to use formal health services of any kind;
> People mainly go to health facilities for curative care and not for preventive care; > Government services, especially in rural areas, are considered to be of very poor
quality, and many people avoid them; and

22 Social Vulnerability Analysis of the Health Sector Reform Program Assistance in Egypt
> Even the socially vulnerable rely heavily on the private sector for outpatient careand are therefore unlikely to receive PHC and preventive care at governmentfacilities.
However, evidence from Egypt as well as other countries suggests that the poor, eventhose in remote rural areas, tend to take advantage of good quality health services when available.This evidence includes the following:
> The demand for outpatient care in the formal health sector, even among the poorand rural residents, is quite high in Egypt. People in rural areas made an averageof 3.5 outpatient visits in the year preceding to the 1994 Health ExpenditureSurvey, and those in rural Upper Egypt made an average of almost 3 visits peryear (Berman et al., 1995). Although these utilization rates are considerablylower than those registered by residents of the urban governorates (whichaveraged 6.25 outpatient visits per year), they do indicate a substantial demandfor modern health care services among the socially vulnerable.
> MOHP facilities remain an important source of outpatient care for the sociallyvulnerable (e.g, the poor, including women, and rural residents), despite theperceived poor quality of their services. As shown in Table 4, 30 percent of thosein the low-income group who reported outpatient visits in the 1994 HealthExpenditure Survey made their last outpatient visit to an MOHP facility,compared with less than 15 percent of those in the high-income group. Althoughmore than 50 percent of the low-income respondents used private providers, thiswas still less than the nearly 60 to 70 percent of those in the middle- and high-income groups who used private providers. Low-income women were alsoslightly more inclined to use MOHP outpatient services than men in the sameincome group. Thus, expanding and improving PHC services at the outpatientlevel at MOHP facilities would especially benefit the poor and women, since theyuse such services more than other groups do.
> Experience in some other countries has shown that an increase in utilization ofcurative public health services can lead to an increase in the use of preventivecare services, even among the poor. In Niger, for example, pilot testsdemonstrated that combining cost recovery with quality improvements (especiallyincreases in the availability of drugs) led not only to a large increase in the use ofcurative services at government health clinics, but also to a 10 percent increase inthe use of prenatal care services (Yazbeck and Leighton, 1995). In these clinics,providers apparently took advantage of their contacts with patients to persuadethem to use preventive and PHC services.
These facts lead us to believe that a redirection of MOHP resources to an increased focuson primary and preventive health services could result in a substantial increase in the use of theseservices by the poor, including women and rural residents, and ultimately lead to significantimprovements in their health status. The MOHP has already demonstrated, through its diarrhealdisease control and tetanus toxoid programs, that it can implement preventive health careprograms that significantly reduce maternal and child mortality and morbidity in a relatively shorttime, even in remote areas. To maximize the impact of these policy reform strategies, however,they should be carried out under the conditions discussed below.

4.0 Analysis of the Impact of the Suggested Health Reform Strategies on the Socially Vulnerable 23
4.2.3 Conditions or Interventions Necessary to Help Ensure a PositiveImpact on the Socially Vulnerable of Efforts to Focus MOHPResources on PHC/MHC
(1) Curative care and PHC services should be offered at the same place and the same time, asStrategy 1.2.4 suggests. Since curative care is the main motive people have for seekinghealth care, one cannot expect the use of PHC and preventive services to increasesignificantly if people cannot also receive curative care at the same time and in the samelocation. This should be especially true for the poor and for women, whose costs in termsof time and travel to health facilities are particularly burdensome. This strategy’simportance in increasing PHC/MHC utilization has been demonstrated in Niger andelsewhere.
(2) Similarly, for the use of government outpatient facilities to increase, especially in ruralareas where utilization rates are lowest, there must be a noticeable improvement in thequality of curative care services in primary health facilities. This would be the likelyoutcome of Strategy 1.2.5 (ensuring adequate allocation of resources), if this reallocationresults in substantial increases in supplies of drugs and equipment, as well as a personnelreallocation.
(3) A further means of improving quality at MOHP outpatient facilities would be to providePHC and MHC training to physicians and nurses as part of a continuing medicaleducation program, since medical student training still largely focuses on curative,technology-intensive, hospital-based care. This training could focus on the application ofstandard diagnostic and treatment protocols, on preventive health measures, and on howto carry out health education and communicate with poor rural people.
(4) Health education and promotion activities should also accompany efforts to focus onPHC/MHC. These should include everything from individual patient counseling to massmedia campaigns using radio and television. The efforts to increase awareness of oralrehydration therapy through TV commercials and other mass media strategies areconsidered to have been an important factor in the success of the Egypt’s NationalDiarrheal Disease Control Program in the 1980s.
(5) The PHC/MHC improvements should not be carried out at the expense of curativeinpatient care, the quality of which must be maintained and preferably improved,particularly in the rural areas where residents have limited access to hospital-basedoutpatient care.
If these strategies are implemented in such a way as to result in expanded and improvedPHC/MHC services in MOHP facilities, they should result in a significant increase in the use ofthese services among the socially vulnerable, and thus have a positive impact on their healthstatus. In addition, by drawing the poor away from private providers and to free or low-costMOHP services, these reform strategies should also help lower their total health care expenditures,leaving more funds available for food and other critical needs.

24 Social Vulnerability Analysis of the Health Sector Reform Program Assistance in Egypt
4.3 Reallocate MOHP Resources, IncludingPersonnel and Facilities, to Where They Are MostNeeded and Reduce Overall Number of MOHPPersonnel
4.3.1 Resource Reallocation
One set of suggested reform strategies focuses on redistributing MOHP resources,particularly personnel, to areas where health care needs are greatest, that is, in areas with thelowest health status indicators and areas that are underserved by the public health system. Theseareas are generally considered to include the rural areas of Egypt, particularly of Upper Egypt (seeTable 7).
Despite the greater unmet health needs in the rural areas, especially in Upper Egypt,MOHP resources are concentrated in the urban areas. This is particularly true of personnel, whichabsorbs approximately 60 percent of total expenditures. Table 8 shows that the number of doctorsper capita in the urban governorates (13.2 per 10,000 population) is 75 percent higher than ineither Upper or Lower Egypt. The number of nurses per capita is also considerably higher in theurban governorates and in Lower Egypt than it is in Upper Egypt. MOHP hospital beds are alsohighly concentrated in urban areas, as expected, but there are also significant regional differencesas well. The number of beds per 1,000 population in Upper Egypt is 1.1 compared with 1.4 and1.3, respectively, in the urban governorates and Lower Egypt. The fact that rural residents arehospitalized at half the rate of urban residents and urban residents of Upper Egypt at two-thirdsthe rate of urban residents of Lower Egypt (Berman et al., 1995) reflects these differences in theaccessibility of inpatient facilities (although the inability of rural residents to pay for services andthe differences in quality of care between areas probably contribute as well to these differentials ininpatient care utilization).
Another indication of the extent to which the allocation of government health resources isbiased against the poor and residents of rural areas is the large differences in government subsidiesper hospital bed between MOHP facilities (often the only source of inpatient care available to ruralresidents) and university and teaching hospitals (mainly available to urban residents and those inLower Egypt). Government subsidies per hospital bed in FY 1990 for MOHP facilities were 40percent lower than those given to teaching hospitals (LE 5.8 thousand versus LE 13.5 thousand)and less than one-third of the subsidies given to university hospitals (LE 19.1 thousand)(Department of Planning, MOHP, 1995).
In addition to a skewed distribution of personnel, facilities, and beds in favor of the urbanpopulation and against the socially vulnerable in the rural areas, there also appears to be a largedifference in the quality of health care services between urban and rural areas in Egypt. Ruralhealth facilities often lack essential drugs and equipment. They are also the facilities to which theleast qualified new medical graduates tend to be assigned to do their compulsory service(Kemprecos, 1993). Anecdotal evidence suggests that people in rural areas enter hospitals only asa last resort (i.e., when they are already very sick). Differences in annual expenditures per bedbetween MOHP hospitals and those of other providers—which include government subsidies andall other revenue sources (e.g., user fees)—also suggest that there are

4.0 Analysis of the Impact of the Suggested Health Reform Strategies on the Socially Vulnerable 25
Table 8
Comparison of MOHP Resources Between Regions in Egypt
Location
MOHP Service Ratios
Doctors per Nurses per Beds per10,000 10,000 1,000
population population population
Urban Governorates 13.2 10.2 1.4
Upper Egypt 7.5 8.2 1.1
Lower Egypt 7.6 12.6 1.3
Urban 2.3
Rural 0.3
Total 9.2 12.1 1.2
Source: Berman et al., 1995
large differentials in the quality of inpatient services available to rural residents compared withurban populations, although such differences can also reflect differences in service deliveryefficiency. Annual expenditure per bed in MOHP hospitals is only around one-third of what it is inprivate hospitals (LE 5,966 versus LE 17,231) and around one-quarter of the per bed expenditurein university hospitals (LE 21,789) (Berman et al., 1995).
The fact that the existing distribution and quality of government health resources is souneven in Egypt suggests that redistributing MOHP resources to underserved areas could have asubstantial positive impact on the health of the socially vulnerable living in the areas benefitingfrom such a redistribution. Basing resource allocation, including personnel, on health statusindicators and assessments of unmet need (Strategies 1.3.2 and 1.4.2), together with targetinggovernment subsidies toward the poorer populations (Strategy 1.4.4), would begin to reverse theexisting bias toward better-off urban populations. The redistributed resources would beadditionally effective, in terms of their impact on health, if they were directed mainly towardexpanding and improving PHC and MHC services, which are more cost-effective in preventingand treating the diseases and health conditions that predominate in the rural areas (e.g., diarrhea,ARI, malnutrition). Using some of these resources to train volunteer, community-based villagehealth workers, as UNICEF has done in the Assiut governorate, could be a cost-effective way toimprove the accessibility of PHC/MHC services in underserved areas.
For these strategies to have the maximum effect on the health status of those living inunderserved areas, it is also critical that some additional resources be made available to these areasand used to purchase drugs and needed equipment and make other much-needed improvements inthe quality of services. These quality improvements will be essential in not only increasing theeffectiveness of MOHP services, but also in attracting the population to MOHP facilities. Anotherimportant way to improve the quality of services in the rural and underserved areas would be toprovide additional training to medical personnel working in these areas, given that they are oftenless qualified than their urban-based colleagues.

26 Social Vulnerability Analysis of the Health Sector Reform Program Assistance in Egypt
Two specific reform strategies—to provide incentives for MOHP personnel (1.3.4) andfor other (including private) personnel to work in underserved areas (1.4.3)—could also have apositive impact on the quality and availability of health services in these areas. These incentives,which might include salary supplements (such as “hardship pay”) or funding for additionalprofessional training, could attract more experienced and qualified doctors to areas where they areneeded most. As the job market for physicians becomes tighter with the elimination of guaranteedemployment for all medical students, these incentives could become increasingly attractive tophysicians and thus serve as an effective inducement in getting physicians and nurses to work inunderserved areas.
There are, however, several constraints to the effectiveness of these strategies. One is thatphysicians in Egypt, as in the United States and most other countries, are reluctant to work inisolated rural areas, far from the amenities of urban life and culture. Another constraint is thatfemale physicians, who now make up 20 to 25 percent of all doctors in Egypt, are typicallyexempted from having to carry out their compulsory (postgraduate) service in rural Upper Egypt,given the harsh conditions under which they would live and work. Therefore, a health care sourcethat rural women may find more culturally acceptable, especially for reproductive health services(e.g., obstetric deliveries), and thus a means of increasing their utilization of such services isusually not available to them. In addition, an incentive program to encourage doctors to move tounderserved rural areas would put female physicians at a disadvantage, given the difficulties theywould face working in these areas.
4.3.2 Reducing the Number of MOHP Personnel
Two reform strategies are aimed at reducing the number of MOHP personnel overall andthus the proportion of the total MOHP budget going to salaries. Strategy 1.3.1 would endguaranteed government employment for new medical school graduates, which is a major reason forwhat is considered to be a general oversupply of doctors in Egypt and for excessive employmentof physicians by MOHP in particular. Strategy 1.3.3 would reduce MOHP manpower overall bynot replacing retired workers and others who leave the system through attrition. Half of theministry’s total expenditures and 60 percent of its recurrent expenditures go to salaries, accordingto the report on the National Health Accounts (Department of Planning, MOHP, 1995). Theoveremployment of physicians puts a considerable burden on the MOHP’s budget and severelyconstrains its ability to provide the system with adequate supplies of drugs, equipment, andmedical supplies.
As noted earlier, 1994 Health Expenditure Survey data show that the poor rely much moreheavily on MOHP services than do better-off groups. Sixty-three percent of those in the lowestincome group (lowest 35 percent) who last sought inpatient care went to an MOHP hospitalcompared with around 40 percent of those in the highest income group. Similarly, 31 percent ofthose in the low-income group who visited outpatient facilities used the MOHP’s services, versusless than 15 percent of those in the highest income group.
Thus, efforts to reduce the MOHP’s salary burden could have the greatest positiveimpact on the poor, including those in rural Upper Egypt, particularly if the resources saved areused to improve the accessibility and quality of primary health care and preventive (e.g., MHC)services and purchase adequate supplies of drugs and equipment for facilities in the underservedareas. Some savings from personnel reductions could also be used to increase salaries of theremaining MOHP physicians and nurses, since their salaries are currently extremely low (with abase salary of around LE 100 per month). The low salaries received currently by MOHP

4.0 Analysis of the Impact of the Suggested Health Reform Strategies on the Socially Vulnerable 27
physicians and other medical personnel provide little incentive to them to work hard; they alsoforce most of them to set up a private practice on the side.
The negative effect of reducing MOHP personnel would be the unemployment that wouldoccur as a consequence of government layoffs. The effects of layoffs and subsequentunemployment might fall most heavily on female physicians, who would be more vulnerable tolayoffs since they tend to be younger and have less seniority than their male colleagues. Theywould also be hit disproportionately if guaranteed employment of new medical school graduateswere to end suddenly.
4.3.3 Conclusions
In summary, reform strategies aimed at reallocating MOHP resources to the most needygroups and areas in Egypt could go a long way to redress the current health care system’sinequities and benefit the socially vulnerable, provided that they focus on the provision of PHCand other cost-effective services, and that the quality of care in the MOHP’s facilities issimultaneously improved. The personnel reforms may, however, adversely affect femalephysicians and health workers more than their male colleagues.
4.4 Improving the HIO and Extending Social HealthInsurance to Universal Coverage
One set of reform strategies (under 2.0) deals with improving the HIO by (1) putting it ona sound financial footing, (2) transforming it into a financing organization, and (3) expandingsocial insurance (either the HIO or a new program) to cover the entire population. For the purposeof this analysis, we will view insurance mainly as a means to finance necessary hospital care. Wewill analyze the potential impact of these insurance reforms on socially vulnerable groups bytrying to answer the following questions:
> To what extent are the socially vulnerable, especially poor women and children,currently covered by the HIO and to what extent are these beneficiaries using itsservices?
> Are a significant number of the poor, women, and other socially vulnerable whoneed to be hospitalized not receiving inpatient care because of inadequatefinancial resources or other reasons?
> Would expanding social insurance improve the health status and financialposition of the socially vulnerable?
> What additional steps or strategies would be required to ensure the aboveoutcomes?

28 Social Vulnerability Analysis of the Health Sector Reform Program Assistance in Egypt
4.4.1 Current HIO Enrollment and Use by Socially Vulnerable Groups
By law, the HIO covers three groups of individuals: (1) government employees, (2)industrial workers in both the public and private sectors, and (3) widows and pensioners. In 1992,there were 4.9 million HIO beneficiaries (9.1 percent of Egypt’s population). In addition, theStudent’s Health Insurance Program, which began in 1992, offers health insurance to all schoolchildren. Although the number of covered school children alone is expected to numberapproximately 14 million when the program is fully implemented (about 25 percent of the totalpopulation), these two social insurance programs together currently cover only about 22 percent ofEgypt’s population.
Since the HIO mainly covers government employees and workers in the formal sector, itexcludes most of the poor, who tend to work in agriculture or in the informal private sector.Women are also less likely to be covered than men, since a greater proportion of them work in theinformal sector and since the HIO does not cover dependents of beneficiaries. Although the newschool health insurance program should help extend health insurance coverage to many poorchildren, a significant portion of the poorest children will not be covered, since they are less likelyto be in school than better-off children. For example, it has been estimated that 27 percent of ruralchildren 6 to 14 years of age are working and not in school, compared with only 11 percent ofurban children (DHS 1992, cited in Nassar, 1995). Girls, particularly those from poor families,will also benefit less from the school insurance program than boys, since only 41 percent of girlscomplete primary education compared with 75 percent of boys (World Bank, 1991, cited inNassar, 1996).
Table 9 shows the percent of the population covered by the HIO by region, as well as thenumber of HIO beds per beneficiary. The coverage rates in the two urban governorates (Cairo andNorthwest Delta, which includes Alexandria) are more than double the rates of Upper Egypt (12and 16 percent, respectively, compared with 6 percent). These differences in coverage rates byregion are not surprising, given that government and formal sector employees are concentrated inthe urban areas. Although the HIO’s 25 hospitals and 116 clinics are distributed throughout thecountry, about half of the beds available through its facilities are located in the urban governoratesand the number of beds per beneficiary is somewhat higher in the urban governorates compared toother regions (see table).
Data from the 1994 Health Expenditure Survey also demonstrate that social insurance inEgypt disproportionately benefits urban-based and better-off populations. Half of all low-income(lowest 35 percent) households reported having some sort of health insurance for at least one of itsmembers, compared with three-quarters of households in the middle- and high-income groups.And for the vast majority (75 percent) of low-income persons, it was SHIP membership that wasreported, which covers only children attending school.
The data on HIO membership and the distribution of HIO resources suggest that HIOmembership benefits middle- and upper-income groups more than it does the socially vulnerable.When the HIO runs a deficit, as it does currently, the GOE funds used to finance the deficit areeffectively a subsidy to the predominantly middle- and upper-income groups that belong to theHIO. Eliminating the HIO’s deficit (strategy 2.1), thereby freeing up additional GOE resources tobe invested in primary and preventive health care, ought to benefit the poor and other sociallyvulnerable groups.

4.0 Analysis of the Impact of the Suggested Health Reform Strategies on the Socially Vulnerable 29
Table 9HIO Coverage Rates and Hospital Beds per Beneficiary
by HIO Branch (Region)
Branch (000’s) (000’s) Rate Hospital Beneficiaries
Number of NumberBeneficiaries Population Coverage of HIO Beds/1,000
(percent) Beds
Cairo 807 6,588 12.2 1,215 1.5
Northwest Delta 1,132 7,090 16.0 1,285 1.1
Lower Egypt
Canal and East Delta
1,050 13,105 8.0 901 0.9
Middle Delta 716 7,688 9.3 449 0.6
Upper Egypt
Giza and NorthUpper Egypt
675 10,541 6.4 682 1.0
Assiut andSouth UpperEgypt
515 8,908 5.8 419 0.8
TOTAL 4,895 53,920 9.1 4,949 1.0
Sources: DOP, HIO, and CAPMAS, cited in Department of Planning, MOHP (1995) and Kemprecos, 1993
Even for those socially vulnerable that are HIO beneficiaries, the quality of care that theyreceive is perceived by most people to be rather poor. The HIO has a reputation for “crowdedclinics with doctors who either cannot take the time or will not make the effort to treat patientsrespectfully, and poor management of resources, which means that HIO cannot cover its costs, andruns out of supplies” (Kemprecos, p. 12). As a result, those who have the option to do so oftenchoose not to use its services. Poorer beneficiaries have fewer options, being able to choosebetween the poor HIO services and even poorer quality MOHP services. Analysis of the 1994Health Expenditure Survey data indicates that, on average, about 75 percent of households in thelow-income group (lowest 35 percent) reported that they use the services provided by theiremployer’s health insurance program (e.g., the HIO), while only about 60 percent of those in thehighest (10 percent) income group reported using theirs.
4.4.2 Are the Socially Vulnerable Not Receiving Needed Hospital(Inpatient) Care?
One of the best arguments for having a national health insurance program is to ensure thatno one, regardless of socioeconomic level or employment status, is prevented from havingnecessary inpatient care because services are not physically accessible or are not affordable.
One indication of whether the socially vulnerable are in fact receiving needed inpatientcare is to compare their hospitalization rates with those of better-off groups. The 1994 HealthExpenditure Survey data show that the annual number of hospital stays per person among those inthe lowest income quintile (0.022) is half the number of visits made by those in the two highestincome quintiles (.041 and .044). Differentials by region are even greater. For example, the annualnumber of hospital stays per person is 0.0576 in the urban governorates, compared with 0.0212 in

30 Social Vulnerability Analysis of the Health Sector Reform Program Assistance in Egypt
rural Upper Egypt (Berman et al., 1995). These differences may be due in part to unnecessary caregiven to the better-off and urban-based populations who have greater access to care and can moreeasily afford it. However, some observed differences are also likely to be because the poor,especially in rural areas, are not receiving needed inpatient care.
Further analysis of the 1994 Health Expenditure Survey data by income group reveals thatonly 28 percent of respondents in the low-income group who said they were in need of inpatientcare in the last 12 months received it, compared with 34 percent of those in the middle-and high-income groups. However, there were no significant differences in the proportions needing inpatientcare and not receiving it between men and women.
The most commonly cited reason for not receiving needed inpatient care was its high cost.This was mentioned by more than 60 percent of those in the low-income group, compared with 52percent in the middle-income group and 40 percent in the high-income group. Although the poorare theoretically exempt from paying for care in MOHP and CCO hospitals, they do in fact pay,primarily for medicines and such services as X-rays and laboratory tests. Because of MOHPbudget decreases in recent years, drugs that used to be available through MOHP facilities at highlysubsidized rates are no longer available, and public hospital patients are regularly provided with alist of drugs and supplies that they must buy before coming to the hospital for treatment(Kemprecos, 1993).
According to the data presented above (Table 6), the poor paid an average of LE 66 perhospital stay at MOHP facilities and LE 70 at CCO hospitals. These amounts are the equivalent ofmore than one month’s salary at the minimum wage rate (LE 60 per month). According to Bermanet al. (1995), a single hospitalization episode costs a household an average of LE 294 in urbanEgypt and LE 228 in rural Egypt, although this includes all income groups and all types ofhospitals (such as more expensive university hospitals). Cost is therefore an important barrier tothe most socially vulnerable in Egypt receiving needed inpatient care.
Other common reasons given by respondents of the 1994 Health Expenditure Survey fornot receiving needed inpatient care were that they did not have the time to be hospitalized and thatthe quality of care was poor. Interestingly, distance from the hospital was not a common reasongiven for not consuming inpatient care, even among those in the low-income group.
4.4.3 Conclusions: Would Expanding Social Health Insurance ReallyHelp the Socially Vulnerable?
If a national health insurance program is properly designed, the answer to this question isyes for a number of reasons. First, as has been shown in the United States and elsewhere,including Egypt, that people with health insurance are more likely to seek medical care than thosewithout insurance. For instance, the mean annual number of outpatient visits per person in the1994 Health Expenditure Survey was 28 percent higher among individuals who were insured thanamong those without insurance (4.83 versus 3.77) (Berman et al., 1995). Second, most of thesocially vulnerable are not currently insured—even the school health insurance program will notreach a significant proportion of the poorest children and of girls who are not able to go to school.Therefore, a program providing universal coverage would significantly decrease the gap in healthcare utilization, especially inpatient care, between the poor and better off, between rural and urbanresidents, and between women and men (and girls and boys).

4.0 Analysis of the Impact of the Suggested Health Reform Strategies on the Socially Vulnerable 31
Several proposed reform strategies would help ensure that a national health insuranceprogram is well designed and would benefit the socially vulnerable in Egypt. Ensuring the viabilityof the HIO by reducing its deficit, developing an appropriate benefits package, establishingpremiums and co-payments based on actual costs, and contracting services out and allowingbeneficiaries to choose providers would be necessary steps to take before the government shouldbe willing to embark on an ambitious and potentially costly program of universal health insurance.To protect the poor, however, both the HIO and the eventual national health insurance programshould include an exemption system or a sliding scale for premiums and co-payments. Such asystem might include charging premiums and co-payments above costs for the wealthiestbeneficiaries to cross-subsidize the health care of poorer beneficiaries. Alternately, the healthinsurance cost for the poor might be subsidized out of general tax revenues.
The strategies that call for separating HIO financing from the provision of health care,which would involve the insurance program contracting with providers and allowing beneficiariesto choose among providers, would potentially benefit the socially vulnerable by improving thequality of care and increasing their utilization of health services. These effects have beendemonstrated in Ismailia, where an HIO experiment allowing a portion of beneficiaries to receiveoutpatient care from the Suez Canal University’s group practice resulted in a substantial increasein utilization of outpatient services (Kemprecos, 1993). Given the relative shortages of MOHP andother government facilities in some rural areas, contracting-out for services would have to includeprivate providers and facilities as well.


5.0 Summary of the Impact of Proposed Health Sector Reforms on the Socially Vulnerable 33
5.0 Summary of the Impact ofProposed Health Sector Reformson the Socially Vulnerable
Table 10 presents a matrix listing the proposed reform strategies, their main effects on thesocially vulnerable, and the actions and conditions that should be considered to maximize thepositive effects and minimize the negative effects on the socially vulnerable in Egypt.

34 Social Vulnerability Analysis of the Health Sector Reform Program Assistance in Egypt
Table 10Summary of Impact of Suggested National Health Sector Reform Strategies on the Socially Vulnerable
Reform Strategy Main Resulting Socially Vulnerable; Major Issues to ConsiderEffect/Action
Conditions/Requirements to Ensure Positive Impact on the
1.1.2 Transfer existing hospitals to other parastatal Cost recovery Cost recovery will have a negative impact on the poor unless (a) anorganizations. effective and fair means testing policy is put into place and well
implemented, and (b) the quality of services (e.g., drug supplies) at theMOHP facilities is greatly improved, which should lead to an increasein utilization, offsetting the negative impact of fees.
Cost recovery should be implemented primarily for curative hospitalservices (particularly for outpatient care, which is used very little bypoor rural groups), to decrease government subsidies and resourceallocation to curative services. Cost recovery could later be phased inat the PHC level.
The PHC level focus should be on increasing utilization, especiallyamong women and in the rural areas. Cost recovery should not beattempted, therefore, until quality improvements are made at PHCfacilities to prevent a utilization decrease among the most vulnerable.
1.1.3 Expand cost recovery in government facilities.
1.1.4 Allow private practitioners to use the MOHPfacilities.
1.1.5 Allow hospital autonomy.
1.1.7. Examine (test) the cost recovery of curativeservices at the PHC level.
1.1.1 Stop the construction of unnecessary Redirecting MOHP Quality of PHC should be noticeably improved, includinghospitals and set strict guidelines for the resources from curative improvements in the availability of medicines, equipment, andcompletion of facilities under construction. care to PHC/MHC supplies.
1.2.1 (Also 1.4.5) Use cost-effectiveness analysis to Curative services should continue to be provided in PHC facilitiesidentify a package of essential preventive because some types of curative care are cost-effective (e.g., ORT,medicine and PHC services to be supported ARI) and because it brings patients in regular contact with primaryby the MOHP to which every Egyptian is health providers.entitled.
MOHP inpatient care should not be allowed to deteriorate with arenewed focus on PHC/MHC, since MOHP hospitals are the mainsource of inpatient care for the socially vulnerable.
1.2.2 Increase emphasis on MHC programs. Health education and promotion activities should accompany all majorefforts to focus on PHC/MHC.
1.2.3 Provide incentives for health care providers tospecialize in preventive medicine, PHC, andfamily medicine.

Table 10Summary of Impact of Suggested National Health Sector Reform Strategies on the Socially Vulnerable
Reform Strategy Main Resulting Socially Vulnerable; Major Issues to ConsiderEffect/Action
Conditions/Requirements to Ensure Positive Impact on the
5.0 Summary of the Impact of Proposed Health Sector Reforms on the Socially Vulnerable 35
1.2.4 Do not separate curative services from PHCservices at the PHC (outpatient) level.
1.2.5 Ensure adequate allocation of resources(e.g., personnel) at the PHC level.
1.3.3 Reduce the overall number of MOHP Reallocating MOHP Overall, these strategies should have a positive impact on the sociallypersonnel. resources to where they vulnerable.
are most needed andreducing MOHP personnel(continued)
1.3.4 Provide incentives for the MOHP personnel to Reallocating medical personnel to rural areas could hurt femaleserve in underserved and remote areas. doctors disproportionately, since they are less willing to work in rural
areas.
Female doctors would also be expected to receive a less thanproportionate share of relocation incentives, since it is anticipated thatfewer female physicians will choose to serve in the rural areas.
Reductions in personnel would negatively affect younger, newerphysicians and those who lack “connections.” Female doctors mightespecially be affected, since they tend to be younger and have lessseniority and because of traditional attitudes which value femaleemployment less than male employment.
1.1.6 Support hospitals based on efficiency Reallocating MOHP Instead of or in addition to ending guaranteed employment for allindicators such as on a per capita, per bed resources to where they medical graduates, GOE needs to reduce medical school classes to abasis. are most needed and level that can be absorbed by the health sector.
reducing MOHP personnel 1.4.2 Prioritize the allocation of MOHP resources
based on needs using health statusindicators.

Table 10Summary of Impact of Suggested National Health Sector Reform Strategies on the Socially Vulnerable
Reform Strategy Main Resulting Socially Vulnerable; Major Issues to ConsiderEffect/Action
Conditions/Requirements to Ensure Positive Impact on the
36 Social Vulnerability Analysis of the Health Sector Reform Program Assistance in Egypt
1.4.3 Create incentives for other health careproviders to function in the underservedareas.
1.4.4 Target GOE subsidy to poor and indigentpopulations.
2.1 Ensure the HIO’s viability (by eliminating the Improving and expanding Need to have a system of exemptions or sliding scale for premiumsdeficit, not adding any new groups of national insurance and co-payments so poorer beneficiaries can afford to obtainbeneficiaries, developing premiums and co- insurance and to use services.payments based on actual costs, identifyingand adopting an affordable health benefitspackage, etc.).
2.2 Transform the HIO into a financing These strategies could increase the utilization of services, includingorganization (by developing mechanisms to among poorer beneficiaries and women.contract out services, allowing beneficiaries tochoose service providers, stoppingconstruction of new HIO hospitals, and sellingor transferring existing HIO facilities to theprivate or parastatal sectors).
If system can actually lead to accessible health care of acceptablequality for the majority of Egyptians, this would greatly benefit thesocially vulnerable (including the poor, women, and school-agedchildren not attending school), since, at present, they receive fewerand poorer quality services, and are less likely be to insured than therest of the population.
6.0 Further Analyses to Conduct from Existing Data 37
6.0 Further Analysis to Conduct fromExisting Data
Several recent surveys can potentially provide much relevant information on the likelyimpact of health reforms on the socially vulnerable. Analysis of these data sets has only just begunin some cases and is fully under way in others. These surveys include:
> the 1996 CAPMAS budget survey;
> the 1996 DHS, including the new women’s module; and
> the 1995 Poverty Study.
As policy reform proceeds, it is important that the results of these analyses be examinedcarefully for any possible implications they may have for the reform’s impact on the sociallyvulnerable.
The DDM project is in the process of preparing an econometric analysis of the demandfor health services using data from both rounds of the Health Expenditure Survey. In particular,this study is concerned with the factors (including quality of care) that determine the choice of apublic versus a private sector provider and the tradeoffs between price and quality in patientdemand for health care (including how this varies by income level). The results of this analysiswill be important in formulating cost recovery policies that benefit the socially vulnerable. Thepreliminary findings from this analysis suggest that household income and quality of care (asperceived by the patient) are major determinants of the public-private provider choice, while priceplays a comparatively minor role. If these preliminary findings hold up to further analysis, they areextremely relevant to cost recovery. For example, one set of preliminary simulations suggests thatsimultaneously improving public facility quality to the “best” category while raising the publicprice by 40 percent actually results in an increased proportion of consumers selecting a publicprovider.
The DDM project is also proceeding with a cost-effectiveness analysis of alternativehealth interventions in Egypt. The results of this analysis will be important for a variety of policyreforms including (1) the pricing of individual services in a cost recovery program so thatconsumers are encouraged to utilize cost-effective health interventions, (2) the design of aminimum package of cost-effective health interventions to which all Egyptians should have access,and (3) the definition of a minimum benefits package for social insurance.
Another useful study would be to analyze the incidence of benefits and costs of theEgyptian health system to estimate the value of the net subsidy in the form of health care that eachincome group currently receives from the GOE budget. A better understanding of who benefitsfrom the current system—and the sources of these benefits and how they vary by incomegroup—would greatly facilitate the formulation of policy reforms that produce the greatest netgains for the socially vulnerable.

38 Social Vulnerability Analysis of the Health Sector Reform Program Assistance in Egypt
6.0 Bibliography 39
Bibliography
Badran, A. 1989. “Structural Adjustments in Health Sector to Protect the Vulnerable Groups.”Prepared by the Third World Forum for UNICEF, Cairo Office (March).
Berman, P., N. Pollock, M. Reich, J. Walsh, H. Salah, N. Hafez, W. Yip, A. Swelam, and A.L.Nandakumar. 1995. “Egypt: Strategies for Health Sector Change” (draft). Data for DecisionMaking, Harvard University, Cambridge, MA (August).
Gertler, Paul, and Jacques van der Gaag. 1990. The Willingness to Pay for Medical Care:Evidence from Two Developing Countries. Baltimore, MD: The Johns Hopkins University Press.
Johnson, C., P. Boddy, M. Church, S. McQueen, G. Provenzano, F. Tadros, and R. Taylor. 1996.“Mid-Term Evaluation: Egypt Cost Recovery Programs for Health Project.” USAID (February).
Kader, Soha Abdel. “The Situation for Women in Egypt.” CAPMAS, UNICEF/Egypt (undated).
Kemprecos, L. 1993. “Health Care Financing in Egypt.” Prepared for the Cost Recovery forHealth Project, Cambridge Consulting Corp. (October).
Korayem, Karima. 1992. “Poverty in Egypt: Literature Review, 1985–1991.” Submitted to theThird World Forum and UNICEF (May).
Moghadam, V.M. 1995. “Economic Reforms, Women’s Employment, and Social Policies, CaseStudies of China, Vietnam, Egypt, and Cuba.” World Development Studies 4, UNU WorldInstitute for Development Economics Research, Helsinki, Finland (August).
Nassar, H., W. Moussa, A. Kamel, and A. Miniawi. 1993. Review of Trends, Policies andProgrammes Affecting Nutrition and Health in Egypt (1970–1990). UN ACC/CN Country CaseStudy prepared for the XV Congress of the International Union of Nutritional Science(September).
Nassar, H. 1996. “Structural Adjustment and its Implications for Women” (draft). Prepared forthe Conference on Egypt Today: State, Society and Regional Role, American University in Cairo,Egypt (May).
Nassar, H. 1995. Economic Aspects of Children’s Vulnerability in Egypt (draft). (May).
Department of Planning, Ministry of Health, Egypt and Data for Decision Making Project. 1995.National Health Accounts for Egypt (working draft). (October).
Reich, M. and A. Swelam. 1994. “School Children’s Health Insurance in Egypt.” Teaching Case,Harvard School of Public Health, Cambridge, MA.
United Nations Development Program. 1995. Egypt, Human Development Report. Cairo, Egypt.

40 Social Vulnerability Analysis of the Health Sector Reform Program Assistance in Egypt
USAID. 1992. Demographic and Health Survey: Egypt. Cairo, Egypt.
USAID. 1995. “Social Soundness and Women in Development Analyses for the HealthyMother/Healthy Child Project.”
Wikan, Unni. 1980. Life among the Poor in Cairo. New York, NY: Tavistock Publications.
Yazbeck, Abdo, and Charlotte Leighton. 1995. “Does Cost Recovery for Curative Care AffectPreventive Care Utilization?” Health Policy and Planning 10(3):296–300.

6.0 Bibliography 41