Combining the Evidence of Multiple Query Representations for Information Retrieval
Upload
independentCategory
view
0download
0
BioMed CentralBMC Cell Biology
ss
Open AcceResearchSurface similarity-based molecular query-retrievalRahul Singh*Address: Department of Computer Science, San Francisco State University, San Francisco, CA 94132, USA
Email: Rahul Singh* - [email protected]
* Corresponding author
AbstractBackground: Discerning the similarity between molecules is a challenging problem in drugdiscovery as well as in molecular biology. The importance of this problem is due to the fact thatthe biochemical characteristics of a molecule are closely related to its structure. Thereforemolecular similarity is a key notion in investigations targeting exploration of molecular structuralspace, query-retrieval in molecular databases, and structure-activity modelling. Determiningmolecular similarity is related to the choice of molecular representation. Currently,representations with high descriptive power and physical relevance like 3D surface-baseddescriptors are available. Information from such representations is both surface-based andvolumetric. However, most techniques for determining molecular similarity tend to focus onidealized 2D graph-based descriptors due to the complexity that accompanies reasoning with moreelaborate representations.
Results: This paper addresses the problem of determining similarity when molecules are describedusing complex surface-based representations. It proposes an intrinsic, spherical representation thatsystematically maps points on a molecular surface to points on a standard coordinate system (asphere). Molecular surface properties such as shape, field strengths, and effects due to field super-positioningcan then be captured as distributions on the surface of the sphere. Surface-basedmolecular similarity is subsequently determined by computing the similarity of the surface-propertydistributions using a novel formulation of histogram-intersection. The similarity formulation is notonly sensitive to the 3D distribution of the surface properties, but is also highly efficient tocompute.
Conclusion: The proposed method obviates the computationally expensive step of molecularpose-optimisation, can incorporate conformational variations, and facilitates highly efficientdetermination of similarity by directly comparing molecular surfaces and surface-based properties.Retrieval performance, applications in structure-activity modeling of complex biological properties,and comparisons with existing research and commercial methods demonstrate the validity andeffectiveness of the approach.
from 2006 International Workshop on Multiscale Biological Imaging, Data Mining and InformaticsSanta Barbara, CA, USA. 7–8 September 2006
Published: 10 July 2007
BMC Cell Biology 2007, 8(Suppl 1):S6 doi:10.1186/1471-2121-8-S1-S6
<supplement> <title> <p>2006 International Workshop on Multiscale Biological Imaging, Data Mining and Informatics</p> </title> <editor>Manfred Auer, Hanchuan Peng and Ambuj Singh</editor> <note>Research</note> </supplement>
This article is available from: http://www.biomedcentral.com/1471-2121/8/S1/S6
© 2007 Singh; licensee BioMed Central Ltd. This is an open access article distributed under the terms of the Creative Commons Attribution License (http://creativecommons.org/licenses/by/2.0), which permits unrestricted use, distribution, and reproduction in any medium, provided the original work is properly cited.
Page 1 of 12(page number not for citation purposes)

BMC Cell Biology 2007, 8(Suppl 1):S6 http://www.biomedcentral.com/1471-2121/8/S1/S6
BackgroundAcross all biological and pharmaceutical investigations,the discovery (or development) of molecules with desiredbiological activity is an important goal. Efforts to attainthis goal are strongly driven by the notion of molecularsimilarity because in general similar molecules tend tobehave similarly [1,2]. Effective determination of molecu-lar similarity requires accounting for both structural andphysicochemical characteristics of molecules [3]. It istherefore closely related to the notions of molecular rep-resentation and molecular descriptors. We begin this sec-tion with a review of techniques for molecularrepresentation and molecular descriptors. Next, we out-line and discuss different formulations of the molecularquery-retrieval problem. This is followed by a review ofthe prior research in this area. The last subsection intro-duces the problems associated with determining molecu-lar similarity using complex 3D surface-based descriptors
Introduction to molecular representations and descriptorsIn their simplest form, molecules can be represented usingchemical formulae. However, different structures mayyield the same formula even though they possess dissimi-lar physical or biochemical properties (e.g. in the case ofisomers). Therefore, commonly employed representationframeworks tend to emphasize a more explicit characteri-zation of the molecular structure and include (see Figure1): (1) one-dimensional string-based descriptors, such asSMILES obtained by ordered traversal of the moleculargraph, (2) vector-space representation of (typically struc-tural) attributes of a molecule called structure keys thatencode presence/absence of predefined sub-structuralmotifs in the molecule in a binary string, (3) two-dimen-sional and three-dimensional graphscharacterizingmolecular connectivity and inter-atomic distances, and(4) three-dimensional surface based representations, suchas the Connolly surface. The Connolly surface is obtainedby rolling a probe-atom over the molecule and is definedas the set of points where the surface of the probe atomtouches the van der Walls surfaces of the atoms in the mol-ecule. It may be noted that the complexity of representa-tions is directly correlated with their fidelity in describingbiochemical characteristics of molecules. For example,simple characteristics of molecules such as their atomicweight or connectivity can be derived from SMILE strings.However, more complex biochemical properties like mol-ecule-molecule interactions or permeation through mem-branes are more accurately modelled using surface-basedrepresentations [4-8].
Molecular descriptors are computationally determinablecharacteristics of a molecule that describe specific molec-ular properties. Examples include physical-chemicaldescriptors such as the number of rotatable bonds, polarsurface area, electronegativity, descriptors of molecular
connectivity such as the Wiener number [9], the Randicindex [10], structure keys and molecular fingerprints,eigenvalue-based descriptors [11], molecular moment-based descriptors such as CoMMA [12], and surface andfield-based descriptors [4]. Other descriptors includedonor-acceptor atoms [13] and those based on the molec-ular wave/density functions [14]. Modern approaches tocorrelating molecular structure with biological activityemphasize the use of molecular fields (see for instance[15] and references therein); given any molecular propertyP that can be calculated at an arbitrary point around amolecule, a field can be created by integrating P withrespect to volume. Field-based descriptors typically aresuperposition-based, in that their value at any particularpoint, takes into account the influence of multiple atomsof the molecule at that point. It is also straightforward todefine field-based descriptors at the molecular surface,thereby incorporating both physicochemical and physi-cally-relevant structural attributes in a single framework.
Formulations for molecular query-retrieval and analysis of prior researchThe problem of molecular query-retrieval can beapproached from two primary and interrelated perspec-tives:
• Query formulationTwo main forms of formulating the query can be distin-guished: (1) Sub-structure-based query, where the query-structure is constrained to be a proper subset of each of theretrieved structures. (2) Whole-molecule query, where mol-ecules are retrieved in terms of their overall similarity, asdefined using appropriate similarity functions, to thequery molecule. It is important to note that sub-structuresearching requires the user to have a clear picture of thestructures which are to be retrieved prior to issuing thequery [16]. Typically such detailed knowledge is availableonly when the mechanism of action of the molecule isestablished in terms of its activity as determined by spe-cific structural fragments. In contrast, "whole molecule"similarity is suitable for exploring structural space [16],generating hypotheses, or querying chemical databaseswhen detailed structure-activity information, at the levelnecessary for sub-structure querying is unavailable.
• Molecular representationMolecular representations have varying capabilities interms of modelling biochemical characteristics of mole-cules. As noted earlier, surface-based representations/descriptors are more faithful to the actual physics of mol-ecules than molecular graphs-based approaches[4,5,7,8,17]. At the same time, graph-based representa-tions, owing to their graphical similarity to chemical nota-tions, tend to be highly intuitive and are alsocomputationally easier to characterize.
Page 2 of 12(page number not for citation purposes)

BMC Cell Biology 2007, 8(Suppl 1):S6 http://www.biomedcentral.com/1471-2121/8/S1/S6
Early attempts at determining molecular similarity, like[9,10], used variations on the sum of inter-atomic dis-tances. Later approaches have looked at schemes for atomre-labelling to minimize a difference-distance matrix ordecomposing the molecular distance and connectivitygraphs into sub-graphs which are numerically character-ized and compared [18]. Other efforts have tried to char-acterize similarity of molecular graphs, using editdistances, frequent sub-graphs [19], or maximal commonsub-graphs [20]. These techniques either focus on build-ing structure-property models (and are inapplicable toquery-retrieval formulations) or do not efficaciously scaleup with repository size. With our research goals in mind,at the state-of-the-art, two classes of techniques merit dis-cussion:
1. Matching techniques using fixed-size representation vectors:have been amongst the most efficient and are employedalmost in all small molecule repositories of significantsize. In this approach a molecule is represented using afixed size vector. Each element of the vector encodes forthe presence (or frequency) of a predefined attribute, forexample, specific structural motifs [21] or the uniquelabelled paths obtained during a traversal [22]. The vec-tors are then compared using well established dissimilar-ity measures such as the Hamming, Euclidean, andTanimoto measures.
2. Matching techniques using 3D molecular graphs: dependon super-positioning the 3D graphs of the moleculesbeing compared. Significant research in this context hasbeen done of aligning structures of large (protein) mole-cules leading to techniques such as DALI [23], SSM [24],SSAP [25], STRUCTAL [26], CE [27], LOCK [28], and LSQ-
MAN [29]. Other efforts include the application of geomet-ric hashing and its variations [8]. In [4,7,17], molecularsimilarity is defined using surface and field characteristics:First, the field-effects around a molecule are estimated.Then, the orientation of the query/model molecule (a 3Dgraph), is varied to minimize an RMS error between thefield values.
The use of fixed-size representation vectors has lead topractical solutions for querying large molecular repositor-ies. However, such approaches have several severe draw-backs: (1) They are limited to 2D information andincapable of being used for complex bio-chemically rele-vant representations/descriptors. (2) They are incapableof representing bioisosteres (structurally different mole-cules exhibiting the same biological effect). (3) Such rep-resentations are predefined rather than being data-driven.Therefore, they are incapable of capturing specificities ofmolecules which were not preconceived. On the otherhand current approaches to 3D matching simply don'tscale with respect to repository size and time constraintstypical to modern query-retrieval formulations. Moreover,such approaches, even when they seek to compare surface-based descriptors, do so indirectly. That is, the 3D graphsare superimposed and only then are the respective sur-faces compared. Such an approach can miss moleculeswhich have similar surface/field-based properties, butwhose 3D structures do not necessarily superimpose well.
Problem characteristics and challengesThe problem of determining the similarity of moleculeswhen they are represented using complex 3D surface-based descriptors presents some unique challenges whichinclude:
Molecular RepresentationsFigure 1Molecular Representations. Different molecular representations shown with the Benzene molecule as an example: (a): chemical (graphical) representation, (b) 2D graph and graph-traversal based string representations, (c) 3D graph-based repre-sentation, (d) surface-based representation. The molecular surface is obtained by rolling a probe-atom over a molecule as shown in (e). The complexity of surface-based representations can be discerned from (f) where the molecule Asprin in shown on the left and the molecule Capceisin on the right.
(c) (d)
(a) (b)C
C C1
C
C
C1C1=CC=CC=C1
(c) (d)
(a) (b)C
C C1
C
C
C1C1=CC=CC=C1
(c) (d)
(a) (b)C
C C1
C
C
C1C1=CC=CC=C1
C
C C1
C
C
C1C1=CC=CC=C1
(e) (f)(c) (d)
(a) (b)C
C C1
C
C
C1C1=CC=CC=C1
(c) (d)
(a) (b)C
C C1
C
C
C1C1=CC=CC=C1
(c) (d)
(a) (b)C
C C1
C
C
C1C1=CC=CC=C1
C
C C1
C
C
C1C1=CC=CC=C1
(e) (f)
Page 3 of 12(page number not for citation purposes)

BMC Cell Biology 2007, 8(Suppl 1):S6 http://www.biomedcentral.com/1471-2121/8/S1/S6
1. Definition of a standard coordinate system for surface-basedmolecular representations: To compare molecules usingtheir surface-based descriptions, it is necessary to have away of representing the shape of their surfaces. The com-plexity lies in defining an intrinsic (view independent)coordinate system over the curved molecular surface thatmaps a point on the curved surface to a point on a stand-ard coordinate system. Additionally, such a mappingshould be one-to-one between points on the molecularsurface and the standard coordinate system.
2. Multi-modal nature of molecular properties: Molecularproperties like geometry and donor/acceptor fields haveentirely different characteristics. For example, while thegeometric representation of a molecule is unique, donor/acceptor fields are superposition-based. Representationframeworks need to account for such issues.
3. Query efficiency: It is typical to conduct molecular simi-larity queries over large sets ranging from thousands tomillions of molecules. The latter order of magnitude isespecially common in pharmaceutical settings. It is there-fore imperative for similarity determination approachesto be computationally efficient.
ResultsThree different types of experiments were conducted tostudy the efficacy of the proposed method: (1) Investiga-tion of the method's accuracy in query-retrieval settings,(2) Evaluation of its performance (speed), and (3) Valida-tion through applications in structure-activity modellingproblems. Each experiment incorporated two stages: Thefirst stage involved a direct application of the method ona data set with subsequent analysis of the results. In thesecond stage, a comparative study was performed byapplying a state-of-the-art research or commercial tech-nique on the same data set. Subsequently the results wereanalysed to evaluate the proposed approach.
Accuracy in query-retrieval settingsThe method was tested in a query-retrieval setting on asubset of 5000 molecules randomly selected from theMDDR collection [21]. The MDDR collection consists ofmolecules that are either marketed drugs or have reachedadvanced stages in a drug discovery process. Each of the5000 molecules was successively used as a query againstthe rest of the molecules. The query and model molecules
were each represented by 20 conformers, i.e. 400 distinctmolecular conformers were used per similarity computa-tion. Since the proposed method does not require super-positioning of the underlying structures, to distinguish itsperformance from approaches that do so, a variation ofthe experiment was performed where the query was repre-sented by 20 novel (distinct from the model) conformers.It may be noted, that for some molecules, 20 novel ener-getically stable conformers could not be obtained. In suchcases, as many novel conformers as could be derived foreach specific structure were used. In the second stage ofthis experiment, for purposes of comparison, the query-retrieval experiments were performed using ISIS [21], awidely used commercial 2D chemical database. ISIS usesstructure-keys in conjunction with indexing for answeringqueries. However, molecular similarity using ISIS isstrictly 2D-substructure-based and can not incorporateissues like conformations. The consolidated results fromthese two stages are presented in Table 1. The first row ofthe table shows results obtained with ISIS. The second rowpresents the results obtained with 20 conformers for eachof the query and model molecules. The final row showsthe accuracy of the retrieval process when distinct con-formers (between the query and the model) wereemployed. Here, the asterisk denotes the aforementionedfact that for some molecules 20 distinct stable conformerswere not obtained. In this setting, of the 5000 molecules,4910 were correctly identified. An analysis of the resultsobtained in this step indicates that the accuracy of the pro-posed approach during query-retrieval is comparable tothat of ISIS, even though the proposed method addressesthe query-retrieval problem in a setting that involvesmolecular conformations, surface-properties, and super-position-based effects and is therefore much more com-plex than the 2D structural motif-based search used inISIS.
Performance evaluationThe computational performance of the proposedapproach was tested with respect to the MolecularHashkeys algorithm [4], which builds on the Compassalgorithm [17,30]. This selection was based on the factthat both the proposed approach and Molecular Hashkeys(along with its predecessor Compass) seek to define thesurface-based similarity between molecules. The distinc-tions of our approach from these methods lie in how themodelling of molecular shape and field-effects are accom-
Table 1: Summary of results from the query-retrieval experiment.
Method Data Size Number of Conformations Accuracy
ISIS 5000 none 100%Proposed 5000 20/20 100%Proposed 5000 20/20* 98.2%
Page 4 of 12(page number not for citation purposes)

BMC Cell Biology 2007, 8(Suppl 1):S6 http://www.biomedcentral.com/1471-2121/8/S1/S6
plished as well as in how the similarity is computed. Fur-thermore, our selection was also motivated by the fact thatCompass along with its derivatives have been extensivelyapplied in pharmaceutical research settings and the pub-lished results [4,17,30] as well as our own investigationsshow it to be amongst the most efficient approaches cur-rently available for determining surface-based molecularsimilarity.
In our experiment, 30 molecules from the MDDR collec-tion were compared against each other, with 20 conform-ers for the model and one for the query. Both the systemsreported a 100% recognition rate on this subset of mole-cules. However, the time requirements were significantlydifferent. A graph plotting the time required for the simi-larity computation with the proposed technique is shownin Figure 2 (left plot with the data points shown assquares). Figure 2 (right plot) shows a comparison of theperformance with the Molecular Hashkeys method (datapoints corresponding to the Molecular Hashkeys algo-rithm are shown as circles). On an average, with the pro-posed technique 120 conformers were processed(histogram generation and matching) every second, whilewith Molecular Hashkeys, one conformer was matchedevery two seconds. Both results were obtained on an SGIIndigo2 machine. Another recent commercially availablemethod [7] reports matching speed of 2 minutes per mol-ecule (on a SUN Ultra-30). It should be noted thatdescriptor generation (estimating the molecular shapeand computing the donor/acceptor fields strengths) inboth the methods took similar time, averaging around 5seconds per conformer and was done offline. However, inthe current implementation of our approach, histogramgeneration is done online. Therefore, further speedups arepossible by making histogram generation part of the one-time off-line computation.
For a given molecular property and its correspondingproperty-histogram having n bins, computing the similar-ity of a pair of conformers using the proposed technique(see the Methods section) involves determining the histo-gram intersection scores for matching the spatial distribu-tion of points corresponding to the each of theaforementioned n bins. For each bin, this score is thenused to weight the intersection score of the property-his-togram. For an encapsulating sphere of circumference C,characterizing the spatial distribution requires O(C) bins.Since histogram intersection is linear in the number ofbins, the matching complexity is therefore O(Cn).
Given the size of molecular repositories, a key technicalproblem is the design of indexing techniques. This is dueto the fact that even highly efficient matching techniques,such as the one presented, require distance comparisonswhich grow linearly with the number of molecules in the
database. Indexing techniques can be broadly classified as(1) spatial access methods, such as Quadtree [31], R-Tree[32], and KD-Tree [33], which are applicable when itemsin the repository are represented by a finite set ofattributes or features and Euclidean distance between apair of features/attributes can be defined. Such methodsfunction by using the Euclidean structure of the embed-ding space to divide repository entities into clusters andavoiding the search of some clusters during retrieval. (2)distance-based indexing methods, such as GNAT-Tree [34]and VP-Tree [35], which rely only on pair-wise distancesfor data retrieval and employ the triangle-inequality forpruning the search space. While a detailed analysis ofindexing techniques is beyond the scope of this paper, itis important to note that the performance of spatial accessmethods is very good for small number of attributes andrapidly degrades as the number of features increase. Onthe other hand, the efficiency of distance-based indexingis not good for large data collections. This underlines thenecessity for developing indexing techniques, such as[36], which utilize specificities of structural data in thedesign of the indexing strategy.
Validation through application in structure-activity modelsA structure-property model captures the relationshipbetween the bio-chemical properties of a molecule and itsphysicochemical description [37] by envisaging the bio-chemical property Φ of a molecule Mi as the function of its"chemical constitution":
Φ = f(Mi) (1)
The basic elements needed for the development of a struc-ture-property model are: (1) Assay results describing thebio-chemical property of interest, (2) a set of parametersdescribing the molecular structure and its physicochemi-cal attributes, and (3) the learning formulation along witha statistical or machine learning technique.
As part of the validation experiments, similarity informa-tion derived using the proposed technique was used tomodel absorption through an in-vitro cell line. The dataset consisted of 30 compounds that were tested using theCaco-2 assay. The Caco-2 (human colon adenocarcinomacell line) provides a close approximation of in vivo absorp-tion and can be used to model the epithelial cell layer bar-rier and absorption from the intestinal lumen to theblood stream. The assay protocol used in this experimentwas designed to measure uni-directional flux and all com-pounds were analysed at identical initial concentrations.The range of measured values was between 0.0% (no per-meation) to 2.8% (maximum permeation) flux units. Theset of parameters describing the molecular structure con-sisted of a 31-dimensional descriptor vector. The first ele-ment of this vector was the computed octanol-water
Page 5 of 12(page number not for citation purposes)

BMC Cell Biology 2007, 8(Suppl 1):S6 http://www.biomedcentral.com/1471-2121/8/S1/S6
partition coefficient (clogP). The remaining thirty ele-ments of the vector were obtained by computing the sim-ilarity (using the proposed method) of the moleculestested in the assay to a predefined set of thirty moleculesthat represented a maximally diverse set of the MDDR col-lection. The central idea behind such form of moleculardescription relates to the concept of vector quantization[38] and implicit dimensionality reduction [4]. A back-propagation-based neural network with one hidden layerwas then used to estimate the unknown continuous rela-tionship between the molecules and Caco-2 permeation.
Two measures were used for evaluation of the results. Thefirst is a ratio-scale measure called cross-validated r2 andshows how well the model predicts data that was not usedduring model construction. This measure is defined as(Eq. (2)):
Here, Vi is the experimentally determined property of the
molecule Mi, Pi is its predicted property, and is the
mean experimental property value. The second measure is
an ordinal measure called Kendall's τ, which shows howwell the ordering of the data is preserved during predictionby the model. This measure, computed for n molecules, isdefined as:
Kendall's τ is determined by considering all pairs of pre-dicted absorption values and the corresponding actualabsorption values (as determined experimentally). A pairof predicted values is deemed to be correctly ordered if theordering coincides with that of the experimentally derivedvalues. The numerator in Eq. 3 is the difference betweenthe numbers of correctly and incorrectly ordered pairs.The denominator denotes the number of all possiblepairs. Thus, if all pairs are correctly ordered, the maximumvalue of τ = 1 is obtained. On the other hand, the mini-mum value of τ = -1 is obtained if none of the pairs of pre-dicted values retain the experimentally derived ordering.An ordinal measure, such as Kendall's τ, reflects how wellthe model can predict the ordering (or prioritisation) ofthe molecules. This provides an alternate way to assess themodel as compared to measuring the numeric predictiveaccuracy. Therefore, using a combination of the abovemeasures allows a multifaceted approach to model evalu-ation.
The assay values for twenty of the thirty compounds weremade available for model construction and constitutedthe learning phase for the neural network. As part of themodel construction step, the complete cross-correlationmatrix of the descriptors was computed and the top eightleast correlated descriptors used to learn the (empirical)mapping between the molecules and their permeabilityvalues. Learning was stopped when the cross-validatederror became lower than a predefined threshold.
r
V P
V V
i ii
ii
2
2
21= −
−
−
∑
∑
( )
( )(2)
V
τ = −−
| | | |
(
correctly orderd pairs incorrectly ordered pairs
n n 11 2)/
(3)
Comparison of computational performanceFigure 2Comparison of computational performance. Computational performance of the proposed method (left) and comparison with the Molecular Hashkeys method [13], which is based on the Compass algorithm (right).
0
50
100
150
200
250
0 10 20 30 40
Number of Molecules
Tim
e (
se
co
nd
s)
0
5000
10000
15000
20000
25000
30000
35000
40000
0 10 20 30 40
Number of Molecules
Tim
e (
se
co
nd
s)
Page 6 of 12(page number not for citation purposes)

BMC Cell Biology 2007, 8(Suppl 1):S6 http://www.biomedcentral.com/1471-2121/8/S1/S6
We begin by presenting the analysis of the method's per-formance in a leave-one-out cross-validated setting on thetraining set. In this setting, one compound was randomlyexcluded from the training set and the remaining com-pounds used to learn a model that predicted the permea-bility for the excluded compound. The results are shownin Figures 3(a) and 3(b). The numbers on the X-axis iden-tify each of the molecules in the test set and the Y-axisshows the permeation values in terms of flux-units. Figure3(a) shows the predictive performance of the model con-structed with the proposed similarity measure. In this casethe cross-validated r2 equalled 0.97 and the value for Ken-dall's τ was 0.65. In Figure 3(b), results are shown for theidentical problem setting, where the only exception wasthe use of the Molecular Hashkeys algorithm for comput-ing the similarity of the molecules. For the best modellearnt based on descriptors generated using MolecularHashkeys, the value for cross-validated r2 equalled 0.64and Kendall's τ equalled 0.29. It should be emphasizedthat in both experiments an identical learning algorithm(single hidden layer neural network with back-propaga-tion) was used and the only distinction was in the similar-ity values (due to the different algorithms used fordetermining them). We also note that the relatively lowvalue for Kendall's τ (as compared to the cross-validatedr2) occurred because the original data had compoundsshowing no absorption. The models that were derivedtypically assigned very low (albeit non-zero) absorptionvalues to these molecules, thus leading to lower values forKendall's τ . The model based on similarity values derivedusing Molecular Hashkeys also exhibited ordering incon-sistencies across the entire range of absorption values.Finally, Figure 3(c) shows the performance of the struc-ture-activity model obtained using the proposed method,on the test set of 10 molecules. Here, the X-axis identifieseach of the ten molecules in the test set, while the Y-axiscorresponds to the permeation values.
In Figure 3(d) – (e), we present an analysis of themethod's performance in a leave-n-out cross-validatedsetting. The goal of this experiment was to examine therobustness of the model under conditions where a signif-icant number of samples get left out during the modelconstruction stage. During each iteration of the experi-ment, 7 of the 20 molecules were randomly excluded. Theremaining 13 molecules were then used for model con-struction and for predicting the absorption values of the 7excluded molecules. The results are based on the perform-ance of the model in 25 iterations of the leave-n-outexperiment. The number of iterations is arbitrarilyselected. To help visualize the results, the absorption val-ues and predictions are grouped into three bins: Bin 1 cor-responds to molecules exhibiting poor absorption(defined to be less than 0.5% flux units), Bin 2 corre-sponds to molecules that exhibited medium absorption
(between 0.5% and 1.0% flux), and Bin 3 corresponds tomolecules that showed high permeation (greater than1.0% flux). The bar-chart in Figure 3(d) shows thenumber of incorrect bin assignments that were made:Over the 25 iterations, 85% of the overall bin assignmentswere correct and in 15% of the assignments, an error ofone adjacent bin was observed (i.e. a compound with lowabsorption got assigned to the medium absorption bin orvice-versa, or a medium absorption compound wasassigned to the high absorption bin). However, in none ofthe iterations, was a poorly absorbed compound pre-dicted to be a highly absorbed one or a highly absorbedcompound predicted to be a poorly absorbed one. Figure3(e), presents the distribution of the prediction resultsacross the 25 iterations of the leave-n-out cross-validationexperiment: 11 of the 25 iterations resulted in perfect binassignments and 7 of the 25 iterations had 83% correctbin assignments. Further, 6 of the iterations had 67%accurate assignments and only one of the 25 iterationshad 50% accuracy in bin assignments. These statisticsindicate the high consistency in the prediction perform-ance of the model across variations in the training set.
ConclusionIn this paper, we considered the problem of defining sim-ilarity between molecules based on complex surface-based representations. Such representations capture thephysics of the molecules better than commonly usedmolecular-graph-based approaches and can thereforehave significant relevance in molecular query-retrieval,similarity-based exploration of structural space, and struc-ture-activity modelling. We have presented a novelapproach for defining a standard coordinate system fordescribing complex surface-based molecular descriptions.For computing the similarity of molecules, we propose anovel formulation of histogram intersection which cantake into account the distribution of surface properties in3D space. Experimental results indicate that the similarityformulation can be used for highly-accurate query-retrieval and outperforms, in terms of computationalspeed, both existing research and commercially availablesolutions. The proposed approach was also validated byapplying it in building structure-activity models for com-plex bio-chemical properties. The efficacy and computa-tional efficiency of the proposed approach underline theimportant role it can play in querying and exploration oflarge molecular repositories.
MethodsWe begin this section by describing how the molecularsurfaces are derived and how at each point of the surface,donor and acceptor fields are defined. Next, the concept ofa standard coordinate system for describing molecularsurfaces is introduced. In this subsection we discuss theGauss map and its derivatives: the Extended Gaussian
Page 7 of 12(page number not for citation purposes)

BMC Cell Biology 2007, 8(Suppl 1):S6 http://www.biomedcentral.com/1471-2121/8/S1/S6
Image and the Spherical Attribute Image. We subse-quently describe how a sphere encapsulating the moleculeis deformed to map the molecular surface to a standardspherical coordinate system. In the final sub-section, thehistogram-intersection based surface matching algorithmis described and illustrated using a simple example.
Computing the molecular surface and surface propertiesStarting from the atomic coordinates, the molecular sur-face (Connolly surface) is obtained by using the programMSRoll [39]. The geometric information provided by themolecular surface is complemented by calculating thedonor field and acceptor field (due to H-bond donor andH-bond acceptor atoms) of the molecule at each surfacepoint. The choice of these descriptors is due to theirimportance in various molecular interactions and theircorrelation with other surface-based properties such aspolar surface area [40].
The measurement of the donor field is done using the fol-lowing three step procedure:
Step 1The Hydrogen-bond donor atoms in the molecule areidentified. Typically these are Nitrogen or Oxygen atomswith hydrogen on them. Other ways of identification likethe PATTY-rule [13] can also be used in this stage.
Step 2The donor field is defined as an isotropic Gaussian distri-bution and the field at point Pj due to an atom at positionXi having van der Walls radii ri is defined as [7]:
f P Xa
r
a
rX Pj i
i ii j( , ) exp | |=
⎛
⎝⎜⎜
⎞
⎠⎟⎟
− −⎛
⎝⎜⎜
⎞
⎠⎟⎟
2
2
32 2
22
2 2π(4)
Performance in structure-property modellingFigure 3Performance in structure-property modelling. Performance, comparison, and analysis of the proposed method in struc-ture-property modelling. In (a) – (c), permeation of each compound is depicted by two adjacent bars with predicted values rep-resented by light-blue bars on the left and measured values represented by the dark maroon bars on the right. The numbers on the X-axis identify each molecule used in the experiment and the Y-axis corresponds to the permeation values, measured in terms of flux-units. (a) Prediction results on the training set in a leave-one-out setting with the proposed method, (b) Predic-tion results on the training set in a leave-one-out setting with the similarity algorithm [13], (c) Performance of the proposed method on the test set. Figures 3(d) and 3(e) present leave-n-out cross-validated results demonstrating the robustness of the predictive model obtained using the proposed method. The correctness of the assignment of the molecules to the three classes "low permeability", "medium permeability", and "high permeability" is shown in (d), while the distribution of the predic-tion results in shown in (e).
0
0.5
1
1.5
2
2.5
3
1 3 5 7 9 11 13 15 17 190
0.5
1
1.5
2
2.5
3
1 3 5 7 9 11 13 15 17 19
0
0.5
1
1.5
2
2.5
3
1 2 3 4 5 6 7 8 9 10
0
10
20
30
40
50
60
Perc
ent of Tota
l in
Each B
in
Bin 1 Bin 2 Bin 3
Predicted Assignments
0
2
4
6
8
10
12
Num
ber
of R
uns
17% 33% 50% 67% 83% 100%
Fraction Correct
(a) (b) (c)
(d) (e)
0
0.5
1
1.5
2
2.5
3
1 3 5 7 9 11 13 15 17 190
0.5
1
1.5
2
2.5
3
1 3 5 7 9 11 13 15 17 19
0
0.5
1
1.5
2
2.5
3
1 2 3 4 5 6 7 8 9 10
0
10
20
30
40
50
60
Perc
ent of Tota
l in
Each B
in
Bin 1 Bin 2 Bin 3
Predicted Assignments
0
2
4
6
8
10
12
Num
ber
of R
uns
17% 33% 50% 67% 83% 100%
Fraction Correct
(a) (b) (c)
(d) (e)
Page 8 of 12(page number not for citation purposes)

BMC Cell Biology 2007, 8(Suppl 1):S6 http://www.biomedcentral.com/1471-2121/8/S1/S6
In Eq. (4) a is a scale factor for the radii. The value of a =2, for which 90% of the electron density lies inside thevan-der walls radius of the atom, is used in all the experi-ments.
Step 3At a given surface point Pj, first, the field strength for eachdonor atom is computed. The direction of each field isgiven by a unit vector obtained by joining the correspond-ing atom to Pj. The resultant donor field at Pj is subse-quently defined as the vector sum of all donor fieldvectors at this point.
The acceptor field is analogously determined. TypicallyNitrogen or Oxygen atoms with a lone pair of electronsare considered as acceptors.
A standard coordinate system for surface-based molecular representationsA pre-requisite for comparing molecules described usingsurface-based representations is the capability to mappoints on the curved molecular surface to points on astandard coordinate system. Such a mapping was derivedby Gauss [41], by using surface orientations to map pointson an arbitrary curved surface to a standard coordinatesystem defined on a unit sphere. This mapping is formallyreferred to as the Gauss map and can be defined as fol-lows:
Definition 1Let G ⊂ R3 be an oriented surface in Euclidean space. Fur-ther, let S be a unit sphere, called the Gaussian sphere. TheGauss map M is the mapping M : G → S, where the surfacenormal for each point on the surface G is translated to theorigin of the sphere S and the end points of each normallie on the surface of the Gaussian sphere S (see Figure 4(a)for an illustration).
The Extended Gaussian Image (EGI), is a derivative of theGauss Map and is obtained from it by assuming that thesurface G is evenly sampled into patches and that eachsurface normal is associated with a single unit of masswhich it votes to the corresponding point on the Gaussiansphere. The distribution of the mass on the surface of theGaussian sphere, obtained in this fashion, depends on theshape of the underlying surface and constitutes the EGI.The EGI possesses certain important characteristics thatinclude: (i) If two convex objects have the same EGI, theyare provably congruent (the Minkowski theorem [42]),(ii) As an object rotates, its EGI rotates in the same man-ner, (iii) The EGI mass on the Gaussian sphere is inverseof the Gaussian curvature of the underlying object surface,and (iv) The centre of mass of the EGI lies at the origin ofthe Gaussian sphere.
The properties of the EGI, especially the Minkowski theo-rem provide the foundations for representing and com-paring surface-based description of objects. However, aninherent problem of EGI-type mappings is their depend-ence on the Gauss map which is non-unique for non-con-vex shapes. Because of this, more than two points on anobject surface may be mapped on the same point on theGaussian sphere. Unfortunately, many molecules in theirstable conformations induce surfaces that are non-convexand therefore the direct application of techniques fromthe EGI family is precluded for their representation andmatching. To address this problem, we utilize the idea ofthe Spherical Attribute Image (SAI) [43], where a geodesicsurface is iteratively defined to fit the underlying surface.We begin by placing the molecule inside a semi-regularlytessellated sphere (Figure 4(c)), which is obtained by sub-divisions of the triangular sides of a 20-side icosahedroninto sub-triangles. The placement of the molecule is donesuch that its centre of mass coincides with the centre of thesphere. The spherical surface is then modelled as amechanical system and iteratively deformed to fit themolecular surface. The deformations are subject to a localregularity constraint [44] that ensures uniformity in meas-urement of the molecular surface and invariance to rota-tion of the molecule. The convergence of thedeformations yield a fit of the deformable surface to themolecular surface and thus provide a one-to-one mappingbetween points on the molecular surface and points onthe encapsulating sphere. The distance of a point on thesphere to its corresponding position on the molecular sur-face is then used to estimate the surface shape. Further, thedonor and acceptor field values at a specific point on themolecular surface are mapped to its corresponding pointon the sphere. At the conclusion of this step, each pointon the sphere contains three values, characterizing respec-tively (1) the shape of the underlying surface, (2) thedonor field strength, and (3) the acceptor field strength, ofthe underlying surface point.
Comparing surface-based molecular representationsWe seek to define the similarity of two molecules in termsof the similarity of their surface-property distributions,described using histograms. The technique of histogramintersection [45] can be used to rapidly compare the empir-ical similarity of these distributions. Given the data pointscorresponding to two distributions, the basic idea consistsof quantizing the range of values in fixed size bins. Subse-quently, the common number of data points across all thebins is determined and normalized by the size of the dis-tribution. Histogram intersection is computationally effi-cient since its complexity is linear in the number of bins.Furthermore, the method is robust to noise and invariantto translation and rotation of the distributions being com-pared.
Page 9 of 12(page number not for citation purposes)

BMC Cell Biology 2007, 8(Suppl 1):S6 http://www.biomedcentral.com/1471-2121/8/S1/S6
In the case of molecules, it is critical not just to account forthe similarity of property distributions, but also the simi-larity of the spatial distribution of these properties on themolecular surface. Hence, a direct application of histo-gram intersection to compare the property distributions isby itself, insufficient. This issue is illustrated in Figure 4(c)where three distributions of four black and two greysquares are shown. Our goal is to devise a technique thatcan distinguish the first and second distributions (whichare identical and related by a planar rotation), from thethird. Clearly using the histogram of greyscale value of thesquares is insufficient, since all the three distributions pro-duce identical greyscale histograms. Intuitively, we wouldlike two distributions to be considered similar when theyhave both similar distribution of values and are similarlydistributed spatially.
Our approach uses the distribution of the pair-wise dis-tances between points having similar property values tocharacterize the spatial distribution of the correspondingmolecular property. Furthermore, we use histogram inter-section to compute the similarity of the property distribu-tions as well as the similarity of the spatial distributions.In addition to efficient computability and invariance totranslations and rotations of the molecule, a significantadvantage of this approach is its ability to characterize(and compare) the relative spatial distribution of surfaceproperties, which act as pharmacophores. The main stepsof the method are:
Step 1For each specific property of the molecule, such as shape,donor field, or acceptor field, the property values across
all the points on the surface of the tessellated sphere aredetermined. The range of values is then uniformly dividedinto a predefined number N of bins (we use N = 100 in allour experiments). Next, the frequency of points lying ineach bin is computed. This defines the histogram of thecorresponding property distribution. We term such histo-grams as property-histograms. In general, let P1...PKdenote the K properties being used to characterize a mol-ecule. In the following, we shall denote by HL, the prop-erty-histogram corresponding to the property PL, L ∈ [1,...,K]. For each property-bin m of HLsteps 2–4 are repeated.
Step 2The points contained in property-bin m are clustered interms of their adjacency on the surface of the encapsulat-ing sphere and the centroid of each cluster is determined.
Step 3The geodesic distance between all pairs of centroids iscomputed. We note that Steps 2–3 constitute a computa-tionally cheaper alternative to computing the distancesbetween all pairs of points in property-bin m.
Step 4These distances are quantized in distance-bins which aredefined in increments of one Angstrom in the range [0, C/2], where C denotes the circumference of the encapsulat-ing sphere (measured in Angstroms). Next, the frequencyin each distance-bin is computed to come up with the dis-tance-histogram. Thus, there is a distance-histogram cor-responding to every bin m of a property-histogram HL.The content of a distance-bin denotes the number ofpoints on the surface of the sphere that lie within a spe-
Illustration of the principle concepts in the proposed molecular representation and matchingFigure 4Illustration of the principle concepts in the proposed molecular representation and matching. (a) The Gauss Map, (b) Embedding of a molecule in the tessellated sphere, (c) Intuition behind the surface matching approach: The three distribu-tions contain an identical number of black and grey squares and can not be disambiguated by a property (colour)-based histo-gram. However, a histogram of pair-wise distances between similar colored squares, which captures their spatial distribution, can distinguish the third distribution from the first two. Such a characterization has the added advantage of being invariant to Euclidean transformations of the distribution.
(a) (b) (c)
X1
X2 X3
X4
Y1 Y2
X1
X2
X3
X4
Y1
Y2
(a) (b) (c)
X1
X2 X3
X4
Y1 Y2
X1
X2
X3
X4
Y1
Y2
Page 10 of 12(page number not for citation purposes)
BMC Cell Biology 2007, 8(Suppl 1):S6 http://www.biomedcentral.com/1471-2121/8/S1/S6
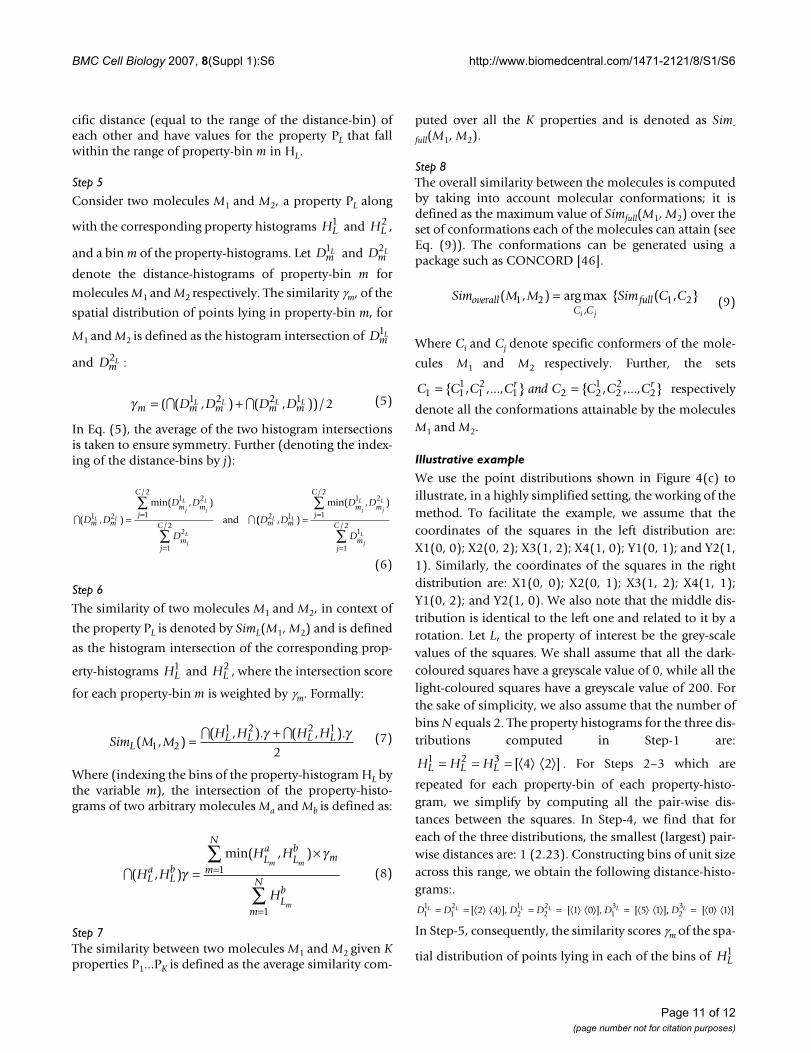
cific distance (equal to the range of the distance-bin) ofeach other and have values for the property PL that fallwithin the range of property-bin m in HL.
Step 5
Consider two molecules M1 and M2, a property PL along
with the corresponding property histograms and ,
and a bin m of the property-histograms. Let and
denote the distance-histograms of property-bin m for
molecules M1 and M2 respectively. The similarity γm, of the
spatial distribution of points lying in property-bin m, for
M1 and M2 is defined as the histogram intersection of
and :
In Eq. (5), the average of the two histogram intersectionsis taken to ensure symmetry. Further (denoting the index-ing of the distance-bins by j):
Step 6
The similarity of two molecules M1 and M2, in context of
the property PL is denoted by SimL(M1, M2) and is defined
as the histogram intersection of the corresponding prop-
erty-histograms and , where the intersection score
for each property-bin m is weighted by γm. Formally:
Where (indexing the bins of the property-histogram HL bythe variable m), the intersection of the property-histo-grams of two arbitrary molecules Ma and Mb is defined as:
Step 7The similarity between two molecules M1 and M2 given Kproperties P1...PK is defined as the average similarity com-
puted over all the K properties and is denoted as Sim-
full(M1, M2).
Step 8The overall similarity between the molecules is computedby taking into account molecular conformations; it isdefined as the maximum value of Simfull(M1, M2) over theset of conformations each of the molecules can attain (seeEq. (9)). The conformations can be generated using apackage such as CONCORD [46].
Where Ci and Cj denote specific conformers of the mole-
cules M1 and M2 respectively. Further, the sets
respectively
denote all the conformations attainable by the moleculesM1 and M2.
Illustrative example
We use the point distributions shown in Figure 4(c) toillustrate, in a highly simplified setting, the working of themethod. To facilitate the example, we assume that thecoordinates of the squares in the left distribution are:X1(0, 0); X2(0, 2); X3(1, 2); X4(1, 0); Y1(0, 1); and Y2(1,1). Similarly, the coordinates of the squares in the rightdistribution are: X1(0, 0); X2(0, 1); X3(1, 2); X4(1, 1);Y1(0, 2); and Y2(1, 0). We also note that the middle dis-tribution is identical to the left one and related to it by arotation. Let L, the property of interest be the grey-scalevalues of the squares. We shall assume that all the dark-coloured squares have a greyscale value of 0, while all thelight-coloured squares have a greyscale value of 200. Forthe sake of simplicity, we also assume that the number ofbins N equals 2. The property histograms for the three dis-tributions computed in Step-1 are:
. For Steps 2–3 which are
repeated for each property-bin of each property-histo-gram, we simplify by computing all the pair-wise dis-tances between the squares. In Step-4, we find that foreach of the three distributions, the smallest (largest) pair-wise distances are: 1 (2.23). Constructing bins of unit sizeacross this range, we obtain the following distance-histo-grams:.
In Step-5, consequently, the similarity scores γm of the spa-
tial distribution of points lying in each of the bins of
HL1 HL
2
DmL1 Dm
L2
DmL1
DmL2
γ m m m m mD D D DL L L L= +( ( , ) ( , ))/∩ ∩1 2 2 1 2 (5)
∩ ∩( , )
min( , )/
/D D
D D
Dm m
m mj
C
mj
CL L
j
L
j
L
j
L
1 2
1 2
1
2
2
1
2= =
=
∑
∑ and (( , )
min( , )/
/D D
D D
Dm m
m mj
C
mj
CL L
j
L
j
L
j
L
2 1
1 2
1
2
1
1
2= =
=
∑
∑
(6)
HL1 HL
2
Sim M MH H H H
LL L L L( , )
( , ). ( , ).1 2
1 2 2 1
2= +∩ ∩γ γ (7)
∩( , )
min( , )
H H
H H
HLa
Lb
La
Lb
mm
N
Lb
m
N
m m
m
γγ
=×
=
=
∑
∑1
1
(8)
Sim M M Sim C CoverallC C
fulli j
( , ) argmax { ( , },
1 2 1 2= (9)
C C C C and C C C Cr r1 1
112
1 2 21
22
2= ={ , ,..., } { , ,..., }
H H HL L L1 2 3 4 2= = = ⟨ ⟩ ⟨ ⟩[ ]
D D D D DL L L L L11
12
21
22
132 5= = ⟨ ⟩ ⟨ ⟩ = = ⟨ ⟩ ⟨ ⟩ = ⟨ ⟩ ⟨ ⟩[ [ 4 ], [ 1 0 ], 1 ],, [ 0 1 ]D L
23 = ⟨ ⟩ ⟨ ⟩
HL1
Page 11 of 12(page number not for citation purposes)

BMC Cell Biology 2007, 8(Suppl 1):S6 http://www.biomedcentral.com/1471-2121/8/S1/S6
and are: γ1 = 0.5; γ2 = 0. In Step-6, the similarity of the
first and third distributions is therefore: SimL(M1, M3) = (4
× 0.5 + 2 × 0)/6 = 0.33. The reader may trivially verify thatSimL(M1, M3) = 1.0.
Competing interestsThe author declares that they have no competing interests.
AcknowledgementsThe author thanks the anonymous reviewer(s) for their comments. These have lead to significant improvements in the presentation of the material. This research was partially funded by the National Science Foundation grant IIS-0644418.
This article has been published as part of BMC Cell Biology Volume 8 Supple-ment 1, 2007: 2006 International Workshop on Multiscale Biological Imag-ing, Data Mining and Informatics. The full contents of the supplement are available online at http://www.biomedcentral.com/1471-2121/8?issue=S1
References1. Bohm H-J, Schneider G: Virtual Screening for Bio-Active Molecules: Meth-
ods and Principles in Medicinal Chemistry Wiley-VCH; 2000. 2. Cramer R, Poss MA, Hermsmeier MA, Caulfield TJ, Kowala MC, Vlen-
tine MT: Prospective Identification of Biologically ActiveStructures by Topomer Shape Similarity Searching. J MedChem 1999, 42:3919-3933.
3. Kinoshita K, Nakamura H: Identification of protein biochemicalfunctions by similarity search using the molecular surfacedatabase eF-site. Protein Science 2003, 12:1589-1595.
4. Ghuloum A, Sage C, Jain A: Molecular Hashkeys: A NovelMethod for Molecular Characterization and its Applicationfor Predicting Important Pharmaceutical Properties of Mol-ecules. J Med Chem 1999, 42(10):1739-1748.
5. Guba W, Cruciani G: Molecular Field-Derived Descriptors ForThe Multivariate Modeling of Pharmacokinetic Data. InMolecular Modeling and Prediction of Bioactivity Edited by: Gundertofte K,Jorgensen F. Kluwer Academic/Plenum Publishers, New York; 2000:89-94.
6. Kubinyi H, Folkers G, Martin Y: 3D QSAR in Drug Design Kluwer; 1998. 7. Labute P, Williams C: Flexible Alignment of Small Molecules. J
Med Chem 2001, 44(10):1483-1490.8. Norel R, Fischer D, Wolfson H, Nussinov R: Molecular Surface-
Recognition by a Computer Vision-Based Technique. ProteinEngineering 1994, 7(1):39-46.
9. Wiener H: Structural determination of Paraffin BoilingPoints. J of Am Chem Soc 1947, 69:17-20.
10. Randic M: On Characterization of Molecular Branching. J AmChem Soc 1975, 97:6609-6615.
11. Pearlman RS, Smith KM: Metric validation and the receptor-rel-evant subspace concept. J Chem Inf Comput Sci 1999, 39:28-35.
12. Silverman BD, Platt DE: Comparative molecular moment anal-ysis (CoMMA): 3D-QSAR without molecular superposition. JMed Chem 1996, 39:2129-2140.
13. Bush B, Sheridan R: PATTY: A programmable Atom Typer andLanguagefor Automatic Classification of Atoms in a Molecu-lar Database. J Chem Inf Comp Sci 1993, 33:756-762.
14. Nikolova N, Jaworska J: Approaches to measure chemical sim-ilarity – a review. QSAR Comb Sci 2003, 22:1006-1026.
15. Carbo-Dorca R, Girones X, Mezey PG: Fundamentals of Molecular Sim-ilarity Kluwer Academic/Plenum; 2001.
16. Barnard J, Downs G, Willett P: Descriptor-Based SimilarityMeasures for Screening Chemical Databases. In Virtual Screen-ing for Bio-Active Molecules, Methods and Principles in Medicinal ChemistryVolume 10. Edited by: Bohm H-J, Schneider G. Wiley-VCH; 2000:59-80.
17. Jain A, Koile K, Chapman D: Compass: Predicting BiologicalActivity from Molecular Surface Properties. PerformanceComparison on a Steroid Benchmark. J Med Chem 1994,37:2315-2327.
18. Bemis G, Kuntz I: A fast and efficient method for 2D and 3Dmolecular shape description. J of Comp -Aided Mol Design 1992,6:607-628.
19. Deshpande M, Kuramochi M, Wale N, Karypis G: Frequent Sub-Structure-Based Approaches for Classifying Chemical Com-pounds. IEEE Trans Knowl Data Eng 2005, 17(8):1036-1050.
20. Raymond J, Gardiner E, Willett P: RASCAL: Calculation of GraphSimilarity using Maximum Common Edge Subgraphs. TheComputer Journal 2002, 46(6):631-644.
21. [http://www.mdli.com].22. Chen J, Swamidass SJ, Dou Y, Bruamd J, Baldi P: ChemDB: A Public
Database of Small Molecules and Related ChemoinformaticsResources. Bioinformatics 2005, 21:4133-4139.
23. Holm L, Sander C: Dali: A network tool for protein structurecomparison. Trends Biochem Sci 1995, 20:478-480.
24. Krissinel E, Henrick K: Secondary Structure Matching (SSM), anew tool for fast protein alignment in three dimensions. Actacrystallogr D Biol Crystallogr 2004, 60:2256-2268.
25. Orengo CA, Taylor WR: Protein Structure Alignment. J TheorlBiol 1990, 147:517-551.
26. Gerstein M, Levitt M: Comprehensive assessment of automaticstructural alignment against a manual standard, the Scopclassification of proteins. Protein Sci 1998, 7(2):445-456.
27. Shindyalov IN, Bourne PE: Protein structure alignment by incre-mental combinatorial extension (CE) of the optimal path.Protein Eng 1998, 11:739-747.
28. Singh A, Brutlag D: Hierarchical protein structure superposi-tion using both secondary structure and atomic representa-tions. Proc 5th Intr Conf on Intell Syst for Mol Biol (ISMB) 1997:284-293.
29. Kleywegt GJ: Use of non-crystallographic symmetry in proteinstructure refinement. Acta Crystallogr D Biol Crystallogr 1996,52:842-857.
30. Jain A, Dietterich T, Lathrop R, Chapman D, Critchlow R, Bauer B,Webster T, Lozano-Perez T: Compass: A Shape-Based MachineLearning Tool for Drug Design. Journal of Computer Aided Molec-ular Design 1994, 8:635-652.
31. Samet H: The Quadtree and Related Hierarchical Data Struc-tures. ACM Computing Surveys 1984, 16(2):187-260.
32. Guttman A: R-tree: A Dynamic Index Structure for SpatialSearching. ACM SIGMOD 1984:47-57.
33. Bently J, Friedman J: Data Structures for Range Searching. ACMComputing Surveys 1979, 11(4):397-409.
34. Brin S: Nearest Neighbor Search in Large Metric Spaces.VLDB 1995:574-584.
35. Yanilos P: Data Structures and Algorithms for Nearest Neigh-bor Search in General Metric Spaces. SODA 1993:311-321.
36. Camoglu O, Kahveci T, Singh A: Index-based Similarity Searchfor Protein Structure Databases. J Bioinform Comput Biol 2004,2(1):99-126.
37. Livingstone DJ: The Characterization of Chemical StructuresUsing Molecular Properties. A Survey. J Chem Inf Comput Sci2000, 40:195-209.
38. Cherkassky VF, Mulier F: Learning From Data Wiley Inter-Science; 1998. 39. Connolly ML: The Molecular Surface Package. J Mol Graph 1993,
11(2):139-141.40. Veber D, Johnson S, Cheng H-Y, Smith B, Ward K, Kopple K: Molec-
ular Properties that Influence the Oral Bioavailability ofDrug Candidates. J Med Chem 2002, 45:2615-2623.
41. Gauss KF: General Investigation of Curved Surfaces Raven Press, NewYork; 1965.
42. Lysternik LA: Convex Figures and Polyhedra Dover Publications, New York;1963.
43. Hebert M, Ikeuchi K, Delingette H: A Spherical Representationfor Recognition of Free-Form Surfaces. IEEE Trans on PatternAnalysis and Machine Intelligence 1995, 17(7):681-689.
44. Singh R: Reasoning About Molecular Similarity and Proper-ties. Proc IEEE Comput Syst Bioinform Conf 2004:266-277.
45. Swain M, Ballard D: Color Indexing. Int J of Comp Vision 1991,7(1):11-32.
46. [http://www.tripos.com].
HL3
Page 12 of 12(page number not for citation purposes)
Copyright © 2022 FDOKUMEN