
Managing the Risk in Pension Plans and Recent Pension ...
61
No. 06‐7 Managing the Risk in Pension Plans and Recent Pension Reforms Richard W. Kopcke Abstract: This paper examines the characteristics of three funding strategies for pension plans and analyzes the investment strategies that complement these strategies. Although the primary focus is on defined benefit plans, which include Social Security, it also applies to employees’ defined contribution plans, which, when their beneficiaries set specific goals for their future retirement benefits, are essentially defined benefit plans. The findings suggest that pension plans should use interest rates on Treasury securities instead of yields on corporate bonds to calculate the value of their liabilities. Defined benefit plans, including Social Security, could stabilize the balance between the value of their assets and their obligations if they financed only the value of the benefits that their beneficiaries have accrued and they invested their assets in Treasury securities. In this case, the required contribution per dollar of wages would need to change significantly with the rate of growth of employment. By funding the obligation entailed by employees’ projected income at retirement, contributions per dollar of wages would change less with the growth of employment. However, in this case, plans would need to invest in a broader range of assets—including Treasury inflation‐protected securities, stocks, and real assets—to prevent the balance between their assets and liabilities from varying too greatly. Furthermore, plans would need to hold surplus assets to minimize the risk of becoming underfunded. JEL Classifications: G23, G28, G38 Richard W. Kopcke is a Visiting Professor at Northeastern University and a Visiting Scholar at the Federal Reserve Bank of Boston. His e‐mail address is [email protected] . The author wishes to thank Zvi Bodie, Peter Fortune, and Alicia Munnell for helpful comments on earlier drafts. This paper, which may be revised, is available on the web site of the Federal Reserve Bank of Boston at http://www.bos.frb.org/economic/ppdp/index.htm . The views expressed in this paper are solely those of the author and do not reflect official positions of the Federal Reserve Bank of Boston or the Federal Reserve System. This version: February 2007 1
-
Upload
khangminh22 -
Category
Documents
-
view
1 -
download
0
Transcript of Managing the Risk in Pension Plans and Recent Pension ...

No. 06‐7 Managing the Risk in Pension Plans and Recent Pension
Reforms
Richard W. Kopcke
Abstract: This paper examines the characteristics of three funding strategies for pension plans and analyzes the investment strategies that complement these strategies. Although the primary focus is on defined benefit plans, which include Social Security, it also applies to employees’ defined contribution plans, which, when their beneficiaries set specific goals for their future retirement benefits, are essentially defined benefit plans. The findings suggest that pension plans should use interest rates on Treasury securities instead of yields on corporate bonds to calculate the value of their liabilities. Defined benefit plans, including Social Security, could stabilize the balance between the value of their assets and their obligations if they financed only the value of the benefits that their beneficiaries have accrued and they invested their assets in Treasury securities. In this case, the required contribution per dollar of wages would need to change significantly with the rate of growth of employment. By funding the obligation entailed by employees’ projected income at retirement, contributions per dollar of wages would change less with the growth of employment. However, in this case, plans would need to invest in a broader range of assets—including Treasury inflation‐protected securities, stocks, and real assets—to prevent the balance between their assets and liabilities from varying too greatly. Furthermore, plans would need to hold surplus assets to minimize the risk of becoming underfunded.
JEL Classifications: G23, G28, G38 Richard W. Kopcke is a Visiting Professor at Northeastern University and a Visiting Scholar at the Federal Reserve Bank of Boston. His e‐mail address is [email protected].
The author wishes to thank Zvi Bodie, Peter Fortune, and Alicia Munnell for helpful comments on earlier drafts.
This paper, which may be revised, is available on the web site of the Federal Reserve Bank of Boston at http://www.bos.frb.org/economic/ppdp/index.htm.
The views expressed in this paper are solely those of the author and do not reflect official positions of the Federal Reserve Bank of Boston or the Federal Reserve System.
This version: February 2007
1

During the last decade the status of companies’ defined benefit pension plans
shifted dramatically from surpluses to deficits. Rising stock and bond prices in the late
1990s lifted the value of assets for most plans well above the value of their obligations.
These surpluses tended to boost the earnings of companies that sponsored these plans
by reducing their need to make contributions to fund their pension obligations. Then,
during the early 2000s, the collapse in prices of securities pushed most of these plans
into deficit, precipitating the termination of many of them. Employers that have
continued their plans confront the need to restore their funded status, a demand that
now threatens to increase their overall labor costs and depress their profit margins. In
the wake of this experience, the federal government included provisions in the Pension
Protection Act of 2006 to promote the full funding of defined benefit pension plans in
the future, and accounting authorities are considering reforms to improve the financial
reporting for employers’ defined benefit pension plans.1
This paper examines the characteristics of three funding strategies for pension
plans. It also analyzes the investment strategies that complement these funding
strategies. Although the discussion emphasizes defined benefit plans, which include
Social Security, it also applies to employees’ defined contribution plans, which are
essentially defined benefit plans when their beneficiaries set specific goals for their
future pension benefits.
Financial accounting standards and federal law measure the financial status of
pension plans differently. For the purposes of financial reporting, a company’s liability
takes into account employees’ current years of service and projections of their future
wages and salaries. Under pension law, a company’s liability reflects only employees’
current years of service and current wages and salaries. For either standard, this article
stresses that the assets for a fully funded plan should exceed its liabilities by a margin
that covers the risks inherent in its investment strategy, and a plan should measure its
liabilities, the present value of its promises, using interest rates on Treasury securities. 1 For more discussion of potential reforms for defined benefit plans, see Wilcox (2006) and its citations. See also Meder and Staub (2006) and its citations for a discussion of the risks in matching the assets and liabilities of pension funds.

Among the possible funding strategies, the strategy of funding pension plans’
projected obligations, as promoted by financial accounting standards, imposes the largest
expected costs and risks on employers. This burden is greatest for companies with
rapidly growing work forces, with limited access to capital on competitive terms, or
with employees who would favor more flexible and portable pension arrangements.
Strategies that, instead, fund employees’ pension benefits as they accumulate, as required
by law, require a smaller investment of resources and promote more stable funding
targets. These funding strategies, which build assets in step with employees’ earned
benefits, also admit investment strategies that eliminate much of the risk in maintaining
plans’ funded status. Employees who fund their defined contribution pension plans in
the traditional way of setting aside a constant share of their income are essentially
funding their accumulating benefit with some provision for a surplus.
The results in this paper imply that defined benefit plans, including Social
Security, could stabilize the balance between the value of their assets and their
obligations if they funded the obligation entailed by employees’ current income, and
they financed this obligation by investing in Treasury securities. But with this strategy,
the required contribution per dollar of wages would need to change significantly with
the rate of growth of employment. By funding the obligation entailed by employees’
projected income at retirement, defined benefit plans could stabilize their contributions
per dollar of wages. This funding strategy would then encourage plans to hold surplus
assets and to invest in a broader range of assets—including Treasury inflation‐protected
securities, stocks, and real assets—to minimize the risk of becoming underfunded.
The first section of this paper introduces three funding targets: the projected
benefit obligation, the accumulated benefit obligation, and the constant contribution
rate, noting that each of these strategies represents a different path to the common goal
of fully funded pensions. The second section describes the investment requirements and
opportunity costs that the three strategies can impose on sponsors. The third section
describes the risks in these funding strategies and the extent to which traditional
immunization can control these risks for each strategy. It also discusses the importance
3

of calculating the present value of pension plans’ obligations using interest rates on
Treasury securities and the importance of plans’ holding surplus assets sufficient to
cover any risks they assume in funding their obligations. The fourth section extends the
discussion of techniques for controlling risk. It presents two‐factor immunization, a
means of combining conventional bonds and inflation‐adjusted bonds to protect a plan
from the risks presented by unexpected changes in rates of inflation and real rates of
return in the future. It also illustrates the value of combining these investments with
stocks and other assets to hedge, albeit less completely, other risks as necessary. The
final section concludes this paper.
I Defined Benefit Pension Obligations
Defined benefit pension plans typically set employees’ annual pension payments
at the time of their retirement according to their years of service, their age, and their
wage or salary during their years of service, mostly either their final year’s wage or the
average of their last three or five years’ wages. For most plans, retirees’ pensions are
fixed for the remainder of their lives. These plans are not obligated to adjust payments to
reflect inflation, although some voluntarily increase their payments to retirees from time
to time at their discretion.
A plan’s obligation to employees before their retirement is often measured in two
ways: the accumulated benefit obligation (ABO) and the projected benefit obligation
(PBO). The ABO is the present value of pension benefits that employees have earned
with their current service, at their current age and wage, for the length of time they
likely will be collecting benefits after they attain retirement age. The PBO is the present
value of pension benefits that employees are likely to earn using their current service
and their projected future wages at the time of their retirement.2 Both the ABO and the
PBO include the value of the potential pension obligations to active employees who
have not yet become vested by participating long enough to qualify for benefits. The
2 The PBO does not recognize the credit for the additional years of service that employees earn before their retirement, even though it does consider their future wages.
4

vested portion of the ABO would be an employer’s liability if its defined benefit plan
were immediately terminated.
Suppose employees with 15 years of service, earning just over $68,000 annually,
are likely to work for their current employer for another 15 years, earning $140,000 in
their last year at work. Suppose also that the employees will qualify for a full pension
equal to one‐half of their final annual wage, or $70,000 per year, with 30 years of service.
Their employer expects these employees to live 20 years in retirement. Accordingly, the
present value of the employer’s pension obligation, at a discount rate of 5 percent, is
about $830,000 per employee at the time of their retirement. In other words, if 15 years
from now the plan holds assets equal to $830,000 per employee and these assets earn a 5
percent return for the employees’ 20 years of retirement, the plan will be able to satisfy
its obligation to the employees.
At the end of the employees’ 15 years of service, they have earned a pension of
$17,000 annually when they attain retirement age (Figure 1). This pension equals one‐
half of their current annual wage of $68,000 scaled by their service credit for having
worked 15 of the 30 years required to earn a full pension. If, in 15 years, their pension
plan holds approximately $202,000 in assets earning 5 percent, it will be able to pay their
$17,000 pension without requiring any further contributions from their employer. The
employer’s ABO for this obligation is the present value of $202,000, or approximately
$97,000.
The employer’s PBO is more substantial. The employer estimates that these
employees with 15 years of service will be earning $140,000 when they retire in another
15 years (Figure 2). At that time, they will have earned a full pension of $70,000 equal to
one‐half of their final salary $140,000. With 15 of the 30 years of service required to earn
this full pension, their current projected annual pension after retirement is $35,000. If, in
15 years, their pension plan holds approximately $400,000 in assets earning 5 percent, it
will be able to pay their $35,000 pension without requiring any further contributions
from their employer. The employer’s PBO for this obligation is the present value of
$400,000, or approximately $200,000.
5

Funding Strategies
In the illustration above, the PBO for employees at the end of their first year of
service would be about $6,400. The employer could contribute this sum to the pension
plan in the year that they are hired. Alternatively, the employer could satisfy its ABO,
about $1,600, by electing to pay greater contributions in future years as the employees’
wages mount. The employer, in principle, also could choose a funding strategy between
these two courses, making somewhat larger contributions earlier during employees’
active service to reduce its required contributions during their later years.
All these strategies, if designed appropriately, will accumulate assets equal to the
$830,000 required to fund the full annual pension of $70,000 at the time of the
employees’ retirement. Yet, because the three strategies take different courses in
reaching this goal, they can entail different rewards and risks for the employer as it
accumulates the assets to satisfy its obligation (Bodie 1990). The three strategies also can
entail different risks for the employees, should the employer’s ability to continue
contributing to the plan deteriorate.
Generally Accepted Accounting Principles (GAAP) measures the funded status
of a defined benefit pension plan as the difference between the fair value of its assets
and its PBO.3 A plan is underfunded when its PBO exceeds the value of its assets.
Recognizing the PBO as a proper measure of a plan’s obligation is consistent with the
conceptual definition of liabilities:
Liabilities are probable future sacrifices of economic benefits arising from present
obligations of a particular entity to transfer assets or provide services to other
entities in the future as a result of past transactions or events.4
3 See the Financial Accounting Standard Board’s SFAS 87 (1985) and SFAS 132 (1998, revised 2003) as well as White, Sondhi, and Fried (2003; Chapter 11, pp 400‐442), Delaney et al. (2003; Chapter 16, pp. 676‐705), and Fortune (2006a). 4 Financial Accounting Standards Board SFAS 6 (1975; paragraph 35). This concept admits various interpretations. Commitments to long‐term operating leases, for example, are not recognized on the balance sheet as a liability.
6

The PBO can be regarded as a liability created by the employer’s implicit contract with
its employees to provide a defined benefit pension. But this implicit contract argument is
not applied consistently. Although the PBO recognizes the effect of employees’ projected
wages at the time of their retirement on their employer’s pension liability, it does not
recognize the effect of the credit for the additional years of service that the employees
will have earned in attaining that projected wage. Furthermore, the PBO recognizes the
pension liability created by future wage increases, but few would contend that the
employer should recognize as a liability the attendant obligation to pay the future wages
that are part of the same implicit contract. Consequently, the PBO records only a fraction
of the employer’s commitment to compensate its employees in the future.
A pension plan is considered seriously underfunded when its ABO exceeds the
value of its assets, and GAAP requires this net liability to be recognized on the
employer’s balance sheet, reducing owners’ equity. If the plan is underfunded, but its
assets exceed its ABO, the deficiency need not be recognized on the employer’s balance
sheet, although GAAP requires all employers to report the PBO and the fair value of
their assets in footnotes to their financial statements.
Federal law regulating defined benefit pension plans measures their funded
status as the difference between the fair value of their assets and their ABO. Plans that
are fully funded by this standard have assets sufficient to cover their current pension
obligations, and they will hold assets sufficient to satisfy their future obligations as long
as employers’ contributions continue to cover employees’ accrual of additional benefits
as their wages increase and their years of service accumulate. If a plan is underfunded,
the Pension Protection Act of 2006 requires employers to eliminate the deficiency in
seven years or less.5, 6
5If a plan is under funded by 40 percent or more, the employer must accelerate its contributions, assuming that employees retire at their earliest retirement ages or otherwise claim the most valuable benefit distributions available under the plan. However, as discussed in immunizing the obligation to current retirees appearing in the third section of this article, the discounting of pension obligations at corporate bond rates, as specified in the Act, understates the effective ABO and overstates plans’ funding status. See also Fortune (2006a).
7

Employers’ funding strategies can range from funding only the ABO to funding
the PBO of their defined benefit pension plans. The ABO sets a floor for adequate
funding. Increasingly, however, financial analysts are regarding the PBO as an
appropriate standard for a plan’s funded status, and any underfunding of this target as
a liability that companies should recognize on their balance sheets.7
Funding the Accumulated Benefit Obligation
Suppose a company expects its employees to remain in active service for 30 years
and spend 20 years in retirement, receiving a pension equal to one‐half their final year’s
wage. It expects inflation to average 2 percent, the real rate of return on assets to average
3 percent, and labor productivity to increase 1.5 percent annually. Furthermore, suppose
the company tilts the structure of its wages to reflect employees’ tenure, so that apart
from inflation and productivity, employees’ wages increase 1 percent each year they
remain in active service.
If the employer were to fund its ABO, it would make contributions for all
employees every year as their increasing wages and accumulating years of service
increase their benefit when they eventually retire. The employer’s annual contribution is
its ABO at the end of the current year less the sum of the previous year’s ABO and the
income earned on the assets that funded the previous year’s ABO. With this funding
strategy, the employer’s contribution increases from 5 percent of wages for new
6 This act covers much more than the funding of defined benefit pension plans. It gives more leeway than was previously allowed for employers to use the plan’s asset to pay employee’s health care benefits, it allows funds to place more of their assets with hedge funds, and it alters rules governing 401(k) defined contribution pension plans to encourage more participation by employees. 7 See, for example, Zion and Cararche (2002, 2004, 2005), Fortune (2006a, 2006b), and the Financial Accounting Standards Board’s Exposure Draft (2006, p. i) which proposes that a business “Recognize in its statement of financial position the overfunded or underfunded status of a defined benefit postretirement plan, measured as the difference between the fair value of plan assets and the benefit obligation. For a pension plan, the benefit obligation would be the projected benefit obligation; for any other postretirement benefit plan, such as a retiree health care plan, the benefit obligation would be the accumulated postretirement benefit obligation.”
8

employees to 47 percent for employees near retirement under the assumptions described
above (Figure 3).
Although an employer’s contributions rise sharply relative to wages as its
employees accumulate years of service, its aggregate expense depends on the
distribution of its active employees’ years of service. If the distribution does not change
over time, the sponsor’s aggregate funding cost relative to its total wage bill is stable.
The more rapidly its work force grows and the lower is the average tenure of its work
force, the lower is the employer’s contribution relative to wages (Table 1). With a stable
work force, the contribution averages 20.8 percent of total wages, and assets in the plan
amount to 2.3 times annual wages (Table 2). With a work force growing 5 percent
annually, the contribution averages only 15.8 percent of wages, with total assets
amounting to only 1.5 times wages. Conversely, if the employer’s labor force is
shrinking 5 percent annually, its contribution relative to wages rises to 25.9 percent, and
the plan’s assets are 3 times wages.
Funding the Projected Benefit Obligation
By funding its PBO, an employer anticipates the higher wages its employees will
be earning in the future as it makes each year’s contribution to its pension plan.
Consequently, the employer pays a greater share of its employees’ pension expense
earlier during their time of active service than it would by funding its ABO, but its
pension expense for its employees increases less steeply as they accumulate more years
of service (Figure 3). With the economic assumptions given above for funding the ABO,
the employer’s contributions would be 18 percent of wages for new employees, rising to
20.7 percent of wages for employees approaching retirement if it were to fund its PBO.
As a result of these higher rates of contribution during the early years of employees’
active service, plans that fund the PBO accumulate assets more rapidly on behalf of
employees (Figure 4).
An employer that funds its PBO contributes more to its pension plan than is
necessary to cover the benefits that its employees have earned to date. This extra margin
9

of funding provides the plan’s beneficiaries a degree of protection from the risks the
plan might take as a result of its strategy for investing its assets. From this point of view,
an employer that funds its PBO accumulates a surplus that permits and, as discussed
below, probably encourages the plan’s adopting a riskier strategy for investing its assets.
Therefore, although plans that fund their PBO might seem more secure, the overall risk
in a plan depends on the combination of their funding and investment strategies.
Because the profile of pension expenses is less steep when an employer funds its
PBO instead of its ABO, its aggregate pension expense varies much less with the growth
of its labor force (Table 1). When the labor force is stable, its total contribution is 19.4
percent of its total annual wage bill, and the plan’s assets are 3.2 times wages (Table 2).
When the labor force is growing 5 percent annually, the contribution is 19.0 percent of
total wages, with assets 2.4 times wages. Finally, when the labor force is shrinking 5
percent annually, the contribution is 19.7 percent of total wages, and assets are 3.9 times
wages.
Constant Contribution Rate
Other intermediate strategies for accumulating assets are feasible in principle.
The employer can fund its projected pension obligation, taking into account its
employees’ likely years of service and wages at the time of their retirement, by making a
contribution equal to a fixed proportion of their wages into the plan each year. This
strategy likely conforms best with the matching principle in accounting, recognizing
labor expenses at the same time as their related product. This constant contribution rate
(CCR) also most closely resembles the funding strategies of employees who participate
in defined contribution pension plans. These employees typically set their contributions
at a fixed share of their incomes.
Other approaches falling between full funding of the PBO and funding only the
ABO are feasible as well. An employer could choose, for example, to fund the ABO plus
a margin to cover the risk its plan bears in the assets that it holds to fund its obligation.
10

The funding target consistent with the risk in its investment strategy, for example, might
be 120 percent of the ABO.
By design, an employer’s contributions to its pension plan relative to its wage bill
are constant with the CCR. Under the economic assumptions given above, the
employer’s contribution with the CCR would be 19.3 percent of employees’ wages over
their entire service lives (Figure 3, Table 1). Because the same CCR applies to all
employees as long as economic and actuarial projections do not change, the employer’s
contribution relative to its wage bill does not change with the rate of growth of its labor
force. The total assets in the plan, however, do vary with the growth of the labor force,
ranging from 2.5 times wages for 5 percent growth to 4 times wages when the labor
force is shrinking 5 percent annually (Table 2).
II Funding Strategies: Expected Costs
Employers incur two types of cost in funding defined benefit pension plans. The
first is explicit, the annual contribution that they pay into their plans. The second is
implicit, the net opportunity cost that they incur on the assets held by their pension
plans: the difference between the risk‐adjusted return that they could earn on alternative
uses of these assets less the risk‐adjusted return earned by their plans. This second type
of cost would be negligible if all assets were priced properly in efficient markets
comprising like‐minded investors subject to similar taxes and regulations. Otherwise,
companies might see a more profitable use for these resources by expanding their
investment in their own productive assets or by retiring a share of their liabilities.
These two types of cost pose trade‐offs for employers. By carrying more assets in
their pension plans, as they do in funding the PBO, employers can reduce their average
contributions relative to their wage bill, because the returns on their plans’ assets will
cover more of their future funding requirements. But carrying more assets in the plan
increases their average opportunity cost by diverting these resources from other
investments.
11

Both types of cost influence not only employers’ strategies for funding their
plans, but also whether they choose to offer their employees a defined benefit plan or a
defined contribution plan. Moreover, implicit costs affect the appeal of a defined benefit
plan for employees. If employees see a substantial opportunity cost in not being able to:
- manage the plan’s assets in accordance with their own interests (even after
retirement),
- claim an unqualified interest in the returns on those assets,
- set their own targets for benefits,
- carry the assets with them in the event they change jobs, or
- avoid losing a share of their pension should their employers fail,
they would favor a defined contribution plan over a defined benefit plan.8
Cost of Contributions
The appeal of a funding strategy partly depends on an employer’s ability to pay
the required contributions. An employer confident in its economic and actuarial
projections would tend to favor the funding strategy whose future contributions
conform best to its projections for its future revenues. A close correspondence between a
strategy’s contributions and the employer’s earnings tends to favor that strategy over
others with weaker correspondences. Because the level and growth of earnings varies
over employers, and even over the course of one employer’s life cycle, no single strategy
universally dominates the others according to this criterion.
Employers who find the expected contributions for all strategies to be too costly
might not offer a defined benefit plan. This decision would not reduce their total labor
expenses unless they can avoid increasing wages sufficiently to compensate their
employees for omitting this component of their pay.9 In competitive labor markets, the
8Employees, for example, might wish to assume more risk on their own behalf or invest funds to attain at least a partially indexed pension. They might also wish to participate more fully in the plan’s returns, receiving the “bonus” of above‐average earnings in good years, rather than allowing the employer to claim them in the form of lower contributions. 9 Risk‐averse employers could increase wages to compensate and still perceive a benefit from shedding the risk of maintaining a fully funded plan.
12

higher wage would not need to offset fully the employers’ expected saving if employees
felt they were incurring a significant opportunity cost by participating in a defined
benefit plan. On the other hand, if employees valued the pooling of risks made possible
by defined benefit plans, the increase in the competitive wage that employers would pay
for not offering these plans would more than offset their saving (Gold 2003).
A rapidly growing company that has a substantial need to accumulate capital
would favor funding only the ABO (Table 1, column 1). The deferral of its contributions
achieves the lowest current funding costs relative to its wage bill, shifting a substantial
share of its funding requirements forward to years when its revenues per employee are
likely to be more ample. In the illustration introduced above, a company whose labor
force is growing 5 percent annually would contribute 19 percent of its wage bill to its
pension plan by funding the PBO versus only 15.8 percent of wages by funding the
ABO. By funding the PBO or adopting a CCR, the employer would reduce its current
earnings and cash flow available for investment, and it would achieve a competitive
profit margin more slowly.
As a company matures and grows more slowly, funding the PBO becomes more
appealing. The distribution of its employees’ tenure shifts towards more years of service.
As a result, the average contribution per employee for funding the PBO eventually falls
below that for funding the ABO (Table 1, column 2). A company whose labor force is not
growing would contribute 19.4 percent of its wage bill to its pension plan annually to
fund the PBO versus 20.8 percent to fund the ABO. In this case, funding the PBO
reduces the company’s annual labor expense and increases its earnings, other things
being equal. Funding the PBO would help it maintain a competitive profit margin and
return on equity when its opportunities for growth are few. Companies in declining
industries have the most to gain from funding the PBO in this respect. Provided they
have the capacity to make the required investment, they can achieve a greater reduction
in labor costs and a greater increase in profit margins than mature companies can
achieve by making the switch (Table 1, column 3, and Table 2, column 3).
13

Employers’ Opportunity Costs
The assets that employers contribute to their employees’ pension plans represent
a substantial investment. In the illustrations above, these assets range between 1.5 and 4
times wages (Table 2). In the national economic accounts, the replacement cost of
structures, plant, equipment, software, and inventories held by businesses is about 4
times their payments of wages and salaries.10 Consequently, employers that offer
defined benefit pension plans are undertaking an explicit commitment of resources that
rivals their investment in their capital assets.
Assets invested in a company’s pension plan are resources that it could have
used to reduce its liabilities or expand its productive capital assets. In competitive,
efficient capital markets comprising investors of similar attitudes, circumstances, and
goals, a company sacrifices little in directing resources into its defined benefit pension
plan when its return on assets equals its cost of capital. It recoups any return that it
forgoes by benefiting from the return to its fund’s assets, a return that reduces its need to
contribute to the plan in the future. Because the risk‐adjusted returns on all assets and
liabilities are competitively priced, the company can replace the funds that it invests in
its plan with funds from other sources at no penalty. In this case, contributions
constitute employers’ only net cost.11
If, however, capital markets are not entirely efficient or investors’ assessments of
the net returns on assets differ considerably, the return on resources invested in the
pension plan does not necessarily cover their opportunity cost. In particular, companies
often judge the prospective return on their own productive capital assets more favorably
10 Wages and salary accruals (other than by government) are just under $5 trillion (U.S. Department of Commerce 2006; Table 1.12). The replacement cost of nonresidential fixed assets is $13.5 trillion (U.S. Department of Commerce 2006; Table 4.1), and inventories of nonfarm nonfinancial corporations are $1.6 trillion (Board of Governors 2006; Table B.102) 11 A company’s average cost of funds reflects the average risks of its investments in these circumstances. Therefore, the company incurs no opportunity cost even if the return on the assets in its pension fund is less than its cost of capital. The relatively low risk of the investment in the pension fund reduces the company’s average cost of capital commensurately in efficient, competitive capital markets, and the marginal cost of capital for this investment equals the return on the plan’s new assets.
14

than many other investors do. In these circumstances, from the companies’ viewpoint,
investments in new capital assets can offer abnormally high risk‐adjusted returns, and
the cost of obtaining external funds can require an excessive risk premium. Funds
invested in their pension plans’ marketable assets would earn a competitive rate of
return, while the opportunity cost of those funds would exceed a competitive return.12
The relatively high opportunity cost for diverting resources to marketable assets
held by the pension plan could encourage companies to fund only the ABO or not to
offer a defined benefit plan. Indeed, younger companies in newer industries that offer
stock options instead of defined benefit plans, and even instead of a share of wages,
diminish their cost of capital by directing employees’ compensation to internal capital
investments, pricing these investments using an internal assessment of their own risk‐
adjusted returns. To the extent employees see equally promising prospects for their
businesses, they too would favor stock options over defined benefit plans.
Suppose a young, rapidly growing company pays, in its opinion, a premium of
2.5 percent above an appropriate risk‐adjusted cost of funds to obtain the financing that
it requires to expand. All of the assets of its pension plan are invested in liquid,
marketable securities of companies that are relatively familiar in capital markets,
securities that offer investors no premium above appropriate risk‐adjusted returns. By
funding its PBO, the employer would make a substantial investment in its pension plan
for its employees as soon as they vest (Figure 4). As a result, its annual contribution
would be 19 percent of its total wage bill (Table 1, column 1), and its plan’s assets would
be 2.4 times its wages (Table 2, column 1). Its contribution plus its opportunity cost (.19
plus the product of .025 and 2.4) amount to one‐quarter of its wage bill (Table 3, column
1). By funding its ABO instead, its contribution plus opportunity cost would drop to
one‐fifth of its wage bill.
12 Companies would be paying a positive alpha to obtain the funds that they would be investing in their pension plans, marketable assets typically tending to return a smaller, perhaps negligible alpha. This net alpha is a measure of the companies’ net opportunity cost for investing resources in its pension plan.
15

As the company matures and grows more slowly, funding the ABO would tend
to remain more attractive longer, unless the premium in its cost of funds falls to zero. If
the company pays no abnormal premium for its funds and its contributions alone
matter, it could reduce its pension costs by funding the PBO instead of the ABO if the
growth of its labor force were zero (Table 1, column 2). With a net opportunity cost of
2.5 percent on funds invested in its pension plan, funding the ABO would remain most
attractive provided its labor force is not shrinking at a considerable rate (Table 3,
columns 2 and 3).
III Funding Strategies: Risk and Immunization
When future economic conditions or actuarial experience fail to match
projections, employers’ costs of funding their pension plans can deviate from their
expectations. The five principal risks examined below are:
1. The rate of inflation will not match current forecasts for the years of
employees’ active service and retirement,
2. The real rate of return on assets will differ from current projections during
employees’ active service and retirement,
3. Employees’ real wages at the time of their retirement will differ from current
expectations,
4. The growth of employers’ labor force will differ from expectations, and
5. Future experience will deviate from today’s actuarial assumptions about
years of active service and employees’ life expectancies.
The contributions required by the three strategies discussed previously respond
differently to these five risks, because each strategy funds the pension obligation
differently. In this regard, no single strategy for funding pension plans dominates the
others, and the relative appeal of the strategies depends partly on employers’ confidence
in their projections and the likely volatility of these variables. The relative appeal of the
16

strategies also depends on employers’ willingness or ability to absorb each of the risks as
well as on their plans’ ability to hedge these risks through the allocation of their assets.
Most of an employer’s risk arises as it accumulates assets to cover its obligation
to currently active employees. The employees’ final wages and the return its plan will
earn as it builds its assets are not certain. An employer’s management of its pension
obligations and risks, therefore, can be divided into two stages. During the first stage, it
accumulates assets to satisfy its future obligations to those employees who are still in
active service. In this stage, changes in economic conditions and actuarial experience can
alter its cost of meeting these obligations. During the second stage, the employer pays
benefits to retired employees. Ignoring mortality risks, the size of the annual payments
of the common defined benefit pension plan is certain, once its employees enter this
second stage. If the pension is indexed for inflation, the real rather than the nominal
benefit to employees is fixed upon their retirement.
Immunizing the Obligation to Current Retirees
Employers’ pension plans bear only two risks with regard to financing their
obligations to current retirees. The return on their assets might be insufficient to pay
their obligations, and their assets might be insufficient if retirees live longer than
expected. Plans can eliminate the first of these risks, which combines inflation and real
return risks into one, by suitably matching the characteristics of their assets to the cash
flow requirements of their liabilities. Plans with few retirees can cover their mortality
risk by purchasing annuities, a solution that essentially embeds their beneficiaries in
larger pools to mitigate this risk. Plans with many retirees can self‐insure more
comfortably.
Employers who fully fund their obligations to employees entering retirement
accumulate assets equal to the value of the ABO, which equals the value of the PBO at
the time of retirement. The only risk in these circumstances is that the returns on their
plans’ assets, due to unexpected changes in market rates of return, will be insufficient to
cover the fixed obligations to retirees. Employers can eliminate this risk, immunizing
17

their fixed obligation to their retirees by financing this obligation with assets in a way
that essentially guarantees that these assets will satisfy the obligations despite any
changes in market returns.13 Immunization, therefore, protects employers from making
any further contributions on behalf of retired employees.
A plan can immunize its obligation in several ways, using fixed‐rate, default‐free
Treasury securities. When the nominal benefit to retirees is fixed, the plan can match
cash flows by acquiring bonds whose coupon and principal payments match its pension
payments year by year. If payments to retirees were indexed to increase at the rate of
inflation, plans could match the cash flows of Treasury inflation‐protected securities
(TIPS) to those of its current pension obligations. In this case, any unexpected changes in
inflation would affect the cash flows of the TIPS and the pension payments in much the
same way. More commonly, however, portfolio managers immunize fixed obligations
by holding bonds whose collective market value changes with interest rates by an
amount equal to the change in the present value of its obligations.14 Managers can
achieve this match not only by choosing bonds with appropriate coupons or maturities
but also by leveraging their portfolios or by taking positions in bond or interest‐rate
forwards, swaps, and other suitable derivatives. When regulations restrict pension funds
from taking some of these positions directly, they can achieve similar results by taking
these positions indirectly, holding shares in leveraged bond funds or structured notes, as
well as by holding interests in hedge funds and other investment funds that serve this
purpose.
The funded status of obligations to current retirees is the market value of the
Treasury securities that finance these obligations less the present value of these
obligations determined by the risk‐free rates of interest for Treasury securities.
Immunization protects plans from unexpected changes in interest rates. Treasury
securities avoid the risk of achieving unexpectedly low returns, including those
13 Immunization is a venerable financial strategy that is enjoying a renaissance in the pension community. See, for example, Bodie (2003), Capon (2005), and Walsh (2006). 14 See, for example, Reilly and Brown (2006, pp. 772–782) or Bodie, Kane, and Marcus (2005, pp. 538–47) for more complete discussions of immunization.
18

resulting from defaults, that accompanies other investments, causing their values to fall
relative to that of Treasury securities or the present value of obligations.15 This double
protection allows plans to fund the ABO of employees at the time of retirement without
incurring the risk of needing to make significant supplemental contributions to maintain
the funded status of their obligation. Consequently, risk‐free rates of return apply both
to assets and to obligations.
Plans can hold corporate bonds, equities, and other securities, in place of
Treasury securities, while avoiding the risk of having to make further contributions to
support the pensions of current retirees. In order to do so, however, employers
accumulate assets whose value exceeds the ABO for retiring employees, and their plans
must make use of a form of dynamic portfolio insurance, such as conditional
immunization.16 The margin provided by these additional assets allows plans to absorb
losses on their assets. Ordinarily, the larger the share of its assets a plan holds in
securities other than Treasury securities, the larger the margin required to provide
conditional immunization for the portfolio against the risk of loss. A larger margin also
is appropriate when the odds of losses increase for the plan’s existing assets. With
conditional immunization, if the outlook for the return on a plan’s assets unexpectedly
deteriorates, causing the market value of its assets to fall relative to the present value of
its obligations, thereby reducing its capacity for bearing risk, it responds by shifting its
assets from other securities into Treasury securities. In the extreme, as its losses almost
exhaust its margin, it shifts its assets entirely into Treasury securities, thereby
immunizing itself against further risk in the traditional manner. This strategy for
managing a plan’s assets protects the plan from becoming inadequately funded.
For this portfolio insurance to be effective and for the margin to represent
accurately the funded status of the obligations to current retirees, the present value of
15 Often a drop in the relative value of these assets is due to a perception of greater risks—such as a deterioration in the issuers’ financial condition—which raises the yields required of these assets compared with Treasury yields. 16 See Leibowitz and Weinberger (1982, 1983); Reilly and Brown (2006, pp. 772‐782); Bodie (1990). The credit risks for investments in corporate bonds also might be insured though credit swaps and related derivatives.
19

the plan’s obligations should be measured using the yields on Treasury securities.
Suppose a plan is fully funded, holding Treasury securities equal to the present value of
its obligations calculated using Treasury yields, and it considers shifting its assets from
Treasury securities into corporate bonds of equal market value. The yields on the
corporate bonds exceed those on the Treasury securities by a risk premium that covers
their expected losses due to defaults.17 As reflected in the zero difference between the
market value of its assets and the present value of its liabilities using Treasury yields,
the plan would have no margin for absorbing losses beyond the expected.
If the plan changed the discount rate for its pension obligations from Treasury
yields to corporate bond yields, the present value of its obligations would drop, thereby
showing a positive margin that would seemingly suggest that the plan’s funded status is
exposed to less risk. Yet, this measure of the margin, which roughly equals the present
value of the risk premiums on the corporate bonds to be received over their lifetimes,
has three strong qualifications. First, it recognizes the value of the risk premiums as an
asset without simultaneously recognizing the expected losses as an offsetting liability.
Moreover, to the extent that expected losses are near the middle of the distribution of
possible losses, larger losses can occur as often as half the time. Second, if the expected
losses occurred too early in the lives of these bonds, the accumulated risk premiums
would not cover these losses. In this circumstance, the drop in the funded status would
exceed the uncovered loss because future risk premiums would potentially be forfeit.
Despite the apparent positive margin, the plan would have little leeway to absorb large
losses and to exercise its portfolio insurance and to preserve a fully funded status by
shifting its assets from the corporate bonds back to Treasury securities.18 Third, when
the economic outlook deteriorates, rising risk premiums on private securities would
depress the present value of pension obligations, artificially limiting the drop in plans’
17 These spreads also reflect differences in liquidity, convexity, tax treatments, and other characteristics. 18 The risk premium alone might provide adequate margin in large, diversified portfolios of risky securities when losses occur randomly with a sufficiently low frequency. But against macroeconomic risks that affect many companies at the same time, the premium cannot provide sufficient margin.
20

reported funded status. In this example, the zero margin that results from discounting
the plan’s obligations to its retirees at Treasury yields more clearly indicates the plan’s
negligible current capacity for absorbing greater‐than‐average losses.
The overstatement of the margin, due to the use of corporate bond yields to
discount future pension benefits, tends to increase as the average age of a plan’s active
employees falls or the risk premium on corporate bonds rises, because the future
pension benefits are discounted at greater rates over longer horizons. For example, the
present value of an obligation 20 years in the future is reduced 9.1 percent by using a
discount rate of 5.5 percent instead of 5 percent, whereas the present value of an
obligation 30 years in the future is reduced 13.3 percent. If the risk premium is 100 basis
points instead of 50 basis points, the present value of the 20‐year obligation is reduced
17.3 percent; the 30‐year obligation, 24.8 percent.
As specified by the Pension Protection Act of 2006, the use of corporate bond
rates for calculating the present value of obligations understates the protection in a
defined benefit pension plan, essentially transferring the risk from the plan’s and the
employer’s financial statements into a conditional liability. If capital markets were
efficient, portfolio managers for a plan would expect no advantage from investing in
corporate bonds and stocks rather than Treasury securities, unless they saw less risk
than other investors in some of these investments or they were inclined to take risks.19 If
the plan could consistently earn a greater return, net of losses, by holding assets other
than Treasury securities, this excess return would reduce the employer’s required
contributions and, therefore, its cost of compensating its employees. If, on the other
hand, the plan failed to earn a net return exceeding that on Treasury securities, the
19This paper does not consider the differences in the taxation of returns to financial instruments under personal, corporate, and pension tax law, differences that can allow pension funds to earn abnormal risk‐adjusted returns by holding instruments whose returns are taxed at relatively high rates for other investors. See, for example, Sharpe (1976), Black (1980), Tepper (1981), and Bader (2003). The value of expected risk‐adjusted returns on equities for pension funds depends on other investors’ tax rates, trading habits, and the correlation of equities’ gross returns with the gross returns of other assets, among other considerations. See Kopcke (2005) and the fourth section of this paper.
21

employer would have to increase its contributions, and retirees would potentially share
the loss, as the value of the plan’s liabilities would increase faster than value of its assets.
The conditional liability created by using the corporate bond rate to discount
pension plans’ benefits transfers risk to retirees who receive no offsetting compensation.
Discounting a plan’s obligations with a yield on risky investments is tantamount to
having retirees, other employers, and taxpayers write, for no premium, a put option to
the employer, wherein the retirees and others incur the risk of sharing the cost of a
deficiency in their plan’s funded status. Plans can minimize this contingent liability by
taking the following actions:
- discounting their future pension obligations, using the interest rates on Treasury
securities,
- overfunding their liabilities by an amount commensurate with the risks entailed
by their investments, and
- using conditional immunization to maintain an adequate funded status.
Immunization and the Obligation to Active Employees
Retirement plans’ obligations to active employees present the five risks listed at
the beginning of this section. The extent of each risk depends partly on employers’
funding strategies and partly on their plans’ investment strategies. No combination of
funding and investment strategies can eliminate all these risks. Traditional
immunization, for example, only partly protects plans’ funded status for active
employees from the risks of unexpected changes in the rate of inflation.
The present value of a plan’s obligation depends on its prospective obligation
and the rate of return it uses to discount that obligation. Immunization insures that
unexpected changes in the rate of return affect the present value of its obligation and the
value of its assets proportionately, thereby maintaining the ratio between the values of
assets and obligations. The plan, therefore, can immunize the present value of a fixed
obligation against unexpected changes in nominal rates of return, which are the sum of
22

inflation and real rate risks, using conventional bonds.20 But the plan’s obligations to
active employees do not remain fixed when changes in nominal returns result from
unexpected variations in the rate of inflation, which also alter employees’ final wages.
Consequently, immunization cannot insure that an unexpected change in the rate of
interest due to a change in the rate of inflation will affect the values of a plan’s
obligations and assets proportionately. Conventional bonds, at best, can maintain the
ratio of assets to obligations against unexpected changes in the real rate of interest,
because the real rate has no direct effect on obligations. Alternatively, the plan can use
TIPS to immunize the present value of a given obligation against unexpected changes in
the real rate of interest.
The following analysis extends the illustration from the previous two sections of
this paper to examine the effects of the five types of risk on employers’ contributions to
their pension plans, using the three funding strategies presented earlier combined with
two investment strategies: Plans purchase either conventional Treasury securities or
TIPS to immunize their obligations against changes in interest rates. Investing in TIPS,
under the conditions of the following illustrations, is equivalent to holding TIPS until
employees retire, when conventional Treasury securities replace the TIPS in amounts
sufficient to immunize the resulting fixed, nominal obligations.21
The analysis considers the effects of the five risks listed above on employers’
contributions relative to their total wage bill, showing the adjustments that occur both in
the year that conditions change and in the long run, assuming no further changes. The
20 When conventional Treasury securities and TIPS’ maturities are not sufficiently long to immunize plans’ obligations to active employees, immunization would require, directly or indirectly, using leverage or forwards, swaps, and other derivatives to match the interest sensitivities of assets and obligations. 21 Plans also could synthetically convert TIPS to conventional securities by entering into swaps to receive the fixed inflation premium on conventional securities while paying the floating inflation premium on TIPS. Plans would agree to receive a fixed payment equal to the difference between the on‐the‐run coupon on conventional Treasury securities and the coupon on their seasoned TIPS, both with notional principal values equal to the value of the TIPS at the time of employees’ retirement, while paying the inflation adjustment on their TIPS. A natural counterparty to this transaction would be financial intermediaries that offer retirees and others the opportunity to swap a fixed annuity into an indexed annuity.
23

first year’s adjustments are greater than longer‐run adjustments when funding strategies
require employers to compensate quickly for past years of recalibrated contributions in
response to changed conditions. Inasmuch as economic forecasts, in particular, tend to
change frequently, the first‐year response of contributions to these shifting forecasts can
affect the volatility of employers’ labor costs and profit margins disproportionately.
In response to revisions in economic and actuarial projections:
- Contributions relative to wages for the PBO vary most in response to changes in inflation or the growth of real wages. Unlike contributions for the ABO or the CCR, those for the PBO adjust in one year to the projected change in future wages.
- The volatility of contributions often is least for funding the ABO. Adopting a
CCR best stabilizes contributions in response to revisions in retirees’ life expectancies.
- Investing in TIPS instead of conventional securities alters the reaction of
contributions only when projections of inflation change; otherwise, the difference between the effects of the two investment strategies is not material.
- Investing in TIPS fails to reduce the variability of contributions in response to
revisions in projections of inflation unless employers fund the PBO. Yet, even when assets that fund the PBO are invested in TIPS, inflation affects employers’ contributions very substantially.
These conclusions assume that employers adjust their contributions annually to match
their plans’ assets to their obligations. Employers who fund the PBO or the ABO can
allocate the adjustment of contributions over more than one year, depending on
investors’ tolerances and the leeway allowed by the Pension Protection Act. In some
circumstances, the strategy of making the full adjustment over several years tends to
reduce the volatility of contributions in any single year. But delaying the full adjustment
can increase the volatility of annual contributions when employers’ revisions of
economic or actuarial assumptions are positively correlated from year to year and tend
to occur in runs extending over very many years. With this positive correlation,
postponement can entail larger, more persistent changes in plans’ funded status,
confronting employers with the mounting need to adjust contributions much more
24

substantially. In this case, delaying the adjustment of contributions can increase the risk
of funding crises.
Unexpected changes in the rate of inflation affect employers’ contributions in
two opposing ways. Suppose that projected inflation jumps to a rate higher than
previously expected. This jump raises projections of active employees’ final wages. This
first effect tends to increase required contributions. Yet projections of higher inflation
increase rates of interest on conventional bonds. Therefore, the jump also increases the
rate of discount applied to fixed pension obligations and reduces the assets that plans
must hold per dollar of final wages in order to pay employees’ retirement benefits. This
second effect tends to reduce required contributions (Figure 5).
In the long run, a one‐percentage‐point increase in inflation, from 2 percent to 3
percent, reduces employers’ contributions relative to their total wages in this illustration
(Table 4). Higher inflation raises the retirement obligation, but once employees retire, the
resulting higher rates of interest reduce employers’ funding requirements per dollar of
final wages more than enough to compensate for the higher wage.
For employers funding the PBO or adopting the CCR, the two strategies that link
contributions to projected final wages, contributions fall relative to wages by the same
proportion, 8.2 percent (Table 5, long‐run columns). For employers that fund the ABO,
the strategy for which contributions do not depend on the projected retirement wage,
long‐run contributions drop the most for companies with the fastest growing labor
forces, because the distribution of the work force is concentrated among those with the
fewest years of service, the lowest relative wages, and the greatest discount factor
applied to their future benefits.
In the year that projections of inflation increase, the results are different from the
long‐run effects (Table 5, first‐year columns, shaded rows). When the outlook for
inflation first increases, projections of final wages increase, but the rate of interest on
conventional bonds currently held by plans does not include an inflation premium large
enough to cover the increase in this obligation. Consequently, in order to maintain their
plans’ funded status, employers do not necessarily decrease their contributions as much
25

as they do in the long run. Contributions by employers that fund the PBO increase
substantially, because their funding targets are related to employees’ final salaries,
which jump substantially with the higher rate of inflation. The current ABO falls when
the rate of inflation increases, so contributions fall relative to wages for plans that fund
the ABO. Although contributions for the CCR, like those of the PBO, are related to
employees’ final salaries, these contributions do not increase abruptly when forecasts of
inflation change, because the CCR adjusts its rate of contributions over the remaining
years of employees’ active service.
Employers’ first‐year contributions fall when their plans hold TIPS instead of
conventional bonds, but TIPS generally do not reduce the variation in employers’
contributions (Table 5, rows without shading). TIPS maintain their purchasing power, so
plans that hold these bonds have no capital losses on their assets when interest rates rise
as a result of an unexpected increase in the rate of inflation. Accordingly, when inflation
rises, the first‐year contributions drop the most for plans that fund the PBO. Due to their
higher funding of benefits, these plans have the greatest surplus as a result of the lower
funding requirements per dollar of final wages. The first‐year cost is greater for plans
that adopt the CCR compared with those that fund the ABO, because the ABO does not
recognize the increase in the final wage.
Revisions to forecasts of the real rate of return affect required contributions by
altering the assets that plans must hold to fund their obligations. Unlike a change in
inflation, a change in the rate of return affects neither final wages nor the benefits
promised by employers. When the projected real rate of return increases from 3 percent
to 4 percent, the present value of pension obligations falls for all funding strategies. With
this reduction in funding requirements, employers’ long‐run contributions per dollar of
wages also drop (Figure 5 and Table 6).
Whether plans immunize their obligations using conventional Treasury
securities or TIPS, the long‐run effects and the first‐year effects are the same, because the
one‐percentage‐point increase in interest rates reduces the present value of assets and
liabilities commensurately. Accordingly, employers need not adjust their contributions
26

by any extraordinary amounts in the first year to maintain the funded status of their
plans (Table 7).
Revisions to projections of real wages affect required contributions by altering
employees’ final wages and pension benefits. Unlike changes in inflation or real rates of
return, a change in the growth of real wages affects neither the value of assets nor the
present value per dollar of employers’ retirement obligations. When the growth of real
wages increases from 2.52 percent to 3.53 percent, the present value of pension
obligations rises for all funding strategies.22 With this increase in funding requirements,
employers’ long‐run contributions per dollar of wages also increase (Table 8).
The higher growth of real wages imposes no first‐year adjustment costs on
employers to cover an unforeseen gap between the value of assets and the present value
of accumulated obligations. Consequently, the first‐year change in contribution rates for
employers that fund the ABO equals the long‐run change in contributions (Table 9). The
PBO and the CCR, however, both depend on projections for final wages, so they impose
more substantial first‐year adjustment costs on employers that adopt these alternative
funding strategies. With the projections of higher growth of real wages, employers that
fund the PBO must compensate their plans for having contributed too little to their plans
in the past. The first‐year adjustment is greater for employers that fund the PBO
compared with those that adopt a CCR, because the CCR allocates its required
correction over the remaining years of employees’ active service.
Revisions to employees’ expected longevity affect required contributions by
altering the assets required to fund employees’ pension obligations. Like new
projections for the growth of real wages, a change in longevity affects neither the value
of assets nor the present value per dollar of employers’ retirement obligations. But,
unlike changes in real wages, a change in longevity alters the assets needed at retirement
to fund retirees’ pensions per dollar of their final wages. The present value of pension
22 2.52 = (1+1.5%)(1+1%) ‐1, and 3.53 = (1+2.5%)(1+1%) ‐1. In the first instance, all real wages rise 1.5 percent annually and the structure of wages gives employees a 1‐percent raise for tenure. In the second instance, the general rate of increase of real wages rises to 2.5 percent, as a result of a one‐percentage‐point increase in productivity.
27

obligations increases for all funding strategies when retirees live longer (Table 10). In the
long run, a two‐year increase in longevity raises contributions for all funding strategies
by 5.6 percent (Table 11).
The first‐year consequences are greatest for employers that fund their PBO or
ABO. The greater longevity increases both the projected benefit and the accumulated
benefit substantially, requiring employers to bring their funding up to date. The CCR, by
contrast, allows employers to reach their funding targets in installments over their
employees’ years of active service, thereby damping the initial effects of an increase in
employees’ life expectancies.
IV. Beyond Traditional Immunization: Managing Returns and Risks with Diversification
Immunization can be a compelling investment strategy for financing the pension
obligations of retirees, but it alone is not necessarily the best strategy for financing
obligations to active employees. Immunization reduces interest‐rate risk, but it does not
attempt to reduce other risks confronting pension plans for active beneficiaries.
Nonetheless, the principles behind immunization suggest two modifications that can
extend pension plans’ techniques for managing risk. The first, two‐factor immunization,
uses conventional Treasury securities and TIPS together to protect plans against the
often critical inflation and real return risks. The second, a multifactor approach,
combines other assets with Treasury securities to manage a broader range of risks.
Traditional immunization protects a plan’s funded status from the effects of a
change in interest rates without regard for its effect on other risks or for its effect on the
plan’s return on assets. This focus can be self‐defeating when a plan faces several
different risks. A strategy that manages one risk to the exclusion of others can
inadvertently increase the plan’s total risk. When the various risks tend to be correlated
—for example, the real rate of return with the growth of real wages or employment—a
narrow treatment of interest‐rate risk could increase the volatility of the plan’s funded
28

status. In most circumstances, a broadly diversified portfolio of assets manages the
range of risks most effectively.
Two‐Factor Immunization
As shown in the previous section, a pension plan’s funded status for active
employees is exposed to considerable risk from unexpected changes in the rate of
inflation when it immunizes its obligation from changes in interest rates. Interest‐rate
risk itself is the product of two more elemental risks: changes in the expected rate of
inflation and unexpected changes in the real rate of interest. Because revisions in the
forecasts of inflation and real interest rates affect the plan’s funded status differently,
protecting the funded status from unexpected changes in the rate of interest cannot give
each of the two underlying risks the specific attention that each requires.
A more effective approach immunizes the plan’s funded status against inflation
risk and real rate risk separately, a strategy that requires two different assets to manage
the two distinct risks. By dividing its assets between conventional Treasury securities
and TIPS, a plan can improve its protection from changes in the expected rate of
inflation without diminishing its protection from other risks, other things equal.
A plan that combines conventional Treasury securities and TIPS in its portfolio of
assets combines their effects on its funded status when risk factors change. An
unexpected jump in the rate of inflation increases an employer’s contributions to its
pension plan for active employees more in the first year than it does in the long run if it
immunizes its liabilities with conventional bonds (Table 5). Conversely, the jump in
inflation decreases contributions in the first year more than in long run if the plan
immunizes its liabilities with TIPS. In the case of an employer that expects its labor force
to grow 5 percent annually and that funds its PBO, an increase in inflation from 2
percent to 3 percent would increase its contributions 111.2 percent relative to wages in
the first year if its plan were immunized using conventional bonds (Table 5, row 1,
column 1); whereas its contributions would fall 176.5 percent if its plan used TIPS (row
2, column 1). In either case, after the first year, its contributions would fall relative to
29

wages by 8.2 percent (column 2). If the plan were to invest 58.5 percent of its assets in
conventional bonds and 41.5 percent of its assets in TIPS, then this blended portfolio
would entail an 8.2 percent drop in contributions the first year, providing a smooth
transition to the unavoidable long‐run result.23 The response of contributions to the
other risks is the same whether the plan invests in conventional bonds or TIPS.
Therefore, the combination of conventional Treasury securities and TIPS better
immunizes the funded status of plans with respect to inflation and real rate risks,
guaranteeing that revisions in forecasts of inflation and real rates of interest impose on
employers no extraordinary first‐year adjustment costs to compensate for unexpected
gaps in their funded status. To accomplish this two‐factor immunization, plans that fund
the PBO must invest much more of their assets in TIPS, other things equal, than plans
that fund the ABO or adopt a CCR.
Immunization Combined with Diversification
Pension plans that immunize their funded status with respect to inflation and
real rate risks essentially ignore other risks; consequently, immunization does not
manage plans’ total risk. In some cases, plans’ total risk can increase as a result of this
narrow focus.
For example, an unexpected increase in real interest rates depresses the present
value of obligations and assets commensurately for immunized plans. But, if the real
rate of interest increases because factors of production have become more productive,
then real wages also are likely to grow more rapidly than previously expected, tending
to increase the present value of obligations for plans that fund their PBO. The first‐year
adjustment cost resulting from an unexpected change in real wages can be substantial
(Table 9). As a result of the combined effects of the higher real rates and higher real
wages, the net drop in the present value of a plan’s PBO is less than the drop in the
value of its assets, and its funded status deteriorates. If the growth of real wages jumps
sufficiently, the plan’s funded status may fall more than it would have if the plan had
23 (111.2) (1 )( 176.5) 8.2 .585w w w+ − − = − ⇒ =
30

not been fully immunized. As a result of this link between real interest rates and the
growth of real wages, immunization does not necessarily maintain the balance between
a plan’s assets and its PBO when real interest rates shift, because other risk factors do
not remain the same.
Immunization, by itself, does not manage a pension plan’s total risk most
effectively when the plan’s funded status is affected by risks that are mutually
correlated. When the holding‐period returns on bonds are correlated with unexpected
changes in the growth of real wages or employment, or when the values of stocks and
real assets are correlated with unexpected changes in inflation and real rates, or when
changes in the values of bonds, stocks, and real assets are correlated, then a plan can
manage its funded status more effectively by allocating its investments over all asset
classes. By combining immunization with an investment in a diversified portfolio, a plan
can achieve the lowest feasible risk for its funded status, given any expected return from
its assets.
Suppose a plan that funds its PBO begins by fully investing its assets in Treasury
securities to immunize its inflation and real rate risks. This immunization‐only portfolio
still exposes the plan to real wage risk. Accordingly, the plan considers reducing its
investment in these Treasury securities, investing the funds in assets—including stocks,
real estate, and commodities—that hedge, for example, a portion of its real wage risk.
When the plan’s managers expect the values of stocks and real assets to rise with the real
wages paid by the employer, the plan purchases these assets to counterbalance any
changes in its PBO due to real wage risk. By allocating its investments over these assets,
tending to invest more heavily in those whose prices have higher correlations with real
wages, and by taking into account the correlations among the prices of these contracts,
the plan may be able to maximize its protection and minimize any extra risk it bears
from these investments. In principle, the plan could move all of its assets into stocks and
other real assets—using leverage, forward contracts, and other suitable derivatives for
Treasury securities—in order to remain immunized against inflation and real rate risks.
31
A pension plan manages its assets to control its sponsor’s labor costs. By dividing
its assets between its immunized‐only portfolio and other securities, the plan can
balance its risk of failing to meet its funding objectives against its opportunity to earn an
attractive expected return on its assets. The greater the expected return on its assets, the
lower is the net cost of funding the plan and the employer’s net contribution. The plan’s
expected net return is the expected return on its assets less the Treasury yield applied to
the present value of its obligations, because its current obligations grow at a rate equal to
the Treasury yield. When this expected net return is positive, the plan expects to reduce
the employer’s normal contribution. But the investments that bring higher returns also
bring more risk.
Minimizing Risk and Maximizing Net Return
For a given funding strategy, a plan’s portfolio of assets determines its expected
return and the exposure of its funded status to various risks. By assessing their
willingness and ability to bear each risk, the plan’s managers can assign weights to these
exposures. These weights then allow the calculation of the total weighted volatility of
the plan’s funded status by combining its exposures to all risks, taking into account the
correlations among these risks. Given any target for total volatility, the calculation finds
the most efficient portfolio of assets that achieves the highest expected net return. By
varying the target for volatility, this analysis produces a frontier of efficient portfolios,
showing the highest excess return the plan should expect to receive for each amount of
total risk. In principle, this approach also allows the plan’s managers to examine their
choice of funding strategy. A shift from funding the plan’s PBO to funding its ABO, for
example, might allow a more favorable combination of risks and returns.
An optimal portfolio of assets is then chosen from the plan’s frontier of efficient
portfolios by comparing their expected net returns and total risk.24 This approach allows
the isolation of the portfolios that offer the highest expected net returns for the range of
24 See for example, Bodie, Kane, and Marcus (2005, Chapter 7, pp. 197–214 and Chapter 8, pp. 223–259).
32

risk that the plan’s managers are willing to assume. Beginning with the portfolio that
offers the lowest acceptable expected net return, the calculation determines the
additional expected net return that the plan would earn per unit of additional volatility
as total risk is increased by small steps. When the calculation reaches a point where the
extra risk does not provide a sufficiently great additional return, the plan attains its
optimal portfolio.
The optimal portfolio, and, therefore, the best funding and investment strategy,
might be different from one employer to another, because the fund managers or the
employers themselves do not necessarily regard or experience the risks in the same way.
For example, an employer whose operations are less labor‐intensive than those of the
average employer might not be so concerned about unexpected jumps in the growth of
real wages, especially if these jumps tended to follow a surge in productivity that also
increased the return to its capital goods and its profit. Employers whose real wages do
not respond to changing economic conditions as much as real wages do for the average
employer might require less protection from this risk. Employers that give relatively low
odds to unexpectedly large changes in real wages might seek less protection from this
risk. The choice of investment strategy also depends on employers’ choice of funding
strategy, on their expectations regarding growth and turnover of their labor force, as
well as on the other factors that determine the present value of their obligations and
affect their response to changing economic conditions.
Illustration of Immunization with Diversification
Consider the efficient portfolios for funding the pension obligations of active
employees of an employer that funds the PBO and another that funds the ABO (Figure
6). For simplicity, suppose the work forces of these employers are not growing and their
plans contend only with inflation, the real rate of return, and real wage risk.
The following illustration tends to understate the risk of funding the PBO
relative to that of the ABO because it considers only real wage risk in addition to the
inflation and real rate risks, which can be eliminated through immunization. The
33
illustration also might overstate the risk for funding PBO by assuming that employers
promptly correct deficiencies in their funded status. The Pension Protection Act gives
employers up to 7 years to bring the assets of underfunded plans back to the ABO.
Similarly, employers that fund the PBO may take several years to restore their funded
status. If a risk’s effects on a plan’s funded status are not correlated from year to year, a
7‐year response reduces the effective volatility of the funded status by approximately 62
percent. However, if a risk’s effects are positively correlated—corrections to forecasts for
the growth of real wages occur in progressive steps spanning years—then the volatility
of the funded status for the PBO can increase if employers do not respond promptly.
The employer that funds the ABO is exposed only to inflation and real rate risks.
Its plan is not exposed, for example, to the risk of erring in forecasting future real wages
because it is only funding the benefits that its employees have earned from their service
to date. Therefore, by investing entirely in an immunization‐only portfolio, comprising
conventional Treasury securities and TIPS, it can eliminate any volatility in the funded
status of its current obligations to its active employees. Because the Treasury securities
in this portfolio earn a yield equal to the rate of growth of the present value of its current
obligations, it also earns a zero net return (Figure 6, red dot at the origin).25 This
employer could shift its investments from the immunization‐only portfolio into other
assets, including stocks, real estate, and commodities, allowing its plan to earn higher
expected net returns at the price of accepting the risks entailed by the other assets. The
efficient frontier between the immunization‐only portfolio and a portfolio that allocates
a share of its funds to other assets initially is a straight line, because the immunization‐
only portfolio is a risk‐free investment whose returns are not correlated with the net
returns on these other assets (the line between the lower and upper red dots). Along this
line, the plan attains an expected net return of .266 percent for each percentage point of
additional volatility. Once the plan is fully invested in other assets, each additional
25 Regarding the appropriate discount rate for the present value of benefits, see the discussion above for immunizing the obligation to current retirees, appearing in Section III.
34

percentage point of volatility yields a steadily decreasing expected net return, as the
plan alters its allocation of assets among, stocks, real estate, and commodities.
The employer that funds the PBO is exposed to real wage risk as well as inflation
and real rate risks. Because the present value of its obligation depends on its employees’
final wage, the immunization‐only portfolio cannot eliminate all risk, so the volatility of
the funded status for this portfolio is about 7 percent (Figure 6, center blue diamond). In
this case, the plan can reduce its risk and earn a positive expected net return by
investing 76 percent of its assets in conventional Treasury bonds and 24 percent in
stocks and real assets (left blue diamond). This shift would reduce total risk to 6.5
percent and offer an expected net return of 1 percent as the plan acquires assets that
hedge more of its exposure to changes in the growth of real wages. This minimum‐risk
portfolio attains an expected net return of .155 percent for each percentage point of
volatility. The investment strategy that achieves the greatest expected net return relative
to volatility in this example shifts nearly all of the plan’s assets from Treasury securities
into other assets (right blue diamond). This allocation attains an expected net return of 4
percent with a volatility of 13 percent, an expected net return of .308 percent for each
percentage point of volatility.
The frontier for the ABO has a tail that extends to the origin, offering it a range of
low‐risk, high‐return positions that are not attainable for the PBO. This tail is important,
because neither frontier necessarily offers plans a sufficient reward for taking very much
risk in financing their pension obligations.
An employer that funds its ABO has an option to immunize its obligation fully
and take no risk, to avoid any variation in its labor costs and profit margin due to
unexpected changes in the funded status of its defined benefit pension plan. If the
employer were to move along its efficient frontier, accepting more risk, it would expect
to earn a net return of .266 of a percentage point for each percentage point of volatility.
Because its plan’s assets and obligations are about 2.3 times its total wages (Table 2,
middle column), each .266 percent of additional net return would reduce its expected
contribution per dollar of wages by .612 percent, which is as much as 3 percent of its
35
expected annual contributions (Tables 1 and 3). If the employer’s gross profit margin
were one‐third of its wage bill, each .612‐percent reduction in its labor costs increases its
margin by 1.84 percent. But, in moving up its efficient frontier, the volatility of its
funded status would increase. For each .266 of a percentage point that its expected net
return increased, the volatility of its labor cost and gross profit margin would increase
by 2.3 percentage points and 6.9 percentage points, respectively. To reduce these risks,
the employer would need to maintain surplus assets in its pension plan.
The employer funding the PBO cannot avoid assuming the risk of experiencing
some variation in its labor costs and gross profit margin due to unexpected changes in
the funded status of its pension plan. If it adopted the minimum‐risk funding strategy, it
would expect to earn a net return of 1 percent on its plan’s assets. Because its plan’s
assets and obligations are about 3.2 times its total wages (Table 2, middle column), this
1‐percent net return would reduce its expected contribution per dollar of wages by 3.2
percent, which is as much as 16 percent of its expected annual contributions (Tables 1
and 3). If the employer’s gross profit margin were one‐third of its wage bill, this 3.2‐
percent reduction in labor costs increases its margin by 9.4 percent. But, the 6.5‐percent
volatility of this net return would increase the volatility of its labor cost and gross profit
margin by 3.2 percentage points and 9.6 percentage points, respectively. If it adopted the
investment strategy that offers the highest return relative to volatility, it would expect a
4‐percent net return, which, under the assumptions given above, would reduce its labor
costs 12.7 percent and increase its margin by 38 percent. With this investment strategy,
the volatility of its net return would be 13 percent, which would add about 41
percentage points to the volatility of its annual wage bill, and over 123 percentage points
to the volatility of its gross profits. To reduce the risks entailed by either of these two
portfolios, the employer would need to hold surplus assets in its pension plan sufficient
to cover the risk entailed by the volatility of the plan’s funded status.
The absence of a very low‐risk investment option for employers funding the PBO
is especially costly for those with relatively high labor costs, volatile profits, substantial
debt financing, limited access to capital on favorable terms, or a generally high aversion
36

to risk. On the other hand, for employers that are willing to absorb the risk and that
expect to earn abnormally generous returns on assets that markets appear not to price
efficiently, funding the PBO offers an opportunity to reduce their expected labor costs
and increase their gross profit margins.
V. Conclusion
The consequences of the bull and bear markets during the last decade have
stirred public and private policymakers to consider ways to make defined contribution
pension plans more secure by ensuring that they fully fund their obligations. The
Pension Protection Act of 2006 requires defined benefit pension plans to fund their ABO,
and the Financial Accounting Standards Board, reflecting a growing consensus in the
financial community, is considering new standards that should encourage employers to
fund their plans’ PBO.
As these two, very different approaches reflect, there are many acceptable ways
to “fully fund” an employer’s obligation to its employees at the time of their retirement.
Federal law requires that plans hold assets that cover their obligations year by year as
they are earned, the ABO. Accounting standards regard a plan as fully funded when it
holds sufficient assets to cover the prospective benefits defined by projections of
employees’ wages at retirement, the PBO. Employees who maintain defined
contribution plans can set aside a constant share of their income, accumulating assets on
an installment plan, to attain their retirement goal. For active employees, each of these
approaches entails different costs and risks. As employees retire, these approaches reach
the same end.
The assets necessary to fund a plan’s PBO exceed those needed to fund its ABO
for active employees, and the difference between these obligations increases with the
rate of growth of the employer’s work force. Consequently, the more strongly a rapidly
growing company feels pressure from financial analysts to fund its PBO, the more
strongly it will consider offering a defined contribution plan, other things equal. The
large contribution to its defined benefit plan would absorb funds that are needed for
37

purchasing productive assets. Moreover, to the extent it requires substantial external
financing, it faces a dilemma. Fully funding the PBO would tend to permit it access to
more capital on better terms, because its solvency ratios would benefit from reporting a
smaller liability. But funding the PBO would absorb much of that capital. By offering its
employees a defined contribution plan and perhaps company stock in place of a share of
wages, the employer might tap an attractive supply of internal capital on favorable
terms. This last approach would be particularly appealing to companies that must pay a
premium to obtain external funding. Companies with generous profit margins and
modest capital budgets would be better able to fund the PBO for a defined benefit plan.
This funding strategy is most attractive for those with stagnant or shrinking work forces.
The risks in all funding strategies can be managed to varying degrees through
the plans’ choice of assets. Given that the ABO is exposed mostly to inflation and real
rate of return risks, a defined benefit plan that is able to fund its ABO can immunize its
funded status against unexpected changes in these variables with a two‐factor strategy
that uses conventional Treasury bonds and Treasury inflation‐protected securities,
thereby achieving a relatively secure funded status. From the employees’ point of view,
employers that fund their PBO offer more protection, provided their plans do not adopt
investment strategies that entail excessive risk. But funding the PBO imposes more risk
on employers. Although a plan funding the PBO is exposed to inflation and real rate
risks against which it can immunize its funded status with a two‐factor strategy, it is
also exposed to other risks, like real wage risk, for which there are no close hedges. Plans
can offset these risks to a degree by holding stocks and real assets, whose values are
correlated with real wages. Although a defined contribution plan that adopts a CCR is
exposed to the same range of risks as a plan that funds its PBO, a CCR strategy is less
sensitive to risks other than inflation and real rate risk. Consequently, it would invest
more heavily in Treasury securities to immunize itself than would a plan that funds its
PBO.
By funding the ABO and investing their plans’ assets in Treasury securities,
employers can stabilize the funded status of their defined benefit pension plans, but this
38

funding strategy increases the volatility of their contributions relative to their wages in
the long‐run if the rate of growth of their work force changes substantially. By funding
the PBO or adopting a CCR, employers can better stabilize contributions relative to
wages, but this funding strategy increases the volatility of their plans’ funded status.
Consequently, plans that fund their PBO can invest in a broader range of assets,
including stocks and real assets, to minimize this risk. And to cover the remaining risk,
they must hold surplus assets.
These results also apply to Social Security. To minimize the variability of the
payroll tax rate, especially when the rate of growth of the work force is falling, the
program would fund its PBO, rather than ABO. Then, to minimize the volatility in its
funded status for obligations to active workers due to changes in economic projections,
the program could reduce its risks by holding a broader range of assets, including stocks
and real assets. Social Security’s funded status for obligations to retirees could be
immunized by funding these benefits with TIPS.
The foregoing conclusions apply in efficient financial markets. The record for the
last decade shows that immunized portfolios have accounted for a comparatively small
share of defined benefit plans’ assets. First, stocks and real estate, now other investment
strategies, including hedge funds and commodities, are attracting funds as employers
seek better performance from their plans. The venerable debates continue as lively as
ever: whether equities offer a reasonably dependable premium or their additional return
is only fair compensation for taking additional risks, whether actively managed
positions can yield a reasonably dependable abnormally high return or, at best,
temporary profits that soon fade, whether stocks ultimately follow a random walk or
economic forces tend to insure that the prices of broadly diversified portfolios will
neither soar too high nor fall too low relative to GDP. Whatever plans’ proclivities for
taking risk in pursuit of returns, the need to fund the PBO increases their exposure to
risk and possibly their willingness to assume more risk in their investments as they seek
attractive returns. In this regard, funding the PBO does not necessarily make defined
benefit plans more secure.
39

If policy is not to discourage employers from adopting or maintaining defined
benefit pension plans, the analysis in this paper suggests that the financial community
might move toward pension law and define the funded status of a plan as its assets less
its ABO. Financial reporting should then provide analysts with the information they
need to assess a company’s ability to continue to fund its ABO, much as they currently
assess its ability to continue to pay its interest expenses, earn an adequate profit margin,
and sustain its dividend or franchise value. For this purpose, financial reporting would
need to distance itself from current law by using the Treasury yield curve to discount
future pension benefits.
Pension law also must continue to evolve if it is to foster an adequate funding of
defined benefit pension obligations. By using corporate bond yields in place of Treasury
yields to calculate the present value of obligations, the new law could understate the
ABO by 10 percent or more for many companies, thereby overstating their funded status
commensurately. Also, by making no provision for the risk that plans assume in their
choice of assets for funding their ABO—no insistence on a surplus in their funded status
to cover any risk—the law allows plans additional latitude for effectively underfunding
their obligations.
In any case, the importance of defined contribution plans will continue to grow,
perhaps in conjunction with defined benefit plans. For many employees, the portability
of defined contribution plans and the ability to customize their coverage or features
within limits is appealing. Accordingly, the financial community will continue to
develop new products to serve these plans. Some could be investment funds that allow
employees to achieve a specified retirement income that maintains its purchasing power
for the life of the beneficiary. These funds could hold conventional bonds and inflation‐
protected bonds to immunize their investors against inflation and real return risks at
various horizons by investing in Treasury securities or corporate bonds protected by
credit swaps or other insurance.
Financial innovations could offer hybrid designs for pension plans blending the
advantages of defined contribution plans and defined benefit plans—customization,
40

professional management, and diversification of risks. Unlike defined benefit and
defined contribution plans, which assign investment risks entirely either to employers or
to employees, hybrid designs could allocate a share of these risks to each. Moreover,
financial innovations could allow employees who participate in defined benefit plans to
alter the timing of their pension payments without subjecting their plans to additional
risk. These innovations might, for example, allow employees to swap annual pension
payments that are fixed during their retirement for payments that maintain their
purchasing power despite changes in rates of inflation and interest rates. When
employers adequately fund their ABO, financial innovations also might allow
employees to “roll over” their vested benefits in their defined benefit plans as they
change jobs.
41

Appendix
The figures and charts in the text use the following basic economic assumptions and definitions. Rate of inflation π 2.0% Real rate of return on Treasury securities
r 3.0%
Nominal rate of interest i (1 )(1 ) 1 5.06%rπ+ + − = Rate of growth of productivity γ 1.5% Rate of growth of wage by tenure ν (1 )(1 ) 1 3.53%γ π+ + − = Rate of growth of wage for tenure τ 1.0% Rate of growth of real wage for employees
ρ (1 )(1 ) 1 2.52%γ τ+ + − =
Rate of growth of wage for employees ϖ (1 )(1 ) 1 4.57%ρ π+ + − = Wage for employees with tenure of n years
w(n) 1
1
( ) ( 1) (1 )( ) (1 )
t t
t
w n w nw n
ϖν
−
−
= − × += × +
Rate of growth of the labor force g 0.0% Rate of growth of total real wage bill (1 )(1 ) 1 1.5%gγ+ + − = Rate of growth of total wage bill (1 )(1 ) 1 3.53%gν+ + − = Years of work to earn a full pension Nw 30 Number of years in retirement Nr 20 Income replacement rate repl 0.5 Pension benefit for tenure n<Nw B(n) ( ) ( / )repl w n n Nw× × Present value of benefit at retirement PV(B(n)) ( ) (1/ )(1 (1 ) )NrB n i i −× − + Accumulated Benefit Obligation For tenure of n<Nw years toward an expected tenure of Nw years
ABO(n) ( )( ( )) /(1 ) Nw nPV B n i −+
Employer’s annual contribution cABO(n) Projected Benefit Obligation For tenure of n<Nw years toward an expected tenure of Nw years
PBO(n) ( )( )
( )
( )
( )
( ( )) (1 ) /(1 )
( ( )) (1 ) /(1 )
( ) (1 )
Nw n
Nw n
Nw n
PV B n i
PV B n r
ABO n
ϖ
ρ
ϖ
−
−
−
× + + =
× + +
× +
=
Employer’s annual contribution cPBO(n)
42

The employer’s annual contributions to its defined benefit pension plan
For employers that exactly fund either the ABO or the PBO, each year’s contribution equals the current year’s obligation less the sum of the previous year’s obligation and the investment income earned on the assets that covered that obligation. This annual contribution on behalf of employees with n years of service, relative to their current annual wage is
( )
( )
( ) / ( ) ( ) ( 1)(1 ) / ( )
( ) / ( ) ( ) ( 1)(1 ) / ( )
cABO n w n ABO n ABO n i w n
cPBO n w n PBO n PBO n i w n
= − − +
= − − +
For employers that adopt the CCR, the annual contribution per dollar of wage for employees is constant over their years of service, provided economic and actuarial assumptions do not change. The rate of contribution times each year’s wage plus the compounded investment on this amount, when summed over an employee’s years of service, equals the value of assets required to fund a full pension at the time of retirement.
( )( )( )
( )( )
( 1)
1
(1) (1 ) / 1 (1 ) ( ) (1 )
/ 1 (1 ) /
NwNw Nr Nw j
j
Nr Nw
w repl i i CCR w j i
CCR repl i i ratio sum
ϖ − −
=
−
× + − + = × × +
= − +
∑ −
( )1
11
/(1 )Nw
ratior
sum ratio ratio ratio
ρ
+
+⎛ ⎞= ⎜ ⎟+⎝ ⎠
= − −
Figures 3, 4, and 5
Figure 3 shows the contribution rates per dollar of wages for each year of an employee’s service, using the base economic and actuarial assumptions that appear in the table above. The lines graph the values of cABO, cPBO, and CCR for n from 1 to 30.
Figure 4 shows the value of accumulated assets per dollar of current wages during employees’ years of service that is entailed by each funding strategy. The lines graph the values of ABO(n)/w(n), PBO(n)/w(n), and the assets for a CCR divided by the current wage.
43
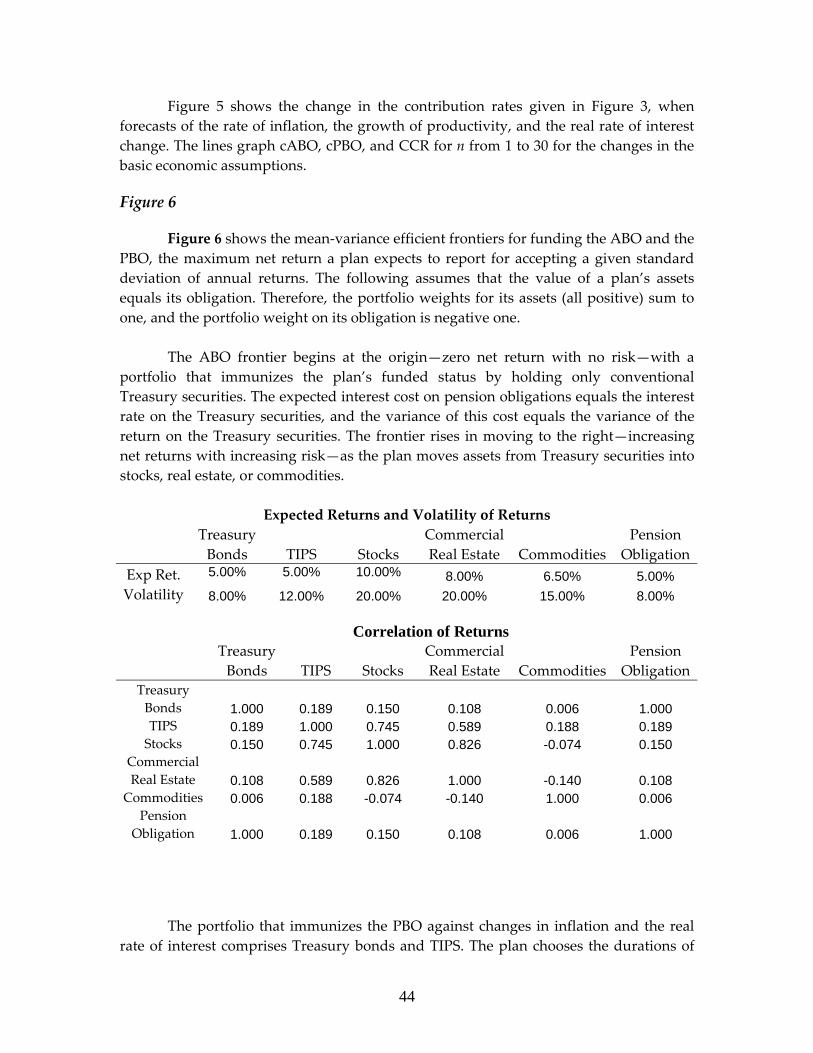
Figure 5 shows the change in the contribution rates given in Figure 3, when forecasts of the rate of inflation, the growth of productivity, and the real rate of interest change. The lines graph cABO, cPBO, and CCR for n from 1 to 30 for the changes in the basic economic assumptions.
Figure 6
Figure 6 shows the mean‐variance efficient frontiers for funding the ABO and the PBO, the maximum net return a plan expects to report for accepting a given standard deviation of annual returns. The following assumes that the value of a plan’s assets equals its obligation. Therefore, the portfolio weights for its assets (all positive) sum to one, and the portfolio weight on its obligation is negative one.
The ABO frontier begins at the origin—zero net return with no risk—with a
portfolio that immunizes the plan’s funded status by holding only conventional Treasury securities. The expected interest cost on pension obligations equals the interest rate on the Treasury securities, and the variance of this cost equals the variance of the return on the Treasury securities. The frontier rises in moving to the right—increasing net returns with increasing risk—as the plan moves assets from Treasury securities into stocks, real estate, or commodities.
Expected Returns and Volatility of Returns
Treasury Bonds
TIPS
Stocks
CommercialReal Estate
Commodities
Pension Obligation
Exp Ret. 5.00% 5.00% 10.00% 8.00% 6.50% 5.00% Volatility 8.00% 12.00% 20.00% 20.00% 15.00% 8.00%
Correlation of Returns
Treasury Bonds
TIPS
Stocks
CommercialReal Estate
Commodities
Pension Obligation
Treasury Bonds 1.000 0.189 0.150 0.108 0.006 1.000 TIPS 0.189 1.000 0.745 0.589 0.188 0.189 Stocks 0.150 0.745 1.000 0.826 -0.074 0.150
Commercial Real Estate 0.108 0.589 0.826 1.000 -0.140 0.108
Commodities 0.006 0.188 -0.074 -0.140 1.000 0.006 Pension
Obligation 1.000 0.189 0.150 0.108 0.006 1.000
The portfolio that immunizes the PBO against changes in inflation and the real rate of interest comprises Treasury bonds and TIPS. The plan chooses the durations of
44

these Treasury securities and the allocation of its assets to each security to achieve this immunization. With the response of holding‐period returns shown in the following table, a portfolio comprising 78.6 percent conventional Treasury bonds and 21.4 percent TIPS immunizes the PBO.
Response of returns to a one‐percentage point
change in: (in percentage points)
Inflation Real Rate Real Wage Treasury Bonds -13.0 -13.0 0.0 TIPS 1.0 -22.3 0.0 PBO -10.0 -15.0 -15.0
45

The PBO is exposed to risks other than interest rate risk, so the immunized
portfolio lies beneath the efficient frontier.
Expected Returns and Volatility of Returns Treasury
Bonds
TIPS
Stocks CommercialReal Estate
Commodities
Pension Obligation
Exp Ret. 5.00% 5.00% 10.00% 8.00% 6.50% 5.00% Volatility 8.00% 12.00% 20.00% 20.00% 15.00% 10.00%
Correlation of Returns
Treasury Bonds
TIPS
Stocks
CommercialReal Estate
Commodities
Pension Obligation
Treasury Bonds 1.000 0.189 0.150 0.108 0.006 0.656 TIPS 0.189 1.000 0.745 0.589 0.188 0.352 Stocks 0.150 0.745 1.000 0.826 -0.074 0.390
Commercial Real Estate 0.108 0.589 0.826 1.000 -0.140 0.266
Commodities 0.006 0.188 -0.074 -0.140 1.000 0.048 Pension
Obligation 0.656 0.352 0.390 0.266 0.048 1.000
The Tables
The tables show the effects of the three funding strategies on the employer’s contributions to its pension plan relative to its total wage bill. The data in the tables are weighted averages of the contributions relative to wages for the n cohorts. The weight for each cohort depends on the share of the employer’s total wage bill paid to that cohort, which is proportional to ((1 )(1 ) n)gτ+ + , the combined effect of the increase in the relative wage by tenure and of the increase in the relative size of the cohorts due to growth.
Table 1 shows the employer’s total contribution relative to its total wage bill for the initial assumption and two alternative assumptions for the rate of growth of its labor force. The entries are the weighted averages of cABO(n), cPBO(n), and the CCR for the 30 values of n. Table 2 shows the accumulated assets relative to the total wage bill, the weighted averages of ABO(n), PBO(n), and the assets accumulated for each cohort with the CCR.
Table 3 adds a 2.5 percent net opportunity cost of funds to the contributions
shown in Table 1. The entries are the weighted averages of cABO(n) + .025 x ABO(n),
46

cPBO(n) + .025 x PBO(n), and the CCR plus 2.5 percent of the assets accumulated for each cohort.
Table 4 shows the long‐run effect of a higher rate of inflation on the employers’
contribution relative to wages. The entries are calculated in the same manner as those in Table 1. Table 5 shows the effect of a change in the expected rate of inflation in the year that the forecast changes. The entries equal the weighted average of the contribution relative to wages needed to keep each cohort’s obligation fully funded at the time inflation increases from 2 percent to 3 percent divided by the pervious year’s contribution relative to wages. The transition to the new long‐run contribution rate is completed after 1 year. The calculations assume that pension plans fully immunize their ABO or PBO against changes in interest rates, using either conventional Treasury securities or TIPS.
When a plan immunizes with conventional Treasury securities, it insures its
funded status for fixed obligations against a change in interest rates. After an increase in the rate of inflation the market value of its accumulated assets falls by the same amount as value of its previous year’s obligation due to the higher rate of interest. The PBO, nonetheless, increases relative to the value of accumulated assets because the final wage also increases with the rate of inflation.
( )( )
( | .03) / ( | .056)( | .02) / ( | .0457)
( | .03) ( 1| .03) (1.0609) / ( | .056)
( | .02) ( 1| .02) (1.0506) / ( | .0457)
( | .03) / ( | .0
cABO n w ncABO n w n
ABO n ABO n w nABO n ABO n w n
cPBO n w n
π ϖπ ϖ
π π ϖπ π ϖ
π ϖ
= == =
= − − = × ==
= − − = × =
= =
( )( )
56)( | .02) / ( | .0457)
( | .056, .0609) ( 1| .0457, .0609) (1.0609) / ( | .056)
( | .02) ( 1| .02) (1.0506) / ( | .0457)
cPBO n w nPBO n i PBO n i w n
PBO n PBO n w n
π ϖϖ ϖ
π π ϖ
= =
= = − − = = × ==
= − − = × =ϖ
The new CCR for each cohort considers the difference between the assets needed to finance the pension at retirement and the future value of the assets that had been accumulated in previous years. The plan immunizes its accumulated CCR assets relative to its liability against the increase in interest rates, but the value of accumulated assets falls relative to the required future value of assets due to the increase in the final wage that results from a higher rate of inflation.
47

( )( )( )( )
( ( 1))
( | .056) (1.056) /(.0609 1 (1.0609)
( 1| .0457, .0609) (1.0609)
( ) ( | .056) (1.0609)
Nw n Nr
Nw n
NwNw j
j n
w n repl
CCRassets n i
CCR n w j
ϖ
ϖ
ϖ
− −
− −
−
=
= × −
− − = = ×
= × = ×∑
The entries in the table show the weighted average of the ratios of these new transition CCRs for each cohort to the previous long‐run CCR. The transition to the new long‐run contribution rate for the employer is completed after 29 years.
When a plan immunizes with TIPS, it only insures its funded status for fixed obligations against a change in the real rate of interest. Therefore, an increase in the rate of inflation does not alter the market value of its accumulated assets while the value of its previous year’s obligation falls due to the higher rate of interest that accompanies a higher expected rate of inflation.
( )( )
( | .03) / ( | .056)( | .02) / ( | .0457)
( | .03) ( 1| .02) (1.0609) / ( | .056)
( | .02) ( 1| .02) (1.0506) / ( | .0457)
( | .03) / ( | .056)
cABO n w ncABO n w n
ABO n ABO n w nABO n ABO n w n
cPBO n w ncP
π ϖπ ϖ
π π ϖπ π ϖ
π ϖ
= == =
= − − = × ==
= − − = × =
= =
( )( )
( | .02) / ( | .0457)( | .056, .0609) ( 1| .02) (1.0609) / ( | .056)
( | .02) ( 1| .02) (1.0506) / ( | .0457)
BO n w nPBO n i PBO n w n
PBO n PBO n w n
π ϖϖ π
π π ϖ
= =
= = − − = × ==
= − − = × =ϖ
( )( )( )( )
( ( 1))
( | .056) (1.056) /(.0609 1 (1.0609)
( 1| .02) (1.0609)
( ) ( | .056) (1.0609)
Nw n Nr
Nw n
NwNw j
j n
w n repl
CCRassets n
CCR n w j
ϖ
π
ϖ
− −
− −
−
=
= × −
− − = ×
= × = ×∑
The entries in the Table 5 show the weighted average of the ratios of these new transition CCRs for each cohort to the previous long‐run CCR. The transition to the new long‐run contribution rate for the employer is completed after 29 years.
Tables 6 through 11 are prepared in the same manner as Tables 4 and 5. With immunization, using either conventional Treasury securities or TIPS, the increase in the real rate of interest reduces the value of accumulated assets and all pension obligations
48

commensurately. The increase in the growth of productivity increases the PBO and the CCR obligation without changing the value of assets. The contribution for plans funding the PBO complete the correction in one year, while the contribution for plans using a CCR complete the correction over 29 years. The increase in longevity increases the obligations for all plans while the value of previously accumulated assets remains the same.
49

References
Bader, Lawrence N. 2003. “The Case Against Stock in Corporate Pension Funds,” Society of Actuaries, Pension Section News, no. 51, February, pp. 17–9.
Black, Fisher. 1980. “The Tax Consequences of Long‐Run Pension Policy,” Financial
Analysts Journal, 36 (July–August), pp. 21–30. Board of Governors of the Federal Reserve System. 2006. Flow of Funds Accounts,
Statistical Release Z.1, June 8. Bodie, Zvi. 1990. “The ABO, the PBO, and Pension Investment Policy,” Financial Analysts
Journal, 46, no. 5 (September–October), pp. 27–34. __________. 2003. “On the Role of Bonds and Stocks in Corporate Pension Plans,”
Tijdschrift voor Corporate Finance, 8, no. 3, pp. 63–69. __________, Alex Kane, and Alan J. Marcus. 2005. Investments. 5th ed. New York:
McGraw‐Hill Irwin. Capon, Andrew. 2005. “Balancing Act,” Institutional Investor, July, pp. 36–43. Delaney, Patrick R., James R. Adler, Barry J. Epstein, and Michael F Foran. 2003. GAAP
2004: Interpretation and Application of Generally Accepted Accounting Principles. Hoboken, NJ: John Wiley & Sons.
Financial Accounting Standards Board. 2006. “Employers’ Accounting for Defined
Benefit Pension and Other Postretirement Plans,” Exposure Draft, Proposed Statement of Financial Accounting Standards, no. 1025‐300, March 31.
__________. 2003. “Employersʹ Disclosures about Pensions and Other Postretirement
Benefits,” Statement of Financial Accounting Standards No.132 (revised 2003), December.
__________. 1985. “Employersʹ Accounting for Pensions,” Statement of Financial
Accounting Standards No. 87, December. __________. 1975. “Classification of Short‐term Obligations Expected to Be Refinanced,”
Statement of Financial Accounting Standards No. 6, May. Fortune, Peter. 2006a. “Pension Accounting and Corporate Earnings: The World
According to GAAP,” Public Policy Discussion Paper no. 06‐2, Federal Reserve Bank of Boston.
50

__________. 2006b. “Pension Plans and Stock Returns: Do Analysts Get It Right?” draft,
Federal Reserve Bank of Boston. Gold, Jeremy. 2003. “What’s next?—DB plans for the long run,” The Actuary, 37, no. 8,
pp. 1, 3, 16–17. Kopcke, Richard W. 2005. “The Taxation of Equity, Dividends, and Stock Prices,”
Federal Reserve Bank of Boston Working Paper No. 05‐1, January. Leibowitz, Martin L. and Alfred Weinberger. 1982. “Contingent Immunization—Part I:
Risk Control Procedures,” Financial Analysts Journal, 38, no.6 (November–December), pp. 17–32.
__________. 1983. “Contingent Immunization—Part II: Problem Areas,” Financial
Analysts Journal, 39, no.1 (January–February), pp. 35–50. Meder, Aaron and Renato Staub. 2006 “Linking Pension Liabilities to Assets,” UBS
Global Asset Management Working Paper, March 17. Reilly, Frank K. and Keith C. Brown. 2006 Investment Analysis and Portfolio Management.
8th ed. Belmont, CA: Thomson‐Southwestern. Sharpe, W. F. 1976. “Corporate Pension Funding Policy,” Journal of Financial Economics, 3
(June), pp. 183–93. Tepper, I. 1981. “Taxation and Corporate Pension Funding Policy,” Journal of Finance, 36,
no. 1 (March), pp. 1–13. U.S. Department of Commerce. 2006. National Economic Accounts, August 30. Walsh, Mary Williams. 2006. “A Different Strategy on Pensions,” New York Times,
Saturday, September 9, pp. B1–4. White, Gerald I., Ashwinpaul C. Sondhi, and Dov Fried. 2003. The Analysis and Use of
Financial Statements. 3rd ed. John Wiley & Sons, Inc. Wilcox, David W. 2006. “Reforming the Defined‐Benefit Pension System,” Brookings
Papers on Economic Activity, 2006, no. 1. Zion, David and Bill Carcache. 2002. “The Magic of Pension Accounting.” Credit Suisse
First Boston. September 27.
51

________. 2004. “The Magical World of Pensions: An Update.” Credit Suisse First Boston. September 15.
________. 2005. “Pension Reform: It’s a Cash Flow Issue.” Credit Suisse First Boston.
June 9.
52

Figure 1:Accumulated Benefit Obligation for an employee with 15 years of service
0
10,000
20,000
30,000
40,000
50,000
60,000
70,000
80,000
90,000
100,000
1 3 5 7 9 11 13 15 17 19 21 23 25 27 29 31 33 35 37 39 41 43 45 47 49
years of participation
annu
al w
age
or p
ensi
on
Current wage of $68,000
Accumulated annual pension obligation:
replacement rate of one-half times current wage
$68,000 x 0.5 = $34,000times service credit for 15 of 30 years
$34,000 x 0.5 = $17,000
Figure 2:Projected Benefit Obligation for an employee with 15 years of service
0
20,000
40,000
60,000
80,000
100,000
120,000
140,000
160,000
1 3 5 7 9 11 13 15 17 19 21 23 25 27 29 31 33 35 37 39 41 43 45 47 49
years of participation
annu
al w
age
or p
ensi
on
Current wage of $68,000
Projected wage at 30 years of service: $140,000
Projected annual pension obligation:
replacement rate ofone-half times prjected final wage
$140,000 x 0.5 = $70,000times service credit for 15 of 30 years
$70,000 x 0.5 = $35,000
53

Figure 3:Annual Pension Contributions
Base case assumptions
0%
5%
10%
15%
20%
25%
30%
35%
40%
45%
50%
1 2 3 4 5 6 7 8 9 10 11 12 13 14 15 16 17 18 19 20 21 22 23 24 25 26 27 28 29 30
years of service
prop
ortio
n of
wag
es
funding the ABO
constant share of wages
funding the PBO
Figure 4:Accumulated Assets
0.00
1.00
2.00
3.00
4.00
5.00
6.00
7.00
1 2 3 4 5 6 7 8 9 10 11 12 13 14 15 16 17 18 19 20 21 22 23 24 25 26 27 28 29 30
years of service
inde
x (p
er d
olla
r cur
rent
wag
e)
funding the ABO
constant share of wages
funding the PBO
54

Figure 5a:Annual Pension Contributions
Effect of changing assumptions for funding the ABO
0%
10%
20%
30%
40%
50%
60%
1 2 3 4 5 6 7 8 9 10 11 12 13 14 15 16 17 18 19 20 21 22 23 24 25 26 27 28 29 30
years of service
prop
ortio
n of
wag
es
Series1Series2Series3Series4
base case assumptionsinflation increases 1 percentage pointgrowth of productivity increases 1 percentage pointreal interest rate increases 1 percentage point
Figure 5b:Annual Pension Contributions
Effect of changing assumptions for funding the PBO
0%
5%
10%
15%
20%
25%
30%
1 2 3 4 5 6 7 8 9 10 11 12 13 14 15 16 17 18 19 20 21 22 23 24 25 26 27 28 29 30
years of service
prop
ortio
n of
wag
es
Series1Series2Series3Series4
base case assumptionsinflation increases 1 percentage pointgrowth of productivity increases 1 percentage pointreal interest rate increases 1 percentage point
55

Figure 5c:Annual Pension Contributions
Effect of changing assumptions for the CCR
0%
5%
10%
15%
20%
25%
1 2 3 4 5 6 7 8 9 10 11 12 13 14 15 16 17 18 19 20 21 22 23 24 25 26 27 28 29 30
years of service
prop
ortio
n of
wag
es
Series1Series2Series3Series4
base case assumptionsinflation increases 1 percentage pointgrowth of productivity increases 1 percentage pointreal interest rate increases 1 percentage point
Figure 6:Strategies for Financing Pension Obligations
to Active Employees
0.00%
0.50%
1.00%
1.50%
2.00%
2.50%
3.00%
3.50%
4.00%
4.50%
5.00%
0.00% 2.00% 4.00% 6.00% 8.00% 10.00% 12.00% 14.00% 16.00%
volatility of the value of assets relative to the present value of obligations
expe
cted
retu
rn o
n as
sets
less
Tre
asur
y in
tere
st ra
te
Efficient Frontierfor financing the PBO
Efficient Frontierfor financing the ABO
immunization only: 80 percent ofassets in conventional Treasuries,20 percent in TIPS.
immunization only
highest ratio of expected return to volatility: 2 percent of assets in conventional Treasuries, the remainder in stocks and real assets.
minimum volatility: 76 percent of assets in conventional Treasuries, the remainderin stocks and real assets.
no immunization
56

Table 1: Funding Costs Relative to Wages (in percent)
annual rate of growth of the Labor Force
5% 0% -5%
Funding the PBO 19.0 19.4 19.7
Funding the ABO 15.8 20.8 25.9 Constant contribution rate (CCR) 19.3 19.3 19.3
Table 2: Assets Relative to Wages (divided by annual wage bill)
annual rate of growth of the Labor Force
5% 0% -5%
Funding the PBO 2.4 3.2 3.9 Funding the ABO 1.5 2.3 3.0 Constant contribution rate (CCR) 2.5 3.3 4.0
Table 3: Funding Costs Relative to Wages Contributions plus 2.5 percent Excess Opportunity Cost on Assets
(in percent) annual rate of growth of the
Labor Force 5% 0%
-5%
Funding the PBO 25.1 27.4 29.5 Funding the ABO 19.6 26.4 33.3 Constant contribution rate (CCR) 25.5 27.5 29.3
57

Table 4: Long‐Run Funding Costs Relative to Wages Higher Inflation (in percent)
Annual Rate of growth of the Labor Force
5% 0% -5%
Rate of Inflation Rate of Inflation Rate of Inflation 2% 3% 2% 3% 2% 3%Funding the PBO 19.0 17.5 19.4 17.8 19.7 18.1 Funding the ABO 15.8 14.1 20.8 19.3 25.9 24.7 CCR 19.3 17.7 19.3 17.7 19.3 17.7
Table 5: Change in Funding Costs from Higher Inflation (percent change relative to initial contribution rate)
Annual Rate of growth of the Labor Force
5% 0% -5%
Inflation jumps from 2% to 3%
Inflation jumps from 2% to 3%
Inflation jumps from 2% to 3%
First Year Long Run First Year Long Run First Year Long RunFunding PBO 111.2 -8.2 117.7 -8.2 115.2 -8.2 Funding PBO with TIPS -176.5 -8.2 -230.5 -8.2 -278.9 -8.2 Funding ABO -3.8 -10.9 0.9 -7.2 4.2 -4.7 Funding ABO with TIPS -145.9 -10.9 -143.3 -7.2 -138.0 -4.7 CCR -2.4 -8.2 -0.4 -8.2 1.4 -8.2 CCR with TIPS -25.2 -8.2 -37.9 -8.2 -53.6 -8.2
58

Table 6: Long‐Run Funding Costs Relative to Wages Higher Real Rate of Return
(in percent) Annual Rate of growth of the Labor Force 5% 0% -5% Real Return Real Return Real Return 3% 4% 3% 4% 3% 4%Funding the PBO 19.0 14.9 19.4 15.7 19.7 16.5 Funding the ABO 15.8 13.0 20.8 17.6 25.9 22.4 CCR 19.3 15.3 19.3 15.3 19.3 15.3
Table 7: Change in Funding Costs from Higher Real Rate of Return (percent change relative to initial contribution rate)
Annual Rate of growth of the Labor Force 5% 0% -5%
Real Return jumps from 3% to 4%
Real Return jumps from 3% to 4%
Real Return jumps from 3% to 4%
First Year Long Run First Year Long Run First Year Long RunFunding PBO -21.9 -21.9 -19.0 -19.0 -16.3 -16.3 Funding the ABO -17.8 -17.8 -15.3 -15.3 -13.5 -13.5 CCR -20.7 -20.7 -20.7 -20.7 -20.7 -20.7
59

Table 8: Long‐Run Funding Costs Relative to Wages Faster Growth of Real Wages
(in percent) Annual Rate of growth of the Labor Force 5% 0% -5%
Real Wage growth Real Wage growth Real Wage growth 2.52% 3.53% 2.52% 3.53% 2.52% 3.53%Funding the PBO 19.0 22.6 19.4 22.2 19.7 21.8 Funding the ABO 15.8 17.1 20.8 22.8 25.9 28.5 CCR 19.3 22.2 19.3 22.2 19.3 22.2
Table 9: Change in Funding Costs from Faster Growth of Real Wages (percent change relative to initial contribution rate)
Annual Rate of growth of the Labor Force 5% 0% -5%
Real wage growth jumps
from 2.52% to 3.53%Real wage growth jumps from 2.52% to 3.53%
Real wage growth jumps from 2.52% to 3.53%
First Year Long Run First Year Long Run First Year Long RunFunding PBO 170.9 18.8 171.4 14.5 161.4 10.7 Funding ABO 8.5 8.5 9.6 9.6 10.3 10.3 CCR 21.1 15.3 23.0 15.3 24.8 15.3
60

Table 10: Long‐Run Funding Costs Relative to Wages Greater Longevity
(in percent) Annual Rate of growth of the Labor Force 5% 0% -5%
Years in retirementYears in retirementYears in retirement 20 22 20 22 20 22Funding the PBO 19.0 20.1 19.4 20.5 19.7 20.8 Funding the ABO 15.8 16.7 20.8 22.0 25.9 27.3 CCR 19.3 20.4 19.3 20.4 19.3 20.4
Table 11: Change in Funding Costs from Greater Longevity (percent change relative to initial contribution rate)
Annual Rate of growth of the Labor Force 5% 0% -5%
Retirement longevity jumps
from 20 to 22 years
Retirement longevity jumps
from 20 to 22 years
Retirement longevity jumps
from 20 to 22 years First Year Long Run First Year Long Run First Year Long RunFunding PBO 71.5 5.6 92.7 5.6 111.6 5.6 Funding ABO 92.2 5.6 103.6 5.6 111.0 5.6 CCR 16.7 5.6 25.5 5.6 36.4 5.6
61