INVESTMENT NEEDS - ESTEP
61
© GreenSteel for Europe Consortium, 2021 INVESTMENT NEEDS Michele De Santis, Antonello Di Donato (CSM) Tobias Kempken, Thorsten Hauck (BFI) Monika Draxler, Axel Sormann (K1-MET) Paula Queipo (IDONIAL) Wojciech Szulc (IMZ) Danny Croon, Jean-Theo Ghenda (EUROFER) Chuan Wang (SWERIM) Jean-Christophe Pierret, Jean Borlee (CRM) March 2021
-
Upload
khangminh22 -
Category
Documents
-
view
1 -
download
0
Transcript of INVESTMENT NEEDS - ESTEP

© GreenSteel for Europe Consortium, 2021
INVESTMENT NEEDS
Michele De Santis, Antonello Di Donato (CSM)
Tobias Kempken, Thorsten Hauck (BFI)
Monika Draxler, Axel Sormann (K1-MET)
Paula Queipo (IDONIAL)
Wojciech Szulc (IMZ)
Danny Croon, Jean-Theo Ghenda (EUROFER)
Chuan Wang (SWERIM)
Jean-Christophe Pierret, Jean Borlee (CRM)
March 2021

1
This project has received funding from the European Union under grant agreement
NUMBER — 882151 — GREENSTEEL
The information and views set out in this document do not necessarily reflect the official opinion of
the European Commission. The European Commission does not guarantee the accuracy of the
data included in this document. Neither the European Commission nor any person acting on the
European Commission’s behalf may be held responsible for the use which may be made of the
information contained therein.
2
Table of contents
Table of contents .............................................................................................................................. 2
List of figures .................................................................................................................................... 4
List of tables ..................................................................................................................................... 4
List of symbols, indices, acronyms and abbreviations ..................................................................... 5
Executive summary .......................................................................................................................... 7
1. Introduction ................................................................................................................................. 14
2. Technologies, technology routes and related investment needs ............................................... 15
2.1. Carbon direct avoidance ................................................................................................. 18
2.1.1. Hydrogen-based direct reduction ............................................................................ 19
2.1.2. Hydrogen plasma smelting reduction ...................................................................... 21
2.1.3. Alkaline iron electrolysis .......................................................................................... 23
2.1.4. Molten oxide electrolysis ......................................................................................... 24
2.2. Carbon capture and usage ............................................................................................. 24
2.2.1. Carbon oxide conversion ......................................................................................... 25
2.3. Process integration ......................................................................................................... 26
2.3.1. Iron bath reactor smelting reduction ........................................................................ 27
2.3.2. Gas injections into the blast furnace ....................................................................... 28
2.3.3. Substitution of fossil energy carriers with biomass ................................................. 30
2.3.4. High quality steel making with increased scrap usage ........................................... 31
2.3.5. Summary of technologies investment needs .......................................................... 33
2.4. Auxiliary processes ......................................................................................................... 33
2.4.1. CO2 capture ............................................................................................................. 34
2.4.2. Water electrolysis .................................................................................................... 35
2.4.3. Summary of auxiliary processes investment needs ................................................ 37
2.5. Set up of technology routes ............................................................................................ 37
2.5.1. Technology routes based on optimised BF-BOF-HR.............................................. 37
2.5.2. Technology routes based on direct reduction ......................................................... 39
2.5.3. Technology routes based on smelting reduction .................................................... 42
2.5.4. Technology routes based on iron ore electrolysis ................................................... 43
2.5.5. Summary of technology route investment needs .................................................... 44
3. Investment roadmapping......................................................................................................... 44
3.1. Grouping of technologies ................................................................................................ 44

3
3.2. Investment roadmapping by technology routes .............................................................. 46
3.2.1. Investment for the technology routes based on optimised BF-BOF ....................... 46
3.2.2. Investment for the technology routes based on direct reduction ............................ 46
3.2.3. Investment for the technology routes based on smelting reduction ....................... 47
3.2.4. Investment for the technology routes based on electrolysis ................................... 47
4. Analysis of regulatory and market context .............................................................................. 48
4.1. Regulatory context .......................................................................................................... 48
4.2. Market context ................................................................................................................. 50
5. Conclusions ............................................................................................................................. 56
Bibliography ...................................................................................................................................... 0
4
List of figures
Figure 1: Schematic and simplified view of a combination of mitigation technologies based on
conventional BF-BOF-HR ............................................................................................................... 38
Figure 2: H2-DR route production costs as a function of the electricity costs ................................ 41
Figure 3: Steel production and use ................................................................................................ 51
Figure 4: EU crude steel output by production route ..................................................................... 52
Figure 5: Steel consumption by sector of economic activity .......................................................... 52
Figure 6: Total imports into the EU ................................................................................................ 53
Figure 7: Total EU exports ............................................................................................................. 53
List of tables
Table 1: Summary of investment roadmapping for single technologies and technology routes ... 10
Table 2: Investment needs for the development of single technologies ........................................ 33
Table 3: Specific CAPEX demands for several electrolysis technologies ..................................... 36
Table 4: Auxiliary processes investment needs ............................................................................. 37
Table 5: Technology route investment needs ................................................................................ 44
5
List of symbols, indices, acronyms and abbreviations
ACER Agency for the cooperation of energy regulators
AEL Alkaline electrolysis
AIE Alkaline iron electrolysis
BF Blast furnace
BOF Basic oxygen furnace
CAPEX Capital expenditure
CCS Carbon capture and storage
CCU Carbon capture and usage
CCUS Carbon capture and usage or storage
CDA Carbon direct avoidance
CE Circular economy
CHP Combined heat and power
CO Carbon monoxide
CO2 Carbon dioxide
CS Crude steel
CS-PPP Clean steel public private partnership
DR Direct reduction
DRI Direct reduced iron
EAF Electric arc furnace
EU European Union
FP Framework Programmes
GHG Greenhouse gas
GREENSTEEL Green Steel for Europe
H2 Hydrogen
H2-DR Hydrogen-based direct reduction
HBI Hot briquetted iron
HTEL High temperature electrolysis
HPSR Hydrogen plasma smelting reduction
IBRSR Iron bath reactor smelting reduction
IMF International Monetary Fund
INDC Intended nationally determined contributions
LULUCF Land use, land-use change and forestry
MOE Molten oxide electrolysis
MSW Municipal solid waste
N2 Nitrogen
NG-DR Natural gas-based direct reduction
O2 Oxygen

6
OPEX Operational expenditure
PEM Polymer electrolyte membrane
PCI Pulverised coal injection
PI Process integration
R&D Research and development
R&D&I Research, development and innovation
RDF Refuse-derived fuel
RFCS Research Fund for Coal and Steel
t Tonne
TGR-BF Top gas recycling – blast furnace
TRL Technology readiness level

7
Executive summary
The production of steel must undergo a deep decarbonisation process if it is to meet the CO2-
reduction objectives envisaged by the European Green Deal, which aims to bring about a transition
to a competitive low-carbon economy by 2050. The Green Steel for Europe (GREENSTEEL)
project, for its part, aims to promote a green revolution in the steel industry.
This report focuses on the investment needs for the expected steel-industry decarbonisation (aimed
at reducing steel industry CO2 emissions by at least 80%) and suggests an investment roadmap.
To this end, the report includes a thorough investigation of the following elements:
a) the current technology developments in the field of CO2 reduction in the steel industry,
with a focus on their related investment needs;
b) an investment roadmap, describing the investment needs for the technologies up to
industrial deployment; and
c) the current regulation and market context, which shapes to the real economic framework
in which the EU steel industry must evolve (sustainable transition).
a) Technologies, technology routes and related investment needs
The selection of technologies was derived from deliverable D1.2 of the GREENSTEEL project. The
following were identified as the most relevant technologies:
• hydrogen-based direct reduction (H2-DR);
• hydrogen plasma smelting reduction (HPSR);
• alkaline iron electrolysis (AIE);
• molten oxide electrolysis (MOE);
• carbon capture and usage (CCU) via carbon oxide conversion;
• iron bath reactor smelting reduction (IBRSR);
• gas injection into the blast furnace;
• substitution of fossil energy carriers by biomass; and
• high quality steel making with increased scrap usage.
Several technologies can be combined to raise the overall CO2-mitigation potential above their
individual limits. The main auxiliary processes connected to many of the above-mentioned
technologies are CO2 capture and H2 generation.
These technologies can be considered as individual modular components within the complete steel
production chain. Technology routes integrate these components into a full process chain, including
upstream operations (transformation of raw materials into intermediate steel products) and
downstream applications (production of final shaped and coated products). The amalgamation of
technologies into technology routes (including the integration into existing/new production chains)
needs substantial additional investment. Four groups of technology routes were identified within
the project as being highly relevant (but non-exclusive) examples:1 routes based on the optimised
1 The groups were the same as those in the D1.2 report of the GREENSTEEL project “Technology assessment and roadmapping”.

8
conventional blast furnace-blast oxygen furnace-route (BF-BOF-route), on direct reduction (DR),
on smelting reduction and on iron ore electrolysis.
Technology routes based on optimised BF-BOF
The first technology route consists of adjustments to the conventional BF-BOF ironmaking process,
many of which are possible in the short term. These adjustments include the injection of hydrogen-
rich gases and the increased use of alternative energy carriers, such as biomass and scrap.
Furthermore, the addition of carbon capture and usage or storage (CCUS) units to conventional
processes is also considered, since CCUS is quite a flexible option that can be combined with
almost all other techniques, e.g. electric arc furnace (EAF), natural gas direct reduction (NG-DR)
plants or downstream processes.
The investment needs can be apportioned as follows:
• up to 2030: industrial investment for first implementations in existing BF-BOF plants and
technological investment for other less mature options, including CCUS; and
• up to 2040: industrial investment for full implementation and minor technological investment
for other less mature options.
Technology routes based on direct reduction (e.g. H2-DR-EAF route)
This route proved to be among those allowing major CO2 mitigation potential. However, its success
in the European steel industry depends on the availability and cost of ‘clean’ energy (hydrogen and
electricity). Therefore, starting with NG-DR is a plausible and more realistic first step for industrial
deployment, which would still enable high CO2 mitigation. For both variants (NG/H2-DR),
challenges and investments should be considered, which are linked to the restructuring of the
existing industrial systems (i.e. the adaption of material, gas and heat supply chains).
The investment needs can be apportioned as follows:
• up to 2030: industrial investment in DR plants using natural gas and technological
investments to increase hydrogen content and upgrade the technology readiness level
(TRL) up to industrial level; and
• up to 2040: industrial investment in the implementation of H2-DR-EAF and the progressive
replacement of blast furnaces (and related plants).
Technology routes based on smelting reduction (e.g. enhanced IBRSR route)
The technology route based on iron bath reactor smelting reduction (IBRSR) technology replaces
the BF and eliminates the need for the cokemaking and sintering (or pelletising) of the iron ore. The
steelmaking and hot-rolling sections can remain unchanged or, if desired, they can accommodate
the additional changes presented in the BF route above.
The investment needs can be apportioned as follows:
• up to 2030: technological investment in scaling up to TRL 8; and
• up to 2040: industrial investment in the progressive replacement of BFs and related plants
and, subsequently, for industrial deployment in the European industry.
Technology routes based on iron ore electrolysis
These routes comprise two technologies, alkaline iron electrolysis (AIE) and molten oxide
electrolysis (MOE), which both reduce iron ores through direct use of electricity but which currently

9
have different technical maturity levels: moderate (TRL 5-6) for AIE and low (TRL 2) for MOE. Both
technologies depend on the availability of large amounts of CO2-free electricity at affordable prices.
For the alkaline electrolysis (AEL), the investment needs can be apportioned as follows:
• up to 2030: technological investment in scaling up to TRL 8; and
• up to 2040: industrial investment in the implementation of AEL plants, for progressive
replacement of BFs and related plants, and subsequently for deployment in European
industry.
For MOE, the investment needs can be divided as follows:
• up to 2030: technological investment in both fundamental and low-scale developments (e.g.
laboratory, pilot plant); and
• up to 2040: industrial investment in further upscaling in view of achieving TRL 9 in 2050.
Note that some of the above-mentioned technologies can be in direct competition with each other,
meaning that only one can be implemented. For example, H2-DR, AIE/MOE and mixed solutions
(HPSR) are in competition, whereas several others may be combined with high synergy (e.g. CCU
and biomass with several other technologies).
b) Investment roadmapping
As to the investment needs, publicly available data have been combined with information derived
from interviews with steel producers and technology providers. In order to design an investment
roadmap, the investment needs for the main technological solutions (the so-called technology
routes in the D1.2 report “Technology assessment and roadmapping”) have also been considered
in the context of the periods in which they will be needed by 2050.
An investment roadmap has been developed based on the analysis of the selected decarbonisation
technologies and their investment needs. The arising within this timeframe are set out as follows:
1. the cost for development up to TRL 8: these are the investment needs to upgrade the
technology from the existing TRL to complete systems, including small-scale demonstration in
an operational environment;
2. the cost for the first industrial deployment (TRL 9): these are the investment needs for
the scale up and full industrial validation of a first-of-a-kind industrial plant;2
3. the cost for production plants: these are the investment needs for a full-scale industrial
production plant (normalised to 1 M t production capacity); and
4. the cost for the deployment of auxiliary technologies: these are the investment needs
for enabling auxiliary technological solutions, with similar development/investment steps as
those described above.
Notably, most of the overall investment needs from 2020 onwards will be concentrated in the period
2030-2050.
A summary of the investment roadmap for single technologies and technology routes is shown
below, in Table 1.
2 At least a one-year operation with about 30% (or more) industrial plant production capacity.

10
Table 1: Summary of investment roadmapping for single technologies and technology routes
Single decarbonisation technologies
Technology
TRL development Investment needs up to TRL 8 (M€)
Investment needs for 1st
industrial depl. TRL 9 (M€)
Investment needs for full
industrial plant (M€)
CO2 abatement (max %) 2020 2030 2050
H2-DR (100 % H2)
6–8 7–9 9
(ind. depl.)
100 150 250* 95
HPSR 5 6 9
(ind. depl.)
100 200 500 95
AIE 5-6 6–8 9 250 500 Not evaluated
due to low TRL
95
MOE 2 3-4 9 1000 Not evaluated due to low TRL 95
CCUS 5- 8 9 9
(ind. depl.)
150 300 1000 60
IBRSR 6 8 9
(ind. depl.)
400 850 ** 20-80
BF-Gas injection
5–9 8–9 9
(ind. depl.)
150 400** 600** 20-60
Biomass usage
2–7 8 9
(ind. depl.)
5 15 30-100
Increased scrap usage
4–7 7–9 9
(ind. depl.)
50 100 100 (with CCS).
Auxiliary technologies
Technology
TRL development Investment needs up to TRL 8 (M€)
Investment needs for 1st
industrial depl. TRL 9 (M€)
Investment needs for full
industrial plant (M€)
CO2 abatement (max %) 2020 2030 2050
CO2 capture 5–6 8–9
9 (ind.
depl.)
(independent from steel industry, n
200 -
Water electrolysis
5–8 7–9 9
(ind. depl.)
Not evaluated (independent from steel industry)
100 -
Technology routes
Technology route
TRL development Investment needs up to TRL 8 (M€)
Investment needs for 1st
industrial depl. TRL 9 (M€)
Investment needs for full
industrial plant (M€)
CO2 abatement (max %) 2020 2030 2050
Optimised BF-BOF
2-9 7–9 9
(ind. depl.)
2,000*** 4,000 95
Direct reduction
4-8 7-9 9
(ind. depl.)
500 650 95
Based on smelting reduction
2-6 6–8 9
(ind. depl.)
400 500** 600** 85
Based on iron electrolysis
2-6 3-6 9 250 400 Not evaluated
due to low TRL
95

11
Source: authors’ own composition based on desk research and stakeholders’ interviews (complete references
in the bibliography). Note: data refer to a crude steel capacity of 1 Mt/a as a reference3. * €500 M including
EAF. ** Excluding CO2 transport and storage. *** From greenfield (brownfield CAPEX costs 40% with respect
to BF-BOF). For the abbreviations used, please see the list of symbols, indices, acronyms and abbreviations.
The table is divided into three parts. The first shows the investment needs for the development of
the single technologies, the second includes the needs for auxiliary technologies, and the third
shows the needs for the technology routes resulting from a combination of technologies, to account
for complete steel production chains. Where information was lacking, general TRL info or a
common investment need for plant deployment is given.
It should be noted that the above-mentioned data refer to technology development from greenfield.4
The investment costs correspond to one (pilot/demonstration/industrial) plant at a time. However,
operating at least two plants for each technology is strongly recommended to ensure reliable results
and gather a broad range of experiences. The information on the technical maturity is given as a
TRL range, representing different aspects of the respective technology/technology route.
Regarding the readiness for first industrial deployment, the upper limit of the TRL range is relevant,
since the less mature aspects are usually optional.
Technologies vs CO2 emission-abatement potential
The investment roadmap needs to be put into the sustainability perspective – allowing for a
sustainable transition, leading to a competitive and resource-efficient industry and providing
enhanced worker safety and new job opportunities. Therefore, the costs of the different options
must be considered in relation to their CO2 emission-abatement potential.
Furthermore, the technologies’ expected maturity progress has to be considered, since the CO2
emission abatement should be achieved as soon as possible, in particular in light of the long
investment cycles of the steel industry. Table 1 allows for both aspects of the technologies to be
compared.
Technologies related to biomass, increased scrap usage, gas injection in BF and CCUS have lower
impact on CO2 emissions when applied individually, but are the closest to industrial development
and have relatively low investment costs. Conversely, the new innovative steelmaking
technologies, such as HPSR and AIE iron ore electrolysis, have a big potential, but their industrial
deployment requires more time and large investments due to rather low TRLs to date.
The H2-DR technology offers a compromise, with its moderate TRL and very high CO2 abatement
potential, even in the medium term. The direct-reduction technology also guarantees a significant
CO2 abatement in the short term via the natural gas-based direct reduction (NG-DR). Since this is
already an industrially established technology, industrial plants can be installed in Europe in the
short term, which would enable a significant short-term decrease of the CO2 footprint of the
European steel industry.
3 In general, real industrial plant sizes differ depending on a specific technology. Taking for example BF-gas injection technology and the route based on smelting reduction, the investment needs for the Hisarna plant with a 1.5 Mt/a CS capacity are reported in Section 2.5.3. 4 In fact, in Europe the optimised BF-BOF route will most probably be based on existing installations (brownfield) rather that new installations (greenfield). The CAPEX for BF-BOF brownfield (BF-BOF retrofit) is estimated to be a bit less than 40% of the CAPEX for greenfield BF-BOF (Ghenda, 2013).
12
These industrial DR plants could afterwards be used for further R&D activities, with the aim of
maximising the ratio of hydrogen to natural gas and further decreasing industrial emissions. With
this approach, major CO2 abatement of industrial emissions would be possible, without having to
wait several years for less mature techniques to be developed. Instead, depending on the local
environment (e.g. favourable conditions with respect to economic and legal barriers and
energy/resource costs), first industrial sites could build DR plants within a couple of years.
However, this approach would have a significant impact on investment needs. As can be derived
from Table 1, huge investments on industrial scale (up to €1-2 B) would be necessary in the short
term, bypassing the cheaper demonstration-plant step.
As a general remark, even though across Europe there is a wide distribution of projects and related
experimental and demo plants based on the new technologies (see comprehensive list in D1.1),
how many EU plants will really be involved in the options identified within the GREENSTEEL project
will depend on several factors (enablers, legal framework, especially public financial support for
R&D&I and upscaling of the current demo). New low-CO2 production technologies will require a
€50-60 B investment, with €80-120 B per year capital and operating costs. The cost of production
per tonne of primary steel will increase by 35% up to 100%. The new technologies would result in
additional production costs for the EU steel industry of at least €20 B per year compared to the
retrofitting of existing plants (i.e. the upgrading of existing plants with the best available techniques).
At least 80% of this share is related to operational expenditure (OPEX), mainly due to increased
use and higher prices for CO2-lean energy.
Moreover, local conditions can foster the deployment of some of the presented technologies, as is
the case, for example, for Belgium, France and the Netherlands, which can take the opportunity of
using carbon capture and storage (CCS) in the North Sea ports, or Sweden, which can rely on the
availability of green energy. Turning all opportunities into reliable pathways will also depend on
other external aspects (e.g. financial support or policies). A thorough analysis of the most promising
pathways, together with a general indication of the expected positive effect on investment needs
will be detailed in a dedicated report.
c) Regulatory and market context
Climate protection is a central element of the European regulatory context and is enshrined in the
European Green Deal Communication, with sets the goal of making the EU carbon neutral by 2050.
The study also looks into the market context, as it affects the investment environment. Steel is a
heavily traded commodity on the global market. Global trends in steel demand, steel supply
capacity and steel trade flows shape the dynamics of the steel industry. Global crude steel
production reached 1.87 B tonnes in 2019, 8.5% of which was produced in the EU. In the last
decade, steel imports to the EU have been increasing while steel exports from the EU have been
decreasing, with the EU being a net importer of finished steel products. The outbreak of the Covid-
19 pandemic across the EU and all world regions has slashed steel consumption and production
forecasts as well as impacting the overall economic outlook.
The production of clean steel will entail (much) higher costs for several reasons, at least for the
foreseeable future. Therefore, as already discussed in the deliverables D1.2 (Technology
assessment and roadmapping) and D1.3 (Technology and investment need assessment from
stakeholder consultation), new markets and business models for clean steel must be established.

13
This need was confirmed by the first part of the GREENSTEEL stakeholder consultation: steel
producers ranked “unknown market conditions for clean steel” among the three main barriers
hindering the projected CO2-emission reduction level in the decarbonisation of steel production. In
order to create a proper market context for clean steel and related products, incentives are
recommended for the use of clean steel (and related products), and for the promotion of clean steel
products in public procurements and the adaption of standards.
There are some decarbonisation technologies, currently available, which enable a short-term
deployment with limited R&D and investment needs, but their mitigation potential is also limited.
Consequently, as there is no single technology which fulfils all demands, parallel investments in
the development and deployment of several technologies are needed. These technologies, which
can also be combined, provide alternatives and offer individual advantages, depending on the
different framework conditions and time scales.
Although all the presented technologies are expected to reach an industrial deployment by 2050 at
the latest, only some of them (namely, H2-DR, CCUS, gas injection on BF, increased scrap usage)
are expected to achieve TRL 9 close to 2030. Most development investments (including
demonstration) are therefore needed before 2030, whereas most investments for industrial
deployment will occur between 2030 and 2050.
However, the DR technology provides a different opportunity, as industrial plants based on natural
gas could be built and then further developed for increasing hydrogen usage. This approach would
require large investments in the short term but would enable a significant short-time mitigation and
a flexible and highly efficient mitigation in the medium term.
The huge investment needs and the related technical-economical risks call for adequate financial
support of the development activities. Parallel to financial support, regulatory initiatives are needed
to support clean steel markets, with the objective of propelling the technological development and
the industrial deployment towards the CO2-mitigation targets.
The results of this report will be used for the upcoming work within the project Green Steel for
Europe, more specifically in work package 3 (Impact Assessment) which analyses and
recommends different policy options.

14
1. Introduction
The project Green Steel for Europe (GREENSTEEL) addresses the challenge of decarbonising the
EU steel industry, which requires considering in an integrated way the following three key aspects:
• the individuation of technologies with appropriate maturity.
• the boundary conditions which support the industrial deployment, in particular with respect
to the investments needed; and
• the appropriate business environment ensured by the adoption of adequate economic and
regulatory policies.
This report (Deliverable D2.2) focuses on the technologies identified and synthesised to technology
routes in the project Task 1.2. The report is composed of three main parts:
• analysis of investment policies and stakeholders’ investment strategies (Chapter 2);
• analysis of the regulatory and market context (Chapter 3); and
• investment roadmapping (Chapter 4).
In chapter 2, two different kinds of investment needs are considered:
• investment needs for technical development (in particular, demonstration plants); and
• investment needs for industrial deployment (considering the decarbonisation processes
themselves and including the additional costs to integrate new processes in existing
brownfield sites/production chains).
In Chapter 3, the regulatory and market context is analysed, given the important role it plays in
driving stakeholders’ investment strategies.
In Chapter 4, the information gathered is used to elaborate an investment roadmap for the identified
technologies.
The report relies on information from the following sources:
• the project LowCarbonFuture5 and the parallel activity carried out within the GREENSTEEL
project in its first work package (WP1), which is dedicated to technological needs;
• the scoping interviews conducted with stakeholders (for which more detail can be found in
the Deliverable D1.3 (Preliminary findings from stakeholder consultation);
• the desk research on the mentioned issues (for which more detail can be found in the
Deliverable D1.2, “Technology assessment and Roadmapping”); and
• the parallel activities carried out when setting up of the Clean steel partnership (CS-PPP),
aimed at “helping remove R&D&I and systemic bottlenecks such as the transition from the
pilot phase to industrial-scale deployment, high technology risks, large capital requirements
and higher production costs”, to “tackle two major challenges: climate change and
sustainable growth for the EU”.
5 For further details, please see https://www.lowcarbonfuture.eu.

15
2. Technologies, technology routes and related
investment needs
In this chapter, the investment needs for the most promising technologies (selected in Deliverable
D1.2) for decarbonisation of the steel industries are presented.
The complete elimination of fossil energy carriers is a logical, direct and drastic way to achieve
deep decarbonisation. A second possibility is to capture the produced CO2 and store it in clearly
confined sites, or to use it as raw material to produce chemical products.
At the same time, a large variety of technologies for reducing the consumption of fossil energy
carriers are either under development or already partly tested in the European steel industry.
According to a widespread classification, also adopted in D1.2, these decarbonisation options are
called, respectively:
• carbon direct avoidance (CDA);
• carbon capture and storage / carbon capture and usage, (CCS/CCU); and
• process integration (PI).
All the options, especially PI, are ever more conceived according to the new paradigm of the
circular economy (CE) approach. This approach replaces the ‘end-of-life’ concept with a ‘zero-
waste’ concept by reducing, or alternatively reusing, by-products and residues, as well as recycling
and recovering energy and valuable materials from production/distribution streams and
consumption processes.
The investment needs are analysed following this classification of technologies (as in D1.2) and
presented in the related paragraphs 2.1, 2.2 and 2.3, respectively. In D1.2, the Section 2.4 is
dedicated to the two main auxiliary processes of CO2 capture and H2 generation, which are
required, for example, for CCS/CCU or hydrogen-based steelmaking. These technologies are not
specific to the iron and steel industry and are therefore being developed independently. However,
their application in steelmaking processes requires specific characteristics, in terms of performance
and capacity and, consequently, specific investment needs that cannot be separated from the
investment needs for their application in the steel industry. For this reason, the investment needs
for these technologies have been included in Section 2.4.
The investment needs of the considered technologies are distributed as follows6.
1. costs for development up to TRL 8: these are the investment needs to upgrade the
technology from the current technology readiness level (TRL) to demo level, as reported in
D1.2.
2. costs for development up to first industrial deployment: these are the investment
needs to upgrade the technology from the current TRL to first industrial deployment, as
reported in D1.2; and
3. costs for production plants: these are the forecast investment needs to implement the
technology at industrial scale, after reaching industrial deployment maturity.
In some cases, a further type of investment need should be considered, where necessary:
6 See also D1.2. Report of the GREENSTEEL project “Technology assessment and roadmapping”.
16
4. costs for deployment of auxiliary technologies: these are the investment needs for
auxiliary enabling technologies, which have not yet been industrially deployed for
application in steelmaking and which are required for the development of other
technologies.
Estimates are based on information from literature, from the already allocated or requested funds
for the development of the technologies (e.g. European funded projects in RFCS, Horizon2020,
FP’s, and national funding), and from interviews with producers and technology providers
performed in the frame of the GREENSTEEL project7. The experience of the partners of the project
has also been considered as a reliable source of information.
Because of the large variety of technologies, maturity levels (in terms of TRL) and framework
conditions, the investment needs are evaluated and explained case by case according to the
following general guidelines:
• the investments concerning upscaling and optimisation have been estimated only for
technologies at a TRL higher than five. The evaluation is mainly based on the envisaged
costs for pilot and demonstration plants, operated for R&D purposes, and thus not for
commercial production. The published estimated costs have been used, when available. In
other cases, the evaluation is based on an analogy with plants, projects and objectives that
can be considered similar in terms of typology, size and complexity of the equipment,
• estimates of the costs concerning production and auxiliary plants are limited to the main
components representing the distinguishing features of the technology while the general
ancillary equipment (common to many other processes and plants) is neglected. The
investment needs inherit the capital expenditure (CAPEX) of these components. The
operational expenditure (OPEX) is just presented when referenced. More detailed
assessment will be done in further reports which will focus on the decarbonisation
pathways;
• in general, CAPEX (and OPEX when available and referenced) is expressed in specific
terms and referred to a specific mass of product (e.g. crude steel, CS) or to its production
in a defined timeframe. When applicable, the cost for a plant has been calculated, assuming
a production capacity of 1Mt per annum (Mt/a) as reference. Extrapolation to larger
capacities can then be utilised, e.g. by linear proportionality. The approximation according
to which 1Mt/a production capacity corresponds to a 100 t/h production rate has been
adopted. Although a more accurate value is estimated to be around 115 t/h, this difference
falls within the precision intervals of the calculation. Overall, the aim of these evaluations is
not to establish the most precise estimated cost for future plants, but rather to give an
indication of the impact of different decarbonisation technologies on investment and
operating costs;
• the investment needs are evaluated for each single technology and for one single
application. An extrapolation to a wider application, with many installations diffused in the
European industry, as well as the mutual interactions between investments for different
technologies, are discussed in Chapter 3.
7 Aggregates info in the GREENSTEEL D1.3 report, available upon request

17
• in most cases the estimates resulted in wide ranges of investment needs, due to the
complexity of the subjects, the large number of existing projects and applications and the
variety of sources. To facilitate the reader and the further use of the information, a summary
of each investment need was prepared for every technology, in terms of cost and impact
on CAPEX. The values reported in this summary are not mere arithmetic means of the
detailed data, but rather a first approximation, given in order of magnitude; and
• the specified costs focus on the technologies, neglecting in most cases the costs of
integration into existing (brownfield) plants. These additional costs are significant and highly
relevant for investment decisions for industrial deployment of techniques; however they
depend on individual plant conditions and are difficult to specify.
Most promising technologies for the decarbonisation of the steel industry
In Europe, about 60% of steel is produced via the primary (or integrated) route, based on blast
furnace (BF) and basic oxygen furnace (BOF) units. The BF uses iron ore (in pellet or in sintered
form) together with coal and coke (derived in turn from coal) for producing liquid hot metal (carbon-
saturated iron), which is further converted into liquid steel. The remaining 40% of steel production
is based on recycling steel scraps (secondary route), which are melted to liquid steel in electric arc
furnaces (EAF).
Beside these industrial technologies mostly deployed in Europe, a third (also primary) route is
utilised, mainly in other parts of the world. It is based on direct reduction (DR) of iron ore (in pellets
or briquettes) into solid iron (sponge iron or direct reduced iron, DRI), generally by using natural
gas as reductant and fuel. The DRI is then melted in an EAF, thus producing liquid steel. Today
DR accounts for about 5% of the global steel production (World Steel Association, 2019 (worldsteel,
2020)). Due to its full industrial maturity, this route offers a strong potential for fast decarbonisation
of the European steel production. At the same time, it offers the opportunity for increase CO2
mitigation by further developing it to hydrogen based direct reduction (H2-DR) in a flexible way.
The production of steel from iron ore consumes much more energy and fossil energy carriers than
the production from recycled scrap. In general, steel production via primary route (BF and BOF)
causes 1.9 t CO2/t CS (tonnes of CO2 emissions per tonne of produced crude steel, CS) (Wörtler
et al., 2014 (Wörtler, et al., 2013)). The secondary route (recycling of scrap in EAF) accounts for
about 0.4 t CO2/t CS. This value includes also the indirect emission for electricity generation. The
production via direct reduction with natural gas results in about 1.2 t CO2/t CS (Wörtler, et al., 2013).
However, the primary route enables the production of all kinds of (high quality) steel products,
whereas the secondary route is often preferred to produce construction steel (for which a lower
metallurgical purity is required) due to the impurities brought in by the scrap (for further details,
please see Deliverable D1.2).
Analyses show that for most technologies, huge amounts of CO2-free energy sources8 are needed
and that the material cycles in the plants will be considerably influenced. Also, significant increases
of OPEX (mostly due to expensive renewable energy supply) and of CAPEX (due to the need to
replace main parts of the upstream process chain) are expected. Most identified technologies have
a moderate maturity level (TRL at 5-7). Some technologies have a high CO2 mitigation potential
8 The EU steel industry will require approximately 400 TWh of CO2-free electricity every year by 2050 (including electricity for the production of yearly 5.5 Mt of hydrogen).

18
but are currently at low maturity (e.g. hydrogen plasma smelting reduction, HPSR, at TRL 4, molten
oxide electrolysis, MOE, at TRL 2). Correspondingly, a high number of R&D needs exist,
particularly regarding the processes themselves and their upscaling, the related plant technologies,
necessary auxiliary processes, material processing and a large number of measurement and
control aspects. More details regarding the technological assessment are given in Deliverable D1.2.
The main conclusions of the analyses are synthesised as follows:
1. many breakthrough decarbonisation technologies are not available for industrial
deployment in the short term (until 2030);
2. there are some decarbonisation technologies currently available which enable short-term
deployment with limited R&D need and investment effort, but their mitigation potential is
also limited; and
3. all decarbonisation technologies need certain framework conditions, with the most
important one being sufficient renewable energy at competitive costs.
To realize the crucial next step of demonstration and completion in an operational environment
(TRL7-8) and to further develop the less mature breakthrough technologies, the R&D actions need
to be taken now. Since there is a great variety of R&D actions needed and the effort by far exceeds
the usual R&D needs, collaborative research is essential for effective progress.
One of the main results of the project was identifying relevant decarbonisation technologies to
complete steel production chains, with a view of proposing breakthrough technology routes with
high potential CO2 emission reduction (see Deliverable D1.2). The following breakthrough
technology routes were identified:
1. BF-BOF-HR route: the technology route based on the conventional route of blast furnace-
basic oxygen furnace-hot rolling (BF-BOF-HR) with applications of several PIs and/or
carbon capture and usage or storage (CCUS) technologies for fast and high CO2 mitigation;
2. H2-DR-EAF route: the technology route based on direct reduction (with high hydrogen
utilization) and electric arc furnace (H2-DR-EAF). While this route needs significant
modifications of existing plants, it achieves high CO2 mitigation without need for CCUS;
3. Enhanced IBRSR (iron bath reactor smelting reduction) route: the technology route
based on smelting reduction which enables high bio-coal, fine ore and scrap usage as well
as effective combination with CCUS technologies; and
4. Iron-ore electrolysis route: the technology route based on iron ore electrolysis which is
directly electrifying iron production. It is still at lower technological maturity but could be an
option for high CO2 mitigation in the long term.
Even though these technology routes represent end points of the decarbonisation process, the
technology implementation (i.e. integration into existing/new production chains) needs substantial
additional effort, both with respect to R&D activities and with respect to accompanying investments.
These conclusions shortly summarise the current results obtained within the GREENSTEEL project
and will be further developed by the following prognosis of industrial deployment scenarios for 2030
and 2050 in Task 1.4/1.5, as well as the linked impact analyses in work package 3.
2.1. Carbon direct avoidance
The carbon direct avoidance (CDA) pathway primarily focuses on the development of new
steelmaking processes using fossil-free reductants and (renewable or clean) energy sources to
19
produce steel from virgin iron ore, avoiding the generation and hence emission of carbon oxides.
Basically, there are two possible options to replace fossil energy carriers in steelmaking processes
based on iron ore: by electricity and/or hydrogen produced from renewable or CO2-free sources.
The third option, using char and syngas produced from biomass, is very limited in Europe (for
further details please see Section 3.1 of D1.2).
With respect to this technology, the following paragraphs present the investment needs for:
1. the direct reduction with (almost) 100% hydrogen (Section 2.1.1), which represents the end
point of the technology route based on the mature natural gas-based direct reduction (NG-
DR);
2. the emerging technologies, which are:
• HPSR (based on a mixed use of hydrogen and electricity) in Section 2.1.2; and
• AIE (alkaline iron ore electrolysis) (paragraph 2.1.3) and MOE (Section 2.1.4), in which the
metallic iron is produced from iron ore only by means of electrical energy.
The investment needs are assessed in terms of the upgrading of the technology from the current
status to a level potentially exploitable for industrial deployment. However, to actualise this
industrial deployment, significant adaptions of existing plants and internal/external infrastructure
are necessary. For the specific case of the presented CDA technologies, the availability of electrical
energy from renewable sources and clean hydrogen, e.g. produced from such electrical energy,
are main enabling conditions.
2.1.1. Hydrogen-based direct reduction
The hydrogen-based direct reduction (H2-DR) is a technology derived from the existing direct
reduction process using natural gas or coal. Starting from NG-DR, it is possible to progressively
enrich the operating gas mixture with hydrogen, depending on plant framework conditions (i.e.
availability of hydrogen). There are different technological approaches: The most common
approach is DR in a shaft furnace, where pelletised iron ore is reduced to DRI by means of
hydrogen gas. Another option consists in the DR of fine ore in a fluidized bed by means of hydrogen
gas. In the conversion process of integrated steel plants towards H2-DR steelmaking process, the
BF and BOF units become obsolete. Downstream of this step, an EAF is utilised to melt the
produced DRI by direct use of electricity. The subsequent downstream processes (secondary
metallurgy and subsequently casting and rolling) mostly do not require significant changes.
Upstream of the DR step, sinter plants may be replaced by pelletising plants, since DR-plants are
usually operated with iron ore pellets. Due to the fact that the majority of European plants buy
pellets from external suppliers, the industry position on how many new pelletising plants will be built
on-site in Europe is not clear yet. This entails an increased risk of carbon leakage if pellets are
bought from non-European (e.g. oversea) suppliers. Furthermore, in this case the advantages of
sinter plants are lost, more specifically the strategical advantage with regard to flexible and tailor-
made sinter produced on-site from iron ore fines and concentrates from different suppliers as well
as the ecological advantage of recycling most internal iron-bearing residues via the sinter. This
might induce investments for alternative recycling plants.

20
The currently most common DR technologies on the market are MIDREX and HYL/ENERGIRON9.
Both solutions can be applied for H2-DR as both suppliers claim that quite high hydrogen contents
should be technically feasible in a short time. The remaining risks and the needs for further
development are difficult to assess, since evidence for DR plants operated with pure hydrogen on
large scale is not yet available. However, due to the high maturity of NG-DR plants, the TRL is
higher and the remaining risks lower than for most other technologies.
Several demonstration activities for H2-DR have already started. Two European examples are: the
ArcelorMittal demonstration plant in Hamburg which is based on the MIDREX Technology10, and
the HYBRIT consortium which signed an agreement with Tenova for using the HYL technology.
Technical details aside, the end point of a passage from natural gas to hydrogen-based technology
will probably require similar investment needs, irrespective of the adopted commercial solution.
Investment costs for development up to TRL 9
Several European steelmakers are currently developing H2-DR, adopting one of the two
predominant technologies with the construction of pilot and demonstration plants with a current
European TRL of 6-8, for the usage of (almost) pure hydrogen.
The technology providers claim that their DR plants could operate with 100% hydrogen without
major modifications. The analysis performed in D1.2 confirms that optimisation is related more to
operational aspects and product qualities than to basic plant engineering. The most important issue
that the pilot and demonstration plants need to study is the perfect integration of the three main
units: the electrolyser for producing clean hydrogen (water electrolysis), the shaft furnace for DR
process and the EAF to melt the DRI. This includes, for example, developing the solutions to
compensate the expectedly variable hydrogen-production rate determined e.g. by the use of
fluctuating electrical energy from renewable sources and optimising the melting process of a DRI
in the EAF without carbon (being produced from hydrogen).
The construction of several pilot and demonstration plants has already been initiated and the first
ones with a capacity of up to 1Mt/a (ArcelorMittal, 2019) are planned to be completed in 2020.
(Agora-Energiewende, 2019). In that context, achievement of TRL 9 is expected before 2030. The
investment costs for these plants depend on the production capacity, auxiliary equipment and
technological objectives. As an estimate, investment costs in the range of €100-200 M can be
expected for a single installation of H2-DR process from pilot to demonstration. As an example, the
total cost of the pilot phase of the HYBRIT project was €136 M (Bioenergy International, 2018).
In parallel, investments are necessary to study the melting process of carbon free DRI from
hydrogen in EAF units. In principle, this step does not require the construction of new plants, as
the existing EAFs (at any scale) can already be suitable for this purpose. However, the carbon
neutral operation of EAFs too needs further development since electrodes and auxiliary burners
currently cause some CO2 emissions. The corresponding investment needs can be estimated in
the order of magnitude of demonstration projects, resulting in €10-20 M for three-year projects.
9 The technology is HYL, owned by Tenova. Tenova HYL and Danieli & C. have formed a partnership for the design and construction of the HYL technology under the ENERGIRON trademark. 10 For further details please see https://corporate.arcelormittal.com/media/case-studies/hydrogen-based-steelmaking-to-begin-in-hamburg.

21
In summary, the investment costs for upgrading the hydrogen-based technology up to TRL 9, hence
ready for industrial scale, can be estimated at around €250 M.
Investment costs for production plants
A sum of €230/t CS is required for the direct reduction shaft (Wörtler, et al., 2013). Assuming that
1 t DRI is required for the production of 1 t CS, this results in investment costs of €230 M for the
industrial deployment of the H2-DR technology with an annual production capacity of 1 Mt CS.
These costs are complemented by significant additional costs for the EAF (for the conversion of
DRI into CS) and the water electrolysis for hydrogen production. These costs are further assessed
in the scope of the complete technology route in Section 2.5.2.
Based on existing reference on OPEX, the total production costs are estimated at around €500/t of
CS, depending on the amount of scrap used and especially electricity and CO2 prices. As to
electricity, the energy requirement is estimated from 3.3 to 4.1 MWh/t CS, of which the largest
share is required for H2 production. Overall, CO2 mitigation costs are estimated as medium level
costs (€60 to 99/t CO2; estimates for 2030, Germany: €60/t CO2 for NG-DR; €99/t CO2 for H2-DR)
(Agora-Energiewende, 2019).
Investment needs for H2-DR are summarised as follows:
• investment needs for achieving TRL 8–9: up to about €100-150 M (for a single
demonstration plant);
• investment needs for industrial deployment: about €250 M for a first industrial plant of
capacity 1Mt/a; and
• the unique situation of DR being industrially established via natural gas (NG-DR) enables
to build industrial NG-DR plants in the short term and raise the hydrogen content
successively towards the midterm H2-DR target (e.g. (SALCOS, 2020)11).
2.1.2. Hydrogen plasma smelting reduction
The hydrogen plasma smelting reduction (HPSR) is a direct transformation from iron ore fines to
liquid steel and represents an evolution from the classical smelting reduction process. In a smelting
reduction the feedstock is fine iron ore. Carbon acts as reductant and provides energy. It is supplied
through fossil energy carriers, typically coal or natural gas. Green alternatives are char and syngas
from biomass. The final product is liquid hot metal (carbon-saturated iron).
In the HPSR process, iron ore fines are converted to liquid steel by means of ionized H2 (H+,
hydrogen plasma). The plasma, generated by passing an electric current through hydrogen gas,
acts as a reducing agent and in addition supplies the energy needed to melt the metallic iron.
Investment costs for development up to TRL 9
The HPSR technology is currently under development with medium technological maturity (TRL 5
at best). The upgrading to TRL 6 and TRL 7 requires investment in different areas. On the one
hand, fundamental research on the process needs to be carried out at large laboratory scale. On
the other hand, the scale-up needs to be investigated in large scale pilot plants.
The subjects under study are diverse and complex, including complete understanding of the
fundamental thermodynamic and kinetic mechanisms of the process, selection and design of
11 For further details, please see SALCOS, salcos.salzgitter-ag.com.

22
materials, design of the plasma system and vessel geometry to maximise the productivity. A full
industrial deployment is not expected until 2050.
These research projects need investments. Some were funded outside of the EU. In 2012, the
University of Utah was awarded $8.9 M by the US Department of Energy to perform tests to
determine the best vessel configuration (Sabat & Murphy, 2017). It is expected that the investment
needs to bring this technology to TRL 9 significantly exceed this funding. The stakeholder
consultations conducted within the GREENSTEEL project provide stakeholders’ estimations of
investment needs in the order of €100 M (excluding H2 production) to bring this technology to TRL
8. This can be achieved with a demonstration plant in the order of 10 t/h. Estimates for the required
investment costs for first industrial deployment of HPSR are available in the literature. The
investment costs for new iron ore reduction technologies are estimated to be in the range of €100-
200 M within ten years to realize a first industrial plant (Hiebler & Plaul, 2004). Overall, investment
needs in the range of €100–200 M are therefore expected to raise the current technological maturity
of HPSR from TRL 5 to TRL 9.
Investment costs for production plants
The requirements of an industrial plant of 1 Mt CS annual production capacity are:
• a refractory lined vessel, adequate to charge, process and cast at the required capacity,
• an electric system (transformer, electrodes, control, etc.) able to supply 150 MWh per hour; and
• the supply of 70,000 m3 H2 per hour.
Although the utilisation of hydrogen is directly linked to the iron and steelmaking by HPSR
technology, the costs for hydrogen production or provision can be assessed separately. Further
information regarding the production of hydrogen and the correlated investment costs can be found
in Section 2.4.2.
The vessel and the electrical system are expected to have the dimension of currently existing large
EAFs with a capacity of 300 t/h. Based on the assumption that the future cost of a HPSR plant will
not exceed the cost of a state-of-the-art modern EAF by more than 10% and taking a reference
value for EAF of €184/t CS (Wörtler, et al., 2013), the costs for a HPSR plant process unit are
estimated below €200/t CS. This results in total investment needs of up to €200 M for a process
unit in a plant of 1Mt CS annual production capacity.
Additionally, the HPSR technology requires more complex units, including systems for iron ore pre-
heating, new materials at high performance for temperature and hydrogen plasma, systems to
control large volumes of gas, probably under pressure, etc. It is estimated that requirements will at
least double the cost, leading to a final value in the order of €500 M. This value is in line with the
indications received by the stakeholder consultations.
Operational expenditures of an industrial plant
Accurate data for calculating the OPEX of a HPSR plant are not available. Basic comparisons
between conventional route (BF-BOF), DR route (DR-EAF) and HPSR can be found (Hiebler &
Plaul, 2004), (Behera, Bhoi, Paramguru, Mukherjee, & Mishra, 2019). In these references, the
OPEX of HPSR is reported to be 21% lower than the conventional route, despite a 40% increase
in electrical energy costs. The main advantage of the HPSR is the use of a single compact reactor,
which reduces the CAPEX and personnel costs (Behera, Bhoi, Paramguru, Mukherjee, & Mishra,

23
2019). Overall, the OPEX for HPSR is difficult to forecast accurately at this stage and will mainly
depend on the cost of the electrical energy.
Investment needs for HPSR technology are summarised as follows:
• investment needs for achieving TRL 8: up to about €100 M (excl. H2 production);
• investment needs for achieving TRL 9: up to about €200 M (excl. H2 production); and
• investment needs for industrial deployment: about €500 M (excl. H2 production) for an
industrial plant of 1Mt CS/a capacity.
2.1.3. Alkaline iron electrolysis
The alkaline iron electrolysis (AIE) is a process whereby electrical energy is used as reductant and
energy source to transform the iron ore in almost pure solid iron. The product can then be melted
in an EAF. Hence, the whole process is completely based on electrical energy.
This technology has been and is still studied in different projects (ULCOS, 2011), (ASCOPE, 2011),
IERO (Lavelaine de Maubeuge, 2016), (VALORCO, 2014)12 (SIDERWIN, 2020).13
Investment costs for development up to TRL 9
The technology is currently under development with a TRL of approximately 5. The budgets for the
projects IERO and SIDERWIN are €2.4 M and €6.8 M, respectively. However, IERO includes both
alkaline electrolysis and molten slag electrolysis, as presented hereafter.
The IERO project upgraded the technology from TRL 3 to TRL4.
The aim of the SIDERWIN project is to validate the technology at TRL 6 by 2022 by means of a
pilot plant. The further step to TRL 7 and TRL 8 will require the design, construction and operation
of a pilot plant of a threefold or fourfold capacity, with a corresponding increase of the investment
costs that can be very roughly estimated at around €25 M, in line with the opinion of stakeholders.
Investment costs for production plants
The production plant basically consists of two units: an electrochemical reactor to produce solid
iron, and an EAF to melt this solid iron into liquid steel. The electrochemical unit produces oxygen
as by-product, which can be valorised in the steelworks.
Sludge containing water and gangue from the original iron ore is also produced from the alkaline
electrolysis process. Hence, the plant will need auxiliary equipment to separate and recycle these
materials. These units can be realized with conventional technologies. Sludge can be recycled in
an EAF or in ancillary processes for the valorisation of by-products, which are increasingly common
in the steel industry.
The capital cost of the electrolytic unit is difficult to estimate at this stage, as dimensions, materials
and productivity are still under evaluation. Considering the few upstream operations, the low
temperature and a unique energy source (electricity) a CAPEX significantly lower than other
technological solutions can be expected.
A Roland Berger Focus estimated a CAPEX in the order of the 25% of a reference BF-BOF plant
from greenfield (Ito, Langefeld, & Goetz, 2020)), which means around €400/t for producing liquid
steel from alkaline electrolysis and EAF, and consequently €400 M for a plant for 1Mt/a.
12 For further details, please see www.ademe.fr/valorco. 13 For further details, please see www.siderwin-spire.eu.
24
From the information collected from stakeholders in the frame of the consultation activities for the
GREENSTEEL project, the investment costs for an industrial plant are estimated at around €250
M for the electrolytic unit for a plant of 1Mt/a.
Adding the cost of the EAF (€184 M), the total value is comparable with the previous one.
Investment needs are summarised as follows:
• investment needs for achieving TRL 7: up to about €25 M (based on pilot plant);
• investment needs for achieving TRL 8: up to about €250 M (based on demonstration plant)
for the electrolytic unit producing solid iron;
• investment needs for industrial deployment: about €500 M for a first industrial plant of 1Mt/a
capacity; and
• the current low TRL does not allow for an evaluation of the investment needs for full
industrial plants.
2.1.4. Molten oxide electrolysis
Molten oxide electrolysis (MOE) is an alternative to alkaline electrolysis of iron ore. Both
technologies use only electricity. The fundamental difference is that MOE directly produces liquid
metal from an electrochemical process performed inside liquid oxide (electrometallurgy).
Consequently, there is no need for a melting step in an EAF, as is the case for alkaline electrolysis.
The process is simplified and compact. The process, based on great energy intensity and
temperature higher than 1600°C, demands greater material performance.
The simplification of the process implies less energy consumption with respect to the conventional
processes, when the maximum efficiency will be achieved. This is greatly valuable for CO2 emission
reduction in steelmaking.
Today, the technology has a low TRL (TRL 2)14. The above-mentioned project IERO (Lavelaine de
Maubeuge, 2016) included the development of the MOE technology.
The energy demand of the optimised process is estimated at 4100 kWh/t CS (D1.2. Section 2.1.4).
Investment costs for development up to TRL 9
According to all the forecasts, this technology will require long time to achieve industrial
deployment. Much research is still needed to design a pilot plant, both for fundamental aspects and
technological solutions. It cannot be considered a potential option in the short term (2030-2040),
optimistically an industrial development can be expected for 2050 and beyond.
Considering the long-term perspective and the necessary improvements, the investment costs can
be estimated at not less than €1,000 M for achieving a TRL 8.
At this stage, any prediction on industrial deployment could be rather premature.
2.2. Carbon capture and usage
Besides CDA, which mitigates the formation of CO2 in the iron and steelmaking process, another
option is to only mitigate CO2 emission instead of its formation. One basic idea is to separate CO2
at the end of the industrial process and to store it in compressed and/or liquefied form, indefinitely,
14 For further details please see www.ademe.fr/valorco.

25
in geologically stable sites. This approach is referenced to as carbon capture and storage (CCS).
Instead of storing it, the separated CO2 can be alternatively used as an input flow for a following
conversion process into more valuable products such as urea, methanol, plastics or other chemical
precursors. This CO2 utilisation is referenced to as carbon capture and usage (CCU). In these
applications, CO2 is stored within the products. As CCU applications replace conventional
production processes, the correlated CO2 emissions are ultimately mitigated.
This section summarises the investment needs specifically for the conversion step of CCU
technologies as selected in D1.2. The additional processes of CO2 separation and H2 provision are
assessed separately in Section 2.4.
2.2.1. Carbon oxide conversion
The implementation of CCU processes includes a carbon oxide conversion step. This step can be
categorized based on the type of conversion (namely chemical or biological) as well as on the
desired product (e.g. fuel, chemical, polymers or its precursors, synthesis gases). Typically, these
processes require the provision of other process gases, such as H2. There are many technical
solutions currently under development for the use of CO2 in chemical or biological conversion
processes (see Deliverable D1.2 for more details). At this stage, the conversion processes are
assessed in a grouped manner.
Overall, these technical solutions are currently at TRLs ranging between 6 and 8 for application in
the iron and steel industry. In cases of application in other industry sectors (e.g. chemical industry),
a TRL of 8 is reached (Dahlmann, 2019). The implementation into integrated steel plants is
currently in demonstration phase at TRL 4-515. The achievement of TRL 9 and first industrial
deployment is estimated for 2025-2030 (Agora-Energiewende, 2019). A full industrial deployment
is expected to be available in the long term, before 2050.
Investment costs for development up to TRL 9
As to a further technological development, there are two specific examples available in Europe,
reflecting respectively the chemical and biological conversion processes: Carbon2Chem®
(ThyssenKrupp, 2020) and Steelanol of ArcelorMittal (STEELANOL, 2015).
Carbon2Chem® aims at developing a chemical conversion process in quasi-industrial scale. This
process is supposed to convert shares of exhaust gas (top gas) from coke oven, BF and BOF into
ammonia and methanol. Within the industrial pilot phase, an industrial-scale plant is scheduled to
be established by 2025. The external funding for the project by the German federal government
amounts to over €60 M, with investment needs even higher than this value.
The project Steelanol has the objective to treat about 15% of the available top gases from a BF
and biologically convert it into bioethanol. The budget for the corresponding Horizon2020 project is
€87 M and the total investment for the project, presented under the commercial name Carbalyst®
(CARBALYST, 2015), is €120 M16.
Based on these two examples, investment needs in the order of €100-150 M are calculated for
upgrading the technological maturity of each of the chemical and biological routes.
15For further details, please see www.greencarcongress.com/2019/12/20191215-arcelormittal.html. 16For further details, please see https://corporate.arcelormittal.com/corporate-library/reporting-hub/carbalyst-capturing-carbon-gas-and-recycling-into-chemicals.

26
Investment costs for production plants, excluding auxiliary plants
The investment needs of carbon oxide conversion strongly correlate to auxiliary processes, as their
main demand is related to the (electrical) energy for production of H2 via e.g. water electrolysis.
Additional thermal energy demands may arise depending on the specific technology.
A study conducted by Agora Energiewende (Agora-Energiewende, 2019) has assessed the
investment needs for the overall CCU process. The results include CAPEX, specifically for the
installation of additional units, and OPEX for the operation of these units. The study estimates the
specific CAPEX for carbon oxide conversion at €129/t CS annual production capacity. The
influences on the OPEX are related to electricity demand, H2 provision and the requirement of other
materials. The increased electricity demand results in requirements amounting to €30-35/t CS. The
main investment need results from the provision of H2 with €310-526/t CS. Other material
requirements cause additional €68/t CS. Overall, the OPEX requirements sum up to €408-629/t
CS.
Overall, the CAPEX demands translate into investment needs of €129 M for 1 Mt annual crude
steel production capacity for the carbon oxide conversion step alone.
Investment costs for production plants, including auxiliary plants
As CCU processes typically contain both CO2 separation and carbon oxide conversion steps, the
overall investment needs can be derived from the partial investment needs. As the technological
maturity of CCU processes is currently in demonstration phase, investment needs of €100-150 M
arise for each chemical or biological CCU process. After the demonstration phase, further
investments in the range of several hundred M€ are required for the first industrial deployments.
Once full technological maturity is reached for CCU technology as application in the steel industry,
the investment needs for industrial deployment of a complete CCU process are estimated from the
literature (Agora-Energiewende, 2019); (Skagestad, Onarheim, & Mathisen, 2014) to be around
300 M€ per 1 Mt CS annual production capacity. According to current estimates, at full
technological maturity 57% of these investments are required for CO2 separation (for further details
please see Section 2.4.1), whereas 43% are required for carbon oxide conversion. The costs for
hydrogen provision are not included in these figures.
Based on the values given in the Steelanol project (STEELANOL, 2015)17, extrapolating the value
of 15% of the top gas treated to 100%, a proportional investment would result in overall investment
needs of about €800-1,000 M for an industrially scaled steel production plant.
Investment needs are summarised as follows:
• investment needs for achieving TRL 8: up to about €150 M (for a single demonstration plant);
• investment needs for achieving TRL 9: up to about €300 M (for a first installation plant); and
• investment needs for industrial deployment: about €1,000 M.
2.3. Process integration
The process integration (PI) pathway refers to existing steel plants and their possible adaptations
to emit less greenhouse gases. Circular economy (CE) strategies too are included in the PI
pathway.
17 For further details, please see http://www.steelanol.eu/en.

27
PI refers to modifications of existing ironmaking and steelmaking processes, or implementation of
innovative processes, based on fossil fuels, which would help to reduce the use of carbon, and
thus the CO2 emission. The definition does not refer to the final CO2 reduction, which could be also
considerable, but rather on the type of action.
The PI technologies are addressed both to the BF-BOF route and the EAF route. Many solutions
are quite mature or even already adopted and can be rolled out in the steel industry in the short
term. The main ones are the followings:
• production of hot metal from a smelting reduction process integrated with a CO2 capturing
system, for partial or total replacement of BF production;
• gas injections in the BF, comprising in particular hydrogen-rich gases (e.g. coke oven gas,
natural gas) but also gases produced from biomass and waste;
• use of biomass derivatives and by-products to replace fossil coal or natural gas in some
phases of the process. Biomass and by-products can be treated with pyrolysis or
gasification processes to obtain, respectively, char or syngas to be used as alternative
fuels, both in the BF and in the EAF;
• energy recovery from hot, gaseous and solid by-products of steel manufacturing processes; and
• scrap selection and production of quality steel from an electric oven, thus reducing the
share of BF production.
Following the same logic adopted in D1.2, the investment needs are presented for the technologies
combining a high mitigation potential, a wide applicability in existing plants and significant needs in
terms of R&D investments.
2.3.1. Iron bath reactor smelting reduction
The smelting reduction is a process where hot metal, with characteristics comparable with that
produced by a BF, is produced directly from fine iron ore and coal. The process uses pure oxygen
for coal gasification and post-combustion of CO, which is the energy source for the process. For
this reason, the top gas is essentially CO2 and minor amounts of H2O, easy to separate.
Consequently, the process is very suitable for CO2 capture technologies (both for CCS and CCU),
much more than other ironmaking processes. This advantage is accompanied by significant energy
savings, as it does not need a costly gas separation stage, and by a net total CO2 saving of 80%
compared to the conventional integrated steel production process.
Moreover, the potential use of alternative green fuels, such as syngas and char from biomass, and
the possibility to recycle scraps and other industrial residues, recovering valuable materials (e.g.
zinc from scrap) makes the technology attractive for integrating or replacing conventional
ironmaking processes.
HIsarna® (Hisarna, 2020) is a European project to develop an IBRSR. It is the only IBRSR under
development. The investment needs reported below are based on information supplied by the
developer (Tata Steel).
Investment costs for development up to TRL 9
The current TRL of HIsarna® is estimated to be 5. TRL 7 is expected to be reached in 2030,
whereas TRL 9 and industrial deployment in 2035-2040. For the development from the current
status up to industrial deployment, Tata Steel estimated an initial need of about €20 M for initial

28
consolidation of the project and an investment of about €250-300 M for an industrial-size demo
plant of a 0.5-1 Mt/y capacity.
Overall, the investment needs for achieving TRL 8 can be estimated at roughly €400 M.
Investment costs for production plants
The industrial plant requires an installation for continuous production of oxygen and must be
integrated with an industrial system for CCS, which requires electrical energy. Based on pilot plant
campaigns’ results, the electrical energy consumption of a full-sized production reactor with CO2
capture is estimated at 0.5 MWh/t CS, but most of this electricity can be produced from the hot
reactor off-gas.
The CAPEX strongly depends on the scale: for a 1.15 Mt /a plant, Tata Steel estimates the
investment at €500 M (€435/t CS) but €600 M for a 1.5Mt/a plant (€400/t CS).
At 1.15 Mt/a, the additional CAPEX for a O2 plant is of about €140 M (€120/t CS) and for CO2
capture it is about €65 M (€45/t CS), not including the external transport network and injection well.
Investment needs are summarised as follows:
• investment needs for achieving TRL 8: about €400 M (based on demonstration plant); and
• investment needs for industrial deployment: €850 M for a 1.5 Mt/a scale (based on first
industrial plant, including O2 production and CO2 capture and compression, but excluding
transport and storage services).
2.3.2. Gas injections into the blast furnace
The current BFs are efficient and highly optimised reactors. Lowering the carbon usage (and thus
CO2 emissions) by increasing efficiency in these furnaces is approaching its limits. Currently, BFs
are usually fed with coke and injected with pulverised coal and the coke consumption has been
optimised at the minimum value. Instead of further aiming for efficiency increases in carbon-based
reduction, one decarbonisation approach is the substitution of carbon-based energy carriers by
hydrogen-based gas injections.
The most simple and fast applicable option is to inject H2-rich gases in the BF, which can have
various origins and compositions (including coke oven gas, biomass, wastes or pure hydrogen). A
further technical possibility is the recycling of CO and H2 from BF top gas back into the BF process
after separation of CO2 (Budinis, 2018 (Budinis, Krevor, MacDowell, Brandon, & Hawkes, 2018)).
This technology was developed and validated as pilot in the frame of the ULCOS project, which
allows a mitigation potential of up to 25% and more in combination with CCUS (ULCOS, 2011
(ULCOS, 2011)). Both options will be assessed separately. Irrespective of the utilised gas stream,
the most important technical challenge is currently the implementation of the heating step for
reducing gas before injection. One possible option is to combine heating with reforming in a plasma
system powered with green electricity. This combination is currently studied in the IGAR project
(IGAR, 2020).18
2.3.2.1. Injection of hydrogen-rich gases into the blast furnace
18 For further details, please see www.ademe.fr/sites/default/files/assets/documents/igar.pdf.
29
Investment costs for development up to TRL 9
The estimates for investment costs vary significantly depending on technical implementation
details. For example, gas injection at the tuyeres (where currently pulverised coal is injected) was
already demonstrated generally with different gases on full industrial level. The remaining R&D
needs concentrate on adaption of BF control. In this implementation, the CO2 mitigation is limited
(up to 10%)19.
The injection into the shaft (the upper part of the BF) can achieve higher CO2 mitigation, in the
range of 17% to 50% (Agrawal, et al., 2019)). This solution requires an investment cost of the order
of €10 M specifically for the gas injection. Additionally, the costs for the development of a suitable
technology for the pre-processing of the gas, which is currently pursued by means of reforming
technologies, are much higher. For instance, the project IGAR (IGAR, 2020) aiming to equip one
tuyere with plasma reforming technology has a budget of €20M. According to information collected
from the stakeholder consultations in the frame of the GREENSTEEL project 20, the total investment
costs for a first implementation of injection of H2-rich gas in the BF shaft is estimated at €140 M.
Consequently, the total investment costs sum up to the order of €150 M.
Investment costs for production plants
The CAPEX of industrial plants for gas injection in BF is largely dependent on the origin of the
injected gas, on the extent of gas injection (in Nm3/t CS) and on the required/considered gas pre-
treatment steps (from cleaning to heating). Specific costs are linked to the pre-processing of the
various gases, especially steel plant gases and biogas (filtering, compression, purification,
reforming), to the large plasma torches in heating/reforming applications and to the gas injection
systems in the BF (modified tuyeres, injections in shaft).
2.3.2.2. Top gas recycling in the blast furnace
Investment costs for development up to TRL 9
Top gas recycling in the blast furnace (TGR-BF) has already been validated on pilot scale in an
operational environment by trials in an experimental BF and is currently at TRL 7 (Toktarova et al.,
2020 (Toktarova, et al., 2020)). During the stakeholder consultations21, a technology provider
estimated the current TRL of top gas recirculation at only 5, expecting to reach TRL 7 in the short
term (2025) with an investment of €5 M. This provider foresees a quite fast development, with TRL
8 reached in 2028 and TRL 9 as soon as 2030.
A full detailed engineering study was performed in 2011 in the frame of the ULCOS project (ULCOS,
2011), aimed at the development of TGR-BF up to TRL 9 in the plant of Florange (France).
Development costs have thus been quite precisely estimated on a complete perimeter, including
CO2 transport and storage in deep saline aquifer (CO2 purification, compression, infrastructure for
transport, storage and monitoring of the storage site). Depending on costs for energy and CO2, the
full project cost was €500-550 M. Notably, the additional oxygen was supplied by a gas supplier,
19 For further details, please see www.lowcarbonfuture.eu. 20 Data were gained from the scoping questionnaires and then further submitted to technology providers in the frame of the GREENSTEEL project (see also D1.3 report) to better integrate and substantiate the investment needs figures. Cost levels up to €150 M were also mentioned by some stakeholder. 21 For further details, please see https://www.lowcarbonfuture.eu.

30
thus without directly charging the corresponding investment to the project but including in the
operating costs the full cost to be paid for the oxygen consumed.
Investment costs for production plants
For the TGR-BF process, estimates (Toktarova, et al., 2020)) provide a value of €639 M for a 1 Mt
/y production capacity. However, the above-mentioned ULCOS study indicates significantly lower
costs: in the frame of a BF relining, the additional investment for revamping the existing BF in full
TGR-BF configuration were calculated at about 135 €/t CS, excluding some external services
(additional oxygen supply and the transport and storage of CO2).
The influences on the OPEX largely depend on reference prices taken for coke, electricity and O2,
but the operation of a TGR-BF is generally up to €10/t CS more expensive than conventional
operation (including the purchase of the extra oxygen). For transport and storage services, various
references indicate additional costs between €15-50/t CS when provided by an external company
mutualising several CO2 sources.
Investment needs are summarised as follows:
• investment needs for achieving TRL 9: about €200 M at a 1.3 Mt/y scale, excluding the
investment for the extra oxygen supply and the transport and storage infrastructure, and
€500-550 M when including transport and storage infrastructure and all project operating
costs; and
• investment for further relining of existing BF plants: €325 M for a 2 Mt CS/y BF, including
additional oxygen plant but excluding the external infrastructure for CO2 storage (pipeline
and injection well).
2.3.3. Substitution of fossil energy carriers with biomass
Biomass is considered CO2 neutral22. Hence solid charcoal or syngas from biomass entail a net
reduction of fossil coal or natural gas. When applied in the integrated route, pre-processed biomass
can be blended to the coal charge of coking ovens, substituted to anthracite in the sinter plant mix
or used in the BF as a substitute of pulverised coal. In EAF-based plants, carbonized biomass can
substitute coals injected in the melting furnace and/or charged in the scrap baskets.
The current TRLs of related technologies and investments vary greatly. Within this project, five
steelmakers and one technology provider gave their own estimation about fossil fuel substitution
by biomass in the coming years23. The main reason for the scattering of information and data is
that the use of biomass-derived materials is already well assessed for the EA- based route, where
many European projects have been successfully concluded.24
22 Schematically, biomass can derive from dedicated cultivation (e.g. eucalyptus plantation in Brazil) or from residues of agriculture, wood industry and so on. In Europe, only residues can be used in steel industry. This biomass, in a first approximation, can be considered neutral. 23 Data were gained from the scoping questionnaires and then further submitted to technology providers in the frame of the GREENSTEEL project (see also D1.3 report) to better integrate and substantiate the investment needs figures. Cost levels as high as up as €150 M were also mentioned by some stakeholder. 24 For further technical details, please see also Green Steel for Europe - D1.2 and https://op.europa.eu/en/publication-detail/-/publication/e7dc500c-82de-4c2d-8558-5e24a2d335fb.
31
Investment costs for development
Besides biomass, other carbon-based waste can also be considered. Refuse-derived fuel (RDF) is
a fuel produced from various types of waste, such as municipal solid waste (MSW), industrial waste
or commercial waste. All these materials can replace fossil fuels.
Because of the variability of feedstocks and technology, a quantification of investment needs, as
well as CAPEX and OPEX, is difficult. The following figures should be considered as indicative.
In the EAF-based route, the current TRL is 6 to 7. TRL 8 is expected in a short time, first industrial
deployment (TRL 9) should arise between 2025 and 2033 and full deployment between 2025 and
2035 with additional investment estimated at €5 M.
In the integrated route, TRL is rated from 2 to 7 depending on the answering company. When TRL
7 is not already attained, the investment needs are estimated between €0.1 and 0.5 M. TRL 8 is
foreseen to be reached between 2022 and 2028, with related investment in the range of €10-15 M.
Investment costs for production plants
The main investment costs for the industrial deployment concern the construction of infrastructures
for biomass collection, storage and distribution in the territory as well as the building of the
necessary plants for supplying charcoal and syngas from biomass in the necessary amount and
consistency. The large spectrum of scenarios prevents a reliable evaluation of investment costs.
Apart from the CAPEX for the infrastructure, additional CAPEX is relatively low: only the pre-
processing (e.g. drying) and upgrade (e.g. pyrolysis, hydrothermal carbonization, etc.) of biomass
(and alternatives) have to be integrated in steel plants. Smart integration (energy, logistic aspects,
off-gas treatment, etc.) also has to be considered.
The main limit in biomass usage is caused by price and raw material availability. The effort to turn
biomass into a usable substance (biochar in most of the cases) is highly dependent on the initial
quality of the biomass itself (size, moisture, fumes treatment in case of paints).
Investment needs are summarised as follows:
• investment needs for achieving TRL 8: about €5 M (based on first installation);
• investment needs for achieving TRL 9: up to about €15 M; and
• impact on CAPEX up to 15 €/t CS.
2.3.4. High quality steel making with increased scrap usage
The internal scrap (produced and used inside the workshop) and the prompt scrap (directly
produced in the manufacturing plants) are already fully recycled. The recycled fraction of the
obsolete scrap (derived from discarded industrial and consumer items) is high, but there is room
for improvement. A certain (and limited) increase of scrap usage in the integrated route is possible.
It is a market decision and no significant technological investment is necessary.
The increase of scrap usage entails allowing steel production via EAF with a larger and more
efficient (higher yield and better selection) use of scrap, thus reducing the necessity of cast iron
and DRI, used for quality steel.
As described in D1.2., the guidelines for increasing scrap usage are:
• direct increase: reducing the loss of unrecycled steel scrap;
• Indirect increase: avoiding the progressive lowering of quality of steel from scrap by
implementing systems for on-line analysis, characterization and sorting; and
32
• increasing scrap yield;
The main related development needs are:
1. technologies for selecting and sorting scrap; and
2. technologies for monitoring and controlling more flexible multi-feedstocks processes.
Investment costs for development
Although there are great expectations and hope for new technologies allowing accurate and
continuous measurement of scrap properties and automatic selection, and even though many
promising results have been achieved, no industrial routine applications are known to date. The
current TRLs range from 4 to 7.
Considering the typical budget of the performed and proposed projects on this subject, a rough
estimate of the investment needs for achieving TRL 8 lies at around €20-30 M in 10 years.
Investment costs for production plants
The implementation of both the scrap analysis and sorting system and the new process monitoring
and control are marginal25, once these systems will be available for routine application.
A typical cost of around €50 M can be considered.
Investment needs are summarised as follows:
• investment needs for achieving TRL 8: about €50 M (development of technologies and first
installation); and
• investment needs for achieving full industrial deployment: about €100 M.
25 An estimate is available in the final report of the RFCS ADAPTEAF project (RFSP‐CT‐2014‐00004, see final report at https://op.europa.eu/en/publication-detail/-/publication/d472d319-4478-11e9-a8ed-01aa75ed71a1) concerning the costs for installation, maintenance, and current use of the various technological systems. Here, the CAPEX for investments needed for application of the different measures is estimated at around €115K, and the OPEX for maintenance and additional probes at around €40K/year. These OPEX/CAPEX have to be compared to the cost savings in electrical energy, estimated at €95K/year, and to the cost savings due to increased productivity, estimated at €200K/year. Thus, the amortization time for the total costs of all measures performed within the project is well below one year.

33
2.3.5. Summary of technologies investment needs
Table 2 summarises the expected evolution of the analysed technologies and the investment needs
for their development.
Table 2: Investment needs for the development of single technologies
Single decarbonisation technologies
Technology
TRL development Investment needs up to TRL 8 (M€)
Investment needs for 1st
industrial depl. TRL 9 (M€)
Investment needs for full
industrial plant (M€)
CO2 abatement (max %) 2020 2030 2050
H2-DR (100 % H2)
6–8 7–9 9
(ind. depl.)
100 150 250* 95
HPSR 5 6 9
(ind. depl.)
100 200 500 95
AIE 5-6 6–8 9 250 500 Not evaluated
due to low TRL 95
MOE 2 3-4 9 1,000 Not evaluated due to low TRL 95
CCUS 5- 8 9 9
(ind. depl.)
150 300 1,000 60
IBRSR 6 8 9
(ind. depl.)
400 850 ** 20-80
BF-Gas injection
5–9 8–9 9
(ind. depl.)
150 550** 850** 20-60
Biomass usage
2–7 8 9
(ind. depl.)
5 15 30-100
Increased scrap usage
4–7 7–9 9
(ind. depl.)
50 100 100(with CCS).
Source: authors’ own composition based on desk research and stakeholders’ interviews (complete references
in the bibliography). Note: data refer to a crude steel capacity of 1 Mt/a as a reference26. *€500 M including
EAF. ** Excluding CO2 transport and storage. For the abbreviations used, please see the list of symbols,
indices, acronyms and abbreviations.
2.4. Auxiliary processes
The previous sections focused on the technologies specific to the iron and steel industry, some of
which require additional auxiliary processes, independent from iron and steel production. In this
regard, the separation of CO2 from gas flows (CO2 capture) and the provision with hydrogen are
the most relevant topics (for further details, please see Deliverable D1.2). Generally, there are two
options as to the assessment of investment needs for hydrogen provision: the external purchase
of H2 (mainly increasing the OPEX of iron and steel production) and the internal production of H2
within the boundaries of the iron and steel plant (mainly additional CAPEX). In the scope of this
report, the internal production of H2 by water electrolysis is assessed.
26 In general, real industrial planta have different dimensions depending on a specific technology. For example, for BF-gas injection technology and smelting reduction, in the text data on Hisarna plant report1.5 Mt/a (CS).

34
2.4.1. CO2 capture
The options for the separation of CO2 from gas streams can be clustered into three categories
according to when the process gases are treated for CO2 separation:
1. before the process gases are utilised (pre-combustion);
2. after their regular utilization (post-combustion); and
3. after their utilization with pure oxygen (oxy-combustion).
Within the iron and steel industry, the post-combustion and oxy-combustion options are considered
most suitable for CO2 capture, as there are various CO2-containing gas streams directly available
within integrated iron and steel plants. A promising technology for post-combustion capture lies in
the chemical absorption process. In this process, CO2 is directly absorbed by chemical substances,
such as amines, which are then regenerated in a desorbing unit under addition of heat (Sadoway,
2019)). Whereas these processes are being developed in other industry sectors since several
years, the current TRL of CO2 capture within the iron and steel industry is in the range of TRL 5-6
(FReSMe, 2017); (CORDIS, 2020)). As this approach is currently considered a research focus,
TRL 9 is expected to be reached in mid-term scale between 2030 and 2040, which would allow a
full industrial deployment by 2050 (for further details please see Deliverable D1.2).
Investment costs for development up to TRL 9
CO2 capture (Bui, 2018)) depends on the type of technology and the process location (BF in most
of the research project). Post-combustion capture from the BF has been estimated to cost up to
€100/t of mitigated CO2 emission. A top-gas recycling blast furnace using post-combustion capture
can capture 65% of emissions at 70€/t of avoided CO2. Post-combustion capture from the coke
oven will also cost an average of €70/t of avoided CO2 (27% of total emissions). Based on the
conventionally taken value of ton CO2/t CS, a cost of about €120 M can be expected.
Investment costs for industrial deployment
Besides the investment costs to bring CO2 capture processes to full technological maturity, there
are specific investment costs for the deployment of industrially-sized plants into the iron and steel
production processes. These costs are assessed exemplarily for the implementation of chemical
absorption, as this is currently regarded as the most promising technology.
The concept of chemical absorption results in different influences on the production costs.
Basically, there are specific ‘overnight’ investment needs in terms of CAPEX requirements for the
additional absorbing and desorbing units and their installation. Besides that, additional OPEX
requirements result from the absorbents itself and their losses during operations as well as in terms
of their regeneration by desorption under the addition of heat. These costs are complemented by
additional fixed OPEX, e.g. by personnel and maintenance required for the additional plants.
In an extensive Australian study conducted in 2013 (Minh-Ho, Bustamante, & Wiley, 2013), the
CAPEX and OPEX requirements for CO2 separation, including its compression for transport, were
estimated. In this study, five different components of CAPEX were analysed: general equipment,
compression unit, separation unit, pre-treatment unit and set up costs. These components sum up
to a specific CAPEX of €12-20/t CO2. Approximately 50% of it is attributed to equipment costs,
while another 50% correlates to the required set up costs. Just as a reference, OPEX was here
analysed in terms of three different components: energy, materials replacement (including

35
absorbents) and fixed OPEX. According to the study, the OPEX demand amounts to €60/t CO2. Its
main share of 65% is correlated to energy expenses (Minh-Ho, Bustamante, & Wiley, 2013)).
A study conducted for the Northern European countries (Skagestad, Onarheim, & Mathisen, 2014))
calculated the corresponding investment needs for a generic steel plant located in Finland. Here,
a CAPEX of 90 € /t CO2 annual capacity is reported. The correlating OPEX accounts for about €40/t
separated CO2. As the production of 1 t CS is correlated to the emission of 1.9 t CO2, an
implementation of a full CO2 separation in a steel production plant of 1 Mt / a capacity in Europe
would result in €171 M.
2.4.2. Water electrolysis
As one approach for decarbonisation of iron and steel production is the substitution of carbon by
hydrogen in terms of reduction agents, the provision of clean hydrogen becomes important if not
critical for the implementation of such technologies. Currently, the most promising approach for
clean hydrogen production is water electrolysis utilizing electricity from preferably renewable
sources. In this section, the investment needs for implementing water electrolysis within the
boundaries of an iron and steel plant are assessed. This basically results in high investment needs
(CAPEX).
For an industrial large-scale application, there are three specific technologies available: polymer
electrolyte membrane (PEM) electrolysis, alkaline electrolysis (AEL) and high temperature
electrolysis (HTEL). These technologies differ in the utilized electrolyte material, operating
temperature and pressure as well as in the degree of maturity and capacity regarding dynamic
operation. More details are available in the technological assessment in Deliverable D1.2.
Regarding the current state of technology readiness, there are technology-specific differences.
Currently, the industrial applications with flexible operation of PEM electrolysis and AEL range
between TRL 7-8, while those of HTEL range between TRL 5-6. Technological maturity in industrial
scale is expected for PEM electrolysis and AEL by 203027. Overall, it is expected that all the three
technologies will reach a possible industrial deployment in a long-term scale, by 2050.
Investment costs for development up to TRL 9
As the water electrolysis is technologically decoupled from the iron and steel production, its
investment costs for development are independent from the steel sector. Therefore, these
investment needs are beyond the scope of the GREENSTEEL project.
Investment costs for industrial deployment
Separated from the investment costs for the technological development, the subsequent industrial
deployment into iron and steel production plants is connected to specific investment needs. As
water electrolysis is subject to further technological improvements, the investment needs are
expected to decrease over time. Table 3 gives an overview of current and future CAPEX
requirements specific for each of the three water electrolysis technologies (IndWEDe, 2018)).
27 For further details, please see GREENSTEEL D1.2. “Technology assessment and roadmapping”.
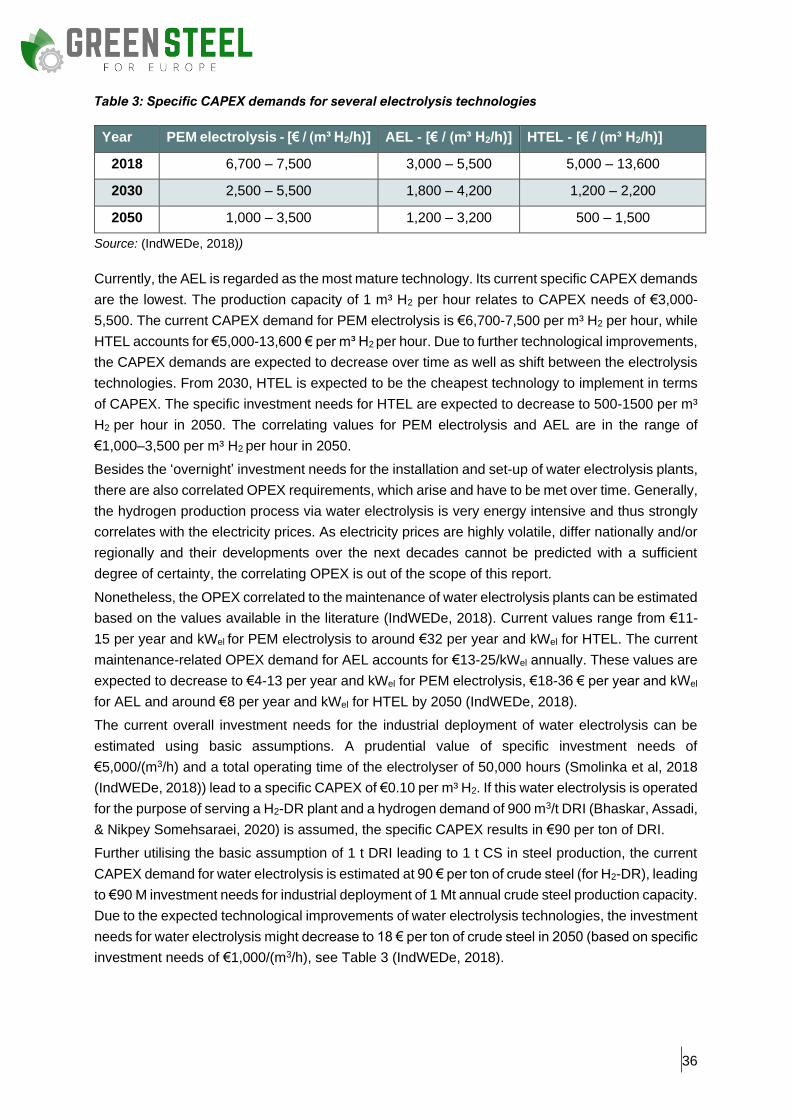
36
Table 3: Specific CAPEX demands for several electrolysis technologies
Year PEM electrolysis - [€ / (m³ H2/h)] AEL - [€ / (m³ H2/h)] HTEL - [€ / (m³ H2/h)]
2018 6,700 – 7,500 3,000 – 5,500 5,000 – 13,600
2030 2,500 – 5,500 1,800 – 4,200 1,200 – 2,200
2050 1,000 – 3,500 1,200 – 3,200 500 – 1,500
Source: (IndWEDe, 2018))
Currently, the AEL is regarded as the most mature technology. Its current specific CAPEX demands
are the lowest. The production capacity of 1 m³ H2 per hour relates to CAPEX needs of €3,000-
5,500. The current CAPEX demand for PEM electrolysis is €6,700-7,500 per m³ H2 per hour, while
HTEL accounts for €5,000-13,600 € per m³ H2 per hour. Due to further technological improvements,
the CAPEX demands are expected to decrease over time as well as shift between the electrolysis
technologies. From 2030, HTEL is expected to be the cheapest technology to implement in terms
of CAPEX. The specific investment needs for HTEL are expected to decrease to 500-1500 per m³
H2 per hour in 2050. The correlating values for PEM electrolysis and AEL are in the range of
€1,000–3,500 per m³ H2 per hour in 2050.
Besides the ‘overnight’ investment needs for the installation and set-up of water electrolysis plants,
there are also correlated OPEX requirements, which arise and have to be met over time. Generally,
the hydrogen production process via water electrolysis is very energy intensive and thus strongly
correlates with the electricity prices. As electricity prices are highly volatile, differ nationally and/or
regionally and their developments over the next decades cannot be predicted with a sufficient
degree of certainty, the correlating OPEX is out of the scope of this report.
Nonetheless, the OPEX correlated to the maintenance of water electrolysis plants can be estimated
based on the values available in the literature (IndWEDe, 2018). Current values range from €11-
15 per year and kWel for PEM electrolysis to around €32 per year and kWel for HTEL. The current
maintenance-related OPEX demand for AEL accounts for €13-25/kWel annually. These values are
expected to decrease to €4-13 per year and kWel for PEM electrolysis, €18-36 € per year and kWel
for AEL and around €8 per year and kWel for HTEL by 2050 (IndWEDe, 2018).
The current overall investment needs for the industrial deployment of water electrolysis can be
estimated using basic assumptions. A prudential value of specific investment needs of
€5,000/(m3/h) and a total operating time of the electrolyser of 50,000 hours (Smolinka et al, 2018
(IndWEDe, 2018)) lead to a specific CAPEX of €0.10 per m³ H2. If this water electrolysis is operated
for the purpose of serving a H2-DR plant and a hydrogen demand of 900 m3/t DRI (Bhaskar, Assadi,
& Nikpey Somehsaraei, 2020) is assumed, the specific CAPEX results in €90 per ton of DRI.
Further utilising the basic assumption of 1 t DRI leading to 1 t CS in steel production, the current
CAPEX demand for water electrolysis is estimated at 90 € per ton of crude steel (for H2-DR), leading
to €90 M investment needs for industrial deployment of 1 Mt annual crude steel production capacity.
Due to the expected technological improvements of water electrolysis technologies, the investment
needs for water electrolysis might decrease to 18 € per ton of crude steel in 2050 (based on specific
investment needs of €1,000/(m3/h), see Table 3 (IndWEDe, 2018).
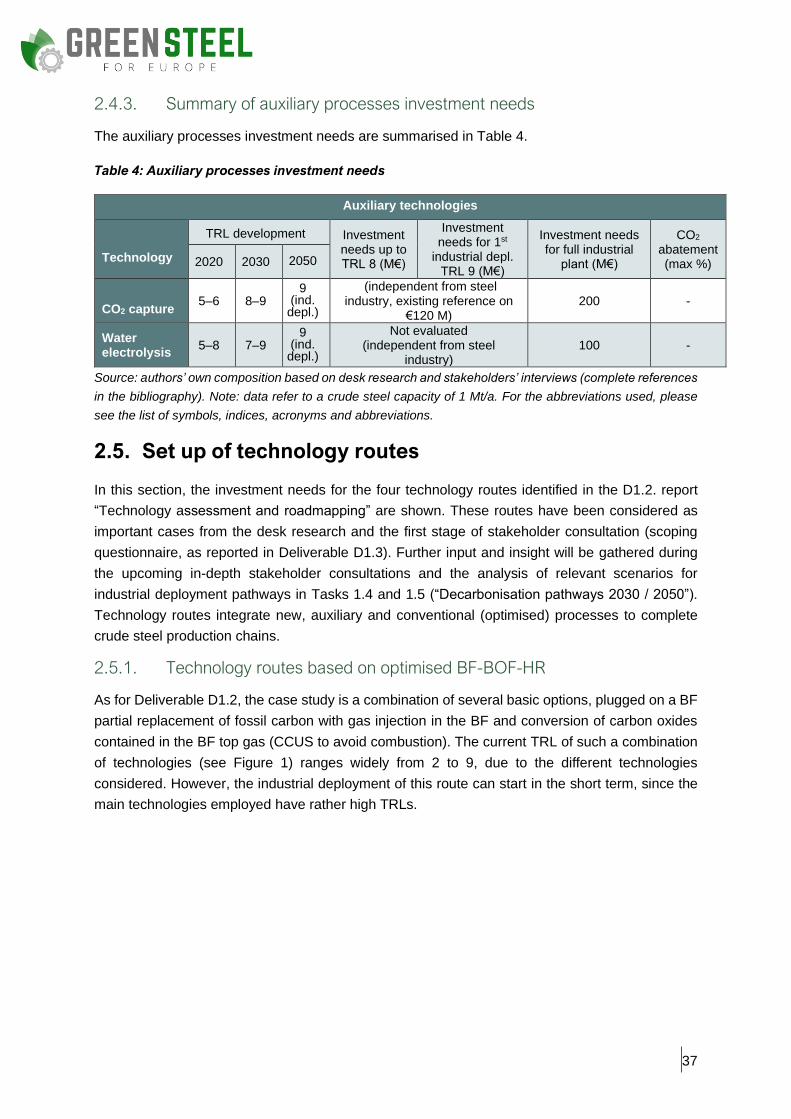
37
2.4.3. Summary of auxiliary processes investment needs
The auxiliary processes investment needs are summarised in Table 4.
Table 4: Auxiliary processes investment needs
Auxiliary technologies
Technology
TRL development Investment needs up to TRL 8 (M€)
Investment needs for 1st
industrial depl. TRL 9 (M€)
Investment needs for full industrial
plant (M€)
CO2 abatement (max %) 2020 2030 2050
CO2 capture 5–6 8–9
9 (ind.
depl.)
(independent from steel industry, existing reference on
€120 M) 200 -
Water electrolysis
5–8 7–9 9
(ind. depl.)
Not evaluated (independent from steel
industry) 100 -
Source: authors’ own composition based on desk research and stakeholders’ interviews (complete references
in the bibliography). Note: data refer to a crude steel capacity of 1 Mt/a. For the abbreviations used, please
see the list of symbols, indices, acronyms and abbreviations.
2.5. Set up of technology routes
In this section, the investment needs for the four technology routes identified in the D1.2. report
“Technology assessment and roadmapping” are shown. These routes have been considered as
important cases from the desk research and the first stage of stakeholder consultation (scoping
questionnaire, as reported in Deliverable D1.3). Further input and insight will be gathered during
the upcoming in-depth stakeholder consultations and the analysis of relevant scenarios for
industrial deployment pathways in Tasks 1.4 and 1.5 (“Decarbonisation pathways 2030 / 2050”).
Technology routes integrate new, auxiliary and conventional (optimised) processes to complete
crude steel production chains.
2.5.1. Technology routes based on optimised BF-BOF-HR
As for Deliverable D1.2, the case study is a combination of several basic options, plugged on a BF
partial replacement of fossil carbon with gas injection in the BF and conversion of carbon oxides
contained in the BF top gas (CCUS to avoid combustion). The current TRL of such a combination
of technologies (see Figure 1) ranges widely from 2 to 9, due to the different technologies
considered. However, the industrial deployment of this route can start in the short term, since the
main technologies employed have rather high TRLs.
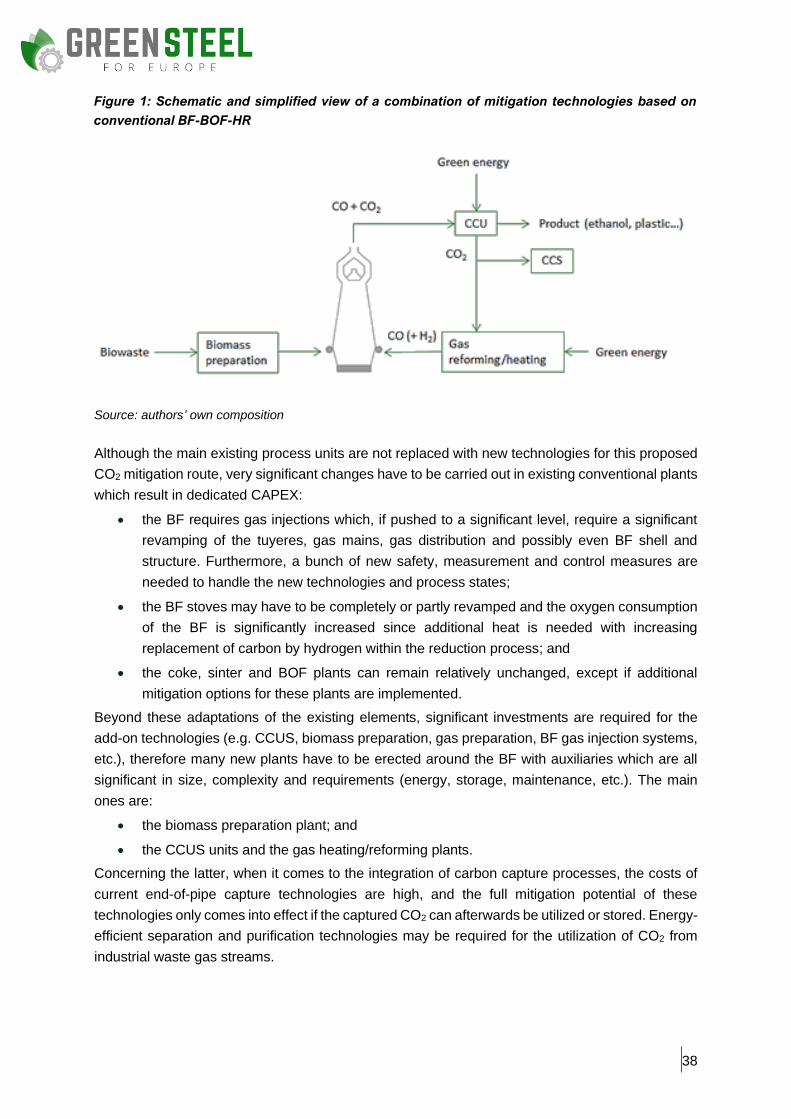
38
Figure 1: Schematic and simplified view of a combination of mitigation technologies based on
conventional BF-BOF-HR
Source: authors’ own composition
Although the main existing process units are not replaced with new technologies for this proposed
CO2 mitigation route, very significant changes have to be carried out in existing conventional plants
which result in dedicated CAPEX:
• the BF requires gas injections which, if pushed to a significant level, require a significant
revamping of the tuyeres, gas mains, gas distribution and possibly even BF shell and
structure. Furthermore, a bunch of new safety, measurement and control measures are
needed to handle the new technologies and process states;
• the BF stoves may have to be completely or partly revamped and the oxygen consumption
of the BF is significantly increased since additional heat is needed with increasing
replacement of carbon by hydrogen within the reduction process; and
• the coke, sinter and BOF plants can remain relatively unchanged, except if additional
mitigation options for these plants are implemented.
Beyond these adaptations of the existing elements, significant investments are required for the
add-on technologies (e.g. CCUS, biomass preparation, gas preparation, BF gas injection systems,
etc.), therefore many new plants have to be erected around the BF with auxiliaries which are all
significant in size, complexity and requirements (energy, storage, maintenance, etc.). The main
ones are:
• the biomass preparation plant; and
• the CCUS units and the gas heating/reforming plants.
Concerning the latter, when it comes to the integration of carbon capture processes, the costs of
current end-of-pipe capture technologies are high, and the full mitigation potential of these
technologies only comes into effect if the captured CO2 can afterwards be utilized or stored. Energy-
efficient separation and purification technologies may be required for the utilization of CO2 from
industrial waste gas streams.

39
The in-scoping questionnaires in the frame of the GREENSTEEL project deliver information that,
considering the important modifications and additions which have to be applied to a state-of-the-
art plant, lead to an estimated CAPEX increase of 50%.
Taking these elements into account, the estimated investment needed for pilot scale tests at TRL
6-7 is around €400 M. TRL 8 may be reached by 2025 but would need investments of up to €2 B
(in a very first calculation). The first industrial deployment (at least one-year operation with about
30% or higher industrial plant production capacity), namely TRL 9, is foreseen for 2030 with full
industrial implementation28 and investment needs amounting to €4 B and. Notably, the above-
mentioned data refer to technology development from greenfield.29.
For the TGR-BF process, the following numbers can be given (already reported in D1.2, derived
from ULCOS (ULCOS, 2011)): CAPEX up to €110/t CS annual capacity without CCUS and up to
€150/t CS with CCUS (i.e. including all the necessary purification and compressions steps required
for CCUS).
These values are In line with the evaluation derived from the questionnaires submitted to
technology providers.
Investment needs can be summarised as follows:
• investment needs for achieving TRL8: about €2 B (first calculation, greenfield);
• investment needs for industrial deployment: up to about €4 B (greenfield); and
• impact on CAPEX up to €150/t CS.
2.5.2. Technology routes based on direct reduction
Since current DR plants (using generally natural gas) are already operated with rather high internal
H2 contents, main parts of the H2-DR-EAF route can be considered to be well advanced with a
corresponding TRL between 4 and 8.
Plants utilising the H2-DR-EAF route would replace the full ironmaking and steelmaking capacities
of existing BF–BOF, thus having to be erected often in greenfield conditions. Although the transition
can be done stepwise in existing plants operating more than one BF, all main facilities and
equipment (cokemaking, sintering, BF and BOF plants) need to be replaced with new production
units.
Further auxiliary facilities (raw materials storage, energy networks with boilers and O2 production
plants, internal transportation means, maintenance areas, etc.) can probably be partly retrofitted
from the existing plants. However, these auxiliary facilities would still require significant revamping.
The investment costs of an industrial plant include the DR shaft furnace, the EAF and the
electrolyser for producing green hydrogen.
Investment costs for production plants.
The investment costs of an industrial plant comprise the units of the DR shaft (including directly
linked auxiliary aggregates) and the EAF. The CAPEX for shaft and EAF is estimated as being
28 Values include plant modifications, e.g. for biomass usage + CCU. 29 In fact, it is worth noting that in Europe the optimized BF-BOF route will most probably be based on existing installations (brownfield) rather that new installation (greenfield). The CAPEX for BF-BOF brownfield (BF-BOF retrofit) is estimated to be a bit less than 40% of the CAPEX of greenfield BF-BOF (Ghenda, 2013 (Ghenda, 2013)).

40
equal to that for the natural gas-based DR, as operated outside the European Union. The capital
costs for shaft and EAF are expected to be constant from today to 2030. Reference values are
€230/t CS for the shaft and €184/t CS for the EAF. As already mentioned, these cost figures do not
include the adaption of existing brownfield integrated plants where BF and BOF should be replaced.
These costs are significant since they include the adaption of most internal and external supply
chains (raw materials, residues and by-products, gas distribution system and power supply).
Total investment costs for the development of an industrial H2-DR plant
Considering the shaft, EAF and electrolyser units, the total CAPEX of a H2-DR plant sums up to
€470/t of CS. As mentioned above, a value of €230/t CS is required for the shaft, €184/t CS for the
EAF and €90/t DRI for the electrolyser utilising the basic assumption of 1 t DRI leading to 1 t CS in
steel production (for further details, please see Section 2.4.2). The electrolyser represents around
18% of total CAPEX. In Vogl et al. (2018) (Vogl, Åhman, & Nilsson, 2018), a CAPEX of €160/t CS
is given for the electrolyser, which would represent 28% of the total CAPEX.
Overall, the absolute cost of the electrolyser is not negligible. For a plant with a capacity of 1Mt/a
CS (i.e. around 100 t/h) and assuming for simplicity the equivalence 1t CS = 1 t DRI, the cost of
the electrolyser would result in €90 M. This estimate is in line with the information obtained by
stakeholder consultations.
According to consultations with the stakeholders30 within the GREENSTEEL project, the investment
costs for H2-DR-EAF steelmaking are estimated to have an increase in the range of 20-30%
compared to current coal-based primary steelmaking.
The CAPEX for shaft and EAF can be considered practically equal to that for the natural gas-based
DR.
The CAPEX is comprised of the following cost components:
• pelletising plant (if not already existing and produced on-site);
• production of bio-coal (if needed and produced on site);
• an electrolyser (+ storage);
• a shaft furnace; and
• an EAF.
When assuming €230/t CS for the reduction shaft, €184/t CS for the EAF and €90/t CS for hydrogen
production - as described in Section 2.1.1 - the CAPEX for the technology route based on DR
amounts to €504/t CS.
The information gained from literature and the stakeholders consultation varies strongly depending
on the prevailing framework conditions:
• the CAPEX for H2-DR plant would amount to €574/t CS capacity (= €160/t capacity for the
electrolyser + €230/t CS for the shaft + €184/t CS for the EAF) (Vogl, 2018 (Vogl, Åhman,
& Nilsson, 2018)). This results in a 30% increase compared to a greenfield-integrated BF-
BOF: and
• a CAPEX of approximately €874/t CS capacity was estimated (Fischedick, Marzinkowsk, &
Winzer, 2014). The difference with respect to other approaches (Vogl, Åhman, & Nilsson,
30 For further details, please see GREENSTEEL - D1.3.

41
2018) lies within the initial investment for the electrolyser, which has increased capacity
and a large-scale storage, due to the fewer operating hours.
For example, when using a 50:50 charge of hot briquetted iron (HBI) and scrap, the overall
production costs decrease compared to pure HBI operation. Because of the higher scrap price
compared to pellet prices, resource costs slightly increase when feeding more scrap in the EAF.
Depending on certain market conditions, this trend can be reversed due to strong modulation of
ore and scrap market prices.
Generally, the production costs of this route are expected to be higher than those of the BF-BOF
route. Based on the study of the Wuppertal Institute in Germany, the production costs are estimated
between €532-630/t CS in 2050 resulting in an increase of 36% to 61% compared to the
conventional BF-BOF route (Lechtenbommer, Nilsson, Åhman, & Schneider, 2015)). Similar values
can also be found in DEEDS (DEEDS, 2020).
However, it could be a competitive alternative when taking low energy prices into account.
Furthermore, the oxygen obtained during hydrogen production could be used to generate additional
revenues if a suitable market is found. Figure 2 shows the production costs relative to the electricity
costs considering two different scrap quantities (0% and 50%).
Figure 2: H2-DR route production costs as a function of the electricity costs
Source: Vögl31. Note: the production costs are estimated for two scenarios: a) 0 % scrap charge and b) 50 %
scrap charge.
Considering the combination of the three basic units (electrolysis, DR and EAF) for producing steel
without scrap, the total CAPEX becomes €470/t CS (€230/t for the shaft, €184/t for the EAF, €56/t
for the electrolyser). The electrolyser represents around 12% of the total CAPEX.
31 For further details, please see https://op.europa.eu/en/publication-detail/-/publication/e7dc500c-82de-4c2d-8558-5e24a2d335fb.
42
The absolute cost of the electrolyser is not negligible. For a plant with a capacity of 1Mt/a CS (i.e.
around 100 t/h), assuming for simplicity the equivalence 1t CS = 1 t DRI, the cost of the electrolyser
is around €560 M. This estimate is in line with the information from the questionnaires.
According to the information gained in the frame of the GREENSTEEL consultations, investment
costs have an increase in the range of 20%-30% compared to current coal-based primary
steelmaking (SSAB) to a much larger increase of 80% (Voestalpine).
However, the main reason for the large difference between SSAB and Voestalpine estimates is
probably attributable to the above-mentioned upstream processes (SSAB has no sinter plant since
several years, unlike Voestalpine).
The information gathered from the stakeholders (in-scoping questionnaires) within the project32 and
from literature confirm the above-mentioned figures. The total production costs are estimated at
around 500 €/t CS depending on the amount of scrap used, electricity and CO2 price.
2.5.3. Technology routes based on smelting reduction
Steelmaking routes based on smelting reduction technology comprise the IBRSR and HPSR
technologies. As the IBRSR technology is more advanced in terms of technical maturity, most
information is focused on this approach.
The technology route based on the IBRSR technology is technically presented in deliverable D1.2.
Based on the basic HIsarna process33, there are additional options for the implementation of further
decarbonisation measures, namely:
• replace injected fossil coal by bio-coal;
• replace part of the iron ore by scrap; and
• integrate CCUS technologies.
In terms of CAPEX, the IBRSR, e.g. HIsarna® process, replaces the full ironmaking side of
conventional plants: it replaces the BF and eliminates the need for cokemaking and sintering (or
pelletising) of the iron ore. Obviously, one single reactor is much cheaper than the several ones
which become useless. Anyway, when implemented in an existing plant, investments are needed
to remove the former part of the steelmaking chain and install the new one. Additionally, the IBRSR
unit requires auxiliaries such as grinding and drying equipment for iron ore and coal, additional O2
capacity and dedicated off-gas treatment (steam recovery, scrubbing, desulphurisation,
baghouses), especially if the off-gas (concentrated in CO2) is directly valorised or stored. The
steelmaking and hot rolling sections can remain unchanged or, if desired, can accommodate the
additional changes presented in the above-mentioned BF route. Similar to the technology routes
based on the conventional BF-BOF-HR, significant investments are first required for the add-on
technologies (e.g. CCUS, biomass preparation etc.).
Based on the status of the different elements of the technological route, a global current TRL 5 may
be estimated. Based on information from the in-scoping questionnaires, bringing the route up to
TRL 8 could be expected by 2035 and TRL 9 by 2045 with investment in the order of €1 B.
32 For further details, please see GREENSTEEL - D1.3. 33 The HIsarna process uses one reactor for two process stages of iron-ore liquefaction in a high-temperature cyclone with following pulverised coal injection (PCI). The reactor is fed directly with iron ore, so pre-processing steps such as sintering, or pelletising become obsolete.
43
The CAPEX strongly depends on the scale: for a 1.15 Mt /a plant, Tata Steel estimates34 the
investment at €500 M (€435/t CS) but €600 M for a 1.5Mt/a plant (€400/t CS), and a CAPEX for O2
plants is of about €120/t CS.
CCS too requires notable infrastructures to capture and transport CO2 from the steelworks to the
storing site. Hence, the investment costs for an industrial plan of about €600 M are estimated at 1
Mt/a scale (based on first industrial plant, including O2 production and CO2 capture and
compression, but excluding transport and storage service).
2.5.4. Technology routes based on iron ore electrolysis
For the AIE option, the production plant consists, basically, of two units: an electrochemical reactor,
to produce solid iron, and an EAF, to melt it to liquid steel. The electrochemical unit produces
oxygen as by-product, which can be valorised in the steelworks.
Sludge containing water and gangue from the original iron ore is also produced from the AIE
process. Hence, the plant will need auxiliary equipment to separate and recycle these materials.
These units can be realized with conventional technologies. Sludge can be recycled in EAF or in
ancillary processes for the valorisation of by-products, which are increasingly common in the steel
industry.
The capital cost of the electrolytic unit is difficult to estimate at this stage, as size, materials, and
productivity are still under evaluation. Considering the few upstream operations, the low
temperature and a unique energy source (electricity), a CAPEX significantly lower than other
technological solutions can be expected.
A Roland Berger Focus estimated a CAPEX at 25% of a reference BF-BOF plant from greenfield
(Ito, Langefeld, & Goetz, 2020), which means around 400 €/t for producing liquid steel from AIE
and EAF, and consequently €400 M for a plant for 1Mt/a.
From the collected stakeholder information, the investment costs for an industrial plant are
estimated at around €250 M for the electrolytic unit for a plant of 1Mt/a. Adding the cost of the EAF
(€184 M), the total value is comparable with the previous one.
CAPEX (and also OPEX, depending on the cost of electricity) are difficult to forecast at this stage.
The MOE is a self-consistent process, which produces liquid steel directly from raw materials. At
this stage of development, the evaluation of the industrial cost of steel with this technology is
premature.
34 Information gained in the consultation activities in the frame of the project GREENSTEEL.

44
2.5.5. Summary of technology route investment needs
The technology route investment needs are summarized in Table 5.
Table 5: Technology route investment needs
Technology routes
Technology route
TRL development Investment needs up to TRL 8 (M€)
Investment needs for 1st
industrial depl. TRL 9 (M€)
Investment needs for full industrial
plant (M€)
CO2 abatement (max %)
2020 2030 2050
Optimised BF-BOF
2-9 7–9 9
(ind. depl.)
2,000* 4,000 95
Direct reduction
4-8 7-9 9
(ind. depl.)
500 650 95
Based on smelting reduction
2-6 6–8 9
(ind. depl.)
400 500** 600*** 85
Based on iron electrolysis
2-6 3-6 9 250 400 Not evaluated due
to low TRL 95
Source: authors’ own composition based on desk research and stakeholders’ interviews (complete references
in the bibliography). Note: data refer to a crude steel capacity of 1 Mt/a as a reference35; * Greenfield
(brownfield CAPEX costs 40% with respect to BF-BOF; Ghenda, 2013); **500 including EAF. *** Excluding
CO2 transport and storage. For the abbreviations used, please see the list of symbols, indices, acronyms and
abbreviations.
3. Investment roadmapping
The aim of this chapter is to elaborate an investment roadmap for the technologies identified in
work package 1. The main goal of this roadmap is to facilitate the decarbonisation of the European
steel industry. For this purpose, the roadmap proposes blending and sequencing solutions to
reduce the times for industrial deployment of the technologies, and to maximise the impact on
decarbonisation.
A roadmap needs to consider the most important technical alternatives to mitigate CO2 emissions.
To this end, in the Section 3.1, the information in the Tables 1 and 3 for the selected
decarbonisation technologies is critically discussed and assessed.
In Section 3.2, the roadmap for investments is presented as a set of investments versus time. The
possible synergies between the various investment lines are considered.
3.1. Grouping of technologies
The main following indications can be drawn from Table 2, Table 4 and Table 5.
35 In general, real industrial plant sizes are different depending on a specific technology. Taking for example BF-gas injection technology and the route based on smelting reduction, the investment needs for Hisarna plant with a 1.5 Mt/a CS capacity are reported in Section 2.5.3.

45
Technologies related to biomass, increased scrap usage, gas injection in BF and CCUS have lower
impact on CO2 emissions as single application but are the closest to the industrial development
and need relatively low investment costs. Conversely, the new, innovative steelmaking
technologies, such as HPSR and IOE have a high potential, but their industrial deployment requires
long time and large investments, due to currently rather low TRLs.
The H2-DR technology provides a good compromise, with a moderate TRL and a very high CO2
abatement potential, already in the medium term. Furthermore, the DR technology enables a
significant CO2 abatement in the short term via the NG-DR. Since this is already an industrially
established technology, industrial plants can be installed in Europe in the short term and would
enable a significant short-term decrease of the CO2 footprint of the European steel industry.
These industrial DR plants could afterwards be used for further R&D activities, with the aim of
maximising the hydrogen-to-natural-gas ratio to further decrease industrial emissions. With this
approach, major CO2 abatement of industrial emissions would be possible, without having to wait
several years for less mature techniques to be developed. Instead, depending on local conditions,
first industrial sites could build DR plants within a couple of years. However, this approach would
also have a significant impact on the investment needs. Huge investments on industrial scale would
be necessary in the short term, instead of lower investments for demonstration plants.
In general, the development of a technology is not neutral when it comes to the development of the
others. In some cases, the impact is ‘positive’: the development of a technology pulls the
development of another one. In other cases, the technologies are in competition. As an example,
let us consider the two options with the highest decarbonisation potential:
a) hydrogen-based steelmaking; and
b) electricity-based steelmaking.
Both a) and b) are based on completely different processes and plants. Namely, the hydrogen-
based steelmaking will be based on a modification of the DR process, whilst the electricity-based
steelmaking will be used to produce iron in electrolytical processes (in water or in molten oxides)
but, in any case, with technologies completely different from the DR. Consequently, the problems
to face, the research needs and the required technical background for the development of the two
options are completely different. This means that the success of one option, inevitably will impair
the development of the other one, meaning that the two options are in competition. The most
appealing line will get more interest and more investments.
In particular, a wide variety of projects and related experimental and demo plants based on the new
technologies are emerging across Europe (see comprehensive list in D1.1). How many EU plants
will be really involved in the options identified within the GREENSTEEL project will depend on
several factors (e.g. enablers, legal framework, especially public financial support for R&D&I and
upscaling of the current demo). New low-CO2 production technologies will require €50-60 B
investment, with capital and operating costs at €80-120 B per year. The cost of production per
tonne of primary steel will increase by 35% up to 100%. The new technologies would result in
additional production costs for the EU steel industry for at least €20 B per year compared to the
retrofitting of existing plants (i.e. upgrading of the existing plants with the best available techniques).
At least 80% of this share is related to OPEX, mainly due to increased use and higher prices for
CO2-lean energy. Just as an example (EUROFER, 2019), the steel production in 2050 arising from
new technologies could amount to 50%, with a CO2 emission reduction going up to 94% in a best-
case scenario (depending on the availability of green hydrogen).

46
Moreover, local conditions can foster the deployment of some of the presented technologies. For
example Belgium, France and The Netherlands can benefit from CCS opportunities in North Sea
ports, and Sweden (Bioenergy International, 2018) and Finland from green-energy availability
(about 80% of electricity production in Sweden comes from nuclear and hydroelectric power, about
12% from wind power, and combined heat and power (CHP) plants account for the remaining 8%,
mainly powered by biofuels). The availability of biomass resources too is a relevant factor. In Italy
there is a large availability of biomass coming from agricultural wastes (a detailed biomass atlas
already exists), but currently no large plants and technologies on CCU/CCS are available, even
though large projects are going to start in other sectors and results could be applied to steel sector.
How these opportunities can be turned into reliable pathways, will also depend on other external
aspects (e.g. financial support or policies). A thorough analysis of the most promising, together with
a general indication of the expected positive effects on the investment needs will be detailed in a
dedicated and separate report.
3.2. Investment roadmapping by technology routes
The investment roadmap is based on the technology routes presented in Chapter 2 and detailed in
deliverable D1.2 (Technology assessment and roadmapping). As mentioned in Chapter 2, these
routes are just selected cases which shall enable a concretisation of the investments needs,
considering the complete process chain. In fact, many more additional combinations of
decarbonisation technologies could be implemented.
3.2.1. Investment for the technology routes based on optimised BF-BOF
The routes based on the optimisation of the conventional BF-BOF iron and steelmaking
processes include several options, e.g. BF gas injection or increasing biomass and scrap usage.
These routes imply investments for a large number of technologies and projects sizes. A further
main option for this route - namely to apply CCUS - specifically implies investments for supporting
many different projects, since a large variety of technology combinations are possible. CCUS is
indeed a quite flexible option, which can be combined with almost all other techniques (with the BF
but also for example with EAF, DR plants or downstream processes).
This route should be targeted for 2030-2040, as it is relevant for existing plants and for new plants
e.g. those based on NG-DR. After 2040, CCU should be more oriented to the EAF-based route and
still existing BFs. The investment needs can be distributed as follows:
• up to 2030: industrial investment of first implementations in existing BF-BOF plants and
technological investment for other less mature options including e.g. CCUS.
• up to 2040: industrial investment for full implementation and remaining technological
investment for other less mature options.
3.2.2. Investment for the technology routes based on direct reduction
The route H2-DR-EAF was shown to be among the most promising ones for its CO2 mitigation
potential. On the other hand, its success in the European steel industry depends on the availability
and cost of CO2-free energy (hydrogen and electricity from renewable sources). Therefore, starting
with NG-DR is a plausible and more realistic first step for industrial deployment, which would enable

47
major CO2 mitigation. For both variants (NG/H2-DR), challenges and investments have to be
considered, which are linked to the restructuration of the existing industrial systems (i.e. in particular
the adaption of material, gas and heat supply chains).
The investment needs can be distributed as follows:
• up to 2030: industrial investment for DR plants using natural gas and technological
investments for increasing hydrogen content and for upgrading the TRL up to industrial
level; and
• up to 2040: industrial investment for H2-DR-EAF implementation and for progressive
replacement of BFs (and related plants).
3.2.3. Investment for the technology routes based on smelting reduction
The route based on smelting reduction implies investments for the technology improvements and
auxiliaries, such as grinding/drying equipment for iron ore and coal, additional O2 capacity and
dedicated off-gas treatment (steam recovery, scrubbing, desulphurisation, baghouses), especially
for off-gas valorisation or storage. TRL 8 could be reached by 2030 and the industrial deployment
on a mid-term scale (2040).
The investment needs can be distributed as follows:
• up to 2030: technological investment for upscaling IBRSR up to TRL 8; and
• up to 2040: industrial investment for the implementation of IBRSR plants, for progressive
replacement of BFs and related plants, and then for industrial deployment in the European
industry.
3.2.4. Investment for the technology routes based on electrolysis
The routes based on iron ore electrolysis include two technologies, AEL and MOE, which have
different technical maturity.
AEL is currently under development with a TRL of approximately 5-6. The development and
construction of a pilot plant is currently in progress and the construction of a demonstration plant is
expected for 2030. TRL 9 is expected to be demonstrated in 2040.
The investment needs can be distributed as follows:
• up to 2030: technological investment for upscaling up to TRL 8; and
• up to 2040: industrial investment for the implementation of AEL plants, for progressive
replacement of BFs and related plants, and then for industrial deployment in the European
industry.
MOE currently has a rather low TRL of 2. Despite intensive R&D efforts on the technological
developments (anode, refractory lining, etc.) and on scale-up issues, it is expected to be brought
up to TRL 9 by 2050, allowing then industrial deployment in the subsequent years.
The investment needs can be distributed as follows:
• up to 2030: technological investment for fundamental and low-scale development
(laboratory, pilot plant); and
• up to 2040: industrial investment for further upscaling in view of achieving TRL 9 in 2050.
48
4. Analysis of regulatory and market context
Within this chapter, the regulatory and market context is analysed, as it is a driver for the investment
strategies of stakeholders. Current and expected regulatory trends and targets (e.g. emissions,
CO2 targets) are considered with respect to what producers need to adapt to such regulatory aims
(EUROFER, 2020)).
4.1. Regulatory context
The institutions of the European Union have made climate protection a central element of the
European Union policy. There are two main dimensions to this approach. First, the precautionary
principle, as embedded in article 191 of the Treaty on the Functioning of the European Union, which
is interpreted (European Commission, 2000 (COM, 2019)) as mandating that decision-makers
faced with an unacceptable risk, scientific uncertainty and public concerns have a duty to find
answers. The scientific consensus on the risks emanating from manmade climate change provides
the basis for said prioritization. Second, across all EU institutions there is the perception that a
carbon-lean economy would in all aspects be superior to the current economy, which completely
ignores, in its main paradigms, the aspects of carbon use, greenhouse gas emissions and the
consequences of both. Provided this superiority is being granted, the question of why this change
of paradigm has not occurred is ascribed to the severe failures in the market system generated by
the currently dominating economic model. These market failures, amongst them welfare-
distribution problems at a global level (Schutti, 2013 (Schutti, 2013)), would affect the current
economic model. Hence, political action is deemed necessary to overcome these.
Against the background of these two fundamental drivers, it does not come as a surprise that the
EU institutions designed the respective implementation structures, procedures and rules as the
solution to a management task. This consists in the definition of quantitative targets, which guide
the establishment and design of implementing instruments, rules and actions. This approach differs
significantly to the approaches of other big greenhouse gas emitters. The Unites States of America
rely on a technology-based and market-guided approach. China applies central planning-oriented
command and control policies. It is interesting to note that the international negotiations are
currently very much focused on objective setting. This allows the speculation that one reason for
the lack of progress of the international efforts may be the difficulty of many regions and countries
to align their strategies with a management approach.
The most recent and significant milestone of the international negotiations was the Paris
agreement in 2015, which calls for zero net anthropogenic greenhouse gas emissions to be
reached during the second half of the 21st century. In the adopted version of the Paris agreement,
the parties will also "pursue efforts to" limit the temperature increase to 1.5 °C. Prior to the
conference, 146 national climate panels publicly presented a draft of national climate contributions
(called “intended nationally determined contributions “, INDCs). The European Union suggested
INDC is a commitment to a 40% reduction in emissions by 2030 compared to 1990. All parties to
the agreement are to present long-term low greenhouse gas emission development strategies by
2020 that deliver on its objectives.
The INDC of the European Union is derived from the EU’s official internal targets for 2030 on
reducing greenhouse gas emissions by at least 40%, increasing the share of renewable energy to

49
at least 27%, and achieving an energy efficiency improvement of at least 27%. Legislation,
provisionally agreed in July 2018, revises two targets upwards to at least 32.5% for energy
efficiency and at least 32% for renewables. These targets spawned a wide range of regulation.
Governance regulation is typical of the management approach of the European Union, as it is an
instrument to ensure coherent long-term energy and climate policy planning. The legislative
framework for a 40% GHG emission reduction target has been established by the revised emission
trading system directive, the effort sharing regulation and the land use land use change and forestry
(LULUCF) regulation. To support the renewable and energy efficiency targets, in May 2020 the EU
institutions achieved an agreement on the adoption of the package ‘Clean energy for all
Europeans’, which consists of a directive on energy performance in buildings, a directive on
renewable energy, a directive on energy efficiency, an electricity regulation, an electricity directive,
a regulation on risk preparedness and the Agency for the cooperation of energy (ACER) regulation.
The above-mentioned three targets inspire and guide legislative and political initiatives for the
mobility sector (three mobility packages consisting of 16 initiatives36), on circular economy, the
common agriculture policy, the cohesion policy, waste policy, the European Union’s multiannual
financial framework and climate mainstreaming in financing as well as special initiatives for the
aviation and maritime sectors. All of these pieces of legislation interact either directly with the steel
industry or indirectly with its markets and steel product end users, with the objective to propel these
sectors and markets towards the 2030 targets.
On the 11th of December 2019, the Commission published a proposal on how to intensify the
European Union’s climate policies, which is called the Green Deal communication (European
Commission, 2019 (European Commission, 12 December 2019)) and is designed to support
increased ambitions for 2030. It puts forward a proposal for the target of climate neutrality in 2050,
together with a bundle of measures to advance towards this new 2050 target. Only one day later
the European Council approved the target and tasked the Commission to immediately commence
with the deliberation and publication of the proposed measures.
The conclusions of the European Council (2019 (European Commission, 12 December 2019)) on
the communication on a European Green Deal and the content of this communication devote
considerations specifically for carbon-intensive sectors and energy-intensive industries,
notably steel. Because they are deemed indispensable for the supply of key value chains, an
enabling framework is to be put in place, which will allow their modernization and thereby their
transformation to carbon neutrality via integrated evolution.
In line with the management approach described in this chapter, the core of the implementation
activities of the Green Deal is a proposal on a European ‘climate law’, legally enshrining a 2050
climate neutrality target and a plan to increase the EU 2030 climate target to at least 50% and
towards 55%. As with past targets, also these will give birth to a very large number of legal and
political initiatives, all expected to see the light of the day between 2020 to 2022.
36 Access to the road haulage market and access to the profession for passenger & freight transport operators, hired freight transport vehicles, road charging and electronic tolling, driving & rest time rules, posting of workers, enforcement, vehicle taxation, CO2 monitoring and reporting of heavy duty vehicles, access to the bus and coach market, clean vehicles directive, combined transport directive, CO2 standards for cars & vans, battery initiative, CO2 standards for heavy duty vehicles, digitalisation of freight transport documents (all modes), deployment of advanced vehicle technology and infrastructure safety management.
50
The initiatives directly relevant to the manufacturing industry, as announced in the Green Deal
communication, are: a review of the emissions trading system directive; a review of the effort-
sharing regulation; a review of the LULUCF regulation; a review of the energy efficiency directive;
a review of the renewable energy directive; CO2 emissions performance standards for cars and
vans; a proposal for a revision of the energy taxation directive; a proposal for a carbon border
adjustment mechanism for selected sectors; a new EU strategy on adaptation to climate change;
a strategy for smart sector integration; a ‘renovation wave’ initiative for the building sector; an
evaluation and review of the trans-European network – energy regulation; a strategy on offshore
wind; an EU industrial strategy; a circular economy action plan; initiatives to stimulate lead markets
for climate neutral and circular products in energy intensive industrial sectors; a proposal to support
zero carbon steel-making processes by 2030; legislation on batteries; legislative waste reforms; a
strategy for sustainable and smart mobility; a revised proposal for a directive on combined
transport; a review of the alternative fuels infrastructure directive and the trans-European network
– transport regulation; a proposal for more stringent air pollutant emissions standards for
combustion-engine vehicles; a chemicals strategy for sustainability; a zero pollution action plan for
water air and soil; a revision of measures to address pollution from large industrial installations; a
proposal for a just transition mechanism, including a Just Transition Fund and a sustainable Europe
investment plan; a renewed sustainable finance strategy; a review of the non-financial reporting
directive; a review of the relevant State aid guidelines, including the environment and energy State
aid guidelines; and the proposal for an 8th environmental action programme. Again, all of these will
interact either directly with the steel industry or indirectly with its markets and steel product end
users, this time with the objective to propel these sectors and markets towards the 2050 target.
4.2. Market context
Steel is a widely heavily traded commodity on the global market. Hence, global trends in steel
demand, steel supply capacity, steel trade flows shape the steel industry dynamics. The global
crude steel production reached 1.87 B tonnes, 8.5% of which was made in the EU. Global steel
consumption patterns have changed dramatically over the past decade, with China becoming a
dominant player with 53.3% of global production (World Steel Association, 2020 (worldsteel, 2020);
see Figure 5).
In the EU, about 58.6% of crude steel production comes from the integrated route (steel production
from virgin iron ore through the BF-BOF route). The remaining 41.4% is produced only via the
recycling of steel scrap EAFs (EUROFER, 2020); see Figure 6).
Major steel-using sectors in the EU are: construction (35% of total finished steel demand);
automotive (19%); mechanical engineering (15%); and metal ware (15%) (see Figure 7).
In the last decade, steel imports to the EU have been increasing while steel exports to the EU have
been decreasing. The EU is a net importer of finished steel products: in 2019 the EU imported 25.3
M tonnes of finished steel products and exported 20.5 M tonnes (EUROFER, 2020)), as shown in
Figure 6 and Figure 7.

51
Figure 3: Steel production and use
Source: World Steel Association (worldsteel, 2020).

52
Figure 4: EU crude steel output by production route
Source: EUROFER (2020) (EUROFER, 2020). Note: the unit is million tonne.
Figure 5: Steel consumption by sector of economic activity
Source: EUROFER (EUROFER, 2020). Note: the unit is million tonne.
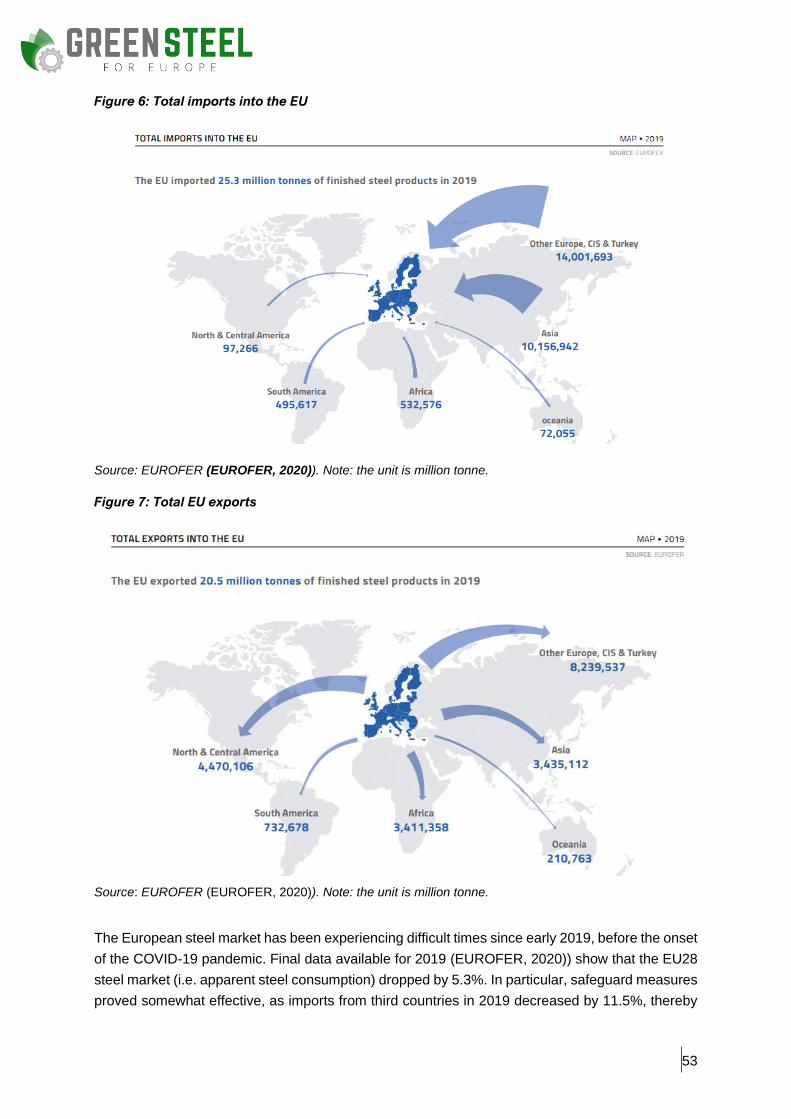
53
Figure 6: Total imports into the EU
Source: EUROFER (EUROFER, 2020)). Note: the unit is million tonne.
Figure 7: Total EU exports
Source: EUROFER (EUROFER, 2020)). Note: the unit is million tonne.
The European steel market has been experiencing difficult times since early 2019, before the onset
of the COVID-19 pandemic. Final data available for 2019 (EUROFER, 2020)) show that the EU28
steel market (i.e. apparent steel consumption) dropped by 5.3%. In particular, safeguard measures
proved somewhat effective, as imports from third countries in 2019 decreased by 11.5%, thereby
54
reducing the pressure on EU steel producers, which was stemming from low-priced imports from
outside the EU. However, in historical terms, imports remained at rather high levels, particularly for
some flat products.
Meanwhile, in the first quarter of 2020 (EUROFER, 2020), the COVID-19 outbreak across the EU
and all the world regions has slashed steel consumption forecasts, as well as the overall economic
outlook. Shutdown measures implemented by governments starting from March 2020 have hugely
impacted manufacturing activity and steel-using industrial sectors. As a result of the dramatic
deterioration in economic prospects and steel consumption outlook since March 2020, the outlook
for this year and for 2021 is obviously particularly affected by the disruption caused by the pandemic
and is likely to be revised significantly over the course of the year, depending on the length and
magnitude of the crisis. The extension of the containment measures that have been put in place in
EU Member States, the subsequent lockdown of industrial activity, and the unprecedented nature
of this crisis, are not without consequence. Because of the uncertainty and volatility surrounding
possible developments in future months, no forecast could be considered reliable. Therefore,
EUROFER has not produced forecasts for 2020 and 2021 in the latest market report on the second
quarter of 2020, being confident that more clarity during the third quarter of 2020 will make it
possible to issue forecasts in the framework of the next report.
The outlook for the global economy has been hugely impacted by the COVID-19 pandemic. The
outbreak has resulted in the shutdown of major economic activities, particularly the manufacturing
and automotive sectors. It is almost certain it will lead to the worst economic recession ever
recorded for the EU, as well as other advanced economies. The downturn is likely to be far larger
than the Great Recession of 2009-2012, which was triggered by the financial crisis. In its latest
Economic Outlook (April 2020), the International Monetary Fund (IMF) has predicted an
unprecedented global recession of -3%, with the US economy experiencing a recession of -5.9%
and the euro area of -7.5%, all followed by a rebound in 2021. With the number of infected people
rising across the continent and partial or full lockdown measures in place in most European
countries, the economic impact of the health crisis is going to be massive, with the EU heading for
an historically deep recession in the first half of the year. Eurostat’s preliminary figures for the first
quarter of 2020 already show a drop of -3.5% quarter-on-quarter in the EU. Even after the return
to normal business conditions, the EU economy will still be particularly vulnerable, as it is exposed
to fluctuations in international trade. As the largest contribution to growth during the previous cycle
came from exports, a slowdown in export markets will further exacerbate the difficulties that EU
economies will face as the lockdowns become a thing of the past.
Total production growth in EU steel-using sectors cooled further: in the fourth quarter of 2019 it was
negative (-1.6%), resulting in the first annual drop, albeit very modest, since 2013 (-0.2%). The
steepest fall was recorded in the automotive sector, followed by the mechanical engineering sector,
the steel tube industry and the metal goods industry. Meanwhile, production activity in the
construction sector continued to prove resilient, albeit slowing down compared to preceding
quarters.
As in preceding quarters, developments in total imports in the fourth quarter of 2019 continued to
conceal distortions at the individual product level. These are essentially caused by the design of
the current safeguard mechanism, and which has resulted in a rush to maximise quarterly quota
allowances by several key exporters to the EU such as Turkey and China. Despite the current
uncertainty on the magnitude and the length of the COVID-19 outbreak, it is expected that once

55
normal market conditions will be restored and steel demand will pick up again persisting import
pressure – resulting from continued stockpiling and capacity expansion by major non-EU exporting
countries – will, in essence, penalise EU steel producers.
Apparent steel consumption in the EU fell by -10.8% year-on-year in the fourth quarter of 2019,
after a drop of 1.6% in the third quarter, resulting in yearly fall of -5.3% for the entire year 2019,
which was the worst performance in EU steel demand since 2012. The negative trend in steel
demand seen in the fourth quarter of 2019 is the result of the continued slump in EU’s
manufacturing sector due to weakened exports and investment that has become more pronounced
during the second half of last year, coupled with escalating trade tensions between the US and its
major trading partners. Equally, data for the fourth quarter of 2019 continued to show growing
import distortions as well as higher volatility as a result of the increase of safeguard measures’
quota.
The dramatic consequences of the COVID-19-related shutdown in industrial activity do not affect
Europe alone. They have reached a global scale, in terms of huge disruption of supply chains and
supplies of input and raw materials. This will probably have unprecedented repercussions on output
in the second and third quarters of 2020. Against this background, a substantial rebound is not in
sight before the first quarter of 2021. Even after the end of the pandemic, external risks will continue
to cast a shadow over steel-using industrial sectors, even in 2021. This will likely seriously hamper
investment. However, the extent remains difficult to predict. Much will depend on other, non-
COVID-19 related factors that were already in place before the outbreak. Whether global trade
fundamentals will improve – which is fundamental given the large exposure of EU’s export-oriented
industrial economies to changes in global trade – is unclear at this stage. Other sources of
uncertainty exist, such as a no-deal Brexit – as the final agreement with the EU must be reached
before the end of 2020 – and a new escalation in protectionist trade measures would also contribute
to a sustained negative outlook.
The onset of the COVID-19 pandemic is expected to dramatically impact the already challenging
steel market situation, with unprecedented consequences for the steel industry. Capacity idling,
reduction in workforce and cuts in production are already taking place at an unprecedented scale
and it is unknown, at the time of writing, as to when – or whether – normal economic activity will be
fully restored. We assume that, according to confinement and lockdown easing schemes that have
been set out by most EU governments, from the beginning of the third quarter production should
have restarted again in almost all industrial sectors. The coming quarters will nevertheless be
determined by some global restrictions on economic activity.
As previously mentioned, market conditions are not expected to improve up to early 2021. Much
will depend on the length of the industrial lockdown in steel-using sectors that has almost put a
stop to new steel orders (on the supply side) – although there are already signs of some restart in
automotive and other sectors - as well as on governments’ ability to alleviate the huge economic
and social costs of the pandemic so as to support demand. However, if and when the economy
returns to normal conditions, all the downside risks that had considerably weakened steel-using
sectors and steel demand during 2019 will still be there, namely import distortions and continued
global overcapacity and weakness in the global manufacturing cycle. Restarting normal industrial
activity after the end of the pandemic will not lead to a rapid return to usual output volumes.
Consumer demand, due to the huge social disruption caused by the pandemic, is set to remain

56
depressed throughout 2020; therefore, it will take time before the end of industrial lockdown leads
to substantial output increases.
The production of clean steel, at least for the foreseeable future, will go along with (much) higher
costs for several reasons, thus, as already discussed in D1.2 (Technology assessment and
roadmapping), new markets and business models for clean steel have to be established. The
extremely high importance of this need was confirmed by the first part of the GREENSTEEL
stakeholder consultation: The steel producers ranked “unknown market conditions for clean steel”
as one of the top three barriers hindering the decarbonisation of steel production. In order to create
a proper market context for clean steel and related products, incentives for users to use clean steel
(and related products), promotion of clean steel products in public procurement and adaption of
standards are discussed (Agora-Energiewende, 2019); (Wijns, Khandekar, & Robson, 2018).
5. Conclusions
The present report shows the main features of the investment needs for the most relevant steel
production technologies and technology routes aimed at reducing CO2 emission by at least 80%
and representing complete process chains, based on the implementation of specific technologies.
These technologies were identified through the technological assessment of the decarbonisation
technologies carried out in the project Deliverable D1.2. For the economic assessments,
considering the content of Tables 1, 3 and 4 of the report and the data discussed in Chapter 3, the
following conclusions can be reached:
• many breakthrough decarbonisation technologies are not available for industrial
deployment in the short term (until 2030),
• there are some decarbonisation technologies currently available which enable short-term
deployment with limited R&D needs and investment effort, but their mitigation potential is
also limited;
• all decarbonisation technologies need certain framework conditions, with the most
important one being sufficient CO2-free energy37 at competitive costs; and
• there is no single technology which fulfils all demands, considering the different framework
conditions within the European steel industry and the pressure to mitigate increasing
percentages of CO2, starting from now until (almost) complete mitigation in 2050.
Hence, parallel investments in the development and deployment of several technologies
are needed. These technologies can either be combined or represent alternatives with
individual advantages for different framework conditions and different time scales.
Overall, there is a wide variety of investment needs. The technology-specific investment needs
comprise investments either to further improve the technologies to full technological maturity, or to
enable the subsequent deployment for industrial production. The investments required for
improving technological maturity range from €5 M (for some biomass applications) up to €1,000 M
(for MOE). Technologies with currently low technological maturity and high CO2-mitigation potential
typically require higher investment:
37 In particular electricity and hydrogen and, in some cases, biomass.

57
• €5 to 400 M with typically around €300 M for one demo plant (TRL 8), with a peak of
€1 B for the not yet mature MOE;
• generally, from €500 M to €1 B (maximum €4 B for BF-BOF- HR route) for deployment and
industrialisation; and
• generally, around €1 B (referring to a capacity of 1 M t CS/a) for deployment as full industrial
plant.
As can be expected, considering the sheer size of the plants, the costs raise considerably with the
TRL. Although all the presented technologies should reach an industrial deployment latest by 2050,
only some of them (H2-DR, CCUS, gas injection on BF, increased scrap usage) are expected to
achieve a TRL level of 9 close to 2030. Therefore, summarising the overall investments needed for
all relevant technologies, the main investments for development (including demonstration) are
needed before 2030, whereas most investments for industrial deployment will occur between 2030
and 2050, leading to most part of the overall investment needs from 2020 onwards, to be
concentrated in the period 2030-2050. However, the DR technology provides a different
opportunity: industrial plants based on natural gas could be built and successively further
developed for increasing hydrogen usage. This would require large investments in the short term
(up to €1-2 B, see Table 1 in the executive summary) but would enable a significant short-time
mitigation and also a flexible and highly efficient mitigation on the medium term.
The efforts invested in developing the new technologies with dedicated projects all across Europe
are encouraging, yet how much of the steel production will really be involved in the options identified
within the GREENSTEEL project will depend on several factors (enablers, legal framework,
especially public financial support for R&D&I and upscaling of the current demo).Moreover, local
conditions, as seaport storage ad green-energy availability, can foster the deployment of some of
the presented technologies. Changing all opportunities into reliable pathways will also depend on
other external aspects (e.g. financial support or policies). A thorough analysis of the most promising
pathways, together with a general indication of the expected positive effect on the investment
needs, will be detailed in a dedicated report.
The huge investment needs and the related technical-economical risks call for adequate financial
support of the development activities, in particular considering the current economic and market
scenario. Parallel to financial support, there are regulatory initiatives needed to support clean-steel
markets, with the objective of propelling the technology development and the industrial deployment
towards the CO2-mitigation targets. Consequently, the results of this report will be used within the
upcoming work within the project Green Steel for Europe in work package 3 “Impact Assessment”,
which will analyse and recommend related policy options.
© GreenSteel for Europe Consortium, 2021
Bibliography
Agora-Energiewende. (2019). Klimaneutrale Industrie Schlüsseltechnologien und Politikoptionen für Stahl,
Chemie und Zement. Retrieved from 164/04-S-2019/DE Version: 1.1: , https://www.agora-
energiewende.de/fileadmin2/Projekte/2018/Dekarbonisierung_Industrie/164_A-
EW_Klimaneutrale-Industrie_Studie_WEB.pdf
Agrawal, A.-K., Peters, K. K., Rösner, B., Kappes, H., Bermes, P., Micheletti, L., . . . Oliveira, A. (2019).
The blast furnace in view of past, current and future – CO2 saving technologies. 49º Seminário de
Redução de Minério de Ferro e Matérias-Primas e 7º Simpósio Brasileiro de Aglomeração de
Minério de Ferro. São Paulo: ABM.
ArcelorMittal. (2019). https://www.greencarcongress.com/2019/12/20191215-arcelormittal.html.
ASCOPE. (2011). French National Research Agency project: Acier sans CO2 par electrolyse - ANR-09-
EESI-0002. Retrieved from https://scanr.enseignementsup-recherche.gouv.fr/project/ANR-09-
EESI-0002
Behera, P., Bhoi, B., Paramguru, R., Mukherjee, P., & Mishra, B. (2019). Hydrogen Plasma Smelting
Reduction of Fe2O3. Metallurgical and Materials Transactions B, 50, 262–270.
Bhaskar, A., Assadi, M., & Nikpey Somehsaraei, H. (2020). “Decarbonization of the Iron and Steel Industry
with Direct Reduction of Iron Ore with Green Hydrogen". Energies, 13(3), 758.
Bioenergy International. (2018, June 18). Swedish Energy Agency awards record funding to HYBRIT.
Retrieved from https://bioenergyinternational.com/research-development/swedish-energy-agency-
awards-record-funding-to-hybrit
Budinis, S., Krevor, S., MacDowell, N., Brandon, N., & Hawkes, A. (2018, November). An assessment of
CCS costs, barriers and potential. Energy Strategy Reviews, 22, 61-81. Retrieved from
https://www.researchgate.net/publication/328664843_An_assessment_of_CCS_costs_barriers_a
nd_potential
Bui, M. (2018). Carbon capture and storage (CCS): the way forward. Retrieved from
https://doi.org/10.1039/C7EE02342A
CARBALYST. (2015). https://corporate.arcelormittal.com/corporate-library/reporting-hub/carbalyst-
capturing-carbon-gas-and-recycling-into-chemicals.
COM. (2019). 640: Communication from the Commission to the European Parliament, the European
Council, the Council, the European Economic and Social Committee and the Committee of the
Regions – The European Green Deal . Retrieved from
https://ec.europa.eu/info/sites/info/files/european-green-deal-communication_en.pdf
CORDIS. (2020, April). Advanced Carbon Capture for steel industries integrated in CCUS Clusters.
Retrieved from https://cordis.europa.eu/project/id/884418.
Dahlmann, P. (2019). Update of the Steel Roadmap for Low Carbon Europe 2050 - Part I: Technical
Assessment of Steelmaking Routes - Final Report. Institute VDEh.
DEEDS. (2020). Dialogue on European Decarbonisation Pathways. Retrieved from
https://www.iamconsortium.org/resources/project-
resources/deeds/#:~:text=DEEDS%20(Dialogue%20on%20European%20Decarbonisation,(EDPI)
%20and%20its%20High%2D

EUROFER. (2019). Retrieved from https://www.eurofer.eu/assets/Uploads/EUROFER-Low-Carbon-
Roadmap-Pathways-to-a-CO2-neutral-European-Steel-Industry.pdf
EUROFER. (2020). Retrieved from https://www.eurofer.eu/assets/Uploads/REPORT-Economic-and-Steel-
Market-Outlook-Quarter-2-2020.pdf
EUROFER. (2020). EUROFER’s Quarterly Economic and Market Outlook 2/2020. Retrieved from Quarterly
Economic and Market Outlook 2/2020: https://www.eurofer.eu/assets/Uploads/REPORT-
Economic-and-Steel-Market-Outlook-Quarter-2-2020.pdf
European Commission. (12 December 2019). European Council Conclusions EUCO 29/19.
Fischedick, M., Marzinkowsk, J., & Winzer, P. (2014). Techno-economic evaluation of innovative steel
production technologies. Journal of Cleaner Production, 84, 563–580.
FReSMe. (2017, June). From Residual Steel Gases to Methanol,. Retrieved from http://www.fresme.eu
Ghenda, J.-T. (2013). A Steel Roadmap for a Low Carbon Europe 2050 - A Global Industry Dialogue and
Expert Review Workshop - Paris. Retrieved from
https://iea.blob.core.windows.net/assets/imports/events/205/NEWSteelRoadmappresentation_IE
A_20131007.pdf
Hiebler, H., & Plaul, J.-F. (2004). Hydrogen plasma smelting reduction – an option for steelmaking in the
future. Metallurgija, 43(3), 155-162.
Hisarna. (2020). http\\Tatasteeleurope.com/static_files/Downloads/Corporate/About%20us/hisarna.
IGAR. (2020). https://www.ademe.fr/sites/default/files/assets/documents/igar.pdf. ArcelorMittal funded by
french agency ADEME: IGAR: Validation pré-industrielle de l’injection de gaz réducteur dans un
haut-fourneau sidérurgique, [online].
IndWEDe. (2018). Industrialisierung der Wasserelektrolyse in Deutschland: Chancen und
Herausforderungen für nachhaltigen Wasserstoff für Verkehr, Strom und Wärme. Berlin.
Ito, A., Langefeld, B., & Goetz, N. (2020, May 2020,). The future of steelmaking / How the European steel
industry can achieve carbon neutrality”,. Retrieved 17 July, 2020, from
https://www.rolandberger.com/nl/Publications/Europe's-steel-industry-at-a-crossroads.html
Lavelaine de Maubeuge, H. v. (2016). IERO.
Lechtenbommer, S., Nilsson, L. J., Åhman, M., & Schneider, C. (2015). Decarbonising the energy intensive
basic materials industry through electrification - implications for future EU electricity demand.
SDEWES2015. Dubrovnik - Croatia.
Minh-Ho, T., Bustamante, A., & Wiley, D. E. (2013, November). Comparison of CO2 capture economics for
iron and steel mills. International Journal of Greenhouse Gas Control, 19, 145-159.
Sabat, K. C., & Murphy, A. B. (2017). Hydrogen Plasma Processing of Iron Ore. Metallurgical and Materials
Transactions B, 48(3), 1561-1594.
Sadoway, D. (2019). Decarbonizing the Production of Steel. Webinar. LowCarbonFuture Project, EU Grant
Agreement N. 800643.
SALCOS. (2020). SALCOS official project website, [online] salcos.salzgitter-ag.com.
Schutti, G. (2013). Nachhaltigkeit in Zeiten des Wachstumsdilemmas: - Von der ungebrochenen
Beschwörung eines brüchigen Paradigmas. Südwestdeutscher Verlag für Hochschulschriften.
SIDERWIN. (2020). SIDERWIN official project website, [online] www.siderwin-spire.eu [01.06.2020].
Skagestad, R., Onarheim, K., & Mathisen, A. (2014). Carbon Capture and Storage (CCS) in industry sectors
– focus on Nordic countries. Energy Procedia, 63, 6611-6622.

STEELANOL. (2015). http://www.steelanol.eu/en.
ThyssenKrupp. (2020). https://www.thyssenkrupp.com/en/newsroom/content-page-162.html.
Toktarova, A., Karlsson, I., Rootzén, J., Göransson, L., Odenberger, M., & Johnsson, F. (2020). Pathways
for Low-Carbon Transition of the Steel. Energies 2020, 13, 3840; doi:10.3390/en13153840.
ULCOS. (2011). Ultra-Low CO2 steelmaking, Funded FP6-NMP, Grant Agreement 515960, 2004 - 2010.
Retrieved from testlink
VALORCO. (2014). https://www.ademe.fr/valorco.
Vogl, V., Åhman, M., & Nilsson, L. J. (2018, December). Assessment of hydrogen direct reduction for fossil-
free steelmaking. Journal of Cleaner Production 203, pp. 736 - 745.
Wijns, T., Khandekar, G., & Robson, I. (2018). Industrial Value Chain: A Bridge Towards a Carbon Neutral
Europe, Europe’s Energy Intensive Industries contribution to the EU Strategy for long-term EU GHG
emissions reductions, IES-VUB. Retrieved from
www.ies.be/files/Industrial_Value_Chain_25sept.pdf
worldsteel. (2020). 2020 world steel in figures. Retrieved from
(https://www.worldsteel.org/en/dam/jcr:f7982217-cfde-4fdc-8ba0-
795ed807f513/World%2520Steel%2520in%2520Figures%25202020i.pdf
Wörtler, M., Schuler, F., Voigt, N., Schmidt, T., Dahlmann, P., Lüngen, H. B., & Ghenda, J.-T. (2013).
Steel’s Contribution to a Low-carbon Europe 2050. Boston Consulting Group.