National Healthcare Establishment and Workforce Statistics ...
Upload
khangminh22Category
view
3download
0
Prepared by: Centers of Excellence Los Rios Community College District Valley Vision Compass Policy Strategies Wen Sun Fran Doherty Applied Development Economics
January 2018
Inform Connect Advance
C E N T E R S O F E X C E L L E N C E
CONSTRUCTION: CLUSTER AND WORKFORCE NEEDS ASSESSMENTSACRAMENTO REGION
2 CONSTRUCTION: CLUSTER AND WORKFORCE NEEDS ASSESSMENT, SACRAMENTO REGION
TABLE OF CONTENTS
INTRODUCTION ......................................................................................................................................... 4
Next Economy initiative ....................................................................................................................................................4
Report overview ................................................................................................................................................................5
INDUSTRY PERFORMANCE ........................................................................................................................ 7
Value of construction put in place ..................................................................................................................................7
Value of nonresidential construction by subcomponents ............................................................................................9
Value of infrastructure as a percent of construction ................................................................................................ 11
Value of construction as a percent of GDP and GRP ............................................................................................. 12
Regional residential construction activity ................................................................................................................... 15
CLUSTER ANALYSIS ................................................................................................................................. 19
Overview .......................................................................................................................................................................... 19
Traded cluster overview ................................................................................................................................................ 20
Non-traded cluster overview ........................................................................................................................................ 20
Cluster earnings .............................................................................................................................................................. 21
Analysis of traded subclusters ..................................................................................................................................... 22
Analysis of non-traded subclusters ............................................................................................................................. 26
ECONOMIC IMPACTS ............................................................................................................................... 35
OCCUPATIONAL DEMAND, TRAINING & EDUCATION SUPPLY GAP ANALYSIS .................................... 40
Occupational demand ................................................................................................................................................... 40
Occupational supply ...................................................................................................................................................... 42
Training and education assets ...................................................................................................................................... 43
Supply & demand workforce gaps ............................................................................................................................ 48
OCCUPATIONAL GAP IMPACTS ON CLUSTERS ....................................................................................... 49
UNIONIZED CONSTRUCTION WORKFORCE............................................................................................ 56
EXECUTIVE INTERVIEW FINDINGS ........................................................................................................... 57
SUMMARY REPORT FINDINGS ................................................................................................................ 62
RECOMMENDATIONS .............................................................................................................................. 64
APPENDIX A: METHODOLOGY NOTES ................................................................................................... 66
APPENDIX B: CLUSTER BUSINESSES ........................................................................................................ 76
APPENDIX C: CLUSTER DETAIL ................................................................................................................ 89
APPENDIX D: EXECUTIVE INTERVIEWS ................................................................................................. 101
APPENDIX E: UNIONIZED CONSTRUCTION EMPLOYMENT, DEMOGRAPHICS AND WAGES ................ 103
3CONSTRUCTION: CLUSTER AND WORKFORCE NEEDS ASSESSMENT, SACRAMENTO REGION
ACKNOWLEDGMENTS
Valley Vision and the Centers of Excellence acknowledge the research team and advisers who contributed to the report:
• Wen Sun (industry and occupational cluster analysis)
• Fran Doherty (construction industry and market indicators)
• Janine Spadafore Kaiser, Compass Policy Strategies (education asset map, training supply and gap analysis)
• Darrene Hackler, Ph.D. (study design and review)
• Kelley Ring (business list analysis)
• Lauren McSherry (executive interviews, editing)
• Karin Odell, Venus Designs Inc. (report design)
• Peter Cheng, Applied Development Economics (impact analysis)
• Rick Larkey, North State Building Industry Association Foundation (study review)
• Tim Murphy, Sacramento Builders Exchange (study review)
• Jon Zeh, Mechanical Electrical Technology, Sacramento City College
The research team also thanks the organizations that supported the data gathering, including the following:
• California Division of Apprenticeship Standards (DAS)
• Construction Industry Research Board (California Homebuilding Foundation)
• California Association of Realtors (CAR)
Finally, the research team acknowledges the Los Angeles Economic Development Corporation (LAEDC). The research team
made extensive use of the 2016 study “Building the Future,” conducted by LAEDC. The study was funded by JPMorgan
Chase & Co.1
1 Cooper, C. et. al. LAEDC Institute for Applied Economics, “Building the Future: Construction in Southern California: The Industry, Its Jobs, and Its Economic Contribution,” (September 2016), https://laedc.org/2016/12/05/laedc-report-socal-construction-industry-forecast-market-update.
Important Disclaimer
All representations included in this report have been produced from primary research and/or secondary review of publicly
and/or privately available data and/or research reports. Efforts have been made to qualify and validate the accuracy of the
data and the reported findings; however, neither the Centers of Excellence, COE host District, nor California Community
Colleges Chancellor’s Office are responsible for applications or decisions made by recipient community colleges or their
representatives based upon components or recommendations contained in this study.
© 2018 California Community Colleges Chancellor’s Office Economic and Workforce Development Program
Please consider the environment before printing.
This document is designed for double-sided printing.
4 CONSTRUCTION: CLUSTER AND WORKFORCE NEEDS ASSESSMENT, SACRAMENTO REGION
INTRODUCTION
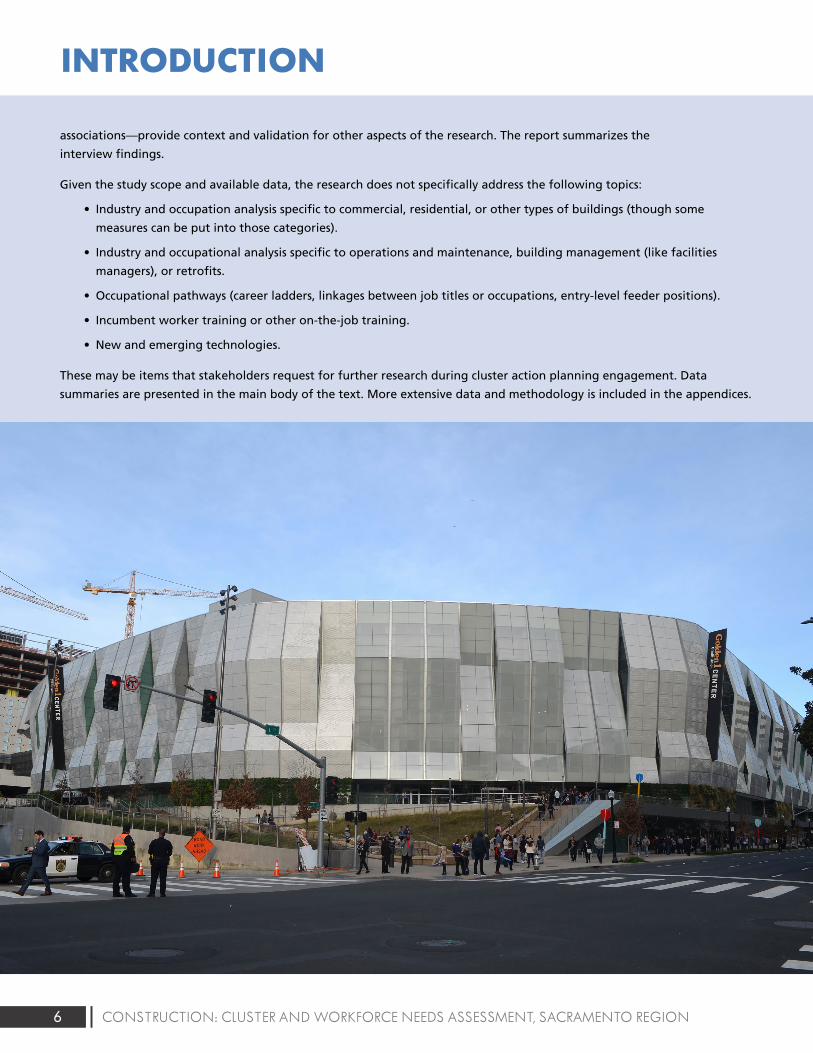
The opening of the Golden 1 Center in downtown Sacramento in September 2016 marked a milestone in the return of
construction projects to the region. For the last several years, the pages of The Sacramento Business Journal have been filled
with news of ground breakings and grand openings.
Entertainment venues and restaurants cropped up around the arena. Mixed-use infill developments proliferated in midtown
and along commercial corridors in outer-ring suburbs and along the riverfront. Cities announced partnerships for hospital
expansions. School districts continued with bond-funded construction. Regional planned residential communities cropped
up in the suburbs of Elk Grove, Rancho Cordova, Roseville and elsewhere. Regional districts issued proposal requests for
water treatment plants.
In 2017, newly elected Mayor Darrell Steinberg reached a deal for public funding to support a renovated convention
center, theater project and auditorium. Amazon opened a distribution center at the Sacramento Metro Air Park. The soccer
club Republic FC partnered with the city and broke ground on a new stadium. And an incentive package approved by the
Sacramento City Council could entice health care company Centene to bring several thousand jobs to the region with a new
headquarters.
Much like the rest of California, the Sacramento region’s construction industry has faced challenges during the economic
recovery. Pent-up demand, lagging supply and tightened residential mortgage lending have led to a housing affordability
crisis that has pushed many would-be buyers into an increasingly expensive rental market.
Jurisdictional mismatch for permitting confuses developers and contractors, causing delays. Federal and state regulations
for building codes and other restrictions result in change orders and longer timelines for project completion. Economic
developers often struggle to find commercial space suitable to meet the need of would-be employers.
Workforce shortages, especially for skilled tradespeople and new entrants to the field, produce cascading effects—delays in
scheduling, quality and safety problems, and increased costs based on ad hoc, on-the-job training. The long shadow of the
housing crisis continues to affect the state and the region’s ability to grow.
These issues challenge the region’s economic development efforts, which hinge on keeping housing prices down, building
attractive office space and providing amenities that young members of the creative class desire. These items underscore
boosters’ clarion call to high-tech entrepreneurs in the Bay Area to relocate to the region, to transform a region dominated
by government agencies into a Silicon Valley satellite hub.
Meanwhile, economists and industry stakeholders continue to monitor the economic recovery, expressing some concern
about the economic cycle growing late, though the labor market and new projects continue to show strong signs of growth.
Next Economy initiative
In response to the global recession that began in the mid-2000s, regional leaders initiated Next Economy, research and
planning to accelerate job creation and new investment in industry-advantaged clusters and priority clusters that hold
additional priorities. (The six-county Sacramento region includes El Dorado, Placer, Sacramento, Sutter, Yolo and Yuba
counties.)
Valley Vision, a regional civic leadership organization, managed the Next Economy design, research and implementation
process on behalf of a wide range of private- and public-sector partners. Valley Vision has received additional funding from
JPMorgan Chase & Co. to continue the work and expand beyond the original six Next Economy studies. The original six
reports focused on advanced manufacturing, clean economy, education and knowledge creation, food and agriculture, life
5CONSTRUCTION: CLUSTER AND WORKFORCE NEEDS ASSESSMENT, SACRAMENTO REGION
INTRODUCTION
sciences and health services, and information and communication technology (ICT).2 The construction cluster study
continues the research and goals of the previous studies. Valley Vision has partnered with the Centers of Excellence, an
initiative of the California Community Colleges Chancellor’s Office Economic and Workforce Development Program, to
conduct the research.
In practice, Valley Vision leverages the Next Economy research to support regional stakeholder action planning among
education and training institutions, workforce intermediaries, economic development organizations, local government and
private industry.
Planning emphasizes setting priorities and developing strategies to address critical issues facing the region’s public policy
and needs of industry. Strategies address the alignment of workforce and economic development policies and resources
and create public-private partnerships to accomplish those goals. The goal of the research and engagement effort is to
encourage local economic transformation in line with the mission, vision and values of Valley Vision and the California
Community Colleges Doing What Matters for Jobs and the Economy initiative.
On the economic development side, this means creating a thriving regional business climate with ample resources to foster
attraction, innovation, growth and retention; on the workforce side, this means creating pipelines and pathways to long-
term, local, high-road employment—careers with wages capable of supporting families and communities.
Report overview
The first section of the report investigates broad national and regional economic indicators to show how investments have
shifted after the recession among various categories in residential and nonresidential construction. Comparisons to gross
product show how the construction industry has shifted in relationship to the overall economy in the Sacramento region,
the Bay Area and California. Permit data shows the change in amount of new housing coming online. Population and
housing data shows the ongoing unmet need for housing in the region.
The report makes use of economics cluster research methods to compare the Sacramento region’s industry activity to the
Bay Area and California. The findings outline the major industry subclusters of opportunity where the Sacramento region
is advantaged, and how the subclusters are impacted by workforce development gaps. Business lists indicate priority
engagement targets for cluster-based action planning.
By comparing the projected occupational demand from new and replacements jobs (retirements and separations)
and the available supply of potential candidates emerging from regional education and training programs (including
apprenticeships), estimates were determined concerning the primary workforce gaps in the region, providing a roadmap
for the specific occupations and subclusters that stakeholders should address. The study team developed a training and
education asset map, occupational priority list by subcluster, and business list to support action planning.
The section on economic impacts provides estimates of the overall economic effects from the regional construction clusters.
The estimates include direct effects from cluster activities, indirect impacts from suppliers hiring and spending, and induced
impacts from household spending of employees in the industry.
The report also includes data on rates of union and non-union workers in the construction industry in the Bay Area and
the Sacramento region. The analysis provides historical trend information in the Sacramento region. It also includes
apprenticeship numbers by trade, demographic information and prevailing wage rates for California.
Executive interviews with a dozen key stakeholders—representatives from construction industry employers and industry
2 Visit valleyvision.org or coeccc.net to access completed reports.
6 CONSTRUCTION: CLUSTER AND WORKFORCE NEEDS ASSESSMENT, SACRAMENTO REGION
INTRODUCTION
associations—provide context and validation for other aspects of the research. The report summarizes the
interview findings.
Given the study scope and available data, the research does not specifically address the following topics:
• Industry and occupation analysis specific to commercial, residential, or other types of buildings (though some
measures can be put into those categories).
• Industry and occupational analysis specific to operations and maintenance, building management (like facilities
managers), or retrofits.
• Occupational pathways (career ladders, linkages between job titles or occupations, entry-level feeder positions).
• Incumbent worker training or other on-the-job training.
• New and emerging technologies.
These may be items that stakeholders request for further research during cluster action planning engagement. Data
summaries are presented in the main body of the text. More extensive data and methodology is included in the appendices.
7CONSTRUCTION: CLUSTER AND WORKFORCE NEEDS ASSESSMENT, SACRAMENTO REGION
INDUSTRY PERFORMANCEThe charts in this section show how the value of construction put in place has changed from 2002 through 2016, the
change in nonresidential construction value added by segment from 2006 (pre-recession) to 2016, the change in percent
of spending on infrastructure in relation to total nonresidential construction and the percent of GDP derived from
construction. These values include both public- and private-sector spending.
Value of construction put in place
The United States Census Bureau tracks the value of construction put in place monthly by geographic area and type of
construction. The Census Bureau administers a monthly survey that asks owners to report the amount of work done on
projects until complete and the actual costs incurred for that work. The annual value of construction put in place is the
cumulative value of work done on projects (in labor and materials) active during the year.
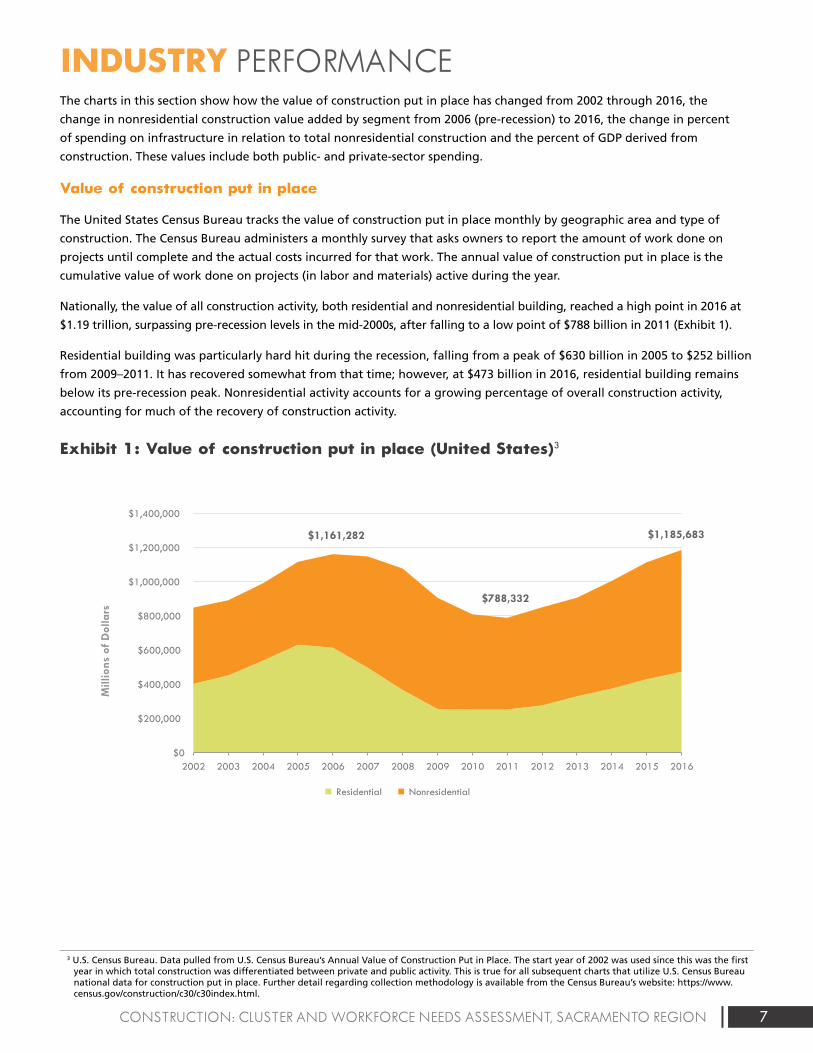
Nationally, the value of all construction activity, both residential and nonresidential building, reached a high point in 2016 at
$1.19 trillion, surpassing pre-recession levels in the mid-2000s, after falling to a low point of $788 billion in 2011 (Exhibit 1).
Residential building was particularly hard hit during the recession, falling from a peak of $630 billion in 2005 to $252 billion
from 2009–2011. It has recovered somewhat from that time; however, at $473 billion in 2016, residential building remains
below its pre-recession peak. Nonresidential activity accounts for a growing percentage of overall construction activity,
accounting for much of the recovery of construction activity.
Exhibit 1: Value of construction put in place (United States)3
Exhibit 1: Value of construction put in place (United States)3
$1,161,282
$788,332
$1,185,683
$0
$200,000
$400,000
$600,000
$800,000
$1,000,000
$1,200,000
$1,400,000
2002 2003 2004 2005 2006 2007 2008 2009 2010 2011 2012 2013 2014 2015 2016
Mill
ions
of
Dol
lars
Residential Nonresidential
Exhibit 2: Value of construction put in place (California)5
$58,091,975
$18,740,050
$51,350,955
$0
$10,000,000
$20,000,000
$30,000,000
$40,000,000
$50,000,000
$60,000,000
$70,000,000
2002 2003 2004 2005 2006 2007 2008 2009 2010 2011 2012 2013 2014 2015 2016
Residential Nonresidential
Exhibit 3: Value of nonresidential construction put in place, by subcomponent (United States)7
24.1%
-0.2%
130.5%
0.6%
5.3%
-54.8%
18.0%
50.9%
98.2%
26.9%
-7.5%
21.7%
Office
Commercial
Manufacturing
Health care
Educational
Religious
Amusement and recreation
Transportation
Power and communication
Highway and street
Public works
Other
Subcomponent percent change 2006-2016
Exhibit 5: Value of Infrastructure as a percent of nonresidential construction put in place (United States)10
37.5% 37.9% 36.5%37.1% 37.0%
37.3%37.5% 41.1% 46.3% 45.5%
46.6% 46.4%46.1% 43.5% 41.6%
$0
$100,000
$200,000
$300,000
$400,000
$500,000
$600,000
$700,000
$800,000
2002 2003 2004 2005 2006 2007 2008 2009 2010 2011 2012 2013 2014 2015 2016
$ M
illio
ns
$ Th
ousa
nds
Nonresidential Infrastructure
Exhibit 6: Value of infrastructure as a percent of nonresidential construction put in place (California)11
11.6% 12.8% 14.3% 13.4%14.3%
11.0% 10.7%10.7% 10.2% 9.9% 10.9%
27.5%
14.9%16.2% 13.0%$5,000,000
$0
$10,000,000
$15,000,000
$20,000,000
$25,000,000
$30,000,000
2002 2003 2004 2005 2006 2007 2008 2009 2010 2011 2012 2013 2014 2015 2016
Nonresidential Infrastructure
Exhibit 7: Construction value added as a percent of GDP (United States)12
Exhibit 8: Construction value added as a percent of GRP (California)13
7.8% 7.8%8.1%
8.6%8.4%
8.0%
7.4%
6.3%
5.4%5.1%
5.3%5.5%
5.8%
6.2%6.4%
3.0%
4.0%
5.0%
6.0%
7.0%
8.0%
9.0%
2002 2003 2004 2005 2006 2007 2008 2009 2010 2011 2012 2013 2014 2015 2016
2002 2003 2004 2005 2006 2007 2008 2009 2010 2011 2012 2013 2014 2015 2016
3.0% 3.1%3.3% 3.3%
2.8%
2.3%
1.6%
1.0% 1.0% 1.1%1.3%
1.8% 1.8%2.0% 2.0%
0.0%
0.5%
1.0%
1.5%
2.0%
2.5%
3.0%
3.5%
4.0%
Exhibit 9: Construction value added as a percent of GRP (California, Sacramento region and Bay Area)16
3.0%
6.8% 6.9%
3.6%
1.2%1.4%
1.7%
2.3%
2.4%
0.0%
1.0%
2.0%
3.0%
4.0%
5.0%
6.0%
7.0%
8.0%
2002 2003 2004 2005 2006 2007 2008 2009 2010 2011 2012 2013 2014 2015
State Sacramento Metro (6-county) Bay Area Metro (9-county)
Exhibit 10: Housing unit supply versus demand in the Sacramento region
Exh ibit 11: Residen tial building units in the six-county Sacramento region (permi t data)20
19,865
14,239
10,996 8,932
6,483 7,768 9,125
10,399
19,122
23,812
17,987
2,293 3,939 4,652
6,492
0
5,000
10,000
15,000
20,000
25,000
30,000
2002 2003 2004 2005 2006 2007 2008 2009 2010 2011 2012 2013 2014 2015 2016 2017
Housing Unit Demand Housing Unit Supply
14,01415,671
19,78419,630
21,65218,612
10,1257,931
4,1752,493 2,326 1,938 2,965 3,772 3,967
5,526 6,401
3,226
3,868
4,628 4,7613,612
2,911
3,568
1,555
1,818 438 539 759631
982 7461,265
1,053
0
5,000
10,000
15,000
20,000
25,000
30,000
2000 2001 2002 2003 2004 2005 2006 2007 2008 2009 2010 2011 2012 2013 2014 2015 2016
Single Family Units Multifamily Units
Exhibit 13: Value of nonresidential construction in the six-county Sacramento region 21
$0
$200,000
$400,000
$600,000
$800,000
$1,000 ,000
$1,200 ,000
$1,400 ,000
$1,600 ,000
$1,800 ,000
$2,000 ,000
2000 2001 2002 2003 2004 2005 2006 2007 2008 2009 2010 2011 2012 2013 2014 2015 2016
El Dorado Placer Sacramento Yolo Yuba Sutter
Exhibit 14: Percent of nonresidential construction value in the Sacramento region, by county22
0%
10%
20%
30%
40%
50%
60%
70%
80%
90%
100%
2006 2016
El Dorado Placer Sacramento Yolo Yuba
Exhibit 17: Average annual earnings in traded and non-traded clusters in the study regions (2016)
$85,
512
$58,
972
$67,
498
$97,
280
$78,
396
$100
,688
$90,
080
$63,
145
$72,
018
$0
$20,000
$40,000
$60,000
$80,000
$100,000
$120,000
Traded Non-Tr aded All Industries
Sacramento Region Bay Area Californ ia
Exhibit 18: Traded subcluster employment index, Sacramento region (2001-2021)25
Water, Sewage, and Other Systems Projection
Projection
Projection
Projection
Projection
Construction Materials
Construction
Construction Products
Construction Components
Empl
oym
ent i
ndex
(2
006
Empl
oym
ent =
100
)
Empl
oym
ent i
ndex
(2
006
Empl
oym
ent =
100
)
Exhibit 24: Non-traded subcluster employment index, Sacramento region (2001-2021)36
101.0 119.3
87.2104.7
73.7
136.3
36.1
29.6
17.9
0.0
25.0
50.0
75.0
100.0
125.0
150.0
2001 2006 2011 2016 2021
Water and Sewer Line Construction Projection
Concrete Products Projection
Real Estate Services Projection
Specialty Contractors Projection
General Contractors Projection
Developers Projection
* Only included subclusters with 10k+employment or significant employment change. Refer to appendix for the complete list of nontraded subclusters.
Exhibit 39: Entering construction industry workers by type of education and training in the Sacramento region (annual average, 2014-2016)59
368
217181
56 54
148125 107
84
28 27 19 13 3
29
369
129
109
198
136
10561
35 8 13 14 8 10
0
50
100
150
200
250
300
350
400
Apprentices Oth er Post-Secondary Completions
Exhibit 44: Projected annual construction industry occupational gaps in the Sacramento region (2016-2021)60
-3
-2
-1
32
45
57
58
68
103
173
196
308
322
397
427
500
524
607
640
864
1,937
-200 100 400 700 1,000 1,300 1,600 1,900
Insulation Workers
Drafters
Interior Designers
PV Installers
Glaziers
Surveyors
Building Inspectors
Roofers
Ironworkers & Welders
Architects
Drywall Installers
HVAC & Sheet Metal
Painters
Masonry, Tile, Floor, Lathe, Plaster
Plumbers & Pipefitters
Engineers
Heavy Equipment Operators
Real Estate Professionals
Electricians
Construction Managers
Carpenters
Exhibit 47: Unionized and non-unionized workforce, Sacramento--Arden-Arcade--Roseville MSA and 10-county Bay Area (annual average, 2014-2017)61
Exhibit 48: Unionization in the construction workforce as an annual average percentage of total employment, Sacramento--Arden-Arcade--Roseville MSA (2000-2017)62
31%, 32,314
29%, 12,555
69%, 70,898
71%, 30,110
0% 20% 40% 60% 80% 100%
10-County Bay Area
Sacramento MSA
Union Non-Union
32%
20% 19%24% 23%
29%
68%
80% 81%76% 77%
71%
0%
10%
20%
30%
40%
50%
60%
70%
80%
90%
2000 – 2002 2003 – 2004 2005 –2008 2008 – 2011 2011 – 2014 2014 – 2017
Union Non-Union
Exhibit 1A. Construction managers projected annual openings, n = 871 (2016-2021)67
Cost Estimators, 206openings, 24%
Construction Managers,
225 openings, 26%
First-Line Supervisors of Construction Trades and
Extraction Workers,440 openings, 50%
0 100 200 300 400 500 600 700 800 900 1,000
Construction Products, 81
Water, Sewage, and Other Systems, 908
-10.0%
-5.0%
0.0%
5.0%
10.0%
15.0%
20.0%
25.0%
0.0 0.5 1.0 1.5 2.0 2.5 3.0 3.5
Location Quotient (2016)
Location Quotient (2016)
Ann
ual E
mpl
oym
ent G
row
th R
ate
(200
6-20
16)
Subcluster with an annual average earnings higher than all-industry annual average earnings in ($67,498) Sacramento region in 2016
LQ=1.0
Exhibit 2C: Non-traded subclusters in the Sacramento region73
Specialty Contractors, 50,899
General Contractors, 16,843
Real Estate Services, 15,475
Construction Materials Retailing, 6,552
Highway and Street Construction, 2,268
Water and Sewer Line Construction, 1,662
Building Equipment Distribution, 1,207
Developers
-15.0%
-10.0%
-5.0%
0.0%
5.0%
0.8 1.0 1.2 1.4
Ann
ual E
mpl
oym
ent G
row
th R
ate
(200
6-20
16
Exhibit 2E: Joint apprentices by gender in the Sacramento region (January 2012-October 2017)
Exhibit 3E: Joint apprentices by county of residence in the Sacramento region (January 2012-October 2017)
8,374, 97%
249, 3%
El Dorado,393, 56%
Placer,949, 11%
Sacramento, 6077, 1
Sutter, 346,4%
Yolo, 549,6%
Yuba, 309,
4%
Exhibit 4E: Joint apprentices’ highest level of education prior to apprenticeship in the Sacramento region (January 2012-October 2017)
Exhibit 5E: Number of weeks worked, all workers in the construction sector in the Sacramento region (2015)84
Less than highschool, 7%
High schoolgraduate orGED, 65%
Some college,25%
4 or more yearsof college, 3%
3,165 6%
3,082 6%
1,650 3%
6,105 12%
7,068 10%
31,037 62%
0 5,000 10,000 15,000 20,000 25,000 30,000 35,000
Did not work
Less than 14
14 to 26
27 to 39
40 to 49
50 to 52
# w
eeks
wor
ked
in th
e la
st y
ear
Exhibit 4: Value of nonresidential construction put in place, by subcomponent (California)9
-0.5%
29.2%
-41.1%
0.0%
62.9%
-34.7%
46.0%
42.8%
19.1%
-14.6%
66.5%
763.4%
Office
Commercial
Manufacturing
Health care
Educational
Religious
Amusement and recreation
Transportation
Power and communication
Highway and street
Public works
Other
Subcomponent percent change 2006-2016
180.8
593.7
818.9
21.4
235.8 342.3
104.9 133.6 173.5
0.0
100.0
200.0
300.0
400.0
500.0
600.0
700.0
800.0
900.0
1000.0
2001 2006 2011 2016 2021
Construction Materials,125
Construction, 1,942
Construction Components, 466
LQ=1.0
Concrete Products, 1,123
Construction Materials Wholesaling, 1,647
Subcluster with an annual average earnings higher than all-industry annual average earnings ($67,498) in Sacramento region in 2016
Exhibit 1E: Total joint apprentice starts, residents in the six-county Sacramento region (January 2012-October 2017) (n = 8,617)2
435
95
104
111
117
121
135
161
174
178
215
302
340
440
458
483
542
602
1,045
1,205
1,354
0 200 400 600 800 1000 1200 1400 1600
All others
Elevator constructor
Drywall finisher
Scaffold and shoring erector
Inspector or surveyor
Pile driver
Glazier
Carpet, linoleum, and soft tile layer
Millwright
Sheet metal worker & related trades
Construction equipment operator trades
Brick, marble, terrazzo, tile, and related trades
Roofer and waterproofer
Plumber and fitter trades
Painter trades
Cement mason and plasterer trades
Electricial trades
Drywall/lather
Ironworker trades
Carpenter
Construction craft laborer
Exhibit 38: Anticipated annual construction industry job openings by new and replacement jobs in the Sacramento region (2016-2021)1
21 26 59 60 52 78 99 167 167 220323 350 399 439 473
596 679788 777 763
2,119
4 6 1 1 20 7 520 27 2
71 56100 95 73
4699
82 95222
215
0
500
1000
1500
2000
2500
Annual Replacement Openings New Jobs (Growth)
Male
Female
$ Th
ousa
nds
Thou
sand
s of
Dol
lars
Average annual openings (demand) minuseducation and training (supply) =approximate annual shortage
Approximate annual shortage = 7,250 workers across all categories
Sutter
6.2% 5.1%
27.6%
14.4%
50.6%69.9%
10.8%7.9%
1.1% 0.6%3.6% 2.0%
3 U.S. Census Bureau. Data pulled from U.S. Census Bureau’s Annual Value of Construction Put in Place. The start year of 2002 was used since this was the first year in which total construction was differentiated between private and public activity. This is true for all subsequent charts that utilize U.S. Census Bureau national data for construction put in place. Further detail regarding collection methodology is available from the Census Bureau’s website: https://www.census.gov/construction/c30/c30index.html.
8 CONSTRUCTION: CLUSTER AND WORKFORCE NEEDS ASSESSMENT, SACRAMENTO REGION
4 The following charts use data provided by the California Homebuilding Foundation’s Construction Industry Research Board (CIRB). CIRB requests monthly permit data from all jurisdictions in the state and maintains a 90% positive rate of reporting. The cities that do not report permit data are believed to be in the respective county’s unincorporated region.
5 Construction Industry Research Board (CIRB) is a department of the California Homebuilding Foundation that tracks and reports residential and nonresidential building permit statistics statewide. The data for the statewide construction activity charts in this report came from CIRB and provides comparable construction value detail to that from the U.S. Census Bureau regarding national activity since both sources collect their information directly from municipalities based on permitting reports. The categories in which construction activity and amounts are reported were substantially the same as the national data, allowing for a direct comparison even though the data sources are different. More information on CIRB and their datasets are available at http://www.mychf.org/cirb-383887.html.
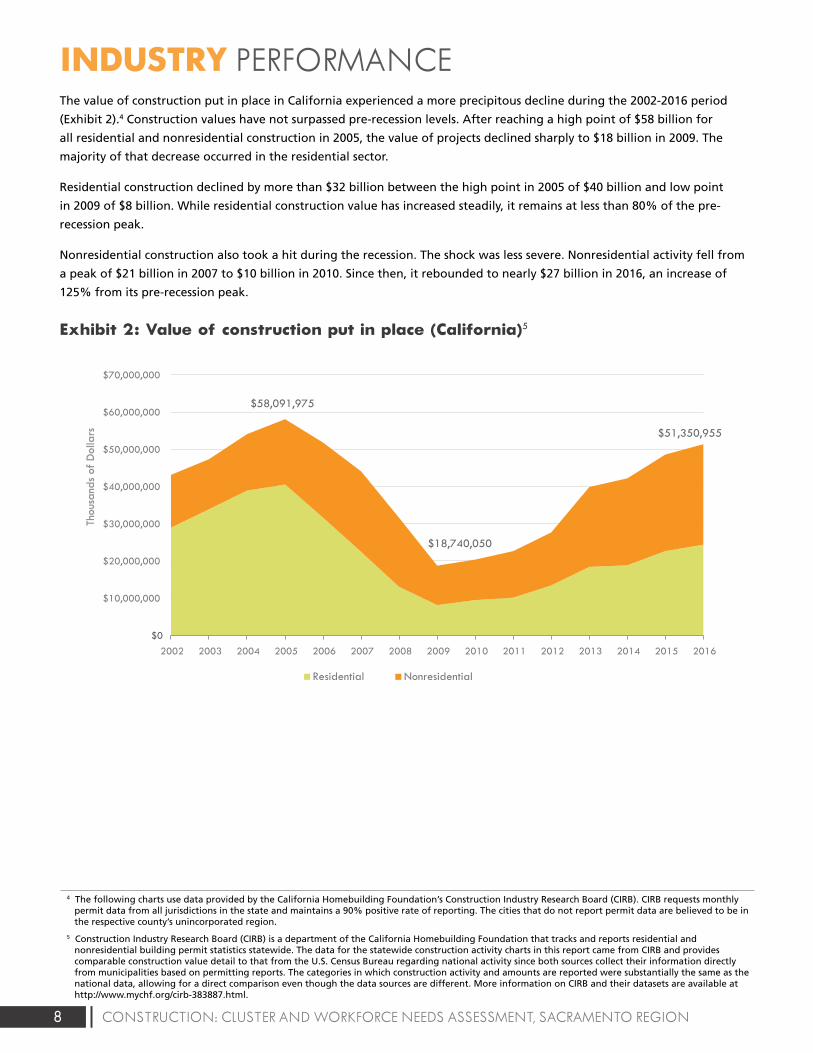
INDUSTRY PERFORMANCEThe value of construction put in place in California experienced a more precipitous decline during the 2002-2016 period
(Exhibit 2).4 Construction values have not surpassed pre-recession levels. After reaching a high point of $58 billion for
all residential and nonresidential construction in 2005, the value of projects declined sharply to $18 billion in 2009. The
majority of that decrease occurred in the residential sector.
Residential construction declined by more than $32 billion between the high point in 2005 of $40 billion and low point
in 2009 of $8 billion. While residential construction value has increased steadily, it remains at less than 80% of the pre-
recession peak.
Nonresidential construction also took a hit during the recession. The shock was less severe. Nonresidential activity fell from
a peak of $21 billion in 2007 to $10 billion in 2010. Since then, it rebounded to nearly $27 billion in 2016, an increase of
125% from its pre-recession peak.
Exhibit 2: Value of construction put in place (California)5
Exhibit 1: Value of construction put in place (United States)3
$1,161,282
$788,332
$1,185,683
$0
$200,000
$400,000
$600,000
$800,000
$1,000,000
$1,200,000
$1,400,000
2002 2003 2004 2005 2006 2007 2008 2009 2010 2011 2012 2013 2014 2015 2016
Mill
ions
of
Dol
lars
Residential Nonresidential
Exhibit 2: Value of construction put in place (California)5
$58,091,975
$18,740,050
$51,350,955
$0
$10,000,000
$20,000,000
$30,000,000
$40,000,000
$50,000,000
$60,000,000
$70,000,000
2002 2003 2004 2005 2006 2007 2008 2009 2010 2011 2012 2013 2014 2015 2016
Residential Nonresidential
Exhibit 3: Value of nonresidential construction put in place, by subcomponent (United States)7
24.1%
-0.2%
130.5%
0.6%
5.3%
-54.8%
18.0%
50.9%
98.2%
26.9%
-7.5%
21.7%
Office
Commercial
Manufacturing
Health care
Educational
Religious
Amusement and recreation
Transportation
Power and communication
Highway and street
Public works
Other
Subcomponent percent change 2006-2016
Exhibit 5: Value of Infrastructure as a percent of nonresidential construction put in place (United States)10
37.5% 37.9% 36.5%37.1% 37.0%
37.3%37.5% 41.1% 46.3% 45.5%
46.6% 46.4%46.1% 43.5% 41.6%
$0
$100,000
$200,000
$300,000
$400,000
$500,000
$600,000
$700,000
$800,000
2002 2003 2004 2005 2006 2007 2008 2009 2010 2011 2012 2013 2014 2015 2016
$ M
illio
ns
$ Th
ousa
nds
Nonresidential Infrastructure
Exhibit 6: Value of infrastructure as a percent of nonresidential construction put in place (California)11
11.6% 12.8% 14.3% 13.4%14.3%
11.0% 10.7%10.7% 10.2% 9.9% 10.9%
27.5%
14.9%16.2% 13.0%$5,000,000
$0
$10,000,000
$15,000,000
$20,000,000
$25,000,000
$30,000,000
2002 2003 2004 2005 2006 2007 2008 2009 2010 2011 2012 2013 2014 2015 2016
Nonresidential Infrastructure
Exhibit 7: Construction value added as a percent of GDP (United States)12
Exhibit 8: Construction value added as a percent of GRP (California)13
7.8% 7.8%8.1%
8.6%8.4%
8.0%
7.4%
6.3%
5.4%5.1%
5.3%5.5%
5.8%
6.2%6.4%
3.0%
4.0%
5.0%
6.0%
7.0%
8.0%
9.0%
2002 2003 2004 2005 2006 2007 2008 2009 2010 2011 2012 2013 2014 2015 2016
2002 2003 2004 2005 2006 2007 2008 2009 2010 2011 2012 2013 2014 2015 2016
3.0% 3.1%3.3% 3.3%
2.8%
2.3%
1.6%
1.0% 1.0% 1.1%1.3%
1.8% 1.8%2.0% 2.0%
0.0%
0.5%
1.0%
1.5%
2.0%
2.5%
3.0%
3.5%
4.0%
Exhibit 9: Construction value added as a percent of GRP (California, Sacramento region and Bay Area)16
3.0%
6.8% 6.9%
3.6%
1.2%1.4%
1.7%
2.3%
2.4%
0.0%
1.0%
2.0%
3.0%
4.0%
5.0%
6.0%
7.0%
8.0%
2002 2003 2004 2005 2006 2007 2008 2009 2010 2011 2012 2013 2014 2015
State Sacramento Metro (6-county) Bay Area Metro (9-county)
Exhibit 10: Housing unit supply versus demand in the Sacramento region
Exh ibit 11: Residen tial building units in the six-county Sacramento region (permi t data)20
19,865
14,239
10,996 8,932
6,483 7,768 9,125
10,399
19,122
23,812
17,987
2,293 3,939 4,652
6,492
0
5,000
10,000
15,000
20,000
25,000
30,000
2002 2003 2004 2005 2006 2007 2008 2009 2010 2011 2012 2013 2014 2015 2016 2017
Housing Unit Demand Housing Unit Supply
14,01415,671
19,78419,630
21,65218,612
10,1257,931
4,1752,493 2,326 1,938 2,965 3,772 3,967
5,526 6,401
3,226
3,868
4,628 4,7613,612
2,911
3,568
1,555
1,818 438 539 759631
982 7461,265
1,053
0
5,000
10,000
15,000
20,000
25,000
30,000
2000 2001 2002 2003 2004 2005 2006 2007 2008 2009 2010 2011 2012 2013 2014 2015 2016
Single Family Units Multifamily Units
Exhibit 13: Value of nonresidential construction in the six-county Sacramento region 21
$0
$200,000
$400,000
$600,000
$800,000
$1,000 ,000
$1,200 ,000
$1,400 ,000
$1,600 ,000
$1,800 ,000
$2,000 ,000
2000 2001 2002 2003 2004 2005 2006 2007 2008 2009 2010 2011 2012 2013 2014 2015 2016
El Dorado Placer Sacramento Yolo Yuba Sutter
Exhibit 14: Percent of nonresidential construction value in the Sacramento region, by county22
0%
10%
20%
30%
40%
50%
60%
70%
80%
90%
100%
2006 2016
El Dorado Placer Sacramento Yolo Yuba
Exhibit 17: Average annual earnings in traded and non-traded clusters in the study regions (2016)
$85,
512
$58,
972
$67,
498
$97,
280
$78,
396
$100
,688
$90,
080
$63,
145
$72,
018
$0
$20,000
$40,000
$60,000
$80,000
$100,000
$120,000
Traded Non-Tr aded All Industries
Sacramento Region Bay Area Californ ia
Exhibit 18: Traded subcluster employment index, Sacramento region (2001-2021)25
Water, Sewage, and Other Systems Projection
Projection
Projection
Projection
Projection
Construction Materials
Construction
Construction Products
Construction Components
Empl
oym
ent i
ndex
(2
006
Empl
oym
ent =
100
)
Empl
oym
ent i
ndex
(2
006
Empl
oym
ent =
100
)
Exhibit 24: Non-traded subcluster employment index, Sacramento region (2001-2021)36
101.0 119.3
87.2104.7
73.7
136.3
36.1
29.6
17.9
0.0
25.0
50.0
75.0
100.0
125.0
150.0
2001 2006 2011 2016 2021
Water and Sewer Line Construction Projection
Concrete Products Projection
Real Estate Services Projection
Specialty Contractors Projection
General Contractors Projection
Developers Projection
* Only included subclusters with 10k+employment or significant employment change. Refer to appendix for the complete list of nontraded subclusters.
Exhibit 39: Entering construction industry workers by type of education and training in the Sacramento region (annual average, 2014-2016)59
368
217181
56 54
148125 107
84
28 27 19 13 3
29
369
129
109
198
136
10561
35 8 13 14 8 10
0
50
100
150
200
250
300
350
400
Apprentices Oth er Post-Secondary Completions
Exhibit 44: Projected annual construction industry occupational gaps in the Sacramento region (2016-2021)60
-3
-2
-1
32
45
57
58
68
103
173
196
308
322
397
427
500
524
607
640
864
1,937
-200 100 400 700 1,000 1,300 1,600 1,900
Insulation Workers
Drafters
Interior Designers
PV Installers
Glaziers
Surveyors
Building Inspectors
Roofers
Ironworkers & Welders
Architects
Drywall Installers
HVAC & Sheet Metal
Painters
Masonry, Tile, Floor, Lathe, Plaster
Plumbers & Pipefitters
Engineers
Heavy Equipment Operators
Real Estate Professionals
Electricians
Construction Managers
Carpenters
Exhibit 47: Unionized and non-unionized workforce, Sacramento--Arden-Arcade--Roseville MSA and 10-county Bay Area (annual average, 2014-2017)61
Exhibit 48: Unionization in the construction workforce as an annual average percentage of total employment, Sacramento--Arden-Arcade--Roseville MSA (2000-2017)62
31%, 32,314
29%, 12,555
69%, 70,898
71%, 30,110
0% 20% 40% 60% 80% 100%
10-County Bay Area
Sacramento MSA
Union Non-Union
32%
20% 19%24% 23%
29%
68%
80% 81%76% 77%
71%
0%
10%
20%
30%
40%
50%
60%
70%
80%
90%
2000 – 2002 2003 – 2004 2005 –2008 2008 – 2011 2011 – 2014 2014 – 2017
Union Non-Union
Exhibit 1A. Construction managers projected annual openings, n = 871 (2016-2021)67
Cost Estimators, 206openings, 24%
Construction Managers,
225 openings, 26%
First-Line Supervisors of Construction Trades and
Extraction Workers,440 openings, 50%
0 100 200 300 400 500 600 700 800 900 1,000
Construction Products, 81
Water, Sewage, and Other Systems, 908
-10.0%
-5.0%
0.0%
5.0%
10.0%
15.0%
20.0%
25.0%
0.0 0.5 1.0 1.5 2.0 2.5 3.0 3.5
Location Quotient (2016)
Location Quotient (2016)
Ann
ual E
mpl
oym
ent G
row
th R
ate
(200
6-20
16)
Subcluster with an annual average earnings higher than all-industry annual average earnings in ($67,498) Sacramento region in 2016
LQ=1.0
Exhibit 2C: Non-traded subclusters in the Sacramento region73
Specialty Contractors, 50,899
General Contractors, 16,843
Real Estate Services, 15,475
Construction Materials Retailing, 6,552
Highway and Street Construction, 2,268
Water and Sewer Line Construction, 1,662
Building Equipment Distribution, 1,207
Developers
-15.0%
-10.0%
-5.0%
0.0%
5.0%
0.8 1.0 1.2 1.4
Ann
ual E
mpl
oym
ent G
row
th R
ate
(200
6-20
16
Exhibit 2E: Joint apprentices by gender in the Sacramento region (January 2012-October 2017)
Exhibit 3E: Joint apprentices by county of residence in the Sacramento region (January 2012-October 2017)
8,374, 97%
249, 3%
El Dorado,393, 56%
Placer,949, 11%
Sacramento, 6077, 1
Sutter, 346,4%
Yolo, 549,6%
Yuba, 309,
4%
Exhibit 4E: Joint apprentices’ highest level of education prior to apprenticeship in the Sacramento region (January 2012-October 2017)
Exhibit 5E: Number of weeks worked, all workers in the construction sector in the Sacramento region (2015)84
Less than highschool, 7%
High schoolgraduate orGED, 65%
Some college,25%
4 or more yearsof college, 3%
3,165 6%
3,082 6%
1,650 3%
6,105 12%
7,068 10%
31,037 62%
0 5,000 10,000 15,000 20,000 25,000 30,000 35,000
Did not work
Less than 14
14 to 26
27 to 39
40 to 49
50 to 52
# w
eeks
wor
ked
in th
e la
st y
ear
Exhibit 4: Value of nonresidential construction put in place, by subcomponent (California)9
-0.5%
29.2%
-41.1%
0.0%
62.9%
-34.7%
46.0%
42.8%
19.1%
-14.6%
66.5%
763.4%
Office
Commercial
Manufacturing
Health care
Educational
Religious
Amusement and recreation
Transportation
Power and communication
Highway and street
Public works
Other
Subcomponent percent change 2006-2016
180.8
593.7
818.9
21.4
235.8 342.3
104.9 133.6 173.5
0.0
100.0
200.0
300.0
400.0
500.0
600.0
700.0
800.0
900.0
1000.0
2001 2006 2011 2016 2021
Construction Materials,125
Construction, 1,942
Construction Components, 466
LQ=1.0
Concrete Products, 1,123
Construction Materials Wholesaling, 1,647
Subcluster with an annual average earnings higher than all-industry annual average earnings ($67,498) in Sacramento region in 2016
Exhibit 1E: Total joint apprentice starts, residents in the six-county Sacramento region (January 2012-October 2017) (n = 8,617)2
435
95
104
111
117
121
135
161
174
178
215
302
340
440
458
483
542
602
1,045
1,205
1,354
0 200 400 600 800 1000 1200 1400 1600
All others
Elevator constructor
Drywall finisher
Scaffold and shoring erector
Inspector or surveyor
Pile driver
Glazier
Carpet, linoleum, and soft tile layer
Millwright
Sheet metal worker & related trades
Construction equipment operator trades
Brick, marble, terrazzo, tile, and related trades
Roofer and waterproofer
Plumber and fitter trades
Painter trades
Cement mason and plasterer trades
Electricial trades
Drywall/lather
Ironworker trades
Carpenter
Construction craft laborer
Exhibit 38: Anticipated annual construction industry job openings by new and replacement jobs in the Sacramento region (2016-2021)1
21 26 59 60 52 78 99 167 167 220323 350 399 439 473
596 679788 777 763
2,119
4 6 1 1 20 7 520 27 2
71 56100 95 73
4699
82 95222
215
0
500
1000
1500
2000
2500
Annual Replacement Openings New Jobs (Growth)
Male
Female
$ Th
ousa
nds
Thou
sand
s of
Dol
lars
Average annual openings (demand) minuseducation and training (supply) =approximate annual shortage
Approximate annual shortage = 7,250 workers across all categories
Sutter
6.2% 5.1%
27.6%
14.4%
50.6%69.9%
10.8%7.9%
1.1% 0.6%3.6% 2.0%
9CONSTRUCTION: CLUSTER AND WORKFORCE NEEDS ASSESSMENT, SACRAMENTO REGION
6 The subcomponents included in the charts have been adjusted to allow for direct comparison with state-level data presented below. The public works segment combines sewage/waste disposal and water supply while the other category combines public safety, conservation and development and alterations.
7 U.S. Census Bureau. The time periods used for comparison here, 2006 and 2016, were chosen to show the difference in activity for the various construction subcomponents prior to and after the recession.
8 The subcomponents included in the above chart have been adjusted to allow for direct comparison with national-level data presented earlier in this report. The public works segment combines sewage/waste disposal and water supply while the other category combines public safety, conservation and development and alterations.
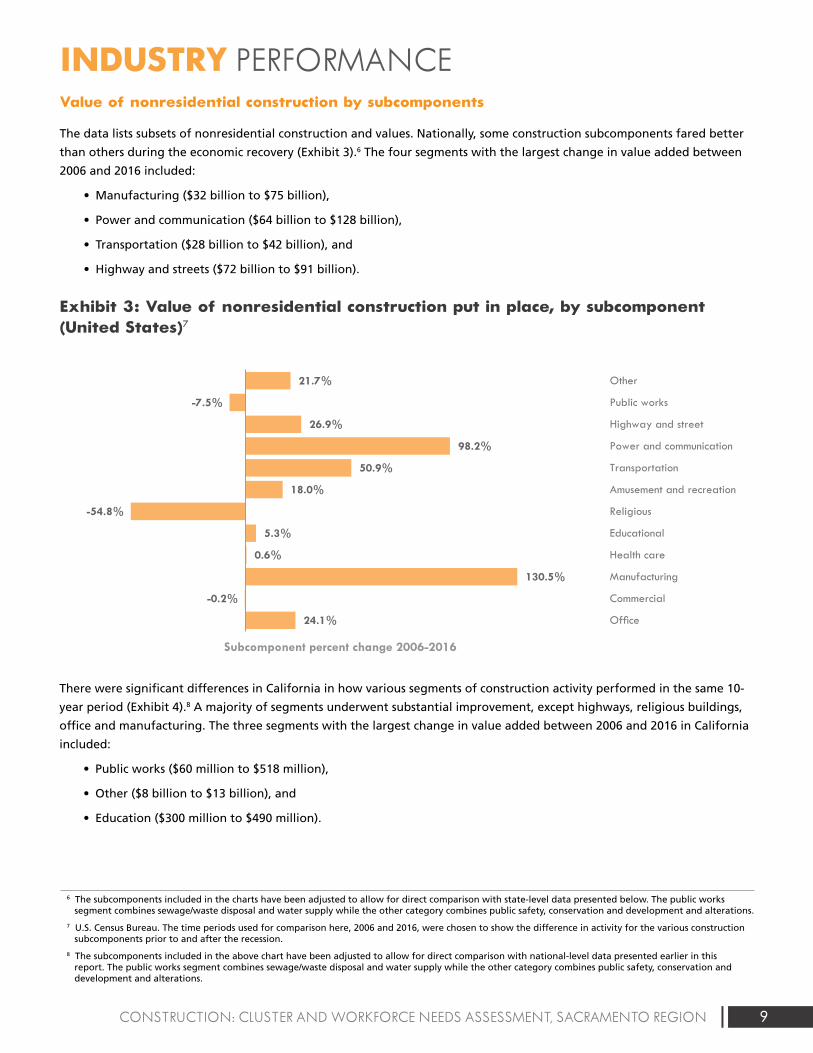
INDUSTRY PERFORMANCEValue of nonresidential construction by subcomponents
The data lists subsets of nonresidential construction and values. Nationally, some construction subcomponents fared better
than others during the economic recovery (Exhibit 3).6 The four segments with the largest change in value added between
2006 and 2016 included:
• Manufacturing ($32 billion to $75 billion),
• Power and communication ($64 billion to $128 billion),
• Transportation ($28 billion to $42 billion), and
• Highway and streets ($72 billion to $91 billion).
Exhibit 3: Value of nonresidential construction put in place, by subcomponent (United States)7
Exhibit 1: Value of construction put in place (United States)3
$1,161,282
$788,332
$1,185,683
$0
$200,000
$400,000
$600,000
$800,000
$1,000,000
$1,200,000
$1,400,000
2002 2003 2004 2005 2006 2007 2008 2009 2010 2011 2012 2013 2014 2015 2016
Mill
ions
of
Dol
lars
Residential Nonresidential
Exhibit 2: Value of construction put in place (California)5
$58,091,975
$18,740,050
$51,350,955
$0
$10,000,000
$20,000,000
$30,000,000
$40,000,000
$50,000,000
$60,000,000
$70,000,000
2002 2003 2004 2005 2006 2007 2008 2009 2010 2011 2012 2013 2014 2015 2016
Residential Nonresidential
Exhibit 3: Value of nonresidential construction put in place, by subcomponent (United States)7
24.1%
-0.2%
130.5%
0.6%
5.3%
-54.8%
18.0%
50.9%
98.2%
26.9%
-7.5%
21.7%
Office
Commercial
Manufacturing
Health care
Educational
Religious
Amusement and recreation
Transportation
Power and communication
Highway and street
Public works
Other
Subcomponent percent change 2006-2016
Exhibit 5: Value of Infrastructure as a percent of nonresidential construction put in place (United States)10
37.5% 37.9% 36.5%37.1% 37.0%
37.3%37.5% 41.1% 46.3% 45.5%
46.6% 46.4%46.1% 43.5% 41.6%
$0
$100,000
$200,000
$300,000
$400,000
$500,000
$600,000
$700,000
$800,000
2002 2003 2004 2005 2006 2007 2008 2009 2010 2011 2012 2013 2014 2015 2016
$ M
illio
ns
$ Th
ousa
nds
Nonresidential Infrastructure
Exhibit 6: Value of infrastructure as a percent of nonresidential construction put in place (California)11
11.6% 12.8% 14.3% 13.4%14.3%
11.0% 10.7%10.7% 10.2% 9.9% 10.9%
27.5%
14.9%16.2% 13.0%$5,000,000
$0
$10,000,000
$15,000,000
$20,000,000
$25,000,000
$30,000,000
2002 2003 2004 2005 2006 2007 2008 2009 2010 2011 2012 2013 2014 2015 2016
Nonresidential Infrastructure
Exhibit 7: Construction value added as a percent of GDP (United States)12
Exhibit 8: Construction value added as a percent of GRP (California)13
7.8% 7.8%8.1%
8.6%8.4%
8.0%
7.4%
6.3%
5.4%5.1%
5.3%5.5%
5.8%
6.2%6.4%
3.0%
4.0%
5.0%
6.0%
7.0%
8.0%
9.0%
2002 2003 2004 2005 2006 2007 2008 2009 2010 2011 2012 2013 2014 2015 2016
2002 2003 2004 2005 2006 2007 2008 2009 2010 2011 2012 2013 2014 2015 2016
3.0% 3.1%3.3% 3.3%
2.8%
2.3%
1.6%
1.0% 1.0% 1.1%1.3%
1.8% 1.8%2.0% 2.0%
0.0%
0.5%
1.0%
1.5%
2.0%
2.5%
3.0%
3.5%
4.0%
Exhibit 9: Construction value added as a percent of GRP (California, Sacramento region and Bay Area)16
3.0%
6.8% 6.9%
3.6%
1.2%1.4%
1.7%
2.3%
2.4%
0.0%
1.0%
2.0%
3.0%
4.0%
5.0%
6.0%
7.0%
8.0%
2002 2003 2004 2005 2006 2007 2008 2009 2010 2011 2012 2013 2014 2015
State Sacramento Metro (6-county) Bay Area Metro (9-county)
Exhibit 10: Housing unit supply versus demand in the Sacramento region
Exh ibit 11: Residen tial building units in the six-county Sacramento region (permi t data)20
19,865
14,239
10,996 8,932
6,483 7,768 9,125
10,399
19,122
23,812
17,987
2,293 3,939 4,652
6,492
0
5,000
10,000
15,000
20,000
25,000
30,000
2002 2003 2004 2005 2006 2007 2008 2009 2010 2011 2012 2013 2014 2015 2016 2017
Housing Unit Demand Housing Unit Supply
14,01415,671
19,78419,630
21,65218,612
10,1257,931
4,1752,493 2,326 1,938 2,965 3,772 3,967
5,526 6,401
3,226
3,868
4,628 4,7613,612
2,911
3,568
1,555
1,818 438 539 759631
982 7461,265
1,053
0
5,000
10,000
15,000
20,000
25,000
30,000
2000 2001 2002 2003 2004 2005 2006 2007 2008 2009 2010 2011 2012 2013 2014 2015 2016
Single Family Units Multifamily Units
Exhibit 13: Value of nonresidential construction in the six-county Sacramento region 21
$0
$200,000
$400,000
$600,000
$800,000
$1,000 ,000
$1,200 ,000
$1,400 ,000
$1,600 ,000
$1,800 ,000
$2,000 ,000
2000 2001 2002 2003 2004 2005 2006 2007 2008 2009 2010 2011 2012 2013 2014 2015 2016
El Dorado Placer Sacramento Yolo Yuba Sutter
Exhibit 14: Percent of nonresidential construction value in the Sacramento region, by county22
0%
10%
20%
30%
40%
50%
60%
70%
80%
90%
100%
2006 2016
El Dorado Placer Sacramento Yolo Yuba
Exhibit 17: Average annual earnings in traded and non-traded clusters in the study regions (2016)
$85,
512
$58,
972
$67,
498
$97,
280
$78,
396
$100
,688
$90,
080
$63,
145
$72,
018
$0
$20,000
$40,000
$60,000
$80,000
$100,000
$120,000
Traded Non-Tr aded All Industries
Sacramento Region Bay Area Californ ia
Exhibit 18: Traded subcluster employment index, Sacramento region (2001-2021)25
Water, Sewage, and Other Systems Projection
Projection
Projection
Projection
Projection
Construction Materials
Construction
Construction Products
Construction Components
Empl
oym
ent i
ndex
(2
006
Empl
oym
ent =
100
)
Empl
oym
ent i
ndex
(2
006
Empl
oym
ent =
100
)
Exhibit 24: Non-traded subcluster employment index, Sacramento region (2001-2021)36
101.0 119.3
87.2104.7
73.7
136.3
36.1
29.6
17.9
0.0
25.0
50.0
75.0
100.0
125.0
150.0
2001 2006 2011 2016 2021
Water and Sewer Line Construction Projection
Concrete Products Projection
Real Estate Services Projection
Specialty Contractors Projection
General Contractors Projection
Developers Projection
* Only included subclusters with 10k+employment or significant employment change. Refer to appendix for the complete list of nontraded subclusters.
Exhibit 39: Entering construction industry workers by type of education and training in the Sacramento region (annual average, 2014-2016)59
368
217181
56 54
148125 107
84
28 27 19 13 3
29
369
129
109
198
136
10561
35 8 13 14 8 10
0
50
100
150
200
250
300
350
400
Apprentices Oth er Post-Secondary Completions
Exhibit 44: Projected annual construction industry occupational gaps in the Sacramento region (2016-2021)60
-3
-2
-1
32
45
57
58
68
103
173
196
308
322
397
427
500
524
607
640
864
1,937
-200 100 400 700 1,000 1,300 1,600 1,900
Insulation Workers
Drafters
Interior Designers
PV Installers
Glaziers
Surveyors
Building Inspectors
Roofers
Ironworkers & Welders
Architects
Drywall Installers
HVAC & Sheet Metal
Painters
Masonry, Tile, Floor, Lathe, Plaster
Plumbers & Pipefitters
Engineers
Heavy Equipment Operators
Real Estate Professionals
Electricians
Construction Managers
Carpenters
Exhibit 47: Unionized and non-unionized workforce, Sacramento--Arden-Arcade--Roseville MSA and 10-county Bay Area (annual average, 2014-2017)61
Exhibit 48: Unionization in the construction workforce as an annual average percentage of total employment, Sacramento--Arden-Arcade--Roseville MSA (2000-2017)62
31%, 32,314
29%, 12,555
69%, 70,898
71%, 30,110
0% 20% 40% 60% 80% 100%
10-County Bay Area
Sacramento MSA
Union Non-Union
32%
20% 19%24% 23%
29%
68%
80% 81%76% 77%
71%
0%
10%
20%
30%
40%
50%
60%
70%
80%
90%
2000 – 2002 2003 – 2004 2005 –2008 2008 – 2011 2011 – 2014 2014 – 2017
Union Non-Union
Exhibit 1A. Construction managers projected annual openings, n = 871 (2016-2021)67
Cost Estimators, 206openings, 24%
Construction Managers,
225 openings, 26%
First-Line Supervisors of Construction Trades and
Extraction Workers,440 openings, 50%
0 100 200 300 400 500 600 700 800 900 1,000
Construction Products, 81
Water, Sewage, and Other Systems, 908
-10.0%
-5.0%
0.0%
5.0%
10.0%
15.0%
20.0%
25.0%
0.0 0.5 1.0 1.5 2.0 2.5 3.0 3.5
Location Quotient (2016)
Location Quotient (2016)
Ann
ual E
mpl
oym
ent G
row
th R
ate
(200
6-20
16)
Subcluster with an annual average earnings higher than all-industry annual average earnings in ($67,498) Sacramento region in 2016
LQ=1.0
Exhibit 2C: Non-traded subclusters in the Sacramento region73
Specialty Contractors, 50,899
General Contractors, 16,843
Real Estate Services, 15,475
Construction Materials Retailing, 6,552
Highway and Street Construction, 2,268
Water and Sewer Line Construction, 1,662
Building Equipment Distribution, 1,207
Developers
-15.0%
-10.0%
-5.0%
0.0%
5.0%
0.8 1.0 1.2 1.4
Ann
ual E
mpl
oym
ent G
row
th R
ate
(200
6-20
16
Exhibit 2E: Joint apprentices by gender in the Sacramento region (January 2012-October 2017)
Exhibit 3E: Joint apprentices by county of residence in the Sacramento region (January 2012-October 2017)
8,374, 97%
249, 3%
El Dorado,393, 56%
Placer,949, 11%
Sacramento, 6077, 1
Sutter, 346,4%
Yolo, 549,6%
Yuba, 309,
4%
Exhibit 4E: Joint apprentices’ highest level of education prior to apprenticeship in the Sacramento region (January 2012-October 2017)
Exhibit 5E: Number of weeks worked, all workers in the construction sector in the Sacramento region (2015)84
Less than highschool, 7%
High schoolgraduate orGED, 65%
Some college,25%
4 or more yearsof college, 3%
3,165 6%
3,082 6%
1,650 3%
6,105 12%
7,068 10%
31,037 62%
0 5,000 10,000 15,000 20,000 25,000 30,000 35,000
Did not work
Less than 14
14 to 26
27 to 39
40 to 49
50 to 52
# w
eeks
wor
ked
in th
e la
st y
ear
Exhibit 4: Value of nonresidential construction put in place, by subcomponent (California)9
-0.5%
29.2%
-41.1%
0.0%
62.9%
-34.7%
46.0%
42.8%
19.1%
-14.6%
66.5%
763.4%
Office
Commercial
Manufacturing
Health care
Educational
Religious
Amusement and recreation
Transportation
Power and communication
Highway and street
Public works
Other
Subcomponent percent change 2006-2016
180.8
593.7
818.9
21.4
235.8 342.3
104.9 133.6 173.5
0.0
100.0
200.0
300.0
400.0
500.0
600.0
700.0
800.0
900.0
1000.0
2001 2006 2011 2016 2021
Construction Materials,125
Construction, 1,942
Construction Components, 466
LQ=1.0
Concrete Products, 1,123
Construction Materials Wholesaling, 1,647
Subcluster with an annual average earnings higher than all-industry annual average earnings ($67,498) in Sacramento region in 2016
Exhibit 1E: Total joint apprentice starts, residents in the six-county Sacramento region (January 2012-October 2017) (n = 8,617)2
435
95
104
111
117
121
135
161
174
178
215
302
340
440
458
483
542
602
1,045
1,205
1,354
0 200 400 600 800 1000 1200 1400 1600
All others
Elevator constructor
Drywall finisher
Scaffold and shoring erector
Inspector or surveyor
Pile driver
Glazier
Carpet, linoleum, and soft tile layer
Millwright
Sheet metal worker & related trades
Construction equipment operator trades
Brick, marble, terrazzo, tile, and related trades
Roofer and waterproofer
Plumber and fitter trades
Painter trades
Cement mason and plasterer trades
Electricial trades
Drywall/lather
Ironworker trades
Carpenter
Construction craft laborer
Exhibit 38: Anticipated annual construction industry job openings by new and replacement jobs in the Sacramento region (2016-2021)1
21 26 59 60 52 78 99 167 167 220323 350 399 439 473
596 679788 777 763
2,119
4 6 1 1 20 7 520 27 2
71 56100 95 73
4699
82 95222
215
0
500
1000
1500
2000
2500
Annual Replacement Openings New Jobs (Growth)
Male
Female
$ Th
ousa
nds
Thou
sand
s of
Dol
lars
Average annual openings (demand) minuseducation and training (supply) =approximate annual shortage
Approximate annual shortage = 7,250 workers across all categories
Sutter
6.2% 5.1%
27.6%
14.4%
50.6%69.9%
10.8%7.9%
1.1% 0.6%3.6% 2.0%
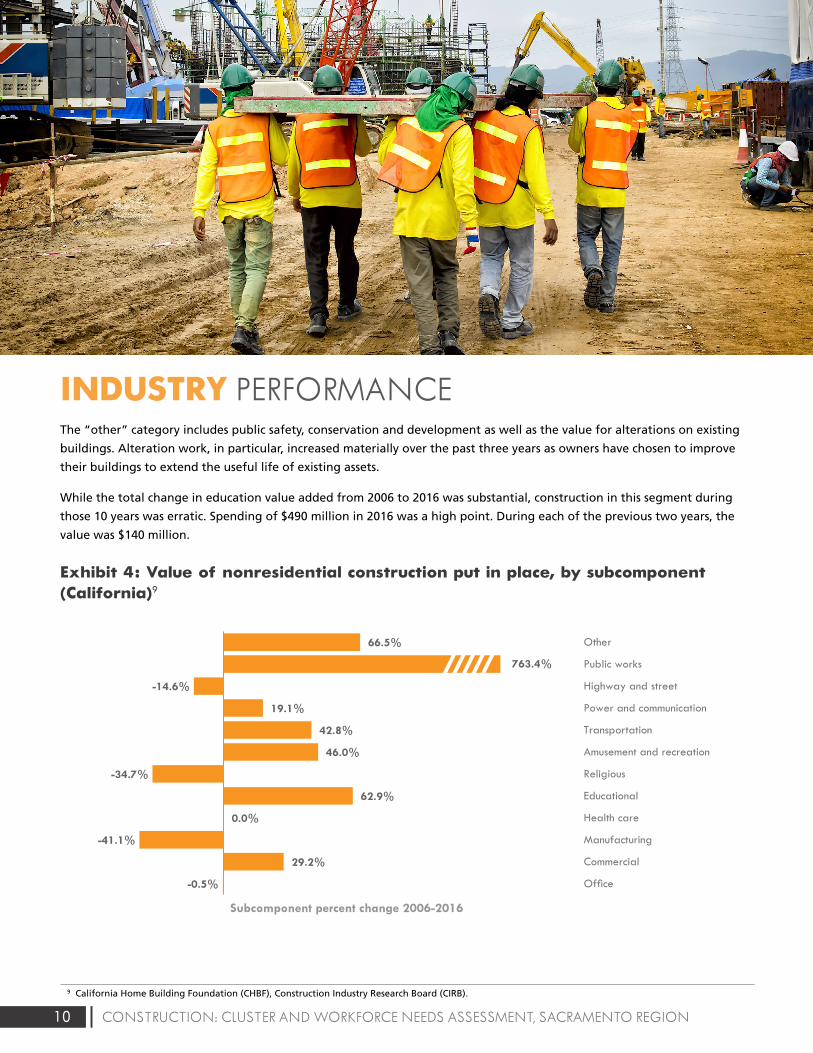
There were significant differences in California in how various segments of construction activity performed in the same 10-
year period (Exhibit 4).8 A majority of segments underwent substantial improvement, except highways, religious buildings,
office and manufacturing. The three segments with the largest change in value added between 2006 and 2016 in California
included:
• Public works ($60 million to $518 million),
• Other ($8 billion to $13 billion), and
• Education ($300 million to $490 million).
10 CONSTRUCTION: CLUSTER AND WORKFORCE NEEDS ASSESSMENT, SACRAMENTO REGION
INDUSTRY PERFORMANCEThe “other” category includes public safety, conservation and development as well as the value for alterations on existing
buildings. Alteration work, in particular, increased materially over the past three years as owners have chosen to improve
their buildings to extend the useful life of existing assets.
While the total change in education value added from 2006 to 2016 was substantial, construction in this segment during
those 10 years was erratic. Spending of $490 million in 2016 was a high point. During each of the previous two years, the
value was $140 million.
Exhibit 4: Value of nonresidential construction put in place, by subcomponent (California)9
Exhibit 1: Value of construction put in place (United States)3
$1,161,282
$788,332
$1,185,683
$0
$200,000
$400,000
$600,000
$800,000
$1,000,000
$1,200,000
$1,400,000
2002 2003 2004 2005 2006 2007 2008 2009 2010 2011 2012 2013 2014 2015 2016
Mill
ions
of
Dol
lars
Residential Nonresidential
Exhibit 2: Value of construction put in place (California)5
$58,091,975
$18,740,050
$51,350,955
$0
$10,000,000
$20,000,000
$30,000,000
$40,000,000
$50,000,000
$60,000,000
$70,000,000
2002 2003 2004 2005 2006 2007 2008 2009 2010 2011 2012 2013 2014 2015 2016
Residential Nonresidential
Exhibit 3: Value of nonresidential construction put in place, by subcomponent (United States)7
24.1%
-0.2%
130.5%
0.6%
5.3%
-54.8%
18.0%
50.9%
98.2%
26.9%
-7.5%
21.7%
Office
Commercial
Manufacturing
Health care
Educational
Religious
Amusement and recreation
Transportation
Power and communication
Highway and street
Public works
Other
Subcomponent percent change 2006-2016
Exhibit 5: Value of Infrastructure as a percent of nonresidential construction put in place (United States)10
37.5% 37.9% 36.5%37.1% 37.0%
37.3%37.5% 41.1% 46.3% 45.5%
46.6% 46.4%46.1% 43.5% 41.6%
$0
$100,000
$200,000
$300,000
$400,000
$500,000
$600,000
$700,000
$800,000
2002 2003 2004 2005 2006 2007 2008 2009 2010 2011 2012 2013 2014 2015 2016
$ M
illio
ns
$ Th
ousa
nds
Nonresidential Infrastructure
Exhibit 6: Value of infrastructure as a percent of nonresidential construction put in place (California)11
11.6% 12.8% 14.3% 13.4%14.3%
11.0% 10.7%10.7% 10.2% 9.9% 10.9%
27.5%
14.9%16.2% 13.0%$5,000,000
$0
$10,000,000
$15,000,000
$20,000,000
$25,000,000
$30,000,000
2002 2003 2004 2005 2006 2007 2008 2009 2010 2011 2012 2013 2014 2015 2016
Nonresidential Infrastructure
Exhibit 7: Construction value added as a percent of GDP (United States)12
Exhibit 8: Construction value added as a percent of GRP (California)13
7.8% 7.8%8.1%
8.6%8.4%
8.0%
7.4%
6.3%
5.4%5.1%
5.3%5.5%
5.8%
6.2%6.4%
3.0%
4.0%
5.0%
6.0%
7.0%
8.0%
9.0%
2002 2003 2004 2005 2006 2007 2008 2009 2010 2011 2012 2013 2014 2015 2016
2002 2003 2004 2005 2006 2007 2008 2009 2010 2011 2012 2013 2014 2015 2016
3.0% 3.1%3.3% 3.3%
2.8%
2.3%
1.6%
1.0% 1.0% 1.1%1.3%
1.8% 1.8%2.0% 2.0%
0.0%
0.5%
1.0%
1.5%
2.0%
2.5%
3.0%
3.5%
4.0%
Exhibit 9: Construction value added as a percent of GRP (California, Sacramento region and Bay Area)16
3.0%
6.8% 6.9%
3.6%
1.2%1.4%
1.7%
2.3%
2.4%
0.0%
1.0%
2.0%
3.0%
4.0%
5.0%
6.0%
7.0%
8.0%
2002 2003 2004 2005 2006 2007 2008 2009 2010 2011 2012 2013 2014 2015
State Sacramento Metro (6-county) Bay Area Metro (9-county)
Exhibit 10: Housing unit supply versus demand in the Sacramento region
Exh ibit 11: Residen tial building units in the six-county Sacramento region (permi t data)20
19,865
14,239
10,996 8,932
6,483 7,768 9,125
10,399
19,122
23,812
17,987
2,293 3,939 4,652
6,492
0
5,000
10,000
15,000
20,000
25,000
30,000
2002 2003 2004 2005 2006 2007 2008 2009 2010 2011 2012 2013 2014 2015 2016 2017
Housing Unit Demand Housing Unit Supply
14,01415,671
19,78419,630
21,65218,612
10,1257,931
4,1752,493 2,326 1,938 2,965 3,772 3,967
5,526 6,401
3,226
3,868
4,628 4,7613,612
2,911
3,568
1,555
1,818 438 539 759631
982 7461,265
1,053
0
5,000
10,000
15,000
20,000
25,000
30,000
2000 2001 2002 2003 2004 2005 2006 2007 2008 2009 2010 2011 2012 2013 2014 2015 2016
Single Family Units Multifamily Units
Exhibit 13: Value of nonresidential construction in the six-county Sacramento region 21
$0
$200,000
$400,000
$600,000
$800,000
$1,000 ,000
$1,200 ,000
$1,400 ,000
$1,600 ,000
$1,800 ,000
$2,000 ,000
2000 2001 2002 2003 2004 2005 2006 2007 2008 2009 2010 2011 2012 2013 2014 2015 2016
El Dorado Placer Sacramento Yolo Yuba Sutter
Exhibit 14: Percent of nonresidential construction value in the Sacramento region, by county22
0%
10%
20%
30%
40%
50%
60%
70%
80%
90%
100%
2006 2016
El Dorado Placer Sacramento Yolo Yuba
Exhibit 17: Average annual earnings in traded and non-traded clusters in the study regions (2016)
$85,
512
$58,
972
$67,
498
$97,
280
$78,
396
$100
,688
$90,
080
$63,
145
$72,
018
$0
$20,000
$40,000
$60,000
$80,000
$100,000
$120,000
Traded Non-Tr aded All Industries
Sacramento Region Bay Area Californ ia
Exhibit 18: Traded subcluster employment index, Sacramento region (2001-2021)25
Water, Sewage, and Other Systems Projection
Projection
Projection
Projection
Projection
Construction Materials
Construction
Construction Products
Construction Components
Empl
oym
ent i
ndex
(2
006
Empl
oym
ent =
100
)
Empl
oym
ent i
ndex
(2
006
Empl
oym
ent =
100
)
Exhibit 24: Non-traded subcluster employment index, Sacramento region (2001-2021)36
101.0 119.3
87.2104.7
73.7
136.3
36.1
29.6
17.9
0.0
25.0
50.0
75.0
100.0
125.0
150.0
2001 2006 2011 2016 2021
Water and Sewer Line Construction Projection
Concrete Products Projection
Real Estate Services Projection
Specialty Contractors Projection
General Contractors Projection
Developers Projection
* Only included subclusters with 10k+employment or significant employment change. Refer to appendix for the complete list of nontraded subclusters.
Exhibit 39: Entering construction industry workers by type of education and training in the Sacramento region (annual average, 2014-2016)59
368
217181
56 54
148125 107
84
28 27 19 13 3
29
369
129
109
198
136
10561
35 8 13 14 8 10
0
50
100
150
200
250
300
350
400
Apprentices Oth er Post-Secondary Completions
Exhibit 44: Projected annual construction industry occupational gaps in the Sacramento region (2016-2021)60
-3
-2
-1
32
45
57
58
68
103
173
196
308
322
397
427
500
524
607
640
864
1,937
-200 100 400 700 1,000 1,300 1,600 1,900
Insulation Workers
Drafters
Interior Designers
PV Installers
Glaziers
Surveyors
Building Inspectors
Roofers
Ironworkers & Welders
Architects
Drywall Installers
HVAC & Sheet Metal
Painters
Masonry, Tile, Floor, Lathe, Plaster
Plumbers & Pipefitters
Engineers
Heavy Equipment Operators
Real Estate Professionals
Electricians
Construction Managers
Carpenters
Exhibit 47: Unionized and non-unionized workforce, Sacramento--Arden-Arcade--Roseville MSA and 10-county Bay Area (annual average, 2014-2017)61
Exhibit 48: Unionization in the construction workforce as an annual average percentage of total employment, Sacramento--Arden-Arcade--Roseville MSA (2000-2017)62
31%, 32,314
29%, 12,555
69%, 70,898
71%, 30,110
0% 20% 40% 60% 80% 100%
10-County Bay Area
Sacramento MSA
Union Non-Union
32%
20% 19%24% 23%
29%
68%
80% 81%76% 77%
71%
0%
10%
20%
30%
40%
50%
60%
70%
80%
90%
2000 – 2002 2003 – 2004 2005 –2008 2008 – 2011 2011 – 2014 2014 – 2017
Union Non-Union
Exhibit 1A. Construction managers projected annual openings, n = 871 (2016-2021)67
Cost Estimators, 206openings, 24%
Construction Managers,
225 openings, 26%
First-Line Supervisors of Construction Trades and
Extraction Workers,440 openings, 50%
0 100 200 300 400 500 600 700 800 900 1,000
Construction Products, 81
Water, Sewage, and Other Systems, 908
-10.0%
-5.0%
0.0%
5.0%
10.0%
15.0%
20.0%
25.0%
0.0 0.5 1.0 1.5 2.0 2.5 3.0 3.5
Location Quotient (2016)
Location Quotient (2016)
Ann
ual E
mpl
oym
ent G
row
th R
ate
(200
6-20
16)
Subcluster with an annual average earnings higher than all-industry annual average earnings in ($67,498) Sacramento region in 2016
LQ=1.0
Exhibit 2C: Non-traded subclusters in the Sacramento region73
Specialty Contractors, 50,899
General Contractors, 16,843
Real Estate Services, 15,475
Construction Materials Retailing, 6,552
Highway and Street Construction, 2,268
Water and Sewer Line Construction, 1,662
Building Equipment Distribution, 1,207
Developers
-15.0%
-10.0%
-5.0%
0.0%
5.0%
0.8 1.0 1.2 1.4
Ann
ual E
mpl
oym
ent G
row
th R
ate
(200
6-20
16
Exhibit 2E: Joint apprentices by gender in the Sacramento region (January 2012-October 2017)
Exhibit 3E: Joint apprentices by county of residence in the Sacramento region (January 2012-October 2017)
8,374, 97%
249, 3%
El Dorado,393, 56%
Placer,949, 11%
Sacramento, 6077, 1
Sutter, 346,4%
Yolo, 549,6%
Yuba, 309,
4%
Exhibit 4E: Joint apprentices’ highest level of education prior to apprenticeship in the Sacramento region (January 2012-October 2017)
Exhibit 5E: Number of weeks worked, all workers in the construction sector in the Sacramento region (2015)84
Less than highschool, 7%
High schoolgraduate orGED, 65%
Some college,25%
4 or more yearsof college, 3%
3,165 6%
3,082 6%
1,650 3%
6,105 12%
7,068 10%
31,037 62%
0 5,000 10,000 15,000 20,000 25,000 30,000 35,000
Did not work
Less than 14
14 to 26
27 to 39
40 to 49
50 to 52
# w
eeks
wor
ked
in th
e la
st y
ear
Exhibit 4: Value of nonresidential construction put in place, by subcomponent (California)9
-0.5%
29.2%
-41.1%
0.0%
62.9%
-34.7%
46.0%
42.8%
19.1%
-14.6%
66.5%
763.4%
Office
Commercial
Manufacturing
Health care
Educational
Religious
Amusement and recreation
Transportation
Power and communication
Highway and street
Public works
Other
Subcomponent percent change 2006-2016
180.8
593.7
818.9
21.4
235.8 342.3
104.9 133.6 173.5
0.0
100.0
200.0
300.0
400.0
500.0
600.0
700.0
800.0
900.0
1000.0
2001 2006 2011 2016 2021
Construction Materials,125
Construction, 1,942
Construction Components, 466
LQ=1.0
Concrete Products, 1,123
Construction Materials Wholesaling, 1,647
Subcluster with an annual average earnings higher than all-industry annual average earnings ($67,498) in Sacramento region in 2016
Exhibit 1E: Total joint apprentice starts, residents in the six-county Sacramento region (January 2012-October 2017) (n = 8,617)2
435
95
104
111
117
121
135
161
174
178
215
302
340
440
458
483
542
602
1,045
1,205
1,354
0 200 400 600 800 1000 1200 1400 1600
All others
Elevator constructor
Drywall finisher
Scaffold and shoring erector
Inspector or surveyor
Pile driver
Glazier
Carpet, linoleum, and soft tile layer
Millwright
Sheet metal worker & related trades
Construction equipment operator trades
Brick, marble, terrazzo, tile, and related trades
Roofer and waterproofer
Plumber and fitter trades
Painter trades
Cement mason and plasterer trades
Electricial trades
Drywall/lather
Ironworker trades
Carpenter
Construction craft laborer
Exhibit 38: Anticipated annual construction industry job openings by new and replacement jobs in the Sacramento region (2016-2021)1
21 26 59 60 52 78 99 167 167 220323 350 399 439 473
596 679788 777 763
2,119
4 6 1 1 20 7 520 27 2
71 56100 95 73
4699
82 95222
215
0
500
1000
1500
2000
2500
Annual Replacement Openings New Jobs (Growth)
Male
Female
$ Th
ousa
nds
Thou
sand
s of
Dol
lars
Average annual openings (demand) minuseducation and training (supply) =approximate annual shortage
Approximate annual shortage = 7,250 workers across all categories
Sutter
6.2% 5.1%
27.6%
14.4%
50.6%69.9%
10.8%7.9%
1.1% 0.6%3.6% 2.0%
9 California Home Building Foundation (CHBF), Construction Industry Research Board (CIRB).
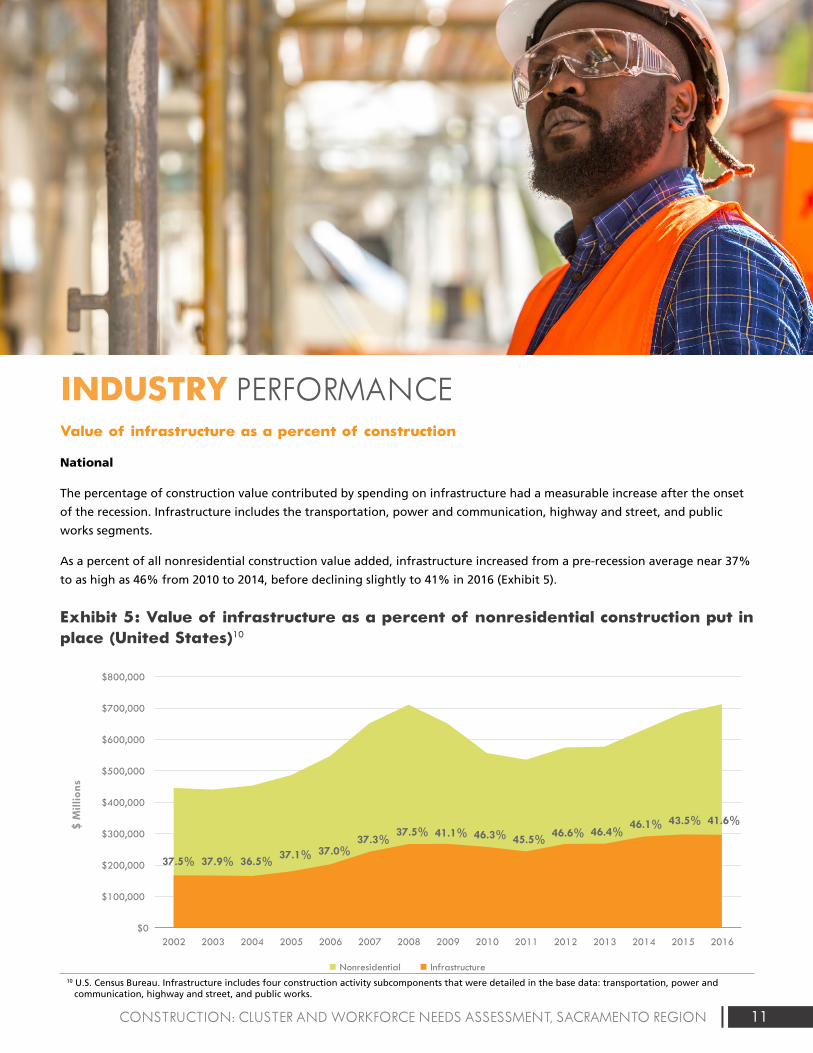
11CONSTRUCTION: CLUSTER AND WORKFORCE NEEDS ASSESSMENT, SACRAMENTO REGION
INDUSTRY PERFORMANCEValue of infrastructure as a percent of construction
National
The percentage of construction value contributed by spending on infrastructure had a measurable increase after the onset
of the recession. Infrastructure includes the transportation, power and communication, highway and street, and public
works segments.
As a percent of all nonresidential construction value added, infrastructure increased from a pre-recession average near 37%
to as high as 46% from 2010 to 2014, before declining slightly to 41% in 2016 (Exhibit 5).
Exhibit 5: Value of infrastructure as a percent of nonresidential construction put in place (United States)10
Exhibit 1: Value of construction put in place (United States)3
$1,161,282
$788,332
$1,185,683
$0
$200,000
$400,000
$600,000
$800,000
$1,000,000
$1,200,000
$1,400,000
2002 2003 2004 2005 2006 2007 2008 2009 2010 2011 2012 2013 2014 2015 2016
Mill
ions
of
Dol
lars
Residential Nonresidential
Exhibit 2: Value of construction put in place (California)5
$58,091,975
$18,740,050
$51,350,955
$0
$10,000,000
$20,000,000
$30,000,000
$40,000,000
$50,000,000
$60,000,000
$70,000,000
2002 2003 2004 2005 2006 2007 2008 2009 2010 2011 2012 2013 2014 2015 2016
Residential Nonresidential
Exhibit 3: Value of nonresidential construction put in place, by subcomponent (United States)7
24.1%
-0.2%
130.5%
0.6%
5.3%
-54.8%
18.0%
50.9%
98.2%
26.9%
-7.5%
21.7%
Office
Commercial
Manufacturing
Health care
Educational
Religious
Amusement and recreation
Transportation
Power and communication
Highway and street
Public works
Other
Subcomponent percent change 2006-2016
Exhibit 5: Value of Infrastructure as a percent of nonresidential construction put in place (United States)10
37.5% 37.9% 36.5%37.1% 37.0%
37.3%37.5% 41.1% 46.3% 45.5%
46.6% 46.4%46.1% 43.5% 41.6%
$0
$100,000
$200,000
$300,000
$400,000
$500,000
$600,000
$700,000
$800,000
2002 2003 2004 2005 2006 2007 2008 2009 2010 2011 2012 2013 2014 2015 2016
$ M
illio
ns
$ Th
ousa
nds
Nonresidential Infrastructure
Exhibit 6: Value of infrastructure as a percent of nonresidential construction put in place (California)11
11.6% 12.8% 14.3% 13.4%14.3%
11.0% 10.7%10.7% 10.2% 9.9% 10.9%
27.5%
14.9%16.2% 13.0%$5,000,000
$0
$10,000,000
$15,000,000
$20,000,000
$25,000,000
$30,000,000
2002 2003 2004 2005 2006 2007 2008 2009 2010 2011 2012 2013 2014 2015 2016
Nonresidential Infrastructure
Exhibit 7: Construction value added as a percent of GDP (United States)12
Exhibit 8: Construction value added as a percent of GRP (California)13
7.8% 7.8%8.1%
8.6%8.4%
8.0%
7.4%
6.3%
5.4%5.1%
5.3%5.5%
5.8%
6.2%6.4%
3.0%
4.0%
5.0%
6.0%
7.0%
8.0%
9.0%
2002 2003 2004 2005 2006 2007 2008 2009 2010 2011 2012 2013 2014 2015 2016
2002 2003 2004 2005 2006 2007 2008 2009 2010 2011 2012 2013 2014 2015 2016
3.0% 3.1%3.3% 3.3%
2.8%
2.3%
1.6%
1.0% 1.0% 1.1%1.3%
1.8% 1.8%2.0% 2.0%
0.0%
0.5%
1.0%
1.5%
2.0%
2.5%
3.0%
3.5%
4.0%
Exhibit 9: Construction value added as a percent of GRP (California, Sacramento region and Bay Area)16
3.0%
6.8% 6.9%
3.6%
1.2%1.4%
1.7%
2.3%
2.4%
0.0%
1.0%
2.0%
3.0%
4.0%
5.0%
6.0%
7.0%
8.0%
2002 2003 2004 2005 2006 2007 2008 2009 2010 2011 2012 2013 2014 2015
State Sacramento Metro (6-county) Bay Area Metro (9-county)
Exhibit 10: Housing unit supply versus demand in the Sacramento region
Exh ibit 11: Residen tial building units in the six-county Sacramento region (permi t data)20
19,865
14,239
10,996 8,932
6,483 7,768 9,125
10,399
19,122
23,812
17,987
2,293 3,939 4,652
6,492
0
5,000
10,000
15,000
20,000
25,000
30,000
2002 2003 2004 2005 2006 2007 2008 2009 2010 2011 2012 2013 2014 2015 2016 2017
Housing Unit Demand Housing Unit Supply
14,01415,671
19,78419,630
21,65218,612
10,1257,931
4,1752,493 2,326 1,938 2,965 3,772 3,967
5,526 6,401
3,226
3,868
4,628 4,7613,612
2,911
3,568
1,555
1,818 438 539 759631
982 7461,265
1,053
0
5,000
10,000
15,000
20,000
25,000
30,000
2000 2001 2002 2003 2004 2005 2006 2007 2008 2009 2010 2011 2012 2013 2014 2015 2016
Single Family Units Multifamily Units
Exhibit 13: Value of nonresidential construction in the six-county Sacramento region 21
$0
$200,000
$400,000
$600,000
$800,000
$1,000 ,000
$1,200 ,000
$1,400 ,000
$1,600 ,000
$1,800 ,000
$2,000 ,000
2000 2001 2002 2003 2004 2005 2006 2007 2008 2009 2010 2011 2012 2013 2014 2015 2016
El Dorado Placer Sacramento Yolo Yuba Sutter
Exhibit 14: Percent of nonresidential construction value in the Sacramento region, by county22
0%
10%
20%
30%
40%
50%
60%
70%
80%
90%
100%
2006 2016
El Dorado Placer Sacramento Yolo Yuba
Exhibit 17: Average annual earnings in traded and non-traded clusters in the study regions (2016)
$85,
512
$58,
972
$67,
498
$97,
280
$78,
396
$100
,688
$90,
080
$63,
145
$72,
018
$0
$20,000
$40,000
$60,000
$80,000
$100,000
$120,000
Traded Non-Tr aded All Industries
Sacramento Region Bay Area Californ ia
Exhibit 18: Traded subcluster employment index, Sacramento region (2001-2021)25
Water, Sewage, and Other Systems Projection
Projection
Projection
Projection
Projection
Construction Materials
Construction
Construction Products
Construction Components
Empl
oym
ent i
ndex
(2
006
Empl
oym
ent =
100
)
Empl
oym
ent i
ndex
(2
006
Empl
oym
ent =
100
)
Exhibit 24: Non-traded subcluster employment index, Sacramento region (2001-2021)36
101.0 119.3
87.2104.7
73.7
136.3
36.1
29.6
17.9
0.0
25.0
50.0
75.0
100.0
125.0
150.0
2001 2006 2011 2016 2021
Water and Sewer Line Construction Projection
Concrete Products Projection
Real Estate Services Projection
Specialty Contractors Projection
General Contractors Projection
Developers Projection
* Only included subclusters with 10k+employment or significant employment change. Refer to appendix for the complete list of nontraded subclusters.
Exhibit 39: Entering construction industry workers by type of education and training in the Sacramento region (annual average, 2014-2016)59
368
217181
56 54
148125 107
84
28 27 19 13 3
29
369
129
109
198
136
10561
35 8 13 14 8 10
0
50
100
150
200
250
300
350
400
Apprentices Oth er Post-Secondary Completions
Exhibit 44: Projected annual construction industry occupational gaps in the Sacramento region (2016-2021)60
-3
-2
-1
32
45
57
58
68
103
173
196
308
322
397
427
500
524
607
640
864
1,937
-200 100 400 700 1,000 1,300 1,600 1,900
Insulation Workers
Drafters
Interior Designers
PV Installers
Glaziers
Surveyors
Building Inspectors
Roofers
Ironworkers & Welders
Architects
Drywall Installers
HVAC & Sheet Metal
Painters
Masonry, Tile, Floor, Lathe, Plaster
Plumbers & Pipefitters
Engineers
Heavy Equipment Operators
Real Estate Professionals
Electricians
Construction Managers
Carpenters
Exhibit 47: Unionized and non-unionized workforce, Sacramento--Arden-Arcade--Roseville MSA and 10-county Bay Area (annual average, 2014-2017)61
Exhibit 48: Unionization in the construction workforce as an annual average percentage of total employment, Sacramento--Arden-Arcade--Roseville MSA (2000-2017)62
31%, 32,314
29%, 12,555
69%, 70,898
71%, 30,110
0% 20% 40% 60% 80% 100%
10-County Bay Area
Sacramento MSA
Union Non-Union
32%
20% 19%24% 23%
29%
68%
80% 81%76% 77%
71%
0%
10%
20%
30%
40%
50%
60%
70%
80%
90%
2000 – 2002 2003 – 2004 2005 –2008 2008 – 2011 2011 – 2014 2014 – 2017
Union Non-Union
Exhibit 1A. Construction managers projected annual openings, n = 871 (2016-2021)67
Cost Estimators, 206openings, 24%
Construction Managers,
225 openings, 26%
First-Line Supervisors of Construction Trades and
Extraction Workers,440 openings, 50%
0 100 200 300 400 500 600 700 800 900 1,000
Construction Products, 81
Water, Sewage, and Other Systems, 908
-10.0%
-5.0%
0.0%
5.0%
10.0%
15.0%
20.0%
25.0%
0.0 0.5 1.0 1.5 2.0 2.5 3.0 3.5
Location Quotient (2016)
Location Quotient (2016)
Ann
ual E
mpl
oym
ent G
row
th R
ate
(200
6-20
16)
Subcluster with an annual average earnings higher than all-industry annual average earnings in ($67,498) Sacramento region in 2016
LQ=1.0
Exhibit 2C: Non-traded subclusters in the Sacramento region73
Specialty Contractors, 50,899
General Contractors, 16,843
Real Estate Services, 15,475
Construction Materials Retailing, 6,552
Highway and Street Construction, 2,268
Water and Sewer Line Construction, 1,662
Building Equipment Distribution, 1,207
Developers
-15.0%
-10.0%
-5.0%
0.0%
5.0%
0.8 1.0 1.2 1.4
Ann
ual E
mpl
oym
ent G
row
th R
ate
(200
6-20
16
Exhibit 2E: Joint apprentices by gender in the Sacramento region (January 2012-October 2017)
Exhibit 3E: Joint apprentices by county of residence in the Sacramento region (January 2012-October 2017)
8,374, 97%
249, 3%
El Dorado,393, 56%
Placer,949, 11%
Sacramento, 6077, 1
Sutter, 346,4%
Yolo, 549,6%
Yuba, 309,
4%
Exhibit 4E: Joint apprentices’ highest level of education prior to apprenticeship in the Sacramento region (January 2012-October 2017)
Exhibit 5E: Number of weeks worked, all workers in the construction sector in the Sacramento region (2015)84
Less than highschool, 7%
High schoolgraduate orGED, 65%
Some college,25%
4 or more yearsof college, 3%
3,165 6%
3,082 6%
1,650 3%
6,105 12%
7,068 10%
31,037 62%
0 5,000 10,000 15,000 20,000 25,000 30,000 35,000
Did not work
Less than 14
14 to 26
27 to 39
40 to 49
50 to 52
# w
eeks
wor
ked
in th
e la
st y
ear
Exhibit 4: Value of nonresidential construction put in place, by subcomponent (California)9
-0.5%
29.2%
-41.1%
0.0%
62.9%
-34.7%
46.0%
42.8%
19.1%
-14.6%
66.5%
763.4%
Office
Commercial
Manufacturing
Health care
Educational
Religious
Amusement and recreation
Transportation
Power and communication
Highway and street
Public works
Other
Subcomponent percent change 2006-2016
180.8
593.7
818.9
21.4
235.8 342.3
104.9 133.6 173.5
0.0
100.0
200.0
300.0
400.0
500.0
600.0
700.0
800.0
900.0
1000.0
2001 2006 2011 2016 2021
Construction Materials,125
Construction, 1,942
Construction Components, 466
LQ=1.0
Concrete Products, 1,123
Construction Materials Wholesaling, 1,647
Subcluster with an annual average earnings higher than all-industry annual average earnings ($67,498) in Sacramento region in 2016
Exhibit 1E: Total joint apprentice starts, residents in the six-county Sacramento region (January 2012-October 2017) (n = 8,617)2
435
95
104
111
117
121
135
161
174
178
215
302
340
440
458
483
542
602
1,045
1,205
1,354
0 200 400 600 800 1000 1200 1400 1600
All others
Elevator constructor
Drywall finisher
Scaffold and shoring erector
Inspector or surveyor
Pile driver
Glazier
Carpet, linoleum, and soft tile layer
Millwright
Sheet metal worker & related trades
Construction equipment operator trades
Brick, marble, terrazzo, tile, and related trades
Roofer and waterproofer
Plumber and fitter trades
Painter trades
Cement mason and plasterer trades
Electricial trades
Drywall/lather
Ironworker trades
Carpenter
Construction craft laborer
Exhibit 38: Anticipated annual construction industry job openings by new and replacement jobs in the Sacramento region (2016-2021)1
21 26 59 60 52 78 99 167 167 220323 350 399 439 473
596 679788 777 763
2,119
4 6 1 1 20 7 520 27 2
71 56100 95 73
4699
82 95222
215
0
500
1000
1500
2000
2500
Annual Replacement Openings New Jobs (Growth)
Male
Female
$ Th
ousa
nds
Thou
sand
s of
Dol
lars
Average annual openings (demand) minuseducation and training (supply) =approximate annual shortage
Approximate annual shortage = 7,250 workers across all categories
Sutter
6.2% 5.1%
27.6%
14.4%
50.6%69.9%
10.8%7.9%
1.1% 0.6%3.6% 2.0%
10 U.S. Census Bureau. Infrastructure includes four construction activity subcomponents that were detailed in the base data: transportation, power and communication, highway and street, and public works.
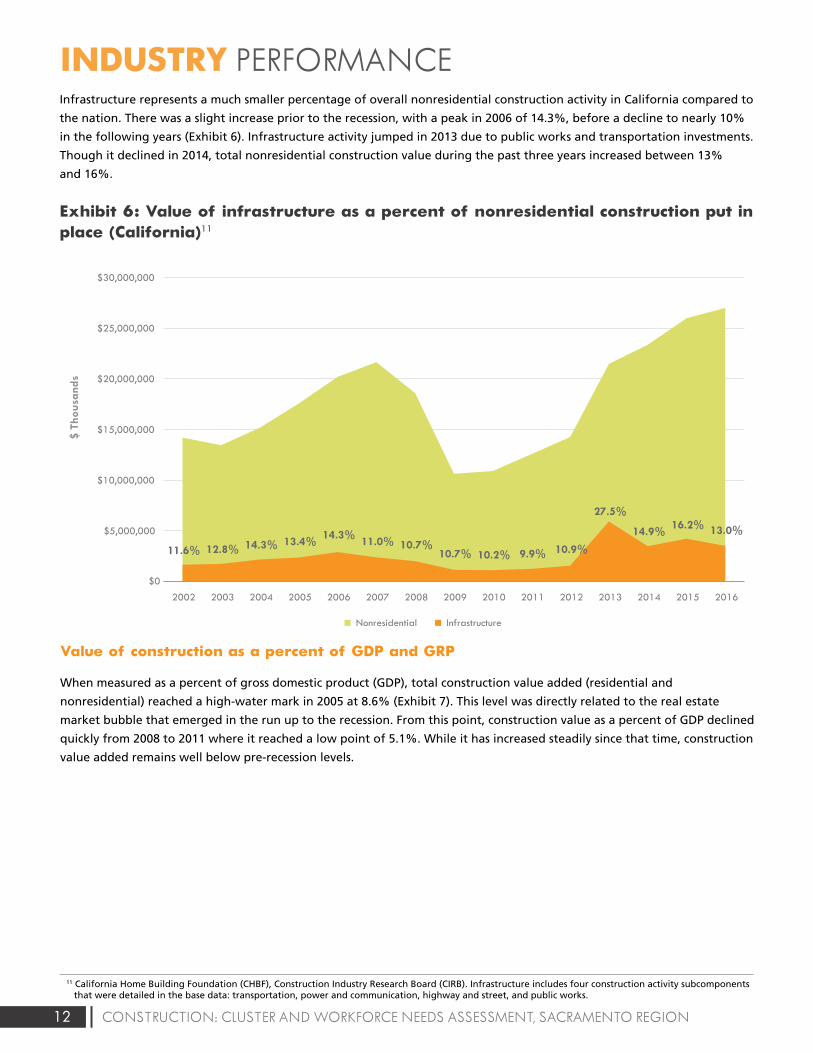
12 CONSTRUCTION: CLUSTER AND WORKFORCE NEEDS ASSESSMENT, SACRAMENTO REGION
INDUSTRY PERFORMANCEInfrastructure represents a much smaller percentage of overall nonresidential construction activity in California compared to
the nation. There was a slight increase prior to the recession, with a peak in 2006 of 14.3%, before a decline to nearly 10%
in the following years (Exhibit 6). Infrastructure activity jumped in 2013 due to public works and transportation investments.
Though it declined in 2014, total nonresidential construction value during the past three years increased between 13%
and 16%.
Exhibit 6: Value of infrastructure as a percent of nonresidential construction put in place (California)11
Value of construction as a percent of GDP and GRP
When measured as a percent of gross domestic product (GDP), total construction value added (residential and
nonresidential) reached a high-water mark in 2005 at 8.6% (Exhibit 7). This level was directly related to the real estate
market bubble that emerged in the run up to the recession. From this point, construction value as a percent of GDP declined
quickly from 2008 to 2011 where it reached a low point of 5.1%. While it has increased steadily since that time, construction
value added remains well below pre-recession levels.
Exhibit 1: Value of construction put in place (United States)3
$1,161,282
$788,332
$1,185,683
$0
$200,000
$400,000
$600,000
$800,000
$1,000,000
$1,200,000
$1,400,000
2002 2003 2004 2005 2006 2007 2008 2009 2010 2011 2012 2013 2014 2015 2016
Mill
ions
of
Dol
lars
Residential Nonresidential
Exhibit 2: Value of construction put in place (California)5
$58,091,975
$18,740,050
$51,350,955
$0
$10,000,000
$20,000,000
$30,000,000
$40,000,000
$50,000,000
$60,000,000
$70,000,000
2002 2003 2004 2005 2006 2007 2008 2009 2010 2011 2012 2013 2014 2015 2016
Residential Nonresidential
Exhibit 3: Value of nonresidential construction put in place, by subcomponent (United States)7
24.1%
-0.2%
130.5%
0.6%
5.3%
-54.8%
18.0%
50.9%
98.2%
26.9%
-7.5%
21.7%
Office
Commercial
Manufacturing
Health care
Educational
Religious
Amusement and recreation
Transportation
Power and communication
Highway and street
Public works
Other
Subcomponent percent change 2006-2016
Exhibit 5: Value of Infrastructure as a percent of nonresidential construction put in place (United States)10
37.5% 37.9% 36.5%37.1% 37.0%
37.3%37.5% 41.1% 46.3% 45.5%
46.6% 46.4%46.1% 43.5% 41.6%
$0
$100,000
$200,000
$300,000
$400,000
$500,000
$600,000
$700,000
$800,000
2002 2003 2004 2005 2006 2007 2008 2009 2010 2011 2012 2013 2014 2015 2016
$ M
illio
ns
$ Th
ousa
nds
Nonresidential Infrastructure
Exhibit 6: Value of infrastructure as a percent of nonresidential construction put in place (California)11
11.6% 12.8% 14.3% 13.4%14.3%
11.0% 10.7%10.7% 10.2% 9.9% 10.9%
27.5%
14.9%16.2% 13.0%$5,000,000
$0
$10,000,000
$15,000,000
$20,000,000
$25,000,000
$30,000,000
2002 2003 2004 2005 2006 2007 2008 2009 2010 2011 2012 2013 2014 2015 2016
Nonresidential Infrastructure
Exhibit 7: Construction value added as a percent of GDP (United States)12
Exhibit 8: Construction value added as a percent of GRP (California)13
7.8% 7.8%8.1%
8.6%8.4%
8.0%
7.4%
6.3%
5.4%5.1%
5.3%5.5%
5.8%
6.2%6.4%
3.0%
4.0%
5.0%
6.0%
7.0%
8.0%
9.0%
2002 2003 2004 2005 2006 2007 2008 2009 2010 2011 2012 2013 2014 2015 2016
2002 2003 2004 2005 2006 2007 2008 2009 2010 2011 2012 2013 2014 2015 2016
3.0% 3.1%3.3% 3.3%
2.8%
2.3%
1.6%
1.0% 1.0% 1.1%1.3%
1.8% 1.8%2.0% 2.0%
0.0%
0.5%
1.0%
1.5%
2.0%
2.5%
3.0%
3.5%
4.0%
Exhibit 9: Construction value added as a percent of GRP (California, Sacramento region and Bay Area)16
3.0%
6.8% 6.9%
3.6%
1.2%1.4%
1.7%
2.3%
2.4%
0.0%
1.0%
2.0%
3.0%
4.0%
5.0%
6.0%
7.0%
8.0%
2002 2003 2004 2005 2006 2007 2008 2009 2010 2011 2012 2013 2014 2015
State Sacramento Metro (6-county) Bay Area Metro (9-county)
Exhibit 10: Housing unit supply versus demand in the Sacramento region
Exh ibit 11: Residen tial building units in the six-county Sacramento region (permi t data)20
19,865
14,239
10,996 8,932
6,483 7,768 9,125
10,399
19,122
23,812
17,987
2,293 3,939 4,652
6,492
0
5,000
10,000
15,000
20,000
25,000
30,000
2002 2003 2004 2005 2006 2007 2008 2009 2010 2011 2012 2013 2014 2015 2016 2017
Housing Unit Demand Housing Unit Supply
14,01415,671
19,78419,630
21,65218,612
10,1257,931
4,1752,493 2,326 1,938 2,965 3,772 3,967
5,526 6,401
3,226
3,868
4,628 4,7613,612
2,911
3,568
1,555
1,818 438 539 759631
982 7461,265
1,053
0
5,000
10,000
15,000
20,000
25,000
30,000
2000 2001 2002 2003 2004 2005 2006 2007 2008 2009 2010 2011 2012 2013 2014 2015 2016
Single Family Units Multifamily Units
Exhibit 13: Value of nonresidential construction in the six-county Sacramento region 21
$0
$200,000
$400,000
$600,000
$800,000
$1,000 ,000
$1,200 ,000
$1,400 ,000
$1,600 ,000
$1,800 ,000
$2,000 ,000
2000 2001 2002 2003 2004 2005 2006 2007 2008 2009 2010 2011 2012 2013 2014 2015 2016
El Dorado Placer Sacramento Yolo Yuba Sutter
Exhibit 14: Percent of nonresidential construction value in the Sacramento region, by county22
0%
10%
20%
30%
40%
50%
60%
70%
80%
90%
100%
2006 2016
El Dorado Placer Sacramento Yolo Yuba
Exhibit 17: Average annual earnings in traded and non-traded clusters in the study regions (2016)
$85,
512
$58,
972
$67,
498
$97,
280
$78,
396
$100
,688
$90,
080
$63,
145
$72,
018
$0
$20,000
$40,000
$60,000
$80,000
$100,000
$120,000
Traded Non-Tr aded All Industries
Sacramento Region Bay Area Californ ia
Exhibit 18: Traded subcluster employment index, Sacramento region (2001-2021)25
Water, Sewage, and Other Systems Projection
Projection
Projection
Projection
Projection
Construction Materials
Construction
Construction Products
Construction Components
Empl
oym
ent i
ndex
(2
006
Empl
oym
ent =
100
)
Empl
oym
ent i
ndex
(2
006
Empl
oym
ent =
100
)
Exhibit 24: Non-traded subcluster employment index, Sacramento region (2001-2021)36
101.0 119.3
87.2104.7
73.7
136.3
36.1
29.6
17.9
0.0
25.0
50.0
75.0
100.0
125.0
150.0
2001 2006 2011 2016 2021
Water and Sewer Line Construction Projection
Concrete Products Projection
Real Estate Services Projection
Specialty Contractors Projection
General Contractors Projection
Developers Projection
* Only included subclusters with 10k+employment or significant employment change. Refer to appendix for the complete list of nontraded subclusters.
Exhibit 39: Entering construction industry workers by type of education and training in the Sacramento region (annual average, 2014-2016)59
368
217181
56 54
148125 107
84
28 27 19 13 3
29
369
129
109
198
136
10561
35 8 13 14 8 10
0
50
100
150
200
250
300
350
400
Apprentices Oth er Post-Secondary Completions
Exhibit 44: Projected annual construction industry occupational gaps in the Sacramento region (2016-2021)60
-3
-2
-1
32
45
57
58
68
103
173
196
308
322
397
427
500
524
607
640
864
1,937
-200 100 400 700 1,000 1,300 1,600 1,900
Insulation Workers
Drafters
Interior Designers
PV Installers
Glaziers
Surveyors
Building Inspectors
Roofers
Ironworkers & Welders
Architects
Drywall Installers
HVAC & Sheet Metal
Painters
Masonry, Tile, Floor, Lathe, Plaster
Plumbers & Pipefitters
Engineers
Heavy Equipment Operators
Real Estate Professionals
Electricians
Construction Managers
Carpenters
Exhibit 47: Unionized and non-unionized workforce, Sacramento--Arden-Arcade--Roseville MSA and 10-county Bay Area (annual average, 2014-2017)61
Exhibit 48: Unionization in the construction workforce as an annual average percentage of total employment, Sacramento--Arden-Arcade--Roseville MSA (2000-2017)62
31%, 32,314
29%, 12,555
69%, 70,898
71%, 30,110
0% 20% 40% 60% 80% 100%
10-County Bay Area
Sacramento MSA
Union Non-Union
32%
20% 19%24% 23%
29%
68%
80% 81%76% 77%
71%
0%
10%
20%
30%
40%
50%
60%
70%
80%
90%
2000 – 2002 2003 – 2004 2005 –2008 2008 – 2011 2011 – 2014 2014 – 2017
Union Non-Union
Exhibit 1A. Construction managers projected annual openings, n = 871 (2016-2021)67
Cost Estimators, 206openings, 24%
Construction Managers,
225 openings, 26%
First-Line Supervisors of Construction Trades and
Extraction Workers,440 openings, 50%
0 100 200 300 400 500 600 700 800 900 1,000
Construction Products, 81
Water, Sewage, and Other Systems, 908
-10.0%
-5.0%
0.0%
5.0%
10.0%
15.0%
20.0%
25.0%
0.0 0.5 1.0 1.5 2.0 2.5 3.0 3.5
Location Quotient (2016)
Location Quotient (2016)
Ann
ual E
mpl
oym
ent G
row
th R
ate
(200
6-20
16)
Subcluster with an annual average earnings higher than all-industry annual average earnings in ($67,498) Sacramento region in 2016
LQ=1.0
Exhibit 2C: Non-traded subclusters in the Sacramento region73
Specialty Contractors, 50,899
General Contractors, 16,843
Real Estate Services, 15,475
Construction Materials Retailing, 6,552
Highway and Street Construction, 2,268
Water and Sewer Line Construction, 1,662
Building Equipment Distribution, 1,207
Developers
-15.0%
-10.0%
-5.0%
0.0%
5.0%
0.8 1.0 1.2 1.4
Ann
ual E
mpl
oym
ent G
row
th R
ate
(200
6-20
16
Exhibit 2E: Joint apprentices by gender in the Sacramento region (January 2012-October 2017)
Exhibit 3E: Joint apprentices by county of residence in the Sacramento region (January 2012-October 2017)
8,374, 97%
249, 3%
El Dorado,393, 56%
Placer,949, 11%
Sacramento, 6077, 1
Sutter, 346,4%
Yolo, 549,6%
Yuba, 309,
4%
Exhibit 4E: Joint apprentices’ highest level of education prior to apprenticeship in the Sacramento region (January 2012-October 2017)
Exhibit 5E: Number of weeks worked, all workers in the construction sector in the Sacramento region (2015)84
Less than highschool, 7%
High schoolgraduate orGED, 65%
Some college,25%
4 or more yearsof college, 3%
3,165 6%
3,082 6%
1,650 3%
6,105 12%
7,068 10%
31,037 62%
0 5,000 10,000 15,000 20,000 25,000 30,000 35,000
Did not work
Less than 14
14 to 26
27 to 39
40 to 49
50 to 52
# w
eeks
wor
ked
in th
e la
st y
ear
Exhibit 4: Value of nonresidential construction put in place, by subcomponent (California)9
-0.5%
29.2%
-41.1%
0.0%
62.9%
-34.7%
46.0%
42.8%
19.1%
-14.6%
66.5%
763.4%
Office
Commercial
Manufacturing
Health care
Educational
Religious
Amusement and recreation
Transportation
Power and communication
Highway and street
Public works
Other
Subcomponent percent change 2006-2016
180.8
593.7
818.9
21.4
235.8 342.3
104.9 133.6 173.5
0.0
100.0
200.0
300.0
400.0
500.0
600.0
700.0
800.0
900.0
1000.0
2001 2006 2011 2016 2021
Construction Materials,125
Construction, 1,942
Construction Components, 466
LQ=1.0
Concrete Products, 1,123
Construction Materials Wholesaling, 1,647
Subcluster with an annual average earnings higher than all-industry annual average earnings ($67,498) in Sacramento region in 2016
Exhibit 1E: Total joint apprentice starts, residents in the six-county Sacramento region (January 2012-October 2017) (n = 8,617)2
435
95
104
111
117
121
135
161
174
178
215
302
340
440
458
483
542
602
1,045
1,205
1,354
0 200 400 600 800 1000 1200 1400 1600
All others
Elevator constructor
Drywall finisher
Scaffold and shoring erector
Inspector or surveyor
Pile driver
Glazier
Carpet, linoleum, and soft tile layer
Millwright
Sheet metal worker & related trades
Construction equipment operator trades
Brick, marble, terrazzo, tile, and related trades
Roofer and waterproofer
Plumber and fitter trades
Painter trades
Cement mason and plasterer trades
Electricial trades
Drywall/lather
Ironworker trades
Carpenter
Construction craft laborer
Exhibit 38: Anticipated annual construction industry job openings by new and replacement jobs in the Sacramento region (2016-2021)1
21 26 59 60 52 78 99 167 167 220323 350 399 439 473
596 679788 777 763
2,119
4 6 1 1 20 7 520 27 2
71 56100 95 73
4699
82 95222
215
0
500
1000
1500
2000
2500
Annual Replacement Openings New Jobs (Growth)
Male
Female
$ Th
ousa
nds
Thou
sand
s of
Dol
lars
Average annual openings (demand) minuseducation and training (supply) =approximate annual shortage
Approximate annual shortage = 7,250 workers across all categories
Sutter
6.2% 5.1%
27.6%
14.4%
50.6%69.9%
10.8%7.9%
1.1% 0.6%3.6% 2.0%
11 California Home Building Foundation (CHBF), Construction Industry Research Board (CIRB). Infrastructure includes four construction activity subcomponents that were detailed in the base data: transportation, power and communication, highway and street, and public works.
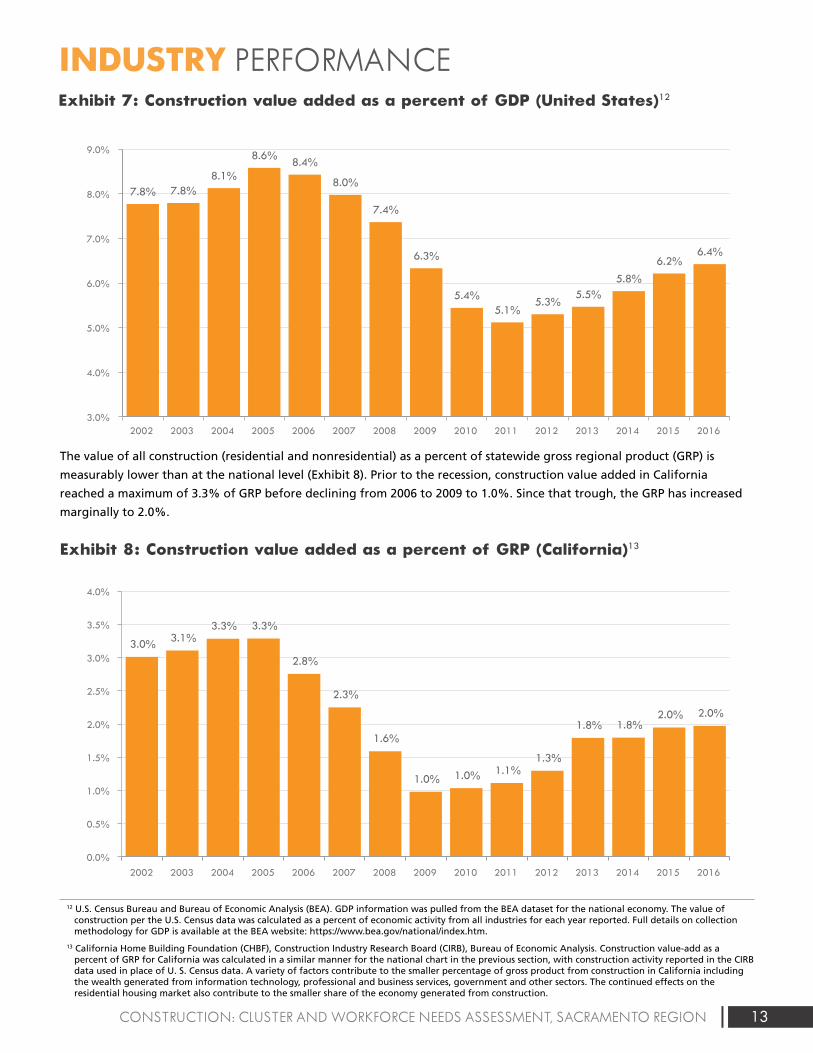
13CONSTRUCTION: CLUSTER AND WORKFORCE NEEDS ASSESSMENT, SACRAMENTO REGION
INDUSTRY PERFORMANCEExhibit 7: Construction value added as a percent of GDP (United States)12
The value of all construction (residential and nonresidential) as a percent of statewide gross regional product (GRP) is
measurably lower than at the national level (Exhibit 8). Prior to the recession, construction value added in California
reached a maximum of 3.3% of GRP before declining from 2006 to 2009 to 1.0%. Since that trough, the GRP has increased
marginally to 2.0%.
Exhibit 8: Construction value added as a percent of GRP (California)13
Exhibit 1: Value of construction put in place (United States)3
$1,161,282
$788,332
$1,185,683
$0
$200,000
$400,000
$600,000
$800,000
$1,000,000
$1,200,000
$1,400,000
2002 2003 2004 2005 2006 2007 2008 2009 2010 2011 2012 2013 2014 2015 2016
Mill
ions
of
Dol
lars
Residential Nonresidential
Exhibit 2: Value of construction put in place (California)5
$58,091,975
$18,740,050
$51,350,955
$0
$10,000,000
$20,000,000
$30,000,000
$40,000,000
$50,000,000
$60,000,000
$70,000,000
2002 2003 2004 2005 2006 2007 2008 2009 2010 2011 2012 2013 2014 2015 2016
Residential Nonresidential
Exhibit 3: Value of nonresidential construction put in place, by subcomponent (United States)7
24.1%
-0.2%
130.5%
0.6%
5.3%
-54.8%
18.0%
50.9%
98.2%
26.9%
-7.5%
21.7%
Office
Commercial
Manufacturing
Health care
Educational
Religious
Amusement and recreation
Transportation
Power and communication
Highway and street
Public works
Other
Subcomponent percent change 2006-2016
Exhibit 5: Value of Infrastructure as a percent of nonresidential construction put in place (United States)10
37.5% 37.9% 36.5%37.1% 37.0%
37.3%37.5% 41.1% 46.3% 45.5%
46.6% 46.4%46.1% 43.5% 41.6%
$0
$100,000
$200,000
$300,000
$400,000
$500,000
$600,000
$700,000
$800,000
2002 2003 2004 2005 2006 2007 2008 2009 2010 2011 2012 2013 2014 2015 2016
$ M
illio
ns
$ Th
ousa
nds
Nonresidential Infrastructure
Exhibit 6: Value of infrastructure as a percent of nonresidential construction put in place (California)11
11.6% 12.8% 14.3% 13.4%14.3%
11.0% 10.7%10.7% 10.2% 9.9% 10.9%
27.5%
14.9%16.2% 13.0%$5,000,000
$0
$10,000,000
$15,000,000
$20,000,000
$25,000,000
$30,000,000
2002 2003 2004 2005 2006 2007 2008 2009 2010 2011 2012 2013 2014 2015 2016
Nonresidential Infrastructure
Exhibit 7: Construction value added as a percent of GDP (United States)12
Exhibit 8: Construction value added as a percent of GRP (California)13
7.8% 7.8%8.1%
8.6%8.4%
8.0%
7.4%
6.3%
5.4%5.1%
5.3%5.5%
5.8%
6.2%6.4%
3.0%
4.0%
5.0%
6.0%
7.0%
8.0%
9.0%
2002 2003 2004 2005 2006 2007 2008 2009 2010 2011 2012 2013 2014 2015 2016
2002 2003 2004 2005 2006 2007 2008 2009 2010 2011 2012 2013 2014 2015 2016
3.0% 3.1%3.3% 3.3%
2.8%
2.3%
1.6%
1.0% 1.0% 1.1%1.3%
1.8% 1.8%2.0% 2.0%
0.0%
0.5%
1.0%
1.5%
2.0%
2.5%
3.0%
3.5%
4.0%
Exhibit 9: Construction value added as a percent of GRP (California, Sacramento region and Bay Area)16
3.0%
6.8% 6.9%
3.6%
1.2%1.4%
1.7%
2.3%
2.4%
0.0%
1.0%
2.0%
3.0%
4.0%
5.0%
6.0%
7.0%
8.0%
2002 2003 2004 2005 2006 2007 2008 2009 2010 2011 2012 2013 2014 2015
State Sacramento Metro (6-county) Bay Area Metro (9-county)
Exhibit 10: Housing unit supply versus demand in the Sacramento region
Exh ibit 11: Residen tial building units in the six-county Sacramento region (permi t data)20
19,865
14,239
10,996 8,932
6,483 7,768 9,125
10,399
19,122
23,812
17,987
2,293 3,939 4,652
6,492
0
5,000
10,000
15,000
20,000
25,000
30,000
2002 2003 2004 2005 2006 2007 2008 2009 2010 2011 2012 2013 2014 2015 2016 2017
Housing Unit Demand Housing Unit Supply
14,01415,671
19,78419,630
21,65218,612
10,1257,931
4,1752,493 2,326 1,938 2,965 3,772 3,967
5,526 6,401
3,226
3,868
4,628 4,7613,612
2,911
3,568
1,555
1,818 438 539 759631
982 7461,265
1,053
0
5,000
10,000
15,000
20,000
25,000
30,000
2000 2001 2002 2003 2004 2005 2006 2007 2008 2009 2010 2011 2012 2013 2014 2015 2016
Single Family Units Multifamily Units
Exhibit 13: Value of nonresidential construction in the six-county Sacramento region 21
$0
$200,000
$400,000
$600,000
$800,000
$1,000 ,000
$1,200 ,000
$1,400 ,000
$1,600 ,000
$1,800 ,000
$2,000 ,000
2000 2001 2002 2003 2004 2005 2006 2007 2008 2009 2010 2011 2012 2013 2014 2015 2016
El Dorado Placer Sacramento Yolo Yuba Sutter
Exhibit 14: Percent of nonresidential construction value in the Sacramento region, by county22
0%
10%
20%
30%
40%
50%
60%
70%
80%
90%
100%
2006 2016
El Dorado Placer Sacramento Yolo Yuba
Exhibit 17: Average annual earnings in traded and non-traded clusters in the study regions (2016)
$85,
512
$58,
972
$67,
498
$97,
280
$78,
396
$100
,688
$90,
080
$63,
145
$72,
018
$0
$20,000
$40,000
$60,000
$80,000
$100,000
$120,000
Traded Non-Traded All Industries
Sacramento Region Bay Area Californ ia
Exhibit 18: Traded subcluster employment index, Sacramento region (2001-2021)25
Water, Sewage, and Other Systems Projection
Projection
Projection
Projection
Projection
Construction Materials
Construction
Construction Products
Construction Components
Empl
oym
ent i
ndex
(2
006
Empl
oym
ent =
100
)
Empl
oym
ent i
ndex
(2
006
Empl
oym
ent =
100
)
Exhibit 24: Non-traded subcluster employment index, Sacramento region (2001-2021)36
101.0 119.3
87.2104.7
73.7
136.3
36.1
29.6
17.9
0.0
25.0
50.0
75.0
100.0
125.0
150.0
2001 2006 2011 2016 2021
Water and Sewer Line Construction Projection
Concrete Products Projection
Real Estate Services Projection
Specialty Contractors Projection
General Contractors Projection
Developers Projection
* Only included subclusters with 10k+employment or significant employment change. Refer to appendix for the complete list of nontraded subclusters.
Exhibit 39: Entering construction industry workers by type of education and training in the Sacramento region (annual average, 2014-2016)59
368
217181
56 54
148125 107
84
28 27 19 13 3
29
369
129
109
198
136
10561
35 8 13 14 8 10
0
50
100
150
200
250
300
350
400
Apprentices Oth er Post-Secondary Completions
Exhibit 44: Projected annual construction industry occupational gaps in the Sacramento region (2016-2021)60
-3
-2
-1
32
45
57
58
68
103
173
196
308
322
397
427
500
524
607
640
864
1,937
-200 100 400 700 1,000 1,300 1,600 1,900
Insulation Workers
Drafters
Interior Designers
PV Installers
Glaziers
Surveyors
Building Inspectors
Roofers
Ironworkers & Welders
Architects
Drywall Installers
HVAC & Sheet Metal
Painters
Masonry, Tile, Floor, Lathe, Plaster
Plumbers & Pipefitters
Engineers
Heavy Equipment Operators
Real Estate Professionals
Electricians
Construction Managers
Carpenters
Exhibit 47: Unionized and non-unionized workforce, Sacramento--Arden-Arcade--Roseville MSA and 10-county Bay Area (annual average, 2014-2017)61
Exhibit 48: Unionization in the construction workforce as an annual average percentage of total employment, Sacramento--Arden-Arcade--Roseville MSA (2000-2017)62
31%, 32,314
29%, 12,555
69%, 70,898
71%, 30,110
0% 20% 40% 60% 80% 100%
10-County Bay Area
Sacramento MSA
Union Non-Union
32%
20% 19%24% 23%
29%
68%
80% 81%76% 77%
71%
0%
10%
20%
30%
40%
50%
60%
70%
80%
90%
2000 – 2002 2003 – 2004 2005 –2008 2008 – 2011 2011 – 2014 2014 – 2017
Union Non-Union
Exhibit 1A. Construction managers projected annual openings, n = 871 (2016-2021)67
Cost Estimators, 206openings, 24%
Construction Managers,
225 openings, 26%
First-Line Supervisors of Construction Trades and
Extraction Workers,440 openings, 50%
0 100 200 300 400 500 600 700 800 900 1,000
Construction Products, 81
Water, Sewage, and Other Systems, 908
-10.0%
-5.0%
0.0%
5.0%
10.0%
15.0%
20.0%
25.0%
0.0 0.5 1.0 1.5 2.0 2.5 3.0 3.5
Location Quotient (2016)
Location Quotient (2016)
Ann
ual E
mpl
oym
ent G
row
th R
ate
(200
6-20
16)
Subcluster with an annual average earnings higher than all-industry annual average earnings in ($67,498) Sacramento region in 2016
LQ=1.0
Exhibit 2C: Non-traded subclusters in the Sacramento region73
Specialty Contractors, 50,899
General Contractors, 16,843
Real Estate Services, 15,475
Construction Materials Retailing, 6,552
Highway and Street Construction, 2,268
Water and Sewer Line Construction, 1,662
Building Equipment Distribution, 1,207
Developers
-15.0%
-10.0%
-5.0%
0.0%
5.0%
0.8 1.0 1.2 1.4
Ann
ual E
mpl
oym
ent G
row
th R
ate
(200
6-20
16
Exhibit 2E: Joint apprentices by gender in the Sacramento region (January 2012-October 2017)
Exhibit 3E: Joint apprentices by county of residence in the Sacramento region (January 2012-October 2017)
8,374, 97%
249, 3%
El Dorado,393, 56%
Placer,949, 11%
Sacramento, 6077, 1
Sutter, 346,4%
Yolo, 549,6%
Yuba, 309,
4%
Exhibit 4E: Joint apprentices’ highest level of education prior to apprenticeship in the Sacramento region (January 2012-October 2017)
Exhibit 5E: Number of weeks worked, all workers in the construction sector in the Sacramento region (2015)84
Less than highschool, 7%
High schoolgraduate orGED, 65%
Some college,25%
4 or more yearsof college, 3%
3,165 6%
3,082 6%
1,650 3%
6,105 12%
7,068 10%
31,037 62%
0 5,000 10,000 15,000 20,000 25,000 30,000 35,000
Did not work
Less than 14
14 to 26
27 to 39
40 to 49
50 to 52
# w
eeks
wor
ked
in th
e la
st y
ear
Exhibit 4: Value of nonresidential construction put in place, by subcomponent (California)9
-0.5%
29.2%
-41.1%
0.0%
62.9%
-34.7%
46.0%
42.8%
19.1%
-14.6%
66.5%
763.4%
Office
Commercial
Manufacturing
Health care
Educational
Religious
Amusement and recreation
Transportation
Power and communication
Highway and street
Public works
Other
Subcomponent percent change 2006-2016
180.8
593.7
818.9
21.4
235.8 342.3
104.9 133.6 173.5
0.0
100.0
200.0
300.0
400.0
500.0
600.0
700.0
800.0
900.0
1000.0
2001 2006 2011 2016 2021
Construction Materials,125
Construction, 1,942
Construction Components, 466
LQ=1.0
Concrete Products, 1,123
Construction Materials Wholesaling, 1,647
Subcluster with an annual average earnings higher than all-industry annual average earnings ($67,498) in Sacramento region in 2016
Exhibit 1E: Total joint apprentice starts, residents in the six-county Sacramento region (January 2012-October 2017) (n = 8,617)2
435
95
104
111
117
121
135
161
174
178
215
302
340
440
458
483
542
602
1,045
1,205
1,354
0 200 400 600 800 1000 1200 1400 1600
All others
Elevator constructor
Drywall finisher
Scaffold and shoring erector
Inspector or surveyor
Pile driver
Glazier
Carpet, linoleum, and soft tile layer
Millwright
Sheet metal worker & related trades
Construction equipment operator trades
Brick, marble, terrazzo, tile, and related trades
Roofer and waterproofer
Plumber and fitter trades
Painter trades
Cement mason and plasterer trades
Electricial trades
Drywall/lather
Ironworker trades
Carpenter
Construction craft laborer
Exhibit 38: Anticipated annual construction industry job openings by new and replacement jobs in the Sacramento region (2016-2021)1
21 26 59 60 52 78 99 167 167 220323 350 399 439 473
596 679788 777 763
2,119
4 6 1 1 20 7 520 27 2
71 56100 95 73
4699
82 95222
215
0
500
1000
1500
2000
2500
Annual Replacement Openings New Jobs (Growth)
Male
Female
$ Th
ousa
nds
Thou
sand
s of
Dol
lars
Average annual openings (demand) minuseducation and training (supply) =approximate annual shortage
Approximate annual shortage = 7,250 workers across all categories
Sutter
6.2% 5.1%
27.6%
14.4%
50.6%69.9%
10.8%7.9%
1.1% 0.6%3.6% 2.0%Exhibit 1: Value of construction put in place (United States)3
$1,161,282
$788,332
$1,185,683
$0
$200,000
$400,000
$600,000
$800,000
$1,000,000
$1,200,000
$1,400,000
2002 2003 2004 2005 2006 2007 2008 2009 2010 2011 2012 2013 2014 2015 2016
Mill
ions
of
Dol
lars
Residential Nonresidential
Exhibit 2: Value of construction put in place (California)5
$58,091,975
$18,740,050
$51,350,955
$0
$10,000,000
$20,000,000
$30,000,000
$40,000,000
$50,000,000
$60,000,000
$70,000,000
2002 2003 2004 2005 2006 2007 2008 2009 2010 2011 2012 2013 2014 2015 2016
Residential Nonresidential
Exhibit 3: Value of nonresidential construction put in place, by subcomponent (United States)7
24.1%
-0.2%
130.5%
0.6%
5.3%
-54.8%
18.0%
50.9%
98.2%
26.9%
-7.5%
21.7%
Office
Commercial
Manufacturing
Health care
Educational
Religious
Amusement and recreation
Transportation
Power and communication
Highway and street
Public works
Other
Subcomponent percent change 2006-2016
Exhibit 5: Value of Infrastructure as a percent of nonresidential construction put in place (United States)10
37.5% 37.9% 36.5%37.1% 37.0%
37.3%37.5% 41.1% 46.3% 45.5%
46.6% 46.4%46.1% 43.5% 41.6%
$0
$100,000
$200,000
$300,000
$400,000
$500,000
$600,000
$700,000
$800,000
2002 2003 2004 2005 2006 2007 2008 2009 2010 2011 2012 2013 2014 2015 2016
$ M
illio
ns
$ Th
ousa
nds
Nonresidential Infrastructure
Exhibit 6: Value of infrastructure as a percent of nonresidential construction put in place (California)11
11.6% 12.8% 14.3% 13.4%14.3%
11.0% 10.7%10.7% 10.2% 9.9% 10.9%
27.5%
14.9%16.2% 13.0%$5,000,000
$0
$10,000,000
$15,000,000
$20,000,000
$25,000,000
$30,000,000
2002 2003 2004 2005 2006 2007 2008 2009 2010 2011 2012 2013 2014 2015 2016
Nonresidential Infrastructure
Exhibit 7: Construction value added as a percent of GDP (United States)12
Exhibit 8: Construction value added as a percent of GRP (California)13
7.8% 7.8%8.1%
8.6%8.4%
8.0%
7.4%
6.3%
5.4%5.1%
5.3%5.5%
5.8%
6.2%6.4%
3.0%
4.0%
5.0%
6.0%
7.0%
8.0%
9.0%
2002 2003 2004 2005 2006 2007 2008 2009 2010 2011 2012 2013 2014 2015 2016
2002 2003 2004 2005 2006 2007 2008 2009 2010 2011 2012 2013 2014 2015 2016
3.0% 3.1%3.3% 3.3%
2.8%
2.3%
1.6%
1.0% 1.0% 1.1%1.3%
1.8% 1.8%2.0% 2.0%
0.0%
0.5%
1.0%
1.5%
2.0%
2.5%
3.0%
3.5%
4.0%
Exhibit 9: Construction value added as a percent of GRP (California, Sacramento region and Bay Area)16
3.0%
6.8% 6.9%
3.6%
1.2%1.4%
1.7%
2.3%
2.4%
0.0%
1.0%
2.0%
3.0%
4.0%
5.0%
6.0%
7.0%
8.0%
2002 2003 2004 2005 2006 2007 2008 2009 2010 2011 2012 2013 2014 2015
State Sacramento Metro (6-county) Bay Area Metro (9-county)
Exhibit 10: Housing unit supply versus demand in the Sacramento region
Exh ibit 11: Residen tial building units in the six-county Sacramento region (permi t data)20
19,865
14,239
10,996 8,932
6,483 7,768 9,125
10,399
19,122
23,812
17,987
2,293 3,939 4,652
6,492
0
5,000
10,000
15,000
20,000
25,000
30,000
2002 2003 2004 2005 2006 2007 2008 2009 2010 2011 2012 2013 2014 2015 2016 2017
Housing Unit Demand Housing Unit Supply
14,01415,671
19,78419,630
21,65218,612
10,1257,931
4,1752,493 2,326 1,938 2,965 3,772 3,967
5,526 6,401
3,226
3,868
4,628 4,7613,612
2,911
3,568
1,555
1,818 438 539 759631
982 7461,265
1,053
0
5,000
10,000
15,000
20,000
25,000
30,000
2000 2001 2002 2003 2004 2005 2006 2007 2008 2009 2010 2011 2012 2013 2014 2015 2016
Single Family Units Multifamily Units
Exhibit 13: Value of nonresidential construction in the six-county Sacramento region 21
$0
$200,000
$400,000
$600,000
$800,000
$1,000 ,000
$1,200 ,000
$1,400 ,000
$1,600 ,000
$1,800 ,000
$2,000 ,000
2000 2001 2002 2003 2004 2005 2006 2007 2008 2009 2010 2011 2012 2013 2014 2015 2016
El Dorado Placer Sacramento Yolo Yuba Sutter
Exhibit 14: Percent of nonresidential construction value in the Sacramento region, by county22
0%
10%
20%
30%
40%
50%
60%
70%
80%
90%
100%
2006 2016
El Dorado Placer Sacramento Yolo Yuba
Exhibit 17: Average annual earnings in traded and non-traded clusters in the study regions (2016)
$85,
512
$58,
972
$67,
498
$97,
280
$78,
396
$100
,688
$90,
080
$63,
145
$72,
018
$0
$20,000
$40,000
$60,000
$80,000
$100,000
$120,000
Traded Non-Traded All Industries
Sacramento Region Bay Area Californ ia
Exhibit 18: Traded subcluster employment index, Sacramento region (2001-2021)25
Water, Sewage, and Other Systems Projection
Projection
Projection
Projection
Projection
Construction Materials
Construction
Construction Products
Construction Components
Empl
oym
ent i
ndex
(2
006
Empl
oym
ent =
100
)
Empl
oym
ent i
ndex
(2
006
Empl
oym
ent =
100
)
Exhibit 24: Non-traded subcluster employment index, Sacramento region (2001-2021)36
101.0 119.3
87.2104.7
73.7
136.3
36.1
29.6
17.9
0.0
25.0
50.0
75.0
100.0
125.0
150.0
2001 2006 2011 2016 2021
Water and Sewer Line Construction Projection
Concrete Products Projection
Real Estate Services Projection
Specialty Contractors Projection
General Contractors Projection
Developers Projection
* Only included subclusters with 10k+employment or significant employment change. Refer to appendix for the complete list of nontraded subclusters.
Exhibit 39: Entering construction industry workers by type of education and training in the Sacramento region (annual average, 2014-2016)59
368
217181
56 54
148125 107
84
28 27 19 13 3
29
369
129
109
198
136
10561
35 8 13 14 8 10
0
50
100
150
200
250
300
350
400
Apprentices Oth er Post-Secondary Completions
Exhibit 44: Projected annual construction industry occupational gaps in the Sacramento region (2016-2021)60
-3
-2
-1
32
45
57
58
68
103
173
196
308
322
397
427
500
524
607
640
864
1,937
-200 100 400 700 1,000 1,300 1,600 1,900
Insulation Workers
Drafters
Interior Designers
PV Installers
Glaziers
Surveyors
Building Inspectors
Roofers
Ironworkers & Welders
Architects
Drywall Installers
HVAC & Sheet Metal
Painters
Masonry, Tile, Floor, Lathe, Plaster
Plumbers & Pipefitters
Engineers
Heavy Equipment Operators
Real Estate Professionals
Electricians
Construction Managers
Carpenters
Exhibit 47: Unionized and non-unionized workforce, Sacramento--Arden-Arcade--Roseville MSA and 10-county Bay Area (annual average, 2014-2017)61
Exhibit 48: Unionization in the construction workforce as an annual average percentage of total employment, Sacramento--Arden-Arcade--Roseville MSA (2000-2017)62
31%, 32,314
29%, 12,555
69%, 70,898
71%, 30,110
0% 20% 40% 60% 80% 100%
10-County Bay Area
Sacramento MSA
Union Non-Union
32%
20% 19%24% 23%
29%
68%
80% 81%76% 77%
71%
0%
10%
20%
30%
40%
50%
60%
70%
80%
90%
2000 – 2002 2003 – 2004 2005 –2008 2008 – 2011 2011 – 2014 2014 – 2017
Union Non-Union
Exhibit 1A. Construction managers projected annual openings, n = 871 (2016-2021)67
Cost Estimators, 206openings, 24%
Construction Managers,
225 openings, 26%
First-Line Supervisors of Construction Trades and
Extraction Workers,440 openings, 50%
0 100 200 300 400 500 600 700 800 900 1,000
Construction Products, 81
Water, Sewage, and Other Systems, 908
-10.0%
-5.0%
0.0%
5.0%
10.0%
15.0%
20.0%
25.0%
0.0 0.5 1.0 1.5 2.0 2.5 3.0 3.5
Location Quotient (2016)
Location Quotient (2016)
Ann
ual E
mpl
oym
ent G
row
th R
ate
(200
6-20
16)
Subcluster with an annual average earnings higher than all-industry annual average earnings in ($67,498) Sacramento region in 2016
LQ=1.0
Exhibit 2C: Non-traded subclusters in the Sacramento region73
Specialty Contractors, 50,899
General Contractors, 16,843
Real Estate Services, 15,475
Construction Materials Retailing, 6,552
Highway and Street Construction, 2,268
Water and Sewer Line Construction, 1,662
Building Equipment Distribution, 1,207
Developers
-15.0%
-10.0%
-5.0%
0.0%
5.0%
0.8 1.0 1.2 1.4
Ann
ual E
mpl
oym
ent G
row
th R
ate
(200
6-20
16
Exhibit 2E: Joint apprentices by gender in the Sacramento region (January 2012-October 2017)
Exhibit 3E: Joint apprentices by county of residence in the Sacramento region (January 2012-October 2017)
8,374, 97%
249, 3%
El Dorado,393, 56%
Placer,949, 11%
Sacramento, 6077, 1
Sutter, 346,4%
Yolo, 549,6%
Yuba, 309,
4%
Exhibit 4E: Joint apprentices’ highest level of education prior to apprenticeship in the Sacramento region (January 2012-October 2017)
Exhibit 5E: Number of weeks worked, all workers in the construction sector in the Sacramento region (2015)84
Less than highschool, 7%
High schoolgraduate orGED, 65%
Some college,25%
4 or more yearsof college, 3%
3,165 6%
3,082 6%
1,650 3%
6,105 12%
7,068 10%
31,037 62%
0 5,000 10,000 15,000 20,000 25,000 30,000 35,000
Did not work
Less than 14
14 to 26
27 to 39
40 to 49
50 to 52
# w
eeks
wor
ked
in th
e la
st y
ear
Exhibit 4: Value of nonresidential construction put in place, by subcomponent (California)9
-0.5%
29.2%
-41.1%
0.0%
62.9%
-34.7%
46.0%
42.8%
19.1%
-14.6%
66.5%
763.4%
Office
Commercial
Manufacturing
Health care
Educational
Religious
Amusement and recreation
Transportation
Power and communication
Highway and street
Public works
Other
Subcomponent percent change 2006-2016
180.8
593.7
818.9
21.4
235.8 342.3
104.9 133.6 173.5
0.0
100.0
200.0
300.0
400.0
500.0
600.0
700.0
800.0
900.0
1000.0
2001 2006 2011 2016 2021
Construction Materials,125
Construction, 1,942
Construction Components, 466
LQ=1.0
Concrete Products, 1,123
Construction Materials Wholesaling, 1,647
Subcluster with an annual average earnings higher than all-industry annual average earnings ($67,498) in Sacramento region in 2016
Exhibit 1E: Total joint apprentice starts, residents in the six-county Sacramento region (January 2012-October 2017) (n = 8,617)2
435
95
104
111
117
121
135
161
174
178
215
302
340
440
458
483
542
602
1,045
1,205
1,354
0 200 400 600 800 1000 1200 1400 1600
All others
Elevator constructor
Drywall finisher
Scaffold and shoring erector
Inspector or surveyor
Pile driver
Glazier
Carpet, linoleum, and soft tile layer
Millwright
Sheet metal worker & related trades
Construction equipment operator trades
Brick, marble, terrazzo, tile, and related trades
Roofer and waterproofer
Plumber and fitter trades
Painter trades
Cement mason and plasterer trades
Electricial trades
Drywall/lather
Ironworker trades
Carpenter
Construction craft laborer
Exhibit 38: Anticipated annual construction industry job openings by new and replacement jobs in the Sacramento region (2016-2021)1
21 26 59 60 52 78 99 167 167 220323 350 399 439 473
596 679788 777 763
2,119
4 6 1 1 20 7 520 27 2
71 56100 95 73
4699
82 95222
215
0
500
1000
1500
2000
2500
Annual Replacement Openings New Jobs (Growth)
Male
Female
$ Th
ousa
nds
Thou
sand
s of
Dol
lars
Average annual openings (demand) minuseducation and training (supply) =approximate annual shortage
Approximate annual shortage = 7,250 workers across all categories
Sutter
6.2% 5.1%
27.6%
14.4%
50.6%69.9%
10.8%7.9%
1.1% 0.6%3.6% 2.0%
12 U.S. Census Bureau and Bureau of Economic Analysis (BEA). GDP information was pulled from the BEA dataset for the national economy. The value of construction per the U.S. Census data was calculated as a percent of economic activity from all industries for each year reported. Full details on collection methodology for GDP is available at the BEA website: https://www.bea.gov/national/index.htm.
13 California Home Building Foundation (CHBF), Construction Industry Research Board (CIRB), Bureau of Economic Analysis. Construction value-add as a percent of GRP for California was calculated in a similar manner for the national chart in the previous section, with construction activity reported in the CIRB data used in place of U. S. Census data. A variety of factors contribute to the smaller percentage of gross product from construction in California including the wealth generated from information technology, professional and business services, government and other sectors. The continued effects on the residential housing market also contribute to the smaller share of the economy generated from construction.
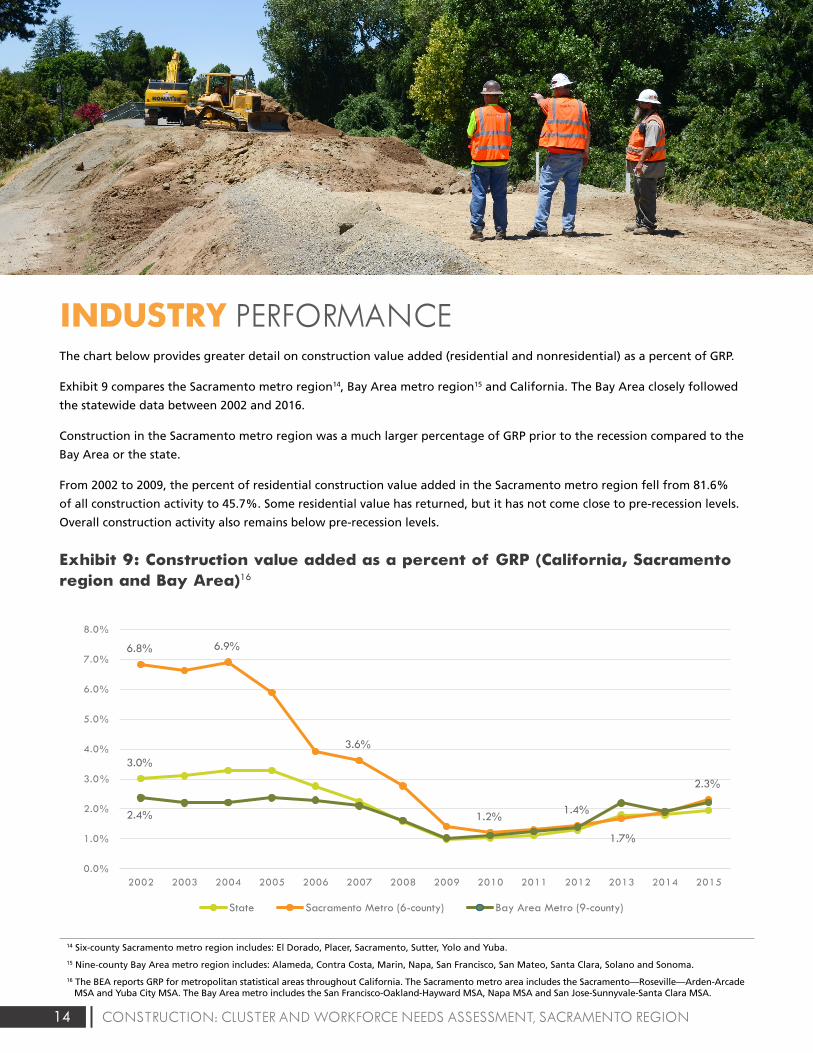
14 CONSTRUCTION: CLUSTER AND WORKFORCE NEEDS ASSESSMENT, SACRAMENTO REGION
INDUSTRY PERFORMANCEThe chart below provides greater detail on construction value added (residential and nonresidential) as a percent of GRP.
Exhibit 9 compares the Sacramento metro region14, Bay Area metro region15 and California. The Bay Area closely followed
the statewide data between 2002 and 2016.
Construction in the Sacramento metro region was a much larger percentage of GRP prior to the recession compared to the
Bay Area or the state.
From 2002 to 2009, the percent of residential construction value added in the Sacramento metro region fell from 81.6%
of all construction activity to 45.7%. Some residential value has returned, but it has not come close to pre-recession levels.
Overall construction activity also remains below pre-recession levels.
Exhibit 9: Construction value added as a percent of GRP (California, Sacramento region and Bay Area)16
Exhibit 1: Value of construction put in place (United States)3
$1,161,282
$788,332
$1,185,683
$0
$200,000
$400,000
$600,000
$800,000
$1,000,000
$1,200,000
$1,400,000
2002 2003 2004 2005 2006 2007 2008 2009 2010 2011 2012 2013 2014 2015 2016
Mill
ions
of
Dol
lars
Residential Nonresidential
Exhibit 2: Value of construction put in place (California)5
$58,091,975
$18,740,050
$51,350,955
$0
$10,000,000
$20,000,000
$30,000,000
$40,000,000
$50,000,000
$60,000,000
$70,000,000
2002 2003 2004 2005 2006 2007 2008 2009 2010 2011 2012 2013 2014 2015 2016
Residential Nonresidential
Exhibit 3: Value of nonresidential construction put in place, by subcomponent (United States)7
24.1%
-0.2%
130.5%
0.6%
5.3%
-54.8%
18.0%
50.9%
98.2%
26.9%
-7.5%
21.7%
Office
Commercial
Manufacturing
Health care
Educational
Religious
Amusement and recreation
Transportation
Power and communication
Highway and street
Public works
Other
Subcomponent percent change 2006-2016
Exhibit 5: Value of Infrastructure as a percent of nonresidential construction put in place (United States)10
37.5% 37.9% 36.5%37.1% 37.0%
37.3%37.5% 41.1% 46.3% 45.5%
46.6% 46.4%46.1% 43.5% 41.6%
$0
$100,000
$200,000
$300,000
$400,000
$500,000
$600,000
$700,000
$800,000
2002 2003 2004 2005 2006 2007 2008 2009 2010 2011 2012 2013 2014 2015 2016
$ M
illio
ns
$ Th
ousa
nds
Nonresidential Infrastructure
Exhibit 6: Value of infrastructure as a percent of nonresidential construction put in place (California)11
11.6% 12.8% 14.3% 13.4%14.3%
11.0% 10.7%10.7% 10.2% 9.9% 10.9%
27.5%
14.9%16.2% 13.0%$5,000,000
$0
$10,000,000
$15,000,000
$20,000,000
$25,000,000
$30,000,000
2002 2003 2004 2005 2006 2007 2008 2009 2010 2011 2012 2013 2014 2015 2016
Nonresidential Infrastructure
Exhibit 7: Construction value added as a percent of GDP (United States)12
Exhibit 8: Construction value added as a percent of GRP (California)13
7.8% 7.8%8.1%
8.6%8.4%
8.0%
7.4%
6.3%
5.4%5.1%
5.3%5.5%
5.8%
6.2%6.4%
3.0%
4.0%
5.0%
6.0%
7.0%
8.0%
9.0%
2002 2003 2004 2005 2006 2007 2008 2009 2010 2011 2012 2013 2014 2015 2016
2002 2003 2004 2005 2006 2007 2008 2009 2010 2011 2012 2013 2014 2015 2016
3.0% 3.1%3.3% 3.3%
2.8%
2.3%
1.6%
1.0% 1.0% 1.1%1.3%
1.8% 1.8%2.0% 2.0%
0.0%
0.5%
1.0%
1.5%
2.0%
2.5%
3.0%
3.5%
4.0%
Exhibit 9: Construction value added as a percent of GRP (California, Sacramento region and Bay Area)16
3.0%
6.8% 6.9%
3.6%
1.2%1.4%
1.7%
2.3%
2.4%
0.0%
1.0%
2.0%
3.0%
4.0%
5.0%
6.0%
7.0%
8.0%
2002 2003 2004 2005 2006 2007 2008 2009 2010 2011 2012 2013 2014 2015
State Sacramento Metro (6-county) Bay Area Metro (9-county)
Exhibit 10: Housing unit supply versus demand in the Sacramento region
Exh ibit 11: Residen tial building units in the six-county Sacramento region (permi t data)20
19,865
14,239
10,996 8,932
6,483 7,768 9,125
10,399
19,122
23,812
17,987
2,293 3,939 4,652
6,492
0
5,000
10,000
15,000
20,000
25,000
30,000
2002 2003 2004 2005 2006 2007 2008 2009 2010 2011 2012 2013 2014 2015 2016 2017
Housing Unit Demand Housing Unit Supply
14,01415,671
19,78419,630
21,65218,612
10,1257,931
4,1752,493 2,326 1,938 2,965 3,772 3,967
5,526 6,401
3,226
3,868
4,628 4,7613,612
2,911
3,568
1,555
1,818 438 539 759631
982 7461,265
1,053
0
5,000
10,000
15,000
20,000
25,000
30,000
2000 2001 2002 2003 2004 2005 2006 2007 2008 2009 2010 2011 2012 2013 2014 2015 2016
Single Family Units Multifamily Units
Exhibit 13: Value of nonresidential construction in the six-county Sacramento region 21
$0
$200,000
$400,000
$600,000
$800,000
$1,000 ,000
$1,200 ,000
$1,400 ,000
$1,600 ,000
$1,800 ,000
$2,000 ,000
2000 2001 2002 2003 2004 2005 2006 2007 2008 2009 2010 2011 2012 2013 2014 2015 2016
El Dorado Placer Sacramento Yolo Yuba Sutter
Exhibit 14: Percent of nonresidential construction value in the Sacramento region, by county22
0%
10%
20%
30%
40%
50%
60%
70%
80%
90%
100%
2006 2016
El Dorado Placer Sacramento Yolo Yuba
Exhibit 17: Average annual earnings in traded and non-traded clusters in the study regions (2016)
$85,
512
$58,
972
$67,
498
$97,
280
$78,
396
$100
,688
$90,
080
$63,
145
$72,
018
$0
$20,000
$40,000
$60,000
$80,000
$100,000
$120,000
Traded Non-Traded All Industries
Sacramento Region Bay Area Californ ia
Exhibit 18: Traded subcluster employment index, Sacramento region (2001-2021)25
Water, Sewage, and Other Systems Projection
Projection
Projection
Projection
Projection
Construction Materials
Construction
Construction Products
Construction Components
Empl
oym
ent i
ndex
(2
006
Empl
oym
ent =
100
)
Empl
oym
ent i
ndex
(2
006
Empl
oym
ent =
100
)
Exhibit 24: Non-traded subcluster employment index, Sacramento region (2001-2021)36
101.0 119.3
87.2104.7
73.7
136.3
36.1
29.6
17.9
0.0
25.0
50.0
75.0
100.0
125.0
150.0
2001 2006 2011 2016 2021
Water and Sewer Line Construction Projection
Concrete Products Projection
Real Estate Services Projection
Specialty Contractors Projection
General Contractors Projection
Developers Projection
* Only included subclusters with 10k+employment or significant employment change. Refer to appendix for the complete list of nontraded subclusters.
Exhibit 39: Entering construction industry workers by type of education and training in the Sacramento region (annual average, 2014-2016)59
368
217181
56 54
148125 107
84
28 27 19 13 3
29
369
129
109
198
136
10561
35 8 13 14 8 10
0
50
100
150
200
250
300
350
400
Apprentices Oth er Post-Secondary Completions
Exhibit 44: Projected annual construction industry occupational gaps in the Sacramento region (2016-2021)60
-3
-2
-1
32
45
57
58
68
103
173
196
308
322
397
427
500
524
607
640
864
1,937
-200 100 400 700 1,000 1,300 1,600 1,900
Insulation Workers
Drafters
Interior Designers
PV Installers
Glaziers
Surveyors
Building Inspectors
Roofers
Ironworkers & Welders
Architects
Drywall Installers
HVAC & Sheet Metal
Painters
Masonry, Tile, Floor, Lathe, Plaster
Plumbers & Pipefitters
Engineers
Heavy Equipment Operators
Real Estate Professionals
Electricians
Construction Managers
Carpenters
Exhibit 47: Unionized and non-unionized workforce, Sacramento--Arden-Arcade--Roseville MSA and 10-county Bay Area (annual average, 2014-2017)61
Exhibit 48: Unionization in the construction workforce as an annual average percentage of total employment, Sacramento--Arden-Arcade--Roseville MSA (2000-2017)62
31%, 32,314
29%, 12,555
69%, 70,898
71%, 30,110
0% 20% 40% 60% 80% 100%
10-County Bay Area
Sacramento MSA
Union Non-Union
32%
20% 19%24% 23%
29%
68%
80% 81%76% 77%
71%
0%
10%
20%
30%
40%
50%
60%
70%
80%
90%
2000 – 2002 2003 – 2004 2005 –2008 2008 – 2011 2011 – 2014 2014 – 2017
Union Non-Union
Exhibit 1A. Construction managers projected annual openings, n = 871 (2016-2021)67
Cost Estimators, 206openings, 24%
Construction Managers,
225 openings, 26%
First-Line Supervisors of Construction Trades and
Extraction Workers,440 openings, 50%
0 100 200 300 400 500 600 700 800 900 1,000
Construction Products, 81
Water, Sewage, and Other Systems, 908
-10.0%
-5.0%
0.0%
5.0%
10.0%
15.0%
20.0%
25.0%
0.0 0.5 1.0 1.5 2.0 2.5 3.0 3.5
Location Quotient (2016)
Location Quotient (2016)
Ann
ual E
mpl
oym
ent G
row
th R
ate
(200
6-20
16)
Subcluster with an annual average earnings higher than all-industry annual average earnings in ($67,498) Sacramento region in 2016
LQ=1.0
Exhibit 2C: Non-traded subclusters in the Sacramento region73
Specialty Contractors, 50,899
General Contractors, 16,843
Real Estate Services, 15,475
Construction Materials Retailing, 6,552
Highway and Street Construction, 2,268
Water and Sewer Line Construction, 1,662
Building Equipment Distribution, 1,207
Developers
-15.0%
-10.0%
-5.0%
0.0%
5.0%
0.8 1.0 1.2 1.4
Ann
ual E
mpl
oym
ent G
row
th R
ate
(200
6-20
16
Exhibit 2E: Joint apprentices by gender in the Sacramento region (January 2012-October 2017)
Exhibit 3E: Joint apprentices by county of residence in the Sacramento region (January 2012-October 2017)
8,374, 97%
249, 3%
El Dorado,393, 56%
Placer,949, 11%
Sacramento, 6077, 1
Sutter, 346,4%
Yolo, 549,6%
Yuba, 309,
4%
Exhibit 4E: Joint apprentices’ highest level of education prior to apprenticeship in the Sacramento region (January 2012-October 2017)
Exhibit 5E: Number of weeks worked, all workers in the construction sector in the Sacramento region (2015)84
Less than highschool, 7%
High schoolgraduate orGED, 65%
Some college,25%
4 or more yearsof college, 3%
3,165 6%
3,082 6%
1,650 3%
6,105 12%
7,068 10%
31,037 62%
0 5,000 10,000 15,000 20,000 25,000 30,000 35,000
Did not work
Less than 14
14 to 26
27 to 39
40 to 49
50 to 52
# w
eeks
wor
ked
in th
e la
st y
ear
Exhibit 4: Value of nonresidential construction put in place, by subcomponent (California)9
-0.5%
29.2%
-41.1%
0.0%
62.9%
-34.7%
46.0%
42.8%
19.1%
-14.6%
66.5%
763.4%
Office
Commercial
Manufacturing
Health care
Educational
Religious
Amusement and recreation
Transportation
Power and communication
Highway and street
Public works
Other
Subcomponent percent change 2006-2016
180.8
593.7
818.9
21.4
235.8 342.3
104.9 133.6 173.5
0.0
100.0
200.0
300.0
400.0
500.0
600.0
700.0
800.0
900.0
1000.0
2001 2006 2011 2016 2021
Construction Materials,125
Construction, 1,942
Construction Components, 466
LQ=1.0
Concrete Products, 1,123
Construction Materials Wholesaling, 1,647
Subcluster with an annual average earnings higher than all-industry annual average earnings ($67,498) in Sacramento region in 2016
Exhibit 1E: Total joint apprentice starts, residents in the six-county Sacramento region (January 2012-October 2017) (n = 8,617)2
435
95
104
111
117
121
135
161
174
178
215
302
340
440
458
483
542
602
1,045
1,205
1,354
0 200 400 600 800 1000 1200 1400 1600
All others
Elevator constructor
Drywall finisher
Scaffold and shoring erector
Inspector or surveyor
Pile driver
Glazier
Carpet, linoleum, and soft tile layer
Millwright
Sheet metal worker & related trades
Construction equipment operator trades
Brick, marble, terrazzo, tile, and related trades
Roofer and waterproofer
Plumber and fitter trades
Painter trades
Cement mason and plasterer trades
Electricial trades
Drywall/lather
Ironworker trades
Carpenter
Construction craft laborer
Exhibit 38: Anticipated annual construction industry job openings by new and replacement jobs in the Sacramento region (2016-2021)1
21 26 59 60 52 78 99 167 167 220323 350 399 439 473
596 679788 777 763
2,119
4 6 1 1 20 7 520 27 2
71 56100 95 73
4699
82 95222
215
0
500
1000
1500
2000
2500
Annual Replacement Openings New Jobs (Growth)
Male
Female
$ Th
ousa
nds
Thou
sand
s of
Dol
lars
Average annual openings (demand) minuseducation and training (supply) =approximate annual shortage
Approximate annual shortage = 7,250 workers across all categories
Sutter
6.2% 5.1%
27.6%
14.4%
50.6%69.9%
10.8%7.9%
1.1% 0.6%3.6% 2.0%
14 Six-county Sacramento metro region includes: El Dorado, Placer, Sacramento, Sutter, Yolo and Yuba.
15 Nine-county Bay Area metro region includes: Alameda, Contra Costa, Marin, Napa, San Francisco, San Mateo, Santa Clara, Solano and Sonoma.
16 The BEA reports GRP for metropolitan statistical areas throughout California. The Sacramento metro area includes the Sacramento—Roseville—Arden-Arcade MSA and Yuba City MSA. The Bay Area metro includes the San Francisco-Oakland-Hayward MSA, Napa MSA and San Jose-Sunnyvale-Santa Clara MSA.
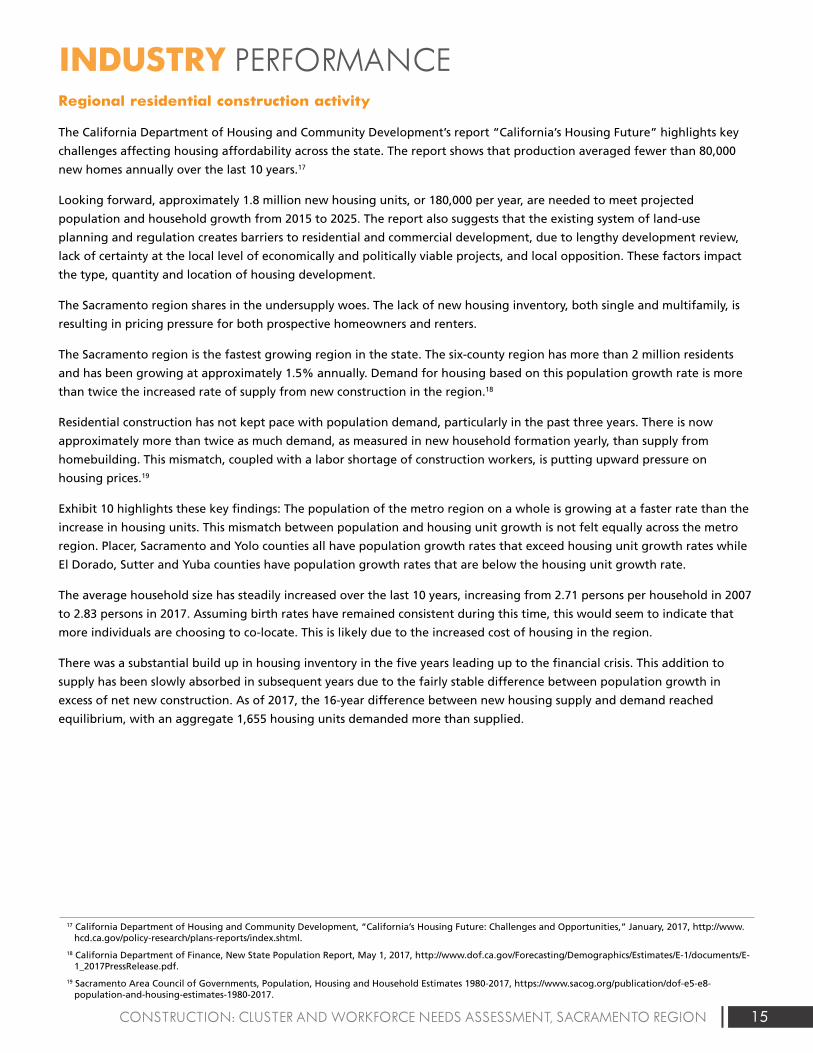
15CONSTRUCTION: CLUSTER AND WORKFORCE NEEDS ASSESSMENT, SACRAMENTO REGION
INDUSTRY PERFORMANCERegional residential construction activity
The California Department of Housing and Community Development’s report “California’s Housing Future” highlights key
challenges affecting housing affordability across the state. The report shows that production averaged fewer than 80,000
new homes annually over the last 10 years.17
Looking forward, approximately 1.8 million new housing units, or 180,000 per year, are needed to meet projected
population and household growth from 2015 to 2025. The report also suggests that the existing system of land-use
planning and regulation creates barriers to residential and commercial development, due to lengthy development review,
lack of certainty at the local level of economically and politically viable projects, and local opposition. These factors impact
the type, quantity and location of housing development.
The Sacramento region shares in the undersupply woes. The lack of new housing inventory, both single and multifamily, is
resulting in pricing pressure for both prospective homeowners and renters.
The Sacramento region is the fastest growing region in the state. The six-county region has more than 2 million residents
and has been growing at approximately 1.5% annually. Demand for housing based on this population growth rate is more
than twice the increased rate of supply from new construction in the region.18
Residential construction has not kept pace with population demand, particularly in the past three years. There is now
approximately more than twice as much demand, as measured in new household formation yearly, than supply from
homebuilding. This mismatch, coupled with a labor shortage of construction workers, is putting upward pressure on
housing prices.19
Exhibit 10 highlights these key findings: The population of the metro region on a whole is growing at a faster rate than the
increase in housing units. This mismatch between population and housing unit growth is not felt equally across the metro
region. Placer, Sacramento and Yolo counties all have population growth rates that exceed housing unit growth rates while
El Dorado, Sutter and Yuba counties have population growth rates that are below the housing unit growth rate.
The average household size has steadily increased over the last 10 years, increasing from 2.71 persons per household in 2007
to 2.83 persons in 2017. Assuming birth rates have remained consistent during this time, this would seem to indicate that
more individuals are choosing to co-locate. This is likely due to the increased cost of housing in the region.
There was a substantial build up in housing inventory in the five years leading up to the financial crisis. This addition to
supply has been slowly absorbed in subsequent years due to the fairly stable difference between population growth in
excess of net new construction. As of 2017, the 16-year difference between new housing supply and demand reached
equilibrium, with an aggregate 1,655 housing units demanded more than supplied.
17 California Department of Housing and Community Development, “California’s Housing Future: Challenges and Opportunities,” January, 2017, http://www.hcd.ca.gov/policy-research/plans-reports/index.shtml.
18 California Department of Finance, New State Population Report, May 1, 2017, http://www.dof.ca.gov/Forecasting/Demographics/Estimates/E-1/documents/E-1_2017PressRelease.pdf.
19 Sacramento Area Council of Governments, Population, Housing and Household Estimates 1980-2017, https://www.sacog.org/publication/dof-e5-e8-population-and-housing-estimates-1980-2017.
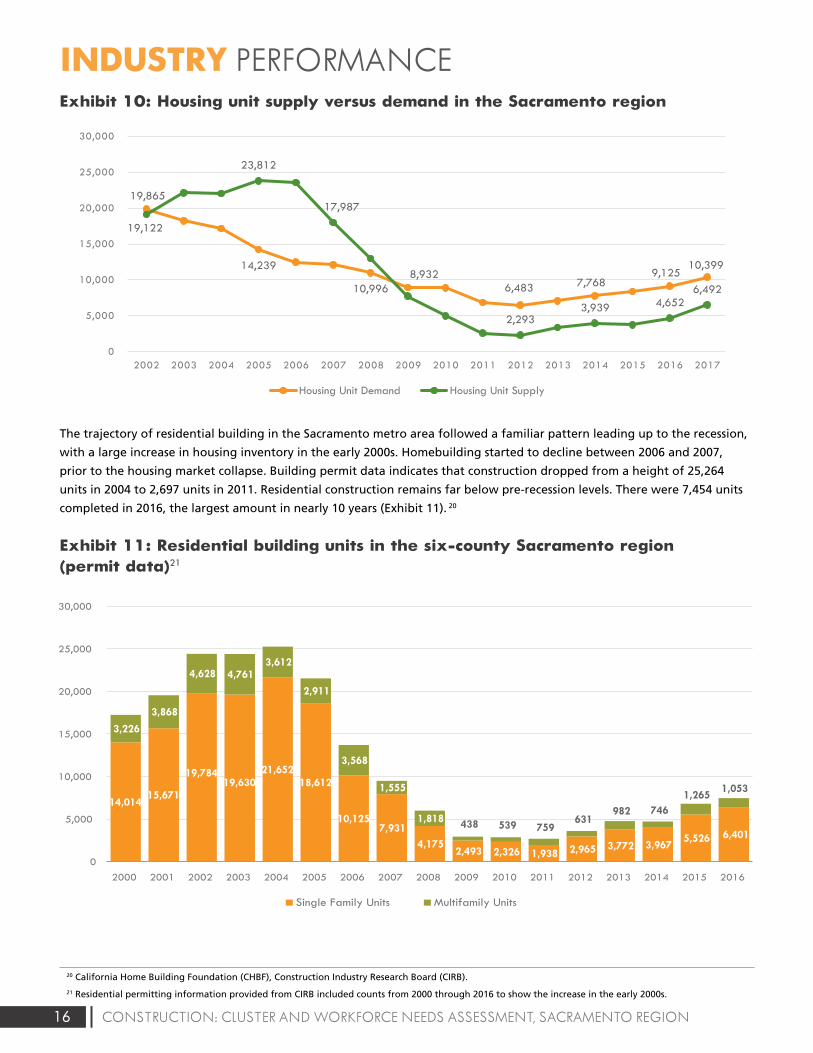
16 CONSTRUCTION: CLUSTER AND WORKFORCE NEEDS ASSESSMENT, SACRAMENTO REGION
INDUSTRY PERFORMANCEExhibit 10: Housing unit supply versus demand in the Sacramento region
The trajectory of residential building in the Sacramento metro area followed a familiar pattern leading up to the recession,
with a large increase in housing inventory in the early 2000s. Homebuilding started to decline between 2006 and 2007,
prior to the housing market collapse. Building permit data indicates that construction dropped from a height of 25,264
units in 2004 to 2,697 units in 2011. Residential construction remains far below pre-recession levels. There were 7,454 units
completed in 2016, the largest amount in nearly 10 years (Exhibit 11). 20
Exhibit 11: Residential building units in the six-county Sacramento region (permit data)21
Exhibit 1: Value of construction put in place (United States)3
$1,161,282
$788,332
$1,185,683
$0
$200,000
$400,000
$600,000
$800,000
$1,000,000
$1,200,000
$1,400,000
2002 2003 2004 2005 2006 2007 2008 2009 2010 2011 2012 2013 2014 2015 2016
Mill
ions
of
Dol
lars
Residential Nonresidential
Exhibit 2: Value of construction put in place (California)5
$58,091,975
$18,740,050
$51,350,955
$0
$10,000,000
$20,000,000
$30,000,000
$40,000,000
$50,000,000
$60,000,000
$70,000,000
2002 2003 2004 2005 2006 2007 2008 2009 2010 2011 2012 2013 2014 2015 2016
Residential Nonresidential
Exhibit 3: Value of nonresidential construction put in place, by subcomponent (United States)7
24.1%
-0.2%
130.5%
0.6%
5.3%
-54.8%
18.0%
50.9%
98.2%
26.9%
-7.5%
21.7%
Office
Commercial
Manufacturing
Health care
Educational
Religious
Amusement and recreation
Transportation
Power and communication
Highway and street
Public works
Other
Subcomponent percent change 2006-2016
Exhibit 5: Value of Infrastructure as a percent of nonresidential construction put in place (United States)10
37.5% 37.9% 36.5%37.1% 37.0%
37.3%37.5% 41.1% 46.3% 45.5%
46.6% 46.4%46.1% 43.5% 41.6%
$0
$100,000
$200,000
$300,000
$400,000
$500,000
$600,000
$700,000
$800,000
2002 2003 2004 2005 2006 2007 2008 2009 2010 2011 2012 2013 2014 2015 2016
$ M
illio
ns
$ Th
ousa
nds
Nonresidential Infrastructure
Exhibit 6: Value of infrastructure as a percent of nonresidential construction put in place (California)11
11.6% 12.8% 14.3% 13.4%14.3%
11.0% 10.7%10.7% 10.2% 9.9% 10.9%
27.5%
14.9%16.2% 13.0%$5,000,000
$0
$10,000,000
$15,000,000
$20,000,000
$25,000,000
$30,000,000
2002 2003 2004 2005 2006 2007 2008 2009 2010 2011 2012 2013 2014 2015 2016
Nonresidential Infrastructure
Exhibit 7: Construction value added as a percent of GDP (United States)12
Exhibit 8: Construction value added as a percent of GRP (California)13
7.8% 7.8%8.1%
8.6%8.4%
8.0%
7.4%
6.3%
5.4%5.1%
5.3%5.5%
5.8%
6.2%6.4%
3.0%
4.0%
5.0%
6.0%
7.0%
8.0%
9.0%
2002 2003 2004 2005 2006 2007 2008 2009 2010 2011 2012 2013 2014 2015 2016
2002 2003 2004 2005 2006 2007 2008 2009 2010 2011 2012 2013 2014 2015 2016
3.0% 3.1%3.3% 3.3%
2.8%
2.3%
1.6%
1.0% 1.0% 1.1%1.3%
1.8% 1.8%2.0% 2.0%
0.0%
0.5%
1.0%
1.5%
2.0%
2.5%
3.0%
3.5%
4.0%
Exhibit 9: Construction value added as a percent of GRP (California, Sacramento region and Bay Area)16
3.0%
6.8% 6.9%
3.6%
1.2%1.4%
1.7%
2.3%
2.4%
0.0%
1.0%
2.0%
3.0%
4.0%
5.0%
6.0%
7.0%
8.0%
2002 2003 2004 2005 2006 2007 2008 2009 2010 2011 2012 2013 2014 2015
State Sacramento Metro (6-county) Bay Area Metro (9-county)
Exhibit 10: Housing unit supply versus demand in the Sacramento region
Exh ibit 11: Residen tial building units in the six-county Sacramento region (permi t data)20
19,865
14,239
10,996 8,932
6,483 7,768 9,125
10,399
19,122
23,812
17,987
2,293 3,939 4,652
6,492
0
5,000
10,000
15,000
20,000
25,000
30,000
2002 2003 2004 2005 2006 2007 2008 2009 2010 2011 2012 2013 2014 2015 2016 2017
Housing Unit Demand Housing Unit Supply
14,01415,671
19,78419,630
21,65218,612
10,1257,931
4,1752,493 2,326 1,938 2,965 3,772 3,967
5,526 6,401
3,226
3,868
4,628 4,7613,612
2,911
3,568
1,555
1,818 438 539 759631
982 7461,265
1,053
0
5,000
10,000
15,000
20,000
25,000
30,000
2000 2001 2002 2003 2004 2005 2006 2007 2008 2009 2010 2011 2012 2013 2014 2015 2016
Single Family Units Multifamily Units
Exhibit 13: Value of nonresidential construction in the six-county Sacramento region 21
$0
$200,000
$400,000
$600,000
$800,000
$1,000 ,000
$1,200 ,000
$1,400 ,000
$1,600 ,000
$1,800 ,000
$2,000 ,000
2000 2001 2002 2003 2004 2005 2006 2007 2008 2009 2010 2011 2012 2013 2014 2015 2016
El Dorado Placer Sacramento Yolo Yuba Sutter
Exhibit 14: Percent of nonresidential construction value in the Sacramento region, by county22
0%
10%
20%
30%
40%
50%
60%
70%
80%
90%
100%
2006 2016
El Dorado Placer Sacramento Yolo Yuba
Exhibit 17: Average annual earnings in traded and non-traded clusters in the study regions (2016)
$85,
512
$58,
972
$67,
498
$97,
280
$78,
396
$100
,688
$90,
080
$63,
145
$72,
018
$0
$20,000
$40,000
$60,000
$80,000
$100,000
$120,000
Traded Non-Traded All Industries
Sacramento Region Bay Area Californ ia
Exhibit 18: Traded subcluster employment index, Sacramento region (2001-2021)25
Water, Sewage, and Other Systems Projection
Projection
Projection
Projection
Projection
Construction Materials
Construction
Construction Products
Construction Components
Empl
oym
ent i
ndex
(2
006
Empl
oym
ent =
100
)
Empl
oym
ent i
ndex
(2
006
Empl
oym
ent =
100
)
Exhibit 24: Non-traded subcluster employment index, Sacramento region (2001-2021)36
101.0 119.3
87.2104.7
73.7
136.3
36.1
29.6
17.9
0.0
25.0
50.0
75.0
100.0
125.0
150.0
2001 2006 2011 2016 2021
Water and Sewer Line Construction Projection
Concrete Products Projection
Real Estate Services Projection
Specialty Contractors Projection
General Contractors Projection
Developers Projection
* Only included subclusters with 10k+employment or significant employment change. Refer to appendix for the complete list of nontraded subclusters.
Exhibit 39: Entering construction industry workers by type of education and training in the Sacramento region (annual average, 2014-2016)59
368
217181
56 54
148125 107
84
28 27 19 13 3
29
369
129
109
198
136
10561
35 8 13 14 8 10
0
50
100
150
200
250
300
350
400
Apprentices Oth er Post-Secondary Completions
Exhibit 44: Projected annual construction industry occupational gaps in the Sacramento region (2016-2021)60
-3
-2
-1
32
45
57
58
68
103
173
196
308
322
397
427
500
524
607
640
864
1,937
-200 100 400 700 1,000 1,300 1,600 1,900
Insulation Workers
Drafters
Interior Designers
PV Installers
Glaziers
Surveyors
Building Inspectors
Roofers
Ironworkers & Welders
Architects
Drywall Installers
HVAC & Sheet Metal
Painters
Masonry, Tile, Floor, Lathe, Plaster
Plumbers & Pipefitters
Engineers
Heavy Equipment Operators
Real Estate Professionals
Electricians
Construction Managers
Carpenters
Exhibit 47: Unionized and non-unionized workforce, Sacramento--Arden-Arcade--Roseville MSA and 10-county Bay Area (annual average, 2014-2017)61
Exhibit 48: Unionization in the construction workforce as an annual average percentage of total employment, Sacramento--Arden-Arcade--Roseville MSA (2000-2017)62
31%, 32,314
29%, 12,555
69%, 70,898
71%, 30,110
0% 20% 40% 60% 80% 100%
10-County Bay Area
Sacramento MSA
Union Non-Union
32%
20% 19%24% 23%
29%
68%
80% 81%76% 77%
71%
0%
10%
20%
30%
40%
50%
60%
70%
80%
90%
2000 – 2002 2003 – 2004 2005 –2008 2008 – 2011 2011 – 2014 2014 – 2017
Union Non-Union
Exhibit 1A. Construction managers projected annual openings, n = 871 (2016-2021)67
Cost Estimators, 206openings, 24%
Construction Managers,
225 openings, 26%
First-Line Supervisors of Construction Trades and
Extraction Workers,440 openings, 50%
0 100 200 300 400 500 600 700 800 900 1,000
Construction Products, 81
Water, Sewage, and Other Systems, 908
-10.0%
-5.0%
0.0%
5.0%
10.0%
15.0%
20.0%
25.0%
0.0 0.5 1.0 1.5 2.0 2.5 3.0 3.5
Location Quotient (2016)
Location Quotient (2016)
Ann
ual E
mpl
oym
ent G
row
th R
ate
(200
6-20
16)
Subcluster with an annual average earnings higher than all-industry annual average earnings in ($67,498) Sacramento region in 2016
LQ=1.0
Exhibit 2C: Non-traded subclusters in the Sacramento region73
Specialty Contractors, 50,899
General Contractors, 16,843
Real Estate Services, 15,475
Construction Materials Retailing, 6,552
Highway and Street Construction, 2,268
Water and Sewer Line Construction, 1,662
Building Equipment Distribution, 1,207
Developers
-15.0%
-10.0%
-5.0%
0.0%
5.0%
0.8 1.0 1.2 1.4
Ann
ual E
mpl
oym
ent G
row
th R
ate
(200
6-20
16
Exhibit 2E: Joint apprentices by gender in the Sacramento region (January 2012-October 2017)
Exhibit 3E: Joint apprentices by county of residence in the Sacramento region (January 2012-October 2017)
8,374, 97%
249, 3%
El Dorado,393, 56%
Placer,949, 11%
Sacramento, 6077, 1
Sutter, 346,4%
Yolo, 549,6%
Yuba, 309,
4%
Exhibit 4E: Joint apprentices’ highest level of education prior to apprenticeship in the Sacramento region (January 2012-October 2017)
Exhibit 5E: Number of weeks worked, all workers in the construction sector in the Sacramento region (2015)84
Less than highschool, 7%
High schoolgraduate orGED, 65%
Some college,25%
4 or more yearsof college, 3%
3,165 6%
3,082 6%
1,650 3%
6,105 12%
7,068 10%
31,037 62%
0 5,000 10,000 15,000 20,000 25,000 30,000 35,000
Did not work
Less than 14
14 to 26
27 to 39
40 to 49
50 to 52
# w
eeks
wor
ked
in th
e la
st y
ear
Exhibit 4: Value of nonresidential construction put in place, by subcomponent (California)9
-0.5%
29.2%
-41.1%
0.0%
62.9%
-34.7%
46.0%
42.8%
19.1%
-14.6%
66.5%
763.4%
Office
Commercial
Manufacturing
Health care
Educational
Religious
Amusement and recreation
Transportation
Power and communication
Highway and street
Public works
Other
Subcomponent percent change 2006-2016
180.8
593.7
818.9
21.4
235.8 342.3
104.9 133.6 173.5
0.0
100.0
200.0
300.0
400.0
500.0
600.0
700.0
800.0
900.0
1000.0
2001 2006 2011 2016 2021
Construction Materials,125
Construction, 1,942
Construction Components, 466
LQ=1.0
Concrete Products, 1,123
Construction Materials Wholesaling, 1,647
Subcluster with an annual average earnings higher than all-industry annual average earnings ($67,498) in Sacramento region in 2016
Exhibit 1E: Total joint apprentice starts, residents in the six-county Sacramento region (January 2012-October 2017) (n = 8,617)2
435
95
104
111
117
121
135
161
174
178
215
302
340
440
458
483
542
602
1,045
1,205
1,354
0 200 400 600 800 1000 1200 1400 1600
All others
Elevator constructor
Drywall finisher
Scaffold and shoring erector
Inspector or surveyor
Pile driver
Glazier
Carpet, linoleum, and soft tile layer
Millwright
Sheet metal worker & related trades
Construction equipment operator trades
Brick, marble, terrazzo, tile, and related trades
Roofer and waterproofer
Plumber and fitter trades
Painter trades
Cement mason and plasterer trades
Electricial trades
Drywall/lather
Ironworker trades
Carpenter
Construction craft laborer
Exhibit 38: Anticipated annual construction industry job openings by new and replacement jobs in the Sacramento region (2016-2021)1
21 26 59 60 52 78 99 167 167 220323 350 399 439 473
596 679788 777 763
2,119
4 6 1 1 20 7 520 27 2
71 56100 95 73
4699
82 95222
215
0
500
1000
1500
2000
2500
Annual Replacement Openings New Jobs (Growth)
Male
Female
$ Th
ousa
nds
Thou
sand
s of
Dol
lars
Average annual openings (demand) minuseducation and training (supply) =approximate annual shortage
Approximate annual shortage = 7,250 workers across all categories
Sutter
6.2% 5.1%
27.6%
14.4%
50.6%69.9%
10.8%7.9%
1.1% 0.6%3.6% 2.0%Exhibit 1: Value of construction put in place (United States)3
$1,161,282
$788,332
$1,185,683
$0
$200,000
$400,000
$600,000
$800,000
$1,000,000
$1,200,000
$1,400,000
2002 2003 2004 2005 2006 2007 2008 2009 2010 2011 2012 2013 2014 2015 2016
Mill
ions
of
Dolla
rs
Residential Nonresidential
Exhibit 2: Value of construction put in place (California)5
$58,091,975
$18,740,050
$51,350,955
$0
$10,000,000
$20,000,000
$30,000,000
$40,000,000
$50,000,000
$60,000,000
$70,000,000
2002 2003 2004 2005 2006 2007 2008 2009 2010 2011 2012 2013 2014 2015 2016
Residential Nonresidential
Exhibit 3: Value of nonresidential construction put in place, by subcomponent (United States)7
24.1%
-0.2%
130.5%
0.6%
5.3%
-54.8%
18.0%
50.9%
98.2%
26.9%
-7.5%
21.7%
Office
Commercial
Manufacturing
Health care
Educational
Religious
Amusement and recreation
Transportation
Power and communication
Highway and street
Public works
Other
Subcomponent percent change 2006-2016
Exhibit 5: Value of Infrastructure as a percent of nonresidential construction put in place (United States)10
37.5% 37.9% 36.5%37.1% 37.0%
37.3%37.5% 41.1% 46.3% 45.5%
46.6% 46.4%46.1% 43.5% 41.6%
$0
$100,000
$200,000
$300,000
$400,000
$500,000
$600,000
$700,000
$800,000
2002 2003 2004 2005 2006 2007 2008 2009 2010 2011 2012 2013 2014 2015 2016
$ M
illio
ns
$ T
housa
nds
Nonresidential Infrastructure
Exhibit 6: Value of infrastructure as a percent of nonresidential construction put in place (California)11
11.6% 12.8% 14.3% 13.4%14.3%
11.0% 10.7%10.7% 10.2% 9.9% 10.9%
27.5%
14.9%16.2% 13.0%$5,000,000
$0
$10,000,000
$15,000,000
$20,000,000
$25,000,000
$30,000,000
2002 2003 2004 2005 2006 2007 2008 2009 2010 2011 2012 2013 2014 2015 2016
Nonresidential Infrastructure
Exhibit 7: Construction value added as a percent of GDP (United States)12
Exhibit 8: Construction value added as a percent of GRP (California)13
7.8% 7.8%8.1%
8.6%8.4%
8.0%
7.4%
6.3%
5.4%5.1%
5.3%5.5%
5.8%
6.2%6.4%
3.0%
4.0%
5.0%
6.0%
7.0%
8.0%
9.0%
2002 2003 2004 2005 2006 2007 2008 2009 2010 2011 2012 2013 2014 2015 2016
2002 2003 2004 2005 2006 2007 2008 2009 2010 2011 2012 2013 2014 2015 2016
3.0% 3.1%3.3% 3.3%
2.8%
2.3%
1.6%
1.0% 1.0% 1.1%1.3%
1.8% 1.8%2.0% 2.0%
0.0%
0.5%
1.0%
1.5%
2.0%
2.5%
3.0%
3.5%
4.0%
Exhibit 9: Construction value added as a percent of GRP (California, Sacramento region and Bay Area)16
3.0%
6.8% 6.9%
3.6%
1.2%1.4%
1.7%
2.3%
2.4%
0.0%
1.0%
2.0%
3.0%
4.0%
5.0%
6.0%
7.0%
8.0%
2002 2003 2004 2005 2006 2007 2008 2009 2010 2011 2012 2013 2014 2015
State Sacramento Metro (6-county) Bay Area Metro (9-county)
Exhibit 10: Housing unit supply versus demand in the Sacramento region
Exh ibit 11: Residen tial building units in the six-county Sacramento region (permi t data)20
19,865
14,239
10,996 8,932
6,483 7,768 9,125
10,399
19,122
23,812
17,987
2,293 3,939 4,652
6,492
0
5,000
10,000
15,000
20,000
25,000
30,000
2002 2003 2004 2005 2006 2007 2008 2009 2010 2011 2012 2013 2014 2015 2016 2017
Housing Unit Demand Housing Unit Supply
14,01415,671
19,78419,630
21,65218,612
10,1257,931
4,1752,493 2,326 1,938 2,965 3,772 3,967
5,526 6,401
3,226
3,868
4,628 4,7613,612
2,911
3,568
1,555
1,818 438 539 759631
982 7461,265
1,053
0
5,000
10,000
15,000
20,000
25,000
30,000
2000 2001 2002 2003 2004 2005 2006 2007 2008 2009 2010 2011 2012 2013 2014 2015 2016
Single Family Units Multifamily Units
Exhibit 13: Value of nonresidential construction in the six-county Sacramento region 21
$0
$200,000
$400,000
$600,000
$800,000
$1,000 ,000
$1,200 ,000
$1,400 ,000
$1,600 ,000
$1,800 ,000
$2,000 ,000
2000 2001 2002 2003 2004 2005 2006 2007 2008 2009 2010 2011 2012 2013 2014 2015 2016
El Dorado Placer Sacramento Yolo Yuba Sutter
Exhibit 14: Percent of nonresidential construction value in the Sacramento region, by county22
0%
10%
20%
30%
40%
50%
60%
70%
80%
90%
100%
2006 2016
El Dorado Placer Sacramento Yolo Yuba
Exhibit 17: Average annual earnings in traded and non-traded clusters in the study regions (2016)
$85,
512
$58,
972
$67,
498
$97,
280
$78,
396
$100
,688
$90,
080
$63,
145
$72,
018
$0
$20,000
$40,000
$60,000
$80,000
$100,000
$120,000
Traded Non-Tr aded All Industries
Sacramento Region Bay Area Californ ia
Exhibit 18: Traded subcluster employment index, Sacramento region (2001-2021)25
Water, Sewage, and Other Systems Projection
Projection
Projection
Projection
Projection
Construction Materials
Construction
Construction Products
Construction Components
Emplo
ym
ent i
ndex
(2
006 E
mplo
ym
ent =
100)
Emplo
ym
ent i
ndex
(2
006 E
mplo
ym
ent =
100)
Exhibit 24: Non-traded subcluster employment index, Sacramento region (2001-2021)36
101.0 119.3
87.2104.7
73.7
136.3
36.1
29.6
17.9
0.0
25.0
50.0
75.0
100.0
125.0
150.0
2001 2006 2011 2016 2021
Water and Sewer Line Construction Projection
Concrete Products Projection
Real Estate Services Projection
Specialty Contractors Projection
General Contractors Projection
Developers Projection
* Only included subclusters with 10k+employment or significant employment change. Refer to appendix for the complete list of nontraded subclusters.
Exhibit 39: Entering construction industry workers by type of education and training in the Sacramento region (annual average, 2014-2016)59
368
217181
56 54
148125 107
84
28 27 19 13 3
29
369
129
109
198
136
10561
35 8 13 14 8 10
0
50
100
150
200
250
300
350
400
Apprentices Oth er Post-Secondary Completions
Exhibit 44: Projected annual construction industry occupational gaps in the Sacramento region (2016-2021)60
-3
-2
-1
32
45
57
58
68
103
173
196
308
322
397
427
500
524
607
640
864
1,937
-200 100 400 700 1,000 1,300 1,600 1,900
Insulation Workers
Drafters
Interior Designers
PV Installers
Glaziers
Surveyors
Building Inspectors
Roofers
Ironworkers & Welders
Architects
Drywall Installers
HVAC & Sheet Metal
Painters
Masonry, Tile, Floor, Lathe, Plaster
Plumbers & Pipefitters
Engineers
Heavy Equipment Operators
Real Estate Professionals
Electricians
Construction Managers
Carpenters
Exhibit 47: Unionized and non-unionized workforce, Sacramento--Arden-Arcade--Roseville MSA and 10-county Bay Area (annual average, 2014-2017)61
Exhibit 48: Unionization in the construction workforce as an annual average percentage of total employment, Sacramento--Arden-Arcade--Roseville MSA (2000-2017)62
31%, 32,314
29%, 12,555
69%, 70,898
71%, 30,110
0% 20% 40% 60% 80% 100%
10-County Bay Area
Sacramento MSA
Union Non-Union
32%
20% 19%24% 23%
29%
68%
80% 81%76% 77%
71%
0%
10%
20%
30%
40%
50%
60%
70%
80%
90%
2000 – 2002 2003 – 2004 2005 –2008 2008 – 2011 2011 – 2014 2014 – 2017
Union Non-Union
Exhibit 1A. Construction managers projected annual openings, n = 871 (2016-2021)67
Cost Estimators, 206openings, 24%
Construction Managers,
225 openings, 26%
First-Line Supervisors of Construction Trades and
Extraction Workers,440 openings, 50%
0 100 200 300 400 500 600 700 800 900 1,000
Construction Products, 81
Water, Sewage, and Other Systems, 908
-10.0%
-5.0%
0.0%
5.0%
10.0%
15.0%
20.0%
25.0%
0.0 0.5 1.0 1.5 2.0 2.5 3.0 3.5
Location Quotient (2016)
Location Quotient (2016)
Annual
Em
plo
ym
ent G
row
th R
ate
(2006-2
016)
Subcluster with an annual average earnings higher than all-industry annual average earnings in ($67,498) Sacramento region in 2016
LQ=1.0
Exhibit 2C: Non-traded subclusters in the Sacramento region73
Specialty Contractors, 50,899
General Contractors, 16,843
Real Estate Services, 15,475
Construction Materials Retailing, 6,552
Highway and Street Construction, 2,268
Water and Sewer Line Construction, 1,662
Building Equipment Distribution, 1,207
Developers
-15.0%
-10.0%
-5.0%
0.0%
5.0%
0.8 1.0 1.2 1.4
Annual
Em
plo
ym
ent G
row
th R
ate
(2006-2
016
Exhibit 2E: Joint apprentices by gender in the Sacramento region (January 2012-October 2017)
Exhibit 3E: Joint apprentices by county of residence in the Sacramento region (January 2012-October 2017)
8,374, 97%
249, 3%
El Dorado,393, 56%
Placer,949, 11%
Sacramento, 6077, 1
Sutter, 346,4%
Yolo, 549,6%
Yuba, 309,
4%
Exhibit 4E: Joint apprentices’ highest level of education prior to apprenticeship in the Sacramento region (January 2012-October 2017)
Exhibit 5E: Number of weeks worked, all workers in the construction sector in the Sacramento region (2015)84
Less than highschool, 7%
High schoolgraduate orGED, 65%
Some college,25%
4 or more yearsof college, 3%
3,165 6%
3,082 6%
1,650 3%
6,105 12%
7,068 10%
31,037 62%
0 5,000 10,000 15,000 20,000 25,000 30,000 35,000
Did not work
Less than 14
14 to 26
27 to 39
40 to 49
50 to 52
# w
eeks
work
ed in
the
last
yea
r
Exhibit 4: Value of nonresidential construction put in place, by subcomponent (California)9
-0.5%
29.2%
-41.1%
0.0%
62.9%
-34.7%
46.0%
42.8%
19.1%
-14.6%
66.5%
763.4%
Office
Commercial
Manufacturing
Health care
Educational
Religious
Amusement and recreation
Transportation
Power and communication
Highway and street
Public works
Other
Subcomponent percent change 2006-2016
180.8
593.7
818.9
21.4
235.8 342.3
104.9 133.6 173.5
0.0
100.0
200.0
300.0
400.0
500.0
600.0
700.0
800.0
900.0
1000.0
2001 2006 2011 2016 2021
Construction Materials,125
Construction, 1,942
Construction Components, 466
LQ=1.0
Concrete Products, 1,123
Construction Materials Wholesaling, 1,647
Subcluster with an annual average earnings higher than all-industry annual average earnings ($67,498) in Sacramento region in 2016
Exhibit 1E: Total joint apprentice starts, residents in the six-county Sacramento region (January 2012-October 2017) (n = 8,617)2
435
95
104
111
117
121
135
161
174
178
215
302
340
440
458
483
542
602
1,045
1,205
1,354
0 200 400 600 800 1000 1200 1400 1600
All others
Elevator constructor
Drywall finisher
Scaffold and shoring erector
Inspector or surveyor
Pile driver
Glazier
Carpet, linoleum, and soft tile layer
Millwright
Sheet metal worker & related trades
Construction equipment operator trades
Brick, marble, terrazzo, tile, and related trades
Roofer and waterproofer
Plumber and fitter trades
Painter trades
Cement mason and plasterer trades
Electricial trades
Drywall/lather
Ironworker trades
Carpenter
Construction craft laborer
Exhibit 38: Anticipated annual construction industry job openings by new and replacement jobs in the Sacramento region (2016-2021)1
21 26 59 60 52 78 99 167 167 220323 350 399 439 473
596 679788 777 763
2,119
4 6 1 1 20 7 520 27 2
71 56100 95 73
4699
82 95222
215
0
500
1000
1500
2000
2500
Annual Replacement Openings New Jobs (Growth)
Male
Female
$ T
housa
nds
Thou
sand
s of
Dol
lars
Average annual openings (demand) minuseducation and training (supply) =approximate annual shortage
Approximate annual shortage = 7,250 workers across all categories
Sutter
6.2% 5.1%
27.6%
14.4%
50.6%69.9%
10.8%7.9%
1.1% 0.6%3.6% 2.0%
20 California Home Building Foundation (CHBF), Construction Industry Research Board (CIRB).
21 Residential permitting information provided from CIRB included counts from 2000 through 2016 to show the increase in the early 2000s.
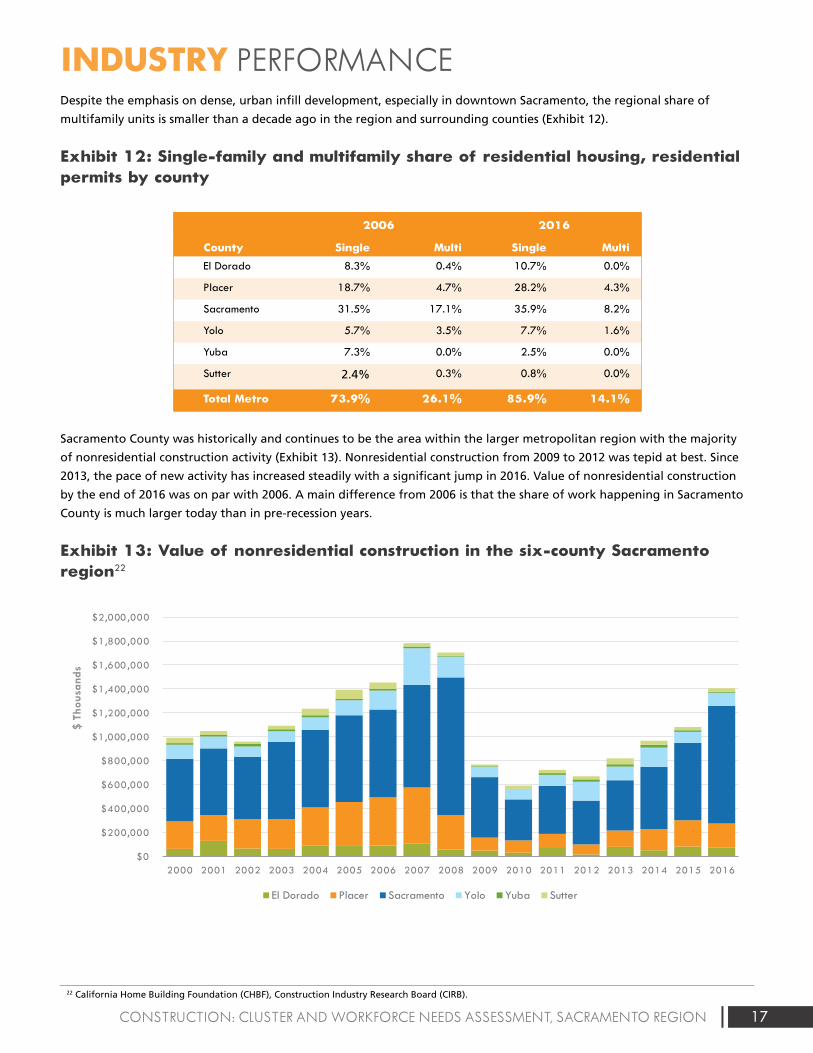
17CONSTRUCTION: CLUSTER AND WORKFORCE NEEDS ASSESSMENT, SACRAMENTO REGION
INDUSTRY PERFORMANCEDespite the emphasis on dense, urban infill development, especially in downtown Sacramento, the regional share of
multifamily units is smaller than a decade ago in the region and surrounding counties (Exhibit 12).
Exhibit 12: Single-family and multifamily share of residential housing, residential permits by county
2006 2016
County Single Multi Single Multi
El Dorado 8.3% 0.4% 10.7% 0.0%
Placer 18.7% 4.7% 28.2% 4.3%
Sacramento 31.5% 17.1% 35.9% 8.2%
Yolo 5.7% 3.5% 7.7% 1.6%
Yuba 7.3% 0.0% 2.5% 0.0%
Sutter 2.4% 0.3% 0.8% 0.0%
Total Metro 73.9% 26.1% 85.9% 14.1%
Sacramento County was historically and continues to be the area within the larger metropolitan region with the majority
of nonresidential construction activity (Exhibit 13). Nonresidential construction from 2009 to 2012 was tepid at best. Since
2013, the pace of new activity has increased steadily with a significant jump in 2016. Value of nonresidential construction
by the end of 2016 was on par with 2006. A main difference from 2006 is that the share of work happening in Sacramento
County is much larger today than in pre-recession years.
Exhibit 13: Value of nonresidential construction in the six-county Sacramento region22
Exhibit 1: Value of construction put in place (United States)3
$1,161,282
$788,332
$1,185,683
$0
$200,000
$400,000
$600,000
$800,000
$1,000,000
$1,200,000
$1,400,000
2002 2003 2004 2005 2006 2007 2008 2009 2010 2011 2012 2013 2014 2015 2016
Mill
ions
of
Dol
lars
Residential Nonresidential
Exhibit 2: Value of construction put in place (California)5
$58,091,975
$18,740,050
$51,350,955
$0
$10,000,000
$20,000,000
$30,000,000
$40,000,000
$50,000,000
$60,000,000
$70,000,000
2002 2003 2004 2005 2006 2007 2008 2009 2010 2011 2012 2013 2014 2015 2016
Residential Nonresidential
Exhibit 3: Value of nonresidential construction put in place, by subcomponent (United States)7
24.1%
-0.2%
130.5%
0.6%
5.3%
-54.8%
18.0%
50.9%
98.2%
26.9%
-7.5%
21.7%
Office
Commercial
Manufacturing
Health care
Educational
Religious
Amusement and recreation
Transportation
Power and communication
Highway and street
Public works
Other
Subcomponent percent change 2006-2016
Exhibit 5: Value of Infrastructure as a percent of nonresidential construction put in place (United States)10
37.5% 37.9% 36.5%37.1% 37.0%
37.3%37.5% 41.1% 46.3% 45.5%
46.6% 46.4%46.1% 43.5% 41.6%
$0
$100,000
$200,000
$300,000
$400,000
$500,000
$600,000
$700,000
$800,000
2002 2003 2004 2005 2006 2007 2008 2009 2010 2011 2012 2013 2014 2015 2016
$ M
illio
ns
$ Th
ousa
nds
Nonresidential Infrastructure
Exhibit 6: Value of infrastructure as a percent of nonresidential construction put in place (California)11
11.6% 12.8% 14.3% 13.4%14.3%
11.0% 10.7%10.7% 10.2% 9.9% 10.9%
27.5%
14.9%16.2% 13.0%$5,000,000
$0
$10,000,000
$15,000,000
$20,000,000
$25,000,000
$30,000,000
2002 2003 2004 2005 2006 2007 2008 2009 2010 2011 2012 2013 2014 2015 2016
Nonresidential Infrastructure
Exhibit 7: Construction value added as a percent of GDP (United States)12
Exhibit 8: Construction value added as a percent of GRP (California)13
7.8% 7.8%8.1%
8.6%8.4%
8.0%
7.4%
6.3%
5.4%5.1%
5.3%5.5%
5.8%
6.2%6.4%
3.0%
4.0%
5.0%
6.0%
7.0%
8.0%
9.0%
2002 2003 2004 2005 2006 2007 2008 2009 2010 2011 2012 2013 2014 2015 2016
2002 2003 2004 2005 2006 2007 2008 2009 2010 2011 2012 2013 2014 2015 2016
3.0% 3.1%3.3% 3.3%
2.8%
2.3%
1.6%
1.0% 1.0% 1.1%1.3%
1.8% 1.8%2.0% 2.0%
0.0%
0.5%
1.0%
1.5%
2.0%
2.5%
3.0%
3.5%
4.0%
Exhibit 9: Construction value added as a percent of GRP (California, Sacramento region and Bay Area)16
3.0%
6.8% 6.9%
3.6%
1.2%1.4%
1.7%
2.3%
2.4%
0.0%
1.0%
2.0%
3.0%
4.0%
5.0%
6.0%
7.0%
8.0%
2002 2003 2004 2005 2006 2007 2008 2009 2010 2011 2012 2013 2014 2015
State Sacramento Metro (6-county) Bay Area Metro (9-county)
Exhibit 10: Housing unit supply versus demand in the Sacramento region
Exh ibit 11: Residen tial building units in the six-county Sacramento region (permi t data)20
19,865
14,239
10,996 8,932
6,483 7,768 9,125
10,399
19,122
23,812
17,987
2,293 3,939 4,652
6,492
0
5,000
10,000
15,000
20,000
25,000
30,000
2002 2003 2004 2005 2006 2007 2008 2009 2010 2011 2012 2013 2014 2015 2016 2017
Housing Unit Demand Housing Unit Supply
14,01415,671
19,78419,630
21,65218,612
10,1257,931
4,1752,493 2,326 1,938 2,965 3,772 3,967
5,526 6,401
3,226
3,868
4,628 4,7613,612
2,911
3,568
1,555
1,818 438 539 759631
982 7461,265
1,053
0
5,000
10,000
15,000
20,000
25,000
30,000
2000 2001 2002 2003 2004 2005 2006 2007 2008 2009 2010 2011 2012 2013 2014 2015 2016
Single Family Units Multifamily Units
Exhibit 13: Value of nonresidential construction in the six-county Sacramento region 21
$0
$200,000
$400,000
$600,000
$800,000
$1,000 ,000
$1,200 ,000
$1,400 ,000
$1,600 ,000
$1,800 ,000
$2,000 ,000
2000 2001 2002 2003 2004 2005 2006 2007 2008 2009 2010 2011 2012 2013 2014 2015 2016
El Dorado Placer Sacramento Yolo Yuba Sutter
Exhibit 14: Percent of nonresidential construction value in the Sacramento region, by county22
0%
10%
20%
30%
40%
50%
60%
70%
80%
90%
100%
2006 2016
El Dorado Placer Sacramento Yolo Yuba
Exhibit 17: Average annual earnings in traded and non-traded clusters in the study regions (2016)
$85,
512
$58,
972
$67,
498
$97,
280
$78,
396
$100
,688
$90,
080
$63,
145
$72,
018
$0
$20,000
$40,000
$60,000
$80,000
$100,000
$120,000
Traded Non-Traded All Industries
Sacramento Region Bay Area Californ ia
Exhibit 18: Traded subcluster employment index, Sacramento region (2001-2021)25
Water, Sewage, and Other Systems Projection
Projection
Projection
Projection
Projection
Construction Materials
Construction
Construction Products
Construction Components
Empl
oym
ent i
ndex
(2
006
Empl
oym
ent =
100
)
Empl
oym
ent i
ndex
(2
006
Empl
oym
ent =
100
)
Exhibit 24: Non-traded subcluster employment index, Sacramento region (2001-2021)36
101.0 119.3
87.2104.7
73.7
136.3
36.1
29.6
17.9
0.0
25.0
50.0
75.0
100.0
125.0
150.0
2001 2006 2011 2016 2021
Water and Sewer Line Construction Projection
Concrete Products Projection
Real Estate Services Projection
Specialty Contractors Projection
General Contractors Projection
Developers Projection
* Only included subclusters with 10k+employment or significant employment change. Refer to appendix for the complete list of nontraded subclusters.
Exhibit 39: Entering construction industry workers by type of education and training in the Sacramento region (annual average, 2014-2016)59
368
217181
56 54
148125 107
84
28 27 19 13 3
29
369
129
109
198
136
10561
35 8 13 14 8 10
0
50
100
150
200
250
300
350
400
Apprentices Oth er Post-Secondary Completions
Exhibit 44: Projected annual construction industry occupational gaps in the Sacramento region (2016-2021)60
-3
-2
-1
32
45
57
58
68
103
173
196
308
322
397
427
500
524
607
640
864
1,937
-200 100 400 700 1,000 1,300 1,600 1,900
Insulation Workers
Drafters
Interior Designers
PV Installers
Glaziers
Surveyors
Building Inspectors
Roofers
Ironworkers & Welders
Architects
Drywall Installers
HVAC & Sheet Metal
Painters
Masonry, Tile, Floor, Lathe, Plaster
Plumbers & Pipefitters
Engineers
Heavy Equipment Operators
Real Estate Professionals
Electricians
Construction Managers
Carpenters
Exhibit 47: Unionized and non-unionized workforce, Sacramento--Arden-Arcade--Roseville MSA and 10-county Bay Area (annual average, 2014-2017)61
Exhibit 48: Unionization in the construction workforce as an annual average percentage of total employment, Sacramento--Arden-Arcade--Roseville MSA (2000-2017)62
31%, 32,314
29%, 12,555
69%, 70,898
71%, 30,110
0% 20% 40% 60% 80% 100%
10-County Bay Area
Sacramento MSA
Union Non-Union
32%
20% 19%24% 23%
29%
68%
80% 81%76% 77%
71%
0%
10%
20%
30%
40%
50%
60%
70%
80%
90%
2000 – 2002 2003 – 2004 2005 –2008 2008 – 2011 2011 – 2014 2014 – 2017
Union Non-Union
Exhibit 1A. Construction managers projected annual openings, n = 871 (2016-2021)67
Cost Estimators, 206openings, 24%
Construction Managers,
225 openings, 26%
First-Line Supervisors of Construction Trades and
Extraction Workers,440 openings, 50%
0 100 200 300 400 500 600 700 800 900 1,000
Construction Products, 81
Water, Sewage, and Other Systems, 908
-10.0%
-5.0%
0.0%
5.0%
10.0%
15.0%
20.0%
25.0%
0.0 0.5 1.0 1.5 2.0 2.5 3.0 3.5
Location Quotient (2016)
Location Quotient (2016)
Ann
ual E
mpl
oym
ent G
row
th R
ate
(200
6-20
16)
Subcluster with an annual average earnings higher than all-industry annual average earnings in ($67,498) Sacramento region in 2016
LQ=1.0
Exhibit 2C: Non-traded subclusters in the Sacramento region73
Specialty Contractors, 50,899
General Contractors, 16,843
Real Estate Services, 15,475
Construction Materials Retailing, 6,552
Highway and Street Construction, 2,268
Water and Sewer Line Construction, 1,662
Building Equipment Distribution, 1,207
Developers
-15.0%
-10.0%
-5.0%
0.0%
5.0%
0.8 1.0 1.2 1.4
Ann
ual E
mpl
oym
ent G
row
th R
ate
(200
6-20
16
Exhibit 2E: Joint apprentices by gender in the Sacramento region (January 2012-October 2017)
Exhibit 3E: Joint apprentices by county of residence in the Sacramento region (January 2012-October 2017)
8,374, 97%
249, 3%
El Dorado,393, 56%
Placer,949, 11%
Sacramento, 6077, 1
Sutter, 346,4%
Yolo, 549,6%
Yuba, 309,
4%
Exhibit 4E: Joint apprentices’ highest level of education prior to apprenticeship in the Sacramento region (January 2012-October 2017)
Exhibit 5E: Number of weeks worked, all workers in the construction sector in the Sacramento region (2015)84
Less than highschool, 7%
High schoolgraduate orGED, 65%
Some college,25%
4 or more yearsof college, 3%
3,165 6%
3,082 6%
1,650 3%
6,105 12%
7,068 10%
31,037 62%
0 5,000 10,000 15,000 20,000 25,000 30,000 35,000
Did not work
Less than 14
14 to 26
27 to 39
40 to 49
50 to 52
# w
eeks
wor
ked
in th
e la
st y
ear
Exhibit 4: Value of nonresidential construction put in place, by subcomponent (California)9
-0.5%
29.2%
-41.1%
0.0%
62.9%
-34.7%
46.0%
42.8%
19.1%
-14.6%
66.5%
763.4%
Office
Commercial
Manufacturing
Health care
Educational
Religious
Amusement and recreation
Transportation
Power and communication
Highway and street
Public works
Other
Subcomponent percent change 2006-2016
180.8
593.7
818.9
21.4
235.8 342.3
104.9 133.6 173.5
0.0
100.0
200.0
300.0
400.0
500.0
600.0
700.0
800.0
900.0
1000.0
2001 2006 2011 2016 2021
Construction Materials,125
Construction, 1,942
Construction Components, 466
LQ=1.0
Concrete Products, 1,123
Construction Materials Wholesaling, 1,647
Subcluster with an annual average earnings higher than all-industry annual average earnings ($67,498) in Sacramento region in 2016
Exhibit 1E: Total joint apprentice starts, residents in the six-county Sacramento region (January 2012-October 2017) (n = 8,617)2
435
95
104
111
117
121
135
161
174
178
215
302
340
440
458
483
542
602
1,045
1,205
1,354
0 200 400 600 800 1000 1200 1400 1600
All others
Elevator constructor
Drywall finisher
Scaffold and shoring erector
Inspector or surveyor
Pile driver
Glazier
Carpet, linoleum, and soft tile layer
Millwright
Sheet metal worker & related trades
Construction equipment operator trades
Brick, marble, terrazzo, tile, and related trades
Roofer and waterproofer
Plumber and fitter trades
Painter trades
Cement mason and plasterer trades
Electricial trades
Drywall/lather
Ironworker trades
Carpenter
Construction craft laborer
Exhibit 38: Anticipated annual construction industry job openings by new and replacement jobs in the Sacramento region (2016-2021)1
21 26 59 60 52 78 99 167 167 220323 350 399 439 473
596 679788 777 763
2,119
4 6 1 1 20 7 520 27 2
71 56100 95 73
4699
82 95222
215
0
500
1000
1500
2000
2500
Annual Replacement Openings New Jobs (Growth)
Male
Female
$ Th
ousa
nds
Thou
sand
s of
Dol
lars
Average annual openings (demand) minuseducation and training (supply) =approximate annual shortage
Approximate annual shortage = 7,250 workers across all categories
Sutter
6.2% 5.1%
27.6%
14.4%
50.6%69.9%
10.8%7.9%
1.1% 0.6%3.6% 2.0%
22 California Home Building Foundation (CHBF), Construction Industry Research Board (CIRB).
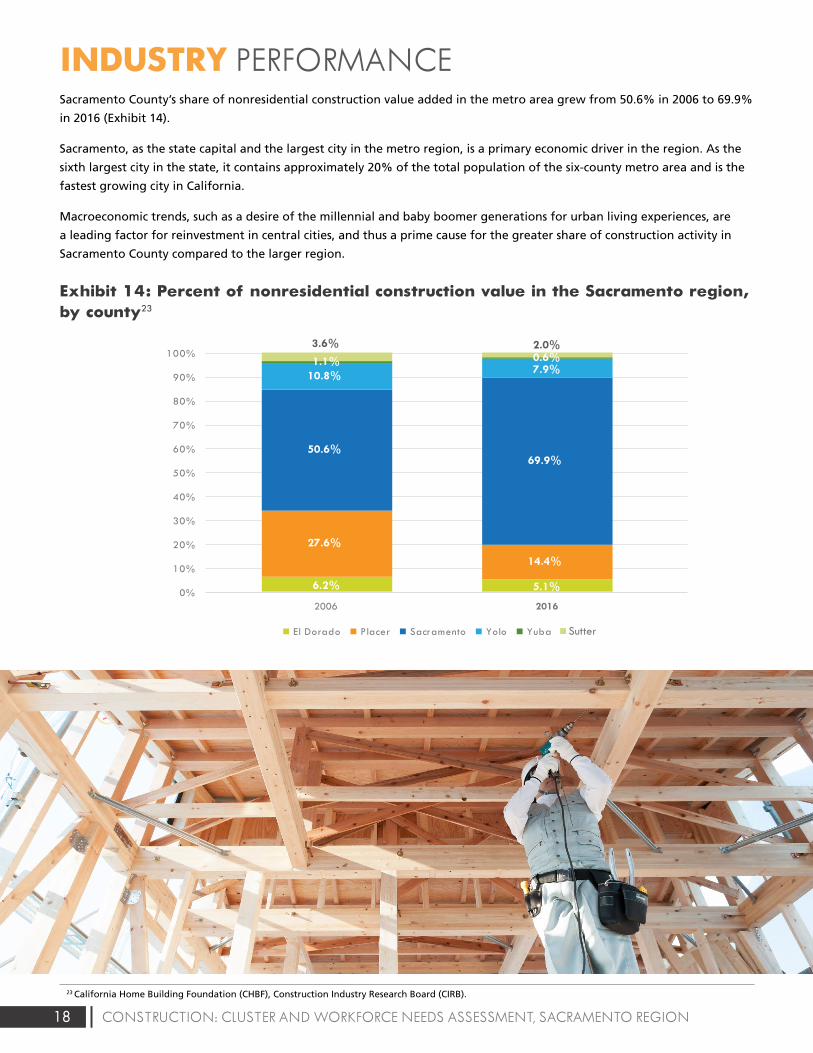
18 CONSTRUCTION: CLUSTER AND WORKFORCE NEEDS ASSESSMENT, SACRAMENTO REGION
INDUSTRY PERFORMANCESacramento County’s share of nonresidential construction value added in the metro area grew from 50.6% in 2006 to 69.9%
in 2016 (Exhibit 14).
Sacramento, as the state capital and the largest city in the metro region, is a primary economic driver in the region. As the
sixth largest city in the state, it contains approximately 20% of the total population of the six-county metro area and is the
fastest growing city in California.
Macroeconomic trends, such as a desire of the millennial and baby boomer generations for urban living experiences, are
a leading factor for reinvestment in central cities, and thus a prime cause for the greater share of construction activity in
Sacramento County compared to the larger region.
Exhibit 14: Percent of nonresidential construction value in the Sacramento region, by county23
Exhibit 1: Value of construction put in place (United States)3
$1,161,282
$788,332
$1,185,683
$0
$200,000
$400,000
$600,000
$800,000
$1,000,000
$1,200,000
$1,400,000
2002 2003 2004 2005 2006 2007 2008 2009 2010 2011 2012 2013 2014 2015 2016
Mill
ions
of
Dol
lars
Residential Nonresidential
Exhibit 2: Value of construction put in place (California)5
$58,091,975
$18,740,050
$51,350,955
$0
$10,000,000
$20,000,000
$30,000,000
$40,000,000
$50,000,000
$60,000,000
$70,000,000
2002 2003 2004 2005 2006 2007 2008 2009 2010 2011 2012 2013 2014 2015 2016
Residential Nonresidential
Exhibit 3: Value of nonresidential construction put in place, by subcomponent (United States)7
24.1%
-0.2%
130.5%
0.6%
5.3%
-54.8%
18.0%
50.9%
98.2%
26.9%
-7.5%
21.7%
Office
Commercial
Manufacturing
Health care
Educational
Religious
Amusement and recreation
Transportation
Power and communication
Highway and street
Public works
Other
Subcomponent percent change 2006-2016
Exhibit 5: Value of Infrastructure as a percent of nonresidential construction put in place (United States)10
37.5% 37.9% 36.5%37.1% 37.0%
37.3%37.5% 41.1% 46.3% 45.5%
46.6% 46.4%46.1% 43.5% 41.6%
$0
$100,000
$200,000
$300,000
$400,000
$500,000
$600,000
$700,000
$800,000
2002 2003 2004 2005 2006 2007 2008 2009 2010 2011 2012 2013 2014 2015 2016
$ M
illio
ns
$ Th
ousa
nds
Nonresidential Infrastructure
Exhibit 6: Value of infrastructure as a percent of nonresidential construction put in place (California)11
11.6% 12.8% 14.3% 13.4%14.3%
11.0% 10.7%10.7% 10.2% 9.9% 10.9%
27.5%
14.9%16.2% 13.0%$5,000,000
$0
$10,000,000
$15,000,000
$20,000,000
$25,000,000
$30,000,000
2002 2003 2004 2005 2006 2007 2008 2009 2010 2011 2012 2013 2014 2015 2016
Nonresidential Infrastructure
Exhibit 7: Construction value added as a percent of GDP (United States)12
Exhibit 8: Construction value added as a percent of GRP (California)13
7.8% 7.8%8.1%
8.6%8.4%
8.0%
7.4%
6.3%
5.4%5.1%
5.3%5.5%
5.8%
6.2%6.4%
3.0%
4.0%
5.0%
6.0%
7.0%
8.0%
9.0%
2002 2003 2004 2005 2006 2007 2008 2009 2010 2011 2012 2013 2014 2015 2016
2002 2003 2004 2005 2006 2007 2008 2009 2010 2011 2012 2013 2014 2015 2016
3.0% 3.1%3.3% 3.3%
2.8%
2.3%
1.6%
1.0% 1.0% 1.1%1.3%
1.8% 1.8%2.0% 2.0%
0.0%
0.5%
1.0%
1.5%
2.0%
2.5%
3.0%
3.5%
4.0%
Exhibit 9: Construction value added as a percent of GRP (California, Sacramento region and Bay Area)16
3.0%
6.8% 6.9%
3.6%
1.2%1.4%
1.7%
2.3%
2.4%
0.0%
1.0%
2.0%
3.0%
4.0%
5.0%
6.0%
7.0%
8.0%
2002 2003 2004 2005 2006 2007 2008 2009 2010 2011 2012 2013 2014 2015
State Sacramento Metro (6-county) Bay Area Metro (9-county)
Exhibit 10: Housing unit supply versus demand in the Sacramento region
Exh ibit 11: Residen tial building units in the six-county Sacramento region (permi t data)20
19,865
14,239
10,996 8,932
6,483 7,768 9,125
10,399
19,122
23,812
17,987
2,293 3,939 4,652
6,492
0
5,000
10,000
15,000
20,000
25,000
30,000
2002 2003 2004 2005 2006 2007 2008 2009 2010 2011 2012 2013 2014 2015 2016 2017
Housing Unit Demand Housing Unit Supply
14,01415,671
19,78419,630
21,65218,612
10,1257,931
4,1752,493 2,326 1,938 2,965 3,772 3,967
5,526 6,401
3,226
3,868
4,628 4,7613,612
2,911
3,568
1,555
1,818 438 539 759631
982 7461,265
1,053
0
5,000
10,000
15,000
20,000
25,000
30,000
2000 2001 2002 2003 2004 2005 2006 2007 2008 2009 2010 2011 2012 2013 2014 2015 2016
Single Family Units Multifamily Units
Exhibit 13: Value of nonresidential construction in the six-county Sacramento region 21
$0
$200,000
$400,000
$600,000
$800,000
$1,000 ,000
$1,200 ,000
$1,400 ,000
$1,600 ,000
$1,800 ,000
$2,000 ,000
2000 2001 2002 2003 2004 2005 2006 2007 2008 2009 2010 2011 2012 2013 2014 2015 2016
El Dorado Placer Sacramento Yolo Yuba Sutter
Exhibit 14: Percent of nonresidential construction value in the Sacramento region, by county22
0%
10%
20%
30%
40%
50%
60%
70%
80%
90%
100%
2006 2016
El Dorado Placer Sacramento Yolo Yuba
Exhibit 17: Average annual earnings in traded and non-traded clusters in the study regions (2016)
$85,
512
$58,
972
$67,
498
$97,
280
$78,
396
$100
,688
$90,
080
$63,
145
$72,
018
$0
$20,000
$40,000
$60,000
$80,000
$100,000
$120,000
Traded Non-Traded All Industries
Sacramento Region Bay Area Californ ia
Exhibit 18: Traded subcluster employment index, Sacramento region (2001-2021)25
Water, Sewage, and Other Systems Projection
Projection
Projection
Projection
Projection
Construction Materials
Construction
Construction Products
Construction Components
Empl
oym
ent i
ndex
(2
006
Empl
oym
ent =
100
)
Empl
oym
ent i
ndex
(2
006
Empl
oym
ent =
100
)
Exhibit 24: Non-traded subcluster employment index, Sacramento region (2001-2021)36
101.0 119.3
87.2104.7
73.7
136.3
36.1
29.6
17.9
0.0
25.0
50.0
75.0
100.0
125.0
150.0
2001 2006 2011 2016 2021
Water and Sewer Line Construction Projection
Concrete Products Projection
Real Estate Services Projection
Specialty Contractors Projection
General Contractors Projection
Developers Projection
* Only included subclusters with 10k+employment or significant employment change. Refer to appendix for the complete list of nontraded subclusters.
Exhibit 39: Entering construction industry workers by type of education and training in the Sacramento region (annual average, 2014-2016)59
368
217181
56 54
148125 107
84
28 27 19 13 3
29
369
129
109
198
136
10561
35 8 13 14 8 10
0
50
100
150
200
250
300
350
400
Apprentices Oth er Post-Secondary Completions
Exhibit 44: Projected annual construction industry occupational gaps in the Sacramento region (2016-2021)60
-3
-2
-1
32
45
57
58
68
103
173
196
308
322
397
427
500
524
607
640
864
1,937
-200 100 400 700 1,000 1,300 1,600 1,900
Insulation Workers
Drafters
Interior Designers
PV Installers
Glaziers
Surveyors
Building Inspectors
Roofers
Ironworkers & Welders
Architects
Drywall Installers
HVAC & Sheet Metal
Painters
Masonry, Tile, Floor, Lathe, Plaster
Plumbers & Pipefitters
Engineers
Heavy Equipment Operators
Real Estate Professionals
Electricians
Construction Managers
Carpenters
Exhibit 47: Unionized and non-unionized workforce, Sacramento--Arden-Arcade--Roseville MSA and 10-county Bay Area (annual average, 2014-2017)61
Exhibit 48: Unionization in the construction workforce as an annual average percentage of total employment, Sacramento--Arden-Arcade--Roseville MSA (2000-2017)62
31%, 32,314
29%, 12,555
69%, 70,898
71%, 30,110
0% 20% 40% 60% 80% 100%
10-County Bay Area
Sacramento MSA
Union Non-Union
32%
20% 19%24% 23%
29%
68%
80% 81%76% 77%
71%
0%
10%
20%
30%
40%
50%
60%
70%
80%
90%
2000 – 2002 2003 – 2004 2005 –2008 2008 – 2011 2011 – 2014 2014 – 2017
Union Non-Union
Exhibit 1A. Construction managers projected annual openings, n = 871 (2016-2021)67
Cost Estimators, 206openings, 24%
Construction Managers,
225 openings, 26%
First-Line Supervisors of Construction Trades and
Extraction Workers,440 openings, 50%
0 100 200 300 400 500 600 700 800 900 1,000
Construction Products, 81
Water, Sewage, and Other Systems, 908
-10.0%
-5.0%
0.0%
5.0%
10.0%
15.0%
20.0%
25.0%
0.0 0.5 1.0 1.5 2.0 2.5 3.0 3.5
Location Quotient (2016)
Location Quotient (2016)
Ann
ual E
mpl
oym
ent G
row
th R
ate
(200
6-20
16)
Subcluster with an annual average earnings higher than all-industry annual average earnings in ($67,498) Sacramento region in 2016
LQ=1.0
Exhibit 2C: Non-traded subclusters in the Sacramento region73
Specialty Contractors, 50,899
General Contractors, 16,843
Real Estate Services, 15,475
Construction Materials Retailing, 6,552
Highway and Street Construction, 2,268
Water and Sewer Line Construction, 1,662
Building Equipment Distribution, 1,207
Developers
-15.0%
-10.0%
-5.0%
0.0%
5.0%
0.8 1.0 1.2 1.4
Ann
ual E
mpl
oym
ent G
row
th R
ate
(200
6-20
16
Exhibit 2E: Joint apprentices by gender in the Sacramento region (January 2012-October 2017)
Exhibit 3E: Joint apprentices by county of residence in the Sacramento region (January 2012-October 2017)
8,374, 97%
249, 3%
El Dorado,393, 56%
Placer,949, 11%
Sacramento, 6077, 1
Sutter, 346,4%
Yolo, 549,6%
Yuba, 309,
4%
Exhibit 4E: Joint apprentices’ highest level of education prior to apprenticeship in the Sacramento region (January 2012-October 2017)
Exhibit 5E: Number of weeks worked, all workers in the construction sector in the Sacramento region (2015)84
Less than highschool, 7%
High schoolgraduate orGED, 65%
Some college,25%
4 or more yearsof college, 3%
3,165 6%
3,082 6%
1,650 3%
6,105 12%
7,068 10%
31,037 62%
0 5,000 10,000 15,000 20,000 25,000 30,000 35,000
Did not work
Less than 14
14 to 26
27 to 39
40 to 49
50 to 52
# w
eeks
wor
ked
in th
e la
st y
ear
Exhibit 4: Value of nonresidential construction put in place, by subcomponent (California)9
-0.5%
29.2%
-41.1%
0.0%
62.9%
-34.7%
46.0%
42.8%
19.1%
-14.6%
66.5%
763.4%
Office
Commercial
Manufacturing
Health care
Educational
Religious
Amusement and recreation
Transportation
Power and communication
Highway and street
Public works
Other
Subcomponent percent change 2006-2016
180.8
593.7
818.9
21.4
235.8 342.3
104.9 133.6 173.5
0.0
100.0
200.0
300.0
400.0
500.0
600.0
700.0
800.0
900.0
1000.0
2001 2006 2011 2016 2021
Construction Materials,125
Construction, 1,942
Construction Components, 466
LQ=1.0
Concrete Products, 1,123
Construction Materials Wholesaling, 1,647
Subcluster with an annual average earnings higher than all-industry annual average earnings ($67,498) in Sacramento region in 2016
Exhibit 1E: Total joint apprentice starts, residents in the six-county Sacramento region (January 2012-October 2017) (n = 8,617)2
435
95
104
111
117
121
135
161
174
178
215
302
340
440
458
483
542
602
1,045
1,205
1,354
0 200 400 600 800 1000 1200 1400 1600
All others
Elevator constructor
Drywall finisher
Scaffold and shoring erector
Inspector or surveyor
Pile driver
Glazier
Carpet, linoleum, and soft tile layer
Millwright
Sheet metal worker & related trades
Construction equipment operator trades
Brick, marble, terrazzo, tile, and related trades
Roofer and waterproofer
Plumber and fitter trades
Painter trades
Cement mason and plasterer trades
Electricial trades
Drywall/lather
Ironworker trades
Carpenter
Construction craft laborer
Exhibit 38: Anticipated annual construction industry job openings by new and replacement jobs in the Sacramento region (2016-2021)1
21 26 59 60 52 78 99 167 167 220323 350 399 439 473
596 679788 777 763
2,119
4 6 1 1 20 7 520 27 2
71 56100 95 73
4699
82 95222
215
0
500
1000
1500
2000
2500
Annual Replacement Openings New Jobs (Growth)
Male
Female
$ Th
ousa
nds
Thou
sand
s of
Dol
lars
Average annual openings (demand) minuseducation and training (supply) =approximate annual shortage
Approximate annual shortage = 7,250 workers across all categories
Sutter
6.2% 5.1%
27.6%
14.4%
50.6%69.9%
10.8%7.9%
1.1% 0.6%3.6% 2.0%
23 California Home Building Foundation (CHBF), Construction Industry Research Board (CIRB).
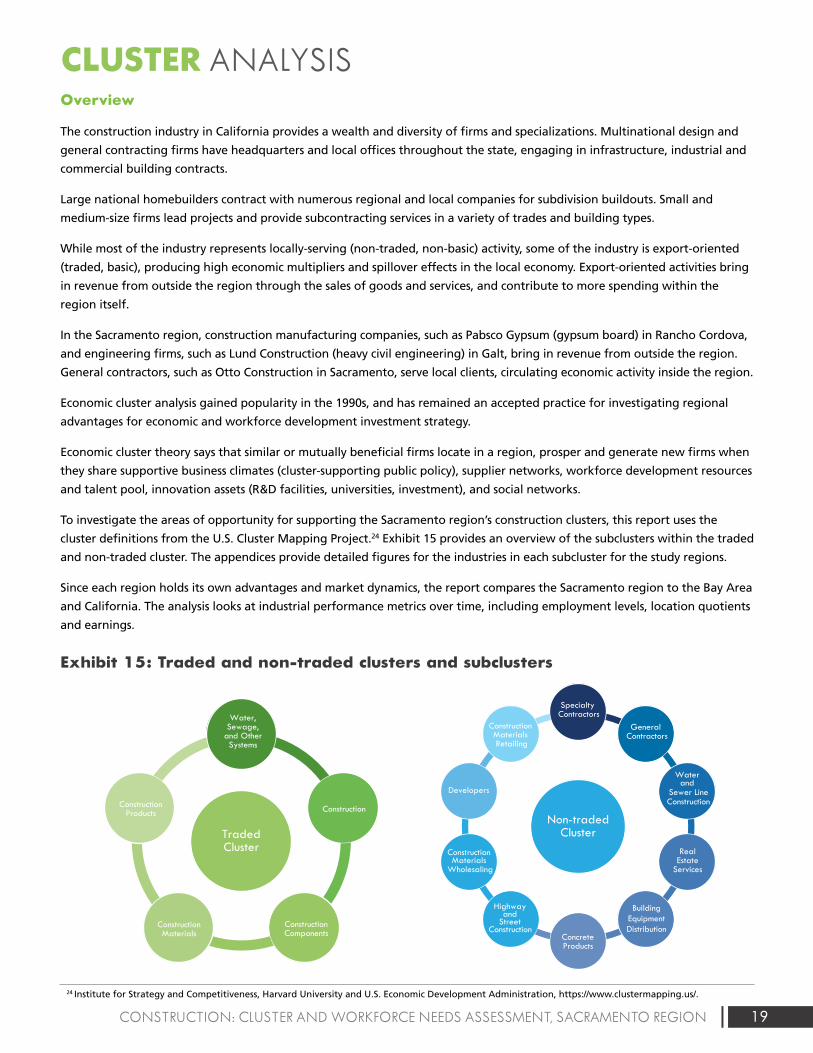
19CONSTRUCTION: CLUSTER AND WORKFORCE NEEDS ASSESSMENT, SACRAMENTO REGION
CLUSTER ANALYSISOverview
The construction industry in California provides a wealth and diversity of firms and specializations. Multinational design and
general contracting firms have headquarters and local offices throughout the state, engaging in infrastructure, industrial and
commercial building contracts.
Large national homebuilders contract with numerous regional and local companies for subdivision buildouts. Small and
medium-size firms lead projects and provide subcontracting services in a variety of trades and building types.
While most of the industry represents locally-serving (non-traded, non-basic) activity, some of the industry is export-oriented
(traded, basic), producing high economic multipliers and spillover effects in the local economy. Export-oriented activities bring
in revenue from outside the region through the sales of goods and services, and contribute to more spending within the
region itself.
In the Sacramento region, construction manufacturing companies, such as Pabsco Gypsum (gypsum board) in Rancho Cordova,
and engineering firms, such as Lund Construction (heavy civil engineering) in Galt, bring in revenue from outside the region.
General contractors, such as Otto Construction in Sacramento, serve local clients, circulating economic activity inside the region.
Economic cluster analysis gained popularity in the 1990s, and has remained an accepted practice for investigating regional
advantages for economic and workforce development investment strategy.
Economic cluster theory says that similar or mutually beneficial firms locate in a region, prosper and generate new firms when
they share supportive business climates (cluster-supporting public policy), supplier networks, workforce development resources
and talent pool, innovation assets (R&D facilities, universities, investment), and social networks.
To investigate the areas of opportunity for supporting the Sacramento region’s construction clusters, this report uses the
cluster definitions from the U.S. Cluster Mapping Project.24 Exhibit 15 provides an overview of the subclusters within the traded
and non-traded cluster. The appendices provide detailed figures for the industries in each subcluster for the study regions.
Since each region holds its own advantages and market dynamics, the report compares the Sacramento region to the Bay Area
and California. The analysis looks at industrial performance metrics over time, including employment levels, location quotients
and earnings.
Exhibit 15: Traded and non-traded clusters and subclusters
24 Institute for Strategy and Competitiveness, Harvard University and U.S. Economic Development Administration, https://www.clustermapping.us/.
Traded Cluster
Water, Sewage,
and Other Systems
Construction Materials
Non-traded Cluster
General Contractors
Specialty Contractors
Concrete Products
Materials Wholesaling
Construction
Building Equipment Distribution
Water and
Sewer Line Construction
ConstructionConstruction Products
Construction Components
Traded Cluster
Water, Sewage,
and Other Systems
Construction Materials
ConstructionConstruction Products
Construction Components
Traded Cluster
Water, Sewage,
and Other Systems
Construction Materials
ConstructionConstruction Products
Construction Components
Traded Cluster
Water, Sewage,
and Other Systems
Construction Materials
ConstructionConstruction Products
Construction Components
Traded Cluster
Water, Sewage,
and Other Systems
Construction Materials
ConstructionConstruction Products
Construction Components
Traded Cluster
Water, Sewage,
and Other Systems
Construction Materials
ConstructionConstruction Products
Construction Components
Real Estate
Services
Highway and
Street Construction
Construction Materials Retailing
Developers
Non-traded Cluster
General Contractors
Specialty Contractors
Concrete Products
Materials Wholesaling
Construction
Building Equipment Distribution
Water and
Sewer Line Construction
Real Estate
Services
Highway and
Street Construction
Construction Materials Retailing
Developers
Non-traded Cluster
General Contractors
Specialty Contractors
Concrete Products
Materials Wholesaling
Construction
Building Equipment Distribution
Water and
Sewer Line Construction
Real Estate
Services
Highway and
Street Construction
Construction Materials Retailing
Developers
Non-traded Cluster
General Contractors
Specialty Contractors
Concrete Products
Materials Wholesaling
Construction
Building Equipment Distribution
Water and
Sewer Line Construction
Real Estate
Services
Highway and
Street Construction
Construction Materials Retailing
Developers
Non-traded Cluster
General Contractors
Specialty Contractors
Concrete Products
Materials Wholesaling
Construction
Building Equipment Distribution
Water and
Sewer Line Construction
Real Estate
Services
Highway and
Street Construction
Construction Materials Retailing
Developers
Non-traded Cluster
General Contractors
Specialty Contractors
Concrete Products
Materials Wholesaling
Construction
Building Equipment Distribution
Water and
Sewer Line Construction
Real Estate
Services
Highway and
Street Construction
Construction Materials Retailing
Developers
Non-traded Cluster
General Contractors
Specialty Contractors
Concrete Products
Materials Wholesaling
Construction
Building Equipment Distribution
Water and
Sewer Line Construction
Real Estate
Services
Highway and
Street Construction
Construction Materials Retailing
Developers
Non-traded Cluster
General Contractors
Specialty Contractors
Concrete Products
Materials Wholesaling
Construction
Building Equipment Distribution
Water and
Sewer Line Construction
Real Estate
Services
Highway and
Street Construction
Construction Materials Retailing
Developers
Non-traded Cluster
General Contractors
Specialty Contractors
Concrete Products
Materials Wholesaling
Construction
Building Equipment Distribution
Water and
Sewer Line Construction
Real Estate
Services
Highway and
Street Construction
Construction Materials Retailing
Developers
Non-traded Cluster
General Contractors
Specialty Contractors
Concrete Products
Materials Wholesaling
Construction
Building Equipment Distribution
Water and
Sewer Line Construction
Real Estate
Services
Highway and
Street Construction
Construction Materials Retailing
Developers
Non-traded Cluster
General Contractors
Specialty Contractors
Concrete Products
Materials Wholesaling
Construction
Building Equipment Distribution
Water and
Sewer Line Construction
Real Estate
Services
Highway and
Street Construction
Construction Materials Retailing
Developers
Traded Cluster
Water, Sewage,
and Other Systems
Construction Materials
Non-traded Cluster
General Contractors
Specialty Contractors
Concrete Products
Materials Wholesaling
Construction
Building Equipment Distribution
Water and
Sewer Line Construction
ConstructionConstruction Products
Construction Components
Traded Cluster
Water, Sewage,
and Other Systems
Construction Materials
ConstructionConstruction Products
Construction Components
Traded Cluster
Water, Sewage,
and Other Systems
Construction Materials
ConstructionConstruction Products
Construction Components
Traded Cluster
Water, Sewage,
and Other Systems
Construction Materials
ConstructionConstruction Products
Construction Components
Traded Cluster
Water, Sewage,
and Other Systems
Construction Materials
ConstructionConstruction Products
Construction Components
Traded Cluster
Water, Sewage,
and Other Systems
Construction Materials
ConstructionConstruction Products
Construction Components
Real Estate
Services
Highway and
Street Construction
Construction Materials Retailing
Developers
Non-traded Cluster
General Contractors
Specialty Contractors
Concrete Products
Materials Wholesaling
Construction
Building Equipment Distribution
Water and
Sewer Line Construction
Real Estate
Services
Highway and
Street Construction
Construction Materials Retailing
Developers
Non-traded Cluster
General Contractors
Specialty Contractors
Concrete Products
Materials Wholesaling
Construction
Building Equipment Distribution
Water and
Sewer Line Construction
Real Estate
Services
Highway and
Street Construction
Construction Materials Retailing
Developers
Non-traded Cluster
General Contractors
Specialty Contractors
Concrete Products
Materials Wholesaling
Construction
Building Equipment Distribution
Water and
Sewer Line Construction
Real Estate
Services
Highway and
Street Construction
Construction Materials Retailing
Developers
Non-traded Cluster
General Contractors
Specialty Contractors
Concrete Products
Materials Wholesaling
Construction
Building Equipment Distribution
Water and
Sewer Line Construction
Real Estate
Services
Highway and
Street Construction
Construction Materials Retailing
Developers
Non-traded Cluster
General Contractors
Specialty Contractors
Concrete Products
Materials Wholesaling
Construction
Building Equipment Distribution
Water and
Sewer Line Construction
Real Estate
Services
Highway and
Street Construction
Construction Materials Retailing
Developers
Non-traded Cluster
General Contractors
Specialty Contractors
Concrete Products
Materials Wholesaling
Construction
Building Equipment Distribution
Water and
Sewer Line Construction
Real Estate
Services
Highway and
Street Construction
Construction Materials Retailing
Developers
Non-traded Cluster
General Contractors
Specialty Contractors
Concrete Products
Materials Wholesaling
Construction
Building Equipment Distribution
Water and
Sewer Line Construction
Real Estate
Services
Highway and
Street Construction
Construction Materials Retailing
Developers
Non-traded Cluster
General Contractors
Specialty Contractors
Concrete Products
Materials Wholesaling
Construction
Building Equipment Distribution
Water and
Sewer Line Construction
Real Estate
Services
Highway and
Street Construction
Construction Materials Retailing
Developers
Non-traded Cluster
General Contractors
Specialty Contractors
Concrete Products
Materials Wholesaling
Construction
Building Equipment Distribution
Water and
Sewer Line Construction
Real Estate
Services
Highway and
Street Construction
Construction Materials Retailing
Developers
Non-traded Cluster
General Contractors
Specialty Contractors
Concrete Products
Materials Wholesaling
Construction
Building Equipment Distribution
Water and
Sewer Line Construction
Real Estate
Services
Highway and
Street Construction
Construction Materials Retailing
Developers
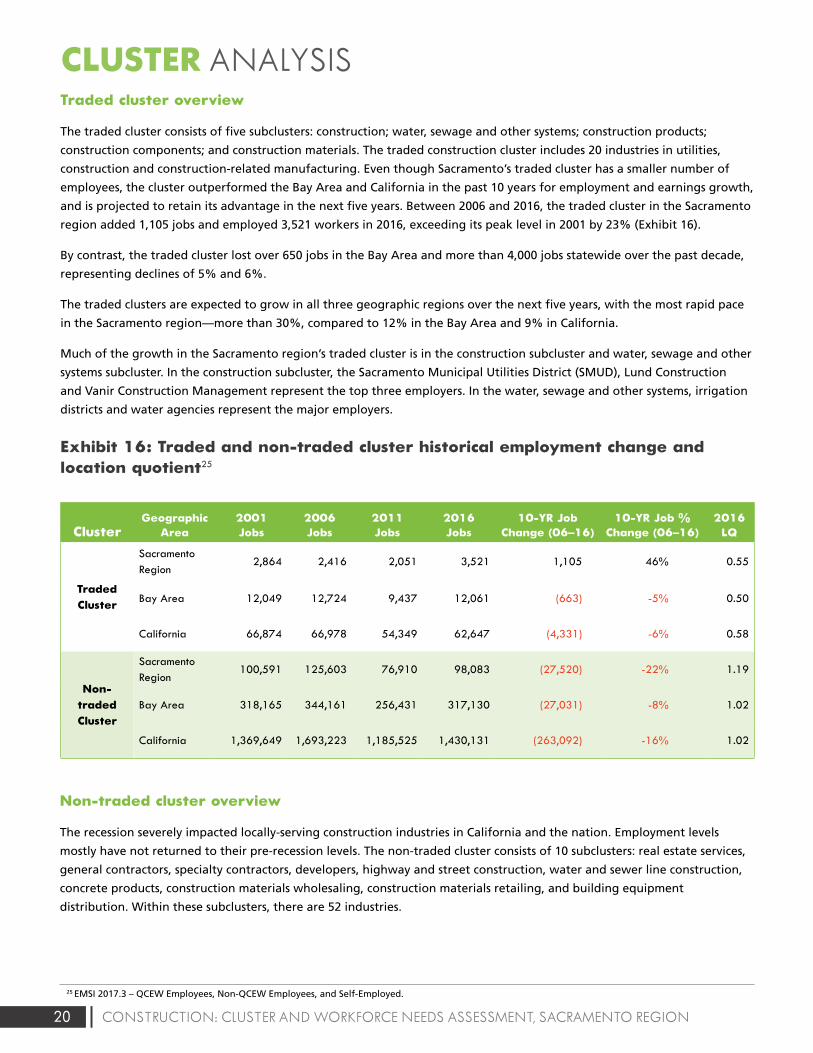
20 CONSTRUCTION: CLUSTER AND WORKFORCE NEEDS ASSESSMENT, SACRAMENTO REGION
CLUSTER ANALYSISTraded cluster overview
The traded cluster consists of five subclusters: construction; water, sewage and other systems; construction products;
construction components; and construction materials. The traded construction cluster includes 20 industries in utilities,
construction and construction-related manufacturing. Even though Sacramento’s traded cluster has a smaller number of
employees, the cluster outperformed the Bay Area and California in the past 10 years for employment and earnings growth,
and is projected to retain its advantage in the next five years. Between 2006 and 2016, the traded cluster in the Sacramento
region added 1,105 jobs and employed 3,521 workers in 2016, exceeding its peak level in 2001 by 23% (Exhibit 16).
By contrast, the traded cluster lost over 650 jobs in the Bay Area and more than 4,000 jobs statewide over the past decade,
representing declines of 5% and 6%.
The traded clusters are expected to grow in all three geographic regions over the next five years, with the most rapid pace
in the Sacramento region—more than 30%, compared to 12% in the Bay Area and 9% in California.
Much of the growth in the Sacramento region’s traded cluster is in the construction subcluster and water, sewage and other
systems subcluster. In the construction subcluster, the Sacramento Municipal Utilities District (SMUD), Lund Construction
and Vanir Construction Management represent the top three employers. In the water, sewage and other systems, irrigation
districts and water agencies represent the major employers.
Exhibit 16: Traded and non-traded cluster historical employment change and location quotient25
ClusterGeographic
Area2001 Jobs
2006 Jobs
2011 Jobs
2016 Jobs
10-YR Job Change (06–16)
10-YR Job % Change (06–16)
2016 LQ
Traded Cluster
Sacramento Region
2,864 2,416 2,051 3,521 1,105 46% 0.55
Bay Area 12,049 12,724 9,437 12,061 (663) -5% 0.50
California 66,874 66,978 54,349 62,647 (4,331) -6% 0.58
Non-traded Cluster
Sacramento Region
100,591 125,603 76,910 98,083 (27,520) -22% 1.19
Bay Area 318,165 344,161 256,431 317,130 (27,031) -8% 1.02
California 1,369,649 1,693,223 1,185,525 1,430,131 (263,092) -16% 1.02
Non-traded cluster overview
The recession severely impacted locally-serving construction industries in California and the nation. Employment levels
mostly have not returned to their pre-recession levels. The non-traded cluster consists of 10 subclusters: real estate services,
general contractors, specialty contractors, developers, highway and street construction, water and sewer line construction,
concrete products, construction materials wholesaling, construction materials retailing, and building equipment
distribution. Within these subclusters, there are 52 industries.
25 EMSI 2017.3 – QCEW Employees, Non-QCEW Employees, and Self-Employed.
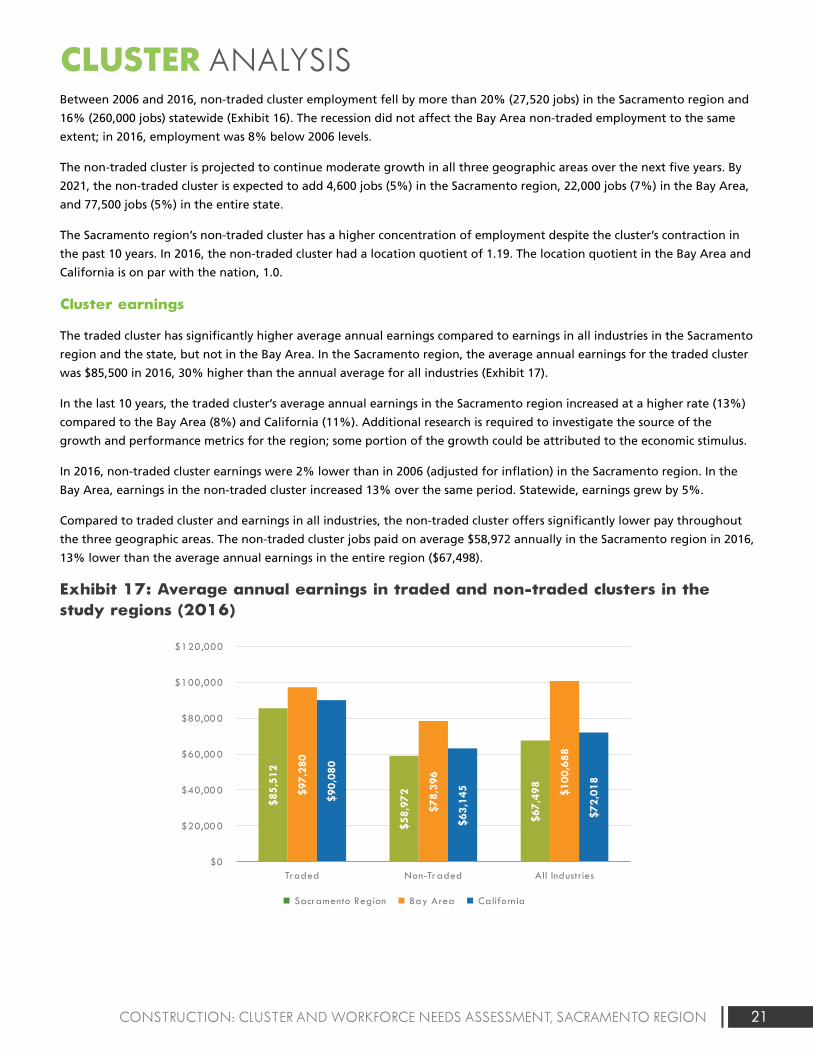
21CONSTRUCTION: CLUSTER AND WORKFORCE NEEDS ASSESSMENT, SACRAMENTO REGION
Between 2006 and 2016, non-traded cluster employment fell by more than 20% (27,520 jobs) in the Sacramento region and
16% (260,000 jobs) statewide (Exhibit 16). The recession did not affect the Bay Area non-traded employment to the same
extent; in 2016, employment was 8% below 2006 levels.
The non-traded cluster is projected to continue moderate growth in all three geographic areas over the next five years. By
2021, the non-traded cluster is expected to add 4,600 jobs (5%) in the Sacramento region, 22,000 jobs (7%) in the Bay Area,
and 77,500 jobs (5%) in the entire state.
The Sacramento region’s non-traded cluster has a higher concentration of employment despite the cluster’s contraction in
the past 10 years. In 2016, the non-traded cluster had a location quotient of 1.19. The location quotient in the Bay Area and
California is on par with the nation, 1.0.
Cluster earnings
The traded cluster has significantly higher average annual earnings compared to earnings in all industries in the Sacramento
region and the state, but not in the Bay Area. In the Sacramento region, the average annual earnings for the traded cluster
was $85,500 in 2016, 30% higher than the annual average for all industries (Exhibit 17).
In the last 10 years, the traded cluster’s average annual earnings in the Sacramento region increased at a higher rate (13%)
compared to the Bay Area (8%) and California (11%). Additional research is required to investigate the source of the
growth and performance metrics for the region; some portion of the growth could be attributed to the economic stimulus.
In 2016, non-traded cluster earnings were 2% lower than in 2006 (adjusted for inflation) in the Sacramento region. In the
Bay Area, earnings in the non-traded cluster increased 13% over the same period. Statewide, earnings grew by 5%.
Compared to traded cluster and earnings in all industries, the non-traded cluster offers significantly lower pay throughout
the three geographic areas. The non-traded cluster jobs paid on average $58,972 annually in the Sacramento region in 2016,
13% lower than the average annual earnings in the entire region ($67,498).
Exhibit 17: Average annual earnings in traded and non-traded clusters in the study regions (2016)
CLUSTER ANALYSIS
Exhibit 1: Value of construction put in place (United States)3
$1,161,282
$788,332
$1,185,683
$0
$200,000
$400,000
$600,000
$800,000
$1,000,000
$1,200,000
$1,400,000
2002 2003 2004 2005 2006 2007 2008 2009 2010 2011 2012 2013 2014 2015 2016
Mill
ions
of
Dol
lars
Residential Nonresidential
Exhibit 2: Value of construction put in place (California)5
$58,091,975
$18,740,050
$51,350,955
$0
$10,000,000
$20,000,000
$30,000,000
$40,000,000
$50,000,000
$60,000,000
$70,000,000
2002 2003 2004 2005 2006 2007 2008 2009 2010 2011 2012 2013 2014 2015 2016
Residential Nonresidential
Exhibit 3: Value of nonresidential construction put in place, by subcomponent (United States)7
24.1%
-0.2%
130.5%
0.6%
5.3%
-54.8%
18.0%
50.9%
98.2%
26.9%
-7.5%
21.7%
Office
Commercial
Manufacturing
Health care
Educational
Religious
Amusement and recreation
Transportation
Power and communication
Highway and street
Public works
Other
Subcomponent percent change 2006-2016
Exhibit 5: Value of Infrastructure as a percent of nonresidential construction put in place (United States)10
37.5% 37.9% 36.5%37.1% 37.0%
37.3%37.5% 41.1% 46.3% 45.5%
46.6% 46.4%46.1% 43.5% 41.6%
$0
$100,000
$200,000
$300,000
$400,000
$500,000
$600,000
$700,000
$800,000
2002 2003 2004 2005 2006 2007 2008 2009 2010 2011 2012 2013 2014 2015 2016
$ M
illio
ns
$ Th
ousa
nds
Nonresidential Infrastructure
Exhibit 6: Value of infrastructure as a percent of nonresidential construction put in place (California)11
11.6% 12.8% 14.3% 13.4%14.3%
11.0% 10.7%10.7% 10.2% 9.9% 10.9%
27.5%
14.9%16.2% 13.0%$5,000,000
$0
$10,000,000
$15,000,000
$20,000,000
$25,000,000
$30,000,000
2002 2003 2004 2005 2006 2007 2008 2009 2010 2011 2012 2013 2014 2015 2016
Nonresidential Infrastructure
Exhibit 7: Construction value added as a percent of GDP (United States)12
Exhibit 8: Construction value added as a percent of GRP (California)13
7.8% 7.8%8.1%
8.6%8.4%
8.0%
7.4%
6.3%
5.4%5.1%
5.3%5.5%
5.8%
6.2%6.4%
3.0%
4.0%
5.0%
6.0%
7.0%
8.0%
9.0%
2002 2003 2004 2005 2006 2007 2008 2009 2010 2011 2012 2013 2014 2015 2016
2002 2003 2004 2005 2006 2007 2008 2009 2010 2011 2012 2013 2014 2015 2016
3.0% 3.1%3.3% 3.3%
2.8%
2.3%
1.6%
1.0% 1.0% 1.1%1.3%
1.8% 1.8%2.0% 2.0%
0.0%
0.5%
1.0%
1.5%
2.0%
2.5%
3.0%
3.5%
4.0%
Exhibit 9: Construction value added as a percent of GRP (California, Sacramento region and Bay Area)16
3.0%
6.8% 6.9%
3.6%
1.2%1.4%
1.7%
2.3%
2.4%
0.0%
1.0%
2.0%
3.0%
4.0%
5.0%
6.0%
7.0%
8.0%
2002 2003 2004 2005 2006 2007 2008 2009 2010 2011 2012 2013 2014 2015
State Sacramento Metro (6-county) Bay Area Metro (9-county)
Exhibit 10: Housing unit supply versus demand in the Sacramento region
Exh ibit 11: Residen tial building units in the six-county Sacramento region (permi t data)20
19,865
14,239
10,996 8,932
6,483 7,768 9,125
10,399
19,122
23,812
17,987
2,293 3,939 4,652
6,492
0
5,000
10,000
15,000
20,000
25,000
30,000
2002 2003 2004 2005 2006 2007 2008 2009 2010 2011 2012 2013 2014 2015 2016 2017
Housing Unit Demand Housing Unit Supply
14,01415,671
19,78419,630
21,65218,612
10,1257,931
4,1752,493 2,326 1,938 2,965 3,772 3,967
5,526 6,401
3,226
3,868
4,628 4,7613,612
2,911
3,568
1,555
1,818 438 539 759631
982 7461,265
1,053
0
5,000
10,000
15,000
20,000
25,000
30,000
2000 2001 2002 2003 2004 2005 2006 2007 2008 2009 2010 2011 2012 2013 2014 2015 2016
Single Family Units Multifamily Units
Exhibit 13: Value of nonresidential construction in the six-county Sacramento region 21
$0
$200,000
$400,000
$600,000
$800,000
$1,000 ,000
$1,200 ,000
$1,400 ,000
$1,600 ,000
$1,800 ,000
$2,000 ,000
2000 2001 2002 2003 2004 2005 2006 2007 2008 2009 2010 2011 2012 2013 2014 2015 2016
El Dorado Placer Sacramento Yolo Yuba Sutter
Exhibit 14: Percent of nonresidential construction value in the Sacramento region, by county22
0%
10%
20%
30%
40%
50%
60%
70%
80%
90%
100%
2006 2016
El Dorado Placer Sacramento Yolo Yuba
Exhibit 17: Average annual earnings in traded and non-traded clusters in the study regions (2016)
$85,
512
$58,
972
$67,
498
$97,
280
$78,
396
$100
,688
$90,
080
$63,
145
$72,
018
$0
$20,000
$40,000
$60,000
$80,000
$100,000
$120,000
Traded Non-Traded All Industries
Sacramento Region Bay Area Californ ia
Exhibit 18: Traded subcluster employment index, Sacramento region (2001-2021)25
Water, Sewage, and Other Systems Projection
Projection
Projection
Projection
Projection
Construction Materials
Construction
Construction Products
Construction Components
Empl
oym
ent i
ndex
(2
006
Empl
oym
ent =
100
)
Empl
oym
ent i
ndex
(2
006
Empl
oym
ent =
100
)
Exhibit 24: Non-traded subcluster employment index, Sacramento region (2001-2021)36
101.0 119.3
87.2104.7
73.7
136.3
36.1
29.6
17.9
0.0
25.0
50.0
75.0
100.0
125.0
150.0
2001 2006 2011 2016 2021
Water and Sewer Line Construction Projection
Concrete Products Projection
Real Estate Services Projection
Specialty Contractors Projection
General Contractors Projection
Developers Projection
* Only included subclusters with 10k+employment or significant employment change. Refer to appendix for the complete list of nontraded subclusters.
Exhibit 39: Entering construction industry workers by type of education and training in the Sacramento region (annual average, 2014-2016)59
368
217181
56 54
148125 107
84
28 27 19 13 3
29
369
129
109
198
136
10561
35 8 13 14 8 10
0
50
100
150
200
250
300
350
400
Apprentices Oth er Post-Secondary Completions
Exhibit 44: Projected annual construction industry occupational gaps in the Sacramento region (2016-2021)60
-3
-2
-1
32
45
57
58
68
103
173
196
308
322
397
427
500
524
607
640
864
1,937
-200 100 400 700 1,000 1,300 1,600 1,900
Insulation Workers
Drafters
Interior Designers
PV Installers
Glaziers
Surveyors
Building Inspectors
Roofers
Ironworkers & Welders
Architects
Drywall Installers
HVAC & Sheet Metal
Painters
Masonry, Tile, Floor, Lathe, Plaster
Plumbers & Pipefitters
Engineers
Heavy Equipment Operators
Real Estate Professionals
Electricians
Construction Managers
Carpenters
Exhibit 47: Unionized and non-unionized workforce, Sacramento--Arden-Arcade--Roseville MSA and 10-county Bay Area (annual average, 2014-2017)61
Exhibit 48: Unionization in the construction workforce as an annual average percentage of total employment, Sacramento--Arden-Arcade--Roseville MSA (2000-2017)62
31%, 32,314
29%, 12,555
69%, 70,898
71%, 30,110
0% 20% 40% 60% 80% 100%
10-County Bay Area
Sacramento MSA
Union Non-Union
32%
20% 19%24% 23%
29%
68%
80% 81%76% 77%
71%
0%
10%
20%
30%
40%
50%
60%
70%
80%
90%
2000 – 2002 2003 – 2004 2005 –2008 2008 – 2011 2011 – 2014 2014 – 2017
Union Non-Union
Exhibit 1A. Construction managers projected annual openings, n = 871 (2016-2021)67
Cost Estimators, 206openings, 24%
Construction Managers,
225 openings, 26%
First-Line Supervisors of Construction Trades and
Extraction Workers,440 openings, 50%
0 100 200 300 400 500 600 700 800 900 1,000
Construction Products, 81
Water, Sewage, and Other Systems, 908
-10.0%
-5.0%
0.0%
5.0%
10.0%
15.0%
20.0%
25.0%
0.0 0.5 1.0 1.5 2.0 2.5 3.0 3.5
Location Quotient (2016)
Location Quotient (2016)
Ann
ual E
mpl
oym
ent G
row
th R
ate
(200
6-20
16)
Subcluster with an annual average earnings higher than all-industry annual average earnings in ($67,498) Sacramento region in 2016
LQ=1.0
Exhibit 2C: Non-traded subclusters in the Sacramento region73
Specialty Contractors, 50,899
General Contractors, 16,843
Real Estate Services, 15,475
Construction Materials Retailing, 6,552
Highway and Street Construction, 2,268
Water and Sewer Line Construction, 1,662
Building Equipment Distribution, 1,207
Developers
-15.0%
-10.0%
-5.0%
0.0%
5.0%
0.8 1.0 1.2 1.4
Ann
ual E
mpl
oym
ent G
row
th R
ate
(200
6-20
16
Exhibit 2E: Joint apprentices by gender in the Sacramento region (January 2012-October 2017)
Exhibit 3E: Joint apprentices by county of residence in the Sacramento region (January 2012-October 2017)
8,374, 97%
249, 3%
El Dorado,393, 56%
Placer,949, 11%
Sacramento, 6077, 1
Sutter, 346,4%
Yolo, 549,6%
Yuba, 309,
4%
Exhibit 4E: Joint apprentices’ highest level of education prior to apprenticeship in the Sacramento region (January 2012-October 2017)
Exhibit 5E: Number of weeks worked, all workers in the construction sector in the Sacramento region (2015)84
Less than highschool, 7%
High schoolgraduate orGED, 65%
Some college,25%
4 or more yearsof college, 3%
3,165 6%
3,082 6%
1,650 3%
6,105 12%
7,068 10%
31,037 62%
0 5,000 10,000 15,000 20,000 25,000 30,000 35,000
Did not work
Less than 14
14 to 26
27 to 39
40 to 49
50 to 52
# w
eeks
wor
ked
in th
e la
st y
ear
Exhibit 4: Value of nonresidential construction put in place, by subcomponent (California)9
-0.5%
29.2%
-41.1%
0.0%
62.9%
-34.7%
46.0%
42.8%
19.1%
-14.6%
66.5%
763.4%
Office
Commercial
Manufacturing
Health care
Educational
Religious
Amusement and recreation
Transportation
Power and communication
Highway and street
Public works
Other
Subcomponent percent change 2006-2016
180.8
593.7
818.9
21.4
235.8 342.3
104.9 133.6 173.5
0.0
100.0
200.0
300.0
400.0
500.0
600.0
700.0
800.0
900.0
1000.0
2001 2006 2011 2016 2021
Construction Materials,125
Construction, 1,942
Construction Components, 466
LQ=1.0
Concrete Products, 1,123
Construction Materials Wholesaling, 1,647
Subcluster with an annual average earnings higher than all-industry annual average earnings ($67,498) in Sacramento region in 2016
Exhibit 1E: Total joint apprentice starts, residents in the six-county Sacramento region (January 2012-October 2017) (n = 8,617)2
435
95
104
111
117
121
135
161
174
178
215
302
340
440
458
483
542
602
1,045
1,205
1,354
0 200 400 600 800 1000 1200 1400 1600
All others
Elevator constructor
Drywall finisher
Scaffold and shoring erector
Inspector or surveyor
Pile driver
Glazier
Carpet, linoleum, and soft tile layer
Millwright
Sheet metal worker & related trades
Construction equipment operator trades
Brick, marble, terrazzo, tile, and related trades
Roofer and waterproofer
Plumber and fitter trades
Painter trades
Cement mason and plasterer trades
Electricial trades
Drywall/lather
Ironworker trades
Carpenter
Construction craft laborer
Exhibit 38: Anticipated annual construction industry job openings by new and replacement jobs in the Sacramento region (2016-2021)1
21 26 59 60 52 78 99 167 167 220323 350 399 439 473
596 679788 777 763
2,119
4 6 1 1 20 7 520 27 2
71 56100 95 73
4699
82 95222
215
0
500
1000
1500
2000
2500
Annual Replacement Openings New Jobs (Growth)
Male
Female
$ Th
ousa
nds
Thou
sand
s of
Dol
lars
Average annual openings (demand) minuseducation and training (supply) =approximate annual shortage
Approximate annual shortage = 7,250 workers across all categories
Sutter
6.2% 5.1%
27.6%
14.4%
50.6%69.9%
10.8%7.9%
1.1% 0.6%3.6% 2.0%
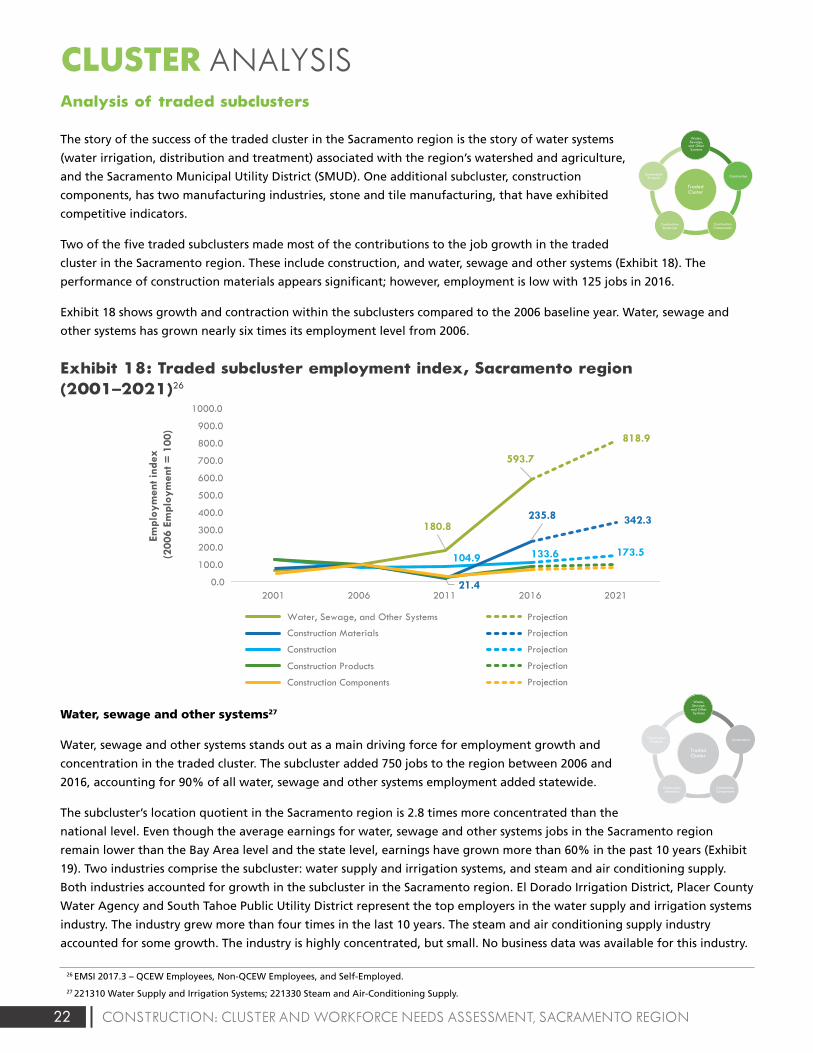
22 CONSTRUCTION: CLUSTER AND WORKFORCE NEEDS ASSESSMENT, SACRAMENTO REGION
CLUSTER ANALYSISAnalysis of traded subclusters
The story of the success of the traded cluster in the Sacramento region is the story of water systems
(water irrigation, distribution and treatment) associated with the region’s watershed and agriculture,
and the Sacramento Municipal Utility District (SMUD). One additional subcluster, construction
components, has two manufacturing industries, stone and tile manufacturing, that have exhibited
competitive indicators.
Two of the five traded subclusters made most of the contributions to the job growth in the traded
cluster in the Sacramento region. These include construction, and water, sewage and other systems (Exhibit 18). The
performance of construction materials appears significant; however, employment is low with 125 jobs in 2016.
Exhibit 18 shows growth and contraction within the subclusters compared to the 2006 baseline year. Water, sewage and
other systems has grown nearly six times its employment level from 2006.
Exhibit 18: Traded subcluster employment index, Sacramento region (2001–2021)26
Water, sewage and other systems27
Water, sewage and other systems stands out as a main driving force for employment growth and
concentration in the traded cluster. The subcluster added 750 jobs to the region between 2006 and
2016, accounting for 90% of all water, sewage and other systems employment added statewide.
The subcluster’s location quotient in the Sacramento region is 2.8 times more concentrated than the
national level. Even though the average earnings for water, sewage and other systems jobs in the Sacramento region
remain lower than the Bay Area level and the state level, earnings have grown more than 60% in the past 10 years (Exhibit
19). Two industries comprise the subcluster: water supply and irrigation systems, and steam and air conditioning supply.
Both industries accounted for growth in the subcluster in the Sacramento region. El Dorado Irrigation District, Placer County
Water Agency and South Tahoe Public Utility District represent the top employers in the water supply and irrigation systems
industry. The industry grew more than four times in the last 10 years. The steam and air conditioning supply industry
accounted for some growth. The industry is highly concentrated, but small. No business data was available for this industry.
Exhibit 1: Value of construction put in place (United States)3
$1,161,282
$788,332
$1,185,683
$0
$200,000
$400,000
$600,000
$800,000
$1,000,000
$1,200,000
$1,400,000
2002 2003 2004 2005 2006 2007 2008 2009 2010 2011 2012 2013 2014 2015 2016
Mill
ions
of
Dol
lars
Residential Nonresidential
Exhibit 2: Value of construction put in place (California)5
$58,091,975
$18,740,050
$51,350,955
$0
$10,000,000
$20,000,000
$30,000,000
$40,000,000
$50,000,000
$60,000,000
$70,000,000
2002 2003 2004 2005 2006 2007 2008 2009 2010 2011 2012 2013 2014 2015 2016
Residential Nonresidential
Exhibit 3: Value of nonresidential construction put in place, by subcomponent (United States)7
24.1%
-0.2%
130.5%
0.6%
5.3%
-54.8%
18.0%
50.9%
98.2%
26.9%
-7.5%
21.7%
Office
Commercial
Manufacturing
Health care
Educational
Religious
Amusement and recreation
Transportation
Power and communication
Highway and street
Public works
Other
Subcomponent percent change 2006-2016
Exhibit 5: Value of Infrastructure as a percent of nonresidential construction put in place (United States)10
37.5% 37.9% 36.5%37.1% 37.0%
37.3%37.5% 41.1% 46.3% 45.5%
46.6% 46.4%46.1% 43.5% 41.6%
$0
$100,000
$200,000
$300,000
$400,000
$500,000
$600,000
$700,000
$800,000
2002 2003 2004 2005 2006 2007 2008 2009 2010 2011 2012 2013 2014 2015 2016
$ M
illio
ns
$ Th
ousa
nds
Nonresidential Infrastructure
Exhibit 6: Value of infrastructure as a percent of nonresidential construction put in place (California)11
11.6% 12.8% 14.3% 13.4%14.3%
11.0% 10.7%10.7% 10.2% 9.9% 10.9%
27.5%
14.9%16.2% 13.0%$5,000,000
$0
$10,000,000
$15,000,000
$20,000,000
$25,000,000
$30,000,000
2002 2003 2004 2005 2006 2007 2008 2009 2010 2011 2012 2013 2014 2015 2016
Nonresidential Infrastructure
Exhibit 7: Construction value added as a percent of GDP (United States)12
Exhibit 8: Construction value added as a percent of GRP (California)13
7.8% 7.8%8.1%
8.6%8.4%
8.0%
7.4%
6.3%
5.4%5.1%
5.3%5.5%
5.8%
6.2%6.4%
3.0%
4.0%
5.0%
6.0%
7.0%
8.0%
9.0%
2002 2003 2004 2005 2006 2007 2008 2009 2010 2011 2012 2013 2014 2015 2016
2002 2003 2004 2005 2006 2007 2008 2009 2010 2011 2012 2013 2014 2015 2016
3.0% 3.1%3.3% 3.3%
2.8%
2.3%
1.6%
1.0% 1.0% 1.1%1.3%
1.8% 1.8%2.0% 2.0%
0.0%
0.5%
1.0%
1.5%
2.0%
2.5%
3.0%
3.5%
4.0%
Exhibit 9: Construction value added as a percent of GRP (California, Sacramento region and Bay Area)16
3.0%
6.8% 6.9%
3.6%
1.2%1.4%
1.7%
2.3%
2.4%
0.0%
1.0%
2.0%
3.0%
4.0%
5.0%
6.0%
7.0%
8.0%
2002 2003 2004 2005 2006 2007 2008 2009 2010 2011 2012 2013 2014 2015
State Sacramento Metro (6-county) Bay Area Metro (9-county)
Exhibit 10: Housing unit supply versus demand in the Sacramento region
Exh ibit 11: Residen tial building units in the six-county Sacramento region (permi t data)20
19,865
14,239
10,996 8,932
6,483 7,768 9,125
10,399
19,122
23,812
17,987
2,293 3,939 4,652
6,492
0
5,000
10,000
15,000
20,000
25,000
30,000
2002 2003 2004 2005 2006 2007 2008 2009 2010 2011 2012 2013 2014 2015 2016 2017
Housing Unit Demand Housing Unit Supply
14,01415,671
19,78419,630
21,65218,612
10,1257,931
4,1752,493 2,326 1,938 2,965 3,772 3,967
5,526 6,401
3,226
3,868
4,628 4,7613,612
2,911
3,568
1,555
1,818 438 539 759631
982 7461,265
1,053
0
5,000
10,000
15,000
20,000
25,000
30,000
2000 2001 2002 2003 2004 2005 2006 2007 2008 2009 2010 2011 2012 2013 2014 2015 2016
Single Family Units Multifamily Units
Exhibit 13: Value of nonresidential construction in the six-county Sacramento region 21
$0
$200,000
$400,000
$600,000
$800,000
$1,000 ,000
$1,200 ,000
$1,400 ,000
$1,600 ,000
$1,800 ,000
$2,000 ,000
2000 2001 2002 2003 2004 2005 2006 2007 2008 2009 2010 2011 2012 2013 2014 2015 2016
El Dorado Placer Sacramento Yolo Yuba Sutter
Exhibit 14: Percent of nonresidential construction value in the Sacramento region, by county22
0%
10%
20%
30%
40%
50%
60%
70%
80%
90%
100%
2006 2016
El Dorado Placer Sacramento Yolo Yuba
Exhibit 17: Average annual earnings in traded and non-traded clusters in the study regions (2016)
$85,
512
$58,
972
$67,
498
$97,
280
$78,
396
$100
,688
$90,
080
$63,
145
$72,
018
$0
$20,000
$40,000
$60,000
$80,000
$100,000
$120,000
Traded Non-Traded All Industries
Sacramento Region Bay Area Californ ia
Exhibit 18: Traded subcluster employment index, Sacramento region (2001-2021)25
Water, Sewage, and Other Systems Projection
Projection
Projection
Projection
Projection
Construction Materials
Construction
Construction Products
Construction Components
Empl
oym
ent i
ndex
(2
006
Empl
oym
ent =
100
)
Empl
oym
ent i
ndex
(2
006
Empl
oym
ent =
100
)
Exhibit 24: Non-traded subcluster employment index, Sacramento region (2001-2021)36
101.0 119.3
87.2104.7
73.7
136.3
36.1
29.6
17.9
0.0
25.0
50.0
75.0
100.0
125.0
150.0
2001 2006 2011 2016 2021
Water and Sewer Line Construction Projection
Concrete Products Projection
Real Estate Services Projection
Specialty Contractors Projection
General Contractors Projection
Developers Projection
* Only included subclusters with 10k+employment or significant employment change. Refer to appendix for the complete list of nontraded subclusters.
Exhibit 39: Entering construction industry workers by type of education and training in the Sacramento region (annual average, 2014-2016)59
368
217181
56 54
148125 107
84
28 27 19 13 3
29
369
129
109
198
136
10561
35 8 13 14 8 10
0
50
100
150
200
250
300
350
400
Apprentices Oth er Post-Secondary Completions
Exhibit 44: Projected annual construction industry occupational gaps in the Sacramento region (2016-2021)60
-3
-2
-1
32
45
57
58
68
103
173
196
308
322
397
427
500
524
607
640
864
1,937
-200 100 400 700 1,000 1,300 1,600 1,900
Insulation Workers
Drafters
Interior Designers
PV Installers
Glaziers
Surveyors
Building Inspectors
Roofers
Ironworkers & Welders
Architects
Drywall Installers
HVAC & Sheet Metal
Painters
Masonry, Tile, Floor, Lathe, Plaster
Plumbers & Pipefitters
Engineers
Heavy Equipment Operators
Real Estate Professionals
Electricians
Construction Managers
Carpenters
Exhibit 47: Unionized and non-unionized workforce, Sacramento--Arden-Arcade--Roseville MSA and 10-county Bay Area (annual average, 2014-2017)61
Exhibit 48: Unionization in the construction workforce as an annual average percentage of total employment, Sacramento--Arden-Arcade--Roseville MSA (2000-2017)62
31%, 32,314
29%, 12,555
69%, 70,898
71%, 30,110
0% 20% 40% 60% 80% 100%
10-County Bay Area
Sacramento MSA
Union Non-Union
32%
20% 19%24% 23%
29%
68%
80% 81%76% 77%
71%
0%
10%
20%
30%
40%
50%
60%
70%
80%
90%
2000 – 2002 2003 – 2004 2005 –2008 2008 – 2011 2011 – 2014 2014 – 2017
Union Non-Union
Exhibit 1A. Construction managers projected annual openings, n = 871 (2016-2021)67
Cost Estimators, 206openings, 24%
Construction Managers,
225 openings, 26%
First-Line Supervisors of Construction Trades and
Extraction Workers,440 openings, 50%
0 100 200 300 400 500 600 700 800 900 1,000
Construction Products, 81
Water, Sewage, and Other Systems, 908
-10.0%
-5.0%
0.0%
5.0%
10.0%
15.0%
20.0%
25.0%
0.0 0.5 1.0 1.5 2.0 2.5 3.0 3.5
Location Quotient (2016)
Location Quotient (2016)
Ann
ual E
mpl
oym
ent G
row
th R
ate
(200
6-20
16)
Subcluster with an annual average earnings higher than all-industry annual average earnings in ($67,498) Sacramento region in 2016
LQ=1.0
Exhibit 2C: Non-traded subclusters in the Sacramento region73
Specialty Contractors, 50,899
General Contractors, 16,843
Real Estate Services, 15,475
Construction Materials Retailing, 6,552
Highway and Street Construction, 2,268
Water and Sewer Line Construction, 1,662
Building Equipment Distribution, 1,207
Developers
-15.0%
-10.0%
-5.0%
0.0%
5.0%
0.8 1.0 1.2 1.4
Ann
ual E
mpl
oym
ent G
row
th R
ate
(200
6-20
16
Exhibit 2E: Joint apprentices by gender in the Sacramento region (January 2012-October 2017)
Exhibit 3E: Joint apprentices by county of residence in the Sacramento region (January 2012-October 2017)
8,374, 97%
249, 3%
El Dorado,393, 56%
Placer,949, 11%
Sacramento, 6077, 1
Sutter, 346,4%
Yolo, 549,6%
Yuba, 309,
4%
Exhibit 4E: Joint apprentices’ highest level of education prior to apprenticeship in the Sacramento region (January 2012-October 2017)
Exhibit 5E: Number of weeks worked, all workers in the construction sector in the Sacramento region (2015)84
Less than highschool, 7%
High schoolgraduate orGED, 65%
Some college,25%
4 or more yearsof college, 3%
3,165 6%
3,082 6%
1,650 3%
6,105 12%
7,068 10%
31,037 62%
0 5,000 10,000 15,000 20,000 25,000 30,000 35,000
Did not work
Less than 14
14 to 26
27 to 39
40 to 49
50 to 52
# w
eeks
wor
ked
in th
e la
st y
ear
Exhibit 4: Value of nonresidential construction put in place, by subcomponent (California)9
-0.5%
29.2%
-41.1%
0.0%
62.9%
-34.7%
46.0%
42.8%
19.1%
-14.6%
66.5%
763.4%
Office
Commercial
Manufacturing
Health care
Educational
Religious
Amusement and recreation
Transportation
Power and communication
Highway and street
Public works
Other
Subcomponent percent change 2006-2016
180.8
593.7
818.9
21.4
235.8 342.3
104.9 133.6 173.5
0.0
100.0
200.0
300.0
400.0
500.0
600.0
700.0
800.0
900.0
1000.0
2001 2006 2011 2016 2021
Construction Materials,125
Construction, 1,942
Construction Components, 466
LQ=1.0
Concrete Products, 1,123
Construction Materials Wholesaling, 1,647
Subcluster with an annual average earnings higher than all-industry annual average earnings ($67,498) in Sacramento region in 2016
Exhibit 1E: Total joint apprentice starts, residents in the six-county Sacramento region (January 2012-October 2017) (n = 8,617)2
435
95
104
111
117
121
135
161
174
178
215
302
340
440
458
483
542
602
1,045
1,205
1,354
0 200 400 600 800 1000 1200 1400 1600
All others
Elevator constructor
Drywall finisher
Scaffold and shoring erector
Inspector or surveyor
Pile driver
Glazier
Carpet, linoleum, and soft tile layer
Millwright
Sheet metal worker & related trades
Construction equipment operator trades
Brick, marble, terrazzo, tile, and related trades
Roofer and waterproofer
Plumber and fitter trades
Painter trades
Cement mason and plasterer trades
Electricial trades
Drywall/lather
Ironworker trades
Carpenter
Construction craft laborer
Exhibit 38: Anticipated annual construction industry job openings by new and replacement jobs in the Sacramento region (2016-2021)1
21 26 59 60 52 78 99 167 167 220323 350 399 439 473
596 679788 777 763
2,119
4 6 1 1 20 7 520 27 2
71 56100 95 73
4699
82 95222
215
0
500
1000
1500
2000
2500
Annual Replacement Openings New Jobs (Growth)
Male
Female
$ Th
ousa
nds
Thou
sand
s of
Dol
lars
Average annual openings (demand) minuseducation and training (supply) =approximate annual shortage
Approximate annual shortage = 7,250 workers across all categories
Sutter
6.2% 5.1%
27.6%
14.4%
50.6%69.9%
10.8%7.9%
1.1% 0.6%3.6% 2.0%
26 EMSI 2017.3 – QCEW Employees, Non-QCEW Employees, and Self-Employed.
27 221310 Water Supply and Irrigation Systems; 221330 Steam and Air-Conditioning Supply.
Traded Cluster
Water, Sewage,
and Other Systems
Construction Materials
Non-traded Cluster
General Contractors
Specialty Contractors
Concrete Products
Materials Wholesaling
Construction
Building Equipment Distribution
Water and
Sewer Line Construction
ConstructionConstruction Products
Construction Components
Traded Cluster
Water, Sewage,
and Other Systems
Construction Materials
ConstructionConstruction Products
Construction Components
Traded Cluster
Water, Sewage,
and Other Systems
Construction Materials
ConstructionConstruction Products
Construction Components
Traded Cluster
Water, Sewage,
and Other Systems
Construction Materials
ConstructionConstruction Products
Construction Components
Traded Cluster
Water, Sewage,
and Other Systems
Construction Materials
ConstructionConstruction Products
Construction Components
Traded Cluster
Water, Sewage,
and Other Systems
Construction Materials
ConstructionConstruction Products
Construction Components
Real Estate
Services
Highway and
Street Construction
Construction Materials Retailing
Developers
Non-traded Cluster
General Contractors
Specialty Contractors
Concrete Products
Materials Wholesaling
Construction
Building Equipment Distribution
Water and
Sewer Line Construction
Real Estate
Services
Highway and
Street Construction
Construction Materials Retailing
Developers
Non-traded Cluster
General Contractors
Specialty Contractors
Concrete Products
Materials Wholesaling
Construction
Building Equipment Distribution
Water and
Sewer Line Construction
Real Estate
Services
Highway and
Street Construction
Construction Materials Retailing
Developers
Non-traded Cluster
General Contractors
Specialty Contractors
Concrete Products
Materials Wholesaling
Construction
Building Equipment Distribution
Water and
Sewer Line Construction
Real Estate
Services
Highway and
Street Construction
Construction Materials Retailing
Developers
Non-traded Cluster
General Contractors
Specialty Contractors
Concrete Products
Materials Wholesaling
Construction
Building Equipment Distribution
Water and
Sewer Line Construction
Real Estate
Services
Highway and
Street Construction
Construction Materials Retailing
Developers
Non-traded Cluster
General Contractors
Specialty Contractors
Concrete Products
Materials Wholesaling
Construction
Building Equipment Distribution
Water and
Sewer Line Construction
Real Estate
Services
Highway and
Street Construction
Construction Materials Retailing
Developers
Non-traded Cluster
General Contractors
Specialty Contractors
Concrete Products
Materials Wholesaling
Construction
Building Equipment Distribution
Water and
Sewer Line Construction
Real Estate
Services
Highway and
Street Construction
Construction Materials Retailing
Developers
Non-traded Cluster
General Contractors
Specialty Contractors
Concrete Products
Materials Wholesaling
Construction
Building Equipment Distribution
Water and
Sewer Line Construction
Real Estate
Services
Highway and
Street Construction
Construction Materials Retailing
Developers
Non-traded Cluster
General Contractors
Specialty Contractors
Concrete Products
Materials Wholesaling
Construction
Building Equipment Distribution
Water and
Sewer Line Construction
Real Estate
Services
Highway and
Street Construction
Construction Materials Retailing
Developers
Non-traded Cluster
General Contractors
Specialty Contractors
Concrete Products
Materials Wholesaling
Construction
Building Equipment Distribution
Water and
Sewer Line Construction
Real Estate
Services
Highway and
Street Construction
Construction Materials Retailing
Developers
Non-traded Cluster
General Contractors
Specialty Contractors
Concrete Products
Materials Wholesaling
Construction
Building Equipment Distribution
Water and
Sewer Line Construction
Real Estate
Services
Highway and
Street Construction
Construction Materials Retailing
Developers
Traded Cluster
Water, Sewage,
and Other Systems
Construction Materials
Non-traded Cluster
General Contractors
Specialty Contractors
Concrete Products
Materials Wholesaling
Construction
Building Equipment Distribution
Water and
Sewer Line Construction
ConstructionConstruction Products
Construction Components
Traded Cluster
Water, Sewage,
and Other Systems
Construction Materials
ConstructionConstruction Products
Construction Components
Traded Cluster
Water, Sewage,
and Other Systems
Construction Materials
ConstructionConstruction Products
Construction Components
Traded Cluster
Water, Sewage,
and Other Systems
Construction Materials
ConstructionConstruction Products
Construction Components
Traded Cluster
Water, Sewage,
and Other Systems
Construction Materials
ConstructionConstruction Products
Construction Components
Traded Cluster
Water, Sewage,
and Other Systems
Construction Materials
ConstructionConstruction Products
Construction Components
Real Estate
Services
Highway and
Street Construction
Construction Materials Retailing
Developers
Non-traded Cluster
General Contractors
Specialty Contractors
Concrete Products
Materials Wholesaling
Construction
Building Equipment Distribution
Water and
Sewer Line Construction
Real Estate
Services
Highway and
Street Construction
Construction Materials Retailing
Developers
Non-traded Cluster
General Contractors
Specialty Contractors
Concrete Products
Materials Wholesaling
Construction
Building Equipment Distribution
Water and
Sewer Line Construction
Real Estate
Services
Highway and
Street Construction
Construction Materials Retailing
Developers
Non-traded Cluster
General Contractors
Specialty Contractors
Concrete Products
Materials Wholesaling
Construction
Building Equipment Distribution
Water and
Sewer Line Construction
Real Estate
Services
Highway and
Street Construction
Construction Materials Retailing
Developers
Non-traded Cluster
General Contractors
Specialty Contractors
Concrete Products
Materials Wholesaling
Construction
Building Equipment Distribution
Water and
Sewer Line Construction
Real Estate
Services
Highway and
Street Construction
Construction Materials Retailing
Developers
Non-traded Cluster
General Contractors
Specialty Contractors
Concrete Products
Materials Wholesaling
Construction
Building Equipment Distribution
Water and
Sewer Line Construction
Real Estate
Services
Highway and
Street Construction
Construction Materials Retailing
Developers
Non-traded Cluster
General Contractors
Specialty Contractors
Concrete Products
Materials Wholesaling
Construction
Building Equipment Distribution
Water and
Sewer Line Construction
Real Estate
Services
Highway and
Street Construction
Construction Materials Retailing
Developers
Non-traded Cluster
General Contractors
Specialty Contractors
Concrete Products
Materials Wholesaling
Construction
Building Equipment Distribution
Water and
Sewer Line Construction
Real Estate
Services
Highway and
Street Construction
Construction Materials Retailing
Developers
Non-traded Cluster
General Contractors
Specialty Contractors
Concrete Products
Materials Wholesaling
Construction
Building Equipment Distribution
Water and
Sewer Line Construction
Real Estate
Services
Highway and
Street Construction
Construction Materials Retailing
Developers
Non-traded Cluster
General Contractors
Specialty Contractors
Concrete Products
Materials Wholesaling
Construction
Building Equipment Distribution
Water and
Sewer Line Construction
Real Estate
Services
Highway and
Street Construction
Construction Materials Retailing
Developers
Non-traded Cluster
General Contractors
Specialty Contractors
Concrete Products
Materials Wholesaling
Construction
Building Equipment Distribution
Water and
Sewer Line Construction
Real Estate
Services
Highway and
Street Construction
Construction Materials Retailing
Developers
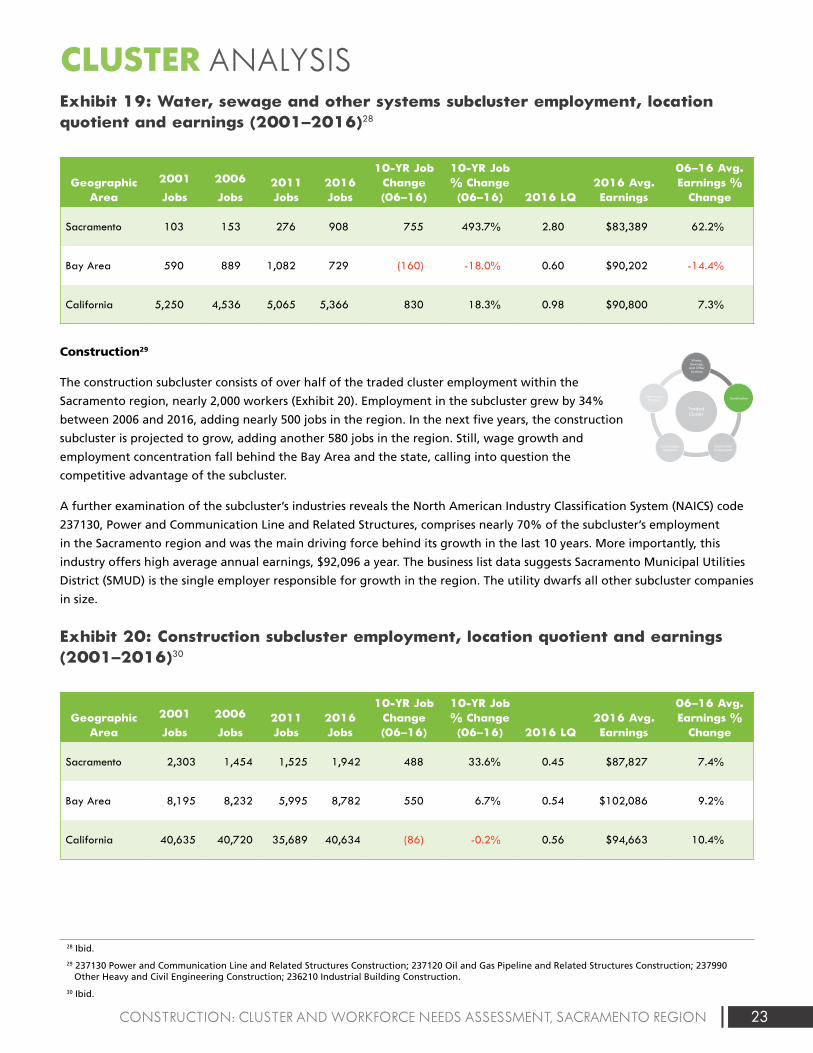
23CONSTRUCTION: CLUSTER AND WORKFORCE NEEDS ASSESSMENT, SACRAMENTO REGION
CLUSTER ANALYSISExhibit 19: Water, sewage and other systems subcluster employment, location quotient and earnings (2001–2016)28
Geographic Area
2001
Jobs
2006
Jobs2011 Jobs
2016 Jobs
10-YR Job Change (06–16)
10-YR Job % Change (06–16) 2016 LQ
2016 Avg. Earnings
06–16 Avg. Earnings %
Change
Sacramento 103 153 276 908 755 493.7% 2.80 $83,389 62.2%
Bay Area 590 889 1,082 729 (160) -18.0% 0.60 $90,202 -14.4%
California 5,250 4,536 5,065 5,366 830 18.3% 0.98 $90,800 7.3%
Construction29
The construction subcluster consists of over half of the traded cluster employment within the
Sacramento region, nearly 2,000 workers (Exhibit 20). Employment in the subcluster grew by 34%
between 2006 and 2016, adding nearly 500 jobs in the region. In the next five years, the construction
subcluster is projected to grow, adding another 580 jobs in the region. Still, wage growth and
employment concentration fall behind the Bay Area and the state, calling into question the
competitive advantage of the subcluster.
A further examination of the subcluster’s industries reveals the North American Industry Classification System (NAICS) code
237130, Power and Communication Line and Related Structures, comprises nearly 70% of the subcluster’s employment
in the Sacramento region and was the main driving force behind its growth in the last 10 years. More importantly, this
industry offers high average annual earnings, $92,096 a year. The business list data suggests Sacramento Municipal Utilities
District (SMUD) is the single employer responsible for growth in the region. The utility dwarfs all other subcluster companies
in size.
Exhibit 20: Construction subcluster employment, location quotient and earnings (2001–2016)30
Geographic Area
2001
Jobs
2006
Jobs2011 Jobs
2016 Jobs
10-YR Job Change (06–16)
10-YR Job % Change (06–16) 2016 LQ
2016 Avg. Earnings
06–16 Avg. Earnings %
Change
Sacramento 2,303 1,454 1,525 1,942 488 33.6% 0.45 $87,827 7.4%
Bay Area 8,195 8,232 5,995 8,782 550 6.7% 0.54 $102,086 9.2%
California 40,635 40,720 35,689 40,634 (86) -0.2% 0.56 $94,663 10.4%
28 Ibid.
29 237130 Power and Communication Line and Related Structures Construction; 237120 Oil and Gas Pipeline and Related Structures Construction; 237990 Other Heavy and Civil Engineering Construction; 236210 Industrial Building Construction.
30 Ibid.
Traded Cluster
Water, Sewage,
and Other Systems
Construction Materials
Non-traded Cluster
General Contractors
Specialty Contractors
Concrete Products
Materials Wholesaling
Construction
Building Equipment Distribution
Water and
Sewer Line Construction
ConstructionConstruction Products
Construction Components
Traded Cluster
Water, Sewage,
and Other Systems
Construction Materials
ConstructionConstruction Products
Construction Components
Traded Cluster
Water, Sewage,
and Other Systems
Construction Materials
ConstructionConstruction Products
Construction Components
Traded Cluster
Water, Sewage,
and Other Systems
Construction Materials
ConstructionConstruction Products
Construction Components
Traded Cluster
Water, Sewage,
and Other Systems
Construction Materials
ConstructionConstruction Products
Construction Components
Traded Cluster
Water, Sewage,
and Other Systems
Construction Materials
ConstructionConstruction Products
Construction Components
Real Estate
Services
Highway and
Street Construction
Construction Materials Retailing
Developers
Non-traded Cluster
General Contractors
Specialty Contractors
Concrete Products
Materials Wholesaling
Construction
Building Equipment Distribution
Water and
Sewer Line Construction
Real Estate
Services
Highway and
Street Construction
Construction Materials Retailing
Developers
Non-traded Cluster
General Contractors
Specialty Contractors
Concrete Products
Materials Wholesaling
Construction
Building Equipment Distribution
Water and
Sewer Line Construction
Real Estate
Services
Highway and
Street Construction
Construction Materials Retailing
Developers
Non-traded Cluster
General Contractors
Specialty Contractors
Concrete Products
Materials Wholesaling
Construction
Building Equipment Distribution
Water and
Sewer Line Construction
Real Estate
Services
Highway and
Street Construction
Construction Materials Retailing
Developers
Non-traded Cluster
General Contractors
Specialty Contractors
Concrete Products
Materials Wholesaling
Construction
Building Equipment Distribution
Water and
Sewer Line Construction
Real Estate
Services
Highway and
Street Construction
Construction Materials Retailing
Developers
Non-traded Cluster
General Contractors
Specialty Contractors
Concrete Products
Materials Wholesaling
Construction
Building Equipment Distribution
Water and
Sewer Line Construction
Real Estate
Services
Highway and
Street Construction
Construction Materials Retailing
Developers
Non-traded Cluster
General Contractors
Specialty Contractors
Concrete Products
Materials Wholesaling
Construction
Building Equipment Distribution
Water and
Sewer Line Construction
Real Estate
Services
Highway and
Street Construction
Construction Materials Retailing
Developers
Non-traded Cluster
General Contractors
Specialty Contractors
Concrete Products
Materials Wholesaling
Construction
Building Equipment Distribution
Water and
Sewer Line Construction
Real Estate
Services
Highway and
Street Construction
Construction Materials Retailing
Developers
Non-traded Cluster
General Contractors
Specialty Contractors
Concrete Products
Materials Wholesaling
Construction
Building Equipment Distribution
Water and
Sewer Line Construction
Real Estate
Services
Highway and
Street Construction
Construction Materials Retailing
Developers
Non-traded Cluster
General Contractors
Specialty Contractors
Concrete Products
Materials Wholesaling
Construction
Building Equipment Distribution
Water and
Sewer Line Construction
Real Estate
Services
Highway and
Street Construction
Construction Materials Retailing
Developers
Non-traded Cluster
General Contractors
Specialty Contractors
Concrete Products
Materials Wholesaling
Construction
Building Equipment Distribution
Water and
Sewer Line Construction
Real Estate
Services
Highway and
Street Construction
Construction Materials Retailing
Developers
24 CONSTRUCTION: CLUSTER AND WORKFORCE NEEDS ASSESSMENT, SACRAMENTO REGION
CLUSTER ANALYSISConstruction components31
Construction components is one of the two traded subclusters that have experienced job loss in the
Sacramento region over the last decade. The Bay Area and California also experienced employment
loss in the subcluster.
Overall, the subcluster has fewer than 500 jobs in the Sacramento region and a relatively low
concentration, with a location quotient of 0.56, which is lower than the state, 0.71 (Exhibit 21). The
subcluster’s average annual earnings, $71,517 in 2016 in Sacramento, is 6% higher than all industries in the region.
All other miscellaneous nonmetallic mineral product manufacturing (135 jobs in 2016), and concrete block and brick
manufacturing (160 jobs in 2016) represent the two largest industries in the regional subcluster.
All other miscellaneous nonmetallic mineral product manufacturing employment has doubled in the Sacramento region
over the past decade and is more concentrated in the region than in the nation, with a location quotient of 0.56 compared
to 1.5. Jobs in all other miscellaneous nonmetallic mineral product manufacturing also offer the highest average annual
earnings, nearly $80,000 in 2016, among all construction components industries in the Sacramento region, a more than 60%
increase from 2006.
Sacramento Stucco Company and Cortopassi Tile & Stone are two large employers in the region in the former industry; in
the latter, Calstone Company is the largest employer in the region.
Exhibit 21: Construction components subcluster employment, location quotient and earnings (2001-2016)32
Geographic Area
2001
Jobs
2006
Jobs2011 Jobs
2016 Jobs
10-YR Job Change (06–16)
10-YR Job % Change (06–16) 2016 LQ
2016 Avg. Earnings
06–16 Avg. Earnings %
Change
Sacramento 304 667 215 466 (201) -30.1% 0.56 $71,517 13.6%
Bay Area 2,503 2,836 1,771 1,939 (896) -31.6% 0.62 $80,284 8.7%
California 12,749 14,595 7,898 9,938 (4,657) -31.9% 0.71 $75,768 8.8%
31 327999 All Other Miscellaneous Nonmetallic Mineral Product Manufacturing; 327331 Concrete Block and Brick Manufacturing; 327420 Gypsum Product Manufacturing; 327310 Cement Manufacturing; 327332 Concrete Pipe Manufacturing; 327410 Lime Manufacturing; 327991 Cut Stone and Stone Product Manufacturing; 327993 Mineral Wool Manufacturing.
32 Ibid.
Traded Cluster
Water, Sewage,
and Other Systems
Construction Materials
Non-traded Cluster
General Contractors
Specialty Contractors
Concrete Products
Materials Wholesaling
Construction
Building Equipment Distribution
Water and
Sewer Line Construction
ConstructionConstruction Products
Construction Components
Traded Cluster
Water, Sewage,
and Other Systems
Construction Materials
ConstructionConstruction Products
Construction Components
Traded Cluster
Water, Sewage,
and Other Systems
Construction Materials
ConstructionConstruction Products
Construction Components
Traded Cluster
Water, Sewage,
and Other Systems
Construction Materials
ConstructionConstruction Products
Construction Components
Traded Cluster
Water, Sewage,
and Other Systems
Construction Materials
ConstructionConstruction Products
Construction Components
Traded Cluster
Water, Sewage,
and Other Systems
Construction Materials
ConstructionConstruction Products
Construction Components
Real Estate
Services
Highway and
Street Construction
Construction Materials Retailing
Developers
Non-traded Cluster
General Contractors
Specialty Contractors
Concrete Products
Materials Wholesaling
Construction
Building Equipment Distribution
Water and
Sewer Line Construction
Real Estate
Services
Highway and
Street Construction
Construction Materials Retailing
Developers
Non-traded Cluster
General Contractors
Specialty Contractors
Concrete Products
Materials Wholesaling
Construction
Building Equipment Distribution
Water and
Sewer Line Construction
Real Estate
Services
Highway and
Street Construction
Construction Materials Retailing
Developers
Non-traded Cluster
General Contractors
Specialty Contractors
Concrete Products
Materials Wholesaling
Construction
Building Equipment Distribution
Water and
Sewer Line Construction
Real Estate
Services
Highway and
Street Construction
Construction Materials Retailing
Developers
Non-traded Cluster
General Contractors
Specialty Contractors
Concrete Products
Materials Wholesaling
Construction
Building Equipment Distribution
Water and
Sewer Line Construction
Real Estate
Services
Highway and
Street Construction
Construction Materials Retailing
Developers
Non-traded Cluster
General Contractors
Specialty Contractors
Concrete Products
Materials Wholesaling
Construction
Building Equipment Distribution
Water and
Sewer Line Construction
Real Estate
Services
Highway and
Street Construction
Construction Materials Retailing
Developers
Non-traded Cluster
General Contractors
Specialty Contractors
Concrete Products
Materials Wholesaling
Construction
Building Equipment Distribution
Water and
Sewer Line Construction
Real Estate
Services
Highway and
Street Construction
Construction Materials Retailing
Developers
Non-traded Cluster
General Contractors
Specialty Contractors
Concrete Products
Materials Wholesaling
Construction
Building Equipment Distribution
Water and
Sewer Line Construction
Real Estate
Services
Highway and
Street Construction
Construction Materials Retailing
Developers
Non-traded Cluster
General Contractors
Specialty Contractors
Concrete Products
Materials Wholesaling
Construction
Building Equipment Distribution
Water and
Sewer Line Construction
Real Estate
Services
Highway and
Street Construction
Construction Materials Retailing
Developers
Non-traded Cluster
General Contractors
Specialty Contractors
Concrete Products
Materials Wholesaling
Construction
Building Equipment Distribution
Water and
Sewer Line Construction
Real Estate
Services
Highway and
Street Construction
Construction Materials Retailing
Developers
Non-traded Cluster
General Contractors
Specialty Contractors
Concrete Products
Materials Wholesaling
Construction
Building Equipment Distribution
Water and
Sewer Line Construction
Real Estate
Services
Highway and
Street Construction
Construction Materials Retailing
Developers
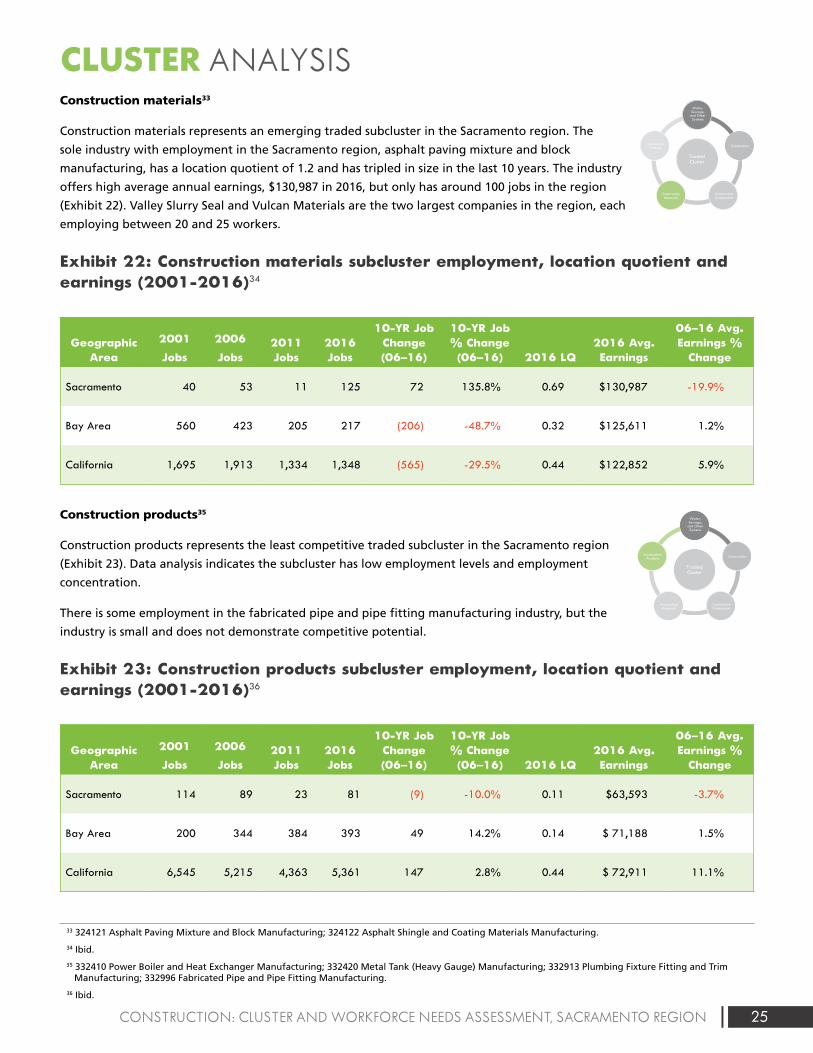
25CONSTRUCTION: CLUSTER AND WORKFORCE NEEDS ASSESSMENT, SACRAMENTO REGION
CLUSTER ANALYSISConstruction materials33
Construction materials represents an emerging traded subcluster in the Sacramento region. The
sole industry with employment in the Sacramento region, asphalt paving mixture and block
manufacturing, has a location quotient of 1.2 and has tripled in size in the last 10 years. The industry
offers high average annual earnings, $130,987 in 2016, but only has around 100 jobs in the region
(Exhibit 22). Valley Slurry Seal and Vulcan Materials are the two largest companies in the region, each
employing between 20 and 25 workers.
Exhibit 22: Construction materials subcluster employment, location quotient and earnings (2001-2016)34
Geographic Area
2001
Jobs
2006
Jobs2011 Jobs
2016 Jobs
10-YR Job Change (06–16)
10-YR Job % Change (06–16) 2016 LQ
2016 Avg. Earnings
06–16 Avg. Earnings %
Change
Sacramento 40 53 11 125 72 135.8% 0.69 $130,987 -19.9%
Bay Area 560 423 205 217 (206) -48.7% 0.32 $125,611 1.2%
California 1,695 1,913 1,334 1,348 (565) -29.5% 0.44 $122,852 5.9%
Construction products35
Construction products represents the least competitive traded subcluster in the Sacramento region
(Exhibit 23). Data analysis indicates the subcluster has low employment levels and employment
concentration.
There is some employment in the fabricated pipe and pipe fitting manufacturing industry, but the
industry is small and does not demonstrate competitive potential.
Exhibit 23: Construction products subcluster employment, location quotient and earnings (2001-2016)36
Geographic Area
2001
Jobs
2006
Jobs2011 Jobs
2016 Jobs
10-YR Job Change (06–16)
10-YR Job % Change (06–16) 2016 LQ
2016 Avg. Earnings
06–16 Avg. Earnings %
Change
Sacramento 114 89 23 81 (9) -10.0% 0.11 $63,593 -3.7%
Bay Area 200 344 384 393 49 14.2% 0.14 $ 71,188 1.5%
California 6,545 5,215 4,363 5,361 147 2.8% 0.44 $ 72,911 11.1%
33 324121 Asphalt Paving Mixture and Block Manufacturing; 324122 Asphalt Shingle and Coating Materials Manufacturing.
34 Ibid.
35 332410 Power Boiler and Heat Exchanger Manufacturing; 332420 Metal Tank (Heavy Gauge) Manufacturing; 332913 Plumbing Fixture Fitting and Trim Manufacturing; 332996 Fabricated Pipe and Pipe Fitting Manufacturing.
36 Ibid.
Traded Cluster
Water, Sewage,
and Other Systems
Construction Materials
Non-traded Cluster
General Contractors
Specialty Contractors
Concrete Products
Materials Wholesaling
Construction
Building Equipment Distribution
Water and
Sewer Line Construction
ConstructionConstruction Products
Construction Components
Traded Cluster
Water, Sewage,
and Other Systems
Construction Materials
ConstructionConstruction Products
Construction Components
Traded Cluster
Water, Sewage,
and Other Systems
Construction Materials
ConstructionConstruction Products
Construction Components
Traded Cluster
Water, Sewage,
and Other Systems
Construction Materials
ConstructionConstruction Products
Construction Components
Traded Cluster
Water, Sewage,
and Other Systems
Construction Materials
ConstructionConstruction Products
Construction Components
Traded Cluster
Water, Sewage,
and Other Systems
Construction Materials
ConstructionConstruction Products
Construction Components
Real Estate
Services
Highway and
Street Construction
Construction Materials Retailing
Developers
Non-traded Cluster
General Contractors
Specialty Contractors
Concrete Products
Materials Wholesaling
Construction
Building Equipment Distribution
Water and
Sewer Line Construction
Real Estate
Services
Highway and
Street Construction
Construction Materials Retailing
Developers
Non-traded Cluster
General Contractors
Specialty Contractors
Concrete Products
Materials Wholesaling
Construction
Building Equipment Distribution
Water and
Sewer Line Construction
Real Estate
Services
Highway and
Street Construction
Construction Materials Retailing
Developers
Non-traded Cluster
General Contractors
Specialty Contractors
Concrete Products
Materials Wholesaling
Construction
Building Equipment Distribution
Water and
Sewer Line Construction
Real Estate
Services
Highway and
Street Construction
Construction Materials Retailing
Developers
Non-traded Cluster
General Contractors
Specialty Contractors
Concrete Products
Materials Wholesaling
Construction
Building Equipment Distribution
Water and
Sewer Line Construction
Real Estate
Services
Highway and
Street Construction
Construction Materials Retailing
Developers
Non-traded Cluster
General Contractors
Specialty Contractors
Concrete Products
Materials Wholesaling
Construction
Building Equipment Distribution
Water and
Sewer Line Construction
Real Estate
Services
Highway and
Street Construction
Construction Materials Retailing
Developers
Non-traded Cluster
General Contractors
Specialty Contractors
Concrete Products
Materials Wholesaling
Construction
Building Equipment Distribution
Water and
Sewer Line Construction
Real Estate
Services
Highway and
Street Construction
Construction Materials Retailing
Developers
Non-traded Cluster
General Contractors
Specialty Contractors
Concrete Products
Materials Wholesaling
Construction
Building Equipment Distribution
Water and
Sewer Line Construction
Real Estate
Services
Highway and
Street Construction
Construction Materials Retailing
Developers
Non-traded Cluster
General Contractors
Specialty Contractors
Concrete Products
Materials Wholesaling
Construction
Building Equipment Distribution
Water and
Sewer Line Construction
Real Estate
Services
Highway and
Street Construction
Construction Materials Retailing
Developers
Non-traded Cluster
General Contractors
Specialty Contractors
Concrete Products
Materials Wholesaling
Construction
Building Equipment Distribution
Water and
Sewer Line Construction
Real Estate
Services
Highway and
Street Construction
Construction Materials Retailing
Developers
Non-traded Cluster
General Contractors
Specialty Contractors
Concrete Products
Materials Wholesaling
Construction
Building Equipment Distribution
Water and
Sewer Line Construction
Real Estate
Services
Highway and
Street Construction
Construction Materials Retailing
Developers
Traded Cluster
Water, Sewage,
and Other Systems
Construction Materials
Non-traded Cluster
General Contractors
Specialty Contractors
Concrete Products
Materials Wholesaling
Construction
Building Equipment Distribution
Water and
Sewer Line Construction
ConstructionConstruction Products
Construction Components
Traded Cluster
Water, Sewage,
and Other Systems
Construction Materials
ConstructionConstruction Products
Construction Components
Traded Cluster
Water, Sewage,
and Other Systems
Construction Materials
ConstructionConstruction Products
Construction Components
Traded Cluster
Water, Sewage,
and Other Systems
Construction Materials
ConstructionConstruction Products
Construction Components
Traded Cluster
Water, Sewage,
and Other Systems
Construction Materials
ConstructionConstruction Products
Construction Components
Traded Cluster
Water, Sewage,
and Other Systems
Construction Materials
ConstructionConstruction Products
Construction Components
Real Estate
Services
Highway and
Street Construction
Construction Materials Retailing
Developers
Non-traded Cluster
General Contractors
Specialty Contractors
Concrete Products
Materials Wholesaling
Construction
Building Equipment Distribution
Water and
Sewer Line Construction
Real Estate
Services
Highway and
Street Construction
Construction Materials Retailing
Developers
Non-traded Cluster
General Contractors
Specialty Contractors
Concrete Products
Materials Wholesaling
Construction
Building Equipment Distribution
Water and
Sewer Line Construction
Real Estate
Services
Highway and
Street Construction
Construction Materials Retailing
Developers
Non-traded Cluster
General Contractors
Specialty Contractors
Concrete Products
Materials Wholesaling
Construction
Building Equipment Distribution
Water and
Sewer Line Construction
Real Estate
Services
Highway and
Street Construction
Construction Materials Retailing
Developers
Non-traded Cluster
General Contractors
Specialty Contractors
Concrete Products
Materials Wholesaling
Construction
Building Equipment Distribution
Water and
Sewer Line Construction
Real Estate
Services
Highway and
Street Construction
Construction Materials Retailing
Developers
Non-traded Cluster
General Contractors
Specialty Contractors
Concrete Products
Materials Wholesaling
Construction
Building Equipment Distribution
Water and
Sewer Line Construction
Real Estate
Services
Highway and
Street Construction
Construction Materials Retailing
Developers
Non-traded Cluster
General Contractors
Specialty Contractors
Concrete Products
Materials Wholesaling
Construction
Building Equipment Distribution
Water and
Sewer Line Construction
Real Estate
Services
Highway and
Street Construction
Construction Materials Retailing
Developers
Non-traded Cluster
General Contractors
Specialty Contractors
Concrete Products
Materials Wholesaling
Construction
Building Equipment Distribution
Water and
Sewer Line Construction
Real Estate
Services
Highway and
Street Construction
Construction Materials Retailing
Developers
Non-traded Cluster
General Contractors
Specialty Contractors
Concrete Products
Materials Wholesaling
Construction
Building Equipment Distribution
Water and
Sewer Line Construction
Real Estate
Services
Highway and
Street Construction
Construction Materials Retailing
Developers
Non-traded Cluster
General Contractors
Specialty Contractors
Concrete Products
Materials Wholesaling
Construction
Building Equipment Distribution
Water and
Sewer Line Construction
Real Estate
Services
Highway and
Street Construction
Construction Materials Retailing
Developers
Non-traded Cluster
General Contractors
Specialty Contractors
Concrete Products
Materials Wholesaling
Construction
Building Equipment Distribution
Water and
Sewer Line Construction
Real Estate
Services
Highway and
Street Construction
Construction Materials Retailing
Developers
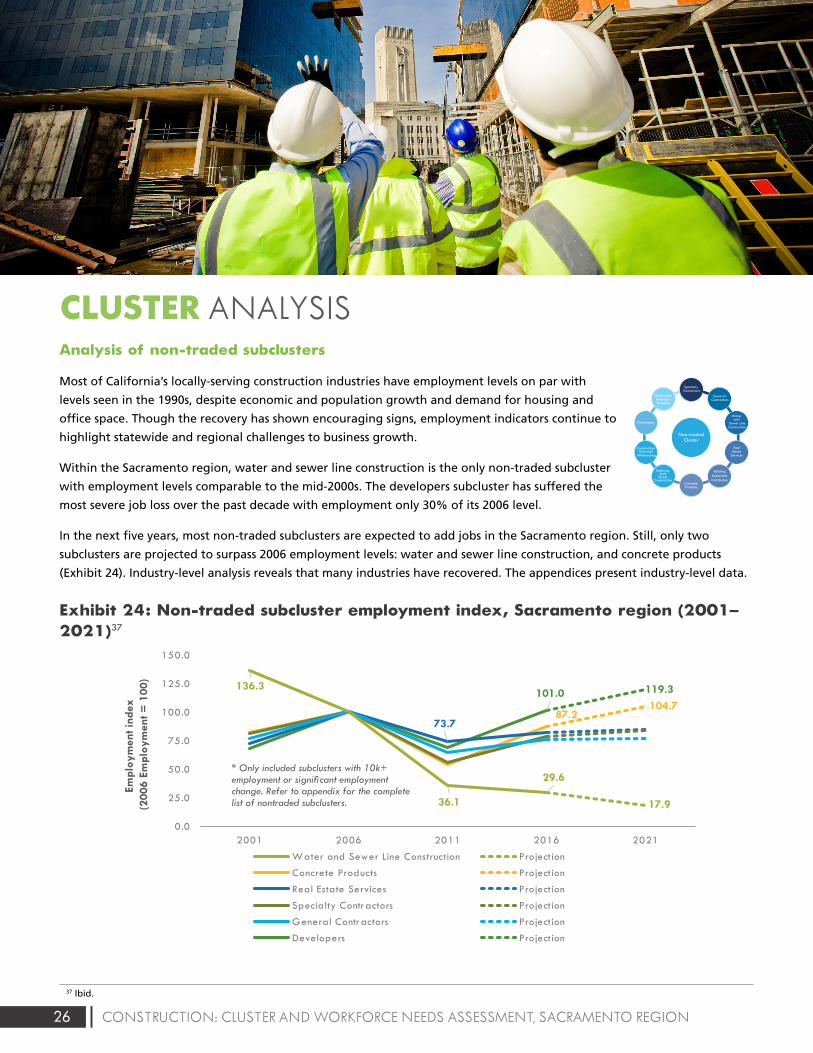
26 CONSTRUCTION: CLUSTER AND WORKFORCE NEEDS ASSESSMENT, SACRAMENTO REGION
CLUSTER ANALYSISAnalysis of non-traded subclusters
Most of California’s locally-serving construction industries have employment levels on par with
levels seen in the 1990s, despite economic and population growth and demand for housing and
office space. Though the recovery has shown encouraging signs, employment indicators continue to
highlight statewide and regional challenges to business growth.
Within the Sacramento region, water and sewer line construction is the only non-traded subcluster
with employment levels comparable to the mid-2000s. The developers subcluster has suffered the
most severe job loss over the past decade with employment only 30% of its 2006 level.
In the next five years, most non-traded subclusters are expected to add jobs in the Sacramento region. Still, only two
subclusters are projected to surpass 2006 employment levels: water and sewer line construction, and concrete products
(Exhibit 24). Industry-level analysis reveals that many industries have recovered. The appendices present industry-level data.
Exhibit 24: Non-traded subcluster employment index, Sacramento region (2001–2021)37
Exhibit 1: Value of construction put in place (United States)3
$1,161,282
$788,332
$1,185,683
$0
$200,000
$400,000
$600,000
$800,000
$1,000,000
$1,200,000
$1,400,000
2002 2003 2004 2005 2006 2007 2008 2009 2010 2011 2012 2013 2014 2015 2016
Mill
ions
of
Dol
lars
Residential Nonresidential
Exhibit 2: Value of construction put in place (California)5
$58,091,975
$18,740,050
$51,350,955
$0
$10,000,000
$20,000,000
$30,000,000
$40,000,000
$50,000,000
$60,000,000
$70,000,000
2002 2003 2004 2005 2006 2007 2008 2009 2010 2011 2012 2013 2014 2015 2016
Residential Nonresidential
Exhibit 3: Value of nonresidential construction put in place, by subcomponent (United States)7
24.1%
-0.2%
130.5%
0.6%
5.3%
-54.8%
18.0%
50.9%
98.2%
26.9%
-7.5%
21.7%
Office
Commercial
Manufacturing
Health care
Educational
Religious
Amusement and recreation
Transportation
Power and communication
Highway and street
Public works
Other
Subcomponent percent change 2006-2016
Exhibit 5: Value of Infrastructure as a percent of nonresidential construction put in place (United States)10
37.5% 37.9% 36.5%37.1% 37.0%
37.3%37.5% 41.1% 46.3% 45.5%
46.6% 46.4%46.1% 43.5% 41.6%
$0
$100,000
$200,000
$300,000
$400,000
$500,000
$600,000
$700,000
$800,000
2002 2003 2004 2005 2006 2007 2008 2009 2010 2011 2012 2013 2014 2015 2016
$ M
illio
ns
$ Th
ousa
nds
Nonresidential Infrastructure
Exhibit 6: Value of infrastructure as a percent of nonresidential construction put in place (California)11
11.6% 12.8% 14.3% 13.4%14.3%
11.0% 10.7%10.7% 10.2% 9.9% 10.9%
27.5%
14.9%16.2% 13.0%$5,000,000
$0
$10,000,000
$15,000,000
$20,000,000
$25,000,000
$30,000,000
2002 2003 2004 2005 2006 2007 2008 2009 2010 2011 2012 2013 2014 2015 2016
Nonresidential Infrastructure
Exhibit 7: Construction value added as a percent of GDP (United States)12
Exhibit 8: Construction value added as a percent of GRP (California)13
7.8% 7.8%8.1%
8.6%8.4%
8.0%
7.4%
6.3%
5.4%5.1%
5.3%5.5%
5.8%
6.2%6.4%
3.0%
4.0%
5.0%
6.0%
7.0%
8.0%
9.0%
2002 2003 2004 2005 2006 2007 2008 2009 2010 2011 2012 2013 2014 2015 2016
2002 2003 2004 2005 2006 2007 2008 2009 2010 2011 2012 2013 2014 2015 2016
3.0% 3.1%3.3% 3.3%
2.8%
2.3%
1.6%
1.0% 1.0% 1.1%1.3%
1.8% 1.8%2.0% 2.0%
0.0%
0.5%
1.0%
1.5%
2.0%
2.5%
3.0%
3.5%
4.0%
Exhibit 9: Construction value added as a percent of GRP (California, Sacramento region and Bay Area)16
3.0%
6.8% 6.9%
3.6%
1.2%1.4%
1.7%
2.3%
2.4%
0.0%
1.0%
2.0%
3.0%
4.0%
5.0%
6.0%
7.0%
8.0%
2002 2003 2004 2005 2006 2007 2008 2009 2010 2011 2012 2013 2014 2015
State Sacramento Metro (6-county) Bay Area Metro (9-county)
Exhibit 10: Housing unit supply versus demand in the Sacramento region
Exh ibit 11: Residen tial building units in the six-county Sacramento region (permi t data)20
19,865
14,239
10,996 8,932
6,483 7,768 9,125
10,399
19,122
23,812
17,987
2,293 3,939 4,652
6,492
0
5,000
10,000
15,000
20,000
25,000
30,000
2002 2003 2004 2005 2006 2007 2008 2009 2010 2011 2012 2013 2014 2015 2016 2017
Housing Unit Demand Housing Unit Supply
14,01415,671
19,78419,630
21,65218,612
10,1257,931
4,1752,493 2,326 1,938 2,965 3,772 3,967
5,526 6,401
3,226
3,868
4,628 4,7613,612
2,911
3,568
1,555
1,818 438 539 759631
982 7461,265
1,053
0
5,000
10,000
15,000
20,000
25,000
30,000
2000 2001 2002 2003 2004 2005 2006 2007 2008 2009 2010 2011 2012 2013 2014 2015 2016
Single Family Units Multifamily Units
Exhibit 13: Value of nonresidential construction in the six-county Sacramento region 21
$0
$200,000
$400,000
$600,000
$800,000
$1,000 ,000
$1,200 ,000
$1,400 ,000
$1,600 ,000
$1,800 ,000
$2,000 ,000
2000 2001 2002 2003 2004 2005 2006 2007 2008 2009 2010 2011 2012 2013 2014 2015 2016
El Dorado Placer Sacramento Yolo Yuba Sutter
Exhibit 14: Percent of nonresidential construction value in the Sacramento region, by county22
0%
10%
20%
30%
40%
50%
60%
70%
80%
90%
100%
2006 2016
El Dorado Placer Sacramento Yolo Yuba
Exhibit 17: Average annual earnings in traded and non-traded clusters in the study regions (2016)
$85,
512
$58,
972
$67,
498
$97,
280
$78,
396
$100
,688
$90,
080
$63,
145
$72,
018
$0
$20,000
$40,000
$60,000
$80,000
$100,000
$120,000
Traded Non-Traded All Industries
Sacramento Region Bay Area Californ ia
Exhibit 18: Traded subcluster employment index, Sacramento region (2001-2021)25
Water, Sewage, and Other Systems Projection
Projection
Projection
Projection
Projection
Construction Materials
Construction
Construction Products
Construction Components
Empl
oym
ent i
ndex
(2
006
Empl
oym
ent =
100
)
Empl
oym
ent i
ndex
(2
006
Empl
oym
ent =
100
)
Exhibit 24: Non-traded subcluster employment index, Sacramento region (2001-2021)36
101.0 119.3
87.2104.7
73.7
136.3
36.1
29.6
17.9
0.0
25.0
50.0
75.0
100.0
125.0
150.0
2001 2006 2011 2016 2021
Water and Sewer Line Construction Projection
Concrete Products Projection
Real Estate Services Projection
Specialty Contractors Projection
General Contractors Projection
Developers Projection
* Only included subclusters with 10k+employment or significant employment change. Refer to appendix for the complete list of nontraded subclusters.
Exhibit 39: Entering construction industry workers by type of education and training in the Sacramento region (annual average, 2014-2016)59
368
217181
56 54
148125 107
84
28 27 19 13 3
29
369
129
109
198
136
10561
35 8 13 14 8 10
0
50
100
150
200
250
300
350
400
Apprentices Oth er Post-Secondary Completions
Exhibit 44: Projected annual construction industry occupational gaps in the Sacramento region (2016-2021)60
-3
-2
-1
32
45
57
58
68
103
173
196
308
322
397
427
500
524
607
640
864
1,937
-200 100 400 700 1,000 1,300 1,600 1,900
Insulation Workers
Drafters
Interior Designers
PV Installers
Glaziers
Surveyors
Building Inspectors
Roofers
Ironworkers & Welders
Architects
Drywall Installers
HVAC & Sheet Metal
Painters
Masonry, Tile, Floor, Lathe, Plaster
Plumbers & Pipefitters
Engineers
Heavy Equipment Operators
Real Estate Professionals
Electricians
Construction Managers
Carpenters
Exhibit 47: Unionized and non-unionized workforce, Sacramento--Arden-Arcade--Roseville MSA and 10-county Bay Area (annual average, 2014-2017)61
Exhibit 48: Unionization in the construction workforce as an annual average percentage of total employment, Sacramento--Arden-Arcade--Roseville MSA (2000-2017)62
31%, 32,314
29%, 12,555
69%, 70,898
71%, 30,110
0% 20% 40% 60% 80% 100%
10-County Bay Area
Sacramento MSA
Union Non-Union
32%
20% 19%24% 23%
29%
68%
80% 81%76% 77%
71%
0%
10%
20%
30%
40%
50%
60%
70%
80%
90%
2000 – 2002 2003 – 2004 2005 –2008 2008 – 2011 2011 – 2014 2014 – 2017
Union Non-Union
Exhibit 1A. Construction managers projected annual openings, n = 871 (2016-2021)67
Cost Estimators, 206openings, 24%
Construction Managers,
225 openings, 26%
First-Line Supervisors of Construction Trades and
Extraction Workers,440 openings, 50%
0 100 200 300 400 500 600 700 800 900 1,000
Construction Products, 81
Water, Sewage, and Other Systems, 908
-10.0%
-5.0%
0.0%
5.0%
10.0%
15.0%
20.0%
25.0%
0.0 0.5 1.0 1.5 2.0 2.5 3.0 3.5
Location Quotient (2016)
Location Quotient (2016)
Ann
ual E
mpl
oym
ent G
row
th R
ate
(200
6-20
16)
Subcluster with an annual average earnings higher than all-industry annual average earnings in ($67,498) Sacramento region in 2016
LQ=1.0
Exhibit 2C: Non-traded subclusters in the Sacramento region73
Specialty Contractors, 50,899
General Contractors, 16,843
Real Estate Services, 15,475
Construction Materials Retailing, 6,552
Highway and Street Construction, 2,268
Water and Sewer Line Construction, 1,662
Building Equipment Distribution, 1,207
Developers
-15.0%
-10.0%
-5.0%
0.0%
5.0%
0.8 1.0 1.2 1.4
Ann
ual E
mpl
oym
ent G
row
th R
ate
(200
6-20
16
Exhibit 2E: Joint apprentices by gender in the Sacramento region (January 2012-October 2017)
Exhibit 3E: Joint apprentices by county of residence in the Sacramento region (January 2012-October 2017)
8,374, 97%
249, 3%
El Dorado,393, 56%
Placer,949, 11%
Sacramento, 6077, 1
Sutter, 346,4%
Yolo, 549,6%
Yuba, 309,
4%
Exhibit 4E: Joint apprentices’ highest level of education prior to apprenticeship in the Sacramento region (January 2012-October 2017)
Exhibit 5E: Number of weeks worked, all workers in the construction sector in the Sacramento region (2015)84
Less than highschool, 7%
High schoolgraduate orGED, 65%
Some college,25%
4 or more yearsof college, 3%
3,165 6%
3,082 6%
1,650 3%
6,105 12%
7,068 10%
31,037 62%
0 5,000 10,000 15,000 20,000 25,000 30,000 35,000
Did not work
Less than 14
14 to 26
27 to 39
40 to 49
50 to 52
# w
eeks
wor
ked
in th
e la
st y
ear
Exhibit 4: Value of nonresidential construction put in place, by subcomponent (California)9
-0.5%
29.2%
-41.1%
0.0%
62.9%
-34.7%
46.0%
42.8%
19.1%
-14.6%
66.5%
763.4%
Office
Commercial
Manufacturing
Health care
Educational
Religious
Amusement and recreation
Transportation
Power and communication
Highway and street
Public works
Other
Subcomponent percent change 2006-2016
180.8
593.7
818.9
21.4
235.8 342.3
104.9 133.6 173.5
0.0
100.0
200.0
300.0
400.0
500.0
600.0
700.0
800.0
900.0
1000.0
2001 2006 2011 2016 2021
Construction Materials,125
Construction, 1,942
Construction Components, 466
LQ=1.0
Concrete Products, 1,123
Construction Materials Wholesaling, 1,647
Subcluster with an annual average earnings higher than all-industry annual average earnings ($67,498) in Sacramento region in 2016
Exhibit 1E: Total joint apprentice starts, residents in the six-county Sacramento region (January 2012-October 2017) (n = 8,617)2
435
95
104
111
117
121
135
161
174
178
215
302
340
440
458
483
542
602
1,045
1,205
1,354
0 200 400 600 800 1000 1200 1400 1600
All others
Elevator constructor
Drywall finisher
Scaffold and shoring erector
Inspector or surveyor
Pile driver
Glazier
Carpet, linoleum, and soft tile layer
Millwright
Sheet metal worker & related trades
Construction equipment operator trades
Brick, marble, terrazzo, tile, and related trades
Roofer and waterproofer
Plumber and fitter trades
Painter trades
Cement mason and plasterer trades
Electricial trades
Drywall/lather
Ironworker trades
Carpenter
Construction craft laborer
Exhibit 38: Anticipated annual construction industry job openings by new and replacement jobs in the Sacramento region (2016-2021)1
21 26 59 60 52 78 99 167 167 220323 350 399 439 473
596 679788 777 763
2,119
4 6 1 1 20 7 520 27 2
71 56100 95 73
4699
82 95222
215
0
500
1000
1500
2000
2500
Annual Replacement Openings New Jobs (Growth)
Male
Female
$ Th
ousa
nds
Thou
sand
s of
Dol
lars
Average annual openings (demand) minuseducation and training (supply) =approximate annual shortage
Approximate annual shortage = 7,250 workers across all categories
Sutter
6.2% 5.1%
27.6%
14.4%
50.6%69.9%
10.8%7.9%
1.1% 0.6%3.6% 2.0%
37 Ibid.
Traded Cluster
Water, Sewage,
and Other Systems
Construction Materials
Non-traded Cluster
General Contractors
Specialty Contractors
Concrete Products
Materials Wholesaling
Construction
Building Equipment Distribution
Water and
Sewer Line Construction
ConstructionConstruction Products
Construction Components
Traded Cluster
Water, Sewage,
and Other Systems
Construction Materials
ConstructionConstruction Products
Construction Components
Traded Cluster
Water, Sewage,
and Other Systems
Construction Materials
ConstructionConstruction Products
Construction Components
Traded Cluster
Water, Sewage,
and Other Systems
Construction Materials
ConstructionConstruction Products
Construction Components
Traded Cluster
Water, Sewage,
and Other Systems
Construction Materials
ConstructionConstruction Products
Construction Components
Traded Cluster
Water, Sewage,
and Other Systems
Construction Materials
ConstructionConstruction Products
Construction Components
Real Estate
Services
Highway and
Street Construction
Construction Materials Retailing
Developers
Non-traded Cluster
General Contractors
Specialty Contractors
Concrete Products
Materials Wholesaling
Construction
Building Equipment Distribution
Water and
Sewer Line Construction
Real Estate
Services
Highway and
Street Construction
Construction Materials Retailing
Developers
Non-traded Cluster
General Contractors
Specialty Contractors
Concrete Products
Materials Wholesaling
Construction
Building Equipment Distribution
Water and
Sewer Line Construction
Real Estate
Services
Highway and
Street Construction
Construction Materials Retailing
Developers
Non-traded Cluster
General Contractors
Specialty Contractors
Concrete Products
Materials Wholesaling
Construction
Building Equipment Distribution
Water and
Sewer Line Construction
Real Estate
Services
Highway and
Street Construction
Construction Materials Retailing
Developers
Non-traded Cluster
General Contractors
Specialty Contractors
Concrete Products
Materials Wholesaling
Construction
Building Equipment Distribution
Water and
Sewer Line Construction
Real Estate
Services
Highway and
Street Construction
Construction Materials Retailing
Developers
Non-traded Cluster
General Contractors
Specialty Contractors
Concrete Products
Materials Wholesaling
Construction
Building Equipment Distribution
Water and
Sewer Line Construction
Real Estate
Services
Highway and
Street Construction
Construction Materials Retailing
Developers
Non-traded Cluster
General Contractors
Specialty Contractors
Concrete Products
Materials Wholesaling
Construction
Building Equipment Distribution
Water and
Sewer Line Construction
Real Estate
Services
Highway and
Street Construction
Construction Materials Retailing
Developers
Non-traded Cluster
General Contractors
Specialty Contractors
Concrete Products
Materials Wholesaling
Construction
Building Equipment Distribution
Water and
Sewer Line Construction
Real Estate
Services
Highway and
Street Construction
Construction Materials Retailing
Developers
Non-traded Cluster
General Contractors
Specialty Contractors
Concrete Products
Materials Wholesaling
Construction
Building Equipment Distribution
Water and
Sewer Line Construction
Real Estate
Services
Highway and
Street Construction
Construction Materials Retailing
Developers
Non-traded Cluster
General Contractors
Specialty Contractors
Concrete Products
Materials Wholesaling
Construction
Building Equipment Distribution
Water and
Sewer Line Construction
Real Estate
Services
Highway and
Street Construction
Construction Materials Retailing
Developers
Non-traded Cluster
General Contractors
Specialty Contractors
Concrete Products
Materials Wholesaling
Construction
Building Equipment Distribution
Water and
Sewer Line Construction
Real Estate
Services
Highway and
Street Construction
Construction Materials Retailing
Developers
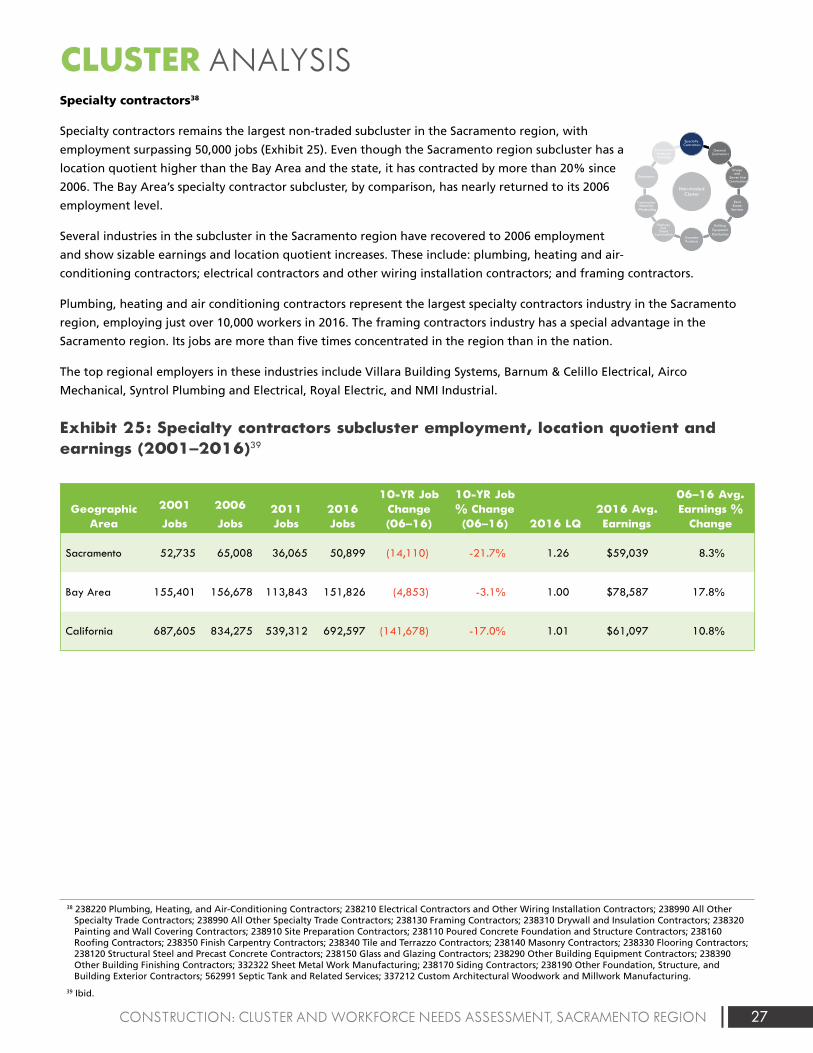
27CONSTRUCTION: CLUSTER AND WORKFORCE NEEDS ASSESSMENT, SACRAMENTO REGION
CLUSTER ANALYSISSpecialty contractors38
Specialty contractors remains the largest non-traded subcluster in the Sacramento region, with
employment surpassing 50,000 jobs (Exhibit 25). Even though the Sacramento region subcluster has a
location quotient higher than the Bay Area and the state, it has contracted by more than 20% since
2006. The Bay Area’s specialty contractor subcluster, by comparison, has nearly returned to its 2006
employment level.
Several industries in the subcluster in the Sacramento region have recovered to 2006 employment
and show sizable earnings and location quotient increases. These include: plumbing, heating and air-
conditioning contractors; electrical contractors and other wiring installation contractors; and framing contractors.
Plumbing, heating and air conditioning contractors represent the largest specialty contractors industry in the Sacramento
region, employing just over 10,000 workers in 2016. The framing contractors industry has a special advantage in the
Sacramento region. Its jobs are more than five times concentrated in the region than in the nation.
The top regional employers in these industries include Villara Building Systems, Barnum & Celillo Electrical, Airco
Mechanical, Syntrol Plumbing and Electrical, Royal Electric, and NMI Industrial.
Exhibit 25: Specialty contractors subcluster employment, location quotient and earnings (2001–2016)39
Geographic Area
2001
Jobs
2006
Jobs2011 Jobs
2016 Jobs
10-YR Job Change (06–16)
10-YR Job % Change (06–16) 2016 LQ
2016 Avg. Earnings
06–16 Avg. Earnings %
Change
Sacramento 52,735 65,008 36,065 50,899 (14,110) -21.7% 1.26 $59,039 8.3%
Bay Area 155,401 156,678 113,843 151,826 (4,853) -3.1% 1.00 $78,587 17.8%
California 687,605 834,275 539,312 692,597 (141,678) -17.0% 1.01 $61,097 10.8%
38 238220 Plumbing, Heating, and Air-Conditioning Contractors; 238210 Electrical Contractors and Other Wiring Installation Contractors; 238990 All Other Specialty Trade Contractors; 238990 All Other Specialty Trade Contractors; 238130 Framing Contractors; 238310 Drywall and Insulation Contractors; 238320 Painting and Wall Covering Contractors; 238910 Site Preparation Contractors; 238110 Poured Concrete Foundation and Structure Contractors; 238160 Roofing Contractors; 238350 Finish Carpentry Contractors; 238340 Tile and Terrazzo Contractors; 238140 Masonry Contractors; 238330 Flooring Contractors; 238120 Structural Steel and Precast Concrete Contractors; 238150 Glass and Glazing Contractors; 238290 Other Building Equipment Contractors; 238390 Other Building Finishing Contractors; 332322 Sheet Metal Work Manufacturing; 238170 Siding Contractors; 238190 Other Foundation, Structure, and Building Exterior Contractors; 562991 Septic Tank and Related Services; 337212 Custom Architectural Woodwork and Millwork Manufacturing.
39 Ibid.
Traded Cluster
Water, Sewage,
and Other Systems
Construction Materials
Non-traded Cluster
General Contractors
Specialty Contractors
Concrete Products
Materials Wholesaling
Construction
Building Equipment Distribution
Water and
Sewer Line Construction
ConstructionConstruction Products
Construction Components
Traded Cluster
Water, Sewage,
and Other Systems
Construction Materials
ConstructionConstruction Products
Construction Components
Traded Cluster
Water, Sewage,
and Other Systems
Construction Materials
ConstructionConstruction Products
Construction Components
Traded Cluster
Water, Sewage,
and Other Systems
Construction Materials
ConstructionConstruction Products
Construction Components
Traded Cluster
Water, Sewage,
and Other Systems
Construction Materials
ConstructionConstruction Products
Construction Components
Traded Cluster
Water, Sewage,
and Other Systems
Construction Materials
ConstructionConstruction Products
Construction Components
Real Estate
Services
Highway and
Street Construction
Construction Materials Retailing
Developers
Non-traded Cluster
General Contractors
Specialty Contractors
Concrete Products
Materials Wholesaling
Construction
Building Equipment Distribution
Water and
Sewer Line Construction
Real Estate
Services
Highway and
Street Construction
Construction Materials Retailing
Developers
Non-traded Cluster
General Contractors
Specialty Contractors
Concrete Products
Materials Wholesaling
Construction
Building Equipment Distribution
Water and
Sewer Line Construction
Real Estate
Services
Highway and
Street Construction
Construction Materials Retailing
Developers
Non-traded Cluster
General Contractors
Specialty Contractors
Concrete Products
Materials Wholesaling
Construction
Building Equipment Distribution
Water and
Sewer Line Construction
Real Estate
Services
Highway and
Street Construction
Construction Materials Retailing
Developers
Non-traded Cluster
General Contractors
Specialty Contractors
Concrete Products
Materials Wholesaling
Construction
Building Equipment Distribution
Water and
Sewer Line Construction
Real Estate
Services
Highway and
Street Construction
Construction Materials Retailing
Developers
Non-traded Cluster
General Contractors
Specialty Contractors
Concrete Products
Materials Wholesaling
Construction
Building Equipment Distribution
Water and
Sewer Line Construction
Real Estate
Services
Highway and
Street Construction
Construction Materials Retailing
Developers
Non-traded Cluster
General Contractors
Specialty Contractors
Concrete Products
Materials Wholesaling
Construction
Building Equipment Distribution
Water and
Sewer Line Construction
Real Estate
Services
Highway and
Street Construction
Construction Materials Retailing
Developers
Non-traded Cluster
General Contractors
Specialty Contractors
Concrete Products
Materials Wholesaling
Construction
Building Equipment Distribution
Water and
Sewer Line Construction
Real Estate
Services
Highway and
Street Construction
Construction Materials Retailing
Developers
Non-traded Cluster
General Contractors
Specialty Contractors
Concrete Products
Materials Wholesaling
Construction
Building Equipment Distribution
Water and
Sewer Line Construction
Real Estate
Services
Highway and
Street Construction
Construction Materials Retailing
Developers
Non-traded Cluster
General Contractors
Specialty Contractors
Concrete Products
Materials Wholesaling
Construction
Building Equipment Distribution
Water and
Sewer Line Construction
Real Estate
Services
Highway and
Street Construction
Construction Materials Retailing
Developers
Non-traded Cluster
General Contractors
Specialty Contractors
Concrete Products
Materials Wholesaling
Construction
Building Equipment Distribution
Water and
Sewer Line Construction
Real Estate
Services
Highway and
Street Construction
Construction Materials Retailing
Developers
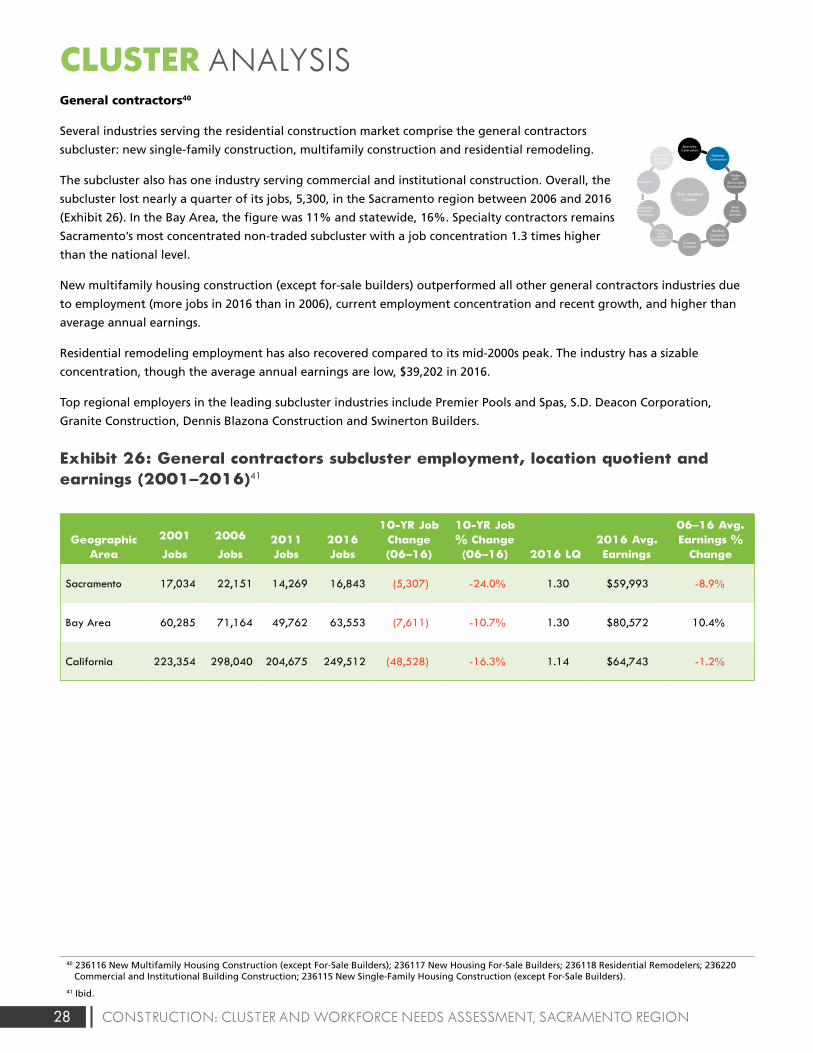
28 CONSTRUCTION: CLUSTER AND WORKFORCE NEEDS ASSESSMENT, SACRAMENTO REGION
CLUSTER ANALYSISGeneral contractors40
Several industries serving the residential construction market comprise the general contractors
subcluster: new single-family construction, multifamily construction and residential remodeling.
The subcluster also has one industry serving commercial and institutional construction. Overall, the
subcluster lost nearly a quarter of its jobs, 5,300, in the Sacramento region between 2006 and 2016
(Exhibit 26). In the Bay Area, the figure was 11% and statewide, 16%. Specialty contractors remains
Sacramento’s most concentrated non-traded subcluster with a job concentration 1.3 times higher
than the national level.
New multifamily housing construction (except for-sale builders) outperformed all other general contractors industries due
to employment (more jobs in 2016 than in 2006), current employment concentration and recent growth, and higher than
average annual earnings.
Residential remodeling employment has also recovered compared to its mid-2000s peak. The industry has a sizable
concentration, though the average annual earnings are low, $39,202 in 2016.
Top regional employers in the leading subcluster industries include Premier Pools and Spas, S.D. Deacon Corporation,
Granite Construction, Dennis Blazona Construction and Swinerton Builders.
Exhibit 26: General contractors subcluster employment, location quotient and earnings (2001–2016)41
Geographic Area
2001
Jobs
2006
Jobs2011 Jobs
2016 Jobs
10-YR Job Change (06–16)
10-YR Job % Change (06–16) 2016 LQ
2016 Avg. Earnings
06–16 Avg. Earnings %
Change
Sacramento 17,034 22,151 14,269 16,843 (5,307) -24.0% 1.30 $59,993 -8.9%
Bay Area 60,285 71,164 49,762 63,553 (7,611) -10.7% 1.30 $80,572 10.4%
California 223,354 298,040 204,675 249,512 (48,528) -16.3% 1.14 $64,743 -1.2%
40 236116 New Multifamily Housing Construction (except For-Sale Builders); 236117 New Housing For-Sale Builders; 236118 Residential Remodelers; 236220 Commercial and Institutional Building Construction; 236115 New Single-Family Housing Construction (except For-Sale Builders).
41 Ibid.
Traded Cluster
Water, Sewage,
and Other Systems
Construction Materials
Non-traded Cluster
General Contractors
Specialty Contractors
Concrete Products
Materials Wholesaling
Construction
Building Equipment Distribution
Water and
Sewer Line Construction
ConstructionConstruction Products
Construction Components
Traded Cluster
Water, Sewage,
and Other Systems
Construction Materials
ConstructionConstruction Products
Construction Components
Traded Cluster
Water, Sewage,
and Other Systems
Construction Materials
ConstructionConstruction Products
Construction Components
Traded Cluster
Water, Sewage,
and Other Systems
Construction Materials
ConstructionConstruction Products
Construction Components
Traded Cluster
Water, Sewage,
and Other Systems
Construction Materials
ConstructionConstruction Products
Construction Components
Traded Cluster
Water, Sewage,
and Other Systems
Construction Materials
ConstructionConstruction Products
Construction Components
Real Estate
Services
Highway and
Street Construction
Construction Materials Retailing
Developers
Non-traded Cluster
General Contractors
Specialty Contractors
Concrete Products
Materials Wholesaling
Construction
Building Equipment Distribution
Water and
Sewer Line Construction
Real Estate
Services
Highway and
Street Construction
Construction Materials Retailing
Developers
Non-traded Cluster
General Contractors
Specialty Contractors
Concrete Products
Materials Wholesaling
Construction
Building Equipment Distribution
Water and
Sewer Line Construction
Real Estate
Services
Highway and
Street Construction
Construction Materials Retailing
Developers
Non-traded Cluster
General Contractors
Specialty Contractors
Concrete Products
Materials Wholesaling
Construction
Building Equipment Distribution
Water and
Sewer Line Construction
Real Estate
Services
Highway and
Street Construction
Construction Materials Retailing
Developers
Non-traded Cluster
General Contractors
Specialty Contractors
Concrete Products
Materials Wholesaling
Construction
Building Equipment Distribution
Water and
Sewer Line Construction
Real Estate
Services
Highway and
Street Construction
Construction Materials Retailing
Developers
Non-traded Cluster
General Contractors
Specialty Contractors
Concrete Products
Materials Wholesaling
Construction
Building Equipment Distribution
Water and
Sewer Line Construction
Real Estate
Services
Highway and
Street Construction
Construction Materials Retailing
Developers
Non-traded Cluster
General Contractors
Specialty Contractors
Concrete Products
Materials Wholesaling
Construction
Building Equipment Distribution
Water and
Sewer Line Construction
Real Estate
Services
Highway and
Street Construction
Construction Materials Retailing
Developers
Non-traded Cluster
General Contractors
Specialty Contractors
Concrete Products
Materials Wholesaling
Construction
Building Equipment Distribution
Water and
Sewer Line Construction
Real Estate
Services
Highway and
Street Construction
Construction Materials Retailing
Developers
Non-traded Cluster
General Contractors
Specialty Contractors
Concrete Products
Materials Wholesaling
Construction
Building Equipment Distribution
Water and
Sewer Line Construction
Real Estate
Services
Highway and
Street Construction
Construction Materials Retailing
Developers
Non-traded Cluster
General Contractors
Specialty Contractors
Concrete Products
Materials Wholesaling
Construction
Building Equipment Distribution
Water and
Sewer Line Construction
Real Estate
Services
Highway and
Street Construction
Construction Materials Retailing
Developers
Non-traded Cluster
General Contractors
Specialty Contractors
Concrete Products
Materials Wholesaling
Construction
Building Equipment Distribution
Water and
Sewer Line Construction
Real Estate
Services
Highway and
Street Construction
Construction Materials Retailing
Developers
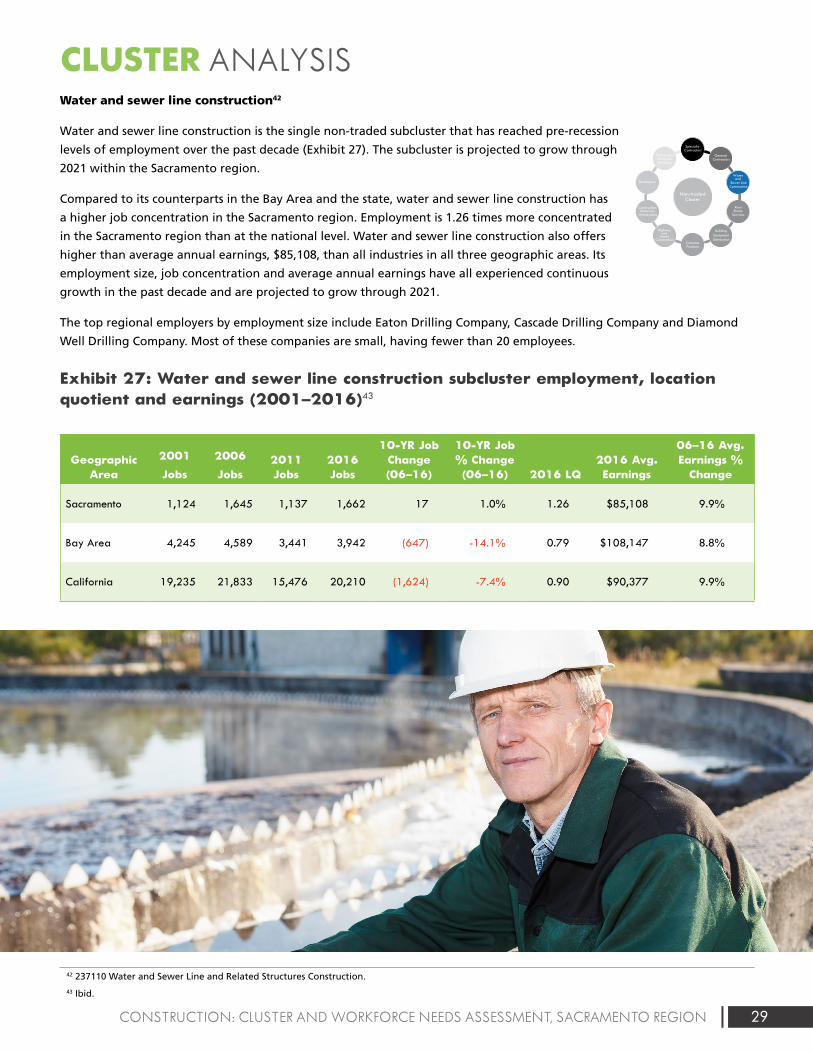
29CONSTRUCTION: CLUSTER AND WORKFORCE NEEDS ASSESSMENT, SACRAMENTO REGION
CLUSTER ANALYSISWater and sewer line construction42
Water and sewer line construction is the single non-traded subcluster that has reached pre-recession
levels of employment over the past decade (Exhibit 27). The subcluster is projected to grow through
2021 within the Sacramento region.
Compared to its counterparts in the Bay Area and the state, water and sewer line construction has
a higher job concentration in the Sacramento region. Employment is 1.26 times more concentrated
in the Sacramento region than at the national level. Water and sewer line construction also offers
higher than average annual earnings, $85,108, than all industries in all three geographic areas. Its
employment size, job concentration and average annual earnings have all experienced continuous
growth in the past decade and are projected to grow through 2021.
The top regional employers by employment size include Eaton Drilling Company, Cascade Drilling Company and Diamond
Well Drilling Company. Most of these companies are small, having fewer than 20 employees.
Exhibit 27: Water and sewer line construction subcluster employment, location quotient and earnings (2001–2016)43
Geographic Area
2001
Jobs
2006
Jobs2011 Jobs
2016 Jobs
10-YR Job Change (06–16)
10-YR Job % Change (06–16) 2016 LQ
2016 Avg. Earnings
06–16 Avg. Earnings %
Change
Sacramento 1,124 1,645 1,137 1,662 17 1.0% 1.26 $85,108 9.9%
Bay Area 4,245 4,589 3,441 3,942 (647) -14.1% 0.79 $108,147 8.8%
California 19,235 21,833 15,476 20,210 (1,624) -7.4% 0.90 $90,377 9.9%
42 237110 Water and Sewer Line and Related Structures Construction.
43 Ibid.
Traded Cluster
Water, Sewage,
and Other Systems
Construction Materials
Non-traded Cluster
General Contractors
Specialty Contractors
Concrete Products
Materials Wholesaling
Construction
Building Equipment Distribution
Water and
Sewer Line Construction
ConstructionConstruction Products
Construction Components
Traded Cluster
Water, Sewage,
and Other Systems
Construction Materials
ConstructionConstruction Products
Construction Components
Traded Cluster
Water, Sewage,
and Other Systems
Construction Materials
ConstructionConstruction Products
Construction Components
Traded Cluster
Water, Sewage,
and Other Systems
Construction Materials
ConstructionConstruction Products
Construction Components
Traded Cluster
Water, Sewage,
and Other Systems
Construction Materials
ConstructionConstruction Products
Construction Components
Traded Cluster
Water, Sewage,
and Other Systems
Construction Materials
ConstructionConstruction Products
Construction Components
Real Estate
Services
Highway and
Street Construction
Construction Materials Retailing
Developers
Non-traded Cluster
General Contractors
Specialty Contractors
Concrete Products
Materials Wholesaling
Construction
Building Equipment Distribution
Water and
Sewer Line Construction
Real Estate
Services
Highway and
Street Construction
Construction Materials Retailing
Developers
Non-traded Cluster
General Contractors
Specialty Contractors
Concrete Products
Materials Wholesaling
Construction
Building Equipment Distribution
Water and
Sewer Line Construction
Real Estate
Services
Highway and
Street Construction
Construction Materials Retailing
Developers
Non-traded Cluster
General Contractors
Specialty Contractors
Concrete Products
Materials Wholesaling
Construction
Building Equipment Distribution
Water and
Sewer Line Construction
Real Estate
Services
Highway and
Street Construction
Construction Materials Retailing
Developers
Non-traded Cluster
General Contractors
Specialty Contractors
Concrete Products
Materials Wholesaling
Construction
Building Equipment Distribution
Water and
Sewer Line Construction
Real Estate
Services
Highway and
Street Construction
Construction Materials Retailing
Developers
Non-traded Cluster
General Contractors
Specialty Contractors
Concrete Products
Materials Wholesaling
Construction
Building Equipment Distribution
Water and
Sewer Line Construction
Real Estate
Services
Highway and
Street Construction
Construction Materials Retailing
Developers
Non-traded Cluster
General Contractors
Specialty Contractors
Concrete Products
Materials Wholesaling
Construction
Building Equipment Distribution
Water and
Sewer Line Construction
Real Estate
Services
Highway and
Street Construction
Construction Materials Retailing
Developers
Non-traded Cluster
General Contractors
Specialty Contractors
Concrete Products
Materials Wholesaling
Construction
Building Equipment Distribution
Water and
Sewer Line Construction
Real Estate
Services
Highway and
Street Construction
Construction Materials Retailing
Developers
Non-traded Cluster
General Contractors
Specialty Contractors
Concrete Products
Materials Wholesaling
Construction
Building Equipment Distribution
Water and
Sewer Line Construction
Real Estate
Services
Highway and
Street Construction
Construction Materials Retailing
Developers
Non-traded Cluster
General Contractors
Specialty Contractors
Concrete Products
Materials Wholesaling
Construction
Building Equipment Distribution
Water and
Sewer Line Construction
Real Estate
Services
Highway and
Street Construction
Construction Materials Retailing
Developers
Non-traded Cluster
General Contractors
Specialty Contractors
Concrete Products
Materials Wholesaling
Construction
Building Equipment Distribution
Water and
Sewer Line Construction
Real Estate
Services
Highway and
Street Construction
Construction Materials Retailing
Developers
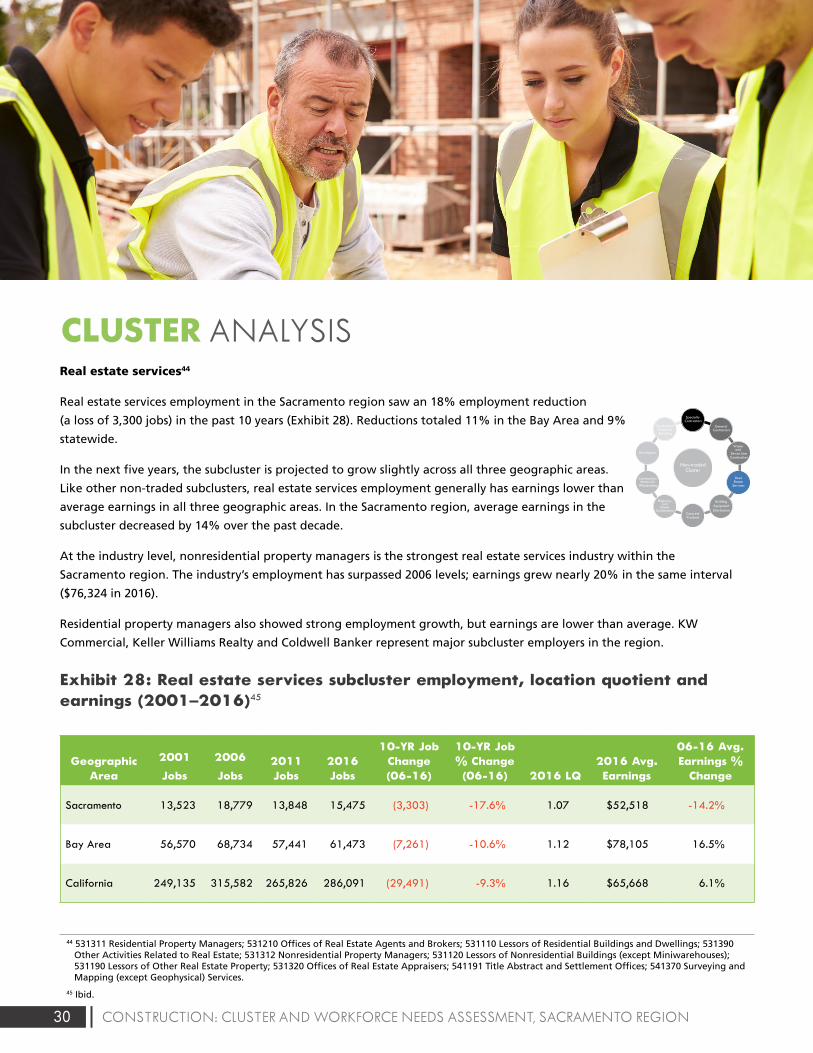
30 CONSTRUCTION: CLUSTER AND WORKFORCE NEEDS ASSESSMENT, SACRAMENTO REGION
CLUSTER ANALYSISReal estate services44
Real estate services employment in the Sacramento region saw an 18% employment reduction
(a loss of 3,300 jobs) in the past 10 years (Exhibit 28). Reductions totaled 11% in the Bay Area and 9%
statewide.
In the next five years, the subcluster is projected to grow slightly across all three geographic areas.
Like other non-traded subclusters, real estate services employment generally has earnings lower than
average earnings in all three geographic areas. In the Sacramento region, average earnings in the
subcluster decreased by 14% over the past decade.
At the industry level, nonresidential property managers is the strongest real estate services industry within the
Sacramento region. The industry’s employment has surpassed 2006 levels; earnings grew nearly 20% in the same interval
($76,324 in 2016).
Residential property managers also showed strong employment growth, but earnings are lower than average. KW
Commercial, Keller Williams Realty and Coldwell Banker represent major subcluster employers in the region.
Exhibit 28: Real estate services subcluster employment, location quotient and earnings (2001–2016)45
Geographic Area
2001
Jobs
2006
Jobs2011 Jobs
2016 Jobs
10-YR Job Change (06-16)
10-YR Job % Change (06-16) 2016 LQ
2016 Avg. Earnings
06-16 Avg. Earnings %
Change
Sacramento 13,523 18,779 13,848 15,475 (3,303) -17.6% 1.07 $52,518 -14.2%
Bay Area 56,570 68,734 57,441 61,473 (7,261) -10.6% 1.12 $78,105 16.5%
California 249,135 315,582 265,826 286,091 (29,491) -9.3% 1.16 $65,668 6.1%
44 531311 Residential Property Managers; 531210 Offices of Real Estate Agents and Brokers; 531110 Lessors of Residential Buildings and Dwellings; 531390 Other Activities Related to Real Estate; 531312 Nonresidential Property Managers; 531120 Lessors of Nonresidential Buildings (except Miniwarehouses); 531190 Lessors of Other Real Estate Property; 531320 Offices of Real Estate Appraisers; 541191 Title Abstract and Settlement Offices; 541370 Surveying and Mapping (except Geophysical) Services.
45 Ibid.
Traded Cluster
Water, Sewage,
and Other Systems
Construction Materials
Non-traded Cluster
General Contractors
Specialty Contractors
Concrete Products
Materials Wholesaling
Construction
Building Equipment Distribution
Water and
Sewer Line Construction
ConstructionConstruction Products
Construction Components
Traded Cluster
Water, Sewage,
and Other Systems
Construction Materials
ConstructionConstruction Products
Construction Components
Traded Cluster
Water, Sewage,
and Other Systems
Construction Materials
ConstructionConstruction Products
Construction Components
Traded Cluster
Water, Sewage,
and Other Systems
Construction Materials
ConstructionConstruction Products
Construction Components
Traded Cluster
Water, Sewage,
and Other Systems
Construction Materials
ConstructionConstruction Products
Construction Components
Traded Cluster
Water, Sewage,
and Other Systems
Construction Materials
ConstructionConstruction Products
Construction Components
Real Estate
Services
Highway and
Street Construction
Construction Materials Retailing
Developers
Non-traded Cluster
General Contractors
Specialty Contractors
Concrete Products
Materials Wholesaling
Construction
Building Equipment Distribution
Water and
Sewer Line Construction
Real Estate
Services
Highway and
Street Construction
Construction Materials Retailing
Developers
Non-traded Cluster
General Contractors
Specialty Contractors
Concrete Products
Materials Wholesaling
Construction
Building Equipment Distribution
Water and
Sewer Line Construction
Real Estate
Services
Highway and
Street Construction
Construction Materials Retailing
Developers
Non-traded Cluster
General Contractors
Specialty Contractors
Concrete Products
Materials Wholesaling
Construction
Building Equipment Distribution
Water and
Sewer Line Construction
Real Estate
Services
Highway and
Street Construction
Construction Materials Retailing
Developers
Non-traded Cluster
General Contractors
Specialty Contractors
Concrete Products
Materials Wholesaling
Construction
Building Equipment Distribution
Water and
Sewer Line Construction
Real Estate
Services
Highway and
Street Construction
Construction Materials Retailing
Developers
Non-traded Cluster
General Contractors
Specialty Contractors
Concrete Products
Materials Wholesaling
Construction
Building Equipment Distribution
Water and
Sewer Line Construction
Real Estate
Services
Highway and
Street Construction
Construction Materials Retailing
Developers
Non-traded Cluster
General Contractors
Specialty Contractors
Concrete Products
Materials Wholesaling
Construction
Building Equipment Distribution
Water and
Sewer Line Construction
Real Estate
Services
Highway and
Street Construction
Construction Materials Retailing
Developers
Non-traded Cluster
General Contractors
Specialty Contractors
Concrete Products
Materials Wholesaling
Construction
Building Equipment Distribution
Water and
Sewer Line Construction
Real Estate
Services
Highway and
Street Construction
Construction Materials Retailing
Developers
Non-traded Cluster
General Contractors
Specialty Contractors
Concrete Products
Materials Wholesaling
Construction
Building Equipment Distribution
Water and
Sewer Line Construction
Real Estate
Services
Highway and
Street Construction
Construction Materials Retailing
Developers
Non-traded Cluster
General Contractors
Specialty Contractors
Concrete Products
Materials Wholesaling
Construction
Building Equipment Distribution
Water and
Sewer Line Construction
Real Estate
Services
Highway and
Street Construction
Construction Materials Retailing
Developers
Non-traded Cluster
General Contractors
Specialty Contractors
Concrete Products
Materials Wholesaling
Construction
Building Equipment Distribution
Water and
Sewer Line Construction
Real Estate
Services
Highway and
Street Construction
Construction Materials Retailing
Developers
31CONSTRUCTION: CLUSTER AND WORKFORCE NEEDS ASSESSMENT, SACRAMENTO REGION
CLUSTER ANALYSISBuilding equipment distribution46
Compared to many other non-traded subclusters, the building equipment distribution subcluster
experienced less of an impact. In the Sacramento region, building equipment distribution has lost
11% of its employment in the past 10 years (Exhibit 29). It has grown by 18% in the Bay Area and has
seen a slight reduction of 3% statewide. In addition, the subcluster offers competitive wages that are
higher than the average annual earnings for all industries for all study regions.
At the industry level, plumbing and heating equipment and supplies (hydronics) merchant
wholesalers, and refrigeration equipment and supplies merchant wholesalers have established
some advantage in the Sacramento region. American Refrigeration Supplies, Park Mechanical and
Mainstream Energy Corporation are among the largest employers in the region.
Exhibit 29: Building equipment distribution subcluster employment, location quotient and earnings (2001–2016)47
Geographic Area
2001
Jobs
2006
Jobs2011 Jobs
2016 Jobs
10-YR Job Change (06–16)
10-YR Job % Change (06–16) 2016 LQ
2016 Avg. Earnings
06–16 Avg. Earnings %
Change
Sacramento 1,084 1,362 943 1,207 (155) -11.4% 1.00 $72,122 -9.3%
Bay Area 2,564 2,572 2,733 3,043 471 18.3% 0.67 $107,347 11.4%
California 13,448 16,251 14,111 15,727 (525) -3.2% 0.77 $81,318 3.5%
Concrete products48
Concrete products in the Sacramento region experienced less of an impact from the recession than
the Bay Area and the state. While employment declined by 40% in the Bay Area and 32% in the state
in the past 10 years, the subcluster declined by 11% in the Sacramento region over the same period
(Exhibit 30).
Concrete products jobs are much more concentrated in the Sacramento region than in the Bay
Area and the state. Subcluster jobs in the Sacramento region offer average earnings higher than all
industries at the regional level.
The concrete products subcluster in the Sacramento region is mostly supported by the other concrete product
manufacturing industry. This industry has many positive indicators: sizeable employment levels and growth, employment
concentration and growth, high earnings and growth.
46 423720 Plumbing and Heating Equipment and Supplies (Hydronics) Merchant Wholesalers; 423740 Refrigeration Equipment and Supplies Merchant Wholesalers; 423730 Warm Air Heating and Air-Conditioning Equipment and Supplies Merchant Wholesalers.
47 Ibid.
48 327390 Other Concrete Product Manufacturing; 327320 Ready-Mix Concrete Manufacturing.
Traded Cluster
Water, Sewage,
and Other Systems
Construction Materials
Non-traded Cluster
General Contractors
Specialty Contractors
Concrete Products
Materials Wholesaling
Construction
Building Equipment Distribution
Water and
Sewer Line Construction
ConstructionConstruction Products
Construction Components
Traded Cluster
Water, Sewage,
and Other Systems
Construction Materials
ConstructionConstruction Products
Construction Components
Traded Cluster
Water, Sewage,
and Other Systems
Construction Materials
ConstructionConstruction Products
Construction Components
Traded Cluster
Water, Sewage,
and Other Systems
Construction Materials
ConstructionConstruction Products
Construction Components
Traded Cluster
Water, Sewage,
and Other Systems
Construction Materials
ConstructionConstruction Products
Construction Components
Traded Cluster
Water, Sewage,
and Other Systems
Construction Materials
ConstructionConstruction Products
Construction Components
Real Estate
Services
Highway and
Street Construction
Construction Materials Retailing
Developers
Non-traded Cluster
General Contractors
Specialty Contractors
Concrete Products
Materials Wholesaling
Construction
Building Equipment Distribution
Water and
Sewer Line Construction
Real Estate
Services
Highway and
Street Construction
Construction Materials Retailing
Developers
Non-traded Cluster
General Contractors
Specialty Contractors
Concrete Products
Materials Wholesaling
Construction
Building Equipment Distribution
Water and
Sewer Line Construction
Real Estate
Services
Highway and
Street Construction
Construction Materials Retailing
Developers
Non-traded Cluster
General Contractors
Specialty Contractors
Concrete Products
Materials Wholesaling
Construction
Building Equipment Distribution
Water and
Sewer Line Construction
Real Estate
Services
Highway and
Street Construction
Construction Materials Retailing
Developers
Non-traded Cluster
General Contractors
Specialty Contractors
Concrete Products
Materials Wholesaling
Construction
Building Equipment Distribution
Water and
Sewer Line Construction
Real Estate
Services
Highway and
Street Construction
Construction Materials Retailing
Developers
Non-traded Cluster
General Contractors
Specialty Contractors
Concrete Products
Materials Wholesaling
Construction
Building Equipment Distribution
Water and
Sewer Line Construction
Real Estate
Services
Highway and
Street Construction
Construction Materials Retailing
Developers
Non-traded Cluster
General Contractors
Specialty Contractors
Concrete Products
Materials Wholesaling
Construction
Building Equipment Distribution
Water and
Sewer Line Construction
Real Estate
Services
Highway and
Street Construction
Construction Materials Retailing
Developers
Non-traded Cluster
General Contractors
Specialty Contractors
Concrete Products
Materials Wholesaling
Construction
Building Equipment Distribution
Water and
Sewer Line Construction
Real Estate
Services
Highway and
Street Construction
Construction Materials Retailing
Developers
Non-traded Cluster
General Contractors
Specialty Contractors
Concrete Products
Materials Wholesaling
Construction
Building Equipment Distribution
Water and
Sewer Line Construction
Real Estate
Services
Highway and
Street Construction
Construction Materials Retailing
Developers
Non-traded Cluster
General Contractors
Specialty Contractors
Concrete Products
Materials Wholesaling
Construction
Building Equipment Distribution
Water and
Sewer Line Construction
Real Estate
Services
Highway and
Street Construction
Construction Materials Retailing
Developers
Non-traded Cluster
General Contractors
Specialty Contractors
Concrete Products
Materials Wholesaling
Construction
Building Equipment Distribution
Water and
Sewer Line Construction
Real Estate
Services
Highway and
Street Construction
Construction Materials Retailing
Developers
Traded Cluster
Water, Sewage,
and Other Systems
Construction Materials
Non-traded Cluster
General Contractors
Specialty Contractors
Concrete Products
Materials Wholesaling
Construction
Building Equipment Distribution
Water and
Sewer Line Construction
ConstructionConstruction Products
Construction Components
Traded Cluster
Water, Sewage,
and Other Systems
Construction Materials
ConstructionConstruction Products
Construction Components
Traded Cluster
Water, Sewage,
and Other Systems
Construction Materials
ConstructionConstruction Products
Construction Components
Traded Cluster
Water, Sewage,
and Other Systems
Construction Materials
ConstructionConstruction Products
Construction Components
Traded Cluster
Water, Sewage,
and Other Systems
Construction Materials
ConstructionConstruction Products
Construction Components
Traded Cluster
Water, Sewage,
and Other Systems
Construction Materials
ConstructionConstruction Products
Construction Components
Real Estate
Services
Highway and
Street Construction
Construction Materials Retailing
Developers
Non-traded Cluster
General Contractors
Specialty Contractors
Concrete Products
Materials Wholesaling
Construction
Building Equipment Distribution
Water and
Sewer Line Construction
Real Estate
Services
Highway and
Street Construction
Construction Materials Retailing
Developers
Non-traded Cluster
General Contractors
Specialty Contractors
Concrete Products
Materials Wholesaling
Construction
Building Equipment Distribution
Water and
Sewer Line Construction
Real Estate
Services
Highway and
Street Construction
Construction Materials Retailing
Developers
Non-traded Cluster
General Contractors
Specialty Contractors
Concrete Products
Materials Wholesaling
Construction
Building Equipment Distribution
Water and
Sewer Line Construction
Real Estate
Services
Highway and
Street Construction
Construction Materials Retailing
Developers
Non-traded Cluster
General Contractors
Specialty Contractors
Concrete Products
Materials Wholesaling
Construction
Building Equipment Distribution
Water and
Sewer Line Construction
Real Estate
Services
Highway and
Street Construction
Construction Materials Retailing
Developers
Non-traded Cluster
General Contractors
Specialty Contractors
Concrete Products
Materials Wholesaling
Construction
Building Equipment Distribution
Water and
Sewer Line Construction
Real Estate
Services
Highway and
Street Construction
Construction Materials Retailing
Developers
Non-traded Cluster
General Contractors
Specialty Contractors
Concrete Products
Materials Wholesaling
Construction
Building Equipment Distribution
Water and
Sewer Line Construction
Real Estate
Services
Highway and
Street Construction
Construction Materials Retailing
Developers
Non-traded Cluster
General Contractors
Specialty Contractors
Concrete Products
Materials Wholesaling
Construction
Building Equipment Distribution
Water and
Sewer Line Construction
Real Estate
Services
Highway and
Street Construction
Construction Materials Retailing
Developers
Non-traded Cluster
General Contractors
Specialty Contractors
Concrete Products
Materials Wholesaling
Construction
Building Equipment Distribution
Water and
Sewer Line Construction
Real Estate
Services
Highway and
Street Construction
Construction Materials Retailing
Developers
Non-traded Cluster
General Contractors
Specialty Contractors
Concrete Products
Materials Wholesaling
Construction
Building Equipment Distribution
Water and
Sewer Line Construction
Real Estate
Services
Highway and
Street Construction
Construction Materials Retailing
Developers
Non-traded Cluster
General Contractors
Specialty Contractors
Concrete Products
Materials Wholesaling
Construction
Building Equipment Distribution
Water and
Sewer Line Construction
Real Estate
Services
Highway and
Street Construction
Construction Materials Retailing
Developers
32 CONSTRUCTION: CLUSTER AND WORKFORCE NEEDS ASSESSMENT, SACRAMENTO REGION
CLUSTER ANALYSISExhibit 30: Concrete products subcluster employment, location quotient and earnings (2001–2016)49
Geographic Area
2001
Jobs
2006
Jobs2011 Jobs
2016 Jobs
10-YR Job Change (06-16)
10-YR Job % Change (06-16) 2016 LQ
2016 Avg. Earnings
06-16 Avg. Earnings %
Change
Sacramento 1,054 1,288 694 1,123 (165) -12.8% 1.06 $83,446 4.5%
Bay Area 3,667 3,799 1,867 2,303 (1,496) -39.4% 0.57 $92,599 13.3%
California 16,495 18,565 10,364 12,583 (5,982) -32.2% 0.70 $73,199 -0.3%
Highway and street construction50
Highway and street construction is represented by one industry of the same name. The subcluster
lost one third of its jobs, 1,100, in the Sacramento region between 2006 and 2016 (Exhibit 31).
Employment losses were also severe in the Bay Area and the state. Regional average annual earnings
in the subcluster are high, $98,147 in 2016.
The following companies are among the largest in the Sacramento region: Meyers & Sons
Construction, Telfer Highway Technologies, Central Valley Engineering and Valley Precision Grading.
Exhibit 31: Highway and street construction subcluster employment, location quotient and earnings (2001–2016)51
Geographic Area
2001
Jobs
2006
Jobs2011 Jobs
2016 Jobs
10-YR Job Change (06–16)
10-YR Job % Change (06–16) 2016 LQ
2016 Avg. Earnings
06–16 Avg. Earnings %
Change
Sacramento 3,292 3,372 2,291 2,268 (1,104) -32.7% 0.98 $98,147 0.7%
Bay Area 7,529 6,691 4,830 5,910 (781) -11.7% 0.67 $108,247 7.8%
California 31,092 29,795 21,317 24,495 (5,300) -17.8% 0.62 $98,254 5.5%
49 Ibid.
50 237310 Highway, Street and Bridge Construction.
51 Ibid.
Traded Cluster
Water, Sewage,
and Other Systems
Construction Materials
Non-traded Cluster
General Contractors
Specialty Contractors
Concrete Products
Materials Wholesaling
Construction
Building Equipment Distribution
Water and
Sewer Line Construction
ConstructionConstruction Products
Construction Components
Traded Cluster
Water, Sewage,
and Other Systems
Construction Materials
ConstructionConstruction Products
Construction Components
Traded Cluster
Water, Sewage,
and Other Systems
Construction Materials
ConstructionConstruction Products
Construction Components
Traded Cluster
Water, Sewage,
and Other Systems
Construction Materials
ConstructionConstruction Products
Construction Components
Traded Cluster
Water, Sewage,
and Other Systems
Construction Materials
ConstructionConstruction Products
Construction Components
Traded Cluster
Water, Sewage,
and Other Systems
Construction Materials
ConstructionConstruction Products
Construction Components
Real Estate
Services
Highway and
Street Construction
Construction Materials Retailing
Developers
Non-traded Cluster
General Contractors
Specialty Contractors
Concrete Products
Materials Wholesaling
Construction
Building Equipment Distribution
Water and
Sewer Line Construction
Real Estate
Services
Highway and
Street Construction
Construction Materials Retailing
Developers
Non-traded Cluster
General Contractors
Specialty Contractors
Concrete Products
Materials Wholesaling
Construction
Building Equipment Distribution
Water and
Sewer Line Construction
Real Estate
Services
Highway and
Street Construction
Construction Materials Retailing
Developers
Non-traded Cluster
General Contractors
Specialty Contractors
Concrete Products
Materials Wholesaling
Construction
Building Equipment Distribution
Water and
Sewer Line Construction
Real Estate
Services
Highway and
Street Construction
Construction Materials Retailing
Developers
Non-traded Cluster
General Contractors
Specialty Contractors
Concrete Products
Materials Wholesaling
Construction
Building Equipment Distribution
Water and
Sewer Line Construction
Real Estate
Services
Highway and
Street Construction
Construction Materials Retailing
Developers
Non-traded Cluster
General Contractors
Specialty Contractors
Concrete Products
Materials Wholesaling
Construction
Building Equipment Distribution
Water and
Sewer Line Construction
Real Estate
Services
Highway and
Street Construction
Construction Materials Retailing
Developers
Non-traded Cluster
General Contractors
Specialty Contractors
Concrete Products
Materials Wholesaling
Construction
Building Equipment Distribution
Water and
Sewer Line Construction
Real Estate
Services
Highway and
Street Construction
Construction Materials Retailing
Developers
Non-traded Cluster
General Contractors
Specialty Contractors
Concrete Products
Materials Wholesaling
Construction
Building Equipment Distribution
Water and
Sewer Line Construction
Real Estate
Services
Highway and
Street Construction
Construction Materials Retailing
Developers
Non-traded Cluster
General Contractors
Specialty Contractors
Concrete Products
Materials Wholesaling
Construction
Building Equipment Distribution
Water and
Sewer Line Construction
Real Estate
Services
Highway and
Street Construction
Construction Materials Retailing
Developers
Non-traded Cluster
General Contractors
Specialty Contractors
Concrete Products
Materials Wholesaling
Construction
Building Equipment Distribution
Water and
Sewer Line Construction
Real Estate
Services
Highway and
Street Construction
Construction Materials Retailing
Developers
Non-traded Cluster
General Contractors
Specialty Contractors
Concrete Products
Materials Wholesaling
Construction
Building Equipment Distribution
Water and
Sewer Line Construction
Real Estate
Services
Highway and
Street Construction
Construction Materials Retailing
Developers
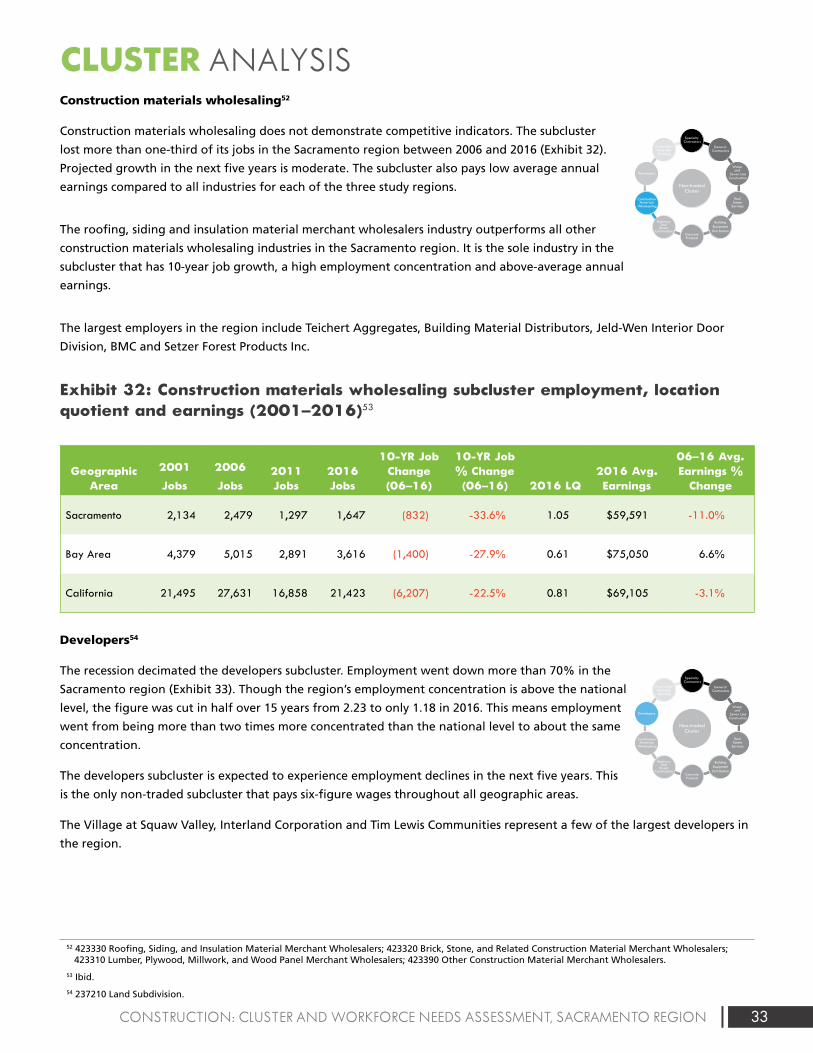
33CONSTRUCTION: CLUSTER AND WORKFORCE NEEDS ASSESSMENT, SACRAMENTO REGION
CLUSTER ANALYSISConstruction materials wholesaling52
Construction materials wholesaling does not demonstrate competitive indicators. The subcluster
lost more than one-third of its jobs in the Sacramento region between 2006 and 2016 (Exhibit 32).
Projected growth in the next five years is moderate. The subcluster also pays low average annual
earnings compared to all industries for each of the three study regions.
The roofing, siding and insulation material merchant wholesalers industry outperforms all other
construction materials wholesaling industries in the Sacramento region. It is the sole industry in the
subcluster that has 10-year job growth, a high employment concentration and above-average annual
earnings.
The largest employers in the region include Teichert Aggregates, Building Material Distributors, Jeld-Wen Interior Door
Division, BMC and Setzer Forest Products Inc.
Exhibit 32: Construction materials wholesaling subcluster employment, location quotient and earnings (2001–2016)53
Geographic Area
2001
Jobs
2006
Jobs2011 Jobs
2016 Jobs
10-YR Job Change (06–16)
10-YR Job % Change (06–16) 2016 LQ
2016 Avg. Earnings
06–16 Avg. Earnings %
Change
Sacramento 2,134 2,479 1,297 1,647 (832) -33.6% 1.05 $59,591 -11.0%
Bay Area 4,379 5,015 2,891 3,616 (1,400) -27.9% 0.61 $75,050 6.6%
California 21,495 27,631 16,858 21,423 (6,207) -22.5% 0.81 $69,105 -3.1%
Developers54
The recession decimated the developers subcluster. Employment went down more than 70% in the
Sacramento region (Exhibit 33). Though the region’s employment concentration is above the national
level, the figure was cut in half over 15 years from 2.23 to only 1.18 in 2016. This means employment
went from being more than two times more concentrated than the national level to about the same
concentration.
The developers subcluster is expected to experience employment declines in the next five years. This
is the only non-traded subcluster that pays six-figure wages throughout all geographic areas.
The Village at Squaw Valley, Interland Corporation and Tim Lewis Communities represent a few of the largest developers in
the region.
52 423330 Roofing, Siding, and Insulation Material Merchant Wholesalers; 423320 Brick, Stone, and Related Construction Material Merchant Wholesalers; 423310 Lumber, Plywood, Millwork, and Wood Panel Merchant Wholesalers; 423390 Other Construction Material Merchant Wholesalers.
53 Ibid.
54 237210 Land Subdivision.
Traded Cluster
Water, Sewage,
and Other Systems
Construction Materials
Non-traded Cluster
General Contractors
Specialty Contractors
Concrete Products
Materials Wholesaling
Construction
Building Equipment Distribution
Water and
Sewer Line Construction
ConstructionConstruction Products
Construction Components
Traded Cluster
Water, Sewage,
and Other Systems
Construction Materials
ConstructionConstruction Products
Construction Components
Traded Cluster
Water, Sewage,
and Other Systems
Construction Materials
ConstructionConstruction Products
Construction Components
Traded Cluster
Water, Sewage,
and Other Systems
Construction Materials
ConstructionConstruction Products
Construction Components
Traded Cluster
Water, Sewage,
and Other Systems
Construction Materials
ConstructionConstruction Products
Construction Components
Traded Cluster
Water, Sewage,
and Other Systems
Construction Materials
ConstructionConstruction Products
Construction Components
Real Estate
Services
Highway and
Street Construction
Construction Materials Retailing
Developers
Non-traded Cluster
General Contractors
Specialty Contractors
Concrete Products
Materials Wholesaling
Construction
Building Equipment Distribution
Water and
Sewer Line Construction
Real Estate
Services
Highway and
Street Construction
Construction Materials Retailing
Developers
Non-traded Cluster
General Contractors
Specialty Contractors
Concrete Products
Materials Wholesaling
Construction
Building Equipment Distribution
Water and
Sewer Line Construction
Real Estate
Services
Highway and
Street Construction
Construction Materials Retailing
Developers
Non-traded Cluster
General Contractors
Specialty Contractors
Concrete Products
Materials Wholesaling
Construction
Building Equipment Distribution
Water and
Sewer Line Construction
Real Estate
Services
Highway and
Street Construction
Construction Materials Retailing
Developers
Non-traded Cluster
General Contractors
Specialty Contractors
Concrete Products
Materials Wholesaling
Construction
Building Equipment Distribution
Water and
Sewer Line Construction
Real Estate
Services
Highway and
Street Construction
Construction Materials Retailing
Developers
Non-traded Cluster
General Contractors
Specialty Contractors
Concrete Products
Materials Wholesaling
Construction
Building Equipment Distribution
Water and
Sewer Line Construction
Real Estate
Services
Highway and
Street Construction
Construction Materials Retailing
Developers
Non-traded Cluster
General Contractors
Specialty Contractors
Concrete Products
Materials Wholesaling
Construction
Building Equipment Distribution
Water and
Sewer Line Construction
Real Estate
Services
Highway and
Street Construction
Construction Materials Retailing
Developers
Non-traded Cluster
General Contractors
Specialty Contractors
Concrete Products
Materials Wholesaling
Construction
Building Equipment Distribution
Water and
Sewer Line Construction
Real Estate
Services
Highway and
Street Construction
Construction Materials Retailing
Developers
Non-traded Cluster
General Contractors
Specialty Contractors
Concrete Products
Materials Wholesaling
Construction
Building Equipment Distribution
Water and
Sewer Line Construction
Real Estate
Services
Highway and
Street Construction
Construction Materials Retailing
Developers
Non-traded Cluster
General Contractors
Specialty Contractors
Concrete Products
Materials Wholesaling
Construction
Building Equipment Distribution
Water and
Sewer Line Construction
Real Estate
Services
Highway and
Street Construction
Construction Materials Retailing
Developers
Non-traded Cluster
General Contractors
Specialty Contractors
Concrete Products
Materials Wholesaling
Construction
Building Equipment Distribution
Water and
Sewer Line Construction
Real Estate
Services
Highway and
Street Construction
Construction Materials Retailing
Developers
Traded Cluster
Water, Sewage,
and Other Systems
Construction Materials
Non-traded Cluster
General Contractors
Specialty Contractors
Concrete Products
Materials Wholesaling
Construction
Building Equipment Distribution
Water and
Sewer Line Construction
ConstructionConstruction Products
Construction Components
Traded Cluster
Water, Sewage,
and Other Systems
Construction Materials
ConstructionConstruction Products
Construction Components
Traded Cluster
Water, Sewage,
and Other Systems
Construction Materials
ConstructionConstruction Products
Construction Components
Traded Cluster
Water, Sewage,
and Other Systems
Construction Materials
ConstructionConstruction Products
Construction Components
Traded Cluster
Water, Sewage,
and Other Systems
Construction Materials
ConstructionConstruction Products
Construction Components
Traded Cluster
Water, Sewage,
and Other Systems
Construction Materials
ConstructionConstruction Products
Construction Components
Real Estate
Services
Highway and
Street Construction
Construction Materials Retailing
Developers
Non-traded Cluster
General Contractors
Specialty Contractors
Concrete Products
Materials Wholesaling
Construction
Building Equipment Distribution
Water and
Sewer Line Construction
Real Estate
Services
Highway and
Street Construction
Construction Materials Retailing
Developers
Non-traded Cluster
General Contractors
Specialty Contractors
Concrete Products
Materials Wholesaling
Construction
Building Equipment Distribution
Water and
Sewer Line Construction
Real Estate
Services
Highway and
Street Construction
Construction Materials Retailing
Developers
Non-traded Cluster
General Contractors
Specialty Contractors
Concrete Products
Materials Wholesaling
Construction
Building Equipment Distribution
Water and
Sewer Line Construction
Real Estate
Services
Highway and
Street Construction
Construction Materials Retailing
Developers
Non-traded Cluster
General Contractors
Specialty Contractors
Concrete Products
Materials Wholesaling
Construction
Building Equipment Distribution
Water and
Sewer Line Construction
Real Estate
Services
Highway and
Street Construction
Construction Materials Retailing
Developers
Non-traded Cluster
General Contractors
Specialty Contractors
Concrete Products
Materials Wholesaling
Construction
Building Equipment Distribution
Water and
Sewer Line Construction
Real Estate
Services
Highway and
Street Construction
Construction Materials Retailing
Developers
Non-traded Cluster
General Contractors
Specialty Contractors
Concrete Products
Materials Wholesaling
Construction
Building Equipment Distribution
Water and
Sewer Line Construction
Real Estate
Services
Highway and
Street Construction
Construction Materials Retailing
Developers
Non-traded Cluster
General Contractors
Specialty Contractors
Concrete Products
Materials Wholesaling
Construction
Building Equipment Distribution
Water and
Sewer Line Construction
Real Estate
Services
Highway and
Street Construction
Construction Materials Retailing
Developers
Non-traded Cluster
General Contractors
Specialty Contractors
Concrete Products
Materials Wholesaling
Construction
Building Equipment Distribution
Water and
Sewer Line Construction
Real Estate
Services
Highway and
Street Construction
Construction Materials Retailing
Developers
Non-traded Cluster
General Contractors
Specialty Contractors
Concrete Products
Materials Wholesaling
Construction
Building Equipment Distribution
Water and
Sewer Line Construction
Real Estate
Services
Highway and
Street Construction
Construction Materials Retailing
Developers
Non-traded Cluster
General Contractors
Specialty Contractors
Concrete Products
Materials Wholesaling
Construction
Building Equipment Distribution
Water and
Sewer Line Construction
Real Estate
Services
Highway and
Street Construction
Construction Materials Retailing
Developers
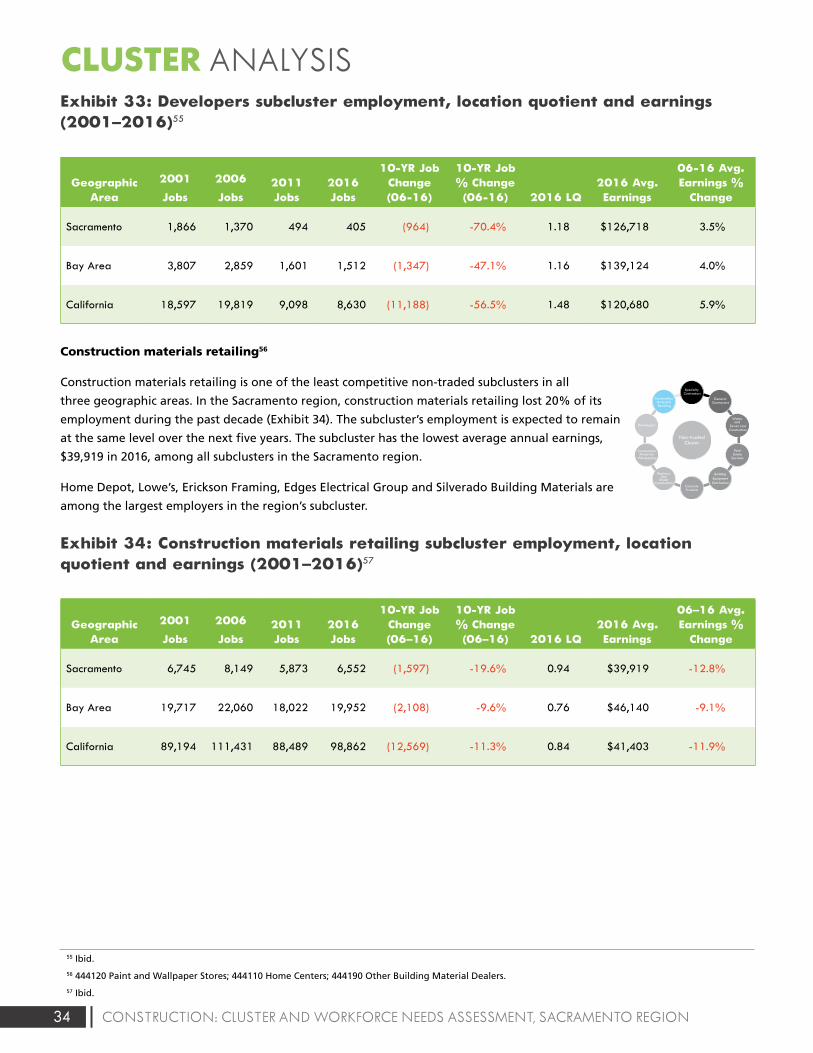
34 CONSTRUCTION: CLUSTER AND WORKFORCE NEEDS ASSESSMENT, SACRAMENTO REGION
CLUSTER ANALYSISExhibit 33: Developers subcluster employment, location quotient and earnings (2001–2016)55
Geographic Area
2001
Jobs
2006
Jobs2011 Jobs
2016 Jobs
10-YR Job Change (06-16)
10-YR Job % Change (06-16) 2016 LQ
2016 Avg. Earnings
06-16 Avg. Earnings %
Change
Sacramento 1,866 1,370 494 405 (964) -70.4% 1.18 $126,718 3.5%
Bay Area 3,807 2,859 1,601 1,512 (1,347) -47.1% 1.16 $139,124 4.0%
California 18,597 19,819 9,098 8,630 (11,188) -56.5% 1.48 $120,680 5.9%
Construction materials retailing56
Construction materials retailing is one of the least competitive non-traded subclusters in all
three geographic areas. In the Sacramento region, construction materials retailing lost 20% of its
employment during the past decade (Exhibit 34). The subcluster’s employment is expected to remain
at the same level over the next five years. The subcluster has the lowest average annual earnings,
$39,919 in 2016, among all subclusters in the Sacramento region.
Home Depot, Lowe’s, Erickson Framing, Edges Electrical Group and Silverado Building Materials are
among the largest employers in the region’s subcluster.
Exhibit 34: Construction materials retailing subcluster employment, location quotient and earnings (2001–2016)57
Geographic Area
2001
Jobs
2006
Jobs2011 Jobs
2016 Jobs
10-YR Job Change (06–16)
10-YR Job % Change (06–16) 2016 LQ
2016 Avg. Earnings
06–16 Avg. Earnings %
Change
Sacramento 6,745 8,149 5,873 6,552 (1,597) -19.6% 0.94 $39,919 -12.8%
Bay Area 19,717 22,060 18,022 19,952 (2,108) -9.6% 0.76 $46,140 -9.1%
California 89,194 111,431 88,489 98,862 (12,569) -11.3% 0.84 $41,403 -11.9%
55 Ibid.
56 444120 Paint and Wallpaper Stores; 444110 Home Centers; 444190 Other Building Material Dealers.
57 Ibid.
Traded Cluster
Water, Sewage,
and Other Systems
Construction Materials
Non-traded Cluster
General Contractors
Specialty Contractors
Concrete Products
Materials Wholesaling
Construction
Building Equipment Distribution
Water and
Sewer Line Construction
ConstructionConstruction Products
Construction Components
Traded Cluster
Water, Sewage,
and Other Systems
Construction Materials
ConstructionConstruction Products
Construction Components
Traded Cluster
Water, Sewage,
and Other Systems
Construction Materials
ConstructionConstruction Products
Construction Components
Traded Cluster
Water, Sewage,
and Other Systems
Construction Materials
ConstructionConstruction Products
Construction Components
Traded Cluster
Water, Sewage,
and Other Systems
Construction Materials
ConstructionConstruction Products
Construction Components
Traded Cluster
Water, Sewage,
and Other Systems
Construction Materials
ConstructionConstruction Products
Construction Components
Real Estate
Services
Highway and
Street Construction
Construction Materials Retailing
Developers
Non-traded Cluster
General Contractors
Specialty Contractors
Concrete Products
Materials Wholesaling
Construction
Building Equipment Distribution
Water and
Sewer Line Construction
Real Estate
Services
Highway and
Street Construction
Construction Materials Retailing
Developers
Non-traded Cluster
General Contractors
Specialty Contractors
Concrete Products
Materials Wholesaling
Construction
Building Equipment Distribution
Water and
Sewer Line Construction
Real Estate
Services
Highway and
Street Construction
Construction Materials Retailing
Developers
Non-traded Cluster
General Contractors
Specialty Contractors
Concrete Products
Materials Wholesaling
Construction
Building Equipment Distribution
Water and
Sewer Line Construction
Real Estate
Services
Highway and
Street Construction
Construction Materials Retailing
Developers
Non-traded Cluster
General Contractors
Specialty Contractors
Concrete Products
Materials Wholesaling
Construction
Building Equipment Distribution
Water and
Sewer Line Construction
Real Estate
Services
Highway and
Street Construction
Construction Materials Retailing
Developers
Non-traded Cluster
General Contractors
Specialty Contractors
Concrete Products
Materials Wholesaling
Construction
Building Equipment Distribution
Water and
Sewer Line Construction
Real Estate
Services
Highway and
Street Construction
Construction Materials Retailing
Developers
Non-traded Cluster
General Contractors
Specialty Contractors
Concrete Products
Materials Wholesaling
Construction
Building Equipment Distribution
Water and
Sewer Line Construction
Real Estate
Services
Highway and
Street Construction
Construction Materials Retailing
Developers
Non-traded Cluster
General Contractors
Specialty Contractors
Concrete Products
Materials Wholesaling
Construction
Building Equipment Distribution
Water and
Sewer Line Construction
Real Estate
Services
Highway and
Street Construction
Construction Materials Retailing
Developers
Non-traded Cluster
General Contractors
Specialty Contractors
Concrete Products
Materials Wholesaling
Construction
Building Equipment Distribution
Water and
Sewer Line Construction
Real Estate
Services
Highway and
Street Construction
Construction Materials Retailing
Developers
Non-traded Cluster
General Contractors
Specialty Contractors
Concrete Products
Materials Wholesaling
Construction
Building Equipment Distribution
Water and
Sewer Line Construction
Real Estate
Services
Highway and
Street Construction
Construction Materials Retailing
Developers
Non-traded Cluster
General Contractors
Specialty Contractors
Concrete Products
Materials Wholesaling
Construction
Building Equipment Distribution
Water and
Sewer Line Construction
Real Estate
Services
Highway and
Street Construction
Construction Materials Retailing
Developers
35CONSTRUCTION: CLUSTER AND WORKFORCE NEEDS ASSESSMENT, SACRAMENTO REGION
ECONOMIC IMPACTSThe economic impact represents a quantitative calculation that estimates the overall economic effect from a project,
industry or group of industries such as a cluster (or subcluster). The impacts from an industry cluster are not limited to
those direct effects that occur from the industry activities and/or business operations. They also represent the multiplier
effect from the ancillary activities created by those industry activities. Impact analysis typically comprises direct, indirect and
induced impacts:
• Direct impacts result from expenditures of operations within that industry cluster.
• Indirect impacts result from suppliers of that cluster spending money and hiring employees.
• Induced impacts are the combined value of employees of the industry cluster spending money at a household level.
Combined, these three variables equate to the total economic impact of a project or industry cluster.
The construction cluster has multiple economic impacts on the Sacramento region. The IMPLAN input-output model was
used to measure the cluster’s total economic impacts. The construction cluster directly benefits the regional economy
through business operations and jobs supported by establishments within its subclusters. On an overall basis, the
construction cluster directly generates about $18.2 billion in industry output, with over 101,600 jobs within the
Sacramento region.
In addition, the construction cluster generates over $784.6 million in output and 3,500 jobs in traded subclusters.
Traded subclusters represent those groups of industries that primarily serve and compete for customers in national and
international markets. Non-traded subclusters generate $17.4 billion in output and over 98,100 jobs. Non-traded subclusters
include industries that largely serve local and regional markets.
In addition to the direct impacts, supplier relationships initiated by construction cluster establishments create indirect
impacts totaling $6.4 billion in industry output and 47,000 jobs within the region. Local spending by employees creates an
induced impact of $10.2 billion in industry output and 72,700 jobs.
When accounting for all the direct and multiplier effects, the construction cluster contributes about $34.8 billion in industry
output, 221,300 jobs, and $17.4 billion in labor income (inclusive of both employee compensation and proprietor income) to
the Sacramento regional economy. This means that for every job created by the construction cluster, an additional 1.2 jobs
are created elsewhere within the region as a result of supplier relationships and employee spending.
Among the individual subclusters, contractors (specialty and general) and real estate services make up the largest share
of the overall direct cluster employment, with each subcluster accounting for over 15,000 jobs. Specialty contractors
alone make up over half of the direct and total jobs (inclusive of indirect and induced effects). Among traded subclusters,
construction (which includes industrial, infrastructure and heavy construction) account for the largest share of jobs.
Exhibits 35 and 36 show construction cluster economic impacts by traded and non-traded subcluster. Exhibit 37 shows total
construction cluster economic impacts by subcluster.
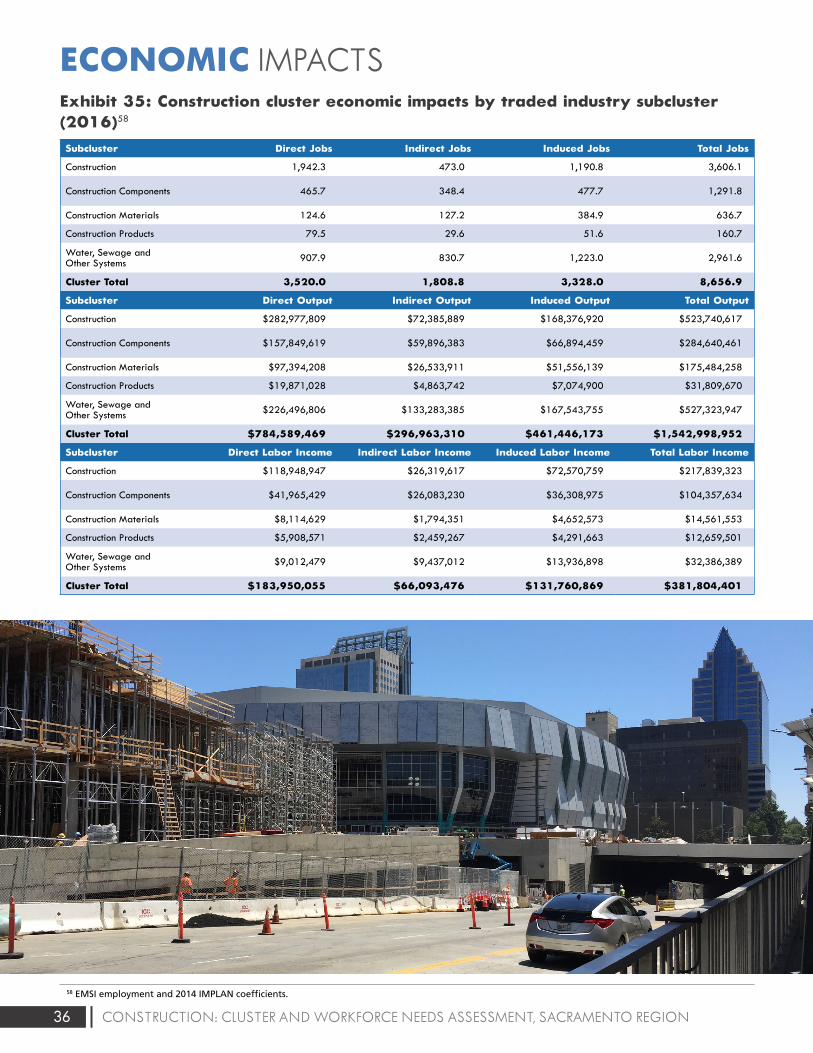
36 CONSTRUCTION: CLUSTER AND WORKFORCE NEEDS ASSESSMENT, SACRAMENTO REGION
ECONOMIC IMPACTSExhibit 35: Construction cluster economic impacts by traded industry subcluster (2016)58
Subcluster Direct Jobs Indirect Jobs Induced Jobs Total Jobs
Construction 1,942.3 473.0 1,190.8 3,606.1
Construction Components 465.7 348.4 477.7 1,291.8
Construction Materials 124.6 127.2 384.9 636.7
Construction Products 79.5 29.6 51.6 160.7
Water, Sewage and Other Systems 907.9 830.7 1,223.0 2,961.6
Cluster Total 3,520.0 1,808.8 3,328.0 8,656.9
Subcluster Direct Output Indirect Output Induced Output Total Output
Construction $282,977,809 $72,385,889 $168,376,920 $523,740,617
Construction Components $157,849,619 $59,896,383 $66,894,459 $284,640,461
Construction Materials $97,394,208 $26,533,911 $51,556,139 $175,484,258
Construction Products $19,871,028 $4,863,742 $7,074,900 $31,809,670
Water, Sewage and Other Systems $226,496,806 $133,283,385 $167,543,755 $527,323,947
Cluster Total $784,589,469 $296,963,310 $461,446,173 $1,542,998,952
Subcluster Direct Labor Income Indirect Labor Income Induced Labor Income Total Labor Income
Construction $118,948,947 $26,319,617 $72,570,759 $217,839,323
Construction Components $41,965,429 $26,083,230 $36,308,975 $104,357,634
Construction Materials $8,114,629 $1,794,351 $4,652,573 $14,561,553
Construction Products $5,908,571 $2,459,267 $4,291,663 $12,659,501
Water, Sewage and Other Systems $9,012,479 $9,437,012 $13,936,898 $32,386,389
Cluster Total $183,950,055 $66,093,476 $131,760,869 $381,804,401
58 EMSI employment and 2014 IMPLAN coefficients.
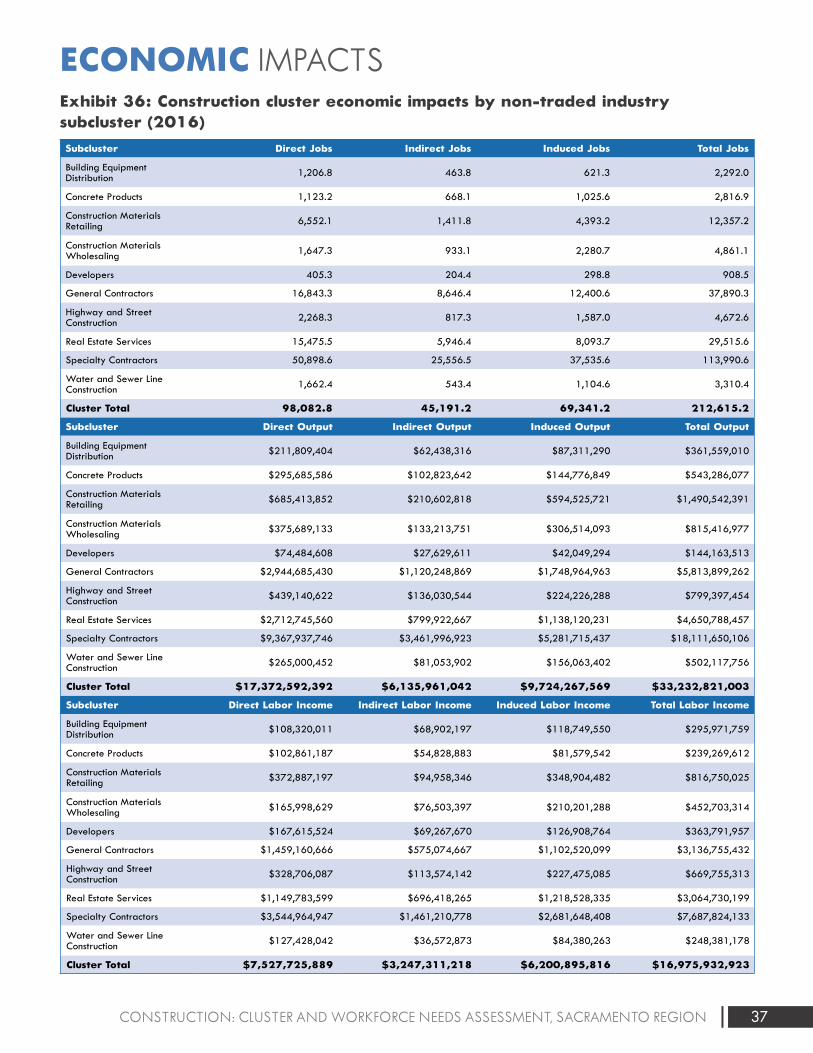
37CONSTRUCTION: CLUSTER AND WORKFORCE NEEDS ASSESSMENT, SACRAMENTO REGION
ECONOMIC IMPACTSExhibit 36: Construction cluster economic impacts by non-traded industry subcluster (2016)Subcluster Direct Jobs Indirect Jobs Induced Jobs Total Jobs
Building Equipment Distribution 1,206.8 463.8 621.3 2,292.0
Concrete Products 1,123.2 668.1 1,025.6 2,816.9
Construction Materials Retailing 6,552.1 1,411.8 4,393.2 12,357.2
Construction Materials Wholesaling 1,647.3 933.1 2,280.7 4,861.1
Developers 405.3 204.4 298.8 908.5
General Contractors 16,843.3 8,646.4 12,400.6 37,890.3
Highway and Street Construction 2,268.3 817.3 1,587.0 4,672.6
Real Estate Services 15,475.5 5,946.4 8,093.7 29,515.6
Specialty Contractors 50,898.6 25,556.5 37,535.6 113,990.6
Water and Sewer Line Construction 1,662.4 543.4 1,104.6 3,310.4
Cluster Total 98,082.8 45,191.2 69,341.2 212,615.2
Subcluster Direct Output Indirect Output Induced Output Total Output
Building Equipment Distribution $211,809,404 $62,438,316 $87,311,290 $361,559,010
Concrete Products $295,685,586 $102,823,642 $144,776,849 $543,286,077
Construction Materials Retailing $685,413,852 $210,602,818 $594,525,721 $1,490,542,391
Construction Materials Wholesaling $375,689,133 $133,213,751 $306,514,093 $815,416,977
Developers $74,484,608 $27,629,611 $42,049,294 $144,163,513
General Contractors $2,944,685,430 $1,120,248,869 $1,748,964,963 $5,813,899,262
Highway and Street Construction $439,140,622 $136,030,544 $224,226,288 $799,397,454
Real Estate Services $2,712,745,560 $799,922,667 $1,138,120,231 $4,650,788,457
Specialty Contractors $9,367,937,746 $3,461,996,923 $5,281,715,437 $18,111,650,106
Water and Sewer Line Construction $265,000,452 $81,053,902 $156,063,402 $502,117,756
Cluster Total $17,372,592,392 $6,135,961,042 $9,724,267,569 $33,232,821,003
Subcluster Direct Labor Income Indirect Labor Income Induced Labor Income Total Labor Income
Building Equipment Distribution $108,320,011 $68,902,197 $118,749,550 $295,971,759
Concrete Products $102,861,187 $54,828,883 $81,579,542 $239,269,612
Construction Materials Retailing $372,887,197 $94,958,346 $348,904,482 $816,750,025
Construction Materials Wholesaling $165,998,629 $76,503,397 $210,201,288 $452,703,314
Developers $167,615,524 $69,267,670 $126,908,764 $363,791,957
General Contractors $1,459,160,666 $575,074,667 $1,102,520,099 $3,136,755,432
Highway and Street Construction $328,706,087 $113,574,142 $227,475,085 $669,755,313
Real Estate Services $1,149,783,599 $696,418,265 $1,218,528,335 $3,064,730,199
Specialty Contractors $3,544,964,947 $1,461,210,778 $2,681,648,408 $7,687,824,133
Water and Sewer Line Construction $127,428,042 $36,572,873 $84,380,263 $248,381,178
Cluster Total $7,527,725,889 $3,247,311,218 $6,200,895,816 $16,975,932,923
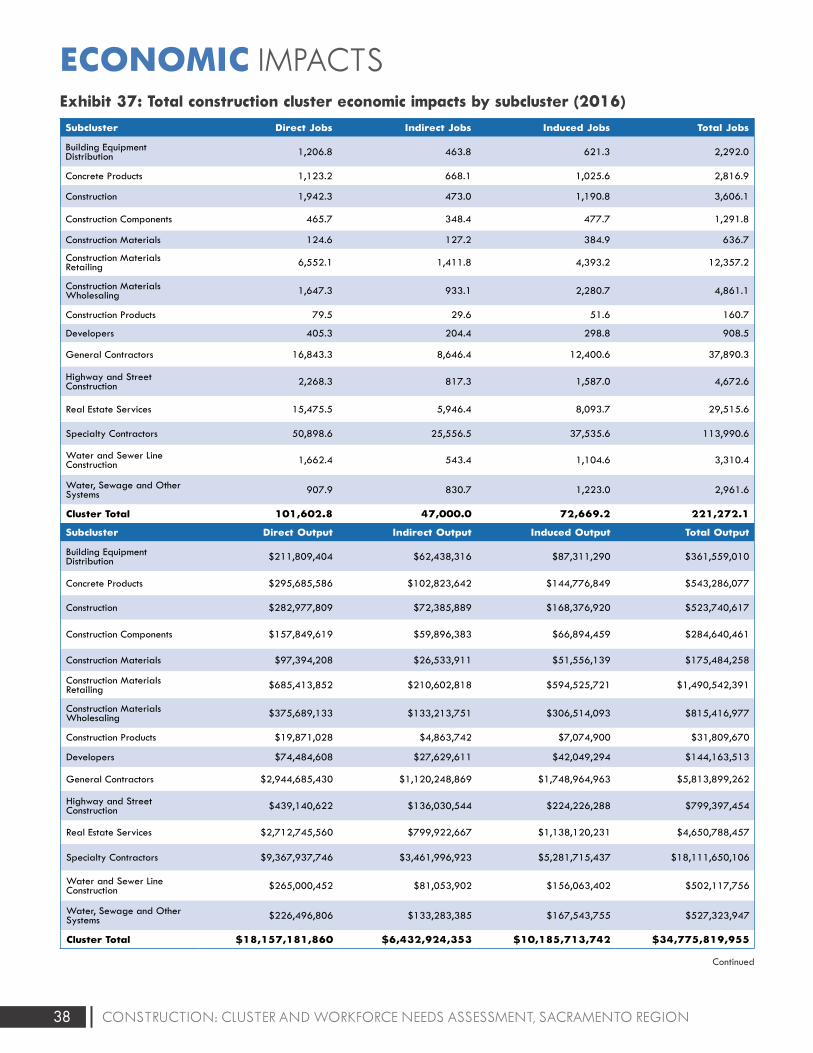
38 CONSTRUCTION: CLUSTER AND WORKFORCE NEEDS ASSESSMENT, SACRAMENTO REGION
ECONOMIC IMPACTSExhibit 37: Total construction cluster economic impacts by subcluster (2016)Subcluster Direct Jobs Indirect Jobs Induced Jobs Total Jobs
Building Equipment Distribution 1,206.8 463.8 621.3 2,292.0
Concrete Products 1,123.2 668.1 1,025.6 2,816.9
Construction 1,942.3 473.0 1,190.8 3,606.1
Construction Components 465.7 348.4 477.7 1,291.8
Construction Materials 124.6 127.2 384.9 636.7
Construction Materials Retailing 6,552.1 1,411.8 4,393.2 12,357.2
Construction Materials Wholesaling 1,647.3 933.1 2,280.7 4,861.1
Construction Products 79.5 29.6 51.6 160.7
Developers 405.3 204.4 298.8 908.5
General Contractors 16,843.3 8,646.4 12,400.6 37,890.3
Highway and Street Construction 2,268.3 817.3 1,587.0 4,672.6
Real Estate Services 15,475.5 5,946.4 8,093.7 29,515.6
Specialty Contractors 50,898.6 25,556.5 37,535.6 113,990.6
Water and Sewer Line Construction 1,662.4 543.4 1,104.6 3,310.4
Water, Sewage and Other Systems 907.9 830.7 1,223.0 2,961.6
Cluster Total 101,602.8 47,000.0 72,669.2 221,272.1
Subcluster Direct Output Indirect Output Induced Output Total Output
Building Equipment Distribution $211,809,404 $62,438,316 $87,311,290 $361,559,010
Concrete Products $295,685,586 $102,823,642 $144,776,849 $543,286,077
Construction $282,977,809 $72,385,889 $168,376,920 $523,740,617
Construction Components $157,849,619 $59,896,383 $66,894,459 $284,640,461
Construction Materials $97,394,208 $26,533,911 $51,556,139 $175,484,258
Construction Materials Retailing $685,413,852 $210,602,818 $594,525,721 $1,490,542,391
Construction Materials Wholesaling $375,689,133 $133,213,751 $306,514,093 $815,416,977
Construction Products $19,871,028 $4,863,742 $7,074,900 $31,809,670
Developers $74,484,608 $27,629,611 $42,049,294 $144,163,513
General Contractors $2,944,685,430 $1,120,248,869 $1,748,964,963 $5,813,899,262
Highway and Street Construction $439,140,622 $136,030,544 $224,226,288 $799,397,454
Real Estate Services $2,712,745,560 $799,922,667 $1,138,120,231 $4,650,788,457
Specialty Contractors $9,367,937,746 $3,461,996,923 $5,281,715,437 $18,111,650,106
Water and Sewer Line Construction $265,000,452 $81,053,902 $156,063,402 $502,117,756
Water, Sewage and Other Systems $226,496,806 $133,283,385 $167,543,755 $527,323,947
Cluster Total $18,157,181,860 $6,432,924,353 $10,185,713,742 $34,775,819,955
Continued
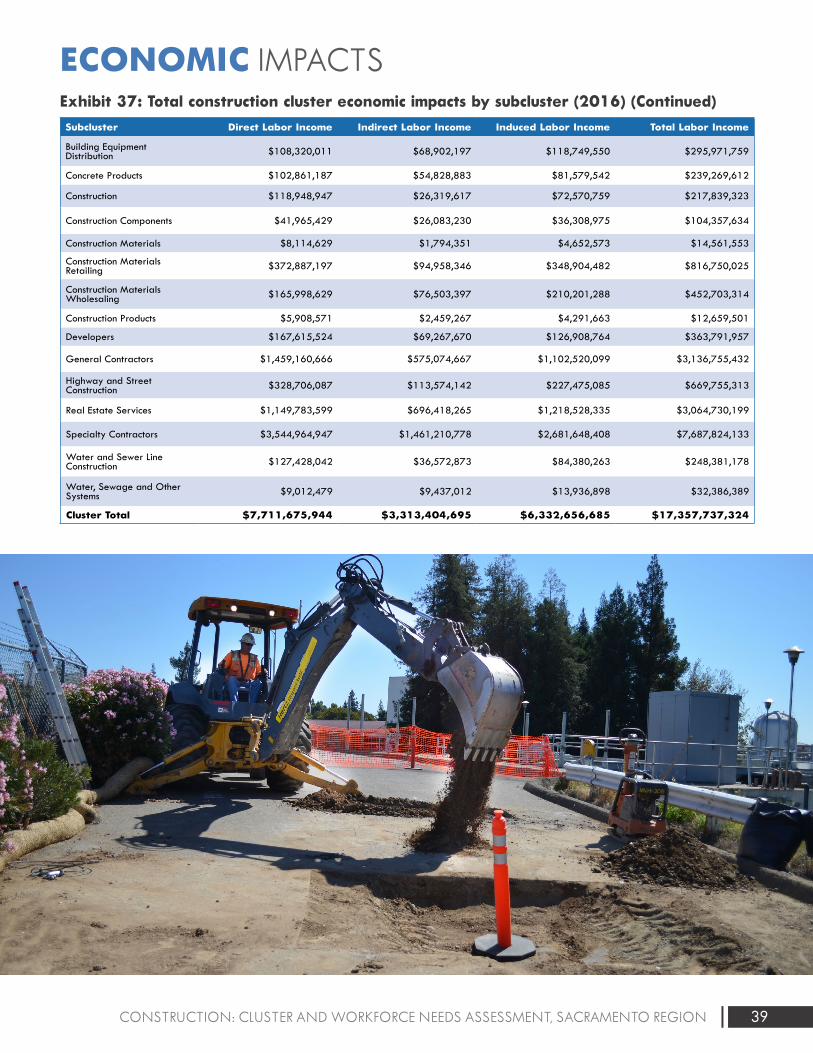
39CONSTRUCTION: CLUSTER AND WORKFORCE NEEDS ASSESSMENT, SACRAMENTO REGION
ECONOMIC IMPACTS
Subcluster Direct Labor Income Indirect Labor Income Induced Labor Income Total Labor Income
Building Equipment Distribution $108,320,011 $68,902,197 $118,749,550 $295,971,759
Concrete Products $102,861,187 $54,828,883 $81,579,542 $239,269,612
Construction $118,948,947 $26,319,617 $72,570,759 $217,839,323
Construction Components $41,965,429 $26,083,230 $36,308,975 $104,357,634
Construction Materials $8,114,629 $1,794,351 $4,652,573 $14,561,553
Construction Materials Retailing $372,887,197 $94,958,346 $348,904,482 $816,750,025
Construction Materials Wholesaling $165,998,629 $76,503,397 $210,201,288 $452,703,314
Construction Products $5,908,571 $2,459,267 $4,291,663 $12,659,501
Developers $167,615,524 $69,267,670 $126,908,764 $363,791,957
General Contractors $1,459,160,666 $575,074,667 $1,102,520,099 $3,136,755,432
Highway and Street Construction $328,706,087 $113,574,142 $227,475,085 $669,755,313
Real Estate Services $1,149,783,599 $696,418,265 $1,218,528,335 $3,064,730,199
Specialty Contractors $3,544,964,947 $1,461,210,778 $2,681,648,408 $7,687,824,133
Water and Sewer Line Construction $127,428,042 $36,572,873 $84,380,263 $248,381,178
Water, Sewage and Other Systems $9,012,479 $9,437,012 $13,936,898 $32,386,389
Cluster Total $7,711,675,944 $3,313,404,695 $6,332,656,685 $17,357,737,324
Exhibit 37: Total construction cluster economic impacts by subcluster (2016) (Continued)
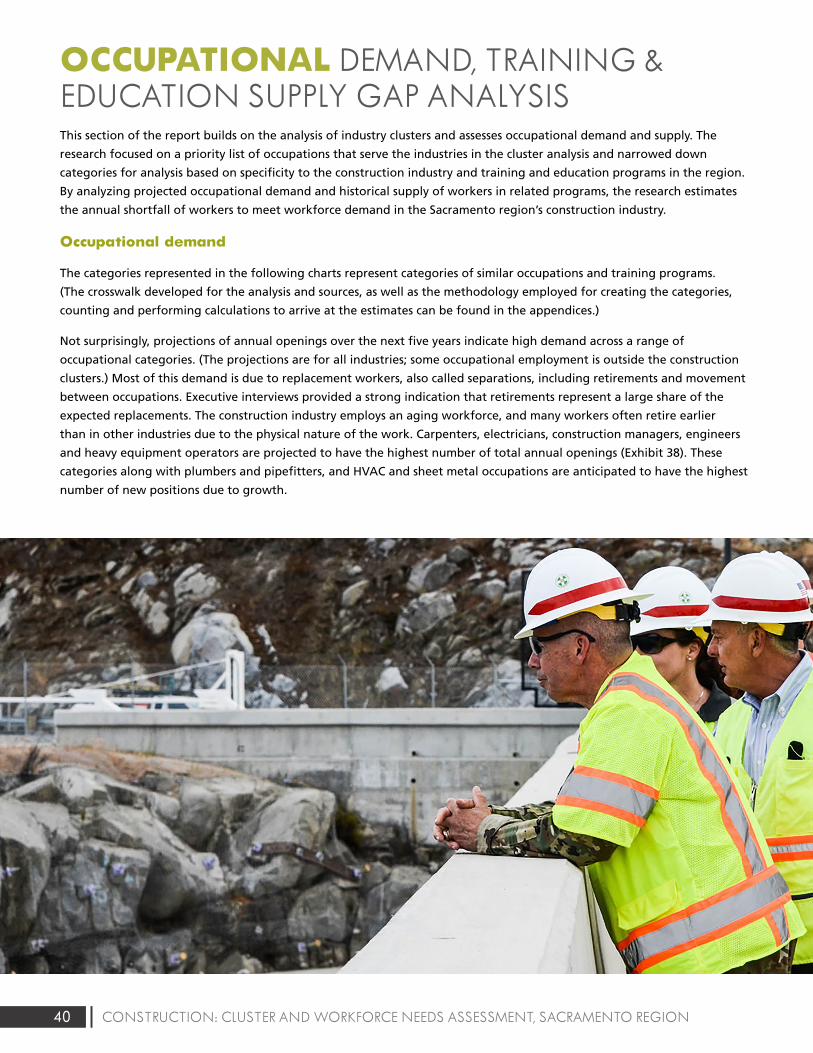
40 CONSTRUCTION: CLUSTER AND WORKFORCE NEEDS ASSESSMENT, SACRAMENTO REGION
OCCUPATIONAL DEMAND, TRAINING & EDUCATION SUPPLY GAP ANALYSISThis section of the report builds on the analysis of industry clusters and assesses occupational demand and supply. The
research focused on a priority list of occupations that serve the industries in the cluster analysis and narrowed down
categories for analysis based on specificity to the construction industry and training and education programs in the region.
By analyzing projected occupational demand and historical supply of workers in related programs, the research estimates
the annual shortfall of workers to meet workforce demand in the Sacramento region’s construction industry.
Occupational demand
The categories represented in the following charts represent categories of similar occupations and training programs.
(The crosswalk developed for the analysis and sources, as well as the methodology employed for creating the categories,
counting and performing calculations to arrive at the estimates can be found in the appendices.)
Not surprisingly, projections of annual openings over the next five years indicate high demand across a range of
occupational categories. (The projections are for all industries; some occupational employment is outside the construction
clusters.) Most of this demand is due to replacement workers, also called separations, including retirements and movement
between occupations. Executive interviews provided a strong indication that retirements represent a large share of the
expected replacements. The construction industry employs an aging workforce, and many workers often retire earlier
than in other industries due to the physical nature of the work. Carpenters, electricians, construction managers, engineers
and heavy equipment operators are projected to have the highest number of total annual openings (Exhibit 38). These
categories along with plumbers and pipefitters, and HVAC and sheet metal occupations are anticipated to have the highest
number of new positions due to growth.
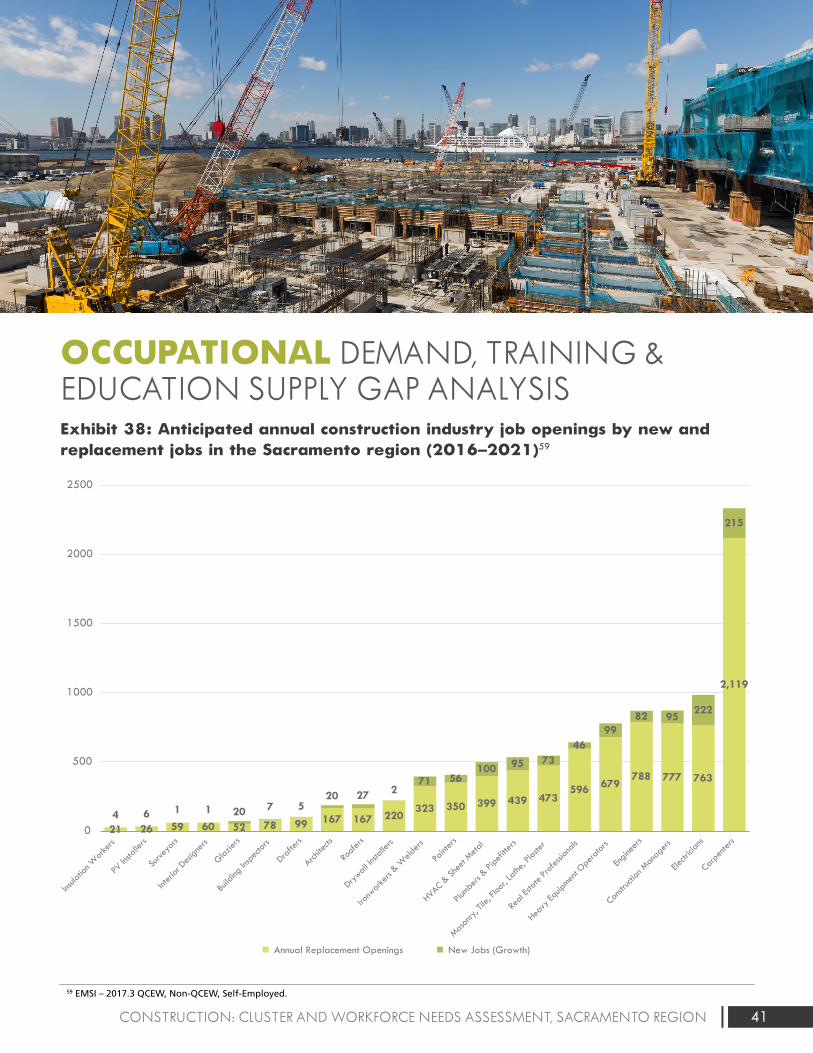
41CONSTRUCTION: CLUSTER AND WORKFORCE NEEDS ASSESSMENT, SACRAMENTO REGION
OCCUPATIONAL DEMAND, TRAINING & EDUCATION SUPPLY GAP ANALYSISExhibit 38: Anticipated annual construction industry job openings by new and replacement jobs in the Sacramento region (2016–2021)59
Exhibit 1: Value of construction put in place (United States)3
$1,161,282
$788,332
$1,185,683
$0
$200,000
$400,000
$600,000
$800,000
$1,000,000
$1,200,000
$1,400,000
2002 2003 2004 2005 2006 2007 2008 2009 2010 2011 2012 2013 2014 2015 2016
Mill
ions
of
Dol
lars
Residential Nonresidential
Exhibit 2: Value of construction put in place (California)5
$58,091,975
$18,740,050
$51,350,955
$0
$10,000,000
$20,000,000
$30,000,000
$40,000,000
$50,000,000
$60,000,000
$70,000,000
2002 2003 2004 2005 2006 2007 2008 2009 2010 2011 2012 2013 2014 2015 2016
Residential Nonresidential
Exhibit 3: Value of nonresidential construction put in place, by subcomponent (United States)7
24.1%
-0.2%
130.5%
0.6%
5.3%
-54.8%
18.0%
50.9%
98.2%
26.9%
-7.5%
21.7%
Office
Commercial
Manufacturing
Health care
Educational
Religious
Amusement and recreation
Transportation
Power and communication
Highway and street
Public works
Other
Subcomponent percent change 2006-2016
Exhibit 5: Value of Infrastructure as a percent of nonresidential construction put in place (United States)10
37.5% 37.9% 36.5%37.1% 37.0%
37.3%37.5% 41.1% 46.3% 45.5%
46.6% 46.4%46.1% 43.5% 41.6%
$0
$100,000
$200,000
$300,000
$400,000
$500,000
$600,000
$700,000
$800,000
2002 2003 2004 2005 2006 2007 2008 2009 2010 2011 2012 2013 2014 2015 2016
$ M
illio
ns
$ Th
ousa
nds
Nonresidential Infrastructure
Exhibit 6: Value of infrastructure as a percent of nonresidential construction put in place (California)11
11.6% 12.8% 14.3% 13.4%14.3%
11.0% 10.7%10.7% 10.2% 9.9% 10.9%
27.5%
14.9%16.2% 13.0%$5,000,000
$0
$10,000,000
$15,000,000
$20,000,000
$25,000,000
$30,000,000
2002 2003 2004 2005 2006 2007 2008 2009 2010 2011 2012 2013 2014 2015 2016
Nonresidential Infrastructure
Exhibit 7: Construction value added as a percent of GDP (United States)12
Exhibit 8: Construction value added as a percent of GRP (California)13
7.8% 7.8%8.1%
8.6%8.4%
8.0%
7.4%
6.3%
5.4%5.1%
5.3%5.5%
5.8%
6.2%6.4%
3.0%
4.0%
5.0%
6.0%
7.0%
8.0%
9.0%
2002 2003 2004 2005 2006 2007 2008 2009 2010 2011 2012 2013 2014 2015 2016
2002 2003 2004 2005 2006 2007 2008 2009 2010 2011 2012 2013 2014 2015 2016
3.0% 3.1%3.3% 3.3%
2.8%
2.3%
1.6%
1.0% 1.0% 1.1%1.3%
1.8% 1.8%2.0% 2.0%
0.0%
0.5%
1.0%
1.5%
2.0%
2.5%
3.0%
3.5%
4.0%
Exhibit 9: Construction value added as a percent of GRP (California, Sacramento region and Bay Area)16
3.0%
6.8% 6.9%
3.6%
1.2%1.4%
1.7%
2.3%
2.4%
0.0%
1.0%
2.0%
3.0%
4.0%
5.0%
6.0%
7.0%
8.0%
2002 2003 2004 2005 2006 2007 2008 2009 2010 2011 2012 2013 2014 2015
State Sacramento Metro (6-county) Bay Area Metro (9-county)
Exhibit 10: Housing unit supply versus demand in the Sacramento region
Exh ibit 11: Residen tial building units in the six-county Sacramento region (permi t data)20
19,865
14,239
10,996 8,932
6,483 7,768 9,125
10,399
19,122
23,812
17,987
2,293 3,939 4,652
6,492
0
5,000
10,000
15,000
20,000
25,000
30,000
2002 2003 2004 2005 2006 2007 2008 2009 2010 2011 2012 2013 2014 2015 2016 2017
Housing Unit Demand Housing Unit Supply
14,01415,671
19,78419,630
21,65218,612
10,1257,931
4,1752,493 2,326 1,938 2,965 3,772 3,967
5,526 6,401
3,226
3,868
4,628 4,7613,612
2,911
3,568
1,555
1,818 438 539 759631
982 7461,265
1,053
0
5,000
10,000
15,000
20,000
25,000
30,000
2000 2001 2002 2003 2004 2005 2006 2007 2008 2009 2010 2011 2012 2013 2014 2015 2016
Single Family Units Multifamily Units
Exhibit 13: Value of nonresidential construction in the six-county Sacramento region 21
$0
$200,000
$400,000
$600,000
$800,000
$1,000 ,000
$1,200 ,000
$1,400 ,000
$1,600 ,000
$1,800 ,000
$2,000 ,000
2000 2001 2002 2003 2004 2005 2006 2007 2008 2009 2010 2011 2012 2013 2014 2015 2016
El Dorado Placer Sacramento Yolo Yuba Sutter
Exhibit 14: Percent of nonresidential construction value in the Sacramento region, by county22
0%
10%
20%
30%
40%
50%
60%
70%
80%
90%
100%
2006 2016
El Dorado Placer Sacramento Yolo Yuba
Exhibit 17: Average annual earnings in traded and non-traded clusters in the study regions (2016)
$85,
512
$58,
972
$67,
498
$97,
280
$78,
396
$100
,688
$90,
080
$63,
145
$72,
018
$0
$20,000
$40,000
$60,000
$80,000
$100,000
$120,000
Traded Non-Traded All Industries
Sacramento Region Bay Area Californ ia
Exhibit 18: Traded subcluster employment index, Sacramento region (2001-2021)25
Water, Sewage, and Other Systems Projection
Projection
Projection
Projection
Projection
Construction Materials
Construction
Construction Products
Construction Components
Empl
oym
ent i
ndex
(2
006
Empl
oym
ent =
100
)
Empl
oym
ent i
ndex
(2
006
Empl
oym
ent =
100
)
Exhibit 24: Non-traded subcluster employment index, Sacramento region (2001-2021)36
101.0 119.3
87.2104.7
73.7
136.3
36.1
29.6
17.9
0.0
25.0
50.0
75.0
100.0
125.0
150.0
2001 2006 2011 2016 2021
Water and Sewer Line Construction Projection
Concrete Products Projection
Real Estate Services Projection
Specialty Contractors Projection
General Contractors Projection
Developers Projection
* Only included subclusters with 10k+employment or significant employment change. Refer to appendix for the complete list of nontraded subclusters.
Exhibit 39: Entering construction industry workers by type of education and training in the Sacramento region (annual average, 2014-2016)59
368
217181
56 54
148125 107
84
28 27 19 13 3
29
369
129
109
198
136
10561
35 8 13 14 8 10
0
50
100
150
200
250
300
350
400
Apprentices Oth er Post-Secondary Completions
Exhibit 44: Projected annual construction industry occupational gaps in the Sacramento region (2016-2021)60
-3
-2
-1
32
45
57
58
68
103
173
196
308
322
397
427
500
524
607
640
864
1,937
-200 100 400 700 1,000 1,300 1,600 1,900
Insulation Workers
Drafters
Interior Designers
PV Installers
Glaziers
Surveyors
Building Inspectors
Roofers
Ironworkers & Welders
Architects
Drywall Installers
HVAC & Sheet Metal
Painters
Masonry, Tile, Floor, Lathe, Plaster
Plumbers & Pipefitters
Engineers
Heavy Equipment Operators
Real Estate Professionals
Electricians
Construction Managers
Carpenters
Exhibit 47: Unionized and non-unionized workforce, Sacramento--Arden-Arcade--Roseville MSA and 10-county Bay Area (annual average, 2014-2017)61
Exhibit 48: Unionization in the construction workforce as an annual average percentage of total employment, Sacramento--Arden-Arcade--Roseville MSA (2000-2017)62
31%, 32,314
29%, 12,555
69%, 70,898
71%, 30,110
0% 20% 40% 60% 80% 100%
10-County Bay Area
Sacramento MSA
Union Non-Union
32%
20% 19%24% 23%
29%
68%
80% 81%76% 77%
71%
0%
10%
20%
30%
40%
50%
60%
70%
80%
90%
2000 – 2002 2003 – 2004 2005 –2008 2008 – 2011 2011 – 2014 2014 – 2017
Union Non-Union
Exhibit 1A. Construction managers projected annual openings, n = 871 (2016-2021)67
Cost Estimators, 206openings, 24%
Construction Managers,
225 openings, 26%
First-Line Supervisors of Construction Trades and
Extraction Workers,440 openings, 50%
0 100 200 300 400 500 600 700 800 900 1,000
Construction Products, 81
Water, Sewage, and Other Systems, 908
-10.0%
-5.0%
0.0%
5.0%
10.0%
15.0%
20.0%
25.0%
0.0 0.5 1.0 1.5 2.0 2.5 3.0 3.5
Location Quotient (2016)
Location Quotient (2016)
Ann
ual E
mpl
oym
ent G
row
th R
ate
(200
6-20
16)
Subcluster with an annual average earnings higher than all-industry annual average earnings in ($67,498) Sacramento region in 2016
LQ=1.0
Exhibit 2C: Non-traded subclusters in the Sacramento region73
Specialty Contractors, 50,899
General Contractors, 16,843
Real Estate Services, 15,475
Construction Materials Retailing, 6,552
Highway and Street Construction, 2,268
Water and Sewer Line Construction, 1,662
Building Equipment Distribution, 1,207
Developers
-15.0%
-10.0%
-5.0%
0.0%
5.0%
0.8 1.0 1.2 1.4
Ann
ual E
mpl
oym
ent G
row
th R
ate
(200
6-20
16
Exhibit 2E: Joint apprentices by gender in the Sacramento region (January 2012-October 2017)
Exhibit 3E: Joint apprentices by county of residence in the Sacramento region (January 2012-October 2017)
8,374, 97%
249, 3%
El Dorado,393, 56%
Placer,949, 11%
Sacramento, 6077, 1
Sutter, 346,4%
Yolo, 549,6%
Yuba, 309,
4%
Exhibit 4E: Joint apprentices’ highest level of education prior to apprenticeship in the Sacramento region (January 2012-October 2017)
Exhibit 5E: Number of weeks worked, all workers in the construction sector in the Sacramento region (2015)84
Less than highschool, 7%
High schoolgraduate orGED, 65%
Some college,25%
4 or more yearsof college, 3%
3,165 6%
3,082 6%
1,650 3%
6,105 12%
7,068 10%
31,037 62%
0 5,000 10,000 15,000 20,000 25,000 30,000 35,000
Did not work
Less than 14
14 to 26
27 to 39
40 to 49
50 to 52
# w
eeks
wor
ked
in th
e la
st y
ear
Exhibit 4: Value of nonresidential construction put in place, by subcomponent (California)9
-0.5%
29.2%
-41.1%
0.0%
62.9%
-34.7%
46.0%
42.8%
19.1%
-14.6%
66.5%
763.4%
Office
Commercial
Manufacturing
Health care
Educational
Religious
Amusement and recreation
Transportation
Power and communication
Highway and street
Public works
Other
Subcomponent percent change 2006-2016
180.8
593.7
818.9
21.4
235.8 342.3
104.9 133.6 173.5
0.0
100.0
200.0
300.0
400.0
500.0
600.0
700.0
800.0
900.0
1000.0
2001 2006 2011 2016 2021
Construction Materials,125
Construction, 1,942
Construction Components, 466
LQ=1.0
Concrete Products, 1,123
Construction Materials Wholesaling, 1,647
Subcluster with an annual average earnings higher than all-industry annual average earnings ($67,498) in Sacramento region in 2016
Exhibit 1E: Total joint apprentice starts, residents in the six-county Sacramento region (January 2012-October 2017) (n = 8,617)2
435
95
104
111
117
121
135
161
174
178
215
302
340
440
458
483
542
602
1,045
1,205
1,354
0 200 400 600 800 1000 1200 1400 1600
All others
Elevator constructor
Drywall finisher
Scaffold and shoring erector
Inspector or surveyor
Pile driver
Glazier
Carpet, linoleum, and soft tile layer
Millwright
Sheet metal worker & related trades
Construction equipment operator trades
Brick, marble, terrazzo, tile, and related trades
Roofer and waterproofer
Plumber and fitter trades
Painter trades
Cement mason and plasterer trades
Electricial trades
Drywall/lather
Ironworker trades
Carpenter
Construction craft laborer
Exhibit 38: Anticipated annual construction industry job openings by new and replacement jobs in the Sacramento region (2016-2021)1
21 26 59 60 52 78 99 167 167 220323 350 399 439 473
596 679788 777 763
2,119
4 6 1 1 20 7 520 27 2
71 56100 95 73
4699
82 95222
215
0
500
1000
1500
2000
2500
Annual Replacement Openings New Jobs (Growth)
Male
Female
$ Th
ousa
nds
Thou
sand
s of
Dol
lars
Average annual openings (demand) minuseducation and training (supply) =approximate annual shortage
Approximate annual shortage = 7,250 workers across all categories
Sutter
6.2% 5.1%
27.6%
14.4%
50.6%69.9%
10.8%7.9%
1.1% 0.6%3.6% 2.0%
59 EMSI – 2017.3 QCEW, Non-QCEW, Self-Employed.

42 CONSTRUCTION: CLUSTER AND WORKFORCE NEEDS ASSESSMENT, SACRAMENTO REGION
OCCUPATIONAL DEMAND, TRAINING & EDUCATION SUPPLY GAP ANALYSISOccupational supply
The Sacramento region possesses robust training and education assets to prepare the construction workforce. Local
programs prepare hundreds of students on average annually. Using the categories developed in the crosswalk enables an
estimate of training supply production. Some categories are served by apprenticeship training programs, such as plumbers
and pipefitters; other categories are served by postsecondary institutions, including colleges, universities or other providers.
(See the training maps and crosswalk tables in Appendix A). Still other occupational categories—such as HVAC and sheet
metal, and electricians—are trained through a blend of apprenticeships and programs offered by other postsecondary
training providers. In reality, workers may cross these category boundaries; in a few cases, the same workers may be
counted in a similar category. Nonetheless, the categories and counts represent accepted labor market research practices
and available data.
The numbers in Exhibit 39 reflect the aggregate numbers of completers of training programs and the number of students
entering apprenticeships. The counts in each category combine a range of program types and duration. The range is
justified due to a similar range of activity captured in the occupational data. The counts represent the average annual
supply of workers in each category by type of education and training—postsecondary (community colleges, universities
and private providers) and apprenticeships (union and non-union). The counts do not take into account workers who may
enter the market from outside the region or local program participants who leave the region. In addition, the counts do
not reflect participants from programs that are not accredited that are offered through community-based organizations,
employer-led incumbent worker training or other third-party providers.
Carpenters, engineers, electricians, ironworkers and welders, and heavy equipment operators represent the categories with
the largest number of construction workers available to enter the workforce.
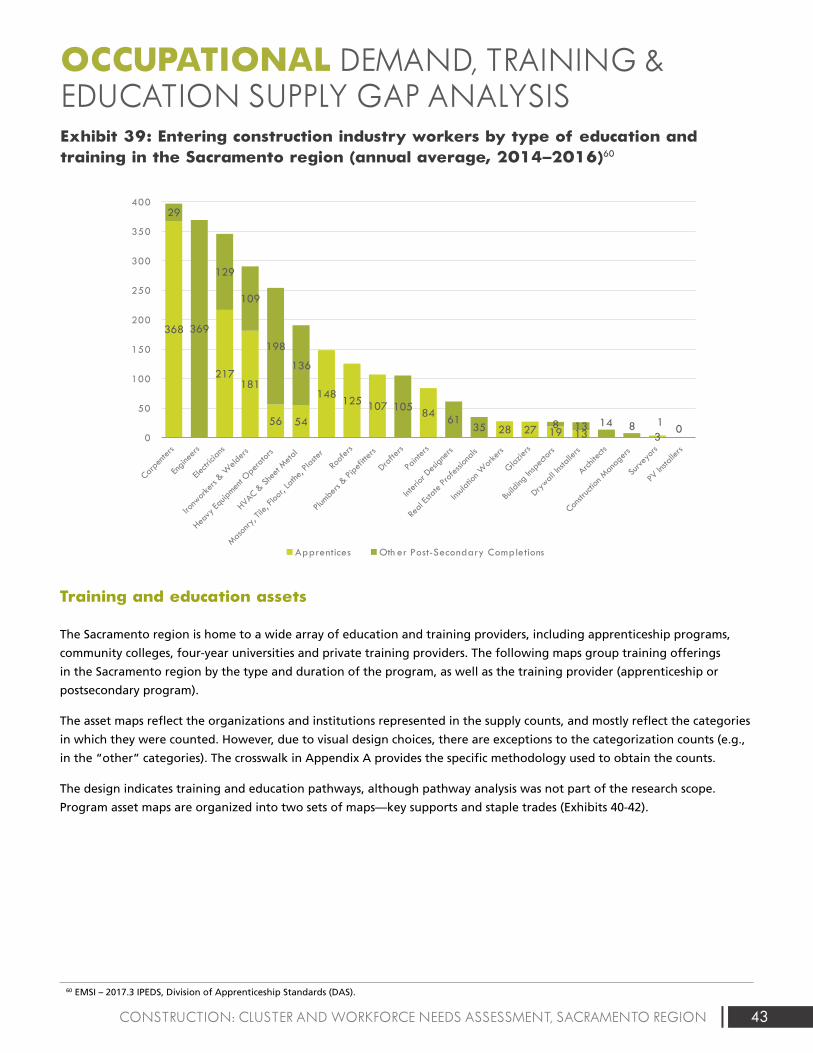
43CONSTRUCTION: CLUSTER AND WORKFORCE NEEDS ASSESSMENT, SACRAMENTO REGION
Training and education assets
The Sacramento region is home to a wide array of education and training providers, including apprenticeship programs,
community colleges, four-year universities and private training providers. The following maps group training offerings
in the Sacramento region by the type and duration of the program, as well as the training provider (apprenticeship or
postsecondary program).
The asset maps reflect the organizations and institutions represented in the supply counts, and mostly reflect the categories
in which they were counted. However, due to visual design choices, there are exceptions to the categorization counts (e.g.,
in the “other” categories). The crosswalk in Appendix A provides the specific methodology used to obtain the counts.
The design indicates training and education pathways, although pathway analysis was not part of the research scope.
Program asset maps are organized into two sets of maps—key supports and staple trades (Exhibits 40-42).
OCCUPATIONAL DEMAND, TRAINING & EDUCATION SUPPLY GAP ANALYSISExhibit 39: Entering construction industry workers by type of education and training in the Sacramento region (annual average, 2014–2016)60Exhibit 1: Value of construction put in place (United States)3
$1,161,282
$788,332
$1,185,683
$0
$200,000
$400,000
$600,000
$800,000
$1,000,000
$1,200,000
$1,400,000
2002 2003 2004 2005 2006 2007 2008 2009 2010 2011 2012 2013 2014 2015 2016
Mill
ions
of
Dol
lars
Residential Nonresidential
Exhibit 2: Value of construction put in place (California)5
$58,091,975
$18,740,050
$51,350,955
$0
$10,000,000
$20,000,000
$30,000,000
$40,000,000
$50,000,000
$60,000,000
$70,000,000
2002 2003 2004 2005 2006 2007 2008 2009 2010 2011 2012 2013 2014 2015 2016
Residential Nonresidential
Exhibit 3: Value of nonresidential construction put in place, by subcomponent (United States)7
24.1%
-0.2%
130.5%
0.6%
5.3%
-54.8%
18.0%
50.9%
98.2%
26.9%
-7.5%
21.7%
Office
Commercial
Manufacturing
Health care
Educational
Religious
Amusement and recreation
Transportation
Power and communication
Highway and street
Public works
Other
Subcomponent percent change 2006-2016
Exhibit 5: Value of Infrastructure as a percent of nonresidential construction put in place (United States)10
37.5% 37.9% 36.5%37.1% 37.0%
37.3%37.5% 41.1% 46.3% 45.5%
46.6% 46.4%46.1% 43.5% 41.6%
$0
$100,000
$200,000
$300,000
$400,000
$500,000
$600,000
$700,000
$800,000
2002 2003 2004 2005 2006 2007 2008 2009 2010 2011 2012 2013 2014 2015 2016
$ M
illio
ns
$ Th
ousa
nds
Nonresidential Infrastructure
Exhibit 6: Value of infrastructure as a percent of nonresidential construction put in place (California)11
11.6% 12.8% 14.3% 13.4%14.3%
11.0% 10.7%10.7% 10.2% 9.9% 10.9%
27.5%
14.9%16.2% 13.0%$5,000,000
$0
$10,000,000
$15,000,000
$20,000,000
$25,000,000
$30,000,000
2002 2003 2004 2005 2006 2007 2008 2009 2010 2011 2012 2013 2014 2015 2016
Nonresidential Infrastructure
Exhibit 7: Construction value added as a percent of GDP (United States)12
Exhibit 8: Construction value added as a percent of GRP (California)13
7.8% 7.8%8.1%
8.6%8.4%
8.0%
7.4%
6.3%
5.4%5.1%
5.3%5.5%
5.8%
6.2%6.4%
3.0%
4.0%
5.0%
6.0%
7.0%
8.0%
9.0%
2002 2003 2004 2005 2006 2007 2008 2009 2010 2011 2012 2013 2014 2015 2016
2002 2003 2004 2005 2006 2007 2008 2009 2010 2011 2012 2013 2014 2015 2016
3.0% 3.1%3.3% 3.3%
2.8%
2.3%
1.6%
1.0% 1.0% 1.1%1.3%
1.8% 1.8%2.0% 2.0%
0.0%
0.5%
1.0%
1.5%
2.0%
2.5%
3.0%
3.5%
4.0%
Exhibit 9: Construction value added as a percent of GRP (California, Sacramento region and Bay Area)16
3.0%
6.8% 6.9%
3.6%
1.2%1.4%
1.7%
2.3%
2.4%
0.0%
1.0%
2.0%
3.0%
4.0%
5.0%
6.0%
7.0%
8.0%
2002 2003 2004 2005 2006 2007 2008 2009 2010 2011 2012 2013 2014 2015
State Sacramento Metro (6-county) Bay Area Metro (9-county)
Exhibit 10: Housing unit supply versus demand in the Sacramento region
Exh ibit 11: Residen tial building units in the six-county Sacramento region (permi t data)20
19,865
14,239
10,996 8,932
6,483 7,768 9,125
10,399
19,122
23,812
17,987
2,293 3,939 4,652
6,492
0
5,000
10,000
15,000
20,000
25,000
30,000
2002 2003 2004 2005 2006 2007 2008 2009 2010 2011 2012 2013 2014 2015 2016 2017
Housing Unit Demand Housing Unit Supply
14,01415,671
19,78419,630
21,65218,612
10,1257,931
4,1752,493 2,326 1,938 2,965 3,772 3,967
5,526 6,401
3,226
3,868
4,628 4,7613,612
2,911
3,568
1,555
1,818 438 539 759631
982 7461,265
1,053
0
5,000
10,000
15,000
20,000
25,000
30,000
2000 2001 2002 2003 2004 2005 2006 2007 2008 2009 2010 2011 2012 2013 2014 2015 2016
Single Family Units Multifamily Units
Exhibit 13: Value of nonresidential construction in the six-county Sacramento region 21
$0
$200,000
$400,000
$600,000
$800,000
$1,000 ,000
$1,200 ,000
$1,400 ,000
$1,600 ,000
$1,800 ,000
$2,000 ,000
2000 2001 2002 2003 2004 2005 2006 2007 2008 2009 2010 2011 2012 2013 2014 2015 2016
El Dorado Placer Sacramento Yolo Yuba Sutter
Exhibit 14: Percent of nonresidential construction value in the Sacramento region, by county22
0%
10%
20%
30%
40%
50%
60%
70%
80%
90%
100%
2006 2016
El Dorado Placer Sacramento Yolo Yuba
Exhibit 17: Average annual earnings in traded and non-traded clusters in the study regions (2016)
$85,
512
$58,
972
$67,
498
$97,
280
$78,
396
$100
,688
$90,
080
$63,
145
$72,
018
$0
$20,000
$40,000
$60,000
$80,000
$100,000
$120,000
Traded Non-Traded All Industries
Sacramento Region Bay Area Californ ia
Exhibit 18: Traded subcluster employment index, Sacramento region (2001-2021)25
Water, Sewage, and Other Systems Projection
Projection
Projection
Projection
Projection
Construction Materials
Construction
Construction Products
Construction Components
Empl
oym
ent i
ndex
(2
006
Empl
oym
ent =
100
)
Empl
oym
ent i
ndex
(2
006
Empl
oym
ent =
100
)
Exhibit 24: Non-traded subcluster employment index, Sacramento region (2001-2021)36
101.0 119.3
87.2104.7
73.7
136.3
36.1
29.6
17.9
0.0
25.0
50.0
75.0
100.0
125.0
150.0
2001 2006 2011 2016 2021
Water and Sewer Line Construction Projection
Concrete Products Projection
Real Estate Services Projection
Specialty Contractors Projection
General Contractors Projection
Developers Projection
* Only included subclusters with 10k+employment or significant employment change. Refer to appendix for the complete list of nontraded subclusters.
Exhibit 39: Entering construction industry workers by type of education and training in the Sacramento region (annual average, 2014-2016)59
368
217181
56 54
148125 107
84
28 27 19 13 3
29
369
129
109
198
136
10561
35 8 13 14 8 10
0
50
100
150
200
250
300
350
400
Apprentices Oth er Post-Secondary Completions
Exhibit 44: Projected annual construction industry occupational gaps in the Sacramento region (2016-2021)60
-3
-2
-1
32
45
57
58
68
103
173
196
308
322
397
427
500
524
607
640
864
1,937
-200 100 400 700 1,000 1,300 1,600 1,900
Insulation Workers
Drafters
Interior Designers
PV Installers
Glaziers
Surveyors
Building Inspectors
Roofers
Ironworkers & Welders
Architects
Drywall Installers
HVAC & Sheet Metal
Painters
Masonry, Tile, Floor, Lathe, Plaster
Plumbers & Pipefitters
Engineers
Heavy Equipment Operators
Real Estate Professionals
Electricians
Construction Managers
Carpenters
Exhibit 47: Unionized and non-unionized workforce, Sacramento--Arden-Arcade--Roseville MSA and 10-county Bay Area (annual average, 2014-2017)61
Exhibit 48: Unionization in the construction workforce as an annual average percentage of total employment, Sacramento--Arden-Arcade--Roseville MSA (2000-2017)62
31%, 32,314
29%, 12,555
69%, 70,898
71%, 30,110
0% 20% 40% 60% 80% 100%
10-County Bay Area
Sacramento MSA
Union Non-Union
32%
20% 19%24% 23%
29%
68%
80% 81%76% 77%
71%
0%
10%
20%
30%
40%
50%
60%
70%
80%
90%
2000 – 2002 2003 – 2004 2005 –2008 2008 – 2011 2011 – 2014 2014 – 2017
Union Non-Union
Exhibit 1A. Construction managers projected annual openings, n = 871 (2016-2021)67
Cost Estimators, 206openings, 24%
Construction Managers,
225 openings, 26%
First-Line Supervisors of Construction Trades and
Extraction Workers,440 openings, 50%
0 100 200 300 400 500 600 700 800 900 1,000
Construction Products, 81
Water, Sewage, and Other Systems, 908
-10.0%
-5.0%
0.0%
5.0%
10.0%
15.0%
20.0%
25.0%
0.0 0.5 1.0 1.5 2.0 2.5 3.0 3.5
Location Quotient (2016)
Location Quotient (2016)
Ann
ual E
mpl
oym
ent G
row
th R
ate
(200
6-20
16)
Subcluster with an annual average earnings higher than all-industry annual average earnings in ($67,498) Sacramento region in 2016
LQ=1.0
Exhibit 2C: Non-traded subclusters in the Sacramento region73
Specialty Contractors, 50,899
General Contractors, 16,843
Real Estate Services, 15,475
Construction Materials Retailing, 6,552
Highway and Street Construction, 2,268
Water and Sewer Line Construction, 1,662
Building Equipment Distribution, 1,207
Developers
-15.0%
-10.0%
-5.0%
0.0%
5.0%
0.8 1.0 1.2 1.4
Ann
ual E
mpl
oym
ent G
row
th R
ate
(200
6-20
16
Exhibit 2E: Joint apprentices by gender in the Sacramento region (January 2012-October 2017)
Exhibit 3E: Joint apprentices by county of residence in the Sacramento region (January 2012-October 2017)
8,374, 97%
249, 3%
El Dorado,393, 56%
Placer,949, 11%
Sacramento, 6077, 1
Sutter, 346,4%
Yolo, 549,6%
Yuba, 309,
4%
Exhibit 4E: Joint apprentices’ highest level of education prior to apprenticeship in the Sacramento region (January 2012-October 2017)
Exhibit 5E: Number of weeks worked, all workers in the construction sector in the Sacramento region (2015)84
Less than highschool, 7%
High schoolgraduate orGED, 65%
Some college,25%
4 or more yearsof college, 3%
3,165 6%
3,082 6%
1,650 3%
6,105 12%
7,068 10%
31,037 62%
0 5,000 10,000 15,000 20,000 25,000 30,000 35,000
Did not work
Less than 14
14 to 26
27 to 39
40 to 49
50 to 52
# w
eeks
wor
ked
in th
e la
st y
ear
Exhibit 4: Value of nonresidential construction put in place, by subcomponent (California)9
-0.5%
29.2%
-41.1%
0.0%
62.9%
-34.7%
46.0%
42.8%
19.1%
-14.6%
66.5%
763.4%
Office
Commercial
Manufacturing
Health care
Educational
Religious
Amusement and recreation
Transportation
Power and communication
Highway and street
Public works
Other
Subcomponent percent change 2006-2016
180.8
593.7
818.9
21.4
235.8 342.3
104.9 133.6 173.5
0.0
100.0
200.0
300.0
400.0
500.0
600.0
700.0
800.0
900.0
1000.0
2001 2006 2011 2016 2021
Construction Materials,125
Construction, 1,942
Construction Components, 466
LQ=1.0
Concrete Products, 1,123
Construction Materials Wholesaling, 1,647
Subcluster with an annual average earnings higher than all-industry annual average earnings ($67,498) in Sacramento region in 2016
Exhibit 1E: Total joint apprentice starts, residents in the six-county Sacramento region (January 2012-October 2017) (n = 8,617)2
435
95
104
111
117
121
135
161
174
178
215
302
340
440
458
483
542
602
1,045
1,205
1,354
0 200 400 600 800 1000 1200 1400 1600
All others
Elevator constructor
Drywall finisher
Scaffold and shoring erector
Inspector or surveyor
Pile driver
Glazier
Carpet, linoleum, and soft tile layer
Millwright
Sheet metal worker & related trades
Construction equipment operator trades
Brick, marble, terrazzo, tile, and related trades
Roofer and waterproofer
Plumber and fitter trades
Painter trades
Cement mason and plasterer trades
Electricial trades
Drywall/lather
Ironworker trades
Carpenter
Construction craft laborer
Exhibit 38: Anticipated annual construction industry job openings by new and replacement jobs in the Sacramento region (2016-2021)1
21 26 59 60 52 78 99 167 167 220323 350 399 439 473
596 679788 777 763
2,119
4 6 1 1 20 7 520 27 2
71 56100 95 73
4699
82 95222
215
0
500
1000
1500
2000
2500
Annual Replacement Openings New Jobs (Growth)
Male
Female
$ Th
ousa
nds
Thou
sand
s of
Dol
lars
Average annual openings (demand) minuseducation and training (supply) =approximate annual shortage
Approximate annual shortage = 7,250 workers across all categories
Sutter
6.2% 5.1%
27.6%
14.4%
50.6%69.9%
10.8%7.9%
1.1% 0.6%3.6% 2.0%
60 EMSI – 2017.3 IPEDS, Division of Apprenticeship Standards (DAS).
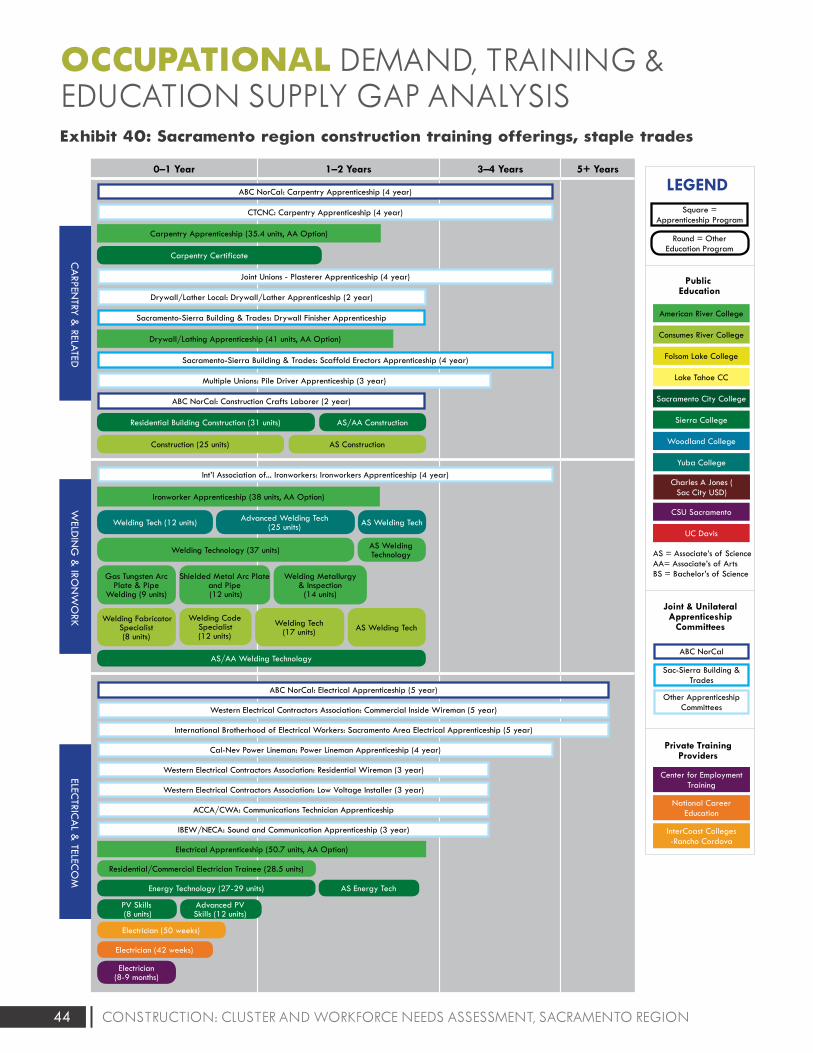
44 CONSTRUCTION: CLUSTER AND WORKFORCE NEEDS ASSESSMENT, SACRAMENTO REGION
Exhibit 40: Sacramento region construction training offerings, staple trades
OCCUPATIONAL DEMAND, TRAINING & EDUCATION SUPPLY GAP ANALYSIS
5+ Years3–4 Years1–2 Years0–1 Year
CA
RPENTRY &
RELATED W
ELDIN
G &
IRON
WO
RK ELEC
TRICA
L & TELEC
OM
Welding Technology (37 units) AS Welding Technology
Shielded Metal Arc Plate and Pipe (12 units)
Welding Metallurgy & Inspection
(14 units)
Gas Tungsten Arc Plate & Pipe
Welding (9 units)
Welding Fabricator Specialist(8 units)
Welding Code Specialist(12 units)
Welding Tech(17 units) AS Welding Tech
Welding Tech (12 units) Advanced Welding Tech (25 units) AS Welding Tech
Int’l Association of... Ironworkers: Ironworkers Apprenticeship (4 year)
Ironworker Apprenticeship (38 units, AA Option)
AS/AA Welding Technology
Electrical Apprenticeship (50.7 units, AA Option)
Residential/Commercial Electrician Trainee (28.5 units)
Electrician(8-9 months)
ABC NorCal: Electrical Apprenticeship (5 year)
Western Electrical Contractors Association: Commercial Inside Wireman (5 year)
International Brotherhood of Electrical Workers: Sacramento Area Electrical Apprenticeship (5 year)
Western Electrical Contractors Association: Residential Wireman (3 year)
Western Electrical Contractors Association: Low Voltage Installer (3 year)
Energy Technology (27-29 units) AS Energy Tech
PV Skills (8 units)
Advanced PV Skills (12 units)
Electrician (42 weeks)
Electrician (50 weeks)
ACCA/CWA: Communications Technician Apprenticeship
Cal-Nev Power Lineman: Power Lineman Apprenticeship (4 year)
IBEW/NECA: Sound and Communication Apprenticeship (3 year)
Carpentry Apprenticeship (35.4 units, AA Option)
Drywall/Lathing Apprenticeship (41 units, AA Option)
Construction (25 units) AS Construction
Residential Building Construction (31 units) AS/AA Construction
ABC NorCal: Construction Crafts Laborer (2 year)
ABC NorCal: Carpentry Apprenticeship (4 year)
CTCNC: Carpentry Apprenticeship (4 year)
Sacramento-Sierra Building & Trades: Drywall Finisher Apprenticeship
Drywall/Lather Local: Drywall/Lather Apprenticeship (2 year)
Joint Unions - Plasterer Apprenticeship (4 year)
Multiple Unions: Pile Driver Apprenticeship (3 year)
Sacramento-Sierra Building & Trades: Scaffold Erectors Apprenticeship (4 year)
Carpentry Certificate
LEGENDSquare =
Apprenticeship Program
Round = Other Education Program
Private Training Providers
Center for Employment Training
National Career Education
InterCoast Colleges -Rancho Cordova
Public Education
American River College
Consumes River College
Folsom Lake College
Lake Tahoe CC
Sacramento City College
Sierra College
Woodland College
Yuba College
CSU Sacramento
UC Davis
Charles A Jones ( Sac City USD)
Joint & Unilateral Apprenticeship
Committees
Other Apprenticeship Committees
ABC NorCal
Sac-Sierra Building & Trades
AS = Associate’s of ScienceAA= Associate’s of ArtsBS = Bachelor’s of Science
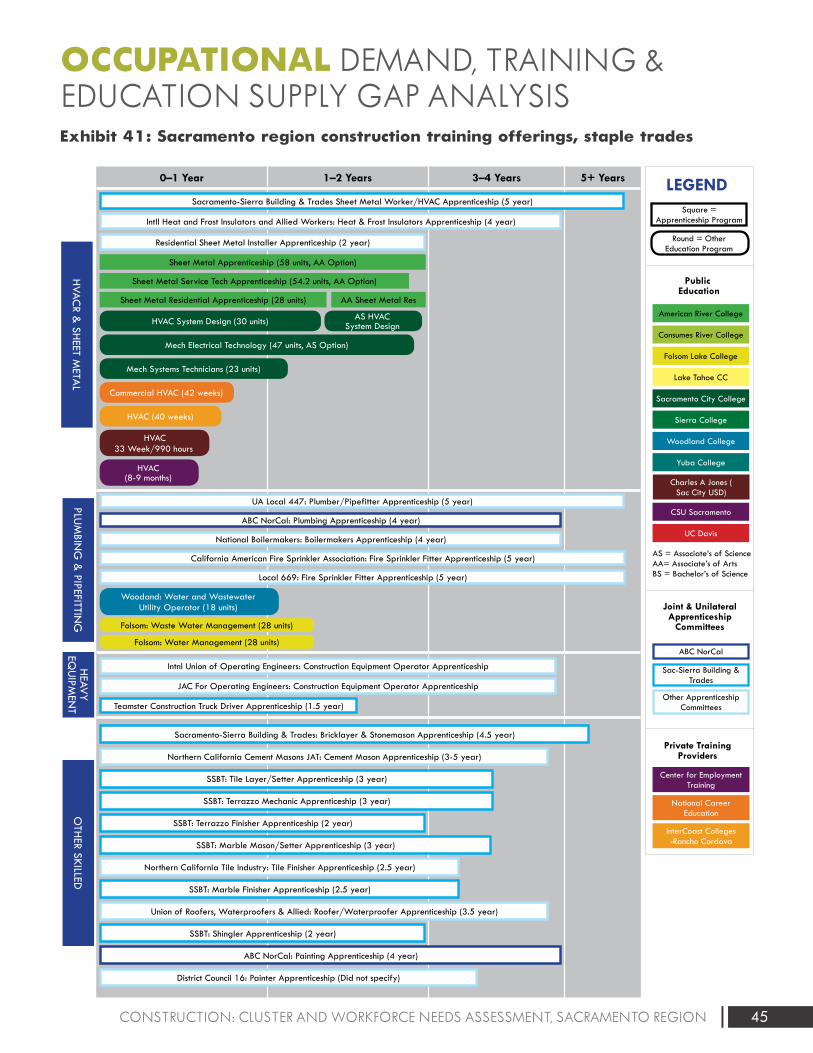
45CONSTRUCTION: CLUSTER AND WORKFORCE NEEDS ASSESSMENT, SACRAMENTO REGION
Exhibit 41: Sacramento region construction training offerings, staple trades
OCCUPATIONAL DEMAND, TRAINING & EDUCATION SUPPLY GAP ANALYSIS
LEGENDSquare =
Apprenticeship Program
Round = Other Education Program
Private Training Providers
Center for Employment Training
National Career Education
InterCoast Colleges -Rancho Cordova
Public Education
American River College
Consumes River College
Folsom Lake College
Lake Tahoe CC
Sacramento City College
Sierra College
Woodland College
Yuba College
CSU Sacramento
UC Davis
Charles A Jones ( Sac City USD)
Joint & Unilateral Apprenticeship
Committees
Other Apprenticeship Committees
ABC NorCal
Sac-Sierra Building & Trades
AS = Associate’s of ScienceAA= Associate’s of ArtsBS = Bachelor’s of Science
5+ Years3–4 Years1–2 Years0–1 Year
HVAC
R & SH
EET META
LPLU
MBIN
G &
PIPEFITTING
OTH
ER SKILLEDH
EAVY
EQU
IPMEN
TSacramento-Sierra Building & Trades: Bricklayer & Stonemason Apprenticeship (4.5 year)
Northern California Cement Masons JAT: Cement Mason Apprenticeship (3-5 year)
SSBT: Tile Layer/Setter Apprenticeship (3 year)
SSBT: Terrazzo Mechanic Apprenticeship (3 year)
SSBT: Terrazzo Finisher Apprenticeship (2 year)
SSBT: Marble Mason/Setter Apprenticeship (3 year)
Northern California Tile Industry: Tile Finisher Apprenticeship (2.5 year)
SSBT: Marble Finisher Apprenticeship (2.5 year)
Union of Roofers, Waterproofers & Allied: Roofer/Waterproofer Apprenticeship (3.5 year)
SSBT: Shingler Apprenticeship (2 year)
District Council 16: Painter Apprenticeship (Did not specify)
ABC NorCal: Painting Apprenticeship (4 year)
Sheet Metal Service Tech Apprenticeship (54.2 units, AA Option)
Sheet Metal Apprenticeship (58 units, AA Option)
Sheet Metal Residential Apprenticeship (28 units) AA Sheet Metal Res
AS HVAC System DesignHVAC System Design (30 units)
HVAC33 Week/990 hours
Intll Heat and Frost Insulators and Allied Workers: Heat & Frost Insulators Apprenticeship (4 year)
Residential Sheet Metal Installer Apprenticeship (2 year)
Sacramento-Sierra Building & Trades Sheet Metal Worker/HVAC Apprenticeship (5 year)
HVAC (8-9 months)
Commercial HVAC (42 weeks)
HVAC (40 weeks)
Mech Electrical Technology (47 units, AS Option)
Mech Systems Technicians (23 units)
ABC NorCal: Plumbing Apprenticeship (4 year)
National Boilermakers: Boilermakers Apprenticeship (4 year)
Woodand: Water and Wastewater Utility Operator (18 units)
Folsom: Waste Water Management (28 units)
Folsom: Water Management (28 units)
UA Local 447: Plumber/Pipefitter Apprenticeship (5 year)
California American Fire Sprinkler Association: Fire Sprinkler Fitter Apprenticeship (5 year)
Local 669: Fire Sprinkler Fitter Apprenticeship (5 year)
Intnl Union of Operating Engineers: Construction Equipment Operator Apprenticeship
Teamster Construction Truck Driver Apprenticeship (1.5 year)
JAC For Operating Engineers: Construction Equipment Operator Apprenticeship
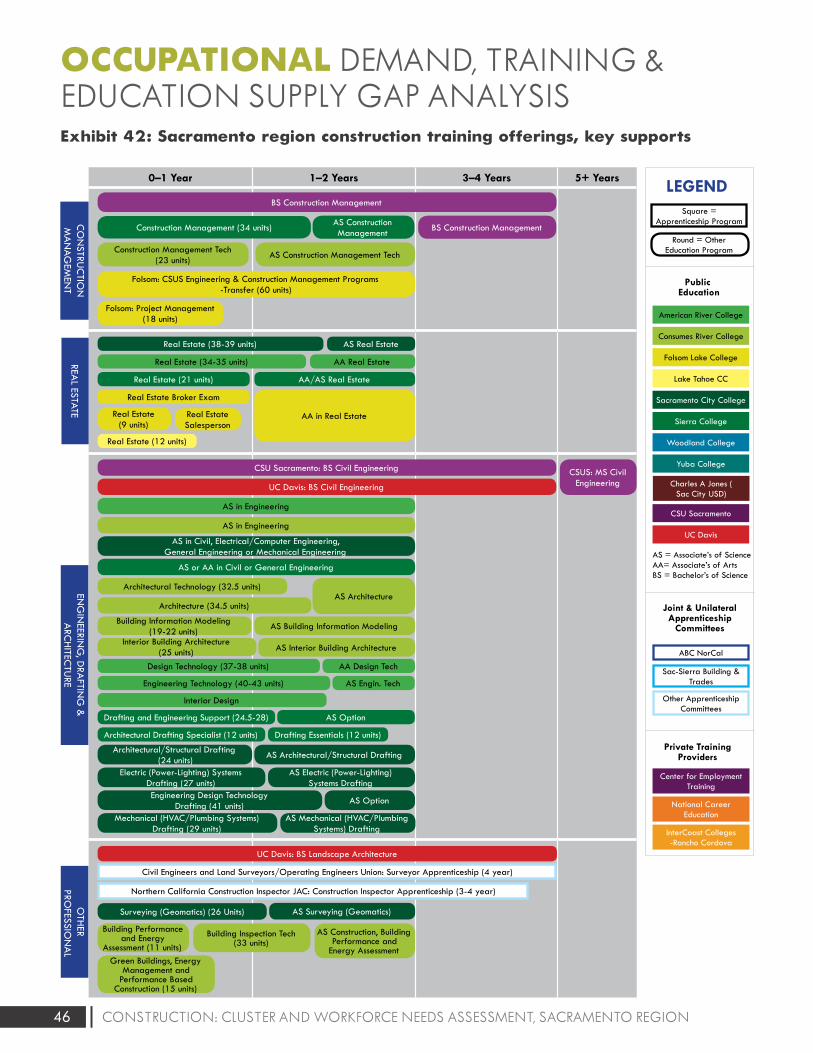
46 CONSTRUCTION: CLUSTER AND WORKFORCE NEEDS ASSESSMENT, SACRAMENTO REGION
Exhibit 42: Sacramento region construction training offerings, key supports
OCCUPATIONAL DEMAND, TRAINING & EDUCATION SUPPLY GAP ANALYSIS
LEGENDSquare =
Apprenticeship Program
Round = Other Education Program
Private Training Providers
Center for Employment Training
National Career Education
InterCoast Colleges -Rancho Cordova
Public Education
American River College
Consumes River College
Folsom Lake College
Lake Tahoe CC
Sacramento City College
Sierra College
Woodland College
Yuba College
CSU Sacramento
UC Davis
Charles A Jones ( Sac City USD)
Joint & Unilateral Apprenticeship
Committees
Other Apprenticeship Committees
ABC NorCal
Sac-Sierra Building & Trades
AS = Associate’s of ScienceAA= Associate’s of ArtsBS = Bachelor’s of Science
5+ Years3–4 Years1–2 Years0–1 Year
OTH
ER PRO
FESSION
AL
REAL ESTATE
ENG
INEERIN
G, D
RAFTIN
G &
A
RCH
ITECTU
RE
AS Construction Management TechConstruction Management Tech (23 units)
BS Construction Management
Folsom: Project Management (18 units)
Folsom: CSUS Engineering & Construction Management Programs -Transfer (60 units)
AS Construction ManagementConstruction Management (34 units) BS Construction Management
Green Buildings, Energy Management and
Performance Based Construction (15 units)
Civil Engineers and Land Surveyors/Operating Engineers Union: Surveyor Apprenticeship (4 year)
Northern California Construction Inspector JAC: Construction Inspector Apprenticeship (3-4 year)
Surveying (Geomatics) (26 Units) AS Surveying (Geomatics)
UC Davis: BS Landscape Architecture
Building Inspection Tech (33 units)
AS Construction, Building Performance and
Energy Assessment
Building Performance and Energy
Assessment (11 units)
CO
NSTRU
CTIO
N
MA
NAG
EMEN
T
Architectural Technology (32.5 units)AS Architecture
Architecture (34.5 units)
Building Information Modeling (19-22 units) AS Building Information Modeling
Interior Building Architecture (25 units) AS Interior Building Architecture
Architectural/Structural Drafting (24 units) AS Architectural/Structural Drafting
Electric (Power-Lighting) Systems Drafting (27 units)
AS Electric (Power-Lighting) Systems Drafting
Engineering Design TechnologyDrafting (41 units) AS Option
Mechanical (HVAC/Plumbing Systems) Drafting (29 units)
AS Mechanical (HVAC/Plumbing Systems) Drafting
CSU Sacramento: BS Civil Engineering CSUS: MS Civil EngineeringUC Davis: BS Civil Engineering
AS in Engineering
AS in Engineering
AS in Civil, Electrical/Computer Engineering, General Engineering or Mechanical Engineering
AS or AA in Civil or General Engineering
Design Technology (37-38 units) AA Design Tech
Engineering Technology (40-43 units) AS Engin. Tech
Drafting and Engineering Support (24.5-28) AS Option
Architectural Drafting Specialist (12 units) Drafting Essentials (12 units)
Interior Design
Real Estate (9 units)
AA in Real EstateReal Estate Salesperson
Real Estate Broker Exam
Real Estate (12 units)
Real Estate (38-39 units) AS Real Estate
Real Estate (34-35 units) AA Real Estate
Real Estate (21 units) AA/AS Real Estate
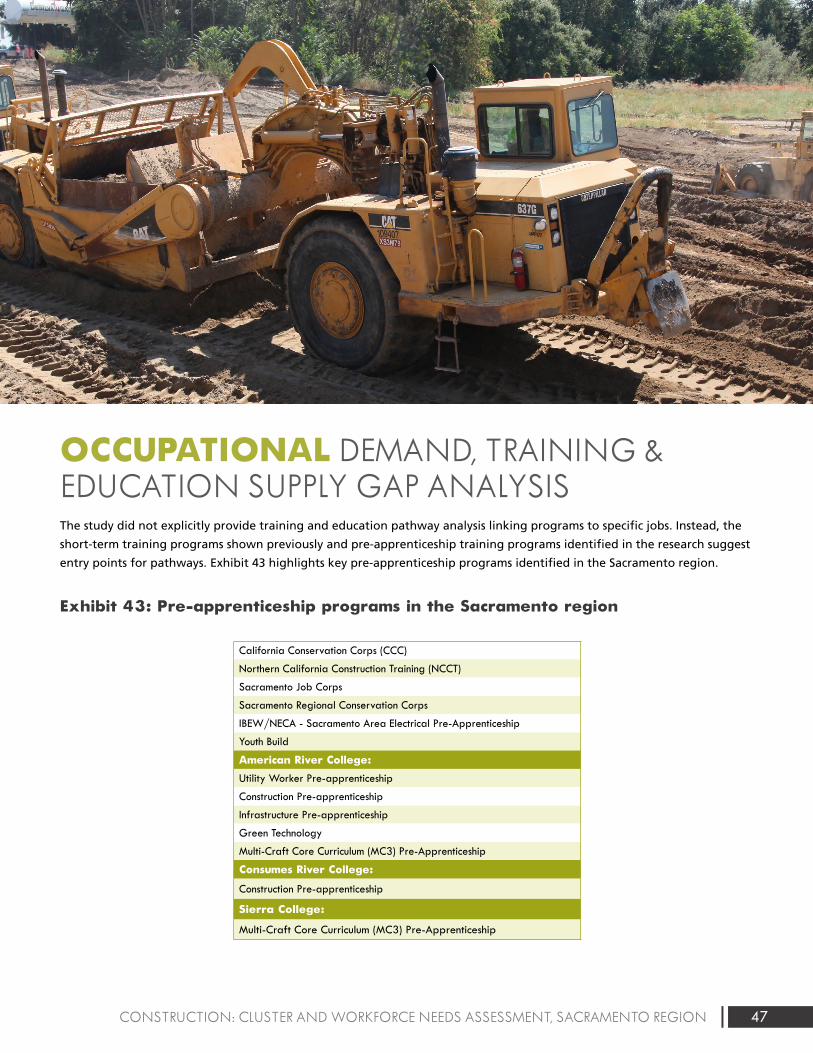
47CONSTRUCTION: CLUSTER AND WORKFORCE NEEDS ASSESSMENT, SACRAMENTO REGION
OCCUPATIONAL DEMAND, TRAINING & EDUCATION SUPPLY GAP ANALYSISThe study did not explicitly provide training and education pathway analysis linking programs to specific jobs. Instead, the
short-term training programs shown previously and pre-apprenticeship training programs identified in the research suggest
entry points for pathways. Exhibit 43 highlights key pre-apprenticeship programs identified in the Sacramento region.
Exhibit 43: Pre-apprenticeship programs in the Sacramento region
California Conservation Corps (CCC)
Northern California Construction Training (NCCT)
Sacramento Job Corps
Sacramento Regional Conservation Corps
IBEW/NECA - Sacramento Area Electrical Pre-Apprenticeship
Youth Build
American River College:
Utility Worker Pre-apprenticeship
Construction Pre-apprenticeship
Infrastructure Pre-apprenticeship
Green Technology
Multi-Craft Core Curriculum (MC3) Pre-Apprenticeship
Consumes River College:
Construction Pre-apprenticeship
Sierra College:
Multi-Craft Core Curriculum (MC3) Pre-Apprenticeship
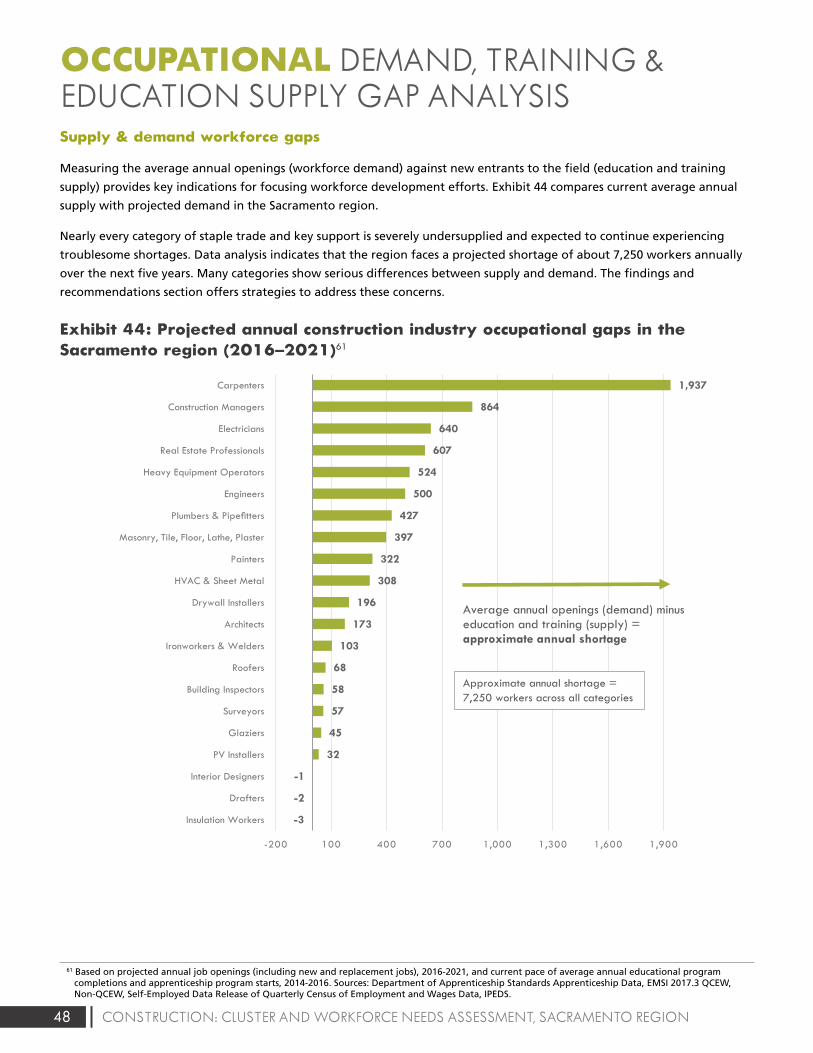
48 CONSTRUCTION: CLUSTER AND WORKFORCE NEEDS ASSESSMENT, SACRAMENTO REGION
Exhibit 1: Value of construction put in place (United States)3
$1,161,282
$788,332
$1,185,683
$0
$200,000
$400,000
$600,000
$800,000
$1,000,000
$1,200,000
$1,400,000
2002 2003 2004 2005 2006 2007 2008 2009 2010 2011 2012 2013 2014 2015 2016
Mill
ions
of
Dol
lars
Residential Nonresidential
Exhibit 2: Value of construction put in place (California)5
$58,091,975
$18,740,050
$51,350,955
$0
$10,000,000
$20,000,000
$30,000,000
$40,000,000
$50,000,000
$60,000,000
$70,000,000
2002 2003 2004 2005 2006 2007 2008 2009 2010 2011 2012 2013 2014 2015 2016
Residential Nonresidential
Exhibit 3: Value of nonresidential construction put in place, by subcomponent (United States)7
24.1%
-0.2%
130.5%
0.6%
5.3%
-54.8%
18.0%
50.9%
98.2%
26.9%
-7.5%
21.7%
Office
Commercial
Manufacturing
Health care
Educational
Religious
Amusement and recreation
Transportation
Power and communication
Highway and street
Public works
Other
Subcomponent percent change 2006-2016
Exhibit 5: Value of Infrastructure as a percent of nonresidential construction put in place (United States)10
37.5% 37.9% 36.5%37.1% 37.0%
37.3%37.5% 41.1% 46.3% 45.5%
46.6% 46.4%46.1% 43.5% 41.6%
$0
$100,000
$200,000
$300,000
$400,000
$500,000
$600,000
$700,000
$800,000
2002 2003 2004 2005 2006 2007 2008 2009 2010 2011 2012 2013 2014 2015 2016
$ M
illio
ns
$ Th
ousa
nds
Nonresidential Infrastructure
Exhibit 6: Value of infrastructure as a percent of nonresidential construction put in place (California)11
11.6% 12.8% 14.3% 13.4%14.3%
11.0% 10.7%10.7% 10.2% 9.9% 10.9%
27.5%
14.9%16.2% 13.0%$5,000,000
$0
$10,000,000
$15,000,000
$20,000,000
$25,000,000
$30,000,000
2002 2003 2004 2005 2006 2007 2008 2009 2010 2011 2012 2013 2014 2015 2016
Nonresidential Infrastructure
Exhibit 7: Construction value added as a percent of GDP (United States)12
Exhibit 8: Construction value added as a percent of GRP (California)13
7.8% 7.8%8.1%
8.6%8.4%
8.0%
7.4%
6.3%
5.4%5.1%
5.3%5.5%
5.8%
6.2%6.4%
3.0%
4.0%
5.0%
6.0%
7.0%
8.0%
9.0%
2002 2003 2004 2005 2006 2007 2008 2009 2010 2011 2012 2013 2014 2015 2016
2002 2003 2004 2005 2006 2007 2008 2009 2010 2011 2012 2013 2014 2015 2016
3.0% 3.1%3.3% 3.3%
2.8%
2.3%
1.6%
1.0% 1.0% 1.1%1.3%
1.8% 1.8%2.0% 2.0%
0.0%
0.5%
1.0%
1.5%
2.0%
2.5%
3.0%
3.5%
4.0%
Exhibit 9: Construction value added as a percent of GRP (California, Sacramento region and Bay Area)16
3.0%
6.8% 6.9%
3.6%
1.2%1.4%
1.7%
2.3%
2.4%
0.0%
1.0%
2.0%
3.0%
4.0%
5.0%
6.0%
7.0%
8.0%
2002 2003 2004 2005 2006 2007 2008 2009 2010 2011 2012 2013 2014 2015
State Sacramento Metro (6-county) Bay Area Metro (9-county)
Exhibit 10: Housing unit supply versus demand in the Sacramento region
Exh ibit 11: Residen tial building units in the six-county Sacramento region (permi t data)20
19,865
14,239
10,996 8,932
6,483 7,768 9,125
10,399
19,122
23,812
17,987
2,293 3,939 4,652
6,492
0
5,000
10,000
15,000
20,000
25,000
30,000
2002 2003 2004 2005 2006 2007 2008 2009 2010 2011 2012 2013 2014 2015 2016 2017
Housing Unit Demand Housing Unit Supply
14,01415,671
19,78419,630
21,65218,612
10,1257,931
4,1752,493 2,326 1,938 2,965 3,772 3,967
5,526 6,401
3,226
3,868
4,628 4,7613,612
2,911
3,568
1,555
1,818 438 539 759631
982 7461,265
1,053
0
5,000
10,000
15,000
20,000
25,000
30,000
2000 2001 2002 2003 2004 2005 2006 2007 2008 2009 2010 2011 2012 2013 2014 2015 2016
Single Family Units Multifamily Units
Exhibit 13: Value of nonresidential construction in the six-county Sacramento region 21
$0
$200,000
$400,000
$600,000
$800,000
$1,000 ,000
$1,200 ,000
$1,400 ,000
$1,600 ,000
$1,800 ,000
$2,000 ,000
2000 2001 2002 2003 2004 2005 2006 2007 2008 2009 2010 2011 2012 2013 2014 2015 2016
El Dorado Placer Sacramento Yolo Yuba Sutter
Exhibit 14: Percent of nonresidential construction value in the Sacramento region, by county22
0%
10%
20%
30%
40%
50%
60%
70%
80%
90%
100%
2006 2016
El Dorado Placer Sacramento Yolo Yuba
Exhibit 17: Average annual earnings in traded and non-traded clusters in the study regions (2016)
$85,
512
$58,
972
$67,
498
$97,
280
$78,
396
$100
,688
$90,
080
$63,
145
$72,
018
$0
$20,000
$40,000
$60,000
$80,000
$100,000
$120,000
Traded Non-Traded All Industries
Sacramento Region Bay Area Californ ia
Exhibit 18: Traded subcluster employment index, Sacramento region (2001-2021)25
Water, Sewage, and Other Systems Projection
Projection
Projection
Projection
Projection
Construction Materials
Construction
Construction Products
Construction Components
Empl
oym
ent i
ndex
(2
006
Empl
oym
ent =
100
)
Empl
oym
ent i
ndex
(2
006
Empl
oym
ent =
100
)
Exhibit 24: Non-traded subcluster employment index, Sacramento region (2001-2021)36
101.0 119.3
87.2104.7
73.7
136.3
36.1
29.6
17.9
0.0
25.0
50.0
75.0
100.0
125.0
150.0
2001 2006 2011 2016 2021
Water and Sewer Line Construction Projection
Concrete Products Projection
Real Estate Services Projection
Specialty Contractors Projection
General Contractors Projection
Developers Projection
* Only included subclusters with 10k+employment or significant employment change. Refer to appendix for the complete list of nontraded subclusters.
Exhibit 39: Entering construction industry workers by type of education and training in the Sacramento region (annual average, 2014-2016)59
368
217181
56 54
148125 107
84
28 27 19 13 3
29
369
129
109
198
136
10561
35 8 13 14 8 10
0
50
100
150
200
250
300
350
400
Apprentices Oth er Post-Secondary Completions
Exhibit 44: Projected annual construction industry occupational gaps in the Sacramento region (2016-2021)60
-3
-2
-1
32
45
57
58
68
103
173
196
308
322
397
427
500
524
607
640
864
1,937
-200 100 400 700 1,000 1,300 1,600 1,900
Insulation Workers
Drafters
Interior Designers
PV Installers
Glaziers
Surveyors
Building Inspectors
Roofers
Ironworkers & Welders
Architects
Drywall Installers
HVAC & Sheet Metal
Painters
Masonry, Tile, Floor, Lathe, Plaster
Plumbers & Pipefitters
Engineers
Heavy Equipment Operators
Real Estate Professionals
Electricians
Construction Managers
Carpenters
Exhibit 47: Unionized and non-unionized workforce, Sacramento--Arden-Arcade--Roseville MSA and 10-county Bay Area (annual average, 2014-2017)61
Exhibit 48: Unionization in the construction workforce as an annual average percentage of total employment, Sacramento--Arden-Arcade--Roseville MSA (2000-2017)62
31%, 32,314
29%, 12,555
69%, 70,898
71%, 30,110
0% 20% 40% 60% 80% 100%
10-County Bay Area
Sacramento MSA
Union Non-Union
32%
20% 19%24% 23%
29%
68%
80% 81%76% 77%
71%
0%
10%
20%
30%
40%
50%
60%
70%
80%
90%
2000 – 2002 2003 – 2004 2005 –2008 2008 – 2011 2011 – 2014 2014 – 2017
Union Non-Union
Exhibit 1A. Construction managers projected annual openings, n = 871 (2016-2021)67
Cost Estimators, 206openings, 24%
Construction Managers,
225 openings, 26%
First-Line Supervisors of Construction Trades and
Extraction Workers,440 openings, 50%
0 100 200 300 400 500 600 700 800 900 1,000
Construction Products, 81
Water, Sewage, and Other Systems, 908
-10.0%
-5.0%
0.0%
5.0%
10.0%
15.0%
20.0%
25.0%
0.0 0.5 1.0 1.5 2.0 2.5 3.0 3.5
Location Quotient (2016)
Location Quotient (2016)
Ann
ual E
mpl
oym
ent G
row
th R
ate
(200
6-20
16)
Subcluster with an annual average earnings higher than all-industry annual average earnings in ($67,498) Sacramento region in 2016
LQ=1.0
Exhibit 2C: Non-traded subclusters in the Sacramento region73
Specialty Contractors, 50,899
General Contractors, 16,843
Real Estate Services, 15,475
Construction Materials Retailing, 6,552
Highway and Street Construction, 2,268
Water and Sewer Line Construction, 1,662
Building Equipment Distribution, 1,207
Developers
-15.0%
-10.0%
-5.0%
0.0%
5.0%
0.8 1.0 1.2 1.4
Ann
ual E
mpl
oym
ent G
row
th R
ate
(200
6-20
16
Exhibit 2E: Joint apprentices by gender in the Sacramento region (January 2012-October 2017)
Exhibit 3E: Joint apprentices by county of residence in the Sacramento region (January 2012-October 2017)
8,374, 97%
249, 3%
El Dorado,393, 56%
Placer,949, 11%
Sacramento, 6077, 1
Sutter, 346,4%
Yolo, 549,6%
Yuba, 309,
4%
Exhibit 4E: Joint apprentices’ highest level of education prior to apprenticeship in the Sacramento region (January 2012-October 2017)
Exhibit 5E: Number of weeks worked, all workers in the construction sector in the Sacramento region (2015)84
Less than highschool, 7%
High schoolgraduate orGED, 65%
Some college,25%
4 or more yearsof college, 3%
3,165 6%
3,082 6%
1,650 3%
6,105 12%
7,068 10%
31,037 62%
0 5,000 10,000 15,000 20,000 25,000 30,000 35,000
Did not work
Less than 14
14 to 26
27 to 39
40 to 49
50 to 52
# w
eeks
wor
ked
in th
e la
st y
ear
Exhibit 4: Value of nonresidential construction put in place, by subcomponent (California)9
-0.5%
29.2%
-41.1%
0.0%
62.9%
-34.7%
46.0%
42.8%
19.1%
-14.6%
66.5%
763.4%
Office
Commercial
Manufacturing
Health care
Educational
Religious
Amusement and recreation
Transportation
Power and communication
Highway and street
Public works
Other
Subcomponent percent change 2006-2016
180.8
593.7
818.9
21.4
235.8 342.3
104.9 133.6 173.5
0.0
100.0
200.0
300.0
400.0
500.0
600.0
700.0
800.0
900.0
1000.0
2001 2006 2011 2016 2021
Construction Materials,125
Construction, 1,942
Construction Components, 466
LQ=1.0
Concrete Products, 1,123
Construction Materials Wholesaling, 1,647
Subcluster with an annual average earnings higher than all-industry annual average earnings ($67,498) in Sacramento region in 2016
Exhibit 1E: Total joint apprentice starts, residents in the six-county Sacramento region (January 2012-October 2017) (n = 8,617)2
435
95
104
111
117
121
135
161
174
178
215
302
340
440
458
483
542
602
1,045
1,205
1,354
0 200 400 600 800 1000 1200 1400 1600
All others
Elevator constructor
Drywall finisher
Scaffold and shoring erector
Inspector or surveyor
Pile driver
Glazier
Carpet, linoleum, and soft tile layer
Millwright
Sheet metal worker & related trades
Construction equipment operator trades
Brick, marble, terrazzo, tile, and related trades
Roofer and waterproofer
Plumber and fitter trades
Painter trades
Cement mason and plasterer trades
Electricial trades
Drywall/lather
Ironworker trades
Carpenter
Construction craft laborer
Exhibit 38: Anticipated annual construction industry job openings by new and replacement jobs in the Sacramento region (2016-2021)1
21 26 59 60 52 78 99 167 167 220323 350 399 439 473
596 679788 777 763
2,119
4 6 1 1 20 7 520 27 2
71 56100 95 73
4699
82 95222
215
0
500
1000
1500
2000
2500
Annual Replacement Openings New Jobs (Growth)
Male
Female
$ Th
ousa
nds
Thou
sand
s of
Dol
lars
Average annual openings (demand) minuseducation and training (supply) =approximate annual shortage
Approximate annual shortage = 7,250 workers across all categories
Sutter
6.2% 5.1%
27.6%
14.4%
50.6%69.9%
10.8%7.9%
1.1% 0.6%3.6% 2.0%
Supply & demand workforce gaps
Measuring the average annual openings (workforce demand) against new entrants to the field (education and training
supply) provides key indications for focusing workforce development efforts. Exhibit 44 compares current average annual
supply with projected demand in the Sacramento region.
Nearly every category of staple trade and key support is severely undersupplied and expected to continue experiencing
troublesome shortages. Data analysis indicates that the region faces a projected shortage of about 7,250 workers annually
over the next five years. Many categories show serious differences between supply and demand. The findings and
recommendations section offers strategies to address these concerns.
Exhibit 44: Projected annual construction industry occupational gaps in the Sacramento region (2016–2021)61
OCCUPATIONAL DEMAND, TRAINING & EDUCATION SUPPLY GAP ANALYSIS
61 Based on projected annual job openings (including new and replacement jobs), 2016-2021, and current pace of average annual educational program completions and apprenticeship program starts, 2014-2016. Sources: Department of Apprenticeship Standards Apprenticeship Data, EMSI 2017.3 QCEW, Non-QCEW, Self-Employed Data Release of Quarterly Census of Employment and Wages Data, IPEDS.
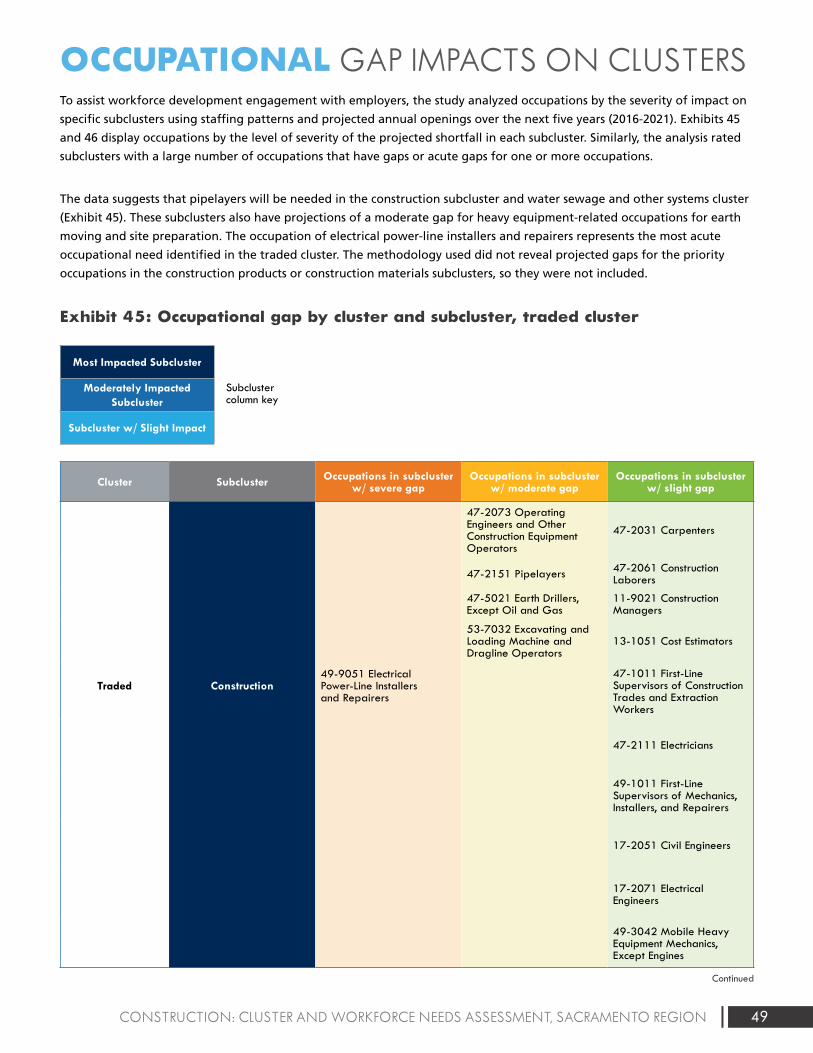
49CONSTRUCTION: CLUSTER AND WORKFORCE NEEDS ASSESSMENT, SACRAMENTO REGION
To assist workforce development engagement with employers, the study analyzed occupations by the severity of impact on
specific subclusters using staffing patterns and projected annual openings over the next five years (2016-2021). Exhibits 45
and 46 display occupations by the level of severity of the projected shortfall in each subcluster. Similarly, the analysis rated
subclusters with a large number of occupations that have gaps or acute gaps for one or more occupations.
The data suggests that pipelayers will be needed in the construction subcluster and water sewage and other systems cluster
(Exhibit 45). These subclusters also have projections of a moderate gap for heavy equipment-related occupations for earth
moving and site preparation. The occupation of electrical power-line installers and repairers represents the most acute
occupational need identified in the traded cluster. The methodology used did not reveal projected gaps for the priority
occupations in the construction products or construction materials subclusters, so they were not included.
Exhibit 45: Occupational gap by cluster and subcluster, traded cluster
Most Impacted Subcluster
Moderately Impacted Subcluster
Subcluster w/ Slight Impact
Cluster Subcluster Occupations in subcluster w/ severe gap
Occupations in subcluster w/ moderate gap
Occupations in subcluster w/ slight gap
Traded Construction49-9051 Electrical Power-Line Installers and Repairers
47-2073 Operating Engineers and Other Construction Equipment Operators
47-2031 Carpenters
47-2151 Pipelayers 47-2061 Construction Laborers
47-5021 Earth Drillers, Except Oil and Gas
11-9021 Construction Managers
53-7032 Excavating and Loading Machine and Dragline Operators
13-1051 Cost Estimators
47-1011 First-Line Supervisors of Construction Trades and Extraction Workers
47-2111 Electricians
49-1011 First-Line Supervisors of Mechanics, Installers, and Repairers
17-2051 Civil Engineers
17-2071 Electrical Engineers
49-3042 Mobile Heavy Equipment Mechanics, Except Engines
Continued
OCCUPATIONAL GAP IMPACTS ON CLUSTERS
Subcluster column key
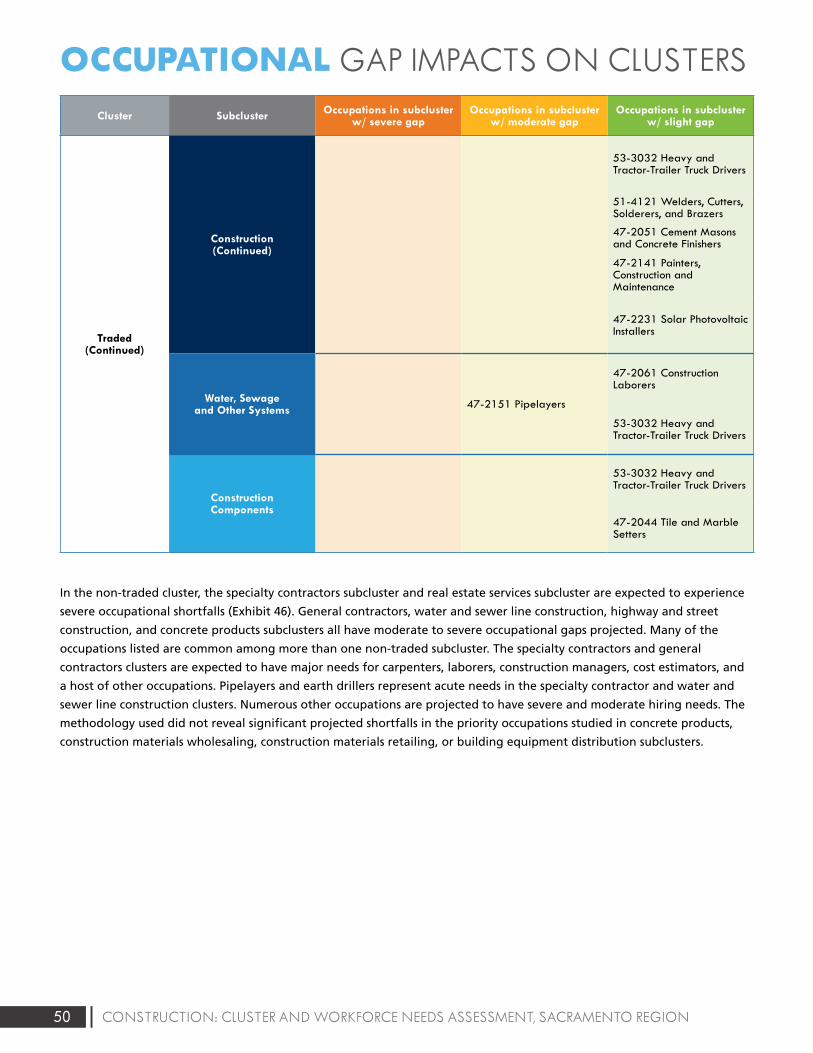
50 CONSTRUCTION: CLUSTER AND WORKFORCE NEEDS ASSESSMENT, SACRAMENTO REGION
OCCUPATIONAL GAP IMPACTS ON CLUSTERS
Cluster Subcluster Occupations in subcluster w/ severe gap
Occupations in subcluster w/ moderate gap
Occupations in subcluster w/ slight gap
Traded(Continued)
Construction(Continued)
53-3032 Heavy and Tractor-Trailer Truck Drivers
51-4121 Welders, Cutters, Solderers, and Brazers
47-2051 Cement Masons and Concrete Finishers
47-2141 Painters, Construction and Maintenance
47-2231 Solar Photovoltaic Installers
Water, Sewage and Other Systems 47-2151 Pipelayers
47-2061 Construction Laborers
53-3032 Heavy and Tractor-Trailer Truck Drivers
Construction Components
53-3032 Heavy and Tractor-Trailer Truck Drivers
47-2044 Tile and Marble Setters
In the non-traded cluster, the specialty contractors subcluster and real estate services subcluster are expected to experience
severe occupational shortfalls (Exhibit 46). General contractors, water and sewer line construction, highway and street
construction, and concrete products subclusters all have moderate to severe occupational gaps projected. Many of the
occupations listed are common among more than one non-traded subcluster. The specialty contractors and general
contractors clusters are expected to have major needs for carpenters, laborers, construction managers, cost estimators, and
a host of other occupations. Pipelayers and earth drillers represent acute needs in the specialty contractor and water and
sewer line construction clusters. Numerous other occupations are projected to have severe and moderate hiring needs. The
methodology used did not reveal significant projected shortfalls in the priority occupations studied in concrete products,
construction materials wholesaling, construction materials retailing, or building equipment distribution subclusters.
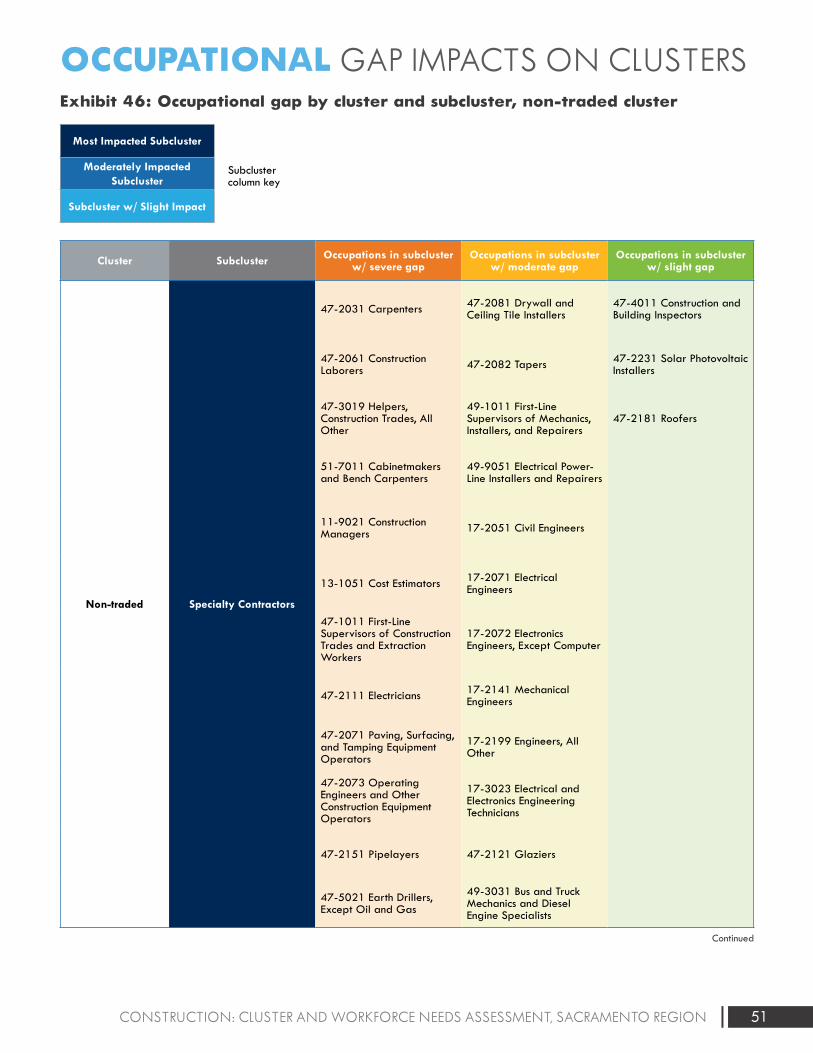
51CONSTRUCTION: CLUSTER AND WORKFORCE NEEDS ASSESSMENT, SACRAMENTO REGION
OCCUPATIONAL GAP IMPACTS ON CLUSTERSExhibit 46: Occupational gap by cluster and subcluster, non-traded cluster
Most Impacted Subcluster
Moderately Impacted Subcluster
Subcluster w/ Slight Impact
Cluster Subcluster Occupations in subcluster w/ severe gap
Occupations in subcluster w/ moderate gap
Occupations in subcluster w/ slight gap
Non-traded Specialty Contractors
47-2031 Carpenters 47-2081 Drywall and Ceiling Tile Installers
47-4011 Construction and Building Inspectors
47-2061 Construction Laborers 47-2082 Tapers 47-2231 Solar Photovoltaic
Installers
47-3019 Helpers, Construction Trades, All Other
49-1011 First-Line Supervisors of Mechanics, Installers, and Repairers
47-2181 Roofers
51-7011 Cabinetmakers and Bench Carpenters
49-9051 Electrical Power-Line Installers and Repairers
11-9021 Construction Managers 17-2051 Civil Engineers
13-1051 Cost Estimators 17-2071 Electrical Engineers
47-1011 First-Line Supervisors of Construction Trades and Extraction Workers
17-2072 Electronics Engineers, Except Computer
47-2111 Electricians 17-2141 Mechanical Engineers
47-2071 Paving, Surfacing, and Tamping Equipment Operators
17-2199 Engineers, All Other
47-2073 Operating Engineers and Other Construction Equipment Operators
17-3023 Electrical and Electronics Engineering Technicians
47-2151 Pipelayers 47-2121 Glaziers
47-5021 Earth Drillers, Except Oil and Gas
49-3031 Bus and Truck Mechanics and Diesel Engine Specialists
Continued
Subcluster column key
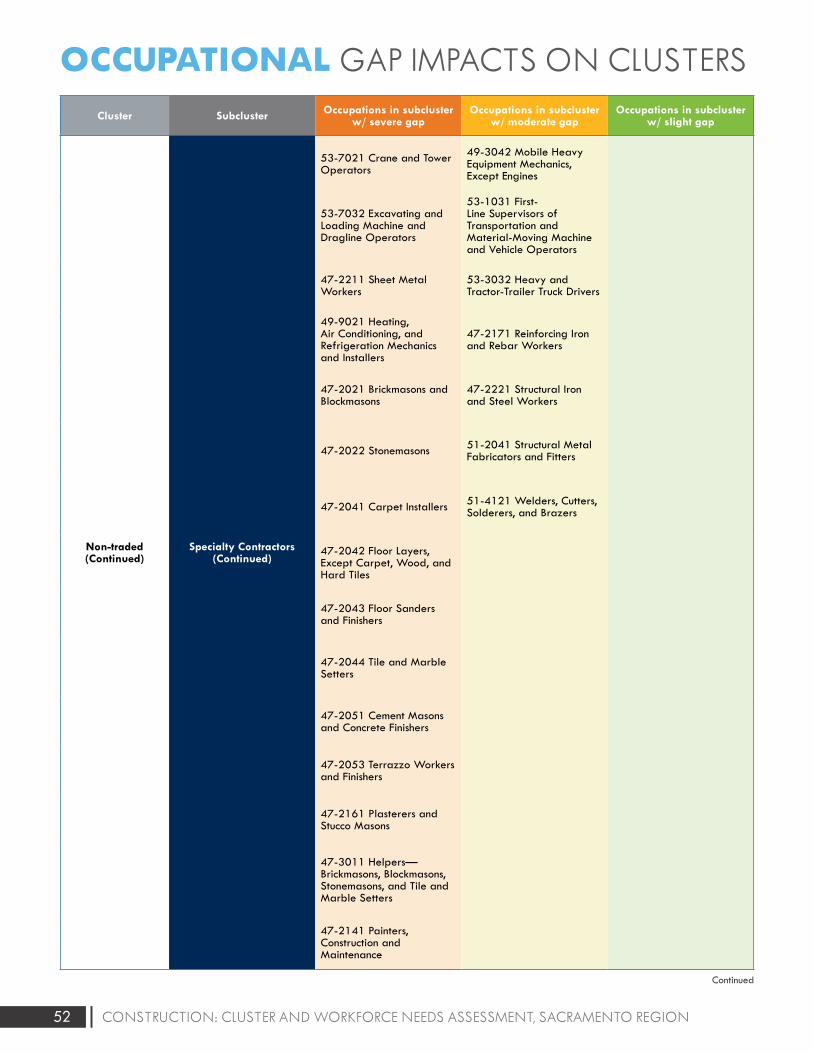
52 CONSTRUCTION: CLUSTER AND WORKFORCE NEEDS ASSESSMENT, SACRAMENTO REGION
OCCUPATIONAL GAP IMPACTS ON CLUSTERS
Cluster Subcluster Occupations in subcluster w/ severe gap
Occupations in subcluster w/ moderate gap
Occupations in subcluster w/ slight gap
Non-traded (Continued)
Specialty Contractors(Continued)
53-7021 Crane and Tower Operators
49-3042 Mobile Heavy Equipment Mechanics, Except Engines
53-7032 Excavating and Loading Machine and Dragline Operators
53-1031 First-Line Supervisors of Transportation and Material-Moving Machine and Vehicle Operators
47-2211 Sheet Metal Workers
53-3032 Heavy and Tractor-Trailer Truck Drivers
49-9021 Heating, Air Conditioning, and Refrigeration Mechanics and Installers
47-2171 Reinforcing Iron and Rebar Workers
47-2021 Brickmasons and Blockmasons
47-2221 Structural Iron and Steel Workers
47-2022 Stonemasons 51-2041 Structural Metal Fabricators and Fitters
47-2041 Carpet Installers 51-4121 Welders, Cutters, Solderers, and Brazers
47-2042 Floor Layers, Except Carpet, Wood, and Hard Tiles
47-2043 Floor Sanders and Finishers
47-2044 Tile and Marble Setters
47-2051 Cement Masons and Concrete Finishers
47-2053 Terrazzo Workers and Finishers
47-2161 Plasterers and Stucco Masons
47-3011 Helpers—Brickmasons, Blockmasons, Stonemasons, and Tile and Marble Setters
47-2141 Painters, Construction and Maintenance
Continued
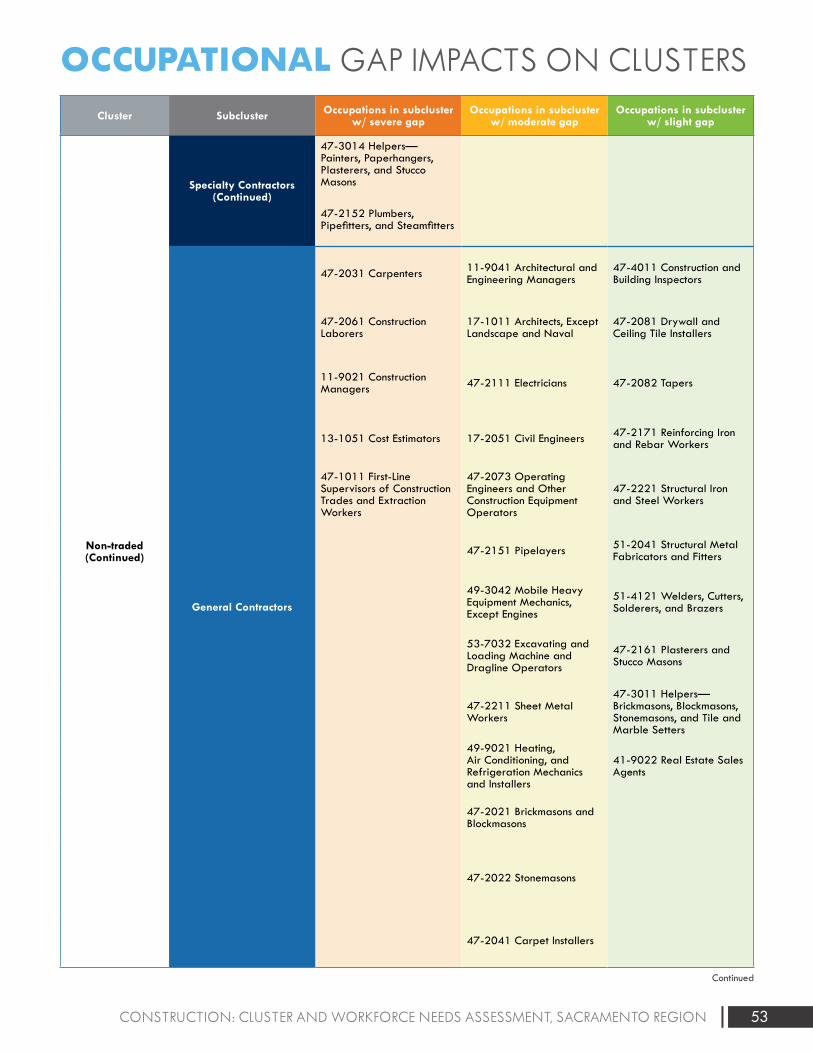
53CONSTRUCTION: CLUSTER AND WORKFORCE NEEDS ASSESSMENT, SACRAMENTO REGION
OCCUPATIONAL GAP IMPACTS ON CLUSTERS
Cluster Subcluster Occupations in subcluster w/ severe gap
Occupations in subcluster w/ moderate gap
Occupations in subcluster w/ slight gap
Non-traded (Continued)
Specialty Contractors (Continued)
47-3014 Helpers—Painters, Paperhangers, Plasterers, and Stucco Masons
47-2152 Plumbers, Pipefitters, and Steamfitters
General Contractors
47-2031 Carpenters 11-9041 Architectural and Engineering Managers
47-4011 Construction and Building Inspectors
47-2061 Construction Laborers
17-1011 Architects, Except Landscape and Naval
47-2081 Drywall and Ceiling Tile Installers
11-9021 Construction Managers 47-2111 Electricians 47-2082 Tapers
13-1051 Cost Estimators 17-2051 Civil Engineers 47-2171 Reinforcing Iron and Rebar Workers
47-1011 First-Line Supervisors of Construction Trades and Extraction Workers
47-2073 Operating Engineers and Other Construction Equipment Operators
47-2221 Structural Iron and Steel Workers
47-2151 Pipelayers 51-2041 Structural Metal Fabricators and Fitters
49-3042 Mobile Heavy Equipment Mechanics, Except Engines
51-4121 Welders, Cutters, Solderers, and Brazers
53-7032 Excavating and Loading Machine and Dragline Operators
47-2161 Plasterers and Stucco Masons
47-2211 Sheet Metal Workers
47-3011 Helpers—Brickmasons, Blockmasons, Stonemasons, and Tile and Marble Setters
49-9021 Heating, Air Conditioning, and Refrigeration Mechanics and Installers
41-9022 Real Estate Sales Agents
47-2021 Brickmasons and Blockmasons
47-2022 Stonemasons
47-2041 Carpet Installers
Continued
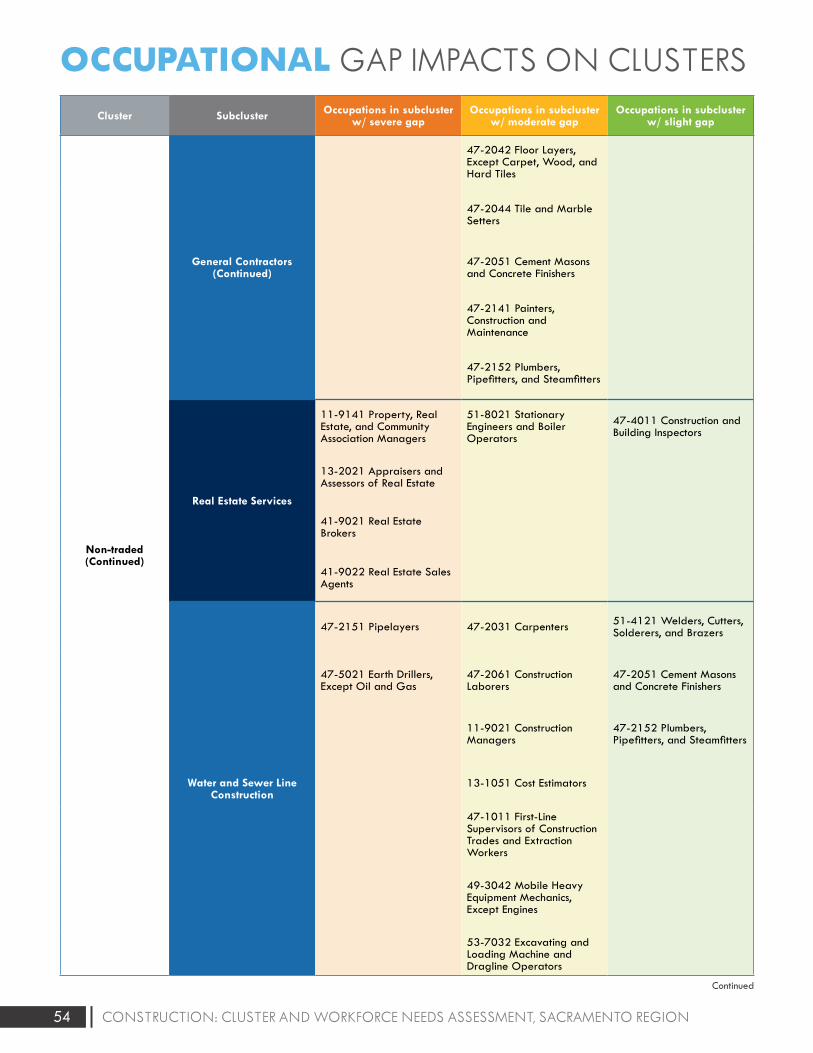
54 CONSTRUCTION: CLUSTER AND WORKFORCE NEEDS ASSESSMENT, SACRAMENTO REGION
OCCUPATIONAL GAP IMPACTS ON CLUSTERS
Cluster Subcluster Occupations in subcluster w/ severe gap
Occupations in subcluster w/ moderate gap
Occupations in subcluster w/ slight gap
Non-traded (Continued)
General Contractors(Continued)
47-2042 Floor Layers, Except Carpet, Wood, and Hard Tiles
47-2044 Tile and Marble Setters
47-2051 Cement Masons and Concrete Finishers
47-2141 Painters, Construction and Maintenance
47-2152 Plumbers, Pipefitters, and Steamfitters
Real Estate Services
11-9141 Property, Real Estate, and Community Association Managers
51-8021 Stationary Engineers and Boiler Operators
47-4011 Construction and Building Inspectors
13-2021 Appraisers and Assessors of Real Estate
41-9021 Real Estate Brokers
41-9022 Real Estate Sales Agents
Water and Sewer Line Construction
47-2151 Pipelayers 47-2031 Carpenters 51-4121 Welders, Cutters, Solderers, and Brazers
47-5021 Earth Drillers, Except Oil and Gas
47-2061 Construction Laborers
47-2051 Cement Masons and Concrete Finishers
11-9021 Construction Managers
47-2152 Plumbers, Pipefitters, and Steamfitters
13-1051 Cost Estimators
47-1011 First-Line Supervisors of Construction Trades and Extraction Workers
49-3042 Mobile Heavy Equipment Mechanics, Except Engines
53-7032 Excavating and Loading Machine and Dragline Operators
Continued
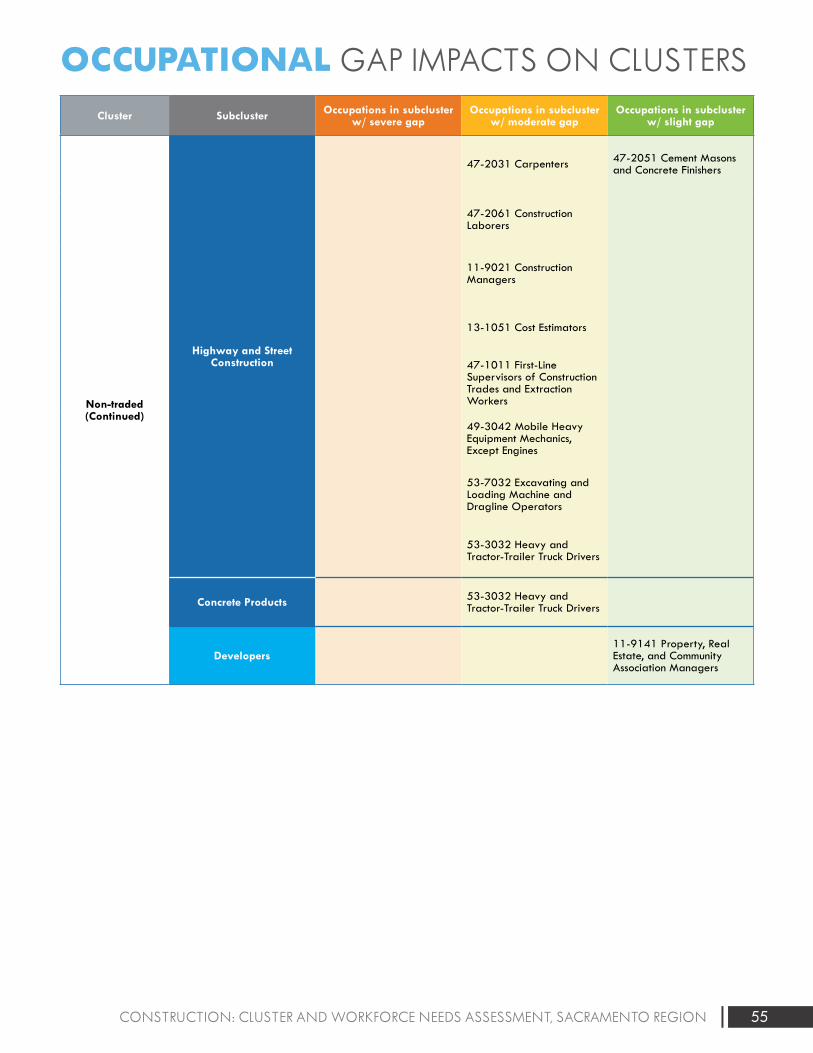
55CONSTRUCTION: CLUSTER AND WORKFORCE NEEDS ASSESSMENT, SACRAMENTO REGION
OCCUPATIONAL GAP IMPACTS ON CLUSTERS
Cluster Subcluster Occupations in subcluster w/ severe gap
Occupations in subcluster w/ moderate gap
Occupations in subcluster w/ slight gap
Non-traded (Continued)
Highway and Street Construction
47-2031 Carpenters 47-2051 Cement Masons and Concrete Finishers
47-2061 Construction Laborers
11-9021 Construction Managers
13-1051 Cost Estimators
47-1011 First-Line Supervisors of Construction Trades and Extraction Workers
49-3042 Mobile Heavy Equipment Mechanics, Except Engines
53-7032 Excavating and Loading Machine and Dragline Operators
53-3032 Heavy and Tractor-Trailer Truck Drivers
Concrete Products 53-3032 Heavy and Tractor-Trailer Truck Drivers
Developers11-9141 Property, Real Estate, and Community Association Managers
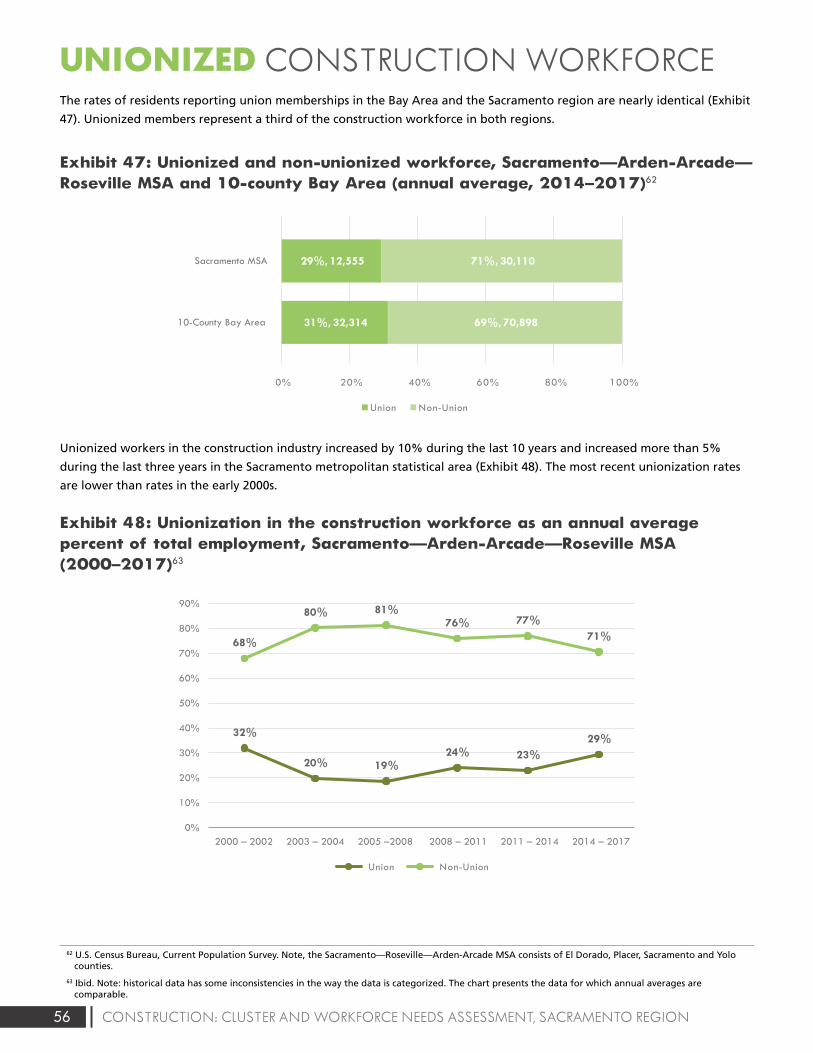
56 CONSTRUCTION: CLUSTER AND WORKFORCE NEEDS ASSESSMENT, SACRAMENTO REGION
UNIONIZED CONSTRUCTION WORKFORCEThe rates of residents reporting union memberships in the Bay Area and the Sacramento region are nearly identical (Exhibit
47). Unionized members represent a third of the construction workforce in both regions.
Exhibit 47: Unionized and non-unionized workforce, Sacramento—Arden-Arcade—Roseville MSA and 10-county Bay Area (annual average, 2014–2017)62
62 U.S. Census Bureau, Current Population Survey. Note, the Sacramento—Roseville—Arden-Arcade MSA consists of El Dorado, Placer, Sacramento and Yolo counties.
63 Ibid. Note: historical data has some inconsistencies in the way the data is categorized. The chart presents the data for which annual averages are comparable.
Exhibit 1: Value of construction put in place (United States)3
$1,161,282
$788,332
$1,185,683
$0
$200,000
$400,000
$600,000
$800,000
$1,000,000
$1,200,000
$1,400,000
2002 2003 2004 2005 2006 2007 2008 2009 2010 2011 2012 2013 2014 2015 2016
Mill
ions
of
Dol
lars
Residential Nonresidential
Exhibit 2: Value of construction put in place (California)5
$58,091,975
$18,740,050
$51,350,955
$0
$10,000,000
$20,000,000
$30,000,000
$40,000,000
$50,000,000
$60,000,000
$70,000,000
2002 2003 2004 2005 2006 2007 2008 2009 2010 2011 2012 2013 2014 2015 2016
Residential Nonresidential
Exhibit 3: Value of nonresidential construction put in place, by subcomponent (United States)7
24.1%
-0.2%
130.5%
0.6%
5.3%
-54.8%
18.0%
50.9%
98.2%
26.9%
-7.5%
21.7%
Office
Commercial
Manufacturing
Health care
Educational
Religious
Amusement and recreation
Transportation
Power and communication
Highway and street
Public works
Other
Subcomponent percent change 2006-2016
Exhibit 5: Value of Infrastructure as a percent of nonresidential construction put in place (United States)10
37.5% 37.9% 36.5%37.1% 37.0%
37.3%37.5% 41.1% 46.3% 45.5%
46.6% 46.4%46.1% 43.5% 41.6%
$0
$100,000
$200,000
$300,000
$400,000
$500,000
$600,000
$700,000
$800,000
2002 2003 2004 2005 2006 2007 2008 2009 2010 2011 2012 2013 2014 2015 2016
$ M
illio
ns
$ Th
ousa
nds
Nonresidential Infrastructure
Exhibit 6: Value of infrastructure as a percent of nonresidential construction put in place (California)11
11.6% 12.8% 14.3% 13.4%14.3%
11.0% 10.7%10.7% 10.2% 9.9% 10.9%
27.5%
14.9%16.2% 13.0%$5,000,000
$0
$10,000,000
$15,000,000
$20,000,000
$25,000,000
$30,000,000
2002 2003 2004 2005 2006 2007 2008 2009 2010 2011 2012 2013 2014 2015 2016
Nonresidential Infrastructure
Exhibit 7: Construction value added as a percent of GDP (United States)12
Exhibit 8: Construction value added as a percent of GRP (California)13
7.8% 7.8%8.1%
8.6%8.4%
8.0%
7.4%
6.3%
5.4%5.1%
5.3%5.5%
5.8%
6.2%6.4%
3.0%
4.0%
5.0%
6.0%
7.0%
8.0%
9.0%
2002 2003 2004 2005 2006 2007 2008 2009 2010 2011 2012 2013 2014 2015 2016
2002 2003 2004 2005 2006 2007 2008 2009 2010 2011 2012 2013 2014 2015 2016
3.0% 3.1%3.3% 3.3%
2.8%
2.3%
1.6%
1.0% 1.0% 1.1%1.3%
1.8% 1.8%2.0% 2.0%
0.0%
0.5%
1.0%
1.5%
2.0%
2.5%
3.0%
3.5%
4.0%
Exhibit 9: Construction value added as a percent of GRP (California, Sacramento region and Bay Area)16
3.0%
6.8% 6.9%
3.6%
1.2%1.4%
1.7%
2.3%
2.4%
0.0%
1.0%
2.0%
3.0%
4.0%
5.0%
6.0%
7.0%
8.0%
2002 2003 2004 2005 2006 2007 2008 2009 2010 2011 2012 2013 2014 2015
State Sacramento Metro (6-county) Bay Area Metro (9-county)
Exhibit 10: Housing unit supply versus demand in the Sacramento region
Exh ibit 11: Residen tial building units in the six-county Sacramento region (permi t data)20
19,865
14,239
10,996 8,932
6,483 7,768 9,125
10,399
19,122
23,812
17,987
2,293 3,939 4,652
6,492
0
5,000
10,000
15,000
20,000
25,000
30,000
2002 2003 2004 2005 2006 2007 2008 2009 2010 2011 2012 2013 2014 2015 2016 2017
Housing Unit Demand Housing Unit Supply
14,01415,671
19,78419,630
21,65218,612
10,1257,931
4,1752,493 2,326 1,938 2,965 3,772 3,967
5,526 6,401
3,226
3,868
4,628 4,7613,612
2,911
3,568
1,555
1,818 438 539 759631
982 7461,265
1,053
0
5,000
10,000
15,000
20,000
25,000
30,000
2000 2001 2002 2003 2004 2005 2006 2007 2008 2009 2010 2011 2012 2013 2014 2015 2016
Single Family Units Multifamily Units
Exhibit 13: Value of nonresidential construction in the six-county Sacramento region 21
$0
$200,000
$400,000
$600,000
$800,000
$1,000 ,000
$1,200 ,000
$1,400 ,000
$1,600 ,000
$1,800 ,000
$2,000 ,000
2000 2001 2002 2003 2004 2005 2006 2007 2008 2009 2010 2011 2012 2013 2014 2015 2016
El Dorado Placer Sacramento Yolo Yuba Sutter
Exhibit 14: Percent of nonresidential construction value in the Sacramento region, by county22
0%
10%
20%
30%
40%
50%
60%
70%
80%
90%
100%
2006 2016
El Dorado Placer Sacramento Yolo Yuba
Exhibit 17: Average annual earnings in traded and non-traded clusters in the study regions (2016) $8
5,51
2
$58,
972
$67,
498
$97,
280
$78,
396
$100
,688
$90,
080
$63,
145
$72,
018
$0
$20,000
$40,000
$60,000
$80,000
$100,000
$120,000
Traded Non-Traded All Industries
Sacramento Region Bay Area Californ ia
Exhibit 18: Traded subcluster employment index, Sacramento region (2001-2021)25
Water, Sewage, and Other Systems Projection
Projection
Projection
Projection
Projection
Construction Materials
Construction
Construction Products
Construction Components
Empl
oym
ent i
ndex
(2
006
Empl
oym
ent =
100
)
Empl
oym
ent i
ndex
(2
006
Empl
oym
ent =
100
)
Exhibit 24: Non-traded subcluster employment index, Sacramento region (2001-2021)36
101.0 119.3
87.2104.7
73.7
136.3
36.1
29.6
17.9
0.0
25.0
50.0
75.0
100.0
125.0
150.0
2001 2006 2011 2016 2021
Water and Sewer Line Construction Projection
Concrete Products Projection
Real Estate Services Projection
Specialty Contractors Projection
General Contractors Projection
Developers Projection
* Only included subclusters with 10k+employment or significant employment change. Refer to appendix for the complete list of nontraded subclusters.
Exhibit 39: Entering construction industry workers by type of education and training in the Sacramento region (annual average, 2014-2016)59
368
217181
56 54
148125 107
84
28 27 19 13 3
29
369
129
109
198
136
10561
35 8 13 14 8 10
0
50
100
150
200
250
300
350
400
Apprentices Oth er Post-Secondary Completions
Exhibit 44: Projected annual construction industry occupational gaps in the Sacramento region (2016-2021)60
-3
-2
-1
32
45
57
58
68
103
173
196
308
322
397
427
500
524
607
640
864
1,937
-200 100 400 700 1,000 1,300 1,600 1,900
Insulation Workers
Drafters
Interior Designers
PV Installers
Glaziers
Surveyors
Building Inspectors
Roofers
Ironworkers & Welders
Architects
Drywall Installers
HVAC & Sheet Metal
Painters
Masonry, Tile, Floor, Lathe, Plaster
Plumbers & Pipefitters
Engineers
Heavy Equipment Operators
Real Estate Professionals
Electricians
Construction Managers
Carpenters
Exhibit 47: Unionized and non-unionized workforce, Sacramento--Arden-Arcade--Roseville MSA and 10-county Bay Area (annual average, 2014-2017)61
Exhibit 48: Unionization in the construction workforce as an annual average percentage of total employment, Sacramento--Arden-Arcade--Roseville MSA (2000-2017)62
31%, 32,314
29%, 12,555
69%, 70,898
71%, 30,110
0% 20% 40% 60% 80% 100%
10-County Bay Area
Sacramento MSA
Union Non-Union
32%
20% 19%24% 23%
29%
68%
80% 81%76% 77%
71%
0%
10%
20%
30%
40%
50%
60%
70%
80%
90%
2000 – 2002 2003 – 2004 2005 –2008 2008 – 2011 2011 – 2014 2014 – 2017
Union Non-Union
Exhibit 1A. Construction managers projected annual openings, n = 871 (2016-2021)67
Cost Estimators, 206openings, 24%
Construction Managers,
225 openings, 26%
First-Line Supervisors of Construction Trades and
Extraction Workers,440 openings, 50%
0 100 200 300 400 500 600 700 800 900 1,000
Construction Products, 81
Water, Sewage, and Other Systems, 908
-10.0%
-5.0%
0.0%
5.0%
10.0%
15.0%
20.0%
25.0%
0.0 0.5 1.0 1.5 2.0 2.5 3.0 3.5
Location Quotient (2016)
Location Quotient (2016)
Ann
ual E
mpl
oym
ent G
row
th R
ate
(200
6-20
16)
Subcluster with an annual average earnings higher than all-industry annual average earnings in ($67,498) Sacramento region in 2016
LQ=1.0
Exhibit 2C: Non-traded subclusters in the Sacramento region73
Specialty Contractors, 50,899
General Contractors, 16,843
Real Estate Services, 15,475
Construction Materials Retailing, 6,552
Highway and Street Construction, 2,268
Water and Sewer Line Construction, 1,662
Building Equipment Distribution, 1,207
Developers
-15.0%
-10.0%
-5.0%
0.0%
5.0%
0.8 1.0 1.2 1.4
Ann
ual E
mpl
oym
ent G
row
th R
ate
(200
6-20
16
Exhibit 2E: Joint apprentices by gender in the Sacramento region (January 2012-October 2017)
Exhibit 3E: Joint apprentices by county of residence in the Sacramento region (January 2012-October 2017)
8,374, 97%
249, 3%
El Dorado,393, 56%
Placer,949, 11%
Sacramento, 6077, 1
Sutter, 346,4%
Yolo, 549,6%
Yuba, 309,
4%
Exhibit 4E: Joint apprentices’ highest level of education prior to apprenticeship in the Sacramento region (January 2012-October 2017)
Exhibit 5E: Number of weeks worked, all workers in the construction sector in the Sacramento region (2015)84
Less than highschool, 7%
High schoolgraduate orGED, 65%
Some college,25%
4 or more yearsof college, 3%
3,165 6%
3,082 6%
1,650 3%
6,105 12%
7,068 10%
31,037 62%
0 5,000 10,000 15,000 20,000 25,000 30,000 35,000
Did not work
Less than 14
14 to 26
27 to 39
40 to 49
50 to 52
# w
eeks
wor
ked
in th
e la
st y
ear
Exhibit 4: Value of nonresidential construction put in place, by subcomponent (California)9
-0.5%
29.2%
-41.1%
0.0%
62.9%
-34.7%
46.0%
42.8%
19.1%
-14.6%
66.5%
763.4%
Office
Commercial
Manufacturing
Health care
Educational
Religious
Amusement and recreation
Transportation
Power and communication
Highway and street
Public works
Other
Subcomponent percent change 2006-2016
180.8
593.7
818.9
21.4
235.8 342.3
104.9 133.6 173.5
0.0
100.0
200.0
300.0
400.0
500.0
600.0
700.0
800.0
900.0
1000.0
2001 2006 2011 2016 2021
Construction Materials,125
Construction, 1,942
Construction Components, 466
LQ=1.0
Concrete Products, 1,123
Construction Materials Wholesaling, 1,647
Subcluster with an annual average earnings higher than all-industry annual average earnings ($67,498) in Sacramento region in 2016
Exhibit 1E: Total joint apprentice starts, residents in the six-county Sacramento region (January 2012-October 2017) (n = 8,617)2
435
95
104
111
117
121
135
161
174
178
215
302
340
440
458
483
542
602
1,045
1,205
1,354
0 200 400 600 800 1000 1200 1400 1600
All others
Elevator constructor
Drywall finisher
Scaffold and shoring erector
Inspector or surveyor
Pile driver
Glazier
Carpet, linoleum, and soft tile layer
Millwright
Sheet metal worker & related trades
Construction equipment operator trades
Brick, marble, terrazzo, tile, and related trades
Roofer and waterproofer
Plumber and fitter trades
Painter trades
Cement mason and plasterer trades
Electricial trades
Drywall/lather
Ironworker trades
Carpenter
Construction craft laborer
Exhibit 38: Anticipated annual construction industry job openings by new and replacement jobs in the Sacramento region (2016-2021)1
21 26 59 60 52 78 99 167 167 220323 350 399 439 473
596 679788 777 763
2,119
4 6 1 1 20 7 520 27 2
71 56100 95 73
4699
82 95222
215
0
500
1000
1500
2000
2500
Annual Replacement Openings New Jobs (Growth)
Male
Female
$ Th
ousa
nds
Thou
sand
s of
Dol
lars
Average annual openings (demand) minuseducation and training (supply) =approximate annual shortage
Approximate annual shortage = 7,250 workers across all categories
Sutter
6.2% 5.1%
27.6%
14.4%
50.6%69.9%
10.8%7.9%
1.1% 0.6%3.6% 2.0%
Unionized workers in the construction industry increased by 10% during the last 10 years and increased more than 5%
during the last three years in the Sacramento metropolitan statistical area (Exhibit 48). The most recent unionization rates
are lower than rates in the early 2000s.
Exhibit 48: Unionization in the construction workforce as an annual average percent of total employment, Sacramento—Arden-Arcade—Roseville MSA (2000–2017)63
57CONSTRUCTION: CLUSTER AND WORKFORCE NEEDS ASSESSMENT, SACRAMENTO REGION
EXECUTIVE INTERVIEW FINDINGSThe COE study team conducted 12, one-hour executive interviews in March and April 2017. Interviewees provided a cross
section of the industry, representing union and non-union industry associations and contractors; the study team also sought
companies from a range of crafts (mechanical, electrical, plumbing, property management), and types of construction
(public works projects, small commercial, large industrial and residential construction). The interviews sought to better
understand the major market and policy issues facing the industry and its workforce in the months and years to come.
The interviews revealed some common findings and themes which are outlined below. These themes inform the overall
findings and recommendations of the study.
Regional development challenges and opportunities
• The Golden 1 Center was widely cited as a catalyst for wider downtown development. Interviewees discussed multiple
downtown projects that will continue to impact the construction industry and its workforce. These include:
o Railyards
o R Street corridor
o Convention Center and associated developments
o Community Center Theater and Memorial Auditorium
o Downtown Commons (DoCo)
o Numerous mixed use, high-density infill development in downtown Sacramento and West Sacramento
• Many projects were cited as having the potential for ongoing construction contracts in the region. These include:
o Roseville area construction, including the Adventist Health campus
o Sacramento County Courthouse
o Wilton Rancheria in Elk Grove, and associated hotels, convention center
o Water treatment plants in Stockton, Elk Grove, Sacramento County
o School district construction bonds across the region
o Residential development in Roseville, Rancho Cordova, Elk Grove, Placer County
o CalTrans road and bridge projects
o Repairs to the Oroville dam
o Industrial food and agricultural facilities
o Health care and pharmaceuticals (hospitals and processing facilities)
o Custom homes and remodeling
• Several employers indicated they are booked out 6-12 months for projects and anticipate demand beyond the
near term.
• Local quarries enable robust supply for the concrete, ready-mix and pre-fab concrete industries.
Regional construction companies partner and contract locally
• Large national and multinational companies have local offices and use local subcontractors—the number of local
contractors and local workers vary by project.
• Many interviewees suggested that even large public works, commercial and infrastructure projects that are served by
out-of-area general contractors have a sizeable local contractor presence to complete the work.
• As the market improved during the recovery, one interviewee commented that the effect was for many contractors to
stay local for projects; fewer contractors from out of the area sought bids locally.
• Contractors achieve efficiencies by working with local partners with whom they have relationships and who have
relationships with local regulatory officials.
58 CONSTRUCTION: CLUSTER AND WORKFORCE NEEDS ASSESSMENT, SACRAMENTO REGION
EXECUTIVE INTERVIEW FINDINGS• The Sacramento region is home to a diverse range of design and engineering firms, general contractors and specialty
contractors, and wholesale suppliers who have the capacity to facilitate many types of projects, including public
works, infrastructure, hospital, municipal, school, single-family residential and multifamily housing projects.
The interviewed firms all reported having extensive local contractual relationships within the region.
Talent gap, workforce shortages and recruitment
• Many interviewees cite using staffing agencies and head hunters to recruit candidates. They also use job fairs,
recruiting events and word of mouth.
• Employer associations and some employers report a willingness to engage with workforce intermediaries and
education and training programs. Some have formalized recruitment and outreach programs to market the
construction industry. Some sponsor and participate in extracurricular activities like design competitions, recruitment
and job fairs, classroom presentations, summer academies and internships.
• Many interviewees remarked that employers were “stealing” workers from other firms to complete projects.
• Others cited the pull from Bay Area wages as a contributing factor to the labor shortage; one interviewee cited
success recruiting commuters back to the Sacramento area, even though it meant taking a pay cut.
• Several employers cited delays in starting and completing projects due to labor shortages. They similarly cited cost
overruns, quality control problems, and safety concerns with the lack of a ready, trained workforce.
• Every interviewee who responded to the question on temporary or contract workers remarked that they strongly
preferred to bring someone on full time and to keep them. None reported using more than a few temporary
workers.
• A few interviewees discussed the seasonality of projects, that work slows down with inclement weather. They noted
that hiring can pick up again with the arrival of spring and summer months.
Workforce pathways and pipelines
• Many interviewees reported a general lack of mid-level, skilled candidates with three to nine years of experience.
Many attributed the gap to the severe reduction of entrants into construction training programs and apprenticeships
during the recession. One union official agreed, saying that longer-term, commercial-oriented apprenticeships have
not had sufficient completers to meet demand; the representative suggested that shorter apprenticeships (typically
for residential applications) have adequate completions to meet demand.
• With the lack of available skilled labor, several employers indicate they are starting or reigniting internal programs
for training entry-level workers. Some seek partnerships with workforce intermediaries and publicly-funded
workforce training programs to broaden their recruitment and training sources.
• Most interviewees expressed concern that ongoing retirements pose a challenge. Many interviewees recalled how the
recession accelerated a wave of retirements that contributed to the contraction of the workforce pipeline alongside
declining training and education enrollments for construction-related programs.
• There are a number of pre-apprenticeship programs at local community colleges to prepare students to enter
apprenticeships: multi-craft core curriculum (MC3) at American River College, Cosumnes River College; National
Center for Construction Education and Research (NCCER) in West Sacramento and Fruitridge; and Association of
Builders and Contractors (ABC) Nor Cal. Some of these programs target special populations—ex-offenders, veterans
and low-income groups through intermediaries. The Sacramento Employment and Training Agency (SETA) uses
funding from Proposition 39 to encourage MC3 training at American River College.
• Some employers report successfully recruiting interns from high schools, community colleges and four-year
universities, and some interns go on to become full-time employees. Some of these recruitments are ad hoc, others
59CONSTRUCTION: CLUSTER AND WORKFORCE NEEDS ASSESSMENT, SACRAMENTO REGION
EXECUTIVE INTERVIEW FINDINGSresult from ongoing networking. Sacramento State University’s Construction Management program was the most
often cited program that resulted in internships and hires. Other institutional relationships include:
o Chico State Construction Management
o Sacramento City College Mechanical Electrical Technology
o Welding programs at American River College, Sierra College, Butte College
o Cosumnes River College Construction
o American River College Pre-Apprenticeship
o Rio Americano High School
o Sheldon High School
o Elk Grove High School
o Burbank High School
o Center for Employment Training
o National Center for Construction Education and Research (NCCER)
• The interviewees nearly all expressed concern regarding the historical disinvestment in industrial arts programs in the
public schools. They expressed concern that a shift toward four-year degrees detracted from the construction industry
as a viable career path, and that the lack of preparation of basic skills meant that employers or postsecondary
programs were left to provide preparatory training. Some acknowledged recent efforts to create pathways between
high schools and community colleges, and between high schools and apprenticeships.
• Several unionized and non-unionized interviewees noted the necessity of keeping projects local to foster a local
workforce pipeline.
• One interviewee commented that projects can be rapidly halted in a market downturn, even after permits have
been issued.
• Though several interviewees commented on the length of the economic recovery and market cycle, none expressed
pressing concerns about an impending downturn. One interviewee remarked that the workforce training and
education system has never adequately addressed the cycles of the construction industry.
Regional workforce stakeholder connectivity
• Even though most interviewees acknowledged the importance of school partnerships for recruitment, only a few
whose mission it is to make such connections reported ongoing engagement with education and training programs.
Several employers perceive a lack of systematic connectivity between regional leadership organizations, schools and
employers. Most employers remarked that they did not know where to go to connect with the education system.
Those who had dedicated efforts suggested the regional array of stakeholders challenged their efforts—these
interviewees experienced uneven and disorganized outreach.
60 CONSTRUCTION: CLUSTER AND WORKFORCE NEEDS ASSESSMENT, SACRAMENTO REGION
EXECUTIVE INTERVIEW FINDINGSHard-to-fill positions
• Interviewees suggest that any skilled trade presents a challenge to fill. Positions that were cited include:
o HVAC and sheet metal workers
o Low-voltage technicians
o Pre-fab manufacturing workers
o Welders
o Plumbers and pipefitters
o Solar installers
o Journey-level electricians
o Estimators
o CAD drafting
• Construction managers (Project engineers, superintendents and foremen) represent an especially acute area of need
for many interviewees.
• A few interviewees cited hiring challenges across the board, but noted that finding entry-level workers in the
residential construction industry represented a major pain point.
Unionized and non-unionized contractors
• Interviewees generally suggested that the size and type of a project determined the prevalence of unionized
contractors on a job. Large projects and project type (for example, public works projects which require prevailing
wages) often encourage unionized contractor bids. Union representatives and a couple non-unionized contractors
indicated that some general contractors will be willing to spend premiums for specialized contracts for which they
have reliable, known unionized partners.
• A few interviewees remarked that they have partnerships with unionized contractors and non-unionized contractors.
• Interviewees affiliated with unions said that competing in the residential market is challenged by low bids and
insurance requirements.
Project labor agreements (PLAs) and community workforce agreements
• Some regional stakeholders view the PLA and community workforce agreement (local hire, low income and barrier
eligibility criteria) connected to contracts for the Golden 1 Center as a beneficial and scalable model that had
measurable impacts for program participants and regional workforce connectivity. More than one interviewee
suggested that the process created new relationships between unions, workforce intermediaries, employers and
other stakeholders that can serve as a foundation to create new community workforce agreements.
• Others voiced concerns that the agreements prevented many contractors from bidding, who are not able to meet the
requirements for the contract. These critics suggest that the policies block small, non-unionized businesses from the
bidding process, and the policies ultimately hurt the local economy and employers.
Building complexity and technology trends
• Design-build approaches, automated, remote-building systems, and 3D computer modeling, among other
technology and practices, require workers with capabilities and skills to address multiple buildings systems at
once. A few interviewees remarked that workers with a broad range of skills that can address integrated building
approaches, multiple building systems, and policies and incentives are valuable and hard to find. They also indicated
that these trends challenge the capacity of an already impacted construction workforce, whose existing workers are
stretched thin.

61CONSTRUCTION: CLUSTER AND WORKFORCE NEEDS ASSESSMENT, SACRAMENTO REGION
EXECUTIVE INTERVIEW FINDINGSRegulatory challenges and environmental policies
• Several interviewees suggested that increasing complexity and a need for systems thinking carries over into
regulatory issues. They suggest that increasing requirements from the federal and state government, and
jurisdictional variation, continue to challenge staff. Most suggested that new regulatory requirements continually
burden staff; some appear to navigate new regulations well; others report having to rely heavily on subcontractors
with expertise in regulatory compliance.
• With a few exceptions, interviewees remarked that environmental policies had not, by themselves, caused a
significant need for retraining. Many lumped in environmental regulations (for example, CalGreen requirements in
Title 24 mandates) with other regulations they currently navigate. Several suggested that environmental practices (for
example, energy efficiency) had already been normalized into standard construction practices. They acknowledged
the wider benefit of enacting these policies, but grouped the policies in with other regulations that they perceived as
challenging a standard way of doing projects and adding costs.
• A few interviewees acknowledged efforts to streamline permitting in some jurisdictions.
• One interviewee mentioned the California Advanced Lighting Controls Training Program (CALCTP). Another
interviewee remarked on challenges to finding qualified training providers to meet energy-efficiency code
requirements related to the Acceptance Test Technician (ATT) for lighting in non-commercial buildings.
• Several interviewees cited the Office of Statewide Health and Planning Development (OSHPD) as presenting
burdensome regulatory challenges for constructing hospitals.
62 CONSTRUCTION: CLUSTER AND WORKFORCE NEEDS ASSESSMENT, SACRAMENTO REGION
SUMMARY REPORT FINDINGS
The report is intended to serve as a reference for regional stakeholder action planning. The section below summarizes the
main findings from each section of the report.
Market indicators
• The impact of the recession that began in the late 2000s has cast a long shadow on the construction industry in
California and its regions. Overall, value added has not returned to pre-recession levels. Residential construction,
especially, was hard hit.
• Nonresidential construction is largely responsible for a return of investment and projects; public works,
transportation, educational buildings and commercial buildings represent the subcomponents with the largest
change in California between 2006 and 2016. Nonresidential construction value added in California in 2015 and
2016 surpassed the peak of investment in 2006 and 2007. The American Recovery and Reinvestment Act (ARRA) and
other factors, such as lower cost municipal bonds, shored up nonresidential construction recovery after the recession
nationally and in California. The share of infrastructure spending declined in 2016 to historical norms, about 13%
of all nonresidential investment. Nonresidential construction appears to have returned to pre-recession levels in
the Sacramento region, but only in the latest year of available data, 2016. Much of the investment is in Sacramento
County, in an apparent shift of projects to the urban core.
• Residential construction represents a troubling phenomenon for the state and the region. The share of residential
investment for the state is far lower than it was in the first half of the 2000s. Analysis of regional permit data,
housing supply data and population data indicates housing is woefully undersupplied in the region. Perhaps
surprisingly, the share of residential housing that is multifamily housing is 12% lower than it was 10 years ago in the
Sacramento region.
Regional cluster opportunity areas
• The Sacramento region demonstrates impressive competitive metrics in the traded cluster, export-oriented industries
that bring investment into the region from outside. The region shows a net gain in jobs since pre-recession levels;
this trend is not shared by the Bay Area or California, which showed net job losses. While employment levels in the
Sacramento region are not large, the data suggests the region possesses competitive advantage with respect to water
distribution, treatment, conveyance and irrigation systems; public works and utilities play a strong role. SMUD, along
with water and irrigation districts and agencies, represent special areas for focus. Some industries and companies in
the construction components subcluster also merit attention for their competitive metric, including companies that
produce stucco, tile and stone components.
• The non-traded, locally-serving cluster was hard hit by the recession in the Bay Area, the Sacramento region and the
state as a whole. The Sacramento region was hardest hit among these three geographies, showing a contraction of
more than 20% of its non-traded construction workforce between 2006 and 2016. Still, employment levels in the
Sacramento region have grown by 20,000 jobs since 2011, and the region shows an above-average employment
concentration, higher than the Bay Area and California. Specialty contractors and general contractors represent
the largest subclusters in the region. Though showing overall contraction, there are bright spots at the industry
level including plumbing, heating and air conditioning contractors, electrical contractors, framing contractors, new
multifamily housing construction and residential remodeling. Following the story of water-related construction
opportunities in the traded cluster, the water and sewer line construction subcluster has returned to pre-recession
levels in the Sacramento region. Building equipment and distribution, and concrete products represent two non-
traded subclusters that recovered most of their employment.
63CONSTRUCTION: CLUSTER AND WORKFORCE NEEDS ASSESSMENT, SACRAMENTO REGION
SUMMARY REPORT FINDINGS
• Lower earnings pose a special challenge for the Sacramento region’s construction workforce. Sacramento’s regional
earnings are lower than the Bay Area and the state. The Sacramento region has a lower cost of living than the Bay
Area, but the housing shortage poses concerns for workforce housing and pricing pressures overall. The upward
pressure on prices has not resulted in higher earnings for most industries studied. Employer representatives confirm
that recruitment and retention is highly challenging, with some employers stealing employees from competitors, and
others citing employment losses to the Bay Area and other industries.
Economic impacts
• For every job created in the construction cluster in the Sacramento region, 1.2 jobs are created elsewhere in the
economy as a result of supplier relationships and employee spending. Considering all the direct and multiplier effects,
the construction cluster contributes about $34.8 billion in industry output, 221,300 jobs and $17.4 billion in labor
income to the Sacramento region.
Education and occupational gaps
• The Sacramento region is home to an array of training and education assets that serve the construction cluster. The
community colleges provide programs in construction, welding, electrical, HVAC, solar photovoltaics (PV), drafting
and architecture, engineering, building inspection, pre-apprenticeship and construction management. Four-year
universities provide construction management, facilities management and engineering programs. A variety of union
and non-union apprenticeship programs serves the region and beyond. Private training providers offer electrical and
HVAC programs. The report provides data on private training providers, but the list is not exhaustive. The report did
not investigate regional high school programs or adult schools. Similarly, the research did not examine employer-led
training programs.
• The report provides metrics that account for the “supply” of eligible workers and uses apprenticeship starts, and
training and education completions to make the estimation. On the employment demand side, occupational annual
openings due to new job growth, separations and replacements account for the demand. Taking both these metrics
into account, the region is woefully undersupplied in terms of the number of skilled workers available. There is
a projected shortage of about 7,250 workers in the cluster annually over the next five years, including a shortfall
of nearly 2,000 carpenters, 860 construction managers, 640 electricians, 600 real estate professionals, 520 heavy
equipment operators and 500 engineers.
• Executive interviews indicate the workforce shortage poses a critical concern for the region and the industry.
Executive interviews highlight not only challenges for new entrants to the field, but an especially acute shortage of
mid-level workers who possess three to nine years of experience. There was universal agreement that the workforce
shortage is causing project delays and adding costs for numerous reasons. While some employers choose to recruit
employees from competitors, others have revived internal training programs that existed prior to the recession and
have sought partnerships with schools and workforce intermediaries for recruitment and training.
• Subcluster analysis reveals occupational pain points. The report highlights these occupations by subcluster and
level of severity in the shortage. The occupations with the largest shortages include pipelaying, heavy equipment
operation and earth moving, drilling, staple trades (carpenters, electricians, estimators, sheet metal workers, HVAC
installers and mechanics, welders, painters, tile and floor workers), architects and engineers, stationary engineers, real
estate service providers, and construction managers. The occupations most in need are specific and narrow in a few
subclusters. For most, there is a widespread, general shortage in the traditional construction trades.
64 CONSTRUCTION: CLUSTER AND WORKFORCE NEEDS ASSESSMENT, SACRAMENTO REGION
RECOMMENDATIONS
Recommendations emphasize building regional coordination capacity for near-term tactical efforts, and long-term strategic
planning for workforce development and industry-supporting public policy that increases building supply and provides high
road employment.
Policymakers, workforce and economic development stakeholders should target high-performing and at-risk
cluster industries for developing policy and investment strategies.
High-performing subclusters in the traded cluster in the Sacramento region include construction, construction materials,
and water, sewage and other systems. These represent areas deserving attention from economic and workforce developers.
The industries in these subclusters have demonstrated employment growth, a high concentration of employment over
time, high annual earnings and earnings growth. The industries in these subclusters generate a disproportionate amount of
wealth in the region, though employment levels are low.
While the recession’s impact on the non-traded cluster was extreme, the region cannot succeed in meeting its population
and development prerogatives without a robust, locally-serving industry. Many industries demonstrate bright spots,
having successfully recovered to pre-recession levels. Others have struggled, but their importance in the region remains.
Many industries serving the cluster merit attention from regional workforce and economic development stakeholders
for economic and business development strategies, and as key partners in meeting regional building needs. Successful
industries in the subclusters can provide key partners to help address workforce and equity goals in the region.
Link construction workforce development strategies to other policy agendas for increasing building supply.
The availability of a skilled workforce has a direct impact on the ability of the construction cluster to increase the supply
of housing and other projects to meet regional population and economic development needs. Strengthening the region’s
skilled workforce should be at the forefront of industry and public-sector priorities for long-term investment. Connecting
workforce development stakeholders to those working on other regional and state policy agendas concerned with
supporting housing affordability, infrastructure development, economic development, and streamlining permitting and
code requirements is of primary importance. Stakeholders should engage, promote, and invest in regional employers who
sponsor innovative and successful workforce partnerships that lead to placement into middle-skill jobs, wage gains for
incumbent workers, and program development that supports cluster-wide efforts.
Reinforce and streamline convening capacity and approaches between target industry employers and
workforce development stakeholders.
Many employer partners interviewed for the study said they did not know whom to contact in the workforce system to
address hiring and training needs. Others voiced a perception that workforce stakeholders are disorganized, holding
dozens of advisory meetings for individual education and training providers. Some efforts, such as Align Capital Region
and the Valley Vision Next Economy initiative, seek to address these concerns. Industry associations, such as the Sacramento
Builders’ Exchange and the North State Building Industry Association, have staff capacity for employer-school engagement.
These efforts may need additional, specific regional capacity to address the scale of the construction cluster’s workforce
challenges. Stakeholders should first agree on a framework for engagement and the staff capacity needed to engage on an
ongoing basis.
Support off-the-shelf, rapid-deployment workforce tactics to address workforce shortages in the near term;
identify slack in the existing system to boost enrollments.
Coordinated regional efforts will rapidly deploy off-the-shelf programs and identify existing slack in the education and
65CONSTRUCTION: CLUSTER AND WORKFORCE NEEDS ASSESSMENT, SACRAMENTO REGION
RECOMMENDATIONS
training system for opportunities to add program participants for a near-term approach. Coordination capacity should
seek to support employer-led training programs, community-based programs, high school and adult education programs,
preparatory programs and private training providers with additional capacity for recruitment and program development.
Existing pre-apprenticeship programs or other curricula may offer resources that can be quickly adopted.
Medium- and long-term planning should use cluster methods to develop measurable performance goals for
workforce training feedback.
Medium- and long-term planning and program development will involve multi-year strategic efforts that engage regional
stakeholders systematically and regularly. Engagement efforts can use the cluster research in this report as a touchstone for
creating engagement strategies to organize partner participation and address specific needs for jobs and skills. These efforts
will establish goals for program investment and track specific areas for targeted investment with performance metrics for
student enrollment, completion, credentialing, job placement and promotion. Engagement should emphasize employer
feedback and strive to leverage existing partnerships and reduce overlap. These efforts should align with workforce policy
goals from the community colleges, adult education providers, federal and state workforce development agencies, the City
of Sacramento and regional conveners, such as Valley Vision and Align Capital Region.
Medium- and long-term planning should emphasize pipeline and pathway development.
Pipeline program development will involve addressing recruitment and progressive stages of training, from career
exploration to upskilling opportunities for journey-level technicians in the field. Regional pre-apprenticeship programs,
employer-led primary and secondary school outreach, and after-school and summer programs are building blocks that
can support these activities. Increasing capacity and participation in existing, successful programs merits consideration for
investment.
The program mapping conducted by the cluster research team provides a starting point for further research and regional
action planning to identify existing and potential areas. Several pathways already exist, but further research is needed to
identify more pathways. Existing and past efforts, including the regional California Career Pathways Trust program and
Guided Pathways may provide a foundation for these efforts. The Career Ladders Project can provide resources and serves as
a model for conducting regional pathway mapping and planning.
Planning and development should take the economic cycle into account.
The previous economic cycles in the region and nation can inform near-term and long-term planning. Further research
should explore case studies and best practices with respect to building a flexible construction workforce infrastructure
capable of absorbing and retraining workers during economic downturns. The system also must be able to recruit, train and
supply the workforce when the market is strong and labor shortages become a concern.
Use education mapping and occupational gap analysis for cluster engagement and partnership development.
The occupational gap impacts on subclusters presented in this study provide a starting point for engaging employers to
develop workforce strategies and planning. Regional stakeholders and employer partners should verify and add to key
targets. Education and training stakeholders should collaborate to plan investments, coordinate training and recruitment,
and marketing, for example. The education asset map in this report can be used to identify areas where additional
programs are warranted. Some areas identified through the gap analysis and targeted subcluster occupational gap
analysis that deserve attention include construction management, utility-scale electricians, heavy equipment operators and
numerous staple trades.
66 CONSTRUCTION: CLUSTER AND WORKFORCE NEEDS ASSESSMENT, SACRAMENTO REGION
APPENDIX A: METHODOLOGY NOTES Methodology for cluster analysis and priority occupation list
The cluster methodology draws on the U.S. Cluster Mapping Project, a partnership between Michael Porter at the Institute
for Strategy and Competitiveness at Harvard University and the U.S. Economic Development Administration. Counts and
calculations in the report are based on the lists of NAICS codes published by the Cluster Mapping Project.64 The baseline
traded and non-traded clusters published there result from measurements of the relationship between industries (input-
output analysis, occupational analysis and co-location measurements), to determine groupings of industries that are similar,
and that share common resources, such as labor (training and skills), or other externalities. The method enables a more
complete picture of the areas where the Sacramento region possesses competitive advantage, and what overall economic
impact comes from industries with strong connectivity.
The research team used the NAICS cluster definitions to perform a scoring of the industries in the traded and local clusters
according to a number of variables. The scoring methods borrowed on the Regional Industry Clusters of Opportunity (RICO)
methods developed by Collaborative Economics and the California Economic Strategy Panel.65 Scored variables included:
• Total employment (2016)
• Employment annual adjusted growth rate (2006-2016)
• Employment projected annual adjusted growth rate (2016-2021)
• Total average earnings (2016)
• Total average earnings growth rate (2006-2016)
• Location quotient (2016)
• Location quotient growth rate (2006-2016)
• Location quotient projected growth rate (2016-2021)
The team designated scoring thresholds for each variable and then added a simple score for each variable that met or
exceeded the threshold. A maximum score of eight was possible. Low scoring industries were eliminated for performing
staffing patterns.
Staffing patterns for the priority list of industries were performed for each traded and non-traded subcluster. Then, the
team scored the occupations to prioritize a list of occupations based on the following metrics:
• Number of subclusters in which the occupation appears
• Total number of employed workers in the occupation for all cluster industries (2016)
• Median hourly occupational earnings (2016)
• Whether the occupation is categorized as middle skill or above (based on education and experience required)
Using these methods, the team prioritized a list of occupations. The priority list of occupations was then used as the basis
for the following crosswalk for the supply-demand gap analysis.
Methodology for occupational demand: Training and education supply gap analysis
Identifying workforce supply and demand using crosswalks between occupational and educational codes is a widely used
method for applied workforce analysis. The method presents some challenges to create exacting measures. A specific
training program may train mostly for one occupation, but partly for others, for example. Conversely, an occupation may
list skills and knowledge taught in more than one training program area across codes. To allow for some leeway in counting
between codes, the research team put similar occupations and training program codes into larger categories.
64 This webpage at the U.S. Cluster Mapping Project offers a summary of the methodology and supporting papers. The analysis uses the traded cluster, “Construction Products and Services,” and the non-traded cluster, “Local Real Estate, Construction, and Development” for analysis, https://clustermapping.us/content/cluster-mapping-methodology.
65 Collaborative Economics, “California Regional Economies Project: Industry Clusters of Opportunity User Guide,” California Economic Strategy Panel (July 2007).
67CONSTRUCTION: CLUSTER AND WORKFORCE NEEDS ASSESSMENT, SACRAMENTO REGION
APPENDIX A: METHODOLOGY NOTES The research team created the crosswalks using a combination of quantitative and qualitative analysis. The method
incorporates several crosswalks, industry partner feedback and internal judgement based on specificity to the clusters and
applicability between occupations and training programs. Three crosswalks were used to align Standard Occupational
Classification (SOC) codes, Classification of Instructional Programs (CIP) codes and Apprenticeship Program codes. The
crosswalks included the U.S. Department of Education’s National Center for Education Statistics’ (NCES) CIP-SOC crosswalk,66
the CIP-TOP-SOC crosswalk created by the Centers of Excellence,67 and DAS Apprenticeship’s O*Net coding system. The
outcome from the applied analysis yields an estimate that provides actionable findings and recommendations. The gap
assessment provides a starting point for partner verification and feedback. (See the crosswalk in the exhibit below.)
Occupational supply and demand gap analysis compares the most recent three-year average annual supply of new workers
in construction cluster-related education and training programs to the projected demand for occupations in the
Sacramento region.
Supply of new workers was estimated by summing new apprentices (who begin work with the apprenticeship) with
completions in identified education and training programs, and averaging these for the 2014-2016 period. New
apprentice data is sourced from the California Department of Apprenticeship Standards (DAS) and reflects the start year
of apprenticeship, and includes all apprentices residing in Sacramento. Some apprentices reside in Sacramento, though are
apprenticed by Joint Apprenticeship Committees or Unilateral Apprenticeship Committees based outside of the region.
Education and training completions data is sourced from the NCES via the IPEDS database (Emsi), and includes private and
public training providers in the Sacramento region. The dataset does not include training programs through K-12 schools or
non-accredited, community-based organizations.
Demand for workers reflects projected average annual job openings by occupational group for the 2016-2021 period,
sourced from Emsi, including new jobs (growth) and replacement jobs (retirements and separations). For the occupational
gap analysis, the research team used the occupational annual openings for all industries, rather than perform a calculation
to determine the percent of openings specific to the construction clusters. (However, the cluster gap assessment section did
employ staffing pattern formulas to estimate the amount of occupational demand for each subcluster.)
Several categories in the gap analysis merit additional explanation.
Construction managers represents the second-ranked category of supply-demand workforce gap in the Sacramento
region, with a projected shortage of more than 850 construction managers annually. The construction managers category
encompasses a few types of jobs, including professionals who manage construction project timelines and budgets, estimate
project costs, as well as supervisors of construction workers. The latter category is the most striking area of demand.
Several general management occupational codes were eliminated from counts to not create noise in the estimates and
to maintain a relevance to the education and training programs that are likely to serve the clusters. Other general-
management-related occupations that were removed from analysis included sales, finance, management analysts,
purchasing, buyers, service managers and market research. However, the removal of many of these codes could mean the
projected shortfall is even worse than estimated.
The training trajectory for supervisors of construction workers and that of construction managers may differ, with some
receiving formal training, and others rising through the ranks to the level of foreman or superintendent. While there
are several formal construction management training programs in the region, including at California State University-
Sacramento, Sierra College, Consumes River College and Folsom College, according to IPEDS data, the data suggests the
number of students completing those programs is low. Exhibit 1A shows the breakdown for the three occupations that were
chosen for the construction management category.
66 “SOC 2010 to CIP 2010 Crosswalk,” https://nces.ed.gov/ipeds/cipcode/resources.aspx?y=55.
67 Centers of Excellence, http://www.coeccc.net/.
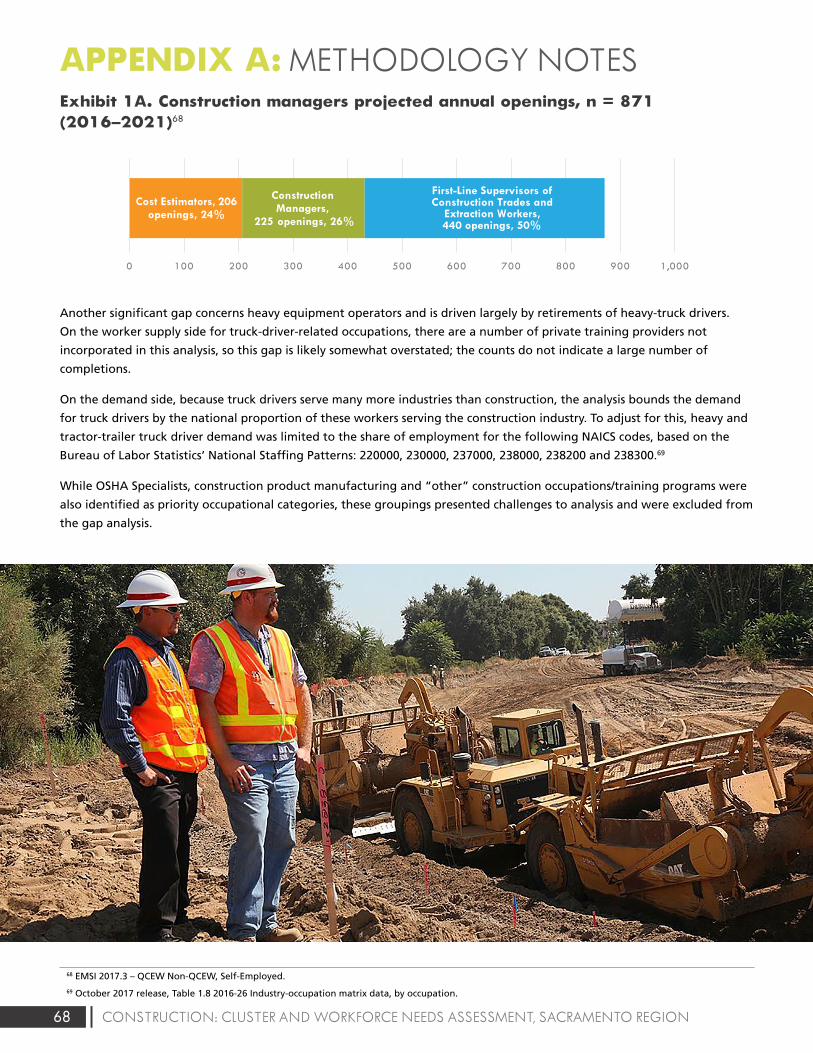
68 CONSTRUCTION: CLUSTER AND WORKFORCE NEEDS ASSESSMENT, SACRAMENTO REGION
Exhibit 1A. Construction managers projected annual openings, n = 871 (2016–2021)68
Another significant gap concerns heavy equipment operators and is driven largely by retirements of heavy-truck drivers.
On the worker supply side for truck-driver-related occupations, there are a number of private training providers not
incorporated in this analysis, so this gap is likely somewhat overstated; the counts do not indicate a large number of
completions.
On the demand side, because truck drivers serve many more industries than construction, the analysis bounds the demand
for truck drivers by the national proportion of these workers serving the construction industry. To adjust for this, heavy and
tractor-trailer truck driver demand was limited to the share of employment for the following NAICS codes, based on the
Bureau of Labor Statistics’ National Staffing Patterns: 220000, 230000, 237000, 238000, 238200 and 238300.69
While OSHA Specialists, construction product manufacturing and “other” construction occupations/training programs were
also identified as priority occupational categories, these groupings presented challenges to analysis and were excluded from
the gap analysis.
APPENDIX A: METHODOLOGY NOTES
68 EMSI 2017.3 – QCEW Non-QCEW, Self-Employed.
69 October 2017 release, Table 1.8 2016-26 Industry-occupation matrix data, by occupation.
Exhibit 1: Value of construction put in place (United States)3
$1,161,282
$788,332
$1,185,683
$0
$200,000
$400,000
$600,000
$800,000
$1,000,000
$1,200,000
$1,400,000
2002 2003 2004 2005 2006 2007 2008 2009 2010 2011 2012 2013 2014 2015 2016
Mill
ions
of
Dol
lars
Residential Nonresidential
Exhibit 2: Value of construction put in place (California)5
$58,091,975
$18,740,050
$51,350,955
$0
$10,000,000
$20,000,000
$30,000,000
$40,000,000
$50,000,000
$60,000,000
$70,000,000
2002 2003 2004 2005 2006 2007 2008 2009 2010 2011 2012 2013 2014 2015 2016
Residential Nonresidential
Exhibit 3: Value of nonresidential construction put in place, by subcomponent (United States)7
24.1%
-0.2%
130.5%
0.6%
5.3%
-54.8%
18.0%
50.9%
98.2%
26.9%
-7.5%
21.7%
Office
Commercial
Manufacturing
Health care
Educational
Religious
Amusement and recreation
Transportation
Power and communication
Highway and street
Public works
Other
Subcomponent percent change 2006-2016
Exhibit 5: Value of Infrastructure as a percent of nonresidential construction put in place (United States)10
37.5% 37.9% 36.5%37.1% 37.0%
37.3%37.5% 41.1% 46.3% 45.5%
46.6% 46.4%46.1% 43.5% 41.6%
$0
$100,000
$200,000
$300,000
$400,000
$500,000
$600,000
$700,000
$800,000
2002 2003 2004 2005 2006 2007 2008 2009 2010 2011 2012 2013 2014 2015 2016
$ M
illio
ns
$ Th
ousa
nds
Nonresidential Infrastructure
Exhibit 6: Value of infrastructure as a percent of nonresidential construction put in place (California)11
11.6% 12.8% 14.3% 13.4%14.3%
11.0% 10.7%10.7% 10.2% 9.9% 10.9%
27.5%
14.9%16.2% 13.0%$5,000,000
$0
$10,000,000
$15,000,000
$20,000,000
$25,000,000
$30,000,000
2002 2003 2004 2005 2006 2007 2008 2009 2010 2011 2012 2013 2014 2015 2016
Nonresidential Infrastructure
Exhibit 7: Construction value added as a percent of GDP (United States)12
Exhibit 8: Construction value added as a percent of GRP (California)13
7.8% 7.8%8.1%
8.6%8.4%
8.0%
7.4%
6.3%
5.4%5.1%
5.3%5.5%
5.8%
6.2%6.4%
3.0%
4.0%
5.0%
6.0%
7.0%
8.0%
9.0%
2002 2003 2004 2005 2006 2007 2008 2009 2010 2011 2012 2013 2014 2015 2016
2002 2003 2004 2005 2006 2007 2008 2009 2010 2011 2012 2013 2014 2015 2016
3.0% 3.1%3.3% 3.3%
2.8%
2.3%
1.6%
1.0% 1.0% 1.1%1.3%
1.8% 1.8%2.0% 2.0%
0.0%
0.5%
1.0%
1.5%
2.0%
2.5%
3.0%
3.5%
4.0%
Exhibit 9: Construction value added as a percent of GRP (California, Sacramento region and Bay Area)16
3.0%
6.8% 6.9%
3.6%
1.2%1.4%
1.7%
2.3%
2.4%
0.0%
1.0%
2.0%
3.0%
4.0%
5.0%
6.0%
7.0%
8.0%
2002 2003 2004 2005 2006 2007 2008 2009 2010 2011 2012 2013 2014 2015
State Sacramento Metro (6-county) Bay Area Metro (9-county)
Exhibit 10: Housing unit supply versus demand in the Sacramento region
Exh ibit 11: Residen tial building units in the six-county Sacramento region (permi t data)20
19,865
14,239
10,996 8,932
6,483 7,768 9,125
10,399
19,122
23,812
17,987
2,293 3,939 4,652
6,492
0
5,000
10,000
15,000
20,000
25,000
30,000
2002 2003 2004 2005 2006 2007 2008 2009 2010 2011 2012 2013 2014 2015 2016 2017
Housing Unit Demand Housing Unit Supply
14,01415,671
19,78419,630
21,65218,612
10,1257,931
4,1752,493 2,326 1,938 2,965 3,772 3,967
5,526 6,401
3,226
3,868
4,628 4,7613,612
2,911
3,568
1,555
1,818 438 539 759631
982 7461,265
1,053
0
5,000
10,000
15,000
20,000
25,000
30,000
2000 2001 2002 2003 2004 2005 2006 2007 2008 2009 2010 2011 2012 2013 2014 2015 2016
Single Family Units Multifamily Units
Exhibit 13: Value of nonresidential construction in the six-county Sacramento region 21
$0
$200,000
$400,000
$600,000
$800,000
$1,000 ,000
$1,200 ,000
$1,400 ,000
$1,600 ,000
$1,800 ,000
$2,000 ,000
2000 2001 2002 2003 2004 2005 2006 2007 2008 2009 2010 2011 2012 2013 2014 2015 2016
El Dorado Placer Sacramento Yolo Yuba Sutter
Exhibit 14: Percent of nonresidential construction value in the Sacramento region, by county22
0%
10%
20%
30%
40%
50%
60%
70%
80%
90%
100%
2006 2016
El Dorado Placer Sacramento Yolo Yuba
Exhibit 17: Average annual earnings in traded and non-traded clusters in the study regions (2016)
$85,
512
$58,
972
$67,
498
$97,
280
$78,
396
$100
,688
$90,
080
$63,
145
$72,
018
$0
$20,000
$40,000
$60,000
$80,000
$100,000
$120,000
Traded Non-Traded All Industries
Sacramento Region Bay Area Californ ia
Exhibit 18: Traded subcluster employment index, Sacramento region (2001-2021)25
Water, Sewage, and Other Systems Projection
Projection
Projection
Projection
Projection
Construction Materials
Construction
Construction Products
Construction Components
Empl
oym
ent i
ndex
(2
006
Empl
oym
ent =
100
)
Empl
oym
ent i
ndex
(2
006
Empl
oym
ent =
100
)
Exhibit 24: Non-traded subcluster employment index, Sacramento region (2001-2021)36
101.0 119.3
87.2104.7
73.7
136.3
36.1
29.6
17.9
0.0
25.0
50.0
75.0
100.0
125.0
150.0
2001 2006 2011 2016 2021
Water and Sewer Line Construction Projection
Concrete Products Projection
Real Estate Services Projection
Specialty Contractors Projection
General Contractors Projection
Developers Projection
* Only included subclusters with 10k+employment or significant employment change. Refer to appendix for the complete list of nontraded subclusters.
Exhibit 39: Entering construction industry workers by type of education and training in the Sacramento region (annual average, 2014-2016)59
368
217181
56 54
148125 107
84
28 27 19 13 3
29
369
129
109
198
136
10561
35 8 13 14 8 10
0
50
100
150
200
250
300
350
400
Apprentices Oth er Post-Secondary Completions
Exhibit 44: Projected annual construction industry occupational gaps in the Sacramento region (2016-2021)60
-3
-2
-1
32
45
57
58
68
103
173
196
308
322
397
427
500
524
607
640
864
1,937
-200 100 400 700 1,000 1,300 1,600 1,900
Insulation Workers
Drafters
Interior Designers
PV Installers
Glaziers
Surveyors
Building Inspectors
Roofers
Ironworkers & Welders
Architects
Drywall Installers
HVAC & Sheet Metal
Painters
Masonry, Tile, Floor, Lathe, Plaster
Plumbers & Pipefitters
Engineers
Heavy Equipment Operators
Real Estate Professionals
Electricians
Construction Managers
Carpenters
Exhibit 47: Unionized and non-unionized workforce, Sacramento--Arden-Arcade--Roseville MSA and 10-county Bay Area (annual average, 2014-2017)61
Exhibit 48: Unionization in the construction workforce as an annual average percentage of total employment, Sacramento--Arden-Arcade--Roseville MSA (2000-2017)62
31%, 32,314
29%, 12,555
69%, 70,898
71%, 30,110
0% 20% 40% 60% 80% 100%
10-County Bay Area
Sacramento MSA
Union Non-Union
32%
20% 19%24% 23%
29%
68%
80% 81%76% 77%
71%
0%
10%
20%
30%
40%
50%
60%
70%
80%
90%
2000 – 2002 2003 – 2004 2005 –2008 2008 – 2011 2011 – 2014 2014 – 2017
Union Non-Union
Exhibit 1A. Construction managers projected annual openings, n = 871 (2016-2021)67
Cost Estimators, 206openings, 24%
Construction Managers,
225 openings, 26%
First-Line Supervisors of Construction Trades and
Extraction Workers,440 openings, 50%
0 100 200 300 400 500 600 700 800 900 1,000
Construction Products, 81
Water, Sewage, and Other Systems, 908
-10.0%
-5.0%
0.0%
5.0%
10.0%
15.0%
20.0%
25.0%
0.0 0.5 1.0 1.5 2.0 2.5 3.0 3.5
Location Quotient (2016)
Location Quotient (2016)
Ann
ual E
mpl
oym
ent G
row
th R
ate
(200
6-20
16)
Subcluster with an annual average earnings higher than all-industry annual average earnings in ($67,498) Sacramento region in 2016
LQ=1.0
Exhibit 2C: Non-traded subclusters in the Sacramento region73
Specialty Contractors, 50,899
General Contractors, 16,843
Real Estate Services, 15,475
Construction Materials Retailing, 6,552
Highway and Street Construction, 2,268
Water and Sewer Line Construction, 1,662
Building Equipment Distribution, 1,207
Developers
-15.0%
-10.0%
-5.0%
0.0%
5.0%
0.8 1.0 1.2 1.4
Ann
ual E
mpl
oym
ent G
row
th R
ate
(200
6-20
16
Exhibit 2E: Joint apprentices by gender in the Sacramento region (January 2012-October 2017)
Exhibit 3E: Joint apprentices by county of residence in the Sacramento region (January 2012-October 2017)
8,374, 97%
249, 3%
El Dorado,393, 56%
Placer,949, 11%
Sacramento, 6077, 1
Sutter, 346,4%
Yolo, 549,6%
Yuba, 309,
4%
Exhibit 4E: Joint apprentices’ highest level of education prior to apprenticeship in the Sacramento region (January 2012-October 2017)
Exhibit 5E: Number of weeks worked, all workers in the construction sector in the Sacramento region (2015)84
Less than highschool, 7%
High schoolgraduate orGED, 65%
Some college,25%
4 or more yearsof college, 3%
3,165 6%
3,082 6%
1,650 3%
6,105 12%
7,068 10%
31,037 62%
0 5,000 10,000 15,000 20,000 25,000 30,000 35,000
Did not work
Less than 14
14 to 26
27 to 39
40 to 49
50 to 52
# w
eeks
wor
ked
in th
e la
st y
ear
Exhibit 4: Value of nonresidential construction put in place, by subcomponent (California)9
-0.5%
29.2%
-41.1%
0.0%
62.9%
-34.7%
46.0%
42.8%
19.1%
-14.6%
66.5%
763.4%
Office
Commercial
Manufacturing
Health care
Educational
Religious
Amusement and recreation
Transportation
Power and communication
Highway and street
Public works
Other
Subcomponent percent change 2006-2016
180.8
593.7
818.9
21.4
235.8 342.3
104.9 133.6 173.5
0.0
100.0
200.0
300.0
400.0
500.0
600.0
700.0
800.0
900.0
1000.0
2001 2006 2011 2016 2021
Construction Materials,125
Construction, 1,942
Construction Components, 466
LQ=1.0
Concrete Products, 1,123
Construction Materials Wholesaling, 1,647
Subcluster with an annual average earnings higher than all-industry annual average earnings ($67,498) in Sacramento region in 2016
Exhibit 1E: Total joint apprentice starts, residents in the six-county Sacramento region (January 2012-October 2017) (n = 8,617)2
435
95
104
111
117
121
135
161
174
178
215
302
340
440
458
483
542
602
1,045
1,205
1,354
0 200 400 600 800 1000 1200 1400 1600
All others
Elevator constructor
Drywall finisher
Scaffold and shoring erector
Inspector or surveyor
Pile driver
Glazier
Carpet, linoleum, and soft tile layer
Millwright
Sheet metal worker & related trades
Construction equipment operator trades
Brick, marble, terrazzo, tile, and related trades
Roofer and waterproofer
Plumber and fitter trades
Painter trades
Cement mason and plasterer trades
Electricial trades
Drywall/lather
Ironworker trades
Carpenter
Construction craft laborer
Exhibit 38: Anticipated annual construction industry job openings by new and replacement jobs in the Sacramento region (2016-2021)1
21 26 59 60 52 78 99 167 167 220323 350 399 439 473
596 679788 777 763
2,119
4 6 1 1 20 7 520 27 2
71 56100 95 73
4699
82 95222
215
0
500
1000
1500
2000
2500
Annual Replacement Openings New Jobs (Growth)
Male
Female
$ Th
ousa
nds
Thou
sand
s of
Dol
lars
Average annual openings (demand) minuseducation and training (supply) =approximate annual shortage
Approximate annual shortage = 7,250 workers across all categories
Sutter
6.2% 5.1%
27.6%
14.4%
50.6%69.9%
10.8%7.9%
1.1% 0.6%3.6% 2.0%
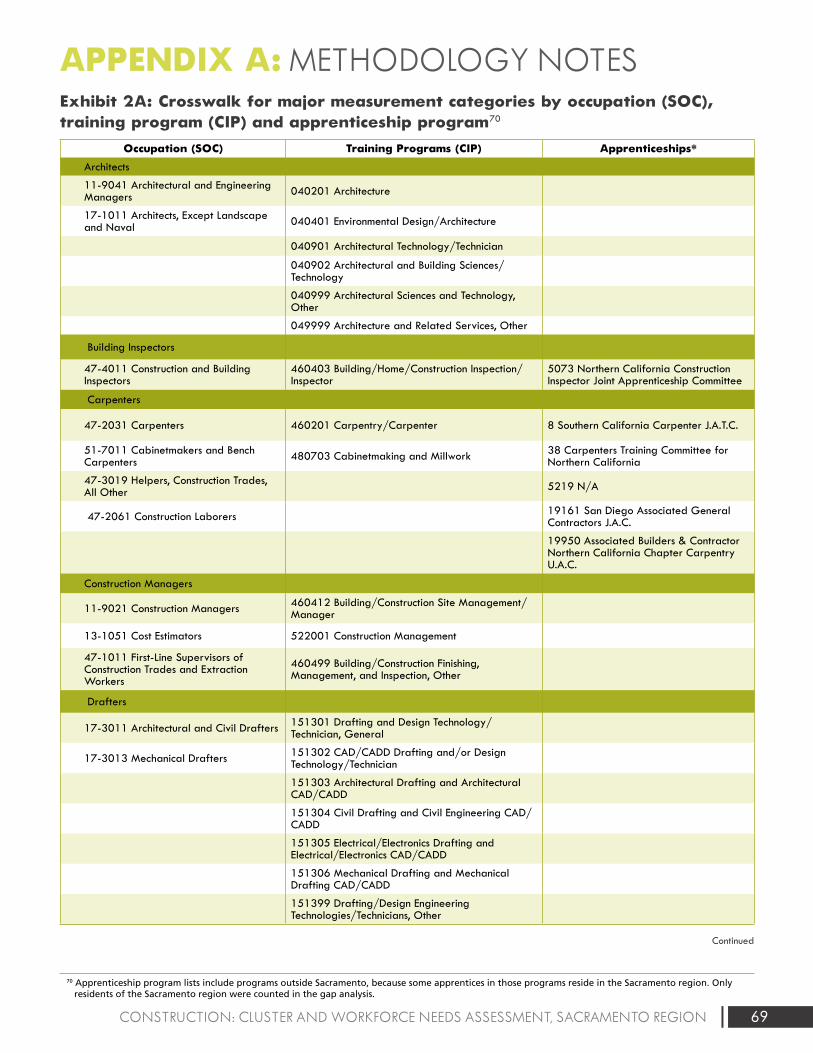
69CONSTRUCTION: CLUSTER AND WORKFORCE NEEDS ASSESSMENT, SACRAMENTO REGION
APPENDIX A: METHODOLOGY NOTES
70 Apprenticeship program lists include programs outside Sacramento, because some apprentices in those programs reside in the Sacramento region. Only residents of the Sacramento region were counted in the gap analysis.
Exhibit 2A: Crosswalk for major measurement categories by occupation (SOC), training program (CIP) and apprenticeship program70
Occupation (SOC) Training Programs (CIP) Apprenticeships*
Architects
11-9041 Architectural and Engineering Managers 040201 Architecture
17-1011 Architects, Except Landscape and Naval 040401 Environmental Design/Architecture
040901 Architectural Technology/Technician
040902 Architectural and Building Sciences/Technology
040999 Architectural Sciences and Technology, Other
049999 Architecture and Related Services, Other
Building Inspectors
47-4011 Construction and Building Inspectors
460403 Building/Home/Construction Inspection/Inspector
5073 Northern California Construction Inspector Joint Apprenticeship Committee
Carpenters
47-2031 Carpenters 460201 Carpentry/Carpenter 8 Southern California Carpenter J.A.T.C.
51-7011 Cabinetmakers and Bench Carpenters 480703 Cabinetmaking and Millwork 38 Carpenters Training Committee for
Northern California
47-3019 Helpers, Construction Trades, All Other 5219 N/A
47-2061 Construction Laborers 19161 San Diego Associated General Contractors J.A.C.
19950 Associated Builders & Contractor Northern California Chapter Carpentry U.A.C.
Construction Managers
11-9021 Construction Managers 460412 Building/Construction Site Management/Manager
13-1051 Cost Estimators 522001 Construction Management
47-1011 First-Line Supervisors of Construction Trades and Extraction Workers
460499 Building/Construction Finishing, Management, and Inspection, Other
Drafters
17-3011 Architectural and Civil Drafters 151301 Drafting and Design Technology/Technician, General
17-3013 Mechanical Drafters 151302 CAD/CADD Drafting and/or Design Technology/Technician
151303 Architectural Drafting and Architectural CAD/CADD
151304 Civil Drafting and Civil Engineering CAD/CADD
151305 Electrical/Electronics Drafting and Electrical/Electronics CAD/CADD
151306 Mechanical Drafting and Mechanical Drafting CAD/CADD
151399 Drafting/Design Engineering Technologies/Technicians, Other
Continued
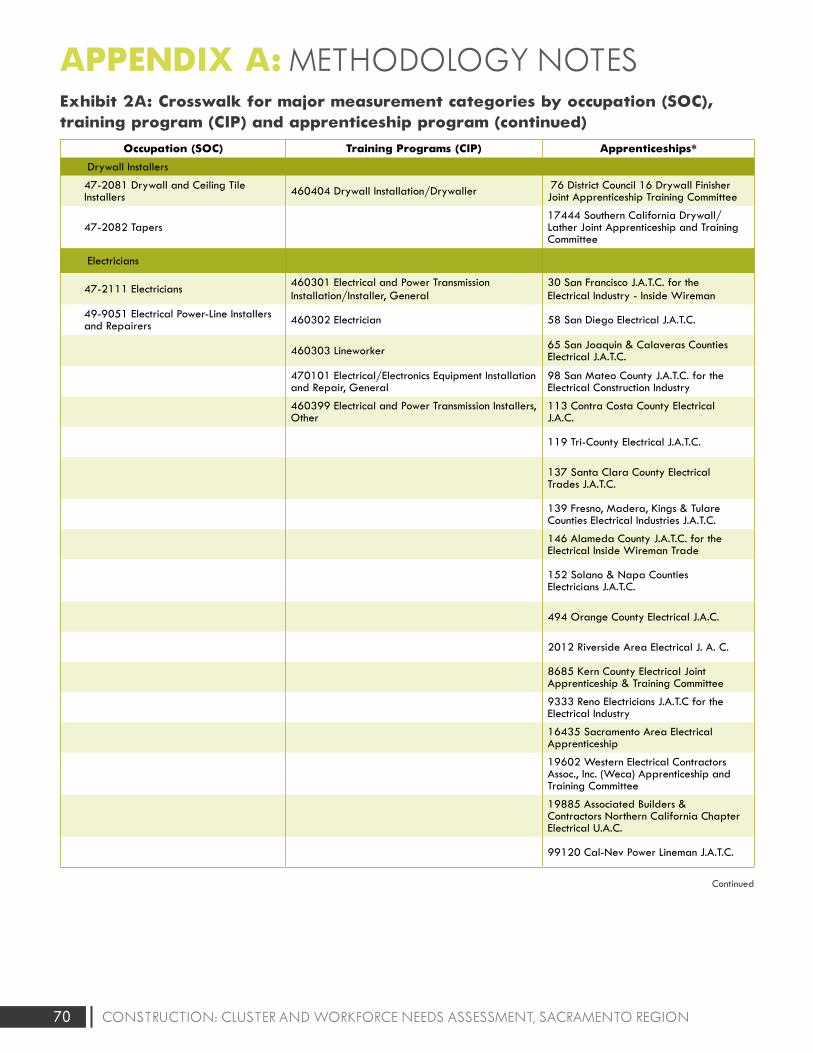
70 CONSTRUCTION: CLUSTER AND WORKFORCE NEEDS ASSESSMENT, SACRAMENTO REGION
APPENDIX A: METHODOLOGY NOTES Exhibit 2A: Crosswalk for major measurement categories by occupation (SOC), training program (CIP) and apprenticeship program (continued)
Occupation (SOC) Training Programs (CIP) Apprenticeships*
Drywall Installers
47-2081 Drywall and Ceiling Tile Installers 460404 Drywall Installation/Drywaller 76 District Council 16 Drywall Finisher
Joint Apprenticeship Training Committee
47-2082 Tapers17444 Southern California Drywall/Lather Joint Apprenticeship and Training Committee
Electricians
47-2111 Electricians460301 Electrical and Power Transmission Installation/Installer, General
30 San Francisco J.A.T.C. for the Electrical Industry - Inside Wireman
49-9051 Electrical Power-Line Installers and Repairers 460302 Electrician 58 San Diego Electrical J.A.T.C.
460303 Lineworker 65 San Joaquin & Calaveras Counties Electrical J.A.T.C.
470101 Electrical/Electronics Equipment Installation and Repair, General
98 San Mateo County J.A.T.C. for the Electrical Construction Industry
460399 Electrical and Power Transmission Installers, Other
113 Contra Costa County Electrical J.A.C.
119 Tri-County Electrical J.A.T.C.
137 Santa Clara County Electrical Trades J.A.T.C.
139 Fresno, Madera, Kings & Tulare Counties Electrical Industries J.A.T.C.
146 Alameda County J.A.T.C. for the Electrical Inside Wireman Trade
152 Solano & Napa Counties Electricians J.A.T.C.
494 Orange County Electrical J.A.C.
2012 Riverside Area Electrical J. A. C.
8685 Kern County Electrical Joint Apprenticeship & Training Committee
9333 Reno Electricians J.A.T.C for the Electrical Industry
16435 Sacramento Area Electrical Apprenticeship
19602 Western Electrical Contractors Assoc., Inc. (Weca) Apprenticeship and Training Committee
19885 Associated Builders & Contractors Northern California Chapter Electrical U.A.C.
99120 Cal-Nev Power Lineman J.A.T.C.
Continued
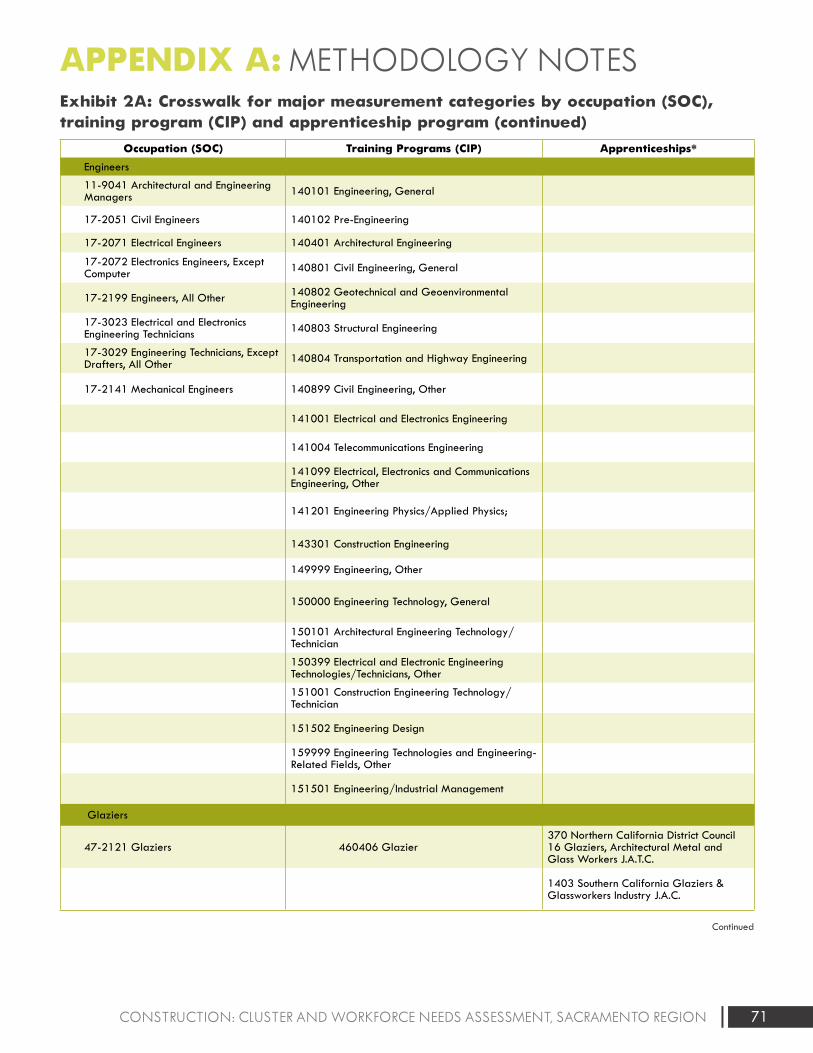
71CONSTRUCTION: CLUSTER AND WORKFORCE NEEDS ASSESSMENT, SACRAMENTO REGION
APPENDIX A: METHODOLOGY NOTES Exhibit 2A: Crosswalk for major measurement categories by occupation (SOC), training program (CIP) and apprenticeship program (continued)
Occupation (SOC) Training Programs (CIP) Apprenticeships*
Engineers
11-9041 Architectural and Engineering Managers 140101 Engineering, General
17-2051 Civil Engineers 140102 Pre-Engineering
17-2071 Electrical Engineers 140401 Architectural Engineering
17-2072 Electronics Engineers, Except Computer 140801 Civil Engineering, General
17-2199 Engineers, All Other 140802 Geotechnical and Geoenvironmental Engineering
17-3023 Electrical and Electronics Engineering Technicians 140803 Structural Engineering
17-3029 Engineering Technicians, Except Drafters, All Other 140804 Transportation and Highway Engineering
17-2141 Mechanical Engineers 140899 Civil Engineering, Other
141001 Electrical and Electronics Engineering
141004 Telecommunications Engineering
141099 Electrical, Electronics and Communications Engineering, Other
141201 Engineering Physics/Applied Physics;
143301 Construction Engineering
149999 Engineering, Other
150000 Engineering Technology, General
150101 Architectural Engineering Technology/Technician
150399 Electrical and Electronic Engineering Technologies/Technicians, Other
151001 Construction Engineering Technology/Technician
151502 Engineering Design
159999 Engineering Technologies and Engineering-Related Fields, Other
151501 Engineering/Industrial Management
Glaziers
47-2121 Glaziers 460406 Glazier370 Northern California District Council 16 Glaziers, Architectural Metal and Glass Workers J.A.T.C.
1403 Southern California Glaziers & Glassworkers Industry J.A.C.
Continued
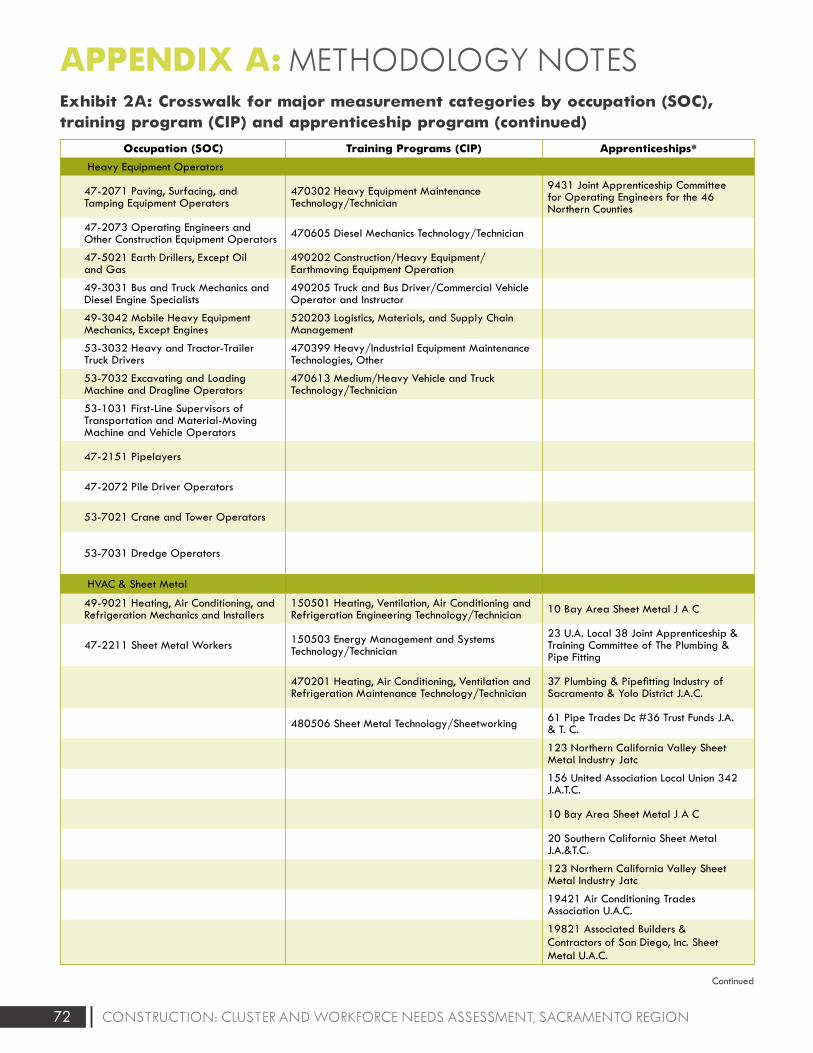
72 CONSTRUCTION: CLUSTER AND WORKFORCE NEEDS ASSESSMENT, SACRAMENTO REGION
APPENDIX A: METHODOLOGY NOTES Exhibit 2A: Crosswalk for major measurement categories by occupation (SOC), training program (CIP) and apprenticeship program (continued)
Occupation (SOC) Training Programs (CIP) Apprenticeships*
Heavy Equipment Operators
47-2071 Paving, Surfacing, and Tamping Equipment Operators
470302 Heavy Equipment Maintenance Technology/Technician
9431 Joint Apprenticeship Committee for Operating Engineers for the 46 Northern Counties
47-2073 Operating Engineers and Other Construction Equipment Operators 470605 Diesel Mechanics Technology/Technician
47-5021 Earth Drillers, Except Oil and Gas
490202 Construction/Heavy Equipment/Earthmoving Equipment Operation
49-3031 Bus and Truck Mechanics and Diesel Engine Specialists
490205 Truck and Bus Driver/Commercial Vehicle Operator and Instructor
49-3042 Mobile Heavy Equipment Mechanics, Except Engines
520203 Logistics, Materials, and Supply Chain Management
53-3032 Heavy and Tractor-Trailer Truck Drivers
470399 Heavy/Industrial Equipment Maintenance Technologies, Other
53-7032 Excavating and Loading Machine and Dragline Operators
470613 Medium/Heavy Vehicle and Truck Technology/Technician
53-1031 First-Line Supervisors of Transportation and Material-Moving Machine and Vehicle Operators
47-2151 Pipelayers
47-2072 Pile Driver Operators
53-7021 Crane and Tower Operators
53-7031 Dredge Operators
HVAC & Sheet Metal
49-9021 Heating, Air Conditioning, and Refrigeration Mechanics and Installers
150501 Heating, Ventilation, Air Conditioning and Refrigeration Engineering Technology/Technician 10 Bay Area Sheet Metal J A C
47-2211 Sheet Metal Workers 150503 Energy Management and Systems Technology/Technician
23 U.A. Local 38 Joint Apprenticeship & Training Committee of The Plumbing & Pipe Fitting
470201 Heating, Air Conditioning, Ventilation and Refrigeration Maintenance Technology/Technician
37 Plumbing & Pipefitting Industry of Sacramento & Yolo District J.A.C.
480506 Sheet Metal Technology/Sheetworking 61 Pipe Trades Dc #36 Trust Funds J.A. & T. C.
123 Northern California Valley Sheet Metal Industry Jatc
156 United Association Local Union 342 J.A.T.C.
10 Bay Area Sheet Metal J A C
20 Southern California Sheet Metal J.A.&T.C.
123 Northern California Valley Sheet Metal Industry Jatc
19421 Air Conditioning Trades Association U.A.C.
19821 Associated Builders & Contractors of San Diego, Inc. Sheet Metal U.A.C.
Continued

73CONSTRUCTION: CLUSTER AND WORKFORCE NEEDS ASSESSMENT, SACRAMENTO REGION
APPENDIX A: METHODOLOGY NOTES Exhibit 2A: Crosswalk for major measurement categories by occupation (SOC), training program (CIP) and apprenticeship program (continued)
Occupation (SOC) Training Programs (CIP) Apprenticeships*
Insulation Workers
47-2132 Insulation Workers, Mechanical 460414 Insulator 38 Carpenters Training Committee for Northern California
47-2131 Insulation Workers, Floor, Ceilings, and Wall
16427 Northern California Heat & Frost Insulators and Allied Workers J.A.C.
Interior Designers
27-1025 Interior Designers 500408 Interior Design
040501 Interior Architecture
Ironworkers & Welders
47-2171 Reinforcing Iron and Rebar Workers
460411 Metal Building Assembly/Assembler1501 Int'L Association of Bridge, Structural, Ornamental And Reinforcing Ironworkers, Local 11
47-2221 Structural Iron and Steel Workers
480509 Ironworking/Ironworker7205 Intl. Assoc. of Bridge, Structural, Ornamental & Reinforcing Ironworkers Local 378 Oakland
51-2041 Structural Metal Fabricators and Fitters
480511 Metal Fabricator7646 Intl. Assoc. of Bridge, Structural, Ornamental & Reinforcing Ironworkers Local 377 San Franc
51-4121 Welders, Cutters, Solderers, and Brazers
480508 Welding Technology/Welder8885 Intl Assoc. of Bridge, Structural, Ornamental & Reinforcing Ironworkers L416 J.A.T.C.
150614 Welding Engineering Technology/Technician
9076 International Assoc. of Bridge, Structural, Ornamental & Reinforcing Ironworkers Local 155
9271 Intl. Assoc. of Bridge, Structural, Ornamental & Reinforcing Ironworkers Local 377 Santa Clara
Masonry, Tile, Floor, Lathe, Plaster
47-2021 Brickmasons and Blockmasons 460101 Mason/Masonry 88 Northern California Tile Industry Joint Apprenticeship Training Committee
47-3011 Helpers—Brickmasons, Blockmasons, Stonemasons, and Tile and Marble Setters
460402 Concrete Finishing/Concrete Finisher5087 Northern California District Council of Laborers Hod Carrier J.A.C.
47-2051 Cement Masons and Concrete Finishers 460413 Carpet, Floor, and Tile Worker
10121 Bricklayers & Allied Crafts Local 3 J.A.T.& E.C.
47-2041 Carpet Installers10999 Sacramento Area Tile, Terrazzo & Marble Trades J.A.T.C.
47-2042 Floor Layers, Except Carpet, Wood, and Hard Tiles
18496 Northern California Cement Masons J.A.T.C.
47-2043 Floor Sanders and Finishers
47-2044 Tile and Marble Setters 4789 Northern California Floor Covering J.A.T.C.
47-2053 Terrazzo Workers and Finishers 10121 Bricklayers & Allied Crafts Local 3 J.A.T.& E.C.
10999 Sacramento Area Tile, Terrazzo & Marble Trades J.A.T.C.
Continued
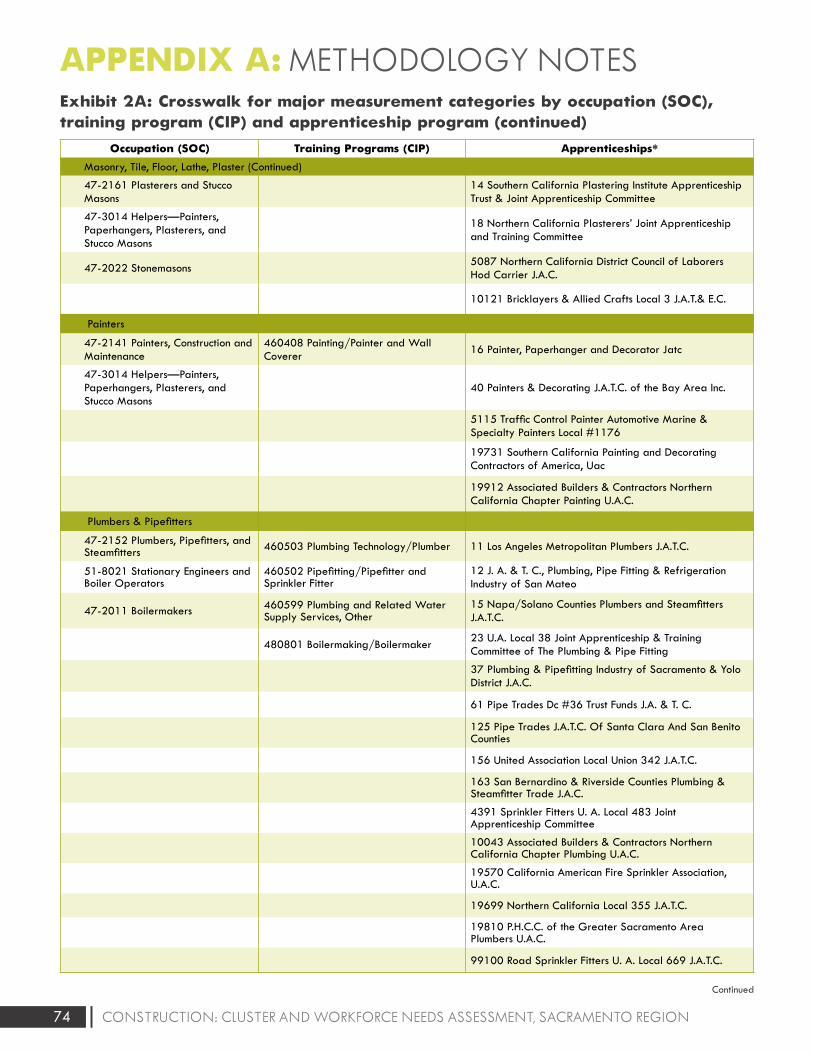
74 CONSTRUCTION: CLUSTER AND WORKFORCE NEEDS ASSESSMENT, SACRAMENTO REGION
APPENDIX A: METHODOLOGY NOTES Exhibit 2A: Crosswalk for major measurement categories by occupation (SOC), training program (CIP) and apprenticeship program (continued)
Occupation (SOC) Training Programs (CIP) Apprenticeships*
Masonry, Tile, Floor, Lathe, Plaster (Continued)
47-2161 Plasterers and Stucco Masons
14 Southern California Plastering Institute Apprenticeship Trust & Joint Apprenticeship Committee
47-3014 Helpers—Painters, Paperhangers, Plasterers, and Stucco Masons
18 Northern California Plasterers’ Joint Apprenticeship and Training Committee
47-2022 Stonemasons5087 Northern California District Council of Laborers Hod Carrier J.A.C.
10121 Bricklayers & Allied Crafts Local 3 J.A.T.& E.C.
Painters
47-2141 Painters, Construction and Maintenance
460408 Painting/Painter and Wall Coverer
16 Painter, Paperhanger and Decorator Jatc
47-3014 Helpers—Painters, Paperhangers, Plasterers, and Stucco Masons
40 Painters & Decorating J.A.T.C. of the Bay Area Inc.
5115 Traffic Control Painter Automotive Marine & Specialty Painters Local #1176
19731 Southern California Painting and Decorating Contractors of America, Uac
19912 Associated Builders & Contractors Northern California Chapter Painting U.A.C.
Plumbers & Pipefitters
47-2152 Plumbers, Pipefitters, and Steamfitters 460503 Plumbing Technology/Plumber 11 Los Angeles Metropolitan Plumbers J.A.T.C.
51-8021 Stationary Engineers and Boiler Operators
460502 Pipefitting/Pipefitter and Sprinkler Fitter
12 J. A. & T. C., Plumbing, Pipe Fitting & Refrigeration Industry of San Mateo
47-2011 Boilermakers 460599 Plumbing and Related Water Supply Services, Other
15 Napa/Solano Counties Plumbers and Steamfitters J.A.T.C.
480801 Boilermaking/Boilermaker23 U.A. Local 38 Joint Apprenticeship & Training Committee of The Plumbing & Pipe Fitting
37 Plumbing & Pipefitting Industry of Sacramento & Yolo District J.A.C.
61 Pipe Trades Dc #36 Trust Funds J.A. & T. C.
125 Pipe Trades J.A.T.C. Of Santa Clara And San Benito Counties
156 United Association Local Union 342 J.A.T.C.
163 San Bernardino & Riverside Counties Plumbing & Steamfitter Trade J.A.C.
4391 Sprinkler Fitters U. A. Local 483 Joint Apprenticeship Committee
10043 Associated Builders & Contractors Northern California Chapter Plumbing U.A.C.
19570 California American Fire Sprinkler Association, U.A.C.
19699 Northern California Local 355 J.A.T.C.
19810 P.H.C.C. of the Greater Sacramento Area Plumbers U.A.C.
99100 Road Sprinkler Fitters U. A. Local 669 J.A.T.C.
Continued
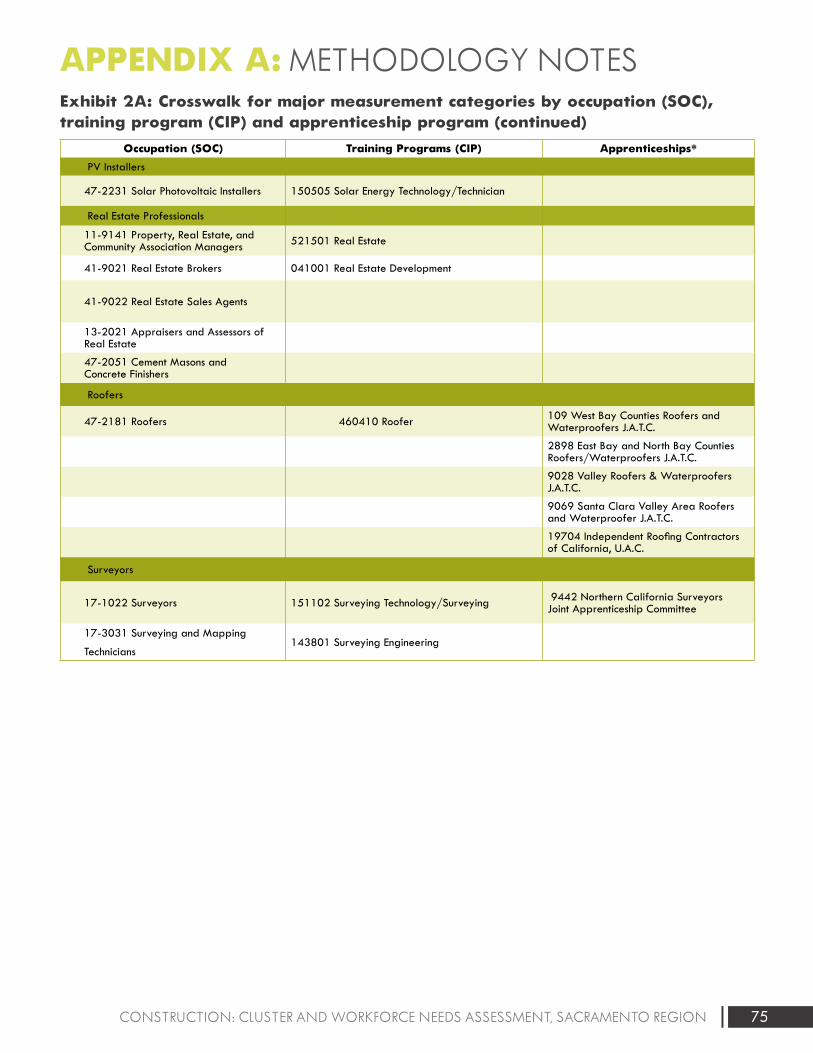
75CONSTRUCTION: CLUSTER AND WORKFORCE NEEDS ASSESSMENT, SACRAMENTO REGION
APPENDIX A: METHODOLOGY NOTES Exhibit 2A: Crosswalk for major measurement categories by occupation (SOC), training program (CIP) and apprenticeship program (continued)
Occupation (SOC) Training Programs (CIP) Apprenticeships*
PV Installers
47-2231 Solar Photovoltaic Installers 150505 Solar Energy Technology/Technician
Real Estate Professionals
11-9141 Property, Real Estate, and Community Association Managers 521501 Real Estate
41-9021 Real Estate Brokers 041001 Real Estate Development
41-9022 Real Estate Sales Agents
13-2021 Appraisers and Assessors of Real Estate
47-2051 Cement Masons and Concrete Finishers
Roofers
47-2181 Roofers 460410 Roofer 109 West Bay Counties Roofers and Waterproofers J.A.T.C.
2898 East Bay and North Bay Counties Roofers/Waterproofers J.A.T.C.
9028 Valley Roofers & Waterproofers J.A.T.C.
9069 Santa Clara Valley Area Roofers and Waterproofer J.A.T.C.
19704 Independent Roofing Contractors of California, U.A.C.
Surveyors
17-1022 Surveyors 151102 Surveying Technology/Surveying 9442 Northern California Surveyors Joint Apprenticeship Committee
17-3031 Surveying and Mapping
Technicians143801 Surveying Engineering
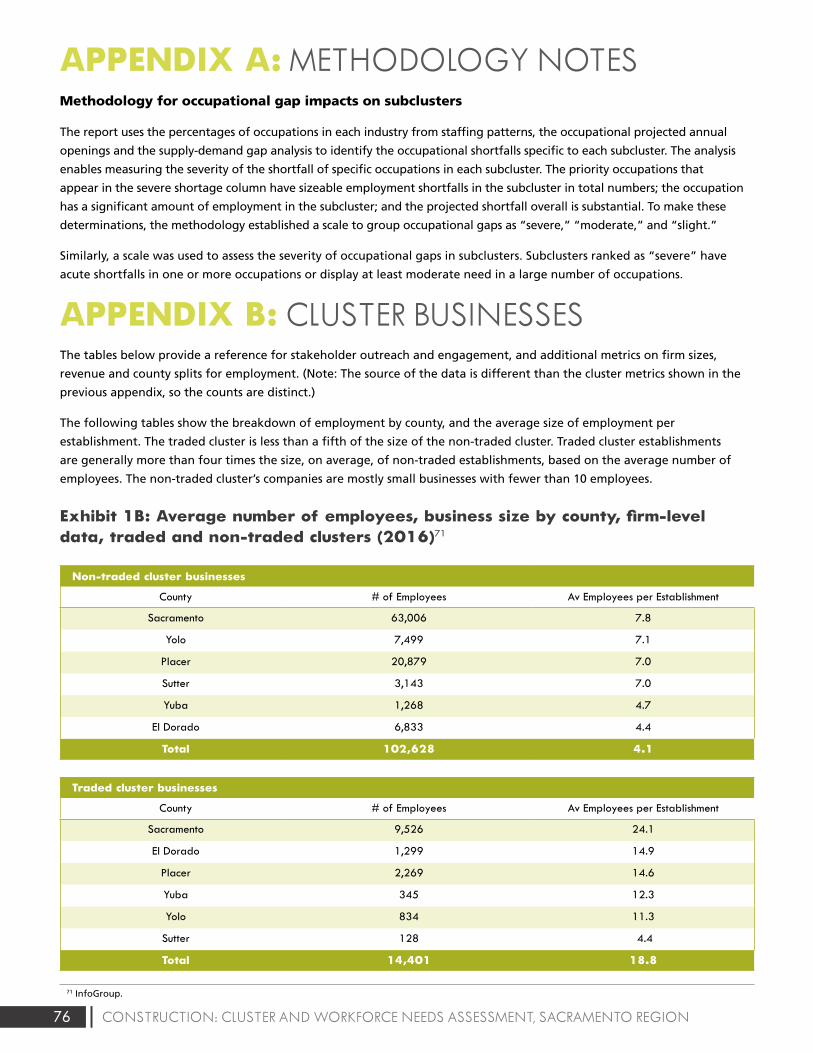
76 CONSTRUCTION: CLUSTER AND WORKFORCE NEEDS ASSESSMENT, SACRAMENTO REGION
APPENDIX B: CLUSTER BUSINESSES The tables below provide a reference for stakeholder outreach and engagement, and additional metrics on firm sizes,
revenue and county splits for employment. (Note: The source of the data is different than the cluster metrics shown in the
previous appendix, so the counts are distinct.)
The following tables show the breakdown of employment by county, and the average size of employment per
establishment. The traded cluster is less than a fifth of the size of the non-traded cluster. Traded cluster establishments
are generally more than four times the size, on average, of non-traded establishments, based on the average number of
employees. The non-traded cluster’s companies are mostly small businesses with fewer than 10 employees.
Exhibit 1B: Average number of employees, business size by county, firm-level data, traded and non-traded clusters (2016)71
Non-traded cluster businesses
County # of Employees Av Employees per Establishment
Sacramento 63,006 7.8
Yolo 7,499 7.1
Placer 20,879 7.0
Sutter 3,143 7.0
Yuba 1,268 4.7
El Dorado 6,833 4.4
Total 102,628 4.1
Traded cluster businesses
County # of Employees Av Employees per Establishment
Sacramento 9,526 24.1
El Dorado 1,299 14.9
Placer 2,269 14.6
Yuba 345 12.3
Yolo 834 11.3
Sutter 128 4.4
Total 14,401 18.8
APPENDIX A: METHODOLOGY NOTES Methodology for occupational gap impacts on subclusters
The report uses the percentages of occupations in each industry from staffing patterns, the occupational projected annual
openings and the supply-demand gap analysis to identify the occupational shortfalls specific to each subcluster. The analysis
enables measuring the severity of the shortfall of specific occupations in each subcluster. The priority occupations that
appear in the severe shortage column have sizeable employment shortfalls in the subcluster in total numbers; the occupation
has a significant amount of employment in the subcluster; and the projected shortfall overall is substantial. To make these
determinations, the methodology established a scale to group occupational gaps as “severe,” “moderate,” and “slight.”
Similarly, a scale was used to assess the severity of occupational gaps in subclusters. Subclusters ranked as “severe” have
acute shortfalls in one or more occupations or display at least moderate need in a large number of occupations.
71 InfoGroup.
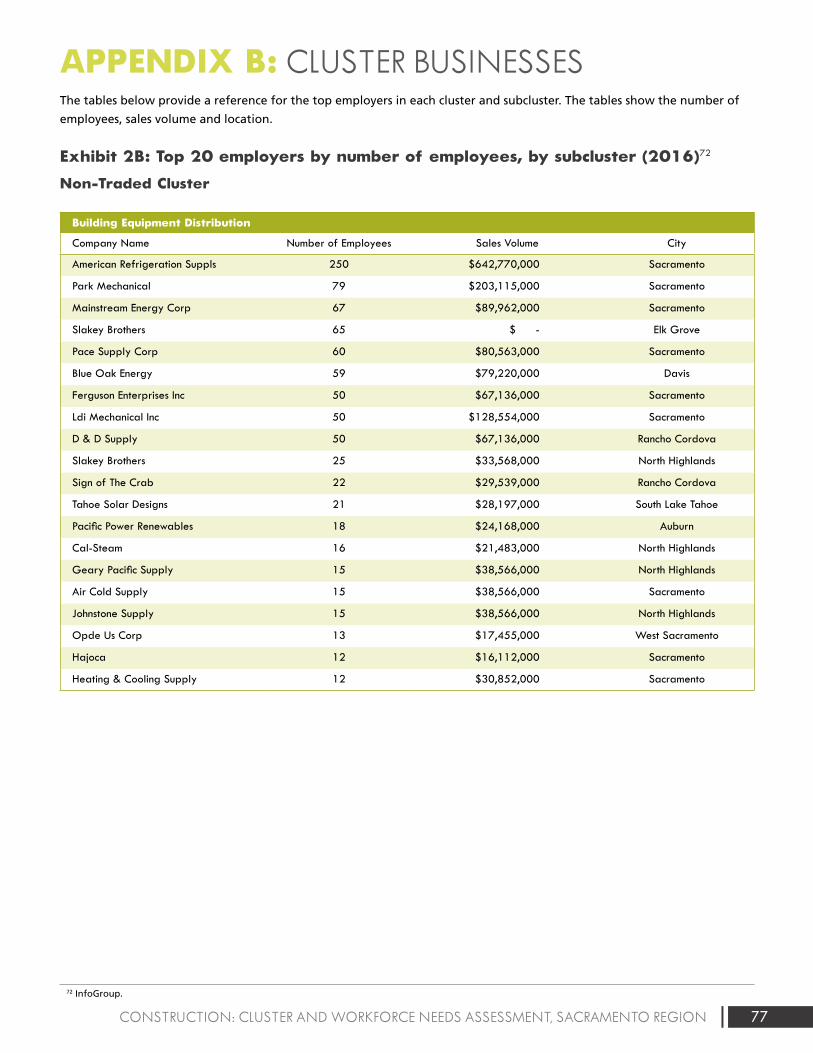
77CONSTRUCTION: CLUSTER AND WORKFORCE NEEDS ASSESSMENT, SACRAMENTO REGION
APPENDIX B: CLUSTER BUSINESSES The tables below provide a reference for the top employers in each cluster and subcluster. The tables show the number of
employees, sales volume and location.
Exhibit 2B: Top 20 employers by number of employees, by subcluster (2016)72
Non-Traded Cluster
Building Equipment Distribution
Company Name Number of Employees Sales Volume City
American Refrigeration Suppls 250 $642,770,000 Sacramento
Park Mechanical 79 $203,115,000 Sacramento
Mainstream Energy Corp 67 $89,962,000 Sacramento
Slakey Brothers 65 $ - Elk Grove
Pace Supply Corp 60 $80,563,000 Sacramento
Blue Oak Energy 59 $79,220,000 Davis
Ferguson Enterprises Inc 50 $67,136,000 Sacramento
Ldi Mechanical Inc 50 $128,554,000 Sacramento
D & D Supply 50 $67,136,000 Rancho Cordova
Slakey Brothers 25 $33,568,000 North Highlands
Sign of The Crab 22 $29,539,000 Rancho Cordova
Tahoe Solar Designs 21 $28,197,000 South Lake Tahoe
Pacific Power Renewables 18 $24,168,000 Auburn
Cal-Steam 16 $21,483,000 North Highlands
Geary Pacific Supply 15 $38,566,000 North Highlands
Air Cold Supply 15 $38,566,000 Sacramento
Johnstone Supply 15 $38,566,000 North Highlands
Opde Us Corp 13 $17,455,000 West Sacramento
Hajoca 12 $16,112,000 Sacramento
Heating & Cooling Supply 12 $30,852,000 Sacramento
72 InfoGroup.
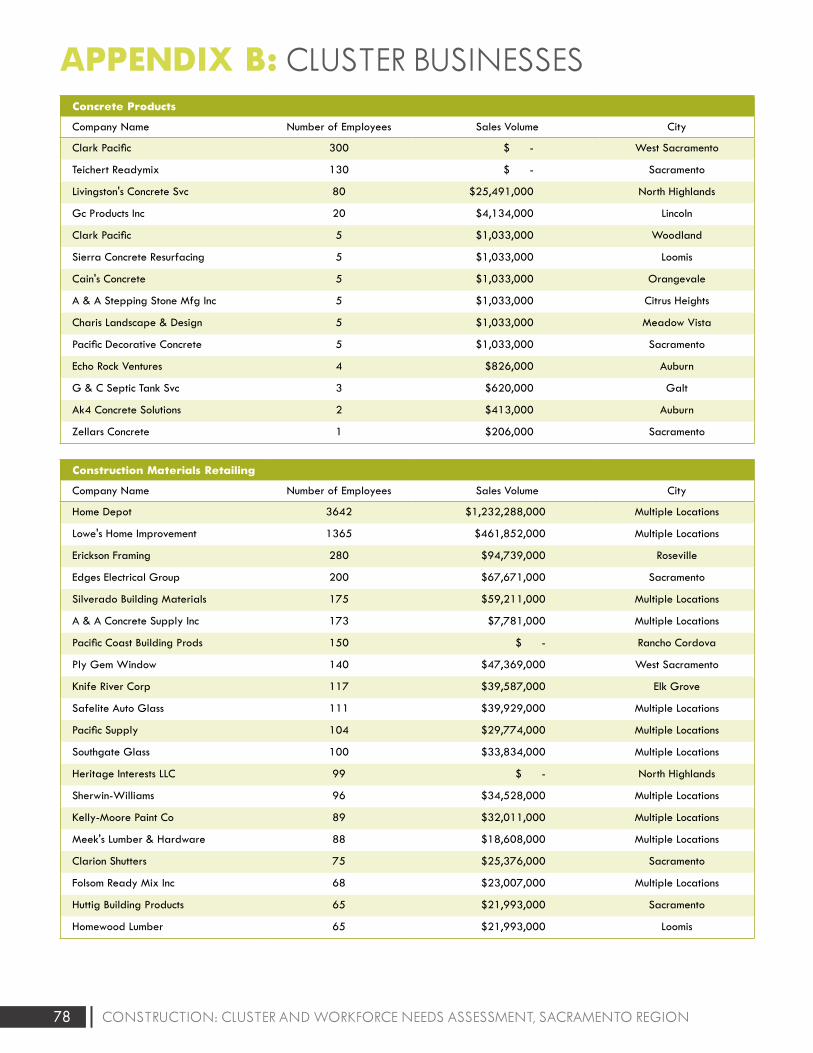
78 CONSTRUCTION: CLUSTER AND WORKFORCE NEEDS ASSESSMENT, SACRAMENTO REGION
APPENDIX B: CLUSTER BUSINESSES Concrete Products
Company Name Number of Employees Sales Volume City
Clark Pacific 300 $ - West Sacramento
Teichert Readymix 130 $ - Sacramento
Livingston's Concrete Svc 80 $25,491,000 North Highlands
Gc Products Inc 20 $4,134,000 Lincoln
Clark Pacific 5 $1,033,000 Woodland
Sierra Concrete Resurfacing 5 $1,033,000 Loomis
Cain's Concrete 5 $1,033,000 Orangevale
A & A Stepping Stone Mfg Inc 5 $1,033,000 Citrus Heights
Charis Landscape & Design 5 $1,033,000 Meadow Vista
Pacific Decorative Concrete 5 $1,033,000 Sacramento
Echo Rock Ventures 4 $826,000 Auburn
G & C Septic Tank Svc 3 $620,000 Galt
Ak4 Concrete Solutions 2 $413,000 Auburn
Zellars Concrete 1 $206,000 Sacramento
Construction Materials Retailing
Company Name Number of Employees Sales Volume City
Home Depot 3642 $1,232,288,000 Multiple Locations
Lowe's Home Improvement 1365 $461,852,000 Multiple Locations
Erickson Framing 280 $94,739,000 Roseville
Edges Electrical Group 200 $67,671,000 Sacramento
Silverado Building Materials 175 $59,211,000 Multiple Locations
A & A Concrete Supply Inc 173 $7,781,000 Multiple Locations
Pacific Coast Building Prods 150 $ - Rancho Cordova
Ply Gem Window 140 $47,369,000 West Sacramento
Knife River Corp 117 $39,587,000 Elk Grove
Safelite Auto Glass 111 $39,929,000 Multiple Locations
Pacific Supply 104 $29,774,000 Multiple Locations
Southgate Glass 100 $33,834,000 Multiple Locations
Heritage Interests LLC 99 $ - North Highlands
Sherwin-Williams 96 $34,528,000 Multiple Locations
Kelly-Moore Paint Co 89 $32,011,000 Multiple Locations
Meek's Lumber & Hardware 88 $18,608,000 Multiple Locations
Clarion Shutters 75 $25,376,000 Sacramento
Folsom Ready Mix Inc 68 $23,007,000 Multiple Locations
Huttig Building Products 65 $21,993,000 Sacramento
Homewood Lumber 65 $21,993,000 Loomis
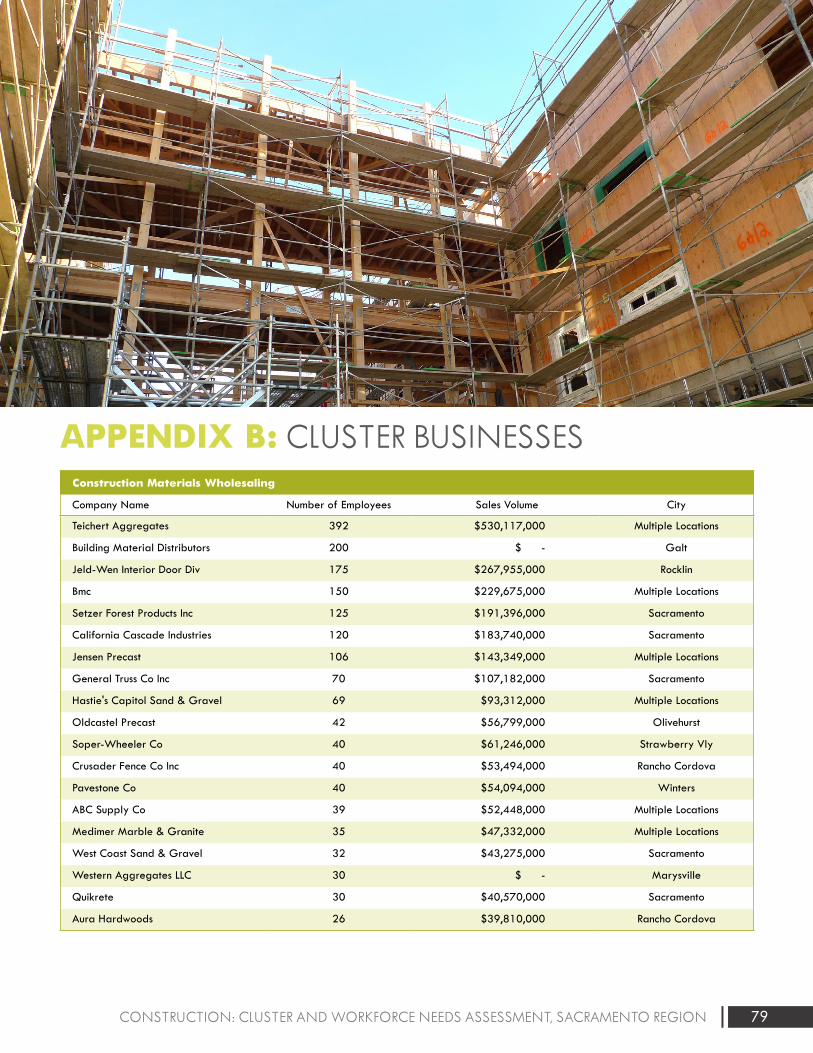
79CONSTRUCTION: CLUSTER AND WORKFORCE NEEDS ASSESSMENT, SACRAMENTO REGION
APPENDIX B: CLUSTER BUSINESSES Construction Materials Wholesaling
Company Name Number of Employees Sales Volume City
Teichert Aggregates 392 $530,117,000 Multiple Locations
Building Material Distributors 200 $ - Galt
Jeld-Wen Interior Door Div 175 $267,955,000 Rocklin
Bmc 150 $229,675,000 Multiple Locations
Setzer Forest Products Inc 125 $191,396,000 Sacramento
California Cascade Industries 120 $183,740,000 Sacramento
Jensen Precast 106 $143,349,000 Multiple Locations
General Truss Co Inc 70 $107,182,000 Sacramento
Hastie's Capitol Sand & Gravel 69 $93,312,000 Multiple Locations
Oldcastel Precast 42 $56,799,000 Olivehurst
Soper-Wheeler Co 40 $61,246,000 Strawberry Vly
Crusader Fence Co Inc 40 $53,494,000 Rancho Cordova
Pavestone Co 40 $54,094,000 Winters
ABC Supply Co 39 $52,448,000 Multiple Locations
Medimer Marble & Granite 35 $47,332,000 Multiple Locations
West Coast Sand & Gravel 32 $43,275,000 Sacramento
Western Aggregates LLC 30 $ - Marysville
Quikrete 30 $40,570,000 Sacramento
Aura Hardwoods 26 $39,810,000 Rancho Cordova
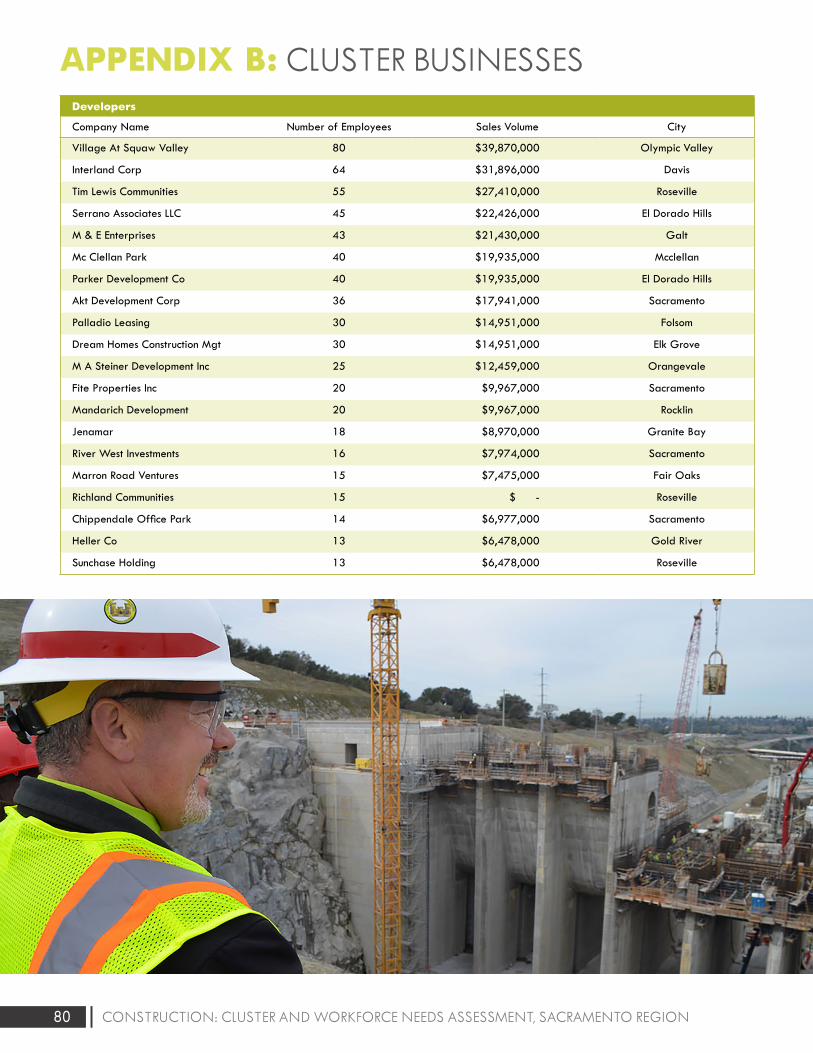
80 CONSTRUCTION: CLUSTER AND WORKFORCE NEEDS ASSESSMENT, SACRAMENTO REGION
APPENDIX B: CLUSTER BUSINESSES Developers
Company Name Number of Employees Sales Volume City
Village At Squaw Valley 80 $39,870,000 Olympic Valley
Interland Corp 64 $31,896,000 Davis
Tim Lewis Communities 55 $27,410,000 Roseville
Serrano Associates LLC 45 $22,426,000 El Dorado Hills
M & E Enterprises 43 $21,430,000 Galt
Mc Clellan Park 40 $19,935,000 Mcclellan
Parker Development Co 40 $19,935,000 El Dorado Hills
Akt Development Corp 36 $17,941,000 Sacramento
Palladio Leasing 30 $14,951,000 Folsom
Dream Homes Construction Mgt 30 $14,951,000 Elk Grove
M A Steiner Development Inc 25 $12,459,000 Orangevale
Fite Properties Inc 20 $9,967,000 Sacramento
Mandarich Development 20 $9,967,000 Rocklin
Jenamar 18 $8,970,000 Granite Bay
River West Investments 16 $7,974,000 Sacramento
Marron Road Ventures 15 $7,475,000 Fair Oaks
Richland Communities 15 $ - Roseville
Chippendale Office Park 14 $6,977,000 Sacramento
Heller Co 13 $6,478,000 Gold River
Sunchase Holding 13 $6,478,000 Roseville
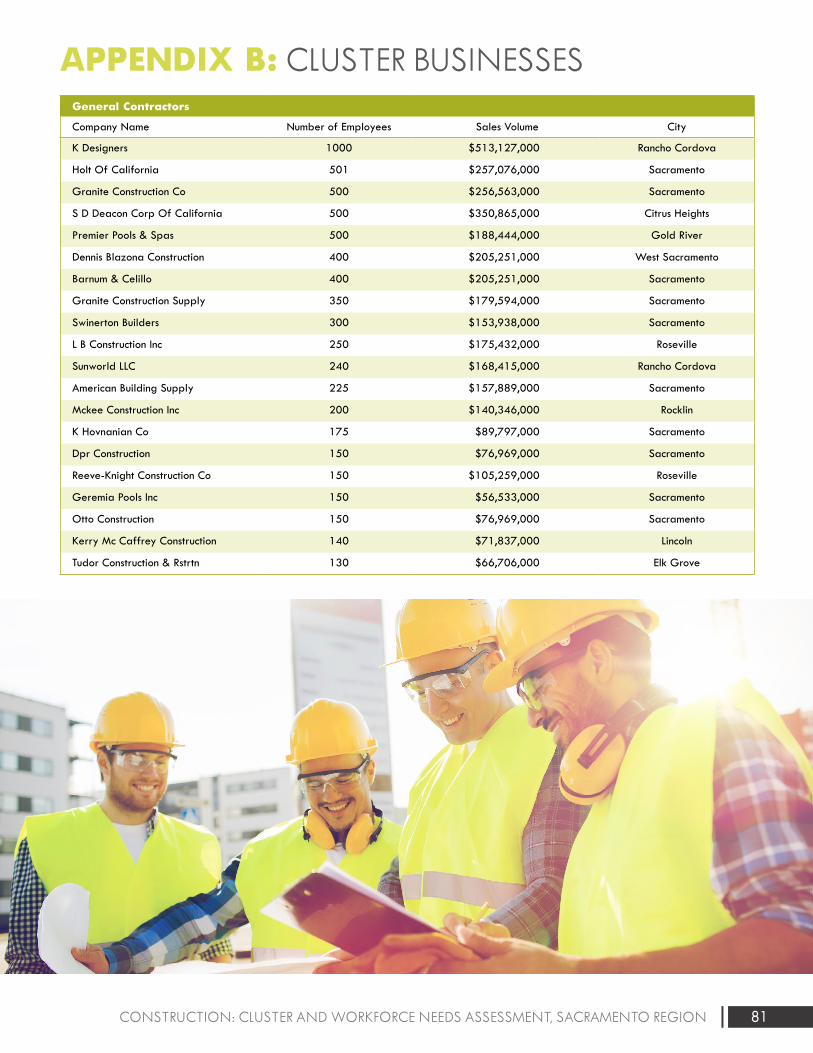
81CONSTRUCTION: CLUSTER AND WORKFORCE NEEDS ASSESSMENT, SACRAMENTO REGION
APPENDIX B: CLUSTER BUSINESSES General Contractors
Company Name Number of Employees Sales Volume City
K Designers 1000 $513,127,000 Rancho Cordova
Holt Of California 501 $257,076,000 Sacramento
Granite Construction Co 500 $256,563,000 Sacramento
S D Deacon Corp Of California 500 $350,865,000 Citrus Heights
Premier Pools & Spas 500 $188,444,000 Gold River
Dennis Blazona Construction 400 $205,251,000 West Sacramento
Barnum & Celillo 400 $205,251,000 Sacramento
Granite Construction Supply 350 $179,594,000 Sacramento
Swinerton Builders 300 $153,938,000 Sacramento
L B Construction Inc 250 $175,432,000 Roseville
Sunworld LLC 240 $168,415,000 Rancho Cordova
American Building Supply 225 $157,889,000 Sacramento
Mckee Construction Inc 200 $140,346,000 Rocklin
K Hovnanian Co 175 $89,797,000 Sacramento
Dpr Construction 150 $76,969,000 Sacramento
Reeve-Knight Construction Co 150 $105,259,000 Roseville
Geremia Pools Inc 150 $56,533,000 Sacramento
Otto Construction 150 $76,969,000 Sacramento
Kerry Mc Caffrey Construction 140 $71,837,000 Lincoln
Tudor Construction & Rstrtn 130 $66,706,000 Elk Grove
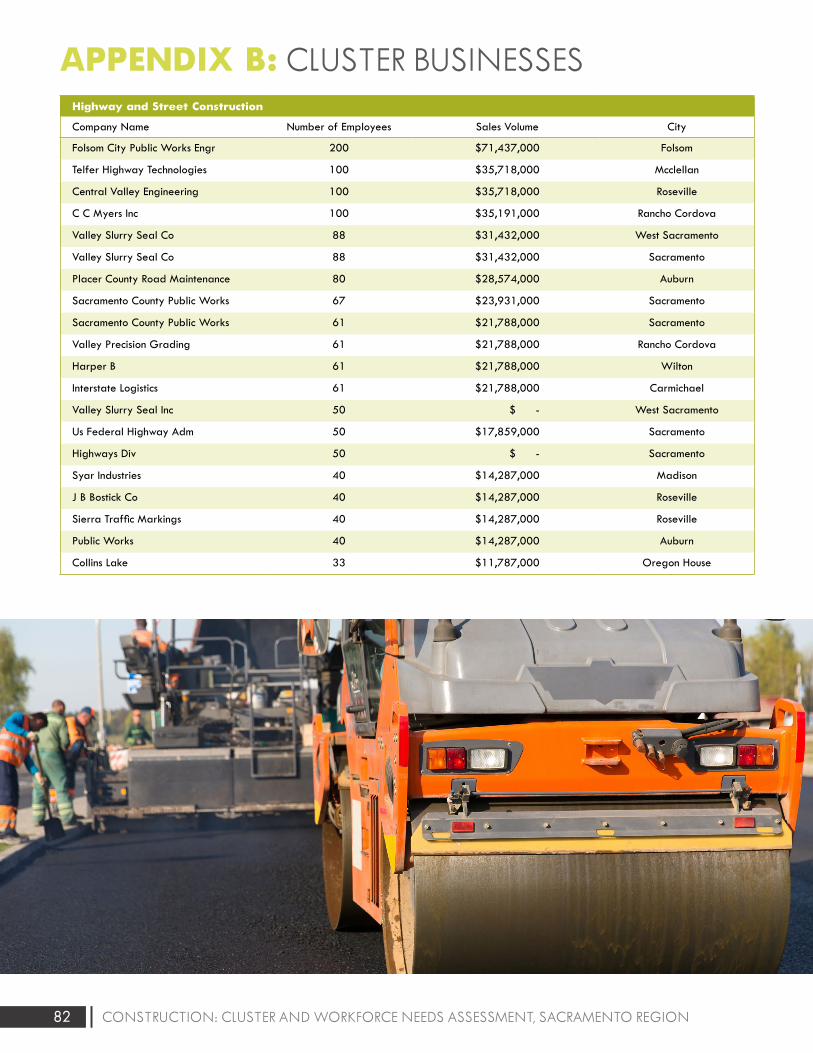
82 CONSTRUCTION: CLUSTER AND WORKFORCE NEEDS ASSESSMENT, SACRAMENTO REGION
APPENDIX B: CLUSTER BUSINESSES Highway and Street Construction
Company Name Number of Employees Sales Volume City
Folsom City Public Works Engr 200 $71,437,000 Folsom
Telfer Highway Technologies 100 $35,718,000 Mcclellan
Central Valley Engineering 100 $35,718,000 Roseville
C C Myers Inc 100 $35,191,000 Rancho Cordova
Valley Slurry Seal Co 88 $31,432,000 West Sacramento
Valley Slurry Seal Co 88 $31,432,000 Sacramento
Placer County Road Maintenance 80 $28,574,000 Auburn
Sacramento County Public Works 67 $23,931,000 Sacramento
Sacramento County Public Works 61 $21,788,000 Sacramento
Valley Precision Grading 61 $21,788,000 Rancho Cordova
Harper B 61 $21,788,000 Wilton
Interstate Logistics 61 $21,788,000 Carmichael
Valley Slurry Seal Inc 50 $ - West Sacramento
Us Federal Highway Adm 50 $17,859,000 Sacramento
Highways Div 50 $ - Sacramento
Syar Industries 40 $14,287,000 Madison
J B Bostick Co 40 $14,287,000 Roseville
Sierra Traffic Markings 40 $14,287,000 Roseville
Public Works 40 $14,287,000 Auburn
Collins Lake 33 $11,787,000 Oregon House
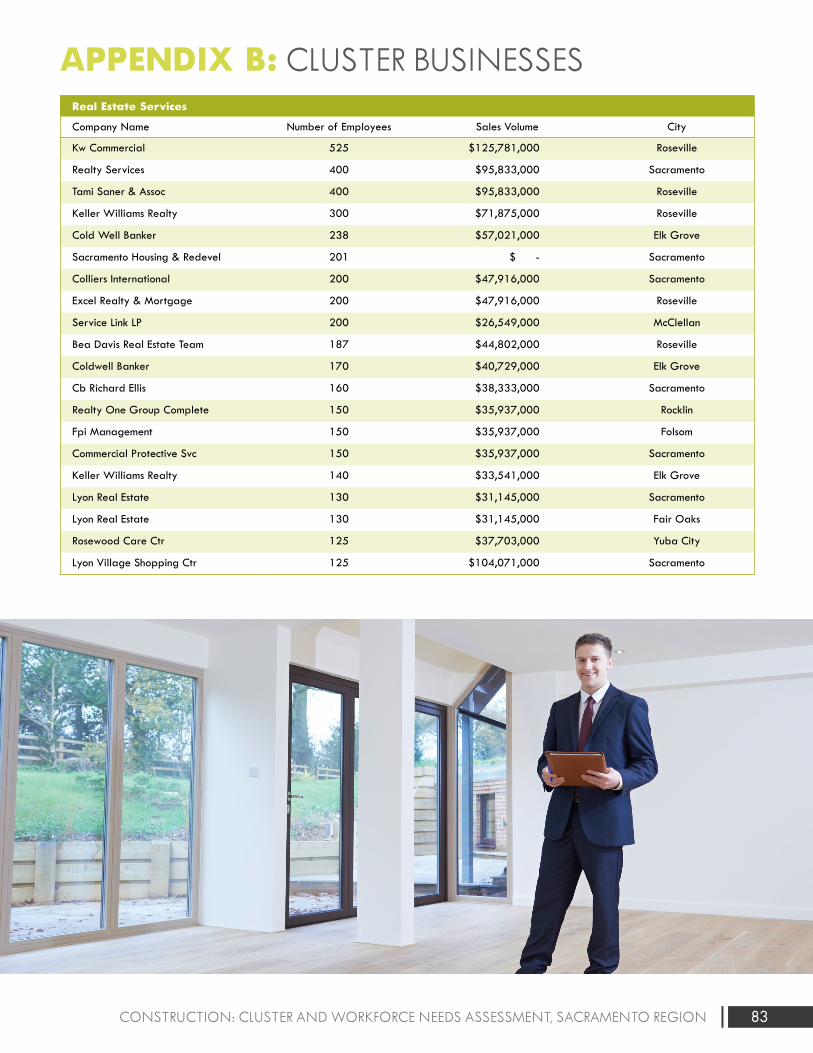
83CONSTRUCTION: CLUSTER AND WORKFORCE NEEDS ASSESSMENT, SACRAMENTO REGION
APPENDIX B: CLUSTER BUSINESSES Real Estate Services
Company Name Number of Employees Sales Volume City
Kw Commercial 525 $125,781,000 Roseville
Realty Services 400 $95,833,000 Sacramento
Tami Saner & Assoc 400 $95,833,000 Roseville
Keller Williams Realty 300 $71,875,000 Roseville
Cold Well Banker 238 $57,021,000 Elk Grove
Sacramento Housing & Redevel 201 $ - Sacramento
Colliers International 200 $47,916,000 Sacramento
Excel Realty & Mortgage 200 $47,916,000 Roseville
Service Link LP 200 $26,549,000 McClellan
Bea Davis Real Estate Team 187 $44,802,000 Roseville
Coldwell Banker 170 $40,729,000 Elk Grove
Cb Richard Ellis 160 $38,333,000 Sacramento
Realty One Group Complete 150 $35,937,000 Rocklin
Fpi Management 150 $35,937,000 Folsom
Commercial Protective Svc 150 $35,937,000 Sacramento
Keller Williams Realty 140 $33,541,000 Elk Grove
Lyon Real Estate 130 $31,145,000 Sacramento
Lyon Real Estate 130 $31,145,000 Fair Oaks
Rosewood Care Ctr 125 $37,703,000 Yuba City
Lyon Village Shopping Ctr 125 $104,071,000 Sacramento
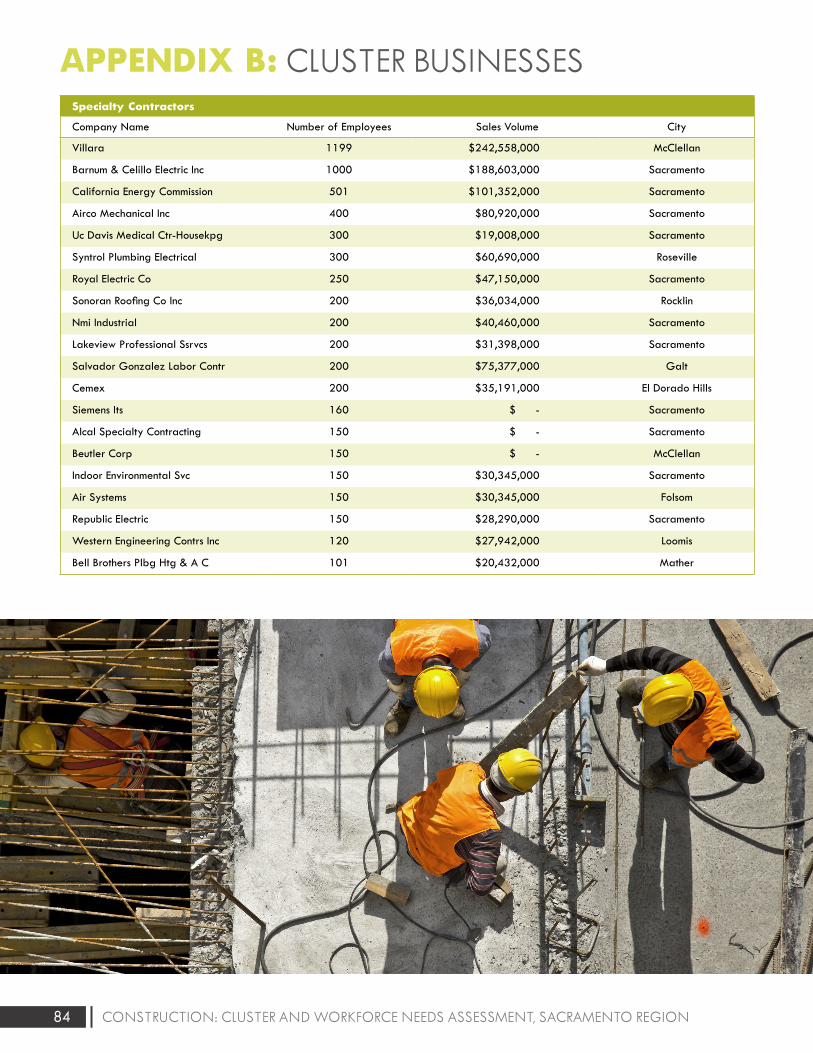
84 CONSTRUCTION: CLUSTER AND WORKFORCE NEEDS ASSESSMENT, SACRAMENTO REGION
APPENDIX B: CLUSTER BUSINESSES Specialty Contractors
Company Name Number of Employees Sales Volume City
Villara 1199 $242,558,000 McClellan
Barnum & Celillo Electric Inc 1000 $188,603,000 Sacramento
California Energy Commission 501 $101,352,000 Sacramento
Airco Mechanical Inc 400 $80,920,000 Sacramento
Uc Davis Medical Ctr-Housekpg 300 $19,008,000 Sacramento
Syntrol Plumbing Electrical 300 $60,690,000 Roseville
Royal Electric Co 250 $47,150,000 Sacramento
Sonoran Roofing Co Inc 200 $36,034,000 Rocklin
Nmi Industrial 200 $40,460,000 Sacramento
Lakeview Professional Ssrvcs 200 $31,398,000 Sacramento
Salvador Gonzalez Labor Contr 200 $75,377,000 Galt
Cemex 200 $35,191,000 El Dorado Hills
Siemens Its 160 $ - Sacramento
Alcal Specialty Contracting 150 $ - Sacramento
Beutler Corp 150 $ - McClellan
Indoor Environmental Svc 150 $30,345,000 Sacramento
Air Systems 150 $30,345,000 Folsom
Republic Electric 150 $28,290,000 Sacramento
Western Engineering Contrs Inc 120 $27,942,000 Loomis
Bell Brothers Plbg Htg & A C 101 $20,432,000 Mather
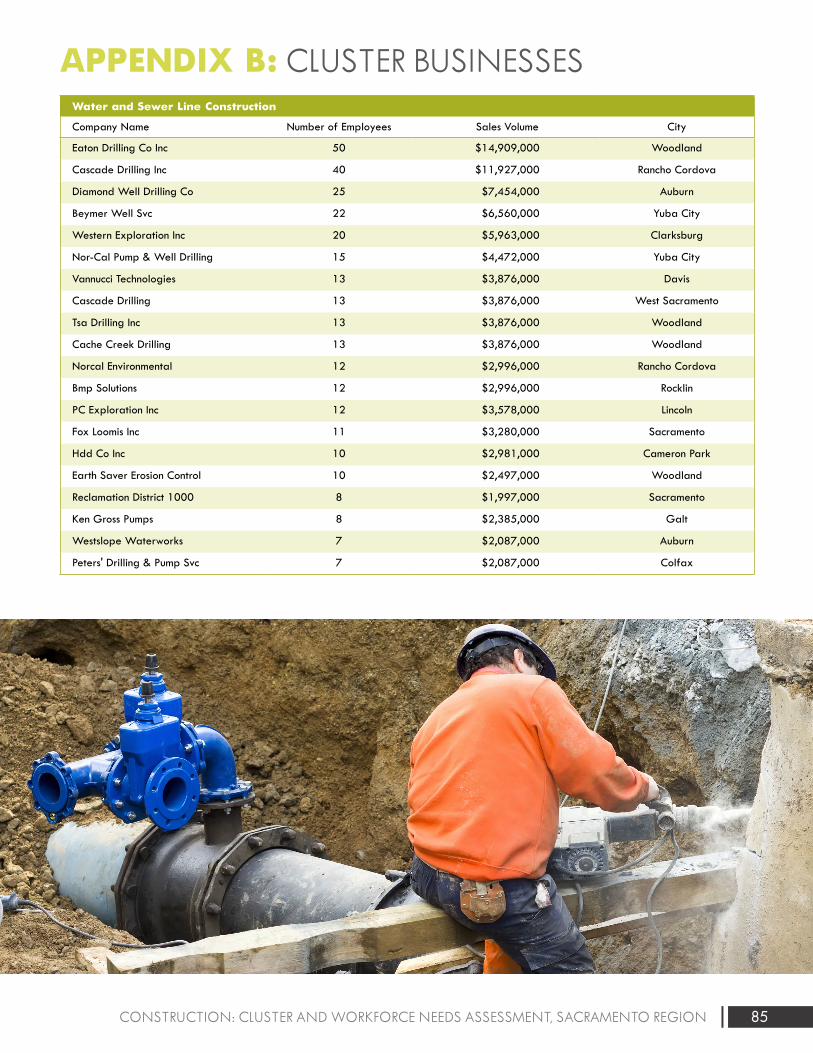
85CONSTRUCTION: CLUSTER AND WORKFORCE NEEDS ASSESSMENT, SACRAMENTO REGION
APPENDIX B: CLUSTER BUSINESSES Water and Sewer Line Construction
Company Name Number of Employees Sales Volume City
Eaton Drilling Co Inc 50 $14,909,000 Woodland
Cascade Drilling Inc 40 $11,927,000 Rancho Cordova
Diamond Well Drilling Co 25 $7,454,000 Auburn
Beymer Well Svc 22 $6,560,000 Yuba City
Western Exploration Inc 20 $5,963,000 Clarksburg
Nor-Cal Pump & Well Drilling 15 $4,472,000 Yuba City
Vannucci Technologies 13 $3,876,000 Davis
Cascade Drilling 13 $3,876,000 West Sacramento
Tsa Drilling Inc 13 $3,876,000 Woodland
Cache Creek Drilling 13 $3,876,000 Woodland
Norcal Environmental 12 $2,996,000 Rancho Cordova
Bmp Solutions 12 $2,996,000 Rocklin
PC Exploration Inc 12 $3,578,000 Lincoln
Fox Loomis Inc 11 $3,280,000 Sacramento
Hdd Co Inc 10 $2,981,000 Cameron Park
Earth Saver Erosion Control 10 $2,497,000 Woodland
Reclamation District 1000 8 $1,997,000 Sacramento
Ken Gross Pumps 8 $2,385,000 Galt
Westslope Waterworks 7 $2,087,000 Auburn
Peters' Drilling & Pump Svc 7 $2,087,000 Colfax
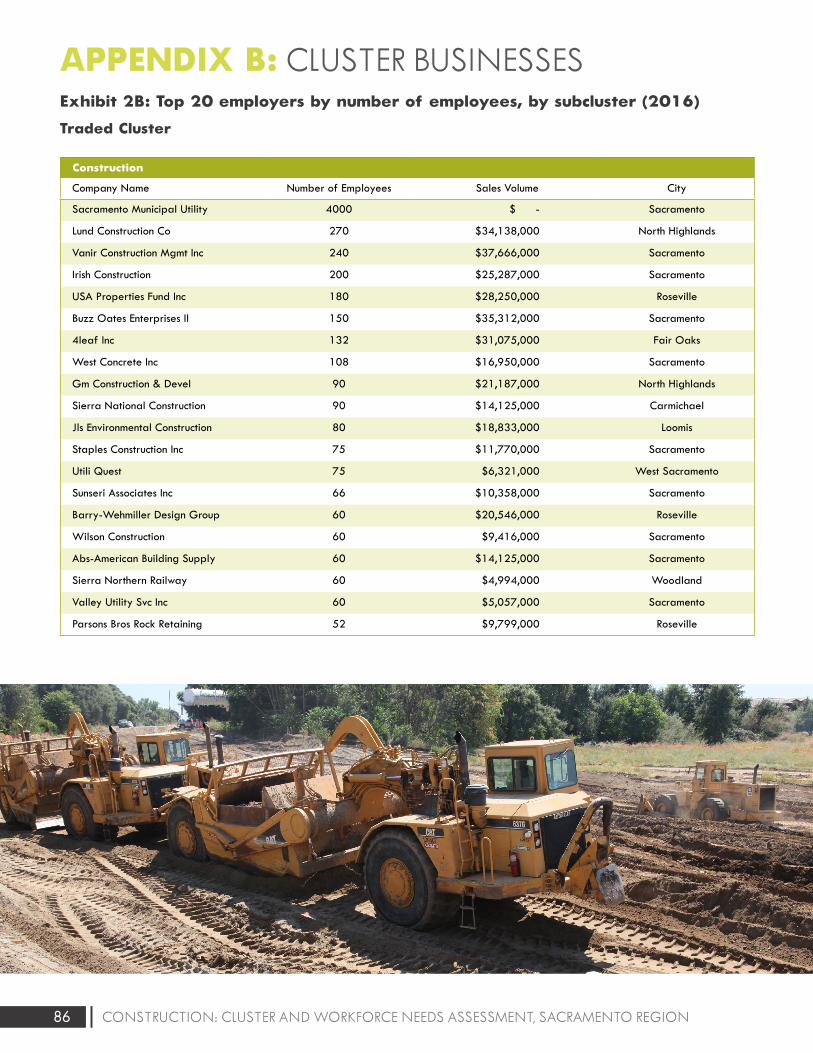
86 CONSTRUCTION: CLUSTER AND WORKFORCE NEEDS ASSESSMENT, SACRAMENTO REGION
APPENDIX B: CLUSTER BUSINESSES Exhibit 2B: Top 20 employers by number of employees, by subcluster (2016)
Traded Cluster
Construction
Company Name Number of Employees Sales Volume City
Sacramento Municipal Utility 4000 $ - Sacramento
Lund Construction Co 270 $34,138,000 North Highlands
Vanir Construction Mgmt Inc 240 $37,666,000 Sacramento
Irish Construction 200 $25,287,000 Sacramento
USA Properties Fund Inc 180 $28,250,000 Roseville
Buzz Oates Enterprises II 150 $35,312,000 Sacramento
4leaf Inc 132 $31,075,000 Fair Oaks
West Concrete Inc 108 $16,950,000 Sacramento
Gm Construction & Devel 90 $21,187,000 North Highlands
Sierra National Construction 90 $14,125,000 Carmichael
Jls Environmental Construction 80 $18,833,000 Loomis
Staples Construction Inc 75 $11,770,000 Sacramento
Utili Quest 75 $6,321,000 West Sacramento
Sunseri Associates Inc 66 $10,358,000 Sacramento
Barry-Wehmiller Design Group 60 $20,546,000 Roseville
Wilson Construction 60 $9,416,000 Sacramento
Abs-American Building Supply 60 $14,125,000 Sacramento
Sierra Northern Railway 60 $4,994,000 Woodland
Valley Utility Svc Inc 60 $5,057,000 Sacramento
Parsons Bros Rock Retaining 52 $9,799,000 Roseville
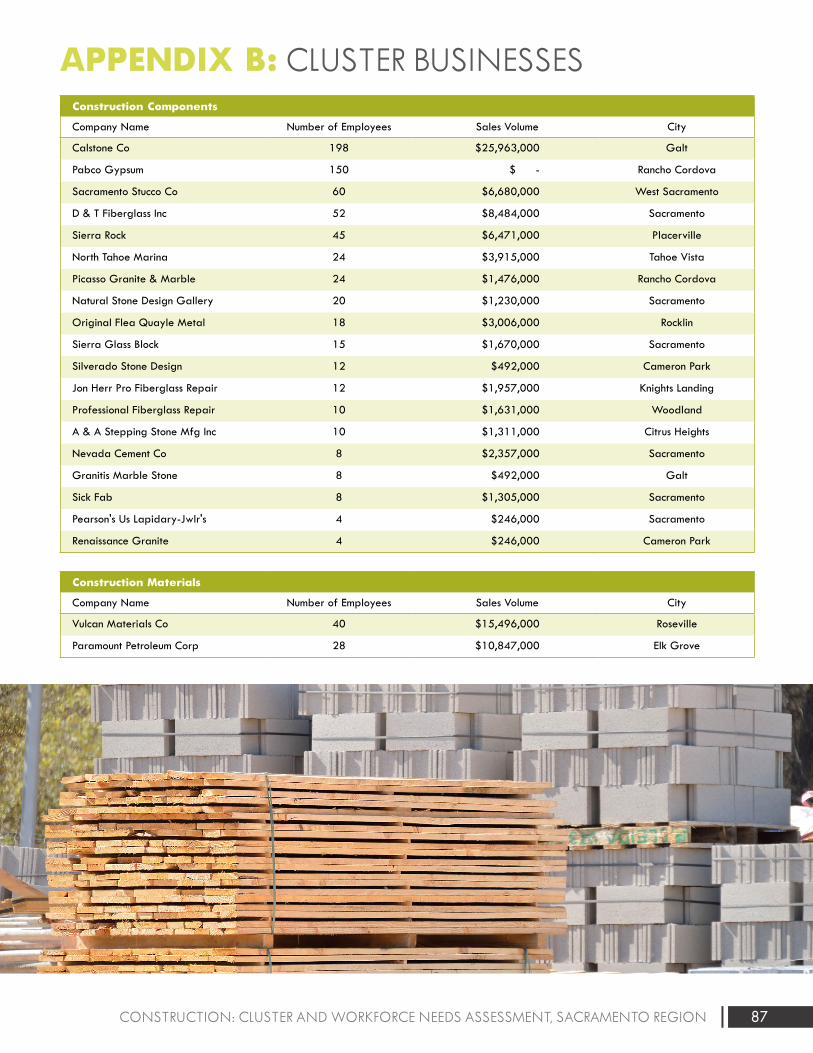
87CONSTRUCTION: CLUSTER AND WORKFORCE NEEDS ASSESSMENT, SACRAMENTO REGION
APPENDIX B: CLUSTER BUSINESSES Construction Components
Company Name Number of Employees Sales Volume City
Calstone Co 198 $25,963,000 Galt
Pabco Gypsum 150 $ - Rancho Cordova
Sacramento Stucco Co 60 $6,680,000 West Sacramento
D & T Fiberglass Inc 52 $8,484,000 Sacramento
Sierra Rock 45 $6,471,000 Placerville
North Tahoe Marina 24 $3,915,000 Tahoe Vista
Picasso Granite & Marble 24 $1,476,000 Rancho Cordova
Natural Stone Design Gallery 20 $1,230,000 Sacramento
Original Flea Quayle Metal 18 $3,006,000 Rocklin
Sierra Glass Block 15 $1,670,000 Sacramento
Silverado Stone Design 12 $492,000 Cameron Park
Jon Herr Pro Fiberglass Repair 12 $1,957,000 Knights Landing
Professional Fiberglass Repair 10 $1,631,000 Woodland
A & A Stepping Stone Mfg Inc 10 $1,311,000 Citrus Heights
Nevada Cement Co 8 $2,357,000 Sacramento
Granitis Marble Stone 8 $492,000 Galt
Sick Fab 8 $1,305,000 Sacramento
Pearson's Us Lapidary-Jwlr's 4 $246,000 Sacramento
Renaissance Granite 4 $246,000 Cameron Park
Construction Materials
Company Name Number of Employees Sales Volume City
Vulcan Materials Co 40 $15,496,000 Roseville
Paramount Petroleum Corp 28 $10,847,000 Elk Grove
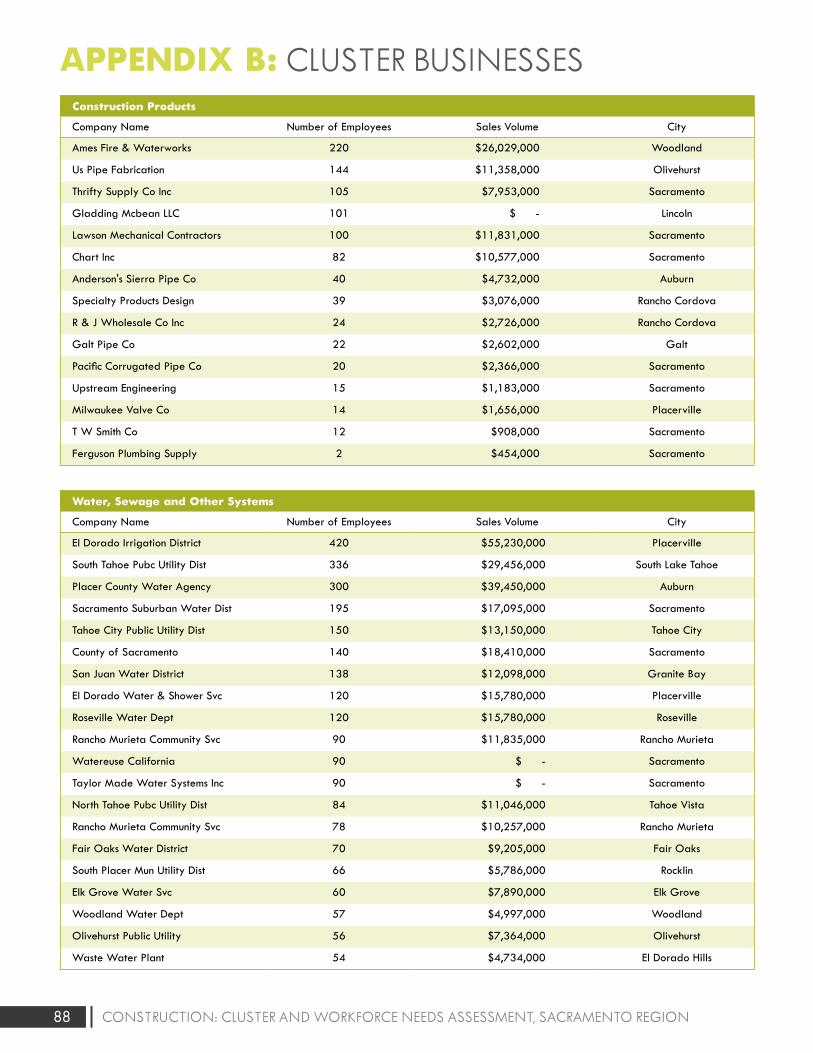
88 CONSTRUCTION: CLUSTER AND WORKFORCE NEEDS ASSESSMENT, SACRAMENTO REGION
APPENDIX B: CLUSTER BUSINESSES
Water, Sewage and Other Systems
Company Name Number of Employees Sales Volume City
El Dorado Irrigation District 420 $55,230,000 Placerville
South Tahoe Pubc Utility Dist 336 $29,456,000 South Lake Tahoe
Placer County Water Agency 300 $39,450,000 Auburn
Sacramento Suburban Water Dist 195 $17,095,000 Sacramento
Tahoe City Public Utility Dist 150 $13,150,000 Tahoe City
County of Sacramento 140 $18,410,000 Sacramento
San Juan Water District 138 $12,098,000 Granite Bay
El Dorado Water & Shower Svc 120 $15,780,000 Placerville
Roseville Water Dept 120 $15,780,000 Roseville
Rancho Murieta Community Svc 90 $11,835,000 Rancho Murieta
Watereuse California 90 $ - Sacramento
Taylor Made Water Systems Inc 90 $ - Sacramento
North Tahoe Pubc Utility Dist 84 $11,046,000 Tahoe Vista
Rancho Murieta Community Svc 78 $10,257,000 Rancho Murieta
Fair Oaks Water District 70 $9,205,000 Fair Oaks
South Placer Mun Utility Dist 66 $5,786,000 Rocklin
Elk Grove Water Svc 60 $7,890,000 Elk Grove
Woodland Water Dept 57 $4,997,000 Woodland
Olivehurst Public Utility 56 $7,364,000 Olivehurst
Waste Water Plant 54 $4,734,000 El Dorado Hills
Construction Products
Company Name Number of Employees Sales Volume City
Ames Fire & Waterworks 220 $26,029,000 Woodland
Us Pipe Fabrication 144 $11,358,000 Olivehurst
Thrifty Supply Co Inc 105 $7,953,000 Sacramento
Gladding Mcbean LLC 101 $ - Lincoln
Lawson Mechanical Contractors 100 $11,831,000 Sacramento
Chart Inc 82 $10,577,000 Sacramento
Anderson's Sierra Pipe Co 40 $4,732,000 Auburn
Specialty Products Design 39 $3,076,000 Rancho Cordova
R & J Wholesale Co Inc 24 $2,726,000 Rancho Cordova
Galt Pipe Co 22 $2,602,000 Galt
Pacific Corrugated Pipe Co 20 $2,366,000 Sacramento
Upstream Engineering 15 $1,183,000 Sacramento
Milwaukee Valve Co 14 $1,656,000 Placerville
T W Smith Co 12 $908,000 Sacramento
Ferguson Plumbing Supply 2 $454,000 Sacramento
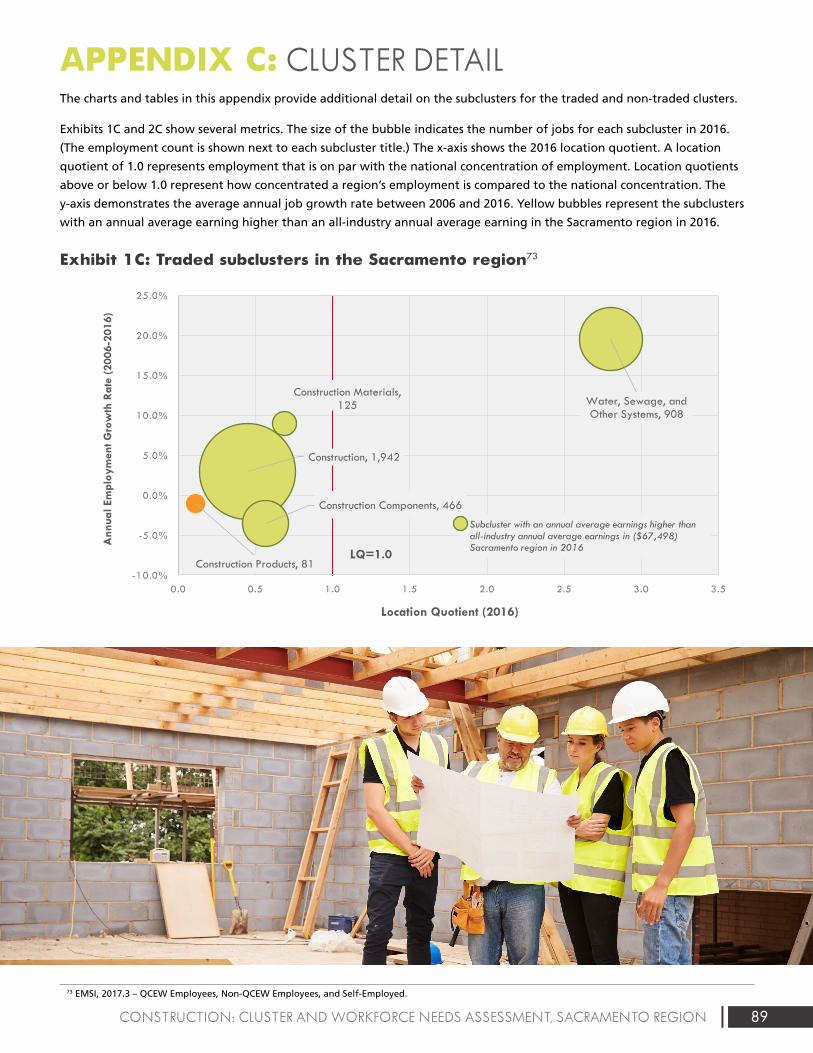
89CONSTRUCTION: CLUSTER AND WORKFORCE NEEDS ASSESSMENT, SACRAMENTO REGION
APPENDIX C: CLUSTER DETAIL The charts and tables in this appendix provide additional detail on the subclusters for the traded and non-traded clusters.
Exhibits 1C and 2C show several metrics. The size of the bubble indicates the number of jobs for each subcluster in 2016.
(The employment count is shown next to each subcluster title.) The x-axis shows the 2016 location quotient. A location
quotient of 1.0 represents employment that is on par with the national concentration of employment. Location quotients
above or below 1.0 represent how concentrated a region’s employment is compared to the national concentration. The
y-axis demonstrates the average annual job growth rate between 2006 and 2016. Yellow bubbles represent the subclusters
with an annual average earning higher than an all-industry annual average earning in the Sacramento region in 2016.
Exhibit 1C: Traded subclusters in the Sacramento region73
73 EMSI, 2017.3 – QCEW Employees, Non-QCEW Employees, and Self-Employed.
Exhibit 1: Value of construction put in place (United States)3
$1,161,282
$788,332
$1,185,683
$0
$200,000
$400,000
$600,000
$800,000
$1,000,000
$1,200,000
$1,400,000
2002 2003 2004 2005 2006 2007 2008 2009 2010 2011 2012 2013 2014 2015 2016
Mill
ions
of
Dol
lars
Residential Nonresidential
Exhibit 2: Value of construction put in place (California)5
$58,091,975
$18,740,050
$51,350,955
$0
$10,000,000
$20,000,000
$30,000,000
$40,000,000
$50,000,000
$60,000,000
$70,000,000
2002 2003 2004 2005 2006 2007 2008 2009 2010 2011 2012 2013 2014 2015 2016
Residential Nonresidential
Exhibit 3: Value of nonresidential construction put in place, by subcomponent (United States)7
24.1%
-0.2%
130.5%
0.6%
5.3%
-54.8%
18.0%
50.9%
98.2%
26.9%
-7.5%
21.7%
Office
Commercial
Manufacturing
Health care
Educational
Religious
Amusement and recreation
Transportation
Power and communication
Highway and street
Public works
Other
Subcomponent percent change 2006-2016
Exhibit 5: Value of Infrastructure as a percent of nonresidential construction put in place (United States)10
37.5% 37.9% 36.5%37.1% 37.0%
37.3%37.5% 41.1% 46.3% 45.5%
46.6% 46.4%46.1% 43.5% 41.6%
$0
$100,000
$200,000
$300,000
$400,000
$500,000
$600,000
$700,000
$800,000
2002 2003 2004 2005 2006 2007 2008 2009 2010 2011 2012 2013 2014 2015 2016
$ M
illio
ns
$ Th
ousa
nds
Nonresidential Infrastructure
Exhibit 6: Value of infrastructure as a percent of nonresidential construction put in place (California)11
11.6% 12.8% 14.3% 13.4%14.3%
11.0% 10.7%10.7% 10.2% 9.9% 10.9%
27.5%
14.9%16.2% 13.0%$5,000,000
$0
$10,000,000
$15,000,000
$20,000,000
$25,000,000
$30,000,000
2002 2003 2004 2005 2006 2007 2008 2009 2010 2011 2012 2013 2014 2015 2016
Nonresidential Infrastructure
Exhibit 7: Construction value added as a percent of GDP (United States)12
Exhibit 8: Construction value added as a percent of GRP (California)13
7.8% 7.8%8.1%
8.6%8.4%
8.0%
7.4%
6.3%
5.4%5.1%
5.3%5.5%
5.8%
6.2%6.4%
3.0%
4.0%
5.0%
6.0%
7.0%
8.0%
9.0%
2002 2003 2004 2005 2006 2007 2008 2009 2010 2011 2012 2013 2014 2015 2016
2002 2003 2004 2005 2006 2007 2008 2009 2010 2011 2012 2013 2014 2015 2016
3.0% 3.1%3.3% 3.3%
2.8%
2.3%
1.6%
1.0% 1.0% 1.1%1.3%
1.8% 1.8%2.0% 2.0%
0.0%
0.5%
1.0%
1.5%
2.0%
2.5%
3.0%
3.5%
4.0%
Exhibit 9: Construction value added as a percent of GRP (California, Sacramento region and Bay Area)16
3.0%
6.8% 6.9%
3.6%
1.2%1.4%
1.7%
2.3%
2.4%
0.0%
1.0%
2.0%
3.0%
4.0%
5.0%
6.0%
7.0%
8.0%
2002 2003 2004 2005 2006 2007 2008 2009 2010 2011 2012 2013 2014 2015
State Sacramento Metro (6-county) Bay Area Metro (9-county)
Exhibit 10: Housing unit supply versus demand in the Sacramento region
Exh ibit 11: Residen tial building units in the six-county Sacramento region (permi t data)20
19,865
14,239
10,996 8,932
6,483 7,768 9,125
10,399
19,122
23,812
17,987
2,293 3,939 4,652
6,492
0
5,000
10,000
15,000
20,000
25,000
30,000
2002 2003 2004 2005 2006 2007 2008 2009 2010 2011 2012 2013 2014 2015 2016 2017
Housing Unit Demand Housing Unit Supply
14,01415,671
19,78419,630
21,65218,612
10,1257,931
4,1752,493 2,326 1,938 2,965 3,772 3,967
5,526 6,401
3,226
3,868
4,628 4,7613,612
2,911
3,568
1,555
1,818 438 539 759631
982 7461,265
1,053
0
5,000
10,000
15,000
20,000
25,000
30,000
2000 2001 2002 2003 2004 2005 2006 2007 2008 2009 2010 2011 2012 2013 2014 2015 2016
Single Family Units Multifamily Units
Exhibit 13: Value of nonresidential construction in the six-county Sacramento region 21
$0
$200,000
$400,000
$600,000
$800,000
$1,000 ,000
$1,200 ,000
$1,400 ,000
$1,600 ,000
$1,800 ,000
$2,000 ,000
2000 2001 2002 2003 2004 2005 2006 2007 2008 2009 2010 2011 2012 2013 2014 2015 2016
El Dorado Placer Sacramento Yolo Yuba Sutter
Exhibit 14: Percent of nonresidential construction value in the Sacramento region, by county22
0%
10%
20%
30%
40%
50%
60%
70%
80%
90%
100%
2006 2016
El Dorado Placer Sacramento Yolo Yuba
Exhibit 17: Average annual earnings in traded and non-traded clusters in the study regions (2016)
$85,
512
$58,
972
$67,
498
$97,
280
$78,
396
$100
,688
$90,
080
$63,
145
$72,
018
$0
$20,000
$40,000
$60,000
$80,000
$100,000
$120,000
Traded Non-Traded All Industries
Sacramento Region Bay Area Californ ia
Exhibit 18: Traded subcluster employment index, Sacramento region (2001-2021)25
Water, Sewage, and Other Systems Projection
Projection
Projection
Projection
Projection
Construction Materials
Construction
Construction Products
Construction Components
Empl
oym
ent i
ndex
(2
006
Empl
oym
ent =
100
)
Empl
oym
ent i
ndex
(2
006
Empl
oym
ent =
100
)
Exhibit 24: Non-traded subcluster employment index, Sacramento region (2001-2021)36
101.0 119.3
87.2104.7
73.7
136.3
36.1
29.6
17.9
0.0
25.0
50.0
75.0
100.0
125.0
150.0
2001 2006 2011 2016 2021
Water and Sewer Line Construction Projection
Concrete Products Projection
Real Estate Services Projection
Specialty Contractors Projection
General Contractors Projection
Developers Projection
* Only included subclusters with 10k+employment or significant employment change. Refer to appendix for the complete list of nontraded subclusters.
Exhibit 39: Entering construction industry workers by type of education and training in the Sacramento region (annual average, 2014-2016)59
368
217181
56 54
148125 107
84
28 27 19 13 3
29
369
129
109
198
136
10561
35 8 13 14 8 10
0
50
100
150
200
250
300
350
400
Apprentices Oth er Post-Secondary Completions
Exhibit 44: Projected annual construction industry occupational gaps in the Sacramento region (2016-2021)60
-3
-2
-1
32
45
57
58
68
103
173
196
308
322
397
427
500
524
607
640
864
1,937
-200 100 400 700 1,000 1,300 1,600 1,900
Insulation Workers
Drafters
Interior Designers
PV Installers
Glaziers
Surveyors
Building Inspectors
Roofers
Ironworkers & Welders
Architects
Drywall Installers
HVAC & Sheet Metal
Painters
Masonry, Tile, Floor, Lathe, Plaster
Plumbers & Pipefitters
Engineers
Heavy Equipment Operators
Real Estate Professionals
Electricians
Construction Managers
Carpenters
Exhibit 47: Unionized and non-unionized workforce, Sacramento--Arden-Arcade--Roseville MSA and 10-county Bay Area (annual average, 2014-2017)61
Exhibit 48: Unionization in the construction workforce as an annual average percentage of total employment, Sacramento--Arden-Arcade--Roseville MSA (2000-2017)62
31%, 32,314
29%, 12,555
69%, 70,898
71%, 30,110
0% 20% 40% 60% 80% 100%
10-County Bay Area
Sacramento MSA
Union Non-Union
32%
20% 19%24% 23%
29%
68%
80% 81%76% 77%
71%
0%
10%
20%
30%
40%
50%
60%
70%
80%
90%
2000 – 2002 2003 – 2004 2005 –2008 2008 – 2011 2011 – 2014 2014 – 2017
Union Non-Union
Exhibit 1A. Construction managers projected annual openings, n = 871 (2016-2021)67
Cost Estimators, 206openings, 24%
Construction Managers,
225 openings, 26%
First-Line Supervisors of Construction Trades and
Extraction Workers,440 openings, 50%
0 100 200 300 400 500 600 700 800 900 1,000
Construction Products, 81
Water, Sewage, and Other Systems, 908
-10.0%
-5.0%
0.0%
5.0%
10.0%
15.0%
20.0%
25.0%
0.0 0.5 1.0 1.5 2.0 2.5 3.0 3.5
Location Quotient (2016)
Location Quotient (2016)
Ann
ual E
mpl
oym
ent G
row
th R
ate
(200
6-20
16)
Subcluster with an annual average earnings higher than all-industry annual average earnings in ($67,498) Sacramento region in 2016
LQ=1.0
Exhibit 2C: Non-traded subclusters in the Sacramento region73
Specialty Contractors, 50,899
General Contractors, 16,843
Real Estate Services, 15,475
Construction Materials Retailing, 6,552
Highway and Street Construction, 2,268
Water and Sewer Line Construction, 1,662
Building Equipment Distribution, 1,207
Developers
-15.0%
-10.0%
-5.0%
0.0%
5.0%
0.8 1.0 1.2 1.4
Ann
ual E
mpl
oym
ent G
row
th R
ate
(200
6-20
16
Exhibit 2E: Joint apprentices by gender in the Sacramento region (January 2012-October 2017)
Exhibit 3E: Joint apprentices by county of residence in the Sacramento region (January 2012-October 2017)
8,374, 97%
249, 3%
El Dorado,393, 56%
Placer,949, 11%
Sacramento, 6077, 1
Sutter, 346,4%
Yolo, 549,6%
Yuba, 309,
4%
Exhibit 4E: Joint apprentices’ highest level of education prior to apprenticeship in the Sacramento region (January 2012-October 2017)
Exhibit 5E: Number of weeks worked, all workers in the construction sector in the Sacramento region (2015)84
Less than highschool, 7%
High schoolgraduate orGED, 65%
Some college,25%
4 or more yearsof college, 3%
3,165 6%
3,082 6%
1,650 3%
6,105 12%
7,068 10%
31,037 62%
0 5,000 10,000 15,000 20,000 25,000 30,000 35,000
Did not work
Less than 14
14 to 26
27 to 39
40 to 49
50 to 52
# w
eeks
wor
ked
in th
e la
st y
ear
Exhibit 4: Value of nonresidential construction put in place, by subcomponent (California)9
-0.5%
29.2%
-41.1%
0.0%
62.9%
-34.7%
46.0%
42.8%
19.1%
-14.6%
66.5%
763.4%
Office
Commercial
Manufacturing
Health care
Educational
Religious
Amusement and recreation
Transportation
Power and communication
Highway and street
Public works
Other
Subcomponent percent change 2006-2016
180.8
593.7
818.9
21.4
235.8 342.3
104.9 133.6 173.5
0.0
100.0
200.0
300.0
400.0
500.0
600.0
700.0
800.0
900.0
1000.0
2001 2006 2011 2016 2021
Construction Materials,125
Construction, 1,942
Construction Components, 466
LQ=1.0
Concrete Products, 1,123
Construction Materials Wholesaling, 1,647
Subcluster with an annual average earnings higher than all-industry annual average earnings ($67,498) in Sacramento region in 2016
Exhibit 1E: Total joint apprentice starts, residents in the six-county Sacramento region (January 2012-October 2017) (n = 8,617)2
435
95
104
111
117
121
135
161
174
178
215
302
340
440
458
483
542
602
1,045
1,205
1,354
0 200 400 600 800 1000 1200 1400 1600
All others
Elevator constructor
Drywall finisher
Scaffold and shoring erector
Inspector or surveyor
Pile driver
Glazier
Carpet, linoleum, and soft tile layer
Millwright
Sheet metal worker & related trades
Construction equipment operator trades
Brick, marble, terrazzo, tile, and related trades
Roofer and waterproofer
Plumber and fitter trades
Painter trades
Cement mason and plasterer trades
Electricial trades
Drywall/lather
Ironworker trades
Carpenter
Construction craft laborer
Exhibit 38: Anticipated annual construction industry job openings by new and replacement jobs in the Sacramento region (2016-2021)1
21 26 59 60 52 78 99 167 167 220323 350 399 439 473
596 679788 777 763
2,119
4 6 1 1 20 7 520 27 2
71 56100 95 73
4699
82 95222
215
0
500
1000
1500
2000
2500
Annual Replacement Openings New Jobs (Growth)
Male
Female
$ Th
ousa
nds
Thou
sand
s of
Dol
lars
Average annual openings (demand) minuseducation and training (supply) =approximate annual shortage
Approximate annual shortage = 7,250 workers across all categories
Sutter
6.2% 5.1%
27.6%
14.4%
50.6%69.9%
10.8%7.9%
1.1% 0.6%3.6% 2.0%
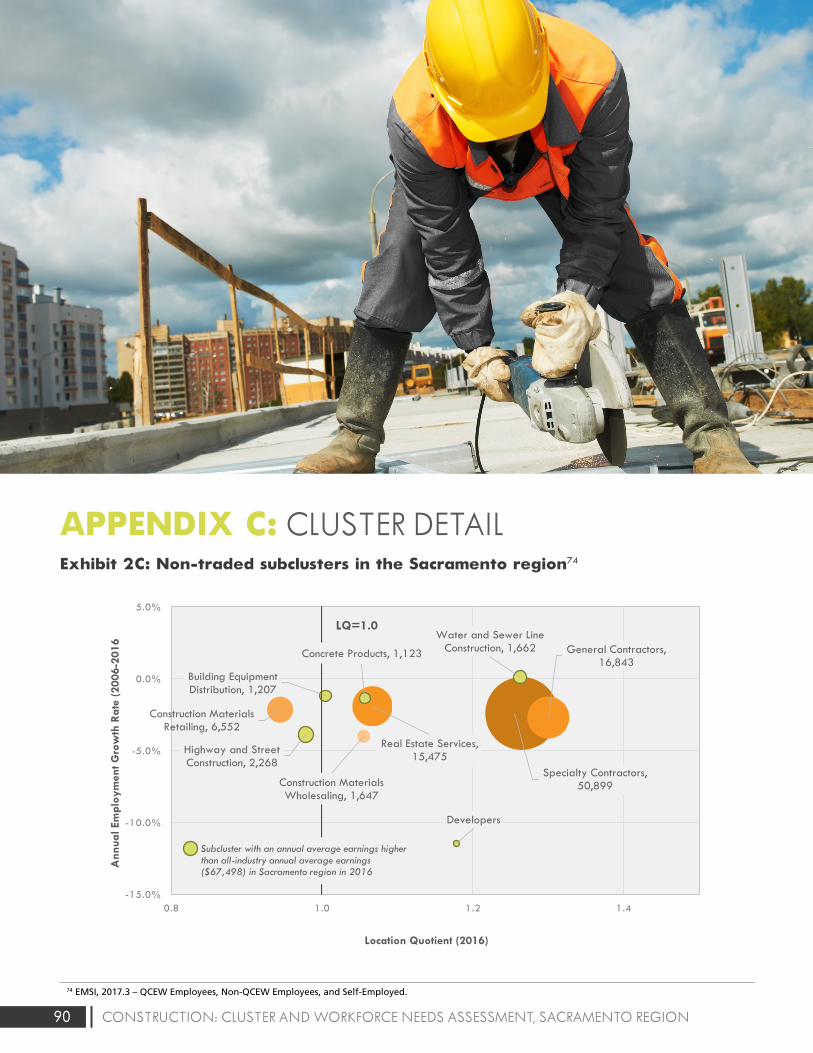
90 CONSTRUCTION: CLUSTER AND WORKFORCE NEEDS ASSESSMENT, SACRAMENTO REGION
APPENDIX C: CLUSTER DETAIL
74 EMSI, 2017.3 – QCEW Employees, Non-QCEW Employees, and Self-Employed.
Exhibit 1: Value of construction put in place (United States)3
$1,161,282
$788,332
$1,185,683
$0
$200,000
$400,000
$600,000
$800,000
$1,000,000
$1,200,000
$1,400,000
2002 2003 2004 2005 2006 2007 2008 2009 2010 2011 2012 2013 2014 2015 2016
Mill
ions
of
Dol
lars
Residential Nonresidential
Exhibit 2: Value of construction put in place (California)5
$58,091,975
$18,740,050
$51,350,955
$0
$10,000,000
$20,000,000
$30,000,000
$40,000,000
$50,000,000
$60,000,000
$70,000,000
2002 2003 2004 2005 2006 2007 2008 2009 2010 2011 2012 2013 2014 2015 2016
Residential Nonresidential
Exhibit 3: Value of nonresidential construction put in place, by subcomponent (United States)7
24.1%
-0.2%
130.5%
0.6%
5.3%
-54.8%
18.0%
50.9%
98.2%
26.9%
-7.5%
21.7%
Office
Commercial
Manufacturing
Health care
Educational
Religious
Amusement and recreation
Transportation
Power and communication
Highway and street
Public works
Other
Subcomponent percent change 2006-2016
Exhibit 5: Value of Infrastructure as a percent of nonresidential construction put in place (United States)10
37.5% 37.9% 36.5%37.1% 37.0%
37.3%37.5% 41.1% 46.3% 45.5%
46.6% 46.4%46.1% 43.5% 41.6%
$0
$100,000
$200,000
$300,000
$400,000
$500,000
$600,000
$700,000
$800,000
2002 2003 2004 2005 2006 2007 2008 2009 2010 2011 2012 2013 2014 2015 2016
$ M
illio
ns
$ Th
ousa
nds
Nonresidential Infrastructure
Exhibit 6: Value of infrastructure as a percent of nonresidential construction put in place (California)11
11.6% 12.8% 14.3% 13.4%14.3%
11.0% 10.7%10.7% 10.2% 9.9% 10.9%
27.5%
14.9%16.2% 13.0%$5,000,000
$0
$10,000,000
$15,000,000
$20,000,000
$25,000,000
$30,000,000
2002 2003 2004 2005 2006 2007 2008 2009 2010 2011 2012 2013 2014 2015 2016
Nonresidential Infrastructure
Exhibit 7: Construction value added as a percent of GDP (United States)12
Exhibit 8: Construction value added as a percent of GRP (California)13
7.8% 7.8%8.1%
8.6%8.4%
8.0%
7.4%
6.3%
5.4%5.1%
5.3%5.5%
5.8%
6.2%6.4%
3.0%
4.0%
5.0%
6.0%
7.0%
8.0%
9.0%
2002 2003 2004 2005 2006 2007 2008 2009 2010 2011 2012 2013 2014 2015 2016
2002 2003 2004 2005 2006 2007 2008 2009 2010 2011 2012 2013 2014 2015 2016
3.0% 3.1%3.3% 3.3%
2.8%
2.3%
1.6%
1.0% 1.0% 1.1%1.3%
1.8% 1.8%2.0% 2.0%
0.0%
0.5%
1.0%
1.5%
2.0%
2.5%
3.0%
3.5%
4.0%
Exhibit 9: Construction value added as a percent of GRP (California, Sacramento region and Bay Area)16
3.0%
6.8% 6.9%
3.6%
1.2%1.4%
1.7%
2.3%
2.4%
0.0%
1.0%
2.0%
3.0%
4.0%
5.0%
6.0%
7.0%
8.0%
2002 2003 2004 2005 2006 2007 2008 2009 2010 2011 2012 2013 2014 2015
State Sacramento Metro (6-county) Bay Area Metro (9-county)
Exhibit 10: Housing unit supply versus demand in the Sacramento region
Exh ibit 11: Residen tial building units in the six-county Sacramento region (permi t data)20
19,865
14,239
10,996 8,932
6,483 7,768 9,125
10,399
19,122
23,812
17,987
2,293 3,939 4,652
6,492
0
5,000
10,000
15,000
20,000
25,000
30,000
2002 2003 2004 2005 2006 2007 2008 2009 2010 2011 2012 2013 2014 2015 2016 2017
Housing Unit Demand Housing Unit Supply
14,01415,671
19,78419,630
21,65218,612
10,1257,931
4,1752,493 2,326 1,938 2,965 3,772 3,967
5,526 6,401
3,226
3,868
4,628 4,7613,612
2,911
3,568
1,555
1,818 438 539 759631
982 7461,265
1,053
0
5,000
10,000
15,000
20,000
25,000
30,000
2000 2001 2002 2003 2004 2005 2006 2007 2008 2009 2010 2011 2012 2013 2014 2015 2016
Single Family Units Multifamily Units
Exhibit 13: Value of nonresidential construction in the six-county Sacramento region 21
$0
$200,000
$400,000
$600,000
$800,000
$1,000 ,000
$1,200 ,000
$1,400 ,000
$1,600 ,000
$1,800 ,000
$2,000 ,000
2000 2001 2002 2003 2004 2005 2006 2007 2008 2009 2010 2011 2012 2013 2014 2015 2016
El Dorado Placer Sacramento Yolo Yuba Sutter
Exhibit 14: Percent of nonresidential construction value in the Sacramento region, by county22
0%
10%
20%
30%
40%
50%
60%
70%
80%
90%
100%
2006 2016
El Dorado Placer Sacramento Yolo Yuba
Exhibit 17: Average annual earnings in traded and non-traded clusters in the study regions (2016)
$85,
512
$58,
972
$67,
498
$97,
280
$78,
396
$100
,688
$90,
080
$63,
145
$72,
018
$0
$20,000
$40,000
$60,000
$80,000
$100,000
$120,000
Traded Non-Traded All Industries
Sacramento Region Bay Area Californ ia
Exhibit 18: Traded subcluster employment index, Sacramento region (2001-2021)25
Water, Sewage, and Other Systems Projection
Projection
Projection
Projection
Projection
Construction Materials
Construction
Construction Products
Construction Components
Empl
oym
ent i
ndex
(2
006
Empl
oym
ent =
100
)
Empl
oym
ent i
ndex
(2
006
Empl
oym
ent =
100
)
Exhibit 24: Non-traded subcluster employment index, Sacramento region (2001-2021)36
101.0 119.3
87.2104.7
73.7
136.3
36.1
29.6
17.9
0.0
25.0
50.0
75.0
100.0
125.0
150.0
2001 2006 2011 2016 2021
Water and Sewer Line Construction Projection
Concrete Products Projection
Real Estate Services Projection
Specialty Contractors Projection
General Contractors Projection
Developers Projection
* Only included subclusters with 10k+employment or significant employment change. Refer to appendix for the complete list of nontraded subclusters.
Exhibit 39: Entering construction industry workers by type of education and training in the Sacramento region (annual average, 2014-2016)59
368
217181
56 54
148125 107
84
28 27 19 13 3
29
369
129
109
198
136
10561
35 8 13 14 8 10
0
50
100
150
200
250
300
350
400
Apprentices Oth er Post-Secondary Completions
Exhibit 44: Projected annual construction industry occupational gaps in the Sacramento region (2016-2021)60
-3
-2
-1
32
45
57
58
68
103
173
196
308
322
397
427
500
524
607
640
864
1,937
-200 100 400 700 1,000 1,300 1,600 1,900
Insulation Workers
Drafters
Interior Designers
PV Installers
Glaziers
Surveyors
Building Inspectors
Roofers
Ironworkers & Welders
Architects
Drywall Installers
HVAC & Sheet Metal
Painters
Masonry, Tile, Floor, Lathe, Plaster
Plumbers & Pipefitters
Engineers
Heavy Equipment Operators
Real Estate Professionals
Electricians
Construction Managers
Carpenters
Exhibit 47: Unionized and non-unionized workforce, Sacramento--Arden-Arcade--Roseville MSA and 10-county Bay Area (annual average, 2014-2017)61
Exhibit 48: Unionization in the construction workforce as an annual average percentage of total employment, Sacramento--Arden-Arcade--Roseville MSA (2000-2017)62
31%, 32,314
29%, 12,555
69%, 70,898
71%, 30,110
0% 20% 40% 60% 80% 100%
10-County Bay Area
Sacramento MSA
Union Non-Union
32%
20% 19%24% 23%
29%
68%
80% 81%76% 77%
71%
0%
10%
20%
30%
40%
50%
60%
70%
80%
90%
2000 – 2002 2003 – 2004 2005 –2008 2008 – 2011 2011 – 2014 2014 – 2017
Union Non-Union
Exhibit 1A. Construction managers projected annual openings, n = 871 (2016-2021)67
Cost Estimators, 206openings, 24%
Construction Managers,
225 openings, 26%
First-Line Supervisors of Construction Trades and
Extraction Workers,440 openings, 50%
0 100 200 300 400 500 600 700 800 900 1,000
Construction Products, 81
Water, Sewage, and Other Systems, 908
-10.0%
-5.0%
0.0%
5.0%
10.0%
15.0%
20.0%
25.0%
0.0 0.5 1.0 1.5 2.0 2.5 3.0 3.5
Location Quotient (2016)
Location Quotient (2016)
Ann
ual E
mpl
oym
ent G
row
th R
ate
(200
6-20
16)
Subcluster with an annual average earnings higher than all-industry annual average earnings in ($67,498) Sacramento region in 2016
LQ=1.0
Exhibit 2C: Non-traded subclusters in the Sacramento region73
Specialty Contractors, 50,899
General Contractors, 16,843
Real Estate Services, 15,475
Construction Materials Retailing, 6,552
Highway and Street Construction, 2,268
Water and Sewer Line Construction, 1,662
Building Equipment Distribution, 1,207
Developers
-15.0%
-10.0%
-5.0%
0.0%
5.0%
0.8 1.0 1.2 1.4
Ann
ual E
mpl
oym
ent G
row
th R
ate
(200
6-20
16
Exhibit 2E: Joint apprentices by gender in the Sacramento region (January 2012-October 2017)
Exhibit 3E: Joint apprentices by county of residence in the Sacramento region (January 2012-October 2017)
8,374, 97%
249, 3%
El Dorado,393, 56%
Placer,949, 11%
Sacramento, 6077, 1
Sutter, 346,4%
Yolo, 549,6%
Yuba, 309,
4%
Exhibit 4E: Joint apprentices’ highest level of education prior to apprenticeship in the Sacramento region (January 2012-October 2017)
Exhibit 5E: Number of weeks worked, all workers in the construction sector in the Sacramento region (2015)84
Less than highschool, 7%
High schoolgraduate orGED, 65%
Some college,25%
4 or more yearsof college, 3%
3,165 6%
3,082 6%
1,650 3%
6,105 12%
7,068 10%
31,037 62%
0 5,000 10,000 15,000 20,000 25,000 30,000 35,000
Did not work
Less than 14
14 to 26
27 to 39
40 to 49
50 to 52
# w
eeks
wor
ked
in th
e la
st y
ear
Exhibit 4: Value of nonresidential construction put in place, by subcomponent (California)9
-0.5%
29.2%
-41.1%
0.0%
62.9%
-34.7%
46.0%
42.8%
19.1%
-14.6%
66.5%
763.4%
Office
Commercial
Manufacturing
Health care
Educational
Religious
Amusement and recreation
Transportation
Power and communication
Highway and street
Public works
Other
Subcomponent percent change 2006-2016
180.8
593.7
818.9
21.4
235.8 342.3
104.9 133.6 173.5
0.0
100.0
200.0
300.0
400.0
500.0
600.0
700.0
800.0
900.0
1000.0
2001 2006 2011 2016 2021
Construction Materials,125
Construction, 1,942
Construction Components, 466
LQ=1.0
Concrete Products, 1,123
Construction Materials Wholesaling, 1,647
Subcluster with an annual average earnings higher than all-industry annual average earnings ($67,498) in Sacramento region in 2016
Exhibit 1E: Total joint apprentice starts, residents in the six-county Sacramento region (January 2012-October 2017) (n = 8,617)2
435
95
104
111
117
121
135
161
174
178
215
302
340
440
458
483
542
602
1,045
1,205
1,354
0 200 400 600 800 1000 1200 1400 1600
All others
Elevator constructor
Drywall finisher
Scaffold and shoring erector
Inspector or surveyor
Pile driver
Glazier
Carpet, linoleum, and soft tile layer
Millwright
Sheet metal worker & related trades
Construction equipment operator trades
Brick, marble, terrazzo, tile, and related trades
Roofer and waterproofer
Plumber and fitter trades
Painter trades
Cement mason and plasterer trades
Electricial trades
Drywall/lather
Ironworker trades
Carpenter
Construction craft laborer
Exhibit 38: Anticipated annual construction industry job openings by new and replacement jobs in the Sacramento region (2016-2021)1
21 26 59 60 52 78 99 167 167 220323 350 399 439 473
596 679788 777 763
2,119
4 6 1 1 20 7 520 27 2
71 56100 95 73
4699
82 95222
215
0
500
1000
1500
2000
2500
Annual Replacement Openings New Jobs (Growth)
Male
Female
$ Th
ousa
nds
Thou
sand
s of
Dol
lars
Average annual openings (demand) minuseducation and training (supply) =approximate annual shortage
Approximate annual shortage = 7,250 workers across all categories
Sutter
6.2% 5.1%
27.6%
14.4%
50.6%69.9%
10.8%7.9%
1.1% 0.6%3.6% 2.0%
Exhibit 2C: Non-traded subclusters in the Sacramento region74
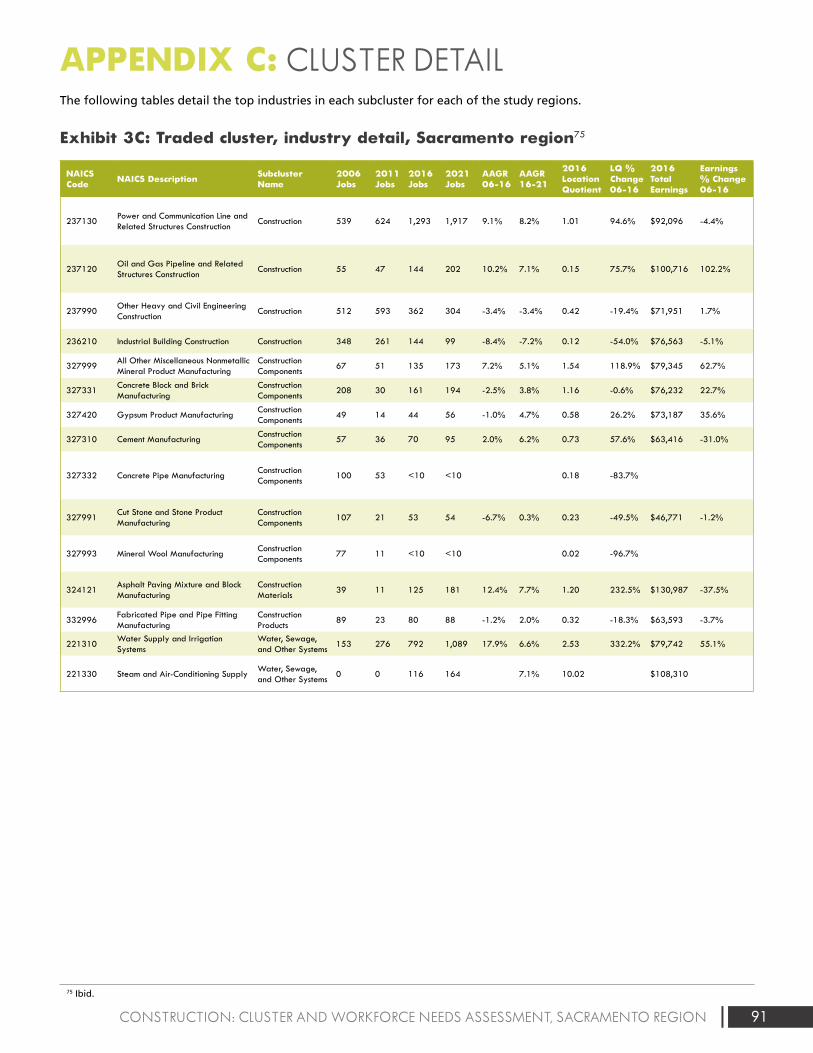
91CONSTRUCTION: CLUSTER AND WORKFORCE NEEDS ASSESSMENT, SACRAMENTO REGION
APPENDIX C: CLUSTER DETAIL
75 Ibid.
The following tables detail the top industries in each subcluster for each of the study regions.
Exhibit 3C: Traded cluster, industry detail, Sacramento region75
NAICS Code NAICS Description Subcluster
Name2006 Jobs
2011 Jobs
2016 Jobs
2021 Jobs
AAGR 06-16
AAGR 16-21
2016 Location Quotient
LQ % Change 06-16
2016 Total Earnings
Earnings % Change 06-16
237130Power and Communication Line and Related Structures Construction
Construction 539 624 1,293 1,917 9.1% 8.2% 1.01 94.6% $92,096 -4.4%
237120Oil and Gas Pipeline and Related Structures Construction
Construction 55 47 144 202 10.2% 7.1% 0.15 75.7% $100,716 102.2%
237990Other Heavy and Civil Engineering Construction
Construction 512 593 362 304 -3.4% -3.4% 0.42 -19.4% $71,951 1.7%
236210 Industrial Building Construction Construction 348 261 144 99 -8.4% -7.2% 0.12 -54.0% $76,563 -5.1%
327999All Other Miscellaneous Nonmetallic Mineral Product Manufacturing
Construction Components
67 51 135 173 7.2% 5.1% 1.54 118.9% $79,345 62.7%
327331Concrete Block and Brick Manufacturing
Construction Components
208 30 161 194 -2.5% 3.8% 1.16 -0.6% $76,232 22.7%
327420 Gypsum Product ManufacturingConstruction Components
49 14 44 56 -1.0% 4.7% 0.58 26.2% $73,187 35.6%
327310 Cement ManufacturingConstruction Components
57 36 70 95 2.0% 6.2% 0.73 57.6% $63,416 -31.0%
327332 Concrete Pipe ManufacturingConstruction Components
100 53 <10 <10 0.18 -83.7%
327991Cut Stone and Stone Product Manufacturing
Construction Components
107 21 53 54 -6.7% 0.3% 0.23 -49.5% $46,771 -1.2%
327993 Mineral Wool ManufacturingConstruction Components
77 11 <10 <10 0.02 -96.7%
324121Asphalt Paving Mixture and Block Manufacturing
Construction Materials
39 11 125 181 12.4% 7.7% 1.20 232.5% $130,987 -37.5%
332996Fabricated Pipe and Pipe Fitting Manufacturing
Construction Products
89 23 80 88 -1.2% 2.0% 0.32 -18.3% $63,593 -3.7%
221310Water Supply and Irrigation Systems
Water, Sewage, and Other Systems
153 276 792 1,089 17.9% 6.6% 2.53 332.2% $79,742 55.1%
221330 Steam and Air-Conditioning SupplyWater, Sewage, and Other Systems
0 0 116 164 7.1% 10.02 $108,310
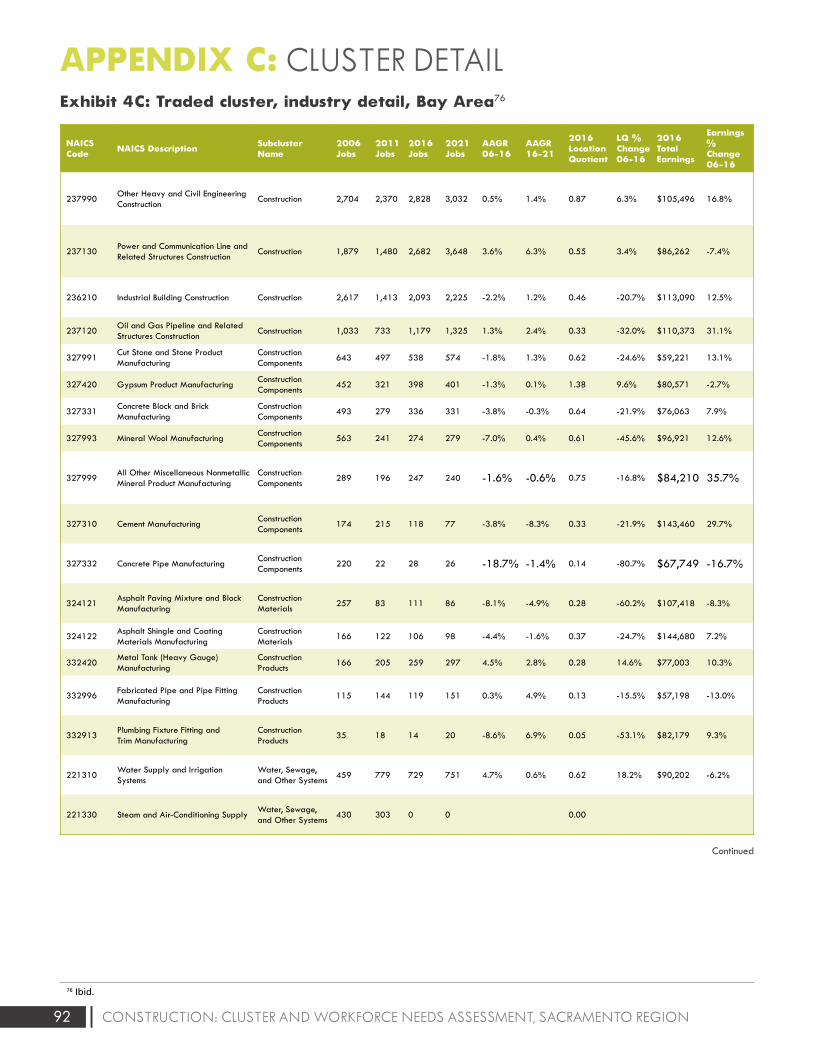
92 CONSTRUCTION: CLUSTER AND WORKFORCE NEEDS ASSESSMENT, SACRAMENTO REGION
APPENDIX C: CLUSTER DETAIL
76 Ibid.
Exhibit 4C: Traded cluster, industry detail, Bay Area76
NAICS Code NAICS Description Subcluster
Name2006 Jobs
2011 Jobs
2016 Jobs
2021 Jobs
AAGR 06-16
AAGR 16-21
2016 Location Quotient
LQ % Change 06-16
2016 Total Earnings
Earnings % Change 06-16
237990Other Heavy and Civil Engineering Construction
Construction 2,704 2,370 2,828 3,032 0.5% 1.4% 0.87 6.3% $105,496 16.8%
237130Power and Communication Line and Related Structures Construction
Construction 1,879 1,480 2,682 3,648 3.6% 6.3% 0.55 3.4% $86,262 -7.4%
236210 Industrial Building Construction Construction 2,617 1,413 2,093 2,225 -2.2% 1.2% 0.46 -20.7% $113,090 12.5%
237120Oil and Gas Pipeline and Related Structures Construction
Construction 1,033 733 1,179 1,325 1.3% 2.4% 0.33 -32.0% $110,373 31.1%
327991Cut Stone and Stone Product Manufacturing
Construction Components
643 497 538 574 -1.8% 1.3% 0.62 -24.6% $59,221 13.1%
327420 Gypsum Product ManufacturingConstruction Components
452 321 398 401 -1.3% 0.1% 1.38 9.6% $80,571 -2.7%
327331Concrete Block and Brick Manufacturing
Construction Components
493 279 336 331 -3.8% -0.3% 0.64 -21.9% $76,063 7.9%
327993 Mineral Wool ManufacturingConstruction Components
563 241 274 279 -7.0% 0.4% 0.61 -45.6% $96,921 12.6%
327999All Other Miscellaneous Nonmetallic Mineral Product Manufacturing
Construction Components
289 196 247 240 -1.6% -0.6% 0.75 -16.8% $84,210 35.7%
327310 Cement ManufacturingConstruction Components
174 215 118 77 -3.8% -8.3% 0.33 -21.9% $143,460 29.7%
327332 Concrete Pipe ManufacturingConstruction Components
220 22 28 26 -18.7% -1.4% 0.14 -80.7% $67,749 -16.7%
324121Asphalt Paving Mixture and Block Manufacturing
Construction Materials
257 83 111 86 -8.1% -4.9% 0.28 -60.2% $107,418 -8.3%
324122Asphalt Shingle and Coating Materials Manufacturing
Construction Materials
166 122 106 98 -4.4% -1.6% 0.37 -24.7% $144,680 7.2%
332420Metal Tank (Heavy Gauge) Manufacturing
Construction Products
166 205 259 297 4.5% 2.8% 0.28 14.6% $77,003 10.3%
332996Fabricated Pipe and Pipe Fitting Manufacturing
Construction Products
115 144 119 151 0.3% 4.9% 0.13 -15.5% $57,198 -13.0%
332913Plumbing Fixture Fitting and Trim Manufacturing
Construction Products
35 18 14 20 -8.6% 6.9% 0.05 -53.1% $82,179 9.3%
221310Water Supply and Irrigation Systems
Water, Sewage, and Other Systems
459 779 729 751 4.7% 0.6% 0.62 18.2% $90,202 -6.2%
221330 Steam and Air-Conditioning SupplyWater, Sewage, and Other Systems
430 303 0 0 0.00
Continued
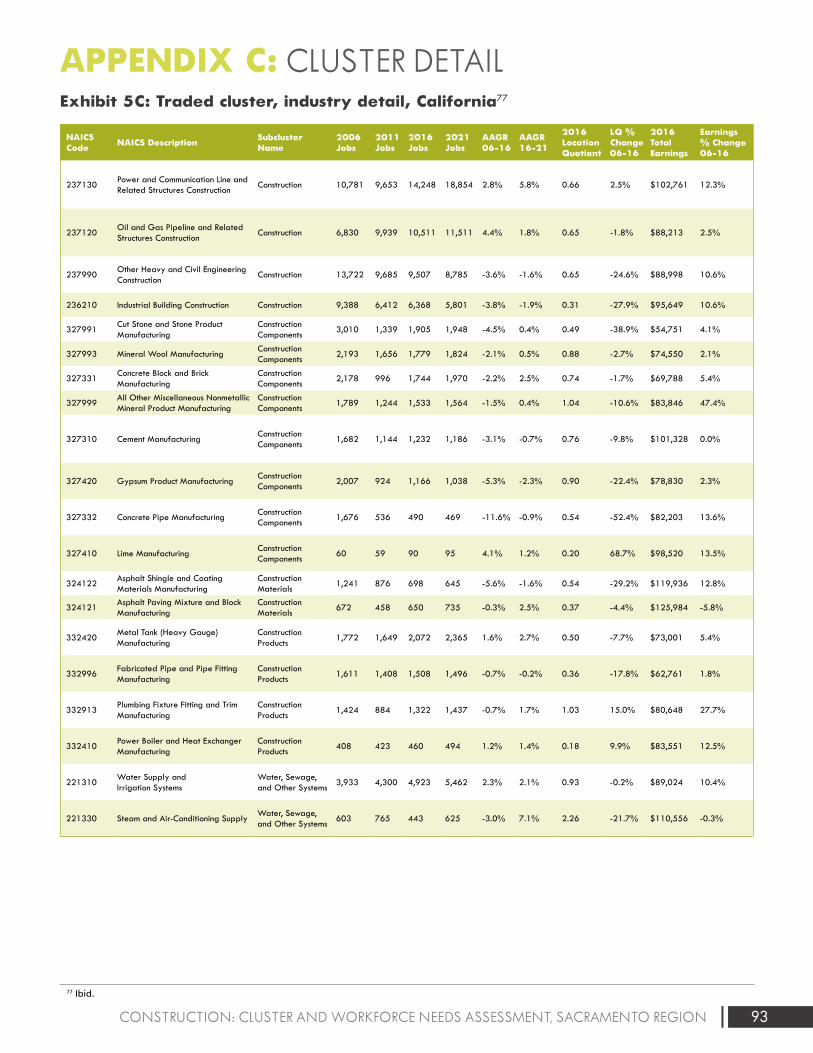
93CONSTRUCTION: CLUSTER AND WORKFORCE NEEDS ASSESSMENT, SACRAMENTO REGION
APPENDIX C: CLUSTER DETAIL
77 Ibid.
Exhibit 5C: Traded cluster, industry detail, California77
NAICS Code NAICS Description Subcluster
Name2006 Jobs
2011 Jobs
2016 Jobs
2021 Jobs
AAGR 06-16
AAGR 16-21
2016 Location Quotient
LQ % Change 06-16
2016 Total Earnings
Earnings % Change 06-16
237130Power and Communication Line and Related Structures Construction
Construction 10,781 9,653 14,248 18,854 2.8% 5.8% 0.66 2.5% $102,761 12.3%
237120Oil and Gas Pipeline and Related Structures Construction
Construction 6,830 9,939 10,511 11,511 4.4% 1.8% 0.65 -1.8% $88,213 2.5%
237990Other Heavy and Civil Engineering Construction
Construction 13,722 9,685 9,507 8,785 -3.6% -1.6% 0.65 -24.6% $88,998 10.6%
236210 Industrial Building Construction Construction 9,388 6,412 6,368 5,801 -3.8% -1.9% 0.31 -27.9% $95,649 10.6%
327991Cut Stone and Stone Product Manufacturing
Construction Components
3,010 1,339 1,905 1,948 -4.5% 0.4% 0.49 -38.9% $54,751 4.1%
327993 Mineral Wool ManufacturingConstruction Components
2,193 1,656 1,779 1,824 -2.1% 0.5% 0.88 -2.7% $74,550 2.1%
327331Concrete Block and Brick Manufacturing
Construction Components
2,178 996 1,744 1,970 -2.2% 2.5% 0.74 -1.7% $69,788 5.4%
327999All Other Miscellaneous Nonmetallic Mineral Product Manufacturing
Construction Components
1,789 1,244 1,533 1,564 -1.5% 0.4% 1.04 -10.6% $83,846 47.4%
327310 Cement ManufacturingConstruction Components
1,682 1,144 1,232 1,186 -3.1% -0.7% 0.76 -9.8% $101,328 0.0%
327420 Gypsum Product ManufacturingConstruction Components
2,007 924 1,166 1,038 -5.3% -2.3% 0.90 -22.4% $78,830 2.3%
327332 Concrete Pipe ManufacturingConstruction Components
1,676 536 490 469 -11.6% -0.9% 0.54 -52.4% $82,203 13.6%
327410 Lime ManufacturingConstruction Components
60 59 90 95 4.1% 1.2% 0.20 68.7% $98,520 13.5%
324122Asphalt Shingle and Coating Materials Manufacturing
Construction Materials
1,241 876 698 645 -5.6% -1.6% 0.54 -29.2% $119,936 12.8%
324121Asphalt Paving Mixture and Block Manufacturing
Construction Materials
672 458 650 735 -0.3% 2.5% 0.37 -4.4% $125,984 -5.8%
332420Metal Tank (Heavy Gauge) Manufacturing
Construction Products
1,772 1,649 2,072 2,365 1.6% 2.7% 0.50 -7.7% $73,001 5.4%
332996Fabricated Pipe and Pipe Fitting Manufacturing
Construction Products
1,611 1,408 1,508 1,496 -0.7% -0.2% 0.36 -17.8% $62,761 1.8%
332913Plumbing Fixture Fitting and Trim Manufacturing
Construction Products
1,424 884 1,322 1,437 -0.7% 1.7% 1.03 15.0% $80,648 27.7%
332410Power Boiler and Heat Exchanger Manufacturing
Construction Products
408 423 460 494 1.2% 1.4% 0.18 9.9% $83,551 12.5%
221310Water Supply and Irrigation Systems
Water, Sewage, and Other Systems
3,933 4,300 4,923 5,462 2.3% 2.1% 0.93 -0.2% $89,024 10.4%
221330 Steam and Air-Conditioning SupplyWater, Sewage, and Other Systems
603 765 443 625 -3.0% 7.1% 2.26 -21.7% $110,556 -0.3%
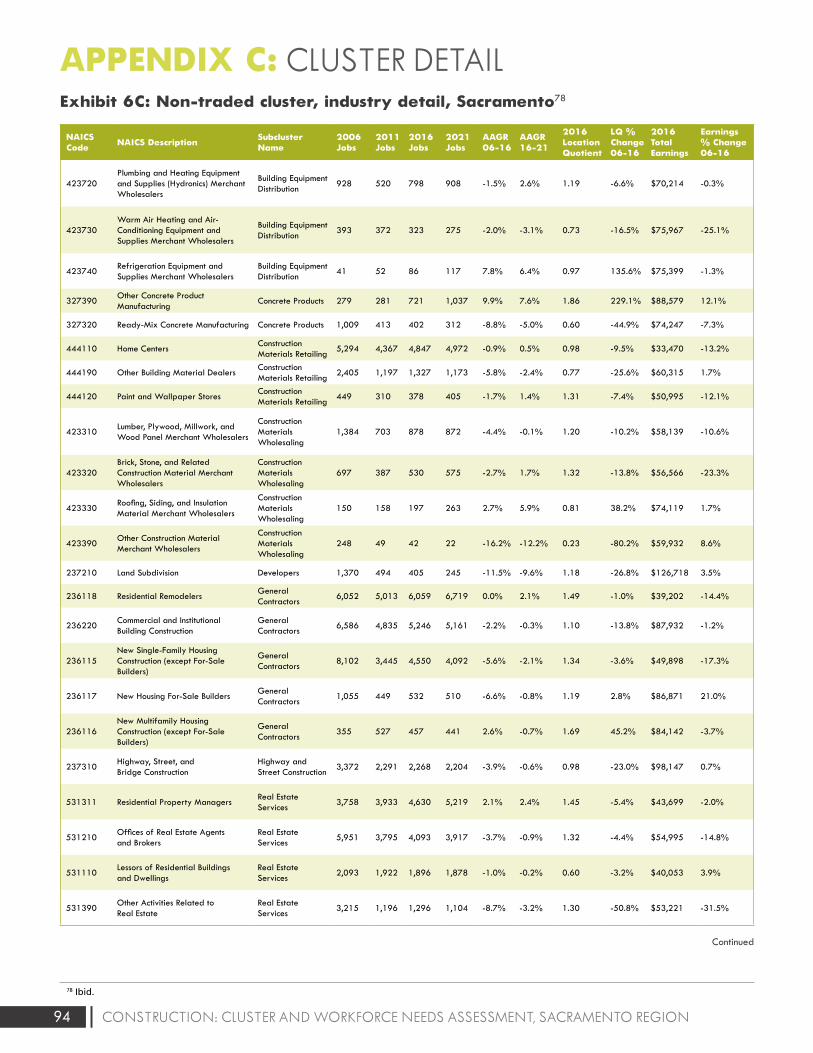
94 CONSTRUCTION: CLUSTER AND WORKFORCE NEEDS ASSESSMENT, SACRAMENTO REGION
APPENDIX C: CLUSTER DETAIL
78 Ibid.
Exhibit 6C: Non-traded cluster, industry detail, Sacramento78
NAICS Code NAICS Description Subcluster
Name2006 Jobs
2011 Jobs
2016 Jobs
2021 Jobs
AAGR 06-16
AAGR 16-21
2016 Location Quotient
LQ % Change 06-16
2016 Total Earnings
Earnings % Change 06-16
423720Plumbing and Heating Equipment and Supplies (Hydronics) Merchant Wholesalers
Building Equipment Distribution
928 520 798 908 -1.5% 2.6% 1.19 -6.6% $70,214 -0.3%
423730Warm Air Heating and Air-Conditioning Equipment and Supplies Merchant Wholesalers
Building Equipment Distribution
393 372 323 275 -2.0% -3.1% 0.73 -16.5% $75,967 -25.1%
423740Refrigeration Equipment and Supplies Merchant Wholesalers
Building Equipment Distribution
41 52 86 117 7.8% 6.4% 0.97 135.6% $75,399 -1.3%
327390Other Concrete Product Manufacturing
Concrete Products 279 281 721 1,037 9.9% 7.6% 1.86 229.1% $88,579 12.1%
327320 Ready-Mix Concrete Manufacturing Concrete Products 1,009 413 402 312 -8.8% -5.0% 0.60 -44.9% $74,247 -7.3%
444110 Home CentersConstruction Materials Retailing
5,294 4,367 4,847 4,972 -0.9% 0.5% 0.98 -9.5% $33,470 -13.2%
444190 Other Building Material DealersConstruction Materials Retailing
2,405 1,197 1,327 1,173 -5.8% -2.4% 0.77 -25.6% $60,315 1.7%
444120 Paint and Wallpaper StoresConstruction Materials Retailing
449 310 378 405 -1.7% 1.4% 1.31 -7.4% $50,995 -12.1%
423310Lumber, Plywood, Millwork, and Wood Panel Merchant Wholesalers
Construction Materials Wholesaling
1,384 703 878 872 -4.4% -0.1% 1.20 -10.2% $58,139 -10.6%
423320Brick, Stone, and Related Construction Material Merchant Wholesalers
Construction Materials Wholesaling
697 387 530 575 -2.7% 1.7% 1.32 -13.8% $56,566 -23.3%
423330Roofing, Siding, and Insulation Material Merchant Wholesalers
Construction Materials Wholesaling
150 158 197 263 2.7% 5.9% 0.81 38.2% $74,119 1.7%
423390Other Construction Material Merchant Wholesalers
Construction Materials Wholesaling
248 49 42 22 -16.2% -12.2% 0.23 -80.2% $59,932 8.6%
237210 Land Subdivision Developers 1,370 494 405 245 -11.5% -9.6% 1.18 -26.8% $126,718 3.5%
236118 Residential RemodelersGeneral Contractors
6,052 5,013 6,059 6,719 0.0% 2.1% 1.49 -1.0% $39,202 -14.4%
236220Commercial and Institutional Building Construction
General Contractors
6,586 4,835 5,246 5,161 -2.2% -0.3% 1.10 -13.8% $87,932 -1.2%
236115New Single-Family Housing Construction (except For-Sale Builders)
General Contractors
8,102 3,445 4,550 4,092 -5.6% -2.1% 1.34 -3.6% $49,898 -17.3%
236117 New Housing For-Sale BuildersGeneral Contractors
1,055 449 532 510 -6.6% -0.8% 1.19 2.8% $86,871 21.0%
236116New Multifamily Housing Construction (except For-Sale Builders)
General Contractors
355 527 457 441 2.6% -0.7% 1.69 45.2% $84,142 -3.7%
237310Highway, Street, and Bridge Construction
Highway and Street Construction
3,372 2,291 2,268 2,204 -3.9% -0.6% 0.98 -23.0% $98,147 0.7%
531311 Residential Property ManagersReal Estate Services
3,758 3,933 4,630 5,219 2.1% 2.4% 1.45 -5.4% $43,699 -2.0%
531210Offices of Real Estate Agents and Brokers
Real Estate Services
5,951 3,795 4,093 3,917 -3.7% -0.9% 1.32 -4.4% $54,995 -14.8%
531110Lessors of Residential Buildings and Dwellings
Real Estate Services
2,093 1,922 1,896 1,878 -1.0% -0.2% 0.60 -3.2% $40,053 3.9%
531390Other Activities Related to Real Estate
Real Estate Services
3,215 1,196 1,296 1,104 -8.7% -3.2% 1.30 -50.8% $53,221 -31.5%
Continued
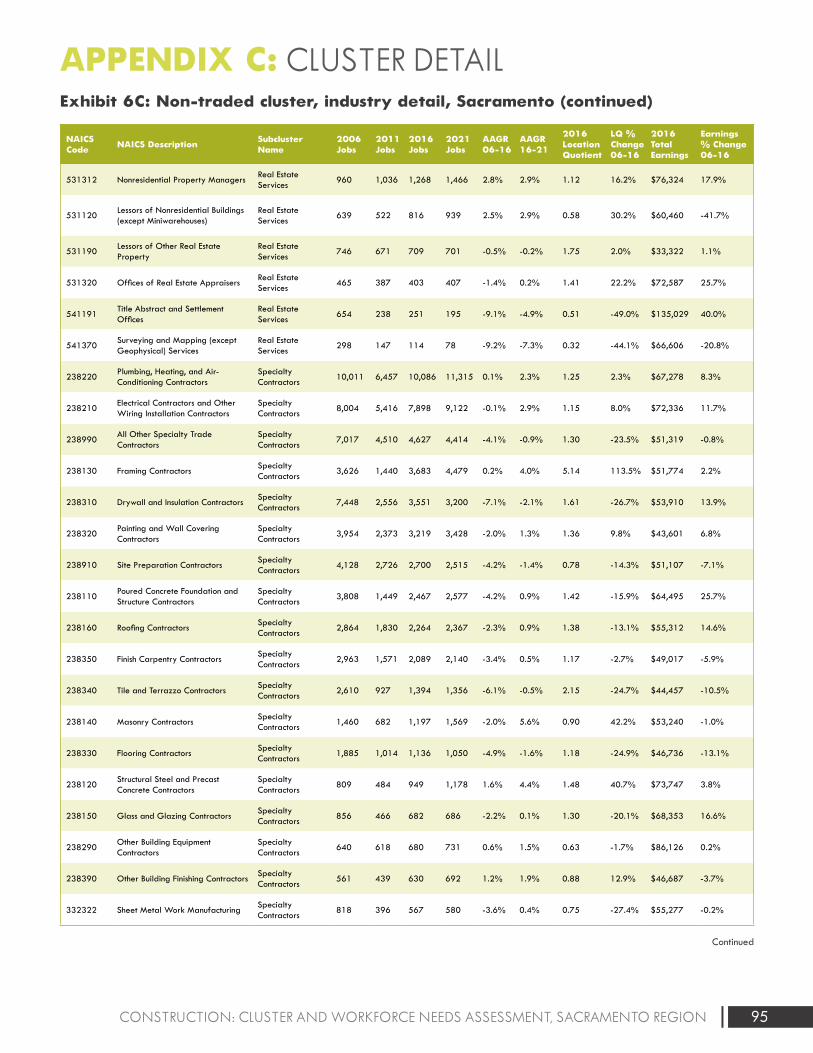
95CONSTRUCTION: CLUSTER AND WORKFORCE NEEDS ASSESSMENT, SACRAMENTO REGION
APPENDIX C: CLUSTER DETAIL Exhibit 6C: Non-traded cluster, industry detail, Sacramento (continued)
NAICS Code NAICS Description Subcluster
Name2006 Jobs
2011 Jobs
2016 Jobs
2021 Jobs
AAGR 06-16
AAGR 16-21
2016 Location Quotient
LQ % Change 06-16
2016 Total Earnings
Earnings % Change 06-16
531312 Nonresidential Property ManagersReal Estate Services
960 1,036 1,268 1,466 2.8% 2.9% 1.12 16.2% $76,324 17.9%
531120Lessors of Nonresidential Buildings (except Miniwarehouses)
Real Estate Services
639 522 816 939 2.5% 2.9% 0.58 30.2% $60,460 -41.7%
531190Lessors of Other Real Estate Property
Real Estate Services
746 671 709 701 -0.5% -0.2% 1.75 2.0% $33,322 1.1%
531320 Offices of Real Estate AppraisersReal Estate Services
465 387 403 407 -1.4% 0.2% 1.41 22.2% $72,587 25.7%
541191Title Abstract and Settlement Offices
Real Estate Services
654 238 251 195 -9.1% -4.9% 0.51 -49.0% $135,029 40.0%
541370Surveying and Mapping (except Geophysical) Services
Real Estate Services
298 147 114 78 -9.2% -7.3% 0.32 -44.1% $66,606 -20.8%
238220Plumbing, Heating, and Air-Conditioning Contractors
Specialty Contractors
10,011 6,457 10,086 11,315 0.1% 2.3% 1.25 2.3% $67,278 8.3%
238210Electrical Contractors and Other Wiring Installation Contractors
Specialty Contractors
8,004 5,416 7,898 9,122 -0.1% 2.9% 1.15 8.0% $72,336 11.7%
238990All Other Specialty Trade Contractors
Specialty Contractors
7,017 4,510 4,627 4,414 -4.1% -0.9% 1.30 -23.5% $51,319 -0.8%
238130 Framing ContractorsSpecialty Contractors
3,626 1,440 3,683 4,479 0.2% 4.0% 5.14 113.5% $51,774 2.2%
238310 Drywall and Insulation ContractorsSpecialty Contractors
7,448 2,556 3,551 3,200 -7.1% -2.1% 1.61 -26.7% $53,910 13.9%
238320Painting and Wall Covering Contractors
Specialty Contractors
3,954 2,373 3,219 3,428 -2.0% 1.3% 1.36 9.8% $43,601 6.8%
238910 Site Preparation ContractorsSpecialty Contractors
4,128 2,726 2,700 2,515 -4.2% -1.4% 0.78 -14.3% $51,107 -7.1%
238110Poured Concrete Foundation and Structure Contractors
Specialty Contractors
3,808 1,449 2,467 2,577 -4.2% 0.9% 1.42 -15.9% $64,495 25.7%
238160 Roofing ContractorsSpecialty Contractors
2,864 1,830 2,264 2,367 -2.3% 0.9% 1.38 -13.1% $55,312 14.6%
238350 Finish Carpentry ContractorsSpecialty Contractors
2,963 1,571 2,089 2,140 -3.4% 0.5% 1.17 -2.7% $49,017 -5.9%
238340 Tile and Terrazzo ContractorsSpecialty Contractors
2,610 927 1,394 1,356 -6.1% -0.5% 2.15 -24.7% $44,457 -10.5%
238140 Masonry ContractorsSpecialty Contractors
1,460 682 1,197 1,569 -2.0% 5.6% 0.90 42.2% $53,240 -1.0%
238330 Flooring ContractorsSpecialty Contractors
1,885 1,014 1,136 1,050 -4.9% -1.6% 1.18 -24.9% $46,736 -13.1%
238120Structural Steel and Precast Concrete Contractors
Specialty Contractors
809 484 949 1,178 1.6% 4.4% 1.48 40.7% $73,747 3.8%
238150 Glass and Glazing ContractorsSpecialty Contractors
856 466 682 686 -2.2% 0.1% 1.30 -20.1% $68,353 16.6%
238290Other Building Equipment Contractors
Specialty Contractors
640 618 680 731 0.6% 1.5% 0.63 -1.7% $86,126 0.2%
238390 Other Building Finishing ContractorsSpecialty Contractors
561 439 630 692 1.2% 1.9% 0.88 12.9% $46,687 -3.7%
332322 Sheet Metal Work ManufacturingSpecialty Contractors
818 396 567 580 -3.6% 0.4% 0.75 -27.4% $55,277 -0.2%
Continued
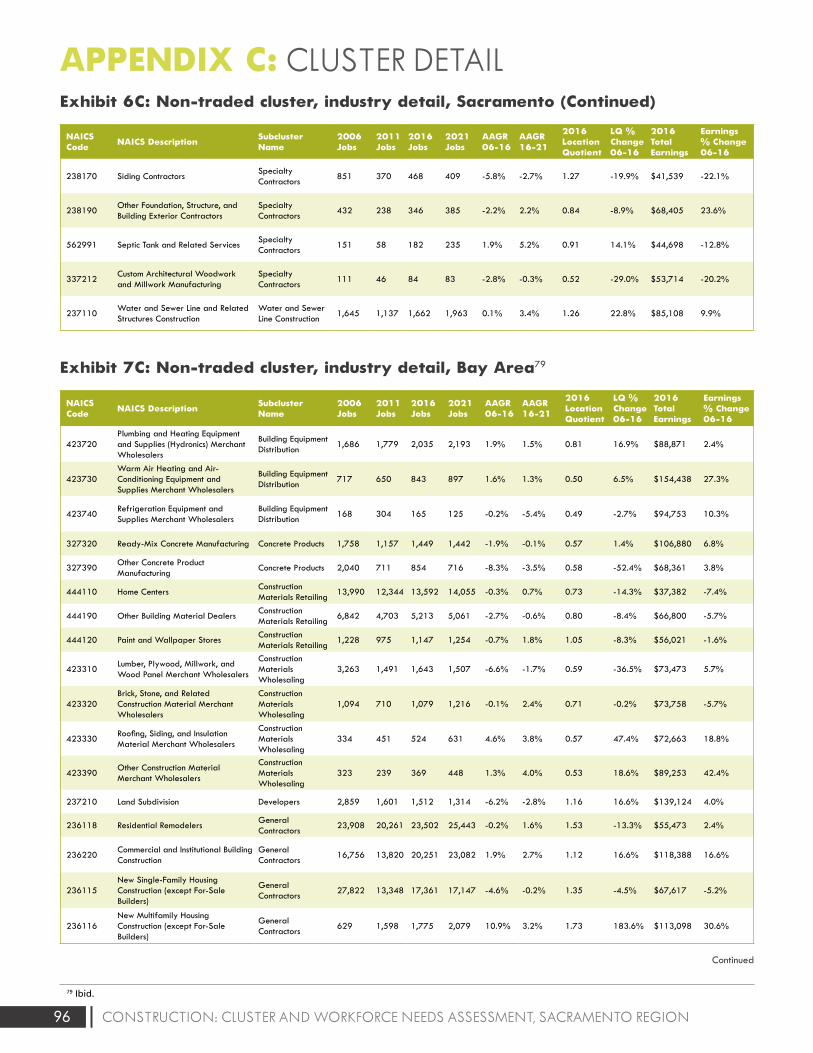
96 CONSTRUCTION: CLUSTER AND WORKFORCE NEEDS ASSESSMENT, SACRAMENTO REGION
79 Ibid.
Exhibit 7C: Non-traded cluster, industry detail, Bay Area79
NAICS Code NAICS Description Subcluster
Name2006 Jobs
2011 Jobs
2016 Jobs
2021 Jobs
AAGR 06-16
AAGR 16-21
2016 Location Quotient
LQ % Change 06-16
2016 Total Earnings
Earnings % Change 06-16
423720Plumbing and Heating Equipment and Supplies (Hydronics) Merchant Wholesalers
Building Equipment Distribution
1,686 1,779 2,035 2,193 1.9% 1.5% 0.81 16.9% $88,871 2.4%
423730Warm Air Heating and Air-Conditioning Equipment and Supplies Merchant Wholesalers
Building Equipment Distribution
717 650 843 897 1.6% 1.3% 0.50 6.5% $154,438 27.3%
423740Refrigeration Equipment and Supplies Merchant Wholesalers
Building Equipment Distribution
168 304 165 125 -0.2% -5.4% 0.49 -2.7% $94,753 10.3%
327320 Ready-Mix Concrete Manufacturing Concrete Products 1,758 1,157 1,449 1,442 -1.9% -0.1% 0.57 1.4% $106,880 6.8%
327390Other Concrete Product Manufacturing
Concrete Products 2,040 711 854 716 -8.3% -3.5% 0.58 -52.4% $68,361 3.8%
444110 Home CentersConstruction Materials Retailing
13,990 12,344 13,592 14,055 -0.3% 0.7% 0.73 -14.3% $37,382 -7.4%
444190 Other Building Material DealersConstruction Materials Retailing
6,842 4,703 5,213 5,061 -2.7% -0.6% 0.80 -8.4% $66,800 -5.7%
444120 Paint and Wallpaper StoresConstruction Materials Retailing
1,228 975 1,147 1,254 -0.7% 1.8% 1.05 -8.3% $56,021 -1.6%
423310Lumber, Plywood, Millwork, and Wood Panel Merchant Wholesalers
Construction Materials Wholesaling
3,263 1,491 1,643 1,507 -6.6% -1.7% 0.59 -36.5% $73,473 5.7%
423320Brick, Stone, and Related Construction Material Merchant Wholesalers
Construction Materials Wholesaling
1,094 710 1,079 1,216 -0.1% 2.4% 0.71 -0.2% $73,758 -5.7%
423330Roofing, Siding, and Insulation Material Merchant Wholesalers
Construction Materials Wholesaling
334 451 524 631 4.6% 3.8% 0.57 47.4% $72,663 18.8%
423390Other Construction Material Merchant Wholesalers
Construction Materials Wholesaling
323 239 369 448 1.3% 4.0% 0.53 18.6% $89,253 42.4%
237210 Land Subdivision Developers 2,859 1,601 1,512 1,314 -6.2% -2.8% 1.16 16.6% $139,124 4.0%
236118 Residential RemodelersGeneral Contractors
23,908 20,261 23,502 25,443 -0.2% 1.6% 1.53 -13.3% $55,473 2.4%
236220Commercial and Institutional Building Construction
General Contractors
16,756 13,820 20,251 23,082 1.9% 2.7% 1.12 16.6% $118,388 16.6%
236115New Single-Family Housing Construction (except For-Sale Builders)
General Contractors
27,822 13,348 17,361 17,147 -4.6% -0.2% 1.35 -4.5% $67,617 -5.2%
236116New Multifamily Housing Construction (except For-Sale Builders)
General Contractors
629 1,598 1,775 2,079 10.9% 3.2% 1.73 183.6% $113,098 30.6%
Continued
APPENDIX C: CLUSTER DETAIL Exhibit 6C: Non-traded cluster, industry detail, Sacramento (Continued)
NAICS Code NAICS Description Subcluster
Name2006 Jobs
2011 Jobs
2016 Jobs
2021 Jobs
AAGR 06-16
AAGR 16-21
2016 Location Quotient
LQ % Change 06-16
2016 Total Earnings
Earnings % Change 06-16
238170 Siding ContractorsSpecialty Contractors
851 370 468 409 -5.8% -2.7% 1.27 -19.9% $41,539 -22.1%
238190Other Foundation, Structure, and Building Exterior Contractors
Specialty Contractors
432 238 346 385 -2.2% 2.2% 0.84 -8.9% $68,405 23.6%
562991 Septic Tank and Related ServicesSpecialty Contractors
151 58 182 235 1.9% 5.2% 0.91 14.1% $44,698 -12.8%
337212Custom Architectural Woodwork and Millwork Manufacturing
Specialty Contractors
111 46 84 83 -2.8% -0.3% 0.52 -29.0% $53,714 -20.2%
237110Water and Sewer Line and Related Structures Construction
Water and Sewer Line Construction
1,645 1,137 1,662 1,963 0.1% 3.4% 1.26 22.8% $85,108 9.9%
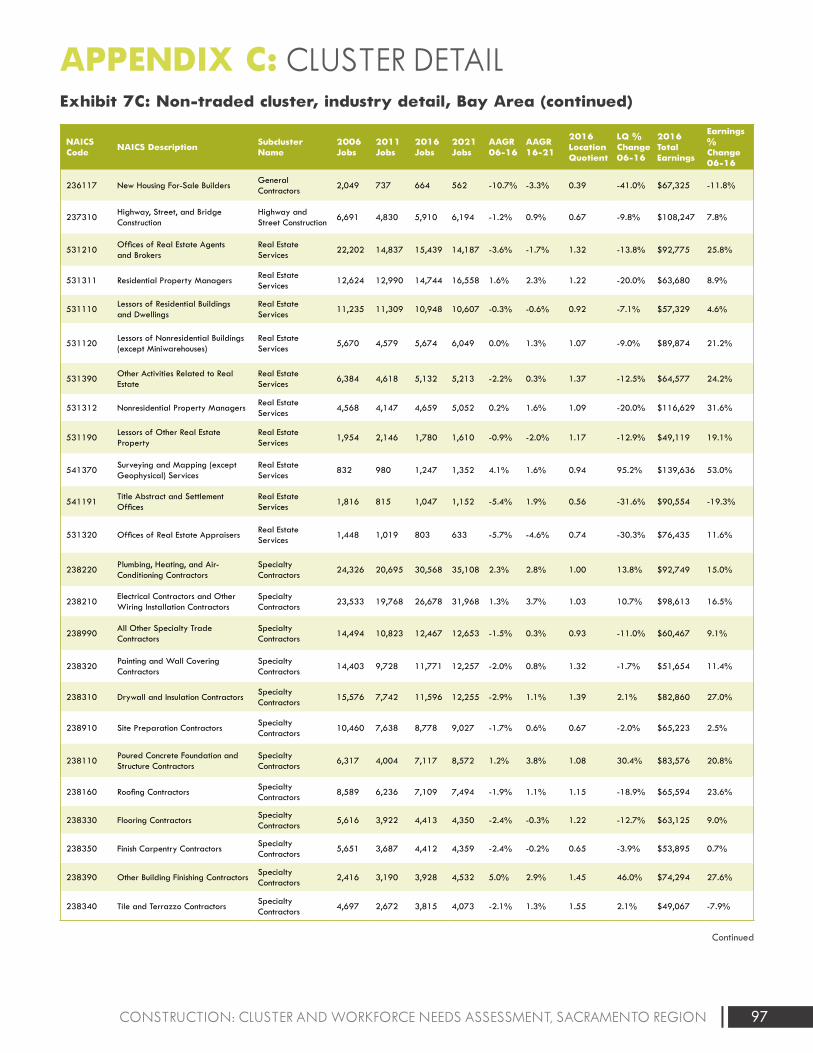
97CONSTRUCTION: CLUSTER AND WORKFORCE NEEDS ASSESSMENT, SACRAMENTO REGION
APPENDIX C: CLUSTER DETAIL Exhibit 7C: Non-traded cluster, industry detail, Bay Area (continued)
NAICS Code NAICS Description Subcluster
Name2006 Jobs
2011 Jobs
2016 Jobs
2021 Jobs
AAGR 06-16
AAGR 16-21
2016 Location Quotient
LQ % Change 06-16
2016 Total Earnings
Earnings % Change 06-16
236117 New Housing For-Sale BuildersGeneral Contractors
2,049 737 664 562 -10.7% -3.3% 0.39 -41.0% $67,325 -11.8%
237310Highway, Street, and Bridge Construction
Highway and Street Construction
6,691 4,830 5,910 6,194 -1.2% 0.9% 0.67 -9.8% $108,247 7.8%
531210Offices of Real Estate Agents and Brokers
Real Estate Services
22,202 14,837 15,439 14,187 -3.6% -1.7% 1.32 -13.8% $92,775 25.8%
531311 Residential Property ManagersReal Estate Services
12,624 12,990 14,744 16,558 1.6% 2.3% 1.22 -20.0% $63,680 8.9%
531110Lessors of Residential Buildings and Dwellings
Real Estate Services
11,235 11,309 10,948 10,607 -0.3% -0.6% 0.92 -7.1% $57,329 4.6%
531120Lessors of Nonresidential Buildings (except Miniwarehouses)
Real Estate Services
5,670 4,579 5,674 6,049 0.0% 1.3% 1.07 -9.0% $89,874 21.2%
531390Other Activities Related to Real Estate
Real Estate Services
6,384 4,618 5,132 5,213 -2.2% 0.3% 1.37 -12.5% $64,577 24.2%
531312 Nonresidential Property ManagersReal Estate Services
4,568 4,147 4,659 5,052 0.2% 1.6% 1.09 -20.0% $116,629 31.6%
531190Lessors of Other Real Estate Property
Real Estate Services
1,954 2,146 1,780 1,610 -0.9% -2.0% 1.17 -12.9% $49,119 19.1%
541370Surveying and Mapping (except Geophysical) Services
Real Estate Services
832 980 1,247 1,352 4.1% 1.6% 0.94 95.2% $139,636 53.0%
541191Title Abstract and Settlement Offices
Real Estate Services
1,816 815 1,047 1,152 -5.4% 1.9% 0.56 -31.6% $90,554 -19.3%
531320 Offices of Real Estate AppraisersReal Estate Services
1,448 1,019 803 633 -5.7% -4.6% 0.74 -30.3% $76,435 11.6%
238220Plumbing, Heating, and Air-Conditioning Contractors
Specialty Contractors
24,326 20,695 30,568 35,108 2.3% 2.8% 1.00 13.8% $92,749 15.0%
238210Electrical Contractors and Other Wiring Installation Contractors
Specialty Contractors
23,533 19,768 26,678 31,968 1.3% 3.7% 1.03 10.7% $98,613 16.5%
238990All Other Specialty Trade Contractors
Specialty Contractors
14,494 10,823 12,467 12,653 -1.5% 0.3% 0.93 -11.0% $60,467 9.1%
238320Painting and Wall Covering Contractors
Specialty Contractors
14,403 9,728 11,771 12,257 -2.0% 0.8% 1.32 -1.7% $51,654 11.4%
238310 Drywall and Insulation ContractorsSpecialty Contractors
15,576 7,742 11,596 12,255 -2.9% 1.1% 1.39 2.1% $82,860 27.0%
238910 Site Preparation ContractorsSpecialty Contractors
10,460 7,638 8,778 9,027 -1.7% 0.6% 0.67 -2.0% $65,223 2.5%
238110Poured Concrete Foundation and Structure Contractors
Specialty Contractors
6,317 4,004 7,117 8,572 1.2% 3.8% 1.08 30.4% $83,576 20.8%
238160 Roofing ContractorsSpecialty Contractors
8,589 6,236 7,109 7,494 -1.9% 1.1% 1.15 -18.9% $65,594 23.6%
238330 Flooring ContractorsSpecialty Contractors
5,616 3,922 4,413 4,350 -2.4% -0.3% 1.22 -12.7% $63,125 9.0%
238350 Finish Carpentry ContractorsSpecialty Contractors
5,651 3,687 4,412 4,359 -2.4% -0.2% 0.65 -3.9% $53,895 0.7%
238390 Other Building Finishing ContractorsSpecialty Contractors
2,416 3,190 3,928 4,532 5.0% 2.9% 1.45 46.0% $74,294 27.6%
238340 Tile and Terrazzo ContractorsSpecialty Contractors
4,697 2,672 3,815 4,073 -2.1% 1.3% 1.55 2.1% $49,067 -7.9%
Continued
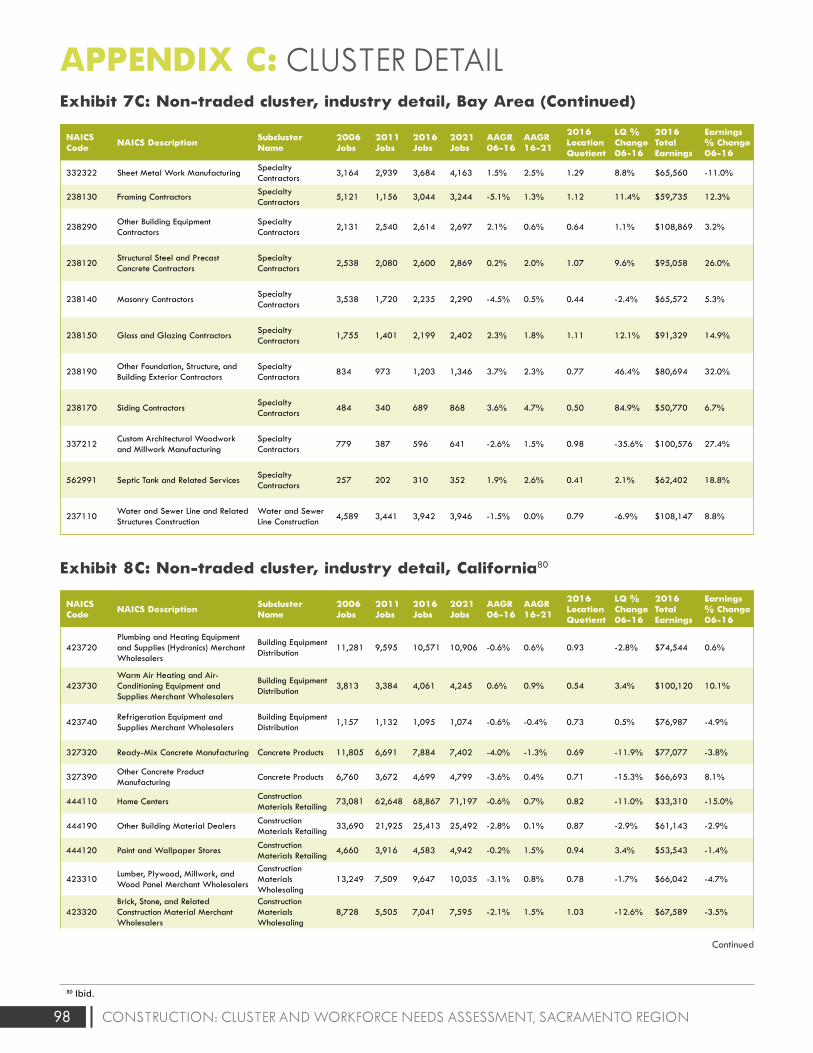
98 CONSTRUCTION: CLUSTER AND WORKFORCE NEEDS ASSESSMENT, SACRAMENTO REGION
80 Ibid.
Exhibit 7C: Non-traded cluster, industry detail, Bay Area (Continued)
NAICS Code NAICS Description Subcluster
Name2006 Jobs
2011 Jobs
2016 Jobs
2021 Jobs
AAGR 06-16
AAGR 16-21
2016 Location Quotient
LQ % Change 06-16
2016 Total Earnings
Earnings % Change 06-16
332322 Sheet Metal Work ManufacturingSpecialty Contractors
3,164 2,939 3,684 4,163 1.5% 2.5% 1.29 8.8% $65,560 -11.0%
238130 Framing ContractorsSpecialty Contractors
5,121 1,156 3,044 3,244 -5.1% 1.3% 1.12 11.4% $59,735 12.3%
238290Other Building Equipment Contractors
Specialty Contractors
2,131 2,540 2,614 2,697 2.1% 0.6% 0.64 1.1% $108,869 3.2%
238120Structural Steel and Precast Concrete Contractors
Specialty Contractors
2,538 2,080 2,600 2,869 0.2% 2.0% 1.07 9.6% $95,058 26.0%
238140 Masonry ContractorsSpecialty Contractors
3,538 1,720 2,235 2,290 -4.5% 0.5% 0.44 -2.4% $65,572 5.3%
238150 Glass and Glazing ContractorsSpecialty Contractors
1,755 1,401 2,199 2,402 2.3% 1.8% 1.11 12.1% $91,329 14.9%
238190Other Foundation, Structure, and Building Exterior Contractors
Specialty Contractors
834 973 1,203 1,346 3.7% 2.3% 0.77 46.4% $80,694 32.0%
238170 Siding ContractorsSpecialty Contractors
484 340 689 868 3.6% 4.7% 0.50 84.9% $50,770 6.7%
337212Custom Architectural Woodwork and Millwork Manufacturing
Specialty Contractors
779 387 596 641 -2.6% 1.5% 0.98 -35.6% $100,576 27.4%
562991 Septic Tank and Related ServicesSpecialty Contractors
257 202 310 352 1.9% 2.6% 0.41 2.1% $62,402 18.8%
237110Water and Sewer Line and Related Structures Construction
Water and Sewer Line Construction
4,589 3,441 3,942 3,946 -1.5% 0.0% 0.79 -6.9% $108,147 8.8%
APPENDIX C: CLUSTER DETAIL
Exhibit 8C: Non-traded cluster, industry detail, California80
NAICS Code NAICS Description Subcluster
Name2006 Jobs
2011 Jobs
2016 Jobs
2021 Jobs
AAGR 06-16
AAGR 16-21
2016 Location Quotient
LQ % Change 06-16
2016 Total Earnings
Earnings % Change 06-16
423720Plumbing and Heating Equipment and Supplies (Hydronics) Merchant Wholesalers
Building Equipment Distribution
11,281 9,595 10,571 10,906 -0.6% 0.6% 0.93 -2.8% $74,544 0.6%
423730Warm Air Heating and Air-Conditioning Equipment and Supplies Merchant Wholesalers
Building Equipment Distribution
3,813 3,384 4,061 4,245 0.6% 0.9% 0.54 3.4% $100,120 10.1%
423740Refrigeration Equipment and Supplies Merchant Wholesalers
Building Equipment Distribution
1,157 1,132 1,095 1,074 -0.6% -0.4% 0.73 0.5% $76,987 -4.9%
327320 Ready-Mix Concrete Manufacturing Concrete Products 11,805 6,691 7,884 7,402 -4.0% -1.3% 0.69 -11.9% $77,077 -3.8%
327390Other Concrete Product Manufacturing
Concrete Products 6,760 3,672 4,699 4,799 -3.6% 0.4% 0.71 -15.3% $66,693 8.1%
444110 Home CentersConstruction Materials Retailing
73,081 62,648 68,867 71,197 -0.6% 0.7% 0.82 -11.0% $33,310 -15.0%
444190 Other Building Material DealersConstruction Materials Retailing
33,690 21,925 25,413 25,492 -2.8% 0.1% 0.87 -2.9% $61,143 -2.9%
444120 Paint and Wallpaper StoresConstruction Materials Retailing
4,660 3,916 4,583 4,942 -0.2% 1.5% 0.94 3.4% $53,543 -1.4%
423310Lumber, Plywood, Millwork, and Wood Panel Merchant Wholesalers
Construction Materials Wholesaling
13,249 7,509 9,647 10,035 -3.1% 0.8% 0.78 -1.7% $66,042 -4.7%
423320Brick, Stone, and Related Construction Material Merchant Wholesalers
Construction Materials Wholesaling
8,728 5,505 7,041 7,595 -2.1% 1.5% 1.03 -12.6% $67,589 -3.5%
Continued
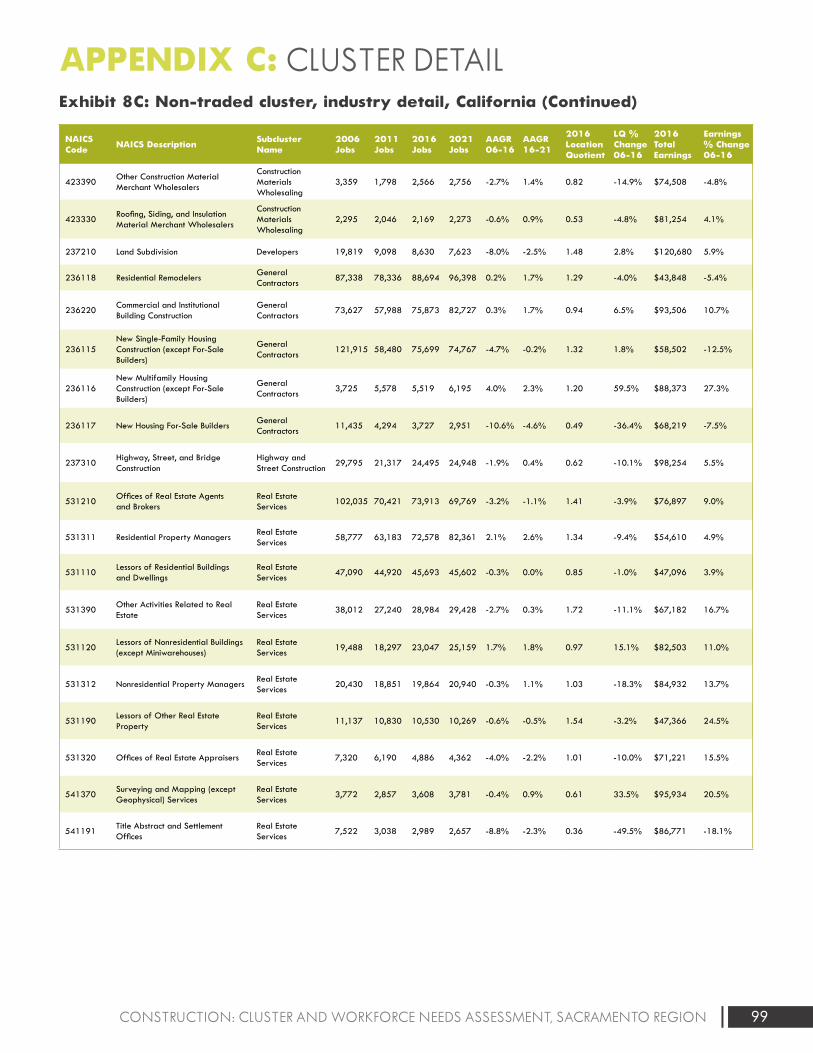
99CONSTRUCTION: CLUSTER AND WORKFORCE NEEDS ASSESSMENT, SACRAMENTO REGION
APPENDIX C: CLUSTER DETAIL Exhibit 8C: Non-traded cluster, industry detail, California (Continued)
NAICS Code NAICS Description Subcluster
Name2006 Jobs
2011 Jobs
2016 Jobs
2021 Jobs
AAGR 06-16
AAGR 16-21
2016 Location Quotient
LQ % Change 06-16
2016 Total Earnings
Earnings % Change 06-16
423390Other Construction Material Merchant Wholesalers
Construction Materials Wholesaling
3,359 1,798 2,566 2,756 -2.7% 1.4% 0.82 -14.9% $74,508 -4.8%
423330Roofing, Siding, and Insulation Material Merchant Wholesalers
Construction Materials Wholesaling
2,295 2,046 2,169 2,273 -0.6% 0.9% 0.53 -4.8% $81,254 4.1%
237210 Land Subdivision Developers 19,819 9,098 8,630 7,623 -8.0% -2.5% 1.48 2.8% $120,680 5.9%
236118 Residential RemodelersGeneral Contractors
87,338 78,336 88,694 96,398 0.2% 1.7% 1.29 -4.0% $43,848 -5.4%
236220Commercial and Institutional Building Construction
General Contractors
73,627 57,988 75,873 82,727 0.3% 1.7% 0.94 6.5% $93,506 10.7%
236115New Single-Family Housing Construction (except For-Sale Builders)
General Contractors
121,915 58,480 75,699 74,767 -4.7% -0.2% 1.32 1.8% $58,502 -12.5%
236116New Multifamily Housing Construction (except For-Sale Builders)
General Contractors
3,725 5,578 5,519 6,195 4.0% 2.3% 1.20 59.5% $88,373 27.3%
236117 New Housing For-Sale BuildersGeneral Contractors
11,435 4,294 3,727 2,951 -10.6% -4.6% 0.49 -36.4% $68,219 -7.5%
237310Highway, Street, and Bridge Construction
Highway and Street Construction
29,795 21,317 24,495 24,948 -1.9% 0.4% 0.62 -10.1% $98,254 5.5%
531210Offices of Real Estate Agents and Brokers
Real Estate Services
102,035 70,421 73,913 69,769 -3.2% -1.1% 1.41 -3.9% $76,897 9.0%
531311 Residential Property ManagersReal Estate Services
58,777 63,183 72,578 82,361 2.1% 2.6% 1.34 -9.4% $54,610 4.9%
531110Lessors of Residential Buildings and Dwellings
Real Estate Services
47,090 44,920 45,693 45,602 -0.3% 0.0% 0.85 -1.0% $47,096 3.9%
531390Other Activities Related to Real Estate
Real Estate Services
38,012 27,240 28,984 29,428 -2.7% 0.3% 1.72 -11.1% $67,182 16.7%
531120Lessors of Nonresidential Buildings (except Miniwarehouses)
Real Estate Services
19,488 18,297 23,047 25,159 1.7% 1.8% 0.97 15.1% $82,503 11.0%
531312 Nonresidential Property ManagersReal Estate Services
20,430 18,851 19,864 20,940 -0.3% 1.1% 1.03 -18.3% $84,932 13.7%
531190Lessors of Other Real Estate Property
Real Estate Services
11,137 10,830 10,530 10,269 -0.6% -0.5% 1.54 -3.2% $47,366 24.5%
531320 Offices of Real Estate AppraisersReal Estate Services
7,320 6,190 4,886 4,362 -4.0% -2.2% 1.01 -10.0% $71,221 15.5%
541370Surveying and Mapping (except Geophysical) Services
Real Estate Services
3,772 2,857 3,608 3,781 -0.4% 0.9% 0.61 33.5% $95,934 20.5%
541191Title Abstract and Settlement Offices
Real Estate Services
7,522 3,038 2,989 2,657 -8.8% -2.3% 0.36 -49.5% $86,771 -18.1%
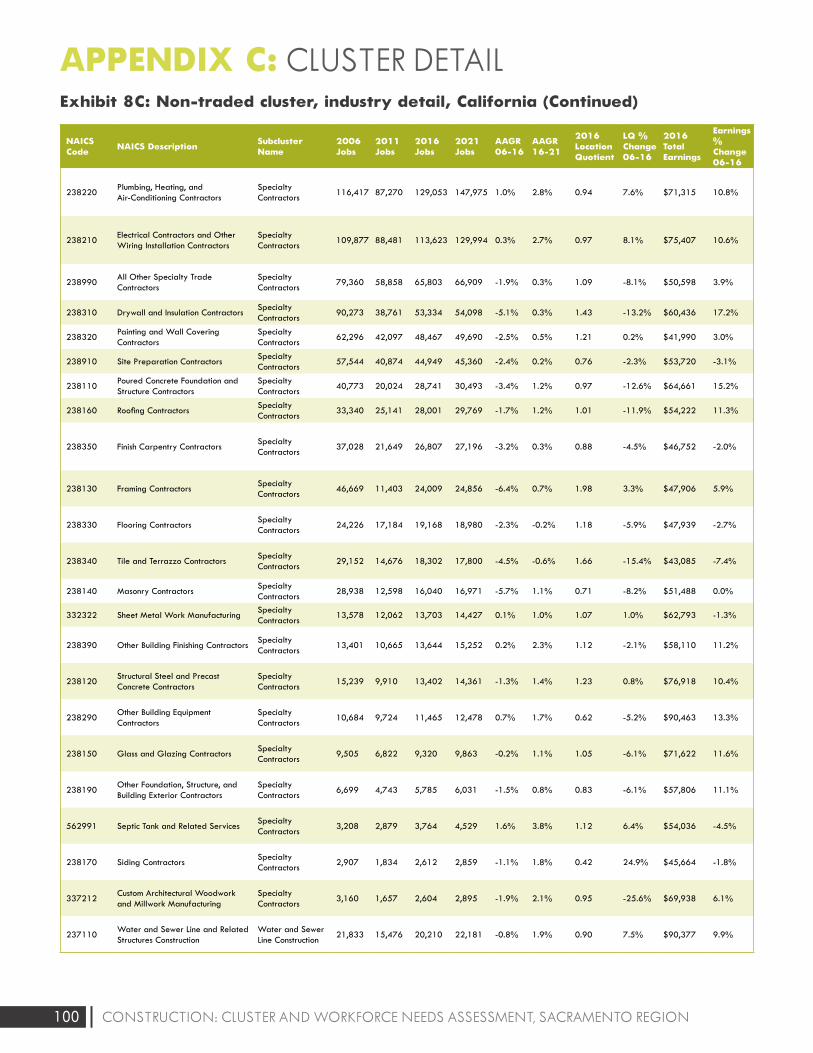
100 CONSTRUCTION: CLUSTER AND WORKFORCE NEEDS ASSESSMENT, SACRAMENTO REGION
APPENDIX C: CLUSTER DETAIL Exhibit 8C: Non-traded cluster, industry detail, California (Continued)
NAICS Code NAICS Description Subcluster
Name2006 Jobs
2011 Jobs
2016 Jobs
2021 Jobs
AAGR 06-16
AAGR 16-21
2016 Location Quotient
LQ % Change 06-16
2016 Total Earnings
Earnings % Change 06-16
238220Plumbing, Heating, and Air-Conditioning Contractors
Specialty Contractors
116,417 87,270 129,053 147,975 1.0% 2.8% 0.94 7.6% $71,315 10.8%
238210Electrical Contractors and Other Wiring Installation Contractors
Specialty Contractors
109,877 88,481 113,623 129,994 0.3% 2.7% 0.97 8.1% $75,407 10.6%
238990All Other Specialty Trade Contractors
Specialty Contractors
79,360 58,858 65,803 66,909 -1.9% 0.3% 1.09 -8.1% $50,598 3.9%
238310 Drywall and Insulation ContractorsSpecialty Contractors
90,273 38,761 53,334 54,098 -5.1% 0.3% 1.43 -13.2% $60,436 17.2%
238320Painting and Wall Covering Contractors
Specialty Contractors
62,296 42,097 48,467 49,690 -2.5% 0.5% 1.21 0.2% $41,990 3.0%
238910 Site Preparation ContractorsSpecialty Contractors
57,544 40,874 44,949 45,360 -2.4% 0.2% 0.76 -2.3% $53,720 -3.1%
238110Poured Concrete Foundation and Structure Contractors
Specialty Contractors
40,773 20,024 28,741 30,493 -3.4% 1.2% 0.97 -12.6% $64,661 15.2%
238160 Roofing ContractorsSpecialty Contractors
33,340 25,141 28,001 29,769 -1.7% 1.2% 1.01 -11.9% $54,222 11.3%
238350 Finish Carpentry ContractorsSpecialty Contractors
37,028 21,649 26,807 27,196 -3.2% 0.3% 0.88 -4.5% $46,752 -2.0%
238130 Framing ContractorsSpecialty Contractors
46,669 11,403 24,009 24,856 -6.4% 0.7% 1.98 3.3% $47,906 5.9%
238330 Flooring ContractorsSpecialty Contractors
24,226 17,184 19,168 18,980 -2.3% -0.2% 1.18 -5.9% $47,939 -2.7%
238340 Tile and Terrazzo ContractorsSpecialty Contractors
29,152 14,676 18,302 17,800 -4.5% -0.6% 1.66 -15.4% $43,085 -7.4%
238140 Masonry ContractorsSpecialty Contractors
28,938 12,598 16,040 16,971 -5.7% 1.1% 0.71 -8.2% $51,488 0.0%
332322 Sheet Metal Work ManufacturingSpecialty Contractors
13,578 12,062 13,703 14,427 0.1% 1.0% 1.07 1.0% $62,793 -1.3%
238390 Other Building Finishing ContractorsSpecialty Contractors
13,401 10,665 13,644 15,252 0.2% 2.3% 1.12 -2.1% $58,110 11.2%
238120Structural Steel and Precast Concrete Contractors
Specialty Contractors
15,239 9,910 13,402 14,361 -1.3% 1.4% 1.23 0.8% $76,918 10.4%
238290Other Building Equipment Contractors
Specialty Contractors
10,684 9,724 11,465 12,478 0.7% 1.7% 0.62 -5.2% $90,463 13.3%
238150 Glass and Glazing ContractorsSpecialty Contractors
9,505 6,822 9,320 9,863 -0.2% 1.1% 1.05 -6.1% $71,622 11.6%
238190Other Foundation, Structure, and Building Exterior Contractors
Specialty Contractors
6,699 4,743 5,785 6,031 -1.5% 0.8% 0.83 -6.1% $57,806 11.1%
562991 Septic Tank and Related ServicesSpecialty Contractors
3,208 2,879 3,764 4,529 1.6% 3.8% 1.12 6.4% $54,036 -4.5%
238170 Siding ContractorsSpecialty Contractors
2,907 1,834 2,612 2,859 -1.1% 1.8% 0.42 24.9% $45,664 -1.8%
337212Custom Architectural Woodwork and Millwork Manufacturing
Specialty Contractors
3,160 1,657 2,604 2,895 -1.9% 2.1% 0.95 -25.6% $69,938 6.1%
237110Water and Sewer Line and Related Structures Construction
Water and Sewer Line Construction
21,833 15,476 20,210 22,181 -0.8% 1.9% 0.90 7.5% $90,377 9.9%
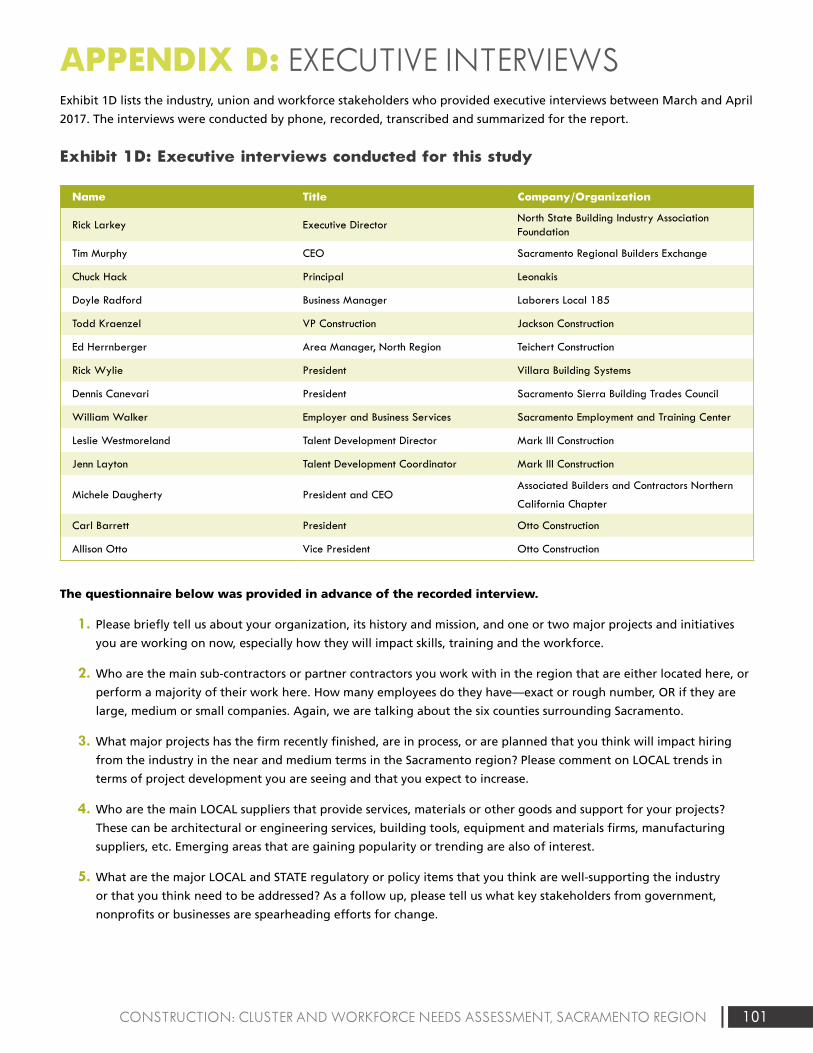
101CONSTRUCTION: CLUSTER AND WORKFORCE NEEDS ASSESSMENT, SACRAMENTO REGION
APPENDIX D: EXECUTIVE INTERVIEWSExhibit 1D lists the industry, union and workforce stakeholders who provided executive interviews between March and April
2017. The interviews were conducted by phone, recorded, transcribed and summarized for the report.
Exhibit 1D: Executive interviews conducted for this study
Name Title Company/Organization
Rick Larkey Executive DirectorNorth State Building Industry Association Foundation
Tim Murphy CEO Sacramento Regional Builders Exchange
Chuck Hack Principal Leonakis
Doyle Radford Business Manager Laborers Local 185
Todd Kraenzel VP Construction Jackson Construction
Ed Herrnberger Area Manager, North Region Teichert Construction
Rick Wylie President Villara Building Systems
Dennis Canevari President Sacramento Sierra Building Trades Council
William Walker Employer and Business Services Sacramento Employment and Training Center
Leslie Westmoreland Talent Development Director Mark III Construction
Jenn Layton Talent Development Coordinator Mark III Construction
Michele Daugherty President and CEOAssociated Builders and Contractors Northern
California Chapter
Carl Barrett President Otto Construction
Allison Otto Vice President Otto Construction
The questionnaire below was provided in advance of the recorded interview.
1. Please briefly tell us about your organization, its history and mission, and one or two major projects and initiatives
you are working on now, especially how they will impact skills, training and the workforce.
2. Who are the main sub-contractors or partner contractors you work with in the region that are either located here, or
perform a majority of their work here. How many employees do they have—exact or rough number, OR if they are
large, medium or small companies. Again, we are talking about the six counties surrounding Sacramento.
3. What major projects has the firm recently finished, are in process, or are planned that you think will impact hiring
from the industry in the near and medium terms in the Sacramento region? Please comment on LOCAL trends in
terms of project development you are seeing and that you expect to increase.
4. Who are the main LOCAL suppliers that provide services, materials or other goods and support for your projects?
These can be architectural or engineering services, building tools, equipment and materials firms, manufacturing
suppliers, etc. Emerging areas that are gaining popularity or trending are also of interest.
5. What are the major LOCAL and STATE regulatory or policy items that you think are well-supporting the industry
or that you think need to be addressed? As a follow up, please tell us what key stakeholders from government,
nonprofits or businesses are spearheading efforts for change.
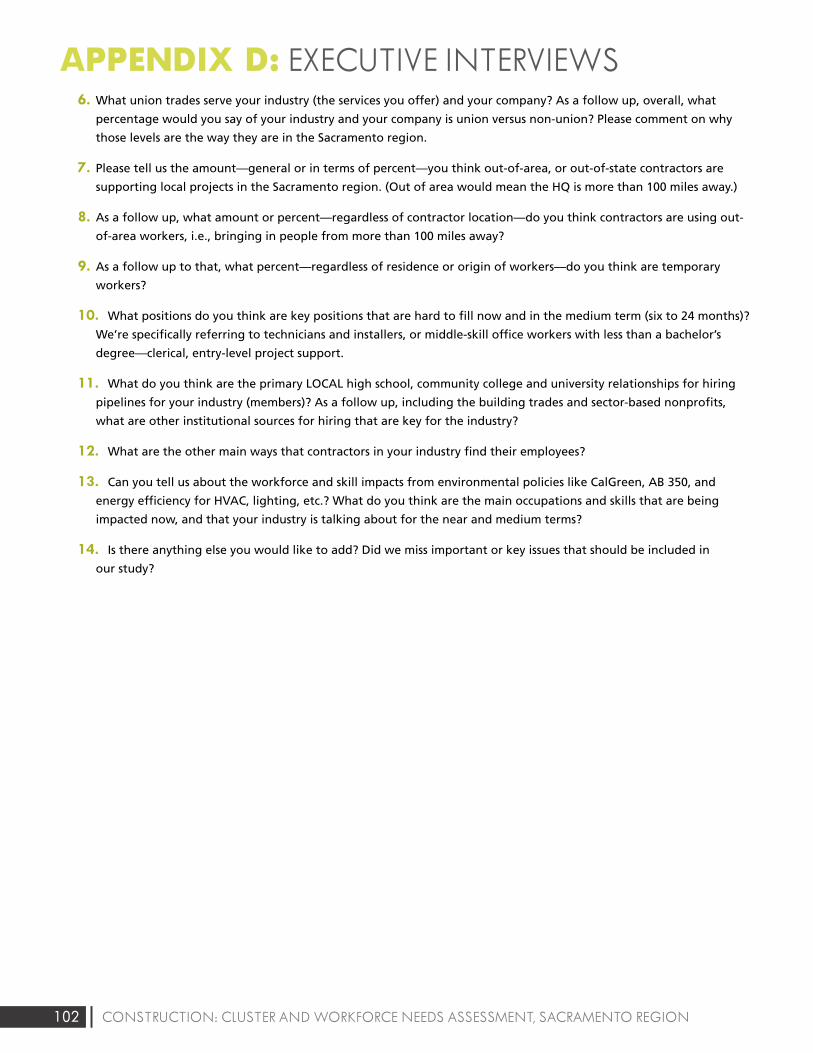
102 CONSTRUCTION: CLUSTER AND WORKFORCE NEEDS ASSESSMENT, SACRAMENTO REGION
APPENDIX D: EXECUTIVE INTERVIEWS6. What union trades serve your industry (the services you offer) and your company? As a follow up, overall, what
percentage would you say of your industry and your company is union versus non-union? Please comment on why
those levels are the way they are in the Sacramento region.
7. Please tell us the amount—general or in terms of percent—you think out-of-area, or out-of-state contractors are
supporting local projects in the Sacramento region. (Out of area would mean the HQ is more than 100 miles away.)
8. As a follow up, what amount or percent—regardless of contractor location—do you think contractors are using out-
of-area workers, i.e., bringing in people from more than 100 miles away?
9. As a follow up to that, what percent—regardless of residence or origin of workers—do you think are temporary
workers?
10. What positions do you think are key positions that are hard to fill now and in the medium term (six to 24 months)?
We’re specifically referring to technicians and installers, or middle-skill office workers with less than a bachelor’s
degree—clerical, entry-level project support.
11. What do you think are the primary LOCAL high school, community college and university relationships for hiring
pipelines for your industry (members)? As a follow up, including the building trades and sector-based nonprofits,
what are other institutional sources for hiring that are key for the industry?
12. What are the other main ways that contractors in your industry find their employees?
13. Can you tell us about the workforce and skill impacts from environmental policies like CalGreen, AB 350, and
energy efficiency for HVAC, lighting, etc.? What do you think are the main occupations and skills that are being
impacted now, and that your industry is talking about for the near and medium terms?
14. Is there anything else you would like to add? Did we miss important or key issues that should be included in
our study?
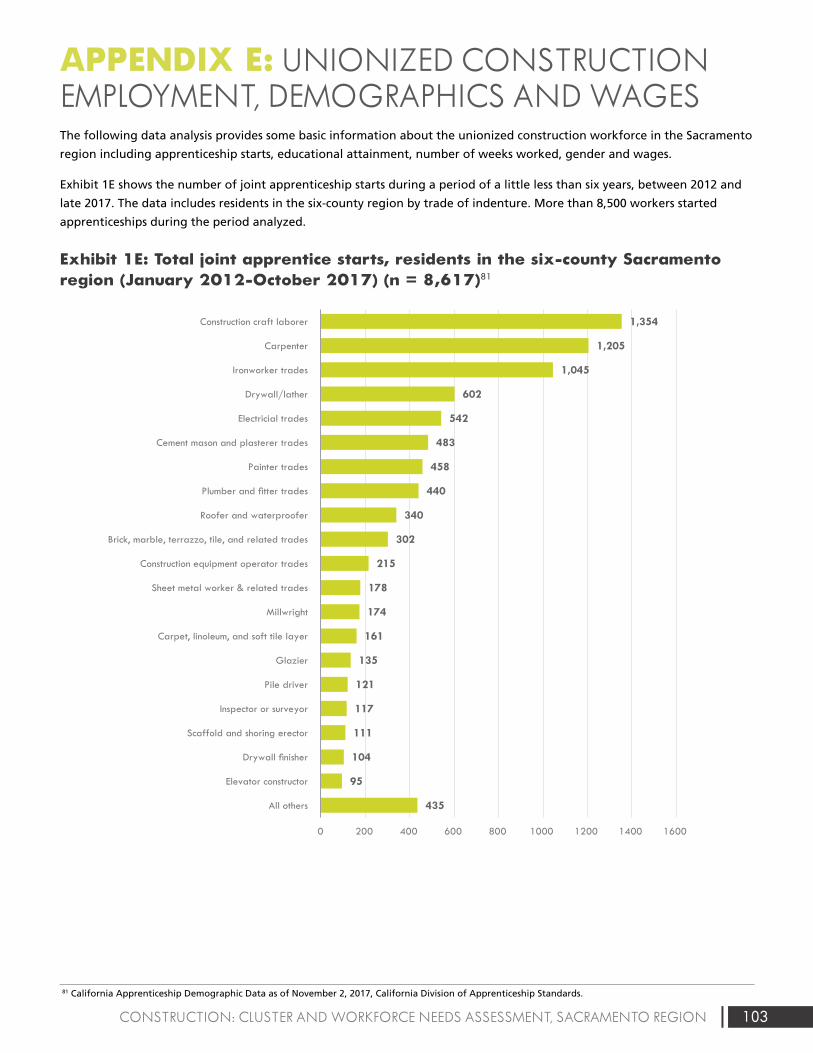
103CONSTRUCTION: CLUSTER AND WORKFORCE NEEDS ASSESSMENT, SACRAMENTO REGION
81 California Apprenticeship Demographic Data as of November 2, 2017, California Division of Apprenticeship Standards.
APPENDIX E: UNIONIZED CONSTRUCTION EMPLOYMENT, DEMOGRAPHICS AND WAGESThe following data analysis provides some basic information about the unionized construction workforce in the Sacramento
region including apprenticeship starts, educational attainment, number of weeks worked, gender and wages.
Exhibit 1E shows the number of joint apprenticeship starts during a period of a little less than six years, between 2012 and
late 2017. The data includes residents in the six-county region by trade of indenture. More than 8,500 workers started
apprenticeships during the period analyzed.
Exhibit 1E: Total joint apprentice starts, residents in the six-county Sacramento region (January 2012-October 2017) (n = 8,617)81
Exhibit 1: Value of construction put in place (United States)3
$1,161,282
$788,332
$1,185,683
$0
$200,000
$400,000
$600,000
$800,000
$1,000,000
$1,200,000
$1,400,000
2002 2003 2004 2005 2006 2007 2008 2009 2010 2011 2012 2013 2014 2015 2016
Mill
ions
of
Dol
lars
Residential Nonresidential
Exhibit 2: Value of construction put in place (California)5
$58,091,975
$18,740,050
$51,350,955
$0
$10,000,000
$20,000,000
$30,000,000
$40,000,000
$50,000,000
$60,000,000
$70,000,000
2002 2003 2004 2005 2006 2007 2008 2009 2010 2011 2012 2013 2014 2015 2016
Residential Nonresidential
Exhibit 3: Value of nonresidential construction put in place, by subcomponent (United States)7
24.1%
-0.2%
130.5%
0.6%
5.3%
-54.8%
18.0%
50.9%
98.2%
26.9%
-7.5%
21.7%
Office
Commercial
Manufacturing
Health care
Educational
Religious
Amusement and recreation
Transportation
Power and communication
Highway and street
Public works
Other
Subcomponent percent change 2006-2016
Exhibit 5: Value of Infrastructure as a percent of nonresidential construction put in place (United States)10
37.5% 37.9% 36.5%37.1% 37.0%
37.3%37.5% 41.1% 46.3% 45.5%
46.6% 46.4%46.1% 43.5% 41.6%
$0
$100,000
$200,000
$300,000
$400,000
$500,000
$600,000
$700,000
$800,000
2002 2003 2004 2005 2006 2007 2008 2009 2010 2011 2012 2013 2014 2015 2016
$ M
illio
ns
$ Th
ousa
nds
Nonresidential Infrastructure
Exhibit 6: Value of infrastructure as a percent of nonresidential construction put in place (California)11
11.6% 12.8% 14.3% 13.4%14.3%
11.0% 10.7%10.7% 10.2% 9.9% 10.9%
27.5%
14.9%16.2% 13.0%$5,000,000
$0
$10,000,000
$15,000,000
$20,000,000
$25,000,000
$30,000,000
2002 2003 2004 2005 2006 2007 2008 2009 2010 2011 2012 2013 2014 2015 2016
Nonresidential Infrastructure
Exhibit 7: Construction value added as a percent of GDP (United States)12
Exhibit 8: Construction value added as a percent of GRP (California)13
7.8% 7.8%8.1%
8.6%8.4%
8.0%
7.4%
6.3%
5.4%5.1%
5.3%5.5%
5.8%
6.2%6.4%
3.0%
4.0%
5.0%
6.0%
7.0%
8.0%
9.0%
2002 2003 2004 2005 2006 2007 2008 2009 2010 2011 2012 2013 2014 2015 2016
2002 2003 2004 2005 2006 2007 2008 2009 2010 2011 2012 2013 2014 2015 2016
3.0% 3.1%3.3% 3.3%
2.8%
2.3%
1.6%
1.0% 1.0% 1.1%1.3%
1.8% 1.8%2.0% 2.0%
0.0%
0.5%
1.0%
1.5%
2.0%
2.5%
3.0%
3.5%
4.0%
Exhibit 9: Construction value added as a percent of GRP (California, Sacramento region and Bay Area)16
3.0%
6.8% 6.9%
3.6%
1.2%1.4%
1.7%
2.3%
2.4%
0.0%
1.0%
2.0%
3.0%
4.0%
5.0%
6.0%
7.0%
8.0%
2002 2003 2004 2005 2006 2007 2008 2009 2010 2011 2012 2013 2014 2015
State Sacramento Metro (6-county) Bay Area Metro (9-county)
Exhibit 10: Housing unit supply versus demand in the Sacramento region
Exh ibit 11: Residen tial building units in the six-county Sacramento region (permi t data)20
19,865
14,239
10,996 8,932
6,483 7,768 9,125
10,399
19,122
23,812
17,987
2,293 3,939 4,652
6,492
0
5,000
10,000
15,000
20,000
25,000
30,000
2002 2003 2004 2005 2006 2007 2008 2009 2010 2011 2012 2013 2014 2015 2016 2017
Housing Unit Demand Housing Unit Supply
14,01415,671
19,78419,630
21,65218,612
10,1257,931
4,1752,493 2,326 1,938 2,965 3,772 3,967
5,526 6,401
3,226
3,868
4,628 4,7613,612
2,911
3,568
1,555
1,818 438 539 759631
982 7461,265
1,053
0
5,000
10,000
15,000
20,000
25,000
30,000
2000 2001 2002 2003 2004 2005 2006 2007 2008 2009 2010 2011 2012 2013 2014 2015 2016
Single Family Units Multifamily Units
Exhibit 13: Value of nonresidential construction in the six-county Sacramento region 21
$0
$200,000
$400,000
$600,000
$800,000
$1,000 ,000
$1,200 ,000
$1,400 ,000
$1,600 ,000
$1,800 ,000
$2,000 ,000
2000 2001 2002 2003 2004 2005 2006 2007 2008 2009 2010 2011 2012 2013 2014 2015 2016
El Dorado Placer Sacramento Yolo Yuba Sutter
Exhibit 14: Percent of nonresidential construction value in the Sacramento region, by county22
0%
10%
20%
30%
40%
50%
60%
70%
80%
90%
100%
2006 2016
El Dorado Placer Sacramento Yolo Yuba
Exhibit 17: Average annual earnings in traded and non-traded clusters in the study regions (2016)
$85,
512
$58,
972
$67,
498
$97,
280
$78,
396
$100
,688
$90,
080
$63,
145
$72,
018
$0
$20,000
$40,000
$60,000
$80,000
$100,000
$120,000
Traded Non-Traded All Industries
Sacramento Region Bay Area Californ ia
Exhibit 18: Traded subcluster employment index, Sacramento region (2001-2021)25
Water, Sewage, and Other Systems Projection
Projection
Projection
Projection
Projection
Construction Materials
Construction
Construction Products
Construction Components
Empl
oym
ent i
ndex
(2
006
Empl
oym
ent =
100
)
Empl
oym
ent i
ndex
(2
006
Empl
oym
ent =
100
)
Exhibit 24: Non-traded subcluster employment index, Sacramento region (2001-2021)36
101.0 119.3
87.2104.7
73.7
136.3
36.1
29.6
17.9
0.0
25.0
50.0
75.0
100.0
125.0
150.0
2001 2006 2011 2016 2021
Water and Sewer Line Construction Projection
Concrete Products Projection
Real Estate Services Projection
Specialty Contractors Projection
General Contractors Projection
Developers Projection
* Only included subclusters with 10k+employment or significant employment change. Refer to appendix for the complete list of nontraded subclusters.
Exhibit 39: Entering construction industry workers by type of education and training in the Sacramento region (annual average, 2014-2016)59
368
217181
56 54
148125 107
84
28 27 19 13 3
29
369
129
109
198
136
10561
35 8 13 14 8 10
0
50
100
150
200
250
300
350
400
Apprentices Oth er Post-Secondary Completions
Exhibit 44: Projected annual construction industry occupational gaps in the Sacramento region (2016-2021)60
-3
-2
-1
32
45
57
58
68
103
173
196
308
322
397
427
500
524
607
640
864
1,937
-200 100 400 700 1,000 1,300 1,600 1,900
Insulation Workers
Drafters
Interior Designers
PV Installers
Glaziers
Surveyors
Building Inspectors
Roofers
Ironworkers & Welders
Architects
Drywall Installers
HVAC & Sheet Metal
Painters
Masonry, Tile, Floor, Lathe, Plaster
Plumbers & Pipefitters
Engineers
Heavy Equipment Operators
Real Estate Professionals
Electricians
Construction Managers
Carpenters
Exhibit 47: Unionized and non-unionized workforce, Sacramento--Arden-Arcade--Roseville MSA and 10-county Bay Area (annual average, 2014-2017)61
Exhibit 48: Unionization in the construction workforce as an annual average percentage of total employment, Sacramento--Arden-Arcade--Roseville MSA (2000-2017)62
31%, 32,314
29%, 12,555
69%, 70,898
71%, 30,110
0% 20% 40% 60% 80% 100%
10-County Bay Area
Sacramento MSA
Union Non-Union
32%
20% 19%24% 23%
29%
68%
80% 81%76% 77%
71%
0%
10%
20%
30%
40%
50%
60%
70%
80%
90%
2000 – 2002 2003 – 2004 2005 –2008 2008 – 2011 2011 – 2014 2014 – 2017
Union Non-Union
Exhibit 1A. Construction managers projected annual openings, n = 871 (2016-2021)67
Cost Estimators, 206openings, 24%
Construction Managers,
225 openings, 26%
First-Line Supervisors of Construction Trades and
Extraction Workers,440 openings, 50%
0 100 200 300 400 500 600 700 800 900 1,000
Construction Products, 81
Water, Sewage, and Other Systems, 908
-10.0%
-5.0%
0.0%
5.0%
10.0%
15.0%
20.0%
25.0%
0.0 0.5 1.0 1.5 2.0 2.5 3.0 3.5
Location Quotient (2016)
Location Quotient (2016)
Ann
ual E
mpl
oym
ent G
row
th R
ate
(200
6-20
16)
Subcluster with an annual average earnings higher than all-industry annual average earnings in ($67,498) Sacramento region in 2016
LQ=1.0
Exhibit 2C: Non-traded subclusters in the Sacramento region73
Specialty Contractors, 50,899
General Contractors, 16,843
Real Estate Services, 15,475
Construction Materials Retailing, 6,552
Highway and Street Construction, 2,268
Water and Sewer Line Construction, 1,662
Building Equipment Distribution, 1,207
Developers
-15.0%
-10.0%
-5.0%
0.0%
5.0%
0.8 1.0 1.2 1.4
Ann
ual E
mpl
oym
ent G
row
th R
ate
(200
6-20
16
Exhibit 2E: Joint apprentices by gender in the Sacramento region (January 2012-October 2017)
Exhibit 3E: Joint apprentices by county of residence in the Sacramento region (January 2012-October 2017)
8,374, 97%
249, 3%
El Dorado,393, 56%
Placer,949, 11%
Sacramento, 6077, 1
Sutter, 346,4%
Yolo, 549,6%
Yuba, 309,
4%
Exhibit 4E: Joint apprentices’ highest level of education prior to apprenticeship in the Sacramento region (January 2012-October 2017)
Exhibit 5E: Number of weeks worked, all workers in the construction sector in the Sacramento region (2015)84
Less than highschool, 7%
High schoolgraduate orGED, 65%
Some college,25%
4 or more yearsof college, 3%
3,165 6%
3,082 6%
1,650 3%
6,105 12%
7,068 10%
31,037 62%
0 5,000 10,000 15,000 20,000 25,000 30,000 35,000
Did not work
Less than 14
14 to 26
27 to 39
40 to 49
50 to 52
# w
eeks
wor
ked
in th
e la
st y
ear
Exhibit 4: Value of nonresidential construction put in place, by subcomponent (California)9
-0.5%
29.2%
-41.1%
0.0%
62.9%
-34.7%
46.0%
42.8%
19.1%
-14.6%
66.5%
763.4%
Office
Commercial
Manufacturing
Health care
Educational
Religious
Amusement and recreation
Transportation
Power and communication
Highway and street
Public works
Other
Subcomponent percent change 2006-2016
180.8
593.7
818.9
21.4
235.8 342.3
104.9 133.6 173.5
0.0
100.0
200.0
300.0
400.0
500.0
600.0
700.0
800.0
900.0
1000.0
2001 2006 2011 2016 2021
Construction Materials,125
Construction, 1,942
Construction Components, 466
LQ=1.0
Concrete Products, 1,123
Construction Materials Wholesaling, 1,647
Subcluster with an annual average earnings higher than all-industry annual average earnings ($67,498) in Sacramento region in 2016
Exhibit 1E: Total joint apprentice starts, residents in the six-county Sacramento region (January 2012-October 2017) (n = 8,617)2
435
95
104
111
117
121
135
161
174
178
215
302
340
440
458
483
542
602
1,045
1,205
1,354
0 200 400 600 800 1000 1200 1400 1600
All others
Elevator constructor
Drywall finisher
Scaffold and shoring erector
Inspector or surveyor
Pile driver
Glazier
Carpet, linoleum, and soft tile layer
Millwright
Sheet metal worker & related trades
Construction equipment operator trades
Brick, marble, terrazzo, tile, and related trades
Roofer and waterproofer
Plumber and fitter trades
Painter trades
Cement mason and plasterer trades
Electricial trades
Drywall/lather
Ironworker trades
Carpenter
Construction craft laborer
Exhibit 38: Anticipated annual construction industry job openings by new and replacement jobs in the Sacramento region (2016-2021)1
21 26 59 60 52 78 99 167 167 220323 350 399 439 473
596 679788 777 763
2,119
4 6 1 1 20 7 520 27 2
71 56100 95 73
4699
82 95222
215
0
500
1000
1500
2000
2500
Annual Replacement Openings New Jobs (Growth)
Male
Female
$ Th
ousa
nds
Thou
sand
s of
Dol
lars
Average annual openings (demand) minuseducation and training (supply) =approximate annual shortage
Approximate annual shortage = 7,250 workers across all categories
Sutter
6.2% 5.1%
27.6%
14.4%
50.6%69.9%
10.8%7.9%
1.1% 0.6%3.6% 2.0%
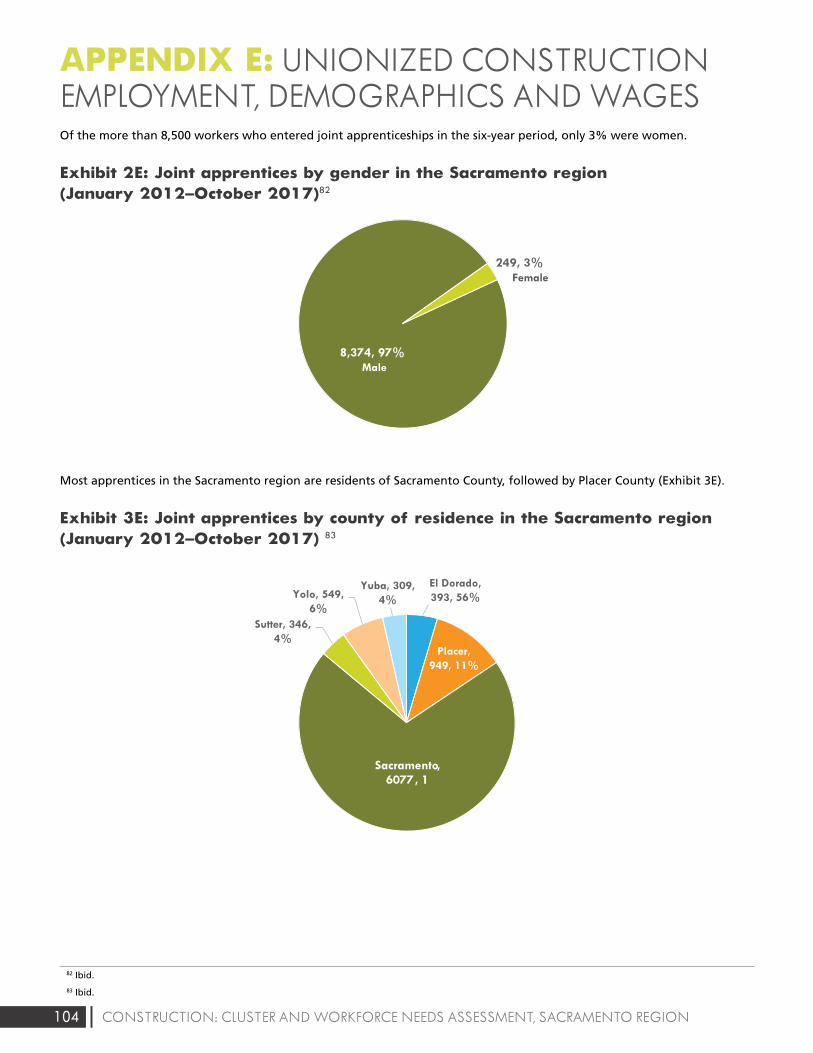
104 CONSTRUCTION: CLUSTER AND WORKFORCE NEEDS ASSESSMENT, SACRAMENTO REGION
82 Ibid.
83 Ibid.
APPENDIX E: UNIONIZED CONSTRUCTION EMPLOYMENT, DEMOGRAPHICS AND WAGESOf the more than 8,500 workers who entered joint apprenticeships in the six-year period, only 3% were women.
Exhibit 2E: Joint apprentices by gender in the Sacramento region (January 2012–October 2017)82
Most apprentices in the Sacramento region are residents of Sacramento County, followed by Placer County (Exhibit 3E).
Exhibit 3E: Joint apprentices by county of residence in the Sacramento region (January 2012–October 2017) 83
Exhibit 1: Value of construction put in place (United States)3
$1,161,282
$788,332
$1,185,683
$0
$200,000
$400,000
$600,000
$800,000
$1,000,000
$1,200,000
$1,400,000
2002 2003 2004 2005 2006 2007 2008 2009 2010 2011 2012 2013 2014 2015 2016
Mill
ions
of
Dol
lars
Residential Nonresidential
Exhibit 2: Value of construction put in place (California)5
$58,091,975
$18,740,050
$51,350,955
$0
$10,000,000
$20,000,000
$30,000,000
$40,000,000
$50,000,000
$60,000,000
$70,000,000
2002 2003 2004 2005 2006 2007 2008 2009 2010 2011 2012 2013 2014 2015 2016
Residential Nonresidential
Exhibit 3: Value of nonresidential construction put in place, by subcomponent (United States)7
24.1%
-0.2%
130.5%
0.6%
5.3%
-54.8%
18.0%
50.9%
98.2%
26.9%
-7.5%
21.7%
Office
Commercial
Manufacturing
Health care
Educational
Religious
Amusement and recreation
Transportation
Power and communication
Highway and street
Public works
Other
Subcomponent percent change 2006-2016
Exhibit 5: Value of Infrastructure as a percent of nonresidential construction put in place (United States)10
37.5% 37.9% 36.5%37.1% 37.0%
37.3%37.5% 41.1% 46.3% 45.5%
46.6% 46.4%46.1% 43.5% 41.6%
$0
$100,000
$200,000
$300,000
$400,000
$500,000
$600,000
$700,000
$800,000
2002 2003 2004 2005 2006 2007 2008 2009 2010 2011 2012 2013 2014 2015 2016
$ M
illio
ns
$ Th
ousa
nds
Nonresidential Infrastructure
Exhibit 6: Value of infrastructure as a percent of nonresidential construction put in place (California)11
11.6% 12.8% 14.3% 13.4%14.3%
11.0% 10.7%10.7% 10.2% 9.9% 10.9%
27.5%
14.9%16.2% 13.0%$5,000,000
$0
$10,000,000
$15,000,000
$20,000,000
$25,000,000
$30,000,000
2002 2003 2004 2005 2006 2007 2008 2009 2010 2011 2012 2013 2014 2015 2016
Nonresidential Infrastructure
Exhibit 7: Construction value added as a percent of GDP (United States)12
Exhibit 8: Construction value added as a percent of GRP (California)13
7.8% 7.8%8.1%
8.6%8.4%
8.0%
7.4%
6.3%
5.4%5.1%
5.3%5.5%
5.8%
6.2%6.4%
3.0%
4.0%
5.0%
6.0%
7.0%
8.0%
9.0%
2002 2003 2004 2005 2006 2007 2008 2009 2010 2011 2012 2013 2014 2015 2016
2002 2003 2004 2005 2006 2007 2008 2009 2010 2011 2012 2013 2014 2015 2016
3.0% 3.1%3.3% 3.3%
2.8%
2.3%
1.6%
1.0% 1.0% 1.1%1.3%
1.8% 1.8%2.0% 2.0%
0.0%
0.5%
1.0%
1.5%
2.0%
2.5%
3.0%
3.5%
4.0%
Exhibit 9: Construction value added as a percent of GRP (California, Sacramento region and Bay Area)16
3.0%
6.8% 6.9%
3.6%
1.2%1.4%
1.7%
2.3%
2.4%
0.0%
1.0%
2.0%
3.0%
4.0%
5.0%
6.0%
7.0%
8.0%
2002 2003 2004 2005 2006 2007 2008 2009 2010 2011 2012 2013 2014 2015
State Sacramento Metro (6-county) Bay Area Metro (9-county)
Exhibit 10: Housing unit supply versus demand in the Sacramento region
Exh ibit 11: Residen tial building units in the six-county Sacramento region (permi t data)20
19,865
14,239
10,996 8,932
6,483 7,768 9,125
10,399
19,122
23,812
17,987
2,293 3,939 4,652
6,492
0
5,000
10,000
15,000
20,000
25,000
30,000
2002 2003 2004 2005 2006 2007 2008 2009 2010 2011 2012 2013 2014 2015 2016 2017
Housing Unit Demand Housing Unit Supply
14,01415,671
19,78419,630
21,65218,612
10,1257,931
4,1752,493 2,326 1,938 2,965 3,772 3,967
5,526 6,401
3,226
3,868
4,628 4,7613,612
2,911
3,568
1,555
1,818 438 539 759631
982 7461,265
1,053
0
5,000
10,000
15,000
20,000
25,000
30,000
2000 2001 2002 2003 2004 2005 2006 2007 2008 2009 2010 2011 2012 2013 2014 2015 2016
Single Family Units Multifamily Units
Exhibit 13: Value of nonresidential construction in the six-county Sacramento region 21
$0
$200,000
$400,000
$600,000
$800,000
$1,000 ,000
$1,200 ,000
$1,400 ,000
$1,600 ,000
$1,800 ,000
$2,000 ,000
2000 2001 2002 2003 2004 2005 2006 2007 2008 2009 2010 2011 2012 2013 2014 2015 2016
El Dorado Placer Sacramento Yolo Yuba Sutter
Exhibit 14: Percent of nonresidential construction value in the Sacramento region, by county22
0%
10%
20%
30%
40%
50%
60%
70%
80%
90%
100%
2006 2016
El Dorado Placer Sacramento Yolo Yuba
Exhibit 17: Average annual earnings in traded and non-traded clusters in the study regions (2016)
$85,
512
$58,
972
$67,
498
$97,
280
$78,
396
$100
,688
$90,
080
$63,
145
$72,
018
$0
$20,000
$40,000
$60,000
$80,000
$100,000
$120,000
Traded Non-Traded All Industries
Sacramento Region Bay Area Californ ia
Exhibit 18: Traded subcluster employment index, Sacramento region (2001-2021)25
Water, Sewage, and Other Systems Projection
Projection
Projection
Projection
Projection
Construction Materials
Construction
Construction Products
Construction Components
Empl
oym
ent i
ndex
(2
006
Empl
oym
ent =
100
)
Empl
oym
ent i
ndex
(2
006
Empl
oym
ent =
100
)
Exhibit 24: Non-traded subcluster employment index, Sacramento region (2001-2021)36
101.0 119.3
87.2104.7
73.7
136.3
36.1
29.6
17.9
0.0
25.0
50.0
75.0
100.0
125.0
150.0
2001 2006 2011 2016 2021
Water and Sewer Line Construction Projection
Concrete Products Projection
Real Estate Services Projection
Specialty Contractors Projection
General Contractors Projection
Developers Projection
* Only included subclusters with 10k+employment or significant employment change. Refer to appendix for the complete list of nontraded subclusters.
Exhibit 39: Entering construction industry workers by type of education and training in the Sacramento region (annual average, 2014-2016)59
368
217181
56 54
148125 107
84
28 27 19 13 3
29
369
129
109
198
136
10561
35 8 13 14 8 10
0
50
100
150
200
250
300
350
400
Apprentices Oth er Post-Secondary Completions
Exhibit 44: Projected annual construction industry occupational gaps in the Sacramento region (2016-2021)60
-3
-2
-1
32
45
57
58
68
103
173
196
308
322
397
427
500
524
607
640
864
1,937
-200 100 400 700 1,000 1,300 1,600 1,900
Insulation Workers
Drafters
Interior Designers
PV Installers
Glaziers
Surveyors
Building Inspectors
Roofers
Ironworkers & Welders
Architects
Drywall Installers
HVAC & Sheet Metal
Painters
Masonry, Tile, Floor, Lathe, Plaster
Plumbers & Pipefitters
Engineers
Heavy Equipment Operators
Real Estate Professionals
Electricians
Construction Managers
Carpenters
Exhibit 47: Unionized and non-unionized workforce, Sacramento--Arden-Arcade--Roseville MSA and 10-county Bay Area (annual average, 2014-2017)61
Exhibit 48: Unionization in the construction workforce as an annual average percentage of total employment, Sacramento--Arden-Arcade--Roseville MSA (2000-2017)62
31%, 32,314
29%, 12,555
69%, 70,898
71%, 30,110
0% 20% 40% 60% 80% 100%
10-County Bay Area
Sacramento MSA
Union Non-Union
32%
20% 19%24% 23%
29%
68%
80% 81%76% 77%
71%
0%
10%
20%
30%
40%
50%
60%
70%
80%
90%
2000 – 2002 2003 – 2004 2005 –2008 2008 – 2011 2011 – 2014 2014 – 2017
Union Non-Union
Exhibit 1A. Construction managers projected annual openings, n = 871 (2016-2021)67
Cost Estimators, 206openings, 24%
Construction Managers,
225 openings, 26%
First-Line Supervisors of Construction Trades and
Extraction Workers,440 openings, 50%
0 100 200 300 400 500 600 700 800 900 1,000
Construction Products, 81
Water, Sewage, and Other Systems, 908
-10.0%
-5.0%
0.0%
5.0%
10.0%
15.0%
20.0%
25.0%
0.0 0.5 1.0 1.5 2.0 2.5 3.0 3.5
Location Quotient (2016)
Location Quotient (2016)
Ann
ual E
mpl
oym
ent G
row
th R
ate
(200
6-20
16)
Subcluster with an annual average earnings higher than all-industry annual average earnings in ($67,498) Sacramento region in 2016
LQ=1.0
Exhibit 2C: Non-traded subclusters in the Sacramento region73
Specialty Contractors, 50,899
General Contractors, 16,843
Real Estate Services, 15,475
Construction Materials Retailing, 6,552
Highway and Street Construction, 2,268
Water and Sewer Line Construction, 1,662
Building Equipment Distribution, 1,207
Developers
-15.0%
-10.0%
-5.0%
0.0%
5.0%
0.8 1.0 1.2 1.4
Ann
ual E
mpl
oym
ent G
row
th R
ate
(200
6-20
16
Exhibit 2E: Joint apprentices by gender in the Sacramento region (January 2012-October 2017)
Exhibit 3E: Joint apprentices by county of residence in the Sacramento region (January 2012-October 2017)
8,374, 97%
249, 3%
El Dorado,393, 56%
Placer,949, 11%
Sacramento, 6077, 1
Sutter, 346,4%
Yolo, 549,6%
Yuba, 309,
4%
Exhibit 4E: Joint apprentices’ highest level of education prior to apprenticeship in the Sacramento region (January 2012-October 2017)
Exhibit 5E: Number of weeks worked, all workers in the construction sector in the Sacramento region (2015)84
Less than highschool, 7%
High schoolgraduate orGED, 65%
Some college,25%
4 or more yearsof college, 3%
3,165 6%
3,082 6%
1,650 3%
6,105 12%
7,068 10%
31,037 62%
0 5,000 10,000 15,000 20,000 25,000 30,000 35,000
Did not work
Less than 14
14 to 26
27 to 39
40 to 49
50 to 52
# w
eeks
wor
ked
in th
e la
st y
ear
Exhibit 4: Value of nonresidential construction put in place, by subcomponent (California)9
-0.5%
29.2%
-41.1%
0.0%
62.9%
-34.7%
46.0%
42.8%
19.1%
-14.6%
66.5%
763.4%
Office
Commercial
Manufacturing
Health care
Educational
Religious
Amusement and recreation
Transportation
Power and communication
Highway and street
Public works
Other
Subcomponent percent change 2006-2016
180.8
593.7
818.9
21.4
235.8 342.3
104.9 133.6 173.5
0.0
100.0
200.0
300.0
400.0
500.0
600.0
700.0
800.0
900.0
1000.0
2001 2006 2011 2016 2021
Construction Materials,125
Construction, 1,942
Construction Components, 466
LQ=1.0
Concrete Products, 1,123
Construction Materials Wholesaling, 1,647
Subcluster with an annual average earnings higher than all-industry annual average earnings ($67,498) in Sacramento region in 2016
Exhibit 1E: Total joint apprentice starts, residents in the six-county Sacramento region (January 2012-October 2017) (n = 8,617)2
435
95
104
111
117
121
135
161
174
178
215
302
340
440
458
483
542
602
1,045
1,205
1,354
0 200 400 600 800 1000 1200 1400 1600
All others
Elevator constructor
Drywall finisher
Scaffold and shoring erector
Inspector or surveyor
Pile driver
Glazier
Carpet, linoleum, and soft tile layer
Millwright
Sheet metal worker & related trades
Construction equipment operator trades
Brick, marble, terrazzo, tile, and related trades
Roofer and waterproofer
Plumber and fitter trades
Painter trades
Cement mason and plasterer trades
Electricial trades
Drywall/lather
Ironworker trades
Carpenter
Construction craft laborer
Exhibit 38: Anticipated annual construction industry job openings by new and replacement jobs in the Sacramento region (2016-2021)1
21 26 59 60 52 78 99 167 167 220323 350 399 439 473
596 679788 777 763
2,119
4 6 1 1 20 7 520 27 2
71 56100 95 73
4699
82 95222
215
0
500
1000
1500
2000
2500
Annual Replacement Openings New Jobs (Growth)
Male
Female
$ Th
ousa
nds
Thou
sand
s of
Dol
lars
Average annual openings (demand) minuseducation and training (supply) =approximate annual shortage
Approximate annual shortage = 7,250 workers across all categories
Sutter
6.2% 5.1%
27.6%
14.4%
50.6%69.9%
10.8%7.9%
1.1% 0.6%3.6% 2.0%
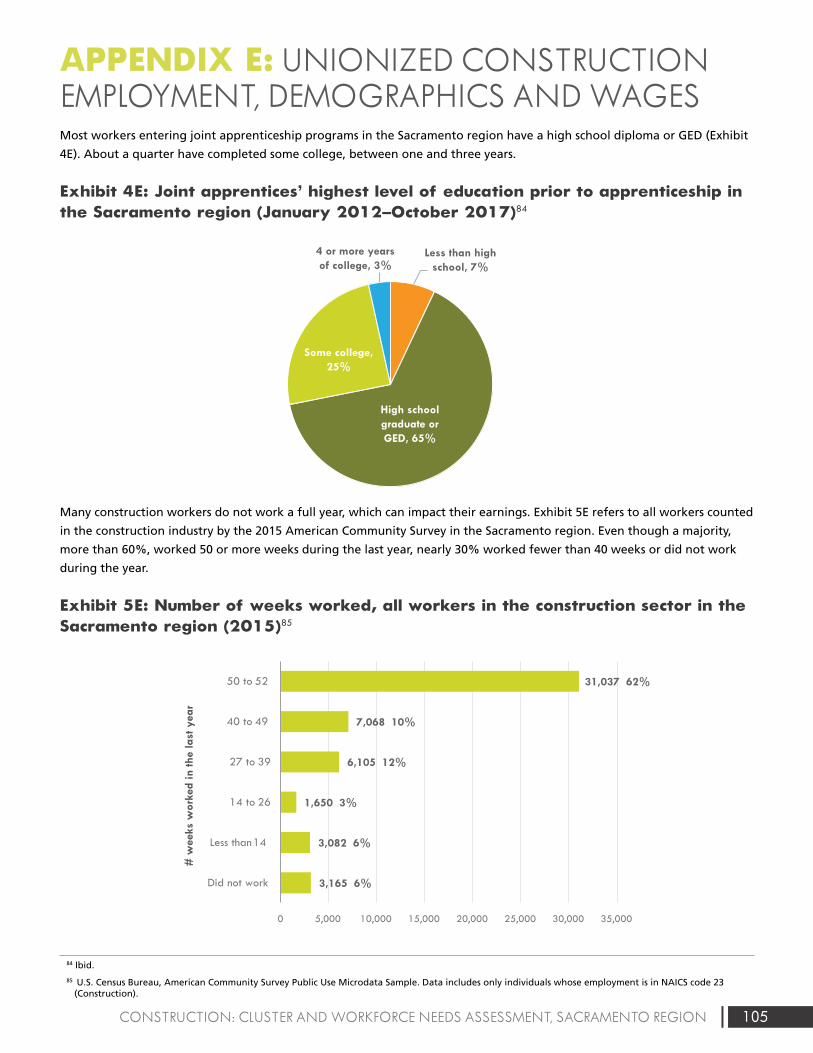
105CONSTRUCTION: CLUSTER AND WORKFORCE NEEDS ASSESSMENT, SACRAMENTO REGION
84 Ibid.
85 U.S. Census Bureau, American Community Survey Public Use Microdata Sample. Data includes only individuals whose employment is in NAICS code 23 (Construction).
APPENDIX E: UNIONIZED CONSTRUCTION EMPLOYMENT, DEMOGRAPHICS AND WAGESMost workers entering joint apprenticeship programs in the Sacramento region have a high school diploma or GED (Exhibit
4E). About a quarter have completed some college, between one and three years.
Exhibit 4E: Joint apprentices’ highest level of education prior to apprenticeship in the Sacramento region (January 2012–October 2017)84
Many construction workers do not work a full year, which can impact their earnings. Exhibit 5E refers to all workers counted
in the construction industry by the 2015 American Community Survey in the Sacramento region. Even though a majority,
more than 60%, worked 50 or more weeks during the last year, nearly 30% worked fewer than 40 weeks or did not work
during the year.
Exhibit 5E: Number of weeks worked, all workers in the construction sector in the Sacramento region (2015)85
Exhibit 1: Value of construction put in place (United States)3
$1,161,282
$788,332
$1,185,683
$0
$200,000
$400,000
$600,000
$800,000
$1,000,000
$1,200,000
$1,400,000
2002 2003 2004 2005 2006 2007 2008 2009 2010 2011 2012 2013 2014 2015 2016
Mill
ions
of
Dol
lars
Residential Nonresidential
Exhibit 2: Value of construction put in place (California)5
$58,091,975
$18,740,050
$51,350,955
$0
$10,000,000
$20,000,000
$30,000,000
$40,000,000
$50,000,000
$60,000,000
$70,000,000
2002 2003 2004 2005 2006 2007 2008 2009 2010 2011 2012 2013 2014 2015 2016
Residential Nonresidential
Exhibit 3: Value of nonresidential construction put in place, by subcomponent (United States)7
24.1%
-0.2%
130.5%
0.6%
5.3%
-54.8%
18.0%
50.9%
98.2%
26.9%
-7.5%
21.7%
Office
Commercial
Manufacturing
Health care
Educational
Religious
Amusement and recreation
Transportation
Power and communication
Highway and street
Public works
Other
Subcomponent percent change 2006-2016
Exhibit 5: Value of Infrastructure as a percent of nonresidential construction put in place (United States)10
37.5% 37.9% 36.5%37.1% 37.0%
37.3%37.5% 41.1% 46.3% 45.5%
46.6% 46.4%46.1% 43.5% 41.6%
$0
$100,000
$200,000
$300,000
$400,000
$500,000
$600,000
$700,000
$800,000
2002 2003 2004 2005 2006 2007 2008 2009 2010 2011 2012 2013 2014 2015 2016
$ M
illio
ns
$ Th
ousa
nds
Nonresidential Infrastructure
Exhibit 6: Value of infrastructure as a percent of nonresidential construction put in place (California)11
11.6% 12.8% 14.3% 13.4%14.3%
11.0% 10.7%10.7% 10.2% 9.9% 10.9%
27.5%
14.9%16.2% 13.0%$5,000,000
$0
$10,000,000
$15,000,000
$20,000,000
$25,000,000
$30,000,000
2002 2003 2004 2005 2006 2007 2008 2009 2010 2011 2012 2013 2014 2015 2016
Nonresidential Infrastructure
Exhibit 7: Construction value added as a percent of GDP (United States)12
Exhibit 8: Construction value added as a percent of GRP (California)13
7.8% 7.8%8.1%
8.6%8.4%
8.0%
7.4%
6.3%
5.4%5.1%
5.3%5.5%
5.8%
6.2%6.4%
3.0%
4.0%
5.0%
6.0%
7.0%
8.0%
9.0%
2002 2003 2004 2005 2006 2007 2008 2009 2010 2011 2012 2013 2014 2015 2016
2002 2003 2004 2005 2006 2007 2008 2009 2010 2011 2012 2013 2014 2015 2016
3.0% 3.1%3.3% 3.3%
2.8%
2.3%
1.6%
1.0% 1.0% 1.1%1.3%
1.8% 1.8%2.0% 2.0%
0.0%
0.5%
1.0%
1.5%
2.0%
2.5%
3.0%
3.5%
4.0%
Exhibit 9: Construction value added as a percent of GRP (California, Sacramento region and Bay Area)16
3.0%
6.8% 6.9%
3.6%
1.2%1.4%
1.7%
2.3%
2.4%
0.0%
1.0%
2.0%
3.0%
4.0%
5.0%
6.0%
7.0%
8.0%
2002 2003 2004 2005 2006 2007 2008 2009 2010 2011 2012 2013 2014 2015
State Sacramento Metro (6-county) Bay Area Metro (9-county)
Exhibit 10: Housing unit supply versus demand in the Sacramento region
Exh ibit 11: Residen tial building units in the six-county Sacramento region (permi t data)20
19,865
14,239
10,996 8,932
6,483 7,768 9,125
10,399
19,122
23,812
17,987
2,293 3,939 4,652
6,492
0
5,000
10,000
15,000
20,000
25,000
30,000
2002 2003 2004 2005 2006 2007 2008 2009 2010 2011 2012 2013 2014 2015 2016 2017
Housing Unit Demand Housing Unit Supply
14,01415,671
19,78419,630
21,65218,612
10,1257,931
4,1752,493 2,326 1,938 2,965 3,772 3,967
5,526 6,401
3,226
3,868
4,628 4,7613,612
2,911
3,568
1,555
1,818 438 539 759631
982 7461,265
1,053
0
5,000
10,000
15,000
20,000
25,000
30,000
2000 2001 2002 2003 2004 2005 2006 2007 2008 2009 2010 2011 2012 2013 2014 2015 2016
Single Family Units Multifamily Units
Exhibit 13: Value of nonresidential construction in the six-county Sacramento region 21
$0
$200,000
$400,000
$600,000
$800,000
$1,000 ,000
$1,200 ,000
$1,400 ,000
$1,600 ,000
$1,800 ,000
$2,000 ,000
2000 2001 2002 2003 2004 2005 2006 2007 2008 2009 2010 2011 2012 2013 2014 2015 2016
El Dorado Placer Sacramento Yolo Yuba Sutter
Exhibit 14: Percent of nonresidential construction value in the Sacramento region, by county22
0%
10%
20%
30%
40%
50%
60%
70%
80%
90%
100%
2006 2016
El Dorado Placer Sacramento Yolo Yuba
Exhibit 17: Average annual earnings in traded and non-traded clusters in the study regions (2016)
$85,
512
$58,
972
$67,
498
$97,
280
$78,
396
$100
,688
$90,
080
$63,
145
$72,
018
$0
$20,000
$40,000
$60,000
$80,000
$100,000
$120,000
Traded Non-Tr aded All Industries
Sacramento Region Bay Area Californ ia
Exhibit 18: Traded subcluster employment index, Sacramento region (2001-2021)25
Water, Sewage, and Other Systems Projection
Projection
Projection
Projection
Projection
Construction Materials
Construction
Construction Products
Construction Components
Empl
oym
ent i
ndex
(2
006
Empl
oym
ent =
100
)
Empl
oym
ent i
ndex
(2
006
Empl
oym
ent =
100
)
Exhibit 24: Non-traded subcluster employment index, Sacramento region (2001-2021)36
101.0 119.3
87.2104.7
73.7
136.3
36.1
29.6
17.9
0.0
25.0
50.0
75.0
100.0
125.0
150.0
2001 2006 2011 2016 2021
Water and Sewer Line Construction Projection
Concrete Products Projection
Real Estate Services Projection
Specialty Contractors Projection
General Contractors Projection
Developers Projection
* Only included subclusters with 10k+employment or significant employment change. Refer to appendix for the complete list of nontraded subclusters.
Exhibit 39: Entering construction industry workers by type of education and training in the Sacramento region (annual average, 2014-2016)59
368
217181
56 54
148125 107
84
28 27 19 13 3
29
369
129
109
198
136
10561
35 8 13 14 8 10
0
50
100
150
200
250
300
350
400
Apprentices Oth er Post-Secondary Completions
Exhibit 44: Projected annual construction industry occupational gaps in the Sacramento region (2016-2021)60
-3
-2
-1
32
45
57
58
68
103
173
196
308
322
397
427
500
524
607
640
864
1,937
-200 100 400 700 1,000 1,300 1,600 1,900
Insulation Workers
Drafters
Interior Designers
PV Installers
Glaziers
Surveyors
Building Inspectors
Roofers
Ironworkers & Welders
Architects
Drywall Installers
HVAC & Sheet Metal
Painters
Masonry, Tile, Floor, Lathe, Plaster
Plumbers & Pipefitters
Engineers
Heavy Equipment Operators
Real Estate Professionals
Electricians
Construction Managers
Carpenters
Exhibit 47: Unionized and non-unionized workforce, Sacramento--Arden-Arcade--Roseville MSA and 10-county Bay Area (annual average, 2014-2017)61
Exhibit 48: Unionization in the construction workforce as an annual average percentage of total employment, Sacramento--Arden-Arcade--Roseville MSA (2000-2017)62
31%, 32,314
29%, 12,555
69%, 70,898
71%, 30,110
0% 20% 40% 60% 80% 100%
10-County Bay Area
Sacramento MSA
Union Non-Union
32%
20% 19%24% 23%
29%
68%
80% 81%76% 77%
71%
0%
10%
20%
30%
40%
50%
60%
70%
80%
90%
2000 – 2002 2003 – 2004 2005 –2008 2008 – 2011 2011 – 2014 2014 – 2017
Union Non-Union
Exhibit 1A. Construction managers projected annual openings, n = 871 (2016-2021)67
Cost Estimators, 206openings, 24%
Construction Managers,
225 openings, 26%
First-Line Supervisors of Construction Trades and
Extraction Workers,440 openings, 50%
0 100 200 300 400 500 600 700 800 900 1,000
Construction Products, 81
Water, Sewage, and Other Systems, 908
-10.0%
-5.0%
0.0%
5.0%
10.0%
15.0%
20.0%
25.0%
0.0 0.5 1.0 1.5 2.0 2.5 3.0 3.5
Location Quotient (2016)
Location Quotient (2016)
Ann
ual E
mpl
oym
ent G
row
th R
ate
(200
6-20
16)
Subcluster with an annual average earnings higher than all-industry annual average earnings in ($67,498) Sacramento region in 2016
LQ=1.0
Exhibit 2C: Non-traded subclusters in the Sacramento region73
Specialty Contractors, 50,899
General Contractors, 16,843
Real Estate Services, 15,475
Construction Materials Retailing, 6,552
Highway and Street Construction, 2,268
Water and Sewer Line Construction, 1,662
Building Equipment Distribution, 1,207
Developers
-15.0%
-10.0%
-5.0%
0.0%
5.0%
0.8 1.0 1.2 1.4
Ann
ual E
mpl
oym
ent G
row
th R
ate
(200
6-20
16
Exhibit 2E: Joint apprentices by gender in the Sacramento region (January 2012-October 2017)
Exhibit 3E: Joint apprentices by county of residence in the Sacramento region (January 2012-October 2017)
8,374, 97%
249, 3%
El Dorado,393, 56%
Placer,949, 11%
Sacramento, 6077, 1
Sutter, 346,4%
Yolo, 549,6%
Yuba, 309,
4%
Exhibit 4E: Joint apprentices’ highest level of education prior to apprenticeship in the Sacramento region (January 2012-October 2017)
Exhibit 5E: Number of weeks worked, all workers in the construction sector in the Sacramento region (2015)84
Less than highschool, 7%
High schoolgraduate orGED, 65%
Some college,25%
4 or more yearsof college, 3%
3,165 6%
3,082 6%
1,650 3%
6,105 12%
7,068 10%
31,037 62%
0 5,000 10,000 15,000 20,000 25,000 30,000 35,000
Did not work
Less than 14
14 to 26
27 to 39
40 to 49
50 to 52
# w
eeks
wor
ked
in th
e la
st y
ear
Exhibit 4: Value of nonresidential construction put in place, by subcomponent (California)9
-0.5%
29.2%
-41.1%
0.0%
62.9%
-34.7%
46.0%
42.8%
19.1%
-14.6%
66.5%
763.4%
Office
Commercial
Manufacturing
Health care
Educational
Religious
Amusement and recreation
Transportation
Power and communication
Highway and street
Public works
Other
Subcomponent percent change 2006-2016
180.8
593.7
818.9
21.4
235.8 342.3
104.9 133.6 173.5
0.0
100.0
200.0
300.0
400.0
500.0
600.0
700.0
800.0
900.0
1000.0
2001 2006 2011 2016 2021
Construction Materials,125
Construction, 1,942
Construction Components, 466
LQ=1.0
Concrete Products, 1,123
Construction Materials Wholesaling, 1,647
Subcluster with an annual average earnings higher than all-industry annual average earnings ($67,498) in Sacramento region in 2016
Exhibit 1E: Total joint apprentice starts, residents in the six-county Sacramento region (January 2012-October 2017) (n = 8,617)2
435
95
104
111
117
121
135
161
174
178
215
302
340
440
458
483
542
602
1,045
1,205
1,354
0 200 400 600 800 1000 1200 1400 1600
All others
Elevator constructor
Drywall finisher
Scaffold and shoring erector
Inspector or surveyor
Pile driver
Glazier
Carpet, linoleum, and soft tile layer
Millwright
Sheet metal worker & related trades
Construction equipment operator trades
Brick, marble, terrazzo, tile, and related trades
Roofer and waterproofer
Plumber and fitter trades
Painter trades
Cement mason and plasterer trades
Electricial trades
Drywall/lather
Ironworker trades
Carpenter
Construction craft laborer
Exhibit 38: Anticipated annual construction industry job openings by new and replacement jobs in the Sacramento region (2016-2021)1
21 26 59 60 52 78 99 167 167 220323 350 399 439 473
596 679788 777 763
2,119
4 6 1 1 20 7 520 27 2
71 56100 95 73
4699
82 95222
215
0
500
1000
1500
2000
2500
Annual Replacement Openings New Jobs (Growth)
Male
Female
$ Th
ousa
nds
Thou
sand
s of
Dol
lars
Average annual openings (demand) minuseducation and training (supply) =approximate annual shortage
Approximate annual shortage = 7,250 workers across all categories
Sutter
6.2% 5.1%
27.6%
14.4%
50.6%69.9%
10.8%7.9%
1.1% 0.6%3.6% 2.0%
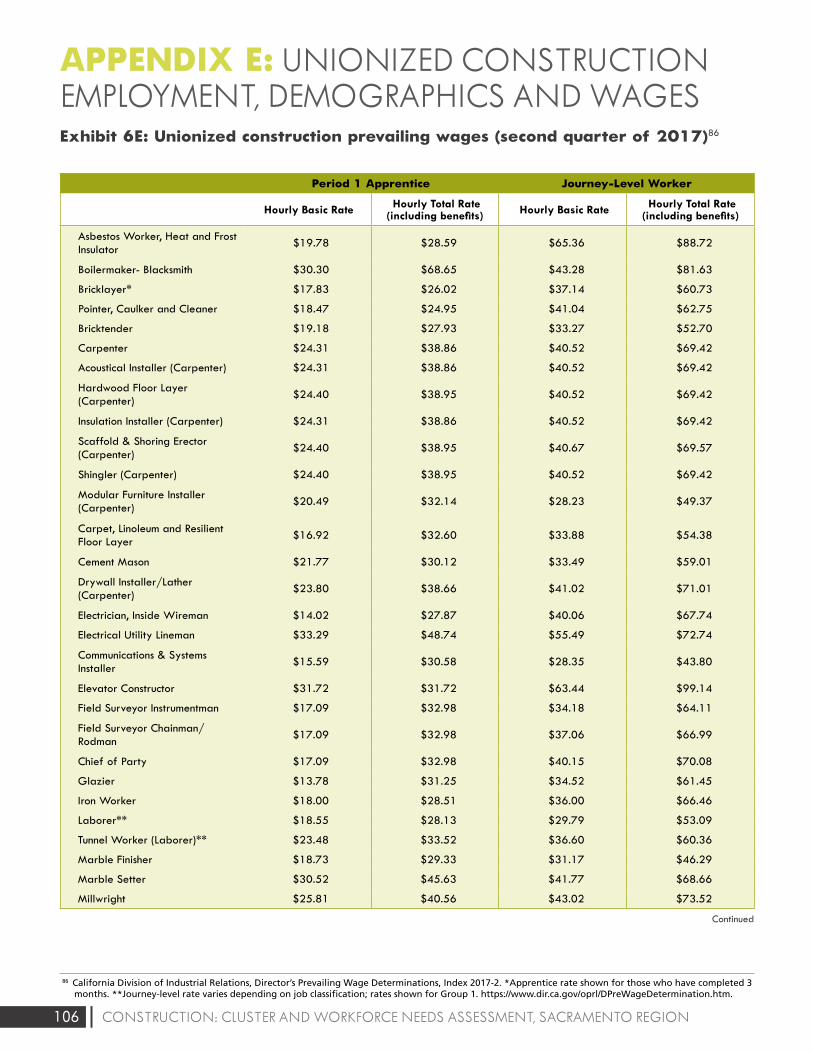
106 CONSTRUCTION: CLUSTER AND WORKFORCE NEEDS ASSESSMENT, SACRAMENTO REGION
APPENDIX E: UNIONIZED CONSTRUCTION EMPLOYMENT, DEMOGRAPHICS AND WAGESExhibit 6E: Unionized construction prevailing wages (second quarter of 2017)86
Period 1 Apprentice Journey-Level Worker
Hourly Basic Rate Hourly Total Rate (including benefits) Hourly Basic Rate Hourly Total Rate
(including benefits)
Asbestos Worker, Heat and Frost Insulator
$19.78 $28.59 $65.36 $88.72
Boilermaker- Blacksmith $30.30 $68.65 $43.28 $81.63
Bricklayer* $17.83 $26.02 $37.14 $60.73
Pointer, Caulker and Cleaner $18.47 $24.95 $41.04 $62.75
Bricktender $19.18 $27.93 $33.27 $52.70
Carpenter $24.31 $38.86 $40.52 $69.42
Acoustical Installer (Carpenter) $24.31 $38.86 $40.52 $69.42
Hardwood Floor Layer (Carpenter)
$24.40 $38.95 $40.52 $69.42
Insulation Installer (Carpenter) $24.31 $38.86 $40.52 $69.42
Scaffold & Shoring Erector (Carpenter)
$24.40 $38.95 $40.67 $69.57
Shingler (Carpenter) $24.40 $38.95 $40.52 $69.42
Modular Furniture Installer (Carpenter)
$20.49 $32.14 $28.23 $49.37
Carpet, Linoleum and Resilient Floor Layer
$16.92 $32.60 $33.88 $54.38
Cement Mason $21.77 $30.12 $33.49 $59.01
Drywall Installer/Lather (Carpenter)
$23.80 $38.66 $41.02 $71.01
Electrician, Inside Wireman $14.02 $27.87 $40.06 $67.74
Electrical Utility Lineman $33.29 $48.74 $55.49 $72.74
Communications & Systems Installer
$15.59 $30.58 $28.35 $43.80
Elevator Constructor $31.72 $31.72 $63.44 $99.14
Field Surveyor Instrumentman $17.09 $32.98 $34.18 $64.11
Field Surveyor Chainman/Rodman
$17.09 $32.98 $37.06 $66.99
Chief of Party $17.09 $32.98 $40.15 $70.08
Glazier $13.78 $31.25 $34.52 $61.45
Iron Worker $18.00 $28.51 $36.00 $66.46
Laborer** $18.55 $28.13 $29.79 $53.09
Tunnel Worker (Laborer)** $23.48 $33.52 $36.60 $60.36
Marble Finisher $18.73 $29.33 $31.17 $46.29
Marble Setter $30.52 $45.63 $41.77 $68.66
Millwright $25.81 $40.56 $43.02 $73.52
Continued
86 California Division of Industrial Relations, Director’s Prevailing Wage Determinations, Index 2017-2. *Apprentice rate shown for those who have completed 3 months. **Journey-level rate varies depending on job classification; rates shown for Group 1. https://www.dir.ca.gov/oprl/DPreWageDetermination.htm.
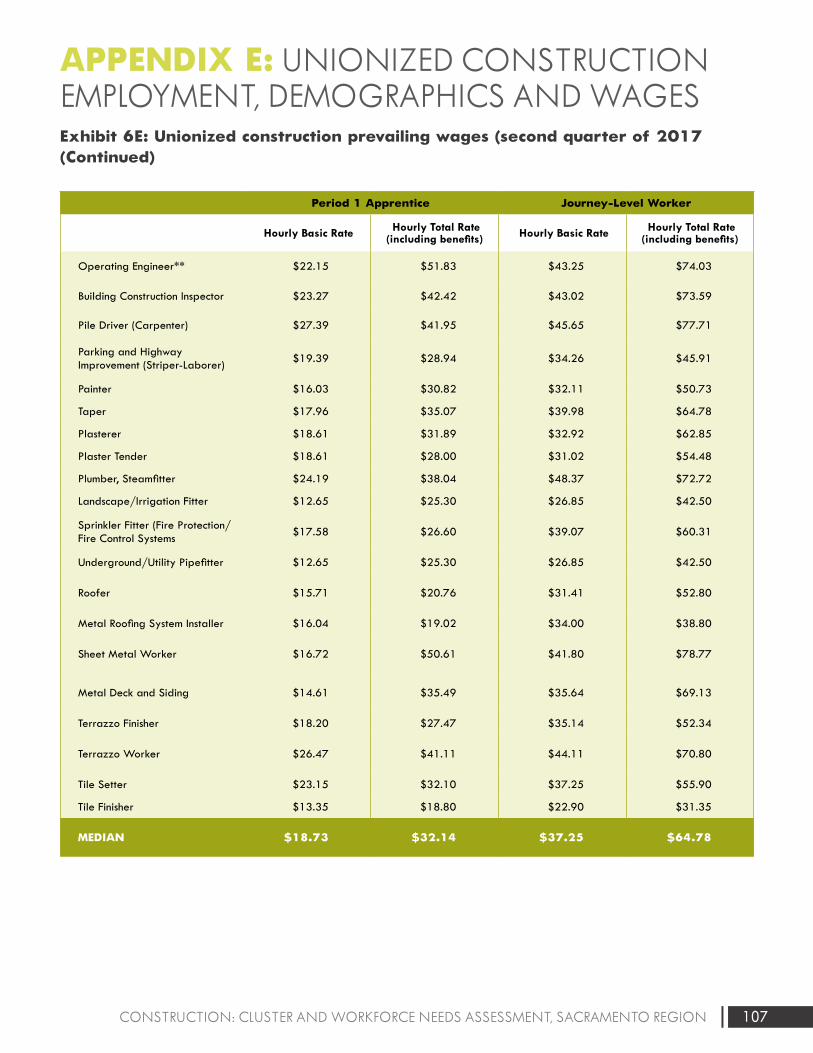
107CONSTRUCTION: CLUSTER AND WORKFORCE NEEDS ASSESSMENT, SACRAMENTO REGION
APPENDIX E: UNIONIZED CONSTRUCTION EMPLOYMENT, DEMOGRAPHICS AND WAGESExhibit 6E: Unionized construction prevailing wages (second quarter of 2017 (Continued)
Period 1 Apprentice Journey-Level Worker
Hourly Basic Rate Hourly Total Rate (including benefits) Hourly Basic Rate Hourly Total Rate
(including benefits)
Operating Engineer** $22.15 $51.83 $43.25 $74.03
Building Construction Inspector $23.27 $42.42 $43.02 $73.59
Pile Driver (Carpenter) $27.39 $41.95 $45.65 $77.71
Parking and Highway Improvement (Striper-Laborer)
$19.39 $28.94 $34.26 $45.91
Painter $16.03 $30.82 $32.11 $50.73
Taper $17.96 $35.07 $39.98 $64.78
Plasterer $18.61 $31.89 $32.92 $62.85
Plaster Tender $18.61 $28.00 $31.02 $54.48
Plumber, Steamfitter $24.19 $38.04 $48.37 $72.72
Landscape/Irrigation Fitter $12.65 $25.30 $26.85 $42.50
Sprinkler Fitter (Fire Protection/Fire Control Systems
$17.58 $26.60 $39.07 $60.31
Underground/Utility Pipefitter $12.65 $25.30 $26.85 $42.50
Roofer $15.71 $20.76 $31.41 $52.80
Metal Roofing System Installer $16.04 $19.02 $34.00 $38.80
Sheet Metal Worker $16.72 $50.61 $41.80 $78.77
Metal Deck and Siding $14.61 $35.49 $35.64 $69.13
Terrazzo Finisher $18.20 $27.47 $35.14 $52.34
Terrazzo Worker $26.47 $41.11 $44.11 $70.80
Tile Setter $23.15 $32.10 $37.25 $55.90
Tile Finisher $13.35 $18.80 $22.90 $31.35
MEDIAN $18.73 $32.14 $37.25 $64.78
Inform Connect Advance
C E N T E R S O F E X C E L L E N C E
www.coeccc.net
The Centers of Excellence (COE) for Labor Market
Research deliver regional workforce research and
technical expertise to California Community Colleges for
program decision making and resource development. This
information has proven valuable to colleges in beginning,
revising, or updating economic development and Career
Technical Education (CTE) programs, strengthening grant
applications, assisting in the accreditation process, and in
supporting strategic planning efforts.
The Centers of Excellence Initiative is funded in part by
the Chancellor’s Office, California Community Colleges,
Economic and Workforce Development Program. The
Centers aspire to be the leading source of regional
workforce information and insight for California
community colleges. More information about the Centers
of Excellence is available at www.coeccc.net.
For more information on this study, contact:
Aaron Wilcher, COE Director
Northern California Region
(916) 563-3233
This study was conducted with support from JPMorgan
Chase & Co. and by Economic and Workforce Development
funds awarded by the Chancellor’s Office, California
Community Colleges. It was produced pursuant to grant
agreement number 16-305-001.
Since 1994, Valley Vision’s work has driven
transformative change and improved lives across
Northern California. An independent social impact
and civic leadership organization headquartered
in Sacramento, Valley Vision strengthens our
communities through unbiased research, boundary-
crossing collaboration and change leadership. Our
work improves overall quality of life and creates the
conditions for economic prosperity and community
health and vitality.
Prepared by: Centers of Excellence, Los Rios Community
College District, with Valley Vision
This research was conducted with the generous support of
JPMorgan Chase & Co.
The research team included,
· Wen Sun (industry and occupational cluster analysis)
· Fran Doherty (construction industry and market indicators)
· Janine Spadafore Kaiser, Compass Policy Strategies (education
asset map, training supply and gap analysis)
· Darrene Hackler, Ph.D. (study design and review)
· Kelley Ring (business list analysis)
· Lauren McSherry (executive interviews, editing)
· Peter Cheng, Applied Development Economics (impact analysis)
MORE ABOUT THE CENTERS OF EXCELLENCE
MORE ABOUT VALLEY VISION
www.valleyvision.net
Copyright © 2022 FDOKUMEN