National Healthcare Establishment and Workforce Statistics ...
159
-
Upload
khangminh22 -
Category
Documents
-
view
0 -
download
0
Transcript of National Healthcare Establishment and Workforce Statistics ...

National Healthcare Establishment & Workforce Statistics Hospital 2012 -2013
1
National Healthcare Establishment and Workforce Statistics (Hospital) 2012-2013
January 2015©Ministry of Health Malaysia
Published by:The National Healthcare Statistics Initiative (NHSI) National Clinical Research CentreMinistry of Health3rd Floor, MMA House 124, Jalan Pahang53000 Kuala LumpurMalaysia
Tel. : (603) 40439300/400Fax : (603) 40439500E-mail : [email protected] : http://www.crc.gov.my/nhsi/
This report is copyrighted. Reproduction and dissemination of its contents- in part or in whole, for research, educational or non-commercial purposes is authorised without any prior written permission; provided the source is fully acknowledged. The suggested citation is ‘National Clinical Research Centre. National Healthcare Establishment & Workforce Statistics (Hospital) 2012-2013. Kuala Lumpur 2015’.
This report is also available electronically on the website of the National Healthcare Statistics Initiative at: http://www.crc.gov.my/nhsi/
Funding:The National Healthcare Statistics Initiative was funded by a grant from the Ministry of Health Malaysia (MRG Grant No. NMRR-09-842-4718)
Please note that there is potential for minor corrections of data in this report. Please check the online version at http://www.crc.gov.my/nhsi/ for any amendments. We welcome any suggestions or further enquiries. Please contact us via the channels stated above.
National Healthcare Establishment & Workforce Statistics Hospital 2012 -2013
i
CONTENTS
ACKNOWLEDGEMENTS iv
ABOUT NATIONAL HEALTHCARE ESTABLISHMENT AND WORKFORCE SURVEY (NHEWS) – HOSPITAL
v
MEMBERS OF NHEWS (HOSPITAL) PROJECT TEAM vii
MEMBERS OF NHEWS (HOSPITAL) EXPERT PANEL viii
SUMMARY OF STUDY PROCESS ix
STUDY METHODOLOGY x
CONSORT DIAGRAM
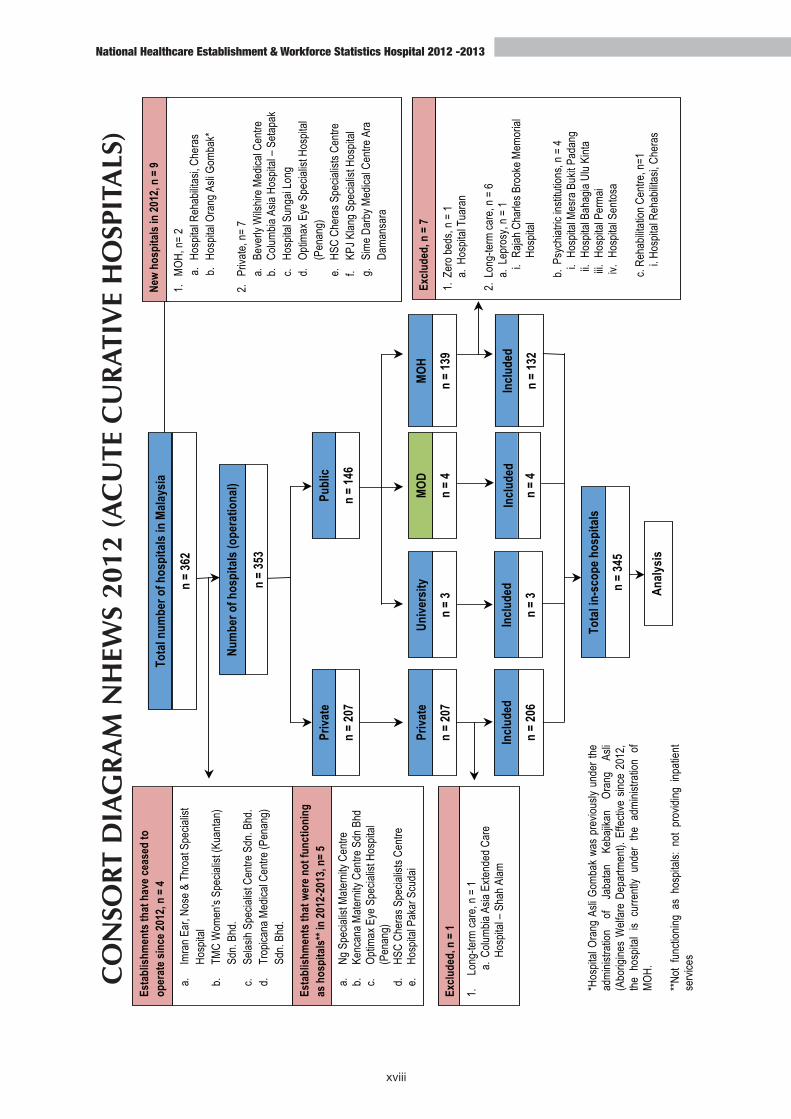
Consort Diagram NHEWS 2012 (Acute Curative Hospitals) xviii
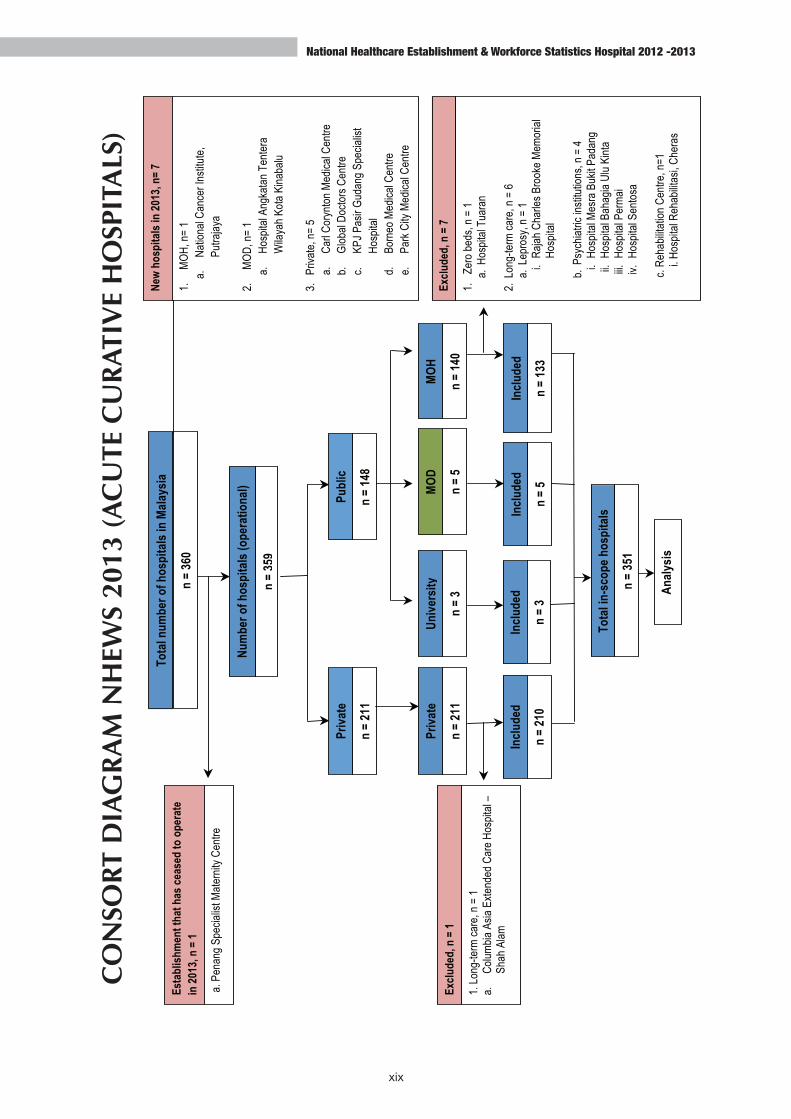
Consort Diagram NHEWS 2013 (Acute Curative Hospitals) xix
SURVEY RESPONSE RATE xx
ABBREVIATIONS & SYMBOLS xxi
EXECUTIVE SUMMARY 1
CHAPTER 1 | HOSPITAL FACILITIES IN MALAYSIA 6
Table 1.1 Acute Curative Hospitals 8
Table 1.1 1 Categories of Acute Curative Hospitals 10
Table 1.2 Total Inpatient Beds 12
Table 1.2.1 Inpatient Beds in Specialist Hospitals 14
Table 1.2.2 Inpatient Beds in Non-specialist Hospitals 16
Table 1.2.3 Inpatient Beds in Maternity Centres 18
CHAPTER 2 | HOSPITAL MEDICAL DEVICE IN MALAYSIA 22
Table 2.1 Mammogram Machines 26
Table 2.2 Total Mammography and Screening Mammography Performed 28
Table 2.3 Estimated Screening Mammography Performed for Women Aged 40-74 Years, 2012
30
Table 2.4 Estimated Screening Mammography Performed for Women Aged 40-74 Years, 2013
31
CHAPTER 3 | HOSPITAL ACTIVITIES IN MALAYSIA 34
Table 3.1 Hospital Admissions, and Rate of Admissions per Day 36
Table 3.2 Average Length of Stay (ALOS), Bed Occupancy Rate (BOR) and Turnover Interval (TOI)
38
Table 3.3 Average Length of Stay (ALOS) by Categories of Acute Curative Hospitals 40
Table 3.4 Bed Occupancy Rate (BOR) by Categories of Acute Curative Hospitals 42
Table 3.5 Turnover Interval (TOI) by Categories of Acute Curative Hospitals 44
Table 3.6 Emergency Department Visits, General Outpatient Department Visits and Specialist Clinic Visits
46
Table 3.7 Public Specialist Clinic Visits (Medicine, General Surgery, Orthopaedics and Obstetrics & Gynaecology)
48
Table 3.8 Public Specialist Clinic Visits (Paediatrics, Otorhinolaryngology (ENT), Ophthalmology, Psychiatry and Oncology)
49
National Healthcare Establishment & Workforce Statistics Hospital 2012 -2013
ii
CHAPTER 4 | HOSPITAL HEALTH WORKFORCE IN MALAYSIA 52
Table 4.1 Medical Practitioners 54
Table 4.1.1 Specialists and Medical Officers 56
Table 4.1.2 Internal Medicine Specialists 58
Table 4.1.3 Cardiologists, Respiratory Medicine Specialists and Nephrologists 60
Table 4.1.4 Endocrinologists, Neurologists and Rheumatologists 62
Table 4.1.5 Gastroenterologists, Hepatologists and Clinical Haematologists 64
Table 4.1.6 Geriatricians, Infectious Disease Specialists and Dermatologists 66
Table 4.1.7 General Surgeons 68
Table 4.1.8 Colorectal Surgeons, Hepatobiliary Surgeons and Urologists 70
Table 4.1.9 Vascular Surgeons, Cardiothoracic Surgeons and Neurosurgeons 72
Table 4.1.10 Breast & Endocrine Surgeons and Breast Surgeons 74
Table 4.1.11 Plastic & Reconstructive Surgeons and Paediatric Surgeons 76
Table 4.1.12 Obstetricians & Gynaecologists and Paediatricians 78
Table 4.1.13 Emergency Medicine Specialists and Anaesthesiologists 80
Table 4.1.14 Ophthalmologists and Otorhinolaryngologists 82
Table 4.1.15 Orthopaedic Surgeons, Sports Medicine Specialists and Rehabilitation Medicine Specialists
84
Table 4.1.16 Psychiatrists and Oncologists 86
Table 4.1.17 Radiologists and Nuclear Medicine Specialists 88
Table 4.1.18 Pathologists and Forensic Pathologists 90
Table 4.2 Staff Nurses and Staff Nurses with Post-Basic Training 92
Table 4.3 Assistant Medical Officers (AMO) and Assistant Medical Officers with Post-Basic Training
94
Table 4.4 Radiographers and Radiographers with Post-Basic Training in Mammography / Computer Tomography (CT) Scan
96
APPENDICES
APPENDIX 1 | DEFINITION OF NHEWS (HOSPITAL) TERMINOLOGY 100
APPENDIX 2 | PARTICIPANTS OF NHEWS (HOSPITAL)
Participants of NHEWS (Hospital) 2012 105
Hospital Sector: Public/ Ministry Of Health 105
Hospital Sector: Public/ Ministry Of Health/Psychiatric Institution 107
Hospital Sector: Public/ University 108
Hospital Sector: Public/ Ministry of Defence 108
Hospital Sector: Private 109
Participants of NHEWS (Hospital) 2013 112
Hospital Sector: Public/ Ministry Of Health 112
Hospital Sector: Public/ Ministry Of Health/Psychiatric Institution 114
Hospital Sector: Public/ University 114
Hospital Sector: Public/ Ministry of Defence 114
Hospital Sector: Private 115

National Healthcare Establishment & Workforce Statistics Hospital 2012 -2013
iii
APPENDIX 3 | MALAYSIAN POPULATION, 2010-2013 119
Table A3.1 Total Population in Malaysia by State, 2010-2013 119
Table A3.2 Female Population in Malaysia by State 2010, 2011, 2013 119
Table A3.3 Female Population (aged 50-69 years old) in Malaysia by State, 2012-2013 120
Table A3.4 Female Population (aged 40-74 years old) in Malaysia by State, 2012-2013 120
Table A3.5 Female Population (aged 40-44 years old) in Malaysia by State, 2012-2013 121
Table A3.6 Female Population (aged 45-49 years old) in Malaysia by State, 2012-2013 121
Table A3.7 Female Population (aged 50-54 years old) in Malaysia by State, 2012-2013 122
Table A3.8 Female Population (aged 55-59 years old) in Malaysia by State, 2012-2013 122
Table A3.9 Female Population (aged 60-64 years old) in Malaysia by State, 2012-2013 123
Table A3.10 Female Population (aged 65-69 years old) in Malaysia by State, 2012-2013 123
Table A3.11 Female Population (aged 70-74 years old) in Malaysia by State, 2012-2013 124
Table A3.12 Paediatric (0-14 years old) Population in Malaysia by State, 2010, 2011, 2013 124
Table A3.13 Geriatric (60 years old and above) Population in Malaysia by State, 2010, 2011, 2013
125
APPENDIX 4 | DATA QUALITY STATEMENT 126
APPENDIX 5 | SURVEY PROFILE & RESPONSE RATE ANALYSIS 130
Table A5.1 Survey Profile of NHEWS (Hospital) 2012 & 2013: Public Hospitals 130
Table A5.2 Survey Profile of NHEWS (Hospital) 2012 & 2013: Private Hospitals 131
Table A5.3 Response Rate of NHEWS (Hospital) 2011, 2012 & 2013 132

National Healthcare Establishment & Workforce Statistics Hospital 2012 -2013
iv
ACKNOWLEDGEMENTS
The National Healthcare Statistics Initiative team would like to thank the Director General of Health Malaysia for his continuous support towards this survey and permission to publish the report.
Also, our sincere appreciation to the following for their participation, assistance, support and contributions:
• Deputy Director General of Health (Research and Technical Support), MOH
• Deputy Director General of Health (Medical), MOH
• Deputy Director General of Health (Public Health), MOH
• Director, National Clinical Research Centre (NCRC), National Institutes of Health (NIH)
• Director, Medical Development Division, MOH
• Director, Medical Practice Division, MOH
• Health Informatics Centre, MOH
• Private Medical Practice Control Section (National level)
• Private Medical Practice Control Unit (State level)
• The Association of Private Hospitals of Malaysia (APHM)
• All participating Ministry of Health, private, university and Ministry of Defence hospitals which provided or allowed access to their establishment and workforce data.
• KPJ Healthcare Berhad
• Pantai Holdings Berhad
• Columbia Asia Sdn Bhd
• Ramsay Sime Darby Healthcare Group
• Malaysian Medical Council
• Training Division, MOH
• Members of the NHEWS- Hospital Expert Panel
• All medical doctors and support personnel who participated in the NHEWS- Hospital • All those who have supported or contributed to the success of the NHEWS- Hospital and
publication of this report
Thank you.
National Healthcare Statistics Initiative (NHSI)Ministry of Health, Malaysia

National Healthcare Establishment & Workforce Statistics Hospital 2012 -2013
v
ABOUT NATIONAL HEALTHCARE ESTABLISHMENTS AND WORKFORCE STATISTICS (HOSPITAL)
Background
National Healthcare Establishment and Workforce Statistics (NHEWS) Hospital is an initiative that gathers information on hospitals in the country concerning their services- with emphasis on specialised clinical services, facilities, medical devices, and health workforce. The NHEWS survey covers all acute curative hospitals and related specialty services for both public and private sectors. (The definition of acute curative care is provided in Appendix 1).
However, unlike the NHEWS (Hospital) surveys of previous years (2008/09, 2010, 2011), the current survey reports only acute curative hospitals without distinguishing the specialty services, except when reporting the public hospital specialist clinic visits. Further, only one medical device is reported here compared to several devices in the previous reports.
Besides that, the hospital population frame also has differed between the current and the past NHEWS (Hospital) surveys. Revision of inclusion criteria has led to the Ministry of Defence (MOD) hospitals being included in the 2012-2013 survey compared to the previous surveys.
Objectives
General Objective
To document the availability and distribution of hospitals/facilities, services, medical devices, and health workforce in the country.
Specific Objectives
• To estimate the number and density (number per population) of hospitals/facilities, services, and health workforce in Malaysia by geographical areas.
• To map out trends in the number and density of hospitals/facilities, services, and health workforce through consistent and reliable data collection.
Structure of Report
This fourth NHEWS (Hospital) report provides overall statistics on the acute curative hospitals in Malaysia during 2012-2013. It consists of four chapters:
• Chapter 1: Hospital Facilities
• Chapter 2: Hospital Medical Device (Mammogram Machine)
• Chapter 3: Hospital Activities
• Chapter 4: Hospital Health Workforce
Data prepared for this report has been reviewed by an expert panel of hospital services. This review process is identical to that of the previous NHEWS (Hospital) reports. Previously, each chapter within the report was written by an expert panel of the respective service. Meanwhile for the current report, all chapters were written by members of the NHEWS (Hospital) project team.
Data will first feature the national picture, and then followed by a drill-down report of sectors within states. We have also included data from the 2010/2011 survey in this report; to serve in presenting patterns/ trends within the datasets across multiple time points, wherever the data is available.

National Healthcare Establishment & Workforce Statistics Hospital 2012 -2013
vi
However, data from the 2010/2011 survey that appears in this report may be dissimilar to data found in the NHEWS (Hospital) 2010 and NHEWS (Hospital) 2011 reports. Several reasons contribute to this:
• The data may have been corrected following information that we received from the data source providers.
• Revision of “acute curative care” definition for this current report has led us to reclassify two hospitals that were labelled as “chronic curative care” in the 2011 report as “acute curative care” in the 2012-2013 report. These two hospitals were included in all re-analyses of the 2011 survey data presented in this report. We did so in order to minimise disharmony among these datasets, and therefore facilitate the three-year comparison.
• Rerun of non-response analysis of the 2011 survey data to standardise the statistical method to that of the NHEWS (Hospital) 2012-2013.
• Revision of calculation method of mean average length of stay (ALOS), mean bed occupancy rate (BOR), and mean turnover interval (TOI). Please refer to study methodology for further details (page xi).
• Referring specifically to the doctor workforce data:
- Continuing and periodic data cleaning based on updated sources of data verification e.g. from the MMC, NSR, and Medical Development Division MOH.
- The current NHEWS (Hospital) 2012-2013 features only acute curative services, whereas the previous NHEWS (Hospital) featured selected specialty services, which took into account long term care hospitals, therefore included the workforce within these hospitals as well for the count of doctor workforce. Thus in this report we present current (2013) and past (2010 & 2011) workforce data that have been standardised to include only doctors working in acute curative hospitals.
A specific example pertaining to this is the psychiatrist workforce. For the NHEWS
(Hospital) 2010 & 2011 survey, data included psychiatrists who were working in the psychiatric institutions. However in this report we only highlight the 2010 & 2011 data on psychiatrists working in acute curative hospitals.
The scenario above would have applied to the rehabilitation medicine specialist workforce as well, except that in 2010 & 2011, there were no rehabilitation medicine specialists working in the long term care hospitals being surveyed.
The NHEWS (Hospital) data was collected based on the needs of our stakeholders. Other data users are advised that the inclusion and exclusion criteria, and data definitions used in this report may differ from other sources. Any interpretation or comparison should be made with caution. The Health Informatics Centre, Ministry of Health Malaysia is the official source of health data in the country. Harmonisation of health data for the purpose of international comparisons should preferably be obtained from this official source.

National Healthcare Establishment & Workforce Statistics Hospital 2012 -2013
vii
MEMBERS OF NHEWS (HOSPITAL) PROJECT TEAM
PRINCIPAL INVESTIGATOR DATUK DR. JEYAINDRAN TAN SRI SINNADURAI
PRINCIPAL CO-INVESTIGATORS
DR. SHEAMINI SIVASAMPU
DR. GOH PIK PIN
CO-INVESTIGATORS
DATO’ DR. NOORAINI BABA
DR. MD KHADZIR SHEIKH AHMAD
MR. ZAMANE ABDUL RAHMAN
PROJECT LIASON OFFICERS
DR. LAILI MURNI MOKHTAR
DR. AFIDAH ALI
PROJECT MANAGERS
DR. YEO SIEW LIAN
DR. FOO CHEE YOONG
DR. AIMI NADIAH JAMEL
SURVEY COORDINATORS
MRS. FATIHAH MAHMUD
MS. KAMILAH DAHIAN
MS. KASTURI MANOHARAN
ASSISTANT SURVEY COORDINATOR MS. SITI HASLINA OTHMAN
DATA ANALYST DR. FOO CHEE YOONG
DATABASE DEVELOPER/ADMINISTRATOR
ALTUS SOLUTIONS SDN. BHD.

National Healthcare Establishment & Workforce Statistics Hospital 2012 -2013
viii
MEMBERS OF THE NHEWS (HOSPITAL) EXPERT PANEL
EXPERT PANEL INSTITUTION
Datin Dr. Nor Akma Yusuf Medical Development Division, Ministry of Health
Dr. Laili Murni Mokhtar Medical Development Division, Ministry of Health
Dr. Khalid Ibrahim Hospital Sungai Buloh
Matron Rosena Abd Ghani Nursing Division, Ministry of Health
Mrs. Jasintha SangarapillaiDepartment of Diagnostic Imaging,Hospital Kuala Lumpur
Ms. Lim Jew Heang Medical Record Department, Hospital Selayang
Tuan Haji Wan Azmi MohdMedical Assistant Board, Medical Practice Division, Ministry of Health
National Healthcare Establishment & Workforce Statistics Hospital 2012 -2013
ix
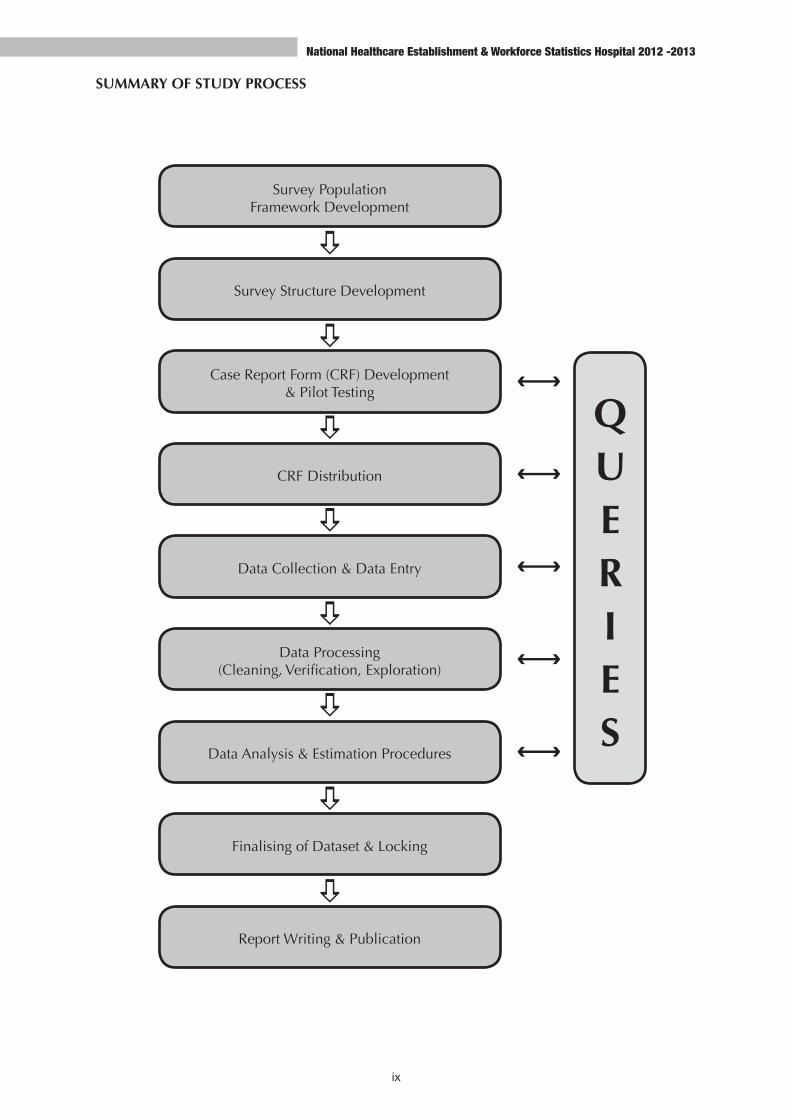
SUMMARY OF STUDY PROCESS
Survey Population Framework Development
Survey Structure Development
Case Report Form (CRF) Development & Pilot Testing
CRF Distribution
Data Collection & Data Entry
Data Processing (Cleaning, Verification, Exploration)
Data Analysis & Estimation Procedures
Finalising of Dataset & Locking
Report Writing & Publication
QUERIES
National Healthcare Establishment & Workforce Statistics Hospital 2012 -2013
x
STUDY METHODOLOGY
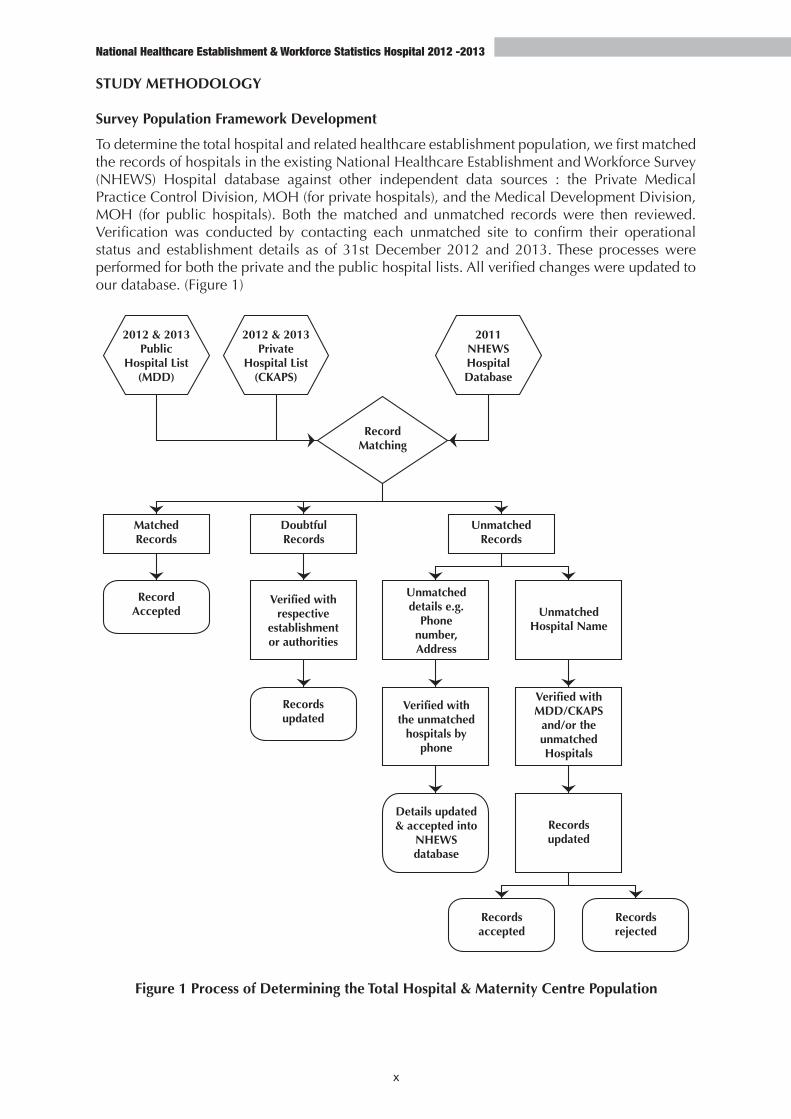
Survey Population Framework Development
To determine the total hospital and related healthcare establishment population, we first matched the records of hospitals in the existing National Healthcare Establishment and Workforce Survey (NHEWS) Hospital database against other independent data sources : the Private Medical Practice Control Division, MOH (for private hospitals), and the Medical Development Division, MOH (for public hospitals). Both the matched and unmatched records were then reviewed. Verification was conducted by contacting each unmatched site to confirm their operational status and establishment details as of 31st December 2012 and 2013. These processes were performed for both the private and the public hospital lists. All verified changes were updated to our database. (Figure 1)
2012 & 2013Public
Hospital List(MDD)
2012 & 2013Private
Hospital List(CKAPS)
2011NHEWSHospitalDatabase
RecordMatching
MatchedRecords
RecordAccepted
Recordsupdated
Recordsupdated
Recordsaccepted
Recordsrejected
Verified withrespective
establishmentor authorities
Verified withthe unmatched
hospitals byphone
Details updated& accepted into
NHEWSdatabase
Verified withMDD/CKAPS
and/or theunmatchedHospitals
Unmatcheddetails e.g.
Phonenumber,Address
UnmatchedHospital Name
DoubtfulRecords
UnmatchedRecords
Figure 1 Process of Determining the Total Hospital & Maternity Centre Population
National Healthcare Establishment & Workforce Statistics Hospital 2012 -2013
xi
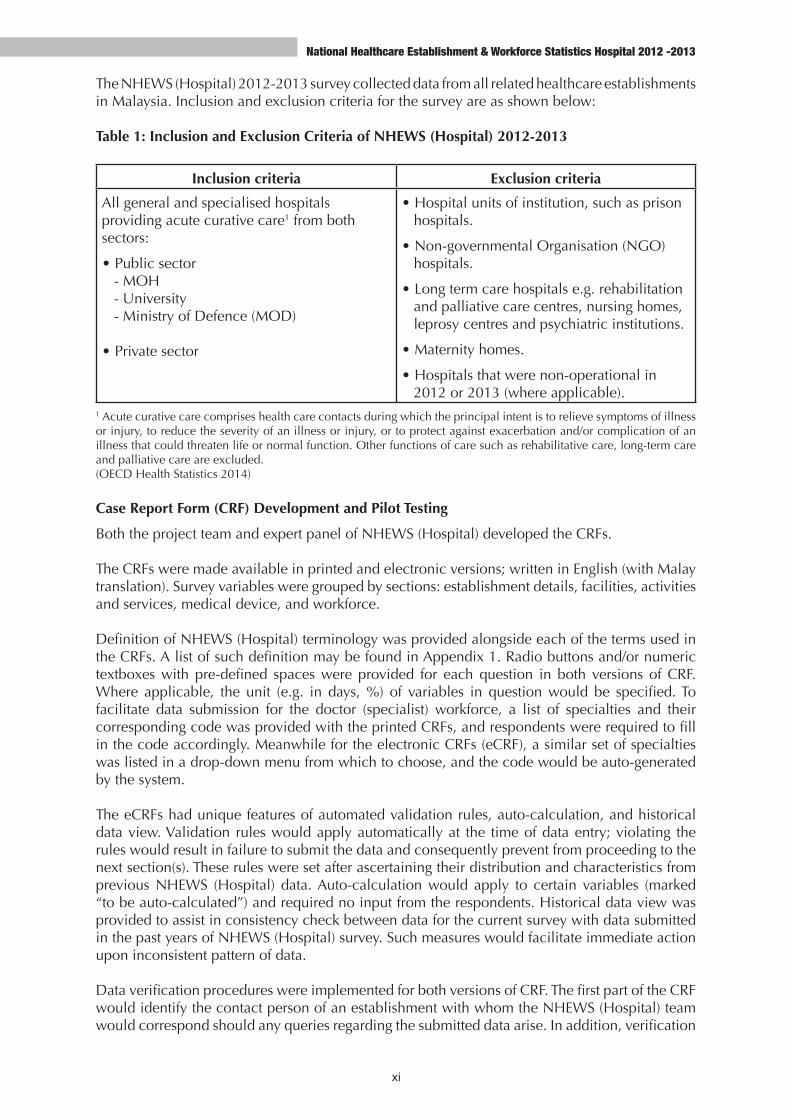
The NHEWS (Hospital) 2012-2013 survey collected data from all related healthcare establishments in Malaysia. Inclusion and exclusion criteria for the survey are as shown below:
Table 1: Inclusion and Exclusion Criteria of NHEWS (Hospital) 2012-2013
Inclusion criteria Exclusion criteria
All general and specialised hospitals providing acute curative care1 from both sectors:
• Public sector - MOH - University - Ministry of Defence (MOD)
• Private sector
• Hospital units of institution, such as prison hospitals.
• Non-governmental Organisation (NGO) hospitals.
• Long term care hospitals e.g. rehabilitation and palliative care centres, nursing homes, leprosy centres and psychiatric institutions.
• Maternity homes.
• Hospitals that were non-operational in 2012 or 2013 (where applicable).
1 Acute curative care comprises health care contacts during which the principal intent is to relieve symptoms of illness or injury, to reduce the severity of an illness or injury, or to protect against exacerbation and/or complication of an illness that could threaten life or normal function. Other functions of care such as rehabilitative care, long-term care and palliative care are excluded. (OECD Health Statistics 2014)
Case Report Form (CRF) Development and Pilot Testing
Both the project team and expert panel of NHEWS (Hospital) developed the CRFs.
The CRFs were made available in printed and electronic versions; written in English (with Malay translation). Survey variables were grouped by sections: establishment details, facilities, activities and services, medical device, and workforce.
Definition of NHEWS (Hospital) terminology was provided alongside each of the terms used in the CRFs. A list of such definition may be found in Appendix 1. Radio buttons and/or numeric textboxes with pre-defined spaces were provided for each question in both versions of CRF. Where applicable, the unit (e.g. in days, %) of variables in question would be specified. To facilitate data submission for the doctor (specialist) workforce, a list of specialties and their corresponding code was provided with the printed CRFs, and respondents were required to fill in the code accordingly. Meanwhile for the electronic CRFs (eCRF), a similar set of specialties was listed in a drop-down menu from which to choose, and the code would be auto-generated by the system.
The eCRFs had unique features of automated validation rules, auto-calculation, and historical data view. Validation rules would apply automatically at the time of data entry; violating the rules would result in failure to submit the data and consequently prevent from proceeding to the next section(s). These rules were set after ascertaining their distribution and characteristics from previous NHEWS (Hospital) data. Auto-calculation would apply to certain variables (marked “to be auto-calculated”) and required no input from the respondents. Historical data view was provided to assist in consistency check between data for the current survey with data submitted in the past years of NHEWS (Hospital) survey. Such measures would facilitate immediate action upon inconsistent pattern of data.
Data verification procedures were implemented for both versions of CRF. The first part of the CRF would identify the contact person of an establishment with whom the NHEWS (Hospital) team would correspond should any queries regarding the submitted data arise. In addition, verification
National Healthcare Establishment & Workforce Statistics Hospital 2012 -2013
xii
by the highest authority (i.e. Director or CEO) of an establishment was a pre-requisite for data submission. For printed CRFs, signature of the Director or CEO was required at the end of the CRF. For eCRFs, the Director or CEO was required to log in through a different username and password, and then review the data that has been entered for his/her hospital prior to verifying it for submission to us (by clicking on a “verify” button).
The CRFs were pilot-tested with a convenient sample of public and private hospitals. Feedbacks from this pilot test informed revisions and improvements of the CRFs prior to its use in the actual survey.
CRF Distribution
A survey pack containing the following documents were distributed via express mail to all target hospitals:
• Survey instruction manual
• An endorsement letter from the State Health Directors- for the public hospitals, or from the Association of Private Hospital Malaysia (APHM)- for the private hospitals.
• Username and password access details for eCRF
• A copy of the NHEWS (Hospital) 2011 report
Within three days after the postage, the first follow-up call was made to each hospital to confirm receipt of the survey pack, and to establish the first point of contact. Subsequent follow-up calls were made after two weeks of the initial call, to serve as reminders and/or monitoring of progress. Question and doubts concerning the survey were answered by trained NHEWS (Hospital) team members. Numerous follow-up calls were made until the response or non-response status of each hospital was confirmed. The list of hospitals that participated in this survey is available in Appendix 2.
Data Collection
Respondents had the option between two modes of data collection and submission:
1. Paper data submission via hard copy CRF (printed CRF) 2. Electronic data submission via NHSI web application (eCRF)
Data collection for the workforce section, particularly for the doctor workforce involved relevant details (e.g. qualification and specialty) of each doctor working in the hospital. Datasets containing the list of doctors for each hospital, which was obtained from its participation in the past NHEWS (Hospital) surveys, were pre-uploaded to the eCRFs of 2013. This aimed at minimising the need for manual data entry of the current survey. In comparison, data obtained for the remaining workforce category involved only the total count of the workforce.
Data Entry
Data from paper submissions were screened manually and reviewed for their completeness and logical consistency before data entry into the NHEWS (Hospital) database by trained members. Data submissions through electronic CRFs were entered directly into the NHEWS (Hospital) database by the data providers. Quality of data entry was inspected and maintained by several built-in features such as a compulsory data checking, consistency checks, auto-calculations and auto-default data from the previous NHEWS (Hospital) surveys. Activities performed in the database were recorded by an audit trail system.

National Healthcare Establishment & Workforce Statistics Hospital 2012 -2013
xiii
Data Processing
Data cleaning was performed in parallel with data entry and based on the results of edit checks. An edit check is a checking procedure for tracing doubtful data being entered. The editing was performed by NHEWS (Hospital) team members who are familiar with hospital settings. Any queries were then attended to by contacting the data entry personnel or any authorised representative at the participant’s site to seek further clarification or verification.
Exploratory data analysis was performed before database locking to ensure that the data was acceptable for analysis. Data duplication, range and consistency checks were performed to detect outliers and data that deviated. In cases where the data were not verifiable with the source(s), cross checks were done against other sources such as the Health Information Management System Reports, Malaysian Medical Council (MMC) Doctor Database, professional societies, National Specialist Register (NSR) and Registry Central Surveys.
Statistical and Estimation Procedures
NHEWS (Hospital) uses the census of all hospitals that are listed in the population frame (as provided by the MDD and CKAPS of MOH) to derive its estimates of the total facility, devices, activity and workforce of related healthcare services within the country. As participation is voluntary, non-response was anticipated and two sources of non-response were accounted for:
Unit non-response – occurs as a result of the healthcare establishment not responding to the survey.Item non-response – occurs as some respondents return partially completed survey forms.
A survey unit will be considered as non-response if the answers to key questions were missing.
Imputation techniques were used to account for item non-response, and weighting was used for unit non-response.
Imputation: Estimating Item Non-Response
The imputation process consisted of two stages. First, the missing values were imputed with reasonable assumptions (logical/ conditional imputation). For example, hospitals without any mammogram machines will have zero mammography performed.
The remaining missing values after the first step was further assessed for its suitability of other imputation techniques. Deterministic regression imputation was used in cases where appropriate predictor(s) was/were available. One fundamental assumption of our missing data imputation is that missing data occured at random i.e. missing completely at random (MCAR) or missing at random (MAR).
Weighting: Estimating Unit Non-Response
Each survey unit was assigned a weight in order to compensate the missing value of unit non-response and to estimate each variable for the whole population. The weight was calculated by dividing the number of hospitals in the population to the number of respondent hospitals in a stratified manner. This procedure also assumes similar characteristics of both respondents and non-respondents by each stratum.
To achieve this, multivariable response propensity model was used. We regressed hospital characteristics (X) that are known for the whole population e.g. size and state/region; to the response status i.e. the outcome (Y). We then computed the propensity score using the model and stratified all hospitals into five strata. Through this method, hospitals with similar characteristics will be grouped within a stratum, and the weight of each of the five stratum will then be calculated as per above description.
National Healthcare Establishment & Workforce Statistics Hospital 2012 -2013
xiv
We estimated the sum of each variable for each state and for the whole country: we first modelled the response propensity for each state that has less than full response using the method described above, to adjust for the non-respondents for each state. Then we obtained the estimates for the whole country for each variable by summing all states’ estimates. Some variables are reported as means, and the method for estimating these is described under the heading “list of formula” below.
An estimate of the sum of variables within Facilities/ Device/ Activities/ Workforce chapter (T) is represented as:
T = ∑ WiTi
Where: Ti is the number of facilities/devices/activities/workforce available in the ith facility
in the year,
Wi is the calculated weight of the ith facility
Limitation of the Estimating Procedures
Standard error is not a suitable mean to gauge variability in our setting since the respondents are not from a random sample.
The fundamental purpose of imputation and weighting is to adjust for bias in the responding units and produce less biased estimates. However, these procedures can only account for and adjust to known population characteristics that impact the response propensity and survey estimates. Should unknown characteristics exist (and there is no means to consider them), adjustment may be ineffective.
Furthermore, an assumption of similarity between respondents and non-respondents within the same propensity strata must be made when imputing for missing data and weighting for non-respondents. Therefore, a certain degree of bias may exist should the assumption not hold i.e. if the non-respondents were different from the respondents. The level of bias in the estimates will not be quantifiable without a further study of the non-respondents.
List of Formula
Facilities, devices, activities and workforce of related healthcare establishment and services are expressed as absolute count, and density by state, sector, and year. The absolute count refers to the count within a year’s duration for each survey year i.e. 2012 and 2013.
Calculations of density and calculations pertinent to each survey chapter are as follows:(The Malaysian population statistics used for density calculations may be found in Appendix 3.)
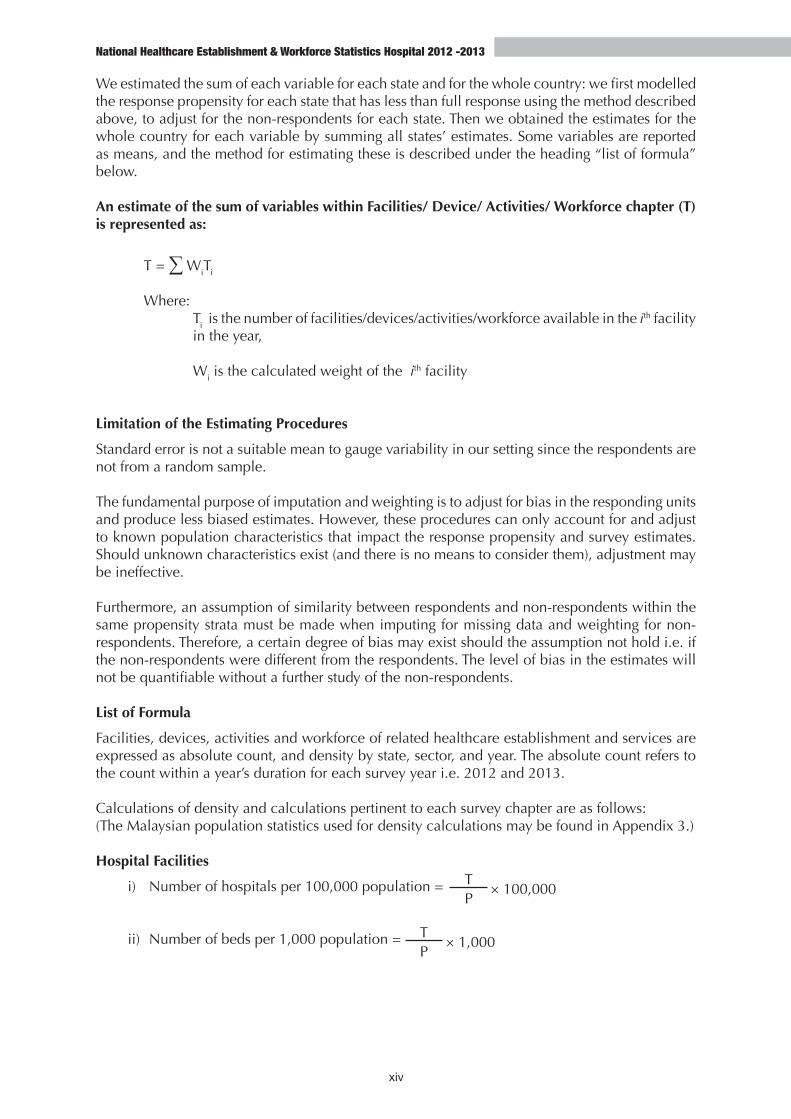
Hospital Facilities
i) Number of hospitals per 100,000 population =
ii) Number of beds per 1,000 population =
T× 100,000
P
T× 1,000
P
National Healthcare Establishment & Workforce Statistics Hospital 2012 -2013
xv
Where: T is an estimate of the total quantity (sum) of the variable available in the
country in the year under consideration.
P is the midyear total population of Malaysia or the relevant geographic region where the survey was conducted, in the year under consideration.
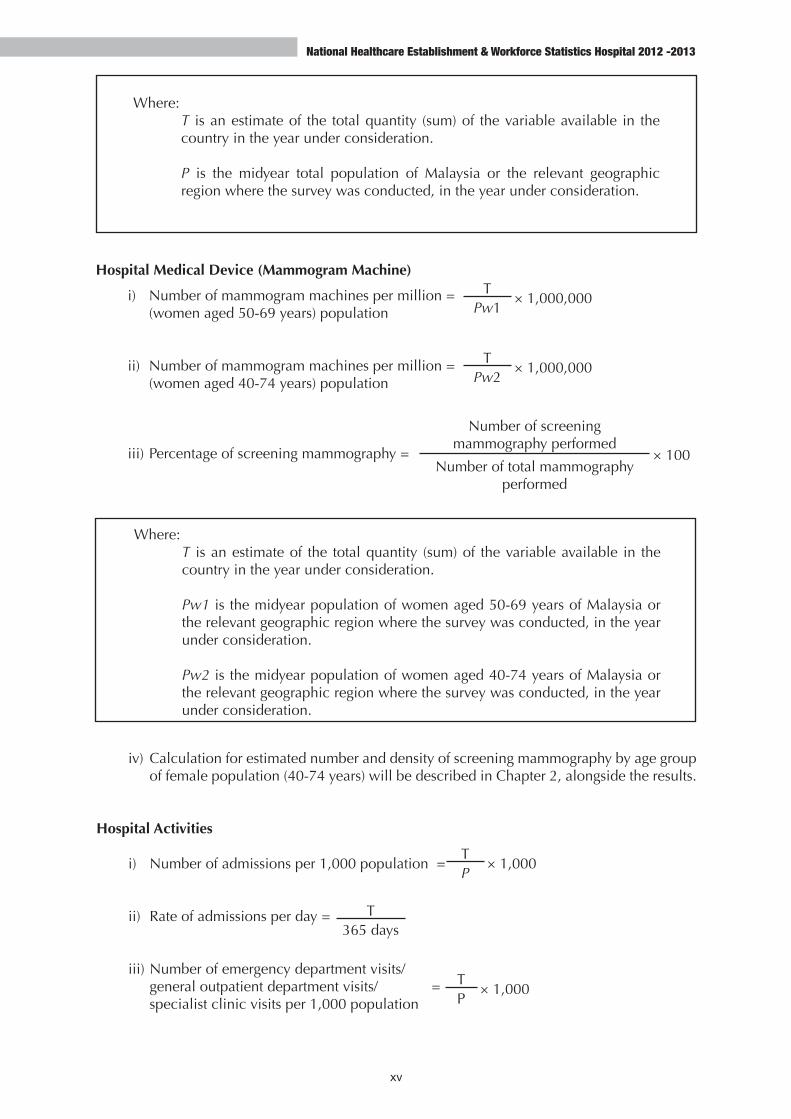
Hospital Medical Device (Mammogram Machine)
i) Number of mammogram machines per million = (women aged 50-69 years) population
ii) Number of mammogram machines per million = (women aged 40-74 years) population
iii) Percentage of screening mammography =
Where: T is an estimate of the total quantity (sum) of the variable available in the
country in the year under consideration.
Pw1 is the midyear population of women aged 50-69 years of Malaysia or the relevant geographic region where the survey was conducted, in the year under consideration.
Pw2 is the midyear population of women aged 40-74 years of Malaysia or the relevant geographic region where the survey was conducted, in the year under consideration.
T× 1,000,000
Pw1
T× 1,000,000
Pw2
Number of screening mammography performed
× 100Number of total mammography
performed
iv) Calculation for estimated number and density of screening mammography by age group of female population (40-74 years) will be described in Chapter 2, alongside the results.
Hospital Activities
i) Number of admissions per 1,000 population =
ii) Rate of admissions per day =
iii) Number of emergency department visits/ general outpatient department visits/ = specialist clinic visits per 1,000 population
T× 1,000
P
T× 1,000
P
T365 days

National Healthcare Establishment & Workforce Statistics Hospital 2012 -2013
xvi
iv) Mean average length of stay (ALOS), mean bed occupancy rate (BOR), and mean turnover interval (TOI):
• Calculation for these means has been revised from calculation of previous reports.
• Previously they were calculated by averaging the sum of each hospital statistic within a state to the total number of hospitals in the state.
• In contrast, for current calculation, we first pool the values of variables involved in the calculation of ALOS, BOR, and TOI for all hospitals within each state, and then run the calculation i.e. taking the state as a unit of analysis. Similarly, in calculating the national mean, the country is taken as a unit of analysis.
• The two methods of calculation is illustrated below, with the example of mean ALOS calculation:
Previous calculation: Mean ALOS for each state =
Mean ALOS for the country =
Where: T is an estimate of the total quantity (sum) of the variable available in the
country in the year under consideration.
P is the midyear total population of Malaysia or the relevant geographic region where the survey was conducted, in the year under consideration.
Sum of ALOS for all hospitals within a state
Total number of hospitals in the state
Sum of ALOS for all states
Total number of states in the country
Where: ALOS =
Total length of stay of discharged patients for a given period (TLOS)
Total number of discharged patients in the same period (TD)
Current calculation: Mean ALOS for each state =
Mean ALOS for the country =
∑ (TLOSi ×Wi) within a state
∑ (TDi ×Wi) within the state
∑ (TLOSi ×Wi) within the country
∑ (TDi ×Wi) within the country
Where: TLOSi is the TLOS for the ith facility in the year under consideration.
TDi is the total number of discharged patients for the ith facility in the year under consideration.
W i is the calculated weight of the ith facility

National Healthcare Establishment & Workforce Statistics Hospital 2012 -2013
xvii
Where: T is an estimate of the total quantity (sum) of the variable available in the
country in the year under consideration.
P is the midyear total population of Malaysia or the relevant geographic region where the survey was conducted, in the year under consideration.
Hospital Workforce
i) Number of medical doctors/ staff nurses/ assistant medical officers/ radiographers = per 100,000 population
T× 100,000
P
Data-Set Finalisation and Locking
All processed data were reviewed by the project team and all members of the expert panel to ensure validity and accuracy before the finalisation. The decision to lock the data set was made by the project team only after the finalisation. No further amendments to the data set were allowed except for rectifying errors that are supported by valid evidence as determined by the project team and/or expert panel. All amendments of data set, if any, must be approved by the co-investigator(s).
Data Security
The NHEWS (Hospital) 2012-2013 data collection was authorised under the Private Healthcare Facilities and Services Act 1998. However, participation was voluntary. Data collected in this NHEWS (Hospital) survey is regulated by the Personal Data Protection Act 2010 where applicable. All information collected is held in the strictest confidence and according to legal and research ethics guidelines.
Data Quality
A full description of NHEWS (Hospital) 2012-2013 data quality may be found in Appendix 4.
National Healthcare Establishment & Workforce Statistics Hospital 2012 -2013
xviii
NAT
ION
AL H
EALT
HC
ARE
ESTA
BLIS
HM
ENT
& W
OR
KFO
RC
E ST
ATIS
TIC
S 20
12-2
013
H
OSP
ITAL
xviii
CONS
ORT
DIAG
RAM
NHEW
S 20
12 (A
CUTE
CUR
ATIV
E HO
SPIT
ALS)
*Hos
pita
l Ora
ng A
sli G
omba
k w
as p
revi
ousl
y un
der
the
adm
inis
tratio
n of
Ja
bata
n Ke
bajik
an
Ora
ng
Asli
(Abo
rigin
es W
elfa
re D
epar
tmen
t). E
ffect
ive
sinc
e 20
12,
the
hosp
ital
is c
urre
ntly
und
er t
he a
dmin
istra
tion
of
MO
H.
**N
ot f
unct
ioni
ng a
s ho
spita
ls:
not
prov
idin
g in
patie
nt
serv
ices
Analy
sis
Exclu
ded,
n =
1
1.
Long
-term
car
e, n
= 1
a.
Col
umbi
a As
ia E
xten
ded
Car
e H
ospi
tal –
Sha
h Al
am
Tota
l num
ber o
f hos
pita
ls in
Mala
ysia
n
= 36
2
Nu
mbe
r of h
ospi
tals
(ope
ratio
nal)
n =
353
Tota
l in-s
cope
hos
pita
ls
n =
345
MOD
n =
4
Unive
rsity
n =
3
MOH
n =
139
Priva
te
n =
207
Esta
blish
men
ts th
at h
ave c
ease
d to
op
erat
e sin
ce 20
12, n
= 4
a.
Im
ran
Ear,
Nos
e &
Thro
at S
peci
alis
t H
ospi
tal
b.
TMC
Wom
en's
Spe
cial
ist (
Kuan
tan)
Sd
n. B
hd.
c.
Sela
sih
Spec
ialis
t Cen
tre S
dn. B
hd.
d.
Trop
ican
a M
edic
al C
entre
(Pen
ang)
Sd
n. B
hd.
Esta
blish
men
ts th
at w
ere n
ot fu
nctio
ning
as
hos
pita
ls** i
n 20
12-2
013,
n= 5
a.
N
g Sp
ecia
list M
ater
nity
Cen
tre
b.
Kenc
ana
Mat
erni
ty C
entre
Sdn
Bhd
c.
O
ptim
ax E
ye S
peci
alis
t Hos
pita
l (P
enan
g)
d.
HSC
Che
ras
Spec
ialis
ts C
entre
e.
H
ospi
tal P
akar
Scu
dai
Exclu
ded,
n =
7
1. Z
ero
beds
, n =
1
a. H
ospi
tal T
uara
n
2. L
ong-
term
car
e, n
= 6
a.
Lep
rosy
, n =
1
i. R
ajah
Cha
rles
Broo
ke M
emor
ial
Hos
pita
l
b. P
sych
iatri
c in
stitu
tions
, n =
4
i. H
ospi
tal M
esra
Buk
it Pa
dang
ii.
Hos
pita
l Bah
agia
Ulu
Kin
ta
iii. H
ospi
tal P
erm
ai
iv.
Hos
pita
l Sen
tosa
c. R
ehab
ilitat
ion
Cen
tre, n
=1
i.
Hos
pita
l Reh
abilit
asi,
Che
ras
Ne
w ho
spita
ls in
2012
, n =
9
, n =
8
1.
MO
H, n
= 2
a. H
ospi
tal R
ehab
ilitas
i, C
hera
s b.
Hos
pita
l Ora
ng A
sli G
omba
k*
2.
Pr
ivat
e, n
= 7
a.
Beve
rly W
ilshi
re M
edic
al C
entre
b.
C
olum
bia
Asia
Hos
pita
l – S
etap
ak
c.
Hos
pita
l Sun
gai L
ong
d.
Opt
imax
Eye
Spe
cial
ist H
ospi
tal
(Pen
ang)
e.
H
SC C
hera
s Sp
ecia
lists
Cen
tre
f. KP
J Kl
ang
Spec
ialis
t Hos
pita
l
g.
Sim
e D
arby
Med
ical
Cen
tre A
ra
Dam
ansa
ra
Priva
te
n =
207
Publ
ic
n =
146
Inclu
ded
n =
132
Inclu
ded
n =
4
Inclu
ded
n =
206
Inclu
ded
n =
3
CO
NSO
RT D
IAG
RA
M N
HEW
S 20
12 (
AC
UTE
CU
RAT
IVE
HO
SPIT
ALS
)
National Healthcare Establishment & Workforce Statistics Hospital 2012 -2013
xix
NAT
ION
AL H
EALT
HC
ARE
ESTA
BLIS
HM
ENT
& W
OR
KFO
RC
E ST
ATIS
TIC
S 20
12-2
013
HO
SPIT
AL
xix
CONS
ORT
DIAG
RAM
NHEW
S 20
13 (A
CUTE
CUR
ATIV
E HO
SPIT
ALS)
Exclu
ded,
n =
1
1. L
ong-
term
car
e, n
= 1
a.
C
olum
bia
Asia
Ext
ende
d C
are
Hos
pita
l –
Shah
Ala
m
Esta
blish
men
t tha
t has
ceas
ed to
ope
rate
in
2013
, n =
1
a. P
enan
g Sp
ecia
list M
ater
nity
Cen
tre
New
hosp
itals
in 20
13, n
= 7
, n =
8
1.
MO
H, n
= 1
a.
Nat
iona
l Can
cer I
nstit
ute,
Pu
traja
ya
2.
M
OD
, n=
1 a.
H
ospi
tal A
ngka
tan
Tent
era
Wila
yah
Kota
Kin
abal
u
3.
Priv
ate,
n=
5 a.
C
arl C
oryn
ton
Med
ical
Cen
tre
b.
Glo
bal D
octo
rs C
entre
c.
KP
J Pa
sir G
udan
g Sp
ecia
list
Hos
pita
l d.
Bo
rneo
Med
ical
Cen
tre
e.
Park
City
Med
ical
Cen
tre
Analy
sis
Tota
l in-s
cope
hos
pita
ls
n =
351
Inclu
ded
n =
133
Inclu
ded
n =
5
Inclu
ded
n =
210
Inclu
ded
n =
3
Num
ber o
f hos
pita
ls (o
pera
tiona
l)
n =
359
Unive
rsity
n =
3
MOH
n =
140
Tota
l num
ber o
f hos
pita
ls in
Mala
ysia
n
= 36
0
Priva
te
n =
211
MOD
n =
5
Priva
te
n =
211
n =
148
Publ
ic
Exclu
ded,
n =
7
1.
Zero
bed
s, n
= 1
a.
Hos
pita
l Tua
ran
2.
Lon
g-te
rm c
are,
n =
6
a. L
epro
sy, n
= 1
i.
Raj
ah C
harle
s Br
ooke
Mem
oria
l H
ospi
tal
b.
Psy
chia
tric
inst
itutio
ns, n
= 4
i.
Hos
pita
l Mes
ra B
ukit
Pada
ng
ii. H
ospi
tal B
ahag
ia U
lu K
inta
iii.
Hos
pita
l Per
mai
iv
. H
ospi
tal S
ento
sa
c
. Reh
abilit
atio
n C
entre
, n=1
i. H
ospi
tal R
ehab
ilitas
i, C
hera
s
CO
NSO
RT D
IAG
RA
M N
HEW
S 20
13 (
AC
UTE
CU
RAT
IVE
HO
SPIT
ALS
)
National Healthcare Establishment & Workforce Statistics Hospital 2012 -2013
xx
SURVEY RESPONSE RATE
We recorded an improvement in response rate for this round of NHEWS (Hospital) survey. There was a 13% increase in response rate of the maternity centres for the 2012-2013 survey (63.8%) compared with that of 2011 survey (50.8%). Private specialist hospitals also responded well; improving their response rate by 12.6% to 83.6% compared with 71% in 2011. In addition, most large chain private hospitals responded favourably, with a response rate of more than 90%.
A detailed analysis of the survey’s response rate by state and sector may be found in Table A5.2 of Appendix 5.
Factors leading to an improved response rate include:
• Strengthened networking between the NHEWS (Hospital) project team and relevant bodies/establishments of the private health sector.
• Maturity in experience of the NHEWS (Hospital) project team in obtaining response from the survey participants.
• Brief CRFs compared to those of previous NHEWS (Hospital) surveys.
National Healthcare Establishment & Workforce Statistics Hospital 2012 -2013
xxi
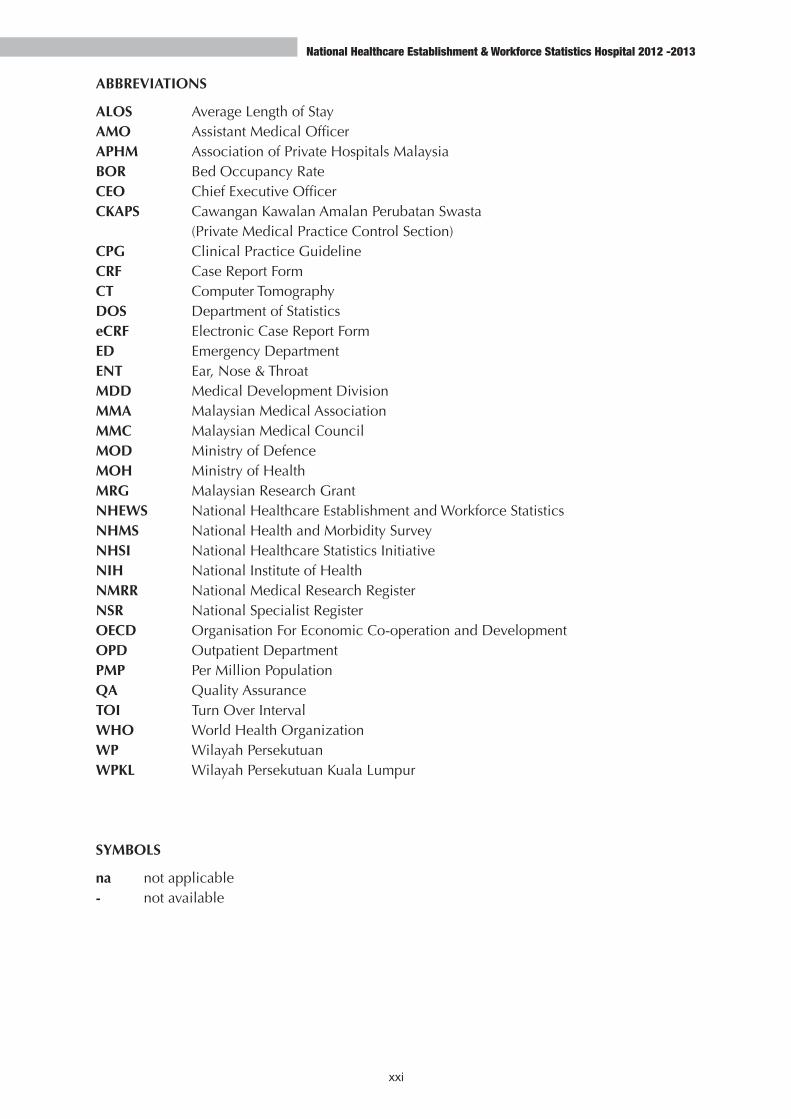
ABBREVIATIONS
ALOS Average Length of StayAMO Assistant Medical OfficerAPHM Association of Private Hospitals MalaysiaBOR Bed Occupancy RateCEO Chief Executive OfficerCKAPS Cawangan Kawalan Amalan Perubatan Swasta (Private Medical Practice Control Section)CPG Clinical Practice GuidelineCRF Case Report FormCT Computer TomographyDOS Department of StatisticseCRF Electronic Case Report FormED Emergency DepartmentENT Ear, Nose & ThroatMDD Medical Development DivisionMMA Malaysian Medical Association MMC Malaysian Medical CouncilMOD Ministry of DefenceMOH Ministry of HealthMRG Malaysian Research GrantNHEWS National Healthcare Establishment and Workforce StatisticsNHMS National Health and Morbidity SurveyNHSI National Healthcare Statistics InitiativeNIH National Institute of HealthNMRR National Medical Research RegisterNSR National Specialist RegisterOECD Organisation For Economic Co-operation and DevelopmentOPD Outpatient DepartmentPMP Per Million PopulationQA Quality AssuranceTOI Turn Over IntervalWHO World Health OrganizationWP Wilayah PersekutuanWPKL Wilayah Persekutuan Kuala Lumpur SYMBOLS
na not applicable- not available

This page intentionally left blank
National Healthcare Establishment & Workforce Statistics Hospital 2012 -2013
1
EXECUTIVE SUMMARY
The NHEWS (Hospital) survey is a provider-based survey, and is essentially a census on relevant hospital services in Malaysia. In this fourth NHEWS (Hospital) report, we feature the country’s hospital statistics for two consecutive years (2012-2013). The statistics report on hospital facilities, activities, selected medical device and health workforce in the delivery of acute curative care services. Besides that, we also aim to highlight patterns / trends in the hospital services. Therefore where applicable, we have also displayed data for the NHEWS (Hospital) 2010/2011 survey in this report for the purpose of comparison.
Chapter 1: Hospital Facilities
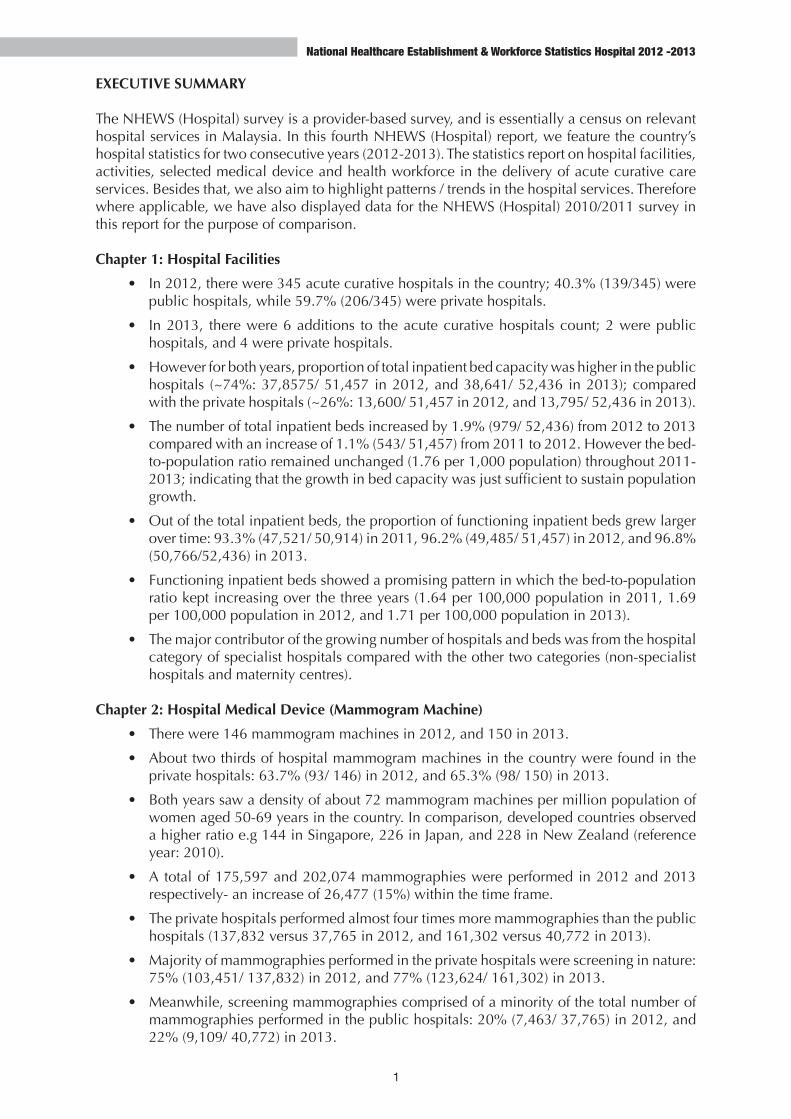
• In 2012, there were 345 acute curative hospitals in the country; 40.3% (139/345) were public hospitals, while 59.7% (206/345) were private hospitals.
• In 2013, there were 6 additions to the acute curative hospitals count; 2 were public hospitals, and 4 were private hospitals.
• However for both years, proportion of total inpatient bed capacity was higher in the public hospitals (~74%: 37,8575/ 51,457 in 2012, and 38,641/ 52,436 in 2013); compared with the private hospitals (~26%: 13,600/ 51,457 in 2012, and 13,795/ 52,436 in 2013).
• The number of total inpatient beds increased by 1.9% (979/ 52,436) from 2012 to 2013 compared with an increase of 1.1% (543/ 51,457) from 2011 to 2012. However the bed-to-population ratio remained unchanged (1.76 per 1,000 population) throughout 2011-2013; indicating that the growth in bed capacity was just sufficient to sustain population growth.
• Out of the total inpatient beds, the proportion of functioning inpatient beds grew larger over time: 93.3% (47,521/ 50,914) in 2011, 96.2% (49,485/ 51,457) in 2012, and 96.8% (50,766/52,436) in 2013.
• Functioning inpatient beds showed a promising pattern in which the bed-to-population ratio kept increasing over the three years (1.64 per 100,000 population in 2011, 1.69 per 100,000 population in 2012, and 1.71 per 100,000 population in 2013).
• The major contributor of the growing number of hospitals and beds was from the hospital category of specialist hospitals compared with the other two categories (non-specialist hospitals and maternity centres).
Chapter 2: Hospital Medical Device (Mammogram Machine)
• There were 146 mammogram machines in 2012, and 150 in 2013.
• About two thirds of hospital mammogram machines in the country were found in the private hospitals: 63.7% (93/ 146) in 2012, and 65.3% (98/ 150) in 2013.
• Both years saw a density of about 72 mammogram machines per million population of women aged 50-69 years in the country. In comparison, developed countries observed a higher ratio e.g 144 in Singapore, 226 in Japan, and 228 in New Zealand (reference year: 2010).
• A total of 175,597 and 202,074 mammographies were performed in 2012 and 2013 respectively- an increase of 26,477 (15%) within the time frame.
• The private hospitals performed almost four times more mammographies than the public hospitals (137,832 versus 37,765 in 2012, and 161,302 versus 40,772 in 2013).
• Majority of mammographies performed in the private hospitals were screening in nature: 75% (103,451/ 137,832) in 2012, and 77% (123,624/ 161,302) in 2013.
• Meanwhile, screening mammographies comprised of a minority of the total number of mammographies performed in the public hospitals: 20% (7,463/ 37,765) in 2012, and 22% (9,109/ 40,772) in 2013.
National Healthcare Establishment & Workforce Statistics Hospital 2012 -2013
2
Chapter 3: Hospital Activities
Inpatient Activities
• The year 2012 and 2013 each observed approximately 3.4-3.5 million hospital admissions per year; demonstrating an increase of 2.3% (83,029/ 3,542,997) within the two-year period.
• Admission-to-population ratio also grew (1.1%) from 2012 to 2013.
• For both years, the public hospitals saw a higher load of admissions (~71%: 2,454,698/ 3,459,968 in 2012, and 2,507,151/ 3,542,997 in 2013); compared with the private hospitals (~29%: 1,005,270/ 3,459,968 in 2012, and 1,035,846/ 3,542,997 in 2013).
• On a daily basis, the public hospitals received 2.5 times more admissions than the private hospitals.
• Over the years, mean average length of stay (ALOS) for the country has kept at 3.5 days. Mean ALOS for the public hospitals was a day longer than the private hospitals (3.8 days versus 2.8 days).
• Mean bed occupancy rate (BOR) was highest in the specialist hospitals among the three hospital categories (~71% in the specialist hospitals, ~46% in the non-specialist hospitals, and ~34% in the maternity centres).
• Interestingly, mean BOR of public specialist hospitals remained almost unchanged over time while that of public non-specialist hospitals demonstrated a decreasing pattern; highlighting underutilisation of public non-specialist hospitals.
• Consistent with BOR, mean turnover interval (TOI) was shortest for the specialist hospitals (~1.5 days) compared with the non-specialist hospitals (~3 days) and the maternity centres (3.5-4.5 days).
Outpatient Activities
• Hospital outpatient activities for 2012 and 2013 each amounted to 32-33 million visits per year; outnumbering inpatient activities (admissions) by nine times.
• In both years, the highest proportion of outpatient visits was observed in the specialist clinics (~49%: 15,836,155/ 32,268,454 in 2012, and 16,090,011/ 32,933,967 in 2013), followed by emergency departments (~28%: 9,147,144/ 32,268,454 in 2012, and 9,362,209/ 32,933,967 in 2013), and general outpatient departments (~23%: 7,285,155/ 32,268,454 in 2012, and 7,481,747/ 32,933,967 in 2013).
• Majority of the emergency department visits occurred in the public hospitals (~82%: 7,585,804/ 9,147,144 in 2012, and 7,632,331/ 9,362,209 in 2013).
• Similarly, most of the general outpatient department visits happened in the public hospitals (~73%: 5,359,471/ 7285,155 in 2012, and 5,413,101/ 7,481,747 in 2013)
Chapter 4: Hospital Health Workforce
Doctors (Specialists and Medical Officers)
• In 2013, there were 19,927 doctors working in acute curative hospitals (67.1 doctors per 100,000 population).
• Most doctors were working in the public hospitals (79.9%: 15,913/ 19,927); while the rest were working in the private hospitals (20.1%: 4,014/ 19,927).
• Over the past four years (2010-2013), the number of doctors has increased by 25% (5,022/ 19,927); the majority of which were public hospital doctors i.e. 87.8% (4,407/ 5,022), while the remaining 12.2% (615/ 5,022) were private hospital doctors.
National Healthcare Establishment & Workforce Statistics Hospital 2012 -2013
3
• Majority of doctors were working in the West Coast region of Peninsular Malaysia. The highest doctor-to-population ratio was seen in Klang Valley* (99.6 per 100,000 population). Meanwhile, the lowest ratios were recorded by Sabah & WP Labuan (9.1 per 100,000 population), Terengganu (12.9 per 100,000 population), and Sarawak (14.8 per 100,000 population).
• The doctor workforce in 2013 consisted of 39% specialists (7,788/ 19.927), and 61% (12,139/ 19,927) medical officers.
• Over the four-year period, the number of medical officers increased at a higher rate (32.2%: 3,910/ 12,139) than that of the specialists (14.3%: 1,112/ 7,788).
* Klang Valley refers to Selangor, WP Putrajaya, and WP Kuala Lumpur
Staff Nurses
• There were 68,121 staff nurses (229 per 100,000 population) working in acute curative hospitals in 2013.
• Staff nurses in the public hospitals made up the majority: 74.2% (50,541/ 68,121), while the remaining 25.8% (17, 580/ 68,121) consisted of staff nurses in the private hospitals.
• There was also a higher proportion of staff nurses with post-basic training qualification within the public hospital staff nurse workforce (35.4%: 17,885/ 50,541) versus the private hospital staff nurse workforce (19.0%: 3,342/17,580).
• Pulau Pinang, Melaka, and the states within Klang Valley had around 300 staff nurses per 100,000 population, while Sarawak, Terengganu, Sabah, WP Labuan, and Johor had less than 200 staff nurses per 100,000 population.
Assistant Medical Officers (AMO)
• In 2013, 6,568 AMOs (22 per 100,000 population) were working in acute curative hospitals.
• A large majority of AMOs were working in the public hospitals (98.8%: 6,488/ 6,568), while the remaining 1.2% were working in the private hospitals (80/ 6,568).
• Out of all AMOs in the public hospitals, 41.3% (2,680/ 6,488) held post-basic training; while only 17.5% (14/ 80) of the total number of AMOs in the private hospitals had similar training.
• Most states recorded AMO-to-population ratio of around 22-27 per 100,000 population i.e. approximating the national average. However Perlis recorded the highest with 44 AMOs per 100,000 population; while Klang Valley, and Johor each recorded about 17 AMOs per 100,000 population.
Radiographers
• In 2013, there were 3,258 radiographers working in acute curative hospitals; 2,419 (74.2%) in the public hospitals, and 839 (25.8%) in the private hospitals.
• The national average of radiographer-to-population ratio was 11 per 100,000 population. The highest ratios were recorded by Pulau Pinang, Perlis, and Klang Valley (12-15 per 100,000 population). Meanwhile the lowest ratios were observed in Kedah, Terengganu, and Sabah & WP Labuan (7-8 per 100,000 population).
• Radiographers with post-basic qualification can only be reported for the public hospitals. There were more radiographers with post-basic training in CT scan (5.3%: 128/ 2,419) compared with radiographers with post-basic training in mammogram (1.3%: 31/ 2,419).

This page intentionally left blank
Chapter 1 :
Hospital Facilities
6
National Healthcare Establishment & Workforce Statistics Hospital 2012 -2013
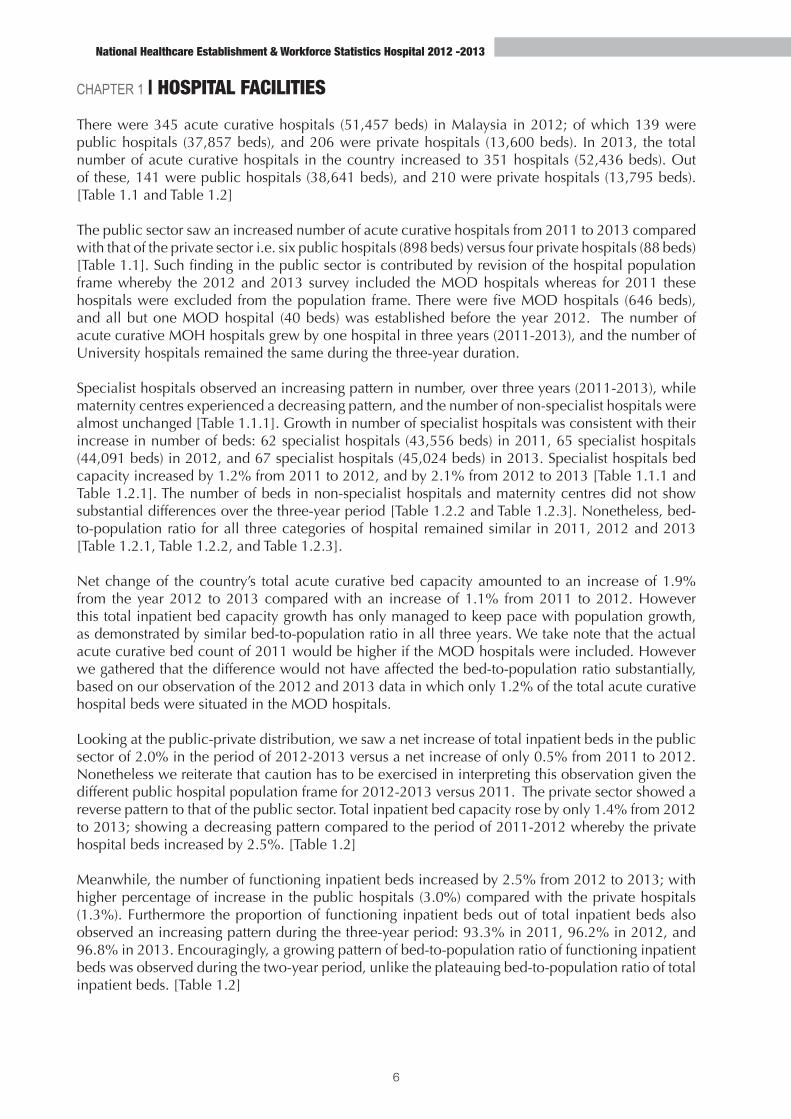
CHAPTER 1 | HOSPITAL FACILITIESThere were 345 acute curative hospitals (51,457 beds) in Malaysia in 2012; of which 139 were public hospitals (37,857 beds), and 206 were private hospitals (13,600 beds). In 2013, the total number of acute curative hospitals in the country increased to 351 hospitals (52,436 beds). Out of these, 141 were public hospitals (38,641 beds), and 210 were private hospitals (13,795 beds). [Table 1.1 and Table 1.2]
The public sector saw an increased number of acute curative hospitals from 2011 to 2013 compared with that of the private sector i.e. six public hospitals (898 beds) versus four private hospitals (88 beds) [Table 1.1]. Such finding in the public sector is contributed by revision of the hospital population frame whereby the 2012 and 2013 survey included the MOD hospitals whereas for 2011 these hospitals were excluded from the population frame. There were five MOD hospitals (646 beds), and all but one MOD hospital (40 beds) was established before the year 2012. The number of acute curative MOH hospitals grew by one hospital in three years (2011-2013), and the number of University hospitals remained the same during the three-year duration.
Specialist hospitals observed an increasing pattern in number, over three years (2011-2013), while maternity centres experienced a decreasing pattern, and the number of non-specialist hospitals were almost unchanged [Table 1.1.1]. Growth in number of specialist hospitals was consistent with their increase in number of beds: 62 specialist hospitals (43,556 beds) in 2011, 65 specialist hospitals (44,091 beds) in 2012, and 67 specialist hospitals (45,024 beds) in 2013. Specialist hospitals bed capacity increased by 1.2% from 2011 to 2012, and by 2.1% from 2012 to 2013 [Table 1.1.1 and Table 1.2.1]. The number of beds in non-specialist hospitals and maternity centres did not show substantial differences over the three-year period [Table 1.2.2 and Table 1.2.3]. Nonetheless, bed-to-population ratio for all three categories of hospital remained similar in 2011, 2012 and 2013 [Table 1.2.1, Table 1.2.2, and Table 1.2.3].
Net change of the country’s total acute curative bed capacity amounted to an increase of 1.9% from the year 2012 to 2013 compared with an increase of 1.1% from 2011 to 2012. However this total inpatient bed capacity growth has only managed to keep pace with population growth, as demonstrated by similar bed-to-population ratio in all three years. We take note that the actual acute curative bed count of 2011 would be higher if the MOD hospitals were included. However we gathered that the difference would not have affected the bed-to-population ratio substantially, based on our observation of the 2012 and 2013 data in which only 1.2% of the total acute curative hospital beds were situated in the MOD hospitals.
Looking at the public-private distribution, we saw a net increase of total inpatient beds in the public sector of 2.0% in the period of 2012-2013 versus a net increase of only 0.5% from 2011 to 2012. Nonetheless we reiterate that caution has to be exercised in interpreting this observation given the different public hospital population frame for 2012-2013 versus 2011. The private sector showed a reverse pattern to that of the public sector. Total inpatient bed capacity rose by only 1.4% from 2012 to 2013; showing a decreasing pattern compared to the period of 2011-2012 whereby the private hospital beds increased by 2.5%. [Table 1.2]
Meanwhile, the number of functioning inpatient beds increased by 2.5% from 2012 to 2013; with higher percentage of increase in the public hospitals (3.0%) compared with the private hospitals (1.3%). Furthermore the proportion of functioning inpatient beds out of total inpatient beds also observed an increasing pattern during the three-year period: 93.3% in 2011, 96.2% in 2012, and 96.8% in 2013. Encouragingly, a growing pattern of bed-to-population ratio of functioning inpatient beds was observed during the two-year period, unlike the plateauing bed-to-population ratio of total inpatient beds. [Table 1.2]
7
CHAP
TER
1: H
OSPI
TAL
FACI
LITI
ES
National Healthcare Establishment & Workforce Statistics Hospital 2012 -2013
Limitation:
1. Inclusion of MOD hospitals into this survey (while being excluded in the previous NHEWS (Hospital) surveys) necessitates caution to be exercised when interpreting trend over the years.
2. Data presented here is at the national and state level. Therefore it does not illustrate intrastate
facility distribution.

8
National Healthcare Establishment & Workforce Statistics Hospital 2012 -2013
Tabl
e 1.
1: N
umbe
r &
Den
sity
of A
cute
Cur
ativ
e H
ospi
tals
in M
alay
sia
by S
tate
and
Sec
tor,
2011
-201
3.
Stat
eSe
ctor
*Ye
ar 2
011
Year
201
2Ye
ar 2
013
Num
ber
Per
100,
000
popu
lati
onN
umbe
rPe
r 10
0,00
0 po
pula
tion
Num
ber
Per
100,
000
popu
lati
onM
alay
sia
Publ
ic13
5 -
13
9 -
14
1 -
M
alay
sia
Priv
ate
206
-
206
-
210
-
Mal
aysi
aTo
tal
341
1.1
8 34
5 1
.18
351
1.1
8 Pe
rlis
Publ
ic1
-
1 -
1
-
Perl
isPr
ivat
e0
-
0 -
0
-
Perl
isTo
tal
1 0
.42
1 0
.42
1 0
.41
Keda
hPu
blic
9 -
9
-
9 -
Ke
dah
Priv
ate
9 -
8
-
8 -
Ke
dah
Tota
l18
0.9
1 17
0.8
5 17
0.8
4 Ke
dah
& P
erlis
Publ
ic10
-
10 -
10
-
Keda
h &
Per
lisPr
ivat
e0
-
0 -
0
-
Keda
h &
Per
lisTo
tal
10 0
.45
10 0
.45
10 0
.44
Pula
u Pi
nang
Publ
ic6
-
6 -
6
-
Pula
u Pi
nang
Priv
ate
22 -
21
-
21 -
Pu
lau
Pina
ngTo
tal
28 1
.73
27 1
.68
27 1
.66
Pera
kPu
blic
14 -
15
-
15 -
Pe
rak
Priv
ate
16 -
16
-
16 -
Pe
rak
Tota
l30
1.2
5 31
1.2
8 31
1.2
7 Se
lang
orPu
blic
11 -
11
-
11 -
Se
lang
orPr
ivat
e49
-
53 -
53
-
Sela
ngor
Tota
l60
1.0
8 64
1.1
3 64
1.1
2 W
P Pu
traj
aya
Publ
ic1
-
1 -
2
-
WP
Putr
ajay
aPr
ivat
e0
-
0 -
0
-
WP
Putr
ajay
aTo
tal
1 1
.31
1 1
.26
2 2
.42
WP
Kual
a Lu
mpu
rPu
blic
4 -
5
-
5 -
W
P Ku
ala
Lum
pur
Priv
ate
37 -
37
-
39 -
W
P Ku
ala
Lum
pur
Tota
l41
2.4
2 42
2.5
1 44
2.6
0 Se
lang
or &
WP
Putr
ajay
a &
WP
Kau
ala
Lum
pur
Publ
ic16
-
17 -
18
-
Sela
ngor
& W
P Pu
traj
aya
& W
P K
aual
a Lu
mpu
rPr
ivat
e86
-
90 -
92
-
Sela
ngor
& W
P Pu
traj
aya
& W
P Ku
ala
Lum
pur
Tota
l10
2 1
.39
107
1.4
5 11
0 1
.47
Abb
revi
atio
n: -
not
ava
ilabl
eSe
lang
or &
WP
Putr
ajay
a &
WPK
L ar
e al
so c
olle
ctiv
ely
refe
rred
to a
s K
lang
Val
ley.
*P
ublic
sec
tor
in 2
011
refe
rs to
MO
H a
nd U
nive
rsity
hos
pita
ls, w
hile
pub
lic s
ecto
r in
201
2 &
201
3 re
fers
to M
OH
, Uni
vers
ity, a
nd M
OD
hos
pita
ls.
Fo
r po
pula
tion
data
, ple
ase
refe
r App
endi
x 3:
Tab
le A
3.1

9
CHAP
TER
1: H
OSPI
TAL
FACI
LITI
ES
National Healthcare Establishment & Workforce Statistics Hospital 2012 -2013
Tabl
e 1.
1 [c
onti
nued
]: N
umbe
r &
Den
sity
of A
cute
Cur
ativ
e H
ospi
tals
in M
alay
sia
by S
tate
and
Sec
tor,
2011
-201
3.
Abb
revi
atio
n: -
not
ava
ilabl
eSe
lang
or &
WP
Putr
ajay
a &
WPK
L ar
e al
so c
olle
ctiv
ely
refe
rred
to a
s K
lang
Val
ley.
*P
ublic
sec
tor
in 2
011
refe
rs to
MO
H a
nd U
nive
rsity
hos
pita
ls, w
hile
pub
lic s
ecto
r in
201
2 &
201
3 re
fers
to M
OH
, Uni
vers
ity, a
nd M
OD
hos
pita
ls.
Fo
r po
pula
tion
data
, ple
ase
refe
r App
endi
x 3:
Tab
le A
3.1
Stat
eSe
ctor
*Ye
ar 2
011
Year
201
2Ye
ar 2
013
Num
ber
Per
100,
000
popu
lati
onN
umbe
rPe
r 10
0,00
0 po
pula
tion
Num
ber
Per
100,
000
popu
lati
onN
eger
i Sem
bila
nPu
blic
6 -
7
-
7 -
N
eger
i Sem
bila
nPr
ivat
e9
-
9 -
9
-
Neg
eri S
embi
lan
Tota
l15
1.4
4 16
1.5
1 16
1.5
0 M
elak
aPu
blic
3 -
4
-
4 -
M
elak
aPr
ivat
e4
-
4 -
4
-
Mel
aka
Tota
l7
0.8
4 8
0.9
5 8
0.9
4 Jo
hor
Publ
ic11
-
11 -
11
-
Joho
rPr
ivat
e30
-
28 -
29
-
Joho
rTo
tal
41 1
.21
39 1
.13
40 1
.15
Paha
ngPu
blic
10 -
10
-
10 -
Pa
hang
Priv
ate
9 -
9
-
9 -
Pa
hang
Tota
l19
1.2
5 19
1.2
3 19
1.2
1 Te
reng
ganu
Publ
ic6
-
6 -
6
-
Tere
ngga
nuPr
ivat
e1
-
1 -
1
-
Tere
ngga
nuTo
tal
7 0
.65
7 0
.64
7 0
.63
Kela
ntan
Publ
ic10
-
10 -
10
-
Kela
ntan
Priv
ate
3 -
3
-
3 -
Ke
lant
anTo
tal
13 0
.82
13 0
.79
13 0
.78
Sara
wak
Publ
ic20
-
20 -
20
-
Sara
wak
Priv
ate
12 -
12
-
13 -
Sa
raw
akTo
tal
32 1
.27
32 1
.26
33 1
.28
Saba
hPu
blic
22 -
22
-
23 -
Sa
bah
Priv
ate
5 -
5
-
5 -
Sa
bah
Tota
l27
0.8
1 27
0.8
0 28
0.8
2 W
P La
buan
Publ
ic1
-
1 -
1
-
WP
Labu
anPr
ivat
e0
-
0 -
0
-
WP
Labu
anTo
tal
1 1
.11
1 1
.09
1 1
.07
Saba
h &
WP
Labu
anPu
blic
23 -
23
-
24 -
Sa
bah
& W
P La
buan
Priv
ate
5 -
5
-
5 -
Sa
bah
& W
P La
buan
Tota
l28
0.8
2 28
0.8
1 29
0.8
2

10
National Healthcare Establishment & Workforce Statistics Hospital 2012 -2013
Tabl
e 1.
1.1:
Num
ber
& D
ensi
ty o
f Cat
egor
ies
of A
cute
Cur
ativ
e H
ospi
tals
in M
alay
sia
by S
tate
and
Sec
tor,
2011
-201
3
Stat
eSe
ctor
*
Spec
ialis
t H
ospi
tal
Non
Spe
cial
ist
Hos
pita
lM
ater
nity
Cen
tre
2011
2012
2013
2011
2012
2013
2011
2012
2013
Number
Per 100,000 population
Number
Per 100,000 population
Number
Per 100,000 population
Number
Per 100,000 population
Number
Per 100,000 population
Number
Per 100,000 population
Number
Per 100,000 population
Number
Per 100,000 population
Number
Per 100,000 population
Mal
aysi
aPu
blic
62-
65-
67-
73-
74-
74-
0-
0-
0-
Mal
aysi
aPr
ivat
e13
5-
136
-14
1-
1-
1-
1-
70-
69-
68-
Mal
aysi
aTo
tal
197
0.6
8 20
1 0
.69
208
0.7
0 74
0.2
6 75
0.2
6 75
0.2
5 70
0.2
4 69
0.2
4 68
0.2
3 Pe
rlis
Publ
ic1
-1
-1
-0
-0
-0
-na
-na
-na
-Pe
rlis
Priv
ate
0-
0-
0-
0-
0-
0-
0-
0-
0-
Perl
isTo
tal
1 0
.42
1 0
.42
1 0
.41
00.
000
0.00
00.
000
0.00
00.
00na
0.00
Keda
hPu
blic
4-
4-
4-
5-
5-
5-
na-
na-
na-
Keda
hPr
ivat
e5
-6
-6
-0
-0
-0
-4
-2
-2
-Ke
dah
Tota
l9
0.4
6 10
0.5
0 10
0.4
9 5
0.2
5 5
0.2
5 5
0.2
5 4
0.2
0 2
0.1
0 2
0.1
0 Ke
dah
& P
erlis
Publ
ic5
-5
-5
-5
-5
-5
-0
-0
-0
-Ke
dah
& P
erlis
Priv
ate
5-
6-
6-
0-
0-
0-
4-
2-
2-
Keda
h &
Per
lisTo
tal
10 0
.45
11 0
.49
11 0
.49
5 0
.23
5 0
.22
5 0
.22
4 0
.18
2 0
.09
2 0
.09
Pula
u Pi
nang
Publ
ic4
-4
-4
-2
-2
-2
-na
-na
-na
-Pu
lau
Pina
ngPr
ivat
e15
-14
-15
-0
-0
-0
-7
-7
-6
-Pu
lau
Pina
ngTo
tal
19 1
.19
18 1
.12
19 1
.17
2 0
.13
2 0
.12
2 0
.12
7 0
.44
7 0
.43
6 0
.37
Pera
kPu
blic
5-
6-
6-
9-
9-
9-
na-
na-
na-
Pera
kPr
ivat
e12
-12
-12
-0
-0
-0
-4
-4
-4
-Pe
rak
Tota
l17
0.7
1 18
0.7
4 18
0.7
4 9
0.3
8 9
0.3
7 9
0.3
7 4
0.1
7 4
0.1
7 4
0.1
6 Se
lang
orPu
blic
7-
7-
7-
4-
4-
4-
na-
na-
na-
Sela
ngor
Priv
ate
34-
36-
36-
0-
0-
0-
15-
17-
17-
Sela
ngor
Tota
l41
0.7
4 43
0.7
6 43
0.7
5 4
0.0
7 4
0.0
7 4
0.0
7 15
0.2
7 17
0.3
0 17
0.3
0 W
P Pu
traj
aya
Publ
ic1
-1
-2
-0
-0
-0
-na
-na
-na
-W
P Pu
traj
aya
Priv
ate
0-
0-
0-
0-
0-
0-
0-
0-
0-
WP
Putr
ajay
aTo
tal
1 1
.31
1 1
.26
2 2
.42
00.
000
0.00
00.
000
0.00
00.
000
0.00
WPK
LPu
blic
4-
5-
5-
0-
0-
0-
na-
na-
na-
WPK
LPr
ivat
e24
-24
-26
-0
-0
-0
-13
-13
-13
-W
PKL
Tota
l28
1.6
5 29
1.7
5 31
1.8
5 0
0.00
00.
000
0.00
13 0
.77
13 0
.76
13 0
.75
Sela
ngor
& W
P Pu
traj
aya
& W
PKL
Publ
ic12
-13
-14
-4
-4
-4
-na
-0
-na
-Se
lang
or &
WP
Putr
ajay
a &
WPK
LPr
ivat
e58
-60
-62
-0
-0
-0
-28
-30
-30
-Se
lang
or &
WP
Putr
ajay
a &
WPK
LTo
tal
70 4
.13
73 4
.32
76 4
.45
4 0
.24
4 0
.23
4 0
.23
28 1
.65
30 1
.75
30 1
.73
Abb
revi
atio
n: -
not
ava
ilabl
e; n
a -
not a
pplic
able
Sela
ngor
& W
P Pu
traj
aya
& W
PKL
are
also
col
lect
ivel
y re
ferr
ed to
as
Kla
ng V
alle
y.
*
Publ
ic s
ecto
r in
201
1 re
fers
to M
OH
and
Uni
vers
ity h
ospi
tals
, whi
le p
ublic
sec
tor
in 2
012
& 2
013
refe
rs to
MO
H, U
nive
rsity
, and
MO
D h
ospi
tals
.
Fo
r po
pula
tion
data
, ple
ase
refe
r App
endi
x 3:
Tab
le A
3.1

11
CHAP
TER
1: H
OSPI
TAL
FACI
LITI
ES
National Healthcare Establishment & Workforce Statistics Hospital 2012 -2013
Tabl
e 1.
1.1
[con
tinu
ed]:
Num
ber
& D
ensi
ty o
f Cat
egor
ies
of A
cute
Cur
ativ
e H
ospi
tals
in M
alay
sia
by S
tate
and
Sec
tor,
2011
-201
3
Stat
eSe
ctor
*
Spec
ialis
t H
ospi
tal
Non
Spe
cial
ist
Hos
pita
lM
ater
nity
Cen
tre
2011
2012
2013
2011
2012
2013
2011
2012
2013
Number
Per 100,000 population
Number
Per 100,000 population
Number
Per 100,000 population
Number
Per 100,000 population
Number
Per 100,000 population
Number
Per 100,000 population
Number
Per 100,000 population
Number
Per 100,000 population
Number
Per 100,000 population
Neg
eri S
embi
lan
Publ
ic3
-3
-3
-3
-4
-4
-na
-na
-na
-N
eger
i Sem
bila
nPr
ivat
e7
-7
-7
-0
-0
-0
-2
-2
-2
-N
eger
i Sem
bila
nTo
tal
10 0
.96
10 0
.95
10 0
.93
3 0
.29
4 0
.38
4 0
.37
2 0
.19
2 0
.19
2 0
.19
Mel
aka
Publ
ic1
-2
-2
-2
-2
-2
-na
-na
-na
-M
elak
aPr
ivat
e4
-4
-4
-0
-0
-0
-0
-0
-0
-M
elak
aTo
tal
5 0
.60
6 0
.71
6 0
.70
2 0
.24
2 0
.24
2 0
.23
00.
000
0.00
00.
00Jo
hor
Publ
ic6
-6
-6
-5
-5
-5
-na
-na
-na
-Jo
hor
Priv
ate
13-
12-
13-
1-
1-
1-
16-
15-
15-
Joho
rTo
tal
19 0
.56
18 0
.52
19 0
.55
6 0
.18
6 0
.17
6 0
.17
16 0
.47
15 0
.44
15 0
.43
Paha
ngPu
blic
4-
4-
4-
6-
6-
6-
na-
na-
na-
Paha
ngPr
ivat
e5
-5
-5
-0
-0
-0
-4
-4
-4
-Pa
hang
Tota
l9
0.5
9 9
0.5
8 9
0.5
7 6
0.3
9 6
0.3
9 6
0.3
8 4
0.2
6 4
0.2
6 4
0.2
5 Te
reng
ganu
Publ
ic2
-2
-2
-4
-4
-4
-na
-na
-na
-Te
reng
ganu
Priv
ate
1-
1-
1-
0-
0-
0-
0-
0-
0-
Tere
ngga
nuTo
tal
3 0
.28
3 0
.27
3 0
.27
4 0
.37
4 0
.37
4 0
.36
00.
000
0.00
00.
00Ke
lant
anPu
blic
4-
4-
4-
6-
6-
6-
na-
na-
na-
Kela
ntan
Priv
ate
3-
3-
3-
0-
0-
0-
0-
0-
0-
Kela
ntan
Tota
l7
0.4
3 7
0.4
3 7
0.4
2 6
0.3
7 6
0.3
7 6
0.3
6 0
0.00
00.
000
0.00
Sara
wak
Publ
ic8
-8
-8
-12
-12
-12
-na
-na
-na
-Sa
raw
akPr
ivat
e9
-9
-10
-0
-0
-0
-3
-3
-3
-Sa
raw
akTo
tal
17 0
.68
17 0
.67
18 0
.70
12 0
.48
12 0
.47
12 0
.47
3 0
.12
3 0
.12
3 0
.12
Saba
hPu
blic
7-
7-
8-
15-
15-
15-
na-
na-
na-
Saba
hPr
ivat
e3
-3
-3
-0
-0
-0
-2
-2
-2
-Sa
bah
Tota
l10
0.3
0 10
0.3
0 11
0.3
2 15
0.4
5 15
0.4
4 15
0.4
4 2
0.0
6 2
0.0
6 2
0.0
6 W
P La
buan
Publ
ic1
-1
-1
-0
-0
-0
-na
-na
-na
-W
P La
buan
Priv
ate
0-
0-
0-
0-
0-
0-
0-
0-
0-
WP
Labu
anTo
tal
1 1
.11
1 1
.09
1 1
.07
00.
000
0.00
00.
000
0.00
00.
000
0.00
Saba
h &
WP
Labu
anPu
blic
8-
8-
9-
15-
15-
15-
0-
0-
na-
Saba
h &
WP
Labu
anPr
ivat
e3
-3
-3
-0
-0
-0
-2
-2
-2
-Sa
bah
& W
P La
buan
Tota
l11
1.3
2 11
1.3
1 12
1.4
1 15
1.7
6 15
1.7
8 15
1.7
6 2
0.2
4 2
0.2
4 2
0.2
3
Abb
revi
atio
n: -
not
ava
ilabl
e; n
a -
not a
pplic
able
Sela
ngor
& W
P Pu
traj
aya
& W
PKL
are
also
col
lect
ivel
y re
ferr
ed to
as
Kla
ng V
alle
y.
*
Publ
ic s
ecto
r in
201
1 re
fers
to M
OH
and
Uni
vers
ity h
ospi
tals
, whi
le p
ublic
sec
tor
in 2
012
& 2
013
refe
rs to
MO
H, U
nive
rsity
, and
MO
D h
ospi
tals
.
For
popu
latio
n da
ta, p
leas
e re
fer A
ppen
dix
3: T
able
A3.
1

12
National Healthcare Establishment & Workforce Statistics Hospital 2012 -2013
Tabl
e 1.
2 : N
umbe
r &
Den
sity
of T
otal
Inp
atie
nt B
eds
& F
unct
ioni
ng I
npat
ient
Bed
s in
Acu
te C
urat
ive
Hos
pita
ls in
Mal
aysi
a by
Sta
te &
Sec
tor,
2011
-201
3
Stat
eSe
ctor
*
Tota
l Inp
atie
nt B
eds
Func
tion
ing
Inpa
tien
t B
eds
2011
2012
2013
2011
2012
2013
Number
Per 1,000 population
Number
Per 1,000 population
Number
Per 1,000 population
Number
Per 1,000 population
Number
Per 1,000 population
Number
Per 1,000 population
Mal
aysi
aPu
blic
37,6
59
-37
,857
-
38,6
41
-35
,581
-
36,3
72
-37
,487
-
Mal
aysi
aPr
ivat
e13
,255
-
13,6
00
- 13
,795
-
11,9
40
- 13
,113
-
13,2
79
- M
alay
sia
Tota
l50
,914
1
.76
51,4
57
1.7
5 52
,436
1
.76
47,5
21
1.6
4 49
,485
1
.69
50,7
66
1.7
1 Pe
rlis
Publ
ic 4
04
- 4
04
- 4
04
- 3
90
- 4
04
- 4
04
- Pe
rlis
Priv
ate
na
- n
a -
na
- n
a -
na
- n
a -
Perl
isTo
tal
404
1
.70
404
1
.69
404
1
.67
390
1
.64
404
1
.69
404
1
.67
Keda
hPu
blic
2,3
90
- 2
,404
-
2,4
30
- 2
,294
-
2,3
43
- 2
,369
-
Keda
hPr
ivat
e 5
42
- 5
29
- 5
33
- 5
37
- 5
29
- 5
33
- Ke
dah
Tota
l 2
,932
1
.49
2,9
33
1.4
7 2
,963
1
.47
2,8
31
1.4
3 2
,872
1
.44
2,9
02
1.4
4 Ke
dah
& P
erlis
Publ
ic 2
,794
-
2,8
08
- 2
,834
-
2,6
84
- 2
,747
-
2,7
73
- Ke
dah
& P
erlis
Priv
ate
542
-
529
-
533
-
537
-
529
-
533
-
Keda
h &
Per
lisTo
tal
3,3
36
1.5
1 3
,337
1
.49
3,3
67
1.4
9 3
,221
1
.46
3,2
76
1.4
6 3
,306
1
.46
Pula
u Pi
nang
Publ
ic 1
,947
-
1,9
47
- 1
,947
-
1,9
47
- 1
,947
-
1,9
47
- Pu
lau
Pina
ngPr
ivat
e 1
,920
-
1,9
96
- 2
,037
-
1,6
93
- 1
,986
-
2,0
14
- Pu
lau
Pina
ngTo
tal
3,8
67
2.4
3 3
,943
2
.45
3,9
84
2.4
5 3
,640
2
.28
3,9
33
2.4
4 3
,961
2
.43
Pera
kPu
blic
3,5
80
- 3
,724
-
3,7
24
- 3
,324
-
3,5
04
- 3
,568
-
Pera
kPr
ivat
e 8
60
- 1
,023
-
1,0
23
- 7
94
- 1
,015
-
1,0
15
- Pe
rak
Tota
l 4
,440
1
.85
4,7
47
1.9
6 4
,747
1
.95
4,1
18
1.7
2 4
,519
1
.87
4,5
83
1.8
8 Se
lang
orPu
blic
4,7
65
- 4
,684
w
- 4
,684
-
4,2
79
- 4
,325
-
4,4
03
- Se
lang
orPr
ivat
e 3
,267
-
3,4
01
- 3
,417
-
2,9
92
- 3
,278
-
3,3
22
- Se
lang
orTo
tal
8,0
32
1.4
4 8
,085
1
.43
8,1
01
1.4
2 7
,271
1
.30
7,6
03
1.3
5 7
,725
1
.35
WP
Putr
ajay
aPu
blic
278
-
341
-
593
-
278
-
310
-
548
-
WP
Putr
ajay
aPr
ivat
e n
a -
na
- n
a -
na
- n
a -
na
- W
P Pu
traj
aya
Tota
l 2
78
3.6
4 3
41
4.2
9 5
93
7.1
9 2
78
3.6
4 3
10
3.9
0 5
48
6.6
4 W
P Ku
ala
Lum
pur
Publ
ic 4
,651
-
4,6
50
- 4
,681
-
4,0
75
- 4
,267
-
4,3
99
- W
P Ku
ala
Lum
pur
Priv
ate
3,0
15
- 3
,188
-
3,2
71
- 2
,584
-
2,9
37
- 2
,982
-
WP
Kual
a Lu
mpu
rTo
tal
7,6
66
4.5
2 7
,838
4
.57
7,9
52
4.5
9 6
,659
3
.93
7,2
04
4.2
0 7
,381
4
.26
Sela
ngor
& W
P Pu
traj
aya
& W
P Ku
ala
Lum
pur
Publ
ic 9
,694
-
9,6
75
- 9
,958
-
8,6
32
- 8
,902
-
9,3
50
- Se
lang
or &
WP
Putr
ajay
a &
WP
Kual
a Lu
mpu
rPr
ivat
e 6
,282
-
6,5
89
- 6
,689
-
5,5
76
- 6
,215
-
6,3
04
- Se
lang
or &
WP
Putr
ajay
a &
WP
Kual
a Lu
mpu
rTo
tal
15,
976
2.1
7 1
6,26
4 2
.18
16,
647
2.2
1 1
4,20
8 1
.93
15,
117
2.0
3 1
5,65
4 2
.08
Abb
revi
atio
n: -
not
ava
ilabl
e; n
a -
not a
pplic
able
Sela
ngor
& W
P Pu
traj
aya
& W
PKL
are
also
col
lect
ivel
y re
ferr
ed to
as
Kla
ng V
alle
y.
*
Publ
ic s
ecto
r in
201
1 re
fers
to M
OH
and
Uni
vers
ity h
ospi
tals
, whi
le p
ublic
sec
tor
in 2
012
& 2
013
refe
rs to
MO
H, U
nive
rsity
, and
MO
D h
ospi
tals
.
Fo
r po
pula
tion
data
, ple
ase
refe
r App
endi
x 3:
Tab
le A
3.1

13
CHAP
TER
1: H
OSPI
TAL
FACI
LITI
ES
National Healthcare Establishment & Workforce Statistics Hospital 2012 -2013
Tabl
e 1.
2 [c
onti
nued
]: N
umbe
r &
Den
sity
of T
otal
Inp
atie
nt B
eds
& F
unct
ioni
ng I
npat
ient
Bed
s in
Acu
te C
urat
ive
Hos
pita
ls in
Mal
aysi
a by
Sta
te &
Sec
tor,
2011
-201
3
Stat
eSe
ctor
*
Tota
l Inp
atie
nt B
eds
Func
tion
ing
Inpa
tien
t B
eds
2011
2012
2013
2011
2012
2013
Number
Per 1,000 population
Number
Per 1,000 population
Number
Per 1,000 population
Number
Per 1,000 population
Number
Per 1,000 population
Number
Per 1,000 population
Neg
eri S
embi
lan
Publ
ic 1
,527
-
1,5
63
- 1
,563
-
1,5
13
- 1
,549
-
1,5
49
- N
eger
i Sem
bila
nPr
ivat
e 5
17
- 5
47
- 5
59
- 5
17
- 5
47
- 5
59
- N
eger
i Sem
bila
nTo
tal
2,0
44
1.9
6 2
,110
2
.00
2,1
22
1.9
8 2
,030
1
.95
2,0
96
1.9
8 2
,108
1
.97
Mel
aka
Publ
ic 1
,006
-
1,2
90
- 1
,339
-
1,0
06
- 1
,290
-
1,3
39
- M
elak
aPr
ivat
e 8
13
- 6
97
- 7
25
- 7
16
- 6
76
- 7
04
- M
elak
aTo
tal
1,8
19
2.1
8 1
,987
2
.36
2,0
64
2.4
2 1
,722
2
.07
1,9
66
2.3
3 2
,043
2
.40
Joho
rPu
blic
3,6
34
- 3
,634
-
3,8
36
- 3
,578
-
3,5
68
- 3
,770
-
Joho
rPr
ivat
e 1
,062
-
1,2
26
- 1
,230
-
968
-
1,1
76
- 1
,170
-
Joho
rTo
tal
4,6
96
1.3
8 4
,860
1
.41
5,0
66
1.4
6 4
,546
1
.34
4,7
44
1.3
8 4
,940
1
.42
Paha
ngPu
blic
2,0
30
- 1
,996
-
2,0
46
- 1
,962
-
1,9
62
- 2
,046
-
Paha
ngPr
ivat
e 3
40
- 2
82
- 2
82
- 3
38
- 2
77
- 2
77
- Pa
hang
Tota
l 2
,370
1
.55
2,2
78
1.4
7 2
,328
1
.48
2,3
00
1.5
1 2
,239
1
.45
2,3
23
1.4
8 Te
reng
ganu
Publ
ic 1
,342
-
1,3
42
- 1
,342
-
1,3
42
- 1
,342
-
1,3
42
- Te
reng
ganu
Priv
ate
33
- 3
3 -
33
- 3
3 -
33
- 3
3 -
Tere
ngga
nuTo
tal
1,3
75
1.2
8 1
,375
1
.26
1,3
75
1.2
4 1
,375
1
.28
1,3
75
1.2
6 1
,375
1
.24
Kela
ntan
Publ
ic 2
,399
-
2,4
75
- 2
,485
-
2,3
99
- 2
,475
-
2,4
85
- Ke
lant
anPr
ivat
e 1
62
- 1
76
- 1
76
- 1
62
- 1
64
- 1
69
- Ke
lant
anTo
tal
2,5
61
1.5
9 2
,651
1
.62
2,6
61
1.6
0 2
,561
1
.59
2,6
39
1.6
1 2
,654
1
.59
Sara
wak
Publ
ic 3
,453
-
3,4
33
- 3
,449
-
3,3
10
- 3
,338
-
3,4
13
- Sa
raw
akPr
ivat
e 4
75
- 3
73
- 3
75
- 4
49
- 3
73
- 3
75
- Sa
raw
akTo
tal
3,9
28
1.5
6 3
,806
1
.50
3,8
24
1.4
8 3
,759
1
.49
3,7
11
1.4
6 3
,788
1
.47
Saba
hPu
blic
4,1
44
- 3
,861
-
4,0
09
- 3
,775
-
3,6
39
- 3
,796
-
Saba
hPr
ivat
e 2
49
- 1
30
- 1
34
- 1
57
- 1
23
- 1
27
- Sa
bah
Tota
l 4
,393
1
.32
3,9
91
1.1
8 4
,143
1
.21
3,9
32
1.1
9 3
,762
1
.12
3,9
23
1.1
4 W
P La
buan
Publ
ic 1
09
- 1
09
- 1
09
- 1
09
- 1
09
- 1
09
- W
P La
buan
Priv
ate
na
- n
a -
na
- n
a -
na
- n
a -
WP
Labu
anTo
tal
109
1
.21
109
1
.19
109
1
.17
109
1
.21
109
1
.19
109
1
.17
Saba
h &
WP
Labu
anPu
blic
4,2
53
- 3
,970
-
4,1
18
- 3
,884
-
3,7
48
- 3
,905
-
Saba
h &
WP
Labu
anPr
ivat
e 2
49
- 1
30
- 1
34
- 1
57
- 1
23
- 1
27
- Sa
bah
& W
P La
buan
Tota
l 4
,502
1
.32
4,1
00
1.1
8 4
,252
1
.21
4,0
41
1.1
9 3
,871
1
.12
4,0
32
1.1
5
Abb
revi
atio
n: -
not
ava
ilabl
e; n
a -
not a
pplic
able
Sela
ngor
& W
P Pu
traj
aya
& W
PKL
are
also
col
lect
ivel
y re
ferr
ed to
as
Kla
ng V
alle
y.
*
Publ
ic s
ecto
r in
201
1 re
fers
to M
OH
and
Uni
vers
ity h
ospi
tals
, whi
le p
ublic
sec
tor
in 2
012
& 2
013
refe
rs to
MO
H, U
nive
rsity
, and
MO
D h
ospi
tals
.
Fo
r po
pula
tion
data
, ple
ase
refe
r App
endi
x 3:
Tab
le A
3.1

14
National Healthcare Establishment & Workforce Statistics Hospital 2012 -2013
Tabl
e 1.
2.1
: Num
ber
& D
ensi
ty o
f Tot
al I
npat
ient
Bed
s an
d Fu
ncti
onin
g B
eds
in (
Acu
te C
urat
ive)
Spe
cial
ist
Hos
pita
ls in
Mal
aysi
a by
Sta
te &
Sec
tor,
2011
-201
3
Stat
eSe
ctor
*
Tota
l Inp
atie
nt B
eds
Func
tion
ing
Inpa
tien
t B
eds
2011
2012
2013
2011
2012
2013
Number
Per 1,000 population
Number
Per 1,000 population
Number
Per 1,000 population
Number
Per 1,000 population
Number
Per 1,000 population
Number
Per 1,000 population
Mal
aysi
aPu
blic
31,0
66-
31,2
99-
32,0
34-
29,4
34-
30,0
62-
31,1
10-
Mal
aysi
aPr
ivat
e12
,490
-12
,792
-12
,990
-11
,219
-12
,317
-12
,485
- M
alay
sia
Tota
l43
,556
1.50
44,0
911.
5045
,024
1.52
40,6
531.
4042
,379
1.44
43,5
951.
47Pe
rlis
Publ
ic40
4-
404
- 40
4-
390
- 40
4-
404
- Pe
rlis
Priv
ate
na -
na -
na -
na -
na -
na-
Perl
isTo
tal
404
1.70
404
1.69
404
1.67
390
1.64
404
1.69
404
1.67
Keda
hPu
blic
1,83
0-
1,84
4-
1,87
0-
1,77
7-
1,82
6-
1,85
2-
Keda
hPr
ivat
e48
5 -
501
-50
5 -
480
-50
1 -
505
- Ke
dah
Tota
l2,
315
1.17
2,34
51.
172,
375
1.18
2,25
71.
142,
327
1.17
2,35
71.
17Ke
dah
& P
erlis
Publ
ic1,
830
- 1,
844
- 1,
870
- 2,
167
- 2,
230
- 2,
256
- Ke
dah
& P
erlis
Priv
ate
485
-50
1 -
505
-48
0 -
501
-50
5-
Keda
h &
Per
lisTo
tal
2,31
51.
052,
345
1.05
2,37
51.
052,
647
1.20
2,73
11.
222,
761
1.22
Pula
u Pi
nang
Publ
ic1,
771
- 1,
771
- 1,
771
- 1,
771
- 1,
771
- 1,
771
- Pu
lau
Pina
ngPr
ivat
e1,
810
-1,
893
-1,
959
-1,
583
-1,
883
-1,
936
- Pu
lau
Pina
ngTo
tal
3,58
12.
253,
664
2.27
3,73
02.
293,
354
2.10
3,65
42.
273,
707
2.28
Pera
kPu
blic
2,66
6-
2,81
0-
2,81
0-
2,55
6-
2,65
0-
2,69
6-
Pera
kPr
ivat
e83
9 -
1,00
4 -
1,00
4 -
773
-99
6 -
996
- Pe
rak
Tota
l3,
505
1.46
3,81
41.
583,
814
1.57
3,32
91.
393,
646
1.51
3,69
21.
52Se
lang
orPu
blic
4,24
2-
4,23
4-
4,23
4-
3,79
6-
3,87
5-
3,95
3-
Sela
ngor
Priv
ate
3,04
8 -
3,18
6 -
3,19
0 -
2,77
3 -
3,06
4 -
3,09
5-
Sela
ngor
Tota
l7,
290
1.31
7,42
01.
317,
424
1.30
6,56
91.
186,
939
1.23
7,04
81.
23W
P Pu
traj
aya
Publ
ic27
8-
341
- 59
3-
278
- 31
0-
548
- W
P Pu
traj
aya
Priv
ate
na -
na -
na -
na -
na -
na-
WP
Putr
ajay
aTo
tal
278
3.64
341
4.29
593
7.19
278
3.64
310
3.90
548
6.64
WP
Kual
a Lu
mpu
rPu
blic
4,65
1-
4,65
0-
4,68
1-
4,07
5-
4,26
7-
4,39
9-
WP
Kual
a Lu
mpu
rPr
ivat
e2,
926
-3,
045
-3,
132
-2,
526
-2,
800
-2,
848
- W
P Ku
ala
Lum
pur
Tota
l7,
577
4.47
7,69
54.
497,
813
4.51
6,60
13.
907,
067
4.12
7,24
74.
18Se
lang
or &
WP
Putr
ajay
a &
WP
Kual
a Lu
mpu
rPu
blic
9,17
1-
9,22
5-
9,50
8-
8,14
9-
8,45
2-
8,90
0-
Sela
ngor
& W
P Pu
traj
aya
& W
P Ku
ala
Lum
pur
Priv
ate
5,97
4 -
6,23
1 -
6,32
1 -
5,29
9 -
5,86
4 -
5,94
3-
Sela
ngor
& W
P Pu
traj
aya
& W
P Ku
ala
Lum
pur
Tota
l15
,145
2.06
15,4
562.
0815
,829
2.10
13,4
481.
8314
,316
1.92
14,8
431.
97
Abb
revi
atio
n: -
not
ava
ilabl
e; n
a -
not a
pplic
able
Sela
ngor
& W
P Pu
traj
aya
& W
PKL
are
also
col
lect
ivel
y re
ferr
ed to
as
Kla
ng V
alle
y.
*
Publ
ic s
ecto
r in
201
1 re
fers
to M
OH
and
Uni
vers
ity h
ospi
tals
, whi
le p
ublic
sec
tor
in 2
012
& 2
013
refe
rs to
MO
H, U
nive
rsity
, and
MO
D h
ospi
tals
.
For
popu
latio
n da
ta, p
leas
e re
fer A
ppen
dix
3: T
able
A3.
1

15
CHAP
TER
1: H
OSPI
TAL
FACI
LITI
ES
National Healthcare Establishment & Workforce Statistics Hospital 2012 -2013
Tabl
e 1.
2.1
[con
tinu
ed]:
Num
ber
& D
ensi
ty o
f Tot
al I
npat
ient
Bed
s an
d Fu
ncti
onin
g B
eds
in (
Acu
te C
urat
ive)
Spe
cial
ist
Hos
pita
ls in
Mal
aysi
a by
Sta
te &
Sec
tor,
2011
-201
3
Stat
eSe
ctor
*
Tota
l Inp
atie
nt B
eds
Func
tion
ing
Inpa
tien
t B
eds
2011
2012
2013
2011
2012
2013
Number
Per 1,000 population
Number
Per 1,000 population
Number
Per 1,000 population
Number
Per 1,000 population
Number
Per 1,000 population
Number
Per 1,000 population
Neg
eri S
embi
lan
Publ
ic1,
258
- 1,
258
- 1,
258
- 1,
248
- 1,
258
- 1,
258
- N
eger
i Sem
bila
nPr
ivat
e51
7 -
538
-55
0 -
517
-53
8 -
550
- N
eger
i Sem
bila
nTo
tal
1,77
51.
701,
796
1.70
1,80
81.
691,
765
1.69
1,79
61.
701,
808
1.69
Mel
aka
Publ
ic90
1-
1,18
5-
1,18
5-
901
- 1,
185
- 1,
185
- M
elak
aPr
ivat
e81
3 -
697
-72
5 -
716
-67
6 -
704
- M
elak
aTo
tal
1,71
42.
061,
882
2.23
1,91
02.
241,
617
1.94
1,86
12.
211,
889
2.22
Joho
rPu
blic
3,13
9-
3,13
9-
3,34
1-
3,08
3-
3,07
3-
3,27
5-
Joho
rPr
ivat
e86
4 -
1,01
0 -
1,00
5 -
783
-96
0 -
945
- Jo
hor
Tota
l4,
003
1.18
4,14
91.
214,
346
1.25
3,86
61.
144,
033
1.17
4,22
01.
21Pa
hang
Publ
ic1,
573
- 1,
573
- 1,
623
- 1,
539
- 1,
539
- 1,
623
- Pa
hang
Priv
ate
312
-25
2 -
252
-31
0 -
252
-25
2-
Paha
ngTo
tal
1,88
51.
241,
825
1.18
1,87
51.
191,
849
1.21
1,79
11.
161,
875
1.19
Tere
ngga
nuPu
blic
937
- 93
7-
937
- 93
7-
937
- 93
7-
Tere
ngga
nuPr
ivat
e33
-33
-33
-33
-33
-33
- Te
reng
ganu
Tota
l97
00.
9097
00.
8997
00.
8797
00.
9097
00.
8997
00.
87Ke
lant
anPu
blic
1,93
7-
1,95
7-
1,96
7-
1,93
7-
1,95
7-
1,96
7-
Kela
ntan
Priv
ate
162
-17
6 -
176
-16
2 -
164
-16
9-
Kela
ntan
Tota
l2,
099
1.30
2,13
31.
302,
143
1.29
2,09
91.
302,
121
1.29
2,13
61.
28Sa
raw
akPu
blic
2,70
5-
2,70
5-
2,72
1-
2,61
6-
2,61
6-
2,69
1-
Sara
wak
Priv
ate
450
-35
6 -
359
-42
4 -
356
-35
9-
Sara
wak
Tota
l3,
155
1.25
3,06
11.
203,
080
1.20
3,04
01.
212,
972
1.17
3,05
01.
18Sa
bah
Publ
ic2,
665
- 2,
382
- 2,
530
- 2,
421
- 2,
285
- 2,
442
- Sa
bah
Priv
ate
231
-10
1 -
101
-13
9 -
94 -
94-
Saba
hTo
tal
2,89
60.
872,
483
0.74
2,63
10.
772,
560
0.77
2,37
90.
712,
536
0.74
WP
Labu
anPu
blic
109
- 10
9-
109
- 10
9-
109
- 10
9-
WP
Labu
anPr
ivat
ena
-na
-na
-na
-na
-na
- W
P La
buan
Tota
l10
91.
2110
91.
1910
91.
1710
91.
2110
91.
1910
91.
17Sa
bah
& W
P La
buan
Publ
ic2,
774
- 2,
491
- 2,
639
- 2,
530
- 2,
394
- 2,
551
- Sa
bah
& W
P La
buan
Priv
ate
231
-10
1 -
101
-13
9 -
94 -
94-
Saba
h &
WP
Labu
anTo
tal
3,00
50.
882,
592
0.75
2,74
00.
782,
669
0.78
2,48
80.
722,
645
0.75
Abb
revi
atio
n: -
not
ava
ilabl
e; n
a -
not a
pplic
able
Sela
ngor
& W
P Pu
traj
aya
& W
PKL
are
also
col
lect
ivel
y re
ferr
ed to
as
Kla
ng V
alle
y.
*
Publ
ic s
ecto
r in
201
1 re
fers
to M
OH
and
Uni
vers
ity h
ospi
tals
, whi
le p
ublic
sec
tor
in 2
012
& 2
013
refe
rs to
MO
H, U
nive
rsity
, and
MO
D h
ospi
tals
.
For
popu
latio
n da
ta, p
leas
e re
fer A
ppen
dix
3: T
able
A3.
1

16
National Healthcare Establishment & Workforce Statistics Hospital 2012 -2013
Tabl
e 1.
2.2:
Num
ber
& D
ensi
ty o
f Tot
al I
npat
ient
Bed
s an
d Fu
ncti
onin
g B
eds
in (
Acu
te C
urat
ive)
Non
-Spe
cial
ist
Hos
pita
ls in
Mal
aysi
a by
Sta
te &
Sec
tor,
2011
-201
3
Stat
eSe
ctor
*
Tota
l Inp
atie
nt B
eds
Func
tion
ing
Inpa
tien
t B
eds
2011
2012
2013
2011
2012
2013
Number
Per 1,000 population
Number
Per 1,000 population
Number
Per 1,000 population
Number
Per 1,000 population
Number
Per 1,000 population
Number
Per 1,000 population
Mal
aysi
aPu
blic
6,59
3-
6,55
8-
6,60
7-
6,14
7-
6,31
0-
6,37
7-
Mal
aysi
aPr
ivat
e51
- 48
- 54
- 51
- 48
- 54
- M
alay
sia
Tota
l6,
644
0.23
6,60
60.
236,
661
0.22
6,19
80.
216,
358
0.22
6,43
10.
22Pe
rlis
Publ
icna
- na
- na
- na
- na
- na
- Pe
rlis
Priv
ate
na-
na-
na-
na-
na-
na-
Perl
isTo
tal
nana
nana
nana
nana
nana
nana
Keda
hPu
blic
560
- 56
0-
560
- 51
7-
517
- 51
7-
Keda
hPr
ivat
ena
- na
- na
- na
- na
- na
- Ke
dah
Tota
l56
00.
2856
00.
2856
00.
2851
70.
2651
70.
2651
70.
26Ke
dah
& P
erlis
Publ
ic56
0-
560
- 56
0-
517
- 51
7-
517
- Ke
dah
& P
erlis
Priv
ate
na-
na-
na-
na-
na-
na-
Keda
h &
Per
lisTo
tal
560
0.25
560
0.25
560
0.25
517
0.23
517
0.23
517
0.23
Pula
u Pi
nang
Publ
ic17
6-
176
- 17
6-
176
- 17
6-
176
- Pu
lau
Pina
ngPr
ivat
ena
- na
- na
- na
- na
- na
- Pu
lau
Pina
ngTo
tal
176
0.11
176
0.11
176
0.11
176
0.11
176
0.11
176
0.11
Pera
kPu
blic
914
- 91
4-
914
- 76
8-
854
- 87
2-
Pera
kPr
ivat
ena
- na
- na
- na
- na
- na
- Pe
rak
Tota
l91
40.
3891
40.
3891
40.
3876
80.
3285
40.
3587
20.
36Se
lang
orPu
blic
523
- 45
0-
450
- 48
3-
450
- 45
0-
Sela
ngor
Priv
ate
na-
na-
na-
na-
na-
na-
Sela
ngor
Tota
l52
30.
0945
00.
0845
00.
0848
30.
0945
00.
0845
00.
08W
P Pu
traj
aya
Publ
icna
- na
- na
- na
- na
- na
- W
P Pu
traj
aya
Priv
ate
na-
na-
na-
na-
na-
na-
WP
Putr
ajay
aTo
tal
nana
nana
nana
nana
nana
nana
WP
Kual
a Lu
mpu
rPu
blic
na-
na-
na-
na-
na-
na-
WP
Kual
a Lu
mpu
rPr
ivat
ena
- na
- na
- na
- na
- na
- W
P Ku
ala
Lum
pur
Tota
lna
nana
nana
na0.
000.
000.
00Se
lang
or &
WP
Putr
ajay
a &
WP
Kual
a Lu
mpu
rPu
blic
523
- 45
0-
450
- 48
3-
450
- 45
0-
Sela
ngor
& W
P Pu
traj
aya
& W
P Ku
ala
Lum
pur
Priv
ate
na-
na-
na-
na-
na-
na-
Sela
ngor
& W
P Pu
traj
aya
& W
P Ku
ala
Lum
pur
Tota
l52
30.
0745
00.
0645
00.
0648
30.
0745
00.
0645
00.
06
Abb
revi
atio
n: -
not
ava
ilabl
e; n
a -
not a
pplic
able
Sela
ngor
& W
P Pu
traj
aya
& W
PKL
are
also
col
lect
ivel
y re
ferr
ed to
as
Kla
ng V
alle
y.
*
Publ
ic s
ecto
r in
201
1 re
fers
to M
OH
and
Uni
vers
ity h
ospi
tals
, whi
le p
ublic
sec
tor
in 2
012
& 2
013
refe
rs to
MO
H, U
nive
rsity
, and
MO
D h
ospi
tals
.
Fo
r po
pula
tion
data
, ple
ase
refe
r App
endi
x 3:
Tab
le A
3.1

17
CHAP
TER
1: H
OSPI
TAL
FACI
LITI
ES
National Healthcare Establishment & Workforce Statistics Hospital 2012 -2013
Tabl
e 1.
2.2
[con
tinu
ed]:
Num
ber
& D
ensi
ty o
f Tot
al I
npat
ient
Bed
s an
d Fu
ncti
onin
g B
eds
in (
Acu
te C
urat
ive)
Non
-Spe
cial
ist
Hos
pita
ls in
Mal
aysi
a by
Sta
te &
Sec
tor,
2011
-201
3
Stat
eSe
ctor
*
Tota
l Inp
atie
nt B
eds
Func
tion
ing
Inpa
tien
t B
eds
2011
2012
2013
2011
2012
2013
Number
Per 1,000 population
Number
Per 1,000 population
Number
Per 1,000 population
Number
Per 1,000 population
Number
Per 1,000 population
Number
Per 1,000 population
Neg
eri S
embi
lan
Publ
ic26
9-
305
- 30
5-
265
- 29
1-
291
- N
eger
i Sem
bila
nPr
ivat
ena
- na
- na
- na
- na
- na
- N
eger
i Sem
bila
nTo
tal
269
0.26
305
0.29
305
0.29
265
0.25
291
0.28
291
0.27
Mel
aka
Publ
ic10
5-
105
- 15
4-
105
- 10
5-
154
- M
elak
aPr
ivat
ena
- na
- na
- na
- na
- na
- M
elak
aTo
tal
105
0.13
105
0.12
154
0.18
105
0.13
105
0.12
154
0.18
Joho
rPu
blic
495
- 49
5-
495
- 49
5-
495
- 49
5-
Joho
rPr
ivat
e51
- 48
- 54
- 51
- 48
- 54
- Jo
hor
Tota
l54
60.
1654
30.
1654
90.
1654
60.
1654
30.
1654
90.
16Pa
hang
Publ
ic45
7-
423
- 42
3-
423
- 42
3-
423
- Pa
hang
Priv
ate
na-
na-
na-
na-
na-
na-
Paha
ngTo
tal
457
0.30
423
0.27
423
0.27
423
0.28
423
0.27
423
0.27
Tere
ngga
nuPu
blic
405
- 40
5-
405
- 40
5-
405
- 40
5-
Tere
ngga
nuPr
ivat
ena
- na
- na
- na
- na
- na
- Te
reng
ganu
Tota
l40
50.
3840
50.
3740
50.
3640
50.
3840
50.
3740
50.
36Ke
lant
anPu
blic
462
- 51
8-
518
- 46
2-
518
- 51
8-
Kela
ntan
Priv
ate
na-
na-
na-
na-
na-
na-
Kela
ntan
Tota
l46
20.
2951
80.
3251
80.
3146
20.
2951
80.
3251
80.
31Sa
raw
akPu
blic
748
- 72
8-
728
- 69
4-
722
- 72
2-
Sara
wak
Priv
ate
na-
na-
na-
na-
na-
na-
Sara
wak
Tota
l74
80.
3072
80.
2972
80.
2869
40.
2872
20.
2872
20.
28Sa
bah
Publ
ic14
79-
1479
- 14
79-
1354
- 13
54-
1354
- Sa
bah
Priv
ate
na-
na-
na-
na-
na-
na-
Saba
hTo
tal
1479
0.45
1479
0.44
1479
0.43
1354
0.41
1354
0.40
1354
0.39
WP
Labu
anPu
blic
na-
na-
na-
na-
na-
na-
WP
Labu
anPr
ivat
ena
- na
- na
- na
- na
- na
- W
P La
buan
Tota
lna
nana
nana
nana
nana
nana
naSa
bah
& W
P La
buan
Publ
ic14
79-
1479
- 14
79-
1354
- 13
54-
1354
- Sa
bah
& W
P La
buan
Priv
ate
na-
na-
na-
na-
na-
na-
Saba
h &
WP
Labu
anTo
tal
1479
0.43
1479
0.43
1479
0.42
1354
0.40
1354
0.39
1354
0.38
Abb
revi
atio
n: -
not
ava
ilabl
e; n
a -
not a
pplic
able
Sela
ngor
& W
P Pu
traj
aya
& W
PKL
are
also
col
lect
ivel
y re
ferr
ed to
as
Kla
ng V
alle
y.
*
Publ
ic s
ecto
r in
201
1 re
fers
to M
OH
and
Uni
vers
ity h
ospi
tals
, whi
le p
ublic
sec
tor
in 2
012
& 2
013
refe
rs to
MO
H, U
nive
rsity
, and
MO
D h
ospi
tals
.
Fo
r po
pula
tion
data
, ple
ase
refe
r App
endi
x 3:
Tab
le A
3.1
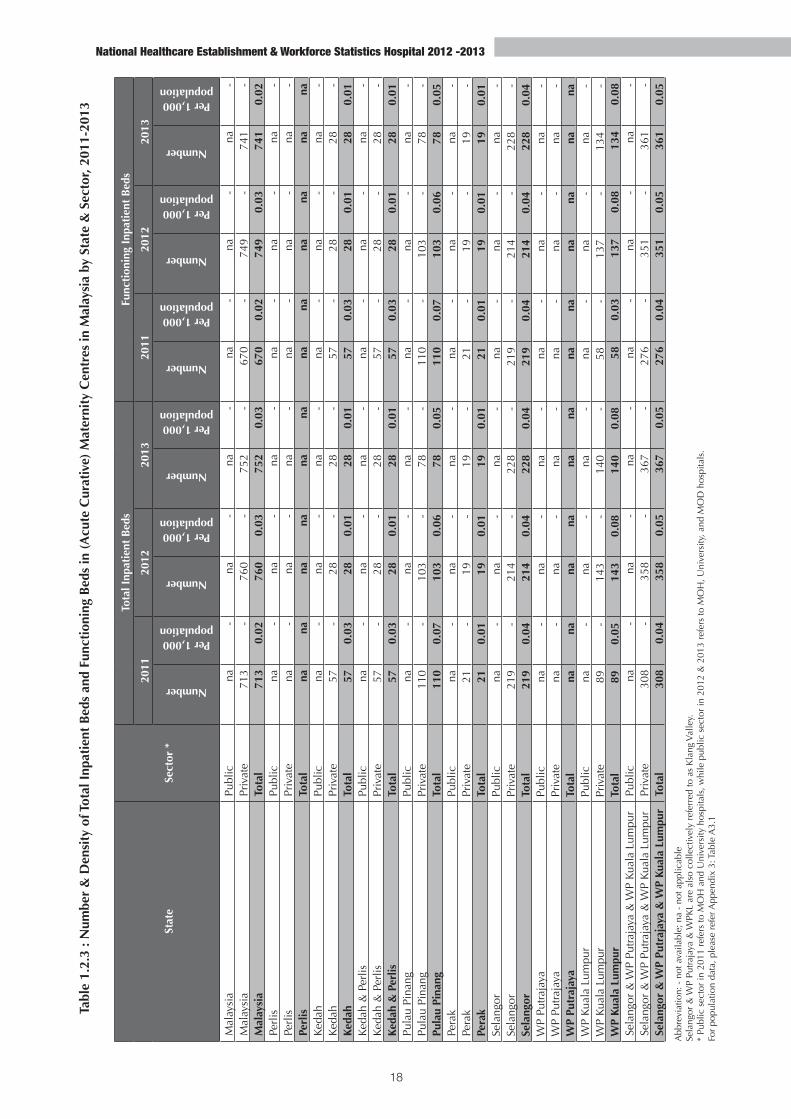
18
National Healthcare Establishment & Workforce Statistics Hospital 2012 -2013
Tabl
e 1.
2.3
: Num
ber
& D
ensi
ty o
f Tot
al I
npat
ient
Bed
s an
d Fu
ncti
onin
g B
eds
in (
Acu
te C
urat
ive)
Mat
erni
ty C
entr
es in
Mal
aysi
a by
Sta
te &
Sec
tor,
2011
-201
3
Stat
eSe
ctor
*
Tota
l Inp
atie
nt B
eds
Func
tion
ing
Inpa
tien
t B
eds
2011
2012
2013
2011
2012
2013
Number
Per 1,000 population
Number
Per 1,000 population
Number
Per 1,000 population
Number
Per 1,000 population
Number
Per 1,000 population
Number
Per 1,000 population
Mal
aysi
aPu
blic
na-
na-
na-
na-
na-
na-
Mal
aysi
aPr
ivat
e71
3-
760
- 75
2-
670
- 74
9-
741
- M
alay
sia
Tota
l71
30.
0276
00.
0375
20.
0367
00.
0274
90.
0374
10.
02Pe
rlis
Publ
icna
- na
- na
- na
- na
- na
- Pe
rlis
Priv
ate
na-
na-
na-
na-
na-
na-
Perl
isTo
tal
nana
nana
nana
nana
nana
nana
Keda
hPu
blic
na-
na-
na-
na-
na-
na-
Keda
hPr
ivat
e57
- 28
- 28
- 57
- 28
- 28
- Ke
dah
Tota
l57
0.03
280.
0128
0.01
570.
0328
0.01
280.
01Ke
dah
& P
erlis
Publ
icna
- na
- na
- na
- na
- na
- Ke
dah
& P
erlis
Priv
ate
57-
28-
28-
57-
28-
28-
Keda
h &
Per
lisTo
tal
570.
0328
0.01
280.
0157
0.03
280.
0128
0.01
Pula
u Pi
nang
Publ
icna
- na
- na
- na
- na
- na
- Pu
lau
Pina
ngPr
ivat
e11
0-
103
- 78
- 11
0-
103
- 78
- Pu
lau
Pina
ngTo
tal
110
0.07
103
0.06
780.
0511
00.
0710
30.
0678
0.05
Pera
kPu
blic
na-
na-
na-
na-
na-
na-
Pera
kPr
ivat
e21
- 19
- 19
- 21
- 19
- 19
- Pe
rak
Tota
l21
0.01
190.
0119
0.01
210.
0119
0.01
190.
01Se
lang
orPu
blic
na-
na-
na-
na-
na-
na-
Sela
ngor
Priv
ate
219
- 21
4-
228
- 21
9-
214
- 22
8-
Sela
ngor
Tota
l21
90.
0421
40.
0422
80.
0421
90.
0421
40.
0422
80.
04W
P Pu
traj
aya
Publ
icna
- na
- na
- na
- na
- na
- W
P Pu
traj
aya
Priv
ate
na-
na-
na-
na-
na-
na-
WP
Putr
ajay
aTo
tal
nana
nana
nana
nana
nana
nana
WP
Kual
a Lu
mpu
rPu
blic
na-
na-
na-
na-
na-
na-
WP
Kual
a Lu
mpu
rPr
ivat
e89
- 14
3-
140
- 58
- 13
7-
134
- W
P Ku
ala
Lum
pur
Tota
l89
0.05
143
0.08
140
0.08
580.
0313
70.
0813
40.
08Se
lang
or &
WP
Putr
ajay
a &
WP
Kual
a Lu
mpu
rPu
blic
na-
na-
na-
na-
na-
na-
Sela
ngor
& W
P Pu
traj
aya
& W
P Ku
ala
Lum
pur
Priv
ate
308
- 35
8-
367
- 27
6-
351
- 36
1-
Sela
ngor
& W
P Pu
traj
aya
& W
P Ku
ala
Lum
pur
Tota
l30
80.
0435
80.
0536
70.
0527
60.
0435
10.
0536
10.
05
Abb
revi
atio
n: -
not
ava
ilabl
e; n
a -
not a
pplic
able
Sela
ngor
& W
P Pu
traj
aya
& W
PKL
are
also
col
lect
ivel
y re
ferr
ed to
as
Kla
ng V
alle
y.
*
Publ
ic s
ecto
r in
201
1 re
fers
to M
OH
and
Uni
vers
ity h
ospi
tals
, whi
le p
ublic
sec
tor
in 2
012
& 2
013
refe
rs to
MO
H, U
nive
rsity
, and
MO
D h
ospi
tals
.
For
popu
latio
n da
ta, p
leas
e re
fer A
ppen
dix
3: T
able
A3.
1

19
CHAP
TER
1: H
OSPI
TAL
FACI
LITI
ES
National Healthcare Establishment & Workforce Statistics Hospital 2012 -2013
Tabl
e 1.
2.3
[con
tinu
ed]:
Num
ber
& D
ensi
ty o
f Tot
al I
npat
ient
Bed
s an
d Fu
ncti
onin
g B
eds
in (
Acu
te C
urat
ive)
Mat
erni
ty C
entr
es in
Mal
aysi
a by
Sta
te &
Sec
tor,
2011
-201
3
Stat
eSe
ctor
*
Tota
l Inp
atie
nt B
eds
Func
tion
ing
Inpa
tien
t B
eds
2011
2012
2013
2011
2012
2013
Number
Per 1,000 population
Number
Per 1,000 population
Number
Per 1,000 population
Number
Per 1,000 population
Number
Per 1,000 population
Number
Per 1,000 population
Neg
eri S
embi
lan
Publ
icna
- na
- na
- na
- na
- na
- N
eger
i Sem
bila
nPr
ivat
e0
- 9
- 9
- 0
- 9
- 9
- N
eger
i Sem
bila
nTo
tal
00.
009
0.01
90.
010.
009
0.01
90.
01M
elak
aPu
blic
na-
na-
na-
na-
na-
na-
Mel
aka
Priv
ate
na-
na-
na-
na-
na-
na-
Mel
aka
Tota
lna
nana
nana
nana
nana
nana
naJo
hor
Publ
icna
- na
- na
- na
- na
- na
- Jo
hor
Priv
ate
146
- 16
8-
171
- 13
4-
168
- 17
1-
Joho
rTo
tal
146
0.04
168
0.05
171
0.05
134
0.04
168
0.05
171
0.05
Paha
ngPu
blic
na-
na-
na-
na-
na-
na-
Paha
ngPr
ivat
e28
- 30
- 30
- 28
- 25
- 25
- Pa
hang
Tota
l28
0.02
300.
0230
0.02
280.
0225
0.02
250.
02Te
reng
ganu
Publ
icna
- na
- na
- na
- na
- na
- Te
reng
ganu
Priv
ate
na-
na-
na-
na-
na-
na-
Tere
ngga
nuTo
tal
nana
nana
nana
nana
nana
nana
Kela
ntan
Publ
icna
- na
- na
- na
- na
- na
- Ke
lant
anPr
ivat
ena
- na
- na
- na
- na
- na
- Ke
lant
anTo
tal
nana
nana
nana
nana
nana
nana
Sara
wak
Publ
icna
- na
- na
- na
- na
- na
- Sa
raw
akPr
ivat
e25
- 17
- 16
- 25
- 17
- 16
- Sa
raw
akTo
tal
250.
0117
0.01
160.
0125
0.01
170.
0116
0.01
Saba
hPu
blic
na-
na-
na-
na-
na-
na-
Saba
hPr
ivat
e18
- 29
- 33
- 18
- 29
- 33
- Sa
bah
Tota
l18
0.01
290.
0133
0.01
180.
0129
0.01
330.
01W
P La
buan
Publ
icna
- na
- na
- na
- na
- na
- W
P La
buan
Priv
ate
na-
na-
na-
na-
na-
na-
WP
Labu
anTo
tal
nana
nana
nana
nana
nana
nana
Saba
h &
WP
Labu
anPu
blic
na-
na-
na-
na-
na-
na-
Saba
h &
WP
Labu
anPr
ivat
e18
- 29
- 33
- 18
- 29
- 33
- Sa
bah
& W
P La
buan
Tota
l18
0.01
290.
0133
0.01
180.
0129
0.01
330.
01
Abb
revi
atio
n: -
not
ava
ilabl
e; n
a -
not a
pplic
able
Sela
ngor
& W
P Pu
traj
aya
& W
PKL
are
also
col
lect
ivel
y re
ferr
ed to
as
Kla
ng V
alle
y.
*
Publ
ic s
ecto
r in
201
1 re
fers
to M
OH
and
Uni
vers
ity h
ospi
tals
, whi
le p
ublic
sec
tor
in 2
012
& 2
013
refe
rs to
MO
H, U
nive
rsity
, and
MO
D h
ospi
tals
.
Fo
r po
pula
tion
data
, ple
ase
refe
r App
endi
x 3:
Tab
le A
3.1

This page intentionally left blank
Chapter 2 :
HospitalMedical Device(Mammogram
Machine)
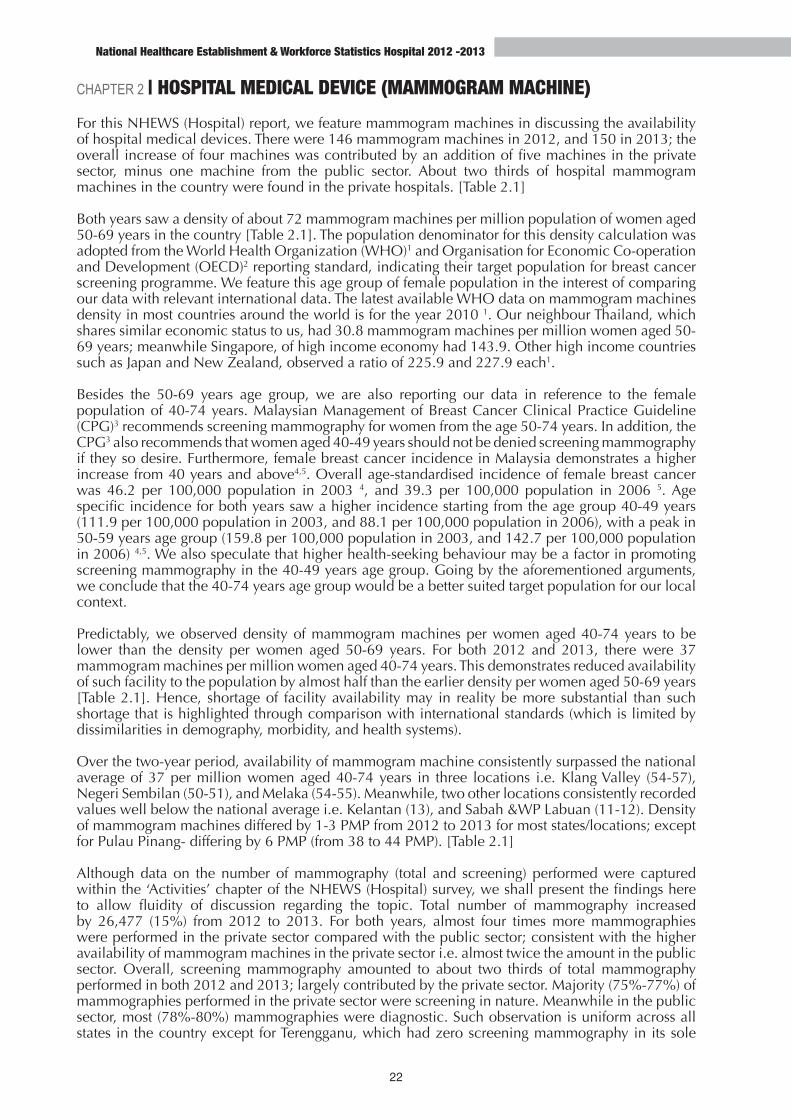
22
National Healthcare Establishment & Workforce Statistics Hospital 2012 -2013
CHAPTER 2 | HOSPITAL MEDICAL DEVICE (MAMMOGRAM MACHINE)For this NHEWS (Hospital) report, we feature mammogram machines in discussing the availability of hospital medical devices. There were 146 mammogram machines in 2012, and 150 in 2013; the overall increase of four machines was contributed by an addition of five machines in the private sector, minus one machine from the public sector. About two thirds of hospital mammogram machines in the country were found in the private hospitals. [Table 2.1]
Both years saw a density of about 72 mammogram machines per million population of women aged 50-69 years in the country [Table 2.1]. The population denominator for this density calculation was adopted from the World Health Organization (WHO)1 and Organisation for Economic Co-operation and Development (OECD)2 reporting standard, indicating their target population for breast cancer screening programme. We feature this age group of female population in the interest of comparing our data with relevant international data. The latest available WHO data on mammogram machines density in most countries around the world is for the year 2010 1. Our neighbour Thailand, which shares similar economic status to us, had 30.8 mammogram machines per million women aged 50-69 years; meanwhile Singapore, of high income economy had 143.9. Other high income countries such as Japan and New Zealand, observed a ratio of 225.9 and 227.9 each1.
Besides the 50-69 years age group, we are also reporting our data in reference to the female population of 40-74 years. Malaysian Management of Breast Cancer Clinical Practice Guideline (CPG)3 recommends screening mammography for women from the age 50-74 years. In addition, the CPG3 also recommends that women aged 40-49 years should not be denied screening mammography if they so desire. Furthermore, female breast cancer incidence in Malaysia demonstrates a higher increase from 40 years and above4,5. Overall age-standardised incidence of female breast cancer was 46.2 per 100,000 population in 2003 4, and 39.3 per 100,000 population in 2006 5. Age specific incidence for both years saw a higher incidence starting from the age group 40-49 years (111.9 per 100,000 population in 2003, and 88.1 per 100,000 population in 2006), with a peak in 50-59 years age group (159.8 per 100,000 population in 2003, and 142.7 per 100,000 population in 2006) 4,5. We also speculate that higher health-seeking behaviour may be a factor in promoting screening mammography in the 40-49 years age group. Going by the aforementioned arguments, we conclude that the 40-74 years age group would be a better suited target population for our local context.
Predictably, we observed density of mammogram machines per women aged 40-74 years to be lower than the density per women aged 50-69 years. For both 2012 and 2013, there were 37 mammogram machines per million women aged 40-74 years. This demonstrates reduced availability of such facility to the population by almost half than the earlier density per women aged 50-69 years [Table 2.1]. Hence, shortage of facility availability may in reality be more substantial than such shortage that is highlighted through comparison with international standards (which is limited by dissimilarities in demography, morbidity, and health systems).
Over the two-year period, availability of mammogram machine consistently surpassed the national average of 37 per million women aged 40-74 years in three locations i.e. Klang Valley (54-57), Negeri Sembilan (50-51), and Melaka (54-55). Meanwhile, two other locations consistently recorded values well below the national average i.e. Kelantan (13), and Sabah &WP Labuan (11-12). Density of mammogram machines differed by 1-3 PMP from 2012 to 2013 for most states/locations; except for Pulau Pinang- differing by 6 PMP (from 38 to 44 PMP). [Table 2.1]
Although data on the number of mammography (total and screening) performed were captured within the ‘Activities’ chapter of the NHEWS (Hospital) survey, we shall present the findings here to allow fluidity of discussion regarding the topic. Total number of mammography increased by 26,477 (15%) from 2012 to 2013. For both years, almost four times more mammographies were performed in the private sector compared with the public sector; consistent with the higher availability of mammogram machines in the private sector i.e. almost twice the amount in the public sector. Overall, screening mammography amounted to about two thirds of total mammography performed in both 2012 and 2013; largely contributed by the private sector. Majority (75%-77%) of mammographies performed in the private sector were screening in nature. Meanwhile in the public sector, most (78%-80%) mammographies were diagnostic. Such observation is uniform across all states in the country except for Terengganu, which had zero screening mammography in its sole

23
CHAP
TER
2: H
OSPI
TAL
MED
ICAL
DEV
ICE
(MAM
MOG
RAM
MAC
HINE
)
National Healthcare Establishment & Workforce Statistics Hospital 2012 -2013
private hospital. [Table 2.2]
We attempted to estimate the rate of screening mammography performed for our selected target population (women aged 40-74 years). Data on screening mammography that we captured were outputs of hospitals, therefore patient details of each mammography were not gathered. As such we cannot be certain that all screening mammographies being reported were indeed performed for only women who fell into the specific age group. However we employ the assumption that most screening mammographies would be performed for said population of women and a negligible number would be contributed by screening mammographies of women out of the age range. This assumption shares common ground with observations made by the National Health and Morbidity Survey (NHMS) 2011 6,7. In NHMS 2011, a sample population of women aged 40 years and above were surveyed via a face-to-face individual interview to determine the prevalence of screening mammography in said population within 12 months prior to the survey6. The findings7 are presented below:
Table 2: Estimated Number and Proportion of Women Aged 40 Years and Above Who Underwent Screening Mammography Within 12 Months Prior to the NHMS 2011.
Age GroupNumber of Women Who
Reported to Have Undergone Screening Mammography
Estimated Population*
Proportion of Estimated Population Out of the Total Estimated Population (%)‡
40-44 81 73,426 27.2
45-49 85 64,859 24.1
50-54 73 57,800 21.4
55-59 52 30,490 11.3
60-64 20 15,079 5.6
65-69 7 6,886 2.6
70-74 12 16,321 6.1
75+ 6 4,637 1.7
40-74 330 264,861 98.3
40-75+ (Total) 336 269,498 100
*Refers to estimated number of women who underwent screening mammography in the population based on the number of women who reported to have undergone screening mammography.‡ These proportions were not reported in the NHMS, but we calculated them by dividing the estimated population within each age group by 269, 498 (the total number of estimated population for all age groups)Source: NHMS 2011 Vol III 7. Adapted from Table 2.22: Promotive and preventive activities by sociodemographic characteristics (Page 117-118).
From the proportions stated above, we estimated that 98.3% of screening mammographies captured in NHEWS (Hospital) 2012-2013 survey would have been performed for women aged 40-74 years. Furthermore, the NHMS 2011 findings appear to reciprocate with our earlier discussion regarding screening mammography in women aged 40-49 years.
In this report, we applied the proportion of each age group to our screening mammography data, and tabulated the estimated number and estimated density (per 1,000 female population) within the respective age group, by state [Table 2.3 and Table 2.4]. The density was calculated by dividing the estimated number of screening mammography by the female population of each age group in each state.
In accordance with the NHMS 2011 observation, the estimated number of screening mammography decreased with increasing age (categorised into five-year intervals within the 40-74 years age group). However, an exception applies to the last five-year interval (70-74 years) for which the number increased from that of the preceding five-year interval. Nonetheless, this pattern did not necessarily hold for the estimated density of screening mammography. Our estimation showed that on average, screening occurred at almost similar rates across the 40-44 year, 45-49 years, and 50-54 years age groups (~33 per 1,000 women of respective age group in 2012, and ~39 per 1,000 women

24
National Healthcare Establishment & Workforce Statistics Hospital 2012 -2013
of respective age group in 2013). For subsequent age groups, the pattern observed in estimated number of screening mammography also held true for the estimated density. Overall, we estimated screening mammography rate per 1,000 women aged 40-74 years to be 28 women for 2012, and 32 women for 2013. From this, a 16.4% increase of screening rate over two years can be observed. [Table 2.3 and Table 2.4]
A general observation that we noticed is that the higher the density of mammogram machines; the higher the density of screening mammography. This may translate into: the more available mammogram machines are to the population; the higher the screening rate is. We observed higher estimated screening rates than the national average for both years in Klang Valley, Negeri Sembilan, Melaka, Pulau Pinang, and Sarawak (34-62 per 1,000 women aged 40-74 years in 2012, and 39-67 women aged 40-74 years in 2013) [Table 2.3 and Table 2.4]. Except for Sarawak, in which availability of mammogram machines was near that of the national average; each of the remaining states recorded mammogram machine availability that was higher than the national average [Table 2.1]. In contrast, over the two-year period, four states (Kelantan, Sabah & WP Labuan, Perlis, and Terengganu) consistently showed estimated screening rates of below 10 per 1,000 women aged 40-74 years [Table 2.3 and Table 2.4]. Kelantan and Sabah & WP Labuan each reported low availability of mammogram machines compared with the national average, while Perlis and Terengganu each observed availability that was approximate to the national average [Table 2.1].
Nonetheless, we acknowledge that influences on the screening rate are multifactorial. For example, in areas that are more urbanised, and have denser population; health promotion can more effectively reach the masses; therefore may encourage a higher uptake of screening mammography. Moreover, areas with higher population density and urbanisation level may lead to higher mammogram machine availability due to higher health demands, and in turn promote higher screening rates. Besides that, cultural influences also exist, which may affect receptiveness of certain populations to screening mammography. We take note that Selangor, WP Putrajaya, WPKL, Pulau Pinang, and Melaka are among the most densely populated areas (493-6,891 persons per square kilometre) with urbanisation level of each state exceeding the national average of 71% 8. In contrast, Kelantan, Sabah, and Terengganu are among the least densely populated areas (44-102 persons per square kilometre) with urbanisation level below 71% each8.
In principle, the rate of screening mammography increased over time (2012-2013); although we noted a few states that observed dissimilar pattern. For example, Pulau Pinang saw a decrease in screening mammography (from 62 to 49 per 1, 000 women aged 40-74 years), despite an increasing availability of mammogram machines. We also found Negeri Sembilan to observe decreasing screening rate (from 55 to 47 per 1, 000 women aged 40-74 years), however with mammogram machine availability remaining almost unchanged. An interesting finding is that Kelantan observed a four-fold increase in screening rate with similar mammogram machine availability over the two years; notwithstanding its low availability of mammogram machines compared with the national average. [Table 2.1, Table 2.3, and Table 2.4]
Internationally, screening rate for mammography is reported as percentage of women aged 50-69 years screened. OECD countries reported an average of 61.5% of women aged 50-69 years screened in 20112. Most developed nations have population-based screening mammography programmes, for which target screening rates are set. According to the European Union9 guidelines, the desirable target screening rate of such programmes is 75%, and the acceptable target is 70%. In Malaysia, population-based screening mammography programme is not yet available, therefore such target screening rate would be inapplicable. However, our attempt in estimating the screening rate for our target population under current practice may provide a baseline assessment for future planning.
Limitation:
1. Our data features mammography facilities and activities specific to hospital settings, thereby may not represent the national scenario. The country has stand-alone diagnostic centres and screening programmes running outside the hospital settings e.g.
a. The subsidised screening mammography programme organised by the National Population and Family Development Board (Lembaga Penduduk dan Pembangunan Keluarga Negara

25
CHAP
TER
2: H
OSPI
TAL
MED
ICAL
DEV
ICE
(MAM
MOG
RAM
MAC
HINE
)
National Healthcare Establishment & Workforce Statistics Hospital 2012 -2013
(LPPKN)), which may involve hospital and non-hospital settings10
b. Mobile breast screening programme organised by the National Cancer Council (Majlis Kanser Negara (MAKNA))11
c. Screening mammography services offered by the Cancer & Health Screening Clinic of the National Cancer Society Malaysia (NCSM)12
References:
1. World Health Organization. Global Health Observatory Data Repository, Total density per million females aged from 50 to 69 years old: Mammography units [Internet]. Geneva: World Health Organization; 2014 [cited 2014 Oct 16]. Available from: http://apps.who.int/gho/data/node.main.510?lang=en.
2. Organisation for Economic Cooperation and Development. Health at a Glance 2013: OECD Indicators., Mammography screening in women aged 50-69, 2001 to 2011 (or nearest year) [Internet]. Organisation for Economic Cooperation and Development; 2013 [cited 2014 Oct 16]. Available from: http://www.oecd-ilibrary.org/social-issues-migration-health/health-at-a-glance-2013/mammography-screening-in-women-aged-50-69-2001-to-2011-or-nearest-year_health_glance-2013-graph117-en.
3. Ministry of Health Malaysia, Academy of Medicine Malaysia. Clinical Practice Guidelines Management of Breast Cancer. 2nd ed. Putrajaya; 2010 [cited 2014 Oct 16]. Available from: http://www.acadmed.org.my/index.cfm?&menuid=67.
4. GCC Lim, Y Halimah, editors. Second Report of the National Cancer Registry. Cancer Incidence in Malaysia 2003. National Cancer Registry. Kuala Lumpur 2004. [cited 2015 Jan 29]. Available from http://www.crc.gov.my/wp-content/uploads/documents/report/2nd%20National%20Cancer%20Registry.pdf
5. Omar ZA, Mohd Ali Z, Ibrahim Tamin NS, editors. Malaysian Cancer Statistics- Data and Figure Peninsular Malaysia 2006. National Cancer Registry, Ministry of Health Malaysia. Putrajaya 2006. [cited 2015 Jan 29]. Available from http://www.moh.gov.my/images/gallery/Report/Cancer/MalaysiaCancerStatistics_2006.pdf
6. Institute for Public Health (IPH). National Health and Morbidity Survey 2011 (NHMS 2011). Vol. 1: Methodology and General Findings. Kuala Lumpur; 2011 [cited 2015 Jan 29].
7. Institute for Public Health (IPH). National Health and Morbidity Survey 2011 (NHMS 2011). Vol. III: Healthcare Demand And Out-of-Pocket Health Expenditure. Kuala Lumpur; 2011 [cited 2015 Jan 29].
8. Department of Statistics Malaysia. Population Distribution and Basic Demographic Characteristics 2010. Putrajaya; 2010 [cited 2015 Feb 2]. Available from http://www.statistics.gov.my/portal/download_Population/files/census2010/Taburan_Penduduk_dan_Ciri-ciri_Asas_Demografi.pdf
9. Perry N, Broeders M, de Wolf C, Tornberg S, Holland T, von Karsa L, editors. European Guidelines for Quality Assurance in Breast Cancer Screening and Diagnosis. 4th ed. Luxembourg: Office for Official Publications of the European Communities; 2006 [cited 2014 Dec 08]. Available from http://www.euref.org/european-guidelines.
10. National Population and Family Development Board. Garis Panduan Pelaksanaan Program Subsidi Ujian Mamogram LPPKN. Kuala Lumpur; 2007 [cited 2015 Jan 29]. Available from http://www.lppkn.gov.my/index.php?view=download&alias=92-garis-panduan-pelaksanaan-program-subsidi-ujian-mamogram-lppkn&category_slug=emamogram&option=com_docman&Itemid=558&lang=en
11. Majlis Kanser Negara [Internet]. Kuala Lumpur: Majlis Kanser Negara; [cited 2015 Feb 2]. Available from http://makna.org.my/services/mobile-screening/
12. National Cancer Society Malaysia [Internet]. Kuala Lumpur: National Cancer Society Malaysia; [cited 2015 Feb 2]. Available from http://www.cancer.org.my/centres/cancer-health-screening-clinic/
Special Acknowledgement:
We would like to express our utmost appreciation to Dr. Evelyn Ho (Consultant Clinical Radiologist) who provided us with invaluable insights during the revision process of this chapter.
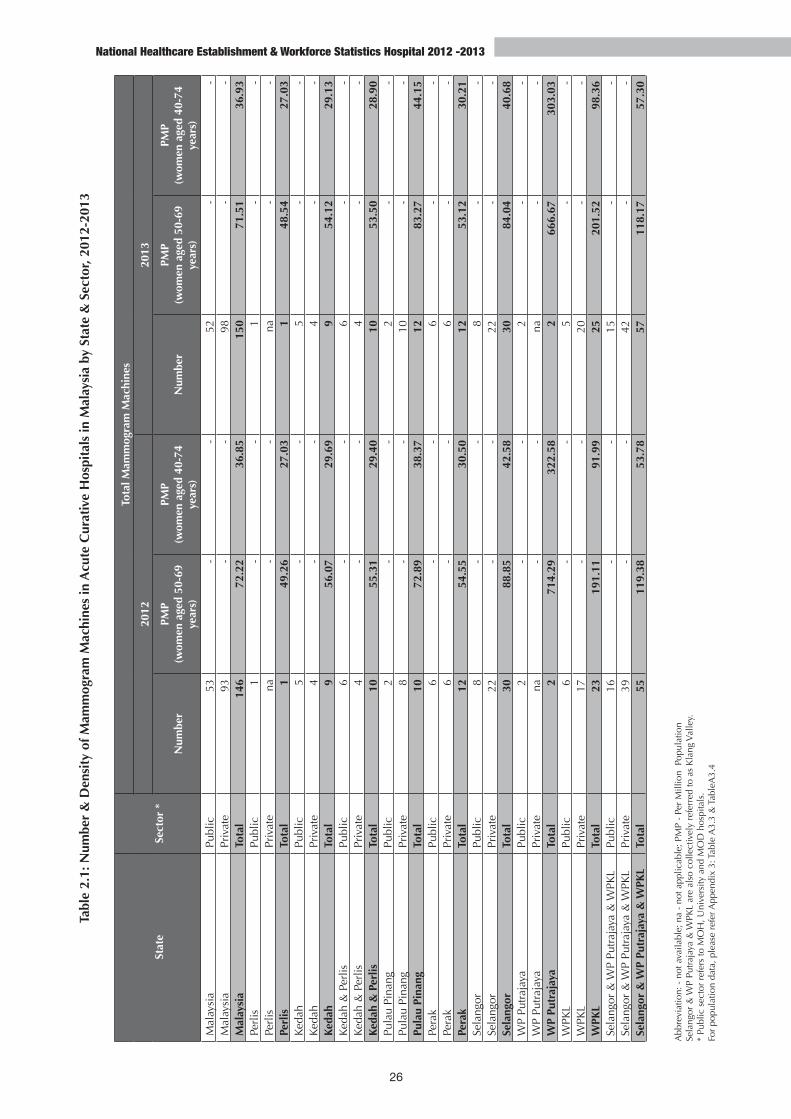
26
National Healthcare Establishment & Workforce Statistics Hospital 2012 -2013
Tabl
e 2.
1: N
umbe
r &
Den
sity
of M
amm
ogra
m M
achi
nes
in A
cute
Cur
ativ
e H
ospi
tals
in M
alay
sia
by S
tate
& S
ecto
r, 20
12-2
013
Abb
revi
atio
n: -
not
ava
ilabl
e; n
a -
not a
pplic
able
; PM
P -
Per
Mill
ion
Pop
ulat
ion
Sela
ngor
& W
P Pu
traj
aya
& W
PKL
are
also
col
lect
ivel
y re
ferr
ed to
as
Kla
ng V
alle
y.
*
Publ
ic s
ecto
r re
fers
to M
OH
, Uni
vers
ity a
nd M
OD
hos
pita
ls.
Fo
r po
pula
tion
data
, ple
ase
refe
r App
endi
x 3:
Tab
le A
3.3
& T
able
A3.
4
Stat
eSe
ctor
*
Tota
l Mam
mog
ram
Mac
hine
s
2012
2013
Num
ber
PMP
(wom
en a
ged
50-6
9 ye
ars)
PMP
(wom
en a
ged
40-7
4 ye
ars)
Num
ber
PMP
(wom
en a
ged
50-6
9 ye
ars)
PMP
(wom
en a
ged
40-7
4 ye
ars)
Mal
aysi
aPu
blic
53-
- 52
- -
Mal
aysi
aPr
ivat
e93
- -
98-
- M
alay
sia
Tota
l14
6 7
2.22
3
6.85
15
0 7
1.51
3
6.93
Pe
rlis
Publ
ic1
- -
1-
- Pe
rlis
Priv
ate
na-
- na
- -
Perl
isTo
tal
1 4
9.26
2
7.03
1
48.
54
27.
03
Keda
hPu
blic
5-
-
5 -
-
Keda
hPr
ivat
e4
- -
4
--
Keda
hTo
tal
9 5
6.07
2
9.69
9
54.
12
29.
13
Keda
h &
Per
lisPu
blic
6-
-
6 -
-
Keda
h &
Per
lisPr
ivat
e4
- -
4
- -
Ke
dah
& P
erlis
Tota
l10
55.
31
29.
40
10 5
3.50
2
8.90
Pu
lau
Pina
ngPu
blic
2-
-
2 -
-
Pula
u Pi
nang
Priv
ate
8-
-
10 -
-
Pula
u Pi
nang
Tota
l10
72.
89
38.
37
12 8
3.27
4
4.15
Pe
rak
Publ
ic6
- -
6
- -
Pera
kPr
ivat
e6
- -
6
- -
Pera
kTo
tal
12 5
4.55
3
0.50
12
53.
12
30.
21
Sela
ngor
Publ
ic8
- -
8
-
-Se
lang
orPr
ivat
e22
- -
22
-
-Se
lang
orTo
tal
30 8
8.85
4
2.58
30
84.
04
40.
68
WP
Putr
ajay
aPu
blic
2-
-2
-
-
WP
Putr
ajay
aPr
ivat
ena
- -
na
- -
WP
Putr
ajay
aTo
tal
2 7
14.2
9 3
22.5
8 2
666
.67
303
.03
WPK
LPu
blic
6-
-5
- -
W
PKL
Priv
ate
17-
-20
- -
W
PKL
Tota
l23
191
.11
91.
99
25 2
01.5
2 9
8.36
Se
lang
or &
WP
Putr
ajay
a &
WPK
LPu
blic
16-
-
15-
-Se
lang
or &
WP
Putr
ajay
a &
WPK
LPr
ivat
e39
- -
42-
-Se
lang
or &
WP
Putr
ajay
a &
WPK
LTo
tal
55 1
19.3
8 5
3.78
57
118
.17
57.
30
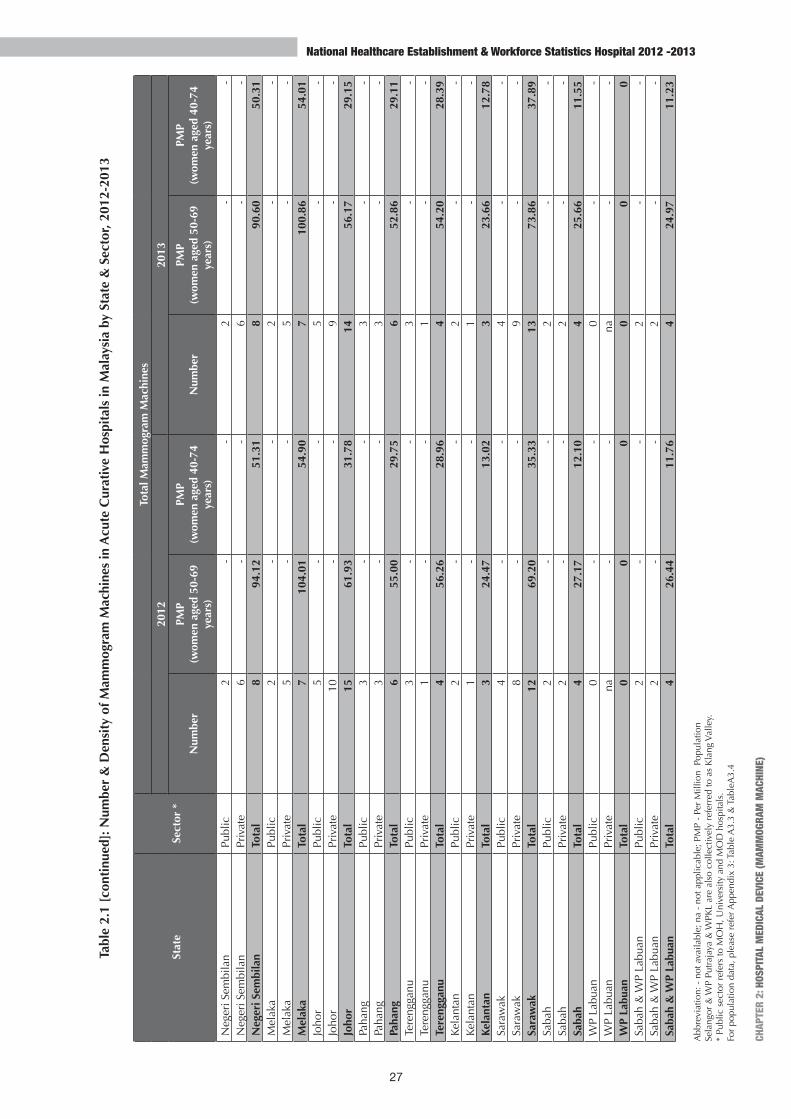
27
CHAP
TER
2: H
OSPI
TAL
MED
ICAL
DEV
ICE
(MAM
MOG
RAM
MAC
HINE
)
National Healthcare Establishment & Workforce Statistics Hospital 2012 -2013
Tabl
e 2.
1 [c
onti
nued
]: N
umbe
r &
Den
sity
of M
amm
ogra
m M
achi
nes
in A
cute
Cur
ativ
e H
ospi
tals
in M
alay
sia
by S
tate
& S
ecto
r, 20
12-2
013
Abb
revi
atio
n: -
not
ava
ilabl
e; n
a -
not a
pplic
able
; PM
P -
Per
Mill
ion
Pop
ulat
ion
Sela
ngor
& W
P Pu
traj
aya
& W
PKL
are
also
col
lect
ivel
y re
ferr
ed to
as
Kla
ng V
alle
y.
*
Publ
ic s
ecto
r re
fers
to M
OH
, Uni
vers
ity a
nd M
OD
hos
pita
ls.
Fo
r po
pula
tion
data
, ple
ase
refe
r App
endi
x 3:
Tab
le A
3.3
& T
able
A3.
4
Stat
eSe
ctor
*
Tota
l Mam
mog
ram
Mac
hine
s
2012
2013
Num
ber
PMP
(wom
en a
ged
50-6
9 ye
ars)
PMP
(wom
en a
ged
40-7
4 ye
ars)
Num
ber
PMP
(wom
en a
ged
50-6
9 ye
ars)
PMP
(wom
en a
ged
40-7
4 ye
ars)
Neg
eri S
embi
lan
Publ
ic2
- -
2-
- N
eger
i Sem
bila
nPr
ivat
e6
- -
6-
- N
eger
i Sem
bila
nTo
tal
8 9
4.12
5
1.31
8
90.
60
50.
31
Mel
aka
Publ
ic2
- -
2-
- M
elak
aPr
ivat
e5
- -
5-
- M
elak
aTo
tal
7 1
04.0
1 5
4.90
7
100
.86
54.
01
Joho
rPu
blic
5-
- 5
- -
Joho
rPr
ivat
e10
- -
9-
- Jo
hor
Tota
l15
61.
93
31.
78
14 5
6.17
2
9.15
Pa
hang
Publ
ic3
- -
3-
- Pa
hang
Priv
ate
3-
- 3
- -
Paha
ngTo
tal
6 5
5.00
2
9.75
6
52.
86
29.
11
Tere
ngga
nuPu
blic
3-
- 3
- -
Tere
ngga
nuPr
ivat
e1
- -
1-
- Te
reng
ganu
Tota
l4
56.
26
28.
96
4 5
4.20
2
8.39
Ke
lant
anPu
blic
2-
- 2
- -
Kela
ntan
Priv
ate
1-
- 1
- -
Kela
ntan
Tota
l3
24.
47
13.
02
3 2
3.66
1
2.78
Sa
raw
akPu
blic
4-
- 4
- -
Sara
wak
Priv
ate
8-
- 9
- -
Sara
wak
Tota
l12
69.
20
35.
33
13 7
3.86
3
7.89
Sa
bah
Publ
ic2
- -
2-
- Sa
bah
Priv
ate
2-
- 2
- -
Saba
hTo
tal
4 2
7.17
1
2.10
4
25.
66
11.
55
WP
Labu
anPu
blic
0-
- 0
- -
WP
Labu
anPr
ivat
ena
- -
na-
- W
P La
buan
Tota
l0
00
00
0Sa
bah
& W
P La
buan
Publ
ic2
- -
2-
- Sa
bah
& W
P La
buan
Priv
ate
2-
- 2
- -
Saba
h &
WP
Labu
anTo
tal
4 2
6.44
1
1.76
4
24.
97
11.
23
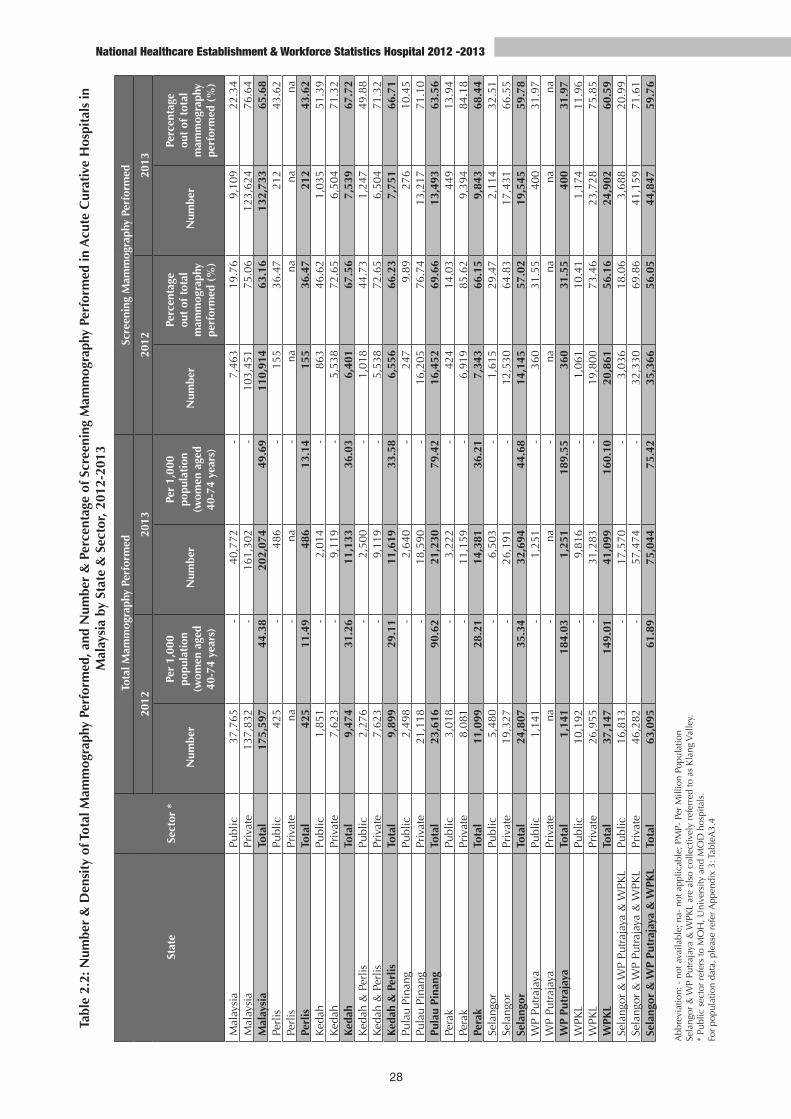
28
National Healthcare Establishment & Workforce Statistics Hospital 2012 -2013
Tabl
e 2.
2: N
umbe
r &
Den
sity
of T
otal
Mam
mog
raph
y Pe
rfor
med
, and
Num
ber
& P
erce
ntag
e of
Scr
eeni
ng M
amm
ogra
phy
Perf
orm
ed in
Acu
te C
urat
ive
Hos
pita
ls in
M
alay
sia
by S
tate
& S
ecto
r, 20
12-2
013
Abb
revi
atio
n: -
not
ava
ilabl
e; n
a- n
ot a
pplic
able
; PM
P- P
er M
illio
n Po
pula
tion
Sela
ngor
& W
P Pu
traj
aya
& W
PKL
are
also
col
lect
ivel
y re
ferr
ed to
as
Kla
ng V
alle
y.
* Pu
blic
sec
tor
refe
rs to
MO
H, U
nive
rsity
and
MO
D h
ospi
tals
.
For
popu
latio
n da
ta, p
leas
e re
fer A
ppen
dix
3: T
able
A3.
4
Stat
eSe
ctor
*
Tot
al M
amm
ogra
phy
Perf
orm
ed
Scre
enin
g M
amm
ogra
phy
Perf
orm
ed
2012
2013
2012
2013
Num
ber
Per
1,00
0 po
pula
tion
(wom
en a
ged
40-7
4 ye
ars)
Num
ber
Per
1,00
0 po
pula
tion
(wom
en a
ged
40-7
4 ye
ars)
Num
ber
Perc
enta
ge
out
of t
otal
m
amm
ogra
phy
perf
orm
ed (
%)
Num
ber
Perc
enta
ge
out
of t
otal
m
amm
ogra
phy
perf
orm
ed (
%)
Mal
aysi
aPu
blic
37,
765
-
40,
772
-
7,4
63
19.7
6 9
,109
22
.34
Mal
aysi
aPr
ivat
e 1
37,8
32
-
161
,302
-
1
03,4
51
75.0
6 1
23,6
24
76.6
4M
alay
sia
Tota
l 1
75,5
97
44.
38
202
,074
4
9.69
1
10,9
14
63.1
6 1
32,7
33
65.6
8Pe
rlis
Publ
ic 4
25
-
486
-
1
55
36.4
7 2
12
43.6
2Pe
rlis
Priv
ate
na
-
na
-
na
na
na
na
Perl
isTo
tal
425
1
1.49
4
86
13.
14
155
36
.47
212
43
.62
Keda
hPu
blic
1,8
51
-
2,0
14
-
863
46
.62
1,0
35
51.3
9Ke
dah
Priv
ate
7,6
23
-
9,1
19
-
5,5
38
72.6
5 6
,504
71
.32
Keda
hTo
tal
9,4
74
31.
26
11,
133
36.
03
6,4
01
67.5
6 7
,539
67
.72
Keda
h &
Per
lisPu
blic
2,2
76
-
2,5
00
-
1,0
18
44.7
3 1
,247
49
.88
Keda
h &
Per
lisPr
ivat
e 7
,623
-
9
,119
-
5
,538
72
.65
6,5
04
71.3
2Ke
dah
& P
erlis
Tota
l 9
,899
2
9.11
1
1,61
9 3
3.58
6
,556
66
.23
7,7
51
66.7
1Pu
lau
Pina
ngPu
blic
2,4
98
-
2,6
40
-
247
9.
89 2
76
10.4
5Pu
lau
Pina
ngPr
ivat
e 2
1,11
8 -
1
8,59
0 -
1
6,20
5 76
.74
13,
217
71.1
0Pu
lau
Pina
ngTo
tal
23,
616
90.
62
21,
230
79.
42
16,
452
69.6
6 1
3,49
3 63
.56
Pera
kPu
blic
3,0
18
-
3,2
22
-
424
14
.03
449
13
.94
Pera
kPr
ivat
e 8
,081
-
1
1,15
9 -
6
,919
85
.62
9,3
94
84.1
8Pe
rak
Tota
l 1
1,09
9 2
8.21
1
4,38
1 3
6.21
7
,343
66
.15
9,8
43
68.4
4Se
lang
orPu
blic
5,4
80
-
6,5
03
-
1,6
15
29.4
7 2
,114
32
.51
Sela
ngor
Priv
ate
19,
327
-
26,
191
-
12,
530
64.8
3 1
7,43
1 66
.55
Sela
ngor
Tota
l 2
4,80
7 3
5.34
3
2,69
4 4
4.68
1
4,14
5 57
.02
19,
545
59.7
8W
P Pu
traj
aya
Publ
ic 1
,141
-
1
,251
-
3
60
31.5
5 4
00
31.9
7W
P Pu
traj
aya
Priv
ate
na
-
na
-
na
na
na
na
WP
Putr
ajay
aTo
tal
1,1
41
184
.03
1,2
51
189
.55
360
31
.55
400
31
.97
WPK
LPu
blic
10,
192
-
9,8
16
-
1,0
61
10.4
1 1
,174
11
.96
WPK
LPr
ivat
e 2
6,95
5 -
3
1,28
3 -
1
9,80
0 73
.46
23,
728
75.8
5W
PKL
Tota
l 3
7,14
7 1
49.0
1 4
1,09
9 1
60.1
0 2
0,86
1 56
.16
24,
902
60.5
9Se
lang
or &
WP
Putr
ajay
a &
WPK
LPu
blic
16,
813
-
17,
570
-
3,0
36
18.0
6 3
,688
20
.99
Sela
ngor
& W
P Pu
traj
aya
& W
PKL
Priv
ate
46,
282
-
57,
474
-
32,
330
69.8
6 4
1,15
9 71
.61
Sela
ngor
& W
P Pu
traj
aya
& W
PKL
Tota
l 6
3,09
5 6
1.89
7
5,04
4 7
5.42
3
5,36
6 56
.05
44,
847
59.7
6
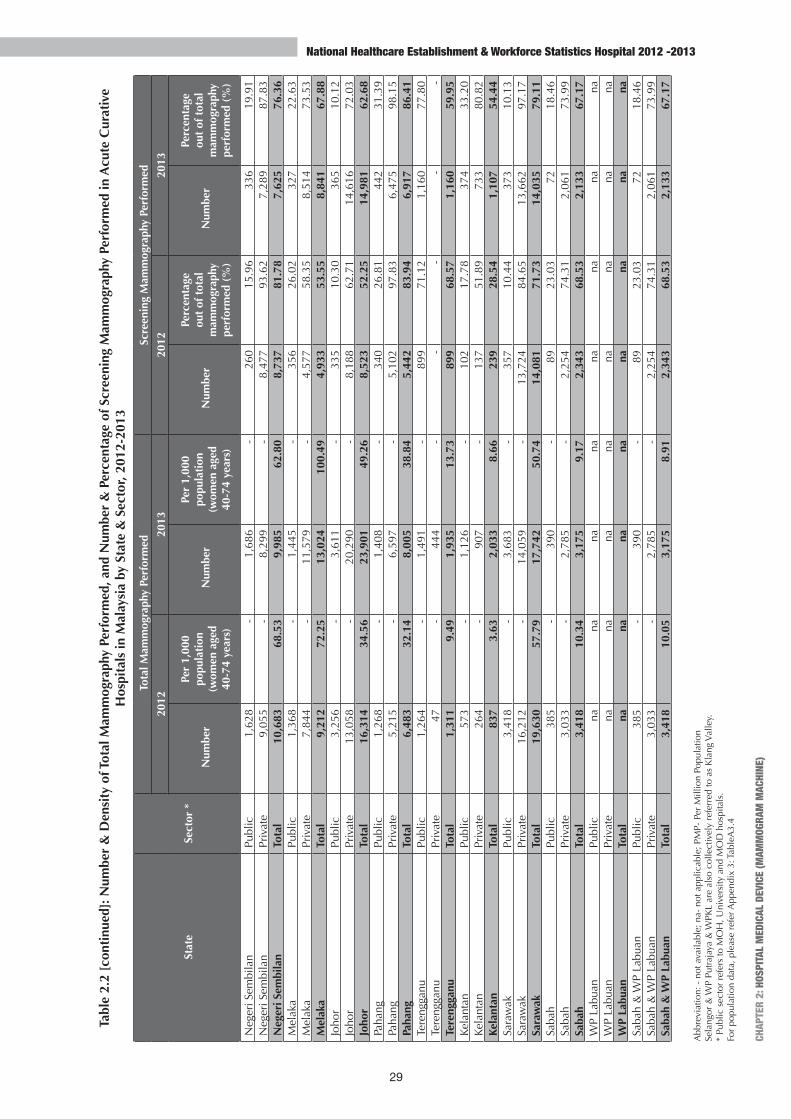
29
CHAP
TER
2: H
OSPI
TAL
MED
ICAL
DEV
ICE
(MAM
MOG
RAM
MAC
HINE
)
National Healthcare Establishment & Workforce Statistics Hospital 2012 -2013
Tabl
e 2.
2 [c
onti
nued
]: N
umbe
r &
Den
sity
of T
otal
Mam
mog
raph
y Pe
rfor
med
, and
Num
ber
& P
erce
ntag
e of
Scr
eeni
ng M
amm
ogra
phy
Perf
orm
ed in
Acu
te C
urat
ive
Hos
pita
ls in
Mal
aysi
a by
Sta
te &
Sec
tor,
2012
-201
3
Abb
revi
atio
n: -
not
ava
ilabl
e; n
a- n
ot a
pplic
able
; PM
P- P
er M
illio
n Po
pula
tion
Sela
ngor
& W
P Pu
traj
aya
& W
PKL
are
also
col
lect
ivel
y re
ferr
ed to
as
Kla
ng V
alle
y.
* Pu
blic
sec
tor
refe
rs to
MO
H, U
nive
rsity
and
MO
D h
ospi
tals
.
For
popu
latio
n da
ta, p
leas
e re
fer A
ppen
dix
3: T
able
A3.
4
Stat
eSe
ctor
*
Tot
al M
amm
ogra
phy
Perf
orm
ed
Scre
enin
g M
amm
ogra
phy
Perf
orm
ed
2012
2013
2012
2013
Num
ber
Per
1,00
0 po
pula
tion
(wom
en a
ged
40-7
4 ye
ars)
Num
ber
Per
1,00
0 po
pula
tion
(wom
en a
ged
40-7
4 ye
ars)
Num
ber
Perc
enta
ge
out
of t
otal
m
amm
ogra
phy
perf
orm
ed (
%)
Num
ber
Perc
enta
ge
out
of t
otal
m
amm
ogra
phy
perf
orm
ed (
%)
Neg
eri S
embi
lan
Publ
ic 1
,628
-
1
,686
-
2
60
15.9
6 3
36
19.9
1N
eger
i Sem
bila
nPr
ivat
e 9
,055
-
8
,299
-
8
,477
93
.62
7,2
89
87.8
3N
eger
i Sem
bila
nTo
tal
10,
683
68.
53
9,9
85
62.
80
8,7
37
81.7
8 7
,625
76
.36
Mel
aka
Publ
ic 1
,368
-
1
,445
-
3
56
26.0
2 3
27
22.6
3M
elak
aPr
ivat
e 7
,844
-
1
1,57
9 -
4
,577
58
.35
8,5
14
73.5
3M
elak
aTo
tal
9,2
12
72.
25
13,
024
100
.49
4,9
33
53.5
5 8
,841
67
.88
Joho
rPu
blic
3,2
56
-
3,6
11
-
335
10
.30
365
10
.12
Joho
rPr
ivat
e 1
3,05
8 -
2
0,29
0 -
8
,188
62
.71
14,
616
72.0
3Jo
hor
Tota
l 1
6,31
4 3
4.56
2
3,90
1 4
9.26
8
,523
52
.25
14,
981
62.6
8Pa
hang
Publ
ic 1
,268
-
1
,408
-
3
40
26.8
1 4
42
31.3
9Pa
hang
Priv
ate
5,2
15
-
6,5
97
-
5,1
02
97.8
3 6
,475
98
.15
Paha
ngTo
tal
6,4
83
32.
14
8,0
05
38.
84
5,4
42
83.9
4 6
,917
86
.41
Tere
ngga
nuPu
blic
1,2
64
-
1,4
91
-
899
71
.12
1,1
60
77.8
0Te
reng
ganu
Priv
ate
47
-
444
-
-
-
-
-
Te
reng
ganu
Tota
l 1
,311
9
.49
1,9
35
13.
73
899
68
.57
1,1
60
59.9
5Ke
lant
anPu
blic
573
-
1
,126
-
1
02
17.7
8 3
74
33.2
0Ke
lant
anPr
ivat
e 2
64
-
907
-
1
37
51.8
9 7
33
80.8
2Ke
lant
anTo
tal
837
3
.63
2,0
33
8.6
6 2
39
28.5
4 1
,107
54
.44
Sara
wak
Publ
ic 3
,418
-
3
,683
-
3
57
10.4
4 3
73
10.1
3Sa
raw
akPr
ivat
e 1
6,21
2 -
1
4,05
9 -
1
3,72
4 84
.65
13,
662
97.1
7Sa
raw
akTo
tal
19,
630
57.
79
17,
742
50.
74
14,
081
71.7
3 1
4,03
5 79
.11
Saba
hPu
blic
385
-
3
90
-
89
23.0
3 7
2 18
.46
Saba
hPr
ivat
e 3
,033
-
2
,785
-
2
,254
74
.31
2,0
61
73.9
9Sa
bah
Tota
l 3
,418
1
0.34
3
,175
9
.17
2,3
43
68.5
3 2
,133
67
.17
WP
Labu
anPu
blic
na
na
na
na
na
na
na
na
WP
Labu
anPr
ivat
e n
a n
a n
a n
a n
a n
a n
a n
a W
P La
buan
Tota
l n
a n
a n
a n
a n
a n
a n
a n
a Sa
bah
& W
P La
buan
Publ
ic 3
85
-
390
-
8
9 23
.03
72
18.4
6Sa
bah
& W
P La
buan
Priv
ate
3,0
33
-
2,7
85
-
2,2
54
74.3
1 2
,061
73
.99
Saba
h &
WP
Labu
anTo
tal
3,4
18
10.
05
3,1
75
8.9
1 2
,343
68
.53
2,1
33
67.1
7
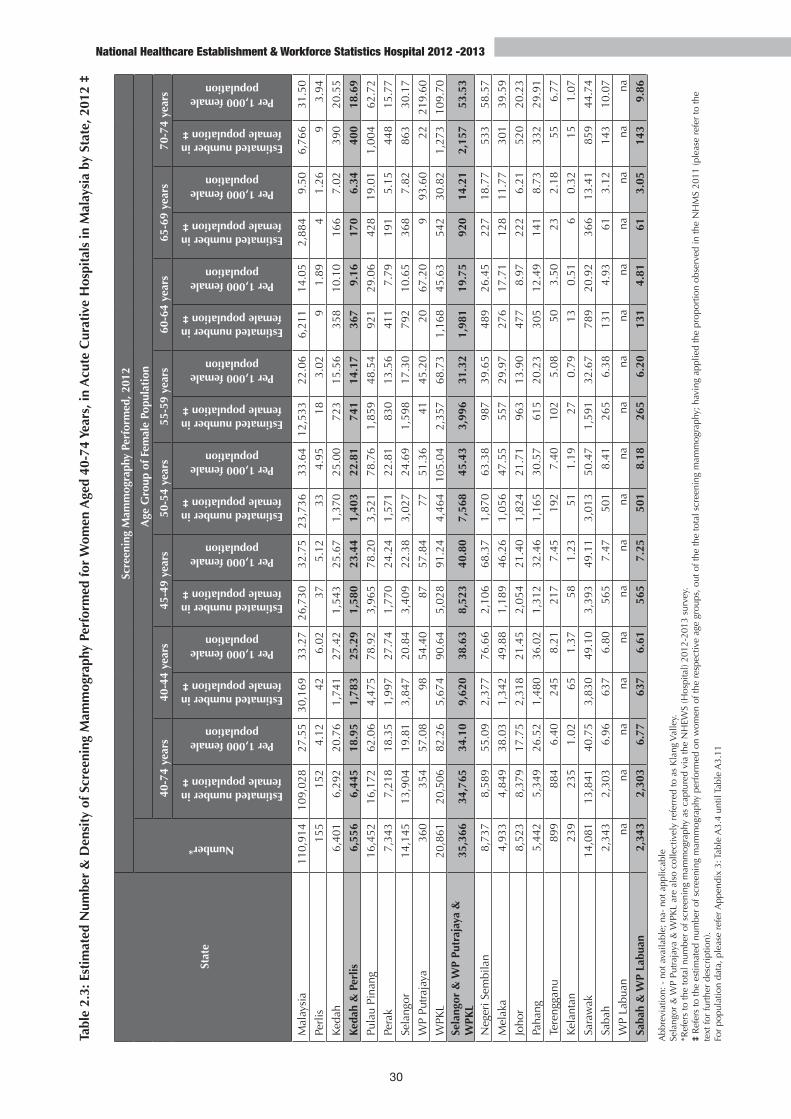
30
National Healthcare Establishment & Workforce Statistics Hospital 2012 -2013
Tabl
e 2.
3: E
stim
ated
Num
ber
& D
ensi
ty o
f Scr
eeni
ng M
amm
ogra
phy
Perf
orm
ed fo
r W
omen
Age
d 40
-74
Year
s, in
Acu
te C
urat
ive
Hos
pita
ls in
Mal
aysi
a by
Sta
te, 2
012
‡
Abb
revi
atio
n: -
not
ava
ilabl
e; n
a- n
ot a
pplic
able
Se
lang
or &
WP
Putr
ajay
a &
WPK
L ar
e al
so c
olle
ctiv
ely
refe
rred
to a
s K
lang
Val
ley.
*Ref
ers
to th
e to
tal n
umbe
r of
scr
eeni
ng m
amm
ogra
phy
as c
aptu
red
via
the
NH
EWS
(Hos
pita
l) 20
12-2
013
surv
ey.
‡
Ref
ers
to th
e es
timat
ed n
umbe
r of
scr
eeni
ng m
amm
ogra
phy
perf
orm
ed o
n w
omen
of t
he r
espe
ctiv
e ag
e gr
oups
, out
of t
he th
e to
tal s
cree
ning
mam
mog
raph
y; h
avin
g ap
plie
d th
e pr
opor
tion
obse
rved
in th
e N
HM
S 20
11 (p
leas
e re
fer
to th
e te
xt fo
r fu
rthe
r de
scri
ptio
n).
For
popu
latio
n da
ta, p
leas
e re
fer A
ppen
dix
3: T
able
A3.
4 un
til T
able
A3.
11
Stat
e
Scre
enin
g M
amm
ogra
phy
Perf
orm
ed, 2
012
Number*
Age
Gro
up o
f Fem
ale
Popu
lati
on
40-7
4 ye
ars
40-4
4 ye
ars
45-4
9 ye
ars
50-5
4 ye
ars
55-5
9 ye
ars
60-6
4 ye
ars
65-6
9 ye
ars
70-7
4 ye
ars
Estimated number in female population ‡
Per 1,000 female population
Estimated number in female population ‡
Per 1,000 female population
Estimated number in female population ‡
Per 1,000 female population
Estimated number in female population ‡
Per 1,000 female population
Estimated number in female population ‡
Per 1,000 female population
Estimated number in female population ‡
Per 1,000 female population
Estimated number in female population ‡
Per 1,000 female population
Estimated number in female population ‡
Per 1,000 female population
Mal
aysi
a11
0,91
4 10
9,02
8 2
7.55
30
,169
3
3.27
26
,730
3
2.75
23
,736
3
3.64
12
,533
2
2.06
6,
211
14.
05
2,8
84
9.5
0 6,
766
31.
50
Perl
is 1
55
152
4.1
2 42
6
.02
37
5.1
2 33
4
.95
18
3.0
2 9
1.8
9 4
1
.26
9 3
.94
Keda
h 6
,401
6,
292
20.
76
1,74
1 2
7.42
1,
543
25.
67
1,37
0 2
5.00
72
3 1
5.56
35
8 1
0.10
1
66
7.0
2 39
0 2
0.55
Keda
h &
Per
lis 6
,556
6,
445
18.
95
1,78
3 2
5.29
1,
580
23.
44
1,40
3 2
2.81
74
1 1
4.17
36
7 9
.16
170
6
.34
400
18.
69
Pula
u Pi
nang
16,
452
16,1
72
62.
06
4,47
5 7
8.92
3,
965
78.
20
3,52
1 7
8.76
1,
859
48.
54
921
29.
06
428
1
9.01
1,
004
62.
72
Pera
k 7
,343
7,
218
18.
35
1,99
7 2
7.74
1,
770
24.
24
1,57
1 2
2.81
83
0 1
3.56
41
1 7
.79
191
5
.15
448
15.
77
Sela
ngor
14,
145
13,9
04
19.
81
3,84
7 2
0.84
3,
409
22.
38
3,02
7 2
4.69
1,
598
17.
30
792
10.
65
368
7
.82
863
30.
17
WP
Putr
ajay
a 3
60
354
57.
08
98
54.
40
87
57.
84
77
51.
36
41
45.
20
20
67.
20
9
93.
60
22
219.
60
WPK
L 2
0,86
1 20
,506
8
2.26
5,
674
90.
64
5,02
8 9
1.24
4,
464
105.
04
2,35
7 6
8.73
1,
168
45.
63
542
3
0.82
1,
273
109.
70
Sela
ngor
& W
P Pu
traj
aya
&
WPK
L 3
5,36
6 34
,765
3
4.10
9,
620
38.
63
8,52
3 4
0.80
7,
568
45.
43
3,99
6 3
1.32
1,
981
19.
75
920
1
4.21
2,
157
53.
53
Neg
eri S
embi
lan
8,7
37
8,58
9 5
5.09
2,
377
76.
66
2,10
6 6
8.37
1,
870
63.
38
987
39.
65
489
26.
45
227
1
8.77
53
3 5
8.57
Mel
aka
4,9
33
4,84
9 3
8.03
1,
342
49.
88
1,18
9 4
6.26
1,
056
47.
55
557
29.
97
276
17.
71
128
1
1.77
30
1 3
9.59
Joho
r 8
,523
8,
379
17.
75
2,31
8 2
1.45
2,
054
21.
40
1,82
4 2
1.71
96
3 1
3.90
47
7 8
.97
222
6
.21
520
20.
23
Paha
ng 5
,442
5,
349
26.
52
1,48
0 3
6.02
1,
312
32.
46
1,16
5 3
0.57
61
5 2
0.23
30
5 1
2.49
1
41
8.7
3 33
2 2
9.91
Tere
ngga
nu 8
99
884
6.4
0 24
5 8
.21
217
7.4
5 19
2 7
.40
102
5.0
8 50
3
.50
23
2.1
8 55
6
.77
Kela
ntan
239
23
5 1
.02
65
1.3
7 58
1
.23
51
1.1
9 27
0
.79
13
0.5
1 6
0
.32
15
1.0
7
Sara
wak
14,
081
13,8
41
40.
75
3,83
0 4
9.10
3,
393
49.
11
3,01
3 5
0.47
1,
591
32.
67
789
20.
92
366
1
3.41
85
9 4
4.74
Saba
h 2
,343
2,
303
6.9
6 63
7 6
.80
565
7.4
7 50
1 8
.41
265
6.3
8 13
1 4
.93
61
3.1
2 14
3 1
0.07
WP
Labu
an n
a n
a n
a n
a n
a n
a n
a n
a n
a n
a n
a n
a n
a n
a n
a n
a n
a
Saba
h &
WP
Labu
an 2
,343
2,
303
6.7
7 63
7 6
.61
565
7.2
5 50
1 8
.18
265
6.2
0 13
1 4
.81
61
3.0
5 14
3 9
.86

31
CHAP
TER
2: H
OSPI
TAL
MED
ICAL
DEV
ICE
(MAM
MOG
RAM
MAC
HINE
)
National Healthcare Establishment & Workforce Statistics Hospital 2012 -2013
Tabl
e 2.
4: E
stim
ated
Num
ber
& D
ensi
ty o
f Scr
eeni
ng M
amm
ogra
phy
Perf
orm
ed fo
r W
omen
Age
d 40
-74
Year
s, in
Acu
te C
urat
ive
Hos
pita
ls in
Mal
aysi
a by
Sta
te, 2
013
‡
Abb
revi
atio
n: -
not
ava
ilabl
e; n
a- n
ot a
pplic
able
Se
lang
or &
WP
Putr
ajay
a &
WPK
L ar
e al
so c
olle
ctiv
ely
refe
rred
to a
s K
lang
Val
ley.
*Ref
ers
to th
e to
tal n
umbe
r of
scr
eeni
ng m
amm
ogra
phy
as c
aptu
red
via
the
NH
EWS
(Hos
pita
l) 20
12-2
013
surv
ey.
‡
Ref
ers
to th
e es
timat
ed n
umbe
r of
scr
eeni
ng m
amm
ogra
phy
perf
orm
ed o
n w
omen
of t
he r
espe
ctiv
e ag
e gr
oups
, out
of t
he th
e to
tal s
cree
ning
mam
mog
raph
y; h
avin
g ap
plie
d th
e pr
opor
tion
obse
rved
in th
e N
HM
S 20
11 (p
leas
e re
fer
to th
e te
xt fo
r fu
rthe
r de
scri
ptio
n).
For
popu
latio
n da
ta, p
leas
e re
fer A
ppen
dix
3: T
able
A3.
4 un
til T
able
A3.
11
Stat
e
Scre
enin
g M
amm
ogra
phy
Perf
orm
ed, 2
013
Number*
Age
Gro
up o
f Fem
ale
Popu
lati
on
40-7
4 ye
ars
40-4
4 ye
ars
45-4
9 ye
ars
50-5
4 ye
ars
55-5
9 ye
ars
60-6
4 ye
ars
65-6
9 ye
ars
70-7
4 ye
ars
Estimated number in female
population ‡
Per 1,000 female population
Estimated number in female
population ‡
Per 1,000 female population
Estimated number in female
population ‡
Per 1,000 female population
Estimated number in female
population ‡
Per 1,000 female population
Estimated number in female
population ‡
Per 1,000 female population
Estimated number in female
population ‡
Per 1,000 female population
Estimated number in female
population ‡
Per 1,000 female population
Estimated number in female
population ‡
Per 1,000 female population
Mal
aysi
a 1
32,7
33
130
,477
3
2.08
3
6,10
3 3
9.44
3
1,98
9 3
8.22
2
8,40
5 3
9.29
1
4,99
9 2
5.22
7
,433
1
6.30
3
,451
1
0.56
8
,097
3
7.80
Perl
is 2
12
208
5
.63
58
8.6
1 5
1 6
.90
45
6.7
7 2
4 4
.06
12
2.5
3 6
1
.67
13
5.6
2
Keda
h 7
,539
7
,411
2
3.98
2
,051
3
2.34
1
,817
2
9.69
1
,613
2
9.07
8
52
17.
60
422
1
1.38
1
96
7.7
5 4
60
25.
41
Keda
h &
Per
lis 7
,751
7
,619
2
2.02
2
,108
3
0.08
1
,868
2
7.23
1
,659
2
6.67
8
76
16.
13
434
1
0.38
2
02
7.0
5 4
73
23.
18
Pula
u Pi
nang
13,
493
13,
263
49.
62
3,6
70
63.
94
3,2
52
62.
41
2,8
87
63.
46
1,5
25
38.
60
756
2
3.25
3
51
14.
50
823
5
1.12
Pera
k 9
,843
9
,675
2
4.36
2
,677
3
8.03
2
,372
3
2.23
2
,106
3
0.35
1
,112
1
7.74
5
51
10.
30
256
6
.35
600
2
1.99
Sela
ngor
19,
545
19,
212
26.
26
5,3
16
27.
80
4,7
10
29.
81
4,1
83
32.
73
2,2
09
22.
58
1,0
94
14.
52
508
9
.55
1,1
92
42.
13
WP
Putr
ajay
a 4
00
393
5
9.58
1
09
57.
26
96
60.
25
86
57.
07
45
41.
09
22
74.
67
10
104
.00
24
244
.00
WPK
L 2
4,90
2 2
4,47
9 9
5.36
6
,773
1
11.7
7 6
,001
1
02.2
4 5
,329
1
21.9
5 2
,814
7
8.16
1
,395
5
2.03
6
47
34.
44
1,5
19
125
.54
Sela
ngor
& W
P Pu
traj
aya
& W
PKL
44,
847
44,
085
44.
31
12,
198
48.
08
10,
808
49.
51
9,5
97
55.
48
5,0
68
37.
57
2,5
11
24.
50
1,1
66
16.
17
2,7
36
67.
55
Neg
eri S
embi
lan
7,6
25
7,4
95
47.
14
2,0
74
66.
90
1,8
38
59.
66
1,6
32
54.
94
862
3
3.14
4
27
21.
90
198
1
5.13
4
65
52.
26
Mel
aka
8,8
41
8,6
91
67.
06
2,4
05
92.
14
2,1
31
80.
10
1,8
92
84.
09
999
5
1.76
4
95
31.
53
230
1
9.32
5
39
71.
91
Joho
r 1
4,98
1 1
4,72
7 3
0.35
4
,075
3
7.35
3
,611
3
6.51
3
,206
3
7.54
1
,693
2
3.35
8
39
15.
17
390
1
0.09
9
14
35.
98
Paha
ng 6
,917
6
,799
3
2.99
1
,881
4
5.12
1
,667
4
1.47
1
,480
3
8.15
7
82
24.
43
387
1
5.62
1
80
10.
05
422
3
9.43
Tere
ngga
nu 1
,160
1
,140
8
.09
316
1
0.59
2
80
9.5
7 2
48
9.3
0 1
31
6.1
8 6
5 4
.33
30
2.7
7 7
1 8
.74
Kela
ntan
1,1
07
1,0
88
4.6
4 3
01
6.4
1 2
67
5.6
6 2
37
5.4
0 1
25
3.4
7 6
2 2
.31
29
1.4
3 6
8 4
.89
Sara
wak
14,
035
13,
797
39.
45
3,8
18
48.
14
3,3
82
47.
84
3,0
04
48.
60
1,5
86
31.
72
786
2
0.05
3
65
12.
85
856
4
2.17
Saba
h 2
,133
2
,096
6
.05
580
5
.98
514
6
.54
456
7
.34
241
5
.34
119
4
.19
55
2.7
6 1
30
8.7
3
WP
Labu
an n
a n
a n
a n
a n
a n
a n
a n
a n
a n
a n
a n
a n
a n
a n
a n
a n
a
Saba
h &
WP
Labu
an 2
,133
2
,096
5
.89
580
5
.81
514
6
.35
456
7
.13
241
5
.20
119
4
.08
55
2.6
9 1
30
8.5
6

This page intentionally left blank
Chapter 3 :
Hospital Activities
34
National Healthcare Establishment & Workforce Statistics Hospital 2012 -2013
CHAPTER 3 | HOSPITAL ACTIVITIESInpatient Activities
There were around 3.5 million hospital admissions per year in 2012 and 2013 each. The number of hospital admissions observed an increasing pattern over time; although the increase between 2011 and 2012 was higher (4.7%) than the increase between 2012 and 2013 (2.3%). Hospital admission density observed an overall increase of 1.1% between 2012 and 2013 (117.94 to 119.23 per 1,000 population). Terengganu, Kelantan, Negeri Sembilan, and Johor saw the highest increase (4.5%-5.8%) of admissions per population. However seven states showed a decreasing pattern of admission density (Perlis, Kedah, Pulau Pinang, Perak, WP Putrajaya, Melaka, and Sarawak). Admissions to the public hospitals held a proportion of 72.3% out of total admissions in 2011. In subsequent years, the proportion dropped to 70.9% in 2012, and 70.8% in 2013. Generally, the public hospitals experienced 2.5 times more admissions per day than the private hospitals. [Table 3.1]
Mean average length of stay (ALOS) over the past three years has maintained at 3.5 days. Overall, ALOS was a day longer in the public hospitals (3.8 days) than in the private hospitals (2.8 days). Top three states with the longest mean ALOS were WP Putrajaya (4.4 days), WP Kuala Lumpur (4.2 days), and Sarawak (3.9 days); main contribution being from the public hospitals in each state i.e. 4.4 days, 4.9 days, and 4.2 days respectively [Table 3.2]. As would be expected, specialist hospitals recorded the longest mean ALOS (around 3.6 days) while maternity centres recorded the shortest mean ALOS (around 2.3 days) [Table 3.3].
On average, bed occupancy rate (BOR) during 2011-2013 period remained at 67%-68%. Over the time frame of 2012-2013, the public hospitals had an increase of 0.6% in mean BOR, while the private hospitals showed an increase of 2.3%. Between 2012 and 2013, three states had the highest increment of mean BOR: Negeri Sembilan (6.9%), Pahang (6.0%), and Terengganu (5.4%). The remaining states observed an increase of mean BOR ranging from 0.2% to 2.7% [Table 3.2]. Specialist hospitals especially from the public sector had the highest mean BOR compared with other hospital types. An interesting observation is that mean BOR of public specialist hospitals remained almost unchanged over time (2011-2013) while that of public non-specialist hospitals demonstrated a decreasing pattern. Once again, we highlight the finding of underutilisation of public non-specialist hospitals; reiterating our past reports. Kedah tops the list with the highest public specialist hospitals mean BOR for both 2012 (88.1%) and 2013 (90.1%). Public specialist hospitals of five other states (Pulau Pinang, Selangor, Melaka, Johor, and Terengganu) also observed mean BORs above national average for two consecutive years (2012-2013). [Table 3.4]
Overall turnover interval (TOI) remained unchanged (around 1.7 days) for the past three years. Mean TOI for the public hospitals was shorter (around 1.6 days) compared with the private hospitals (around 2.0 days) [Table 3.2]. This reflects on the higher number of admissions, and longer ALOS in the public hospitals. Among the three hospital categories, maternity centres had the longest mean TOI (3.5 days in 2012, and 4.5 days in 2013) compared with non-specialist hospitals (about 3 days), and specialist hospitals (about 1.5 days). Public specialist hospitals of six states recorded mean TOIs below national average for both 2012 and 2013 (Perlis, Kedah, Pulau Pinang, Selangor, Johor, and Terengganu) [Table 3.5]. Consistently, five out of those six states also recorded mean BORs above national average.
Outpatient Activities
Under this section of hospital activity, we gathered data on total visits per year in different hospital outpatient settings: emergency department (ED), general outpatient department (OPD), and specialist clinic. Overall, outpatient activities surpassed inpatient activities ninefold in 2012 and 2013. The year 2012 and 2013 each reported a total of 32-33 million hospital outpatient visits per year. We observed that in both years, nearly half (49%) of all hospital outpatient visits were made to the specialist clinics. The remaining half showed a slightly higher proportion of ED visits (28%) over
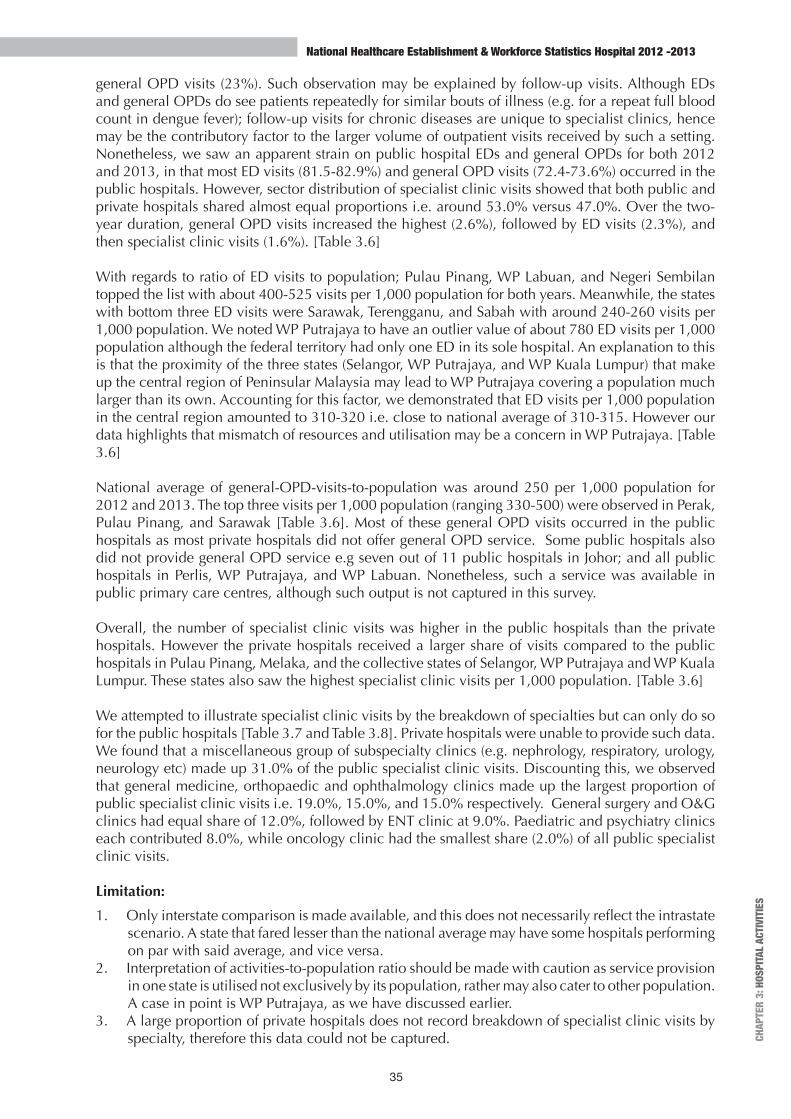
35
CHAP
TER
3: H
OSPI
TAL A
CTIV
ITIE
S
National Healthcare Establishment & Workforce Statistics Hospital 2012 -2013
general OPD visits (23%). Such observation may be explained by follow-up visits. Although EDs and general OPDs do see patients repeatedly for similar bouts of illness (e.g. for a repeat full blood count in dengue fever); follow-up visits for chronic diseases are unique to specialist clinics, hence may be the contributory factor to the larger volume of outpatient visits received by such a setting. Nonetheless, we saw an apparent strain on public hospital EDs and general OPDs for both 2012 and 2013, in that most ED visits (81.5-82.9%) and general OPD visits (72.4-73.6%) occurred in the public hospitals. However, sector distribution of specialist clinic visits showed that both public and private hospitals shared almost equal proportions i.e. around 53.0% versus 47.0%. Over the two-year duration, general OPD visits increased the highest (2.6%), followed by ED visits (2.3%), and then specialist clinic visits (1.6%). [Table 3.6]
With regards to ratio of ED visits to population; Pulau Pinang, WP Labuan, and Negeri Sembilan topped the list with about 400-525 visits per 1,000 population for both years. Meanwhile, the states with bottom three ED visits were Sarawak, Terengganu, and Sabah with around 240-260 visits per 1,000 population. We noted WP Putrajaya to have an outlier value of about 780 ED visits per 1,000 population although the federal territory had only one ED in its sole hospital. An explanation to this is that the proximity of the three states (Selangor, WP Putrajaya, and WP Kuala Lumpur) that make up the central region of Peninsular Malaysia may lead to WP Putrajaya covering a population much larger than its own. Accounting for this factor, we demonstrated that ED visits per 1,000 population in the central region amounted to 310-320 i.e. close to national average of 310-315. However our data highlights that mismatch of resources and utilisation may be a concern in WP Putrajaya. [Table 3.6]
National average of general-OPD-visits-to-population was around 250 per 1,000 population for 2012 and 2013. The top three visits per 1,000 population (ranging 330-500) were observed in Perak, Pulau Pinang, and Sarawak [Table 3.6]. Most of these general OPD visits occurred in the public hospitals as most private hospitals did not offer general OPD service. Some public hospitals also did not provide general OPD service e.g seven out of 11 public hospitals in Johor; and all public hospitals in Perlis, WP Putrajaya, and WP Labuan. Nonetheless, such a service was available in public primary care centres, although such output is not captured in this survey.
Overall, the number of specialist clinic visits was higher in the public hospitals than the private hospitals. However the private hospitals received a larger share of visits compared to the public hospitals in Pulau Pinang, Melaka, and the collective states of Selangor, WP Putrajaya and WP Kuala Lumpur. These states also saw the highest specialist clinic visits per 1,000 population. [Table 3.6]
We attempted to illustrate specialist clinic visits by the breakdown of specialties but can only do so for the public hospitals [Table 3.7 and Table 3.8]. Private hospitals were unable to provide such data. We found that a miscellaneous group of subspecialty clinics (e.g. nephrology, respiratory, urology, neurology etc) made up 31.0% of the public specialist clinic visits. Discounting this, we observed that general medicine, orthopaedic and ophthalmology clinics made up the largest proportion of public specialist clinic visits i.e. 19.0%, 15.0%, and 15.0% respectively. General surgery and O&G clinics had equal share of 12.0%, followed by ENT clinic at 9.0%. Paediatric and psychiatry clinics each contributed 8.0%, while oncology clinic had the smallest share (2.0%) of all public specialist clinic visits.
Limitation:
1. Only interstate comparison is made available, and this does not necessarily reflect the intrastate scenario. A state that fared lesser than the national average may have some hospitals performing on par with said average, and vice versa.
2. Interpretation of activities-to-population ratio should be made with caution as service provision in one state is utilised not exclusively by its population, rather may also cater to other population. A case in point is WP Putrajaya, as we have discussed earlier.
3. A large proportion of private hospitals does not record breakdown of specialist clinic visits by specialty, therefore this data could not be captured.

36
National Healthcare Establishment & Workforce Statistics Hospital 2012 -2013
Stat
eSe
ctor
*
Adm
issi
ons
2011
2012
2013
Number
per 1,000 population
Rate per Day
Number
per 1,000 population
Rate per Day
Number
per 1,000 population
Rate per Day
Mal
aysi
aPu
blic
2,3
82,5
40
- 6
,523
.04
2,4
54,6
98
- 6
,720
.60
2,5
07,1
51
- 6
,864
.21
Mal
aysi
aPr
ivat
e91
4,77
8-
2,5
04.5
2 1
,005
,270
-
2,7
52.2
8 1
,035
,846
-
2,8
35.9
9 M
alay
sia
Tota
l3,
297,
318
113
.84
9,0
27.5
6 3
,459
,968
1
17.9
4 9
,472
.88
3,5
42,9
97
119
.23
9,7
00.2
0 Pe
rlis
Publ
ic 2
9,72
1 -
81.
37
32,
653
- 8
9.40
3
1,32
4 -
85.
76
Perl
isPr
ivat
e n
a -
na
-
na
-
na
- n
a Pe
rlis
Tota
l 2
9,72
1 1
25.1
4 8
1.37
3
2,65
3 1
36.4
0 8
9.40
3
1,32
4 1
29.7
6 8
5.76
Ke
dah
Publ
ic 1
86,1
24
- 5
09.5
8 1
91,9
32
- 5
25.4
8 1
92,1
69
- 5
26.1
3 Ke
dah
Priv
ate
44,
620
- 1
22.1
6 4
3,79
7 -
119
.91
43,
639
- 1
19.4
8 Ke
dah
Tota
l 2
30,7
44
116
.94
631
.74
235
,729
1
18.0
5 6
45.3
9 2
35,8
08
116
.67
645
.61
Keda
h &
Per
lisPu
blic
215
,845
-
590
.95
224
,585
-
614
.88
223
,493
-
611
.89
Keda
h &
Per
lisPr
ivat
e 4
4,62
0 -
122
.16
43,
797
- 1
19.9
1 4
3,63
9 -
119
.48
Keda
h &
Per
lisTo
tal
260
,465
1
17.8
3 7
13.1
1 2
68,3
82
120
.02
734
.79
267
,132
1
18.0
7 7
31.3
7 Pu
lau
Pina
ngPu
blic
140
,929
-
385
.84
137
,875
-
377
.48
131
,812
-
360
.88
Pula
u Pi
nang
Priv
ate
119
,272
-
326
.55
158
,225
-
433
.20
147
,822
-
404
.72
Pula
u Pi
nang
Tota
l 2
60,2
01
163
.28
712
.39
296
,100
1
83.7
9 8
10.6
8 2
79,6
34
171
.72
765
.60
Pera
kPu
blic
224
,969
-
615
.93
229
,786
-
629
.12
226
,838
-
621
.05
Pera
kPr
ivat
e 5
9,52
7 -
162
.97
81,
442
- 2
22.9
7 8
4,61
2 -
231
.65
Pera
kTo
tal
284
,496
1
18.6
6 7
78.9
1 3
11,2
28
128
.78
852
.09
311
,450
1
27.8
3 8
52.7
0 Se
lang
orPu
blic
310
,249
-
849
.42
326
,322
-
893
.42
331
,260
-
906
.94
Sela
ngor
Priv
ate
244
,568
-
669
.59
259
,585
-
710
.71
275
,995
-
755
.63
Sela
ngor
Tota
l 5
54,8
17
99.
48
1,5
19.0
1 5
85,9
07
103
.69
1,6
04.1
3 6
07,2
55
106
.07
1,6
62.5
7 W
P Pu
traj
aya
Publ
ic 2
4,47
6 -
67.
01
25,
112
- 6
8.75
2
4,60
6 -
67.
37
WP
Putr
ajay
aPr
ivat
e n
a -
na
na
- n
a n
a -
na
WP
Putr
ajay
aTo
tal
24,
476
320
.37
67.
01
25,
112
316
.27
68.
75
24,
606
298
.25
67.
37
WP
Kual
a Lu
mpu
rPu
blic
205
,994
-
563
.98
214
,347
-
586
.85
215
,736
-
590
.65
WP
Kual
a Lu
mpu
rPr
ivat
e 1
77,2
91
- 4
85.4
0 1
67,4
45
- 4
58.4
4 1
74,7
78
- 4
78.5
2 W
P Ku
ala
Lum
pur
Tota
l 3
83,2
85
226
.19
1,0
49.3
8 3
81,7
92
222
.83
1,0
45.2
9 3
90,5
14
225
.47
1,0
69.1
7 Se
lang
or &
WP
Putr
ajay
a &
WP
Kual
a Lu
mpu
rPu
blic
540
,719
-
1,4
80.4
1 5
65,7
81
- 1
,549
.02
571
,602
-
1,5
64.9
6 Se
lang
or &
WP
Putr
ajay
a &
WP
Kual
a Lu
mpu
rPr
ivat
e 4
21,8
59
- 1
,154
.99
427
,030
-
1,1
69.1
5 4
50,7
73
- 1
,234
.15
Sela
ngor
& W
P Pu
traj
aya
& W
P Ku
ala
Lum
pur
Tota
l 9
62,5
78
130
.99
2,6
35.4
0 9
92,8
11
133
.38
2,7
18.1
7 1
,022
,375
1
35.6
0 2
,799
.11
Tabl
e 3.
1: N
umbe
r &
Den
sity
of A
dmis
sion
s, a
nd R
ate
of A
dmis
sion
Per
Day
in A
cute
Cur
ativ
e H
ospi
tals
in M
alay
sia
by S
tate
& S
ecto
r, 20
11-2
013
Abb
revi
atio
n: -
not
ava
ilabl
e; n
a -
not a
pplic
able
Sela
ngor
& W
P Pu
traj
aya
& W
PKL
are
also
col
lect
ivel
y re
ferr
ed to
as
Kla
ng V
alle
y.
*
Publ
ic s
ecto
r in
201
1 re
fers
to M
OH
and
Uni
vers
ity h
ospi
tals
, whi
le p
ublic
sec
tor
in 2
012
& 2
013
refe
rs to
MO
H, U
nive
rsity
, and
MO
D h
ospi
tals
.
Fo
r po
pula
tion
data
, ple
ase
refe
r App
endi
x 3:
Tab
le A
3.1
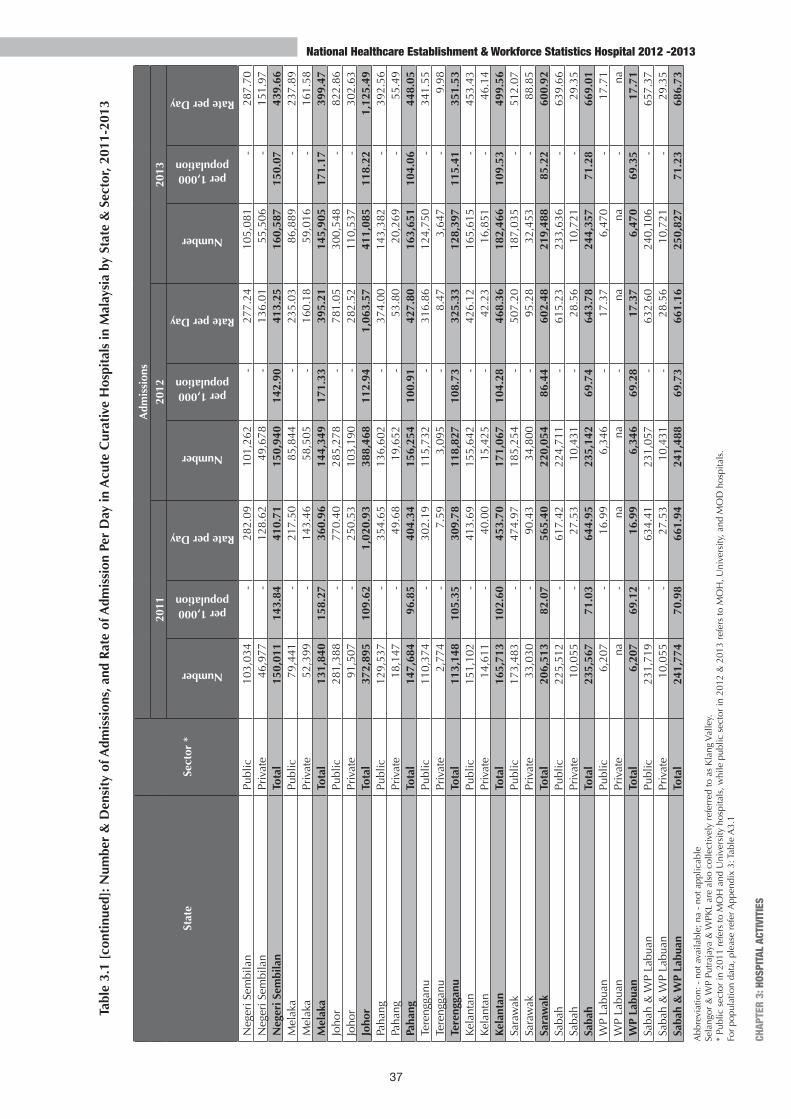
37
CHAP
TER
3: H
OSPI
TAL A
CTIV
ITIE
S
National Healthcare Establishment & Workforce Statistics Hospital 2012 -2013
Tabl
e 3.
1 [c
onti
nued
]: N
umbe
r &
Den
sity
of A
dmis
sion
s, a
nd R
ate
of A
dmis
sion
Per
Day
in A
cute
Cur
ativ
e H
ospi
tals
in M
alay
sia
by S
tate
& S
ecto
r, 20
11-2
013
Stat
eSe
ctor
*
Adm
issi
ons
2011
2012
2013
Number
per 1,000 population
Rate per Day
Number
per 1,000 population
Rate per Day
Number
per 1,000 population
Rate per Day
Neg
eri S
embi
lan
Publ
ic 1
03,0
34
- 2
82.0
9 1
01,2
62
- 2
77.2
4 1
05,0
81
- 2
87.7
0 N
eger
i Sem
bila
nPr
ivat
e 4
6,97
7 -
128
.62
49,
678
- 1
36.0
1 5
5,50
6 -
151
.97
Neg
eri S
embi
lan
Tota
l 1
50,0
11
143
.84
410
.71
150
,940
1
42.9
0 4
13.2
5 1
60,5
87
150
.07
439
.66
Mel
aka
Publ
ic 7
9,44
1 -
217
.50
85,
844
- 2
35.0
3 8
6,88
9 -
237
.89
Mel
aka
Priv
ate
52,
399
- 1
43.4
6 5
8,50
5 -
160
.18
59,
016
- 1
61.5
8 M
elak
aTo
tal
131
,840
1
58.2
7 3
60.9
6 1
44,3
49
171
.33
395
.21
145
,905
1
71.1
7 3
99.4
7 Jo
hor
Publ
ic 2
81,3
88
- 7
70.4
0 2
85,2
78
- 7
81.0
5 3
00,5
48
- 8
22.8
6 Jo
hor
Priv
ate
91,
507
- 2
50.5
3 1
03,1
90
- 2
82.5
2 1
10,5
37
- 3
02.6
3 Jo
hor
Tota
l 3
72,8
95
109
.62
1,0
20.9
3 3
88,4
68
112
.94
1,0
63.5
7 4
11,0
85
118
.22
1,1
25.4
9 Pa
hang
Publ
ic 1
29,5
37
- 3
54.6
5 1
36,6
02
- 3
74.0
0 1
43,3
82
- 3
92.5
6 Pa
hang
Priv
ate
18,
147
- 4
9.68
1
9,65
2 -
53.
80
20,
269
- 5
5.49
Pa
hang
Tota
l 1
47,6
84
96.
85
404
.34
156
,254
1
00.9
1 4
27.8
0 1
63,6
51
104
.06
448
.05
Tere
ngga
nuPu
blic
110
,374
-
302
.19
115
,732
-
316
.86
124
,750
-
341
.55
Tere
ngga
nuPr
ivat
e 2
,774
-
7.5
9 3
,095
-
8.4
7 3
,647
-
9.9
8 Te
reng
ganu
Tota
l 1
13,1
48
105
.35
309
.78
118
,827
1
08.7
3 3
25.3
3 1
28,3
97
115
.41
351
.53
Kela
ntan
Publ
ic 1
51,1
02
- 4
13.6
9 1
55,6
42
- 4
26.1
2 1
65,6
15
- 4
53.4
3 Ke
lant
anPr
ivat
e 1
4,61
1 -
40.
00
15,
425
- 4
2.23
1
6,85
1 -
46.
14
Kela
ntan
Tota
l 1
65,7
13
102
.60
453
.70
171
,067
1
04.2
8 4
68.3
6 1
82,4
66
109
.53
499
.56
Sara
wak
Publ
ic 1
73,4
83
- 4
74.9
7 1
85,2
54
- 5
07.2
0 1
87,0
35
- 5
12.0
7 Sa
raw
akPr
ivat
e 3
3,03
0 -
90.
43
34,
800
- 9
5.28
3
2,45
3 -
88.
85
Sara
wak
Tota
l 2
06,5
13
82.
07
565
.40
220
,054
8
6.44
6
02.4
8 2
19,4
88
85.
22
600
.92
Saba
hPu
blic
225
,512
-
617
.42
224
,711
-
615
.23
233
,636
-
639
.66
Saba
hPr
ivat
e 1
0,05
5 -
27.
53
10,
431
- 2
8.56
1
0,72
1 -
29.
35
Saba
hTo
tal
235
,567
7
1.03
6
44.9
5 2
35,1
42
69.
74
643
.78
244
,357
7
1.28
6
69.0
1 W
P La
buan
Publ
ic 6
,207
-
16.
99
6,3
46
- 1
7.37
6
,470
-
17.
71
WP
Labu
anPr
ivat
e n
a -
na
na
- n
a n
a -
na
WP
Labu
anTo
tal
6,2
07
69.
12
16.
99
6,3
46
69.
28
17.
37
6,4
70
69.
35
17.
71
Saba
h &
WP
Labu
anPu
blic
231
,719
-
634
.41
231
,057
-
632
.60
240
,106
-
657
.37
Saba
h &
WP
Labu
anPr
ivat
e 1
0,05
5 -
27.
53
10,
431
- 2
8.56
1
0,72
1 -
29.
35
Saba
h &
WP
Labu
anTo
tal
241
,774
7
0.98
6
61.9
4 2
41,4
88
69.
73
661
.16
250
,827
7
1.23
6
86.7
3
Abb
revi
atio
n: -
not
ava
ilabl
e; n
a -
not a
pplic
able
Sela
ngor
& W
P Pu
traj
aya
& W
PKL
are
also
col
lect
ivel
y re
ferr
ed to
as
Kla
ng V
alle
y.
*
Publ
ic s
ecto
r in
201
1 re
fers
to M
OH
and
Uni
vers
ity h
ospi
tals
, whi
le p
ublic
sec
tor
in 2
012
& 2
013
refe
rs to
MO
H, U
nive
rsity
, and
MO
D h
ospi
tals
.
Fo
r po
pula
tion
data
, ple
ase
refe
r App
endi
x 3:
Tab
le A
3.1
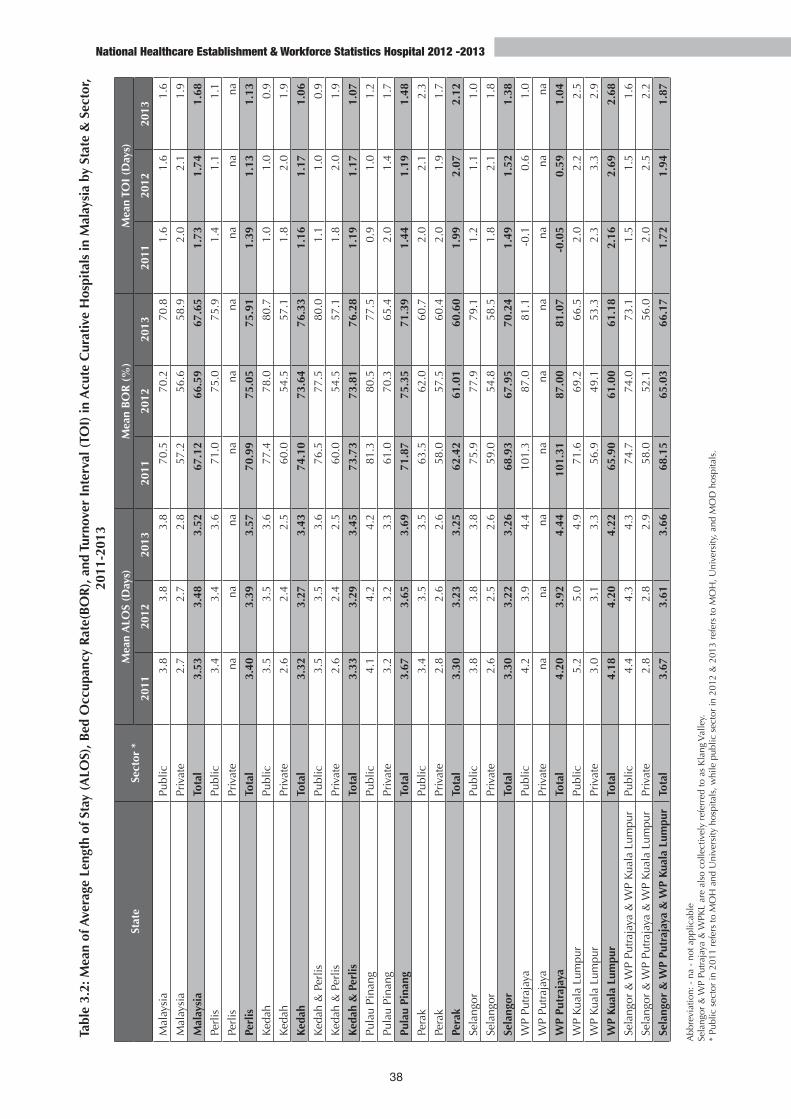
38
National Healthcare Establishment & Workforce Statistics Hospital 2012 -2013
Tabl
e 3.
2: M
ean
of A
vera
ge L
engt
h of
Sta
y (A
LOS)
, Bed
Occ
upan
cy R
ate(
BO
R),
and
Tur
nove
r In
terv
al (
TOI)
in A
cute
Cur
ativ
e H
ospi
tals
in M
alay
sia
by S
tate
& S
ecto
r, 20
11-2
013
Stat
eSe
ctor
*M
ean
ALO
S (D
ays)
Mea
n B
OR
(%
)M
ean
TOI
(Day
s)
2011
2012
2013
2011
2012
2013
2011
2012
2013
Mal
aysi
aPu
blic
3.8
3.8
3.8
70.5
70.2
70.8
1.6
1.6
1.6
Mal
aysi
aPr
ivat
e2.
72.
72.
857
.256
.658
.92.
02.
11.
9
Mal
aysi
aTo
tal
3.53
3.48
3.52
67.1
266
.59
67.6
51.
731.
741.
68
Perl
isPu
blic
3.4
3.4
3.6
71.0
75.0
75.9
1.4
1.1
1.1
Perl
isPr
ivat
ena
nana
nana
nana
nana
Perl
isTo
tal
3.40
3.39
3.57
70.9
975
.05
75.9
11.
391.
131.
13
Keda
hPu
blic
3.5
3.5
3.6
77.4
78.0
80.7
1.0
1.0
0.9
Keda
hPr
ivat
e2.
62.
42.
560
.054
.557
.11.
82.
01.
9
Keda
hTo
tal
3.32
3.27
3.43
74.1
073
.64
76.3
31.
161.
171.
06
Keda
h &
Per
lisPu
blic
3.5
3.5
3.6
76.5
77.5
80.0
1.1
1.0
0.9
Keda
h &
Per
lisPr
ivat
e2.
62.
42.
560
.054
.557
.11.
82.
01.
9
Keda
h &
Per
lisTo
tal
3.33
3.29
3.45
73.7
373
.81
76.2
81.
191.
171.
07
Pula
u Pi
nang
Publ
ic4.
14.
24.
281
.380
.577
.50.
91.
01.
2
Pula
u Pi
nang
Priv
ate
3.2
3.2
3.3
61.0
70.3
65.4
2.0
1.4
1.7
Pula
u Pi
nang
Tota
l3.
673.
653.
6971
.87
75.3
571
.39
1.44
1.19
1.48
Pera
kPu
blic
3.4
3.5
3.5
63.5
62.0
60.7
2.0
2.1
2.3
Pera
kPr
ivat
e2.
82.
62.
658
.057
.560
.42.
01.
91.
7
Pera
kTo
tal
3.30
3.23
3.25
62.4
261
.01
60.6
01.
992.
072.
12
Sela
ngor
Publ
ic3.
83.
83.
875
.977
.979
.11.
21.
11.
0
Sela
ngor
Priv
ate
2.6
2.5
2.6
59.0
54.8
58.5
1.8
2.1
1.8
Sela
ngor
Tota
l3.
303.
223.
2668
.93
67.9
570
.24
1.49
1.52
1.38
WP
Putr
ajay
aPu
blic
4.2
3.9
4.4
101.
387
.081
.1-0
.10.
61.
0
WP
Putr
ajay
aPr
ivat
ena
nana
nana
nana
nana
WP
Putr
ajay
aTo
tal
4.20
3.92
4.44
101.
3187
.00
81.0
7-0
.05
0.59
1.04
WP
Kual
a Lu
mpu
rPu
blic
5.2
5.0
4.9
71.6
69.2
66.5
2.0
2.2
2.5
WP
Kual
a Lu
mpu
rPr
ivat
e3.
03.
13.
356
.949
.153
.32.
33.
32.
9
WP
Kual
a Lu
mpu
rTo
tal
4.18
4.20
4.22
65.9
061
.00
61.1
82.
162.
692.
68
Sela
ngor
& W
P Pu
traj
aya
& W
P Ku
ala
Lum
pur
Publ
ic4.
44.
34.
374
.774
.073
.11.
51.
51.
6
Sela
ngor
& W
P Pu
traj
aya
& W
P Ku
ala
Lum
pur
Priv
ate
2.8
2.8
2.9
58.0
52.1
56.0
2.0
2.5
2.2
Sela
ngor
& W
P Pu
traj
aya
& W
P Ku
ala
Lum
pur
Tota
l3.
673.
613.
6668
.15
65.0
366
.17
1.72
1.94
1.87
Abb
revi
atio
n: -
na
- no
t app
licab
leSe
lang
or &
WP
Putr
ajay
a &
WPK
L ar
e al
so c
olle
ctiv
ely
refe
rred
to a
s K
lang
Val
ley.
* Pu
blic
sec
tor
in 2
011
refe
rs to
MO
H a
nd U
nive
rsity
hos
pita
ls, w
hile
pub
lic s
ecto
r in
201
2 &
201
3 re
fers
to M
OH
, Uni
vers
ity, a
nd M
OD
hos
pita
ls.

39
CHAP
TER
3: H
OSPI
TAL A
CTIV
ITIE
S
National Healthcare Establishment & Workforce Statistics Hospital 2012 -2013
Tabl
e 3.
2 [c
onti
nued
]: M
ean
of A
vera
ge L
engt
h of
Sta
y (A
LOS)
, Bed
Occ
upan
cy R
ate
(BO
R),
and
Tur
nove
r In
terv
al (
TOI)
in A
cute
Cur
ativ
e H
ospi
tals
in M
alay
sia
by
Stat
e &
Sec
tor,
2011
-201
3
Stat
eSe
ctor
*M
ean
ALO
S (D
ays)
Mea
n B
OR
(%
)M
ean
TOI
(Day
s)
2011
2012
2013
2011
2012
2013
2011
2012
2013
Neg
eri S
embi
lan
Publ
ic3.
53.
53.
866
.163
.470
.01.
82.
01.
6
Neg
eri S
embi
lan
Priv
ate
2.5
2.7
2.8
61.2
68.0
75.5
1.6
1.3
0.9
Neg
eri S
embi
lan
Tota
l3.
203.
273.
4364
.87
64.5
671
.49
1.74
1.80
1.37
Mel
aka
Publ
ic3.
84.
14.
183
.174
.873
.20.
81.
41.
5
Mel
aka
Priv
ate
2.7
2.7
2.8
53.8
63.3
65.4
2.3
1.5
1.5
Mel
aka
Tota
l3.
383.
523.
6170
.90
70.8
270
.55
1.39
1.45
1.51
Joho
rPu
blic
3.4
3.4
3.4
72.7
74.7
73.8
1.3
1.2
1.2
Joho
rPr
ivat
e2.
12.
02.
154
.948
.253
.81.
72.
21.
8
Joho
rTo
tal
3.07
3.04
3.03
68.9
368
.12
69.0
41.
381.
421.
36
Paha
ngPu
blic
3.9
3.5
3.8
71.4
66.0
72.3
1.6
1.8
1.4
Paha
ngPr
ivat
e3.
02.
82.
943
.754
.457
.93.
82.
32.
1
Paha
ngTo
tal
3.83
3.38
3.66
67.3
264
.57
70.5
61.
861.
851.
53
Tere
ngga
nuPu
blic
3.1
3.1
3.1
70.9
72.5
77.8
1.3
1.2
0.9
Tere
ngga
nuPr
ivat
e3.
03.
03.
069
.177
.190
.81.
30.
90.
3
Tere
ngga
nuTo
tal
3.14
3.07
3.05
70.8
872
.62
78.0
61.
291.
160.
86
Kela
ntan
Publ
ic4.
14.
03.
970
.069
.771
.41.
71.
81.
6
Kela
ntan
Priv
ate
2.5
2.5
2.4
63.0
64.2
66.0
1.5
1.4
1.2
Kela
ntan
Tota
l3.
933.
913.
7769
.59
69.3
571
.02
1.72
1.73
1.54
Sara
wak
Publ
ic4.
14.
24.
258
.463
.463
.42.
92.
42.
4
Sara
wak
Priv
ate
2.1
2.0
1.9
42.7
50.9
43.9
2.8
1.9
2.4
Sara
wak
Tota
l3.
763.
833.
8756
.56
62.1
661
.43
2.89
2.33
2.43
Saba
hPu
blic
3.9
3.7
3.8
64.2
63.1
64.3
2.2
2.2
2.1
Saba
hPr
ivat
e2.
82.
72.
749
.262
.461
.52.
91.
61.
7
Saba
hTo
tal
3.88
3.68
3.73
63.6
263
.08
64.1
62.
222.
162.
08
WP
Labu
anPu
blic
2.8
3.1
3.1
43.4
50.1
50.0
3.6
3.1
3.1
WP
Labu
anPr
ivat
ena
nana
nana
nana
nana
WP
Labu
anTo
tal
2.78
3.14
3.08
43.3
750
.14
50.0
53.
633.
133.
07
Saba
h &
WP
Labu
anPu
blic
3.9
3.7
3.8
63.6
62.7
63.9
2.2
2.2
2.1
Saba
h &
WP
Labu
anPr
ivat
e2.
82.
72.
749
.262
.461
.52.
91.
61.
7
Saba
h &
WP
Labu
anTo
tal
3.85
3.67
3.71
63.0
762
.72
63.7
82.
252.
182.
11
Abb
revi
atio
n: -
na
- no
t app
licab
leSe
lang
or &
WP
Putr
ajay
a &
WPK
L ar
e al
so c
olle
ctiv
ely
refe
rred
to a
s K
lang
Val
ley.
* Pu
blic
sec
tor
in 2
011
refe
rs to
MO
H a
nd U
nive
rsity
hos
pita
ls, w
hile
pub
lic s
ecto
r in
201
2 &
201
3 re
fers
to M
OH
, Uni
vers
ity, a
nd M
OD
hos
pita
ls.

40
National Healthcare Establishment & Workforce Statistics Hospital 2012 -2013
Tabl
e 3.
3: M
ean
of A
vera
ge L
engt
h of
Sta
y (A
LOS)
in M
alay
sia
by C
ateg
orie
s of
Acu
te C
urat
ive
Hos
pita
ls, b
y St
ate
& S
ecto
r, 20
11-2
013
Stat
eSe
ctor
*
Mea
n A
LOS
(Day
s)
Spec
ialis
t H
ospi
tal
Non
Spe
cial
ist
Hos
pita
l M
ater
nity
Cen
tre
2011
2012
2013
2011
2012
2013
2011
2012
2013
Mal
aysi
aPu
blic
4.0
4 4
.00
4.0
6 2
.82
2.7
0 2
.70
na
na
na
Mal
aysi
aPr
ivat
e 2
.73
2.7
1 2
.77
1.0
0 1
.00
1.0
0 2
.41
2.2
1 2
.29
Mal
aysi
aTo
tal
3.6
4 3
.59
3.6
4 2
.82
2.7
0 2
.70
2.4
1 2
.21
2.2
9 Pe
rlis
Publ
ic 3
.40
3.3
9 3
.57
na
na
na
na
na
na
Perl
isPr
ivat
e n
a n
a n
a n
a n
a n
a n
a n
a n
a Pe
rlis
Tota
l 3
.40
3.3
9 3
.57
na
na
na
na
na
na
Keda
hPu
blic
3.7
2 3
.70
3.8
7 2
.39
2.4
1 2
.54
na
na
na
Keda
hPr
ivat
e 2
.67
2.4
2 2
.56
na
na
na
2.1
8 2
.05
2.0
3 Ke
dah
Tota
l 3
.49
3.4
3 3
.59
2.3
9 2
.41
2.5
4 2
.18
2.0
5 2
.03
Keda
h &
Per
lisPu
blic
3.6
6 3
.64
3.8
2 2
.39
2.4
1 2
.54
na
na
na
Keda
h &
Per
lisPr
ivat
e 2
.67
2.4
2 2
.56
na
na
na
2.1
8 2
.05
2.0
3 Ke
dah
& P
erlis
Tota
l 3
.48
3.4
2 3
.59
2.3
9 2
.41
2.5
4 2
.18
2.0
5 2
.03
Pula
u Pi
nang
Publ
ic 4
.14
4.1
6 4
.19
3.5
9 4
.01
4.0
0 n
a n
a n
a Pu
lau
Pina
ngPr
ivat
e 3
.24
3.2
8 3
.28
na
na
na
1.8
7 1
.92
2.1
6 Pu
lau
Pina
ngTo
tal
3.7
2 3
.68
3.7
0 3
.59
4.0
1 4
.00
1.8
7 1
.92
2.1
6 Pe
rak
Publ
ic 3
.66
3.7
1 3
.77
2.6
4 2
.59
2.5
5 n
a n
a n
a Pe
rak
Priv
ate
2.8
4 2
.62
2.6
5 n
a n
a n
a 1
.68
1.6
5 1
.64
Pera
kTo
tal
3.4
5 3
.37
3.4
1 2
.64
2.5
9 2
.55
1.6
8 1
.65
1.6
4 Se
lang
orPu
blic
3.8
4 3
.81
3.8
9 3
.51
3.0
6 3
.13
na
na
na
Sela
ngor
Priv
ate
2.6
1 2
.53
2.5
7 n
a n
a n
a 3
.23
2.5
6 2
.65
Sela
ngor
Tota
l 3
.29
3.2
4 3
.28
3.5
1 3
.06
3.1
3 3
.23
2.5
6 2
.65
WP
Putr
ajay
aPu
blic
4.2
0 3
.92
4.4
4 n
a n
a n
a n
a n
a n
a W
P Pu
traj
aya
Priv
ate
na
na
na
na
na
na
na
na
na
WP
Putr
ajay
aTo
tal
4.2
0 3
.92
4.4
4 n
a n
a n
a n
a n
a n
a W
P Ku
ala
Lum
pur
Publ
ic 5
.17
5.0
3 4
.95
na
na
na
na
na
na
WP
Kual
a Lu
mpu
rPr
ivat
e 3
.03
3.1
5 3
.33
na
na
na
2.4
1 3
.04
3.1
4 W
P Ku
ala
Lum
pur
Tota
l 4
.19
4.2
2 4
.23
na
na
na
2.4
1 3
.04
3.1
4 Se
lang
or &
WP
Putr
ajay
a &
WP
Kual
a Lu
mpu
rPu
blic
4.3
9 4
.29
4.3
3 3
.51
3.0
6 3
.13
na
na
na
Sela
ngor
& W
P Pu
traj
aya
& W
P Ku
ala
Lum
pur
Priv
ate
2.7
9 2
.77
2.8
6 n
a n
a n
a 3
.12
2.7
6 2
.80
Sela
ngor
& W
P Pu
traj
aya
& W
P Ku
ala
Lum
pur
Tota
l 3
.68
3.6
4 3
.68
3.5
1 3
.06
3.1
3 3
.12
2.7
6 2
.80
Abb
revi
atio
n: -
na
- no
t app
licab
leSe
lang
or &
WP
Putr
ajay
a &
WPK
L ar
e al
so c
olle
ctiv
ely
refe
rred
to a
s K
lang
Val
ley.
* Pu
blic
sec
tor
in 2
011
refe
rs to
MO
H a
nd U
nive
rsity
hos
pita
ls, w
hile
pub
lic s
ecto
r in
201
2 &
201
3 re
fers
to M
OH
, Uni
vers
ity, a
nd M
OD
hos
pita
ls.
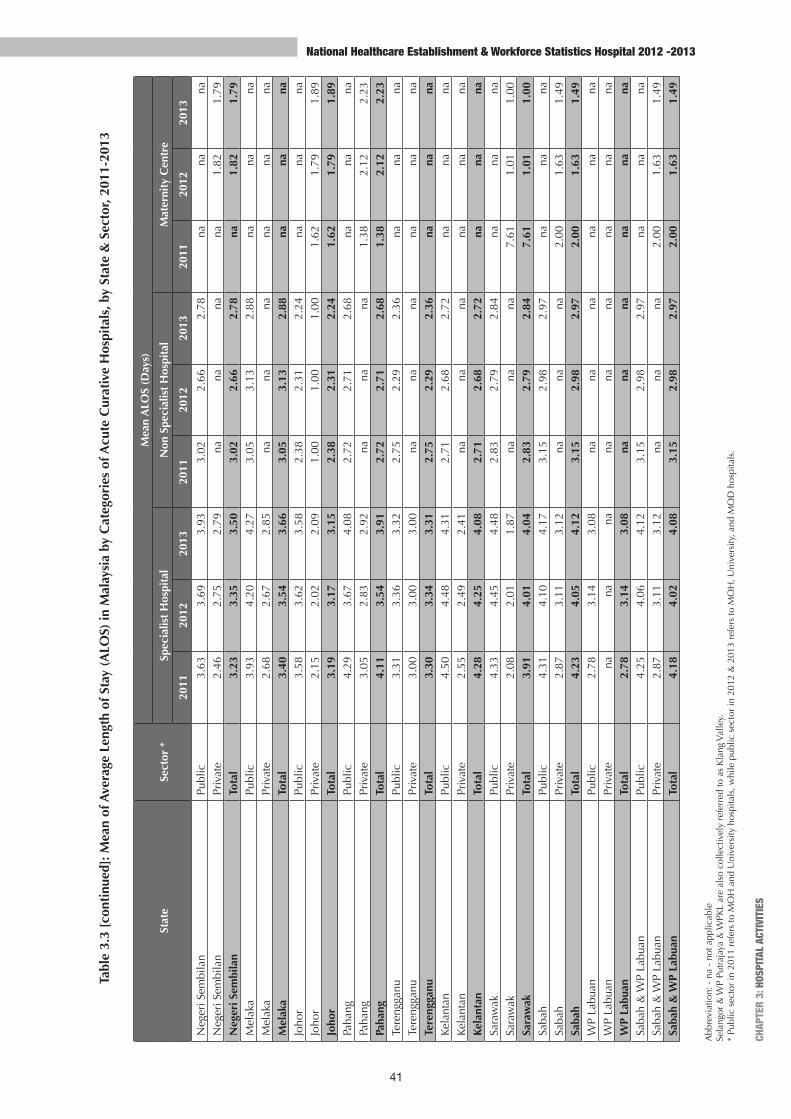
41
CHAP
TER
3: H
OSPI
TAL A
CTIV
ITIE
S
National Healthcare Establishment & Workforce Statistics Hospital 2012 -2013
Tabl
e 3.
3 [c
onti
nued
]: M
ean
of A
vera
ge L
engt
h of
Sta
y (A
LOS)
in M
alay
sia
by C
ateg
orie
s of
Acu
te C
urat
ive
Hos
pita
ls, b
y St
ate
& S
ecto
r, 20
11-2
013
Stat
eSe
ctor
*
Mea
n A
LOS
(Day
s)
Spec
ialis
t H
ospi
tal
Non
Spe
cial
ist
Hos
pita
l M
ater
nity
Cen
tre
2011
2012
2013
2011
2012
2013
2011
2012
2013
Neg
eri S
embi
lan
Publ
ic 3
.63
3.6
9 3
.93
3.0
2 2
.66
2.7
8 n
a n
a n
a N
eger
i Sem
bila
nPr
ivat
e 2
.46
2.7
5 2
.79
na
na
na
na
1.8
2 1
.79
Neg
eri S
embi
lan
Tota
l 3
.23
3.3
5 3
.50
3.0
2 2
.66
2.7
8 n
a 1
.82
1.7
9 M
elak
aPu
blic
3.9
3 4
.20
4.2
7 3
.05
3.1
3 2
.88
na
na
na
Mel
aka
Priv
ate
2.6
8 2
.67
2.8
5 n
a n
a n
a n
a n
a n
a M
elak
aTo
tal
3.4
0 3
.54
3.6
6 3
.05
3.1
3 2
.88
na
na
na
Joho
rPu
blic
3.5
8 3
.62
3.5
8 2
.38
2.3
1 2
.24
na
na
na
Joho
rPr
ivat
e 2
.15
2.0
2 2
.09
1.0
0 1
.00
1.0
0 1
.62
1.7
9 1
.89
Joho
rTo
tal
3.1
9 3
.17
3.1
5 2
.38
2.3
1 2
.24
1.6
2 1
.79
1.8
9 Pa
hang
Publ
ic 4
.29
3.6
7 4
.08
2.7
2 2
.71
2.6
8 n
a n
a n
a Pa
hang
Priv
ate
3.0
5 2
.83
2.9
2 n
a n
a n
a 1
.38
2.1
2 2
.23
Paha
ngTo
tal
4.1
1 3
.54
3.9
1 2
.72
2.7
1 2
.68
1.3
8 2
.12
2.2
3 Te
reng
ganu
Publ
ic 3
.31
3.3
6 3
.32
2.7
5 2
.29
2.3
6 n
a n
a n
a Te
reng
ganu
Priv
ate
3.0
0 3
.00
3.0
0 n
a n
a n
a n
a n
a n
a Te
reng
ganu
Tota
l 3
.30
3.3
4 3
.31
2.7
5 2
.29
2.3
6 n
a n
a n
a Ke
lant
anPu
blic
4.5
0 4
.48
4.3
1 2
.71
2.6
8 2
.72
na
na
na
Kela
ntan
Priv
ate
2.5
5 2
.49
2.4
1 n
a n
a n
a n
a n
a n
a Ke
lant
anTo
tal
4.2
8 4
.25
4.0
8 2
.71
2.6
8 2
.72
na
na
na
Sara
wak
Publ
ic 4
.33
4.4
5 4
.48
2.8
3 2
.79
2.8
4 n
a n
a n
a Sa
raw
akPr
ivat
e 2
.08
2.0
1 1
.87
na
na
na
7.6
1 1
.01
1.0
0 Sa
raw
akTo
tal
3.9
1 4
.01
4.0
4 2
.83
2.7
9 2
.84
7.6
1 1
.01
1.0
0 Sa
bah
Publ
ic 4
.31
4.1
0 4
.17
3.1
5 2
.98
2.9
7 n
a n
a n
a Sa
bah
Priv
ate
2.8
7 3
.11
3.1
2 n
a n
a n
a 2
.00
1.6
3 1
.49
Saba
hTo
tal
4.2
3 4
.05
4.1
2 3
.15
2.9
8 2
.97
2.0
0 1
.63
1.4
9 W
P La
buan
Publ
ic 2
.78
3.1
4 3
.08
na
na
na
na
na
na
WP
Labu
anPr
ivat
e n
a n
a n
a n
a n
a n
a n
a n
a n
a W
P La
buan
Tota
l 2
.78
3.1
4 3
.08
na
na
na
na
na
na
Saba
h &
WP
Labu
anPu
blic
4.2
5 4
.06
4.1
2 3
.15
2.9
8 2
.97
na
na
na
Saba
h &
WP
Labu
anPr
ivat
e 2
.87
3.1
1 3
.12
na
na
na
2.0
0 1
.63
1.4
9 Sa
bah
& W
P La
buan
Tota
l 4
.18
4.0
2 4
.08
3.1
5 2
.98
2.9
7 2
.00
1.6
3 1
.49
Abb
revi
atio
n: -
na
- no
t app
licab
leSe
lang
or &
WP
Putr
ajay
a &
WPK
L ar
e al
so c
olle
ctiv
ely
refe
rred
to a
s K
lang
Val
ley.
* Pu
blic
sec
tor
in 2
011
refe
rs to
MO
H a
nd U
nive
rsity
hos
pita
ls, w
hile
pub
lic s
ecto
r in
201
2 &
201
3 re
fers
to M
OH
, Uni
vers
ity, a
nd M
OD
hos
pita
ls.
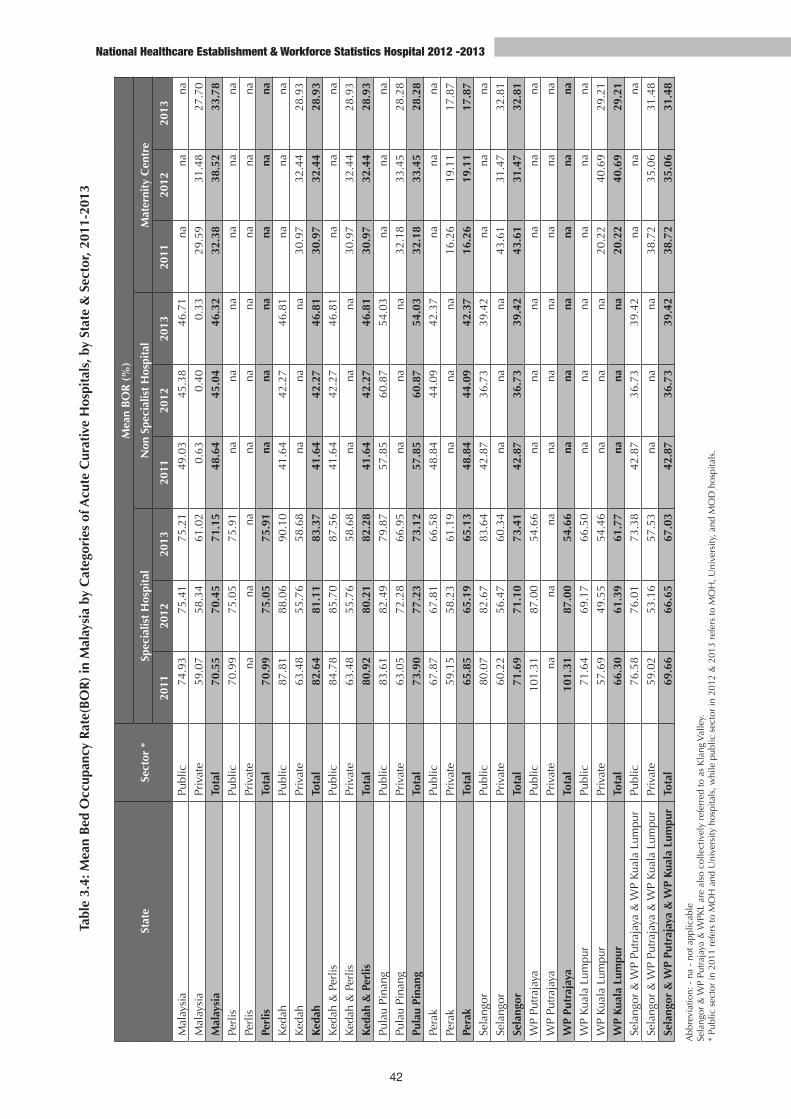
42
National Healthcare Establishment & Workforce Statistics Hospital 2012 -2013
Tabl
e 3.
4: M
ean
Bed
Occ
upan
cy R
ate(
BO
R)
in M
alay
sia
by C
ateg
orie
s of
Acu
te C
urat
ive
Hos
pita
ls, b
y St
ate
& S
ecto
r, 20
11-2
013
Stat
eSe
ctor
*
Mea
n B
OR
(%
)
Spec
ialis
t H
ospi
tal
Non
Spe
cial
ist
Hos
pita
l M
ater
nity
Cen
tre
2011
2012
2013
2011
2012
2013
2011
2012
2013
Mal
aysi
aPu
blic
74.
93
75.
41
75.
21
49.
03
45.
38
46.
71
na
na
na
Mal
aysi
aPr
ivat
e 5
9.07
5
8.34
6
1.02
0
.63
0.4
0 0
.33
29.
59
31.
48
27.
70
Mal
aysi
aTo
tal
70.
55
70.
45
71.
15
48.
64
45.
04
46.
32
32.
38
38.
52
33.
78
Perl
isPu
blic
70.
99
75.
05
75.
91
na
na
na
na
na
na
Perl
isPr
ivat
e n
a n
a n
a n
a n
a n
a n
a n
a n
a Pe
rlis
Tota
l 7
0.99
7
5.05
7
5.91
n
a n
a n
a n
a n
a n
a Ke
dah
Publ
ic 8
7.81
8
8.06
9
0.10
4
1.64
4
2.27
4
6.81
n
a n
a n
a Ke
dah
Priv
ate
63.
48
55.
76
58.
68
na
na
na
30.
97
32.
44
28.
93
Keda
hTo
tal
82.
64
81.
11
83.
37
41.
64
42.
27
46.
81
30.
97
32.
44
28.
93
Keda
h &
Per
lisPu
blic
84.
78
85.
70
87.
56
41.
64
42.
27
46.
81
na
na
na
Keda
h &
Per
lisPr
ivat
e 6
3.48
5
5.76
5
8.68
n
a n
a n
a 3
0.97
3
2.44
2
8.93
Ke
dah
& P
erlis
Tota
l 8
0.92
8
0.21
8
2.28
4
1.64
4
2.27
4
6.81
3
0.97
3
2.44
2
8.93
Pu
lau
Pina
ngPu
blic
83.
61
82.
49
79.
87
57.
85
60.
87
54.
03
na
na
na
Pula
u Pi
nang
Priv
ate
63.
05
72.
28
66.
95
na
na
na
32.
18
33.
45
28.
28
Pula
u Pi
nang
Tota
l 7
3.90
7
7.23
7
3.12
5
7.85
6
0.87
5
4.03
3
2.18
3
3.45
2
8.28
Pe
rak
Publ
ic 6
7.87
6
7.81
6
6.58
4
8.84
4
4.09
4
2.37
n
a n
a n
a Pe
rak
Priv
ate
59.
15
58.
23
61.
19
na
na
na
16.
26
19.
11
17.
87
Pera
kTo
tal
65.
85
65.
19
65.
13
48.
84
44.
09
42.
37
16.
26
19.
11
17.
87
Sela
ngor
Publ
ic 8
0.07
8
2.67
8
3.64
4
2.87
3
6.73
3
9.42
n
a n
a n
a Se
lang
orPr
ivat
e 6
0.22
5
6.47
6
0.34
n
a n
a n
a 4
3.61
3
1.47
3
2.81
Se
lang
orTo
tal
71.
69
71.
10
73.
41
42.
87
36.
73
39.
42
43.
61
31.
47
32.
81
WP
Putr
ajay
aPu
blic
101
.31
87.
00
54.
66
na
na
na
na
na
na
WP
Putr
ajay
aPr
ivat
e n
a n
a n
a n
a n
a n
a n
a n
a n
a W
P Pu
traj
aya
Tota
l 1
01.3
1 8
7.00
5
4.66
n
a n
a n
a n
a n
a n
a W
P Ku
ala
Lum
pur
Publ
ic 7
1.64
6
9.17
6
6.50
n
a n
a n
a n
a n
a n
a W
P Ku
ala
Lum
pur
Priv
ate
57.
69
49.
55
54.
46
na
na
na
20.
22
40.
69
29.
21
WP
Kual
a Lu
mpu
rTo
tal
66.
30
61.
39
61.
77
na
na
na
20.
22
40.
69
29.
21
Sela
ngor
& W
P Pu
traj
aya
& W
P Ku
ala
Lum
pur
Publ
ic 7
6.58
7
6.01
7
3.38
4
2.87
3
6.73
3
9.42
n
a n
a n
a Se
lang
or &
WP
Putr
ajay
a &
WP
Kual
a Lu
mpu
rPr
ivat
e 5
9.02
5
3.16
5
7.53
n
a n
a n
a 3
8.72
3
5.06
3
1.48
Se
lang
or &
WP
Putr
ajay
a &
WP
Kual
a Lu
mpu
rTo
tal
69.
66
66.
65
67.
03
42.
87
36.
73
39.
42
38.
72
35.
06
31.
48
Abb
revi
atio
n: -
na
- no
t app
licab
leSe
lang
or &
WP
Putr
ajay
a &
WPK
L ar
e al
so c
olle
ctiv
ely
refe
rred
to a
s K
lang
Val
ley.
* Pu
blic
sec
tor
in 2
011
refe
rs to
MO
H a
nd U
nive
rsity
hos
pita
ls, w
hile
pub
lic s
ecto
r in
201
2 &
201
3 re
fers
to M
OH
, Uni
vers
ity, a
nd M
OD
hos
pita
ls.
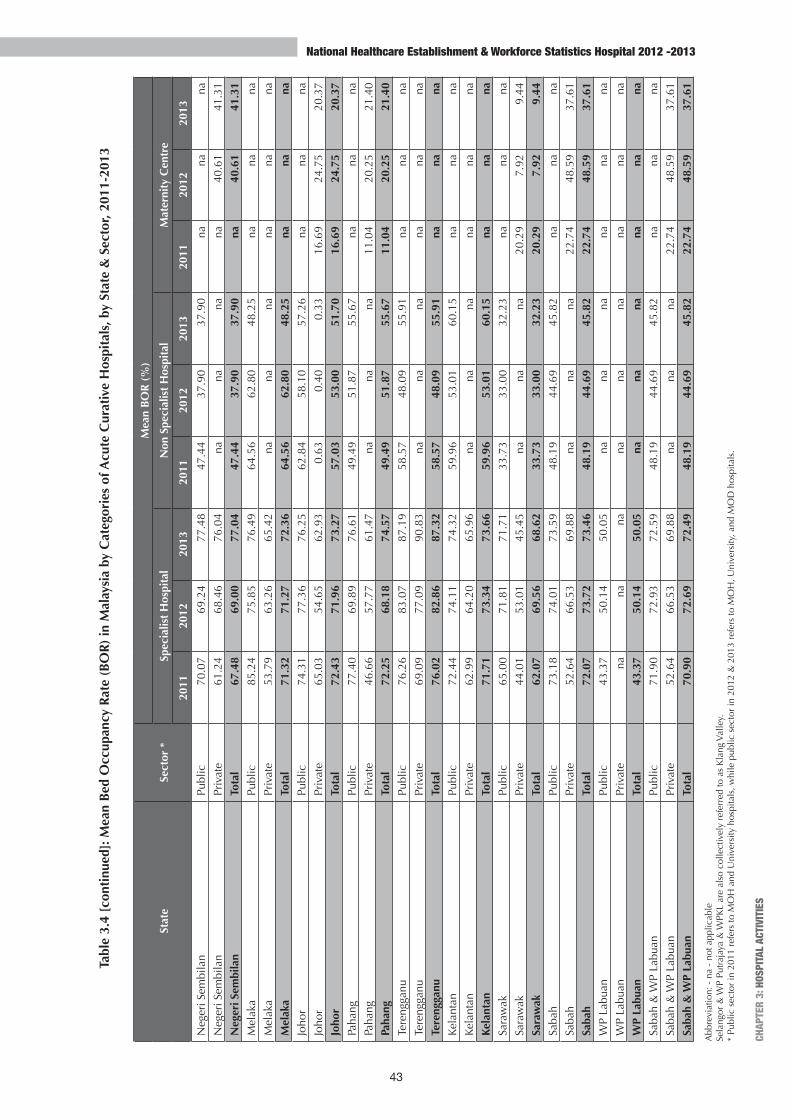
43
CHAP
TER
3: H
OSPI
TAL A
CTIV
ITIE
S
National Healthcare Establishment & Workforce Statistics Hospital 2012 -2013
Tabl
e 3.
4 [c
onti
nued
]: M
ean
Bed
Occ
upan
cy R
ate
(BO
R)
in M
alay
sia
by C
ateg
orie
s of
Acu
te C
urat
ive
Hos
pita
ls, b
y St
ate
& S
ecto
r, 20
11-2
013
Stat
eSe
ctor
*
Mea
n B
OR
(%
)
Spec
ialis
t H
ospi
tal
Non
Spe
cial
ist
Hos
pita
l M
ater
nity
Cen
tre
2011
2012
2013
2011
2012
2013
2011
2012
2013
Neg
eri S
embi
lan
Publ
ic 7
0.07
6
9.24
7
7.48
4
7.44
3
7.90
3
7.90
n
a n
a n
a N
eger
i Sem
bila
nPr
ivat
e 6
1.24
6
8.46
7
6.04
n
a n
a n
a n
a 4
0.61
4
1.31
N
eger
i Sem
bila
nTo
tal
67.
48
69.
00
77.
04
47.
44
37.
90
37.
90
na
40.
61
41.
31
Mel
aka
Publ
ic 8
5.24
7
5.85
7
6.49
6
4.56
6
2.80
4
8.25
n
a n
a n
a M
elak
aPr
ivat
e 5
3.79
6
3.26
6
5.42
n
a n
a n
a n
a n
a n
a M
elak
aTo
tal
71.
32
71.
27
72.
36
64.
56
62.
80
48.
25
na
na
na
Joho
rPu
blic
74.
31
77.
36
76.
25
62.
84
58.
10
57.
26
na
na
na
Joho
rPr
ivat
e 6
5.03
5
4.65
6
2.93
0
.63
0.4
0 0
.33
16.
69
24.
75
20.
37
Joho
rTo
tal
72.
43
71.
96
73.
27
57.
03
53.
00
51.
70
16.
69
24.
75
20.
37
Paha
ngPu
blic
77.
40
69.
89
76.
61
49.
49
51.
87
55.
67
na
na
na
Paha
ngPr
ivat
e 4
6.66
5
7.77
6
1.47
n
a n
a n
a 1
1.04
2
0.25
2
1.40
Pa
hang
Tota
l 7
2.25
6
8.18
7
4.57
4
9.49
5
1.87
5
5.67
1
1.04
2
0.25
2
1.40
Te
reng
ganu
Publ
ic 7
6.26
8
3.07
8
7.19
5
8.57
4
8.09
5
5.91
n
a n
a n
a Te
reng
ganu
Priv
ate
69.
09
77.
09
90.
83
na
na
na
na
na
na
Tere
ngga
nuTo
tal
76.
02
82.
86
87.
32
58.
57
48.
09
55.
91
na
na
na
Kela
ntan
Publ
ic 7
2.44
7
4.11
7
4.32
5
9.96
5
3.01
6
0.15
n
a n
a n
a Ke
lant
anPr
ivat
e 6
2.99
6
4.20
6
5.96
n
a n
a n
a n
a n
a n
a Ke
lant
anTo
tal
71.
71
73.
34
73.
66
59.
96
53.
01
60.
15
na
na
na
Sara
wak
Publ
ic 6
5.00
7
1.81
7
1.71
3
3.73
3
3.00
3
2.23
n
a n
a n
a Sa
raw
akPr
ivat
e 4
4.01
5
3.01
4
5.45
n
a n
a n
a 2
0.29
7
.92
9.4
4 Sa
raw
akTo
tal
62.
07
69.
56
68.
62
33.
73
33.
00
32.
23
20.
29
7.9
2 9
.44
Saba
hPu
blic
73.
18
74.
01
73.
59
48.
19
44.
69
45.
82
na
na
na
Saba
hPr
ivat
e 5
2.64
6
6.53
6
9.88
n
a n
a n
a 2
2.74
4
8.59
3
7.61
Sa
bah
Tota
l 7
2.07
7
3.72
7
3.46
4
8.19
4
4.69
4
5.82
2
2.74
4
8.59
3
7.61
W
P La
buan
Publ
ic 4
3.37
5
0.14
5
0.05
n
a n
a n
a n
a n
a n
a W
P La
buan
Priv
ate
na
na
na
na
na
na
na
na
na
WP
Labu
anTo
tal
43.
37
50.
14
50.
05
na
na
na
na
na
na
Saba
h &
WP
Labu
anPu
blic
71.
90
72.
93
72.
59
48.
19
44.
69
45.
82
na
na
na
Saba
h &
WP
Labu
anPr
ivat
e 5
2.64
6
6.53
6
9.88
n
a n
a n
a 2
2.74
4
8.59
3
7.61
Sa
bah
& W
P La
buan
Tota
l 7
0.90
7
2.69
7
2.49
4
8.19
4
4.69
4
5.82
2
2.74
4
8.59
3
7.61
Abb
revi
atio
n: -
na
- no
t app
licab
leSe
lang
or &
WP
Putr
ajay
a &
WPK
L ar
e al
so c
olle
ctiv
ely
refe
rred
to a
s K
lang
Val
ley.
* Pu
blic
sec
tor
in 2
011
refe
rs to
MO
H a
nd U
nive
rsity
hos
pita
ls, w
hile
pub
lic s
ecto
r in
201
2 &
201
3 re
fers
to M
OH
, Uni
vers
ity, a
nd M
OD
hos
pita
ls.

44
National Healthcare Establishment & Workforce Statistics Hospital 2012 -2013
Tabl
e 3.
5: M
ean
Turn
Ove
r In
terv
al (
TOI)
in M
alay
sia
by C
ateg
orie
s of
Acu
te C
urat
ive
Hos
pita
ls, b
y St
ate
& S
ecto
r, 20
11-2
013
Stat
eSe
ctor
*
Mea
n Tu
rnov
er I
nter
val (
Day
s)
Spec
ialis
t H
ospi
tal
Non
Spe
cial
ist
Hos
pita
l M
ater
nity
Cen
tre
2011
2012
2013
2011
2012
2013
2011
2012
2013
Mal
aysi
aPu
blic
1.35
1.31
1.34
2.93
3.25
3.08
nana
naM
alay
sia
Priv
ate
1.89
1.94
1.77
157.
7024
7.86
303.
175.
744.
815.
97M
alay
sia
Tota
l1.
521.
511.
482.
983.
293.
135.
043.
534.
48Pe
rlis
Publ
ic1.
391.
131.
13na
nana
nana
naPe
rlis
Priv
ate
nana
nana
nana
nana
naPe
rlis
Tota
l1.
391.
131.
13na
nana
nana
naKe
dah
Publ
ic0.
520.
500.
433.
353.
292.
89na
nana
Keda
hPr
ivat
e1.
541.
921.
81na
nana
4.87
4.28
4.99
Keda
hTo
tal
0.73
0.80
0.72
3.35
3.29
2.89
4.87
4.28
4.99
Keda
h &
Per
lisPu
blic
0.66
0.61
0.54
3.35
3.29
2.89
nana
naKe
dah
& P
erlis
Priv
ate
1.54
1.92
1.81
nana
na4.
874.
284.
99Ke
dah
& P
erlis
Tota
l0.
820.
840.
773.
353.
292.
894.
874.
284.
99Pu
lau
Pina
ngPu
blic
0.81
0.88
1.06
2.61
2.57
3.41
nana
naPu
lau
Pina
ngPr
ivat
e1.
901.
261.
62na
nana
3.95
3.83
5.47
Pula
u Pi
nang
Tota
l1.
321.
091.
362.
612.
573.
413.
953.
835.
47Pe
rak
Publ
ic1.
731.
761.
892.
763.
293.
46na
nana
Pera
kPr
ivat
e1.
961.
881.
68na
nana
8.64
6.97
7.52
Pera
kTo
tal
1.79
1.80
1.82
2.76
3.29
3.46
8.64
6.97
7.52
Sela
ngor
Publ
ic0.
960.
800.
764.
675.
274.
80na
nana
Sela
ngor
Priv
ate
1.72
1.95
1.69
nana
na4.
185.
575.
42Se
lang
orTo
tal
1.30
1.32
1.19
4.67
5.27
4.80
4.18
5.57
5.42
WP
Putr
ajay
aPu
blic
-0.0
50.
593.
69na
nana
nana
naW
P Pu
traj
aya
Priv
ate
nana
nana
nana
nana
naW
P Pu
traj
aya
Tota
l-0
.05
0.59
3.69
nana
nana
nana
WP
Kual
a Lu
mpu
rPu
blic
2.05
2.24
2.49
nana
nana
nana
WP
Kual
a Lu
mpu
rPr
ivat
e2.
223.
212.
78na
nana
9.52
4.43
7.60
WP
Kual
a Lu
mpu
rTo
tal
2.13
2.65
2.62
nana
na9.
524.
437.
60Se
lang
or &
WP
Putr
ajay
a &
WP
Kual
a Lu
mpu
rPu
blic
1.34
1.36
1.57
4.67
5.27
4.80
nana
naSe
lang
or &
WP
Putr
ajay
a &
WP
Kual
a Lu
mpu
rPr
ivat
e1.
942.
442.
11na
nana
4.93
5.11
6.09
Sela
ngor
& W
P Pu
traj
aya
& W
P Ku
ala
Lum
pur
Tota
l1.
601.
821.
814.
675.
274.
804.
935.
116.
09
Abb
revi
atio
n: -
na
- no
t app
licab
leSe
lang
or &
WP
Putr
ajay
a &
WPK
L ar
e al
so c
olle
ctiv
ely
refe
rred
to a
s K
lang
Val
ley.
* Pu
blic
sec
tor
in 2
011
refe
rs to
MO
H a
nd U
nive
rsity
hos
pita
ls, w
hile
pub
lic s
ecto
r in
201
2 &
201
3 re
fers
to M
OH
, Uni
vers
ity, a
nd M
OD
hos
pita
ls.

45
CHAP
TER
3: H
OSPI
TAL A
CTIV
ITIE
S
National Healthcare Establishment & Workforce Statistics Hospital 2012 -2013
Tabl
e 3.
5 [c
onti
nued
]: M
ean
Turn
Ove
r In
terv
al (
TOI)
in M
alay
sia
by C
ateg
orie
s of
Acu
te C
urat
ive
Hos
pita
ls, b
y St
ate
& S
ecto
r, 20
11-2
013
Stat
eSe
ctor
*
Mea
n Tu
rnov
er I
nter
val (
Day
s)
Spec
ialis
t H
ospi
tal
Non
Spe
cial
ist
Hos
pita
l M
ater
nity
Cen
tre
2011
2012
2013
2011
2012
2013
2011
2012
2013
Neg
eri S
embi
lan
Publ
ic1.
551.
641.
143.
344.
374.
56na
nana
Neg
eri S
embi
lan
Priv
ate
1.56
1.26
0.88
nana
nana
2.66
2.55
Neg
eri S
embi
lan
Tota
l1.
551.
501.
043.
344.
374.
56na
2.66
2.55
Mel
aka
Publ
ic0.
681.
341.
311.
681.
853.
09na
nana
Mel
aka
Priv
ate
2.30
1.55
1.51
nana
nana
nana
Mel
aka
Tota
l1.
371.
431.
401.
681.
853.
09na
nana
Joho
rPu
blic
1.24
1.06
1.12
1.41
1.67
1.67
nana
naJo
hor
Priv
ate
1.16
1.68
1.23
157.
7024
7.86
303.
178.
065.
437.
39Jo
hor
Tota
l1.
221.
231.
151.
792.
052.
098.
065.
437.
39Pa
hang
Publ
ic1.
251.
581.
252.
772.
512.
13na
nana
Paha
ngPr
ivat
e3.
482.
071.
83na
nana
11.1
68.
348.
21Pa
hang
Tota
l1.
581.
651.
332.
772.
512.
1311
.16
8.34
8.21
Tere
ngga
nuPu
blic
1.03
0.68
0.49
1.95
2.47
1.86
nana
naTe
reng
ganu
Priv
ate
1.34
0.89
0.30
nana
nana
nana
Tere
ngga
nuTo
tal
1.04
0.69
0.48
1.95
2.47
1.86
nana
naKe
lant
anPu
blic
1.71
1.56
1.49
1.81
2.38
1.80
nana
naKe
lant
anPr
ivat
e1.
501.
391.
25na
nana
nana
naKe
lant
anTo
tal
1.69
1.54
1.46
1.81
2.38
1.80
nana
naSa
raw
akPu
blic
2.33
1.75
1.77
5.55
5.66
5.96
nana
naSa
raw
akPr
ivat
e2.
641.
782.
24na
nana
29.8
911
.71
9.59
Sara
wak
Tota
l2.
391.
751.
855.
555.
665.
9629
.89
11.7
19.
59Sa
bah
Publ
ic1.
581.
441.
503.
393.
693.
51na
nana
Saba
hPr
ivat
e2.
581.
571.
35na
nana
6.80
1.73
2.47
Saba
hTo
tal
1.64
1.44
1.49
3.39
3.69
3.51
6.80
1.73
2.47
WP
Labu
anPu
blic
3.63
3.13
3.07
nana
nana
nana
WP
Labu
anPr
ivat
ena
nana
nana
nana
nana
WP
Labu
anTo
tal
3.63
3.13
3.07
nana
nana
nana
Saba
h &
WP
Labu
anPu
blic
1.66
1.51
1.56
3.39
3.69
3.51
nana
naSa
bah
& W
P La
buan
Priv
ate
2.58
1.57
1.35
nana
na6.
801.
732.
47Sa
bah
& W
P La
buan
Tota
l1.
711.
511.
553.
393.
693.
516.
801.
732.
47
Abb
revi
atio
n: -
na
- no
t app
licab
leSe
lang
or &
WP
Putr
ajay
a &
WPK
L ar
e al
so c
olle
ctiv
ely
refe
rred
to a
s K
lang
Val
ley.
* Pu
blic
sec
tor
in 2
011
refe
rs to
MO
H a
nd U
nive
rsity
hos
pita
ls, w
hile
pub
lic s
ecto
r in
201
2 &
201
3 re
fers
to M
OH
, Uni
vers
ity, a
nd M
OD
hos
pita
ls.

46
National Healthcare Establishment & Workforce Statistics Hospital 2012 -2013
Tabl
e 3.
6 : N
umbe
r &
Den
sity
of E
mer
genc
y D
epar
tmen
t, G
ener
al O
utpa
tien
t D
epar
tmen
t an
d Sp
ecia
list
Clin
ic V
isit
s in
Acu
te C
urat
ive
Hos
pita
ls in
Mal
aysi
a by
St
ate
& S
ecto
r, 20
12-2
013
Stat
eSe
ctor
*
Tota
l Em
erge
ncy
Dep
artm
ent V
isit
sTo
tal G
ener
al O
utpa
tien
t D
epar
tmen
t Vis
its
Tota
l Spe
cial
ist
Out
pati
ent
Dep
artm
ent V
isit
s
2012
2013
2012
2013
2012
2013
Number
per 1,000 population
Number
per 1,000 population
Number
per 1,000 population
Number
per 1,000 population
Number
per 1,000 population
Number
per 1,000 population
Mal
aysi
aPu
blic
7,5
85,8
04
- 7
,632
,331
-
5,3
59,4
71
- 5
,413
,101
-
8,3
87,4
48
- 8
,567
,888
-
Mal
aysi
aPr
ivat
e 1
,561
,340
-
1,7
29,8
78
- 1,
925,
684
- 2,
068,
646
- 7
,448
,707
- 7
,522
,123
-
Mal
aysi
aTo
tal
9,14
7,14
4 3
11.8
0 9,
362,
209
315
.07
7,28
5,15
5 2
48.3
3 7,
481,
747
251
.79
15,8
36,1
55 5
39.8
1 16
,090
,011
5
41.4
8 Pe
rlis
Publ
ic 9
2,41
0 -
97,
438
- -
-
-
- 1
07,3
81
- 1
12,1
09
- Pe
rlis
Priv
ate
na
- n
a -
na
- n
a -
na
- n
a -
Perl
isTo
tal
92,
410
386
.01
97,
438
403
.64
-
-
-
-
107
,381
4
48.5
4 1
12,1
09
464
.41
Keda
hPu
blic
593
,476
-
599
,959
-
321
,119
-
321
,165
-
539
,401
-
587
,777
-
Keda
hPr
ivat
e 7
3,39
8 -
94,
742
- 6
7,32
1 -
74,
405
- 3
35,8
57
- 3
22,4
06
- Ke
dah
Tota
l 6
66,8
74
333
.97
694
,701
3
43.7
2 3
88,4
40
194
.53
395
,570
1
95.7
2 8
75,2
58
438
.33
910
,183
4
50.3
4 Ke
dah
& P
erlis
Publ
ic 6
85,8
86
- 6
97,3
97
- 3
21,1
19
- 3
21,1
65
- 6
46,7
82
- 6
99,8
86
- Ke
dah
& P
erlis
Priv
ate
73,
398
- 9
4,74
2 -
67,
321
- 7
4,40
5 -
335
,857
-
322
,406
-
Keda
h &
Per
lisTo
tal
759
,284
3
39.5
4 7
92,1
39
350
.12
388
,440
1
73.7
1 3
95,5
70
174
.84
982
,639
4
39.4
2 1
,022
,292
4
51.8
4 Pu
lau
Pina
ngPu
blic
450
,886
-
443
,608
-
485
,287
-
521
,405
-
569
,177
-
564
,480
-
Pula
u Pi
nang
Priv
ate
395
,925
-
387
,837
-
51,
414
- 6
6,07
4 -
1,4
57,8
62
- 1
,566
,015
-
Pula
u Pi
nang
Tota
l 8
46,8
11
525
.61
831
,445
5
10.5
9 5
36,7
01
333
.13
587
,479
3
60.7
7 2
,027
,039
1,
258.
17
2,1
30,4
95
1,30
8.34
Pe
rak
Publ
ic 7
82,6
50
- 7
99,3
46
- 1
,104
,937
-
1,1
80,4
99
- 7
61,0
08
- 7
88,1
82
- Pe
rak
Priv
ate
72,
677
- 6
8,21
4 -
51,
007
- 5
1,30
3 -
442
,263
-
435
,700
-
Pera
kTo
tal
855
,327
3
53.9
2 8
67,5
60
356
.08
1,1
55,9
44
478
.32
1,2
31,8
02
505
.58
1,2
03,2
71
497
.90
1,2
23,8
82
502
.33
Sela
ngor
Publ
ic 1
,083
,437
-
1,0
91,5
27
- 2
00,1
81
- 1
97,1
06
- 1
,059
,756
-
1,1
52,8
33
- Se
lang
orPr
ivat
e 3
86,4
95
- 4
75,3
74
- 7
93,3
53
- 8
98,5
76
- 2
,102
,751
-
2,0
11,2
42
- Se
lang
orTo
tal
1,46
9,93
2 2
60.1
3 1,
566,
901
273
.68
993
,534
1
75.8
2 1
,095
,682
1
91.3
8 3
,162
,507
5
59.6
6 3
,164
,075
5
52.6
5 W
P Pu
traj
aya
Publ
ic 6
2,22
0 -
64,
128
- -
-
-
- 1
55,4
21
- 1
64,1
91
- W
P Pu
traj
aya
Priv
ate
na
- n
a -
na
- n
a -
na
- n
a -
WP
Putr
ajay
aTo
tal
62,
220
783
.63
64,
128
777
.31
-
-
-
-
155
,421
1,
957.
44
164
,191
1,
990.
19
WP
Kual
a Lu
mpu
rPu
blic
514
,542
-
476
,688
-
434
,579
-
382
,438
-
1,5
44,2
67
- 1
,466
,877
-
WP
Kual
a Lu
mpu
rPr
ivat
e 2
83,2
93
- 3
02,8
05
- 3
67,7
97
- 4
10,3
31
- 1
,106
,863
-
1,2
31,9
72
- W
P Ku
ala
Lum
pur
Tota
l 7
97,8
35
465
.64
779
,493
4
50.0
5 8
02,3
76
468
.29
792
,769
4
57.7
2 2
,651
,130
1,
547.
29
2,6
98,8
49
1,55
8.23
Se
lang
or &
WP
Putr
ajay
a &
WP
Kual
a Lu
mpu
rPu
blic
1,6
60,1
99
- 1
,632
,343
-
634
,760
-
579
,544
-
2,7
59,4
44
- 2
,783
,901
-
Sela
ngor
& W
P Pu
traj
aya
& W
P Ku
ala
Lum
pur
Priv
ate
669
,788
-
778
,179
-
1,1
61,1
50
- 1
,308
,907
-
3,20
9,61
4-
3,2
43,2
14
- Se
lang
or &
WP
Putr
ajay
a &
WP
Kual
a Lu
mpu
rTo
tal
2,32
9,98
7 3
13.0
2 2,
410,
522
319
.71
1,7
95,9
10
241
.27
1,8
88,4
51
250
.46
5,96
9,05
8 8
01.9
0 6
,027
,115
7
99.3
7
Abb
revi
atio
n: -
not
ava
ilabl
e; n
a -
not a
pplic
able
Sela
ngor
& W
P Pu
traj
aya
& W
PKL
are
also
col
lect
ivel
y re
ferr
ed to
as
Kla
ng V
alle
y.
*
Publ
ic s
ecto
r in
201
1 re
fers
to M
OH
and
Uni
vers
ity h
ospi
tals
, whi
le p
ublic
sec
tor
in 2
012
& 2
013
refe
rs to
MO
H, U
nive
rsity
, and
MO
D h
ospi
tals
.
For
popu
latio
n da
ta, p
leas
e re
fer A
ppen
dix
3: T
able
A3.
1
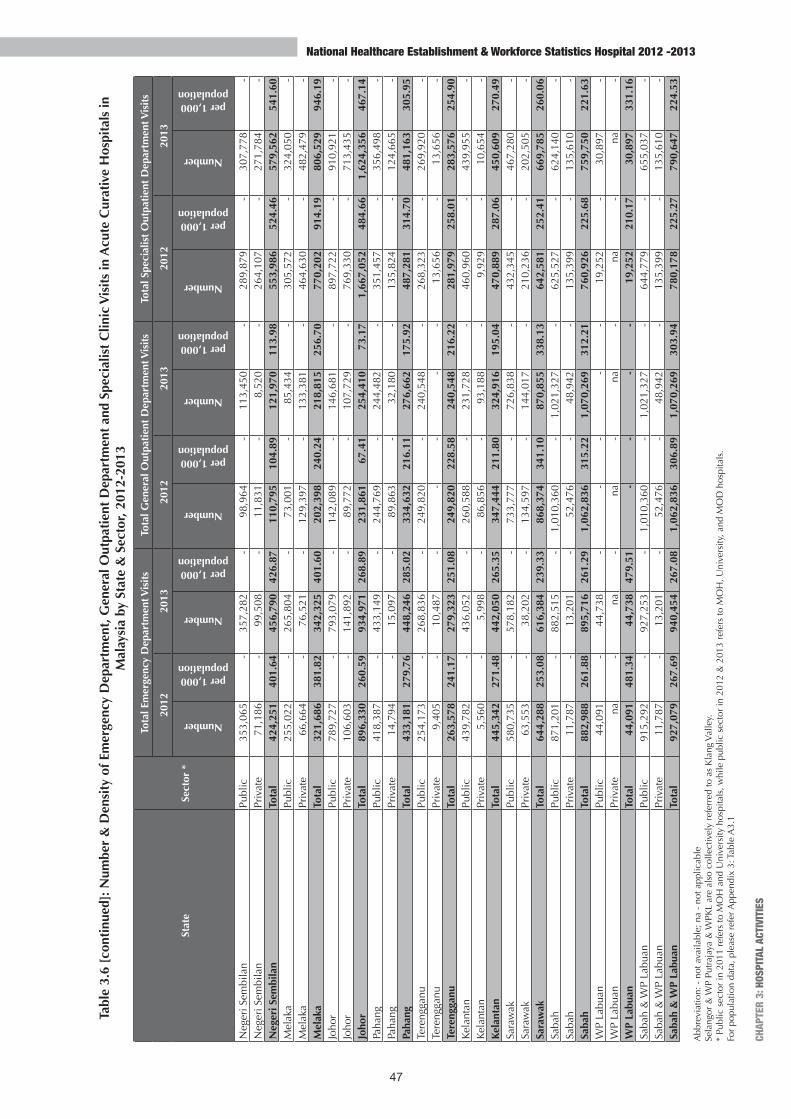
47
CHAP
TER
3: H
OSPI
TAL A
CTIV
ITIE
S
National Healthcare Establishment & Workforce Statistics Hospital 2012 -2013
Tabl
e 3.
6 [c
onti
nued
]: N
umbe
r &
Den
sity
of E
mer
genc
y D
epar
tmen
t, G
ener
al O
utpa
tien
t D
epar
tmen
t an
d Sp
ecia
list
Clin
ic V
isit
s in
Acu
te C
urat
ive
Hos
pita
ls in
M
alay
sia
by S
tate
& S
ecto
r, 20
12-2
013
Stat
eSe
ctor
*
Tota
l Em
erge
ncy
Dep
artm
ent V
isit
sTo
tal G
ener
al O
utpa
tien
t D
epar
tmen
t Vis
its
Tota
l Spe
cial
ist
Out
pati
ent
Dep
artm
ent V
isit
s
2012
2013
2012
2013
2012
2013
Number
per 1,000 population
Number
per 1,000 population
Number
per 1,000 population
Number
per 1,000 population
Number
per 1,000 population
Number
per 1,000 population
Neg
eri S
embi
lan
Publ
ic 3
53,0
65
- 3
57,2
82
- 9
8,96
4 -
113
,450
-
289
,879
-
307
,778
-
Neg
eri S
embi
lan
Priv
ate
71,
186
- 9
9,50
8 -
11,
831
- 8
,520
-
264
,107
-
271
,784
-
Neg
eri S
embi
lan
Tota
l 4
24,2
51
401
.64
456
,790
4
26.8
7 1
10,7
95
104
.89
121
,970
1
13.9
8 5
53,9
86
524
.46
579
,562
5
41.6
0 M
elak
aPu
blic
255
,022
-
265
,804
-
73,
001
- 8
5,43
4 -
305
,572
-
324
,050
-
Mel
aka
Priv
ate
66,
664
- 7
6,52
1 -
129
,397
-
133
,381
-
464
,630
-
482
,479
-
Mel
aka
Tota
l 3
21,6
86
381
.82
342
,325
4
01.6
0 2
02,3
98
240
.24
218
,815
2
56.7
0 7
70,2
02
914
.19
806
,529
9
46.1
9 Jo
hor
Publ
ic 7
89,7
27
- 7
93,0
79
- 1
42,0
89
- 1
46,6
81
- 8
97,7
22
- 9
10,9
21
- Jo
hor
Priv
ate
106
,603
-
141
,892
-
89,
772
- 1
07,7
29
- 7
69,3
30
- 7
13,4
35
- Jo
hor
Tota
l 8
96,3
30
260
.59
934
,971
2
68.8
9 2
31,8
61
67.
41
254
,410
7
3.17
1
,667
,052
4
84.6
6 1
,624
,356
4
67.1
4 Pa
hang
Publ
ic 4
18,3
87
- 4
33,1
49
- 2
44,7
69
- 2
44,4
82
- 3
51,4
57
- 3
56,4
98
- Pa
hang
Priv
ate
14,
794
- 1
5,09
7 -
89,
863
- 3
2,18
0 -
135
,824
-
124
,665
-
Paha
ngTo
tal
433
,181
2
79.7
6 4
48,2
46
285
.02
334
,632
2
16.1
1 2
76,6
62
175
.92
487
,281
3
14.7
0 4
81,1
63
305
.95
Tere
ngga
nuPu
blic
254
,173
-
268
,836
-
249
,820
-
240
,548
-
268
,323
-
269
,920
-
Tere
ngga
nuPr
ivat
e 9
,405
-
10,
487
- -
-
-
- 1
3,65
6 -
13,
656
- Te
reng
ganu
Tota
l 2
63,5
78
241
.17
279
,323
2
51.0
8 2
49,8
20
228
.58
240
,548
2
16.2
2 2
81,9
79
258
.01
283
,576
2
54.9
0 Ke
lant
anPu
blic
439
,782
-
436
,052
-
260
,588
-
231
,728
-
460
,960
-
439
,955
-
Kela
ntan
Priv
ate
5,5
60
- 5
,998
-
86,
856
- 9
3,18
8 -
9,9
29
- 1
0,65
4 -
Kela
ntan
Tota
l 4
45,3
42
271
.48
442
,050
2
65.3
5 3
47,4
44
211
.80
324
,916
1
95.0
4 4
70,8
89
287
.06
450
,609
2
70.4
9 Sa
raw
akPu
blic
580
,735
-
578
,182
-
733
,777
-
726
,838
-
432
,345
-
467
,280
-
Sara
wak
Priv
ate
63,
553
- 3
8,20
2 -
134
,597
-
144
,017
-
210
,236
-
202
,505
-
Sara
wak
Tota
l 6
44,2
88
253
.08
616
,384
2
39.3
3 8
68,3
74
341
.10
870
,855
3
38.1
3 6
42,5
81
252
.41
669
,785
2
60.0
6 Sa
bah
Publ
ic 8
71,2
01
- 8
82,5
15
- 1
,010
,360
-
1,0
21,3
27
- 6
25,5
27
- 6
24,1
40
- Sa
bah
Priv
ate
11,
787
- 1
3,20
1 -
52,
476
- 4
8,94
2 -
135
,399
-
135
,610
-
Saba
hTo
tal
882
,988
2
61.8
8 8
95,7
16
261
.29
1,0
62,8
36
315
.22
1,0
70,2
69
312
.21
760
,926
2
25.6
8 7
59,7
50
221
.63
WP
Labu
anPu
blic
44,
091
- 4
4,73
8 -
-
- -
-
19,
252
- 3
0,89
7 -
WP
Labu
anPr
ivat
e n
a -
na
- n
a -
na
- n
a -
na
- W
P La
buan
Tota
l 4
4,09
1 4
81.3
4 4
4,73
8 4
79.5
1 -
-
-
-
1
9,25
2 2
10.1
7 3
0,89
7 3
31.1
6 Sa
bah
& W
P La
buan
Publ
ic 9
15,2
92
- 9
27,2
53
- 1
,010
,360
-
1,0
21,3
27
- 6
44,7
79
- 6
55,0
37
- Sa
bah
& W
P La
buan
Priv
ate
11,
787
- 1
3,20
1 -
52,
476
- 4
8,94
2 -
135
,399
-
135
,610
-
Saba
h &
WP
Labu
anTo
tal
927
,079
2
67.6
9 9
40,4
54
267
.08
1,0
62,8
36
306
.89
1,0
70,2
69
303
.94
780
,178
2
25.2
7 7
90,6
47
224
.53
Abb
revi
atio
n: -
not
ava
ilabl
e; n
a -
not a
pplic
able
Sela
ngor
& W
P Pu
traj
aya
& W
PKL
are
also
col
lect
ivel
y re
ferr
ed to
as
Kla
ng V
alle
y.
*
Publ
ic s
ecto
r in
201
1 re
fers
to M
OH
and
Uni
vers
ity h
ospi
tals
, whi
le p
ublic
sec
tor
in 2
012
& 2
013
refe
rs to
MO
H, U
nive
rsity
, and
MO
D h
ospi
tals
.
Fo
r po
pula
tion
data
, ple
ase
refe
r App
endi
x 3:
Tab
le A
3.1

48
National Healthcare Establishment & Workforce Statistics Hospital 2012 -2013
Tabl
e 3.
7: N
umbe
r of
Spe
cial
ist
Clin
ic V
isit
s (M
edic
ine,
Gen
eral
Sur
gery
, Ort
hopa
edic
s an
d O
bste
tric
s &
Gyn
aeco
logy
) in
Acu
te C
urat
ive
Hos
pita
ls
(Pub
lic H
ospi
tals
Onl
y) in
Mal
aysi
a by
Sta
te, 2
012-
2013
Stat
eG
ener
al M
edic
ine
Clin
icSu
rgic
al C
linic
Ort
hopa
edic
Clin
icO
bste
tric
Clin
icG
ynae
colo
gy C
linic
2012
2013
2012
2013
2012
2013
2012
2013
2012
2013
Mal
aysi
a 1
,209
,050
1
,259
,418
7
73,6
24
783
,765
9
89,6
05
1,0
35,3
43
508
,483
4
87,7
86
342
,558
3
41,2
07
Perl
is 1
6,79
7 1
8,19
8 1
2,59
9 1
2,79
1 1
4,85
1 1
6,00
7 4
,883
5
,225
3
,024
3
,299
Keda
h 8
7,35
0 9
2,42
0 7
4,29
5 8
2,92
3 6
8,87
6 7
4,91
5 3
9,24
9 3
9,80
9 2
7,55
0 2
7,11
5
Keda
h &
Per
lis 1
04,1
47
110
,618
8
6,89
4 9
5,71
4 8
3,72
7 9
0,92
2 4
4,13
2 4
5,03
4 3
0,57
4 3
0,41
4
Pula
u Pi
nang
78,
032
78,
642
51,
130
49,
829
76,
599
69,
652
26,
074
23,
344
20,
723
19,
399
Pera
k 9
8,97
1 1
03,2
84
85,
568
88,
792
106
,801
1
07,9
43
45,
829
41,
238
34,
048
35,
430
Sela
ngor
157
,987
1
85,5
65
83,
771
93,
812
134
,774
1
43,4
36
67,
747
71,
397
50,
117
50,
774
WP
Putr
ajay
a 4
4,28
8 4
4,46
7 1
8,70
9 2
0,58
2 1
7,46
4 1
9,72
1 1
9,51
6 1
9,10
3 8
,336
6
,637
WPK
L 2
41,6
16
219
,688
1
10,5
54
90,
096
149
,922
1
46,8
39
108
,752
1
10,2
72
42,
899
42,
707
Sela
ngor
& W
P Pu
traj
aya
& W
PKL
443
,891
4
49,7
20
213
,034
2
04,4
90
302
,160
3
09,9
96
196
,015
2
00,7
72
101
,352
1
00,1
18
Neg
eri S
embi
lan
32,
978
40,
794
30,
120
30,
557
39,
483
43,
904
16,
194
15,
655
12,
571
12,
739
Mel
aka
47,
685
50,
973
31,
391
34,
792
45,
332
49,
176
19,
783
20,
834
13,
231
14,
976
Joho
r 1
16,0
66
117
,127
7
7,47
0 8
2,58
7 1
02,4
96
115
,449
7
6,46
4 5
3,35
6 3
4,61
5 3
4,22
6
Paha
ng 4
4,74
9 4
9,06
9 3
1,17
7 3
3,62
8 3
8,36
1 4
6,41
0 1
0,05
2 1
2,85
7 9
,794
1
0,60
3
Tere
ngga
nu 5
2,36
9 5
6,89
5 2
7,80
2 2
9,17
7 2
8,19
4 2
8,28
0 9
,764
1
0,88
4 1
2,57
8 1
2,95
2
Kela
ntan
51,
879
53,
291
40,
849
34,
735
58,
132
56,
120
23,
374
22,
030
16,
174
15,
887
Sara
wak
71,
908
75,
293
47,
391
49,
621
51,
460
52,
521
12,
013
12,
663
23,
540
21,
984
Saba
h 6
0,12
8 6
6,09
3 4
8,56
0 4
6,71
2 5
4,11
8 6
1,35
4 2
7,58
9 2
8,07
9 3
2,03
8 3
1,28
9
WP
Labu
an 6
,247
7
,619
2
,238
3
,131
2
,742
3
,616
1
,200
1
,040
1
,320
1
,190
Saba
h &
WP
Labu
an 6
6,37
5 7
3,71
2 5
0,79
8 4
9,84
3 5
6,86
0 6
4,97
0 2
8,78
9 2
9,11
9 3
3,35
8 3
2,47
9
Sela
ngor
& W
P Pu
traj
aya
& W
PKL
are
also
col
lect
ivel
y re
ferr
ed to
as
Kla
ng V
alle
y. v
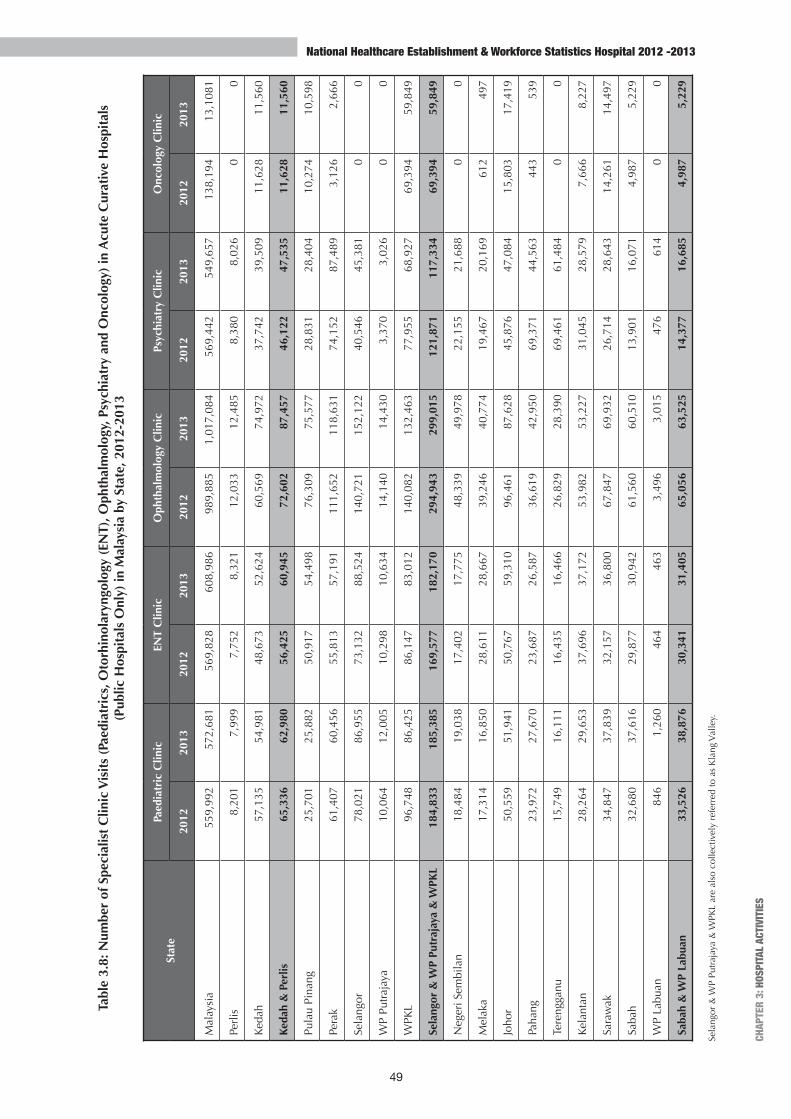
49
CHAP
TER
3: H
OSPI
TAL A
CTIV
ITIE
S
National Healthcare Establishment & Workforce Statistics Hospital 2012 -2013
Tabl
e 3.
8: N
umbe
r of
Spe
cial
ist
Clin
ic V
isit
s (P
aedi
atri
cs, O
torh
inol
aryn
golo
gy (
ENT)
, Oph
thal
mol
ogy,
Psy
chia
try
and
Onc
olog
y) in
Acu
te C
urat
ive
Hos
pita
ls
(Pub
lic H
ospi
tals
Onl
y) in
Mal
aysi
a by
Sta
te, 2
012-
2013
Stat
ePa
edia
tric
Clin
icEN
T C
linic
Oph
thal
mol
ogy
Clin
icPs
ychi
atry
Clin
icO
ncol
ogy
Clin
ic
2012
2013
2012
2013
2012
2013
2012
2013
2012
2013
Mal
aysi
a 5
59,9
92
572
,681
56
9,82
860
8,98
698
9,88
51,
017,
084
569,
442
549,
657
138,
194
13,1
081
Perl
is 8
,201
7
,999
7,
752
8,32
112
,033
12,4
858,
380
8,02
60
0
Keda
h 5
7,13
5 5
4,98
1 48
,673
52,6
2460
,569
74,9
7237
,742
39,5
0911
,628
11,5
60
Keda
h &
Per
lis 6
5,33
6 6
2,98
0 56
,425
60,9
4572
,602
87,4
5746
,122
47,5
3511
,628
11,5
60
Pula
u Pi
nang
25,
701
25,
882
50,9
1754
,498
76,3
0975
,577
28,8
3128
,404
10,2
7410
,598
Pera
k 6
1,40
7 6
0,45
6 55
,813
57,1
9111
1,65
211
8,63
174
,152
87,4
893,
126
2,66
6
Sela
ngor
78,
021
86,
955
73,1
3288
,524
140,
721
152,
122
40,5
4645
,381
00
WP
Putr
ajay
a 1
0,06
4 1
2,00
5 10
,298
10,6
3414
,140
14,4
303,
370
3,02
60
0
WPK
L 9
6,74
8 8
6,42
5 86
,147
83,0
1214
0,08
213
2,46
377
,955
68,9
2769
,394
59,8
49
Sela
ngor
& W
P Pu
traj
aya
& W
PKL
184
,833
1
85,3
85
169,
577
182,
170
294,
943
299,
015
121,
871
117,
334
69,3
9459
,849
Neg
eri S
embi
lan
18,
484
19,
038
17,4
0217
,775
48,3
3949
,978
22,1
5521
,688
00
Mel
aka
17,
314
16,
850
28,6
1128
,667
39,2
4640
,774
19,4
6720
,169
612
497
Joho
r 5
0,55
9 5
1,94
1 50
,767
59,3
1096
,461
87,6
2845
,876
47,0
8415
,803
17,4
19
Paha
ng 2
3,97
2 2
7,67
0 23
,687
26,5
8736
,619
42,9
5069
,371
44,5
6344
353
9
Tere
ngga
nu 1
5,74
9 1
6,11
1 16
,435
16,4
6626
,829
28,3
9069
,461
61,4
840
0
Kela
ntan
28,
264
29,
653
37,6
9637
,172
53,9
8253
,227
31,0
4528
,579
7,66
68,
227
Sara
wak
34,
847
37,
839
32,1
5736
,800
67,8
4769
,932
26,7
1428
,643
14,2
6114
,497
Saba
h 3
2,68
0 3
7,61
6 29
,877
30,9
4261
,560
60,5
1013
,901
16,0
714,
987
5,22
9
WP
Labu
an 8
46
1,2
60
464
463
3,49
63,
015
476
614
00
Saba
h &
WP
Labu
an 3
3,52
6 3
8,87
6 30
,341
31,4
0565
,056
63,5
2514
,377
16,6
854,
987
5,22
9
Sela
ngor
& W
P Pu
traj
aya
& W
PKL
are
also
col
lect
ivel
y re
ferr
ed to
as
Kla
ng V
alle
y.

This page intentionally left blank

Chapter 4 :
Hospital Health
Workforce
52
National Healthcare Establishment & Workforce Statistics Hospital 2012 -2013
CHAPTER 4 | HOSPITAL HEALTH WORKFORCEDoctors
In this report, we focus on fully-registered medical practitioners i.e. the specialists and medical officers, hence house officers are excluded. In 2013, there were 19,927 doctors working in acute curative hospitals in the country; 79.9% in the public hospitals, and 20.1% in the private hospitals. This sector distribution of doctor workforce is consistent with the proportion of bed capacity between the sectors. Over the past four years (2010-2013), the number of doctors has increased by 25% (5,022/ 19,927); the public hospitals contributed to a majority of 87.8% (4,407/ 5,022), and the remaining 12.2% (615/ 5,022) was from the private hospitals. Consistently, the public hospitals experienced a higher percentage of increase in the doctor workforce (27.7%) compared with the private hospitals (15.3%). In total, the country had 67.1 doctors per 100,000 population for the year 2013. Many were working in the West Coast region of Peninsular Malaysia. The highest doctor-to-population ratio was seen in Klang Valley (99.6 per 100,000 population), and three other states held a ratio well above national average i.e. Pulau Pinang (93.3 per 100,000 population), Melaka (87.8 per 100,000 population), and Negeri Sembilan (75.2 per 100,000 population). On the other hand, the top five states with the least number of doctors per 100,000 population were Sabah & WP Labuan (33.4), Sarawak (46.1), Johor (47.1), Terengganu (52.8), and Pahang (53.7). [Table 4.1]
With regards to specialists, the year 2013 saw 7,788 specialists working in acute curative hospitals in Malaysia. There were more specialists in the public hospitals (4,368; 56.1%) as opposed to the private hospitals (3,420; 43.9%). In the four-year period, the total number of specialists grew by 1,112 (14.3%). Out of such, 621 specialists (55.8%) were from the public hospitals, and 491 specialists (44.2%) were from the private hospitals. In addition, specialist workforce growth within the public hospitals (14.2%) was comparable to that of the private hospitals (14.4%). Overall, the number of specialists per 100,000 population in the country stood at 26.2 for the year 2013. Klang Valley, Pulau Pinang, and Melaka held the top three highest ratios; 47.6, 40.1, and 34.6 respectively. In contrast, three states had the lowest ratios i.e. Sabah & WP Labuan (9.1), Terengganu (12.9), and Sarawak (14.8). [Table 4.1.1]
Specialties that topped the list for highest specialist-to-population ratio remained similar throughout the four-year period (paediatrics, obstetrics and gynaecology, anaesthesiology, orthopaedics, internal medicine, and general surgery). Meanwhile specialties with the lowest ratio include sports medicine, nuclear medicine, rehabilitation medicine, and forensic pathology. [Table 4.1.2- Table 4.1.18]
In 2013, medical officers working in acute curative hospitals in the country numbered 12,139; a majority of 95% (11,545) being in the public hospitals while the remaining were in the private hospitals (594). Over the past four years, the number has increased by 3,910 (32.2%); out of which 3,786 (96.8%) medical officers were working in the public hospitals, and only 124 (3.2%) were working in the private hospitals. Furthermore, medical officer workforce of the public hospitals observed a higher increase (32.8%) compared with that of the private hospitals (20.9%). The national average of medical officers per 100,000 population was 40.9 for the year 2013. Melaka, Pulau Pinang, Perlis, and Klang Valley reported ratios well above the national average (53.1, 52.7, 52.2, and 52.1 medical officers per 100,000 population respectively); while Sabah & WP Labuan, Johor, and Sarawak recorded ratios well below the national average (24.3, 31.0, and 31.2 medical officers per 100,000 population respectively). [Table 4.1.1]
Staff Nurses
Total hospital staff nurses in 2013 numbered 68,121; with 50,541 staff nurses (74.2%) in the public hospitals, and 17,580 staff nurses (25.8%) in the private hospitals. There was an overall increase of 6.6% from the total number of hospital staff nurses in 2012. Both sectors experienced comparable increase in workforce over the two-year period; 6.4% in the public hospitals, and 7.2% in the private hospital. The country observed a staff-nurses-to-population ratio of 229 per 100,000 population in
53
CHAP
TER
4: H
OSPI
TAL
HEAL
TH W
ORKF
ORCE
National Healthcare Establishment & Workforce Statistics Hospital 2012 -2013
2013. The highest ratio of 305-308 per 1,000 population was seen in Pulau Pinang, Melaka, and Klang Valley (consisting the collective states of Selangor, WP Putrajaya, and WP Kuala Lumpur). Meanwhile Sarawak, Terengganu, Sabah, WP Labuan, and Johor had the ratio of below 200 per 100,000 population. [Table 4.2]
Staff nurses with post-basic training grew in number by 12.8% from 2012 to 2013; again with the private hospitals showing higher increase (14.0%) than the public hospitals (12.6%). However, 35.4% of all staff nurses in the public hospitals had post-basic training versus 19.0% of all staff nurses in the private. Public hospitals in Melaka had the highest proportion of post-basic trained staff nurses out of total staff nurses (50.2%), while those in Sabah had the lowest (23.7%). [Table 4.2]
Assistant Medical Officers (AMO)
There were 6,568 AMOs working in Malaysian hospitals in 2013. Most (98.8%) AMOs were working in the public hospitals. The number of AMOs grew by 3.9% from 2012 to 2013; maintaining the AMO-to-population ratio of 22 per 100,000 population in both years. Perlis recorded AMO density well above national average at 44 per 100,000 population. Meanwhile Klang Valley, and Johor recorded the lowest AMO density, at 17-18 per 100,000 population each. [Table 4.3]
The number of post-basic trained AMOs increased by 6.4% over one-year period (2012-2013); mostly observed in the public hospitals. The private hospitals lost three post-basic trained AMOs (21.4%) in 2013. Out of all AMOs in the public hospitals, 41.3% held post-basic training; while only 17.5% of the total number of AMOs in the private hospitals had such training. [Table 4.3]
Radiographers
TThere were 3,258 radiographers in Malaysia in 2013; 2,419 (74.2%) in the public hospitals, and 839 (25.8%) in the private hospitals. In total, the number of radiographers increased by 5.3%; with a higher increase in the private hospitals (12.5%) compared with the public hospitals (2.8%). Nationwide, there were 11 radiographers per 100,000 population in 2013. Pulau Pinang, Perlis, and Klang Valley had the highest ratio, at 12-15 per 100,000 population; while Kedah, Terengganu and Sabah & WP Labuan had the lowest ratio, at 7-8 per 100,000 population. [Table 4.4]
We attempted to report about the country’s post-basic trained radiographers (particularly in mammography and computer tomography (CT) scan). However such data could only be reported for the public hospitals. Of all radiographers in the public hospitals, 1.3% had post-basic training in mammogram, and 5.3% had post-basic training in CT scan. Most states had only three or less radiographers with mammogram post-basic training, while in Klang Valley there were 13 radiographers with such qualification. A similar situation is seen among the radiographers with post-basic qualification in CT scan: in most states, they numbered less than 10, while in Klang Valley they amounted to 47 in number. [Table 4.4]
Limitation:
1. Our data pertains to hospital workforce, therefore paints only a partial picture of health workforce (of selected professions) in the country.
2. Only doctor workforce data was collected at an individual doctor’s level. As for the remaining professions, data was collected in aggregated manner i.e. total count of the workforce. Therefore thorough data verification and cleaning was employed for the doctor workforce data, while the nature of the other workforce data permitted verification and cleaning procedure on a smaller scale.
3. Compared with workforce data of other professions, doctor workforce data for the latest NHEWS (Hospital) survey is available only for the year 2013 instead of for both years (2012 & 2013). This is attributable to the dissimilarity in data collection as has been mentioned.
4. A proportion of private hospitals reported post-basic trained radiographers that did not meet our definition. Therefore we omitted this data on the ground of questionable reliability.
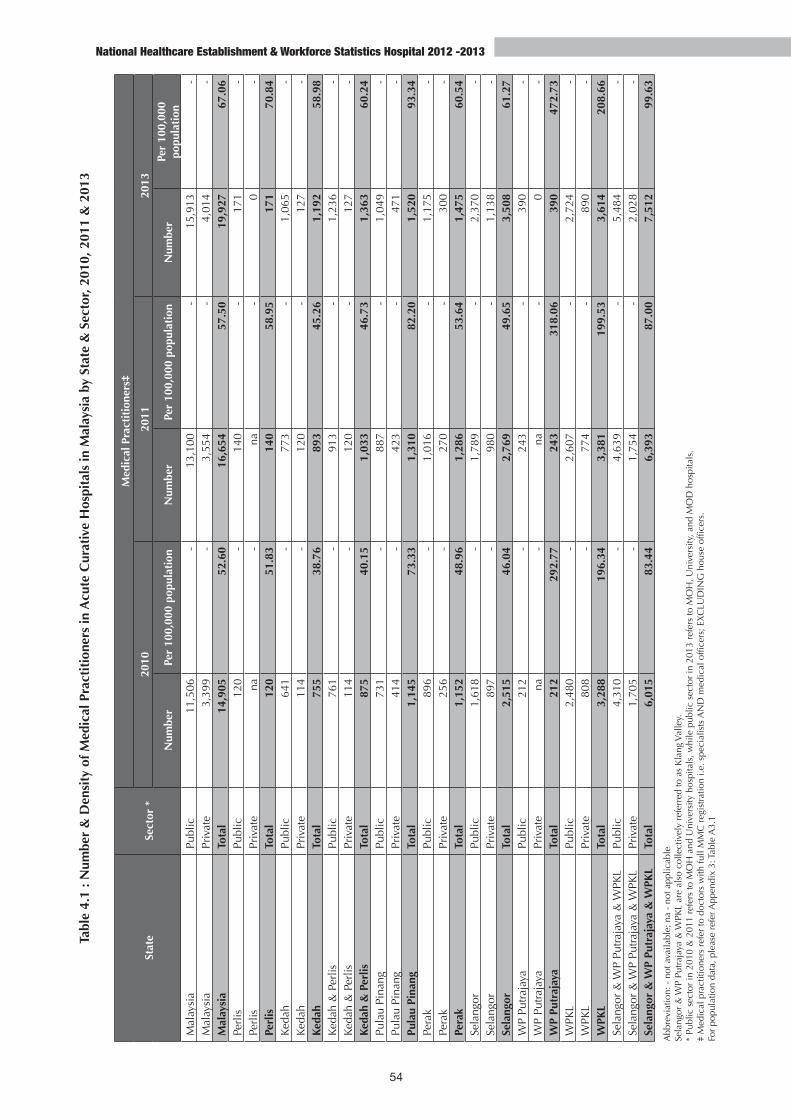
54
National Healthcare Establishment & Workforce Statistics Hospital 2012 -2013
Stat
eSe
ctor
*
Med
ical
Pra
ctit
ione
rs‡
2010
2011
2013
Num
ber
Per
100,
000
popu
lati
onN
umbe
rPe
r 10
0,00
0 po
pula
tion
Num
ber
Per
100,
000
popu
lati
onM
alay
sia
Publ
ic 1
1,50
6 -
13,
100
- 15
,913
- M
alay
sia
Priv
ate
3,3
99
- 3
,554
-
4,01
4-
Mal
aysi
aTo
tal
14,
905
52.6
0 1
6,65
4 5
7.50
19
,927
67.0
6Pe
rlis
Publ
ic 1
20
- 1
40
- 17
1-
Perl
isPr
ivat
e n
a -
na
- 0
- Pe
rlis
Tota
l 1
20
51.8
3 1
40
58.
95
171
70.8
4Ke
dah
Publ
ic 6
41
- 7
73
- 1,
065
- Ke
dah
Priv
ate
114
-
120
-
127
- Ke
dah
Tota
l 7
55
38.7
6 8
93
45.
26
1,19
258
.98
Keda
h &
Per
lisPu
blic
761
-
913
-
1,23
6-
Keda
h &
Per
lisPr
ivat
e 1
14
- 1
20
- 12
7-
Keda
h &
Per
lisTo
tal
875
40
.15
1,0
33
46.
73
1,36
360
.24
Pula
u Pi
nang
Publ
ic 7
31
- 8
87
- 1,
049
- Pu
lau
Pina
ngPr
ivat
e 4
14
- 4
23
- 47
1-
Pula
u Pi
nang
Tota
l 1
,145
73
.33
1,3
10
82.
20
1,52
093
.34
Pera
kPu
blic
896
-
1,0
16
- 1,
175
- Pe
rak
Priv
ate
256
-
270
-
300
- Pe
rak
Tota
l 1
,152
48
.96
1,2
86
53.
64
1,47
560
.54
Sela
ngor
Publ
ic 1
,618
-
1,7
89
- 2,
370
- Se
lang
orPr
ivat
e 8
97
- 9
80
- 1,
138
- Se
lang
orTo
tal
2,5
15
46.0
4 2
,769
4
9.65
3,
508
61.2
7W
P Pu
traj
aya
Publ
ic 2
12
- 2
43
- 39
0-
WP
Putr
ajay
aPr
ivat
e n
a -
na
- 0
- W
P Pu
traj
aya
Tota
l 2
12
292.
77 2
43
318
.06
390
472.
73W
PKL
Publ
ic 2
,480
-
2,6
07
- 2,
724
- W
PKL
Priv
ate
808
-
774
-
890
- W
PKL
Tota
l 3
,288
19
6.34
3,3
81
199
.53
3,61
420
8.66
Sela
ngor
& W
P Pu
traj
aya
& W
PKL
Publ
ic 4
,310
-
4,6
39
- 5,
484
- Se
lang
or &
WP
Putr
ajay
a &
WPK
LPr
ivat
e 1
,705
-
1,7
54
- 2,
028
- Se
lang
or &
WP
Putr
ajay
a &
WPK
LTo
tal
6,0
15
83.4
4 6
,393
8
7.00
7,
512
99.6
3
Tabl
e 4.
1 : N
umbe
r &
Den
sity
of M
edic
al P
ract
itio
ners
in A
cute
Cur
ativ
e H
ospi
tals
in M
alay
sia
by S
tate
& S
ecto
r, 20
10, 2
011
& 2
013
Abb
revi
atio
n: -
not
ava
ilabl
e; n
a -
not a
pplic
able
Sela
ngor
& W
P Pu
traj
aya
& W
PKL
are
also
col
lect
ivel
y re
ferr
ed to
as
Kla
ng V
alle
y.
* Pu
blic
sec
tor
in 2
010
& 2
011
refe
rs to
MO
H a
nd U
nive
rsity
hos
pita
ls, w
hile
pub
lic s
ecto
r in
201
3 re
fers
to M
OH
, Uni
vers
ity, a
nd M
OD
hos
pita
ls.
‡ M
edic
al p
ract
ition
ers
refe
r to
doc
tors
with
full
MM
C r
egis
trat
ion
i.e. s
peci
alis
ts A
ND
med
ical
offi
cers
; EX
CLU
DIN
G h
ouse
offi
cers
.Fo
r po
pula
tion
data
, ple
ase
refe
r App
endi
x 3:
Tab
le A
3.1
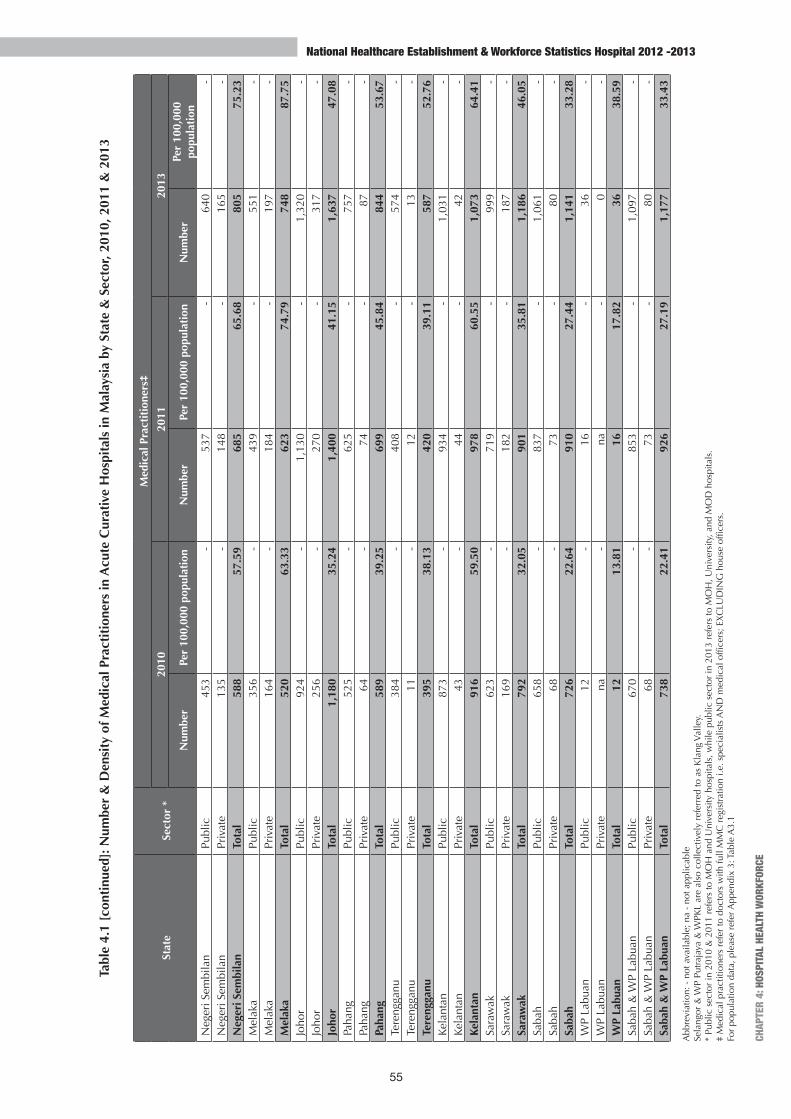
55
CHAP
TER
4: H
OSPI
TAL
HEAL
TH W
ORKF
ORCE
National Healthcare Establishment & Workforce Statistics Hospital 2012 -2013
Tabl
e 4.
1 [c
onti
nued
]: N
umbe
r &
Den
sity
of M
edic
al P
ract
itio
ners
in A
cute
Cur
ativ
e H
ospi
tals
in M
alay
sia
by S
tate
& S
ecto
r, 20
10, 2
011
& 2
013
Stat
eSe
ctor
*
Med
ical
Pra
ctit
ione
rs‡
2010
2011
2013
Num
ber
Per
100,
000
popu
lati
onN
umbe
rPe
r 10
0,00
0 po
pula
tion
Num
ber
Per
100,
000
popu
lati
onN
eger
i Sem
bila
nPu
blic
453
-
537
-
640
- N
eger
i Sem
bila
nPr
ivat
e 1
35
- 1
48
- 16
5-
Neg
eri S
embi
lan
Tota
l 5
88
57.5
9 6
85
65.
68
805
75.2
3M
elak
aPu
blic
356
-
439
-
551
- M
elak
aPr
ivat
e 1
64
- 1
84
- 19
7-
Mel
aka
Tota
l 5
20
63.3
3 6
23
74.
79
748
87.7
5Jo
hor
Publ
ic 9
24
- 1
,130
-
1,32
0-
Joho
rPr
ivat
e 2
56
- 2
70
- 31
7-
Joho
rTo
tal
1,1
80
35.2
4 1
,400
4
1.15
1,
637
47.0
8Pa
hang
Publ
ic 5
25
- 6
25
- 75
7-
Paha
ngPr
ivat
e 6
4 -
74
- 87
- Pa
hang
Tota
l 5
89
39.2
5 6
99
45.
84
844
53.6
7Te
reng
ganu
Publ
ic 3
84
- 4
08
- 57
4-
Tere
ngga
nuPr
ivat
e 1
1 -
12
- 13
- Te
reng
ganu
Tota
l 3
95
38.1
3 4
20
39.
11
587
52.7
6Ke
lant
anPu
blic
873
-
934
-
1,03
1-
Kela
ntan
Priv
ate
43
- 4
4 -
42-
Kela
ntan
Tota
l 9
16
59.5
0 9
78
60.
55
1,07
364
.41
Sara
wak
Publ
ic 6
23
- 7
19
- 99
9-
Sara
wak
Priv
ate
169
-
182
-
187
- Sa
raw
akTo
tal
792
32
.05
901
3
5.81
1,
186
46.0
5Sa
bah
Publ
ic 6
58
- 8
37
- 1,
061
- Sa
bah
Priv
ate
68
- 7
3 -
80-
Saba
hTo
tal
726
22
.64
910
2
7.44
1,
141
33.2
8W
P La
buan
Publ
ic 1
2 -
16
- 36
- W
P La
buan
Priv
ate
na
- n
a -
0-
WP
Labu
anTo
tal
12
13.8
1 1
6 1
7.82
36
38.5
9Sa
bah
& W
P La
buan
Publ
ic 6
70
- 8
53
- 1,
097
- Sa
bah
& W
P La
buan
Priv
ate
68
- 7
3 -
80-
Saba
h &
WP
Labu
anTo
tal
738
22
.41
926
2
7.19
1,
177
33.4
3
Abb
revi
atio
n: -
not
ava
ilabl
e; n
a -
not a
pplic
able
Sela
ngor
& W
P Pu
traj
aya
& W
PKL
are
also
col
lect
ivel
y re
ferr
ed to
as
Kla
ng V
alle
y.
* Pu
blic
sec
tor
in 2
010
& 2
011
refe
rs to
MO
H a
nd U
nive
rsity
hos
pita
ls, w
hile
pub
lic s
ecto
r in
201
3 re
fers
to M
OH
, Uni
vers
ity, a
nd M
OD
hos
pita
ls.
‡
Med
ical
pra
ctiti
oner
s re
fer
to d
octo
rs w
ith fu
ll M
MC
reg
istr
atio
n i.e
. spe
cial
ists
AN
D m
edic
al o
ffice
rs; E
XC
LUD
ING
hou
se o
ffice
rs.
For
popu
latio
n da
ta, p
leas
e re
fer A
ppen
dix
3: T
able
A3.
1

56
National Healthcare Establishment & Workforce Statistics Hospital 2012 -2013
Tabl
e 4.
1.1
: Num
ber
& D
ensi
ty o
f Spe
cial
ists
and
Med
ical
Offi
cers
in A
cute
Cur
ativ
e H
ospi
tals
in M
alay
sia
by S
tate
& S
ecto
r, 20
10, 2
011
& 2
013
Stat
eSe
ctor
*
Spec
ialis
tsM
edic
al O
ffice
rs
2010
2011
2013
2010
2011
2013
Number
Per 100,000 population
Number
Per 100,000 population
Number
Per 100,000 population
Number
Per 100,000 population
Number
Per 100,000 population
Number
Per 100,000 population
Mal
aysi
aPu
blic
3,7
47
- 3
,892
-
4,36
8-
7,7
59
- 9
,208
-
11,5
45-
Mal
aysi
aPr
ivat
e 2
,929
-
3,0
81
- 3,
420
- 4
70
- 4
73
- 59
4-
Mal
aysi
aTo
tal
6,6
76
23.5
6 6
,973
24
.08
7,78
826
.21
8,2
29
29.
04
9,6
81
33.
42
12,1
3940
.85
Perl
isPu
blic
40
- 4
0 -
45-
80
- 1
00
- 12
6-
Perl
isPr
ivat
e n
a -
na
- 0
- n
a -
na
- 0
- Pe
rlis
Tota
l 4
0 17
.28
40
16.8
445
18.6
4 8
0 3
4.55
1
00
42.
11
126
52.2
0Ke
dah
Publ
ic 1
80
- 1
87
-22
7-
461
-
586
-
838
- Ke
dah
Priv
ate
102
-
111
-
113
- 1
2 -
9
- 14
- Ke
dah
Tota
l 2
82
14.4
8 2
98
15.1
034
016
.82
473
2
4.29
5
95
30.
16
852
42.1
6Ke
dah
& P
erlis
Publ
ic 2
20
- 2
27
- 27
2-
541
-
686
-
964
- Ke
dah
& P
erlis
Priv
ate
102
-
111
-
113
- 1
2 -
9
- 14
- Ke
dah
& P
erlis
Tota
l 3
22
14.7
8 3
38
15.2
938
517
.02
553
2
5.38
6
95
31.
44
978
43.2
3Pu
lau
Pina
ngPu
blic
200
-
203
-
242
- 5
31
- 6
84
- 80
7-
Pula
u Pi
nang
Priv
ate
375
-
381
-
420
- 3
9 -
42
- 51
- Pu
lau
Pina
ngTo
tal
575
36
.83
584
36
.71
662
40.6
5 5
70
36.
51
726
4
5.49
85
852
.69
Pera
kPu
blic
212
-
214
-
245
- 6
84
- 8
02
- 93
0-
Pera
kPr
ivat
e 2
20
- 2
35
- 25
1-
36
- 3
5 -
49-
Pera
kTo
tal
432
18
.36
449
18
.73
496
20.3
6 7
20
30.
60
837
3
4.91
97
940
.18
Sela
ngor
Publ
ic 6
28
- 6
19
- 68
9-
990
-
1,1
70
- 1,
681
- Se
lang
orPr
ivat
e 7
63
- 8
40
- 95
3-
134
-
140
-
185
- Se
lang
orTo
tal
1,3
91
25.4
7 1
,459
26
.16
1,64
228
.68
1,1
24
20.
58
1,3
10
23.
49
1,86
632
.59
WP
Putr
ajay
aPu
blic
74
- 7
8 -
98-
138
-
165
-
292
- W
P Pu
traj
aya
Priv
ate
na
- n
a -
0-
na
- n
a -
0-
WP
Putr
ajay
aTo
tal
74
102.
19 7
8 10
2.09
9811
8.79
138
1
90.5
7 1
65
215
.97
292
353.
94W
PKL
Publ
ic 9
19
- 1
,031
-
1,08
6-
1,5
61
- 1
,576
-
1,63
8-
WPK
LPr
ivat
e 7
08
- 6
74
- 75
9 -
100
-
100
-
131
- W
PKL
Tota
l 1
,627
97
.16
1,7
05
100.
621,
845
106.
52 1
,661
9
9.19
1
,676
9
8.91
1,
769
102.
14Se
lang
or &
WP
Putr
ajay
a &
WPK
LPu
blic
1,6
21
- 1
,728
-
1,87
3-
2,6
89
- 2
,911
-
3,61
1-
Sela
ngor
& W
P Pu
traj
aya
& W
PKL
Priv
ate
1,4
71
- 1
,514
-
1,71
2-
234
-
240
-
316
- Se
lang
or &
WP
Putr
ajay
a &
WPK
LTo
tal
3,0
92
42.8
9 3
,242
44
.12
3,58
547
.55
2,9
23
40.
55
3,1
51
42.
88
3,92
752
.08
Abb
revi
atio
n: -
not
ava
ilabl
e; n
a -
not a
pplic
able
Sela
ngor
& W
P Pu
traj
aya
& W
PKL
are
also
col
lect
ivel
y re
ferr
ed to
as
Kla
ng V
alle
y.
* Pu
blic
sec
tor
in 2
010
& 2
011
refe
rs to
MO
H a
nd U
nive
rsity
hos
pita
ls, w
hile
pub
lic s
ecto
r in
201
3 re
fers
to M
OH
, Uni
vers
ity, a
nd M
OD
hos
pita
ls.
For
popu
latio
n da
ta, p
leas
e re
fer A
ppen
dix
3: T
able
A3.
1

57
CHAP
TER
4: H
OSPI
TAL
HEAL
TH W
ORKF
ORCE
National Healthcare Establishment & Workforce Statistics Hospital 2012 -2013
Tabl
e 4.
1.1
[con
tinu
ed]:
Num
ber
& D
ensi
ty o
f Spe
cial
ists
and
Med
ical
Offi
cers
in A
cute
Cur
ativ
e H
ospi
tals
in M
alay
sia
by S
tate
& S
ecto
r, 20
10, 2
011
& 2
013
Stat
eSe
ctor
*
Spec
ialis
tsM
edic
al O
ffice
rs
2010
2011
2013
2010
2011
2013
Number
Per 100,000 population
Number
Per 100,000 population
Number
Per 100,000 population
Number
Per 100,000 population
Number
Per 100,000 population
Number
Per 100,000 population
Neg
eri S
embi
lan
Publ
ic 1
23
- 1
19
- 15
4-
330
-
418
-
486
- N
eger
i Sem
bila
nPr
ivat
e 1
14
- 1
26
- 13
3-
21
- 2
2 -
32-
Neg
eri S
embi
lan
Tota
l 2
37
23.2
1 2
45
23.4
928
726
.82
351
3
4.38
4
40
42.
19
518
48.4
1M
elak
aPu
blic
95
- 7
8 -
111
- 2
61
- 3
61
- 44
0-
Mel
aka
Priv
ate
159
-
173
-
184
- 5
-
11
- 13
- M
elak
aTo
tal
254
30
.93
251
30
.13
295
34.6
1 2
66
32.
40
372
4
4.66
45
353
.14
Joho
rPu
blic
270
-
280
-
295
- 6
54
- 8
50
- 1,
025
- Jo
hor
Priv
ate
204
-
229
-
264
- 5
2 -
41
- 53
- Jo
hor
Tota
l 4
74
14.1
6 5
09
14.9
655
916
.08
706
2
1.09
8
91
26.
19
1,07
831
.00
Paha
ngPu
blic
184
-
169
-
187
- 3
41
- 4
56
- 57
0-
Paha
ngPr
ivat
e 4
9 -
59
- 74
- 1
5 -
15
- 13
- Pa
hang
Tota
l 2
33
15.5
2 2
28
14.9
526
116
.60
356
2
3.72
4
71
30.
89
583
37.0
7Te
reng
ganu
Publ
ic 1
08
- 1
10
13
4-
276
-
298
-
440
- Te
reng
ganu
Priv
ate
6
- 7
10-
5
- 5
-
3-
Tere
ngga
nuTo
tal
114
11
.00
117
10
.89
144
12.9
4 2
81
27.
12
303
2
8.21
44
339
.82
Kela
ntan
Publ
ic 3
30
- 3
65
37
9-
543
-
569
-
652
- Ke
lant
anPr
ivat
e 3
4 -
33
34
- 9
-
11
- 8
- Ke
lant
anTo
tal
364
23
.64
398
24
.64
413
24.7
9 5
52
35.
85
580
3
5.91
66
039
.62
Sara
wak
Publ
ic 1
88
- 1
92
23
3-
435
-
527
-
766
- Sa
raw
akPr
ivat
e 1
32
- 1
45
14
8-
37
- 3
7 -
39-
Sara
wak
Tota
l 3
20
12.9
5 3
37
13.3
938
114
.79
472
1
9.10
5
64
22.
41
805
31.2
6Sa
bah
Publ
ic 1
92
- 2
03
23
6-
466
-
634
-
825
- Sa
bah
Priv
ate
63
- 6
8
77-
5
- 5
-
3-
Saba
hTo
tal
255
7.
95 2
71
8.17
313
9.13
471
1
4.69
6
39
19.
27
828
24.1
5W
P La
buan
Publ
ic 4
-
4
7
- 8
-
12
- 29
- W
P La
buan
Priv
ate
na
- n
a
0-
na
- n
a -
0-
WP
Labu
anTo
tal
4
4.60
4
4.45
77.
50 8
9
.21
12
13.
36
2931
.08
Saba
h &
WP
Labu
anPu
blic
196
-
207
243
- 4
74
- 6
46
- 85
4-
Saba
h &
WP
Labu
anPr
ivat
e 6
3 -
68
77
- 5
-
5
- 3
- Sa
bah
& W
P La
buan
Tota
l 2
59
7.86
275
8.
0732
09.
09 4
79
14.
54
651
1
9.11
85
724
.34
Abb
revi
atio
n: -
not
ava
ilabl
e; n
a -
not a
pplic
able
Sela
ngor
& W
P Pu
traj
aya
& W
PKL
are
also
col
lect
ivel
y re
ferr
ed to
as
Kla
ng V
alle
y.
* Pu
blic
sec
tor
in 2
010
& 2
011
refe
rs to
MO
H a
nd U
nive
rsity
hos
pita
ls, w
hile
pub
lic s
ecto
r in
201
3 re
fers
to M
OH
, Uni
vers
ity, a
nd M
OD
hos
pita
ls.
Fo
r po
pula
tion
data
, ple
ase
refe
r App
endi
x 3:
Tab
le A
3.1

58
National Healthcare Establishment & Workforce Statistics Hospital 2012 -2013
Tabl
e 4.
1.2
: Num
ber
& D
ensi
ty o
f Int
erna
l Med
icin
e Sp
ecia
lists
in A
cute
Cur
ativ
e H
ospi
tals
in M
alay
sia
by S
tate
& S
ecto
r, 20
10, 2
011
& 2
013
Stat
eSe
ctor
*
Inte
rnal
Med
icin
e Sp
ecia
lists
‡
2010
2011
2013
Num
ber
Per
100,
000
popu
lati
onN
umbe
rPe
r 10
0,00
0 po
pula
tion
Num
ber
Per
100,
000
popu
lati
onM
alay
sia
Publ
ic32
9-
327
- 36
8-
Mal
aysi
aPr
ivat
e14
9-
163
- 15
1-
Mal
aysi
aTo
tal
478
1.69
490
1.69
519
1.75
Perl
isPu
blic
5-
3-
4-
Perl
isPr
ivat
ena
- na
- 0
- Pe
rlis
Tota
l5
2.16
31.
264
1.66
Keda
hPu
blic
23-
26-
23-
Keda
hPr
ivat
e3
- 5
- 5
- Ke
dah
Tota
l26
1.33
311.
5728
1.39
Keda
h &
Per
lisPu
blic
28-
29-
27-
Keda
h &
Per
lisPr
ivat
e3
- 5
- 5
- Ke
dah
& P
erlis
Tota
l31
1.42
341.
5432
1.41
Pula
u Pi
nang
Publ
ic19
- 28
- 28
- Pu
lau
Pina
ngPr
ivat
e16
- 19
- 17
- Pu
lau
Pina
ngTo
tal
352.
2447
2.95
452.
76Pe
rak
Publ
ic19
- 18
- 26
- Pe
rak
Priv
ate
13-
15-
14-
Pera
kTo
tal
321.
3633
1.38
401.
64Se
lang
orPu
blic
63-
52-
66-
Sela
ngor
Priv
ate
21-
26-
25-
Sela
ngor
Tota
l84
1.54
781.
4091
1.59
WP
Putr
ajay
aPu
blic
5-
4-
12-
WP
Putr
ajay
aPr
ivat
ena
- na
- na
- W
P Pu
traj
aya
Tota
l5
6.90
45.
2412
14.5
5W
PKL
Publ
ic49
- 63
- 72
- W
PKL
Priv
ate
31-
29-
26-
WPK
LTo
tal
804.
7892
5.43
985.
66Se
lang
or &
WP
Putr
ajay
a &
WPK
LPu
blic
117
- 11
9-
150
- Se
lang
or &
WP
Putr
ajay
a &
WPK
LPr
ivat
e52
- 55
- 51
- Se
lang
or &
WP
Putr
ajay
a &
WPK
LTo
tal
169
2.34
174
2.37
201
2.67
Abb
revi
atio
n: -
not
ava
ilabl
e; n
a -
not a
pplic
able
Sela
ngor
& W
P Pu
traj
aya
& W
PKL
are
also
col
lect
ivel
y re
ferr
ed to
as
Kla
ng V
alle
y.
* Pu
blic
sec
tor
in 2
010
& 2
011
refe
rs to
MO
H a
nd U
nive
rsity
hos
pita
ls, w
hile
pub
lic s
ecto
r in
201
3 re
fers
to M
OH
, Uni
vers
ity, a
nd M
OD
hos
pita
ls.
‡ In
tern
al m
edic
ine
spec
ialis
ts E
XC
LUD
E sp
ecia
lists
from
the
med
ical
sub
spec
ialti
es (e
.g. c
ardi
olog
y, r
espi
rato
ry m
edic
ine,
nep
hrol
ogy,
etc
.) Fo
r po
pula
tion
data
, ple
ase
refe
r App
endi
x 3:
Tab
le A
3.1

59
CHAP
TER
4: H
OSPI
TAL
HEAL
TH W
ORKF
ORCE
National Healthcare Establishment & Workforce Statistics Hospital 2012 -2013
Tabl
e 4.
1.2
[con
tinu
ed]:
Num
ber
& D
ensi
ty o
f Int
erna
l Med
icin
e Sp
ecia
lists
in A
cute
Cur
ativ
e H
ospi
tals
in M
alay
sia
by S
tate
& S
ecto
r, 20
10, 2
011
& 2
013
Stat
eSe
ctor
*
Inte
rnal
Med
icin
e Sp
ecia
lists
‡
2010
2011
2013
Num
ber
Per
100,
000
popu
lati
onN
umbe
rPe
r 10
0,00
0 po
pula
tion
Num
ber
Per
100,
000
popu
lati
onN
eger
i Sem
bila
nPu
blic
14-
10-
15-
Neg
eri S
embi
lan
Priv
ate
14-
17-
13-
Neg
eri S
embi
lan
Tota
l28
2.74
272.
5928
2.62
Mel
aka
Publ
ic12
- 7
- 9
- M
elak
aPr
ivat
e10
- 10
- 11
- M
elak
aTo
tal
222.
6817
2.04
202.
35Jo
hor
Publ
ic21
- 20
- 19
- Jo
hor
Priv
ate
13-
14-
19-
Joho
rTo
tal
341.
0234
1.00
381.
09Pa
hang
Publ
ic22
- 22
- 17
- Pa
hang
Priv
ate
9-
7-
5-
Paha
ngTo
tal
312.
0729
1.90
221.
40Te
reng
ganu
Publ
ic17
- 15
- 10
- Te
reng
ganu
Priv
ate
1-
1-
2-
Tere
ngga
nuTo
tal
181.
7416
1.49
121.
08Ke
lant
anPu
blic
15-
14-
14-
Kela
ntan
Priv
ate
3-
3-
1-
Kela
ntan
Tota
l18
1.17
171.
0515
0.90
Sara
wak
Publ
ic21
- 23
- 25
- Sa
raw
akPr
ivat
e10
- 11
- 9
- Sa
raw
akTo
tal
311.
2534
1.35
341.
32Sa
bah
Publ
ic23
- 21
- 27
- Sa
bah
Priv
ate
5-
6-
4-
Saba
hTo
tal
280.
8727
0.81
310.
90W
P La
buan
Publ
ic1
- 1
- 1
- W
P La
buan
Priv
ate
na-
na-
na-
WP
Labu
anTo
tal
11.
151
1.11
11.
07Sa
bah
& W
P La
buan
Publ
ic24
- 22
- 28
- Sa
bah
& W
P La
buan
Priv
ate
5-
6-
4-
Saba
h &
WP
Labu
anTo
tal
290.
8828
0.82
320.
91
Abb
revi
atio
n: -
not
ava
ilabl
e; n
a -
not a
pplic
able
Sela
ngor
& W
P Pu
traj
aya
& W
PKL
are
also
col
lect
ivel
y re
ferr
ed to
as
Kla
ng V
alle
y.
* Pu
blic
sec
tor
in 2
010
& 2
011
refe
rs to
MO
H a
nd U
nive
rsity
hos
pita
ls, w
hile
pub
lic s
ecto
r in
201
3 re
fers
to M
OH
, Uni
vers
ity, a
nd M
OD
hos
pita
ls.
‡ In
tern
al m
edic
ine
spec
ialis
ts E
XC
LUD
E sp
ecia
lists
from
the
med
ical
sub
spec
ialti
es (e
.g. c
ardi
olog
y, r
espi
rato
ry m
edic
ine,
nep
hrol
ogy,
etc
.) Fo
r po
pula
tion
data
, ple
ase
refe
r App
endi
x 3:
Tab
le A
3.1

60
National Healthcare Establishment & Workforce Statistics Hospital 2012 -2013
Tabl
e 4.
1.3
: Num
ber
& D
ensi
ty o
f Car
diol
ogis
ts, R
espi
rato
ry M
edic
ine
Spec
ialis
ts a
nd N
ephr
olog
ists
in A
cute
Cur
ativ
e H
ospi
tals
in M
alay
sia
by S
tate
& S
ecto
r, 20
10, 2
011
& 2
013
Stat
eSe
ctor
*
Car
diol
ogis
tsR
espi
rato
ry M
edic
ine
Spec
ialis
tsN
ephr
olog
ists
2010
2011
2013
2010
2011
2013
2010
2011
2013
Number
Per 100,000 population
Number
Per 100,000 population
Number
Per 100,000 population
Number
Per 100,000 population
Number
Per 100,000 population
Number
Per 100,000 population
Number
Per 100,000 population
Number
Per 100,000 population
Number
Per 100,000 population
Mal
aysi
aPu
blic
47-
39-
53-
30-
32-
35-
64-
62-
75-
Mal
aysi
aPr
ivat
e15
5-
160
- 19
4-
37-
36-
44-
43-
50-
58-
Mal
aysi
aTo
tal
202
0.71
199
0.6
9 24
70.
8367
0.24
680.
2379
0.27
107
0.38
112
0.39
133
0.45
Perl
isPu
blic
0-
0-
0-
0-
0-
0-
0-
0-
0-
Perl
isPr
ivat
ena
- na
- na
- na
- na
- na
- na
- na
- na
- Pe
rlis
Tota
l0
0.00
0 -
0
0.00
00.
000
0.00
00.
000
0.00
00.
000
0.00
Keda
hPu
blic
0-
1-
4-
2-
2-
4-
2-
2-
3-
Keda
hPr
ivat
e6
- 6
- 6
- 1
- 1
- 1
- 1
- 2
- 2
- Ke
dah
Tota
l6
0.31
7 0
.35
100.
493
0.15
30.
155
0.25
30.
154
0.20
50.
25Ke
dah
& P
erlis
Publ
ic0
- 1
- 4
- 2
- 2
- 4
- 2
- 2
- 3
- Ke
dah
& P
erlis
Priv
ate
6-
6-
6-
1-
1-
1-
1-
2-
2-
Keda
h &
Per
lisTo
tal
60.
287
0.3
2 10
0.44
30.
143
0.14
50.
223
0.14
40.
185
0.22
Pula
u Pi
nang
Publ
ic8
- 2
- 9
- 3
- 2
- 4
- 6
- 6
- 6
- Pu
lau
Pina
ngPr
ivat
e19
- 19
- 28
- 6
- 6
- 7
- 7
- 8
- 9
- Pu
lau
Pina
ngTo
tal
271.
7321
1.3
2 37
2.27
90.
588
0.50
110.
6813
0.83
140.
8815
0.92
Pera
kPu
blic
0-
1-
1-
2-
2-
3-
1-
1-
4-
Pera
kPr
ivat
e10
- 10
- 11
- 3
- 3
- 4
- 5
- 5
- 5
- Pe
rak
Tota
l10
0.43
11 0
.46
120.
495
0.21
50.
217
0.29
60.
266
0.25
90.
37Se
lang
orPu
blic
9-
7-
7-
1-
2-
3-
13-
12-
17-
Sela
ngor
Priv
ate
32-
33-
41-
14-
14-
17-
15-
17-
18-
Sela
ngor
Tota
l41
0.75
40 0
.72
480.
8415
0.27
160.
2920
0.35
280.
5129
0.52
350.
61W
P Pu
traj
aya
Publ
ic0
- 0
- 0
- 0
- 0
- 0
- 0
- 0
- 0
- W
P Pu
traj
aya
Priv
ate
na-
na-
na-
na-
na-
na-
na-
na-
na-
WP
Putr
ajay
aTo
tal
00.
000
-
00.
000
0.00
00.
000
0.00
00.
000
0.00
00.
00W
PKL
Publ
ic9
- 8
- 8
- 13
- 15
- 13
- 22
- 20
- 21
- W
PKL
Priv
ate
52-
52-
65-
11-
9-
11-
6-
6-
7-
WPK
LTo
tal
613.
6460
3.5
4 73
4.21
241.
4324
1.42
241.
3928
1.67
261.
5328
1.62
Sela
ngor
& W
P Pu
traj
aya
& W
PKL
Publ
ic18
- 15
- 15
- 14
- 17
- 16
- 35
- 32
- 38
- Se
lang
or &
WP
Putr
ajay
a &
WPK
LPr
ivat
e84
- 85
- 10
6-
25-
23-
28-
21-
23-
25-
Sela
ngor
& W
P Pu
traj
aya
& W
PKL
Tota
l10
21.
4110
0 1
.36
121
1.60
390.
5440
0.54
440.
5856
0.78
550.
7563
0.84
Abb
revi
atio
n: -
not
ava
ilabl
e; n
a -
not a
pplic
able
Sela
ngor
& W
P Pu
traj
aya
& W
PKL
are
also
col
lect
ivel
y re
ferr
ed to
as
Kla
ng V
alle
y.
* Pu
blic
sec
tor
in 2
010
& 2
011
refe
rs to
MO
H a
nd U
nive
rsity
hos
pita
ls, w
hile
pub
lic s
ecto
r in
201
3 re
fers
to M
OH
, Uni
vers
ity, a
nd M
OD
hos
pita
ls.
Fo
r po
pula
tion
data
, ple
ase
refe
r App
endi
x 3:
Tab
le A
3.1
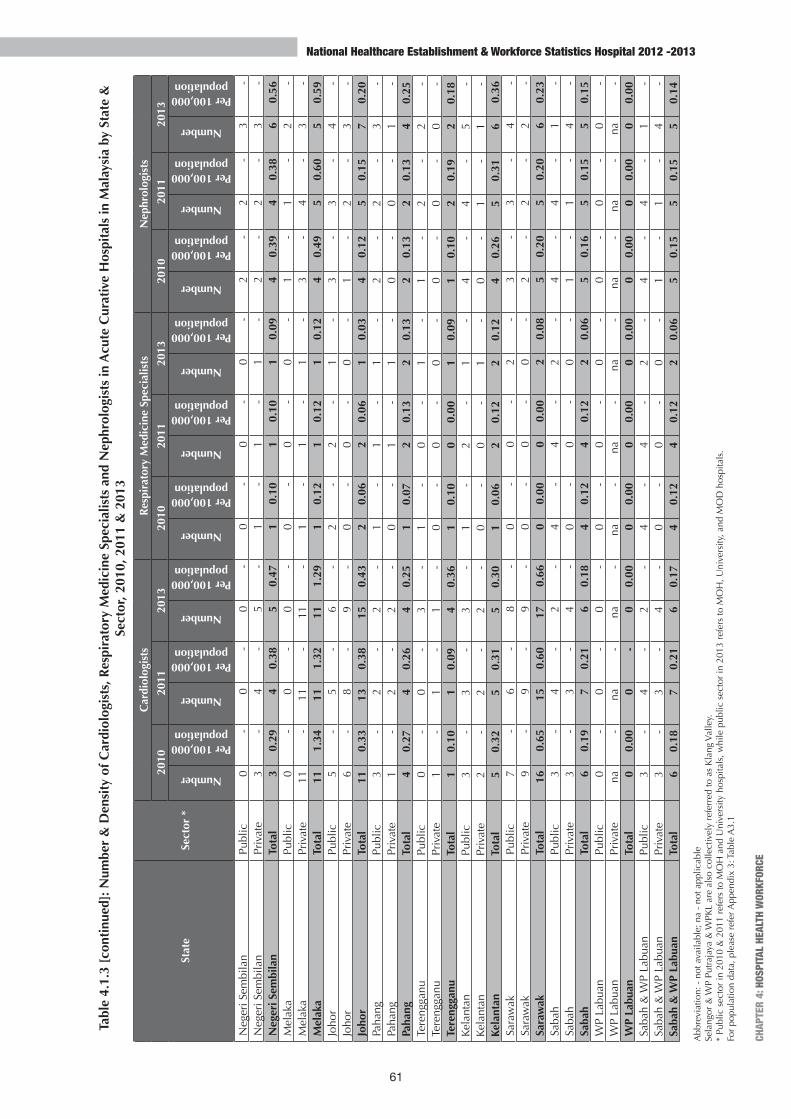
61
CHAP
TER
4: H
OSPI
TAL
HEAL
TH W
ORKF
ORCE
National Healthcare Establishment & Workforce Statistics Hospital 2012 -2013
Tabl
e 4.
1.3
[con
tinu
ed]:
Num
ber
& D
ensi
ty o
f Car
diol
ogis
ts, R
espi
rato
ry M
edic
ine
Spec
ialis
ts a
nd N
ephr
olog
ists
in A
cute
Cur
ativ
e H
ospi
tals
in M
alay
sia
by S
tate
&
Sect
or, 2
010,
201
1 &
201
3
Stat
eSe
ctor
*
Car
diol
ogis
tsR
espi
rato
ry M
edic
ine
Spec
ialis
tsN
ephr
olog
ists
2010
2011
2013
2010
2011
2013
2010
2011
2013
Number
Per 100,000 population
Number
Per 100,000 population
Number
Per 100,000 population
Number
Per 100,000 population
Number
Per 100,000 population
Number
Per 100,000 population
Number
Per 100,000 population
Number
Per 100,000 population
Number
Per 100,000 population
Neg
eri S
embi
lan
Publ
ic0
- 0
- 0
- 0
- 0
- 0
- 2
- 2
- 3
- N
eger
i Sem
bila
nPr
ivat
e3
- 4
- 5
- 1
- 1
- 1
- 2
- 2
- 3
- N
eger
i Sem
bila
nTo
tal
30.
294
0.3
8 5
0.47
10.
101
0.10
10.
094
0.39
40.
386
0.56
Mel
aka
Publ
ic0
- 0
- 0
- 0
- 0
- 0
- 1
- 1
- 2
- M
elak
aPr
ivat
e11
- 11
- 11
- 1
- 1
- 1
- 3
- 4
- 3
- M
elak
aTo
tal
111.
3411
1.3
2 11
1.29
10.
121
0.12
10.
124
0.49
50.
605
0.59
Joho
rPu
blic
5-
5-
6-
2-
2-
1-
3-
3-
4-
Joho
rPr
ivat
e6
- 8
- 9
- 0
- 0
- 0
- 1
- 2
- 3
- Jo
hor
Tota
l11
0.33
13 0
.38
150.
432
0.06
20.
061
0.03
40.
125
0.15
70.
20Pa
hang
Publ
ic3
- 2
- 2
- 1
- 1
- 1
- 2
- 2
- 3
- Pa
hang
Priv
ate
1-
2-
2-
0-
1-
1-
0-
0-
1-
Paha
ngTo
tal
40.
274
0.2
6 4
0.25
10.
072
0.13
20.
132
0.13
20.
134
0.25
Tere
ngga
nuPu
blic
0-
0-
3-
1-
0-
1-
1-
2-
2-
Tere
ngga
nuPr
ivat
e1
- 1
- 1
- 0
- 0
- 0
- 0
- 0
- 0
- Te
reng
ganu
Tota
l1
0.10
1 0
.09
40.
361
0.10
00.
001
0.09
10.
102
0.19
20.
18Ke
lant
anPu
blic
3-
3-
3-
1-
2-
1-
4-
4-
5-
Kela
ntan
Priv
ate
2-
2-
2-
0-
0-
1-
0-
1-
1-
Kela
ntan
Tota
l5
0.32
5 0
.31
50.
301
0.06
20.
122
0.12
40.
265
0.31
60.
36Sa
raw
akPu
blic
7-
6-
8-
0-
0-
2-
3-
3-
4-
Sara
wak
Priv
ate
9-
9-
9-
0-
0-
0-
2-
2-
2-
Sara
wak
Tota
l16
0.65
15 0
.60
170.
660
0.00
00.
002
0.08
50.
205
0.20
60.
23Sa
bah
Publ
ic3
- 4
- 2
- 4
- 4
- 2
- 4
- 4
- 1
- Sa
bah
Priv
ate
3-
3-
4-
0-
0-
0-
1-
1-
4-
Saba
hTo
tal
60.
197
0.2
1 6
0.18
40.
124
0.12
20.
065
0.16
50.
155
0.15
WP
Labu
anPu
blic
0-
0-
0-
0-
0-
0-
0-
0-
0-
WP
Labu
anPr
ivat
ena
- na
- na
- na
- na
- na
- na
- na
- na
- W
P La
buan
Tota
l0
0.00
0 -
0
0.00
00.
000
0.00
00.
000
0.00
00.
000
0.00
Saba
h &
WP
Labu
anPu
blic
3-
4-
2-
4-
4-
2-
4-
4-
1-
Saba
h &
WP
Labu
anPr
ivat
e3
- 3
- 4
- 0
- 0
- 0
- 1
- 1
- 4
- Sa
bah
& W
P La
buan
Tota
l6
0.18
7 0
.21
60.
174
0.12
40.
122
0.06
50.
155
0.15
50.
14
Abb
revi
atio
n: -
not
ava
ilabl
e; n
a -
not a
pplic
able
Sela
ngor
& W
P Pu
traj
aya
& W
PKL
are
also
col
lect
ivel
y re
ferr
ed to
as
Kla
ng V
alle
y.
* Pu
blic
sec
tor
in 2
010
& 2
011
refe
rs to
MO
H a
nd U
nive
rsity
hos
pita
ls, w
hile
pub
lic s
ecto
r in
201
3 re
fers
to M
OH
, Uni
vers
ity, a
nd M
OD
hos
pita
ls.
For
popu
latio
n da
ta, p
leas
e re
fer A
ppen
dix
3: T
able
A3.
1

62
National Healthcare Establishment & Workforce Statistics Hospital 2012 -2013
Tabl
e 4.
1.4
: Num
ber
& D
ensi
ty o
f End
ocri
nolo
gist
s, N
euro
logi
sts
and
Rhe
umat
olog
ists
in A
cute
Cur
ativ
e H
ospi
tals
in M
alay
sia
by S
tate
& S
ecto
r, 20
10, 2
011
& 2
013
Stat
eSe
ctor
*
Endo
crin
olog
ists
Neu
rolo
gist
sR
heum
atol
ogis
ts
2010
2011
2013
2010
2011
2013
2010
2011
2013
Number
Per 100,000 population
Number
Per 100,000 population
Number
Per 100,000 population
Number
Per 100,000 population
Number
Per 100,000 population
Number
Per 100,000 population
Number
Per 100,000 population
Number
Per 100,000 population
Number
Per 100,000 population
Mal
aysi
aPu
blic
33-
34-
36-
28-
30-
41-
25-
26-
40-
Mal
aysi
aPr
ivat
e19
- 18
- 23
- 35
- 36
- 42
- 13
- 14
- 15
- M
alay
sia
Tota
l52
0.18
52 0
.18
590.
2063
0.22
66 0
.23
830.
2838
0.13
400.
1455
0.19
Perl
isPu
blic
0-
0-
0-
0-
0-
0-
0-
0-
0-
Perl
isPr
ivat
ena
- na
- na
- na
- na
- na
- na
- na
- na
- Pe
rlis
Tota
l0
0.00
00.
000
0.00
00.
000
0.00
00.
000
0.00
00.
000
0.00
Keda
hPu
blic
0-
0-
1-
0-
0-
1-
0-
0-
0-
Keda
hPr
ivat
e0
- 0
- 0
- 1
- 1
- 1
- 0
- 0
- 0
- Ke
dah
Tota
l0
0.00
00.
001
0.05
10.
051
0.0
5 2
0.10
00.
000
0.00
00.
00Ke
dah
& P
erlis
Publ
ic0
- 0
- 1
- 0
- 0
- 1
- 0
- 0
- 0
- Ke
dah
& P
erlis
Priv
ate
0-
0-
0-
1-
1-
1-
0-
0-
0-
Keda
h &
Per
lisTo
tal
00.
000
0.00
10.
041
0.05
1 0
.05
20.
090
0.00
00.
000
0.00
Pula
u Pi
nang
Publ
ic2
- 2
- 4
- 3
- 3
- 2
- 0
- 0
- 2
- Pu
lau
Pina
ngPr
ivat
e4
- 3
- 2
- 5
- 5
- 6
- 1
- 1
- 1
- Pu
lau
Pina
ngTo
tal
60.
385
0.3
1 6
0.37
80.
518
0.5
0 8
0.49
10.
061
0.06
30.
18Pe
rak
Publ
ic1
- 1
- 2
- 0
- 1
- 0
- 1
- 1
- 1
- Pe
rak
Priv
ate
1-
1-
1-
2-
2-
2-
1-
1-
1-
Pera
kTo
tal
20.
092
0.0
8 3
0.12
20.
093
0.1
3 2
0.08
20.
092
0.08
20.
08Se
lang
orPu
blic
2-
2-
4-
0-
0-
1-
7-
6-
9-
Sela
ngor
Priv
ate
8-
9-
10-
11-
11-
15-
5-
6-
6-
Sela
ngor
Tota
l10
0.18
11 0
.20
140.
2411
0.20
11 0
.20
160.
2812
0.22
120.
2215
0.26
WP
Putr
ajay
aPu
blic
8-
8-
5-
0-
0-
0-
5-
5-
4-
WP
Putr
ajay
aPr
ivat
ena
- na
- na
- na
- na
- na
- na
- na
- na
- W
P Pu
traj
aya
Tota
l8
11.0
58
10.4
7 5
6.06
00.
000
0.00
00.
005
6.90
56.
544
4.85
WPK
LPu
blic
13-
13-
12-
22-
20-
28-
3-
3-
6-
WPK
LPr
ivat
e5
- 5
- 8
- 10
- 10
- 10
- 4
- 4
- 4
- W
PKL
Tota
l18
1.07
18 1
.06
201.
1532
1.91
30 1
.77
382.
197
0.42
70.
4110
0.58
Sela
ngor
& W
P Pu
traj
aya
& W
PKL
Publ
ic23
- 23
- 21
- 22
- 20
- 29
- 15
- 14
- 19
- Se
lang
or &
WP
Putr
ajay
a &
WPK
LPr
ivat
e13
- 14
- 18
- 21
- 21
- 25
- 9
- 10
- 10
- Se
lang
or &
WP
Putr
ajay
a &
WPK
LTo
tal
360.
5037
0.5
0 39
0.52
430.
6041
0.5
6 54
0.72
240.
3324
0.33
290.
38
Abb
revi
atio
n: -
not
ava
ilabl
e; n
a -
not a
pplic
able
Sela
ngor
& W
P Pu
traj
aya
& W
PKL
are
also
col
lect
ivel
y re
ferr
ed to
as
Kla
ng V
alle
y.
* Pu
blic
sec
tor
in 2
010
& 2
011
refe
rs to
MO
H a
nd U
nive
rsity
hos
pita
ls, w
hile
pub
lic s
ecto
r in
201
3 re
fers
to M
OH
, Uni
vers
ity, a
nd M
OD
hos
pita
ls.
For
popu
latio
n da
ta, p
leas
e re
fer A
ppen
dix
3: T
able
A3.
1
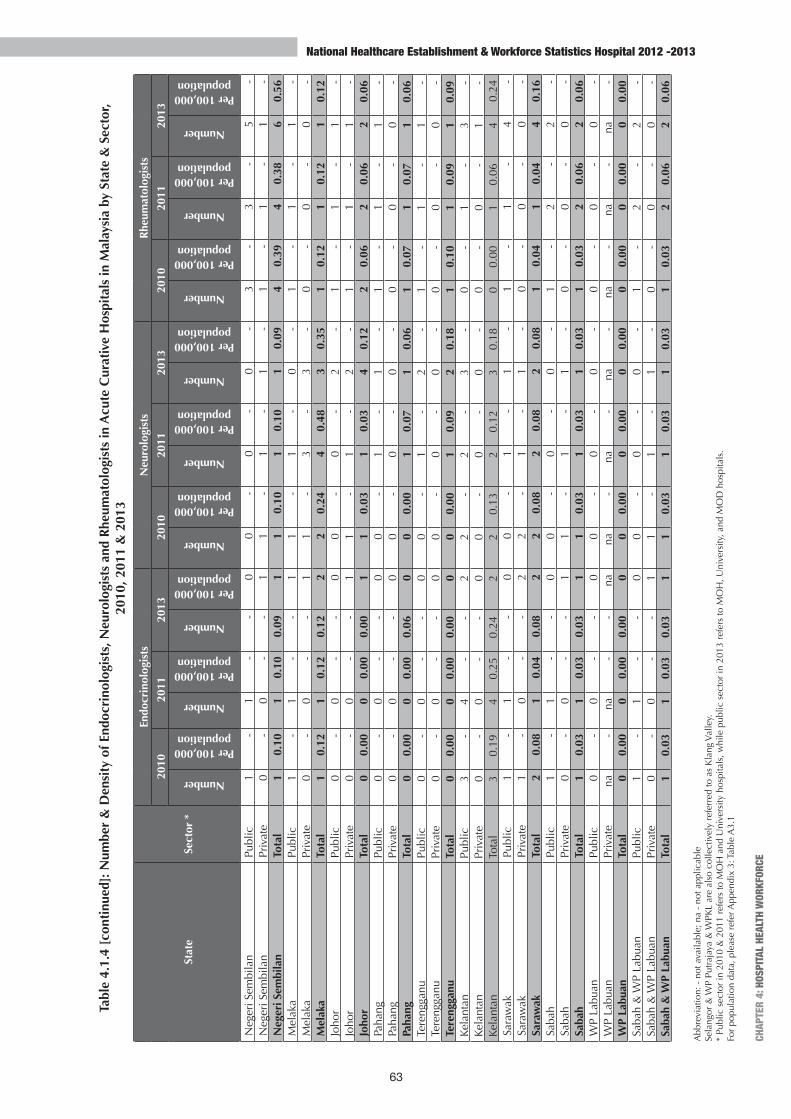
63
CHAP
TER
4: H
OSPI
TAL
HEAL
TH W
ORKF
ORCE
National Healthcare Establishment & Workforce Statistics Hospital 2012 -2013
Tabl
e 4.
1.4
[con
tinu
ed]:
Num
ber
& D
ensi
ty o
f End
ocri
nolo
gist
s, N
euro
logi
sts
and
Rhe
umat
olog
ists
in A
cute
Cur
ativ
e H
ospi
tals
in M
alay
sia
by S
tate
& S
ecto
r, 20
10, 2
011
& 2
013
Stat
eSe
ctor
*
Endo
crin
olog
ists
Neu
rolo
gist
sR
heum
atol
ogis
ts
2010
2011
2013
2010
2011
2013
2010
2011
2013
Number
Per 100,000 population
Number
Per 100,000 population
Number
Per 100,000 population
Number
Per 100,000 population
Number
Per 100,000 population
Number
Per 100,000 population
Number
Per 100,000 population
Number
Per 100,000 population
Number
Per 100,000 population
Neg
eri S
embi
lan
Publ
ic1
- 1
- -
00
- 0
- 0
- 3
- 3
- 5
- N
eger
i Sem
bila
nPr
ivat
e0
- 0
- -
11
- 1
- 1
- 1
- 1
- 1
- N
eger
i Sem
bila
nTo
tal
10.
101
0.1
0 0.
091
10.
101
0.1
0 1
0.09
40.
394
0.38
60.
56M
elak
aPu
blic
1-
1-
- 1
1-
1-
0-
1-
1-
1-
Mel
aka
Priv
ate
0-
0-
- 1
1-
3-
3-
0-
0-
0-
Mel
aka
Tota
l1
0.12
1 0
.12
0.12
22
0.24
4 0
.48
30.
351
0.12
10.
121
0.12
Joho
rPu
blic
0-
0-
- 0
0-
0-
2-
1-
1-
1-
Joho
rPr
ivat
e0
- 0
- -
11
- 1
- 2
- 1
- 1
- 1
- Jo
hor
Tota
l0
0.00
00.
000.
001
10.
031
0.0
3 4
0.12
20.
062
0.06
20.
06Pa
hang
Publ
ic0
- 0
- -
00
- 1
- 1
- 1
- 1
- 1
- Pa
hang
Priv
ate
0-
0-
- 0
0-
0-
0-
0-
0-
0-
Paha
ngTo
tal
00.
000
0.00
0.06
00
0.00
1 0
.07
10.
061
0.07
10.
071
0.06
Tere
ngga
nuPu
blic
0-
0-
- 0
0-
1-
2-
1-
1-
1-
Tere
ngga
nuPr
ivat
e0
- 0
- -
00
- 0
- 0
- 0
- 0
- 0
- Te
reng
ganu
Tota
l0
0.00
00.
000.
000
00.
001
0.0
9 2
0.18
10.
101
0.09
10.
09Ke
lant
anPu
blic
3-
4-
- 2
2-
2-
3-
0-
1-
3-
Kela
ntan
Priv
ate
0-
0-
- 0
0-
0-
0-
0-
0-
1-
Kela
ntan
Tota
l3
0.19
4 0
.25
0.24
22
0.13
2 0
.12
30.
180
0.00
10.
064
0.24
Sara
wak
Publ
ic1
- 1
- -
00
- 1
- 1
- 1
- 1
- 4
- Sa
raw
akPr
ivat
e1
- 0
- -
22
- 1
- 1
- 0
- 0
- 0
- Sa
raw
akTo
tal
20.
081
0.0
4 0.
082
20.
082
0.0
8 2
0.08
10.
041
0.04
40.
16Sa
bah
Publ
ic1
- 1
- -
00
- 0
- 0
- 1
- 2
- 2
- Sa
bah
Priv
ate
0-
0-
- 1
1-
1-
1-
0-
0-
0-
Saba
hTo
tal
10.
031
0.0
3 0.
031
10.
031
0.0
3 1
0.03
10.
032
0.06
20.
06W
P La
buan
Publ
ic0
- 0
- -
00
- 0
- 0
- 0
- 0
- 0
- W
P La
buan
Priv
ate
na-
na-
- na
na-
na-
na-
na-
na-
na-
WP
Labu
anTo
tal
00.
000
0.00
0.00
00
0.00
00.
000
0.00
00.
000
0.00
00.
00Sa
bah
& W
P La
buan
Publ
ic1
- 1
- -
00
- 0
- 0
- 1
- 2
- 2
- Sa
bah
& W
P La
buan
Priv
ate
0-
0-
- 1
1-
1-
1-
0-
0-
0-
Saba
h &
WP
Labu
anTo
tal
10.
031
0.0
3 0.
031
10.
031
0.0
3 1
0.03
10.
032
0.06
20.
06
Abb
revi
atio
n: -
not
ava
ilabl
e; n
a -
not a
pplic
able
Sela
ngor
& W
P Pu
traj
aya
& W
PKL
are
also
col
lect
ivel
y re
ferr
ed to
as
Kla
ng V
alle
y.
* Pu
blic
sec
tor
in 2
010
& 2
011
refe
rs to
MO
H a
nd U
nive
rsity
hos
pita
ls, w
hile
pub
lic s
ecto
r in
201
3 re
fers
to M
OH
, Uni
vers
ity, a
nd M
OD
hos
pita
ls.
Fo
r po
pula
tion
data
, ple
ase
refe
r App
endi
x 3:
Tab
le A
3.1

64
National Healthcare Establishment & Workforce Statistics Hospital 2012 -2013
Tabl
e 4.
1.5
: Num
ber
& D
ensi
ty o
f Gas
troe
nter
olog
ists
, Hep
atol
ogis
ts a
nd C
linic
al H
aem
atol
ogis
ts in
Acu
te C
urat
ive
Hos
pita
ls in
Mal
aysi
a by
Sta
te &
Sec
tor,
2010
, 201
1 &
201
3
Stat
eSe
ctor
*
Gas
troe
nter
olog
ists
Hep
atol
ogis
tsC
linic
al H
aem
atol
ogis
ts
2010
2011
2013
2010
2011
2013
2010
2011
2013
Number
Per 100,000 population
Number
Per 100,000 population
Number
Per 100,000 population
Number
Per 100,000 population
Number
Per 100,000 population
Number
Per 100,000 population
Number
Per 100,000 population
Number
Per 100,000 population
Number
Per 100,000 population
Mal
aysi
aPu
blic
35-
29-
37-
5-
9-
6-
31-
34-
39-
Mal
aysi
aPr
ivat
e71
- 76
- 87
- 0
- 0
- 3
- 10
- 11
- 12
- M
alay
sia
Tota
l10
60.
3710
5 0
.36
124
0.42
50.
029
0.0
3 9
0.03
410.
1445
0.16
510.
17Pe
rlis
Publ
ic0
- 0
- 1
- 0
- 0
- 0
- 0
- 0
- 0
- Pe
rlis
Priv
ate
na-
na-
0-
na-
na-
0-
na-
na-
0-
Perl
isTo
tal
00.
000
0.00
10.
410
0.00
00.
000
0.00
00.
000
0.00
00.
00Ke
dah
Publ
ic3
- 3
- 3
- 0
- 0
- 0
- 0
- 0
- 1
- Ke
dah
Priv
ate
3-
3-
3-
0-
0-
0-
0-
0-
0-
Keda
hTo
tal
60.
316
0.3
0 6
0.30
00.
000
0.00
00.
000
0.00
00.
001
0.05
Keda
h &
Per
lisPu
blic
3-
3-
4-
0-
0-
0-
0-
0-
1-
Keda
h &
Per
lisPr
ivat
e3
- 3
- 3
- 0
- 0
- 0
- 0
- 0
- 0
- Ke
dah
& P
erlis
Tota
l6
0.28
6 0
.27
70.
310
0.00
00.
000
0.00
00.
000
0.00
10.
04Pu
lau
Pina
ngPu
blic
1-
1-
1-
0-
0-
0-
2-
2-
3-
Pula
u Pi
nang
Priv
ate
9-
9-
9-
0-
0-
0-
2-
2-
2-
Pula
u Pi
nang
Tota
l10
0.64
10 0
.63
100.
610
0.00
00.
000
0.00
40.
264
0.25
50.
31Pe
rak
Publ
ic1
- 0
- 0
- 0
- 0
- 0
- 1
- 1
- 1
- Pe
rak
Priv
ate
4-
4-
4-
0-
0-
1-
0-
1-
1-
Pera
kTo
tal
50.
214
0.1
7 4
0.16
00.
000
0.00
10.
041
0.04
20.
082
0.08
Sela
ngor
Publ
ic5
- 4
- 8
- 4
- 7
- 5
- 17
- 18
- 15
- Se
lang
orPr
ivat
e24
- 26
- 33
- 0
- 0
- 0
- 3
- 3
- 4
- Se
lang
orTo
tal
290.
5330
0.5
4 41
0.72
40.
077
0.1
3 5
0.09
200.
3721
0.38
190.
33W
P Pu
traj
aya
Publ
ic0
- 0
- 0
- 0
- 0
- 0
- 0
- 0
- 0
- W
P Pu
traj
aya
Priv
ate
na-
na-
0-
na-
na-
0-
na-
na-
na-
WP
Putr
ajay
aTo
tal
00.
000
0.00
00.
000
0.00
00.
000
0.00
00.
000
0.00
00.
00W
PKL
Publ
ic12
- 12
- 15
- 1
- 2
- 1
- 8
- 7
- 8
- W
PKL
Priv
ate
17-
20-
19-
0-
0-
2-
3-
3-
3-
WPK
LTo
tal
291.
7332
1.8
9 34
1.96
10.
062
0.1
2 3
0.17
110.
6610
0.59
110.
64Se
lang
or &
WP
Putr
ajay
a &
WPK
LPu
blic
17-
16-
23-
5-
9-
6-
25-
25-
23-
Sela
ngor
& W
P Pu
traj
aya
& W
PKL
Priv
ate
41-
46-
52-
0-
0-
2-
6-
6-
7-
Sela
ngor
& W
P Pu
traj
aya
& W
PKL
Tota
l58
0.80
62 0
.84
750.
995
0.07
9 0
.12
80.
1131
0.43
310.
4230
0.40
Abb
revi
atio
n: -
not
ava
ilabl
e; n
a -
not a
pplic
able
Sela
ngor
& W
P Pu
traj
aya
& W
PKL
are
also
col
lect
ivel
y re
ferr
ed to
as
Kla
ng V
alle
y.
* Pu
blic
sec
tor
in 2
010
& 2
011
refe
rs to
MO
H a
nd U
nive
rsity
hos
pita
ls, w
hile
pub
lic s
ecto
r in
201
3 re
fers
to M
OH
, Uni
vers
ity, a
nd M
OD
hos
pita
ls.
Fo
r po
pula
tion
data
, ple
ase
refe
r App
endi
x 3:
Tab
le A
3.1

65
CHAP
TER
4: H
OSPI
TAL
HEAL
TH W
ORKF
ORCE
National Healthcare Establishment & Workforce Statistics Hospital 2012 -2013
Tabl
e 4.
1.5
[con
tinu
ed]:
Num
ber
& D
ensi
ty o
f Gas
troe
nter
olog
ists
, Hep
atol
ogis
ts a
nd C
linic
al H
aem
atol
ogis
ts in
Acu
te C
urat
ive
Hos
pita
ls in
Mal
aysi
a by
Sta
te &
Se
ctor
, 201
0, 2
011
& 2
013
Stat
eSe
ctor
*
Gas
troe
nter
olog
ists
Hep
atol
ogis
tsC
linic
al H
aem
atol
ogis
ts
2010
2011
2013
2010
2011
2013
2010
2011
2013
Number
Per 100,000 population
Number
Per 100,000 population
Number
Per 100,000 population
Number
Per 100,000 population
Number
Per 100,000 population
Number
Per 100,000 population
Number
Per 100,000 population
Number
Per 100,000 population
Number
Per 100,000 population
Neg
eri S
embi
lan
Publ
ic0
- 0
- 0
- 0
- 0
- 0
- 0
- 0
- 0
- N
eger
i Sem
bila
nPr
ivat
e1
- 1
- 2
- 0
- 0
- 0
- 0
- 0
- 0
- N
eger
i Sem
bila
nTo
tal
10.
101
0.1
0 2
0.19
00.
000
0.00
00.
000
0.00
00.
000
0.00
Mel
aka
Publ
ic1
- 0
- 0
- 0
- 0
- 0
- 0
- 0
- 1
- M
elak
aPr
ivat
e5
- 6
- 6
- 0
- 0
- 0
- 1
- 1
- 1
- M
elak
aTo
tal
60.
736
0.7
2 6
0.70
00.
000
0.00
00.
001
0.12
10.
122
0.23
Joho
rPu
blic
0-
0-
2-
0-
0-
0-
0-
0-
1-
Joho
rPr
ivat
e4
- 4
- 6
- 0
- 0
- 0
- 0
- 0
- 0
- Jo
hor
Tota
l4
0.12
4 0
.12
80.
230
0.00
00.
000
0.00
00.
000
0.00
10.
03Pa
hang
Publ
ic1
- 1
- 1
- 0
- 0
- 0
- 0
- 0
- 1
- Pa
hang
Priv
ate
0-
0-
0-
0-
0-
0-
0-
0-
0-
Paha
ngTo
tal
10.
071
0.0
7 1
0.06
00.
000
0.00
00.
000
0.00
00.
001
0.06
Tere
ngga
nuPu
blic
0-
0-
0-
0-
0-
0-
0-
0-
0-
Tere
ngga
nuPr
ivat
e0
- 0
- 0
- 0
- 0
- 0
- 0
- 0
- 0
- Te
reng
ganu
Tota
l0
0.00
00.
000
0.00
00.
000
0.00
00.
000
0.00
00.
000
0.00
Kela
ntan
Publ
ic8
- 5
- 4
- 0
- 0
- 0
- 1
- 3
- 4
- Ke
lant
anPr
ivat
e0
- 0
- 0
- 0
- 0
- 0
- 0
- 0
- 0
- Ke
lant
anTo
tal
80.
525
0.3
1 4
0.24
00.
000
0.00
00.
001
0.06
30.
194
0.24
Sara
wak
Publ
ic0
- 0
- 0
- 0
- 0
- 0
- 1
- 1
- 2
- Sa
raw
akPr
ivat
e2
- 2
- 3
- 0
- 0
- 0
- 1
- 1
- 1
- Sa
raw
akTo
tal
20.
082
0.0
8 3
0.12
00.
000
0.00
00.
002
0.08
20.
083
0.12
Saba
hPu
blic
3-
3-
2-
0-
0-
0-
1-
2-
2-
Saba
hPr
ivat
e2
- 1
- 2
- 0
- 0
- 0
- 0
- 0
- 0
- Sa
bah
Tota
l5
0.16
4 0
.12
40.
120
0.00
00.
000
0.00
10.
032
0.06
20.
06W
P La
buan
Publ
ic0
- 0
- 0
- 0
- 0
- 0
- 0
- 0
- 0
- W
P La
buan
Priv
ate
na-
na-
0-
na-
na-
0-
na-
na-
na-
WP
Labu
anTo
tal
00.
000
0.00
00.
000
0.00
00.
000
0.00
00.
000
0.00
00.
00Sa
bah
& W
P La
buan
Publ
ic3
- 3
- 2
- 0
- 0
- 0
- 1
- 2
- 2
- Sa
bah
& W
P La
buan
Priv
ate
2-
1-
2-
0-
0-
0-
0-
0-
0-
Saba
h &
WP
Labu
anTo
tal
50.
154
0.1
2 4
0.11
00.
000
0.00
00.
001
0.03
20.
062
0.06
Abb
revi
atio
n: -
not
ava
ilabl
e; n
a -
not a
pplic
able
Sela
ngor
& W
P Pu
traj
aya
& W
PKL
are
also
col
lect
ivel
y re
ferr
ed to
as
Kla
ng V
alle
y.
* Pu
blic
sec
tor
in 2
010
& 2
011
refe
rs to
MO
H a
nd U
nive
rsity
hos
pita
ls, w
hile
pub
lic s
ecto
r in
201
3 re
fers
to M
OH
, Uni
vers
ity, a
nd M
OD
hos
pita
ls.
Fo
r po
pula
tion
data
, ple
ase
refe
r App
endi
x 3:
Tab
le A
3.1

66
National Healthcare Establishment & Workforce Statistics Hospital 2012 -2013
Tabl
e 4.
1.6
: Num
ber
& D
ensi
ty o
f Ger
iatr
icia
ns, I
nfec
tiou
s D
isea
se S
peci
alis
ts a
nd D
erm
atol
ogis
ts in
Acu
te C
urat
ive
Hos
pita
ls in
Mal
aysi
a by
Sta
te &
Sec
tor,
2010
, 201
1 &
201
3
Stat
eSe
ctor
*
Ger
iatr
icia
nsIn
fect
ious
Dis
ease
Spe
cial
ists
Der
mat
olog
ists
2010
2011
2013
2010
2011
2013
2010
2011
2013
Number
Per 100,000 Geriatric
Population
Number
Per 100,000 Geriatric
Population
Number
Per 100,000 Geriatric
Population
Number
Per 100,000 population
Number
Per 100,000 population
Number
Per 100,000 population
Number
Per 100,000 population
Number
Per 100,000 population
Number
Per 100,000 population
Mal
aysi
aPu
blic
6-
7-
12-
16-
15-
23-
38-
42-
39-
Mal
aysi
aPr
ivat
e4
- 5
- 5
- 3
- 3
- 3
- 38
- 38
- 47
- M
alay
sia
Tota
l10
0.44
120.
5117
0.67
190.
0718
0.06
260.
0976
0.27
80 0
.28
860.
29Pe
rlis
Publ
ic0
- 0
- 0
- 0
- 0
- 0
- 1
- 1
- 2
- Pe
rlis
Priv
ate
na-
na-
0-
na-
na-
0-
na-
na-
na-
Perl
isTo
tal
00.
000
0.00
00.
000
0.00
00.
000
0.00
10.
431
0.4
2 2
0.83
Keda
hPu
blic
0-
0-
0-
0-
0-
1-
1-
1-
1-
Keda
hPr
ivat
e0
- 0
- 0
- 0
- 0
- 0
- 1
- 1
- 1
- Ke
dah
Tota
l0
0.00
00.
000
0.00
00.
000
0.00
10.
052
0.10
2 0
.10
20.
10Ke
dah
& P
erlis
Publ
ic0
- 0
- 0
- 0
- 0
- 1
- 2
- 2
- 3
- Ke
dah
& P
erlis
Priv
ate
0-
0-
0-
0-
0-
0-
1-
1-
1-
Keda
h &
Per
lisTo
tal
00.
000
0.00
00.
000
0.00
00.
001
0.04
30.
143
0.1
4 4
0.18
Pula
u Pi
nang
Publ
ic0
- 0
- 0
- 2
- 2
- 3
- 2
- 2
- 1
- Pu
lau
Pina
ngPr
ivat
e0
- 0
- 0
- 0
- 0
- 0
- 4
- 4
- 5
- Pu
lau
Pina
ngTo
tal
00.
000
0.00
00.
002
0.13
20.
133
0.18
60.
386
0.3
8 6
0.37
Pera
kPu
blic
0-
0-
1-
1-
1-
1-
1-
1-
1-
Pera
kPr
ivat
e2
- 2
- 2
- 0
- 0
- 0
- 5
- 5
- 5
- Pe
rak
Tota
l2
0.71
20.
693
0.97
10.
041
0.04
10.
046
0.26
6 0
.25
60.
25Se
lang
orPu
blic
0-
0-
0-
5-
5-
6-
2-
2-
4-
Sela
ngor
Priv
ate
0-
0-
0-
2-
2-
1-
13-
11-
18-
Sela
ngor
Tota
l0
0.00
00.
000
0.00
70.
137
0.13
70.
1215
0.27
13 0
.23
220.
38W
P Pu
traj
aya
Publ
ic0
- 0
- 0
- 0
- 0
- 0
- 0
- 0
- 1
- W
P Pu
traj
aya
Priv
ate
na-
na-
0-
na-
na-
0-
na-
na-
na-
WP
Putr
ajay
aTo
tal
00.
000
0.00
00.
000
0.00
00.
000
0.00
00.
000
0.00
11.
21W
PKL
Publ
ic4
- 5
- 8
- 4
- 3
- 5
- 18
- 21
- 18
- W
PKL
Priv
ate
1-
2-
2-
0-
0-
1-
9-
11-
12-
WPK
LTo
tal
53.
917
5.30
106.
804
0.24
30.
186
0.35
271.
6132
1.8
9 30
1.73
Sela
ngor
& W
P Pu
traj
aya
& W
PKL
Publ
ic4
- 5
- 8
- 9
- 8
- 11
- 20
- 23
- 23
- Se
lang
or &
WP
Putr
ajay
a &
WPK
LPr
ivat
e1
- 2
- 2
- 2
- 2
- 2
- 22
- 22
- 30
- Se
lang
or &
WP
Putr
ajay
a &
WPK
LTo
tal
51.
087
1.46
101.
8811
0.15
100.
1413
0.17
420.
5845
0.6
1 53
0.70
Abb
revi
atio
n: -
not
ava
ilabl
e; n
a -
not a
pplic
able
Sela
ngor
& W
P Pu
traj
aya
& W
PKL
are
also
col
lect
ivel
y re
ferr
ed to
as
Kla
ng V
alle
y.
*
Publ
ic s
ecto
r in
201
0 &
201
1 re
fers
to M
OH
and
Uni
vers
ity h
ospi
tals
, whi
le p
ublic
sec
tor
in 2
013
refe
rs to
MO
H, U
nive
rsity
, and
MO
D h
ospi
tals
.
For
popu
latio
n da
ta, p
leas
e re
fer A
ppen
dix
3: T
able
A3.
1 &
Tab
le A
3.13

67
CHAP
TER
4: H
OSPI
TAL
HEAL
TH W
ORKF
ORCE
National Healthcare Establishment & Workforce Statistics Hospital 2012 -2013
Tabl
e 4.
1.6
[con
tinu
ed]:
Num
ber
& D
ensi
ty o
f Ger
iatr
icia
ns, I
nfec
tiou
s D
isea
se S
peci
alis
ts a
nd D
erm
atol
ogis
ts in
Acu
te C
urat
ive
Hos
pita
ls in
Mal
aysi
a by
Sta
te &
Sec
-to
r, 20
10, 2
011
& 2
013
Stat
eSe
ctor
*
Ger
iatr
icia
nsIn
fect
ious
Dis
ease
Spe
cial
ists
Der
mat
olog
ists
2010
2011
2013
2010
2011
2013
2010
2011
2013
Number
Per 100,000 Geriatric
Population
Number
Per 100,000 Geriatric
Population
Number
Per 100,000 Geriatric
Population
Number
Per 100,000 population
Number
Per 100,000 population
Number
Per 100,000 population
Number
Per 100,000 population
Number
Per 100,000 population
Number
Per 100,000 population
Neg
eri S
embi
lan
Publ
ic0
- 0
- 0
- 0
- 0
- 0
- 1
- 2
- 1
- N
eger
i Sem
bila
nPr
ivat
e0
- 0
- 0
- 0
- 0
- 0
- 1
- 1
- 0
- N
eger
i Sem
bila
nTo
tal
00.
000
0.00
00.
000
0.00
00.
000
0.00
20.
203
0.2
9 1
0.09
Mel
aka
Publ
ic0
- 0
- 0
- 0
- 0
- 0
- 1
- 1
- 1
- M
elak
aPr
ivat
e0
- 0
- 1
- 0
- 0
- 0
- 1
- 1
- 1
- M
elak
aTo
tal
00.
000
0.00
11.
140
0.00
00.
000
0.00
20.
242
0.2
4 2
0.23
Joho
rPu
blic
0-
0-
1-
1-
1-
2-
4-
4-
4-
Joho
rPr
ivat
e0
- 0
- 0
- 0
- 0
- 0
- 2
- 2
- 2
- Jo
hor
Tota
l0
0.00
00.
001
0.32
10.
031
0.03
20.
066
0.18
6 0
.18
60.
17Pa
hang
Publ
ic0
- 0
- 0
- 0
- 0
- 0
- 1
- 1
- 1
- Pa
hang
Priv
ate
0-
0-
0-
0-
0-
0-
0-
0-
1-
Paha
ngTo
tal
00.
000
0.00
00.
000
0.00
00.
000
0.00
10.
071
0.0
7 2
0.13
Tere
ngga
nuPu
blic
0-
0-
0-
1-
1-
1-
1-
1-
0-
Tere
ngga
nuPr
ivat
e0
- 0
- 0
- 0
- 0
- 0
- 0
- 0
- 0
- Te
reng
ganu
Tota
l0
0.00
00.
000
0.00
10.
101
0.09
10.
091
0.10
1 0
.09
00.
00Ke
lant
anPu
blic
0-
0-
0-
1-
1-
2-
3-
3-
2-
Kela
ntan
Priv
ate
0-
0-
0-
1-
1-
1-
0-
0-
0-
Kela
ntan
Tota
l0
0.00
00.
000
0.00
20.
132
0.12
30.
183
0.19
3 0
.19
20.
12Sa
raw
akPu
blic
1-
1-
1-
0-
0-
1-
1-
1-
1-
Sara
wak
Priv
ate
1-
1-
0-
0-
0-
0-
1-
1-
1-
Sara
wak
Tota
l2
5.28
25.
041
0.42
00.
000
0.00
10.
042
0.08
2 0
.08
20.
08Sa
bah
Publ
ic1
- 1
- 1
- 1
- 1
- 1
- 1
- 1
- 1
- Sa
bah
Priv
ate
0-
0-
0-
0-
0-
0-
1-
1-
1-
Saba
hTo
tal
10.
721
0.66
10.
601
0.03
10.
031
0.03
20.
062
0.0
6 2
0.06
WP
Labu
anPu
blic
0-
0-
0-
0-
0-
0-
0-
0-
0-
WP
Labu
anPr
ivat
ena
- na
- 0
- na
- na
- 0
- na
- na
- na
- W
P La
buan
Tota
l0
0.00
00.
000
0.00
00.
000
0.00
00.
000
0.00
00.
000
0.00
Saba
h &
WP
Labu
anPu
blic
1-
0-
1-
1-
1-
1-
1-
1-
1-
Saba
h &
WP
Labu
anPr
ivat
e0
- 0
- 0
- 0
- 0
- 0
- 1
- 1
- 1
- Sa
bah
& W
P La
buan
Tota
l1
0.70
00.
001
0.58
10.
031
0.03
10.
032
0.06
2 0
.06
20.
06
Abb
revi
atio
n: -
not
ava
ilabl
e; n
a -
not a
pplic
able
Sela
ngor
& W
P Pu
traj
aya
& W
PKL
are
also
col
lect
ivel
y re
ferr
ed to
as
Kla
ng V
alle
y.
*
Publ
ic s
ecto
r in
201
0 &
201
1 re
fers
to M
OH
and
Uni
vers
ity h
ospi
tals
, whi
le p
ublic
sec
tor
in 2
013
refe
rs to
MO
H, U
nive
rsity
, and
MO
D h
ospi
tals
.
For
popu
latio
n da
ta, p
leas
e re
fer A
ppen
dix
3: T
able
A3.
1 &
Tab
le A
3.13
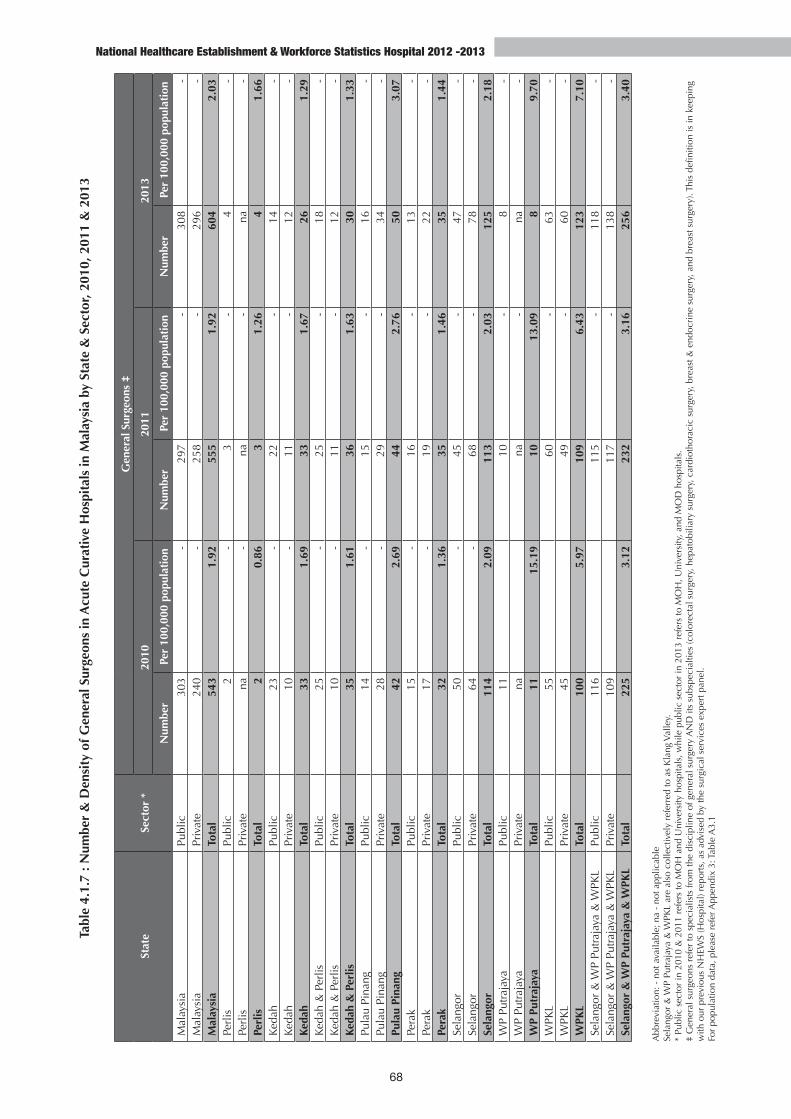
68
National Healthcare Establishment & Workforce Statistics Hospital 2012 -2013
Tabl
e 4.
1.7
: Num
ber
& D
ensi
ty o
f Gen
eral
Sur
geon
s in
Acu
te C
urat
ive
Hos
pita
ls in
Mal
aysi
a by
Sta
te &
Sec
tor,
2010
, 201
1 &
201
3
Stat
eSe
ctor
*
Gen
eral
Sur
geon
s ‡
2010
2011
2013
Num
ber
Per
100,
000
popu
lati
onN
umbe
rPe
r 10
0,00
0 po
pula
tion
Num
ber
Per
100,
000
popu
lati
on
Mal
aysi
aPu
blic
303
- 29
7-
308
- M
alay
sia
Priv
ate
240
- 25
8-
296
- M
alay
sia
Tota
l54
31.
9255
51.
9260
42.
03Pe
rlis
Publ
ic2
- 3
- 4
- Pe
rlis
Priv
ate
na-
na-
na-
Perl
isTo
tal
20.
863
1.26
41.
66Ke
dah
Publ
ic23
- 22
- 14
- Ke
dah
Priv
ate
10-
11-
12-
Keda
hTo
tal
331.
6933
1.67
261.
29Ke
dah
& P
erlis
Publ
ic25
- 25
- 18
- Ke
dah
& P
erlis
Priv
ate
10-
11-
12-
Keda
h &
Per
lisTo
tal
351.
6136
1.63
301.
33Pu
lau
Pina
ngPu
blic
14-
15-
16-
Pula
u Pi
nang
Priv
ate
28-
29-
34-
Pula
u Pi
nang
Tota
l42
2.69
442.
7650
3.07
Pera
kPu
blic
15-
16-
13-
Pera
kPr
ivat
e17
- 19
- 22
- Pe
rak
Tota
l32
1.36
351.
4635
1.44
Sela
ngor
Publ
ic50
- 45
- 47
- Se
lang
orPr
ivat
e64
- 68
- 78
- Se
lang
orTo
tal
114
2.09
113
2.03
125
2.18
WP
Putr
ajay
aPu
blic
11
10-
8-
WP
Putr
ajay
aPr
ivat
ena
na
- na
- W
P Pu
traj
aya
Tota
l11
15.1
910
13.0
98
9.70
WPK
LPu
blic
55
60-
63-
WPK
LPr
ivat
e45
49
- 60
- W
PKL
Tota
l10
05.
9710
96.
4312
37.
10Se
lang
or &
WP
Putr
ajay
a &
WPK
LPu
blic
116
11
5-
118
- Se
lang
or &
WP
Putr
ajay
a &
WPK
LPr
ivat
e10
9
117
- 13
8-
Sela
ngor
& W
P Pu
traj
aya
& W
PKL
Tota
l22
53.
1223
23.
1625
63.
40
Abb
revi
atio
n: -
not
ava
ilabl
e; n
a -
not a
pplic
able
Sela
ngor
& W
P Pu
traj
aya
& W
PKL
are
also
col
lect
ivel
y re
ferr
ed to
as
Kla
ng V
alle
y.
* Pu
blic
sec
tor
in 2
010
& 2
011
refe
rs to
MO
H a
nd U
nive
rsity
hos
pita
ls, w
hile
pub
lic s
ecto
r in
201
3 re
fers
to M
OH
, Uni
vers
ity, a
nd M
OD
hos
pita
ls.
‡ G
ener
al s
urge
ons
refe
r to
spe
cial
ists
from
the
disc
iplin
e of
gen
eral
sur
gery
AN
D it
s su
bspe
cial
ties
(col
orec
tal s
urge
ry, h
epat
obili
ary
surg
ery,
car
diot
hora
cic
surg
ery,
bre
ast &
end
ocri
ne s
urge
ry, a
nd b
reas
t sur
gery
). Th
is d
efini
tion
is in
kee
ping
w
ith o
ur p
revi
ous
NH
EWS
(Hos
pita
l) re
port
s, a
s ad
vise
d by
the
surg
ical
ser
vice
s ex
pert
pan
el.
For
popu
latio
n da
ta, p
leas
e re
fer A
ppen
dix
3: T
able
A3.
1

69
CHAP
TER
4: H
OSPI
TAL
HEAL
TH W
ORKF
ORCE
National Healthcare Establishment & Workforce Statistics Hospital 2012 -2013
Tabl
e 4.
1.7
[con
tinu
ed]:
Num
ber
& D
ensi
ty o
f Gen
eral
Sur
geon
s in
Acu
te C
urat
ive
Hos
pita
ls in
Mal
aysi
a by
Sta
te &
Sec
tor,
2010
, 201
1 &
201
3
Abb
revi
atio
n: -
not
ava
ilabl
e; n
a -
not a
pplic
able
Sela
ngor
& W
P Pu
traj
aya
& W
PKL
are
also
col
lect
ivel
y re
ferr
ed to
as
Kla
ng V
alle
y.
* Pu
blic
sec
tor
in 2
010
& 2
011
refe
rs to
MO
H a
nd U
nive
rsity
hos
pita
ls, w
hile
pub
lic s
ecto
r in
201
3 re
fers
to M
OH
, Uni
vers
ity, a
nd M
OD
hos
pita
ls.
‡ G
ener
al s
urge
ons
refe
r to
spe
cial
ists
from
the
disc
iplin
e of
gen
eral
sur
gery
AN
D it
s su
bspe
cial
ties
(col
orec
tal s
urge
ry, h
epat
obili
ary
surg
ery,
car
diot
hora
cic
surg
ery,
bre
ast &
end
ocri
ne s
urge
ry, a
nd b
reas
t sur
gery
). Th
is d
efini
tion
is in
kee
ping
w
ith o
ur p
revi
ous
NH
EWS
(Hos
pita
l) re
port
s, a
s ad
vise
d by
the
surg
ical
ser
vice
s ex
pert
pan
el.
For
popu
latio
n da
ta, p
leas
e re
fer A
ppen
dix
3: T
able
A3.
1
Stat
eSe
ctor
*
Gen
eral
Sur
geon
s ‡
2010
2011
2013
Num
ber
Per
100,
000
popu
lati
onN
umbe
rPe
r 10
0,00
0 po
pula
tion
Num
ber
Per
100,
000
popu
lati
onN
eger
i Sem
bila
nPu
blic
10-
11-
13-
Neg
eri S
embi
lan
Priv
ate
10-
11-
13-
Neg
eri S
embi
lan
Tota
l20
1.96
222.
1126
2.43
Mel
aka
Publ
ic8
- 7
- 7
- M
elak
aPr
ivat
e13
- 13
- 15
- M
elak
aTo
tal
212.
5620
2.40
222.
58Jo
hor
Publ
ic24
- 25
- 27
- Jo
hor
Priv
ate
25-
27-
29-
Joho
rTo
tal
491.
4652
1.53
561.
61Pa
hang
Publ
ic18
- 13
- 11
- Pa
hang
Priv
ate
4-
6-
8-
Paha
ngTo
tal
221.
4719
1.25
191.
21Te
reng
ganu
Publ
ic6
- 7
- 13
- Te
reng
ganu
Priv
ate
0-
0-
0-
Tere
ngga
nuTo
tal
60.
587
0.65
131.
17Ke
lant
anPu
blic
27-
26-
25-
Kela
ntan
Priv
ate
4-
3-
2-
Kela
ntan
Tota
l31
2.01
291.
8027
1.62
Sara
wak
Publ
ic21
- 17
- 23
- Sa
raw
akPr
ivat
e13
- 15
- 16
- Sa
raw
akTo
tal
341.
3832
1.27
391.
51Sa
bah
Publ
ic18
- 19
- 23
- Sa
bah
Priv
ate
7-
7-
7-
Saba
hTo
tal
250.
7826
0.78
300.
88W
P La
buan
Publ
ic1
- 1
- 1
- W
P La
buan
Priv
ate
na-
na-
na-
WP
Labu
anTo
tal
11.
151
1.11
11.
07Sa
bah
& W
P La
buan
Publ
ic19
- 20
- 24
- Sa
bah
& W
P La
buan
Priv
ate
7-
7-
7-
Saba
h &
WP
Labu
anTo
tal
260.
7927
0.79
310.
88
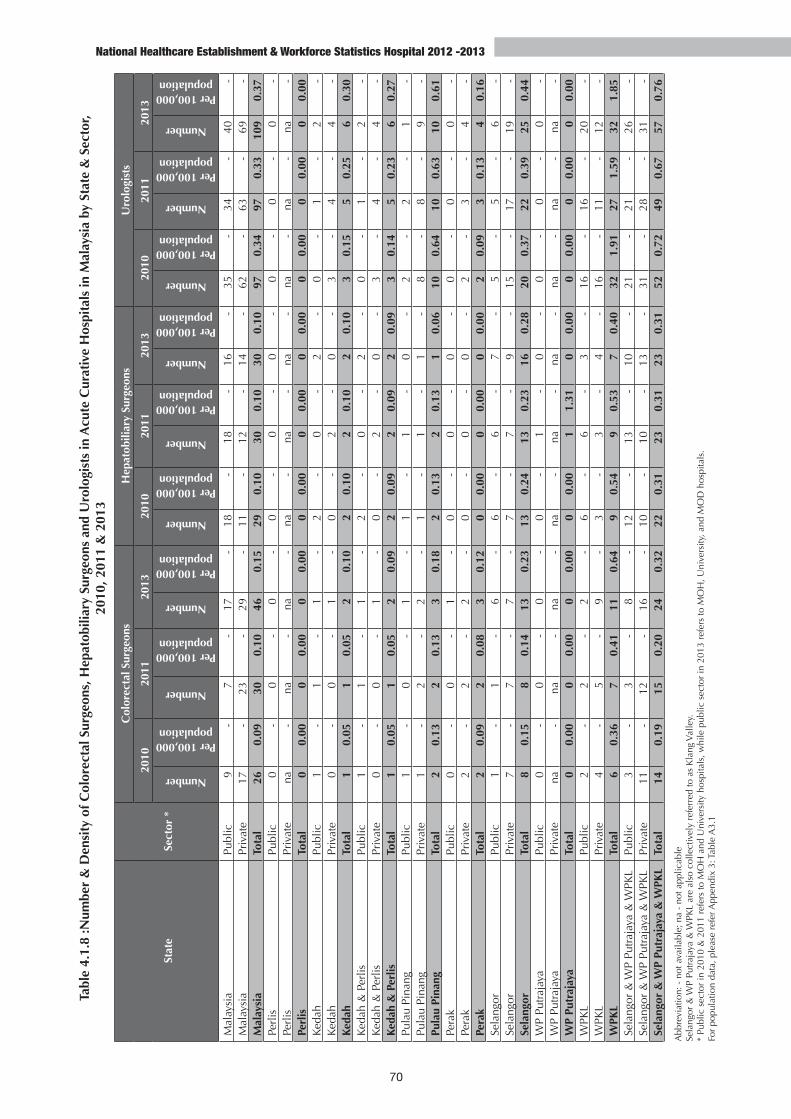
70
National Healthcare Establishment & Workforce Statistics Hospital 2012 -2013
Tabl
e 4.
1.8
:Num
ber
& D
ensi
ty o
f Col
orec
tal S
urge
ons,
Hep
atob
iliar
y Su
rgeo
ns a
nd U
rolo
gist
s in
Acu
te C
urat
ive
Hos
pita
ls in
Mal
aysi
a by
Sta
te &
Sec
tor,
2010
, 201
1 &
201
3
Stat
eSe
ctor
*
Col
orec
tal S
urge
ons
Hep
atob
iliar
y Su
rgeo
nsU
rolo
gist
s
2010
2011
2013
2010
2011
2013
2010
2011
2013
Number
Per 100,000 population
Number
Per 100,000 population
Number
Per 100,000 population
Number
Per 100,000 population
Number
Per 100,000 population
Number
Per 100,000 population
Number
Per 100,000 population
Number
Per 100,000 population
Number
Per 100,000 population
Mal
aysi
aPu
blic
9-
7-
17-
18-
18-
16-
35-
34-
40-
Mal
aysi
aPr
ivat
e17
- 23
- 29
- 11
- 12
- 14
- 62
- 63
- 69
- M
alay
sia
Tota
l26
0.09
300.
1046
0.15
290.
1030
0.10
300.
1097
0.34
970.
3310
90.
37Pe
rlis
Publ
ic0
- 0
- 0
- 0
- 0
- 0
- 0
- 0
- 0
- Pe
rlis
Priv
ate
na-
na-
na-
na-
na-
na-
na-
na-
na-
Perl
isTo
tal
00.
000
0.00
00.
000
0.00
00.
000
0.00
00.
000
0.00
00.
00Ke
dah
Publ
ic1
- 1
- 1
- 2
- 0
- 2
- 0
- 1
- 2
- Ke
dah
Priv
ate
0-
0-
1-
0-
2-
0-
3-
4-
4-
Keda
hTo
tal
10.
051
0.05
20.
102
0.10
20.
102
0.10
30.
155
0.25
60.
30Ke
dah
& P
erlis
Publ
ic1
- 1
- 1
- 2
- 0
- 2
- 0
- 1
- 2
- Ke
dah
& P
erlis
Priv
ate
0-
0-
1-
0-
2-
0-
3-
4-
4-
Keda
h &
Per
lisTo
tal
10.
051
0.05
20.
092
0.09
20.
092
0.09
30.
145
0.23
60.
27Pu
lau
Pina
ngPu
blic
1-
0-
1-
1-
1-
0-
2-
2-
1-
Pula
u Pi
nang
Priv
ate
1-
2-
2-
1-
1-
1-
8-
8-
9-
Pula
u Pi
nang
Tota
l2
0.13
20.
133
0.18
20.
132
0.13
10.
0610
0.64
100.
6310
0.61
Pera
kPu
blic
0-
0-
1-
0-
0-
0-
0-
0-
0-
Pera
kPr
ivat
e2
- 2
- 2
- 0
- 0
- 0
- 2
- 3
- 4
- Pe
rak
Tota
l2
0.09
20.
083
0.12
00.
000
0.00
00.
002
0.09
30.
134
0.16
Sela
ngor
Publ
ic1
- 1
- 6
- 6
- 6
- 7
- 5
- 5
- 6
- Se
lang
orPr
ivat
e7
- 7
- 7
- 7
- 7
- 9
- 15
- 17
- 19
- Se
lang
orTo
tal
80.
158
0.14
130.
2313
0.24
130.
2316
0.28
200.
3722
0.39
250.
44W
P Pu
traj
aya
Publ
ic0
- 0
- 0
- 0
- 1
- 0
- 0
- 0
- 0
- W
P Pu
traj
aya
Priv
ate
na-
na-
na-
na-
na-
na-
na-
na-
na-
WP
Putr
ajay
aTo
tal
00.
000
0.00
00.
000
0.00
11.
310
0.00
00.
000
0.00
00.
00W
PKL
Publ
ic2
- 2
- 2
- 6
- 6
- 3
- 16
- 16
- 20
- W
PKL
Priv
ate
4-
5-
9-
3-
3-
4-
16-
11-
12-
WPK
LTo
tal
60.
367
0.41
110.
649
0.54
90.
537
0.40
321.
9127
1.59
321.
85Se
lang
or &
WP
Putr
ajay
a &
WPK
LPu
blic
3-
3-
8-
12-
13-
10-
21-
21-
26-
Sela
ngor
& W
P Pu
traj
aya
& W
PKL
Priv
ate
11-
12-
16-
10-
10-
13-
31-
28-
31-
Sela
ngor
& W
P Pu
traj
aya
& W
PKL
Tota
l14
0.19
150.
2024
0.32
220.
3123
0.31
230.
3152
0.72
490.
6757
0.76
Abb
revi
atio
n: -
not
ava
ilabl
e; n
a -
not a
pplic
able
Sela
ngor
& W
P Pu
traj
aya
& W
PKL
are
also
col
lect
ivel
y re
ferr
ed to
as
Kla
ng V
alle
y.
* Pu
blic
sec
tor
in 2
010
& 2
011
refe
rs to
MO
H a
nd U
nive
rsity
hos
pita
ls, w
hile
pub
lic s
ecto
r in
201
3 re
fers
to M
OH
, Uni
vers
ity, a
nd M
OD
hos
pita
ls.
Fo
r po
pula
tion
data
, ple
ase
refe
r App
endi
x 3:
Tab
le A
3.1

71
CHAP
TER
4: H
OSPI
TAL
HEAL
TH W
ORKF
ORCE
National Healthcare Establishment & Workforce Statistics Hospital 2012 -2013
Tabl
e 4.
1.8
[con
tinu
ed]:
Num
ber
& D
ensi
ty o
f Col
orec
tal S
urge
ons,
Hep
atob
iliar
y Su
rgeo
ns a
nd U
rolo
gist
s in
Acu
te C
urat
ive
Hos
pita
ls in
Mal
aysi
a by
Sta
te &
Sec
tor,
2010
, 201
1 &
201
3
Stat
eSe
ctor
*
Col
orec
tal S
urge
ons
Hep
atob
iliar
y Su
rgeo
nsU
rolo
gist
s
2010
2011
2013
2010
2011
2013
2010
2011
2013
Number
Per 100,000 population
Number
Per 100,000 population
Number
Per 100,000 population
Number
Per 100,000 population
Number
Per 100,000 population
Number
Per 100,000 population
Number
Per 100,000 population
Number
Per 100,000 population
Number
Per 100,000 population
Neg
eri S
embi
lan
Publ
ic1
- 1
- 2
- 0
- 0
- 0
- 0
- 0
- 0
- N
eger
i Sem
bila
nPr
ivat
e1
- 1
- 0
- 0
- 1
- 0
- 2
- 2
- 3
- N
eger
i Sem
bila
nTo
tal
20.
202
0.19
20.
190
0.00
10.
100
0.00
20.
202
0.19
30.
28M
elak
aPu
blic
0-
0-
0-
1-
1-
1-
0-
0-
0-
Mel
aka
Priv
ate
0-
0-
2-
0-
0-
0-
7-
7-
7-
Mel
aka
Tota
l0
0.00
00.
002
0.23
10.
121
0.12
10.
127
0.85
70.
847
0.82
Joho
rPu
blic
1-
1-
1-
0-
0-
0-
3-
2-
2-
Joho
rPr
ivat
e2
- 3
- 4
- 0
- 0
- 0
- 5
- 6
- 6
- Jo
hor
Tota
l3
0.09
40.
125
0.14
00.
000
0.00
00.
008
0.24
80.
248
0.23
Paha
ngPu
blic
1-
0-
1-
0-
0-
0-
2-
2-
2-
Paha
ngPr
ivat
e0
- 2
- 1
- 0
- 0
- 0
- 2
- 2
- 2
- Pa
hang
Tota
l1
0.07
20.
132
0.13
00.
000
0.00
00.
004
0.27
40.
264
0.25
Tere
ngga
nuPu
blic
0-
0-
0-
0-
0-
1-
0-
0-
0-
Tere
ngga
nuPr
ivat
e0
- 0
- 0
- 0
- 0
- 0
- 0
- 0
- 0
- Te
reng
ganu
Tota
l0
0.00
00.
000
0.00
00.
000
0.00
10.
090
0.00
00.
000
0.00
Kela
ntan
Publ
ic1
- 1
- 2
- 0
- 0
- 0
- 4
- 2
- 2
- Ke
lant
anPr
ivat
e0
- 0
- 0
- 0
- 0
- 0
- 0
- 1
- 1
- Ke
lant
anTo
tal
10.
061
0.06
20.
120
0.00
00.
000
0.00
40.
263
0.19
30.
18Sa
raw
akPu
blic
0-
0-
0-
2-
1-
1-
2-
2-
3-
Sara
wak
Priv
ate
0-
1-
1-
0-
0-
0-
1-
1-
1-
Sara
wak
Tota
l0
0.00
10.
041
0.04
20.
081
0.04
10.
043
0.12
30.
124
0.16
Saba
hPu
blic
0-
0-
0-
0-
0-
1-
1-
2-
2-
Saba
hPr
ivat
e0
- 0
- 0
- 0
- 0
- 0
- 1
- 1
- 1
- Sa
bah
Tota
l0
0.00
00.
000
0.00
00.
000
0.00
10.
032
0.06
30.
093
0.09
WP
Labu
anPu
blic
0-
0-
0-
0-
0-
0-
0-
0-
0-
WP
Labu
anPr
ivat
ena
- na
- na
- na
- na
- na
- na
- na
- na
- W
P La
buan
Tota
l0
0.00
00.
000
0.00
00.
000
0.00
00.
000
0.00
00.
000
0.00
Saba
h &
WP
Labu
anPu
blic
0-
0-
0-
0-
0-
1-
1-
2-
2-
Saba
h &
WP
Labu
anPr
ivat
e0
- 0
- 0
- 0
- 0
- 0
- 1
- 1
- 1
- Sa
bah
& W
P La
buan
Tota
l0
0.00
00.
000
0.00
00.
000
0.00
10.
032
0.06
30.
093
0.09
Abb
revi
atio
n: -
not
ava
ilabl
e; n
a -
not a
pplic
able
Sela
ngor
& W
P Pu
traj
aya
& W
PKL
are
also
col
lect
ivel
y re
ferr
ed to
as
Kla
ng V
alle
y.
* Pu
blic
sec
tor
in 2
010
& 2
011
refe
rs to
MO
H a
nd U
nive
rsity
hos
pita
ls, w
hile
pub
lic s
ecto
r in
201
3 re
fers
to M
OH
, Uni
vers
ity, a
nd M
OD
hos
pita
ls.
Fo
r po
pula
tion
data
, ple
ase
refe
r App
endi
x 3:
Tab
le A
3.1

72
National Healthcare Establishment & Workforce Statistics Hospital 2012 -2013
Tabl
e 4.
1.9
: Num
ber
& D
ensi
ty o
f Vas
cula
r Su
rgeo
ns, C
ardi
otho
raci
c Su
rgeo
ns a
nd N
euro
surg
eons
in A
cute
Cur
ativ
e H
ospi
tals
in M
alay
sia
by S
tate
& S
ecto
r, 20
10, 2
011
& 2
013
Abb
revi
atio
n: -
not
ava
ilabl
e; n
a -
not a
pplic
able
Sela
ngor
& W
P Pu
traj
aya
& W
PKL
are
also
col
lect
ivel
y re
ferr
ed to
as
Kla
ng V
alle
y.
* Pu
blic
sec
tor
in 2
010
& 2
011
refe
rs to
MO
H a
nd U
nive
rsity
hos
pita
ls, w
hile
pub
lic s
ecto
r in
201
3 re
fers
to M
OH
, Uni
vers
ity, a
nd M
OD
hos
pita
ls.
Fo
r po
pula
tion
data
, ple
ase
refe
r App
endi
x 3:
Tab
le A
3.1
Stat
eSe
ctor
*
Vas
cula
r Su
rgeo
nsC
ardi
otho
raci
c Su
rgeo
nsN
euro
surg
eons
2010
2011
2013
2010
2011
2013
2010
2011
2013
Number
Per 100,000 population
Number
Per 100,000 population
Number
Per 100,000 population
Number
Per 100,000 population
Number
Per 100,000 population
Number
Per 100,000 population
Number
Per 100,000 population
Number
Per 100,000 population
Number
Per 100,000 population
Mal
aysi
aPu
blic
10-
10-
13-
23-
24-
25-
36-
44-
47-
Mal
aysi
aPr
ivat
e9
- 9
- 13
- 41
- 45
- 49
- 32
- 33
- 43
- M
alay
sia
Tota
l19
0.07
190.
0726
0.09
640.
2369
0.24
740.
2568
0.24
770.
2790
0.30
Perl
isPu
blic
0-
0-
0-
0-
0-
0-
0-
0-
0-
Perl
isPr
ivat
ena
- na
- na
- na
- na
- na
- na
- na
- na
- Pe
rlis
Tota
l0
0.00
00.
000
0.00
00.
000
0.00
00.
000
0.00
00.
000
0.00
Keda
hPu
blic
0-
0-
0-
0-
0-
0-
0-
1-
2-
Keda
hPr
ivat
e0
- 0
- 0
- 0
- 0
- 0
- 0
- 0
- 0
- Ke
dah
Tota
l0
0.00
00.
000
0.00
00.
000
0.00
00.
000
0.00
10.
052
0.10
Keda
h &
Per
lisPu
blic
0-
0-
0-
0-
0-
0-
0-
1-
2-
Keda
h &
Per
lisPr
ivat
e0
- 0
- 0
- 0
- 0
- 0
- 0
- 0
- 0
- Ke
dah
& P
erlis
Tota
l0
0.00
00.
000
0.00
00.
000
0.00
00.
000
0.00
10.
052
0.09
Pula
u Pi
nang
Publ
ic0
- 0
- 0
- 3
- 2
- 6
- 3
- 3
- 2
- Pu
lau
Pina
ngPr
ivat
e2
- 2
- 2
- 8
- 9
- 8
- 7
- 7
- 9
- Pu
lau
Pina
ngTo
tal
20.
132
0.13
20.
1211
0.70
110.
6914
0.86
100.
6410
0.63
110.
68Pe
rak
Publ
ic0
- 0
- 0
- 0
- 0
- 0
- 0
- 1
- 2
- Pe
rak
Priv
ate
0-
0-
0-
1-
1-
2-
2-
2-
3-
Pera
kTo
tal
00.
000
0.00
00.
001
0.04
10.
042
0.08
20.
093
0.13
50.
21Se
lang
orPu
blic
2-
2-
2-
6-
7-
2-
2-
4-
4-
Sela
ngor
Priv
ate
4-
4-
5-
7-
8-
11-
11-
9-
11-
Sela
ngor
Tota
l6
0.11
60.
117
0.12
130.
2415
0.27
130.
2313
0.24
130.
2315
0.26
WP
Putr
ajay
aPu
blic
0-
0-
0-
0-
0-
0-
0-
0-
0-
WP
Putr
ajay
aPr
ivat
ena
- na
- na
- na
- na
- na
- na
- na
- na
- W
P Pu
traj
aya
Tota
l0
0.00
00.
000
0.00
00.
000
0.00
00.
000
0.00
00.
000
0.00
WPK
LPu
blic
7-
7-
10-
5-
5-
5-
14-
16-
18-
WPK
LPr
ivat
e1
- 2
- 3
- 19
- 22
- 21
- 5
- 5
- 7
- W
PKL
Tota
l8
0.48
90.
5313
0.75
241.
4327
1.59
261.
5019
1.13
211.
2425
1.44
Sela
ngor
& W
P Pu
traj
aya
& W
PKL
Publ
ic9
- 9
- 12
- 11
- 12
- 7
- 16
- 20
- 22
- Se
lang
or &
WP
Putr
ajay
a &
WPK
LPr
ivat
e5
- 6
- 8
- 26
- 30
- 32
- 16
- 14
- 18
- Se
lang
or &
WP
Putr
ajay
a &
WPK
LTo
tal
140.
1915
0.20
200.
2737
0.51
420.
5739
0.52
320.
4434
0.46
400.
53

73
CHAP
TER
4: H
OSPI
TAL
HEAL
TH W
ORKF
ORCE
National Healthcare Establishment & Workforce Statistics Hospital 2012 -2013
Tabl
e 4.
1.9
[con
tinu
ed]:
Num
ber
& D
ensi
ty o
f Vas
cula
r Su
rgeo
ns, C
ardi
otho
raci
c Su
rgeo
ns a
nd N
euro
surg
eons
in A
cute
Cur
ativ
e H
ospi
tals
in M
alay
sia
by S
tate
& S
ec-
tor,
2010
, 201
1 &
201
3
Abb
revi
atio
n: -
not
ava
ilabl
e; n
a -
not a
pplic
able
Sela
ngor
& W
P Pu
traj
aya
& W
PKL
are
also
col
lect
ivel
y re
ferr
ed to
as
Kla
ng V
alle
y.
* Pu
blic
sec
tor
in 2
010
& 2
011
refe
rs to
MO
H a
nd U
nive
rsity
hos
pita
ls, w
hile
pub
lic s
ecto
r in
201
3 re
fers
to M
OH
, Uni
vers
ity, a
nd M
OD
hos
pita
ls.
Fo
r po
pula
tion
data
, ple
ase
refe
r App
endi
x 3:
Tab
le A
3.1
Stat
eSe
ctor
*
Vas
cula
r Su
rgeo
nsC
ardi
otho
raci
c Su
rgeo
nsN
euro
surg
eons
2010
2011
2013
2010
2011
2013
2010
2011
2013
Number
Per 100,000 population
Number
Per 100,000 population
Number
Per 100,000 population
Number
Per 100,000 population
Number
Per 100,000 population
Number
Per 100,000 population
Number
Per 100,000 population
Number
Per 100,000 population
Number
Per 100,000 population
Neg
eri S
embi
lan
Publ
ic0
- 0
- 0
- 0
- 0
- 0
- 0
- 0
- 0
- N
eger
i Sem
bila
nPr
ivat
e0
- 0
- 0
- 0
- 0
- 0
- 0
- 0
- 0
- N
eger
i Sem
bila
nTo
tal
00.
000
0.00
00.
000
0.00
00.
000
0.00
00.
000
0.00
00.
00M
elak
aPu
blic
0-
0-
0-
0-
0-
0-
0-
0-
0-
Mel
aka
Priv
ate
1-
0-
0-
4-
3-
4-
3-
6-
5-
Mel
aka
Tota
l1
0.12
00.
000
0.00
40.
493
0.36
40.
473
0.37
60.
725
0.59
Joho
rPu
blic
0-
0-
0-
4-
4-
3-
5-
5-
5-
Joho
rPr
ivat
e1
- 1
- 2
- 1
- 1
- 1
- 2
- 2
- 4
- Jo
hor
Tota
l1
0.03
10.
032
0.06
50.
155
0.15
40.
127
0.21
70.
219
0.26
Paha
ngPu
blic
1-
1-
0-
0-
0-
1-
0-
0-
0-
Paha
ngPr
ivat
e0
- 0
- 1
- 0
- 0
- 0
- 1
- 1
- 2
- Pa
hang
Tota
l1
0.07
10.
071
0.06
00.
000
0.00
10.
061
0.07
10.
072
0.13
Tere
ngga
nuPu
blic
0-
0-
0-
0-
0-
0-
2-
2-
2-
Tere
ngga
nuPr
ivat
e0
- 0
- 0
- 0
- 0
- 0
- 0
- 0
- 0
- Te
reng
ganu
Tota
l0
0.00
00.
000
0.00
00.
000
0.00
00.
002
0.19
20.
192
0.18
Kela
ntan
Publ
ic0
- 0
- 0
- 2
- 2
- 3
- 6
- 7
- 5
- Ke
lant
anPr
ivat
e0
- 0
- 0
- 0
- 0
- 0
- 0
- 0
- 1
- Ke
lant
anTo
tal
00.
000
0.00
00.
002
0.13
20.
123
0.18
60.
397
0.43
60.
36Sa
raw
akPu
blic
0-
0-
1-
2-
2-
4-
3-
3-
3-
Sara
wak
Priv
ate
0-
0-
0-
1-
1-
1-
1-
1-
1-
Sara
wak
Tota
l0
0.00
00.
001
0.04
30.
123
0.12
50.
194
0.16
40.
164
0.16
Saba
hPu
blic
0-
0-
0-
1-
2-
1-
1-
2-
4-
Saba
hPr
ivat
e0
- 0
- 0
- 0
- 0
- 1
- 0
- 0
- 0
- Sa
bah
Tota
l0
0.00
00.
000
0.00
10.
032
0.06
20.
061
0.03
20.
064
0.12
WP
Labu
anPu
blic
0-
0-
0-
0-
0-
0-
0-
0-
0-
WP
Labu
anPr
ivat
ena
- na
- na
- na
- na
- na
- na
- na
- na
- W
P La
buan
Tota
l0
0.00
00.
000
0.00
00.
000
0.00
00.
000
0.00
00.
000
0.00
Saba
h &
WP
Labu
anPu
blic
0-
0-
0-
1-
2-
1-
1-
2-
4-
Saba
h &
WP
Labu
anPr
ivat
e0
- 0
- 0
- 0
- 0
- 1
- 0
- 0
- 0
- Sa
bah
& W
P La
buan
Tota
l0
0.00
00.
000
0.00
10.
032
0.06
20.
061
0.03
20.
064
0.11
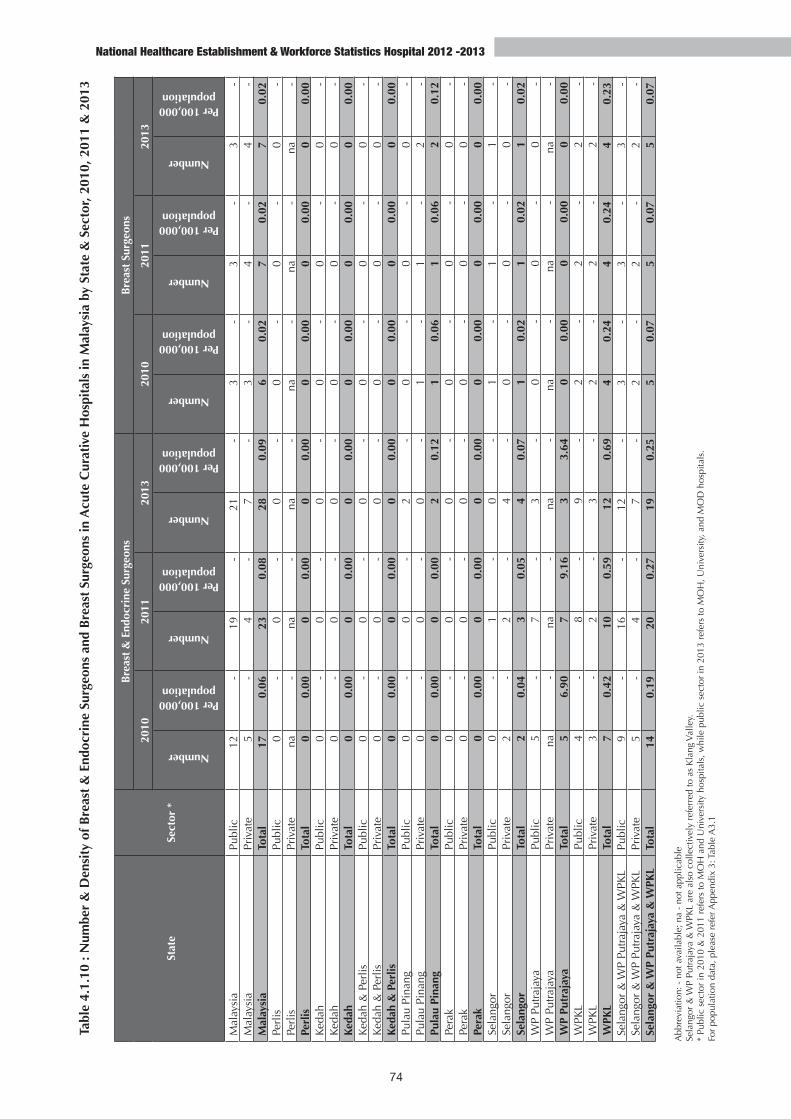
74
National Healthcare Establishment & Workforce Statistics Hospital 2012 -2013
Tabl
e 4.
1.10
: N
umbe
r &
Den
sity
of B
reas
t &
End
ocri
ne S
urge
ons
and
Bre
ast
Surg
eons
in A
cute
Cur
ativ
e H
ospi
tals
in M
alay
sia
by S
tate
& S
ecto
r, 20
10, 2
011
& 2
013
Stat
eSe
ctor
*
Bre
ast
& E
ndoc
rine
Sur
geon
sB
reas
t Su
rgeo
ns
2010
2011
2013
2010
2011
2013
Number
Per 100,000 population
Number
Per 100,000 population
Number
Per 100,000 population
Number
Per 100,000 population
Number
Per 100,000 population
Number
Per 100,000 population
Mal
aysi
aPu
blic
12-
19-
21-
3-
3-
3-
Mal
aysi
aPr
ivat
e5
- 4
- 7
- 3
- 4
- 4
- M
alay
sia
Tota
l17
0.06
230.
0828
0.09
60.
027
0.02
70.
02Pe
rlis
Publ
ic0
- 0
- 0
- 0
- 0
- 0
- Pe
rlis
Priv
ate
na-
na-
na-
na-
na-
na-
Perl
isTo
tal
00.
000
0.00
00.
000
0.00
00.
000
0.00
Keda
hPu
blic
0-
0-
0-
0-
0-
0-
Keda
hPr
ivat
e0
- 0
- 0
- 0
- 0
- 0
- Ke
dah
Tota
l0
0.00
00.
000
0.00
00.
000
0.00
00.
00Ke
dah
& P
erlis
Publ
ic0
- 0
- 0
- 0
- 0
- 0
- Ke
dah
& P
erlis
Priv
ate
0-
0-
0-
0-
0-
0-
Keda
h &
Per
lisTo
tal
00.
000
0.00
00.
000
0.00
00.
000
0.00
Pula
u Pi
nang
Publ
ic0
- 0
- 2
- 0
- 0
- 0
- Pu
lau
Pina
ngPr
ivat
e0
- 0
- 0
- 1
- 1
- 2
- Pu
lau
Pina
ngTo
tal
00.
000
0.00
20.
121
0.06
10.
062
0.12
Pera
kPu
blic
0-
0-
0-
0-
0-
0-
Pera
kPr
ivat
e0
- 0
- 0
- 0
- 0
- 0
- Pe
rak
Tota
l0
0.00
00.
000
0.00
00.
000
0.00
00.
00Se
lang
orPu
blic
0-
1-
0-
1-
1-
1-
Sela
ngor
Priv
ate
2-
2-
4-
0-
0-
0-
Sela
ngor
Tota
l2
0.04
30.
054
0.07
10.
021
0.02
10.
02W
P Pu
traj
aya
Publ
ic5
- 7
- 3
- 0
- 0
- 0
- W
P Pu
traj
aya
Priv
ate
na-
na-
na-
na-
na-
na-
WP
Putr
ajay
aTo
tal
56.
907
9.16
33.
640
0.00
00.
000
0.00
WPK
LPu
blic
4-
8-
9-
2-
2-
2-
WPK
LPr
ivat
e3
- 2
- 3
- 2
- 2
- 2
- W
PKL
Tota
l7
0.42
100.
5912
0.69
40.
244
0.24
40.
23Se
lang
or &
WP
Putr
ajay
a &
WPK
LPu
blic
9-
16-
12-
3-
3-
3-
Sela
ngor
& W
P Pu
traj
aya
& W
PKL
Priv
ate
5-
4-
7-
2-
2-
2-
Sela
ngor
& W
P Pu
traj
aya
& W
PKL
Tota
l14
0.19
200.
2719
0.25
50.
075
0.07
50.
07
Abb
revi
atio
n: -
not
ava
ilabl
e; n
a -
not a
pplic
able
Sela
ngor
& W
P Pu
traj
aya
& W
PKL
are
also
col
lect
ivel
y re
ferr
ed to
as
Kla
ng V
alle
y.
* Pu
blic
sec
tor
in 2
010
& 2
011
refe
rs to
MO
H a
nd U
nive
rsity
hos
pita
ls, w
hile
pub
lic s
ecto
r in
201
3 re
fers
to M
OH
, Uni
vers
ity, a
nd M
OD
hos
pita
ls.
For
popu
latio
n da
ta, p
leas
e re
fer A
ppen
dix
3: T
able
A3.
1
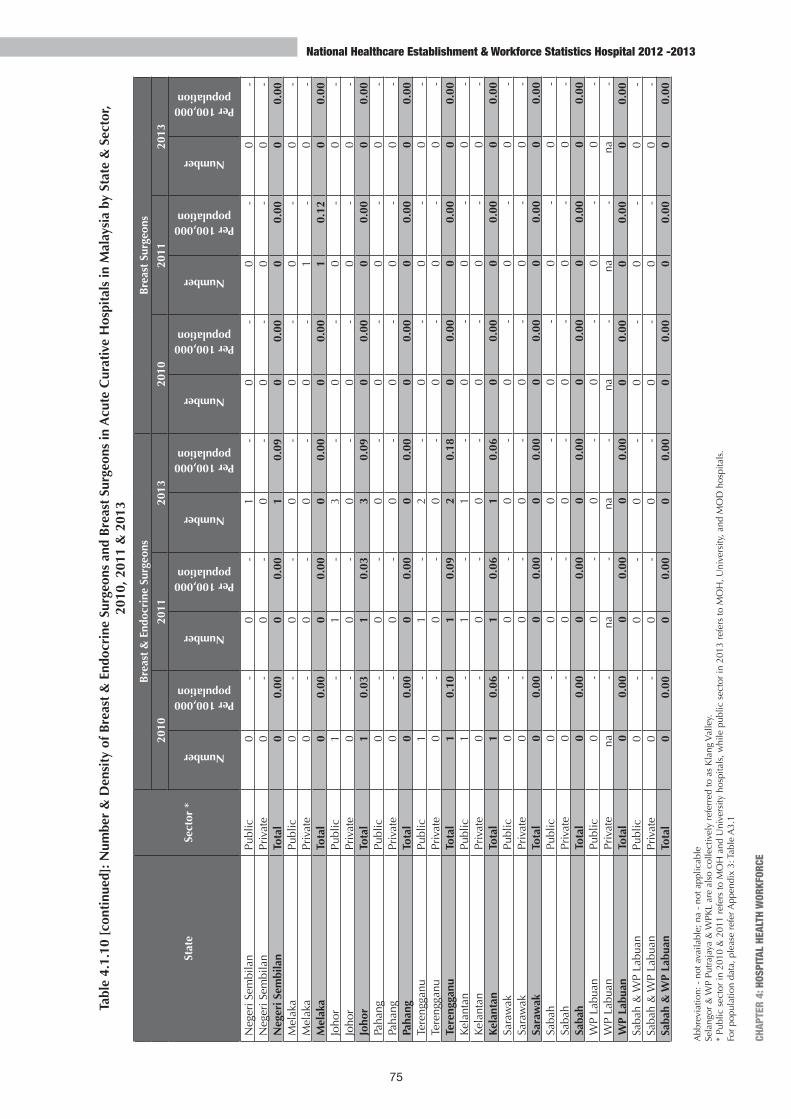
75
CHAP
TER
4: H
OSPI
TAL
HEAL
TH W
ORKF
ORCE
National Healthcare Establishment & Workforce Statistics Hospital 2012 -2013
Tabl
e 4.
1.10
[co
ntin
ued]
: Num
ber
& D
ensi
ty o
f Bre
ast
& E
ndoc
rine
Sur
geon
s an
d B
reas
t Su
rgeo
ns in
Acu
te C
urat
ive
Hos
pita
ls in
Mal
aysi
a by
Sta
te &
Sec
tor,
2010
, 201
1 &
201
3
Stat
eSe
ctor
*
Bre
ast
& E
ndoc
rine
Sur
geon
sB
reas
t Su
rgeo
ns
2010
2011
2013
2010
2011
2013
Number
Per 100,000 population
Number
Per 100,000 population
Number
Per 100,000 population
Number
Per 100,000 population
Number
Per 100,000 population
Number
Per 100,000 population
Neg
eri S
embi
lan
Publ
ic0
- 0
- 1
- 0
- 0
- 0
- N
eger
i Sem
bila
nPr
ivat
e0
- 0
- 0
- 0
- 0
- 0
- N
eger
i Sem
bila
nTo
tal
00.
000
0.00
10.
090
0.00
00.
000
0.00
Mel
aka
Publ
ic0
- 0
- 0
- 0
- 0
- 0
- M
elak
aPr
ivat
e0
- 0
- 0
- 0
- 1
- 0
- M
elak
aTo
tal
00.
000
0.00
00.
000
0.00
10.
120
0.00
Joho
rPu
blic
1-
1-
3-
0-
0-
0-
Joho
rPr
ivat
e0
- 0
- 0
- 0
- 0
- 0
- Jo
hor
Tota
l1
0.03
10.
033
0.09
00.
000
0.00
00.
00Pa
hang
Publ
ic0
- 0
- 0
- 0
- 0
- 0
- Pa
hang
Priv
ate
0-
0-
0-
0-
0-
0-
Paha
ngTo
tal
00.
000
0.00
00.
000
0.00
00.
000
0.00
Tere
ngga
nuPu
blic
1-
1-
2-
0-
0-
0-
Tere
ngga
nuPr
ivat
e0
- 0
- 0
- 0
- 0
- 0
- Te
reng
ganu
Tota
l1
0.10
10.
092
0.18
00.
000
0.00
00.
00Ke
lant
anPu
blic
1-
1-
1-
0-
0-
0-
Kela
ntan
Priv
ate
0-
0-
0-
0-
0-
0-
Kela
ntan
Tota
l1
0.06
10.
061
0.06
00.
000
0.00
00.
00Sa
raw
akPu
blic
0-
0-
0-
0-
0-
0-
Sara
wak
Priv
ate
0-
0-
0-
0-
0-
0-
Sara
wak
Tota
l0
0.00
00.
000
0.00
00.
000
0.00
00.
00Sa
bah
Publ
ic0
- 0
- 0
- 0
- 0
- 0
- Sa
bah
Priv
ate
0-
0-
0-
0-
0-
0-
Saba
hTo
tal
00.
000
0.00
00.
000
0.00
00.
000
0.00
WP
Labu
anPu
blic
0-
0-
0-
0-
0-
0-
WP
Labu
anPr
ivat
ena
- na
- na
- na
- na
- na
- W
P La
buan
Tota
l0
0.00
00.
000
0.00
00.
000
0.00
00.
00Sa
bah
& W
P La
buan
Publ
ic0
- 0
- 0
- 0
- 0
- 0
- Sa
bah
& W
P La
buan
Priv
ate
0-
0-
0-
0-
0-
0-
Saba
h &
WP
Labu
anTo
tal
00.
000
0.00
00.
000
0.00
00.
000
0.00
Abb
revi
atio
n: -
not
ava
ilabl
e; n
a -
not a
pplic
able
Sela
ngor
& W
P Pu
traj
aya
& W
PKL
are
also
col
lect
ivel
y re
ferr
ed to
as
Kla
ng V
alle
y.
* Pu
blic
sec
tor
in 2
010
& 2
011
refe
rs to
MO
H a
nd U
nive
rsity
hos
pita
ls, w
hile
pub
lic s
ecto
r in
201
3 re
fers
to M
OH
, Uni
vers
ity, a
nd M
OD
hos
pita
ls.
Fo
r po
pula
tion
data
, ple
ase
refe
r App
endi
x 3:
Tab
le A
3.1

76
National Healthcare Establishment & Workforce Statistics Hospital 2012 -2013
Tabl
e 4.
1.11
: N
umbe
r &
Den
sity
of P
last
ic &
Rec
onst
ruct
ive
Surg
eons
and
Pae
diat
ric
Surg
eons
in A
cute
Cur
ativ
e H
ospi
tals
in M
alay
sia
by S
tate
& S
ecto
r, 20
10, 2
011
& 2
013
Stat
eSe
ctor
*
Plas
tic
& R
econ
stru
ctiv
e Su
rgeo
nsPa
edia
tric
Sur
geon
s
2010
2011
2013
2010
2011
2013
Number
Per 100,000 population
Number
Per 100,000 population
Number
Per 100,000 population
Number
Per 100,000 population
Number
Per 100,000 population
Number
Per 100,000 population
Mal
aysi
aPu
blic
28-
34-
39-
21-
19-
24-
Mal
aysi
aPr
ivat
e36
- 33
- 31
- 18
- 20
- 21
- M
alay
sia
Tota
l64
0.23
670.
2371
0.24
390.
5039
0.50
450.
58Pe
rlis
Publ
ic0
- 0
- 0
- 0
- 0
- 0
- Pe
rlis
Priv
ate
na-
na-
na-
na-
na-
na-
Perl
isTo
tal
00.
000
0.00
00.
000
0.00
00.
000
0.00
Keda
hPu
blic
1-
1-
1-
2-
2-
2-
Keda
hPr
ivat
e0
- 0
- 0
- 0
- 0
- 0
- Ke
dah
Tota
l1
0.05
10.
051
0.05
20.
352
0.35
20.
36Ke
dah
& P
erlis
Publ
ic1
- 1
- 1
- 2
- 2
- 2
- Ke
dah
& P
erlis
Priv
ate
0-
0-
0-
0-
0-
0-
Keda
h &
Per
lisTo
tal
10.
051
0.05
10.
042
0.32
20.
322
0.33
Pula
u Pi
nang
Publ
ic3
- 3
- 5
- 1
- 0
- 0
- Pu
lau
Pina
ngPr
ivat
e3
- 3
- 6
- 3
- 4
- 4
- Pu
lau
Pina
ngTo
tal
60.
386
0.38
110.
684
1.11
41.
114
1.13
Pera
kPu
blic
2-
2-
2-
1-
0-
0-
Pera
kPr
ivat
e3
- 3
- 3
- 1
- 1
- 1
- Pe
rak
Tota
l5
0.21
50.
215
0.21
20.
321
0.16
10.
16Se
lang
orPu
blic
4-
5-
5-
0-
1-
1-
Sela
ngor
Priv
ate
9-
10-
9-
6-
6-
5-
Sela
ngor
Tota
l13
0.24
150.
2714
0.24
60.
447
0.51
60.
43W
P Pu
traj
aya
Publ
ic0
- 0
- 0
- 0
- 0
- 0
- W
P Pu
traj
aya
Priv
ate
na-
na-
na-
na-
na-
na-
WP
Putr
ajay
aTo
tal
00.
000
0.00
00.
000
0.00
00.
000
0.00
WPK
LPu
blic
7-
8-
10-
9-
9-
12-
WPK
LPr
ivat
e14
- 12
- 13
- 6
- 6
- 7
- W
PKL
Tota
l21
1.25
201.
1823
1.33
154.
0515
4.04
195.
02Se
lang
or &
WP
Putr
ajay
a &
WPK
LPu
blic
11-
13-
15-
9-
10-
13-
Sela
ngor
& W
P Pu
traj
aya
& W
PKL
Priv
ate
23-
22-
22-
12-
12-
12-
Sela
ngor
& W
P Pu
traj
aya
& W
PKL
Tota
l34
0.47
350.
4837
0.49
211.
1922
1.24
251.
39
Abb
revi
atio
n: -
not
ava
ilabl
e; n
a -
not a
pplic
able
Sela
ngor
& W
P Pu
traj
aya
& W
PKL
are
also
col
lect
ivel
y re
ferr
ed to
as
Kla
ng V
alle
y.
* Pu
blic
sec
tor
in 2
010
& 2
011
refe
rs to
MO
H a
nd U
nive
rsity
hos
pita
ls, w
hile
pub
lic s
ecto
r in
201
3 re
fers
to M
OH
, Uni
vers
ity, a
nd M
OD
hos
pita
ls.
For
popu
latio
n da
ta, p
leas
e re
fer A
ppen
dix
3: T
able
A3.
1

77
CHAP
TER
4: H
OSPI
TAL
HEAL
TH W
ORKF
ORCE
National Healthcare Establishment & Workforce Statistics Hospital 2012 -2013
Tabl
e 4.
1.11
[co
ntin
ued]
: Num
ber
& D
ensi
ty o
f Pla
stic
& R
econ
stru
ctiv
e Su
rgeo
ns a
nd P
aedi
atri
c Su
rgeo
ns in
Acu
te C
urat
ive
Hos
pita
ls in
Mal
aysi
a by
Sta
te &
Sec
tor,
2010
, 201
1 &
201
3
Stat
eSe
ctor
*
Plas
tic
& R
econ
stru
ctiv
e Su
rgeo
nsPa
edia
tric
Sur
geon
s
2010
2011
2013
2010
2011
2013
Number
Per 100,000 population
Number
Per 100,000 population
Number
Per 100,000 population
Number
Per 100,000 population
Number
Per 100,000 population
Number
Per 100,000 population
Neg
eri S
embi
lan
Publ
ic0
- 0
- 0
- 0
- 0
- 0
- N
eger
i Sem
bila
nPr
ivat
e0
- 0
- 0
- 0
- 0
- 0
- N
eger
i Sem
bila
nTo
tal
00.
000
0.00
00.
000
0.00
00.
000
0.00
Mel
aka
Publ
ic0
- 0
- 1
- 1
- 0
- 1
- M
elak
aPr
ivat
e2
- 1
- 1
- 0
- 0
- 0
- M
elak
aTo
tal
20.
241
0.12
20.
231
0.46
00.
001
0.47
Joho
rPu
blic
2-
3-
1-
2-
2-
3-
Joho
rPr
ivat
e2
- 2
- 5
- 1
- 1
- 1
- Jo
hor
Tota
l4
0.12
50.
156
0.17
30.
333
0.33
40.
45Pa
hang
Publ
ic0
- 0
- 0
- 1
- 1
- 0
- Pa
hang
Priv
ate
0-
0-
0-
0-
0-
0-
Paha
ngTo
tal
00.
000
0.00
00.
001
0.22
10.
220
0.00
Tere
ngga
nuPu
blic
1-
1-
1-
0-
0-
0-
Tere
ngga
nuPr
ivat
e0
- 0
- 0
- 0
- 0
- 0
- Te
reng
ganu
Tota
l1
0.10
10.
091
0.09
00.
000
0.00
00.
00Ke
lant
anPu
blic
6-
7-
4-
2-
2-
3-
Kela
ntan
Priv
ate
0-
0-
0-
1-
2-
2-
Kela
ntan
Tota
l6
0.39
70.
434
0.24
30.
604
0.75
50.
94Sa
raw
akPu
blic
0-
0-
0-
1-
1-
1-
Sara
wak
Priv
ate
2-
1-
1-
0-
0-
0-
Sara
wak
Tota
l2
0.08
10.
041
0.04
10.
141
0.14
10.
14Sa
bah
Publ
ic2
- 4
- 2
- 1
- 1
- 1
- Sa
bah
Priv
ate
1-
1-
1-
0-
0-
1-
Saba
hTo
tal
30.
095
0.15
30.
091
0.10
10.
112
0.21
WP
Labu
anPu
blic
0-
0-
0-
0-
0-
0-
WP
Labu
anPr
ivat
ena
- na
- na
- na
- na
- na
- W
P La
buan
Tota
l0
0.00
00.
000
0.00
00.
000
0.00
00.
00Sa
bah
& W
P La
buan
Publ
ic2
- 4
- 2
- 1
- 1
- 1
- Sa
bah
& W
P La
buan
Priv
ate
1-
1-
1-
0-
0-
1-
Saba
h &
WP
Labu
anTo
tal
30.
095
0.15
30.
091
0.10
10.
112
0.21
Abb
revi
atio
n: -
not
ava
ilabl
e; n
a -
not a
pplic
able
Sela
ngor
& W
P Pu
traj
aya
& W
PKL
are
also
col
lect
ivel
y re
ferr
ed to
as
Kla
ng V
alle
y.
* Pu
blic
sec
tor
in 2
010
& 2
011
refe
rs to
MO
H a
nd U
nive
rsity
hos
pita
ls, w
hile
pub
lic s
ecto
r in
201
3 re
fers
to M
OH
, Uni
vers
ity, a
nd M
OD
hos
pita
ls.
Fo
r po
pula
tion
data
, ple
ase
refe
r App
endi
x 3:
Tab
le A
3.1

78
National Healthcare Establishment & Workforce Statistics Hospital 2012 -2013
Tabl
e 4.
1.12
: Num
ber
& D
ensi
ty o
f Obs
tetr
icia
ns &
Gyn
aeco
logi
sts
and
Paed
iatr
icia
ns in
Acu
te C
urat
ive
Hos
pita
ls in
Mal
aysi
a by
Sta
te &
Sec
tor,
2010
, 201
1 &
201
3
Stat
eSe
ctor
*
Obs
tetr
icia
ns &
Gyn
aeco
logi
sts
Paed
iatr
icia
ns
2010
2011
2013
2010
2011
2013
Number
Per 100,000 female
population
Number
Per 100,000 female
population
Number
Per 100,000 female
population
Number
Per 100,000 pediatric
population
Number
Per 100,000 pediatric
population
Number
Per 100,000 pediatric
population
Mal
aysi
aPu
blic
319
- 32
4-
345
- 34
6-
377
- 41
4-
Mal
aysi
aPr
ivat
e46
1-
510
- 54
4-
291
- 29
1-
314
- M
alay
sia
Tota
l78
05.
6683
45.
9388
96.
1663
78.
1466
88.
5872
89.
40Pe
rlis
Publ
ic5
- 6
- 6
- 3
- 3
- 4
- Pe
rlis
Priv
ate
na-
na-
na-
na-
na-
na-
Perl
isTo
tal
54.
256
4.97
64.
903
5.13
34.
894
6.53
Keda
hPu
blic
22-
23-
29-
18-
17-
19-
Keda
hPr
ivat
e19
- 21
- 21
- 9
- 10
- 11
- Ke
dah
Tota
l41
4.26
444.
5150
5.00
274.
7227
4.78
305.
44Ke
dah
& P
erlis
Publ
ic27
- 29
- 35
- 21
- 20
- 23
- Ke
dah
& P
erlis
Priv
ate
19-
21-
21-
9-
10-
11-
Keda
h &
Per
lisTo
tal
464.
2650
4.56
564.
9830
4.76
304.
7934
5.54
Pula
u Pi
nang
Publ
ic14
- 16
- 16
- 25
- 29
- 26
- Pu
lau
Pina
ngPr
ivat
e52
- 52
- 52
- 43
- 41
- 45
- Pu
lau
Pina
ngTo
tal
668.
4768
8.56
688.
3868
18.8
370
19.4
971
20.0
2Pe
rak
Publ
ic25
- 21
- 22
- 26
- 27
- 28
- Pe
rak
Priv
ate
42-
43-
44-
19-
20-
19-
Pera
kTo
tal
675.
7564
5.40
665.
4845
7.18
477.
4447
7.73
Sela
ngor
Publ
ic57
- 53
- 53
- 51
- 53
- 62
- Se
lang
orPr
ivat
e12
0-
139
- 15
5-
78-
87-
94-
Sela
ngor
Tota
l17
76.
7119
27.
6420
87.
5312
99.
4014
010
.15
156
11.2
1W
P Pu
traj
aya
Publ
ic7
- 7
- 7
- 6
- 8
- 11
- W
P Pu
traj
aya
Priv
ate
na-
na-
na-
na-
na-
na-
WP
Putr
ajay
aTo
tal
718
.32
717
.24
715
.98
626
.84
831
.25
1136
.91
WPK
LPu
blic
52-
57-
61-
91-
102
- 10
6-
WPK
LPr
ivat
e10
2-
102
- 10
9-
70-
56-
67-
WPK
LTo
tal
154
18.7
215
919
.17
170
20.0
016
143
.49
158
42.5
617
345
.68
Sela
ngor
& W
P Pu
traj
aya
& W
PKL
Publ
ic11
6-
117
- 12
1-
148
- 16
3-
179
- Se
lang
or &
WP
Putr
ajay
a &
WPK
LPr
ivat
e22
2-
241
- 26
4-
148
- 14
3-
161
- Se
lang
or &
WP
Putr
ajay
a &
WPK
LTo
tal
338
9.66
358
10.5
838
510
.53
296
16.7
730
617
.23
340
18.8
9
Abb
revi
atio
n: -
not
ava
ilabl
e; n
a -
not a
pplic
able
FSel
ango
r &
WP
Putr
ajay
a &
WPK
L ar
e al
so c
olle
ctiv
ely
refe
rred
to a
s K
lang
Val
ley.
* Pu
blic
sec
tor
in 2
010
& 2
011
refe
rs to
MO
H a
nd U
nive
rsity
hos
pita
ls, w
hile
pub
lic s
ecto
r in
201
3 re
fers
to M
OH
, Uni
vers
ity, a
nd M
OD
hos
pita
ls.
Fo
r po
pula
tion
data
, ple
ase
refe
r App
endi
x 3:
Tab
le A
3.2
& T
able
A3.
12

79
CHAP
TER
4: H
OSPI
TAL
HEAL
TH W
ORKF
ORCE
National Healthcare Establishment & Workforce Statistics Hospital 2012 -2013
Tabl
e 4.
1.12
[co
ntin
ued]
: Num
ber
& D
ensi
ty o
f Obs
tetr
icia
ns &
Gyn
aeco
logi
sts
and
Paed
iatr
icia
ns in
Acu
te C
urat
ive
Hos
pita
ls in
Mal
aysi
a by
Sta
te &
Sec
tor,
2010
, 201
1 &
201
3
Stat
eSe
ctor
*
Obs
tetr
icia
ns &
Gyn
aeco
logi
sts
Paed
iatr
icia
ns
2010
2011
2013
2010
2011
2013
Number
Per 100,000 female
population
Number
Per 100,000 female
population
Number
Per 100,000 female
population
Number
Per 100,000 pediatric
population
Number
Per 100,000 pediatric
population
Number
Per 100,000 pediatric
population
Neg
eri S
embi
lan
Publ
ic10
- 12
- 13
- 10
- 13
- 13
- N
eger
i Sem
bila
nPr
ivat
e18
- 20
- 22
- 12
- 15
- 14
- N
eger
i Sem
bila
nTo
tal
285.
6932
6.35
356.
7522
8.11
2810
.14
279.
85M
elak
aPu
blic
9-
5-
8-
7-
8-
9-
Mel
aka
Priv
ate
18-
20-
21-
13-
13-
14-
Mel
aka
Tota
l27
6.61
256.
0429
6.85
209.
2721
9.77
2310
.87
Joho
rPu
blic
27-
31-
24-
23-
28-
26-
Joho
rPr
ivat
e38
- 50
- 52
- 17
- 17
- 18
- Jo
hor
Tota
l65
4.11
815.
0476
4.61
404.
3945
4.96
444.
93Pa
hang
Publ
ic16
- 15
- 17
- 14
- 13
- 21
- Pa
hang
Priv
ate
7-
10-
13-
6-
6-
6-
Paha
ngTo
tal
233.
2625
3.49
304.
0620
4.42
194.
2427
6.01
Tere
ngga
nuPu
blic
10-
11-
16-
7-
7-
9-
Tere
ngga
nuPr
ivat
e1
- 2
- 2
- 1
- 1
- 1
- Te
reng
ganu
Tota
l11
2.17
132.
4718
3.30
82.
398
2.29
102.
85Ke
lant
anPu
blic
22-
24-
30-
25-
26-
29-
Kela
ntan
Priv
ate
6-
5-
5-
6-
5-
5-
Kela
ntan
Tota
l28
3.66
293.
6135
4.21
316.
2331
5.78
346.
42Sa
raw
akPu
blic
19-
21-
21-
21-
23-
26-
Sara
wak
Priv
ate
24-
29-
31-
13-
15-
14-
Sara
wak
Tota
l43
3.59
504.
1252
4.18
344.
7738
5.35
405.
74Sa
bah
Publ
ic23
- 21
- 21
- 19
- 20
- 24
- Sa
bah
Priv
ate
14-
17-
17-
4-
5-
6-
Saba
hTo
tal
372.
3938
2.39
382.
3123
2.24
252.
7130
3.22
WP
Labu
anPu
blic
1-
1-
1-
0-
0-
1-
WP
Labu
anPr
ivat
ena
- na
- na
- na
- na
- na
- W
P La
buan
Tota
l1
2.38
12.
301
2.21
00.
000
0.00
13.
62Sa
bah
& W
P La
buan
Publ
ic24
- 22
- 22
- 19
- 20
- 25
- Sa
bah
& W
P La
buan
Priv
ate
14-
17-
17-
4-
5-
6-
Saba
h &
WP
Labu
anTo
tal
382.
3939
2.39
392.
3123
2.19
252.
6431
3.23
Abb
revi
atio
n: -
not
ava
ilabl
e; n
a -
not a
pplic
able
FSel
ango
r &
WP
Putr
ajay
a &
WPK
L ar
e al
so c
olle
ctiv
ely
refe
rred
to a
s K
lang
Val
ley.
* Pu
blic
sec
tor
in 2
010
& 2
011
refe
rs to
MO
H a
nd U
nive
rsity
hos
pita
ls, w
hile
pub
lic s
ecto
r in
201
3 re
fers
to M
OH
, Uni
vers
ity, a
nd M
OD
hos
pita
ls.
Fo
r po
pula
tion
data
, ple
ase
refe
r App
endi
x 3:
Tab
le A
3.2
& T
able
A3.
12
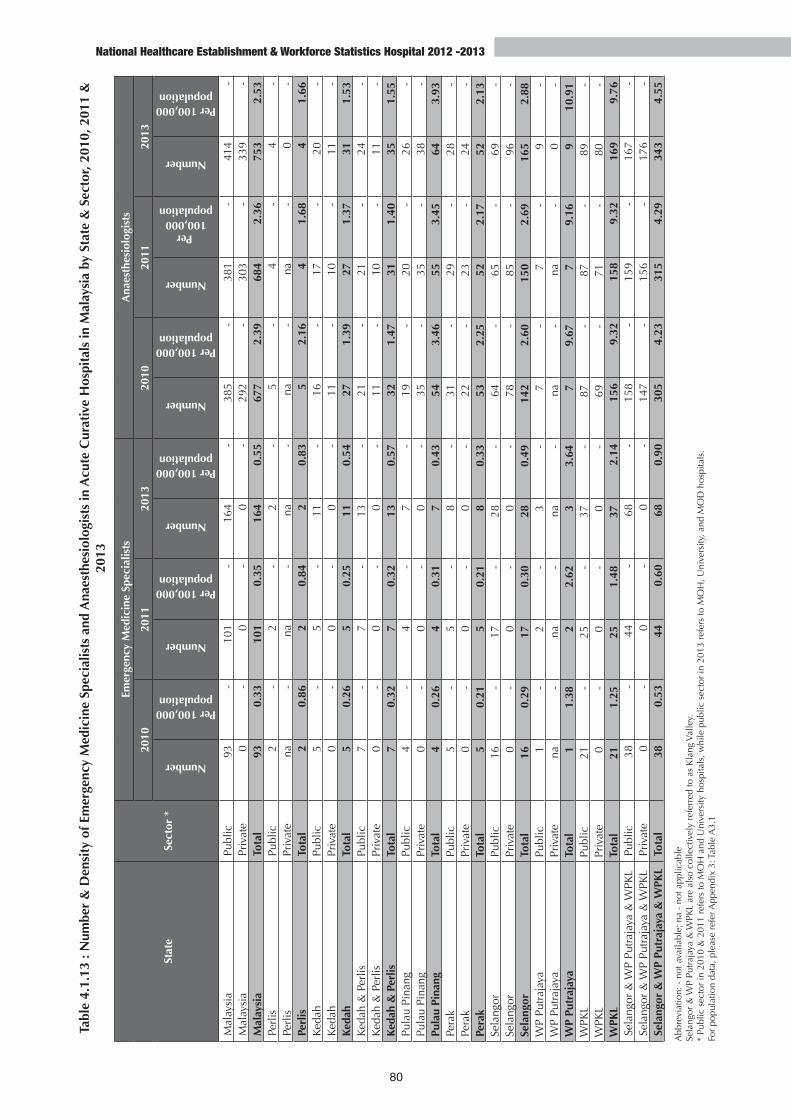
80
National Healthcare Establishment & Workforce Statistics Hospital 2012 -2013
Tabl
e 4.
1.13
: N
umbe
r &
Den
sity
of E
mer
genc
y M
edic
ine
Spec
ialis
ts a
nd A
naes
thes
iolo
gist
s in
Acu
te C
urat
ive
Hos
pita
ls in
Mal
aysi
a by
Sta
te &
Sec
tor,
2010
, 201
1 &
20
13
Stat
eSe
ctor
*
Emer
genc
y M
edic
ine
Spec
ialis
tsA
naes
thes
iolo
gist
s
2010
2011
2013
2010
2011
2013
Number
Per 100,000 population
Number
Per 100,000 population
Number
Per 100,000 population
Number
Per 100,000 population
Number
Per 100,000
population
Number
Per 100,000 population
Mal
aysi
aPu
blic
93-
101
- 16
4-
385
- 38
1-
414
-M
alay
sia
Priv
ate
0-
0-
0-
292
- 30
3-
339
-M
alay
sia
Tota
l93
0.33
101
0.3
5 16
40.
5567
72.
3968
4 2
.36
753
2.53
Perl
isPu
blic
2-
2-
2-
5-
4-
4-
Perl
isPr
ivat
ena
- na
- na
-na
-na
-0
-Pe
rlis
Tota
l2
0.86
2 0
.84
20.
835
2.16
4 1
.68
41.
66Ke
dah
Publ
ic5
- 5
- 11
-16
-17
-20
-Ke
dah
Priv
ate
0-
0-
0-
11-
10-
11-
Keda
hTo
tal
50.
265
0.2
5 11
0.54
271.
3927
1.3
7 31
1.53
Keda
h &
Per
lisPu
blic
7-
7-
13-
21-
21-
24-
Keda
h &
Per
lisPr
ivat
e0
- 0
- 0
-11
-10
-11
-Ke
dah
& P
erlis
Tota
l7
0.32
7 0
.32
130.
5732
1.47
31 1
.40
351.
55Pu
lau
Pina
ngPu
blic
4-
4-
7-
19-
20-
26-
Pula
u Pi
nang
Priv
ate
0-
0-
0-
35-
35-
38-
Pula
u Pi
nang
Tota
l4
0.26
4 0
.31
70.
4354
3.46
55 3
.45
643.
93Pe
rak
Publ
ic5
- 5
- 8
-31
-29
-28
-Pe
rak
Priv
ate
0-
0-
0-
22-
23-
24-
Pera
kTo
tal
50.
215
0.2
1 8
0.33
532.
2552
2.1
7 52
2.13
Sela
ngor
Publ
ic16
- 17
- 28
-64
-65
-69
-Se
lang
orPr
ivat
e0
- 0
- 0
-78
-85
-96
-Se
lang
orTo
tal
160.
2917
0.3
0 28
0.49
142
2.60
150
2.6
9 16
52.
88W
P Pu
traj
aya
Publ
ic1
- 2
- 3
-7
-7
-9
-W
P Pu
traj
aya
Priv
ate
na-
na-
na-
na-
na-
0-
WP
Putr
ajay
aTo
tal
11.
382
2.6
2 3
3.64
79.
677
9.1
6 9
10.9
1W
PKL
Publ
ic21
- 25
- 37
-87
-87
-89
-W
PKL
Priv
ate
0-
0-
0-
69-
71-
80-
WPK
LTo
tal
211.
2525
1.4
8 37
2.14
156
9.32
158
9.3
2 16
99.
76Se
lang
or &
WP
Putr
ajay
a &
WPK
LPu
blic
38 -
44-
68-
158
-15
9-
167
-Se
lang
or &
WP
Putr
ajay
a &
WPK
LPr
ivat
e0
- 0
- 0
-14
7-
156
-17
6-
Sela
ngor
& W
P Pu
traj
aya
& W
PKL
Tota
l38
0.53
44 0
.60
680.
9030
54.
2331
5 4
.29
343
4.55
Abb
revi
atio
n: -
not
ava
ilabl
e; n
a -
not a
pplic
able
Sela
ngor
& W
P Pu
traj
aya
& W
PKL
are
also
col
lect
ivel
y re
ferr
ed to
as
Kla
ng V
alle
y.
* Pu
blic
sec
tor
in 2
010
& 2
011
refe
rs to
MO
H a
nd U
nive
rsity
hos
pita
ls, w
hile
pub
lic s
ecto
r in
201
3 re
fers
to M
OH
, Uni
vers
ity, a
nd M
OD
hos
pita
ls.
For
popu
latio
n da
ta, p
leas
e re
fer A
ppen
dix
3: T
able
A3.
1

81
CHAP
TER
4: H
OSPI
TAL
HEAL
TH W
ORKF
ORCE
National Healthcare Establishment & Workforce Statistics Hospital 2012 -2013
Tabl
e 4.
1.13
[co
ntin
ued]
: Num
ber
& D
ensi
ty o
f Em
erge
ncy
Med
icin
e Sp
ecia
lists
and
Ana
esth
esio
logi
sts
in A
cute
Cur
ativ
e H
ospi
tals
in M
alay
sia
by S
tate
& S
ecto
r, 20
10, 2
011
& 2
013
Stat
eSe
ctor
*
Emer
genc
y M
edic
ine
Spec
ialis
tsA
naes
thes
iolo
gist
s
2010
2011
2013
2010
2011
2013
Number
Per 100,000
population
Number
Per 100,000
population
Number
Per 100,000
population
Number
Per 100,000
population
Number
Per 100,000
population
Number
Per 100,000
population
Neg
eri S
embi
lan
Publ
ic3
-3
-6
-10
-11
-13
-N
eger
i Sem
bila
nPr
ivat
e0
-0
-0
-9
-9
-12
-N
eger
i Sem
bila
nTo
tal
30.
293
0.2
9 6
0.56
191.
8620
1.9
2 25
2.34
Mel
aka
Publ
ic3
-3
-5
-11
-10
-12
-M
elak
aPr
ivat
e0
-0
-0
-17
-17
-18
-M
elak
aTo
tal
30.
373
0.3
6 5
0.59
283.
4127
3.2
4 30
3.52
Joho
rPu
blic
5-
5-
9-
35-
35-
35-
Joho
rPr
ivat
e0
-0
-0
-25
-25
-27
-Jo
hor
Tota
l5
0.15
5 0
.15
90.
2660
1.79
60 1
.76
621.
78Pa
hang
Publ
ic3
-3
-7
-18
-17
-19
-Pa
hang
Priv
ate
0-
0-
0-
5-
6-
7-
Paha
ngTo
tal
30.
203
0.2
0 7
0.45
231.
5323
1.5
1 26
1.65
Tere
ngga
nuPu
blic
4-
4-
5-
12-
12-
18-
Tere
ngga
nuPr
ivat
e0
-0
-0
-1
-1
-1
-Te
reng
ganu
Tota
l4
0.39
4 0
.37
50.
4513
1.25
13 1
.21
191.
71Ke
lant
anPu
blic
14-
15-
15-
25-
27-
28-
Kela
ntan
Priv
ate
0-
0-
0-
3-
2-
2-
Kela
ntan
Tota
l14
0.91
15 0
.93
150.
9028
1.82
29 1
.80
301.
80Sa
raw
akPu
blic
3-
3-
8-
22-
18-
18-
Sara
wak
Priv
ate
0-
0-
0-
13-
14-
15-
Sara
wak
Tota
l3
0.12
3 0
.12
80.
3135
1.42
32 1
.27
331.
28Sa
bah
Publ
ic4
-5
-13
-22
-21
-25
-Sa
bah
Priv
ate
0-
0-
0-
4-
5-
8-
Saba
hTo
tal
40.
125
0.1
5 13
0.38
260.
8126
0.7
8 33
0.96
WP
Labu
anPu
blic
0-
0-
0-
1-
1-
1-
WP
Labu
anPr
ivat
ena
-na
-na
-na
-na
-0
-W
P La
buan
Tota
l0
0.00
00
00.
001
1.15
1 1
.11
11.
07Sa
bah
& W
P La
buan
Publ
ic4
-5
-13
-23
-22
-26
-Sa
bah
& W
P La
buan
Priv
ate
0-
0-
0-
4-
5-
8-
Saba
h &
WP
Labu
anTo
tal
40.
125
0.1
5 13
0.37
270.
8227
0.7
9 34
0.97
Abb
revi
atio
n: -
not
ava
ilabl
e; n
a -
not a
pplic
able
Sela
ngor
& W
P Pu
traj
aya
& W
PKL
are
also
col
lect
ivel
y re
ferr
ed to
as
Kla
ng V
alle
y.
* Pu
blic
sec
tor
in 2
010
& 2
011
refe
rs to
MO
H a
nd U
nive
rsity
hos
pita
ls, w
hile
pub
lic s
ecto
r in
201
3 re
fers
to M
OH
, Uni
vers
ity, a
nd M
OD
hos
pita
ls.
Fo
r po
pula
tion
data
, ple
ase
refe
r App
endi
x 3:
Tab
le A
3.1

82
National Healthcare Establishment & Workforce Statistics Hospital 2012 -2013
Tabl
e 4.
1.14
: N
umbe
r &
Den
sity
of O
phth
alm
olog
ists
and
Oto
rhin
olar
yngo
logi
sts
in A
cute
Cur
ativ
e H
ospi
tals
in M
alay
sia
by S
tate
& S
ecto
r, 20
10, 2
011
& 2
013
Stat
eSe
ctor
*
Oph
thal
mol
ogis
tsO
torh
inol
aryn
golo
gist
s
2010
2011
2013
2010
2011
2013
Number
Per 100,000 population
Number
Per 100,000 population
Number
Per 100,000 population
Number
Per 100,000 population
Number
Per 100,000 population
Number
Per 100,000 population
Mal
aysi
aPu
blic
216
- 21
8-
245
- 14
7-
153
- 16
7-
Mal
aysi
aPr
ivat
e15
9-
164
- 18
5-
139
- 14
2-
158
- M
alay
sia
Tota
l37
51.
3238
21.
3243
01.
4528
61.
0129
51.
0232
51.
09Pe
rlis
Publ
ic3
- 3
- 3
- 3
- 4
- 3
-Pe
rlis
Priv
ate
na-
na-
na-
na-
na-
na-
Perl
isTo
tal
31.
303
1.26
31.
243
1.30
41.
683
1.24
Keda
hPu
blic
13-
11-
13-
10-
9-
12-
Keda
hPr
ivat
e6
- 7
- 5
- 5
- 6
- 6
- Ke
dah
Tota
l19
0.98
180.
9118
0.89
150.
7715
0.76
180.
89Ke
dah
& P
erlis
Publ
ic16
- 14
- 16
- 13
- 13
- 15
-Ke
dah
& P
erlis
Priv
ate
6-
7-
5-
5-
6-
6-
Keda
h &
Per
lisTo
tal
221.
0121
0.95
210.
9318
0.83
190.
8621
0.93
Pula
u Pi
nang
Publ
ic10
- 9
- 10
- 5
- 4
- 7
-Pu
lau
Pina
ngPr
ivat
e21
- 20
- 25
- 18
- 18
- 18
- Pu
lau
Pina
ngTo
tal
311.
9929
1.82
352.
1523
1.47
221.
3825
1.54
Pera
kPu
blic
11-
8-
16-
10-
12-
14-
Pera
kPr
ivat
e14
- 14
- 16
- 10
- 10
- 10
- Pe
rak
Tota
l25
1.06
220.
9232
1.31
200.
8522
0.92
240.
99Se
lang
orPu
blic
47-
51-
54-
21-
23-
25-
Sela
ngor
Priv
ate
46-
52-
62-
35-
40-
43-
Sela
ngor
Tota
l93
1.70
103
1.85
116
2.03
561.
0363
1.13
681.
19W
P Pu
traj
aya
Publ
ic3
- 4
- 4
- 4
- 5
- 6
-W
P Pu
traj
aya
Priv
ate
na-
na-
na-
na-
na-
na-
WP
Putr
ajay
aTo
tal
34.
144
5.24
44.
854
5.52
56.
546
7.27
WPK
LPu
blic
40-
44-
47-
29-
33-
27-
WPK
LPr
ivat
e33
- 29
- 28
- 33
- 30
- 35
- W
PKL
Tota
l73
4.36
734.
3175
4.33
623.
7063
3.72
623.
58Se
lang
or &
WP
Putr
ajay
a &
WPK
LPu
blic
90-
63-
105
- 54
- 61
- 58
-Se
lang
or &
WP
Putr
ajay
a &
WPK
LPr
ivat
e79
- 40
- 90
- 68
- 70
- 78
- Se
lang
or &
WP
Putr
ajay
a &
WPK
LTo
tal
169
2.34
180
2.45
195
2.59
901.
2513
11.
7813
61.
80
Abb
revi
atio
n: -
not
ava
ilabl
e; n
a -
not a
pplic
able
Sela
ngor
& W
P Pu
traj
aya
& W
PKL
are
also
col
lect
ivel
y re
ferr
ed to
as
Kla
ng V
alle
y.
* Pu
blic
sec
tor
in 2
010
& 2
011
refe
rs to
MO
H a
nd U
nive
rsity
hos
pita
ls, w
hile
pub
lic s
ecto
r in
201
3 re
fers
to M
OH
, Uni
vers
ity, a
nd M
OD
hos
pita
ls.
Fo
r po
pula
tion
data
, ple
ase
refe
r App
endi
x 3:
Tab
le A
3.1
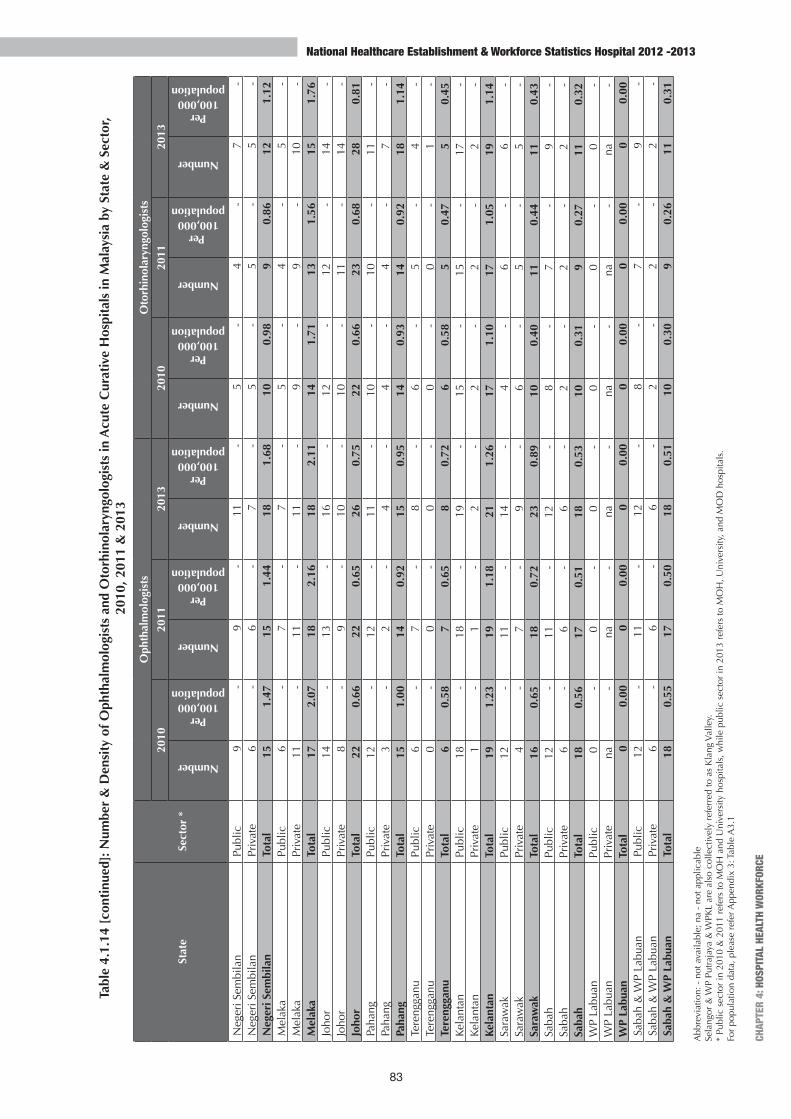
83
CHAP
TER
4: H
OSPI
TAL
HEAL
TH W
ORKF
ORCE
National Healthcare Establishment & Workforce Statistics Hospital 2012 -2013
Tabl
e 4.
1.14
[co
ntin
ued]
: Num
ber
& D
ensi
ty o
f Oph
thal
mol
ogis
ts a
nd O
torh
inol
aryn
golo
gist
s in
Acu
te C
urat
ive
Hos
pita
ls in
Mal
aysi
a by
Sta
te &
Sec
tor,
2010
, 201
1 &
201
3
Stat
eSe
ctor
*
Oph
thal
mol
ogis
tsO
torh
inol
aryn
golo
gist
s
2010
2011
2013
2010
2011
2013
Number
Per 100,000
population
Number
Per 100,000
population
Number
Per 100,000
population
Number
Per 100,000
population
Number
Per 100,000
population
Number
Per 100,000
population
Neg
eri S
embi
lan
Publ
ic9
- 9
- 11
- 5
- 4
- 7
-N
eger
i Sem
bila
nPr
ivat
e6
- 6
- 7
- 5
- 5
- 5
- N
eger
i Sem
bila
nTo
tal
151.
4715
1.44
181.
6810
0.98
90.
8612
1.12
Mel
aka
Publ
ic6
- 7
- 7
- 5
- 4
- 5
-M
elak
aPr
ivat
e11
- 11
- 11
- 9
- 9
- 10
- M
elak
aTo
tal
172.
0718
2.16
182.
1114
1.71
131.
5615
1.76
Joho
rPu
blic
14-
13-
16-
12-
12-
14-
Joho
rPr
ivat
e8
- 9
- 10
- 10
- 11
- 14
- Jo
hor
Tota
l22
0.66
220.
6526
0.75
220.
6623
0.68
280.
81Pa
hang
Publ
ic12
- 12
- 11
- 10
- 10
- 11
-Pa
hang
Priv
ate
3-
2-
4-
4-
4-
7-
Paha
ngTo
tal
151.
0014
0.92
150.
9514
0.93
140.
9218
1.14
Tere
ngga
nuPu
blic
6-
7-
8-
6-
5-
4-
Tere
ngga
nuPr
ivat
e0
- 0
- 0
- 0
- 0
- 1
- Te
reng
ganu
Tota
l6
0.58
70.
658
0.72
60.
585
0.47
50.
45Ke
lant
anPu
blic
18-
18-
19-
15-
15-
17-
Kela
ntan
Priv
ate
1-
1-
2-
2-
2-
2-
Kela
ntan
Tota
l19
1.23
191.
1821
1.26
171.
1017
1.05
191.
14Sa
raw
akPu
blic
12-
11-
14-
4-
6-
6-
Sara
wak
Priv
ate
4-
7-
9-
6-
5-
5-
Sara
wak
Tota
l16
0.65
180.
7223
0.89
100.
4011
0.44
110.
43Sa
bah
Publ
ic12
- 11
- 12
- 8
- 7
- 9
-Sa
bah
Priv
ate
6-
6-
6-
2-
2-
2-
Saba
hTo
tal
180.
5617
0.51
180.
5310
0.31
90.
2711
0.32
WP
Labu
anPu
blic
0-
0-
0-
0-
0-
0-
WP
Labu
anPr
ivat
ena
- na
- na
- na
- na
- na
- W
P La
buan
Tota
l0
0.00
00.
000
0.00
00.
000
0.00
00.
00Sa
bah
& W
P La
buan
Publ
ic12
- 11
- 12
- 8
- 7
- 9
-Sa
bah
& W
P La
buan
Priv
ate
6-
6-
6-
2-
2-
2-
Saba
h &
WP
Labu
anTo
tal
180.
5517
0.50
180.
5110
0.30
90.
2611
0.31
Abb
revi
atio
n: -
not
ava
ilabl
e; n
a -
not a
pplic
able
Sela
ngor
& W
P Pu
traj
aya
& W
PKL
are
also
col
lect
ivel
y re
ferr
ed to
as
Kla
ng V
alle
y.
* Pu
blic
sec
tor
in 2
010
& 2
011
refe
rs to
MO
H a
nd U
nive
rsity
hos
pita
ls, w
hile
pub
lic s
ecto
r in
201
3 re
fers
to M
OH
, Uni
vers
ity, a
nd M
OD
hos
pita
ls.
For
popu
latio
n da
ta, p
leas
e re
fer A
ppen
dix
3: T
able
A3.
1

84
National Healthcare Establishment & Workforce Statistics Hospital 2012 -2013
Tabl
e 4.
1.15
: N
umbe
r &
Den
sity
of O
rtho
paed
ic S
urge
ons,
Spo
rts
Med
icin
e Sp
ecia
lists
and
Reh
abili
tati
on M
edic
ine
Spec
ialis
ts in
Acu
te C
urat
ive
Hos
pita
ls in
Mal
ay-
sia
by S
tate
& S
ecto
r, 20
10, 2
011
& 2
013
Stat
eSe
ctor
*
Ort
hopa
edic
Sur
geon
sSp
orts
Med
icin
e Sp
ecia
lists
Reh
abili
tati
on M
edic
ine
Spec
ialis
ts
2010
2011
2013
2010
2011
2013
2010
2011
2013
Number
Per 100,000 population
Number
Per 100,000 population
Number
Per 100,000 population
Number
Per 100,000 population
Number
Per 100,000 population
Number
Per 100,000 population
Number
Per 100,000 population
Number
Per 100,000 population
Number
Per 100,000 population
Mal
aysi
aPu
blic
268
- 27
9-
288
- 9
- 10
- 18
- 30
- 34
- 44
- M
alay
sia
Priv
ate
269
- 28
3-
319
- 0
- 0
- 0
- 4
- 3
- 4
- M
alay
sia
Tota
l53
71.
9056
21.
9460
72.
049
0.03
100.
0318
0.06
340.
1237
0.13
480.
16Pe
rlis
Publ
ic4
- 4
- 4
- 0
- 0
- 0
- 0
- 0
- 0
- Pe
rlis
Priv
ate
na-
na-
na-
na-
na-
na-
na-
na-
na-
Perl
isTo
tal
41.
734
1.68
41.
660
0.00
00.
000
0.00
00.
000
0.00
00.
00Ke
dah
Publ
ic12
- 15
- 15
- 0
- 0
- 0
- 0
- 0
- 1
- Ke
dah
Priv
ate
14-
14-
14-
0-
0-
0-
0-
0-
0-
Keda
hTo
tal
261.
3329
1.47
291.
430
0.00
00.
000
0.00
00.
000
0.00
10.
05Ke
dah
& P
erlis
Publ
ic16
- 19
- 19
- 0
- 0
- 0
- 0
- 0
- 1
- Ke
dah
& P
erlis
Priv
ate
14-
14-
14-
0-
0-
0-
0-
0-
0-
Keda
h &
Per
lisTo
tal
301.
3833
1.49
331.
460
0.00
00.
000
0.00
00.
000
0.00
10.
04Pu
lau
Pina
ngPu
blic
11-
10-
13-
0-
0-
0-
1-
1-
1-
Pula
u Pi
nang
Priv
ate
33-
33-
37-
0-
0-
0-
0-
0-
0-
Pula
u Pi
nang
Tota
l44
2.82
432.
7050
3.07
00.
000
0.00
00.
001
0.06
10.
061
0.06
Pera
kPu
blic
18-
20-
23-
0-
1-
1-
1-
2-
1-
Pera
kPr
ivat
e23
- 24
- 26
- 0
- 0
- 0
- 0
- 0
- 0
- Pe
rak
Tota
l41
1.74
441.
8449
2.01
00.
001
0.04
10.
041
0.04
20.
081
0.04
Sela
ngor
Publ
ic41
- 42
- 38
- 3
- 3
- 5
- 8
- 9
- 9
- Se
lang
orPr
ivat
e62
- 67
- 81
- 0
- 0
- 0
- 1
- 1
- 2
- Se
lang
orTo
tal
103
1.89
109
1.95
119
2.08
30.
053
0.05
50.
099
0.16
100.
1811
0.19
WP
Putr
ajay
aPu
blic
5-
7-
6-
0-
0-
0-
0-
0-
0-
WP
Putr
ajay
aPr
ivat
ena
- na
- na
- na
- na
- na
- na
- na
- na
- W
P Pu
traj
aya
Tota
l5
6.90
79.
166
7.27
00.
000
0.00
00.
000
0.00
00.
000
0.00
WPK
LPu
blic
60-
63-
61-
4-
4-
8-
12-
12-
14-
WPK
LPr
ivat
e58
- 57
- 66
- 0
- 0
- 0
- 3
- 2
- 2
- W
PKL
Tota
l11
87.
0512
07.
0812
77.
334
0.24
40.
248
0.46
150.
9014
0.83
160.
92Se
lang
or &
WP
Putr
ajay
a &
WPK
LPu
blic
106
- 11
2-
105
- 7
- 7
- 0
- 20
- 21
- 23
- Se
lang
or &
WP
Putr
ajay
a &
WPK
LPr
ivat
e12
0-
124
- 14
7-
0-
0-
0-
4-
3-
4-
Sela
ngor
& W
P Pu
traj
aya
& W
PKL
Tota
l22
63.
1323
63.
2125
23.
347
0.10
70.
100
0.00
240.
3324
0.33
270.
36
Abb
revi
atio
n: -
not
ava
ilabl
e; n
a -
not a
pplic
able
Sela
ngor
& W
P Pu
traj
aya
& W
PKL
are
also
col
lect
ivel
y re
ferr
ed to
as
Kla
ng V
alle
y.
* Pu
blic
sec
tor
in 2
010
& 2
011
refe
rs to
MO
H a
nd U
nive
rsity
hos
pita
ls, w
hile
pub
lic s
ecto
r in
201
3 re
fers
to M
OH
, Uni
vers
ity, a
nd M
OD
hos
pita
ls.
For
popu
latio
n da
ta, p
leas
e re
fer A
ppen
dix
3: T
able
A3.
1

85
CHAP
TER
4: H
OSPI
TAL
HEAL
TH W
ORKF
ORCE
National Healthcare Establishment & Workforce Statistics Hospital 2012 -2013
Tabl
e 4.
1.15
[co
ntin
ued]
: Num
ber
& D
ensi
ty o
f Ort
hopa
edic
Sur
geon
s, S
port
s M
edic
ine
Spec
ialis
ts a
nd R
ehab
ilita
tion
Med
icin
e Sp
ecia
lists
in A
cute
Cur
ativ
e H
ospi
tals
in
Mal
aysi
a by
Sta
te &
Sec
tor,
2010
, 201
1 &
201
3
Stat
eSe
ctor
*
Ort
hopa
edic
Sur
geon
sSp
orts
Med
icin
e Sp
ecia
lists
Reh
abili
tati
on M
edic
ine
Spec
ialis
ts
2010
2011
2013
2010
2011
2013
2010
2011
2013
Number
Per 100,000 population
Number
Per 100,000 population
Number
Per 100,000 population
Number
Per 100,000 population
Number
Per 100,000 population
Number
Per 100,000 population
Number
Per 100,000 population
Number
Per 100,000 population
Number
Per 100,000 population
Neg
eri S
embi
lan
Publ
ic8
- 8
- 13
- 1
- 1
- 1
- 4
- 5
- 5
- N
eger
i Sem
bila
nPr
ivat
e15
- 14
- 14
- 0
- 0
- 0
- 0
- 0
- 0
- N
eger
i Sem
bila
nTo
tal
232.
2522
2.11
272.
521
0.10
10.
101
0.09
40.
395
0.48
50.
47M
elak
aPu
blic
6-
6-
8-
0-
0-
1-
0-
0-
2-
Mel
aka
Priv
ate
14-
16-
18-
0-
0-
0-
0-
0-
0-
Mel
aka
Tota
l20
2.44
222.
6426
3.05
00.
000
0.00
10.
120
0.00
00.
002
0.23
Joho
rPu
blic
19-
23-
22-
0-
0-
0-
2-
3-
3-
Joho
rPr
ivat
e25
- 25
- 30
- 0
- 0
- 0
- 0
- 0
- 0
- Jo
hor
Tota
l44
1.31
481.
4152
1.50
00.
000
0.00
00.
002
0.06
30.
093
0.09
Paha
ngPu
blic
19-
14-
13-
0-
0-
0-
0-
0-
2-
Paha
ngPr
ivat
e4
- 9
- 10
- 0
- 0
- 0
- 0
- 0
- 0
- Pa
hang
Tota
l23
1.53
231.
5123
1.46
00.
000
0.00
00.
000
0.00
00.
002
0.13
Tere
ngga
nuPu
blic
9-
9-
9-
0-
0-
0-
0-
0-
1-
Tere
ngga
nuPr
ivat
e1
- 1
- 1
- 0
- 0
- 0
- 0
- 0
- 0
- Te
reng
ganu
Tota
l10
0.97
100.
9310
0.90
00.
000
0.00
00.
000
0.00
00.
001
0.09
Kela
ntan
Publ
ic31
- 30
- 29
- 0
- 0
- 1
- 1
- 1
- 2
- Ke
lant
anPr
ivat
e4
- 4
- 4
- 0
- 0
- 0
- 0
- 0
- 0
- Ke
lant
anTo
tal
352.
2734
2.11
331.
980
0.00
00.
001
0.06
10.
061
0.06
20.
12Sa
raw
akPu
blic
16-
15-
17-
0-
0-
0-
0-
0-
1-
Sara
wak
Priv
ate
10-
12-
11-
0-
0-
0-
0-
0-
0-
Sara
wak
Tota
l26
1.05
271.
0728
1.09
00.
000
0.00
00.
000
0.00
00.
001
0.04
Saba
hPu
blic
9-
13-
16-
1-
1-
1-
1-
1-
2-
Saba
hPr
ivat
e6
- 7
- 7
- 0
- 0
- 0
- 0
- 0
- 0
- Sa
bah
Tota
l15
0.47
200.
6023
0.67
10.
031
0.03
10.
031
0.03
10.
032
0.06
WP
Labu
anPu
blic
0-
0-
1-
0-
0-
0-
0-
0-
0-
WP
Labu
anPr
ivat
ena
- na
- na
- na
- na
- na
- na
- na
- na
- W
P La
buan
Tota
l0
0.00
00.
001
1.07
00.
000
0.00
00.
000
0.00
00.
000
0.00
Saba
h &
WP
Labu
anPu
blic
9-
13-
17-
1-
1-
1-
1-
1-
2-
Saba
h &
WP
Labu
anPr
ivat
e6
- 7
- 7
- 0
- 0
- 0
- 0
- 0
- 0
- Sa
bah
& W
P La
buan
Tota
l15
0.46
200.
5924
0.68
10.
031
0.03
10.
031
0.03
10.
032
0.06
Abb
revi
atio
n: -
not
ava
ilabl
e; n
a -
not a
pplic
able
Sela
ngor
& W
P Pu
traj
aya
& W
PKL
are
also
col
lect
ivel
y re
ferr
ed to
as
Kla
ng V
alle
y.
* Pu
blic
sec
tor
in 2
010
& 2
011
refe
rs to
MO
H a
nd U
nive
rsity
hos
pita
ls, w
hile
pub
lic s
ecto
r in
201
3 re
fers
to M
OH
, Uni
vers
ity, a
nd M
OD
hos
pita
ls.
Fo
r po
pula
tion
data
, ple
ase
refe
r App
endi
x 3:
Tab
le A
3.1

86
National Healthcare Establishment & Workforce Statistics Hospital 2012 -2013
Tabl
e 4.
1.16
: N
umbe
r &
Den
sity
of P
sych
iatr
ists
and
Onc
olog
ists
in A
cute
Cur
ativ
e H
ospi
tals
in M
alay
sia
by S
tate
& S
ecto
r, 20
10, 2
011
& 2
013
Stat
eSe
ctor
*
Psyc
hiat
rist
s ‡
Onc
olog
ists
2010
2011
2013
2010
2011
2013
Number
Per 100,000 population
Number
Per 100,000 population
Number
Per 100,000 population
Number
Per 100,000 population
Number
Per 100,000
population
Number
Per 100,000 population
Mal
aysi
aPu
blic
157
- 16
2-
184
- 33
- 30
- 37
- M
alay
sia
Priv
ate
49-
48-
58-
34-
38-
48-
Mal
aysi
aTo
tal
206
0.73
210
0.73
242
0.81
670.
2468
0.23
850.
29Pe
rlis
Publ
ic2
- 2
- 2
- 0
- 0
- 0
- Pe
rlis
Priv
ate
na-
na-
na-
na-
na-
na-
Perl
isTo
tal
20.
862
0.84
20.
830
0.00
00.
000
0.00
Keda
hPu
blic
7-
6-
9-
0-
0-
0-
Keda
hPr
ivat
e2
- 2
- 3
- 0
- 0
- 0
- Ke
dah
Tota
l9
0.46
80.
4112
0.59
00.
000
0.00
00.
00Ke
dah
& P
erlis
Publ
ic9
- 8
- 11
- 0
- 0
- 0
- Ke
dah
& P
erlis
Priv
ate
2-
2-
3-
0-
0-
0-
Keda
h &
Per
lisTo
tal
110.
5010
0.45
140.
620
0.00
00.
000
0.00
Pula
u Pi
nang
Publ
ic10
- 7
- 8
- 2
- 2
- 2
- Pu
lau
Pina
ngPr
ivat
e6
- 6
- 7
- 10
- 11
- 11
- Pu
lau
Pina
ngTo
tal
161.
0213
0.82
150.
9212
0.77
130.
8213
0.80
Pera
kPu
blic
9-
10-
12-
0-
0-
0-
Pera
kPr
ivat
e3
- 3
- 4
- 2
- 2
- 4
- Pe
rak
Tota
l12
0.51
130.
5416
0.66
20.
092
0.08
40.
16Se
lang
orPu
blic
25-
24-
26-
0-
0-
0-
Sela
ngor
Priv
ate
12-
15-
20-
9-
10-
11-
Sela
ngor
Tota
l37
0.68
390.
7046
0.80
90.
1610
0.18
110.
19W
P Pu
traj
aya
Publ
ic2
- 3
- 3
- 0
- 0
- 4
- W
P Pu
traj
aya
Priv
ate
na-
na-
na-
na-
na-
na-
WP
Putr
ajay
aTo
tal
22.
763
3.93
33.
640
0.00
00.
004
4.85
WPK
LPu
blic
43-
47-
54-
21-
19-
19-
WPK
LPr
ivat
e18
- 12
- 14
- 5
- 5
- 8
- W
PKL
Tota
l61
3.64
593.
4868
3.93
261.
5524
1.42
271.
56Se
lang
or &
WP
Putr
ajay
a &
WPK
LPu
blic
70-
74-
83-
21-
19-
23-
Sela
ngor
& W
P Pu
traj
aya
& W
PKL
Priv
ate
30-
27-
34-
14-
15-
19-
Sela
ngor
& W
P Pu
traj
aya
& W
PKL
Tota
l10
01.
3910
11.
3711
71.
5535
0.49
340.
4642
0.56
Abb
revi
atio
n: -
not
ava
ilabl
e; n
a -
not a
pplic
able
Sela
ngor
& W
P Pu
traj
aya
& W
PKL
are
also
col
lect
ivel
y re
ferr
ed to
as
Kla
ng V
alle
y.
* Pu
blic
sec
tor
in 2
010
& 2
011
refe
rs to
MO
H a
nd U
nive
rsity
hos
pita
ls, w
hile
pub
lic s
ecto
r in
201
3 re
fers
to M
OH
, Uni
vers
ity, a
nd M
OD
hos
pita
ls.
For
popu
latio
n da
ta, p
leas
e re
fer A
ppen
dix
3: T
able
A3.
1‡
Dat
a on
the
tota
l num
ber
of h
ospi
tal p
sych
iatr
ists
in th
e co
untr
y (i.
e. in
bot
h ac
ute
cura
tive
hosp
itals
and
psy
chia
tric
inst
itutio
ns) i
s av
aila
ble
in th
e N
HSI
dat
abas
e. T
he ta
ble
abov
e sh
ows
psyc
hiat
rist
s in
the
acut
e cu
rativ
e ho
spita
ls o
nly.
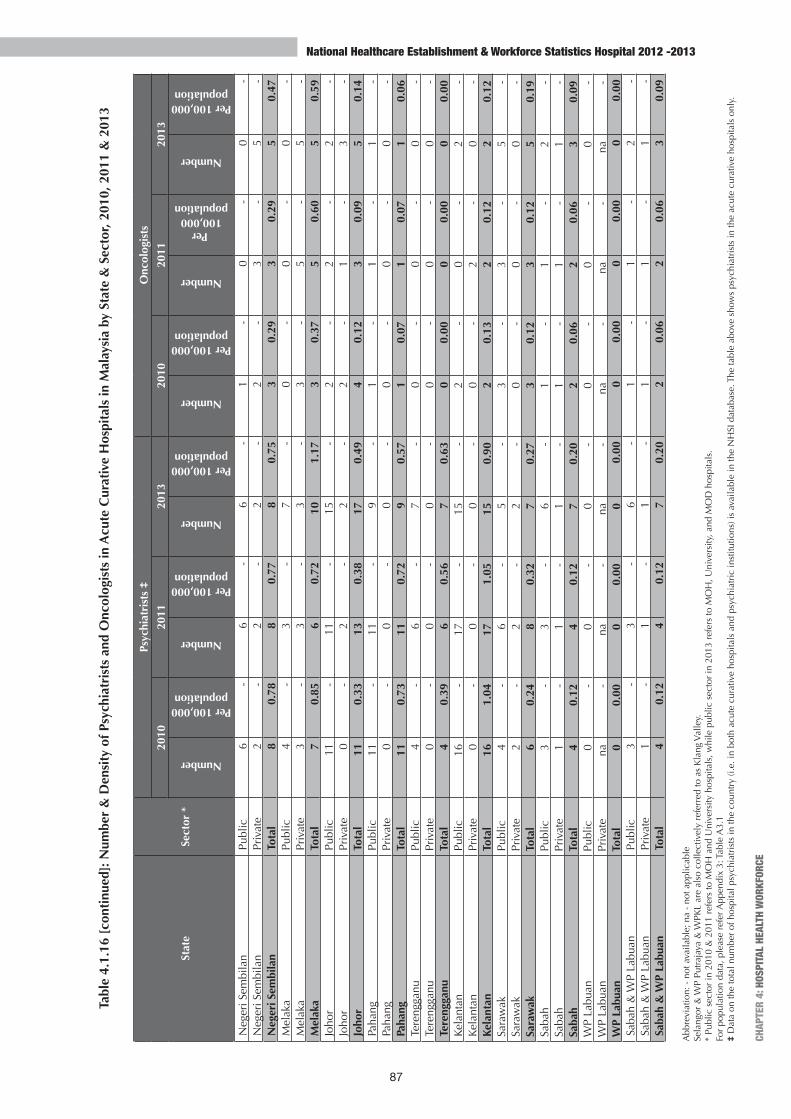
87
CHAP
TER
4: H
OSPI
TAL
HEAL
TH W
ORKF
ORCE
National Healthcare Establishment & Workforce Statistics Hospital 2012 -2013
Tabl
e 4.
1.16
[co
ntin
ued]
: Num
ber
& D
ensi
ty o
f Psy
chia
tris
ts a
nd O
ncol
ogis
ts in
Acu
te C
urat
ive
Hos
pita
ls in
Mal
aysi
a by
Sta
te &
Sec
tor,
2010
, 201
1 &
201
3
Abb
revi
atio
n: -
not
ava
ilabl
e; n
a -
not a
pplic
able
Sela
ngor
& W
P Pu
traj
aya
& W
PKL
are
also
col
lect
ivel
y re
ferr
ed to
as
Kla
ng V
alle
y.
* Pu
blic
sec
tor
in 2
010
& 2
011
refe
rs to
MO
H a
nd U
nive
rsity
hos
pita
ls, w
hile
pub
lic s
ecto
r in
201
3 re
fers
to M
OH
, Uni
vers
ity, a
nd M
OD
hos
pita
ls.
For
popu
latio
n da
ta, p
leas
e re
fer A
ppen
dix
3: T
able
A3.
1‡
Dat
a on
the
tota
l num
ber
of h
ospi
tal p
sych
iatr
ists
in th
e co
untr
y (i.
e. in
bot
h ac
ute
cura
tive
hosp
itals
and
psy
chia
tric
inst
itutio
ns) i
s av
aila
ble
in th
e N
HSI
dat
abas
e. T
he ta
ble
abov
e sh
ows
psyc
hiat
rist
s in
the
acut
e cu
rativ
e ho
spita
ls o
nly.
Stat
eSe
ctor
*
Psyc
hiat
rist
s ‡
Onc
olog
ists
2010
2011
2013
2010
2011
2013
Number
Per 100,000 population
Number
Per 100,000 population
Number
Per 100,000 population
Number
Per 100,000 population
Number
Per 100,000
population
Number
Per 100,000 population
Neg
eri S
embi
lan
Publ
ic6
- 6
- 6
- 1
- 0
- 0
- N
eger
i Sem
bila
nPr
ivat
e2
- 2
- 2
- 2
- 3
- 5
- N
eger
i Sem
bila
nTo
tal
80.
788
0.77
80.
753
0.29
30.
295
0.47
Mel
aka
Publ
ic4
- 3
- 7
- 0
- 0
- 0
- M
elak
aPr
ivat
e3
- 3
- 3
- 3
- 5
- 5
- M
elak
aTo
tal
70.
856
0.72
101.
173
0.37
50.
605
0.59
Joho
rPu
blic
11-
11-
15-
2-
2-
2-
Joho
rPr
ivat
e0
- 2
- 2
- 2
- 1
- 3
- Jo
hor
Tota
l11
0.33
130.
3817
0.49
40.
123
0.09
50.
14Pa
hang
Publ
ic11
- 11
- 9
- 1
- 1
- 1
- Pa
hang
Priv
ate
0-
0-
0-
0-
0-
0-
Paha
ngTo
tal
110.
7311
0.72
90.
571
0.07
10.
071
0.06
Tere
ngga
nuPu
blic
4-
6-
7-
0-
0-
0-
Tere
ngga
nuPr
ivat
e0
- 0
- 0
- 0
- 0
- 0
- Te
reng
ganu
Tota
l4
0.39
60.
567
0.63
00.
000
0.00
00.
00Ke
lant
anPu
blic
16-
17-
15-
2-
0-
2-
Kela
ntan
Priv
ate
0-
0-
0-
0-
2-
0-
Kela
ntan
Tota
l16
1.04
171.
0515
0.90
20.
132
0.12
20.
12Sa
raw
akPu
blic
4-
6-
5-
3-
3-
5-
Sara
wak
Priv
ate
2-
2-
2-
0-
0-
0-
Sara
wak
Tota
l6
0.24
80.
327
0.27
30.
123
0.12
50.
19Sa
bah
Publ
ic3
- 3
- 6
- 1
- 1
- 2
- Sa
bah
Priv
ate
1-
1-
1-
1-
1-
1-
Saba
hTo
tal
40.
124
0.12
70.
202
0.06
20.
063
0.09
WP
Labu
anPu
blic
0-
0-
0-
0-
0-
0-
WP
Labu
anPr
ivat
ena
- na
- na
- na
- na
- na
- W
P La
buan
Tota
l0
0.00
00.
000
0.00
00.
000
0.00
00.
00Sa
bah
& W
P La
buan
Publ
ic3
- 3
- 6
- 1
- 1
- 2
- Sa
bah
& W
P La
buan
Priv
ate
1-
1-
1-
1-
1-
1-
Saba
h &
WP
Labu
anTo
tal
40.
124
0.12
70.
202
0.06
20.
063
0.09
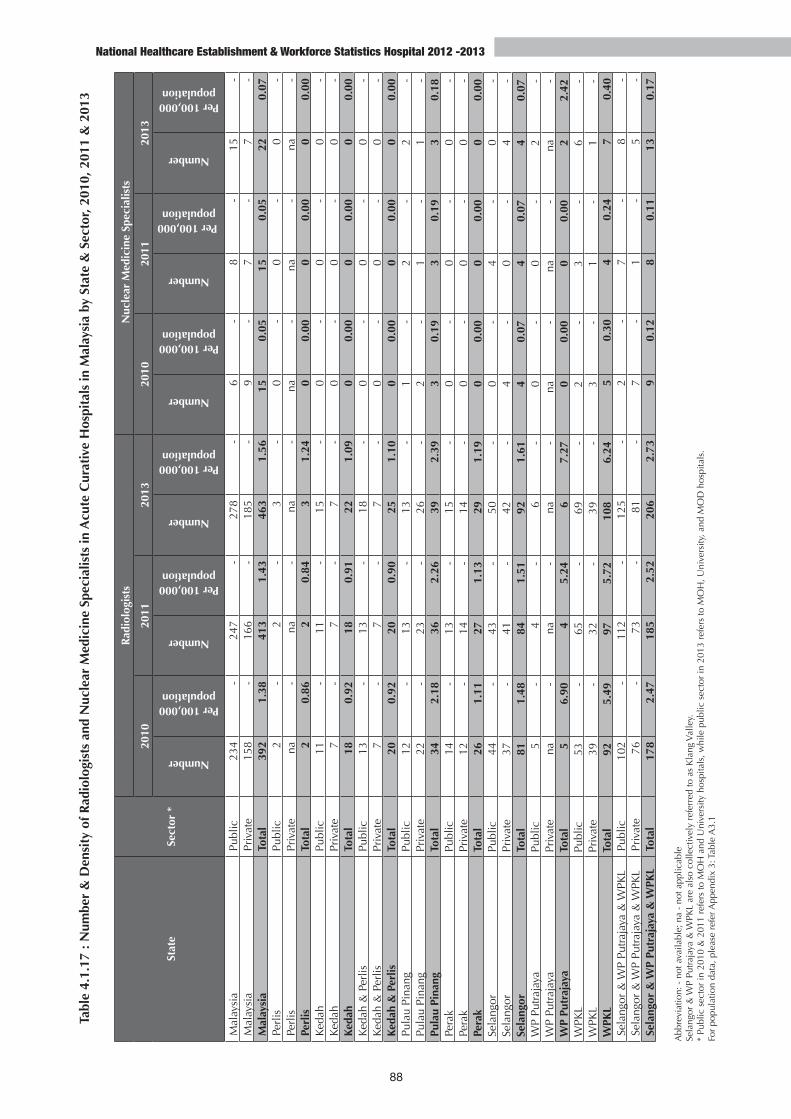
88
National Healthcare Establishment & Workforce Statistics Hospital 2012 -2013
Tabl
e 4.
1.17
: N
umbe
r &
Den
sity
of R
adio
logi
sts
and
Nuc
lear
Med
icin
e Sp
ecia
lists
in A
cute
Cur
ativ
e H
ospi
tals
in M
alay
sia
by S
tate
& S
ecto
r, 20
10, 2
011
& 2
013
Stat
eSe
ctor
*
Rad
iolo
gist
s N
ucle
ar M
edic
ine
Spec
ialis
ts
2010
2011
2013
2010
2011
2013
Number
Per 100,000 population
Number
Per 100,000 population
Number
Per 100,000 population
Number
Per 100,000 population
Number
Per 100,000 population
Number
Per 100,000 population
Mal
aysi
aPu
blic
234
- 24
7-
278
- 6
- 8
- 15
- M
alay
sia
Priv
ate
158
- 16
6-
185
- 9
- 7
- 7
- M
alay
sia
Tota
l39
21.
3841
31.
4346
31.
5615
0.05
150.
0522
0.07
Perl
isPu
blic
2-
2-
3-
0-
0-
0 -
Perl
isPr
ivat
ena
- na
- na
- na
- na
- na
- Pe
rlis
Tota
l2
0.86
20.
843
1.24
00.
000
0.00
00.
00Ke
dah
Publ
ic11
- 11
- 15
- 0
- 0
- 0
- Ke
dah
Priv
ate
7-
7-
7-
0-
0-
0-
Keda
hTo
tal
180.
9218
0.91
221.
090
0.00
00.
000
0.00
Keda
h &
Per
lisPu
blic
13-
13-
18-
0-
0-
0-
Keda
h &
Per
lisPr
ivat
e7
- 7
- 7
- 0
- 0
- 0
-Ke
dah
& P
erlis
Tota
l20
0.92
200.
9025
1.10
00.
000
0.00
00.
00Pu
lau
Pina
ngPu
blic
12-
13-
13-
1-
2-
2-
Pula
u Pi
nang
Priv
ate
22-
23-
26-
2-
1-
1 -
Pula
u Pi
nang
Tota
l34
2.18
362.
2639
2.39
30.
193
0.19
30.
18Pe
rak
Publ
ic14
- 13
- 15
- 0
- 0
- 0
- Pe
rak
Priv
ate
12-
14-
14-
0-
0-
0 -
Pera
kTo
tal
261.
1127
1.13
291.
190
0.00
00.
000
0.00
Sela
ngor
Publ
ic44
- 43
- 50
- 0
- 4
- 0
- Se
lang
orPr
ivat
e37
- 41
- 42
- 4
- 0
- 4
-Se
lang
orTo
tal
811.
4884
1.51
921.
614
0.07
40.
074
0.07
WP
Putr
ajay
aPu
blic
5-
4-
6-
0-
0-
2-
WP
Putr
ajay
aPr
ivat
ena
- na
- na
- na
- na
- na
-W
P Pu
traj
aya
Tota
l5
6.90
45.
246
7.27
00.
000
0.00
22.
42W
PKL
Publ
ic53
- 65
- 69
- 2
- 3
- 6
- W
PKL
Priv
ate
39-
32-
39-
3-
1-
1 -
WPK
LTo
tal
925.
4997
5.72
108
6.24
50.
304
0.24
70.
40Se
lang
or &
WP
Putr
ajay
a &
WPK
LPu
blic
102
- 11
2-
125
- 2
- 7
- 8
- Se
lang
or &
WP
Putr
ajay
a &
WPK
LPr
ivat
e76
- 73
- 81
- 7
- 1
- 5
-Se
lang
or &
WP
Putr
ajay
a &
WPK
LTo
tal
178
2.47
185
2.52
206
2.73
90.
128
0.11
130.
17
Abb
revi
atio
n: -
not
ava
ilabl
e; n
a -
not a
pplic
able
Sela
ngor
& W
P Pu
traj
aya
& W
PKL
are
also
col
lect
ivel
y re
ferr
ed to
as
Kla
ng V
alle
y.
* Pu
blic
sec
tor
in 2
010
& 2
011
refe
rs to
MO
H a
nd U
nive
rsity
hos
pita
ls, w
hile
pub
lic s
ecto
r in
201
3 re
fers
to M
OH
, Uni
vers
ity, a
nd M
OD
hos
pita
ls.
For
popu
latio
n da
ta, p
leas
e re
fer A
ppen
dix
3: T
able
A3.
1

89
CHAP
TER
4: H
OSPI
TAL
HEAL
TH W
ORKF
ORCE
National Healthcare Establishment & Workforce Statistics Hospital 2012 -2013
Tabl
e 4.
1.17
[co
ntin
ued]
: Num
ber
& D
ensi
ty o
f Rad
iolo
gist
s an
d N
ucle
ar M
edic
ine
Spec
ialis
ts in
Acu
te C
urat
ive
Hos
pita
ls in
Mal
aysi
a by
Sta
te &
Sec
tor,
2010
, 201
1 &
201
3
Stat
eSe
ctor
*
Rad
iolo
gist
s N
ucle
ar M
edic
ine
Spec
ialis
ts
2010
2011
2013
2010
2011
2013
Number
Per 100,000 population
Number
Per 100,000 population
Number
Per 100,000 population
Number
Per 100,000 population
Number
Per 100,000 population
Number
Per 100,000 population
Neg
eri S
embi
lan
Publ
ic9
- 7
- 13
- 0
- 0
- 0
- N
eger
i Sem
bila
nPr
ivat
e6
- 8
- 9
- 0
- 0
- 0
-N
eger
i Sem
bila
nTo
tal
151.
4715
1.44
222.
060
0.00
00.
000
0.00
Mel
aka
Publ
ic7
- 5
- 11
- 0
- 0
- 0
- M
elak
aPr
ivat
e7
- 9
- 9
- 0
- 0
- 0
-M
elak
aTo
tal
141.
7114
1.68
202.
350
0.00
00.
000
0.00
Joho
rPu
blic
18-
19-
16-
1-
1-
1-
Joho
rPr
ivat
e13
- 15
- 19
- 0
- 1
- 1
-Jo
hor
Tota
l31
0.93
341.
0035
1.01
10.
032
0.06
20.
06Pa
hang
Publ
ic14
- 13
- 15
- 0
- 0
- 0
- Pa
hang
Priv
ate
3-
3-
5-
0-
0-
0 -
Paha
ngTo
tal
171.
1316
1.05
201.
270
0.00
00.
000
0.00
Tere
ngga
nuPu
blic
6-
8-
8-
0-
0-
0-
Tere
ngga
nuPr
ivat
e0
- 0
- 1
- 0
- 0
- 0
-Te
reng
ganu
Tota
l6
0.58
80.
749
0.81
00.
000
0.00
00.
00Ke
lant
anPu
blic
17-
18-
20-
1-
1-
1-
Kela
ntan
Priv
ate
1-
1-
1-
0-
0-
0 -
Kela
ntan
Tota
l18
1.17
191.
1821
1.26
10.
061
0.06
10.
06Sa
raw
akPu
blic
13-
14-
12-
1-
1-
2-
Sara
wak
Priv
ate
9-
11-
11-
0-
0-
0 -
Sara
wak
Tota
l22
0.89
250.
9923
0.89
10.
041
0.04
20.
08Sa
bah
Publ
ic9
- 12
- 11
- 0
- 0
- 1
- Sa
bah
Priv
ate
2-
2-
2-
0-
0-
0 -
Saba
hTo
tal
110.
3414
0.42
130.
380
0.00
00.
001
0.03
WP
Labu
anPu
blic
0-
0-
1-
0-
0-
0-
WP
Labu
anPr
ivat
ena
- na
- na
- na
- na
- na
-W
P La
buan
Tota
l0
0.00
00.
001
1.07
00.
000
0.00
00.
00Sa
bah
& W
P La
buan
Publ
ic9
- 12
- 12
- 0
- 0
- 1
- Sa
bah
& W
P La
buan
Priv
ate
2-
2-
2-
0-
0-
0 -
Saba
h &
WP
Labu
anTo
tal
110.
3314
0.41
140.
400
0.00
00.
001
0.03
Abb
revi
atio
n: -
not
ava
ilabl
e; n
a -
not a
pplic
able
Sela
ngor
& W
P Pu
traj
aya
& W
PKL
are
also
col
lect
ivel
y re
ferr
ed to
as
Kla
ng V
alle
y.
* Pu
blic
sec
tor
in 2
010
& 2
011
refe
rs to
MO
H a
nd U
nive
rsity
hos
pita
ls, w
hile
pub
lic s
ecto
r in
201
3 re
fers
to M
OH
, Uni
vers
ity, a
nd M
OD
hos
pita
ls.
Fo
r po
pula
tion
data
, ple
ase
refe
r App
endi
x 3:
Tab
le A
3.1

90
National Healthcare Establishment & Workforce Statistics Hospital 2012 -2013
Tabl
e 4.
1.18
: N
umbe
r &
Den
sity
of P
atho
logi
sts
and
Fore
nsic
Pat
holo
gist
s in
Acu
te C
urat
ive
Hos
pita
ls in
Mal
aysi
a by
Sta
te &
Sec
tor,
2010
, 201
1 &
201
3
Stat
eSe
ctor
*
Path
olog
ists
‡Fo
rens
ic P
atho
logi
sts
2010
2011
2013
2010
2011
2013
Number
Per 100,000
population
Number
Per 100,000
population
Number
Per 100,000
population
Number
Per 100,000 population
Number
Per 100,000
population
Number
Per 100,000 population
Mal
aysi
aPu
blic
256
- 27
8-
332
- 27
- 26
- 33
- M
alay
sia
Priv
ate
43-
43-
40-
0-
0-
0-
Mal
aysi
aTo
tal
299
1.06
321
1.11
372
1.25
270.
1026
0.09
330.
11Pe
rlis
Publ
ic3
- 3
- 3
- 0
- 0
- 0
- Pe
rlis
Priv
ate
0-
0-
0-
na-
na-
na-
Perl
isTo
tal
31.
303
1.26
31.
240
0.00
00.
000
0.00
Keda
hPu
blic
8-
9-
15-
1-
1-
1-
Keda
hPr
ivat
e0
- 0
- 0
- 0
- 0
- 0
- Ke
dah
Tota
l8
0.41
90.
4615
0.74
10.
051
0.05
10.
05Ke
dah
& P
erlis
Publ
ic11
- 12
- 18
- 1
- 0
- 1
- Ke
dah
& P
erlis
Priv
ate
0-
0-
0-
0-
0-
0-
Keda
h &
Per
lisTo
tal
110.
5012
0.54
180.
801
0.05
00.
001
0.04
Pula
u Pi
nang
Publ
ic10
- 9
- 14
- 1
- 2
- 2
- Pu
lau
Pina
ngPr
ivat
e2
- 2
- 3
- 0
- 0
- 0
- Pu
lau
Pina
ngTo
tal
120.
7711
0.69
171.
041
0.06
20.
132
0.12
Pera
kPu
blic
13-
13-
16-
1-
1-
2-
Pera
kPr
ivat
e1
- 2
- 2
- 0
- 0
- 0
- Pe
rak
Tota
l14
0.60
150.
6318
0.74
10.
041
0.04
20.
08Se
lang
orPu
blic
43-
36-
46-
5-
6-
6-
Sela
ngor
Priv
ate
16-
17-
16-
0-
0-
0-
Sela
ngor
Tota
l59
1.08
530.
9562
1.08
50.
096
0.11
60.
10W
P Pu
traj
aya
Publ
ic5
- 4
- 7
- 0
- 0
- 0
- W
P Pu
traj
aya
Priv
ate
na-
na-
na-
na-
na-
na-
WP
Putr
ajay
aTo
tal
56.
904
5.24
78.
480
0.00
00.
000
0.00
WPK
LPu
blic
68-
92-
86-
9-
8-
9-
WPK
LPr
ivat
e17
- 16
- 13
- 0
- 0
- 0
- W
PKL
Tota
l85
5.08
108
6.37
995.
729
0.54
80.
479
0.52
Sela
ngor
& W
P Pu
traj
aya
& W
PKL
Publ
ic11
6-
132
- 13
9-
14-
14-
15-
Sela
ngor
& W
P Pu
traj
aya
& W
PKL
Priv
ate
33-
33-
29-
0-
0-
0-
Sela
ngor
& W
P Pu
traj
aya
& W
PKL
Tota
l14
92.
0716
52.
2516
82.
2314
0.19
140.
1915
0.20
Abb
revi
atio
n: -
not
ava
ilabl
e; n
a -
not a
pplic
able
Sela
ngor
& W
P Pu
traj
aya
& W
PKL
are
also
col
lect
ivel
y re
ferr
ed to
as
Kla
ng V
alle
y.
* Pu
blic
sec
tor
in 2
010
& 2
011
refe
rs to
MO
H a
nd U
nive
rsity
hos
pita
ls, w
hile
pub
lic s
ecto
r in
201
3 re
fers
to M
OH
, Uni
vers
ity, a
nd M
OD
hos
pita
ls.
‡ Pa
thol
ogis
ts r
efer
to s
peci
alis
ts fr
om th
e di
scip
line
of p
atho
logy
AN
D it
s su
bspe
cial
ties
(ana
tom
ical
pat
holo
gy, b
ioch
emis
try,
hae
mat
olog
y, m
edic
al m
icro
biol
ogy,
and
met
abol
ic m
edic
ine)
For
popu
latio
n da
ta, p
leas
e re
fer A
ppen
dix
3: T
able
A3.
1
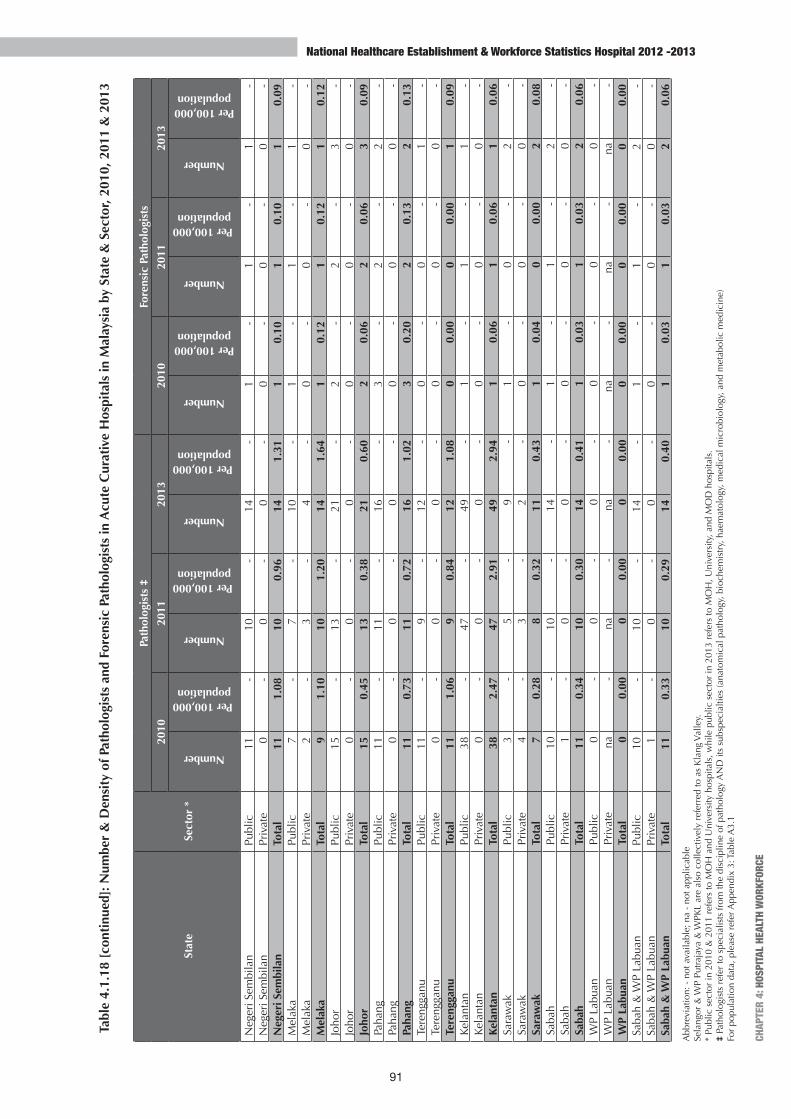
91
CHAP
TER
4: H
OSPI
TAL
HEAL
TH W
ORKF
ORCE
National Healthcare Establishment & Workforce Statistics Hospital 2012 -2013
Tabl
e 4.
1.18
[co
ntin
ued]
: Num
ber
& D
ensi
ty o
f Pat
holo
gist
s an
d Fo
rens
ic P
atho
logi
sts
in A
cute
Cur
ativ
e H
ospi
tals
in M
alay
sia
by S
tate
& S
ecto
r, 20
10, 2
011
& 2
013
Abb
revi
atio
n: -
not
ava
ilabl
e; n
a -
not a
pplic
able
Sela
ngor
& W
P Pu
traj
aya
& W
PKL
are
also
col
lect
ivel
y re
ferr
ed to
as
Kla
ng V
alle
y.
* Pu
blic
sec
tor
in 2
010
& 2
011
refe
rs to
MO
H a
nd U
nive
rsity
hos
pita
ls, w
hile
pub
lic s
ecto
r in
201
3 re
fers
to M
OH
, Uni
vers
ity, a
nd M
OD
hos
pita
ls.
‡ Pa
thol
ogis
ts r
efer
to s
peci
alis
ts fr
om th
e di
scip
line
of p
atho
logy
AN
D it
s su
bspe
cial
ties
(ana
tom
ical
pat
holo
gy, b
ioch
emis
try,
hae
mat
olog
y, m
edic
al m
icro
biol
ogy,
and
met
abol
ic m
edic
ine)
For
popu
latio
n da
ta, p
leas
e re
fer A
ppen
dix
3: T
able
A3.
1
Stat
eSe
ctor
*
Path
olog
ists
‡Fo
rens
ic P
atho
logi
sts
2010
2011
2013
2010
2011
2013
Number
Per 100,000 population
Number
Per 100,000 population
Number
Per 100,000 population
Number
Per 100,000 population
Number
Per 100,000 population
Number
Per 100,000 population
Neg
eri S
embi
lan
Publ
ic11
- 10
- 14
- 1
- 1
- 1
- N
eger
i Sem
bila
nPr
ivat
e0
- 0
- 0
- 0
- 0
- 0
- N
eger
i Sem
bila
nTo
tal
111.
0810
0.96
141.
311
0.10
10.
101
0.09
Mel
aka
Publ
ic7
- 7
- 10
- 1
- 1
- 1
- M
elak
aPr
ivat
e2
- 3
- 4
- 0
- 0
- 0
- M
elak
aTo
tal
91.
1010
1.20
141.
641
0.12
10.
121
0.12
Joho
rPu
blic
15-
13-
21-
2-
2-
3-
Joho
rPr
ivat
e0
- 0
- 0
- 0
- 0
- 0
- Jo
hor
Tota
l15
0.45
130.
3821
0.60
20.
062
0.06
30.
09Pa
hang
Publ
ic11
- 11
- 16
- 3
- 2
- 2
- Pa
hang
Priv
ate
0-
0-
0-
0-
0-
0-
Paha
ngTo
tal
110.
7311
0.72
161.
023
0.20
20.
132
0.13
Tere
ngga
nuPu
blic
11-
9-
12-
0-
0-
1-
Tere
ngga
nuPr
ivat
e0
- 0
- 0
- 0
- 0
- 0
- Te
reng
ganu
Tota
l11
1.06
90.
8412
1.08
00.
000
0.00
10.
09Ke
lant
anPu
blic
38-
47-
49-
1-
1-
1-
Kela
ntan
Priv
ate
0-
0-
0-
0-
0-
0-
Kela
ntan
Tota
l38
2.47
472.
9149
2.94
10.
061
0.06
10.
06Sa
raw
akPu
blic
3-
5-
9-
1-
0-
2-
Sara
wak
Priv
ate
4-
3-
2-
0-
0-
0-
Sara
wak
Tota
l7
0.28
80.
3211
0.43
10.
040
0.00
20.
08Sa
bah
Publ
ic10
- 10
- 14
- 1
- 1
- 2
- Sa
bah
Priv
ate
1-
0-
0-
0-
0-
0-
Saba
hTo
tal
110.
3410
0.30
140.
411
0.03
10.
032
0.06
WP
Labu
anPu
blic
0-
0-
0-
0-
0-
0-
WP
Labu
anPr
ivat
ena
- na
- na
- na
- na
- na
- W
P La
buan
Tota
l0
0.00
00.
000
0.00
00.
000
0.00
00.
00Sa
bah
& W
P La
buan
Publ
ic10
- 10
- 14
- 1
- 1
- 2
- Sa
bah
& W
P La
buan
Priv
ate
1-
0-
0-
0-
0-
0-
Saba
h &
WP
Labu
anTo
tal
110.
3310
0.29
140.
401
0.03
10.
032
0.06
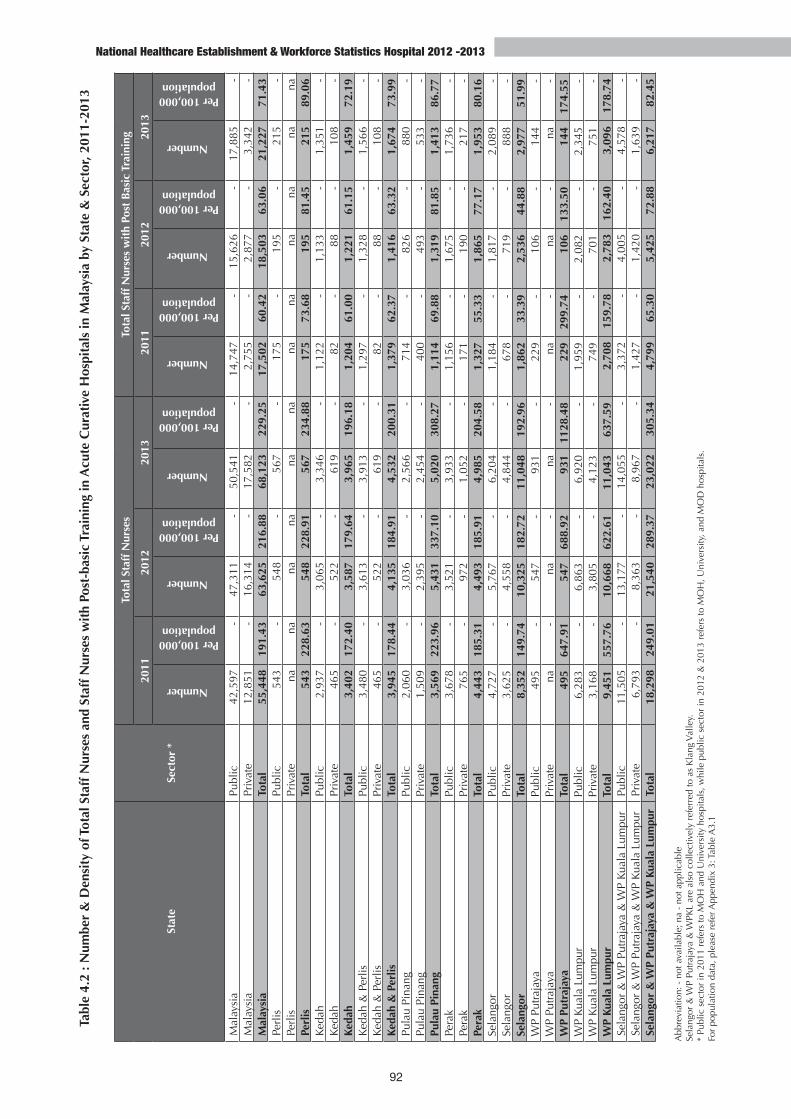
92
National Healthcare Establishment & Workforce Statistics Hospital 2012 -2013
Tabl
e 4.
2 : N
umbe
r &
Den
sity
of T
otal
Sta
ff N
urse
s an
d St
aff N
urse
s w
ith
Post
-bas
ic T
rain
ing
in A
cute
Cur
ativ
e H
ospi
tals
in M
alay
sia
by S
tate
& S
ecto
r, 20
11-2
013
Stat
eSe
ctor
*
Tota
l Sta
ff N
urse
sTo
tal S
taff
Nur
ses
wit
h Po
st B
asic
Tra
inin
g
2011
2012
2013
2011
2012
2013
Number
Per 100,000 population
Number
Per 100,000 population
Number
Per 100,000 population
Number
Per 100,000 population
Number
Per 100,000 population
Number
Per 100,000 population
Mal
aysi
aPu
blic
42,
597
- 4
7,31
1 -
50,
541
- 1
4,74
7 -
15,
626
- 1
7,88
5 -
M
alay
sia
Priv
ate
12,8
51
- 16
,314
-17
,582
- 2
,755
-2,
877
- 3
,342
-
Mal
aysi
aTo
tal
55,4
48
191.
4363
,625
216.
8868
,123
229.
2517
,502
60
.42
18,5
0363
.06
21,2
27
71.4
3Pe
rlis
Publ
ic 5
43
- 5
48
-
567
-
1
75
- 1
95
- 2
15
-
Perl
isPr
ivat
e n
a n
a n
a n
a n
a n
a n
a n
a n
a n
a n
a n
a Pe
rlis
Tota
l 5
43
228.
63 5
48
228.
91 5
67
234.
88 1
75
73.6
8 1
95
81.4
5 2
15
89.0
6Ke
dah
Publ
ic 2
,937
-
3,0
65
-
3,3
46
-
1,1
22
-
1,1
33
- 1
,351
-
Keda
hPr
ivat
e 4
65
- 5
22
-
619
-
82
-
88
-
108
-
Keda
hTo
tal
3,4
02
172.
40 3
,587
17
9.64
3,9
65
196.
18 1
,204
61
.00
1,2
21
61.1
5 1
,459
72
.19
Keda
h &
Per
lisPu
blic
3,4
80
-
3,6
13
- 3
,913
-
1,2
97
-
1,3
28
- 1
,566
-
Keda
h &
Per
lisPr
ivat
e 4
65
-
522
-
619
-
82
- 8
8 -
108
-
Keda
h &
Per
lisTo
tal
3,9
45
178.
44 4
,135
18
4.91
4,5
32
200.
31 1
,379
62
.37
1,4
16
63.3
2 1
,674
73
.99
Pula
u Pi
nang
Publ
ic 2
,060
-
3
,036
-
2,5
66
-
714
-
826
-
880
-
Pu
lau
Pina
ngPr
ivat
e 1
,509
-
2,3
95
- 2
,454
-
4
00
- 4
93
- 5
33
-
Pula
u Pi
nang
Tota
l 3
,569
22
3.96
5,4
31
337.
10 5
,020
30
8.27
1,1
14
69.8
8 1
,319
81
.85
1,4
13
86.7
7Pe
rak
Publ
ic 3
,678
-
3,5
21
-
3,9
33
- 1
,156
-
1,6
75
- 1
,736
-
Pe
rak
Priv
ate
765
-
972
-
1,0
52
- 1
71
- 1
90
- 2
17
-
Pera
kTo
tal
4,4
43
185.
31 4
,493
18
5.91
4,9
85
204.
58 1
,327
55
.33
1,8
65
77.1
7 1
,953
80
.16
Sela
ngor
Publ
ic 4
,727
-
5
,767
-
6,2
04
-
1,1
84
- 1
,817
-
2,0
89
- Se
lang
orPr
ivat
e 3
,625
-
4
,558
-
4,8
44
- 6
78
- 7
19
- 8
88
- Se
lang
orTo
tal
8,3
52
149.
74 1
0,32
5 18
2.72
11,
048
192.
96 1
,862
33
.39
2,5
36
44.8
8 2
,977
51
.99
WP
Putr
ajay
aPu
blic
495
-
547
-
931
-
229
-
106
-
144
-
W
P Pu
traj
aya
Priv
ate
na
- n
a -
na
- n
a -
na
- n
a -
WP
Putr
ajay
aTo
tal
495
64
7.91
547
68
8.92
931
11
28.4
8 2
29
299.
74 1
06
133.
50 1
44
174.
55W
P Ku
ala
Lum
pur
Publ
ic 6
,283
-
6,8
63
- 6
,920
-
1,9
59
- 2
,082
-
2,3
45
-
WP
Kual
a Lu
mpu
rPr
ivat
e 3
,168
-
3
,805
-
4,1
23
- 7
49
- 7
01
- 7
51
- W
P Ku
ala
Lum
pur
Tota
l 9
,451
55
7.76
10,
668
622.
61 1
1,04
3 63
7.59
2,7
08
159.
78 2
,783
16
2.40
3,0
96
178.
74Se
lang
or &
WP
Putr
ajay
a &
WP
Kual
a Lu
mpu
rPu
blic
11,
505
- 1
3,17
7 -
14,
055
- 3
,372
-
4,0
05
- 4
,578
-
Sela
ngor
& W
P Pu
traj
aya
& W
P Ku
ala
Lum
pur
Priv
ate
6,7
93
- 8
,363
-
8,9
67
- 1
,427
-
1,4
20
- 1
,639
-
Sela
ngor
& W
P Pu
traj
aya
& W
P Ku
ala
Lum
pur
Tota
l 1
8,29
8 24
9.01
21,
540
289.
37 2
3,02
2 30
5.34
4,7
99
65.3
0 5
,425
72
.88
6,21
782
.45
Abb
revi
atio
n: -
not
ava
ilabl
e; n
a -
not a
pplic
able
Sela
ngor
& W
P Pu
traj
aya
& W
PKL
are
also
col
lect
ivel
y re
ferr
ed to
as
Kla
ng V
alle
y.
*
Publ
ic s
ecto
r in
201
1 re
fers
to M
OH
and
Uni
vers
ity h
ospi
tals
, whi
le p
ublic
sec
tor
in 2
012
& 2
013
refe
rs to
MO
H, U
nive
rsity
, and
MO
D h
ospi
tals
.
For
popu
latio
n da
ta, p
leas
e re
fer A
ppen
dix
3: T
able
A3.
1
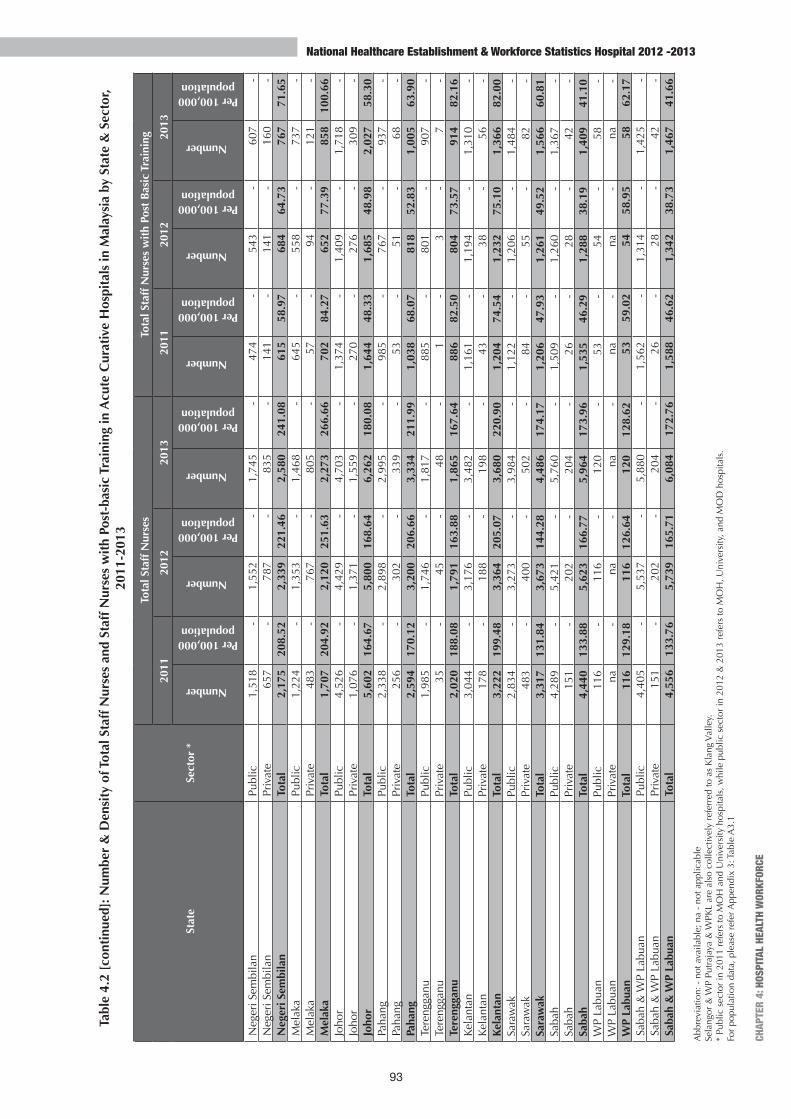
93
CHAP
TER
4: H
OSPI
TAL
HEAL
TH W
ORKF
ORCE
National Healthcare Establishment & Workforce Statistics Hospital 2012 -2013
Tabl
e 4.
2 [c
onti
nued
]: N
umbe
r &
Den
sity
of T
otal
Sta
ff N
urse
s an
d St
aff N
urse
s w
ith
Post
-bas
ic T
rain
ing
in A
cute
Cur
ativ
e H
ospi
tals
in M
alay
sia
by S
tate
& S
ecto
r, 20
11-2
013
Stat
eSe
ctor
*
Tota
l Sta
ff N
urse
sTo
tal S
taff
Nur
ses
wit
h Po
st B
asic
Tra
inin
g
2011
2012
2013
2011
2012
2013
Number
Per 100,000 population
Number
Per 100,000 population
Number
Per 100,000 population
Number
Per 100,000 population
Number
Per 100,000 population
Number
Per 100,000 population
Neg
eri S
embi
lan
Publ
ic 1
,518
-
1,5
52
-
1,7
45
- 4
74
- 5
43
- 6
07
- N
eger
i Sem
bila
nPr
ivat
e 6
57
- 7
87
-
835
-
141
-
141
-
160
-
Neg
eri S
embi
lan
Tota
l 2
,175
20
8.52
2,3
39
221.
46 2
,580
24
1.08
615
58
.97
684
64
.73
767
71
.65
Mel
aka
Publ
ic 1
,224
-
1
,353
-
1
,468
-
645
-
558
-
737
-
Mel
aka
Priv
ate
483
-
7
67
- 8
05
- 5
7 -
94
- 1
21
- M
elak
aTo
tal
1,7
07
204.
92 2
,120
25
1.63
2,2
73
266.
66 7
02
84.2
7 6
52
77.3
9 8
58
100.
66Jo
hor
Publ
ic 4
,526
-
4,4
29
- 4
,703
-
1,3
74
- 1
,409
-
1,7
18
- Jo
hor
Priv
ate
1,0
76
- 1
,371
-
1,5
59
- 2
70
- 2
76
- 3
09
-
Joho
rTo
tal
5,6
02
164.
67 5
,800
16
8.64
6,2
62
180.
08 1
,644
48
.33
1,6
85
48.9
8 2
,027
58
.30
Paha
ngPu
blic
2,3
38
- 2
,898
-
2
,995
-
985
-
767
-
937
-
Paha
ngPr
ivat
e 2
56
- 3
02
-
339
-
53
- 5
1 -
68
- Pa
hang
Tota
l 2
,594
17
0.12
3,2
00
206.
66 3
,334
21
1.99
1,0
38
68.0
7 8
18
52.8
3 1
,005
63
.90
Tere
ngga
nuPu
blic
1,9
85
- 1
,746
-
1,8
17
- 8
85
- 8
01
-
907
-
Te
reng
ganu
Priv
ate
35
- 4
5 -
48
- 1
-
3
-
7
-
Tere
ngga
nuTo
tal
2,0
20
188.
08 1
,791
16
3.88
1,8
65
167.
64 8
86
82.5
0 8
04
73.5
7 9
14
82.1
6Ke
lant
anPu
blic
3,0
44
- 3
,176
-
3,4
82
- 1
,161
-
1,1
94
- 1
,310
-
Ke
lant
anPr
ivat
e 1
78
- 1
88
- 1
98
- 4
3 -
38
- 5
6 -
Ke
lant
anTo
tal
3,2
22
199.
48 3
,364
20
5.07
3,6
80
220.
90 1
,204
74
.54
1,2
32
75.1
0 1
,366
82
.00
Sara
wak
Publ
ic 2
,834
-
3,2
73
- 3
,984
-
1,1
22
- 1
,206
-
1,4
84
- Sa
raw
akPr
ivat
e 4
83
- 4
00
- 5
02
- 8
4 -
55
- 8
2 -
Sara
wak
Tota
l 3
,317
13
1.84
3,6
73
144.
28 4
,486
17
4.17
1,2
06
47.9
3 1
,261
49
.52
1,5
66
60.8
1Sa
bah
Publ
ic 4
,289
-
5,4
21
- 5
,760
-
1,5
09
-
1,2
60
- 1
,367
-
Saba
hPr
ivat
e 1
51
-
202
-
204
-
26
-
28
- 4
2 -
Saba
hTo
tal
4,4
40
133.
88 5
,623
16
6.77
5,9
64
173.
96 1
,535
46
.29
1,2
88
38.1
9 1
,409
41
.10
WP
Labu
anPu
blic
116
-
116
-
120
-
53
-
54
- 5
8 -
WP
Labu
anPr
ivat
e n
a -
na
- n
a -
na
- n
a -
na
-W
P La
buan
Tota
l 1
16
129.
18 1
16
126.
64 1
20
128.
62 5
3 59
.02
54
58.9
5 5
8 62
.17
Saba
h &
WP
Labu
anPu
blic
4,4
05
-
5,5
37
-
5,8
80
- 1
,562
-
1
,314
-
1,4
25
- Sa
bah
& W
P La
buan
Priv
ate
151
-
202
-
204
-
26
-
28
-
42
- Sa
bah
& W
P La
buan
Tota
l 4
,556
13
3.76
5,7
39
165.
71 6
,084
17
2.76
1,5
88
46.6
2 1
,342
38
.73
1,4
67
41.6
6
Abb
revi
atio
n: -
not
ava
ilabl
e; n
a -
not a
pplic
able
Sela
ngor
& W
P Pu
traj
aya
& W
PKL
are
also
col
lect
ivel
y re
ferr
ed to
as
Kla
ng V
alle
y.
*
Publ
ic s
ecto
r in
201
1 re
fers
to M
OH
and
Uni
vers
ity h
ospi
tals
, whi
le p
ublic
sec
tor
in 2
012
& 2
013
refe
rs to
MO
H, U
nive
rsity
, and
MO
D h
ospi
tals
.
Fo
r po
pula
tion
data
, ple
ase
refe
r App
endi
x 3:
Tab
le A
3.1
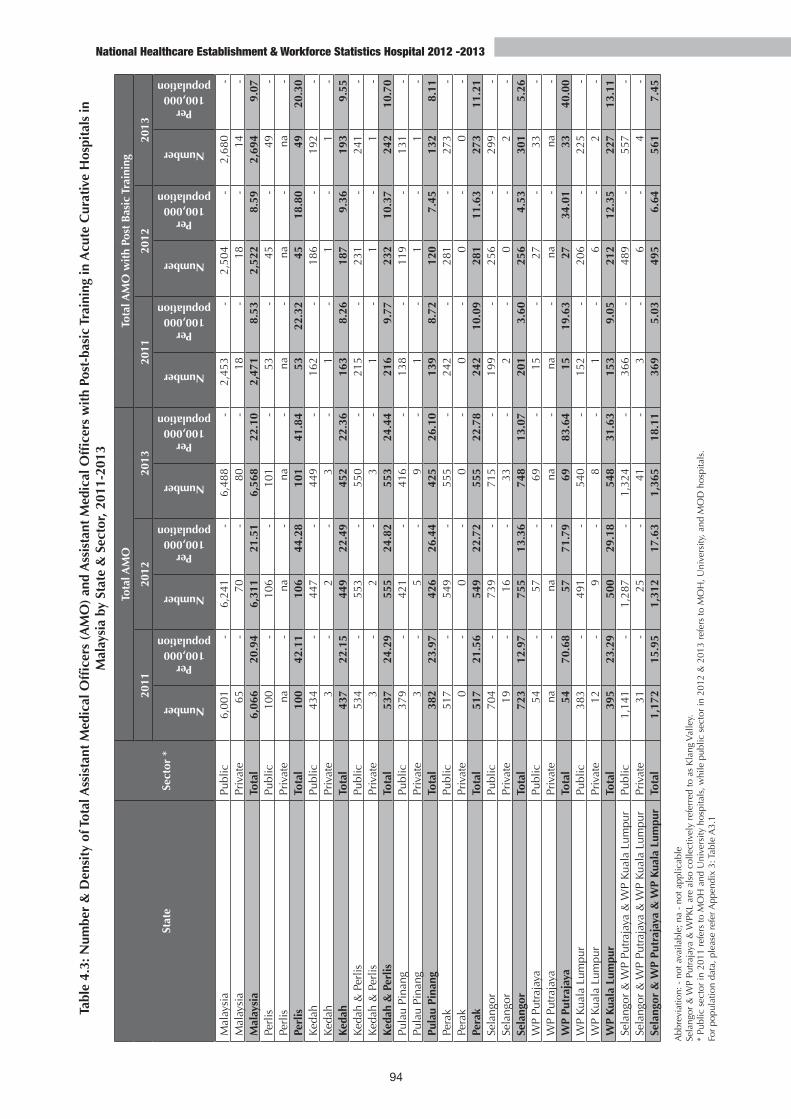
94
National Healthcare Establishment & Workforce Statistics Hospital 2012 -2013
Tabl
e 4.
3: N
umbe
r &
Den
sity
of T
otal
Ass
ista
nt M
edic
al O
ffice
rs (
AM
O)
and
Ass
ista
nt M
edic
al O
ffice
rs w
ith
Post
-bas
ic T
rain
ing
in A
cute
Cur
ativ
e H
ospi
tals
in
Mal
aysi
a by
Sta
te &
Sec
tor,
2011
-201
3
Stat
eSe
ctor
*
Tota
l AM
OTo
tal A
MO
wit
h Po
st B
asic
Tra
inin
g
2011
2012
2013
2011
2012
2013
Number
Per 100,000
population
Number
Per 100,000
population
Number
Per 100,000
population
Number
Per 100,000
population
Number
Per 100,000
population
Number
Per 100,000
population
Mal
aysi
aPu
blic
6,0
01
- 6
,241
-
6,4
88
- 2
,453
-
2,5
04
- 2
,680
-
Mal
aysi
aPr
ivat
e 6
5-
70
- 8
0 -
18
- 18
- 1
4 -
Mal
aysi
aTo
tal
6,06
620
.94
6,3
11
21.5
1 6
,568
22
.10
2,4
71
8.53
2,52
28.
59 2
,694
9.
07Pe
rlis
Publ
ic 1
00
- 1
06
- 1
01
- 5
3 -
45
- 4
9 -
Perl
isPr
ivat
e n
a -
na
- n
a -
na
- n
a -
na
-Pe
rlis
Tota
l 1
00
42.1
1 1
06
44.2
8 1
01
41.8
4 5
3 22
.32
45
18.8
0 4
9 20
.30
Keda
hPu
blic
434
-
447
-
449
-
162
-
186
-
192
-
Keda
hPr
ivat
e 3
-
2
- 3
-
1
- 1
-
1
- Ke
dah
Tota
l 4
37
22.1
5 4
49
22.4
9 4
52
22.3
6 1
63
8.26
187
9.
36 1
93
9.55
Keda
h &
Per
lisPu
blic
534
-
553
-
550
-
215
-
231
-
241
-
Keda
h &
Per
lisPr
ivat
e 3
-
2
- 3
-
1
- 1
-
1
- Ke
dah
& P
erlis
Tota
l 5
37
24.2
9 5
55
24.8
2 5
53
24.4
4 2
16
9.77
232
10
.37
242
10
.70
Pula
u Pi
nang
Publ
ic 3
79
- 4
21
- 4
16
- 1
38
- 1
19
- 1
31
- Pu
lau
Pina
ngPr
ivat
e 3
-
5
- 9
-
1
- 1
-
1
-Pu
lau
Pina
ngTo
tal
382
23
.97
426
26
.44
425
26
.10
139
8.
72 1
20
7.45
132
8.
11Pe
rak
Publ
ic 5
17
- 5
49
- 5
55
- 2
42
- 2
81
- 2
73
-Pe
rak
Priv
ate
0-
0-
0-
0-
0-
0 -
Pera
kTo
tal
517
21
.56
549
22
.72
555
22
.78
242
10
.09
281
11
.63
273
11
.21
Sela
ngor
Publ
ic 7
04
- 7
39
- 7
15
- 1
99
- 2
56
- 2
99
- Se
lang
orPr
ivat
e 1
9 -
16
- 3
3 -
2
- 0
- 2
-
Sela
ngor
Tota
l 7
23
12.9
7 7
55
13.3
6 7
48
13.0
7 2
01
3.60
256
4.
53 3
01
5.26
WP
Putr
ajay
aPu
blic
54
- 5
7 -
69
- 1
5 -
27
- 3
3 -
WP
Putr
ajay
aPr
ivat
e n
a -
na
- n
a -
na
- n
a -
na
-W
P Pu
traj
aya
Tota
l 5
4 70
.68
57
71.7
9 6
9 83
.64
15
19.6
3 2
7 34
.01
33
40.0
0W
P Ku
ala
Lum
pur
Publ
ic 3
83
- 4
91
- 5
40
- 1
52
- 2
06
- 2
25
- W
P Ku
ala
Lum
pur
Priv
ate
12
- 9
-
8
- 1
-
6
- 2
-
WP
Kual
a Lu
mpu
rTo
tal
395
23
.29
500
29
.18
548
31
.63
153
9.
05 2
12
12.3
5 2
27
13.1
1Se
lang
or &
WP
Putr
ajay
a &
WP
Kual
a Lu
mpu
rPu
blic
1,1
41
- 1
,287
-
1,3
24
- 3
66
- 4
89
- 5
57
- Se
lang
or &
WP
Putr
ajay
a &
WP
Kual
a Lu
mpu
rPr
ivat
e 3
1 -
25
- 4
1 -
3
- 6
-
4-
Sela
ngor
& W
P Pu
traj
aya
& W
P Ku
ala
Lum
pur
Tota
l 1
,172
15
.95
1,3
12
17.6
3 1
,365
18
.11
369
5.
03 4
95
6.64
561
7.
45
Abb
revi
atio
n: -
not
ava
ilabl
e; n
a -
not a
pplic
able
Sela
ngor
& W
P Pu
traj
aya
& W
PKL
are
also
col
lect
ivel
y re
ferr
ed to
as
Kla
ng V
alle
y.
*
Publ
ic s
ecto
r in
201
1 re
fers
to M
OH
and
Uni
vers
ity h
ospi
tals
, whi
le p
ublic
sec
tor
in 2
012
& 2
013
refe
rs to
MO
H, U
nive
rsity
, and
MO
D h
ospi
tals
.
Fo
r po
pula
tion
data
, ple
ase
refe
r App
endi
x 3:
Tab
le A
3.1

95
CHAP
TER
4: H
OSPI
TAL
HEAL
TH W
ORKF
ORCE
National Healthcare Establishment & Workforce Statistics Hospital 2012 -2013
Tabl
e 4.
3 [c
onti
nued
]: N
umbe
r &
Den
sity
of T
otal
Ass
ista
nt M
edic
al O
ffice
rs (
AM
O)
and
Ass
ista
nt M
edic
al O
ffice
rs w
ith
Post
-bas
ic T
rain
ing
in A
cute
Cur
ativ
e H
ospi
tals
in M
alay
sia
by S
tate
& S
ecto
r, 20
11-2
013
Stat
eSe
ctor
*
Tota
l AM
OTo
tal A
MO
wit
h Po
st B
asic
Tra
inin
g20
1120
1220
1320
1120
1220
13
Number
Per 100,000 population
Number
Per 100,000 population
Number
Per 100,000 population
Number
Per 100,000 population
Number
Per 100,000 population
Number
Per 100,000 population
Neg
eri S
embi
lan
Publ
ic 2
50
- 2
83
- 2
69
- 8
8 -
75
- 8
5 -
Neg
eri S
embi
lan
Priv
ate
5
- 9
-
14
- 2
-
5
- 5
-
Neg
eri S
embi
lan
Tota
l 2
55
24.4
2 2
92
27.6
0 2
83
26.4
2 9
0 8.
63 8
0 7.
55 9
0 8.
39M
elak
aPu
blic
251
-
230
-
246
-
141
-
103
-
116
-
Mel
aka
Priv
ate
4
- 3
-
4
- 1
-
0 -
0-
Mel
aka
Tota
l 2
55
30.6
1 2
33
27.6
6 2
50
29.3
3 1
42
17.0
5 1
03
12.2
3 1
16
13.6
1Jo
hor
Publ
ic 5
38
- 5
64
- 5
91
- 2
22
- 2
42
- 2
63
- Jo
hor
Priv
ate
3
- 1
5 -
4
- 3
-
2
- 2
-
Joho
rTo
tal
541
15
.89
579
16
.83
595
17
.11
225
6.
61 2
44
7.09
265
7.
62Pa
hang
Publ
ic 4
43
- 3
98
- 4
10
- 1
52
- 1
49
- 1
61
- Pa
hang
Priv
ate
2
- 1
-
2
- 0
-0
- 1
-
Paha
ngTo
tal
445
29
.18
399
25
.77
412
26
.20
152
9.
97 1
49
9.62
162
10
.30
Tere
ngga
nuPu
blic
240
-
250
-
266
-
117
-
101
-
107
-
Tere
ngga
nuPr
ivat
e0
- 0
- 0
- 0
- 0
-0
- Te
reng
ganu
Tota
l 2
40
22.3
5 2
50
22.8
7 2
66
23.9
1 1
17
10.8
9 1
01
9.24
107
9.
62Ke
lant
anPu
blic
342
-
370
-
377
-
153
-
164
-
169
-
Kela
ntan
Priv
ate
1
- 2
-
2
- -
-
-
- -
-
Kela
ntan
Tota
l 3
43
21.2
4 3
72
22.6
8 3
79
22.7
5 1
53
9.47
164
10
.00
169
10
.14
Sara
wak
Publ
ic 6
46
- 5
96
- 6
48
- 2
85
- 2
90
- 3
15
- Sa
raw
akPr
ivat
e 1
3 -
8
- 1
-
7
- 3
-
-
- Sa
raw
akTo
tal
659
26
.19
604
23
.73
649
25
.21
292
11
.60
293
11
.50
315
12
.23
Saba
hPu
blic
697
-
716
-
812
-
323
-
253
-
255
-
Saba
hPr
ivat
e0
-0
- 0
- 0
- 0
- 0
- Sa
bah
Tota
l 6
97
21.0
2 7
16
21.2
4 8
12
23.6
9 3
23
9.74
253
7.
50 2
55
7.44
WP
Labu
anPu
blic
23
- 2
4 -
24
- 1
1 -
7
- 7
-
WP
Labu
anPr
ivat
e n
a -
na
- n
a -
na
- n
a -
na
-W
P La
buan
Tota
l 2
3 25
.61
24
26.2
0 2
4 25
.72
11
12.2
5 7
7.
64 7
7.
50Sa
bah
& W
P La
buan
Publ
ic 7
20
- 7
40
- 8
36
- 3
34
- 2
60
- 2
62
- Sa
bah
& W
P La
buan
Priv
ate
0-
0-
0-
0-
0-
0-
Saba
h &
WP
Labu
anTo
tal
720
21
.14
740
21
.37
836
23
.74
334
9.
81 2
60
7.51
262
7.
44
Abb
revi
atio
n: -
not
ava
ilabl
e; n
a -
not a
pplic
able
Sela
ngor
& W
P Pu
traj
aya
& W
PKL
are
also
col
lect
ivel
y re
ferr
ed to
as
Kla
ng V
alle
y.
*
Publ
ic s
ecto
r in
201
1 re
fers
to M
OH
and
Uni
vers
ity h
ospi
tals
, whi
le p
ublic
sec
tor
in 2
012
& 2
013
refe
rs to
MO
H, U
nive
rsity
, and
MO
D h
ospi
tals
.
For
popu
latio
n da
ta, p
leas
e re
fer A
ppen
dix
3: T
able
A3.
1

96
National Healthcare Establishment & Workforce Statistics Hospital 2012 -2013
Tabl
e 4.
4 : N
umbe
r &
Den
sity
of T
otal
Rad
iogr
aphe
rs, a
nd N
umbe
r of
Rad
iogr
aphe
rs w
ith
Post
-bas
ic T
rain
ing
in M
amm
ogra
phy
/ C
ompu
ter T
omog
raph
y (C
T) in
Acu
te
Cur
ativ
e H
ospi
tals
in M
alay
sia
by S
tate
& S
ecto
r, 20
12-2
013
Stat
eSe
ctor
*
Tota
l Rad
iogr
aphe
rTo
tal R
adio
grap
her
wit
h Po
st B
asic
Tr
aini
ng in
Mam
mog
raph
yTo
tal R
adio
grap
her
wit
h Po
st B
asic
Tr
aini
ng in
Com
pute
r Tom
ogra
phy
(CT)
2012
2013
2012
2013
2012
2013
Num
ber
Per
10
0,00
0 N
umbe
r P
er
100,
000
Num
ber
Num
ber
Num
ber
Num
ber
Mal
aysi
aPu
blic
2,3
51
-
2,4
19
- 24
3112
012
8M
alay
sia
Priv
ate
736
-
839
-
- -
- -
Mal
aysi
aTo
tal
3,0
87
10.5
2 3
,258
10
.96
- -
- -
Perl
isPu
blic
30
- 3
0 -
0
07
7Pe
rlis
Priv
ate
na
na
na
na
na
na
na
na
Perl
isTo
tal
30
12.5
3 3
0 12
.43
- -
- -
Keda
hPu
blic
132
-
134
-
0
11
2Ke
dah
Priv
ate
21
- 3
0 -
- -
- -
Keda
hTo
tal
153
7.
66 1
64
8.11
- -
- -
Keda
h &
Per
lisPu
blic
162
-
1
64
-
01
89
Keda
h &
Per
lisPr
ivat
e 2
1 -
3
0 -
- -
-
- Ke
dah
& P
erlis
Tota
l 1
83
8.18
194
8.
57-
-
- -
Pula
u Pi
nang
Publ
ic 1
45
- 1
33
-3
310
9Pu
lau
Pina
ngPr
ivat
e 9
9 -
116
-
-
- -
- Pu
lau
Pina
ngTo
tal
244
15
.17
249
15
.27
- -
- -
Pera
kPu
blic
169
-
172
-
00
23
Pera
kPr
ivat
e 4
5 -
5
1 -
- -
--
Pera
kTo
tal
214
8.
86 2
23
9.15
- -
-
- Se
lang
orPu
blic
255
-
255
-
36
2019
Sela
ngor
Priv
ate
187
-
205
-
-
-
--
Sela
ngor
Tota
l 4
42
7.83
460
8.
03-
-
--
WP
Putr
ajay
aPu
blic
27
-
60
-
01
04
WP
Putr
ajay
aPr
ivat
e n
a n
a n
a n
a n
a n
a n
a n
a W
P Pu
traj
aya
Tota
l 2
7 34
.01
60
72.7
3-
--
- W
P Ku
ala
Lum
pur
Publ
ic 4
37
-
442
-
4
625
24W
P Ku
ala
Lum
pur
Priv
ate
176
-
1
94
- -
-
-
- W
P Ku
ala
Lum
pur
Tota
l 6
13
35.8
0 6
36
36.7
1 -
- -
- Se
lang
or &
WP
Putr
ajay
a &
WP
Kual
a Lu
mpu
rPu
blic
719
-
757
-
713
4547
Sela
ngor
& W
P Pu
traj
aya
& W
P Ku
ala
Lum
pur
Priv
ate
364
-
399
-
- -
-
Se
lang
or &
WP
Putr
ajay
a &
WP
Kual
a Lu
mpu
rTo
tal
1,0
83
14.5
5 1
,156
15
.33
- -
-
-
Abb
revi
atio
n: -
not
ava
ilabl
e; n
a -
not a
pplic
able
Sela
ngor
& W
P Pu
traj
aya
& W
PKL
are
also
col
lect
ivel
y re
ferr
ed to
as
Kla
ng V
alle
y.
*
Publ
ic s
ecto
r in
201
1 re
fers
to M
OH
and
Uni
vers
ity h
ospi
tals
, whi
le p
ublic
sec
tor
in 2
012
& 2
013
refe
rs to
MO
H, U
nive
rsity
, and
MO
D h
ospi
tals
.
Fo
r po
pula
tion
data
, ple
ase
refe
r App
endi
x 3:
Tab
le A
3.1
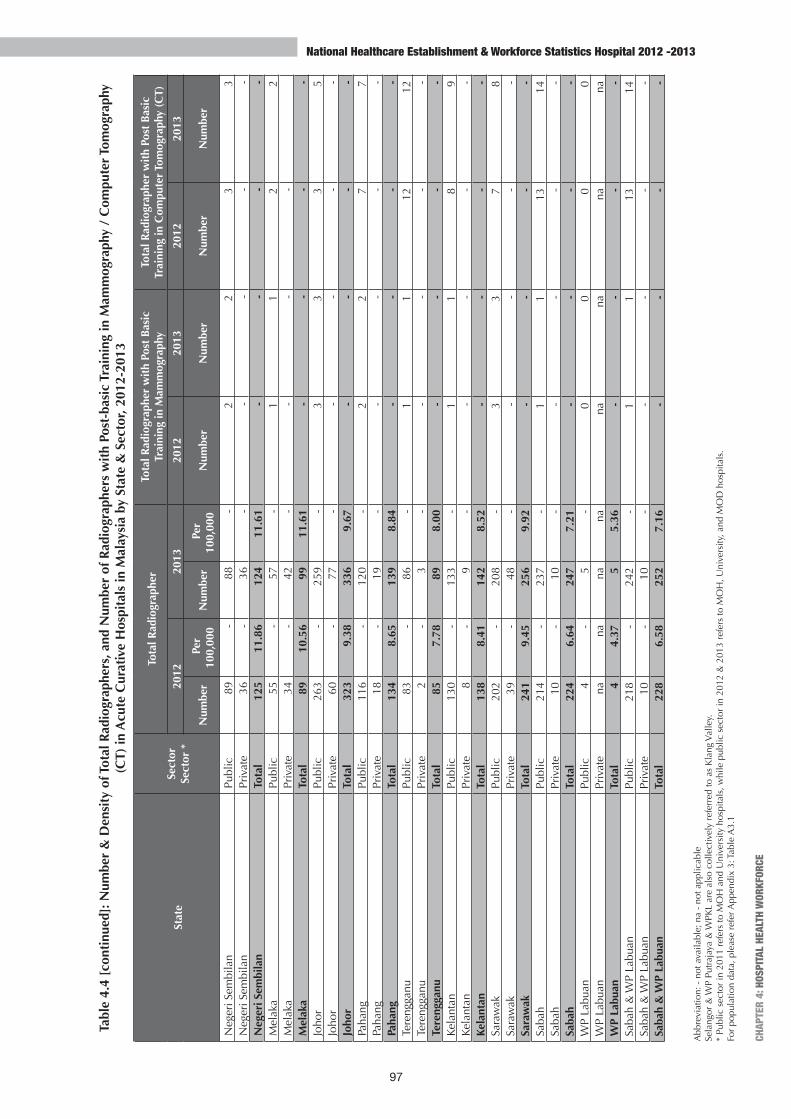
97
CHAP
TER
4: H
OSPI
TAL
HEAL
TH W
ORKF
ORCE
National Healthcare Establishment & Workforce Statistics Hospital 2012 -2013
Tabl
e 4.
4 [c
onti
nued
]: N
umbe
r &
Den
sity
of T
otal
Rad
iogr
aphe
rs, a
nd N
umbe
r of
Rad
iogr
aphe
rs w
ith
Post
-bas
ic T
rain
ing
in M
amm
ogra
phy
/ C
ompu
ter T
omog
raph
y (C
T) in
Acu
te C
urat
ive
Hos
pita
ls in
Mal
aysi
a by
Sta
te &
Sec
tor,
2012
-201
3
Stat
eSe
ctor
Se
ctor
*
Tota
l Rad
iogr
aphe
rTo
tal R
adio
grap
her
wit
h Po
st B
asic
Tr
aini
ng in
Mam
mog
raph
yTo
tal R
adio
grap
her
wit
h Po
st B
asic
Tr
aini
ng in
Com
pute
r Tom
ogra
phy
(CT)
2012
2013
2012
2013
2012
2013
Num
ber
Per
10
0,00
0 N
umbe
r P
er
100,
000
Num
ber
Num
ber
Num
ber
Num
ber
Neg
eri S
embi
lan
Publ
ic 8
9 -
88
- 2
23
3N
eger
i Sem
bila
nPr
ivat
e 3
6 -
3
6 -
- -
- -
Neg
eri S
embi
lan
Tota
l 1
25
11.8
6 1
24
11.6
1-
- -
-
Mel
aka
Publ
ic 5
5 -
5
7 -
11
22
Mel
aka
Priv
ate
34
-
42
- -
- -
M
elak
aTo
tal
89
10.5
6 9
9 11
.61
- -
-
-
Joho
rPu
blic
263
-
259
-
3
33
5Jo
hor
Priv
ate
60
- 7
7 -
-
- -
-
Joho
rTo
tal
323
9.
38 3
36
9.67
- -
--
Paha
ngPu
blic
116
-
120
-
2
27
7Pa
hang
Priv
ate
18
- 1
9 -
-
- -
- Pa
hang
Tota
l 1
34
8.65
139
8.
84 -
-
--
Tere
ngga
nuPu
blic
83
- 8
6 -
11
1212
Tere
ngga
nuPr
ivat
e 2
-
3
-
-
-
--
Tere
ngga
nuTo
tal
85
7.78
89
8.00
-
-
--
Kela
ntan
Publ
ic 1
30
- 1
33
-
11
89
Kela
ntan
Priv
ate
8
-
9
-
-
-
--
Kela
ntan
Tota
l 1
38
8.41
142
8.
52 -
-
--
Sara
wak
Publ
ic 2
02
-
208
-
33
78
Sara
wak
Priv
ate
39
-
48
- -
-
- -
Sa
raw
akTo
tal
241
9.
45 2
56
9.92
-
-
- -
Saba
hPu
blic
214
-
2
37
-1
113
14Sa
bah
Priv
ate
10
- 1
0 -
- -
-
-
Saba
hTo
tal
224
6.
64 2
47
7.21
- -
-
-
WP
Labu
anPu
blic
4
- 5
-
00
00
WP
Labu
anPr
ivat
e n
a n
a n
a n
a n
a n
a n
a n
a W
P La
buan
Tota
l 4
4.
37 5
5.
36-
-
-
-Sa
bah
& W
P La
buan
Publ
ic 2
18
- 2
42
-1
113
14Sa
bah
& W
P La
buan
Priv
ate
10
- 1
0 -
- -
-
-
Sa
bah
& W
P La
buan
Tota
l 2
28
6.58
252
7.
16 -
-
-
-
Abb
revi
atio
n: -
not
ava
ilabl
e; n
a -
not a
pplic
able
Sela
ngor
& W
P Pu
traj
aya
& W
PKL
are
also
col
lect
ivel
y re
ferr
ed to
as
Kla
ng V
alle
y.
*
Publ
ic s
ecto
r in
201
1 re
fers
to M
OH
and
Uni
vers
ity h
ospi
tals
, whi
le p
ublic
sec
tor
in 2
012
& 2
013
refe
rs to
MO
H, U
nive
rsity
, and
MO
D h
ospi
tals
.
Fo
r po
pula
tion
data
, ple
ase
refe
r App
endi
x 3:
Tab
le A
3.1

This page intentionally left blank

Appendices

National Healthcare Establishment & Workforce Statistics Hospital 2012 -2013
100
APPENDIX 1 | DEFINITION OF NHEWS (HOSPITAL) TERMINOLOGYAcute Curative Care
Comprises health care contacts during which the principal intent is to relieve symptoms of illness or injury, to reduce the severity of an illness or injury, or to protect against exacerbation and/or complication of an illness that could threaten life or normal function. Other functions of care such as rehabilitative care, long-term care and palliative care are excluded. (OECD Health Statistics 2014)
Hospital
An institution that primarily provides inpatient services (diagnostic and therapeutic); catering for a variety of medical conditions- both surgical and non surgical.
Non-Specialist Hospital
A hospital without permanent or resident specialists that provides services including medicine and surgery to meet the general medical and surgical needs of the community.
Specialist Hospital
A hospital with permanent or resident specialists that provides services including medicine, surgery, and other specialty services to meet the medical and surgical needs of the community.
Hospital with Tertiary Services
A hospital with more than 20 resident specialties or subspecialties services.
Hospital with Secondary Services
A hospital that provides up to 20 resident specialties or subspecialties services.
Special Institutions
A hospital that provides only specific resident specialty service(s).
Maternity Centre
A hospital that is used or intended to be used for the provision of obstetric and/ or gynaecological care that extends beyond care in a normal pregnancy/ labour/ post-partum period/ normal newborns, and may offer the conduct of deliveries besides spontaneous vertex deliveries.
Name of Establishment
A name by which the establishment is identified; as approved or licensed by the Ministry of Health Malaysia (Medical Practice Division - CKAPS).
Address
A location where the establishment operates; as approved or licensed by the Ministry of Health Malaysia (Medical Practice Division - CKAPS). The location information includes postcode, city/town, district, and state.
New Establishment
A hospital that was established in either 2012 or 2013 (the survey years for the latest NHEWS- Hospital survey). The survey recorded the date (in month and year) during which the establishment began operating.

National Healthcare Establishment & Workforce Statistics Hospital 2012 -2013
101
Gazetted Inpatient Beds
Hospital beds that can be used for patients admitted for diagnostic and/or therapeutic purposes. Both occupied and vacant beds on any given day are counted.
Include:
• Cots/bassinets set aside for babies requiring special care at Special Care Nursery (SCN), and Neonatal Intensive Care Unit (NICU).
Exclude:
• Beds in treatment rooms
• Beds in examining rooms
• Beds in emergency rooms
• Beds in physical/occupational therapy departments
• Beds in labour rooms
• Beds in observation or recovery rooms
• Cots/bassinets for normal newborns in obstetric (postnatal) wards
Gazetted Functioning Inpatient Beds
Hospital beds that are readily available to take in patients and provide care according to the manpower and equipments available for that bed. Exclude beds in the ward(s) that are gazetted, but not used or are yet to be used for actual service.
Non-gazetted Functioning Inpatient Beds
Additional non-gazetted (non-official) beds to take in patients and provide care when needed.
Inpatient Admission
The formal acceptance by a hospital of a patient who will occupy a hospital bed, cot or bassinet for observation, care, diagnosis or treatment, and will have a medical record maintained for him/her. Day case admission is excluded.
Total Length of Stay (TLOS) (in days)
The sum of number of days each inpatient stayed for the duration of a particular year (for all diagnoses/admissions of that particular year)
Average Length of Stay (ALOS) (in days)
The average number of days that inpatients (excluding newborns) remained in the hospital.
ALOS = Sum of length of stay of discharged patients for a given
period
Total number of discharged patients in the same period
APPE
NDIX
1: D
EFIN
ITIO
N OF
TERM
INOL
OGY
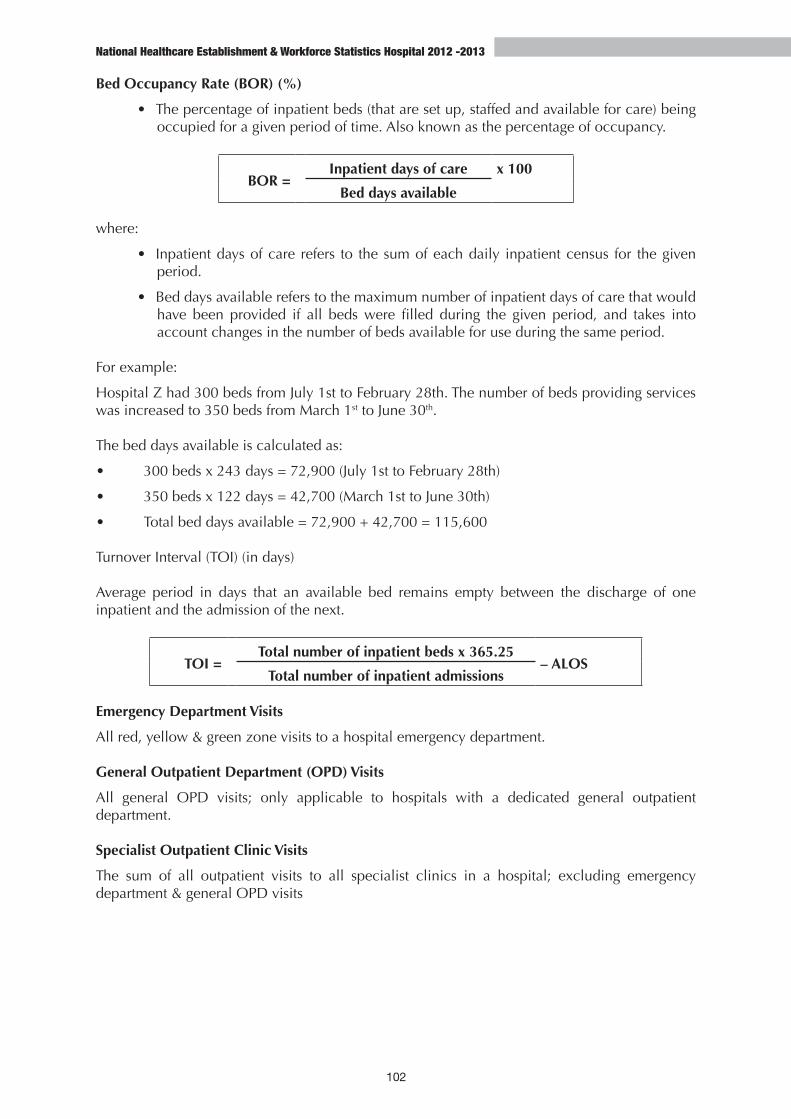
National Healthcare Establishment & Workforce Statistics Hospital 2012 -2013
102
Bed Occupancy Rate (BOR) (%)
• The percentage of inpatient beds (that are set up, staffed and available for care) being occupied for a given period of time. Also known as the percentage of occupancy.
BOR =Inpatient days of care x 100
Bed days available
where:
• Inpatient days of care refers to the sum of each daily inpatient census for the given period.
• Bed days available refers to the maximum number of inpatient days of care that would have been provided if all beds were filled during the given period, and takes into account changes in the number of beds available for use during the same period.
For example:
Hospital Z had 300 beds from July 1st to February 28th. The number of beds providing services was increased to 350 beds from March 1st to June 30th.
The bed days available is calculated as:
• 300 beds x 243 days = 72,900 (July 1st to February 28th)
• 350 beds x 122 days = 42,700 (March 1st to June 30th)
• Total bed days available = 72,900 + 42,700 = 115,600
Turnover Interval (TOI) (in days)
Average period in days that an available bed remains empty between the discharge of one inpatient and the admission of the next.
TOI =Total number of inpatient beds x 365.25
– ALOSTotal number of inpatient admissions
Emergency Department Visits
All red, yellow & green zone visits to a hospital emergency department.
General Outpatient Department (OPD) Visits
All general OPD visits; only applicable to hospitals with a dedicated general outpatient department.
Specialist Outpatient Clinic Visits
The sum of all outpatient visits to all specialist clinics in a hospital; excluding emergency department & general OPD visits
National Healthcare Establishment & Workforce Statistics Hospital 2012 -2013
103
Mammogram Machine
Equipment that functions to perform mammography (either analogue or digital)
Total Mammograms
Total number of mammography (both screening and diagnostic) performed for the particular year.
Total Screening Mammograms
The number of mammography performed for screening purpose only.
Medical Doctor
A fully registered medical practitioner with the Malaysian Medical Council. This may refer to a clinical specialist or a medical officer, but not a house officer.
Specialist
A registered medical practitioner who holds a postgraduate qualification recognised by both the Ministry of Health and the Public Service Department Malaysia; and has the necessary core clinical competence and core procedural skills as expected of doctors with the responding recognised postgraduate qualification.
Permanent / Resident Doctor
An in-house medical practitioner (specialist/medical officer) who is available to diagnose and treat patients in a hospital, and he/she is a permanent staff of the hospital.
Visiting Doctor
A medical practitioner (specialist/medical officer) who is available to diagnose and treat patients in a hospital, but he/she is not a permanent staff of the hospital. Such medical practitioner may make regular visits (e.g. monthly/biweekly/weekly etc) to see patients in the hospital or is accessible on an ad-hoc or emergency basis only.
Nurse
A registered nurse with the Malaysian Nursing Board who holds a degree/diploma qualification.
Nurse with Post-basic Training
A registered nurse with the Malaysian Nursing Board who holds a degree/diploma qualification, and has post-basic training.
Assistant Medical Officer
A registered assistant medical officer with the Malaysian Medical Assistant Board.
Assistant Medical Officer with Post-basic Training
A registered assistant medical officer with the Malaysian Medical Assistant Board who has post basic training.
Radiographer
A radiographer with a recognised degree/diploma qualification.
APPE
NDIX
1: D
EFIN
ITIO
N OF
TERM
INOL
OGY

National Healthcare Establishment & Workforce Statistics Hospital 2012 -2013
104
Post-basic Training
Formal and accredited training aimed at enhancing competency of healthcare professionals. Upon completion, one is awarded with a certification and recognition in providing high quality specialised care in the trained discipline. On-the-job training does not fulfil this definition hence excluded.
Radiographer with Post-basic Training in Mammography
A radiographer with a recognised degree/diploma qualification, and has post-basic training in mammography.
Radiographer with Post-basic Training in Computer Tomography (CT) Scan
A radiographer with a recognised degree/diploma qualification, and has post-basic training in CT Scan.
National Healthcare Establishment & Workforce Statistics Hospital 2012 -2013
105
APPENDIX 2.1 | PARTICIPANTS FOR NHEWS (HOSPITAL) 2012HOSPITAL SECTOR: PUBLIC/ MINISTRY OF HEALTH
Perlis
1. Hospital Tuanku Fauziah, Kangar
Wilayah Persekutuan Putrajaya
1. Hospital Putrajaya
Wilayah Persekutuan Labuan
1 Hospital Labuan
Wilayah Persekutuan Kuala Lumpur
1. Institut Perubatan Respiratori 3. Hospital Kuala Lumpur
2. Hospital Rehabilitasi Cheras
Melaka
1. Hospital Jasin 3. Hospital Melaka
2. Hospital Alor Gajah
Pulau Pinang
1. Hospital Balik Pulau 4. Hospital Pulau Pinang
2. Hospital Bukit Mertajam 5. Hospital Seberang Jaya
3. Hospital Kepala Batas 6. Hospital Sungai Bakap
Negeri Sembilan
1. Hospital Jelebu 4. Hospital Tampin
2. Hospital Jempol 5. Hospital Tuanku Jaafar, Seremban
3. Hospital Port Dickson 6. Hospital Tuanku Ampuan Najihah, Kuala Pilah
Terengganu
1. Hospital Besut 4. Hospital Kemaman
2. Hospital Dungun 5. Hospital Setiu
3. Hospital Hulu Terengganu 6. Hospital Sultanah Nur Zahirah, Kuala Terengganu
Kelantan
1. Hospital Gua Musang 6. Hospital Raja Perempuan Zainab II, Kota Bharu
2. Hospital Jeli 7. Hospital Tanah Merah
3. Hospital Kuala Krai 8. Hospital Tengku Anis, Pasir Puteh
4. Hospital Machang 9. Hospital Tumpat
5. Hospital Pasir Mas
APPE
NDIX
2: P
ARTI
CIPA
NTS
OF N
HEW
S (H
OSPI
TAL)
201
2

National Healthcare Establishment & Workforce Statistics Hospital 2012 -2013
106
Kedah
1. Hospital Langkawi 6. Hospital Sik
2. Hospital Jitra 7. Hospital Sultan Abdul Halim, Sungai Petani
3. Hospital Kuala Nerang 8. Hospital Sultanah Bahiyah, Alor Setar
4. Hospital Kulim 9. Hospital Yan
5. Hospital Baling
Selangor
1. Hospital Ampang 7. Hospital Serdang
2. Hospital Banting 8. Hospital Sungai Buloh
3. Hospital Kuala Kubu Bharu 9. Hospital Tanjong Karang
4. Hospital Selayang 10. Hospital Kajang
5. Hospital Tengku Ampuan Jemaah, Sabak Bernam
11. Hospital Orang Asli Gombak
6. Hospital Tengku Ampuan Rahimah, Klang
Pahang
1. Hospital Bentong 6. Hospital Pekan
2. Hospital Jengka 7. Hospital Raub
3. Hospital Jerantut 8. Hospital Sultan Haji Ahmad Shah, Temerloh
4. Hospital Kuala Lipis 9. Hospital Tengku Ampuan Afzan, Kuantan
5. Hospital Sultanah Hajjah Kalsom, Tanah Rata Cameron Highlands
10. Hospital Muadzam Shah, Rompin
Johor
1. Hospital Sultanah Nora Ismail, Batu Pahat 7. Hospital Sultanah Aminah, Johor Bahru
2. Hospital Kluang(Hospital Enche’ Besar Hajjah Khalsom)
8. Hospital Pakar Sultanah Fatimah, Muar
3. Hospital Sultan Ismail, Johor Bahru 9. Hospital Kota Tinggi
4. Hospital Mersing 10. Hospital Tangkak
5. Hospital Pontian 11. Hospital Segamat
6. Hospital Temenggung Seri Maharaja Tun Ibrahim, Kulai
National Healthcare Establishment & Workforce Statistics Hospital 2012 -2013
107
Perak
1. Hospital Batu Gajah 8. Hospital Seri Manjung
2. Hospital Changkat Melintang 9. Hospital Slim River
3. Hospital Gerik 10. Hospital Sungai Siput
4. Hospital Raja Permaisuri Bainun, Ipoh 11. Hospital Taiping
5. Hospital Kampar 12. Hospital Tapah
6. Hospital Kuala Kangsar 13. Hospital Teluk Intan
7. Hospital Parit Buntar 14. Hospital Selama
Sarawak
1. Hospital Daerah Bau 12. Hospital Miri
2. Hospital Betong 13. Hospital Sentosa
3. Hospital Sri Aman 14. Hospital Saratok
4. Hospital Bintulu 15. Hospital Serian
5. Hospital Daro 16. Hospital Sibu
6. Hospital Kanowit 17. Hospital Simunjan
7. Hospital Kapit 18. Hospital Rajah Charles Brooke Memorial
8. Hospital Daerah Lawas 19. Hospital Umum Sarawak
9. Hospital Limbang 20. Hospital Sarikei
10. Hospital Daerah Lundu 21. Hospital Dalat
11. Hospital Marudi
Sabah
1. Hospital Beaufort 13. Hospital Queen Elizabeth, Kota Kinabalu
2. Hospital Beluran 14. Hospital Ranau
3. Hospital Duchess of Kent, Sandakan 15. Hospital Semporna
4. Hospital Keningau 16. Hospital Likas
5. Hospital Kinabatangan 17. Hospital Tambunan
6. Hospital Tenom 18. Hospital Tawau
7. Hospital Kota Marudu 19. Hospital Sipitang
8. Hospital Kudat 20. Hospital Tuaran
9. Hospital Kunak 21. Hospital Pitas
10. Hospital Lahad Datu 22. Hospital Kuala Penyu
11. Hospital Papar 23. Hospital Queen Elizabeth II
12. Hospital Kota Belud
HOSPITAL SECTOR: PUBLIC/ MINISTRY OF HEALTH/ PSYCHIATRIC INSTITUTION
1. Hospital Bahagia, Ulu Kinta, Perak 3. Hospital Permai, Johor
2. Hospital Sentosa, Sarawak 4. Hospital Mesra, Bukit Padang, Sabah
APPE
NDIX
2: P
ARTI
CIPA
NTS
OF N
HEW
S (H
OSPI
TAL)
201
2
National Healthcare Establishment & Workforce Statistics Hospital 2012 -2013
108
HOSPITAL SECTOR: PUBLIC/ UNIVERSITY
1. Pusat Perubatan Universiti Kebangsaan Malaysia (PPUKM), WPKL
3. Hospital Universiti Sains Malaysia (HUSM), Kubang Kerian, Kelantan
2. Pusat Perubatan Universiti Malaya (PPUM), WPKL
HOSPITAL SECTOR: PUBLIC/ MINISTRY OF DEFENCE
1. Hospital Angkatan Tentera Darat, Negeri Sembilan
3. Hospital Angkatan Tentera Terendak, Melaka
2. Hospital Angkatan Tentera Kuala Lumpur 4. Hospital Angkatan Tentera Lumut, Perak

National Healthcare Establishment & Workforce Statistics Hospital 2012 -2013
109
HOSPITAL SECTOR: PRIVATE
Terengganu
1. Kuala Terengganu Specialist Hospital
Kelantan
1. Perdana Specialist Hospital 3. Pusat Perubatan An-Nisa’2. Kota Bharu Medical Centre
Melaka
1. Putra Specialist Hospital (Melaka) 3. Mahkota Medical Centre2. Pantai Hospital, Ayer Keroh 4. Damai Medical and Heart Clinic
Pahang
1. Kuantan Medical Centre 5. Darul Makmur Medical Centre Sdn. Bhd2. Kuantan Specialist Hospital 6. Sethu Medical Centre3. Klinik Pakar Wanita Chan 7. Dr S.T. Chong, Maternity and Surgery4. W. Y. Ko Specialist Maternity and
Gynaecology Centre8. Pusat Rawatan Keluarga MUIP Sdn. Bhd.
Kedah
1. Kedah Medical Centre 5. Metro Specialist Hospital2. INS Specialist Centre 6. Pantai Hospital, Sg. Petani3. Pusat Pakar Amanjaya 7. Chang & Koh Maternity & Fertility
Centre Sdn. Bhd.4. Putra Medical Centre 8. Wisma Pakar Perbidanan & Sakit Puan
Sabah
1. Damai Specialist Hospital (Kota Kinabalu Specialist Hospital Sdn Bhd)
3. Kota Kinabalu Specialist Centre
2. Sabah Medical Centre 4. Tawau Maternity and Specialist Hospital Sdn. Bhd
Sarawak
1. Columbia Asia Hospital-Miri 6. Bintulu Medical Centre
2. Rejang Medical Centre 7. Columbia Asia Hospital-Bintulu
3. Miri City Medical Centre 8. Helen Ngu Women Hospital
4. Timberland Medical Centre 9. Ong Specialist Centre
5. Sibu Specialist Medical Centre
Negeri Sembilan
1. Columbia Asia Hospital Rawatan Lanjutan Seremban
5. Columbia Asia Medical Centre, Seremban
2. N.S. Chinese Maternity Hospital & Medical Centre
6. Seremban Specialist Hospital
3. Senawang Specialist Hospital 7. Mawar Renal Medical Centre
4. NCI Hospital 8. Hospital Bersalin Sukhilmi
APPE
NDIX
2: P
ARTI
CIPA
NTS
OF N
HEW
S (H
OSPI
TAL)
201
2

National Healthcare Establishment & Workforce Statistics Hospital 2012 -2013
110
HOSPITAL SECTOR: PRIVATE
Perak
1. Columbia Asia Taiping Hospital 8. The Perak Chinese Maternity Association(Perak Community Specialist Hospital)
2. Fatimah Hospital 9. Kinta medical Centre Sdn. Bhd.
3. Taiping Medical Centre 10. Pusat Perubatan UNIKL-RCMP
4. KPJ Ipoh Specialist Hospital 11. Pantai Hospital Ipoh
5. Yeak Maternity & Gynae Centre Sdn. Bhd 12. Sri Manjung Specialist Centre Sdn. Bhd.
6. Tan Specialist Maternity Centre Sdn. Bhd. 13. Klinik Bersalin Yasmin
7. Sejati Maternity and Specialist Centre
Pulau Pinang
1. Island Hospital 8. Loh Guan Lye Specialists Centre
2. Pantai Hospital Pulau Pinang 9. Pulau Pinang Adventist Hospital (Adventist Hospital & Clinic Services (M)
3. Lam Wah Ee Hospital 10. KPJ Penang Specialist Hospital
4. Tanjung Medical Centre 11. Gleneagles Penang
5. K.S. Wan & Liow Specialist Maternity Centre Sdn. Bhd
12. Tan & Tan Specialist Maternity Centre
6. Public Specialist Centre
Johor
1. Century Specialist Maternity Sdn Bhd 10. Pantai Hospital Batu Pahat
2. Columbia Asia Hospital - Nusajaya 11. Pelangi Medical Centre Sdn.Bhd
3. Hoo Specialists Maternity & Surgery Sdn Bhd
12. Pusat Pakar Perbidanan & Sakit Puan Raja
4. Hospital Waqaf An-Nur Pasir Gudang 13. Pusat Pakar Sakit Puan dan Perbidanan Khor & Loh Sdn.Bhd
5. JB Specialist Hospital Sdn. Bhd (Formerly known as Hospital Pakar Siow Sdn Bhd)
14. Puteri Specialist Hospital
6. Johor Jaya Maternity Centre Sdn Bhd 15. Specialist Women's Hospital Sdn Bhd
7. Kempas Medical Centre 16. Tan Klinik Pakar Perbidanan
8. Kluang Utama Specialist Hospital 17. Tey Maternity Specialist & Gynae Centre Sdn Bhd
9. KPJ Johor Specialist Hospital
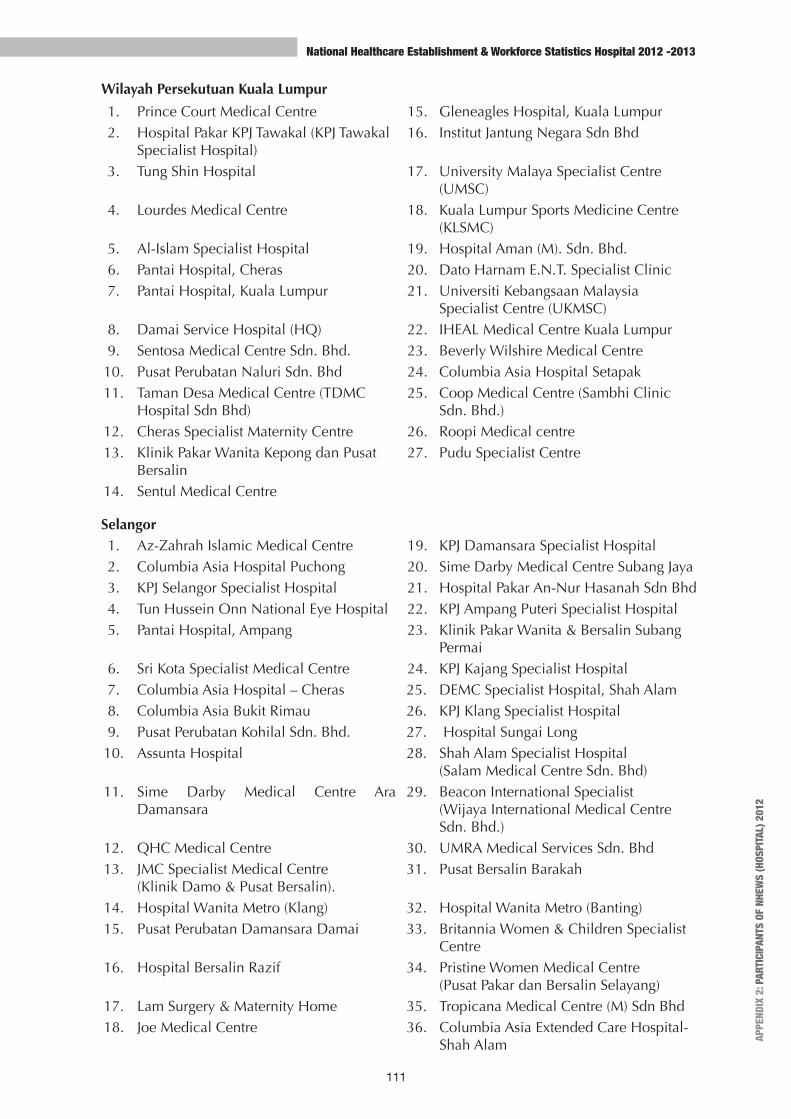
National Healthcare Establishment & Workforce Statistics Hospital 2012 -2013
111
Wilayah Persekutuan Kuala Lumpur
1. Prince Court Medical Centre 15. Gleneagles Hospital, Kuala Lumpur2. Hospital Pakar KPJ Tawakal (KPJ Tawakal
Specialist Hospital)16. Institut Jantung Negara Sdn Bhd
3. Tung Shin Hospital 17. University Malaya Specialist Centre (UMSC)
4. Lourdes Medical Centre 18. Kuala Lumpur Sports Medicine Centre (KLSMC)
5. Al-Islam Specialist Hospital 19. Hospital Aman (M). Sdn. Bhd.6. Pantai Hospital, Cheras 20. Dato Harnam E.N.T. Specialist Clinic7. Pantai Hospital, Kuala Lumpur 21. Universiti Kebangsaan Malaysia
Specialist Centre (UKMSC)8. Damai Service Hospital (HQ) 22. IHEAL Medical Centre Kuala Lumpur9. Sentosa Medical Centre Sdn. Bhd. 23. Beverly Wilshire Medical Centre10. Pusat Perubatan Naluri Sdn. Bhd 24. Columbia Asia Hospital Setapak11. Taman Desa Medical Centre (TDMC
Hospital Sdn Bhd)25. Coop Medical Centre (Sambhi Clinic
Sdn. Bhd.)12. Cheras Specialist Maternity Centre 26. Roopi Medical centre13. Klinik Pakar Wanita Kepong dan Pusat
Bersalin27. Pudu Specialist Centre
14. Sentul Medical Centre
Selangor1. Az-Zahrah Islamic Medical Centre 19. KPJ Damansara Specialist Hospital2. Columbia Asia Hospital Puchong 20. Sime Darby Medical Centre Subang Jaya3. KPJ Selangor Specialist Hospital 21. Hospital Pakar An-Nur Hasanah Sdn Bhd4. Tun Hussein Onn National Eye Hospital 22. KPJ Ampang Puteri Specialist Hospital5. Pantai Hospital, Ampang 23. Klinik Pakar Wanita & Bersalin Subang
Permai6. Sri Kota Specialist Medical Centre 24. KPJ Kajang Specialist Hospital7. Columbia Asia Hospital – Cheras 25. DEMC Specialist Hospital, Shah Alam8. Columbia Asia Bukit Rimau 26. KPJ Klang Specialist Hospital9. Pusat Perubatan Kohilal Sdn. Bhd. 27. Hospital Sungai Long10. Assunta Hospital 28. Shah Alam Specialist Hospital
(Salam Medical Centre Sdn. Bhd)11. Sime Darby Medical Centre Ara
Damansara29. Beacon International Specialist
(Wijaya International Medical Centre Sdn. Bhd.)
12. QHC Medical Centre 30. UMRA Medical Services Sdn. Bhd13. JMC Specialist Medical Centre
(Klinik Damo & Pusat Bersalin).31. Pusat Bersalin Barakah
14. Hospital Wanita Metro (Klang) 32. Hospital Wanita Metro (Banting)15. Pusat Perubatan Damansara Damai 33. Britannia Women & Children Specialist
Centre16. Hospital Bersalin Razif 34. Pristine Women Medical Centre
(Pusat Pakar dan Bersalin Selayang)17. Lam Surgery & Maternity Home 35. Tropicana Medical Centre (M) Sdn Bhd18. Joe Medical Centre 36. Columbia Asia Extended Care Hospital-
Shah Alam APPE
NDIX
2: P
ARTI
CIPA
NTS
OF N
HEW
S (H
OSPI
TAL)
201
2
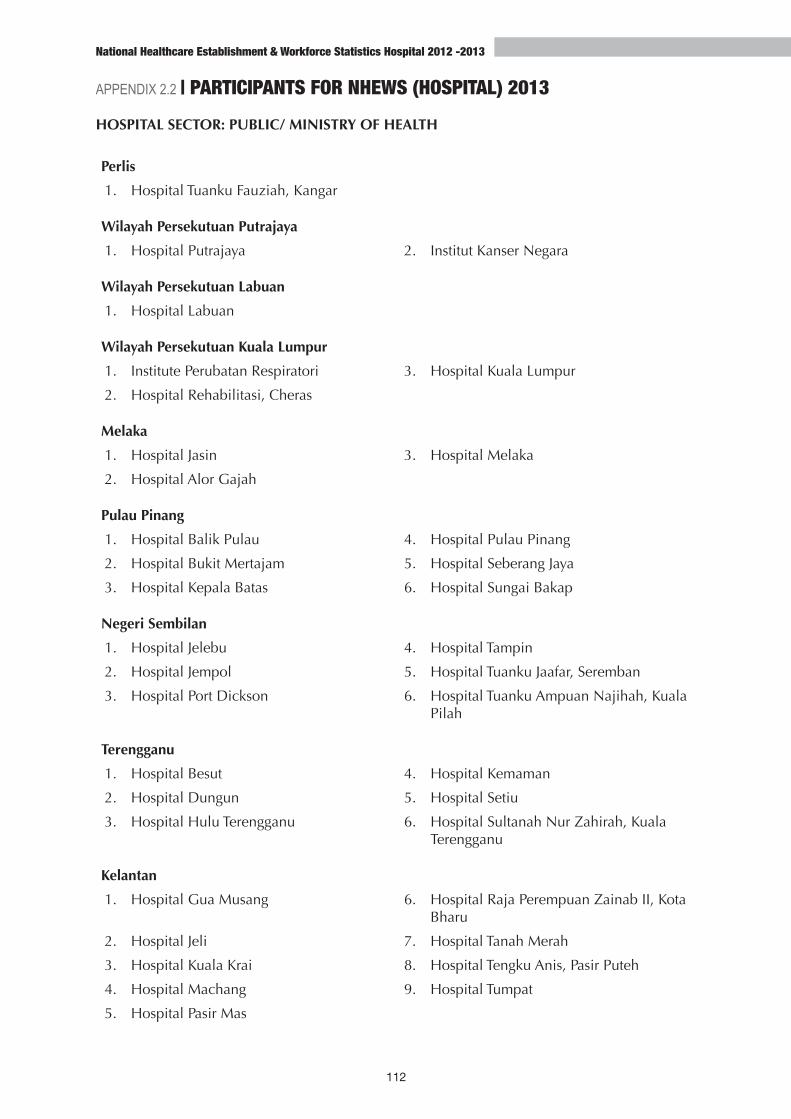
National Healthcare Establishment & Workforce Statistics Hospital 2012 -2013
112
APPENDIX 2.2 | PARTICIPANTS FOR NHEWS (HOSPITAL) 2013HOSPITAL SECTOR: PUBLIC/ MINISTRY OF HEALTH
Perlis
1. Hospital Tuanku Fauziah, Kangar
Wilayah Persekutuan Putrajaya
1. Hospital Putrajaya 2. Institut Kanser Negara
Wilayah Persekutuan Labuan
1. Hospital Labuan
Wilayah Persekutuan Kuala Lumpur
1. Institute Perubatan Respiratori 3. Hospital Kuala Lumpur
2. Hospital Rehabilitasi, Cheras
Melaka
1. Hospital Jasin 3. Hospital Melaka
2. Hospital Alor Gajah
Pulau Pinang
1. Hospital Balik Pulau 4. Hospital Pulau Pinang
2. Hospital Bukit Mertajam 5. Hospital Seberang Jaya
3. Hospital Kepala Batas 6. Hospital Sungai Bakap
Negeri Sembilan
1. Hospital Jelebu 4. Hospital Tampin
2. Hospital Jempol 5. Hospital Tuanku Jaafar, Seremban
3. Hospital Port Dickson 6. Hospital Tuanku Ampuan Najihah, Kuala Pilah
Terengganu
1. Hospital Besut 4. Hospital Kemaman
2. Hospital Dungun 5. Hospital Setiu
3. Hospital Hulu Terengganu 6. Hospital Sultanah Nur Zahirah, Kuala Terengganu
Kelantan
1. Hospital Gua Musang 6. Hospital Raja Perempuan Zainab II, Kota Bharu
2. Hospital Jeli 7. Hospital Tanah Merah
3. Hospital Kuala Krai 8. Hospital Tengku Anis, Pasir Puteh
4. Hospital Machang 9. Hospital Tumpat
5. Hospital Pasir Mas

National Healthcare Establishment & Workforce Statistics Hospital 2012 -2013
113
Kedah
1. Hospital Langkawi 6. Hospital Sik
2. Hospital Jitra 7. Hospital Sultan Abdul Halim, Sungai Petani
3. Hospital Kuala Nerang 8. Hospital Sultanah Bahiyah, Alor Setar
4. Hospital Kulim 9. Hospital Yan
5. Hospital Baling
Selangor
1. Hospital Ampang 7. Hospital Serdang
2.. Hospital Banting 8. Hospital Sungai Buloh
3. Hospital Kuala Kubu Bharu 9. Hospital Tanjong Karang
4. Hospital Selayang 10. Hospital Kajang
5. Hospital Tengku Ampuan Jemaah, Sabak Bernam
11. Hospital Orang Asli Gombak
6. Hospital Tengku Ampuan Rahimah, Klang
Pahang
1. Hospital Bentong 6. Hospital Pekan
2. Hospital Jengka 7. Hospital Raub
3. Hospital Jerantut 8. Hospital Sultan Haji Ahmad Shah, Temerloh
4. Hospital Kuala Lipis 9. Hospital Tengku Ampuan Afzan, Kuantan
5. Hospital Sultanah Hajjah Kalsom, Tanah Rata Cameron Highlands
10. Hospital Muadzam Shah, Rompin
Johor
1. Hospital Sultanah Nora Ismail, Batu Pahat 7. Hospital Sultanah Aminah, Johor Bahru
2. Hospital Kluang(Hospital Enche’ Besar Hajjah Khalsom)
8. Hospital Pakar Sultanah Fatimah, Muar
3. Hospital Sultan Ismail, Johor Bahru 9. Hospital Kota Tinggi
4. Hospital Mersing 10. Hospital Tangkak
5. Hospital Pontian 11. Hospital Segamat
6. Hospital Temenggung Seri Maharaja Tun Ibrahim, Kulai
Perak
1. Hospital Slim River 7. Hospital Seri Manjung
2. Hospital Changkat Melintang 8. Hospital Sungai Siput
3. Hospital Parit Buntar 9. Hospital Tapah
4. Hospital Raja Permaisuri Bainun, Ipoh 10. Hospital Teluk Intan
5. Hospital Kampar 11. Hospital Selama
6. Hospital Kuala Kangsar APPE
NDIX
2: P
ARTI
CIPA
NTS
OF N
HEW
S (H
OSPI
TAL)
201
3
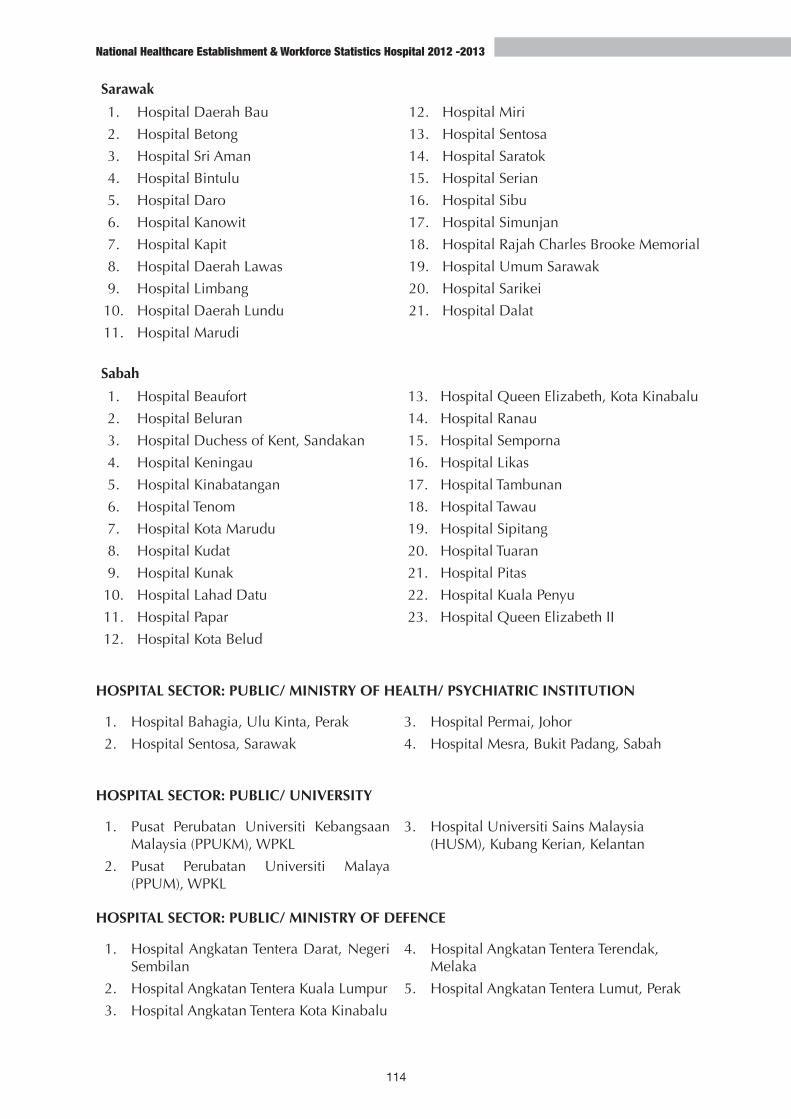
National Healthcare Establishment & Workforce Statistics Hospital 2012 -2013
114
Sarawak
1. Hospital Daerah Bau 12. Hospital Miri
2. Hospital Betong 13. Hospital Sentosa
3. Hospital Sri Aman 14. Hospital Saratok
4. Hospital Bintulu 15. Hospital Serian
5. Hospital Daro 16. Hospital Sibu
6. Hospital Kanowit 17. Hospital Simunjan
7. Hospital Kapit 18. Hospital Rajah Charles Brooke Memorial
8. Hospital Daerah Lawas 19. Hospital Umum Sarawak
9. Hospital Limbang 20. Hospital Sarikei
10. Hospital Daerah Lundu 21. Hospital Dalat
11. Hospital Marudi
Sabah
1. Hospital Beaufort 13. Hospital Queen Elizabeth, Kota Kinabalu
2. Hospital Beluran 14. Hospital Ranau
3. Hospital Duchess of Kent, Sandakan 15. Hospital Semporna
4. Hospital Keningau 16. Hospital Likas
5. Hospital Kinabatangan 17. Hospital Tambunan
6. Hospital Tenom 18. Hospital Tawau
7. Hospital Kota Marudu 19. Hospital Sipitang
8. Hospital Kudat 20. Hospital Tuaran
9. Hospital Kunak 21. Hospital Pitas
10. Hospital Lahad Datu 22. Hospital Kuala Penyu
11. Hospital Papar 23. Hospital Queen Elizabeth II
12. Hospital Kota Belud
HOSPITAL SECTOR: PUBLIC/ MINISTRY OF HEALTH/ PSYCHIATRIC INSTITUTION
1. Hospital Bahagia, Ulu Kinta, Perak 3. Hospital Permai, Johor
2. Hospital Sentosa, Sarawak 4. Hospital Mesra, Bukit Padang, Sabah
HOSPITAL SECTOR: PUBLIC/ UNIVERSITY
1. Pusat Perubatan Universiti Kebangsaan Malaysia (PPUKM), WPKL
3. Hospital Universiti Sains Malaysia (HUSM), Kubang Kerian, Kelantan
2. Pusat Perubatan Universiti Malaya (PPUM), WPKL
HOSPITAL SECTOR: PUBLIC/ MINISTRY OF DEFENCE
1. Hospital Angkatan Tentera Darat, Negeri Sembilan
4. Hospital Angkatan Tentera Terendak, Melaka
2. Hospital Angkatan Tentera Kuala Lumpur 5. Hospital Angkatan Tentera Lumut, Perak
3. Hospital Angkatan Tentera Kota Kinabalu
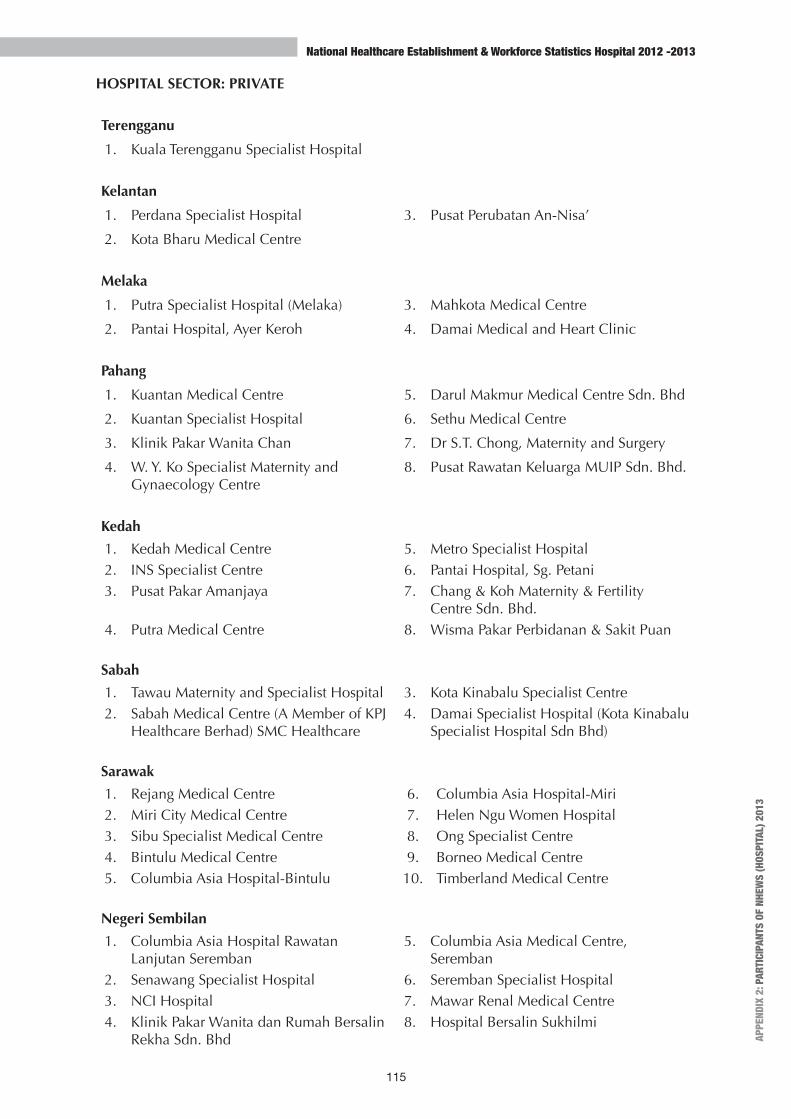
National Healthcare Establishment & Workforce Statistics Hospital 2012 -2013
115
HOSPITAL SECTOR: PRIVATE
Terengganu
1. Kuala Terengganu Specialist Hospital
Kelantan
1. Perdana Specialist Hospital 3. Pusat Perubatan An-Nisa’
2. Kota Bharu Medical Centre
Melaka
1. Putra Specialist Hospital (Melaka) 3. Mahkota Medical Centre
2. Pantai Hospital, Ayer Keroh 4. Damai Medical and Heart Clinic
Pahang
1. Kuantan Medical Centre 5. Darul Makmur Medical Centre Sdn. Bhd
2. Kuantan Specialist Hospital 6. Sethu Medical Centre
3. Klinik Pakar Wanita Chan 7. Dr S.T. Chong, Maternity and Surgery
4. W. Y. Ko Specialist Maternity and Gynaecology Centre
8. Pusat Rawatan Keluarga MUIP Sdn. Bhd.
Kedah
1. Kedah Medical Centre 5. Metro Specialist Hospital2. INS Specialist Centre 6. Pantai Hospital, Sg. Petani3. Pusat Pakar Amanjaya 7. Chang & Koh Maternity & Fertility
Centre Sdn. Bhd.4. Putra Medical Centre 8. Wisma Pakar Perbidanan & Sakit Puan
Sabah
1. Tawau Maternity and Specialist Hospital 3. Kota Kinabalu Specialist Centre2. Sabah Medical Centre (A Member of KPJ
Healthcare Berhad) SMC Healthcare4. Damai Specialist Hospital (Kota Kinabalu
Specialist Hospital Sdn Bhd)
Sarawak
1. Rejang Medical Centre 6. Columbia Asia Hospital-Miri2. Miri City Medical Centre 7. Helen Ngu Women Hospital3. Sibu Specialist Medical Centre 8. Ong Specialist Centre4. Bintulu Medical Centre 9. Borneo Medical Centre5. Columbia Asia Hospital-Bintulu 10. Timberland Medical Centre
Negeri Sembilan
1. Columbia Asia Hospital Rawatan Lanjutan Seremban
5. Columbia Asia Medical Centre, Seremban
2. Senawang Specialist Hospital 6. Seremban Specialist Hospital3. NCI Hospital 7. Mawar Renal Medical Centre4. Klinik Pakar Wanita dan Rumah Bersalin
Rekha Sdn. Bhd8. Hospital Bersalin Sukhilmi
APPE
NDIX
2: P
ARTI
CIPA
NTS
OF N
HEW
S (H
OSPI
TAL)
201
3
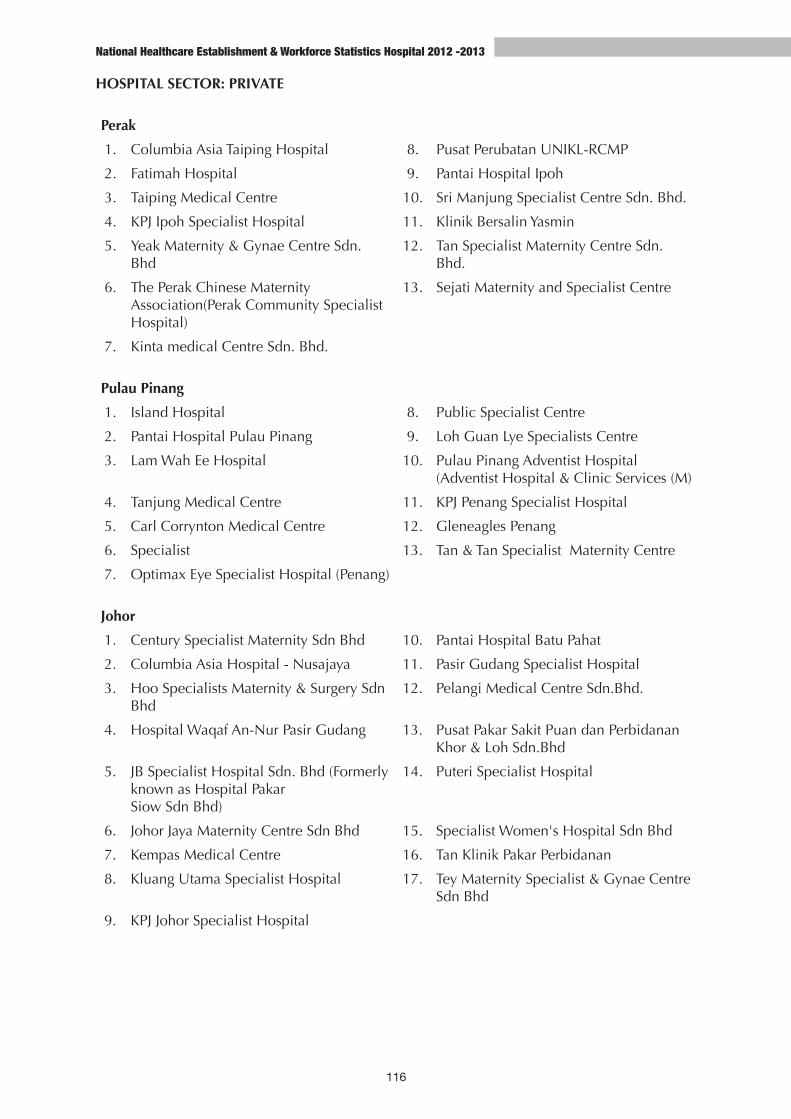
National Healthcare Establishment & Workforce Statistics Hospital 2012 -2013
116
HOSPITAL SECTOR: PRIVATE
Perak
1. Columbia Asia Taiping Hospital 8. Pusat Perubatan UNIKL-RCMP
2. Fatimah Hospital 9. Pantai Hospital Ipoh
3. Taiping Medical Centre 10. Sri Manjung Specialist Centre Sdn. Bhd.
4. KPJ Ipoh Specialist Hospital 11. Klinik Bersalin Yasmin
5. Yeak Maternity & Gynae Centre Sdn. Bhd
12. Tan Specialist Maternity Centre Sdn. Bhd.
6. The Perak Chinese Maternity Association(Perak Community Specialist Hospital)
13. Sejati Maternity and Specialist Centre
7. Kinta medical Centre Sdn. Bhd.
Pulau Pinang
1. Island Hospital 8. Public Specialist Centre
2. Pantai Hospital Pulau Pinang 9. Loh Guan Lye Specialists Centre
3. Lam Wah Ee Hospital 10. Pulau Pinang Adventist Hospital (Adventist Hospital & Clinic Services (M)
4. Tanjung Medical Centre 11. KPJ Penang Specialist Hospital
5. Carl Corrynton Medical Centre 12. Gleneagles Penang
6. Specialist 13. Tan & Tan Specialist Maternity Centre
7. Optimax Eye Specialist Hospital (Penang)
Johor
1. Century Specialist Maternity Sdn Bhd 10. Pantai Hospital Batu Pahat
2. Columbia Asia Hospital - Nusajaya 11. Pasir Gudang Specialist Hospital
3. Hoo Specialists Maternity & Surgery Sdn Bhd
12. Pelangi Medical Centre Sdn.Bhd.
4. Hospital Waqaf An-Nur Pasir Gudang 13. Pusat Pakar Sakit Puan dan Perbidanan Khor & Loh Sdn.Bhd
5. JB Specialist Hospital Sdn. Bhd (Formerly known as Hospital PakarSiow Sdn Bhd)
14. Puteri Specialist Hospital
6. Johor Jaya Maternity Centre Sdn Bhd 15. Specialist Women's Hospital Sdn Bhd
7. Kempas Medical Centre 16. Tan Klinik Pakar Perbidanan
8. Kluang Utama Specialist Hospital 17. Tey Maternity Specialist & Gynae Centre Sdn Bhd
9. KPJ Johor Specialist Hospital

National Healthcare Establishment & Workforce Statistics Hospital 2012 -2013
117
Wilayah Persekutuan Kuala Lumpur
1. Al-Islam Specialist Hospital 17. Kuala Lumpur Sports Medicine Centre Sdn Bhd (KLSMC)
2. Beverly Wilshire Medical Centre 18. Lourdes Medical Centre
3. Chaudhury Medic-Centre 19. Pantai Hospital Cheras
4. Cheras Specialist Maternity Centre 20. Pantai Hospital Kuala Lumpur
5. Columbia Asia Hospital - Setapak 21. Prince Court Medical Centre
6. Coop Medical Centre (Sambhi Clinic Sdn. Bhd.)
22. Pudu Specialists Centre Sdn Bhd
7. Damai Service Hospital (HQ) Sdn. Bhd. 23. Pusat Perubatan Naluri Sdn. Bhd.
8. Dato Harnam E.N.T. Specialist Clinic Sdn. Bhd
24. Roopi Medical Centre
9. Gleneagles Kuala Lumpur 25. Sentosa Medical Centre Sdn. Bhd.
10. Global Doctors Centre 26. Sentul Medical Centre
11. Hospital Aman (M) Sdn. Bhd. 27. Taman Desa Medical Centre (TDMC Hospital Sdn Bhd)
12. Hospital Pakar KPJ Tawakkal (KPJ Tawakkal Specialist Hospital)
28. Tung Shin Hospital
13. iHEAL Medical Centre Kuala Lumpur 29. UKM Specialist Centre
14. Institut Jantung Negara Sdn Bhd 30. UM Specialist Centre Sdn.Bhd
15. Kencana Maternity Centre Sdn Bhd 31. Parkcity Medical Centre
16. Klinik Pakar Wanita Kepong Dan Pusat Bersalin
Selangor
1. Assunta Hospital 19. KPJ Damansara Specialist Hospital
2. Az-Zahrah Islamic Medical Centre 20. KPJ Kajang Specialist Hospital
3. Beacon International Specialist Centre (Wijaya International Medical Centre Sdn. Bhd)
21. KPJ Klang Specialist Hospital
4. Britannia Women & Children Specialist Centre
22. KPJ Selangor Specialist Hospital
5. Columbia Asia Extended Care Hospital-Shah Alam
23. Pantai Hospital Ampang
6. Columbia Asia Hospital - Cheras 24. Pristine Women Medical Centre (Pusat Pakar Wanita dan Bersalin Selayang)
7. Columbia Asia Hospital Bukit Rimau 25. Pusat Bersalin Barakah
8. Columbia Asia Hospital Puchong 26. Pusat Perubatan Damansara Damai
9. DEMC Specialist Hospital Shah Alam 27. Pusat Perubatan Kohilal Sdn Bhd
10. Hospital Bersalin Razif 28. QHC Medical Centre
11. Hospital Pakar An-Nur Hasanah Sdn Bhd 29. Shah Alam Specialist Hospital (Salam Medical Centre Sdn. Bhd)
12. Hospital Sungai Long 30. Sime Darby Medical Centre Ara Damansara
13. Hospital Wanita Metro (Banting) 31. Sri Kota Specialist Medical Centre
APPE
NDIX
2: P
ARTI
CIPA
NTS
OF N
HEW
S (H
OSPI
TAL)
201
3
National Healthcare Establishment & Workforce Statistics Hospital 2012 -2013
118
14. Hospital Wanita Metro (Klang) 32. Subang Jaya Medical Centre Sdn Bhd (formerly known as Sime Darby Medical Centre Subang Jaya)
15. JMC Specialist Medical Centre (Klinik Damo & Pusat Bersalin)
33. Tropicana Medical Centre (M) Sdn Bhd
16. Joe Medical Centre 34. Tun Hussein Onn National Eye Hospital
17. Klinik Pakar Wanita & Bersalin Subang Permai
35. Umra Medical Services Sdn. Bhd
18. KPJ Ampang Puteri Specialist Hospital
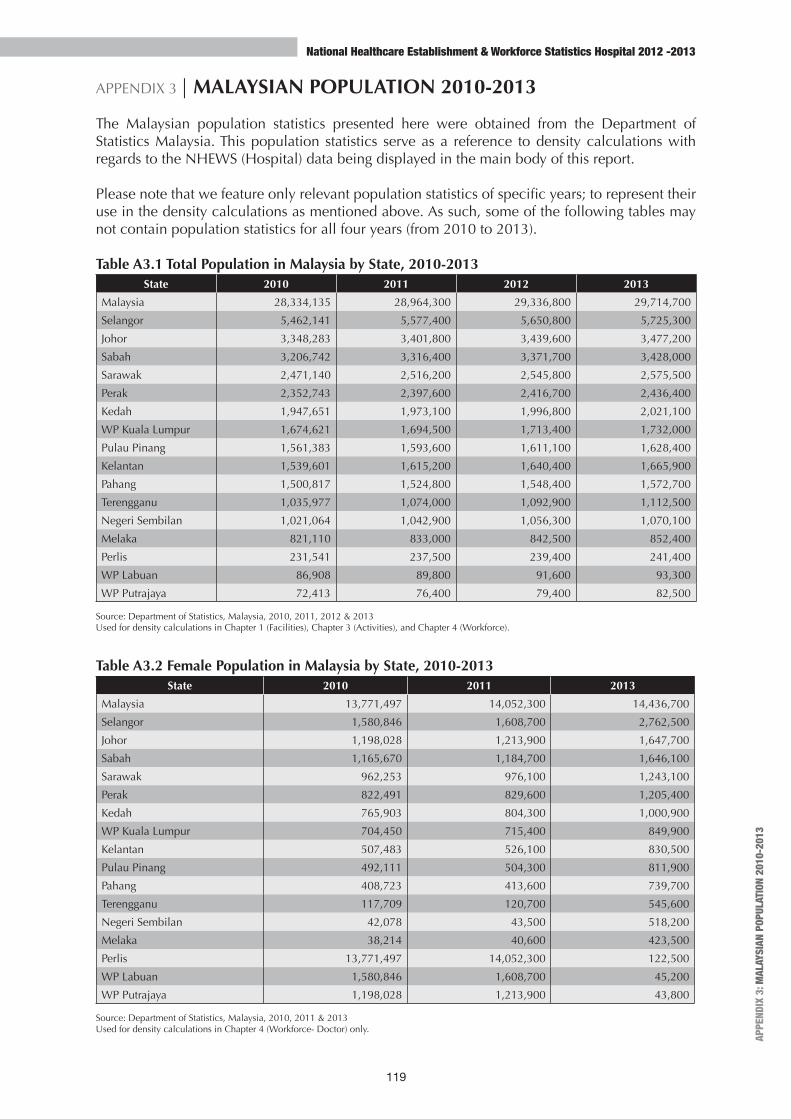
National Healthcare Establishment & Workforce Statistics Hospital 2012 -2013
119
APPENDIX 3 | MALAYSIAN POPULATION 2010-2013
The Malaysian population statistics presented here were obtained from the Department of Statistics Malaysia. This population statistics serve as a reference to density calculations with regards to the NHEWS (Hospital) data being displayed in the main body of this report.
Please note that we feature only relevant population statistics of specific years; to represent their use in the density calculations as mentioned above. As such, some of the following tables may not contain population statistics for all four years (from 2010 to 2013).
Table A3.1 Total Population in Malaysia by State, 2010-2013State 2010 2011 2012 2013
Malaysia 28,334,135 28,964,300 29,336,800 29,714,700
Selangor 5,462,141 5,577,400 5,650,800 5,725,300
Johor 3,348,283 3,401,800 3,439,600 3,477,200
Sabah 3,206,742 3,316,400 3,371,700 3,428,000
Sarawak 2,471,140 2,516,200 2,545,800 2,575,500
Perak 2,352,743 2,397,600 2,416,700 2,436,400
Kedah 1,947,651 1,973,100 1,996,800 2,021,100
WP Kuala Lumpur 1,674,621 1,694,500 1,713,400 1,732,000
Pulau Pinang 1,561,383 1,593,600 1,611,100 1,628,400
Kelantan 1,539,601 1,615,200 1,640,400 1,665,900
Pahang 1,500,817 1,524,800 1,548,400 1,572,700
Terengganu 1,035,977 1,074,000 1,092,900 1,112,500
Negeri Sembilan 1,021,064 1,042,900 1,056,300 1,070,100
Melaka 821,110 833,000 842,500 852,400
Perlis 231,541 237,500 239,400 241,400
WP Labuan 86,908 89,800 91,600 93,300
WP Putrajaya 72,413 76,400 79,400 82,500
Source: Department of Statistics, Malaysia, 2010, 2011, 2012 & 2013Used for density calculations in Chapter 1 (Facilities), Chapter 3 (Activities), and Chapter 4 (Workforce).
Table A3.2 Female Population in Malaysia by State, 2010-2013State 2010 2011 2013
Malaysia 13,771,497 14,052,300 14,436,700
Selangor 1,580,846 1,608,700 2,762,500
Johor 1,198,028 1,213,900 1,647,700
Sabah 1,165,670 1,184,700 1,646,100
Sarawak 962,253 976,100 1,243,100
Perak 822,491 829,600 1,205,400
Kedah 765,903 804,300 1,000,900
WP Kuala Lumpur 704,450 715,400 849,900
Kelantan 507,483 526,100 830,500
Pulau Pinang 492,111 504,300 811,900
Pahang 408,723 413,600 739,700
Terengganu 117,709 120,700 545,600
Negeri Sembilan 42,078 43,500 518,200
Melaka 38,214 40,600 423,500
Perlis 13,771,497 14,052,300 122,500
WP Labuan 1,580,846 1,608,700 45,200
WP Putrajaya 1,198,028 1,213,900 43,800
Source: Department of Statistics, Malaysia, 2010, 2011 & 2013Used for density calculations in Chapter 4 (Workforce- Doctor) only.
APPE
NDIX
3: M
ALAY
SIAN
POP
ULAT
ION
2010
-201
3

National Healthcare Establishment & Workforce Statistics Hospital 2012 -2013
120
Table A3.3 Female Population (50-69 years old) in Malaysia by State, 2012-2013State 2012 2013
Malaysia 2,019,200 2,100,600
Selangor 336,400 354,200
Johor 242,200 251,800
Perak 220,000 225,900
Sarawak 173,400 179,400
Kedah 160,500 166,300
Sabah 147,200 155,900
Pulau Pinang 137,200 141,700
Kelantan 122,600 126,800
WP Kuala Lumpur 120,000 125,300
Pahang 109,100 113,500
Negeri Sembilan 85,000 88,300
Terengganu 71,100 73,800
Melaka 67,300 69,400
Perlis 20,300 20,600
WP Labuan 4,100 4,300
WP Putrajaya 2,800 3,000
Source: Department of Statistics, Malaysia, 2012 & 2013Used for density calculations in Chapter 2 (Medical Device) only.
Table A3.4 Female Population (40-74 years old) in Malaysia by State, 2012-2013State 2012 2013
Malaysia 3,957,000 4,067,000
Selangor 701,900 731,700
Johor 472,000 485,200
Perak 393,400 397,200
Sarawak 339,700 349,700
Sabah 330,700 346,400
Kedah 303,100 309,000
Pulau Pinang 260,600 267,300
WP Kuala Lumpur 249,300 256,700
Kelantan 230,400 234,700
Pahang 201,700 206,100
Negeri Sembilan 155,900 159,000
Terengganu 138,100 140,900
Melaka 127,500 129,600
Perlis 37,000 37,000
WP Labuan 9,400 9,800
WP Putrajaya 6,200 6,600
Source: Department of Statistics, Malaysia, 2012 & 2013Used for density calculations in Chapter 2 (Medical Device) only

National Healthcare Establishment & Workforce Statistics Hospital 2012 -2013
121
Table A3.5 Female Population (40-44 years old) in Malaysia by State, 2012-2013State 2012 2013
Malaysia 906,900 915,300
Selangor 184,600 191,200
Johor 108,100 109,100
Sabah 93,700 97,000
Sarawak 78,000 79,300
Perak 72,000 70,400
Kedah 63,500 63,400
WP Kuala Lumpur 62,600 60,600
Pulau Pinang 56,700 57,400
Kelantan 47,300 47,000
Pahang 41,100 41,700
Negeri Sembilan 31,000 31,000
Terengganu 29,800 29,800
Melaka 26,900 26,100
Perlis 7,000 6,700
WP Labuan 2,700 2,800
WP Putrajaya 1,800 1,900
Source: Department of Statistics, Malaysia, 2012 & 2013Used for density calculations in Chapter 2 (Medical Device) only
Table A3.6 Female Population (45-49 years old) in Malaysia by State, 2012-2013State 2012 2013
Malaysia 816,100 836,900
Selangor 152,300 158,000
Johor 96,000 98,900
Sabah 75,600 78,600
Perak 73,000 73,600
Sarawak 69,100 70,700
Kedah 60,100 61,200
WP Kuala Lumpur 55,100 58,700
Pulau Pinang 50,700 52,100
Kelantan 46,900 47,100
Pahang 40,400 40,200
Negeri Sembilan 30,800 30,800
Terengganu 29,100 29,200
Melaka 25,700 26,600
Perlis 7,300 7,400
WP Labuan 2,300 2,400
WP Putrajaya 1,500 1,600
Source: Department of Statistics, Malaysia, 2012 & 2013Used for density calculations in Chapter 2 (Medical Device) only
APPE
NDIX
3: M
ALAY
SIAN
POP
ULAT
ION
2010
-201
3

National Healthcare Establishment & Workforce Statistics Hospital 2012 -2013
122
Table A3.7 Female Population (50-54 years old) in Malaysia by State, 2012-2013State 2012 2013
Malaysia 705,600 723,000
Selangor 122,600 127,800
Johor 84,000 85,400
Perak 68,900 69,400
Sarawak 59,700 61,800
Sabah 59,600 62,200
Kedah 54,800 55,500
Pulau Pinang 44,700 45,500
Kelantan 43,100 43,900
WP Kuala Lumpur 42,500 43,700
Pahang 38,100 38,800
Negeri Sembilan 29,500 29,700
Terengganu 26,000 26,700
Melaka 22,200 22,500
Perlis 6,700 6,700
WP Labuan 1,700 1,800
WP Putrajaya 1,500 1,500
Source: Department of Statistics, Malaysia, 2012 & 2013Used for density calculations in Chapter 2 (Medical Device) only
Table A3.8 Female Population (54-59 years old) in Malaysia by State, 2012-2013State 2012 2013
Malaysia 568,100 594,700
Selangor 92,400 97,800
Johor 69,300 72,500
Perak 61,200 62,700
Sarawak 48,700 50,000
Kedah 46,500 48,400
Sabah 41,500 45,100
Pulau Pinang 38,300 39,500
WP Kuala Lumpur 34,300 36,000
Kelantan 34,200 36,000
Pahang 30,400 32,000
Negeri Sembilan 24,900 26,000
Terengganu 20,000 21,200
Melaka 18,600 19,300
Perlis 5,800 5,900
WP Labuan 1,200 1,200
WP Putrajaya 900 1,100
Source: Department of Statistics, Malaysia, 2012 & 2013Used for density calculations in Chapter 2 (Medical Device) only

National Healthcare Establishment & Workforce Statistics Hospital 2012 -2013
123
Table A3.9 Female Population (60-64 years old) in Malaysia by State, 2012-2013State 2012 2013
Malaysia 442,100 456,100
Selangor 74,400 75,400
Johor 53,200 55,300
Perak 52,800 53,500
Sarawak 37,700 39,200
Kedah 35,500 37,100
Pulau Pinang 31,700 32,500
Sabah 26,600 28,500
Kelantan 26,100 26,800
WP Kuala Lumpur 25,600 26,800
Pahang 24,400 24,800
Negeri Sembilan 18,500 19,500
Melaka 15,600 15,700
Terengganu 14,400 15,000
Perlis 4,600 4,700
WP Labuan 700 800
WP Putrajaya 300 300
Source: Department of Statistics, Malaysia, 2012 & 2013Used for density calculations in Chapter 2 (Medical Device) only
Table A3.10 Female Population (65-69 years old) in Malaysia by State, 2012-2013State 2012 2013
Malaysia 303,400 326,800
Selangor 47,000 53,200
Perak 37,100 40,300
Johor 35,700 38,600
Sarawak 27,300 28,400
Kedah 23,700 25,300
Pulau Pinang 22,500 24,200
Sabah 19,500 20,100
Kelantan 19,200 20,100
WP Kuala Lumpur 17,600 18,800
Pahang 16,200 17,900
Negeri Sembilan 12,100 13,100
Melaka 10,900 11,900
Terengganu 10,700 10,900
Perlis 3,200 3,300
WP Labuan 500 500
WP Putrajaya 100 100
Source: Department of Statistics, Malaysia, 2012 & 2013Used for density calculations in Chapter 2 (Medical Device) only
APPE
NDIX
3: M
ALAY
SIAN
POP
ULAT
ION
2010
-201
3

National Healthcare Establishment & Workforce Statistics Hospital 2012 -2013
124
Table A3.11 Female Population (70-74 years old) in Malaysia by State, 2012-2013State 2012 2013
Malaysia 214,800 214,200
Selangor 28,600 28,300
Perak 28,400 27,300
Johor 25,700 25,400
Sarawak 19,200 20,300
Kedah 19,000 18,100
Pulau Pinang 16,000 16,100
Sabah 14,200 14,900
Kelantan 13,600 13,800
WP Kuala Lumpur 11,600 12,100
Pahang 11,100 10,700
Negeri Sembilan 9,100 8,900
Terengganu 8,100 8,100
Melaka 7,600 7,500
Perlis 2,400 2,300
WP Labuan 300 300
WP Putrajaya 100 100
Source: Department of Statistics, Malaysia, 2012 & 2013Used for density calculations in Chapter 2 (Medical Device) only
Table A3.12 Paediatric (0-14 years old) Population in Malaysia by State, 2010-2013State 2010 2011 2013
Malaysia 7,827,907 7,784,600 7,741,300
Perlis 1,372,012 1,378,700 1,391,500
Kedah 1,026,161 922,100 932,400
Pulau Pinang 910,413 907,600 893,000
Perak 626,615 631,900 608,100
Selangor 571,559 564,600 551,900
WP Putrajaya 497,464 535,900 529,200
WP Kuala Lumpur 452,801 448,600 449,200
Negeri Sembilan 370,204 371,200 378,700
Melaka 361,081 359,200 354,700
Johor 334,533 349,900 351,000
Pahang 271,214 276,000 274,000
Terengganu 215,670 215,000 211,600
Kelantan 183,393 710,400 697,100
Sarawak 58,435 61,300 61,300
Sabah 25,064 26,600 27,600
WP Labuan 22,354 25,600 29,800
Source: Department of Statistics, Malaysia, 2010, 2011 & 2013Used for density calculations in Chapter 4 (Workforce- Doctor) only.

National Healthcare Establishment & Workforce Statistics Hospital 2012 -2013
125
Table A3.13 Geriatric (60 years old and above) Population in Malaysia by State, 2010-2013State 2010 2011 2013
Malaysia 2,251,216 2,338,300 2,542,600
Selangor 334,289 347,900 383,900
Perak 280,118 289,100 310,300
Johor 278,028 287,300 311,600
Kedah 184,087 189,700 203,000
Pulau Pinang 159,285 165,900 181,100
Sabah 138,386 150,400 167,700
Kelantan 135,935 140,800 149,300
WP Kuala Lumpur 127,825 132,000 147,000
Pahang 122,719 127,600 138,200
Negeri Sembilan 91,920 96,500 106,600
Melaka 79,422 81,900 87,900
Terengganu 78,058 80,900 87,000
Sarawak 37,844 39,700 236,700
Perlis 25,499 25,900 26,900
WP Labuan 3,483 3,700 4,400
WP Putrajaya 981 1,000 1,200
Source: Department of Statistics, Malaysia, 2010, 2011 & 2013Used for density calculations in Chapter 4 (Workforce-Doctor) only.
APPE
NDIX
3: M
ALAY
SIAN
POP
ULAT
ION
2010
-201
3

National Healthcare Establishment & Workforce Statistics Hospital 2012 -2013
126
APPENDIX 4 | DATA QUALITY STATEMENT
NHEWS (Hospital) 2012-2013 Quality Statement
Dimension Description
Institutional Environment
Data Collector(s):The data was collected by the Health Statistics Unit (HSU) of the National Clinical Research Centre (CRC) Malaysia.
Collection authority:Under the jurisdiction of the MDD of MOH, public hospitals were directed to participate in this survey and provide access to their available data.
For private healthcare establishments, legal authorities for the collection of such data by the MOH are provided by (where applicable) the Private Healthcare Facilities and Services Act 1998 and Control of Drugs & Cosmetics Regulation 1984. The relevant regulatory authorities in the MOH are the Medical Practice Division, National Pharmaceutical Control Bureau and Medical Device Bureau respectively. They have designated the CRC as their data collection agency.
Data Compiler(s): The data was compiled by the same organisation that collected the data.
Additional information: Statistical confidentiality was maintained by ensuring that the information provided is:- Securely maintained - Used only for statistical purposes- Not inadvertently revealed in any published literature- Used safely as unidentifiable micro-data to support research and analysis
Any identified data error will be notified to the public and data user through an online notice published on the organisation website where the report and data are posted. All effort will be made to ensure any data error is corrected within 5 working days and be re-released. All key data users will be specifically notified through email or telephone.
Relevance Data topic:The data represents all acute curative hospitals of both public and private sectors within Malaysia for 2012 and 2013.
Level of geography:Data is available at national and state level.
Key Data Items: The key data items produced from this collection include the facilities, medical device, activities and health workforce of the identified hospitals for 2012 and 2013.
Numerator/Denominator Source: Numerators and denominators of all the rates, percentages and densities were derived from the same data source and auxiliary sources e.g. population census obtained from the Department of Statistics Malaysia (DOS).
Additional information: Healthcare establishment and workforce data was collected to assist in evidence based health policy planning and projection.
The data is a measure of acute curative healthcare establishment characteristic in terms of facilities, activities, medical device and health workforce.
Key variables have been defined in this survey to assist in data standardisation. However, standard international coding or classification was not used, owing to technical limitation.

National Healthcare Establishment & Workforce Statistics Hospital 2012 -2013
127
Timeliness Data collection: Data was intended to reflect annual hospital statistics. The current survey collected data for both years at one point of time. However data for each year relates to its own reference period.
Data availability:Data collection took place in January-April 2014. This was followed by data cleaning, validation, verification and analysis between May-August 2014. The report shall be published with approval from the Ministry of Health, by July of the next calendar year.
Reference Period: The data reference period is from 1st-Jan-2012 to 31st-Dec-2012 and from 1st-Jan-2013 to 31st-Dec-2013
Additional information: Updates or revisions of the data may become necessary because new information may become available during the preparation of the report.
Accuracy Method of Collection: The data was collected using either printed or online survey questionnaires. These were distributed to all related healthcare establishments listed under the Ministry of Health and Private Hospital Registry.
Data Adjustments: The data was adjusted to account for item and/or unit non-responses by using imputation (logical, conditional and regressing) and weighting methods.
Logical and conditional imputation based on reasonable assumption was used to replace missing data. Regression imputation was used for the remaining missing data which had a 5% or less missing rate. Despite these efforts, certain variables were found to have a higher missing rate than expected. Caution will be needed when interpreting these estimates due to their inaccuracy. Percentages of missing values and the imputation status for each variable can be found at Appendix 6.
Collection size: All registered acute curative hospitals within the country were included: 345 hospitals in 2012, and 351 hospitals in 2013.
Under and over counts: Undercount and over-count of the survey variables will not be known until a post-enumeration survey is conducted to measure how effective the original survey was.
Additional information: Any sensitive question or topics that may have the potential to cause bias was not collected. Manual data cleaning, review and verification with source personnel, and automated data validation were performed to minimize processing errors. All hospitals in the country fulfilling the inclusion criteria were accounted for in this survey.
Coherence Consistency over time: Similar survey methods have been used for this survey in 2009, 2010, and 2011. However, definition of certain health services and key variables has been revised in the present survey to allow for a more practical and reflective interpretation. These changes may have affected the value of certain variables collected and, any comparisons with previous years must be treated with caution.
Numerator/ denominator: The impact of differences between the criteria for numerators and denominators was minor in most cases. Data produced from this survey is of cross-sectional nature. No time series data was collected.
Additional information: There were no significant changes of the mode of data collection compared to previous years. Further, there was no occurrence of substantial local or regional events that that may have had an impact on the data since the last report.
Coherence Data collected in this survey is broadly comparable to data of similar nature available from the Health Informatics Centre (HIC) of the Ministry of Health. The HIC obtains such data from routine (monthly) data submission by healthcare establishments. However, certain data from our survey and from the HIC may not be directly comparable because of differences in definition as well as in inclusion and exclusion criteria. Furthermore, additional data have been collected in greater detail in this survey in order to answer specific health policy questions. Please refer to the survey questionnaire for more details on the specific survey questions, at our website: www.crc.gov.my/nhsi/survey-form.
Besides the routine monthly data collected by the HIC, no other similar information or data source are available at the national level.
APPE
NDIX
4: D
ATA
QUAL
ITY
STAT
EMEN
T
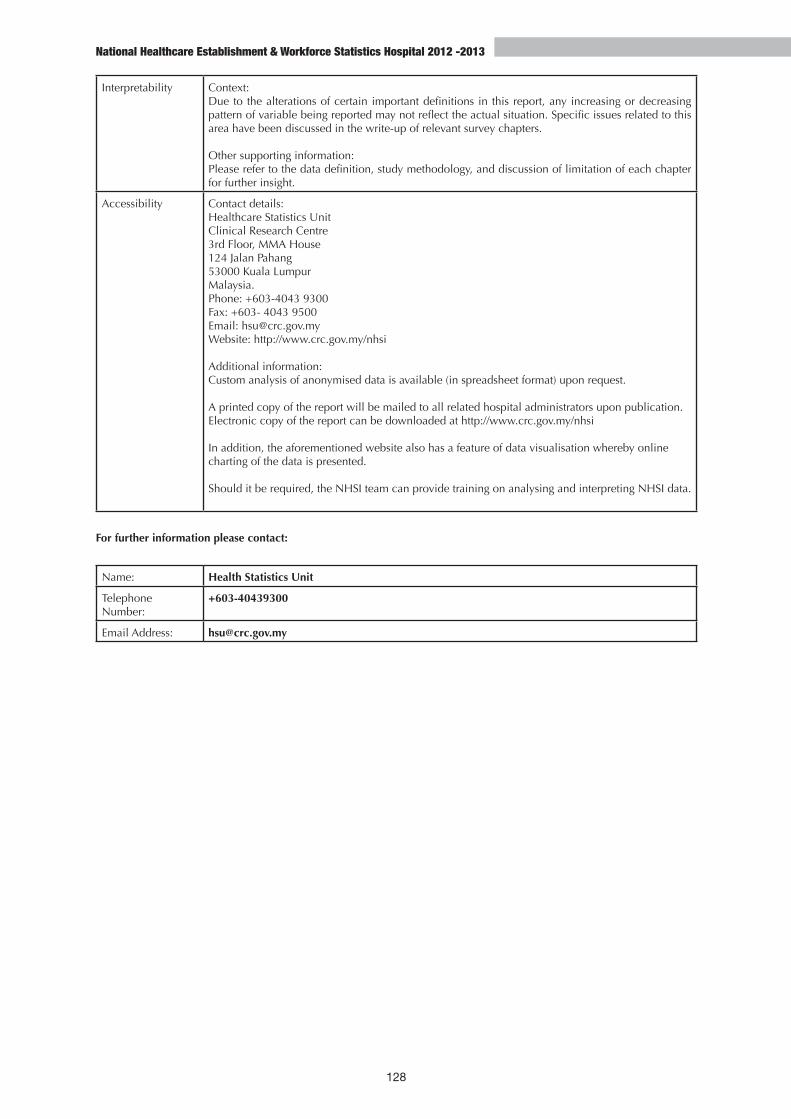
National Healthcare Establishment & Workforce Statistics Hospital 2012 -2013
128
Interpretability Context:Due to the alterations of certain important definitions in this report, any increasing or decreasing pattern of variable being reported may not reflect the actual situation. Specific issues related to this area have been discussed in the write-up of relevant survey chapters.
Other supporting information: Please refer to the data definition, study methodology, and discussion of limitation of each chapter for further insight.
Accessibility Contact details:Healthcare Statistics UnitClinical Research Centre3rd Floor, MMA House124 Jalan Pahang53000 Kuala LumpurMalaysia.Phone: +603-4043 9300Fax: +603- 4043 9500Email: [email protected]: http://www.crc.gov.my/nhsi
Additional information: Custom analysis of anonymised data is available (in spreadsheet format) upon request.
A printed copy of the report will be mailed to all related hospital administrators upon publication.Electronic copy of the report can be downloaded at http://www.crc.gov.my/nhsi
In addition, the aforementioned website also has a feature of data visualisation whereby online charting of the data is presented.
Should it be required, the NHSI team can provide training on analysing and interpreting NHSI data.
For further information please contact:
Name: Health Statistics Unit
Telephone Number:
+603-40439300
Email Address: [email protected]

This page intentionally left blank
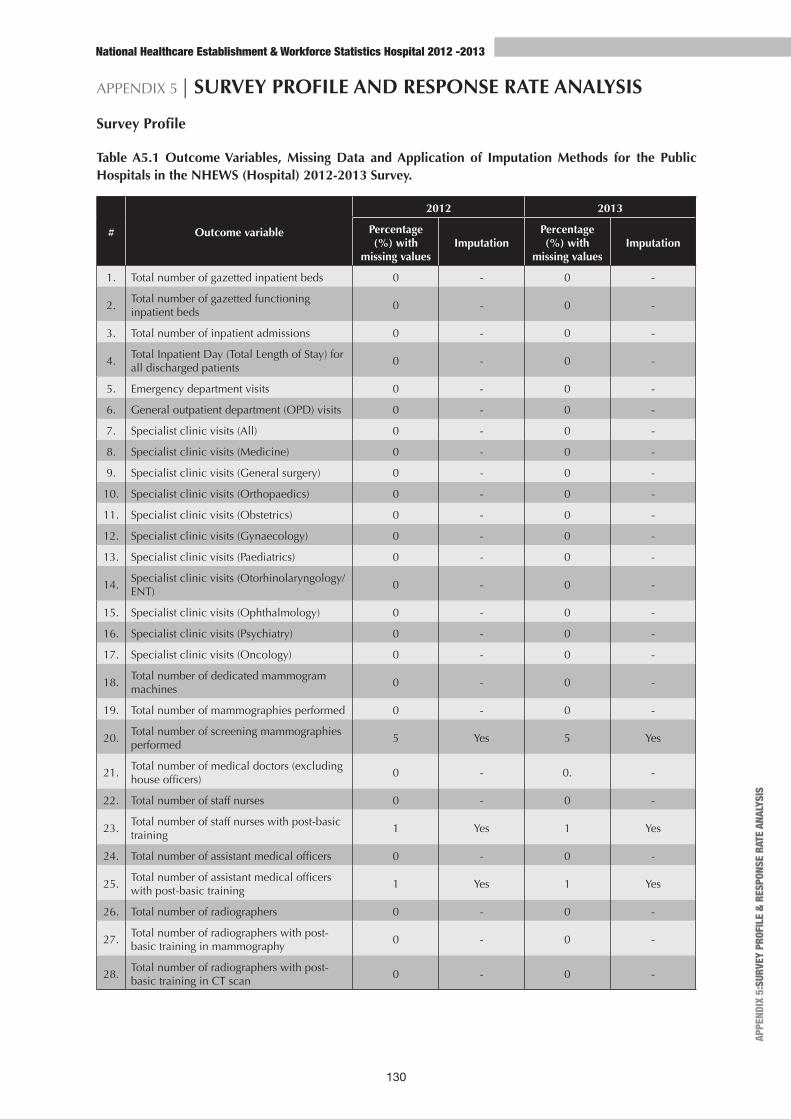
National Healthcare Establishment & Workforce Statistics Hospital 2012 -2013
130
APPENDIX 5 | SURVEY PROFILE AND RESPONSE RATE ANALYSIS
Survey Profile
Table A5.1 Outcome Variables, Missing Data and Application of Imputation Methods for the Public Hospitals in the NHEWS (Hospital) 2012-2013 Survey.
# Outcome variable
2012 2013
Percentage (%) with
missing valuesImputation
Percentage (%) with
missing valuesImputation
1. Total number of gazetted inpatient beds 0 - 0 -
2.Total number of gazetted functioning inpatient beds
0 - 0 -
3. Total number of inpatient admissions 0 - 0 -
4.Total Inpatient Day (Total Length of Stay) for all discharged patients
0 - 0 -
5. Emergency department visits 0 - 0 -
6. General outpatient department (OPD) visits 0 - 0 -
7. Specialist clinic visits (All) 0 - 0 -
8. Specialist clinic visits (Medicine) 0 - 0 -
9. Specialist clinic visits (General surgery) 0 - 0 -
10. Specialist clinic visits (Orthopaedics) 0 - 0 -
11. Specialist clinic visits (Obstetrics) 0 - 0 -
12. Specialist clinic visits (Gynaecology) 0 - 0 -
13. Specialist clinic visits (Paediatrics) 0 - 0 -
14.Specialist clinic visits (Otorhinolaryngology/ENT)
0 - 0 -
15. Specialist clinic visits (Ophthalmology) 0 - 0 -
16. Specialist clinic visits (Psychiatry) 0 - 0 -
17. Specialist clinic visits (Oncology) 0 - 0 -
18.Total number of dedicated mammogram machines
0 - 0 -
19. Total number of mammographies performed 0 - 0 -
20.Total number of screening mammographies performed
5 Yes 5 Yes
21.Total number of medical doctors (excluding house officers)
0 - 0. -
22. Total number of staff nurses 0 - 0 -
23.Total number of staff nurses with post-basic training
1 Yes 1 Yes
24. Total number of assistant medical officers 0 - 0 -
25.Total number of assistant medical officers with post-basic training
1 Yes 1 Yes
26. Total number of radiographers 0 - 0 -
27.Total number of radiographers with post-basic training in mammography
0 - 0 -
28.Total number of radiographers with post-basic training in CT scan
0 - 0 -
APPE
NDIX
5:S
URVE
Y PR
OFIL
E &
RESP
ONSE
RAT
E AN
ALYS
IS
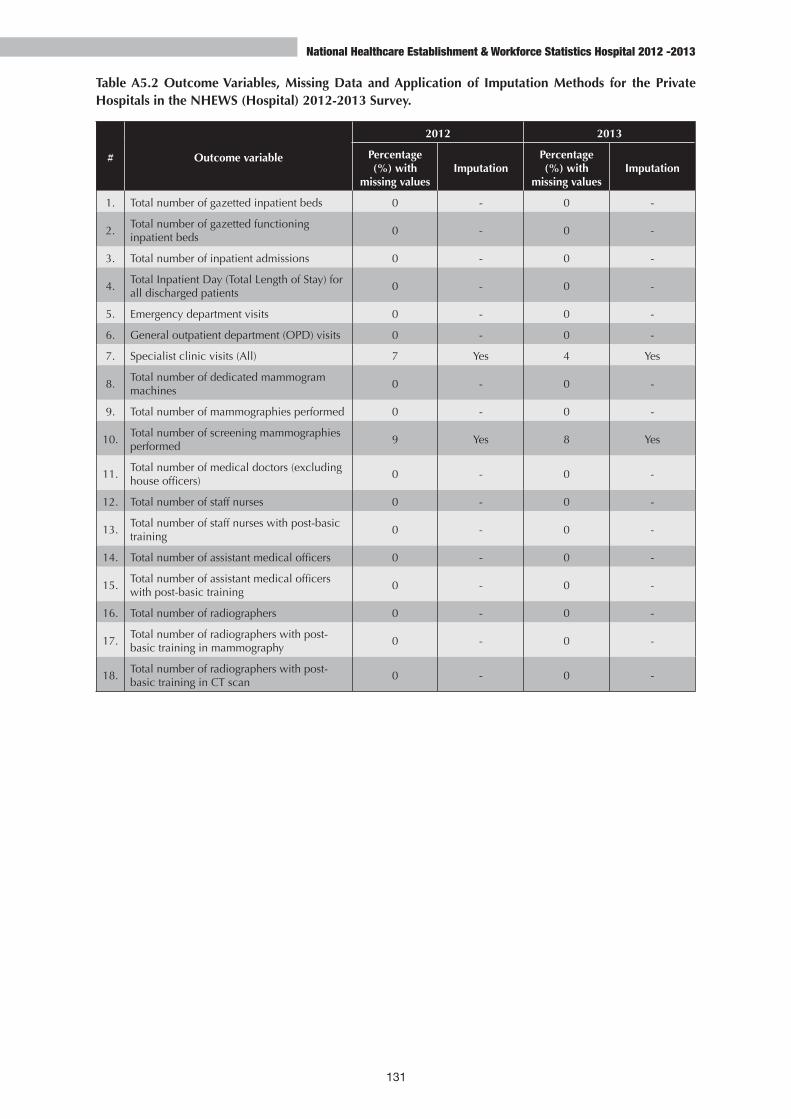
National Healthcare Establishment & Workforce Statistics Hospital 2012 -2013
131
Table A5.2 Outcome Variables, Missing Data and Application of Imputation Methods for the Private Hospitals in the NHEWS (Hospital) 2012-2013 Survey.
# Outcome variable
2012 2013
Percentage (%) with
missing valuesImputation
Percentage (%) with
missing valuesImputation
1. Total number of gazetted inpatient beds 0 - 0 -
2.Total number of gazetted functioning inpatient beds
0 - 0 -
3. Total number of inpatient admissions 0 - 0 -
4.Total Inpatient Day (Total Length of Stay) for all discharged patients
0 - 0 -
5. Emergency department visits 0 - 0 -
6. General outpatient department (OPD) visits 0 - 0 -
7. Specialist clinic visits (All) 7 Yes 4 Yes
8.Total number of dedicated mammogram machines
0 - 0 -
9. Total number of mammographies performed 0 - 0 -
10.Total number of screening mammographies performed
9 Yes 8 Yes
11.Total number of medical doctors (excluding house officers)
0 - 0 -
12. Total number of staff nurses 0 - 0 -
13.Total number of staff nurses with post-basic training
0 - 0 -
14. Total number of assistant medical officers 0 - 0 -
15.Total number of assistant medical officers with post-basic training
0 - 0 -
16. Total number of radiographers 0 - 0 -
17.Total number of radiographers with post-basic training in mammography
0 - 0 -
18.Total number of radiographers with post-basic training in CT scan
0 - 0 -
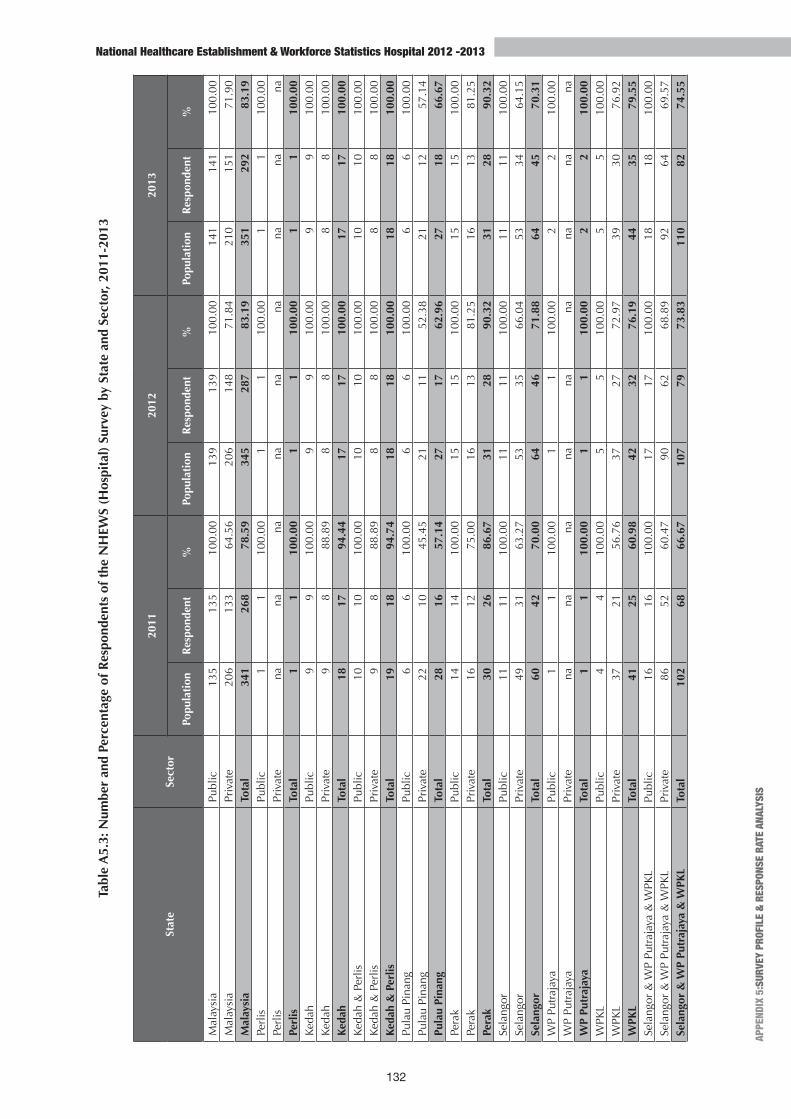
National Healthcare Establishment & Workforce Statistics Hospital 2012 -2013
132
Tabl
e A
5.3:
Num
ber
and
Perc
enta
ge o
f Res
pond
ents
of t
he N
HEW
S (H
ospi
tal)
Sur
vey
by S
tate
and
Sec
tor,
2011
-201
3
Stat
eSe
ctor
2011
2012
2013
Popu
lati
onR
espo
nden
t%
Popu
lati
onR
espo
nden
t%
Popu
lati
onR
espo
nden
t%
Mal
aysi
aPu
blic
135
135
100.
0013
913
910
0.00
141
141
100.
00M
alay
sia
Priv
ate
206
133
64.5
620
614
871
.84
210
151
71.9
0M
alay
sia
Tota
l34
126
878
.59
345
287
83.1
935
129
283
.19
Perl
isPu
blic
11
100.
001
110
0.00
11
100.
00Pe
rlis
Priv
ate
nana
nana
nana
nana
naPe
rlis
Tota
l1
110
0.00
11
100.
001
110
0.00
Keda
hPu
blic
99
100.
009
910
0.00
99
100.
00Ke
dah
Priv
ate
98
88.8
98
810
0.00
88
100.
00Ke
dah
Tota
l18
1794
.44
1717
100.
0017
1710
0.00
Keda
h &
Per
lisPu
blic
1010
100.
0010
1010
0.00
1010
100.
00Ke
dah
& P
erlis
Priv
ate
98
88.8
98
810
0.00
88
100.
00Ke
dah
& P
erlis
Tota
l19
1894
.74
1818
100.
0018
1810
0.00
Pula
u Pi
nang
Publ
ic6
610
0.00
66
100.
006
610
0.00
Pula
u Pi
nang
Priv
ate
2210
45.4
521
1152
.38
2112
57.1
4Pu
lau
Pina
ngTo
tal
2816
57.1
427
1762
.96
2718
66.6
7Pe
rak
Publ
ic14
1410
0.00
1515
100.
0015
1510
0.00
Pera
kPr
ivat
e16
1275
.00
1613
81.2
516
1381
.25
Pera
kTo
tal
3026
86.6
731
2890
.32
3128
90.3
2Se
lang
orPu
blic
1111
100.
0011
1110
0.00
1111
100.
00Se
lang
orPr
ivat
e49
3163
.27
5335
66.0
453
3464
.15
Sela
ngor
Tota
l60
4270
.00
6446
71.8
864
4570
.31
WP
Putr
ajay
aPu
blic
11
100.
001
110
0.00
22
100.
00W
P Pu
traj
aya
Priv
ate
nana
nana
nana
nana
naW
P Pu
traj
aya
Tota
l1
110
0.00
11
100.
002
210
0.00
WPK
LPu
blic
44
100.
005
510
0.00
55
100.
00W
PKL
Priv
ate
3721
56.7
637
2772
.97
3930
76.9
2W
PKL
Tota
l41
2560
.98
4232
76.1
944
3579
.55
Sela
ngor
& W
P Pu
traj
aya
& W
PKL
Publ
ic16
1610
0.00
1717
100.
0018
1810
0.00
Sela
ngor
& W
P Pu
traj
aya
& W
PKL
Priv
ate
8652
60.4
790
6268
.89
9264
69.5
7Se
lang
or &
WP
Putr
ajay
a &
WPK
LTo
tal
102
6866
.67
107
7973
.83
110
8274
.55
APPE
NDIX
5:S
URVE
Y PR
OFIL
E &
RESP
ONSE
RAT
E AN
ALYS
IS
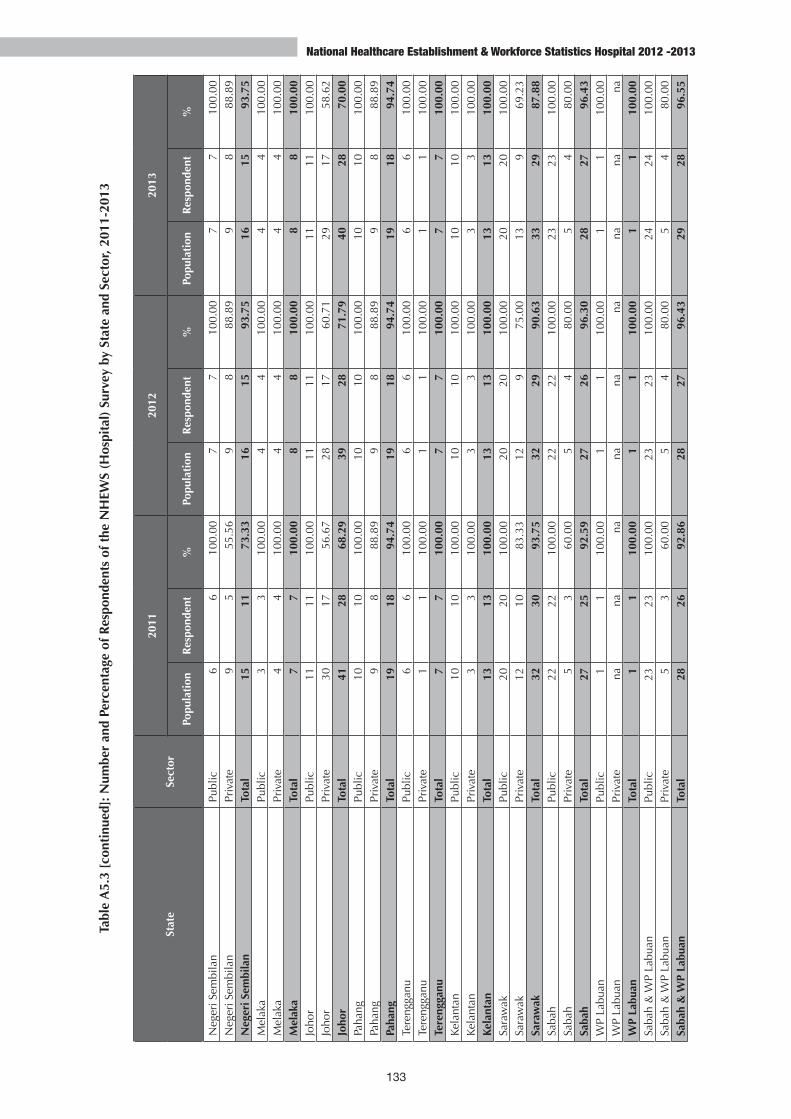
National Healthcare Establishment & Workforce Statistics Hospital 2012 -2013
133
Stat
eSe
ctor
2011
2012
2013
Popu
lati
onR
espo
nden
t%
Popu
lati
onR
espo
nden
t%
Popu
lati
onR
espo
nden
t%
Neg
eri S
embi
lan
Publ
ic6
610
0.00
77
100.
007
710
0.00
Neg
eri S
embi
lan
Priv
ate
95
55.5
69
888
.89
98
88.8
9N
eger
i Sem
bila
nTo
tal
1511
73.3
316
1593
.75
1615
93.7
5M
elak
aPu
blic
33
100.
004
410
0.00
44
100.
00M
elak
aPr
ivat
e4
410
0.00
44
100.
004
410
0.00
Mel
aka
Tota
l7
710
0.00
88
100.
008
810
0.00
Joho
rPu
blic
1111
100.
0011
1110
0.00
1111
100.
00Jo
hor
Priv
ate
3017
56.6
728
1760
.71
2917
58.6
2Jo
hor
Tota
l41
2868
.29
3928
71.7
940
2870
.00
Paha
ngPu
blic
1010
100.
0010
1010
0.00
1010
100.
00Pa
hang
Priv
ate
98
88.8
99
888
.89
98
88.8
9Pa
hang
Tota
l19
1894
.74
1918
94.7
419
1894
.74
Tere
ngga
nuPu
blic
66
100.
006
610
0.00
66
100.
00Te
reng
ganu
Priv
ate
11
100.
001
110
0.00
11
100.
00Te
reng
ganu
Tota
l7
710
0.00
77
100.
007
710
0.00
Kela
ntan
Publ
ic10
1010
0.00
1010
100.
0010
1010
0.00
Kela
ntan
Priv
ate
33
100.
003
310
0.00
33
100.
00Ke
lant
anTo
tal
1313
100.
0013
1310
0.00
1313
100.
00Sa
raw
akPu
blic
2020
100.
0020
2010
0.00
2020
100.
00Sa
raw
akPr
ivat
e12
1083
.33
129
75.0
013
969
.23
Sara
wak
Tota
l32
3093
.75
3229
90.6
333
2987
.88
Saba
hPu
blic
2222
100.
0022
2210
0.00
2323
100.
00Sa
bah
Priv
ate
53
60.0
05
480
.00
54
80.0
0Sa
bah
Tota
l27
2592
.59
2726
96.3
028
2796
.43
WP
Labu
anPu
blic
11
100.
001
110
0.00
11
100.
00W
P La
buan
Priv
ate
nana
nana
nana
nana
naW
P La
buan
Tota
l1
110
0.00
11
100.
001
110
0.00
Saba
h &
WP
Labu
anPu
blic
2323
100.
0023
2310
0.00
2424
100.
00Sa
bah
& W
P La
buan
Priv
ate
53
60.0
05
480
.00
54
80.0
0Sa
bah
& W
P La
buan
Tota
l28
2692
.86
2827
96.4
329
2896
.55
Tabl
e A
5.3
[con
tinu
ed]:
Num
ber
and
Perc
enta
ge o
f Res
pond
ents
of t
he N
HEW
S (H
ospi
tal)
Sur
vey
by S
tate
and
Sec
tor,
2011
-201
3

This page intentionally left blank