HEALTH NEEDS ASSESSMENT - Prince George's County
265
2016 PRINCE GEORGE’S COUNTY COMMUNITY HEALTH NEEDS ASSESSMENT Prepared by: Prince George’s County Health Department
-
Upload
khangminh22 -
Category
Documents
-
view
0 -
download
0
Transcript of HEALTH NEEDS ASSESSMENT - Prince George's County
2016 PRINCE GEORGE’S COUNTY
COMMUNITY HEALTH NEEDS ASSESSMENT
Prepared by: Prince George’s County Health Department
INTRODUCTION
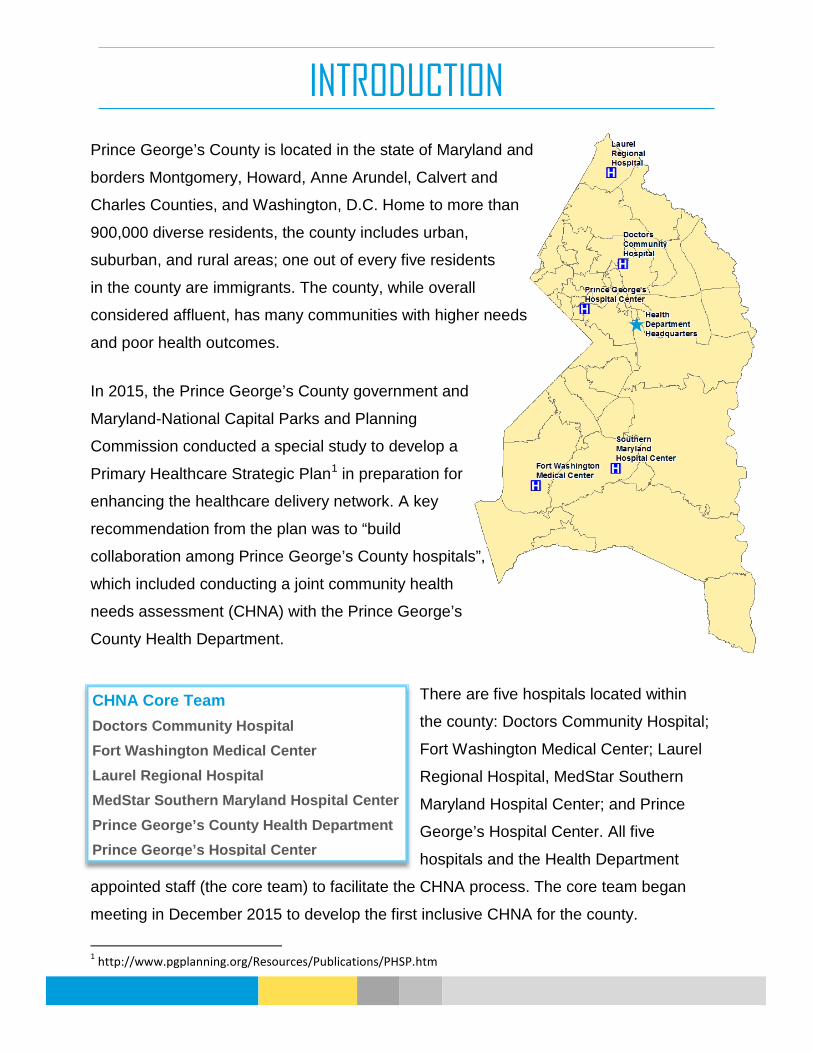
Prince George’s County is located in the state of Maryland and
borders Montgomery, Howard, Anne Arundel, Calvert and
Charles Counties, and Washington, D.C. Home to more than
900,000 diverse residents, the county includes urban,
suburban, and rural areas; one out of every five residents
in the county are immigrants. The county, while overall
considered affluent, has many communities with higher needs
and poor health outcomes.
In 2015, the Prince George’s County government and
Maryland-National Capital Parks and Planning
Commission conducted a special study to develop a
Primary Healthcare Strategic Plan1 in preparation for
enhancing the healthcare delivery network. A key
recommendation from the plan was to “build
collaboration among Prince George’s County hospitals”,
which included conducting a joint community health
needs assessment (CHNA) with the Prince George’s
County Health Department.
There are five hospitals located within
the county: Doctors Community Hospital;
Fort Washington Medical Center; Laurel
Regional Hospital, MedStar Southern
Maryland Hospital Center; and Prince
George’s Hospital Center. All five
hospitals and the Health Department
appointed staff (the core team) to facilitate the CHNA process. The core team began
meeting in December 2015 to develop the first inclusive CHNA for the county.
1 http://www.pgplanning.org/Resources/Publications/PHSP.htm
CHNA Core Team Doctors Community Hospital Fort Washington Medical Center Laurel Regional Hospital MedStar Southern Maryland Hospital Center Prince George’s County Health Department Prince George’s Hospital Center

PROCESS OVERVIEW
The CHNA Process was developed to 1) maximize community input, 2) learn from the
community experts, 3) utilize existing data, and 4) ensure a comprehensive community
prioritization process. The Health Department staff led the CHNA process in developing
the data collection tools and analyzing the results with input from the hospital
representatives. The process included:
• A community resident survey available in both English and Spanish distributed by
the hospitals and health department;
• Secondary data analyses that included the county demographics and population
description through socioeconomic indicators, and a comprehensive health
indicator profile;
• Hospital Service Profiles to detail the residents served by the core team;
• A community-based organization survey and key informant interviews;
• A comprehensive collection of community resources and assets; and
• An inclusive community prioritization process that included forty representatives
from across the county.
While the core team led the data gathering process, there was recognition that there
must be shared ownership of the county’s health. The community data collection
strategies and the prioritization process were intentionally developed with this in mind,
and set the foundation for community inclusion moving forward. The prioritization process
resulted in a community focus on:
• behavioral health,
• metabolic syndrome, and
• cancer,
while acknowledging that any strategies to address these issues in the county would
have to include a consideration of the disparate social determinants of health. The results
of this process will be used to guide the health department and hospitals in addressing
the health needs of the county, with the insight and support of the CHNA participants.

KEY FINDINGS
Drivers of Poor Health Outcomes:
• Poor social determinants of health drive many of our health disparities.
o Poverty, food insecurity, access to healthy food, affordable housing,
employment, lack of educational attainment, inadequate financial
resources, and a disparate built environment result in poorer health
outcomes.
o Resources may be available in communities with greater needs, but are of
poorer quality. For example, a recent study in access to healthy foods in an
urban area of the county show that there are many grocery stores, but they
lack quality healthy food options.2
• Access to health insurance through the Affordable Care Act has not helped everyone.
o Many residents still lack health insurance (some have not enrolled, some are not eligible).
o Those with health insurance cannot afford healthcare (co-pays).
• Residents lack knowledge of or how to use available resources.
o The healthcare system is challenging to navigate, and providers and
support services need more coordination.
o There are services available, but they are perceived as underutilized because residents do not know how to locate or use them.
o Low literacy and low health literacy contribute to poor outcomes.
• The county does not have enough healthcare providers to serve the residents.
o There is a lack of behavioral health providers, dentists, specialists, and
primary care providers (also noted in the 2015 Primary Healthcare Strategic
Plan for the county3).
2 Prince George’s County Food System Study, November 2015, http://www.mncppcapps.org/planning/Publications/PDFs/304/Cover%20page,%20Introduction%20and%20Executive%20summary.pdf 3 Primary Healthcare Strategic Plan, 2015, http://www.pgplanning.org/Resources/Publications/PHSP.htm

o There is a lack of providers who accept public insurance.
• The county lacks quality healthcare providers.
o Surrounding jurisdictions are perceived to have better quality providers.
o There is a lack of culturally competent and bilingual providers.
• Lack of ability to access healthcare providers
o There are limited transportation options available, and the supply does not meet the need. There is also a lack of transportation for urgent but non-
emergency needs that cannot be scheduled in advance.
Leading Health Challenges
• Chronic conditions such as heart disease, diabetes, and stroke continue to lead in poor outcomes for many county residents.
o Residents have not adopted behaviors that promote good health, such as healthy eating and active living.
o An estimated two-thirds of residents are obese or overweight.
o The lack of physical activity and increased obesity is closely related to
residents with metabolic syndrome4, which increases the risk for heart disease, diabetes, and stroke.
• Behavioral health affects entire families and communities, not just individuals.
o The ambulance crews, hospitals, police, and criminal justice system see
many residents needing behavioral health services and treatment.
o The county lacks adequate resources needed to address residents with
significant behavioral health issues.
o The stigma around behavioral health is an ongoing problem in the county.
• While the trend for many health issues has improved in the county, we still have significant disparities. For example:
4 Metabolic Syndrome is a group of risk factors that raises the risk of heart disease and other health problems such as diabetes and stroke. The risk factors include: a large waist; high triglycerides (fat in the blood); low HDL or “good” cholesterol; high blood pressure, and high blood glucose (sugar). Source: NIH, accessed on 6/1/16, http://www.nhlbi.nih.gov/health/health-topics/topics/ms

o Cancer: By cancer site, Black residents in the county had higher incidence and mortality rates for breast, colorectal, and prostate cancers. However,
overall, White non-Hispanic residents had a higher cancer mortality rate
(2014).
o HIV: Prince George’s County had the second highest rate of HIV diagnoses in the state in 2013, and had the highest number of actual cases in the
state.
o Asthma: For adults, Black county residents have an age-adjusted hospitalization rate due to asthma that is more than twice as high as White,
non-Hispanic residents (2010-2012).
Recommendations
• More partnership and collaborative efforts are needed.
o Current coordinated efforts in the county were recognized as improving outcomes through care coordination and by and addressing systemic
issues in the county.
• More funding and resource for health.
o Successful efforts to improve resident health in the county are often limited
in scope and effect due to lack of funding. Building public health capacity in
the county requires the necessary resources.
o Funding is needed to strengthen the health safety net and build capacity of local non-profits.
• Increase community-specific outreach and education
o More outreach and education is needed, and should be tailored at a community-level to be culturally sensitive and reach residents.
o Residents need education about the available resources, and how to utilize
and navigate them.
TABLE OF CONTENTS
Population Profile
Health Indicators
Key Informant Interviews
Community-Based Organization Survey
Resident Survey
Prioritization Process
Resources and Assets

1
White, NH, 14.1%
Black, NH, 62.1%
Asian, NH,
4.4%
Other, NH, 2.6% Hispanic,
16.9%
POPULATION PROFILE
Overall Population
From 2000 to 2010, Prince George’s County population grew by 7.7% to 863,420. The county is currently on track to surpass the growth of the previous decade with a 6.5% increase in population from 2010 to 2016.
Prince George’s County Population, 2000-2016
Data Source: U.S. Census, Annual Population Estimates; * 2016 estimate provided by Claritas
Prince George’s County by Race and Ethnicity, 2014
Over three-fourths of the population in the county is comprised of minorities, led by 62.1% Black, Non-Hispanic (NH) followed by the Hispanic population (16.9%). Between 2010 and 2014, the Hispanic population grew the fastest with an 18.3% increase. The Asian population grew by 13.6% and the Black or African American population grew by 2.3%. The White, Non-Hispanic population declined slightly, from 129,668 in 2010 to 128,234 in 2014.
919,417
801,515
863,420
740000
760000
780000
800000
820000
840000
860000
880000
900000
920000
940000
2000census
2010census
2011estimate
2012estimate
2013estimate
2014estimate
2016estimate*
Num
ber o
f Res
iden
ts
Data Source: 2014 American Community Survey 1-Year Estimates, Table DP05

2
Population Demographics, 2014
2014 Estimates Prince George’s Maryland United States
Population
Total Population 904,430 5,976,407 318,857,056
Male 435,891 (48%) 2,896,033 (48%) 156,890,101 (49%)
Female 468,539 (52%) 3,080,374 (52%) 161,966,955 (51%)
Race and Hispanic Origin
White, Non-Hispanic (NH) 127,383 (14%) 3,133,653 (52%) 197,409,353 (62%)
Black, NH 561,215 (62%) 1,744,971 (29%) 39,267,149 (12%)
Asian, NH 39,434 (4%) 367,948 (6%) 16,513,652 (5%)
Other, NH 23,837 (3%) 173,656 (3%) 10,387,450 (3%)
Hispanic (any race) 152,561 (17%) 556,179 (9%) 55,279,452 (17%)
Age
Under 5 Years 60,169 (7%) 369,754 (6%) 19,876,883 (6%)
5-17 Years 145,001 (16%) 980,790 (16%) 53,706,735 (17%)
18-24 Years 97,019 (11%) 562,215 (9%) 31,464,158 (10%)
25-44 Years 260,385 (29%) 1,598,270 (27%) 84,029,637 (26%)
45-64 Years 240,550 (27%) 1,643,118 (27%) 83,536,432 (26%)
65 Years and Over 101,306 (11%) 822,260 (14%) 46,243,211 (15%)
Median Age (years) 36.1 38.2 37.7 Data Source: 2014 American Community Survey 1-Year Estimates, Table DP05; U.S. Census Population Estimates
Prince George’s County, Median Age by Race and Ethnicity, 2014
Race and Ethnicity Median Age (yrs.) White, NH 44.6
Black 38.6
Hispanic, Any Race 28.4
Asian 36.1 Data Source: 2014 American Community Survey 1-Year Estimates, Table B01002

3
Overall, the demographics of Prince George’s County differ from the state of Maryland. While Maryland has a majority White, Non-Hispanic (NH) population, Prince George’s County has a majority Black, NH population. Prince George’s County also has a higher proportion of Hispanics than the state.
Overall, Prince George’s County has a younger population compared to Maryland and the U.S. The median age in the county is 36.1 years, while the state is at 38.3 and the U.S. is at 37.7. This can also be seen by the age groups in Table 1; a larger percent of the County’s population is under 45 years of age.
However, there are some variations by race and ethnicity, as demonstrated in Table 2, with the median age of the Hispanic population of 28.4, which is much younger compared to other residents. In contrast, the White, NH population is older, with a median age of 44.6.
By ZIP code, most of the county has a Black, Non-Hispanic majority as seen in Map 1. However, the northern part of the county is more diverse, with no majority population in many areas, and a few ZIP codes with a Hispanic or White, Non-Hispanic majority.
62.1% Black 16.9% Hispanic 14.1% White
52.4% White 29.2% Black 9.3% Hispanic
PRINCE GEORGE’S COUNTY, MARYLAND STATE OF MARYLAND

4
ZIP Codes by Population Racial and Ethnic Majority, Prince George’s County, 2010-2014
Data Source: 2010-2014 American Community Survey 5-Year Estimates, Table B03002

5
Foreign Born Residents
In Prince George’s County, 1 out of every 5 residents (21.8%)1 are born outside the United States. The countries that contribute the most to the foreign-born population include El Salvador, Guatemala, Nigeria, Mexico, and Jamaica: these five countries account for nearly half of the total foreign-born population. Of the nearly 200,000 foreign born residents in the County, 40% are naturalized U.S. citizens with a median household income of $72,093, compared to $56,274 for the 60% who are not U.S. citizens.
Country of Origin of Foreign-born Residents, Prince George’s County, 2010-2014
Data Source: 2010-2014 American Community Survey 5-Year Estimates, Table B05006
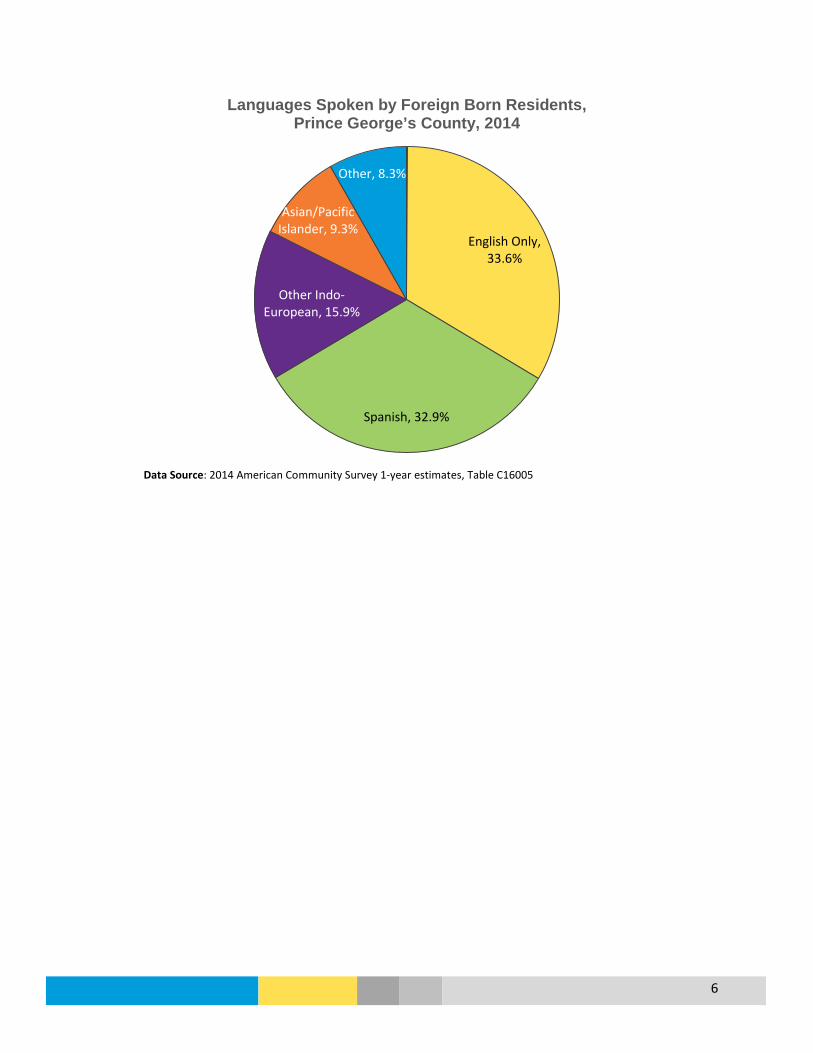
The majority of county foreign-born residents speak English (33.6%) or Spanish (32.9%). For those that speak languages other than English, 45% report speaking English “very well”; of those who do not speak English well, most (66.2%) are Spanish-speaking2, which translates to approximately 47,000 residents.
1 American Community Survey 1-year estimates, 2014, Table S0501 2 American Community Survey 1-year estimates, 2014, Table C16005
21.9%
7.7% 6.6% 6.5% 5.3% 4.4%
3.2% 3.0% 3.0% 2.4%
0.0%
5.0%
10.0%
15.0%
20.0%
25.0%
6
Languages Spoken by Foreign Born Residents, Prince George’s County, 2014
Data Source: 2014 American Community Survey 1-year estimates, Table C16005
English Only, 33.6%
Spanish, 32.9%
Other Indo-European, 15.9%
Asian/Pacific Islander, 9.3%
Other, 8.3%

7
Poverty
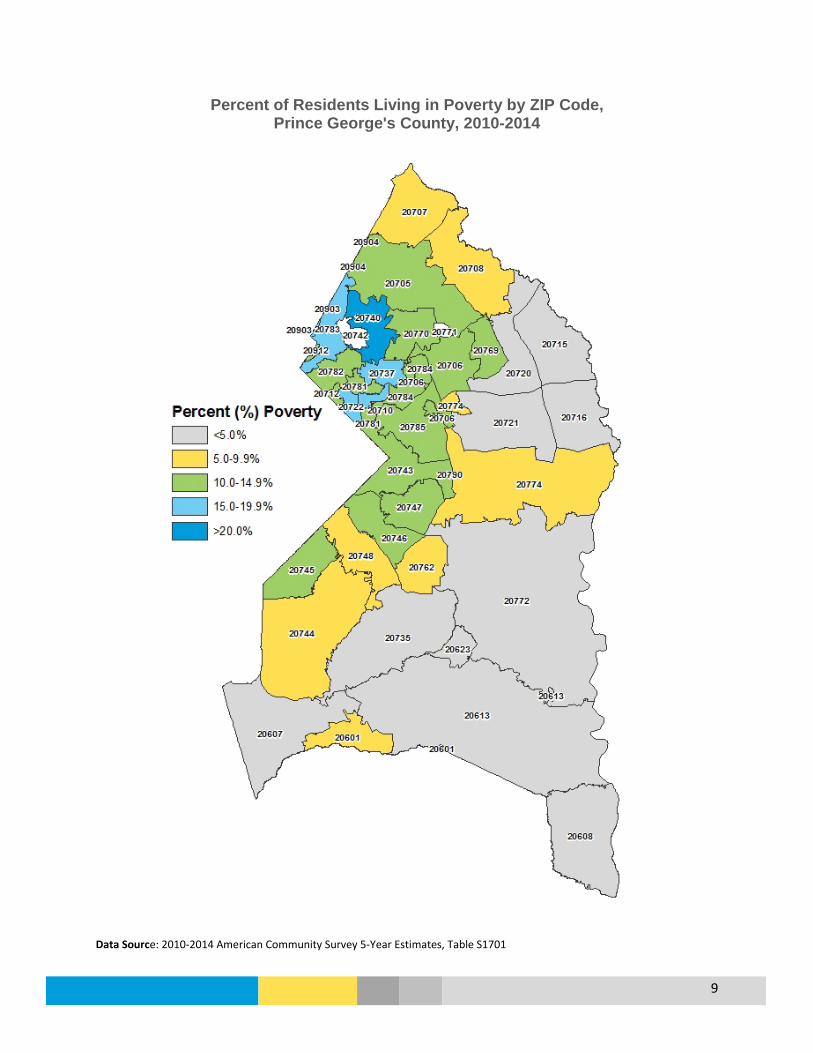
Over 10% of people in Prince George’s County lived in poverty in 2014, which is similar to Maryland at 10.1% and lower than the United States at 15.5%. There are noticeable differences in poverty by gender with more women in poverty than men, and by age with 14% of children living in poverty. Racial and ethnic disparities also exist in the county: approximately 17% of Hispanic and Latino residents live in poverty, compared to 9.3% among the county’s White non-Hispanic population and 8.6% among the county’s Black population. Residents with more education had lower levels of poverty, while those without a high school degree had the highest level of poverty at 15.7%. Individual Poverty Status in the Past 12 Months, Prince George’s County, 2014 (N=882,402)
Prince Georges County
Indicators N % Poverty Maryland % Poverty
U.S. % Poverty
Total individuals in poverty 89,672 10.2% 10.1% 15.5% Male 39,168 9.2% 9.1% 14.2% Female 50,504 11.0% 11.1% 9.5% Age Under 18 years 28,051 14.0% 13.0% 21.7% 18 to 64 years 55,609 9.6% 9.6% 14.6% 65 years and over 6,012 6.0% 7.4% 9.5% Race & Ethnicity White, non-Hispanic 11,024 9.3% 6.9% 10.8% Black 47,902 8.6% 14.6% 27.0% Asian 3,212 8.6% 9.0% 12.5% Hispanic (of any race) 25,684 17.1% 14.2% 24.1% Educational Attainment (population 25 years+) Less than high school 13,596 15.7% 21.3% 27.8% High school graduate (or equivalent) 14,566 9.3% 11.3% 14.7% Some college, associate’s degree 11,231 6.6% 7.4% 10.6% Bachelor’s degree and higher 8,091 4.3% 3.3% 4.7% Data Source: American Community Survey 1-Year Estimates, 2014, Table S1701 Approximately 7% of families in Prince George’s County live in poverty, which is similar to Maryland at 7.1% and lower than the United States at 11.3%. Fewer married couple families experience poverty (3.4%), but 12.4% of families with a female head of household lived in poverty. This figure increases to 17.6% among single-mother households with children under 18 years of age. Family poverty by race and ethnicity shows a disparity with approximately two times the percent of Hispanic families lived in poverty across the different families types.

8
Family Poverty Status in the Past 12 Months, 2014
Prince George’s County % Poverty
Maryland % Poverty
United States % Poverty
All families 7.0% 7.1% 11.3%
With related children under 18 years 11.2% 10.8% 18.0%
Married couple families 3.4% 3.1% 5.6%
With related children under 18 years 5.7% 4.1% 8.2%
Families with female householder, no husband present
12.4% 18.5% 30.5%
With related children under 18 years 17.6% 25.4% 40.6%
Data Source: 2014 American Community Survey 1-Year Estimates, Table S1702
Poverty by Family Status and Race & Ethnicity,
Prince George's County, 2014
Data Source: 2014 American Community Survey 1-Year Estimates, Table S1702
4.7% 6.2%
4.7%
14.2%
7.0%
3.1% 2.2% 3.6%
10.2%
3.4%
10.2% 11.4%
10.0%
22.5%
12.4%
0.0%
5.0%
10.0%
15.0%
20.0%
25.0%
White, non-Hispanic
Black Asian Hispanic (of anyrace)
Overall
Perc
ent (
%) B
elow
Pov
erty
Lev
el
All families Married-couple families Female householder, no husband present
9
Percent of Residents Living in Poverty by ZIP Code, Prince George's County, 2010-2014
Data Source: 2010-2014 American Community Survey 5-Year Estimates, Table S1701
10
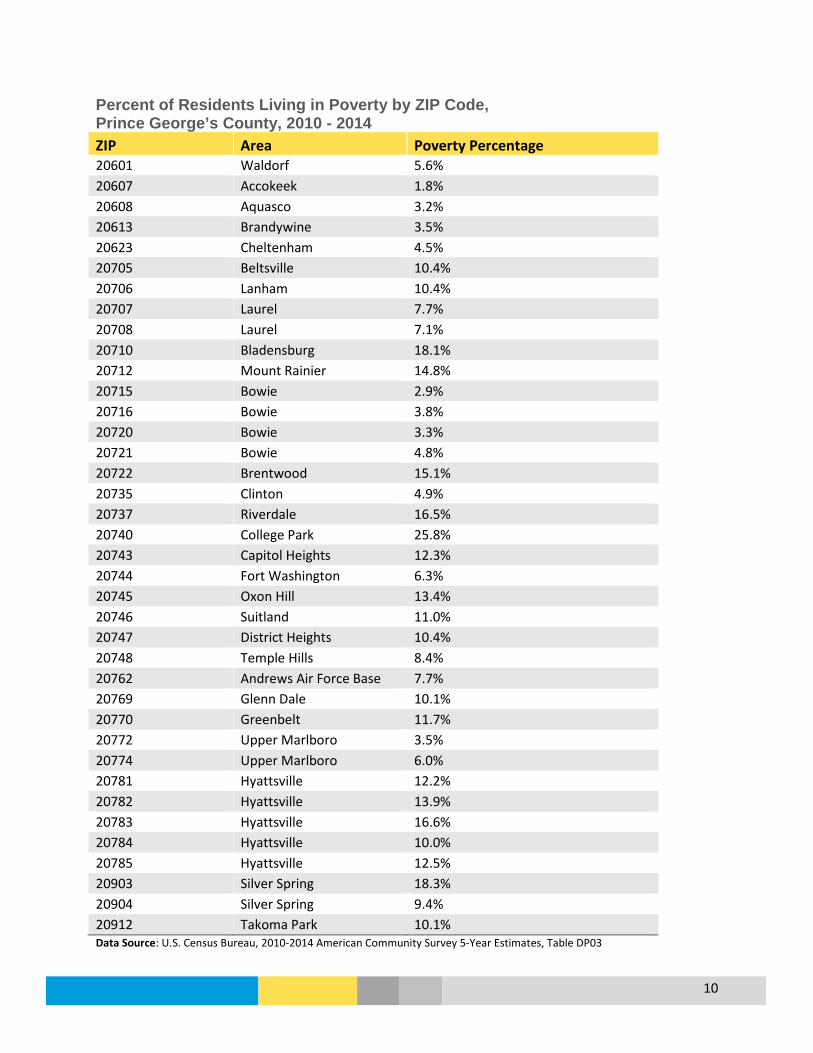
Percent of Residents Living in Poverty by ZIP Code, Prince George’s County, 2010 - 2014 ZIP Area Poverty Percentage 20601 Waldorf 5.6% 20607 Accokeek 1.8% 20608 Aquasco 3.2% 20613 Brandywine 3.5% 20623 Cheltenham 4.5% 20705 Beltsville 10.4% 20706 Lanham 10.4% 20707 Laurel 7.7% 20708 Laurel 7.1% 20710 Bladensburg 18.1% 20712 Mount Rainier 14.8% 20715 Bowie 2.9% 20716 Bowie 3.8% 20720 Bowie 3.3% 20721 Bowie 4.8% 20722 Brentwood 15.1% 20735 Clinton 4.9% 20737 Riverdale 16.5% 20740 College Park 25.8% 20743 Capitol Heights 12.3% 20744 Fort Washington 6.3% 20745 Oxon Hill 13.4% 20746 Suitland 11.0% 20747 District Heights 10.4% 20748 Temple Hills 8.4% 20762 Andrews Air Force Base 7.7% 20769 Glenn Dale 10.1% 20770 Greenbelt 11.7% 20772 Upper Marlboro 3.5% 20774 Upper Marlboro 6.0% 20781 Hyattsville 12.2% 20782 Hyattsville 13.9% 20783 Hyattsville 16.6% 20784 Hyattsville 10.0% 20785 Hyattsville 12.5% 20903 Silver Spring 18.3% 20904 Silver Spring 9.4% 20912 Takoma Park 10.1% Data Source: U.S. Census Bureau, 2010-2014 American Community Survey 5-Year Estimates, Table DP03

11
Food Stamp/Supplemental Nutrition Assistance Program (SNAP) Benefits Prince George’s County had a higher percent of households that received food stamps/ SNAP benefits in 2014 (12.4%) compared to Maryland (11.6%), but was lower than the United States at 13.2%. In the County, over half (54.6%) of households receiving food stamps/SNAP include children under 18 years of age. An additional 27.1% of households receiving food stamps/SNAP included people over 60 years of age. Percent of Household with Food Stamp/SNAP Benefits, 2014
Prince George’s County
Maryland United States
Households Receiving Food Stamps/SNAP
12.4% 11.6% 13.2%
Data Source: 2014 American Community Survey 1-Year Estimates, Table S2201
For household s by race and ethnicity, a low percent of White, Non-Hispanic (NH) and Asian households received food stamps/SNAP in 2014 (5.4% and 5.5%, respectively). In contrast, 13.5% of Black households and 16.6% of Hispanic households received food stamps/SNAP.
Percent of Households Receiving Food Stamps/SNAP by Race and Ethnicity, Prince George’s County, 2014
Data Source: 2014 American Community Survey 1-Year Estimates, Table B2205
5.4%
13.5%
5.5%
16.6%
0.0%
2.0%
4.0%
6.0%
8.0%
10.0%
12.0%
14.0%
16.0%
18.0%
White, NH Black Asian Hispanic (any race)

12
Percentage of Households with Food Stamp/SNAP Benefits by ZIP Code, Prince George’s County, 2010-2014 ZIP Area Percent of Households on SNAP 20601 Waldorf 8.8% 20607 Accokeek 2.8% 20608 Aquasco 9.1% 20613 Brandywine 4.2% 20623 Cheltenham 0.7% 20705 Beltsville 9.7% 20706 Lanham 10.1% 20707 Laurel 8.5% 20708 Laurel 8.2% 20710 Bladensburg 20.3% 20712 Mount Rainier 11.3% 20715 Bowie 2.4% 20716 Bowie 3.1% 20720 Bowie 3.3% 20721 Bowie 4.8% 20722 Brentwood 14.8% 20735 Clinton 6.3% 20737 Riverdale 15.7% 20740 College Park 5.4% 20743 Capitol Heights 19.0% 20744 Fort Washington 7.6% 20745 Oxon Hill 21.5% 20746 Suitland 13.4% 20747 District Heights 14.3% 20748 Temple Hills 12.6% 20762 Andrews Air Force Base 4.0% 20769 Glenn Dale 11.1% 20770 Greenbelt 9.5% 20772 Upper Marlboro 5.5% 20774 Upper Marlboro 7.5% 20781 Hyattsville 10.7% 20782 Hyattsville 9.7% 20783 Hyattsville 11.6% 20784 Hyattsville 14.2% 20785 Hyattsville 15.7% 20903 Silver Spring 13.1% 20904 Silver Spring 8.5% 20912 Takoma Park 9.5% Data Source: U.S. Census Bureau, 2010-2014 American Community Survey 5-Year Estimates, Table DP03

13
Disability
In 2014, an estimated 9.2% of the County’s population lives with a disability. Some disabilities may occur with age, while others may be from birth, or from disease or accident. By race and ethnicity, the White, Non-Hispanic population is estimated to have the highest proportion of County residents with a disability at 12.9%. Over 31% of residents age 65 years and older have a disability; of those approximately two-thirds have an ambulatory disability.
Percent of Residents with a Disability, 2014
Prince George’s County
Maryland United States
With a Disability 9.2% 10.6% 12.6%
Data Source: 2014 American Community Survey 1-Year Estimates, Table S1810
Percent of Residents by Disability and Age,
Prince George’s County, 2014
Data Source: 2014 American Community Survey 1-Year Estimates, Table S1810
4.7% 7.5%
31.1%
0.0%
5.0%
10.0%
15.0%
20.0%
25.0%
30.0%
35.0%
Hearing Vision Cognitive Ambulatory Self-Care IndependentLiving
TOTAL
Perc
ent o
f Res
iden
ts
5 to 17 years 18 to 64 years 65 years+
14
Education
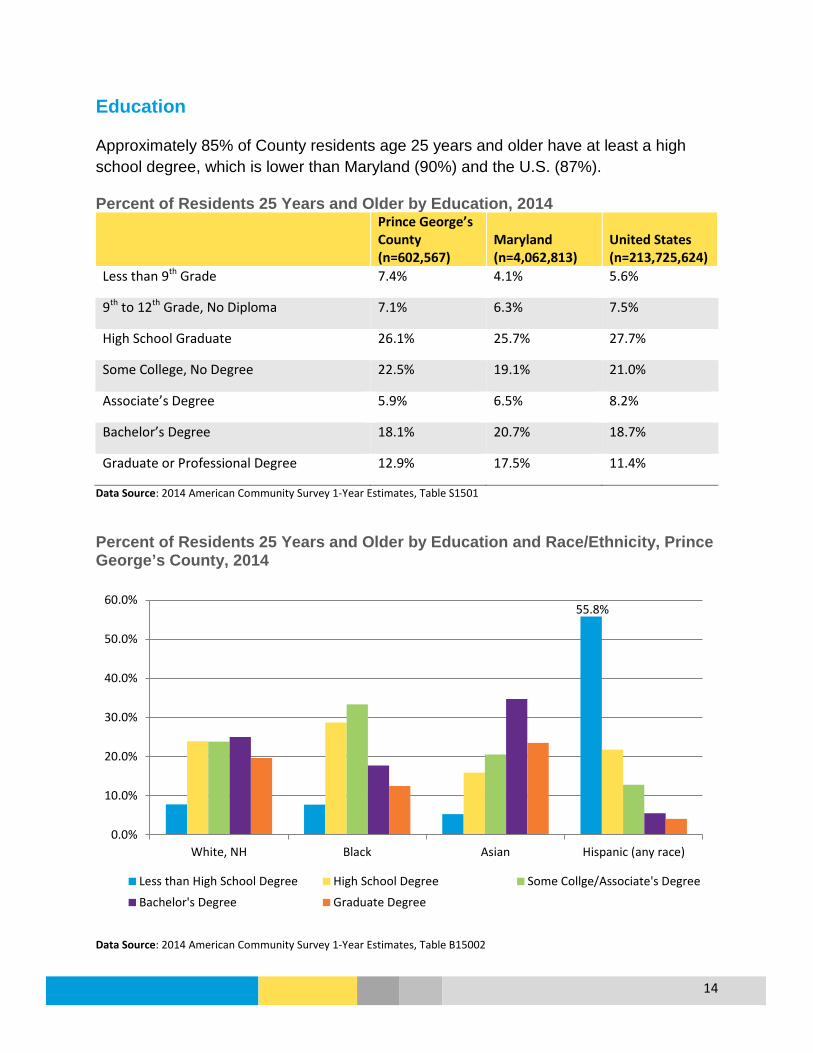
Approximately 85% of County residents age 25 years and older have at least a high school degree, which is lower than Maryland (90%) and the U.S. (87%).
Percent of Residents 25 Years and Older by Education, 2014
Prince George’s County (n=602,567)
Maryland (n=4,062,813)
United States (n=213,725,624)
Less than 9th Grade 7.4% 4.1% 5.6%
9th to 12th Grade, No Diploma 7.1% 6.3% 7.5%
High School Graduate 26.1% 25.7% 27.7%
Some College, No Degree 22.5% 19.1% 21.0%
Associate’s Degree 5.9% 6.5% 8.2%
Bachelor’s Degree 18.1% 20.7% 18.7%
Graduate or Professional Degree 12.9% 17.5% 11.4%
Data Source: 2014 American Community Survey 1-Year Estimates, Table S1501 Percent of Residents 25 Years and Older by Education and Race/Ethnicity, Prince George’s County, 2014
Data Source: 2014 American Community Survey 1-Year Estimates, Table B15002
55.8%
0.0%
10.0%
20.0%
30.0%
40.0%
50.0%
60.0%
White, NH Black Asian Hispanic (any race)
Less than High School Degree High School Degree Some Collge/Associate's Degree
Bachelor's Degree Graduate Degree

15
While Prince George’s County is similar to the U.S. (see Table 7) for those with Bachelor’s Degrees and higher (31% and 30%), the County falls behind when compared to Maryland (38%). There is more of disparity when comparing the County to the neighboring jurisdiction of Washington, D.C., which has 55% of residents with a Bachelor’s Degree or higher.
There are noticeable differences within the County by race and ethnicity (see Graph 6), with Asian residents having high educational attainment, followed by White, Non-Hispanic (NH) residents. Most Black residents do have a High School Degree, but fewer have a college degree compared to Asian and White, NH residents. The County’s Hispanic residents have the most significant disparity, with over 50% lacking a High School Degree or equivalent, and less than 10% having a Bachelor’s Degree or higher.
In 2015, 127,576 County children and adolescents enrolled in public schools. While the overall graduation rate has increased since 2012 (see Graph 7), Hispanic students are still less likely to complete high school in the County. Overall, Prince George’s County has a lower graduation rate (78.75%) compared to Maryland (86.98%) in 2015. Part of that difference may be due to the graduation rate for Hispanic students in Maryland being over 10 percent higher (76.89% compared to 67.37% for the County).
Graduation Rate by Race/Ethnicity, Prince George’s County Public Schools
Data Source: Maryland Report Card http://reportcard.msde.maryland.gov/
81.28 78.96
89.27
67.37
0102030405060708090
100
2010 2011 2012 2013 2014 2015
Gra
duat
ion
Rate
(%)
Black or AA White Asian Hispanic, Any Race Overall
Overall Rate: 78.75
16
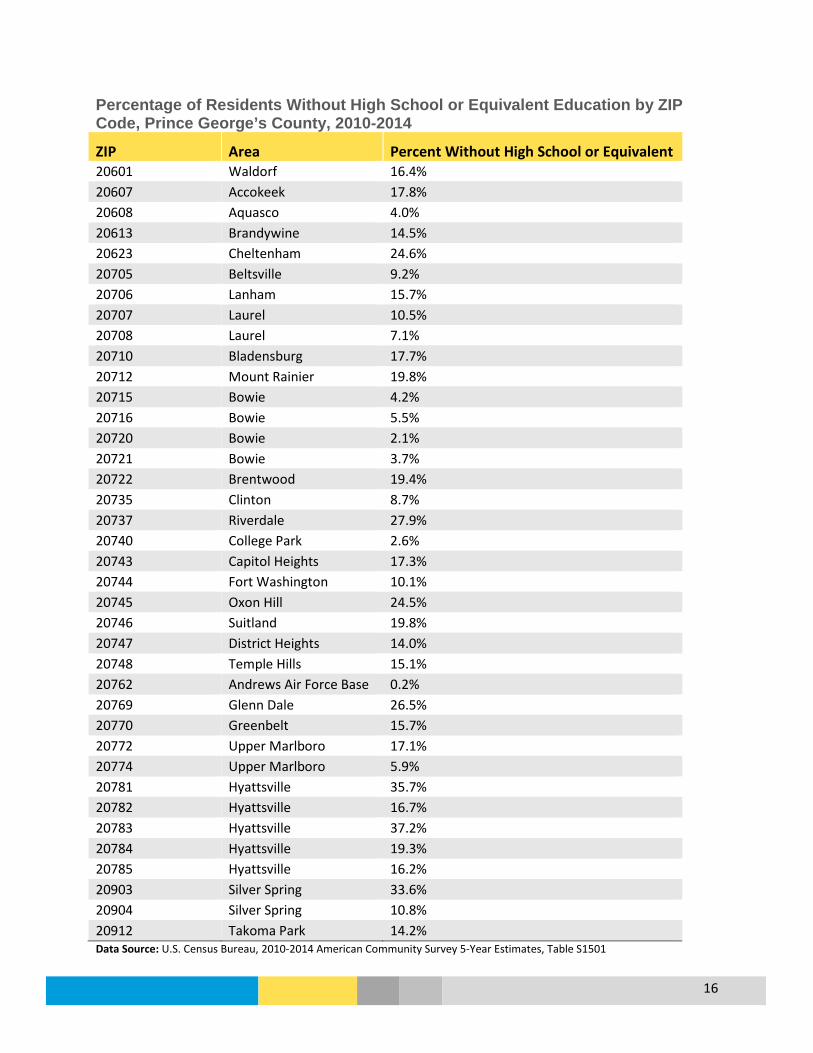
Percentage of Residents Without High School or Equivalent Education by ZIP Code, Prince George’s County, 2010-2014
ZIP Area Percent Without High School or Equivalent 20601 Waldorf 16.4% 20607 Accokeek 17.8% 20608 Aquasco 4.0% 20613 Brandywine 14.5% 20623 Cheltenham 24.6% 20705 Beltsville 9.2% 20706 Lanham 15.7% 20707 Laurel 10.5% 20708 Laurel 7.1% 20710 Bladensburg 17.7% 20712 Mount Rainier 19.8% 20715 Bowie 4.2% 20716 Bowie 5.5% 20720 Bowie 2.1% 20721 Bowie 3.7% 20722 Brentwood 19.4% 20735 Clinton 8.7% 20737 Riverdale 27.9% 20740 College Park 2.6% 20743 Capitol Heights 17.3% 20744 Fort Washington 10.1% 20745 Oxon Hill 24.5% 20746 Suitland 19.8% 20747 District Heights 14.0% 20748 Temple Hills 15.1% 20762 Andrews Air Force Base 0.2% 20769 Glenn Dale 26.5% 20770 Greenbelt 15.7% 20772 Upper Marlboro 17.1% 20774 Upper Marlboro 5.9% 20781 Hyattsville 35.7% 20782 Hyattsville 16.7% 20783 Hyattsville 37.2% 20784 Hyattsville 19.3% 20785 Hyattsville 16.2% 20903 Silver Spring 33.6% 20904 Silver Spring 10.8% 20912 Takoma Park 14.2% Data Source: U.S. Census Bureau, 2010-2014 American Community Survey 5-Year Estimates, Table S1501
17
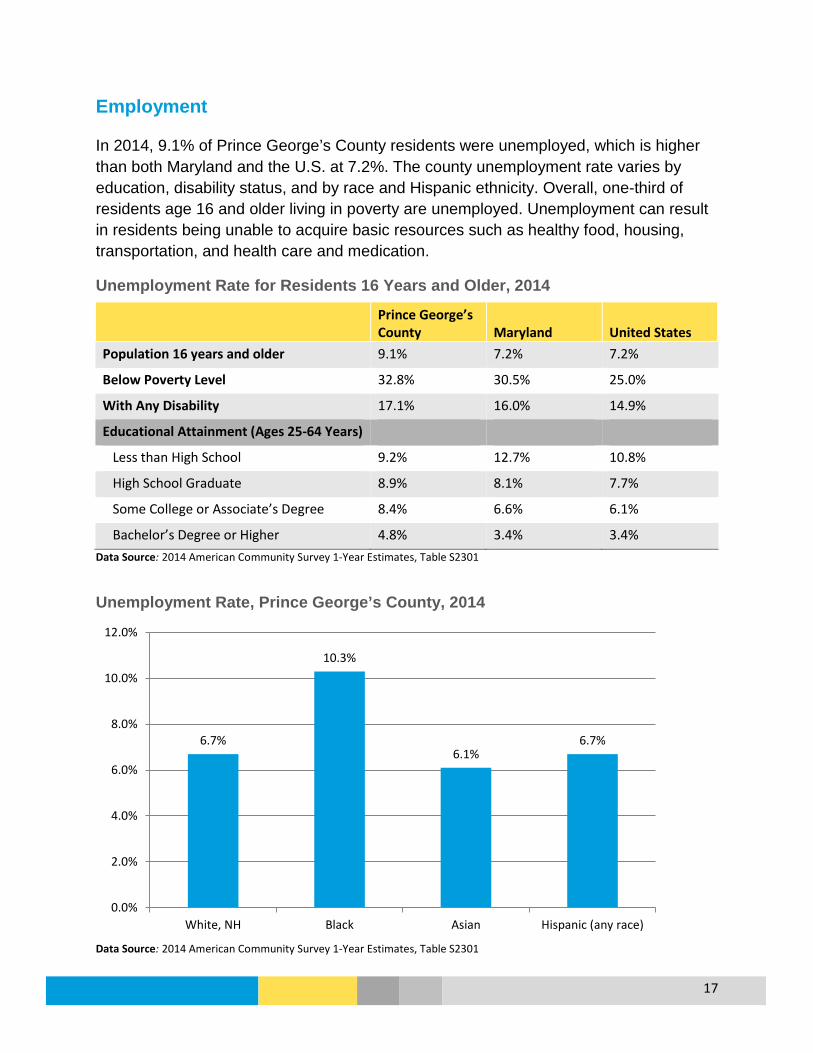
Employment
In 2014, 9.1% of Prince George’s County residents were unemployed, which is higher than both Maryland and the U.S. at 7.2%. The county unemployment rate varies by education, disability status, and by race and Hispanic ethnicity. Overall, one-third of residents age 16 and older living in poverty are unemployed. Unemployment can result in residents being unable to acquire basic resources such as healthy food, housing, transportation, and health care and medication.
Unemployment Rate for Residents 16 Years and Older, 2014
Prince George’s County Maryland United States
Population 16 years and older 9.1% 7.2% 7.2%
Below Poverty Level 32.8% 30.5% 25.0%
With Any Disability 17.1% 16.0% 14.9%
Educational Attainment (Ages 25-64 Years)
Less than High School 9.2% 12.7% 10.8%
High School Graduate 8.9% 8.1% 7.7%
Some College or Associate’s Degree 8.4% 6.6% 6.1%
Bachelor’s Degree or Higher 4.8% 3.4% 3.4% Data Source: 2014 American Community Survey 1-Year Estimates, Table S2301
Unemployment Rate, Prince George’s County, 2014
Data Source: 2014 American Community Survey 1-Year Estimates, Table S2301
6.7%
10.3%
6.1% 6.7%
0.0%
2.0%
4.0%
6.0%
8.0%
10.0%
12.0%
White, NH Black Asian Hispanic (any race)

18
Access to Food
Access to healthy food has been shown to increase fruit and vegetable consumption and lower the risk of obesity.3 The presence of a supermarket in a community is a sign health by providing residents with access to affordable and nutritious food. A food desert is an area lacking supermarket access. In the county, most areas designated as food deserts are within the Washington D.C. metro area (inside the beltway). A food desert is defined as a low income area where urban residents are more than one mile away from a supermarket, or suburban residents are more than 10 miles away.
Data Source: United States Department of Agriculture, Economic Research Service, Food Access Research Atlas
3 Robert Wood Johnson Foundtation, http://www.rwjf.org/en/library/research/2012/12/do-all-americans-have-equal-access-to-healthy-foods-.html
Food Deserts: Low Income and Low Access, Prince George’s County, 2010
19
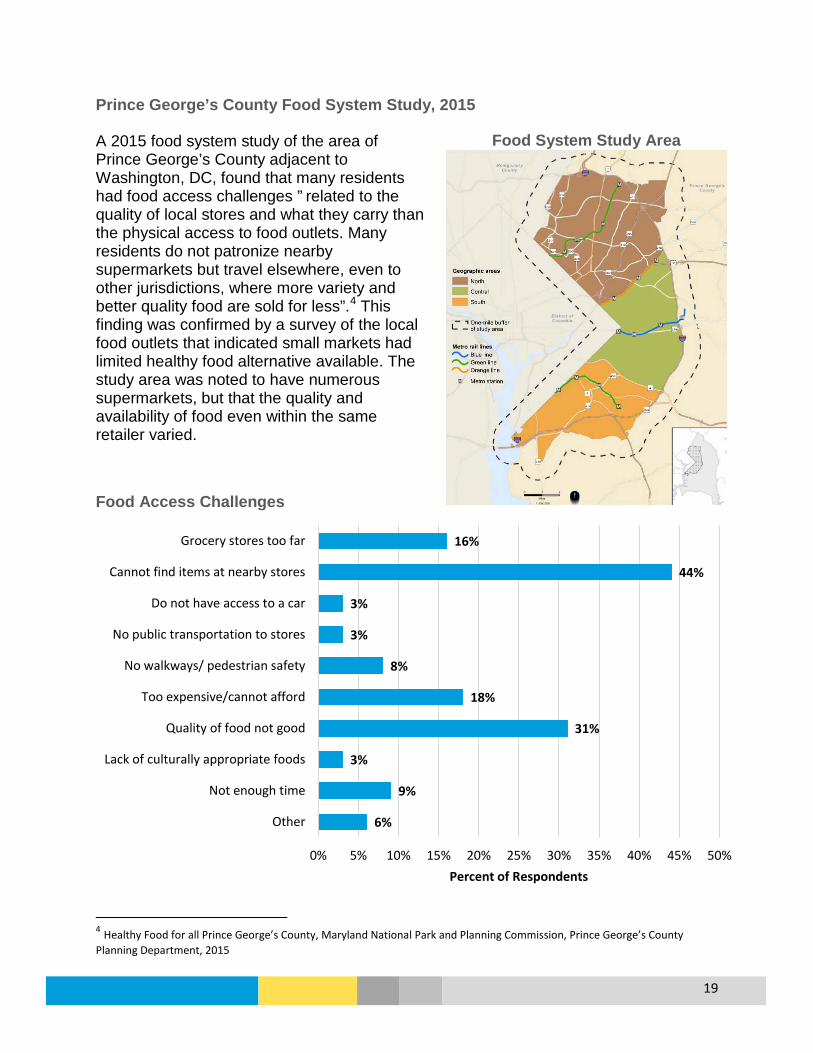
Prince George’s County Food System Study, 2015 A 2015 food system study of the area of Prince George’s County adjacent to Washington, DC, found that many residents had food access challenges ” related to the quality of local stores and what they carry than the physical access to food outlets. Many residents do not patronize nearby supermarkets but travel elsewhere, even to other jurisdictions, where more variety and better quality food are sold for less”.4 This finding was confirmed by a survey of the local food outlets that indicated small markets had limited healthy food alternative available. The study area was noted to have numerous supermarkets, but that the quality and availability of food even within the same retailer varied.
Food Access Challenges
4 Healthy Food for all Prince George’s County, Maryland National Park and Planning Commission, Prince George’s County Planning Department, 2015
6%
9%
3%
31%
18%
8%
3%
3%
44%
16%
0% 5% 10% 15% 20% 25% 30% 35% 40% 45% 50%
Other
Not enough time
Lack of culturally appropriate foods
Quality of food not good
Too expensive/cannot afford
No walkways/ pedestrian safety
No public transportation to stores
Do not have access to a car
Cannot find items at nearby stores
Grocery stores too far
Percent of Respondents
Food System Study Area

20
Housing
There are fewer housing vacancies in Prince George’s County (7.1%) compared to both Maryland (10.6%) and the U.S. (12.5%). The County has more single-family households (21%) compared to Maryland (14.7%) and the U.S. (13%).5 The median value of homes in Prince George’s County is $247,600 which is lower than the overall state ($280,220) but higher than the national value ($173,900).6
Housing Characteristics, 2014
Indicators Prince George’s Maryland U.S. N % N % N %
Total Housing Units 330,514 2,422,317 133,962,970 Vacancy Occupied Housing Units 307,022 92.9% 2,165,438 89.4% 117,259,427 87.5% Vacant Housing Units 23,492 7.1% 256,879 10.6% 16,703,543 12.5% For Rent 10,033 54,918 2,963,407 Occupied Housing Units Owner-occupied 185,502 60.4% 1,426,748 65.9% 73,991,995 63.1% Renter-occupied 121,520 39.6% 738,690 34.1% 43,267,432 36.9% Owner-Occupied Units Household Type Married couple family 48.9% 58.4% 60.0% Male householder, no wife present
5.7% 4.2% 4.1%
Female householder, no husband present
16.7% 10.9% 9.2%
Nonfamily household 28.8% 26.5% 26.7% Renter-Occupied Units Household Type Married couple family 23.0% 25.5% 27.1% Male householder, no wife present
9.8% 6.3% 6.3%
Female householder, no husband present
25.6% 21.9% 19.6%
Nonfamily household 41.7% 46.3% 47.0% Average Household Size Owner-occupied 2.97 2.77 2.71 Renter-occupied 2.76 2.54 2.55 Data Source: 2014 American Community Survey 1-Year Estimates, Tables B25004, S2501, S2502, B25010
5 Census.gov Table S1101 6 Census.gov Table DP04

21
Fair Market Rent
Approximately 40% of occupied housing units in Prince George’s County are rentals (Table 8). The estimated median income for renters in the County is $50,792, which is 30% lower than the overall County median household income of $72,290. Based on the Fair Market Rent values, affordable housing can be a challenge in the County. When limited income has to be used for rent, these households may affect their ability to purchase other necessities, such as food, transportation and medical expenses. While the rental income in Prince George’s County is greater than Maryland, the rental costs are also higher.
Fair Market Rent, 2015
Prince George’s County Maryland Fair Market Rent by Unit
Efficiency $1,167 $936
One bedroom $1,230 $1,049
Two bedroom $1,458 $1,281
Three bedroom $1,951 $1,677
Four bedroom $2,451 $1,957
Income Needed to Afford Fair Market Rent by Unit
Efficiency $46,680 $37,448
One bedroom $49,200 $41,942
Two bedroom $58,320 $51,249
Three bedroom $78,040 $67,074
Four bedroom $98,040 $78,299
Income of Renter
Estimated renter median income $50,792 $46,697 Rent affordable for households earning the renter median income $1,270 $1,167
Data Source: National Low Income Housing Coalition, www.nlihc.org

22
Income
The median household income in the County is $72,290 which is lower than Maryland ($73,971), but is higher than the U.S. When looking at income by groups (Graph 8), Maryland has more residents making below $25,000 compared to Prince George’s County; however, Maryland also has more residents making above $150,000 compared to Prince George’s County, which helps to explain the higher mean and median income for the state.
Income in the Past 12 Months (In 2014 Inflation-Adjusted Dollars)
Prince George’s
County Maryland United States
Median household income $72,290 $73,971 $53,657
Mean household income $89,171 $97,016 $75,591
Median family income $83,167 $89,678 $65,910
Mean family income $99,201 $112,887 $88,394 Data Source: 2014 American Community Survey 1-Year Estimates, Table S1901
Household Income (In 2014 Inflation-Adjusted Dollars)
Data Source: 2014 American Community Survey 1-Year Estimates, Table S1901
3.8%
2.3%
5.7%
7.6%
12.3%
19.9%
13.9%
19.2%
8.6%
6.6%
0.0% 5.0% 10.0% 15.0% 20.0% 25.0%
Less than $10k
$10k - $14,999
$15k - $24,999
$25k - $34,999
$35k - $49,999
$50k - $74,999
$75k - $99,999
$100k - $149,999
$150k - $199,999
$200,000k or more
Prince George's County Maryland

23
Income by Race and Ethnicity in the County shows both that more White, Non-Hispanic (NH) and Asian households have an income over $100,000. The Hispanic population has an income disparity, with nearly half of the households with an income under $50,000, and only 3% of households earning over $150,000 compared to over 15% Black, Asian, and White, NH households. Household Income (In 2014 Inflation-Adjusted Dollars) by Race and Ethnicity, Prince George’s County
Data Source: 2014 American Community Survey 1-Year Estimates, Table B19001
0.00%
5.00%
10.00%
15.00%
20.00%
25.00%
30.00%
35.00%
40.00%
White, NH Black Asian Hispanic (any race)
<$25k $25-$49k $50-$74k $75-$99k $100-149k >$150k
24
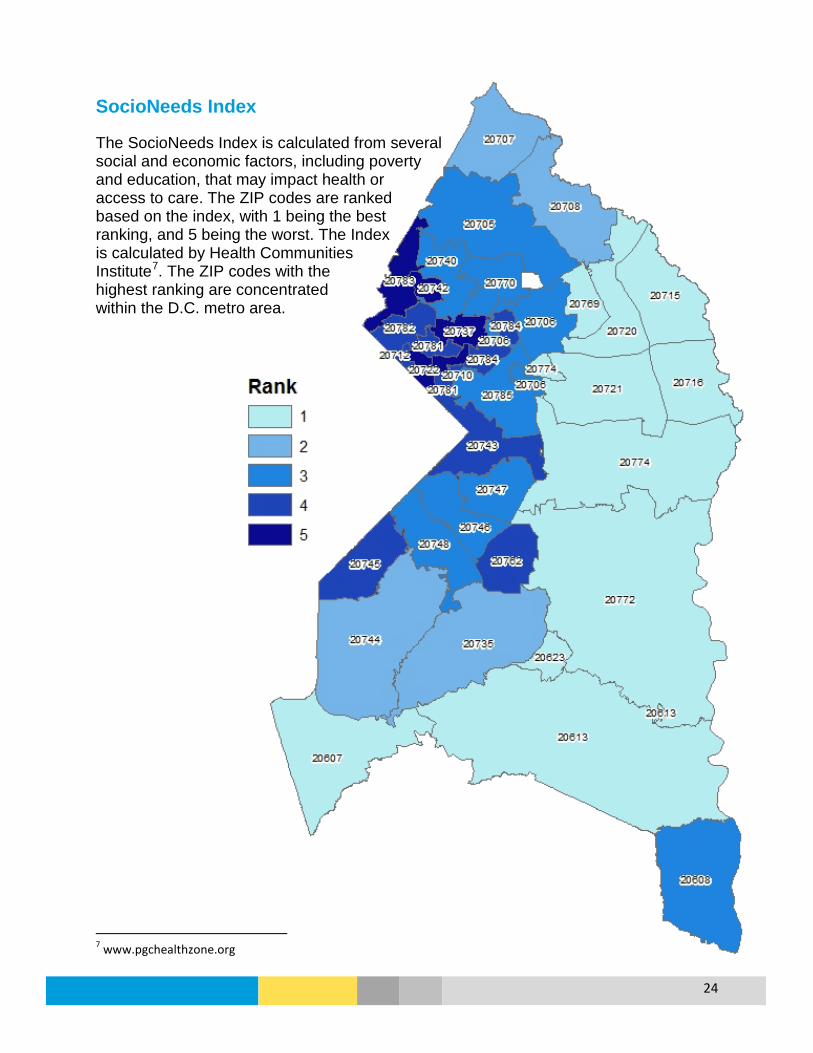
SocioNeeds Index
The SocioNeeds Index is calculated from several social and economic factors, including poverty and education, that may impact health or access to care. The ZIP codes are ranked based on the index, with 1 being the best ranking, and 5 being the worst. The Index is calculated by Health Communities Institute7. The ZIP codes with the highest ranking are concentrated within the D.C. metro area.
7 www.pgchealthzone.org

1
HEALTH INDICATORS REPORT Introduction The following report includes existing health data for Prince George’s County, compiled using the most current local, state, and national sources. This report was developed to inform and support a joint Community Health Needs Assessment for the Health Department and area hospitals, and was used as part of the Prioritization Process that included resident representation from across the county.
Methods
Much of the information in this report is generated through a variety of sources, including: Maryland Health Services Cost Review Commission; Maryland Vital Statistics Annual Reports, Maryland Department of Health and Mental Hygiene’s (DHMH) Annual Cancer Reports, Behavioral Risk Factor Surveillance System (BRFSS), Centers for Disease Control and Prevention’s CDC WONDER Online Database, Centers for Medicare and Medicaid Services, National Vital Statistics Reports, Maryland SHIP, and the Prince George’s County Health Department data website: www.pgchealthzone.org. Some of the data presented, specifically some birth and death data as well as some emergency room and hospitalization data, were analyzed by the Health Department using data files provided by Maryland DHMH. The specific data sources used are listed throughout the report. When available, state (noted as MD SHIP) and national (noted as HP 2020) comparisons were provided as benchmarks. Most topics were analyzed by gender, race and ethnicity, age group and ZIP Code level to study the burden of health conditions, determinants of health and health disparities.
Limitations
While efforts were made to include accurate and current data, data gaps and limitations exist. One major limitation is that Prince George’s County residents sometimes seek services in Washington, D.C.; because this is a different jurisdiction the data for these services may be unavailable (Emergency Room Visits) or older (hospitalizations). Another major limitation is that the diversity of the county is often not captured through traditional race and ethnicity. The county has a large immigrant population, but data specific to this population is often not available related to health issue. Data with small numbers can also be difficult to analyze and interpret and should be viewed carefully. Current events can also affect data, such as the implementation of the Affordable Care Act (ACA). While the ACA has increased health insurance coverage, the data that is needed to fully understand how this has affected our residents is not yet available.
2
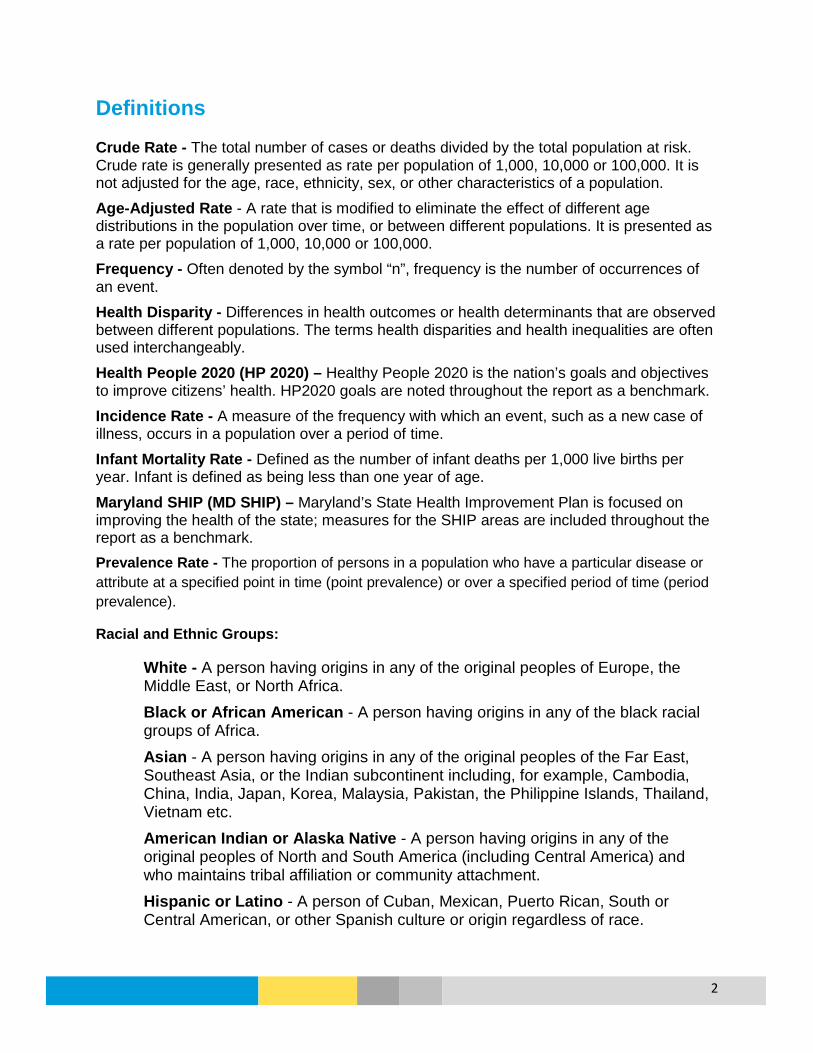
Definitions Crude Rate - The total number of cases or deaths divided by the total population at risk. Crude rate is generally presented as rate per population of 1,000, 10,000 or 100,000. It is not adjusted for the age, race, ethnicity, sex, or other characteristics of a population. Age-Adjusted Rate - A rate that is modified to eliminate the effect of different age distributions in the population over time, or between different populations. It is presented as a rate per population of 1,000, 10,000 or 100,000. Frequency - Often denoted by the symbol “n”, frequency is the number of occurrences of an event. Health Disparity - Differences in health outcomes or health determinants that are observed between different populations. The terms health disparities and health inequalities are often used interchangeably. Health People 2020 (HP 2020) – Healthy People 2020 is the nation’s goals and objectives to improve citizens’ health. HP2020 goals are noted throughout the report as a benchmark. Incidence Rate - A measure of the frequency with which an event, such as a new case of illness, occurs in a population over a period of time. Infant Mortality Rate - Defined as the number of infant deaths per 1,000 live births per year. Infant is defined as being less than one year of age.
Maryland SHIP (MD SHIP) – Maryland’s State Health Improvement Plan is focused on improving the health of the state; measures for the SHIP areas are included throughout the report as a benchmark. Prevalence Rate - The proportion of persons in a population who have a particular disease or attribute at a specified point in time (point prevalence) or over a specified period of time (period prevalence).
Racial and Ethnic Groups:
White - A person having origins in any of the original peoples of Europe, the Middle East, or North Africa. Black or African American - A person having origins in any of the black racial groups of Africa. Asian - A person having origins in any of the original peoples of the Far East, Southeast Asia, or the Indian subcontinent including, for example, Cambodia, China, India, Japan, Korea, Malaysia, Pakistan, the Philippine Islands, Thailand, Vietnam etc. American Indian or Alaska Native - A person having origins in any of the original peoples of North and South America (including Central America) and who maintains tribal affiliation or community attachment. Hispanic or Latino - A person of Cuban, Mexican, Puerto Rican, South or Central American, or other Spanish culture or origin regardless of race.

3
Table of Contents
Health Status Indicators 4 Life Expectancy 4 Mortality 5 Emergency Department Visits 10 Hospital Admissions 11 Access to Health Care 12 Diseases and Conditions 17 Alzheimer’s Disease 17 Cancer 19 Chronic Lower Respiratory Disease 28 Diabetes 41 Heart Disease 48 HIV 54 Hypertension and Stroke 61 Infectious Disease 68 Lead Poisoning 70 Maternal and Infant Health 72 Mental Health 78 Nephritis 81 Obesity 82 Oral Health 88 Sexually Transmitted Infections 92 Substance Use Disorder 96 Unintentional Injuries 104 Violence and Domestic Violence 108

4
Health Status Indicators Life Expectancy Prince George’s County has a life expectancy about the same as Maryland and above the U.S. Life expectancy has steadily increased in the county, and the Maryland SHIP Goal of 79.8 years was met as of 2014. However, there is still a disparity in life expectancy by race, with White residents living longer on average than Black residents.
Life Expectancy at Birth by Race, 2011-2013
Data Source: National Vital Statistics Report, CDC http://www.cdc.gov/nchs/data/nvsr/nvsr64/nvsr64_02.pdf; Maryland Vital Statistics Annual Report 2014, Maryland Department of Health and Mental Hygiene Life Expectancy at Birth by Race, Prince George’s County, 2008-2014
Data Source: Maryland Vital Statistics Annual Report 2014, Maryland Department of Health and Mental Hygiene
79.6 80.6 78.9 79.6 80.3 77.2 78.7 79.7 75.4
0102030405060708090
All Races White Black
Age
in Y
ears
Prince George's Maryland United States
77.8 78.6
79.2 79.6 80.0
80.2 79.6
80.3 80.6 80.7
75.9
77.1
78.4 78.9 79.3
73
74
75
76
77
78
79
80
81
82
2008-2010 2009-2011 2010-2012 2011-2013 2012-2014
Age
in Y
ears
Prince George's White Black
MD SHIP Goal: 79.8
MD SHIP Goal: 79.8

5
Mortality From 2012-2014, 16,585 deaths occurred to Prince George’s County residents. The leading two causes of death in the county, heart disease and cancer, account for half of all resident deaths. Overall, the age-adjusted death rate for the county is higher than Maryland, but lower than the U.S. for 2012-2014. For the leading causes of death, the county’s age-adjusted mortality rates are higher than Maryland and the U.S. for heart disease, cancer, stroke, diabetes, septicemia, nephritis, homicide, hypertension, and perinatal conditions.
Leading Causes of Death, 2012-2014
Cause of Death
Prince George’s County Deaths
Age-Adjusted Death Rates per
100,000 Population Healthy People 2020 Target
Maryland SHIP 2017 Goal Number Percent
Prince George’s Maryland U.S.
All Causes 16,585 100% 720.3 706.3 729.7 --- ---
Heart Disease 4,182 25.2% 185.8 171.6 169.1 --- 166.3
Cancer 4,056 24.5% 166.4 163.3 163.6 161.4 147.4
Stroke 823 5.0% 37.8 36.9 36.5 34.8 ---
Diabetes 683 4.1% 29.4 19.4 21.1 66.6 ---
Accidents 667 4.0% 26.5 27.4 39.7 36.4 ---
CLRD* 458 2.8% 21.0 31.4 41.4 --- ---
Septicemia 370 2.2% 16.1 15.1 10.6 --- ---
Influenza and Pneumonia 318 1.9% 15.0 16.2 15.2 --- ---
Nephritis 305 1.8% 13.8 11.4 13.2 --- ---
Alzheimer’s 273 1.6% 14.5 14.5 24.3 --- ---
Homicide 213 1.3% 7.8 7.0 5.2 10.2 9.0
Hypertension 199 1.2% 9.0 7.1 8.3 5.5 ---
Perinatal Conditions 183 1.1% 7.2 5.2 4.2 3.3 ---
*CLRD=Chronic Lower Respiratory Disease, includes both chronic obstructive pulmonary disease and asthma Data Source: Centers for Disease Control and Prevention, National Center for Health Statistics, CDC WONDER Online Database

6
Overall, White non-Hispanic (NH) male residents have the highest age-adjusted death rate in the county, followed by Black NH males. White, NH, Asian NH, and Hispanic residents all have higher age-adjusted death rates than in Maryland. Age-Adjusted Death Rate per 100,000 by Race, Ethnicity, and Sex, 2012-2014
Race and Ethnicity Prince George’s County Maryland U.S. White, Non-Hispanic 815.1 707.7 745.2
Male 953.4 832.1 875.0 Female 701.1 607.8 636.6
Black, Non-Hispanic 723.9 806.1 880.8 Male 888.7 1,002.4 1,076.4 Female 608.5 671.5 737.8
Hispanic, Any Race 390.8 323.6 532.2 Male 460.3 362.5 636.4 Female 330.2 285.4 445.9
Asian, Non-Hispanic 400.8 343.3 402.1 Male * 390.4 479.6 Female * 305.5 342.7
All Races and Ethnicities 720.3 706.3 729.7 Male 871.1 838.9 861.2 Female 609.6 603.4 621.6
*Rates unavailable due to low death counts Data Source: Centers for Disease Control and Prevention, National Center for Health Statistics, CDC WONDER Online Database Age-Adjusted Death Rate per 100,000 for All Causes of Death by Race and Ethnicity, Prince George’s County, 2008-2014
Data Source: Centers for Disease Control and Prevention, National Center for Health Statistics, CDC WONDER Online Database
2008-2010 2009-2011 2010-2012 2011-2013 2012-2014White NH 882.8 871.4 835.3 822.2 815.1Black NH 833.6 790.0 767.6 738.2 723.9Hispanic, Any Race 393.9 386.0 409.0 398.8 390.8Asian NH 434.3 458.2 425.9 414.8 400.8Prince George's 810.0 781.6 756.9 736.3 720.3
0
200
400
600
800
1,000
Deat
hs p
er 1
00,0
00 P
opul
atio
n

7
Leading Causes of Death, Age-Adjusted Rates, 2012-2014
Data Source: Centers for Disease Control and Prevention, National Center for Health Statistics, CDC WONDER Online Database Leading Causes of Death for White Non-Hispanic Residents, Prince George’s County, 2010-2014 (N=8,462)
*CLRD=Chronic Lower Respiratory Disease, includes both chronic obstructive pulmonary disease and asthma Data Source: Centers for Disease Control and Prevention, National Center for Health Statistics, CDC WONDER Online Database
185.8 166.4
37.8 29.4 26.5
0.0
50.0
100.0
150.0
200.0
Heart Disease Cancer Stroke Diabetes Accidents
Deat
hs p
er 1
00,0
00 P
opul
atio
n
Prince George's Maryland U.S.
2,313
1,949
409 378 282
0
500
1,000
1,500
2,000
2,500
3,000
Heart Disease Cancer Stroke CLRD* Accidents
Male Female Total

8
Leading Causes of Death for Black Non-Hispanic Residents, Prince George’s County, 2010-2014 (N=17,148)
Data Source: Centers for Disease Control and Prevention, National Center for Health Statistics, CDC WONDER Online Database Leading Causes of Death for Hispanic Residents of Any Race, Prince George’s County, 2009-2014 (N=1,014)
Data Source: Centers for Disease Control and Prevention, National Center for Health Statistics, CDC WONDER Online Database
4,347 4,294
837 798 626
0
1,000
2,000
3,000
4,000
5,000
Cancer Heart Disease Stroke Diabetes Accidents
Male Female Total
189 168
143
54 45
0
40
80
120
160
200
240
Cancer Heart Disease Accidents Conditions inPerinatal Period
Homicide
Male Female Total
9
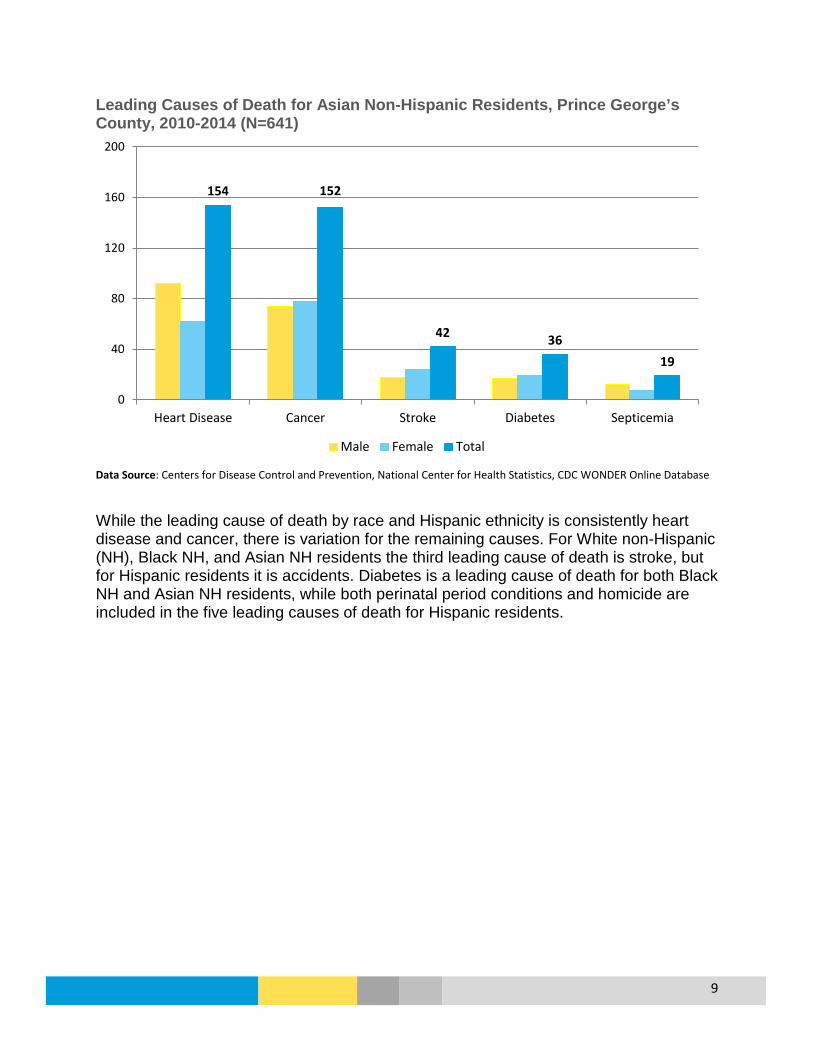
Leading Causes of Death for Asian Non-Hispanic Residents, Prince George’s County, 2010-2014 (N=641)
Data Source: Centers for Disease Control and Prevention, National Center for Health Statistics, CDC WONDER Online Database While the leading cause of death by race and Hispanic ethnicity is consistently heart disease and cancer, there is variation for the remaining causes. For White non-Hispanic (NH), Black NH, and Asian NH residents the third leading cause of death is stroke, but for Hispanic residents it is accidents. Diabetes is a leading cause of death for both Black NH and Asian NH residents, while both perinatal period conditions and homicide are included in the five leading causes of death for Hispanic residents.
154 152
42 36 19
0
40
80
120
160
200
Heart Disease Cancer Stroke Diabetes Septicemia
Male Female Total
10
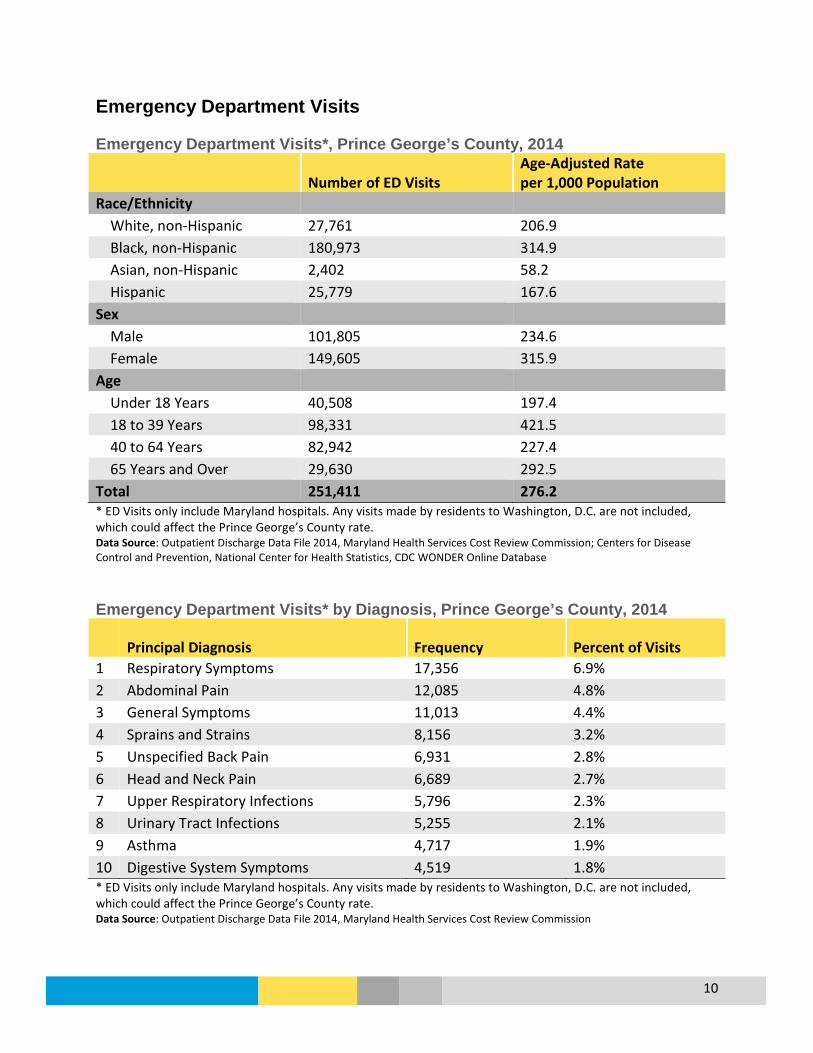
Emergency Department Visits Emergency Department Visits*, Prince George’s County, 2014
Number of ED Visits Age-Adjusted Rate per 1,000 Population
Race/Ethnicity White, non-Hispanic 27,761 206.9 Black, non-Hispanic 180,973 314.9 Asian, non-Hispanic 2,402 58.2 Hispanic 25,779 167.6 Sex Male 101,805 234.6 Female 149,605 315.9 Age Under 18 Years 40,508 197.4 18 to 39 Years 98,331 421.5 40 to 64 Years 82,942 227.4 65 Years and Over 29,630 292.5 Total 251,411 276.2 * ED Visits only include Maryland hospitals. Any visits made by residents to Washington, D.C. are not included, which could affect the Prince George’s County rate. Data Source: Outpatient Discharge Data File 2014, Maryland Health Services Cost Review Commission; Centers for Disease Control and Prevention, National Center for Health Statistics, CDC WONDER Online Database Emergency Department Visits* by Diagnosis, Prince George’s County, 2014
Principal Diagnosis Frequency Percent of Visits 1 Respiratory Symptoms 17,356 6.9% 2 Abdominal Pain 12,085 4.8% 3 General Symptoms 11,013 4.4% 4 Sprains and Strains 8,156 3.2% 5 Unspecified Back Pain 6,931 2.8% 6 Head and Neck Pain 6,689 2.7% 7 Upper Respiratory Infections 5,796 2.3% 8 Urinary Tract Infections 5,255 2.1% 9 Asthma 4,717 1.9% 10 Digestive System Symptoms 4,519 1.8% * ED Visits only include Maryland hospitals. Any visits made by residents to Washington, D.C. are not included, which could affect the Prince George’s County rate. Data Source: Outpatient Discharge Data File 2014, Maryland Health Services Cost Review Commission
11
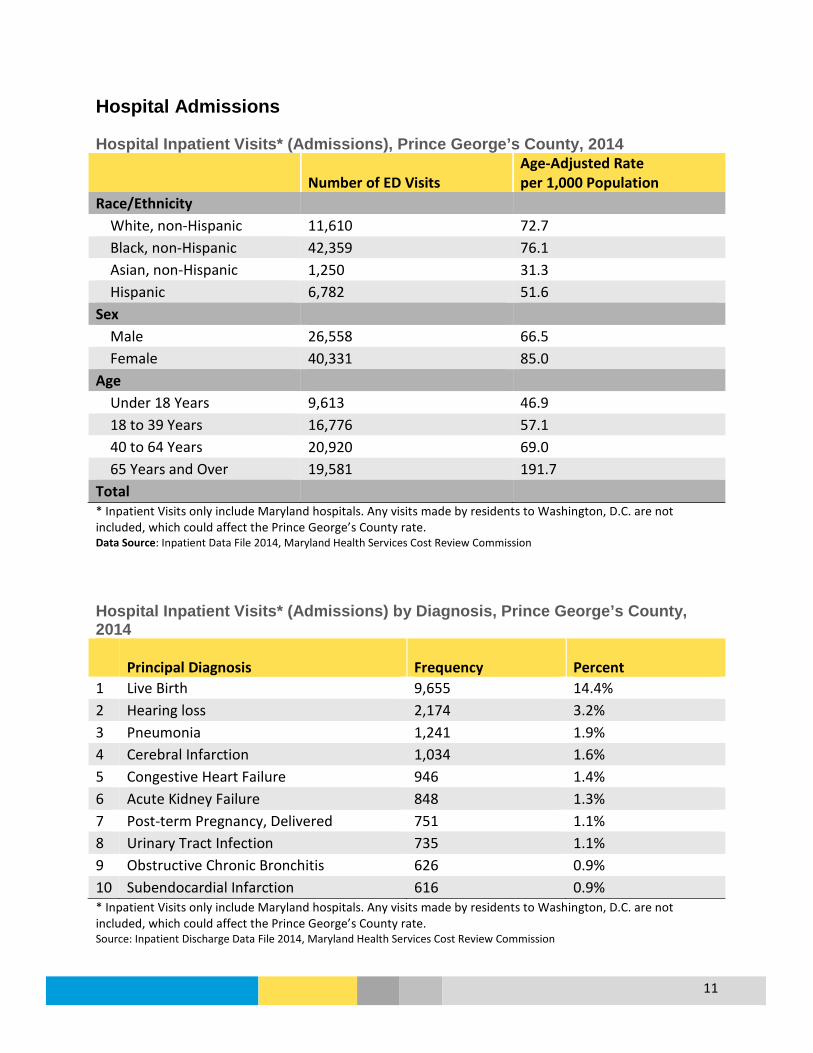
Hospital Admissions Hospital Inpatient Visits* (Admissions), Prince George’s County, 2014
Number of ED Visits Age-Adjusted Rate per 1,000 Population
Race/Ethnicity White, non-Hispanic 11,610 72.7 Black, non-Hispanic 42,359 76.1 Asian, non-Hispanic 1,250 31.3 Hispanic 6,782 51.6 Sex Male 26,558 66.5 Female 40,331 85.0 Age Under 18 Years 9,613 46.9 18 to 39 Years 16,776 57.1 40 to 64 Years 20,920 69.0 65 Years and Over 19,581 191.7 Total * Inpatient Visits only include Maryland hospitals. Any visits made by residents to Washington, D.C. are not included, which could affect the Prince George’s County rate. Data Source: Inpatient Data File 2014, Maryland Health Services Cost Review Commission Hospital Inpatient Visits* (Admissions) by Diagnosis, Prince George’s County, 2014
Principal Diagnosis Frequency Percent 1 Live Birth 9,655 14.4% 2 Hearing loss 2,174 3.2% 3 Pneumonia 1,241 1.9% 4 Cerebral Infarction 1,034 1.6% 5 Congestive Heart Failure 946 1.4% 6 Acute Kidney Failure 848 1.3% 7 Post-term Pregnancy, Delivered 751 1.1% 8 Urinary Tract Infection 735 1.1% 9 Obstructive Chronic Bronchitis 626 0.9% 10 Subendocardial Infarction 616 0.9% * Inpatient Visits only include Maryland hospitals. Any visits made by residents to Washington, D.C. are not included, which could affect the Prince George’s County rate. Source: Inpatient Discharge Data File 2014, Maryland Health Services Cost Review Commission
12
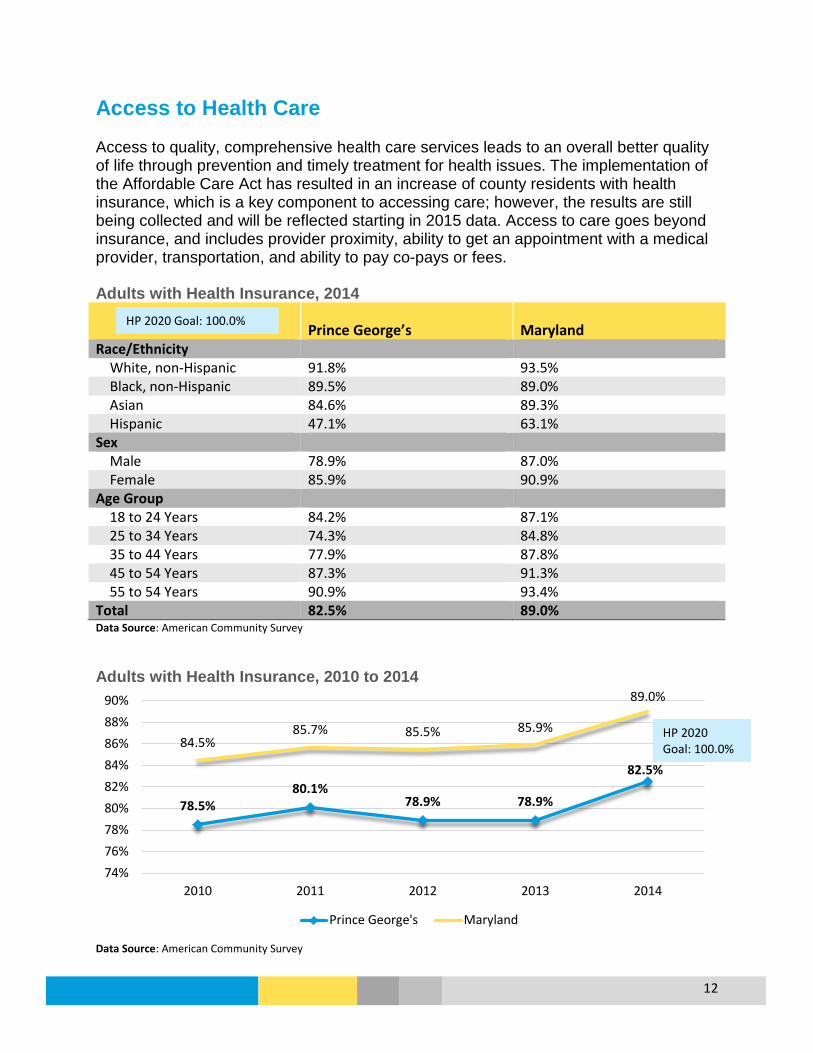
Access to Health Care Access to quality, comprehensive health care services leads to an overall better quality of life through prevention and timely treatment for health issues. The implementation of the Affordable Care Act has resulted in an increase of county residents with health insurance, which is a key component to accessing care; however, the results are still being collected and will be reflected starting in 2015 data. Access to care goes beyond insurance, and includes provider proximity, ability to get an appointment with a medical provider, transportation, and ability to pay co-pays or fees. Adults with Health Insurance, 2014
Prince George’s Maryland Race/Ethnicity White, non-Hispanic 91.8% 93.5% Black, non-Hispanic 89.5% 89.0% Asian 84.6% 89.3% Hispanic 47.1% 63.1% Sex Male 78.9% 87.0% Female 85.9% 90.9% Age Group 18 to 24 Years 84.2% 87.1% 25 to 34 Years 74.3% 84.8% 35 to 44 Years 77.9% 87.8% 45 to 54 Years 87.3% 91.3% 55 to 54 Years 90.9% 93.4% Total 82.5% 89.0% Data Source: American Community Survey Adults with Health Insurance, 2010 to 2014
Data Source: American Community Survey
78.5% 80.1%
78.9% 78.9%
82.5%
84.5% 85.7% 85.5% 85.9%
89.0%
74%76%78%80%82%84%86%88%90%
2010 2011 2012 2013 2014
Prince George's Maryland
HP 2020 Goal: 100.0%
HP 2020 Goal: 100.0%

13
Adults who had a Routine Checkup Within the Last 2 Years, 2014
Demographic Prince George’s Maryland Race/Ethnicity White, non-Hispanic 88.4% 89.0% Black, non-Hispanic 92.3% 93.5% Hispanic 77.4% 77.9% Sex Male 87.1% 86.2% Female 91.9% 92.6% Age Group 18 to 44 Years 84.0% 84.2% 45 to 64 Years 95.2% 93.1% Over 65 Years 96.3% 96.6% Total 89.6% 89.6% Data Source: 2014 Maryland BRFSS Adults who had a Routine Checkup Within the Last 2 Years, 2011 to 2014
Data Source: MD BRFSS
89.6% 89.8%
87.0%
89.6%
88.4% 88.3% 87.5%
89.6%
86%
86%
87%
87%
88%
88%
89%
89%
90%
90%
91%
2011 2012 2013 2014
Prince George's Maryland

14
Children with Health Insurance, 2014
Prince George’s Maryland Race/Ethnicity White, non-Hispanic 98.6% 97.9% Black, non-Hispanic 97.0% 97.3% Asian 98.3% 96.8% Hispanic 86.1% 91.6% Sex Male 94.9% 96.9% Female 94.2% 96.8% Age Group Under 6 Years 96.2% 97.4% 6 to 17 Years 93.7% 96.6% Total 94.6% 96.8% Data Source: American Community Survey Children with Health Insurance, 2010 to 2014
Data Source: American Community Survey
93.4% 93.8%
94.7% 95.0%
94.6%
95.2% 95.4%
96.2% 95.6%
96.8%
91%
92%
93%
94%
95%
96%
97%
98%
2010 2011 2012 2013 2014
Prince George's Maryland
HP 2020 Target: 100.0%
HP 2020 Target: 100.0%

15
Adolescents Enrolled In Medicaid* Who Received a Wellness Checkup in the Last Year, 2010 to 2014
*Number of adolescents aged 13 to 20 years enrolled in Medicaid for at least 320 days Data Source: Maryland Medicaid Service Utilization Uninsured Emergency Department Visits, 2009-2014
Data Source: Maryland Health Services Cost Review Commission (HSCRC) Research Level Statewide Outpatient Data Files
2010 2011 2012 2013PGC White NH 40.9% 42.8% 42.3% 47.4%PGC Black NH 44.6% 46.8% 47.2% 50.0%PGC Asian 49.1% 50.8% 49.2% 53.4%PGC Hispanic 63.4% 66.1% 65.5% 71.5%PGC 47.8% 50.2% 50.7% 54.7%Maryland 51.5% 53.4% 52.6% 54.7%
0%
10%
20%
30%
40%
50%
60%
70%
80%
Perc
ent (
%)
20.4% 20.2% 19.6% 19.3% 18.9%
15.5% 19.6%
17.1% 15.8% 15.7% 15.2%
11.0%
0%
5%
10%
15%
20%
25%
2009 2010 2011 2012 2013 2014
Perc
ent
Prince George's Maryland
MD SHIP Goal: 14.7%
MD SHIP Goal: 57.4%
16
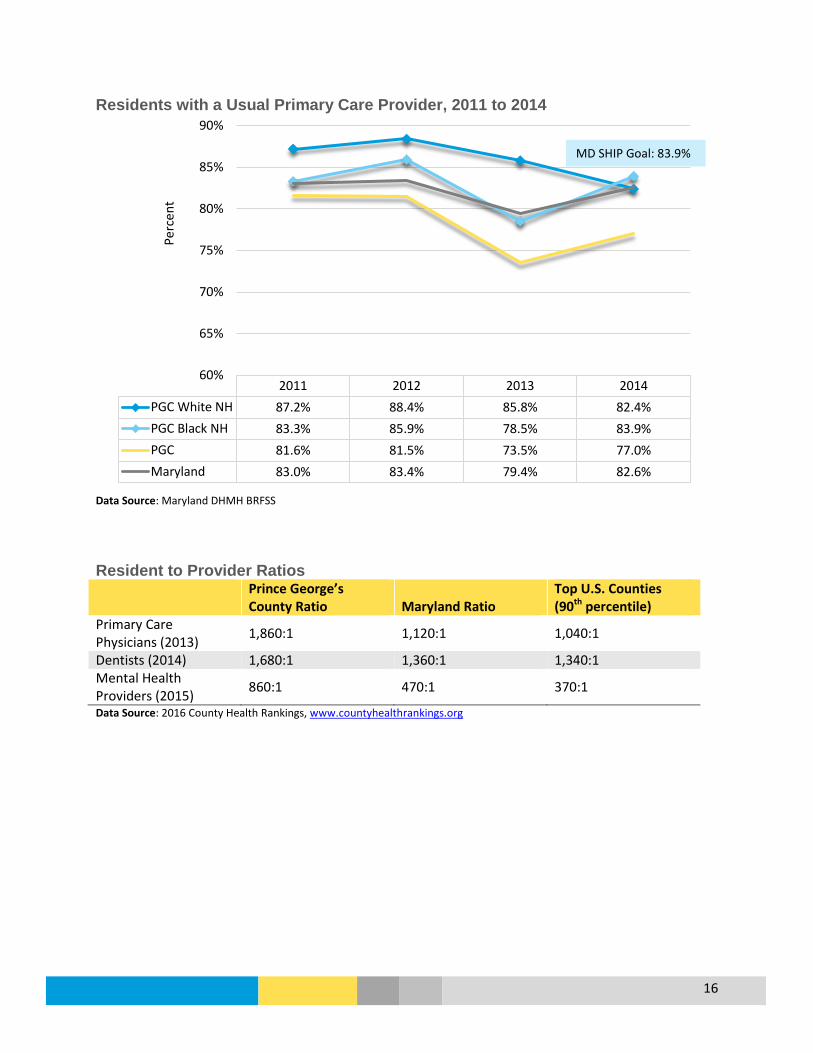
Residents with a Usual Primary Care Provider, 2011 to 2014
Data Source: Maryland DHMH BRFSS Resident to Provider Ratios Prince George’s
County Ratio Maryland Ratio Top U.S. Counties (90th percentile)
Primary Care Physicians (2013) 1,860:1 1,120:1 1,040:1
Dentists (2014) 1,680:1 1,360:1 1,340:1 Mental Health Providers (2015) 860:1 470:1 370:1
Data Source: 2016 County Health Rankings, www.countyhealthrankings.org
2011 2012 2013 2014PGC White NH 87.2% 88.4% 85.8% 82.4%PGC Black NH 83.3% 85.9% 78.5% 83.9%PGC 81.6% 81.5% 73.5% 77.0%Maryland 83.0% 83.4% 79.4% 82.6%
60%
65%
70%
75%
80%
85%
90%
Perc
ent
MD SHIP Goal: 83.9%

17
Diseases and Conditions
Alzheimer’s Disease Age-Adjusted Death Rate per 100,000 for Alzheimer’s Disease 2007-2014
* Residents of Hispanic Origin and Asian/Pacific Islanders were not included due to insufficient numbers Data Source: Centers for Disease Control and Prevention, National Center for Health Statistics, CDC WONDER Online Database Percentage of Medicare Beneficiaries who were Treated for Alzheimer’s Disease or Dementia, 2009 to 2014
Data Source: Centers for Medicare and Medicaid Services
2007-2009 2008-2010 2009-2011 2010-2012 2011-2013 2012-2014PGC White NH 23.4 23.6 20.2 18.3 18.1 16.6PGC Black NH 22.2 19.8 14.9 15.0 13.9 14.4PGC 21.1 20.4 17.0 16.4 15.1 14.5Maryland 16.9 17.1 16.0 15.5 14.7 14.5
0.0
5.0
10.0
15.0
20.0
25.0
Deat
hs p
er 1
00,0
00 P
opul
atio
n
10.2% 10.2% 10.2%
9.7%
10.1%
9.7%
10.8% 10.7%
10.6%
10.0%
10.4%
10.1%
9.0%
9.2%
9.4%
9.6%
9.8%
10.0%
10.2%
10.4%
10.6%
10.8%
11.0%
2009 2010 2011 2012 2013 2014
Perc
ent (
%)
Prince George's Maryland

18
Age-Adjusted Hospital Inpatient* Visit Rate Related to Alzheimer’s and Other Dementias, 2011 to 2014
* Includes visits to Maryland and Washington, D.C. hospitals Asian/Pacific Island Residents were not included due to insufficient numbers Data Source: Maryland Health Services Cost Review Commission (HSCRC), Research Level Statewide Inpatient Data Files
2010 2011 2012 2013 2014PGC White NH 234.2 226.0 210.7 181.5 165.0PGC Black NH 444.1 365.3 370.9 296.1 243.7Hispanic 172.0 106.7 109.5 119.1 81.2PGC 347.4 316.8 311.2 254.0 204.8Maryland 291.1 267.8 247.6 221.6 194.1
0
50
100
150
200
250
300
350
400
450
500
Visi
ts p
er 1
00,0
00 P
opul
atio
n
MD SHIP Goal: 199.4

19
Cancer Overview
What is it? Cancer is a term used for diseases in which abnormal cells divide without control and can invade other tissues; there are more than 100 kinds of cancer.
Who is affected?
In 2011, 3,235 residents were diagnosed with cancer in the county, and the cancer incidence rate was 390.0 per 100,000 residents. In 2014, there were 1,417 deaths from cancer in the county, which accounted for one out of every four deaths. Prostate and breast cancer are the most common types of cancer in the county, and in 2011 accounted for 36% of all new cancer cases. Overall, Black residents have the highest age-adjusted rate for new cancer cases, while White non-Hispanic residents have the highest age-adjusted death rate for cancer. By site, lung and bronchus cancer has the highest age-adjusted death rate for county residents, followed by breast cancer.
Prevention and Treatment
According to the CDC, there are several ways to help prevent cancer: • Healthy choices can reduce cancer risk, like avoiding tobacco, limiting alcohol
use, protecting your skin from the sun and avoiding indoor tanning, eating a diet rich in fruits and vegetables, keeping a healthy weight, and being physically active.
• The human papillomavirus (HPV) vaccine helps prevent most cervical cancers and several other kinds of cancer; the hepatitis B vaccine can lower liver cancer risk.
• Screening for cervical and colorectal cancers helps prevent these diseases by finding precancerous lesions so they can be treated before they become cancerous. Screening for cervical, colorectal, and breast cancers also helps find these diseases at an early stage, when treatment works best.
Cancer treatment can involve surgery, chemotherapy, radiation therapy, targeted therapy, and immunotherapy.
What are the outcomes?
Remission (no cancer signs or symptoms); long-term treatment and care; death.
Disparity Overall, men had a higher age-adjusted cancer incidence rate per 100,000 (475.5) than women (333.1), and Black residents had a higher rate (393.4) compared to White and Asian residents in 2011. In 2014, men had a higher cancer mortality rate at 199.4 compared to women (149.6), and White non-Hispanic (NH) residents had a higher mortality rate (208.3) compared to Black NH residents (167.7). By cancer site, Black residents in the county had higher incidence and mortality rates for breast, colorectal, and prostate cancers.
How do we compare?
Prince George’s County 2011 age-adjusted cancer incidence rate was 390.0 per 100,000 residents, much lower than the state at 440.7; other Maryland counties range from 387.4 to 553.7 (2014 MD Cancer Report). The age-adjusted death rate for the county from 2012-2014 was 166.4, compared to Maryland at 163.3 with a range of 121.7 to 208.5 across Maryland counties. The county is similar to the state for cancer screening.

20
Overall, Prince George’s County Age-Adjusted Cancer Incidence Rate is less than Maryland and the U.S, and for most leading types of cancer. An exception to this is Prostate Cancer with a county rate of 180.4 compared to Maryland at 148.7 and the nation at 143.6. Cancer Age-Adjusted Incidence Rates per 100,000 Population by Site, 2007-2011
Site Prince George’s Maryland United States HP 2020 Goal All Sites 403.5 451.8 470.6 --- Breast (Female) 116.1 127.8 123.2 --- Colorectal 36.7 39.3 43.5 39.9
Male 42.0 45.1 50.3 --- Female 32.9 34.8 38.0 ---
Lung and Bronchus 47.7 59.9 65.2 --- Male 59.8 69.9 79.0 --- Female 39.5 52.8 54.9 ---
Prostate 180.4 148.7 143.6 --- Cervical 7.4 6.7 7.9 7.2 Data Source: Maryland Department of Health and Mental Hygiene, Annual Cancer Report, 2014; CDC National Center for Health Statistics, CDC WONDER Online Database Cancer Age-Adjusted Incidence Rates by Site, Prince George’s County, 2002-2011
*2006 incidence rates are lower than actual due to case underreporting Data Source: Maryland Department of Health and Mental Hygiene, Annual Cancer Reports
123.0 114.2
46.1 37.7
56.8 44.2
212.4
161.7
8.9 5.4 0.0
50.0
100.0
150.0
200.0
250.0
2002 2003 2004 2005 2006* 2007 2008 2009 2010 2011
Inci
denc
e Ra
te p
er 1
00,0
00 P
opul
atio
n
Breast Colorectal Lung and Bronchus Prostate Cervical

21
Cancer Age-Adjusted Incidence Rates by Site, Prince George’s County, 2002-2011
Year All Sites Breast Colon Lung and Bronchus Prostate Cervical
2002 435.0 123.0 46.1 56.8 212.4 8.9 2003 463.0 128.7 55.1 62.4 208.7 11.4 2004 386.3 112.4 46.4 52.6 147.0 6.4 2005 386.3 115.8 39.5 51.7 155.0 5.3 2006* 364.4 106.8 43.4 53.0 164.7 5.3 2007 409.8 106.8 41.7 50.1 189.9 6.3 2008 429.1 128.6 37.7 54.2 191.7 9.2 2009 387.6 115.0 33.7 43.3 180.4 8.2 2010 403.5 115.6 33.3 47.4 182.0 8.2 2011 390.0 114.2 37.7 44.2 161.7 5.4 *2006 incidence rates are lower than actual due to case underreporting Data Source: Maryland Department of Health and Mental Hygiene, Annual Cancer Reports Cancer Age-Adjusted Incidence Rates by Race, Prince George’s County, 2007-2011
*Cervical cancer age-adjusted incidence rate unavailable for Asian/PI due to small number of cases Data Source: Maryland Department of Health and Mental Hygiene, Annual Cancer Report, 2014 Individuals of Hispanic origin were included within the White or Black estimates and are not listed separately
Breast(Female) Colorectal Lung and
Bronchus Prostate Cervical All Sites
White 98.1 32.0 52.3 112.4 7.5 374.1Black 122.7 40.4 45.9 220.8 7.4 415.0Asian/PI 80.1 22.9 26.6 82.2 247.4All Races 116.1 36.7 47.7 180.4 7.4 403.5
0
50
100
150
200
250
300
350
400
450
Inci
denc
e Ra
te p
er 1
00,0
00 P
opul
atio
n
*
*
HP 2020 Goal: 39.9 HP 2020
Goal: 7.2

22
Deaths due to cancer decreased in the county by nearly 10% from 2007-2009 to 2012-2014; the county is nearing the Healthy People 2020 Goal to reduce the cancer death rate to 161.4. White, non-Hispanic (NH) residents have the highest age-adjusted death rate due to cancer at 191.9, followed by Black NH residents at 168.2. Age-Adjusted Death Rate per 100,000 for Cancer by Race and Ethnicity, Prince George’s County, 2007-2014
Data Source: Centers for Disease Control and Prevention, National Center for Health Statistics, CDC WONDER Online Database
2007-2009 2008-2010 2009-2011 2010-2012 2011-2013 2012-2014PGC White NH 205.8 202.3 200.9 191.6 187.0 191.9PGC Black NH 185.2 186.0 176.9 177.0 168.6 168.2PGC Asian NH 98.3 91.2 89.0 83.0 83.7 90.5PGC Hispanic 90.3 90.7 101.9 88.1 89.5 77.6PGC 182.6 182.0 177.4 173.8 167.2 166.4Maryland 179.0 176.0 171.3 167.6 164.8 163.3
0.0
50.0
100.0
150.0
200.0
250.0
Deat
hs p
er 1
00,0
00 P
opul
atio
n
HP 2020 Goal: 161.4 MD SHIP Goal: 147.4

23
Cancer Age-Adjusted Death Rates per 100,000 by Site and Sex, 2012-2014
Site Prince George’s Maryland United States
HP 2020 Goal
MD SHIP 2017 Goal
All Sites 166.4 163.3 163.6 161.4 147.4 Breast (Female) 25.6 22.7 20.9 20.7 Colorectal 17.3 14.4 14.4 14.5
Male 22.1 17.6 17.3 --- Female 13.6 12.0 12.2 ---
Lung and Bronchus 37.0 41.9 43.4 45.5 Male 46.8 50.5 53.8 --- Female 30.6 35.7 35.5 ---
Prostate 26.0 19.6 19.2 21.8 Cervical 2.5 1.9 2.3 2.2 Source: Maryland Department of Health and Mental Hygiene, Annual Cancer Report, 2014; Centers for Disease Control and Prevention, National Center for Health Statistics, CDC WONDER Online Database; DHMH Maryland SHIP http://dhmh.maryland.gov/ship/Pages/home.aspx; Healthy People 2020 https://www.healthypeople.gov/ Cancer Age-Adjusted Death Rates by Race* and Hispanic Origin, Prince George’s County, 2012-2014
* Individuals of Hispanic origin and Asian/Pacific Islanders were not included due to insufficient numbers; Cervical cancer age-adjusted rates not shown by race due to insufficient numbers Data Source: Centers for Disease Control and Prevention, National Center for Health Statistics, CDC WONDER Online Database .
21.8 18.3
47.8
16.9
191.9
27.9 18.6
35.8 33.2
168.2
25.6 17.3 37.0
26.0
166.4
0
50
100
150
200
250
Breast (Female) Colorectal Lung and Bronchus Prostate All Sites
White NH Black NH Total
HP 2020 Goal: 20.7 HP 2020
Goal: 14.7
HP 2020 Goal: 45.5 HP 2020
Goal: 21.8
HP2020 Goal: 161.4 MD SHIP Goal: 147.4
24
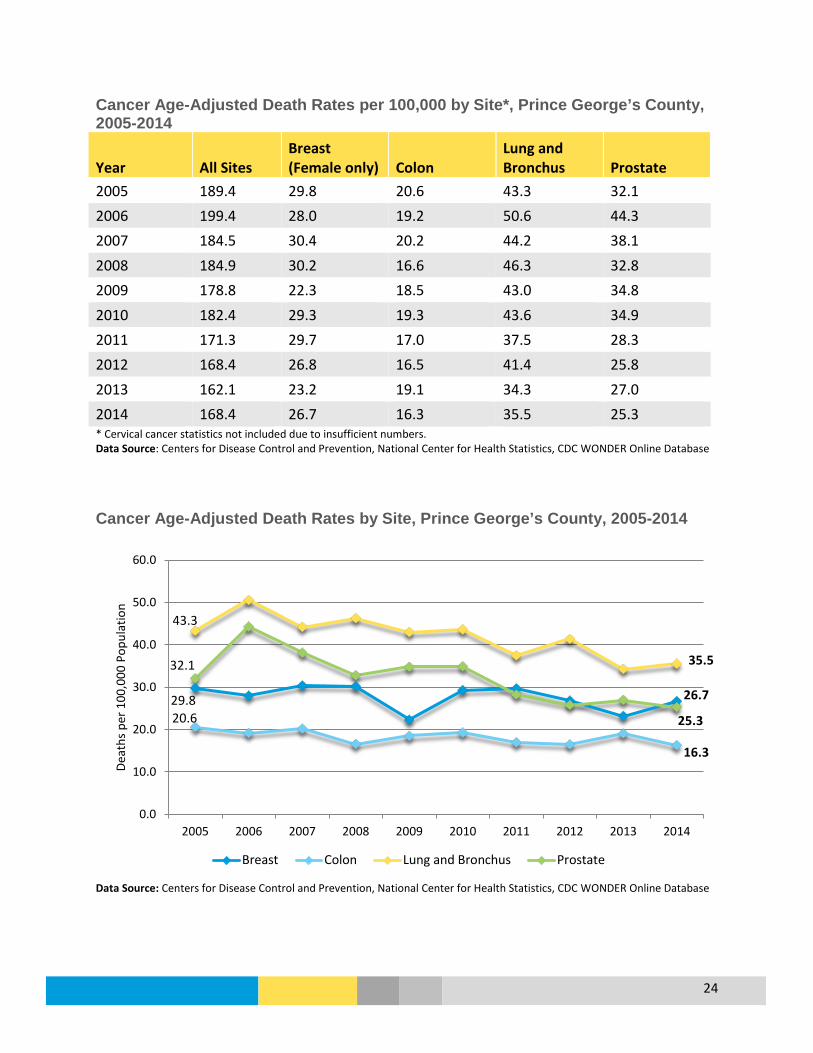
Cancer Age-Adjusted Death Rates per 100,000 by Site*, Prince George’s County, 2005-2014
Year All Sites Breast (Female only) Colon
Lung and Bronchus Prostate
2005 189.4 29.8 20.6 43.3 32.1 2006 199.4 28.0 19.2 50.6 44.3 2007 184.5 30.4 20.2 44.2 38.1 2008 184.9 30.2 16.6 46.3 32.8 2009 178.8 22.3 18.5 43.0 34.8 2010 182.4 29.3 19.3 43.6 34.9 2011 171.3 29.7 17.0 37.5 28.3 2012 168.4 26.8 16.5 41.4 25.8 2013 162.1 23.2 19.1 34.3 27.0 2014 168.4 26.7 16.3 35.5 25.3 * Cervical cancer statistics not included due to insufficient numbers. Data Source: Centers for Disease Control and Prevention, National Center for Health Statistics, CDC WONDER Online Database Cancer Age-Adjusted Death Rates by Site, Prince George’s County, 2005-2014
Data Source: Centers for Disease Control and Prevention, National Center for Health Statistics, CDC WONDER Online Database
29.8 26.7
20.6
16.3
43.3
35.5 32.1
25.3
0.0
10.0
20.0
30.0
40.0
50.0
60.0
2005 2006 2007 2008 2009 2010 2011 2012 2013 2014
Deat
hs p
er 1
00,0
00 P
opul
atio
n
Breast Colon Lung and Bronchus Prostate
25
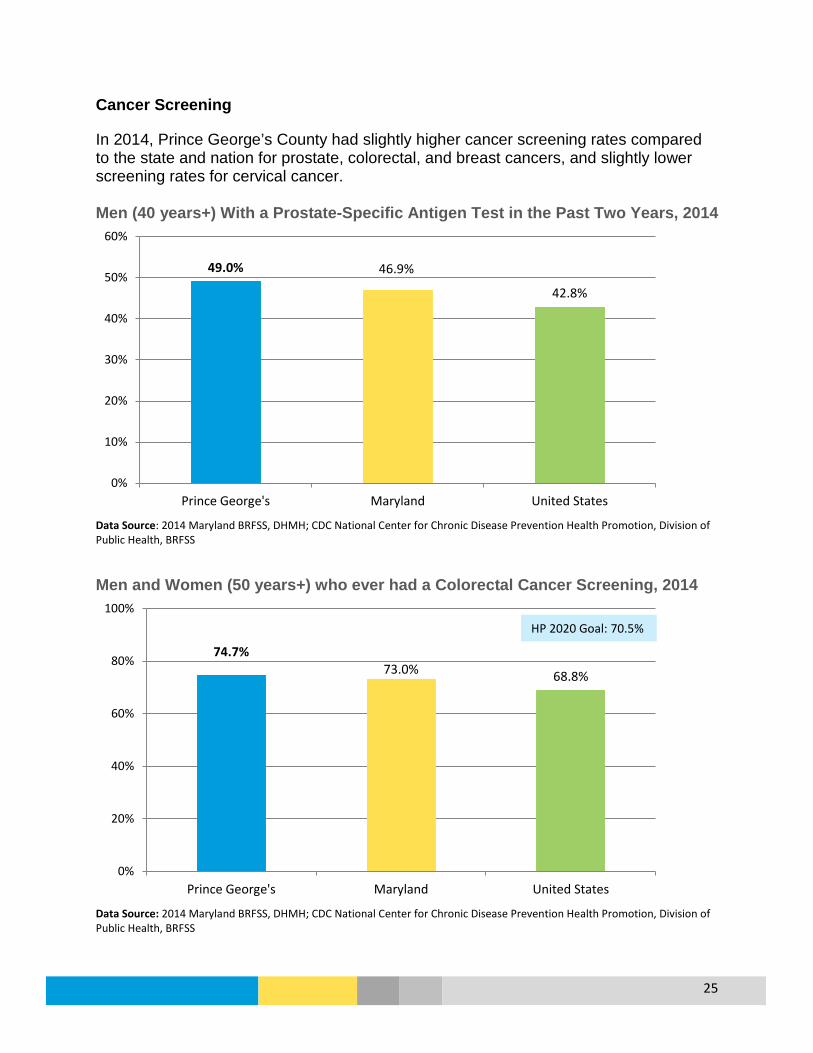
Cancer Screening In 2014, Prince George’s County had slightly higher cancer screening rates compared to the state and nation for prostate, colorectal, and breast cancers, and slightly lower screening rates for cervical cancer. Men (40 years+) With a Prostate-Specific Antigen Test in the Past Two Years, 2014
Data Source: 2014 Maryland BRFSS, DHMH; CDC National Center for Chronic Disease Prevention Health Promotion, Division of Public Health, BRFSS
Men and Women (50 years+) who ever had a Colorectal Cancer Screening, 2014
Data Source: 2014 Maryland BRFSS, DHMH; CDC National Center for Chronic Disease Prevention Health Promotion, Division of Public Health, BRFSS
49.0% 46.9%
42.8%
0%
10%
20%
30%
40%
50%
60%
Prince George's Maryland United States
74.7% 73.0% 68.8%
0%
20%
40%
60%
80%
100%
Prince George's Maryland United States
HP 2020 Goal: 70.5%

26
Women (50 years+) who had a Mammography in the Past 2 Years, 2014
Data Source: 2014 Maryland BRFSS, DHMH; CDC National Center for Chronic Disease Prevention Health Promotion, Division of Public Health, BRFSS
Women (18 years+) who had a Pap Smear in the Past Three Years, 2014
Data Source: 2014 Maryland BRFSS, DHMH; CDC National Center for Chronic Disease Prevention Health Promotion, Division of Public Health, BRFSS
83.7% 82.0% 75.6%
0%
20%
40%
60%
80%
100%
Prince George's Maryland United States
77.1% 80.1% 75.2%
0%
20%
40%
60%
80%
100%
Prince George's Maryland United States
27
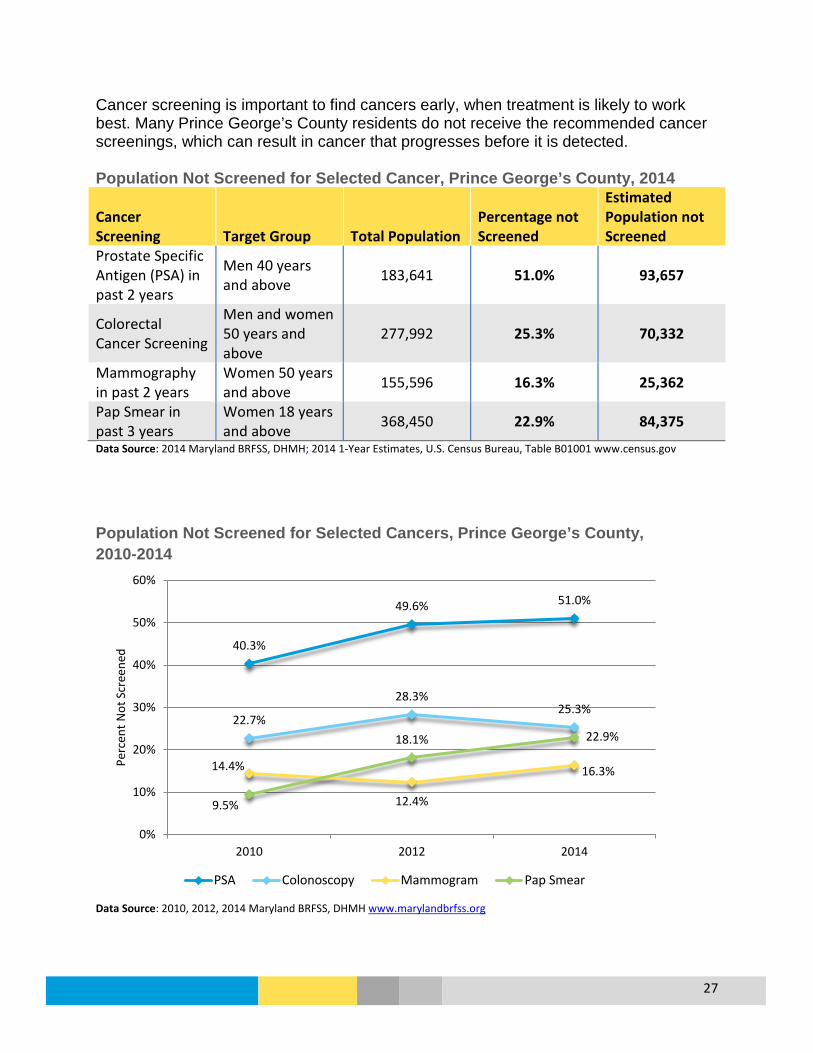
Cancer screening is important to find cancers early, when treatment is likely to work best. Many Prince George’s County residents do not receive the recommended cancer screenings, which can result in cancer that progresses before it is detected. Population Not Screened for Selected Cancer, Prince George’s County, 2014
Cancer Screening Target Group Total Population
Percentage not Screened
Estimated Population not Screened
Prostate Specific Antigen (PSA) in past 2 years
Men 40 years and above 183,641 51.0% 93,657
Colorectal Cancer Screening
Men and women 50 years and above
277,992 25.3% 70,332
Mammography in past 2 years
Women 50 years and above 155,596 16.3% 25,362
Pap Smear in past 3 years
Women 18 years and above 368,450 22.9% 84,375
Data Source: 2014 Maryland BRFSS, DHMH; 2014 1-Year Estimates, U.S. Census Bureau, Table B01001 www.census.gov
Population Not Screened for Selected Cancers, Prince George’s County, 2010-2014
Data Source: 2010, 2012, 2014 Maryland BRFSS, DHMH www.marylandbrfss.org
40.3%
49.6% 51.0%
22.7%
28.3% 25.3%
14.4%
12.4%
16.3%
9.5%
18.1% 22.9%
0%
10%
20%
30%
40%
50%
60%
2010 2012 2014
Perc
ent N
ot S
cree
ned
PSA Colonoscopy Mammogram Pap Smear
28
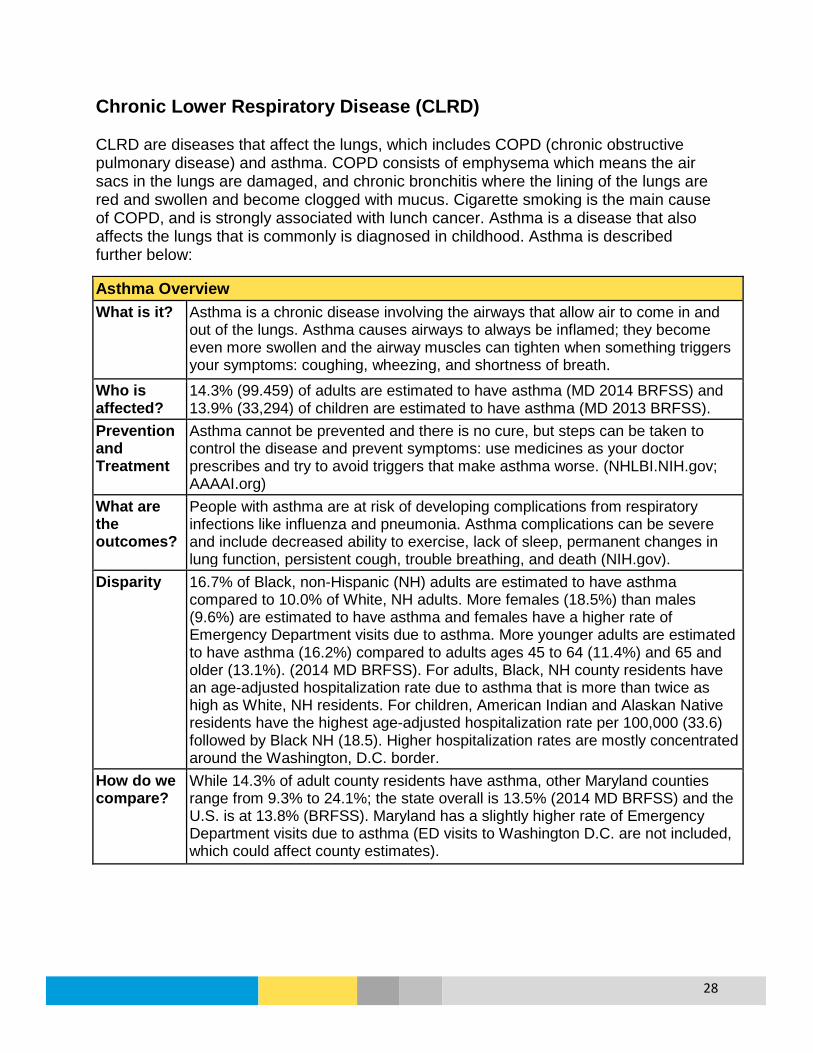
Chronic Lower Respiratory Disease (CLRD) CLRD are diseases that affect the lungs, which includes COPD (chronic obstructive pulmonary disease) and asthma. COPD consists of emphysema which means the air sacs in the lungs are damaged, and chronic bronchitis where the lining of the lungs are red and swollen and become clogged with mucus. Cigarette smoking is the main cause of COPD, and is strongly associated with lunch cancer. Asthma is a disease that also affects the lungs that is commonly is diagnosed in childhood. Asthma is described further below:
Asthma Overview
What is it? Asthma is a chronic disease involving the airways that allow air to come in and out of the lungs. Asthma causes airways to always be inflamed; they become even more swollen and the airway muscles can tighten when something triggers your symptoms: coughing, wheezing, and shortness of breath.
Who is affected?
14.3% (99.459) of adults are estimated to have asthma (MD 2014 BRFSS) and 13.9% (33,294) of children are estimated to have asthma (MD 2013 BRFSS).
Prevention and Treatment
Asthma cannot be prevented and there is no cure, but steps can be taken to control the disease and prevent symptoms: use medicines as your doctor prescribes and try to avoid triggers that make asthma worse. (NHLBI.NIH.gov; AAAAI.org)
What are the outcomes?
People with asthma are at risk of developing complications from respiratory infections like influenza and pneumonia. Asthma complications can be severe and include decreased ability to exercise, lack of sleep, permanent changes in lung function, persistent cough, trouble breathing, and death (NIH.gov).
Disparity 16.7% of Black, non-Hispanic (NH) adults are estimated to have asthma compared to 10.0% of White, NH adults. More females (18.5%) than males (9.6%) are estimated to have asthma and females have a higher rate of Emergency Department visits due to asthma. More younger adults are estimated to have asthma (16.2%) compared to adults ages 45 to 64 (11.4%) and 65 and older (13.1%). (2014 MD BRFSS). For adults, Black, NH county residents have an age-adjusted hospitalization rate due to asthma that is more than twice as high as White, NH residents. For children, American Indian and Alaskan Native residents have the highest age-adjusted hospitalization rate per 100,000 (33.6) followed by Black NH (18.5). Higher hospitalization rates are mostly concentrated around the Washington, D.C. border.
How do we compare?
While 14.3% of adult county residents have asthma, other Maryland counties range from 9.3% to 24.1%; the state overall is 13.5% (2014 MD BRFSS) and the U.S. is at 13.8% (BRFSS). Maryland has a slightly higher rate of Emergency Department visits due to asthma (ED visits to Washington D.C. are not included, which could affect county estimates).
29
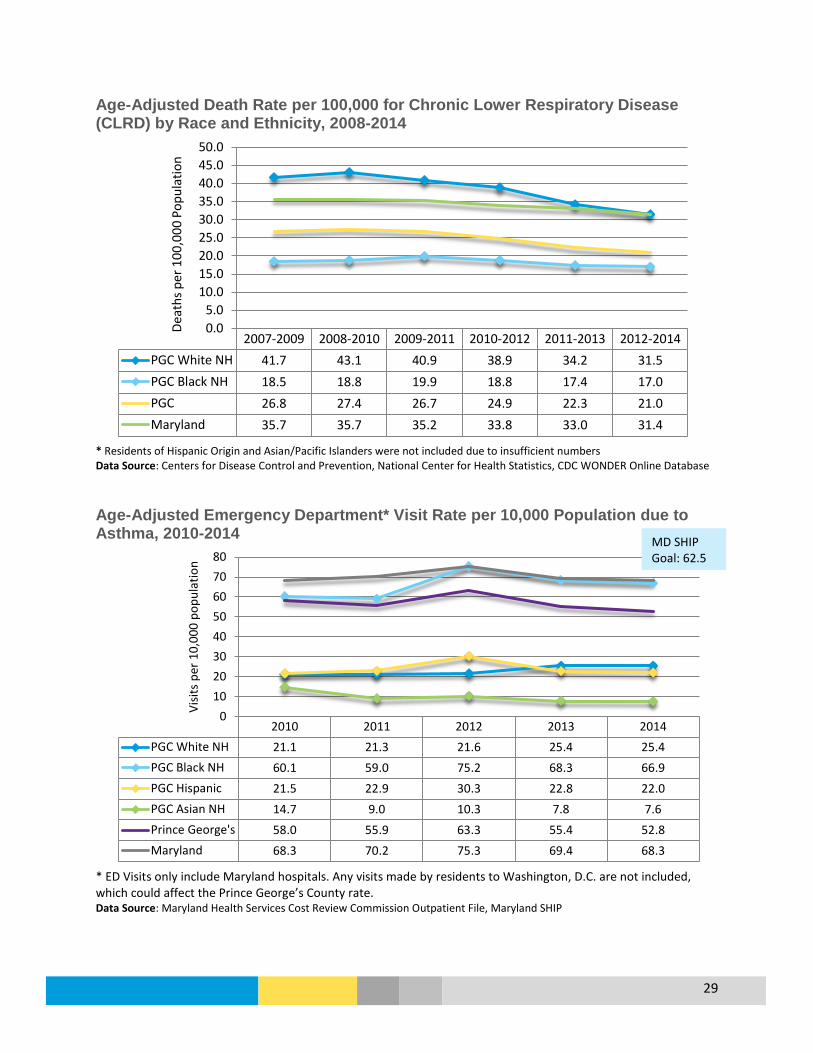
Age-Adjusted Death Rate per 100,000 for Chronic Lower Respiratory Disease (CLRD) by Race and Ethnicity, 2008-2014
* Residents of Hispanic Origin and Asian/Pacific Islanders were not included due to insufficient numbers Data Source: Centers for Disease Control and Prevention, National Center for Health Statistics, CDC WONDER Online Database Age-Adjusted Emergency Department* Visit Rate per 10,000 Population due to Asthma, 2010-2014
* ED Visits only include Maryland hospitals. Any visits made by residents to Washington, D.C. are not included, which could affect the Prince George’s County rate. Data Source: Maryland Health Services Cost Review Commission Outpatient File, Maryland SHIP
2007-2009 2008-2010 2009-2011 2010-2012 2011-2013 2012-2014PGC White NH 41.7 43.1 40.9 38.9 34.2 31.5PGC Black NH 18.5 18.8 19.9 18.8 17.4 17.0PGC 26.8 27.4 26.7 24.9 22.3 21.0Maryland 35.7 35.7 35.2 33.8 33.0 31.4
0.05.0
10.015.020.025.030.035.040.045.050.0
Deat
hs p
er 1
00,0
00 P
opul
atio
n
2010 2011 2012 2013 2014PGC White NH 21.1 21.3 21.6 25.4 25.4PGC Black NH 60.1 59.0 75.2 68.3 66.9PGC Hispanic 21.5 22.9 30.3 22.8 22.0PGC Asian NH 14.7 9.0 10.3 7.8 7.6Prince George's 58.0 55.9 63.3 55.4 52.8Maryland 68.3 70.2 75.3 69.4 68.3
01020304050607080
Visit
s per
10,
000
popu
latio
n
MD SHIP Goal: 62.5
30
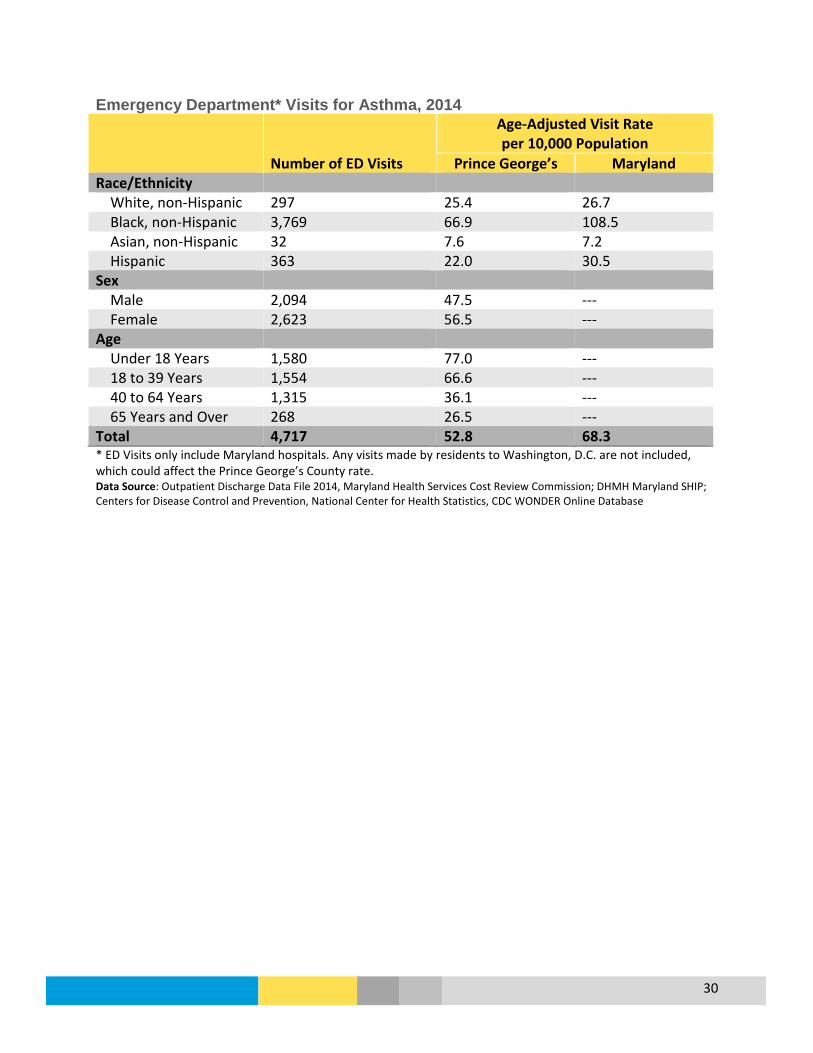
Emergency Department* Visits for Asthma, 2014
Number of ED Visits
Age-Adjusted Visit Rate per 10,000 Population
Prince George’s Maryland Race/Ethnicity White, non-Hispanic 297 25.4 26.7 Black, non-Hispanic 3,769 66.9 108.5 Asian, non-Hispanic 32 7.6 7.2 Hispanic 363 22.0 30.5 Sex Male 2,094 47.5 --- Female 2,623 56.5 --- Age Under 18 Years 1,580 77.0 --- 18 to 39 Years 1,554 66.6 --- 40 to 64 Years 1,315 36.1 --- 65 Years and Over 268 26.5 --- Total 4,717 52.8 68.3 * ED Visits only include Maryland hospitals. Any visits made by residents to Washington, D.C. are not included, which could affect the Prince George’s County rate. Data Source: Outpatient Discharge Data File 2014, Maryland Health Services Cost Review Commission; DHMH Maryland SHIP; Centers for Disease Control and Prevention, National Center for Health Statistics, CDC WONDER Online Database

31
Emergency Department* Visit Rate per 100,000 Population, Asthma as Primary Discharge Diagnosis, Prince George’s County, 2014
* ED Visits only include Maryland hospitals. Any visits made by residents to Washington, D.C. are not included, which could affect the Prince George’s County rate. Data Source: Outpatient Discharge Data File 2014, Maryland Health Services Cost Review Commission

32
Adult Asthma Age-Adjusted Hospital Inpatient* Visit Rate due to Adult Asthma by Race and Ethnicity, Prince George’s County, 2010-2012
* Includes visits to Maryland and Washington, D.C. hospitals Data Source: The Maryland Health Services Cost Review Commission; Maryland Health Care Commission Age-Adjusted Hospital Inpatient* Visit Rate due to Adult Asthma by Age Group, Prince George’s County, 2010-2012
* Includes visits to Maryland and Washington, D.C. hospitals Data Source: The Maryland Health Services Cost Review Commission; Maryland Health Care Commission
14.5
7.0
18.5
6.6
0 2 4 6 8 10 12 14 16 18 20
Overall
White, non-Hispanic
Black
Asian or Pacific Islander
Hospitalizations per 10,000 Population 18+ Years
45.5
36.6
28.5
20.7
7.0
3.9
3.9
0 5 10 15 20 25 30 35 40 45 50
Overall
85+ Years
65 to 84 Years
45 to 64 Years
25 to 44 Years
20 to 24 Years
18 to 19 Years
Hospitalizations per 10,000 Population 18+ Years
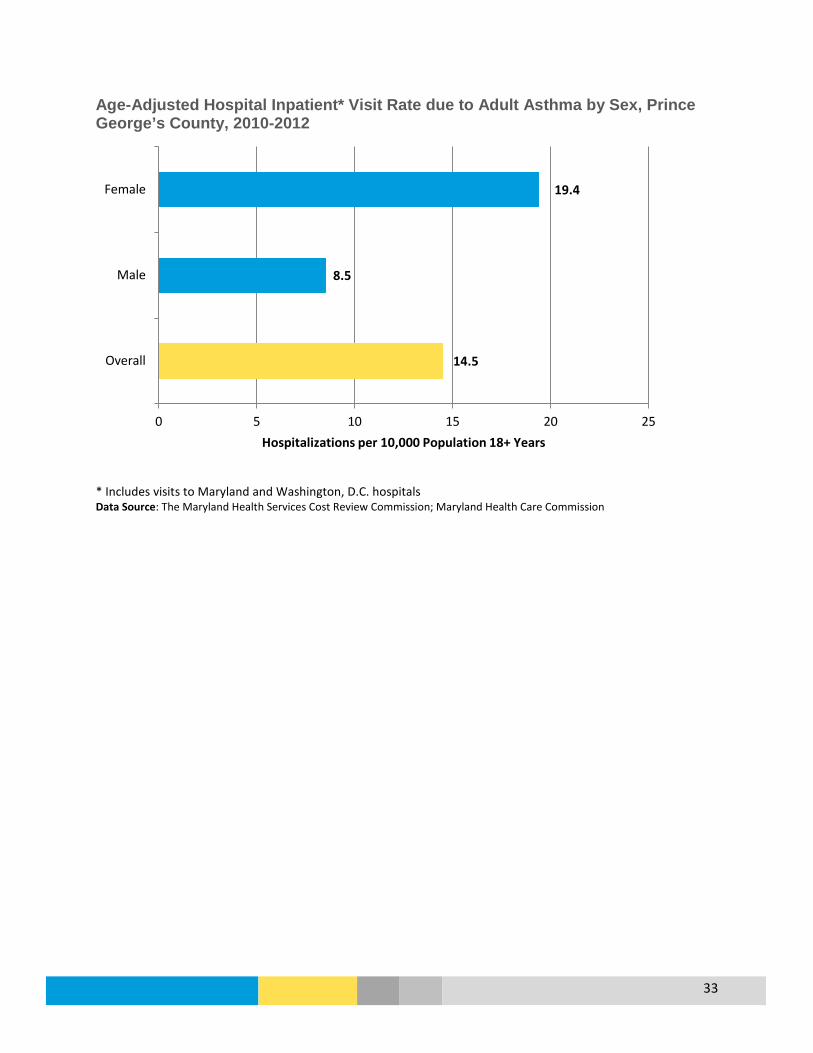
33
Age-Adjusted Hospital Inpatient* Visit Rate due to Adult Asthma by Sex, Prince George’s County, 2010-2012
* Includes visits to Maryland and Washington, D.C. hospitals Data Source: The Maryland Health Services Cost Review Commission; Maryland Health Care Commission
14.5
8.5
19.4
0 5 10 15 20 25
Overall
Male
Female
Hospitalizations per 10,000 Population 18+ Years

34
Age-Adjusted Hospital Inpatient* Visit Rate due to Adult Asthma, Prince George’s County, 2010-2012
* Includes visits to Maryland and Washington, D.C. hospitals Data Source: The Maryland Health Services Cost Review Commission; Maryland Health Care Commission

35
Pediatric Asthma Age-Adjusted Hospital Inpatient* Visit Rate due to Pediatric Asthma (Under 18 Years) by Race and Ethnicity, Prince George’s County, 2010-2012
* Includes visits to Maryland and Washington, D.C. hospitals Data Source: The Maryland Health Services Cost Review Commission; Maryland Health Care Commission Age-Adjusted Hospital Inpatient* Visit Rate due to Pediatric Asthma (Under 18 Years) by Age, Prince George’s County, 2010-2012
* Includes visits to Maryland and Washington, D.C. hospitals Data Source: The Maryland Health Services Cost Review Commission; Maryland Health Care Commission
16.2
5.4
18.5
6.3
33.6
0 5 10 15 20 25 30 35 40
Overall
White, non-Hispanic
Black
Asian or Pacific Islander
American Indian or Alaska Native
Hospitalizations per 10,000 Population Under 18 Years
16.2
2.9
9.4
20.7
26.9
0 5 10 15 20 25 30
Overall
15 to 17 Years
10 to 14 Years
5 to 9 Years
0 to 4 Years
Hospitalizations per 10,000 Population Under 18 Years

36
Age-Adjusted Hospital Inpatient* Visit Rate due to Pediatric Asthma (Under 18 Years) by Sex, Prince George’s County, 2010-2012
* Includes visits to Maryland and Washington, D.C. hospitals Data Source: The Maryland Health Services Cost Review Commission; Maryland Health Care Commission
16.2
19.3
13.0
0 5 10 15 20 25
Overall
Male
Female
Hospitalizations per 10,000 Population Under 18 Years

37
Age-Adjusted Hospital Inpatient* Visit Rate due to Pediatric Asthma (Under 18 Years), Prince George’s County, 2010-2012
* Includes visits to Maryland and Washington, D.C. hospitals Data Source: The Maryland Health Services Cost Review Commission; Maryland Health Care Commission

38
Chronic Obstructive Pulmonary Disease (COPD) Age-Adjusted Hospital Inpatient* Visit Rate due to COPD by Race and Ethnicity, Prince George’s County, 2010-2012
* Includes visits to Maryland and Washington, D.C. hospitals Data Source: The Maryland Health Services Cost Review Commission; Maryland Health Care Commission Age-Adjusted Hospital Inpatient* Visit Rate due to COPD by Age Group, Prince George’s County, 2010-2012
* Includes visits to Maryland and Washington, D.C. hospitals Data Source: The Maryland Health Services Cost Review Commission; Maryland Health Care Commission
13.5
14.9
14.1
2.6
0 2 4 6 8 10 12 14 16
Overall
White, non-Hispanic
Black
Asian or Pacific Islander
Hospitalizations per 10,000 Population 18+ Years
13.5
86.5
55.2
10.7
0.6
0 10 20 30 40 50 60 70 80 90 100
Overall
85+ Years
65 to 84 Years
45 to 64 Years
25 to 44 Years
Hospitalizations per 10,000 Population 18+ Years

39
Age-Adjusted Hospital Inpatient* Visit Rate due to COPD by Sex, Prince George’s County, 2010-2012
* Includes visits to Maryland and Washington, D.C. hospitals Data Source: The Maryland Health Services Cost Review Commission; Maryland Health Care Commission
13.5
14.0
13.3
0 2 4 6 8 10 12 14 16
Overall
Male
Female
Hospitalizations per 10,000 Population 18+ Years
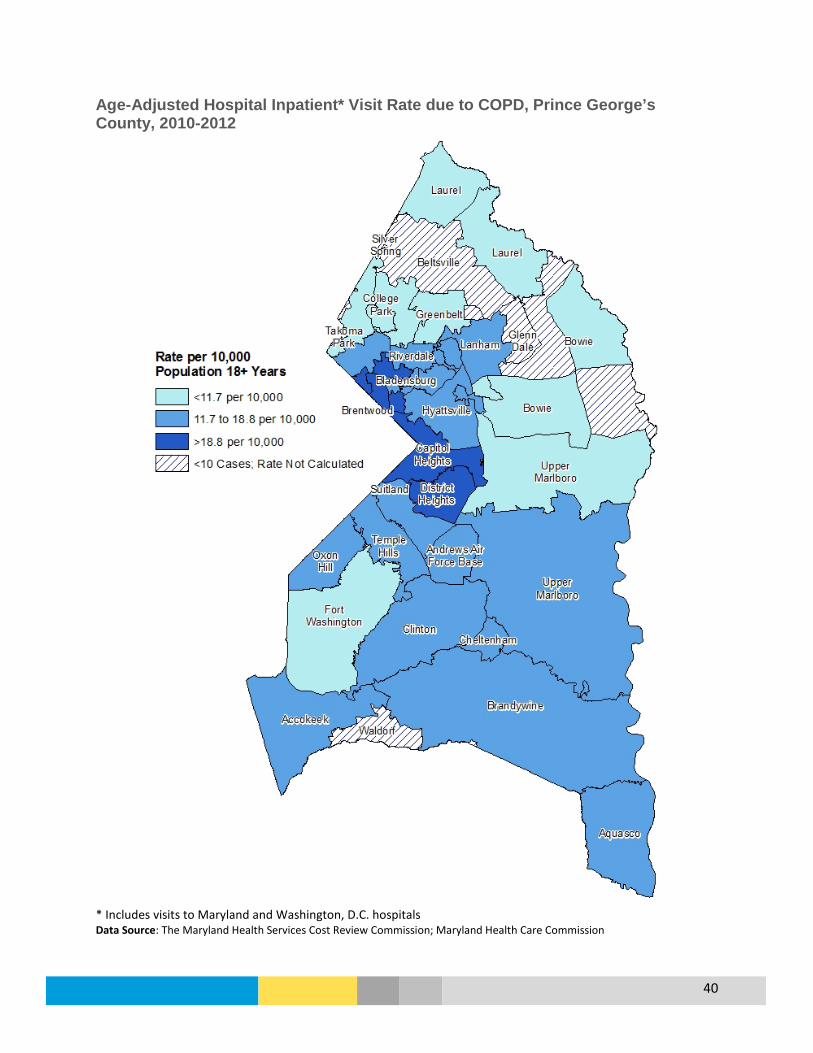
40
Age-Adjusted Hospital Inpatient* Visit Rate due to COPD, Prince George’s County, 2010-2012
* Includes visits to Maryland and Washington, D.C. hospitals Data Source: The Maryland Health Services Cost Review Commission; Maryland Health Care Commission
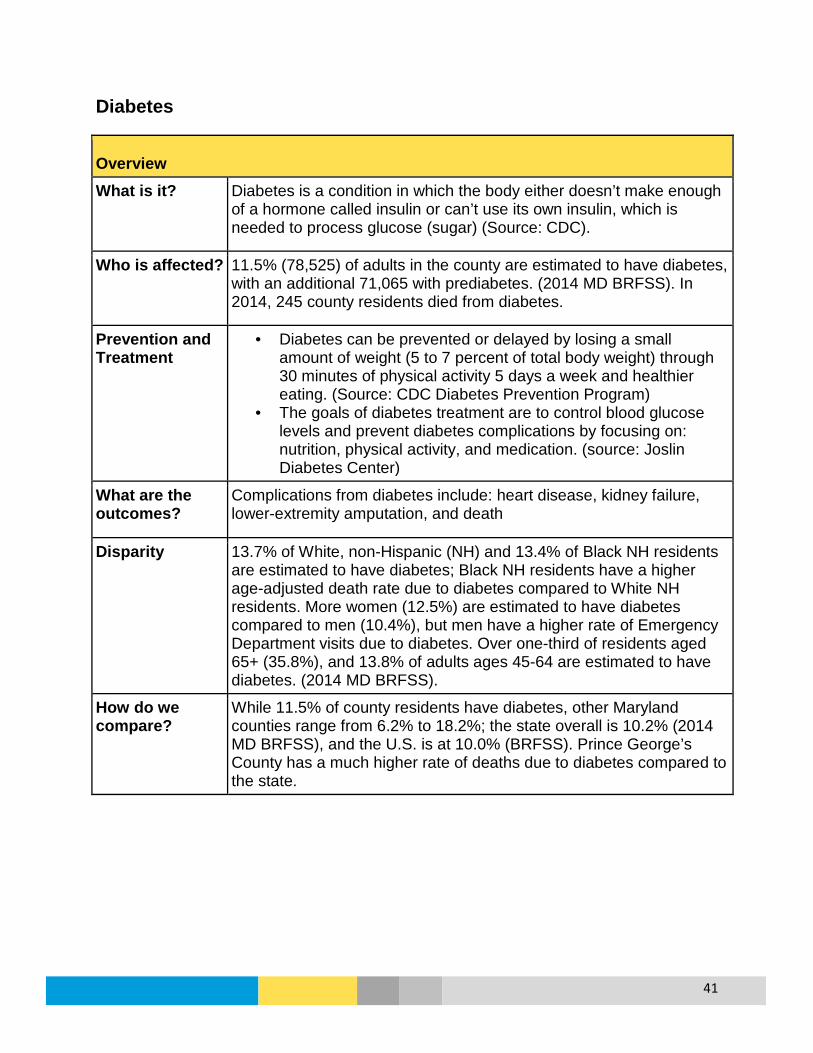
41
Diabetes
Overview What is it? Diabetes is a condition in which the body either doesn’t make enough
of a hormone called insulin or can’t use its own insulin, which is needed to process glucose (sugar) (Source: CDC).
Who is affected? 11.5% (78,525) of adults in the county are estimated to have diabetes, with an additional 71,065 with prediabetes. (2014 MD BRFSS). In 2014, 245 county residents died from diabetes.
Prevention and Treatment
• Diabetes can be prevented or delayed by losing a small amount of weight (5 to 7 percent of total body weight) through 30 minutes of physical activity 5 days a week and healthier eating. (Source: CDC Diabetes Prevention Program)
• The goals of diabetes treatment are to control blood glucose levels and prevent diabetes complications by focusing on: nutrition, physical activity, and medication. (source: Joslin Diabetes Center)
What are the outcomes?
Complications from diabetes include: heart disease, kidney failure, lower-extremity amputation, and death
Disparity 13.7% of White, non-Hispanic (NH) and 13.4% of Black NH residents are estimated to have diabetes; Black NH residents have a higher age-adjusted death rate due to diabetes compared to White NH residents. More women (12.5%) are estimated to have diabetes compared to men (10.4%), but men have a higher rate of Emergency Department visits due to diabetes. Over one-third of residents aged 65+ (35.8%), and 13.8% of adults ages 45-64 are estimated to have diabetes. (2014 MD BRFSS).
How do we compare?
While 11.5% of county residents have diabetes, other Maryland counties range from 6.2% to 18.2%; the state overall is 10.2% (2014 MD BRFSS), and the U.S. is at 10.0% (BRFSS). Prince George’s County has a much higher rate of deaths due to diabetes compared to the state.

42
Percent of Adults Who Have Ever Been Told By a Health Professional That They Have Diabetes, 2014 (Excludes Diabetes During Pregnancy)
Prince George’s County Maryland Sex Male 10.4% 10.4% Female 12.5% 10.0% Race/Ethnicity White, non-Hispanic 13.7% 10.0% Black, non-Hispanic 13.4% 12.9% Hispanic 2.0% 3.9% Age Group 18 to 34 Years 1.5% 1.5% 35 to 49 Years 5.4% 5.5% 50 to 64 Years 16.4% 15.1% Over 65 Years 35.8% 23.2% TOTAL 11.5% 10.2% Data Source: Maryland BRFSS 2014
Age-Adjusted Death Rate per 100,000 for Diabetes, 2007-2014
* Individuals of Hispanic origin and Asian/Pacific Islanders were not included due to insufficient numbers Data Source: Centers for Disease Control and Prevention, National Center for Health Statistics, CDC WONDER Online Database;
2007-2009 2008-2010 2009-2011 2010-2012 2011-2013 2012-2014PGC White NH 25.1 24.1 22.7 22.9 24.1 25.3PGC Black NH 40.3 41.7 37.3 35.4 32.2 32.9PGC 33.0 33.2 30.5 29.4 28.7 29.4Maryland 21.8 20.7 20.6 20.1 19.8 19.4
0.0
10.0
20.0
30.0
40.0
50.0
60.0
70.0
Deat
hs p
er 1
00,0
00 P
opul
atio
n
HP 2020 Goal: 66.6

43
Age-Adjusted Emergency Department* Visits per 100,000 Population due to Diabetes, 2010-2014
* ED Visits only include Maryland hospitals. Any visits made by residents to Washington, D.C. are not included, which could affect the Prince George’s County rate. Data Source: Maryland Health Services Cost Review Commission Outpatient File Emergency Department* Visits for Diabetes, 2014
Number of ED Visits
Age-Adjusted Visit Rate per 100,000 Population
Prince George’s Maryland Race/Ethnicity White, non-Hispanic 137 86.1 107.9 Black, non-Hispanic 1,198 200.2 309.4 Asian, non-Hispanic <10 --- 28.6 Hispanic 128 129.6 116.1 Sex Male 766 180.6 --- Female 800 159.8 --- Age Under 18 Years 46 22.4 18 to 39 Years 321 137.6 40 to 64 Years 827 226.8 65 Years and Over 372 367.2 Total 1,566 169.0 204.0 * ED Visits only include Maryland hospitals. Any visits made by residents to Washington, D.C. are not included, which could affect the Prince George’s County rate. Data Source: Outpatient Discharge Data File 2014, Maryland Health Services Cost Review Commission; DHMH Maryland SHIP http://dhmh.maryland.gov/ship/; Centers for Disease Control and Prevention, National Center for Health Statistics, CDC WONDER Online Database
156.6 163.8 168.5 167.6 169.0
177.3 180.9 194.8 192.1
204.0
0
50
100
150
200
250
2010 2011 2012 2013 2014
Visit
s per
100
,000
Pop
ulat
ion
Prince George's Maryland
MD SHIP Goal: 186.3

44
Emergency Department Visit Crude Rate per 100,000 Population, Diabetes as Primary Discharge Diagnosis, Prince George’s County, 2014
* ED Visits only include Maryland hospitals. Any visits made by residents to Washington, D.C. are not included, which could affect the Prince George’s County rate. Data Source: Outpatient Discharge Data File 2014, Maryland Health Services Cost Review Commission
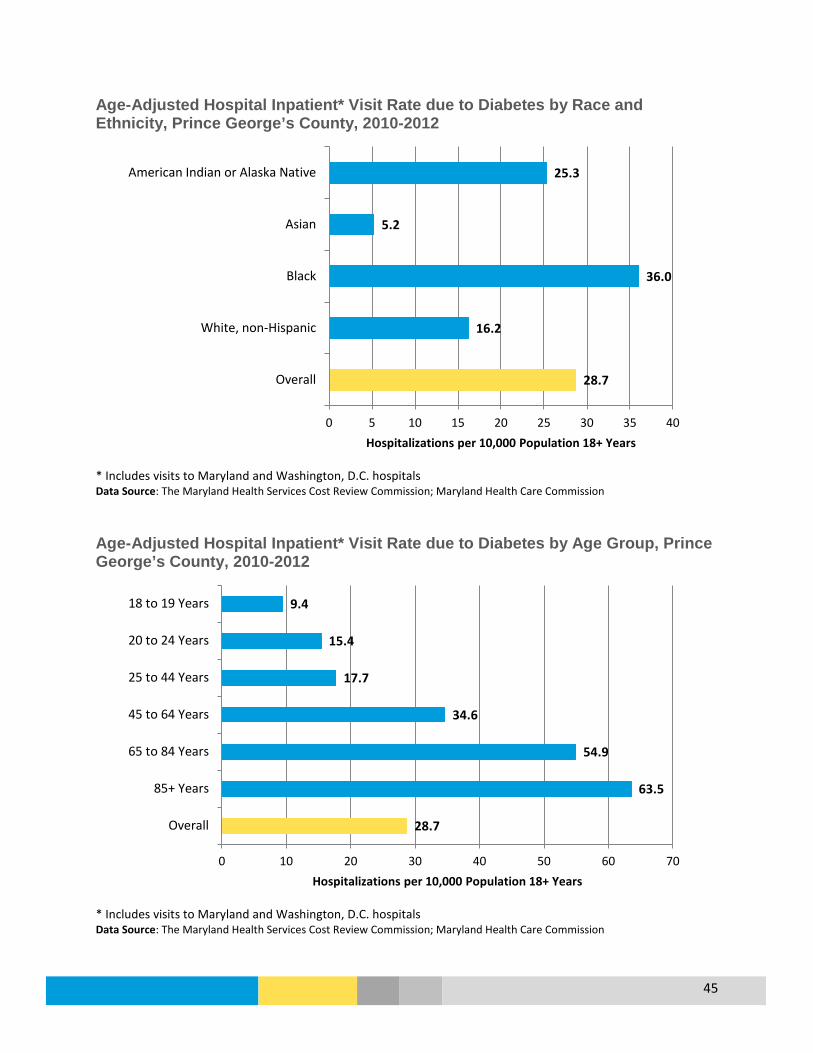
45
Age-Adjusted Hospital Inpatient* Visit Rate due to Diabetes by Race and Ethnicity, Prince George’s County, 2010-2012
* Includes visits to Maryland and Washington, D.C. hospitals Data Source: The Maryland Health Services Cost Review Commission; Maryland Health Care Commission Age-Adjusted Hospital Inpatient* Visit Rate due to Diabetes by Age Group, Prince George’s County, 2010-2012
* Includes visits to Maryland and Washington, D.C. hospitals Data Source: The Maryland Health Services Cost Review Commission; Maryland Health Care Commission
28.7
16.2
36.0
5.2
25.3
0 5 10 15 20 25 30 35 40
Overall
White, non-Hispanic
Black
Asian
American Indian or Alaska Native
Hospitalizations per 10,000 Population 18+ Years
28.7
63.5
54.9
34.6
17.7
15.4
9.4
0 10 20 30 40 50 60 70
Overall
85+ Years
65 to 84 Years
45 to 64 Years
25 to 44 Years
20 to 24 Years
18 to 19 Years
Hospitalizations per 10,000 Population 18+ Years
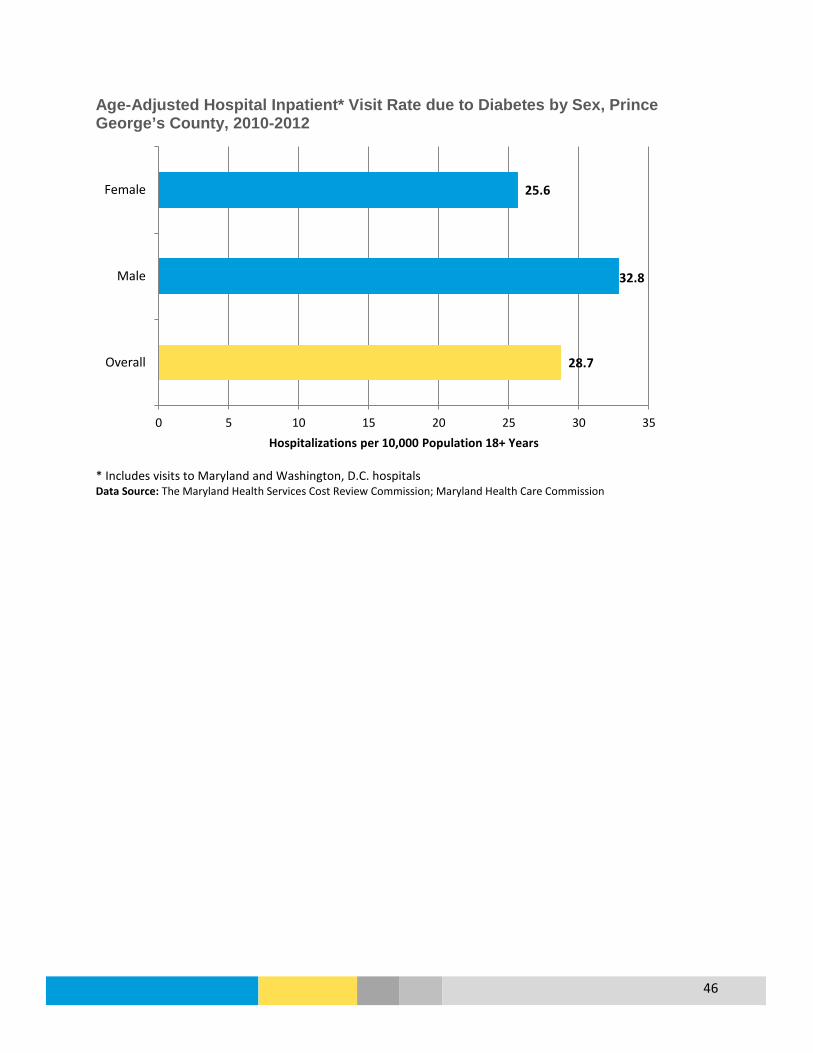
46
Age-Adjusted Hospital Inpatient* Visit Rate due to Diabetes by Sex, Prince George’s County, 2010-2012
* Includes visits to Maryland and Washington, D.C. hospitals Data Source: The Maryland Health Services Cost Review Commission; Maryland Health Care Commission
28.7
32.8
25.6
0 5 10 15 20 25 30 35
Overall
Male
Female
Hospitalizations per 10,000 Population 18+ Years

47
Age-Adjusted Hospital Inpatient* Visit Rate due to Diabetes, Prince George’s County, 2010-2012
* Includes visits to Maryland and Washington, D.C. hospitals Data Source: The Maryland Health Services Cost Review Commission & Maryland Health Care Commission
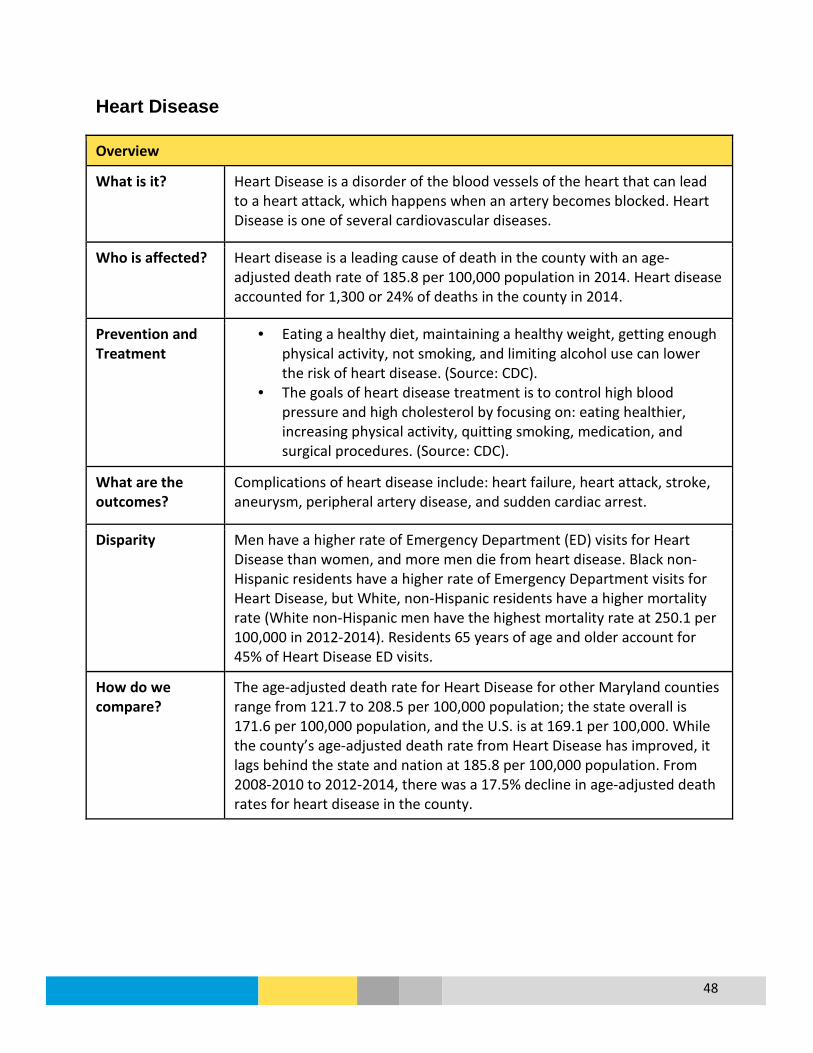
48
Heart Disease
Overview
What is it? Heart Disease is a disorder of the blood vessels of the heart that can lead to a heart attack, which happens when an artery becomes blocked. Heart Disease is one of several cardiovascular diseases.
Who is affected? Heart disease is a leading cause of death in the county with an age-adjusted death rate of 185.8 per 100,000 population in 2014. Heart disease accounted for 1,300 or 24% of deaths in the county in 2014.
Prevention and Treatment
• Eating a healthy diet, maintaining a healthy weight, getting enough physical activity, not smoking, and limiting alcohol use can lower the risk of heart disease. (Source: CDC).
• The goals of heart disease treatment is to control high blood pressure and high cholesterol by focusing on: eating healthier, increasing physical activity, quitting smoking, medication, and surgical procedures. (Source: CDC).
What are the outcomes?
Complications of heart disease include: heart failure, heart attack, stroke, aneurysm, peripheral artery disease, and sudden cardiac arrest.
Disparity Men have a higher rate of Emergency Department (ED) visits for Heart Disease than women, and more men die from heart disease. Black non-Hispanic residents have a higher rate of Emergency Department visits for Heart Disease, but White, non-Hispanic residents have a higher mortality rate (White non-Hispanic men have the highest mortality rate at 250.1 per 100,000 in 2012-2014). Residents 65 years of age and older account for 45% of Heart Disease ED visits.
How do we compare?
The age-adjusted death rate for Heart Disease for other Maryland counties range from 121.7 to 208.5 per 100,000 population; the state overall is 171.6 per 100,000 population, and the U.S. is at 169.1 per 100,000. While the county’s age-adjusted death rate from Heart Disease has improved, it lags behind the state and nation at 185.8 per 100,000 population. From 2008-2010 to 2012-2014, there was a 17.5% decline in age-adjusted death rates for heart disease in the county.

49
Age-Adjusted Death Rate per 100,000 for Heart Disease by Race and Ethnicity, 2008-2014
Data Source: CDC, National Center for Health Statistics, CDC WONDER Online Database
Emergency Department* Visits for Heart Disease, 2014
Demographic Number of ED Visits Age-Adjusted Rate per 100,000 Population
Race and Ethnicity White, non-Hispanic 422 222.4
Black, non-Hispanic 1,433 257.4 Asian, non-Hispanic 18 48.2 Hispanic 55 62.6 Gender
Male 1,056 273.2 Female 977 204.1 Age Under 18 Years 25 12.2 18 to 39 Years 226 96.9 40 to 64 Years 861 236.1 65 Years and Over 921 909.1 Total 2,033 234.6 * ED Visits only include Maryland hospitals. Any visits made by residents to Washington, D.C. are not included, which could affect the Prince George’s County rate. Data Source: Outpatient Discharge Data File 2014, Maryland Health Services Cost Review Commission; Centers for Disease Control and Prevention, National Center for Health Statistics, CDC WONDER Online Database
2008-2010 2009-2011 2010-2012 2011-2013 2012-2014PGC White NH 239.5 237.1 222.3 212.7 205.4PGC Black NH 234.6 215.0 205.1 193.5 186.7PGC Hispanic 97.8 89.0 110.6 109.5 96.7PGC Asian NH 109.4 111.1 98.6 89.1 103.7PGC 225.3 213.2 202.7 193.1 185.8Maryland 189.3 181.3 175.9 172.7 171.6
0
50
100
150
200
250
300
Deat
hs p
er 1
00,0
00 P
opul
atio
n MD SHIP Goal: 166.3

50
Emergency Department Visit* Crude Rate per 100,000 Population, Heart Disease as Primary Discharge Diagnosis, Prince George’s County, 2014
* ED Visits only include Maryland hospitals. Any visits made by residents to Washington, D.C. are not included, which could affect the Prince George’s County rate. Data Source: Outpatient Discharge Data File 2014, Maryland Health Services Cost Review Commission
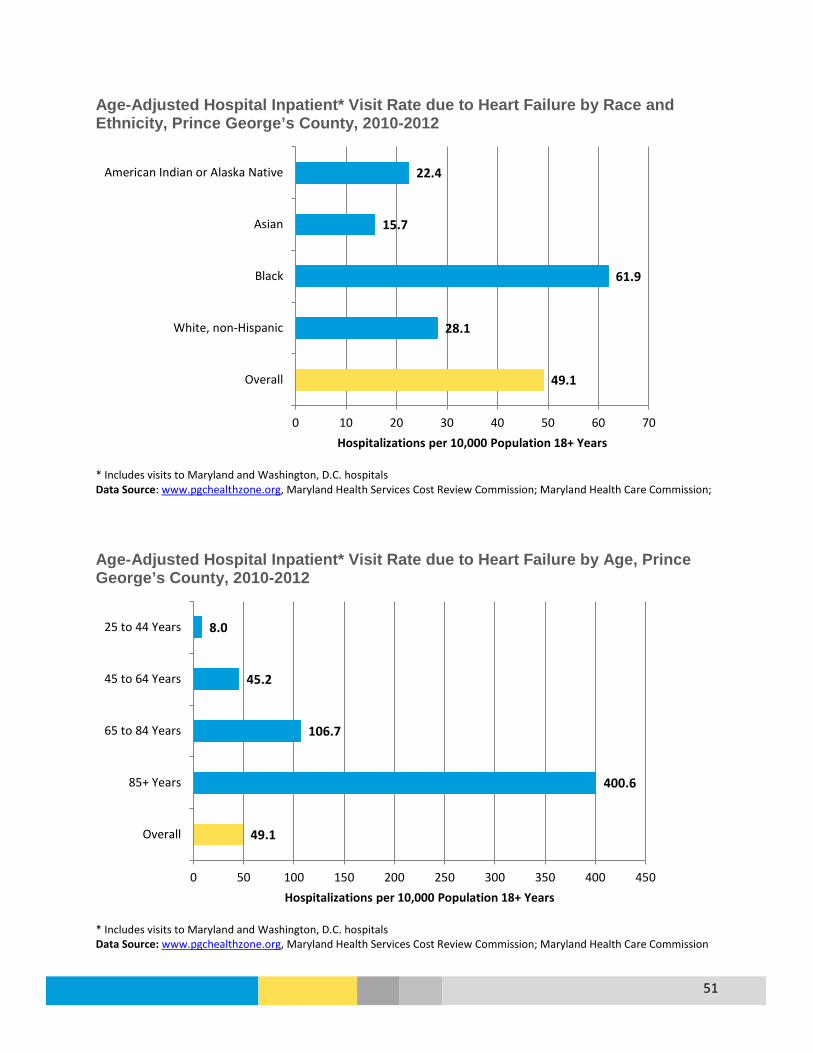
51
Age-Adjusted Hospital Inpatient* Visit Rate due to Heart Failure by Race and Ethnicity, Prince George’s County, 2010-2012
* Includes visits to Maryland and Washington, D.C. hospitals Data Source: www.pgchealthzone.org, Maryland Health Services Cost Review Commission; Maryland Health Care Commission; Age-Adjusted Hospital Inpatient* Visit Rate due to Heart Failure by Age, Prince George’s County, 2010-2012
* Includes visits to Maryland and Washington, D.C. hospitals Data Source: www.pgchealthzone.org, Maryland Health Services Cost Review Commission; Maryland Health Care Commission
49.1
28.1
61.9
15.7
22.4
0 10 20 30 40 50 60 70
Overall
White, non-Hispanic
Black
Asian
American Indian or Alaska Native
Hospitalizations per 10,000 Population 18+ Years
49.1
400.6
106.7
45.2
8.0
0 50 100 150 200 250 300 350 400 450
Overall
85+ Years
65 to 84 Years
45 to 64 Years
25 to 44 Years
Hospitalizations per 10,000 Population 18+ Years

52
Age-Adjusted Hospital Inpatient* Visit Rate due to Heart Failure by Sex, Prince George’s County, 2010-2012
* Includes visits to Maryland and Washington, D.C. hospitals Data Source: www.pgchealthzone.org, Maryland Health Services Cost Review Commission; Maryland Health Care Commission
49.1
56.7
42.8
0 10 20 30 40 50 60
Overall
Male
Female
Hospitalizations per 10,000 Population 18+ Years

53
Age-Adjusted Hospital Inpatient* Visit Rate due to Heart Failure, Prince George’s County, 2010-2012
* Includes visits to Maryland and Washington, D.C. hospitals Data Source: www.pgchealthzone.org, Maryland Health Services Cost Review Commission; Maryland Health Care Commission
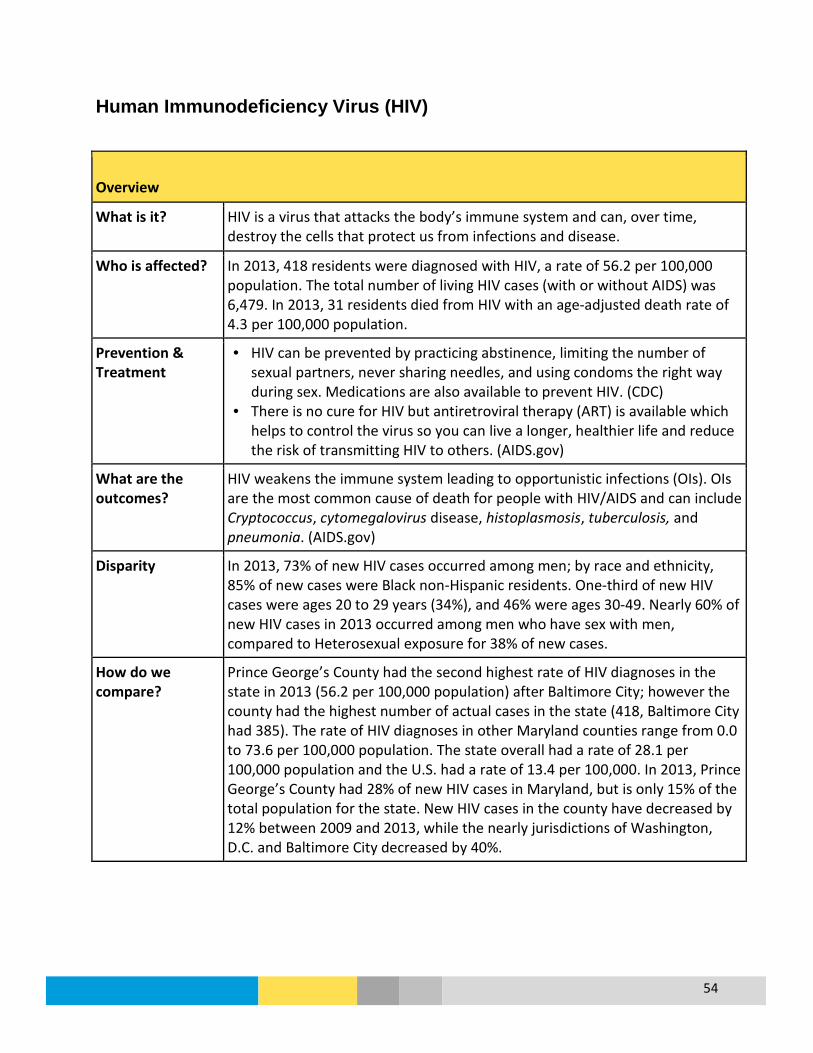
54
Human Immunodeficiency Virus (HIV)
Overview
What is it? HIV is a virus that attacks the body’s immune system and can, over time, destroy the cells that protect us from infections and disease.
Who is affected? In 2013, 418 residents were diagnosed with HIV, a rate of 56.2 per 100,000 population. The total number of living HIV cases (with or without AIDS) was 6,479. In 2013, 31 residents died from HIV with an age-adjusted death rate of 4.3 per 100,000 population.
Prevention & Treatment
• HIV can be prevented by practicing abstinence, limiting the number of sexual partners, never sharing needles, and using condoms the right way during sex. Medications are also available to prevent HIV. (CDC)
• There is no cure for HIV but antiretroviral therapy (ART) is available which helps to control the virus so you can live a longer, healthier life and reduce the risk of transmitting HIV to others. (AIDS.gov)
What are the outcomes?
HIV weakens the immune system leading to opportunistic infections (OIs). OIs are the most common cause of death for people with HIV/AIDS and can include Cryptococcus, cytomegalovirus disease, histoplasmosis, tuberculosis, and pneumonia. (AIDS.gov)
Disparity In 2013, 73% of new HIV cases occurred among men; by race and ethnicity, 85% of new cases were Black non-Hispanic residents. One-third of new HIV cases were ages 20 to 29 years (34%), and 46% were ages 30-49. Nearly 60% of new HIV cases in 2013 occurred among men who have sex with men, compared to Heterosexual exposure for 38% of new cases.
How do we compare?
Prince George’s County had the second highest rate of HIV diagnoses in the state in 2013 (56.2 per 100,000 population) after Baltimore City; however the county had the highest number of actual cases in the state (418, Baltimore City had 385). The rate of HIV diagnoses in other Maryland counties range from 0.0 to 73.6 per 100,000 population. The state overall had a rate of 28.1 per 100,000 population and the U.S. had a rate of 13.4 per 100,000. In 2013, Prince George’s County had 28% of new HIV cases in Maryland, but is only 15% of the total population for the state. New HIV cases in the county have decreased by 12% between 2009 and 2013, while the nearly jurisdictions of Washington, D.C. and Baltimore City decreased by 40%.
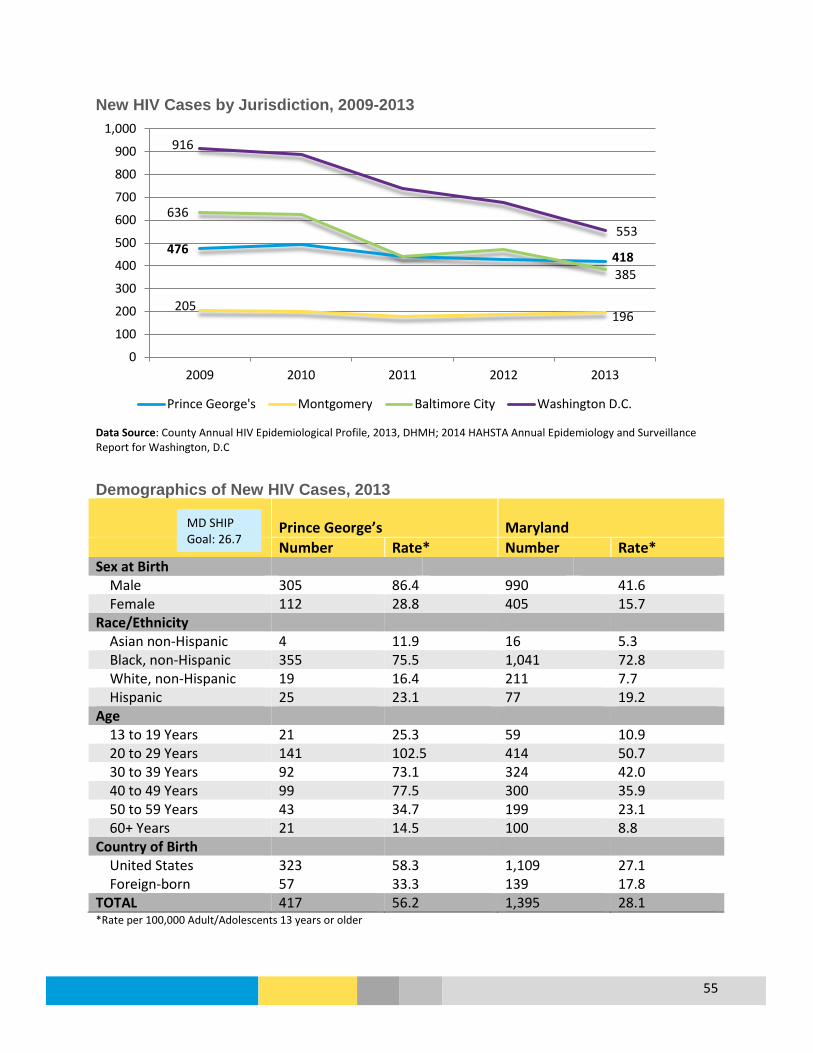
55
New HIV Cases by Jurisdiction, 2009-2013
Data Source: County Annual HIV Epidemiological Profile, 2013, DHMH; 2014 HAHSTA Annual Epidemiology and Surveillance Report for Washington, D.C Demographics of New HIV Cases, 2013
Prince George’s Maryland Number Rate* Number Rate* Sex at Birth Male 305 86.4 990 41.6 Female 112 28.8 405 15.7 Race/Ethnicity Asian non-Hispanic 4 11.9 16 5.3 Black, non-Hispanic 355 75.5 1,041 72.8 White, non-Hispanic 19 16.4 211 7.7 Hispanic 25 23.1 77 19.2 Age 13 to 19 Years 21 25.3 59 10.9 20 to 29 Years 141 102.5 414 50.7 30 to 39 Years 92 73.1 324 42.0 40 to 49 Years 99 77.5 300 35.9 50 to 59 Years 43 34.7 199 23.1 60+ Years 21 14.5 100 8.8 Country of Birth United States 323 58.3 1,109 27.1 Foreign-born 57 33.3 139 17.8 TOTAL 417 56.2 1,395 28.1 *Rate per 100,000 Adult/Adolescents 13 years or older
476 418
205 196
636
385
916
553
0
100
200
300
400
500
600
700
800
900
1,000
2009 2010 2011 2012 2013
Prince George's Montgomery Baltimore City Washington D.C.
MD SHIP Goal: 26.7

56
Data Source: County Annual HIV Epidemiological Profile, 2013, DHMH for Prince George’s County, Maryland; Maryland State Health Improvement Process (SHIP) New HIV Cases by Exposure, 2013 Prince George’s Maryland
Number Rate* Number Rate* Exposure Men who have Sex with Men (MSM) 139 59.4% 506 53.0% Injection Drug Users (IDU) ** ** 52 5.4% MSM & IDU 0 0.0% 15 1.6% Heterosexual 88 37.6% 377 39.5% Other ** ** 5 0.5% No Reported Exposure 183 440 TOTAL 417 56.2 1,395 28.1 **Data withheld due to low population and/or case counts Data Source: County Annual HIV Epidemiological Profile, 2013, DHMH for Prince George’s County Living HIV Cases, Prince George’s County, 2003 to 2013
Data Source: Prince George’s County Annual HIV Epidemiological Profile, 2013, DHMH http://phpa.dhmh.maryland.gov/OIDEOR/CHSE/SitePages/statistics.aspx
0
1,000
2,000
3,000
4,000
5,000
6,000
7,000
2003 2004 2005 2006 2007 2008 2009 2010 2011 2012 2013
AIDS HIV without AIDS
6,479
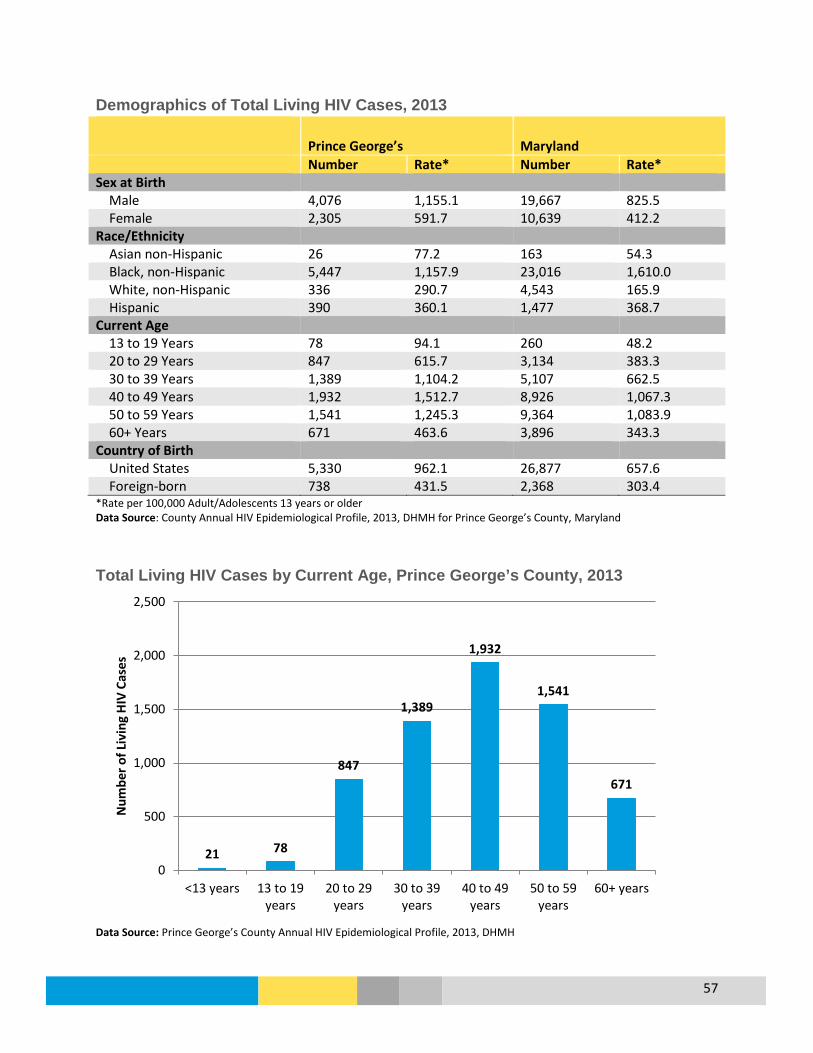
57
Demographics of Total Living HIV Cases, 2013
Prince George’s Maryland Number Rate* Number Rate* Sex at Birth Male 4,076 1,155.1 19,667 825.5 Female 2,305 591.7 10,639 412.2 Race/Ethnicity Asian non-Hispanic 26 77.2 163 54.3 Black, non-Hispanic 5,447 1,157.9 23,016 1,610.0 White, non-Hispanic 336 290.7 4,543 165.9 Hispanic 390 360.1 1,477 368.7 Current Age 13 to 19 Years 78 94.1 260 48.2 20 to 29 Years 847 615.7 3,134 383.3 30 to 39 Years 1,389 1,104.2 5,107 662.5 40 to 49 Years 1,932 1,512.7 8,926 1,067.3 50 to 59 Years 1,541 1,245.3 9,364 1,083.9 60+ Years 671 463.6 3,896 343.3 Country of Birth United States 5,330 962.1 26,877 657.6 Foreign-born 738 431.5 2,368 303.4 *Rate per 100,000 Adult/Adolescents 13 years or older Data Source: County Annual HIV Epidemiological Profile, 2013, DHMH for Prince George’s County, Maryland
Total Living HIV Cases by Current Age, Prince George’s County, 2013
Data Source: Prince George’s County Annual HIV Epidemiological Profile, 2013, DHMH
21 78
847
1,389
1,932
1,541
671
0
500
1,000
1,500
2,000
2,500
<13 years 13 to 19years
20 to 29years
30 to 39years
40 to 49years
50 to 59years
60+ years
Num
ber o
f Liv
ing
HIV
Cas
es
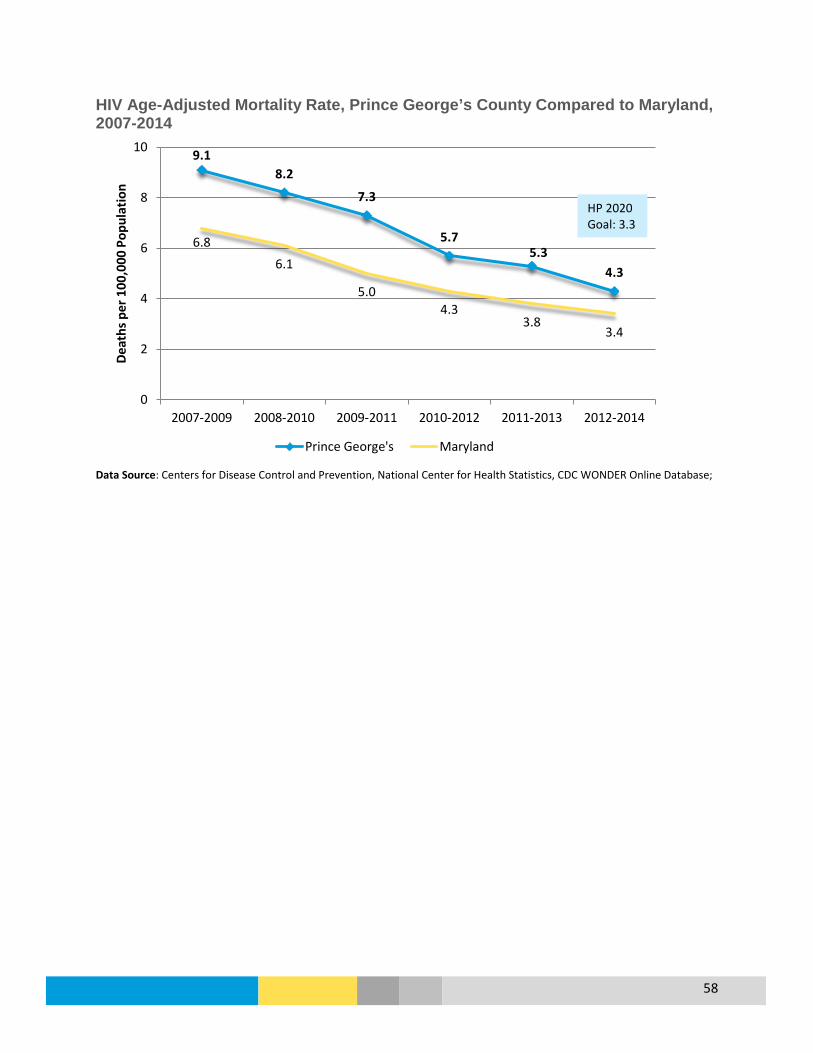
58
HIV Age-Adjusted Mortality Rate, Prince George’s County Compared to Maryland, 2007-2014
Data Source: Centers for Disease Control and Prevention, National Center for Health Statistics, CDC WONDER Online Database;
9.1 8.2
7.3
5.7 5.3
4.3
6.8 6.1
5.0 4.3
3.8 3.4
0
2
4
6
8
10
2007-2009 2008-2010 2009-2011 2010-2012 2011-2013 2012-2014
Deat
hs p
er 1
00,0
00 P
opul
atio
n
Prince George's Maryland
HP 2020 Goal: 3.3

59
2013 New HIV Cases per 100,000 Population, Age 13 and Over
Data Source: Prince George’s County Annual HIV Epidemiological Profile, 2013, DHMH

60
2013 Total Living HIV Cases per 100,000 Population, Age 13 and Over
Data Source: Prince George’s County Annual HIV Epidemiological Profile, 2013, DHMH

61
Hypertension and Stroke
Overview
What is it? High blood pressure, or hypertension, is when the force of blood pumping through the arteries is too strong. Hypertension is a risk factor for stroke, which is when the flow of blood (and thus oxygen) to the brain is blocked.
Who is affected? In the county, 37.9% (252,160) of adults are estimated to have hypertension (Maryland BRFSS 2013). Among Medicare beneficiaries, 4.6% were treated for stroke in 2014 (CMS). In 2014, 298 county residents died from stroke.
Prevention & Treatment
• Hypertension and stroke can be prevented by eating a healthy diet, maintaining a healthy weight, exercising regularly, avoiding stress, and limiting alcohol and tobacco use (source: CDC)
• The goal of stroke treatment is to maintain healthy blood pressure through proper nutrition, exercise, and medication (source: American Heart Association).
What are the outcomes?
Complications from hypertension include damage to the heart and coronary arteries, stroke, kidney damage, vision loss, erectile dysfunction, angina, and death. (source: American Heart Association).
Disparity In 2013, 29.9% of White, non-Hispanic (NH) and 42.6% of Black NH residents are estimated to have hypertension; Black NH residents have the highest age-adjusted Emergency Department visit rate. Slightly more men (38.7%) are estimated to have hypertension than women (37.1%), but women have a higher rate of Emergency Department visits due to hypertension. Both Black NH and White NH have a higher mortality rate due to stroke compared to Asian NH and Hispanic residents. Over 75% of residents aged 65+ and half of adults ages 50 to 64 are estimated to have hypertension (MD BRFSS 2013).
How do we compare?
Other Maryland counties range from 25.8% to 44.6% of residents with hypertension; the county (37.9% with hypertension) is higher than the state at 33.6% (Maryland BRFSS 2013) and the U.S. at 31.4% (BRFSS). The county has a slightly higher age-adjusted death rate due to stroke (37.8 per 100,000) compared to the state (36.9 per 100,000) and U.S (36.5 per 100,000).

62
Percent of Adults Who Have Ever Been Told By A Health Professional They Have High Blood Pressure, 2013
Prince George’s Maryland Overall 37.9% 33.6% Sex Male 38.7% 33.9% Female 37.1% 33.2% Race/Ethnicity White, non-Hispanic 29.9% 33.3% Black, non-Hispanic 42.6% 39.2% Hispanic 29.9% 22.6% Age Group 18 to 34 Years 13.6% 11.4% 35 to 49 Years 36.1% 23.6% 50 to 64 Years 49.5% 45.6% Over 65 Years 76.1% 66.3% Data Source: Maryland BRFSS 2013
Age-Adjusted Death Rate per 100,000 for Stoke by Race and Ethnicity, Prince George’s County, 2008-2014
*Rates are unavailable due to small numbers Data Source: Centers for Disease Control and Prevention, National Center for Health Statistics, CDC WONDER Online Database
2008-2010 2009-2011 2010-2012 2011-2013 2012-2014PGC White NH 38.7 38.0 39.0 36.8 38.9PGC Black NH 36.5 38.0 37.1 37.9 38.0Hispanic*, any race 25.7 29.4 28.4PGC Asian NH 40.9 36.7 25.7 29.4 23.1PGC 37.6 38.1 37.6 37.3 37.8Maryland 39.9 38.7 37.7 36.8 36.9
0.0
5.0
10.0
15.0
20.0
25.0
30.0
35.0
40.0
45.0
Deat
hs p
er 1
00,0
00 P
opul
atio
n
HP 2020 Goal: 34.8

63
Age-Adjusted Emergency Department* Visits per 100,000 Population Due to Hypertension, 2010-2014
* ED Visits only include Maryland hospitals. Any visits made by residents to Washington, D.C. are not included, which could affect the Prince George’s County rate. Data Source: Maryland Health Services Cost Review Commission, Maryland SHIP metrics http://dhmh.maryland.gov/ship Emergency Department* Visits for Hypertension, 2014
Demographics Prince George’s County Number of ED Visits
Age-Adjusted ED Visit Rate per 100,000 Population
Prince George’s County Maryland
Race and Ethnicity White, non-Hispanic 178 113.6 113.2 Black, non-Hispanic 1,772 295.3 415.1 Asian, non-Hispanic 32 72.3 54.6 Hispanic 96 93.9 125.0 Gender Male 899 212.7 --- Female 1,290 259.0 --- Age Under 18 Years <10 -- --- 18 to 39 Years 342 146.6 --- 40 to 64 Years 1,376 377.3 --- 65 Years and Over 679 670.2 --- TOTAL 2,189 261.7 252.2 * ED Visits only include Maryland hospitals. Any visits made by residents to Washington, D.C. are not included, which could affect the Prince George’s County rate. Data Source: Outpatient Discharge Data File 2014, Maryland Health Services Cost Review Commission; DHMH Maryland SHIP; Centers for Disease Control and Prevention, National Center for Health Statistics, CDC WONDER Online Database
243.4 263.0
293.3 283.8 261.7
205.9 226.3
244.1 246.3 252.2
0
50
100
150
200
250
300
350
2010 2011 2012 2013 2014
Visit
s per
100
,000
Pop
ulat
ion
Prince George's Maryland
MD SHIP Goal: 234.0

64
Emergency Department* Visit Crude Rate per 100,000 Population, Hypertension as Primary Diagnosis, Prince George’s County, 2014
* ED Visits only include Maryland hospitals. Any visits made by residents to Washington, D.C. are not included, which could affect the Prince George’s County rate. Data Source: Outpatient Discharge Data File 2014, Maryland Health Services Cost Review Commission

65
Age-Adjusted Hospital Inpatient* Visit Rate due to Hypertension by Race and Ethnicity, Prince George’s County, 2010-2012
* Includes visits to Maryland and Washington, D.C. hospitals Data Source: The Maryland Health Services Cost Review Commission & Maryland Health Care Commission Age-Adjusted Hospital Inpatient* Visit Rate due to Hypertension by Age Group, Prince George’s County, 2010-2012
* Includes visits to Maryland and Washington, D.C. hospitals Data Source: The Maryland Health Services Cost Review Commission & Maryland Health Care Commission
9.3
3.3
12.5
2.2
0 2 4 6 8 10 12 14
Overall
White, non-Hispanic
Black
Asian
Hospitalizations per 10,000 Population 18+ Years
9.3
35.0
22.0
11.5
4.5
0 5 10 15 20 25 30 35 40
Overall
85+ Years
65 to 84 Years
45 to 64 Years
25 to 44 Years
Hospitalizations per 10,000 Population 18+ Years

66
Age-Adjusted Hospital Inpatient* Visit Rate due to Hypertension by Sex, Prince George’s County, 2010-2012
* Includes visits to Maryland and Washington, D.C. hospitals Data Source: The Maryland Health Services Cost Review Commission & Maryland Health Care Commission
9.3
8.4
9.9
0 2 4 6 8 10 12
Overall
Male
Female
Hospitalizations per 10,000 Population 18+ Years

67
Age-Adjusted Hospital Inpatient* Visit Rate due to Hypertension, Prince George’s County, 2010-2012
* Includes visits to Maryland and Washington, D.C. hospitals Data Source: The Maryland Health Services Cost Review Commission & Maryland Health Care Commission

68
Infectious Disease Selected Reportable Disease, Prince George’s County, 2012-2014
Morbidity 2012 2013 2014 5-Year Mean
Campylobacteriosis 32 39 38 35 H. influenza, invasive 14 10 12 11 Hepatitis A, acute 7 3 3 5 Legionellosis 14 30 18 17 Measles 0 0 0 0 Meningitis, viral 43 28 78 60 Meningitis, meningococcal 0 0 0 1 Pertussis 34 18 9 16 Salmonellosis 86 70 82 88 Shiga-toxin producing E.coli 5 6 2 6 Shigellosis 36 22 59 32 Strep Group B 53 55 76 66 Strep pneumonia, invasive 44 36 47 45 Tuberculosis 50 43 50 47 Outbreaks Outbreaks: Gastrointestinal 17 7 Outbreaks: Respiratory 2 1 Animal-Related Illness Animal Bites 781 752 912 746 Animal Rabies 21 17 24 19 Data Source: Infectious Disease Bureau, Prevention and Health Promotion Administration, DHMH
Percent of Adults Who Had a Seasonal Influenza Shot or Influenza Vaccine Nasal Spray During the Past Year, 2014
Prince George’s Maryland Male 34.8% 38.0% Female 34.1% 45.2% Race/Ethnicity White, non-Hispanic 54.1% 45.4% Black, non-Hispanic 35.7% 39.0% Hispanic 12.1% 27.0% Age Group 18 to 34 Years 22.2% 30.1% 35 to 49 Years 24.1% 36.7% 50 to 64 Years 45.7% 44.9% Over 65 Years 59.7% 62.1% Overall 34.4% 41.7% Data Source: Maryland BRFSS

69
Percent of Adults Who Had a Seasonal Influenza Shot or Influenza Vaccine Nasal Spray During the Past Year, 2011-2014
Data Source: Maryland BRFSS Percent of Adults Age 65+ Who Ever Had a Pneumonia Vaccine, 2011-2014
Data Source: Maryland BRFSS 2014
31.1% 34.1% 36.9%
34.4%
41.0% 41.4% 44.6%
41.7%
0%
5%
10%
15%
20%
25%
30%
35%
40%
45%
50%
2011 2012 2013 2014
Prince George's Maryland
61.6%
58.3%
67.4% 66.0%
69.9%
67.4%
69.3% 69.8%
52%
54%
56%
58%
60%
62%
64%
66%
68%
70%
72%
2011 2012 2013 2014
Prince George's Maryland

70
Lead Poisoning Children can be exposed to lead through lead-based paint and dust with lead in it. Although lead paint was banned in 1978 it can be found in homes built before then, and the deterioration of the paint results in the contaminated dust. Lead exposure often occurs without symptoms and can go unrecognized; however, lead can affect nearly every system in the body. There is no safe blood lead level in children, and action is recommended with levels above 5 micrograms per deciliter. Lead poisoning can result in damage to the brain, slowed development and growth, learning and behavior problems, and hearing and speech problems (CDC). Percentage of Children Ages 12-35 Months Enrolled in Medicaid* Who Received a Blood Lead Test, 2011-2013
* Includes children enrolled in Medicaid for at least 90 days Data Source: Maryland Medicaid Service Utilization, Maryland SHIP website, http://dhmh.maryland.gov/ship
2011 2012 2013PGC White 59.8% 61.2% 60.2%PGC Black 55.1% 55.7% 56.3%PGC Asian 65.4% 63.6% 61.5%PGC Hispanic 74.5% 75.4% 76.2%Prince George's 62.2% 62.4% 63.3%Maryland 65.8% 65.6% 66.2%
0.0%
10.0%
20.0%
30.0%
40.0%
50.0%
60.0%
70.0%
80.0%
90.0%
Perc
ent
MD SHIP Goal: 69.5%

71
Percentage of Children Under Six Years of Age Tested for Blood Lead who have 10 or More Micrograms/Deciliter of Lead in Blood, 2009 to 2014
Data Source: Maryland Department of the Environment
0.23% 0.19% 0.20%
0.10% 0.06%
0.23%
0.35% 0.35%
0.41%
0.33% 0.34% 0.33%
0.00%
0.05%
0.10%
0.15%
0.20%
0.25%
0.30%
0.35%
0.40%
0.45%
2009 2010 2011 2012 2013 2014
Perc
ent
Prince George's Maryland
MD SHIP Goal: 0.28%
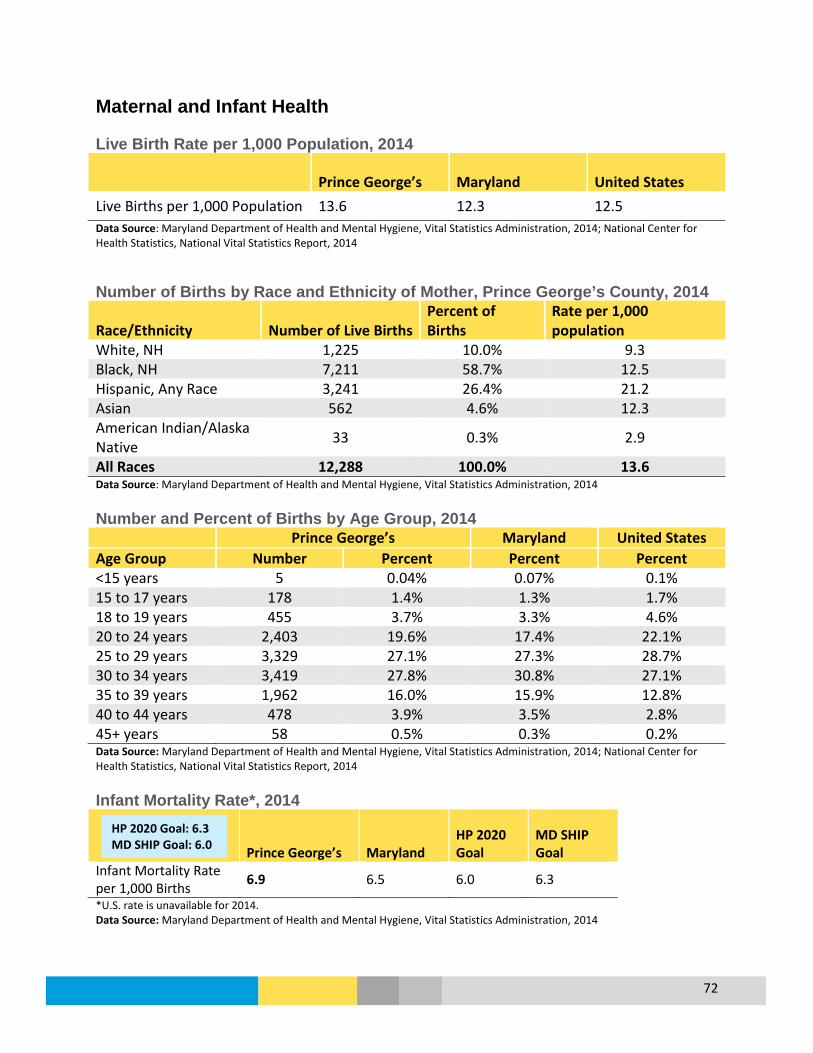
72
Maternal and Infant Health Live Birth Rate per 1,000 Population, 2014
Prince George’s Maryland United States Live Births per 1,000 Population 13.6 12.3 12.5 Data Source: Maryland Department of Health and Mental Hygiene, Vital Statistics Administration, 2014; National Center for Health Statistics, National Vital Statistics Report, 2014 Number of Births by Race and Ethnicity of Mother, Prince George’s County, 2014
Race/Ethnicity Number of Live Births Percent of Births
Rate per 1,000 population
White, NH 1,225 10.0% 9.3 Black, NH 7,211 58.7% 12.5 Hispanic, Any Race 3,241 26.4% 21.2 Asian 562 4.6% 12.3 American Indian/Alaska Native 33 0.3% 2.9
All Races 12,288 100.0% 13.6 Data Source: Maryland Department of Health and Mental Hygiene, Vital Statistics Administration, 2014 Number and Percent of Births by Age Group, 2014 Prince George’s Maryland United States Age Group Number Percent Percent Percent <15 years 5 0.04% 0.07% 0.1% 15 to 17 years 178 1.4% 1.3% 1.7% 18 to 19 years 455 3.7% 3.3% 4.6% 20 to 24 years 2,403 19.6% 17.4% 22.1% 25 to 29 years 3,329 27.1% 27.3% 28.7% 30 to 34 years 3,419 27.8% 30.8% 27.1% 35 to 39 years 1,962 16.0% 15.9% 12.8% 40 to 44 years 478 3.9% 3.5% 2.8% 45+ years 58 0.5% 0.3% 0.2% Data Source: Maryland Department of Health and Mental Hygiene, Vital Statistics Administration, 2014; National Center for Health Statistics, National Vital Statistics Report, 2014
Infant Mortality Rate*, 2014
Prince George’s Maryland HP 2020 Goal
MD SHIP Goal
Infant Mortality Rate per 1,000 Births 6.9 6.5 6.0 6.3
*U.S. rate is unavailable for 2014. Data Source: Maryland Department of Health and Mental Hygiene, Vital Statistics Administration, 2014
HP 2020 Goal: 6.3 MD SHIP Goal: 6.0

73
Infant Deaths, 2012-2014
2012 2013 2014 Prince George’s County Infant Deaths White, non-Hispanic 4 6 3 Black, non-Hispanic 69 61 59 Hispanic (any race) 26 21 17 Total Deaths 103 92 85 Infant Mortality Rate: All Races per 1,000 Live Births Prince George’s 8.6 7.8 6.9 Maryland 6.3 6.6 6.5 Infant Mortality Rate: White, non-Hispanic per 1,000 Live Births Prince George’s * 5.4 * Maryland 3.8 4.6 4.4 Infant Mortality Rate: Black, non-Hispanic per 1,000 Live Births Prince George’s 9.6 8.7 8.2 Maryland 10.4 10.6 10.7 Infant Mortality Rate: Hispanic (any race) per 1,000 Live Births Prince George’s 8.8 6.9 5.2 Maryland 5.5 4.7 4.4 *Rates based on <5 deaths are not presented since they are subject to instability. Data Source: Maryland Department of Health and Mental Hygiene, Vital Statistics Administration Low Birth Weight (<2500g) by Race/Ethnicity and Age, 2014
Prince George’s Maryland United States Race/Ethnicity
White, NH 5.3% 6.6% 7.0% Black, NH 11.0% 12.1% 13.2% Asian/PI 8.0% 8.1% * Hispanic, any race 7.1% 7.3% 7.1%
Age Group Under 18 years 9.3% 11.1% 9.7% 18 to 19 years 12.5% 10.9% 9.2% 20 to 24 years 9.0% 9.3% 8.2% 25 to 29 years 8.3% 7.8% 7.4% 30 to 34 years 9.3% 7.9% 7.5% 35 to 39 years 9.2% 9.2% 8.7% 40 + years 13.1% 11.6% 11.6%
Overall 9.2% 8.6% 8.0% *Data not available for Asian/Pacific Islander Data Source: Maryland Department of Health and Mental Hygiene, Vital Statistics Administration, 2014; National Center for Health Statistics, Births Final Data for 2014
HP 2020 Goal: 7.8% MD SHIP Goal: 8.0%
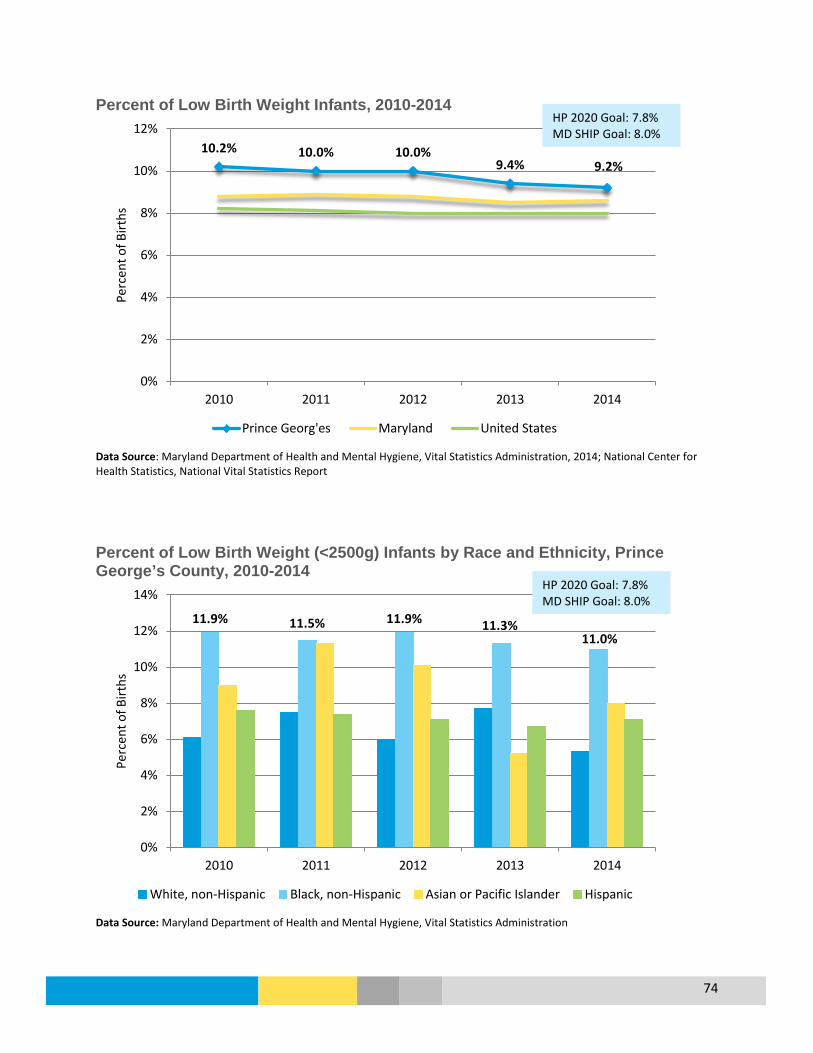
74
Percent of Low Birth Weight Infants, 2010-2014
Data Source: Maryland Department of Health and Mental Hygiene, Vital Statistics Administration, 2014; National Center for Health Statistics, National Vital Statistics Report Percent of Low Birth Weight (<2500g) Infants by Race and Ethnicity, Prince George’s County, 2010-2014
Data Source: Maryland Department of Health and Mental Hygiene, Vital Statistics Administration
10.2% 10.0% 10.0% 9.4% 9.2%
0%
2%
4%
6%
8%
10%
12%
2010 2011 2012 2013 2014
Perc
ent o
f Birt
hs
Prince Georg'es Maryland United States
11.9% 11.5% 11.9% 11.3% 11.0%
0%
2%
4%
6%
8%
10%
12%
14%
2010 2011 2012 2013 2014
Perc
ent o
f Birt
hs
White, non-Hispanic Black, non-Hispanic Asian or Pacific Islander Hispanic
HP 2020 Goal: 7.8% MD SHIP Goal: 8.0%
HP 2020 Goal: 7.8% MD SHIP Goal: 8.0%
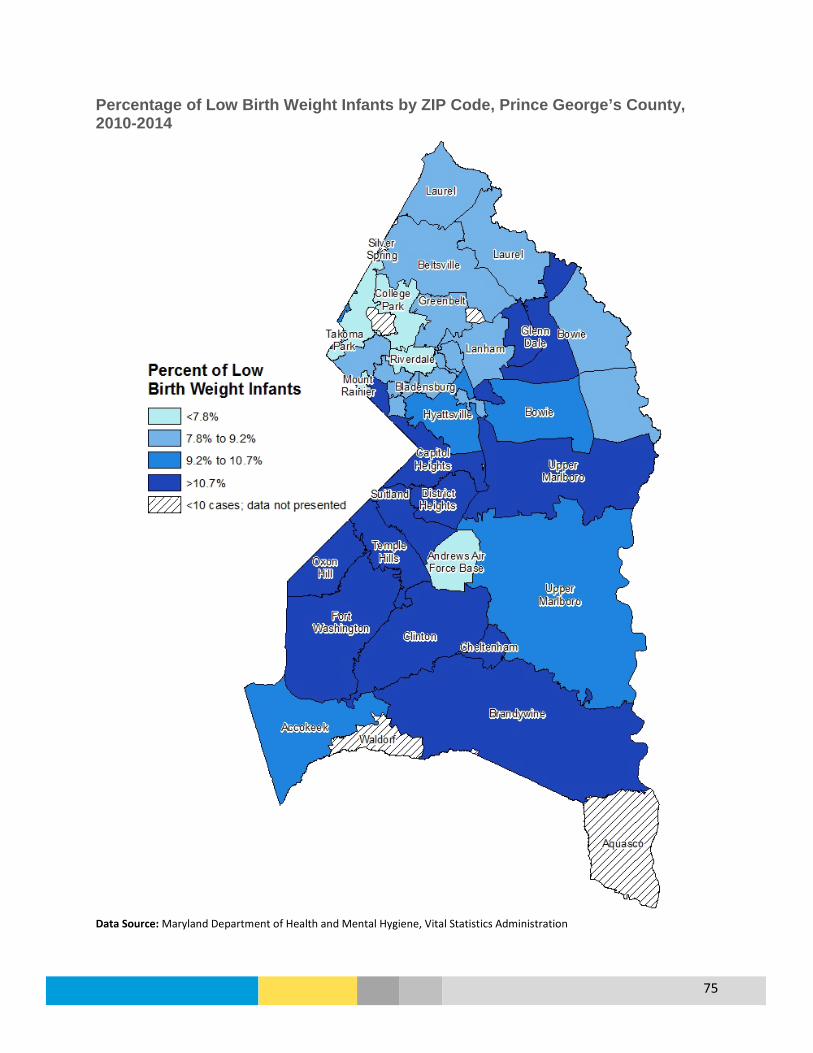
75
Percentage of Low Birth Weight Infants by ZIP Code, Prince George’s County, 2010-2014
Data Source: Maryland Department of Health and Mental Hygiene, Vital Statistics Administration

76
Teen Birth Rate (Ages 15 to 19 Years), 2010-2014
Data Source: Maryland Department of Health and Mental Hygiene, Vital Statistics Administration; National Center for Health Statistics, National Vital Statistics Report, 2014 Teen Birth Rate (Ages 15 to 19) by Race and Ethnicity, Prince George’s County, 2010-2014
Data Source: Maryland Department of Health and Mental Hygiene, Vital Statistics Administration
33.1
30.7 27.7
24.2 21.3
0
5
10
15
20
25
30
35
40
2010 2011 2012 2013 2014
Birt
hs p
er 1
,000
Live
Birt
hs
Prince George's Maryland U.S.
66.4 68.2 63.6
54.0 49.3
0
10
20
30
40
50
60
70
80
2010 2011 2012 2013 2014
Birt
hs p
er 1
,000
Live
Birt
hs
White, non-Hispanic Black, non-Hispanic Hispanic (any race)
MD SHIP Goal: 17.8
MD SHIP Goal: 17.8
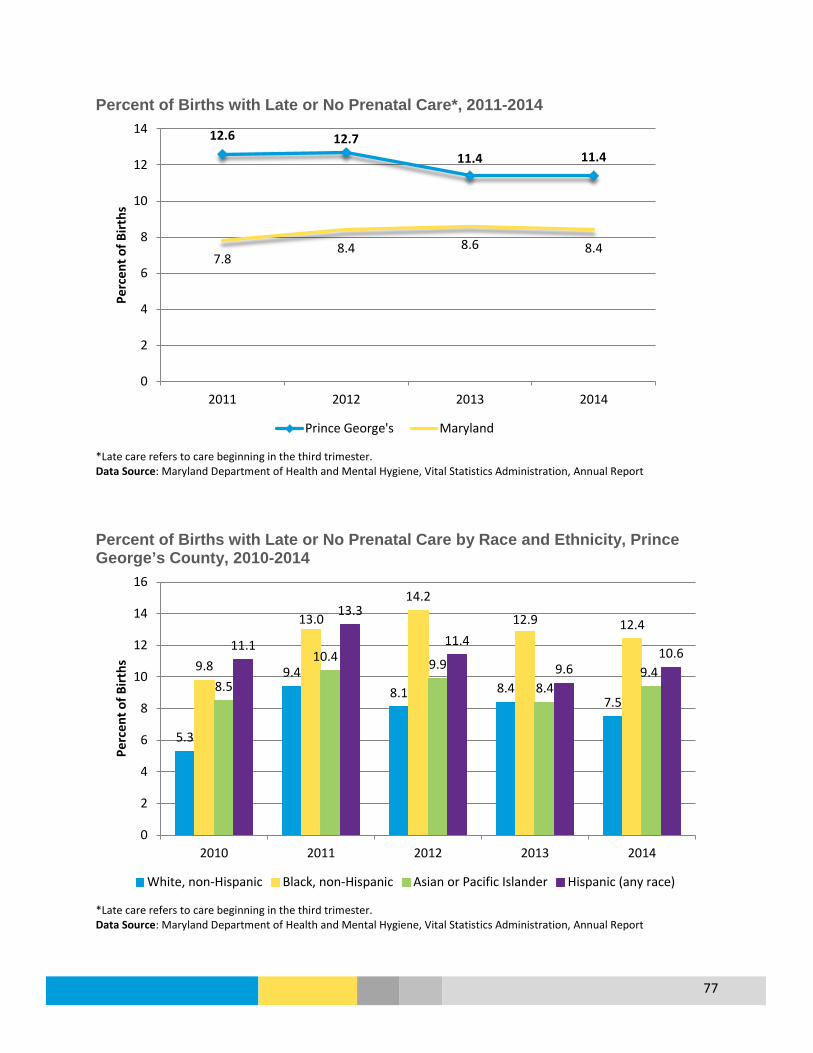
77
Percent of Births with Late or No Prenatal Care*, 2011-2014
*Late care refers to care beginning in the third trimester. Data Source: Maryland Department of Health and Mental Hygiene, Vital Statistics Administration, Annual Report Percent of Births with Late or No Prenatal Care by Race and Ethnicity, Prince George’s County, 2010-2014
*Late care refers to care beginning in the third trimester. Data Source: Maryland Department of Health and Mental Hygiene, Vital Statistics Administration, Annual Report
12.6 12.7 11.4 11.4
7.8 8.4 8.6 8.4
0
2
4
6
8
10
12
14
2011 2012 2013 2014
Perc
ent o
f Birt
hs
Prince George's Maryland
5.3
9.4 8.1 8.4
7.5
9.8
13.0
14.2
12.9 12.4
8.5
10.4 9.9
8.4 9.4
11.1
13.3
11.4
9.6 10.6
0
2
4
6
8
10
12
14
16
2010 2011 2012 2013 2014
Perc
ent o
f Birt
hs
White, non-Hispanic Black, non-Hispanic Asian or Pacific Islander Hispanic (any race)

78
Mental Health Overview What is it? Mental health includes emotional, psychological, and social well-being. It affects
how we think, feel and act. It also helps determine how we handle stress, relate to others, and make choices.
Who is affected?
10.9% (74,502) of residents reported experiencing at least 8 days of poor mental health during the last 30 days (2014 MD BRFSS). In 2014, there were 51 suicide deaths in the county.
Prevention & Treatment
• Poor mental health prevention includes helping individuals develop the knowledge, attitudes, and skills they need to make good choices or change harmful behaviors (SAMHSA.gov).
• Mental health treatment includes psychotherapy, medication, case management, partial hospitalization programs, support groups, and peer support.
What are the outcomes?
Mental health covers a number of different conditions that can vary in outcomes. Early engagement and support are crucial to improving outcomes.
Disparity White non-Hispanic residents had a higher Emergency Department (ED) visit rate related to mental health conditions compared to other county residents. The suicide rate was also higher among White non-Hispanics compared to other county residents.
How do we compare?
While 10.9% of county residents reported at least 8 poor mental health days, other Maryland counties range from 6.4% to 24.2%; the state overall is 13.2% (2014 MD BRFSS). The county has the lowest suicide age-adjusted death rate in the state.
Percent of Residents with Poor Mental Health Days within a Month, 2014
Data Source: 2014 Maryland BRFSS
71.0%
8.3% 9.8% 7.7% 3.2%
0%
10%
20%
30%
40%
50%
60%
70%
80%
None 1-2 Days 3-7 Days 8-29 Days 30 Days
Perc
ent o
f Res
iden
ts
Prince George's Maryland

79
Percent of Residents with Poor Mental Health Days within the Past Month, Prince George’s County, 2011 to 2014
Data Source: 2014 Maryland BRFSS Age-Adjusted Suicide Rate per 100,000, 2007 to 2014
* Residents of Hispanic Origin and Asian/Pacific Islanders were not included due to insufficient numbers Data Source: Centers for Disease Control and Prevention, National Center for Health Statistics, CDC WONDER Online Database
9.1% 9.4%
10.4% 9.8%
7.9%
9.9%
7.5% 7.7%
5.7% 5.7%
4.6%
3.2%
0%
2%
4%
6%
8%
10%
12%
2011 2012 2013 2014
Perc
ent o
f Res
iden
ts
3 to 7 Days 8 to 29 Days 30 Days
2007-2009 2008-2010 2009-2011 2010-2012 2011-2013 2012-2014PGC White NH 11.5 14.6 17.0 15.0 14.4 14.1PGC Black NH 5.0 4.1 4.5 4.3 4.6 4.4PGC Total 6.6 6.3 6.7 6.2 6.2 6.0Maryland 9.0 8.8 9.0 9.0 9.3 9.5
0
2
4
6
8
10
12
14
16
18
Deat
hs p
er 1
00,0
00 P
opul
atio
n
HP 2020 Goal: 10.2 MD SHIP Goal: 9.0

80
Age-Adjusted Rate of Emergency Department* Visits Related to Mental Health Conditions per 100,000, 2010 to 2014
* ED Visits only include Maryland hospitals. Any visits made by residents to Washington, D.C. are not included, which could affect the Prince George’s County rate. Data Source: MD Health Services Cost Review Commission (HSCRC), Research Level Statewide Outpatient Data Files Emergency Department Visits* for Behavioral Health Conditions, Prince George’s County, 2014
Behavioral Health Condition Frequency Percent Alcohol-related disorders 1,795 26.2% Mood disorders 1,497 21.9% Anxiety disorders 1,225 17.9% Schizophrenia and other psychotic disorders 829 12.1% Drug-related disorders 652 9.5% Miscellaneous disorders 298 4.4% Suicide and intentional self-inflicted injury 252 3.7% Adjustment disorders 165 2.4% Disruptive behavior disorders 89 1.3% Personality disorders 27 0.4% Disorders usually diagnosed in infancy, childhood, or adolescence 13 0.2%
Total 6,842 * ED Visits only include Maryland hospitals. Any visits made by residents to Washington, D.C. are not included, which could affect the Prince George’s County numbers and percent. Data Source: Outpatient Discharge Data File 2014, Maryland Health Services Cost Review Commission
2010 2011 2012 2013 2014PGC White NH 1,245.7 1,573.5 1,646.1 2,097.2 2,381.9PGC Black NH 882.4 1,042.1 1,270.6 1,400.5 1,591.8PGC Asian NH 129.2 147.3 185.6 239.0 191.2PGC Hispanic 389.4 474.7 586.4 542.3 601.2PGC Total 1,206.2 1,304.3 1,314.5 1,379.5 1,539.3Maryland 2,780.8 3,211.2 3,500.6 3,318.5 3,442.6
0
500
1,000
1,500
2,000
2,500
3,000
3,500
4,000
Visit
s per
100
,000
Pop
ulat
ion
MD SHIP Goal: 3,152.6

81
Nephritis (Chronic Kidney Disease) Age-Adjusted Death Rate for Nephritis, 2007-2014
* Residents of Hispanic Origin and Asian/Pacific Islanders were not included due to insufficient numbers Data Source: Centers for Disease Control and Prevention, National Center for Health Statistics, CDC WONDER Online Database Percentage of Medicare Beneficiaries Who Were Treated for Chronic Kidney Disease, 2009 to 2014
Data Source: Centers for Medicare and Medicaid Services
2007-2011 2008-2010 2009-2011 2010-2012 2011-2013 2012-2014PGC White NH 13.0 13.3 12.8 11.6 11.2 9.8PGC Black NH 19.3 20.6 18.9 18.0 16.5 16.6Prince George's 16.0 16.6 15.4 14.8 13.9 13.8Maryland 13.6 13.7 13.1 12.2 11.5 11.4
0.0
5.0
10.0
15.0
20.0
25.0De
aths
per
100
,000
Pop
ulat
ion
15.3% 16.3% 17.6% 17.9% 18.3%
18.6%
14.6% 15.4% 16.0% 16.3% 16.5% 16.6%
0%2%4%6%8%
10%12%14%16%18%20%
2009 2010 2011 2012 2013 2014
Perc
ent (
%)
Prince George's Maryland

82
Obesity
Overview What is it? Weight that is higher than what is considered a healthy weight for a given
height is described as overweight or obese. Body Mass Index (BMI) is used as a screening tool for overweight or obesity that takes into consideration height and weight. Children and adolescents are measured differently based on their age and sex.
Who is affected?
34.2% (218,270) of adults in the county are estimated to be obese, and an additional 34.1% are considered to be overweight. (2014 MD BRFSS). In 2013, 52.6% (310,107) of adults did not meet physical activity recommendations of participating in at least 150 minutes of aerobic physical activity per week. In 2013, 13.7% of high school students were estimated as obese.
Prevention and Treatment
• The key to achieving and maintaining a healthy weight is not short-term dietary changes; it’s about a lifestyle that includes healthy eating and regular physical activity. (CDC.gov).
• Follow a healthy eating plan, focus on portion size, be active, reduce screen time and a sedentary lifestyle, and keep track of your weight (NHLBI.NIH.gov).
What are the outcomes?
Obesity causes an increased risk for hypertension, type 2 diabetes, heart disease, stroke, gallbladder disease, osteoarthritis, sleep apnea and breathing problems, some cancers, low quality of life, and mental illness. (CDC.gov)
Disparity In the county, more adult females (40.4%) than males (27.5%) are estimated to be obese. By age, more residents age 45 and are obese compared to those under 45 (2014 MD BRFSS). For adolescents, more Hispanic youth were obese compared to other students. More males (50.5%) than females (44.6%) participate in regular physical activity (2013 MD BRFSS).
How do we compare?
While 34.2% of county residents are obese, other Maryland counties range from 20.3% to 49.5%; the state overall is at 29.6% (2014 MD BRFSS) and the U.S. is at 29.5% (BRFSS). 47.4% of county residents met aerobic recommendations, other Maryland counties range from 32% to 55.3%; the state overall is 48% (2014 MD BRFSS) and the U.S. is at 50.6% (BRFSS). More county high school students are estimated to be obese (13.7%) compared to the state (11.0%) (YRBS).
How Obesity Is Classified
Body Mass Index (BMI) Weight Status Below 18.5 Underweight 18.5 – 24.9 Normal or Healthy Weight 25.0 – 29.9 Overweight 30.0 and Above Obese Data Source: Centers for Disease Control and Prevention

83
Percent of Adults Who Are Obese, 2014
Prince George’s Maryland Sex Male 27.5% 27.8% Female 40.4% 31.3% Race/Ethnicity White, non-Hispanic 34.6% 27.9% Black, non-Hispanic 38.9% 39.1% Hispanic 20.9% 22.6% Age 18 to 44 Years 25.9% 25.8% 45 to 64 Years 42.8% 34.8% Over 65 Years 42.9% 29.0% Total 34.2% 29.6% Data Source: Maryland Behavioral Risk Factor Surveillance System, DHMH Percent of Adults Who Are Overweight, 2014
Prince George’s Maryland Sex Male 37.4% 40.7% Female 31.1% 30.1% Race/Ethnicity White, non-Hispanic 32.0% 34.8% Black, non-Hispanic 35.9% 34.7% Hispanic 34.6% 46.2% Age 18 to 44 Years 33.2% 32.0% 45 to 64 Years 35.7% 37.1% Over 65 Years 33.9% 40.3% Total 34.1% 35.4% Data Source: Maryland Behavioral Risk Factor Surveillance System, DHMH
HP2020 Goal: 30.5%
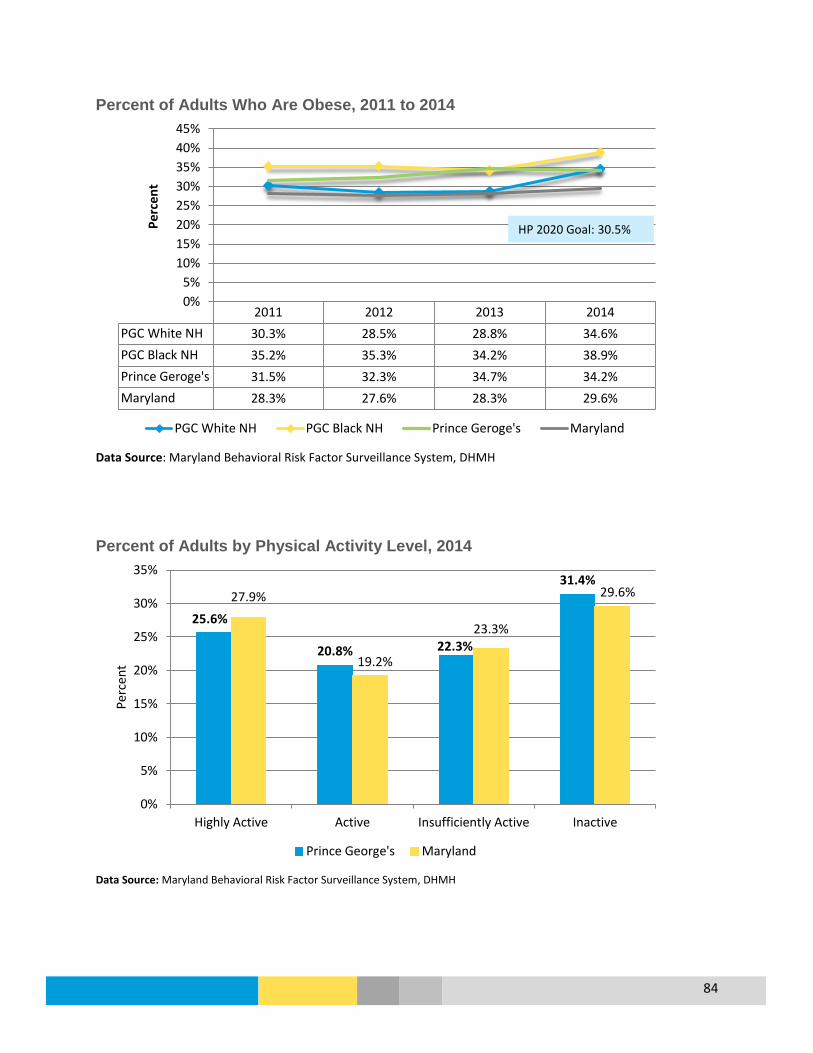
84
Percent of Adults Who Are Obese, 2011 to 2014
Data Source: Maryland Behavioral Risk Factor Surveillance System, DHMH Percent of Adults by Physical Activity Level, 2014
Data Source: Maryland Behavioral Risk Factor Surveillance System, DHMH
2011 2012 2013 2014PGC White NH 30.3% 28.5% 28.8% 34.6%PGC Black NH 35.2% 35.3% 34.2% 38.9%Prince Geroge's 31.5% 32.3% 34.7% 34.2%Maryland 28.3% 27.6% 28.3% 29.6%
0%5%
10%15%20%25%30%35%40%45%
Perc
ent
PGC White NH PGC Black NH Prince Geroge's Maryland
25.6%
20.8% 22.3%
31.4% 27.9%
19.2%
23.3%
29.6%
0%
5%
10%
15%
20%
25%
30%
35%
Highly Active Active Insufficiently Active Inactive
Perc
ent
Prince George's Maryland
HP 2020 Goal: 30.5%

85
Percent of Adults That Participated in at least 150 Minutes of Moderate Physical Activity or 75 Minutes of Vigorous Activity per Week, 2013
Prince George's Maryland Sex Male 50.5% 50.0% Female 44.6% 46.0% Race/Ethnicity White, non-Hispanic 49.3% 51.5% Black, non-Hispanic 49.6% 45.4% Hispanic 33.6% 30.0% Age Group 18 to 44 Years 50.0% 49.1% 45 to 64 Years 45.6% 48.1% Over 65 Years 43.5% 45.4% Total 47.4% 48.0% Data Source: Maryland Behavioral Risk Factor Surveillance System Percentage of High School Students who are Obese, 2013
Prince George’s Maryland Sex Male 15.9% 13.8% Female 11.3% 8.1% Race/Ethnicity White, non-Hispanic 8.2% 9.1% Black, non-Hispanic 13.2% 13.5% Hispanic 16.3% 12.7% Age Group 15 or Younger 14.4% 11.1% 16 or 17 Years 12.6% 10.8% 18 or Older 15.1% 11.5% Total 13.7% 11.0% Data Source: 2013 Youth Risk Behavior Survey Report for Prince George's County and Maryland, Maryland DHMH
MD SHIP Goal: 50.4%
HP 2020 Goal: 10.7% MD SHIP Goal: 16.1%

86
Percent of High School Students who are Obese, Prince George’s County, 2010 and 2013
Data Source: Youth Risk Behavior Survey Report for Prince George's County and Maryland, Maryland DHMH Percentage of High School Students Who Ate Fruits and Vegetables Five or More Times per day During the Past Week, 2013
Prince George’s Maryland Sex Male 21.4% 21.1% Female 15.4% 19.0% Race/Ethnicity White, non-Hispanic 16.7% 19.0% Black, non-Hispanic 17.8% 19.6% Hispanic 19.6% 22.1% Age Group 15 or Younger 17.8% 19.4% 16 or 17 Years 19.3% 20.3% 18 or Older 18.7% 22.4% Total 18.6% 20.1% Data Source: 2013 Youth Risk Behavior Survey Report for Prince George's County and Maryland, Maryland DHMH
9.6%
14.7%
18.8%
11.7%
15.0%
8.2%
13.2%
16.3%
13.7% 13.7%
0%
5%
10%
15%
20%
White NH Black NH Hispanic Asian Total
2010 2013
HP 2020 Goal: 16.1% MD SHIP Goal: 10.7%

87
Percentage of High School Students who were Physically Active for a Total of at Least 60 Minutes per day on Five or More of the Past Week, 2013
Prince George’s Maryland Sex Male 34.7% 46.8% Female 25.0% 33.8% Race/Ethnicity White, non-Hispanic 39.4% 47.4% Black, non-Hispanic 29.2% 33.3% Hispanic 29.7% 34.1% Age Group 15 or Younger 28.8% 42.4% 16 or 17 Years 31.3% 39.1% 18 or Older 25.1% 34.8% Overall 29.6% 40.1% Data Source: Youth Risk Behavior Survey Report for Prince George's County and Maryland, Maryland DHMH
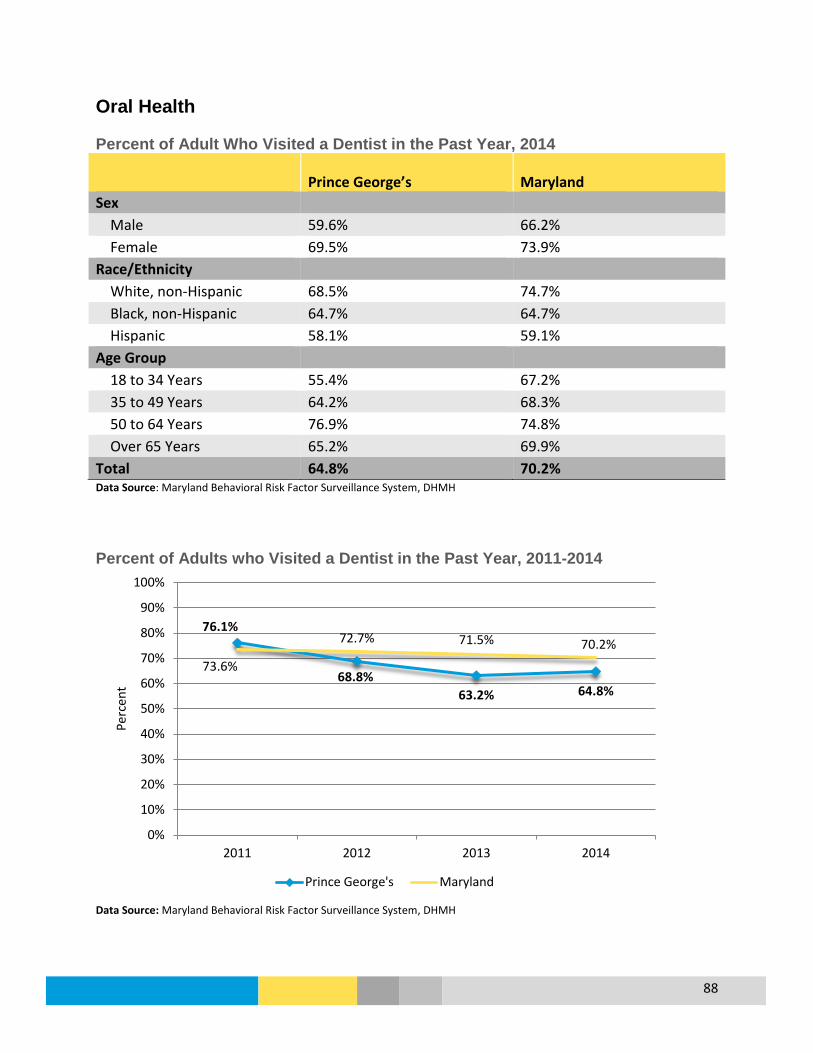
88
Oral Health Percent of Adult Who Visited a Dentist in the Past Year, 2014
Prince George’s Maryland Sex Male 59.6% 66.2% Female 69.5% 73.9% Race/Ethnicity White, non-Hispanic 68.5% 74.7% Black, non-Hispanic 64.7% 64.7% Hispanic 58.1% 59.1% Age Group 18 to 34 Years 55.4% 67.2% 35 to 49 Years 64.2% 68.3% 50 to 64 Years 76.9% 74.8% Over 65 Years 65.2% 69.9% Total 64.8% 70.2% Data Source: Maryland Behavioral Risk Factor Surveillance System, DHMH Percent of Adults who Visited a Dentist in the Past Year, 2011-2014
Data Source: Maryland Behavioral Risk Factor Surveillance System, DHMH
76.1%
68.8% 63.2% 64.8%
73.6%
72.7% 71.5% 70.2%
0%
10%
20%
30%
40%
50%
60%
70%
80%
90%
100%
2011 2012 2013 2014
Perc
ent
Prince George's Maryland

89
Percent of Children (0 to 20 years) Enrolled in Medicaid who had a Dental Visit within the Past 12 Months*, 2010 to 2013
*Only children enrolled in Medicaid for at least 320 days were included in the measure Data Source: Maryland Department of Health and Mental Hygiene, Maryland State Health Improvement Process Age-Adjusted Emergency Department Visit* Rate for Dental Care, 2010 to 2014
* ED Visits only include Maryland hospitals. Any visits made by residents to Washington, D.C. are not included, which could affect the Prince George’s County rate. Data Source: Maryland Health Services Cost Review Commission (HSCRC) Research Level Statewide Outpatient Data Files
2010 2011 2012 2013PGC White 49.8% 52.0% 55.5% 57.9%PGC Black 51.4% 54.6% 56.5% 57.9%PGC Hispanic 68.6% 72.6% 72.6% 76.6%PGC Asian 56.8% 59.3% 57.8% 63.1%Prince George's 53.9% 58.9% 61.6% 64.0%Maryland 57.1% 60.2% 62.2% 63.3%
0%10%20%30%40%50%60%70%80%90%
Perc
ent
2010 2011 2012 2013 2014PGC White NH 340.7 365.5 421.4 411.7 377.7PGC Black NH 376.8 419.9 484.6 487.2 483.2PGC Hispanic 100.6 99.1 123.9 125.6 106.8PGC 391.7 411.4 422.3 401.8 390.1Maryland 767.5 789.6 816.7 809.0 779.7
0100200300400500600700800900
Visit
s per
100
,000
Pop
ulat
ion
PGC White NH PGC Black NH PGC Hispanic PGC Maryland
MD SHIP Goal: 792.8
MD SHIP Goal: 64.6%
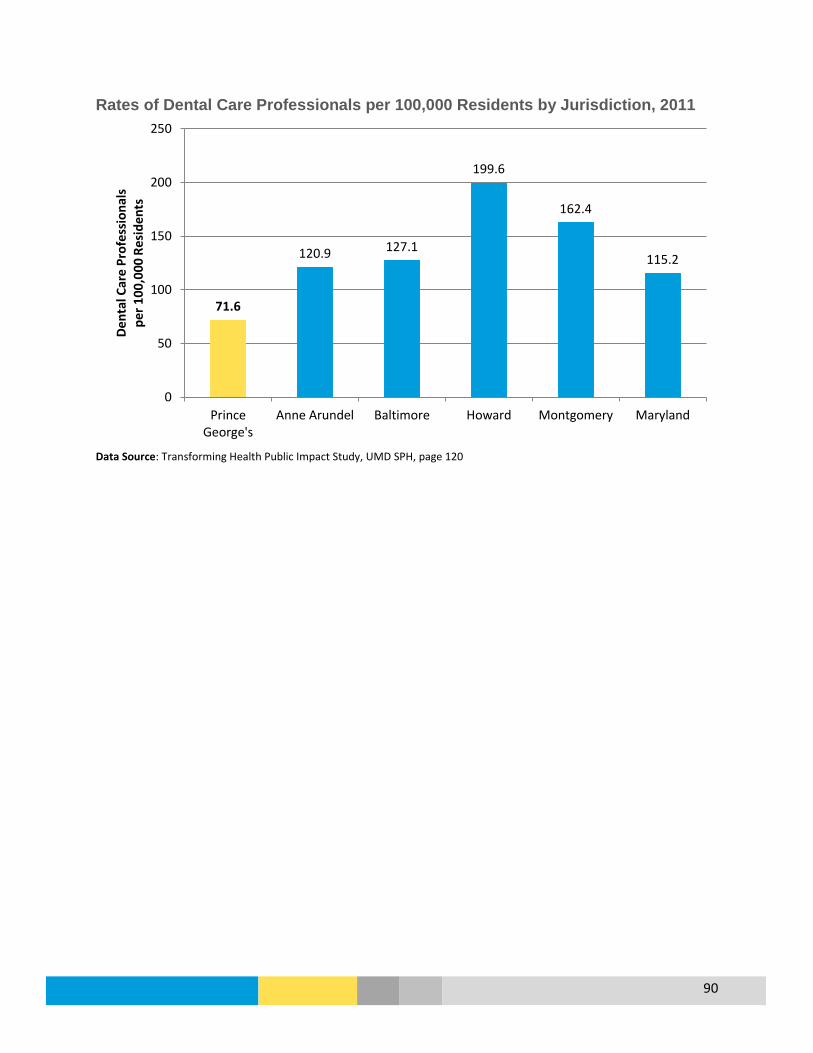
90
Rates of Dental Care Professionals per 100,000 Residents by Jurisdiction, 2011
Data Source: Transforming Health Public Impact Study, UMD SPH, page 120
71.6
120.9 127.1
199.6
162.4
115.2
0
50
100
150
200
250
PrinceGeorge's
Anne Arundel Baltimore Howard Montgomery Maryland
Dent
al C
are
Prof
essi
onal
s pe
r 100
,000
Res
iden
ts

91
Rate of Dentists per 100,000 Residents, Prince George’s County, 2011
Data Source: Transforming Health Public Impact Study, UMD SPH, page 122
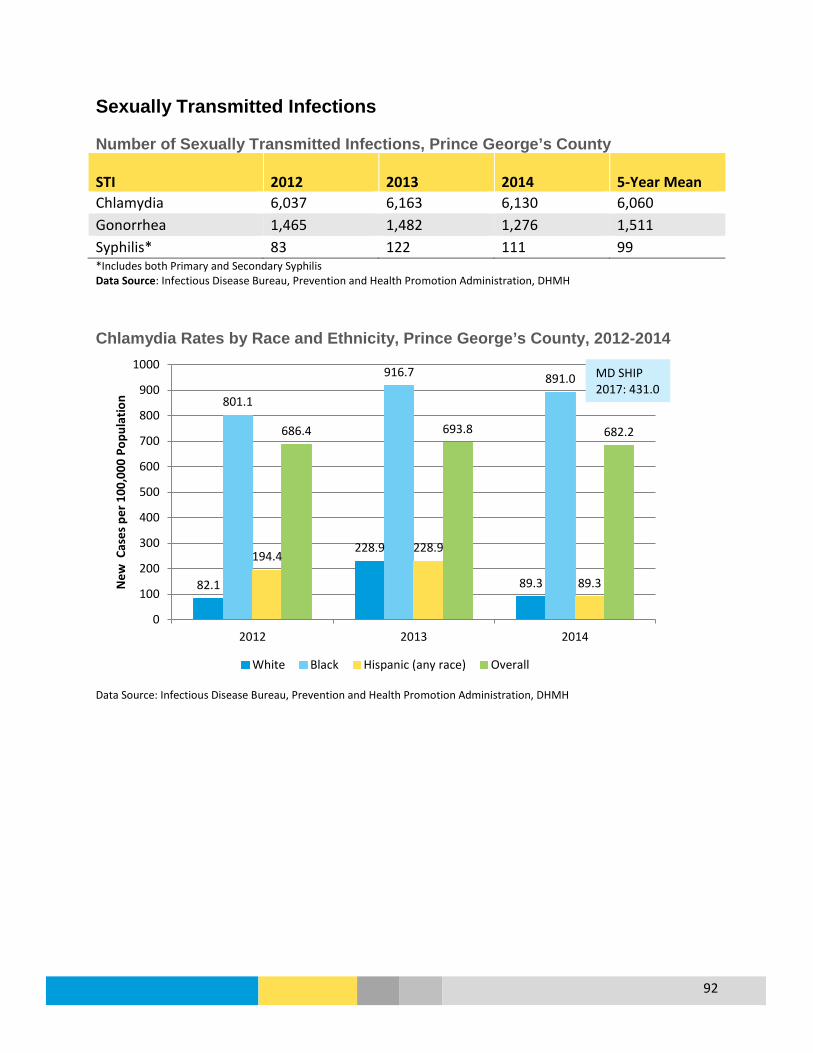
92
Sexually Transmitted Infections Number of Sexually Transmitted Infections, Prince George’s County
STI 2012 2013 2014 5-Year Mean Chlamydia 6,037 6,163 6,130 6,060 Gonorrhea 1,465 1,482 1,276 1,511 Syphilis* 83 122 111 99 *Includes both Primary and Secondary Syphilis Data Source: Infectious Disease Bureau, Prevention and Health Promotion Administration, DHMH Chlamydia Rates by Race and Ethnicity, Prince George’s County, 2012-2014
Data Source: Infectious Disease Bureau, Prevention and Health Promotion Administration, DHMH
82.1
228.9
89.3
801.1
916.7 891.0
194.4 228.9
89.3
686.4 693.8 682.2
0
100
200
300
400
500
600
700
800
900
1000
2012 2013 2014
New
Cas
es p
er 1
00,0
00 P
opul
atio
n
White Black Hispanic (any race) Overall
MD SHIP 2017: 431.0
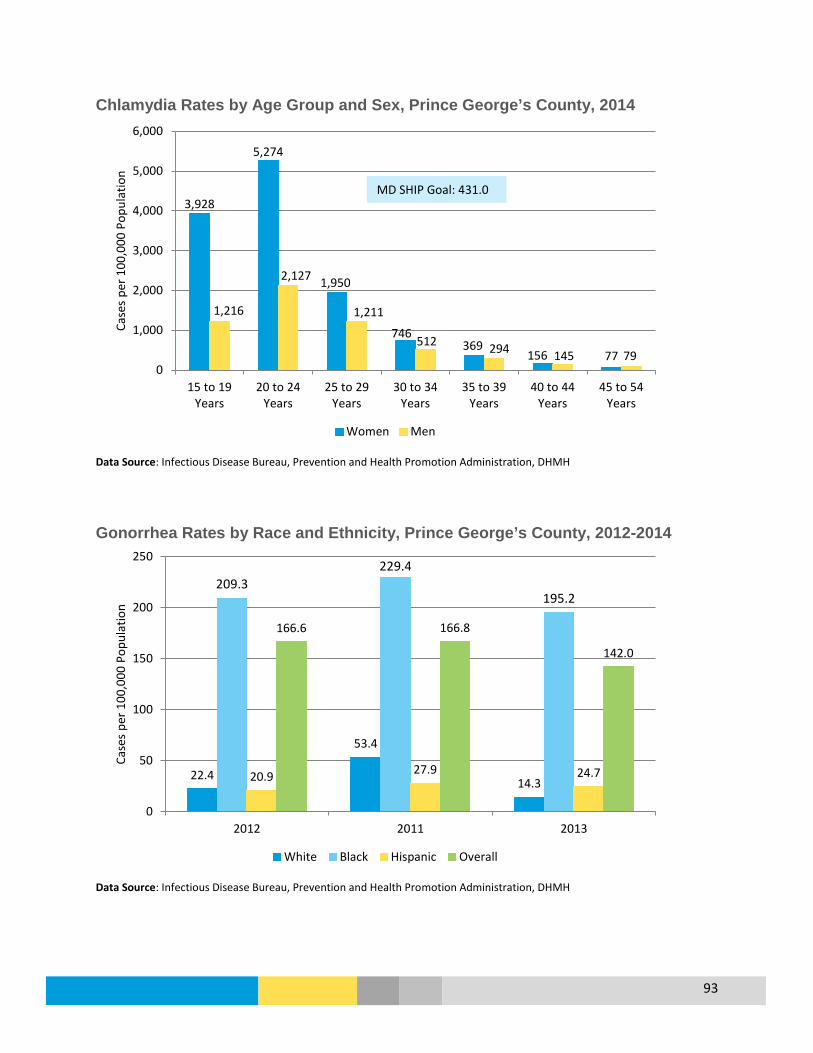
93
Chlamydia Rates by Age Group and Sex, Prince George’s County, 2014
Data Source: Infectious Disease Bureau, Prevention and Health Promotion Administration, DHMH Gonorrhea Rates by Race and Ethnicity, Prince George’s County, 2012-2014
Data Source: Infectious Disease Bureau, Prevention and Health Promotion Administration, DHMH
3,928
5,274
1,950
746 369
156 77
1,216
2,127
1,211
512 294 145 79 0
1,000
2,000
3,000
4,000
5,000
6,000
15 to 19Years
20 to 24Years
25 to 29Years
30 to 34Years
35 to 39Years
40 to 44Years
45 to 54Years
Case
s pe
r 100
,000
Pop
ulat
ion
Women Men
22.4
53.4
14.3
209.3 229.4
195.2
20.9 27.9 24.7
166.6 166.8
142.0
0
50
100
150
200
250
2012 2011 2013
Case
s pe
r 100
,000
Pop
ulat
ion
White Black Hispanic Overall
MD SHIP Goal: 431.0
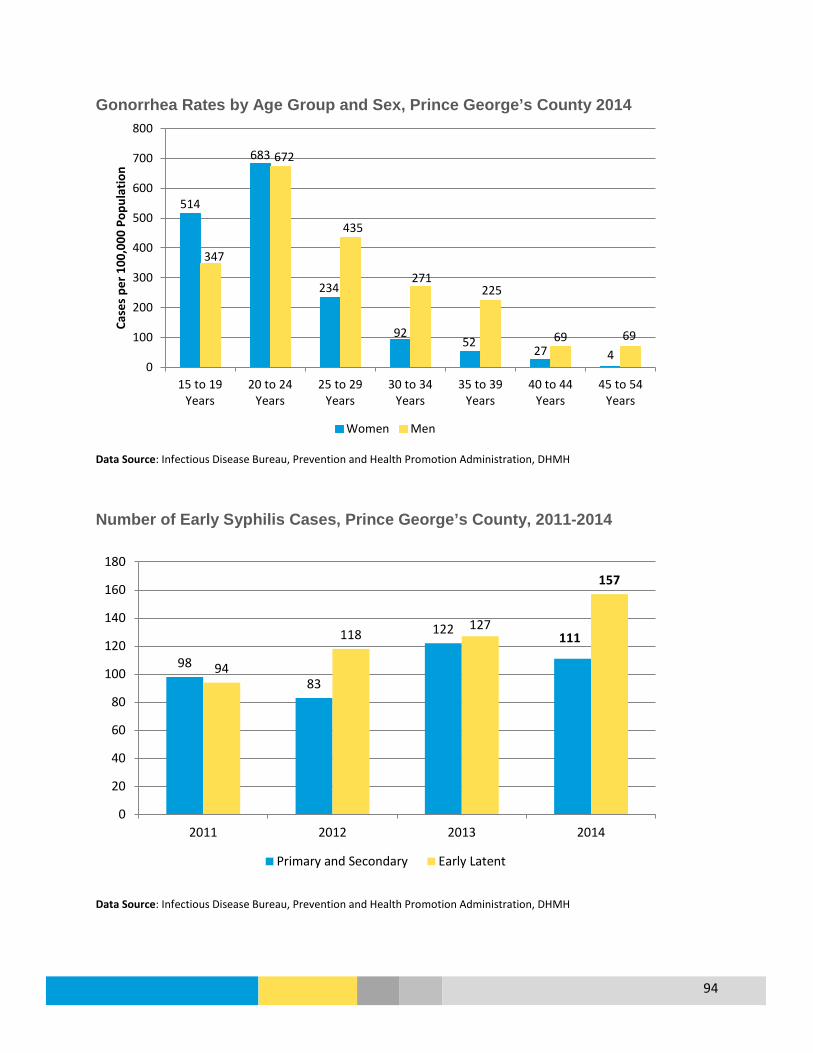
94
Gonorrhea Rates by Age Group and Sex, Prince George’s County 2014
Data Source: Infectious Disease Bureau, Prevention and Health Promotion Administration, DHMH Number of Early Syphilis Cases, Prince George’s County, 2011-2014
Data Source: Infectious Disease Bureau, Prevention and Health Promotion Administration, DHMH
514
683
234
92 52
27 4
347
672
435
271 225
69 69
0
100
200
300
400
500
600
700
800
15 to 19Years
20 to 24Years
25 to 29Years
30 to 34Years
35 to 39Years
40 to 44Years
45 to 54Years
Case
s pe
r 100
,000
Pop
ulat
ion
Women Men
98 83
122 111
94
118 127
157
0
20
40
60
80
100
120
140
160
180
2011 2012 2013 2014
Primary and Secondary Early Latent
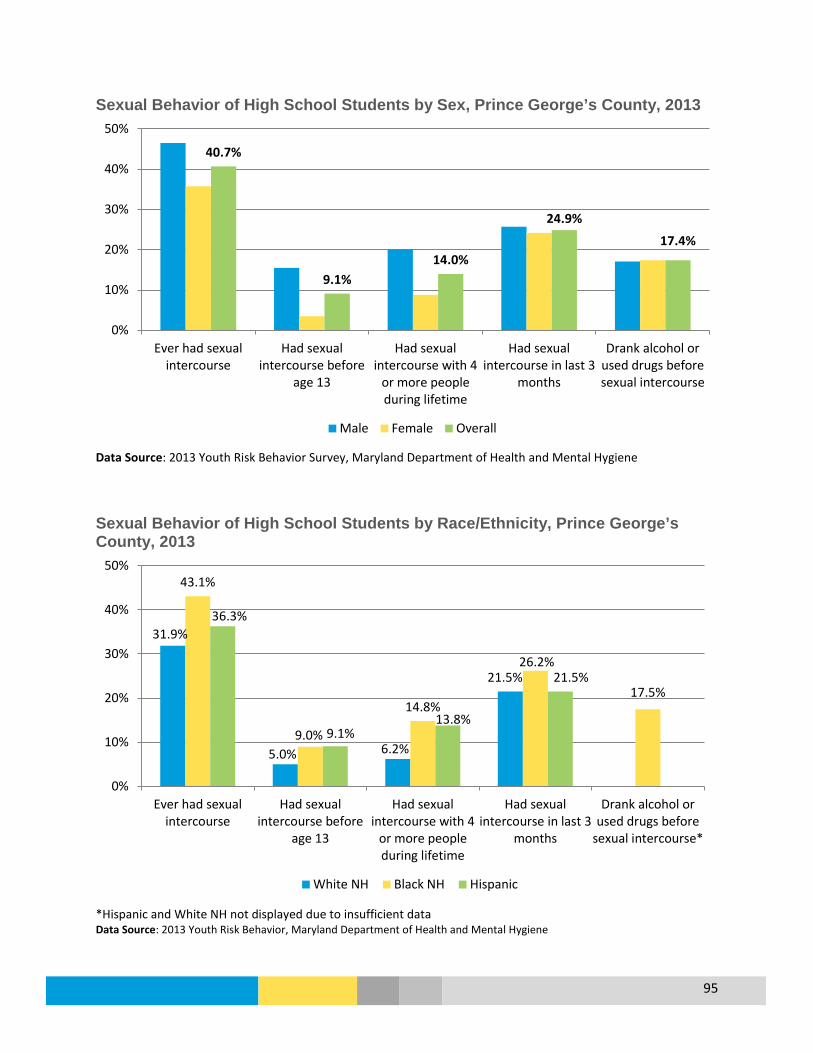
95
Sexual Behavior of High School Students by Sex, Prince George’s County, 2013
Data Source: 2013 Youth Risk Behavior Survey, Maryland Department of Health and Mental Hygiene Sexual Behavior of High School Students by Race/Ethnicity, Prince George’s County, 2013
*Hispanic and White NH not displayed due to insufficient data Data Source: 2013 Youth Risk Behavior, Maryland Department of Health and Mental Hygiene
40.7%
9.1% 14.0%
24.9%
17.4%
0%
10%
20%
30%
40%
50%
Ever had sexualintercourse
Had sexualintercourse before
age 13
Had sexualintercourse with 4
or more peopleduring lifetime
Had sexualintercourse in last 3
months
Drank alcohol orused drugs beforesexual intercourse
Male Female Overall
31.9%
5.0% 6.2%
21.5%
43.1%
9.0%
14.8%
26.2%
17.5%
36.3%
9.1% 13.8%
21.5%
0%
10%
20%
30%
40%
50%
Ever had sexualintercourse
Had sexualintercourse before
age 13
Had sexualintercourse with 4
or more peopleduring lifetime
Had sexualintercourse in last 3
months
Drank alcohol orused drugs before
sexual intercourse*
White NH Black NH Hispanic
96
Substance Use Disorder
Overview
What is it? Substance use disorders occur when the recurrent use of alcohol and/or drugs causes clinically and functionally significant impairment, such as health problems, disability and failure to meet major responsibilities at work, school, or home. (SAMHSA.gov)
Who is affected?
In 2014, 14% of county residents reported binge drinking, and 4.5% indicated they chronically drink. There were 855.6 Emergency Room visits per every 100,000 county residents in 2014. In 2013, 13.3% of adolescents reported using tobacco. Between 2012 and 2014, there were 184 drug-induced deaths in the county of which 123 (67%) were White males.
Prevention & Treatment
• Substance use prevention includes helping individuals develop the knowledge, attitudes, and skills they need to make good choices or change harmful behaviors (SAMHSA.gov).
• Substance use treatment includes counseling, inpatient and residential treatment, case management, medication, and peer support.
What are the outcomes?
Substance use disorders result in human suffering for the individual consuming alcohol or drugs as well as their family members and friends. Substance use disorders are associated with lost productivity, child abuse and neglect, crime, motor vehicle accidents and premature death (SAMHSA).
Disparity White non-Hispanic (NH) residents had a higher Emergency Department (ED) visit rate and a much higher drug-induced death rate compared to other county residents. A higher percentage of White NH residents also binge drink compared to other residents. For Adolescents, White NH residents also had a higher percent of tobacco use.
How do we compare?
The county has a lower drug-induced death rate compared to the state. The percent of residents reporting binge drinking for the county is lower than the state.
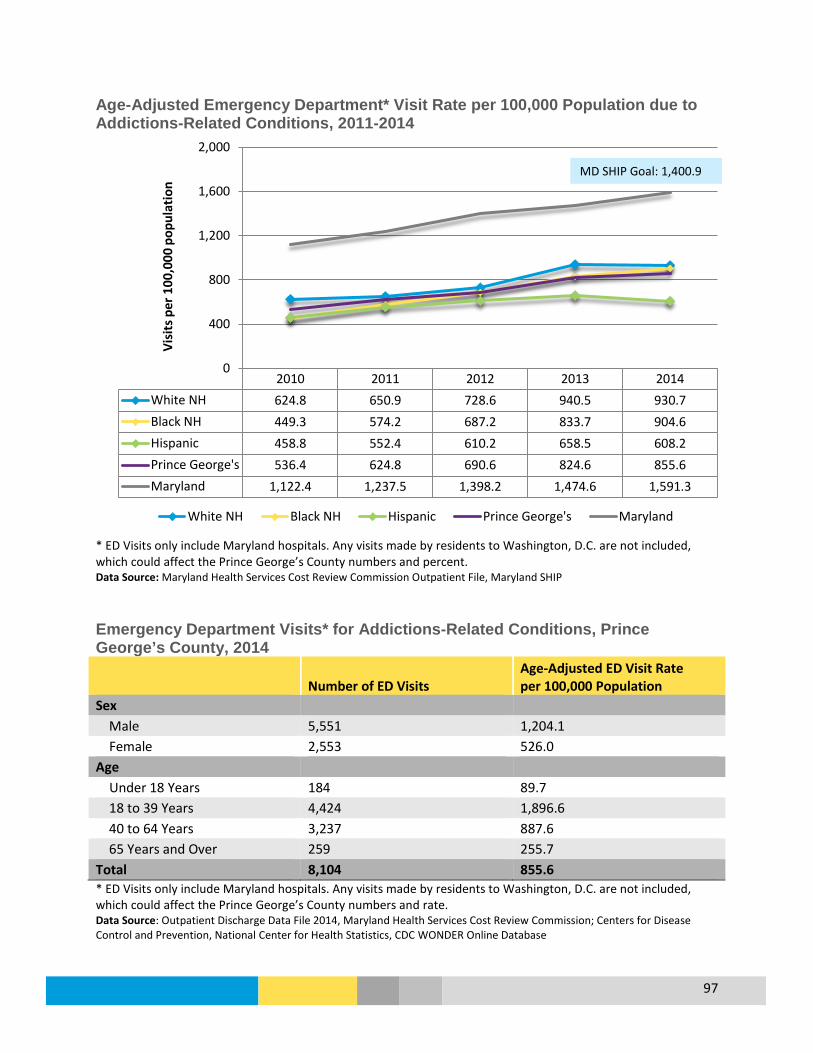
97
Age-Adjusted Emergency Department* Visit Rate per 100,000 Population due to Addictions-Related Conditions, 2011-2014
* ED Visits only include Maryland hospitals. Any visits made by residents to Washington, D.C. are not included, which could affect the Prince George’s County numbers and percent. Data Source: Maryland Health Services Cost Review Commission Outpatient File, Maryland SHIP Emergency Department Visits* for Addictions-Related Conditions, Prince George’s County, 2014
Number of ED Visits Age-Adjusted ED Visit Rate per 100,000 Population
Sex Male 5,551 1,204.1 Female 2,553 526.0 Age Under 18 Years 184 89.7 18 to 39 Years 4,424 1,896.6 40 to 64 Years 3,237 887.6 65 Years and Over 259 255.7 Total 8,104 855.6 * ED Visits only include Maryland hospitals. Any visits made by residents to Washington, D.C. are not included, which could affect the Prince George’s County numbers and rate. Data Source: Outpatient Discharge Data File 2014, Maryland Health Services Cost Review Commission; Centers for Disease Control and Prevention, National Center for Health Statistics, CDC WONDER Online Database
2010 2011 2012 2013 2014White NH 624.8 650.9 728.6 940.5 930.7Black NH 449.3 574.2 687.2 833.7 904.6Hispanic 458.8 552.4 610.2 658.5 608.2Prince George's 536.4 624.8 690.6 824.6 855.6Maryland 1,122.4 1,237.5 1,398.2 1,474.6 1,591.3
0
400
800
1,200
1,600
2,000Vi
sits
per
100
,000
pop
ulat
ion
White NH Black NH Hispanic Prince George's Maryland
MD SHIP Goal: 1,400.9
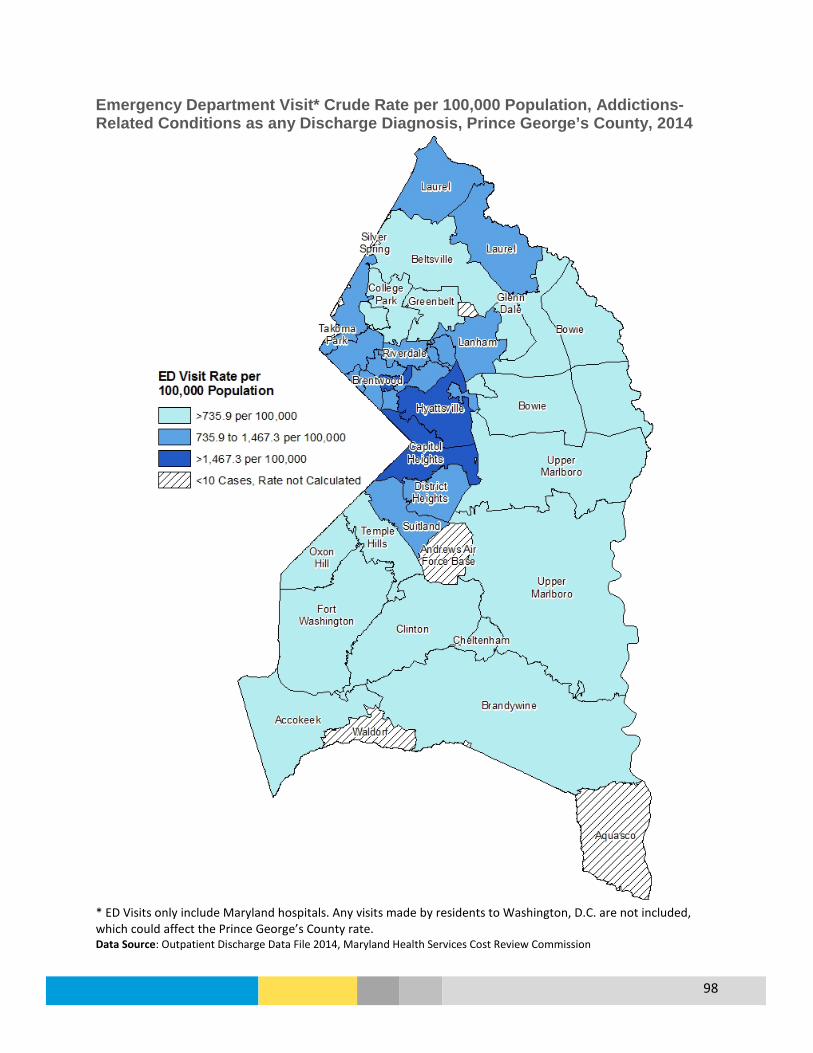
98
Emergency Department Visit* Crude Rate per 100,000 Population, Addictions-Related Conditions as any Discharge Diagnosis, Prince George’s County, 2014
* ED Visits only include Maryland hospitals. Any visits made by residents to Washington, D.C. are not included, which could affect the Prince George’s County rate. Data Source: Outpatient Discharge Data File 2014, Maryland Health Services Cost Review Commission

99
Drug-Induced Death Rate per 100,000 Population, 2007 to 2014
Data Source: Centers for Disease Control and Prevention, National Center for Health Statistics, CDC WONDER Online Database Age-Adjusted Hospital Inpatient* Visit Rate due to Alcohol Abuse by Race and Ethnicity, Prince George’s County, 2010-2012
* Includes visits to Maryland and Washington, D.C. hospitals Data Source: The Maryland Health Services Cost Review Commission; Maryland Health Care Commission
2007-2009 2008-2010 2009-2011 2010-2012 2011-2013 2012-2014PGC White NH 16.2 20.7 21.3 24.1 20.8 22.7PGC Black NH 5.3 5.0 4.5 4.0 4.3 5.2PGC Total 6.5 6.7 6.4 6.2 5.9 6.7Maryland 13.0 12.2 12.1 12.5 13.7 15.6
0
5
10
15
20
25
30
Deat
hs p
er 1
00,0
00 P
opul
atio
n
4.5
7.7
3.3
0 1 2 3 4 5 6 7 8 9
Overall
White, non-Hispanic
Black
Hospitalizations per 10,000 Population 18+ Years
HP2020 Goal: 11.3 MD SHIP Goal: 12.6

100
Age-Adjusted Hospital Inpatient* Visit Rate due to Alcohol Abuse by Age Group, Prince George’s County, 2010-2012
* Includes visits to Maryland and Washington, D.C. hospitals Data Source: The Maryland Health Services Cost Review Commission; Maryland Health Care Commission
Age-Adjusted Hospital Inpatient* Visit Rate due to Alcohol Abuse by Sex, Prince George’s County, 2010-2012
* Includes visits to Maryland and Washington, D.C. hospitals Data Source: The Maryland Health Services Cost Review Commission; Maryland Health Care Commission
4.5
3.6
7.4
4.1
1.1
0 1 2 3 4 5 6 7 8
Overall
65 to 84 Years
45 to 64 Years
25 to 44 Years
20 to 24 Years
Hospitalizations per 10,000 Population 18+ Years
4.5
7.8
1.7
0 1 2 3 4 5 6 7 8 9
Overall
Male
Female
Hospitalizations per 10,000 Population 18+ Years

101
Percent of Adult Binge Drinkers* in the Past Month, 2014
Prince George’s Maryland Overall 14.0% 15.4% Sex Male 18.4% 19.8% Female 10.0% 11.5% Race/Ethnicity White, non-Hispanic 21.3% 17.8% Black, non-Hispanic 11.4% 12.8% Hispanic 17.6% 13.8% Age Group 18 to 34 Years 21.4% 26.4% 35 to 49 Years 12.2% 15.0% 50 to 64 Years 11.9% 11.8% Over 65 Years 5.3% 4.2% *Binge drinking is defined as males having five or more drinks on one occasion, females having four or more drinks on one occasion Data Source: Maryland Behavioral Risk Factor Surveillance System, DHMH
Percent of Adult Binge Drinkers* in the Past Month, 2011 to 2014
*Binge drinking is defined as males having five or more drinks on one occasion, females having four or more drinks on one occasion Data Source: Maryland Behavioral Risk Factor Surveillance System, DHMH
16.8%
12.1% 10.4%
14.0%
15.4% 16.0%
0%
2%
4%
6%
8%
10%
12%
14%
16%
18%
20%
2011 2012 2013 2014
Perc
ent
Prince George's Maryland U.S.
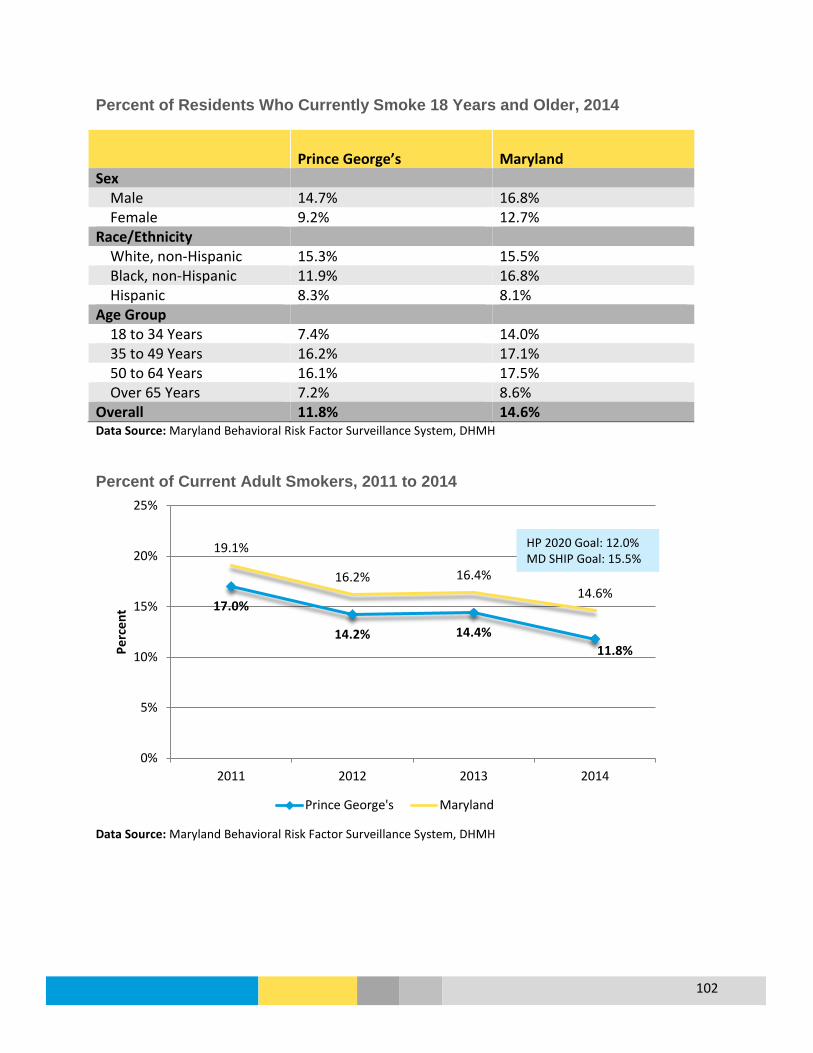
102
Percent of Residents Who Currently Smoke 18 Years and Older, 2014
Prince George’s Maryland Sex Male 14.7% 16.8% Female 9.2% 12.7% Race/Ethnicity White, non-Hispanic 15.3% 15.5% Black, non-Hispanic 11.9% 16.8% Hispanic 8.3% 8.1% Age Group 18 to 34 Years 7.4% 14.0% 35 to 49 Years 16.2% 17.1% 50 to 64 Years 16.1% 17.5% Over 65 Years 7.2% 8.6% Overall 11.8% 14.6% Data Source: Maryland Behavioral Risk Factor Surveillance System, DHMH
Percent of Current Adult Smokers, 2011 to 2014
Data Source: Maryland Behavioral Risk Factor Surveillance System, DHMH
17.0%
14.2% 14.4% 11.8%
19.1%
16.2% 16.4% 14.6%
0%
5%
10%
15%
20%
25%
2011 2012 2013 2014
Perc
ent
Prince George's Maryland
HP 2020 Goal: 12.0% MD SHIP Goal: 15.5%

103
Percentage of Students who Drank Alcohol During the Past Month, 2013
Prince George’s Maryland Sex Male 19.3% 29.3% Female 26.5% 33.0% Race/Ethnicity White, non-Hispanic 28.2% 37.4% Black, non-Hispanic 22.9% 25.2% Hispanic 23.1% 30.4% Age Group 15 or Younger 19.8% 23.5% 16 or 17 Years 24.6% 35.8% 18 or Older 32.7% 42.9% Total 23.2% 31.2% Data Source: 2013 Youth Risk Behavior Survey Report for Prince George's County and Maryland, Maryland Department of Health and Mental Hygiene Adolescents Who Used Tobacco Products During the Past Month, Prince George’s County, 2010 and 2013
Data Source: 2013 Youth Risk Behavior Survey Report for Prince George's County and Maryland, Maryland Department of Health and Mental Hygiene
32.5%
22.3% 21.6% 24.5% 23.3%
24.7%
12.6% 11.0%
13.7% 13.3%
0%
5%
10%
15%
20%
25%
30%
35%
White NH Black NH Asian Hispanic Total
2010 2013
MD SHIP Goal: 15.2% HP2020 Goal: 21.0%
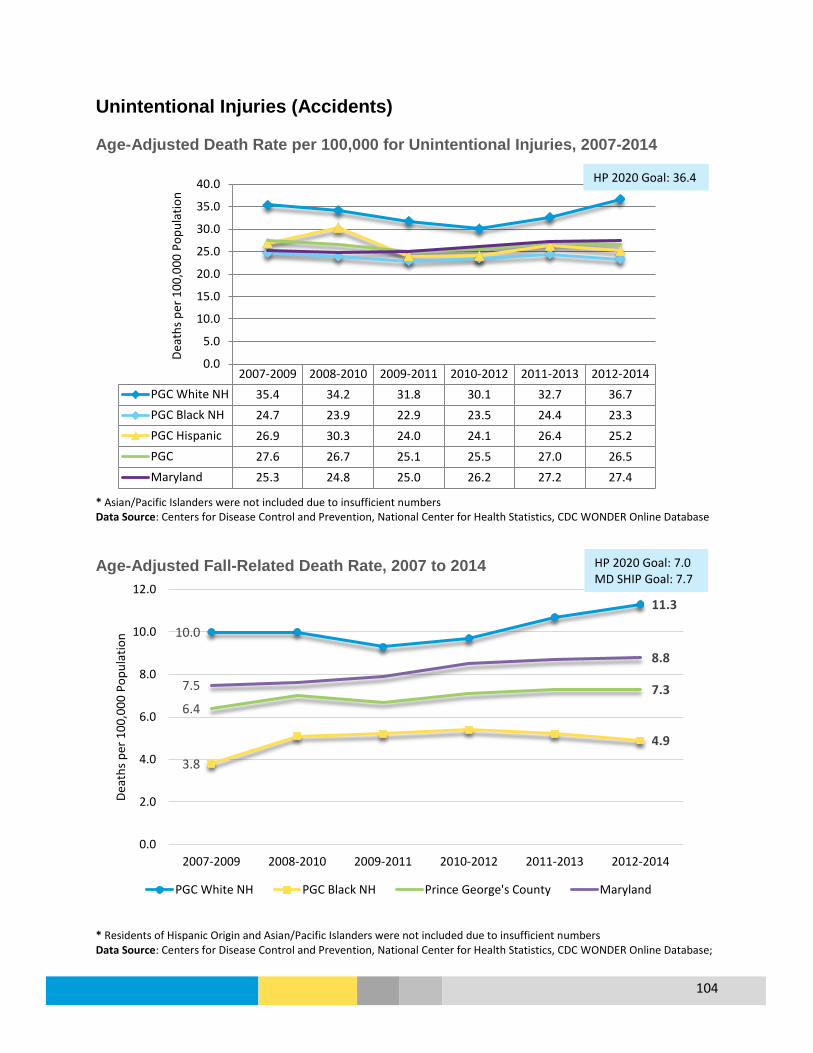
104
Unintentional Injuries (Accidents) Age-Adjusted Death Rate per 100,000 for Unintentional Injuries, 2007-2014
* Asian/Pacific Islanders were not included due to insufficient numbers Data Source: Centers for Disease Control and Prevention, National Center for Health Statistics, CDC WONDER Online Database Age-Adjusted Fall-Related Death Rate, 2007 to 2014
* Residents of Hispanic Origin and Asian/Pacific Islanders were not included due to insufficient numbers Data Source: Centers for Disease Control and Prevention, National Center for Health Statistics, CDC WONDER Online Database;
2007-2009 2008-2010 2009-2011 2010-2012 2011-2013 2012-2014PGC White NH 35.4 34.2 31.8 30.1 32.7 36.7PGC Black NH 24.7 23.9 22.9 23.5 24.4 23.3PGC Hispanic 26.9 30.3 24.0 24.1 26.4 25.2PGC 27.6 26.7 25.1 25.5 27.0 26.5Maryland 25.3 24.8 25.0 26.2 27.2 27.4
0.0
5.0
10.0
15.0
20.0
25.0
30.0
35.0
40.0De
aths
per
100
,000
Pop
ulat
ion
10.0
11.3
3.8
4.9
6.4 7.3 7.5
8.8
0.0
2.0
4.0
6.0
8.0
10.0
12.0
2007-2009 2008-2010 2009-2011 2010-2012 2011-2013 2012-2014
Deat
hs p
er 1
00,0
00 P
opul
atio
n
PGC White NH PGC Black NH Prince George's County Maryland
HP 2020 Goal: 36.4
HP 2020 Goal: 7.0 MD SHIP Goal: 7.7

105
Age-Adjusted Death Rate due to Motor Vehicle Accidents, 2007 to 2014
* Asian/Pacific Island Residents were not included due to insufficient numbers Data Source: Centers for Disease Control and Prevention, National Center for Health Statistics, CDC WONDER Online Database; Healthy People 2020 https://www.healthypeople.gov/
Pedestrian Injury Rate on Public Roads, 2009 to 2014
Data Source: Maryland State Highway Administration (SHA)
2007-2009 2008-2010 2009-2011 2010-2012 2011-2013 2012-2014PGC White NH 12.5 11.2 11.4 9.8 10.1 11.0PGC Black NH 14.7 12.0 11.0 10.5 11.0 10.5PGC Hispanic 17.0 18.9 13.9 11.4 12.0 10.9PGC 14.1 12.0 10.9 10.3 10.8 10.3Maryland 11.2 10.2 9.3 8.8 8.8 8.5
0
4
8
12
16
20
Deat
hs p
er 1
00,0
00 P
opul
atio
n
41.2
36.8 33.6
35.4 37.2
39.6
41.2 40.5 37.3
41.2 39.5 42.5
0
5
10
15
20
25
30
35
40
45
2009 2010 2011 2012 2013 2014
Inju
ries p
er 1
00,0
00 P
opul
atio
n
Prince George's Maryland
HP 2020 Goal: 20.3 MD SHIP Goal: 35.6
HP 2020 Goal: 12.4

106
Fatal Motor Vehicle Crashes Involving Pedestrians on Foot, Prince George’s County, 2009 to 2013
Data Source: Motor Vehicle Administration, Maryland Department of Transportation Fatal Motor Vehicle Crashes Involving Distracted Driving, Prince George’s County, 2009 to 2013
Data Source: Motor Vehicle Administration, Maryland Department of Transportation
21 22
30
22
17
0
5
10
15
20
25
30
35
2009 2010 2011 2012 2013
Num
ber o
f Cra
shes
35 35
48
35 35
0
10
20
30
40
50
60
2009 2010 2011 2012 2013
Num
ber o
f Cra
shes

107
Fatal Motor Vehicle Crashes Involving Driver Speed, Prince George’s County, 2009-2013
Data Source: Motor Vehicle Administration, Maryland Department of Transportation
20 23
17
20
15
0
5
10
15
20
25
30
2009 2010 2011 2012 2013
Num
ber o
f Cra
shes

108
Violence and Domestic Violence
Overview
What is it? Violence affects all stages of life and includes child abuse, elder abuse, sexual violence, homicides, and domestic violence. Domestic violence is a pattern of abusive behavior including willful intimidation, physical assault, battery, and sexual assault used by one partner to gain or maintain power and control over another intimate partner. Domestic violence can happen to anyone regardless of age, economic status, race, religion, sexual orientation, nationality, sex, or educational background (National Coalition Against Domestic Violence).
Who is affected?
There were 4,490 violent crimes (includes homicide, rape, robbery, and aggravated assault) in 2014, and 66 residents in the county died by homicide. (MD Vital Statistics). In 2014, there were 2,083 reports of domestic violence in the county and from July 2014 to June 2015 there were 14 domestic violence-related deaths. (Maryland Network Against Domestic Violence).
Prevention and Treatment
• Domestic violence prevention efforts depend on the population and include: • Prevent domestic violence before is exists (primary prevention) • Decrease the start of a problem by targeting services to at-risk
individuals and addressing risk factors (secondary prevention) • Minimize a problem that is clear evidence and causing harm (tertiary
prevention) (Maryland Network Against Domestic Violence).
What are the outcomes?
Apart from deaths and injuries, domestic violence is associated with adverse physical, reproductive, psychological, social, and health behaviors. (CDC.gov).
Disparity No data is currently available about disparities for violence and domestic violence. However, anyone can experience domestic violence. Women generally experience the highest rates of partner violence compared to males. Teenaged, pregnant, and disabled women are especially at risk. (MD Network Against Domestic Violence).
How do we compare?
The county’s homicide rate in 2014 was 7.5; other Maryland counties ranged from 2.2 to 30.6; the state overall is 7.0 and the U.S. is at 5.8 per 100,000 population. The county’s violent crime rate in 2013 was 505.6, the third highest in the state with a range from 118.8 to 1,406.4 among other Maryland counties, and the state rate was 467.5 per 100,000. The county ranked as the fifth lowest for the rate of domestic violence in 2014. (MD Governor’s Office of Crime Control and Prevention)

109
Age-Adjusted Death Rate for Homicide, 2007 to 2014
* Data unavailable by race and ethnicity. Data Source: Centers for Disease Control and Prevention, National Center for Health Statistics, CDC WONDER Online Database Violent Crime* Rate, Prince George’s County Compared to Maryland, 2010 to 2014
*Violent crimes include homicide, rape, robbery, and aggravated assault. Data Source: Maryland Uniform Crime Report Rate of Domestic Violence, 2010 to 2014
14.0
12.4 11.3
10.3 8.9
7.8 9.2
8.3 7.7 7.3 7.2 7.0
0.0
2.0
4.0
6.0
8.0
10.0
12.0
14.0
16.0
2007-2009 2008-2010 2009-2011 2010-2012 2011-2013 2012-2014
Deat
hs p
er 1
00,0
00 P
opul
atio
n
Prince George's Maryland
736.1
593.0 562.3 505.6
456.4 547.4
494.1 477.2 467.5 441.3
0
100
200
300
400
500
600
700
800
2010 2011 2012 2013 2014
Crim
es p
er 1
00,0
00 P
opul
atio
n
Prince George's Maryland
HP 2020 Goal: 5.5

110
*In 2013, domestic violence data reporting was expanded to include additional relationships and reflect changes in Maryland law. This change explains the increase in the total number of Domestically Related Crimes reported. Data Source: Maryland Uniform Crime Report Domestic Violence-Related Deaths in Prince George’s County, 2009 to 2015
Data Source: Maryland Network Against Domestic Violence
180.5
104.2 140.5
279.6 230.3
310.6 312.4 299.3
468.6 455.8
0
100
200
300
400
500
2010 2011 2012 2013* 2014
DV In
cide
nt p
er 1
00,0
00 P
opul
atio
n
Prince George's Maryland
2
5
13 12
6
14
0
2
4
6
8
10
12
14
16
July 2009 toJune 2010
July 2010 toJune 2011
July 2011 toJune 2012
July 2012 toJune 2013
July 2013 toJune 2014
July 2014 toJune 2015

111
Produced by:
The Office of Assessment and Planning Prince George’s County Health Department
[email protected] 301-883-3108

1
KEY INFORMANT INTERVIEWS
Introduction
As part of the 2016 Community Health Needs Assessment conducted in partnership with the county’s five hospitals, the Prince George’s County Health Department (PGCHD) conducted key informant interviews with 24 County residents drawn from diverse backgrounds with varying perspectives on health in the County. The present report summarizes the approach to the interviews and the findings.
Key Findings
• The three most important health issues facing the County are improving access to primary care, improving access to healthy food, and increasing prevention efforts around chronic disease.
• The most important social determinants of health in the County are (1) lack of transportation; (2) immigration status that renders some residents uninsurable; (3) low health literacy and (4) poverty.
• The three most important barriers relative to the health and well being of residents are (1) limited access to healthcare due to lack of insurance, poverty, provider shortages, lack of transportation, and low health literacy; (2) limited access to healthy foods; and (3) poor adoption of behaviors and activities that promote healthy eating and active living.
• The leading physical health concerns are the incidence and prevalence of chronic disease- cardiovascular disease, hypertension, Type 2 diabetes in adults and Type 2 diabetes and asthma in children.
• The rising incidence of behavioral health problems among adults and children, the stigma around seeking help for mental conditions, and limited access to behavioral health services due to a lack of providers, are three pressing problems in the County.
• Environmental health challenges mainly affect children and are poor air quality that is associated with high rates of asthma and exposure to lead in older housing stock.
• Current health challenges are being addressed through direct services; community health education and outreach; and partnerships and collaborations
2
but the County needs to develop permanent solutions by allocating funding to expand and strengthen the health safety net and build the capacity of local non-profits to address the health needs of residents.
• Partnerships and collaborations that promote systems of care; the integration of primary and public health services ; and community care coordination hold promise of being effective approaches to tackling serious systemic problems in the County.
• More needs to be done to ensure the cultural and linguistic competency of providers and available services, particularly as they relate to vulnerable sub-populations such as the uninsured, the Piscataway Indians, and recent immigrants and refugees.
Methodology
Sample: PGCHD provided a consultant with the names of 38 individuals who were proposed by the five hospitals and PGCHD. These individuals represented Local government; patient advocates; faith-based organizations; the public school health service; local politicians; safety net providers; state government; physician providers; academia; private industry; local philanthropy and special populations – seniors, Hispanics, the Piscataway Indian tribe; veterans, and the disabled. The representatives live and work in all areas of the County. Of the 38 potential respondents 24 completed the interviews by the deadline set by PGCHD. Notably absent were respondents representing physician providers and academia. Despite repeated contacts representative of these groups did not respond to the request for an interview. Appendix A presents the list of persons who completed the interviews.
Interview Protocol: PGCHD approved the interview guide (see Appendix B) which consisted of 17 open ended questions with related probes. The guide addressed the following main topics- assets and barriers relative to health promotion in the County; opinions on the leading health threats currently facing the County; specific priorities in the areas of physical, behavioral and environmental health; and emerging threats to residents’ health.
Implementation: The consultant conducted 20 of the 24 interviews by telephone. Interviews ranged from 30 to 45 minutes in duration and respondents were emailed the questions in advance of the interview. PGCHD extended the option of completing the interview questions in writing to four respondents who were unavailable by telephone

3
due to scheduling difficulties. All of the interview data were collected between March 10 and 31, 2016.
Analysis: Preliminary content analysis of the interview data occurred at the conclusion of each data collection activity. The consultant identified and recorded first impressions and highlights. The second stage of content analysis identified common categories and overarching themes that emerged as patterns in the data. In the presentation of the interview findings, key patterns are reported along with supportive quotes.

4
Question-by-Question Analysis
1. What is your organization/ program’s role relative to the health and well being of County residents?
See Appendix A for a list of participants.
2. How long has your organization/ program played this role?
As stated earlier the interviewee sample was drawn to reflect various disciplines including local government; patient advocates; faith-based organizations; the public school health service; local politicians; safety net providers; state government; physician providers; academia; private industry; local philanthropy and special populations. Local government agencies represented included the County’s health department; social services; family services; public housing; transportation; emergency response; division of aging; planning; and domestic violence and human trafficking prevention services, respectively. Three faith leaders representing the health ministries in their respective organizations also participated as did a representative from the County’s Chamber of Commerce. Other respondents included a school health administrator; three safety net providers; five providers serving different special populations; one representative of a local philanthropy; and two local elected officials. These respondents averaged 15.5 years of active service in some aspect of healthcare in the County.
3. In your opinion has the health of County residents improved, stayed the same, or declined over the past few years? What makes you say that?
Roughly half (54%, 13) of the respondents believed that over the past few years, residents’ health has improved. However, ten of the 13 emphasized that the improvement has been “slight” or “limited”. Evidence cited for improvement included: the trend in the health status indicators presented in the County’s 2015 Health Report1; residents’ increasing awareness of and demands for prevention information and programming; and increases in the number of residents able to access healthcare due to the provisions of the Affordable Care Act and the County’s Health Enterprise Zone. Nevertheless, the observed improvements were restricted, as one respondent voiced “to persons who are in a position to take advantage of the resources in the County. For various reasons not everyone can do so.” Respondents who felt that residents’ health has declined concur with that observation. They noted that a significant proportion2 of the population continues to be uninsured, and several were concerned
1 PGCHD, Office of Assessment and Planning, Health Report 2015
5
that the health status of the uninsured may not be adequately measured since they tend not to be included in routine surveillance and monitoring efforts. Others pointed to rising incidence of chronic disease (diabetes, hypertension, and cardiovascular disease) in adults and diabetes and asthma among children, as well as the aging of the population as signs of overall health decline. The increasing incidence of untreated behavioral health problems was another indicator cited by some as evidence of declining health.
4. What are the County’s three most important assets/strengths relative to the health and well being of residents?
Perhaps due to the highly diverse nature of the sample, this question elicited a very wide range of answers. The most common responses were in descending order of frequency: the County’s parks and recreation centers that promote active living; the proposed regional health center that holds promise of increasing residents’ access to health care; and the Health Department that has assumed a proactive and collaborative approach to promoting the public’s health.
5. What are the County’s three most important barriers relative to the health and well being of residents?
In contrast to the variation observed in the responses to the question about the County’s assets relative to health, there was a virtual consensus that the three most important barriers are in descending order of frequency cited: limited access to healthcare due to lack of insurance, poverty, provider shortages, lack of transportation, and low health literacy; limited access to healthy foods as evidenced by food desserts in some communities and the ubiquity of fast food restaurants; and poor adoption of behaviors and activities that promote healthy eating and active living.
Access to Care: With respect to access to healthcare, several respondents noted that although the ACA provided many previously uninsured or underinsured residents with insurance, some of these persons cannot afford the monthly premiums and/or co-payments for service. The provider shortage, particularly for primary care and pediatric, behavioral health and oral health services, also creates long waiting lists and effectively means that some residents will not receive needed care in a timely and efficient manner, if ever. While respondents believe that this problem may be redressed somewhat when the proposed regional health center opens, a few individuals pointed to the elimination of maternal and child health services as well as inpatient care at Laurel Regional Hospital and the cessation of PGCHD prenatal services as moves that have further curtailed access to care. In addition, several respondents observed that it is unreasonable to expect the proposed regional center alone to close the gaps in the
6
County’s current frayed safety net. Safety net representatives who were interviewed noted that while their organizations deliver sliding scale services to uninsured residents, ultimately the service model is not viable because in some cases over 30% of all persons seeking care are uninsured. Also symptomatic of the lack of access is the fact that, according to EMS personnel who were interviewed, the fourth most common reason for medical emergency calls in the County is for generic sick patients, i.e. persons with a non-acute problem who lack a medical home and therefore seek care from an emergency department.
Transportation was mentioned so frequently and in relation to so many barriers to health that comments were sought from a manager at the County’s Department of Public Works and Transportation, Office of Transportation. According to this individual the County currently provides transportation services to dialysis patients; seniors who eat the County’s four senior centers; and the Call-a-Bus service that takes any County resident who is not served by or cannot use existing bus or rail services. However, priority is given to senior and persons with disabilities. The respondent noted that demand for all of these services far outstrips capacity and that would-be riders need to reserve a ride a minimum of two weeks in advance. The manager expressed that augmenting the current fleet of 41 vehicles and 45 drivers with ten (10) additional buses and ten (10) additional drivers would allow meet the present demand during business hours. However, demand is predicted to rise as the population ages. Furthermore, transportation services are not offered after business hours, or on weekends or holidays, and Call-a-Bus is only available between the hours of 8:30 and 3:30.
The lack of culturally and linguistically competent health services is also a barrier to access according to some respondents. This is particularly the case for persons with behavioral health conditions, where provider sensitivity and communication style may greatly influence the treatment intervention. Treatment approaches and/or providers that do not take into consideration patients’ health beliefs discourage care seeking and hinder access.
Access to Healthy Food: According to respondents limited access to healthy food caused by food desserts, and the presence of numerous fast food establishments do not support healthy eating. Several respondents cited the closure of major supermarkets; the community’s lack of awareness of the produce offered by and the location of local farmers markets; and limited transportation options that prevent residents from traveling to farmers markets or full service supermarkets as ongoing challenges to health. Others noted that the permitting process and other regulations surrounding the opening and operation of farmers markets are much more complicated

7
than those relative to fast food establishments. Perhaps as a result the fast food restaurant density in the County is .83/1000 residents as opposed to .58 for counties of comparable population and geographic size elsewhere in the country.3 Yet, even when healthy food is accessible some residents do not necessarily access it. According to one respondent “some family traditions around diet, they just are not healthy. Then culture plays a role. In all of the diverse cultures within the County there are foods that are tasty but bad for you. Unfortunately they are also often the most affordable foods.”
Personal/Behavioral Factors: Low health literacy and poverty were given as the main reasons for residents’ not engaging in healthy eating and active living (HEAL) behaviors. Nearly all (92%, 22) of the respondents mentioned residents’ lack of understanding of the importance of HEAL as a major barrier. One respondent observed that the needs of residents with limited or no proficiency in English are not addressed by current community health education efforts. Specifically, the Health Department’s website does not provide information in Spanish, the second most commonly spoken language after English in the County, or any other language for that matter. As a result non-English speaking residents often lack accurate information about available resources and how to access them. Even in cases where there is no linguistic barrier, patient advocates report that the lack of coordination among the various health and social services and providers in the County makes navigating the system a challenge for many residents. While the Health Department’s efforts to deploy community health workers (CHWs)are welcomed the consensus is that more are needed, with some respondents calling for “a network of CHWs across the County” that can raise community awareness of available services and how to access them.
The high cost of living in the County results in a significant number of working poor. These are often residents who work two or more jobs and commute long distances from home. Many struggle to achieve an optimal work–life balance that favors health. The average commute to work for County residents is 41 minutes versus 35 for the rest of the State. Roughly half (57%) of County residents who commute drive alone to work and commute for more than 30 minutes versus 47.2% for the rest of the State.4 Roughly one in five (20.5%) of County residents suffer from severe housing problems that include overcrowding, high housing costs, lack of kitchen, or lack of plumbing facilities.5 According to several patient advocates, the homeless population (particularly
3 PGCHD PGC Health Zone. Accessed on April 5, 2016 at www.pgchealthzone.org 4 Ibid 5 Ibid
8
unaccompanied youth) suffers disproportionately because of their unstable living situation and often present for services in advanced stages of disease.
The parks and recreation centers touted as some of the County’s most important health assets may not be readily accessible to some communities. Respondents observed that in fact, some residents in poorer neighborhoods may lack safe outdoor or even indoor space to engage in physical activity. Furthermore due to changes in the school curricula, children in these neighborhoods may not engage in physical education at school.
6. What do you think are the three most important social determinants of health in the County? (Social determinants of health are factors related to the social environment, physical environment, health services, and structural and societal characteristics.)
In descending order of frequency the social determinants that were mentioned were: Lack of transportation (see discussion under Question 5 above), immigration status that renders some residents uninsurable, and low health literacy and poverty tied in third place. A closer analysis of the responses indicate that in fact poverty could be singled out as the key determinant because poverty limits the transportation options such as owning and operating a personal vehicle, affording housing close to public transportation and/or affording the cost of public transportation. Undocumented status is typically a proxy for poverty. However, several interviewees noted that low health literacy has been observed even among the County’s significant population of highly educated individuals. In this connection, one respondent observed that the County’s low birthweight rate of 9.2%6 is high even after controlling for maternal socioeconomic status and urged further study to explore the reasons behind this finding.
7. What do you think are the three most important physical health needs or concerns of County residents?
The incidence and prevalence of chronic disease- cardiovascular disease, hypertension, and Type 2 diabetes in adults and Type 2 diabetes and asthma in children are seen as the leading physical health concerns. The overwhelming majority (88%, 21) of respondents believe that low income residents, uninsured residents, and linguistic minorities are disproportionately affected by these conditions as these tend to be the persons who experience the most difficulty accessing healthcare, for reasons discussed earlier under Question 5. Oral and vision health particularly for the homeless
6 Ibid
9
and for adults is also key concerns as they are typically not covered by basic insurance policies or included in safety net services.
8. What do you think are the three most important behavioral/mental health needs facing the County?
Virtually all (96%, 23) of the respondents expressed that the rising incidence of behavioral health problems among adults and children, the stigma around seeking help for mental conditions, and limited access to behavioral health services due to a lack of providers, are three pressing problems in the County. Respondents noted that substance abuse, depression, anxiety, and suicide provoked by the stresses of long commutes, high cost of living, limited social support, and for some immigrants, feelings of isolation from the greater community are prevalent concerns. Several observed that the County is home to the highest number of veterans in the state and yet veterans remain unaware of or are unwilling to seek mental health services despite the increasing prevalence of post traumatic stress disorder (PTSD) in this sub-population. Family dysfunction including the exposure of children and youth to violence within or outside the home is another contributor to the incidence of mental health conditions. A provider who serves the Hispanic population expressed the view that 60 to 70 percent of all physical problems actually have a root cause in mental health.
Seeking mental health treatment has traditionally been stigmatized in the African American community. A similar pattern is observed in the Hispanic population, whereas the Native American culture has its own approaches to the management of mental health, approaches that mainstream providers may not understand and/or respect. One respondent noted that few of the local faith organizations actively promote care seeking for mental disorders, yet faith organizations are a trusted if not the trusted source of health information, counseling and social support for many residents, particularly those who lack ready access to healthcare. Thus according to one respondent, perhaps a lack of awareness of and/or confidence in the available behavioral health resources may explain why only 7% of all Medicaid beneficiaries in the County access the available services.
When residents do attempt to seek behavioral health care however, they are often confronted by a lack of providers. PGCHD reports that it would like to cease offering direct services in behavioral health but cannot do so until private and safety net provider capacity in this area is significantly enhanced. The majority of behavioral health providers in the County do not accept insurance, necessitating efforts by the PGCHD to make the business case to providers as to why they should do so. EMS staff report that because of the provider shortage only the most acute cases are referred to behavioral
10
health providers. The rest are taken to the local hospitals that lack inpatient capacity and so end up returning to the community, experiencing another crisis, and entering an endless cycle between the community and under-resourced hospitals. Seniors lack providers trained to address their specific behavioral problems as do children and youth. Housing officials report that seniors with behavioral problems are often incapable of living independently in the community and are therefore at high risk of becoming homeless. As one official stated “deinstitutionalization means there is nowhere for them to go.” Another respondent lamented that an entire generation of minority youth is at risk for mental health misdiagnoses because of the lack of pediatric behavioral health providers who are culturally competent. Similar concerns were expressed by respondents who serve recent immigrants and refugees, many of whom have suffered or continue to suffer trauma and different forms of abuse. Immigrant and refugee children in particular are in need of early intervention to detect and address problems proactively. Some attribute the County’s rising incidence of domestic violence to untreated mental health issues.
9. What do you think are the three most important health-related environmental concerns facing the County?
The most commonly mentioned concern (75%, 18) was residential air quality which respondents felt might be responsible for the rising incidence of childhood asthma. Respondents noted that the County has made great strides in reducing exposure to secondhand smoke including the ban on smoking in all public housing which goes into effect on May 1, 2016. However, overcrowded, substandard, poorly maintained housing is said to be responsible for compromised air quality.
Additional concerns relate to lead exposure – a problem in parts of the County with older housing stock. Several respondents reflected that the community, particularly parents of young children, does not seem sufficiently aware of the dangers of lead. Others note that, given the recent, widely publicized problems with water quality in Flint, Michigan, water quality assessments should be conducted, particularly in poor neighborhoods in close proximity to the Anacostia River. Interestingly, none of these respondents was aware that childhood lead levels and water quality measures are both reported on the PGCHD health statistics website – www.pgchealthzone.org.
10. Now if you had to prioritize and select the three most important health issues facing the County from among those you just mentioned what would they be?
The three issues that were most commonly (75%, n=18) mentioned were: improving access to primary care, improving access to healthy food, and increasing prevention

11
efforts around chronic disease. These issues are seen as intertwined and fueled in large part by poverty, low health literacy and a provider shortage, as discussed earlier. Several respondents expressed the view that the success of the proposed regional health center will be in jeopardy if the County does not address the problem of care for the uninsured. One respondent wondered “why won’t the regional health center face the same problems as Prince George’s Health Center if it has to treat the same if not a larger volume of uninsured patients? What’s the plan for addressing that before the new center opens?” Several responses mentioned the need to address super-users: persons who utilize hospital inpatient and emergency services because they either lack a medical home and/or do not practice effective self-management. One respondent estimated that effective management of super-users could save the County upwards of $6,000,000 annually in reduced healthcare costs. Efforts to expand access also need to be tailored to the specific cultural and linguistic needs of specials populations. For example, provider recruitment and professional development should include considerations of cultural and linguistic competency.
Respondents were equally adamant that the County must curtail the proliferation of fast food restaurants and work actively to end food deserts and make farmers markets and full service supermarkets readily accessible to all residents. To this end, several respondents believe that more needs to be done to promote farmers markets including the fact that many accept Supplemental Nutrition Assistance Program (SNAP) and Women Infants and Children (WIC) benefits. Respondents proposed that increased public and private collaboration to raise awareness of available services and resources through social marketing campaigns and enhancing the capacity of faith based and community based organizations would further this goal.
Many respondents appeared to agree with the view that the County “should make health the center of all its planning- economic development, education, housing, transportation – all should revolve around the health of residents.” The consensus was that policies that support living wages, expansion of the safety net, and creation of more jobs within the County will reduce poverty and thereby reduce stress and allow residents to focus more on prevention and have the financial and other resources to practice effective preventive behaviors.
11. In what way does your organization/ program address each of the three issues you just mentioned?
Efforts to address the myriad of health problems and concerns raised by the respondents fell into three main categories –direct services; community health education and outreach; and partnerships and collaborations.
12
Direct Service: All of the direct service providers reported working at capacity and still being unable to meet the demand. Many predict that the demand for services will continue to rise and given the significant proportion of highly educated residents in the County, savvy consumers will increasingly demand high quality services. A few providers mentioned making a concerted effort to hire culturally and linguistically competent staff. All noted that in addition to the provider shortage the non-profit sector particularly in the area of supportive services is very underdeveloped often leaving providers with no referral options. To illustrate the paucity of options, one respondent stated that the County with a population of almost one million has just one domestic violence shelter with approximately 50 beds and a maximum stay of 89 days.
Education and Outreach: FBOs and CBOs were most likely to mention health education and outreach as their response to health issues facing the community. However, several respondents expressed that their organizations need capacity building so that they are better equipped to disseminate the latest information to their constituents. PGCHD has undertaken various countywide health education efforts including one around HEAL and is proposing additional efforts in the area of behavioral health. The Health Department is also using the HEZ as the incubator for its health literacy interventions with the goal of scaling them up countywide over time. EMS continues a practice of providing health education, e.g. the importance of daily blood glucose measurements for diabetics or the need for working smoke detectors in the home, during each resident encounter.
Partnerships and Collaborations: Several respondents praised PGCHD’s efforts to form partnerships and collaborations such as the local health action coalition; the Community Care Coordination Team of the HEZ to address various public health issues in the County; the involvement of Maryland-National Capital Park and Planning Commission (MNCPPC) in the County’s Primary Healthcare Strategic Plan; and prevention partnerships formed with local hospitals and advocacy groups such as the American Diabetes Association and the American Cancer Society. However, several providers observed that at times the Health Department, safety net providers, and private practices seemed to be in competition for limited resources. Some stated that more needs to be done to ensure that all stakeholders participate fully in various planning functions and that decisions are data-driven. Several respondents noted that the more needs to be done to integrate school health, public health and primary care. The existing four school-based health clinics are considered a step in the right direction but some respondents would like to see the clinics expanded to serve the entire school community including students’ families, perhaps through extending current school health resources through the addition of federally qualified health center staff.

13
Some respondents complained that it is not clear that the results of various needs assessments, such as the present effort, are used to inform policy and programmatic decisions. At times assessment results appear to be deliberately ignored undermining efforts at collaboration. Additionally, several advocated for specialized studies to be conducted on the needs of special populations including but not limited to the Piscataway Indian tribe, the uninsured, the homeless, and recent immigrants as a way of engaging these groups.
12. How well is the County as a whole responding to these issues?
The County, particularly PGCHD, is lauded for its increasing efforts to partner with other public and private agencies, as discussed under Question 11. PGCHD is also seen as leading the effort to design interventions, solutions, and programs that are data-driven and evidence based. Respondents would like to see other County agencies adopt a similar approach as they work in the health arena.
However, overall the County received mixed marks on its efforts to address the various public health challenges raised by the respondents. Some respondents felt that the County faces an uphill battle to counter the negative image of Prince George’s that tends to be presented in the media and that discourages economic growth including provider recruitment. Others believe that the battle involves dispelling deeply held personal, cultural beliefs that impact health behaviors and outcomes at the individual level. Another viewpoint is that County leaders do not recognize the interrelationship between economic development and health and as result proposed policies and programs in both areas are not synergistic. County bureaucracy is also seen as a hindrance to innovation and rapid response to identified problems.
Frustrations were voiced that very little has been done to address the following longstanding and well documented problems: access to care for the uninsured; improved transportation services to improve access to care; the proliferation of fast food establishments; adult oral health; and the needs of sub-populations particularly non-English speaking residents and the Piscataway Indians. Some respondents suggested that there may be efforts underway to address the above mentioned problems, but if they are not widely known in the community the resulting impression is that nothing is being done. Others voiced concerns that the Health Department is eliminating some direct service programs and Laurel Regional Hospital is transitioning to become an ambulatory care center in an environment where access to care continues to be limited for significant portions of the population. Again, many expressed doubts that the proposed regional center could completely or even partially correct the problems associated with caring for the uninsured in the absence of dedicated funds to reimburse

14
these costs. Thus Montgomery Cares is cited as model worthy of emulation in Prince George’s County.
13. What more needs to be done and by which organizations/ programs?
As far as the County is concerned promoting service integration across public and private providers and developing systems of care for physical and behavioral health were noted as high priorities by most (75%, n=18) respondents. In this connection, respondents commended PGCHD’s efforts around behavioral health. In general, respondents hoped that these efforts will lead to a strengthening of the safety net and address key barriers to care. PGCHD also needs to explore the use of telehealth to stretch the limited provider resources and do a better job of raising community awareness of available resources and how to access them. Additional recommendations for PGCHD include spearheading a more comprehensive but streamlined countywide, health planning process that engages a wide array of stakeholders; increased care coordination efforts; and leveraging the expertise of local academic institutions to ensure that proposed interventions are state of the art and evidence based.
The role of non profits was less clear, however. Respondents expressed the view that more non profits need to be involved in addressing the County’s health needs but acknowledged that many lack the capacity to do so. Therefore, a pressing priority is capacity building for non-profits so that more may participate meaningfully in promoting and protecting the health of residents. Capacity building may include technical assistance in board development, grant writing, and program planning, monitoring and evaluation in addition to professional development to ensure that staff is linguistically and culturally competent. It is noteworthy, that respondents did not identify who should deliver the proposed capacity building or how it would be funded.
14. What resources are needed but not available to address each of the three issues?
All except one respondent stated that funding is the missing ingredient and the key resource needed. Respondents commented on the disparity in the funding accorded to health in the County when compared to the funding made available to the health departments of neighboring counties and the District. One respondent stated flatly “Public health is not a top priority for the leadership of this County. Look at what we spend on health. Look at what Montgomery, Howard even the District spends on health. Look at what we spend on schools, libraries and public safety compared to health. It doesn’t compare.” Several respondents observed that a significant proportion of the costs of many essential public health services such as the
15
safety net, medical transportation, basic primary care, and community behavioral health are covered by grant funding that may be eliminated at any time. In addition, safety net providers are currently unable to be reimbursed by insurers for much of the primary prevention services they offer. Given that the non-profit sector is currently unable to meet the demand for these and other services, this creates a highly unstable environment in which to attempt to promote public health. Another noted that new spirit of partnership and collaboration fostered by the Health Department is leading to innovative ideas but funding is needed to implement them. In the same vein, one respondent affirmed, “You can’t do great things without good staff and you have to pay good staff.”
15. What are the 3 most important emerging threats to health and well being in the County?
Only half of the respondents were able to cite any emerging threats. The three most commonly mentioned threats were- effective management of a mass disaster due to natural or terrorist forces; Zika; and the increasing demand for behavioral health services across the population. Several respondents felt that the County has no disaster relief plans or at least has not publicized any plans and residents do not appear cognizant of the threat of a mass disaster and how to respond. Related to this concern is the high probability that an infectious disease like Zika or Ebola could become epidemic in the County. Respondents note that the County is very diverse with residents coming from and traveling to all corners of the globe. One respondent queried “what’s to prevent an infectious disease from coming to the County and what do we do when it does?”
One respondent predicted a silver tsunami as the population ages that will result in a growing demand for services related to dementia and Alzheimer’s in addition to those needed by the growing population of veterans returning from stressful combat theaters. PCP addiction, synthetic marijuana use, and electronic cigarettes use, particularly among youth are other behavioral health problems that respondents expect to increase.
16. How is your organization/program addressing these emerging threats?
Respondents uniformly agreed that although they identified threats their organizations are hardly addressing them because they are too occupied with responding to current needs. In addition, some respondents believe that the three threats outlined above require a uniform, comprehensive approach by a County agency and not siloed actions undertaken by individual organizations. The proposed behavioral health system of care is considered to be such a comprehensive approach. Nevertheless, the District Heights

16
Police Force is poised to unveil a plan for mass evacuation in the event of a disaster. One FQHC has retained an infectious disease specialist to retrain its staff on the latest prevention protocols as they are released by the Department of Health and Mental Hygiene (DHMH). Another provider is offering online mental health screening as well as other mental health services and supports and has joined a workgroup that will be studying dementia in the County. These examples are illustrative of the individual actions taken by local entities to address threats that they have identified.
17. Do you have any other comments to add relative to health and the County?
The bulk of respondents’ closing remarks centered on four key recommendations. The County needs to improve access to care by strengthening the safety net; improve health literacy; improve the cultural and linguistic competence of providers and services offered; and ensure stable levels of funding that are commensurate to the size and scope of identified and emerging health needs in the County.

17
Appendix A: List of Key Informants
NAME ORGANIZATION TYPE Rev. Esther Gordon First Baptist Church of Glenarden Faith-based
Karen Bates, RN, MS PGC Public Schools School Health
David Harrington PGC Chamber of Commerce Business
Cathy Stasny, RD, L.D. PGC Area Agency on Aging Seniors
Maria Gomez Mary's Center FQHC, Hispanic Population
Melony Griffith Greater Baden Medical Services. FQHC
Kathleen Knolhoff Community Clinic, Inc. FQHC
Pamela Creekmur PGC County Health Department Local Government
Elizabeth M. Hewlett Maryland-National Capital Park and Planning Commission State Government
Gus Suarez First Baptist Church of Laurel Latino Population; Faith-based
Craig Moe City of Laurel Elected Official
Natalie Standing on the Rock Proctor
Wild Turkey Clan, Cedarville Band of Piscataway Indians Tribal Leader
Reverend Robert Screen River Jordan Project, Inc Faith-based
Rosa Goyes Mary's Center FQHC, Hispanic Population
Marcus Daniels United Way Local Philanthropy
Christal Batey City of Greenbelt Assistance in Living Program Local Government; Seniors
Cynthia Miller City of District Heights Elected Official
Eric Brown PGC Department of Housing and Community Development Local Government; Housing
Renee Ensor-Pope PGC Department of Social Services, Community Services Division Local Government
Dennis Wood PGC Fire/EMS Department Local Government
Jackie Rhone PGC Department of Family Services Local Government; Domestic Violence and Human Trafficking
Carol-Lynn Snowden PGC Department of Family Services Local Government; Veterans
Michelle Howell The ARC Non profit, Disabled persons
Geralyn Bruce PGC Department of Public Works and Transportation Local Government
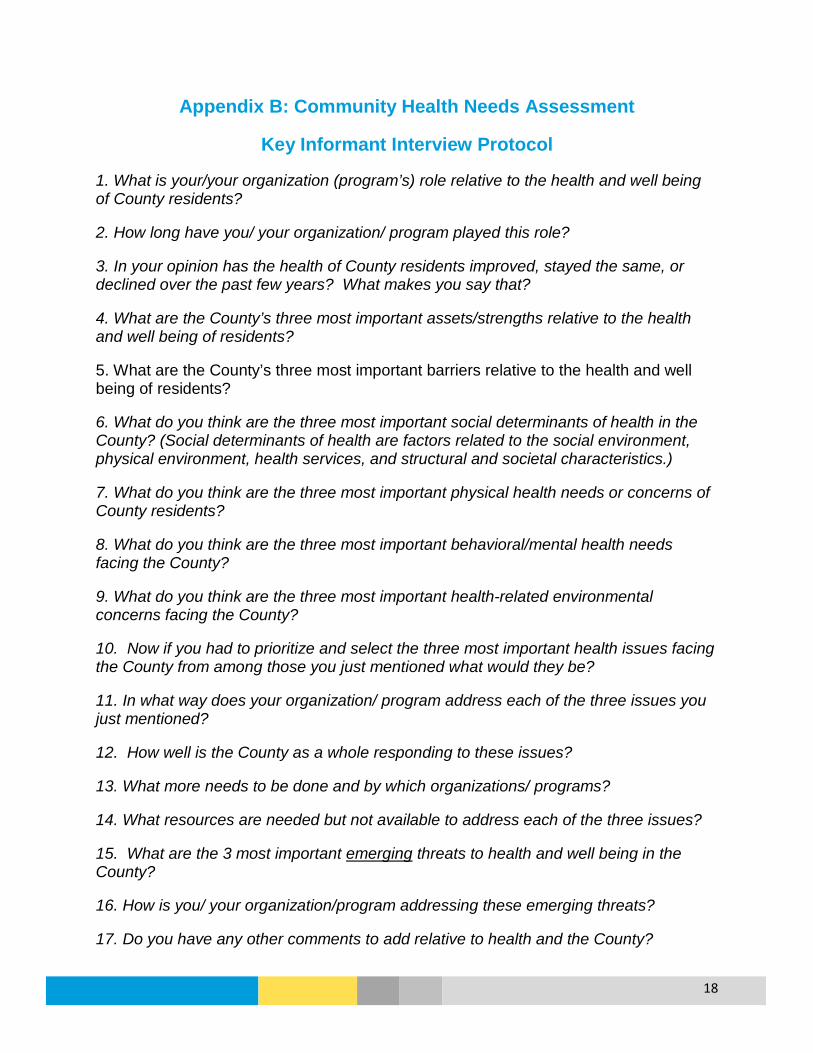
18
Appendix B: Community Health Needs Assessment
Key Informant Interview Protocol
1. What is your/your organization (program’s) role relative to the health and well being of County residents? 2. How long have you/ your organization/ program played this role? 3. In your opinion has the health of County residents improved, stayed the same, or declined over the past few years? What makes you say that? 4. What are the County’s three most important assets/strengths relative to the health and well being of residents? 5. What are the County’s three most important barriers relative to the health and well being of residents? 6. What do you think are the three most important social determinants of health in the County? (Social determinants of health are factors related to the social environment, physical environment, health services, and structural and societal characteristics.) 7. What do you think are the three most important physical health needs or concerns of County residents? 8. What do you think are the three most important behavioral/mental health needs facing the County? 9. What do you think are the three most important health-related environmental concerns facing the County? 10. Now if you had to prioritize and select the three most important health issues facing the County from among those you just mentioned what would they be? 11. In what way does your organization/ program address each of the three issues you just mentioned? 12. How well is the County as a whole responding to these issues? 13. What more needs to be done and by which organizations/ programs? 14. What resources are needed but not available to address each of the three issues? 15. What are the 3 most important emerging threats to health and well being in the County? 16. How is you/ your organization/program addressing these emerging threats? 17. Do you have any other comments to add relative to health and the County?
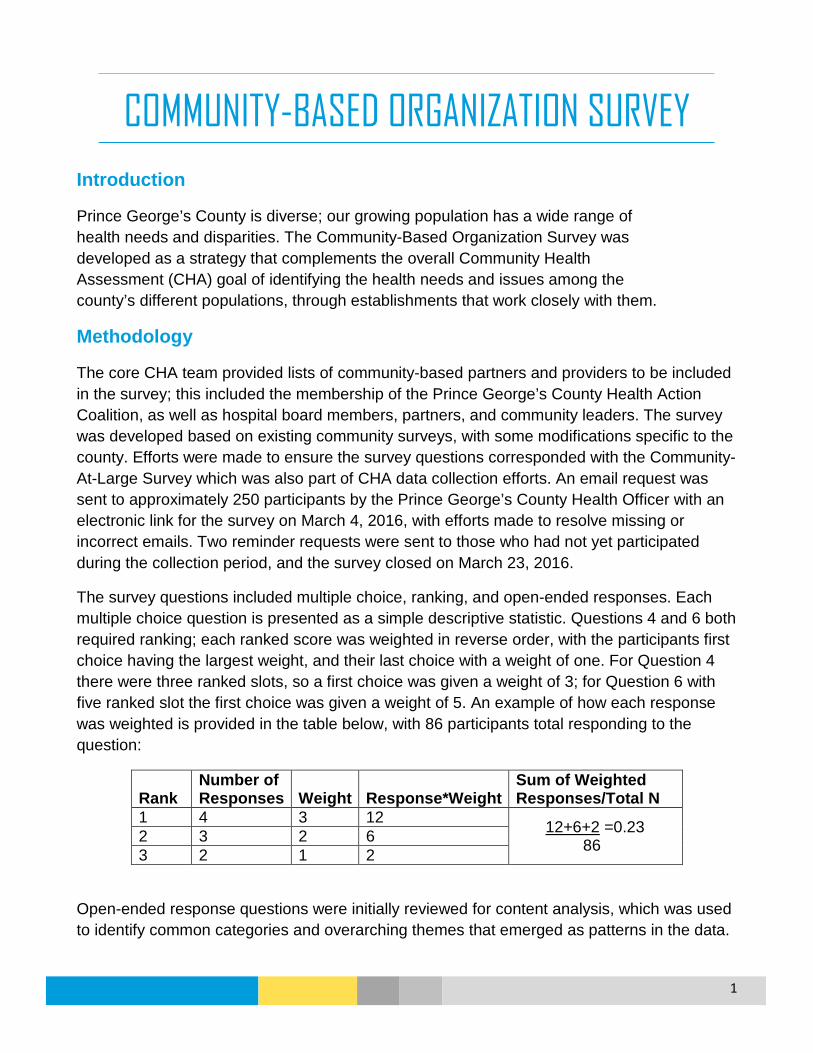
1
COMMUNITY-BASED ORGANIZATION SURVEY
Introduction
Prince George’s County is diverse; our growing population has a wide range of health needs and disparities. The Community-Based Organization Survey was developed as a strategy that complements the overall Community Health Assessment (CHA) goal of identifying the health needs and issues among the county’s different populations, through establishments that work closely with them.
Methodology
The core CHA team provided lists of community-based partners and providers to be included in the survey; this included the membership of the Prince George’s County Health Action Coalition, as well as hospital board members, partners, and community leaders. The survey was developed based on existing community surveys, with some modifications specific to the county. Efforts were made to ensure the survey questions corresponded with the Community-At-Large Survey which was also part of CHA data collection efforts. An email request was sent to approximately 250 participants by the Prince George’s County Health Officer with an electronic link for the survey on March 4, 2016, with efforts made to resolve missing or incorrect emails. Two reminder requests were sent to those who had not yet participated during the collection period, and the survey closed on March 23, 2016.
The survey questions included multiple choice, ranking, and open-ended responses. Each multiple choice question is presented as a simple descriptive statistic. Questions 4 and 6 both required ranking; each ranked score was weighted in reverse order, with the participants first choice having the largest weight, and their last choice with a weight of one. For Question 4 there were three ranked slots, so a first choice was given a weight of 3; for Question 6 with five ranked slot the first choice was given a weight of 5. An example of how each response was weighted is provided in the table below, with 86 participants total responding to the question:
Rank Number of Responses Weight Response*Weight
Sum of Weighted Responses/Total N
1 4 3 12 12+6+2 =0.23 86 2 3 2 6
3 2 1 2
Open-ended response questions were initially reviewed for content analysis, which was used to identify common categories and overarching themes that emerged as patterns in the data.

2
Each response was then reviewed and analyzed according to the categories and themes, with summary responses presented to capture the participants’ information.
Participation
Surveys were submitted by 92 participants, with a return rate of 36.8%. All areas of the county were represented by the participants (Question 19), and most ZIP codes had at least one expert participant (Question 20). Participants represented a variety of organizations (Question 18): not-for-profits (32.6%), Healthcare Providers (21.7%), Community Members (17.4%), Government Organizations (16.3%), Faith-Based Organizations (12.0%), and Social Service Organizations (8.7%); participants also worked with a variety of populations in the county (Question 21). Not all participants responded to every question; each question includes the number (N) of participants that did respond.
Key Findings
• Overall health: Two-third of respondents indicated Prince George’s County to be unhealthy or very unhealthy.
• Leading health issues: Chronic disease and related issues including diabetes, obesity/overweight, and heart disease led as the most pressing health issues for the overall county. However, every health issue that was rated had over half of participants indicate it was at least a major or moderate problem in the county.
• Access to healthcare: While nearly 60% of participants agreed or somewhat agreed that most residents could access a primary care provider, three-fourths disagreed or somewhat disagreed that county residents are able to access bilingual providers and mental health providers, closely followed by providers accepting Medicaid or other forms of medical assistance. More than half of participants also indicated issues with access to dentists and medical specialists. In addition, open-ended comments noted a lack of “quality” healthcare and providers in the county and that the available services need improvement.
• Leading barriers: The leading barriers to care varied by number of responses through the related questions, though the same list of issues was consistently included:
o Inability to pay for care; those with co-pays could not afford them, and those without insurance could not afford overall care for those without insurance (also cited as a specific issue)
o Transportation needs outstrip the available services and lack flexibility
o Knowledge of available services and ability to utilize
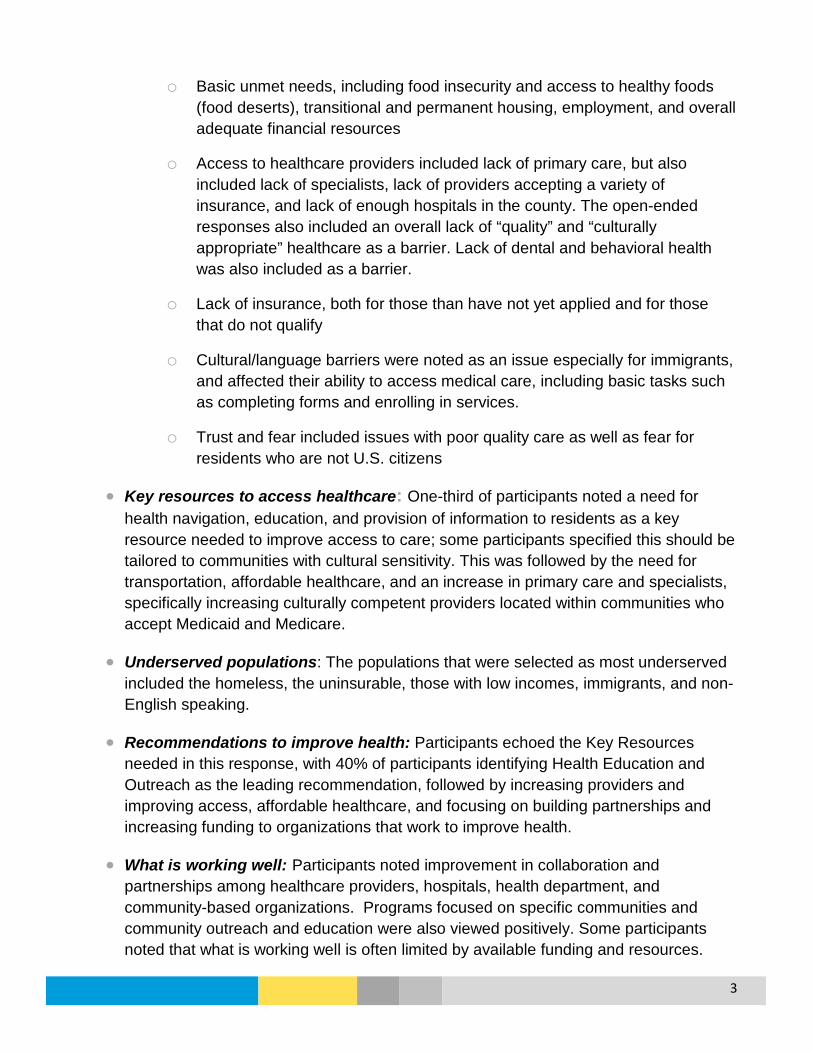
3
o Basic unmet needs, including food insecurity and access to healthy foods (food deserts), transitional and permanent housing, employment, and overall adequate financial resources
o Access to healthcare providers included lack of primary care, but also included lack of specialists, lack of providers accepting a variety of insurance, and lack of enough hospitals in the county. The open-ended responses also included an overall lack of “quality” and “culturally appropriate” healthcare as a barrier. Lack of dental and behavioral health was also included as a barrier.
o Lack of insurance, both for those than have not yet applied and for those that do not qualify
o Cultural/language barriers were noted as an issue especially for immigrants, and affected their ability to access medical care, including basic tasks such as completing forms and enrolling in services.
o Trust and fear included issues with poor quality care as well as fear for residents who are not U.S. citizens
• Key resources to access healthcare: One-third of participants noted a need for health navigation, education, and provision of information to residents as a key resource needed to improve access to care; some participants specified this should be tailored to communities with cultural sensitivity. This was followed by the need for transportation, affordable healthcare, and an increase in primary care and specialists, specifically increasing culturally competent providers located within communities who accept Medicaid and Medicare.
• Underserved populations: The populations that were selected as most underserved included the homeless, the uninsurable, those with low incomes, immigrants, and non-English speaking.
• Recommendations to improve health: Participants echoed the Key Resources needed in this response, with 40% of participants identifying Health Education and Outreach as the leading recommendation, followed by increasing providers and improving access, affordable healthcare, and focusing on building partnerships and increasing funding to organizations that work to improve health.
• What is working well: Participants noted improvement in collaboration and partnerships among healthcare providers, hospitals, health department, and community-based organizations. Programs focused on specific communities and community outreach and education were also viewed positively. Some participants noted that what is working well is often limited by available funding and resources.
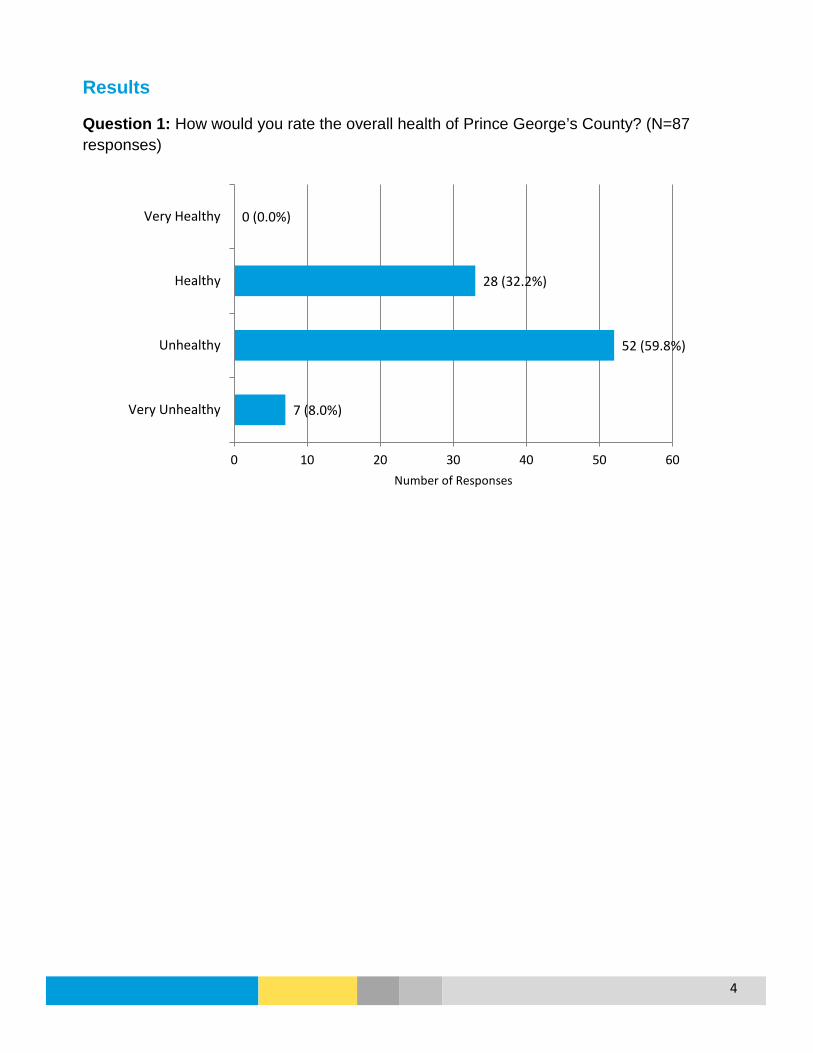
4
Results
Question 1: How would you rate the overall health of Prince George’s County? (N=87 responses)
7 (8.0%)
52 (59.8%)
28 (32.2%)
0 (0.0%)
0 10 20 30 40 50 60
Very Unhealthy
Unhealthy
Healthy
Very Healthy
Number of Responses

5
Question 2: Please rate the following health issues for Prince George’s County. (N=92 responses)
“Other” Included: lead poisoning; kidney disease; health education disparity; hunger/lack of healthy food/lack of knowledge about healthy foods; residents with comorbidities; young adults lacking employment; pedestrian injury and death
0% 10% 20% 30% 40% 50% 60% 70% 80% 90% 100%
OtherDisabilities (physical, developmental)
Unintentional InjuriesDementia/Alzheimer's
Maternal/Infant HealthAsthma/Lung Disease
Infectious DiseaseTobacco Use
Sexually Transmitted DiseasesCancer
Mental Health/Mental Illness/SuicideDental Health
Violence/Domestic ViolenceHIV/AIDS
Substance Abuse/Alcohol AbusePhysical Inactivity
Heart DiseaseStroke/High Blood Pressure
DiabetesObesity/Overweight
Major Problem Moderate Problem Minor Problem Not a Problem N/A or Don't Know

6
Question 2: Please rate the following health issues for Prince George’s County. Major and Moderate Responses
0% 10% 20% 30% 40% 50% 60% 70% 80% 90% 100%
Other
Unintentional Injuries
Disabilities (physical, developmental)
Infectious Disease
Sexually Transmitted Diseases
Dementia/Alzheimer's
HIV/AIDS
Maternal/Infant Health
Tobacco Use
Dental Health
Mental Health/Mental Illness/Suicide
Asthma/Lung Disease
Substance Abuse/Alcohol Abuse
Violence/Domestic Violence
Cancer
Physical Inactivity
Heart Disease
Stroke/High Blood Pressure
Diabetes
Obesity/Overweight
Major Problem Moderate Problem

7
Question 3: Respondents were asked to share any additional information about health issues in the county in an open-ended response (N=21 responses). The responses are summarized in the table below; many responses included statements about multiple issues.
Issues mentioned Number of Responses Summary of Responses
Prevention/Addressing Issues 6
Need for prevention and focus on a variety of issues, including: cancer; breast cancer (mortality); crisis pregnancy & abortion; violence (gun); need more HIV prevention (condoms, needle exchange, PREP) and retention in care; dementia/Alzheimer’s; heart disease/stroke; hepatitis treatment
Healthy Lifestyle 5
Need to focus on promoting healthy lifestyles; built environment (walkable/bike trails); encourage physical activity; opportunities for exercise are underutilized; county needs to focus more on prevention overall
Healthy Food/Food Desert/Food Security
5
Communities need more healthy food options available to them; too many fast food restaurants; areas of food insecurity impact ability to eat healthy (mentioned south county)
Health Disparities 3
The lower income population with chronic disease issues do not have the resources to address them and lacks access to care; disparity between different health issues needs to have a tailored response to the affected population; immigrant population is difficult to care for; stigma for those with HIV
Health Insurance/ Affordable Care 3 Concern for population that are un-and under-insured;
inability for many to pay
Providers/Clinics 3 Not enough primary care and specialty providers; need for better access to primary care
Social Determinants of Health/Basic Needs 3
Overall lack of public health infrastructure, education, housing, poverty, crime, disengagement of residents, lack of resources and political will have to be addressed to improve health
Health Education and Campaigns 2 Focus on developing good habits at an early age; hospitals
need to be involved in providing education
Hospitals/Acute Care 2 Hospitals need to help address local issues, and need to have services throughout the county within the communities; need for more and better quality healthcare facilities
“Other” Included: multiple tobacco stores opening recently in south county; need for improve the quality and number of mental health programs/providers

8
Question 4: From the list for Question 2, please select the three overall most important health issues in Prince George’s County. (Shown in order of ranked score) (N=92 responses)
0 5 10 15 20 25 30 35 40 45 50
Other
Infectious Disease
Tobacco Use
Dental Health
Asthma/Lung Disease
Dementia/Alzheimer's
Sexually Transmitted Diseases
Maternal/Infant Health
Physical Inactivity
Substance Abuse/Alcohol Abuse
Mental Health/Mental Illness/Suicide
Violence/Domestic Violence
Stroke/High Blood Pressure
Cancer
HIV/AIDS
Heart Disease
Obesity/Overweight
Diabetes
First Second Third

9
Question 5: Please rate the following statements about health care access in Prince George’s County. (N=86 responses)
Disagree Somewhat Disagree
Somewhat Agree Agree
Most residents in are able to access a primary care provider. (N=84)
14 (16.7%) 20 (23.8%) 37 (44.0%) 13 (15.5%)
Most residents are able to access a medical specialist. (N=82) 21 (25.6%) 23 (28.0%) 27 (32.9%) 11 (13.4%)
Most residents can access a mental health provider. (N=84) 32 (38.1%) 31 (36.9%) 17 (20.2%) 4 (4.8%)
Most residents are able to access a dentist. (N=79) 25 (31.6%) 20 (25.3%) 24 (30.4%) 10 (12.7%)
Transportation for medical appointments is available to the majority of residents. (N=81)
13 (16.0%) 38 (46.9%) 22 (27.2%) 8 (9.9%)
There are a sufficient number of providers accepting Medicaid or other forms of medical assistance. (N=68)
19 (27.9%) 31 (45.6%) 12 (17.6%) 6 (8.8%)
There are a sufficient number of bilingual providers. (N=72) 30 (41.7%) 24 (33.3%) 12 (16.7%) 6 (8.3%)

10
Question 5: Please rate the following statements about health care access in Prince George’s County .
40.5%
53.7%
75.0%
57.0%
63.0%
73.5% 75.0%
59.5%
46.3%
25.0%
43.0%
37.0%
26.5% 25.0%
0%
10%
20%
30%
40%
50%
60%
70%
80%
Most residents areable to access a
primary careprovider
Most residents areable to access a
medical specialist
Most residents canaccess a mentalhealth provider
Most residents areable to access a
dentist
Transportation formedical
appointments isavailable to the
majority of residents
There are asufficient number ofproviders acceptingMedicaid or otherforms of medical
assistance
There are asufficient number ofbilingual providers
Disagree/Somewhat Disagree Agree/Somewhat Agree

11
Question 6: Please rank the top five most significant barriers that keep people in Prince George’s County from accessing health care. (Shown in order of ranked score) (N=86 responses)
“Other” Included: lack of investment in own health; lack of quality providers; fear by undocumented residents, social determinants of health; pattern of using hospital emergency department for regular care
0 10 20 30 40 50 60 70
Other
Lack of Trust
Lack of Child Care
Language/Cultural Barriers
Lack of Transportation
Time Limitations
Lack of Health Insurance
Basic Needs Not Met
Provider Availability
Inability to Navigate System
Inability to Pay
First Second Third Fourth Fifth

12
Question 7: Respondents were asked to name two key resources that are needed to improve access to health care for County residents in an open-ended response (N=85 responses). The responses are grouped and summarized in the table below; some responses included statements about multiple issues.
Key Resources
Number of Responses Summary of Responses
Health navigation, education, and information
28 (32.9%) Need for: culturally sensitive help in navigating the health care system; health literacy education for consumers; help with using Medicaid and Medicare; community-level engagement
Transportation 18 (21.2%) Need for: both more and more reliable transportation options; more timely transportation options for handicap population; more options for south county; increased call-a-bus services
Affordable Healthcare 16 (18.8%) Need for: assistance with co-pays; services that people (even with health insurance) can afford
More Primary Care Providers 14 (16.5%)
Need for: providers who are culturally competent; providers who are physically located in the community; providers who accept Medicaid/Medicare
More Medical Specialists 13 (15.3%)
Need for: providers who accept Medicaid/Medicare; providers who are culturally competent; providers who are physically located in the community; providers who are academically-affiliated; providers specializing in HIV
Health Insurance 11 (12.9%) Need to: locate and enroll those eligible for insurance; have coverage for those who do not quality for Obamacare (like Montgomery Cares)
Improved Healthcare Quality 10 (11.8%)
Need for: providers who are diverse, culturally competent, and trained in mental health issues; better quality labor and delivery services; better quality inpatient services
More Behavioral Health Providers 7 (8.2%) Need for: providers who are culturally competent; providers and
support services for behavioral health issues
Location of Medical Providers 6 (7.0%)
Need for: health care centers and services to be located in communities throughout the county; ensure clinic-oriented offices are available for physicians
Better Integration of Services 6 (7.0%) Need for: culturally competent services; integrated prevention
services; need for more one-stop-shops Basic Needs (Housing, Food, Employment) 5 (5.9%) Need for: more supportive housing
Dental Care Coverage 4 (4.7%) Need for: dental coverage for Medicaid; Dental care that covers prevention, extractions, and dentures
More and improved support for FQHCs and community centers
3 (35%) Need for: better support/funding for existing FQHCs and community healthcare centers; increase in the number of FQHC and community healthcare centers in the county
More provider hours 3 (3.5%) Need for: weekend and evening appointments
Additional Resources mentioned by one respondent: nursing aides, emergency department services, resources for domestic violence, telemedicine, county policies more supportive of health care coverage

13
Question 8: Respondents were asked to share any additional information about barriers to health care in the county and their selection for Question 7 in an open-ended response (N=25 responses). The responses are summarized in the table below; some responses included statements about multiple barriers.
Barriers
Number of Responses Summary of Responses
Lack of services tailored to different populations
5 Latinos are second largest group in county but there is a lack bilingual staff; there are difference in access to care by region and ethnicity; services are not tailored to the populations with the most need
Affordable Healthcare 4 Inadequate supply of affordable healthcare and insurance
Service Coordination 4
Lack of coordination to get residents connected with behavioral health services; need for more social/health service coordination; need for consistency across services; more challenging for non-English speaking residents
Providers 4 Lack of quality providers; lack of specialists accepting Medicaid; need to attract health care professionals to the county
Transportation 3 Need for more transportation options; need transportation for seniors;
Housing/Social Determinants 3 Lack of stable housing for low income; lack of transitional housing;
lack of resources to improve the social determinants of health
Additional Barriers mentioned by one respondent: lack of resident motivation; lack of knowledge about health priorities in the county by providers/organizations; lack of routine health care access; lack of public health approach to addressing violence; residents with chronic health issues lack education and understanding of their issues Question 9: Please indicate if you believe the following populations are underserved for health-related services and issues in Prince George’s County. (N listed for each population) Very
Underserved Moderately
Underserved Somewhat
Underserved Not
Underserved Homeless Population (N=77) 61 (79.2%) 12 (15.6%) 3 (3.9%) 1 (1.3%)
Uninsurable Population (N=77) 60 (77.9%) 10 (13.0%) 5 (6.5%) 2 (2.6%)
Low Income Individuals (N=83) 46 (55.4%) 29 (34.9%) 5 (6.0%) 3 (3.6)
Immigrant Population (N=69) 36 (52.2%) 21 (30.4%) 10 (14.5%) 2 (2.9%)
Non-English Speaking Population (N=71) 36 (50.7%) 22 (31.0%) 10 (14.1%) 3 (4.2%)

14
Hispanic/Latino Individuals (N=77) 33 (42.9%) 30 (39.0%) 10 (13.0%) 4 (5.2%)
People with Disabilities (N=66) 23 (34.8%) 20 (30.3%) 16 (24.2%) 7 (10.6%)
Black Individuals (N=80) 26 (32.5%) 25 (31.3%) 25 (31.3%) 4 (5.0%)
Seniors/Elderly (>65 years) (N=81) 21 (25.9%) 26 (32.1%) 24 (29.6%) 10 (12.3%)
Young Adults (18 to 29 years) (N=75)
16 (21.3%) 25 (33.3%) 27 (36.0%) 7 (9.3%)
Young Children (Under 5 years) (N=70) 14 (20.0%) 19 (27.1%) 24 (34.3%) 13 (18.6%)
Children/Youth (5 to 17 years) (N=70) 11 (15.7%) 20 (28.6%) 28 (40.0%) 11 (15.7%)
Adults (30 to 64 years) (N=74)
11 (14.9%) 22 (29.7%) 36 (48.6%) 5 (6.8%)
Asian Individuals (N=58) 5 (8.6%) 12 (20.7%) 24 (41.4%) 17 (29.3%)
Other (N=3) 0 2 0 1 “Other” Included: young children who are part of the immigrant population are very underserved; veterans; the population that lacks health education
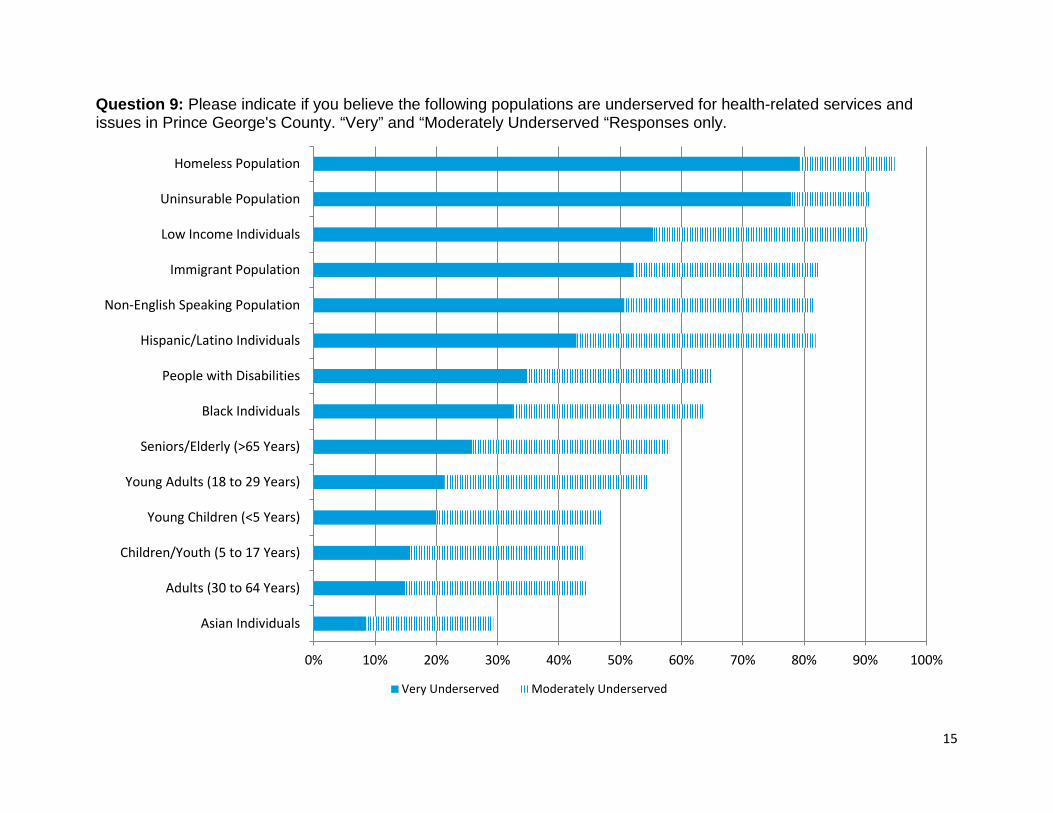
15
Question 9: Please indicate if you believe the following populations are underserved for health-related services and issues in Prince George's County. “Very” and “Moderately Underserved “Responses only.
0% 10% 20% 30% 40% 50% 60% 70% 80% 90% 100%
Asian Individuals
Adults (30 to 64 Years)
Children/Youth (5 to 17 Years)
Young Children (<5 Years)
Young Adults (18 to 29 Years)
Seniors/Elderly (>65 Years)
Black Individuals
People with Disabilities
Hispanic/Latino Individuals
Non-English Speaking Population
Immigrant Population
Low Income Individuals
Uninsurable Population
Homeless Population
Very Underserved Moderately Underserved

16
Question 10: Respondents were asked what the primary barriers are for the populations listed in Question 9 in an open-ended response (N=80 responses). The responses are grouped and summarized in the table below; many responses included statements about multiple issues.
Primary Barriers
Number of Responses Summary of Responses
Lack of Financial and Basic Resources 36 (45.0%)
For those with insurance, co-pays are too high; For those without insurance, health care is unaffordable; overall basic needs take priority over paying for medical care; lack of computer access
Access to Providers/Healthcare 30 (37.5%)
Providers need to be located within the community and have extended hours, need to provide quality care, and need to be culturally competent; need for more providers overall; need for more providers (including specialists) who see low income patients; need health care that is timely; long wait times on phone or in offices is not feasible due to jobs, limits to time on pre-paid cell phones
Cultural/Language Barriers 21 (26.3%) Immigrant population are not treated with respect; lack of culturally
competent healthcare; lack of diversity in languages spoken Knowledge About Health and Services 20 (25.0%) Lack of knowledge about available services increases use of
emergency services; education needed about health and screenings Navigation of Services/ Care Coordination 19 (23.8%) Vulnerable populations need help connecting to available services;
population released from jail/prison; need for healthcare advocates Transportation 17 (21.3%) Need for more transportation options
Lack of Insurance 15 (18.8%) Uninsurable population will continue to have unmet health needs; Insurance is still not affordable for those who do qualify
Community Resources and Outreach 5 (6.25%)
Need for more public-private partnership; need for referral resources; lack of culturally competent community interventions; outreach and focus is not on more vulnerable populations; too much focus on African American population
Lack of Trust 4 (5%) Fear and trust are a barrier to care Inadequate Government Funding 2 (2.5%) Need to serve more non-reimbursable residents
Additional Barriers mentioned by one respondent: immigration status, lack of access to medication

17
Question 11: Respondents were asked is being done well in Prince George’s County in terms of health and well-being and by whom in an open-ended response (n=77 responses). The responses are grouped and summarized in the table below; many responses included statements about multiple health and wellness activities and contributing organizations.
What is being done well
Number of Responses Summary of Responses
Collaboration/Partnerships 17 (22.1%)
Seeing more collaboration between health department, healthcare providers, hospitals, and community groups; better care coordination; need to align priorities and strategies and for more sharing of resources for collaborative efforts.
Community-Based Services/Programs 13 (16.9%)
Community-focused programs that provided services within the community were cited as working well, including: mobile units, services being provided at community events, focus on specific communities (Health Enterprise Zone in 20743), programs at nontraditional locations (such as Langley Park MSC, the Salvation Army).
Community Outreach/Education 12 (15.6%) Increased visibility through community outreach and education
efforts; getting information to the public through the media;
Nothing 3 (3.9%) Respondents did not believe anything is being done well or has improved in the county.
What organizations are doing well for health
Number of Responses Summary of Responses
Health Department 26 (33.8%) Planning and bringing community groups and hospitals together for collaboration (Health Action Coalition, care coordination); community-focused programs and strategies; outreach.
Community-based Organizations 16 (20.8%) Coordination of efforts; outreach; addressing social determinants
of health; providing a safety net; taking services to the residents.
Hospitals 15 (19.5%)
Hospitals have increased their efforts, are doing more community programs (outreach, cancer screenings for women, diabetes); new planned hospital; working to get patients into primary care through partnerships.
Clinics/Providers Hospitals 9 (11.7%)
Overall there is better access to care and more providers available; quality of care is improvement; shift to patient centered medical homes; health care at FQHCs and community clinics are viewed as necessary services.
Other 8 (10.4%)
Department of Social Services was noted for health insurance enrollment activities; MNCPP was noted as an active partner for improving county health; efforts by overall County government to improve health and access to care; providing immunizations at schools.
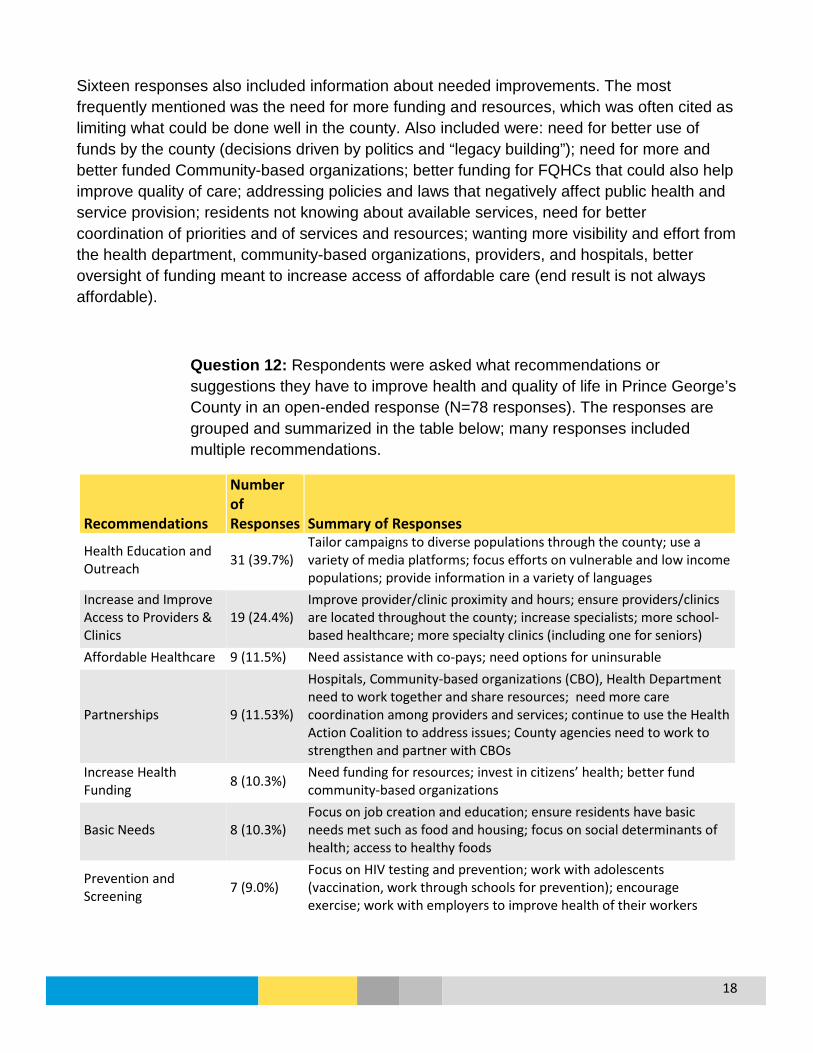
18
Sixteen responses also included information about needed improvements. The most frequently mentioned was the need for more funding and resources, which was often cited as limiting what could be done well in the county. Also included were: need for better use of funds by the county (decisions driven by politics and “legacy building”); need for more and better funded Community-based organizations; better funding for FQHCs that could also help improve quality of care; addressing policies and laws that negatively affect public health and service provision; residents not knowing about available services, need for better coordination of priorities and of services and resources; wanting more visibility and effort from the health department, community-based organizations, providers, and hospitals, better oversight of funding meant to increase access of affordable care (end result is not always affordable).
Question 12: Respondents were asked what recommendations or suggestions they have to improve health and quality of life in Prince George’s County in an open-ended response (N=78 responses). The responses are grouped and summarized in the table below; many responses included multiple recommendations.
Recommendations
Number of Responses Summary of Responses
Health Education and Outreach 31 (39.7%)
Tailor campaigns to diverse populations through the county; use a variety of media platforms; focus efforts on vulnerable and low income populations; provide information in a variety of languages
Increase and Improve Access to Providers & Clinics
19 (24.4%) Improve provider/clinic proximity and hours; ensure providers/clinics are located throughout the county; increase specialists; more school-based healthcare; more specialty clinics (including one for seniors)
Affordable Healthcare 9 (11.5%) Need assistance with co-pays; need options for uninsurable
Partnerships 9 (11.53%)
Hospitals, Community-based organizations (CBO), Health Department need to work together and share resources; need more care coordination among providers and services; continue to use the Health Action Coalition to address issues; County agencies need to work to strengthen and partner with CBOs
Increase Health Funding 8 (10.3%) Need funding for resources; invest in citizens’ health; better fund
community-based organizations
Basic Needs 8 (10.3%) Focus on job creation and education; ensure residents have basic needs met such as food and housing; focus on social determinants of health; access to healthy foods
Prevention and Screening 7 (9.0%)
Focus on HIV testing and prevention; work with adolescents (vaccination, work through schools for prevention); encourage exercise; work with employers to improve health of their workers
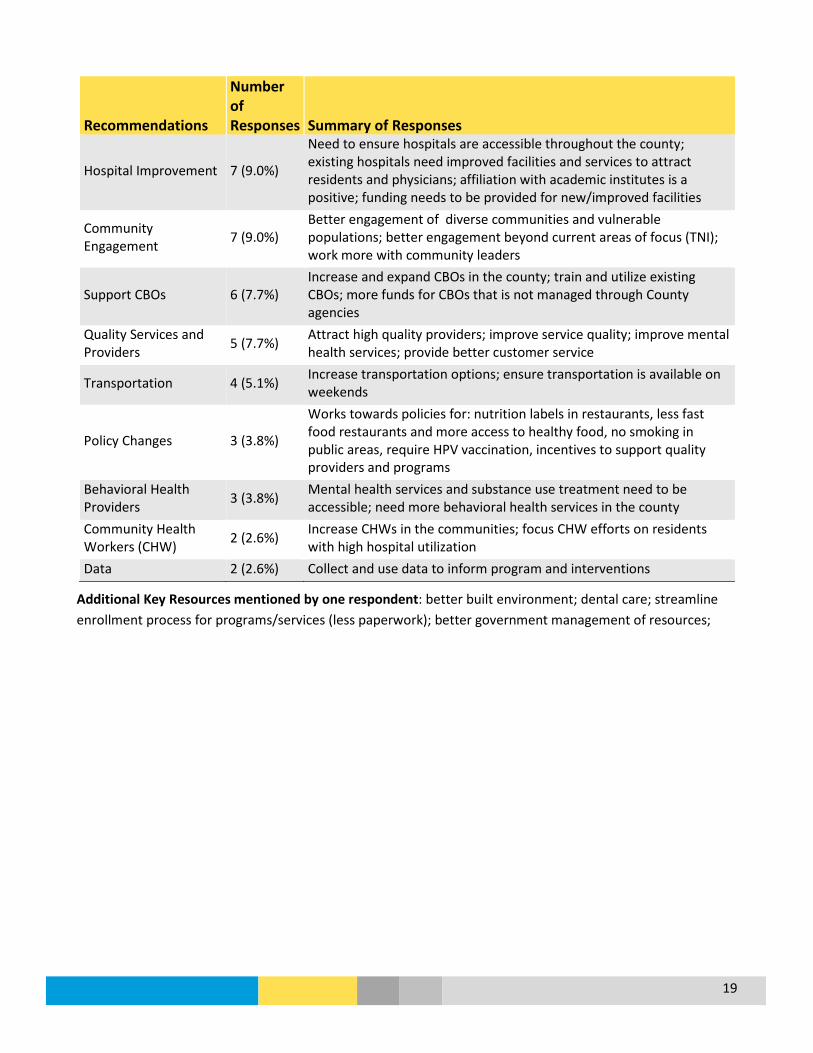
19
Recommendations
Number of Responses Summary of Responses
Hospital Improvement 7 (9.0%)
Need to ensure hospitals are accessible throughout the county; existing hospitals need improved facilities and services to attract residents and physicians; affiliation with academic institutes is a positive; funding needs to be provided for new/improved facilities
Community Engagement 7 (9.0%)
Better engagement of diverse communities and vulnerable populations; better engagement beyond current areas of focus (TNI); work more with community leaders
Support CBOs 6 (7.7%) Increase and expand CBOs in the county; train and utilize existing CBOs; more funds for CBOs that is not managed through County agencies
Quality Services and Providers 5 (7.7%) Attract high quality providers; improve service quality; improve mental
health services; provide better customer service
Transportation 4 (5.1%) Increase transportation options; ensure transportation is available on weekends
Policy Changes 3 (3.8%)
Works towards policies for: nutrition labels in restaurants, less fast food restaurants and more access to healthy food, no smoking in public areas, require HPV vaccination, incentives to support quality providers and programs
Behavioral Health Providers 3 (3.8%) Mental health services and substance use treatment need to be
accessible; need more behavioral health services in the county Community Health Workers (CHW) 2 (2.6%) Increase CHWs in the communities; focus CHW efforts on residents
with high hospital utilization Data 2 (2.6%) Collect and use data to inform program and interventions
Additional Key Resources mentioned by one respondent: better built environment; dental care; streamline enrollment process for programs/services (less paperwork); better government management of resources;

20
Question 13: What do you think could encourage and support more community involvement around health issues in Prince George’s County (select all that apply)? (N=82 responses)
“Other” Included: More involvement of churches and school system; Use of media campaigns in coordination with community and faith-based organizations; incentives to attract mental health and medical specialists to the county; more engagement from providers regarding copayments; county policy around healthcare for contractors; better leadership; more community engagement and more effective outreach; provision of information about available services
17.1%
45.1%
53.7%
56.1%
63.4%
65.9%
68.3%
69.5%
81.7%
0% 10% 20% 30% 40% 50% 60% 70% 80% 90%
Other
Web-based Resources
Community Forums/Summits
Opportunities for Community Input
Increased Emphasis on Action/Implementation
Increased Partnership/Collaboration
Engaging Diverse Leaders/Residents
More Community Outreach
Increased Communication/Awareness

21
Participant Profile
Question 15: What is your gender (N=77 responses)
Question 16: Are you Hispanic or Latino? (N=77 responses)
58.4%
41.6%
0% 10% 20% 30% 40% 50% 60% 70%
Female
Male
93.5%
6.5%
0% 10% 20% 30% 40% 50% 60% 70% 80% 90% 100%
No
Yes
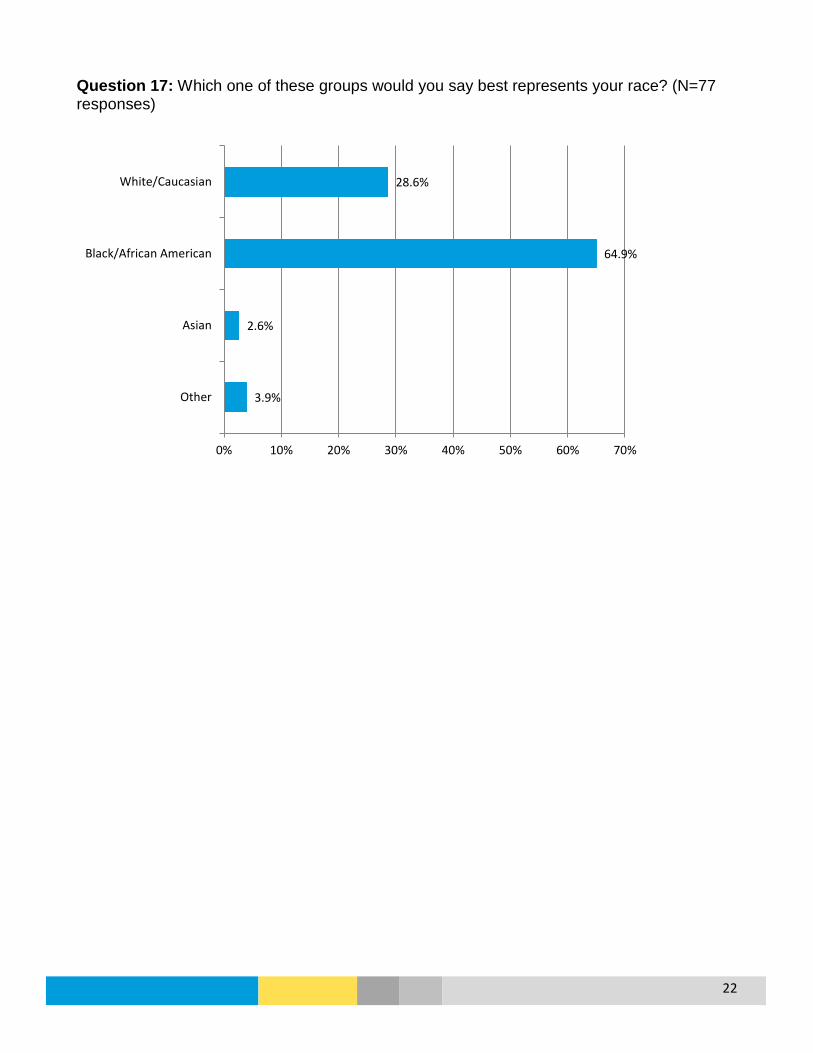
22
Question 17: Which one of these groups would you say best represents your race? (N=77 responses)
3.9%
2.6%
64.9%
28.6%
0% 10% 20% 30% 40% 50% 60% 70%
Other
Asian
Black/African American
White/Caucasian
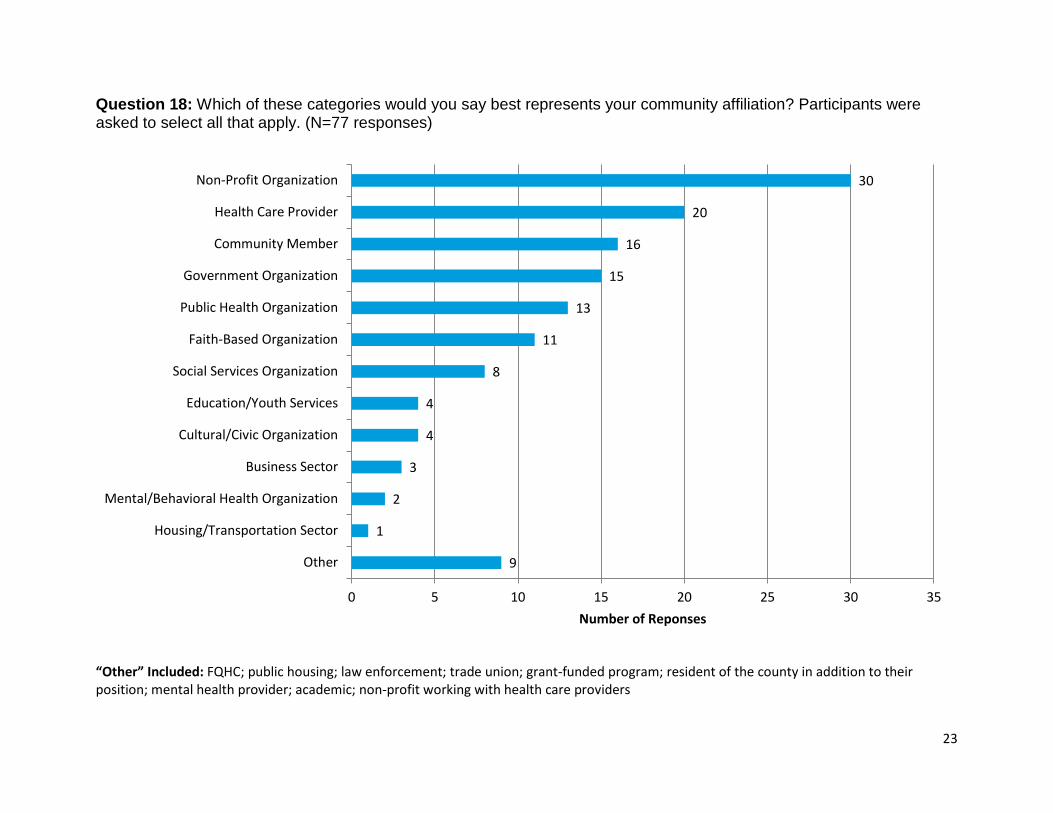
23
Question 18: Which of these categories would you say best represents your community affiliation? Participants were asked to select all that apply. (N=77 responses)
“Other” Included: FQHC; public housing; law enforcement; trade union; grant-funded program; resident of the county in addition to their position; mental health provider; academic; non-profit working with health care providers
9
1
2
3
4
4
8
11
13
15
16
20
30
0 5 10 15 20 25 30 35
Other
Housing/Transportation Sector
Mental/Behavioral Health Organization
Business Sector
Cultural/Civic Organization
Education/Youth Services
Social Services Organization
Faith-Based Organization
Public Health Organization
Government Organization
Community Member
Health Care Provider
Non-Profit Organization
Number of Reponses

24
Question 19: In what geographic part of Prince George’s County are you most knowledgeable about the population? Participants were asked to select all that apply. (N=77 responses)
“Other” included: public housing throughout the county; county areas with a high Latino population
23
14
24
10
24
21
2
0
5
10
15
20
25
30
Multiple areasaround the
County
Outside the D.C.Beltway
Inside the D.C.Beltway
South County Central County North County Other
Num
ber o
f Res
pons
es

25
Question 20: What one ZIP Code in the county are you most knowledgeable about for the population (N=74 responses). Eight respondents listed multiple ZIP codes instead.

26
Question 21: Please select the types of populations you can represent in Prince George’s County through either professional or volunteer roles. Participants were asked to select all that apply. (N=77 responses)
“Other” included: women; victims of domestic violence, undocumented families, and people with mental health and substance abuse issues
2
17
32
17
7
20
38
45
40
31
20
14
60
22
56
0 10 20 30 40 50 60 70
Other
Homeless Population
Uninsurable Population
Non-English Speaking Population
Refugee Population
People with Disabilities
Seniors/Elderly (>65 Years)
Adults (30 to 64 Years)
Young Adults (18 to 29 Years)
Children/Youth (5 to 17 Years)
Young Children (<5 Years)
Asian Individuals
Black Individuals
Hispanic/Latino Individuals
Low Income Individuals
Number of Responses
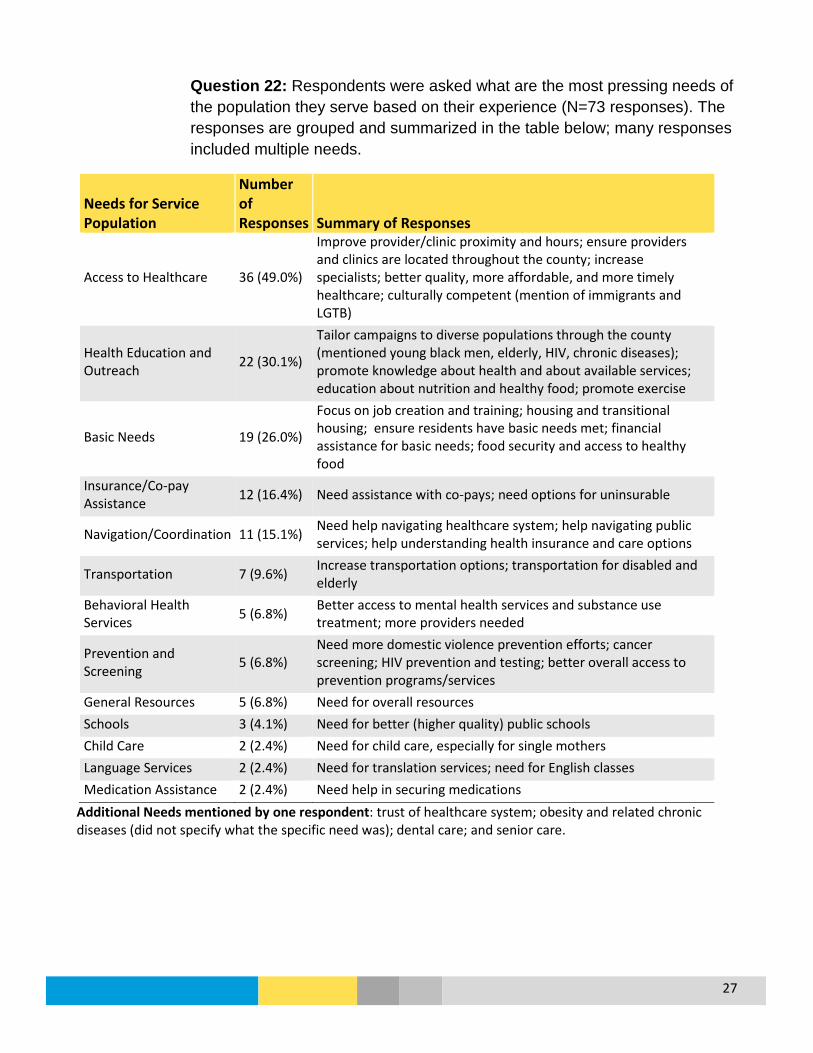
27
Question 22: Respondents were asked what are the most pressing needs of the population they serve based on their experience (N=73 responses). The responses are grouped and summarized in the table below; many responses included multiple needs.
Needs for Service Population
Number of Responses Summary of Responses
Access to Healthcare 36 (49.0%)
Improve provider/clinic proximity and hours; ensure providers and clinics are located throughout the county; increase specialists; better quality, more affordable, and more timely healthcare; culturally competent (mention of immigrants and LGTB)
Health Education and Outreach 22 (30.1%)
Tailor campaigns to diverse populations through the county (mentioned young black men, elderly, HIV, chronic diseases); promote knowledge about health and about available services; education about nutrition and healthy food; promote exercise
Basic Needs 19 (26.0%)
Focus on job creation and training; housing and transitional housing; ensure residents have basic needs met; financial assistance for basic needs; food security and access to healthy food
Insurance/Co-pay Assistance 12 (16.4%) Need assistance with co-pays; need options for uninsurable
Navigation/Coordination 11 (15.1%) Need help navigating healthcare system; help navigating public services; help understanding health insurance and care options
Transportation 7 (9.6%) Increase transportation options; transportation for disabled and elderly
Behavioral Health Services 5 (6.8%) Better access to mental health services and substance use
treatment; more providers needed
Prevention and Screening 5 (6.8%)
Need more domestic violence prevention efforts; cancer screening; HIV prevention and testing; better overall access to prevention programs/services
General Resources 5 (6.8%) Need for overall resources Schools 3 (4.1%) Need for better (higher quality) public schools Child Care 2 (2.4%) Need for child care, especially for single mothers Language Services 2 (2.4%) Need for translation services; need for English classes Medication Assistance 2 (2.4%) Need help in securing medications
Additional Needs mentioned by one respondent: trust of healthcare system; obesity and related chronic diseases (did not specify what the specific need was); dental care; and senior care.

28
Question 22: Respondents were asked to share any additional information about the health of Prince George’s County (N=8 responses). The responses are grouped and summarized in the table below; the majority of these responses reiterated information that had already been provided in previous questions.
Additional Information
Number of Responses Summary of Responses
Collaboration 3 Need for more collaboration among hospitals, physician organizations, government, schools and employers; more collaboration between hospitals and faith-based organizations
Increase in providers/hospitals 2 Need for more providers; need for more hospitals
Better healthcare quality 2
Need for better quality providers; providers receiving public funds need to be held accountable in use of funds, better practice management, and better patient outcomes
Obesity 1 Need to focus on obesity as a cause of many other health issues
Not-for-profits 1 Need a strategy to build capacity of health and social service not-for-profits
Care coordination and information 1 Need for residents to know about and be able to access services
Overall County services 1 Need for better infrastructure ,and better schools
County funding 1 Need for funding to be used for the public instead of politically-motived projects
Question 24: Would you be interested in becoming more involved in local health initiatives?
35.10%
10.40%
54.50%
0.00%
10.00%
20.00%
30.00%
40.00%
50.00%
60.00%
Yes No Already Invovled
1
COMMUNITY RESIDENT SURVEY
Introduction
Prince George’s County is home to over 900,000 residents and growing, with a wide range of health needs and disparities. The Community Resident Survey was a strategy developed to complement the overall Community Health Assessment (CHA) goal of identifying the health needs and issues for the county’s diverse population by hearing directly from our residents.
Methodology
The Community Resident Survey was developed based on existing community surveys provided by the CHA core team and examples from successful CHAs with some modifications specific to the county. Efforts were made to ensure the survey questions corresponded with the Community-Based Organization Survey which was also part of CHA data collection efforts. The survey questions included mostly multiple choice and rating scales with a few open-ended responses for demographics and an option for writing in a response if the participant answered with “other”.
The survey was translated into Spanish (the most common language spoken in the county after English), and was made available online and through printed copies. Due to time limitations, the survey was distributed as a convenience sample, with each participating hospital requested to help distribute the survey in their service area; two hospitals (Fort Washington Medical Center and Doctors Community Hospital) collected and entered surveys from their service area. The Health Department made the survey available by website, social media, and through provided services. Survey distribution began on March 14, 2016 and ended on April 8, 2016.
For analysis, each multiple choice and rating scale question is presented as a simple descriptive statistic. Because the surveys were collected as a convenience sample, the results were intended as an additional method of gaining community input in support of the overall process, while acknowledging the lack of an adequate sample size to statistically represent the county. Surveys were excluded if the majority of the survey was incomplete or if the participant did not indicate they were a county resident. The English and Spanish surveys were initially analyzed separately with the intent to combine the responses; however, due to notable differences in responses the survey results are presented separately. Each question includes the number (N) of responses.
Participation Surveys were completed by 201 participants in English and 115 in Spanish for a total of 316 county residents. Nearly all areas of the county were represented by the participants with the exception of the most southern part of the county (a map of representation is available with
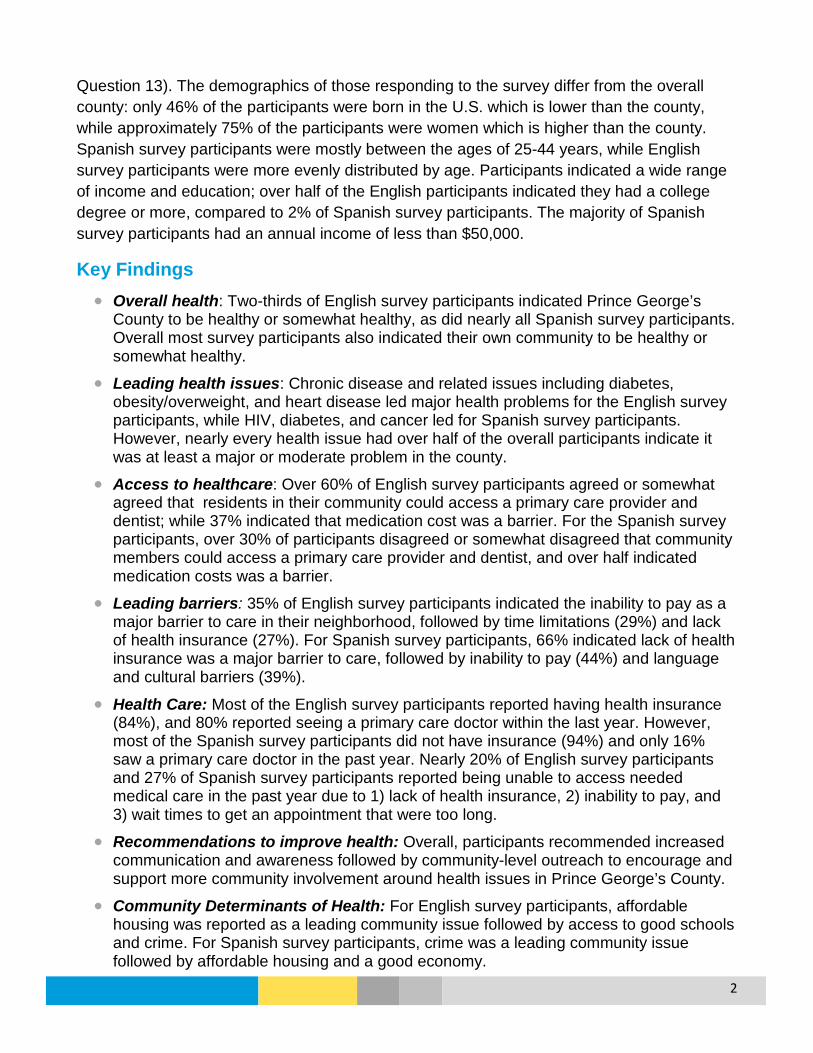
2
Question 13). The demographics of those responding to the survey differ from the overall county: only 46% of the participants were born in the U.S. which is lower than the county, while approximately 75% of the participants were women which is higher than the county. Spanish survey participants were mostly between the ages of 25-44 years, while English survey participants were more evenly distributed by age. Participants indicated a wide range of income and education; over half of the English participants indicated they had a college degree or more, compared to 2% of Spanish survey participants. The majority of Spanish survey participants had an annual income of less than $50,000.
Key Findings • Overall health: Two-thirds of English survey participants indicated Prince George’s
County to be healthy or somewhat healthy, as did nearly all Spanish survey participants. Overall most survey participants also indicated their own community to be healthy or somewhat healthy.
• Leading health issues: Chronic disease and related issues including diabetes, obesity/overweight, and heart disease led major health problems for the English survey participants, while HIV, diabetes, and cancer led for Spanish survey participants. However, nearly every health issue had over half of the overall participants indicate it was at least a major or moderate problem in the county.
• Access to healthcare: Over 60% of English survey participants agreed or somewhat agreed that residents in their community could access a primary care provider and dentist; while 37% indicated that medication cost was a barrier. For the Spanish survey participants, over 30% of participants disagreed or somewhat disagreed that community members could access a primary care provider and dentist, and over half indicated medication costs was a barrier.
• Leading barriers: 35% of English survey participants indicated the inability to pay as a major barrier to care in their neighborhood, followed by time limitations (29%) and lack of health insurance (27%). For Spanish survey participants, 66% indicated lack of health insurance was a major barrier to care, followed by inability to pay (44%) and language and cultural barriers (39%).
• Health Care: Most of the English survey participants reported having health insurance (84%), and 80% reported seeing a primary care doctor within the last year. However, most of the Spanish survey participants did not have insurance (94%) and only 16% saw a primary care doctor in the past year. Nearly 20% of English survey participants and 27% of Spanish survey participants reported being unable to access needed medical care in the past year due to 1) lack of health insurance, 2) inability to pay, and 3) wait times to get an appointment that were too long.
• Recommendations to improve health: Overall, participants recommended increased communication and awareness followed by community-level outreach to encourage and support more community involvement around health issues in Prince George’s County.
• Community Determinants of Health: For English survey participants, affordable housing was reported as a leading community issue followed by access to good schools and crime. For Spanish survey participants, crime was a leading community issue followed by affordable housing and a good economy.
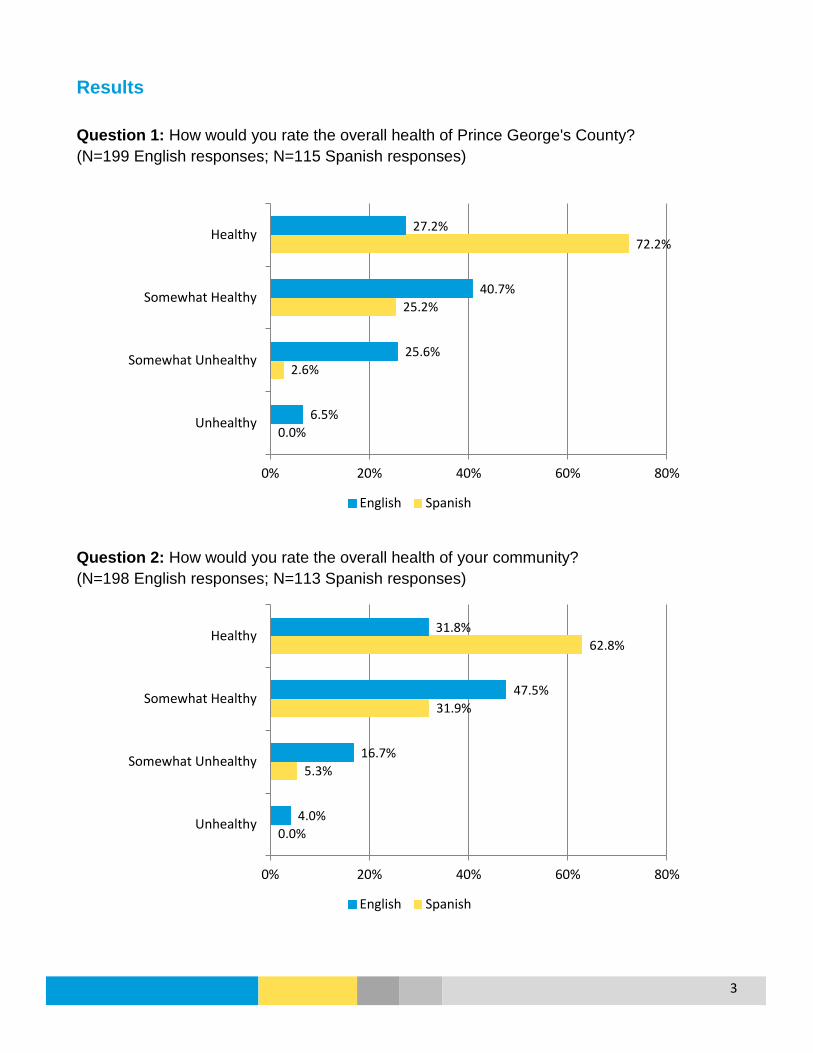
3
Results Question 1: How would you rate the overall health of Prince George's County? (N=199 English responses; N=115 Spanish responses)
Question 2: How would you rate the overall health of your community? (N=198 English responses; N=113 Spanish responses)
0.0%
2.6%
25.2%
72.2%
6.5%
25.6%
40.7%
27.2%
0% 20% 40% 60% 80%
Unhealthy
Somewhat Unhealthy
Somewhat Healthy
Healthy
English Spanish
0.0%
5.3%
31.9%
62.8%
4.0%
16.7%
47.5%
31.8%
0% 20% 40% 60% 80%
Unhealthy
Somewhat Unhealthy
Somewhat Healthy
Healthy
English Spanish

4
Question 3: Please rate the following health issues for your neighborhood or community. (N=200 English responses)
“Other” Included: teen violence; hearing; podiatry; vascular; lack of maternity clinic services
0% 10% 20% 30% 40% 50% 60% 70% 80% 90% 100%
OtherMaternal/Infant Health
Unintentional InjuriesInfectious Disease
Disabilities (physical, developmental)Sexually Transmitted Diseases
Dementia/Alzheimer'sDental Health
HIV/AIDSAsthma/Lung Disease
Mental Health/Mentall Illness/SuicideViolence/Domestic Violence
Substance Abuse/Alcohol AbuseTobacco Use
Physical InactivityCancer
Stroke/High Blood PressureHeart Disease
Obesity/OverweightDiabetes
Major Problem Moderate Problem Minor Problem Not a Problem N/A or Don't Know

5
Question 3: Please rate the following health issues for your neighborhood or community. (N=109 Spanish responses)
“Other” Included: drug abuse; the overall community’s health
0% 10% 20% 30% 40% 50% 60% 70% 80% 90% 100%
OtherDental Health
Unintentional InjuriesMaternal/Infant Health
Physical InactivityAsthma/Lung Disease
Infectious DiseaseDementia/Alzheimer's
Disabilities (physical, developmental)Tobacco Use
Obesity/OverweightStroke/High Blood Pressure
Substance Abuse/Alcohol AbuseSexually Transmitted Diseases
Mental Health/Mentall Illness/SuicideHeart Disease
Violence/Domestic ViolenceCancer
DiabetesHIV/AIDS
Major Problem Moderate Problem Minor Problem Not a Problem N/A or Don't Know

6
Question 3: Please rate the following health issues for your neighborhood or community. Major and Moderate Responses (N=200 English responses)
0% 10% 20% 30% 40% 50% 60% 70% 80%
Other
Infectious Disease
Unintentional Injuries
Maternal/Infant Health
Disabilities (physical, developmental)
Sexually Transmitted Diseases
HIV/AIDS
Asthma/Lung Disease
Dementia/Alzheimer's
Mental Health/Mentall Illness/Suicide
Dental Health
Violence/Domestic Violence
Tobacco Use
Substance Abuse/Alcohol Abuse
Heart Disease
Physical Inactivity
Cancer
Stroke/High Blood Pressure
Obesity/Overweight
Diabetes
Major Problem Moderate Problem

7
Question 3: Please rate the following health issues for your neighborhood or community. Major and Moderate Responses (N=109 Spanish responses)
0% 10% 20% 30% 40% 50% 60% 70% 80%
Other
Asthma/Lung Disease
Dementia/Alzheimer's
Maternal/Infant Health
Disabilities (physical, developmental)
Unintentional Injuries
Infectious Disease
Mental Health/Mentall Illness/Suicide
Physical Inactivity
Tobacco Use
Dental Health
Heart Disease
Stroke/High Blood Pressure
Sexually Transmitted Diseases
Violence/Domestic Violence
HIV/AIDS
Obesity/Overweight
Substance Abuse/Alcohol Abuse
Cancer
Diabetes
Major Problem Moderate Problem

8
Question 4: Please rate the following statements about health care access in your community.
Disagree Somewhat Disagree Somewhat Agree Agree NA/Don’t Know
English Spanish English Spanish English Spanish English Spanish English Spanish Most residents in my community are able to access a primary care provider. (N=200; 113)
11 (5.5%) 29 (25.7%) 17 (8.5%) 13 (11.5%) 55 (27.5%) 15 (13.3%) 76 (38.0%) 19 (16.8%) 41 (20.5%) 37 (32.7%)
There are enough providers in my community for the number of residents. (N=200; 110)
28 (14.0%) 19 (17.3%) 31 (15.5%) 13 (11.8%) 44 (22.0%) 16 (14.6%) 57 (28.5%) 20 (18.2%) 40 (20.0%) 42 (38.2%)
Most residents in my community are able to access a medical specialist such as a dermatologist or neurologist. (N=197; 109)
26 (13.2%) 23 (21.1%) 24 (12.2%) 15 (13.8%) 58 (29.4%) 11 (10.1%) 51 (25.9%) 19 (17.4%) 38 (19.3%) 41 (37.6%)
Most residents in my community can access a mental health provider. (N=200; 110)
25 (12.5%) 20 (18.2%) 36 (18.0%) 16 (14.6%) 43 (21.5%) 10 (9.1%) 49 (24.5%) 16 (14.6%) 47 (23.5%) 48 (43.6%)
Most residents in my community are able to access a dentist. (N=200; 109)
15 (7.5%) 28 (25.7%) 23 (11.5%) 11 (10.1%) 55 (27.5%) 12 (11.0%) 71 (35.5%) 27 (24.8%) 36 (18.0%) 31 (28.4%)
Transportation for medical appointments is available to the majority of residents in my community. (N=199; 108)
17 (8.5%) 20 (18.5%) 30 (15.1%) 11 (10.2%) 54 (27.1%) 16 (14.8%) 53 (26.6%) 15 (13.9%) 45 (22.6%) 46 (42.6%)
The residents in my community can afford their medication. (N=196; 109)
32 (16.3%) 41 (37.6%) 40 (20.4%) 16 (14.7%) 44 (22.5%) 3 (2.8%) 32 (16.3%) 8 (7.3%) 48 (24.5%) 41 (37.6%)

9
Question 4: Please rate the following statements about health care access in your community. (N=200 English responses).
14.0%
29.5%
25.4%
30.5%
19.0%
23.6%
36.7%
65.50%
50.5%
55.3%
46.0%
63.0%
53.8%
38.8%
0%
10%
20%
30%
40%
50%
60%
70%
Most residents in mycommunity are ableto access a primary
care provider
There are enoughproviders in my
community for thenumber of residents
Most residents in mycommunity are ableto access a medical
specialist
Most residents in mycommunity canaccess a mentalhealth provider
Most residents in mycommunity are ableto access a dentist
Transportation formedical
appointments isavailable to the
majority of residents
The residents in mycommunity can
afford theirmedication
Disagree/Somewhat Disagree Agree/Somewhat Agree

10
Question 4: Please rate the following statements about health care access in your community. (N=113 Spanish responses)
37.2%
29.1%
34.9% 32.7%
35.8%
28.7%
52.3%
30.1% 32.7%
27.5% 23.6%
35.8%
28.7%
10.1%
0%
10%
20%
30%
40%
50%
60%
Most residents in mycommunity are ableto access a primary
care provider
There are enoughproviders in my
community for thenumber of residents
Most residents in mycommunity are ableto access a medical
specialist
Most residents in mycommunity canaccess a mentalhealth provider
Most residents in mycommunity are ableto access a dentist
Transportation formedical
appointments isavailable to the
majority of residents
The residents in mycommunity can
afford theirmedication
Disagree/Somewhat Disagree Agree/Somewhat Agree

11
Question 5: Please rate if the following barriers keep people in your community from accessing healthcare. (N=198 English responses)
“Other” Included: lack of quality providers, hospitals, specialists, and dentists in the county; lack of appropriate transportation tailored to meet special health needs; urgent care clinics not accepting Medicare; lack of providers accepting insurance; residents whose insurance coverage lapses; lack of home care to support elderly; lack of personal responsibility for health
0% 10% 20% 30% 40% 50% 60% 70% 80% 90% 100%
Other
Basic Needs Not Met
Provider Availability
Lack of Transportation
Language/Cultural Barriers
Lack of Trust
Inability to Navigate System
Lack of Child Care
Lack of Health Insurance
Time Limitations
Inability to Pay
Major Problem Moderate Problem Minor Problem Not a Problem

12
Question 5: Please rate if the following barriers keep people in your community from accessing healthcare. (N=112 Spanish responses)
“Other” Included: “the family”
0% 10% 20% 30% 40% 50% 60% 70% 80% 90% 100%
Other
Basic Needs Not Met
Inability to Navigate System
Lack of Trust
Provider Availability
Time Limitations
Lack of Transportation
Lack of Child Care
Language/Cultural Barriers
Inability to Pay
Lack of Health Insurance
Major Problem Moderate Problem Minor Problem Not a Problem
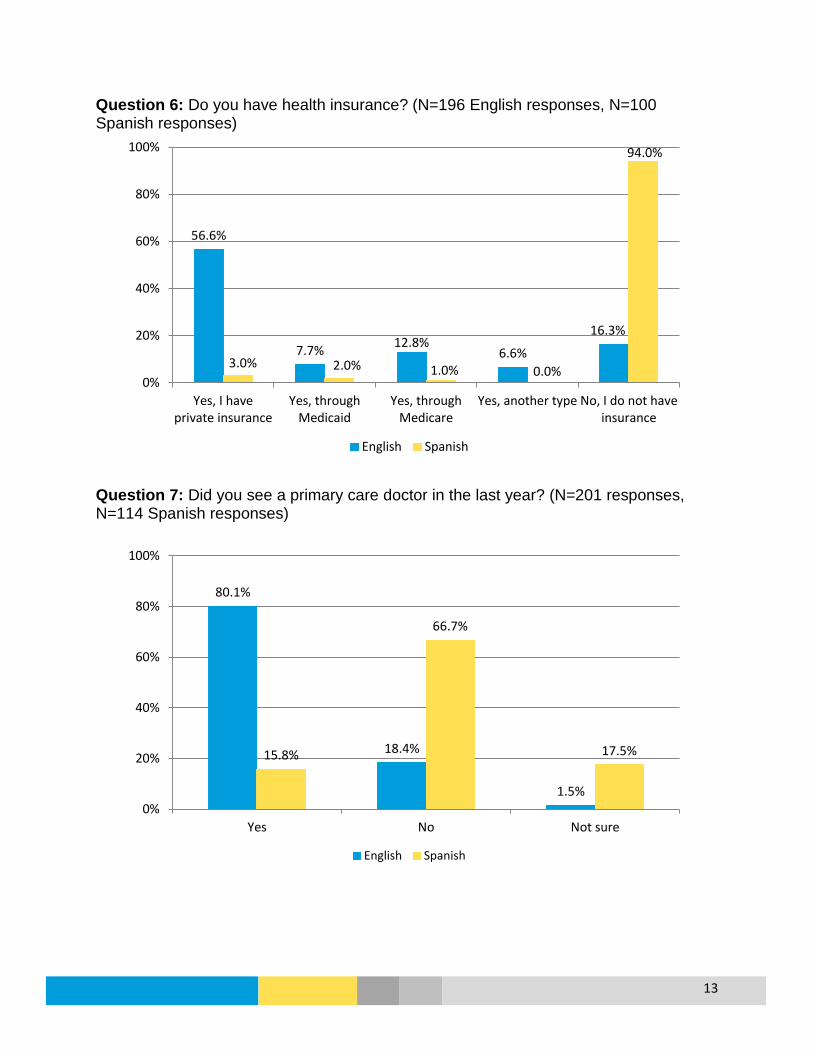
13
Question 6: Do you have health insurance? (N=196 English responses, N=100 Spanish responses)
Question 7: Did you see a primary care doctor in the last year? (N=201 responses, N=114 Spanish responses)
56.6%
7.7% 12.8% 6.6%
16.3%
3.0% 2.0% 1.0% 0.0%
94.0%
0%
20%
40%
60%
80%
100%
Yes, I haveprivate insurance
Yes, throughMedicaid
Yes, throughMedicare
Yes, another type No, I do not haveinsurance
English Spanish
80.1%
18.4%
1.5%
15.8%
66.7%
17.5%
0%
20%
40%
60%
80%
100%
Yes No Not sure
English Spanish

14
Question 8: Has there been a time in the past year when you needed medical care but were not able to get it? (N=201 English responses; N=113 Spanish responses)
19.4%
77.1%
3.5%
26.5%
67.3%
6.2%
0%
10%
20%
30%
40%
50%
60%
70%
80%
90%
Yes No Not sure
English Spanish

15
Question 9: If you answered that you were unable to get medical care, what prevented you from getting the medical care you needed (select all that apply)? (N=38 English responses; N=27 Spanish responses)
For English participants, “Other” included: green card issues; doctor being fully booked for weeks; lack of quality healthcare in the county; Urgent Care not accepting Medicare; inadequate insurance, not having options close in proximity, and not being able to take time off work. Some participants did not select the items listed, but did include them as barriers in “other”: transportation; co-payment; child care.
For Spanish participants, “Other” included: not having a Social Security Number, no place to go for a health consultation; no insurance and no money to pay for medical care; wait for Cobra enrollment after a job loss.
2
4
6
6
14
24
8
1
3
11
10
17
0 5 10 15 20 25 30
Other
Lack of Child Care
Lack of Transportation
Wait Time was too Long
Could Not Pay
No Insurance
Number of Responses
English Spanish

16
Question 10: What do you think could encourage and support more community involvement around health issues in Prince George’s County (select all that apply)? (N=196 English responses; N=106 Spanish responses)
For English participants, “Other” included: education on health risks, nutrition, prevention, health lifestyles; starting health education at an early age and tailoring education for culture and age groups; more funding for public health; using a variety of platforms for outreach (TV, radio, local store, schools); increase high quality healthcare providers; community-oriented events and partners; urgent cares that serve all insurance types; providing health-supporting services through schools, such as emergency mental health, immunizations, and access to bilingual providers; providing more education through the hospitals; adequate low income housing; more emphasis on prevention. For Spanish participants, “Other” included: community-level support; not needing to see a doctor; having insurance.
26.4%
39.6%
26.4%
35.8%
27.4%
33.0%
50.9%
67.9%
8.2%
34.2%
35.7%
38.8%
39.8%
42.3%
42.9%
59.2%
76.5%
0% 10% 20% 30% 40% 50% 60% 70% 80% 90%
Other
Web-Based Resources
Community Forums/Summits
Engaging Diverse Leaders/Residents
Opportunities for Community Input
Increased Emphasis on Action/Implementation
Increased Partnership/Collaboration
More Community Outreach
Increased Communication/Awareness
Percent
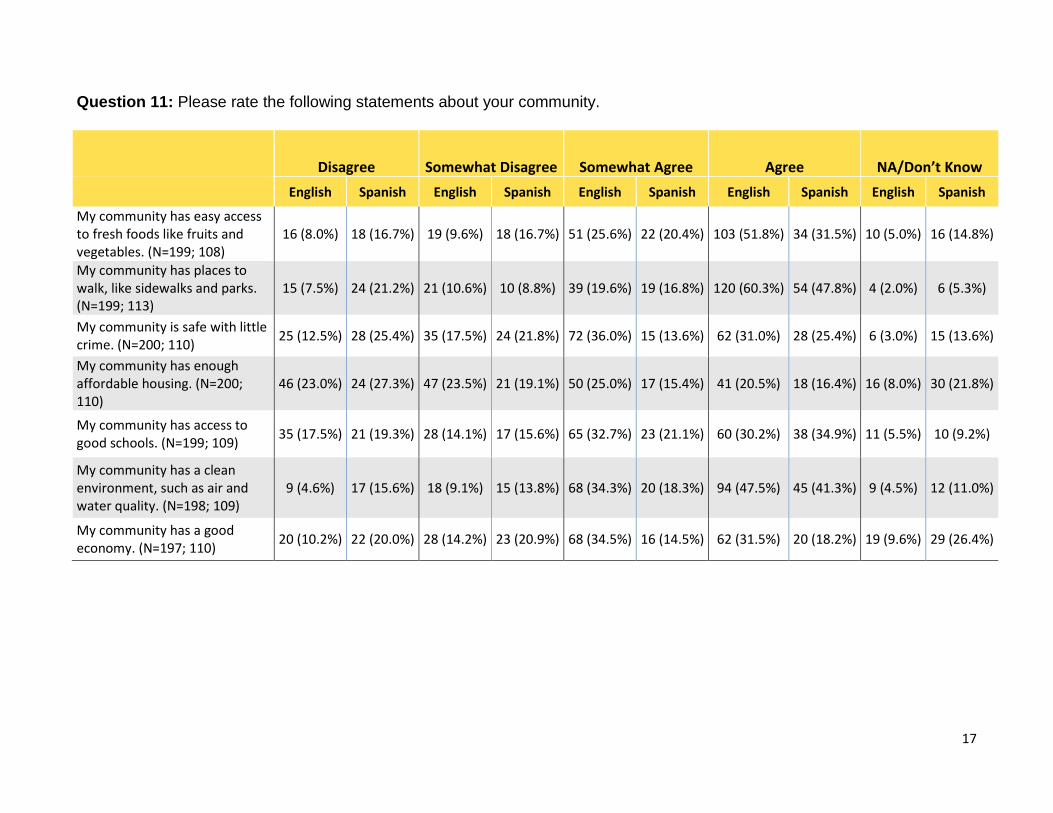
17
Question 11: Please rate the following statements about your community.
Disagree Somewhat Disagree Somewhat Agree Agree NA/Don’t Know English Spanish English Spanish English Spanish English Spanish English Spanish
My community has easy access to fresh foods like fruits and vegetables. (N=199; 108)
16 (8.0%) 18 (16.7%) 19 (9.6%) 18 (16.7%) 51 (25.6%) 22 (20.4%) 103 (51.8%) 34 (31.5%) 10 (5.0%) 16 (14.8%)
My community has places to walk, like sidewalks and parks. (N=199; 113)
15 (7.5%) 24 (21.2%) 21 (10.6%) 10 (8.8%) 39 (19.6%) 19 (16.8%) 120 (60.3%) 54 (47.8%) 4 (2.0%) 6 (5.3%)
My community is safe with little crime. (N=200; 110) 25 (12.5%) 28 (25.4%) 35 (17.5%) 24 (21.8%) 72 (36.0%) 15 (13.6%) 62 (31.0%) 28 (25.4%) 6 (3.0%) 15 (13.6%)
My community has enough affordable housing. (N=200; 110)
46 (23.0%) 24 (27.3%) 47 (23.5%) 21 (19.1%) 50 (25.0%) 17 (15.4%) 41 (20.5%) 18 (16.4%) 16 (8.0%) 30 (21.8%)
My community has access to good schools. (N=199; 109) 35 (17.5%) 21 (19.3%) 28 (14.1%) 17 (15.6%) 65 (32.7%) 23 (21.1%) 60 (30.2%) 38 (34.9%) 11 (5.5%) 10 (9.2%)
My community has a clean environment, such as air and water quality. (N=198; 109)
9 (4.6%) 17 (15.6%) 18 (9.1%) 15 (13.8%) 68 (34.3%) 20 (18.3%) 94 (47.5%) 45 (41.3%) 9 (4.5%) 12 (11.0%)
My community has a good economy. (N=197; 110) 20 (10.2%) 22 (20.0%) 28 (14.2%) 23 (20.9%) 68 (34.5%) 16 (14.5%) 62 (31.5%) 20 (18.2%) 19 (9.6%) 29 (26.4%)

18
Question 11: Please rate the following statements about your community. (N=200 English responses)
17.6% 18.1%
30.0%
46.5%
31.7%
13.6%
24.4%
77.4% 79.9%
67.0%
45.5%
62.8%
81.8%
66.0%
0%
10%
20%
30%
40%
50%
60%
70%
80%
90%
My community haseasy access to freshfoods like fruits and
vegetables
My community hasplaces to walk, like
sidewalks and parks
My community issafe with little crime
My community hasenough affordable
housing
My community hasaccess to good
schools
My community has aclean environment,
such as air and waterquality
My community has agood economy
Disagree/Somewhat Disagree Agree/Somewhat Agree

19
Question 11: Please rate the following statements about your community. (N=114 Spanish responses)
33.3% 30.1%
47.3% 46.4%
34.9%
29.4%
40.9%
51.9%
64.6%
39.1%
31.8%
56.0% 59.6%
32.7%
0%
10%
20%
30%
40%
50%
60%
70%
My community haseasy access to freshfoods like fruits and
vegetables
My community hasplaces to walk, like
sidewalks and parks
My community issafe with little crime
My community hasenough affordable
housing
My community hasaccess to good
schools
My community has aclean environment,
such as air and waterquality
My community has agood economy
Disagree/Somewhat Disagree Agree/Somewhat Agree
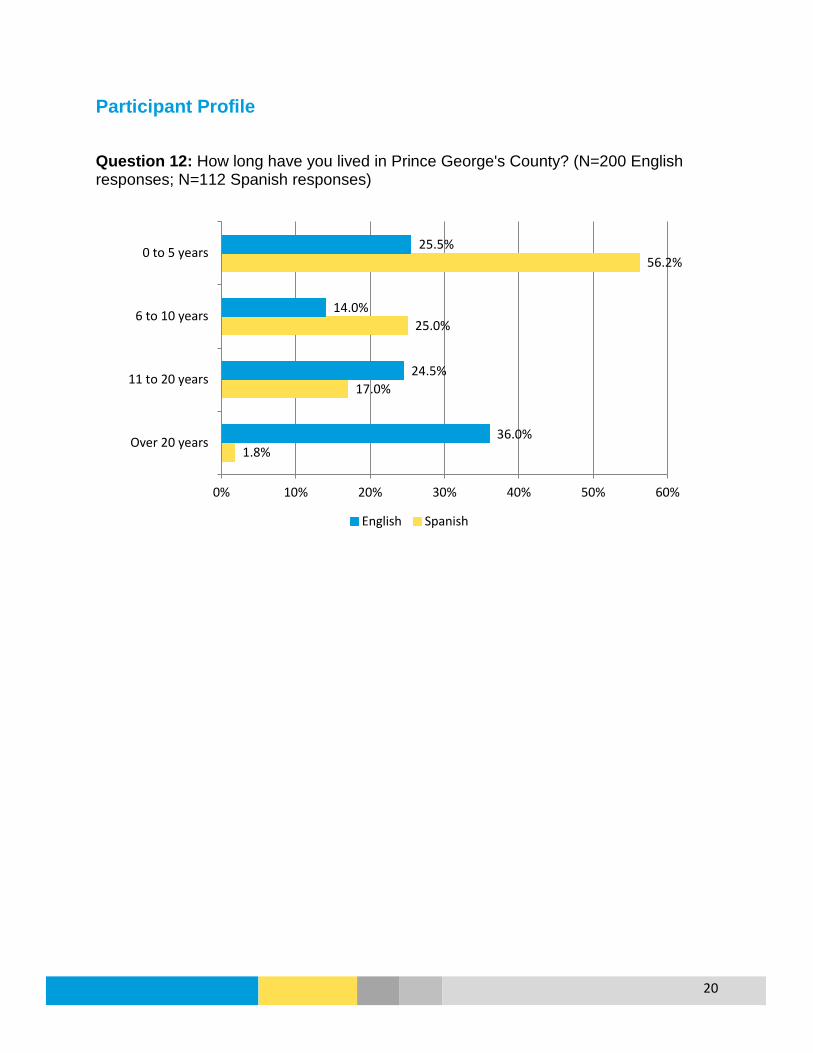
20
Participant Profile
Question 12: How long have you lived in Prince George's County? (N=200 English responses; N=112 Spanish responses)
1.8%
17.0%
25.0%
56.2%
36.0%
24.5%
14.0%
25.5%
0% 10% 20% 30% 40% 50% 60%
Over 20 years
11 to 20 years
6 to 10 years
0 to 5 years
English Spanish
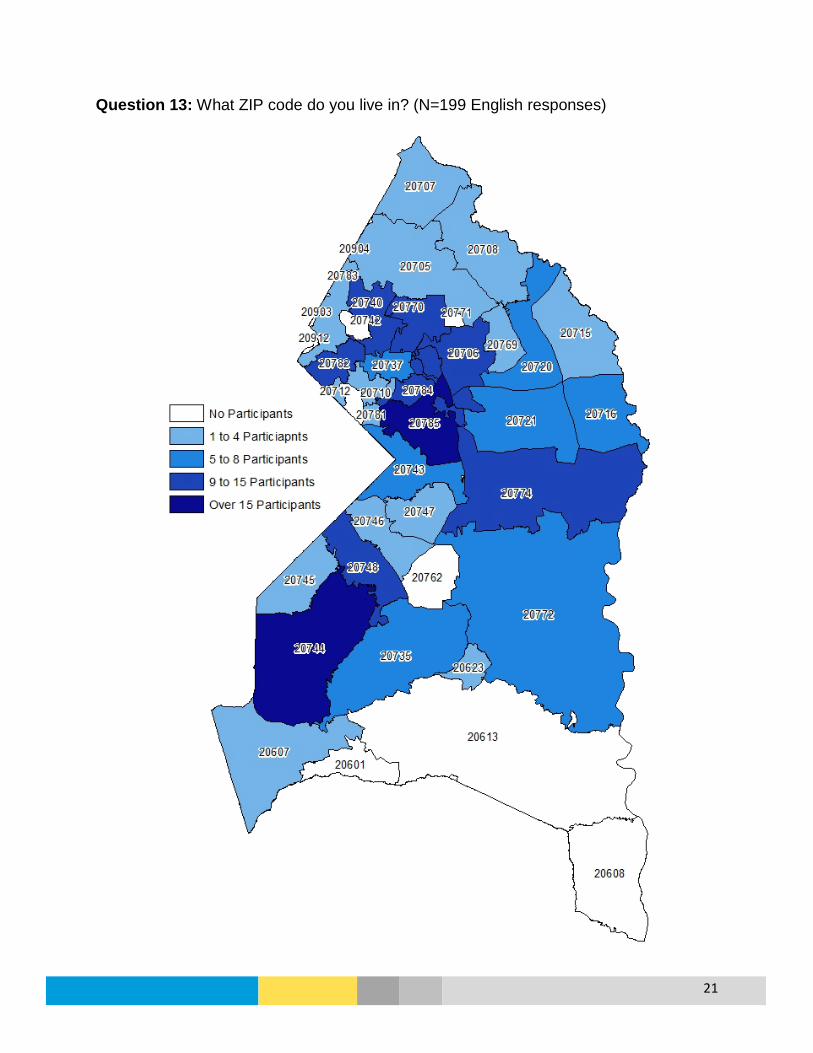
21
Question 13: What ZIP code do you live in? (N=199 English responses)

22
Question 13: What ZIP code do you live in? (N=90 Spanish responses)
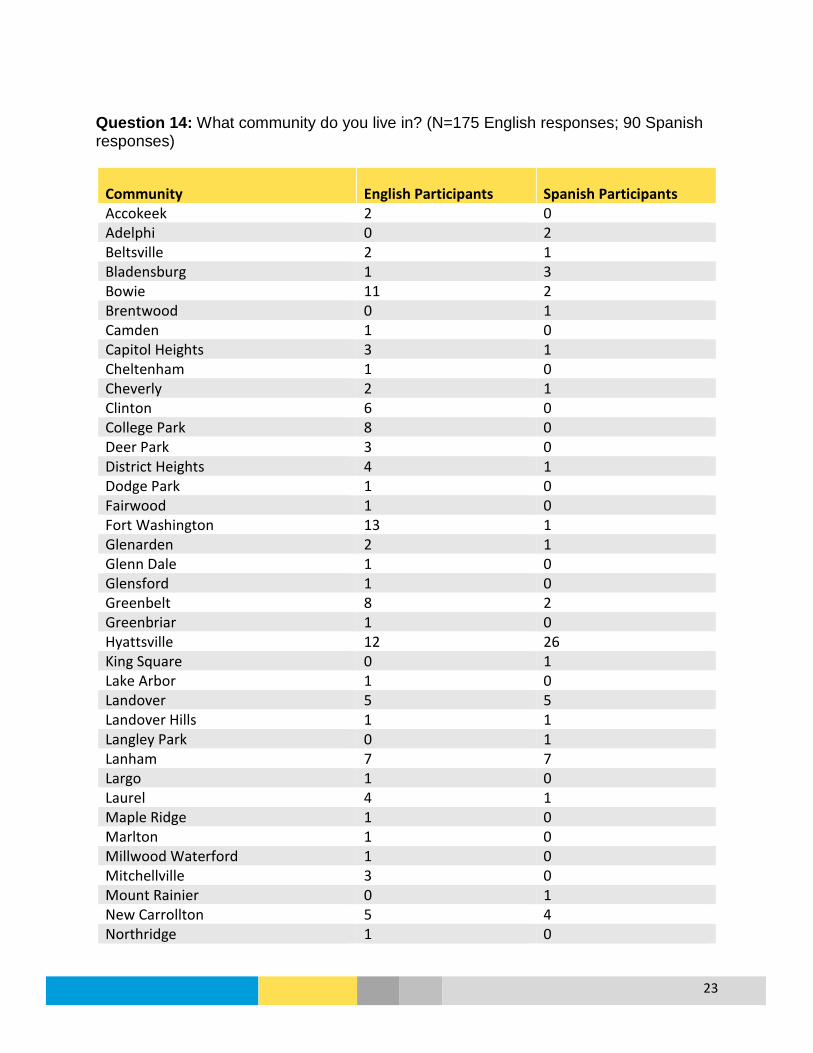
23
Question 14: What community do you live in? (N=175 English responses; 90 Spanish responses)
Community English Participants Spanish Participants Accokeek 2 0 Adelphi 0 2 Beltsville 2 1 Bladensburg 1 3 Bowie 11 2 Brentwood 0 1 Camden 1 0 Capitol Heights 3 1 Cheltenham 1 0 Cheverly 2 1 Clinton 6 0 College Park 8 0 Deer Park 3 0 District Heights 4 1 Dodge Park 1 0 Fairwood 1 0 Fort Washington 13 1 Glenarden 2 1 Glenn Dale 1 0 Glensford 1 0 Greenbelt 8 2 Greenbriar 1 0 Hyattsville 12 26 King Square 0 1 Lake Arbor 1 0 Landover 5 5 Landover Hills 1 1 Langley Park 0 1 Lanham 7 7 Largo 1 0 Laurel 4 1 Maple Ridge 1 0 Marlton 1 0 Millwood Waterford 1 0 Mitchellville 3 0 Mount Rainier 0 1 New Carrollton 5 4 Northridge 1 0

24
Community English Participants Spanish Participants Oxford Run 1 0 Oxon Hill 2 5 Prince George's County 14 3 Riverdale 3 16 Riverdale Park 1 0 Riverhill 1 0 Rose Valley 1 0 Seabrook 1 0 Seat Pleasant 1 0 Silver Spring 0 1 Suitland 1 1 Summerfield 1 0 Summit Creek 1 0 Tantallon 1 0 Temple Hills 3 0 Ternberry 1 0 University Park 10 0 Upper Marlboro 14 0 Westchester Park 2 0 Willow Hills 1 0 Woodland 0 1
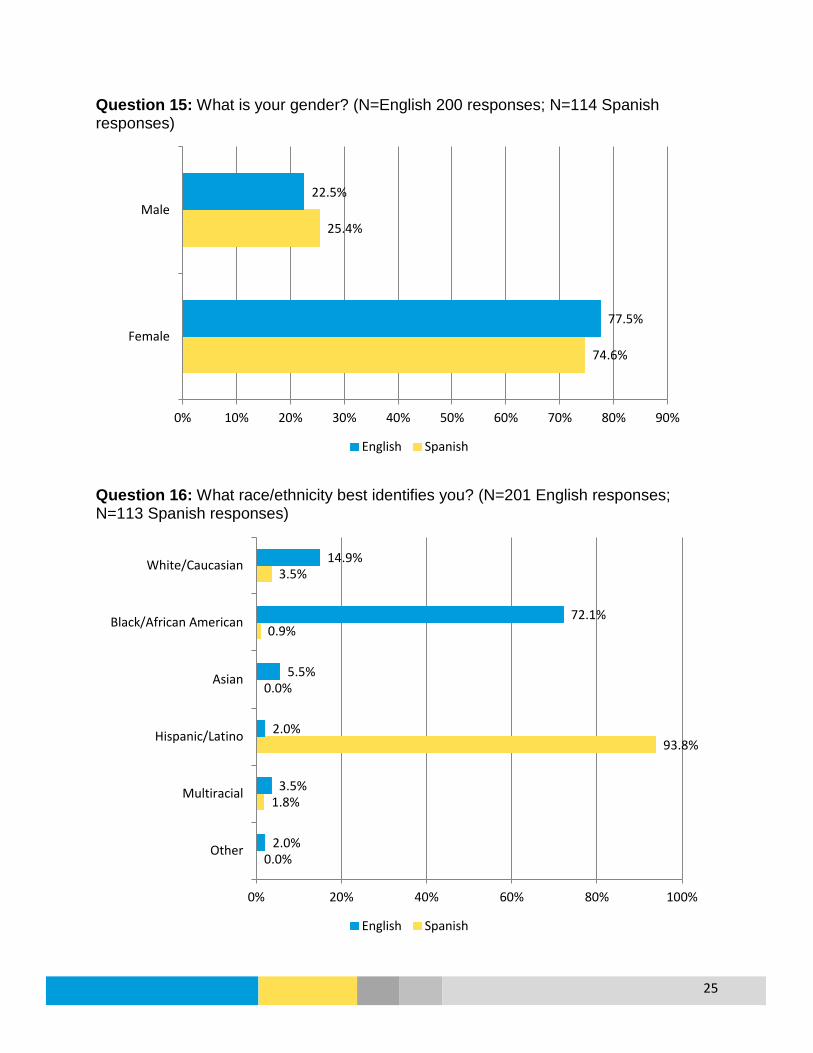
25
Question 15: What is your gender? (N=English 200 responses; N=114 Spanish responses)
Question 16: What race/ethnicity best identifies you? (N=201 English responses; N=113 Spanish responses)
74.6%
25.4%
77.5%
22.5%
0% 10% 20% 30% 40% 50% 60% 70% 80% 90%
Female
Male
English Spanish
0.0%
1.8%
93.8%
0.0%
0.9%
3.5%
2.0%
3.5%
2.0%
5.5%
72.1%
14.9%
0% 20% 40% 60% 80% 100%
Other
Multiracial
Hispanic/Latino
Asian
Black/African American
White/Caucasian
English Spanish

26
Question 17: How old are you? (N=200 English responses; N=100 Spanish responses)
Question 18: What is the highest level of education you completed? (N=197 English responses; N=105 Spanish responses)
*Other included trade school
1.0%
5.0%
74.0%
20.0%
14.0%
34.0%
40.0%
12.0%
0% 10% 20% 30% 40% 50% 60% 70% 80%
More than 65 years
45 to 64 years
25 to 44 yeas
18 to 24 years
English Spanish
0.0%
1.9%
11.4%
41.0%
45.7%
0.5%
58.9%
19.8%
16.2%
4.6%
0% 10% 20% 30% 40% 50% 60% 70%
Other*
College Degree or Higher
Some College
High School or GED
Less than High School
English Spanish

27
Question 19: What is your annual household income? (N=198 English responses; N=109 Spanish responses)
28.7%
0.0%
0.0%
0.0%
0.0%
0.9%
11.1%
27.8%
31.5%
14.1%
7.1%
9.6%
10.6%
9.1%
16.7%
13.6%
12.1%
7.1%
0% 5% 10% 15% 20% 25% 30% 35%
Prefer not to answer
$200,000 or more
$150,000 to $199,999
$100,000 to $149,999
$75,000 to $99,999
$50,000 to $74,999
$25,000 to $49,999
$10,000 to $24,999
Less than $10,000
English Spanish
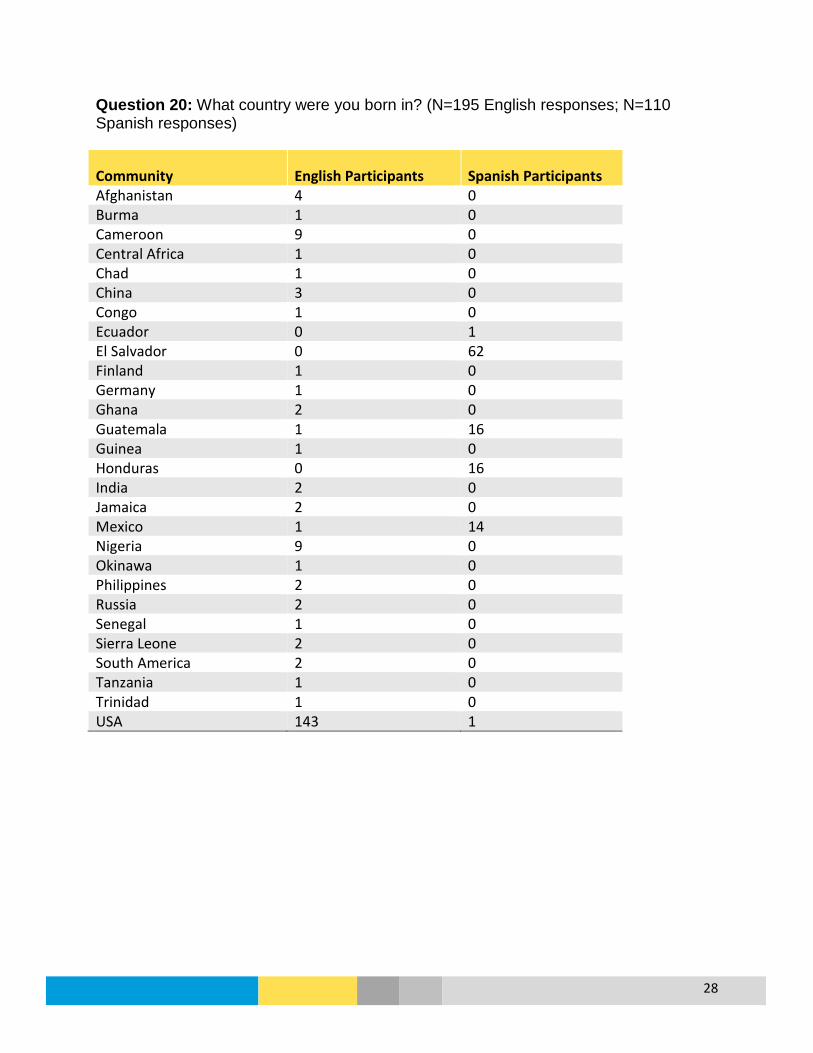
28
Question 20: What country were you born in? (N=195 English responses; N=110 Spanish responses)
Community English Participants Spanish Participants Afghanistan 4 0 Burma 1 0 Cameroon 9 0 Central Africa 1 0 Chad 1 0 China 3 0 Congo 1 0 Ecuador 0 1 El Salvador 0 62 Finland 1 0 Germany 1 0 Ghana 2 0 Guatemala 1 16 Guinea 1 0 Honduras 0 16 India 2 0 Jamaica 2 0 Mexico 1 14 Nigeria 9 0 Okinawa 1 0 Philippines 2 0 Russia 2 0 Senegal 1 0 Sierra Leone 2 0 South America 2 0 Tanzania 1 0 Trinidad 1 0 USA 143 1

29
Question 21: What language do you speak at home? (N=198 English responses; N=109 Spanish responses)
Community English Participants Spanish Participants Bimese 1 0 Chinese 3 0 Dari 1 0 English 169 2 English & Creole 2 0 English & Another 1 0 English & French 2 0 English & Scoalt 1 0 English & Finnish 1 0 English & Spanish 2 5 English & Toruba 1 0 French 2 0 Hindi 1 0 Krio 1 0 Pashto 1 0 Persian 2 0 Spanish 4 102 Swahili 1 0 Yoruba 2 0
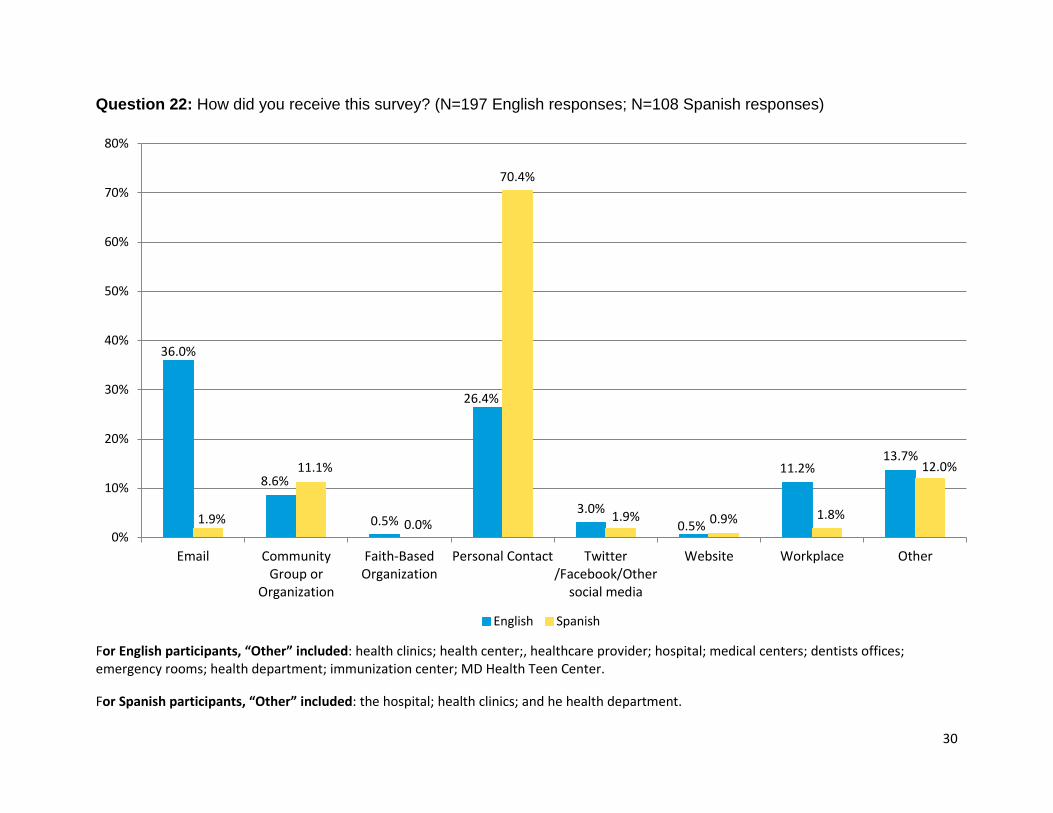
30
Question 22: How did you receive this survey? (N=197 English responses; N=108 Spanish responses)
For English participants, “Other” included: health clinics; health center;, healthcare provider; hospital; medical centers; dentists offices; emergency rooms; health department; immunization center; MD Health Teen Center. For Spanish participants, “Other” included: the hospital; health clinics; and he health department.
36.0%
8.6%
0.5%
26.4%
3.0% 0.5%
11.2% 13.7%
1.9%
11.1%
0.0%
70.4%
1.9% 0.9% 1.8%
12.0%
0%
10%
20%
30%
40%
50%
60%
70%
80%
Email CommunityGroup or
Organization
Faith-BasedOrganization
Personal Contact Twitter/Facebook/Other
social media
Website Workplace Other
English Spanish

1
PRIORITIZATION PROCESS
Introduction
Prince George’s County conducted the first ever joint Community Health Needs Assessment (CHNA) with a partnership between five local hospitals and the Health Department. This core team began the process of collecting primary and secondary data to describe the residents and health needs in the county. This data was planned to be used during the prioritization process to determine the overall county health priorities. The core team planned for broad community participation for the prioritization process to ensure residents were well represented, with the goal of consensus for shared community priorities. The prioritization meeting took place on April 22, 2016 with 40 participants.
Participants
The Prince George’s County Health Department developed a list of prioritization participant roles using the CHNA key informant interviews as a starting point, with additions recommended by the consultant who conducted the interviews and Health Department leadership. Overall, 32 participant roles were recognized as necessary for adequate community representation during the prioritization process. Participants were selected to fill the specified roles as recognized leaders in the community, and each hospital provided representatives for their services area. A list of participant roles, individuals selected to fill those roles, and participation in the prioritization process is included in Attachment A. To ensure participation, an invitation and reminders about the meeting were sent by the Prince George’s County Health Officer.
Process Summary
To make the best use of a one day prioritization meeting and ensure adequate discussion time for the issues, the core CHNA team selected ten issues to consider during the prioritization meeting using the primary and secondary data collected during the CHNA process:
• Asthma • Hypertension/Stroke • Cancer • Mental Health • Diabetes • Obesity • Heart Disease • Substance Use • HIV • Violence/Domestic Violence
The selection process and issues not selected were presented to the participants, with time for discussion to acknowledge the challenges of these issues that was tracked through a “parking lot”.
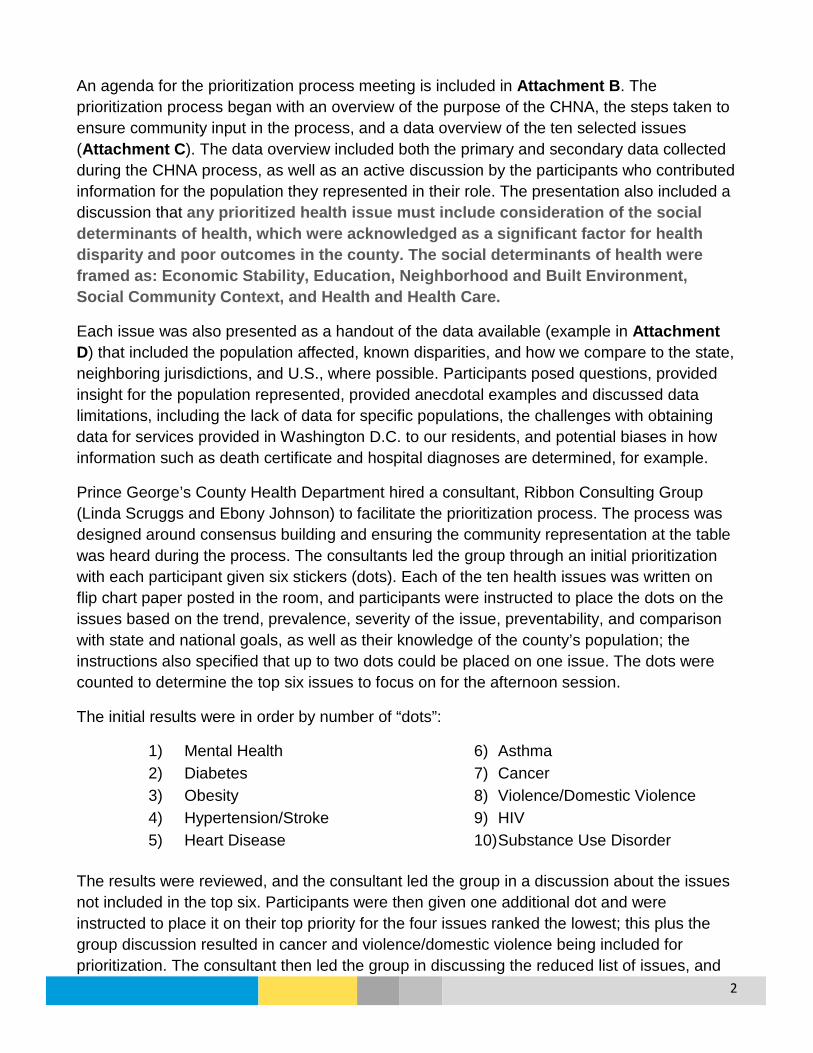
2
An agenda for the prioritization process meeting is included in Attachment B. The prioritization process began with an overview of the purpose of the CHNA, the steps taken to ensure community input in the process, and a data overview of the ten selected issues (Attachment C). The data overview included both the primary and secondary data collected during the CHNA process, as well as an active discussion by the participants who contributed information for the population they represented in their role. The presentation also included a discussion that any prioritized health issue must include consideration of the social determinants of health, which were acknowledged as a significant factor for health disparity and poor outcomes in the county. The social determinants of health were framed as: Economic Stability, Education, Neighborhood and Built Environment, Social Community Context, and Health and Health Care.
Each issue was also presented as a handout of the data available (example in Attachment D) that included the population affected, known disparities, and how we compare to the state, neighboring jurisdictions, and U.S., where possible. Participants posed questions, provided insight for the population represented, provided anecdotal examples and discussed data limitations, including the lack of data for specific populations, the challenges with obtaining data for services provided in Washington D.C. to our residents, and potential biases in how information such as death certificate and hospital diagnoses are determined, for example.
Prince George’s County Health Department hired a consultant, Ribbon Consulting Group (Linda Scruggs and Ebony Johnson) to facilitate the prioritization process. The process was designed around consensus building and ensuring the community representation at the table was heard during the process. The consultants led the group through an initial prioritization with each participant given six stickers (dots). Each of the ten health issues was written on flip chart paper posted in the room, and participants were instructed to place the dots on the issues based on the trend, prevalence, severity of the issue, preventability, and comparison with state and national goals, as well as their knowledge of the county’s population; the instructions also specified that up to two dots could be placed on one issue. The dots were counted to determine the top six issues to focus on for the afternoon session.
The initial results were in order by number of “dots”:
1) Mental Health 6) Asthma 2) Diabetes 7) Cancer 3) Obesity 8) Violence/Domestic Violence 4) Hypertension/Stroke 9) HIV 5) Heart Disease 10) Substance Use Disorder
The results were reviewed, and the consultant led the group in a discussion about the issues not included in the top six. Participants were then given one additional dot and were instructed to place it on their top priority for the four issues ranked the lowest; this plus the group discussion resulted in cancer and violence/domestic violence being included for prioritization. The consultant then led the group in discussing the reduced list of issues, and

3
participants were encouraged to share their concerns of the population they were representing.
The final first round results that the group decided to further consider were:
1) Mental Health 2) Diabetes 3) Obesity 4) Hypertension/Stroke 5) Heart Disease 6) Asthma 7) Cancer 8) Violence/Domestic Violence
Discussion about the priorities focused on how mental health is overarching, and intersects with overall health and an individual’s perception and judgment. The group also discussed how many of the top issues were related through a cardio-metabolic lens, and that identifying diseases with common causes and symptoms can help to reduce the collective impact.
In the afternoon session, a second round of prioritization was completed with participants each receiving four dots to place on the remaining issues and instructions that only one dot could be used per issue. The results of this second round were (in order):
1) Mental Health 2) Obesity 3) Diabetes 4) Cancer 5) Heart Disease
with Hypertension/Stroke, Asthma, and Violence receiving fewer votes. Through the following discussion, participants considered grouping Hypertension/Stroke with Heart Disease as overall cardiovascular health. This led to a further focus on the commonalities between the issues, and came to a consensus of two priority “groups”. The final groupings were agreed upon by nearly all participants, and included:
1) Behavioral Health: Mental Health, Substance Use, Domestic Violence/Violence
2) Metabolic Syndrome: Obesity, Diabetes, Heart Disease, Hypertension/Stroke
The participants also viewed the remaining issues of Cancer, Asthma, and HIV as “stand-alone” issues that would need to be considered individually. The participants reviewed the voting and discussion for these issues, and determined that an additional community priority would be:
3) Cancer

4
The overall consensus building process included discussion about the priorities, limitations, and need within the county (included in Attachment E). Issues that affected the represented populations that were not included in the prioritization process were also discussed and captured through use of a “parking lot” and by staff taking notes throughout the process.
Parking Lot
Throughout the process, the consultant encouraged participants to document and discuss health issues not included in the prioritization process. These issues included:
• Dental • Sexually Transmitted Infections • Maternal and Child Health • Dementia/Alzheimer’s • Injury
• Disability • COPD • Lead • Kidneys
The parking lot was discussed and reviewed for clarity and to access value for the prioritization process. It was determined that some of the parking lot areas would combine into other health areas, and others would be discussed in the future and considered within individual organizations and agencies. Overall, dental health was the issue most discussed, and several participants shared the challenges faced by the residents they serve to obtain dental care.
Conclusion
The participants were asked to continue to represent county residents beyond the prioritization meeting to monitor the progress for the CHNA plans and implementation for the selected priorities, and were asked about the frequency of meetings to review progress. The suggested meeting frequency included:
• Once per year (5 participants) • 2 Times per year (9 participants) • 4 Times per year (8 participants) • Monthly (1 participant)
Overall, participants widely recommended ongoing updates, a focus on preventive care, and continued dialogue, education and coordination of resources and partnerships.

5
Attachment A: Prioritization Participants and Roles Represented
Name Organization Title Category Represented Attended
Kleinman, DDS, MScD, Dushanka
University of Maryland School of Public Health, Department of Epidemiology and Biostatistics
Associate Dean for Research and Professor Academia Yes
Terry, Milly African Women's Cancer Awareness Association African Immigrants Yes
Grant, Teresa PGC Department of Family Services Community Developer/Program Manager Aging Services Yes
Carvana, Anthony Community Counseling and Mentoring Services, Inc. Executive Director Behavioral Health Yes
McDonough, Mary Lou PGC Department of Corrections Director Criminal Justice System Yes
Howell, Michelle The ARC Director, Quality Advancement & Nursing Disabled Community Yes
Shiver, Sanders PGC Public Schools Program Manager Early Childhood Yes Hoban, Evelyn PGC Health Department Associate Director Environmental Health Yes Hall,PhD, MPH, Clarence PACANet USA President Faith-based Leaders Yes Belon-Butler, Elana PGC Department of Family Services Director Family Services Yes
Gomez, Maria Mary's Center CEO FQHC/Community Clinics Yes
LoBrano, MD, Marcia Community Clinic, Inc. Chief Medical Officer FQHC/Community Clinics Yes
Malloy, Colenthia Greater Baden Medical Center Executive Director FQHC/Community Clinics Yes
Matthews, Saundra Community Clinic, Inc. Nursing Director FQHC/Community Clinics Yes Demus, Leslie Heart to Hand Community Health Worker Frontline/Grassroots Yes
Spann, Monica PGC Health Department Health Enterprise Zone Community Health Worker Frontline/Grassroots Yes

6
Name Organization Title Category Represented Attended
Aldoory, PhD, Linda University of Maryland, Department of Communication Associate Professor Health Literacy Yes
Wilson, Alicia La Clinica del Pueblo Executive Director Hispanic Population Yes Moore, Major Elaine PGC Police Department Major Law Enforcement Yes
Cooper, MD, Carnell Dimensions Healthcare System/Prince George's Hospital Center
Chief Medical Officer, Dimensions Healthcare System & VP, Medical Affairs, Prince George's Hospital Center Medical Provider Yes
Hall, MD, Trudy Laurel Regional Hospital Center VP, Medical Affairs Medical Provider Yes
Johnson-Threat, MD, Yvette Medstar Southern Maryland Hospital Center VP, Medical Affairs Medical Provider Yes
Moore, Sherri Doctors Community Hospital Development Officer Medical Provider Yes Smith, MD, Sharnell Ft. Washington Medical Center/Nexus General Surgeon Medical Provider Yes Sullivan, Tiffany Dimensions Healthcare System VP, Population Health Medical Provider Yes Waters, MD, JD, FCLM, Victor Ft. Washington Medical Center/Nexus Chief Medical Officer Medical Provider Yes Proctor, Natalie StandingontheRock
Wild Turkey Clan, Cedarville Band of Piscataway Conoy Tribal Chairwoman Native Americans No
Dodo, Kodjo PGC Health Department, WIC Program Program Chief Nutrition No
Hewlett, Elizabeth Maryland National Park and Planning Commission Chairwoman Parks and Recreation Yes
Bryant, Tracy United HealthCare Community Plan Community Development Specialist Payer Yes Moorehead, Creighton Norvartis (formerly with Kaiser) Pharmacist Pharmacy Yes
Amin, Mena The Community Foundation, Prince George's County Program Officer Philanthropy Yes
Barron, Erek House of Delegates Delegate Policymaker Yes Owusu-Acheaw, Pokuaa For Senator Joanne Benson Staff Member Policymaker Yes
Creekmur, Pamela B. PGC Health Department Health Officer/Director Prince George's Health Action Coalition Yes
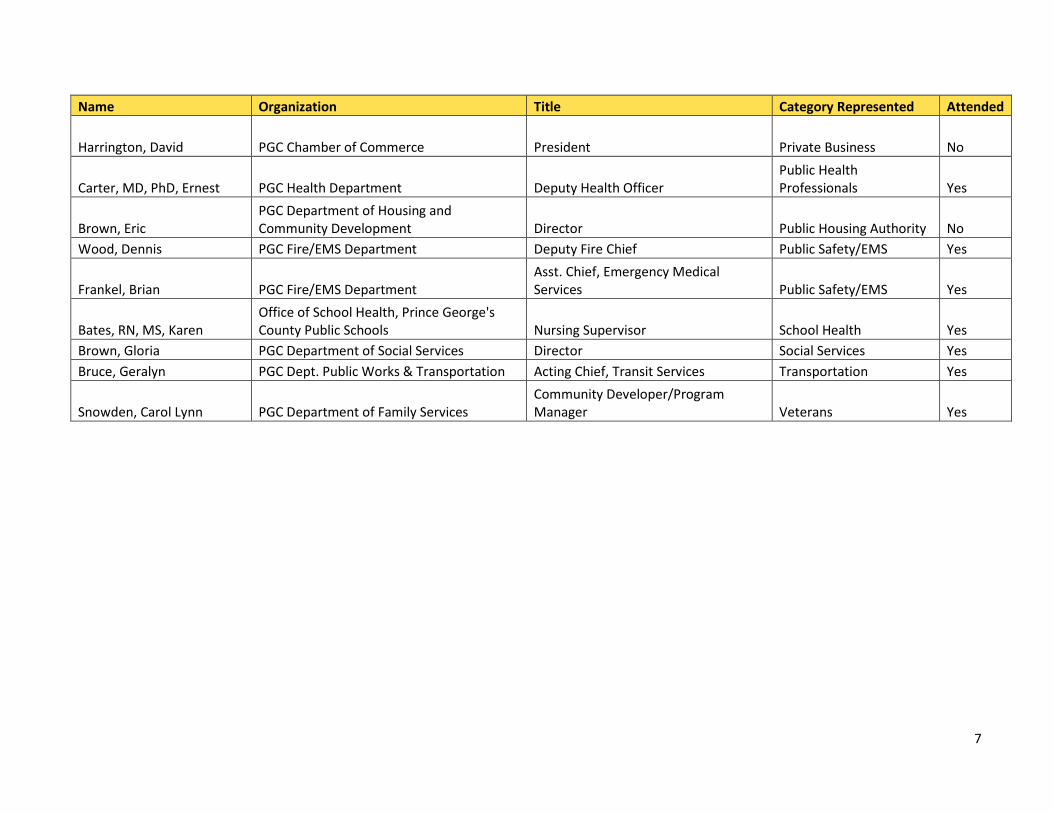
7
Name Organization Title Category Represented Attended
Harrington, David PGC Chamber of Commerce President Private Business No
Carter, MD, PhD, Ernest PGC Health Department Deputy Health Officer Public Health Professionals Yes
Brown, Eric PGC Department of Housing and Community Development Director Public Housing Authority No
Wood, Dennis PGC Fire/EMS Department Deputy Fire Chief Public Safety/EMS Yes
Frankel, Brian PGC Fire/EMS Department Asst. Chief, Emergency Medical Services Public Safety/EMS Yes
Bates, RN, MS, Karen Office of School Health, Prince George's County Public Schools Nursing Supervisor School Health Yes
Brown, Gloria PGC Department of Social Services Director Social Services Yes Bruce, Geralyn PGC Dept. Public Works & Transportation Acting Chief, Transit Services Transportation Yes
Snowden, Carol Lynn PGC Department of Family Services Community Developer/Program Manager Veterans Yes

8
Attachment B: Prioritization Agenda
Prince George's County
Community Health Needs Assessment Prioritization Session
Friday April 22, 2016 8:30 AM – 3:30 PM
Prince George’s County Health Department 1801 McCormick Drive
Largo, MD 20774
AGENDA
8:30 AM – 9:00 AM Registration/Continental Breakfast
9:00 AM – 9:30 AM Introduction/Expectations for the Day
9:30 AM – 10:30 AM Data Overview
10:30 AM – 10:45 AM Break 10:45 AM – 11:45 AM Prioritization Round I
12:00 AM – 12:45 PM Lunch
12:45 PM – 2:00 PM Prioritization Round II
2:00 PM- 2:15 PM Break
2:15 PM – 3:30 PM Prioritization Round II
3:30 PM Closing

9
Attachment C: Prioritization Presentation

10

11

12

13

14
15

16
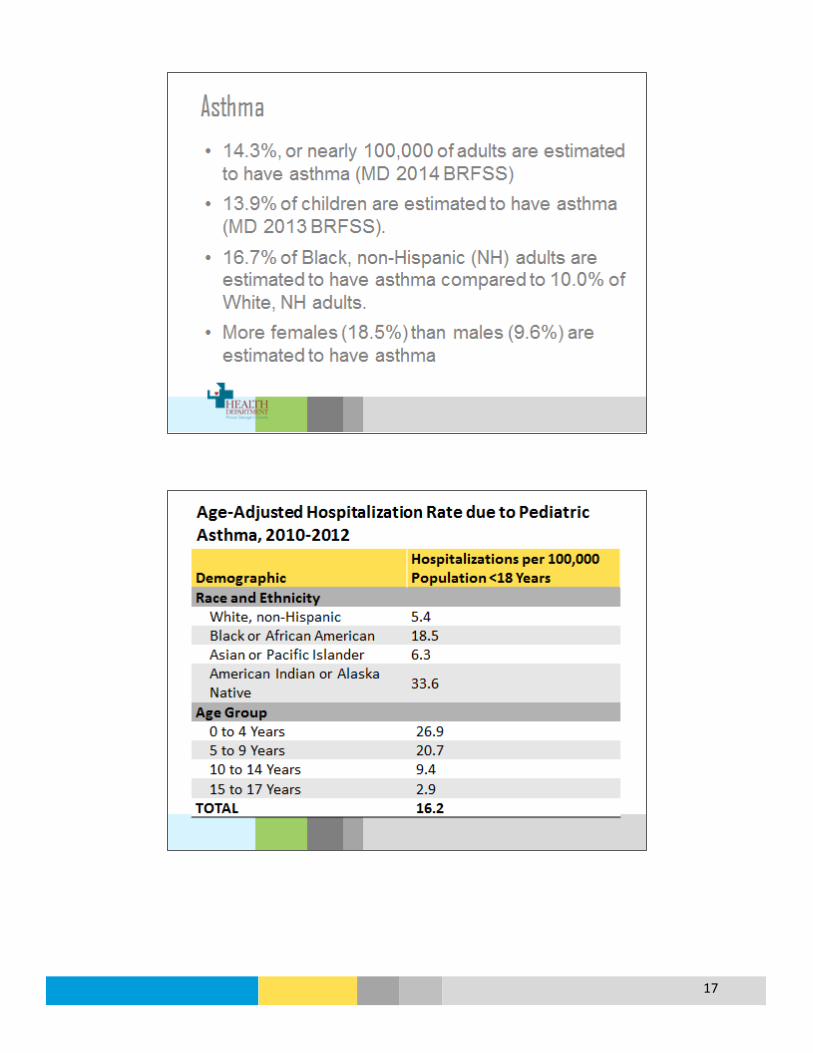
17
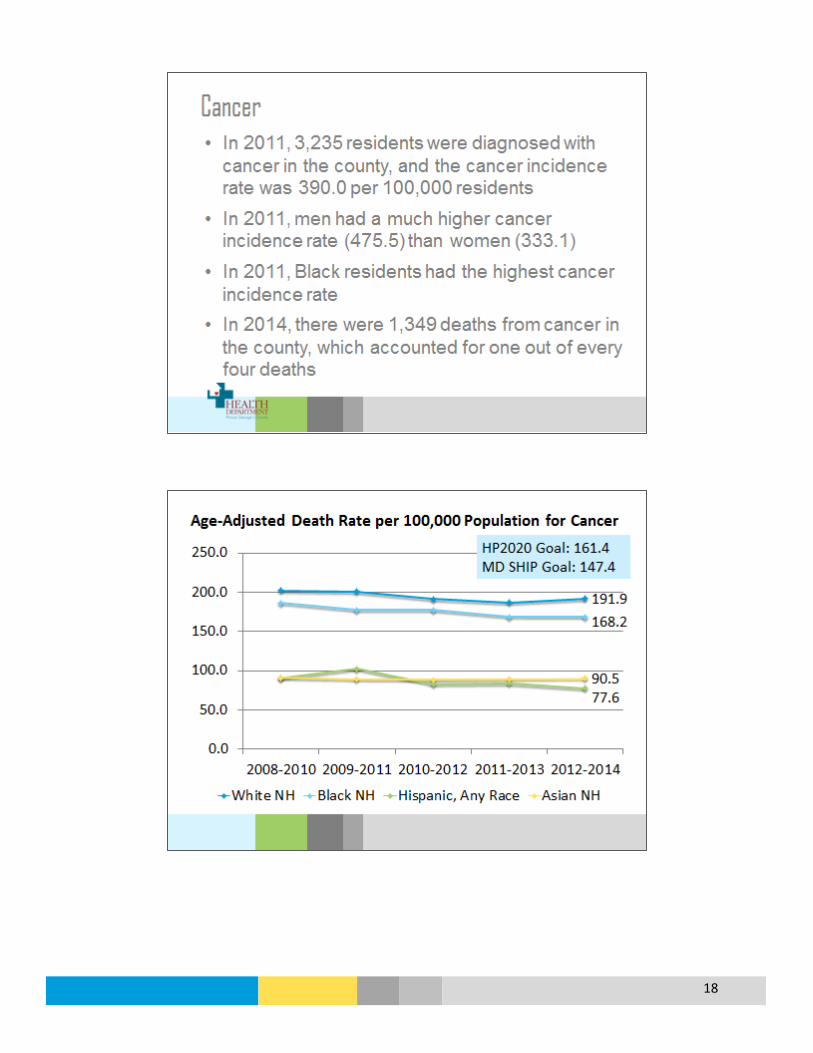
18

19
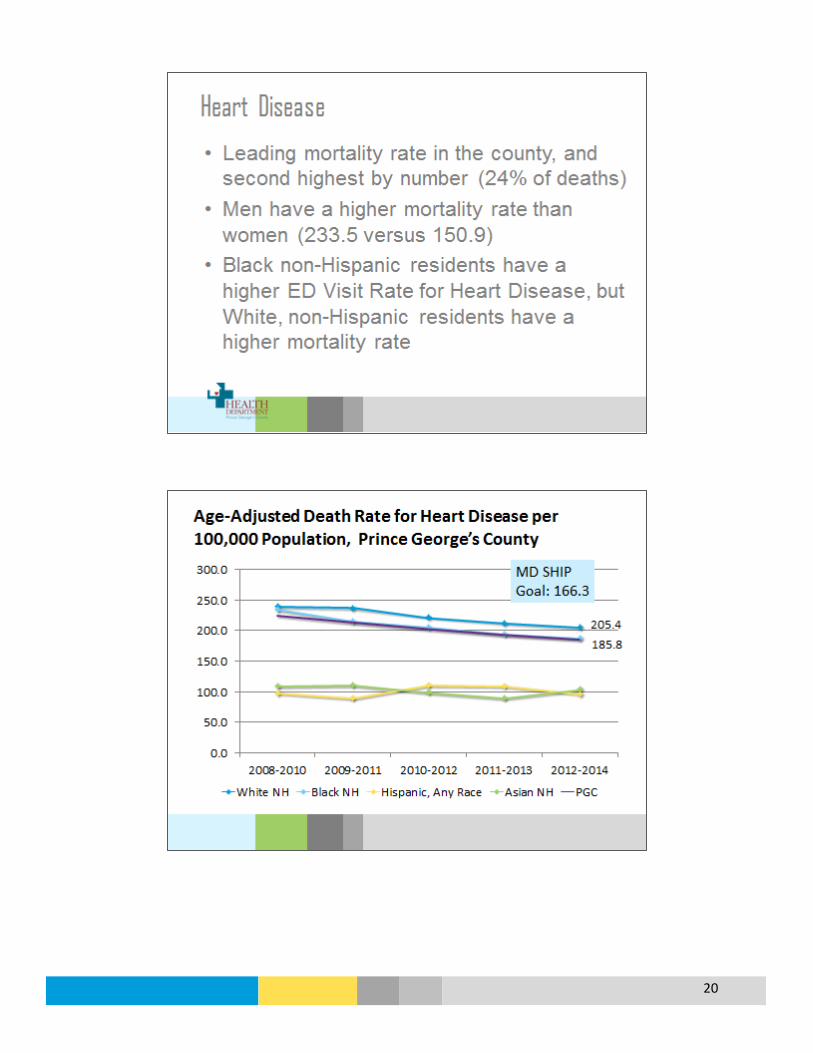
20

21

22
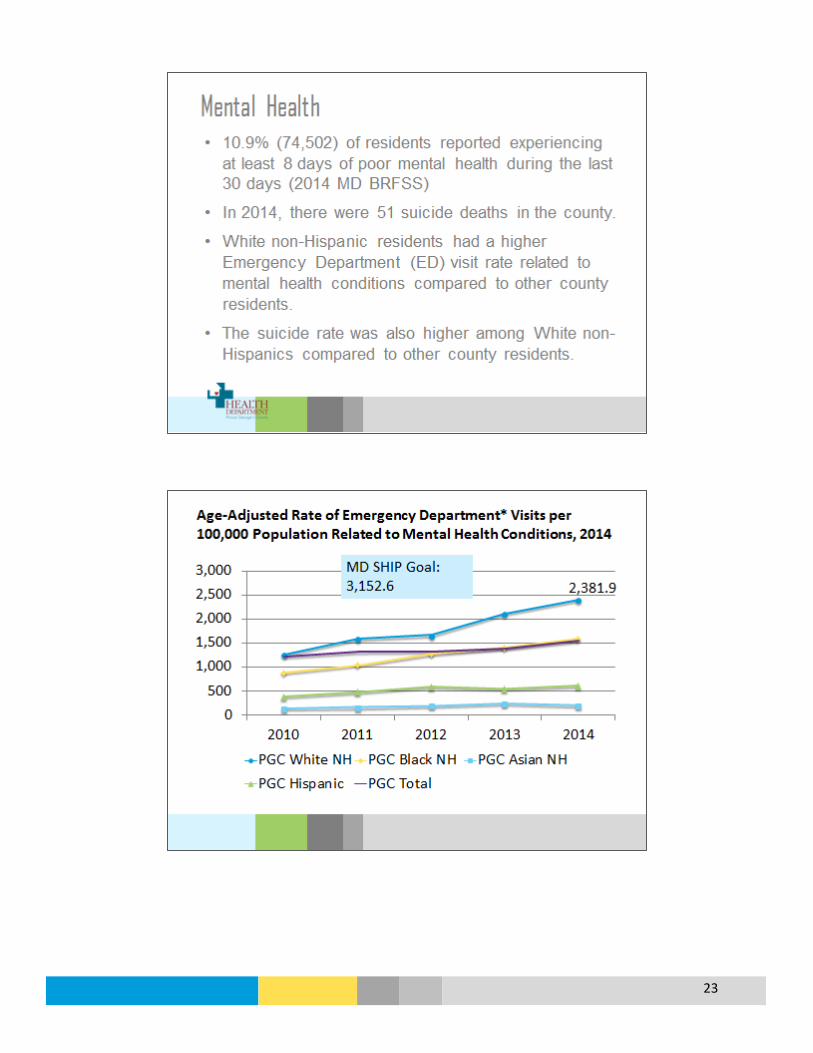
23
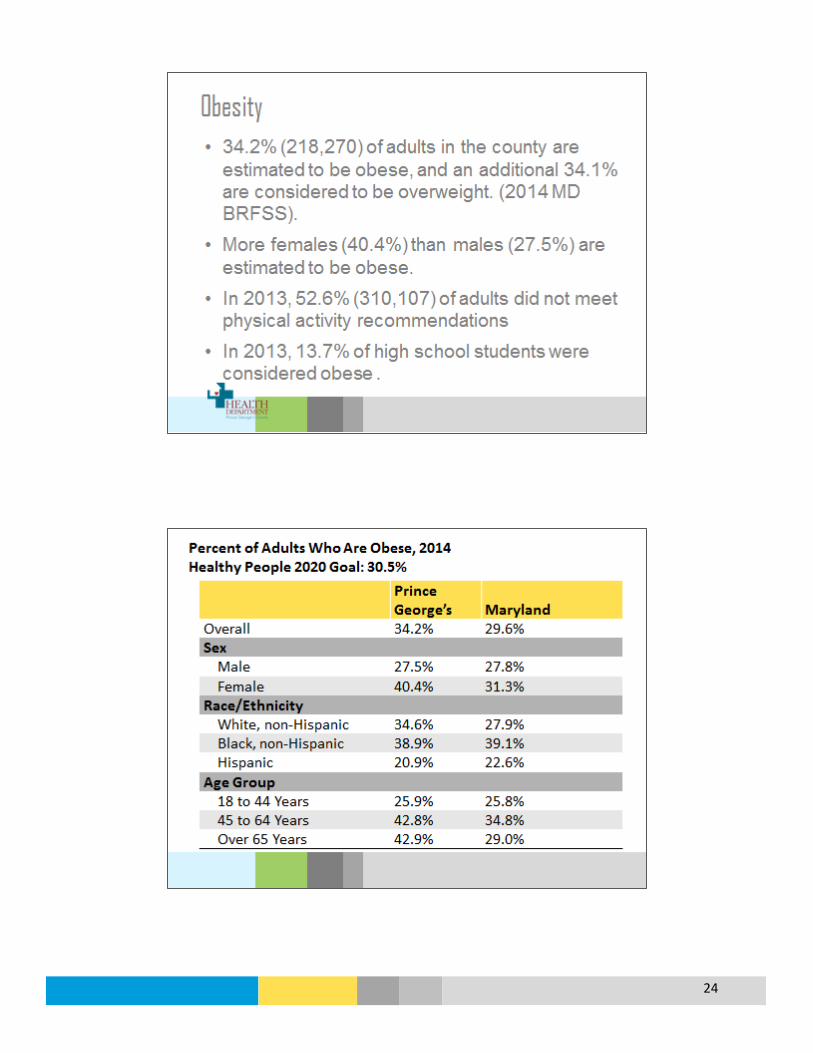
24

25
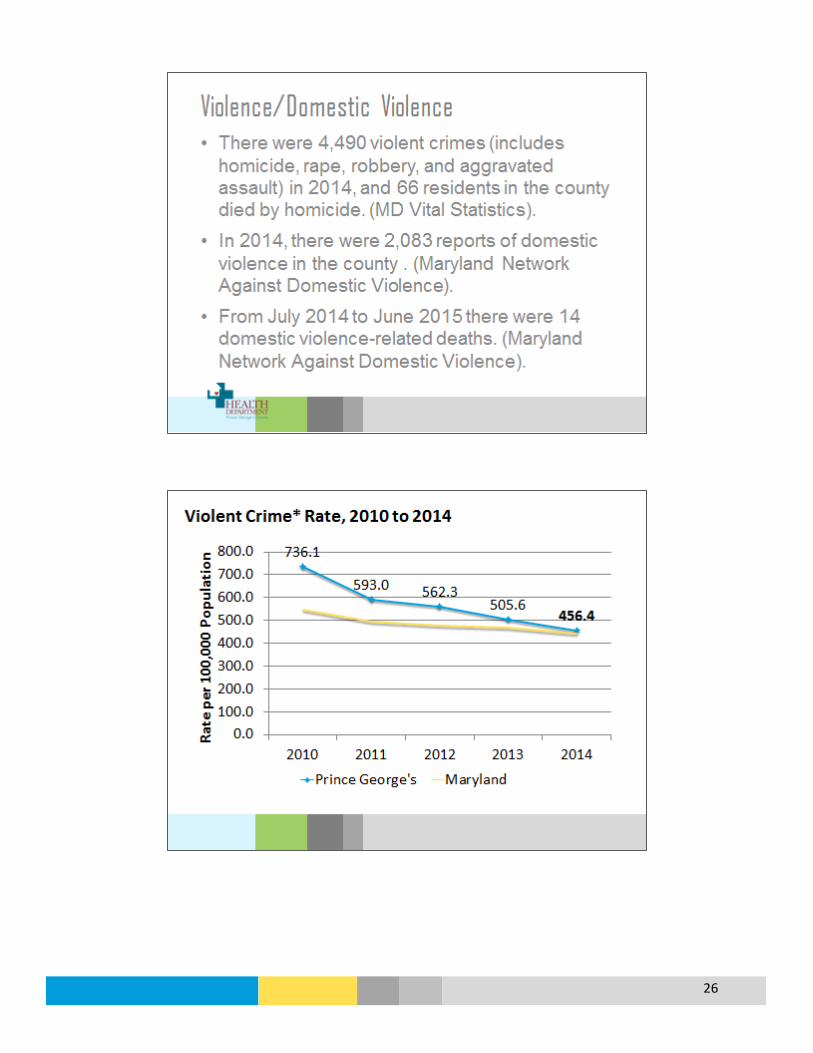
26

27
Attachment D: Data Summary Example
Overview Prince George’s County
What is it? Cancer is a term used for diseases in which abnormal cells divide without control and can invade other tissues; there are more than 100 kinds of cancer.
Who is affected?
In 2011, 3,235 residents were diagnosed with cancer in the county, and the cancer incidence rate was 390.0 per 100,000 residents. In 2014, there were 1,349 deaths from cancer in the county, which accounted for one out of every four deaths.
Prevention and Treatment
According to the CDC, there are several ways to help prevent cancer: • Healthy choices can reduce cancer risk, like avoiding tobacco, limiting alcohol use,
protecting your skin from the sun and avoiding indoor tanning, eating a diet rich in fruits and vegetables, keeping a healthy weight, and being physically active.
• The human papillomavirus (HPV) vaccine helps prevent most cervical cancers and several other kinds of cancer; the hepatitis B vaccine can lower liver cancer risk.
• Screening for cervical and colorectal cancers helps prevent these diseases by finding precancerous lesions so they can be treated before they become cancerous. Screening for cervical, colorectal, and breast cancers also helps find these diseases at an early stage, when treatment works best.
Cancer treatment can involve surgery, chemotherapy, radiation therapy, targeted therapy, and immunotherapy.
What are the outcomes?
Remission (no cancer signs or symptoms); long-term treatment and care; death.
Disparity Overall, men had a higher cancer incidence rate (475.5) than women (333.1), and Black residents had a higher rate (393.4) compared to White and Asian residents in 2011 (Source: 2014 MD Cancer Report). Men also had a higher mortality rate at 197.7 compared to women (143.9), and Black residents had a slightly higher mortality rate (165.7) compared to White residents (161.7). By cancer type, Black residents in the county had higher incidence and mortality rates for breast, colorectal, and prostate cancers.
How do we compare?
Prince George’s County 2011 age-adjusted cancer incidence rate was 390.0 per 100,000 residents, much lower than the state at 440.7; other Maryland counties range from 387.4 to 553.7 (2014 MD Cancer Report). The age-adjusted death rate for the county from 2012-2014 was 156.5, compared to Maryland at 162.0 with a range of 121.7 to 208.5 across the counties. The county is similar to the state for cancer screening.
Key Informant Interviews
Cancer was not specifically noted in the interviews.
Community Expert Survey
85% of respondents indicated cancer was a major or moderate issue in the county. Cancer was ranked as the fifth most important health issue.
Community-at-large Survey
66% of English survey participants and 62% of Spanish survey participants indicated cancer is at least a major or moderate problem in the county. Cancer was ranked as one of the top 5 health issues.
Cancer

28
123.0 114.2
46.1 37.7
56.8 44.2
212.4
161.7
8.9 5.4 0.0
50.0
100.0
150.0
200.0
250.0
2002 2003 2004 2005 2006* 2007 2008 2009 2010 2011
Age-
Adju
sted
Inci
denc
e Ra
te (p
er 1
00,0
00)
Breast Colorectal Lung and Bronchus Prostate Cervical
Cancer
Cancer Age-Adjusted Incidence Rates per 100,000 Population, Prince George’s County
*2006 incidence rates are lower than actual due to case underreporting
Data Source: Maryland Department of Health and Mental Hygiene, Annual Cancer Report, 2006-2014
Cancer Age-Adjusted Incidence Rates by Type, Prince George’s County, 2002-2011
*2006 incidence rates are lower than actual due to case underreporting Data Source: Maryland Department of Health and Mental Hygiene, Annual Cancer Report, 2006-2014
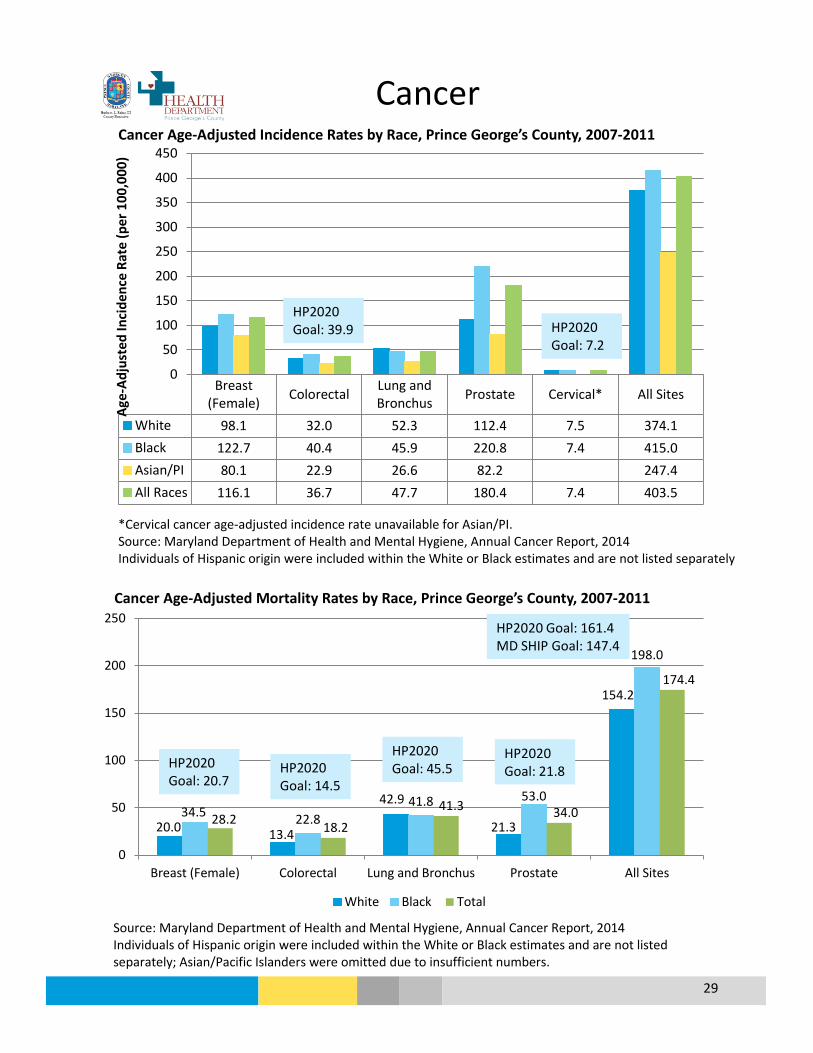
29
Breast(Female) Colorectal Lung and
Bronchus Prostate Cervical* All Sites
White 98.1 32.0 52.3 112.4 7.5 374.1Black 122.7 40.4 45.9 220.8 7.4 415.0Asian/PI 80.1 22.9 26.6 82.2 247.4All Races 116.1 36.7 47.7 180.4 7.4 403.5
0
50
100
150
200
250
300
350
400
450
Age-
Adju
sted
Inci
denc
e Ra
te (p
er 1
00,0
00)
20.0 13.4
42.9
21.3
154.2
34.5 22.8 41.8 53.0
198.0
28.2 18.2 41.3 34.0
174.4
0
50
100
150
200
250
Breast (Female) Colorectal Lung and Bronchus Prostate All Sites
White Black Total
HP2020 Goal: 21.8
HP2020 Goal: 161.4 MD SHIP Goal: 147.4
Cancer
Cancer Age-Adjusted Incidence Rates by Race, Prince George’s County, 2007-2011
*Cervical cancer age-adjusted incidence rate unavailable for Asian/PI. Source: Maryland Department of Health and Mental Hygiene, Annual Cancer Report, 2014 Individuals of Hispanic origin were included within the White or Black estimates and are not listed separately
HP2020 Goal: 39.9 HP2020
Goal: 7.2
Cancer Age-Adjusted Mortality Rates by Race, Prince George’s County, 2007-2011
Source: Maryland Department of Health and Mental Hygiene, Annual Cancer Report, 2014 Individuals of Hispanic origin were included within the White or Black estimates and are not listed separately; Asian/Pacific Islanders were omitted due to insufficient numbers.
HP2020 Goal: 20.7
HP2020 Goal: 14.5
HP2020 Goal: 45.5

30
2008-2010 2009-2011 2010-2012 2011-2013 2012-2014White NH 202.3 200.9 191.6 187.0 191.9Black NH 186.0 176.9 177.0 168.6 168.2Hispanic, Any Race 90.7 101.9 83.0 83.7 77.6Asian NH 91.2 89.0 88.1 89.5 90.5
0.0
50.0
100.0
150.0
200.0
250.0Ag
e-Ad
just
ed D
eath
Rat
e pe
r 100
,000
Cancer
Age-Adjusted Death Rate per 100,000 Population for Cancer
Data Source: CDC, National Center for Health Statistics, CDC WONDER Online Database
HP2020 Goal: 161.4 MD SHIP Goal: 147.4
Residents Lacking Cancer Screening, Prince George’s County, 2014
Source: 2014 Maryland BRFSS, DHMH www.marylandbrfss.org; 2014 1-Year Estimates, U.S. Census Bureau, Table B01001 www.census.gov
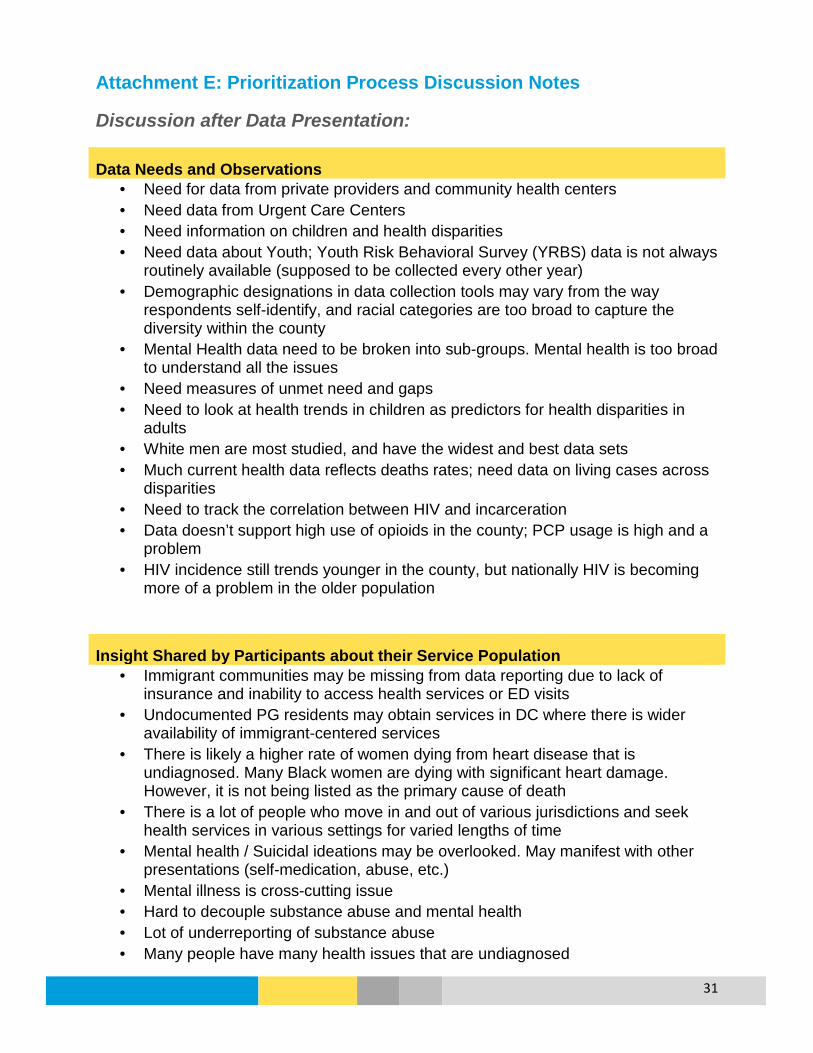
31
Attachment E: Prioritization Process Discussion Notes
Discussion after Data Presentation:
Data Needs and Observations • Need for data from private providers and community health centers • Need data from Urgent Care Centers • Need information on children and health disparities • Need data about Youth; Youth Risk Behavioral Survey (YRBS) data is not always
routinely available (supposed to be collected every other year) • Demographic designations in data collection tools may vary from the way
respondents self-identify, and racial categories are too broad to capture the diversity within the county
• Mental Health data need to be broken into sub-groups. Mental health is too broad to understand all the issues
• Need measures of unmet need and gaps • Need to look at health trends in children as predictors for health disparities in
adults • White men are most studied, and have the widest and best data sets • Much current health data reflects deaths rates; need data on living cases across
disparities • Need to track the correlation between HIV and incarceration • Data doesn’t support high use of opioids in the county; PCP usage is high and a
problem • HIV incidence still trends younger in the county, but nationally HIV is becoming
more of a problem in the older population
Insight Shared by Participants about their Service Population • Immigrant communities may be missing from data reporting due to lack of
insurance and inability to access health services or ED visits • Undocumented PG residents may obtain services in DC where there is wider
availability of immigrant-centered services • There is likely a higher rate of women dying from heart disease that is
undiagnosed. Many Black women are dying with significant heart damage. However, it is not being listed as the primary cause of death
• There is a lot of people who move in and out of various jurisdictions and seek health services in various settings for varied lengths of time
• Mental health / Suicidal ideations may be overlooked. May manifest with other presentations (self-medication, abuse, etc.)
• Mental illness is cross-cutting issue • Hard to decouple substance abuse and mental health • Lot of underreporting of substance abuse • Many people have many health issues that are undiagnosed
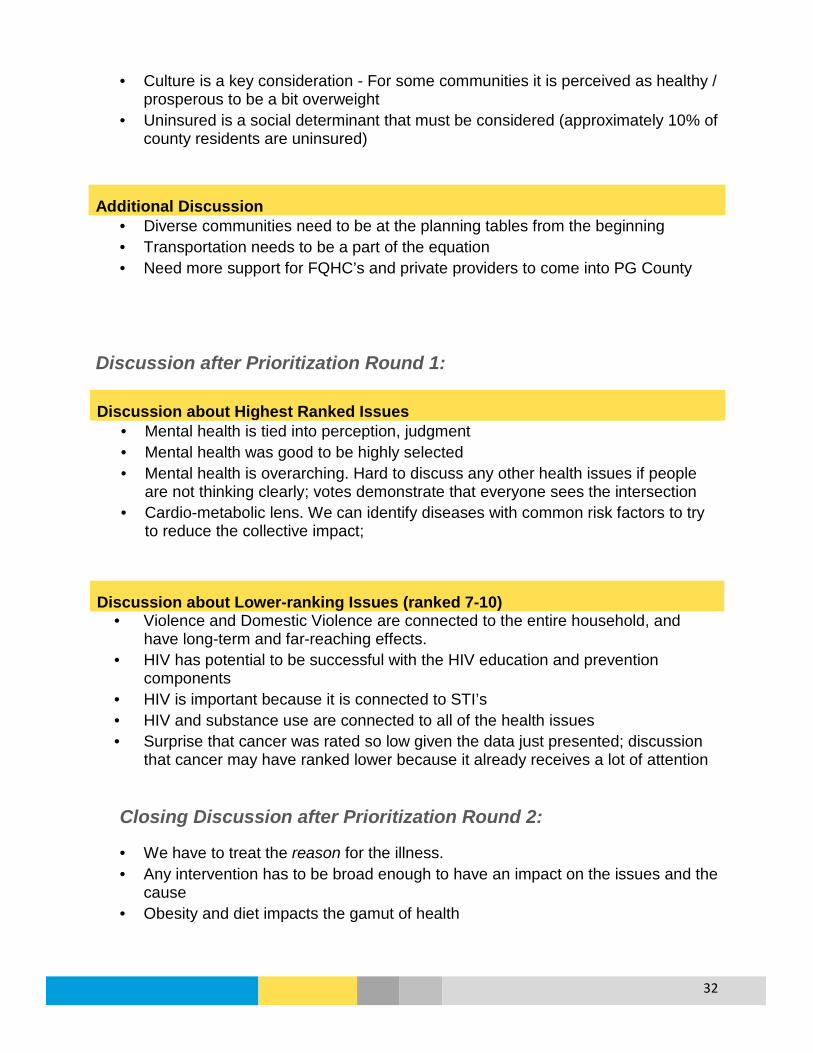
32
• Culture is a key consideration - For some communities it is perceived as healthy / prosperous to be a bit overweight
• Uninsured is a social determinant that must be considered (approximately 10% of county residents are uninsured)
Additional Discussion • Diverse communities need to be at the planning tables from the beginning • Transportation needs to be a part of the equation • Need more support for FQHC’s and private providers to come into PG County
Discussion after Prioritization Round 1:
Discussion about Highest Ranked Issues • Mental health is tied into perception, judgment • Mental health was good to be highly selected • Mental health is overarching. Hard to discuss any other health issues if people
are not thinking clearly; votes demonstrate that everyone sees the intersection • Cardio-metabolic lens. We can identify diseases with common risk factors to try
to reduce the collective impact;
Discussion about Lower-ranking Issues (ranked 7-10) • Violence and Domestic Violence are connected to the entire household, and
have long-term and far-reaching effects. • HIV has potential to be successful with the HIV education and prevention
components • HIV is important because it is connected to STI’s • HIV and substance use are connected to all of the health issues • Surprise that cancer was rated so low given the data just presented; discussion
that cancer may have ranked lower because it already receives a lot of attention
Closing Discussion after Prioritization Round 2:
• We have to treat the reason for the illness. • Any intervention has to be broad enough to have an impact on the issues and the
cause • Obesity and diet impacts the gamut of health

33
• Keep obesity in the conversation. Can be good for adults and pediatric patients. Discussing obesity can lead to discussions on heart disease, diabetes, hypertension & stroke
• Need data on co-morbidities that occur with the prioritized issues • Dental needs to be added across clusters (dental impacts cancer, surgery,
elderly, maternal health, school) • Need to address preventable deaths (asthma, suicide) • Asthma is being treated but underreported
Additional feedback/recommendations received from participants during the day included:
• Using the Public Health Information Network (PHIN) • Need for expanded funding • Recommendation to pursue alternative services outside of the criminal justice
system to address mental health crisis or substance abuse issues
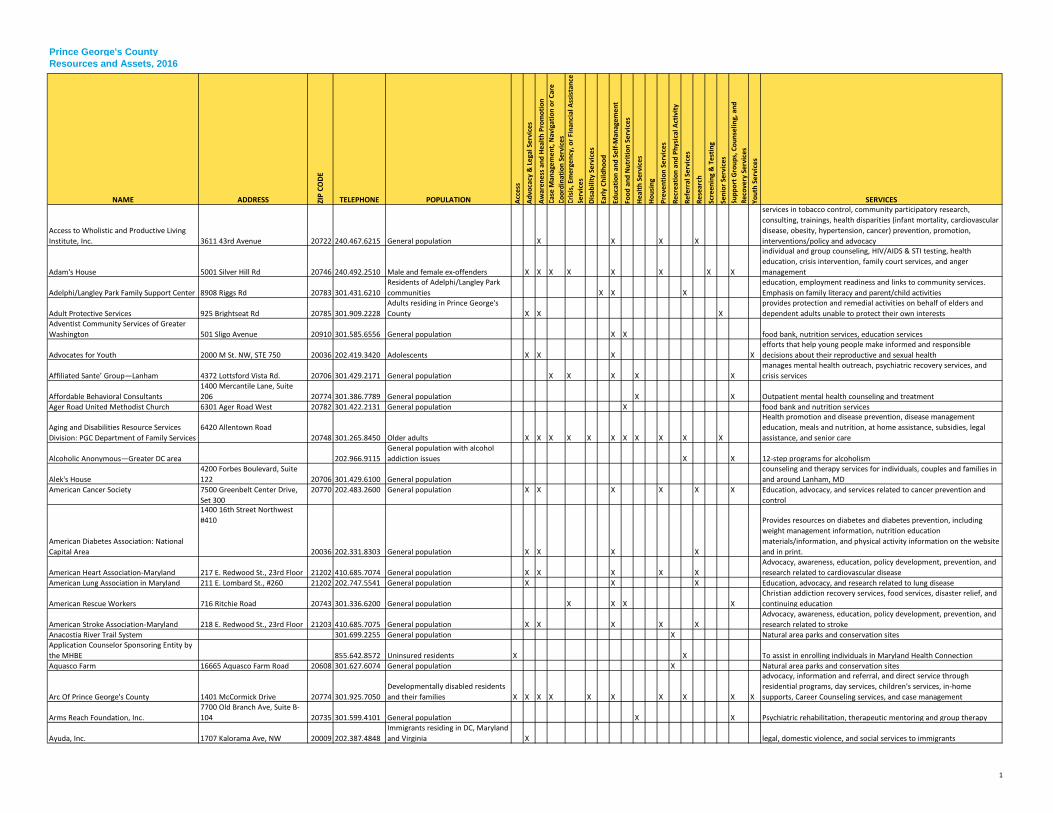
1
Prince George's CountyResources and Assets, 2016
NAME ADDRESS ZIP
CODE
TELEPHONE POPULATION Acce
ss
Advo
cacy
& L
egal
Ser
vice
s
Awar
enes
s an
d H
ealth
Pro
mot
ion
Case
Man
agem
ent,
Nav
igat
ion
or C
are
Coor
dina
tion
Serv
ices
Cris
is, E
mer
genc
y, o
r Fin
anci
al A
ssis
tanc
e Se
rvic
esD
isab
ility
Ser
vice
s
Early
Chi
ldho
od
Educ
atio
n an
d Se
lf-M
anag
emen
t
Food
and
Nut
ritio
n Se
rvic
es
Hea
lth S
ervi
ces
Hou
sing
Prev
entio
n Se
rvic
es
Recr
eatio
n an
d Ph
ysic
al A
ctiv
ity
Refe
rral
Ser
vice
s
Rese
arch
Scre
enin
g &
Tes
ting
Seni
or S
ervi
ces
Supp
ort G
roup
s, C
ouns
elin
g, a
nd
Reco
very
Ser
vice
sYo
uth
Serv
ices
SERVICES
Access to Wholistic and Productive Living Institute, Inc. 3611 43rd Avenue 20722 240.467.6215 General population X X X X
services in tobacco control, community participatory research, consulting, trainings, health disparities (infant mortality, cardiovascular disease, obesity, hypertension, cancer) prevention, promotion, interventions/policy and advocacy
Adam's House 5001 Silver Hill Rd 20746 240.492.2510 Male and female ex-offenders X X X X X X X X
individual and group counseling, HIV/AIDS & STI testing, health education, crisis intervention, family court services, and anger management
Adelphi/Langley Park Family Support Center 8908 Riggs Rd 20783 301.431.6210Residents of Adelphi/Langley Park communities X X X
education, employment readiness and links to community services. Emphasis on family literacy and parent/child activities
Adult Protective Services 925 Brightseat Rd 20785 301.909.2228Adults residing in Prince George's County X X X
provides protection and remedial activities on behalf of elders and dependent adults unable to protect their own interests
Adventist Community Services of Greater Washington 501 Sligo Avenue 20910 301.585.6556 General population X X food bank, nutrition services, education services
Advocates for Youth 2000 M St. NW, STE 750 20036 202.419.3420 Adolescents X X X Xefforts that help young people make informed and responsible decisions about their reproductive and sexual health
Affiliated Sante’ Group—Lanham 4372 Lottsford Vista Rd. 20706 301.429.2171 General population X X X X Xmanages mental health outreach, psychiatric recovery services, and crisis services
Affordable Behavioral Consultants1400 Mercantile Lane, Suite 206 20774 301.386.7789 General population X X Outpatient mental health counseling and treatment
Ager Road United Methodist Church 6301 Ager Road West 20782 301.422.2131 General population X food bank and nutrition services
Aging and Disabilities Resource Services Division: PGC Department of Family Services
6420 Allentown Road 20748 301.265.8450 Older adults X X X X X X X X X X X
Health promotion and disease prevention, disease management education, meals and nutrition, at home assistance, subsidies, legal assistance, and senior care
Alcoholic Anonymous—Greater DC area 202.966.9115General population with alcohol addiction issues X X 12-step programs for alcoholism
Alek's House4200 Forbes Boulevard, Suite 122 20706 301.429.6100 General population
counseling and therapy services for individuals, couples and families in and around Lanham, MD
American Cancer Society 7500 Greenbelt Center Drive, Set 300
20770 202.483.2600 General population X X X X X X Education, advocacy, and services related to cancer prevention and control
American Diabetes Association: National Capital Area
1400 16th Street Northwest #410
20036 202.331.8303 General population X X X X
Provides resources on diabetes and diabetes prevention, including weight management information, nutrition education materials/information, and physical activity information on the website and in print.
American Heart Association-Maryland 217 E. Redwood St., 23rd Floor 21202 410.685.7074 General population X X X X XAdvocacy, awareness, education, policy development, prevention, and research related to cardiovascular disease
American Lung Association in Maryland 211 E. Lombard St., #260 21202 202.747.5541 General population X X X Education, advocacy, and research related to lung disease
American Rescue Workers 716 Ritchie Road 20743 301.336.6200 General population X X X XChristian addiction recovery services, food services, disaster relief, and continuing education
American Stroke Association-Maryland 218 E. Redwood St., 23rd Floor 21203 410.685.7075 General population X X X X XAdvocacy, awareness, education, policy development, prevention, and research related to stroke
Anacostia River Trail System 301.699.2255 General population X Natural area parks and conservation sitesApplication Counselor Sponsoring Entity by the MHBE 855.642.8572 Uninsured residents X X To assist in enrolling individuals in Maryland Health Connection Aquasco Farm 16665 Aquasco Farm Road 20608 301.627.6074 General population X Natural area parks and conservation sites
Arc Of Prince George's County 1401 McCormick Drive 20774 301.925.7050Developmentally disabled residents and their families X X X X X X X X X X
advocacy, information and referral, and direct service through residential programs, day services, children's services, in-home supports, Career Counseling services, and case management
Arms Reach Foundation, Inc.7700 Old Branch Ave, Suite B-104 20735 301.599.4101 General population X X Psychiatric rehabilitation, therapeutic mentoring and group therapy
Ayuda, Inc. 1707 Kalorama Ave, NW 20009 202.387.4848Immigrants residing in DC, Maryland and Virginia X legal, domestic violence, and social services to immigrants
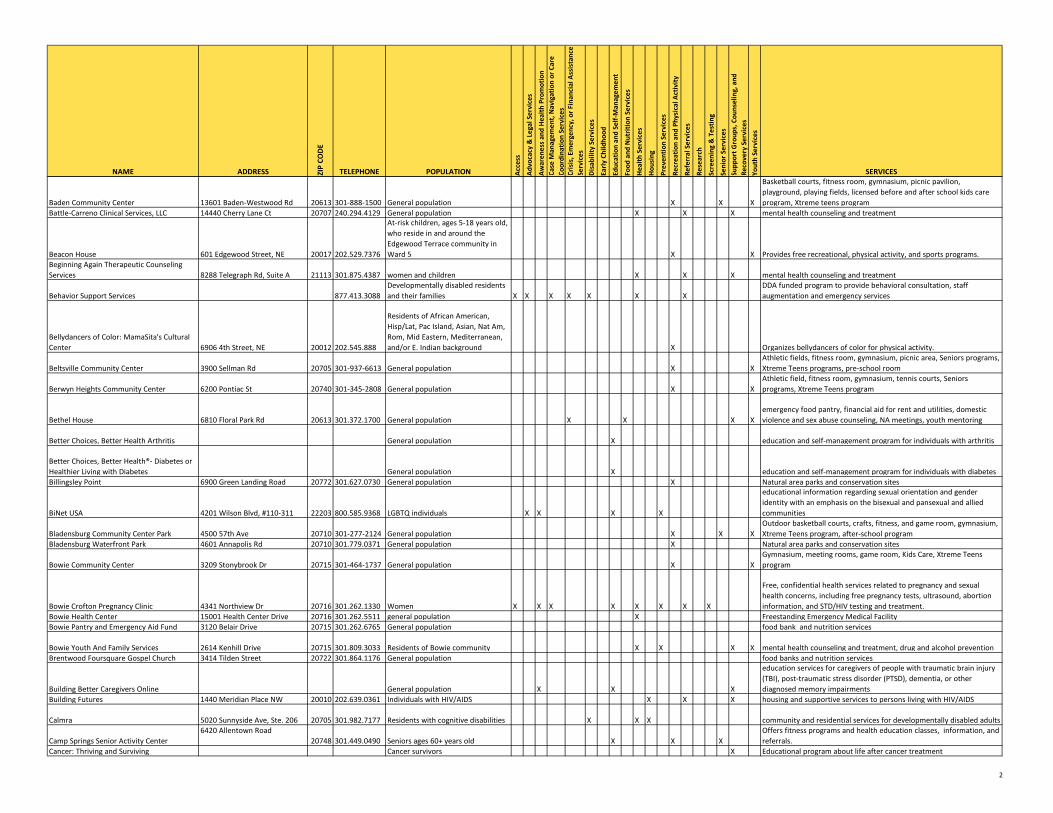
2
NAME ADDRESS ZIP
CODE
TELEPHONE POPULATION Acce
ss
Advo
cacy
& L
egal
Ser
vice
s
Awar
enes
s an
d H
ealth
Pro
mot
ion
Case
Man
agem
ent,
Nav
igat
ion
or C
are
Coor
dina
tion
Serv
ices
Cris
is, E
mer
genc
y, o
r Fin
anci
al A
ssis
tanc
e Se
rvic
esD
isab
ility
Ser
vice
s
Early
Chi
ldho
od
Educ
atio
n an
d Se
lf-M
anag
emen
t
Food
and
Nut
ritio
n Se
rvic
es
Hea
lth S
ervi
ces
Hou
sing
Prev
entio
n Se
rvic
es
Recr
eatio
n an
d Ph
ysic
al A
ctiv
ity
Refe
rral
Ser
vice
s
Rese
arch
Scre
enin
g &
Tes
ting
Seni
or S
ervi
ces
Supp
ort G
roup
s, C
ouns
elin
g, a
nd
Reco
very
Ser
vice
sYo
uth
Serv
ices
SERVICES
Baden Community Center 13601 Baden-Westwood Rd 20613 301-888-1500 General population X X X
Basketball courts, fitness room, gymnasium, picnic pavilion, playground, playing fields, licensed before and after school kids care program, Xtreme teens program
Battle-Carreno Clinical Services, LLC 14440 Cherry Lane Ct 20707 240.294.4129 General population X X X mental health counseling and treatment
Beacon House 601 Edgewood Street, NE 20017 202.529.7376
At-risk children, ages 5-18 years old, who reside in and around the Edgewood Terrace community in Ward 5 X X Provides free recreational, physical activity, and sports programs.
Beginning Again Therapeutic Counseling Services 8288 Telegraph Rd, Suite A 21113 301.875.4387 women and children X X X mental health counseling and treatment
Behavior Support Services 877.413.3088Developmentally disabled residents and their families X X X X X X X
DDA funded program to provide behavioral consultation, staff augmentation and emergency services
Bellydancers of Color: MamaSita's Cultural Center 6906 4th Street, NE 20012 202.545.888
Residents of African American, Hisp/Lat, Pac Island, Asian, Nat Am, Rom, Mid Eastern, Mediterranean, and/or E. Indian background X Organizes bellydancers of color for physical activity.
Beltsville Community Center 3900 Sellman Rd 20705 301-937-6613 General population X XAthletic fields, fitness room, gymnasium, picnic area, Seniors programs, Xtreme Teens programs, pre-school room
Berwyn Heights Community Center 6200 Pontiac St 20740 301-345-2808 General population X XAthletic field, fitness room, gymnasium, tennis courts, Seniors programs, Xtreme Teens program
Bethel House 6810 Floral Park Rd 20613 301.372.1700 General population X X X Xemergency food pantry, financial aid for rent and utilities, domestic violence and sex abuse counseling, NA meetings, youth mentoring
Better Choices, Better Health Arthritis General population X education and self-management program for individuals with arthritis
Better Choices, Better Health®- Diabetes or Healthier Living with Diabetes General population X education and self-management program for individuals with diabetesBillingsley Point 6900 Green Landing Road 20772 301.627.0730 General population X Natural area parks and conservation sites
BiNet USA 4201 Wilson Blvd, #110-311 22203 800.585.9368 LGBTQ individuals X X X X
educational information regarding sexual orientation and gender identity with an emphasis on the bisexual and pansexual and allied communities
Bladensburg Community Center Park 4500 57th Ave 20710 301-277-2124 General population X X XOutdoor basketball courts, crafts, fitness, and game room, gymnasium, Xtreme Teens program, after-school program
Bladensburg Waterfront Park 4601 Annapolis Rd 20710 301.779.0371 General population X Natural area parks and conservation sites
Bowie Community Center 3209 Stonybrook Dr 20715 301-464-1737 General population X XGymnasium, meeting rooms, game room, Kids Care, Xtreme Teens program
Bowie Crofton Pregnancy Clinic 4341 Northview Dr 20716 301.262.1330 Women X X X X X X X X
Free, confidential health services related to pregnancy and sexual health concerns, including free pregnancy tests, ultrasound, abortion information, and STD/HIV testing and treatment.
Bowie Health Center 15001 Health Center Drive 20716 301.262.5511 general population X Freestanding Emergency Medical FacilityBowie Pantry and Emergency Aid Fund 3120 Belair Drive 20715 301.262.6765 General population food bank and nutrition services
Bowie Youth And Family Services 2614 Kenhill Drive 20715 301.809.3033 Residents of Bowie community X X X X mental health counseling and treatment, drug and alcohol preventionBrentwood Foursquare Gospel Church 3414 Tilden Street 20722 301.864.1176 General population food banks and nutrition services
Building Better Caregivers Online General population X X X
education services for caregivers of people with traumatic brain injury (TBI), post-traumatic stress disorder (PTSD), dementia, or other diagnosed memory impairments
Building Futures 1440 Meridian Place NW 20010 202.639.0361 Individuals with HIV/AIDS X X X housing and supportive services to persons living with HIV/AIDS
Calmra 5020 Sunnyside Ave, Ste. 206 20705 301.982.7177 Residents with cognitive disabilities X X X community and residential services for developmentally disabled adults
Camp Springs Senior Activity Center6420 Allentown Road
20748 301.449.0490 Seniors ages 60+ years old X X XOffers fitness programs and health education classes, information, and referrals.
Cancer: Thriving and Surviving Cancer survivors X Educational program about life after cancer treatment

3
NAME ADDRESS ZIP
CODE
TELEPHONE POPULATION Acce
ss
Advo
cacy
& L
egal
Ser
vice
s
Awar
enes
s an
d H
ealth
Pro
mot
ion
Case
Man
agem
ent,
Nav
igat
ion
or C
are
Coor
dina
tion
Serv
ices
Cris
is, E
mer
genc
y, o
r Fin
anci
al A
ssis
tanc
e Se
rvic
esD
isab
ility
Ser
vice
s
Early
Chi
ldho
od
Educ
atio
n an
d Se
lf-M
anag
emen
t
Food
and
Nut
ritio
n Se
rvic
es
Hea
lth S
ervi
ces
Hou
sing
Prev
entio
n Se
rvic
es
Recr
eatio
n an
d Ph
ysic
al A
ctiv
ity
Refe
rral
Ser
vice
s
Rese
arch
Scre
enin
g &
Tes
ting
Seni
or S
ervi
ces
Supp
ort G
roup
s, C
ouns
elin
g, a
nd
Reco
very
Ser
vice
sYo
uth
Serv
ices
SERVICESCapital Area Food Bank 645 Taylor Street, NE 20017 202.526.5344 General population food bank and nutrition services
Capital Area Food Bank: Operation Frontline Program
4900 Puerto Rico Avenue, NE
20017 202.644.9800 General population XCooking-based nutrition program that focuses on teaching cooking skills, nutrition basics, and food budgeting.
Capital Region Health Connection 240.773.8250Residents of Montgomery and Prince George's Counties X Enrolling individuals into qualified health plans
CASA de Maryland 8151 15th Avenue 20883 301.270.8432Latino residents of Prince George's County X Latino and immigration advocacy-and-assistance organization
Catholic Charities of Baltimore 320 Cathedral St 21201 410.547.5490
Children and families, seniors, immigrants, people living in poverty, and individuals with intellectual disabilities X X X X X X X X X X
Health services, education, food, foster care, residential services, shelters, crisis intervention, family navigator services, homeless services, and services for older adults
Catholic Charities: Archdiocese of Washington 924 G Street, NW 20001 202.772.4300 General population X food bank and emergency aidCatholic Charities: Langley Park 7949 15th Avenue 20883 301.434.6453 General population X food bank and emergency aid
Cedar Heights Community Center Park 1200 Glen Willow Dr 20743 301-773-8881 General population X X XDance and fitness room, gymnasium, preschool room, photography dark room, Xtreme Teens program, Seniors program
Cedarhaven Fishing Area18400 Phyllis Wheatley Boulevard 20608 301.627.6074 General population X Natural area parks and conservation sites
Center For Healthy Families 4200 Valley Drive, Room 0142 20742 301.405.2273 General population X X couple and family therapy clinic
Center For Therapeutic Concepts 1300 Mercantile Lane 20774 301.386.2991 General population X X X Outpatient mental health clinic and psychiatric rehabilitation program for adults and children
Central Baptist Church 5412 Annapolis Rd 20712 301.699.5886 General population food bank and nutrition services
Centro De Apoyo Familiar 6801 Kenilworth Ave 20737 301.328.3292 Latino families X X X X X
The Comida Sana-Vida Sana/Healthy Eating-Healthy Living program provides healthy eating education and access to healthy food and other resources, primarily among Latinos and other low income immigrant communities.
Cheltenham Wetlands Park 9020 Commo Rd 20623 301.627.7755 General population X Natural area parks and conservation sitesChesapeake Bay Critical Area Tour 16000 Croom Airport Road 20772 301.627.6074 General population X Natural area parks and conservation sites
Cheverly Health Center 3003 Hospital Drive 20785 301.583.7752 General population X X X X X X X
Health services, family planning, STI/HIV/TB screening and treatment services, immunizations, health education, behavioral health services, and dental care
Children and Parents Program 501 Hampton Park Blvd 20743 301.324.2872 General population X X X X X X X X Xaddiction, mental health, rehabilitative and case management services to adult women, including pregnant women and women with children
Children, Youth and Families Division: PGC Department of Family Services
6420 Allentown Road 20748 301.265.8446 Children and families X X X X X
After school programs, gang prevention, Children in Need of Supervision, Teen Court, Truancy Prevention Initiative, kinship care, home visiting, Local Access Mechanism, Local Care Teams, and Healthy Families
Children’s Development Clinic: Prince George's Community College 301 Largo Rd, CE-123 20774 301.322.0519
Children 0–12 experiencing developmental delays X X X X X
services for children in the areas of motor, language, reading and social skills
Children's National Medical Center: Upper Marlboro Outpatient Clinic 9400 Marlboro Pike, Ste 210 20772 301.297.4000 Children and adolescents X X X X X X X X Outpatient specialty health services for children and adolescents Church of Living God 1417 Chillum Rd 20883 301.559.8893 General population food bank and nutrition servicesCity of College Park Seniors' Program: Attick Towers
9014 Rhode Island Avenue20740 301.345.8100
Senior residents of the city of College Park X X X X
Offers periodic Presentations on Senior Topics in Safety, Wellness, and Health.
City of College Park Seniors' Program: Spellman House
4711 Berwyn House Road
20740 301.220.0037Senior residents of the city of College Park X X X X Offers periodic Presentations on Senior Topics in wellness and health.
Clearwater Nature Center 10999 Thrift Rd 20735 301.297.4575 General population X Natural area parks and conservation sitesClinton Baptist Church 8701 Woodyard Rd 20735 301.868.1177 General population food bank and nutrition services
Clyde Watson Boating Area 17901 Magruder's Ferry Road 20613 301.627.6074 General population X Natural area parks and conservation sitesCollege Park Community Center Park and Youth Soccer Complex 5051 Pierce Ave 20740 301-441-2647 General population X X
Dance and fitness room, gymnasium, soccer fields, teen room, after-school program, Xtreme Teens program

4
NAME ADDRESS ZIP
CODE
TELEPHONE POPULATION Acce
ss
Advo
cacy
& L
egal
Ser
vice
s
Awar
enes
s an
d H
ealth
Pro
mot
ion
Case
Man
agem
ent,
Nav
igat
ion
or C
are
Coor
dina
tion
Serv
ices
Cris
is, E
mer
genc
y, o
r Fin
anci
al A
ssis
tanc
e Se
rvic
esD
isab
ility
Ser
vice
s
Early
Chi
ldho
od
Educ
atio
n an
d Se
lf-M
anag
emen
t
Food
and
Nut
ritio
n Se
rvic
es
Hea
lth S
ervi
ces
Hou
sing
Prev
entio
n Se
rvic
es
Recr
eatio
n an
d Ph
ysic
al A
ctiv
ity
Refe
rral
Ser
vice
s
Rese
arch
Scre
enin
g &
Tes
ting
Seni
or S
ervi
ces
Supp
ort G
roup
s, C
ouns
elin
g, a
nd
Reco
very
Ser
vice
sYo
uth
Serv
ices
SERVICESCollege Park Youth And Family Services 4912 Nantucket Road 20740 240.487.3550 Residents of College Park X X X community outreach and family counseling
Columbia Park Community Center Park 1901 Kent Village Dr 20785 301-341-3749 General population X XGymnasium, office space, after-school programs, Xtreme Teens program
Community Advocates For Youth: Counseling Center 1300 Caraway Ct 20774 301.390.4092 General population X X X X X X
Provides victim advocacy and support services, crisis intervention, and community education
Community Clinic, Inc. 7676 New Hampshire Avenue 20912 301.431.2972 General population X X X X X X X X medical, behavioral health, and WIC servicesCommunity Clinic, Inc. 9001 Edmonston RD, STE 40 20770 240.790.3325 General population X X X X X X X X family planning, prenatal care, and WIC servicesCommunity Clinic, Inc. 9220 Springhill Lane 20770 240.624.2278 General population X X X X X X X X Medical, Dental and Behavioral Health services
Community Counseling & Mentoring Services 1300 Mercantile Lane 20774 301.583.0001 General population X X X X X X X X
comprehensive mental health services including assessments, intervention and consultation, to children, adolescents and their families
Community Crisis Services, Inc. PO Box 149 20781 301.864.7095 General population X X X X X Xcrisis intervention and suicide prevention through outreach and 24-hour hotline services
Community Education Group 3233 Pennsylvania Ave SE 20020 202.543.2376 General population X X X HIV/AIDS awareness, education and prevention
Community Health Empowerment Through Education and Research (CHEER) 8545 Piney Branch Rd, STE B 20910 301.589.3633 General population X X X X community health improvement education and research
Community Hospices of Maryland 11785 Beltsville Dr, STE 1300 20705 301.560.6000 General population X hospiceCommunity Legal Services Of Prince George's County PO Box 734 20738 240.391.6370 low-income residents X X
lawyer-referral organization matching low income clients with lawyers who would provide free advice.
Community Outreach and Development Corporation (CDC) 4719 Marlboro Pike, STE 104 20743 301.404.1551 general population X X X X X X
community development; early childhood development programs; food, clothing, financial assistance, and linkages to community-based services
Compassion Power 14817 Kelley Farm Road 20874 301.921.2010 men and families X X X X anger management services and emotional abuse counseling
Contemporary Family Services 6525 Belcrest Rd 20782 301.779.0258 Families and children X X X X X XMental health services for foster children, foster families, and family psychiatric care
Cora B. Wood Senior Center4009 Wallace Road
20722 301.699.1238 Seniors ages 60+ years old X XExercise classes provided by the National Institutes of Health Heart Center at Suburban Hospital
Cornerstone Baptist Church 3636 Dixon Street 20748 301.894.7998 General population food bank and nutrition servicesCosca Regional Park 11000 Thrift Rd 20735 301.868.1397 General population X Natural area parks and conservation sitesCrescent Ridge Adult Day Health 7001 Oxon Hill Rd 20745 301.567.1885 adults and seniors X elder care
D. Leonard Dyer Regional Health Center 9314 Piscataway Road 20735 301.856.9520 General population X X X X X X X X X XHealth services, family planning, STI/HIV/TB screening and treatment services, immunizations, health education, behavioral health services
Damien Ministries 2200 Rhode Island Ave NE 20018 202.526.3020 People living with HIV/AIDS X XFood bank, medical nutrition services, medical case management, and spiritual retreats
Deerfield Run Community Center 13000 Laurel-Bowie Rd 20708 301-953-7882 General population X X
Ball fields, basketball courts, classroom space, fitness and game room, gymnasium, playground, pre-school room, after-school program, Xtreme Teens program
Depression and Bipolar Support Alliance: Beltsville 301.937.6024
Individuals with depression and bipolar disorder and their families X support groups
Destiny, Power & Purpose 4917 Marlboro Pike, Ste. 101 20743 301.420.2383 General population X X XATR Care Coordination Agency for Prince Georges County; recovery and re-entry support services
Dimenions Healthcare System - Dimensions Healthcare Associates
7350 Van Dusen Road, Suite 260/Suite 350 20707 301.618.2273 general population X X X X
comprehensive healthcare services in the areas of dental care, women’s health, men’s health and family medicine to include pediatric health
Dimensions Healthcare System - Dimensions Healthcare Associates - Dr. Craig Persons
7501 Greenway Center Drive, Suite 220 20770 301.618.2274 general population X X X X
comprehensive healthcare services in the areas of dental care, women’s health, men’s health and family medicine to include pediatric health
Dimensions Surgery Center 14999 Health Center Drive 20716 301.809.2000 general population X Ambulatory surgical servicesDimensions Healthcare System - Family 2900 Mercy Lane 20785 301.618.2273 General population X X X X X X X X comprehensive healthcare services in the areas of women’s health, Dimensions Healthcare System - Family 5001 Silver Hill Rd 20746 301.618.2273 General population X X X X X X X X comprehensive healthcare services in the areas of dental care, Dimensions Healthcare System - Rachel H. 3601 Taylor Street, Suite 108 20722 301.927.4987 Residents ages 55 years and older X X X X Primary and continuing comprehensive medical and nursing services

5
NAME ADDRESS ZIP
CODE
TELEPHONE POPULATION Acce
ss
Advo
cacy
& L
egal
Ser
vice
s
Awar
enes
s an
d H
ealth
Pro
mot
ion
Case
Man
agem
ent,
Nav
igat
ion
or C
are
Coor
dina
tion
Serv
ices
Cris
is, E
mer
genc
y, o
r Fin
anci
al A
ssis
tanc
e Se
rvic
esD
isab
ility
Ser
vice
s
Early
Chi
ldho
od
Educ
atio
n an
d Se
lf-M
anag
emen
t
Food
and
Nut
ritio
n Se
rvic
es
Hea
lth S
ervi
ces
Hou
sing
Prev
entio
n Se
rvic
es
Recr
eatio
n an
d Ph
ysic
al A
ctiv
ity
Refe
rral
Ser
vice
s
Rese
arch
Scre
enin
g &
Tes
ting
Seni
or S
ervi
ces
Supp
ort G
roup
s, C
ouns
elin
g, a
nd
Reco
very
Ser
vice
sYo
uth
Serv
ices
SERVICESDimensions Healthcare System - Wound 7400 Van Dusen Road 20707 301.725.4300 general population X X X X health service dedicated to caring for persons with wounds that have Dinosaur Park 13201 Mid-Atlantic Boulevard 20708 301.627.1286 General population X Natural area parks and conservation sitesDistrict Heights Family And Youth Services Center 2000 Marbury Dr 20747 301.336.7600 General population X X X X X X
counseling program dedicated to promoting responsible behavior and appropriate family management skills
Diversified Counseling Service 9131 Piscataway Rd 20735 301.856.4477 General population X X individual, group and couples counseling.
Doctors Community Hospital
8118 Good Luck Road
20706 301.552.8661 General population X X X X X X
Services including emergency care, inpatient care, preventive services, outpatient rehabilitation, and a comprehensive range of specialty services
Doctors Community Hospital-Support Groups
8119 Good Luck Road
20707 301.552.8662 General population XSupport group services for a comprehensive range of conditions and experiences
Dueling Creek Natural Area in Colmar Manor Lawrence St 20722 301.927.2163 General population X Natural area parks and conservation sites
Educare Resources Center 107 Bonhill Drive 20744 301.203.0293Mentally or developmentally disabled residents X
services for more independent mentally and developmentally disabled who need supportive living services
Elizabeth House, FISH of Laurel PO Box 36 20707 301.776.9296 General population food bank and nutrition services
Engaged Community Offshoots, Inc. aka ECO City Farms 6010 Taylor Road 20737 301.288.1125 general population X
seeks to enhance food security, safety and access, to improve nutrition and health, to preserve cultural and ecological diversity, and to accelerate the transition to an economy based on preservation, recycling and restoration
Essential Therapeutic Perspectives8100 Professional Place, Suite 205 20735 301.577.4440 children, adolescents, and families X X behavioral and mental health care, including psychiatric rehabilitation
Evelyn Cole Senior Activity Center5720 Addison Road
20743 301.386.5525 Seniors ages 60+ years old X X XOffers fitness programs and health education classes, information, and referrals.
Evergreen Health7501 Greenway Center Drive, Suite 600 20770 240.542.0170 General population X X X X X X
non-profit insurance cooperative; primary care, care coordination, wellness services, preventive care, and behavioral health services
Fairland Regional Park 13950 Old Gunpowder Rd 20707 301.362.6060 General population X Natural area parks and conservation sitesFaith Community Baptist Church 13618 Layhill Rd 20906 301.460.8188 General population food bank and nutrition services
Family and Medical Counseling Service, Inc. 2041 MLK Jr Ave SE 20020 202.889.7900 Medically underserved community X X X X X X X XCommunity health center providing medical, mental health, substance abuse education, treatment and referral services
Family Behavioral Services6475 New Hampshire Ave, STE 650 20783 301.270.3200
General population, but specializes in adolescents X X X X
Consultation, case management, evaluations, medication monitoring, and individual, family or group counseling
Family Crisis Center of Prince George's County 3601 Taylor St 20722 301.779.2100
Individuals and family members affected by domestic violence X X X X
domestic violence victims and offenders, anger management counseling, emergency shelter, and legal advocacy
Family Matters of Greater Washington: Oxon Hill Center 6196 Oxon Hill Road 20745 301.839.1960 Youth, families and senior citizens X X X X X X X X X
Provides assistance to children, youth, families and seniors with programs, including: therapeutic and traditional foster care; youth development programs; mental health/counseling services; psychiatric rehabilitation services, psychiatric assessments and medication management
Family Outreach Center of Ebenezer AME Church 7800 Allentown Rd 20744 301.248.5000 General population food bank and nutrition services
Family Service Foundation, Inc. 5301 76th Avenue 20784 301.459.2121
individuals with developmental disabilities and/or severe mental illness X
mental health services, substance abuse counseling; community residential programs; and day habilitation
Family Services Foundation 8101 Sandy Springs Rd, STE 104 20707 301.317.0114Developmentally disabled residents and their families X health and supportive services for developmentally disabled residents
First Baptist Church of Suitland 5400 Silver Hill Road 20747 301.735.6111 General population food bank and nutrition servicesFirst Baptist of Upper Marlboro 7415 Crain Highway 20772 301.952.0117 General population food bank and nutrition services
First Metropolitan Facilities 5801 Allentown Rd 20746 301.316.2717Children with developmental disabilities and their families X X wraparound services for children with developmental disabilities
First New Horizon Baptist Church 9511 Piscataway Rd 20735 301.856.9177 General population food bank and nutrition services

6
NAME ADDRESS ZIP
CODE
TELEPHONE POPULATION Acce
ss
Advo
cacy
& L
egal
Ser
vice
s
Awar
enes
s an
d H
ealth
Pro
mot
ion
Case
Man
agem
ent,
Nav
igat
ion
or C
are
Coor
dina
tion
Serv
ices
Cris
is, E
mer
genc
y, o
r Fin
anci
al A
ssis
tanc
e Se
rvic
esD
isab
ility
Ser
vice
s
Early
Chi
ldho
od
Educ
atio
n an
d Se
lf-M
anag
emen
t
Food
and
Nut
ritio
n Se
rvic
es
Hea
lth S
ervi
ces
Hou
sing
Prev
entio
n Se
rvic
es
Recr
eatio
n an
d Ph
ysic
al A
ctiv
ity
Refe
rral
Ser
vice
s
Rese
arch
Scre
enin
g &
Tes
ting
Seni
or S
ervi
ces
Supp
ort G
roup
s, C
ouns
elin
g, a
nd
Reco
very
Ser
vice
sYo
uth
Serv
ices
SERVICES
First United Methodist Church of Hyattsville- HIV/AIDS Awareness Ministry 6201 Belcrest Rd 20782 301.927.6133 General population X X X
Hosts community group events as well as a free HIV/STI testing clinic once a month on the third Saturday of the month from 1 to 3 p.m.
Forestville New Redeemer Baptist Church 7808 Marlboro Pike 20747 301.736.4488 General population food bank and nutrition services
Fort Lincoln Medical Center 4151 Bladensburg Rd 20722 301.699.7700 General population X X X X X
Family medicine physicians and other healthcare professionals providing comprehensive health care services for all members of the family, from prenatal and pediatric to geriatric care.
Fort Washington Forest Community Center 1200 Fillmore Rd 20744 301-292-4300 General population X XArts and crafts room, computer lab, fitness room, gymnasium, teen lounge area, fitness classes, Xtreme Teens program
Fort Washington Medical Center11711 Livingston Rd
20744 301.292.7000 General population X X X X
37-bed acute care hospital with comprehensive services including: diabetes education, emergency care, general surgery, imaging, inpatient care, nursing services, orthopedics and preventive screenings
Fort Washington Medical Center-Diabetes Center 11711 Livingston Road 20744 240.766.4197 General population X X X
Support services, education and referrals for the prevention and control of diabetes
Fort Washington Medical Center-Health Screenings 11711 Livingston Road 20744 301.686.9010 General population X X X X Screening programs for prevention, detection, and interventionFran Uhler Natural Area 10300 Lemons Bridge Road 20720 301.627.6074 General population X Natural area parks and conservation sitesFreedom Way Baptist Church 1266 Benning Road 20743 301.736.0184 General population food bank and nutrition servicesGalilee Baptist Church 2101 Shadyside Avenue 20746 301.420.5013 General population food bank and nutrition services
GapBuster, Inc.- Riverdale Office 6200 Sheridan St 20737 301.779.4252 Youth and young adults Xafter-school tutoring, leadership development, college preparation and drop-out prevention programs
Gerald Family Care 4744 Marlboro Pike 20743 240.670.1003 Medically underserved residents X X X X X X X providing a full range of preventive, primary care, and wellness servicesGethsemane United Methodist Church 910 Addison Road South 20743 301.336.1219 General population food bank and nutrition services
Glassmanor Community Center Park 1101 Marcy Ave 20745 301-567-6033 General population X X
Fitness room, football/softball fields, game room, gymnasium, office space, playground, tennis court, after-school program, camps, mentoring, Xtreme Teens program
Glenarden/Theresa Banks Complex 8615 McLain Ave 20706 301-772-3151 General population X X X
Arts and crafts room, basketball courts, computer lab, game room, fitness room, gymnasium, imagination playground, lighted tennis courts, picnic area, softball field, Xtreme Teens program, Seniors program
Glenn Dale Community Center Park11901 Glenn Dale Boulevard (Rte 193) 20769 301-352-8983 General population X X X
Arts and crafts room, fitness room, gymnasium, multipurpose room, office space, pre-school room, Xtreme Teens program, Seniors program
Global Vision Community Health Center 9171 Central Ave. Suite B11 and B12 20743 301.499.2270 Medically underserved residents X X X X X X X providing a full range of preventive, primary care, and wellness services
Good Luck Community Center Park 8601 Good Luck Rd 20706 301-552-1093 General population X X X
Basketball courts, dance/multipurpose room, fitness room, gymnasium, imagination playground, picnic area, pre-school program, softball field, teen room, tennis courts, camps, Xtreme Teens program, Seniors program
Governor Bridge Natural Area & Canoe Launch 7600 Governor Bridge Rd 20716 301.627.6074 General population X Natural area parks and conservation sites
Greater Baden Medical Services 1458 Addison Rd. S 20743 301.324.1500 Medically underserved residents X X X X X X XFederally Qualified Health Center (FQHC) providing a full range of preventive, primary care, and wellness services
Greater Baden Medical Services: Women, Infants and Children Clinics 1458 Addison Rd. S 20743 301.324.1873 Medically underserved residents X X X X nutrition and wellness services
Greenbelt Assistance In Living Program 25 Crescent Road 20770 301.345.6660Senior citizens residing in the City of Greenbelt X Support services to aid senior citizens living in place
Greenbelt Cares Youth and Family Service Bureau 25 Crescent Rd 20770 301.345.6660 General population X X X
counseling program dedicated to promoting responsible behavior and appropriate family management skills; crisis counseling
Greenbelt Park 6565 Greenbelt Rd 20770 301.344.3948 General population X National Park services
GW Healing Clinic: Bridge to Care Clinic 3003 Hospital Drive 20785 301.583.3108 Medically underserved residents X X X X X XPrimary care clinic run by volunteers and students from George Washington University School of Medicine
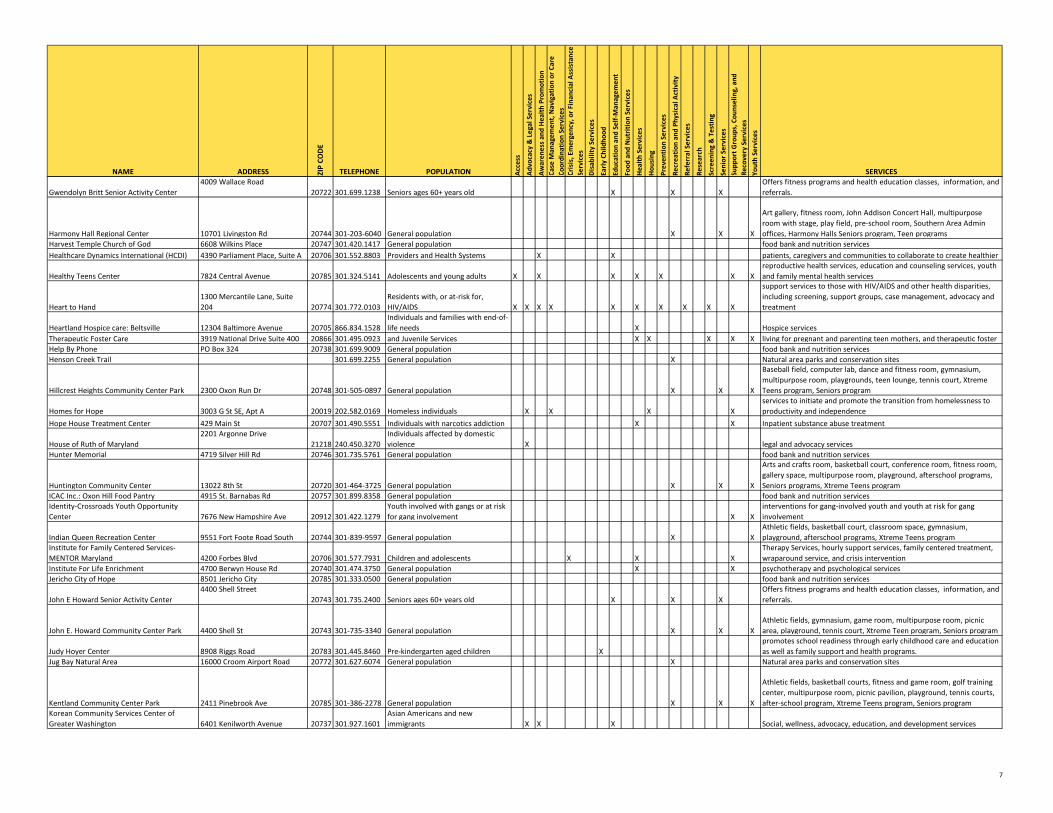
7
NAME ADDRESS ZIP
CODE
TELEPHONE POPULATION Acce
ss
Advo
cacy
& L
egal
Ser
vice
s
Awar
enes
s an
d H
ealth
Pro
mot
ion
Case
Man
agem
ent,
Nav
igat
ion
or C
are
Coor
dina
tion
Serv
ices
Cris
is, E
mer
genc
y, o
r Fin
anci
al A
ssis
tanc
e Se
rvic
esD
isab
ility
Ser
vice
s
Early
Chi
ldho
od
Educ
atio
n an
d Se
lf-M
anag
emen
t
Food
and
Nut
ritio
n Se
rvic
es
Hea
lth S
ervi
ces
Hou
sing
Prev
entio
n Se
rvic
es
Recr
eatio
n an
d Ph
ysic
al A
ctiv
ity
Refe
rral
Ser
vice
s
Rese
arch
Scre
enin
g &
Tes
ting
Seni
or S
ervi
ces
Supp
ort G
roup
s, C
ouns
elin
g, a
nd
Reco
very
Ser
vice
sYo
uth
Serv
ices
SERVICES
Gwendolyn Britt Senior Activity Center4009 Wallace Road
20722 301.699.1238 Seniors ages 60+ years old X X XOffers fitness programs and health education classes, information, and referrals.
Harmony Hall Regional Center 10701 Livingston Rd 20744 301-203-6040 General population X X X
Art gallery, fitness room, John Addison Concert Hall, multipurpose room with stage, play field, pre-school room, Southern Area Admin offices, Harmony Halls Seniors program, Teen programs
Harvest Temple Church of God 6608 Wilkins Place 20747 301.420.1417 General population food bank and nutrition servicesHealthcare Dynamics International (HCDI) 4390 Parliament Place, Suite A 20706 301.552.8803
Providers and Health Systems X X
patients, caregivers and communities to collaborate to create healthier
Healthy Teens Center 7824 Central Avenue 20785 301.324.5141 Adolescents and young adults X X X X X X Xreproductive health services, education and counseling services, youth and family mental health services
Heart to Hand1300 Mercantile Lane, Suite 204 20774 301.772.0103
Residents with, or at-risk for, HIV/AIDS X X X X X X X X X X
support services to those with HIV/AIDS and other health disparities, including screening, support groups, case management, advocacy and treatment
Heartland Hospice care: Beltsville 12304 Baltimore Avenue 20705 866.834.1528Individuals and families with end-of-life needs X Hospice services
Therapeutic Foster Care 3919 National Drive Suite 400 20866 301.495.0923
and Juvenile Services X X X X X
living for pregnant and parenting teen mothers, and therapeutic foster Help By Phone PO Box 324 20738 301.699.9009 General population food bank and nutrition servicesHenson Creek Trail 301.699.2255 General population X Natural area parks and conservation sites
Hillcrest Heights Community Center Park 2300 Oxon Run Dr 20748 301-505-0897 General population X X X
Baseball field, computer lab, dance and fitness room, gymnasium, multipurpose room, playgrounds, teen lounge, tennis court, Xtreme Teens program, Seniors program
Homes for Hope 3003 G St SE, Apt A 20019 202.582.0169 Homeless individuals X X X Xservices to initiate and promote the transition from homelessness to productivity and independence
Hope House Treatment Center 429 Main St 20707 301.490.5551 Individuals with narcotics addiction X X Inpatient substance abuse treatment
House of Ruth of Maryland 2201 Argonne Drive
21218 240.450.3270Individuals affected by domestic violence X legal and advocacy services
Hunter Memorial 4719 Silver Hill Rd 20746 301.735.5761 General population food bank and nutrition services
Huntington Community Center 13022 8th St 20720 301-464-3725 General population X X X
Arts and crafts room, basketball court, conference room, fitness room, gallery space, multipurpose room, playground, afterschool programs, Seniors programs, Xtreme Teens program
ICAC Inc.: Oxon Hill Food Pantry 4915 St. Barnabas Rd 20757 301.899.8358 General population food bank and nutrition servicesIdentity-Crossroads Youth Opportunity Center 7676 New Hampshire Ave 20912 301.422.1279
Youth involved with gangs or at risk for gang involvement X X
interventions for gang-involved youth and youth at risk for gang involvement
Indian Queen Recreation Center 9551 Fort Foote Road South 20744 301-839-9597 General population X XAthletic fields, basketball court, classroom space, gymnasium, playground, afterschool programs, Xtreme Teens program
Institute for Family Centered Services-MENTOR Maryland 4200 Forbes Blvd 20706 301.577.7931 Children and adolescents X X X
Therapy Services, hourly support services, family centered treatment, wraparound service, and crisis intervention
Institute For Life Enrichment 4700 Berwyn House Rd 20740 301.474.3750 General population X X psychotherapy and psychological servicesJericho City of Hope 8501 Jericho City 20785 301.333.0500 General population food bank and nutrition services
John E Howard Senior Activity Center4400 Shell Street
20743 301.735.2400 Seniors ages 60+ years old X X XOffers fitness programs and health education classes, information, and referrals.
John E. Howard Community Center Park 4400 Shell St 20743 301-735-3340 General population X X XAthletic fields, gymnasium, game room, multipurpose room, picnic area, playground, tennis court, Xtreme Teen program, Seniors program
Judy Hoyer Center 8908 Riggs Road 20783 301.445.8460 Pre-kindergarten aged children Xpromotes school readiness through early childhood care and education as well as family support and health programs.
Jug Bay Natural Area 16000 Croom Airport Road 20772 301.627.6074 General population X Natural area parks and conservation sites
Kentland Community Center Park 2411 Pinebrook Ave 20785 301-386-2278 General population X X X
Athletic fields, basketball courts, fitness and game room, golf training center, multipurpose room, picnic pavilion, playground, tennis courts, after-school program, Xtreme Teens program, Seniors program
Korean Community Services Center of Greater Washington 6401 Kenilworth Avenue 20737 301.927.1601
Asian Americans and new immigrants X X X Social, wellness, advocacy, education, and development services

8
NAME ADDRESS ZIP
CODE
TELEPHONE POPULATION Acce
ss
Advo
cacy
& L
egal
Ser
vice
s
Awar
enes
s an
d H
ealth
Pro
mot
ion
Case
Man
agem
ent,
Nav
igat
ion
or C
are
Coor
dina
tion
Serv
ices
Cris
is, E
mer
genc
y, o
r Fin
anci
al A
ssis
tanc
e Se
rvic
esD
isab
ility
Ser
vice
s
Early
Chi
ldho
od
Educ
atio
n an
d Se
lf-M
anag
emen
t
Food
and
Nut
ritio
n Se
rvic
es
Hea
lth S
ervi
ces
Hou
sing
Prev
entio
n Se
rvic
es
Recr
eatio
n an
d Ph
ysic
al A
ctiv
ity
Refe
rral
Ser
vice
s
Rese
arch
Scre
enin
g &
Tes
ting
Seni
or S
ervi
ces
Supp
ort G
roup
s, C
ouns
elin
g, a
nd
Reco
very
Ser
vice
sYo
uth
Serv
ices
SERVICES
La Clínica del Pueblo
2831 15th Street, NW
20009 202.462.4788 Latino and immigrant populations X X X X X X X X X X
Federally qualified health center providing culturally appropriate clinical, mental health and substance abuse services; community health action; and interpreter services
Lake Arbor Community Center 10100 Lake Arbor Way 20721 301-333-6561 General population X X X
Arts and crafts room, computer lab, dance and fitness room, gymnasium, multipurpose room, patio area, Xtreme Teens program, Seniors program
Lake Artemesia in Berwyn Heights and College Park Berwyn Rd & 55th Avenue 20740 301.627.7755 General population X Natural area parks and conservation sites
Lakewood Family Clinic1400 Mercantile Lane, Suite 180 20774 301.925.7022 General population X X X X X X X
Provides comprehensive family care, with special programs for immigrants, homeless individuals, and individuals in crisis
Lambda Center 4228 Wisconsin Avenue, NW 20016 202.885.5610 LGBTQ individuals X X X Xmental health and substance abuse treatment services for the LGBT community, sliding scale
Langley Park Community Center 1500 Merrimack Rd 20784 301.445.4508 General population X food bank and nutrition services
Langley Park Senior Activity Center1500 Merrimac Drive
20783 301.408.4343 Seniors ages 60+ years old X X XOffers fitness programs and health education classes, information, and referrals.
Lanham Church of God 9030 Second St 20706 301.340.8888 General population X food bank and nutrition services
Largo/Perrywood/Kettering Community Park School Center 431 Watkins Park Dr 20774 301-390-8390 General population X X X
Arts and crafts room, dance and fitness room, game room, gymnasium, multipurpose room, pre-school area, showering areas, Xtreme Teens program, Seniors program
Larking Chase Care and Rehabilitation 15005 Health Center Drive 20716 301.805.6070 general population X Long-term care and rehabilitation
Latin American Youth Center-Langley Park (Maryland Multicultural Youth Center) 7411 Riggs Road, Suite 418 20783 301.431.3121 Latin American Youth X X X X X X X X X
Counseling services, and case managers assist students with matters ranging from housing assistance, transportation, child care referrals
Latin American Youth Center-Riverdale (Center for Educational Partnership)(Maryland Multicultural Youth Center) 6200 Sheridan St 20737 301.779.2851 Latin American Youth X X X X X X X X X
Counseling services, and case managers assist students with matters ranging from housing assistance, transportation, child care referrals
Laurel Advocacy & Referral Services (LARS) 311 Laurel Ave 20707 301.776.0442Low-income and homeless individuals X X utility assistance, referrals for addiction treatment and counseling
Laurel Regional Hospital 7300 Van Dusen Rd 20707 301.497.7914 general population X X X X X X X acute-care community hospital Laurel Regional Hospital-Al-Anon 7300 Van Dusen Rd 20707 301.497.7914 general population X Support program for family members of alcoholicsLaurel Regional Hospital-Alcoholics Anonymous 7300 Van Dusen Rd 20707 301.497.7914 general population X Alcoholics AnonymousLaurel Regional Hospital-Bipolar Support Group 7300 Van Dusen Rd 20707 301.497.7914 general population X Bipolar Support GroupLaurel Regional Hospital-Childbirth Education Classes 7300 Van Dusen Rd 20707 301.497.7983 general population X X X X Childbirth Education ClassesLaurel Regional Hospital-Diabetes Management Program 7300 Van Dusen Rd 20707 301.618.6555 general population X X X X Diabetes Management Program Laurel Regional Hospital-HeartSaver First Aid/CPR 7300 Van Dusen Rd 20707 301.497.7917 general population X X CPR and Lifesaver Training courses
Laurel Regional Hospital-Nar Anon 7300 Van Dusen Rd 20707 301.497.7914 general population XSupport program for family members of individuals addicted to narcotics
Laurel Regional Hospital-Narcotics Anonymous 7300 Van Dusen Rd 20707 301.497.7914 general population X Narcotics Anonymous
Laurel Regional Hospital-Rehabilitation Sharing Group (strokes and longtime illness) 7300 Van Dusen Rd 20707 301.497.7914 general population X Support group for individuals undergoing long-term rehabilitationLaurel Regional Hospital - Sleep Wellness Center 7300 Van Dusen Rd 20707 301.725.4300 general population X X X
Comprehensive diagnostic and treatment program for patients suffering sleep-related health issues.
Laurel Regional Hospital-Smoking Cessation Program 7300 Van Dusen Rd 20707 301.618.6363 general population X X X Smoking Cessation
Laurel-Beltsville Oasis Youth Services Bureau13900 Laurel Lakes Ave, STE 225 20702 301.498.4500 Children and youth up to age 18 X X X X X
Counseling for children and their families, anger management, parenting education, trauma treatment, substance abuse screening, referral to services, and crisis intervention

9
NAME ADDRESS ZIP
CODE
TELEPHONE POPULATION Acce
ss
Advo
cacy
& L
egal
Ser
vice
s
Awar
enes
s an
d H
ealth
Pro
mot
ion
Case
Man
agem
ent,
Nav
igat
ion
or C
are
Coor
dina
tion
Serv
ices
Cris
is, E
mer
genc
y, o
r Fin
anci
al A
ssis
tanc
e Se
rvic
esD
isab
ility
Ser
vice
s
Early
Chi
ldho
od
Educ
atio
n an
d Se
lf-M
anag
emen
t
Food
and
Nut
ritio
n Se
rvic
es
Hea
lth S
ervi
ces
Hou
sing
Prev
entio
n Se
rvic
es
Recr
eatio
n an
d Ph
ysic
al A
ctiv
ity
Refe
rral
Ser
vice
s
Rese
arch
Scre
enin
g &
Tes
ting
Seni
or S
ervi
ces
Supp
ort G
roup
s, C
ouns
elin
g, a
nd
Reco
very
Ser
vice
sYo
uth
Serv
ices
SERVICES
Laurel-Beltsville Senior Activity Center7120 Contee Road
20707 301.206.3350 Seniors ages 60+ years old X X XOffers fitness programs and health education classes, information, and referrals.
Maple Springs Baptist Church 4131 Belt Rd 20743 301.735.1020 General population X food bank and nutrition services
Marlow Heights Community Center Park 2800 St. Clair Dr 20748 301-423-0505 General population X X XGame and fitness room, playground, picnic area, tennis courts, Seniors program, Xtreme Teens program
Martha's Closet 5601 Randolph St 20784 301.262.3744 General population X food bank and nutrition services
Maryland Crime Victims Resource Center1001 Prince George's Blvd, Set 750 20774 301.952.0063 Victims of crime X X
legal and advocacy services for victims of crime, including counseling, criminal justice education, community education, policy advocacy and court accompaniment
Maryland Disability Law Center 1500 Union Avenue 21211 800.233.7201 Individuals with disabilities X X
Free legal services to Marylanders of any age with all types of disabilities, who live in facilities, in the community or who are homeless
Maryland Division Of Rehabilitation Services 4451 Parliament Place 20706 301.306.3600 Individuals with disabilities X XPrograms and services that help people with disabilities go to work or stay independent in their homes and communities
Maryland Legal Aid Bureau 6811 Kenilworth Ave 20737 301.927.6800Financially qualified residents and residents over 60 X
Free civil legal services, including consumer rights, housing, elder rights, farmworker rights, benefits, employment, family and healthcare
Maryland Medicaid Pharmacy Program 201 W. Preston St. 21201 877.463.3464
Individuals eligible through Medical Assistance Program, HealthChoice, Family Planning Program, and Medicare Part D dual eligible X X Pharmacy Services
Maryland National Guard-Family Assistance Center 18 Willow St. 21401 410.266.7514
Service members and military family members X X X X
Crisis intervention, legal resource information and referral, financial resource information and referral, Tricare information, ID cards and Deers information, and Community resource information and referral
Mary's Center 8908 Riggs Road 20783 301.422.5900 Medically underserved populations X X X X X X X X
Federally Qualified Health Center providing comprehensive, integrated set of health care, education and social services to help individuals and families achieve physical and mental health
Medstar-Southern Maryland Hospital Center 7503 Surratts Rd 20735 855.633.0205 General population X X X
A range of medical and surgical specialties including emergency department and critical care services, outpatient radiology, surgical services, sleep disorders center, adult inpatient and day treatment mental health program, asthma and allergy center, physical and occupational therapy, cardiac care, orthopedics, and an oncology program
Melwood 5606 Dower House Road 20772 301.599.8000Children, youth and adults with disabilities X X X X X X X
Workforce development, therapeutic services, day-services, transition assistance, and services for veterans
Mental Health Association of Prince George's County 5012 Rhode Island Avenue 20781 301.699.2737
Individuals and families affected by mental illness X X X information, education and advocacy regarding mental illness
Metropolitan Mental Health Clinic 96 Truman Drive, Ste. 250 20774 301.324.0600 General population X X Outpatient Mental Health Clinic and psychiatric rehabilitation program Mission of Love 6180 Old Central Avenue 20746 301.333.4440 General population X food bankMount Calvert Historical and Archaeological Park 16801 Mount Calvert Road 20772 301.627.1286 General population X Natural area parks and conservation sitesMount Rainier Nature and Recreation Center 4701 31st Place 20712 301.927.2163 General population X Natural area parks and conservation sitesMt. Calvary Church 6700 Marlboro Pike 20747 301.735.5532 General population X food bank
Narcotics Anonymous: Referral Line 888.319.2606 Individuals with narcotics addiction X support groups for recovering addictsNational Alliance for the Mentally Ill, Prince George's County 8511 Legation Road 20784 301.429.0970
Individuals and families affected by mental illness X X X X X Support, education, and advocacy related to mental illness
National Church of God 6700 Bock Road 20744 301.567.9500 General population X food bank and nutrition services
National Kidney Foundation-Maryland 1301 York Rd, STE 404 21093 410.494.8545 General population X X X XAdvocacy, education, patient services and research related to kidney diseases
New Revival Kingdom Church 7821 Parston Drive 20747 301.736.4535 General population X food bank and nutrition services

10
NAME ADDRESS ZIP
CODE
TELEPHONE POPULATION Acce
ss
Advo
cacy
& L
egal
Ser
vice
s
Awar
enes
s an
d H
ealth
Pro
mot
ion
Case
Man
agem
ent,
Nav
igat
ion
or C
are
Coor
dina
tion
Serv
ices
Cris
is, E
mer
genc
y, o
r Fin
anci
al A
ssis
tanc
e Se
rvic
esD
isab
ility
Ser
vice
s
Early
Chi
ldho
od
Educ
atio
n an
d Se
lf-M
anag
emen
t
Food
and
Nut
ritio
n Se
rvic
es
Hea
lth S
ervi
ces
Hou
sing
Prev
entio
n Se
rvic
es
Recr
eatio
n an
d Ph
ysic
al A
ctiv
ity
Refe
rral
Ser
vice
s
Rese
arch
Scre
enin
g &
Tes
ting
Seni
or S
ervi
ces
Supp
ort G
roup
s, C
ouns
elin
g, a
nd
Reco
very
Ser
vice
sYo
uth
Serv
ices
SERVICES
North Brentwood Community Center Park 4012 Webster St 20722 301-864-0756 General population X X XFitness and game room, gymnasium, playground, shower areas, tennis courts, Seniors program, Xtreme Teens program
North Forestville Community Center 2311 Ritchie Rd 20747 301-350-8660 General population X X XGymnasium, multipurpose room, tennis court, community park and trails, Xtreme Teens program, Seniors program
Oakcrest Community Park School Center 1300 Capitol Heights Blvd 20743 301-736-5355 General population X X
Athletic fields, basketball courts, classrooms, community room, dance and fitness room, gymnasium, playground, summer camps, Xtreme Teens program, Prince George's County Boys and Girls Club
On Our Own of Prince George's County 10007 Rhode Island Ave 20740 301.699.8939 Adults with mental illness X X Xself-management and recovery services for individuals with mental illness
Oxford House, Inc. 1010 Wayne Ave, STE 300 20910 800.689.6411Individuals recovering from drug and alcohol addiction X X X X Sober living facilities: democratically run, drug free, and self-supporting
Palmer Park Community Center Park 7720 Barlowe Rd 20785 301-773-5665 General population X XBasketball court, computer lab, dance and fitness room, game room, gymnasium, playground, tennis court, Xtreme Teens program
Patuxent Community Center 4410 Bishopmill Dr 20772 301-780-7577 General population X XBasketball court, gymnasium, multipurpose room, Xtreme Teens program, fitness classes
Patuxent River 4-H Center 18405 Queen Anne Road 20774 301.218.3079 General population X Natural area parks and conservation sitesPatuxent River Park 16000 Croom Airport Road 20772 301.627.6074 General population X Natural area parks and conservation sites
People Encouraging People 337 Brightseat Rd 20785 301.429.8950 Disabled residents and their families X XTreatment, rehabilitation and support services for those with severe mental illness.
Peppermill Village Community Center Park 610 Hill Rd 20785 301-350-8410 General population X X
Athletic fields, basketball court, fitness room, game room, gymnasium, playground, tennis courts, trail with exercise stations, Xtreme Teens program, fitness classes, Seniors program
Potomac Landing Community Center Park 12500 Fort Washington Rd 20744 301-292-9191 General population X XBasketball court, classroom space, football field, gymnasium, playground, Xtreme Teens program, fitness programs
Pregnancy Aid Center 4809 Greenbelt Rd 20740 301.441.9150Low-income women, adolescents and newborns X X X X X X X X
Women's health clinic providing pregnancy, perinatal, cancer screening, Medicaid Assistance, counseling, birth control, STI, and teen services
Prince George’s County Health Department1701 McCormick Drive
20774 301.883.7879 Residents of Prince George's County X X X X X X X X X X X
comprehensive public health services addressing family health, maternal and child health, immunizations, behavioral health, infectious diseases, environmental health, health access, health disparities, and overall health and wellness
Prince George's Child Resource Center 9475 Lottsford Rd, STE 202 20774 301.772.8420Children, parents, and childcare providers X X X
Support services to families, and training to child care providers, parents and human services workers
Prince George's Community College: Health Education Center
301 Largo Road
20774 301.336.6000 PGCC students, faculty and staff X X X X X X XServices that promote prevention, increase healthy lifestyle choices and prevent disease
Prince George's County Boys and Girls Club 7833 Walker Drive, Suite 430 20770 301.446.6800 Youth ages 5–18 X X Enrichment activities for youth ages 5–18
Prince George's County Department of Family Services
6420 Allentown Road 20748 301.265.8401 General population X X X X X X X X X X
Composed of three administrations that serve the aging, mentally-ill, disabled and children, youth and families in need of support and resources
Prince George's County Department of Parks and Recreation 6600 Kenilworth Avenue 20737 301.699.2255 General population X X Fitness, recreation, and educational resources
Prince George's County Department of Parks and Recreation Community Centers
6600 Kenilworth Avenue
20737 301.699.2255Residents and non-residents of Prince George's County X X X
43 community centers located through the county offer a variety of recreation and fitness activities.
Prince George's County Department of Social Services 805 Brightseat Rd 20785 301.209.5000 General population X X X X X X X X X X X X X
Intervention services that strengthen families, protect children and vulnerable adults, encourage self-sufficiency and promote personal responsibility
Prince George's County Department of Social Services-Child, Adult & Family Services 807 Brightseat Rd 20787 301.909.7002 Children and families X X X X X X X
Services designed to assist the family develop new ways of communicating, coping with and overcoming barriers to their well-being

11
NAME ADDRESS ZIP
CODE
TELEPHONE POPULATION Acce
ss
Advo
cacy
& L
egal
Ser
vice
s
Awar
enes
s an
d H
ealth
Pro
mot
ion
Case
Man
agem
ent,
Nav
igat
ion
or C
are
Coor
dina
tion
Serv
ices
Cris
is, E
mer
genc
y, o
r Fin
anci
al A
ssis
tanc
e Se
rvic
esD
isab
ility
Ser
vice
s
Early
Chi
ldho
od
Educ
atio
n an
d Se
lf-M
anag
emen
t
Food
and
Nut
ritio
n Se
rvic
es
Hea
lth S
ervi
ces
Hou
sing
Prev
entio
n Se
rvic
es
Recr
eatio
n an
d Ph
ysic
al A
ctiv
ity
Refe
rral
Ser
vice
s
Rese
arch
Scre
enin
g &
Tes
ting
Seni
or S
ervi
ces
Supp
ort G
roup
s, C
ouns
elin
g, a
nd
Reco
very
Ser
vice
sYo
uth
Serv
ices
SERVICESPrince George's County Department of Social Services-Community Services 805 Brightseat Rd 20785 301.909.7000 General population X X X
Housing and homeless, emergency shelter, energy program, food, and volunteer services
Prince George's County Department of Social Services-Family Investment Division 808 Brightseat Rd 20788 301.909.7003 General population X X X X X X X
Program services include: Emergency Assistance, Food Supplement, Medical Assistance, Child Care Subsidy, and Temporary Cash Assistance.
Prince George's County Department of Social Services-Medical Assistance Program 806 Brightseat Rd 20786 301.909.7001 General population X X
Assistance may include payments for doctor's visits, exams, prescription costs, hospital bills, payment of Medicare premiums,
Prince George's County Public Schools Food and Nutrition Services
13300 Old Marlboro Pike, Room 8
20772 301.952.6580 Students attending Prince George's County Public Schools X X
Provides a total learning environment that enhances the development of lifelong healthy habits in wellness, nutrition, and regular physical activity.
Prince George's County Public Schools-Special Education Office 1400 Nalley Terrace 20785 301.618.8300
Individuals with disabilities attending Prince George's County Public Schools and their families X X X X X
continuum of services to fully engage all students in the program of instruction
Prince George's County Sports and Learning Complex 8001 Sheriff Rd 20785 301.583.2400 General population X X Fitness and educational resourcesPrince George's Hospital Center 3001 Hospital Drive 20785 301.618.2000 general population X X X X X acute care teaching hospital and regional referral centerPrince George's Hospital Center- Alcoholics Anonymous 3001 Hospital Drive 20785 301.618.2112 general population X Alcoholics AnonymousPrince George's Hospital Center- Women's Heart Seminar Support Group 3001 Hospital Drive 20785 301.618.2449 general population X Support Group for women with heart diseasePrince George's Hospital Center-Childbirth Education Classes 3001 Hospital Drive 20785 301.618.3275 general population X X X Childbirth Education ClassesPrince George's Hospital Center-Diabetes Management Program 3001 Hospital Drive 20785 301.618.6555 general population X X X X Diabetes Management Program Prince George's Hospital Center-Free HIV Testing Program 3001 Hospital Drive 20785 301.618.2487 general population X X HIV TestingPrince George's Hospital Center-Preemie Support Group 3001 Hospital Drive 20785 301.618.3280 general population X X X Parents of children born pre-maturely
Prince George's Hospital Center- Perinatal Diagnostic Center 3001 Hospital Drive 20785 301.618.3542 general population X X
In/outpatient referral Center providing the highest consultative services to those mothers who have medical complications prior to pregnancy.
Prince George's Hospital Center-Smoking Cessation Program 3001 Hospital Drive 20785 301.618.6363 general population X X X X X Smoking CessationPrince George's Hospital Center-Stroke Support Group 3001 Hospital Drive 20785 301.618.2024 general population X Support group for stroke survivors, familes, friends and care givers
Prince George's Hospital Center-Survivors of Rape and Sexual Abuse Support Group 3001 Hospital Drive 20785 301.618.3154 general population X Survivors of Rape and Sexual Abuse Support Group
Prince George's Hospital Center- Domestic Violence and Sexual Assault Center 3001 Hospital Drive 20785 301.618.3154 General population X X X X X X X
Offers full range of services to victims/survivors of domestic violence and sexual violence to include crisis intervention, folow up counseling, forensic exams, victim advocacy and community education
Prince George's Plaza Community Center 6600 Adelphi Rd 20782 301-864-1611 General population X X XFitness center, gymnasium, meeting room, multipurpose room, Xtreme Teens program, recreations programs, Seniors program
Progressive Life Center 8800 Jericho City Drive 20785 301.909.6824Individuals and families with mental health needs X X X X
nonprofit, human services organization geared to serve children, youth and families through care management services, individual, family, and group counseling.
QCI Behavioral Health 9475 Lottsford Rd 20774 301.636.6504Individuals, children and families with mental health needs X X X X X X X X SPMI, SED, mobile services, includes service in shelters, step down
Rachel H. Pemberton Senior Health Center 3601 Taylor St., Set 108 20722 301.927.4987 Residents ages 55 years and older X X X X primary and continuing comprehensive medical and nursing services
Renaissance Treatment Center8001 Sheriff Road
20785 301.583.2400Individuals with addiction and mental health needs X X X X X Addiction and mental health related programs

12
NAME ADDRESS ZIP
CODE
TELEPHONE POPULATION Acce
ss
Advo
cacy
& L
egal
Ser
vice
s
Awar
enes
s an
d H
ealth
Pro
mot
ion
Case
Man
agem
ent,
Nav
igat
ion
or C
are
Coor
dina
tion
Serv
ices
Cris
is, E
mer
genc
y, o
r Fin
anci
al A
ssis
tanc
e Se
rvic
esD
isab
ility
Ser
vice
s
Early
Chi
ldho
od
Educ
atio
n an
d Se
lf-M
anag
emen
t
Food
and
Nut
ritio
n Se
rvic
es
Hea
lth S
ervi
ces
Hou
sing
Prev
entio
n Se
rvic
es
Recr
eatio
n an
d Ph
ysic
al A
ctiv
ity
Refe
rral
Ser
vice
s
Rese
arch
Scre
enin
g &
Tes
ting
Seni
or S
ervi
ces
Supp
ort G
roup
s, C
ouns
elin
g, a
nd
Reco
very
Ser
vice
sYo
uth
Serv
ices
SERVICES
Rims Center For Enrichment And Development 1895 Brightseat Road 20785 301.773.8201
children, adults, and families coping with mental illness X X X X
comprehensive mental and behavioral health care services through outpatient mental health clinic and psychiatric rehabilitation program
Rising Star Holy Temple 5312 Sheriff Road 20743 301.773.9655 General population X food bank and nutrition services
Rollingcrest/Chillum Community Center Park 6120 Sargent Rd 20782 301-853-2005 General population X X X
Cardio fitness room, craft room, game room, gymnasium, meeting room, pre-school room, after-school program, Xtreme Teens program, Seniors program
RX for Healthy Weight Management: Capital Area Food Bank
645 Taylor Street, NE 20017 202.526.5344
Low-income overweight or obese Latino/Hispanic children X X X X
Provides free nutrition education classes for children, whose families are also involved. Topics include food preparation, healthy eating behavior, budget food shopping, and food safety. The first half of the class focuses on nutrition education, while a cooking demonstration takes place during the second half of the class. Two hour weekly classes for six weeks.
Saint Hugh of Grenoble Church 135 Crescent Road 20770 301.474.4322 General population X food bank and nutrition services
Salvation Army Adult Rehabilitation Center 3304 Kenilworth Avenue 20781 301.277.7878Adults with substance or alcohol addiction X X X X X
occupational work therapy, educational tutoring, counseling, and housing for addicts
Salvation Army of Prince George's County 4825 Edmonston Rd 20781 301.277.6103 Individuals and families in crisis X X X X X X Xsupport services for individuals and families in crisis: addiction, emergency response, health services and family tracing
School House Pond in Upper Marlboro14100 Governor Oden Bowie Drive 20772 301.627.7755 General population X Natural area parks and conservation sites
Seat Pleasant Activity Center 5720 Addison Rd 20743 301-699-2544 General population X X X
Basketball courts, fitness room, game room, gymnasium, kitchen, multipurpose room, playground, Xtreme Teens program, Seniors program
SEED Food Distribution Center 6201 Riverdale Road 20737 301.458.9808 General population X food bank and nutrition services
Sexual Minority Youth Assistance League 410 7th St, SE 20003 202.546.5940 LGBTQ individuals X X X X X
creates opportunities for LGBTQ youth to build self-confidence, develop critical life skills, and engage their peers and community through service and advocacy
Shabach Ministries 2101 Kent Village Drive 20785 301.322.9593 General population X food bank and nutrition servicesSHARE Food Network 3222 Hubbard Road 20785 301.864.3115 General population X food bank and nutrition servicesSharing Pantry: Saint Pius X Parish 3300 Moreland Place 20715 301.262.2141 General population X food bank and nutrition services
South Bowie Community Center Park 1717 Pittsfield Ln 20716 301-249-1622 General population X X X
Computer lab, community garden, conference room, gymnasium with basketball courts, fitness room, imagination playground, therapeutic sensory room, after-school programs, Xtreme Teen program, Seniors program, workshops
Southeast Church of Christ 3601 Southern Avenue 20746 301.423.2320 General population X food bank and nutrition services
Southern Regional Technology and Recreation Complex 7007 Bock Rd 20744 301-749-4160 General population X X X
Adult and teen cafes, computer lab, dance studio, fitness room, gymnasium, multipurpose room, outdoor patio, recording studio, rock climbing wall, seminar rooms, science lab, teen fitness room, health and wellness classes, summer day camps, Xtreme Teens program
St. Ann’s Center for Children, Youth and Families 4901 Eastern Avenue 20782 301.559.5500 Women and children X X X X X X X X X X
Housing and support programs, services for pregnant and parenting young women, child care, and education and employment services
St. Bernadine of Siena Catholic Church 2400 Brooks Drive 20746 301.736.0707 General population X food bank and nutrition servicesSt. Camillus 1600 Camillus Drive 20903 301.434.8400 General population X food bank and nutrition servicesSt. John's Episcopal Church 9801 Livingston Rd 20744 301.248.4290 General population X food bank and nutrition servicesSt. Margaret's Food Pantry 408 Addison Rd South 20743 301.366.3345 General population X food bank and nutrition servicesSt. Mark the Evangelist Catholic Church 7501 Adelphi Rd 20783 301.422.8300 General population X food bank and nutrition servicesSt. Paul's United Methodist Church 6634 St. Barnabas Rd 20745 301.567.4433 General population X food bank and nutrition services

13
NAME ADDRESS ZIP
CODE
TELEPHONE POPULATION Acce
ss
Advo
cacy
& L
egal
Ser
vice
s
Awar
enes
s an
d H
ealth
Pro
mot
ion
Case
Man
agem
ent,
Nav
igat
ion
or C
are
Coor
dina
tion
Serv
ices
Cris
is, E
mer
genc
y, o
r Fin
anci
al A
ssis
tanc
e Se
rvic
esD
isab
ility
Ser
vice
s
Early
Chi
ldho
od
Educ
atio
n an
d Se
lf-M
anag
emen
t
Food
and
Nut
ritio
n Se
rvic
es
Hea
lth S
ervi
ces
Hou
sing
Prev
entio
n Se
rvic
es
Recr
eatio
n an
d Ph
ysic
al A
ctiv
ity
Refe
rral
Ser
vice
s
Rese
arch
Scre
enin
g &
Tes
ting
Seni
or S
ervi
ces
Supp
ort G
roup
s, C
ouns
elin
g, a
nd
Reco
very
Ser
vice
sYo
uth
Serv
ices
SERVICES
Start Early, Start Right: The Family Place 3309 16th Street, NW 20010 202.476.5539Latino children ages 1-5 and their families X X X X X
Offers a free obesity prevention/reduction program. Program consists of weekly classes that provide individual family counseling, behavior modification techniques, and information about nutrition, physical activity, and weight management. One parent attends each class session. Classes for parents are in Spanish; classes for children are in English. Both parents need to be Latino.
Stephen Decatur Community Center 8200 Pinewood Dr 20735 301-297-4648 General population X X X
Basketball court, fitness and game room, gymnasium, playground, tennis courts, after-school programs, seniors program, Xtreme Teens program
Suitland Bog 6000 Block Suitland Rd 20747 301.627.7755 General population X Natural area parks and conservation sites
Suitland Community Park School Center 5600 Regency Ln 20747 301-736-3518 General population X X X
Art room, basketball courts, computer room, conference room, fitness room, game room, gymnasium, kitchen, playground, science room, tennis courts, Kids Care, Xtreme Teens program
Takoma Park Food Pantry 7001 New Hampshire Ave 20912 240.450.2092 X food pantry
Temple Hills Community Center Park 5300 Temple Hill Rd 20748 301-894-6616 General population X X X
Fitness and game room, gymnasium, meeting room, multipurpose room, playground, tennis courts, Kids Care, Seniors program, Xtreme Teens program
The Center: A Home for GLBT 1111 14th St NW, Set 350 20005 202.682.2245 LGBT individuals X X X X X X X Xfour core areas of service: health and wellness, arts & culture, social & support services, and advocacy and community building
TOPS Club Weight Loss Program: Grace Lutheran Church
2503 Belair Dr 20715 301.262.6447 Ages 9 years old to adults X X X X X
Provides support system for people trying to lose weight naturally as well as by surgical means. Includes physical activity information, nutrition education, and weight management assistance. Nutrition education includes lessons on portion control and food planning, among other lessons.
Transition Center At Prince George's House 603 Addison Road South 20743 301.808.5317 Homeless individuals X X X X X X X X
Emergency shelter; Transitional housing; Meals; Housing Counseling; Substance Abuse Counseling; Mental Health Counseling; Career Counseling & Training Services.
Tucker Road Community Center Park 1771 Tucker Rd 20744 301-248-4404 General population X X
Fitness room, gymnasium, meeting room, picnic area, playground, showering areas, tennis courts, Kids Care program, Xtreme Teens program
United Communities Against Poverty 1400 Doewood Lane 20743 301.322.5700 General population X food bank and nutrition services
United Methodist Church of the Redeemer 1901 Iverson St 20748 301.894.8622 General population X food bank and nutrition services
University of Maryland: University Health Center University of Maryland 20742 301.314.8180
Faculty, staff and students at the University of Maryland, College Park X X X X X Clinical, mental health, health promotion, and wellness services
Upper Marlboro Community Center Park5400 Marlboro Race Track Road 20772 301-627-2828 General population X X
Activity room, athletic fields, fitness room, gymnasium, meeting room, playground, pre-school room, racquetball courts, tennis court, Kids Care program, Xtreme Teens program
Us Helping Us: People Into Living 3636 Georgia Ave, NW 20010 202.446.1100 Black, gay men X X X X XPrevention, HIV/STI screenings, case management, mental health services, support groups and women's services
Vansville Community Center 6813 Ammendale Rd 20705 301-937-6621 General population X XAthletic fields, L.E.E.D. certified building, fitness room, gymnasium, storage area, tennis courts, Kids Care program, Xtreme Teens program
VESTA 9301 Annapolis Rd 20706 240.296.6301adults with persistent mental illness, children, and veterans X X X X X X
rehabilitation programs, residential services, supported housing, outpatient mental health services and veterans services
Veterans Affairs (VA) Outpatient Clinic: Greenbelt 7525 Greenway Center Drive 20770 301.345.2463 Veterans X X X X X X X X X X X
Primary and preventative care, comprehensive women's health care, audiology and mental health services
Veterans Affairs (VA) Outpatient Clinic: Southern Prince George's County 5801 Allentown Rd 20746 301.423.3700 Veterans X X X X X X X X X X X
Primary and preventative care, comprehensive women's health care, audiology and mental health services
Walker Mill Garden Outreach Center 6974 Walker Mill Rd 20743 301.808.0096 General population X food bank and nutrition servicesWalker Mill Regional Park 8840 Walker Mill Rd 20747 301.699.2400 General population X Natural area parks and conservation sites
Washington, Baltimore, & Annapolis Trail 301.699.2255 General population X Natural area parks and conservation sitesWatkins Regional Park 301 Watkins Park Drive 20774 301.218.6700 General population X Natural area parks and conservation sites

14
NAME ADDRESS ZIP
CODE
TELEPHONE POPULATION Acce
ss
Advo
cacy
& L
egal
Ser
vice
s
Awar
enes
s an
d H
ealth
Pro
mot
ion
Case
Man
agem
ent,
Nav
igat
ion
or C
are
Coor
dina
tion
Serv
ices
Cris
is, E
mer
genc
y, o
r Fin
anci
al A
ssis
tanc
e Se
rvic
esD
isab
ility
Ser
vice
s
Early
Chi
ldho
od
Educ
atio
n an
d Se
lf-M
anag
emen
t
Food
and
Nut
ritio
n Se
rvic
es
Hea
lth S
ervi
ces
Hou
sing
Prev
entio
n Se
rvic
es
Recr
eatio
n an
d Ph
ysic
al A
ctiv
ity
Refe
rral
Ser
vice
s
Rese
arch
Scre
enin
g &
Tes
ting
Seni
or S
ervi
ces
Supp
ort G
roup
s, C
ouns
elin
g, a
nd
Reco
very
Ser
vice
sYo
uth
Serv
ices
SERVICES
Whitman-Walker Health 1701 14th St NW 20009 202.745.7000General population with expertise in LGBT and HIV/AIDS care X X X X X X X X X
Community health center serving the greater Washington, DC area, including individuals who face barriers to accessing care
William Beanes Community Center Park 5108 Dianna Dr 20746 301-568-7719 General population X XClassrooms, gymnasium, playground, tennis courts, Kids Care, Xtreme Teens program
Women, Infants & Children: Prince George's County Health Department 7836 Central Avenue, STE A 20785 301.856.9600 General population X X X X promote mother and child welfare and healthy behaviorsWoodrow Wilson Bridge Trail 301.699.2255 General population X Natural area parks and conservation sites
YMCA-Bowie (Trinity Lutheran Church)6600 Laurel Bowie Road
20715 301.262.4342 General population X X X X X X
Provides physical activity opportunities, adult education classes, including health and wellness education programs with nutrition education, and health screenings.