Aging on Nantucket: A community needs assessment
109
Center for Social & Demographic Research on Aging Gerontology Institute John W. McCormack Graduate School of Policy & Global Studies University of Massachusetts Boston Aging on Nantucket: A community needs assessment The Nantucket Center for Elder Affairs, Inc. Needs Assessment Study
-
Upload
khangminh22 -
Category
Documents
-
view
2 -
download
0
Transcript of Aging on Nantucket: A community needs assessment
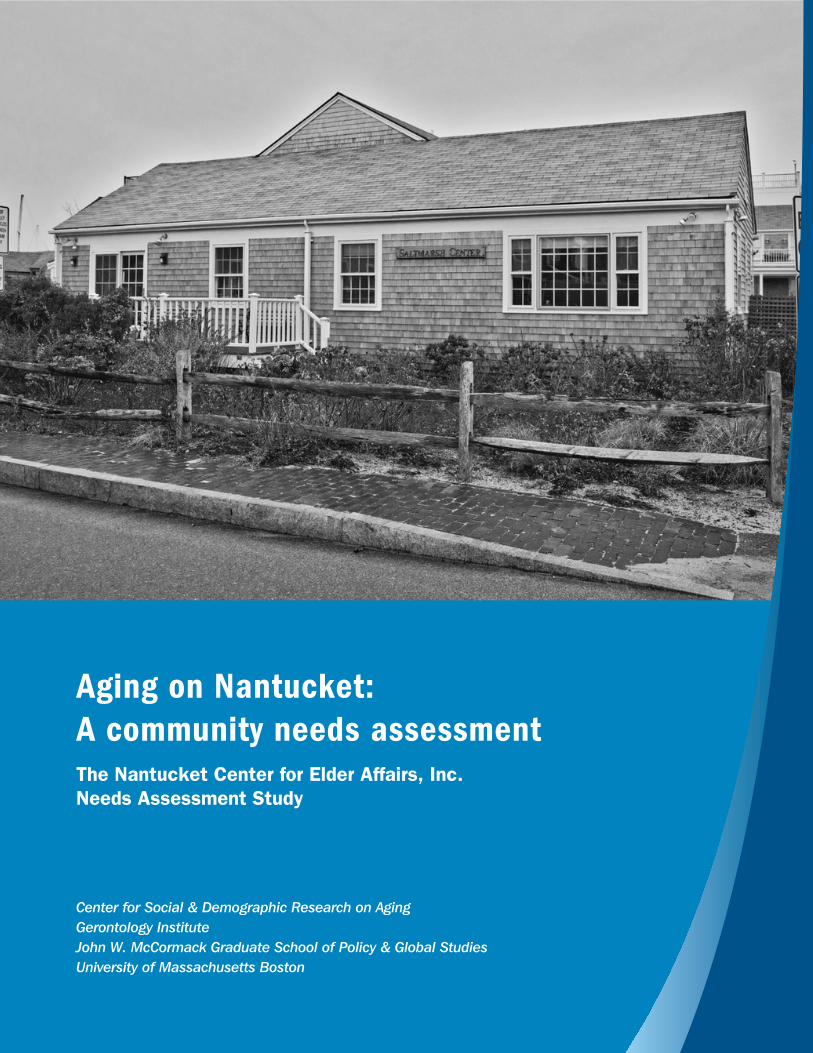
Center for Social & Demographic Research on AgingGerontology InstituteJohn W. McCormack Graduate School of Policy & Global StudiesUniversity of Massachusetts Boston
Aging on Nantucket:A community needs assessment The Nantucket Center for Elder Affairs, Inc. Needs Assessment Study
*The 501(c)(3) nonprofit organization that owns and supports the Saltmarsh Senior Center and programs for Nantucket seniors
Nantucket Center for Elder Affairs, Inc.* 81 Washington St. Ext.
PO Box 3643 Nantucket, Massachusetts 02554
Senior Center Phone: (508) 228-4490 | Fax: (508) 325-5366
December, 2017 Nantucket Residents, The Nantucket Center for Elder Affairs, Inc. with the extremely generous support from The Community Foundation’s Nantucket Fund™ and Remain Nantucket commissioned a survey of Nantucket residents age 60 and older to investigate the needs, interests, preferences, and opinions of Nantucket’s nearly 2,000 seniors with respect to the quality of living and aging on Nantucket. The results of the survey are intended for use by the Nantucket Center for Elder Affairs, Inc., the Nantucket Council on Aging, and the Town of Nantucket in their future planning for Nantucket seniors, who currently represent 20% of the Town’s population. The Gerontology Institute at the John W. McCormack Graduate School of Policy and Global Studies at UMass Boston was engaged to design a survey strategy, develop and administer a survey instrument, analyze data, report findings, and offer recommendations, resulting in a final report. The report was completed in December, 2017 and we are proud to discuss the report with Nantucket policymakers and all interested residents. The research focused on issues of housing, transportation and mobility, community/involvement and engagement, well-being and life style, and how the NCEA, Inc. and the Saltmarsh Center could improve and expand its current programming, not just for current seniors but for all those who will soon become seniors. All of us are aware of the growth in senior populations, locally as well as nationwide. It is projected that the senior population on Nantucket will grow to 25% of the total population over the next twelve years. We are extremely proud of the comprehensiveness of this report. Those of us who can begin to act on the recommendations should do so as soon as possible, including interim steps to serve the senior population. The true value of this survey will only be realized when we acknowledge the needs of seniors and implement the recommendations. We are grateful for the thoroughness of the work done by Dr. Caitlin Coyle, representing the Gerontology Institute at UMass Boston. We are indebted to the 734 Nantucketers who set aside time to respond to the survey. We would like to thank the NCEA, Inc. Board of Directors who unanimously approved undertaking this project, Jean Grimmer, Treasurer, who assisted in editing the questions we need answers to, and especially Julie Fitzgerald, who proposed the idea, developed the grant proposal, and secured the necessary funding. Joe Aguiar, President Board of Directors, Nantucket Center for Elder Affairs, Inc. Laura Stewart, Saltmarsh Senior Center Alison Forsgren, NCOA

3
Aging on Nantucket: A community needs assessment
Commissioned by the Nantucket Center for Elder Affairs, Inc.
January 2018
Center for Social and Demographic Research on Aging Gerontology Institute
John W. McCormack Graduate School of Policy & Global Studies University of Massachusetts Boston
4
Executive Summary
This report describes efforts undertaken by the Nantucket Center for Elder Affairs, Inc. (NCEA), in partnership with the Center for Social & Demographic Research on Aging within the Gerontology Institute at the University of Massachusetts Boston. The purpose of these efforts was to investigate the needs, interests, preferences, and opinions of Nantucket’s older residents. The focus of this report is on the cohort of Nantucket’s residents age 60 and older. The contents of this report are intended to inform NCEA, the Saltmarsh Senior Center, the Council on Aging, the Town of Nantucket, and organizations that provide services to older residents, as well as those who advocate for older people, and community members at large.
Data for the study were drawn from several sources, including publicly available information obtained through the U.S. Census Bureau and data collected expressly for this study. Primary data collection included:
• Three focus groups including residents, representatives of local nonprofit organizations and Town offices.
• Nine key-informant interviews with Town leaders, department heads, and major senior housing or senior service providers on the island.
• A resident survey was distributed to residents age 60 and older, based on the most recent Town Census list. The survey was mailed mid-September of 2017 to avoid some of the major fluctuation of the population in the summer months. A total of 734 survey responses were received, representing a response rate of 26%.
Nantucket’s older residents represent 20% of the community’s current population and projections indicate that by the year 2030, older residents will make up 25% of Nantucket’s population. On the basis of this growth, and the expectation of continued growth, demand for the programs offered by the Saltmarsh Senior Center is greater today than ever before. Demographic projections suggest that the need for senior services will continue to increase.
Sample survey results suggest that the typical Nantucket senior wants to stay on Nantucket moving forward. Over two-thirds (67%) of survey respondents reported having lived on Nantucket for 25 years or more; however, 17% have lived in the community for less than 15 years and may have chosen Nantucket as a retirement destination. Most Nantucket respondents are aging with sufficient finances, good health, and strong social support. However, segments struggle financially or with managing care for family members, or with health concerns of their own. Many more older residents of Nantucket worry that increasing costs of living, lack of access to local medical care, lack of affordable housing options or home care supports, and lack of family members living nearby will challenge their ability to age in place.
Key issues for the Saltmarsh Senior Center were also identified in the study. Generally respondents believe that the Saltmarsh Senior Center is an important aspect of the community, but several limitations were noted. First, the building that currently houses the Saltmarsh Senior Center is inadequate for the community’s needs. Concerns were
5
voiced about the small-size of the current building as well as the depressing décor of the structure as a barrier to participation for many Nantucket seniors. The small size of the building and limited number of rooms puts limitations on the expansion of programming and thus the reach of the Saltmarsh Senior Center in the community. It is a shared goal among study participants that better space be made available to the Saltmarsh Senior Center in support of both improving access to the current programs, and supporting expansion of programs and services. Many survey respondents, focus group participants, and key-informants preferred the creation of a community center, within which the Saltmarsh Senior Center could be housed.
To increase its effectiveness, the Saltmarsh Senior Center will need to identify and communicate its mission more clearly, identify and secure the resources needed to increase its impact, and take steps to ensure that residents of Nantucket, other Town Departments, and nonprofits working in the community know how to access the Saltmarsh Senior Center programs. Currently, many residents are not aware of the full range of programs offered at the Saltmarsh Senior Center. Lack of awareness limits the ability of the Saltmarsh Senior Center to increase its impact within the Nantucket Community.
Key Findings in Brief Demographics and Economics • As of the last federal census in 2010, 1,799 Nantucket residents were age 60 or older,
representing 18% of the population. • Projections suggest that by 2030, 2,851 Nantucket residents will be age 60 or older, and
that age group will represent more than 25% of the town’s population. • Currently, about 43% of the owner-occupied homes on Nantucket are owned by
someone age 60 or older. • Nearly 1 out of 4 Nantucket seniors live alone. • Data from the federal American Community Survey (ACS) suggest that older residents
have lower incomes than their middle-aged counterparts on Nantucket. • Data from the survey conducted for the Nantucket Center for Elder Affairs, Inc. suggest
that as many as 11% of seniors have lacked money for necessities in the previous 12 months.
• The most frequently mentioned concern about aging on Nantucket is the rising cost of living on the island.
Community & Neighborhood • Nantucket seniors are largely long-term residents. Over two-thirds of the survey
respondents age 60 or older have lived on Nantucket for at least 25 years. Nearly all survey respondents reported living on Nantucket year-round and spend, on average, 11 months a year on the island.
• Older residents want to stay on Nantucket. Three-quarters of seniors responding to the survey say that it is “very important” to them to stay on Nantucket as they age. Most of
6
the remaining respondents say that it is “somewhat important” to them to remain living on the island.
• Older residents appreciate the lifestyle offered by Nantucket. Most seniors feel safe on Nantucket, and feel informed about what to do in an emergency.
• At least half of survey respondents believe that older residents of Nantucket are treated respectfully and that older residents can safely access beaches and public buildings. About one-quarter of survey respondents do not believe that local policymakers take into account the interests and concerns of older residents.
Housing & Living Situation • A large share of owner-occupied housing is senior-headed and most of these individuals
would prefer to stay in their homes. Some older residents need help maintaining their homes and property; and some need to adapt their homes to make them safer to live in as they age. Most do have the resources to accomplish these goals but may benefit from information about how to accomplish them. Some would prefer to downsize, but many survey respondents (81%) do not perceive that there are sufficient downsizing options available on Nantucket that they could afford.
• Forty-four percent of survey respondents indicate that their current residence needs modifications to improve their ability to age in place. A majority of the homeowners who feel modifications are needed say that they are able to afford them.
• Four out of ten seniors responding to the survey say that if a change in health or physical ability required a move from their current homes, they would seek out a senior independent living community. One out of three respondents say they would seek out an assisted living community, and one out of four respondents would prefer a single-family home under those circumstances.
• Nearly three-quarters of survey respondents reported that it was “very important” to have a skilled nursing facility on Nantucket.
Transportation • Most residents drive in order to get where they need and want to go on Nantucket.
One in five survey respondents report that parking limitations on the island are a transportation challenge.
• Nearly one-third of survey respondents age 60-69 and more than one quarter of respondents age 70-79 walk or bike as a primary mode of transportation.
• Year-round public transportation options on Nantucket are limited. More than one-third of survey respondents said they “likely” or “very likely” use NRTA-WAVE transportation if it was made available year-round.
• One in five survey respondents had to miss, cancel or reschedule an off-island medical appointment due to lack of transportation. Four out of ten survey respondents who traveled off-island for medical treatment in the previous year encountered difficulty because of a delayed or canceled boat or plane needed to take them to the mainland.
7
Caregiving • More than one-third of survey respondents age 60-69, and one-quarter of respondents
age 70 and older are currently providing care to someone or have provided care to someone in the last year.
• Most caregivers report that the experience was “very” or “somewhat” challenging to both provide care and maintain their other responsibilities.
• Caregivers reported that mobility impairment (e.g., difficulty walking or climbing stairs) and sensory impairment (e.g., vision or hearing loss) were the most common conditions of the care-recipients they support.
• A majority of survey respondents (70%) reported that it was "important" or "very important" to have an adult day health program on-island.
Health and Disability • Among survey respondents age 70-79, 15% rate their health as “fair” or “poor.” 19% of
respondents 80 and older rate their physical health as “fair” or “poor.” • Having “fair” or “poor” emotional well-being was reported by 11% of survey
respondents. • Nineteen percent of survey respondents age 70-79, and 38% of respondents age 80 and
older say they need help with activities around the house, like housecleaning or cooking, due to health. 7% of respondents age 80 and older say they need help with daily activities or personal care, like bathing, due to health. One in five survey respondents age 80 and older say that they need help with errands around Town.
• Survey data suggest that many seniors are concerned about obtaining necessary medical and long-term services as they get older. Lack of local medical services was the second most frequently mentioned concern regarding ability to remain living on Nantucket. These residents need information about how to obtain services, and transportation to access services located off-island.
Social Activities & Relationships • Most older Nantucket residents are engaged with their community, friends or relatives.
However, 8% of survey respondents report getting together in-person with friends or relatives less than once a week. These individuals may be at risk of isolation.
• The third most frequently reported concern about being able to remain on Nantucket is the lack of family nearby (reported by 26% of respondents).
• Some study participants cite concerns about isolation as a barrier to staying on Nantucket as they get older. Seniors recognize that having family live off-island can increase risk of isolation, particularly if: they can no longer drive; they are unable to find the help that they need; or if they can no longer do the things they currently enjoy due to physical or other limitations.
• Forty-four percent of respondent’s report that they provide help to neighbors or friends with minor tasks or errands. In addition, many respondents are willing to receive this kind of help (72%). Drawing on this existing community cohesion is an opportunity to promote aging in place.
8
Programs & Services at the Saltmarsh Senior Center • A large majority (84%) of survey respondents report that the Saltmarsh Senior Center
plays a role in their own lives and the lives of their loved ones and neighbors. • Currently, rates of participation at the Saltmarsh Senior Center are relatively low among
respondents in their 60s (19%), higher among survey respondents in their 70s (43%), while over half of respondents in their 80s participate (54%). This is in line with other communities in Massachusetts, and reflects the range of interests of older adults of varying ages. The Saltmarsh Senior Center should therefore balance the interests and goals of residents who may need significant supports to participate, with those who are quite active and independent but still looking for new and engaging activities and opportunities.
• Seven percent of survey respondents age 60-69, 20% age 70-79, and 28% age 80 and older participate at the Saltmarsh Senior Center on a weekly basis. However, 14% of survey respondents participate just a few times a year. This range of participation levels highlights the broad continuum of affiliation with the COA.
• Lack of awareness about programs and services offered and lack of interest are the most common reasons reported for lack of participation at the Saltmarsh Senior Center. In addition, 20% of the respondents age 60-69 indicate that they are not old enough to participate. Improving publicity about the Saltmarsh Senior Center and its offerings may be beneficial.
• Survey respondents were asked to rate eight specific types of programs offered through The Saltmarsh Senior Center in terms of their importance to the respondent or a family member. All but one program was rated highly by at least 30% of the survey respondents, and five out of the eight of the specific services were rated highly by at least 45% of survey respondents. Programs related to physical health and wellness were the highest rated programs.
• Most survey respondents view the Saltmarsh Senior Center as an important aspect of life on Nantucket. 84% of respondents responded affirmatively that the Saltmarsh Senior Center plays a role in the lives of themselves, their loved ones or neighbors.
• The oldest survey respondents indicated that they prefer to receive information about the Saltmarsh Senior Center through the Senior Center Newsletter. Younger respondents prefer the local newspaper, and are receptive to learning about the Center via email.
• Many survey respondents wrote in positive comments about the Saltmarsh Senior Center and its staff. Others offered suggestions for improving the building, including renovating the current space or building a new center altogether. Opportunities to improve programming were also offered, especially around increasing programs that would appeal to younger adults.
• Space limitations were noted by many participating residents via focus groups, survey responses and interviews. These limitations were described as affecting the quality and quantity of the programs and number of people who can take advantage of the Saltmarsh Senior Center as well as the capacity of paid staff.
• The Saltmarsh Senior Center is described as one of the few places in town to gather, share information, and seek support. For this reason, participating resident suggest that making the Saltmarsh Senior Center a more inviting space could raise participation rates by the community. For example, it could function as a way of helping newcomers
9
acclimate to life on Nantucket and give year-round residents a place to gather and maintain a sense of community.
Recommendations We offer the following recommendations for the Nantucket Center for Elder Affairs Inc. and the Saltmarsh Senior Center: Prepare for growth in Senior Center participation. Growth is especially high among
age groups 70 and older who are most likely to use the Senior Center. Consider embarking on a strategic planning process for the Saltmarsh Senior Center as a means of addressing programming needs, communication strategies, and space needs.
Improve communication and collaboration across Town offices and community organizations For example, clarify communication about the roles and responsibilities of the varying senior stakeholder groups on Nantucket (e.g., COA, NCEA Inc., Elder Services of Cape Cod & the Islands, and Saltmarsh Senior Center). Devise a plan for working together regularly to promote the programs currently offered at the Saltmarsh Senior Center and brainstorm ways to expand programing. By promoting communication across organizations, knowledge of the Saltmarsh Senior Center and its programs can be broadened to increase impact in the community.
Support current residents’ efforts to stay in their homes as they grow older. Work to improve housing options for older adults who cannot stay in the current homes.
o Develop and disseminate information about home modifications that can help residents make their homes safe to live in as they age. Many residents reported needing these modifications to age in place.
o Consider developing more housing options for older adults who wish to downsize while still staying on Nantucket. Include options that current residents can afford, including condominiums and other types of housing that offer low maintenance and single-floor living.
o Drawing on the existing community cohesion, develop formal ways for neighbors to help neighbors. For example, consider piloting a volunteer driver program or explore the Village to Village Network.
Strengthen residents’ access to health care and in-home services that will help them age at home. Healthcare is limited on Nantucket. Travel is a challenge in accessing off-island services. Improved access to services provided in the home could be beneficial to many older residents.
o Provide more information about local resources and referral information through the Saltmarsh Senior Center.
o Investigate ways to connect older residents with volunteer travel companions or coordinate travel days for groups of seniors to travel to medical appointments together as ways to mitigate travel challenges.
o Expand residents’ access to health care by expanding options available on Nantucket, where feasible.
10
Support informal caregivers on Nantucket. Many residents participate in caregiving
and report needs for support, including respite care and adult day care. Include ways for remote-caregivers to participate in informational sessions about the elder services available on Nantucket.
o Consider hosting a memory café at the Saltmarsh Senior Center or other local space to bring together caregivers and their loved ones to socialize and relax.
o Further investigate the need for respite services and/or adult day programming.
Address programmatic factors limiting participation of Nantucket Residents in Saltmarsh Senior Center programs. Without expansion, rethinking elements of existing programming may draw more residents to the Saltmarsh Senior Center. Update program offerings and develop more opportunities that may appeal to a wide range of older adults. Specifically,
o Respondents are most interested in health and wellness programs that include physical fitness and health promotion programs. Consider offering more challenging exercise programs that require greater exertion levels and appeal to the more fit segments of the senior population.
o Evaluate opportunities to offer special programs that would appeal to diverse segments of the community, including cultural groups, LGBT seniors, and others.
o Educational programs and opportunities for lifelong learning are popular in highly-educated communities like Nantucket. Drawing on retired faculty or other professionals is an option for getting started.
o Cross-departmental partnerships or collaborations with local organizations may be encouraged as a means of expanding options. In the short-term, consider creating satellite sites for additional programming sponsored by the Saltmarsh Senior Center—particularly in the summer months.
Improve transportation options available to older Nantucket residents. Nantucket’s downtown area is not “age friendly” when it comes to walkability, parking and access.
o Explore opportunities to pilot-test the year-round operation of the NRTA-WAVE transportation program1.
o Consider designating “senior parking spots” as a way of encouraging older residents and their families to enjoy the downtown areas.
o Investigate other opportunities to establish programs that will help older adults travel where they need to go, at a price they can afford, and with the flexibility they value. Consider ride-share options and volunteer driver programs.
Improve community knowledge about what the Saltmarsh Senior Center is and its range of offerings.
1Beginning in 2018, NRTA-Wave service will be offered year-round.
11
o Correct misperceptions about who is “eligible” to participate in Senior Center activities by distributing information about the Saltmarsh Senior Center as widely as possible.
o Distribute the newsletter more broadly in an effort to make the Saltmarsh Senior Center better known. ·
o Selectively expand other means of communicating about the Senior Center, including postings in the local newspaper, electronic communication, and attending popular events.
o Consider op-ed columns in the newspaper, or local cable opportunities to explain eligibility for and resources of the Saltmarsh Senior Center. Take advantage of publicity opportunities regularly throughout the
year on an ongoing basis so that newcomers are informed, and longer-term residents are reminded, about what the Saltmarsh Senior Center offers.
o Consider “newcomer” events like hosting a “60th birthday party” for residents who recently turned 60 to familiarize them with the offerings of the Saltmarsh Senior Center. Target family caregivers for a night of respite and to learn about local resources for them and their loved ones. Consider recruiting volunteers to greet and orient new participants.
Consider opportunities to reconfigure and renovate existing space, as well as identify or build new space.
o Review and revise the building lease between NCEA Inc. and the Town of Nantucket.
o Some of the recommended programmatic changes cannot be implemented without added or renovated space. ·
o Expand capacity for special events, so more residents can participate, feel involved, and understand that the Saltmarsh Senior Center is for them. ·
o Consider exploring satellite space options as a means of expanding programs, or seek partnerships to accommodate exercise programs as part of a health promotion activity in Town.
12
Acknowledgements
The authors wish to acknowledge the Community Foundation’s Nantucket Fund™ and Remain Nantucket, who generously provided support for this project. We thank Joe Aguiar, Julie Fitzgerald, and Jean Grimmer all members of the Board of Directors for the Nantucket Center for Elder Affairs, Inc. for commissioning this project.
NCEA Board of Directors:
Joe Aguiar Julie Fitzgerald Jack Fritsch Jean Grimmer Robert Hall Peggy Kaufman Deborah Killen Rich Leone Mary Richrod Michael Varbalow
Margot Montgomery Gerry Crown Jay D'Aprix John Copenhaver Linda Patton Margaret Eger Maureen Herman Merry Bouscaren Sarah Ann Miller
We express thanks to the many residents of Nantucket who supported our data collection efforts, and took the time to complete our survey. We are also indebted to Libby Gibson (Town Administrator), Kevin Marshall (Nantucket Police Department), Jim Kelly (Selectman), Melissa Philbrick (ReMain Nantucket), Rachel Day (Director of Human Services for the Town of Nantucket and Administrator of Our Island Home), Sheri Hunt (Elder Services of Cape Cod and the Islands), Kevin Comick (Executive Director of the Residences at Sherburne Commons), and Peter Mackay (Director of Social Services, Nantucket Cottage Hospital) who each sat down with us in interviews to share their perspectives on aging on Nantucket. Photo credit is to be given to Garth Grimmer. We wish to acknowledge Rose Cagliano, Kathleen Travelo, Denise Rego, Mandi Speakman, Laura Stewart, and Judi Wilson for taking time from their very busy days to share with us details about their organizations. The authors, Caitlin Coyle and Jan Mutchler, from the University of Massachusetts Boston, are responsible for the contents of this report; however, the project could not have been completed without the cooperation and efforts of all those mentioned above. We would also like to thank the graduate and undergraduate students who provided research support for this project.
13
Table of Contents Executive Summary ................................................................................................................................ 4
Key Findings in Brief .......................................................................................................................... 5
Acknowledgements .............................................................................................................................. 12
Introduction ........................................................................................................................................... 15
Background & Literature Review .................................................................................................. 15
Housing ......................................................................................................................................................... 16
Transportation .......................................................................................................................................... 17
Community Features & Services .......................................................................................................... 18
The Saltmarsh Senior Center ................................................................................................................ 18
Purpose of the Study ......................................................................................................................... 20
Methods ................................................................................................................................................... 21
Demographic Profile ........................................................................................................................ 21
Focus Groups ...................................................................................................................................... 21
Key-Informant Interviews ............................................................................................................... 21
Resident Survey ................................................................................................................................. 22
Results ..................................................................................................................................................... 23
Demographic Profile of Nantucket ................................................................................................ 23
Age Structure and Population Growth .............................................................................................. 23
Socio-Demographic Composition of Nantucket’s Older Population ....................................... 27
Resident Survey ................................................................................................................................. 34
Respondent Demographics ................................................................................................................... 34
Community & Neighborhood ................................................................................................................ 35
Housing & Living Situation .................................................................................................................... 39
Transportation .......................................................................................................................................... 43
Caregiving .................................................................................................................................................... 47
Health ............................................................................................................................................................ 49
Current & Future Retirement Plans ................................................................................................... 53
Social Activities & Relationships ......................................................................................................... 53
Programs & Services at the Senior Center ....................................................................................... 55
Financial Security ..................................................................................................................................... 68
Focus Groups ...................................................................................................................................... 69
Key-Informant Interviews ............................................................................................................... 74
Peer Community Comparison ......................................................................................................... 75
Recommendations ................................................................................................................................ 78
14
References .............................................................................................................................................. 82
Appendix A. Reproduction of Community Survey .......................................................................... 83
Appendix B: Complete tables, Saltmarsh Senior Center Community Survey ............................ 84
15
Introduction Over the coming decades, the senior2 population of Nantucket is expected to increase substantially, with growth rates far outpacing those of younger segments of the population. Currently, many older residents benefit from programs and services designed to address aging-related needs and prolong independence in the community, offered through the Saltmarsh Senior Center. The Saltmarsh Senior Center is an important and valued resource, operating as one of the Town’s central points of contact for older residents who seek services to promote healthful aging and fulfilling lives. Growth of the older population therefore has special significance for the Saltmarsh Senior Center, and increasing demand for its services and programs can be expected moving forward.
This report presents results of a comprehensive examination of issues relating to aging and older adults on Nantucket. A needs assessment was undertaken in order to support planning on the part of the Saltmarsh Senior Center and the Nantucket Center for Elder Affairs, Inc. (NCEA). The NCEA, Inc., is a nonprofit board that functions as a “friends group” for the Saltmarsh Senior Center. In addition to owning the building that currently houses the Saltmarsh Senior Center, its mission is to raise funds for the operation of programs to benefit the older residents of Nantucket. Results presented here focus on the current and future consumers of Saltmarsh Senior Center services and programs. Analysis focused on the characteristics and needs of Nantucket residents who are age 60 and older, all of whom are age-eligible to participate in the Senior Center; and those who in the coming decade will be aging into a life stage where they may begin to seek out services meant for older adults. While the primary goal of this report is to support planning on the part of the Saltmarsh Senior Center, a secondary goal is to present information that will be useful to other Nantucket offices and organizations interacting with older adults.
Background & Literature Review
Nantucket is an island about 30 miles south of Cape Cod, Massachusetts that together with two smaller islands (Tuckernuck and Muskeget) make up Nantucket County, the smallest county in Massachusetts. The island of Nantucket proper is 47.8 square miles; population estimates indicate that although 10,556 residents live on the island year-round, the summer population can grow up to 50,000 residents. With a history as a whaling port and arts colony, the cobblestone streets and cedar shingles make Nantucket a quintessential New England seaport community and a vacation destination for many who come from far and wide to enjoy the dune-backed beaches as a peaceful retreat from life on the mainland. Thus, it is not surprising that the tourism industry is the largest employer on the island.
Current estimates suggest that approximately 20% of Nantucket’s year-round residents are age 60 and older. Projections suggest that the total population of Nantucket will continue to grow over the coming 15 years. Because a large share of the population growth will occur among older age groups, the share of the population that is age 60 and older is expected to reach about one-quarter by 2030. While much of this growth in the older population will be 2 For purposes of this report, “older adults” and “seniors” are defined as individuals age 60 and older. This is consistent with usage in the Older Americans Act, the legislation authorizing many services meant for older adults, which also uses age 60 and over to define the population covered by its provisions. The terms “seniors” and “older adults” are used interchangeably in this report.
16
the result of residents, now in their 40s and 50s, staying on Nantucket as they reach their 60s and 70s, some growth is attributed to older adults moving to Nantucket for retirement. Additions to the older population through in-migration may contribute to the aging of Nantucket, and perhaps even enhance the pace with which the population of older adults swell.
Broadly speaking, growth in the older population has implications for virtually every community organization. A number of common aging-related circumstances have been identified that place unique demands on the resources that communities have available as they plan to accommodate greater numbers of older people. Among them are changes in the health and service needs of older people. Many older adults experience physical and social changes that could threaten their independence and wellbeing, if not addressed by specialized and targeted services. In addition, some retirees may experience constraints associated with living on fixed incomes that could limit their choices and reduce their quality of life in retirement. Insofar as many services required by older populations are provided either publicly or through public-private partnerships, towns like Nantucket find it necessary to adapt to changing age profiles within their populations.
A common goal of many older adults is to remain living in their homes as long as possible. The term “aging in place” implies remaining in familiar home and community settings, with supports as needed, as opposed to moving to institutional settings, such as nursing homes (Salomon, 2010). By aging in place, and in communities of their choice, older adults are able to retain their independence, as well as maintain valued social relationships and engagement with the community. In turn, aging in place may promote “successful aging,” by supporting physical activities that reduce risk of chronic disease and by accommodating disabling conditions. By proactively taking steps to support the goals of older people in successful aging and aging in place, Nantucket can retain a larger share of its older population and benefit from the experiences and local commitment that vital long-term residents offer, while reducing potential demands on resources associated with frailty and dependence.
The Saltmarsh Senior Center aims to plan for the continued expansion of its participants by learning about the current and expected needs and experiences of Nantucket’s aging residents. In this report, we describe recent activities conducted to assess the aging-related needs of current and future older adult residents on Nantucket. Our approach aligns with efforts to identify ways in which communities may become more "livable" for residents of all ages. Livable communities have features that allow older adults "to maintain their independence and quality of life as they age and retire" (Nelson & Guengerich, 2009). Key components that facilitate livability include adequate and appropriate housing and transportation options, along with community services that target the needs of older people.
Housing The availability and affordability of housing suitable to meet the changing capacity of older people is a key factor that influences the ability of residents to age in place, and to lead fulfilling and healthy lives in older age. Many studies point to the well-documented preference of older adults to remain in their existing homes as long as possible (e.g., AARP,
17
2005). For many, the home serves not only as a source of shelter, but also as the platform for connection to neighborhood amenities and maintaining social networks. Homes are also an important source of financial security, as home equity and/or ownership may represent one of the most significant sources of wealth held by many older adults. In addition, the home may be the basis for long-standing memories that connect older individuals to their past. Consequently, the attachment many have to their homes is often substantial.
Nevertheless, as people age, the “fit” between individuals and their home environments may decrease (Pynoos, Steinman, Nguyen, & Bressette, 2012). Homes may become too large for current needs, or may become too cumbersome or expensive to maintain on a fixed income. Some older adults will develop functional impairments and disabilities; for these individuals, outdated home features may not provide adequate support for their changing physical and cognitive capacities. Home design features, such as the number of stories and manageability of stairs, may challenge an older resident’s ability to remain living safely in their home. Home modifications, including installation of bathroom grab bars, railings on stairs, adequate lighting throughout the home, ramps, and/or first floor bathrooms, may support the resident’s safety and facilitate aging in place; however, some individuals will need to change residences in later life.
The availability of affordable housing options not only allows residents to stay in the community, but also attract newcomers. This is especially true for housing options with accommodating features, such as home accessibility modifications or elements of universal design, and housing that blends shelter and services, such as assisted living or continuing care retirement communities. These supportive housing options may allow residents who are no longer able to stay in their existing homes to remain in the community (AARP, 2005), or at least delay the move into more supportive and expensive institutional alternatives. The goal of aging in the community can be further facilitated by making residents aware of home-based services for which they may be eligible, including services that would help maintain and modify a home for safe living, and programs that may help them pay utility or other home-related expenses.
Transportation
Along with housing, adequate transportation is needed to maintain social ties, obtain necessary goods and services, access community amenities, and be engaged with others. The vast majority of Americans rely primarily on private transportation to meet these needs, and most individuals drive their own automobiles well into old age. Many communities, like Nantucket, have limited public transportation options, and those that do exist may be inconvenient, expensive, unreliable, or not easily accessible for residents with mobility limitations. Due to difficulties with transportation, individuals with health conditions and disabilities that adversely affect their ability to drive safely may be unable to participate in activities they previously enjoyed and valued. Indeed, a national survey of people age 50 and older conducted by the AARP (2005) found that compared to drivers, non-drivers reported lower quality of life, less involvement with other people, and more isolation. By supporting high quality, reliable and convenient local travel options, communities can promote quality of life and community engagement for older adults as well as other community members who are unable to drive safely, or who prefer public transportation alternatives.
18
Community Features & Services
Livable communities also require adequate and appropriate community features and services designed to respond to the evolving needs of older people, including home- and community-based long-term services and supports. Older adults with mobility limitations and those who experience challenges with driving may need medical and social services that are either easily accessed or delivered to their homes. Programs that connect older homeowners with affordable assistance for maintaining their homes and property can help protect investment value and improve the neighborhoods in which older adults live. Safe and “walkable” shopping and entertainment districts are valued by all members of the community regardless of age and physical capacity, but may be especially helpful for those with mobility and transportation limitations. Providing opportunities for social engagement and participation in community events—through volunteer programs, learning opportunities, and exercise programs, as well as social activities—can help community members maintain social support, remain active, prolong independence and improve quality of life. Research has demonstrated that social support is a key component of wellbeing in later life, and that continued engagement in social and community activities promotes successful aging (Pardasani & Thompson, 2012).
The Saltmarsh Senior Center In Massachusetts, virtually every community has a Council on Aging (COA)—a municipal agency meant to serve as the community focal point for local services for older adults, their families, and caregivers. Many Massachusetts COAs operate senior centers that serve as the physical structure through which these services may be obtained. In addition, senior centers frequently offer fitness, recreation, socialization, education, and many other programs that enhance quality of life. Many COAs also have a “friends group” that raises funds to support regular programming and other costs associated with successful operation of the senior center, but that fall outside of the budget allocated by the Town.
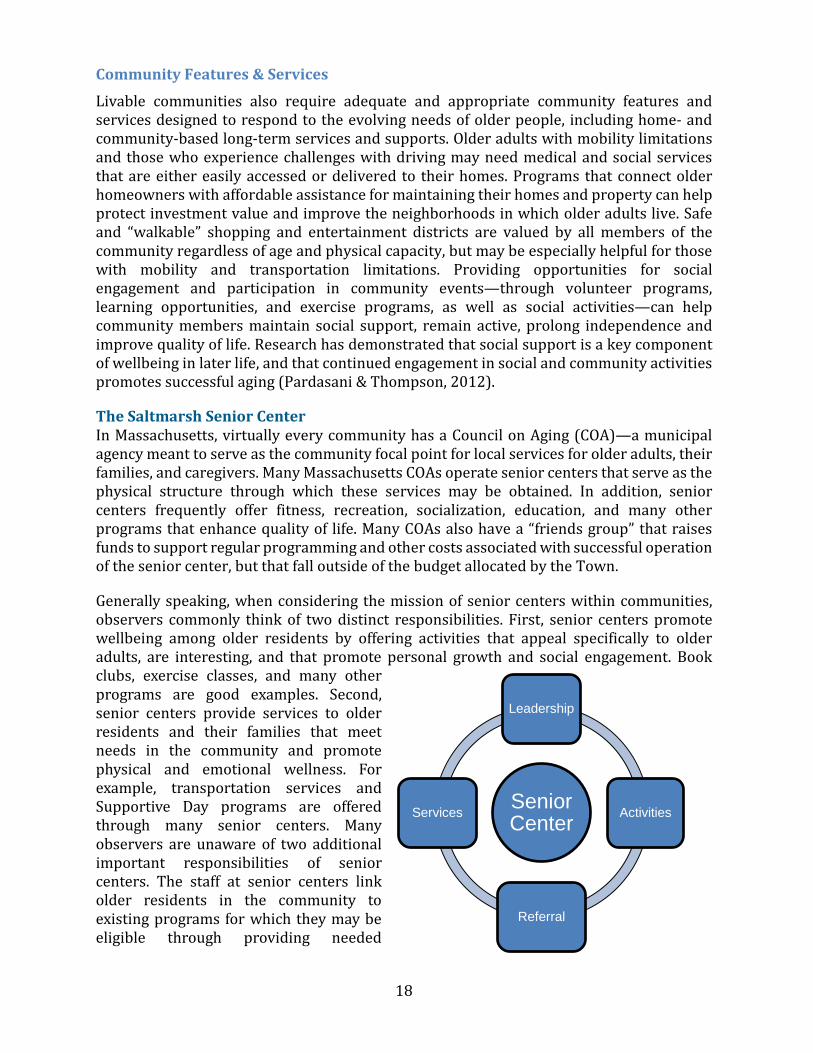
Generally speaking, when considering the mission of senior centers within communities, observers commonly think of two distinct responsibilities. First, senior centers promote wellbeing among older residents by offering activities that appeal specifically to older adults, are interesting, and that promote personal growth and social engagement. Book clubs, exercise classes, and many other programs are good examples. Second, senior centers provide services to older residents and their families that meet needs in the community and promote physical and emotional wellness. For example, transportation services and Supportive Day programs are offered through many senior centers. Many observers are unaware of two additional important responsibilities of senior centers. The staff at senior centers link older residents in the community to existing programs for which they may be eligible through providing needed
Senior Center
Leadership
Activities
Referral
Services
19
information and referring residents to appropriate programs and services. For example, staff may help seniors apply for income support programs or health insurance made available through the state or federal government. Finally, it is common for senior center staff to provide leadership within the community around senior issues, interacting with other Town offices, and serving as resources to residents and organizations.
In the case of Nantucket, the organization of these entities is slightly unique when compared to other towns in Massachusetts. The Nantucket COA is a Town-appointed Board that provides support, input, and advocacy on behalf of Nantucket’s seniors as well as establishing priorities and offering opportunities to older residents, their families, and their caregivers. They meet regularly and have a liaison to the Nantucket Board of Selectmen. Further, unlike COAs throughout Massachusetts, the COA does not have a direct oversight role when it comes to the Saltmarsh Senior Center operations. The Saltmarsh Senior Center is a sub-department of the Department of Human Services and oversight is provided by the Director of Human Services and its staff are employed by the Town of Nantucket. In addition, the Town owns the property on which the building is located. Unlike other COAs in the state, the Saltmarsh Senior Center solely provides programming and does not operate or administer transportation, meals programs (although they are a host site for congregate meals), or information and referral to services and supports. Services are provided through other community based agencies such as Elder Services of Cape Cod & the Islands. Operating as the “friends group” to the Saltmarsh Senior Center is the Nantucket Center for Elder Affairs, Inc. (NCEA), a nonprofit fundraising board that generates funds by hosting events, applying for grants, and receiving donations. Additional funding for the Saltmarsh Senior Center is provided through the Town through: annual grants from the Massachusetts Executive Office of Elder Affairs; fees charged for some programs; and donations. What makes the Saltmarsh Senior Center unique is that the building that the Center operates out of is owned by NCEA, Inc., although the property is owned by the Town of Nantucket. These various entities each have unique responsibilities to the Nantucket seniors and they work relatively independently from one another. Occasionally, they do interact and work together to address the needs of the community. The Saltmarsh Senior Center is open Monday through Thursday from 8:00 a.m. to 4:30 p.m., and Fridays from 8:00 a.m. to 4:00 p.m. Its staff includes a full-time Program Coordinator and one full-time Assistant Program Coordinator. The Saltmarsh Senior Center also relies on the contributions of many dedicated volunteers. The building includes a dining area where meals are served to seniors in the community, a space also used for a variety of programs, several small offices, and a reception area. The Saltmarsh Senior Center offers an array of programs and services for free or at low cost to residents who are aged 60 and older. Programs offered through the Saltmarsh Senior Center include the following:
20
• Health and Wellness Programs: These programs include health screenings, health education, and health benefits counseling. In FY16, the Saltmarsh Senior Center provided 146 health screenings to Nantucket seniors. In addition, 14 individual seniors took advantage of the health education programs and 17 received counseling with respect to their health benefits.
• Nutrition Programs: Lunch is served every weekday and monthly dinners are hosted at the Saltmarsh Senior Center. In FY16, 3,347 meals were served, including to residents under age 60. In addition, the Saltmarsh Senior Center hosts many special lunches and dinners for holidays and other occasions.
• Fitness and Exercise Activities: Regularly scheduled fitness classes, such as Zumba and Yoga, are offered. In FY 2016, 4,683 exercise and fitness service units were provided.
• Professional Services: Informational presentations on a variety of topics are scheduled at the Saltmarsh Senior Center; for example, officers from the Nantucket Police Department share information about scams and other safety concerns. In FY 2016, 1,072 community education units were provided through the Senior Center, 233 general information service units were provided, and 31 residents took advantage of the legal services offered at the Saltmarsh Senior Center.
• Social Events & Recreational Activities: Social activities include parties for holidays and birthdays, day-trips, sailing, and movies. A variety of recreational activities are scheduled, including crafts, art classes, cooking classes, quilting, knitting, book club, and various games such as Bridge, Bingo and Mah-Jong. In FY16, 5,577 social and recreational service units were provided.
• Educational Programs: The Saltmarsh Senior Center hosts lectures on a variety of topics and offer computer classes to residents wishing to enhance their computer skills.
• Volunteer Opportunities: Volunteers at the Saltmarsh Senior Center typically call Bingo and help with serving and cleaning for the men’s breakfast and for the monthly dinner.
The Saltmarsh Senior Center plays an instrumental role in providing key services to older adults in the Town, as well as guiding older residents to available services offered elsewhere. As the number of older residents increases, the need for resources dedicated to this segment of the population will also continue to grow and change. Thus, it is crucial that the Saltmarsh Senior Center plan in earnest to assure that resources are used efficiently and effectively to meet the current and future needs of older people on Nantucket.
Purpose of the Study This report represents the collaborative efforts by the Nantucket Center for Elder Affairs, Inc. and University of Massachusetts Boston (UMass Boston) to assemble information suitable for planning. In the following pages, we present a profile of the characteristics and resources of the current population of Nantucket— those who are at and approaching later life (age 60 and older). Knowledge of these characteristics provides an important basis for planning by the Saltmarsh Senior Center, as well as by other town offices and community organizations. The project was conducted in two phases, with the first occurring in May 2017, and the second in September and October 2017. Findings from both phases are included in this document.
21
Methods
Mixed evaluation methods, that is, assembling both quantitative and qualitative types of data, are often used to assess the needs of older residents and to aid organizations in planning and prioritizing the programs and services they offer to the community. Collecting data from multiple sources is a good strategy for converging on accurate and multifaceted representations of community needs from the perspective of a diverse set of stakeholders (Royse, Thyer, & Padgett, 2010). In the current project, we compiled data from several sources, including publicly available information obtained through the U.S. Census Bureau, quantitative and qualitative data collected directly from residents of Nantucket, and administrative data from Councils on Aging in similar communities around the Commonwealth. All research methods and instruments used in this project were approved by the University’s Institutional Review Board, which is charged with protecting the rights and welfare of human subjects who take part in research conducted at UMass Boston.
Demographic Profile As an initial step toward understanding characteristics of Nantucket’s older population through quantitative data, we generated a demographic profile of the Town using data from the decennial U.S. Census and the American Community Survey (ACS)—a large, annual survey conducted by the U.S. Census Bureau. For purposes of this assessment, we primarily used information drawn from the most current 5-year ACS files (2011-2015), along with U.S. Census data, to summarize demographic characteristics including growth of the older population, shifts in the age distribution, gender, race and education distributions, householder status, living arrangements, household income, and disability status.
Focus Groups In May 2017, we conducted three focus groups with stakeholders and residents who were hand-selected and recruited by NCEA board members and staff of the Saltmarsh Senior Center. One focus group included eight representatives from Town offices and organizations, all of whom have regular interactions with older adult residents. Some but not all of the individuals in that group work regularly with one another around senior issues. The next two focus groups were designed to hear directly from residents. The first included six residents who had some familiarity or experience with the Saltmarsh Senior Center and the second included three women under age 60 to speak about the needs of seniors on Nantucket both now and with an eye towards the future.
Key-Informant Interviews In May 2017, we conducted individual interviews with nine individuals holding leadership roles in organizations relevant to seniors living on Nantucket. Interviews focused on the interviewee’s perceptions relating to unmet needs of seniors in the community, and how the growing size of the older population is impacting Nantucket and the work that the key informants do. We spoke with the Town Manager, the program coordinator at the Saltmarsh Senior Center, the director of the Department of Human Services for the Town, the Executive Director of the Residences at Sherburne Commons, a member of the Board of
22
Selectmen, the director of the Nantucket Branch of Elder Services of Cape Cod & the Islands (a.k.a. the local aging service access point), Executive Director of ReMain Nantucket, the Elder Affairs Officer from the Nantucket Police Department, and the Director of Social Services at Nantucket Cottage Hospital.
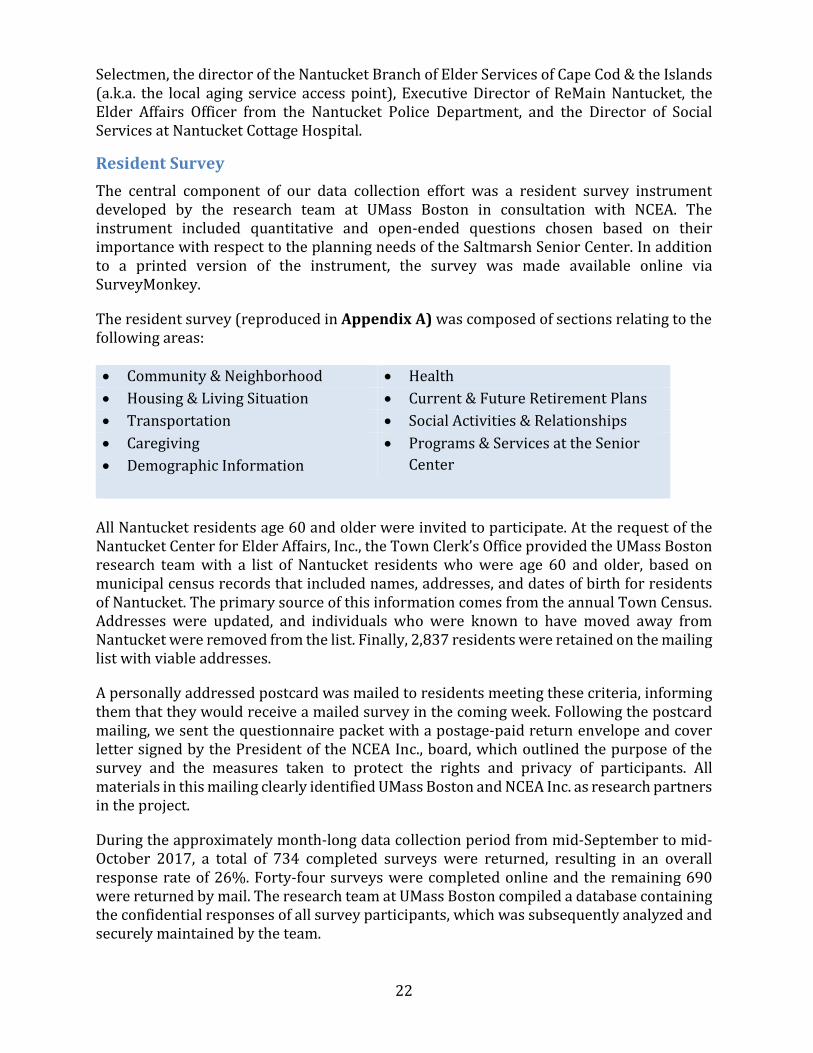
Resident Survey The central component of our data collection effort was a resident survey instrument developed by the research team at UMass Boston in consultation with NCEA. The instrument included quantitative and open-ended questions chosen based on their importance with respect to the planning needs of the Saltmarsh Senior Center. In addition to a printed version of the instrument, the survey was made available online via SurveyMonkey.
The resident survey (reproduced in Appendix A) was composed of sections relating to the following areas: • Community & Neighborhood • Health • Housing & Living Situation • Current & Future Retirement Plans • Transportation • Social Activities & Relationships • Caregiving • Demographic Information
• Programs & Services at the Senior Center
All Nantucket residents age 60 and older were invited to participate. At the request of the Nantucket Center for Elder Affairs, Inc., the Town Clerk’s Office provided the UMass Boston research team with a list of Nantucket residents who were age 60 and older, based on municipal census records that included names, addresses, and dates of birth for residents of Nantucket. The primary source of this information comes from the annual Town Census. Addresses were updated, and individuals who were known to have moved away from Nantucket were removed from the list. Finally, 2,837 residents were retained on the mailing list with viable addresses.
A personally addressed postcard was mailed to residents meeting these criteria, informing them that they would receive a mailed survey in the coming week. Following the postcard mailing, we sent the questionnaire packet with a postage-paid return envelope and cover letter signed by the President of the NCEA Inc., board, which outlined the purpose of the survey and the measures taken to protect the rights and privacy of participants. All materials in this mailing clearly identified UMass Boston and NCEA Inc. as research partners in the project.
During the approximately month-long data collection period from mid-September to mid-October 2017, a total of 734 completed surveys were returned, resulting in an overall response rate of 26%. Forty-four surveys were completed online and the remaining 690 were returned by mail. The research team at UMass Boston compiled a database containing the confidential responses of all survey participants, which was subsequently analyzed and securely maintained by the team.
23
Results
Demographic Profile of Nantucket
Age Structure and Population Growth
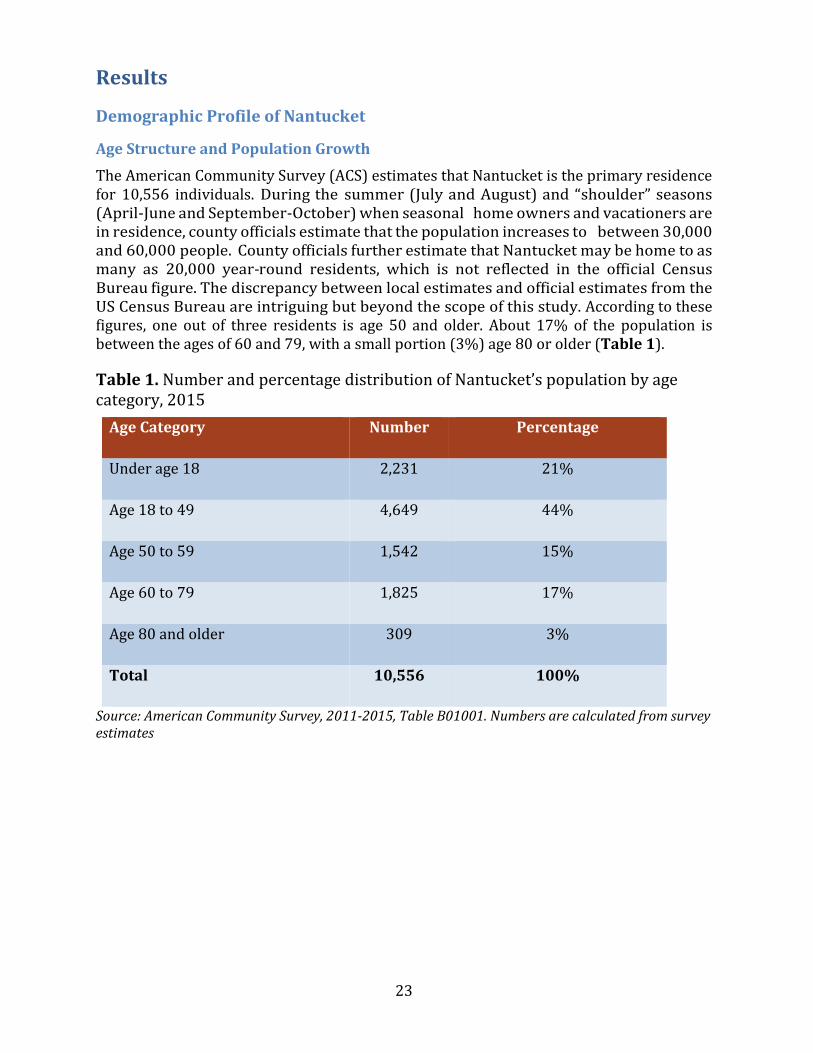
The American Community Survey (ACS) estimates that Nantucket is the primary residence for 10,556 individuals. During the summer (July and August) and “shoulder” seasons (April-June and September-October) when seasonal home owners and vacationers are in residence, county officials estimate that the population increases to between 30,000 and 60,000 people. County officials further estimate that Nantucket may be home to as many as 20,000 year-round residents, which is not reflected in the official Census Bureau figure. The discrepancy between local estimates and official estimates from the US Census Bureau are intriguing but beyond the scope of this study. According to these figures, one out of three residents is age 50 and older. About 17% of the population is between the ages of 60 and 79, with a small portion (3%) age 80 or older (Table 1).
Table 1. Number and percentage distribution of Nantucket’s population by age category, 2015
Age Category Number Percentage
Under age 18 2,231 21%
Age 18 to 49 4,649 44%
Age 50 to 59 1,542 15%
Age 60 to 79 1,825 17%
Age 80 and older 309 3%
Total 10,556 100%
Source: American Community Survey, 2011-2015, Table B01001. Numbers are calculated from survey estimates
24
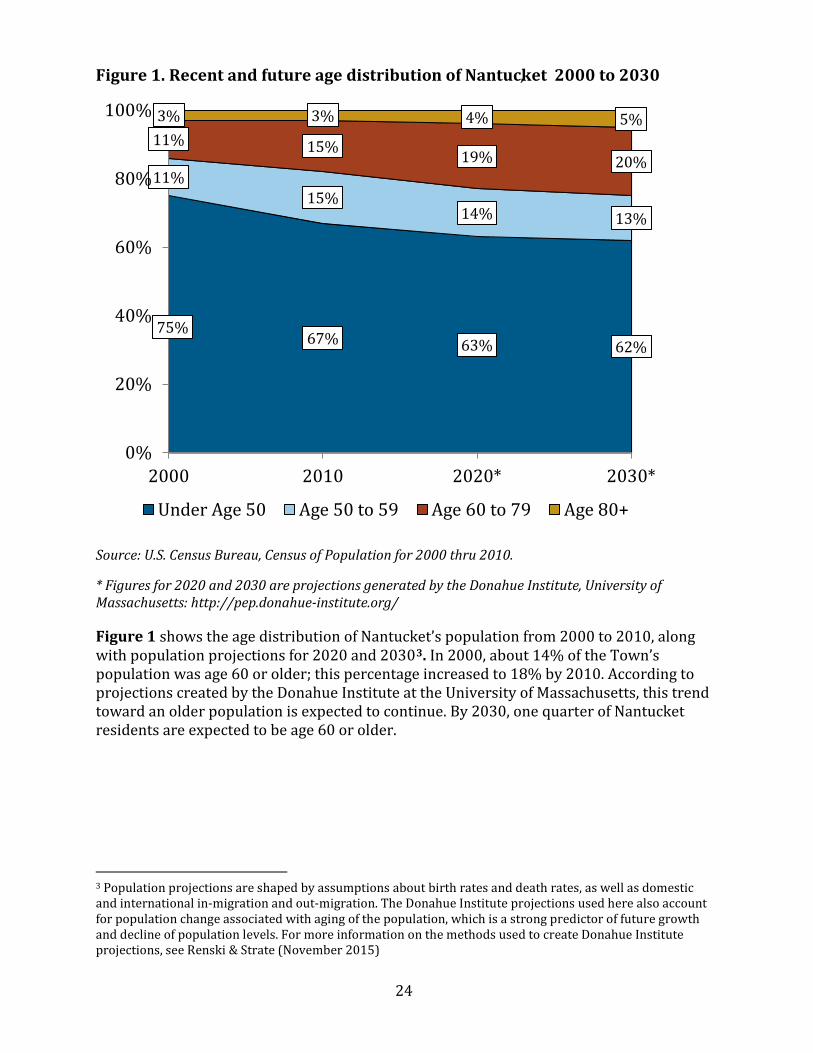
Figure 1. Recent and future age distribution of Nantucket 2000 to 2030,
Source: U.S. Census Bureau, Census of Population for 2000 thru 2010.
* Figures for 2020 and 2030 are projections generated by the Donahue Institute, University of Massachusetts: http://pep.donahue-institute.org/
Figure 1 shows the age distribution of Nantucket’s population from 2000 to 2010, along with population projections for 2020 and 20303. In 2000, about 14% of the Town’s population was age 60 or older; this percentage increased to 18% by 2010. According to projections created by the Donahue Institute at the University of Massachusetts, this trend toward an older population is expected to continue. By 2030, one quarter of Nantucket residents are expected to be age 60 or older.
3 Population projections are shaped by assumptions about birth rates and death rates, as well as domestic and international in-migration and out-migration. The Donahue Institute projections used here also account for population change associated with aging of the population, which is a strong predictor of future growth and decline of population levels. For more information on the methods used to create Donahue Institute projections, see Renski & Strate (November 2015)
75%67% 63% 62%
11%15%
14% 13%
11% 15% 19% 20%
3% 3% 4% 5%
0%
20%
40%
60%
80%
100%
2000 2010 2020* 2030*
Under Age 50 Age 50 to 59 Age 60 to 79 Age 80+
25
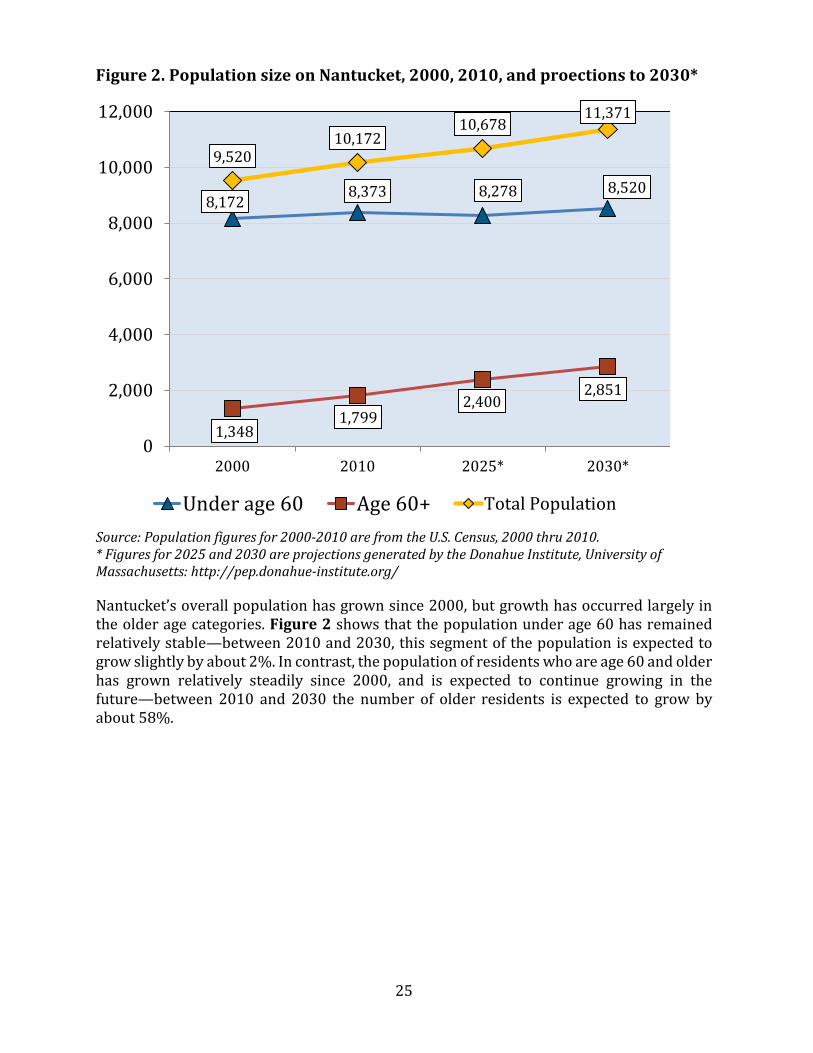
Figure 2. Population size on Nantucket, 2000, 2010, and projections to 2030*
Source: Population figures for 2000-2010 are from the U.S. Census, 2000 thru 2010. * Figures for 2025 and 2030 are projections generated by the Donahue Institute, University of Massachusetts: http://pep.donahue-institute.org/
Nantucket’s overall population has grown since 2000, but growth has occurred largely in the older age categories. Figure 2 shows that the population under age 60 has remained relatively stable—between 2010 and 2030, this segment of the population is expected to grow slightly by about 2%. In contrast, the population of residents who are age 60 and older has grown relatively steadily since 2000, and is expected to continue growing in the future—between 2010 and 2030 the number of older residents is expected to grow by about 58%.
8,1728,373 8,278 8,520
1,3481,799
2,4002,851
9,52010,172
10,67811,371
0
2,000
4,000
6,000
8,000
10,000
12,000
2000 2010 2025* 2030*
Under age 60 Age 60+ Total Population
26
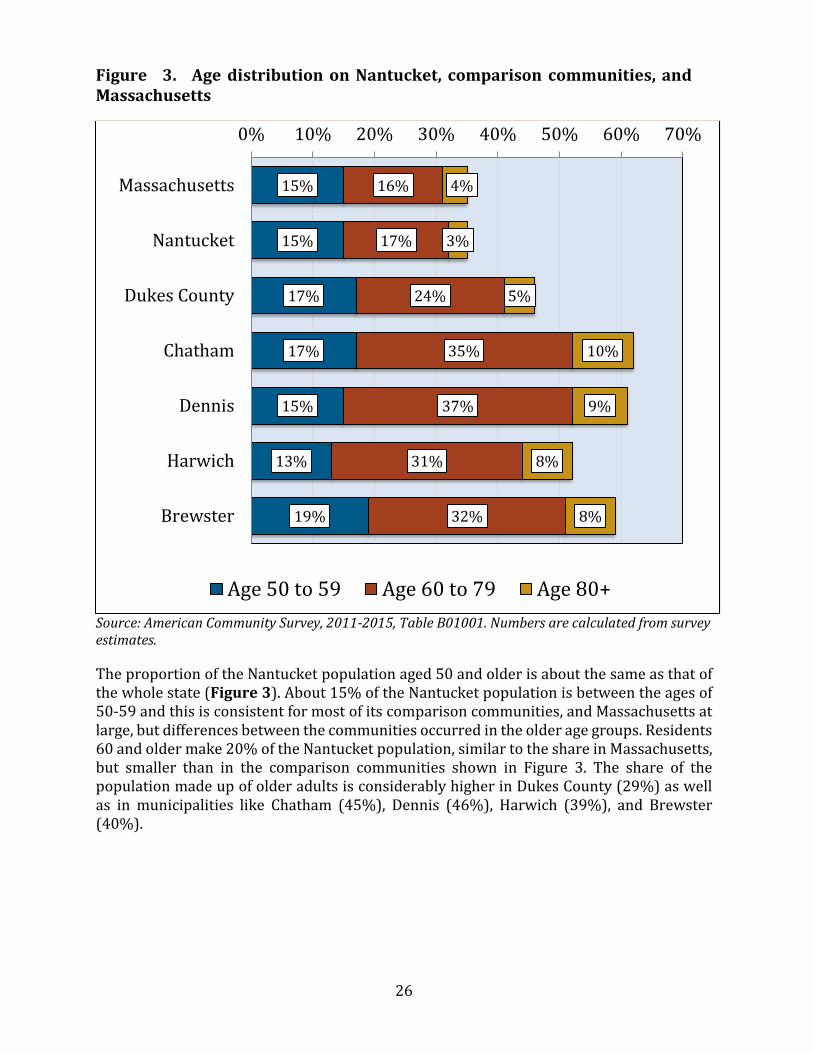
Figure 3. Age distribution on Nantucket, comparison communities, and Massachusetts
Source: American Community Survey, 2011-2015, Table B01001. Numbers are calculated from survey estimates.
The proportion of the Nantucket population aged 50 and older is about the same as that of the whole state (Figure 3). About 15% of the Nantucket population is between the ages of 50-59 and this is consistent for most of its comparison communities, and Massachusetts at large, but differences between the communities occurred in the older age groups. Residents 60 and older make 20% of the Nantucket population, similar to the share in Massachusetts, but smaller than in the comparison communities shown in Figure 3. The share of the population made up of older adults is considerably higher in Dukes County (29%) as well as in municipalities like Chatham (45%), Dennis (46%), Harwich (39%), and Brewster (40%).
15%
15%
17%
17%
15%
13%
19%
16%
17%
24%
35%
37%
31%
32%
4%
3%
5%
10%
9%
8%
8%
0% 10% 20% 30% 40% 50% 60% 70%
Massachusetts
Nantucket
Dukes County
Chatham
Dennis
Harwich
Brewster
Age 50 to 59 Age 60 to 79 Age 80+
27
Socio-Demographic Composition of Nantucket’s Older Population
According to the most recent decennial census, the vast majority of older Nantucket residents report being white (95%). About 3% of the senior population report Black or African American race and the remaining 2% report their race as Asia or some “other”. About 1% of those 65 and older report Hispanic or Latino ethnicity, which may be reported in combination with any racial identity.
A small portion (9%) of Nantucket residents age 65 and older speak a language other than English at home (ACS, 2011 – 2015, Table B16004). Among those who speak another language at home, the most commonly spoken language is Spanish.
The gender distribution among Nantucket seniors is similar to that of most communities— slightly more than half of residents who are age 60 and older are women (51%; ACS, 2011 – 2015, Table B01001). The greater number of older women is largely due to longer life expectancies of women compared to men—a demographic disparity that is widely observed in older populations globally.
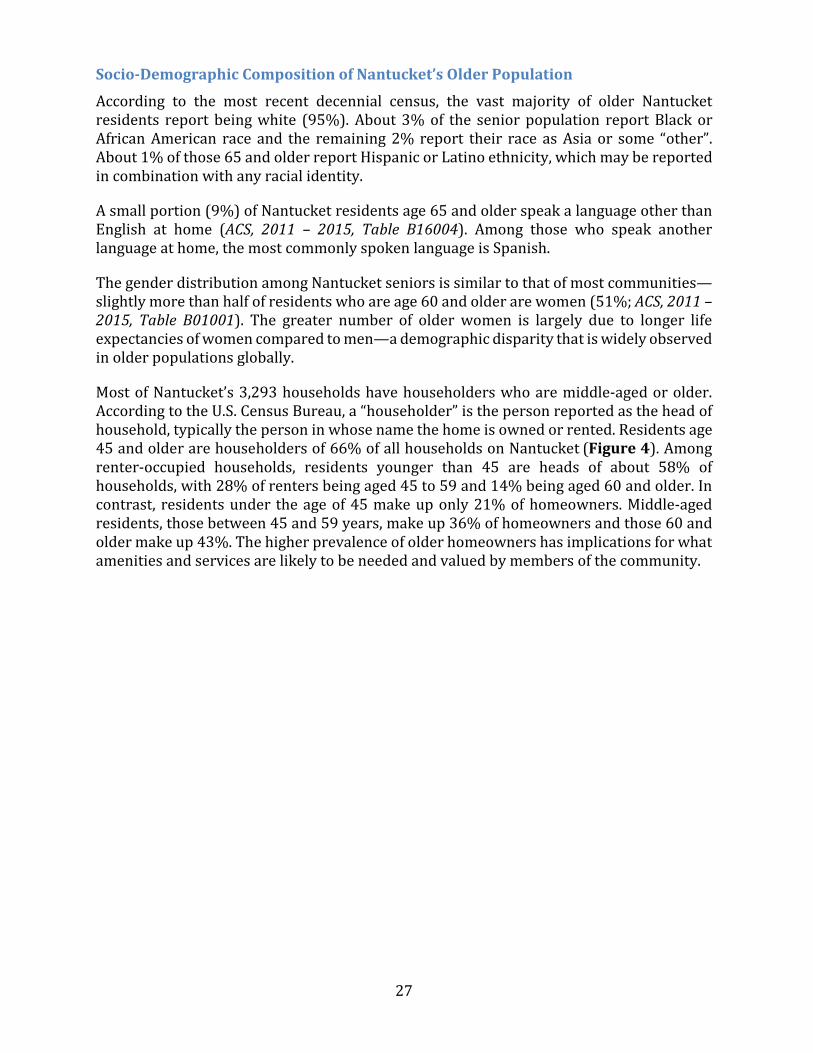
Most of Nantucket’s 3,293 households have householders who are middle-aged or older. According to the U.S. Census Bureau, a “householder” is the person reported as the head of household, typically the person in whose name the home is owned or rented. Residents age 45 and older are householders of 66% of all households on Nantucket (Figure 4). Among renter-occupied households, residents younger than 45 are heads of about 58% of households, with 28% of renters being aged 45 to 59 and 14% being aged 60 and older. In contrast, residents under the age of 45 make up only 21% of homeowners. Middle-aged residents, those between 45 and 59 years, make up 36% of homeowners and those 60 and older make up 43%. The higher prevalence of older homeowners has implications for what amenities and services are likely to be needed and valued by members of the community.
28
Figure 4. Age structure of householders by owner status
Source: American Community Survey, 2011-2015, Table B25007. Numbers are calculated from survey estimates.
21%
58%
34%
36%
28%
33%
43%
14%
33%
0% 20% 40% 60% 80% 100%
Owner Occupied
Renter Occupied
All Households
Younger than 45 Age 45 to 59 Age 60+
29
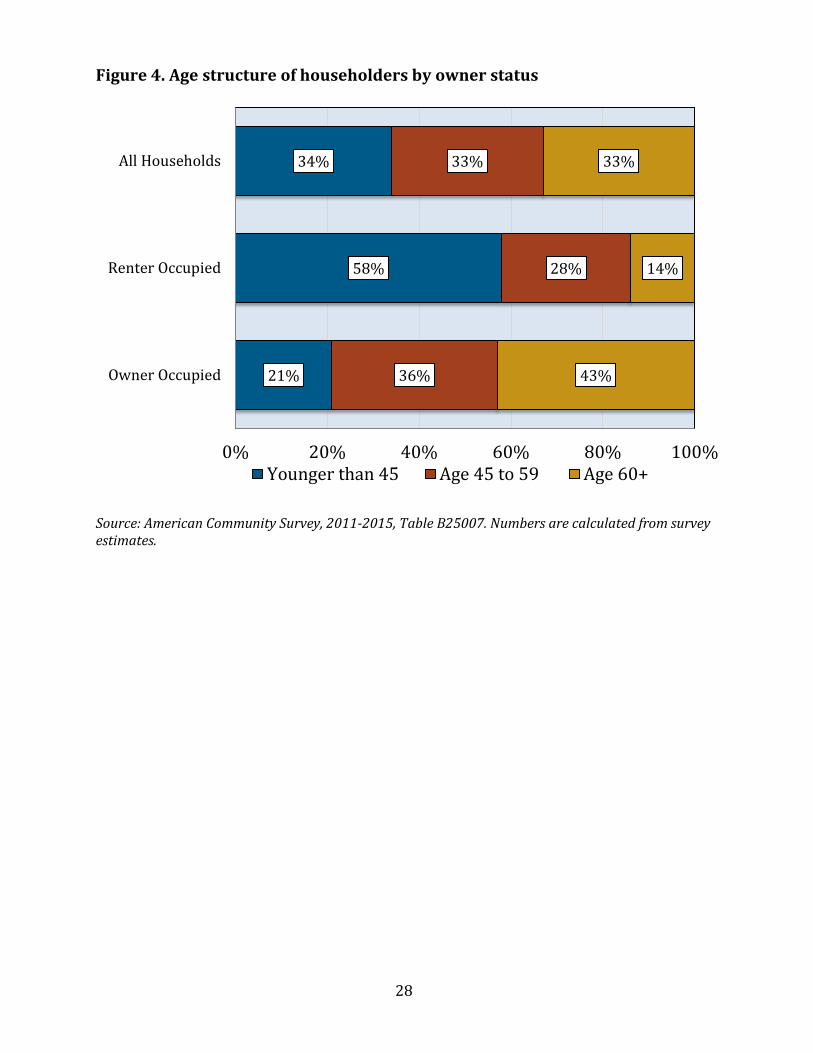
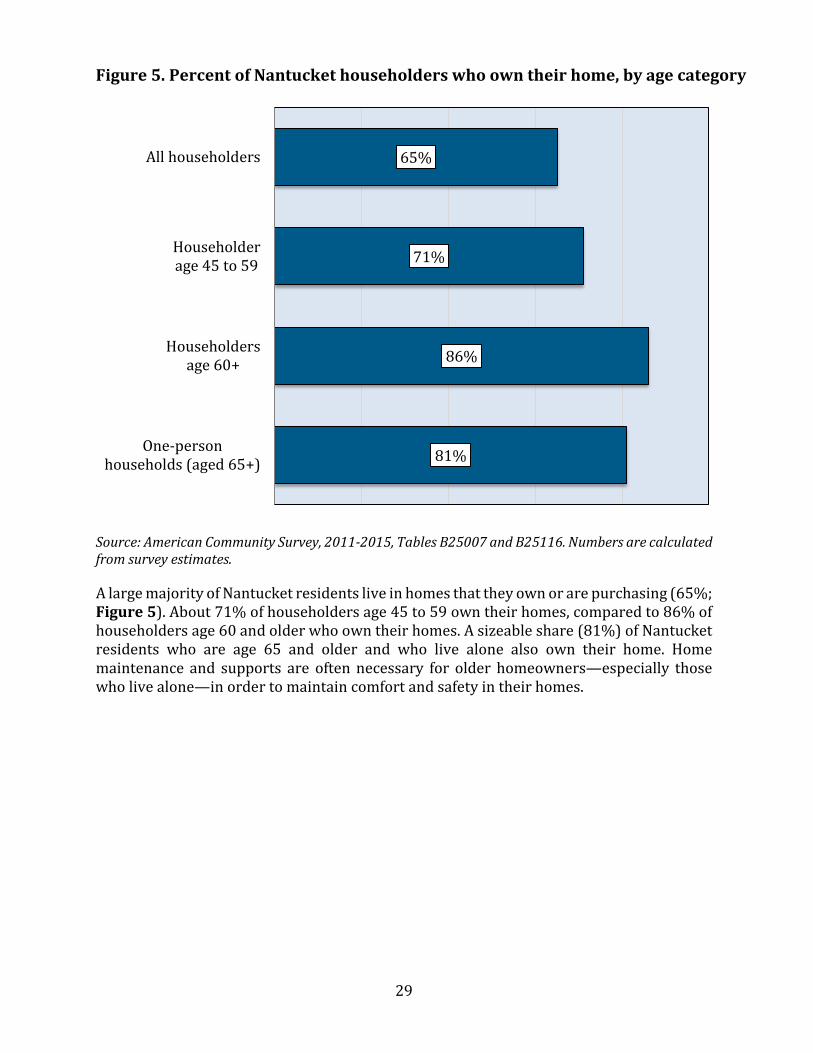
Figure 5. Percent of Nantucket householders who own their home, by age category
Source: American Community Survey, 2011-2015, Tables B25007 and B25116. Numbers are calculated from survey estimates.
A large majority of Nantucket residents live in homes that they own or are purchasing (65%; Figure 5). About 71% of householders age 45 to 59 own their homes, compared to 86% of householders age 60 and older who own their homes. A sizeable share (81%) of Nantucket residents who are age 65 and older and who live alone also own their home. Home maintenance and supports are often necessary for older homeowners—especially those who live alone—in order to maintain comfort and safety in their homes.
65%
71%
86%
81%
All householders
Householderage 45 to 59
Householdersage 60+
One-personhouseholds (aged 65+)
30
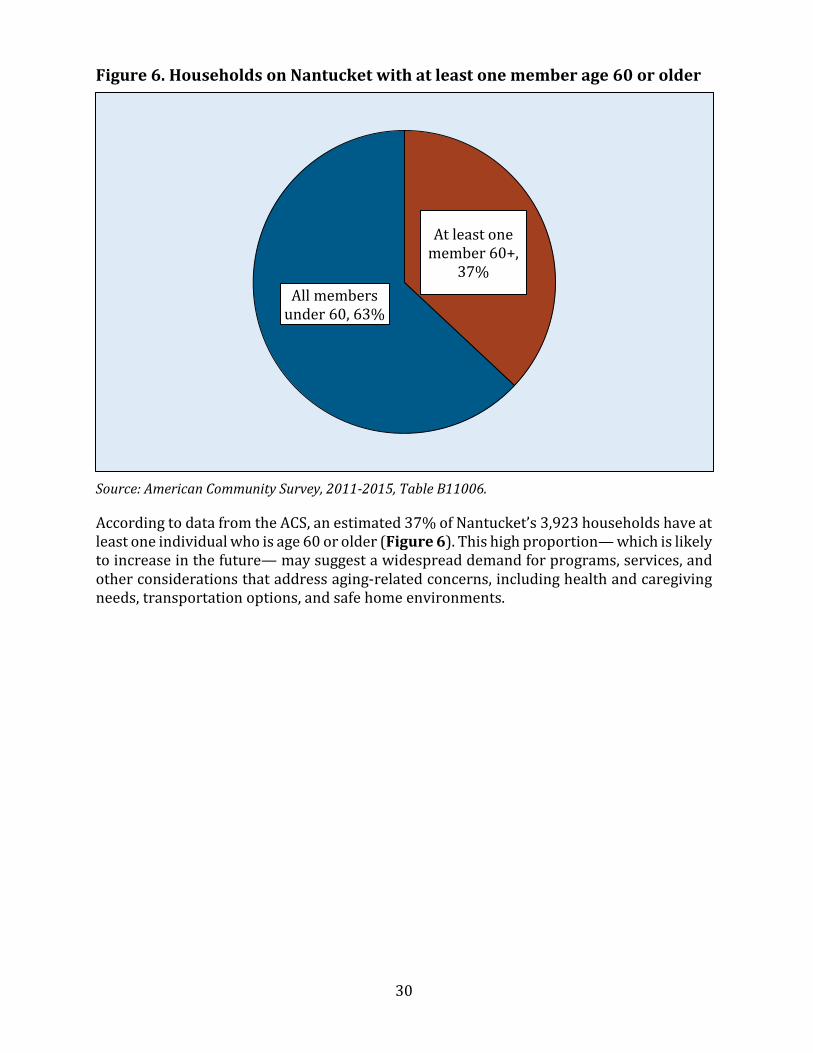
Figure 6. Households on Nantucket with at least one member age 60 or older
Source: American Community Survey, 2011-2015, Table B11006.
According to data from the ACS, an estimated 37% of Nantucket’s 3,923 households have at least one individual who is age 60 or older (Figure 6). This high proportion— which is likely to increase in the future— may suggest a widespread demand for programs, services, and other considerations that address aging-related concerns, including health and caregiving needs, transportation options, and safe home environments.
At least one member 60+,
37%All members
under 60, 63%
31
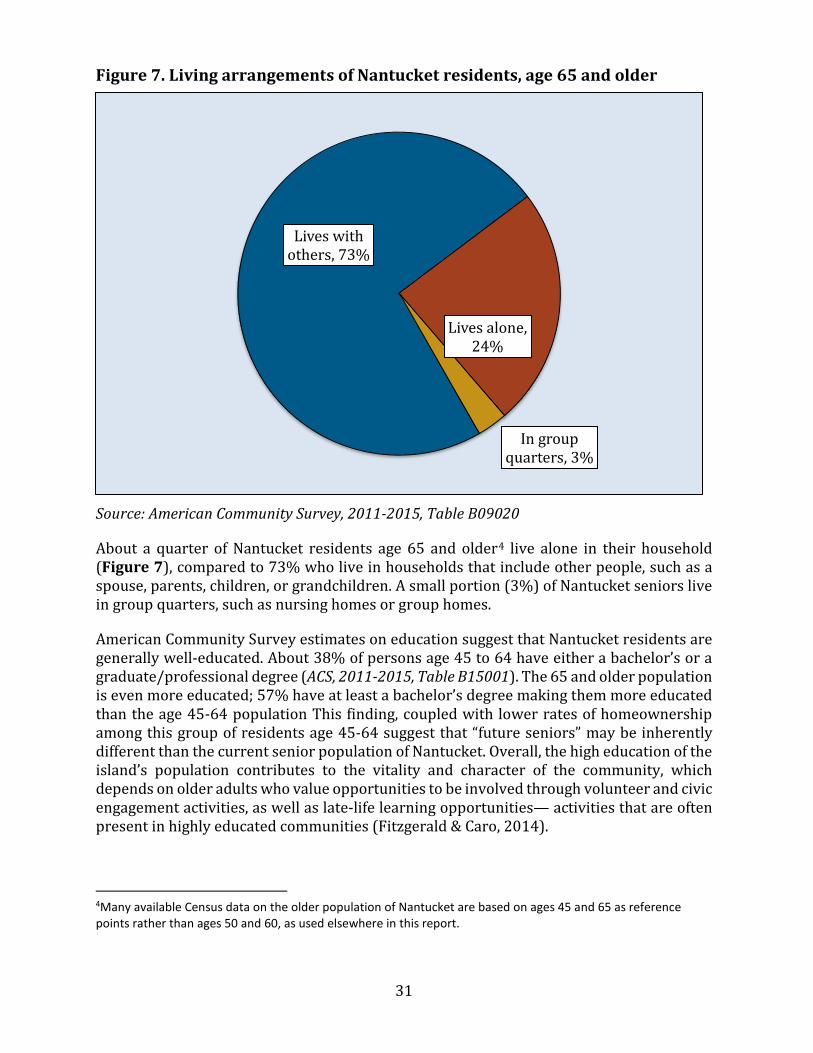
Figure 7. Living arrangements of Nantucket residents, age 65 and older
Source: American Community Survey, 2011-2015, Table B09020
About a quarter of Nantucket residents age 65 and older4 live alone in their household (Figure 7), compared to 73% who live in households that include other people, such as a spouse, parents, children, or grandchildren. A small portion (3%) of Nantucket seniors live in group quarters, such as nursing homes or group homes.
American Community Survey estimates on education suggest that Nantucket residents are generally well-educated. About 38% of persons age 45 to 64 have either a bachelor’s or a graduate/professional degree (ACS, 2011-2015, Table B15001). The 65 and older population is even more educated; 57% have at least a bachelor’s degree making them more educated than the age 45-64 population This finding, coupled with lower rates of homeownership among this group of residents age 45-64 suggest that “future seniors” may be inherently different than the current senior population of Nantucket. Overall, the high education of the island’s population contributes to the vitality and character of the community, which depends on older adults who value opportunities to be involved through volunteer and civic engagement activities, as well as late-life learning opportunities— activities that are often present in highly educated communities (Fitzgerald & Caro, 2014).
4Many available Census data on the older population of Nantucket are based on ages 45 and 65 as reference points rather than ages 50 and 60, as used elsewhere in this report.
Lives with others, 73%
Lives alone, 24%
In group quarters, 3%
32
Similar to older adults living in communities throughout the U.S., a sizeable proportion (33%) of Nantucket residents aged 65 to 74 remain in the workforce. Almost one-fifth of those age 75 and older are also still in the workforce (ACS, 2011-2015, Table B23001). Two-fifths (41%) of men age 65 and older report veteran status, with less than 1% of older women on Nantucket reporting veteran status (ACS, 2011-2015, Table B21001). As a result, many of the Town’s older residents may be eligible to receive some benefits and program services based on their military service or that of their spouses.
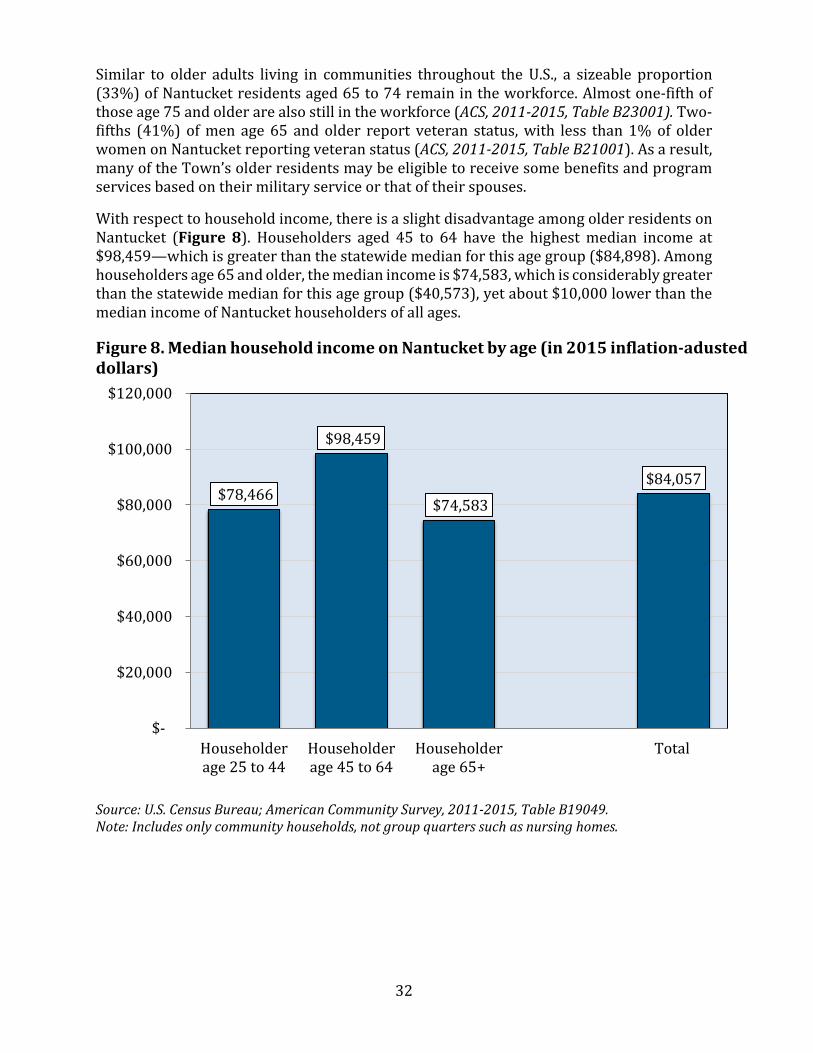
With respect to household income, there is a slight disadvantage among older residents on Nantucket (Figure 8). Householders aged 45 to 64 have the highest median income at $98,459—which is greater than the statewide median for this age group ($84,898). Among householders age 65 and older, the median income is $74,583, which is considerably greater than the statewide median for this age group ($40,573), yet about $10,000 lower than the median income of Nantucket householders of all ages.
Figure 8. Median household income on Nantucket by age (in 2015 inflation-adjusted dollars)
Source: U.S. Census Bureau; American Community Survey, 2011-2015, Table B19049. Note: Includes only community households, not group quarters such as nursing homes.
$78,466
$98,459
$74,583 $84,057
$-
$20,000
$40,000
$60,000
$80,000
$100,000
$120,000
Householderage 25 to 44
Householderage 45 to 64
Householderage 65+
Total
33
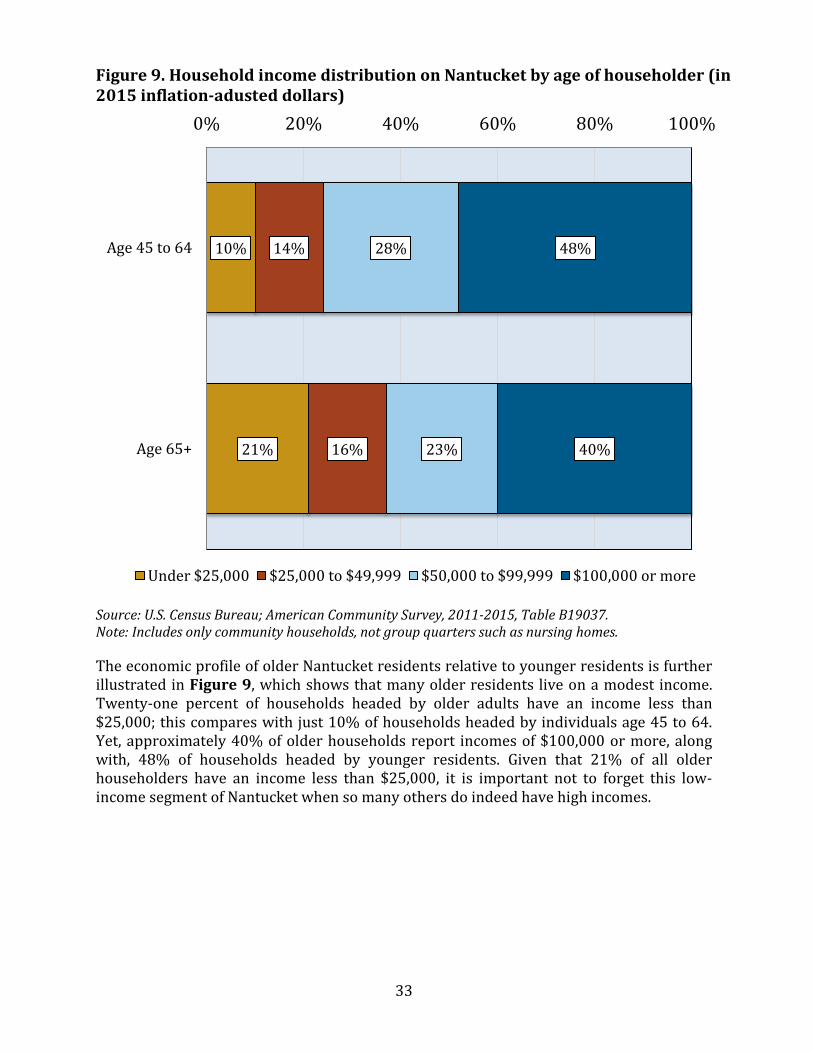
Figure 9. Household income distribution on Nantucket by age of householder (in 2015 inflation-adjusted dollars)
Source: U.S. Census Bureau; American Community Survey, 2011-2015, Table B19037. Note: Includes only community households, not group quarters such as nursing homes.
The economic profile of older Nantucket residents relative to younger residents is further illustrated in Figure 9, which shows that many older residents live on a modest income. Twenty-one percent of households headed by older adults have an income less than $25,000; this compares with just 10% of households headed by individuals age 45 to 64. Yet, approximately 40% of older households report incomes of $100,000 or more, along with, 48% of households headed by younger residents. Given that 21% of all older householders have an income less than $25,000, it is important not to forget this low-income segment of Nantucket when so many others do indeed have high incomes.
10%
21%
14%
16%
28%
23%
48%
40%
0% 20% 40% 60% 80% 100%
Age 45 to 64
Age 65+
Under $25,000 $25,000 to $49,999 $50,000 to $99,999 $100,000 or more
34
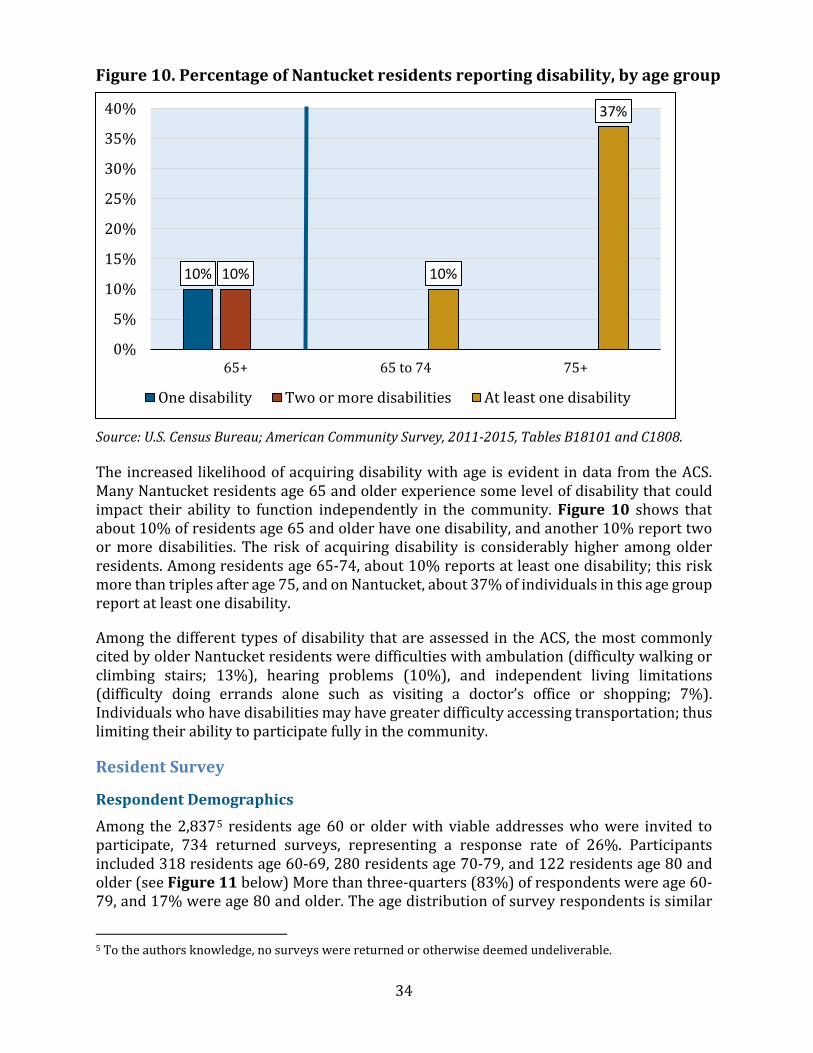
Figure 10. Percentage of Nantucket residents reporting disability, by age group
Source: U.S. Census Bureau; American Community Survey, 2011-2015, Tables B18101 and C1808. The increased likelihood of acquiring disability with age is evident in data from the ACS. Many Nantucket residents age 65 and older experience some level of disability that could impact their ability to function independently in the community. Figure 10 shows that about 10% of residents age 65 and older have one disability, and another 10% report two or more disabilities. The risk of acquiring disability is considerably higher among older residents. Among residents age 65-74, about 10% reports at least one disability; this risk more than triples after age 75, and on Nantucket, about 37% of individuals in this age group report at least one disability.
Among the different types of disability that are assessed in the ACS, the most commonly cited by older Nantucket residents were difficulties with ambulation (difficulty walking or climbing stairs; 13%), hearing problems (10%), and independent living limitations (difficulty doing errands alone such as visiting a doctor’s office or shopping; 7%). Individuals who have disabilities may have greater difficulty accessing transportation; thus limiting their ability to participate fully in the community.
Resident Survey
Respondent Demographics
Among the 2,8375 residents age 60 or older with viable addresses who were invited to participate, 734 returned surveys, representing a response rate of 26%. Participants included 318 residents age 60-69, 280 residents age 70-79, and 122 residents age 80 and older (see Figure 11 below) More than three-quarters (83%) of respondents were age 60-79, and 17% were age 80 and older. The age distribution of survey respondents is similar
5 To the authors knowledge, no surveys were returned or otherwise deemed undeliverable.
10% 10% 10%
37%
0%
5%
10%
15%
20%
25%
30%
35%
40%
65+ 65 to 74 75+
One disability Two or more disabilities At least one disability
35
to that of the population age 60 and older on Nantucket.6 Complete survey results are presented in tables in Appendix B.
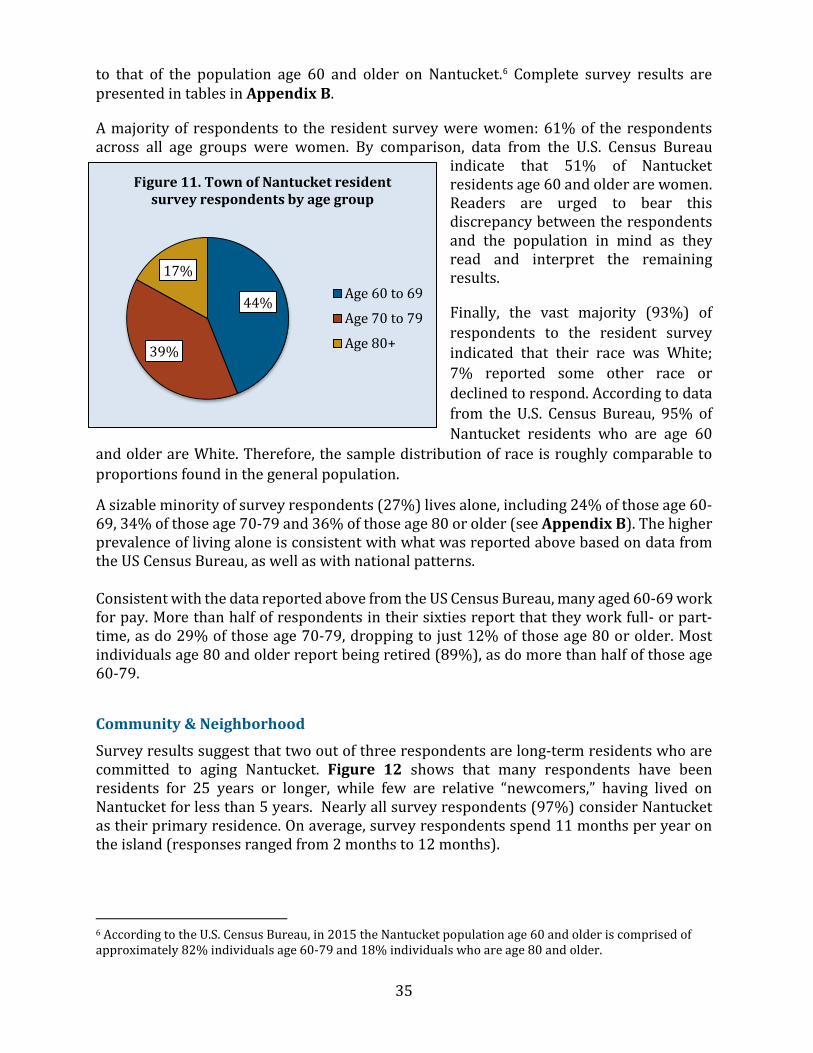
A majority of respondents to the resident survey were women: 61% of the respondents across all age groups were women. By comparison, data from the U.S. Census Bureau
indicate that 51% of Nantucket residents age 60 and older are women. Readers are urged to bear this discrepancy between the respondents and the population in mind as they read and interpret the remaining results.
Finally, the vast majority (93%) of respondents to the resident survey indicated that their race was White; 7% reported some other race or declined to respond. According to data from the U.S. Census Bureau, 95% of Nantucket residents who are age 60
and older are White. Therefore, the sample distribution of race is roughly comparable to proportions found in the general population.
A sizable minority of survey respondents (27%) lives alone, including 24% of those age 60-69, 34% of those age 70-79 and 36% of those age 80 or older (see Appendix B). The higher prevalence of living alone is consistent with what was reported above based on data from the US Census Bureau, as well as with national patterns. Consistent with the data reported above from the US Census Bureau, many aged 60-69 work for pay. More than half of respondents in their sixties report that they work full- or part-time, as do 29% of those age 70-79, dropping to just 12% of those age 80 or older. Most individuals age 80 and older report being retired (89%), as do more than half of those age 60-79.
Community & Neighborhood
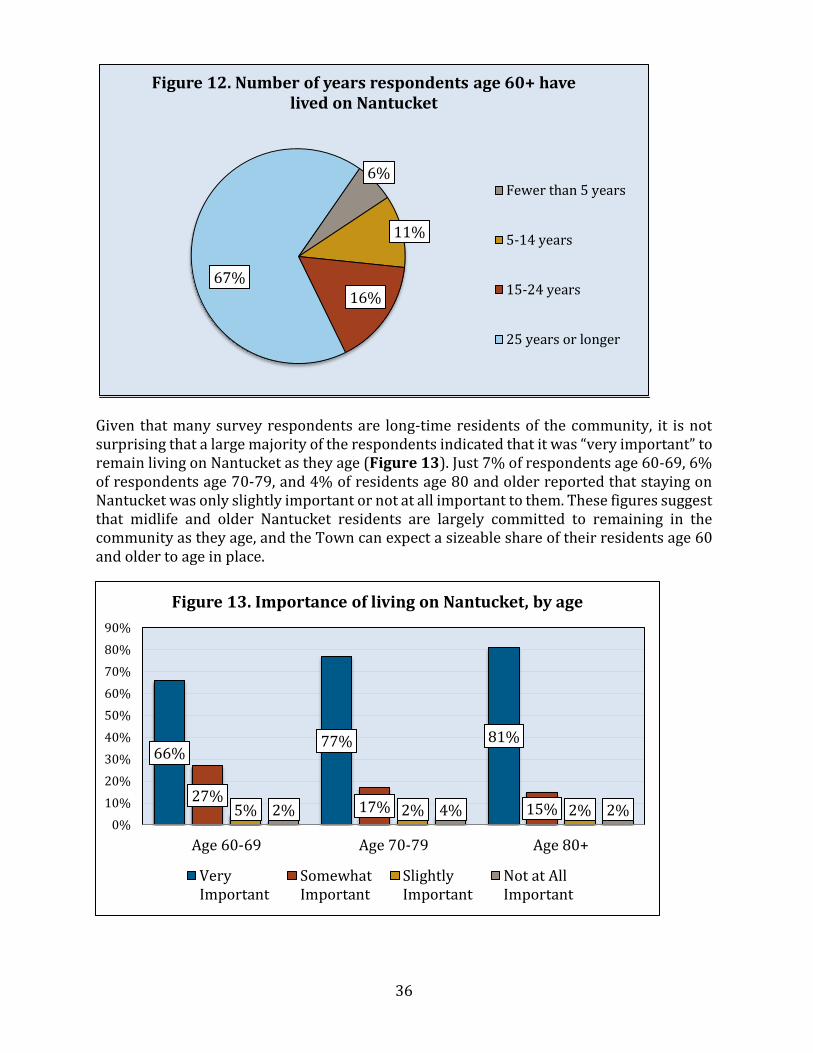
Survey results suggest that two out of three respondents are long-term residents who are committed to aging Nantucket. Figure 12 shows that many respondents have been residents for 25 years or longer, while few are relative “newcomers,” having lived on Nantucket for less than 5 years. Nearly all survey respondents (97%) consider Nantucket as their primary residence. On average, survey respondents spend 11 months per year on the island (responses ranged from 2 months to 12 months).
6 According to the U.S. Census Bureau, in 2015 the Nantucket population age 60 and older is comprised of approximately 82% individuals age 60-79 and 18% individuals who are age 80 and older.
44%
39%
17%
Figure 11. Town of Nantucket resident survey respondents by age group
Age 60 to 69
Age 70 to 79
Age 80+
36
Given that many survey respondents are long-time residents of the community, it is not surprising that a large majority of the respondents indicated that it was “very important” to remain living on Nantucket as they age (Figure 13). Just 7% of respondents age 60-69, 6% of respondents age 70-79, and 4% of residents age 80 and older reported that staying on Nantucket was only slightly important or not at all important to them. These figures suggest that midlife and older Nantucket residents are largely committed to remaining in the community as they age, and the Town can expect a sizeable share of their residents age 60 and older to age in place.
6%
11%
16%67%
Figure 12. Number of years respondents age 60+ have lived on Nantucket
Fewer than 5 years
5-14 years
15-24 years
25 years or longer
66%77% 81%
27%17% 15%5% 2% 2%2% 4% 2%
0%10%20%30%40%50%60%70%80%90%
Age 60-69 Age 70-79 Age 80+
Figure 13. Importance of living on Nantucket, by age
VeryImportant
SomewhatImportant
SlightlyImportant
Not at AllImportant
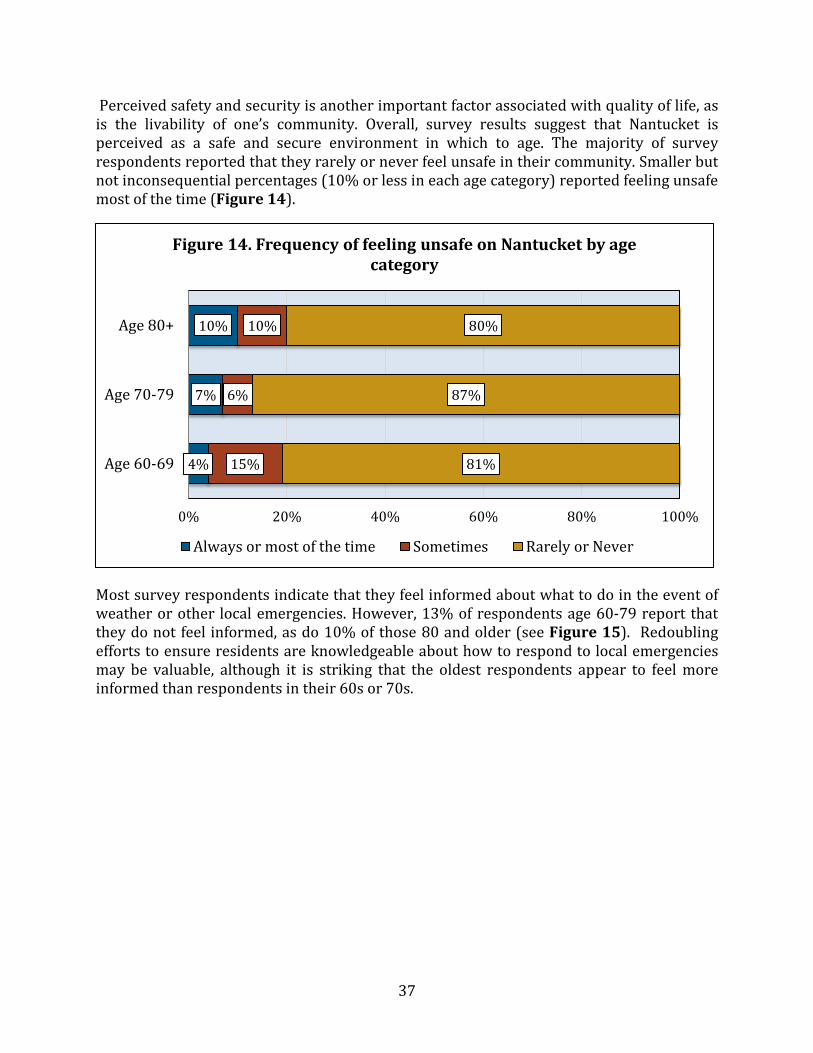
37
Perceived safety and security is another important factor associated with quality of life, as is the livability of one’s community. Overall, survey results suggest that Nantucket is perceived as a safe and secure environment in which to age. The majority of survey respondents reported that they rarely or never feel unsafe in their community. Smaller but not inconsequential percentages (10% or less in each age category) reported feeling unsafe most of the time (Figure 14).
Most survey respondents indicate that they feel informed about what to do in the event of weather or other local emergencies. However, 13% of respondents age 60-79 report that they do not feel informed, as do 10% of those 80 and older (see Figure 15). Redoubling efforts to ensure residents are knowledgeable about how to respond to local emergencies may be valuable, although it is striking that the oldest respondents appear to feel more informed than respondents in their 60s or 70s.
4%
7%
10%
15%
6%
10%
81%
87%
80%
0% 20% 40% 60% 80% 100%
Age 60-69
Age 70-79
Age 80+
Figure 14. Frequency of feeling unsafe on Nantucket by age category
Always or most of the time Sometimes Rarely or Never
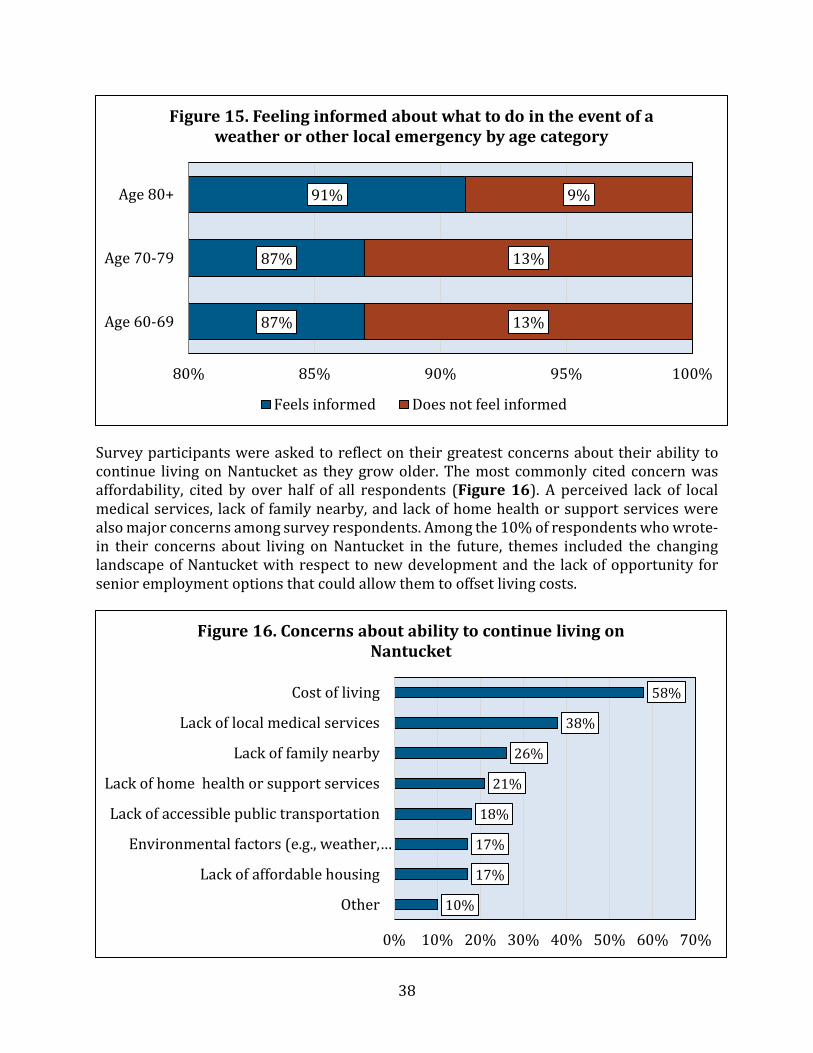
38
Survey participants were asked to reflect on their greatest concerns about their ability to continue living on Nantucket as they grow older. The most commonly cited concern was affordability, cited by over half of all respondents (Figure 16). A perceived lack of local medical services, lack of family nearby, and lack of home health or support services were also major concerns among survey respondents. Among the 10% of respondents who wrote-in their concerns about living on Nantucket in the future, themes included the changing landscape of Nantucket with respect to new development and the lack of opportunity for senior employment options that could allow them to offset living costs.
87%
87%
91%
13%
13%
9%
80% 85% 90% 95% 100%
Age 60-69
Age 70-79
Age 80+
Figure 15. Feeling informed about what to do in the event of a weather or other local emergency by age category
Feels informed Does not feel informed
10%
17%
17%
18%
21%
26%
38%
58%
0% 10% 20% 30% 40% 50% 60% 70%
Other
Lack of affordable housing
Environmental factors (e.g., weather,…
Lack of accessible public transportation
Lack of home health or support services
Lack of family nearby
Lack of local medical services
Cost of living
Figure 16. Concerns about ability to continue living on Nantucket
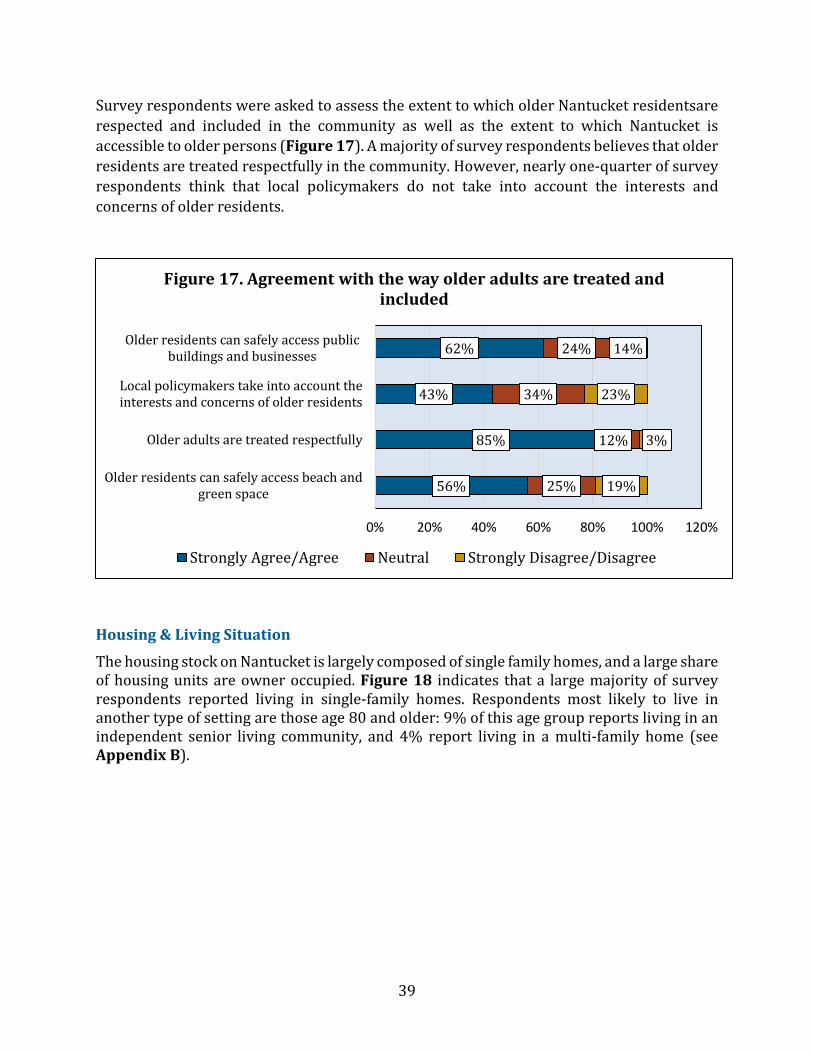
39
Survey respondents were asked to assess the extent to which older Nantucket residentsare respected and included in the community as well as the extent to which Nantucket is accessible to older persons (Figure 17). A majority of survey respondents believes that older residents are treated respectfully in the community. However, nearly one-quarter of survey respondents think that local policymakers do not take into account the interests and concerns of older residents.
Housing & Living Situation
The housing stock on Nantucket is largely composed of single family homes, and a large share of housing units are owner occupied. Figure 18 indicates that a large majority of survey respondents reported living in single-family homes. Respondents most likely to live in another type of setting are those age 80 and older: 9% of this age group reports living in an independent senior living community, and 4% report living in a multi-family home (see Appendix B).
56%
85%
43%
62%
25%
12%
34%
24%
19%
3%
23%
14%
0% 20% 40% 60% 80% 100% 120%
Older residents can safely access beach andgreen space
Older adults are treated respectfully
Local policymakers take into account theinterests and concerns of older residents
Older residents can safely access publicbuildings and businesses
Figure 17. Agreement with the way older adults are treated and included
Strongly Agree/Agree Neutral Strongly Disagree/Disagree
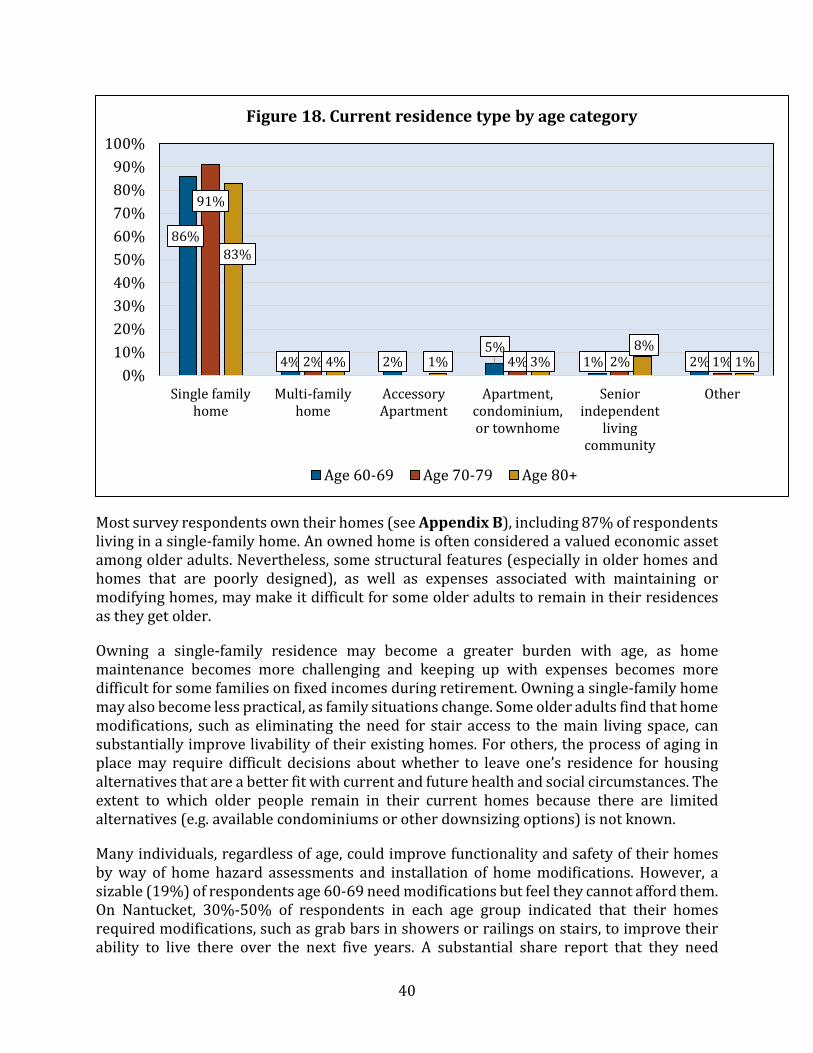
40
Most survey respondents own their homes (see Appendix B), including 87% of respondents living in a single-family home. An owned home is often considered a valued economic asset among older adults. Nevertheless, some structural features (especially in older homes and homes that are poorly designed), as well as expenses associated with maintaining or modifying homes, may make it difficult for some older adults to remain in their residences as they get older.
Owning a single-family residence may become a greater burden with age, as home maintenance becomes more challenging and keeping up with expenses becomes more difficult for some families on fixed incomes during retirement. Owning a single-family home may also become less practical, as family situations change. Some older adults find that home modifications, such as eliminating the need for stair access to the main living space, can substantially improve livability of their existing homes. For others, the process of aging in place may require difficult decisions about whether to leave one’s residence for housing alternatives that are a better fit with current and future health and social circumstances. The extent to which older people remain in their current homes because there are limited alternatives (e.g. available condominiums or other downsizing options) is not known.
Many individuals, regardless of age, could improve functionality and safety of their homes by way of home hazard assessments and installation of home modifications. However, a sizable (19%) of respondents age 60-69 need modifications but feel they cannot afford them. On Nantucket, 30%-50% of respondents in each age group indicated that their homes required modifications, such as grab bars in showers or railings on stairs, to improve their ability to live there over the next five years. A substantial share report that they need
86%
4% 2%5%
1% 2%
91%
2% 4% 2% 1%
83%
4% 1% 3%8%
1%0%
10%20%30%40%50%60%70%80%90%
100%
Single familyhome
Multi-familyhome
AccessoryApartment
Apartment,condominium,or townhome
Seniorindependent
livingcommunity
Other
Figure 18. Current residence type by age category
Age 60-69 Age 70-79 Age 80+
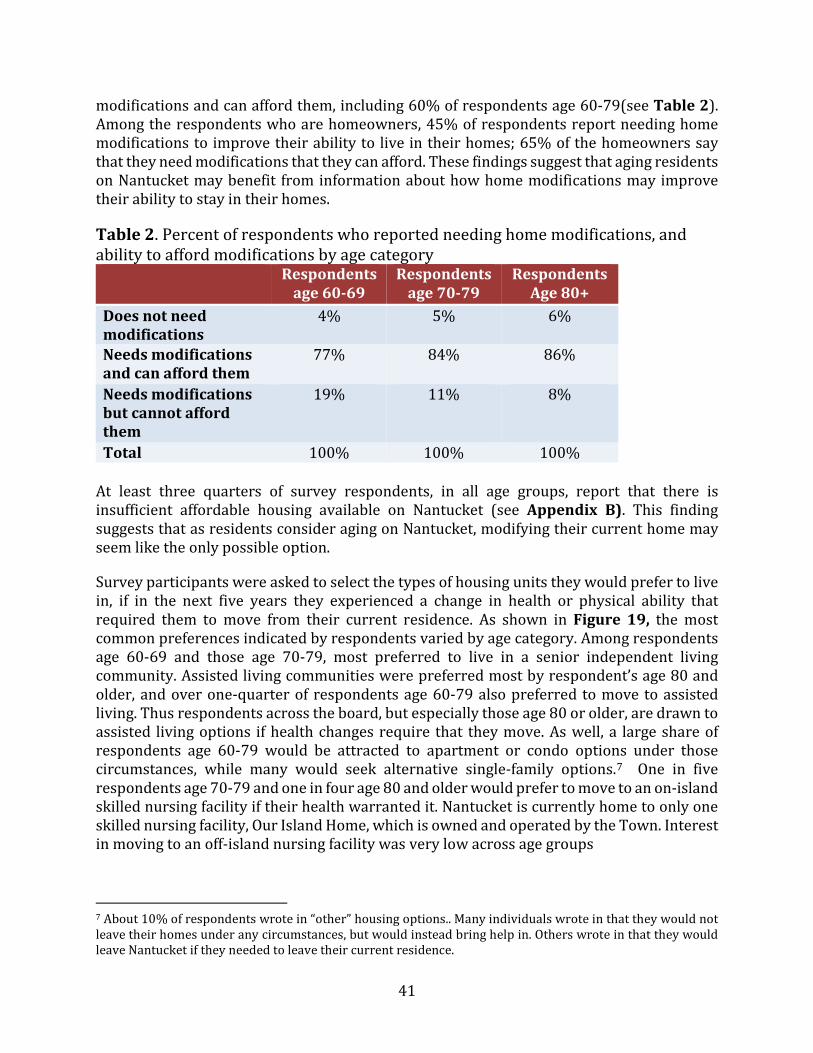
41
modifications and can afford them, including 60% of respondents age 60-79(see Table 2). Among the respondents who are homeowners, 45% of respondents report needing home modifications to improve their ability to live in their homes; 65% of the homeowners say that they need modifications that they can afford. These findings suggest that aging residents on Nantucket may benefit from information about how home modifications may improve their ability to stay in their homes.
Table 2. Percent of respondents who reported needing home modifications, and ability to afford modifications by age category
Respondents age 60-69
Respondents age 70-79
Respondents Age 80+
Does not need modifications
4% 5% 6%
Needs modifications and can afford them
77% 84% 86%
Needs modifications but cannot afford them
19% 11% 8%
Total 100% 100% 100% At least three quarters of survey respondents, in all age groups, report that there is insufficient affordable housing available on Nantucket (see Appendix B). This finding suggests that as residents consider aging on Nantucket, modifying their current home may seem like the only possible option.
Survey participants were asked to select the types of housing units they would prefer to live in, if in the next five years they experienced a change in health or physical ability that required them to move from their current residence. As shown in Figure 19, the most common preferences indicated by respondents varied by age category. Among respondents age 60-69 and those age 70-79, most preferred to live in a senior independent living community. Assisted living communities were preferred most by respondent’s age 80 and older, and over one-quarter of respondents age 60-79 also preferred to move to assisted living. Thus respondents across the board, but especially those age 80 or older, are drawn to assisted living options if health changes require that they move. As well, a large share of respondents age 60-79 would be attracted to apartment or condo options under those circumstances, while many would seek alternative single-family options.7 One in five respondents age 70-79 and one in four age 80 and older would prefer to move to an on-island skilled nursing facility if their health warranted it. Nantucket is currently home to only one skilled nursing facility, Our Island Home, which is owned and operated by the Town. Interest in moving to an off-island nursing facility was very low across age groups
7 About 10% of respondents wrote in “other” housing options.. Many individuals wrote in that they would not leave their homes under any circumstances, but would instead bring help in. Others wrote in that they would leave Nantucket if they needed to leave their current residence.
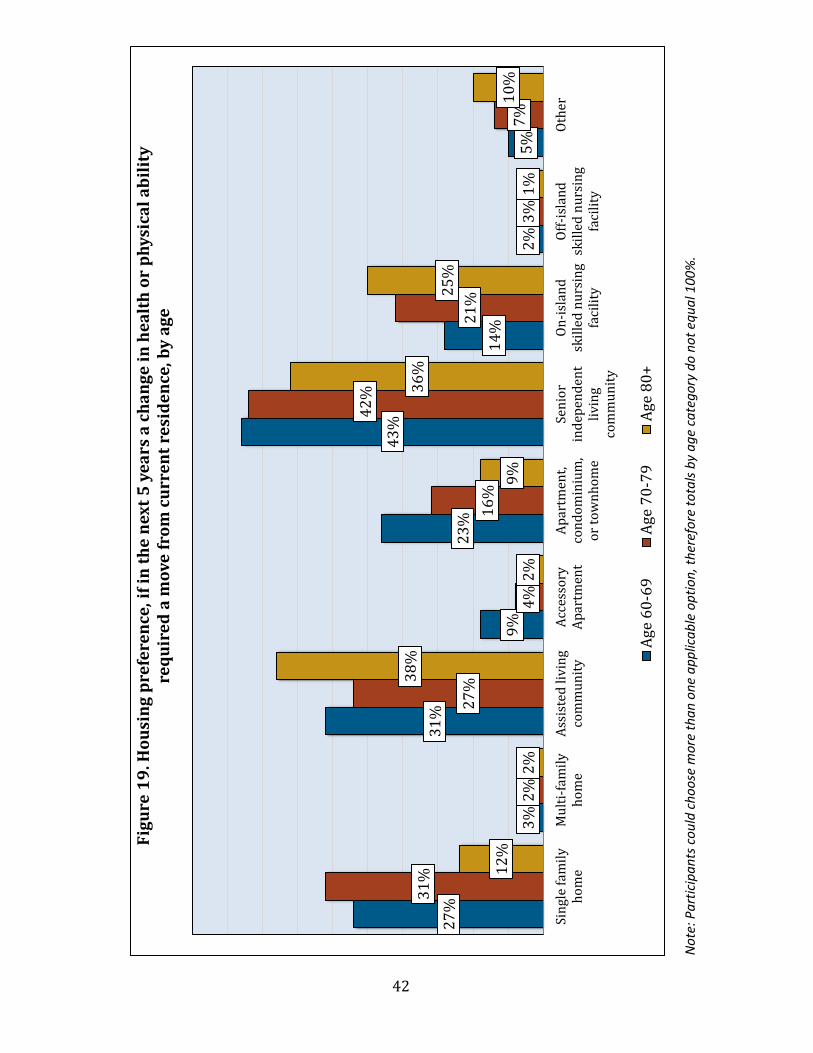
42
Not
e: P
artic
ipan
ts c
ould
cho
ose
mor
e th
an o
ne a
pplic
able
opt
ion,
ther
efor
e to
tals
by a
ge c
ateg
ory
do n
ot e
qual
100
%.
27%
3%
31%
9%
23%
43%
14%
2%5%
31%
2%
27%
4%
16%
42%
21%
3%7%
12%
2%
38%
2%9%
36%
25%
1%10
%
Sing
le fa
mily
hom
eM
ulti-
fam
ilyho
me
Assi
sted
livi
ngco
mm
unity
Acce
ssor
yAp
artm
ent
Apar
tmen
t,co
ndom
iniu
m,
or to
wnh
ome
Seni
orin
depe
nden
tliv
ing
com
mun
ity
On-is
land
skill
ed n
ursi
ngfa
cilit
y
Off-i
slan
dsk
illed
nur
sing
faci
lity
Othe
r
Figu
re 1
9. H
ousi
ng p
refe
renc
e, if
in th
e ne
xt 5
yea
rs a
cha
nge
in h
ealth
or
phys
ical
abi
lity
requ
ired
a m
ove
from
cur
rent
res
iden
ce, b
y ag
e
Age
60-6
9Ag
e 70
-79
Age
80+
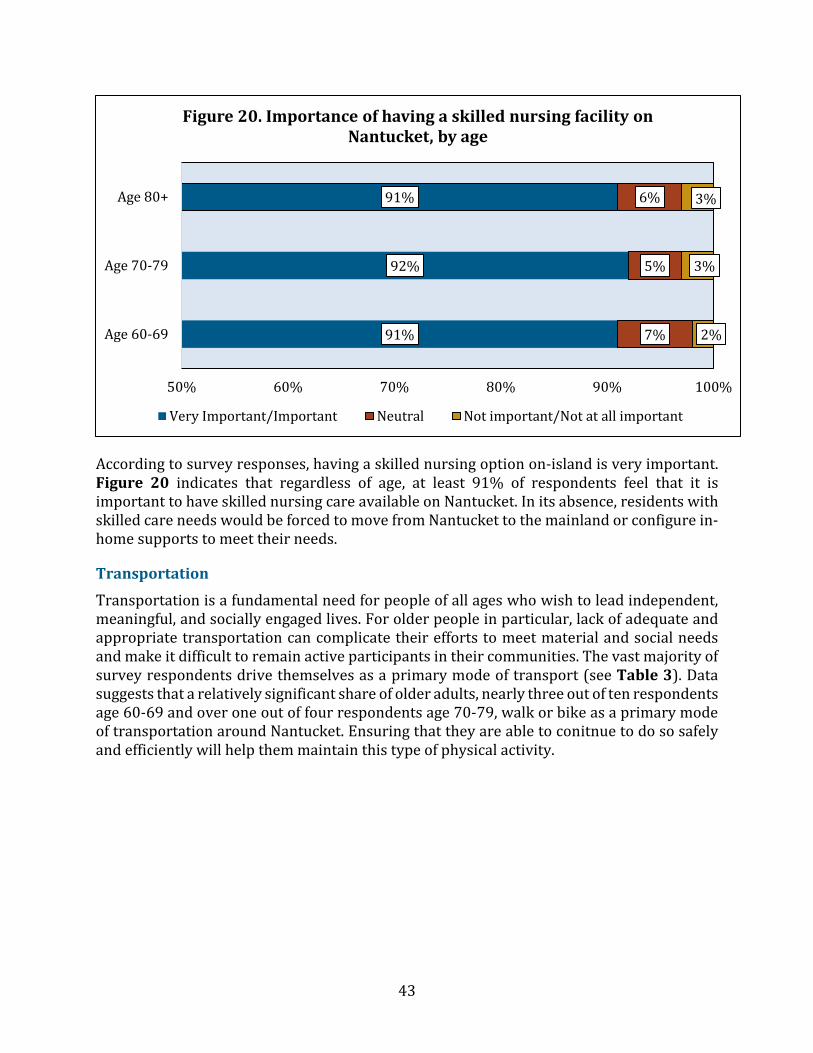
43
According to survey responses, having a skilled nursing option on-island is very important. Figure 20 indicates that regardless of age, at least 91% of respondents feel that it is important to have skilled nursing care available on Nantucket. In its absence, residents with skilled care needs would be forced to move from Nantucket to the mainland or configure in-home supports to meet their needs.
Transportation
Transportation is a fundamental need for people of all ages who wish to lead independent, meaningful, and socially engaged lives. For older people in particular, lack of adequate and appropriate transportation can complicate their efforts to meet material and social needs and make it difficult to remain active participants in their communities. The vast majority of survey respondents drive themselves as a primary mode of transport (see Table 3). Data suggests that a relatively significant share of older adults, nearly three out of ten respondents age 60-69 and over one out of four respondents age 70-79, walk or bike as a primary mode of transportation around Nantucket. Ensuring that they are able to conitnue to do so safely and efficiently will help them maintain this type of physical activity.
91%
92%
91%
7%
5%
6%
2%
3%
3%
50% 60% 70% 80% 90% 100%
Age 60-69
Age 70-79
Age 80+
Figure 20. Importance of having a skilled nursing facility on Nantucket, by age
Very Important/Important Neutral Not important/Not at all important
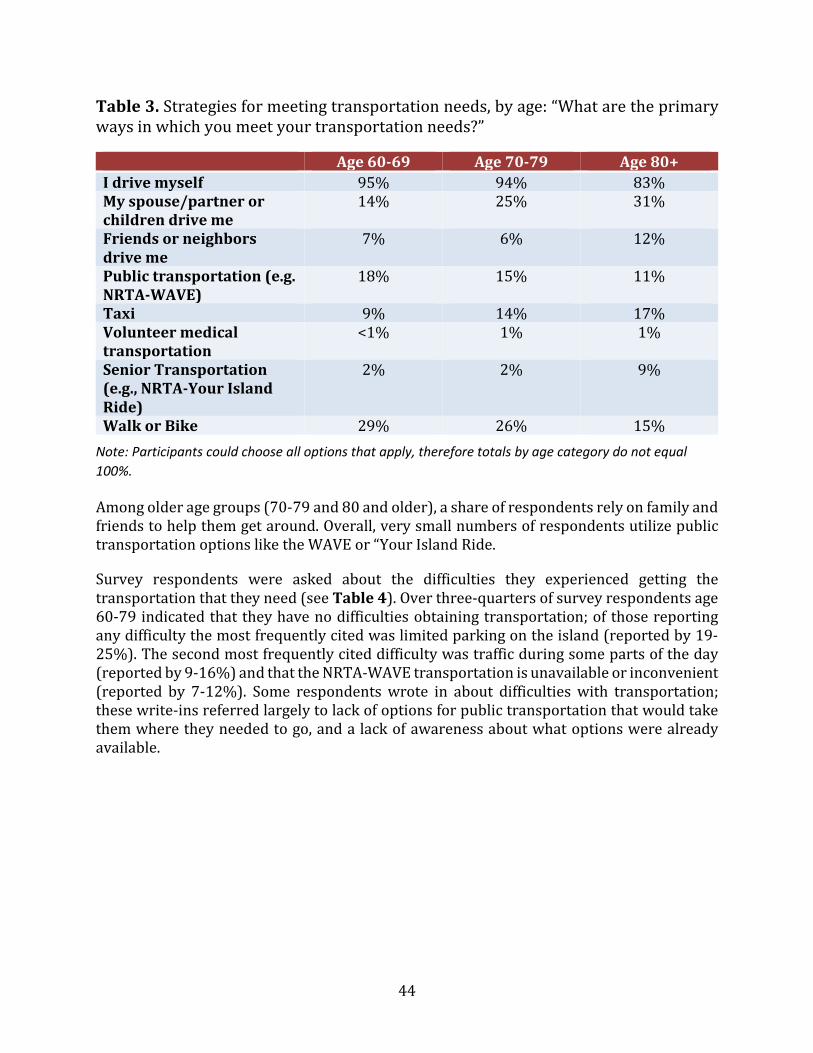
44
Table 3. Strategies for meeting transportation needs, by age: “What are the primary ways in which you meet your transportation needs?”
Age 60-69 Age 70-79 Age 80+ I drive myself 95% 94% 83% My spouse/partner or children drive me
14% 25% 31%
Friends or neighbors drive me
7% 6% 12%
Public transportation (e.g. NRTA-WAVE)
18% 15% 11%
Taxi 9% 14% 17% Volunteer medical transportation
<1% 1% 1%
Senior Transportation (e.g., NRTA-Your Island Ride)
2% 2% 9%
Walk or Bike 29% 26% 15% Note: Participants could choose all options that apply, therefore totals by age category do not equal 100%.
Among older age groups (70-79 and 80 and older), a share of respondents rely on family and friends to help them get around. Overall, very small numbers of respondents utilize public transportation options like the WAVE or “Your Island Ride.
Survey respondents were asked about the difficulties they experienced getting the transportation that they need (see Table 4). Over three-quarters of survey respondents age 60-79 indicated that they have no difficulties obtaining transportation; of those reporting any difficulty the most frequently cited was limited parking on the island (reported by 19-25%). The second most frequently cited difficulty was traffic during some parts of the day (reported by 9-16%) and that the NRTA-WAVE transportation is unavailable or inconvenient (reported by 7-12%). Some respondents wrote in about difficulties with transportation; these write-ins referred largely to lack of options for public transportation that would take them where they needed to go, and a lack of awareness about what options were already available.
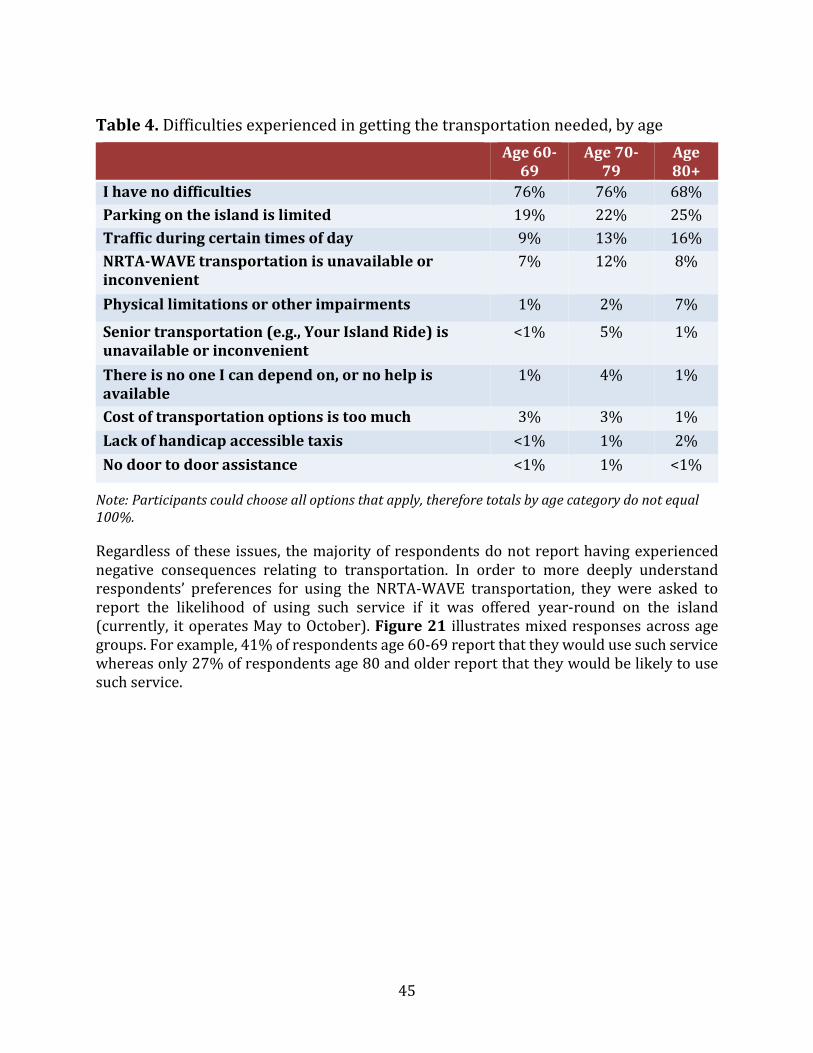
45
Table 4. Difficulties experienced in getting the transportation needed, by age
Age 60-69
Age 70-79
Age 80+
I have no difficulties 76% 76% 68% Parking on the island is limited 19% 22% 25% Traffic during certain times of day 9% 13% 16% NRTA-WAVE transportation is unavailable or inconvenient
7% 12% 8%
Physical limitations or other impairments 1% 2% 7%
Senior transportation (e.g., Your Island Ride) is unavailable or inconvenient
<1% 5% 1%
There is no one I can depend on, or no help is available
1% 4% 1%
Cost of transportation options is too much 3% 3% 1% Lack of handicap accessible taxis <1% 1% 2% No door to door assistance <1% 1% <1%
Note: Participants could choose all options that apply, therefore totals by age category do not equal 100%.
Regardless of these issues, the majority of respondents do not report having experienced negative consequences relating to transportation. In order to more deeply understand respondents’ preferences for using the NRTA-WAVE transportation, they were asked to report the likelihood of using such service if it was offered year-round on the island (currently, it operates May to October). Figure 21 illustrates mixed responses across age groups. For example, 41% of respondents age 60-69 report that they would use such service whereas only 27% of respondents age 80 and older report that they would be likely to use such service.
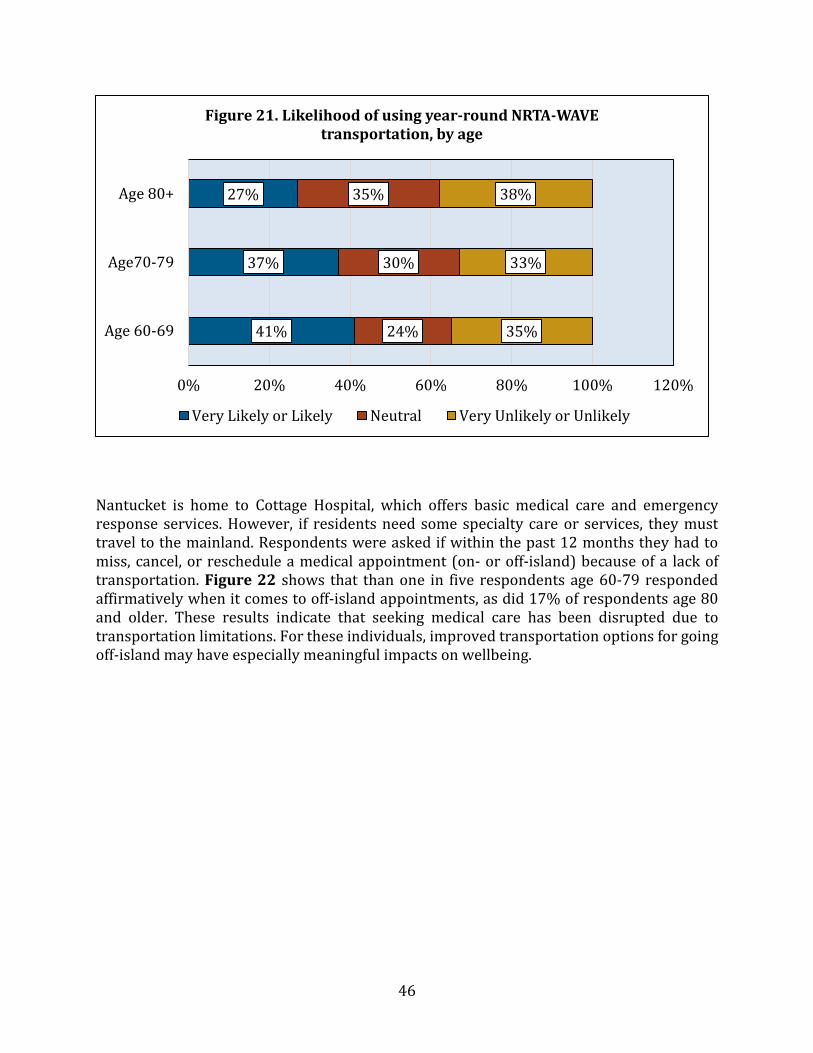
46
Nantucket is home to Cottage Hospital, which offers basic medical care and emergency response services. However, if residents need some specialty care or services, they must travel to the mainland. Respondents were asked if within the past 12 months they had to miss, cancel, or reschedule a medical appointment (on- or off-island) because of a lack of transportation. Figure 22 shows that than one in five respondents age 60-79 responded affirmatively when it comes to off-island appointments, as did 17% of respondents age 80 and older. These results indicate that seeking medical care has been disrupted due to transportation limitations. For these individuals, improved transportation options for going off-island may have especially meaningful impacts on wellbeing.
41%
37%
27%
24%
30%
35%
35%
33%
38%
0% 20% 40% 60% 80% 100% 120%
Age 60-69
Age70-79
Age 80+
Figure 21. Likelihood of using year-round NRTA-WAVE transportation, by age
Very Likely or Likely Neutral Very Unlikely or Unlikely
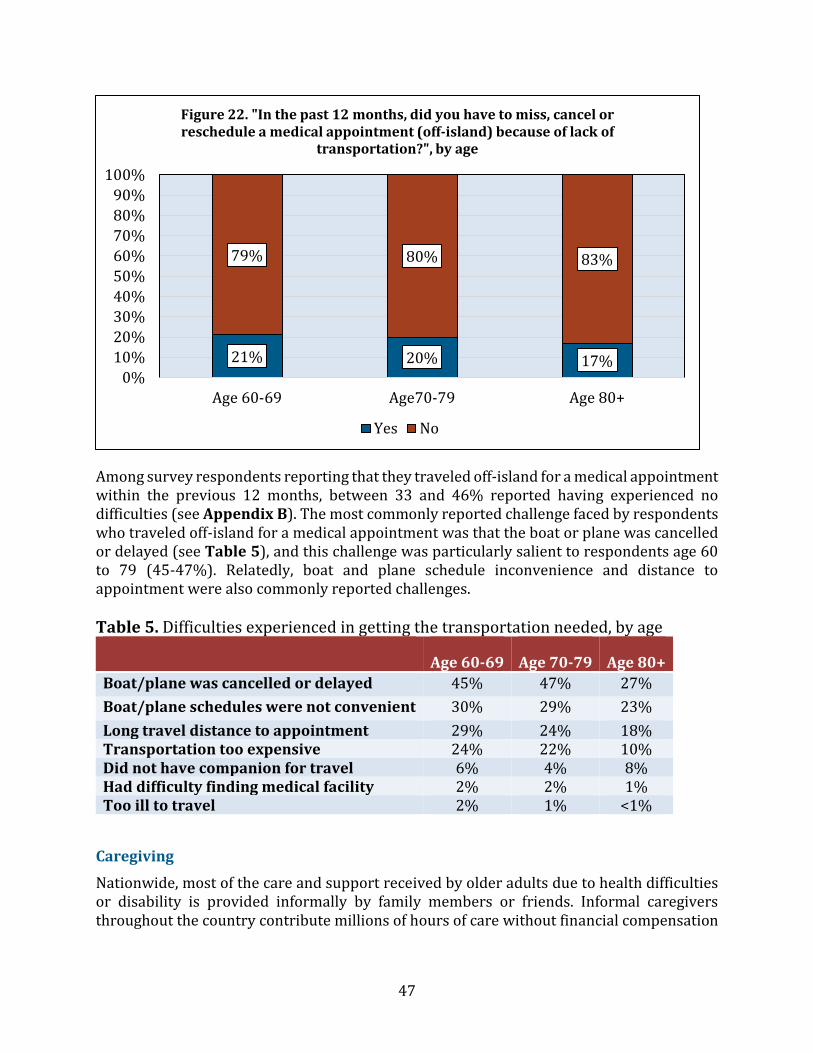
47
Among survey respondents reporting that they traveled off-island for a medical appointment within the previous 12 months, between 33 and 46% reported having experienced no difficulties (see Appendix B). The most commonly reported challenge faced by respondents who traveled off-island for a medical appointment was that the boat or plane was cancelled or delayed (see Table 5), and this challenge was particularly salient to respondents age 60 to 79 (45-47%). Relatedly, boat and plane schedule inconvenience and distance to appointment were also commonly reported challenges. Table 5. Difficulties experienced in getting the transportation needed, by age
Age 60-69 Age 70-79 Age 80+ Boat/plane was cancelled or delayed 45% 47% 27% Boat/plane schedules were not convenient 30% 29% 23% Long travel distance to appointment 29% 24% 18% Transportation too expensive 24% 22% 10% Did not have companion for travel 6% 4% 8% Had difficulty finding medical facility 2% 2% 1% Too ill to travel 2% 1% <1%
Caregiving
Nationwide, most of the care and support received by older adults due to health difficulties or disability is provided informally by family members or friends. Informal caregivers throughout the country contribute millions of hours of care without financial compensation
21% 20% 17%
79% 80% 83%
0%10%20%30%40%50%60%70%80%90%
100%
Age 60-69 Age70-79 Age 80+
Figure 22. "In the past 12 months, did you have to miss, cancel or reschedule a medical appointment (off-island) because of lack of
transportation?", by age
Yes No
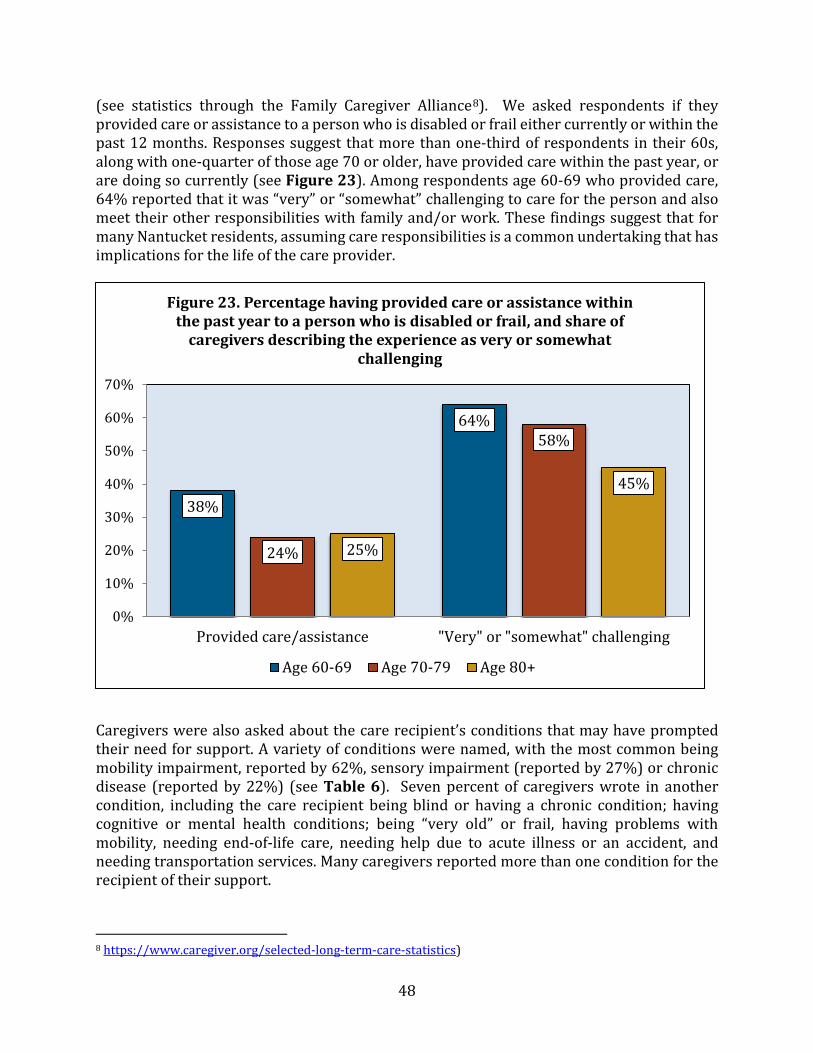
48
(see statistics through the Family Caregiver Alliance8). We asked respondents if they provided care or assistance to a person who is disabled or frail either currently or within the past 12 months. Responses suggest that more than one-third of respondents in their 60s, along with one-quarter of those age 70 or older, have provided care within the past year, or are doing so currently (see Figure 23). Among respondents age 60-69 who provided care, 64% reported that it was “very” or “somewhat” challenging to care for the person and also meet their other responsibilities with family and/or work. These findings suggest that for many Nantucket residents, assuming care responsibilities is a common undertaking that has implications for the life of the care provider.
Caregivers were also asked about the care recipient’s conditions that may have prompted their need for support. A variety of conditions were named, with the most common being mobility impairment, reported by 62%, sensory impairment (reported by 27%) or chronic disease (reported by 22%) (see Table 6). Seven percent of caregivers wrote in another condition, including the care recipient being blind or having a chronic condition; having cognitive or mental health conditions; being “very old” or frail, having problems with mobility, needing end-of-life care, needing help due to acute illness or an accident, and needing transportation services. Many caregivers reported more than one condition for the recipient of their support.
8 https://www.caregiver.org/selected-long-term-care-statistics)
38%
64%
24%
58%
25%
45%
0%
10%
20%
30%
40%
50%
60%
70%
Provided care/assistance "Very" or "somewhat" challenging
Figure 23. Percentage having provided care or assistance within the past year to a person who is disabled or frail, and share of
caregivers describing the experience as very or somewhat challenging
Age 60-69 Age 70-79 Age 80+
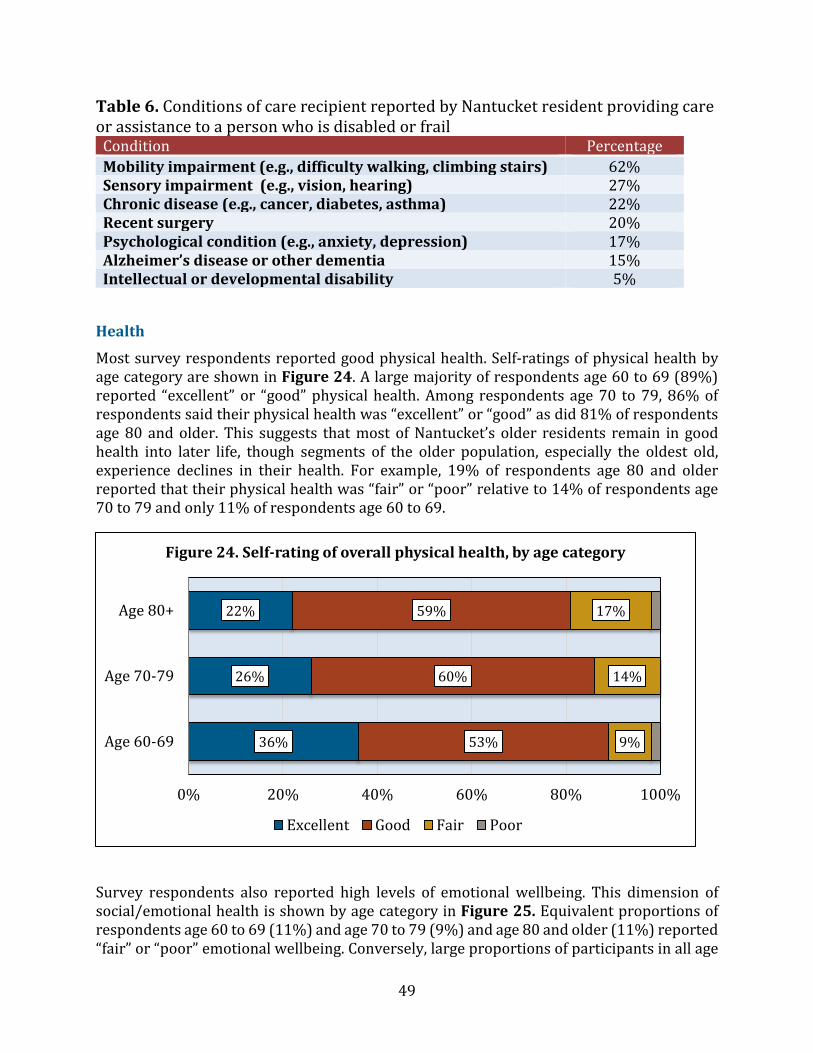
49
Table 6. Conditions of care recipient reported by Nantucket resident providing care or assistance to a person who is disabled or frail
Condition Percentage Mobility impairment (e.g., difficulty walking, climbing stairs) 62% Sensory impairment (e.g., vision, hearing) 27% Chronic disease (e.g., cancer, diabetes, asthma) 22% Recent surgery 20% Psychological condition (e.g., anxiety, depression) 17% Alzheimer’s disease or other dementia 15% Intellectual or developmental disability 5%
Health
Most survey respondents reported good physical health. Self-ratings of physical health by age category are shown in Figure 24. A large majority of respondents age 60 to 69 (89%) reported “excellent” or “good” physical health. Among respondents age 70 to 79, 86% of respondents said their physical health was “excellent” or “good” as did 81% of respondents age 80 and older. This suggests that most of Nantucket’s older residents remain in good health into later life, though segments of the older population, especially the oldest old, experience declines in their health. For example, 19% of respondents age 80 and older reported that their physical health was “fair” or “poor” relative to 14% of respondents age 70 to 79 and only 11% of respondents age 60 to 69.
Survey respondents also reported high levels of emotional wellbeing. This dimension of social/emotional health is shown by age category in Figure 25. Equivalent proportions of respondents age 60 to 69 (11%) and age 70 to 79 (9%) and age 80 and older (11%) reported “fair” or “poor” emotional wellbeing. Conversely, large proportions of participants in all age
36%
26%
22%
53%
60%
59%
9%
14%
17%
0% 20% 40% 60% 80% 100%
Age 60-69
Age 70-79
Age 80+
Figure 24. Self-rating of overall physical health, by age category
Excellent Good Fair Poor

50
categories rated their social and emotional health as “excellent” or “good”, including 89% of the youngest respondents, 91% of respondents age 70 to 79, and 89% of respondents who are age 80 and older.
Health status may impact an individual’s ability to participate in community activities; as well, people struggling with health deficits or some types of disability may need assistance with activities in and around the home. Figure 26 shows percentages of respondents in each age category who indicated that health required them to seek help with household activities (such as doing routine chores like cleaning or yard work), and with daily activities outside the home (such as grocery shopping or picking up prescriptions) or with personal care activities (such as taking a shower or getting dressed). Needing help with these sorts of daily living activities was much more common among residents who are 80 and older. More than one-third of respondents in the oldest age category required assistance with activities around the house; 20% required assistance with daily activities and 7% with personal care.
42%38%
36%
47%
53% 53%
11% 9% 11%
0%
10%
20%
30%
40%
50%
60%
Age 60-69 Age 70-79 Age 80+
Figure 25. Self-ratings of emotional wellbeing by age
Excellent Good Fair or poor
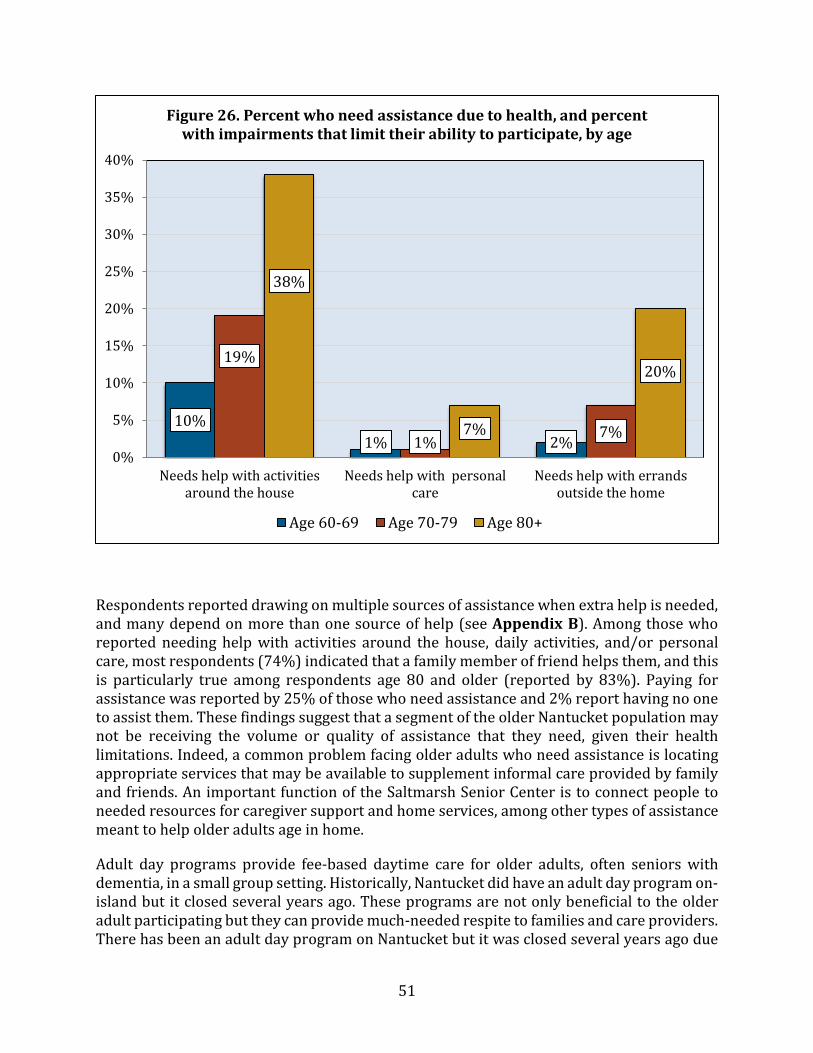
51
Respondents reported drawing on multiple sources of assistance when extra help is needed, and many depend on more than one source of help (see Appendix B). Among those who reported needing help with activities around the house, daily activities, and/or personal care, most respondents (74%) indicated that a family member of friend helps them, and this is particularly true among respondents age 80 and older (reported by 83%). Paying for assistance was reported by 25% of those who need assistance and 2% report having no one to assist them. These findings suggest that a segment of the older Nantucket population may not be receiving the volume or quality of assistance that they need, given their health limitations. Indeed, a common problem facing older adults who need assistance is locating appropriate services that may be available to supplement informal care provided by family and friends. An important function of the Saltmarsh Senior Center is to connect people to needed resources for caregiver support and home services, among other types of assistance meant to help older adults age in home.
Adult day programs provide fee-based daytime care for older adults, often seniors with dementia, in a small group setting. Historically, Nantucket did have an adult day program on-island but it closed several years ago. These programs are not only beneficial to the older adult participating but they can provide much-needed respite to families and care providers. There has been an adult day program on Nantucket but it was closed several years ago due
10%1% 2%
19%
1%7%
38%
7%
20%
0%
5%
10%
15%
20%
25%
30%
35%
40%
Needs help with activitiesaround the house
Needs help with personalcare
Needs help with errandsoutside the home
Figure 26. Percent who need assistance due to health, and percent with impairments that limit their ability to participate, by age
Age 60-69 Age 70-79 Age 80+
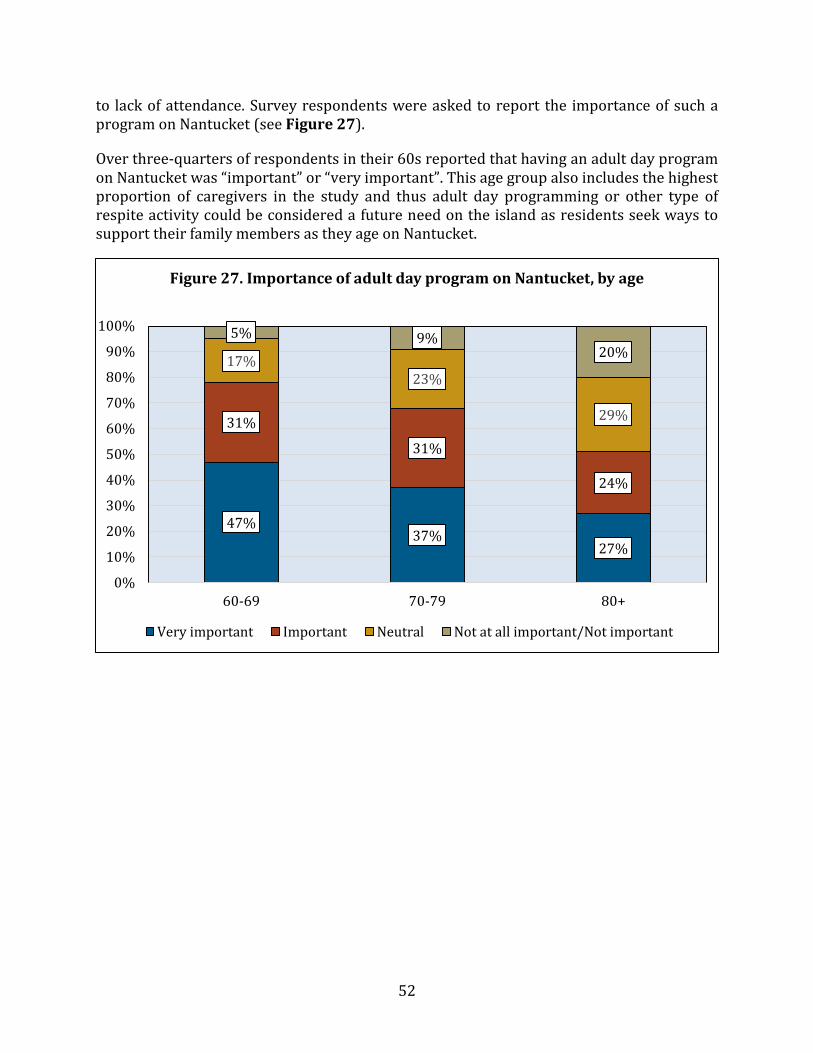
52
to lack of attendance. Survey respondents were asked to report the importance of such a program on Nantucket (see Figure 27).
Over three-quarters of respondents in their 60s reported that having an adult day program on Nantucket was “important” or “very important”. This age group also includes the highest proportion of caregivers in the study and thus adult day programming or other type of respite activity could be considered a future need on the island as residents seek ways to support their family members as they age on Nantucket.
47%37%
27%
31%
31%
24%
17%23%
29%
5% 9%20%
0%
10%
20%
30%
40%
50%
60%
70%
80%
90%
100%
60-69 70-79 80+
Figure 27. Importance of adult day program on Nantucket, by age
Very important Important Neutral Not at all important/Not important
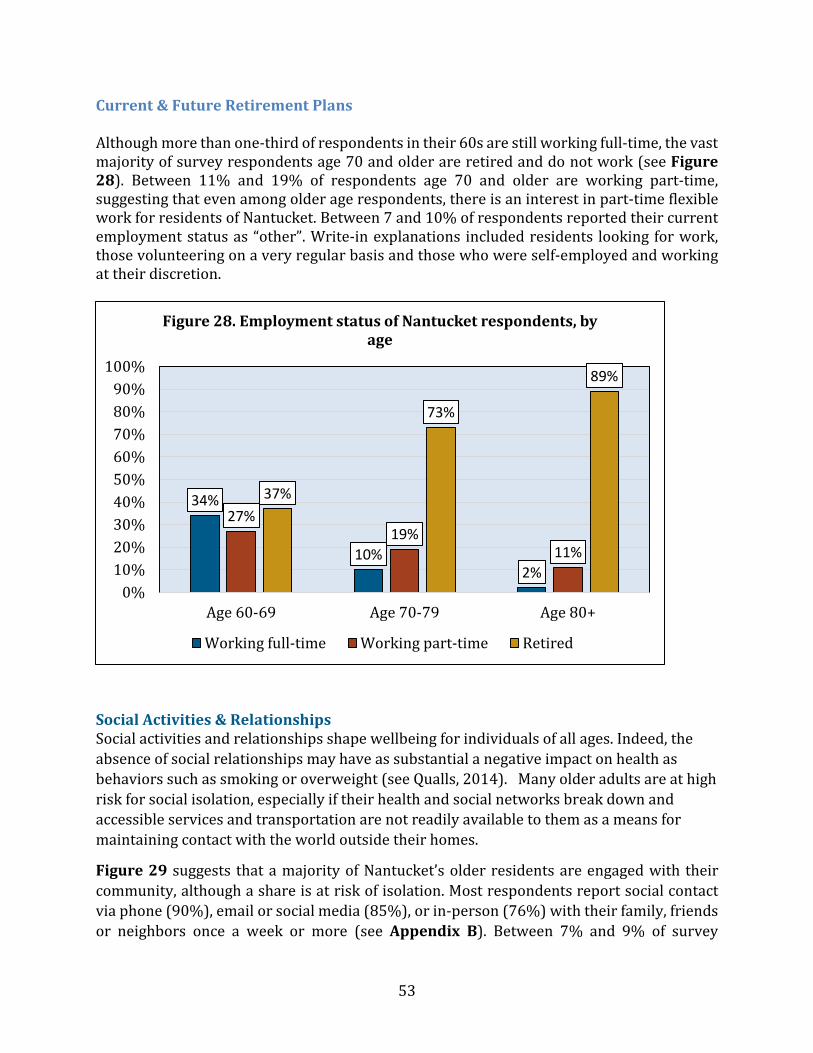
53
Current & Future Retirement Plans Although more than one-third of respondents in their 60s are still working full-time, the vast majority of survey respondents age 70 and older are retired and do not work (see Figure 28). Between 11% and 19% of respondents age 70 and older are working part-time, suggesting that even among older age respondents, there is an interest in part-time flexible work for residents of Nantucket. Between 7 and 10% of respondents reported their current employment status as “other”. Write-in explanations included residents looking for work, those volunteering on a very regular basis and those who were self-employed and working at their discretion.
Social Activities & Relationships Social activities and relationships shape wellbeing for individuals of all ages. Indeed, the absence of social relationships may have as substantial a negative impact on health as behaviors such as smoking or overweight (see Qualls, 2014). Many older adults are at high risk for social isolation, especially if their health and social networks break down and accessible services and transportation are not readily available to them as a means for maintaining contact with the world outside their homes.
Figure 29 suggests that a majority of Nantucket’s older residents are engaged with their community, although a share is at risk of isolation. Most respondents report social contact via phone (90%), email or social media (85%), or in-person (76%) with their family, friends or neighbors once a week or more (see Appendix B). Between 7% and 9% of survey
34%
10%2%
27%19%
11%
37%
73%
89%
0%10%20%30%40%50%60%70%80%90%
100%
Age 60-69 Age 70-79 Age 80+
Figure 28. Employment status of Nantucket respondents, by age
Working full-time Working part-time Retired
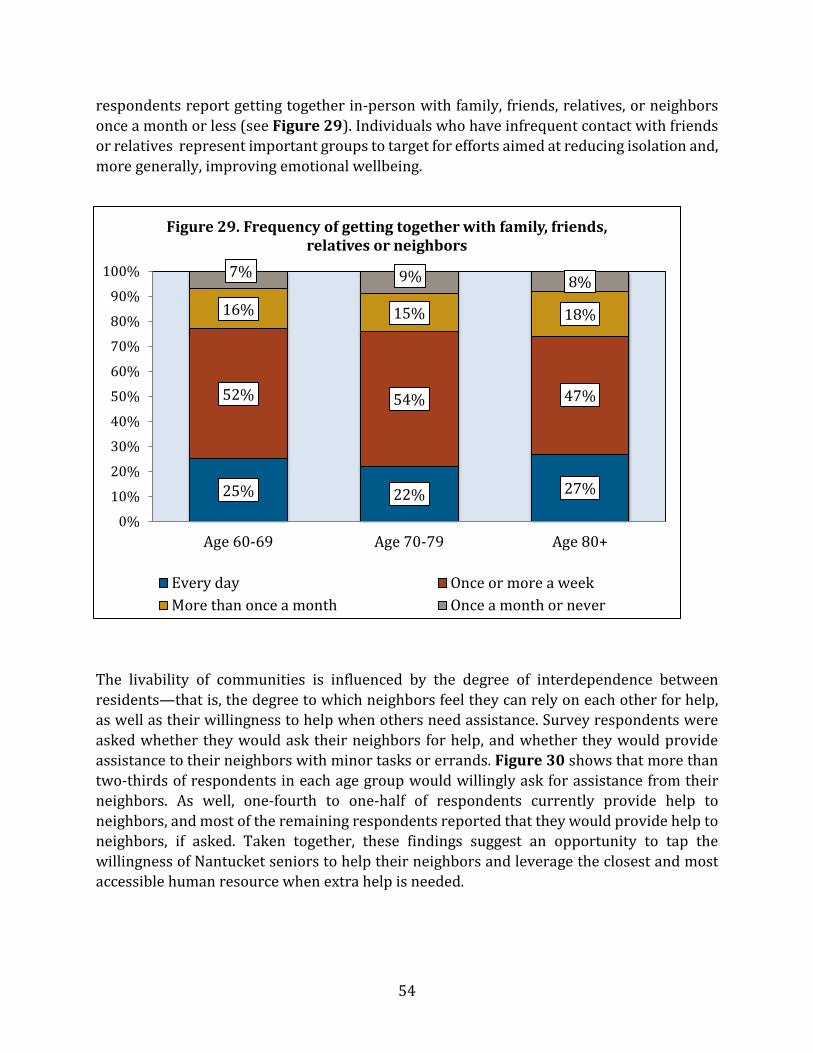
54
respondents report getting together in-person with family, friends, relatives, or neighbors once a month or less (see Figure 29). Individuals who have infrequent contact with friends or relatives represent important groups to target for efforts aimed at reducing isolation and, more generally, improving emotional wellbeing.
The livability of communities is influenced by the degree of interdependence between residents—that is, the degree to which neighbors feel they can rely on each other for help, as well as their willingness to help when others need assistance. Survey respondents were asked whether they would ask their neighbors for help, and whether they would provide assistance to their neighbors with minor tasks or errands. Figure 30 shows that more than two-thirds of respondents in each age group would willingly ask for assistance from their neighbors. As well, one-fourth to one-half of respondents currently provide help to neighbors, and most of the remaining respondents reported that they would provide help to neighbors, if asked. Taken together, these findings suggest an opportunity to tap the willingness of Nantucket seniors to help their neighbors and leverage the closest and most accessible human resource when extra help is needed.
25% 22% 27%
52% 54% 47%
16% 15% 18%
7% 9% 8%
0%
10%
20%
30%
40%
50%
60%
70%
80%
90%
100%
Age 60-69 Age 70-79 Age 80+
Figure 29. Frequency of getting together with family, friends, relatives or neighbors
Every day Once or more a weekMore than once a month Once a month or never
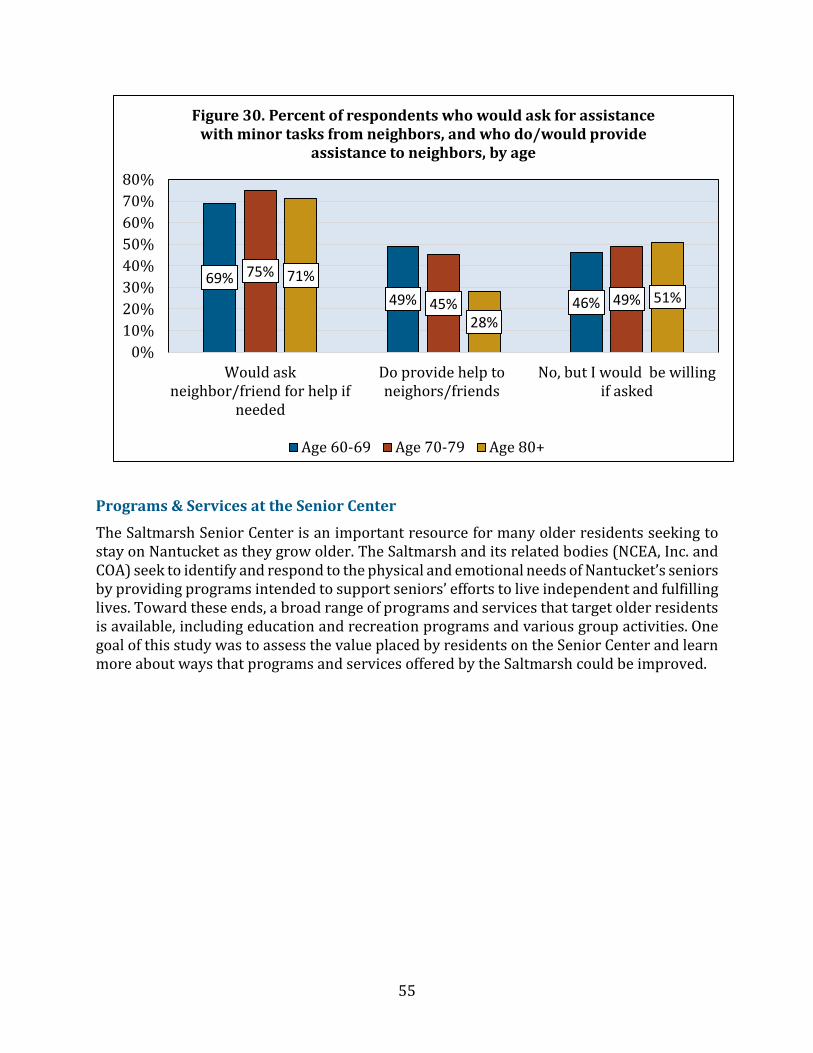
55
Programs & Services at the Senior Center
The Saltmarsh Senior Center is an important resource for many older residents seeking to stay on Nantucket as they grow older. The Saltmarsh and its related bodies (NCEA, Inc. and COA) seek to identify and respond to the physical and emotional needs of Nantucket’s seniors by providing programs intended to support seniors’ efforts to live independent and fulfilling lives. Toward these ends, a broad range of programs and services that target older residents is available, including education and recreation programs and various group activities. One goal of this study was to assess the value placed by residents on the Senior Center and learn more about ways that programs and services offered by the Saltmarsh could be improved.
69%49% 46%
75%
45% 49%71%
28%51%
0%10%20%30%40%50%60%70%80%
Would askneighbor/friend for help if
needed
Do provide help toneighors/friends
No, but I would be willingif asked
Figure 30. Percent of respondents who would ask for assistance with minor tasks from neighbors, and who do/would provide
assistance to neighbors, by age
Age 60-69 Age 70-79 Age 80+
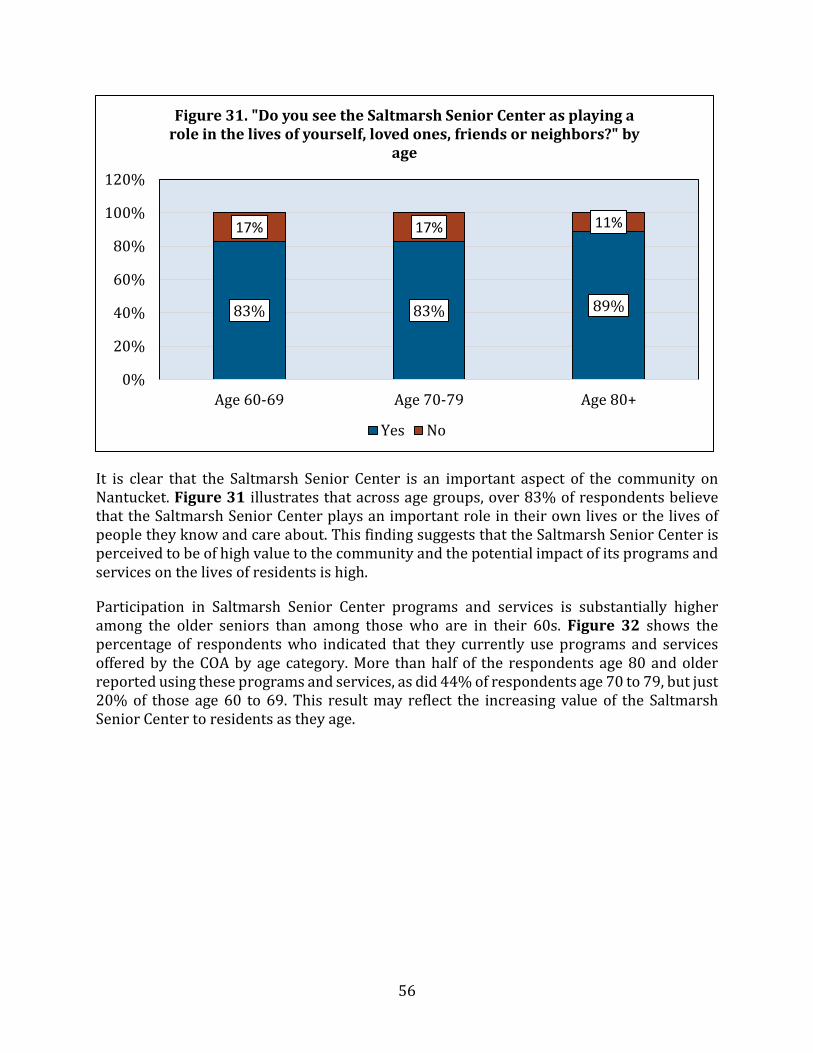
56
It is clear that the Saltmarsh Senior Center is an important aspect of the community on Nantucket. Figure 31 illustrates that across age groups, over 83% of respondents believe that the Saltmarsh Senior Center plays an important role in their own lives or the lives of people they know and care about. This finding suggests that the Saltmarsh Senior Center is perceived to be of high value to the community and the potential impact of its programs and services on the lives of residents is high.
Participation in Saltmarsh Senior Center programs and services is substantially higher among the older seniors than among those who are in their 60s. Figure 32 shows the percentage of respondents who indicated that they currently use programs and services offered by the COA by age category. More than half of the respondents age 80 and older reported using these programs and services, as did 44% of respondents age 70 to 79, but just 20% of those age 60 to 69. This result may reflect the increasing value of the Saltmarsh Senior Center to residents as they age.
83% 83% 89%
17% 17% 11%
0%
20%
40%
60%
80%
100%
120%
Age 60-69 Age 70-79 Age 80+
Figure 31. "Do you see the Saltmarsh Senior Center as playing a role in the lives of yourself, loved ones, friends or neighbors?" by
age
Yes No
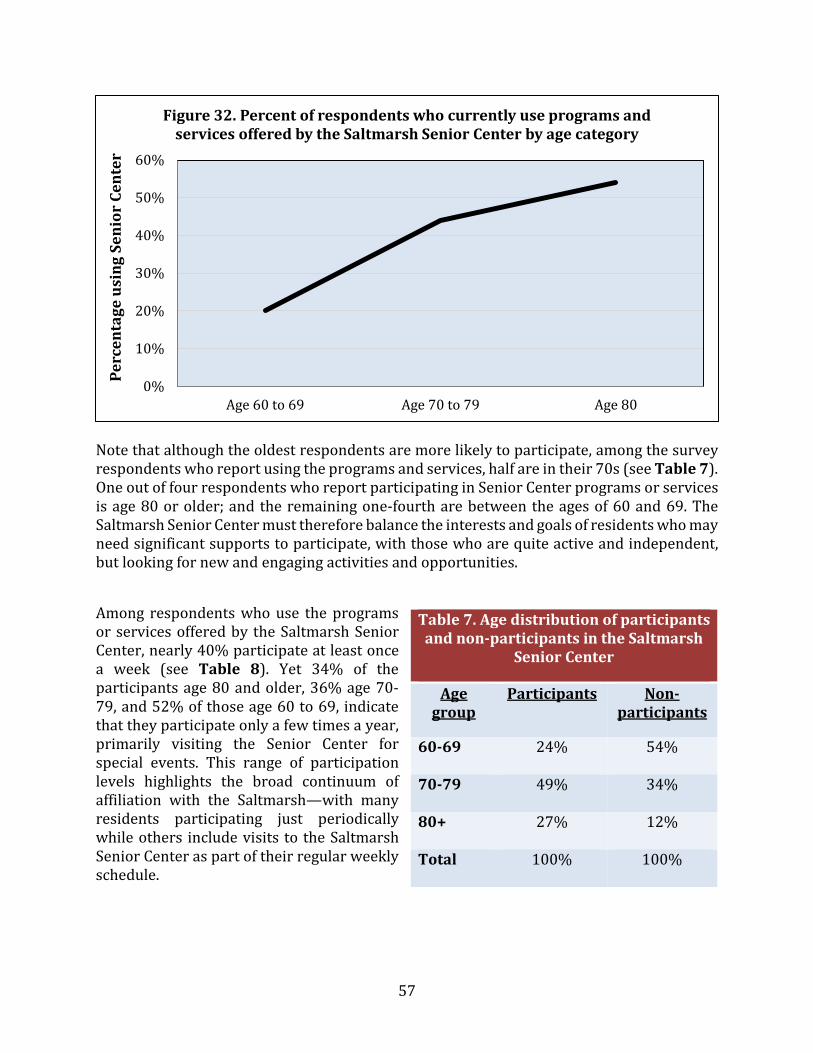
57
Note that although the oldest respondents are more likely to participate, among the survey respondents who report using the programs and services, half are in their 70s (see Table 7). One out of four respondents who report participating in Senior Center programs or services is age 80 or older; and the remaining one-fourth are between the ages of 60 and 69. The Saltmarsh Senior Center must therefore balance the interests and goals of residents who may need significant supports to participate, with those who are quite active and independent, but looking for new and engaging activities and opportunities.
Among respondents who use the programs or services offered by the Saltmarsh Senior Center, nearly 40% participate at least once a week (see Table 8). Yet 34% of the participants age 80 and older, 36% age 70-79, and 52% of those age 60 to 69, indicate that they participate only a few times a year, primarily visiting the Senior Center for special events. This range of participation levels highlights the broad continuum of affiliation with the Saltmarsh—with many residents participating just periodically while others include visits to the Saltmarsh Senior Center as part of their regular weekly schedule.
0%
10%
20%
30%
40%
50%
60%
Age 60 to 69 Age 70 to 79 Age 80
Perc
enta
ge u
sing
Sen
ior
Cent
erFigure 32. Percent of respondents who currently use programs and
services offered by the Saltmarsh Senior Center by age category
Table 7. Age distribution of participants and non-participants in the Saltmarsh
Senior Center
Age group
Participants Non-participants
60-69 24% 54%
70-79 49% 34%
80+ 27% 12%
Total 100% 100%
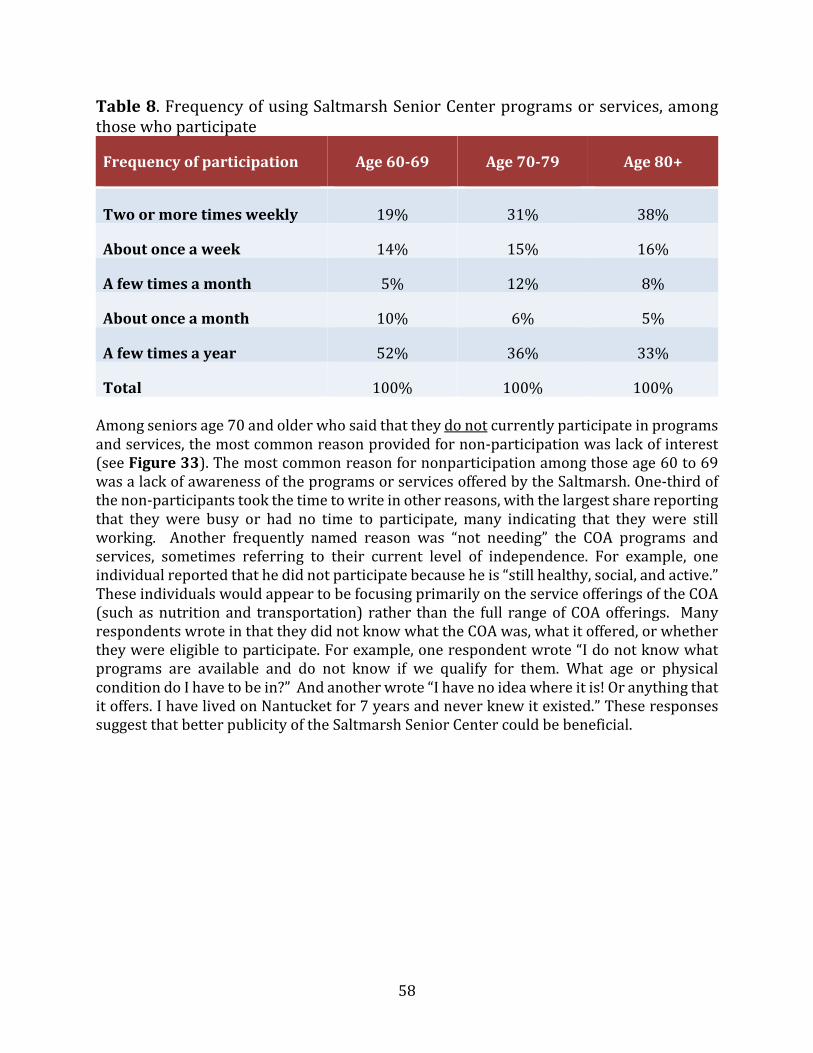
58
Table 8. Frequency of using Saltmarsh Senior Center programs or services, among those who participate
Frequency of participation Age 60-69 Age 70-79 Age 80+
Two or more times weekly 19% 31% 38%
About once a week 14% 15% 16%
A few times a month 5% 12% 8%
About once a month 10% 6% 5%
A few times a year 52% 36% 33%
Total 100% 100% 100% Among seniors age 70 and older who said that they do not currently participate in programs and services, the most common reason provided for non-participation was lack of interest (see Figure 33). The most common reason for nonparticipation among those age 60 to 69 was a lack of awareness of the programs or services offered by the Saltmarsh. One-third of the non-participants took the time to write in other reasons, with the largest share reporting that they were busy or had no time to participate, many indicating that they were still working. Another frequently named reason was “not needing” the COA programs and services, sometimes referring to their current level of independence. For example, one individual reported that he did not participate because he is “still healthy, social, and active.” These individuals would appear to be focusing primarily on the service offerings of the COA (such as nutrition and transportation) rather than the full range of COA offerings. Many respondents wrote in that they did not know what the COA was, what it offered, or whether they were eligible to participate. For example, one respondent wrote “I do not know what programs are available and do not know if we qualify for them. What age or physical condition do I have to be in?” And another wrote “I have no idea where it is! Or anything that it offers. I have lived on Nantucket for 7 years and never knew it existed.” These responses suggest that better publicity of the Saltmarsh Senior Center could be beneficial.
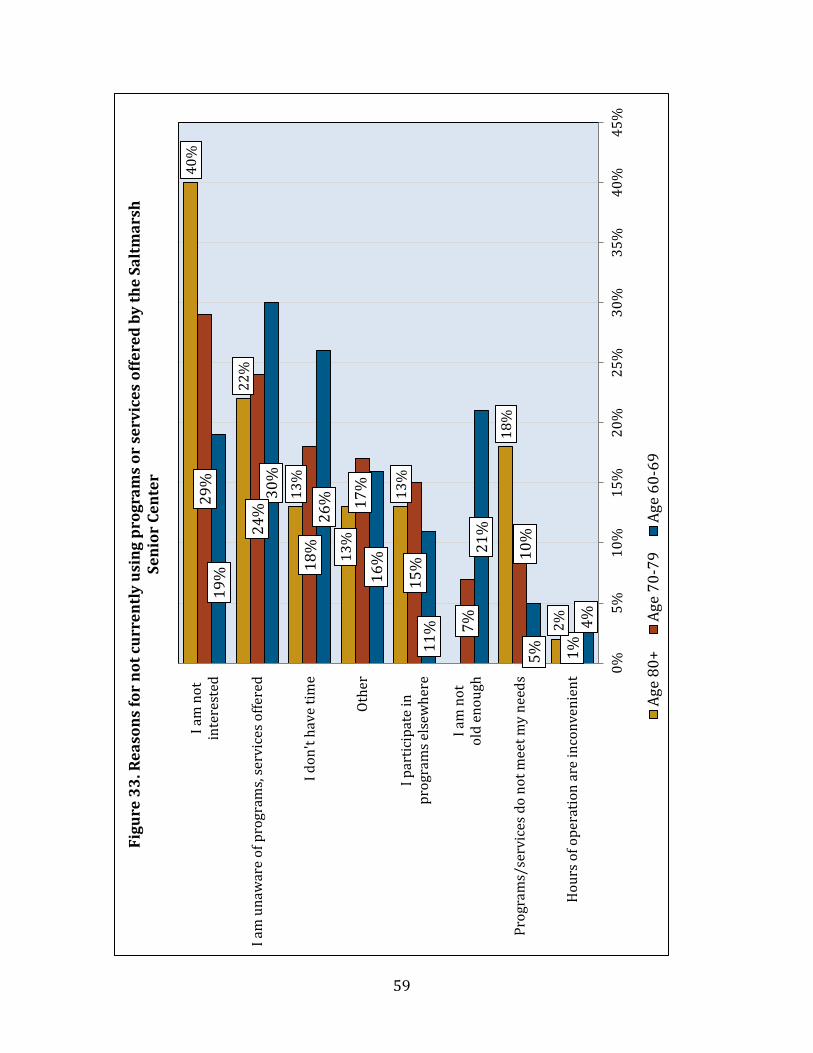
59
4%
5%
21%
11%
16%
26%30
%
19%
1%
10%
7%
15%
17%
18%
24%
29%
2%
18%
13%
13%
13%
22%
40%
0%5%
10%
15%
20%
25%
30%
35%
40%
45%
Hou
rs o
f ope
ratio
n ar
e in
conv
enie
nt
Prog
ram
s/se
rvic
es d
o no
t mee
t my
need
s
I am
not
old
enou
gh
I par
ticip
ate
inpr
ogra
ms e
lsew
here
Othe
r
I don
't ha
ve ti
me
I am
una
war
e of
pro
gram
s, se
rvic
es o
ffere
d
I am
not
inte
rest
ed
Figu
re 3
3. R
easo
ns fo
r no
t cur
rent
ly u
sing
pro
gram
s or
ser
vice
s of
fere
d by
the
Salt
mar
sh
Seni
or C
ente
r
Age
80+
Age
70-7
9Ag
e 60
-69
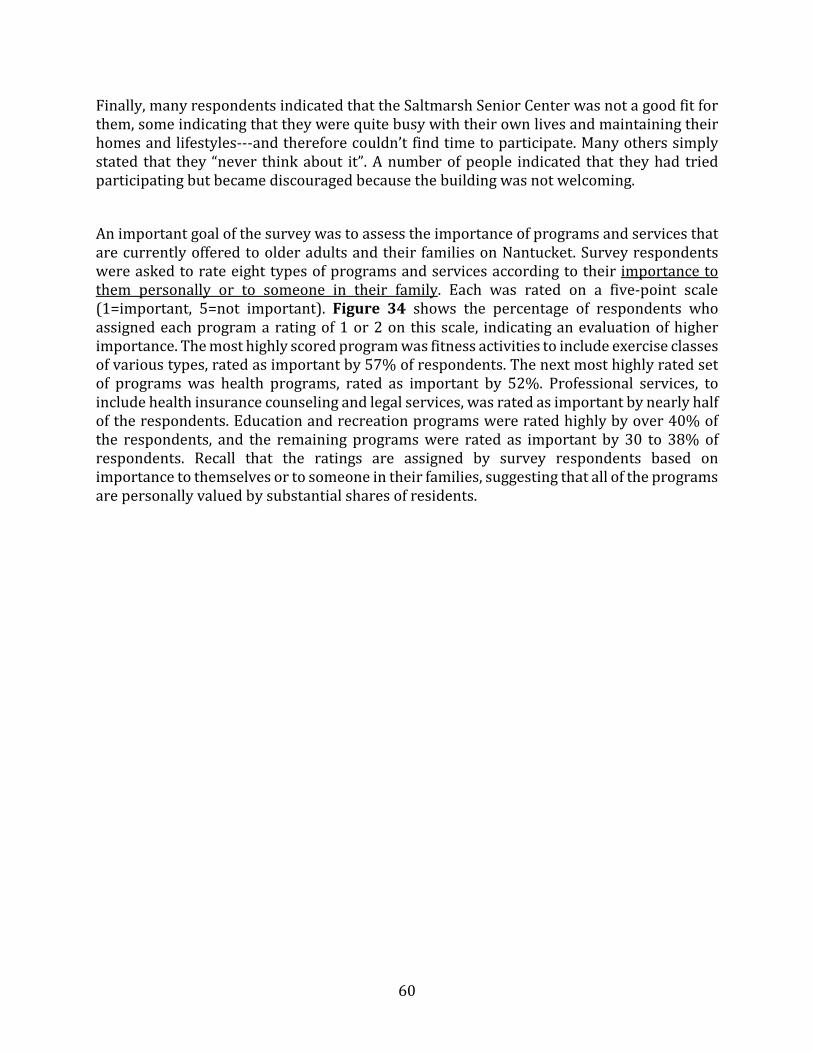
60
Finally, many respondents indicated that the Saltmarsh Senior Center was not a good fit for them, some indicating that they were quite busy with their own lives and maintaining their homes and lifestyles---and therefore couldn’t find time to participate. Many others simply stated that they “never think about it”. A number of people indicated that they had tried participating but became discouraged because the building was not welcoming.
An important goal of the survey was to assess the importance of programs and services that are currently offered to older adults and their families on Nantucket. Survey respondents were asked to rate eight types of programs and services according to their importance to them personally or to someone in their family. Each was rated on a five-point scale (1=important, 5=not important). Figure 34 shows the percentage of respondents who assigned each program a rating of 1 or 2 on this scale, indicating an evaluation of higher importance. The most highly scored program was fitness activities to include exercise classes of various types, rated as important by 57% of respondents. The next most highly rated set of programs was health programs, rated as important by 52%. Professional services, to include health insurance counseling and legal services, was rated as important by nearly half of the respondents. Education and recreation programs were rated highly by over 40% of the respondents, and the remaining programs were rated as important by 30 to 38% of respondents. Recall that the ratings are assigned by survey respondents based on importance to themselves or to someone in their families, suggesting that all of the programs are personally valued by substantial shares of residents.
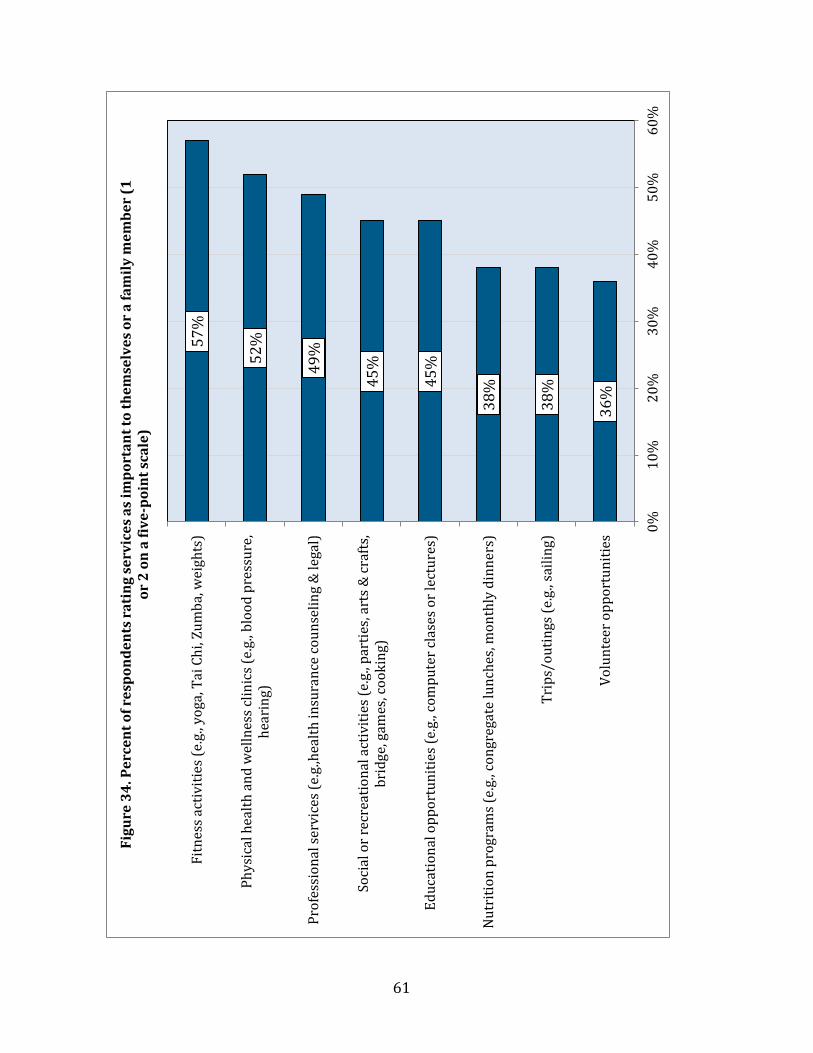
61
36%
38%
38%45
%
45%49
%52%57
%
0%10
%20
%30
%40
%50
%60
%
Volu
ntee
r opp
ortu
nitie
s
Trip
s/ou
tings
(e.g
., sai
ling)
Nut
ritio
n pr
ogra
ms (
e.g.
, con
greg
ate
lunc
hes,
mon
thly
din
ners
)
Educ
atio
nal o
ppor
tuni
ties (
e.g.
, com
pute
r cla
ses o
r lec
ture
s)
Soci
al o
r rec
reat
iona
l act
iviti
es (e
.g., p
artie
s, ar
ts &
craf
ts,
brid
ge, g
ames
, coo
king
)
Prof
essi
onal
serv
ices
(e.g
.,hea
lth in
sura
nce
coun
selin
g &
lega
l)
Phys
ical
hea
lth a
nd w
elln
ess c
linic
s (e.
g., b
lood
pre
ssur
e,he
arin
g)
Fitn
ess a
ctiv
ities
(e.g
., yog
a, T
ai C
hi, Z
umba
, wei
ghts
)
Figu
re 3
4. P
erce
nt o
f res
pond
ents
rati
ng se
rvic
es a
s im
port
ant t
o th
emse
lves
or
a fa
mily
mem
ber (
1 or
2 o
n a
five-
poin
t sca
le)
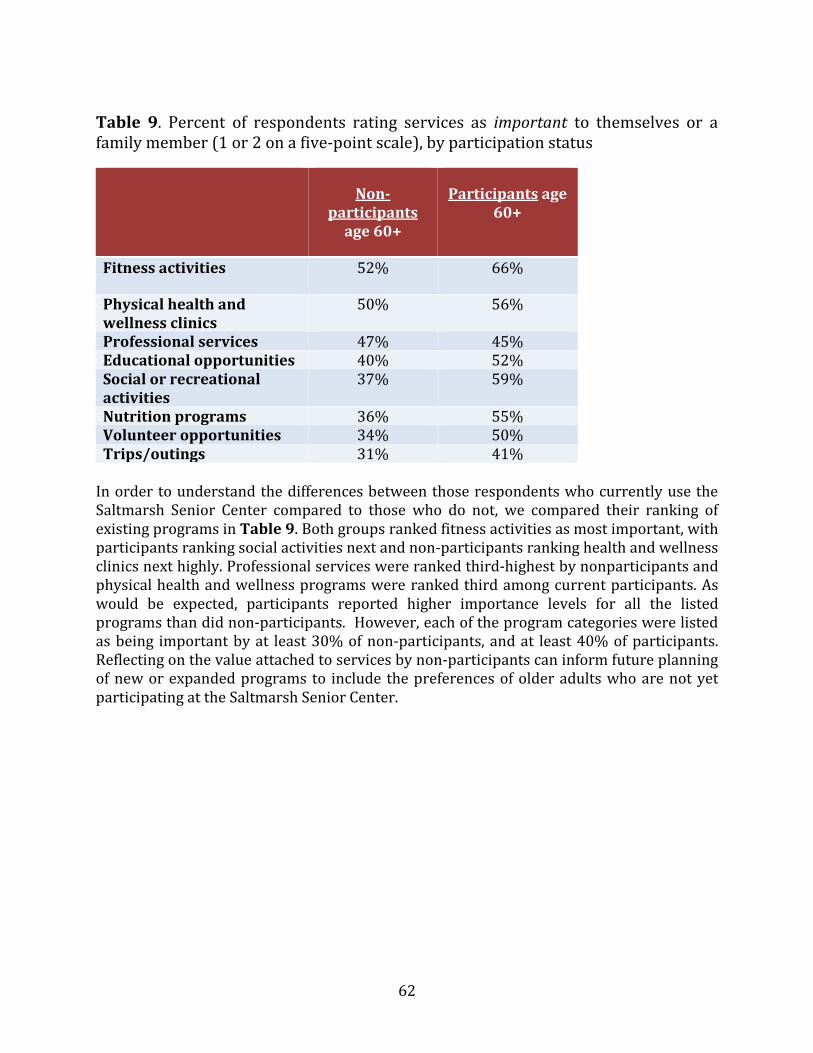
62
Table 9. Percent of respondents rating services as important to themselves or a family member (1 or 2 on a five-point scale), by participation status
Non-participants
age 60+
Participants age 60+
Fitness activities 52% 66%
Physical health and wellness clinics
50% 56%
Professional services 47% 45% Educational opportunities 40% 52% Social or recreational activities
37% 59%
Nutrition programs 36% 55% Volunteer opportunities 34% 50% Trips/outings 31% 41%
In order to understand the differences between those respondents who currently use the Saltmarsh Senior Center compared to those who do not, we compared their ranking of existing programs in Table 9. Both groups ranked fitness activities as most important, with participants ranking social activities next and non-participants ranking health and wellness clinics next highly. Professional services were ranked third-highest by nonparticipants and physical health and wellness programs were ranked third among current participants. As would be expected, participants reported higher importance levels for all the listed programs than did non-participants. However, each of the program categories were listed as being important by at least 30% of non-participants, and at least 40% of participants. Reflecting on the value attached to services by non-participants can inform future planning of new or expanded programs to include the preferences of older adults who are not yet participating at the Saltmarsh Senior Center.
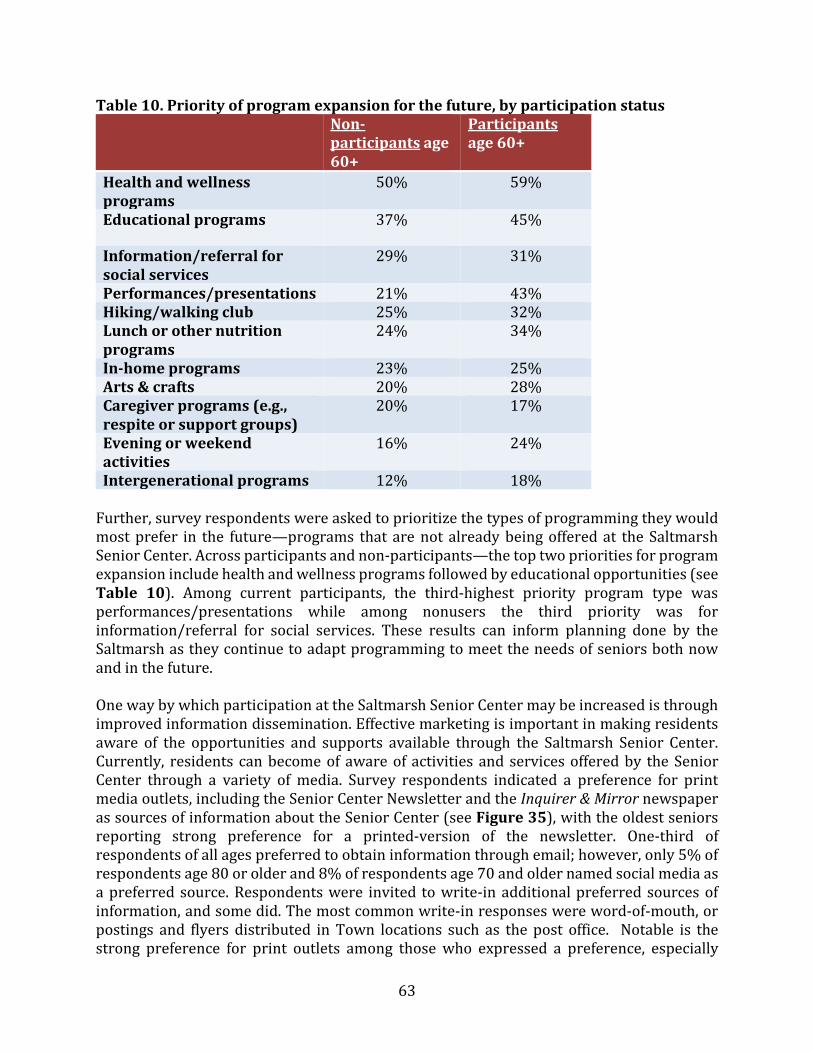
63
Table 10. Priority of program expansion for the future, by participation status Non-
participants age 60+
Participants age 60+
Health and wellness programs
50% 59%
Educational programs 37% 45%
Information/referral for social services
29% 31%
Performances/presentations 21% 43% Hiking/walking club 25% 32% Lunch or other nutrition programs
24% 34%
In-home programs 23% 25% Arts & crafts 20% 28% Caregiver programs (e.g., respite or support groups)
20% 17%
Evening or weekend activities
16% 24%
Intergenerational programs 12% 18% Further, survey respondents were asked to prioritize the types of programming they would most prefer in the future—programs that are not already being offered at the Saltmarsh Senior Center. Across participants and non-participants—the top two priorities for program expansion include health and wellness programs followed by educational opportunities (see Table 10). Among current participants, the third-highest priority program type was performances/presentations while among nonusers the third priority was for information/referral for social services. These results can inform planning done by the Saltmarsh as they continue to adapt programming to meet the needs of seniors both now and in the future. One way by which participation at the Saltmarsh Senior Center may be increased is through improved information dissemination. Effective marketing is important in making residents aware of the opportunities and supports available through the Saltmarsh Senior Center. Currently, residents can become of aware of activities and services offered by the Senior Center through a variety of media. Survey respondents indicated a preference for print media outlets, including the Senior Center Newsletter and the Inquirer & Mirror newspaper as sources of information about the Senior Center (see Figure 35), with the oldest seniors reporting strong preference for a printed-version of the newsletter. One-third of respondents of all ages preferred to obtain information through email; however, only 5% of respondents age 80 or older and 8% of respondents age 70 and older named social media as a preferred source. Respondents were invited to write-in additional preferred sources of information, and some did. The most common write-in responses were word-of-mouth, or postings and flyers distributed in Town locations such as the post office. Notable is the strong preference for print outlets among those who expressed a preference, especially

64
among respondents age 70 and older. Electronic means of information distribution, such as the Town website or email, may be effective in reaching middle-aged adults and younger seniors; however, for the near-term, effectively reaching Nantucket’s older adults will continue to require outreach through print media.
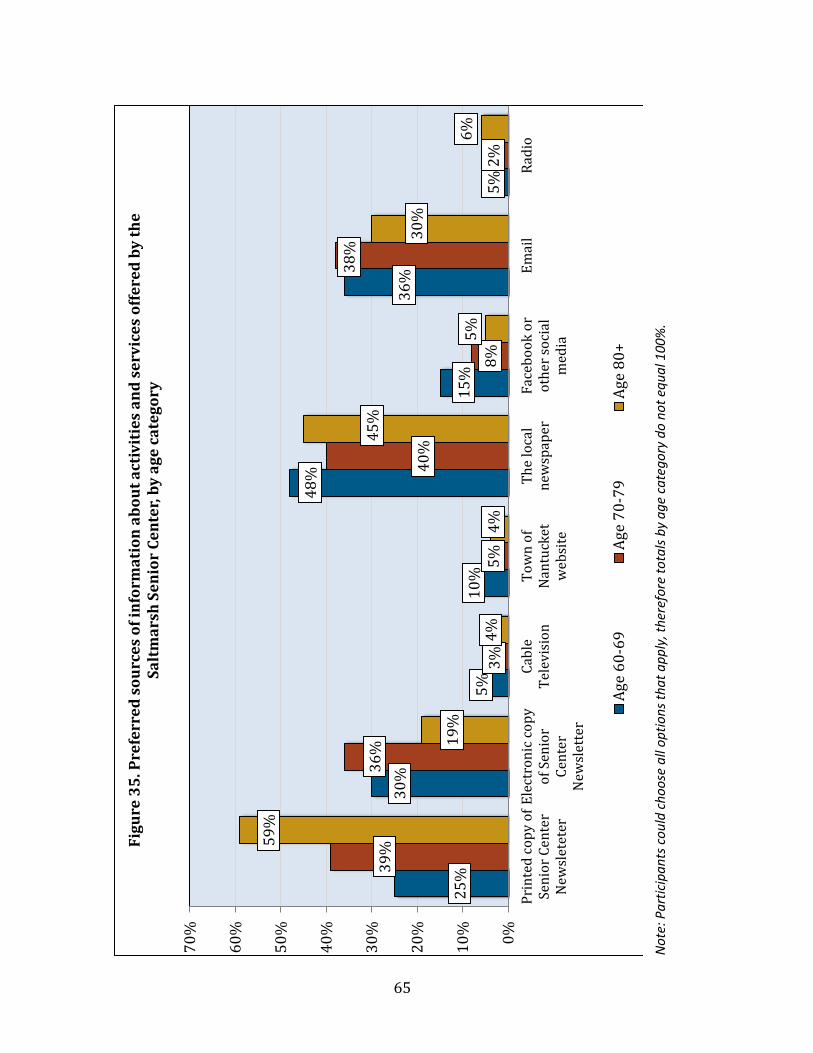
65
N
ote:
Par
ticip
ants
cou
ld c
hoos
e al
l opt
ions
that
app
ly, t
here
fore
tota
ls by
age
cat
egor
y do
not
equ
al 1
00%
.
25%
30%
5%10
%
48%
15%
36%
5%
39%
36%
3%5%
40%
8%
38%
2%
59%
19%
4%4%
45%
5%
30%
6%
0%10%
20%
30%
40%
50%
60%
70%
Prin
ted
copy
of
Seni
or C
ente
rN
ewsl
etet
er
Elec
tron
ic co
pyof
Sen
ior
Cent
erN
ewsl
ette
r
Cabl
eTe
levi
sion
Tow
n of
Nan
tuck
etw
ebsi
te
The
loca
lne
wsp
aper
Face
book
or
othe
r soc
ial
med
ia
Emai
lRa
dio
Figu
re 3
5. P
refe
rred
sou
rces
of i
nfor
mat
ion
abou
t act
ivit
ies
and
serv
ices
offe
red
by th
e Sa
ltm
arsh
Sen
ior
Cent
er, b
y ag
e ca
tego
ry
Age
60-6
9Ag
e 70
-79
Age
80+
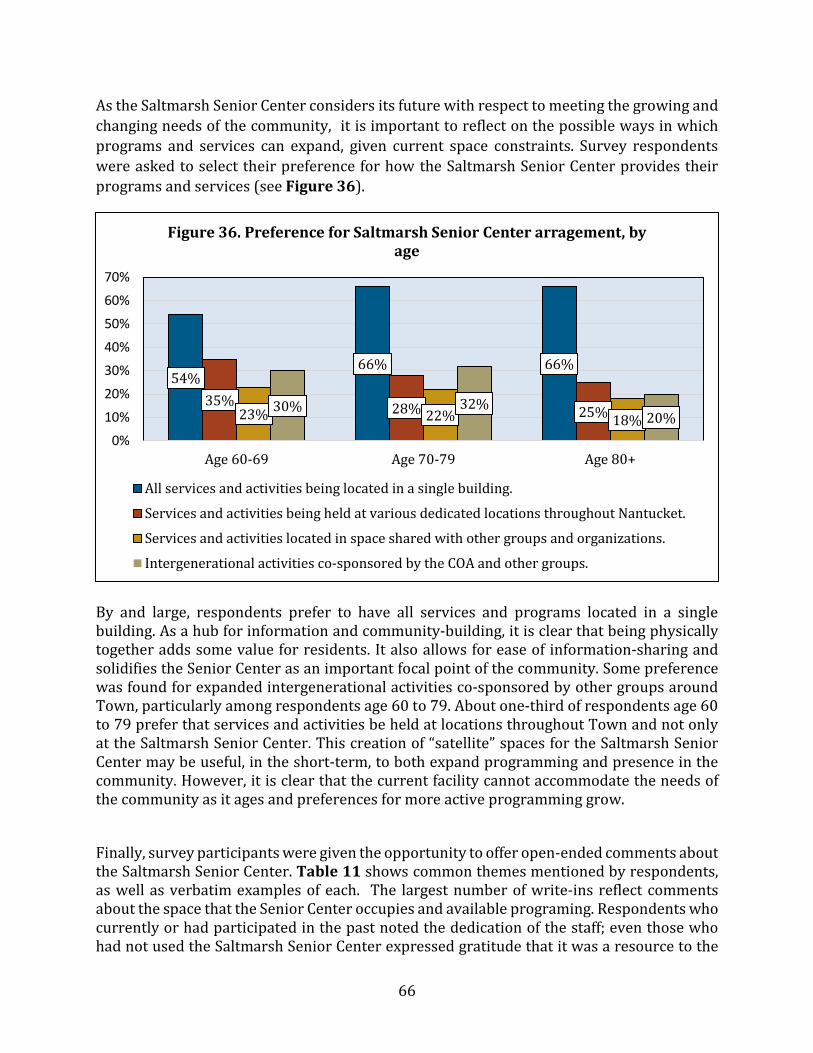
66
As the Saltmarsh Senior Center considers its future with respect to meeting the growing and changing needs of the community, it is important to reflect on the possible ways in which programs and services can expand, given current space constraints. Survey respondents were asked to select their preference for how the Saltmarsh Senior Center provides their programs and services (see Figure 36).
By and large, respondents prefer to have all services and programs located in a single building. As a hub for information and community-building, it is clear that being physically together adds some value for residents. It also allows for ease of information-sharing and solidifies the Senior Center as an important focal point of the community. Some preference was found for expanded intergenerational activities co-sponsored by other groups around Town, particularly among respondents age 60 to 79. About one-third of respondents age 60 to 79 prefer that services and activities be held at locations throughout Town and not only at the Saltmarsh Senior Center. This creation of “satellite” spaces for the Saltmarsh Senior Center may be useful, in the short-term, to both expand programming and presence in the community. However, it is clear that the current facility cannot accommodate the needs of the community as it ages and preferences for more active programming grow.
Finally, survey participants were given the opportunity to offer open-ended comments about the Saltmarsh Senior Center. Table 11 shows common themes mentioned by respondents, as well as verbatim examples of each. The largest number of write-ins reflect comments about the space that the Senior Center occupies and available programing. Respondents who currently or had participated in the past noted the dedication of the staff; even those who had not used the Saltmarsh Senior Center expressed gratitude that it was a resource to the
54%66% 66%
35% 28% 25%23% 22% 18%30% 32%
20%0%
10%
20%
30%
40%
50%
60%
70%
Age 60-69 Age 70-79 Age 80+
Figure 36. Preference for Saltmarsh Senior Center arragement, by age
All services and activities being located in a single building.
Services and activities being held at various dedicated locations throughout Nantucket.
Services and activities located in space shared with other groups and organizations.
Intergenerational activities co-sponsored by the COA and other groups.
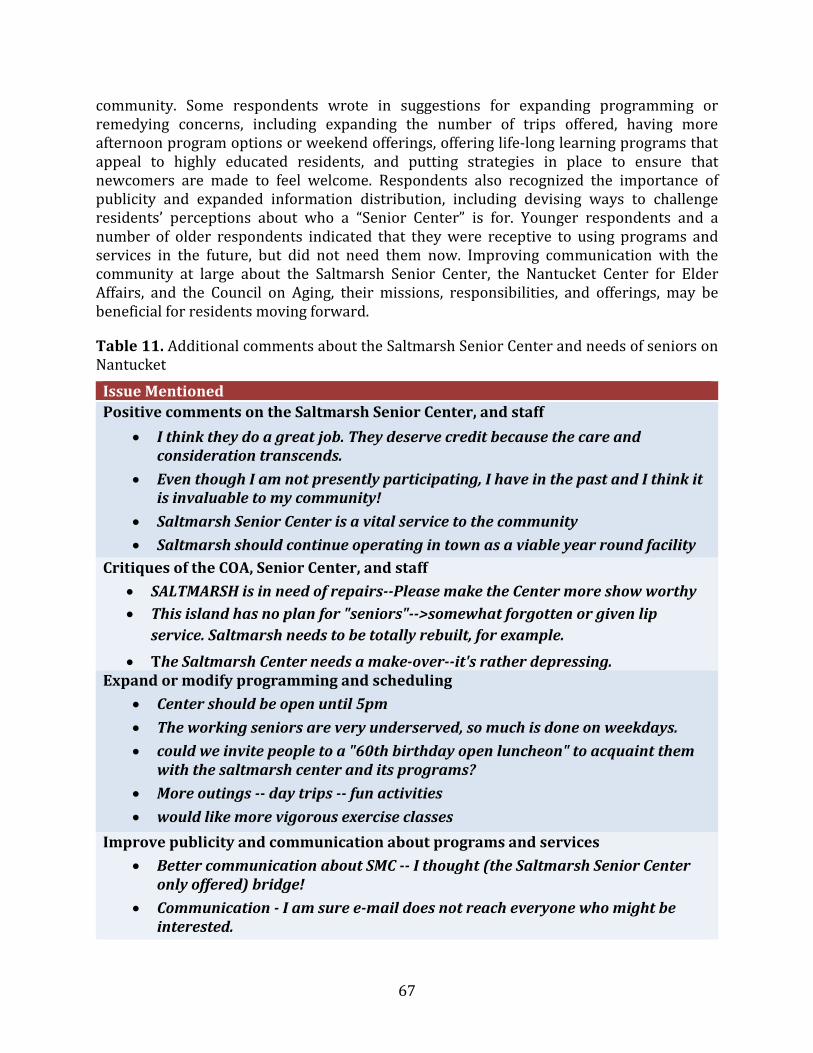
67
community. Some respondents wrote in suggestions for expanding programming or remedying concerns, including expanding the number of trips offered, having more afternoon program options or weekend offerings, offering life-long learning programs that appeal to highly educated residents, and putting strategies in place to ensure that newcomers are made to feel welcome. Respondents also recognized the importance of publicity and expanded information distribution, including devising ways to challenge residents’ perceptions about who a “Senior Center” is for. Younger respondents and a number of older respondents indicated that they were receptive to using programs and services in the future, but did not need them now. Improving communication with the community at large about the Saltmarsh Senior Center, the Nantucket Center for Elder Affairs, and the Council on Aging, their missions, responsibilities, and offerings, may be beneficial for residents moving forward.
Table 11. Additional comments about the Saltmarsh Senior Center and needs of seniors on Nantucket
Issue Mentioned Positive comments on the Saltmarsh Senior Center, and staff
• I think they do a great job. They deserve credit because the care and consideration transcends.
• Even though I am not presently participating, I have in the past and I think it is invaluable to my community!
• Saltmarsh Senior Center is a vital service to the community • Saltmarsh should continue operating in town as a viable year round facility
Critiques of the COA, Senior Center, and staff • SALTMARSH is in need of repairs--Please make the Center more show worthy • This island has no plan for "seniors"-->somewhat forgotten or given lip
service. Saltmarsh needs to be totally rebuilt, for example. • The Saltmarsh Center needs a make-over--it's rather depressing.
Expand or modify programming and scheduling • Center should be open until 5pm • The working seniors are very underserved, so much is done on weekdays. • could we invite people to a "60th birthday open luncheon" to acquaint them
with the saltmarsh center and its programs? • More outings -- day trips -- fun activities • would like more vigorous exercise classes
Improve publicity and communication about programs and services • Better communication about SMC -- I thought (the Saltmarsh Senior Center
only offered) bridge! • Communication - I am sure e-mail does not reach everyone who might be
interested.
68
• I am a member and never receive any email or mail updates. Communication needs improvement
• I affiliate based on shared interests NOT age. Drop the use of "older" "elder" "senior"
Several respondents wrote-in continuing concerns about costs of living and limited housing options on Nantucket. Challenges associated with few public transportation options were also reiterated. Although these concerns are largely beyond the scope of the Saltmarsh Senior Center’s mission, respondents clearly see these issues as barriers to aging well on Nantucket as well as factors that would take older, lifelong, residents of Nantucket off-island in search of a more accessible and affordable place to age well.
Financial Security
One survey question was meant to tap income shortfalls for necessary expenses among Nantucket’s residents. Respondents were asked if there was any time in the previous 12 months when he or she did not have money for necessities (see Figure 37). Most respondents across the age groups reported not lacking money for necessary expenses during the previous year, including 82% of respondents age 60 to 69, 88% of respondents age 70 to 79, and 91% of seniors age 80 and older. However, a segment of each group reported lacking money at some point for one or more of the listed necessities, including 8% to 9% not having funds for car repairs or home repairs, and 4 to 6% lacking money for rent, mortgage, or real estate taxes.

69
Note: Participants could choose all options that apply, therefore totals by age category do not equal 100%.
The findings just discussed suggest that most Nantucket respondents are able to cover their bills at present, although some do struggle especially with expenses like car and home repairs that may be easier to defer than regular expenses like rent or utilities. When asked to look ahead, a larger share of survey respondents indicate concerns about their financial security.
Focus Groups Focus group #1 (N=6) consisted of senior Nantucket residents, including individuals who had participated at the Saltmarsh Senior Center and were relatively long-time residents of the island. Focus group #2 (N=3) consisted of younger residents of Nantucket who were active in the community. For example, one participant organized a community-based program for older adults and another was a hospital volunteer.
These two group of residents (Focus Group #1 and Focus Group #2) highlighted the sense of community on Nantucket as being a real benefit of living on-island. They also talked about the changes to the community in recent years that challenge resident’s ability to maintain this sense of community. The development of the island and the overall perceived population growth have led to increases in traffic and parking congestion. One participant said, “…it becomes more and more congested, as a senior citizen, just getting around is becoming perilous
6%
4%
10%
5%
2%2%3%
5%
3%2%
2% 2%3%
2%1%
0%
2%
4%
6%
8%
10%
12%
Rent, mortgage,or real estate
taxes
Medical needs Car or homerepairs
Utilities (e.g., oilor electricity)
Food
Figure 37. Percentage lacking money for necessities in the previous 12 months
Age 60-69 Age 70-79 Age 80+
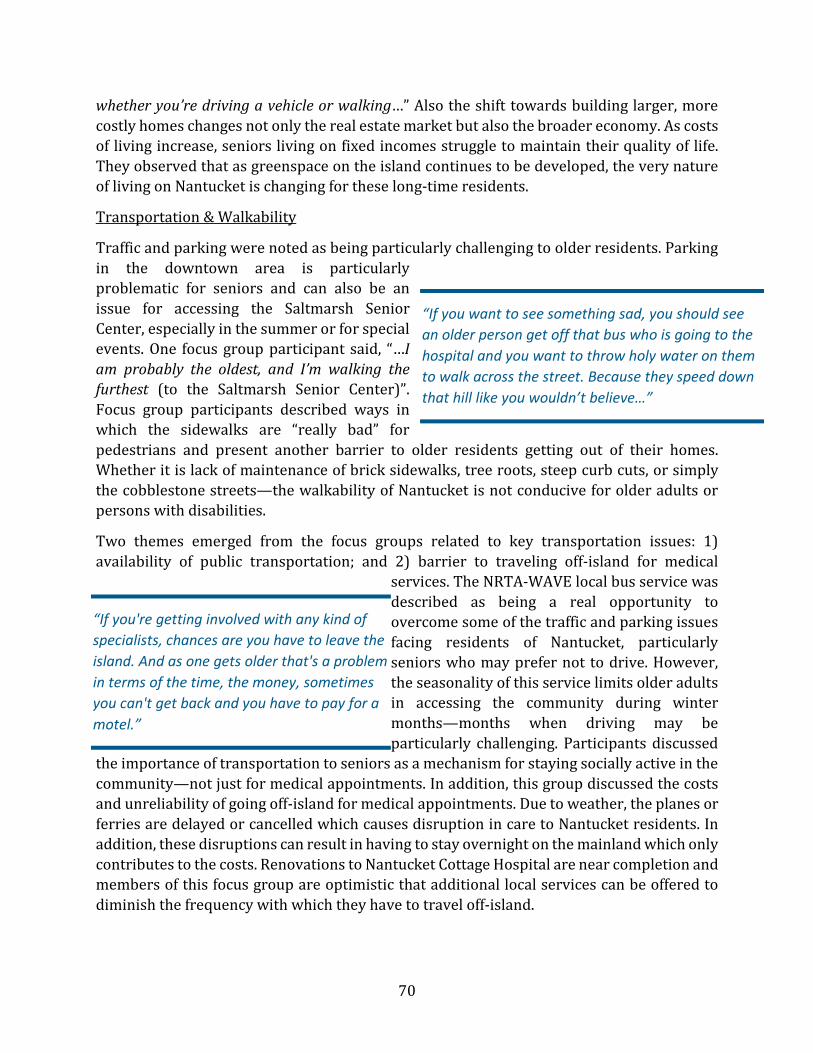
70
whether you’re driving a vehicle or walking…” Also the shift towards building larger, more costly homes changes not only the real estate market but also the broader economy. As costs of living increase, seniors living on fixed incomes struggle to maintain their quality of life. They observed that as greenspace on the island continues to be developed, the very nature of living on Nantucket is changing for these long-time residents.
Transportation & Walkability
Traffic and parking were noted as being particularly challenging to older residents. Parking in the downtown area is particularly problematic for seniors and can also be an issue for accessing the Saltmarsh Senior Center, especially in the summer or for special events. One focus group participant said, “…I am probably the oldest, and I’m walking the furthest (to the Saltmarsh Senior Center)”. Focus group participants described ways in which the sidewalks are “really bad” for pedestrians and present another barrier to older residents getting out of their homes. Whether it is lack of maintenance of brick sidewalks, tree roots, steep curb cuts, or simply the cobblestone streets—the walkability of Nantucket is not conducive for older adults or persons with disabilities.
Two themes emerged from the focus groups related to key transportation issues: 1) availability of public transportation; and 2) barrier to traveling off-island for medical
services. The NRTA-WAVE local bus service was described as being a real opportunity to overcome some of the traffic and parking issues facing residents of Nantucket, particularly seniors who may prefer not to drive. However, the seasonality of this service limits older adults in accessing the community during winter months—months when driving may be particularly challenging. Participants discussed
the importance of transportation to seniors as a mechanism for staying socially active in the community—not just for medical appointments. In addition, this group discussed the costs and unreliability of going off-island for medical appointments. Due to weather, the planes or ferries are delayed or cancelled which causes disruption in care to Nantucket residents. In addition, these disruptions can result in having to stay overnight on the mainland which only contributes to the costs. Renovations to Nantucket Cottage Hospital are near completion and members of this focus group are optimistic that additional local services can be offered to diminish the frequency with which they have to travel off-island.
“If you want to see something sad, you should see an older person get off that bus who is going to the hospital and you want to throw holy water on them to walk across the street. Because they speed down that hill like you wouldn’t believe…”
“If you're getting involved with any kind of specialists, chances are you have to leave the island. And as one gets older that's a problem in terms of the time, the money, sometimes you can't get back and you have to pay for a motel.”
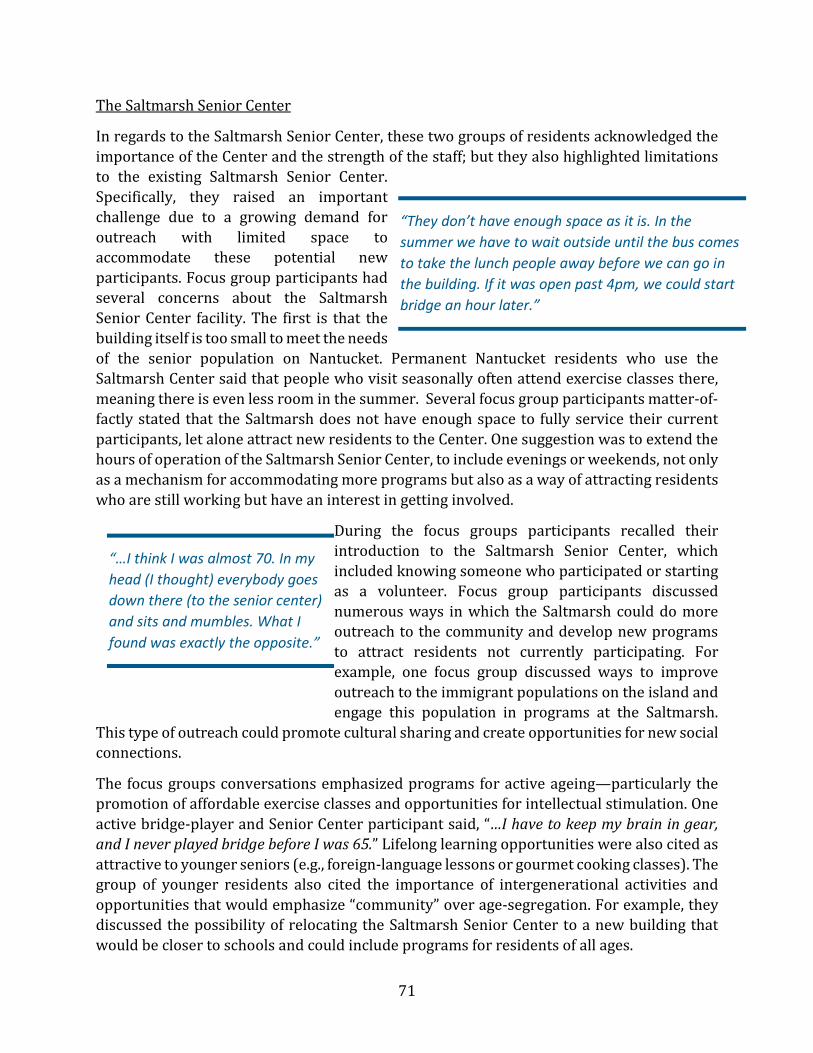
71
The Saltmarsh Senior Center
In regards to the Saltmarsh Senior Center, these two groups of residents acknowledged the importance of the Center and the strength of the staff; but they also highlighted limitations to the existing Saltmarsh Senior Center. Specifically, they raised an important challenge due to a growing demand for outreach with limited space to accommodate these potential new participants. Focus group participants had several concerns about the Saltmarsh Senior Center facility. The first is that the building itself is too small to meet the needs of the senior population on Nantucket. Permanent Nantucket residents who use the Saltmarsh Center said that people who visit seasonally often attend exercise classes there, meaning there is even less room in the summer. Several focus group participants matter-of-factly stated that the Saltmarsh does not have enough space to fully service their current participants, let alone attract new residents to the Center. One suggestion was to extend the hours of operation of the Saltmarsh Senior Center, to include evenings or weekends, not only as a mechanism for accommodating more programs but also as a way of attracting residents who are still working but have an interest in getting involved.
During the focus groups participants recalled their introduction to the Saltmarsh Senior Center, which included knowing someone who participated or starting as a volunteer. Focus group participants discussed numerous ways in which the Saltmarsh could do more outreach to the community and develop new programs to attract residents not currently participating. For example, one focus group discussed ways to improve outreach to the immigrant populations on the island and engage this population in programs at the Saltmarsh.
This type of outreach could promote cultural sharing and create opportunities for new social connections.
The focus groups conversations emphasized programs for active ageing—particularly the promotion of affordable exercise classes and opportunities for intellectual stimulation. One active bridge-player and Senior Center participant said, “…I have to keep my brain in gear, and I never played bridge before I was 65.” Lifelong learning opportunities were also cited as attractive to younger seniors (e.g., foreign-language lessons or gourmet cooking classes). The group of younger residents also cited the importance of intergenerational activities and opportunities that would emphasize “community” over age-segregation. For example, they discussed the possibility of relocating the Saltmarsh Senior Center to a new building that would be closer to schools and could include programs for residents of all ages.
“…I think I was almost 70. In my head (I thought) everybody goes down there (to the senior center) and sits and mumbles. What I found was exactly the opposite.”
“They don’t have enough space as it is. In the summer we have to wait outside until the bus comes to take the lunch people away before we can go in the building. If it was open past 4pm, we could start bridge an hour later.”
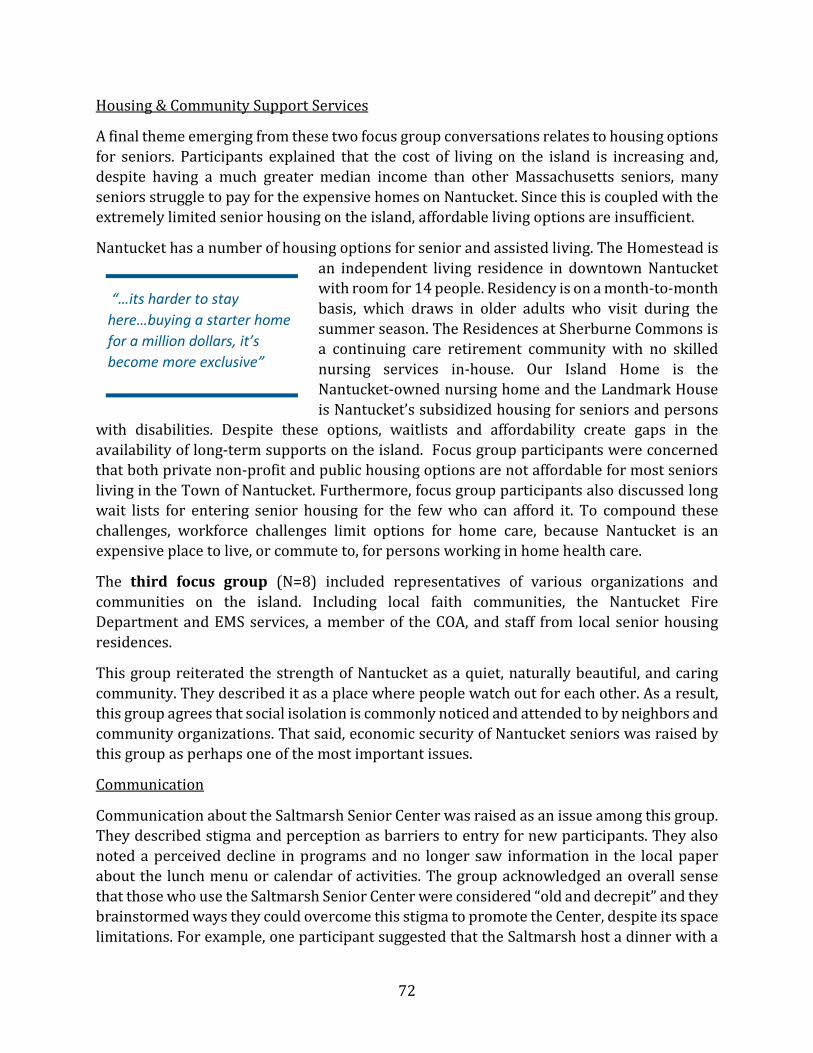
72
Housing & Community Support Services
A final theme emerging from these two focus group conversations relates to housing options for seniors. Participants explained that the cost of living on the island is increasing and, despite having a much greater median income than other Massachusetts seniors, many seniors struggle to pay for the expensive homes on Nantucket. Since this is coupled with the extremely limited senior housing on the island, affordable living options are insufficient.
Nantucket has a number of housing options for senior and assisted living. The Homestead is an independent living residence in downtown Nantucket with room for 14 people. Residency is on a month-to-month basis, which draws in older adults who visit during the summer season. The Residences at Sherburne Commons is a continuing care retirement community with no skilled nursing services in-house. Our Island Home is the Nantucket-owned nursing home and the Landmark House is Nantucket’s subsidized housing for seniors and persons
with disabilities. Despite these options, waitlists and affordability create gaps in the availability of long-term supports on the island. Focus group participants were concerned that both private non-profit and public housing options are not affordable for most seniors living in the Town of Nantucket. Furthermore, focus group participants also discussed long wait lists for entering senior housing for the few who can afford it. To compound these challenges, workforce challenges limit options for home care, because Nantucket is an expensive place to live, or commute to, for persons working in home health care.
The third focus group (N=8) included representatives of various organizations and communities on the island. Including local faith communities, the Nantucket Fire Department and EMS services, a member of the COA, and staff from local senior housing residences.
This group reiterated the strength of Nantucket as a quiet, naturally beautiful, and caring community. They described it as a place where people watch out for each other. As a result, this group agrees that social isolation is commonly noticed and attended to by neighbors and community organizations. That said, economic security of Nantucket seniors was raised by this group as perhaps one of the most important issues.
Communication
Communication about the Saltmarsh Senior Center was raised as an issue among this group. They described stigma and perception as barriers to entry for new participants. They also noted a perceived decline in programs and no longer saw information in the local paper about the lunch menu or calendar of activities. The group acknowledged an overall sense that those who use the Saltmarsh Senior Center were considered “old and decrepit” and they brainstormed ways they could overcome this stigma to promote the Center, despite its space limitations. For example, one participant suggested that the Saltmarsh host a dinner with a
“…its harder to stay here…buying a starter home for a million dollars, it’s become more exclusive”
73
presentation featuring these local resources so that residents can learn more about the options available on the island. Another suggested offering an “Aging Mastery” course that could attract persons wanting to prepare for retirement and the next phase of life. Another participant pondered the feasibility of soliciting contact information from older residents to help providers stay in touch with those who may be struggling. This group noted that there are mechanisms for fire and police to track “at-risk” residents; but perhaps that definition could be widened and those conversations could include a wider range of partners.
Another key issue of concern among this group was lack of adequate information about resources for seniors on Nantucket. Despite the fact that this group was highly-informed about the social service networks on-island, they described cases in which residents and families are unclear about the various organizations and services. Overall, these focus group participants felt that the network of elder service providers on the island was strong and communicated with one another regularly even though they noted that there is not a formal mechanism for them to gather or communicate. Currently, communication among this group occurs naturally and is rooted in personal relationships rather than professional interaction.
Economic Disparity
Despite the belief that older residents are “less likely to fall through the cracks here, compared to the mainland,” this group draws on their service experience to explain that the economic disparities among residents can create additional barriers for seniors aging on Nantucket. Specifically, economic instability can keep residents, particularly seniors, from achieving a high-quality of life or participating fully in the community as they age on the island. In part, focus group members attributed this type of isolation to factors associated with stigma of “needing help” which can cause residents to reach a crisis situation before they are ever connected to social or human services on the island. In addition, this group of stakeholders discussed the needs of middle-income seniors on the island. These are adults with economic resources sufficient to keep them from qualifying for some of the services provided by Elder Services (e.g., meals on wheels or home care) yet who are not in a position to pay privately for care. The representative from the Fire Department comments, “We identify people…that are extreme risks. So we may get a report, so the house is – has hoarding issues, or significant health concerns. We may be able to report it to elder services. But that in-between group…to give you a little bit of help, we could probably do a better job there, help them matching them up with services.”
“I’m always shocked that people don’t know about anything that is available to them. They don’t know the food pantry, or the rental assistance program…”
74
Coordination of Health & Community Services
According to focus group participants, one common situation for older residents of Nantucket is for adult children and other family members to live on the mainland—sometimes quite a distance. This creates challenges to managing care in later life and can put pressure on the local social and human services organizations, as well as neighbors and friends, to step in and coordinate services.
Further complicating these issues is the limitation of health services on the island, as previously mentioned. Beyond the challenges of getting-off island for medical treatment not offered by the local hospital and the shortage of primary care physicians on Nantucket, the representative from emergency services also highlights the difficulty in getting residents off-island in an emergency. He said, “We’re having trouble getting people off island, too, that need ambulances…the private ambulances don’t want to come here anymore. They lose a lot of money.” As a result, helicopter or plane services can be arranged, at a high cost.
A final gap discussed by this group is the lack of adult day programs. As mentioned by all three groups, there is a gap in long-term services and supports for middle-income residents of Nantucket. They describe families that do not qualify for low-income programs through Elder Services of Cape Cod & the Islands and yet cannot afford the local assisted living or nursing facilities. These residents must cobble together a system of support that may include the Saltmarsh Senior Center, in order to remain living independently. It was the view of this focus group that an adult day program would not only provide support to older adults with cognitive or severe mobility needs, but it would also provide much-needed respite to families and friends who are otherwise providing care to these residents. They recounted that a similar program on Nantucket was shut-down a few years earlier due to declining enrollment and funding issues.
Overall, the focus group participants were optimistic about the opportunities to ensure that Nantucket is a good place to both grow up and grow old. They agree that with the spirit of community and places like the Saltmarsh Senior Center, Nantucket can support its senior residents in balance.
Key-Informant Interviews All nine of the interview participants are Nantucket residents; as well, all hold leadership positions in the community. Six of the interviews were conducted in-person and three were conducted by telephone. These individuals recognize the changing demographics of the community with respect to age and diversity and are aware of the significance of these changes for the Town. All of them are familiar with the Saltmarsh Senior Center and believe that for those who participate there—it is an important community resource.
“Another thing that concerns me…people who have no family here, who may have friends or a social circle who manage, manage, manage…until they’re not managing.”
75
Nearly all of the key-informants remarked on the absence of in-home services and supports for older adult residents, particularly those middle-income residents, on the island. Despite the close proximity of providers on the island, the transfer of information about available social services is not evenly distributed across Town employees and nonprofit providers. This is a particularly striking unmet need in the community as Nantucket grapples with the future of the Town-owned and -operated nursing home, the need of a new senior center space, and most generally, meeting the needs of Nantucket’s growing senior population. A coalition of elder service providers could perhaps work together to contribute to a master planning process in an effort to create a continuum of care on Nantucket that was more appropriate for residents. Added communication about the Saltmarsh Senior Center could also reduce stigma about the users of the Saltmarsh Senior Center as only being a place for frail Nantucket residents. Currently, the Saltmarsh Senior Center is strictly programmatic and aside from health insurance counseling and serving as a host for congregate meals, it provides no direct service or formal information and referral services. Given the myriad of other available services on the island and the public nature of the Saltmarsh Senior Center, it could make sense to expand the capacity of the Saltmarsh Senior Center to provide more information and referral to area organizations. The hours of operation of the Senior Saltmarsh Center were also cited by key-informants as being a challenge to access to services. Current programming is scheduled tightly in the existing space. In fact, to accommodate all programs, they have only one open time-slot per week —otherwise the same schedule is in place every week. This limits the creativity of the programming and affects the ability to pilot-test new programs and invite speakers. Further, there is only one room available for programming. With dividers, they could run up to three programs at one time in the same room. Interviews suggested that more exercise classes and active programming would be attractive to new participants, but that the current space would not allow for expanded exercise or active programs. In addition to space limitations, the operating hours of the Senior Saltmarsh Center would have to extend in order to extend to improve access to services. One key-informant suggests that more center staff are needed to ensure that staff is available during the proposed extended hours (e.g., evenings or weekends). These results suggest that the community work together to coordinate mechanisms for additional programming to take place at other locations in Town and to seriously consider the expansion or rebuilding of the current Saltmarsh Senior Center to accommodate for this growing segment of the population and their changing needs and preferences.
Peer Community Comparison Nantucket does not have any true “peer communities”--that is, communities that are like Nantucket both in terms of demographic characteristics and island-lifestyle. That said, a set of communities that could be looked to for models of how to balance an aging population and a seasonal aspect of the community were identified as “peer communities” for the purposes of this study (see Table 12).
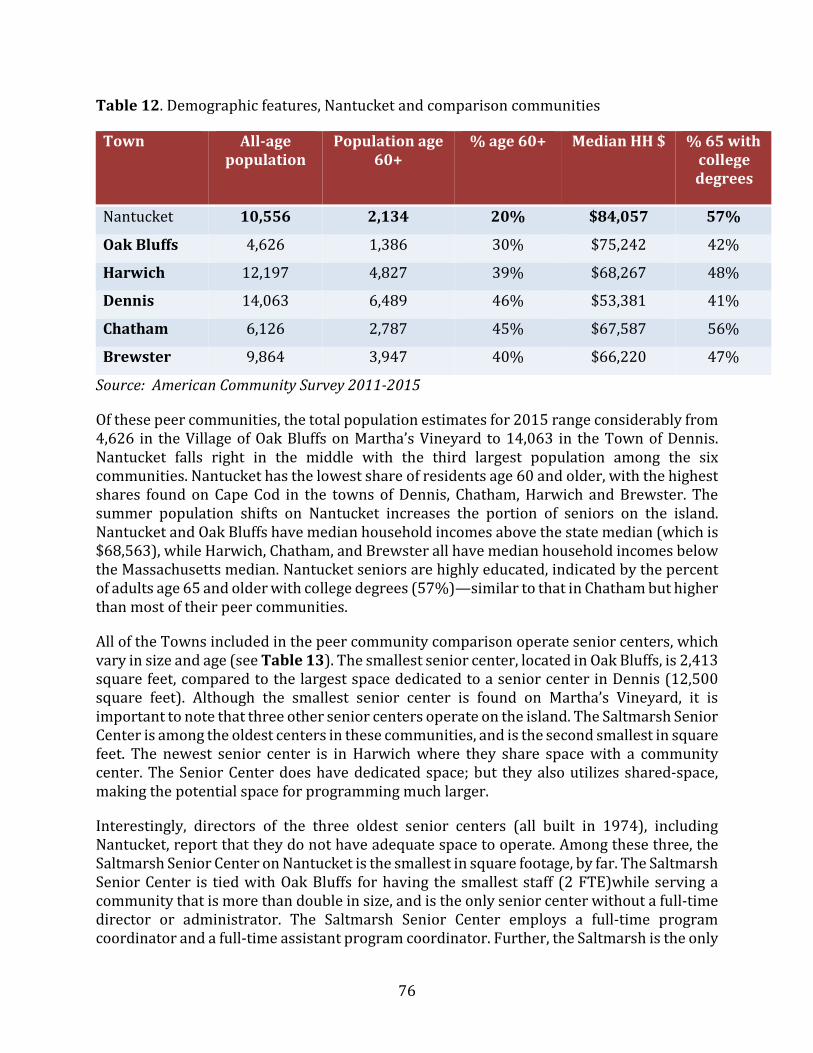
76
Table 12. Demographic features, Nantucket and comparison communities
Source: American Community Survey 2011-2015
Of these peer communities, the total population estimates for 2015 range considerably from 4,626 in the Village of Oak Bluffs on Martha’s Vineyard to 14,063 in the Town of Dennis. Nantucket falls right in the middle with the third largest population among the six communities. Nantucket has the lowest share of residents age 60 and older, with the highest shares found on Cape Cod in the towns of Dennis, Chatham, Harwich and Brewster. The summer population shifts on Nantucket increases the portion of seniors on the island. Nantucket and Oak Bluffs have median household incomes above the state median (which is $68,563), while Harwich, Chatham, and Brewster all have median household incomes below the Massachusetts median. Nantucket seniors are highly educated, indicated by the percent of adults age 65 and older with college degrees (57%)—similar to that in Chatham but higher than most of their peer communities.
All of the Towns included in the peer community comparison operate senior centers, which vary in size and age (see Table 13). The smallest senior center, located in Oak Bluffs, is 2,413 square feet, compared to the largest space dedicated to a senior center in Dennis (12,500 square feet). Although the smallest senior center is found on Martha’s Vineyard, it is important to note that three other senior centers operate on the island. The Saltmarsh Senior Center is among the oldest centers in these communities, and is the second smallest in square feet. The newest senior center is in Harwich where they share space with a community center. The Senior Center does have dedicated space; but they also utilizes shared-space, making the potential space for programming much larger.
Interestingly, directors of the three oldest senior centers (all built in 1974), including Nantucket, report that they do not have adequate space to operate. Among these three, the Saltmarsh Senior Center on Nantucket is the smallest in square footage, by far. The Saltmarsh Senior Center is tied with Oak Bluffs for having the smallest staff (2 FTE)while serving a community that is more than double in size, and is the only senior center without a full-time director or administrator. The Saltmarsh Senior Center employs a full-time program coordinator and a full-time assistant program coordinator. Further, the Saltmarsh is the only
Town All-age population
Population age 60+
% age 60+ Median HH $ % 65 with college degrees
Nantucket 10,556 2,134 20% $84,057 57%
Oak Bluffs 4,626 1,386 30% $75,242 42%
Harwich 12,197 4,827 39% $68,267 48%
Dennis 14,063 6,489 46% $53,381 41%
Chatham 6,126 2,787 45% $67,587 56%
Brewster 9,864 3,947 40% $66,220 47%
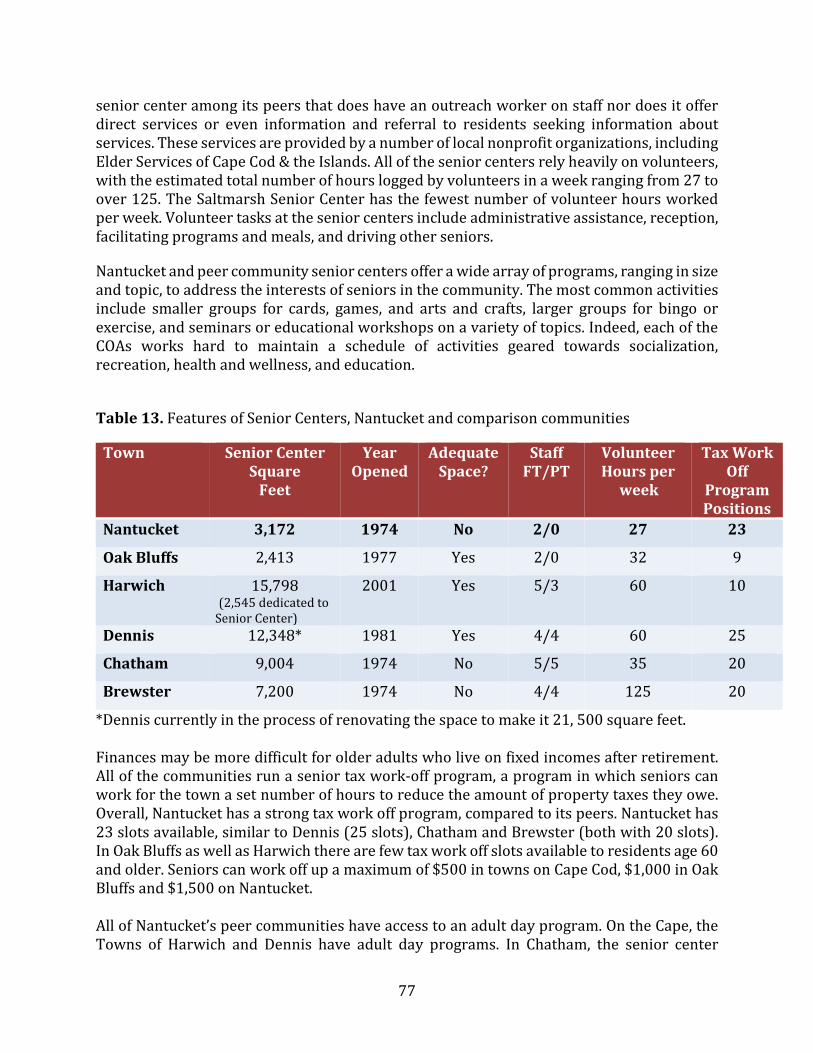
77
senior center among its peers that does have an outreach worker on staff nor does it offer direct services or even information and referral to residents seeking information about services. These services are provided by a number of local nonprofit organizations, including Elder Services of Cape Cod & the Islands. All of the senior centers rely heavily on volunteers, with the estimated total number of hours logged by volunteers in a week ranging from 27 to over 125. The Saltmarsh Senior Center has the fewest number of volunteer hours worked per week. Volunteer tasks at the senior centers include administrative assistance, reception, facilitating programs and meals, and driving other seniors.
Nantucket and peer community senior centers offer a wide array of programs, ranging in size and topic, to address the interests of seniors in the community. The most common activities include smaller groups for cards, games, and arts and crafts, larger groups for bingo or exercise, and seminars or educational workshops on a variety of topics. Indeed, each of the COAs works hard to maintain a schedule of activities geared towards socialization, recreation, health and wellness, and education.
Table 13. Features of Senior Centers, Nantucket and comparison communities
Town Senior Center Square
Feet
Year Opened
Adequate Space?
Staff FT/PT
Volunteer Hours per
week
Tax Work Off
Program Positions
Nantucket 3,172 1974 No 2/0 27 23
Oak Bluffs 2,413 1977 Yes 2/0 32 9
Harwich 15,798 (2,545 dedicated to Senior Center)
2001 Yes 5/3 60 10
Dennis 12,348* 1981 Yes 4/4 60 25
Chatham 9,004 1974 No 5/5 35 20
Brewster 7,200 1974 No 4/4 125 20
*Dennis currently in the process of renovating the space to make it 21, 500 square feet. Finances may be more difficult for older adults who live on fixed incomes after retirement. All of the communities run a senior tax work-off program, a program in which seniors can work for the town a set number of hours to reduce the amount of property taxes they owe. Overall, Nantucket has a strong tax work off program, compared to its peers. Nantucket has 23 slots available, similar to Dennis (25 slots), Chatham and Brewster (both with 20 slots). In Oak Bluffs as well as Harwich there are few tax work off slots available to residents age 60 and older. Seniors can work off up a maximum of $500 in towns on Cape Cod, $1,000 in Oak Bluffs and $1,500 on Nantucket. All of Nantucket’s peer communities have access to an adult day program. On the Cape, the Towns of Harwich and Dennis have adult day programs. In Chatham, the senior center
78
provides transportation to the adult day program in Dennis and the Brewster senior center provides transportation to the program operating in Barnstable. On Martha’s Vineyard, an adult day program is offered four days a week at two of the local senior centers. The other two senior centers on the island provide transportation for their residents to attend.
Recommendations
In recent years, the number and share of older adults on Nantucket has increased substantially. Population projections suggest that this growth will continue in the coming decades. While these shifting demographic considerations have implications for all Town offices and organizations, the Saltmarsh Senior Center has special responsibility for anticipating and responding to the needs and concerns of older residents and their families. By offering programs and services, connecting residents to supports that may be beneficial to them and for which they are already eligible, and by sharing knowledge and exerting leadership in the community around aging issues, the Saltmarsh Senior Center represents an important asset to the community. A community survey was conducted, eliciting more than 700 responses from Nantucket residents age 60 and older. From the survey it was learned that older Nantucket residents are secure financially and socially, have good physical and emotional health, and are committed to remaining on Nantucket as they grow older. However, segments of the older population struggle with income shortfalls, health or mobility limitations, or isolation. Residents recognize the many positive features of Nantucket as a community in which to live—the natural beauty of the island, slow pace of life and strong sense of community are elements attracting them to the island. However, residents look ahead to a time when they may be unable to drive, need to downsize, or may need to frequently access specialized medical services and they do not know how effectively those needs can be met on Nantucket. Some segments of the resident population who experience those situations right now struggle to meet their needs. Based on our research, including data drawn from the community survey, information provided by key informants and focus group participants, and comparisons with other communities, we offer the following recommendations for the Saltmarsh Senior Center and the community as a whole.
Prepare for growth in Senior Center participation. Growth is especially high among age groups 70 and older who are most likely to use the Senior Center. Consider embarking on a strategic planning process for the Saltmarsh Senior Center as a means of addressing programming needs, communication strategies, and space needs.
Improve communication and collaboration across Town offices and community organizations For example, clarify communication about the roles and responsibilities of the varying senior stakeholder groups on Nantucket (e.g., COA, NCEA Inc., Elder Services of Cape Cod & the Islands, and Saltmarsh Senior Center). Devise a plan for working together regularly to promote the programs currently
79
offered at the Saltmarsh Senior Center and brainstorm ways to expand programing. By promoting communication across organizations, knowledge of the Saltmarsh Senior Center and its programs can be broadened to increase impact in the community.
Support current residents’ efforts to stay in their homes as they grow older. Work to improve housing options for older adults who cannot stay in the current homes.
o Develop and disseminate information about home modifications that can help residents make their homes safe to live in as they age. Many residents reported needing these modifications to age in place.
o Consider developing more housing options for older adults who wish to downsize while still staying on Nantucket. Include options that current residents can afford, including condominiums and other types of housing that offer low maintenance and single-floor living.
o Drawing on the existing community cohesion, develop formal ways for neighbors to help neighbors. For example, consider piloting a volunteer driver program or explore the Village to Village Network.
Strengthen residents’ access to health care and in-home services that will help them age at home. Healthcare is limited on Nantucket. Travel is a challenge in accessing off-island services. Improved access to services provided in the home could be beneficial to many older residents.
o Provide more information about local resources and referral information through the Saltmarsh Senior Center.
o Investigate ways to connect older residents with volunteer travel companions or coordinate travel days for groups of seniors to travel to medical appointments together as ways to mitigate travel challenges.
o Expand residents’ access to health care by expanding options available on Nantucket, where feasible.
Support informal caregivers on Nantucket. Many residents participate in caregiving and report needs for support, including respite care and adult day care. Include ways for remote-caregivers to participate in informational sessions about the elder services available on Nantucket.
o Consider hosting a memory café at the Saltmarsh Senior Center or other local space to bring together caregivers and their loved ones to socialize and relax.
o Further investigate the need for respite services and/or adult day programming.
Address programmatic factors limiting participation of Nantucket Residents in Saltmarsh Senior Center programs. Without expansion, rethinking elements of existing programming may draw more residents to the Saltmarsh Senior Center. Update program offerings and develop more opportunities that may appeal to a wide range of older adults. Specifically,
o Respondents are most interested in health and wellness programs that include physical fitness and health promotion programs. Consider offering more
80
challenging exercise programs that require greater exertion levels and appeal to the more fit segments of the senior population.
o Evaluate opportunities to offer special programs that would appeal to diverse segments of the community, including cultural groups, LGBT seniors, and others.
o Educational programs and opportunities for lifelong learning are popular in highly-educated communities like Nantucket. Drawing on retired faculty or other professionals is an option for getting started.
o Cross-departmental partnerships or collaborations with local organizations may be encouraged as a means of expanding options. In the short-term, consider creating satellite sites for additional programming sponsored by the Saltmarsh Senior Center—particularly in the summer months.
Improve transportation options available to older Nantucket residents. Nantucket’s downtown area is not “age friendly” when it comes to walkability, parking and access.
o Explore opportunities to pilot-test the year-round operation of the NRTA-WAVE transportation program9.
o Consider designating “senior parking spots” as a way of encouraging older residents and their families to enjoy the downtown areas.
o Investigate other opportunities to establish programs that will help older adults travel where they need to go, at a price they can afford, and with the flexibility they value. Consider ride-share options and volunteer driver programs.
Improve community knowledge about what the Saltmarsh Senior Center is and its range of offerings.
o Correct misperceptions about who is “eligible” to participate in Senior Center activities by distributing information about the Saltmarsh Senior Center as widely as possible.
o Distribute the newsletter more broadly in an effort to make the Saltmarsh Senior Center better known. ·
o Selectively expand other means of communicating about the Senior Center, including postings in the local newspaper, electronic communication, and attending popular events.
o Consider op-ed columns in the newspaper, or local cable opportunities to explain eligibility for and resources of the Saltmarsh Senior Center. Take advantage of publicity opportunities regularly throughout the
year on an ongoing basis so that newcomers are informed, and longer-term residents are reminded, about what the Saltmarsh Senior Center offers.
o Consider “newcomer” events like hosting a “60th birthday party” for residents who recently turned 60 to familiarize them with the offerings of the Saltmarsh Senior Center. Target family caregivers for a night of respite and to learn about
9Beginning in 2018, NRTA-Wave service will be offered year-round.
81
local resources for them and their loved ones. Consider recruiting volunteers to greet and orient new participants.
Consider opportunities to reconfigure and renovate existing space, as well as identify or build new space.
o Review and revise the building lease between NCEA Inc. and the Town of Nantucket.
o Some of the recommended programmatic changes cannot be implemented without added or renovated space. ·
o Expand capacity for special events, so more residents can participate, feel involved, and understand that the Saltmarsh Senior Center is for them. ·
o Consider exploring satellite space options as a means of expanding programs, or seek partnerships to accommodate exercise programs as part of a health promotion activity in Town.
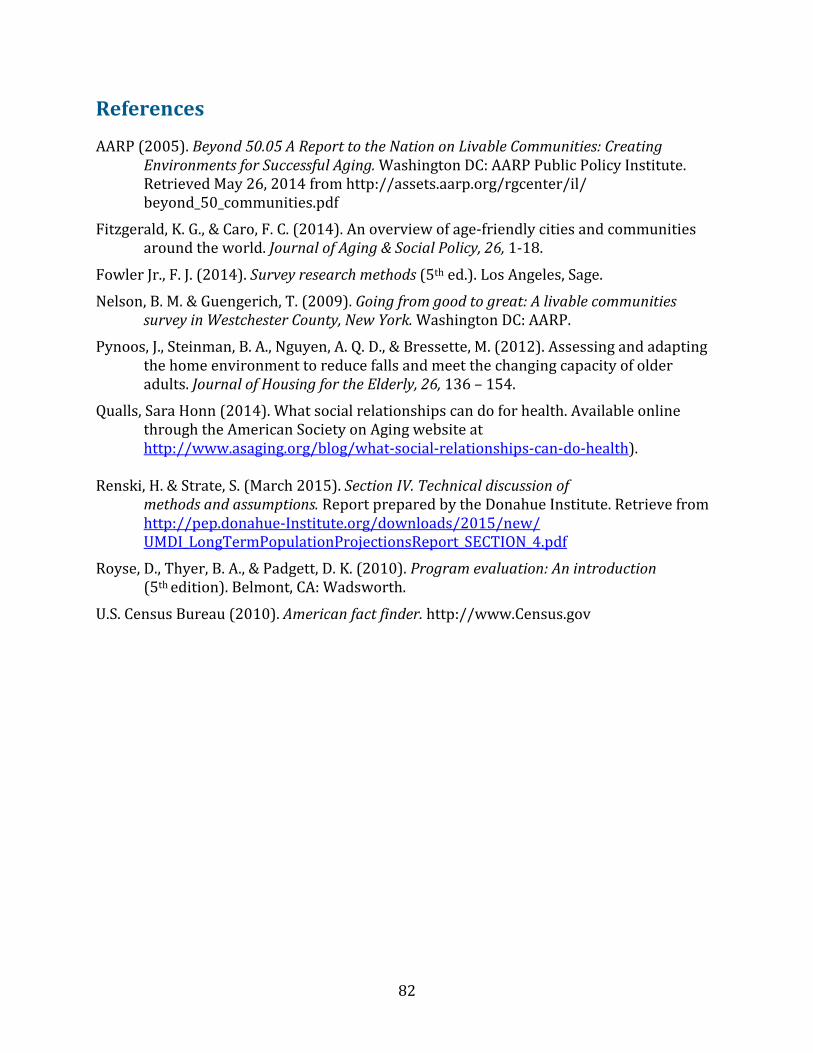
82
References
AARP (2005). Beyond 50.05 A Report to the Nation on Livable Communities: Creating Environments for Successful Aging. Washington DC: AARP Public Policy Institute. Retrieved May 26, 2014 from http://assets.aarp.org/rgcenter/il/ beyond_50_communities.pdf
Fitzgerald, K. G., & Caro, F. C. (2014). An overview of age-friendly cities and communities around the world. Journal of Aging & Social Policy, 26, 1-18.
Fowler Jr., F. J. (2014). Survey research methods (5th ed.). Los Angeles, Sage.
Nelson, B. M. & Guengerich, T. (2009). Going from good to great: A livable communities survey in Westchester County, New York. Washington DC: AARP.
Pynoos, J., Steinman, B. A., Nguyen, A. Q. D., & Bressette, M. (2012). Assessing and adapting the home environment to reduce falls and meet the changing capacity of older adults. Journal of Housing for the Elderly, 26, 136 – 154.
Qualls, Sara Honn (2014). What social relationships can do for health. Available online through the American Society on Aging website at http://www.asaging.org/blog/what-social-relationships-can-do-health).
Renski, H. & Strate, S. (March 2015). Section IV. Technical discussion of
methods and assumptions. Report prepared by the Donahue Institute. Retrieve from http://pep.donahue-Institute.org/downloads/2015/new/ UMDI_LongTermPopulationProjectionsReport_SECTION_4.pdf
Royse, D., Thyer, B. A., & Padgett, D. K. (2010). Program evaluation: An introduction (5th edition). Belmont, CA: Wadsworth.
U.S. Census Bureau (2010). American fact finder. http://www.Census.gov
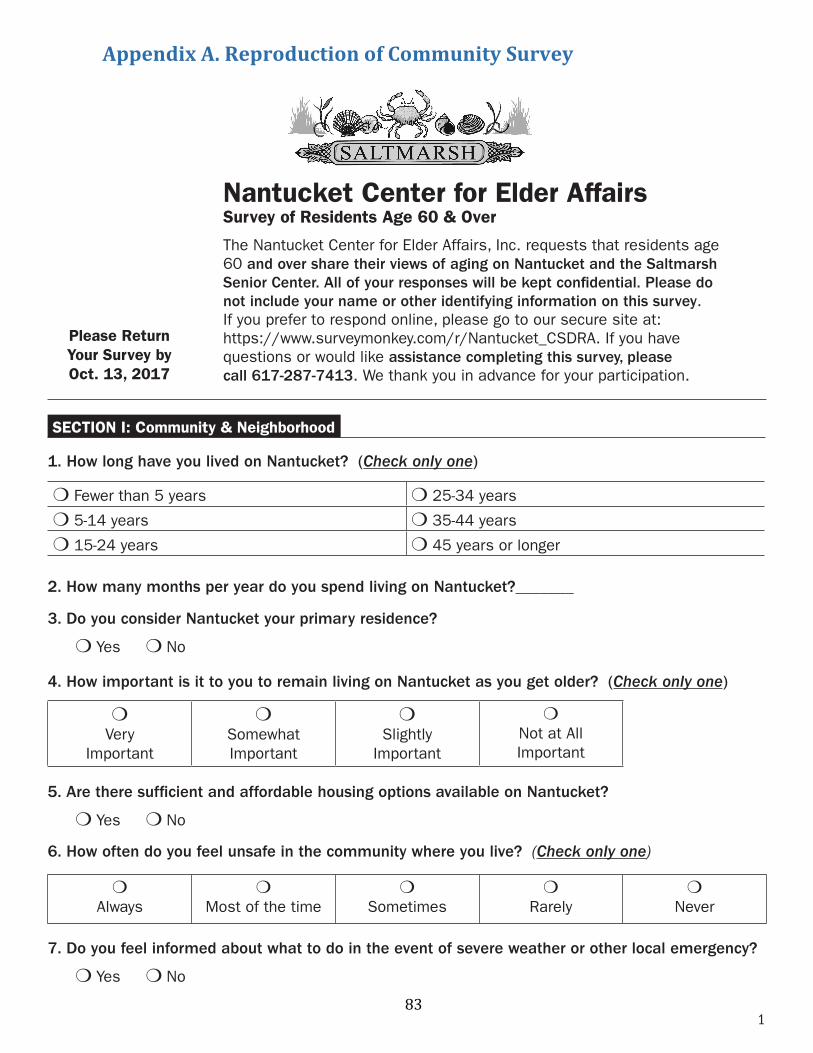
1
Nantucket Center for Elder Affairs Survey of Residents Age 60 & Over
The Nantucket Center for Elder Affairs, Inc. requests that residents age 60 and over share their views of aging on Nantucket and the Saltmarsh Senior Center. All of your responses will be kept confidential. Please do not include your name or other identifying information on this survey. If you prefer to respond online, please go to our secure site at: https://www.surveymonkey.com/r/Nantucket_CSDRA. If you have questions or would like assistance completing this survey, please call 617-287-7413. We thank you in advance for your participation.
Please Return Your Survey by Oct. 13, 2017
SECTION I: Community & Neighborhood
1. How long have you lived on Nantucket? (Check only one)
4. How important is it to you to remain living on Nantucket as you get older? (Check only one)
2. How many months per year do you spend living on Nantucket?_______
3. Do you consider Nantucket your primary residence?
m Yes m No
mVery
Important
mSomewhat Important
mSlightly
Important
mNot at AllImportant
Key Code: 99999
m Fewer than 5 years m 25-34 years
m 5-14 years m 35-44 years
m 15-24 years m 45 years or longer
5. Are there sufficient and affordable housing options available on Nantucket?
m Yes m No
6. How often do you feel unsafe in the community where you live? (Check only one)
7. Do you feel informed about what to do in the event of severe weather or other local emergency?
m Yes m No
mAlways
mMost of the time
mSometimes
mRarely
mNever
Appendix A. Reproduction of Community Survey
83
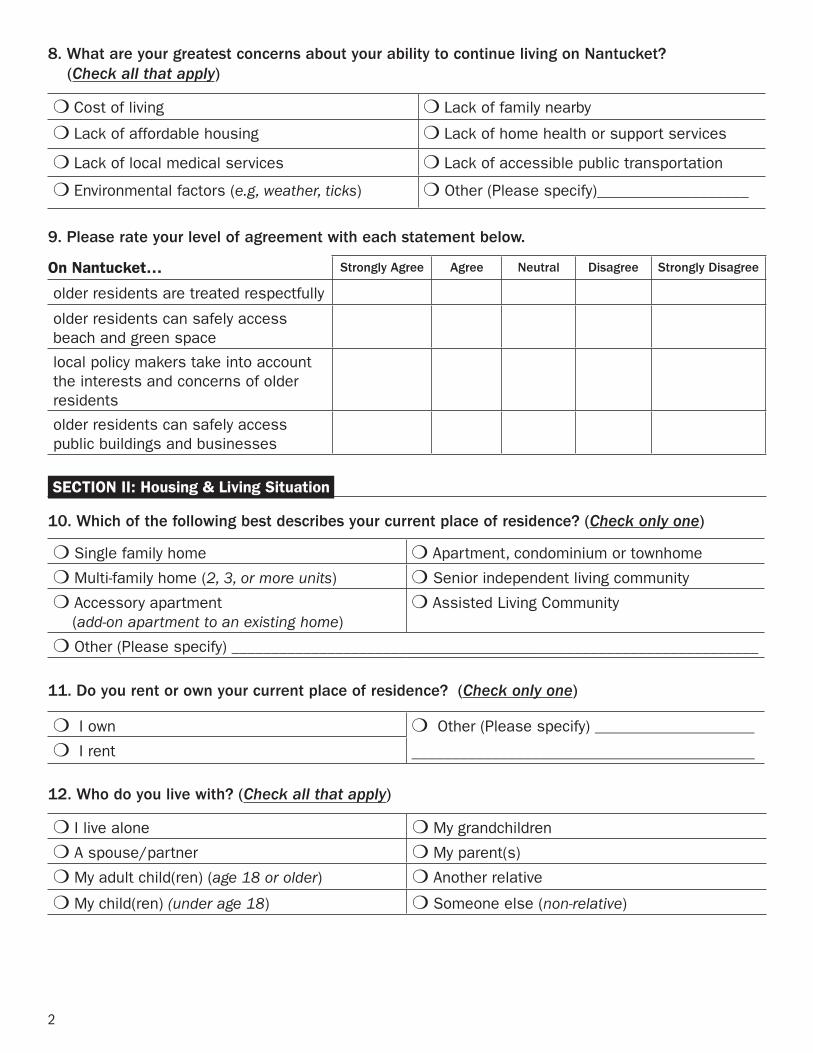
2
SECTION II: Housing & Living Situation
10. Which of the following best describes your current place of residence? (Check only one)
12. Who do you live with? (Check all that apply)
m Single family home m Apartment, condominium or townhome
m Multi-family home (2, 3, or more units) m Senior independent living community
m Accessory apartment (add-on apartment to an existing home)
m Assisted Living Community
m Other (Please specify) __________________________________________________________________
m I own m Other (Please specify) ____________________
___________________________________________m I rent
11. Do you rent or own your current place of residence? (Check only one)
m I live alone m My grandchildren
m A spouse/partner m My parent(s)
m My adult child(ren) (age 18 or older) m Another relative
m My child(ren) (under age 18) m Someone else (non-relative)
9. Please rate your level of agreement with each statement below.
Strongly Agree Agree Neutral Disagree Strongly Disagree
older residents are treated respectfully
older residents can safely access beach and green space
local policy makers take into account the interests and concerns of older residents
older residents can safely access public buildings and businesses
8. What are your greatest concerns about your ability to continue living on Nantucket? (Check all that apply)
m Cost of living m Lack of family nearby
m Lack of affordable housing m Lack of home health or support services
m Lack of local medical services m Lack of accessible public transportation
m Environmental factors (e.g, weather, ticks) m Other (Please specify)___________________
On Nantucket…
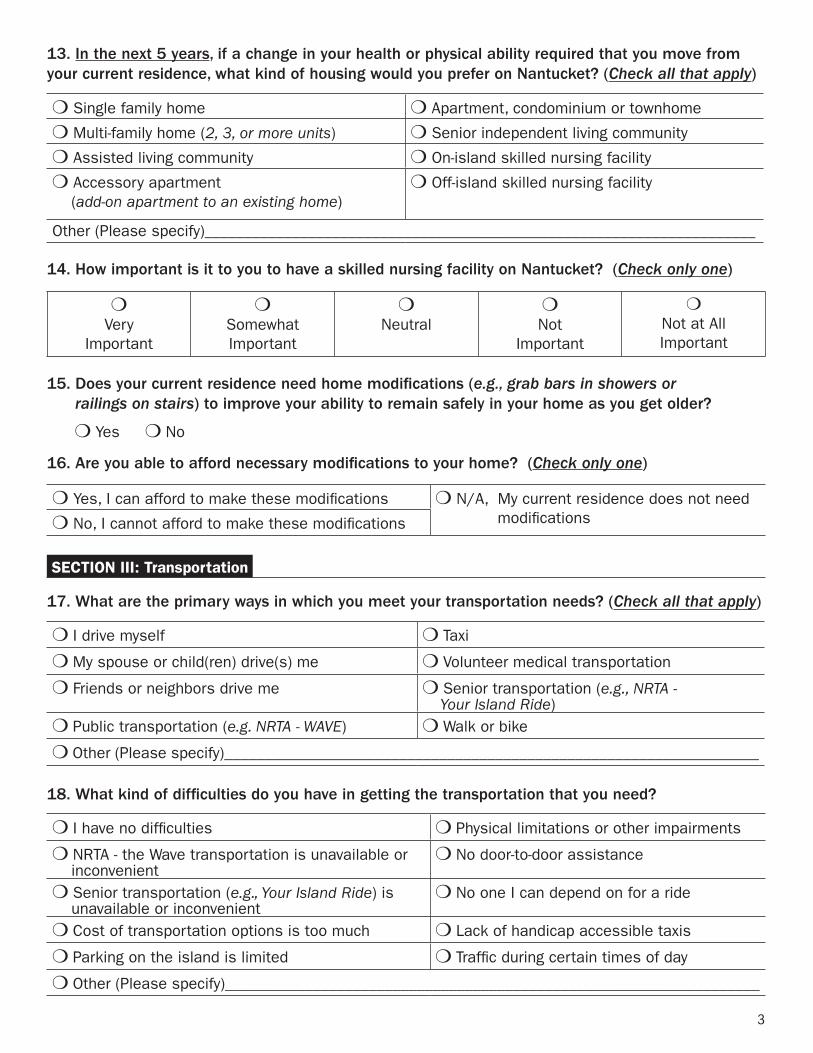
3
15. Does your current residence need home modifications (e.g., grab bars in showers or railings on stairs) to improve your ability to remain safely in your home as you get older?
m Yes m No
SECTION III: Transportation
17. What are the primary ways in which you meet your transportation needs? (Check all that apply)
m I drive myself m Taxi
m My spouse or child(ren) drive(s) me m Volunteer medical transportation
m Friends or neighbors drive me m Senior transportation (e.g., NRTA - Your Island Ride)
m Public transportation (e.g. NRTA - WAVE) m Walk or bike
m Other (Please specify)___________________________________________________________________
m I have no difficulties m Physical limitations or other impairments
m NRTA - the Wave transportation is unavailable or inconvenient
m No door-to-door assistance
m Senior transportation (e.g., Your Island Ride) is unavailable or inconvenient
m No one I can depend on for a ride
m Cost of transportation options is too much m Lack of handicap accessible taxis
m Parking on the island is limited m Traffic during certain times of day
m Other (Please specify)___________________________________________________________________
18. What kind of difficulties do you have in getting the transportation that you need?
14. How important is it to you to have a skilled nursing facility on Nantucket? (Check only one)
mVery
Important
mSomewhat Important
mNeutral
mNot
Important
mNot at AllImportant
13. In the next 5 years, if a change in your health or physical ability required that you move from your current residence, what kind of housing would you prefer on Nantucket? (Check all that apply)
m Single family home m Apartment, condominium or townhome
m Multi-family home (2, 3, or more units) m Senior independent living community
m Assisted living community m On-island skilled nursing facility
m Accessory apartment (add-on apartment to an existing home)
m Off-island skilled nursing facility
Other (Please specify)_____________________________________________________________________
m Yes, I can afford to make these modifications m N/A, My current residence does not need modificationsm No, I cannot afford to make these modifications
16. Are you able to afford necessary modifications to your home? (Check only one)
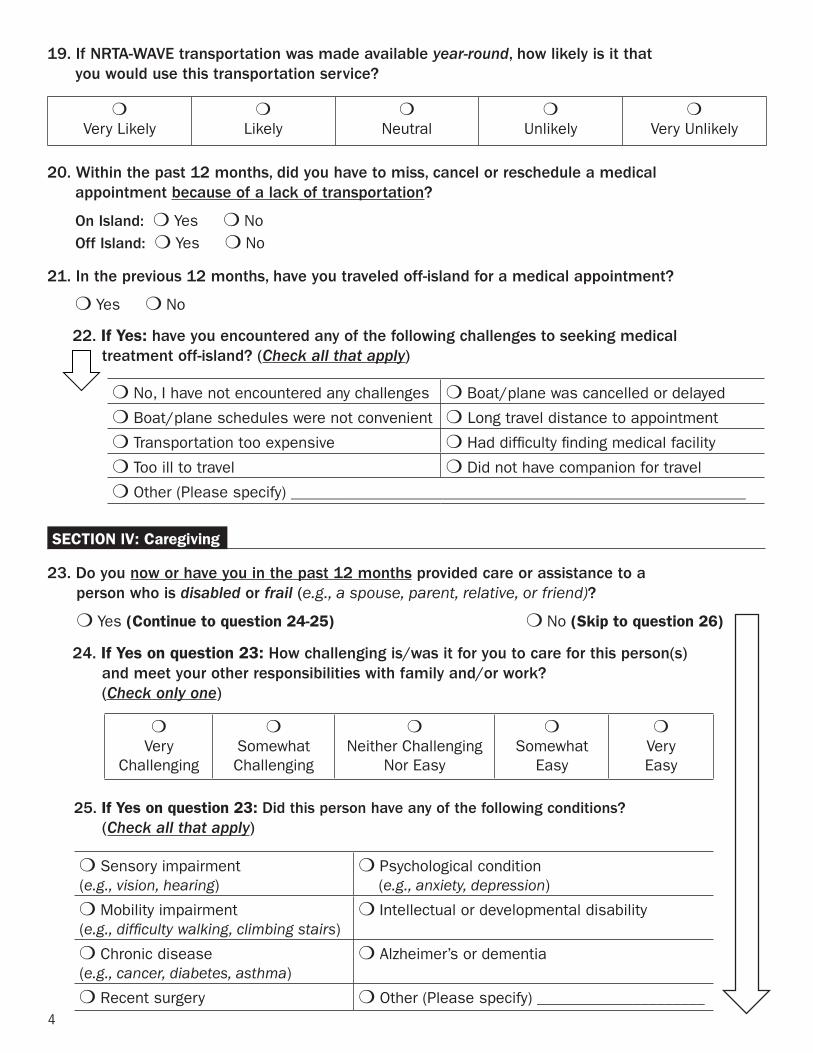
4
SECTION lV: Caregiving
23. Do you now or have you in the past 12 months provided care or assistance to a person who is disabled or frail (e.g., a spouse, parent, relative, or friend)?
m Yes (Continue to question 24-25) m No (Skip to question 26)
24. If Yes on question 23: How challenging is/was it for you to care for this person(s) and meet your other responsibilities with family and/or work? (Check only one)
mVery
Challenging
mSomewhatChallenging
mNeither Challenging
Nor Easy
mSomewhat
Easy
mVeryEasy
25. If Yes on question 23: Did this person have any of the following conditions? (Check all that apply)
19. If NRTA-WAVE transportation was made available year-round, how likely is it that you would use this transportation service?
mVery Likely
mLikely
mNeutral
mUnlikely
mVery Unlikely
20. Within the past 12 months, did you have to miss, cancel or reschedule a medical appointment because of a lack of transportation?
On Island: m Yes m No Off Island: m Yes m No
21. In the previous 12 months, have you traveled off-island for a medical appointment?
m Yes m No
22. If Yes: have you encountered any of the following challenges to seeking medical treatment off-island? (Check all that apply)
m No, I have not encountered any challenges m Boat/plane was cancelled or delayed
m Boat/plane schedules were not convenient m Long travel distance to appointment
m Transportation too expensive m Had difficulty finding medical facility
m Too ill to travel m Did not have companion for travel
m Other (Please specify) _________________________________________________________
m Sensory impairment (e.g., vision, hearing)
m Psychological condition (e.g., anxiety, depression)
m Mobility impairment (e.g., difficulty walking, climbing stairs)
m Intellectual or developmental disability
m Chronic disease (e.g., cancer, diabetes, asthma)
m Alzheimer’s or dementia
m Recent surgery m Other (Please specify) _____________________
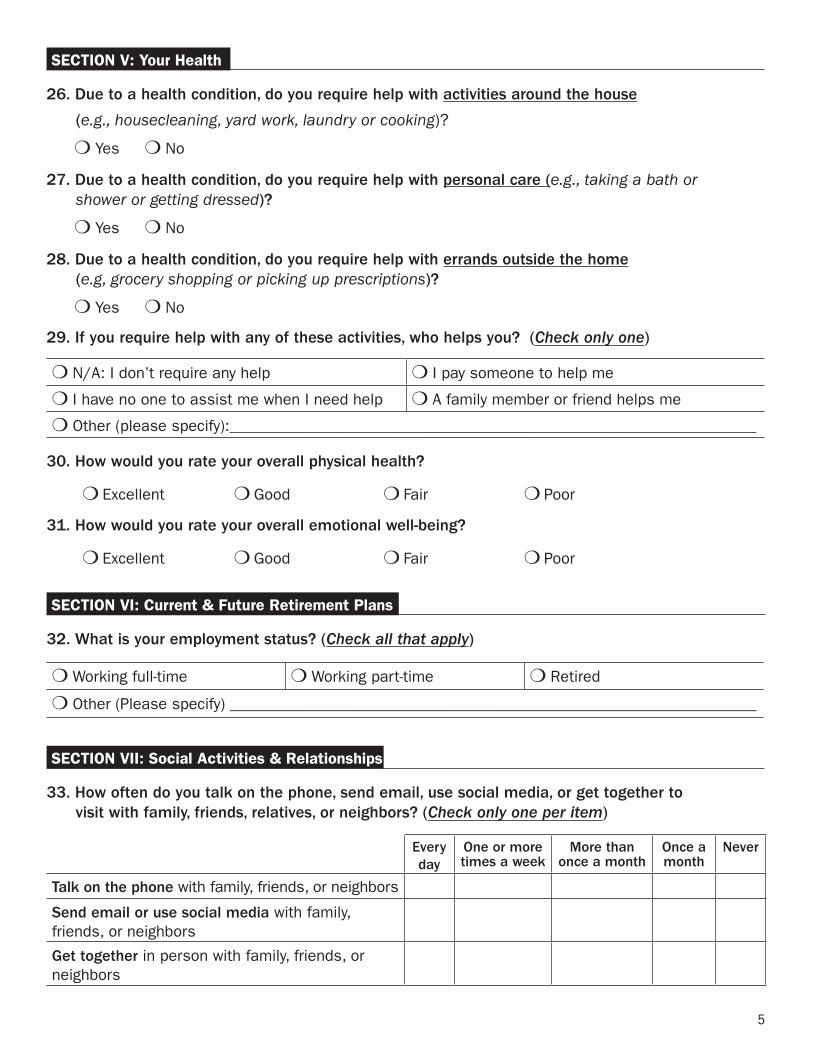
5
SECTION VI: Current & Future Retirement Plans
32. What is your employment status? (Check all that apply)
m Working full-time m Working part-time m Retired
m Other (Please specify) __________________________________________________________________
SECTION VII: Social Activities & Relationships
33. How often do you talk on the phone, send email, use social media, or get together to visit with family, friends, relatives, or neighbors? (Check only one per item)
m N/A: I don’t require any help m I pay someone to help me
m I have no one to assist me when I need help m A family member or friend helps me
m Other (please specify):__________________________________________________________________
29. If you require help with any of these activities, who helps you? (Check only one)
30. How would you rate your overall physical health?
31. How would you rate your overall emotional well-being?
SECTION V: Your Health
26. Due to a health condition, do you require help with activities around the house
(e.g., housecleaning, yard work, laundry or cooking)?
m Yes m No
27. Due to a health condition, do you require help with personal care (e.g., taking a bath or shower or getting dressed)?
m Yes m No
28. Due to a health condition, do you require help with errands outside the home (e.g, grocery shopping or picking up prescriptions)?
m Yes m No
m Excellent m Good m Fair m Poor
m Excellent m Good m Fair m Poor
m No, I have not encountered any challenges m Boat/plane was cancelled or delayed
m Boat/plane schedules were not convenient m Long travel distance to appointment
m Transportation too expensive m Had difficulty finding medical facility
m Too ill to travel m Did not have companion for travel
m Other (Please specify) _________________________________________________________
Every day
One or more times a week
More than once a month
Once a month
Never
Talk on the phone with family, friends, or neighbors
Send email or use social media with family, friends, or neighbors
Get together in person with family, friends, or neighbors

6
36. How frequently do you use programs or services offered at the Saltmarsh Senior Center? (Check only one)
37. If never: What is the reason that you do not currently use programs or services offered at the Saltmarsh Senior Center? (Check all that apply)
38. Do you see the Saltmarsh Senior Center as playing a role in the lives of yourself, loved ones, friends, or neighbors?
m Yes m No
m Two or more times a week
m About once a week
m A few times a month
m About once a month
m A few times a year (e.g., special events only)
m Never, I do not use programs or services offered by the Saltmarsh Senior Center (skip to question #37)
SECTION VIII: Programs & Services at the Saltmarsh Senior Center
34. Would you ask a neighbor/friend for help if you needed assistance with a minor task or errand (e.g., changing a light bulb, shopping, shoveling snow)?
m Yes m No
35. Do you provide any help to neighbors/friends with minor tasks or errands?
m Yes m No m No, but I would be willing if asked
m I am not interested m I do not have time
m I participate in programs elsewhere m I am not old enough
m Hours of operation are inconvenient m Programs/Services do not meet my needs
m Other (Please specify) _________________m I am unaware of programs, services offered
39. Below is a list of issues one could encounter when accessing the Saltmarsh Senior Center or its programs. Which of these issues have you experienced? (Check all that apply)
m Lack of transportation m Hours of the Senior Center are inconvenient
m Lack of sufficient parking m Limited class size for events/activities
m Not knowing what programs and services are available
m I don’t think I would fit in there
m Programs don’t interest me m Cost for programs
m Location of the Senior Center is inconvenient m Other (Please specify) ____________________
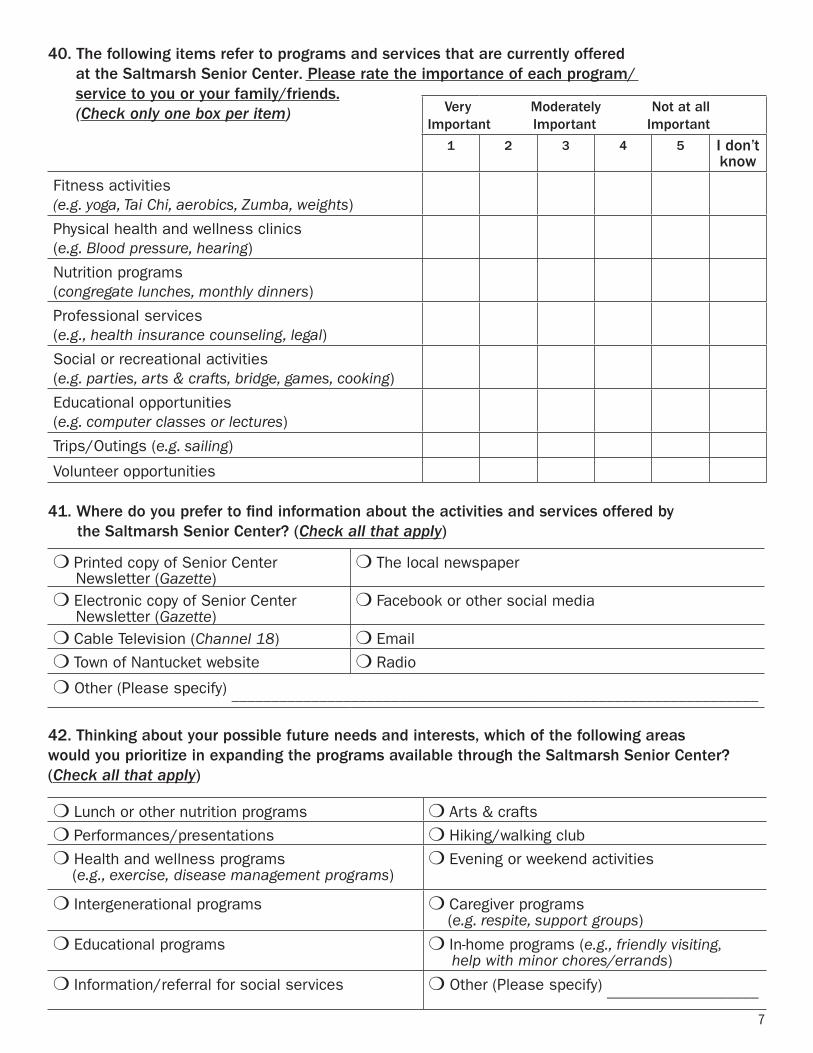
7
Very Moderately Not at all Important Important Important
1 2 3 4 5 I don’t know
Fitness activities (e.g. yoga, Tai Chi, aerobics, Zumba, weights)
Physical health and wellness clinics (e.g. Blood pressure, hearing)
Nutrition programs (congregate lunches, monthly dinners)
Professional services (e.g., health insurance counseling, legal)
Social or recreational activities (e.g. parties, arts & crafts, bridge, games, cooking)
Educational opportunities (e.g. computer classes or lectures)
Trips/Outings (e.g. sailing)
Volunteer opportunities
40. The following items refer to programs and services that are currently offeredat the Saltmarsh Senior Center. Please rate the importance of each program/service to you or your family/friends.(Check only one box per item)
41. Where do you prefer to find information about the activities and services offered bythe Saltmarsh Senior Center? (Check all that apply)
m Printed copy of Senior Center Newsletter (Gazette)
m The local newspaper
m Electronic copy of Senior Center Newsletter (Gazette)
m Facebook or other social media
m Cable Television (Channel 18) m Email
m Town of Nantucket website m Radio
m Other (Please specify) __________________________________________________________________
42. Thinking about your possible future needs and interests, which of the following areaswould you prioritize in expanding the programs available through the Saltmarsh Senior Center?(Check all that apply)
m Lunch or other nutrition programs m Arts & crafts
m Performances/presentations m Hiking/walking club
m Health and wellness programs (e.g., exercise, disease management programs)
m Evening or weekend activities
m Intergenerational programs m Caregiver programs (e.g. respite, support groups)
m Educational programs m In-home programs (e.g., friendly visiting, help with minor chores/errands)
m Information/referral for social services m Other (Please specify) ___________________
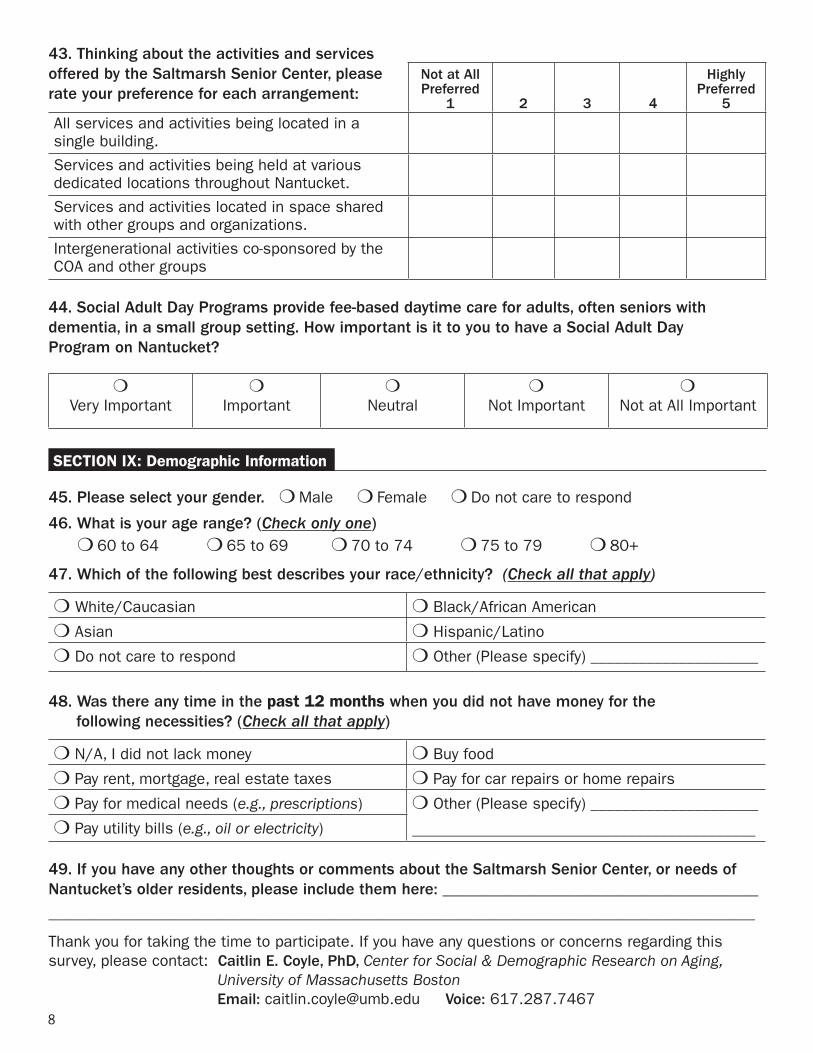
8
SECTION IX: Demographic Information
45. Please select your gender. m Male m Female m Do not care to respond
46. What is your age range? (Check only one) m 60 to 64 m 65 to 69 m 70 to 74 m 75 to 79 m 80+
48. Was there any time in the past 12 months when you did not have money for thefollowing necessities? (Check all that apply)
47. Which of the following best describes your race/ethnicity? (Check all that apply)
m N/A, I did not lack money m Buy food
m Pay rent, mortgage, real estate taxes m Pay for car repairs or home repairs
m Pay for medical needs (e.g., prescriptions) m Other (Please specify) _____________________
___________________________________________m Pay utility bills (e.g., oil or electricity)
m White/Caucasian m Black/African American
m Asian m Hispanic/Latino
m Do not care to respond m Other (Please specify) _____________________
49. If you have any other thoughts or comments about the Saltmarsh Senior Center, or needs ofNantucket’s older residents, please include them here: ______________________________________
_____________________________________________________________________________________
Thank you for taking the time to participate. If you have any questions or concerns regarding this survey, please contact: Caitlin E. Coyle, PhD, Center for Social & Demographic Research on Aging,
University of Massachusetts Boston Email: [email protected] Voice: 617.287.7467
44. Social Adult Day Programs provide fee-based daytime care for adults, often seniors withdementia, in a small group setting. How important is it to you to have a Social Adult DayProgram on Nantucket?
mVery Important
mImportant
mNeutral
mNot Important
mNot at All Important
43. Thinking about the activities and servicesoffered by the Saltmarsh Senior Center, pleaserate your preference for each arrangement:
Not at All Preferred
1 2 3 4
Highly Preferred
5All services and activities being located in a single building.
Services and activities being held at various dedicated locations throughout Nantucket.
Services and activities located in space shared with other groups and organizations.
Intergenerational activities co-sponsored by the COA and other groups
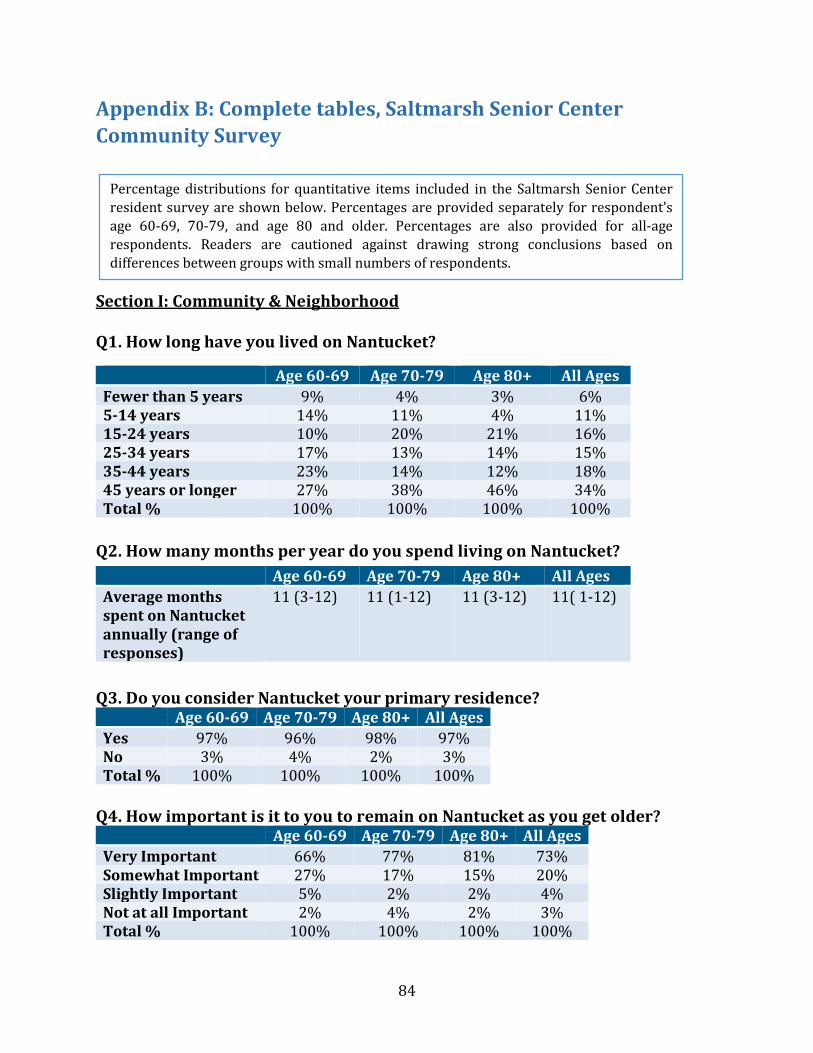
84
Appendix B: Complete tables, Saltmarsh Senior Center Community Survey
Section I: Community & Neighborhood Q1. How long have you lived on Nantucket?
Q2. How many months per year do you spend living on Nantucket?
Q3. Do you consider Nantucket your primary residence?
Age 60-69 Age 70-79 Age 80+ All Ages Yes 97% 96% 98% 97% No 3% 4% 2% 3% Total % 100% 100% 100% 100%
Q4. How important is it to you to remain on Nantucket as you get older?
Age 60-69 Age 70-79 Age 80+ All Ages Very Important 66% 77% 81% 73% Somewhat Important 27% 17% 15% 20% Slightly Important 5% 2% 2% 4% Not at all Important 2% 4% 2% 3% Total % 100% 100% 100% 100%
Age 60-69 Age 70-79 Age 80+ All Ages Fewer than 5 years 9% 4% 3% 6% 5-14 years 14% 11% 4% 11% 15-24 years 10% 20% 21% 16% 25-34 years 17% 13% 14% 15% 35-44 years 23% 14% 12% 18% 45 years or longer 27% 38% 46% 34% Total % 100% 100% 100% 100%
Age 60-69 Age 70-79 Age 80+ All Ages Average months spent on Nantucket annually (range of responses)
11 (3-12) 11 (1-12) 11 (3-12) 11( 1-12)
Percentage distributions for quantitative items included in the Saltmarsh Senior Center resident survey are shown below. Percentages are provided separately for respondent’s age 60-69, 70-79, and age 80 and older. Percentages are also provided for all-age respondents. Readers are cautioned against drawing strong conclusions based on differences between groups with small numbers of respondents.
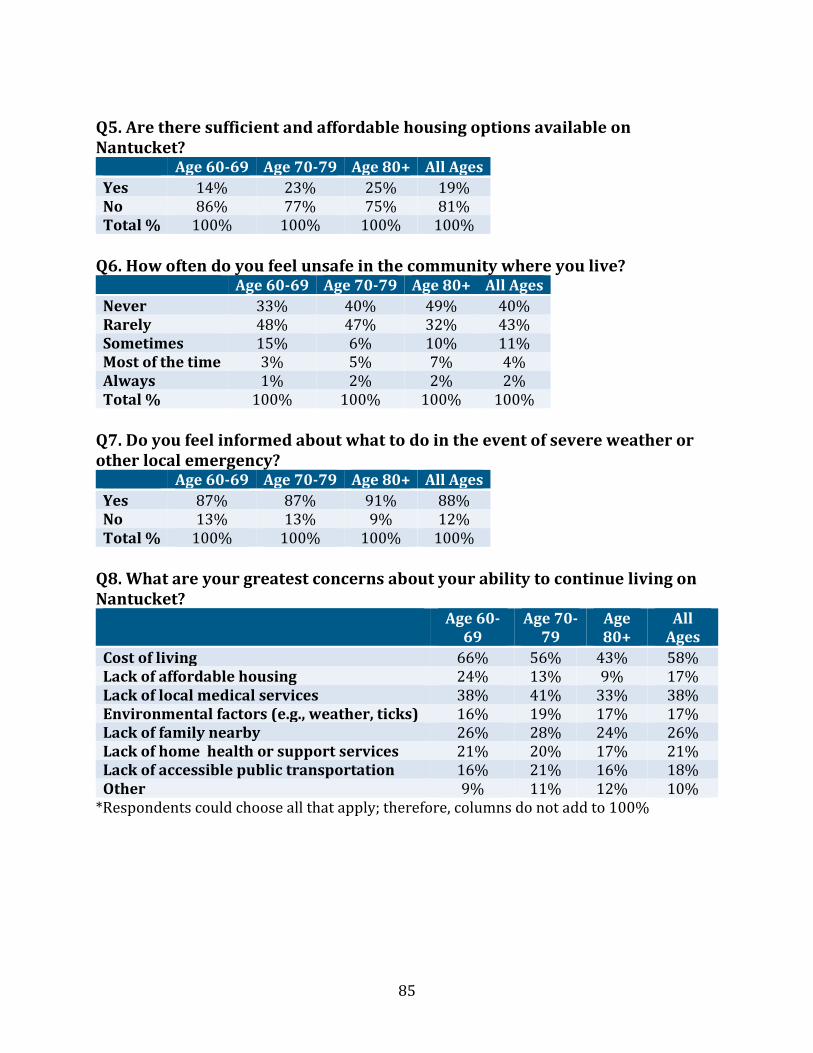
85
Q5. Are there sufficient and affordable housing options available on Nantucket?
Age 60-69 Age 70-79 Age 80+ All Ages Yes 14% 23% 25% 19% No 86% 77% 75% 81% Total % 100% 100% 100% 100%
Q6. How often do you feel unsafe in the community where you live?
Age 60-69 Age 70-79 Age 80+ All Ages Never 33% 40% 49% 40% Rarely 48% 47% 32% 43% Sometimes 15% 6% 10% 11% Most of the time 3% 5% 7% 4% Always 1% 2% 2% 2% Total % 100% 100% 100% 100%
Q7. Do you feel informed about what to do in the event of severe weather or other local emergency?
Age 60-69 Age 70-79 Age 80+ All Ages Yes 87% 87% 91% 88% No 13% 13% 9% 12% Total % 100% 100% 100% 100%
Q8. What are your greatest concerns about your ability to continue living on Nantucket?
Age 60-69
Age 70-79
Age 80+
All Ages
Cost of living 66% 56% 43% 58% Lack of affordable housing 24% 13% 9% 17% Lack of local medical services 38% 41% 33% 38% Environmental factors (e.g., weather, ticks) 16% 19% 17% 17% Lack of family nearby 26% 28% 24% 26% Lack of home health or support services 21% 20% 17% 21% Lack of accessible public transportation 16% 21% 16% 18% Other 9% 11% 12% 10%
*Respondents could choose all that apply; therefore, columns do not add to 100%
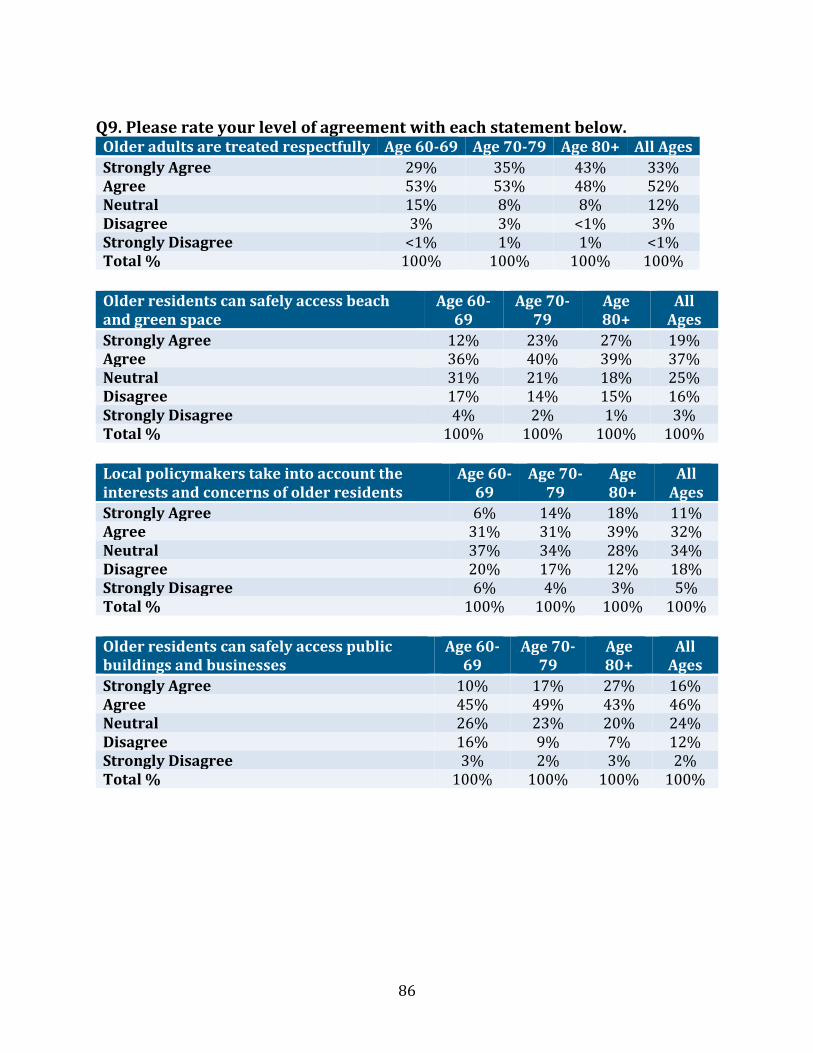
86
Q9. Please rate your level of agreement with each statement below.
Older adults are treated respectfully Age 60-69 Age 70-79 Age 80+ All Ages Strongly Agree 29% 35% 43% 33% Agree 53% 53% 48% 52% Neutral 15% 8% 8% 12% Disagree 3% 3% <1% 3% Strongly Disagree <1% 1% 1% <1% Total % 100% 100% 100% 100%
Older residents can safely access beach and green space
Age 60-69
Age 70-79
Age 80+
All Ages
Strongly Agree 12% 23% 27% 19% Agree 36% 40% 39% 37% Neutral 31% 21% 18% 25% Disagree 17% 14% 15% 16% Strongly Disagree 4% 2% 1% 3% Total % 100% 100% 100% 100%
Local policymakers take into account the interests and concerns of older residents
Age 60-69
Age 70-79
Age 80+
All Ages
Strongly Agree 6% 14% 18% 11% Agree 31% 31% 39% 32% Neutral 37% 34% 28% 34% Disagree 20% 17% 12% 18% Strongly Disagree 6% 4% 3% 5% Total % 100% 100% 100% 100%
Older residents can safely access public buildings and businesses
Age 60-69
Age 70-79
Age 80+
All Ages
Strongly Agree 10% 17% 27% 16% Agree 45% 49% 43% 46% Neutral 26% 23% 20% 24% Disagree 16% 9% 7% 12% Strongly Disagree 3% 2% 3% 2% Total % 100% 100% 100% 100%
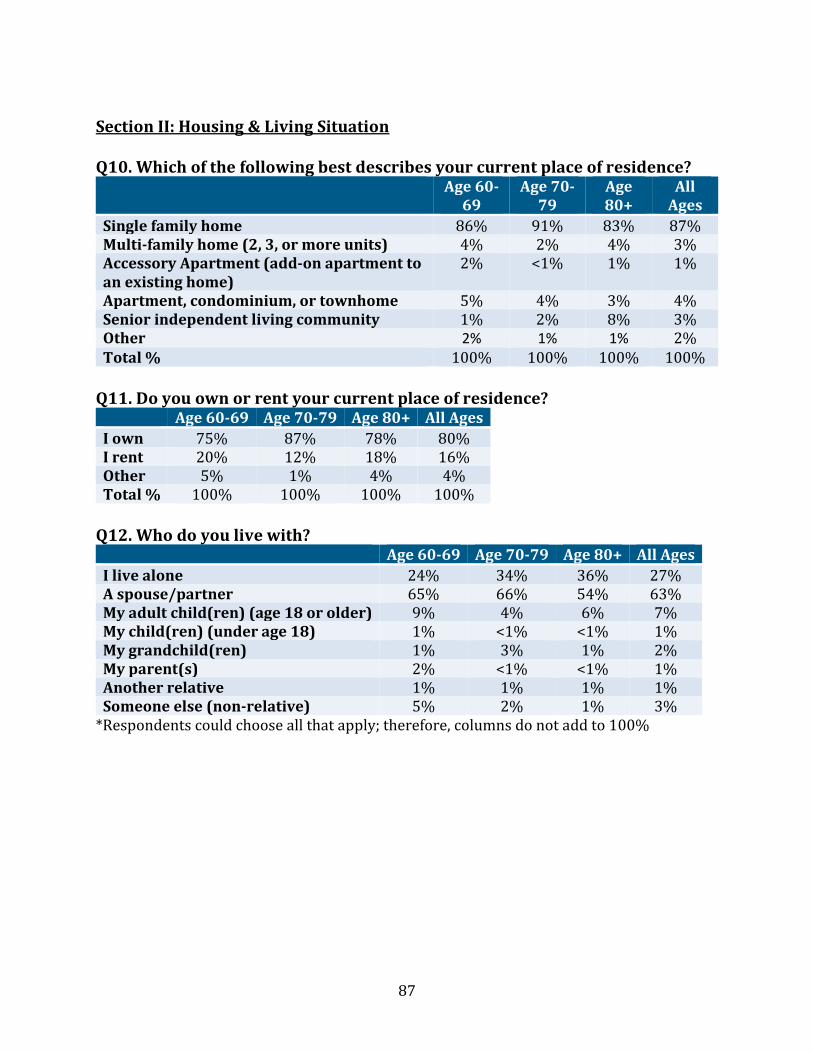
87
Section II: Housing & Living Situation Q10. Which of the following best describes your current place of residence?
Age 60-69
Age 70-79
Age 80+
All Ages
Single family home 86% 91% 83% 87% Multi-family home (2, 3, or more units) 4% 2% 4% 3% Accessory Apartment (add-on apartment to an existing home)
2% <1% 1% 1%
Apartment, condominium, or townhome 5% 4% 3% 4% Senior independent living community 1% 2% 8% 3% Other 2% 1% 1% 2% Total % 100% 100% 100% 100%
Q11. Do you own or rent your current place of residence?
Age 60-69 Age 70-79 Age 80+ All Ages I own 75% 87% 78% 80% I rent 20% 12% 18% 16% Other 5% 1% 4% 4% Total % 100% 100% 100% 100%
Q12. Who do you live with?
Age 60-69 Age 70-79 Age 80+ All Ages I live alone 24% 34% 36% 27% A spouse/partner 65% 66% 54% 63% My adult child(ren) (age 18 or older) 9% 4% 6% 7% My child(ren) (under age 18) 1% <1% <1% 1% My grandchild(ren) 1% 3% 1% 2% My parent(s) 2% <1% <1% 1% Another relative 1% 1% 1% 1% Someone else (non-relative) 5% 2% 1% 3%
*Respondents could choose all that apply; therefore, columns do not add to 100%
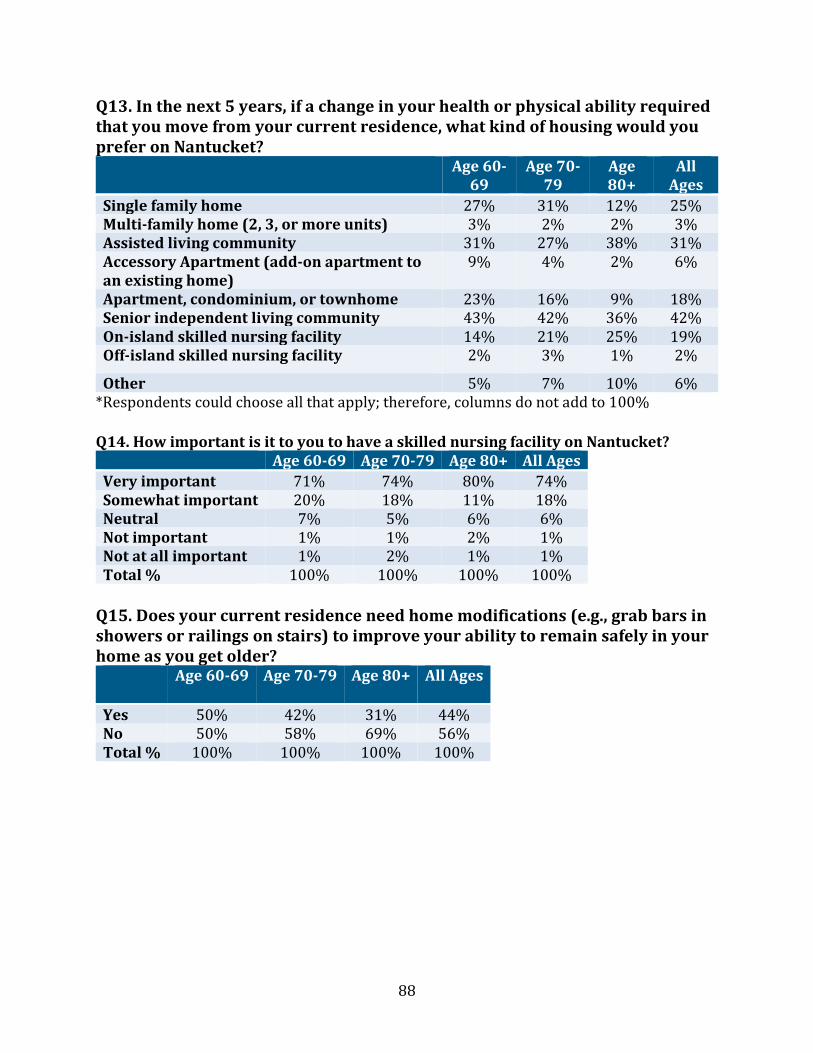
88
Q13. In the next 5 years, if a change in your health or physical ability required that you move from your current residence, what kind of housing would you prefer on Nantucket?
Age 60-69
Age 70-79
Age 80+
All Ages
Single family home 27% 31% 12% 25% Multi-family home (2, 3, or more units) 3% 2% 2% 3% Assisted living community 31% 27% 38% 31% Accessory Apartment (add-on apartment to an existing home)
9% 4% 2% 6%
Apartment, condominium, or townhome 23% 16% 9% 18% Senior independent living community 43% 42% 36% 42% On-island skilled nursing facility 14% 21% 25% 19% Off-island skilled nursing facility 2% 3% 1% 2%
Other 5% 7% 10% 6% *Respondents could choose all that apply; therefore, columns do not add to 100% Q14. How important is it to you to have a skilled nursing facility on Nantucket?
Age 60-69 Age 70-79 Age 80+ All Ages Very important 71% 74% 80% 74% Somewhat important 20% 18% 11% 18% Neutral 7% 5% 6% 6% Not important 1% 1% 2% 1% Not at all important 1% 2% 1% 1% Total % 100% 100% 100% 100%
Q15. Does your current residence need home modifications (e.g., grab bars in showers or railings on stairs) to improve your ability to remain safely in your home as you get older?
Age 60-69 Age 70-79 Age 80+ All Ages
Yes 50% 42% 31% 44% No 50% 58% 69% 56% Total % 100% 100% 100% 100%
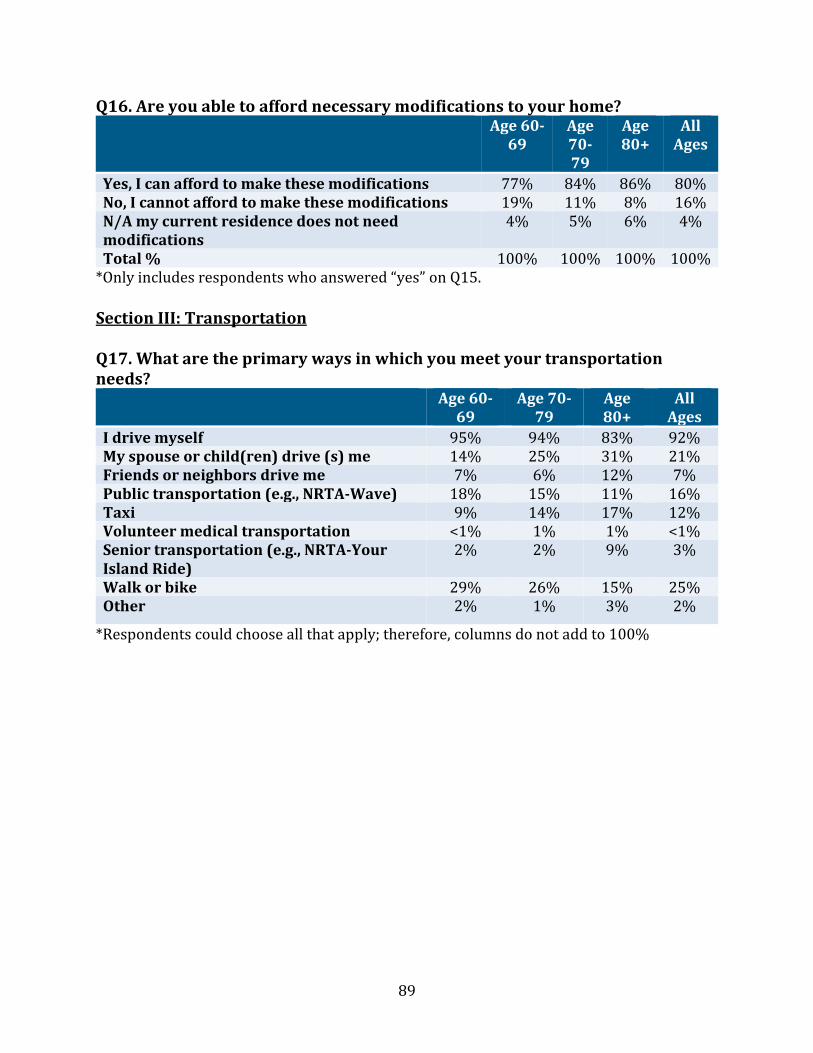
89
Q16. Are you able to afford necessary modifications to your home? Age 60-
69 Age 70-79
Age 80+
All Ages
Yes, I can afford to make these modifications 77% 84% 86% 80% No, I cannot afford to make these modifications 19% 11% 8% 16% N/A my current residence does not need modifications
4% 5% 6% 4%
Total % 100% 100% 100% 100% *Only includes respondents who answered “yes” on Q15. Section III: Transportation Q17. What are the primary ways in which you meet your transportation needs?
Age 60-69
Age 70-79
Age 80+
All Ages
I drive myself 95% 94% 83% 92% My spouse or child(ren) drive (s) me 14% 25% 31% 21% Friends or neighbors drive me 7% 6% 12% 7% Public transportation (e.g., NRTA-Wave) 18% 15% 11% 16% Taxi 9% 14% 17% 12% Volunteer medical transportation <1% 1% 1% <1% Senior transportation (e.g., NRTA-Your Island Ride)
2% 2% 9% 3%
Walk or bike 29% 26% 15% 25% Other 2% 1% 3% 2%
*Respondents could choose all that apply; therefore, columns do not add to 100%
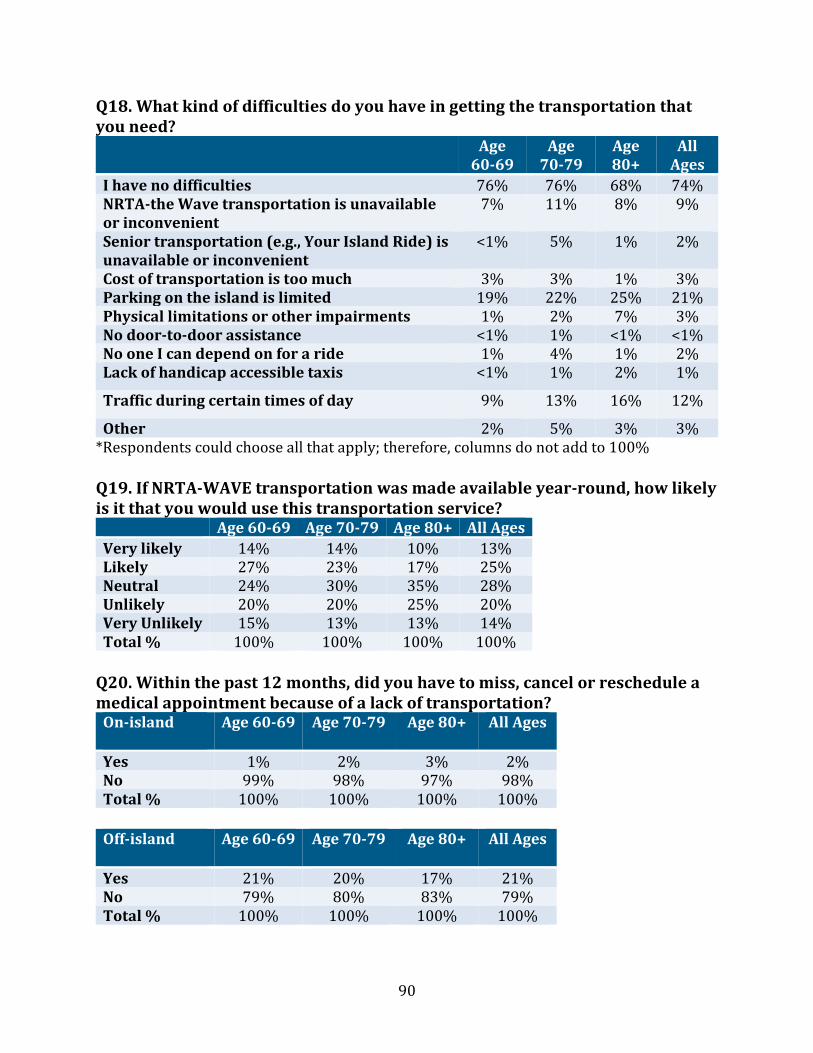
90
Q18. What kind of difficulties do you have in getting the transportation that you need?
Age 60-69
Age 70-79
Age 80+
All Ages
I have no difficulties 76% 76% 68% 74% NRTA-the Wave transportation is unavailable or inconvenient
7% 11% 8% 9%
Senior transportation (e.g., Your Island Ride) is unavailable or inconvenient
<1% 5% 1% 2%
Cost of transportation is too much 3% 3% 1% 3% Parking on the island is limited 19% 22% 25% 21% Physical limitations or other impairments 1% 2% 7% 3% No door-to-door assistance <1% 1% <1% <1% No one I can depend on for a ride 1% 4% 1% 2% Lack of handicap accessible taxis <1% 1% 2% 1%
Traffic during certain times of day 9% 13% 16% 12%
Other 2% 5% 3% 3% *Respondents could choose all that apply; therefore, columns do not add to 100% Q19. If NRTA-WAVE transportation was made available year-round, how likely is it that you would use this transportation service?
Age 60-69 Age 70-79 Age 80+ All Ages Very likely 14% 14% 10% 13% Likely 27% 23% 17% 25% Neutral 24% 30% 35% 28% Unlikely 20% 20% 25% 20% Very Unlikely 15% 13% 13% 14% Total % 100% 100% 100% 100%
Q20. Within the past 12 months, did you have to miss, cancel or reschedule a medical appointment because of a lack of transportation?
On-island
Age 60-69 Age 70-79 Age 80+ All Ages
Yes 1% 2% 3% 2% No 99% 98% 97% 98% Total % 100% 100% 100% 100%
Off-island
Age 60-69 Age 70-79 Age 80+ All Ages
Yes 21% 20% 17% 21% No 79% 80% 83% 79% Total % 100% 100% 100% 100%
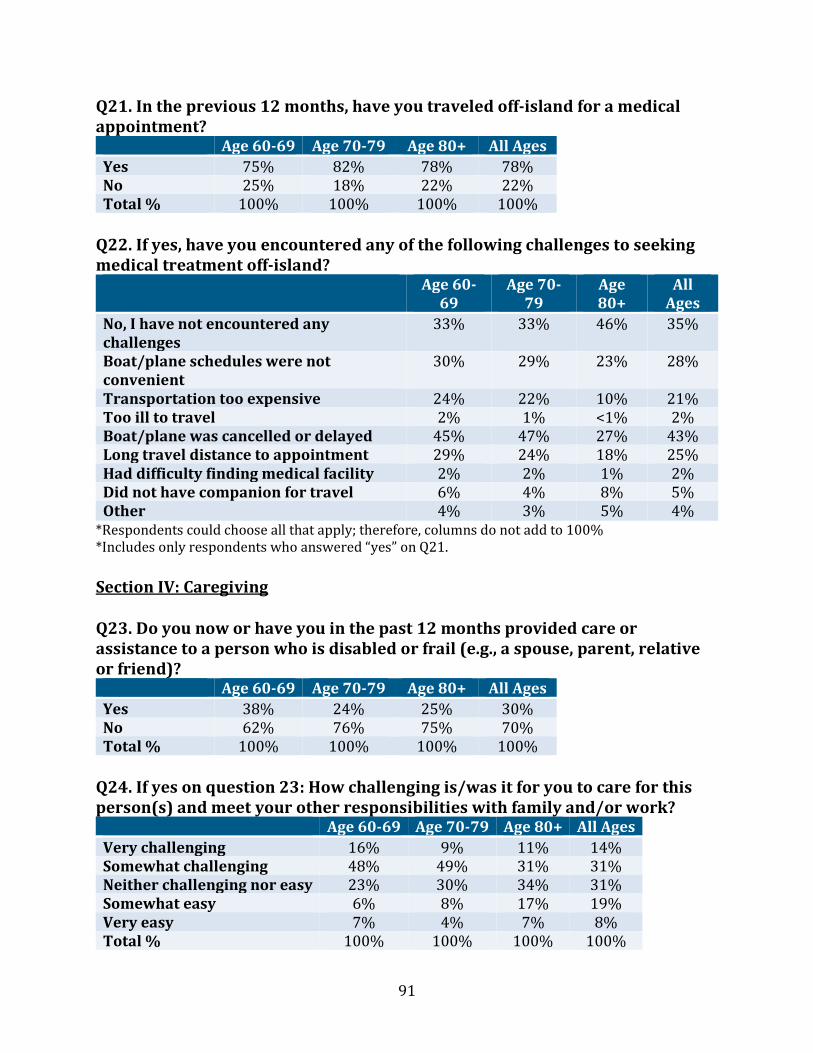
91
Q21. In the previous 12 months, have you traveled off-island for a medical appointment?
Age 60-69 Age 70-79 Age 80+ All Ages Yes 75% 82% 78% 78% No 25% 18% 22% 22% Total % 100% 100% 100% 100%
Q22. If yes, have you encountered any of the following challenges to seeking medical treatment off-island?
Age 60-69
Age 70-79
Age 80+
All Ages
No, I have not encountered any challenges
33% 33% 46% 35%
Boat/plane schedules were not convenient
30% 29% 23% 28%
Transportation too expensive 24% 22% 10% 21% Too ill to travel 2% 1% <1% 2% Boat/plane was cancelled or delayed 45% 47% 27% 43% Long travel distance to appointment 29% 24% 18% 25% Had difficulty finding medical facility 2% 2% 1% 2% Did not have companion for travel 6% 4% 8% 5% Other 4% 3% 5% 4%
*Respondents could choose all that apply; therefore, columns do not add to 100% *Includes only respondents who answered “yes” on Q21. Section IV: Caregiving Q23. Do you now or have you in the past 12 months provided care or assistance to a person who is disabled or frail (e.g., a spouse, parent, relative or friend)?
Age 60-69 Age 70-79 Age 80+ All Ages Yes 38% 24% 25% 30% No 62% 76% 75% 70% Total % 100% 100% 100% 100%
Q24. If yes on question 23: How challenging is/was it for you to care for this person(s) and meet your other responsibilities with family and/or work?
Age 60-69 Age 70-79 Age 80+ All Ages Very challenging 16% 9% 11% 14% Somewhat challenging 48% 49% 31% 31% Neither challenging nor easy 23% 30% 34% 31% Somewhat easy 6% 8% 17% 19% Very easy 7% 4% 7% 8% Total % 100% 100% 100% 100%
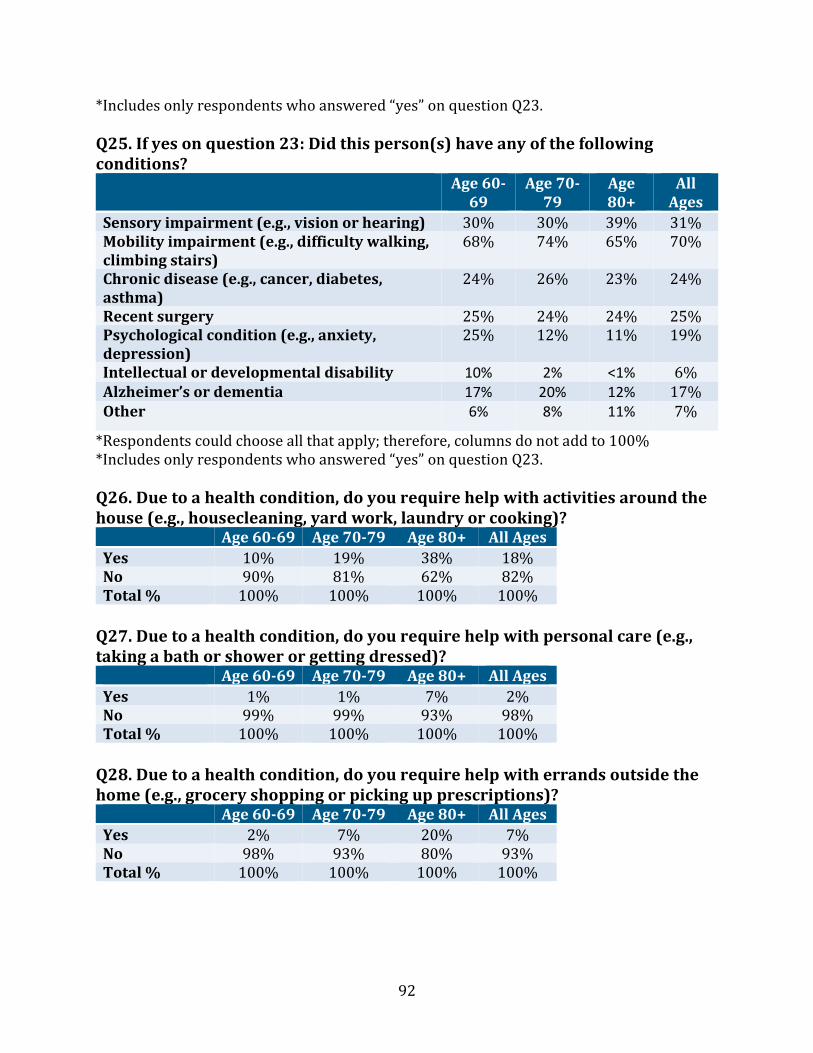
92
*Includes only respondents who answered “yes” on question Q23. Q25. If yes on question 23: Did this person(s) have any of the following conditions?
Age 60-69
Age 70-79
Age 80+
All Ages
Sensory impairment (e.g., vision or hearing) 30% 30% 39% 31% Mobility impairment (e.g., difficulty walking, climbing stairs)
68% 74% 65% 70%
Chronic disease (e.g., cancer, diabetes, asthma)
24% 26% 23% 24%
Recent surgery 25% 24% 24% 25% Psychological condition (e.g., anxiety, depression)
25% 12% 11% 19%
Intellectual or developmental disability 10% 2% <1% 6% Alzheimer’s or dementia 17% 20% 12% 17% Other 6% 8% 11% 7%
*Respondents could choose all that apply; therefore, columns do not add to 100% *Includes only respondents who answered “yes” on question Q23. Q26. Due to a health condition, do you require help with activities around the house (e.g., housecleaning, yard work, laundry or cooking)?
Age 60-69 Age 70-79 Age 80+ All Ages Yes 10% 19% 38% 18% No 90% 81% 62% 82% Total % 100% 100% 100% 100%
Q27. Due to a health condition, do you require help with personal care (e.g., taking a bath or shower or getting dressed)?
Age 60-69 Age 70-79 Age 80+ All Ages Yes 1% 1% 7% 2% No 99% 99% 93% 98% Total % 100% 100% 100% 100%
Q28. Due to a health condition, do you require help with errands outside the home (e.g., grocery shopping or picking up prescriptions)?
Age 60-69 Age 70-79 Age 80+ All Ages Yes 2% 7% 20% 7% No 98% 93% 80% 93% Total % 100% 100% 100% 100%
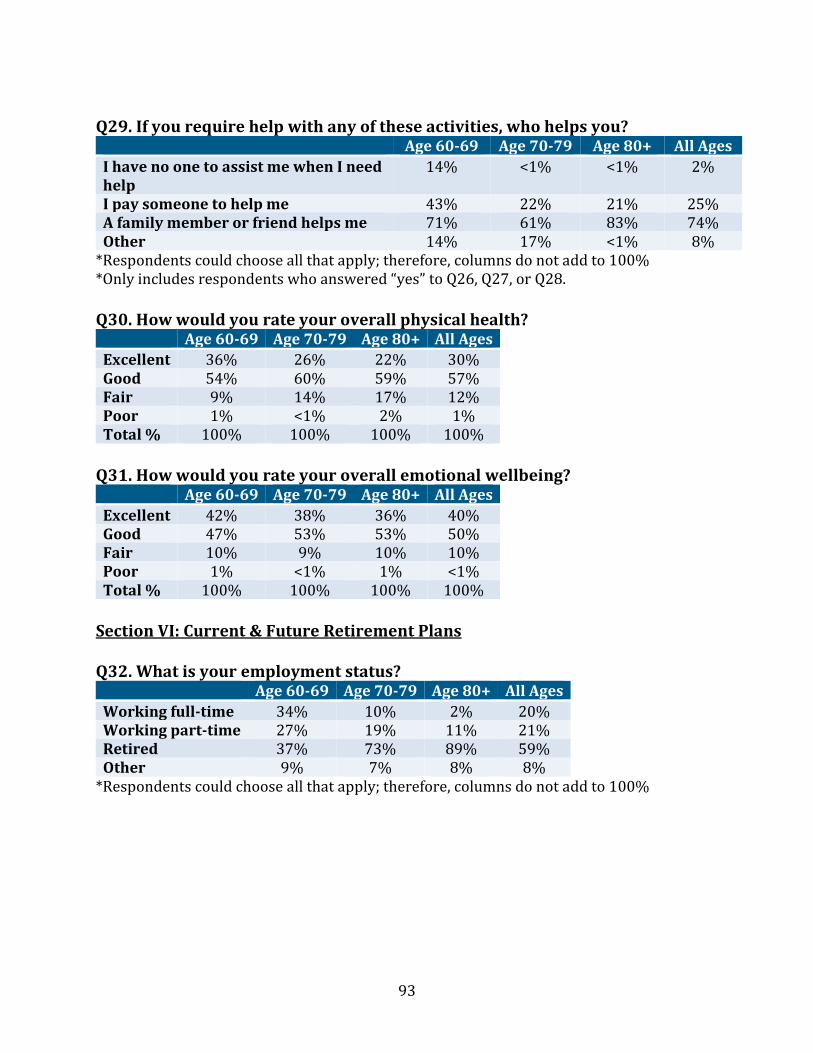
93
Q29. If you require help with any of these activities, who helps you?
Age 60-69 Age 70-79 Age 80+ All Ages I have no one to assist me when I need help
14% <1% <1% 2%
I pay someone to help me 43% 22% 21% 25% A family member or friend helps me 71% 61% 83% 74% Other 14% 17% <1% 8%
*Respondents could choose all that apply; therefore, columns do not add to 100% *Only includes respondents who answered “yes” to Q26, Q27, or Q28. Q30. How would you rate your overall physical health?
Age 60-69 Age 70-79 Age 80+ All Ages Excellent 36% 26% 22% 30% Good 54% 60% 59% 57% Fair 9% 14% 17% 12% Poor 1% <1% 2% 1% Total % 100% 100% 100% 100%
Q31. How would you rate your overall emotional wellbeing?
Age 60-69 Age 70-79 Age 80+ All Ages Excellent 42% 38% 36% 40% Good 47% 53% 53% 50% Fair 10% 9% 10% 10% Poor 1% <1% 1% <1% Total % 100% 100% 100% 100%
Section VI: Current & Future Retirement Plans Q32. What is your employment status?
Age 60-69 Age 70-79 Age 80+ All Ages Working full-time 34% 10% 2% 20% Working part-time 27% 19% 11% 21% Retired 37% 73% 89% 59% Other 9% 7% 8% 8%
*Respondents could choose all that apply; therefore, columns do not add to 100%
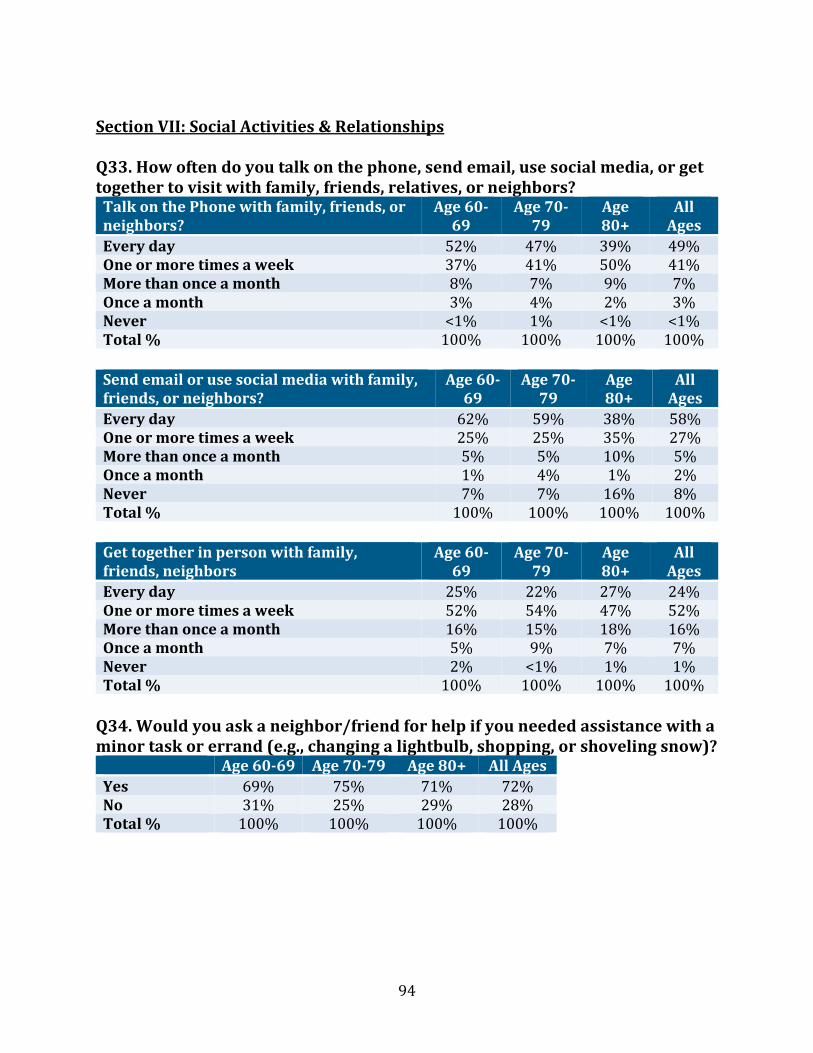
94
Section VII: Social Activities & Relationships Q33. How often do you talk on the phone, send email, use social media, or get together to visit with family, friends, relatives, or neighbors?
Talk on the Phone with family, friends, or neighbors?
Age 60-69
Age 70-79
Age 80+
All Ages
Every day 52% 47% 39% 49% One or more times a week 37% 41% 50% 41% More than once a month 8% 7% 9% 7% Once a month 3% 4% 2% 3% Never <1% 1% <1% <1% Total % 100% 100% 100% 100%
Send email or use social media with family, friends, or neighbors?
Age 60-69
Age 70-79
Age 80+
All Ages
Every day 62% 59% 38% 58% One or more times a week 25% 25% 35% 27% More than once a month 5% 5% 10% 5% Once a month 1% 4% 1% 2% Never 7% 7% 16% 8% Total % 100% 100% 100% 100%
Get together in person with family, friends, neighbors
Age 60-69
Age 70-79
Age 80+
All Ages
Every day 25% 22% 27% 24% One or more times a week 52% 54% 47% 52% More than once a month 16% 15% 18% 16% Once a month 5% 9% 7% 7% Never 2% <1% 1% 1% Total % 100% 100% 100% 100%
Q34. Would you ask a neighbor/friend for help if you needed assistance with a minor task or errand (e.g., changing a lightbulb, shopping, or shoveling snow)?
Age 60-69 Age 70-79 Age 80+ All Ages Yes 69% 75% 71% 72% No 31% 25% 29% 28% Total % 100% 100% 100% 100%
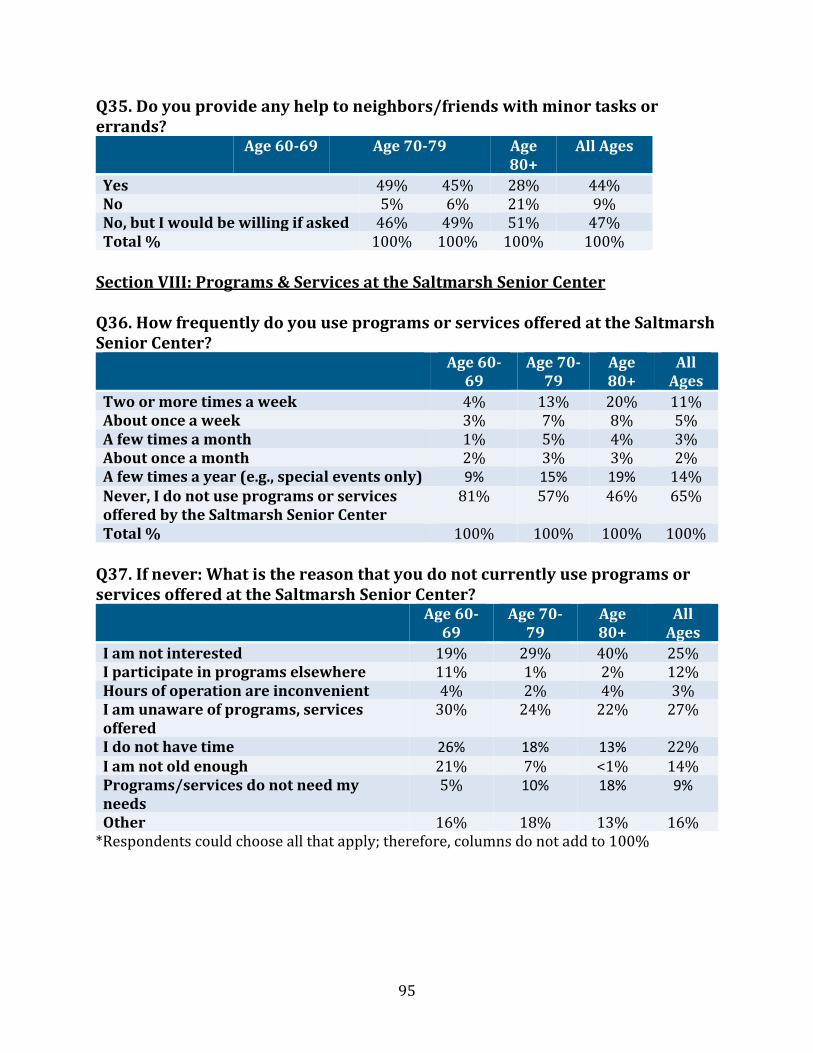
95
Q35. Do you provide any help to neighbors/friends with minor tasks or errands?
Age 60-69 Age 70-79 Age 80+
All Ages
Yes 49% 45% 28% 44% No 5% 6% 21% 9% No, but I would be willing if asked 46% 49% 51% 47% Total % 100% 100% 100% 100%
Section VIII: Programs & Services at the Saltmarsh Senior Center Q36. How frequently do you use programs or services offered at the Saltmarsh Senior Center?
Age 60-69
Age 70-79
Age 80+
All Ages
Two or more times a week 4% 13% 20% 11% About once a week 3% 7% 8% 5% A few times a month 1% 5% 4% 3% About once a month 2% 3% 3% 2% A few times a year (e.g., special events only) 9% 15% 19% 14% Never, I do not use programs or services offered by the Saltmarsh Senior Center
81% 57% 46% 65%
Total % 100% 100% 100% 100% Q37. If never: What is the reason that you do not currently use programs or services offered at the Saltmarsh Senior Center?
Age 60-69
Age 70-79
Age 80+
All Ages
I am not interested 19% 29% 40% 25% I participate in programs elsewhere 11% 1% 2% 12% Hours of operation are inconvenient 4% 2% 4% 3% I am unaware of programs, services offered
30% 24% 22% 27%
I do not have time 26% 18% 13% 22% I am not old enough 21% 7% <1% 14% Programs/services do not need my needs
5% 10% 18% 9%
Other 16% 18% 13% 16% *Respondents could choose all that apply; therefore, columns do not add to 100%
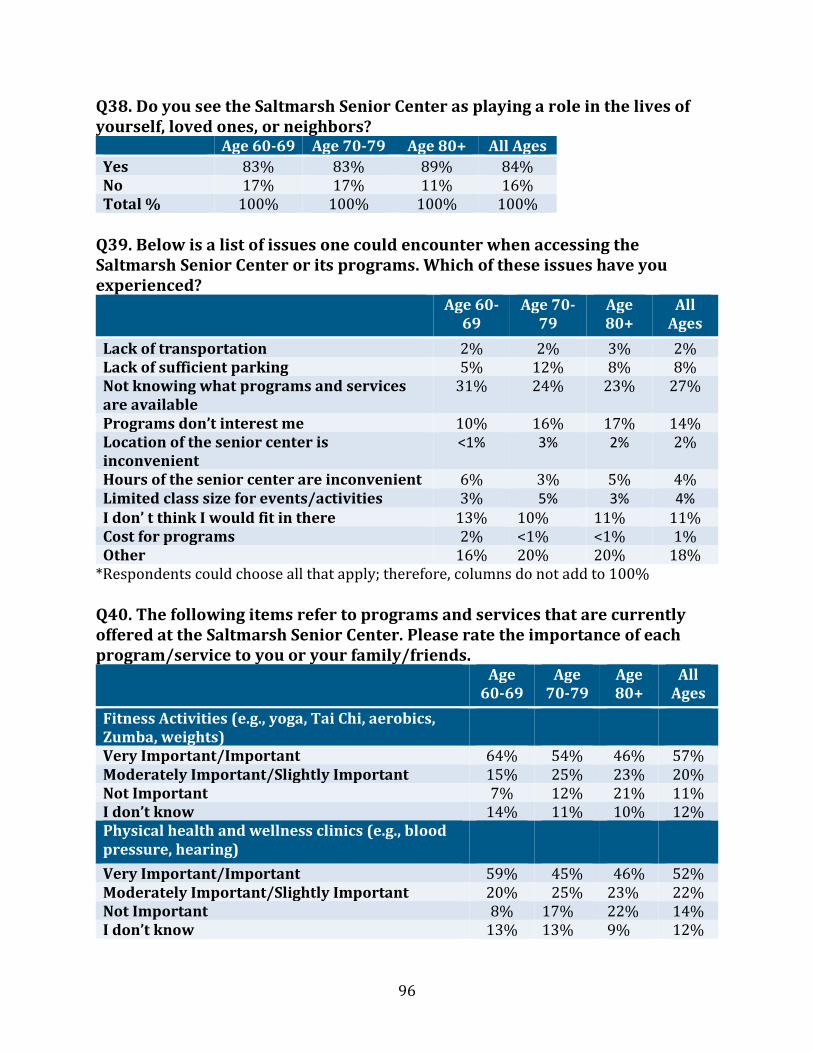
96
Q38. Do you see the Saltmarsh Senior Center as playing a role in the lives of yourself, loved ones, or neighbors?
Age 60-69 Age 70-79 Age 80+ All Ages Yes 83% 83% 89% 84% No 17% 17% 11% 16% Total % 100% 100% 100% 100%
Q39. Below is a list of issues one could encounter when accessing the Saltmarsh Senior Center or its programs. Which of these issues have you experienced?
Age 60-69
Age 70-79
Age 80+
All Ages
Lack of transportation 2% 2% 3% 2% Lack of sufficient parking 5% 12% 8% 8% Not knowing what programs and services are available
31% 24% 23% 27%
Programs don’t interest me 10% 16% 17% 14% Location of the senior center is inconvenient
<1% 3% 2% 2%
Hours of the senior center are inconvenient 6% 3% 5% 4% Limited class size for events/activities 3% 5% 3% 4% I don’ t think I would fit in there 13% 10% 11% 11% Cost for programs 2% <1% <1% 1% Other 16% 20% 20% 18%
*Respondents could choose all that apply; therefore, columns do not add to 100% Q40. The following items refer to programs and services that are currently offered at the Saltmarsh Senior Center. Please rate the importance of each program/service to you or your family/friends.
Age 60-69
Age 70-79
Age 80+
All Ages
Fitness Activities (e.g., yoga, Tai Chi, aerobics, Zumba, weights)
Very Important/Important 64% 54% 46% 57% Moderately Important/Slightly Important 15% 25% 23% 20% Not Important 7% 12% 21% 11% I don’t know 14% 11% 10% 12% Physical health and wellness clinics (e.g., blood pressure, hearing)
Very Important/Important 59% 45% 46% 52% Moderately Important/Slightly Important 20% 25% 23% 22% Not Important 8% 17% 22% 14% I don’t know 13% 13% 9% 12%
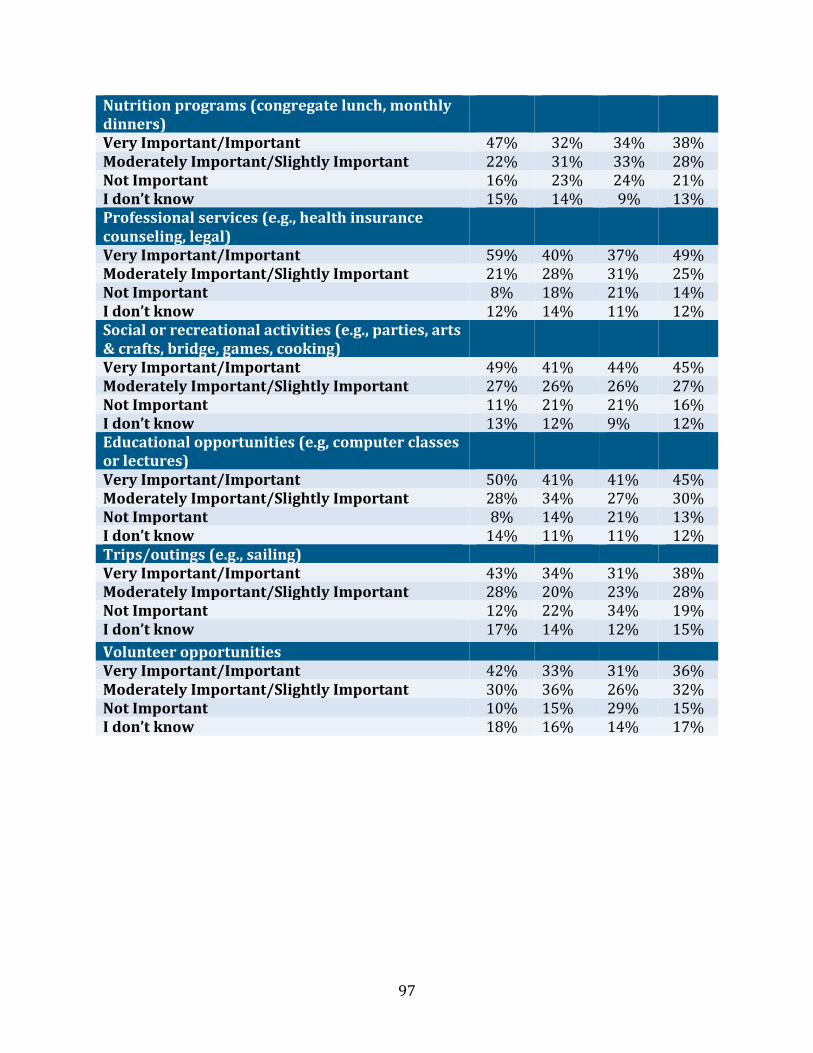
97
Nutrition programs (congregate lunch, monthly dinners)
Very Important/Important 47% 32% 34% 38% Moderately Important/Slightly Important 22% 31% 33% 28% Not Important 16% 23% 24% 21% I don’t know 15% 14% 9% 13% Professional services (e.g., health insurance counseling, legal)
Very Important/Important 59% 40% 37% 49% Moderately Important/Slightly Important 21% 28% 31% 25% Not Important 8% 18% 21% 14% I don’t know 12% 14% 11% 12% Social or recreational activities (e.g., parties, arts & crafts, bridge, games, cooking)
Very Important/Important 49% 41% 44% 45% Moderately Important/Slightly Important 27% 26% 26% 27% Not Important 11% 21% 21% 16% I don’t know 13% 12% 9% 12% Educational opportunities (e.g, computer classes or lectures)
Very Important/Important 50% 41% 41% 45% Moderately Important/Slightly Important 28% 34% 27% 30% Not Important 8% 14% 21% 13% I don’t know 14% 11% 11% 12% Trips/outings (e.g., sailing) Very Important/Important 43% 34% 31% 38% Moderately Important/Slightly Important 28% 20% 23% 28% Not Important 12% 22% 34% 19% I don’t know 17% 14% 12% 15% Volunteer opportunities Very Important/Important 42% 33% 31% 36% Moderately Important/Slightly Important 30% 36% 26% 32% Not Important 10% 15% 29% 15% I don’t know 18% 16% 14% 17%
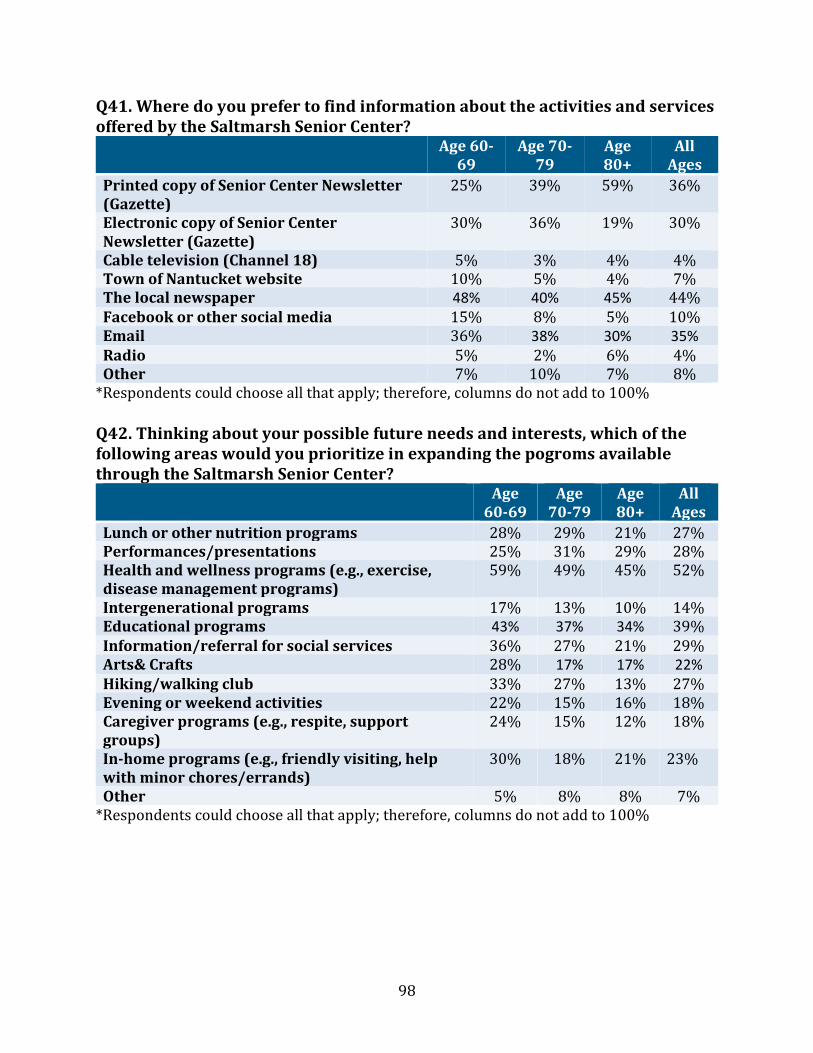
98
Q41. Where do you prefer to find information about the activities and services offered by the Saltmarsh Senior Center?
Age 60-69
Age 70-79
Age 80+
All Ages
Printed copy of Senior Center Newsletter (Gazette)
25% 39% 59% 36%
Electronic copy of Senior Center Newsletter (Gazette)
30% 36% 19% 30%
Cable television (Channel 18) 5% 3% 4% 4% Town of Nantucket website 10% 5% 4% 7% The local newspaper 48% 40% 45% 44% Facebook or other social media 15% 8% 5% 10% Email 36% 38% 30% 35% Radio 5% 2% 6% 4% Other 7% 10% 7% 8%
*Respondents could choose all that apply; therefore, columns do not add to 100% Q42. Thinking about your possible future needs and interests, which of the following areas would you prioritize in expanding the pogroms available through the Saltmarsh Senior Center?
Age 60-69
Age 70-79
Age 80+
All Ages
Lunch or other nutrition programs 28% 29% 21% 27% Performances/presentations 25% 31% 29% 28% Health and wellness programs (e.g., exercise, disease management programs)
59% 49% 45% 52%
Intergenerational programs 17% 13% 10% 14% Educational programs 43% 37% 34% 39% Information/referral for social services 36% 27% 21% 29% Arts& Crafts 28% 17% 17% 22% Hiking/walking club 33% 27% 13% 27% Evening or weekend activities 22% 15% 16% 18% Caregiver programs (e.g., respite, support groups)
24% 15% 12% 18%
In-home programs (e.g., friendly visiting, help with minor chores/errands)
30% 18% 21% 23%
Other 5% 8% 8% 7% *Respondents could choose all that apply; therefore, columns do not add to 100%
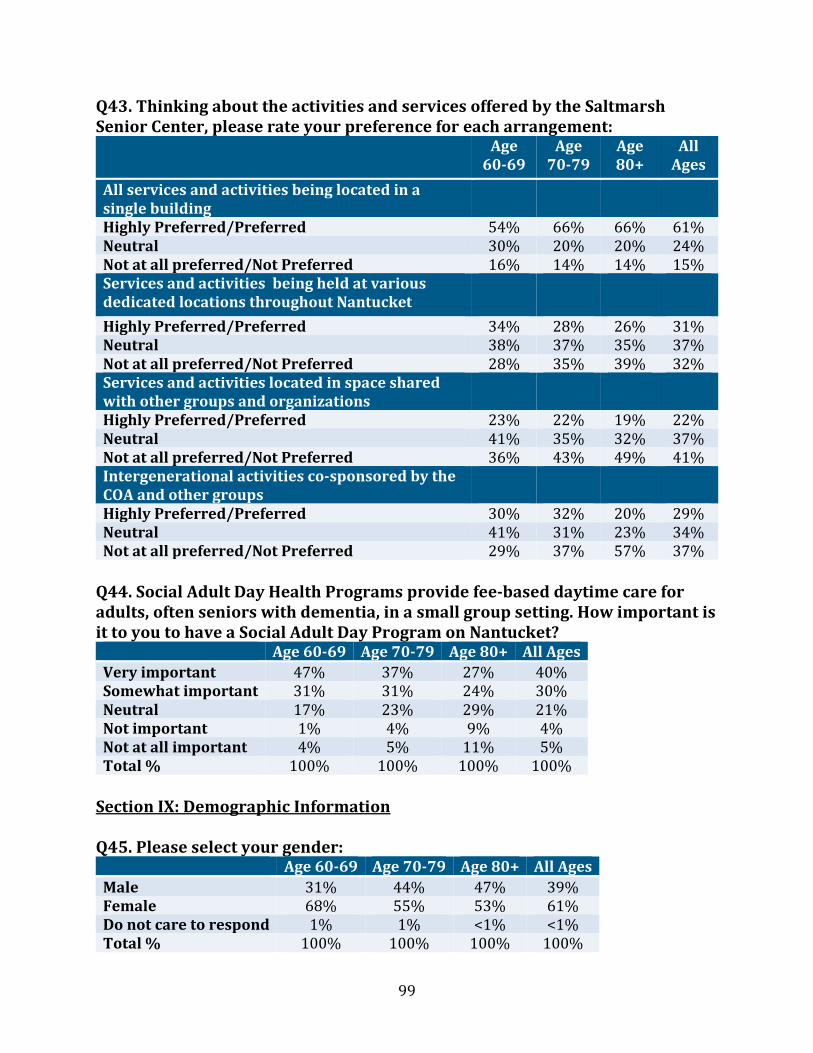
99
Q43. Thinking about the activities and services offered by the Saltmarsh Senior Center, please rate your preference for each arrangement:
Age 60-69
Age 70-79
Age 80+
All Ages
All services and activities being located in a single building
Highly Preferred/Preferred 54% 66% 66% 61% Neutral 30% 20% 20% 24% Not at all preferred/Not Preferred 16% 14% 14% 15% Services and activities being held at various dedicated locations throughout Nantucket
Highly Preferred/Preferred 34% 28% 26% 31% Neutral 38% 37% 35% 37% Not at all preferred/Not Preferred 28% 35% 39% 32% Services and activities located in space shared with other groups and organizations
Highly Preferred/Preferred 23% 22% 19% 22% Neutral 41% 35% 32% 37% Not at all preferred/Not Preferred 36% 43% 49% 41% Intergenerational activities co-sponsored by the COA and other groups
Highly Preferred/Preferred 30% 32% 20% 29% Neutral 41% 31% 23% 34% Not at all preferred/Not Preferred 29% 37% 57% 37%
Q44. Social Adult Day Health Programs provide fee-based daytime care for adults, often seniors with dementia, in a small group setting. How important is it to you to have a Social Adult Day Program on Nantucket?
Age 60-69 Age 70-79 Age 80+ All Ages Very important 47% 37% 27% 40% Somewhat important 31% 31% 24% 30% Neutral 17% 23% 29% 21% Not important 1% 4% 9% 4% Not at all important 4% 5% 11% 5% Total % 100% 100% 100% 100%
Section IX: Demographic Information Q45. Please select your gender:
Age 60-69 Age 70-79 Age 80+ All Ages Male 31% 44% 47% 39% Female 68% 55% 53% 61% Do not care to respond 1% 1% <1% <1% Total % 100% 100% 100% 100%
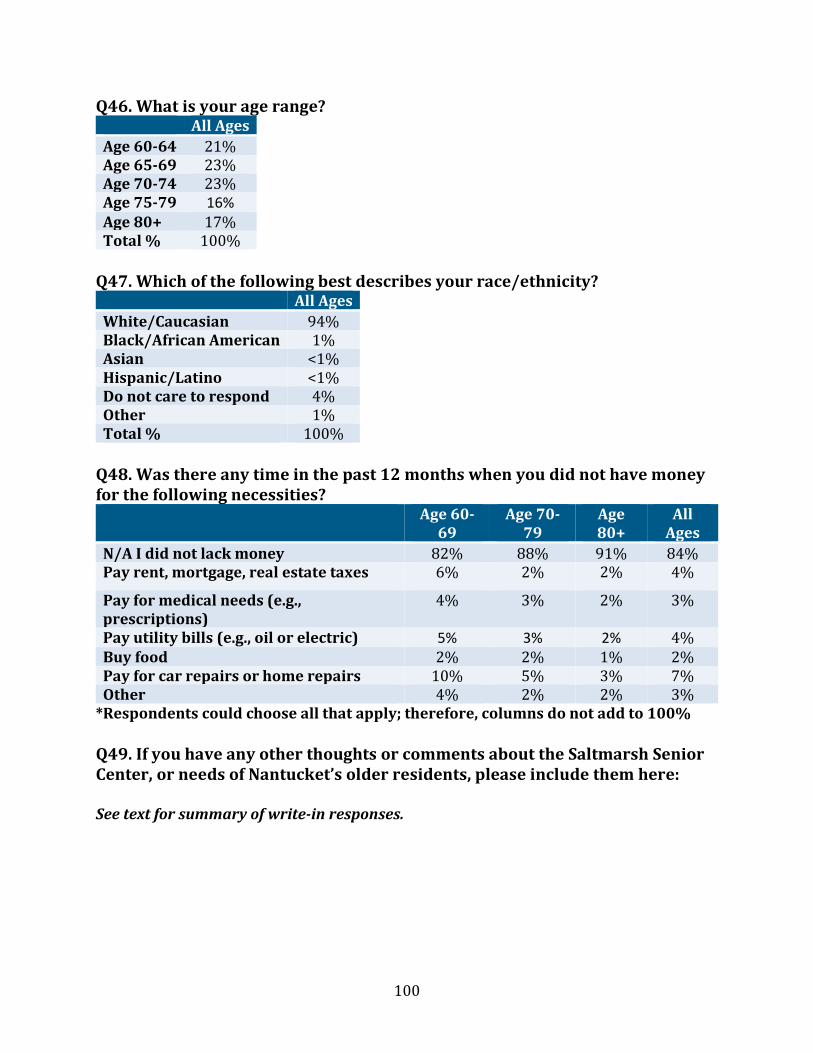
100
Q46. What is your age range? All Ages Age 60-64 21% Age 65-69 23% Age 70-74 23% Age 75-79 16% Age 80+ 17% Total % 100%
Q47. Which of the following best describes your race/ethnicity?
All Ages White/Caucasian 94% Black/African American 1% Asian <1% Hispanic/Latino <1% Do not care to respond 4% Other 1% Total % 100%
Q48. Was there any time in the past 12 months when you did not have money for the following necessities?
Age 60-69
Age 70-79
Age 80+
All Ages
N/A I did not lack money 82% 88% 91% 84% Pay rent, mortgage, real estate taxes 6% 2% 2% 4%
Pay for medical needs (e.g., prescriptions)
4% 3% 2% 3%
Pay utility bills (e.g., oil or electric) 5% 3% 2% 4% Buy food 2% 2% 1% 2% Pay for car repairs or home repairs 10% 5% 3% 7% Other 4% 2% 2% 3%
*Respondents could choose all that apply; therefore, columns do not add to 100% Q49. If you have any other thoughts or comments about the Saltmarsh Senior Center, or needs of Nantucket’s older residents, please include them here: See text for summary of write-in responses.
TOWN OF NANTUCKETTHE NANTUCKET CENTER FOR ELDER AFFAIRS, INC.81 Washington StreetNantucket, MA 02554Phone 508.228.4490http://www.nantucket-ma.gov/169/Council-on-Aging
UNIVERSITY OF MASSACHUSETTS BOSTONGERONTOLOGY INSTITUTE
100 Morrissey BoulevardBoston, MA 02125-3393Phone 617.287.7300www.umb.edu/demographyofaging
CENTER FOR SOCIAL & DEMOGRAPHIC RESEARCH ON AGING
is_Nantucket back cover.pdf 1 1/18/18 11:58 AM