Health status transitions in community-living elderly with complex care needs: a latent class...
14
BioMed Central Page 1 of 14 (page number not for citation purposes) BMC Geriatrics Open Access Research article Health status transitions in community-living elderly with complex care needs: a latent class approach Louise Lafortune* 1,2,3 , François Béland 1,3,4 , Howard Bergman 1,3,4 and Joël Ankri 2 Address: 1 Department of Health Administration, Université de Montréal, Québec, Canada, 2 Laboratoire Santé et Vieillissement, Université de Versailles-Saint-Quentin, INSERM U687, Paris, France, 3 Solidage Research Group, Montréal, Québec, Canada and 4 Division of Geriatric Medicine, McGill University, Jewish General Hospital, Montréal, Québec, Canada Email: Louise Lafortune* - [email protected]; François Béland - [email protected]; Howard Bergman - [email protected]; Joël Ankri - [email protected] * Corresponding author Abstract Background: For older persons with complex care needs, accounting for the variability and interdependency in how health dimensions manifest themselves is necessary to understand the dynamic of health status. Our objective is to test the hypothesis that a latent classification can capture this heterogeneity in a population of frail elderly persons living in the community. Based on a person-centered approach, the classification corresponds to substantively meaningful groups of individuals who present with a comparable constellation of health problems. Methods: Using data collected for the SIPA project, a system of integrated care for frail older people (n = 1164), we performed latent class analyses to identify homogenous categories of health status (i.e. health profiles) based on 17 indicators of prevalent health problems (chronic conditions; depression; cognition; functional and sensory limitations; instrumental, mobility and personal care disability) Then, we conducted latent transition analyses to study change in profile membership over 2 consecutive periods of 12 and 10 months, respectively. We modeled competing risks for mortality and lost to follow-up as absorbing states to avoid attrition biases. Results: We identified four health profiles that distinguish the physical and cognitive dimensions of health and capture severity along the disability dimension. The profiles are stable over time and robust to mortality and lost to follow-up attrition. The differentiated and gender-specific patterns of transition probabilities demonstrate the profiles' sensitivity to change in health status and unmasked the differential relationship of physical and cognitive domains with progression in disability. Conclusion: Our approach may prove useful at organization and policy levels where many issues call for classification of individuals into pragmatically meaningful groups. In dealing with attrition biases, our analytical strategy could provide critical information for the planning of longitudinal studies of aging. Combined, these findings address a central challenge in geriatrics by making the multidimensional and dynamic nature of health computationally tractable. Published: 3 February 2009 BMC Geriatrics 2009, 9:6 doi:10.1186/1471-2318-9-6 Received: 11 September 2008 Accepted: 3 February 2009 This article is available from: http://www.biomedcentral.com/1471-2318/9/6 © 2009 Lafortune et al; licensee BioMed Central Ltd. This is an Open Access article distributed under the terms of the Creative Commons Attribution License (http://creativecommons.org/licenses/by/2.0 ), which permits unrestricted use, distribution, and reproduction in any medium, provided the original work is properly cited.
Transcript of Health status transitions in community-living elderly with complex care needs: a latent class...

BioMed CentralBMC Geriatrics
ss
Open AcceResearch articleHealth status transitions in community-living elderly with complex care needs: a latent class approachLouise Lafortune*1,2,3, François Béland1,3,4, Howard Bergman1,3,4 and Joël Ankri2Address: 1Department of Health Administration, Université de Montréal, Québec, Canada, 2Laboratoire Santé et Vieillissement, Université de Versailles-Saint-Quentin, INSERM U687, Paris, France, 3Solidage Research Group, Montréal, Québec, Canada and 4Division of Geriatric Medicine, McGill University, Jewish General Hospital, Montréal, Québec, Canada
Email: Louise Lafortune* - [email protected]; François Béland - [email protected]; Howard Bergman - [email protected]; Joël Ankri - [email protected]
* Corresponding author
AbstractBackground: For older persons with complex care needs, accounting for the variability andinterdependency in how health dimensions manifest themselves is necessary to understand thedynamic of health status. Our objective is to test the hypothesis that a latent classification cancapture this heterogeneity in a population of frail elderly persons living in the community. Based ona person-centered approach, the classification corresponds to substantively meaningful groups ofindividuals who present with a comparable constellation of health problems.
Methods: Using data collected for the SIPA project, a system of integrated care for frail olderpeople (n = 1164), we performed latent class analyses to identify homogenous categories of healthstatus (i.e. health profiles) based on 17 indicators of prevalent health problems (chronic conditions;depression; cognition; functional and sensory limitations; instrumental, mobility and personal caredisability) Then, we conducted latent transition analyses to study change in profile membershipover 2 consecutive periods of 12 and 10 months, respectively. We modeled competing risks formortality and lost to follow-up as absorbing states to avoid attrition biases.
Results: We identified four health profiles that distinguish the physical and cognitive dimensionsof health and capture severity along the disability dimension. The profiles are stable over time androbust to mortality and lost to follow-up attrition. The differentiated and gender-specific patternsof transition probabilities demonstrate the profiles' sensitivity to change in health status andunmasked the differential relationship of physical and cognitive domains with progression indisability.
Conclusion: Our approach may prove useful at organization and policy levels where many issuescall for classification of individuals into pragmatically meaningful groups. In dealing with attritionbiases, our analytical strategy could provide critical information for the planning of longitudinalstudies of aging. Combined, these findings address a central challenge in geriatrics by making themultidimensional and dynamic nature of health computationally tractable.
Published: 3 February 2009
BMC Geriatrics 2009, 9:6 doi:10.1186/1471-2318-9-6
Received: 11 September 2008Accepted: 3 February 2009
This article is available from: http://www.biomedcentral.com/1471-2318/9/6
© 2009 Lafortune et al; licensee BioMed Central Ltd. This is an Open Access article distributed under the terms of the Creative Commons Attribution License (http://creativecommons.org/licenses/by/2.0), which permits unrestricted use, distribution, and reproduction in any medium, provided the original work is properly cited.
Page 1 of 14(page number not for citation purposes)

BMC Geriatrics 2009, 9:6 http://www.biomedcentral.com/1471-2318/9/6
BackgroundThe general approach to studying older people's healthhas been to look at relationships among measures ofchronic conditions, cognition, frailty and steps along thedisablement pathway [1-4]; the goals have been to iden-tify determinants and rates of decline and recovery [5-14],and predict mortality [15], institutionalization [16,13],and service utilization [17-21]. Although these measuresserve as valid outcomes predictors, they relate differentlyto various dimensions of health. Trends in any one ofthem are not evidence of health trends overall [22,23].Evidence suggests that population subgroups have quali-tatively and quantitatively different patterns of changeand probabilities of adverse outcomes[24,9,6,26,27,14,25,8]. In fact, elderly populations arehighly heterogeneous in their health status owing to thevariability and interdependency in how health dimen-sions manifest themselves overtime. Thus, it becomesincreasingly clear that health changes cannot be fullydescribed by any one dimension. Instead, it takes anapproach that allows for multiple measures of health toembrace this complexity.
Many valid approaches exist to study the relationshipbetween multiple health indicators and the unobservable(or latent) construct of health [28]. The choice depends,among other considerations, on the distribution of healthindicators. Because health indicators commonly used ingeriatrics are rarely continuous or normally distributed,factor analysis is unwieldy. Instead, we chose a latent classanalytical framework [29], also called finite mixture mod-els [30]. Latent class analysis (LCA) is a "person-centered"approach designed to divide the population under studyinto latent subpopulations (i.e. classes) that share a dis-tinct interpretation pattern of relationships among indica-tors [31]. In populations of older people with complexhealth needs, observed health indicators can serve to iden-tify groups of individuals – unobserved a priori – whopresent with similar constellations of health problems.The goal is to find the smallest number of health profilesthat can describe the association among the set ofobserved health indicators.
Latent class models present several advantages over classi-cal statistical models (e.g. cluster analysis) [32,33]: theclassification is model-based and statistical diagnostictools exist to assess the quality of the classification, varia-bles may take several forms, there is no need to make par-ametric assumptions about the relationship betweenobservations, and covariates can be included duringmodel estimation to describe the groups. For the predic-tion of a dependant variable, LCA offer a parsimoniousalternative to models with an unmanageably highnumber of variables and interaction terms.
Whereas LCA studies class membership using cross-sec-tional data, latent transition analysis (LTA) studies changein class membership using longitudinal data [31]. LTAcombines the cross-sectional measurement of health stateprofiles and the description of transition over time fromone health profile to another [34]. It thus supports theanalysis of qualitative change in health status in contrastto continuous models were quantitative change isobserved.
Several applications of LCA exist in the social, medicaland economic literature, where heterogeneous popula-tions constitute the typical object of analysis. In geriatrics,LCA was used to test criterion validity of physical frailty[35], measure mobility disability [36] and study behavio-ral syndromes in Alzheimer' patients [37]. We found noexample of its use to model heterogeneity in older indi-viduals' health status. Grade of membership (GoM),another latent classification technique [38], was success-ful in identifying clinically meaningful health profiles incommunity-living elderly [39-42]. GoM assumes thatindividuals can be partial members of more than one classof a continuous distribution of latent variables [43]. Incontrast, LCA assumes that individuals are full membersof one of the class for a discrete latent variable. Practically,LCA classifies individuals in health profiles whereas GoMestimates their degree of proximity to each profile. To ourknowledge, these studies did not study transitions in pro-file membership; though Portrait et al. [41] studied mor-tality. Conversely, Markov models were used to describetransitions along the disablement pathway[14,9,8,44,45]. Although similar in spirit to LTA [34],these models focused on observable disability indicatorsas opposed to directly unobservable health status profiles.
The objective of this paper is to identify profiles of healthstatus and study their evolution in a population of frailelderly individuals living in the community. We used LCAto group individuals into homogenous categories ofhealth status based on observed indicators of prevalenthealth problems. We then applied LTA to study transi-tions in profile membership over 2 consecutive periods of12- and 10-months, respectively. The question we addressis whether there exists a latent classification that makessubstantive sense to study the dynamic of health status inolder populations presenting with complex care needs.Many research and policy questions call for a person-cen-tered as opposed to a variable-centered approach [31].Practical examples include planning of long-term careresources and identification of appropriate sub-groups forprevention studies. We identified and validated a classifi-cation that captures the multidimensional and dynamicnature of health, and show how a person-centeredapproach could prove useful to address these importantquestions.
Page 2 of 14(page number not for citation purposes)

BMC Geriatrics 2009, 9:6 http://www.biomedcentral.com/1471-2318/9/6
MethodsData sourcesThis research uses data collected for the randomized trialof the SIPA program (French acronym for System of Inte-grated Care for Older Persons), carried out in Montreal,Canada (1999–2001). SIPA aimed at improving continu-ity of community- and institution-based care for olderpeople with complex health and social needs; its distin-guishing features and the results of the experimentationare described elsewhere [46,47]. Eligible people wereolder than 64 years, competent in French or English(either the individual or the caregiver), had a score of -10or less on the Functional Autonomy Measurement System(SMAF; -87 represents the worst health state) [48], and noplans for institutionalization within 3 months. Partici-pants were recruited from two public community organi-zations responsible for home care (with a smallproportion from other sources) and randomly assigned tothe SIPA program or usual care. Health and sociodemo-graphic data were collected via structured home inter-views at baseline (T0), 12-months (T1), and 22-months(T2). Living status (deceased or not) and information onnursing home use come from administrative databases.Given the short intervention period, SIPA had no effect onchange in health status or mortality [46]. For our purpose,we thus combined the two groups and included thosewho had a baseline questionnaire (n = 1164). Theresearch ethics committee of the Montreal Jewish GeneralHospital granted approval for these secondary analyses.
Health indicatorsLCA uses observed response patterns on a set of healthindicators to model heterogeneity and reveal health pro-files. We selected 17 indicators based on their high preva-lence in older populations. Chronic conditions (no/yes)include self-reported hypertension, stroke, diabetes, can-cer as well as circulatory, respiratory, joint and arthritis,stomach and bladder problems. To increase validity, indi-viduals were asked whether a physician had confirmed thediagnosis. Sensory limitations (no/yes) refer to self-declared problems with speech, audition and/or vision.Cognition is measured with the Short Portable MentalHealth Questionnaire (scores < 4 indicate no cognitiveimpairment; scores ≥4 indicate cognitive impairment)[49], and depression with the Geriatric Depression Scale(GDS scores < 3.5 indicate no depression; scores between3.5–8.5 indicate moderate depression; scores ≥8.5 indi-cate severe depression) [50]. Functional limitations (no/yes) are defined as difficulty performing upper limbs (≥ 1;raising arms, picking/handling small objects, lifting 5 kg)and lower limbs (≥ 1; pulling/pushing large objects, bend-ing/kneeling; using stairs) movements [51]. Disability isdefined as requiring help with mobility activities of dailyliving (ADL) (getting up from bed/chair; using the toilet;taking a bath/shower; moving around the home, going
up/down stairs, walking one block); personal care ADL(eating, drinking, dressing upper and lower body, per-sonal grooming, washing) [52]; and instrumental ADL(IADL; using the phone, transportation, shopping, mealpreparation, light housework, taking medication, manag-ing money [53]. Disability measures are coded as three-levels categorical variables. The sociodemographic covari-ates used in our analyses are gender, age (64–75; 75–84;85+ years) and living arrangements (whether people livealone or not).
Analysis StrategyLTA requires a step-wise approach to be accurate in itsaccount of the change process. Using Mplus [54], we firstexplored alternative LCA models at (T0) to reveal thelatent class variable that best captures the health status ofour sample (i.e. number and characteristics of health pro-files). Then, we fitted LCA models at (T1) and (T2) toexamine the profiles' stability over time. Finally, we fittedLTA models to study transitions in health status.
Baseline health state profilesUnder latent class theory [55], individuals are assumed tobelong to one of a number of unobserved categories (i.e.latent classes). Here, these categories represent health sta-tus profiles. It is assumed that a sufficient number of pro-files result in conditional independence among observedhealth indicators [29]. In Mplus [54], LCA relies on maxi-mum-likelihood methods to estimate the posterior prob-ability p [c/Y] of membership in health state profile c foran individual with an observed health indicator responsepattern Y. These posterior probabilities determine the rel-ative prevalence and serve to characterize the profiles [28].
Two types of parameters serve to estimate class member-ship: health indicator and health profile probabilities.Health indicator probabilities are profile-specific and con-sist of the probability that a response is associated withthe profile (e.g. probability of cognitive problems givenmembership in health profile 1). Within classes, individ-uals have comparable health indicator probabilities.Health profile probabilities represent individuals' proba-bility of belonging to each profile; assignment to one pro-file proceeds on the basis of their highest health profileprobability.
Using data for our 17 health indicators, we fitted LCAmodels successively for 1 through 5 classes. We used mul-tiple start values to avoid convergence on local maxima[34] and assumed a missing at random mechanism(MAR), i.e. missingness depends on the observed compo-nents of the complete data and not on missing data [56].For most health indicators, MAR is justified given the lowproportion of missing data. For depression, however, thedepression score is missing for all individuals with cogni-
Page 3 of 14(page number not for citation purposes)

BMC Geriatrics 2009, 9:6 http://www.biomedcentral.com/1471-2318/9/6
tive impairment (n = 174) and for those who are missingon the cognitive test (n = 101). To test the effect of theMAR hypothesis on the classification, LCA models werefitted with and without the depression indicator for 1) thecomplete sample (n = 1164), 2) a sub-sample with com-plete data for depression (n = 890) and 3) a sub-samplethat excludes individuals with missing data for the cogni-tion and depression scores (n = 1063). These sensitivityanalyses showed that although depression significantlycontributes to the classification, assuming a MAR mecha-nism for missing depression scores did not significantlychange how individuals are grouped.
We decided on the best model based on the lowest valuesobserved for the Akaike Information Criteria (AIC), Baye-sian Information Criteria (BIC) and adjusted BIC (aBIC),which combine goodness of fit and parsimony [34]. Theadjusted Lo-Mendell-Rubin likelihood ratio test (aLMR-LRT) served to decide on the number of classes [57]; itcompares improvement in fit (p < 0.001) betweensequential class models through an approximation of theLRT distribution. We used an entropy measure to assesshow well the model predicts class membership; valuesrange from 0 to 1 and high values are preferred [54]. Bivar-iate residual statistics served to confirm local independ-ence [34].
Including covariates in LCA models can serve three pur-poses: describe the formation of health profiles, character-ize and validate them. This is accomplished by theconcurrent identification of the latent health profiles var-iable and its multinomial regression on covariates ofinterest [29,36]. This approach avoids the limits of post-hoc regressions (i.e. performed on a priori classified indi-viduals), which assume that the latent classification is anobserved variable measured without error [29]. We foundthat including gender, age and/or living arrangements ascovariates did not significantly influence the formation ofthe profiles. Therefore, the LCA model without covariatesis our basecase. LCA regression models are used for char-acterization and validation.
To further validate the profiles, we fitted 2 LCA models toestimate the association between profile membership anddistal outcomes: mortality and use of nursing home serv-ices at 22-months. These associations were estimated byallowing the proportion for each outcome to vary acrossprofiles [54]. Age and gender are included to control forconfounding. Differences between classes are reported asodd ratios. Finally, to evaluate construct validity, wemeasured the relationship between class membership anddisability measures (ADL-Personal care, ADL-Mobility,IADL), cognitive status and comorbidity (# chronic condi-tions) with chi-square and contingency coefficient statis-tics.
T1 and T2 health state profilesUsing available data, we proceeded the same way to iden-tify health status profiles at subsequent time points. Toassess whether the health status profiles identified at T1and T2 have the same substantive meaning as those iden-tified at baseline, we first compared patterns of healthindicators probabilities over time. Then, we compared theclassifications to those obtained by LCA models con-strained to have baseline class-specific health indicatorprobabilities. The concordance (%) in how individualsare grouped is used to confirm the classification' stabilityover time. This also allows testing of the classification'robustness to death and lost to follow-up (LTF) attrition.
Latent transition analysisBuilding from LCA, LTA studies change in class member-ship using longitudinal data [31,58]. Health indicators aremeasured repeatedly over time to identify profile mem-bership at each occasion. The transition probability matri-ces are estimated by a logistic regression for nominalresponse (e.g. probability of health profile membership atT1, conditional on baseline health profile membership)[33,54]. When covariates are included in LTA, transitionprobabilities are no longer conditioned only on the previ-ous time(s) membership but also on covariate values [59].
We ran two separate LTA: one to assess transitions inhealth status between T0 and T1 (LTA-T0T1); one to assesstransitions between T1 and T2 (LTA-T1T2). Age and gen-der are included in our models – a provision that allowsus to compare transition probabilities across these covari-ates. Death and LTF are modeled as absorbing states.Thus, each model adjusts the probability of health statustransition for the competing risks of death and being LTF.Finally, we imposed measurement invariance (MI; con-straining conditional health indicator probabilities to bethe same across time points) to ensure health profileshave the same meaning at each occasion. The plausibilityof MI was confirmed by comparing the classificationswith and without MI constraints: the differences in classi-fication were not significant (χ2; p < 0.001) and informa-tion criterion favored the constrained model.
ResultsSample descriptionThe baseline sample consists of 1164 people between 64and 104 years old, with 70.9% female and considerablesocioeconomic variability (Table 1). Comorbidity rangesfrom none to seven chronic conditions. Comparisons ofhealth indicators proportions reveal great heterogeneity inhealth status (Table 2). Given the low proportions ofmissing values, attribution under the MAR hypothesis hadno effect on health indicator proportions, except fordepression, cognition and bladder problems. For these
Page 4 of 14(page number not for citation purposes)

BMC Geriatrics 2009, 9:6 http://www.biomedcentral.com/1471-2318/9/6
indicators, Mplus modeled proportions appear in paren-theses.
At 12-months (T1), 11.5% (n = 134) of the sample haddied, 7.6% (n = 88) did not complete the interview and12.4% (n = 144) were lost-to-follow-up (LTF). At 22-months (T2), 20.8% (n = 242) of the sample had died,38.2% (n = 446) were LTF. Individuals who died weremore likely to be male, older; they had worst functionalscores and were less likely to live alone. In bivariate anal-yses, LTF individuals, either at T1 or T2, did not signifi-cantly differ from the rest of the sample onsociodemographic characteristics or baseline health status(i.e. IADL, ADL-personal care, cognition, depression, sen-sory deficits, functional limitations) except for ADL-mobility at T1 (χ2, p < 0.05) and sensory deficits at T2 (χ2,p < 0.05). In multivariable models, only ADL-mobilityremained significantly associated with LTF status at T1.
Health state profilesLCA models estimated for each time point suggest that a4-class solution provides the best overall fit and explana-tion of the observed health indicators frequencies. The
classification identified at baseline was reproduced in theT1 and T2 LCA as well as in LTA. Accordingly, we describethe four health state profiles identified at baseline. Wethen present results for subsequent steps with reference tothat basecase.
Table 3 presents model fit statistics for LCA models fittedat baseline, T1 and T2. At baseline, increasing the numberof classes improved the classification up to the fifth class(i.e. the LMR-LRT are no longer significant). Informationcriterion statistics suggest the four-class model best fits thedata. The quality of the classification for that model ishigh (entropy: 0.805), with no identification problem(condition number: 0.233) and no major violation ofconditional independence. LCA performed at T1 and T2also point to 4 health status profiles.
Table 4 presents profile-specific health indicators proba-bilities for the four latent classes (λ; presented as %).These probabilities express how individuals within a pro-file differ from those in other profiles at each time point.For example, at T0, the first two profiles are characterizedby high probabilities of cognitive problems (λ = 0.687
Table 1: Sample characteristics at T0; % of deceased and LTF individuals at T1 and T2 *
Baseline T1 T2
% (n = 1164) Deceased% (n = 134)
LTF% (n = 232)§
Deceased% (n = 242)
LTF% (n = 446)
Age Average (± SD) 82.2 (7.2) 83.7 (7.6) 82.2 (7.3) 84.3 (7.2) 82.1 (7.4)64–74 yrs 16.1 12.7 15.9 9.5 16.175–84 yrs 43.8 35.8 41.4 38.8 42.0>84 yrs 40.2 51.5 42.7 51.7 41.9
Gender Female 70.9 56.0 73.3 57.4 74.0Male 29.1 44.0 26.7 42.6 26.0
Marital status† Married 33.2 40.6 34.3 40.8 30.4Not married 66.8 59.4 65.7 59.2 69.6
Living arrangements Lives alone 43.7 26.1 46.8 30.7 46.7Not alone 56.6 73.9 53.2 69.3 53.3
Education Primary 32.3 33.8 32.6 35.2 32.7Secondary 48.6 44.9 47.3 47.0 48.8Higher 19.1 21.3 20.1 17.8 18.5
Income sufficiency† Sufficient 62.7 64.9 59.5 62.7 61.4Not sufficient 37.3 35.1 40.5 37.3 38.6
Comorbidity 0 29.1 31.6 33.8 28.8 31.21–2 42.8 37.6 41.1 37.9 43.63+ 28.1 12.6 25.1 33.3 25.2
SMAF c Average (± SD) -23.5 (12.0) -29.0 (13.8) -23.3 (11.7) -27.9 (12.7) -23.5 (12.5)
* Statistical difference calculated using χ2 statistics for categorical variables and logistic regression for age and SMAF; values in bold are significantly different at p < 0.001.§ Includes individuals who did not complete the interview (n = 88) at T1 but who did at T2.† Married includes having a common law spouse. Income sufficiency: Does your income currently satisfy your needs? Sufficient = very well or adequately; Not sufficient = with some difficulty, not very well or totally inadequate. SMAF: French acronym for Functional Autonomy Measurement System; a minimum score of -87 indicates the worst health state [48].
Page 5 of 14(page number not for citation purposes)

BMC Geriatrics 2009, 9:6 http://www.biomedcentral.com/1471-2318/9/6
and λ = 0.858, respectively), whereas the other two are not(λ = 0.078 and λ = 0.139). Profiles are assigned a label tosubstantiate these differences.
All selected health indicators significantly contribute tothe classification (p < 0.001). However, the pattern ofrelationships along the cognitive and physical dimensionsbest describes the profiles' distinguishing features. Severe
cognitive and physical impairments characterize the firsthealth profile. Individuals have high probabilities of cog-nitive disorders, chronic conditions, stroke, sensory prob-lems, and functional limitations. Their high probabilitiesof disability in IADL, personal care and mobility ADL cap-ture the severity and combined consequences of theseproblems. This group is labeled "Cognitively & physicallyimpaired" (Cog&Physic-Imp) and represents 23% of the
Table 2: Health indicator proportions (%) at baseline, 12 months and 22 months*
T0(n = 1164)
T1(n = 797)
T2(n = 475)
Cognitive problems Yes 28.6 (31.4) 24.1 (25.8) 33.3 (35.9)Missing 8.9 (-) 6.6 (-) 7.4 (-)
Depression Moderate 29.1 (38.1) 21.0 (28.5) 17.7 (25.8)Severe 15.0 (19.7) 20.2 (27.5) 20.4 (29.8)Missing 23.6 (-) § 26.6 (-) 31.6 (-)
High blood pressure Yes 27.0 27.6 37.9Missing 0.9 0.5 0.8
Circulatory problems Yes 39.3 40.5 44.0Missing 0.9 0.9 1.1
Stroke Yes 20.6 23.2 25.5Missing 0.7 0.8 0.4
Diabetes Yes 19.0 18.7 20.0Missing 0.9 0.9 -
Respiratory problems Yes 25.3 25.5 26.1Missing 0.6 0.1 0.6
Joint & Arthritis Yes 50.0 51.6 56.8Missing 0.9 0.5 0.6
Tumor or Cancer Yes 17.4 17.8 18.1Missing 0.8 0.5 0.2
Bladder problems Yes 31.1 (34.1) 29.1 (32.1) 25.7 (28.7)Missing 8.8 (-) 9.4 (-) 10.5 (-)
Stomach problems Yes 26.1 24.8 27.6Missing 0.5 0.6 0.2
Sensory problems Yes 24.4 23.5 28.4Missing 0.4 0.4 1.1
Functional limits (U) Yes 56.7 75.3 78.9Missing 0.6 0.1 1.3
Functional limits (L) Yes 75.0 62.1 67.6Missing 0.9 0.1 1.3
ADL-Mobility Disability None 31.0 29.7 22.51–2 activities 38.4 32.7 35.6+ 2 activities 30.6 37.5 41.5Missing - - 0.4
ADL-Personal Care Disability None 58.4 63.2 57.71–2 activities 22.2 16.1 16.0+ 2 activities 19.4 20.7 25.9Missing - - 0.4
IADL Disability 0–2 activities 35.6 32.7 31.23–4 activities 26.6 29.0 21.5+4 activities 37.8 38.0 46.7Missing - - 0.6
* Entries in parentheses are the proportions generated by Mplus under the MAR hypothesis; proportions for other health indicators are not affected by missing values.§ Of these 23.6% (n = 274) missing GDS scores, 14% (n = 163) are missing by design for severely cognitively impaired individuals. Real missing scores represent 8.7% only. At T1 and T2, 18.4% (n = 147) and 13.1% (n = 62) respectively are missing by design.ADL = Activity of daily living; IADL = Instrumental activity of daily living; U = upper limbs; L = lower limbs The upper and lower limbs distinction was made to capture variability in functional ability.
Page 6 of 14(page number not for citation purposes)

BMC Geriatrics 2009, 9:6 http://www.biomedcentral.com/1471-2318/9/6
sample at baseline. The second health profile is predomi-nantly "COGNITIVELY IMPAIRED" (Cog-Imp), withminimal physical impairments. These individuals(11.4%) report relatively low probabilities for chronicconditions and functional limitations. The likelihood forthem to present with ADL disability is comparatively lowbut high for severe IADL disability.
Individuals in the third health status profile have thehighest probabilities for chronic conditions, but no cogni-tive problem. They are very likely to report depression,functional limitations and mobility disability, butunlikely to require help for personal care. We labeled thisgroup "PHYSICALLY IMPAIRED" (Physic-Imp). Finally,we found a "RELATIVELY HEALTHY" (R-Healthy) profile.It comprises older people who report comparatively lesschronic conditions (circulatory problems, respiratory dis-eases, arthritis, depression; p < 0.01) and who manifestlow probabilities of disability, functional limitations andcognitive disorders. The later two profiles represent,respectively, 35.6% and 29.9% of the sample at baseline.
Comparison across time points of profile-specific healthindicator probabilities (Table 4) shows that the profiles
revealed at T1 and T2 correspond to constellations ofhealth problems equivalent to those observed at baseline.When we compared T1 and T2 profiles with thoseobtained with T1 and T2 models constrained to havebaseline conditional health indicator probabilities, theconcordance in how individuals are grouped reaches 90%at T1, and 88% at T2. At T1, the concordance is 96% forthe Cog&Physic-Imp, 92% for the Cog-Imp, 83% (p <0.01) for the Physic-Imp and 86% (p < 0.05) for the R-Healthy. At T2, the concordance is 83% (p < 0.05) for theCog&Physic-Imp (with 13% classified as Physic-Imp),100% for the Cog-Imp, 69% (p < 0.001) for the Physic-Imp (with 27.4% classified as R-Healthy), and 95.6% forthe R-Healthy. These differences in classification reflectthe net progression of the sample as a whole towards amore compromised health state (as seen in tables 2 and4). Although this results in an upward shift in the "sever-ity" of health profiles at T1 and T2, each maintained itssubstantive meaning. Combined, these results confirmthe stability of our classification, despite mortality andLTF.
The health indicator probabilities predicted by LCA areconsistent with the proportion of people who have con-
Table 3: Model fit statistics for latent class analysis at baseline, T1, T2
T0 T1 T2
2 classes 3 classes 4 classes 5 classes 4 classes 5 classes 4 classes 5 classes
Sequential model comparisons
2 vs. 1 classes 3 vs. 2 classes 4 vs. 3 classes 5 vs. 4 classes 4 vs. 3 classes 5 vs. 4 classes 4 vs. 3 classes 5 vs. 4 classes
LMR LRTLog-likelihood value (c+1 classes)
13265.31 13595.67 12239.68 12093.26 8366.61 8119.41 4603.94 4449.05
-2 difference in log likelihood
1468.19 2711.98 292.85 107.55 494.40 108.374 309.774 77.03
p value 0.000 0.000 0.0006 0.307 0.000 0.286 0.000 0.198
Adjusted LMR LRT
1458.80 2375.46 290.97 106.86 490.03 107.64 265.99 76.43
p value 0.000 0.000 0.0006 0.309 0.000 0.289 0.000 0.198
Information criterionAIC 25148.43 24483.26 24192.52 24296.97 16244.82 16348.45 9072.11 9039.11BIC 25365.96 24493.48 24207.69 24848.37 16258.87 16858.66 9426.66 9483.32Adjusted BIC 25229.38 24487.13 24198.16 24502.15 16249.34 16512.53 9150.57 9137.40
Entropy 0.814 0.791 0.805 0.765 0.815 0.804 0.830 0.849Condition number
0.0029 0.309 0.233 0.0012 0.0524 0.0014 0.0301 0.022
LMR-LRT = Lo-Mendell-Rubin Likelihood Ratio Test; AIC: Akaike Information Criterion; BIC: Bayesian Information Criterion.Condition number = ratio of largest Eigen value to the smallest Eigen value for the Fisher information matrix. Values less than 10E-09 indicate problem with model identification.
Page 7 of 14(page number not for citation purposes)

BMC Geriatrics 2009, 9:6 http://www.biomedcentral.com/1471-2318/9/6
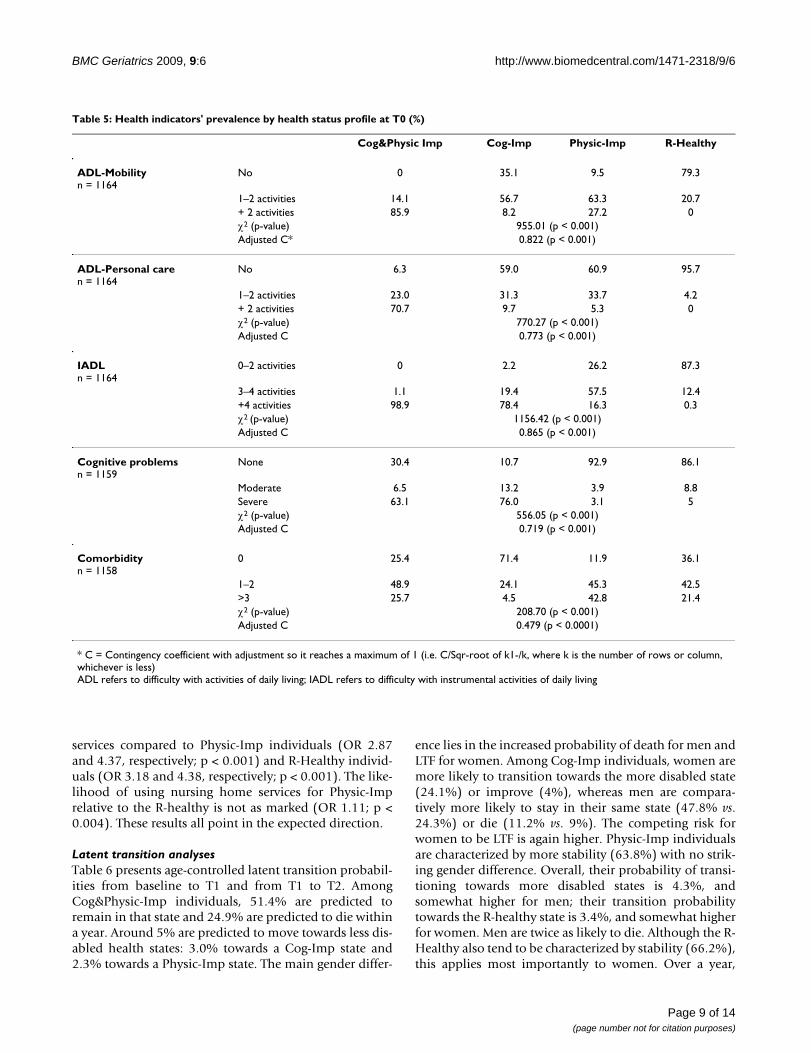
tributed each response patterns in the actual data. Further-more, chi-square and contingency coefficients (Table 5)for health state profiles versus disability measures, comor-bidity and cognitive problems confirm both the qualita-tive differences between health profiles and theircoherence with key measures of health status. The correla-tion with the comorbidity measure is much lower.
The relationships between profile membership, covari-ates, and distal outcomes also support the validity of theclasses. Results of LCA regression models indicate thatCog&Physic-Imp individuals are significantly older com-pared to those classified in the Physic-Imp and R-Healthyprofiles. Relative to their younger peers (64–74 years),individuals in the age groups 75–84 and 85+ are 1.6 and2.5 times more likely to be highly disabled as opposed tobeing "only" physically impaired (p < 0.01). These oddsincrease to 2 and 4, respectively, when compared to beingrelatively healthy (p < 0.001). Whereas women tend to beclassified in the profiles with disability or be relativelyhealthy, men are significantly more likely to be classified
in the Physic-Imp profile (OR range: 2.18–3.2; p < 0.01),where the probability of any type of disability is compar-atively low despite high probability of chronic conditions.In both profiles characterized by cognitive problems, indi-viduals are more likely not to live alone (OR range: 3.84–9.28; p < 0.001).
Controlling for age and gender, we found thatCog&Physic-Imp individuals are significantly more likelyto die within 22-months compared to Cog-Imp (OR 2.84;p < 0.002), Physic-Imp (OR 3.27; p < 0.001) and R-Healthy individuals (OR 4.75; p < 0.001). In turn, Cog-Imp individuals are more likely to die compared to thePhysic-Imp (OR 1.15; p < 0.003) and the R-Healthy (OR1.67; p < 0.003); and Physic-Imp individuals more likelyto die than the R-Healthy (OR 1.45; p < 0.001). Finally,we find that Cog&Physic-Imp individuals are less likely touse nursing home services within 22-months compared toCog-Imp individuals (OR 0.72; p < 0.001). In turn, indi-viduals in the later two profiles, i.e. characterized by cog-nitive impairments, are more likely to use nursing home
Table 4: Health indicators distribution and conditional probabilities per health profile *
Cog&Physic Impaired Cognitively Impaired Physically Impaired Relatively Healthy
T0 T1 T2 T0 T1 T2 T0 T1 T2 T0 T1 T2
Cognition 68.7 58.8 74.2 85.8 71.1 89.2 7.8 2.5 12.1 13.9 6.6 2.4DepressionModerate 43.5 25.9 28.1 24.7 43.8 18.3 45.3 30.3 26.0 32.2 24.1 26.4Severe 35.7 45.6 46.8 8.3 12.8 12.9 25.1 38.9 38.2 9.9 9.8 19.3Hypertension 24.7 25.7 33.0 13.8 17.3 17.5 32.9 34.9 45.6 27.8 26.1 41.1Circulation 45.9 46.5 48.7 12.7 22.5 25.8 50.8 55.4 60.5 31.4 27.1 38.0Stroke 37.1 36.6 39.4 11.5 23.4 23.1 21.1 20.4 17.4 11.1 14.4 21.8Respiratory 26.7 33.2 27.9 9.0 10.9 5.5 35.7 30.4 38.9 19.0 19.1 21.3Diabetes 20.9 21.4 19.1 15.7 9.3 6.9 20.2 18.0 19.3 18.2 22.1 25.6Joint & Arthritis 46.4 52.6 47.9 19.2 24.3 33.6 71.9 72.7 79.5 40.1 38.8 58.4Cancer 14.0 17.0 19.4 11.9 10.2 11.5 20.0 21.5 17.1 20.3 17.7 20.6Bladder 24.3 24.9 19.3 11.8 1.5 6.4 43.6 50.3 42.6 36.8 28.8 33.2Gastrointestinal 23.2 23.7 27.1 16.4 7.4 12.6 32.6 32.0 32.9 24.7 25.9 30.2Sensory 48.4 44.7 56.4 23.2 24.7 21.7 18.7 16.1 15.1 14.0 11.9 15.6Fx Limits (U) 84.4 95.3 92.9 12.8 22.9 8.0 78.6 86.9 94.2 28.6 20.1 50.3Fx Limits (L) 98.4 99.1 100 47.3 62.8 58.7 94.3 96.6 92.6 47.4 33.4 59.1ADL-MobilityNone 0.0 0.0 1.6 32.3 17.8 25 11.4 20.5 0.0 77.6 74.3 56.71–2 activities 14.7 7.5 8.3 57.2 54.8 59.9 60.5 49.9 49.3 22.4 23.5 41.6+2 activities 85.3 92.5 90.0 10.4 27.5 15.1 28.1 29.6 50.7 0.0 0.0 1.8ADL-Personal careNone 7.1 11.0 12.0 57.9 56.5 75.1 60.8 79.5 52.2 95.1 96.1 96.21–2 activities 21.7 20.4 10.8 31.4 28.4 18.9 33.7 17.7 38.0 4.9 3.9 3.8+ 2 activities 71.2 68.5 77.2 10.7 15.1 6.0 5.5 2.8 9.8 0.0 0.0 0.0IADL 0.0 0.0 0.0 4.7 0.0 18.3 27.8 36.3 11.7 84.8 74.7 79.90–2 activities3–4 activities 2.6 10.4 1.0 20.0 25.0 9.8 55.0 49.8 53.9 13.8 23.5 18.3+4 activities 97.4 89.6 99.0 75.4 75.0 72.0 17.2 14.0 34.3 1.4 1.8 1.8
* Entries represent profile-specific probabilities (λ) × 100 of reporting problems for the index health indicator.ADL refers to difficulty with activities of daily living; IADL refers to difficulty with instrumental activities of daily living; Fx limits U = functional limitations with upper limbs; L = lower limbs The upper and lower limbs distinction was made to capture variability in functional ability.
Page 8 of 14(page number not for citation purposes)
BMC Geriatrics 2009, 9:6 http://www.biomedcentral.com/1471-2318/9/6
services compared to Physic-Imp individuals (OR 2.87and 4.37, respectively; p < 0.001) and R-Healthy individ-uals (OR 3.18 and 4.38, respectively; p < 0.001). The like-lihood of using nursing home services for Physic-Imprelative to the R-healthy is not as marked (OR 1.11; p <0.004). These results all point in the expected direction.
Latent transition analysesTable 6 presents age-controlled latent transition probabil-ities from baseline to T1 and from T1 to T2. AmongCog&Physic-Imp individuals, 51.4% are predicted toremain in that state and 24.9% are predicted to die withina year. Around 5% are predicted to move towards less dis-abled health states: 3.0% towards a Cog-Imp state and2.3% towards a Physic-Imp state. The main gender differ-
ence lies in the increased probability of death for men andLTF for women. Among Cog-Imp individuals, women aremore likely to transition towards the more disabled state(24.1%) or improve (4%), whereas men are compara-tively more likely to stay in their same state (47.8% vs.24.3%) or die (11.2% vs. 9%). The competing risk forwomen to be LTF is again higher. Physic-Imp individualsare characterized by more stability (63.8%) with no strik-ing gender difference. Overall, their probability of transi-tioning towards more disabled states is 4.3%, andsomewhat higher for men; their transition probabilitytowards the R-healthy state is 3.4%, and somewhat higherfor women. Men are twice as likely to die. Although the R-Healthy also tend to be characterized by stability (66.2%),this applies most importantly to women. Over a year,
Table 5: Health indicators' prevalence by health status profile at T0 (%)
Cog&Physic Imp Cog-Imp Physic-Imp R-Healthy
ADL-Mobilityn = 1164
No 0 35.1 9.5 79.3
1–2 activities 14.1 56.7 63.3 20.7+ 2 activities 85.9 8.2 27.2 0χ2 (p-value) 955.01 (p < 0.001)Adjusted C* 0.822 (p < 0.001)
ADL-Personal caren = 1164
No 6.3 59.0 60.9 95.7
1–2 activities 23.0 31.3 33.7 4.2+ 2 activities 70.7 9.7 5.3 0χ2 (p-value) 770.27 (p < 0.001)Adjusted C 0.773 (p < 0.001)
IADLn = 1164
0–2 activities 0 2.2 26.2 87.3
3–4 activities 1.1 19.4 57.5 12.4+4 activities 98.9 78.4 16.3 0.3χ2 (p-value) 1156.42 (p < 0.001)Adjusted C 0.865 (p < 0.001)
Cognitive problemsn = 1159
None 30.4 10.7 92.9 86.1
Moderate 6.5 13.2 3.9 8.8Severe 63.1 76.0 3.1 5χ2 (p-value) 556.05 (p < 0.001)Adjusted C 0.719 (p < 0.001)
Comorbidityn = 1158
0 25.4 71.4 11.9 36.1
1–2 48.9 24.1 45.3 42.5>3 25.7 4.5 42.8 21.4χ2 (p-value) 208.70 (p < 0.001)Adjusted C 0.479 (p < 0.0001)
* C = Contingency coefficient with adjustment so it reaches a maximum of 1 (i.e. C/Sqr-root of k1-/k, where k is the number of rows or column, whichever is less)ADL refers to difficulty with activities of daily living; IADL refers to difficulty with instrumental activities of daily living
Page 9 of 14(page number not for citation purposes)

BMC Geriatrics 2009, 9:6 http://www.biomedcentral.com/1471-2318/9/6
men' transition probabilities towards more compromisedhealth states is higher despite their higher competing riskfor dying or being LTF.
The patterns of transitions between T1 to T2 are similar,with quantitative differences. Overall, transition probabil-ities towards more disabled states are higher, andimprovements less likely. A noteworthy gender differenceis the increased probability of R-Healthy women to tran-sition to the Physic-Imp or Cog-Physic-Imp states, asopposed to stability. Also, Cog-Imp women have a 35%probability of becoming highly disabled whereas men inthat state appear more stable. The probability of dyingacross health profiles is lower, except for Physic-Imp men.These differences must be considered in light of theincreased competing risk of being LTF and the 10-monthinterval.
DiscussionOur aim was to identify a meaningful latent classificationthat encompasses multiple dimensions of health and cap-
tures their synergistic effect on older people's health sta-tus. We identified four homogeneous health state profilesthat are stable over time and sensitive to change.
The uncovered classification has face validity. It clearlydistinguishes the physical and cognitive dimensions ofhealth. And within each of these dimensions, a qualitativedistinction along the disability dimension captures theconsequences of diseases and impairments [1]. Thesefindings generally agree with classifications obtained byother methods [39,41,40,42]. In elderly populations com-parable to ours [39,40], published classifications revealedmore nuanced groups (i.e. 5–7 profiles) but with mean-ings anchored in the same dimensions as those character-izing our profiles. In samples representative ofcommunity-living older people [41,42], an additional"Healthy" profile typically emerges. Given our target pop-ulation's compromised health, we did not find norexpected a healthy profile. In our sample, four latentclasses were sufficient to capture health status heterogene-ity while maintaining interpretability and stability over
Table 6: Transition probabilities *
12 monthsCog&Physic-Imp Cog-Imp Physic-Imp R-Healthy Deceased LTF
BaselineCog&Physic-Imp 0.514 0.030 0.023 0.000 0.249 0.184Female 0.550 0.013 0.033 0.000 0.184 0.220Male 0.502 0.032 0.025 0.000 0.284 0.156Cog-Imp 0.181 0.438 0.001 0.023 0.101 0.256Female 0.241 0.243 0.001 0.040 0.090 0.385Male 0.177 0.478 0.001 0.013 0.112 0.219Physic-Imp 0.043 0.000 0.638 0.034 0.064 0.221Female 0.036 0.000 0.692 0.033 0.040 0.199Male 0.042 0.000 0.683 0.017 0.079 0.179R-Healthy 0.046 0.025 0.041 0.662 0.071 0.155Female 0.037 0.008 0.042 0.732 0.038 0.143Male 0.061 0.036 0.059 0.551 0.107 0.185
22-monthsCog&Physic-Imp Cog-Imp Physic-Imp R-Healthy Deceased LTF
12-monthsCog&Physic-Imp 0.412 0.013 0.000 0.000 0.153 0.422Female 0.477 0.006 0.000 0.000 0.104 0.413Male 0.402 0.019 0.000 0.000 0.196 0.384Cog-Imp 0.256 0.329 0.000 0.018 0.037 0.361Female 0.353 0.171 0.000 0.028 0.029 0.420Male 0.224 0.422 0.000 0.020 0.040 0.294Physic-Imp 0.062 0.003 0.479 0.022 0.076 0.358Female 0.065 0.001 0.521 0.025 0.055 0.333Male 0.070 0.005 0.363 0.030 0.132 0.399R-Healthy 0.062 0.049 0.101 0.406 0.013 0.369Female 0.064 0.019 0.111 0.467 0.009 0.330Male 0.057 0.065 0.064 0.471 0.017 0.326
*The overall transitions control for age and gender. Female and male transition probabilities represent marginal probabilities, also controlling for age. LTA ran under the assumption of MI.
Page 10 of 14(page number not for citation purposes)

BMC Geriatrics 2009, 9:6 http://www.biomedcentral.com/1471-2318/9/6
time. There is no longitudinal evidence to determinewhether the additional profiles of previously publishedclassifications possess the later qualities.
The profiles' stability over and above observed changes inthe sample's overall health substantiates the validity ofour classification. The profiles are robust not only in beingcomparable across time points but also in holding despitehigh mortality and LTF. The differentiated and gender-specific patterns of transition probabilities demonstratethe profiles' sensitivity to change in health states.Although most individuals tended to remain in theirhealth state or died, we found higher probabilities ofunfavorable transitions for individuals in the more com-promised health states, and lower probabilities ofimprovements. These observations concord with studiesof change in disability [7,26,25], functional limitations[6,11,10] and frailty [60]. The consistent finding, acrossoutcome measures, is a decreased probability of recoveryand an increased probability of decline or death whenmore deficits are reported at baseline. For the Cog-Impprofile, our findings appear consistent with the course ofdisability progression as cognitive problems worsen: IADLare affected first, followed by basic activities of personalcare [4,6]. Yet, a shortcoming of traditional functionalmeasures is their inadequate ability to detect cognitiveimpairments, particularly when scaled with items influ-enced by physical ability [61]. Our results show that clas-sification into homogenous health categories unmaskedthe differential relationship of physical and cognitivedomains with progression in disability; gender specificanalyses provide further insights.
Overall, the classification has good construct validity. Weobserved higher mortality and older individuals in themore vulnerable groups; an increased likelihood of nurs-ing home use for cognitively impaired profiles; gender dif-ferences in transition probabilities, as well as highcoherence between class membership and individualhealth indicators except comorbidity. The latter is consist-ent with previous work showing that assessment of dis-ease alone is a weak marker of health status in olderindividuals, even when indicators of disease severity areconsidered [62].
In considering the generalizability of our findings, it isimportant to keep in mind that our reference populationwas selected to demonstrate the value of integrated serv-ices for older people with complex care needs [46,47]. Thecharacteristics of our sample thus closely match those ofthe sub-population of community-living elderly targetedby such programs [63], not those of the general popula-tion; our classification reflects their compromised healthstatus. Evidence shows that particular groups, namely frailelderly, may be more likely than others to benefit from
better integration of care [46] but identifying themremains a challenge. Application of LCA may prove usefulfor doing so.
Three other issues deserve discussion. The first relates tomissing depression and cognitive scores. Firstly, depres-sion scores are mainly missing by design for the cogni-tively impaired. Assuming a MAR mechanism fordepression did not significantly change how individualsare grouped yet we cannot exclude misclassification forindividuals who also have a missing cognition score. Sec-ondly, despite the known association between depressivesymptoms and cognitive impairments [64], we could notassess the effect of our MAR assumption on subsequentcognitive decline.
The second issue pertains to attrition. LTF individuals didnot differ on sociodemographic characteristics and mosthealth indicators at baseline but differed on mobility dis-ability. Combined with our inability to control for unob-served individuals effects (e.g. lifestyle, social support),this means that we cannot exclude a selection bias. Yet,there is no significant difference between profiles in theproportions of LTF individuals at T1 (χ2:6.317; p = 0.097)or T2 (χ2:2.544; p = 0.467). Moreover, the high concord-ance in how individuals are grouped confirmed the classi-fication's stability overtime, which also points to itsrobustness to the competing risk of being LTF. For thetransition analyses, we captured LTF individuals throughan absorbing state. This provision does not inform us onthe effect of change in health status on attrition – or viceversa. Nevertheless, it deals with the potential attritionbiases introduced in transition studies when these indi-viduals are excluded.
Conversely, a mortality bias is unlikely: we recorded deathusing administrative databases and captured these transi-tions through an absorbing state. Excluding deceasedindividuals would have yielded a healthier sample, over-estimated stability and recovery, and underestimated pro-gression relative to a more representative sample. Ourmodeling approach avoids this bias without having tomodify the indicators, run separate analyses or use impu-tation techniques – all common shortcomings in geriatricstudies [65,66].
Thirdly, we performed the transition analyses in two stepsto avoid convergence problems due to the large number ofmissing data patterns. This approach is not as powerful asperforming one LTA on 3 time points but it allowed us toaccount for the competing risks of death and being LTF inthe same analyses. Moreover, because we constrainedhealth profiles to have the same meaning across timepoints, this two-step strategy should yield valid transitionpatterns. To be sure, concurrent information on transi-
Page 11 of 14(page number not for citation purposes)

BMC Geriatrics 2009, 9:6 http://www.biomedcentral.com/1471-2318/9/6
tion, death and LTF probabilities by health status providescritical information for the planning of longitudinal stud-ies of aging.
Despite those limits, our work tackles a core challenge ofgerontology research by making the multidimensionaland dynamic nature of older people's health status com-putationally tractable. LCA capture multiple dimensionsof health; reveal the smallest number of health profilesthat can explain away the associations among observedhealth dimensions; and makes no assumption about thedistribution of health indicators or their relationshipsother than that of local independence [34]. On thesemethodological grounds, LCA supersedes classical statisti-cal models by eliminating part of the endogeneity bias[67] introduced in multivariable modeling when indica-tors of diseases, cognition and disability enter in themodel simultaneously. Dealing with this problem is evenmore pressing when measuring the dynamic of health sta-tus, which implies concomitant and interrelated changesin various factors over time [68]. LTA provides a usefulempirical heuristic for studying this complex processbecause the measurement model is specifically developedfor dynamic variables as an outgrowth of substantive the-ory [33,69].
ConclusionIn his seminal paper on the compression of morbidity,Fries argues that the means for affecting positive change inan aging population are to be found in the variability ofthe population, as well as in the average values [70]. Ourstudy presents some means to identify and quantify inter-individual variability in health status. Notably, the impor-tant weight of the cognitive dimension in explaining thisvariability and transitions along the disability dimensionunderscores the importance of moving beyond "simple"functional measures if we are to comprehend the dynamicof elderly people health and social needs. The combina-tion of chronic conditions, cognition and disability itemsfor our LCA finds a parallel in the approaches used todevelop the Frailty Index [71] and Clinical Frailty Scale[72]. Compared to our profiles, the former continuousmeasures of health status provide finer gradations likelyto be pertinent to clinical practice and aging research.Conversely, our approach may be unwieldy for clinicaluse but finds its application at organization and policylevels where many issues call for classification of individ-uals into pragmatically meaningful groups. Econometricmodeling has already demonstrated the sensitivity of suchclassifications to differences, and changes, in availablepatterns of health and social services in specific milieu[40,73]. Applications of LCA and LTA to larger, more rep-resentative samples are needed to confirm our findingsand expand the methodological underpinnings of theseapproaches to study health status in older populations.
AbbreviationsADL: Activity of Daily Living; AIC: Akaike InformationCriteria; BIC: Bayesian Information Criteria; Cog-Imp:Cognitively Impaired; Cog&Physic-Imp: Cognitively andPhysically Impaired; GDS: Geriatric Depression Scale;GoM: Grade of Membership; IADL: Instrumental Activityof Daily Living; LCA: Latent Class Analysis; LMR-LRT: Lo-Mendell-Rubin Likelihood Ratio Test; LTF: Lost to Follow-up; LTA: Latent Transition Analysis; MAR: Missing at Ran-dom; Physic-Imp: Physically Impaired; R-Healthy: Rela-tively Healthy; SIPA: System of Integrated Care for OlderPeople.
Competing interestsThe authors declare that they have no competing interests.
Authors' contributionsLL conceived and designed the study, performed the sta-tistical analyses, drafted and revised the manuscript. FBmade substantial contributions to the conception anddesign of the study, acquisition of the original data andinterpretation of the data. HB made substantial contribu-tions to the acquisition of the original data. FB, HB and JAall critically revised the manuscript. All authors read andapproved the final manuscript.
AcknowledgementsSpecial thanks to John Fletcher for his precious help with data preparation. This research was funded through a PhD dissertation grant supplied to the first author by the Quebec Network for Research on Aging.
References1. Verbrugge LM, Jette AM: The disablement process. Soc Sci Med
1994, 38(1):1-14.2. Fried LP, Ferrucci L, Darer J, Williamson JD, Anderson G: Untan-
gling the concepts of disability, frailty, and comorbidity:implications for improved targeting and care. J Gerontol A BiolSci Med Sci 2004, 59(3):255-263.
3. Hogan DB, MacKnight C, Bergman H, Steering Committee CIoFaA:Models, definitions, and criteria of frailty. Aging Clin Exp Res2003, 15(3 Suppl):1-29.
4. Barberger-Gateau P, Alioum A, Peres K, Regnault A, Fabrigoule C,Nikulin M, Dartigues JF: The contribution of dementia to thedisablement process and modifying factors. Dement GeriatrCogn Disord 2004, 18(3–4):330-337.
5. Stuck AE, Walthert JM, Nikolaus T, Bula CJ, Hohmann C, Beck JC:Risk factors for functional status decline in community-livingelderly people: a systematic literature review. [see com-ment]. Soc Sci Med 1999, 48(4):445-469.
6. Deeg DJ: Longitudinal characterization of course types offunctional limitations. Disabil Rehabil 2005, 27(5):253-261.
7. Hardy SE, Dubin JA, Holford TR, Gill TM: Transitions betweenstates of disability and independence among older persons.Am J Epidemiol 2005, 161(6):575-584.
8. Peres K, Verret C, Alioum A, Barberger-Gateau P: The disable-ment process: factors associated with progression of disabil-ity and recovery in French elderly people. Disabil Rehabil 2005,27(5):263-276.
9. Mendes de Leon CF, Glass TA, Beckett LA, Seeman TE, Evans DA,Berkman LF: Social networks and disability transitions acrosseight intervals of yearly data in the New Haven EPESE. J Ger-ontol B Psychol Sci Soc Sci 1999, 54(3):S162-172.
10. Anderson RT, James MK, Miller ME, Worley AS, Longino CFJ: Thetiming of change: patterns in transitions in functional status
Page 12 of 14(page number not for citation purposes)
http://www.ncbi.nlm.nih.gov/entrez/query.fcgi?cmd=Retrieve&db=PubMed&dopt=Abstract&list_uids=8146699
http://www.ncbi.nlm.nih.gov/entrez/query.fcgi?cmd=Retrieve&db=PubMed&dopt=Abstract&list_uids=9469176

BMC Geriatrics 2009, 9:6 http://www.biomedcentral.com/1471-2318/9/6
among elderly persons. J Gerontol B Psychol Sci Soc Sci 1998,53(1):S17-S27.
11. Béland F, Zunzunegui M-V: Predictors of functional status inolder people living at home. Age Ageing 1999, 28(2):153-159.
12. Hébert R, Brayne C, Spiegelhalter D: Factors associated withfunctional decline and improvement in a very elderly com-munity-dwelling population. Am J Epidemiol 1999,150(5):501-510.
13. Comijs HC, Dik MG, Aartsen MJ, Deeg DJ, Jonker C: The impact ofchange in cognitive functioning and cognitive decline on dis-ability, well-being, and the use of healthcare services in olderpersons. Results of Longitudinal Aging Study Amsterdam.Dement Geriatr Cogn Disord 2005, 19(5–6):316-323.
14. Leveille SG, Penninx BW, Melzer D, Izmirlian G, Guralnik JM: Sex dif-ferences in the prevalence of mobility disability in old age:the dynamics of incidence, recovery, and mortality. J GerontolB Psychol Sci Soc Sci 2000, 55(1):S41-50.
15. Lamarca R, Ferrer M, Andersen PK, Liestol K, Keiding N, Alonso J: Achanging relationship between disability and survival in theelderly population: differences by age. [erratum appears in JClin Epidemiol. 2004 Mar;57(3):324]. J Clin Epidemiol 2003,56(12):1192-1201.
16. Aguero-Torres H, von Strauss E, Viitanen M, Winblad B, Fratiglioni L:Institutionalization in the elderly: the role of chronic dis-eases and dementia. Cross-sectional and longitudinal datafrom a population-based study. J Clin Epidemiol 2001,54(8):795-801.
17. Wolff JL, Starfield B, Anderson G: Prevalence, expenditures, andcomplications of multiple chronic conditions in the elderly.Arch Intern Med 2002, 162(20):2269-2276.
18. Himelhoch S, Weller WE, Wu AW, Anderson GF, Cooper LA:Chronic medical illness, depression, and use of acute medicalservices among Medicare beneficiaries. Medical Care 2004,42(6):512-521.
19. Fried TR, Bradley EH, Williams CS, Tinetti ME: Functional disabil-ity and health care expenditures for older persons. Arch InternMed 2001, 161(21):2602-2607.
20. Borrayo EA, Salmon JR, Polivka L, Dunlop BD: Utilization acrossthe continuum of long-term care services. Gerontologist 2002,42(5):603-612.
21. Walsh EG, Wu B, Mitchell JB, Berkmann LF: Cognitive functionand acute care utilization. J Gerontol B Psychol Sci Soc Sci 2003,58(1):S38-S49.
22. Crimmins EM: Trends in the health of the elderly. Annu Rev Pub-lic Health 2004, 25:79-98.
23. Parker MG, Thorslund M: Health trends in the elderly popula-tion: getting better and getting worse. Gerontologist 2007,47(2):150-158.
24. Ferrucci L, Guralnik JM, Simonsick E, Salive ME, Corti C, Langlois J:Progressive versus catastrophic disability: a longitudinalview of the disablement process. J Gerontol A Biol Sci Med Sci1996, 51(3):M123-130.
25. Wolinsky FD, Armbrecht ES, Wyrwich KW: Rethinking functionallimitation pathways. Gerontologist 2000, 40(2):137-146.
26. Romoren TI, Blekeseaune M: Trajectories of disability amongthe oldest old. Journal of Aging & Health 2003, 15(3):548-566.
27. Lunney JR, Lynn J, Foley DJ, Lipson S, Guralnik JM: Patterns of func-tional decline at the end of life. JAMA 2003, 289(18):2387-2392.
28. Lubke GH, Muthen B: Investigating population heterogeneitywith factor mixture models. Psychol Methods 2005, 10(1):21-39.
29. Muthén B: Beyond SEM: General latent variable modeling.Behaviormetrica 2002, 29(1):81-117.
30. McLachlan GJ, Peel D: Finite Mixture Models. New York,Toronto: Wiley; 2000.
31. Muthén B, Muthén LK: Integrating person-centered and varia-ble-centered analyses: growth mixture modeling with latenttrajectory classes. Alcohol Clin Exp Res 2000, 24(6):882-891.
32. Madigson J, Vermunt JK: Latent class models for clustering: Acomparison with K-means. Canadian Journal of Marketing Research2002, 20:37-44.
33. Reboussin BA, Liang KY, Reboussin DM: Estimating equations fora latent transition model with multiple discrete indicators.Biometrics 1999, 55(3):839-845.
34. Hagenaars J, McCutcheon AL: Applied Latent Class Analysis.Cambridge: Cambridge University Press; 2002.
35. Bandeen-Roche K, Xue QL, Ferrucci L, Walston J, Guralnik JM,Chaves P, Zeger SL, Fried LP: Phenotype of frailty: characteriza-tion in the women's health and aging studies. J Gerontol A BiolSci Med Sci 2006, 61(3):262-266.
36. Bandeen-Roche K, Miglioretti DL, Zeger SL, Rathouz PJ: Latent var-iable regression for multiple discrete outcome. J Am Stat Assoc1997, 92(440):1375-1386.
37. Moran M, Walsh C, Lynch A, Coen RF, Coakley D, Lawlor BA: Syn-dromes of behavioural and psychological symptoms in mildAlzheimer's disease. Int J Geriatr Psychiatry 2004, 19(4):359-364.
38. Manton KG, Woodbury MA: Grade of Membership generaliza-tions and aging research. Exp Aging Res 1991, 17(4):217-226.
39. McNamee P: A comparison of the grade of membership meas-ure with alternative health indicators in explaining costs forolder people. Health Econ 2004, 13(4):379-395.
40. Wieland D, Lamb V, Wang H, Sutton S, Eleazer GP, Egbert J: Partic-ipants in the Program of All-Inclusive Care for the Elderly(PACE) demonstration: developing disease-impairment-dis-ability profiles. Gerontologist 2000, 40(2):218-227.
41. Portrait F, Lindeboom M, Deeg D: Health and mortality of theelderly: the grade of membership method, classification anddetermination. Health Econ 1999, 8(5):441-457.
42. Berkman L, Singer B, Manton K: Black/white differences in healthstatus and mortality among the elderly. Demography 1989,26(4):661-678.
43. Erosheva EA: Latent class representation of the grade ofmembership model. Seatle: University of Washington; 2006.
44. Melzer D, Izmirlian G, Leveille SG, Guralnik JM: Educational differ-ences in the prevalence of mobility disability in old age: thedynamics of incidence, mortality, and recovery. J Gerontol BPsychol Sci Soc Sci 2001, 56(5):S294-301.
45. Beckett LA, Brock DB, Lemke JH, Mendes de Leon CF, Guralnik JM,Fillenbaum GG, Branch LG, Wetle TT, Evans DA: Analysis ofchange in self-reported physical function among older per-sons in four population studies. Am J Epidemiol 1996,143(8):766-778.
46. Béland F, Bergman H, Lebel P, Clarfield AM, Tousignant P, Contandri-opoulos A-P, Dallaire L: A system of integrated care for olderpersons with disabilities in Canada: results from a rand-omized controlled trial. J Gerontol A Biol Sci Med Sci 2006,61(4):367-373.
47. Bergman H, Béland F, Lebel P, Contandriopoulos AP, Tousignant P,Brunelle Y, Kaufman T, Leibovich E, Rodriguez R, Clarfield M: Carefor Canada's frail elderly population: fragmentation or inte-gration? CMAJ 1997, 157(8):1116-1121.
48. Hebert R, Carrier R, Bilodeau A: The Functional AutonomyMeasurement System (SMAF): description and validation ofan instrument for the measurement of handicaps. Age Ageing1988, 17(5):293-302.
49. Pfeiffer E: A short portable mental status questionnaire forthe assessment of organic brain deficit in elderly patients. JAm Geriatr Soc 1975, 23(10):433-441.
50. Yesavage JA, Brink TL, Rose TL, Lum O, Huang V, Adey M, Leirer VO:Development and validation of a geriatric depression screen-ing scale: a preliminary report. J Psychiatr Res 1982, 17(1):37-49.
51. Nagi SZ: An epidemiology of disability among adults in theUnited States. Milbank Mem Fund Q Health Soc 1976,54(4):439-467.
52. Mahoney FI, Barthel DW: Functional Evaluation: The BarthelIndex. Md State Med J 1965, 14:61-65.
53. Fillenbaum GG, Smyer MA: The development, validity, and reli-ability of the OARS multidimensional functional assessmentquestionnaire. J Gerontol 1981, 36(4):428-434.
54. Muthén L, Muthén B: Mplus: statistical analysis with latent var-iables. Los Angeles: Muthén & Muthén; 1998.
55. Lazerfeld PF, Henry NW: Latent structure analysis. Boston:Houghton Mifflin; 1968.
56. Rubin RJA, Rubin DB: Statistical analysis with missing data. Sec-ond edition. Wiley Interscience; 2002.
57. Lo Y, Mendell NR, Rubin DB: Testing the number of compo-nents in a normal mixture. Biometrika 2001, 88:767-778.
58. Collins LM, Flaherty BP: Latent class models for longitudinaldata. In Applied latent class analysis Edited by: Hagenaars JA,McCutcheon AL. Cambridge: Cambridge University Press;2002:287-303.
Page 13 of 14(page number not for citation purposes)
http://www.ncbi.nlm.nih.gov/entrez/query.fcgi?cmd=Retrieve&db=PubMed&dopt=Abstract&list_uids=9469176
http://www.ncbi.nlm.nih.gov/entrez/query.fcgi?cmd=Retrieve&db=PubMed&dopt=Abstract&list_uids=8630705
http://www.ncbi.nlm.nih.gov/entrez/query.fcgi?cmd=Retrieve&db=PubMed&dopt=Abstract&list_uids=8630705
http://www.ncbi.nlm.nih.gov/entrez/query.fcgi?cmd=Retrieve&db=PubMed&dopt=Abstract&list_uids=8630705
http://www.ncbi.nlm.nih.gov/entrez/query.fcgi?cmd=Retrieve&db=PubMed&dopt=Abstract&list_uids=1820287
http://www.ncbi.nlm.nih.gov/entrez/query.fcgi?cmd=Retrieve&db=PubMed&dopt=Abstract&list_uids=1820287
http://www.ncbi.nlm.nih.gov/entrez/query.fcgi?cmd=Retrieve&db=PubMed&dopt=Abstract&list_uids=2583323
http://www.ncbi.nlm.nih.gov/entrez/query.fcgi?cmd=Retrieve&db=PubMed&dopt=Abstract&list_uids=2583323
http://www.ncbi.nlm.nih.gov/entrez/query.fcgi?cmd=Retrieve&db=PubMed&dopt=Abstract&list_uids=8610686
http://www.ncbi.nlm.nih.gov/entrez/query.fcgi?cmd=Retrieve&db=PubMed&dopt=Abstract&list_uids=8610686
http://www.ncbi.nlm.nih.gov/entrez/query.fcgi?cmd=Retrieve&db=PubMed&dopt=Abstract&list_uids=8610686
http://www.ncbi.nlm.nih.gov/entrez/query.fcgi?cmd=Retrieve&db=PubMed&dopt=Abstract&list_uids=9347783
http://www.ncbi.nlm.nih.gov/entrez/query.fcgi?cmd=Retrieve&db=PubMed&dopt=Abstract&list_uids=9347783
http://www.ncbi.nlm.nih.gov/entrez/query.fcgi?cmd=Retrieve&db=PubMed&dopt=Abstract&list_uids=9347783
http://www.ncbi.nlm.nih.gov/entrez/query.fcgi?cmd=Retrieve&db=PubMed&dopt=Abstract&list_uids=2976575
http://www.ncbi.nlm.nih.gov/entrez/query.fcgi?cmd=Retrieve&db=PubMed&dopt=Abstract&list_uids=2976575
http://www.ncbi.nlm.nih.gov/entrez/query.fcgi?cmd=Retrieve&db=PubMed&dopt=Abstract&list_uids=2976575
http://www.ncbi.nlm.nih.gov/entrez/query.fcgi?cmd=Retrieve&db=PubMed&dopt=Abstract&list_uids=1159263
http://www.ncbi.nlm.nih.gov/entrez/query.fcgi?cmd=Retrieve&db=PubMed&dopt=Abstract&list_uids=1159263
http://www.ncbi.nlm.nih.gov/entrez/query.fcgi?cmd=Retrieve&db=PubMed&dopt=Abstract&list_uids=7183759
http://www.ncbi.nlm.nih.gov/entrez/query.fcgi?cmd=Retrieve&db=PubMed&dopt=Abstract&list_uids=7183759
http://www.ncbi.nlm.nih.gov/entrez/query.fcgi?cmd=Retrieve&db=PubMed&dopt=Abstract&list_uids=7183759
http://www.ncbi.nlm.nih.gov/entrez/query.fcgi?cmd=Retrieve&db=PubMed&dopt=Abstract&list_uids=7252074
http://www.ncbi.nlm.nih.gov/entrez/query.fcgi?cmd=Retrieve&db=PubMed&dopt=Abstract&list_uids=7252074

BMC Geriatrics 2009, 9:6 http://www.biomedcentral.com/1471-2318/9/6
Publish with BioMed Central and every scientist can read your work free of charge
"BioMed Central will be the most significant development for disseminating the results of biomedical research in our lifetime."
Sir Paul Nurse, Cancer Research UK
Your research papers will be:
available free of charge to the entire biomedical community
peer reviewed and published immediately upon acceptance
cited in PubMed and archived on PubMed Central
yours — you keep the copyright
Submit your manuscript here:http://www.biomedcentral.com/info/publishing_adv.asp
BioMedcentral
59. Nylund KL: Latent transition analysis: Modeling extensionsand an application to peer victimization. PhD dissertation.Los Angeles: University of California; 2007.
60. Gill TM, Gahbauer EA, Allore HG, Han L: Transitions betweenfrailty states among community-living older persons. ArchIntern Med 2006, 166(4):418-423.
61. Johnson RJ, Wolinsky FD: The structure of health status amongolder adults: disease, disability, functional limitation, andperceived health. J Health Soc Behav 1993, 34(2):105-121.
62. Hogan DB, Ebly EM, Fung TS: Disease, disability, and age in cog-nitively intact seniors: results from the Canadian Study ofHealth and Aging. J Gerontol A Biol Sci Med Sci 1999, 54(2):M77-82.
63. Johri M, Béland F, Bergman H: International experiments in inte-grated care for the elderly: a synthesis of the evidence. Inter-national Journal of Geriatric Psychiatry 2003, 18(3):222-235.
64. Ganguli M, Du Y, Dodge HH, Ratcliff GG, Chang CC: Depressivesymptoms and cognitive decline in late life: a prospectiveepidemiological study. Arch Gen Psychiatry 2006, 63(2):153-160.
65. Brogan DJ, Haber M, Kutner NG: Functional decline amongolder adults: comparing a chronic disease cohort and con-trols when mortality rates are markedly different. J Clin Epi-demiol 2000, 53(8):847-851.
66. Diehr P, Johnson LL, Patrick DL, Psaty B: Methods for incorporat-ing death into health-related variables in longitudinal stud-ies. J Clin Epidemiol 2005, 58(11):1115-1124.
67. Berg GD, Mansley EC: Endogeneity bias in the absence of unob-served heterogeneity. Ann Epidemiol 2004, 14(8):561-565.
68. Rockwood K: What would make a definition of frailty success-ful? Age Ageing 2005, 34(5):432-434.
69. Collins LM: The measurement of dynamic latent variables inlongitudinal aging research: quantifying adult development.Gerodontology 1990, 9(4):13-20.
70. Fries JF: The compression of morbidity. Milbank Mem Fund QHealth Soc 1983, 61(3):397-419.
71. Mitnitski AB, Mogilner AJ, MacKnight C, Rockwood K: The mortal-ity rate as a function of accumulated deficits in a frailty index.Mech Ageing Dev 2002, 123(11):1457-1460.
72. Rockwood K, Song X, MacKnight C, Bergman H, Hogan DB, McDow-ell I, Mitnitski A: A global clinical measure of fitness and frailtyin elderly people. CMAJ 2005, 173(5):489-495.
73. Lafortune L, Béland F, Bergman H, Ankri J: Health state profilesand service utilization in community-living elderly. MedicalCare 2009 in press.
Pre-publication historyThe pre-publication history for this paper can be accessedhere:
http://www.biomedcentral.com/1471-2318/9/6/prepub
Page 14 of 14(page number not for citation purposes)
http://www.ncbi.nlm.nih.gov/entrez/query.fcgi?cmd=Retrieve&db=PubMed&dopt=Abstract&list_uids=8277124
http://www.ncbi.nlm.nih.gov/entrez/query.fcgi?cmd=Retrieve&db=PubMed&dopt=Abstract&list_uids=8277124
http://www.ncbi.nlm.nih.gov/entrez/query.fcgi?cmd=Retrieve&db=PubMed&dopt=Abstract&list_uids=8277124