
A Person's a Person: Children's Rights in Children's Literature

Akron Children’s Hospital Mahoning ValleyBeeghly Campus6505 Market Street Boardman, Ohio 44512 www.akronchildrens.org
Community Health Needs Assessment2013

Table&of&Contents&
!Executive!Summary!.......................................................................................................................!2!!Background!! Purpose!..............................................................................................................................!3!
Request!Copies!and!More!Information!..............................................................................!4!Description!of!Hospital!Facility!..........................................................................................!4!Description!of!Community!Served!.....................................................................................!5!!
Methodology!! Approach!............................................................................................................................!7!
Epidemiologic!Data!............................................................................................................!8!Community!Leader!Interviews!...........................................................................................!9!Community!Resident!Focus!Groups!.................................................................................!10!Other!Community!Health!Needs!Assessments!................................................................!14!Prioritization!Process!.......................................................................................................!15!
!Community!Resources!.................................................................................................................!16!!Summary!of!Results!.....................................................................................................................!19!!Conclusions!..................................................................................................................................!20!!Acknowledgements!.....................................................................................................................!22!!& &

Community&Health&Needs&Assessment& & &&
! ! 2!
EXECUTIVE&SUMMARY&
!Akron! Children’s! Hospital! operates! two! hospitals:! one! at! its! Akron! campus! and! one! at! its!Beeghly! campus! in! Boardman,! Ohio! in!Mahoning! County.! The! area’s! only! pediatric! hospital,!Akron!Children’s!Hospital!Mahoning!Valley!opened!in!December!2008.!This!non[profit,!32[bed!pediatric!hospital!offers!a!full!range!of!pediatric!services!to!the!children!of!the!Mahoning!Valley!and! surrounding! areas,! including! access! to! a! 24/7! emergency! department,! laboratory,!radiology,! outpatient! surgical! center,! endocrinology,! rehabilitation! and! EEG/ECHO/EKG!services,!as!well!as!a!hematology/oncology!clinic!and!infusion!center!and!child!advocacy!center.!!In! 2013,! Akron! Children’s! Hospital!Mahoning! Valley! partnered! with! Kent! State! University! to!conduct! a! Community! Health! Needs! Assessment! (CHNA).! ! During! the! CHNA! process,!epidemiologic! data! were! reviewed! and! compared! to! the! rates! for! Trumbull,!Mahoning,! and!Columbiana! Counties! to! two! peer! counties,! the! state,! the! nation,! and! Healthy! People! 2020!objectives.! Input! was! also! obtained! from! community! leaders! and! community! residents! and!CHNAs!conducted!by!other!community!groups!were!consulted.!!All!of!this!information!was!used!to!develop!a!list!of!prioritized!health!needs!for!children!in!Trumbull,!Mahoning,!and!Columbiana!Counties.!!!!The!unranked! list!of!prioritized!health!needs! for!children!that!were! identified!across!all! three!counties!were:!!
!These!prioritized!health!needs!are!being!used!by!Akron!Children’s!Hospital!Mahoning!Valley!to!guide!intervention!and!outreach!efforts!aimed!at!improving!community!health.!!Background! information!on! the!CHNA,! the!methodology!used! to! conduct! the!CHNA,! and! the!results! of! the! analysis! are! contained! in! this! report.! ! The! activities! undertaken! by! Akron!Children’s!Hospital!Mahoning!Valley!to!address!these!prioritized!health!needs!are!contained!in!the!“Implementation!Strategy,”!which!is!also!located!on!the!hospital’s!website.!
&Chronic&Diseases&• Asthma!• Diabetes!
!Maternal&&&Infant&Health&• Premature!Births!• Low!&!Very!Low!Birth!Weight!• Infant,!Neonatal,!&!Post[Neonatal!Mortality!
!Child&Lifestyle&Factors&• Overweight!&!Obesity!• Exercise!• Nutrition&
&Mental&Health&&
Substance&Abuse&• Opioid!Drug!Abuse!
!Sexually&Transmitted&Diseases&• Adolescent!Gonorrhea!
&Access&to&Health&Care&• Health!Insurance!Coverage!• Access!to!Dental!Care!• Mental!Health!Insurance!Coverage!• Number!of!Pediatric!Specialists!
!Environmental&Factors&• Access!to!Healthy!Food!
&
&

Community&Health&Needs&Assessment& & &&
! ! 3!
BACKGROUND&
!Purpose&
In!keeping!with!Akron!Children’s!Hospital’s!mission,! relationships!have!been!established!with!various!community!and!professional!organizations!who!share!common!goals!for!the!delivery!of!services!to!children!and!families!with!a!focus!on!access!and!improvement!of!health!outcomes.!!To! better! identify! the! health! needs! of! the! community,! Akron! Children’s! Hospital! Mahoning!Valley!engaged!in!a!more!formalized!process!with!Kent!State!University!to!provide!a!Community!Health!Needs!Assessment!to!validate!and!prioritize!the!needs!of!the!community!we!serve.!!In!March!2010,!the!US!Congress!passed!and!President!Obama!signed!the!Patient!Protection!and!Affordable!Care!Act!(ACA).!!The!ACA!contains!numerous!changes!to!the!US!health!care!system,!including! requiring! non[profit! hospitals! to! conduct! CHNAs! every! three! years.! ! The! Internal!Revenue! Service! (IRS),! the! federal! agency! that! is! charged! with! enforcing! these! new!requirements,!has! issued!regulations!pertaining! to! these!new!reporting! requirements!of!non[profit!hospitals.!!These!regulations!require!CHNAs!to!include!a!description!of:!
• The!community!served!and!how!it!was!defined;!• The!process!and!methods!used!to!conduct!the!assessment,!including!a!description!of!the!
sources! and!dates!of! the!data! and!other! information!used! in! the! assessment! and! the!analytical!methods!applied!to!identify!community!health!needs;!
• The!information!gaps!that!impact!the!ability!to!assess!health!needs;!• Collaborating!hospitals!and!vendors!used!while!conducting!the!CHNA;!• How! input! was! received! from! persons!who! have! expertise! in! public! health! and! from!
persons!who!represent!the!broad!interests!of!the!community,!including!a!description!of!when!and!how!these!persons!were!consulted;!
• The! prioritized! community! health! needs,! including! a! description! of! the! process! and!criteria!used!in!prioritizing!the!health!needs;!
• Existing! health! care! facilities! and! other! resources! within! the! community! available! to!meet!the!prioritized!community!health!needs;!
!Akron!Children’s!Hospital!Mahoning!Valley!has!a!long!history!of!collaboration!on!a!wide!range!of! projects! aimed! at! improving! community! health.! ! The! results! of! this! CHNA!will! help! guide!these!intervention!efforts!and!will!also!act!as!a!resource!for!other!community!groups!working!toward!improving!the!health!of!the!community.!!!!!!!!!!!

Community&Health&Needs&Assessment& & &&
! ! 4!
Request&Copies&and&More&Information&
In!addition!to!being!publicly!available!on!our!website,!a! limited!number!of!reports!have!been!printed.! ! If! you!would! like!a!copy!of! this! report!or! if! you!have!any!questions!about! it,!please!contact:!!
Heather!Wuensch!Akron!Children’s!Hospital!
One!Perkins!Square!Akron,!OH!44308!
Phone:!330[543[8130!Email:[email protected]!http://www.akronchildrens.org!
!
Roseann!Marsico!Akron!Children’s!Hospital!Mahoning!Valley!
Beeghly!Campus!6505!Market!Street!
Boardman,!OH!!44512!Phone:!!330[746[8701!
Email:[email protected]!http://www.akronchildrens.org/mv!
!Description&of&Hospital&Facility&
Akron! Children’s! Hospital! operates! two! hospitals:! one! at! its! Akron! campus! and! one! at! its!Beeghly! campus! in! Boardman,! Ohio! in!Mahoning! County.! The! area’s! only! pediatric! hospital,!Akron!Children’s!Hospital!Mahoning!Valley!opened!in!December!2008.!This!non[profit,!32[bed!pediatric!hospital!offers!a!full!range!of!pediatric!services!to!the!children!of!the!Mahoning!Valley!and! surrounding! areas.! ! The! hospital! provides! access! to! a! 24/7! emergency! department,!laboratory,! radiology,! outpatient! surgical! center,! endocrinology,! rehabilitation! and!EEG/ECHO/EKG!services,!as!well!as!a!hematology/oncology!clinic!and!infusion!center!and!child!advocacy!center.!During!calendar!year!2012,!the!following!patient!encounters!occurred!on!the!Beeghly! campus:! 1,739! inpatient! and!observation! admissions,! 27,774!emergency! room!visits,!and!22,528!specialty!visits.!!Akron!Children’s!also!owns!and!operates!a!19[bed!Level!II!Special!Care!Nursery!at!the!hospital’s!Beeghly! campus! and! a! 25[bed! Level! IIIB!Neonatal! Intensive! Care!Unit! at! St.! Elizabeth!Health!Center! in! Youngstown.! Akron! Children's!neonatal! team!is! committed! to! providing! the! most!effective! and! efficient! care! for! our! tiniest! patients,! as! well! as! providing! parents! with! the!emotional!and!educational!support!they!need.!!!Also!located!in!the!Mahoning!Valley!is!the!Community!Outreach,!Education!&!Support!Center,!which! provides! education! and! support! for! children! and! their! families.! These! programs!meet!specified! criteria! of! nationally! accredited! disease! management! programs,! as! well! as! Akron!Children's! criteria! and! monitoring! requirements.! Our! community! health! outreach! includes!asthma! and! diabetes! education! and! support,! school! programs,! disease[specific! camps! and!support! groups,! fitness!programs,! community!events!and!educational!programs! that! touched!more!than!45,000!individuals!in!calendar!year!2012.!!!In! 2012,! Akron! Children’s! Hospital! was! re[designated! as! a!Magnet! hospital! by! the! American!Nurses! Credentialing! Center’s! (ANCC)! Magnet! Recognition! Program®.! This! is! the! highest!recognition! granted! by! ANCC! and! recognizes! the! very! best! in! nursing! care.! ! Ranked! a! Best!Children’s! Hospital! by! US! News! &! World! Report,! Akron! Children’s! Hospital! is! the! largest!

Community&Health&Needs&Assessment& & &&
! ! 5!
pediatric! provider! in! northeast! Ohio.! Akron! Children’s! Hospital! has! been! caring! for! children!since!1890!guided!by!three!promises!that!we!consider!sacred:!!To!care!for!all!children!as!if!they!were!our!own;!to!treat!everyone!the!way!we!would!want!to!be!treated;!and!to!turn!no!child!away!for!an!inability!to!pay.!!For!more!information,!visit!www.akronchildrens.org/mv.!!!Description&of&Community&Served&
Akron! Children’s! Hospital!Mahoning! Valley! has! and! continues! to! serve! patients! and! families!from!many!communities!across!the!region.!!Most!people!who!receive!services!from!the!hospital!are! located! in!Mahoning,! Trumbull! and!Columbiana!Counties.! ! Thus,! for! the!purposes!of! this!report,!the!community!identified!for!this!CHNA!consists!of!those!counties.!!
Akron&Children's&Hospital&Mahoning&Valley&Community&Discharges!from!Akron!Children's!Hospital!Mahoning!Valley!NICU,!!
Special!Care!Nursery!and!Pediatrics!Unit!(2012)!
County!Where!Patients!Reside! Akron!Children's!Hospital!Mahoning!Valley!%!Mahoning!County! 55%!Trumbull!County! 20%!
Columbiana!County! 14%!All!Other! 11%!
!Trumbull!County!There!are!approximately!207,406!people!living!in!Trumbull!County,!which!is!a!decrease!of!1.4%!since!2010.! ! There!are!7! cities! and!5! villages! in!Trumbull! County,!with! the! county! seat!being!Warren.!!Compared!to!the!State!of!Ohio,!Trumbull!County!has!a!slightly!smaller!proportion!of!children! (under! 18! years! old)! and! a! larger! proportion! of! older! adults! (65! years! and! older).!!Nearly! 8%! of! the! population! in! Trumbull! County! is! Black! or! African! American! and! 1.5%! is!Hispanic!or!Latino!compared!to!12.5%!and!3.3%,!respectively,!in!the!State!of!Ohio.!!Educational!attainment!in!Trumbull!County!is!lower!than!the!State!of!Ohio!with!87.1%!having!a!high!school!diploma!or!higher!and!16.6%!having!a!bachelor’s!degree!or!higher.!!Similarly,!annual!per!capita!income!in!Trumbull!County!is!lower!than!the!State!of!Ohio!and!the!percent!of!Trumbull!County!residents!living!in!poverty!is!higher!than!that!of!the!State.!!Mahoning!County!There!are!approximately!235,145!people!living!in!Mahoning!County,!which!is!a!decrease!of!1.5%!since! 2010.! ! There! are! 7! cities! and! 7! villages! in! Mahoning! County,! with! the! largest! being!Youngstown.! ! Compared! to! the! State! of!Ohio,!Mahoning!County! has! a! smaller! proportion!of!children! (under! 18! years! old)! and! a! higher! proportion! of! older! adults! (65! years! and! older).!!Sixteen!percent!of!the!population!in!Mahoning!County!is!Black!or!African!American!and!5.0%!is!Hispanic!or!Latino!compared!to!12.5%!and!3.3%,!respectively,!in!the!State!of!Ohio.!!The!percent!of!Mahoning!County!residents!with!a!high!school!diploma!or!higher!is!roughly!the!same!as!the!State!of!Ohio,!but!the!percent!with!a!bachelor’s!degree!or!higher!is! lower!than!the!State.!The!annual!per!capita!income!in!Mahoning!County!is!lower!than!the!State!of!Ohio!and!the!percent!of!Mahoning!County!residents!living!in!poverty!is!higher!than!the!State!average.!!

Community&Health&Needs&Assessment& & &&
! ! 6!
Columbiana!County!There!are!approximately!106,507!people! living! in!Columbiana!County,!which! is! a!decrease!of!1.2%!since!2010.!!There!are!3!cities,!11!villages,!and!18!townships!in!Columbiana!County,!with!the! largest! being! Salem.! ! Compared! to! the! State! of! Ohio,! Columbiana! County! has! a! smaller!proportion!of!children! (under!18!years!old)!and!a!higher!proportion!of!older!adults! (65!years!and!older).! ! Approximately! 2.4%!percent!of! the!population! in!Columbiana!County! is! Black!or!African!American!and!1.4%!is!Hispanic!or!Latino!compared!to!12.5%!and!3.3%,!respectively,!in!the!State!of!Ohio.!!The!percent!of!Columbiana!County!residents!with!a!high!school!diploma!or!higher! is! lower! than! the! State!of!Ohio!and! the!percent!with!a!bachelor’s!degree!or!higher! is!nearly! half! of! the! State! average! (13.0%! versus! 24.5%).! ! The! annual! per! capita! income! in!Columbiana! County! is! much! lower! than! the! State! of! Ohio! and! the! percent! of! Columbiana!County!residents!living!in!poverty!is!higher!than!the!State!average.!!!Table&1.&Demographic&Characteristics&of&Communities&Served&and&the&State&of&Ohio!! Trumbull! Mahoning! Columbiana! Ohio!Total!population1! 207,406! 235,145! 106,507! 11,544,225!Percent!population!change2! [1.4%! [1.5%! [1.2%! 0.1%!Percent!under!18!years!old1! 21.5%! 20.9%! 21.2%! 23.1%!Percent!65!years!and!older1! 18.4%! 18.4%! 17.3%! 14.8%!Percent!female1! 51.4%! 51.5%! 49.7%! 51.1%!Percent!Black!or!African!American1! 8.4%! 16.0%! 2.4%! 12.5%!Percent!Hispanic!or!Latino1! 1.5%! 5.0%! 1.4%! 3.3%!Percent!with!high!school!diploma!or!higher3! 87.1%! 87.9%! 85.7%! 87.8%!Percent!with!bachelor’s!degree!or!higher3! 16.6%! 20.9%! 13.0%! 24.5%!Homeownership!rate4! 73.7%! 71.6%! 74.5%! 68.7%!Median!value!of!owner[occupied!housing!units4! $100,500! $97,800! $97,700! $135,600!Persons!per!household4! 2.39! 2.36! 2.46! 2.46!Annual!per!capita!income4!! $22,127! $23,261! $20,691! $25,618!Median!household!income4! $42,441! $40,570! $41,003! $48,071!Percent!living!below!poverty!level4! 16.4%! 17.1%! 15.9%! 14.8%!Notes:!!1!2012!estimate,!2!Since!2010,!3!persons!age!25+,!2007[2011,!4!2007[2011!Source:!!US!Census!Bureau!(http://quickfacts.census.gov/qfd/maps/ohio_map.html)!!

Community&Health&Needs&Assessment& & &&
! ! 7!
METHODOLOGY&
!Approach&
To!conduct!the!Community!Health!Needs!Assessment,!a!modified!version!of!a!well[established!framework!for!strategic!planning!in!public!health!called!“Mobilizing!for!Action!through!Planning!and!Partnerships”!or!MAPP!process!was!followed.!!MAPP!has!been!utilized!by!numerous!public!health! stakeholders! to! strengthen!and! improve! local! community!health! through!collaborative!and!methodical!processes!involving!multiple!stakeholders.!!!The!MAPP!process!has!six!phases:!
1. Organizing!for!success!and!developing!partnerships!
2. Visioning!3. Conducting!MAPP!assessments!4. Identifying!strategic!issues!and!
prioritizing!identified!issues!5. Formulating!goals!and!strategies!6. Taking!action!(planning,!
implementing,!and!evaluating!programs/policies)!
!In! the! first! phase,! Akron! Children’s! Hospital!Mahoning! Valley! convened! meetings! and!discussed! the! new! IRS! requirements!pertaining!to!CHNAs,!the!resources!needed!to!conduct!the!CHNA,!and!the!desire!to!hire!a!contractor!to!help!facilitate!the!process.!!At!the!end!of!the!first!phase,!the!hospital!solicited!a!proposal!from!Kent!State!University!College!of!Public!Health!(KSU[CPH)!and!then!hired!KSU[CPH!to!facilitate!the!development!of!the!CHNA.!!In!the!second!phase,!meetings!were!held!to!identify!a!vision!and!process!to!conduct!the!CHNA,!which!were!determined!primarily!by!the!specific!requirements!of!CHNAs!mandated!by!the!IRS.!!A!work!plan!with!anticipated!timelines!was!also!created.!!!In!the!third!phase,!existing!county[level!epidemiologic!data!were!gathered!instead!of!collecting!data!through!a!survey!due!to!concerns!of!self[report!bias!with!the!latter!approach.!!In!addition,!interviews! with! community! leaders! and! focus! groups! with! community! residents! were!conducted.! !Some!hospital[based!data!were!also!added!to!the!analysis.! !A!Local!Public!Health!System!Assessment!and!a!Forces!of!Change!Assessment!were!not!conducted!because!the!Tri[County!Community!Health!Assessment!&!Planning!Initiative!conducted!them!in!2011.!!!In! the! fourth! phase,! a! series! of!meetings! were! held! to! identify! the! prioritized! health! needs!based!on!the!epidemiologic!data,!the!input!from!community! leaders!and!residents,!and!other!CHNAs! that!had!been!previously!been!conducted.! !Health!needs!were!prioritized! for!children!only.!!

Community&Health&Needs&Assessment& & &&
! ! 8!
In!the!fifth!and!six!phases,!Implementation!Plans!were!developed!that!identified!the!strategies!the! hospital!will! undertake! to! address! some! of! the! prioritized! health! needs! identified! in! the!fourth! phase.! ! The! hospital’s! Implementation! Plans! will! be! publicly! available! at!www.akronchildrens.org!by!Dec.!31,!2013.!!!Epidemiologic&Data&
The!epidemiologic!data!used!in!this!report!were!collected!from!a!variety!of!sources!that!report!information! at! the! county,! state,! and! national! levels.! ! The! epidemiologic! data! collected!represented!a!very!wide!range!of!factors!that!affect!community!health!such!as!mortality!rates,!health!behaviors,!environmental!factors,!and!health!care!access!issues.!!County!Health!Rankings!The!County!Health!Rankings!&!Roadmaps!program!is!a!collaboration!between!the!Robert!Wood!Johnson!Foundation!and!the!University!of!Wisconsin!Population!Health!Institute.!!The!program!collects!information!on!mortality,!morbidity,!health!behaviors,!clinical!care,!social!and!economic!factors,!and!physical!environment!at!a!county[level!for!nearly!all!counties!in!the!United!States.!!Some! data! reported! are! actual! counts! based! on! actual! reports! (i.e.,! reported! disease!diagnoses),!some!data!are!estimated!based!on!samples!(i.e.,!the!Behavioral!Risk!Factor!Survey),!and!some!data!are!modeled!to!obtain!a!more!current!estimate!!(i.e.,!projected!2012!estimates!based!on!2010!census!data).!!For!more!information!about!the!County!Health!Rankings!program,!please!visit:!www.countyhealthrankings.org.!!Community!Health!Status!Indicators!The! Community! Health! Status! Indicators! project! is! a! partnership! between! the! Centers! for!Disease!Control!and!Prevention,!the!National!Institutes!of!Health/National!Library!of!Medicine,!the!Health!Resources!Services!Administration,!the!Public!Health!Foundation,!the!Association!of!State! and! Territorial! Health! Officials,! the! National! Association! of! County! and! City! Health!Officials,!the!National!Association!of!Local!Boards!of!Health,!and!the!Johns!Hopkins!University!School!of!Public!Health.!!Similar!to!the!County!Health!Rankings!project,!the!Community!Health!Status! Indicators! project! collects! information! on! a! variety! of! sources! and! generates! county!profiles.!!Currently,!most!of!the!data!are!from!2009,!however!it!does!contain!information!that!the! County! Health! Rankings! does! not.! ! For! more! information! about! the! Community! Health!Status!Indicators!project,!please!visit:!!wwwn.cdc.gov/CommunityHealth/HomePage.aspx.!!Community!Health!Needs!Assessment!Toolkit!The!Community!Health!Needs!Assessment! Toolkit! is! a! collaborative!partnership!between! the!Kaiser!Permanente;!the!Institute!for!People,!Place,!and!Possibility!(IP3);!the!Centers!for!Disease!Control! and! Prevention;! and! other! partners! that! seek! to!make! freely! available! data! that! can!assist! hospitals,! non[profit! organizations,! state! and! local! health! departments,! financial!institutions,!and!other!organizations!seeking!to!better!understand!the!needs!and!assets!of!their!communities!and!to!collaborate!to!make!measureable!improvements!in!community!health!and!well[being.! ! Similar! to! the! County! Health! Rankings! program,! the! Community! Health! Needs!Assessment!Toolkit!project!collects! information!from!a!variety!of!sources!and!creates!county[

Community&Health&Needs&Assessment& & &&
! ! 9!
level! profiles! for! comparison! purposes.! ! For!more! information! about! the! Community! Health!Needs!Assessment!Toolkit,!please!visit:!!assessment.communitycommons.org.!!Ohio!Department!of!Health!The!Ohio!Department!of!Health! is!a!cabinet[level!agency!that!administers!most!of! the!state’s!state[level!health!programs! including!coordination!of! the!activities! for!child!and!family!health!services,! health! care! quality! improvement,! services! for! children! with! medical! handicaps,!nutrition! services,! licensure! and! regulation!of! long[term! care! facilities,! environmental! health,!prevention!and! control!of! injuries! and!diseases,! and!others.! ! County[level!data! that! could!be!compared!to!national!statistics!were!collected!in!a!variety!of!areas!and!used!in!this!CHNA.!!For!more! information! about! the! data! available! at! the! Ohio! Department! of! Health,! please! visit:!www.odh.ohio.gov/healthstats/datastats.aspx!!Annie!E!Casey!Foundation!The! Annie! E! Casey! Foundation! runs! a! program! called! KIDS! COUNT®,!which! is! a! national! and!state[by[state! effort! to! track! the! wellbeing! of! children! in! the! United! States.! ! KIDS! COUNT®!collects! and! reports! data! at! the! county[level! in! a! variety! of! areas! related! to! child! health!including! demographics,! education,! economic! well[being,! health,! safety! and! risky! behaviors,!and!other!indicators.!!Most!of!the!data!in!KIDS!COUNT®!for!Ohio!is!supplied!by!Ohio’s!Children’s!Defense!Fund!and!is!taken!from!a!variety!of!sources,!including!the!Ohio!Department!of!Health.!!For!more!information!about!KIDS!COUNT®,!please!visit:!datacenter.kidscount.org.!!!!!Ohio!Hospital!Association!Established! in! 1915,! the! Ohio! Hospital! Association! is! the! nation’s! first! state[level! hospital!association.!OHA!collaborates!with!member!hospitals! and!health! systems! to!meet! the!health!care! needs! of! their! communities! and! to! create! a! vision! for! the! future! of! Ohio’s! health! care!environment.!OHA,! in! coordination! with!member! hospitals,! have! developed! new!web! based!software! called! “Insight”! that! allows! hospitals! to! run! customized! and! standard! reports! for!Marketing,!Physician!Recruiting,!Business!Development!and!Benchmarking!purposes.! ! Several!health! indicators! were! drawn! from! OHA’s! Insight! system! with! their! permission.! ! For! more!information!about!OHA!Insight,!please!visit:!http://www.ohanet.org/insight/!!!Community&Leader&Interviews!In!addition!to!examining!the!county[level!epidemiologic!data,!interviews!were!conducted!with!community! leaders! in!July!–!August!2013!to!gain!their! insight!on!what!they!thought!were!the!significant! health! needs! of! children! and! adults! in! their! communities,! the! factors! that! affect!those!health!needs,!other!existing!community!health!needs!assessments,!possible!collaboration!opportunities,!and! to!get! suggestions!on!what! the!hospitals! can!do! to!address! the!significant!health!needs!identified!in!the!CHNA.!!These!community!leaders!represent!the!broad!interests!of!the! communities! served! by! the! hospital! facility! including! the! medically! underserved,! low[income! persons,! minority! groups,! those! with! chronic! disease! needs,! and! leaders! from! local!public! health! agencies! and!departments!who!have! special! knowledge!and!expertise! in!public!health.!!!

Community&Health&Needs&Assessment& & &&
! ! 10!
Leaders!from!the!following!community!organizations!were!consulted!during!this!CHNA:!• Youngstown!City!Health!District,!Acting!Health!Commissioner!• Youngstown/Warren!Regional!Chamber,!President!&!Chief!Executive!Officer!• Pediatric!Associates!of!Youngstown,!Physician!• Mahoning!County!Children’s!Services,!Quality!Improvement!Supervisor!• Help!Hotline!Crisis!Center,!Chief!Executive!Officer!• Mahoning!County!District!Board!of!Health,!Health!Commissioner!• Trumbull!County!Women,!Infants,!and!Children!(WIC)!Program,!Director!• Trumbull! County!Mental!Health! and!Recovery!Board,!Director!of! Evaluation!&!Quality!
Improvement!• Trumbull!County!Children’s!Services,!Executive!Director!• St.!Joseph!Health!Center,!Chair!of!Pediatrics!• Columbiana!County!Mental!Health!and!Recovery!Services!Board,!Executive!Director!• Portage/Columbiana!Counties!Women,!Infants,!and!Children!(WIC)!Program,!Director!• The!Morning!Journal,!Editor!• Salem!Community!Hospital,!Vice!President!for!Medical!Affairs!• Columbiana!County!Educational!Service!Center,!Superintendent!• Columbiana! County! Department! of! Job! and! Family! Services,! Children’s! Services!
Administrator!• Coordinated!Action!for!School!Health!(CASH)!Coalition,!Coordinator!• Columbiana!County!Health!Department,!Health!Commissioner!
&
&
Community&Resident&Focus&Groups&
In! addition! to! the! input! from! community! leaders,! focus! groups! were! conducted! with!community!residents!in!August!–!September!2013!to!get!their!input!on!what!they!thought!were!the!significant!health!needs!of!children!and!adults!in!their!communities,!the!factors!that!affect!those!needs,!the!solutions!they!thought!would!solve!those!needs,!and!what!the!hospitals!and!other! community! groups! could! do! to! address! those! needs.!Due! to! the! observed! information!gap!in!the!epidemiologic!data!on!the!health!of!children,!adult!and!child!substance!abuse!issues,!and!adult!and!child!mental!health! issues,!several!questions!were!asked!to!probe!more!deeply!on! these! issues.! ! In! addition,! a! questionnaire!was! distributed! to! focus! group! participants! to!gather!demographic! information!and!basic!perceptions!of! community!health.! ! The!discussion!guide,!questionnaire,!and!protocol!were! reviewed!and!approved!by! the!Kent!State!University!Institutional!Review!Board.!!Recruitment!Community! residents! were! recruited! to! participate! in! the! focus! groups! by! posting! and!distributing!flyers!in!the!community.!!The!sites!where!the!community!resident!groups!were!held!were! selected!based!on!proximity! to!population!areas,! ease!of! access! (including! free!parking!and!bus!lines),!and!recommendations!from!local!community!leaders.!!Community!residents!that!participated! in! the! focus! groups! were! given! a! $50! Visa! gift! card! as! a! “thank! you”! and! to!

Community&Health&Needs&Assessment& & &&
! ! 11!
compensate! them! for! their! time! and! expense.! ! A! total! of! 82! people! participated! in! the!Community!Resident!Focus!Groups.!!!!Characteristics!of!Participants!As!noted! in!Table!2,!participants!were!drawn! from!across! the! region!and!were!diverse.! ! Fifty!percent!of!participants!were!from!Trumbull!County,!31.7%!from!Mahoning!County,!and!18.3%!were! from!Columbiana!County.! ! The!average!number!of! years! that!participants! lived! in! their!home!county!was!36.6!years.! !Six!percent!of!participants!were!African!American,!90.2%!were!Caucasian,!and!2.4%!were!Hispanic.!!Table&2.&Demographic&Characteristics&of&Community&Resident&Focus&Group&Participants&(n=82)&
Characteristic! Number! Percent!County!of!Residence! ! !!!!!!Trumbull!County! 41! 50.0%!!!!!!Mahoning!County! 26! 31.7%!!!!!!Columbiana!County! 15! 18.3%!
! ! !Number!of!Years!Lived!in!County!(average!and!SD)! 36.6! 21.0!! ! !Racial!Background! ! !!!!!!African!American!(or!Black)! 5! 6.1%!!!!!!Asian!American! 0! 0.0%!!!!!!Caucasian!(or!White)! 74! 90.2%!!!!!!Native!Hawaiian!or!Other!Pacific!Islander! 1! 1.2%!!!!!!American!Indian!or!Alaska!Native! 0! 0.0%!!!!!!Other/Missing! 2! 2.4%!! ! !Ethnic!Background! ! !!!!!!Hispanic!or!Latino/a! 2! 2.4%!!!!!!Not!Hispanic!or!Latino/a! 73! 89.0%!!!!!!Missing! 7! 8.5%!!As!noted!in!Table!3!(next!page),!participants!had!diverse!household!characteristics.!!Nearly!16%!percent! of! participants! lived! by! themselves,! 32.9%! lived!with! one! other! person,! 24.4%! lived!with!two!other!people,!15.9%!lived!with!three!other!people,!and!9.8%!lived!with!four!or!more!people.! ! !Nearly!66%!percent!had!no!children!in!the!home,!8.5%!had!one!child,!6.1%!had!two!children,!and!7.3%!had!three!or!more!children!in!the!home.!!!!!!!!!

Community&Health&Needs&Assessment& & &&
! ! 12!
Table&3.&Household&Characteristics&of&Community&Resident&Focus&Group&Participants&(n=82)&
Characteristic! Number! Percent!Number!of!People!in!Home! ! !!!!!!One! 13! 15.9%!!!!!!Two! 27! 32.9%!!!!!!Three! 20! 24.4%!!!!!!Four! 13! 15.9%!!!!!!Five!or!More! 8! 9.8%!!!!!!Missing! ! !
! ! !Number!of!Children!in!the!Home! ! !!!!!!None! 54! 65.9%!!!!!!One! 7! 8.5%!!!!!!Two! 5! 6.1%!!!!!!Three!or!More! 6! 7.3%!!!!!!Missing! 10! 12.2%!!As!noted!on!Table!4,!participants!ranged!in!terms!of!their!income!and!health!insurance!status.!!Twelve!percent!of!participants!reported!a!monthly!household!income!between!$0[$999,!14.6%!between! $1,000[$1,999,! 11%! between! $2,000[$2,999,! 17.1%! between! $3,000[$3,999,! 6.1%!between!$4,000[$4,999,! and!22%! reported!monthly!household! income!exceeding!$5,000!per!month.! ! In! addition,! 15.9%! reported! they! had! no! health! insurance,! 39%! had! private! health!insurance,! 1.2%! had! health! insurance! as! a! veteran! or! member! of! the! military,! 24.4%! had!Medicare,!and!17.1%!had!Medicaid.!!Table&4.&Income&and&Insurance&Status&of&Community&Resident&Focus&Group&Participants&(n=82)!
! Number! Percent!Total!Household!Monthly!Income! ! !!!!!!0[$999! 10! 12.2%!!!!!!$1,000
Community&Health&Needs&Assessment& & &&
! ! 13!
As!noted!in!Table!5,!participants!had!diverse!health!care!utilization!experiences.!!Forty!percent!stated!that!someone!in!their!home!did!not!receive!health!care!due!to!the!cost!and!that!42.7%!of! them! had! someone! in! their! home! with! a! chronic! disease! or! condition.! ! Seven! percent!reported!that!they!usually!don’t!go!to!a!doctor!during!the!year,!12.2%!go!once!per!year,!24.4%!go!twice!per!year,!9.8%!go!three!times!per!year,!15.9%!go!four!times!per!year,!11%!go!five!to!nine!times!per!year,!and!8.5%!go!ten!or!more!times!per!year.!!!!Table&5.&Health&Care&Status&and&Utilization&of&Community&Resident&Focus&Group&Participants&(n=82)!! Number! Percent!Had!Someone!in!Home!Who!Did!Not!Receive!Health!Care!Due!to!Cost! 33! 40.2%!
! ! !Has!Someone!in!Home!With!a!Chronic!Disease! 35! 42.7%!
! ! !Times!Per!Year!That!Participant!Goes!To!a!Doctor! ! !!!!!!None! 6! 7.3%!!!!!!One! 10! 12.2%!!!!!!Two! 20! 24.4%!!!!!!Three! 8! 9.8%!!!!!!Four! 13! 15.9%!!!!!!Five!to!Nine! 9! 11.0%!!!!!!Ten!or!More! 7! 8.5%!!!!!!Missing! 9! 11.0%!! ! !Participant’s!Description!of!Current!Health!! ! !!!!!!Excellent! 10! 12.2%!!!!!!Very!Good! 30! 36.6%!!!!!!Good! 28! 34.1%!!!!!!Fair! 8! 9.8%!!!!!!Poor! 1! 1.2%!!!!!!Missing! 5! 6.1%!!Lastly,!as!noted!in!Table!6!(next!page),!participants!reported!fairly!diverse!views!of!the!health!of!adults!and!children! in! their!county.! !One!percent!of!participants!described!the!current!health!status!of!adults!in!their!county!as!“excellent,”!1.2%!described!it!as!“very!good,”!32.9%!described!it!as!“good,”!54.9%!described!it!as!“fair,”!and!4.9%!described!the!current!health!status!of!adults!in! their! county! as! “poor.”! ! Participants! rated! the! current! health! status! of! children! in! their!County!slightly!higher.!!None!described!it!as!“excellent,”!4.9%!described!it!as!“very!good,”!50%!described! it! as! “good,”! 35.4%! described! it! as! “fair,”! and! 3.7%! described! the! current! health!status!of!children!in!their!county!as!“poor.”!!!!!!!!!

Community&Health&Needs&Assessment& & &&
! ! 14!
Table&6.&Community&Health&Perceptions&of&Community&Resident&Focus&Group&Participants&(n=82)!! Number! Percent!Participant’s!Description!of!Current!Health!of!County!Adults! ! !!!!!!Excellent! 1! 1.2%!!!!!!Very!Good! 1! 1.2%!!!!!!Good! 27! 32.9%!!!!!!Fair! 45! 54.9%!!!!!!Poor! 4! 4.9%!!!!!!Missing! 4! 4.9%!
! ! !Participant’s!Description!of!Current!Health!of!County!Children! ! !!!!!!Excellent! 0! 0.0%!!!!!!Very!Good! 4! 4.9%!!!!!!Good! 41! 50.0%!!!!!!Fair! 29! 35.4%!!!!!!Poor! 3! 3.7%!!!!!!Missing! 5! 6.1%!
!!Other&Community&Health&Needs&Assessments&
Lastly,!prior!community!health!needs!assessments!that!were!conducted!in!the!region!were!also!reviewed!and!helped!to!inform!this!CHNA.!!Some!of!these!CHNAs!were!known!to!the!Steering!Committee,!some!were!found!using!Internet!searches,!and!some!were!sent!to!us!by!Community!Leaders.!!!!The!other!CHNAs!that!were!reviewed!during!the!preparation!of!this!CHNA!included:!!
• Humility!of!Mary!Health!Partners,!St.!Elizabeth!Health!Center!• Tri[County!Community!Health!Assessment!&!Planning!Initiative!• East!Liverpool!City!Hospital!and!Salem!Community!Hospital!CHNA!• Humility!of!Mary!Health!Partners,!St.!Joseph!Health!Center!
!!

Community&Health&Needs&Assessment& & &&
! ! 15!
Prioritization&Process&
As! mentioned! previously,! epidemiologic! data! for! children! were! collected! from! a! variety! of!sources.! ! To! prioritize! these! health! indicators,! the! data! from! Trumbull,! Mahoning,! and!Columbiana! Counties! were! compared! to! their! two! peer! counties! in! Ohio! that! were!demographically!similar,!the!state!and!US!averages,!and!the!Healthy!People!2020!target,!if!one!was!available.!!To!aid!the!prioritization!process,!the!indicators!were!plotted!on!matrices.!!!!Indicators! listed! on! the! left[hand! side! of! the!matrix! compared! unfavorably! to! the! two!comparison! counties,! the! state,! and! the! US.!!Indicators! on! the! right[hand! side! of! the! matrix!compared! favorably! to! those! benchmarks.! ! In!addition,!on!each!side!of!the!matrix,!it!was!noted!if!the!indicators!were!higher/lower!than!2,!3,!or!4!of! the! benchmarks.! ! For! example,! indicators! in!the!upper! left! box!of! the!matrix! (shaded! in! red)!were! “worse”! in!Mahoning!County! compared! to!the!two!comparison!counties,! the!State,!and!the!US.! ! Indicators! in! the! bottom! right! (shaded! in!blue)! were! “better”! in! Mahoning! County!compared! to! these! benchmarks.! ! The! use! of!these! matrices! helped! the! Steering! Committee!quickly! compare! the!vast!amount!of!data! to!key!benchmarks! and! identify! the! prioritized! health!needs!based!on!the!epidemiologic!data.!!The! list! of! prioritized! health! needs! resulting! from! the! epidemiologic! analysis! was! then!supplemented!with! additional! health! needs! identified! by! community! leaders! and! community!residents.!!A!content!analysis!was!conducted!on!the!notes!and!transcripts!of!community!leader!interviews!and!community!resident!focus!groups!to!identify!themes!that!consistently!emerged.!!The! health! areas! listed! below! were! the! health! needs! identified! for! children! by! community!leaders!and!residents!that!were!added!to!the!list.!!Community!Leaders!
• Nutrition!• Physical!activity!• Obesity!• Mental!health!• Substance!abuse!• Number!of!pediatric!specialists!
Community!Residents!• Obesity!• Mental!health!• Diabetes!• Sexually!transmitted!diseases!
!&
& &
Community&Health&Needs&Assessment& & &&
! ! 16!
COMMUNITY&RESOURCES&
!There!are!a!wide!variety!of!resources!in!the!community!that!can!help!address!the!prioritized!health!needs!identified!in!this!CHNA.!!Trumbull!County!
• Access!Health!Mahoning!Valley!• Belmont!Pines!• Child!and!Family!Solutions!• Children's!Rehabilitation!Center!of!Warren,!Ohio!• Churchill!Counseling!• Coleman!Professional!Services!• Comprehensive!Psych!Services!• Easter!Seals,!Mahoning,!Trumbull!and!Columbiana!Counties!• Family!and!Children!First!Council!• Girl!Scouts!of!Northeast!Ohio!• H.C.!Mines!Intermediate!School!(Howland)!• Health!Board:!!TCAP!Head!Start!• HMHP,!St.!Joseph!Health!Center!• Homes!for!Kids!• Kent!State!University!• Niles!City!Health!Department!• One!Health!Ohio!• Potential!Development!• PsyCare!• The!Mayor!Ralph!A.!Infante!Wellness!Center!• The!Trumbull!County!Mental!Health!and!Recovery!Board!• Trumbull!County!Career!and!Technical!Center!(TCCTC)!• Trumbull!County!Children's!Services!• Trumbull!County!Educational!Service!Center!• Trumbull!County!Health!Dept!• Trumbull!County!Juvenile!Justice!Center!• United!Methodist!Community!Ceter!• Valley!Care,!Hillside!Rehabilitation!Hospital!• Valley!Care,!Trumbull!Memorial!Hospital!• Warren!City!Health!Department!• Warren!City!Schools!• WIC,!Trumbull!County!
!!!!

Community&Health&Needs&Assessment& & &&
! ! 17!
Mahoning!County!• Access!Health!Mahoning!Valley!• Beatitude!House!• Central!YMCA,!Youngstown,!Ohio!• Comprehensive!Psych!• D&E!Counseling!• Davis!Family!YMCA,!Boardman,!Ohio!• Easter!Seals,!Mahoning,!Trumbull!and!Columbiana!Counties!• Help!Hotline!Crisis!Center,!Inc.!• HMHP,!St.!Elizabeth!Health!Center!• Jewish!Community!Center!of!Youngstown!• Mahoning!County!Board!of!Health!• Mahoning!County!Children's!Services!• Mahoning!County!Educational!Service!Center!• Mahoning!County!Juvenile!Justice!Center!• Mahoning!County!Mental!Health!Board!• Mahoning!Youngstown!Community!Action!Partnership!• One!Health!Ohio!• Pediatric!Associates!Of!Youngstown!• Pioneering!Healthier!Communities;!Youngstown!• Potential!Development!• Second!Harvest!Food!Bank!of!the!Mahoning!Valley!• Sojourner!House!• The!Mahoning!County!Board!of!Developmental!Disabilities!• The!Rich!Center!for!Autism!• United!Methodist!Community!Center!• United!Way!of!Youngstown!and!the!Mahoning!Valley!• Valley!Care!Health!System,!Northside!Medical!Center!• Valley!Counseling!• WIC,!Mahoning!County!• Youngstown!City!Health!Department!• Youngstown!City!Schools!• Youngstown!Hearing!and!Speech!• Youngstown!State!University!
!!!!!!!!

Community&Health&Needs&Assessment& & &&
! ! 18!
Columbiana!County!• Columbiana!County!Career!and!Technical!Center!(CCCTC)!• Columbiana!County!Community!Action!Agency!(Head!Start)!• Columbiana!County!Dept!of!Job!and!Family!Services!• Columbiana!County!Educational!Service!Center!• Columbiana!County!Health!Dept!• Columbiana!County!Juvenile!Court!• Columbiana!County!MHRS!Board!• Columbiana!County!MRDD!• Damascus!Elementary!• East!Liverpool!City!Hospital!• Easter!Seals,!Mahoning,!Trumbull!and!Columbiana!Counties!• Hannah!Mullins!School!of!Practical!Nursing!• Salem!Community!Center!• Salem!Community!Hospital!• Salem!YMCA!• WIC,!Columbiana!County!
!National!Organizations!
• American!Association!of!Pediatrics,!Ohio!Chapter!• American!Diabetes!Association!• American!Lung!Association!• Children's!Hospital!Association!
!!& &

Community&Health&Needs&Assessment& & &&
! ! 19!
SUMMARY&OF&RESULTS&
!The!final!list!of!prioritized!health!needs!for!children!(based!on!the!epidemiologic!data!and!input!from!community! leaders!and!community! residents)!were! then!grouped! into!broad!categories!representing!the!type!of!health!indicator:!!Table&9.&Prioritized&Health&Needs&By&County&for&Children!! Trumbull! Mahoning! Columbiana!Chronic&Diseases& ! ! !!!!!!Asthma! X! X! X!!!!!!Diabetes! X! X! X!! ! ! !Maternal&&&Infant&Health& ! ! !!!!!!Premature!Births! X! X! X!!!!!!Low!&!Very!Low!Birth!Weight! X! X! X!!!!!!Infant,!Neonatal,!&!Post[Neonatal!Mortality! X! X! X!! ! ! !Child&Lifestyle&Factors& ! ! !!!!!!Overweight!&!Obesity! X! X! X!!!!!!Exercise! X! X! X!!!!!!Nutrition! X! X! X!! ! ! !Mental&Health& X! X! X!! ! ! !Substance&Abuse& ! ! !!!!!!Opioid!Drug!Abuse! X! X! X!! ! ! !Sexually&Transmitted&Diseases& ! ! !!!!!!Adolescent!Gonorrhea& X! X! !& ! ! !Access&to&Health&Care& ! ! !!!!!!Health!Insurance!Coverage! X! X! X!!!!!!Access!to!Dental!Care! X! X! X!!!!!!Mental!Health!Insurance!Coverage! X! X! X!!!!!!Number!of!Pediatric!Specialists! X! X! X!! ! ! !Environmental&Factors& ! ! !!!!!!Access!to!Healthy!Food! X! X! X!!!!!& &

Community&Health&Needs&Assessment& & &&
! ! 20!
CONCLUSIONS&
!Our! analysis! of! the! epidemiologic! data,! the! input! received! from! community! leaders! and!community! residents,! and! our! review! of! other! CHNAs! identified! a! broad! range! of! prioritized!health!needs!for!children!in!our!community.!!These!include!physical,!mental,!and!environmental!health!outcomes!as!well!as!risk!factors!for!diseases!or!conditions.!!Chronic&Diseases&
Chronic!diseases!are!a! type!of!disease!where! the!person! can! live!with! the!disease! for! a! long!time,!sometimes!indefinitely.!!People!with!chronic!diseases!usually!need!to!see!their!doctors!on!a!regular!basis!to!monitor!the!progression!of!their!disease!and!get!treatment.! !The!prioritized!chronic!disease!health!needs!for!children!in!our!community!include!asthma!and!diabetes.!!!!Maternal&&&Infant&Health&
Maternal!and!infant!health!is!a!broad!category!of!factors!that!affect!pregnancy!and!childbirth.!!The! prioritized! maternal! and! infant! health! needs! for! children! in! our! community! include!premature& births;! low& and& very& low& birth& weight;! and! infant,& neonatal,& and& post`neonatal&mortality.!!!!Child&Lifestyle&Factors&&
Lifestyle! risk! factors! are! “everyday”! behaviors! that! children! engage! in! that! can! negatively!impact!their!health.! !Children!that!engage!in!these!lifestyle!risk!factors!are!at!higher!risk!for!a!large!number!of!chronic!diseases!such!as!heart!disease,!diabetes,!and!cancer.! !The!prioritized!lifestyle! factors! for! children! in! our! community! are! overweight& and& obesity,! exercise,! and!nutrition.!!!!Mental&Health&
Mental!health!refers!to!the!successful!performance!of!mental!function,!resulting!in!productive!activities,!fulfilling!relationships!with!other!people,!and!the!ability!to!adapt!to!change!and!cope!with! adversity.! ! Mental! health! is! particularly! important! for! children! since! it! can! affect!psychological!and!emotional!development,!school!performance,!family!and!peer!relationships,!and!physical!health.!!For!this!reason,!all&mental&health&conditions&were!identified!as!prioritized!community!health!needs!for!children!in!our!community.!!Substance&Abuse&
Substance!abuse! refers! to! a! set!of! conditions! associated!with! the! consumption!of!mind[! and!behavior[altering!substances!that!have!negative!behavioral!and!health!outcomes.! !The!impact!of!substance!abuse!on!the!bodies!of!growing!children!is!a!very!serious!concern!since!it!can!have!lasting!negative!effects.!!The!prioritized!substance!abuse!issue!for!children!in!our!community!is!opioid&drug&abuse.!!&
&
&

Community&Health&Needs&Assessment& & &&
! ! 21!
Sexually&Transmitted&Diseases&
Sexually!transmitted!diseases!are!spread!through!unprotected!sex!and!can!result!in!significant!health! problems,! including! infertility.! ! The! sexually! transmitted! disease! identified! as! a!prioritized!health!need!for!children!in!our!community!is!adolescent&gonorrhea.!&
Access&to&Health&Care&
Access! to! health! care! is! a! broad! term! used! to! describe! the! availability,! acceptability,!affordability,!and!accessibility!of!health!care!systems!and!providers.!!Among!kids,!lack!of!access!to! health! care! means! that! children! can’t! get! the! immunizations! and! screenings! they! need,!which!can!increase!their!risk!for!disease!and!poor!development.!!The!prioritized!access!to!care!needs!for!children!in!our!community!are!health&insurance&coverage,!access&to&dental&care,!and!mental&health&insurance&coverage,!and!number&of&pediatric&specialists.!!Environmental&Factors&&
Environmental!risk!factors!are!a!broad!category!of!external!conditions!that!can!negatively!affect!health!outcomes.!!The!prioritized!environmental!factor!for!children!in!our!community!is!access&to&healthy&food.!!!For! detailed! charts! and! data! on! these! prioritized! health! needs! for! every! county! in! our!community,!please!see!the!Detailed!Data!Appendix.!!! !

Community&Health&Needs&Assessment& & &&
! ! 22!
ACKNOWLEDGEMENTS&
&
The! Kent! State! University! College! of! Public! Health! (KSU[CPH)! was! hired! to! conduct! this!Community!Health!Needs!Assessment! under! the! direction! of! a! Steering! Committee! that!was!comprised! of! representatives! from! Akron! Children’s! Hospital! Mahoning! Valley! and! Akron!Children’s!Hospital!in!Akron.!!The!Steering!Committee!Members!are:!! ! !Akron!Children’s!Hospital!Mahoning!Valley!Sharon!A.!Hrina,!MSN,!RN,!NE[BC!Vice%President,%Akron%Children’s%Hospital%Mahoning%Valley%!Lisa!Taafe,!MSN,!RN,!CNP!Clinical%Administrative%Director,%Akron%Children’s%Hospital%Mahoning%Valley%!Roseann!Marsico,!BA!Executive%Secretary%!
Akron!Children’s!Hospital!in!Akron!Bernett!L.!Williams,!MPA!Vice%President,%External%Affairs%%Michael!Wellendorf,!MPA!Government%Relations%Liaison%%Heather!Wuensch%Director%of%Community%Benefit,%Advocacy%and%Outreach%!
!The!KSU[CPH!authors!of!this!report!were:!
%Willie!H.!Oglesby,!PhD,!MSPH,!FACHE!Assistant%Professor%of%Health%Policy%&%Management%and%%Assistant%Director,%Office%of%Public%Health%Practice%and%Partnerships%%%Diana!M.!Kingsbury,!MA,!MPH!Graduate%Research%Assistant!!Joseph!Smith,!MPH!Graduate%Research%Assistant!!!
Ken!Slenkovich,!MA!Assistant%Dean%%Tegan!Anne!Beechey,!MPA!Graduate%Research%Assistant%!Olivia!Hartman,!BSPH!Graduate%Research%Assistant%!Patrick!Gorby,!BS!Graduate%Research%Assistant%
!

Akron Children’s Hospital Mahoning ValleyBeeghly Campus6505 Market Street Boardman, Ohio 44512 www.akronchildrens.org
Community Health Needs Assessment 2013 Detailed Data Appendix
Detailed(Data(Appendix( ( (
! ! !
Table(of(Contents(!Trumbull!County!Children!.....................................................................................................!A14A33!!Mahoning!County!Children!...................................................................................................!B14B33!!Columbiana!County!Children!................................................................................................!C14C32!!References!.............................................................................................................................!D14D6!!!

Detailed(Data(Appendix( ( (
Trumbull(County(–(Children(! ! A1!
Trumbull(County(Children)
Chronic(Diseases(!Chronic!diseases!are!a! type!of!disease!where! the!person! can! live!with! the!disease! for! a! long!time,!sometimes!indefinitely.!!People!with!chronic!diseases!usually!need!to!see!their!doctors!on!a! regular! basis! to!monitor! the! progression! of! their! disease! and! get! treatment.! ! As! a! nation,!about! 75%! of! our! total! health! care! dollars! goes! to! the! treatment! of! chronic! diseases.!!Fortunately,!some!chronic!diseases!are!preventable.!!The!chronic!diseases!identified!as!prioritized!health!needs!among!Trumbull(County(Children!are:!
• Asthma!• Diabetes!
!!Asthma'!Why'is'this'indicator'important?'Asthma!is!a!disease!that!affects!the!lungs.!When!irritants!such!as!smoke!and!air!pollution!are!inhaled!by!a!person!with!asthma,! the! lining!of! the! respiratory! system!may!become! inflamed,!leading!to!wheezing,!chest! tightness,!coughing,!and!even!difficulty!breathing.! Individuals!with!asthma! must! take! specific! medicines! to! avoid! this! inflammation! (also! known! as! an! asthma!attack),!and!must!avoid!triggers,!which!make!asthma!worse!(CDC,!2012e).!Asthma!is!one!of!the!most! common! chronic! diseases! among! children,! with! one! in! every! eleven! children! affected!(CDC,! 2012f).! ! It! is! more! common! among! the! multiracial,! Puerto! Rican! Hispanics,! and! nonNHispanic!blacks!than!among!nonNHispanic!whites!(CDC,!2011e).!
''''How'does'our'community'rank?'In! Trumbull! County,! 0.7%!of! days!were!designated! as!exceeding!National!Ambient!Air!Quality! Standards! for!particulate!matter,!which!is!the!same!as!the!Ohio!rate!and! lower! than! the!national! rate.! In! comparison!with!two! peerNmatched! counties,! the! percentage! of! days!exceeding!air!quality!standards!in!Trumbull!County!was!higher! than! both! Columbiana! County! and! Richland!County.!)!
0.0%!
0.5%!
1.0%!
1.5%!
Percent!of!days!Trumbull! 0.7%!
Columbiana! 0.5%!
Richland! 0.4%!
Ohio! 0.7%!
U.S.! 1.2%!
Poor(Air(Quality;(Par<culate(Ma>er(

Detailed(Data(Appendix( ( (
Trumbull(County(–(Children(! ! A2!
!!In!Trumbull!County,!0.3%!of!days!were!designated!as! exceeding! National! Ambient! Air! Quality!Standards! for! ozone,! which! was! lower! than! the!Ohio! rate! and! lower! than! the! national! rate.! In!comparison! with! two! peerNmatched! counties,! the!percentage!of!days!exceeding!air!quality!standards!in! Trumbull! County! was! the! same! as! Columbiana!County,!but!higher!than!Richland!County.!!!!!!
!!!!!!!In! Trumbull! County,! the! rate! of! children! that! were!discharged! from! a! hospital! with! a! diagnosis! of!asthma!was!153.94!per!100,000!children,!which!was!lower! than! Columbiana! County! but! higher! than!Richland!County.!!!!!!!!!!!
!!In! Trumbull! County,! the! rate! of! children! that!visited!an!emergency!department!for!asthma!was!870.87! per! 100,000! children,! which! was! lower!than! both! Columbiana! County! and! Richland!County.!!!!!
0.0%!
0.2%!
0.4%!
0.6%!
0.8%!
1.0%!
Percent!of!days!Trumbull! 0.3%!
Columbiana! 0.3%!
Richland! 0.0%!
Ohio! 0.6%!
U.S.! 0.8%!
Poor(Air(Quality;(Ozone(
0.00!
100.00!
200.00!
300.00!
400.00!
Rate!per!100,000!children!
Trumbull! 153.94!
Columbiana! 360.16!
Richland! 69.71!
Hospital(Discharges(with(Asthma(Diagnosis(
0.00!
500.00!
1000.00!
1500.00!
Rate!per!100,000!children!
Trumbull! 870.87!
Columbiana! 1058.80!
Richland! 928.27!
Emergency(Department(Visits(for(Asthma(

Detailed(Data(Appendix( ( (
Trumbull(County(–(Children(! ! A3!
What'are'the'data'sources?'“Poor!Air!Quality!–!Particulate!Matter”! is! the!percentage!of!days!with!particulate!matter!that!are! 2.5! levels! above! the! National! Ambient! Air! Quality! Standard! of! 35!micrograms! per! cubic!meter! per! year.! ! It! is! calculated! using! data! collected! by!monitoring! stations! and!modeled! to!include! counties! where! no! monitoring! stations! are! located.! ! The! most! recent! countyN! and!nationalNlevel! data! (2008)! was! collected! from! the! National! Environmental! Public! Health!Tracking!Network!at!the!Centers!for!Disease!Control!and!Prevention!and!was!reported!on!the!Community!Health!Needs!Assessment!toolkit!on!the!Community!Commons!web!site.!!“Poor!Air!Quality!–!Ozone”!is!the!percentage!of!days!per!year!with!ozone!(O3)!levels!above!the!National!Ambient!Air!Quality!Standard!of!75!parts!per!billion!(ppb).!!It!is!calculated!using!data!collected!by!monitoring!stations!and!modeled!to!include!counties!where!no!monitoring!stations!are! located.! ! The!most! recent! countyN! and!nationalNlevel! data! (2008)!was! collected! from! the!National!Environmental!Public!Health!Tracking!Network!at!the!Centers!for!Disease!Control!and!Prevention! and! was! reported! on! the! Community! Health! Needs! Assessment! toolkit! on! the!Community!Commons!web!site.!!“Hospital! Discharges! with! Asthma! Diagnosis”! is! the! number! of! hospital! discharges! with! a!primary!diagnosis!of!asthma!per!100,000!children!in!2011.!!It!is!calculated!using!data!received!from! the!Ohio! Hospital! Association! and! 2011! estimates! of! the! child! (less! than! 18! years! old)!population.!!!“Emergency!Department!Visits!for!Asthma”!is!the!number!of!emergency!department!visits!for!asthma! per! 100,000! children! in! 2011.! ! It! is! calculated! using! data! received! from! the! Ohio!Hospital!Association!and!2011!estimates!of!the!child!(less!than!18!years!old)!population.!))What'puts'kids'at'risk?'Children! who! live! with! smokers! are! more! likely! to! develop! asthma.! ! Additionally,! boys! and!AfricanNAmericans!are!at!higher!risk!for!asthma!than!girls!and!Whites!(CDC,!2012f).' '

Detailed(Data(Appendix( ( (
Trumbull(County(–(Children(! ! A4!
Diabetes')Why'is'this'indicator'important?'Diabetes!is!an!illness!in!which!blood!sugar!(glucose)!levels!are!higher!than!normal.!Most!of!the!food!that!an!individual!eats!is!converted!into!glucose,!which!must!in!turn!be!absorbed!by!cells.!The!pancreas!produces!a!hormone!called!insulin,!which!helps!cells!absorb!glucose.!In!diabetes,!the!body!either! cannot!produce!enough! insulin,! or! cannot!use! the! insulin! it! produces,!which!leads! to! a! buildup! of! sugar! in! the! blood.! The! two! primary! forms! of! diabetes! are! Type! 1,! or!juvenileNonset!diabetes,!and!Type!2,!or!adultNonset!diabetes!(CDC,!2011b).!Diabetes!affects!25.8!million!people,!or!8.3%!of!the!US!population!and!is!the!7th!leading!cause!of!death!in!the!United!States! (CDC,!2011c).! ! From!1980! through!2011,! the!ageNadjusted!percentage!of!persons!with!diagnosed!diabetes!increased!127%!for!whites!and!107%!for!blacks,!however,!overall!rates!are!higher!for!blacks.!!In!2011,!the!ageNadjusted!percentage!of!blacks!with!a!diagnosis!of!diabetes!was!nearly!double!that!of!whites!(9.3%!and!5.9%,!respectively)!(CDC,!2013f).!!!How'does'our'community'rank?'The!rate!of!children!that!were!discharged!from!a!hospital!with!a!diagnosis!of!diabetes! in!Trumbull!County! was! 70.37! per! 100,000! children,! which!was! higher! than! both! Columbiana! County! and!Richland!County.!!))What'are'the'data'sources?'“Hospital! Discharges!with! Diabetes! Diagnosis”! is!the!number!of!hospital!discharges!with!a!primary!diagnosis! of! diabetes! per! 100,000! children! in!2011.! ! It! is! calculated! using! data! received! from!the!Ohio!Hospital!Association!and!2011!estimates!of!the!child!(less!than!18!years!old)!population.!!))What'puts'kids'at'risk?'Risk!factors!for!developing!Type!1!diabetes!are!not!well!defined,!but!may!include!autoimmune,!genetic,! and! environmental! components.! Risk! factors! for! Type! 2! diabetes! are! much! better!established,!including!age,!obesity,!family!history,!diminished!glucose!tolerance,!inactivity,!and!race!(CDC,!2011b).!!
0.00!
20.00!
40.00!
60.00!
80.00!
Rate!per!100,000!children!
Trumbull! 70.37!
Columbiana! 17.36!
Richland! 47.70!
Hospital(Discharges(with(Diabetes(Diagnosis(

Detailed(Data(Appendix( ( (
Trumbull(County(–(Children(! ! A5!
Maternal(&(Infant(Health(!Maternal!and!infant!health!is!a!broad!category!of!factors!that!affect!pregnancy!and!childbirth.!!Improving! the! wellNbeing! of! mothers! and! infants! is! an! important! public! health! goal! in! the!United! States.! ! Healthy! birth! outcomes! and! early! identification! and! treatment! of! health!conditions!among!infants!can!prevent!death!or!disability!and!enable!children!to!reach!their!full!potential!(HHS,!2013).!!!!The!maternal! and! infant! health! issues! identified! as! prioritized! health! needs! among!Trumbull(County(Children!are:!
• Premature!Births!• Low!&!Very!Low!Birth!Weight!Births!• Infant,!Neonatal,!&!PostNNeonatal!Mortality!
!!Premature'Births'!Why'is'this'indicator'important?'A! fetus!goes! through! important! stages!of!growth!during! the! final!months!of!pregnancy.! If! an!infant!is!born!before!37!weeks!of!pregnancy!(or!prematurely),!the!brain,!the!lungs,!and!the!liver!may! not! be! fully! developed,! increasing! the! risk! of! disability! and! death.! Premature! birth! can!result! in! breathing! problems,! difficulty! feeding,! developmental! delay,! cerebral! palsy,! vision!problems,!and!hearing!problems.!Every!year,!close!to!500,000!babies,!or!1! in!every!9! infants,!are!born!prematurely.!Medical! care! for!premature!births!and! the! resulting!medical!problems!cost! the! US! health! care! system! more! than! $26! billion! annually! (CDC,! 2013g).! ! By! race,!approximately!1!out!of!every!5! infants!born! to!nonNHispanic!black!mothers! in!2007!was!born!preterm,!compared!to!1! in!8N9! infants!born!to!nonNHispanic!white!and!Hispanic!women!(CDC,!2011e).!
!!'How'does'our'community'rank?'Of! births! in! Trumbull! County,! 13%!were! a! premature!birth,! which! was! higher! than! both! the! Ohio! and!national! rates.! ! Moreover,! the! Trumbull! County! rate!did!not!meet!the!Healthy)People)2020!target!of!11.4%.!In! comparison! with! two! peerNmatched! counties,!Trumbull! County! had! a! slightly! lower! percentage! of!premature! births! than! Columbiana! County,! but! a!higher!percentage!than!Richland!County.!!''
10.0%!
11.0%!
12.0%!
13.0%!
14.0%!
Percent!of!births!
Trumbull! 13.0%!
Columbiana! 13.2%!
Richland! 11.8%!
Ohio! 12.3%!
U.S.! 12.7%!
HP2020! 11.4%!
Premature(Births(

Detailed(Data(Appendix( ( (
Trumbull(County(–(Children(! ! A6!
What'are'the'data'sources?'“Premature!Births”!is!the!percentage!of!births!with!a!reported!gestation!period!of!less!than!37!completed!weeks.!!The!most!recent!countyN!and!nationalNlevel!data!(2009)!were!modeled!based!on!reported!data! from!1996N2005.! !The!data!were!collected! from!the!National!Vital!Statistics!System!at!the!National!Center!for!Health!Statistics!and!was!reported!on!the!Community!Health!Status!Indicators!web!site.!!!What'puts'kids'at'risk?'Risk! factors!which! impact! the! likelihood!of!premature!birth! include!maternal!age,!black! race,!low!maternal! income,! maternal! infection,! history! of! preterm! birth,! pregnancy! with! multiple!fetuses,! high! blood! pressure,! tobacco! use,! alcohol! use,! substance! abuse,! limited! access! to!prenatal!care,!and!maternal!stress!(CDC,!2013g).!))!!!!!!!!!!!' '

Detailed(Data(Appendix( ( (
Trumbull(County(–(Children(! ! A7!
Low'&'Very'Low'Birth'Weight'Births'!
Why'is'this'indicator'important?'Birth!weight!is!important!for!infant!health,!both!in!terms!of!a!newborn’s!development,!and!in!
terms!of!an!infant’s!resilience!to!infection.! !Low!birth!weight! is!defined!as!birth!weight!below!
5.5! pounds! (2,500! grams),! while! very! low! birth! weight! is! a! birth! weight! below! 3! pounds! 4!
ounces!(1,500!grams).!!Low!and!very!low!birth!weight!can!lead!to!breathing!problems,!difficulty!
feeding,! developmental! delay,! cerebral! palsy,! vision! problems,! and! hearing! problems! (CDC,!
2013g).!!!
!
'''How'does'our'community'rank?'In! Trumbull! County,! the! rate! of! low! birth! weight!
births! was! 8.9%,! which! was! higher! than! both! the!
Ohio! and! national! rates;! additionally,! the! Trumbull!
County! rate! failed! to!meet! the!Healthy)People)2020!target! of! 7.8%.! In! comparison! with! two! peerN
matched! counties,! Trumbull! County! had! a! higher!
percentage! of! low! birth! weight! births! than! both!
Columbiana!County!and!Richland!County.!
)
!
!
!
In! Trumbull! County,! the! rate! of! very! low! birth!
weight!births!was!1.5%,!which!was!slightly!lower!
than!the!Ohio!rate!and!the!same!as!the!national!
rate;! additionally,! the! Trumbull! County! rate! did!
not!meet!the!Healthy)People)2020!target!of!1.4%.!In! comparison!with! two! peerNmatched! counties,!
Trumbull!County!had!a!higher!percentage!of!very!
low!birth!weight!births!than!either!peer!county.!
!
!
!
!
'
7.0%!
8.0%!
9.0%!
10.0%!
Percent!of!births!
Trumbull! 8.9%!
Columbiana! 7.7%!
Richland! 8.8%!
Ohio! 8.6%!
U.S.! 8.2%!
HP2020! 7.8%!
Low(Birth(Weight(Births(
0.0%!
0.5%!
1.0%!
1.5%!
2.0%!
Percent!of!births!
Trumbull! 1.5%!
Columbiana! 1.2%!
Richland! 1.3%!
Ohio! 1.6%!
U.S.! 1.5%!
HP2020! 1.4%!
Very(Low(Birth(Weight(Births(

Detailed(Data(Appendix( ( (
Trumbull(County(–(Children(! ! A8!
What'are'the'data'sources?'“Low!Birth!Weight!Births”! is! the!percentage!of! all! births! less! than!5.5!pounds! (2,500!grams).!!The!most!recent!countyN!and!nationalNlevel!data!(2012)!were!modeled!based!on!reported!data!from! 2002N2008.! ! The! data! were! collected! from! the! National! Vital! Statistics! System! at! the!National! Center! for! Health! Statistics! and!were! reported! on! the! County!Health! Rankings!web!site.!!“Very! Low! Birth!Weight! Births”! is! the! percentage! of! all! births! less! than! 3! pounds! 4! ounces!(1,500!grams).!!The!most!recent!countyN!and!nationalNlevel!data!(2009)!were!modeled!based!on!reported! data! from! 1996N2005.! ! The! data! were! collected! from! the! National! Vital! Statistics!System!at!the!National!Center!for!Health!Statistics!and!was!reported!on!the!Community!Health!Status!Indicators!web!site.!!!What'puts'kids'at'risk?'Low!birth!weight!can!be!caused!by!either!premature!birth!or!by!a! slow!prenatal!growth! rate!(that!is,!small!for!gestational!age).!!!Risk!factors!for!premature!birth!include!maternal!age,!black!race,! low! maternal! income,! maternal! infection,! history! of! preterm! birth,! pregnancy! with!multiple!fetuses,!high!blood!pressure,!tobacco!use,!alcohol!use,!substance!abuse,!limited!access!to!prenatal!care,!and!maternal!stress!(CDC,!2013g).!!!' '

Detailed(Data(Appendix( ( (
Trumbull(County(–(Children(! ! A9!
Infant,'Neonatal,'&'PostDNeonatal'Mortality'!Why'is'this'indicator'important?'Each! year,! roughly! 25,000! infants! die! in! the!United! States! (CDC,! 2012g).! ! In! 2008,! the! infant!mortality!rate!for!nonNHispanic!black!women!was!2.4!times!that!of!nonNHispanic!white!women!(HHS,!2013).!!Infant!mortality!is!measured!by!the!overall!number!of!deaths!between!birth!and!1!year!of! life!and! the!number!of!deaths!before!day!28! (neonatal!mortality)!and! the!number!of!deaths!between!28!days!and!1!year!(postNneonatal!mortality).!!!!!
!'How'does'our'community'rank?'In! Trumbull! County,! the! overall! rate! of! infant!mortality!(death!before!1!year!of!age)!was!8.9!per!1,000! live!births,!which!was!higher!than!both!the!Ohio!and!national!rates.! !Moreover,!the!Trumbull!County! rate! failed! to! meet! the! Healthy) People)2020! target! rate! of! 6! per! 1,000! live! births.! In!comparison! with! two! peerNmatched! counties,!Trumbull! County! was! higher! than! Columbiana!County!and!higher!than!Richland!County.!!
)!!!!!
!!In! Trumbull! County,! the! rate! of! neonatal!mortality!(death!before!day!28)!was!5.7!per!1,000!live!births,!which!was!higher!than!both!the!Ohio!and! national! rates.! Moreover,! the! Trumbull!County! rate! failed! to! meet! the! Healthy) People)2020! target! rate! of! 4.1! per! 1,000! live! births.! In!comparison!with!two!peerNmatched!counties,!the!neonatal! mortality! rate! in! Trumbull! County! was!higher! than! Columbiana! County! and! slightly!higher!than!Richland!County.!!
)!!
4!
6!
8!
10!
Rate!per!1,000!live!births!
Trumbull! 8.9!
Columbiana! 6.1!
Richland! 8!
Ohio! 7.9!
U.S.! 6.9!
HP2020! 6!
Infant(Mortality(
0!
2!
4!
6!
Rate!per!1,000!live!births!
Trumbull! 5.7!
Columbiana! 3.6!
Richland! 5.3!
Ohio! 5.3!
U.S.! 4.5!
HP2020! 4.1!
Neonatal(Mortality((Death(before(Day(28)(

Detailed(Data(Appendix( ( (
Trumbull(County(–(Children(! ! A10!
!
In! Trumbull! County,! the! rate! of! postNneonatal!
mortality! (death! between!day! 28! and! 1! year)!was!
3.1! per! 1,000! live! births,! which! was! higher! than!
both! the!Ohio! and! national! rates.! !Moreover,! the!
Trumbull! County! rate! did! not! meet! the! Healthy)People)2020!target!rate!of!2!per!1,000!live!births.!In!comparison! with! two! peerNmatched! counties,! the!
postNneonatal! mortality! rate! in! Trumbull! County!
was!higher!than!either!peer!county.!!
!
!
What'are'the'data'sources?'“Infant! Mortality”! is! the! number! of! deaths! from!
any! cause! in! the! first! 12!months! of! life! per! 1,000!
live!births.! !The!most!recent!countyN!and!nationalN
level!data!(2009)!were!modeled!based!on!reported!
data! from! 1996N2005.! ! The! data! were! collected!
from! the! National! Vital! Statistics! System! at! the!
National! Center! for! Health! Statistics! and! was!
reported! on! the! Community! Health! Status!
Indicators!web!site.!
!
“Neonatal!Mortality”! is! the! number! of! deaths! from!any! cause! in! the! first! 28! days! of! life! per!
1,000!live!births.!!The!most!recent!countyN!and!nationalNlevel!data!(2009)!were!modeled!based!
on!reported!data! from!1996N2005.! !The!data!were!collected! from!the!National!Vital!Statistics!
System!at!the!National!Center!for!Health!Statistics!and!was!reported!on!the!Community!Health!
Status!Indicators!web!site.!
!
“PostNNeonatal!Mortality”! is! the!number!of!deaths!from!any!cause!occurring!between!day!28!
and!1!year!of!life!per!1,000!live!births.!!The!most!recent!countyN!and!nationalNlevel!data!(2009)!
were!modeled! based! on! reported! data! from! 1996N2005.! ! The! data! were! collected! from! the!
National!Vital!Statistics!System!at!the!National!Center!for!Health!Statistics!and!was!reported!on!
the!Community!Health!Status!Indicators!web!site.!
!
!
What'puts'kids'at'risk?'The!risk!of!death!in!infancy!is!increased!for!infants!born!with!a!serious!birth!defect,!for!infants!
who! are! born! prematurely,! who! have! low! birth! weight,! for! infants! born! to! mothers! with!
pregnancy! complications,! victims! of! violence,! and! victims! of! Sudden! Infant! Death! Syndrome!
(SIDS).! Factors! such! as! race,! ethnicity,! age,! and! income!may! impact! the! likelihood! of! infant!
death!as!well!(CDC,!2012g).!
0!
1!
2!
3!
4!
Rate!
per!
1,000!
live!
births!
Trumbull! 3.1!
Columbiana! 2.5!
Richland! 2.5!
Ohio! 2.5!
!U.S.! 2.3!
HP2020! 2!
Post;Neonatal(Mortality((Death(between(Day(28(and(1(Year)(

Detailed(Data(Appendix( ( (
Trumbull(County(–(Children(! ! A11!
Child(Lifestyle(Factors(!Lifestyle!risk!factors!are!“everyday”!behaviors!that!people!engage!in!that!can!negatively!impact!their!health.!!LifestyleNrelated!risk!factors!include!a!range!of!behaviors!such!as!unhealthy!eating,!low!or!no!physical!activity,!and!tobacco!use.! !People!that!engage!in!these!lifestyle!risk!factors!are!at!higher! risk! for!a! large!number!of!chronic!diseases!such!as!heart!disease,!diabetes,!and!cancer.! ! Lifestyle! risk! factors! in! children! are! especially! important! because! they! can! affect!physical! and! mental! development! and! establish! behavioral! patterns! that! are! taken! into!adulthood.!!The!lifestyle!risk!factors!identified!as!prioritized!health!needs!among!Trumbull(County(Children!are:!
• Overweight!&!Obesity!• Exercise!• Nutrition!
!!Overweight'&'Obesity'!Why'is'this'indicator'important?'Body!mass!index!(BMI)!is!a!measure!used!to!determine!whether!a!child’s!weight!is!healthy!for!their! size.! It! is! calculated! by! assessing! a! child’s! weight! in! relation! to! their! height,! age,! and!gender.!Children!who!are!overweight,! especially! young!children,! are!at! increased! risk!of!high!blood!pressure,!high!cholesterol,!and!subsequent!cardiovascular!disease.!One!study!found!that!70%!of!obese!children!had!at!least!one!of!these!risk!factors,!and!39%!had!two!or!more.!Children!who!are!overweight!or!obese!are!also!at!increased!risk!of!developing!Type!2!diabetes,!asthma,!sleep!apnea,!joint!problems,!acid!reflux,!and!mental!health!problems!(CDC,!2012h).!!!
!!'How'does'our'community'rank?'In! Trumbull! County,! 14.9%! of! the! child! population!between!two!and!five!years!old!was!reported!as!being!overweight,!which!was! lower! than! the!Ohio! rate! and!the! national! rate.! In! comparison! with! two! peerNmatched! counties,! Trumbull! County! had! a! lower!percentage!of!overweight!two!to!five!year!old!children!than! Columbiana! County! and! a! slightly! higher!percentage!than!Richland!County.!!!!!!
0.0%!
10.0%!
20.0%!
30.0%!
Percent!child!populahon!Trumbull! 14.9%!
Columbiana! 15.9%!
Richland! 14.8%!
Ohio! 28.2%!
U.S.! 26.7%!
Overweight(Children(((2;5(Years(Old)(

Detailed(Data(Appendix( ( (
Trumbull(County(–(Children(! ! A12!
!!In!Trumbull!County,!10.6%!of! the!child!population!was!reported!as!being!obese,!which!was!lower!than!both! the! Ohio! and! national! rates;! however,! the!Trumbull! County! rate! failed! to! meet! the! Healthy)People) 2020) target! rate! of! 9.6%.! In! comparison!with!two!peerNmatched!counties,!Trumbull!County!had! a! higher! percentage! than! both! Columbiana!County!and!Richland!County.!!'''''''What'are'the'data'sources?'“Overweight!Children!(2N5!Years!Old)”!is!the!percentage!of!children!whose!weight!is!in!the!85th!to!94th!percentile.!!The!most!recent!countyN!and!nationalNlevel!data!(2012)!were!collected!from!the!CRHS!and!RHWP!Health!Status!Profile!Reports!at!the!Ohio!Department!of!Health!web!site.!!“Obese!Children”!is!the!percentage!of!children!whose!weight!is!in!the!95th!percentile!or!higher.!!The! most! recent! countyN! and! nationalNlevel! data! (2011)! were! collected! from! the! Pediatric!Nutrition!Surveillance!System!at!the!Ohio!Department!of!Health!web!site.!!!What'puts'kids'at'risk?'Factors! which! increase! the! likelihood! of! children! becoming! overweight! or! obese! include!consumption! of! sugary! drinks,! unhealthy! school! food,! lack! of! daily! physical! activity! in! all!schools,! no! place! to! play! and! be! outside! safely,! limited! access! to! healthy,! affordable! foods,!increasing!portion!sizes,!lack!of!breastfeeding!support,!and!sedentary!lifestyle!from!overuse!of!TV!and!media!(CDC,!2012h).!!!))))))! !
0.0%!
5.0%!
10.0%!
15.0%!
Percent!of!child!populahon!
Trumbull! 10.6%!
Columbiana! 10.4%!
Richland! 9.9%!
Ohio! 11.2%!
!U.S.! 12.4%!
HP2020! 9.6%!
Obese(Children(

Detailed(Data(Appendix( ( (
Trumbull(County(–(Children(! ! A13!
Exercise'!Why'is'this'indicator'important?'Physical! activity! is! important! to!maintaining! a! healthy! body!weight! and! reducing! the! risk! for!various! cardiovascular! diseases.! ! Among! children,! physical! activity! can! improve! bone! health,!improve! cardiorespiratory! and!muscular! fitness,! decrease! body! fat,! and! reduce! symptoms! of!depression!(HHS,!2013).!!The!CDC!recommends!that!children!get!at!least!60!minutes!of!physical!activity!each!day!(CDC,!2011g).!!!
!'How'does'our'community'rank?'Trumbull!County! is! located! in! the!Northeast!Central!region,! which! has! a! slightly! higher! or! equal!percentage! of! children! that! exercised! all! 7! days! of!the!past!week!compared!to!most!of!the!other!regions!in!the!state,!except!for!the!Southeast!region.!!!!!!!!!''''''
!!!Trumbull!County!is!located!in!the!Northeast!Central!region,! in!which!53%!of!children!had!two!hours!or!less! of! screen! time! on! an! average!weekday.! ! This!percent! is! lower! than! all! the! other! regions! in! the!state.!!!!!!!!!
0%!10%!20%!30%!40%!50%!
Percent!Northwest! 25%!
Northeast! 24%!
Northeast!Central! 29%!
East!Central! 24%!
Central! 24%!
West!Central! 29%!
Southwest! 25%!
Southeast! 33%!
Exercised(7(Days(in(Past(Week(
30%!40%!50%!60%!70%!
Percent!Northwest! 59%!
Northeast! 56%!
Northeast!Central! 53%!
East!Central! 58%!
Central! 58%!
West!Central! 63%!
Southwest! 57%!
Southeast! 58%!
2(Hours(or(Less(of(Screen(Time(on(Average(Weekday(

Detailed(Data(Appendix( ( (
Trumbull(County(–(Children(! ! A14!
What'are'the'data'sources?'“Exercised! 7! Days! in! Past!Week”! is! the! percent! of! parents! who! reported! that! their! children!exercised,!played!a!sport,!or!participated!in!physical!activity!every!day!of!the!past!week!for!at!least!20!minutes!that!made!him/her!sweat!and!breathe!hard.!!The!most!recent!data!(2012)!in!Ohio!were!analyzed!using!the!2012!Ohio!Medicaid!Assessment!Survey.!!“2!Hours!or!Less!of!Screen!Time!on!Average!Week!Day”!is!the!percent!of!parents!who!reported!that! their! children! had! 2! hours! or! less! of! screen! time! on! an! average!weekday.! ! Screen! time!includes!watching!TV,! videos,!or!playing!video!games!except! schoolNrelated.! The!most! recent!data!(2012)!in!Ohio!were!analyzed!using!the!2012!Ohio!Medicaid!Assessment!Survey.!!!What'puts'kids'at'risk?'A!variety!of!personal,!social,!economic,!and!environmental!factors!play!a!role!in!physical!activity!including!access!to!recreational!facilities!and!sidewalks,!income,!enjoyment,!social!and!parental!support,!safe!neighborhoods,!and!school!policies!(CDC,!2012h).!!!!!! !

Detailed(Data(Appendix( ( (
Trumbull(County(–(Children(! ! A15!
Nutrition'!
Why'is'this'indicator'important?'Eating!healthy! foods! is! important! to!maintaining!a!healthy!body!weight!and!reducing!the!risk!
for!various!diseases.! ! For!children,!good!nutrition! is!essential! for!healthy!development.! !Poor!
nutrition! can! lead! to! overweight! and! obesity,!malnutrition,! diabetes,! oral! disease,! and! some!
cancers!(CDC,!2012h).!
!
'How'does'our'community'rank?'Trumbull!County! is! located! in! the!Northeast!Central!
region,! which! has! a! higher! percentage! of! family!
meals! cooked! at! home! compared! to! most! other!
regions,!with!the!exception!of!the!Southeast!and!East!
Central!regions.!!!
''What'are'the'data'sources?'“Family! Meals! Cooked! at! Home”! is! the! percent! of!
parents!reporting!having!at!least!five!family!meals!at!
home!in!the!past!week!that!were!cooked!at!home!all!
or!most!of!the!time.!!The!most!recent!data!(2012)!in!
Ohio! were! analyzed! using! the! 2012! Ohio! Medicaid!
Assessment!Survey.!
!
!
!
''''What'puts'kids'at'risk?'There! are! many! factors! that! affect! healthy! eating! among! kids! including! knowledge! and!
attitudes,! societal! and! cultural! norms,! family! eating! behaviors,! family! income,! parental!
attitudes,!and!school!food!policies!(CDC,!2012h).!
!
!
!
50%!
55%!
60%!
65%!
70%!
75%!
Percent!
Northwest! 61%!
Northeast! 58%!
Northeast!
Central!64%!
East!Central! 66%!
Central! 59%!
West!Central! 61%!
Southwest! 63%!
Southeast! 65%!
Family(Meals(Cooked(at(Home(

Detailed(Data(Appendix( ( (
Trumbull(County(–(Children(! ! A16!
Mental(Health(!Why'is'this'indicator'important?'Mental!health!refers!to!the!successful!performance!of!mental!function,!resulting!in!productive!activities,!fulfilling!relationships!with!other!people,!and!the!ability!to!adapt!to!change!and!cope!with! adversity.! ! Mental! health! is! essential! to! personal! wellNbeing,! family! and! interpersonal!relationships,!and!the!ability!to!contribute!to!community!or!society!(HHS,!2013).!!!!Mental! illness! refers! to!a!broad! range!of!diagnosable!mental!health! conditions!and!disorders!and!contribute!to!a!host!of!problems!including!disability,!distress,!and!death.!!According!to!the!National!Institute!of!Mental!Health,!in!any!given!year!an!estimated!13!million!Americans!(about!1!in!17!people)!have!a!seriously!debilitating!mental!illness!(Kessler!et!al.,!2005).!!Mental!health!disorders!are!the!leading!cause!of!disability!in!the!United!States!and!account!for!approximately!25%!of!all!years!of!life!lost!due!to!disability!and!premature!death!(WHO,!2004).!!Mental! health! is! particularly! important! for! children! since! it! can! affect! psychological! and!emotional! development,! school! performance,! family! and! peer! relationships,! and! physical!health.! ! Common!mental! health! issues! for! children! include!bullying! (and! the! impact!of!being!bullied),!depression,!anxiety,!and!behavioral!disorders! (such!as!Attention!Deficit!Hyperactivity!disorder!and!Oppositional!Defiant!Disorder)!(MedlinePlus,!2013a).!!
'''
How'does'our'community'rank?'The! rate! of! children! that! were! discharged! from! a!hospital! with! a!mental! health! diagnosis!was! 112.16!per!100,000!children!in!Trumbull!County,!which!was!higher! than! Columbiana! County,! but! lower! than!Richland!County.)!!!!!!!!!!
!!!!
0.00!
250.00!
500.00!
750.00!
1000.00!
Rate!per!100,000!children!
Trumbull! 112.16!
Columbiana! 86.79!
Richland! 843.88!
Hospital(Discharges(with(a(Mental(Health(Diagnosis(
Detailed(Data(Appendix( ( (
Trumbull(County(–(Children(! ! A17!
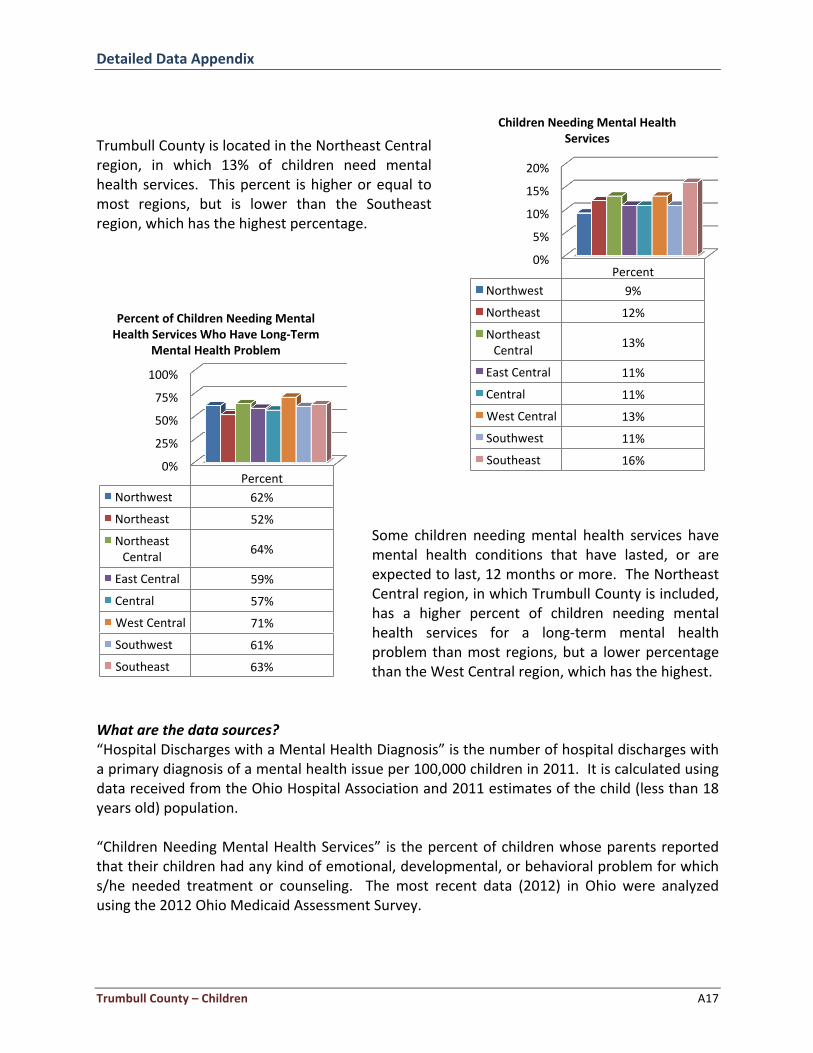
!!Trumbull!County!is!located!in!the!Northeast!Central!region,! in! which! 13%! of! children! need! mental!health!services.! !This!percent! is!higher!or!equal! to!most! regions,! but! is! lower! than! the! Southeast!region,!which!has!the!highest!percentage.!!!!
!!!!!!!!!!!!Some! children! needing!mental! health! services! have!mental! health! conditions! that! have! lasted,! or! are!expected!to!last,!12!months!or!more.!!The!Northeast!Central!region,!in!which!Trumbull!County!is!included,!has! a! higher! percent! of! children! needing! mental!health! services! for! a! longNterm! mental! health!problem!than!most! regions,!but!a! lower!percentage!than!the!West!Central!region,!which!has!the!highest.!
!!What'are'the'data'sources?'“Hospital!Discharges!with!a!Mental!Health!Diagnosis”!is!the!number!of!hospital!discharges!with!a!primary!diagnosis!of!a!mental!health!issue!per!100,000!children!in!2011.!!It!is!calculated!using!data!received!from!the!Ohio!Hospital!Association!and!2011!estimates!of!the!child!(less!than!18!years!old)!population.!!!“Children!Needing!Mental!Health!Services”! is!the!percent!of!children!whose!parents!reported!that!their!children!had!any!kind!of!emotional,!developmental,!or!behavioral!problem!for!which!s/he! needed! treatment! or! counseling.! ! The!most! recent! data! (2012)! in! Ohio! were! analyzed!using!the!2012!Ohio!Medicaid!Assessment!Survey.!!!
0%!
25%!
50%!
75%!
100%!
Percent!Northwest! 62%!
Northeast! 52%!
Northeast!Central! 64%!
East!Central! 59%!
Central! 57%!
West!Central! 71%!
Southwest! 61%!
Southeast! 63%!
Percent(of(Children(Needing(Mental(Health(Services(Who(Have(Long;Term(
Mental(Health(Problem(
0%!
5%!
10%!
15%!
20%!
Percent!Northwest! 9%!
Northeast! 12%!
Northeast!Central! 13%!
East!Central! 11%!
Central! 11%!
West!Central! 13%!
Southwest! 11%!
Southeast! 16%!
Children(Needing(Mental(Health(Services(

Detailed(Data(Appendix( ( (
Trumbull(County(–(Children(! ! A18!
“Percent! of! Children! Needing! Mental! Health! Services! Who! Have! LongNTerm! Mental! Health!Problem”! is! the! percent! of! children! needing!mental! health! services!whose! parents! reported!that! their! children!had!an!emotional,! developmental,! or!behavioral! problem! that! lasted!or! is!expected!to!last!12!months!or!longer.!!The!most!recent!data!(2012)!in!Ohio!were!analyzed!using!the!2012!Ohio!Medicaid!Assessment!Survey.!!!What'puts'kids'at'risk?'There!are!many!“warning!signs”!of!mental!health! issues! in!children.! !They! include!harming!or!threatening!themselves,!others,!or!pets;!damaging!or!destroying!property;!lying!or!stealing;!not!doing!well! or! skipping! school;! smoking! tobacco,! drinking! alcohol,! or! using! illegal! drugs;! early!sexual!activity;!and!hostility!toward!authority!figures!(MedlinePlus,!2013b).!!!!)!!!!

Detailed(Data(Appendix( ( (
Trumbull(County(–(Children(! ! A19!
Substance(Abuse(!Substance!abuse! refers! to! a! set!of! conditions! associated!with! the! consumption!of!mindN! and!behaviorNaltering! substances! that! have! negative! behavioral! and! health! outcomes! (Healthy!People!2020).! !Some!of!the!substances!abused!are! legal,!such!as!alcohol! for!adults;!some!are!illegal,!such!as!heroin;!and!some!are!legal!but!illegally!used,!such!as!the!misuse!of!prescription!drugs!by!people!not!prescribed!them.!!!!The!substance!abuse!issues!identified!as!prioritized!health!needs!among!Trumbull(County(Children!are:!
• Opioid!Drug!Abuse!!!Opioid'Drug'Abuse'!Why'is'this'indicator'important?'Opioids! are! a! family! of! medications! derived! from! the! opium! poppy,! including! Vicodin,!morphine,!heroin,!and!codeine.!!Opioid!drugs!are!designed!to!diminish!the!transmission!of!pain!signals!throughout!the!body,!and!are!commonly!utilized!to!combat!both!acute!and!chronic!pain!of! moderate! and! severe! intensity.! While! opioids! have! proven! therapeutically! useful,! the!beneficial! effects! of! opioid! use,! including! pain! reduction! and! euphoria,! have! made! them!appealing! recreational! drugs.! In! 2008,! two! of! the! most! frequently! abused! opioid! drugs,!hydrocode!and!oxycodone,!resulted! in!89,047!and!105,208!hospitalizations,!respectively!(NIH,!2009).!!By!race,!the!ageNadjusted!opioid!overdose!death!rates!are!highest!among!nonNHispanic!whites!(6.3)!and!American!Indian/Alaska!Natives!(6.2),!with!Hispanics!and!blacks!being!among!the!lowest!(2.1!and!1.9,!respectively)!(CDC,!2011f).!!How'does'our'community'rank?'At! the! time! of! publication,! epidemiologic! data! were! not! available! on! the! actual! rates! of!childhood!or!adolescent!opioid!drug!abuse!to!be!able!to!determine!how!Trumbull!County!ranks!relative!to!its!peer!counties,!the!state,!and!the!US.!!However,!opioid!drug!abuse!among!children!and!especially!adolescents!was! repeatedly! cited!by!many!community! leaders!and!community!residents!as!a!significant!public!health!problem!in!the!community.!!!!What'are'the'data'sources?'Input!from!community!residents!and!community! leaders!were!obtained!through!focus!groups!and!interviews,!respectively.!!What'puts'kids'at'risk?'Young!adults!aged!18—25!have!the!highest!rate!of!current!use!of!illicit!drugs!of!any!age!group,!while! both!males! and! females! have! similar! rates! of! using! opioid! drugs.! The! risk! of! overdose!from!opioid!drugs!is!higher,!however,!for!males,!and!for!middleNaged!individuals!(CDC,!2010a).!!

Detailed(Data(Appendix( ( (
Trumbull(County(–(Children(! ! A20!
Sexually(Transmitted(Diseases(!Sexually! transmitted!diseases! (STDs)! refer! to! the!more! than!25! infectious!organisms! that! are!transmitted! primarily! through! sexual! activity! (Healthy! People! 2020).! While! STDs! are! largely!preventable,!they!continue!to!remain!a!significant!public!health!problem.!Among!the!significant!burden! they!place!on!physical!health! for! the! individual,! they!may!also! result! in! costly! clinical!complications.!!!!The!sexually!transmitted!diseases!identified!as!prioritized!health!needs!among!Trumbull(County(Children!are:!
• Adolescent!gonorrhea!!Adolescent'Gonorrhea'!Why'is'this'indicator'important?'According!to!the!CDC,!there!are!approximately!19!million!new!sexually! transmitted! infections!each!year!and!almost!half!of!them!occur!among!adolescents!aged!15!to!24!years!(CDC,!2012).!Gonorrhea! is! considered! a! very! common! STD! and! any! sexually! active! teenager! may! be!considered! atNrisk! for! contracting! it.! Individuals!who! are! treated! for! gonorrhea!may! become!infected!again! if! they!engage! in!sexual!activity!with!an! infected!person.!Untreated!gonorrhea!may!result!in!significant!health!problems,!including!infertility.
!How'does'our'community'rank?'In!Trumbull!County,! the! rate!of!adolescent!gonorrhea!was! 155!per! 100,000! individuals! under! age! 20,!which!was!lower!than!the!Ohio!rate.!In!comparison!with!two!peerNmatched!counties,!Trumbull!County!had!a!higher!rate!of!adolescent!gonorrhea!than!either!peer!county.!)What'are'the'data'sources?'“Adolescent! Gonorrhea”! is! the! number! of! gonorrhea!cases!for!individuals!below!age!20!per!100,000!in!2011.!The! most! recent! data! is! reported! from! the! Ohio!Department! of! Health’s! State! Epidemiological!Outcomes!Workgroup.!!
What'puts'kids'at'risk?'Adolescents!who!engage!in!unprotected!sex!and/or!are!not!familiar!with!their!partners’!sexual!history! can! be! considered! atNrisk.! Certain! racial! and! ethnic! minority! groups! (mainly! African!Americans,! Hispanics,! and! American! Indian/Alaska! Natives)! often! have! higher! rates! of! STDS,!compared! to!whites.! Individuals!who! engage! in! highNrisk! sexual! behaviors,! who! abuse! drugs!and/or!alcohol,!or!who!do!not!communicate!their!sexual!history!with!their!partners!can!also!be!considered!atNrisk.( (
0!50!
100!150!200!
Rate!per!100,000!child!populahon!
Trumbull! 155!
Columbiana! 42!
Richland! 137!
Ohio! 167!
Adolescent(Gonorrhea(

Detailed(Data(Appendix( ( (
Trumbull(County(–(Children(! ! A21!
Access(to(Health(Care(!Access! to! health! care! is! a! broad! term! used! to! describe! the! availability,! acceptability,!affordability,!and!accessibility!of!health!care! systems!and!providers.! ! Lack!of!access! to!health!care!makes!it!difficult!for!people!to!get!the!health!care!they!need,!which!can!cause!premature!disability!and!death.! ! !Among!kids,! lack!of!access!to!health!care!means!that!children!can’t!get!the!immunizations!and!screenings!they!need,!which!can!increase!their!risk!for!disease!and!poor!development.!!The! health! care! accessNrelated! issues! identified! as! prioritized! health! needs! among! Trumbull(County(Children!are:!
• Health!Insurance!Coverage!• Access!to!Dental!Care!• Mental!Health!Insurance!Coverage!• Number!of!Pediatric!Specialists!
!!Health'Insurance'Coverage'!Why'is'this'indicator'important?'Having! adequate! health! insurance! to! help! cover! the! costs! associated! with! health! care! is! an!important!component!to!increasing!health!care!access.!!Without!it,!some!people!don’t!get!the!health!care! they!need,!which!can!cause!premature!disability!and!death.! !Additionally,! lack!of!adequate! health! insurance! sometimes! causes! health! problems! to! become! worse! and! more!costly!than!if!they!were!prevented!or!treated!earlier.!!Uninsured!children!are!10!times!more!likely!than!insured!children!to!have!unmet!medical!needs!and!are!5!times!more!likely!to!go!more!than!2!years!without!seeing!a!doctor!(Children’s!Defense!Fund,!2010b).
!!!How'does'our'community'rank?'In! Trumbull! County,! 1.4%!of! the! child!population!was!reported! as! having! no! health! insurance,! which! was!lower! than! both! the! Ohio! and! national! rates.! In!comparison!with!two!peerNmatched!counties,!Trumbull!County!had!a! lower!percentage!of!uninsured! children!than!either!peer!county.!
!!!!
0.0%!
5.0%!
10.0%!
Percent!of!child!populahon!
Trumbull! 1.4%!
Columbiana! 4.7%!
Richland! 5.7%!
Ohio! 4.0%!
U.S.! 10.0%!
Uninsured(Children(

Detailed(Data(Appendix( ( (
Trumbull(County(–(Children(! ! A22!
!
!
!
In!Trumbull!County,!39.3%!of! the!child!population!
was! enrolled! in! Medicaid,! which! was! lower! than!
the! Ohio! rate.! In! comparison! with! two! peerN
matched! counties,! Trumbull! County! had! a! lower!
percentage! of! children! enrolled! in! Medicaid! than!
Columbiana!County!and!Richland!County.!
!
!
!
!
!
!
!
!
!
!
In!Trumbull!County,!5.3%!of!the!child!population!was!
reported! as! not! having! prescription! drug! insurance!
coverage,! which! was! lower! than! the! Ohio! rate.! In!
comparison! with! two! peerNmatched! counties,!
Trumbull! County! had! lower! percentage! of! children!
without!prescription!drug!coverage!than!either!peer!
county.!
!
!
!
!
What'are'the'data'sources?'“Uninsured!Children”! is!an!estimate!of! the!percentage!of!children!under!age!18! (excluding!1N
year!olds)!without!health! insurance.! ! The!most! recent! countyN! and!nationalNlevel!data! (2008)!
were! collected! from! the! Children’s! Defense! Fund! and! reported! on! the! Annie! E! Casey!
Foundation!web!site.!
!
“Children! Enrolled! in! Medicaid”! is! the! percentage! of! children! under! age! 18! enrolled! in!
Medicaid.! ! The!most! recent! countyN! and! nationalNlevel! data! (2009)! were! collected! from! the!
Ohio!Department!of!Job!and!Family!Services!County!Profiles!on!their!web!site!and!compared!to!
the!2009!child!population!calculated!by!the!US!Census.!
!
!
!
!
20.0%!
30.0%!
40.0%!
50.0%!
Percent!of!child!
populahon!
Trumbull! 39.3%!
Columbiana! 42.5%!
Richland! 50.4%!
Ohio! 44.6%!
Children(Enrolled(in(Medicaid(
4.0%!
6.0%!
8.0%!
10.0%!
12.0%!
Percent!of!child!populahon!
Trumbull! 5.3%!
Columbiana! 10.6%!
Richland! 8.0%!
Ohio! 6.9%!
Children(without(Prescrip<on(Coverage(
Detailed(Data(Appendix( ( (
Trumbull(County(–(Children(! ! A23!
“Children!without! Prescription! Coverage”! is! an! estimate! of! the! percentage! of! children! under!age! 18! (excluding! 1Nyear! olds)! without! insurance! for! prescription! drugs.! ! The! most! recent!countyN! and! nationalNlevel! data! (2008)!were! collected! from! the! Children’s!Defense! Fund! and!reported!on!the!Annie!E!Casey!Foundation!web!site.!!!What'puts'kids'at'risk?'Most! adults! (60.3%)! have! health! insurance! through! private! providers! (such! as! Anthem! Blue!Cross!and!Blue!Shield,!Medical!Mutual!of!Ohio,!etc.)!and!usually!get!it!through!their!employers!(CDC,! 2012d).! ! These! policies! almost! always! offer! plan! options! that! include! coverage! for! the!entire! family! ! (including!children).! !Children!from!unemployed!or! lowNincome!families!can!get!health!insurance!through!their!state’s!Medicaid!program!even!when!their!parents!don’t!qualify!themselves.!!!!( (

Detailed(Data(Appendix( ( (
Trumbull(County(–(Children(! ! A24!
Access'to'Dental'Care'!Why'is'this'indicator'important?'Among!children,!dental!caries!are!considered!the!most!common!childhood!chronic!disease!and!research!has!shown!that!dental!care!is!the!most!prevalent!unmet!health!need!among!children!in!the!US!(Mouradian,!Wehr,!&!Crall,!2000).!An!estimated!16.5!million!children!go!without!basic!dental! care! each! year! (Pew! Foundation,! 2011).! Periodontal! disease! has! also! been! linked! to!adverse! pregnancy! outcomes,! diabetes,! cardiovascular! disease,! and! respiratory! disease.!Routine!dental!examinations!and!practicing!good!oral!hygiene!are!important!components!of!an!overall!healthy!lifestyle,!as!well!as!a!good!preventive!measure!to!protect!your!personal!health!and!wellNbeing!(CDC,!2009a).!!While!many!children!may!have!access!to!dental!coverage!through!private!insurance!or!Medicaid,!this!does!not!necessarily!translate!into!actual!care.!!
!''How'does'our'community'rank?'In! Trumbull! County,! 70.9%! of! the! child! population!was!reported!as!having!a!dental!visit!in!the!previous!year,!which!was!lower!than!the!Ohio!rate!and!higher!than! the! national! rate.! ! Moreover,! the! Trumbull!County!rate! is!much!higher! than!the!Healthy)People)2020) target! rate!of!49.0%.! ! In! comparison!with! two!peerNmatched! counties,! Trumbull! County! had! a!higher! percentage! of! children! having! a! dental! visit!than! Columbiana! County,! but! a! lower! percentage!than!Richland!County.!)!!!!
!!!In! Trumbull! County,! 22.0%! of! 3rd! grade! children!were! reported! as! having! untreated! tooth! decay,!which! was! higher! than! the! Ohio! rate! and! lower!than! the! national! rate.! ! Moreover,! the! Trumbull!County!rate!is!lower!than!the!Healthy)People)2020)target!rate!of!26.0%.!!In!comparison!with!two!peerNmatched! counties,! Trumbull! County! had! a! lower!percentage!of!children!with!untreated!tooth!decay!than!both!Columbiana!and!Richland!Counties.!!
30.0%!40.0%!50.0%!60.0%!70.0%!80.0%!
Percent!of!child!populahon!
Trumbull! 70.9%!
Columbiana! 65.9%!
Richland! 81.9%!
Ohio! 78.0%!
!!U.S.! 44.5%!
HP2020! 49.0%!
Dental(Visit(in(Last(Year(
0.0%!
10.0%!
20.0%!
30.0%!
Percent!of!3rd!grade!children!
Trumbull! 22.0%!
Columbiana! 28.0%!
Richland! 23.9%!
Ohio! 18.7%!
U.S.! 28.8%!
HP2020! 26.0%!
Untreated(Tooth(Decay(

Detailed(Data(Appendix( ( (
Trumbull(County(–(Children(! ! A25!
!!!In!Trumbull!County,!59.4%!of!3rd!grade!children!were!reported! as! having! one! or! more! dental! sealants,!which! was! higher! than! both! the! Ohio! and! national!rates.! !Moreover,! the!Trumbull!County!rate! is! lower!than! the!Healthy) People) 2020) target! rate! of! 28.0%.!!In! comparison! with! two! peerNmatched! counties,!Trumbull!County!had!a!higher!percentage!of!children!having!one!or!more!dental!sealants!than!Columbiana!County!and!Richland!County.!!
!!!!!!
!In! Trumbull! County,! 16.7%! of! 3rd! grade! children!were! reported! as! having! a! toothache,! which! was!higher!than!the!Ohio!rate.!In!comparison!with!two!peerNmatched! counties,! Trumbull! County! had!higher! percentage! of! children! having! a! toothache!than! both! Columbiana! County! and! Richland!County.!
!!
!!!!!In! Trumbull! County,! 17.4%! of! the! child! population!was!reported!as!never!having!visited!a!dentist,!which!was! higher! than! the! Ohio! rate.! In! comparison! with!two!peerNmatched! counties,! Trumbull! County! had! a!higher!percentage!of!children!never!having!visited!a!dentist! than! Columbiana! County! and! a! lower!percentage!than!Richland!County.!!!!!!
20.0%!32.0%!44.0%!56.0%!68.0%!
Percent!of!3rd!grade!children!
Trumbull! 59.4%!
Columbiana! 43.1%!
Richland! 34.5%!
Ohio! 50.4%!
U.S.! 32.0%!
HP2020! 28.0%!
One(or(More(Dental(Sealants(
5.0%!7.0%!9.0%!11.0%!13.0%!15.0%!17.0%!19.0%!
Percent!of!3rd!grade!children!
Trumbull! 16.7%!
Columbiana! 9.8%!
Richland! 14.0%!
Ohio! 11.4%!
Toothache(
0.0%!
5.0%!
10.0%!
15.0%!
20.0%!
Percent!of!child!populahon!Trumbull! 17.4%!
Columbiana! 14.0%!
Richland! 18.9%!
Ohio! 14.6%!
Never(Visited(a(Den<st(

Detailed(Data(Appendix( ( (
Trumbull(County(–(Children(! ! A26!
!!!!In! Trumbull! County,! 19.6%! of! the! child! population!was! reported! as! being! without! dental! insurance,!which! was! lower! than! both! the! Ohio! and! national!rates.! In! comparison! with! two! peerNmatched!counties,!Trumbull!County!had!a!lower!percentage!of!children! without! dental! insurance! than! Columbiana!County,! but! a! higher! percentage! than! Richland!County.!!!!!!!!
What'are'the'data'sources?'“Dental!Visit! in!Last!Year”! is! the!percentage!of!children!under!18!years!of!age!whose!parents!reported!that!they!visited!a!dentist!in!the!last!year.!!The!most!recent!countyN!and!nationalNlevel!data! (2008)! are! from! the! Ohio! Family! Health! Survey! reported! on! the! Ohio! Oral! Health!Surveillance!System!web!site.!!“Untreated!Tooth!Decay”!is!the!percentage!of!3rd!graders!whose!parents!reported!that!they!had!untreated!tooth!decay.! !The!most! recent!countyN!and!nationalNlevel!data! (2010)!are! from!the!Ohio!Oral!Health!and!BMI!Survey! reported!on! the!Ohio!Oral!Health!Surveillance!System!web!site.!!“One!or!More!Dental!Sealants”! is! the!percentage!of!3rd!graders!whose!parents! reported! that!they!had!one!or!more!dental!sealants.!!The!most!recent!countyN!and!nationalNlevel!data!(2010)!are!from!the!Ohio!Oral!Health!and!BMI!Survey!reported!on!the!Ohio!Oral!Health!Surveillance!System!web!site.!!“Toothache”! is! the! percentage! of! 3rd! graders! whose! parents! reported! that! they! had! a!toothache.! ! The!most! recent! countyN! and! nationalNlevel! data! (2010)! are! from! the! Ohio! Oral!Health!and!BMI!Survey!reported!on!the!Ohio!Oral!Health!Surveillance!System!web!site.!!“Never! Visited! a! Dentist”! is! the! percent! of! children! under! 18! years! of! age! whose! parents!reported!that!they!visited!a!dentist!in!the!last!year.!!The!most!recent!data!(2008)!are!from!the!Ohio!Family!Health!Survey!reported!on!the!Ohio!Oral!Health!Surveillance!System!web!site.!!!!
0.0%!
10.0%!
20.0%!
30.0%!
40.0%!
Percent!of!child!populahon!Trumbull! 19.6%!
Columbiana! 34.6%!
Richland! 18.0%!
Ohio! 36.4%!
U.S.! 26.0%!
Children(without(Dental(Insurance(

Detailed(Data(Appendix( ( (
Trumbull(County(–(Children(! ! A27!
“Children!without!Dental! Insurance”! is! the! percent! of! children! under! 18! years! of! age!whose!parents! reported! that! they! did! not! have! dental! insurance! coverage.! ! The! most! recent! data!(2008)!are!from!the!Ohio!Family!Health!Survey!reported!on!the!Ohio!Oral!Health!Surveillance!System!web!site.!!!What'puts'kids'at'risk?'Children! from! low! income! and! minority! families! are! more! likely! to! report! poor! oral! health!outcomes,! fewer!dental! visits,! and! less! usage!of! protective!dental! sealants! (Pew!Foundation,!2011).!!Additionally,!children!that!do!not!receive!regular!preventative!care!and!do!not!properly!clean!their!teeth!are!also!more!likely!to!experience!poor!dental!health.!!)) )

Detailed(Data(Appendix( ( (
Trumbull(County(–(Children(! ! A28!
Mental'Health'Insurance'Coverage'!Why'is'this'indicator'important?'According!to!national!estimates,!the!percentage!of!children!across!the!country!who!suffer!from!a! serious!mental!health!problem! ranges! from!5! to!26%! (Health!Affairs,! 2013).! It! is! estimated!that! countless! other! children! and! adolescents! confront! social! and! emotional! challenges! that,!while! they!may!not!be!considered!“serious”!or!diagnosable,! significantly! impact! their!optimal!development.! Central! to! ensuring! children! and! adolescents! receive! the! help! they! need! to!adequately!address!social,!emotional,!and!psychological!disturbances! is!appropriate!access! to!mental!health!services.!Currently,!more!than!1!in!10!adolescents’!lacks!mental!health!insurance!and!for!those!that!are!covered,!mental!health!services!within!their!community!are!often!limited!(Knopf,!Park,!&!Mulye,!2008).!According!to!the!“National!Voices!Project”!(2013),!a!joint!national!survey! by! the! University! of! Michigan! and! the!W.K.! Kellogg! Foundation,! only! 30%! of! survey!respondents!reported!significant!availability!of!mental!health!services!in!their!community.!!Such!lack,! including! limited! access! to! mental! health! insurance,! negatively! impacts! the! ability! to!deliver!needed!services!to!children!and!adolescents!who!are!at!risk.!!!
How'does'our'community'rank?'In!Trumbull!County,!9.6%!of!the!child!population!was! reported! as! being! without! mental! health!insurance,! which! was! lower! than! the! Ohio!percentage.! In! comparison! with! two! peerNmatched!counties,!Trumbull!County!had!a! lower!percentage! of! children! without! mental! health!insurance.!!What'are'the'data'sources?'“Children!without!Mental!Health!Insurance”!is!an!estimate!of!the!percentage!of!children!under!age!18!(excluding!1Nyear!olds)!without!mental!health!insurance.! ! The! most! recent! countyN! and!nationalNlevel! data! (2008)! were! collected! from!the!Children’s!Defense!Fund!and!reported!on!the!Annie!E!Casey!Foundation!web!site.!!
What'puts'kids'at'risk?'Currently,! less! than! one! quarter! of! the! adolescents! who! need! mental! health! care! services!receive! treatment! (Knopf,! Park,! &! Mulye,! 2008).! Among! children! whose! parents! lack!appropriate!insurance,!their!risk!of!being!uninsured!themselves!increases!substantially.!It!is!also!estimated!that!among!adolescents!who!are!homeless,!served!within!a!state’s!child!welfare!or!juvenile!justice!systems,!or!are!lesbian,!gay,!bisexual,!or!transgender,!they!are!often!least!likely!to!receive!mental!health!services!(National!Institute!for!Healthcare!Management,!2009).!
0.0%!
5.0%!
10.0%!
15.0%!
Percent!of!child!populahon!
Trumbull! 9.6%!
Columbiana! 10.7%!
Richland! 14.7%!
Ohio! 10.4%!
Children(without(Mental(Health(Insurance(

Detailed(Data(Appendix( ( (
Trumbull(County(–(Children(! ! A29!
Number'of'Pediatric'Specialists'!Why'is'this'indicator'important?'In! a! survey! conducted! by! the! National! Association! of! Children’s! Hospitals! and! Related!Institutions!(NACHRI)!(2010),!it!was!determined!that!shortages!in!pediatric!subspecialities,!such!as! neurology,! developmentalNbehavioral!medicine,! general! surgery,! pulmonology,! and! others!are!negatively!impacting!patient!care.!It!was!estimated!that!among!children!who!were!in!need!of!specialty!care,!many!waited!for!nearly!10!weeks!to!see!a!pediatric!endocrinologist!and!nearly!9!weeks!to!see!a!pediatric!neurologist! in! their!communities.!A! lack!of!pediatric!specialty!care!may! result! in! families! needing! to! travel! long! distances! to! receive! the! necessary! care,! or!choosing!to!forgo!the!care!entirely.!!!How'does'our'community'rank?'At! the! time! of! publication,! epidemiologic! data! were! not! available! on! the! actual! number! of!pediatric!specialists!in!a!given!area!to!be!able!to!determine!how!Trumbull!County!ranks!relative!to!its!peer!counties,!the!state,!and!the!US.!!However,!a!lack!of!pediatric!specialists!was!cited!by!community! leaders! and! community! residents! as! a! significant! public! health! problem! in! the!community.!!!!!What'are'the'data'sources?'Input!from!community!residents!and!community! leaders!were!obtained!through!focus!groups!and!interviews,!respectively.!!!What'puts'kids'at'risk?'Children!who! live! in! areas!with! limited! access! to!healthcare!providers!may!be!more! likely! to!experience! a! lack! of! pediatric! specialists! in! their! communities,! though! the! problem!may! be!universally!spread,!regardless!of!access.!!!!))!!! !

Detailed(Data(Appendix( ( (
Trumbull(County(–(Children(! ! A30!
Environmental(Factors(!Environmental!risk!factors!are!a!broad!category!of!external!conditions!that!can!negatively!affect!health! outcomes.! ! These! include! air! and! water! quality,! presence! of! toxic! substances,! public!health! infrastructure,! and! community! assets! and! deficits.! ! They! are! especially! important! for!children,!since!they!can!have!a!lasting!impact!on!healthy!physical!and!mental!development.!!The! environmental! factor! identified! as! prioritized! health! need! among! Trumbull( County(Children!is:!
• Access!to!Healthy!Food!!!Access'to'Healthy'Food'!Why'is'this'indicator'important?'For! children,! a! lack! of! access! to! healthy! foods! contributes! significantly! to! weightNrelated!complications!and!diseases.!Diminished!access! to!and!consumption!of!healthy! foods!has!also!been! shown! to! negatively! impact! school! performance! and! cognitive! development! among!children!(Let’s!Move!,!n.d.).!Hunger!among!children!is!also!of!immediate!concern,!where!it!was!estimated!by!the!USDA!that!49.1!million!people,!including!16.7!million!children,!lived!in!homes!that!experienced!food!insecurity!at!multiple!times!throughout!the!year!(USDA,!n.d).!The!USDA!also!estimates!that!23.5!million!people,!including!6.5!million!children,!live!in!lowNincome!areas!that!are!more!than!a!mile!from!a!supermarket.!!
!!'How'does'our'community'rank?'In! Trumbull! County,! the! density! of! WICNauthorized!food!stores!was!13.86!stores!per!100,000!population,!which! was! lower! than! both! the! Ohio! and! national!rates.! In! comparison! with! two! peerNmatched!counties,!Trumbull!County!had!a! lower! rate!of!WICNauthorized!stores!than!both!Columbiana!County!and!Richland!County.!!
!
0!
5!
10!
15!
20!
Stores!per!100,000!populahon!
Trumbull! 13.86!
Columbiana! 18.59!
Richland! 19.43!
Ohio! 15.4!
U.S.! 15.6!
WIC(Authorized(Food(Store(Access(
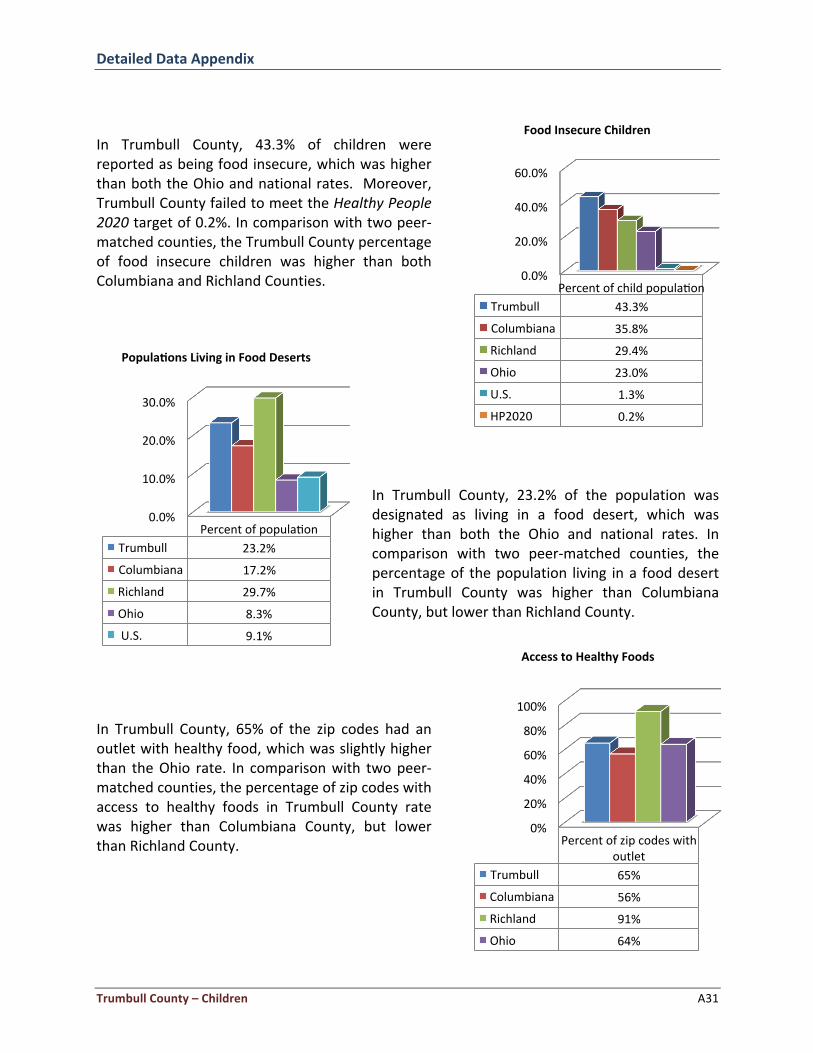
Detailed(Data(Appendix( ( (
Trumbull(County(–(Children(! ! A31!
!In! Trumbull! County,! 43.3%! of! children! were!reported!as!being!food!insecure,!which!was!higher!than!both!the!Ohio!and!national!rates.! !Moreover,!Trumbull!County!failed!to!meet!the!Healthy)People)2020!target!of!0.2%.!In!comparison!with!two!peerNmatched!counties,!the!Trumbull!County!percentage!of! food! insecure! children! was! higher! than! both!Columbiana!and!Richland!Counties.!!
!!
!!!
!!!!!In! Trumbull! County,! 23.2%! of! the! population! was!designated! as! living! in! a! food! desert,! which! was!higher! than! both! the! Ohio! and! national! rates.! In!comparison! with! two! peerNmatched! counties,! the!percentage!of! the!population! living! in!a! food!desert!in! Trumbull! County! was! higher! than! Columbiana!County,!but!lower!than!Richland!County.!!
!!!
!!In! Trumbull! County,! 65%! of! the! zip! codes! had! an!outlet!with!healthy!food,!which!was!slightly!higher!than! the!Ohio! rate.! In! comparison!with! two!peerNmatched!counties,!the!percentage!of!zip!codes!with!access! to! healthy! foods! in! Trumbull! County! rate!was! higher! than! Columbiana! County,! but! lower!than!Richland!County.!!
0.0%!
20.0%!
40.0%!
60.0%!
Percent!of!child!populahon!Trumbull! 43.3%!
Columbiana! 35.8%!
Richland! 29.4%!
Ohio! 23.0%!
U.S.! 1.3%!
HP2020! 0.2%!
Food(Insecure(Children(
0.0%!
10.0%!
20.0%!
30.0%!
Percent!of!populahon!Trumbull! 23.2%!
Columbiana! 17.2%!
Richland! 29.7%!
Ohio! 8.3%!
!U.S.! 9.1%!
Popula<ons(Living(in(Food(Deserts(
0%!
20%!
40%!
60%!
80%!
100%!
Percent!of!zip!codes!with!outlet!
Trumbull! 65%!
Columbiana! 56%!
Richland! 91%!
Ohio! 64%!
Access(to(Healthy(Foods(

Detailed(Data(Appendix( ( (
Trumbull(County(–(Children(! ! A32!
!!!!In! Trumbull! County,! 7%! of! poor! populations! were!designated!as!having! limited!access!to!healthy!food,!which!was!the!same!as!the!Ohio!rate.!In!comparison!with! two!peerNmatched! counties,! the!percentage!of!poor! populations!with! no! access! to! healthy! food! in!Trumbull!County!was!slightly!higher!than!Columbiana!County!and!the!same!as!Richland!County.!!!!!!!!
What'are'the'data'sources?'“WIC! Authorized! Food! Store! Access”! is! the! number! of! food! stores! and! other! retail!establishments! per! 100,000! population! that! are! authorized! to! accept! WIC! Program! (Special!Supplemental! Nutrition! Program! for! Women,! Infants,! and! Children)! benefits! and! that! carry!designated!WIC! foods! and! food! categories.! ! The!most! recent! countyN! and!nationalNlevel! data!(2011)! were! acquired! from! the! United! States! Department! of! Agriculture! (USDA)! Food!Environmental! Atlas! (FEA)! and! were! reported! on! the! Community! Health! Needs! Assessment!toolkit!on!the!Community!Commons!web!site.!!“Food! Insecure! Children”! is! the! percentage! of! the! child! population! living! in! households!experiencing!food!insecurity.!!Food!insecurity!refers!to!the!USDA’s!measure!of!lack!of!access,!at!times,! to! enough! food! for! active,! healthy! life! for! all! household! members! and! limited! or!uncertain!availability!of!nutritionally! adequate! foods.! ! The!most! recent! countyN! and!nationalNlevel! data! (2010)! were! taken! from! the! Feeding! America’s! Map! to! Meal! Gap! Project! and!reported!on!the!Annie!E!Casey!Foundation!web!site.!!“Population!Living! in!Food!Deserts”! is!the!percentage!of!the!population! living! in!census!tracts!designated!as!food!deserts,!which!are!lowNincome!census!tracts!where!a!substantial!number!or!share!of! residents! has! low!access! to! a! supermarket! or! large! grocery! store.! ! The!most! recent!countyN! and! nationalNlevel! data! (2010)!were! acquired! from! the!United! States!Department! of!Agriculture! (USDA)! Food! Environmental! Atlas! (FEA)! and! were! reported! on! the! Community!Health!Needs!Assessment!toolkit!on!the!Community!Commons!web!site.!!“Access! to!Healthy! Foods”! is! the!percent!of! ZIP! codes!with! a!healthy! food!outlet.! ! The!most!recent! countyN! and!nationalNlevel! data! (2012)!were! taken! from! the!County!Business! Patterns!database!from!the!US!Census!Bureau!and!reported!on!the!County!Health!Rankings!web!site.!
6%!
6%!
7%!
7%!
8%!
Percent!of!poor!populahon!Trumbull! 7%!
Columbiana! 6%!
Richland! 7%!
Ohio! 7%!
Limited(Access(to(Healthy(Food(

Detailed(Data(Appendix( ( (
Trumbull(County(–(Children(! ! A33!
“Limited!Access!to!Healthy!Food”!is!the!percent!of!the!population!who!are!lowNincome!and!do!not!live!close!to!a!grocery!store.!!The!most!recent!countyN!and!nationalNlevel!data!(2012)!were!acquired! from!the!United!States!Department!of!Agriculture! (USDA)!Food!Environmental!Atlas!(FEA)!and!were!reported!on!the!County!Health!Rankings!web!site.!!!What'puts'kids'at'risk?'Children! living! in! lowNincome! urban! and! rural! communities! are!most! at! risk! for! experiencing!diminished! access! to! healthy! foods! (White! House! Task! Force! on! Childhood! Obesity,! 2010).!Families!who! report! times!of! food! insecurity! at!multiple! points! throughout! the! year! are! also!significantly!less!likely!to!have!regular!and!stable!access!to!nutritious!foods.!!

Detailed(Data(Appendix( ( (
Mahoning(County(–(Children(! ! B1!
Mahoning(County(Children)
Chronic(Diseases(!
Chronic!diseases!are!a! type!of!disease!where! the!person! can! live!with! the!disease! for! a! long!
time,!sometimes!indefinitely.!!People!with!chronic!diseases!usually!need!to!see!their!doctors!on!
a! regular! basis! to!monitor! the! progression! of! their! disease! and! get! treatment.! ! As! a! nation,!
about! 75%! of! our! total! health! care! dollars! goes! to! the! treatment! of! chronic! diseases.!!
Fortunately,!some!chronic!diseases!are!preventable.!
!
The!chronic!diseases!identified!as!prioritized!health!needs!among!Mahoning(County(Children!are:!
• Asthma!
• Diabetes!
!
!
Asthma'!
Why'is'this'indicator'important?'Asthma!is!a!disease!that!affects!the!lungs.!When!irritants!such!as!smoke!and!air!pollution!are!
inhaled!by!a!person!with!asthma,! the! lining!of! the! respiratory! system!may!become! inflamed,!
leading!to!wheezing,!chest! tightness,!coughing,!and!even!difficulty!breathing.! Individuals!with!
asthma! must! take! specific! medicines! to! avoid! this! inflammation! (also! known! as! an! asthma!
attack),!and!must!avoid!triggers,!which!make!asthma!worse!(CDC,!2012e).!Asthma!is!one!of!the!
most! common! chronic! diseases! among! children,! with! one! in! every! eleven! children! affected!
(CDC,! 2012f).! ! It! is! more! common! among! the! multiracial,! Puerto! Rican! Hispanics,! and! nonO
Hispanic!blacks!than!among!nonOHispanic!whites!(CDC,!2011e).!
''''How'does'our'community'rank?'In!Mahoning! County,! 0.6%! of! days! were! designated! as!
exceeding! National! Ambient! Air! Quality! Standards! for!
particulate! matter,! which! is! lower! than! both! the! Ohio!
and!national!rate.!In!comparison!with!two!peerOmatched!
counties,! the! percentage! of! days! exceeding! air! quality!
standards! in! Mahoning! County! was! lower! than! Lucas!
County!and!the!same!as!Lorain!County.!!
)!
!
0.0%!
0.5%!
1.0%!
1.5%!
Percent!
of!days!
Mahoning! 0.6%!
Lucas! 0.8%!
Lorain! 0.6%!
Ohio! 0.7%!
U.S.! 1.2%!
Poor(Air(Quality:(Par;culate(Ma<er(

Detailed(Data(Appendix( ( (
Mahoning(County(–(Children(! ! B2!
!!In!Mahoning!County,!0.3%!of!days!were!designated!as! exceeding! National! Ambient! Air! Quality!Standards! for! ozone,! which! was! lower! than! the!Ohio! rate! and! lower! than! the! national! rate.! In!comparison! with! two! peerOmatched! counties,! the!percentage!of!days!exceeding!air!quality!standards!in! Mahoning! County! was! the! same! as! Lorain!County,!but!higher!than!Lucas!County.!!!!!!
!!!!!!!In! Mahoning! County,! the! rate! of! children! that! were!discharged!from!a!hospital!with!a!diagnosis!of!asthma!was!155.10,!which!was!higher! than! Lucas!County!and!lower!than!Lorain!County.!!!!!!!!!!!!
!In! Mahoning! County,! the! rate! of! children! that!visited! an! emergency! department! for! asthma!was!1809.47,!which!was!higher! than!Lucas!County!and!Lorain!County.!!!!!!!
0.0%!
0.2%!
0.4%!
0.6%!
0.8%!
1.0%!
Percent!of!days!
Mahoning! 0.3%!
Lucas! 0.0%!
Lorain! 0.3%!
Ohio! 0.6%!
U.S.! 0.8%!
Poor(Air(Quality:(Ozone(
0.00!
50.00!
100.00!
150.00!
200.00!
250.00!
Rate!per!100,000!children!Mahoning! 155.10!
Lucas! 30.77!
Lorain! 204.40!
Hospital(Discharges(with(Asthma(Diagnosis(
0.00!
500.00!
1000.00!
1500.00!
2000.00!
Rate!per!100,000!children!Mahoning! 1809.47!
Lucas! 1245.05!
Lorain! 978.32!
Emergency(Department(Visits(for(Asthma(

Detailed(Data(Appendix( ( (
Mahoning(County(–(Children(! ! B3!
What'are'the'data'sources?'“Poor!Air!Quality!–!Particulate!Matter”! is! the!percentage!of!days!with!particulate!matter!that!are! 2.5! levels! above! the! National! Ambient! Air! Quality! Standard! of! 35!micrograms! per! cubic!meter! per! year.! ! It! is! calculated! using! data! collected! by!monitoring! stations! and!modeled! to!include! counties! where! no! monitoring! stations! are! located.! ! The! most! recent! countyO! and!nationalOlevel! data! (2008)! was! collected! from! the! National! Environmental! Public! Health!Tracking!Network!at!the!Centers!for!Disease!Control!and!Prevention!and!was!reported!on!the!Community!Health!Needs!Assessment!toolkit!on!the!Community!Commons!web!site.!!“Poor!Air!Quality!–!Ozone”!is!the!percentage!of!days!per!year!with!ozone!(O3)!levels!above!the!National!Ambient!Air!Quality!Standard!of!75!parts!per!billion!(ppb).!!It!is!calculated!using!data!collected!by!monitoring!stations!and!modeled!to!include!counties!where!no!monitoring!stations!are! located.! ! The!most! recent! countyO! and!nationalOlevel! data! (2008)!was! collected! from! the!National!Environmental!Public!Health!Tracking!Network!at!the!Centers!for!Disease!Control!and!Prevention! and! was! reported! on! the! Community! Health! Needs! Assessment! toolkit! on! the!Community!Commons!web!site.!!“Hospital! Discharges! with! Asthma! Diagnosis”! is! the! number! of! hospital! discharges! with! a!primary!diagnosis!of!asthma!per!100,000!children!in!2011.!!It!is!calculated!using!data!received!from! the!Ohio! Hospital! Association! and! 2011! estimates! of! the! child! (less! than! 18! years! old)!population.!!!“Emergency!Department!Visits!for!Asthma”!is!the!number!of!emergency!department!visits!for!asthma! per! 100,000! children! in! 2011.! ! It! is! calculated! using! data! received! from! the! Ohio!Hospital!Association!and!2011!estimates!of!the!child!(less!than!18!years!old)!population.!))What'puts'kids'at'risk?'Children! who! live! with! smokers! are! more! likely! to! develop! asthma.! ! Additionally,! boys! and!AfricanOAmericans!are!at!higher!risk!for!asthma!than!girls!and!Whites!(CDC,!2012f).' '

Detailed(Data(Appendix( ( (
Mahoning(County(–(Children(! ! B4!
Diabetes')Why'is'this'indicator'important?'Diabetes!is!an!illness!in!which!blood!sugar!(glucose)!levels!are!higher!than!normal.!Most!of!the!food!that!an!individual!eats!is!converted!into!glucose,!which!must!in!turn!be!absorbed!by!cells.!The!pancreas!produces!a!hormone!called!insulin,!which!helps!cells!absorb!glucose.!In!diabetes,!the!body!either! cannot!produce!enough! insulin,! or! cannot!use! the! insulin! it! produces,!which!leads! to! a! buildup! of! sugar! in! the! blood.! The! two! primary! forms! of! diabetes! are! Type! 1,! or!juvenileOonset!diabetes,!and!Type!2,!or!adultOonset!diabetes!(CDC,!2011b).!Diabetes!affects!25.8!million!people,!or!8.3%!of!the!US!population!and!is!the!7th!leading!cause!of!death!in!the!United!States! (CDC,!2011c).! ! From!1980! through!2011,! the!ageOadjusted!percentage!of!persons!with!diagnosed!diabetes!increased!127%!for!whites!and!107%!for!blacks,!however,!overall!rates!are!higher!for!blacks.!!In!2011,!the!ageOadjusted!percentage!of!blacks!with!a!diagnosis!of!diabetes!was!nearly!double!that!of!whites!(9.3%!and!5.9%,!respectively)!(CDC,!2013f).!!!How'does'our'community'rank?'The!rate!of!children!that!were!discharged!from!a!hospital!with!a!diagnosis!of!diabetes!in!Mahoning!County!was!59.65!per!100,000!children,!which! is!higher! than!Lucas!County,!but! lower! than!Lorain!County.!!))What'are'the'data'sources?'“Hospital! Discharges!with! Diabetes! Diagnosis”! is!the!number!of!hospital!discharges!with!a!primary!diagnosis! of! diabetes! per! 100,000! children! in!2011.! ! It! is! calculated! using! data! received! from!the!Ohio!Hospital!Association!and!2011!estimates!of!the!child!(less!than!18!years!old)!population.!!))What'puts'kids'at'risk?'Risk! factors! for! developing! Type! 1! diabetes! are!not!well!defined,!but!may!include!autoimmune,!genetic,!and!environmental!components.!Risk!factors!for!Type!2!diabetes!are!much!better!established,!including!age,!obesity,!family!history,!diminished!glucose!tolerance,!inactivity,!and!race!(CDC,!2011b).!!
0.00!
20.00!
40.00!
60.00!
80.00!
Rate!per!100,000!children!Mahoning! 59.65!
Lucas! 53.84!
Lorain! 69.07!
Hospital(Discharges(with(Diabetes(Diagnosis(

Detailed(Data(Appendix( ( (
Mahoning(County(–(Children(! ! B5!
Maternal(&(Infant(Health(!Maternal!and!infant!health!is!a!broad!category!of!factors!that!affect!pregnancy!and!childbirth.!!Improving! the! wellObeing! of! mothers! and! infants! is! an! important! public! health! goal! in! the!United! States.! ! Healthy! birth! outcomes! and! early! identification! and! treatment! of! health!conditions!among!infants!can!prevent!death!or!disability!and!enable!children!to!reach!their!full!potential!(HHS,!2013).!!!!The!maternal!and! infant!health! issues! identified!as!prioritized!health!needs!among!Mahoning(County(Children!are:!
• Premature!Births!• Low!&!Very!Low!Birth!Weight!Births!• Infant,!Neonatal,!&!PostONeonatal!Mortality!
!!Premature'Births'!Why'is'this'indicator'important?'A! fetus!goes! through! important! stages!of!growth!during! the! final!months!of!pregnancy.! If! an!infant!is!born!before!37!weeks!of!pregnancy!(or!prematurely),!the!brain,!the!lungs,!and!the!liver!may! not! be! fully! developed,! increasing! the! risk! of! disability! and! death.! Premature! birth! can!result! in! breathing! problems,! difficulty! feeding,! developmental! delay,! cerebral! palsy,! vision!problems,!and!hearing!problems.!Every!year,!close!to!500,000!babies,!or!1! in!every!9! infants,!are!born!prematurely.!Medical! care! for!premature!births!and! the! resulting!medical!problems!cost! the! US! health! care! system! more! than! $26! billion! annually! (CDC,! 2013g).! ! By! race,!approximately!1!out!of!every!5! infants!born! to!nonOHispanic!black!mothers! in!2007!was!born!preterm,!compared!to!1! in!8O9! infants!born!to!nonOHispanic!white!and!Hispanic!women!(CDC,!2011e).!
!!'How'does'our'community'rank?'Of!births! in!Mahoning!County,!13.7%!were!a!premature!birth,!which!was!higher!than!both!the!Ohio!and!national!rates.! ! Moreover,! the! Mahoning! County! rate! did! not!meet! the! Healthy) People) 2020! target! of! 11.4%.! In!comparison!with!two!peerOmatched!counties,!Mahoning!County! had! a! higher! percentage! of! premature! births!than!either!peer!county.!!'''
10.0%!
11.0%!
12.0%!
13.0%!
14.0%!
Percent!of!births!
Mahoning! 13.7%!
Lucas! 13.2%!
Lorain! 11.6%!
Ohio! 12.3%!
U.S.! 12.7%!
HP2020! 11.4%!
Premature(Births(

Detailed(Data(Appendix( ( (
Mahoning(County(–(Children(! ! B6!
What'are'the'data'sources?'“Premature!Births”!is!the!percentage!of!births!with!a!reported!gestation!period!of!less!than!37!completed!weeks.!!The!most!recent!countyO!and!nationalOlevel!data!(2009)!were!modeled!based!on!reported!data! from!1996O2005.! !The!data!were!collected! from!the!National!Vital!Statistics!System!at!the!National!Center!for!Health!Statistics!and!was!reported!on!the!Community!Health!Status!Indicators!web!site.!!!What'puts'kids'at'risk?'Risk! factors!which! impact! the! likelihood!of!premature!birth! include!maternal!age,!black! race,!low!maternal! income,! maternal! infection,! history! of! preterm! birth,! pregnancy! with! multiple!fetuses,! high! blood! pressure,! tobacco! use,! alcohol! use,! substance! abuse,! limited! access! to!prenatal!care,!and!maternal!stress!(CDC,!2013g).!))!!!!!!!!!!!' '

Detailed(Data(Appendix( ( (
Mahoning(County(–(Children(! ! B7!
Low'&'Very'Low'Birth'Weight'Births'!Why'is'this'indicator'important?'Birth!weight!is!important!for!infant!health,!both!in!terms!of!a!newborn’s!development,!and!in!terms!of!an!infant’s!resilience!to!infection.! !Low!birth!weight! is!defined!as!birth!weight!below!5.5! pounds! (2,500! grams),! while! very! low! birth! weight! is! a! birth! weight! below! 3! pounds! 4!ounces!(1,500!grams).!!Low!and!very!low!birth!weight!can!lead!to!breathing!problems,!difficulty!feeding,! developmental! delay,! cerebral! palsy,! vision! problems,! and! hearing! problems! (CDC,!2013g).!!!
!'''How'does'our'community'rank?'In! Mahoning! County,! the! rate! of! low! birth! weight!births!was!10.0%,!which!was!higher!than!both!the!Ohio!and!national!rates;!additionally,! the!Mahoning!County!rate! failed! to!meet! the!Healthy)People)2020! target!of!7.8%.! In!comparison!with!two!peerOmatched!counties,!Mahoning!County!had!a!higher!percentage!of!low!birth!weight! births! than! both! Lucas! County! and! Lorain!County.!
)
!!!In! Mahoning! County,! the! rate! of! very! low! birth!weight! births! was! 2.0%,! which! was! higher! than!both!the!Ohio!and!national!rates;!additionally,! the!Mahoning! County! rate! did! not! meet! the! Healthy)People) 2020! target! of! 1.4%.! In! comparison! with!two!peerOmatched!counties,!Mahoning!County!had!a!higher!percentage!of!very!low!birth!weight!births!than!either!peer!county.!!!!!'
7.0%!
8.0%!
9.0%!
10.0%!
Percent!of!births!Mahoning! 10.0%!
Lucas! 9.5%!
Lorain! 8.1%!
Ohio! 8.6%!
U.S.! 8.2%!
HP2020! 7.8%!
Low(Birth(Weight(Births(
0.0%!
0.5%!
1.0%!
1.5%!
2.0%!
Percent!of!births!Mahoning! 2.0%!
Lucas! 1.7%!
Lorain! 1.4%!
Ohio! 1.6%!
U.S.! 1.5%!
HP2020! 1.4%!
Very(Low(Birth(Weight(Births(

Detailed(Data(Appendix( ( (
Mahoning(County(–(Children(! ! B8!
What'are'the'data'sources?'“Low!Birth!Weight!Births”! is! the!percentage!of! all! births! less! than!5.5!pounds! (2,500!grams).!!The!most!recent!countyO!and!nationalOlevel!data!(2012)!were!modeled!based!on!reported!data!from! 2002O2008.! ! The! data! were! collected! from! the! National! Vital! Statistics! System! at! the!National! Center! for! Health! Statistics! and!were! reported! on! the! County!Health! Rankings!web!site.!!“Very! Low! Birth!Weight! Births”! is! the! percentage! of! all! births! less! than! 3! pounds! 4! ounces!(1,500!grams).!!The!most!recent!countyO!and!nationalOlevel!data!(2009)!were!modeled!based!on!reported! data! from! 1996O2005.! ! The! data! were! collected! from! the! National! Vital! Statistics!System!at!the!National!Center!for!Health!Statistics!and!was!reported!on!the!Community!Health!Status!Indicators!web!site.!!!What'puts'kids'at'risk?'Low!birth!weight!can!be!caused!by!either!premature!birth!or!by!a! slow!prenatal!growth! rate!(that!is,!small!for!gestational!age).!!!Risk!factors!for!premature!birth!include!maternal!age,!black!race,! low! maternal! income,! maternal! infection,! history! of! preterm! birth,! pregnancy! with!multiple!fetuses,!high!blood!pressure,!tobacco!use,!alcohol!use,!substance!abuse,!limited!access!to!prenatal!care,!and!maternal!stress!(CDC,!2013g).!!!' '

Detailed(Data(Appendix( ( (
Mahoning(County(–(Children(! ! B9!
Infant,'Neonatal,'&'PostDNeonatal'Mortality'!Why'is'this'indicator'important?'Each! year,! roughly! 25,000! infants! die! in! the!United! States! (CDC,! 2012g).! ! In! 2008,! the! infant!mortality!rate!for!nonOHispanic!black!women!was!2.4!times!that!of!nonOHispanic!white!women!(HHS,!2013).!!Infant!mortality!is!measured!by!the!overall!number!of!deaths!between!birth!and!1!year!of! life!and! the!number!of!deaths!before!day!28! (neonatal!mortality)!and! the!number!of!deaths!between!28!days!and!1!year!(postOneonatal!mortality).!!!!
!!!'How'does'our'community'rank?'In! Mahoning! County,! the! overall! rate! of! infant!mortality! (death! before! 1! year! of! age)!was! 9.4! per!1,000! live! births,! which! was! higher! than! both! the!Ohio! and! national! rates.! !Moreover,! the!Mahoning!County!rate!failed!to!meet!the!Healthy)People)2020!target!rate!of!6!per!1,000! live!births.! In!comparison!with! two!peerOmatched!counties,!Mahoning!County!was!higher!than!Lucas!County!and!higher!than!Lorain!County.!
)!!!!!!
!)In!Mahoning!County,!the!rate!of!neonatal!mortality!(death!before!day!28)!was!5.7!per!1,000!live!births,!which!was!higher!than!both!the!Ohio!and!national!rates.!!Moreover,!the!Mahoning!County!rate!failed!to!meet!the!Healthy)People)2020!target!rate!of!4.1!per!1,000!live!births.!In!comparison!with!two!peerOmatched! counties,! the! neonatal! mortality! rate! in!Mahoning! County! was! nearly! the! same! as! Lucas!County,!but!higher!than!Lorain!County.!!
)!!
4!
6!
8!
10!
12!
Rate!per!1,000!live!births!
Mahoning! 9.4!
Lucas! 8.8!
Lorain! 7.6!
Ohio! 7.9!
U.S.! 6.9!
HP2020! 6!
Infant(Mortality(
0!
2!
4!
6!
Rate!per!1,000!live!births!
Mahoning! 5.7!
Lucas! 5.6!
Lorain! 4.5!
Ohio! 5.3!
U.S.! 4.5!
HP2020! 4.1!
Neonatal(Mortality((Death(before(Day(28)(

Detailed(Data(Appendix( ( (
Mahoning(County(–(Children(! ! B10!
!
In! Mahoning! County,! the! rate! of! postOneonatal!
mortality! (death! between!day! 28! and! 1! year)!was!
3.7! per! 1,000! live! births,! which! was! higher! than!
both! the!Ohio! and! national! rates.! !Moreover,! the!
Mahoning! County! rate! did! not! meet! the! Healthy)People)2020!target!rate!of!2!per!1,000!live!births.!In!comparison! with! two! peerOmatched! counties,! the!
postOneonatal! mortality! rate! in! Mahoning! County!
was!higher!than!either!peer!county.!!
!
'What'are'the'data'sources?'“Infant! Mortality”! is! the! number! of! deaths! from!
any! cause! in! the! first! 12!months! of! life! per! 1,000!
live!births.! !The!most!recent!countyO!and!nationalO
level!data!(2009)!were!modeled!based!on!reported!
data! from! 1996O2005.! ! The! data! were! collected!
from! the! National! Vital! Statistics! System! at! the!
National! Center! for! Health! Statistics! and! was!
reported! on! the! Community! Health! Status!
Indicators!web!site.!
!
“Neonatal!Mortality”! is! the! number! of! deaths! from!any! cause! in! the! first! 28! days! of! life! per!
1,000!live!births.!!The!most!recent!countyO!and!nationalOlevel!data!(2009)!were!modeled!based!
on!reported!data! from!1996O2005.! !The!data!were!collected! from!the!National!Vital!Statistics!
System!at!the!National!Center!for!Health!Statistics!and!was!reported!on!the!Community!Health!
Status!Indicators!web!site.!
!
“PostONeonatal!Mortality”! is! the!number!of!deaths!from!any!cause!occurring!between!day!28!
and!1!year!of!life!per!1,000!live!births.!!The!most!recent!countyO!and!nationalOlevel!data!(2009)!
were!modeled! based! on! reported! data! from! 1996O2005.! ! The! data! were! collected! from! the!
National!Vital!Statistics!System!at!the!National!Center!for!Health!Statistics!and!was!reported!on!
the!Community!Health!Status!Indicators!web!site.!
!
!
What'puts'kids'at'risk?'The!risk!of!death!in!infancy!is!increased!for!infants!born!with!a!serious!birth!defect,!for!infants!
who! are! born! prematurely,! who! have! low! birth! weight,! for! infants! born! to! mothers! with!
pregnancy! complications,! victims! of! violence,! and! victims! of! Sudden! Infant! Death! Syndrome!
(SIDS).! Factors! such! as! race,! ethnicity,! age,! and! income!may! impact! the! likelihood! of! infant!
death!as!well!(CDC,!2012g).!
0!
1!
2!
3!
4!
Rate!
per!
1,000!
live!
births!
Mahoning! 3.7!
Lucas! 3.3!
Lorain! 2.2!
Ohio! 2.5!
!U.S.! 2.3!
HP2020! 2!
Post:Neonatal(Mortality((Death(between(Day(28(and(1(Year)(

Detailed(Data(Appendix( ( (
Mahoning(County(–(Children(! ! B11!
Child(Lifestyle(Factors(!Lifestyle!risk!factors!are!“everyday”!behaviors!that!people!engage!in!that!can!negatively!impact!their!health.!!LifestyleOrelated!risk!factors!include!a!range!of!behaviors!such!as!unhealthy!eating,!low!or!no!physical!activity,!and!tobacco!use.! !People!that!engage!in!these!lifestyle!risk!factors!are!at!higher! risk! for!a! large!number!of!chronic!diseases!such!as!heart!disease,!diabetes,!and!cancer.! ! Lifestyle! risk! factors! in! children! are! especially! important! because! they! can! affect!physical! and! mental! development! and! establish! behavioral! patterns! that! are! taken! into!adulthood.!!The!lifestyle!risk!factors!identified!as!prioritized!health!needs!among!Mahoning(County(Children!are:!
• Overweight!&!Obesity!• Exercise!• Nutrition!
!!Overweight'&'Obesity'!Why'is'this'indicator'important?'Body!mass!index!(BMI)!is!a!measure!used!to!determine!whether!a!child’s!weight!is!healthy!for!their! size.! It! is! calculated! by! assessing! a! child’s! weight! in! relation! to! their! height,! age,! and!gender.!Children!who!are!overweight,! especially! young!children,! are!at! increased! risk!of!high!blood!pressure,!high!cholesterol,!and!subsequent!cardiovascular!disease.!One!study!found!that!70%!of!obese!children!had!at!least!one!of!these!risk!factors,!and!39%!had!two!or!more.!Children!who!are!overweight!or!obese!are!also!at!increased!risk!of!developing!Type!2!diabetes,!asthma,!sleep!apnea,!joint!problems,!acid!reflux,!and!mental!health!problems!(CDC,!2012h).!!!
!!'How'does'our'community'rank?'In!Mahoning! County,! 15.9%! of! the! child! population!between! two! and! five! years! old! was! reported! as!being! overweight,! which! was! lower! than! the! Ohio!rate!and!lower!than!the!national!rate.!In!comparison!with! two! peerOmatched! counties,!Mahoning! County!had! a! higher! percentage! of! overweight! two! to! five!year! old! children! than! Lucas! County! and! Lorain!County.!!!!!!
0.0%!
10.0%!
20.0%!
30.0%!
Percent!child!populahon!Mahoning! 15.9%!
Lucas! 14.0%!
Lorain! 14.3%!
Ohio! 28.2%!
U.S.! 26.7%!
Overweight(Children(((2:5(Years(Old)(

Detailed(Data(Appendix( ( (
Mahoning(County(–(Children(! ! B12!
!!In!Mahoning!County,!11.1%!of!the!child!population!was!reported!as!being!obese,!which!was!lower!than!both! the! Ohio! and! national! rates;! however,! the!Mahoning! County! rate! failed! to!meet! the!Healthy)People) 2020) target! rate! of! 9.6%.! In! comparison!with! two! peerOmatched! counties,! Mahoning!County!had!a!higher!percentage!of!obese!children!than!both!Lucas!and!Lorain!Counties.!!'''''''What'are'the'data'sources?'“Overweight!Children!(2O5!Years!Old)”!is!the!percentage!of!children!whose!weight!is!in!the!85th!to!94th!percentile.!!The!most!recent!countyO!and!nationalOlevel!data!(2012)!were!collected!from!the!CRHS!and!RHWP!Health!Status!Profile!Reports!at!the!Ohio!Department!of!Health!web!site.!!“Obese!Children”!is!the!percentage!of!children!whose!weight!is!in!the!95th!percentile!or!higher.!!The! most! recent! countyO! and! nationalOlevel! data! (2011)! were! collected! from! the! Pediatric!Nutrition!Surveillance!System!at!the!Ohio!Department!of!Health!web!site.!!!What'puts'kids'at'risk?'Factors! which! increase! the! likelihood! of! children! becoming! overweight! or! obese! include!consumption! of! sugary! drinks,! unhealthy! school! food,! lack! of! daily! physical! activity! in! all!schools,! no! place! to! play! and! be! outside! safely,! limited! access! to! healthy,! affordable! foods,!increasing!portion!sizes,!lack!of!breastfeeding!support,!and!sedentary!lifestyle!from!overuse!of!TV!and!media!(CDC,!2012h).!!!))))))! !
0.0%!
5.0%!
10.0%!
15.0%!
Percent!of!child!populahon!Mahoning! 11.1%!
Lucas! 9.9%!
Lorain! 10.3%!
Ohio! 11.2%!
!U.S.! 12.4%!
HP2020! 9.6%!
Obese(Children(

Detailed(Data(Appendix( ( (
Mahoning(County(–(Children(! ! B13!
Exercise'!Why'is'this'indicator'important?'Physical! activity! is! important! to!maintaining! a! healthy! body!weight! and! reducing! the! risk! for!various! cardiovascular! diseases.! ! Among! children,! physical! activity! can! improve! bone! health,!improve! cardiorespiratory! and!muscular! fitness,! decrease! body! fat,! and! reduce! symptoms! of!depression!(HHS,!2013).!!The!CDC!recommends!that!children!get!at!least!60!minutes!of!physical!activity!each!day!(CDC,!2011g).!!!
!'How'does'our'community'rank?'Mahoning!County!is!located!in!the!Northeast!Central!region,! which! has! a! slightly! higher! or! equal!percentage! of! children! that! exercised! all! 7! days! of!the!past!week!compared!to!most!of!the!other!regions!in!the!state,!except!for!the!Southeast!region.!!!!!!!!!''''''
!!!Mahoning! County! is! located! in! the! Northeast!Central!region,!in!which!53%!of!children!had!two!hours! or! less! of! screen! time! on! an! average!weekday.!!This!percent!is!lower!than!all!the!other!regions!in!the!state.!!!!!!!!!
0%!10%!20%!30%!40%!50%!
Percent!Northwest! 25%!
Northeast! 24%!
Northeast!Central! 29%!
East!Central! 24%!
Central! 24%!
West!Central! 29%!
Southwest! 25%!
Southeast! 33%!
Exercised(7(Days(in(Past(Week(
30%!40%!50%!60%!70%!
Percent!Northwest! 59%!
Northeast! 56%!
Northeast!Central! 53%!
East!Central! 58%!
Central! 58%!
West!Central! 63%!
Southwest! 57%!
Southeast! 58%!
2(Hours(or(Less(of(Screen(Time(on(Average(Weekday(

Detailed(Data(Appendix( ( (
Mahoning(County(–(Children(! ! B14!
What'are'the'data'sources?'“Exercised! 7! Days! in! Past!Week”! is! the! percent! of! parents! who! reported! that! their! children!exercised,!played!a!sport,!or!participated!in!physical!activity!every!day!of!the!past!week!for!at!least!20!minutes!that!made!him/her!sweat!and!breathe!hard.!!The!most!recent!data!(2012)!in!Ohio!were!analyzed!using!the!2012!Ohio!Medicaid!Assessment!Survey.!!“2!Hours!or!Less!of!Screen!Time!on!Average!Week!Day”!is!the!percent!of!parents!who!reported!that! their! children! had! 2! hours! or! less! of! screen! time! on! an! average!weekday.! ! Screen! time!includes!watching!TV,! videos,!or!playing!video!games!except! schoolOrelated.! The!most! recent!data!(2012)!in!Ohio!were!analyzed!using!the!2012!Ohio!Medicaid!Assessment!Survey.!!!What'puts'kids'at'risk?'A!variety!of!personal,!social,!economic,!and!environmental!factors!play!a!role!in!physical!activity!including!access!to!recreational!facilities!and!sidewalks,!income,!enjoyment,!social!and!parental!support,!safe!neighborhoods,!and!school!policies!(CDC,!2012h).!!!!!! !

Detailed(Data(Appendix( ( (
Mahoning(County(–(Children(! ! B15!
Nutrition'!
Why'is'this'indicator'important?'Eating!healthy! foods! is! important! to!maintaining!a!healthy!body!weight!and!reducing!the!risk!
for!various!diseases.! ! For!children,!good!nutrition! is!essential! for!healthy!development.! !Poor!
nutrition! can! lead! to! overweight! and! obesity,!malnutrition,! diabetes,! oral! disease,! and! some!
cancers!(CDC,!2012h).!
!
'How'does'our'community'rank?'Mahoning!County!is!located!in!the!Northeast!Central!
region,! which! has! a! higher! percentage! of! family!
meals! cooked! at! home! compared! to! most! other!
regions,!with!the!exception!of!the!Southeast!and!East!
Central!regions.!!!
''What'are'the'data'sources?'“Family! Meals! Cooked! at! Home”! is! the! percent! of!
parents!reporting!having!at!least!five!family!meals!at!
home!in!the!past!week!that!were!cooked!at!home!all!
or!most!of!the!time.!!The!most!recent!data!(2012)!in!
Ohio! were! analyzed! using! the! 2012! Ohio! Medicaid!
Assessment!Survey.!
!
!
!
''''What'puts'kids'at'risk?'There! are! many! factors! that! affect! healthy! eating! among! kids! including! knowledge! and!
attitudes,! societal! and! cultural! norms,! family! eating! behaviors,! family! income,! parental!
attitudes,!and!school!food!policies!(CDC,!2012h).!
!
!
!
50%!
55%!
60%!
65%!
70%!
75%!
Percent!
Northwest! 61%!
Northeast! 58%!
Northeast!
Central!64%!
East!Central! 66%!
Central! 59%!
West!Central! 61%!
Southwest! 63%!
Southeast! 65%!
Family(Meals(Cooked(at(Home(

Detailed(Data(Appendix( ( (
Mahoning(County(–(Children(! ! B16!
Mental(Health(!Why'is'this'indicator'important?'Mental!health!refers!to!the!successful!performance!of!mental!function,!resulting!in!productive!activities,!fulfilling!relationships!with!other!people,!and!the!ability!to!adapt!to!change!and!cope!with! adversity.! ! Mental! health! is! essential! to! personal! wellObeing,! family! and! interpersonal!relationships,!and!the!ability!to!contribute!to!community!or!society!(HHS,!2013).!!!!Mental! illness! refers! to!a!broad! range!of!diagnosable!mental!health! conditions!and!disorders!and!contribute!to!a!host!of!problems!including!disability,!distress,!and!death.!!According!to!the!National!Institute!of!Mental!Health,!in!any!given!year!an!estimated!13!million!Americans!(about!1!in!17!people)!have!a!seriously!debilitating!mental!illness!(Kessler!et!al.,!2005).!!Mental!health!disorders!are!the!leading!cause!of!disability!in!the!United!States!and!account!for!approximately!25%!of!all!years!of!life!lost!due!to!disability!and!premature!death!(WHO,!2004).!!Mental! health! is! particularly! important! for! children! since! it! can! affect! psychological! and!emotional! development,! school! performance,! family! and! peer! relationships,! and! physical!health.! ! Common!mental! health! issues! for! children! include!bullying! (and! the! impact!of!being!bullied),!depression,!anxiety,!and!behavioral!disorders! (such!as!Attention!Deficit!Hyperactivity!disorder!and!Oppositional!Defiant!Disorder)!(MedlinePlus,!2013a).!!
'''
How'does'our'community'rank?'The! rate! of! children! that! were! discharged! from! a!hospital! with! a!mental! health! diagnosis!was! 127.60!per!100,000!children! in!Mahoning,!which!was! lower!than!both!Lucas!County!and!Lorain!County.!!!!)!!!!!!!
!!!!
0.00!
250.00!
500.00!
750.00!
Rate!per!100,000!children!Mahoning! 127.60!
Lucas! 575.90!
Lorain! 222.73!
Hospital(Discharges(with(a(Mental(Health(Diagnosis(

Detailed(Data(Appendix( ( (
Mahoning(County(–(Children(! ! B17!
!
!
Mahoning! County! is! located! in! the! Northeast!
Central! region,! in! which! 13%! of! children! need!
mental! health! services.! ! This! percent! is! higher! or!
equal! to! most! regions,! but! is! lower! than! the!
Southeast! region,! which! has! the! highest!
percentage.!
!
!
!
!
!
!
!
!
!
!
!
!
!
!
Some! children! needing!mental! health! services! have!
mental! health! conditions! that! have! lasted,! or! are!
expected!to!last,!12!months!or!more.!!The!Northeast!
Central! region,! in! which! Mahoning! County! is!
included,! has! a! higher! percent! of! children! needing!
mental!health!services!for!a!longOterm!mental!health!
problem!than!most! regions,!but!a! lower!percentage!
than!the!West!Central!region,!which!has!the!highest.!
!
!
What'are'the'data'sources?'“Hospital!Discharges!with!a!Mental!Health!Diagnosis”!is!the!number!of!hospital!discharges!with!
a!primary!diagnosis!of!a!mental!health!issue!per!100,000!children!in!2011.!!It!is!calculated!using!
data!received!from!the!Ohio!Hospital!Association!and!2011!estimates!of!the!child!(less!than!18!
years!old)!population.!!
!
“Children!Needing!Mental!Health!Services”! is!the!percent!of!children!whose!parents!reported!
that!their!children!had!any!kind!of!emotional,!developmental,!or!behavioral!problem!for!which!
s/he! needed! treatment! or! counseling.! ! The!most! recent! data! (2012)! in! Ohio! were! analyzed!
using!the!2012!Ohio!Medicaid!Assessment!Survey.!
!
0%!
25%!
50%!
75%!
100%!
Percent!
Northeast*! 0%!
Northwest! 0%!
Northeast!
Central!0%!
East!Central! 0%!
Central! 0%!
West!Central! 0%!
Southwest! 0%!
Southeast! 0%!
Children(Needing(Mental(Health(Services(
0%!
25%!
50%!
75%!
100%!
Percent!
Northwest! 62%!
Northeast! 52%!
Northeast!
Central!64%!
East!Central! 59%!
Central! 57%!
West!Central! 71%!
Southwest! 61%!
Southeast! 63%!
Percent(of(Children(Needing(Mental(Health(Services(Who(Have(Long:Term(
Mental(Health(Problem(
0%!
5%!
10%!
15%!
20%!
Percent!
Northwest! 9%!
Northeast! 12%!
Northeast!
Central!13%!
East!Central! 11%!
Central! 11%!
West!Central! 13%!
Southwest! 11%!
Southeast! 16%!
Children(Needing(Mental(Health(Services(

Detailed(Data(Appendix( ( (
Mahoning(County(–(Children(! ! B18!
“Percent! of! Children! Needing! Mental! Health! Services! Who! Have! LongOTerm! Mental! Health!Problem”! is! the! percent! of! children! needing!mental! health! services!whose! parents! reported!that! their! children!had!an!emotional,! developmental,! or!behavioral! problem! that! lasted!or! is!expected!to!last!12!months!or!longer.!!The!most!recent!data!(2012)!in!Ohio!were!analyzed!using!the!2012!Ohio!Medicaid!Assessment!Survey.!!!What'puts'kids'at'risk?'There!are!many!“warning!signs”!of!mental!health! issues! in!children.! !They! include!harming!or!threatening!themselves,!others,!or!pets;!damaging!or!destroying!property;!lying!or!stealing;!not!doing!well! or! skipping! school;! smoking! tobacco,! drinking! alcohol,! or! using! illegal! drugs;! early!sexual!activity;!and!hostility!toward!authority!figures!(MedlinePlus,!2013b).!!!!)!!!!

Detailed(Data(Appendix( ( (
Mahoning(County(–(Children(! ! B19!
Substance(Abuse(!Substance!abuse! refers! to! a! set!of! conditions! associated!with! the! consumption!of!mindO! and!behaviorOaltering! substances! that! have! negative! behavioral! and! health! outcomes! (Healthy!People!2020).! !Some!of!the!substances!abused!are! legal,!such!as!alcohol! for!adults;!some!are!illegal,!such!as!heroin;!and!some!are!legal!but!illegally!used,!such!as!the!misuse!of!prescription!drugs!by!people!not!prescribed!them.!!!!The!substance!abuse!issues!identified!as!prioritized!health!needs!among!Mahoning(County(Children!are:!
• Opioid!Drug!Abuse!!!Opioid'Drug'Abuse'!Why'is'this'indicator'important?'Opioids! are! a! family! of! medications! derived! from! the! opium! poppy,! including! Vicodin,!morphine,!heroin,!and!codeine.!!Opioid!drugs!are!designed!to!diminish!the!transmission!of!pain!signals!throughout!the!body,!and!are!commonly!utilized!to!combat!both!acute!and!chronic!pain!of! moderate! and! severe! intensity.! While! opioids! have! proven! therapeutically! useful,! the!beneficial! effects! of! opioid! use,! including! pain! reduction! and! euphoria,! have! made! them!appealing! recreational! drugs.! In! 2008,! two! of! the! most! frequently! abused! opioid! drugs,!hydrocode!and!oxycodone,!resulted! in!89,047!and!105,208!hospitalizations,!respectively!(NIH,!2009).!!By!race,!the!ageOadjusted!opioid!overdose!death!rates!are!highest!among!nonOHispanic!whites!(6.3)!and!American!Indian/Alaska!Natives!(6.2),!with!Hispanics!and!blacks!being!among!the!lowest!(2.1!and!1.9,!respectively)!(CDC,!2011f).!!How'does'our'community'rank?'At! the! time! of! publication,! epidemiologic! data! were! not! available! on! the! actual! rates! of!childhood! or! adolescent! opioid! drug! abuse! to! be! able! to! determine! how!Mahoning! County!ranks!relative!to!its!peer!counties,!the!state,!and!the!US.! !However,!opioid!drug!abuse!among!children! and! especially! adolescents! was! repeatedly! cited! by! many! community! leaders! and!community!residents!as!a!significant!public!health!problem!in!the!community.!!!!What'are'the'data'sources?'Input!from!community!residents!and!community! leaders!were!obtained!through!focus!groups!and!interviews,!respectively.!!What'puts'kids'at'risk?'Young!adults!aged!18—25!have!the!highest!rate!of!current!use!of!illicit!drugs!of!any!age!group,!while! both!males! and! females! have! similar! rates! of! using! opioid! drugs.! The! risk! of! overdose!from!opioid!drugs!is!higher,!however,!for!males,!and!for!middleOaged!individuals!(CDC,!2010a).!!

Detailed(Data(Appendix( ( (
Mahoning(County(–(Children(! ! B20!
Sexually(Transmitted(Diseases(!Sexually! transmitted!diseases! (STDs)! refer! to! the!more! than!25! infectious!organisms! that! are!transmitted! primarily! through! sexual! activity! (Healthy! People! 2020).! While! STDs! are! largely!preventable,!they!continue!to!remain!a!significant!public!health!problem.!Among!the!significant!burden! they!place!on!physical!health! for! the! individual,! they!may!also! result! in! costly! clinical!complications.!!!!The!sexually!transmitted!diseases!identified!as!prioritized!health!needs!among!Mahoning(County(Children!are:!
• Adolescent!gonorrhea!!Adolescent'Gonorrhea'!Why'is'this'indicator'important?'According!to!the!CDC,!there!are!approximately!19!million!new!sexually! transmitted! infections!each!year!and!almost!half!of!them!occur!among!adolescents!aged!15!to!24!years!(CDC,!2012).!Gonorrhea! is! considered! a! very! common! STD! and! any! sexually! active! teenager! may! be!considered! atOrisk! for! contracting! it.! Individuals!who! are! treated! for! gonorrhea!may! become!infected!again! if! they!engage! in!sexual!activity!with!an! infected!person.!Untreated!gonorrhea!may!result!in!significant!health!problems,!including!infertility.
!How'does'our'community'rank?'In!Mahoning!County,!the!rate!of!adolescent!gonorrhea!was! 222!per! 100,000! individuals! under! age! 20,!which!was!higher!than!the!Ohio!rate.!In!comparison!with!two!peerOmatched!counties,!Mahoning!County!had!a!higher!rate!of!adolescent!gonorrhea!than!either!peer!county.!!What'are'the'data'sources?'“Adolescent! Gonorrhea”! is! the! number! of! gonorrhea!cases!for!individuals!below!age!20!per!100,000!in!2011.!The! most! recent! data! is! reported! from! the! Ohio!Department! of! Health’s! State! Epidemiological!Outcomes!Workgroup.!!
What'puts'kids'at'risk?'Adolescents!who!engage!in!unprotected!sex!and/or!are!not!familiar!with!their!partners’!sexual!history! can! be! considered! atOrisk.! Certain! racial! and! ethnic! minority! groups! (mainly! African!Americans,! Hispanics,! and! American! Indian/Alaska! Natives)! often! have! higher! rates! of! STDS,!compared! to!whites.! Individuals!who! engage! in! highOrisk! sexual! behaviors,! who! abuse! drugs!and/or!alcohol,!or!who!do!not!communicate!their!sexual!history!with!their!partners!can!also!be!considered!atOrisk.( (
50!
100!
150!
200!
250!
Rate!per!100,000!child!populahon!
Mahoning! 222!
Lucas! 196!
Lorain! 96!
Ohio! 167!
Adolescent(Gonorrhea(

Detailed(Data(Appendix( ( (
Mahoning(County(–(Children(! ! B21!
Access(to(Health(Care(!Access! to! health! care! is! a! broad! term! used! to! describe! the! availability,! acceptability,!affordability,!and!accessibility!of!health!care! systems!and!providers.! ! Lack!of!access! to!health!care!makes!it!difficult!for!people!to!get!the!health!care!they!need,!which!can!cause!premature!disability!and!death.! ! !Among!kids,! lack!of!access!to!health!care!means!that!children!can’t!get!the!immunizations!and!screenings!they!need,!which!can!increase!their!risk!for!disease!and!poor!development.!!The!health! care! accessOrelated! issues! identified! as! prioritized!health!needs! among!Mahoning(County(Children!are:!
• Health!Insurance!Coverage!• Access!to!Dental!Care!• Mental!Health!Insurance!Coverage!• Number!of!Pediatric!Specialists!
!!Health'Insurance'Coverage'!Why'is'this'indicator'important?'Having! adequate! health! insurance! to! help! cover! the! costs! associated! with! health! care! is! an!important!component!to!increasing!health!care!access.!!Without!it,!some!people!don’t!get!the!health!care! they!need,!which!can!cause!premature!disability!and!death.! !Additionally,! lack!of!adequate! health! insurance! sometimes! causes! health! problems! to! become! worse! and! more!costly!than!if!they!were!prevented!or!treated!earlier.!!Uninsured!children!are!10!times!more!likely!than!insured!children!to!have!unmet!medical!needs!and!are!5!times!more!likely!to!go!more!than!2!years!without!seeing!a!doctor!(Children’s!Defense!Fund,!2010b).
!!!How'does'our'community'rank?'In! Mahoning! County,! 2.2%! of! the! child! population!was! reported! as! having! no! health! insurance,! which!was! lower!than!both!the!Ohio!and!national!rates.! In!comparison! with! two! peerOmatched! counties,!Mahoning! County! had! lower! percentage! of!uninsured!children!than!either!peer!county.!
!!!!
0.0%!
5.0%!
10.0%!
Percent!of!child!populahon!Mahoning! 2.2%!
Lucas! 4.1%!
Lorain! 3.7%!
Ohio! 4.0%!
U.S.! 10.0%!
Uninsured(Children(

Detailed(Data(Appendix( ( (
Mahoning(County(–(Children(! ! B22!
!
!
!
In!Mahoning!County,!44.3%!of!the!child!population!
was! enrolled! in! Medicaid,! which! was! lower! than!
the!Ohio!percentage.!In!comparison!with!two!peerO
matched! counties,!Mahoning! County! had! a! lower!
percentage! of! children! enrolled! in! Medicaid! than!
Lucas!County,!but!a!higher!percentage!than!Lorain!
County.!
!
!
!
!
!
!
!
!
!
!
In!Mahoning!County,!4.7%!of!the!child!population!was!
reported! as! not! having! prescription! drug! insurance!
coverage,! which! was! lower! than! the! Ohio! rate.! In!
comparison! with! two! peerOmatched! counties,!
Mahoning! County! had! lower! percentage! of! children!
without! prescription! drug! coverage! than! either! peer!
county.!
!
!
!
!
What'are'the'data'sources?'“Uninsured!Children”! is!an!estimate!of! the!percentage!of!children!under!age!18! (excluding!1O
year!olds)!without!health! insurance.! ! The!most! recent! countyO! and!nationalOlevel!data! (2008)!
were! collected! from! the! Children’s! Defense! Fund! and! reported! on! the! Annie! E! Casey!
Foundation!web!site.!
!
“Children! Enrolled! in! Medicaid”! is! the! percentage! of! children! under! age! 18! enrolled! in!
Medicaid.! ! The!most! recent! countyO! and! nationalOlevel! data! (2009)! were! collected! from! the!
Ohio!Department!of!Job!and!Family!Services!County!Profiles!on!their!web!site!and!compared!to!
the!2009!child!population!calculated!by!the!US!Census.!
!
!
!
20.0%!
30.0%!
40.0%!
50.0%!
Percent!of!child!populahon!
Mahoning! 44.3%!
Lucas! 55.3%!
Lorain! 41.8%!
Ohio! 44.6%!
Children(Enrolled(in(Medicaid(
4.0%!
5.0%!
6.0%!
7.0%!
Percent!of!child!populahon!
Mahoning! 4.7%!
Lucas! 6.7%!
Lorain! 5.6%!
Ohio! 6.9%!
Children(without(Prescrip;on(Coverage(

Detailed(Data(Appendix( ( (
Mahoning(County(–(Children(! ! B23!
“Children!without! Prescription! Coverage”! is! an! estimate! of! the! percentage! of! children! under!age! 18! (excluding! 1Oyear! olds)! without! insurance! for! prescription! drugs.! ! The! most! recent!countyO! and! nationalOlevel! data! (2008)!were! collected! from! the! Children’s!Defense! Fund! and!reported!on!the!Annie!E!Casey!Foundation!web!site.!!!What'puts'kids'at'risk?'Most! adults! (60.3%)! have! health! insurance! through! private! providers! (such! as! Anthem! Blue!Cross!and!Blue!Shield,!Medical!Mutual!of!Ohio,!etc.)!and!usually!get!it!through!their!employers!(CDC,! 2012d).! ! These! policies! almost! always! offer! plan! options! that! include! coverage! for! the!entire! family! ! (including!children).! !Children!from!unemployed!or! lowOincome!families!can!get!health!insurance!through!their!state’s!Medicaid!program!even!when!their!parents!don’t!qualify!themselves.!!!!( (

Detailed(Data(Appendix( ( (
Mahoning(County(–(Children(! ! B24!
Access'to'Dental'Care'!Why'is'this'indicator'important?'Among!children,!dental!caries!are!considered!the!most!common!childhood!chronic!disease!and!research!has!shown!that!dental!care!is!the!most!prevalent!unmet!health!need!among!children!in!the!US!(Mouradian,!Wehr,!&!Crall,!2000).!An!estimated!16.5!million!children!go!without!basic!dental! care! each! year! (Pew! Foundation,! 2011).! Periodontal! disease! has! also! been! linked! to!adverse! pregnancy! outcomes,! diabetes,! cardiovascular! disease,! and! respiratory! disease.!Routine!dental!examinations!and!practicing!good!oral!hygiene!are!important!components!of!an!overall!healthy!lifestyle,!as!well!as!a!good!preventive!measure!to!protect!your!personal!health!and!wellObeing!(CDC,!2009a).!!While!many!children!may!have!access!to!dental!coverage!through!private!insurance!or!Medicaid,!this!does!not!necessarily!translate!into!actual!care.!!
!''How'does'our'community'rank?'In!Mahoning!County,!73.1%!of!the!child!population!was!reported!as!having!a!dental!visit! in! the!previous!year,!which!was!higher!than!the!Ohio!and!the!national!rates.!!Moreover,! the!Mahoning! County! rate! is!much! higher!than!the!Healthy)People)2020)target!rate!of!49.0%.!!In!comparison! with! two! peerOmatched! counties,!Mahoning!County!had!a! lower!percentage!of! children!having!a!dental!visit!than!either!peer!county.!)!!!!!!
!In!Mahoning!County,!22.2%!of!3rd!grade!children!were! reported!as!having!untreated! tooth!decay,!which!was! higher! than! the!Ohio! rate,! but! lower!than!the!national!rate.!!Moreover,!the!Mahoning!County! rate! is! lower! than! the! Healthy) People)2020) target! rate! of! 26.0%.! ! In! comparison! with!two! peerOmatched! counties,! Mahoning! County!had! a! higher! percentage! of! children! with!untreated! tooth! decay! than! both! Lucas! and!Lorain!Counties.!!
!
30.0%!40.0%!50.0%!60.0%!70.0%!80.0%!
Percent!of!child!populahon!Mahoning! 73.1%!
Lucas! 79.5%!
Lorain! 81.9%!
Ohio! 69.6%!
!!U.S.! 44.5%!
HP2020! 49.0%!
Dental(Visit(in(Last(Year(
0.0%!
10.0%!
20.0%!
30.0%!
Percent!of!3rd!grade!children!Mahoning! 22.2%!
Lucas! 6.3%!
Lorain! 13.8%!
Ohio! 18.7%!
U.S.! 28.8%!
HP2020! 26.0%!
Untreated(Tooth(Decay(

Detailed(Data(Appendix( ( (
Mahoning(County(–(Children(! ! B25!
!!!In!Mahoning!County,!55.1%!of!3rd!grade!children!were!reported!as!having!one!or!more!dental!sealants,!which!was! higher! than! both! the! Ohio! and! national! rates.!!Moreover,! the!Mahoning! County! rate! is!much! higher!than!the!Healthy)People)2020)target!rate!of!28.0%.!!In!comparison! with! two! peerOmatched! counties,!Mahoning!County!had!a!higher!percentage!of!children!having! one! or! more! dental! sealants! than! Lorain!County,! but! a! slightly! lower! percentage! than! Lucas!County.!!
!!!!!
!!In!Mahoning!County,!12.5%!of!3rd!grade!children!were!reported!as!having!a!toothache,!which!was!higher! than! the! Ohio! rate.! In! comparison! with!two! peerOmatched! counties,! Mahoning! County!had! higher! percentage! of! children! having! a!toothache! than! Lucas! County! and! a! lower!percentage!than!Lorain!County.!
!!
!!!!!In!Mahoning!County,!10.5%!of!the!child!population!was!reported!as!never!having! visited!a!dentist,!which!was!lower! than! the! Ohio! rate.! In! comparison! with! two!peerOmatched!counties,!Mahoning!County!had!a!lower!percentage! of! children! never! having! visited! a! dentist!than!either!peer!county.!!!!!!
20.0%!32.0%!44.0%!56.0%!68.0%!
Percent!of!3rd!grade!children!Mahoning! 55.1%!
Lucas! 55.5%!
Lorain! 48.5%!
Ohio! 50.4%!
U.S.! 32.0%!
HP2020! 28.0%!
One(or(More(Dental(Sealants(
5.0%!7.0%!9.0%!11.0%!13.0%!15.0%!17.0%!19.0%!
Percent!of!3rd!grade!children!
Mahoning! 12.5%!
Lucas! 9.2%!
Lorain! 14.4%!
Ohio! 11.4%!
Toothache(
0.0%!
5.0%!
10.0%!
15.0%!
Percent!of!child!populahon!Mahoning! 10.5%!
Lucas! 14.3%!
Lorain! 12.4%!
Ohio! 14.6%!
Never(Visited(a(Den;st(
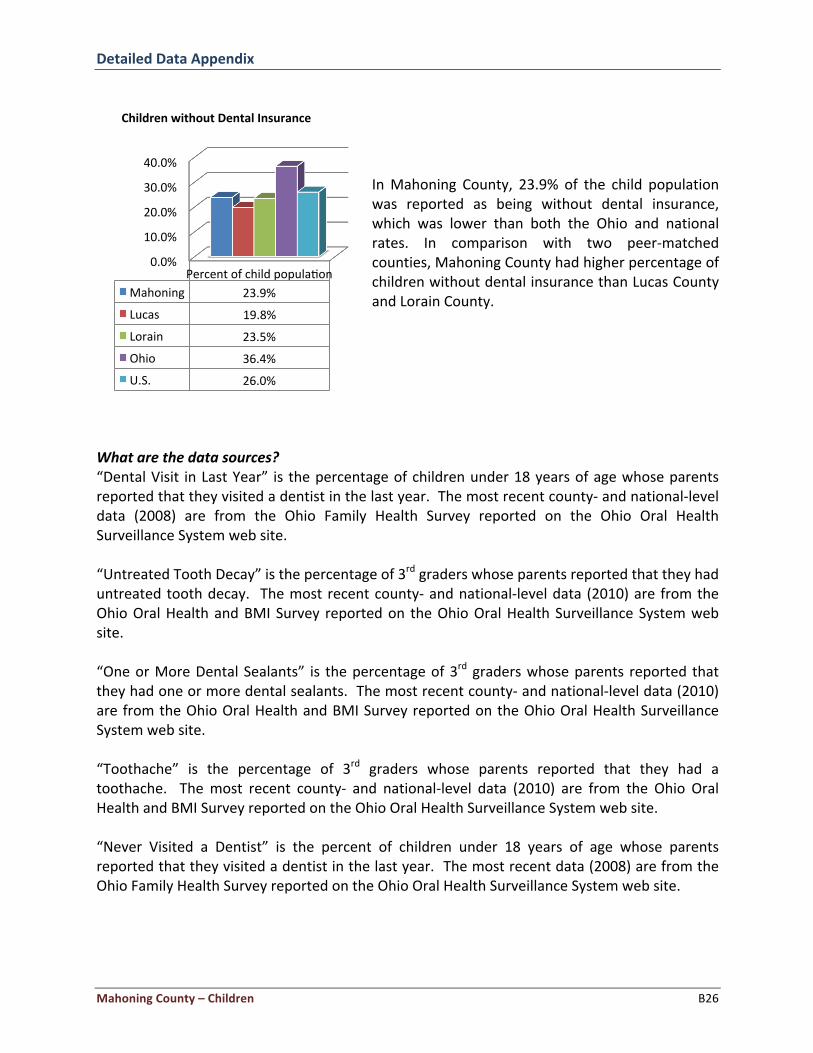
Detailed(Data(Appendix( ( (
Mahoning(County(–(Children(! ! B26!
!!!!In!Mahoning! County,! 23.9%! of! the! child! population!was! reported! as! being! without! dental! insurance,!which! was! lower! than! both! the! Ohio! and! national!rates.! In! comparison! with! two! peerOmatched!counties,!Mahoning!County!had!higher!percentage!of!children!without!dental!insurance!than!Lucas!County!and!Lorain!County.!!!!!!!!!
What'are'the'data'sources?'“Dental!Visit! in!Last!Year”! is! the!percentage!of!children!under!18!years!of!age!whose!parents!reported!that!they!visited!a!dentist!in!the!last!year.!!The!most!recent!countyO!and!nationalOlevel!data! (2008)! are! from! the! Ohio! Family! Health! Survey! reported! on! the! Ohio! Oral! Health!Surveillance!System!web!site.!!“Untreated!Tooth!Decay”!is!the!percentage!of!3rd!graders!whose!parents!reported!that!they!had!untreated!tooth!decay.! !The!most! recent!countyO!and!nationalOlevel!data! (2010)!are! from!the!Ohio!Oral!Health!and!BMI!Survey! reported!on! the!Ohio!Oral!Health!Surveillance!System!web!site.!!“One!or!More!Dental!Sealants”! is! the!percentage!of!3rd!graders!whose!parents! reported! that!they!had!one!or!more!dental!sealants.!!The!most!recent!countyO!and!nationalOlevel!data!(2010)!are!from!the!Ohio!Oral!Health!and!BMI!Survey!reported!on!the!Ohio!Oral!Health!Surveillance!System!web!site.!!“Toothache”! is! the! percentage! of! 3rd! graders! whose! parents! reported! that! they! had! a!toothache.! ! The!most! recent! countyO! and! nationalOlevel! data! (2010)! are! from! the! Ohio! Oral!Health!and!BMI!Survey!reported!on!the!Ohio!Oral!Health!Surveillance!System!web!site.!!“Never! Visited! a! Dentist”! is! the! percent! of! children! under! 18! years! of! age! whose! parents!reported!that!they!visited!a!dentist!in!the!last!year.!!The!most!recent!data!(2008)!are!from!the!Ohio!Family!Health!Survey!reported!on!the!Ohio!Oral!Health!Surveillance!System!web!site.!!!!
0.0%!
10.0%!
20.0%!
30.0%!
40.0%!
Percent!of!child!populahon!
Mahoning! 23.9%!
Lucas! 19.8%!
Lorain! 23.5%!
Ohio! 36.4%!
U.S.! 26.0%!
Children(without(Dental(Insurance(

Detailed(Data(Appendix( ( (
Mahoning(County(–(Children(! ! B27!
“Children!without!Dental! Insurance”! is! the! percent! of! children! under! 18! years! of! age!whose!parents! reported! that! they! did! not! have! dental! insurance! coverage.! ! The! most! recent! data!(2008)!are!from!the!Ohio!Family!Health!Survey!reported!on!the!Ohio!Oral!Health!Surveillance!System!web!site.!!!What'puts'kids'at'risk?'Children! from! low! income! and! minority! families! are! more! likely! to! report! poor! oral! health!outcomes,! fewer!dental! visits,! and! less! usage!of! protective!dental! sealants! (Pew!Foundation,!2011).!!Additionally,!children!that!do!not!receive!regular!preventative!care!and!do!not!properly!clean!their!teeth!are!also!more!likely!to!experience!poor!dental!health.!!)' '

Detailed(Data(Appendix( ( (
Mahoning(County(–(Children(! ! B28!
Mental'Health'Insurance'Coverage'!Why'is'this'indicator'important?'According!to!national!estimates,!the!percentage!of!children!across!the!country!who!suffer!from!a! serious!mental!health!problem! ranges! from!5! to!26%! (Health!Affairs,! 2013).! It! is! estimated!that! countless! other! children! and! adolescents! confront! social! and! emotional! challenges! that,!while! they!may!not!be!considered!“serious”!or!diagnosable,! significantly! impact! their!optimal!development.! Central! to! ensuring! children! and! adolescents! receive! the! help! they! need! to!adequately!address!social,!emotional,!and!psychological!disturbances! is!appropriate!access! to!mental!health!services.!Currently,!more!than!1!in!10!adolescents’!lacks!mental!health!insurance!and!for!those!that!are!covered,!mental!health!services!within!their!community!are!often!limited!(Knopf,!Park,!&!Mulye,!2008).!According!to!the!“National!Voices!Project”!(2013),!a!joint!national!survey! by! the! University! of! Michigan! and! the!W.K.! Kellogg! Foundation,! only! 30%! of! survey!respondents!reported!significant!availability!of!mental!health!services!in!their!community.!!Such!lack,! including! limited! access! to! mental! health! insurance,! negatively! impacts! the! ability! to!deliver!needed!services!to!children!and!adolescents!who!are!at!risk.!!
!How'does'our'community'rank?'In!Mahoning!County,! 7.7%!of! the! child!population!was! reported! as! being! without! mental! health!insurance,! which! was! lower! than! the! Ohio!percentage.!In!comparison!with!two!peerOmatched!counties,!Mahoning!County!had!a!lower!percentage!of!children!without!mental!health!insurance.!!!What'are'the'data'sources?'“Children! without!Mental! Health! Insurance”! is! an!estimate! of! the! percentage! of! children! under! age!18! (excluding! 1Oyear! olds)! without! mental! health!insurance.! ! The!most! recent! countyO! and!nationalOlevel! data! (2008)! were! collected! from! the!Children’s!Defense!Fund!and!reported!on!the!Annie!E!Casey!Foundation!web!site.!
!What'puts'kids'at'risk?'Currently,! less! than! one! quarter! of! the! adolescents! who! need! mental! health! care! services!receive! treatment! (Knopf,! Park,! &! Mulye,! 2008).! Among! children! whose! parents! lack!appropriate!insurance,!their!risk!of!being!uninsured!themselves!increases!substantially.!It!is!also!estimated!that!among!adolescents!who!are!homeless,!served!within!a!state’s!child!welfare!or!juvenile!justice!systems,!or!are!lesbian,!gay,!bisexual,!or!transgender,!they!are!often!least!likely!to!receive!mental!health!services!(National!Institute!for!Healthcare!Management,!2009).!!
0.0%!
5.0%!
10.0%!
15.0%!
Percent!of!child!populahon!Mahoning! 7.7%!
Lucas! 10.5%!
Lorain! 9.2%!
Ohio! 10.4%!
Children(without(Mental(Health(Insurance(

Detailed(Data(Appendix( ( (
Mahoning(County(–(Children(! ! B29!
Number'of'Pediatric'Specialists'
Why'is'this'indicator'important?'In! a! survey! conducted! by! the! National! Association! of! Children’s! Hospitals! and! Related!Institutions!(NACHRI)!(2010),!it!was!determined!that!shortages!in!pediatric!subspecialities,!such!as! neurology,! developmentalObehavioral!medicine,! general! surgery,! pulmonology,! and! others!are!negatively!impacting!patient!care.!It!was!estimated!that!among!children!who!were!in!need!of!specialty!care,!many!waited!for!nearly!10!weeks!to!see!a!pediatric!endocrinologist!and!nearly!9!weeks!to!see!a!pediatric!neurologist! in! their!communities.!A! lack!of!pediatric!specialty!care!may! result! in! families! needing! to! travel! long! distances! to! receive! the! necessary! care,! or!choosing!to!forgo!the!care!entirely.!!!How'does'our'community'rank?'At! the! time! of! publication,! epidemiologic! data! were! not! available! on! the! actual! number! of!pediatric! specialists! in! a! given! area! to! be! able! to! determine! how! Mahoning! County! ranks!relative!to!its!peer!counties,!the!state,!and!the!US.!!However,!a!lack!of!pediatric!specialists!was!cited!by!community!leaders!and!community!residents!as!a!significant!public!health!problem!in!the!community.!!!!!What'are'the'data'sources?'Input!from!community!residents!and!community! leaders!were!obtained!through!focus!groups!and!interviews,!respectively.!!!What'puts'kids'at'risk?'Children!who! live! in! areas!with! limited! access! to!healthcare!providers!may!be!more! likely! to!experience! a! lack! of! pediatric! specialists! in! their! communities,! though! the! problem!may! be!universally!spread,!regardless!of!access.!!!!))!!! !

Detailed(Data(Appendix( ( (
Mahoning(County(–(Children(! ! B30!
Environmental(Factors(!Environmental!risk!factors!are!a!broad!category!of!external!conditions!that!can!negatively!affect!health! outcomes.! ! These! include! air! and! water! quality,! presence! of! toxic! substances,! public!health! infrastructure,! and! community! assets! and! deficits.! ! They! are! especially! important! for!children,!since!they!can!have!a!lasting!impact!on!healthy!physical!and!mental!development.!!The! environmental! factor! identified! as! prioritized! health! need! among! Mahoning( County(Children!is:!
• Access!to!Healthy!Food!!!Access'to'Healthy'Food'!Why'is'this'indicator'important?'For! children,! a! lack! of! access! to! healthy! foods! contributes! significantly! to! weightOrelated!complications!and!diseases.!Diminished!access! to!and!consumption!of!healthy! foods!has!also!been! shown! to! negatively! impact! school! performance! and! cognitive! development! among!children!(Let’s!Move!,!n.d.).!Hunger!among!children!is!also!of!immediate!concern,!where!it!was!estimated!by!the!USDA!that!49.1!million!people,!including!16.7!million!children,!lived!in!homes!that!experienced!food!insecurity!at!multiple!times!throughout!the!year!(USDA,!n.d).!The!USDA!also!estimates!that!23.5!million!people,!including!6.5!million!children,!live!in!lowOincome!areas!that!are!more!than!a!mile!from!a!supermarket.!!
!!'How'does'our'community'rank?'In!Mahoning! County,! the! density! of!WICOauthorized!food!stores!was!13.07!stores!per!100,000!population,!which! was! lower! than! both! the! Ohio! and! national!rates.! In! comparison! with! two! peerOmatched!counties,!Mahoning!County!had!a!higher!rate!of!WICOauthorized! stores! than! Lucas! County,! but! a! lower!rate!than!Lorain.!!
!
0!
5!
10!
15!
20!
Stores!per!100,000!populahon!Mahoning! 13.07!
Lucas! 12.5!
Lorain! 16.91!
Ohio! 15.4!
U.S.! 15.6!
WIC(Authorized(Food(Store(Access(

Detailed(Data(Appendix( ( (
Mahoning(County(–(Children(! ! B31!
!In! Mahoning! County,! 38.2%! of! children! were!reported!as!being!food!insecure,!which!was!higher!than!both!the!Ohio!and!national!rates.! !Moreover,!Mahoning! County! failed! to! meet! the! Healthy)People) 2020! target! of! 0.2%.! In! comparison! with!two!peerOmatched!counties,!the!Mahoning!County!percentage! of! food! insecure! children! was! higher!than!Lucas!County,!but!lower!than!Lorain!County.!!
!!
!!!
!!!!!In! Mahoning! County,! 32.3%! of! the! population! was!designated! as! living! in! a! food! desert,! which! was!higher! than! both! the! Ohio! and! national! rates.! In!comparison! with! two! peerOmatched! counties,! the!percentage!of! the!population! living! in!a! food!desert!in!Mahoning! County!was! higher! than! Lucas! County,!but!slightly!lower!than!Lorain!County.!!
!!!
!!In!Mahoning!County,!60%!of! the!zip!codes!had!an!outlet!with!healthy!food,!which!was!lower!than!the!Ohio! rate.! In! comparison! with! two! peerOmatched!counties,! the! percentage! of! zip! codes!with! access!to! healthy! foods! in! Mahoning! County! rate! was!lower!than!both!peer!counties.!!!!
0.0%!
10.0%!
20.0%!
30.0%!
40.0%!
Percent!of!child!populahon!Mahoning! 38.2%!
Lucas! 36.8%!
Lorain! 39.2%!
Ohio! 23.0%!
U.S.! 1.3%!
HP2020! 0.2%!
Food(Insecure(Children(
0.0%!
10.0%!
20.0%!
30.0%!
40.0%!
Percent!of!populahon!Mahoning! 32.3%!
Lucas! 15.9%!
Lorain! 32.8%!
Ohio! 8.3%!
!U.S.! 9.1%!
Popula;ons(Living(in(Food(Deserts(
0%!20%!40%!60%!80%!
100%!
Percent!of!zip!codes!with!outlet!
Mahoning! 60%!
Lucas! 84%!
Lorain! 76%!
Ohio! 64%!
Access(to(Healthy(Foods(

Detailed(Data(Appendix( ( (
Mahoning(County(–(Children(! ! B32!
!!!!In!Mahoning!County,!13%!of!poor!populations!were!designated!as!having! limited!access!to!healthy!food,!which! was! higher! than! both! the! Ohio! rate.! In!comparison! with! two! peerOmatched! counties,! the!percentage! of! poor! populations! with! no! access! to!healthy! food! in! Mahoning! County! was! higher! than!both!Lucas!and!Lorain!Counties.!!!!!!!!
What'are'the'data'sources?'“WIC! Authorized! Food! Store! Access”! is! the! number! of! food! stores! and! other! retail!establishments! per! 100,000! population! that! are! authorized! to! accept! WIC! Program! (Special!Supplemental! Nutrition! Program! for! Women,! Infants,! and! Children)! benefits! and! that! carry!designated!WIC! foods! and! food! categories.! ! The!most! recent! countyO! and!nationalOlevel! data!(2011)! were! acquired! from! the! United! States! Department! of! Agriculture! (USDA)! Food!Environmental! Atlas! (FEA)! and! were! reported! on! the! Community! Health! Needs! Assessment!toolkit!on!the!Community!Commons!web!site.!!“Food! Insecure! Children”! is! the! percentage! of! the! child! population! living! in! households!experiencing!food!insecurity.!!Food!insecurity!refers!to!the!USDA’s!measure!of!lack!of!access,!at!times,! to! enough! food! for! active,! healthy! life! for! all! household! members! and! limited! or!uncertain!availability!of!nutritionally! adequate! foods.! ! The!most! recent! countyO! and!nationalOlevel! data! (2010)! were! taken! from! the! Feeding! America’s! Map! to! Meal! Gap! Project! and!reported!on!the!Annie!E!Casey!Foundation!web!site.!!“Population!Living! in!Food!Deserts”! is!the!percentage!of!the!population! living! in!census!tracts!designated!as!food!deserts,!which!are!lowOincome!census!tracts!where!a!substantial!number!or!share!of! residents! has! low!access! to! a! supermarket! or! large! grocery! store.! ! The!most! recent!countyO! and! nationalOlevel! data! (2010)!were! acquired! from! the!United! States!Department! of!Agriculture! (USDA)! Food! Environmental! Atlas! (FEA)! and! were! reported! on! the! Community!Health!Needs!Assessment!toolkit!on!the!Community!Commons!web!site.!!“Access! to!Healthy! Foods”! is! the!percent!of! ZIP! codes!with! a!healthy! food!outlet.! ! The!most!recent! countyO! and!nationalOlevel! data! (2012)!were! taken! from! the!County!Business! Patterns!database!from!the!US!Census!Bureau!and!reported!on!the!County!Health!Rankings!web!site.!
0%!
5%!
10%!
15%!
Percent!of!poor!populahon!Mahoning! 13%!
Lucas! 5%!
Lorain! 9%!
Ohio! 7%!
Limited(Access(to(Healthy(Food(

Detailed(Data(Appendix( ( (
Mahoning(County(–(Children(! ! B33!
“Limited!Access!to!Healthy!Food”!is!the!percent!of!the!population!who!are!lowOincome!and!do!not!live!close!to!a!grocery!store.!!The!most!recent!countyO!and!nationalOlevel!data!(2012)!were!acquired! from!the!United!States!Department!of!Agriculture! (USDA)!Food!Environmental!Atlas!(FEA)!and!were!reported!on!the!County!Health!Rankings!web!site.!!!What'puts'kids'at'risk?'Children! living! in! lowOincome! urban! and! rural! communities! are!most! at! risk! for! experiencing!diminished! access! to! healthy! foods! (White! House! Task! Force! on! Childhood! Obesity,! 2010).!Families!who! report! times!of! food! insecurity! at!multiple! points! throughout! the! year! are! also!significantly!less!likely!to!have!regular!and!stable!access!to!nutritious!foods.!!

Detailed(Data(Appendix( ( (
Columbiana(County(–(Children(! ! C1!
Columbiana(County(Children)
Chronic(Diseases(!Chronic!diseases!are!a! type!of!disease!where! the!person! can! live!with! the!disease! for! a! long!time,!sometimes!indefinitely.!!People!with!chronic!diseases!usually!need!to!see!their!doctors!on!a! regular! basis! to!monitor! the! progression! of! their! disease! and! get! treatment.! ! As! a! nation,!about! 75%! of! our! total! health! care! dollars! goes! to! the! treatment! of! chronic! diseases.!!Fortunately,!some!chronic!diseases!are!preventable.!!The!chronic!diseases!identified!as!prioritized!health!needs!among!Columbiana(County(Children!are:!
• Asthma!• Diabetes!
!!Asthma'!Why'is'this'indicator'important?'Asthma!is!a!disease!that!affects!the!lungs.!When!irritants!such!as!smoke!and!air!pollution!are!inhaled!by!a!person!with!asthma,! the! lining!of! the! respiratory! system!may!become! inflamed,!leading!to!wheezing,!chest! tightness,!coughing,!and!even!difficulty!breathing.! Individuals!with!asthma! must! take! specific! medicines! to! avoid! this! inflammation! (also! known! as! an! asthma!attack),!and!must!avoid!triggers,!which!make!asthma!worse!(CDC,!2012e).!Asthma!is!one!of!the!most! common! chronic! diseases! among! children,! with! one! in! every! eleven! children! affected!(CDC,! 2012f).! ! It! is! more! common! among! the! multiracial,! Puerto! Rican! Hispanics,! and! nonNHispanic!blacks!than!among!nonNHispanic!whites!(CDC,!2011e).!
''''How'does'our'community'rank?'In! Columbiana! County,! 0.5%!of! days!were! designated!as! exceeding! National! Ambient! Air! Quality! Standards!for! particulate! matter,! which! is! lower! than! both! the!Ohio! rate! and! the! national! rate.! In! comparison! with!two! peerNmatched! counties,! the! percentage! of! days!exceeding!air!quality! standards! in!Columbiana!County!was! lower! than! both! Trumbull! County! and! Clark!County.!!)!
0.0%!
0.5%!
1.0%!
1.5%!
Percent!of!days!Columbiana! 0.5%!
Trumbull! 0.7%!
Clark! 0.8%!
Ohio! 0.7%!
U.S.! 1.2%!
Poor(Air(Quality:(Par;culate(Ma=er(
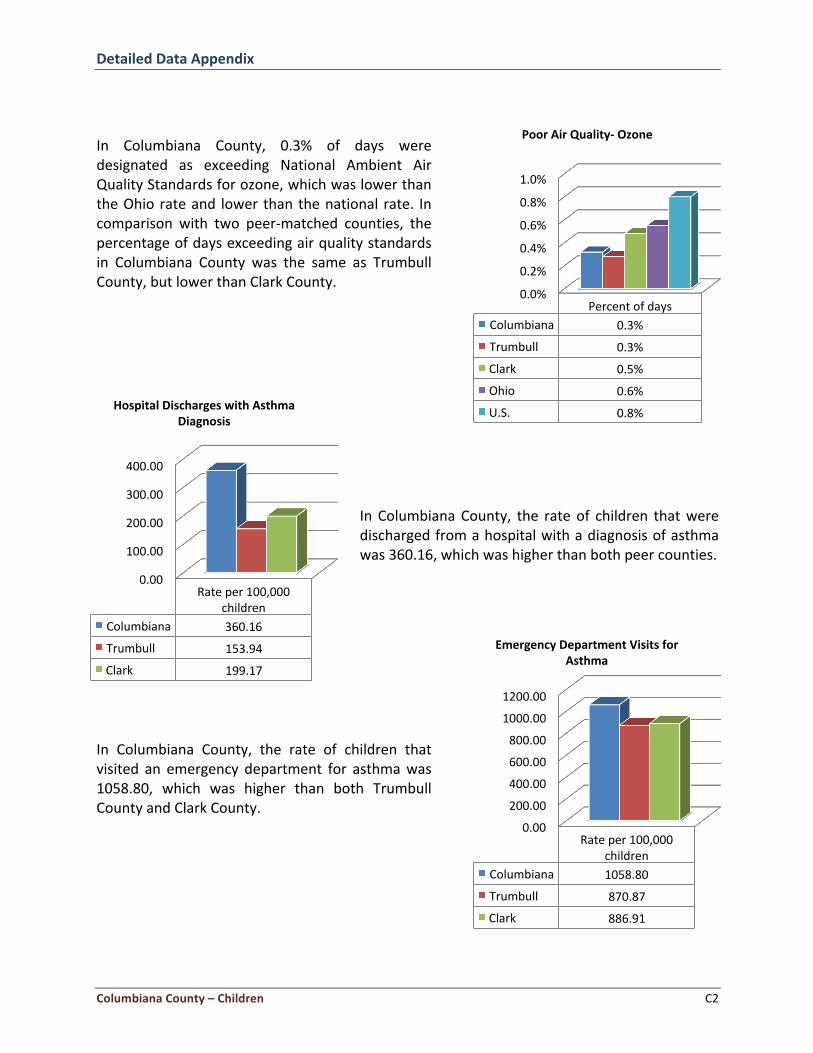
Detailed(Data(Appendix( ( (
Columbiana(County(–(Children(! ! C2!
!!In! Columbiana! County,! 0.3%! of! days! were!designated! as! exceeding! National! Ambient! Air!Quality!Standards!for!ozone,!which!was!lower!than!the!Ohio!rate!and! lower! than!the!national! rate.! In!comparison! with! two! peerNmatched! counties,! the!percentage!of!days!exceeding!air!quality!standards!in! Columbiana! County! was! the! same! as! Trumbull!County,!but!lower!than!Clark!County.!!!!!!
!!!!!!!In! Columbiana!County,! the! rate!of! children! that!were!discharged!from!a!hospital!with!a!diagnosis!of!asthma!was!360.16,!which!was!higher!than!both!peer!counties.!!!!!!!!!!!!!
In! Columbiana! County,! the! rate! of! children! that!visited! an! emergency! department! for! asthma!was!1058.80,! which! was! higher! than! both! Trumbull!County!and!Clark!County.!!!!!!!'
0.0%!
0.2%!
0.4%!
0.6%!
0.8%!
1.0%!
Percent!of!days!Columbiana! 0.3%!
Trumbull! 0.3%!
Clark! 0.5%!
Ohio! 0.6%!
U.S.! 0.8%!
Poor(Air(Quality:(Ozone(
0.00!
100.00!
200.00!
300.00!
400.00!
Rate!per!100,000!children!
Columbiana! 360.16!
Trumbull! 153.94!
Clark! 199.17!
Hospital(Discharges(with(Asthma(Diagnosis(
0.00!
200.00!
400.00!
600.00!
800.00!
1000.00!
1200.00!
Rate!per!100,000!children!
Columbiana! 1058.80!
Trumbull! 870.87!
Clark! 886.91!
Emergency(Department(Visits(for(Asthma(

Detailed(Data(Appendix( ( (
Columbiana(County(–(Children(! ! C3!
What'are'the'data'sources?'“Poor!Air!Quality!–!Particulate!Matter”! is! the!percentage!of!days!with!particulate!matter!that!are! 2.5! levels! above! the! National! Ambient! Air! Quality! Standard! of! 35!micrograms! per! cubic!meter! per! year.! ! It! is! calculated! using! data! collected! by!monitoring! stations! and!modeled! to!include! counties! where! no! monitoring! stations! are! located.! ! The! most! recent! countyN! and!nationalNlevel! data! (2008)! was! collected! from! the! National! Environmental! Public! Health!Tracking!Network!at!the!Centers!for!Disease!Control!and!Prevention!and!was!reported!on!the!Community!Health!Needs!Assessment!toolkit!on!the!Community!Commons!web!site.!!“Poor!Air!Quality!–!Ozone”!is!the!percentage!of!days!per!year!with!ozone!(O3)!levels!above!the!National!Ambient!Air!Quality!Standard!of!75!parts!per!billion!(ppb).!!It!is!calculated!using!data!collected!by!monitoring!stations!and!modeled!to!include!counties!where!no!monitoring!stations!are! located.! ! The!most! recent! countyN! and!nationalNlevel! data! (2008)!was! collected! from! the!National!Environmental!Public!Health!Tracking!Network!at!the!Centers!for!Disease!Control!and!Prevention! and! was! reported! on! the! Community! Health! Needs! Assessment! toolkit! on! the!Community!Commons!web!site.!!“Hospital! Discharges! with! Asthma! Diagnosis”! is! the! number! of! hospital! discharges! with! a!primary!diagnosis!of!asthma!per!100,000!children!in!2011.!!It!is!calculated!using!data!received!from! the!Ohio! Hospital! Association! and! 2011! estimates! of! the! child! (less! than! 18! years! old)!population.!!!“Emergency!Department!Visits!for!Asthma”!is!the!number!of!emergency!department!visits!for!asthma! per! 100,000! children! in! 2011.! ! It! is! calculated! using! data! received! from! the! Ohio!Hospital!Association!and!2011!estimates!of!the!child!(less!than!18!years!old)!population.!))What'puts'kids'at'risk?'Children! who! live! with! smokers! are! more! likely! to! develop! asthma.! ! Additionally,! boys! and!AfricanNAmericans!are!at!higher!risk!for!asthma!than!girls!and!Whites!(CDC,!2012f).' '

Detailed(Data(Appendix( ( (
Columbiana(County(–(Children(! ! C4!
Diabetes')Why'is'this'indicator'important?'Diabetes!is!an!illness!in!which!blood!sugar!(glucose)!levels!are!higher!than!normal.!Most!of!the!food!that!an!individual!eats!is!converted!into!glucose,!which!must!in!turn!be!absorbed!by!cells.!The!pancreas!produces!a!hormone!called!insulin,!which!helps!cells!absorb!glucose.!In!diabetes,!the!body!either! cannot!produce!enough! insulin,! or! cannot!use! the! insulin! it! produces,!which!leads! to! a! buildup! of! sugar! in! the! blood.! The! two! primary! forms! of! diabetes! are! Type! 1,! or!juvenileNonset!diabetes,!and!Type!2,!or!adultNonset!diabetes!(CDC,!2011b).!Diabetes!affects!25.8!million!people,!or!8.3%!of!the!US!population!and!is!the!7th!leading!cause!of!death!in!the!United!States! (CDC,!2011c).! ! From!1980! through!2011,! the!ageNadjusted!percentage!of!persons!with!diagnosed!diabetes!increased!127%!for!whites!and!107%!for!blacks,!however,!overall!rates!are!higher!for!blacks.!!In!2011,!the!ageNadjusted!percentage!of!blacks!with!a!diagnosis!of!diabetes!was!nearly!double!that!of!whites!(9.3%!and!5.9%,!respectively)!(CDC,!2013f).!!!How'does'our'community'rank?'The!rate!of!children!that!were!discharged!from!a!hospital! with! a! diagnosis! of! diabetes! in!Columbiana! County! was! lower! than! both!Trumbull!County!and!Clark!County.!!))What'are'the'data'sources?'“Hospital! Discharges!with! Diabetes! Diagnosis”! is!the!number!of!hospital!discharges!with!a!primary!diagnosis! of! diabetes! per! 100,000! children! in!2011.! ! It! is! calculated! using! data! received! from!the!Ohio!Hospital!Association!and!2011!estimates!of!the!child!(less!than!18!years!old)!population.!!))What'puts'kids'at'risk?'Risk! factors! for! developing! Type! 1! diabetes! are!not!well! defined,! but!may! include! autoimmune,!genetic,! and! environmental! components.! Risk! factors! for! Type! 2! diabetes! are! much! better!established,!including!age,!obesity,!family!history,!diminished!glucose!tolerance,!inactivity,!and!race!(CDC,!2011b).!!
0.00!
20.00!
40.00!
60.00!
80.00!
100.00!
Rate!per!100,000!children!
Columbiana! 17.36!
Trumbull! 70.37!
Clark! 99.58!
Hospital(Discharges(with(Diabetes(Diagnosis(

Detailed(Data(Appendix( ( (
Columbiana(County(–(Children(! ! C5!
Maternal(&(Infant(Health(!Maternal!and!infant!health!is!a!broad!category!of!factors!that!affect!pregnancy!and!childbirth.!!Improving! the! wellNbeing! of! mothers! and! infants! is! an! important! public! health! goal! in! the!United! States.! ! Healthy! birth! outcomes! and! early! identification! and! treatment! of! health!conditions!among!infants!can!prevent!death!or!disability!and!enable!children!to!reach!their!full!potential!(HHS,!2013).!!!!The!maternal!and!infant!health!issues!identified!as!prioritized!health!needs!among!Columbiana(County(Children!are:!
• Premature!Births!• Low!&!Very!Low!Birth!Weight!Births!• Infant,!Neonatal,!&!PostNNeonatal!Mortality!
!!Premature'Births'!Why'is'this'indicator'important?'A! fetus!goes! through! important! stages!of!growth!during! the! final!months!of!pregnancy.! If! an!infant!is!born!before!37!weeks!of!pregnancy!(or!prematurely),!the!brain,!the!lungs,!and!the!liver!may! not! be! fully! developed,! increasing! the! risk! of! disability! and! death.! Premature! birth! can!result! in! breathing! problems,! difficulty! feeding,! developmental! delay,! cerebral! palsy,! vision!problems,!and!hearing!problems.!Every!year,!close!to!500,000!babies,!or!1! in!every!9! infants,!are!born!prematurely.!Medical! care! for!premature!births!and! the! resulting!medical!problems!cost! the! US! health! care! system! more! than! $26! billion! annually! (CDC,! 2013g).! ! By! race,!approximately!1!out!of!every!5! infants!born! to!nonNHispanic!black!mothers! in!2007!was!born!preterm,!compared!to!1! in!8N9! infants!born!to!nonNHispanic!white!and!Hispanic!women!(CDC,!2011e).!
!!'How'does'our'community'rank?'Of! births! in! Columbiana! County,! 13.2%! were! a!premature!birth,!which!was!higher!than!both!the!Ohio!and!national!rates.!!Moreover,!the!Columbiana!County!rate! did! not!meet! the!Healthy) People) 2020! target! of!11.4%.!In!comparison!with!two!peerNmatched!counties,!Columbiana!County!had!a!slightly!higher!percentage!of!premature! births! than! Trumbull! County! and! a! lower!percentage!than!Clark!County.!!''
10.0%!
11.0%!
12.0%!
13.0%!
14.0%!
Percent!of!births!
Columbiana! 13.2%!
Trumbull! 13.0%!
Clark! 13.8%!
Ohio! 12.3%!
U.S.! 12.7%!
HP2020! 11.4%!
Premature(Births(

Detailed(Data(Appendix( ( (
Columbiana(County(–(Children(! ! C6!
What'are'the'data'sources?'“Premature!Births”!is!the!percentage!of!births!with!a!reported!gestation!period!of!less!than!37!completed!weeks.!!The!most!recent!countyN!and!nationalNlevel!data!(2009)!were!modeled!based!on!reported!data! from!1996N2005.! !The!data!were!collected! from!the!National!Vital!Statistics!System!at!the!National!Center!for!Health!Statistics!and!was!reported!on!the!Community!Health!Status!Indicators!web!site.!!!What'puts'kids'at'risk?'Risk! factors!which! impact! the! likelihood!of!premature!birth! include!maternal!age,!black! race,!low!maternal! income,! maternal! infection,! history! of! preterm! birth,! pregnancy! with! multiple!fetuses,! high! blood! pressure,! tobacco! use,! alcohol! use,! substance! abuse,! limited! access! to!prenatal!care,!and!maternal!stress!(CDC,!2013g).!))!!!!!!!!!!!' '

Detailed(Data(Appendix( ( (
Columbiana(County(–(Children(! ! C7!
Low'&'Very'Low'Birth'Weight'Births'!Why'is'this'indicator'important?'Birth!weight!is!important!for!infant!health,!both!in!terms!of!a!newborn’s!development,!and!in!terms!of!an!infant’s!resilience!to!infection.! !Low!birth!weight! is!defined!as!birth!weight!below!5.5! pounds! (2,500! grams),! while! very! low! birth! weight! is! a! birth! weight! below! 3! pounds! 4!ounces!(1,500!grams).!!Low!and!very!low!birth!weight!can!lead!to!breathing!problems,!difficulty!feeding,! developmental! delay,! cerebral! palsy,! vision! problems,! and! hearing! problems! (CDC,!2013g).!!!
!'''How'does'our'community'rank?'In! Columbiana! County,! the! rate! of! low! birth!weight!births!was!7.7%,!which!was!lower!than!both!the!Ohio!and! national! rates;! additionally,! the! Columbiana!County! rate!met! the!Healthy) People) 2020! target! of!7.8%.! In! comparison! with! two! peerNmatched!counties,!Columbiana!County!had!a!lower!percentage!of!low!birth!weight!births!than!both!Trumbull!County!and!Clark!County.!
)
!!!In!Columbiana!County,!the!rate!of!very!low!birth!weight! births! was! 1.2%,! which! was! lower! than!both! the! Ohio! rate! and! the! national! rate;!additionally,!the!Columbiana!County!rate!met!the!Healthy) People) 2020! target! of! 1.4%.! In!comparison! with! two! peerNmatched! counties,!Columbiana! County! had! a! lower! percentage! of!very! low! birth! weight! births! than! either! peer!county.!!!!!
7.0%!
8.0%!
9.0%!
10.0%!
Percent!of!births!Columbiana! 7.7%!
Trumbull! 8.9%!
Clark! 8.5%!
Ohio! 8.6%!
U.S.! 8.2%!
HP2020! 7.8%!
Low(Birth(Weight(Births(
0.0%!
0.5%!
1.0%!
1.5%!
2.0%!
Percent!of!births!Columbiana! 1.2%!
Trumbull! 1.5%!
Clark! 1.5%!
Ohio! 1.6%!
U.S.! 1.5%!
HP2020! 1.4%!
Very(Low(Birth(Weight(Births(

Detailed(Data(Appendix( ( (
Columbiana(County(–(Children(! ! C8!
What'are'the'data'sources?'“Low!Birth!Weight!Births”! is! the!percentage!of! all! births! less! than!5.5!pounds! (2,500!grams).!!The!most!recent!countyN!and!nationalNlevel!data!(2012)!were!modeled!based!on!reported!data!from! 2002N2008.! ! The! data! were! collected! from! the! National! Vital! Statistics! System! at! the!National! Center! for! Health! Statistics! and!were! reported! on! the! County!Health! Rankings!web!site.!!“Very! Low! Birth!Weight! Births”! is! the! percentage! of! all! births! less! than! 3! pounds! 4! ounces!(1,500!grams).!!The!most!recent!countyN!and!nationalNlevel!data!(2009)!were!modeled!based!on!reported! data! from! 1996N2005.! ! The! data! were! collected! from! the! National! Vital! Statistics!System!at!the!National!Center!for!Health!Statistics!and!was!reported!on!the!Community!Health!Status!Indicators!web!site.!!!What'puts'kids'at'risk?'Low!birth!weight!can!be!caused!by!either!premature!birth!or!by!a! slow!prenatal!growth! rate!(that!is,!small!for!gestational!age).!!!Risk!factors!for!premature!birth!include!maternal!age,!black!race,! low! maternal! income,! maternal! infection,! history! of! preterm! birth,! pregnancy! with!multiple!fetuses,!high!blood!pressure,!tobacco!use,!alcohol!use,!substance!abuse,!limited!access!to!prenatal!care,!and!maternal!stress!(CDC,!2013g).!!!' '

Detailed(Data(Appendix( ( (
Columbiana(County(–(Children(! ! C9!
Infant,'Neonatal,'&'PostDNeonatal'Mortality'!Why'is'this'indicator'important?'Each! year,! roughly! 25,000! infants! die! in! the!United! States! (CDC,! 2012g).! ! In! 2008,! the! infant!mortality!rate!for!nonNHispanic!black!women!was!2.4!times!that!of!nonNHispanic!white!women!(HHS,!2013).!!Infant!mortality!is!measured!by!the!overall!number!of!deaths!between!birth!and!1!year!of! life!and! the!number!of!deaths!before!day!28! (neonatal!mortality)!and! the!number!of!deaths!between!28!days!and!1!year!(postNneonatal!mortality).!!!!
!!!'How'does'our'community'rank?'In! Columbiana! County,! the! overall! rate! of! infant!mortality! (death!before!1! year!of! age)!was!6.1!per!1,000! live! births,! which! was! lower! than! both! the!Ohio!and!national!rates.!!Moreover,!the!Columbiana!County! rate!was! slightly! above! the!Healthy) People)2020! target! rate! of! 6! per! 1,000! live! births.! In!comparison! with! two! peerNmatched! counties,!Columbiana! County!was! lower! than! both! Trumbull!County!and!Clark!County.!
)!!!!!!!
)In! Columbiana! County,! the! rate! of! neonatal!mortality!(death!before!day!28)!was!3.6!per!1,000!live! births,!which!was! lower! than!both! the!Ohio!and! national! rates.! ! Moreover,! the! Columbiana!County! rate!met! the!Healthy)People)2020! target!rate! of! 4.1! per! 1,000! live! births.! In! comparison!with! two! peerNmatched! counties,! the! neonatal!mortality! rate! in! Columbiana! County! was! lower!than!both!Trumbull!County!and!Clark!County.!!
)!!
4!
6!
8!
10!
12!
Rate!per!1,000!live!births!
Columbiana! 6.1!
Trumbull! 8.9!
Clark! 8.2!
Ohio! 7.9!
U.S.! 6.9!
HP2020! 6!
Infant(Mortality(
0!
2!
4!
6!
Rate!per!1,000!live!births!
Columbiana! 3.6!
Trumbull! 5.7!
Clark! 4.8!
Ohio! 5.3!
U.S.! 4.5!
HP2020! 4.1!
Neonatal(Mortality((Death(before(Day(28)(

Detailed(Data(Appendix( ( (
Columbiana(County(–(Children(! ! C10!
!In! Columbiana! County,! the! rate! of! postNneonatal!mortality! (death! between!day! 28! and! 1! year)!was!2.5!per!1,000!live!births,!which!was!the!same!as!the!Ohio! rate,! but! higher! than! the! national! rate.!!Moreover,! the! Columbiana! County! rate! did! not!meet!the!Healthy)People)2020! target!rate!of!2!per!1,000! live! births.! In! comparison! with! two! peerNmatched!counties,!the!postNneonatal!mortality!rate!in!Columbiana!County!was! lower! than!either!peer!county.!!!!What'are'the'data'sources?'“Infant! Mortality”! is! the! number! of! deaths! from!any! cause! in! the! first! 12!months! of! life! per! 1,000!live!births.! !The!most!recent!countyN!and!nationalNlevel!data!(2009)!were!modeled!based!on!reported!data! from! 1996N2005.! ! The! data! were! collected!from! the! National! Vital! Statistics! System! at! the!National! Center! for! Health! Statistics! and! was!reported! on! the! Community! Health! Status!Indicators!web!site.!!“Neonatal!Mortality”! is! the! number! of! deaths! from!any! cause! in! the! first! 28! days! of! life! per!1,000!live!births.!!The!most!recent!countyN!and!nationalNlevel!data!(2009)!were!modeled!based!on!reported!data! from!1996N2005.! !The!data!were!collected! from!the!National!Vital!Statistics!System!at!the!National!Center!for!Health!Statistics!and!was!reported!on!the!Community!Health!Status!Indicators!web!site.!!“PostNNeonatal!Mortality”! is! the!number!of!deaths!from!any!cause!occurring!between!day!28!and!1!year!of!life!per!1,000!live!births.!!The!most!recent!countyN!and!nationalNlevel!data!(2009)!were!modeled! based! on! reported! data! from! 1996N2005.! ! The! data! were! collected! from! the!National!Vital!Statistics!System!at!the!National!Center!for!Health!Statistics!and!was!reported!on!the!Community!Health!Status!Indicators!web!site.!!!What'puts'kids'at'risk?'The!risk!of!death!in!infancy!is!increased!for!infants!born!with!a!serious!birth!defect,!for!infants!who! are! born! prematurely,! who! have! low! birth! weight,! for! infants! born! to! mothers! with!pregnancy! complications,! victims! of! violence,! and! victims! of! Sudden! Infant! Death! Syndrome!(SIDS).! Factors! such! as! race,! ethnicity,! age,! and! income!may! impact! the! likelihood! of! infant!death!as!well!(CDC,!2012g).!
0!1!2!3!4!
Rate!per!1,000!live!births!
Columbiana! 2.5!
Trumbull! 3.1!
Clark! 3.2!
Ohio! 2.5!
!U.S.! 2.3!
HP2020! 2!
Post:Neonatal(Mortality((Death(between(Day(28(and(1(Year)(

Detailed(Data(Appendix( ( (
Columbiana(County(–(Children(! ! C11!
Child(Lifestyle(Factors(!Lifestyle!risk!factors!are!“everyday”!behaviors!that!people!engage!in!that!can!negatively!impact!their!health.!!LifestyleNrelated!risk!factors!include!a!range!of!behaviors!such!as!unhealthy!eating,!low!or!no!physical!activity,!and!tobacco!use.! !People!that!engage!in!these!lifestyle!risk!factors!are!at!higher! risk! for!a! large!number!of!chronic!diseases!such!as!heart!disease,!diabetes,!and!cancer.! ! Lifestyle! risk! factors! in! children! are! especially! important! because! they! can! affect!physical! and! mental! development! and! establish! behavioral! patterns! that! are! taken! into!adulthood.!!The!lifestyle!risk!factors!identified!as!prioritized!health!needs!among!Columbiana(County(Children!are:!
• Overweight!&!Obesity!• Exercise!• Nutrition!
!!Overweight'&'Obesity'!Why'is'this'indicator'important?'Body!mass!index!(BMI)!is!a!measure!used!to!determine!whether!a!child’s!weight!is!healthy!for!their! size.! It! is! calculated! by! assessing! a! child’s! weight! in! relation! to! their! height,! age,! and!gender.!Children!who!are!overweight,! especially! young!children,! are!at! increased! risk!of!high!blood!pressure,!high!cholesterol,!and!subsequent!cardiovascular!disease.!One!study!found!that!70%!of!obese!children!had!at!least!one!of!these!risk!factors,!and!39%!had!two!or!more.!Children!who!are!overweight!or!obese!are!also!at!increased!risk!of!developing!Type!2!diabetes,!asthma,!sleep!apnea,!joint!problems,!acid!reflux,!and!mental!health!problems!(CDC,!2012h).!!!
!!'How'does'our'community'rank?'In!Columbiana!County,!15.9%!of!the!child!population!between! two! and! five! years! old! was! reported! as!being! overweight,! which! was! lower! than! the! Ohio!rate! and! the! national! rate.! In! comparison!with! two!peerNmatched! counties,! Columbiana! County! had! a!higher!percentage!of!overweight!two!to!five!year!old!children! than! Trumbull! County! and! a! lower!percentage!than!Clark!County.!!!!!!
0.0%!
10.0%!
20.0%!
30.0%!
Percent!child!populahon!Columbiana! 15.9%!
Trumbull! 14.9%!
Clark! 17.5%!
Ohio! 28.2%!
U.S.! 26.7%!
Overweight(Children(((2:5(Years(Old)(

Detailed(Data(Appendix( ( (
Columbiana(County(–(Children(! ! C12!
!!In! Columbiana! County,! 10.8%! of! the! child!population! was! reported! as! being! obese,! which!was! lower! than!both! the!Ohio! and!national! rates;!however,! the! Columbiana! County! rate! failed! to!meet!the!Healthy)People)2020)target!rate!of!9.6%.!In! comparison! with! two! peerNmatched! counties,!Columbiana! County! had! a! higher! percentage! than!both!Trumbull!County!and!Clark!County.!!'''''''What'are'the'data'sources?'“Overweight!Children!(2N5!Years!Old)”!is!the!percentage!of!children!whose!weight!is!in!the!85th!to!94th!percentile.!!The!most!recent!countyN!and!nationalNlevel!data!(2012)!were!collected!from!the!CRHS!and!RHWP!Health!Status!Profile!Reports!at!the!Ohio!Department!of!Health!web!site.!!“Obese!Children”!is!the!percentage!of!children!whose!weight!is!in!the!95th!percentile!or!higher.!!The! most! recent! countyN! and! nationalNlevel! data! (2011)! were! collected! from! the! Pediatric!Nutrition!Surveillance!System!at!the!Ohio!Department!of!Health!web!site.!!!What'puts'kids'at'risk?'Factors! which! increase! the! likelihood! of! children! becoming! overweight! or! obese! include!consumption! of! sugary! drinks,! unhealthy! school! food,! lack! of! daily! physical! activity! in! all!schools,! no! place! to! play! and! be! outside! safely,! limited! access! to! healthy,! affordable! foods,!increasing!portion!sizes,!lack!of!breastfeeding!support,!and!sedentary!lifestyle!from!overuse!of!TV!and!media!(CDC,!2012h).!!!))))))! !
0.0%!
5.0%!
10.0%!
15.0%!
Percent!of!child!populahon!
Columbiana! 10.8%!
Trumbull! 10.4%!
Clark! 9.7%!
Ohio! 11.2%!
!U.S.! 12.4%!
HP2020! 9.6%!
Obese(Children(

Detailed(Data(Appendix( ( (
Columbiana(County(–(Children(! ! C13!
Exercise'!Why'is'this'indicator'important?'Physical! activity! is! important! to!maintaining! a! healthy! body!weight! and! reducing! the! risk! for!various! cardiovascular! diseases.! ! Among! children,! physical! activity! can! improve! bone! health,!improve! cardiorespiratory! and!muscular! fitness,! decrease! body! fat,! and! reduce! symptoms! of!depression!(HHS,!2013).!!The!CDC!recommends!that!children!get!at!least!60!minutes!of!physical!activity!each!day!(CDC,!2011g).!!!
!'How'does'our'community'rank?'Columbiana! County! is! located! in! the! Northeast!Central! region,! which! has! a! slightly! higher! or! equal!percentage! of! children! that! exercised! all! 7! days! of!the!past!week!compared!to!most!of!the!other!regions!in!the!state,!except!for!the!Southeast!region.!!!!!!!!!''''''
!!!Columbiana! County! is! located! in! the! Northeast!Central!region,!in!which!53%!of!children!had!two!hours! or! less! of! screen! time! on! an! average!weekday.!!This!percent!is!lower!than!all!the!other!regions!in!the!state.!!!!!!!!!
0%!10%!20%!30%!40%!50%!
Percent!Northwest! 25%!
Northeast! 24%!
Northeast!Central! 29%!
East!Central! 24%!
Central! 24%!
West!Central! 29%!
Southwest! 25%!
Southeast! 33%!
Exercised(7(Days(in(Past(Week(
30%!40%!50%!60%!70%!
Percent!Northwest! 59%!
Northeast! 56%!
Northeast!Central! 53%!
East!Central! 58%!
Central! 58%!
West!Central! 63%!
Southwest! 57%!
Southeast! 58%!
2(Hours(or(Less(of(Screen(Time(on(Average(Weekday(
Detailed(Data(Appendix( ( (
Columbiana(County(–(Children(! ! C14!
What'are'the'data'sources?'“Exercised! 7! Days! in! Past!Week”! is! the! percent! of! parents! who! reported! that! their! children!exercised,!played!a!sport,!or!participated!in!physical!activity!every!day!of!the!past!week!for!at!least!20!minutes!that!made!him/her!sweat!and!breathe!hard.!!The!most!recent!data!(2012)!in!Ohio!were!analyzed!using!the!2012!Ohio!Medicaid!Assessment!Survey.!!“2!Hours!or!Less!of!Screen!Time!on!Average!Week!Day”!is!the!percent!of!parents!who!reported!that! their! children! had! 2! hours! or! less! of! screen! time! on! an! average!weekday.! ! Screen! time!includes!watching!TV,! videos,!or!playing!video!games!except! schoolNrelated.! The!most! recent!data!(2012)!in!Ohio!were!analyzed!using!the!2012!Ohio!Medicaid!Assessment!Survey.!!!What'puts'kids'at'risk?'A!variety!of!personal,!social,!economic,!and!environmental!factors!play!a!role!in!physical!activity!including!access!to!recreational!facilities!and!sidewalks,!income,!enjoyment,!social!and!parental!support,!safe!neighborhoods,!and!school!policies!(CDC,!2012h).!!!!!! !

Detailed(Data(Appendix( ( (
Columbiana(County(–(Children(! ! C15!
Nutrition'!
Why'is'this'indicator'important?'Eating!healthy! foods! is! important! to!maintaining!a!healthy!body!weight!and!reducing!the!risk!
for!various!diseases.! ! For!children,!good!nutrition! is!essential! for!healthy!development.! !Poor!
nutrition! can! lead! to! overweight! and! obesity,!malnutrition,! diabetes,! oral! disease,! and! some!
cancers!(CDC,!2012h).!
!
'How'does'our'community'rank?'Columbiana! County! is! located! in! the! Northeast!
Central! region,! which! has! a! higher! percentage! of!
family! meals! cooked! at! home! compared! to! most!
other! regions,! with! the! exception! of! the! Southeast!
and!East!Central!regions.!!!
''What'are'the'data'sources?'“Family! Meals! Cooked! at! Home”! is! the! percent! of!
parents!reporting!having!at!least!five!family!meals!at!
home!in!the!past!week!that!were!cooked!at!home!all!
or!most!of!the!time.!!The!most!recent!data!(2012)!in!
Ohio! were! analyzed! using! the! 2012! Ohio! Medicaid!
Assessment!Survey.!
!
!
!
''''What'puts'kids'at'risk?'There! are! many! factors! that! affect! healthy! eating! among! kids! including! knowledge! and!
attitudes,! societal! and! cultural! norms,! family! eating! behaviors,! family! income,! parental!
attitudes,!and!school!food!policies!(CDC,!2012h).!
!
!
!
50%!
55%!
60%!
65%!
70%!
75%!
Percent!
Northwest! 61%!
Northeast! 58%!
Northeast!
Central!64%!
East!Central! 66%!
Central! 59%!
West!Central! 61%!
Southwest! 63%!
Southeast! 65%!
Family(Meals(Cooked(at(Home(

Detailed(Data(Appendix( ( (
Columbiana(County(–(Children(! ! C16!
Mental(Health(!Why'is'this'indicator'important?'Mental!health!refers!to!the!successful!performance!of!mental!function,!resulting!in!productive!activities,!fulfilling!relationships!with!other!people,!and!the!ability!to!adapt!to!change!and!cope!with! adversity.! ! Mental! health! is! essential! to! personal! wellNbeing,! family! and! interpersonal!relationships,!and!the!ability!to!contribute!to!community!or!society!(HHS,!2013).!!!!Mental! illness! refers! to!a!broad! range!of!diagnosable!mental!health! conditions!and!disorders!and!contribute!to!a!host!of!problems!including!disability,!distress,!and!death.!!According!to!the!National!Institute!of!Mental!Health,!in!any!given!year!an!estimated!13!million!Americans!(about!1!in!17!people)!have!a!seriously!debilitating!mental!illness!(Kessler!et!al.,!2005).!!Mental!health!disorders!are!the!leading!cause!of!disability!in!the!United!States!and!account!for!approximately!25%!of!all!years!of!life!lost!due!to!disability!and!premature!death!(WHO,!2004).!!Mental! health! is! particularly! important! for! children! since! it! can! affect! psychological! and!emotional! development,! school! performance,! family! and! peer! relationships,! and! physical!health.! ! Common!mental! health! issues! for! children! include!bullying! (and! the! impact!of!being!bullied),!depression,!anxiety,!and!behavioral!disorders! (such!as!Attention!Deficit!Hyperactivity!disorder!and!Oppositional!Defiant!Disorder)!(MedlinePlus,!2013a).!!
'''
How'does'our'community'rank?'The! rate! of! children! that! were! discharged! from! a!hospital! with! a! mental! health! diagnosis! was! 86.79!per! 100,000! children! in! Columbiana! County,! which!was! lower! than! both! Trumbull! County! and! Clark!County.!!!!)!!!!!!
!!!!
0.00!
250.00!
500.00!
Rate!per!100,000!children!
Columbiana! 86.79!
Trumbull! 112.16!
Clark! 295.64!
Hospital(Discharges(with(a(Mental(Health(Diagnosis(

Detailed(Data(Appendix( ( (
Columbiana(County(–(Children(! ! C17!
!!Columbiana! County! is! located! in! the! Northeast!Central! region,! in! which! 13%! of! children! need!mental! health! services.! ! This! percent! is! higher! or!equal! to! most! regions,! but! is! lower! than! the!Southeast! region,! which! has! the! highest!percentage.!!!!!
!!!!!!!!!!!Some! children! needing!mental! health! services! have!mental! health! conditions! that! have! lasted,! or! are!expected!to!last,!12!months!or!more.!!The!Northeast!Central! region,! in! which! Columbiana! County! is!included,! has! a! higher! percent! of! children! needing!mental!health!services!for!a!longNterm!mental!health!problem!than!most! regions,!but!a! lower!percentage!than!the!West!Central!region,!which!has!the!highest.!!
!What'are'the'data'sources?'“Hospital!Discharges!with!a!Mental!Health!Diagnosis”!is!the!number!of!hospital!discharges!with!a!primary!diagnosis!of!a!mental!health!issue!per!100,000!children!in!2011.!!It!is!calculated!using!data!received!from!the!Ohio!Hospital!Association!and!2011!estimates!of!the!child!(less!than!18!years!old)!population.!!!“Children!Needing!Mental!Health!Services”! is!the!percent!of!children!whose!parents!reported!that!their!children!had!any!kind!of!emotional,!developmental,!or!behavioral!problem!for!which!s/he! needed! treatment! or! counseling.! ! The!most! recent! data! (2012)! in! Ohio! were! analyzed!using!the!2012!Ohio!Medicaid!Assessment!Survey.!!
0%!
25%!
50%!
75%!
100%!
Percent!Northwest! 62%!
Northeast! 52%!
Northeast!Central! 64%!
East!Central! 59%!
Central! 57%!
West!Central! 71%!
Southwest! 61%!
Southeast! 63%!
Percent(of(Children(Needing(Mental(Health(Services(Who(Have(Long:Term(
Mental(Health(Problem(
0%!
5%!
10%!
15%!
20%!
Percent!Northwest! 9%!
Northeast! 12%!
Northeast!Central! 13%!
East!Central! 11%!
Central! 11%!
West!Central! 13%!
Southwest! 11%!
Southeast! 16%!
Children(Needing(Mental(Health(Services(

Detailed(Data(Appendix( ( (
Columbiana(County(–(Children(! ! C18!
“Percent! of! Children! Needing! Mental! Health! Services! Who! Have! LongNTerm! Mental! Health!Problem”! is! the! percent! of! children! needing!mental! health! services!whose! parents! reported!that! their! children!had!an!emotional,! developmental,! or!behavioral! problem! that! lasted!or! is!expected!to!last!12!months!or!longer.!!The!most!recent!data!(2012)!in!Ohio!were!analyzed!using!the!2012!Ohio!Medicaid!Assessment!Survey.!!!What'puts'kids'at'risk?'There!are!many!“warning!signs”!of!mental!health! issues! in!children.! !They! include!harming!or!threatening!themselves,!others,!or!pets;!damaging!or!destroying!property;!lying!or!stealing;!not!doing!well! or! skipping! school;! smoking! tobacco,! drinking! alcohol,! or! using! illegal! drugs;! early!sexual!activity;!and!hostility!toward!authority!figures!(MedlinePlus,!2013b).!!!!)!!!!

Detailed(Data(Appendix( ( (
Columbiana(County(–(Children(! ! C19!
Substance(Abuse(!Substance!abuse! refers! to! a! set!of! conditions! associated!with! the! consumption!of!mindN! and!behaviorNaltering! substances! that! have! negative! behavioral! and! health! outcomes! (Healthy!People!2020).! !Some!of!the!substances!abused!are! legal,!such!as!alcohol! for!adults;!some!are!illegal,!such!as!heroin;!and!some!are!legal!but!illegally!used,!such!as!the!misuse!of!prescription!drugs!by!people!not!prescribed!them.!!!!The!substance!abuse!issues!identified!as!prioritized!health!needs!among!Columbiana(County(Children!are:!
• Opioid!Drug!Abuse!!!Opioid'Drug'Abuse'!Why'is'this'indicator'important?'Opioids! are! a! family! of! medications! derived! from! the! opium! poppy,! including! Vicodin,!morphine,!heroin,!and!codeine.!!Opioid!drugs!are!designed!to!diminish!the!transmission!of!pain!signals!throughout!the!body,!and!are!commonly!utilized!to!combat!both!acute!and!chronic!pain!of! moderate! and! severe! intensity.! While! opioids! have! proven! therapeutically! useful,! the!beneficial! effects! of! opioid! use,! including! pain! reduction! and! euphoria,! have! made! them!appealing! recreational! drugs.! In! 2008,! two! of! the! most! frequently! abused! opioid! drugs,!hydrocode!and!oxycodone,!resulted! in!89,047!and!105,208!hospitalizations,!respectively!(NIH,!2009).!!By!race,!the!ageNadjusted!opioid!overdose!death!rates!are!highest!among!nonNHispanic!whites!(6.3)!and!American!Indian/Alaska!Natives!(6.2),!with!Hispanics!and!blacks!being!among!the!lowest!(2.1!and!1.9,!respectively)!(CDC,!2011f).!!How'does'our'community'rank?'At! the! time! of! publication,! epidemiologic! data! were! not! available! on! the! actual! rates! of!childhood!or! adolescent!opioid!drug! abuse! to!be! able! to!determine!how!Columbiana!County!ranks!relative!to!its!peer!counties,!the!state,!and!the!US.! !However,!opioid!drug!abuse!among!children! and! especially! adolescents! was! repeatedly! cited! by! many! community! leaders! and!community!residents!as!a!significant!public!health!problem!in!the!community.!!!!What'are'the'data'sources?'Input!from!community!residents!and!community! leaders!were!obtained!through!focus!groups!and!interviews,!respectively.!!What'puts'kids'at'risk?'Young!adults!aged!18—25!have!the!highest!rate!of!current!use!of!illicit!drugs!of!any!age!group,!while! both!males! and! females! have! similar! rates! of! using! opioid! drugs.! The! risk! of! overdose!from!opioid!drugs!is!higher,!however,!for!males,!and!for!middleNaged!individuals!(CDC,!2010a).!!

Detailed(Data(Appendix( ( (
Columbiana(County(–(Children(! ! C20!
Access(to(Health(Care(!Access! to! health! care! is! a! broad! term! used! to! describe! the! availability,! acceptability,!affordability,!and!accessibility!of!health!care! systems!and!providers.! ! Lack!of!access! to!health!care!makes!it!difficult!for!people!to!get!the!health!care!they!need,!which!can!cause!premature!disability!and!death.! ! !Among!kids,! lack!of!access!to!health!care!means!that!children!can’t!get!the!immunizations!and!screenings!they!need,!which!can!increase!their!risk!for!disease!and!poor!development.!!The!health!care!accessNrelated!issues!identified!as!prioritized!health!needs!among!Columbiana(County(Children!are:!
• Health!Insurance!Coverage!• Access!to!Dental!Care!• Mental!Health!Insurance!Coverage!• Number!of!Pediatric!Specialists!
!!Health'Insurance'Coverage'!Why'is'this'indicator'important?'Having! adequate! health! insurance! to! help! cover! the! costs! associated! with! health! care! is! an!important!component!to!increasing!health!care!access.!!Without!it,!some!people!don’t!get!the!health!care! they!need,!which!can!cause!premature!disability!and!death.! !Additionally,! lack!of!adequate! health! insurance! sometimes! causes! health! problems! to! become! worse! and! more!costly!than!if!they!were!prevented!or!treated!earlier.!!Uninsured!children!are!10!times!more!likely!than!insured!children!to!have!unmet!medical!needs!and!are!5!times!more!likely!to!go!more!than!2!years!without!seeing!a!doctor!(Children’s!Defense!Fund,!2010b).
!!!How'does'our'community'rank?'In! Columbiana! County,! 4.7%! of! the! child! population!was!reported!as!having!no!health!insurance,!which!was!higher!than!the!Ohio!rate!and!lower!than!the!national!rate.! In! comparison!with! two! peerNmatched! counties,!Columbiana! County! had! a! higher! percentage! of!uninsured!children!than!either!peer!county.!
!!!!
0.0%!
5.0%!
10.0%!
Percent!of!child!populahon!
Columbiana! 4.7%!
Trumbull! 1.4%!
Clark! 3.3%!
Ohio! 4.0%!
U.S.! 10.0%!
Uninsured(Children(
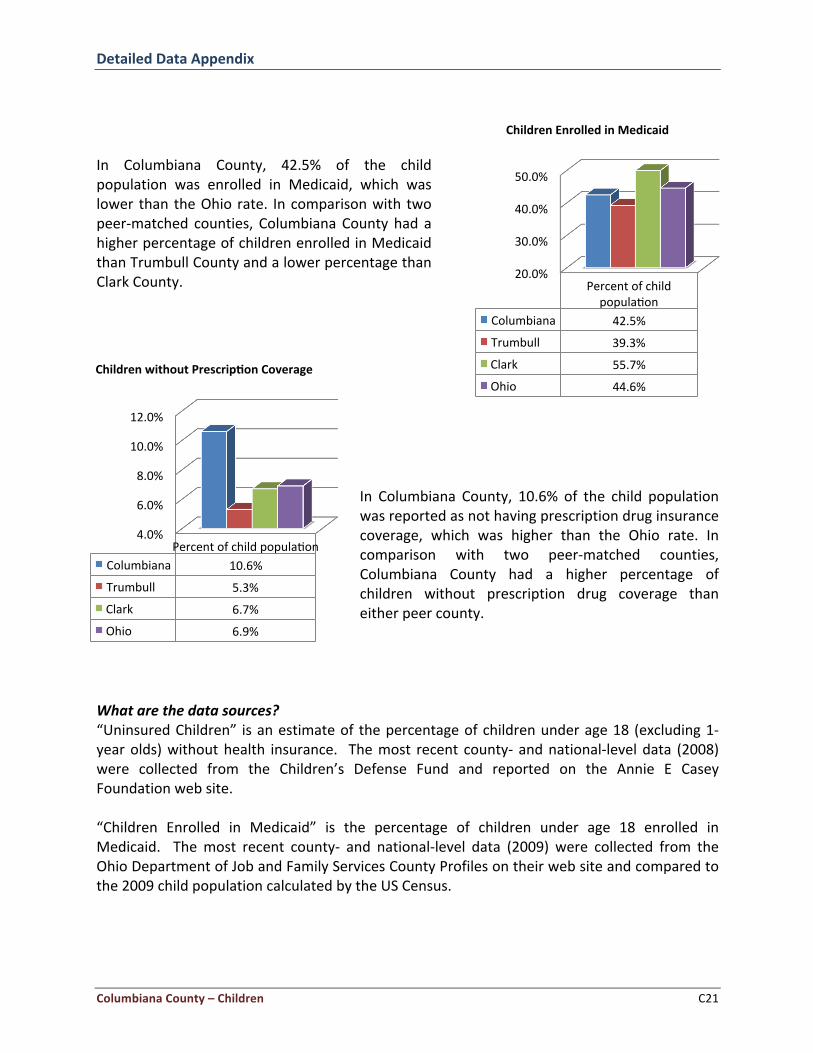
Detailed(Data(Appendix( ( (
Columbiana(County(–(Children(! ! C21!
!!!
In! Columbiana! County,! 42.5%! of! the! child!population! was! enrolled! in! Medicaid,! which! was!lower! than! the!Ohio! rate.! In!comparison!with! two!peerNmatched! counties,! Columbiana!County! had! a!higher!percentage!of!children!enrolled!in!Medicaid!than!Trumbull!County!and!a!lower!percentage!than!Clark!County.!!!
!!!!!!!!In! Columbiana! County,! 10.6%! of! the! child! population!was!reported!as!not!having!prescription!drug!insurance!coverage,! which! was! higher! than! the! Ohio! rate.! In!comparison! with! two! peerNmatched! counties,!Columbiana! County! had! a! higher! percentage! of!children! without! prescription! drug! coverage! than!either!peer!county.!!!!!
What'are'the'data'sources?'“Uninsured!Children”! is!an!estimate!of! the!percentage!of!children!under!age!18! (excluding!1Nyear!olds)!without!health! insurance.! ! The!most! recent! countyN! and!nationalNlevel!data! (2008)!were! collected! from! the! Children’s! Defense! Fund! and! reported! on! the! Annie! E! Casey!Foundation!web!site.!!“Children! Enrolled! in! Medicaid”! is! the! percentage! of! children! under! age! 18! enrolled! in!Medicaid.! ! The!most! recent! countyN! and! nationalNlevel! data! (2009)! were! collected! from! the!Ohio!Department!of!Job!and!Family!Services!County!Profiles!on!their!web!site!and!compared!to!the!2009!child!population!calculated!by!the!US!Census.!!!!
20.0%!
30.0%!
40.0%!
50.0%!
Percent!of!child!populahon!
Columbiana! 42.5%!
Trumbull! 39.3%!
Clark! 55.7%!
Ohio! 44.6%!
Children(Enrolled(in(Medicaid(
4.0%!
6.0%!
8.0%!
10.0%!
12.0%!
Percent!of!child!populahon!Columbiana! 10.6%!
Trumbull! 5.3%!
Clark! 6.7%!
Ohio! 6.9%!
Children(without(Prescrip;on(Coverage(

Detailed(Data(Appendix( ( (
Columbiana(County(–(Children(! ! C22!
“Children!without! Prescription! Coverage”! is! an! estimate! of! the! percentage! of! children! under!age! 18! (excluding! 1Nyear! olds)! without! insurance! for! prescription! drugs.! ! The! most! recent!countyN! and! nationalNlevel! data! (2008)!were! collected! from! the! Children’s!Defense! Fund! and!reported!on!the!Annie!E!Casey!Foundation!web!site.!!!What'puts'kids'at'risk?'Most! adults! (60.3%)! have! health! insurance! through! private! providers! (such! as! Anthem! Blue!Cross!and!Blue!Shield,!Medical!Mutual!of!Ohio,!etc.)!and!usually!get!it!through!their!employers!(CDC,! 2012d).! ! These! policies! almost! always! offer! plan! options! that! include! coverage! for! the!entire! family! ! (including!children).! !Children!from!unemployed!or! lowNincome!families!can!get!health!insurance!through!their!state’s!Medicaid!program!even!when!their!parents!don’t!qualify!themselves.!!!!( (

Detailed(Data(Appendix( ( (
Columbiana(County(–(Children(! ! C23!
Access'to'Dental'Care'!Why'is'this'indicator'important?'Among!children,!dental!caries!are!considered!the!most!common!childhood!chronic!disease!and!research!has!shown!that!dental!care!is!the!most!prevalent!unmet!health!need!among!children!in!the!US!(Mouradian,!Wehr,!&!Crall,!2000).!An!estimated!16.5!million!children!go!without!basic!dental! care! each! year! (Pew! Foundation,! 2011).! Periodontal! disease! has! also! been! linked! to!adverse! pregnancy! outcomes,! diabetes,! cardiovascular! disease,! and! respiratory! disease.!Routine!dental!examinations!and!practicing!good!oral!hygiene!are!important!components!of!an!overall!healthy!lifestyle,!as!well!as!a!good!preventive!measure!to!protect!your!personal!health!and!wellNbeing!(CDC,!2009a).!!While!many!children!may!have!access!to!dental!coverage!through!private!insurance!or!Medicaid,!this!does!not!necessarily!translate!into!actual!care.!!
!''How'does'our'community'rank?'In!Columbiana!County,!65.9%!of!the!child!population!was!reported!as!having!a!dental!visit!in!the!previous!year,!which!was!lower!than!the!Ohio!rate!and!higher!than! the! national! rate.! ! Moreover,! the! Columbiana!County! rate! is! higher! than! the!Healthy) People) 2020)target! rate!of!49.0%.! ! In!comparison!with! two!peerNmatched! counties,! Columbiana! County! had! a! lower!percentage!of!children!having!a!dental!visit!than!both!Trumbull!County!and!Richland!County.!!)!!!!
!!!In!Columbiana!County,!28.0%!of!3rd!grade!children!were! reported! as! having! untreated! tooth! decay,!which! was! higher! than! the! Ohio! rate! and! slightly!lower! than! the! national! rate.! ! Moreover,! the!Trumbull! County! rate! is! higher! than! the! Healthy)People) 2020) target! rate! of! 26.0%.! ! In! comparison!with! two! peerNmatched! counties,! Columbiana!County! had! a! higher! percentage! of! children! with!untreated! tooth! decay! than! both! Trumbull! and!Clark!Counties.!!
30.0%!40.0%!50.0%!60.0%!70.0%!80.0%!
Percent!of!child!populahon!
Columbiana! 65.9%!
Trumbull! 70.9%!
Clark! 74.1%!
Ohio! 69.6%!
!!U.S.! 44.5%!
HP2020! 49.0%!
Dental(Visit(in(Last(Year(
0.0%!
10.0%!
20.0%!
30.0%!
Percent!of!3rd!grade!children!
Columbiana! 28.0%!
Trumbull! 22.0%!
Clark! 15.5%!
Ohio! 18.7%!
U.S.! 28.8%!
HP2020! 26.0%!
Untreated(Tooth(Decay(

Detailed(Data(Appendix( ( (
Columbiana(County(–(Children(! ! C24!
!!!In! Columbiana! County,! 43.1%! of! 3rd! grade! children!were! reported! as! having! one! or! more! dental!sealants,! which! was! lower! than! the! Ohio! rate! and!higher! than! the! national! rate.! ! Moreover,! the!Columbiana! County! rate! is! higher! than! the!Healthy)People) 2020) target! rate! of! 28.0%.! ! In! comparison!with!two!peerNmatched!counties,!Columbiana!County!had! a! lower! percentage! of! children! having! one! or!more!dental!sealants!than!both!Trumbull!County!and!Clark!County.!!
!!!!!
!!In!Columbiana!County,!9.8%!of!3rd!grade!children!were! reported! as! having! a! toothache,! which! was!lower!than!the!Ohio!rate.! In!comparison!with!two!peerNmatched!counties,!Columbiana!County!had!a!lower! percentage! of! children! having! a! toothache!than!both!Trumbull!County!and!Clark!County.!
!!
!!!!!In! Columbiana! County,! 14.0%! of! the! child! population!was! reported!as!never!having! visited!a!dentist,!which!was!higher!than!the!Ohio!rate.!In!comparison!with!two!peerNmatched! counties,! Columbiana! County! had! a!lower! percentage! of! children! never! having! visited! a!dentist!than!both!Trumbull!County!and!Clark!County.!!!!!!!
20.0%!32.0%!44.0%!56.0%!68.0%!
Percent!of!3rd!grade!children!
Columbiana! 43.1%!
Trumbull! 59.4%!
Clark! 53.3%!
Ohio! 50.4%!
U.S.! 32.0%!
HP2020! 28.0%!
One(or(More(Dental(Sealants(
5.0%!7.0%!9.0%!11.0%!13.0%!15.0%!17.0%!19.0%!
Percent!of!3rd!grade!children!
Columbiana! 9.8%!
Trumbull! 16.7%!
Clark! 14.1%!
Ohio! 11.4%!
Toothache(
0.0%!
5.0%!
10.0%!
15.0%!
20.0%!
Percent!of!child!populahon!Columbiana! 14.0%!
Trumbull! 17.4%!
Clark! 17.4%!
Ohio! 4.6%!
Never(Visited(a(Den;st(

Detailed(Data(Appendix( ( (
Columbiana(County(–(Children(! ! C25!
!!!!In!Columbiana!County,!34.6%!of!the!child!population!was! reported! as! being! without! dental! insurance,!which!was!lower!than!the!Ohio!rate!and!higher!than!the! national! rate.! In! comparison! with! two! peerNmatched! counties,! Columbiana!County!had!a!higher!percentage!of!children!without!dental!insurance!than!both!Trumbull!and!Clark!Counties.!!!!!!!!!
What'are'the'data'sources?'“Dental!Visit! in!Last!Year”! is! the!percentage!of!children!under!18!years!of!age!whose!parents!reported!that!they!visited!a!dentist!in!the!last!year.!!The!most!recent!countyN!and!nationalNlevel!data! (2008)! are! from! the! Ohio! Family! Health! Survey! reported! on! the! Ohio! Oral! Health!Surveillance!System!web!site.!!“Untreated!Tooth!Decay”!is!the!percentage!of!3rd!graders!whose!parents!reported!that!they!had!untreated!tooth!decay.! !The!most! recent!countyN!and!nationalNlevel!data! (2010)!are! from!the!Ohio!Oral!Health!and!BMI!Survey! reported!on! the!Ohio!Oral!Health!Surveillance!System!web!site.!!“One!or!More!Dental!Sealants”! is! the!percentage!of!3rd!graders!whose!parents! reported! that!they!had!one!or!more!dental!sealants.!!The!most!recent!countyN!and!nationalNlevel!data!(2010)!are!from!the!Ohio!Oral!Health!and!BMI!Survey!reported!on!the!Ohio!Oral!Health!Surveillance!System!web!site.!!“Toothache”! is! the! percentage! of! 3rd! graders! whose! parents! reported! that! they! had! a!toothache.! ! The!most! recent! countyN! and! nationalNlevel! data! (2010)! are! from! the! Ohio! Oral!Health!and!BMI!Survey!reported!on!the!Ohio!Oral!Health!Surveillance!System!web!site.!!“Never! Visited! a! Dentist”! is! the! percent! of! children! under! 18! years! of! age! whose! parents!reported!that!they!visited!a!dentist!in!the!last!year.!!The!most!recent!data!(2008)!are!from!the!Ohio!Family!Health!Survey!reported!on!the!Ohio!Oral!Health!Surveillance!System!web!site.!!!!
0.0%!
10.0%!
20.0%!
30.0%!
40.0%!
Percent!of!child!populahon!Columbiana! 34.6%!
Trumbull! 19.6%!
Clark! 19.0%!
Ohio! 36.4%!
U.S.! 26.0%!
Children(without(Dental(Insurance(

Detailed(Data(Appendix( ( (
Columbiana(County(–(Children(! ! C26!
“Children!without!Dental! Insurance”! is! the! percent! of! children! under! 18! years! of! age!whose!parents! reported! that! they! did! not! have! dental! insurance! coverage.! ! The! most! recent! data!(2008)!are!from!the!Ohio!Family!Health!Survey!reported!on!the!Ohio!Oral!Health!Surveillance!System!web!site.!!!What'puts'kids'at'risk?'Children! from! low! income! and! minority! families! are! more! likely! to! report! poor! oral! health!outcomes,! fewer!dental! visits,! and! less! usage!of! protective!dental! sealants! (Pew!Foundation,!2011).!!Additionally,!children!that!do!not!receive!regular!preventative!care!and!do!not!properly!clean!their!teeth!are!also!more!likely!to!experience!poor!dental!health.!!)))!' '
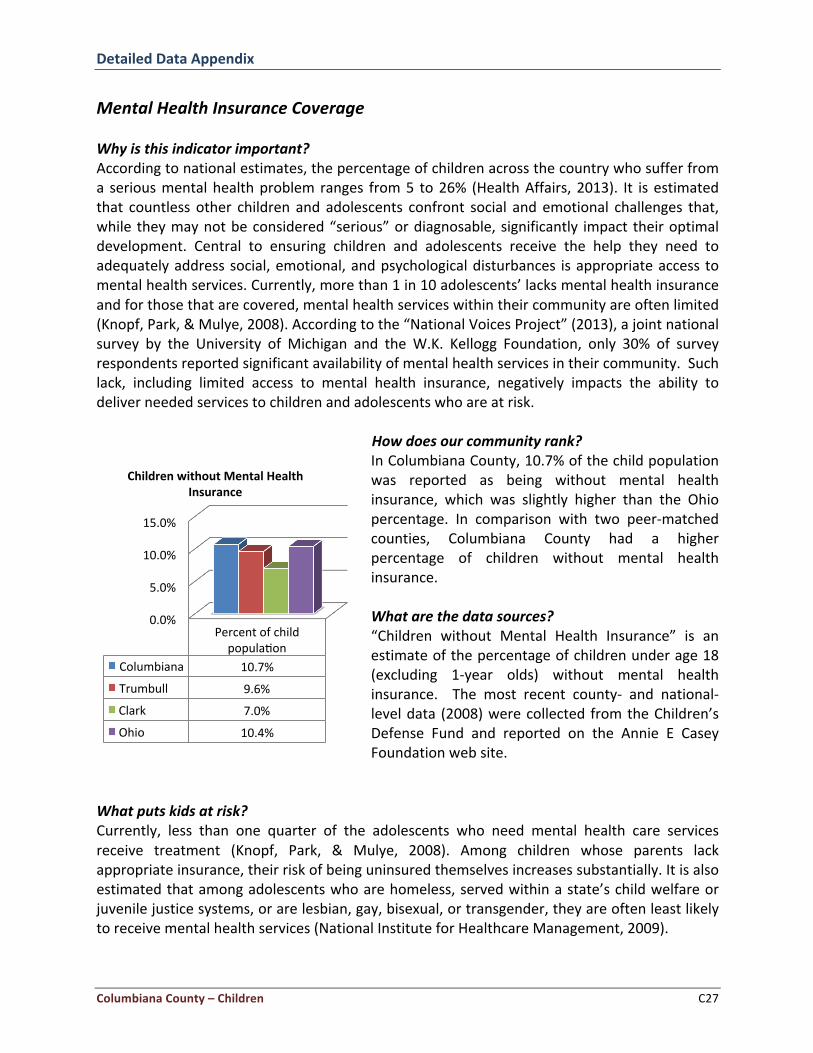
Detailed(Data(Appendix( ( (
Columbiana(County(–(Children(! ! C27!
Mental'Health'Insurance'Coverage'!Why'is'this'indicator'important?'According!to!national!estimates,!the!percentage!of!children!across!the!country!who!suffer!from!a! serious!mental!health!problem! ranges! from!5! to!26%! (Health!Affairs,! 2013).! It! is! estimated!that! countless! other! children! and! adolescents! confront! social! and! emotional! challenges! that,!while! they!may!not!be!considered!“serious”!or!diagnosable,! significantly! impact! their!optimal!development.! Central! to! ensuring! children! and! adolescents! receive! the! help! they! need! to!adequately!address!social,!emotional,!and!psychological!disturbances! is!appropriate!access! to!mental!health!services.!Currently,!more!than!1!in!10!adolescents’!lacks!mental!health!insurance!and!for!those!that!are!covered,!mental!health!services!within!their!community!are!often!limited!(Knopf,!Park,!&!Mulye,!2008).!According!to!the!“National!Voices!Project”!(2013),!a!joint!national!survey! by! the! University! of! Michigan! and! the!W.K.! Kellogg! Foundation,! only! 30%! of! survey!respondents!reported!significant!availability!of!mental!health!services!in!their!community.!!Such!lack,! including! limited! access! to! mental! health! insurance,! negatively! impacts! the! ability! to!deliver!needed!services!to!children!and!adolescents!who!are!at!risk.!!''''''''''''''''''''''''''''''''''''''''''''''''''''''''''''''''''''' How'does'our'community'rank?'
In!Columbiana!County,!10.7%!of!the!child!population!was! reported! as! being! without! mental! health!insurance,! which! was! slightly! higher! than! the! Ohio!percentage.! In! comparison! with! two! peerNmatched!counties,! Columbiana! County! had! a! higher!percentage! of! children! without! mental! health!insurance.!!What'are'the'data'sources?'“Children! without! Mental! Health! Insurance”! is! an!estimate!of!the!percentage!of!children!under!age!18!(excluding! 1Nyear! olds)! without! mental! health!insurance.! ! The! most! recent! countyN! and! nationalNlevel!data! (2008)!were!collected! from!the!Children’s!Defense! Fund! and! reported! on! the! Annie! E! Casey!Foundation!web!site.!!'
What'puts'kids'at'risk?'Currently,! less! than! one! quarter! of! the! adolescents! who! need! mental! health! care! services!receive! treatment! (Knopf,! Park,! &! Mulye,! 2008).! Among! children! whose! parents! lack!appropriate!insurance,!their!risk!of!being!uninsured!themselves!increases!substantially.!It!is!also!estimated!that!among!adolescents!who!are!homeless,!served!within!a!state’s!child!welfare!or!juvenile!justice!systems,!or!are!lesbian,!gay,!bisexual,!or!transgender,!they!are!often!least!likely!to!receive!mental!health!services!(National!Institute!for!Healthcare!Management,!2009).' '
0.0%!
5.0%!
10.0%!
15.0%!
Percent!of!child!populahon!
Columbiana! 10.7%!
Trumbull! 9.6%!
Clark! 7.0%!
Ohio! 10.4%!
Children(without(Mental(Health(Insurance(

Detailed(Data(Appendix( ( (
Columbiana(County(–(Children(! ! C28!
Number'of'Pediatric'Specialists'!Why'is'this'indicator'important?'In! a! survey! conducted! by! the! National! Association! of! Children’s! Hospitals! and! Related!Institutions!(NACHRI,!2010),!it!was!determined!that!shortages!in!pediatric!subspecialities,!such!as! neurology,! developmentalNbehavioral!medicine,! general! surgery,! pulmonology,! and! others!are!negatively!impacting!patient!care.!It!was!estimated!that!among!children!who!were!in!need!of!specialty!care,!many!waited!for!nearly!10!weeks!to!see!a!pediatric!endocrinologist!and!nearly!9!weeks!to!see!a!pediatric!neurologist! in! their!communities.!A! lack!of!pediatric!specialty!care!may! result! in! families! needing! to! travel! long! distances! to! receive! the! necessary! care,! or!choosing!to!forgo!the!care!entirely.!!!How'does'our'community'rank?'At! the! time! of! publication,! epidemiologic! data! were! not! available! on! the! actual! number! of!pediatric! specialists! in! a! given! area! to! be! able! to! determine! how! Columbiana! County! ranks!relative!to!its!peer!counties,!the!state,!and!the!US.!!However,!a!lack!of!pediatric!specialists!was!cited!by!community!leaders!and!community!residents!as!a!significant!public!health!problem!in!the!community.!!!!!What'are'the'data'sources?'Input!from!community!residents!and!community! leaders!were!obtained!through!focus!groups!and!interviews,!respectively.!!!What'puts'kids'at'risk?'Children!who! live! in! areas!with! limited! access! to!healthcare!providers!may!be!more! likely! to!experience! a! lack! of! pediatric! specialists! in! their! communities,! though! the! problem!may! be!universally!spread,!regardless!of!access.!!!! !

Detailed(Data(Appendix( ( (
Columbiana(County(–(Children(! ! C29!
Environmental(Factors(!Environmental!risk!factors!are!a!broad!category!of!external!conditions!that!can!negatively!affect!health! outcomes.! ! These! include! air! and! water! quality,! presence! of! toxic! substances,! public!health! infrastructure,! and! community! assets! and! deficits.! ! They! are! especially! important! for!children,!since!they!can!have!a!lasting!impact!on!healthy!physical!and!mental!development.!!The! environmental! factor! identified! as! prioritized! health! need! among! Columbiana( County(Children!is:!
• Access!to!Healthy!Food!!!Access'to'Healthy'Food'!Why'is'this'indicator'important?'For! children,! a! lack! of! access! to! healthy! foods! contributes! significantly! to! weightNrelated!complications!and!diseases.!Diminished!access! to!and!consumption!of!healthy! foods!has!also!been! shown! to! negatively! impact! school! performance! and! cognitive! development! among!children!(Let’s!Move!,!n.d.).!Hunger!among!children!is!also!of!immediate!concern,!where!it!was!estimated!by!the!USDA!that!49.1!million!people,!including!16.7!million!children,!lived!in!homes!that!experienced!food!insecurity!at!multiple!times!throughout!the!year!(USDA,!n.d).!The!USDA!also!estimates!that!23.5!million!people,!including!6.5!million!children,!live!in!lowNincome!areas!that!are!more!than!a!mile!from!a!supermarket.!!
!!'How'does'our'community'rank?'In!Columbiana!County,!the!density!of!WICNauthorized!food!stores!was!18.59!stores!per!100,000!population,!which! was! higher! than! both! the! Ohio! and! national!rates.! In! comparison! with! two! peerNmatched!counties,! Columbiana! County! had! a! higher! rate! of!WICNauthorized! stores! than! both! Trumbull! County!and!Clark!County.!!
!
0!
5!
10!
15!
20!
Stores!per!100,000!populahon!
Columbiana! 18.59!
Trumbull! 13.86!
Clark! 14.53!
Ohio! 15.4!
U.S.! 15.6!
WIC(Authorized(Food(Store(Access(

Detailed(Data(Appendix( ( (
Columbiana(County(–(Children(! ! C30!
!In! Columbiana! County,! 35.8%! of! children! were!reported!as!being!food!insecure,!which!was!higher!than!both!the!Ohio!and!national!rates.! !Moreover,!Columbiana! County! failed! to! meet! the! Healthy)People) 2020! target! of! 0.2%.! In! comparison! with!two! peerNmatched! counties,! the! Columbiana!County! percentage! of! food! insecure! children! was!lower!than!Trumbull!County!and!higher!than!Clark!County.!!
!!
!!!
!!!!In!Columbiana!County,!17.2%!of! the!population!was!designated! as! living! in! a! food! desert,! which! was!higher! than! both! the! Ohio! and! national! rates.! In!comparison! with! two! peerNmatched! counties,! the!percentage!of! the!population! living! in!a! food!desert!in!Columbiana!County!was!lower!than!both!Trumbull!County!and!Clark!County.!!
!!!!
!!In!Columbiana!County,!56%!of!the!zip!codes!had!an!outlet!with!healthy!food,!which!was!lower!than!the!Ohio! rate.! In! comparison! with! two! peerNmatched!counties,! the! percentage! of! zip! codes!with! access!to! healthy! foods! in! Columbiana! County! rate! was!lower!than!Trumbull!County!and!Clark!County.!!!!
0.0%!
20.0%!
40.0%!
60.0%!
Percent!of!child!populahon!Columbiana! 35.8%!
Trumbull! 43.3%!
Clark! 28.7%!
Ohio! 23.0%!
U.S.! 1.3%!
HP2020! 0.2%!
Food(Insecure(Children(
0.0%!
5.0%!
10.0%!
15.0%!
20.0%!
25.0%!
Percent!of!populahon!Columbiana! 17.2%!
Trumbull! 23.2%!
Clark! 19.4%!
Ohio! 8.3%!
!U.S.! 9.1%!
Popula;ons(Living(in(Food(Deserts(
0%!
20%!
40%!
60%!
80%!
100%!
Percent!of!zip!codes!with!outlet!
Columbiana! 56%!
Trumbull! 65%!
Clark! 100%!
Ohio! 64%!
Access(to(Healthy(Foods(

Detailed(Data(Appendix( ( (
Columbiana(County(–(Children(! ! C31!
!!!!In!Columbiana!County,!6%!of!poor!populations!were!designated!as!having! limited!access!to!healthy!food,!which! was! slightly! lower! than! the! Ohio! rate.! In!comparison! with! two! peerNmatched! counties,! the!percentage! of! poor! populations! with! no! access! to!healthy! food! in! Columbiana! County!was! lower! than!both!Trumbull!and!Clark!Counties.!!!!!!!!
What'are'the'data'sources?'“WIC! Authorized! Food! Store! Access”! is! the! number! of! food! stores! and! other! retail!establishments! per! 100,000! population! that! are! authorized! to! accept! WIC! Program! (Special!Supplemental! Nutrition! Program! for! Women,! Infants,! and! Children)! benefits! and! that! carry!designated!WIC! foods! and! food! categories.! ! The!most! recent! countyN! and!nationalNlevel! data!(2011)! were! acquired! from! the! United! States! Department! of! Agriculture! (USDA)! Food!Environmental! Atlas! (FEA)! and! were! reported! on! the! Community! Health! Needs! Assessment!toolkit!on!the!Community!Commons!web!site.!!“Food! Insecure! Children”! is! the! percentage! of! the! child! population! living! in! households!experiencing!food!insecurity.!!Food!insecurity!refers!to!the!USDA’s!measure!of!lack!of!access,!at!times,! to! enough! food! for! active,! healthy! life! for! all! household! members! and! limited! or!uncertain!availability!of!nutritionally! adequate! foods.! ! The!most! recent! countyN! and!nationalNlevel! data! (2010)! were! taken! from! the! Feeding! America’s! Map! to! Meal! Gap! Project! and!reported!on!the!Annie!E!Casey!Foundation!web!site.!!“Population!Living! in!Food!Deserts”! is!the!percentage!of!the!population! living! in!census!tracts!designated!as!food!deserts,!which!are!lowNincome!census!tracts!where!a!substantial!number!or!share!of! residents! has! low!access! to! a! supermarket! or! large! grocery! store.! ! The!most! recent!countyN! and! nationalNlevel! data! (2010)!were! acquired! from! the!United! States!Department! of!Agriculture! (USDA)! Food! Environmental! Atlas! (FEA)! and! were! reported! on! the! Community!Health!Needs!Assessment!toolkit!on!the!Community!Commons!web!site.!!“Access! to!Healthy! Foods”! is! the!percent!of! ZIP! codes!with! a!healthy! food!outlet.! ! The!most!recent! countyN! and!nationalNlevel! data! (2012)!were! taken! from! the!County!Business! Patterns!database!from!the!US!Census!Bureau!and!reported!on!the!County!Health!Rankings!web!site.!
0%!
2%!
4%!
6%!
8%!
Percent!of!poor!populahon!Columbiana! 6%!
Trumbull! 8%!
Clark! 7%!
Ohio! 7%!
Limited(Access(to(Healthy(Food(

Detailed(Data(Appendix( ( (
Columbiana(County(–(Children(! ! C32!
“Limited!Access!to!Healthy!Food”!is!the!percent!of!the!population!who!are!lowNincome!and!do!not!live!close!to!a!grocery!store.!!The!most!recent!countyN!and!nationalNlevel!data!(2012)!were!acquired! from!the!United!States!Department!of!Agriculture! (USDA)!Food!Environmental!Atlas!(FEA)!and!were!reported!on!the!County!Health!Rankings!web!site.!!!What'puts'kids'at'risk?'Children! living! in! lowNincome! urban! and! rural! communities! are!most! at! risk! for! experiencing!diminished! access! to! healthy! foods! (White! House! Task! Force! on! Childhood! Obesity,! 2010).!Families!who! report! times!of! food! insecurity! at!multiple! points! throughout! the! year! are! also!significantly!less!likely!to!have!regular!and!stable!access!to!nutritious!foods.!!

Detailed(Data(Appendix( ( (
! ! D1!
REFERENCES(!Administration!on!Aging.!(2013).!“Aging!Statistics.”!Accessed!June!15,!2013.!Available!at:!http://www.aoa.gov/AoARoot/Aging_Statistics/index.aspx.!!!Agency!for!Healthcare!Research!and!Quality!(AHRQ).!(2012).!“Primary!Care!Workforce!Facts!and!Stats.”!Accessed!June!15,!2013.!Available!at:!http://www.ahrq.gov/research/findings/factsheets/primary/pcworkforce/index.html.!!American!Academy!of!Pediatrics.!(2000).!“Insurance!Coverage!of!Mental!Health!and!Substance!Abuse!Services!for!Children!and!Adolescents:!A!Consensus!Statement.”!Pediatrics,!106,!860W862.!!American!Medical!News.!(2012).!“Primary!Care!Access!a!Key!to!Health!Disparities!Among!Counties.”!Accessed!June!15,!2013.!Available!at:!http://www.amednews.com/article/20130401/government/130409976/1/.!!American!Psychological!Association.!(n.d.)!“African!Americans!Have!Limited!Access!to!Mental!Health!and!Behavioral!Health!Care.”!Accessed!June!14,!2013.!Available!at:!http://www.apa.org/about/gr/issues/minority/access.aspx.!!Centers!for!Disease!Control!and!Prevention!(CDC).!(2009a).!“HygieneWRelated!Diseases:!Dental!Caries!(Tooth!Decay).”!Centers!for!Disease!Control!and!Prevention.!Accessed!June!14,!2013.!Available!at:!http://www.cdc.gov/healthywater/hygiene/disease/dental_caries.html.!!CDC.!(2009b).!“Heart!Disease!Behavior.”!Centers!for!Disease!Control!and!Prevention.!!Accessed!June!11,!2013.!Available!at:!http://www.cdc.gov/heartdisease/behavior.htm!!CDC.!!(2010a).!!“Unintentional!Drug!Poisoning!in!the!United!States.”!!Centers!for!Disease!Control!and!Prevention.!!Accessed!July!6,!2013.!!Available!at:!!http://www.cdc.gov/homeandrecreationalsafety/pdf/poisonWissueWbrief.pdf!!!CDC.!(2010b).!“Tobacco!Use!and!Pregnancy.”!Centers!for!Disease!Control!and!Prevention.!Accessed!June!11,!2013.!Available!at:!http://www.cdc.gov/reproductivehealth/TobaccoUsePregnancy/index.htm!!CDC.!(2010c).!Prevalence!of!Underweight!Among!Children!and!Adolescents:!United!States,!2007W2008.”!Centers!for!Disease!Control!and!Prevention.!Accessed!June!11,!2013.!Available!at:!http://www.cdc.gov/NCHS/data/hestat/underweight_child_07_08/underweight_child_07_08.pdf!!CDC.!(2011a).!“National!Cardiovascular!Disease!Surveillance.”!Centers!for!Disease!Control!and!Prevention.!Accessed!June!11,!2013.!Available!at:!!http://www.cdc.gov/dhdsp/ncvdss/index.htm!
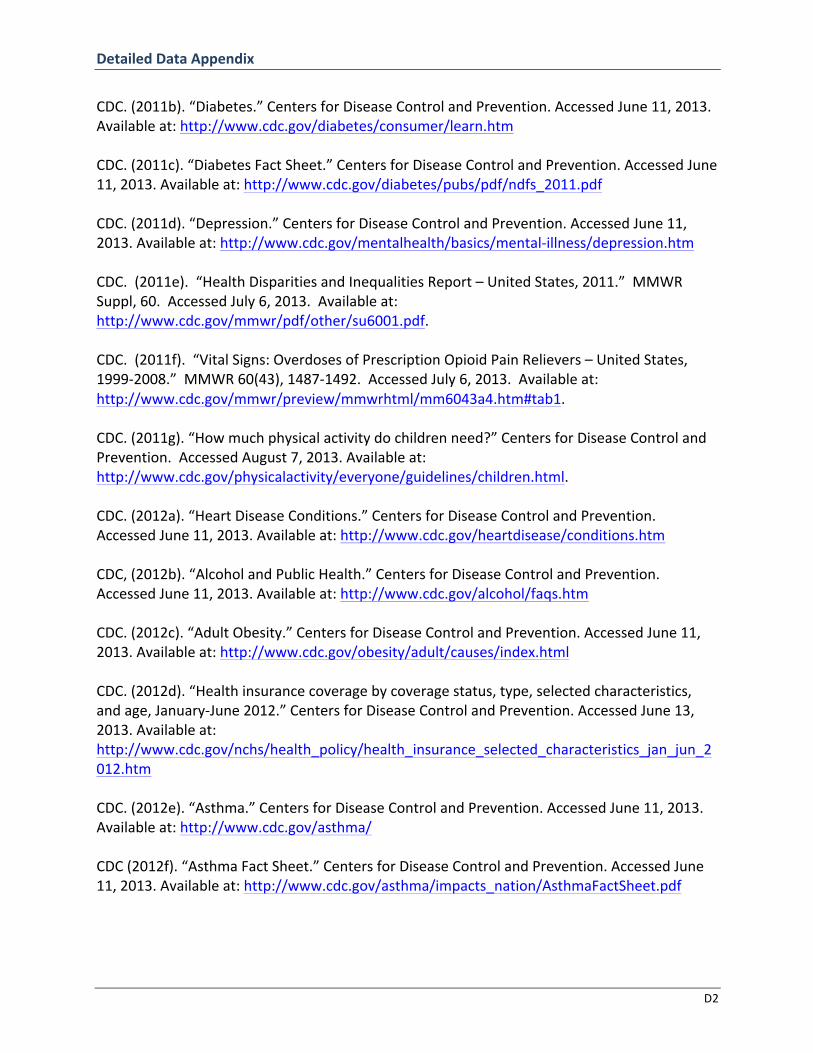
Detailed(Data(Appendix( ( (
! ! D2!
CDC.!(2011b).!“Diabetes.”!Centers!for!Disease!Control!and!Prevention.!Accessed!June!11,!2013.!
Available!at:!http://www.cdc.gov/diabetes/consumer/learn.htm!
!
CDC.!(2011c).!“Diabetes!Fact!Sheet.”!Centers!for!Disease!Control!and!Prevention.!Accessed!June!
11,!2013.!Available!at:!http://www.cdc.gov/diabetes/pubs/pdf/ndfs_2011.pdf!
!
CDC.!(2011d).!“Depression.”!Centers!for!Disease!Control!and!Prevention.!Accessed!June!11,!
2013.!Available!at:!http://www.cdc.gov/mentalhealth/basics/mentalWillness/depression.htm!
!
CDC.!!(2011e).!!“Health!Disparities!and!Inequalities!Report!–!United!States,!2011.”!!MMWR!
Suppl,!60.!!Accessed!July!6,!2013.!!Available!at:!
http://www.cdc.gov/mmwr/pdf/other/su6001.pdf.!!
!
CDC.!!(2011f).!!“Vital!Signs:!Overdoses!of!Prescription!Opioid!Pain!Relievers!–!United!States,!
1999W2008.”!!MMWR!60(43),!1487W1492.!!Accessed!July!6,!2013.!!Available!at:!
http://www.cdc.gov/mmwr/preview/mmwrhtml/mm6043a4.htm#tab1.!
!
CDC.!(2011g).!“How!much!physical!activity!do!children!need?”!Centers!for!Disease!Control!and!
Prevention.!!Accessed!August!7,!2013.!Available!at:!
http://www.cdc.gov/physicalactivity/everyone/guidelines/children.html.!
!
CDC.!(2012a).!“Heart!Disease!Conditions.”!Centers!for!Disease!Control!and!Prevention.!!
Accessed!June!11,!2013.!Available!at:!http://www.cdc.gov/heartdisease/conditions.htm!
!
CDC,!(2012b).!“Alcohol!and!Public!Health.”!Centers!for!Disease!Control!and!Prevention.!!
Accessed!June!11,!2013.!Available!at:!http://www.cdc.gov/alcohol/faqs.htm!
!
CDC.!(2012c).!“Adult!Obesity.”!Centers!for!Disease!Control!and!Prevention.!Accessed!June!11,!
2013.!Available!at:!http://www.cdc.gov/obesity/adult/causes/index.html!
!
CDC.!(2012d).!“Health!insurance!coverage!by!coverage!status,!type,!selected!characteristics,!
and!age,!JanuaryWJune!2012.”!Centers!for!Disease!Control!and!Prevention.!Accessed!June!13,!
2013.!Available!at:!!
http://www.cdc.gov/nchs/health_policy/health_insurance_selected_characteristics_jan_jun_2
012.htm!
!
CDC.!(2012e).!“Asthma.”!Centers!for!Disease!Control!and!Prevention.!Accessed!June!11,!2013.!
Available!at:!http://www.cdc.gov/asthma/!
!
CDC!(2012f).!“Asthma!Fact!Sheet.”!Centers!for!Disease!Control!and!Prevention.!Accessed!June!
11,!2013.!Available!at:!http://www.cdc.gov/asthma/impacts_nation/AsthmaFactSheet.pdf!
!

Detailed(Data(Appendix( ( (
! ! D3!
CDC.!(2012g).!“Infant!Mortality.”!Centers!for!Disease!Control!and!Prevention.!Accessed!June!11,!2013.!Available!at:!http://www.cdc.gov/reproductivehealth/MaternalInfantHealth/InfantMortality.htm!!CDC.!(2012h).!“Childhood!Obesity.”!Centers!for!Disease!Control!and!Prevention.!Accessed!June!11,!2013.!Available!at:!http://www.cdc.gov/obesity/childhood/basics.html!!CDC.!(2012i).!“Child!Maltreatment!W!Facts!at!a!Glance.”!Centers!for!Disease!Control!and!Prevention.!Accessed!June!15,!2013.!Available!at:!http://www.cdc.gov/violenceprevention/pdf/cm_datasheet2012Wa.pdf!!CDC.!(2012j).!“Suicide”.!Centers!for!Disease!Control!and!Prevention.!Accessed!June!11,!2013.!Available!at:!http://www.cdc.gov/violenceprevention/suicide/statistics/leading_causes.html!!CDC.!(2012k).!“Suicide!Risk!Factors.”!Centers!for!Disease!Control!and!Prevention.!Accessed!June!11,!2013.!Available!at:!http://www.cdc.gov/violenceprevention/suicide/riskprotectivefactors.html!!CDC.!!(2013a).!!“Chronic!Disease!Prevention!and!Health!Promotion.”!!Centers!for!Disease!Control!and!Prevention.!!Accessed!July!6,!2013.!!Available!at:!!http://www.cdc.gov/chronicdisease/index.htm!!!CDC.!(2013b).!“Basic!Information!About!Health!Disparities!in!Cancer.”!Centers!for!Disease!Control!and!Prevention.!Accessed!June!11,!2013.!Available!at:!http://www.cdc.gov/cancer/healthdisparities/basic_info/index.htm!!CDC.!(2013c).!“United!States!Cancer!StatisticsW!Cancer!Type.”!Centers!for!Disease!Control!and!Prevention.!Accessed!June!11,!2013.!Available!at:!!!http://www.cdc.gov/Features/CancerStatistics/!!CDC.!(2013d).!“Risk!Factors!that!Contribute!to!Health!Disparities!in!Cancer.”!Centers!for!Disease!Control!and!Prevention.!!Accessed!June!11,!2013.!Available!at:!http://www.cdc.gov/cancer/healthdisparities/basic_info/challenges.htm!!CDC.!(2013e).!“Tobacco!Fast!Facts.”!Centers!for!Disease!Control!and!Prevention.!Accessed!June!11,!2013.!Available!at:!http://www.cdc.gov/tobacco/data_statistics/fact_sheets/fast_facts/index.htm!!CDC.!(2013f).!!“Diabetes!Data!&!Trends.”!!Centers!for!Disease!Control!and!Prevention.!!Accessed!July!6,!2013.!!Available!at:!!http://www.cdc.gov/diabetes/statistics/prev/national/figbyrace.htm.!!!

Detailed(Data(Appendix( ( (
! ! D4!
CDC.!(2013g).!“Preterm!Birth.”!Centers!for!Disease!Control!and!Prevention.!Accessed!June!11,!2013.!Available!at:!http://www.cdc.gov/reproductivehealth/MaternalInfantHealth/PDF/PretermBirthWInfographic.pdf!!Children’s!Defense!Fund.!(2010a).!“Children’s!Defense!Fund:!Mental!Health!Fact!Sheet.”!Accessed!June!15,!2013.!Available!at:!http://www.childrensdefense.org/childWresearchWdataWpublications/data/mentalWhealthWfactsheet.pdf.!!Children’s!Defense!Fund.!(2010b).!“Uninsured!Children.”!Accessed!June!15,!2013.!Available!at:!http://www.childrensdefense.org/policyWpriorities/childrensWhealth/uninsuredWchildren/.!!Fitzpatrick!AL,!et!al.!(2004).!“Barriers!to!Health!Care!Access!Among!the!Elderly!and!Who!Perceives!Them.”!American!Journal!of!Public!Health,!94(10),!1788W1794.!!Health!Affairs.!(2012).!“Improving!Care!Transitions.”!Accessed!June!15,!2013.!Available!at:!http://healthaffairs.org/healthpolicybriefs/brief_pdfs/healthpolicybrief_76.pdf!!Institute!of!Medicine!(IOM).!(2001).!“Crossing!the!Quality!Chasm:!A!New!Health!System!for!the!21st!Century.”!Accessed!June!15,!2013.!Available!at:!http://iom.edu/Reports/2001/CrossingWtheWQualityWChasmWAWNewWHealthWSystemWforWtheW21stWCentury.aspx.!!!IOM.!(2011).!“Advancing!Oral!Health!in!America.”!Accessed!June!14,!2013.!Available!at:!http://www.iom.edu/Reports/2011/AdvancingWOralWHealthWinWAmerica.aspx!!Kaiser!Family!Foundation.!(2011).!“Primary!Care!Shortage.”!Accessed!June!14,!2013.!Available!at:!http://www.kaiseredu.org/IssueWModules/PrimaryWCareWShortage/BackgroundWBrief.aspx#footnote1.!!Kaiser!Family!Foundation.!(2012).!“The!Uninsured!W!A!Primer:!Key!Facts!About!Americans!Without!Health!Insurance.”!!Accessed!June!14,!2013.!Available!at:!http://kaiserfamilyfoundation.files.wordpress.com/2013/01/7451W08.pdf!!Kessler!RC,!Chiu!W,!Demler!O,!et!al.!!(2005).!!Prevalence,!severity,!and!comorbidity!of!twelveWmonth!DSMWIV!disorders!in!the!National!Comorbidity!Survey!Replication.!Arch!Gen!Psychiatry.!2005!Jun;62(6):617W27.!!Let’s!Move!!(n.d.)!“Healthy!Communities.”!Accessed!June!15,!2013.!Available!at:!http://www.letsmove.gov/healthyWcommunities!!Mayo!Clinic.!(2012).!“Prescription!Drug!Abuse.”!Mayo!Clinic.!!Accessed!June!11,!2013.!Available!at:!http://www.mayoclinic.com/health/prescriptionWdrugWabuse/DS01079/DSECTION=riskWfactors!

Detailed(Data(Appendix( ( (
! ! D5!
MedlinePlus.!!(2013a).!!Bethesda,!MD:!National!Library!of!Medicine!(US);!updated!June!6,!3013.!!Accessed!June!13,!2013.!!Available!at:!!http://www.nlm.nih.gov/medlineplus/childmentalhealth.html.!!MedlinePlus!(2013b).!!Bethesda,!MD:!National!Library!of!Medicine!(US);!updated!July!4,!2013.!!Accessed!July!6,!2013.!!Available!at:!!http://www.nlm.nih.gov/medlineplus/childbehaviordisorders.html.!!Mouradian!WE,!Wehr!E,!&!Crall!JJ.!(2000).!“Disparities!in!Children’s!Oral!Health!and!Access!to!Dental!Care.”!Journal!of!the!American!Medical!Association,!284(20),!2625W2631.!!National!Center!on!Addiction!and!Substance!Abuse!(NCASA).!!(2008).!!“National!Survey!of!American!Attitudes!on!Substance!Abuse!XIII:!Teens!and!Parents.”!!Accessed!July!6,!2013.!!Available!at:!http://www.casacolumbia.org/articlefiles/380W2008%20Teen%20Survey%20Report.pdf.!!NIH.!(2009).!“Mind!Over!Matter:!Opiates.”!National!Institute!on!Drug!Abuse.!http://www.drugabuse.gov/publications/mindWoverWmatter/opiates!!NIH.!(2012).!“Prescription!Drugs.”!National!Institute!on!Drug!Abuse.!Accessed!June!11,!2013.!Available!at:!!http://www.drugabuse.gov/drugsWabuse/prescriptionWdrugs!!Ohio!Department!of!Health!(ODH).!!(2011).!!2011!Youth!Risk!Behavior!Survey!Results.!!Accessed!July!6,!2013.!!Available!at:!http://www.odh.ohio.gov/~/media/ODH/ASSETS/Files/web%20team/features/yrbsresultstable.ashx.!!The!Pew!Foundation.!(2011).!“The!State!of!Children’s!Dental!Health:!Making!Coverage!Matter.”!Accessed!June!15,!2013.!Available!at:!http://www.pewtrusts.org/uploadedFiles/wwwpewtrustsorg/Reports/State_policy/Childrens_Dental_50_State_Report_2011.pdf!!Robert!Wood!Johnson!Foundation.!(2012).!“Health!Policy!Snapshot:!Do!All!Americans!Have!Equal!Access!to!Healthy!Foods?”!Accessed!June!15,!2013.!Available!at:!http://www.rwjf.org/content/dam/farm/reports/issue_briefs/2012/rwjf71327.!!United!States!Department!of!Agriculture!(USDA).!(n.d.)!“Healthy!Food!Access.”!Accessed!June!15,!2013.!Available!at:!http://www.usda.gov/documents/7WHealthyfoodaccess.pdf.!!United!States!Department!of!Health!and!Human!Services!(HHS).!!(2013).!!Office!of!Disease!Prevention!and!Health!Promotion.!!Healthy!People!2020.!!Washington,!DC.!!Accessed!June!15,!2013.!!Available!at:!http://www.healthypeople.gov/2020/!!

Detailed(Data(Appendix( ( (
! ! D6!
United!States!Office!of!the!Surgeon!General.!(2000).!“Oral!Health!in!America:!A!Report!of!the!Surgeon!General.”!Accessed!June!15,!2013.!Available!at:!http://www2.nidcr.nih.gov/sgr/execsumm.htm.!!White!House!Task!Force!on!Childhood!Obesity.!(2010).!“Solving!the!Problem!of!Childhood!Obesity!Within!a!Generation.”!Accessed!June!15,!2013.!Available!at:!http://www.letsmove.gov/sites/letsmove.gov/files/TaskForce_on_Childhood_Obesity_May2010_FullReport.pdf.!!!The!World!Health!Organization!(WHO).!The!world!health!report!2004:!Changing!history.!Annex!Table!3:!Burden!of!disease!in!DALYs!by!cause,!sex,!and!mortality!stratum!in!WHO!regions,!Estimates!for!2002;!A126WA127.!Geneva:!WHO;!2004.!!!!!!
Copyright © 2022 FDOKUMEN