CHILDREN'S BARGAINING BEHAVIOR
40
BARGAINING BY CHILDREN William T. Harbaugh University of Oregon and N.B.E.R. Eugene, Oregon 97403-1285 [email protected] Kate Krause University of New Mexico 1915 Roma NE, Economics Building. Albuquerque, NM 87131-1101 [email protected] Steven G. Liday, Jr. University of Oregon (Student) Eugene, Oregon 97403-1285 [email protected] JEL classifications: C70 D10 D63 Keywords: children, bargaining, dictator game, ultimatum game. Abstract: We study the development of bargaining behavior in children age seven through 18, using ultimatum and dictator games. We find that bargaining behavior changes substantially with age and that most of this change appears to be related to changes in preferences for fairness, rather than bargaining ability. Younger children make and accept smaller ultimatum proposals than do older children, Even young children are quite strategic in their behavior, making much smaller dictator than ultimatum proposals. Boys claim to be more aggressive bargainers than girls do, but they are not. Older girls make larger dictator proposals than older boys, but dictator proposals differ more by height than by sex. We argue that the existence of systematic differences in bargaining behavior across age and sex supports the argument that culture is a determinant of economic behavior, and suggests that people acquire this culture during childhood. Acknowledgments: We thank the children, teachers and administrators of the Coquille and Myrtle Point, Oregon public school districts for their assistance, without which this research would have been impossible. This research was supported by a grant from the NSF.
Transcript of CHILDREN'S BARGAINING BEHAVIOR
BARGAINING BY CHILDREN
William T. Harbaugh University of Oregon
and N.B.E.R. Eugene, Oregon 97403-1285 [email protected]
Kate Krause
University of New Mexico 1915 Roma NE, Economics Building.
Albuquerque, NM 87131-1101 [email protected]
Steven G. Liday, Jr.
University of Oregon (Student) Eugene, Oregon 97403-1285
JEL classifications: C70 D10 D63 Keywords: children, bargaining, dictator game, ultimatum game. Abstract: We study the development of bargaining behavior in children age seven through 18, using ultimatum and dictator games. We find that bargaining behavior changes substantially with age and that most of this change appears to be related to changes in preferences for fairness, rather than bargaining ability. Younger children make and accept smaller ultimatum proposals than do older children, Even young children are quite strategic in their behavior, making much smaller dictator than ultimatum proposals. Boys claim to be more aggressive bargainers than girls do, but they are not. Older girls make larger dictator proposals than older boys, but dictator proposals differ more by height than by sex. We argue that the existence of systematic differences in bargaining behavior across age and sex supports the argument that culture is a determinant of economic behavior, and suggests that people acquire this culture during childhood. Acknowledgments: We thank the children, teachers and administrators of the Coquille and Myrtle Point, Oregon public school districts for their assistance, without which this research would have been impossible. This research was supported by a grant from the NSF.
2
BARGAINING BY CHILDREN
JEL classifications: C70 D10 D63 Keywords: children, bargaining, fairness, dictator game, ultimatum game. Abstract: We study the development of bargaining behavior in children age seven through 18, using ultimatum and dictator games. We find that bargaining behavior changes substantially with age and that most of this change appears to be related to changes in preferences for fairness, rather than bargaining ability. Younger children make and accept smaller ultimatum proposals than do older children, Even young children are quite strategic in their behavior, making much smaller dictator than ultimatum proposals. Boys claim to be more aggressive bargainers than girls do, but they are not. Older girls make larger dictator proposals than older boys, but dictator proposals differ more by height than by sex. We argue that the existence of systematic differences in bargaining behavior across age and sex supports the argument that culture is a determinant of economic behavior, and suggests that people acquire this culture during childhood.
BARGAINING BY CHILDREN
I. Introduction
While Adam Smith believed that the propensity to “truck, barter, and exchange” was a
part of human nature1, it seems unlikely that these behaviors are completely determined at birth.
Instead it seems probable that they are at least in part acquired during childhood. In this paper we
report on the results of a study that uses economic experiments to examine the development of
bargaining behavior in children from age seven to eighteen.
There are good reasons to study bargaining in children. One motivation is that studying
bargaining in children may teach us more about bargaining by adults. In most bargaining
situations optimal decisions depend on an understanding of how others will respond. Beliefs
about fairness, and about what others believe to be acceptable, are important considerations.
Very little work has been done on when or how these beliefs and knowledge are acquired. We
think it’s likely that people learn how to bargain at the same time they learn so much else - when
they are children. We know that adults exhibit wide variations in bargaining behavior, both
within and across cultures. It seems likely that these variations lead to different outcomes in such
matters as wages, job searches, and housing and auto purchases. Studying the development of
bargaining behavior will lead to more knowledge about the sources of this heterogeneity in both
behavior and in economic outcomes.
Another set of reasons arise because children make many important decisions that
involve bargaining with others. Many family decisions, with important consequences for adults
and children, are the result of bargaining between parents and children. An understanding of how
children bargain will lead to better models of these decisions. For example, rich parents often
want their children to make larger investments in education than the children themselves want to
make, while poor parents often prefer smaller investments. Parents and children bargain
extensively over the size of these investments, over who will make the sacrifices needed to
finance them, and over what kind of education will be acquired. The outcome of this bargaining
process will obviously depend in part on the bargaining abilities of the parties involved. An
understanding of how these strategies change with variables such as age and sex may also lead to
1 Smith (1776/1937)
2
a better modeling of human capital accumulation. Another important example involves
bargaining between children. Research on education consistently shows the importance of peer
effects. Modeling how peer effects work requires an understanding of how children with
different preferences influence each other’s decisions, which is in part a bargaining question.
We use the ultimatum game to study bargaining behavior. For this game two children are
paired anonymously and assigned the role of proposer or responder. The proposer suggests how
to split some money. If the responder accepts, each gets the amount proposed. If the responder
rejects, neither gets anything. If both players only care about their own payoffs then the proposer
should offer the smallest possible amount, and the responder should accept. But, there are two
reasons to make larger proposals: the proposer might care about the responder’s payoff, or she
might fear that responder cares about fairness and will reject a small proposal. To distinguish
between these two motives we also conducted dictator game experiments. The dictator game is
the same as the ultimatum game except the responder has no ability to reject: he just gets
whatever the proposer offers. In combination these two games allow us to separate proposals into
a fairness component and a strategic component, where the second component is due to a
calculation of the chance that a small proposal will be rejected.
We did both experiments on a total of 310 children, in second through twelfth grade
classrooms. Almost all the children acted strategically, making larger ultimatum than dictator
proposals. We found significant differences in behavior in both games across age, sex, and
height. Young children made considerably smaller dictator and ultimatum proposals than older
children and adults. Interestingly, they were also more likely to accept small proposals. As a
result, when acting as proposers in the ultimatum games, the youngest children actually earned
more than the older ones. Older girls made larger proposals than older boys. Among the younger
children, shorter girls made much larger proposals than tall ones, particularly in the dictator
games. Last, we found that children’s self-reported propensity to reject “unfair” ultimatum offers
was substantially exaggerated, and that all this exaggeration came from boys.
We conclude that children are good bargainers by the age of seven. Like adults they have
preferences about their own payoff and the payoffs of others. Their choices show that they
understand that the optimal bargaining strategy depends on the situation and on the preferences
of those with whom they are bargaining, and that they have a working knowledge of what those
preferences are. However, we do not find that these preferences are fixed, homogenous, or
3
unexplainable: they vary substantially across age, sex, and relative height. We believe that these
results not only support existing work on the existence of cultural differences in economic
behavior, they also suggest two new directions for further research in that area: one into how
cultural influences affect behavior, and another into the origins of differences in behavior within
a culture.
This paper begins with a brief review of the literature from economics, anthropology, and
developmental psychology. This is followed by a description of our protocol. We begin the
analysis of our experimental results with a descriptive section comparing proposals in the
ultimatum and dictator games. We then trace the development of concerns for fairness by
looking at how dictator proposals and ultimatum rejections vary with age and height. Next we
look at strategic considerations: how good are children at making optimal ultimatum proposals,
given the probabilities that small offers will be rejected? We then compare children’s actual and
stated behavior. In the conclusion we discuss some of the implications of these results.
II: Literature Review
The economic literature on bargaining is extensive, and a more comprehensive review is
in Roth (1995). Since devised by Guth, Schmittberger and Schwarze (1982), the ultimatum
experiment has been done many times. Proposals typically have a mode at 50% of the
endowment and a mean of about 40%. Proposals smaller than this are often rejected, even when
the sums involved are very large, as in Cameron (1999), who conducts the experiments on
Indonesians using amounts equivalent to several months’ wages. While these results are very
different from the subgame perfect Nash predictions for selfish preferences, they are not
necessarily irrational. Rabin (1993), Fehr and Schmidt (1999) and Bolton and Ockenfels (2000)
have created models of preferences for fairness that can accommodate this behavior.
There is evidence that ultimatum behavior varies across cultures. Roth, et al. (1991) study
students from four different countries. For their first round ultimatum experiments, average
proposals range from 36% in Israel to 47% in the United States. Correspondingly, Israelis are
more likely to accept a given proposal than Americans. Henrich (2000) compares ultimatum
bargaining behavior (over amounts equivalent to several day’s wages) between members of the
Machiguenga tribe in Peru with that of graduate students in the UCLA anthropology department.
4
He finds that the mean offer among the Machiguenga is only 26% of the endowment, and even
lower offers are almost always accepted, while at UCLA the mean offer was 48%, and many
people at least claimed that they would reject lower amounts. He argues that this provides
evidence for cultural differences in economic behavior, and he attributes the Machiguenga’s
behavior to their culture, which involves few economic relationships outside of the family.
Henrich, et al. (2001) report further results from 15 small-scale societies, and argue that
differences in the general level of social interactions within a culture can explain differences in
behaviors across societies.
In addition to this evidence that culture matters in bargaining there is some evidence of
systematic behavioral differences within a culture. Eckel and Grossman (2001) report that in
their experiments female college students make statistically significantly larger ultimatum offers
than males. While the proposal differences were small, they also found that females were much
less likely to reject a given offer. Solnick (2000) also looks at ultimatum games and finds no sex
differences in ultimatum proposals, but that female students were much less likely to reject
proposals. Croson and Buchan (1999) look for differences in behavior in the “trust game” for
different sexes in different countries. They find no differences across countries, but in general
women return a larger proportion of the money sent them by an anonymous partner than men do.
There is also work on sex differences in dictator games. Eckel and Grossman (1998) report that
men give 8% of their endowment, women 16%. Andreoni and Vesterlund (2001) do a version of
the dictator game with different endowments and costs of giving, and find that men’s proposals
are more sensitive to price than women’s. Ayres and Siegelman (1995) find that even when using
identical bargaining strategies car dealers quote higher prices to (American) women and blacks
than to white men. This could be a consequence of the dealers reacting to systematic differences
in bargaining behaviors among regular customers, but it could also result from discrimination or
differences in average reservation prices among these groups.
Several papers report on across subjects comparisons of behavior in ultimatum and
dictator games. In their treatments with real payoffs, Forsythe, et al. (1994) find that proposals in
the ultimatum games are significantly larger than those in the dictator games: 46% versus 22% of
the pie. They conclude that the ultimatum offers are due in part to fear of rejection, and in part to
concern for the other person’s payoff. Anderson, Rodgers and Rodriguez (2000) compare
ultimatum and dictator behavior for university students in the U.S. and in Honduras. They find

5
that while in the U.S. people make smaller dictator proposals if they do ultimatum bargaining
first, order has no effect with the Honduran participants.
There is one previous study of children and ultimatum games. Murnighan and Saxon
(1998) report on a study of bargaining attitudes in children from kindergarten through ninth
grade. In face to face interviews they asked individual children, recruited from public school
classes, what offers they would make and accept in hypothetical ultimatum bargaining situations
involving first money and then candy. In general, subjects seemed much more interested in
candy than money, and they often said very different things across the money and candy
treatments. They found that the proposals kindergartners gave were quite unstrategic: sometimes
they told the experimenter they would give away everything. Third graders said they would
make smaller proposals than sixth graders did. Third grade boys seemed the most strategic, and
boys in general were more likely to say they would take advantage of others in treatments where
they had better information. For responses, the only significant age difference was that the
youngest children said they were more likely to accept very small proposals.
In addition to this economic literature, there is a large literature from developmental
psychology that relates, sometimes indirectly, to the development of bargaining behavior. Most
of this literature is concerned with how “prosocial” reasoning and behavior develop with age and
differ across sexes, and what factors encourage such behavior. Eisenberg and Fabes (1998)
provide a comprehensive survey. The word prosocial includes things such as cooperative
behavior, distinctions between what is right and what is wrong, compliance with social norms,
and absence of criminality. This literature is at least as concerned with how children reason about
these issues as about their behavior, and the methodology is often very different from that used
in economic experiments. Many studies use surveys or interviews, often asking mothers to
describe their children’s behavior. Some involve observations in classrooms and playgrounds,
and a few involve laboratory simulations of real life situations, using puppets or similar devices.
The experiments often involve some sort of deception and generally do not have salient payoffs.
Kohlberg (1976) is perhaps the most widely cited work in this field. Kohlberg used
survey data on how children reason about a series of hypothetical moral dilemmas to argue that
children pass through a series of stages of moral development. He found that the biggest shift
occurs around age 12, when children begin to move away from seeing moral behavior as a matter
of obeying rigid rules and towards seeing it as being a matter of fulfilling obligations to others.

6
As with earlier theories that have proposed discreet stages of development, e.g. Piaget (1965),
attempts to link these stages of reasoning with actual behavior have met with mixed success.
However, a meta-analysis of 125 studies by Fabes and Eisenberg (1996), does find that prosocial
behaviors generally increase with age. Studies in which simulated or actual donating took place
found larger age affects than did surveys. Eisenberg (1986) has shown a positive correlation
between prosocial reasoning and cognitive ability within ages, and argues that the age trend is in
part due to an increasing capacity for the sort of cognitive reasoning that is needed to keep score
and figure out what is fair and what is not.
Perhaps the most related experiment from this literature is Keil (1986). Keil showed
second and sixth grade children a videotape of another child, telling them that this was live video
and that the two of them would be simultaneously sorting letters by zip-code, for a nickel per
letter. Treatments had the videotaped child performing their part of the task either quickly or
slowly. At the end of each round, the subject and the co-worker (actually, the experimenter, who
decided randomly) allocated the pair’s earnings between themselves, taking turns as to who
decided the split. Older children were less vengeful after the “co-worker” had divided the nickels
unfairly, and were more likely to reciprocate fair and generous distributions. (In the end, every
participant was give the same $2.50 payoff.)
The development of sex differences has also received attention from psychologists. The
meta-analysis by Fabes and Eisenberg (1996) documents differences in prosocial reasoning,
(girls are better) but reports that differences in actual behavior are not so strong. They also show
that there is a general increase in sex differences with age, with some research finding that the
differences arise during adolescence. They caution that much of this research suffers from using
sex-biased definitions of pro-social behavior. For example, girls might report yes when asked if
they would give up their lunch milk to feed a stray kitten, but boys might say yes if asked if they
would rescue a kitten from a tree, particularly if use of a ladder or a fire-truck was involved.
Last, there is a substantial literature on the effect of physical characteristics on wages.
Perhaps the paper with the closest connection to this work is Persico, Postlewaite and Silverman
(2001). The authors find that while taller men earn more than short ones, all this correlation can
be explained using height at age 16. Height as an adult does not add any additional explanatory
power. They attribute this to the fact that taller adolescents report having larger social networks,
7
which they hypothesize lead to the development of skills that are valuable in the labor market.
This suggests that childhood developmental factors have important consequences for adults.
By conducting standard economic bargaining experiments on children we make several
contributions to this literature. We are able to compare children’s behavior to what others have
already documented for adults, and we can compare the differences that have been found across
cultures with differences across age. We can look at how the sex differences in bargaining that
have been reported by others occur with age. Last, we can ask whether children are strategic
bargainers – do their proposals make sense, given the rules of the game and the odds of rejection.
III. Participants and protocol
We modified the usual dictator and ultimatum protocols so as to make them
understandable to children. The instructions are in the appendix. We obtained permission from
the Coquille and Myrtle Point, Oregon public school districts to run experiments in their schools
and then asked individual teachers for permission to conduct the experiments in their classrooms.
Coquille and Myrtle Point are logging and farming towns with populations of about 4,000, and
our samples range from about 50% to 90% of the local population in each age group. Since
school attendance is mandatory, and few children in these towns go to private schools or are
home schooled, we avoid the usual problems of over-sampling children from richer and more
educated families present in self-selected samples. Our sample is also more representative of the
population from which it is drawn than is typical for economic experiments. On the other hand,
while our sample is representative of children in these towns, it is not representative of the
national population of children, and it also differs from the samples of college students on which
most experiments are conducted.
We did the experiments on 310 children in second, fourth, fifth, ninth, and twelfth grades.
The twelfth-graders are included because they are close in age to college freshmen, but closer in
other respects to the rest of our sample. We did not collect data on individual ages, but the
average ages of these groups are seven, nine, ten, fourteen, and eighteen respectively, and
variations of more than a year are rare. Since the experiments were conducted in their regular
classrooms, children always played against others of the same age. They also knew the other
players, though their specific partners were anonymous and they made their decisions secretly.

8
Each participant played two ultimatum games, once as proposer and once as responder, and two
dictator games, again as both proposer and responder. They were told that multiple games would
be played, but not how many of each or of what type. We paid them after each round, and
matched them with a different player each time.
Each game was played with an endowment of ten tokens. The ninth and twelfth graders
could exchange tokens for cash at the end of the experiment, at preannounced rates of $0.25 and
$0.50 per token. The younger children could use the tokens to buy toys and school supplies from
us at the end of the experiment. We told them that each token was worth about $0.25, and that
our prices were about the same as in a regular store. It was very clear that these payoffs were
sufficient to engage the interest of all the age groups.
We conducted two versions of the experiment, one starting with the dictator game and
another with the ultimatum game. Within each version there were two groups of subjects, those
whose initial role was as a proposer, and those who started as a responder. Subjects kept the
same initial role for both games, so that while everyone played each role in each game, they did
so in one of four different treatments, with their roles ordered as follows:
Version A: Treatment 1: dictator proposer, dictator responder, ultimatum proposer, ultimatum responder. Treatment 2: dictator responder, dictator proposer, ultimatum responder, ultimatum proposer. Version B: Treatment 3: ultimatum proposer, ultimatum responder, dictator proposer, dictator responder. Treatment 4: ultimatum responder, ultimatum proposer, dictator responder, dictator proposer.
Note that with our design some people make, say, their dictator proposal in the first round
of the experiment, while others make it in the second, and so on. The number of participants by
grade and experiment version are shown in the appendix. In the analysis, we pool the fourth and
fifth grade classes.
IV. Results
We start with descriptive data by age and across games. We show that there are
significant differences in proposals across age groups and that even the youngest children make
very different proposals in the dictator and the ultimatum games, indicating that they understand

9
the protocol and that they play strategically. We then look at how behavior is affected by the
order in which a game is played and by experience. The next sub-section examines demographic
effects. We find that proposals vary with sex and height, as well as with age. Then we look at
whether children’s ultimatum proposals are optimal, given the observed rejection rates. We
follow this with a within-subjects comparison of behaviors across games, and finally we compare
stated and actual rejection decisions.
Descriptive results by age and game
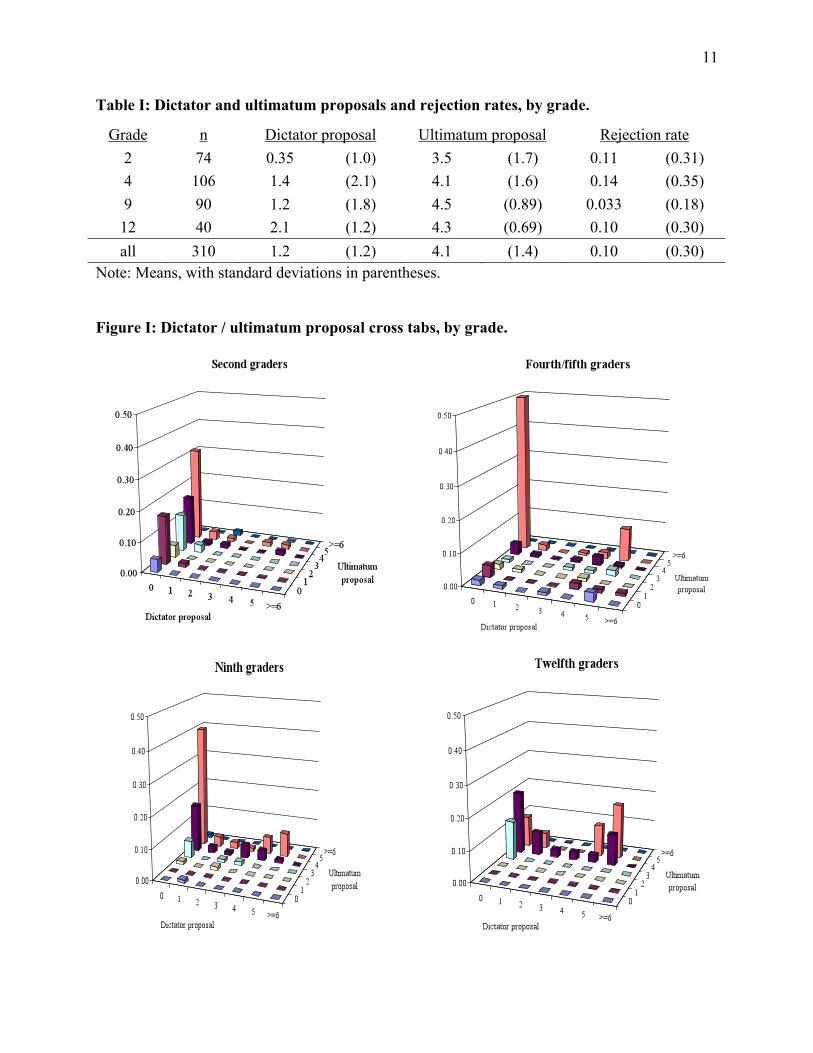
Table I shows averages and standard deviations for proposals in the dictator and
ultimatum games and for the proportion of proposals rejected, by grade.2 There are several
interesting results. First, children’s behavior is broadly similar to that found in the many previous
experiments on adults. Average behavior in both games is different from the subgame perfect
Nash predictions for selfish people. Dictator proposals are greater than zero, ultimatum proposals
are much higher than the sub-game perfect prediction of zero or one, and rejection rates are non-
zero for every age group. Only the second grader’s dictator proposals come close to the Nash
prediction of zero. We find that even the youngest children make larger ultimatum than dictator
proposals. Second, we find that dictator proposals increase substantially with age. Ultimatum
proposals also increase but by a smaller amount, and most of the increase occurs from second to
fourth/fifth grade. The variance of the dictator proposals increases and then decreases with age,
while that of ultimatum proposals decreases steadily.
Figure I shows the possible combinations of proposals in the dictator game and in the
ultimatum game, with the percentage of children making each combination on the vertical axis.
Over all participants, the modal proposal combination is five tokens in the ultimatum game and
zero in the dictator game. Combinations in the northwest quadrants of these figures are
“strategic” in the sense that they involve a larger proposal in the ultimatum game, where there is
a possibility of rejection, than in the dictator game. Overall, 78% of the participants make strictly
larger ultimatum proposals, while 92% of the second graders do. Only 7% of kids make a
2 Table A.II in the appendix shows the results of Mann-Whitney and Epps-Singleton tests of differences in these proposals across grades. Dictator and ultimatum proposals by second graders differ from those of every other age, with either test. Dictator and ultimatum proposals for any age are significantly different at better than the 1% level, with either test.

10
dictator proposal that is larger than their ultimatum proposal, and only one of the 74 second
graders does this. We conclude that children, even the youngest ones, have a good understanding
of the protocols used in these games, and that evidence of strategic behavior can be seen even in
the youngest participants.
Figure I also reveals some interesting differences across ages. Among second graders,
most of the heterogeneity is in ultimatum proposals, while hardly anybody gives any tokens
away in the dictator game. The opposite holds among the twelfth graders - dictator proposals
cover the range from zero to five, while ultimatum proposals are almost all either four or five.
Only a few second graders offer anything close to an even division in both games, while a
substantial proportion of the older participants, particularly twelfth graders, do so. For all grades
except twelfth, the modal combination of proposals is zero in the dictator game and five in the
ultimatum.
11
Table I: Dictator and ultimatum proposals and rejection rates, by grade.
Grade n Dictator proposal Ultimatum proposal Rejection rate 2 74 0.35 (1.0) 3.5 (1.7) 0.11 (0.31) 4 106 1.4 (2.1) 4.1 (1.6) 0.14 (0.35) 9 90 1.2 (1.8) 4.5 (0.89) 0.033 (0.18) 12 40 2.1 (1.2) 4.3 (0.69) 0.10 (0.30) all 310 1.2 (1.2) 4.1 (1.4) 0.10 (0.30)
Note: Means, with standard deviations in parentheses.
Figure I: Dictator / ultimatum proposal cross tabs, by grade.
12
Order and History
With our protocol there are two reasons why the round in which a decision is made might
affect behavior. First, behavior might be affected by history. For example, if someone rejects
what you feel was a perfectly reasonable ultimatum proposal, you might feel justified in
subsequently making a smaller dictator proposal than you otherwise would have, even to a
different partner. Or you might then decide that maybe your proposal wasn’t so reasonable after
all, and give more in the dictator game, thinking that somehow makes up for it. Second,
decisions in one game may be affected by the simple fact that a person played another game first,
regardless of the particular events of that game. For example, people may make smaller
proposals in later dictator games because, say, playing an ultimatum game reminds them of
competition and makes them less generous, regardless of their particular experience in that game.
(Similar effects might derive from playing the role of proposer before responder.)
These possibilities create both a problem, in that they complicate the analysis of
differences in behavior with respect to demographic variables, and an opportunity, in that by
looking at how ordering of the games and individual variations in history affect behavior we can
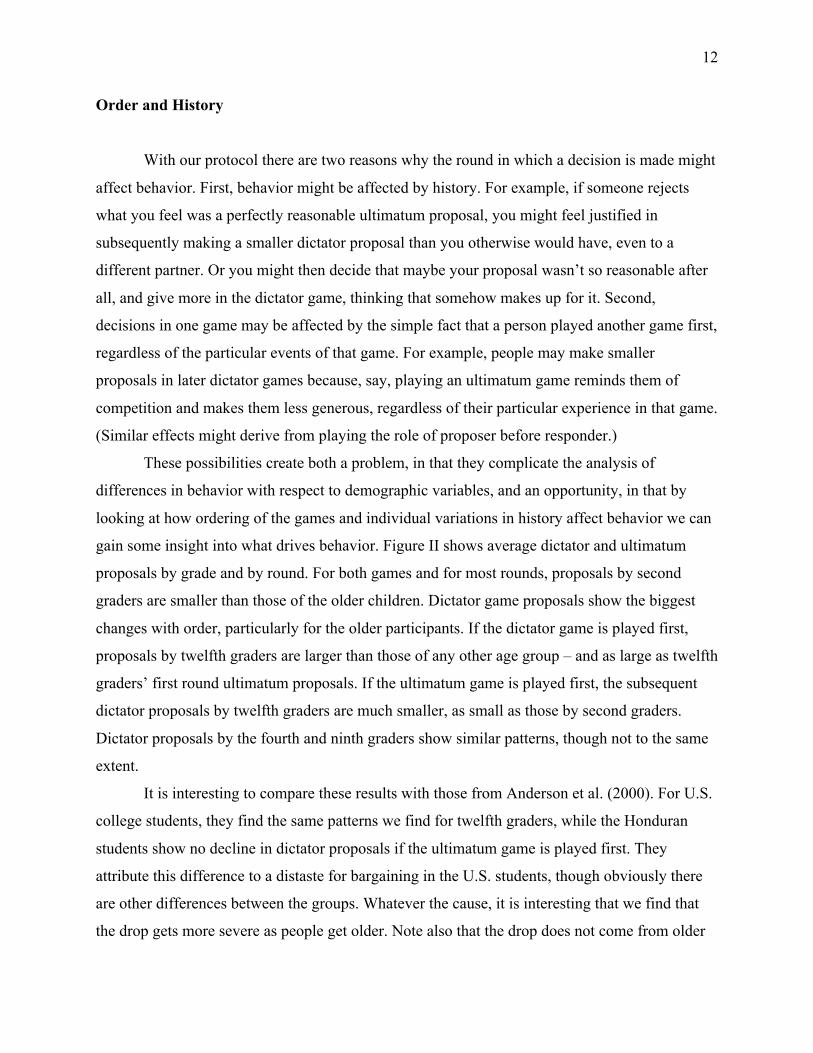
gain some insight into what drives behavior. Figure II shows average dictator and ultimatum
proposals by grade and by round. For both games and for most rounds, proposals by second
graders are smaller than those of the older children. Dictator game proposals show the biggest
changes with order, particularly for the older participants. If the dictator game is played first,
proposals by twelfth graders are larger than those of any other age group – and as large as twelfth
graders’ first round ultimatum proposals. If the ultimatum game is played first, the subsequent
dictator proposals by twelfth graders are much smaller, as small as those by second graders.
Dictator proposals by the fourth and ninth graders show similar patterns, though not to the same
extent.
It is interesting to compare these results with those from Anderson et al. (2000). For U.S.
college students, they find the same patterns we find for twelfth graders, while the Honduran
students show no decline in dictator proposals if the ultimatum game is played first. They
attribute this difference to a distaste for bargaining in the U.S. students, though obviously there
are other differences between the groups. Whatever the cause, it is interesting that we find that
the drop gets more severe as people get older. Note also that the drop does not come from older
13
children making small late round dictator proposals: these are almost identical across ages.
Rather it comes from the older children making relatively high proposals in the early rounds.
This wide variation in dictator proposals across rounds for older children explains part of the
standard deviations in Table I. Within a given round, dictator proposals for the older children are
quite homogenous.

14
Figure II: Proposals by game, grade, and order.
0
1
2
3
4
5
1 2 3 4
Round
Proposal
U2U4/5U9U12D2D4/5D9D12
15
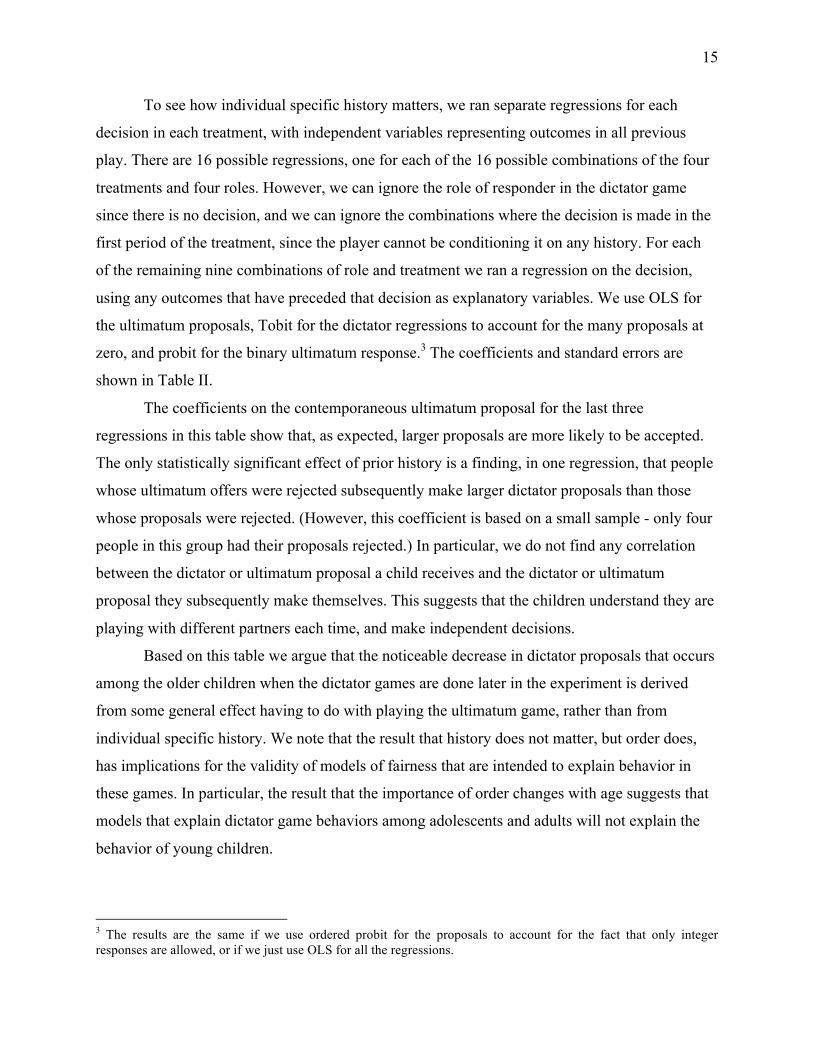
To see how individual specific history matters, we ran separate regressions for each
decision in each treatment, with independent variables representing outcomes in all previous
play. There are 16 possible regressions, one for each of the 16 possible combinations of the four
treatments and four roles. However, we can ignore the role of responder in the dictator game
since there is no decision, and we can ignore the combinations where the decision is made in the
first period of the treatment, since the player cannot be conditioning it on any history. For each
of the remaining nine combinations of role and treatment we ran a regression on the decision,
using any outcomes that have preceded that decision as explanatory variables. We use OLS for
the ultimatum proposals, Tobit for the dictator regressions to account for the many proposals at
zero, and probit for the binary ultimatum response.3 The coefficients and standard errors are
shown in Table II.
The coefficients on the contemporaneous ultimatum proposal for the last three
regressions in this table show that, as expected, larger proposals are more likely to be accepted.
The only statistically significant effect of prior history is a finding, in one regression, that people
whose ultimatum offers were rejected subsequently make larger dictator proposals than those
whose proposals were rejected. (However, this coefficient is based on a small sample - only four
people in this group had their proposals rejected.) In particular, we do not find any correlation
between the dictator or ultimatum proposal a child receives and the dictator or ultimatum
proposal they subsequently make themselves. This suggests that the children understand they are
playing with different partners each time, and make independent decisions.
Based on this table we argue that the noticeable decrease in dictator proposals that occurs
among the older children when the dictator games are done later in the experiment is derived
from some general effect having to do with playing the ultimatum game, rather than from
individual specific history. We note that the result that history does not matter, but order does,
has implications for the validity of models of fairness that are intended to explain behavior in
these games. In particular, the result that the importance of order changes with age suggests that
models that explain dictator game behaviors among adolescents and adults will not explain the
behavior of young children.
3 The results are the same if we use ordered probit for the proposals to account for the fact that only integer responses are allowed, or if we just use OLS for all the regressions.
16
Table II: Does history matter?
Dictator proposal Ultimatum proposal Ultimatum rejection
Round: 2 3 4 2 3 4 2 3 4
Model: Tobit Tobit Tobit OLS OLS OLS OLS+ Probit Probit
Partner’s 0.354 -0.056 0.153 0.090 0.097 0.078 dictator proposal (0.219) (0.898) (0.095) (0.059) (0.110) (0.148)
Partner’s 3.600* -31.577 -0.057 0.529 ultimatum rejection
(1.827) (0.000) (0.084) (0.639)
Partner’s -0.531 -0.802 0.138 0.085 -0.110*** -0.603*** -0.570*** ultimatum proposal
(0.530) (0.831) (0.092) (0.078) (0.024) (0.148) (0.203)
Adjusted or pseudo r-squared
0.0105 0.0269 0.0277 0.0161 0.0209 0.0213 0.21144 0.4075 0.3323
Observations 77 79 78 78 76 77 79 77 76
Notes: Coefficients shown. Standard errors in parentheses. * means the underlying coefficient is significantly different from 0 at the 0.10 level, ** at the 0.05 level, *** at the 0.01 level. The dictator proposal regressions are done with Tobit, ultimatum proposals with OLS, and ultimatum rejections with probit. + means unable to estimate probit because some responses were perfectly predicted, so results shown are for OLS.
17
Age, sex, and size
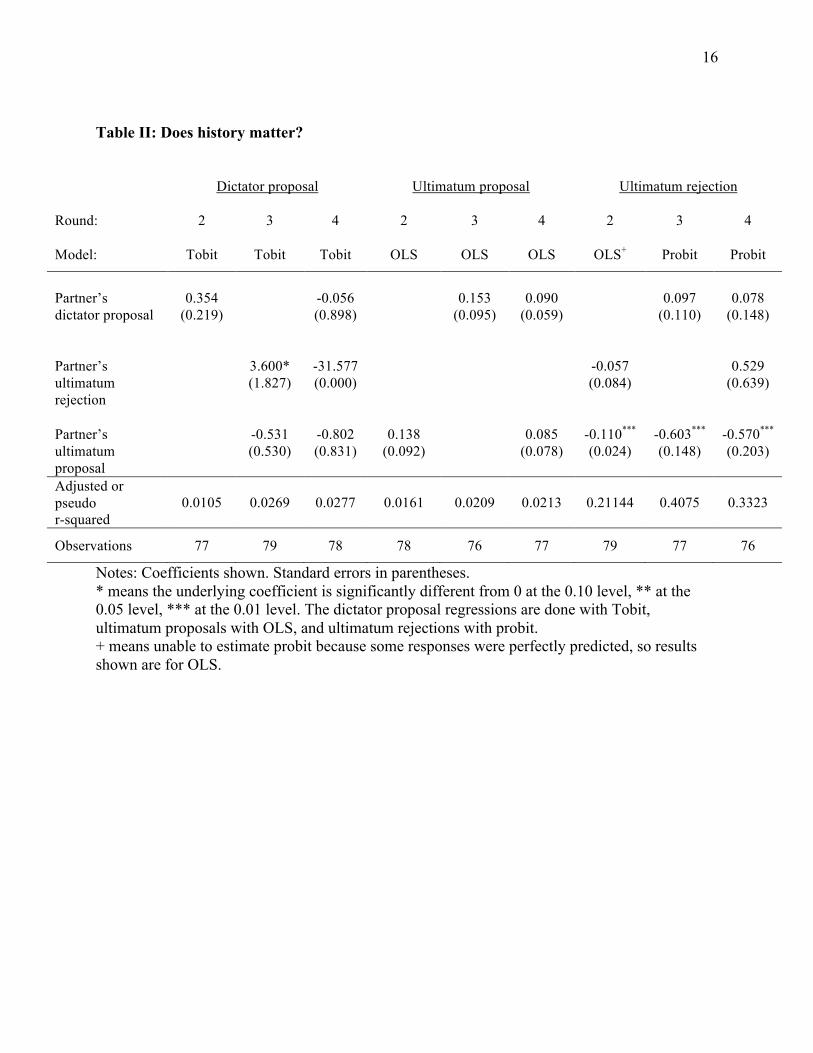
Next we look at differences in proposals and responses across demographic variables,
while controlling for order with regressions. Results are shown in Table III. For the order effects,
the proposal regressions basically mirror what is shown in Figure II. Dictator proposals decrease
with order, at a rate that accelerates with age. We omitted the order/grade interactions for the
ultimatum game proposals, since there is no obvious pattern in Figure I. The age differences also
mirror the Figure II results. The older children make significantly larger dictator and ultimatum
proposals than the second graders do. These differences are not trivial: in the dictator game the
average proposal is 1.2 tokens, and each year of age is associated with an increase in the
proposal of about 0.23 tokens. For the ultimatum game the overall average proposal is 4.1
tokens, and each year of age is associated with an increase of about 0.1 tokens. Large changes in
behavior are occurring between the ages of 7 and 18.
The first regression for every behavior includes an indicator variable for sex. Boys tend
to make smaller dictator and ultimatum proposals, though only the dictator difference is
statistically significant. Boys are perhaps slightly less likely to reject a given ultimatum proposal,
though the coefficient is not significant. We get insignificant coefficients if we add a sex with
proposal interaction effect, to allow the gender effect to vary with proposal size, or an age with
proposal interaction. These differences in proposals for boys and girls are similar to the
differences cited in Eckel and Grossman (2001) for undergraduate men and women.
Along with sex, the second regression for every behavior includes a measure of relative
height. This is the percentage deviation of the participant’s height from the mean of all those
who participated in the experiment with them – that is, their fellow class members. We measured
the second graders ourselves at the end of the experiment, while the other heights are from a
survey the students filled out before being paid. Relative height has a significant effect on
dictator proposals: children who are one standard deviation taller than the mean propose about
half a token less than children who are one standard deviation shorter. As a percentage, this
effect is very large.
18
Table III: Regressions.
Dependent variable:
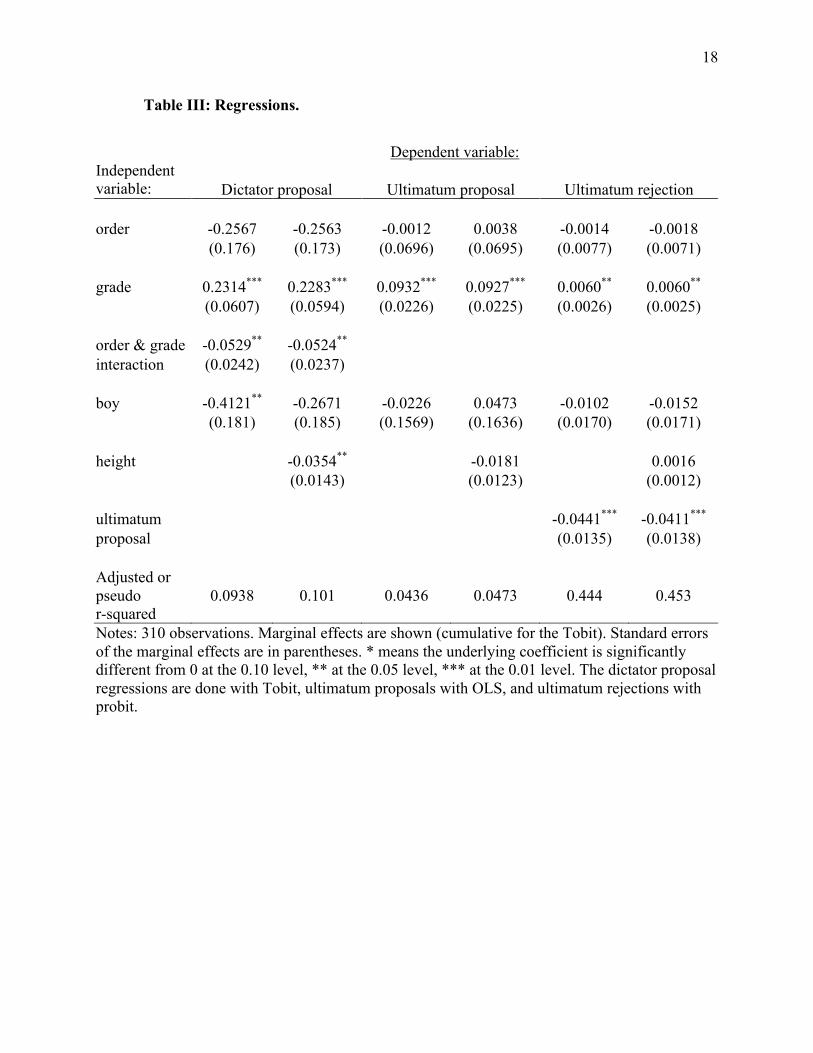
Independent variable: Dictator proposal Ultimatum proposal Ultimatum rejection order -0.2567 -0.2563 -0.0012 0.0038 -0.0014 -0.0018 (0.176) (0.173) (0.0696) (0.0695) (0.0077) (0.0071) grade 0.2314*** 0.2283*** 0.0932*** 0.0927*** 0.0060** 0.0060** (0.0607) (0.0594) (0.0226) (0.0225) (0.0026) (0.0025) order & grade -0.0529** -0.0524** interaction (0.0242) (0.0237) boy -0.4121** -0.2671 -0.0226 0.0473 -0.0102 -0.0152 (0.181) (0.185) (0.1569) (0.1636) (0.0170) (0.0171) height -0.0354** -0.0181 0.0016 (0.0143) (0.0123) (0.0012) ultimatum -0.0441*** -0.0411*** proposal (0.0135) (0.0138) Adjusted or pseudo r-squared
0.0938 0.101 0.0436 0.0473 0.444 0.453
Notes: 310 observations. Marginal effects are shown (cumulative for the Tobit). Standard errors of the marginal effects are in parentheses. * means the underlying coefficient is significantly different from 0 at the 0.10 level, ** at the 0.05 level, *** at the 0.01 level. The dictator proposal regressions are done with Tobit, ultimatum proposals with OLS, and ultimatum rejections with probit.
19
Interestingly, height alone explains more of the variance in dictator and ultimatum
proposals and ultimatum responses than sex alone does. For all three of these behaviors, adding
height to a regression that includes sex improves the fit more than does adding sex to a
regression that includes height. Adding it to the regression for dictator proposals decreases the
sex coefficient and makes it insignificant at even the 10% level. Adding it to the ultimatum
proposal regression actually changes the sign of the sex coefficient, though it is insignificant
before and after the addition. We get similar results if we use a measure of height relative to
others of the same sex in the experiment, rather than relative to everyone. The regression results
on sex and height are essentially unchanged if we run the regressions with indicator variables for
order and grade instead of the continuous measures. While there are some nonlinearities with age
and order, the basic age and order patterns also hold.
The age, sex and height story is more revealing if we just sort the girls and the boys in
each class by height, and then evenly divide each sex into three groups: short, medium, and tall.
While this doesn’t provide the controls for order that the regressions to, the design is balanced
and so the means are still unbiased. Figure III shows average dictator proposals for kids grouped
by age, sex and by this measure of relative height.4 If we look at the last pair of bars in the top
panel of this figure, for the younger children, we see that, ignoring height, the proposals by
young girls and boys are the same. But if we look across the first three pairs of bars we see that,
for girls though not boys, there is a large decrease in proposals as height increases. The shortest
girls give nearly four times more than the tall ones. The tall boys give three times as much as the
tall girls.
For the older kids, shown in the bottom panel, the sex and height story is very different.
The last pair of bars shows that, overall, the older girls give more than twice as much as older
boys. The first three pairs of bars show that the height effect in girls has diminished , and that
again that proposals by boys are similar across height. So, we find that for young children the
heterogeneity in dictator proposals is driven entirely by height, not by sex. For the older children,
it’s driven more by sex than by height.
4 We also did this with relative height by class only, rather than class and sex. This makes little difference for the younger kids, but because among the older students the males are on average taller, we end up with very unequal cell sizes.

20
Figure III: Average dictator proposals by age, sex and size.
Second and fourth/fifth graders
Ninth and twelfth graders
21
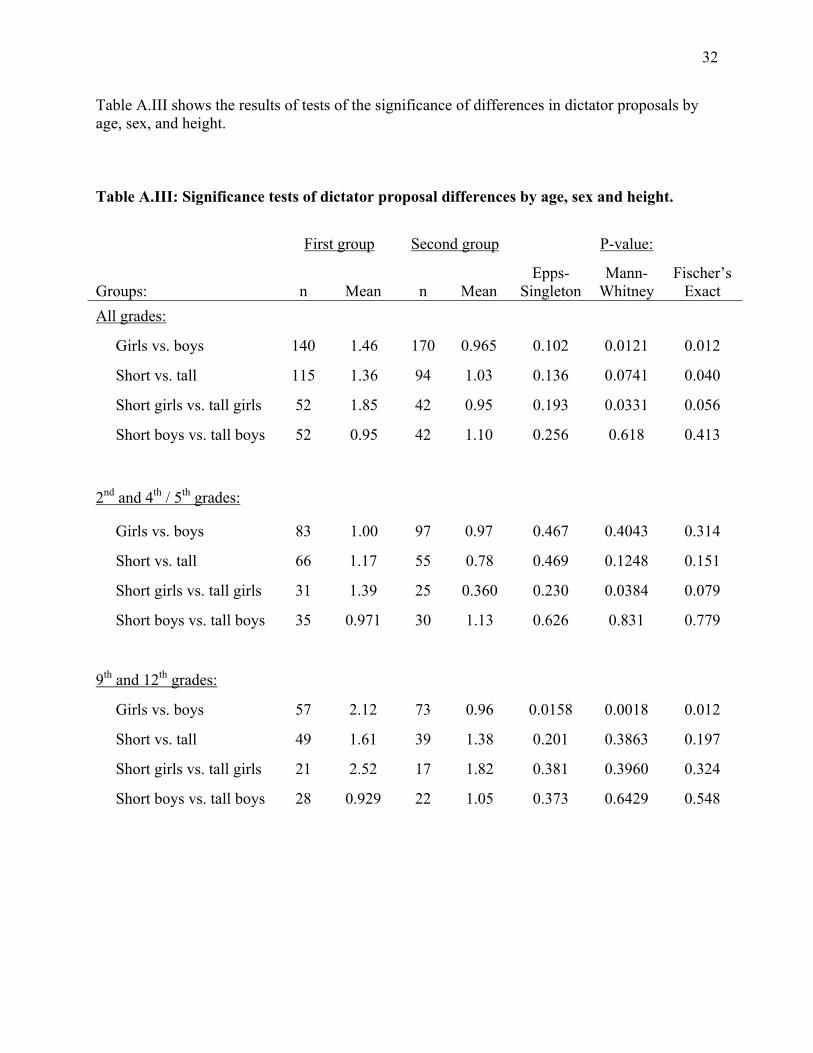
Table A.III in the appendix shows the results of non-parametric tests for differences in
dictator proposals according to sex and height. In addition to the ES and MW tests, we also
report Fisher’s exact test of independence for the proportions of people making zero versus
greater than zero proposals. These tests support the statistical significance of sex differences in
proposals, particularly among the older children. For differences across the relative height groups
the support is mixed: the ES test cannot reject the hypothesis that the distributions are the same,
while the MW test and Fisher’s test both show a robust difference. The tests support the
existence of differences by height in proposals by girls, though Fisher’s test is significant only at
the 10% level. For boys, the support is weak: the ES test does not support a difference, and the
MW and Fisher’s tests only support it at the 10% level. None of the tests can reject the
hypothesis that the short boy/tall girl groups have the same contributions. Statistical significance
also holds if we test these patterns using regressions that control for order effects as was done in
Table III. A likelihood ratio test gives a p-value of 0.0364 for the hypothesis that saturated
models with grade, sex, and interactions of age with sex and sex with height fit the dictator
proposal data better than does a model with only the order, grade, and order with grade
interaction variables.
When we include relative height, it is hard to generalize about sex and fairness in the
dictator game. For the younger kids, if we compare across the sexes while holding height
constant, the sex difference actually switches sign in the tall kids, with tall boys giving more than
tall girls. Across sex and height, short girls give the most, but tall girls give the least. For the
ultimatum proposals, we don’t find any substantial sex differences. There is a modest and barely
significant height effect, as the Table III regressions indicate, but it’s not monotonic in the boys.
Interestingly, it seems to be relative rather than absolute height that matters. The twelfth graders
are more than half again as tall as the second graders, but when playing against other twelfth
graders, they actually make larger dictator and ultimatum proposals.

22
Rejections and optimal ultimatum proposals
The analysis of rejections is only based on few observations, since just 30 of the 310
proposals are rejected. Despite this, the relationship between the proposal amount and the
probability of rejection is statistically significant in the regressions shown in the last two
columns of Table II. Order does not appear to have any effect on the decision to reject a
proposal. Older children are more likely to reject. A one token increase in the proposal decreases
the probability of rejection by about 4%, and this effect is significant at the 1% level.
We ran probit regressions on rejections separately for each of the four grades, with the
proposal as the independent variable, and then used the estimated probit functions to predict
rejection rates for different proposal amounts for each grade. Rounding off to halves, we find
that proposals of 2.0, 3.5, 3.5, and 4.0 maximize the predicted returns for grades 2, 4/5, 9, and 12
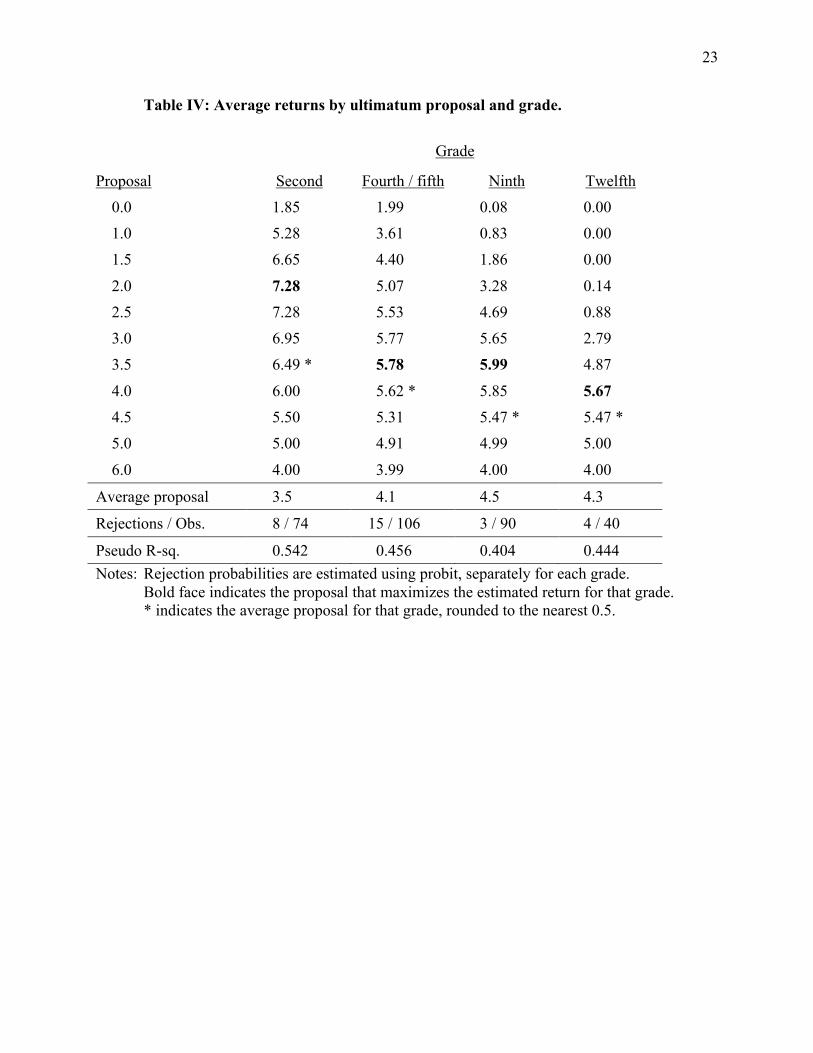
respectively.5 These results are shown in Table IV. For every grade, average actual proposals are
higher than the estimated optimal proposals. Risk aversion, altruism, and upward bias in
children’s estimation of the rejection probabilities are all possible explanations for this. The
differences, both in terms of the deviation from the optimal proposal, and in terms of the loss in
the expected return, are largest for the second graders, the age group least likely to be able to
figure this out.
5 We get similar results, in levels and changes across grades, if we estimate this using a linear probability model, or if we pool the data across grades and add a variable for the grade to the regression.
23
Table IV: Average returns by ultimatum proposal and grade.
Grade
Proposal Second Fourth / fifth Ninth Twelfth 0.0 1.85 1.99 0.08 0.00 1.0 5.28 3.61 0.83 0.00 1.5 6.65 4.40 1.86 0.00
2.0 7.28 5.07 3.28 0.14 2.5 7.28 5.53 4.69 0.88 3.0 6.95 5.77 5.65 2.79 3.5 6.49 * 5.78 5.99 4.87
4.0 6.00 5.62 * 5.85 5.67 4.5 5.50 5.31 5.47 * 5.47 * 5.0 5.00 4.91 4.99 5.00
6.0 4.00 3.99 4.00 4.00
Average proposal 3.5 4.1 4.5 4.3
Rejections / Obs. 8 / 74 15 / 106 3 / 90 4 / 40
Pseudo R-sq. 0.542 0.456 0.404 0.444 Notes: Rejection probabilities are estimated using probit, separately for each grade. Bold face indicates the proposal that maximizes the estimated return for that grade. * indicates the average proposal for that grade, rounded to the nearest 0.5.

24
Within-subjects behavior
We can also use this data to look for connections between behaviors in the two games.
None of the raw correlations between people’s dictator proposals, ultimatum proposals, and
ultimatum rejections are statistically significant. This result seems at odds with the finding that
proposals in both games and ultimatum responses all differ systematically with age, shown in
Table III. We resolve this puzzle by looking at regressions that include behavior/grade
interaction terms, shown in Table V.
For the dictator proposal, we find that the coefficient on the direct effect is now negative
and significant, while that on the interaction term is positive and significant. In other words,
young children that are more generous in the dictator game tend to make smaller ultimatum
proposals, while older children that are more generous in the dictator game tend to make larger
ultimatum proposals. These effects cancel out when we omit the interaction, explaining the zero
raw correlation. Results for ultimatum proposals are consistent with those for dictator proposals.
The coefficients on the ultimatum response decision and its interaction are not significantly
correlated with either proposal, and only the ultimatum proposal coefficient is significant, and
that only at the 10% level. (The partner’s ultimatum proposal is included as a control for the
ultimatum rejection decision.)
These results suggest that different models of behavior may be at work with different age
children, and in particular that other-regarding preferences are more likely to be behind the
bargaining decisions of the older children than the younger ones. However, while the coefficients
in this regression are statistically significant, the r-squareds for the proposal regressions are very
low. (The only exception is for the ultimatum rejection regression, but that is driven almost
entirely by the explanatory power of the partner’s ultimatum proposal. With that variable
omitted, the pseudo r-squared is 0.164) The r-squareds don’t increase if we just look at the ninth
grade and older kids. The most reasonable conclusion should probably be that there is very little
connection between behaviors in these games, at any age.

25
Table V: Within-subjects behavior regressions.
Dependent variable and regression model:
Dictator proposal
Ultimatum proposal
Ultimatum rejection
Independent variable: Tobit OLS probit Ultimatum -0.616** 0.058 proposal (0.257) (0.114) Grade/ultimatum 0.080*** 0.022* proposal interaction (0.021) (0.012) Ultimatum -2.378 0.143 response (2.356) (0.548) Grade/ultimatum 0.054 0.071 response interaction (0.327) (0.078) Dictator -0.210** -0.024 proposal (0.082) (0.161) Grade/dictator 0.028*** -0.007 proposal interaction (0.010) (0.021) Partner’s -0.229 0.150** -0.757*** ultimatum proposal (0.275) (0.072) (0.107) Observations 310 310 310 R-squared 0.0224 0.0355 0.4556 Notes: Coefficients shown. Standard errors in parentheses. * means the underlying coefficient is significantly different from 0 at the 0.10 level, ** at the 0.05 level, *** at the 0.01 level. The dictator proposal regressions are done with Tobit, ultimatum proposals with OLS, and ultimatum rejections with probit. + means unable to estimate probit because some responses were perfectly predicted, so results shown are for OLS.
26
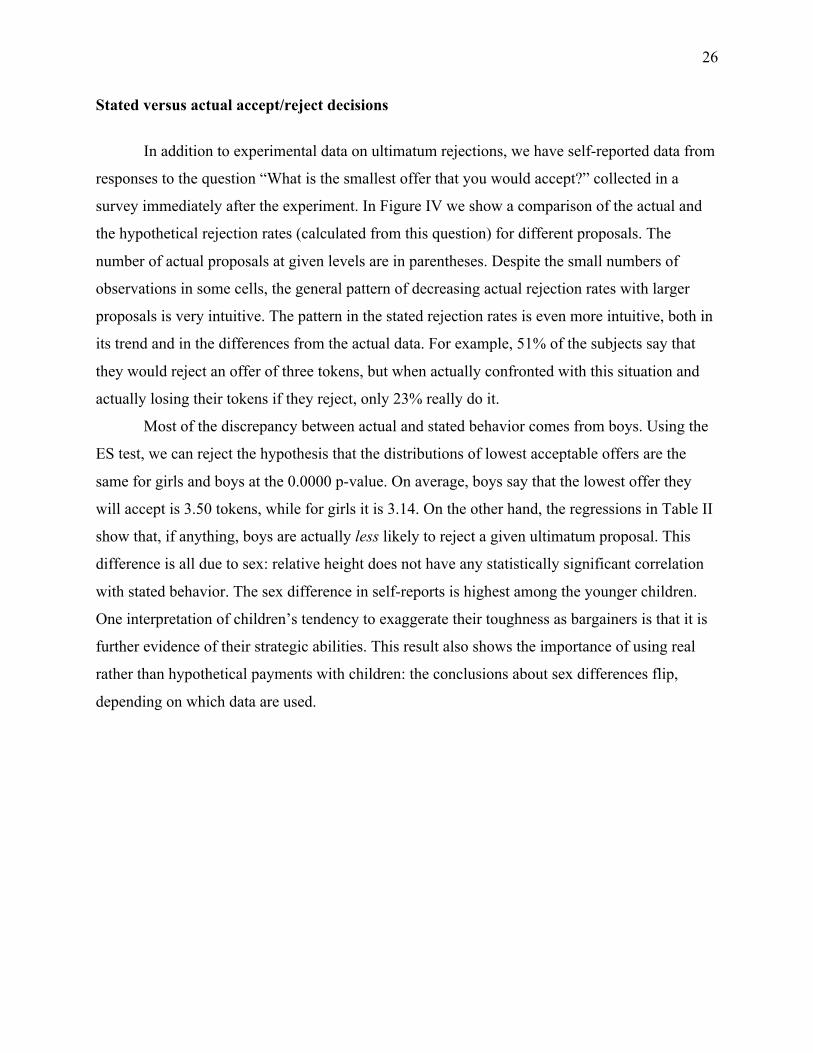
Stated versus actual accept/reject decisions
In addition to experimental data on ultimatum rejections, we have self-reported data from
responses to the question “What is the smallest offer that you would accept?” collected in a
survey immediately after the experiment. In Figure IV we show a comparison of the actual and
the hypothetical rejection rates (calculated from this question) for different proposals. The
number of actual proposals at given levels are in parentheses. Despite the small numbers of
observations in some cells, the general pattern of decreasing actual rejection rates with larger
proposals is very intuitive. The pattern in the stated rejection rates is even more intuitive, both in
its trend and in the differences from the actual data. For example, 51% of the subjects say that
they would reject an offer of three tokens, but when actually confronted with this situation and
actually losing their tokens if they reject, only 23% really do it.
Most of the discrepancy between actual and stated behavior comes from boys. Using the
ES test, we can reject the hypothesis that the distributions of lowest acceptable offers are the
same for girls and boys at the 0.0000 p-value. On average, boys say that the lowest offer they
will accept is 3.50 tokens, while for girls it is 3.14. On the other hand, the regressions in Table II
show that, if anything, boys are actually less likely to reject a given ultimatum proposal. This
difference is all due to sex: relative height does not have any statistically significant correlation
with stated behavior. The sex difference in self-reports is highest among the younger children.
One interpretation of children’s tendency to exaggerate their toughness as bargainers is that it is
further evidence of their strategic abilities. This result also shows the importance of using real
rather than hypothetical payments with children: the conclusions about sex differences flip,
depending on which data are used.
27
Figure IV: Actual and stated rejection rates.

28
V: Conclusion
In this paper we have shown that bargaining behavior changes systematically with age. In
the dictator game children make considerably smaller proposals than adults do. Children also
make, and accept, smaller ultimatum proposals than adults do. The youngest children make the
lowest proposals and they have the highest acceptance rates, controlling for the proposal amount.
Even young children are quite strategic, and are very good at playing the ultimatum game. All
age groups make proposals that are close to maximizing the expected return, given the rejection
rates. When making ultimatum proposals, we actually found that second graders earned more
than any other age group, though this may have been as much due to their willingness to make
small proposals as to their ability to predict rejection probabilities. When combined with the fact
that the second graders give less in the dictator game, we interpret this to mean that the
behavioral differences across ages are related to different preferences for fairness, not to
differences in the ability to play strategically.
This result gives a new twist to work by others on cross-cultural differences in economic
behavior. Explanations of these cultural differences are either really about genetic differences, or
they require that there be some way that different cultures persuade people with the same genes
to behave differently. We suggest that this latter process happens in childhood, and we provide
evidence of substantial behavioral changes in a sample of children from the same culture, over
the ages seven to 18.
We have also identified a height effect: relatively taller girls make much smaller dictator
proposals, and they are more likely to reject ultimatum proposals. These differences do not
decrease as children get more experience with the experiment, however they do decrease with
age. This suggests that even within a culture individual differences in bargaining can be sensibly
explained using characteristics that affect bargaining power outside the lab. The result that the
height effect is supplanted by a sex effect around the age of puberty fits with evidence from the
developmental psychology literature on a variety of prosocial (and other) behaviors, and from the
evidence from economic experiments on men and women. We think the fact that the differences
are larger for the dictator proposals than the ultimatum proposals makes good sense. Dictator
proposals are purely a matter of the proposer’s preferences, while optimal ultimatum proposals
must take the preferences of the responders into consideration.
29
To our knowledge no prior bargaining experiments have looked at variables such as
height, though there is a large literature on sex differences, and a smaller one on status
differences. While the evidence is mixed, the general conclusion is that, when making proposals
to respondents of unknown sex, women make noticeably larger dictator proposals than men do,
make nearly equivalent ultimatum proposals, and are considerably more likely to accept a given
ultimatum proposal. Except for ultimatum responses, where we have very little data, these are
exactly the results that we find for older children.
We think these height results are not only intrinsically interesting, but also that they have
implications for more important issues. When people behave differently it is either because they
have different preferences or because they face different constraints. On a playground with
sporadic adult supervision, decisions may involve very different constraints for a little kid than
for a big one, and it would not be surprising to see smaller children “sharing” more than large
ones. In our experiments, however, decisions are anonymous, and so the constraints are the same
for everyone. Given this, the fact that different size kids make different decisions in the
experiment means that different size kids have different preferences. In the dictator games with
the younger kids, the differences in preferences implied by the proposal differences of the short
and tall girls seem very large. Since we do not have data on the height of the older children when
they were younger, we are not able to determine whether this effect is permanent or transitory.
However, the Persico, Postlewaite and Silverman (2001) result on the permanent effect of
adolescent height on adult income, cited above, suggests that it may well be.
Bargaining is a basic economic process, determining how limited resources are allocated
to competing interests. Children’s own resources are extraordinarily limited relative to their often
apparently insatiable desires. Every day they must strike a host of complicated bargains with
their parents, teachers, and peers in efforts to obtain things that, in their ultimate importance,
range from trivial to vital. In this paper we have shown that children are rational and strategic
bargainers by the age of seven, and that the sorts of tools that economists have successfully
applied to studying the bargaining behavior of adults can also be used to study bargaining
behavior in children.
30
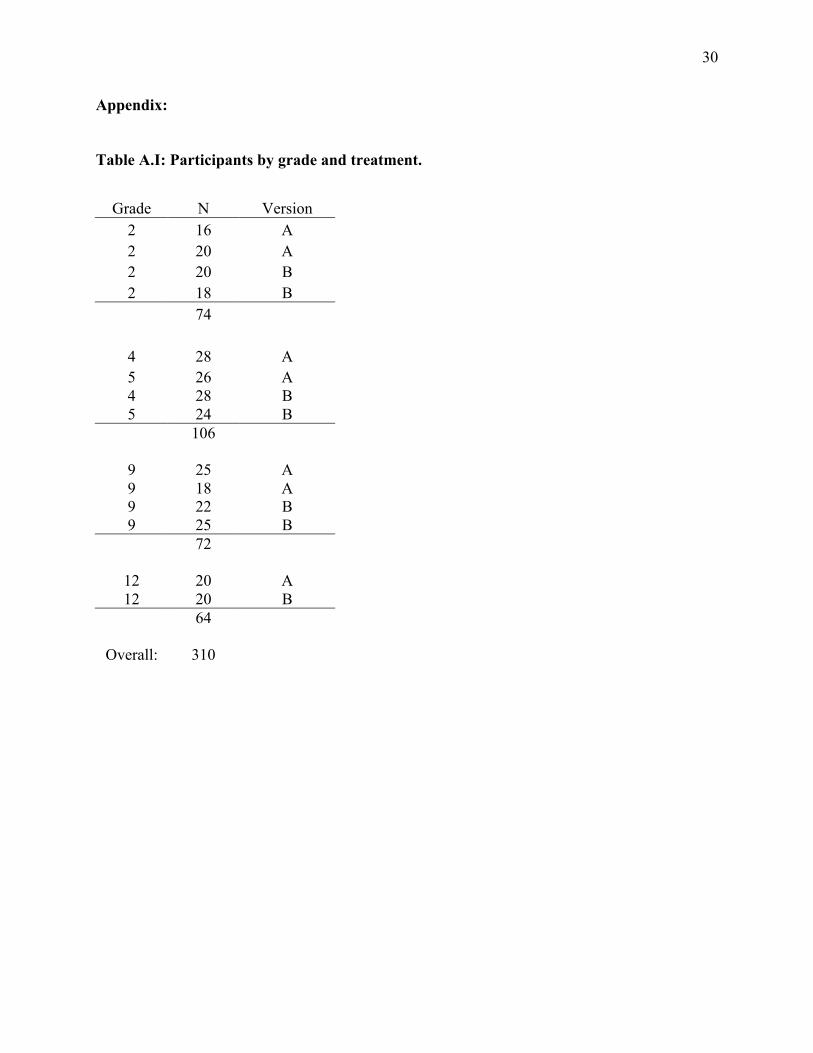
Appendix:
Table A.I: Participants by grade and treatment.
Grade N Version
2 16 A 2 20 A 2 20 B 2 18 B 74 4 28 A 5 26 A 4 28 B 5 24 B 106 9 25 A 9 18 A 9 22 B 9 25 B 72
12 20 A 12 20 B 64
Overall: 310

31
Forsythe et al. [1994] show that with ultimatum game proposals, the Epps and Singleton
[1986] (ES) test of the hypothesis that data from different populations is drawn from the same
underlying discrete distribution has considerably more power to reject the hypothesis that the
distributions are the same when they are different than do the common non-parametric
alternatives. This power is derived from the fact that the alternatives either assume a continuous
rather than a discrete distribution, or only compare a measure of central tendency, rather than the
entire distributions. Table A.II shows the results of tests of the hypothesis that the distribution of
proposals for each game differ across grades, using this test as well as the more familiar Mann-
Whitney.
Table A.II: Non-parametric tests of differences in proposals by grade and game.
Dictator
Grade 2 4/5 9
4/5 1.07***,+++
9 0.83***,+++ -0.25
12 1.77***,+++ 0.70** 0.95**,++
Ultimatum
Grade 2 4/5 9
4/5 0.58***,+++
9 0.97***,+++ 0.39+++
12 0.81***,+++ 0.23+++ -0.16*,+++ Notes: The numbers are the row mean minus the column mean. *, **, and *** indicate the difference is significant at the 0.1, 0.05, or 0.01 level respectively using the Mann-Whitney test. +, ++, and ++ indicate the same using the Epps-Singleton test.
32
Table A.III shows the results of tests of the significance of differences in dictator proposals by age, sex, and height. Table A.III: Significance tests of dictator proposal differences by age, sex and height.
First group Second group P-value:
Groups: n Mean n Mean Epps-
Singleton Mann-
Whitney Fischer’s
Exact All grades:
Girls vs. boys 140 1.46 170 0.965 0.102 0.0121 0.012
Short vs. tall 115 1.36 94 1.03 0.136 0.0741 0.040
Short girls vs. tall girls 52 1.85 42 0.95 0.193 0.0331 0.056
Short boys vs. tall boys 52 0.95 42 1.10 0.256 0.618 0.413
2nd and 4th / 5th grades:
Girls vs. boys 83 1.00 97 0.97 0.467 0.4043 0.314
Short vs. tall 66 1.17 55 0.78 0.469 0.1248 0.151
Short girls vs. tall girls 31 1.39 25 0.360 0.230 0.0384 0.079
Short boys vs. tall boys 35 0.971 30 1.13 0.626 0.831 0.779
9th and 12th grades:
Girls vs. boys 57 2.12 73 0.96 0.0158 0.0018 0.012
Short vs. tall 49 1.61 39 1.38 0.201 0.3863 0.197
Short girls vs. tall girls 21 2.52 17 1.82 0.381 0.3960 0.324
Short boys vs. tall boys 28 0.929 22 1.05 0.373 0.6429 0.548

33
Protocol
Experiment Script
Note: The vocabulary given here was designed to make sense to the fourth graders. We used it as is on the ninth graders, except as noted. For the second graders, it was necessary to start by explaining the terms proposer and responder. In addition, the directions were given more slowly and with more examples. When giving the examples to the second graders we physically showed them the division and the allocation using the tokens. Whenever possible, we answered questions by repeating or rephrasing the words in the protocol. While these protocols were followed as closely as possible, we did find it necessary to remind the children to pay attention and not talk to each other. Their teachers were very helpful with this. We did not tell them that the games would be repeated with different roles, or that two different games would be played. If asked, we just said “Sorry, we can’t tell you that. You will have to wait and see what happens.” “We are going to play some games today. In these games you can get some tokens. When we are all done you can use the tokens to buy items from our store. Each token is worth about 25 cents or a quarter. The stuff you buy in the store is about the same price as in a regular store. Here are the things we have to sell.” We then showed the kids the items in the store. We had a selection of toys and school supplies that have proved popular in previous experiments, and the children were invariably quite attentive after this. To avoid threshold effects, we did not tell them prices if asked but just repeated that prices were about the same as in a regular store. The ninth graders were told that each token could be traded in for 25 cents cash at the end of the experiment, the twelfth graders that each could be traded for 50 cents. We then used playing cards to randomly divide the class evenly into two groups, A and B, and we separated the groups to different sides of the classroom. “In each of these games half of you are going to be proposers and half responders. We are not going to tell you which you are until later, so pay attention to all the instructions about who does what. (For the second graders, we then explained what these terms meant.) Each of you will have a partner from the other group. We will decide who is a proposer and who is a responder by chance. We will also decide who is partner with who by chance, and we will keep it a secret. You will never know who your partner is, and they will never know who you are.” “I want you to know that no one else in the class will know what you choose to do in today’s game. To be sure of this, on your game sheets you will not even put your name, instead we will give you a number. So do not worry about other people in the game knowing what you choose, because they won’t.” “You will make all of your decisions by filling out forms that I give you. To help keep your choices secret, we will collect the forms in these envelopes. On your envelope is an ID number.
34
This is your personal ID number and you need to put it on all the papers that you fill out so that we make sure you get your tokens and so that everything you do is secret.” Depending on the treatment, we then either started with the ultimatum or the dictator game instructions below.
Ultimatum Bargaining Protocol. “Here is the game. I am going to give you and your secret partner 10 tokens. Your job is to decide how to divide them. But we have a special way of doing this. We’ll call the first partner the proposer. First, the proposer will pick how many of the 10 tokens they want to keep for themselves and how many they want to offer to the other person. They can choose any combination that adds up to ten tokens. After they have decided this, we will tell their responder partner how many tokens the proposer offered them. Then it is the responders turn. They decide if they want to accept or reject the offer. If they accept, the proposer and the responder each get the amount of tokens that the proposer picked. If they reject then both the responder and the proposer get nothing.” “We’ll try it one time to make sure everyone understands. This is just an example, so it does not count for tokens. (Pick a child from the front.) Let’s pretend we are partners. Right now I can see who my partner is, but remember in the real game you will not know who your partner is. I will be the proposer, the person who decides how the chips are split up. You are the responder, who chooses if you accept or not. Suppose I choose 6 tokens for me and 4 for my partner. If you accept, that’s what we each get. If you reject, neither of us gets any tokens. Now let’s say that I said 7 for me and 3 for my partner. Suppose you said you will not accept this. Than we both get zero tokens. So does everybody understand? Are there any questions?” To group A (Tell group B to listen too.): “OK, you are the proposers who will make a proposal about how the tokens will be divided. You will be paired with another person in the other group. You will not know who they are and they will not know who you are. You will make a proposal about how to divide the tokens. If your partner accepts how you divided them, then that is how the 10 tokens will be divided. But if they reject your proposal you both get nothing. You can divide the tokens any way you want. Take the first form out of your envelope now. Be sure and write the number on your envelope on the top right side of the form. Make your choice by circling across the two numbers that you choose and then put your form back in your envelope. For example, you could circle 8 for you and 2 for your partner, or 3 for you and 7 for you partner. (When describing how to fill out the form, hold up a form as an example.) We have all the time you need, so think about what you want to do.” (Collect the envelopes from the proposers. Match proposers up with responders and fill out forms for the responders and put it in their envelopes. If there was an odd number of players, we matched one player with two partners when computing payoffs.) To group B:

35
“You are the responders. You will decide whether to accept or reject the offer. If you accept the offer then you will get the tokens that proposer offered to you and they will get the tokens for they proposed for themselves. If you do not accept the offer then both you and your partner will get zero tokens. In your envelope is a form that tells you how many tokens you have been offered. First, be sure and put your ID number on the envelope on the top right part of your paper. Has everybody done this? OK, now, circle the box to accept or reject the offer. Don’t rush, take your time and think about what you want to do.” (Collect the envelopes from the responders. Fill out the forms for the proposers, which tell what the responders decided to do. Put the appropriate number of tokens in the envelopes.) “OK, now we are going to do this same game again. But this time everybody will switch roles. So, if you were a proposer, this time you are a responder. If you were a responder, this time you are a proposer.” (Repeat the protocol, starting with the specific instructions to the proposers.) Dictator Bargaining Protocol: “Here is the game. I am going to give you and your secret partner 10 tokens. The proposer’s job is to decide how to split these tokens between the two people. Whatever the proposer says is final. The responder doesn’t really decide anything, they just get the tokens the proposer offers them, if any. (If this game followed the ultimatum game, we added “So, it’s different than the other game. This time the responder doesn’t get a chance to reject the split that the proposer makes. Whatever the proposer says goes.”) “We’ll try it one time to make sure everyone understands. This is just an example, so it does not count for tokens. (Pick a child from the front.) Let’s pretend we are partners. Right now I can see who my partner is, but remember in the real game you will not know who your partner is. I will be the proposer, the person who decides how the chips are split up. You are the responder. Suppose I choose 6 tokens for me and 4 for my partner. So, that’s what we each get. Now let’s say that I said 7 for me and 3 for my partner. So, that’s what we each get. So does everybody understand? Are there any questions?” To group A (Tell group B to listen too.): “OK, you are the proposers who will make a proposal about how the tokens will be divided. You will be paired with another person in the other group. You will not know who they are and they will not know who you are. You will make a proposal about how to divide the tokens. Whatever you decide goes. You can divide the tokens any way you want. Take the first form out of your envelope now. Be sure and write the number on your envelope on the top right side of the form. Make your choice by circling across the two numbers that you choose and then put your form back in your envelope. For example, you could circle 8 for you and 2 for your partner, or 3 for

36
you and 7 for you partner. (When describing how to fill out the form, hold up a form as an example.) We have all the time you need, so think about what you want to do.” (Collect the envelopes from the proposers. Match proposers up with responders and fill out forms for the responders and put it in their envelopes. If there was an odd number of players, we matched one player with two partners when computing payoffs.) To group B: “You are the responders. The form in your envelope tells you how many tokens your partner gets and how many you get.” (Collect the envelopes from the responders. Fill out the forms for the proposers, which tell what the responders decided to do. Put the appropriate number of tokens in the envelopes.) “OK, now we are going to do this same game again. But this time everybody will switch roles. So, if you were a proposer, this time you are a responder. If you were a responder, this time you are a proposer.” (Repeat the protocol, starting with the specific instructions to the proposers.) Payouts: After all 4 rounds, we passed out sheets to the children, with the prices of the items in the store. We asked them to write down how many of each item they wanted, and to make sure they didn’t spend more than they had. We then collected these sheets along with their envelopes with the tokens, put the items in bags, and returned them. For the ninth and twelfth graders we collected the envelopes, exchanged the tokens for cash, at rates of 25 and 50 cents respectively, and then returned them.
37
References: Anderson, Lisa R., Yana V. Rodgers, and Roger R. Rodriguez. "Cultural Differences in Attitudes
toward Bargaining." In Economics Letters, 45-54, 2000. Andreoni, James, and Lise Vesterlund. "Which Is the Fair Sex? Gender Differences in Altruism."
Quarterly Journal of Economics 116, no. 1 (2001): 293-312. Ayres, Ian, and Peter Siegelman. "Race and Gender Discrimination in Bargaining for a New
Car." American Economic Review 85, no. 3 (1995): 304-21. Bolton, Gary E., and Axel Ockenfels. "Erc: A Theory of Equity, Reciprocity, and Competition."
American Economic Review 90, no. 1 (2000): 166-93. Cameron, Lisa A. "Raising the Stakes in the Ultimatum Game: Experimental Evidence from
Indonesia." Economic Inquiry 37, no. 1 (1999): 47-59. Croson, Rachel, and Nancy Buchan. "Gender and Culture: International Experimental Evidence
from Trust Games." American Economic Review 89, no. 2 (1999): 386-91. Eckel, Catherine C., and Philip J. Grossman. "Are Women Less Selfish Than Men? Evidence
from Dictator Experiments." Economic Journal 108, no. 448 (1998): 726-35. ———. "Chivalry and Solidarity in Ultimatum Games." Economic Inquiry 39, no. 2 (2001):
171-88. Eisenberg, Nancy. Altruistic Emotion, Cognition, and Behavior. Hillsdale, NJ: Erlbaum, 1986. Eisenberg, Nancy, and Richard A. Fabes. "Prosocial Development." In Handbook of Child
Psychology, edited by William Damon, 701-78. New York: J. Wiley, 1998. Fabes, Richard A., and Nancy Eisenberg. "Meta Analysis of Sex and Age Differences in
Prosocial Behavior." Arizona State University Working Paper (1996). Fehr, Ernst, and Klaus M. Schmidt. "A Theory of Fairness, Competition, and Cooperation."
Quarterly Journal of Economics 114, no. 3 (1999): 817-68. Forsythe, Robert, Joel L. Horowitz, N. E. Savin, and Martin Sefton. "Fairness in Simple
Bargaining Experiments." Games and Economic Behavior 6, no. 3 (1994): 347-69. Guth, Werner, Rolf Schmittberger, and Bernd Schwarze. "An Experimental Analysis of
Ultimatum Bargaining." Journal of Economic Behavior and Organization 3, no. 4 (1982): 367-88.
Henrich, Joseph. "Does Culture Matter in Economic Behavior? Ultimatum Game Bargaining among the Machiguenga of the Peruvian Amazon." American Economic Review 90, no. 4 (2000): 973-79.
Henrich, Joseph, Robert Boyd, Samuel Bowles, Colin Camerer, Ernst Fehr, Herbert Gintis, and Richard McElreath. "In Search of Homo Economicus: Behavioral Experiments in 15 Small-Scale Societies." American Economic Review 91, no. 2 (2001): 73-78.
Keil, Linda J. "Rules, Reciprocity, and Rewards: A Developmental Study of Resource Allocation in Social Interaction." Journal of Experimental Social Psychology 22 (1986): 419-35.
Kohlberg, Lawrence. "Moral Stages and Moralization: The Cognitive-Developmental Approach." In Moral Development and Behavior: Theory, Research, and Social Issues, edited by T. Lickona, 31-53. New York: Holt, Rinehart and Winston., 1976.
Murnighan, J. Keith, and Michael Scott Saxon. "Ultimatum Bargaining by Children and Adults." Journal of Economic Psychology 19, no. 4 (1998): 415-45.
38
Persico, Nicola, Andrew Postlewaite, and Dan Silverman. "The Effect of Adolescent Experience on Labor Market Outcomes: The Case of Height." University of Pennsylvania Working Paper (2001).
Piaget, Jean. The Moral Judgement of the Child. New York: Free Press, 1965. Rabin, Matthew. "Incorporating Fairness into Game Theory and Economics." American
Economic Review 83, no. 5 (1993): 1281-302. Roth, Alvin E. "Bargaining Experiments." In The Handbook of Experimental Economics, edited
by John H. Kagel and Alvin E. Roth. Princeton: Princeton University Press, 1995. Roth, Alvin E., Vesna Prasnikar, Masahiro Okuno-Fujiwara, and Shmuel Zamir. "Bargaining and
Market Behavior in Jerusalem, Ljubljana, Pittsburgh, and Tokyo: An Experimental Study." American Economic Review 81, no. 5 (1991): 1068-95.
Smith, Adam. An Inquiry into the Nature and Causes of the Wealth of Nations. New York: The Modern Library, 1776/1937.
Solnick, Sara J. "Sex Differences in the Ultimatum Game." Economic Inquiry 39, no. 2 (2000): 189-200.