Franciscan Children's 2021 Community Health Needs ...
39
Submitted to: Jennifer Atlas, MS Assistant Vice President, Strategy and Government Relations Franciscan Children’s Franciscan Children’s 2021 Community Health Needs Assessment Report July 2021
-
Upload
khangminh22 -
Category
Documents
-
view
0 -
download
0
Transcript of Franciscan Children's 2021 Community Health Needs ...

Submitted to: Jennifer Atlas, MS Assistant Vice President, Strategy and Government Relations Franciscan Children’s
[DATE]
Franciscan Children’s 2021 Community Health Needs Assessment Full Report
Franciscan Children’s 2021 Community Health Needs Assessment Report July 2021

2
Franciscan Children’s Community Health Needs Assessment 2021
Contents
BACKGROUND ................................................................................................................................. 4
Overview of Franciscan Children’s .............................................................................................. 4
Purpose and Scope of the Franciscan Children’s Community Health Needs Assessment (CHNA) ......................................................................................................................................... 4
Definition of Community Served ................................................................................................ 5
METHODS ........................................................................................................................................ 5
Social Determinants of Health Framework ................................................................................. 5
Health Equity Lens/Approach ..................................................................................................... 6
COVID-19 Context ....................................................................................................................... 6
Quantitative Data Collection ...................................................................................................... 6
Qualitative Data Collection ......................................................................................................... 6
Interviews With Service Providers .......................................................................................... 7
Interviews With Parents ......................................................................................................... 7
Analyses .................................................................................................................................. 7
Data Limitations .......................................................................................................................... 7
COMMUNITY SOCIAL AND ECONOMIC CONTEXT .......................................................................... 8
Demographics ............................................................................................................................. 8
Population ............................................................................................................................... 8
Language and Foreign-Born Population ............................................................................... 11
Education .................................................................................................................................. 12
Income, Poverty, and Employment .......................................................................................... 12
Median household income ................................................................................................... 12
Poverty .................................................................................................................................. 13
Unemployment Rate ............................................................................................................. 15
Housing and Transportation ..................................................................................................... 16
COMMUNITY HEALTH OUTCOMES AND BEHAVIORS ................................................................... 18
Behavioral and Mental Health .............................................................................................. 18
Substance Misuse ................................................................................................................. 22
Healthy Eating / Active Living ............................................................................................... 25

3
Franciscan Children’s Community Health Needs Assessment 2021
Perceptions of Health in the Community ............................................................................. 26
HEALTH CARE ACCESS AND UTILIZATION ..................................................................................... 27
Health Insurance Coverage in Children .................................................................................... 27
Access to Health Care Services ................................................................................................. 27
Access to Primary and Mental Health Care .......................................................................... 27
Access to Oral Health Services .............................................................................................. 29
Access to Physical, Occupational, and Speech Therapy ....................................................... 30
Barriers to Accessing Care ........................................................................................................ 30
COMMUNITY RESOURCES AND SUGGESTIONS ............................................................................ 31
Community Resources and Assets ............................................................................................ 31
Community Suggestions ........................................................................................................... 31
Mental Health ....................................................................................................................... 32
Dental Services ...................................................................................................................... 32
Physical, Occupational, and Speech Therapy Services ......................................................... 32
Family Supports .................................................................................................................... 33
Youth Programming .............................................................................................................. 33
KEY THEMES AND CONCLUSIONS ................................................................................................. 33
APPENDIX ...................................................................................................................................... 35
A. List Of Organizations Involved in Interviews .................................................................. 35
B. Prioritization of Needs Identified in 2021 CHNA ........................................................... 36
C. Activities Completed Since the 2018 CHNA ................................................................... 37

4
Franciscan Children’s Community Health Needs Assessment 2021
Overview of Franciscan Children’s Franciscan Children’s mission is to provide a compassionate and positive environment where children with complex medical, mental health and educational needs receive specialized care from people who are committed to excellence, innovation, and family support so that children can reach their fullest potential and live their best life.
Purpose and Scope of the Franciscan Children’s Community Health Needs Assessment (CHNA) In 2021, Franciscan Children’s conducted a community health needs assessment (CHNA) of the community it serves. The purpose of the CHNA was to provide an empirical foundation for future health planning, as well as fulfill the CHNA requirement for non-profit institutions put forth by the Internal Revenue Service (IRS). Franciscan hired Health Resources in Action (HRiA), a non-profit public health organization in Boston, Massachusetts specialized in CHNA development, to collect and analyze data and to develop the CHNA report.
The 2021 CHNA builds off of the work from the previous assessments conducted in 2015 and 2018. Priority areas identified in the 2018 CHNA included mental health for children and adolescents, primary care for children and adolescents, child wellness (e.g., nutrition, child development, physical activity), and community engagement with Allston/Brighton organizations. Franciscan Children’s and its partners developed and implemented a range of strategies to address these identified needs. These strategies can be found in Appendix C.
The 2021 CHNA used a similar methodology as the prior assessments. Although the methods were slightly revamped to accommodate data collection during the COVID-19 pandemic, described in detail in the Methods section contained in this report, the two assessment approaches were largely the same. In both assessments, the assessment team employed primary and secondary data collection methods to describe the community’s social and economic issues, health behaviors and health outcomes, health care access, strengths and challenges, and resources to help achieve a vision for the future. This report discusses the findings from the 2021 CHNA conducted April-June 2021.
Overall, the 2021 Franciscan Children’s CHNA was conducted to accomplish the following goals: • Examine the current health status of children and families in the Allston/Brighton
community • Identify the current health priorities among children and families, focusing specifically on
pediatric health including: o Mental and behavioral health o Oral health o Physical, occupational, and speech therapy
• Explore community strengths, resources, and gaps in services in order to guide future planning and programming efforts for Franciscan Children’s
• Understand perceptions of – and explore ways to address – health and racial inequities in the Allston/Brighton neighborhood
BACKGROUND

5
Franciscan Children’s Community Health Needs Assessment 2021
Definition of Community Served While Franciscan Children’s patients come from across the United States and even international destinations, the institution is located in the Allston/Brighton neighborhood of Boston, Massachusetts. Therefore, the community of focus for this CHNA is defined as the Allston/Brighton neighborhood. This geographic area was selected for the CHNA because Franciscan Children’s recognizes the importance of focusing efforts directly in the neighborhood where the hospital is located and addressing the health needs of the local community. Where possible, neighborhood-level data for Allston/Brighton are discussed. Boston and Massachusetts data are also shown to provide more context and/or where neighborhood-level data are not available.
METHODS The following section describes the data collection activities, as well as the approaches used to collect the data. This section also provides context about the overarching framework used to guide the assessment process.
Social Determinants of Health Framework While delivering quality health care to residents is an important part of maintaining community health, it is not the only factor that allows a community to thrive. In addition to individual factors (e.g., genetic makeup and personal behaviors), community health is also influenced by several economic and social factors. These factors create the Social Determinants of Health framework (see Figure 1) and were used to guide discussions with interview participants and the search for secondary data indicators.
Figure 1. Social Determinants of Health
SOURCE: World Health Organization, Commission on the Social Determinants of Health, Towards a Conceptual Framework for Analysis and Action on the Social Determinants of Health, 2005. Graphic adapted by Health Resources in Action from the County of Monterey Health Department.

6
Franciscan Children’s Community Health Needs Assessment 2021
Health Equity Lens/Approach In addition to capturing the impact of social determinants of health within a community, it is also important to understand how underserved populations in a community are disproportionately affected by social determinants. This understanding is captured by employing a health equity lens while conducting activities related to the assessment. According to the Robert Wood Johnson Foundation, “Health equity means that everyone has a fair and just opportunity to be as healthy as possible. This requires removing obstacles to health such as poverty, discrimination, and their consequences, including powerlessness and lack of access to good jobs with fair pay, quality education and housing, safe environments, and health care.”1 The assessment team also employed a health equity lens to guide data collection methods by engaging with interview participants either representing or identifying with various populations that are typically underrepresented in data collection (e.g., people with substance use disorder, youth and children, and people of color).
COVID-19 Context It is important to recognize that an assessment study is a snapshot in time. The 2021 Franciscan Children’s CHNA occurred 13 months after the Governor of Massachusetts issued an emergency order to curtail the COVID-19 pandemic. This emergency order included school closures, business closures, and limitations on gatherings. During the spring of 2021, at the time of this CHNA, schools and businesses began to open up and vaccine rates increased, but the nation was still very much in the midst of the COVID-19 pandemic. Logistically, the pandemic impacted the feasibility of convening in-person discussions for the CHNA and the availability of key stakeholders and community members to participate in CHNA activities. To accommodate this shift in data collection logistics, the assessment team engaged in more creative approaches for recruitment and conducted all interviews virtually by telephone or video conference.
Quantitative Data Collection In an effort to develop a comprehensive picture of the Allston/Brighton neighborhoods, the assessment team reviewed existing data from national, state, and local sources. The types of data included demographics, vital statistics, public health surveillance, and self-reported health behaviors. Data sources included but were not limited to the U.S. Census, Massachusetts Department of Public Health, Boston Public Schools, Boston Public Health Commission, among others. Data analyses such as significance testing were generally conducted by the original data source (e.g., U.S. Census, Boston Public Health Commission). Much of the U.S. Census data derive from the American Community Survey, which is comprised of data from a sample of a given geographic area. Per the U.S. Census recommendations, 5-year aggregated data (e.g., the 2015-2019 data combined together) was used for these indicators to yield a large enough sample size to examine results by municipality and census tract.
Qualitative Data Collection In addition to quantitative data from the Allston/Brighton neighborhoods, the assessment team gathered qualitative information through interviews with leaders from organizations serving the Allston/Brighton community and parents living in Allston/Brighton to develop a more nuanced understanding of the perceptions of community strengths and assets, health concerns, and suggestions
1 Braveman P, Arkin E, Orleans T, Proctor D, and Plough A. What Is Health Equity? And What Difference Does a Definition Make? Princeton, NJ: Robert Wood Johnson Foundation, 2017.

7
Franciscan Children’s Community Health Needs Assessment 2021
on what programming or services are most needed to address these concerns. In selecting both residents and service providers, the assessment team engaged in a careful and deliberate process to ensure that 1) the community was properly engaged in the development of the CHNA, and 2) Franciscan Children’s is able to gain a clear understanding of the needs in the community from the CHNA. As diversity, equity, and belonging are high priorities for Franciscan Children’s, in all interviews, participants were asked to provide their perspectives on how conversations around racial injustice and health inequities have taken shape in the community. During May and June 2021, seven interviews were conducted with service providers and seven interviews were conducted with Allston/Brighton parents.
Interviews With Service Providers A total of seven interviews were conducted with service providers representing a range of sectors including public health, housing/community development, social services, and healthcare. The interviews explored participants’ perceptions of the community, priority health concerns and suggestions for future programming and services to address perceived health issues. A semi-structured interview guide was used across all discussions to ensure consistency in the topics covered. Interviews were approximately 40-60 minutes in length. A list of the service providers interviewed can be found in Appendix A.
Interviews With Parents A total of seven interviews were conducted with parents of youth and adolescent children living in Allston/Brighton. Parents ranged in age, racial identity, socioeconomic background, and length of residence in Allston/Brighton. In order to better understand how services at Franciscan Children’s can reach more community members, the assessment team prioritized interviewing Allston/Brighton parents whose children had not received services at Franciscan Children’s. Five Allston/Brighton residents interviewed had children who had not received services at Franciscan Children’s while two Allston/Brighton residents interviewed had children who had received services at Franciscan Children’s. Similar to conversations with organization leaders, discussions with parents explored perceptions of the Allston/Brighton community, health concerns, and suggestions for future programming and services to address these concerns. A semi-structured interview guide was used across all discussions to ensure consistency in the topics covered. Interviews were approximately 40-60 minutes in length and all participants were provided a small stipend ($25) for their time.
Analyses The collected qualitative information was manually coded and then analyzed thematically for main categories and sub-themes. The assessment team identified key themes that emerged across the interviews, as well as the unique issues that were noted for specific populations. Frequency and intensity of discussions on a specific topic were key indicators used for extracting main themes. Selected quotes – without personal identifying information – are presented in the narrative of this report to further illustrate points within topic areas.
Data Limitations As with all data collection efforts, there are some limitations related to the assessment’s methods that should be acknowledged. Regarding surveillance systems, some indicators available on the city level could not be disaggregated to the neighborhood level due to the small population size of the Allston/Brighton neighborhood. Additionally, while quantitative data is available for health outcomes

8
Franciscan Children’s Community Health Needs Assessment 2021
among youth, they tend to be limited among younger children. Finally, there is a time lag in data analyses for data surveillance systems. While this lag is not ideal, it is a challenge faced by health-related organizations and agencies across the state and nation.
Data based on self-reported information should be interpreted with caution, as respondents may over- or under-report behaviors and illnesses based on fear of social stigma or misunderstanding the question being asked. In addition, respondents may be prone to recall bias—that is, they may attempt to answer accurately but remember incorrectly.
For the qualitative data, it is important to recognize results are not statistically representative of a larger population due to non-random recruiting techniques and a small sample size. While efforts were made to talk to a diverse cross-section of individuals, it is not possible to confirm whether they reflect the composition of the region. Lastly, it is important to note that data were collected at one point in time, so findings, while directional and descriptive, should not be interpreted as definitive.
COMMUNITY SOCIAL AND ECONOMIC CONTEXT Demographics The following section provides an overview of the demographics of the Allston/Brighton neighborhood including total population, racial/ethnic composition, age distribution, language and country of origin, and income-related measures. Most of these measures are provided in relation to Boston as well as Massachusetts.
Population According to the American Community Survey 2015-2019 aggregated estimate, the population of Allston/Brighton was 67,479 residents, accounting for nearly 10% of Boston’s total population during that time period. The 2019 estimate is higher compared to 2017 and 2018 (63,270 and 66,585, respectively). See Quantitative Data Appendix for detailed data tables.
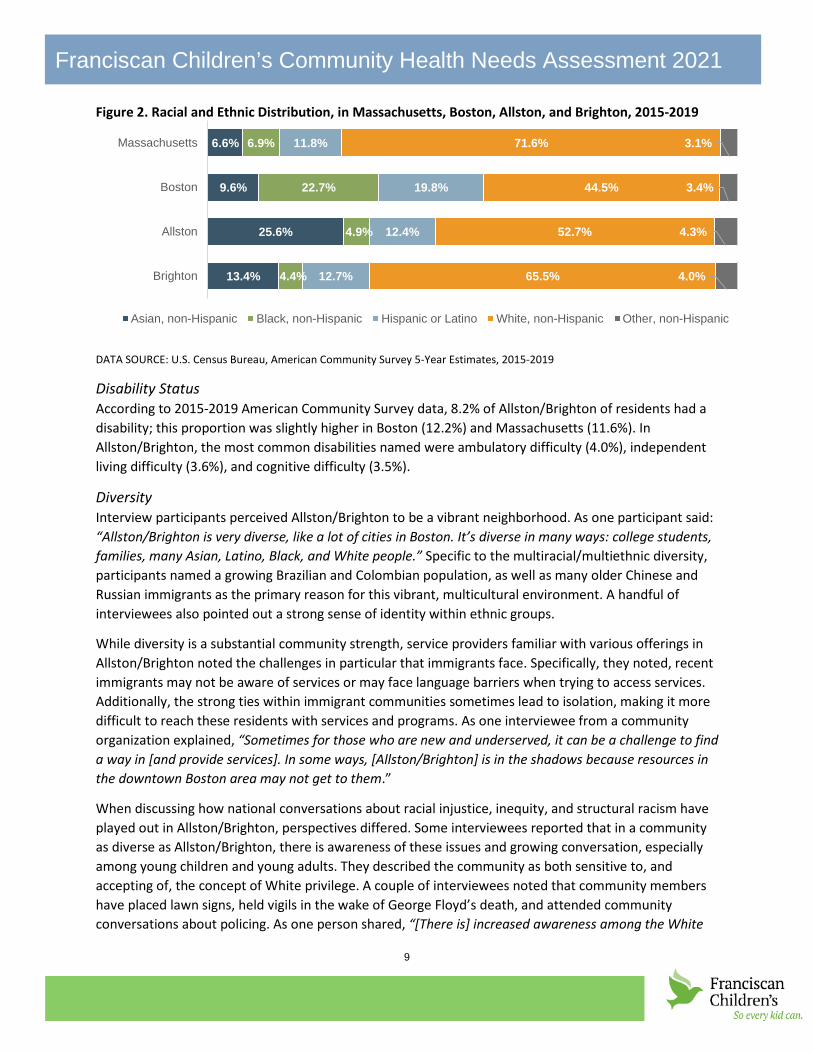
Both Allston and Brighton neighborhoods have less racial and ethnic diversity than Boston but more than Massachusetts, per American Community Survey data (see Figure 2). In 2019, nearly half (47.3%) of Allston residents and more than one in three (34.5%) of Brighton residents were people of color, compared to Boston residents (55.5%) and Massachusetts residents (28.4%). Among residents of color in Allston and Brighton, Asian residents comprise the largest proportion (25.6% and 13.4%, respectively), followed by Hispanic or Latinx residents (12.4% and 12.7%, respectively). Proportions in both neighborhoods are comparable to 2018 data. For example, in Allston, the proportion of Asian, Black, and Hispanic/Latino residents was 25.0%, 3.8%, and 12.4%, respectively. In Brighton, the proportion of Asian, Black, and Hispanic/Latino residents was 14.4%, 3.9%, and 12.0%, respectively.
9
Franciscan Children’s Community Health Needs Assessment 2021
Figure 2. Racial and Ethnic Distribution, in Massachusetts, Boston, Allston, and Brighton, 2015-2019
DATA SOURCE: U.S. Census Bureau, American Community Survey 5-Year Estimates, 2015-2019
Disability Status According to 2015-2019 American Community Survey data, 8.2% of Allston/Brighton of residents had a disability; this proportion was slightly higher in Boston (12.2%) and Massachusetts (11.6%). In Allston/Brighton, the most common disabilities named were ambulatory difficulty (4.0%), independent living difficulty (3.6%), and cognitive difficulty (3.5%).
Diversity Interview participants perceived Allston/Brighton to be a vibrant neighborhood. As one participant said: “Allston/Brighton is very diverse, like a lot of cities in Boston. It’s diverse in many ways: college students, families, many Asian, Latino, Black, and White people.” Specific to the multiracial/multiethnic diversity, participants named a growing Brazilian and Colombian population, as well as many older Chinese and Russian immigrants as the primary reason for this vibrant, multicultural environment. A handful of interviewees also pointed out a strong sense of identity within ethnic groups.
While diversity is a substantial community strength, service providers familiar with various offerings in Allston/Brighton noted the challenges in particular that immigrants face. Specifically, they noted, recent immigrants may not be aware of services or may face language barriers when trying to access services. Additionally, the strong ties within immigrant communities sometimes lead to isolation, making it more difficult to reach these residents with services and programs. As one interviewee from a community organization explained, “Sometimes for those who are new and underserved, it can be a challenge to find a way in [and provide services]. In some ways, [Allston/Brighton] is in the shadows because resources in the downtown Boston area may not get to them.”
When discussing how national conversations about racial injustice, inequity, and structural racism have played out in Allston/Brighton, perspectives differed. Some interviewees reported that in a community as diverse as Allston/Brighton, there is awareness of these issues and growing conversation, especially among young children and young adults. They described the community as both sensitive to, and accepting of, the concept of White privilege. A couple of interviewees noted that community members have placed lawn signs, held vigils in the wake of George Floyd’s death, and attended community conversations about policing. As one person shared, “[There is] increased awareness among the White
6.6%
9.6%
25.6%
13.4%
6.9%
22.7%
4.9%
4.4%
11.8%
19.8%
12.4%
12.7%
71.6%
44.5%
52.7%
65.5%
3.1%
3.4%
4.3%
4.0%
Massachusetts
Boston
Allston
Brighton
Asian, non-Hispanic Black, non-Hispanic Hispanic or Latino White, non-Hispanic Other, non-Hispanic
10
Franciscan Children’s Community Health Needs Assessment 2021
community about racial injustice.” More recently, participants reported, community groups have been active in educating the Allston/Brighton community on behalf of the Asian American and Pacific Islander (AAPI) community.
“[There is a] large immigrant community – people are moving here to Allston/Brighton and settling.”
Some interviewees, however, commented that because there are fewer Black residents in Allston/Brighton than in other Boston communities, some may perceive these conversations to be unnecessary. As one interviewee explained, “Because there is not a prominent Black population, Allston/Brighton is not seen as a neighborhood that needs to have that conversation.” Others noted that while conversation is beginning, there is a need to translate this into more concrete action. As one resident observed, “I see people with signs out and that’s making a statement, but I don’t know how much more is happening.”
Age Distribution
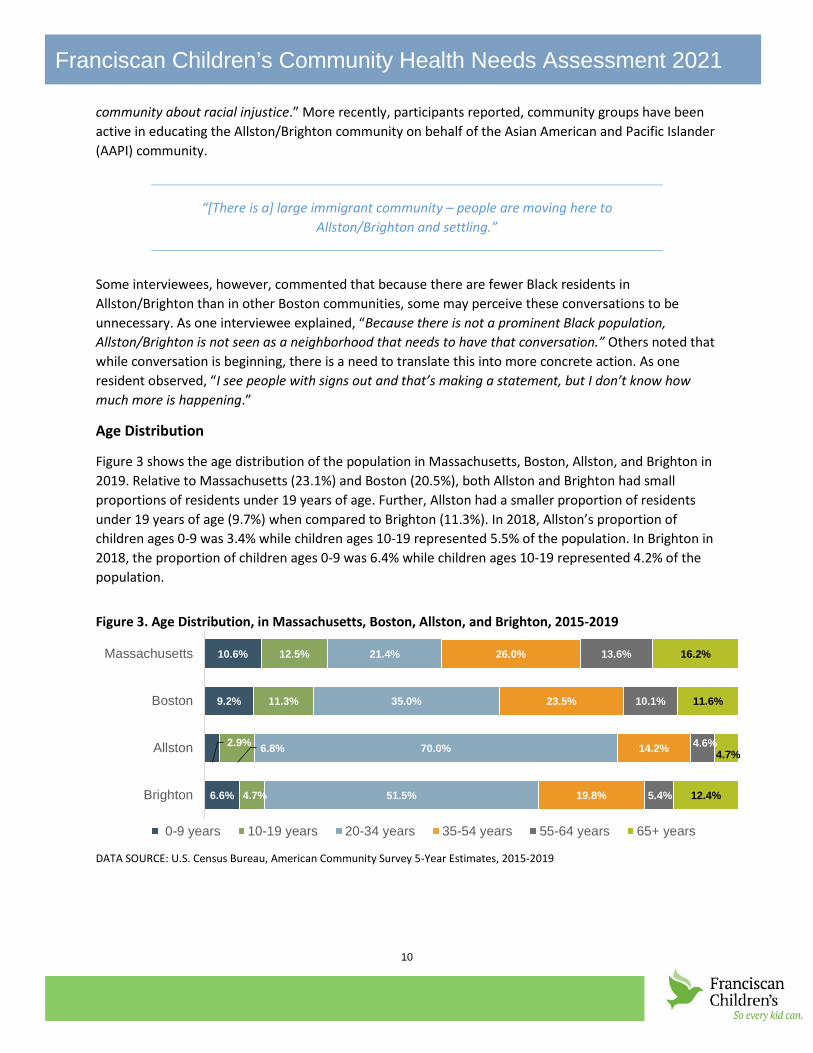
Figure 3 shows the age distribution of the population in Massachusetts, Boston, Allston, and Brighton in 2019. Relative to Massachusetts (23.1%) and Boston (20.5%), both Allston and Brighton had small proportions of residents under 19 years of age. Further, Allston had a smaller proportion of residents under 19 years of age (9.7%) when compared to Brighton (11.3%). In 2018, Allston’s proportion of children ages 0-9 was 3.4% while children ages 10-19 represented 5.5% of the population. In Brighton in 2018, the proportion of children ages 0-9 was 6.4% while children ages 10-19 represented 4.2% of the population.
Figure 3. Age Distribution, in Massachusetts, Boston, Allston, and Brighton, 2015-2019
DATA SOURCE: U.S. Census Bureau, American Community Survey 5-Year Estimates, 2015-2019
10.6%
9.2%
2.9%
6.6%
12.5%
11.3%
6.8%
4.7%
21.4%
35.0%
70.0%
51.5%
26.0%
23.5%
14.2%
19.8%
13.6%
10.1%
4.6%
5.4%
16.2%
11.6%
4.7%
12.4%
Massachusetts
Boston
Allston
Brighton
0-9 years 10-19 years 20-34 years 35-54 years 55-64 years 65+ years

11
Franciscan Children’s Community Health Needs Assessment 2021
In 2019, children under 18 years represented 6.0% of Allston’s residents and 10.3% of Brighton’s residents, a smaller proportion than Boston overall (16.0%) and Massachusetts (20.1%) (see Figure 4). These proportions were comparable to those in 2018 where children under 18 represented 6.3% of the Allston population and 9.8% of the Brighton population.
Figure 4. Percent Population Under 18 years, in Massachusetts, Boston, Allston, and Brighton, 2015-2019
DATA SOURCE: U.S. Census Bureau, American Community Survey 5-Year Estimates, 2015-2019
Interview participants reported that they enjoyed living in the community, which they described as having a mix of families, seniors, and young adults. Because Allston is located near several universities, interviewees reported that the town has a large number of college students and young professionals. By contrast, the Brighton area was reported to be more suburban, with fewer students and more families with younger children. Residents also shared that the community has experienced a lot of change in recent years due to substantial construction of new commercial space and housing. As one resident described, “there has been a lot of change in community. I think of the I-90 area – it used to be an industrial area, but it’s now the location of the New Balance headquarters, new apartment buildings. There has been a lot of urban renewal.”
Language and Foreign-Born Population In 2019, 43.1% of Allston residents, and 35.0% of Brighton residents spoke a language other than English at home. While these proportions were similar to Boston (37.7%), they are higher than Massachusetts overall where fewer than one in four (23.8%) residents reported speaking a language other than English at home. In Allston, the most common languages spoken at home were Chinese (13.3%), Spanish (9.2%), and other Indo-European languages (7.7%). Brighton had similar commonly spoken languages with slightly different proportions: Spanish (10.3%), Chinese (6.9%), other Indo-European languages (6.2%), and Russian, Polish, or other Slavic languages (5.1%). The proportions for language data differ from 2018, particularly in Allston where the most commonly spoken languages were: Spanish (20.3%), Chinese (19.7%), other Indo-European languages (19.7%), other Asian and Pacific Island languages (7.2%), and French, Haitian, or Cajun (5.1%). In Brighton, the most commonly spoken languages were largely the same: Spanish (9.7%), Chinese (7.7%), other Indo-European languages (7.1%), and Russian, Polish, or other Slavic languages (5.2%). See Quantitative Data Appendix for more tables.
As language data above suggests, Allston and Brighton had a relatively large proportion of foreign-born residents in 2019 (Figure 5). More than one in three (36.9%) Allston residents and more than one in four (26.7%) Brighton residents reported being born outside of the United States. While these proportions were comparable to Boston (28.3%), they were much larger than Massachusetts (16.8%). These
20.1%
16.0%
6.0%
10.3%
Massachusetts
Boston
Allston
Brighton

12
Franciscan Children’s Community Health Needs Assessment 2021
proportions are comparable to 2018 data where 36.1% of Allston residents and 27.3% of Brighton residents reported being born outside of the United States.
Figure 5. Percent Foreign Born Population in Massachusetts, Boston, Allston, and Brighton, 2015-2019
DATA SOURCE: U.S. Census Bureau, American Community Survey 5-Year Estimates, 2015-2019
Education Across Massachusetts, Boston, and Allston/Brighton, most residents have completed at least some college and/or have attained at least an associate degree. In Allston and Brighton, though, proportions of residents who have completed at least a bachelor’s degree are considerably higher than Boston overall and Massachusetts. Roughly two in five Allston and Brighton residents have received at least a bachelor’s degree (39.1% and 40.1%, respectively) compared to 27.0% in Boston and 24.1% in Massachusetts. Similar differences exist when examining the proportion of residents who have completed a graduate or professional degree. In Allston and Brighton, roughly one in three residents have a graduate or professional degree (32.1% and 28.1% respectively), while in Boston and Massachusetts, the proportions are lower (22.7% and 19.6% respectively). Similar to the age distribution data, these proportions reflect the large college population in the area. For a detailed table, see Quantitative Data Appendix.
Income, Poverty, and Employment The following section provides data on the economic factors that contribute to a community’s growth and wellbeing, including unemployment data during the height of the COVID-19 pandemic.
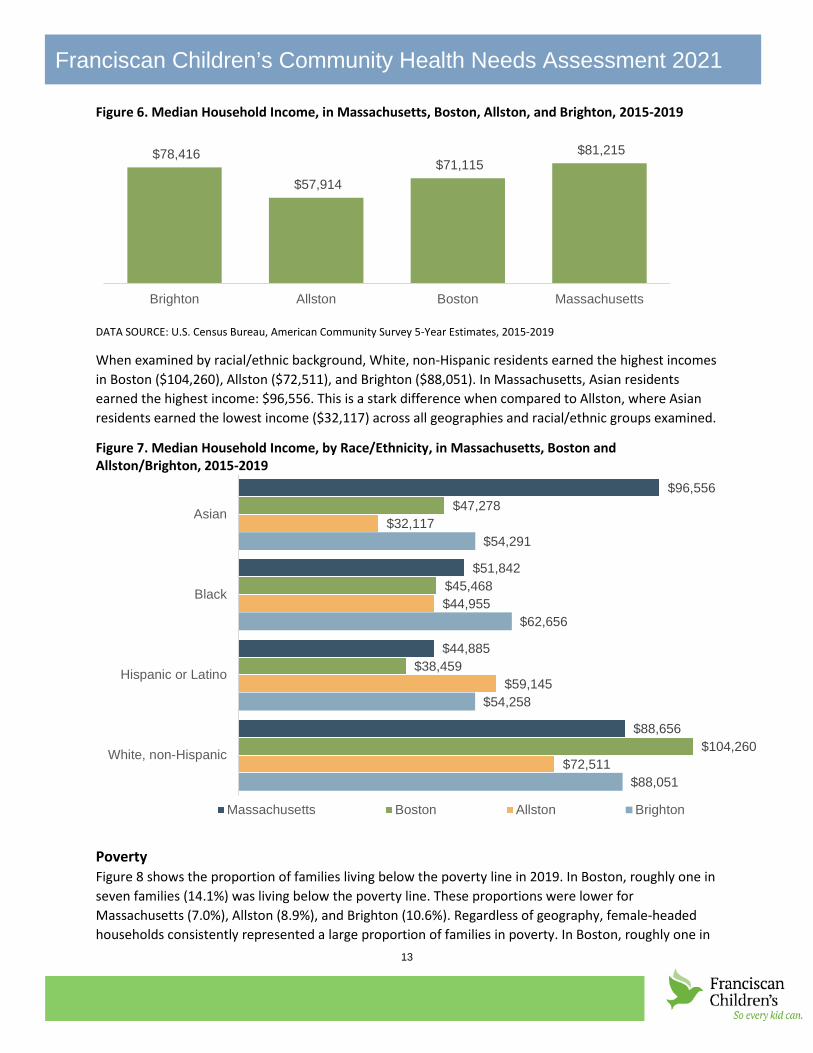
Median household income According to American Community Survey data (2015-2019), the median household income in Brighton was $78,416 while the median income in Allston was $57,914 (see Figure 6). While 2019 income in Allston was higher compared to previous years, the neighborhood’s income remained lower than both Boston ($71,115) and Massachusetts ($81,215).
16.8%
28.3%
36.9%
26.7%
Massachusetts
Boston
Allston
Brighton
13
Franciscan Children’s Community Health Needs Assessment 2021
Figure 6. Median Household Income, in Massachusetts, Boston, Allston, and Brighton, 2015-2019
DATA SOURCE: U.S. Census Bureau, American Community Survey 5-Year Estimates, 2015-2019
When examined by racial/ethnic background, White, non-Hispanic residents earned the highest incomes in Boston ($104,260), Allston ($72,511), and Brighton ($88,051). In Massachusetts, Asian residents earned the highest income: $96,556. This is a stark difference when compared to Allston, where Asian residents earned the lowest income ($32,117) across all geographies and racial/ethnic groups examined.
Figure 7. Median Household Income, by Race/Ethnicity, in Massachusetts, Boston and Allston/Brighton, 2015-2019
Poverty Figure 8 shows the proportion of families living below the poverty line in 2019. In Boston, roughly one in seven families (14.1%) was living below the poverty line. These proportions were lower for Massachusetts (7.0%), Allston (8.9%), and Brighton (10.6%). Regardless of geography, female-headed households consistently represented a large proportion of families in poverty. In Boston, roughly one in
$81,215 $71,115
$57,914
$78,416
MassachusettsBostonAllstonBrighton
$96,556
$51,842
$44,885
$88,656
$47,278
$45,468
$38,459
$104,260
$32,117
$44,955
$59,145
$72,511
$54,291
$62,656
$54,258
$88,051
Asian
Black
Hispanic or Latino
White, non-Hispanic
Massachusetts Boston Allston Brighton

14
Franciscan Children’s Community Health Needs Assessment 2021
three (30.8%) female-headed households reported living below the poverty line. Allston had the lowest proportion of female-headed households living in poverty (18.7%), while Brighton had the second highest proportion, with more than one in four (26.2%) female-headed households living in poverty.
Figure 8. Percent Families Living Below the Poverty Line, in Massachusetts, Boston, Allston, and Brighton, 2015-2019
DATA SOURCE: U.S. Census Bureau, American Community Survey 5-Year Estimates, 2015-2019
Figure 9 shows the proportion of children living in poverty in 2015-2019. Across all of Boston, more than one in four (27.7%) children under 18 were living in poverty, with slightly higher proportions among children aged 5-17 years. When examined by neighborhood, both Allston and Brighton had smaller proportions of children under 18 living in poverty (15.8% and 17.4%, respectively). However, there were stark differences in poverty among children under age 5 in Allston and Brighton. In Allston, 48.5% of children under 5 were living in poverty while 7.8% of children under 5 were living in poverty in Brighton. While 48.5% is a large proportion, it should be noted that in Allston, there were fewer than 200 total children under 5 for whom poverty status was determined during this time period, meaning that 48.5% represented fewer than 100 children under age 5.
Figure 9. Percent Children Living Below the Poverty Line, in Massachusetts, Boston, Allston, and Brighton, 2015-2019
DATA SOURCE: U.S. Census Bureau, American Community Survey 5-Year Estimates, 2015-2019
7.0%
14.1%
8.9%
10.6%
22.1%
30.8%
18.7%
26.2%
Massachusetts
Boston
Allston
Brighton
All Families Female headed households
14.4%
23.4%
48.5%
7.8%
12.7%
29.6%
10.6%
23.6%
13.2%
27.7%
15.8%
17.4%
Massachusetts
Boston
Allston
Brighton
Under 5 years 5 to 17 years Under 18 years

15
Franciscan Children’s Community Health Needs Assessment 2021
Unemployment Rate Across all geographies examined, the 2019 unemployment rate was low (Figure 10). Specifically, the unemployment rates in Allston and Brighton were lower than the rate for Boston (6.6%), though the rate in Allston was slightly higher than Massachusetts (5.0% vs. 4.8%). Compared to 2017, the 2019 unemployment rate in Allston/Brighton was also slightly lower than the unemployment rate reported for the neighborhood in 2017.
Figure 10. Percent Population 16 Years and Over Unemployed, in Massachusetts, Boston, Allston, and Brighton, 2015-2019
DATA SOURCE: U.S. Census Bureau, American Community Survey 5-Year Estimates, 2015-2019 Unemployment rates changed substantially due to the effects of the statewide lockdowns and closures related to the COVID-19 pandemic. Unemployment data for this time were available for the City of Boston and Massachusetts overall. As shown in Figure 11, between March and April 2020, the unemployment rate grew from 2.6% to 14.9% in Boston and 3.1% to 16.3% in Massachusetts. The unemployment rate, while lowering slightly during summer 2020, remained high through the remainder of the year. Between January and May 2021, these rates steadily declined in both geographies, though rates remained higher than March 2021.
Figure 11. Percent Population 16 Years and Over Unemployed, in Massachusetts and Boston, 2020-2021
DATA SOURCE: U.S. Department of Labor, Bureau of Labor Statistics, Local Area Unemployment Statistics, 2021
Several interview participants expressed concern about economic conditions in the Allston/Brighton neighborhood, noting that the COVID-19 pandemic created economic hardships that left many families
4.8%
6.6%
5.0%
3.5%
Massachusetts
Boston
Allston
Brighton
3.1%
16.3%
15.4%
10.1% 8.9% 7.7% 7.5%6.6%
6.1%2.6%
14.9%15.5%
11.5% 10.3%8.1% 7.5%
6.3%
6.4%
3/2020 5/2020 7/2020 9/2020 11/2020 1/2021 3/2021 5/2021Massachusetts Boston

16
Franciscan Children’s Community Health Needs Assessment 2021
struggling financially. When discussing the impacts of the pandemic, participants most often mentioned an increase in food needs. As one resident commented, “There’s a lot more food insecurity now than before COVID.”
Though one resident interviewee observed that employment opportunities are once again increasing, especially for bilingual applicants, many other resident interviewees stated that rising costs for food and housing and difficulty finding affordable childcare are making post-pandemic recovery more difficult for low-income families. Service providers also echoed this sentiment noting that there continues to be a need for food pantries, clothing, and other essentials such as diapers and wipes in the community.
“Organizations have seen needs skyrocket. Needs have increased exponentially.”
According to many interviewees, community response to these needs has been significant: food programs grew in size and number during the pandemic, with the active participation of community organizations and schools. Examples include expansion of About Fresh’s mobile food pantry and creation of an indoor winter farmer’s market through the Presentation School Foundation Community Center. Still, interviewees perceived that food affordability will continue to be an issue even after the pandemic ends due to the devastating impacts on employment.
Housing and Transportation According to 2015-2019 American Community Survey data, individuals who rented their homes experienced a higher proportion of housing burden (defined as households that spend 30% or more of their income on housing costs), when compared to individuals who own their homes (Figure 12). While roughly one in three homeowners in Massachusetts, Boston, and Allston/Brighton experienced housing burden (30.1%, 33.4%, and 33.7%, respectively), nearly half of renters in Massachusetts, Boston, and Allston/Brighton experienced housing burden (49.5%, 50.5%, and 48.9%, respectively).
Figure 12. Percent Housing Units Where 30% or More of Income Spent on Monthly Housing Costs, by Housing Tenure, in Massachusetts, Boston and Allston/Brighton, 2015-2019
DATA SOURCE: U.S. Census Bureau, American Community Survey 5-Year Estimates, 2015-2019
Similar to the 2018 CHNA, participants interviewed for the 2021 CHNA identified the high cost of housing as a significant and long-standing community concern, and one that has been exacerbated by the COVID-19 pandemic.
30.1%
33.4%
33.7%
49.5%
50.5%
48.9%
Massachusetts
Boston
Allston/Brighton
Owner-occupied (with a mortgage) Renter-occupied

17
Franciscan Children’s Community Health Needs Assessment 2021
“Housing is probably the major issue of health equity in the neighborhood because a lot of things flow from that. It impacts food access, transit, jobs, and medical care.”
One resident interviewee suggested that rental costs in Allston/Brighton have risen during and since the pandemic, contributing to overcrowding and homelessness. Some interviewees also perceived that many families, seeking more affordable neighborhoods, have moved away from Allston/Brighton in recent years. These interview participants also added this shift has negatively affected school enrollment and community well-being. At the same time, residents and service providers viewed Allston/Brighton as one of the fastest growing Boston neighborhoods with substantial investment in new housing. While this can be attractive to young professionals, the cost can create barriers for local families. As one interviewee summarized, “there is not much affordable housing. We are losing families and schools. That has a huge impact on the vitality of the neighborhood. It impacts services available. There is a lot of income inequality around housing.” According to another interviewee, new construction has also meant the loss of green space in the community and an increase in the number of cars and traffic. For residents living in older housing, aging buildings and perceived property mismanagement have led to issues such as mold, poor ventilation, overcrowding, all of which contribute to health concerns.
“A lot of people are being driven out [of Allston/Brighton]; many are low-income families. Families cannot buy here anymore.”
Transportation was also a frequent topic in conversations with interview participants, though their perspectives on the topic differed. While some reported that there is good public transit in the community and getting around is relatively easy, others described public transit as difficult to navigate especially during the pandemic. One service provider explained, for residents in Allston/Brighton, “[there are] a lot of challenges for families with no car…Unless you have car, or use the green line, you can only rely on buses to get there.” Per the American Community Survey, in 2019, 12.4% of households in Massachusetts did not have a vehicle. This proportion was more than double in Boston and Allston/Brighton, where roughly one in three households did not have a vehicle (34.2% and 34.0%, respectively). The proportions in all geographies have remained consistent since 2013. Additionally, personal vehicles and public transportation remained the top means of transportation to work among Allston/Brighton residents in 2019 (41.4% and 35.3%, respectively). The recent completion and adoption of the Allston/Brighton Mobility Plan offers the opportunity to address the community’s transportation concerns, including the potential addition of new bus lines and commuter rail stops.2
2 http://www.bostonplans.org/planning/planning-initiatives/allston-brighton-mobility-study

18
Franciscan Children’s Community Health Needs Assessment 2021
COMMUNITY HEALTH OUTCOMES AND BEHAVIORS The following section provides data on health outcomes and concerns in the community, with particular attention paid to concerns related to children and youth. Where appropriate and available, community-level statistics are compared to state and city data. While the school data is not specific to Allston/Brighton, public schools in the neighborhood are part of the Boston Public School system, meaning the self-reported behaviors shown below capture the sentiments of Allston/Brighton students to an extent. Specific to the tables displaying Youth Risk Behavior Surveys, 2017 data is shown for Massachusetts, while 2019 data is shown for Boston. As of July 2021, more recent data for Massachusetts has yet to be released by the Massachusetts Department of Education. For that reason, the Massachusetts data is displayed for reference only. Readers should not attempt to draw comparisons between the 2017 Massachusetts data and the 2019 Boston data, as they represent two separate points in time. Additionally, tables displaying the Youth Risk Behavior Surveys may show an asterisk (*) next to some proportions. This indicates that any statistical significance testing performed provided a statistically significant result. Statistical significance testing was not performed for data displayed in other tables.
Graphs with more detailed surveillance survey data on a variety of health topics, including youth perceptions of bodyweight, sugar sweetened beverage consumption, screen time, physical activity, violence, injury, and trauma, and sexual health can be found in the Quantitative Data Appendix.
Behavioral and Mental Health Similar to the 2018 community health needs assessment, mental health concerns, especially among children and teens, were a primary health concern among interview participants. Interviewees noted that while mental health has been a longstanding health concern in the community, the COVID-19 pandemic exacerbated the issue. Social isolation, virtual schooling, lockdowns/restrictions, and general uncertainty associated with the pandemic were cited as contributors to increased stress, depression, and trauma. As one person mentioned, “Isolation has been a critical factor for folks who have struggled in the past and those for whom it was not an issue [before the pandemic].” The rising number of mental health concerns among young children was seen as particularly alarming. Those working with children and youth perceived an increase in mental health concerns and use of substances as a coping mechanism. One service provider commented that, “[because of COVID-19] we are going to see another wave of children and families dealing with mental health” and also added that there has been an increase in emergency room boarding for mental health issues since COVID-19.
“We regularly hear providers saying they are stressed about the levels of [mental health] needs of children.”
One service provider noted that trauma among young children—stemming from issues such as homelessness, substance use disorder, and mental health issues among parents—is particularly concerning because, if left unaddressed, this can lead to a lifetime of behavioral health issues. Difficulty diagnosing very young children with mental health issues and an insufficient number of mental health providers for this age group was also perceived to be a substantial challenge for families and the health care system. Interviewees emphasized that addressing early childhood mental health issues requires an

19
Franciscan Children’s Community Health Needs Assessment 2021
intergenerational approach, as well as a broad set of supports to address underlying social determinants of health.
Interviewees also pointed to the many ways racial injustice impacts people’s health. They pointed to the differential effects of race and ethnicity on health outcomes and a handful of participants explicitly linked racial injustice and racism to adverse mental health effects. As one resident explained, “The more we struggle with racism, the more mental health is problem. Racism creates insecurities and violence. It inhibits the ability for us to care for each other.”
Figure 13 shows the proportions of middle school and high school students who reported being bullied on school property. State-level proportions are shown for 2017 youth, the most recent year available. Overall, Boston middle school students reported being bullied at a higher proportion than Boston high school students, with two in five middle school students (40.0%) reporting being bullied on school property compared to roughly one in ten high school students (11.2%). Among middle school students, these proportions were significantly higher among gay, lesbian, bisexual (GLB) students compared to heterosexual students. Among high school students, these proportions were significantly higher among female students, compared to male students.
DATA SOURCE: Massachusetts Youth Risk Behavior Survey (YRBS), 2017; Boston Middle and High School Youth Risk Behavior Survey (YRBS), 2019 NOTE: Data represent time frame of ever for Boston middle school students and time frame of one or more times during the 12 months before the survey for Boston high school and Massachusetts middle and high school students; Bars with pattern indicate reference group for its specific category; Asterisk (*) denotes where estimate was significantly different compared to reference group within specific category (p <0.05)
Figure 16 shows the proportions of middle school and high school students who reported being bullied electronically. State-level proportions are shown for 2017 youth, the most recent year available. Overall, Boston middle school students reported being bullied at a higher proportion than Boston high school students, with one in five middle school students (20.5%) reporting being bullied electronically compared to roughly one in ten high school students (9.1%). Among middle school students, these proportions were significantly higher among female, and gay, lesbian, bisexual (GLB) students compared to their respective reference groups. Among high school students, proportions were significantly higher among gay, lesbian, bisexual (GLB) students compared to heterosexual students, and significantly lower among 12th grade students compared to 9th grade students.
34.0%
40.0%
36.3%
60.9%*
Massachusetts
Boston
Hetero
GLB
MIDDLE SCHOOL14.6%
11.2%
7.3%
15.1%*
Massachusetts
Boston
Male
Female
HIGH SCHOOL
Figure 13. Percent Students Reported Being Bullied on School Property, Massachusetts (2017), Boston and Selected Boston Indicators (2019)

20
Franciscan Children’s Community Health Needs Assessment 2021
Figure 14. Percent Students Reported Being Electronically Bullied, Massachusetts (2017), Boston and Selected Boston Indicators (2019)
DATA SOURCE: Massachusetts Youth Risk Behavior Survey (YRBS), 2017; Boston Middle and High School Youth Risk Behavior Survey (YRBS), 2019 NOTE: Data represent time frame of ever for Boston middle school students and time frame of one or more times during the 12 months before the survey for Boston high school and Massachusetts middle and high school students; Bars with pattern indicate reference group for its specific category; Asterisk (*) denotes where estimate was significantly different compared to reference group within specific category (p <0.05)
According to previous Youth Risk Behavior surveys of Boston youth, Boston students had higher proportions of high school students experiencing persistent sadness compared to middle school students (Figure 15). State-level proportions are shown for 2017 youth, the most recent year available. Among middle school students, these proportions were significantly higher among non-White, female, or gay, lesbian, bisexual (GLB) students compared to their respective reference groups. Similarly, among high school students, these proportions were significantly higher among female or gay, lesbian, bisexual (GLB) students, compared to their respective reference groups.
14.1%
20.5%
16.7%24.1%*
17.7%36.8%*
Massachusetts
Boston
MaleFemale
HeteroGLB
MIDDLE SCHOOL
13.6%
9.1%
11.3%11.7%
7.7%5.5%*
7.8%16.7%*
Massachusetts
Boston
9th10th11th12th
HeteroGLB
HIGH SCHOOL

21
Franciscan Children’s Community Health Needs Assessment 2021
Figure 15. Percent Students Reporting Experiencing Persistent Sadness, Massachusetts 2017 and Boston and Selected Boston Indicators 2019
DATA SOURCE: Boston Middle and High School Youth Risk Behavior Survey (YRBS), 2019; Massachusetts Youth Risk Behavior Survey (YRBS), 2017 NOTE: Persistent sadness defined as being sad almost every day for 2 or more weeks in a row so that they stopped doing some usual activities; Data represent time frame of ever for Boston middle school students and time frame of one or more times during the 12 months before the survey for Boston high school and Massachusetts middle and high school students; Bars with pattern indicate reference group for its specific category; Asterisk (*) denotes where estimate was significantly different compared to reference group within specific category (p <0.05)
Figure 16 shows the proportion of middle and high school students in 2017 and 2019 who have attempted suicide in the past year. State-level proportions are shown for 2017 youth, the most recent year available. In 2019, 11.2% Boston middle school students and 9.3% of Boston high school students reported at least one suicide attempt in the past 12 months. In both middle and high school, students who identified as gay, lesbian, or bisexual were significantly more likely to report at least one suicide attempt in the past year (27.2% and 24.5%, respectively).
18.9%
26.5%
16.5%23.7%*
26.8%*29.4%*
20.6%32.6%*
21.9%62.6%*
Massachusetts
Boston
WhiteAsianBlack
Hispanic/Latinx
MaleFemale
HeteroGLB
MIDDLE SCHOOL
27.4%
35.0%
21.5%
44.8%*
30.5%
59.1%*
Massachusetts
Boston
Male
Female
Hetero
GLB
HIGH SCHOOL

22
Franciscan Children’s Community Health Needs Assessment 2021
Figure 16. Percent Students Reporting Attempting Suicide, Massachusetts 2017 and Boston and Selected Boston Indicators 2019
DATA SOURCE: Boston Middle and High School Youth Risk Behavior Survey (YRBS), 2019; Massachusetts Youth Risk Behavior Survey (YRBS), 2017 NOTE: Data represent time frame of ever for Boston middle school students and time frame of one or more times during the 12 months before the survey for Boston high school and Massachusetts middle and high school students; Bars with pattern indicate reference group for its specific category; Asterisk (*) denotes where estimate was significantly different compared to reference group within specific category (p <0.05)
Substance Misuse Substance misuse, according to interviewees, seems to be increasing in Allston/Brighton, in part due to the pandemic. However, one interviewee perceived that the misuse rates are not as high as in other communities, though the interviewee did acknowledge that there have been overdoses in the community, particularly fentanyl-related overdoses.
“We were seeing [substance misuse] before the pandemic but it has gotten worse since the pandemic.”
Alcohol consumption was also reported to be high, particularly among college-age students. Additionally, interview participants voiced concern that marijuana use has increased in the wake of its legalization. One interviewee who works on substance misuse programming described the current situation as follows: “Right now, the environment is riddled with risk factors. Most common reports are of alcohol. In the older young adults, there is an uptick in opioids. Alcohol is still easiest because the older kids can get it and there is a low perception of harm.”
Figure 17 shows opioid overdose deaths from all intents in Boston and Massachusetts between 2015 and 2020. Overall, trends in Boston and Massachusetts were similar between 2015 and 2018, though Massachusetts is slightly higher in 2015, 2016, 2018, and 2019. In 2019, the rate in Boston went down slightly from 26.9 in 2018 to 25.3 in 2019. This was followed by a sharp incline to 35.8 in 2020.
4.2%
11.2%
8.4%*11.4%
14.1%
3.6%*14.2%*
10.0%*12.0%
7.6%*15.0%
9.5%27.2%*
Massachusetts
Boston
6th7th8th
WhiteAsianBlack
Hispanic/Latinx
MaleFemale
HeteroGLB
MIDDLE SCHOOL
5.4%
9.3%
5.5%
24.5%*
Massachusetts
Boston
Hetero
GLB
HIGH SCHOOL

23
Franciscan Children’s Community Health Needs Assessment 2021
Figure 17. Opioid Overdose Mortality per 100,000 Residents, by Massachusetts and Boston, 2015-2020
NOTE: Rates are calculated by HRiA based upon ACS total population estimates and should be considered as unofficial estimates only; 2015-2019 population estimates used for 2020 rate calculation; Year represents year of death and geography represents city/town of residence for the decedent; Data updated as of 4/6/2021, and 2017 to 2020 death data are preliminary and subject to updates; data displays causes of death from "all intents," meaning the data includes unintentional/undetermined deaths and suicide. DATA SOURCE: U.S. Census Bureau, American Community Survey 5-Year Estimates, 2011-2015 to 2015-2019; Massachusetts Department of Public Health, Registry of Vital Records and Statistics, 2021
When reporting substance usage in 2019 Youth Behavior Risk surveys, roughly half (48.3%) of Boston high school students reported ever drinking alcohol. This was a slightly lower proportion than Massachusetts high school students in 2017 (See Quantitative Data Appendix). When examined by grade level, 12th grade students had a significantly higher proportion of youth reporting ever using alcohol (60.0%) compared to 9th grade students. Similarly, when examined by sexual orientation, GLB youth had a significantly higher proportion of youth reporting ever using alcohol (57.5%) when compared to heterosexual youth.
Figure 18 shows the proportion of middle and high school students in 2017 and 2019 who reported current alcohol use. In 2019, 5.4% of Boston middle school students and 21.2% of Boston high school students reported alcohol use. In middle school students, youth who identified as gay, lesbian, or bisexual (GLB) had significantly higher rates of current alcohol use (14.0%) compared to youth who identified as heterosexual (4.2%). More detailed charts showing alcohol consumption can be found in Quantitative Data Appendix.
26.031.2
29.4
29.4 29.2
29.723.8
29.9
30.2
26.9 25.3
35.8
2015 2016 2017 2018 2019 2020
Massachusetts Boston

24
Franciscan Children’s Community Health Needs Assessment 2021
Figure 18. Percent Students Reporting Current Alcohol Consumption, Massachusetts 2017, Boston and Selected Boston Indicators 2019
DATA SOURCE: Massachusetts Youth Risk Behavior Survey (YRBS), 2017; Boston Middle and High School Youth Risk Behavior Survey (YRBS), 2019 NOTE: Current is defined as one or more times in the past 30 days; Bars with pattern indicate reference group for its specific category; Asterisk (*) denotes where estimate was significantly different compared to reference group within specific category (p <0.05)
When reporting current marijuana use, high school students reported higher proportions of usage than middle school students. In 2019, 5.9% of Boston middle school students and 22.6% of Boston high school students reported current marijuana use. When examining current electronic vapor product use (“vaping”), fewer than one in ten Boston middle school students reported vaping (7.6%), while 12.2% of Boston high school students reported vaping. Among middle school students, these proportions were significantly higher in 8th grade students as well as Black and Hispanic/Latinx youth. Among high school students, these proportions were significantly higher in 10th grade students and significantly lower in Black youth.
A considerably smaller proportion of high school students reported current cigarette smoking relative to vaping. Fewer than 1 in 35 (2.8%) Boston high school students reported current cigarette smoking while more than one in ten (12.2%) Boston high school students reported current electronic vapor product use. Detailed charts showing marijuana, tobacco, and e-cigarette consumption can be found in the Quantitative Data Appendix.
When reporting misuse of prescription pain medicine, middle and high school students in Boston reported similar proportions (Figure 19) with just over one in ten youth reporting misuse (12.2% and 11.3%, respectively). Among middle school students, there proportions were significantly higher in Black and Hispanic/Latinx youth (11.9% and 13.1% respectively). Among high school students, these proportions were significantly higher in Black youth (15.5%) and in GLB youth (17.4%).
4.2%
5.4%
1.7%1.9%
5.0%7.0%*
4.2%14.0%*
Massachusetts
Boston
WhiteAsianBlack
Hispanic/Latinx
HeteroGLB
MIDDLE SCHOOL31.4%
21.2%
14.1%19.5%
17.7%33.6%*
35.7%14.5%*
16.8%*22.6%*
Massachusetts
Boston
9th10th11th12th
WhiteAsianBlack
Hispanic/Latinx
HIGH SCHOOL

25
Franciscan Children’s Community Health Needs Assessment 2021
Figure 19. Percent Students Reporting Ever Misusing Prescription Pain Medicine, Massachusetts 2017, Boston and Selected Boston Indicators 2019
DATA SOURCE: Boston Middle and High School Youth Risk Behavior Survey (YRBS), 2019; Massachusetts Youth Risk Behavior Survey (YRBS), 2017 NOTE: For MA survey, misusing defined as not using their own prescription medicine; For Boston survey, misusing is defined as without a doctor's prescription or differently than how a doctor told them to use it; Bars with pattern indicate reference group for its specific category; Asterisk (*) denotes where estimate was significantly different compared to reference group within specific category (p <0.05)
Healthy Eating / Active Living Figure 20 shows the proportion of middle school and high school students who reported at least 60 minutes of physical activity. Roughly one in three Boston middle and high school students (33.3% and 28.2%, respectively) reported at least 60 minutes of physical activity on five or more days per week. In both middle and high school students, proportions were significantly lower among non-White, female, and GLB youth. When reporting perceptions of weight, nearly one in five high school students (19.1%) in Boston perceived themselves to be overweight. When examined by race/ethnicity, Hispanic/Latinx students’ perceptions of being overweight were significantly higher compared to White students (24.3% vs. 12.6%) (see Quantitative Data Appendix).
3.7%
12.2%
3.3%
7.8%
11.9%*
13.1%*
Massachusetts
Boston
White
Asian
Black
Hispanic/Latinx
MIDDLE SCHOOL10.6%
11.3%
6.2%9.0%
15.5%*9.0%
9.1%17.4%*
Massachusetts
Boston
WhiteAsianBlack
Hispanic/Latinx
HeteroGLB
HIGH SCHOOL

26
Franciscan Children’s Community Health Needs Assessment 2021
DATA SOURCE: Boston Middle and High School Youth Risk Behavior Survey (YRBS), 2019 NOTE: Bars with pattern indicate reference group for its specific category; Asterisk (*) denotes where estimate was significantly different compared to reference group within specific category (p <0.05)
Perceptions of Health in the Community While a handful of interview participants mentioned chronic disease, specifically diabetes and heart disease among older residents, healthy eating and active living were not prominent themes in conversations with residents or service providers.
Several resident interviewees described the Allston/Brighton community as safe and quiet. One person attributed this in part to a strong community development initiative within the local police department.
“It’s a pretty safe here; overall, I’m really happy.”
A few interviewees expressed concerns about a perceived rise in crime and violence in the community recently. Specifically, growth in domestic violence during the pandemic was cited as a growing community issue. As service provider shared, “There was an increase in domestic violence and child neglect. A lot is anecdotal but [I am] hearing from clients that they are in domestic violence situations.” A resident remarked that there has been an increase in car break-ins and other petty crime in the community. This resident linked these crimes to a perceived increase in substance misuse in the community. Finally, one resident reported being troubled by the rising number of unhoused individuals in Allston/Brighton, particularly those with untreated mental/behavioral health issues.
45.7%
28.2%
54.7%23.3%*22.7%*
25.8%*
36.8%20.3%*
30.7%21.1%*
Massachusetts
Boston
WhiteAsianBlack
Hispanic/Latinx
MaleFemale
HeteroGLB
HIGH SCHOOL50.9%
33.3%
52.4%31.0%*32.2%*
28.9%*
42.1%24.1%*
33.8%25.5%*
Massachusetts
Boston
WhiteAsianBlack
Hispanic/Latinx
MaleFemale
HeteroGLB
MIDDLE SCHOOL
Figure 20. Percent Students Reporting at least 60 Minutes of Physical Activity on Five or More Days a Week, Massachusetts 2017, Boston and Selected Boston Indicators 2019

27
Franciscan Children’s Community Health Needs Assessment 2021
HEALTH CARE ACCESS AND UTILIZATION Health Insurance Coverage in Children Over 97% of youth under 19 years of age in Allston/Brighton, Boston, and Massachusetts are insured. (See Quantitative Data Appendix). Among those insured, roughly one in three (30.6%) children under 6 years old in Allston/Brighton were covered by public insurance,3 including Medicaid (MassHealth) and the Children’s Health Insurance Program (CHIP) (see Figure 21). This proportion is lower than Boston overall (49.4%), as well as Massachusetts (37.8%). Rates for publicly insured children 6-18 years old were similar in Boston and Allston/Brighton (52.2% vs. 52.9%) and considerably higher than Massachusetts (33.4%).
Figure 21. Percent Children with Public Insurance (among Insured), in Massachusetts, Boston and Allston/Brighton, 2015-2019
DATA SOURCE: U.S. Census Bureau, American Community Survey 5-Year Estimates, 2015-2019 NOTE: Public coverage includes Medicare, Medicaid, Civilian Health and Medical Program of the Department of Veterans Affairs (CHAMPVA), and as well as care provided by the Department of Veterans Affairs (VA) and the military. NOTE: In the state of Massachusetts, Medicaid, and the Children’s Health Insurance Program (CHIP) are combined into one program – MassHealth.
Health insurance, including cost and understanding whether providers accept certain types of insurance, was named as a primary factor affecting healthcare decision making. As one resident shared, “Coverage would be the biggest factor. Seeing what insurance offers and what is covered.” For dental care, participants pointed out that finding providers who accept one’s coverage can be particularly challenging, as some dentists do not accept MassHealth.
Access to Health Care Services Access to Primary and Mental Health Care According to 2021 County Health Rankings 4, the ratio of the population to primary care providers in Massachusetts was 970:1 and 670:1 in Suffolk County. For mental health providers, the ratio was 150:1 in Massachusetts and 120:1 in Suffolk County. While there is no county-level benchmark for an ideal ratio of population to providers, County Health Rankings provides a ratio for the “top performers” in the United States. For primary care providers, the 90th percentile ratio is 1,030:1, and the 90th percentile
3Public coverage includes Medicare, Medicaid, Civilian Health and Medical Program of the Department of Veterans Affairs (CHAMPVA), and as well as care provided by the Department of Veterans Affairs (VA) and the military. 4DATA SOURCE: American Medical Association, Area Health Resource File, as reported by County Health Rankings, University of Wisconsin Population Health Institute, Robert Wood Johnson Foundation, 2018.
37.8%
49.4%
30.6%
33.4%
52.2%
52.9%
Massachusetts
Boston
Allston/Brighton
Under 6 years 6 to 18 years

28
Franciscan Children’s Community Health Needs Assessment 2021
ratio for mental health providers is 270:1. This means that compared to the nation as a whole, both Massachusetts and Suffolk County have a better ratio of primary care and mental health providers relative to their respective populations.
While the Boston area was generally seen as an area with an abundance of medical services, interviewees noted some gaps in Allston/Brighton and barriers to access for some in the community. One interviewee reported that it is challenging to find specialists who have expertise in pediatric issues related to allergies and gastrointestinal health. According to one resident, finding primary care for children can be difficult. As this person explained, “One of the things I experience is that when I look to get something for my kids, the wait is almost two months to be seen. I’ve waited six months before. When you have a child, that is discouraging because that’s your kid and that wait is a long time for a child when you think about their development time.” When naming resources for medical care, interview participants often mentioned Charles River Community Health as a key source of primary care. St. Elizabeth’s Hospital was seen as a resource for emergency care, and Franciscan Children’s was viewed as a resource for children with complex care needs.
Specific to mental health, interviewees cited a lack of mental health providers in their area as a challenge in addressing mental health in the Allston/Brighton community. Several participants elaborated by stating that the number of providers in the community is insufficient to meet the demand for services, leading to long waits for mental health services. While telehealth options have become more prevalent since the pandemic, and can work for some, they were still seen as barriers to building the relationships and trust that make many treatment modalities successful. Additionally, stigma and denial about mental health concerns, especially within some groups, creates additional challenges for those seeking treatment. As one interviewee explained, “Mental health can be stigmatizing. Families may fear their children being labeled.”
When asked about mental health services in the community, most resident interviewees did not know what was available because they had not sought out these services for their children. Other interviewees mentioned Franciscan Children’s and St. Elizabeth’s Hospital as places where they could go to access mental health services for their children. Other mental health services mentioned were Arbor Counseling and Brighton Allston Mental Health Association. According to interviewees, school social workers, counselors and family liaisons play an important role in connecting students and families to necessary mental health resources and other services.
Resident interview participants perceived that well-resourced families had greater access to mental health services while families with fewer resources faced substantial challenges, including transportation, lack of insurance, and lack of resources to pay for out-of-pocket services. One service provider familiar with the many challenges faced by families pointed out that there are families who need services that, while they may be partially covered by MassHealth, the coverage is insufficient. This ultimately makes the services inaccessible because low-income families “cannot afford private care” to obtain the full spectrum of services. This person continued to say, “It is hard to find someone for your child if you are not a White, middle class family, in terms of location and convenience.” While virtual approaches have increased access to mental health care, interviewees pointed out that they are not appropriate for all services or people. As one service provider explained, “Telemedicine can be okay, but it’s hard for people who are new to reaching out for therapy. Building relationships via Zoom is hard.”

29
Franciscan Children’s Community Health Needs Assessment 2021
Another service provider explained that for some families, in-home therapy (IHT) is critical and if unavailable, a family may choose to forego care altogether.
As previously mentioned, service providers remarked that they have observed an increase in emergency room boarding for mental health issues since COVID-19. One provider familiar with children’s mental health attributed this increase to larger, systemic issues, including a lack of community supports for children with mental health needs and a child welfare system ill-equipped to address the many needs of children today. As this interviewee explained, “What really caused the boarding issue is [services] not meeting needs of the community. What is drawing attention is the shift in beds not being available and that is because of COVID. I don’t know that there are more children in need, but there are more children with no place to go.”
“In general, we are dealing with a mental health service system that is set up for older kids.”
Lack of services for young children was specifically noted, as this is a group with high need and also a substantial return on investment. As another service provider explained, “Anything we don’t address in ages 0-5 becomes a bigger issue in older youth and then adulthood. If we met all the needs of kids 0-5, we’d have fewer issues for older kids.”
Access to Oral Health Services According to 2021 County Health Rankings5, the ratio of the population to oral health care providers in Massachusetts was 930:1 and 450:1 in Suffolk County. Similar to primary care providers and mental health providers, County Health Rankings provides a ratio for the “top performers” in the United States. For oral health care providers, the 90th percentile ratio is 1,210:1. This means that compared to the nation as a whole, both Massachusetts and Suffolk County have a better ratio of oral health providers relative to their respective populations.
While some interview participants mentioned that they were not sure where families could go for dental care in Allston/Brighton, several residents and service providers acknowledged that both Franciscan Children’s and Charles River Community Health offer dental services and wondered if more could be done to promote these services in the community. Some dental services are also available in schools for children enrolled in MassHealth. While a couple of residents reported that it is easy to find dentists in the area, others reported that it was challenging, especially finding dentists who accept MassHealth. When looking for a dentist for their children, resident interviewees stated that cost is a factor affecting their decisions. They also look for dentists who are good with children — “kid friendly” in the words of one interviewee.
5 DATA SOURCE: American Medical Association, Area Health Resource File, as reported by County Health Rankings, University of Wisconsin Population Health Institute, Robert Wood Johnson Foundation, 2018.

30
Franciscan Children’s Community Health Needs Assessment 2021
“Dental care is a challenge. Around here, there are either top tier places that charge an arm and a leg and then there’s [places that accept] MassHealth and [also] some
places don’t accept MassHealth.”
Access to Physical, Occupational, and Speech Therapy Few interviewees were able to comment about where families in Allston/Brighton accessed physical, occupational, and speech therapy services. Most often, residents and service providers said they believed families relied on their primary care provider or local hospitals for referrals. A couple of interviewees stated that they know Franciscan Children’s provides these services for children. According to one resident, navigating the healthcare system for a child with complex health issues is very difficult. As this person explained, “When you have [a child with] developmental issues and sensory issues, those get complicated really fast.” This person saw a need for more health care navigators to help families navigate where to receive complex care and ensure they are connected to needed programs and providers.
Barriers to Accessing Care Similar to the 2018 CHNA, language barriers were named as a factor that can hinder access to healthcare for some families in Allston/Brighton. As one service provider stated, “Boston is resource rich, but we have so many barriers including language.” While some healthcare providers have bilingual staff or other language capacity, not all do. Cultural competency— the ability to understand and respond to patients’ diverse values, beliefs, and behaviors and meet their social, cultural, and linguistic needs—is a related issue. According to another service provider, when thinking about cultural competency in healthcare, Allston/Brighton is not as adept as other communities such as Dorchester, Mattapan, and Hyde Park: “[Dorchester, Mattapan, and Hyde Park] are ahead in terms of being culturally compatible. We are just getting started and have long way to go.”
Transportation was also named as a barrier to accessing healthcare for some Allston/Brighton residents. Resident interviewees shared that location, including proximity to public transit, affects their decisions about where to go for healthcare.
Both residents and service providers also shared examples of barriers to accessing quality healthcare that arise from current and long-standing inequities and injustices in the healthcare system, including a lack of cultural competency, mistrust, and limited access to technology to utilize telehealth.
Specific to pandemic-related barriers, service providers who were interviewed reported that their agencies faced difficulties in addressing community needs during the pandemic. Transportation to services was and remains a challenge for families. Due to pandemic restrictions during the past year, some transportation services still remain unavailable. Additionally, it was difficult communicating to residents the availability of services like food pantries and unemployment assistance to alleviate the stresses of the pandemic and transitioning to “contactless” interactions with clients/residents because providers were unable to have their typical engaging conversations with families. As one service provider explained, “With a [contactless, but in-person] model for services, sometimes things can be lost. We may miss out on things people are struggling with. Figuring out how to provide high quality services

31
Franciscan Children’s Community Health Needs Assessment 2021
in a pandemic is challenging.” Finally, another service provider explained that providing virtual services, while successful for some, was difficult for those who did not have the necessary technology.
COMMUNITY RESOURCES AND SUGGESTIONS Community Resources and Assets Interviewees described the Allston/Brighton community as a desirable place to live. Residents value the community’s proximity to Boston and its numerous local assets, including parks, walking paths, shops, libraries, and schools. As a resident commented, “If you have children, there are plenty of parks. It is a good place to raise children.” Healthcare resources—including Franciscan Children’s and St. Elizabeth’s hospitals—and community organizations such as the YMCA, Action for Boston Community Development, and the Boys & Girls Club were perceived as additional resources that contribute to Allston/Brighton’s appealing qualities.
“There is a strong sense of community and participation. Allston/Brighton is unique in its level of engagement [of residents].”
Social cohesion is also a strength according to all interviewees. They shared that, despite its urbanity, Allston/Brighton has a “neighborhood feel.” Residents described community members as “friendly,” “nice,” and “helpful.” They reported that outside of the pandemic-related closures and restrictions, there are many community-led social events and family activities, including concerts and parades, and that these are well attended. High rates of resident participation in schools and community activism are also community characteristics. As one resident commented, “I would say despite the fact that you are in big city, people are more townish friendly than I would have thought [they] would be.”
Specific to racial equity and inclusion, service providers shared that their organizations are working to promote more conversation and action around these issues, both in the community and in their own organizations. For example, the Allston Brighton Health Collaborative’s mental wellness committee recently identified racial equity as a goal for the year and the Allston Brighton Substance Abuse Task Force is partnering with an organization in Dorchester to support youth to increase their comfort level with conversations around racial justice and health equity. Interviewees from community organizations also stated that their agencies are examining racism and inequity in their internal policies and structures. For example, some noted that their organizations are examining representation in leadership positions, including boards and committees, improving hiring and promotion practices, and addressing overall organizational culture. As one organizational interviewee shared, “It’s a new dialogue and we’ve been new to [having these conversations] in our organization.”
Community Suggestions Both residents and service providers shared several suggestions for services that could address many of the challenges and needs outlined in this report. These spanned a variety of areas, some of which are areas in which Franciscan Children’s is currently focused. One resident suggested focusing on only a few

32
Franciscan Children’s Community Health Needs Assessment 2021
things saying, “Every hospital doesn’t have to be everything. There tends to be a lot of overlaps and in a big city, it’s better to be specialized rather than doing everything and not being good at all of it.”
Mental Health As in 2018, mental health was a frequently mentioned concern. Specific suggestions for improving mental health included:
• Promote existing mental health services in the community. Broadly, both residents and service providers suggested more promotion of existing mental health services in the Allston/Brighton community.
• Expand trauma-focused mental health services. Specifically, service providers saw a need for more mental health services for children and youth, especially those that address trauma. As one service provider stated, “[Trauma is a] serious concern in Allston/Brighton because we have a number of [immigrant] families that already experienced trauma in their home country.”
• Expand mental health services for young children. Service providers also reported a gap in early childhood mental health services. In addition to expanding provider services in this area, service providers suggested raising awareness of the importance of addressing mental health in young children, including participating in the Massachusetts Association for Infant Mental Health, a policy workgroup that aims to address systemic issues. Additionally, because addressing early childhood mental health issues requires an intergenerational approach, partnering with community organizations that provide parenting support was viewed as an essential component in addressing mental health.
• Offer substance misuse services for children and adolescents. Given the close relationship between mental health and substance misuse and a lack of substance use disorder programs and services for those under 18 in the community, one service provider suggested organizations begin offering those services. Another suggested the increasing support for drug use prevention programs for children and youth.
“Mental health for young kids could be good because that is not really discussed in the community. Kids – even if they are young – can still have issues and need help
navigating through life.”
Dental Services Overall, interviewees did not provide many suggestions for dental services. One resident mentioned a need for more parent education around the importance of starting preventative dental care for their children as early as possible. As this person stated, “Some parents wait a long time before they start dental care…which makes it harder on the kids in the long run.”
Physical, Occupational, and Speech Therapy Services Two residents mentioned that organizations could play an important role in supporting the differently abled community by educating the public about disabilities. One of these residents elaborated by suggesting workshops or webinars to educate, raise awareness, and promote discussion in the community about disabilities in children, equitable care and approaches, and the experiences of parents of children with disabilities.

33
Franciscan Children’s Community Health Needs Assessment 2021
Family Supports A general need for more family support was mentioned by a small number of residents and service providers. Suggestions included:
• Increase awareness among families for various support programs. Both residents and service providers saw a need for more family partners, health navigators, and family advocate programs, including therapeutic mentors. One service provider suggested increasing access to these resources through funding, training, and support of partner organizations. As this interviewee stated, “Over and over again, we know that for families, especially families of color, the family partners are a useful resource and the reason people access services.”
• Support parent and family programs. Service providers (along with a handful of residents) suggested that organizations collaborate to provide parent and family programming. Suggestions included education support for youth, parenting classes for parents of children with ADHD and autism, and general family-oriented activities. As described earlier, parenting programs were also seen as a key component in addressing and preventing mental health concerns in very young children.
Youth Programming Several resident interviewees stated that Allston/Brighton does not have enough programming for teens and young adults and perceived that this may increase the likelihood of youth engaging in risky behavior. Suggestions to address this included:
• Afterschool programs. One resident commented that the Allston/Brighton community needs more afterschool programs and suggested increased support for organizations, such as the YMCA, which work to provide these programs. As this person explained, “There is not enough for [children younger than high school aged youth], so they are always home on video games and the phone.”
• Job readiness programs. Another resident interviewee suggested supporting teens through job readiness programs. As this person explained, “Kids don’t have a lot to do, and their parents are working and so the kids are left to their own devices. They need a place to learn job skills, volunteer, be mentored.” This person also noted that while some opportunities for this exist outside the community, they perceived little to no opportunities in Allston/Brighton.
KEY THEMES AND CONCLUSIONS After reviewing the secondary data, along with suggestions from the community discussions with service providers and parents in Allston/Brighton, several key themes arose and are outlined below.
• Allston/Brighton has a strong sense of community. Similar to the 2018 CHNA, a common theme that arose was the perception that Allston/Brighton is a vibrant and diverse community. Many residents viewed the community as one that has a neighborhood-feel while still being in Boston. All service providers interviewed commented on their several partnerships with other organizations in the community. Additionally, several residents interviewed were able to name organizations that provide essential services in the area.
• Housing affordability remains an issue in the community. As in 2015 and 2018, the combination of high housing costs and limited affordable housing stock remain a challenge in Allston/Brighton and the rest of Boston. Many residents pointed out that this issue has

34
Franciscan Children’s Community Health Needs Assessment 2021
widespread impacts on the vitality of the Allston/Brighton neighborhood. Among both residents and service providers, the increasing housing costs were viewed as a primary factor driving out families and recent immigrants.
• Long-term pandemic-related effects remain a challenge. While the immediate impacts of the COVID-19 pandemic begin to wane, challenges such as employment, food insecurity and mental health continue to create barriers for many residents, particularly low-income residents. While data from this CHNA, along with previous CHNAs, indicate that these issues were present before the pandemic, most service providers pointed out that the issues increased substantially during the COVID-19 lockdowns and closures. Many services were named as useful resources in addressing food insecurity, but gaps still remain.
• Access to mental health care is a pressing concern in the community, particularly among children. In addition to the mental health challenges faced prior to the pandemic, various traumas associated with the pandemic were viewed as exacerbating mental health concerns in the community. Specific to children, virtual schooling, isolation, and a general uncertainty regarding the pandemic were viewed by residents and service providers as contributors to poor mental health. While there are several mental health services/resources in the area, issues related to accessibility of these services, including language, cost, coverage, and wait times, can create barriers for residents.
• Increased visibility of and access to oral health is needed in the community. While there are some oral health resources in the community, there is a need for increased awareness of the resources. Additionally, both residents and service providers agree that there is a strong need for oral health services that are affordable, particularly for low-income residents.
• There is a need for more education and family support in health care. Given the frequent challenges associated with navigating the healthcare system, providing residents with family support could increase engagement, particularly in communities of color and immigrant communities. Definitions for “family support” varied in interviews. Broadly, residents tended to view family support as any services intended to increase patient engagement with the healthcare system, while service providers tended to provide more specific examples, such as healthcare navigators and therapeutic mentors. Additionally, providing community members (e.g., parents, teachers, organization leaders) with education about the children served at Franciscan Children’s can help the community understand the needs of parents and children engaged in care.

35
Franciscan Children’s Community Health Needs Assessment 2021
APPENDIX A. List Of Organizations Involved in Interviews
1. Presentation School Foundation
2. Boston Public Health Commission
3. Allston Brighton Health Collaborative
4. Charlesview, Inc.
5. Allston-Brighton Substance Abuse Task Force
6. Massachusetts Society for the Prevention of Cruelty to Children
7. Children’s Services of Roxbury (NOTE: While this organization is based in Roxbury, some of the children served by the organization live in Allston/Brighton. Additionally, Children’s Services of Roxbury refers some of their families to Franciscan Children’s when complex behavioral health needs arise.)

36
Franciscan Children’s Community Health Needs Assessment 2021
B. Prioritization of Needs Identified in 2021 CHNA Franciscan Children’s examined the findings of the 2021 CHNA and worked to prioritize areas where the institution could successfully engage and intervene. The prioritization of each item identified by the community stemmed from: 1) demonstrated need in the community as evidenced by CHNA findings; 2) the perceived impact that Franciscan Children’s involvement would have on this need; 3) the perceived feasibility of Franciscan Children’s involvement in addressing this need, including institutional expertise and resource allocation; and 4) the alignment with Franciscan Children’s mission and institutional strategic priorities as defined in its strategic plan.
Based upon these criteria, the following areas were identified as priorities:
• Mental health for children and adolescents • Dental care for children and adolescents
The other areas identified in the 2021 CHNA –including but not limited to housing, transportation, substance misuse, job readiness programs, and family advocacy and navigator programs– are areas that Franciscan Children’s did not make a priority due to less perceived feasibility, lack of institutional expertise, and/or other organizations addressing these needs within the community.

37
Franciscan Children’s Community Health Needs Assessment 2021
C. Activities Completed Since the 2018 CHNA Below is an overview of the activities that Franciscan Children’s engaged in over the last three years (FY18, FY19, and FY20) to address the priorities the institution established from the findings of the 2018 Community Health Needs Assessment of Allston/Brighton. Activities noted here include those specifically held in Allston/Brighton, as well as those of the broader Massachusetts and Boston area that were open to and/or served Allston/Brighton residents.
Activity Year/s Completed
Priority 1: Improve access to mental health services in Allston/Brighton Results: Through Franciscan’s efforts below, the institution was able to serve more children needing mental health services and raise awareness of the importance of mental health and corresponding resources.
Through our Children’s Wellness Initiative (CWI) program, Franciscan Children’s provided school-based behavioral health counseling and psychiatry services to children in 9 different schools. Four of these schools are located in Allston/Brighton. Even during the COVID-19 pandemic, this service continued to operate virtually through telehealth.
FY20, FY19, FY18
Franciscan’s outpatient behavioral health department provided individual, group, and family therapy to children and their caregivers, including many from Allston/Brighton. The department continued to expand its hours throughout the past three years to be as accessible to families as possible. During the COVID-19 pandemic, this service continued to operate virtually through telehealth, serving families who would not have been able to access services otherwise.
FY20, FY19, FY18
Through our Kids Healthy Minds Initiative in partnership with the Archdiocese of Boston, Franciscan Children’s provided education at community sites, including St. Columbkille School and Parish, the Women’s Table, Allston/Brighton health fairs, on the signs and symptoms of mental illness and available resources.
FY20, FY19, FY18
Franciscan’s outpatient behavioral health department established virtual parent support groups to provide additional support to families impacted by the COVID-19 pandemic.
FY20
Franciscan Children’s provided expertise on pediatric mental health by participating in and hosting community events to raise awareness about mental illness and emphasize resources for those seeking care. These events included but were not limited to:
o Franciscan Children’s hosted a four-part virtual mental health series on the impact of COVID-19 on children featuring our Director of Outpatient Behavioral Health Services. The audience was primarily comprised of Allston/Brighton families, community partners, and educators. The sessions included the impact of COVID-19 on children as specifically related to: addressing stress and anxiety (two separate sessions held), addressing grief, and PTSD and children’s return to school.
o Franciscan Children’s hosted a mental health virtual forum featuring leading clinicians and researchers from the organization to provide expertise and awareness about mental health challenges that children face. The session was moderated by an individual from NBC Boston.
o Franciscan’s Outpatient Behavioral Health Service Director presented at an event sponsored by the organization Sister to Sister during the pandemic through a webinar titled “Surviving Together: If We're Confused, How Do You Think Our Kids Feel?”
FY20
FY20
FY20

38
Franciscan Children’s Community Health Needs Assessment 2021
o Franciscan Children’s mental health clinicians presented at a virtual disability event sponsored by Wellington Financial that targeted parents with children facing mental health challenges.
o Franciscan’s Chief Operating and Chief Nursing Officer presented on pediatric mental health challenges at a community event sponsored by WGBH and the Boston Police Department.
o Franciscan Children's provided information on the prevalence of mental illness and the organization's mental health programming by participating in an annual event led by the National Alliance on Mental Illness.
FY20
FY19
FY19, FY18
Priority 2: Improve access to primary care services in Allston/Brighton Results: Through Franciscan’s efforts detailed below, the institution was able to increase access to primary care up until the time the program was discontinued in September 2019.
While Franciscan Children’s made the difficult decision to close its primary care program in fall 2019 due to changes in the health care market, the organization worked to seamlessly transition families to Charles River Community Health, a local community health center in the same geographic area as Franciscan Children’s that provides accessible, culturally competent, high quality primary care to patients regardless of their ability to pay.
FY19
Prior to the closure of its primary care services, Franciscan expanded to offering services three evenings a week, in addition to during the day, in an effort to increase access.
FY19 until closure, FY18
Priority 3: Improve access to child wellness (e.g., physical activity, nutrition) in Allston/Brighton Results: Through Franciscan’s efforts, the institution was able to improve opportunities for child wellness -physical activity and nutrition - in the community.
Franciscan Children’s operated adaptive sports camps – including biking, skating, and baseball – for children in the community with special health care needs. The camps incorporated physical activity using extensive expertise from our rehabilitative therapies departments.
FY19, FY18 offered all three camps
FY20 – only offered skating camp due to COVID-19 pandemic
The institution served as a premier sponsor of the Oak Square community farmer’s market in Brighton. The goal of the farmer’s market is to bring fresh produce and resources to those in need.
FY19, FY18
Priority 4: Enhance contributions to and visibility at community-based meetings and events, especially health related ones (additional activities noted in aforementioned priority areas) Results: Through Franciscan’s efforts, the institution was able to improve visibility at community meetings and events.
Staffing: o Increased existing staff members’ time on community relations, devoting a 0.5
FTE.
FY20, FY19, FY18
Community committee participation: o Franciscan Children’s became a steering member of the Allston Brighton Health
Collaborative and participated in bi-weekly community calls. The institution also became an organizational member of the Allston Brighton Taskforce.
o Participated in St. Elizabeth’s Hospital Determination of Need Advisory Committee.
FY20, FY19, FY18
FY19, FY18

39
Franciscan Children’s Community Health Needs Assessment 2021
Community event participation: o Franciscan Children's Chief Operating Officer and Chief Nursing Officer updated
YMCA after school program leaders on relevant health concerns and issues specific to children.
o Child life and rehabilitative therapy staff from Franciscan Children’s attended the Boston Children’s Healthy Kids Festival to provide educational activities for the Boston community.
o Franciscan Children's clinical team members presented to Massachusetts families and professionals on strategies for successful hospital discharges for children with complex health needs in the child welfare system at the 27th annual View from All Sides conference sponsored by the Massachusetts Department of Children and Families.
o Franciscan Children's provided information on the unique pediatric care we provide by participating in an annual walk dedicated to raising awareness and funds for the March of Dimes.
o World Against Toys Causing Harm (W.A.T.C.H.) press conferences hosted at Franciscan Children's to provide community education and information about dangerous toys on the market and how to keep children safe.
o Conducted bike evaluations for families of children with special needs in the community. Children trialed our adaptive bikes and Franciscan provided families with recommendations about the type of bikes and adaptations needed for safe riding.
o Hosted a car seat event at Franciscan Children’s for the local community where certified car seat technicians checked car seats for proper use, installation and fit, helped install new car seats, and educated parents and families about proper car seat safety. Car seats were provided to families in need if their car seat was broken or they did not have one.
o Hosted a parent led workshop and support group for parents of children complex medical needs in the community.
o Hosted Allston/Brighton community groups in our New Balance Foundation Park, an adaptive park for children with special needs. The park was designed for children of all ages and has wheelchair accessible equipment, ensuring all children have the opportunity to play.
o The Kennedy Day School at Franciscan Children's hosted a workshop for special education administrators. The workshop was focused on self-care and work/life balance and featured guest speakers.
o Served as a training site for pet therapy dogs on two different occasions in partnership with two different nonprofits, Guiding Eyes for the Blind and Dogs Building Opportunities for Nurturing Support.
o Hosted Boston EMT cadets for a lunch-and-learn regarding patients with complex medical and mental health challenges.
Twice in FY19, twice
in FY18
FY19, FY18
FY19
FY18
FY20, FY19, FY18
FY19, FY18
FY19, FY18
FY19, FY18
FY19
FY19
FY19
FY19