2005 Health Needs Assessment
349
2005 2005 2005 Health Needs Health Needs Health Needs Assessment Assessment Assessment
-
Upload
khangminh22 -
Category
Documents
-
view
2 -
download
0
Transcript of 2005 Health Needs Assessment

200520052005 Health NeedsHealth NeedsHealth Needs
Assessment Assessment Assessment

Contents
1. INTRODUCTION _________________________________________________1
1.1 BACKGROUND ............................................................................................... 1
1.2 THE APPROACH OF THE CURRENT HEALTH NEEDS ASSESSMENT .............................. 1
1.3 OUTLINE OF HEALTH NEEDS ASSESSMENT REPORT ............................................... 1
2. MIDCENTRAL DISTRICT DEMOGRAPHY _____________________________4
2.1 INTRODUCTION ............................................................................................. 4
2.2 MIDCENTRAL DISTRICT POPULATION................................................................. 4
2.3 LIFE EXPECTANCY........................................................................................... 9
3. SOCIOECONOMIC FACTORS ______________________________________ 10
3.1 INTRODUCTION ........................................................................................... 10
3.2 NZDEP2001 ................................................................................................ 10
3.3 INCOME ..................................................................................................... 12
3.4 UNEMPLOYMENT.......................................................................................... 13
3.5 WELFARE BENEFITS....................................................................................... 14
3.6 EDUCATION ................................................................................................ 14
3.7 HOUSING ................................................................................................... 15
4. HEALTH RISKS AND PROTECTIVE FACTORS_________________________ 16
4.1 INTRODUCTION ........................................................................................... 16
4.2 SMOKING ................................................................................................... 16
4.3 PHYSICAL ACTIVITY...................................................................................... 17
4.4 OBESITY ..................................................................................................... 18
4.5 ALCOHOL CONSUMPTION .............................................................................. 19
4.6 NUTRITION................................................................................................. 21
4.7 SELF RATED HEALTH .................................................................................... 22
4.8 CANNABIS/MARIJUANA USE ........................................................................... 23
4.9 INJURY AND POISONING ................................................................................ 23
4.10 SEXUAL HEALTH .......................................................................................... 24
4.11 ORAL HEALTH............................................................................................. 24
4.12 COMMUNICABLE DISEASES............................................................................. 25
5. MIDCENTRAL DISTRICT ROAD TRAFFIC ISSUES______________________ 26
5.1 ROAD TRAFFIC ISSUES IDENTIFIED BY THE LAND TRANSPORT SAFETY AUTHORITY .... 26
5.1.1 Manawatu-Wanganui Region ......................................................................................26 5.1.2 Palmerston North .....................................................................................................27

5.1.3 Horowhenua............................................................................................................27 5.1.4 Manawatu ...............................................................................................................27 5.1.5 Tararua ...................................................................................................................28 5.1.6 Kapiti Coast District ..................................................................................................28
5.2 SEAT BELT WEARING RATES........................................................................... 28
5.3 HOSPITALISATION FOR ROAD TRAFFIC INJURIES ................................................. 29
5.3.1 Road Traffic Injuries Hospitalisation by Ethnicity............................................................29 5.3.2 Road Injuries Hospitalisation by Territorial Authority......................................................30
5.4 ALCOHOL AND ROAD SAFETY ......................................................................... 31
5.5 EXCESSIVE VEHICLE SPEED AND ROAD SAFETY................................................... 33
6. NOTIFIABLE DISEASES ___________________________________________ 35
6.1 MIDCENTRAL DISTRICT OVERVIEW ................................................................. 35
6.2 ESR MARCH 2005 NOTIFIABLE DISEASES ISSUES................................................. 36
6.3 MEASLES NOTIFICATIONS .............................................................................. 37
6.4 CRYPTOSPORIDIUM....................................................................................... 38
7. ENVIRONMENT AS AN INFLUENCE ON HEALTH______________________ 40
8. MENINGOCOCCAL DISEASE ______________________________________ 42
9. SUICIDE _______________________________________________________ 44
10. REPRODUCTIVE HEALTH _________________________________________ 46
10.1 BIRTH RATES .............................................................................................. 46
10.2 CAESAREAN SECTIONS .................................................................................. 47
10.3 TEENAGE PREGNANCY................................................................................... 47
10.4 PREGNANCY COMPLICATIONS ......................................................................... 48
10.5 COMPLICATIONS OF LABOUR AND DELIVERY ..................................................... 49
11. SEXUAL HEALTH________________________________________________ 51
12. MIDCENTRAL DISTRICT MENTAL HEALTH INFORMATION NATIONAL COLLECTION DATA _____________________________________________ 53
13. PRIMARY CARE DATA ___________________________________________ 58
13.1 PRIMARY HEALTH ORGANISATION REGISTRATIONS ............................................ 58
13.2 PHARMACEUTICAL PRESCRIPTIONS .................................................................. 58
13.3 TOTAL PHARMACEUTICAL AND LABORATORY USE .............................................. 59
14. CHILD HEALTH _________________________________________________ 62
14.1 LOW BIRTH WEIGHT BABIES........................................................................... 62
14.2 DENTAL HEALTH ......................................................................................... 63

14.3 CHILDHOOD HEARING TEST RESULTS .............................................................. 64
14.4 CHILDHOOD INJURIES ................................................................................... 64
14.5 CHILDHOOD POISONINGS .............................................................................. 66
14.6 SUDDEN INFANT DEATH SYNDROME ................................................................ 68
14.7 CHILDHOOD MORTALITY............................................................................... 68
14.7.1 Causes for Childhood Mortality...................................................................................68 14.7.2 Childhood Mortality Comparison to New Zealand 1997 to 2001.........................................69 14.7.3 Children Aged 1 to 14 Mortality ..................................................................................72 14.7.4 Infant Mortality Rates ................................................................................................74
15. DISABILITY IN MIDCENTRAL DISTRICT_____________________________ 75
15.1 DISABILITY OVERVIEW .................................................................................. 75
15.1.1 Information Sources ..................................................................................................75 15.1.2 Disability in the Community .......................................................................................75
15.2 DISABILITY CHARACTERISTICS ........................................................................ 76
15.2.1 Types of Disability ....................................................................................................76 15.2.2 Causes of Disability...................................................................................................77 15.2.3 Severity of Disability .................................................................................................77 15.2.4 Disability and Household Size.....................................................................................78 15.2.5 Educational Qualifications ..........................................................................................78 15.2.6 Participation in the Labour Force .................................................................................79 15.2.7 Personal Income .......................................................................................................79 15.2.8 Use of Special Equipment...........................................................................................79 15.2.9 Help for Everyday Activities .......................................................................................79 15.2.10 Unmet Health Need ..................................................................................................80 15.2.11 Unmet Need for Special Equipment .............................................................................80 15.2.12 Disability and Children ..............................................................................................80
15.3 DATA FROM HEALTHPAC’S CLIENT CLAIMS PROCESSING SYSTEM ......................... 81
15.3.1 Overall MidCentral District Disability Service Use Patterns...............................................81 15.3.2 Age Related Residential Care ......................................................................................82 15.3.3 Home Support .........................................................................................................83 15.3.4 Intellectual Disability .................................................................................................85 15.3.5 Physical Disability .....................................................................................................87
16. MIDCENTRAL DISTRICT MORBIDITY AND MORTALITY _______________ 89
16.1 INTRODUCTION ........................................................................................... 90
16.1.1 Outline of Section Contents ........................................................................................90
16.2 ETHNICITY IN MIDCENTRAL DISTRICT.............................................................. 91
16.3 MOST COMMON REASONS FOR HOSPITALISATION .............................................. 91
16.3.1 MidCentral District Children Aged 0 to 14 Years Hospitalisations ......................................92 16.3.2 MidCentral District Adults of All Ethnicities Aged 15 to 64 Years Hospitalisations.............. 106 16.3.3 MidCentral District Adults of All Ethnicities Aged 65+ Years Hospitalisations.................... 124
16.4 MIDCENTRAL DISTRICT DISEASE SPECIFIC HOSPITAL DISCHARGES ....................... 138
16.4.1 Circulatory System Diseases ..................................................................................... 139 16.4.2 Ischaemic Heart Disease........................................................................................... 143 16.4.3 Stroke ................................................................................................................... 147 16.4.4 Diabetes ................................................................................................................ 151 16.4.5 Asthma ................................................................................................................. 155 16.4.6 Respiratory Infections .............................................................................................. 160 16.4.7 Chronic Obstructive Respiratory Disease (CORD) ......................................................... 164 16.4.8 Chronic Obstructive Respiratory Disease Mortality ....................................................... 168

16.4.9 All Cause Injuries ................................................................................................... 170 16.4.10 Digestive System Major Diagnostic Category ............................................................... 174 16.4.11 Skin Infections ....................................................................................................... 178 16.4.12 Non-Suppurative Otitis Media (Glue Ear).................................................................... 183 16.4.13 Chronic Diseases of Tonsils and Adenoids .................................................................. 187 16.4.14 Suppurative Otitis Media (Middle Ear Infection)........................................................... 191 16.4.15 Immunisation Preventable Hospitalisations ................................................................. 194
16.5 CANCER .................................................................................................... 198
16.5.1 Cancer Registrations 1998 to 2000............................................................................... 198 16.5.2 MidCentral District Cancer Registrations 1998 to 2000.................................................... 198 16.5.3 MidCentral District Maori Cancer Registrations 1998 to 2000........................................... 199 16.5.4 MidCentral District Pacific Peoples Cancer Registrations 1998 to 2000............................... 199 16.5.5 MidCentral District Asian Peoples Cancer Registrations 1998 to 2000................................ 199 16.5.6 MidCentral District Other Ethnicities Cancer Registrations 1998 to 2000 ............................ 200
16.6 CANCER REGISTRATION ETHNIC COMPARISONS ................................................ 200
16.7 CANCER MORTALITY 1999 TO 2001.................................................................. 202
16.7.1 MidCentral District Cancer Mortality 1999 to 2001......................................................... 202 16.7.2 MidCentral District Maori Cancer Mortality 1999 to 2001 ................................................ 203 16.7.3 MidCentral District Pacific Peoples Cancer Mortality 1999 to 2001 .................................... 203 16.7.4 MidCentral District Asian Peoples Cancer Mortality 1999 to 2001..................................... 204 16.7.5 MidCentral District Other Ethnicities Cancer Mortality 1999 to 2001 ................................. 204
16.8 DIGESTIVE AND RESPIRATORY CANCER ANALYSIS BY ETHNICITY .......................... 204
16.8.1 Digestive Cancer Mortality ....................................................................................... 205 16.8.2 Respiratory Cancer.................................................................................................. 207
16.9 MIDCENTRAL DISTRICT MORTALITY BY ETHNICITY............................................ 208
16.10 MIDCENTRAL DISTRICT AND NEW ZEALAND COMPARISONS FOR MAJOR CAUSES OF MORTALITY ............................................................................................... 209
16.10.1 Mortality from All Causes ........................................................................................ 210 16.10.2 Circulatory System Mortality..................................................................................... 215 16.10.3 Cancer Mortality..................................................................................................... 218 16.10.4 Respiratory System Mortality .................................................................................... 220 16.10.5 Mortality Due to External Causes............................................................................... 223
17. MIDCENTRAL DISTRICT TERRITORIAL AUTHORITY MORBIDITY AND MORTALITY ANALYSIS _________________________________________ 228
17.1 INTRODUCTION .......................................................................................... 228
17.2 HOSPITAL DISCHARGES “CANCER REGISTRATIONS AND CANCER MORTALITY” FOR TERRITORIAL AUTHORITIES........................................................................... 228
17.2.1 Common Patterns Across Territorial Authorities........................................................... 229 17.2.2 Palmerston North ................................................................................................... 230 17.2.3 Horowhenua.......................................................................................................... 232 17.2.4 Manawatu ............................................................................................................. 235 17.2.5 Tararua ................................................................................................................. 238 17.2.6 Kapiti Coast (MidCentral District Portion) ................................................................... 241
17.3 TERRITORIAL AUTHORITY DISEASE SPECIFIC HOSPITAL DISCHARGES..................... 244
17.3.1 Circulatory System Diseases ..................................................................................... 245 17.3.2 Ischaemic Heart Disease........................................................................................... 248 17.3.3 Stroke ................................................................................................................... 251 17.3.4 Diabetes ................................................................................................................ 253 17.3.5 Non-Suppurative Otitis Media (Glue Ear).................................................................... 257 17.3.6 Suppurative Otitis Media (Middle Ear Infection)........................................................... 259 17.3.7 Chronic Diseases of the Tonsils and Adenoids ............................................................. 261 17.3.8 Respiratory Infections .............................................................................................. 263 17.3.9 Asthma ................................................................................................................. 267

17.3.10 Chronic Obstructive Respiratory Disease (CORD) ......................................................... 270 17.3.11 Digestive System Major Diagnostic Category ............................................................... 273 17.3.12 Skin Infections ....................................................................................................... 276 17.3.13 All Cause Injuries ................................................................................................... 278
17.4 CANCER REGISTRATION TERRITORIAL AUTHORITY COMPARISON.......................... 282
17.5 TERRITORIAL AUTHORITY MORTALITY PATTERNS .............................................. 283
17.6 TERRITORIAL AUTHORITY COMPARISONS FOR MAJOR CAUSES OF MORTALITY ........ 283
17.6.1 Mortality Due to All Causes...................................................................................... 284 17.6.2 Circulatory System Mortality..................................................................................... 286 17.6.3 Neoplasm (Cancer) Mortality .................................................................................... 289 17.6.4 Respiratory System Mortality .................................................................................... 292 17.6.5 External Causes of Mortality ..................................................................................... 295
18. MIDCENTRAL DISTRICT MOST SOCIOECONOMICALLY DISADVANTAGED CENSUS AREA UNITS ___________________________ 300
18.1 INTRODUCTION .......................................................................................... 300
18.2 HOSPITAL DISCHARGES ANALYSIS.................................................................. 302
18.3 MIDCENTRAL DISTRICT NZDEP2001 9 AND 10 CENSUS AREA UNITS DISEASE SPECIFIC HOSPITAL DISCHARGES ................................................................... 305
18.3.1 Ischaemic Heart Disease........................................................................................... 306 18.3.2 Asthma ................................................................................................................. 308 18.3.3 Respiratory Infections .............................................................................................. 310 18.3.4 Chronic Obstructive Respiratory Disease (CORD) ......................................................... 311 18.3.5 Diabetes ................................................................................................................ 313 18.3.6 Skin Infections ....................................................................................................... 315 18.3.7 Non-Suppurative Otitis Media (Glue Ear).................................................................... 317 18.3.8 All Cause Injuries ................................................................................................... 319
18.4 CANCER .................................................................................................... 320
18.5 CANCER REGISTRATION FOR SOCIOECONOMICALLY DISADVANTAGED AREAS ......... 321
18.6 MORTALITY ANALYSIS ................................................................................. 322
18.6.1 Mortality Due to All Causes...................................................................................... 323 18.6.2 Circulatory System Mortality..................................................................................... 326 18.6.3 Neoplasm (Cancer) Mortality .................................................................................... 328 18.6.4 Respiratory System Mortality .................................................................................... 330 18.6.5 External Causes Mortality......................................................................................... 332
19. APPENDIX ONE: DATA SOURCES _________________________________ 336
20. APPENDIX TWO: FILTERING CRITERIA USED IN HOSPITALISATION DATA ________________________________________________________ 339
21. APPENDIX THREE: ICD CODES USED IN SELECTED DISEASE COMPARISONS ________________________________________________ 340
Disclaimer
MidCentral District Health Board gives no indemnity to the correctness of the data or information
supplied. MidCentral District Health Board will not be liable for any loss or damage directly or indirectly from the use of this document.
All care has been made to ensure data and information accuracy. The data and information in this
document were considered correct at the time of publication, but may be subject to change.
FOREWORD
MidCentral District Health Board (MidCentral) is responsible for planning and funding health services on behalf of the people of Horowhenua, Manawatu, Palmerston North, Tararua, and Otaki ward of Kapiti Coast territorial authorities. In order to fulfil this responsibility MidCentral must understand the health needs of its resident population. One way in which it does this is by undertaking a health needs assessment. MidCentral District Health Board 2005 Health Needs Assessment is a technical report intended to give an indication of the health status of MidCentral’s population. The focus has been to gather and examine generally available MidCentral district health data, and look for patterns that indicate health status or health needs of the community. Emphasis has been given to groups of people within the community, as well as MidCentral district overall. The main groupings looked at are ethnicity, territorial authority, and people living in socioeconomically disadvantaged areas. These groupings were chosen based on what is already known about health status, especially health disparity, in New Zealand. The demographic profile of MidCentral district is a challenging one: the percentages of Maori and people aged 65 and older are greater than the New Zealand national average, for example. This assessment has identified, and, where possible, quantified health gaps and inequalities so that they can be addressed. These findings will benefit the diverse range of communities within MidCentral district. Already, they have informed the development of some of MidCentral’s strategies, and its six health priority service plans, in particular. Recently, the assessment aided the review of the District Strategic Plan. Over the coming years, it will help a broad range of health planners and practitioners plan and deliver health services so that the diverse range of communities in MidCentral District enjoy: “Quality Living, Healthy Lives”.
Murray Georgel Chief Executive Officer
December 2005

1
1. INTRODUCTION
1.1 Background The New Zealand Public Health and Disability Act 2000 requires district health boards to carry out health needs assessments before significant amendments to their district strategic plans. The health needs assessment is intended to collect and analyse data on the population’s health status and its need for health services. This information contributes towards the focus and direction of district health boards’ district strategic plans. The 2001 MidCentral health needs assessment was carried out as a collaborative project with eleven other district health boards. Public Health Consultancy of the Wellington Medical School were the main project planners and researchers. Staff from the individual district health boards also contributed work. Public Health Consultancy wrote the reports as well as gathering and interpreting data and information. The resulting report consisted mainly of health and socioeconomic data collected from existing databases. This 2005 health needs assessment is authored entirely by MidCentral District Health Board. Central Region Technical Advisory Services, a support organisation for the lower North Island’s six district health boards, helped gather most of the data. Data were also obtained from the Ministry of Health. Most of the subsequent processing and interpretation of this data was done by MidCentral District Health Board.
1.2 The Approach of the Current Health Needs Assessment The focus of the current report was to gather and examine generally available MidCentral district health data, and look for patterns that indicate health status or health needs of the community. Emphasis was given to groups of people within the community, as well as MidCentral district overall. The main groupings looked at were ethnicity, territorial authority, and people living in socioeconomically disadvantaged areas. These groupings were chosen based on what is already known about health status, especially health disparity, in New Zealand. Different age groups were also considered, for example, by looking at the most common causes of hospitalisation divided by age groups, and by showing how hospitalisation or mortality is distributed across the age bands. Greater detail has been given to provide more guidance to health service planners. The objective of this report is therefore: examination of recent MidCentral district health data looking for patterns or trends that give information on the health status or needs of MidCentral district residents. The data and information given here are meant to supplement, and not replace, health patterns and trends identified by national studies. Most of the national patterns also apply to MidCentral district. In some cases, this report took a different approach because replicating the same methods as existing national reports is likely to show similar or identical results. Some examples are the diagnostic and cancer groupings.
1.3 Outline of Health Needs Assessment Report This chapter describes the layout of the report. Chapters two and three describe demographic and socioeconomic background to MidCentral district. Factors that have direct and indirect influence on health status are described.

2
The following 12 chapters cover specific health issues or topics. They are:
• Chapter 4: Health risks and protective factors–Healthy and unhealthy behaviours that influence later illnesses
• Chapter 5: Road traffic issues–The current road traffic issues that concern road traffic injuries
• Chapter 6: Notifiable diseases • Chapter 7: Environment as an influence on health • Chapter 8: Meningococcal disease • Chapter 9: Suicide • Chapter 10: Reproductive health • Chapter 11: Sexual health • Chapter 12: Mental health–Data from the Mental Health Information National
Collection • Chapter 13: Primary Care–Primary care information, mostly: primary health
organisation registration numbers, community pharmacy prescription information, and community laboratory use information
• Chapter 14: Child health • Chapter 15: Disability–Disability information derived from Statistics New Zealand
disability surveys in 2001 and disability service use data. The next chapter, chapter 16, titled MidCentral District Morbidity and Mortality looks at health parameters for MidCentral district overall and its ethnic groups. Health issues covered are:
• The most common illnesses causing hospitalisation, firstly by organ system (Major Diagnostic Category) and then by diagnoses within those organ systems
• The most common cancer diagnostic groupings registered • The most common cancer diagnostic groupings causing death • The most common causes of death • Comparisons between MidCentral district’s ethnicities and New Zealand for selected
disease hospitalisations • Comparisons between MidCentral district’s ethnicities and New Zealand for the most
common causes of death. The next chapter, chapter 17, titled MidCentral District’s Territorial Authority Morbidity and Mortality Analysis looks at health parameters for its territorial authorities. They are: Palmerston North City, Manawatu District, Tararua District, Horowhenua District, and the MidCentral district portion of Kapiti Coast District. Health issues covered are:
• The most common illnesses causing hospitalisation, firstly by organ system (Major Diagnostic Category) and then by diagnoses within those organ systems. This is done for each territorial authority
• The most common cancer diagnostic groupings registered for each territorial authority • The most common cancer diagnostic groupings causing death for each territorial
authority • The most common causes of death • Comparisons between territorial authority and MidCentral district for selected disease
hospitalisations • Comparisons between territorial authority and MidCentral district for the most
common causes of death. Chapter 18, titled MidCentral District’s Most Socioeconomically Disadvantaged Census Area Units looks at health parameters for its socioeconomically disadvantaged areas. These areas were determined using the NZDep2001 deciles. Census area units with NZDep2001 deciles of 9

3
or 10 were considered socioeconomically disadvantaged and combined together for this analysis. Health issues covered are:
• The most common illnesses causing hospitalisation, firstly by organ system (Major Diagnostic Category) and then by diagnoses within those organ systems
• The most common cancer diagnostic groupings registered for socioeconomically disadvantaged areas
• The most common cancer diagnostic groupings causing death for socioeconomically disadvantaged areas
• The most common causes of death • Comparisons between ethnicities living in socioeconomically disadvantaged areas and
MidCentral district overall for selected disease hospitalisations • Comparisons between ethnicities living in socioeconomically disadvantaged areas and
MidCentral district overall for the most common causes of death. Dr Richard Fong MBChB, DipCommH, DipInfoSci Principal Researcher Funding Division MidCentral District Health Board

4
2. MIDCENTRAL DISTRICT DEMOGRAPHY
Key Points
• MidCentral district’s population at the 2001 Census was 155,007 (usually resident population).
• MidCentral district’s population declined from 1996 to 2001 but is projected to increase in the foreseeable future.
• Maori made up 15.3% of MidCentral district’s population in 2001, compared to 14.1% of New Zealand’s population.
• MidCentral district Maori population has higher proportions of children and young people and smaller proportions of older adults, compared to the non Maori, non Pacific population.
• MidCentral district Pacific peoples population structure also has higher proportions of children and young people and smaller proportions of older adults, compared to the non Maori, non Pacific population.
• Horowhenua (20%) and Otaki township (31.2%) have high proportions of Maori residents.
• MidCentral district’s proportion of residents aged 65 and older was 13.4% at the 2001 Census compared to 12.1% for New Zealand.
• Horowhenua (18.6%) and Kapiti Coast (MidCentral district portion) (19.8%) have high proportions of people aged 65 and older.
• The proportion of people aged 65 and over is expected to increase. Maori and Pacific peoples population structure is also expected to age.
• MidCentral district life expectancy estimates, based on 1998 to 2001 data, are slightly less than national equivalents.
2.1 Introduction This chapter looks at MidCentral district demographic patterns. It examines current population size and future projections, and present and future age and ethnic compositions. Territorial authority crude birth and mortality rates at the 2001 Census are briefly described.
2.2 MidCentral District Population The MidCentral district population from the 2001 Census was 155,007 (usually resident population). The population of MidCentral district fell from the 1996 Census to the 2001 Census, but population projections anticipate ongoing growth.
MidCentral Population Estimates 1996 to 2011 Based on 2001 Census Data
156000
158000
160000
162000
164000
166000
168000
170000
1996
1997
1998
1999
2000
2001
2002
2003
2004
2005
2006
2007
2008
2009
2010
2011
Year
Po
pu
lati
on
Some explanation is needed for the larger MidCentral district population numbers in the graph

5
above, compared to the tables below. The projection in the graph above is based on a Statistics New Zealand population count type called “estimated resident population”. There are different ways Statistics New Zealand counts people, with each method including or excluding different groups of people. The estimated resident population includes residents temporarily overseas and also births, deaths, and net migration between census night and a given date. These groups are excluded from the other counting methods; therefore, estimated resident population is larger than the other types of population count. However, the growth trend shown by the graph is still valid. The other methods of counting population are the “census night count” and the “usually resident population” count. MidCentral district covers four whole territorial authorities and part of a fifth, Kapiti Coast. The four whole territorial authorities are Palmerston North, Horowhenua, Manawatu, and Tararua. Palmerston North is the largest with a population of around 72,000. Horowhenua and Manawatu are similar sized, with just fewer than 30,000 residents. Tararua has just over half that, with a population of 17,800 at the last census. The portion of the Kapiti Coast District within MidCentral district’s boundaries comprises Otaki, Otaki Forks, and Te Horo census area units–together called the Otaki Ward. This is the smallest of the five areas, with a population of approximately 7,700, most living in Otaki township.
1991 1996 2001Palmerston North 69519 73170 72069Horowhenua 29796 30138 29808Manawatu 27156 28074 27468Tararua 19851 19011 17811Kapiti (MidCentral portion) 7026 7551 7764MidCentral 153348 157944 154920
MidCentral Population by Territorial Authority 1991, 1996, and 2001
Palmerston North is by far the most urban of MidCentral district’s territorial authorities. Horowhenua and the Kapiti Coast are somewhat more rural, while Manawatu, and especially Tararua, are extensively rural.
Proportion ruralPalmerston North 2%Horowhenua 14%Manawatu 36%Tararua 44%Kapiti (MidCentral portion) 19%MidCentral 16%
MidCentral Proportion of Rural Population by Territorial Authority 2001
The main ethnicities in MidCentral district are New Zealand European, Maori, Pacific peoples and Asian peoples. Maori made up 15.3% of the population at the 2001 census, slightly higher than the New Zealand average of 14.1%. Asian peoples made up 3.5% of MidCentral district population (approximately 5,300); and 2% of the district’s population were Pacific peoples (approximately 3,000 people). New Zealand European and remaining ethnic groups were 79.3% of the district’s population, or around 123,000 people. The Maori population structure is younger than non Maori, non Pacific structure, with higher proportions of people in the younger age groups (especially childhood and teenage years) and smaller proportions among older adults (65+ years). The Pacific peoples population also have a younger age structure, with higher proportions in childhood, adolescent, and young adult age groups. The percentage of Maori in the population is expected to gradually increase in the foreseeable future.
6
Age groups
No. of people Percentage No. of people Percentage No. of people Percentage No. of people Percentage No. of people Percentage
<1 624 2.6% 90 3.0% 81 1.5% 1365 1.1% 2160 1.4%
1-4 2559 10.8% 306 10.1% 306 5.7% 5631 4.6% 8802 5.7%
5-14 5925 25.1% 696 22.9% 780 14.5% 16761 13.6% 24162 15.6%
15-24 4347 18.4% 612 20.2% 1302 24.2% 16332 13.3% 22593 14.6%
25-44 6531 27.6% 855 28.2% 1650 30.7% 33807 27.5% 42843 27.6%
45-64 2880 12.2% 381 12.6% 981 18.2% 29394 23.9% 33636 21.7%
65-74 567 2.4% 63 2.1% 216 4.0% 10413 8.5% 11259 7.3%
75-84 189 0.8% 24 0.8% 54 1.0% 6990 5.7% 7257 4.7%
85+ 24 0.1% 6 0.2% 12 0.2% 2253 1.8% 2295 1.5%
Total 23646 100.0% 3033 100.0% 5382 100.0% 122946 100.0% 155007 100.0%
All ethnicities
MidCentral Ethnicity by Age Groups 2001
Maori Pacific Asian
Other ethnicities
(excludes Asian)
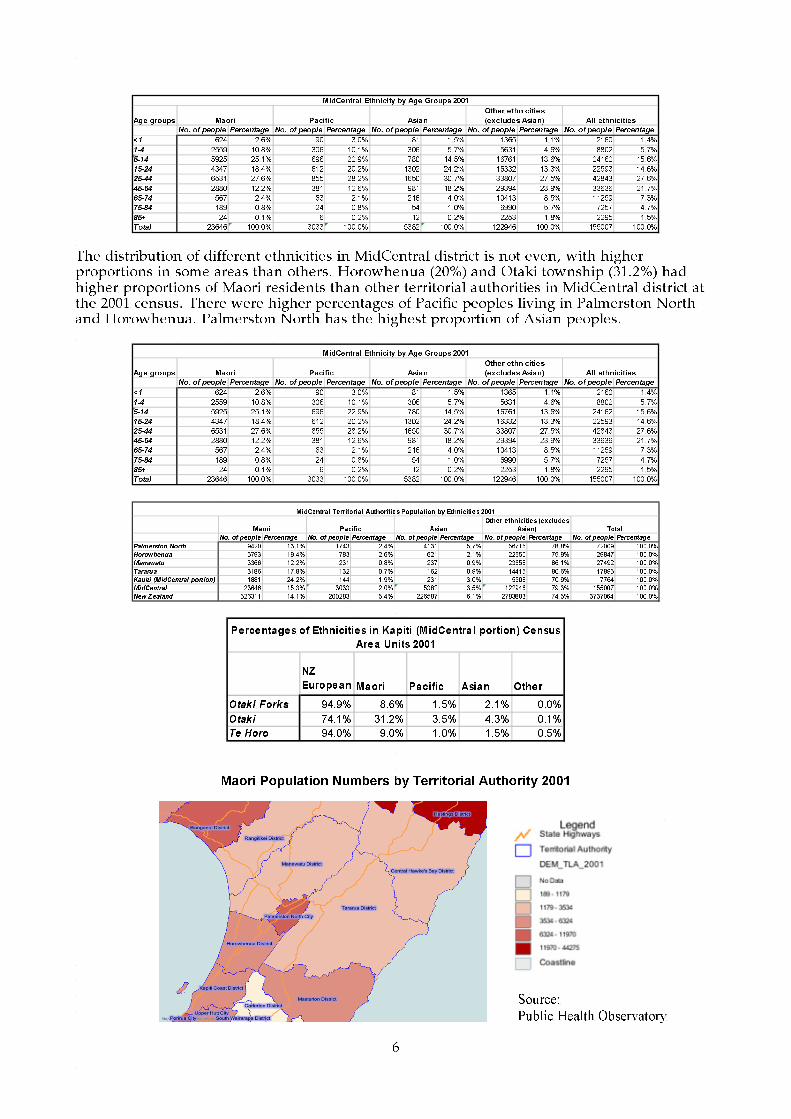
The distribution of different ethnicities in MidCentral district is not even, with higher proportions in some areas than others. Horowhenua (20%) and Otaki township (31.2%) had higher proportions of Maori residents than other territorial authorities in MidCentral district at the 2001 census. There were higher percentages of Pacific peoples living in Palmerston North and Horowhenua. Palmerston North has the highest proportion of Asian peoples.
Age groups
No. of people Percentage No. of people Percentage No. of people Percentage No. of people Percentage No. of people Percentage
<1 624 2.6% 90 3.0% 81 1.5% 1365 1.1% 2160 1.4%
1-4 2559 10.8% 306 10.1% 306 5.7% 5631 4.6% 8802 5.7%
5-14 5925 25.1% 696 22.9% 780 14.5% 16761 13.6% 24162 15.6%
15-24 4347 18.4% 612 20.2% 1302 24.2% 16332 13.3% 22593 14.6%
25-44 6531 27.6% 855 28.2% 1650 30.7% 33807 27.5% 42843 27.6%
45-64 2880 12.2% 381 12.6% 981 18.2% 29394 23.9% 33636 21.7%
65-74 567 2.4% 63 2.1% 216 4.0% 10413 8.5% 11259 7.3%
75-84 189 0.8% 24 0.8% 54 1.0% 6990 5.7% 7257 4.7%
85+ 24 0.1% 6 0.2% 12 0.2% 2253 1.8% 2295 1.5%
Total 23646 100.0% 3033 100.0% 5382 100.0% 122946 100.0% 155007 100.0%
All ethnicities
MidCentral Ethnicity by Age Groups 2001
Maori Pacific Asian
Other ethnicities
(excludes Asian)
No. of people Percentage No. of people Percentage No. of people Percentage No. of people Percentage No. of people Percentage
Palmerston North 9420 13.1% 1743 2.4% 4131 5.7% 56715 78.8% 72009 100.0%
Horowhenua 5793 19.4% 783 2.6% 621 2.1% 22650 75.9% 29847 100.0%
Manawatu 3366 12.2% 231 0.8% 237 0.9% 23658 86.1% 27492 100.0%
Tararua 3186 17.8% 132 0.7% 162 0.9% 14415 80.6% 17895 100.0%
Kapiti (M idCentral portion) 1881 24.2% 144 1.9% 231 3.0% 5508 70.9% 7764 100.0%
MidCentral 23646 15.3% 3033 2.0% 5382 3.5% 122946 79.3% 155007 100.0%
New Zealand 526311 14.1% 200283 5.4% 226587 6.1% 2783883 74.5% 3737064 100.0%
Total
MidCentral Territorial Authoritie s Population by Ethnicitie s 2001
Ma ori Pacific Asian
Other e thnicitie s (exclude s
Asia n)
NZ
European Maori Pacific Asian Other
Otaki Forks 94.9% 8.6% 1.5% 2.1% 0.0%
Otaki 74.1% 31.2% 3.5% 4.3% 0.1%
Te Horo 94.0% 9.0% 1.0% 1.5% 0.5%
Percentages of Ethnicities in Kapiti (MidCentra l portion) Census
Area Units 2001
Maori Population Numbers by Territorial Authority 2001
Source:
Public Health Observatory
7
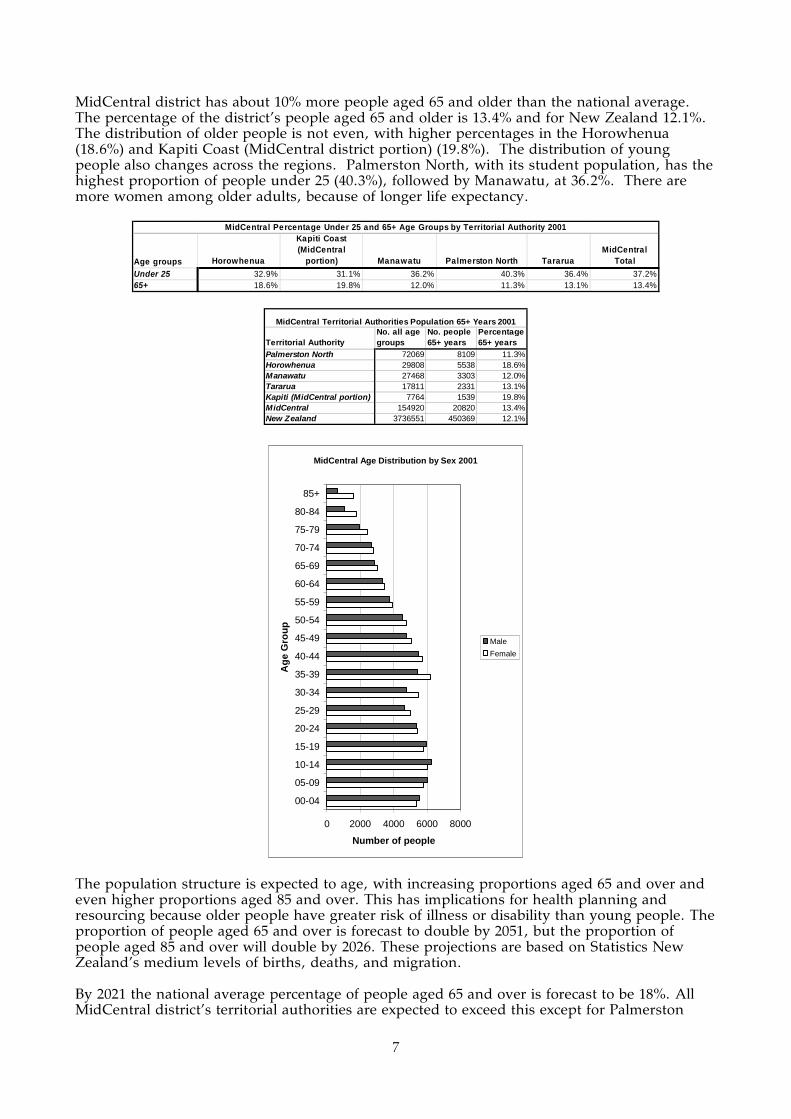
MidCentral district has about 10% more people aged 65 and older than the national average. The percentage of the district’s people aged 65 and older is 13.4% and for New Zealand 12.1%. The distribution of older people is not even, with higher percentages in the Horowhenua (18.6%) and Kapiti Coast (MidCentral district portion) (19.8%). The distribution of young people also changes across the regions. Palmerston North, with its student population, has the highest proportion of people under 25 (40.3%), followed by Manawatu, at 36.2%. There are more women among older adults, because of longer life expectancy.
Age groups Horowhenua
Kapiti Coast (MidCentral
portion) Manawatu Palmerston North TararuaMidCentral
Total
Under 25 32.9% 31.1% 36.2% 40.3% 36.4% 37.2%65+ 18.6% 19.8% 12.0% 11.3% 13.1% 13.4%
MidCentral Percentage Under 25 and 65+ Age Groups by Territoria l Authority 2001
Territorial AuthorityNo. all age groups
No. people 65+ years
Percentage 65+ years
Palmerston North 72069 8109 11.3%Horowhenua 29808 5538 18.6%Manawatu 27468 3303 12.0%Tararua 17811 2331 13.1%Kapiti (MidCentral portion) 7764 1539 19.8%MidCentral 154920 20820 13.4%New Zealand 3736551 450369 12.1%
MidCentral Territorial Authorities Population 65+ Years 2001
MidCentral Age Distribution by Sex 2001
0 2000 4000 6000 8000
00-04
05-09
10-14
15-19
20-24
25-29
30-34
35-39
40-44
45-49
50-54
55-59
60-64
65-69
70-74
75-79
80-84
85+
Ag
e G
rou
p
Number of people
Male
Female
The population structure is expected to age, with increasing proportions aged 65 and over and even higher proportions aged 85 and over. This has implications for health planning and resourcing because older people have greater risk of illness or disability than young people. The proportion of people aged 65 and over is forecast to double by 2051, but the proportion of people aged 85 and over will double by 2026. These projections are based on Statistics New Zealand’s medium levels of births, deaths, and migration. By 2021 the national average percentage of people aged 65 and over is forecast to be 18%. All MidCentral district’s territorial authorities are expected to exceed this except for Palmerston

8
North, with an anticipated 15% 65 years and over. Of MidCentral district’s territorial authorities, Horowhenua and Kapiti Coast (total area) are expected to have the highest proportions aged 65 and over, 26.8% and 26.6% respectively. Maori and Pacific peoples population structures are also expected to age.
Territorial AuthorityNo. all age groups
No. people 65+ years
Percentage 65+ years
Palmerston North 85100 13300 15.6%Horowhenua 29500 7900 26.8%Manawatu 29600 6100 20.6%Tararua 15100 3600 23.8%Kapiti (total area) 56400 15000 26.6%New Zealand 4505900 811900 18.0%
MidCentral Territorial Authorities Projected Population 65+ Years 2021
Age groupsNo. of people Percentage No. of people Percentage No. of people Percentage No. of people Percentage
<1 750 2.2% 100 2.2% 1150 0.9% 2000 1.2%1-4 2900 8.6% 380 8.2% 4720 3.5% 8000 4.6%5-14 6380 18.9% 840 18.1% 11970 9.0% 19190 11.2%15-24 6030 17.9% 920 19.8% 19210 14.4% 26160 15.2%25-44 8770 26.0% 1290 27.8% 29440 22.0% 39500 23.0%45-64 6280 18.6% 830 17.9% 36360 27.2% 43470 25.3%65-74 1640 4.9% 220 4.7% 16310 12.2% 18170 10.6%75-84 740 2.2% 60 1.3% 10020 7.5% 10820 6.3%85+ 220 0.7% 0 0.0% 4520 3.4% 4740 2.8%Total 33710 100.0% 4640 100.0% 133700 100.0% 172050 100.0%
MidCentral Ethnicity by Age Groups Projected 2021
Maori PacificOther ethnicities (includes Asian) All ethnicities
Crude birth and death rates differ considerably between the territorial authorities. Comparing births in 2001 to the population in each territorial authority shows a crude birth rate that is highest in MidCentral’s portion of the Kapiti Coast, and lowest in Horowhenua. To put these figures in perspective, if Kapiti Coast had the same ratio of births as Horowhenua, it would have had 19 (approximately 20%) fewer births in 2001. MidCentral district, territorial authority, and New Zealand birth rates per number of women of child bearing age are examined in the reproductive health section of this document.
MidCentral Crude Birth Rate by Territorial
Authority 2001
0.4
0.6
0.8
1
1.2
1.4
1.6
Kapiti Coast PalmerstonNorth
Manawatu Tararua Horowhenua
Territorial Authority
Bir
ths
per
Hu
nd
red
Peo
ple
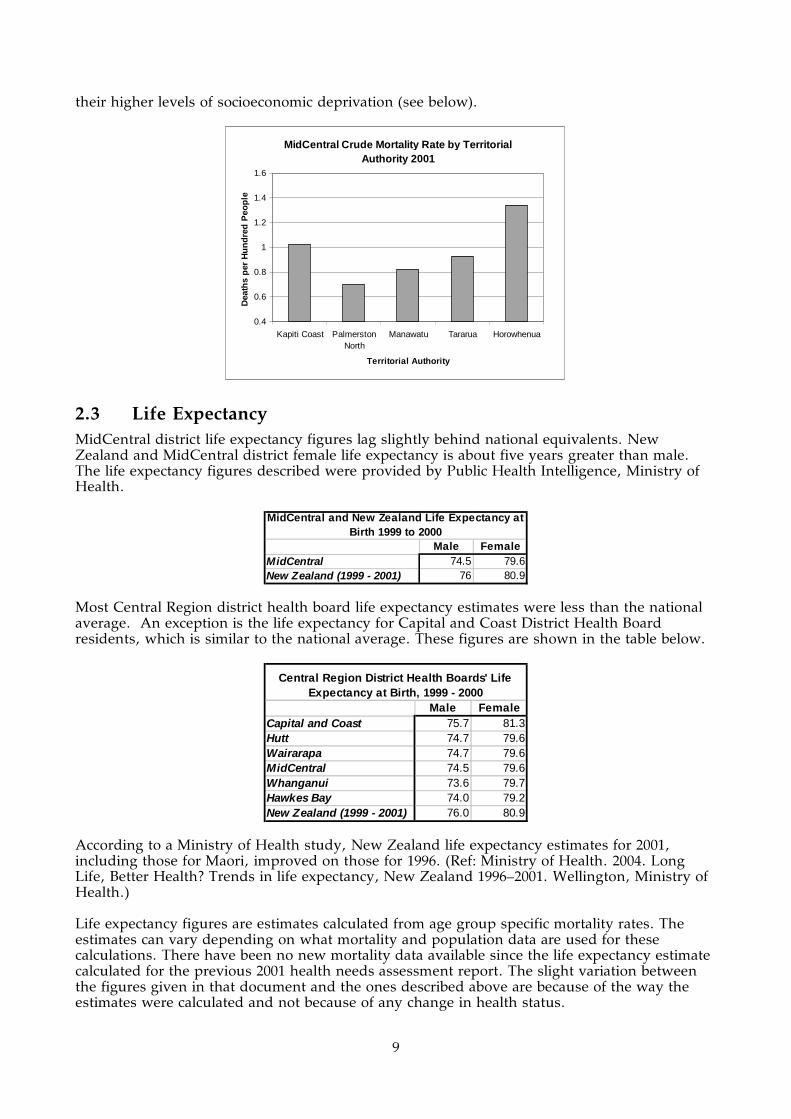
The picture shown by comparing the number of deaths to the populations of the territorial authorities is considerably different. Horowhenua has the highest crude rate of deaths, while Palmerston North has the lowest. If Horowhenua’s ratio of deaths applied to Palmerston North, the territorial authority would have had 458 (approximately 90%) more deaths in 2001. Horowhenua and the Kapiti Coast’s high death rate is in part explained by the age distribution of their populations–they have the highest proportions of over 65 in MidCentral district, and by
9
their higher levels of socioeconomic deprivation (see below).
MidCentral Crude Mortality Rate by Territorial Authority 2001
0.4
0.6
0.8
1
1.2
1.4
1.6
Kapiti Coast PalmerstonNorth
Manawatu Tararua Horowhenua
Territorial Authority
Dea
ths
per
Hu
nd
red
Peo
ple
2.3 Life Expectancy MidCentral district life expectancy figures lag slightly behind national equivalents. New Zealand and MidCentral district female life expectancy is about five years greater than male. The life expectancy figures described were provided by Public Health Intelligence, Ministry of Health.
Male FemaleMidCentral 74.5 79.6New Zealand (1999 - 2001) 76 80.9
MidCentral and New Zealand Life Expectancy at Birth 1999 to 2000
Most Central Region district health board life expectancy estimates were less than the national average. An exception is the life expectancy for Capital and Coast District Health Board residents, which is similar to the national average. These figures are shown in the table below.
Male FemaleCapital and Coast 75.7 81.3Hutt 74.7 79.6Wairarapa 74.7 79.6MidCentral 74.5 79.6Whanganui 73.6 79.7Hawkes Bay 74.0 79.2New Zealand (1999 - 2001) 76.0 80.9
Central Region District Health Boards' Life Expectancy at Birth, 1999 - 2000
According to a Ministry of Health study, New Zealand life expectancy estimates for 2001, including those for Maori, improved on those for 1996. (Ref: Ministry of Health. 2004. Long Life, Better Health? Trends in life expectancy, New Zealand 1996–2001. Wellington, Ministry of Health.) Life expectancy figures are estimates calculated from age group specific mortality rates. The estimates can vary depending on what mortality and population data are used for these calculations. There have been no new mortality data available since the life expectancy estimate calculated for the previous 2001 health needs assessment report. The slight variation between the figures given in that document and the ones described above are because of the way the estimates were calculated and not because of any change in health status.

10
3. SOCIOECONOMIC FACTORS
Key Points
• The NZDep2001 decile rating, based on 2001 Census results, is used to grade areas according to socioeconomic disadvantage.
• MidCentral district has slightly higher proportions of residents living in the most socioeconomically disadvantaged NZDep2001 deciles compared to New Zealand overall.
• Horowhenua and Kapiti Coast (MidCentral district portion) have high proportions of people living in socioeconomically disadvantaged NZDep2001 deciles. Tararua also has slightly higher proportions living in disadvantaged deciles, but to a lesser degree.
• Manawatu has slightly higher proportions living in more advantaged NZDep2001 deciles.
• MidCentral district Maori have higher proportions living in the most socioeconomically disadvantaged areas.
• In general, other socioeconomic parameters follow the same trends as NZDep2001, for example, education, home ownership, car and telephone access.
3.1 Introduction This chapter looks at some of MidCentral district socioeconomic parameters. This is important because socioeconomic disadvantage has been shown to be associated with poorer health and wellbeing in New Zealand. (Ref: Crampton P, Salmond C, Kirkpatrick R. Degrees of Deprivation in New Zealand 2nd edition. Bateman, Auckland 2004.) MidCentral district has slightly higher socioeconomic disadvantage compared to New Zealand. Additionally, there are some parts of the district where socioeconomic disadvantage is more pronounced. A description of the NZDep2001 measure of socioeconomic deprivation is given. There is also analysis of MidCentral district income, unemployment, welfare benefits, education and housing data. The health status of MidCentral district socioeconomically disadvantaged areas is examined an in another part of this document.
3.2 NZDep2001 The NZDep2001 scale is a commonly used tool to indicate socioeconomic disadvantage in New Zealand. It uses data collected for the 2001 Census in its analysis. Its predecessors were the NZDep91 and NZDep96, using 1991 and 1996 data. NZDep2001 is an index that measures the degree of deprivation experienced by the people in a small area. Data based on nine variables are used to assess the relative deprivation experienced by the people in the area. These variables (in decreasing order of weighting) are described below.
The proportion of people in the small area:
• Aged 18-59 years receiving a means tested benefit • Aged 18-59 years unemployed • Living in households with equivalised income (income adjusted to account for
household composition, for example, number of dependants) below an income threshold
• With no access to a telephone

11
• With no access to a car • Aged less than 60 years living in a single parent family • Aged 18-59 without any qualifications • Living in households above equivalised bedroom occupancy threshold (more than one
person per bedroom, adjusted to account for household composition, for example, number of children below a certain age, couples etc)
• Not living in own home.
The NZDep2001 scale uses the index to divide areas into deciles. These deciles are based on tenths of the total New Zealand population, so, for example, a value of 10 indicates the area is within the 10% most deprived in New Zealand, based on the nine parameters measured. It is important to remember that NZDep2001 describes general socioeconomic deprivation in an area. It does not describe the deprivation of individuals. The graphs below in this document will show the numbers and proportions of the graphed populations who were usually resident in an area grouped into the ten categories on census night 2001 (Crampton et al, 2004). The NZDep2001 does have limitations. It is based on only nine parameters, and may oversimplify deprivation. The NZDep2001 categorises areas and not individuals. Someone living in a disadvantaged area may not necessarily be socioeconomically disadvantaged themselves; and a disadvantaged person may live in a relatively advantaged area. Also, it is not an absolute measure of disadvantage–it compares areas to each other. However, despite its limitations, it has proven a useful tool in health and social research. For example, various studies in New Zealand have shown poorer NZDep deciles coincide with poorer health outcomes, for example, mortality, adult asthma prevalence, sudden infant death syndrome, domestic fire deaths, among others.
NZDep2001 Distributions for MidCentral District, MidCentral District Maori, and Territorial Authorities
The adjacent graphs show the population of the given area living in the ten deprivation deciles. For the whole of New Zealand, the proportion in each decile should be equal, so the degree to which each area differs from that shows the relative deprivation of the area. New Zealand, if graphed in this fashion, would have almost even bars in each of the ten deciles.
The picture these graphs show us is that MidCentral district has a slightly higher population living in areas with more deprived NZDep scores compared to New Zealand. MidCentral district highest populations are in decile 8 and 9 areas; the district has more people in decile 10 than decile 1. The picture for Maori in the district is worse. By far the largest proportion of
Palmerston North City
0
2000
4000
6000
8000
10000
12000
14000
1 2 3 4 5 6 7 8 9 10
Tararua District
0
500
1000
1500
2000
2500
3000
1 2 3 4 5 6 7 8 9 10
Manawatu District
0
1000
2000
3000
4000
5000
1 2 3 4 5 6 7 8 9 10
Kapiti Coast (MidCentral Portion)
0
400
800
1200
1600
2000
1 2 3 4 5 6 7 8 9 10
Horowhenua District
0
1000
2000
3000
4000
5000
6000
7000
1 2 3 4 5 6 7 8 9 10
MidCentral Region
0
5000
10000
15000
20000
25000
1 2 3 4 5 6 7 8 9 10
MidCentral Region (Maori)
0
1000
2000
3000
4000
5000
6000
1 2 3 4 5 6 7 8 9 10
12
Maori live in more deprived areas, and there is only a very small population of Maori in the least deprived areas.
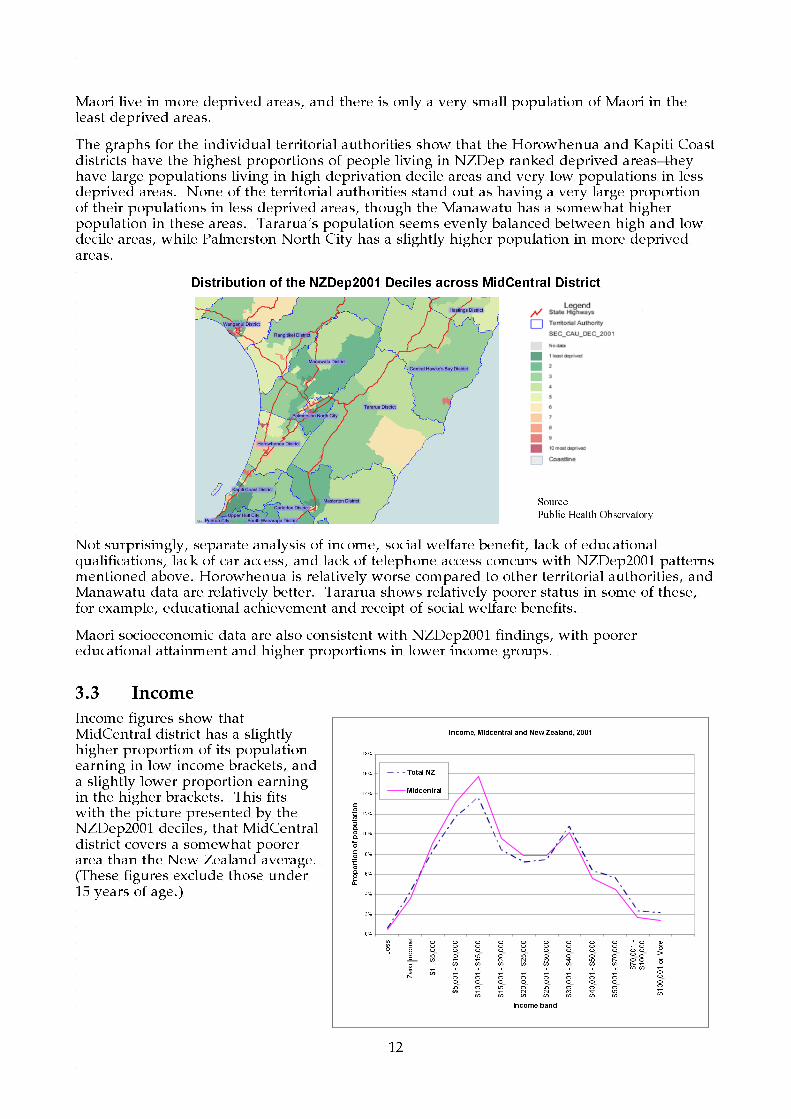
The graphs for the individual territorial authorities show that the Horowhenua and Kapiti Coast districts have the highest proportions of people living in NZDep ranked deprived areas–they have large populations living in high deprivation decile areas and very low populations in less deprived areas. None of the territorial authorities stand out as having a very large proportion of their populations in less deprived areas, though the Manawatu has a somewhat higher population in these areas. Tararua’s population seems evenly balanced between high and low decile areas, while Palmerston North City has a slightly higher population in more deprived areas.
Distribution of the NZDep2001 Deciles across MidCentral District
Not surprisingly, separate analysis of income, social welfare benefit, lack of educational qualifications, lack of car access, and lack of telephone access concurs with NZDep2001 patterns mentioned above. Horowhenua is relatively worse compared to other territorial authorities, and Manawatu data are relatively better. Tararua shows relatively poorer status in some of these, for example, educational achievement and receipt of social welfare benefits.
Maori socioeconomic data are also consistent with NZDep2001 findings, with poorer educational attainment and higher proportions in lower income groups.
3.3 Income
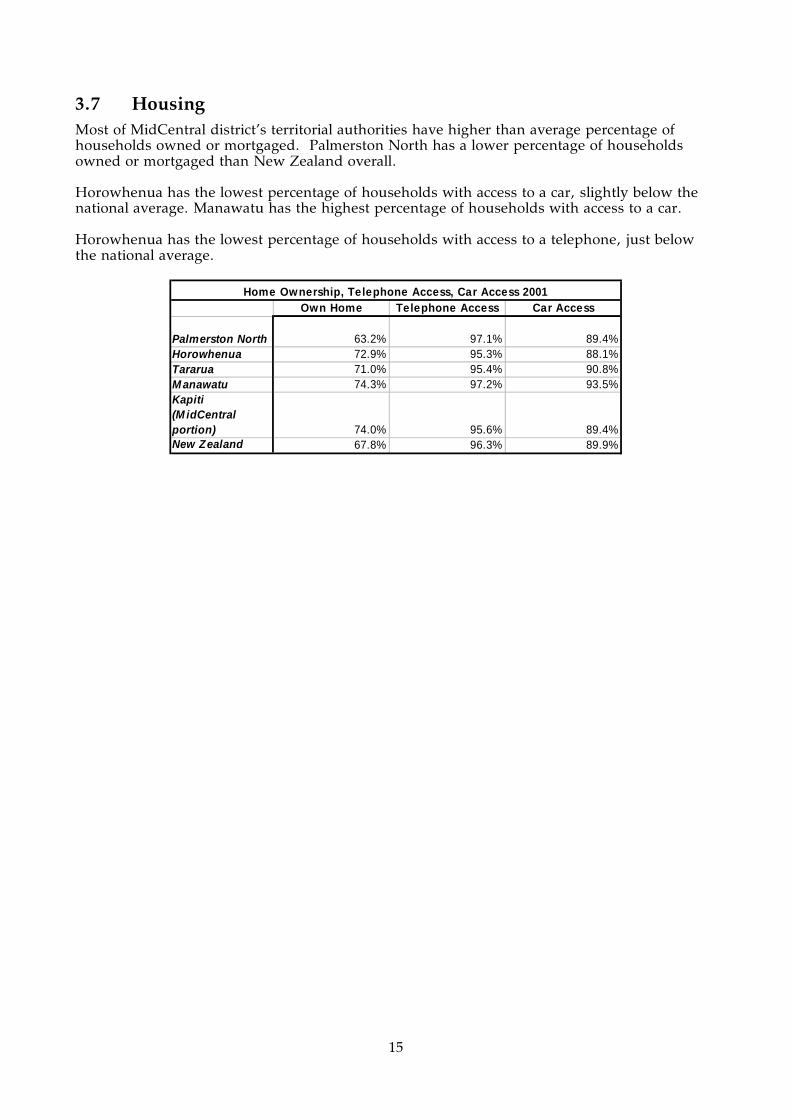
Income figures show that MidCentral district has a slightly higher proportion of its population earning in low income brackets, and a slightly lower proportion earning in the higher brackets. This fits with the picture presented by the NZDep2001 deciles, that MidCentral district covers a somewhat poorer area than the New Zealand average. (These figures exclude those under 15 years of age.)
Source:
Public Health Observatory
Income, Midcentral and New Zealand, 2001
0%
2%
4%
6%
8%
10%
12%
14%
16%
18%
Loss
Zero Income
$1 - $5,000
$5,001 - $10,000
$10,001 - $15,000
$15,001 - $20,000
$20,001 - $25,000
$25,001 - $30,000
$30,001 - $40,000
$40,001 - $50,000
$50,001 - $70,000
$70,001 -
$100,000
$100,001 or More
Income band
Proportion of population
Total NZ
Midcentral

13
The figures for Maori show lower proportions in high income brackets, and higher proportions in low income brackets, than the total population.
MidCentral Income, Maori and Total, 2001
0.00%
2.00%
4.00%
6.00%
8.00%
10.00%
12.00%
14.00%
16.00%
18.00%
Loss
Zero Income
$1 - $5,000
$5,001 - $10,000
$10,001 - $15,000
$15,001 - $20,000
$20,001 - $25,000
$25,001 - $30,000
$30,001 - $40,000
$40,001 - $50,000
$50,001 - $70,000
$70,001 - $100,000
$100,001 or More
Income
Proportion of Population
MidCentral (Maori)
Midcentral (Total)
Looking at the individual territorial authorities, Horowhenua has a high proportion of low income earners, and a low proportion of high income earners. Kapiti Coast has a similar, but less pronounced distribution, whereas Manawatu is the reverse, with one of the lowest proportions in the low income brackets, and one of the highest in the high income brackets.
Income by Territorial Authority 2001
0%
3%
5%
8%
10%
13%
15%
18%
20%
Loss
Zero Income
$1 - $5,000
$5,001 - $10,000
$10,001 - $15,000
$15,001 - $20,000
$20,001 - $25,000
$25,001 - $30,000
$30,001 - $40,000
$40,001 - $50,000
$50,001 - $70,000
$70,001 - $100,000
$100,001 or More
Income Band
Proportion of Population
Manawatu District
Palmerston North City
Tararua District
Horowhenua District
Kapiti Coast District
3.4 Unemployment
As the national unemployment rate has fallen dramatically in the last few years, the census 2001 figures on unemployment are now unreliable. The latest Department of Labour figures give an unemployment rate of 4.9% for the whole Manawatu-Wanganui region. What this

14
means for MidCentral district unemployment rate is unclear. The Wanganui district is, by NZDep2001, a more deprived area than MidCentral district, which indicates that the unemployment rate for MidCentral district may be lower than for the whole area. On the other hand, the Department of Labour figures do not include the MidCentral district portion of Kapiti Coast, which is likely to have a high rate of unemployment.
3.5 Welfare Benefits Horowhenua has the highest overall proportion of beneficiaries and the highest proportion in each category except “Non-ben” (non beneficiaries) receiving assistance. This fits with the profile of the region as an NZDep2001 “more deprived” area. Manawatu has the lowest overall proportion of beneficiaries, and is the lowest in almost all categories. This fits with the profile of the region as an NZDep2001 “less deprived” area. No figures were available for the Kapiti Coast region.
DPB-CSI DPB-SP DPB-WA IB Non-benHorowhenua 0.10% 3.43% 0.14% 4.39% 0.60%M anawatu 0.04% 2.32% 0.05% 1.54% 0.37%Palmerston North 0.04% 2.79% 0.08% 2.31% 0.89%Tararua 0.06% 2.64% 0.11% 1.99% 0.27%
NZS_VP_TRB SB_SBH UBs Related Other benefit TotalHorowhenua 19.71% 1.38% 3.50% 0.86% 34.11%M anawatu 11.09% 0.94% 1.63% 0.42% 18.39%Palmerston North 12.36% 0.93% 1.94% 0.52% 21.87%Tararua 13.86% 0.98% 2.67% 0.79% 23.36%
Percentage of People Receiving Welfare Benefits by Territorial Authority 2001
Abbreviation Definitions: DPB-CSI: Domestic Purposes Benefit–Caring for Sick or Infirm DPB-SP: Domestic Purposes Benefit–Sole Parent DPB-WA: Domestic Purposes Benefit–Woman Alone IB: Invalids Benefit Non-ben: Non Beneficiary receiving assistance eg, accommodation allowance NZS_VP_TRB: New Zealand Superannuation, Veterans, and Transitional Retirement Benefit SB_SBH: Sickness Benefit and Sickness Benefit Hardship UBs Related: Unemployment Benefit, Unemployment Benefit (in Training) and Unemployment Benefit Hardship, Job Search Allowance and Independent Youth (in Training) Other benefit: Emergency Benefit, Widows Benefit, Orphans and Unsupported Child benefits
3.6 Education MidCentral district has a somewhat higher proportion of people with no qualification, and a lower proportion of people with university qualifications than the total population of New Zealand. This is in keeping with the picture of the district as slightly less well off than average. The proportions of qualifications follow the trends indicated by NZDep2001, with the exception that Palmerston North has a much higher proportion of the population with university qualifications, probably due to the proximity of Massey University. Maori qualification distribution follows much the same pattern as the total population, except in much lower proportions. Kapiti Coast showed a high proportion of Maori with university qualifications, in contrast to its NZDep2001 decile.
No Qualification
University Qualification
No Qualification
University Qualification
M anawatu 28.80% 6.20% 37.22% 2.87%Palmerston North 20.70% 13.20% 29.70% 6.46%Tararua 34.20% 4.10% 42.81% 1.90%Horowhenua 35.30% 4.00% 42.43% 2.45%Kapiti Coast 23.10% 9.40% 30.33% 6.40%M idCentral 25.90% 9.10% 35.81% 4.49%Total NZ 23.70% 10.10% 37.14% 4.05%
Formal Educational Qualifications MidCentral and Territorial Authorities 2001Total Population Maori
15
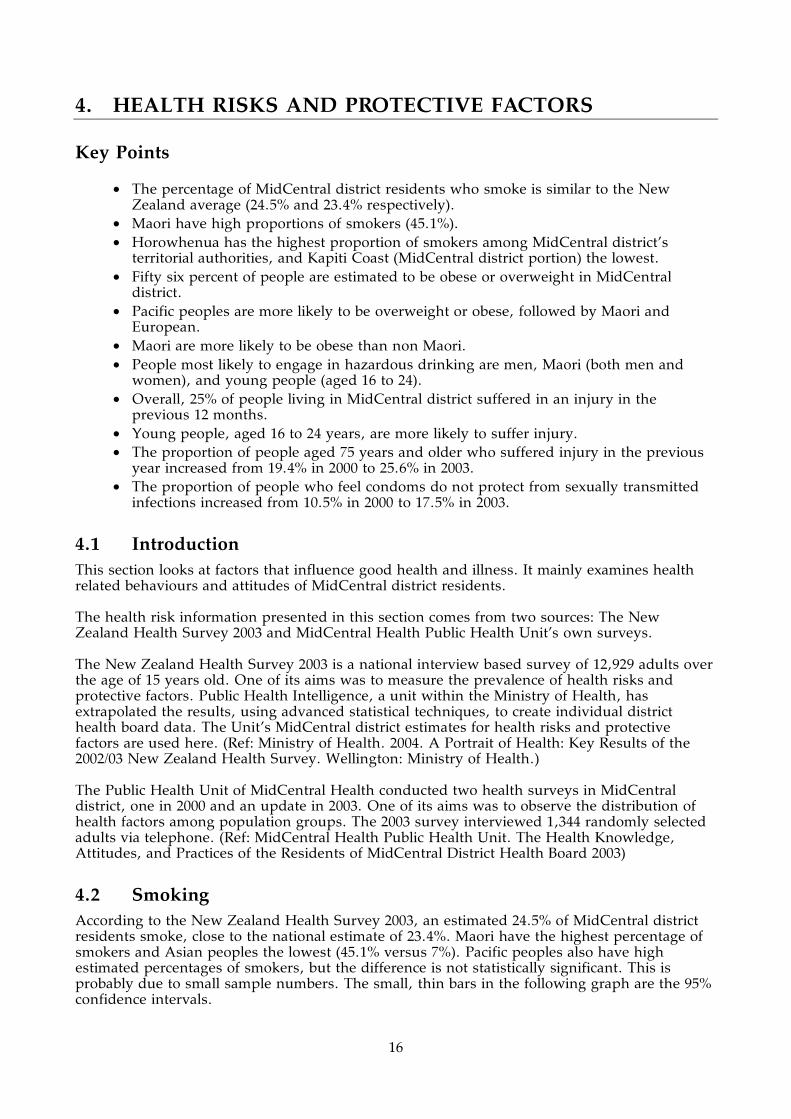
3.7 Housing Most of MidCentral district’s territorial authorities have higher than average percentage of households owned or mortgaged. Palmerston North has a lower percentage of households owned or mortgaged than New Zealand overall. Horowhenua has the lowest percentage of households with access to a car, slightly below the national average. Manawatu has the highest percentage of households with access to a car. Horowhenua has the lowest percentage of households with access to a telephone, just below the national average.
Own Home Telephone Access Car Access
Palmerston North 63.2% 97.1% 89.4%Horowhenua 72.9% 95.3% 88.1%Tararua 71.0% 95.4% 90.8%M anawatu 74.3% 97.2% 93.5%Kapiti (M idCentral portion) 74.0% 95.6% 89.4%New Zealand 67.8% 96.3% 89.9%
Home Ownership, Telephone Access, Car Access 2001
16
4. HEALTH RISKS AND PROTECTIVE FACTORS
Key Points
• The percentage of MidCentral district residents who smoke is similar to the New Zealand average (24.5% and 23.4% respectively).
• Maori have high proportions of smokers (45.1%). • Horowhenua has the highest proportion of smokers among MidCentral district’s
territorial authorities, and Kapiti Coast (MidCentral district portion) the lowest. • Fifty six percent of people are estimated to be obese or overweight in MidCentral
district. • Pacific peoples are more likely to be overweight or obese, followed by Maori and
European. • Maori are more likely to be obese than non Maori. • People most likely to engage in hazardous drinking are men, Maori (both men and
women), and young people (aged 16 to 24). • Overall, 25% of people living in MidCentral district suffered in an injury in the
previous 12 months. • Young people, aged 16 to 24 years, are more likely to suffer injury. • The proportion of people aged 75 years and older who suffered injury in the previous
year increased from 19.4% in 2000 to 25.6% in 2003. • The proportion of people who feel condoms do not protect from sexually transmitted
infections increased from 10.5% in 2000 to 17.5% in 2003.
4.1 Introduction This section looks at factors that influence good health and illness. It mainly examines health related behaviours and attitudes of MidCentral district residents. The health risk information presented in this section comes from two sources: The New Zealand Health Survey 2003 and MidCentral Health Public Health Unit’s own surveys. The New Zealand Health Survey 2003 is a national interview based survey of 12,929 adults over the age of 15 years old. One of its aims was to measure the prevalence of health risks and protective factors. Public Health Intelligence, a unit within the Ministry of Health, has extrapolated the results, using advanced statistical techniques, to create individual district health board data. The Unit’s MidCentral district estimates for health risks and protective factors are used here. (Ref: Ministry of Health. 2004. A Portrait of Health: Key Results of the 2002/03 New Zealand Health Survey. Wellington: Ministry of Health.) The Public Health Unit of MidCentral Health conducted two health surveys in MidCentral district, one in 2000 and an update in 2003. One of its aims was to observe the distribution of health factors among population groups. The 2003 survey interviewed 1,344 randomly selected adults via telephone. (Ref: MidCentral Health Public Health Unit. The Health Knowledge, Attitudes, and Practices of the Residents of MidCentral District Health Board 2003)
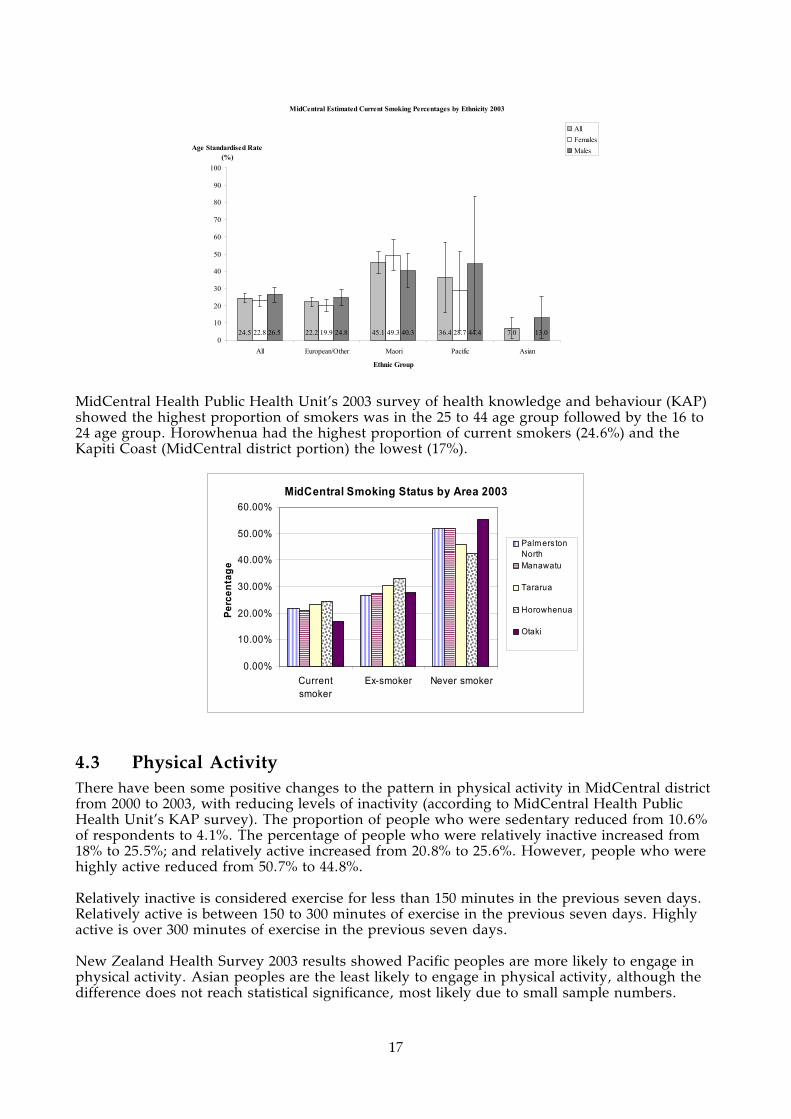
4.2 Smoking According to the New Zealand Health Survey 2003, an estimated 24.5% of MidCentral district residents smoke, close to the national estimate of 23.4%. Maori have the highest percentage of smokers and Asian peoples the lowest (45.1% versus 7%). Pacific peoples also have high estimated percentages of smokers, but the difference is not statistically significant. This is probably due to small sample numbers. The small, thin bars in the following graph are the 95% confidence intervals.
17
MidCentral Estimated Current Smoking Percentages by Ethnicity 2003
24.5 22.2 45.1 36.4 7.022.8 19.9 49.3 28.726.5 24.8 40.3 44.4 13.00
10
20
30
40
50
60
70
80
90
100
All European/Other Maori Pacific Asian
Ethnic Group
Age Standardised Rate (%)
AllFemalesMales
MidCentral Health Public Health Unit’s 2003 survey of health knowledge and behaviour (KAP) showed the highest proportion of smokers was in the 25 to 44 age group followed by the 16 to 24 age group. Horowhenua had the highest proportion of current smokers (24.6%) and the Kapiti Coast (MidCentral district portion) the lowest (17%).
MidCentral Smoking Status by Area 2003
0.00%
10.00%
20.00%
30.00%
40.00%
50.00%
60.00%
Currentsmoker
Ex-smoker Never smoker
Perc
enta
ge
Palm ers tonNorthManawatu
Tararua
Horowhenua
Otaki
4.3 Physical Activity There have been some positive changes to the pattern in physical activity in MidCentral district from 2000 to 2003, with reducing levels of inactivity (according to MidCentral Health Public Health Unit’s KAP survey). The proportion of people who were sedentary reduced from 10.6% of respondents to 4.1%. The percentage of people who were relatively inactive increased from 18% to 25.5%; and relatively active increased from 20.8% to 25.6%. However, people who were highly active reduced from 50.7% to 44.8%. Relatively inactive is considered exercise for less than 150 minutes in the previous seven days. Relatively active is between 150 to 300 minutes of exercise in the previous seven days. Highly active is over 300 minutes of exercise in the previous seven days. New Zealand Health Survey 2003 results showed Pacific peoples are more likely to engage in physical activity. Asian peoples are the least likely to engage in physical activity, although the difference does not reach statistical significance, most likely due to small sample numbers.
18
MidCentral Estimated Percentages Physical Activity 150 Minutes or More Weekly by Ethnicity 2003
75.4 75.9 74.4 83.0 63.573.3 74.8 66.6 76.0 60.677.6 77.0 83.4 90.3 66.70
10
20
30
40
50
60
70
80
90
100
All European/Other Maori Pacific Asian
Ethnic Group
Age Standardised Rate (%)
All
Females
Males
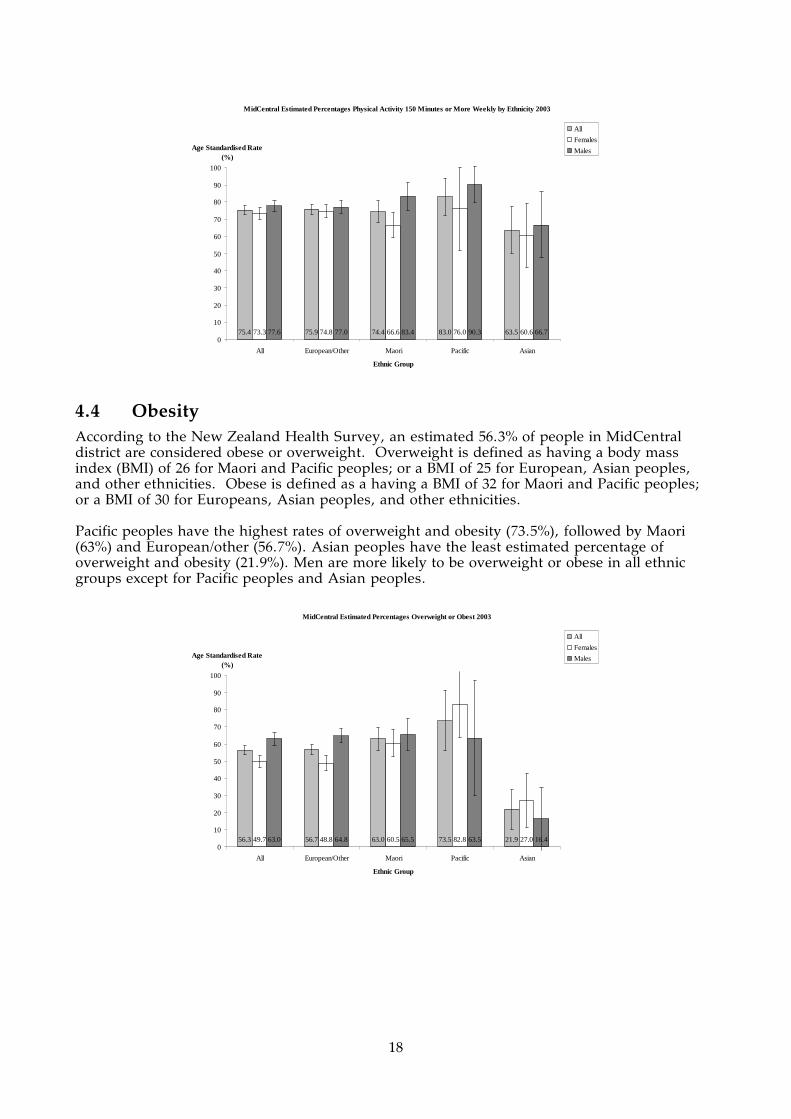
4.4 Obesity According to the New Zealand Health Survey, an estimated 56.3% of people in MidCentral district are considered obese or overweight. Overweight is defined as having a body mass index (BMI) of 26 for Maori and Pacific peoples; or a BMI of 25 for European, Asian peoples, and other ethnicities. Obese is defined as a having a BMI of 32 for Maori and Pacific peoples; or a BMI of 30 for Europeans, Asian peoples, and other ethnicities. Pacific peoples have the highest rates of overweight and obesity (73.5%), followed by Maori (63%) and European/other (56.7%). Asian peoples have the least estimated percentage of overweight and obesity (21.9%). Men are more likely to be overweight or obese in all ethnic groups except for Pacific peoples and Asian peoples.
MidCentral Estimated Percentages Overweight or Obest 2003
56.3 56.7 63.0 73.5 21.949.7 48.8 60.5 82.8 27.063.0 64.8 65.5 63.5 16.40
10
20
30
40
50
60
70
80
90
100
All European/Other Maori Pacific Asian
Ethnic Group
Age Standardised Rate (%)
All
Females
Males

19
Maori have higher risk of obesity than non Maori in MidCentral district. An estimated 31.3% of Maori are obese compared to 22.3% of non Maori.
MidCentral Estimated Percentages of Obesity, Maori and Non-Maori, 2003
22.3 31.3 21.122.0 28.9 21.122.7 33.7 21.20
10
20
30
40
50
60
70
80
90
100
All Maori Non Maori
Ethnic Group
Age Standardised Rate (%)
All
Females
Males
MidCentral Estimated Percentages of Obesity 2003
22.3 22.0 31.3 14.8 4.722.0 21.8 28.9 18.522.7 22.3 33.70
10
20
30
40
50
60
70
80
90
100
All European/Other Maori Pacific Asian
Ethnic Group
Age Standardised Rate (%)
All
Females
Males
4.5 Alcohol Consumption The New Zealand Health Survey 2003 found both MidCentral district Maori men and Maori women indulged in hazardous drinking more than corresponding non Maori genders. Men were at greater risk of hazardous drinking than women, for both Maori and non Maori ethnicities. New Zealand data suggest male Pacific peoples may also have a high percentage of hazardous drinking, although this did not reach statistical significance.

20
MidCentral Estimated Percentages of Hazardous Alcohol Consumption, Maori and Non-Maori (AUDIT Questionnaire Score > 8) 2003
22.3 29.3 21.414.7 23.1 13.630.7 36.3 30.00
10
20
30
40
50
60
70
80
90
100
All Maori Non Maori
Ethnic Group
Age Standardised Rate (%)
All
Females
Males
New Zealand Percentages of Hazardous Alcohol Consumption (AUDIT Questionnaire Score > 8) 2003
18.9 19.2 25.9 18.6 3.911.4 11.4 18.4 7.627.1 27.3 34.5 30.8 6.80
10
20
30
40
50
60
70
80
90
100
All European/Other Maori Pacific Asian
Ethnic Group
Age Standardised Rate (%)
All
Females
Males
MidCentral Health Public Health Unit’s KAP survey found the likelihood of intoxication reduced with increasing age. The age groups most at risk of alcohol intoxication were the 16 to 24 age group, followed by the 25 to 44 age group. According to MidCentral Health Drug and Alcohol Service’s client contact by problematic drug data 1999/2000 to 2002/2003, alcohol was the most common problematic drug by client numbers.
MidCentral Health Alcohol & Drug Service Clients by Problematic Drug 1999/2000 to 2002/2003
0200400600800
10001200140016001800
Alc
ohol
Am
phet
amin
es/s
timul
ants
Ben
zodi
azep
ines
Coc
aine
Cod
eine
pro
duct
s
Dol
oxen
e
Hal
luci
noge
ns (
LSD
,
Her
oin
Hom
e B
ake
Illic
it (s
tree
t) m
etha
done
Inha
lant
s
Mar
ijuan
a an
d ot
her
Met
hado
ne (
prog
ram
me)
Mor
phin
e
Non
e
Not
kno
wn
Oth
er d
rugs
not
list
ed
Oth
er o
poid
s
Oth
er s
edat
ive/
hypn
otic
Pol
y D
rug
Pop
pies
Tem
gesi
c
Tob
acco
Nu
mb
er o
f cl
ien
ts

21
4.6 Nutrition The New Zealand Health Survey 2003 includes information on the nutrition of MidCentral district residents. It estimated proportions of people who consumed two or more servings of fruit, three or more servings of vegetables, and five or more servings of fruit and vegetables daily. European/other females consume two or more servings of fruit daily in higher rates than any other group, and females of all ethnicities consume more fruit than men. This difference is most marked amongst European/other and Maori. Maori have the lowest overall consumption of fruit, while Asian peoples have the highest.
MidCentral Estimated Consumption of Fruit by Ethnicity 2003 (2 or more servings per day)
50.5 50.7 45.3 56.0 59.060.1 61.6 50.8 54.0 58.640.1 39.0 39.0 58.0 59.50
10
20
30
40
50
60
70
80
90
100
All European/Other Maori Pacific Asian
Ethnic Group
Age Standardised Rate (%)
All
Females
Males
(Source: 2002/03 New Zealand Health Survey)
Pacific males consume three or more servings of vegetables daily in higher rates than any other group, and far in excess of Pacific females, who have a relatively low rate of vegetable consumption. European/other have the highest overall daily consumption of three or more servings of vegetables, while Asian peoples have the lowest, by a significant margin. With the exception of Pacific people, women have higher rates of vegetable consumption than men.
MidCentral Estimated Consumption of Vegetables by Ethnicity 2003 (3 or more servings per day)
73.1 74.7 71.8 72.1 42.476.7 79.3 71.7 54.3 48.169.0 69.7 72.0 90.3 36.00
10
20
30
40
50
60
70
80
90
100
All European/Other Maori Pacific Asian
Ethnic Group
Age Standardised Rate (%)
All
Females
Males
(Source: 2002/03 New Zealand Health Survey)

22
Pacific males and European/other females have a higher rate of fruit and vegetable consumption than any other group. With the exception of Pacific peoples (and perhaps Maori), women have higher rates of fruit and vegetable consumption than men.
MidCentral Estimated Consumption of Fruit and Vegetables by Ethnicity 2003 (5 or more servings per day)
40.7 42.2 35.7 37.9 23.149.6 52.7 41.1 19.5 23.231.0 31.0 29.6 56.8 23.00
10
20
30
40
50
60
70
80
90
100
All European/Other Maori Pacific Asian
Ethnic Group
Age Standardised Rate (%)
All
Females
Males
(Source: 2002/03 New Zealand Health Survey)
MidCentral Health’s KAP Survey also surveyed respondents’ consumption of fruit and vegetables. About two thirds of respondents from the 2003 survey ate two or more servings of fruit (66.4%) and two or more servings of vegetables (71.8%) daily. Almost half of the respondents consumed three or more servings of vegetables daily (45.8%). Compared with the KAP 2000 survey, fruit consumption of three or more servings daily showed a significant increase (from 31.1% to 39.7%) while vegetable consumption remained similar. A gap between the recommended consumption of fruit/vegetables still exists; especially for males and Maori. Consistent with national survey results, females ate more vegetables than males and have a slightly increased fruit consumption compared to males. Overall, the proportion of people consuming two or more servings of fruit per day was higher for MidCentral district than is the case nationally while fewer people consumed three or more servings of vegetables. Maori had a similar consumption of fruit per day to non Maori, while they ate fewer servings of vegetables than non Maori.
4.7 Self Rated Health In MidCentral Health’s 2003 KAP survey, 87.5% of respondents reported their health as good, very good or excellent. The figure is close to the National Health Survey in 2003 where nine out of ten adults rated their health in the same categories and also close to the rate reported for the KAP 2000 survey (90.3%).
Health Status Number PercentageCumulative Percentage
Excellent 232 23.10% 23.10%Very good 364 36.30% 59.40%Good 281 28% 87.50%Fair 97 9.60% 97.10%Poor 29 2.90% 100%
Self Rated Health Status, KAP Survey 2003
Maori self rated health was similar to non Maori, with slightly higher figures in the “Good”

23
category, and lower figures in the “Excellent” and “Very Good”.
Excellent Very Good Good Fair PoorMaori 21.1% 34.2% 32.1% 8.9% 3.7%Non-Maori 23.1% 36.8% 27.6% 9.4% 3.1%
Self Rated Health Status by Ethnicity, KAP Survey 2003
4.8 Cannabis/Marijuana Use The New Zealand Health Survey 2003 shows that Maori have a much higher rate of marijuana use than non Maori in MidCentral district, with 55.4% having used the drug, and 26.6% having used it in the last 12 months. Males use marijuana in greater numbers than females, and this trend is most pronounced among non Maori. Overall, roughly 42% of MidCentral district residents have tried marijuana, approximately 16% of these in the last twelve months.
MidCentral Health’s KAP survey 2003 showed a slightly lower rate of cannabis use, with 8.8% of respondents having tried the drug in the last 12 months. General trends were the same however, with Maori and Males using the drug at greater rates than other groups. The KAP survey also shows figures for regular cannabis users, representing 2.2% of MidCentral district residents in 2003. Compared with the KAP 2000 result, cannabis use remained similar in all levels of user.
Level of Use 2000 2003Never 72.9% 71.3%Tried over a year ago 15.9% 17.7%Tried in last year 8.5% 8.8%Regular user 2.7% 2.2%
MidCentral Level of Cannabis Use, KAP Surveys 2000 and 2003
4.9 Injury and Poisoning MidCentral Health’s KAP survey asked respondents if they had suffered an injury or poisoning requiring medical attention in the last twelve months. Those aged 16-24 were most likely to have suffered such an injury. There was little change between the 2000 and 2003 surveys. There was an increase in the proportion of people aged 75+ who suffered an injury, from 19.4% in 2000 to 25.6% in 2003. Overall, roughly a quarter of MidCentral district residents reported an injury or poisoning in the previous twelve months.
16 - 24 25 - 44 45 - 64 65 - 74 75+ Total2000 37.1% 26.3% 19.1% 24.5% 19.4% 25.0%2003 30.3% 22.9% 21.6% 19.1% 25.6% 23.6%
Age Group
MidCentral Proportions Suffering Injury in Previous 12 Months by Age Group, KAP Surveys 2000 and 2003
The “other” category was the most frequently cited cause of injury or poisoning requiring medical attention in 2003. This was a significant increase from 2000. “Other” cause of injury includes work related, animal related, back, and lifting injuries. The leading single injury cause was falls, followed by sports and games.
Ethnic Group All Female MaleAll 41.8% 36.9% 47.2%Maori 55.4% 50.3% 61.1%Non-Maori 40.1% 35.1% 45.4%
MidCentral Estimated Percentage of People Who Have Ever Tried Marijuana 2003
Ethnic Group All Female MaleAll 17.4% 13.0% 22.2%Maori 26.6% 24.6% 28.9%Non-Maori 16.2% 11.4% 21.3%
MidCentral Estimated Percentage of People Who Used Marijuana in Past 12 Months (2003)
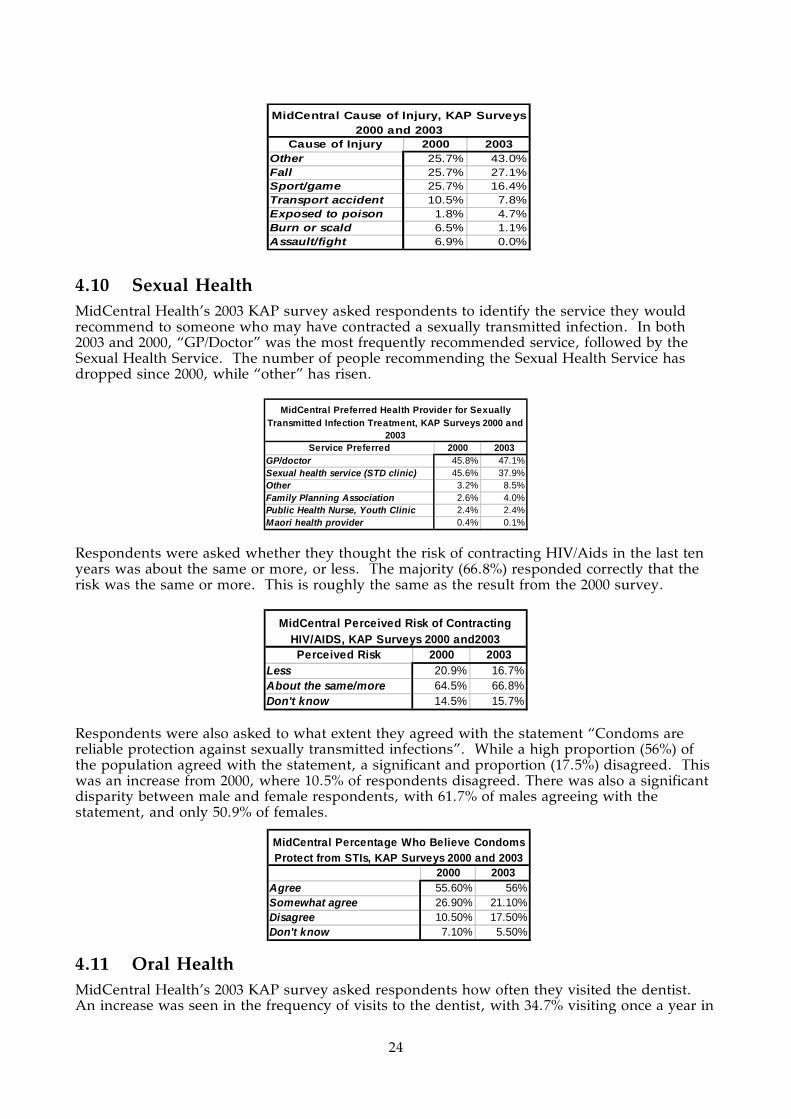
24
4.10 Sexual Health MidCentral Health’s 2003 KAP survey asked respondents to identify the service they would recommend to someone who may have contracted a sexually transmitted infection. In both 2003 and 2000, “GP/Doctor” was the most frequently recommended service, followed by the Sexual Health Service. The number of people recommending the Sexual Health Service has dropped since 2000, while “other” has risen.
Service Preferred 2000 2003GP/doctor 45.8% 47.1%Sexual health service (STD clinic) 45.6% 37.9%Other 3.2% 8.5%Family Planning Association 2.6% 4.0%Public Health Nurse, Youth Clinic 2.4% 2.4%Maori health provider 0.4% 0.1%
MidCentral Preferred Health Provider for Sexually Transmitted Infection Treatment, KAP Surveys 2000 and
2003
Respondents were asked whether they thought the risk of contracting HIV/Aids in the last ten years was about the same or more, or less. The majority (66.8%) responded correctly that the risk was the same or more. This is roughly the same as the result from the 2000 survey.
Perceived Risk 2000 2003Less 20.9% 16.7%About the same/more 64.5% 66.8%Don't know 14.5% 15.7%
MidCentral Perceived Risk of Contracting HIV/AIDS, KAP Surveys 2000 and2003
Respondents were also asked to what extent they agreed with the statement “Condoms are reliable protection against sexually transmitted infections”. While a high proportion (56%) of the population agreed with the statement, a significant and proportion (17.5%) disagreed. This was an increase from 2000, where 10.5% of respondents disagreed. There was also a significant disparity between male and female respondents, with 61.7% of males agreeing with the statement, and only 50.9% of females.
4.11 Oral Health MidCentral Health’s 2003 KAP survey asked respondents how often they visited the dentist. An increase was seen in the frequency of visits to the dentist, with 34.7% visiting once a year in
2000 2003Agree 55.60% 56%Somewhat agree 26.90% 21.10%Disagree 10.50% 17.50%Don't know 7.10% 5.50%
MidCentral Percentage Who Believe Condoms Protect from STIs, KAP Surveys 2000 and 2003
Cause of Injury 2000 2003Other 25.7% 43.0%Fall 25.7% 27.1%Sport/game 25.7% 16.4%Transport accident 10.5% 7.8%Exposed to poison 1.8% 4.7%Burn or scald 6.5% 1.1%Assault/fight 6.9% 0.0%
MidCentral Cause of Injury, KAP Surveys 2000 and 2003

25
2003 compared to 28.2% in 2000. This can be attributed both to better access to dental services, and an increase in dental disease.
2000 20036 monthly 18.5% 18.1%Once a year 28.2% 34.7%Once every 2 years 11.8% 12.0%More than 2 years apart 19.0% 19.4%Never 22.4% 15.8%
MidCentral Frequency of Visits to Dentist, KAP Surveys 2000 and 2003
The reasons that respondents did not visit the dentist more often were also surveyed. “Cost” decreased as a reason for people not to visit the dentist more often. “Other” increased very significantly, but it is difficult to draw any inferences from this.
2000 2003Other 6.6% 42.1%No problems with my teeth 21.9% 25.4%Cost 55.5% 23.6%Fear 11.7% 6.6%Effort/time 3.9% 2.0%Travel/access 0.4% 0.3%
MidCentral - Reasons for Not Visiting Dentist, KAP Surveys 2000 and 2003
4.12 Communicable Diseases MidCentral Health’s 2003 KAP survey asked respondents to indicate which of three options was the best way to prevent meningococcal disease. The best method to prevent this disease is to not share spit, and this was identified by 60.4% of respondents in 2003, a large increase from 2000. A significant proportion (27.8%) identified “Wash your hands” as the best method.
2000 2003Eat a healthy diet 7.0% 5.0%Don't share spit 48.6% 60.4%Wash your hands 31.3% 27.8%Don't know 13.2% 6.8%
MidCentral Opinions on Best Method to Prevent Meningococcal Disease, KAP
Surveys 2000 and 2003
Respondents were asked to what extent they agreed with the statement “Immunisation is a safe and effective way to prevent some important diseases”. The vast majority (90.2%) agreed with the statement, an improvement on the 2000 survey.
2000 2003Agree 80.5% 90.2%Somewhat agree 10.1% 4.6%Disagree 4.5% 3.8%Don't know 4.9% 1.5%
MidCentral Opinions on Immunisation to Prevent Disease, KAP Surveys 2000 and 2003

26
5. MIDCENTRAL DISTRICT ROAD TRAFFIC ISSUES
Key Points
• MidCentral district road traffic injury hospitalisation numbers have been falling. • MidCentral district hospitalisation rate for road traffic injuries from 1999 to 2003 is
similar to New Zealand’s rate. • Tararua and Horowhenua had higher than expected rates of road traffic injury
hospitalisations. • Tararua had much lower seatbelt wearing rates compared to the national average (81%
versus 94% respectively) • Land Transport Safety Authority’s main safety issues affecting the Manawatu-
Wanganui area were: negotiating intersections, loss of vehicle control, speed, and driver fatigue.
• Injuries and deaths due to alcohol affected driving is still an important road safety issue.
5.1 Road Traffic Issues Identified by the Land Transport Safety Authority
These notes were taken from the Land Transport Safety Authority’s Road Safety Issues documents for Manawatu-Wanganui Region, Palmerston North, Horowhenua, Manawatu, Tararua, and Kapiti Coast (whole district). These documents were issued in July 2004 and include road crash and injury data up to 2003. (Ref: Road Safety Issues–Manawatu Wanganui Region, Road Safety Issues–Palmerston North City, Road Safety Issues–Horowhenua District, Road Safety Issues–Manawatu District, Road Safety Issues–Tararua, Road Safety Issues–Kapiti Coast District. All July 2004. Land Transport Safety Authority, Wellington.) The New Zealand road safety issues highlighted by Land Transport Safety Authority were: excessive speed, alcohol, failure to give way, insufficient use of restraints.
5.1.1 Manawatu-Wanganui Region
This region includes the following territorial authorities: Palmerston North, Wanganui, Ruapehu, Rangitikei, Manawatu, Horowhenua, and Tararua. LTSA’s highlighted issues for the Manawatu-Wanganui region were: intersections, loss of control, speed, and fatigue. The number of people injured or killed on the road reduced from 2002 to 2003. Most road user casualties were either car drivers (48%) or car passengers (31%). Cyclist and motorcyclist injuries were above the national average for urban roads. However, there has been a downward trend for these accidents in the past 10 years. From 1999 to 2003, these two groups made up 13% of road casualties in the Manawatu-Wanganui region.
Manawatu-Wanganui Regional Council Area Road Casualties by User Type 1999 to 2003
0%
10%
20%
30%
40%
50%
60%
car d
river
s
car p
asse
ngers
cycli
sts
mot
orcy
clists
pede
stria
ns
heav
y veh
icles
Road user
Per
cen
tag
e

27
The most common type of crash on rural roads is the driver losing control of their vehicle; whereas the most common type of crash on urban roads is when negotiating intersections. Sixty nine percent of rural crashes involved loss of vehicle control. The main reasons for loss of control in 1999 to 2003 crashes were driving too fast for conditions, alcohol, and/or fatigue. Speed was a factor in 22% (348) or rural crashes and 12% (154) of urban injury crashes. These are around the national average. Speed is more likely to be a contributing factor for younger drivers than for older drivers. Poor driver skills, such as poor judgement, observation, or handling techniques were regularly recorded as contributing factors in injury crashes. Fatigue was a contributing factor for 14% of injury causing crashes from 1999 to 2003 (230 crashes). This percentage is higher than for similar regions or the national average. A higher percentage of drivers involved in injury crashes in 2003 held learner or restricted licences. Most of these issues also apply to the territorial authorities within the Manawatu-Wanganui Regional Council area. Any differences or issues given special emphasis are outlined for the territorial authorities below.
5.1.2 Palmerston North
Land Transport Safety Authority’s highlighted issues for Palmerston North were: intersections, loss of control, speed, cyclists and motorcyclists. Most of the issues seemed the same as for Manawatu-Wanganui.
5.1.3 Horowhenua
Major issues identified by Land Transport Safety Authority for Horowhenua District were: intersections, fatigue, loss of control, older road users. Drivers aged over 65 years are over represented in crashes in Horowhenua roads. Other similar issues to Manawatu-Wanganui: intersections, fatigue, loss of control. Speed and poor handling leading to loss of control were also problems.
5.1.4 Manawatu
Major issues identified by Land Transport Safety Authority for Manawatu District were: loss of control, intersections, and vulnerable road users. Over 90% of roads in the district are rural roads governed by speed limits greater than 70 km/hour. Manawatu is centrally located, so many of its roads form important linkage routes with other parts of the North Island. Also, local roads are also important for Manawatu’s agricultural and horticultural activities. The most common type of crash (based on 1999 to 2003 data) involved loss of control. Over 45% of all crashes were loss of control crashes. Ninety percent of “loss of control” injury crashes were on rural roads. From 1999 to 2003, 80% of Manawatu District injury crashes occurred on rural roads (with speed limits greater than 70 km/hour). A higher than expected proportion of injuries were to vulnerable road users–motorcyclists, cyclists, and pedestrians. Vulnerable road users have higher risk of injury. Forty seven percent of vulnerable road users experienced fatal or serious injury compared to 27% of other road users. Half of vulnerable road user injuries occurred in urban areas (less than 70 km/hour) and half in rural areas.

28
5.1.5 Tararua
Major issues identified by Land Transport Safety Authority for Tararua District were: intersections, loss of control, speed, and pedestrian and motorcyclists. Injury crashes at intersections increased from 2000 to 2003. For the previous 10 years, the percentage of urban injury crashes has been higher compared to similar authorities. They have been above the national average for the previous 10 years except for 2000. The number of rural loss of control crashes has been increasing since 2000, for example, 48 injury crashes in 2003 compared to 39 in 2002.
5.1.6 Kapiti Coast District
Land Transport Safety Authority highlighted issues for Kapiti Coast District were: older road users, crossing/turning and rear end/obstruction. Older road users, particularly drivers and pedestrians, are prominent in road casualty numbers. People over 50 years of age represented over 30% of Kapiti Coast’s road casualties from 1999 to 2003. This is greater than the New Zealand average or similar authorities. Older road users are more likely to be involved in rear end/obstruction crashes, crossing/turning crashes, and pedestrian crashes than younger road users. Most common type of crash from 1999 to 2003 was the rear end or obstruction crash–about 25% (or 86) of all injury causing crashes. This is higher than for similar authorities, for both urban and rural crashes. The main causes of these crashes are poor observation of traffic or following too closely. Cyclists were involved in 12% of these crashes and motorcyclists in 8%, as either the vehicle who struck the object, or object being struck. Crossing/turning accidents were the second most common cause of crash in the Kapiti Coast District. This type of crash also includes intersections. Sixty two percent of crossing/turning crashes occurred on the state highway network.
5.2 Seat Belt Wearing Rates Seat belt wearing counts have been carried out by the Land Transport Safety Authority since 1996. Over that time, the national front seatbelt wearing rate has increased from 86% in 1996 to 94% in 2004. Some gender patterns have been recognised for front seat belt wearing rates. Female front seat belt wearing rates tend to be higher than male. Although there was no difference in wearing rates between female driver and female passenger; male passengers have lower wearing rates than male drivers. The Land Transport Safety Authority expanded the number of sites surveyed in 2003 from 114 to 274. The increased sampling allows analysis by sub region, including territorial authority. According to these data, Tararua’s front seat belt percentage (81%) is much lower than the national average and other MidCentral district’s territorial authorities. This is shown in the table below. Manawatu’s front seat belt wearing rate is also slightly below the national rate.
Sample size
Percentage wearing belts
Palmerston North 1520 94%Horowhenua 1315 95%Manawatu 940 91%Tararua 1073 81%Kapiti (whole district) 1638 92%New Zealand 94%
Front Seat Belt Wearing Rates by Territorial Authority, 2004
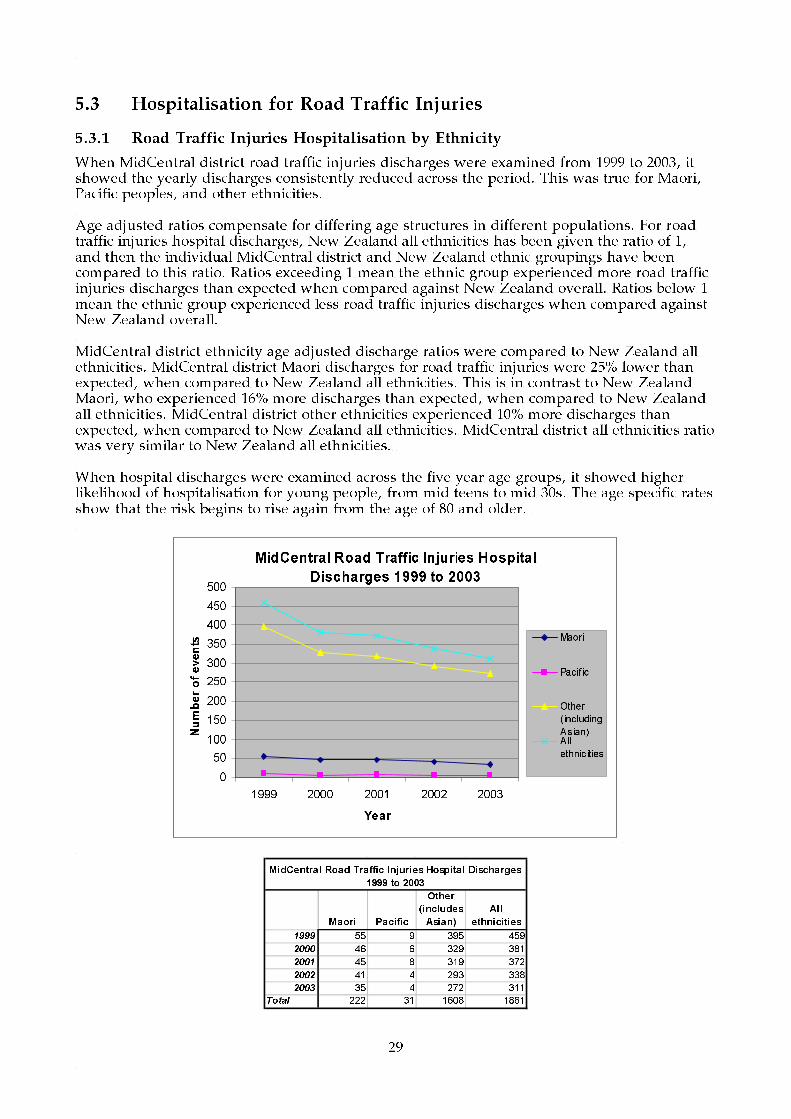
29
5.3 Hospitalisation for Road Traffic Injuries
5.3.1 Road Traffic Injuries Hospitalisation by Ethnicity
When MidCentral district road traffic injuries discharges were examined from 1999 to 2003, it showed the yearly discharges consistently reduced across the period. This was true for Maori, Pacific peoples, and other ethnicities. Age adjusted ratios compensate for differing age structures in different populations. For road traffic injuries hospital discharges, New Zealand all ethnicities has been given the ratio of 1, and then the individual MidCentral district and New Zealand ethnic groupings have been compared to this ratio. Ratios exceeding 1 mean the ethnic group experienced more road traffic injuries discharges than expected when compared against New Zealand overall. Ratios below 1 mean the ethnic group experienced less road traffic injuries discharges when compared against New Zealand overall. MidCentral district ethnicity age adjusted discharge ratios were compared to New Zealand all ethnicities. MidCentral district Maori discharges for road traffic injuries were 25% lower than expected, when compared to New Zealand all ethnicities. This is in contrast to New Zealand Maori, who experienced 16% more discharges than expected, when compared to New Zealand all ethnicities. MidCentral district other ethnicities experienced 10% more discharges than expected, when compared to New Zealand all ethnicities. MidCentral district all ethnicities ratio was very similar to New Zealand all ethnicities. When hospital discharges were examined across the five year age groups, it showed higher likelihood of hospitalisation for young people, from mid teens to mid 30s. The age specific rates show that the risk begins to rise again from the age of 80 and older.
MidCentral Road Traffic Injuries Hospital
Discharges 1999 to 2003
0
50
100
150
200
250
300
350
400
450
500
1999 2000 2001 2002 2003
Year
Number of events
Maori
Pacif ic
Other
(including
Asian)All
ethnicities
Maori Pacific
Other
(includes
Asian)
All
ethnicities
1999 55 9 395 459
2000 46 6 329 381
2001 45 8 319 372
2002 41 4 293 338
2003 35 4 272 311
Total 222 31 1608 1861
MidCentral Road Traffic Injuries Hospital Discharges
1999 to 2003

30
Ratio95%
conf.limits Ratio95%
conf.limits Ratio95%
conf.limits Ratio95%
conf.limits
MidCentral 0.75 0.65 - 0.85 0.8 0.52 - 1.09 1.1 1.05 - 1.15 1.03 0.99 - 1.08New Zealand 1.16 1.13 - 1.18 0.72 0.69 - 0.76 0.99 0.98 - 1 1
Other (includes Asian) All ethnicitiesMaori Pacific(New Zealand all ethnicities road traffic injuries hospital discharges 1999 to 2003 used as comparison)
MidCentral and NZ Road Traffic Injuries Indirect Age Adjusted Hospital Discharge Ratios 1999 to 2003
MidCentral All Ethnicities Road Traffic Injuries Hospital Discharges by Age Group 1999 to 2003
0
50
100
150
200
250
300
350
400
0001
-0405
-0910
-1415
-1920
-2425
-2930
-3435
-3940
-4445
-4950
-5455
-5960
-6465
-6970
-7475
-7980
-84
85+
Age group
Nu
mb
er o
f ev
ents
MidCentral All Ethnicities Road Traffic Injuries Hospital Discharge Age Specific Rates 1999 to
2003
0
500
1000
1500
2000
2500
3000
3500
0001
-0405
-0910
-1415
-1920
-2425
-2930
-3435
-3940
-4445
-4950
-5455
-5960
-6465
-6970
-7475
-7980
-84
85+
Age group
Ag
e sp
ecif
ic r
ate/
100,
000
peo
ple
5.3.2 Road Injuries Hospitalisation by Territorial Authority
Road traffic injuries discharges for 1999 to 2003 were also examined by territorial authority. This showed the number of discharges declined across the 1999 to 2003 period for most MidCentral district’s territorial authorities. Age adjusted ratios compensate for differing age structures in different populations. For road traffic injuries hospital discharges, MidCentral district overall has been given the ratio of 1, and then the individual territorial authorities have been compared to this ratio. Ratios exceeding 1 mean the territorial authority experienced more discharges than expected when compared against MidCentral district overall. Ratios below 1 mean the territorial authority experienced less road traffic injuries hospital discharges when compared against MidCentral district overall. Analysing the data in this way showed Tararua experienced 47% more hospitalisation for road traffic injuries than expected, when compared to MidCentral district overall. Tararua also had markedly lower front seat belt wearing rates than the national average for 2004–81% versus 94%.
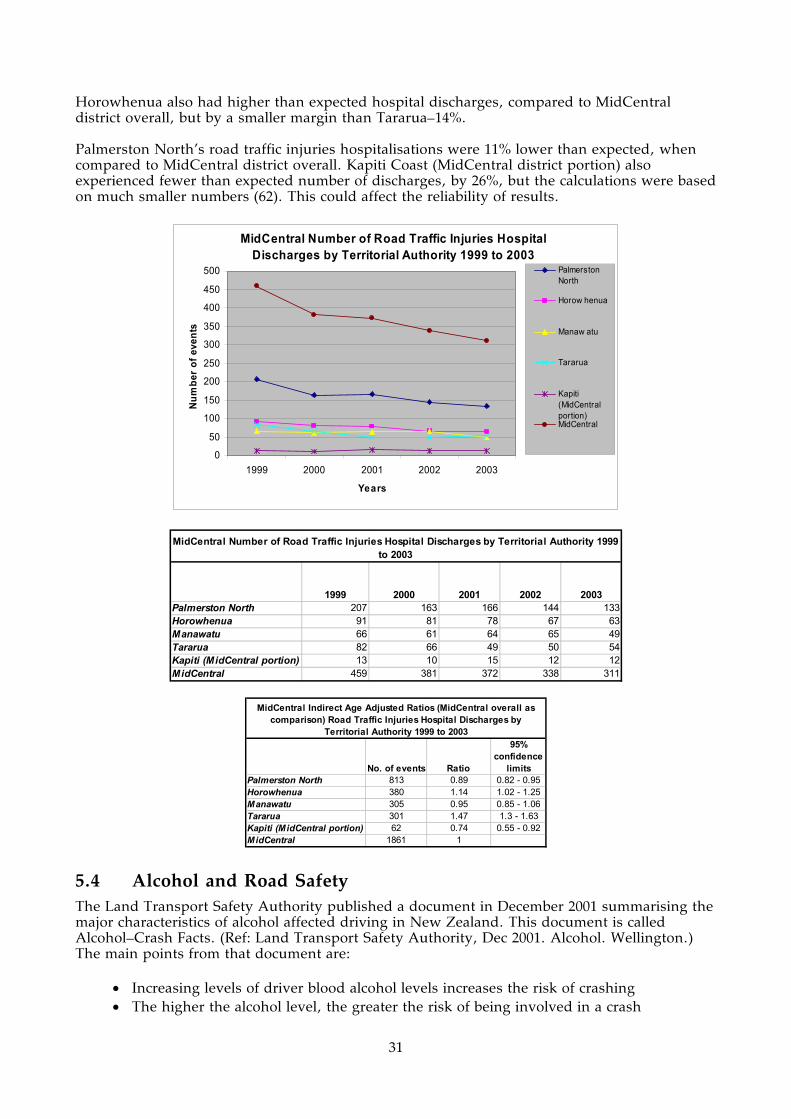
31
Horowhenua also had higher than expected hospital discharges, compared to MidCentral district overall, but by a smaller margin than Tararua–14%. Palmerston North’s road traffic injuries hospitalisations were 11% lower than expected, when compared to MidCentral district overall. Kapiti Coast (MidCentral district portion) also experienced fewer than expected number of discharges, by 26%, but the calculations were based on much smaller numbers (62). This could affect the reliability of results.
MidCentral Number of Road Traffic Injuries Hospital Discharges by Territorial Authority 1999 to 2003
0
50
100
150
200
250
300
350
400
450
500
1999 2000 2001 2002 2003
Years
Num
ber
of e
vent
s
PalmerstonNorth
Horow henua
Manaw atu
Tararua
Kapiti(MidCentralportion)MidCentral
1999 2000 2001 2002 2003Palmerston North 207 163 166 144 133Horowhenua 91 81 78 67 63Manawatu 66 61 64 65 49Tararua 82 66 49 50 54Kapiti (MidCentral portion) 13 10 15 12 12MidCentral 459 381 372 338 311
MidCentral Number of Road Traffic Injuries Hospital Discharges by Territorial Authority 1999 to 2003
No. of events Ratio
95% confidence
limitsPalmerston North 813 0.89 0.82 - 0.95Horowhenua 380 1.14 1.02 - 1.25Manawatu 305 0.95 0.85 - 1.06Tararua 301 1.47 1.3 - 1.63Kapiti (MidCentral portion) 62 0.74 0.55 - 0.92MidCentral 1861 1
MidCentral Indirect Age Adjusted Ratios (MidCentral overall as comparison) Road Traffic Injuries Hospital Discharges by
Territorial Authority 1999 to 2003
5.4 Alcohol and Road Safety The Land Transport Safety Authority published a document in December 2001 summarising the major characteristics of alcohol affected driving in New Zealand. This document is called Alcohol–Crash Facts. (Ref: Land Transport Safety Authority, Dec 2001. Alcohol. Wellington.) The main points from that document are:
• Increasing levels of driver blood alcohol levels increases the risk of crashing • The higher the alcohol level, the greater the risk of being involved in a crash

32
• From 1998 to 2000, alcohol was a factor in 25% of fatal crashes, 20% of serious injury crashes, and 13% of minor injury crashes
• The proportion of crashes where alcohol was a factor fell from the low forty percentages in the late 1980s/early 1990s to 26% in 2000
• From 1998 to 2000, 19% of car and van drivers, and 25% of motorcyclists involved in fatal crashes were affected by alcohol
• Most alcohol affected drivers in fatal crashes are young people, with the 20 to 24 age group the peak age group. Twenty five percent of drivers aged 20 to 24 in fatal crashes were affected by alcohol
• Most drivers (80%) involved in drink driving are male
• Disqualified (76%) and never licensed drivers (37%) are more likely to be involved in alcohol affected fatal crashes. This compares with 11% of fully licensed drivers
• Loss of control and head on are the most common types of crashes for alcohol affected drivers
• Fatal crashes with alcohol as a factor are more likely in the evenings and nights than daytime, especially on Friday and Saturday nights
• Drivers affected by alcohol are less likely to wear seat belts than sober drivers. For 1998 to 2000, 47% of alcohol affected car and van drivers were not wearing a seat belt compared to 16% of unaffected drivers.
Some MidCentral district alcohol affected road casualty (injury and death) data were obtained. From 1999 to 2003, alcohol influenced road casualty numbers remained reasonably stable, although Palmerston North experienced a steady decrease. Total road casualty numbers for Manawatu were similar to Palmerston North, despite the larger population of Palmerston North.
1999 2000 2001 2002 2003 Total
Horowhenua 15 18 29 9 14 85
Manawatu 25 24 24 22 27 122
Palmerston North 30 30 28 23 13 124
Tararua 12 15 15 7 16 65
Total 82 87 96 61 70 396
MidCentral Territorial Authorities Alcohol Influenced Road Traffic Casualties
1999 to 2003
MidCentral district alcohol influenced road casualties from 1998 to 2003 shows a similar pattern to national alcohol affected drivers in fatal crashes. Most road casualties were young people, especially male.
MidCentral Road Casualties with Alcohol as a Contributing Factor, by Age and Gender 1999 -
2003
0
5
10
15
20
25
30
35
40
45
50
05-09
10-14
15-19
20-24
25-29
30-34
35-39
40-44
45-49
50-54
55-59
60-64
80-84
Unknown
00-04
05-09
10-14
15-19
20-24
25-29
30-34
35-39
40-44
45-49
50-54
55-59
60-64
65-69
70-74
80-84
Unknown
Driver alcohol & speed Driver alcohol, not speed
Age Groups
Number of Casualties
Female
Male
Undefined

33
Most MidCentral district road casualties from alcohol affected crashes from 1999 to 2003 were either drivers or vehicle passengers.
MidCentral Road Casualties with Alcohol as a Contributing Factor, by Type of Road Users 1999 - 2003
0
10
20
30
40
50
60
70
80
90
100
Driver Passenger Pedes trian Cyclis t Driver Passenger Pedes trian
Driver alcohol & speed Driver alcohol, not speed
Type of Road Users
Num
ber o
f Cas
ualti
es
DeathsMinor InjuriesSerious Injuries
Most MidCentral district alcohol influenced road crashes which resulted in injury or death were from lost control or head on type crashes. This is the same as the national pattern described earlier. Crossing/turning type of crashes was also prominent in urban alcohol influenced crashes causing injury or death.
5.5 Excessive Vehicle Speed and Road Safety Driving too fast for the road conditions is now considered a major contributor to road crashes and associated deaths and injuries. Land Transport Safety Authority’s information on speed related crashes is reproduced here to help give context to previous mention of speed in the regional road safety issues. (Ref: www.ltsa.govt.nz/research/speed.html accessed 24 Feb 2005.)
MidCentral Road Casualties with Alcohol as a Contributing Factor, by Type of Crashes and Road 1999 - 2003
0
10
20
30
40
50
60
70
80
Ben
d-Lo
stco
ntro
l/Hea
d on
Cro
ssin
g/Tu
rnin
g
Mis
cella
neou
s
Ove
rtaki
ng
Pede
stria
n vs
Veh
icle
Rea
ren
d/ob
stru
ctio
n
Stra
ight
-Los
tco
ntro
l/Hea
d on
Ben
d-Lo
stco
ntro
l/Hea
d on
Cro
ssin
g/Tu
rnin
g
Mis
cella
neou
s
Ove
rtaki
ng
Pede
stria
n vs
Veh
icle
Rea
ren
d/ob
stru
ctio
n
Stra
ight
-Los
tco
ntro
l/Hea
d on
Driver alcohol & speed Driver alcohol, not speed
Type of Crashes
Num
ber o
f Cas
ualti
es
Open Road
Urban

34
The main points outlined by the Land Transport Safety Authority concerning speed and road safety were:
• Increasing vehicle speed increases the risk of a crash • Increasing vehicle speed increases the severity of any injuries suffered in a crash • Most speeding drivers are male (78% in 2003) • Speeding drivers put other people at risk of injury and death as well as themselves. In
2003, there were 166 speed related deaths. Ninety of these deaths were speeding drivers, 46 were their passengers, and 30 were other road users (such as other drivers and their passengers, other types of road users, and pedestrians)
• The risk of a pedestrian struck by a speeding vehicle dying increases as vehicle speed increases
• Although the number of deaths and injuries from excessive vehicle speed declined from 1980 to 2003, the percentage of all deaths and all injuries caused by excessive speed remained very similar. In 1980 there were 216 deaths caused by excessive vehicle speed, which was 36.1% of all road deaths. In 2003, there were 166 deaths from excessive speed, which was 36.0% of all road deaths. In 1980, there were 3,006 injuries caused by excessive vehicle speed, which is 18.9% of all road injuries. In 2003, there were 2,635 injuries, which was 18.3% of all road injuries.

35
6. NOTIFIABLE DISEASES
Key Points
• MidCentral district rates of cryptosporidiosis and measles were higher than the national rates (2001 to 2003 data).
• MidCentral district rates of campylobacteriosis, salmonellosis, giardiasis, pertussis (whooping cough), meningococcal disease, yersiniosis, lead absorption, tuberculosis, rheumatic fever, and hepatitis A were below national rates (2001 to 2003 data).
6.1 MidCentral District Overview MidCentral district and New Zealand notifiable diseases data for 2001 to 2003 were gathered and processed by Central Region Technical Advisory Services. ESR (Environmental Science and Research Ltd) was the source for these data. Notifiable disease data usually underestimate the true incidence of these diseases because of under reporting, under diagnosis, and affected people not attending health services. Age standardised rates, per 10,000 people, for the notifiable disease data were calculated. Age standardised rates are a form of age adjustment, calculating a disease rate that compensates for different age structures in different populations. The reason is because many diseases or disorders are more common in some age groups and less common in others. Age standardisation is done by applying the rates of disease per age group for the population of interest to an artificial population, in this case the World Health Organization (WHO) standard population. The overall rate from the WHO standard population is then used as the age standardised rate. When this is done for multiple populations of interest, the resulting rates can be compared against each other. This is to see which populations are more affected by the disease or disorder of interest, without different population age structures influencing the results. The age standardisation described here is also called direct age adjustment. This contrasts with another method of age adjustment/standardisation used in this document called indirect age adjustment. Also calculated were the 95% confidence limits for the age standardised rates. Confidence limits refer to the likelihood (in this case, 95% likelihood) that the true result in the population lies between the limit boundaries. The diseases where MidCentral district age standardised rates were significantly lower than the national rates were:
• Campylobacteriosis • Salmonellosis • Giardiasis • Pertussis (whooping cough) • Meningococcal disease • Yersiniosis • Lead absorption • Leptospirosis • Tuberculosis • Rheumatic fever • Hepatitis A.
The diseases where MidCentral district age standardised rates were significantly higher than
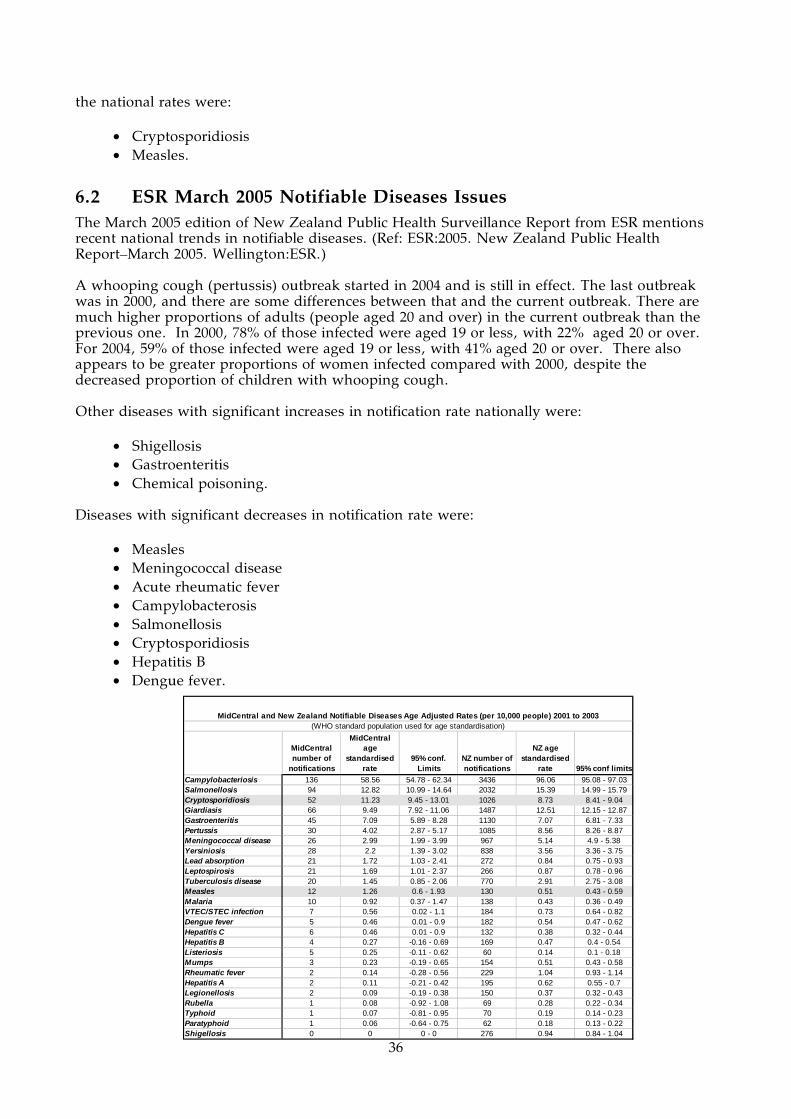
36
the national rates were:
• Cryptosporidiosis • Measles.
6.2 ESR March 2005 Notifiable Diseases Issues The March 2005 edition of New Zealand Public Health Surveillance Report from ESR mentions recent national trends in notifiable diseases. (Ref: ESR:2005. New Zealand Public Health Report–March 2005. Wellington:ESR.) A whooping cough (pertussis) outbreak started in 2004 and is still in effect. The last outbreak was in 2000, and there are some differences between that and the current outbreak. There are much higher proportions of adults (people aged 20 and over) in the current outbreak than the previous one. In 2000, 78% of those infected were aged 19 or less, with 22% aged 20 or over. For 2004, 59% of those infected were aged 19 or less, with 41% aged 20 or over. There also appears to be greater proportions of women infected compared with 2000, despite the decreased proportion of children with whooping cough. Other diseases with significant increases in notification rate nationally were:
• Shigellosis • Gastroenteritis • Chemical poisoning.
Diseases with significant decreases in notification rate were:
• Measles • Meningococcal disease • Acute rheumatic fever • Campylobacterosis • Salmonellosis • Cryptosporidiosis • Hepatitis B • Dengue fever.
MidCentral number of
notifications
MidCentral age
standardised rate
95% conf. Limits
NZ number of notifications
NZ age standardised
rate 95% conf limitsCampylobacteriosis 136 58.56 54.78 - 62.34 3436 96.06 95.08 - 97.03Salmonellosis 94 12.82 10.99 - 14.64 2032 15.39 14.99 - 15.79Cryptosporidiosis 52 11.23 9.45 - 13.01 1026 8.73 8.41 - 9.04Giardiasis 66 9.49 7.92 - 11.06 1487 12.51 12.15 - 12.87Gastroenteritis 45 7.09 5.89 - 8.28 1130 7.07 6.81 - 7.33Pertussis 30 4.02 2.87 - 5.17 1085 8.56 8.26 - 8.87Meningococcal disease 26 2.99 1.99 - 3.99 967 5.14 4.9 - 5.38Yersiniosis 28 2.2 1.39 - 3.02 838 3.56 3.36 - 3.75Lead absorption 21 1.72 1.03 - 2.41 272 0.84 0.75 - 0.93Leptospirosis 21 1.69 1.01 - 2.37 266 0.87 0.78 - 0.96Tuberculosis disease 20 1.45 0.85 - 2.06 770 2.91 2.75 - 3.08Measles 12 1.26 0.6 - 1.93 130 0.51 0.43 - 0.59Malaria 10 0.92 0.37 - 1.47 138 0.43 0.36 - 0.49VTEC/STEC infection 7 0.56 0.02 - 1.1 184 0.73 0.64 - 0.82Dengue fever 5 0.46 0.01 - 0.9 182 0.54 0.47 - 0.62Hepatitis C 6 0.46 0.01 - 0.9 132 0.38 0.32 - 0.44Hepatitis B 4 0.27 -0.16 - 0.69 169 0.47 0.4 - 0.54Listeriosis 5 0.25 -0.11 - 0.62 60 0.14 0.1 - 0.18Mumps 3 0.23 -0.19 - 0.65 154 0.51 0.43 - 0.58Rheumatic fever 2 0.14 -0.28 - 0.56 229 1.04 0.93 - 1.14Hepatitis A 2 0.11 -0.21 - 0.42 195 0.62 0.55 - 0.7Legionellosis 2 0.09 -0.19 - 0.38 150 0.37 0.32 - 0.43Rubella 1 0.08 -0.92 - 1.08 69 0.28 0.22 - 0.34Typhoid 1 0.07 -0.81 - 0.95 70 0.19 0.14 - 0.23Paratyphoid 1 0.06 -0.64 - 0.75 62 0.18 0.13 - 0.22Shigellosis 0 0 0 - 0 276 0.94 0.84 - 1.04
MidCentral and New Zealand Notifiable Diseases Age Adjusted Rates (per 10,000 people) 2001 to 2003(WHO standard population used for age standardisation)

37
6.3 Measles Notifications More detailed analysis of MidCentral district measles notification data for 2001 to 2003 was done. This showed most notifications occurred in 2003 and were for non Maori, non Pacific ethnicities. Analysis using indirect age adjusted ratios showed MidCentral district non Maori, non Pacific ethnicities measles notifications were 3.6 times greater than expected when compared to New Zealand all ethnicities. There was only one notification for a Maori patient and none for Pacific peoples. Indirect age adjusted ratios compensate for differing age structures in different populations. For measles notifications, New Zealand all ethnicities has been given the ratio of 1, and then the individual MidCentral district and New Zealand ethnic groupings have been compared to this ratio. Ratios exceeding 1 mean the ethnic group experienced more measles notifications than expected when compared against New Zealand overall. Ratios below 1 mean the ethnic group experienced less than expected measles notifications when compared against New Zealand overall. The graph of MidCentral district measles notifications by age group show most notifications were for children, although adults were not spared.
Ratio95%
conf.limits Ratio95%
conf.limits Ratio95%
conf.limits Ratio95%
conf.limits
MIdCentral 0.54 -0.51 - 1.58 0 - 3.68 1.93 - 5.43 2.67 1.44 - 3.91
New Zealand 0.39 0.2 - 0.58 0.4 0.08 - 0.72 1.31 1.1 - 1.52 1
Other (includes Asian) All ethnicitiesMaori Pacific(New Zealand all ethnicities measles notifications 2001 - 2003 used as comparison)
MidCentral and NZ Measles Indirect Age Adjusted Notification Ratios 2001 to 2003
MidCentral All Ethnicities Measles Notifications
by Age Group 2001 to 2003
0
1
2
3
4
5
6
7
8
0001
-0405
-0910
-1415
-1920
-2425
-2930
-3435
-3940
-4445
-4950
-5455
-5960
-6465
-69
70+
Unknown
Age group
Nu
mb
er o
f p
eop
le
Maori Pacific
Other (includes
Asian)All
ethnicities2001 1 0 1 22002 0 0 0 02003 0 0 16 16
Total 1 0 17 18
MidCentral Measles Notifications 2001 to 2003
Maori Pacific
Other (includes
Asian)All
ethnicities2001 7 1 74 822002 2 1 18 212003 7 4 56 67
Total 16 6 148 170
New Zealand Measles Notifications 2001 to 2003

38
6.4 Cryptosporidium More detailed analysis of MidCentral district cryptosporidium notification data for 2001 to 2003 was done. This showed most notifications were for non Maori, non Pacific ethnicities. Cryptosporidiosis is a digestive system infection caused by the protozoa cryptosporidium. It causes watery diarrhoea, which is usually self limiting for fit, healthy people. However, it can persist in people who are unwell, especially people with impaired immune systems. The disease is usually transmitted by consuming contaminated water or food. Analysis using indirect age adjusted ratios showed MidCentral district non Maori, non Pacific ethnicities cryptosporidiosis notifications were 45% higher than expected when compared to New Zealand all ethnicities. There were only seven notifications for MidCentral district Maori and none for the district’s Pacific peoples. Indirect age adjusted ratios compensate for differing age structures in different populations. For cryptosporidiosis notifications, New Zealand all ethnicities has been given the ratio of 1, and then the individual MidCentral district and New Zealand ethnic groupings have been compared to this ratio. Ratios exceeding 1 mean the ethnic group experienced more cryptosporidiosis notifications than expected when compared against New Zealand overall. Ratios below 1 mean the ethnic group experienced less than expected cryptosporidiosis notifications when compared against New Zealand overall. Graphing MidCentral district cryptosporidiosis notifications across five year age bands show babies and young children were at highest risk. Disease rates then decline with increasing age.
Ratio95%
conf.limits Ratio95%
conf.limits Ratio95%
conf.limits Ratio95%
conf.limits
MIdCentral 0.77 0.2 - 1.35 0 - 1.45 1.02 - 1.87 1.26 0.92 - 1.6
New Zealand 0.67 0.56 - 0.79 0.33 0.2 - 0.46 1.16 1.08 - 1.23 1
Other (includes Asian) All ethnicitiesMaori Pacific(New Zealand all ethnicities cryptosporidium notifications 2001 - 2003 used as comparison)
MidCentral and NZ Cryptosporidium Indirect Age Adjusted Notification Ratios 2001 to 2003
Maori Pacific
Other (includes
Asian)All
ethnicities2001 1 0 16 172002 3 0 16 192003 3 0 13 16
Total 7 0 45 52
MidCentral Cryptosporidium Notifications 2001 to 2003
Maori Pacific
Other (includes
Asian)All
ethnicities2001 57 12 305 3742002 36 5 304 3452003 42 8 257 307
Total 135 25 866 1026
New Zealand Cryptosporidium Notifications 2001 to 2003
MidCentral All Ethnicities Cryptosporidium Notifications by Age Group 2001 to 2003
0123456789
10
0001
-0405
-0910
-1415
-1920
-2425
-2930
-3435
-3940
-4445
-4950
-5455
-5960
-6465
-69
70+
Unknown
Age group
Nu
mb
er o
f p
eop
le

39
MidCentral All Ethnicities Cryptosporidium Notifications Age Specific Rates 2001 to 2003
0
50
100
150
200
250
0001
-0405
-0910
-1415
-1920
-2425
-2930
-3435
-3940
-4445
-4950
-5455
-5960
-6465
-69
70+
Age group
Ag
e sp
ecif
ic r
ate/
100,
000
peo
ple

40
7. ENVIRONMENT AS AN INFLUENCE ON HEALTH
Key Points
• Enteric diseases are the most commonly notified cause of morbidity in humans. • The standard of drinking water in rural areas has been a concern. • The Manawatu and Rangitikei Rivers have been found to be the principal sources of
pollution for shellfish water. • Palmerston North City Council is currently upgrading its sewerage system. • MidCentral Health’s Public Health Unit has responded to six white powder incidents
over the past three years. • The two international airports in MidCentral district can be potential points of entry for
unwanted organisms from overseas. The airports are Palmerston North International Airport and Ohakea.
Enteric diseases are the most commonly notified cause of morbidity in human. Enteric diseases sources are combined food, contaminated water, and poor hygiene. Significant food safety issues for MidCentral district include a low uptake of food programmes, and food producers relying on inspections rather that building safety into production at every step. Several outbreaks of enteric disease have been linked to local food premises. The standard of drinking water is generally a concern in the rural district health board areas. The Drinking Water Standards for New Zealand, 2000, lists two Priority 1 determinants, namely E.coli and protozoa (giardia and cryptosporidium). These pose the greatest biological risk to human health. Levin (Horowhenua District Council) has implemented a boil water notice protocol in response elevated turbidity, an indicator of potential contamination by giardia and cryptosporidium. Over 2003 and 2004, monitoring of 10 water supplies in MidCentral district has reported E.coli transgressions. These water supplies include Norsewood, Cheltenham, Kimbolton, Woodville, Shannon and Oroua No.l. In addition, a number of water supplies have been severely affected by the February 2004 floods. The Waituna West, Oroua No.l, and Kiwitea (Cheltenham/Kimbolton) are subject to permanent boil water notices. Information on shellfish water quality comes from a pollution source survey (1995) which indicated that principal sources of pollution were indirect, reaching the coast by way of the Manawatu and Rangitikei Rivers. Water quality and flesh quality of microbiological shellfish were highly correlated to the average flow rates of the Manawatu River. Paralytic shellfish poison (PSP) was first detected at Himatangi Beach in a sample collected in August 2000. This result was above the national level for warning against the collection of shellfish. PSP was then detected at Hokio Beach in a sample collected in September 2000. Results from a sample of tuatua from Hokio Beach collected in November 2000 detected the highest concentration of PSP in tuatua ever seen in New Zealand (although other species accumulated toxin to a higher level). On 14 May 2001 the coastline was reopened for shellfish collection. The Awapuni Landfill in Palmerston North has a short lifespan and there is no alternative site owned by the Palmerston North City Council. There are nine gasworks sites in MidCentral district, and all are regarded as contaminated sites. However, none of these sites pose an immediate risk to human health, as they are covered and in most cases used for commercial or industrial activities. The direct exposure to contaminants from these sites is minimal. The response to white powder incidents has occurred following terrorism using Anthrax spores in the United States, and the deliberate threats and posting of Cyanide crystals in New Zealand. The following hazardous substance incidents have resulted in a Public Health response over the last three years:
• August 2004: White powder incident, Levin • June 2004: Small quantities of substances spilled in a chemical store, Palmerston North

41
• November 2003: Derailment of a train carrying some hazardous substances, Shannon • April 2003: White powder incident, Palmerston North • April 2003: White powder incident, Massey University • March 2003: White powder incident following cyanide threats, Palmerston North.
Palmerston North city has completed stage 1 of the Waste Water 2006 Project. Palmerston North continues to upgrade its sewage treatment system to meet the regional plan. The Public Health Service is represented on the Community Monitoring Group established as a condition of the resource consent. There are human effluent discharges into rivers in the area. Some communicable diseases are notifiable (meaning that diagnosed cases must be reported to the Medical Officer of Health). However, numbers are generally considered to be underestimated because of under reporting, under diagnosis and the fact that many people with some of these diseases never access health services, either because of barriers to access or a lack of serious symptoms. In MidCentral district, there has tended to be a lower overall notification rate for all main notifiable diseases compared with the national rates. There was also a high incidence of malaria during 2000, after 60 military personnel contracted the disease while stationed in East Timor. The hospitalisation rate in MidCentral district for vaccine preventable diseases has been lower than average. The following is a list of outbreaks reported to the Medical Officer of Health in recent years:
Disease Number of Notified Cases
Setting
January 2005 Campylobacteriosis 11 Restaurant October 2004 Gastroenteritis 20 Rest Home June 2004 Gastroenteritis (Norovirus) 58 Hospital June 2004 Gastroenteritis (Nororvirus) 25 Rest Home November 2003 Gastroenteritis 40 Rest Home June 2002 Gastroenteritis 30 Rest Home October 2001 Gastroenteritis (Rotavirus) 19 Early Childhood Centre January 2001 Gastroenteritis 35 Rest Home April/May 2000 Salmonellosis 23 Bakery September 1999 Salmonellosis 24 Bakery
The two international airports within MidCentral district are Palmerston North International Airport and Ohakea Airport, and it is currently proposed that Palmerston North become a transport hub, for the unloading of large amounts of cargo. These factors mean that there is always the possibility of interceptions and incursions of unwanted organisms. Recently, for example, an exotic mosquito was identified at Porangahau, just north of MidCentral district.

42
8. MENINGOCOCCAL DISEASE
Key Points
• MidCentral district notification numbers for meningococcal disease declined from 2001 to 2003.
• There are disproportionately high numbers of Maori among meningococcal disease notifications.
• Most people affected with meningococcal diseases are less than 20 years old, with the majority under 5 years old.
• There is a meningococcal disease immunisation campaign currently under way in MidCentral district.
Meningococcal disease is an infection with the bacteria Neisseria meningitides. The bacteria usually cause either meningitis (infection of the lining of the brain and spinal chord) or septicaemia (infection spread throughout the blood system). There has been an epidemic of the B strain of meningococcal disease in New Zealand since 1991. A national B strain vaccination programme for people under 20 years old is currently under way in MidCentral district. A report analysing New Zealand’s meningococcal notifications for 2003 was published in 2004. (Ref: Martin D, McDowell R. 2004. The Epidemiology of Meningococcal Disease in New Zealand in 2003. ESR, Wellington, New Zealand.) Some important points from this report are:
• A total of 541 cases of meningococcal disease were notified in 2003 • The highest number of cases were in the upper North Island, especially Auckland • The age groups most affected were children less than 5 years old, and especially babies
less than one year old • Pacific peoples meningococcal disease rates were 3.8 times higher than European rates • Maori meningococcal disease rates were 2.2 times higher than European rates • There is an association between socioeconomic deprivation and the risk of
meningococcal disease in children under 5 years • There is no sign the epidemic is ending, although yearly numbers of cases have been
declining since a peak year in 2001. There were 650 cases in 2001, 557 cases in 2002, and 541 cases in 2003. There was a prior peak in 1997 (613 cases).
MidCentral district notifications for meningococcal disease from 2001 to 2003 showed disproportionately high numbers of Maori people affected. The numbers of MidCentral district people with meningococcal disease declined from 2001 to 2003. Analysing notifications by age group shows most people affected were under 20 years old, with the majority under 5 years of age.
Maori PacificOther
ethnicitiesAll
ethnicities2001 12 0 7 192002 5 1 5 112003 4 1 4 9
MidCentral Yearly Meningococcal Disease Notifications 2001 to 2003
Maori PacificOther
ethnicitiesAll
ethnicitiesMidCentral 21 2 16 39New Zealand 545 355 845 1745
MidCentral and New Zealand Meningococcal Disease Notifications 2001 to 2003

43
MidCentral Meningococcal Disease Notifications by Ethnicity 2001 to 2003
0
2
4
6
8
10
12
<1
1 to
4
5 to
9
10 to
14
15 to
19
20 to
24
25 to
29
30 to
34
35 to
39
40 to
44
45 to
49
50 to
54
55 to
59
60 to
64
65 to
69
70+
Age group
Nu
mb
er o
f n
oti
fica
tio
ns Maori
Other
PacificPeoples
MidCentral Other Ethnicities (includes Asian) Meningococcal Disease Notifications Age
Specific Rates 2001 to 2003
0
50
100
150
200
250
0001
-0405
-0910
-1415
-1920
-2425
-2930
-3435
-3940
-4445
-4950
-5455
-5960
-6465
-69
70+
Age group
Ag
e sp
ecif
ic r
ate/
100,
000
peo
ple
MidCentral Maori Meningococcal Disease Notifications Age Specific Rates 2001 to 2003
0
200
400
600
800
1000
1200
0001
-0405
-0910
-1415
-1920
-2425
-2930
-3435
-3940
-4445
-4950
-5455
-5960
-6465
-69
70+
Unknown
Age group
Ag
e sp
ecif
ic r
ate/
100,
000
peo
ple

44
9. SUICIDE
Key Points
• Although national suicide rates from 1998 to 2002 have declined, New Zealand’s suicide rate in 2002 was sixth highest among OECD countries supplying comparable data.
• MidCentral district suicide rate is similar to the national average (1997 to 2001 data). • MidCentral district suicide numbers declined from 1997 to 2001.
Suicide, particularly youth suicide, is a growing issue internationally. (Ref: World Health Organization. The World Report 2001: Mental Health: New Hope, New Understanding. WHO, Geneva, 2001.) New Zealand’s suicide rate has been increasing for the past 20 years, particularly among youth and males. Its youth suicide rates have been among the highest in the world. (Ref: Ministry of Health. 2001. Suicide Prevention DHB Toolkit. Ministry of Health, Wellington.) A Ministry of Health report describing provisional 2002 suicide data was released in April 2005. (Ref: Ministry of Health. 2005. Suicide Facts: Provisional 2002 All Ages Statistics. Ministry of Health, Wellington.) The main points from this report are:
• New Zealand’s 2002 suicide rates were the sixth highest among OECD countries supplying comparable 2002 suicide data
• Suicide mortality rate has reduced by 25% since a peak year of 1998 • Males continue to have higher suicide rates than female (3.2 male suicides to every
female suicide per 100,000 population) • Maori suicide rates are higher than non Maori • The age groups with the highest suicide rate were 20 to 29 years old • For males, the age groups with the highest suicide rates were 25 to 44 years old; for
females 15 to 24 years old. When suicide mortality data for 1997 to 2001 were examined, MidCentral district all ethnicities suicide deaths were similar to the number expected when compared to New Zealand all ethnicities. Examination of suicide mortality by age group showed most deaths occurred from late teens to early middle age. This pattern was true for Maori as well. The small absolute numbers of suicide deaths made it difficult to calculate statistically stable measures, limiting analysis and interpretation. It is difficult to tell whether suicide numbers are declining across the five year period because of small numbers. Age adjusted ratios compensate for differing age structures in different populations. For suicide mortality, New Zealand all ethnicities has been given the ratio of 1, and then the individual MidCentral district and New Zealand ethnic groups have been compared to this ratio. Ratios exceeding 1 mean the ethnic group experienced more suicide deaths than expected when compared against New Zealand overall. Ratios below 1 mean the ethnic group experienced less suicide deaths when compared against New Zealand overall. The age adjusted ratios for suicide mortality 1997 to 2001 showed New Zealand Maori suicide deaths were 31% higher than expected when compared to New Zealand all ethnicities. MidCentral district Maori did not follow the same pattern, with 21% fewer than expected deaths compared to New Zealand all ethnicities. However, this result is not statistically significant due to small numbers in the analysis. MidCentral district other ethnicities and all ethnicities had a similar number of deaths to that expected when compared to New Zealand all ethnicities (age adjusted ratios of 1 and 0.96 respectively).

45
Maori Pacific
Other (includes
Asian)All
ethnicities1997 4 0 16 201998 2 0 26 281999 2 0 27 292000 3 0 11 142001 2 1 18 21
Total 13 1 98 112
MidCentral Suicide Mortality 1997 to 2001
Ratio95%
conf.limits Ratio95%
conf.limits Ratio95%
conf.limits Ratio95%
conf.limits
MidCentral 0.79 0.36 - 1.22 0.46 - 1 0.81 - 1.2 0.96 0.78 - 1.14New Zealand 1.31 1.2 - 1.43 0.66 0.53 - 0.8 0.97 0.93 - 1.01 1
MidCentral and NZ Suicide Indirect Age Adjusted Mortality Ratios 1997 to 2001
All ethnicitiesMaori Pacific People(New Zealand all ethnicities suicide mortality 1997 to 2001 used as comparison)
Other (includes Asian)
MidCentral All Ethnicities Suicide Mortality by Age Group 1997 to 2001
02468
101214161820
0001
-0405
-0910
-1415
-1920
-2425
-2930
-3435
-3940
-4445
-4950
-5455
-5960
-6465
-6970
-7475
-7980
-84
85+
Age group
Nu
mb
er o
f ev
ents
MidCentral Maori Suicide Mortality by Age Group 1997 to 2001
0
1
2
3
4
5
6
0001
-0405
-0910
-1415
-1920
-2425
-2930
-3435
-3940
-4445
-4950
-5455
-5960
-6465
-6970
-7475
-7980
-84
85+
Age group
Nu
mb
er o
f ev
ents

46
10. REPRODUCTIVE HEALTH
Key Points
• The overall MidCentral district average annual fertility rate for 2000 to 2002 was slightly below New Zealand’s rate.
• Maori and Pacific peoples average annual fertility rate was over twice that for non Maori, non Pacific ethnicities (2000 to 2002 data).
• Tararua, Kapiti Coast (MidCentral district portion), and Horowhenua had higher average annual fertility rates than MidCentral district overall.
• MidCentral district teenage pregnancy rate is similar to New Zealand’s rate. • MidCentral district Maori had higher teenage pregnancy rates than non Maori, non
Pacific ethnicities. • Horowhenua, Tararua, and Kapiti Coast (MidCentral district portion) had higher
teenage pregnancy rates than MidCentral overall. • MidCentral district caesarean birth rate was slightly below New Zealand’s. • Non Maori, non Pacific ethnicities have higher caesarean birth rates than Maori or
Pacific peoples. • MidCentral district non Maori, non Pacific ethnicities pregnancy complication
hospitalisation rates were slightly higher than New Zealand non Maori, non Pacific rates.
• MidCentral district Maori and Pacific peoples had lower pregnancy complication rates than corresponding New Zealand ethnicities.
• The average ratio of birthing complication hospitalisations to live births was lower for MidCentral district Maori, Pacific peoples, and other ethnicities than for corresponding New Zealand ethnic groups.
• Non Maori, non Pacific ethnicities birthing complication hospitalisation ratios were higher than Maori or Pacific peoples ratios.
10.1 Birth Rates MidCentral district birth data from 2000 to 2002 were analysed using fertility rates. Fertility rates are the number of births divided by the number of women aged from 15 to 44. They are expressed here as annual fertility rates, averaged out for the three year period. Ethnicity for birth data in this chapter refer to ethnicity of the baby. These data showed Maori and Pacific peoples had over double the average annual fertility rates than non Maori, non Pacific ethnicities from 2000 to 2002 (119.8 and 116.6 births per 1,000 women aged 15 to 44 respectively versus 50.4 births per 1,000 women aged 15 to 44 for non Maori, non Pacific ethnicities). The overall MidCentral district average annual fertility rate was slightly below New Zealand’s (63.5 versus 66.9 births per 1,000 women aged 15 to 44). Using the same birth data to analyse fertility by territorial authority showed Tararua, Kapiti Coast (MidCentral district portion), and Horowhenua had higher annual fertility rates than MidCentral district overall.
Maori Pacific Other MidCentral New ZealandNumber of births 2037 254 4120 6411 166425
Average annual fertility rate/1,000 women aged 15 - 44 119.8 116.6 50.4 63.5 66.9
MidCentral Fertility Rate by Ethnicity 2000 to 2002
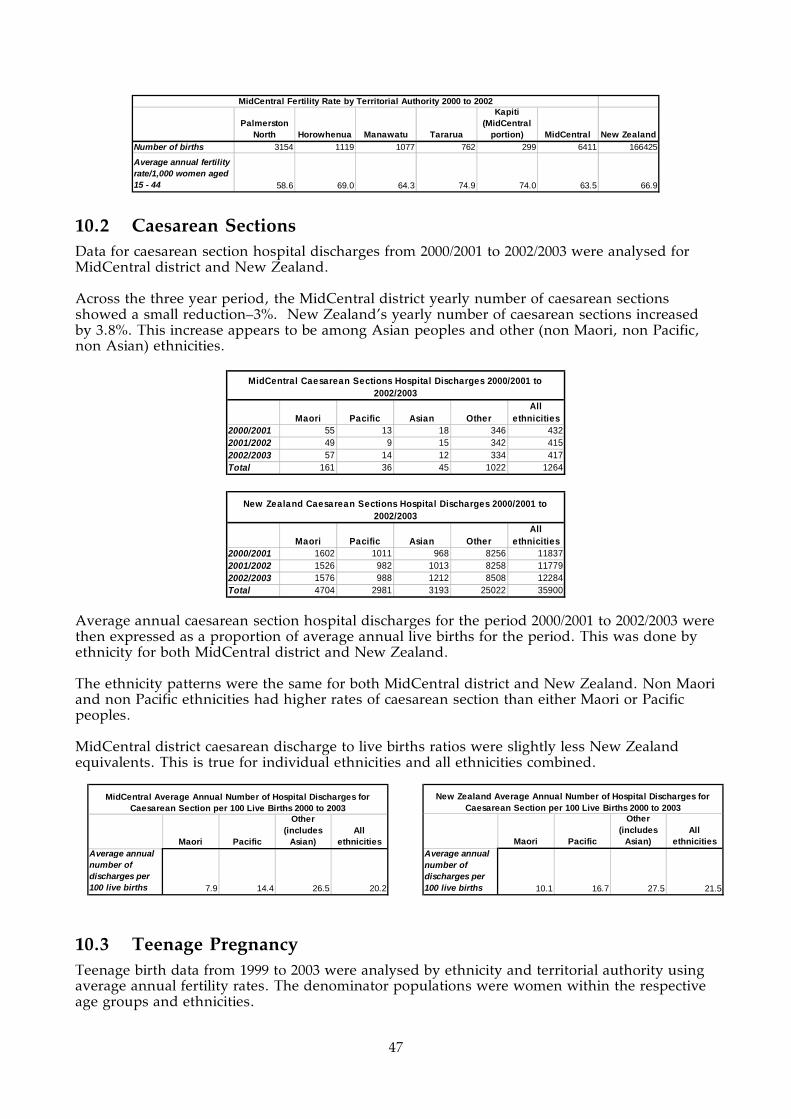
47
Palmerston North Horowhenua Manawatu Tararua
Kapiti (MidCentral
portion) MidCentral New ZealandNumber of births 3154 1119 1077 762 299 6411 166425
Average annual fertility rate/1,000 women aged 15 - 44 58.6 69.0 64.3 74.9 74.0 63.5 66.9
MidCentral Fertility Rate by Territorial Authority 2000 to 2002
10.2 Caesarean Sections Data for caesarean section hospital discharges from 2000/2001 to 2002/2003 were analysed for MidCentral district and New Zealand. Across the three year period, the MidCentral district yearly number of caesarean sections showed a small reduction–3%. New Zealand’s yearly number of caesarean sections increased by 3.8%. This increase appears to be among Asian peoples and other (non Maori, non Pacific, non Asian) ethnicities.
Maori Pacific Asian OtherAll
ethnicities2000/2001 55 13 18 346 4322001/2002 49 9 15 342 4152002/2003 57 14 12 334 417Total 161 36 45 1022 1264
MidCentral Caesarean Sections Hospital Discharges 2000/2001 to 2002/2003
Maori Pacific Asian OtherAll
ethnicities2000/2001 1602 1011 968 8256 118372001/2002 1526 982 1013 8258 117792002/2003 1576 988 1212 8508 12284Total 4704 2981 3193 25022 35900
New Zealand Caesarean Sections Hospital Discharges 2000/2001 to 2002/2003
Average annual caesarean section hospital discharges for the period 2000/2001 to 2002/2003 were then expressed as a proportion of average annual live births for the period. This was done by ethnicity for both MidCentral district and New Zealand. The ethnicity patterns were the same for both MidCentral district and New Zealand. Non Maori and non Pacific ethnicities had higher rates of caesarean section than either Maori or Pacific peoples. MidCentral district caesarean discharge to live births ratios were slightly less New Zealand equivalents. This is true for individual ethnicities and all ethnicities combined.
10.3 Teenage Pregnancy Teenage birth data from 1999 to 2003 were analysed by ethnicity and territorial authority using average annual fertility rates. The denominator populations were women within the respective age groups and ethnicities.
Maori Pacific
Other (includes
Asian)All
ethnicitiesAverage annual number of discharges per 100 live births 7.9 14.4 26.5 20.2
MidCentral Average Annual Number of Hospital Discharges for Caesarean Section per 100 Live Births 2000 to 2003
Maori Pacific
Other (includes
Asian)All
ethnicitiesAverage annual number of discharges per 100 live births 10.1 16.7 27.5 21.5
New Zealand Average Annual Number of Hospital Discharges for Caesarean Section per 100 Live Births 2000 to 2003

48
MidCentral district all ethnicities teenage average annual fertility rate was similar to the corresponding national fertility rate (30.9 births per 1,000 teenaged women versus 29.0 births per 1,000 teenaged women). Both MidCentral district and New Zealand Maori had higher teenage average annual fertility rates than non Maori ethnicities. MidCentral district Maori teenage rate was slightly below the national Maori teenage rate (87.9 births per 1,000 teenaged Maori women versus 90.0 births per 1,000 teenaged Maori women). However, Horowhenua and Tararua Maori teenage fertility rates were much higher, 107.7 births per 1,000 teenaged Maori women and 98.7 births per 1,000 teenaged Maori women respectively. New Zealand and MidCentral district Pacific peoples teenage average annual fertility rates were higher than those for non Maori, non Pacific ethnicities. MidCentral district Pacific peoples teenage average annual fertility rate was higher than for New Zealand Pacific peoples. However, this is based on relatively low number of births, which affects the reliability of any rates, especially the territorial authority ones. The teenage average annual fertility rates for non Maori, non Pacific ethnicities were higher in Horowhenua (22.2 births per 1,000 teenage women), Manawatu (20.2 births per 1,000 teenage women), and Tararua (22.4 births per 1,000 teenage women) territorial authorities. The teenage average annual fertility rate for MidCentral district non Maori, non Pacific ethnicities was 14.9 births per 1,000 non Maori, non Pacific teenage women.
TotalAged 15-19 Aged 20-44 Aged 15-19 Aged 20-44 Aged 15-19 Aged 20-44 Aged 15-19 Aged 20-44 Aged 15-44
Palmerston North 84.7 135.9 36.8 125.7 10.7 53.3 23.2 66.0 58.1Horowhenua 107.7 124.7 133.3 174.2 22.2 55.6 52.0 74.6 71.0Manawatu 69.3 128.2 44.4 193.3 20.2 60.8 29.2 70.0 63.7Tararua 98.7 124.7 50.0 66.7 22.4 67.3 44.3 79.0 73.5Kapiti (MidCentral portion) 56.8 120.1 166.7 106.7 19.3 56.6 38.8 78.0 72.2MidCentral 87.9 129.6 57.0 136.5 14.9 56.5 30.9 69.9 63.2New Zealand 90.0 131.0 49.5 135.9 11.3 59.8 29.0 74.6 67.5
MidCentral and New Zealand Average Annual Fertility Rates/1,000 Age Group Women by Ethnicity and Territorial Authority, 1999 to 2003Maori Pacific Other All ethnicities
10.4 Pregnancy Complications The number of yearly hospital discharges for complications of pregnancy declined over the three year period from 2000/2001 to 2002/2003. MidCentral district number of discharges fell by 13% and the New Zealand number reduced by 3%. It should be mentioned that the data here refer to the number of hospital discharges and not counts of individual women. The same woman hospitalised multiple times counts as multiple discharges. Also, there is an increasing tendency for women with pregnancy complications to be managed without hospitalisation (Dr Ken Clark, personal communication).
Maori Pacific Asian OtherAll
ethnicities2000/2001 205 50 32 1094 13812001/2002 215 44 43 991 12932002/2003 199 36 40 923 1198Total 619 130 115 3008 3872
MidCentral Pregnancy Complication Hospital Discharges 2000/2001 to 2002/2003
Maori Pacific Asian OtherAll
ethnicities2000/2001 7058 3877 2434 23384 367532001/2002 7024 3942 2585 22130 356812002/2003 6995 3995 2993 21398 35381Total 21077 11814 8012 66912 107815
New Zealand Pregnancy Complication Hospital Discharges 2000/2001 to 2002/2003

49
Average annual pregnancy complications hospital discharges for the period 2000/2001 to 2002/2003 were then expressed as a proportion of average annual live births for the period. This was done by ethnicity for both MidCentral district and New Zealand. Live births are birth registrations, both hospital and non hospital births. The ethnicity differences were similar for both MidCentral district and New Zealand. Non Maori, non Pacific ethnicities had higher ratios of pregnancy complication discharges, than either Pacific peoples, or Maori. MidCentral district non Maori, non Pacific ethnicities had slightly higher ratio than New Zealand non Maori, non Pacific ethnicities (77.4 average annual discharges per 100 live births for the district versus 73.1 average annual discharges per 100 live births for New Zealand). MidCentral district ratios for Maori, Pacific peoples, and combined ethnicities were lower than New Zealand equivalent ratios.
When MidCentral district 2000/2001 to 2002/2003 hospital discharges for pregnancy complications were divided by territorial authority, the number of discharges fell across all the territorial authorities across the three year period.
2000/2001 2001/2002 2002/2003Palmerston North 725 680 660Horowhenua 215 214 176Manawatu 176 174 169Tararua 221 186 165Kapiti (MidCentral portion) 44 39 28MidCentral 1381 1293 1198
MidCentral Number of Pregnancy Complication Hospital Discharges by Territorial Authority 2000/2001 to 2002/2003
10.5 Complications of Labour and Delivery The number of yearly hospital discharges for birthing complications (complications of labour and delivery) declined for MidCentral district over the three year period from 2000/2001 to 2002/2003. MidCentral district number of discharges fell by 10.4% and the New Zealand number increased by 1.4%. MidCentral district Maori yearly number of birthing complications hospitalisations were about the same. MidCentral district Pacific peoples and Asian peoples yearly hospitalisations rose, although the absolute numbers were small. Yearly hospitalisations for MidCentral district other ethnicities (non Maori, non Pacific, non Asian) reduced by 14.9% from 2000/2001 to 2002/2003. It should be mentioned that the data here refer to the number of hospital discharges and not counts of individual women. The same woman hospitalised multiple times counts as multiple discharges. Also, there is an increasing tendency for women with birthing complications to be managed without hospitalisation (Dr Ken Clark, personal communication).
Maori Pacific
Other (includes
Asian)All
ethnicitiesAverage annual number of discharges per 100 live births 30.2 52.1 77.4 61.9
MidCentral Average Annual Number of Hospital Discharges for Pregnancy Complications per 100 Live Births 2000 to 2003
Maori Pacific
Other (includes
Asian)All
ethnicitiesAverage annual number of discharges per 100 live births 45.2 66.3 73.1 64.6
New Zealand Average Annual Number of Hospital Discharges for Pregnancy Complications per 100 Live Births 2000 to 2003
Maori Pacific Asian OtherAll
ethnicities2000/2001 128 21 25 680 8542001/2002 112 23 33 568 7362002/2003 128 25 33 579 765Total 368 69 91 1827 2355
MidCentral Birthing Complication Hospital Discharges 2000/2001 to 2002/2003
Maori Pacific Asian OtherAll
ethnicities2000/2001 4471 2709 2168 17108 264562001/2002 4168 2744 2208 16380 255002002/2003 4452 2982 2890 16493 26817Total 13091 8435 7266 49981 78773
New Zealand Birthing Complication Hospital Discharges 2000/2001 to 2002/2003

50
Average annual hospital discharges for birthing complications for the period 2000/2001 to 2002/2003 were then expressed as a proportion of average annual live births for the period. This was done by ethnicity for both MidCentral district and New Zealand. Live births are birth registrations, both hospital and non hospital births. The ethnicity patterns were similar for MidCentral district and New Zealand. Other ethnicities (non Maori, non Pacific) had the highest ratios, followed by Pacific peoples, and Maori. MidCentral district ratios for individual and combined ethnicities were lower than their New Zealand equivalents.
MidCentral district 2000/2001 to 2002/2003 hospital discharges for birthing complications were examined by territorial authority. The number of discharges fell across most of the territorial authorities across the three year period. The numbers of yearly discharges for Horowhenua were about the same for 2002/2003 compared to 2000/2001.
2000/2001 2001/2002 2002/2003Palmerston North 495 438 453Horowhenua 124 127 122Manawatu 114 81 89Tararua 93 72 85Kapiti (MidCentral portion) 28 18 16MidCentral 854 736 765
MidCentral Number of Birthing Complication Hospital Discharges by Territorial Authority 2000/2001 to 2002/2003
Maori Pacific
Other (includes
Asian)All
ethnicitiesAverage annual number of discharges per 100 live births 18.0 27.6 47.5 37.6
MidCentral Average Annual Number of Hospital Discharges for Birthing Complications per 100 Live Births 2000 to 2003
Maori Pacific
Other (includes
Asian)All
ethnicitiesAverage annual number of discharges per 100 live births 28.1 47.3 55.9 47.2
New Zealand Average Annual Number of Hospital Discharges for Birthing Complications per 100 Live Births 2000 to 2003

51
11. SEXUAL HEALTH
Key Points
• The most commonly diagnosed sexually transmitted infections in New Zealand were: chlamydia, genital warts, male non specific urethritis, genital herpes, and gonorrhoea.
• Young Maori males and females, and young Pacific males have higher rates of sexually transmitted infections than non Maori, non Pacific ethnicities.
• According to the STI (Sexually Transmitted Infections) Surveillance Team’s quarterly report (July to September 2004), rates of chlamydia, gonorrhoea, and genital herpes rose slightly for the Palmerston North/Levin/Dannevirke clinics.
• According to the same report, Palmerston North/Levin/Dannevirke clinic rates of genital warts and male non specific urethritis fell over the same period.
In December 2003, the Ministry of Health released a resource book for health organisations called Sexual and Reproductive Health. It included background information on how New Zealanders are currently affected by sexually transmitted infections. Some of this background material will be outlined here, followed by some recent MidCentral district data and information. (Ref: Ministry of Health. Sexual and Reproductive Health. Wellington, December 2003.) The most common sexually transmitted infections diagnosed in New Zealanders are:
• Chlamydia • Genital warts • Non specific urethritis in males • Genital herpes • Gonorrhoea.
Chlamydia is the most diagnosed sexually transmitted disease. Young people aged 15 to 24 are the most frequent age group infected, and Maori have higher rates of infection than non Maori. Laboratory data suggest the incidence of chlamydia is higher in New Zealand than in Canada, Australia, and the United States–perhaps as much as four or five times higher. Other main points from Sexual and Reproductive Health were:
• Rises in rates of chlamydia and gonorrhoea in recent years. • Young Maori experience higher rates of sexually transmitted infections than non Maori. • Many infections can be asymptomatic. • There can be long term consequences of sexually transmitted diseases, such as
impaired fertility, ectopic pregnancy, cancer, and the increased risk of passing on HIV infection.
According to the STI Surveillance Team’s quarterly report for July to September 2004, Maori males and Pacific peoples males have higher rates of sexually transmitted diseases than other ethnic groupings by gender. The rates are especially high for younger age groups, from 15 to 29 years. The STI Surveillance Team is a part of Environmental Science and Research Ltd. (Ref: STI Surveillance Team. Clinic Surveillance of Sexually Transmitted Infections in New Zealand: July to September 2004. Institute of Environmental Science and Research Ltd, Wellington. Dec 2004.) According to the same quarterly report, Maori females, particularly aged 15 to 24 years, had higher rates of chlamydia (7% of clinic visits) than European male (4.6% of clinic visits) or European female (3.5% of clinic visits). Thirteen percent of clinic visits for Maori male were for chlamydia, and 10% of Pacific peoples male clinic visits were for chlamydia. Again, younger

52
age groups, from 15 to 29, were more likely to be affected. The quarterly report compared rates of infections from July to September 2004 to the same quarter of the previous year. This was done for both New Zealand overall, and some regional clinics including combined Palmerston North/Levin/Dannevirke clinics. According to these results, the New Zealand rates of chlamydia, gonorrhoea, genital herpes, and genital warts reduced slightly. However, rates of chlamydia, gonorrhoea, and genital herpes rose slightly for the Palmerston North/Levin/Dannevirke clinics. There was a fall of male non specific urethritis for Palmerston North/Levin/Dannevirke (from 12.7% to 8.1% of clinic visits). Rates of genital warts also fell for the Palmerston North/Levin/Dannevirke clinics (5.1 % to 4.3%). However, care should be taken not to over interpret these results. Periodic random fluctuation could influence the data. The Palmerston North/Levin/Dannevirke patient numbers are small and would be more vulnerable to chance variation. Continued observation of future data would be needed to see whether the patterns described are true trends or not.
Total no. of cases
(confirmed &
probable)
Rate (% of total clinic visits)
Total no. of cases
(confirmed &
probable)
Rate (% of total clinic visits)
Sexual health clinicsChlamydia 1061 5.1% 1045 4.8% FallGonorrhoea 177 0.9% 160 0.7% FallGenital herpes 200 1.0% 180 0.8% FallGenital warts 921 4.5% 862 4.0% FallSyphilis 9 0.0% 10 0.0% No changeNSU (males only) 277 3.3% 198 2.2% Fall
Family planning clinicsChlamydia 618 1.3% 451 1.0% FallGonorrhoea 58 0.1% 39 0.1% No changeGenital herpes 39 0.1% 35 0.1% No changeGenital warts 129 0.3% 126 0.3% No changeSyphilis 0 0.0% 0 0.0% No changeNSU (males only) 2 0.1% 4 0.2% Rise
Student & Youth Health Clinics
Chlamydia 89 0.2% 117 0.3% RiseGonorrhoea 6 0.0% 2 0.0% No changeGenital herpes 7 0.0% 14 0.0% No changeGenital warts 20 0.1% 27 0.1% No changeSyphilis 0 0.0% 0 0.0% No changeNSU (males only) 0 0.0% 1 0.0% No change
July - Sept 2003 July - Sept 2004
Rate change
between quarters
NZ Number and Rate of Sexually Transmitted Infections by Clinic Type July - Sept 2004 Quarter Compared to July - Sept 2003 Quarter
Total no. of cases
(confirmed & probable)
Rate (% of total clinic visits)
Total no. of cases
(confirmed & probable)
Rate (% of total clinic visits)
Chlamydia 54 5.6% 79 7.7% RiseGonorrhoea 9 0.9% 13 1.3% RiseGenital herpes 14 1.4% 18 1.8% RiseGenital warts 49 5.1% 44 4.3% FallSyphilis 2 0.2% 2 0.2% No changeNSU (males only) 55 12.7% 35 8.1% Fall
July - Sept 2003 July - Sept 2004
Rate change
between quarters
Palmerston North/Levin/Dannevirke Number and Rate of Sexually Transmitted Infections at Sexual Health Clinic July - Sept 2004 Quarter
Compared to July - Sept 2003 Quarter

53
12. MIDCENTRAL DISTRICT MENTAL HEALTH INFORMATION NATIONAL COLLECTION DATA
Key Points
• Data from the Mental Health Information National Collection (MHINC) for 2003 are now available, although there are still issues with completeness and reliability.
• The most used services based on patient contacts are: (1) Community Team; (2) Inpatient Team; (3) Child, Adolescent, and Family Team; (4) Alcohol and Drug Team; (5) Kaupapa Maori Team.
• Maori are proportionally higher users of Child, Adolescent, and Family services, inpatient services, Alcohol and Drug services, and Forensic services compared to non Maori.
• Both Maori and Pacific peoples are high users of the Youth Speciality Team. No data are currently available on the prevalence of mental illness in MidCentral district. There is a national epidemiological study in progress, the New Zealand Mental Health Survey, Te Rau Hinengaro, that will provide information on prevalence of mental health problems in New Zealand. The study is based on a household survey conducted across the country. The study was conducted from November 2003 to October 2004. The data will be analysed this year with a final report expected in 2006. (Ref: The Mental Health Research and Development Strategy. Epidemiology: www.mhrds.govt.nz/dynz.aspx?ID1=1&ID2=26 accessed April 2005.) Data from the Mental Health Information National Collection (MHINC) are now available. It is a collection of data concerning use of secondary mental health, alcohol, and drug services. It covers inpatient, outpatient, and community care, but does not cover services provided by primary care services, like general practitioners. Additionally, many non government organisations providing secondary mental health care do not yet contribute data to MHINC, although this is a goal for MHINC. There might be some unreliability with MHINC data. This is because MHINC is a new database, so there may be some incomplete data and some data inaccuracy. This should improve with time. The data analysed for this report are from 2003 mental health service use, obtained by Central Region Technical Advisory Services from the New Zealand Health Information Service. When all the district health board 2003 client numbers and client rate per population are graphed, MidCentral and most of the Central Region district health boards fall below the national rate. They also fall short of the 3% Blueprint benchmark. The exception is Whanganui District Health Board, which is above both the national rate and the Blueprint level. This is shown in the following graph.

54
District Health Board Resident Clients per 10,000 population (All MHINC
Providers), 2003
0
1,000
2,000
3,000
4,000
5,000
6,000
7,000
8,000
9,000
10,000
Auckland
Bay of P
lenty
Canter
bury
Capita
l & C
oast
Counti
es M
anuk
au
Hawke
s Bay Hutt
Lakes
MidCen
tral
Nelson
Marl
borou
gh
Northla
ndOtag
o
South
Canterbu
ry
Southl
and
Taira
whiti
Tara
naki
Waika
to
Wairara
pa
Waite
mata
Wes
t Coa
st
Wha
nganu
i
Number of Clients
0
50
100
150
200
250
300
350
400
450
500
550
Clients per 10,000 population
Total Clients Clients per 10,000
3% Blue Print
Benchmark
National
Average Rate
The most used services based on patient contacts are: (1) Community Team; (2) Inpatient Team; (3) Child, Adolescent, and Family Team; (4) Alcohol and Drug Team; (5) Kaupapa Maori Team.
MidCentral Non-Inpatient Mental Health Service Use by Contact
and Ethnicity 2003 (MHINC)
0 5000 10000 15000 20000 25000 30000
Alcohol and Drug Dual Diagnosis Team
Alcohol and Drug Team
Child, Adolescent and Family Team
Community Skills Enhancement Team
Community Team
Eating Disorder Team
Forensic Team
Inpatient Team
Intellectual Disability Dual Diagnosis Team
Kaupapa Maori Tamariki and Rangatahi (child and youth)
mental health services
Kaupapa Maori Team
Maternal Mental Health Team
Needs Assessment and Service Coordination Team
Other
Pacif ic People Team
Psychogeriatric Team
Residential Team
Specialist Psychotherapy Team
Youth Specialty Team
Service team
Number of contacts
Other ethnicities
Pacif ic
Maori

55
MidCentral Inpatient Mental Health Service Use by Bed Nights
and Ethnicity 2003 (MHINC)
0 1000 2000 3000 4000 5000 6000 7000 8000 9000
Alcohol and Drug Dual Diagnosis Team
Alcohol and Drug Team
Child, Adolescent and Family Team
Community Skills Enhancement Team
Community Team
Eating Disorder Team
Forensic Team
Inpatient Team
Intellectual Disability Dual Diagnosis Team
Kaupapa Maori Tamariki and Rangatahi (child and youth)
mental health services
Kaupapa Maori Team
Maternal Mental Health Team
Needs Assessment and Service Coordination Team
Other
Pacif ic People Team
Psychogeriatric Team
Residential Team
Specialist Psychotherapy Team
Youth Specialty Team
Service team
Bed nights
Other ethnicities
Pacif ic
Maori
There were some mental health service use patterns apparent for Maori and Pacific peoples. Maori are proportionally higher users of Child, Adolescent, and Family services, inpatient services, Alcohol and Drug services, and Forensic services compared to non Maori. Both Maori and Pacific peoples are high users of the Youth Speciality Team. Maori aged 10 to 54 years are disproportionately high users of services, including inpatient bed nights. The inpatient bed night pattern could indicate more severe mental health needs, but further information is needed to elaborate this. Other ethnicities (non Maori, non Pacific) aged 5 to 14 years are high users of mental health services.

56
Team Type DescriptionBed
NightsContacts Bed
NightsContacts Bed
NightsContacts Bed
NightsContacts
Alcohol and Drug Dual Diagnosis Team 0 2 0 2Alcohol and Drug Team 125 1,274 371 5,648 0 42 496 6,964Child, Adolescent and Family Team 4 968 2 8,702 0 36 6 9,706Community Skills Enhancement Team 0 6 0 6Community Team 13 3,555 70 27,593 0 187 83 31,335
Eating Disorder Team 0 15 0 424 0 439
Forensic Team 0 168 418 366 0 2 418 536
Inpatient Team 2,334 3 8,339 1 4 0 10,677 4
Dual Diagnosis Team 0 2 0 49 0 51
Tamariki and 0 2 0 58 0 60Kaupapa Maori Team 1 4,329 0 664 1 4,993
Health Team 0 24 0 112 0 136Needs Assessment and Service Coordination Team 0 41 0 197 0 4 0 242Other 0 7 0 12 0 19
Pacific Island Team 0 1 0 1
Psychogeriatric Team 33 41 33 41
Residential Team 180 0 63 0 243 0
Psychotherapy Team 0 3 0 26 0 29
Youth Specialty Team 143 10 301 29 0 6 444 45
Grand Total 2,800 10,401 9,597 43,930 4 278 12,401 54,609
MidCentral District Clients' Total Mental Health Service Team Type Utilisation by Ethnicity (All providers in MHINC), 2003
Maori Other Pacific Total
Age GroupBed
NightsContacts Bed
NightsContacts Bed
NightsContacts Bed
NightsContacts
01-04 0 59 0 130 0 189
05-09 0 595 0 2,374 0 7 0 2,976
10-14 102 911 68 3,631 0 24 170 4,566
15-19 164 1,088 533 3,806 0 8 697 4,902
20-24 647 1,154 422 2,456 4 66 1,073 3,676
25-29 494 1,323 552 3,330 0 46 1,046 4,699
30-34 516 1,210 1,388 4,827 0 38 1,904 6,075
35-39 363 1,516 1,396 6,146 0 61 1,759 7,723
40-44 190 1,337 1,127 5,798 0 14 1,317 7,149
45-49 79 610 1,251 3,443 0 8 1,330 4,061
50-54 222 294 483 3,296 705 3,590
55-59 1 231 1,148 1,824 0 6 1,149 2,061
60-64 22 48 747 1,655 769 1,703
65-69 0 14 187 520 187 534
70-74 0 10 203 540 203 550
75-79 3 87 3 87
80-84 58 29 58 29
85+ 31 38 31 38
Grand Total 2,800 10,401 9,597 43,930 4 278 12,401 54,609
Other Pacific Total
MidCentral District Resident Clients' Total Mental Health Service Utilisation by Ethnicity and Age (All providers in MHINC), 2003
Maori

57
Horowhenua had proportionately lower use of inpatient bed nights, but higher use of non inpatient contacts. Palmerston North residents had proportionately higher use of inpatient bed nights. Manawatu, and Kapiti Coast (MidCentral district portion) had proportionately lower use of both inpatient bed nights and non inpatient contacts.
Maori PacificOther
ethnicities TotalBed nights 2800 4 9597 12401Contacts 10401 278 43930 54609
MidCentral Secondary Care Mental Health Bed Nights and Contacts 2003 (MHINC) by Ethnicity
Palmerston North Horowhenua Manawatu Tararua Kapiti
Non-territorial authority
Bed nights 7754 1747 1725 930 218 27Contacts 27641 13003 6666 5460 1822 17
MidCentral Secondary Care Mental Health Bed Nights and Contacts 2003 (MHINC) by Territorial Authority

58
13. PRIMARY CARE DATA
Key Points
• As of March 2005, 122,725 people had registered with a primary health organisation (75% of the population).
• MidCentral district five pharmaceutical therapeutic groups with the highest expenditure were: (1) nervous system, (2) alimentary tract and metabolism, (3) cardiovascular system, (4) respiratory system and allergies, and (5) blood and blood forming organs.
• MidCentral district and New Zealand medicines dispensed per capita have been rising (1998/1999 to 2003/2004 data).
• MidCentral district has had slightly higher medicines dispensed per capita compared to New Zealand (1998/1999 to 2003/2004 data).
• MidCentral district and New Zealand laboratory test per capita have been increasing (1998/1999 to 2003/2004)
• MidCentral district laboratory tests per capita has been lower than the New Zealand rate, and this gap is widening.
• Palmerston North and Horowhenua had higher per capita rate of pharmaceutical expenditure than New Zealand.
• Palmerston North had higher per capita rate of laboratory expenditure than New Zealand. The rates for other MidCentral district’s territorial authorities were below the national rate.
13.1 Primary Health Organisation Registrations As of March 2005, 122,772 or 75% of MidCentral district population had been registered with a primary health organisation (PHO). The sub regional breakdowns are shown in the table below.
Non-Maori/Pacific Maori/Pacific TotalTararua 13053 2780 15833Otaki 4019 1964 5983Horowhenua 18824 4935 23759Manawatu 70826 6371 77197
MidCentral Population Registered with PHOs for Quarter Ending 31 March 2005
13.2 Pharmaceutical Prescriptions Pharmaceutical expenditure divided into therapeutic group was analysed for twelve months ending November 2004. These data include medicines dispensed in the community, which received partial or whole government subsidy. These data do not include medication used in hospitals, and compounds made up by the pharmacy. The expenditure values do not include pharmacy fee or patient copayment. MidCentral district pattern of pharmaceuticals dispensed by therapeutic group is similar to the national pattern. The five highest expenditures were for pharmaceuticals concerning:
1. Nervous system (25%) 2. Alimentary tract and metabolism (21%) 3. Cardiovascular system (13%) 4. Respiratory system and allergies (11%) 5. Blood and blood forming organs (11%).
The classification of therapeutic groups is by anatomy according to the Anatomical Therapeutic Chemical System (ATC). In this classification, diabetes medicines are in the alimentary tract and metabolism group, and lipid lowering agents are in the blood and blood forming organs group.
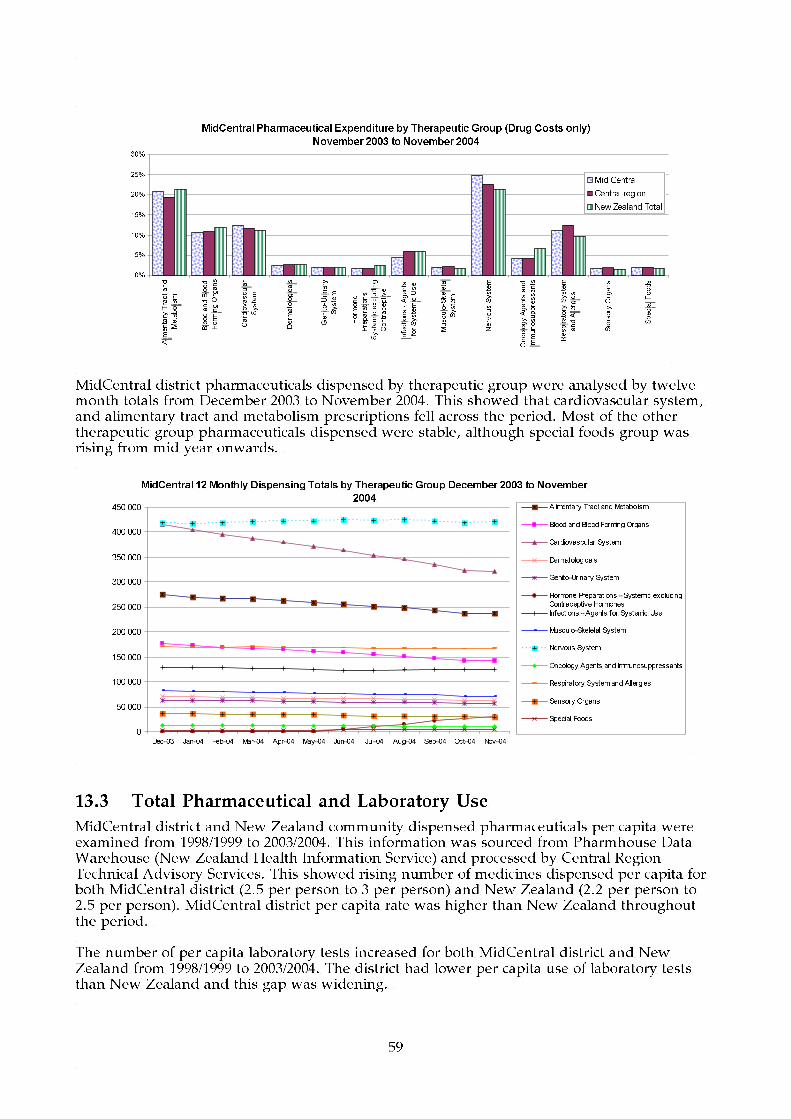
59
MidCentral Pharmaceutical Expenditure by Therapeutic Group (Drug Costs only)
November 2003 to November 2004
0%
5%
10%
15%
20%
25%
30%
Alimentary Tract and
Metabolism
Blood and Blood
Forming Organs
Cardiovascular
System
Dermatologicals
Genito-Urinary
System
Hormone
Preparations -
Systemic excluding
Contraceptive
Infections - Agents
for Systemic Use
Musculo-Skeletal
System
Nervous System
Oncology Agents and
Immunosuppressants
Respiratory System
and Allergies
Sensory Organs
Special Foods
Mid Central
Central region
New Zealand Total
MidCentral district pharmaceuticals dispensed by therapeutic group were analysed by twelve month totals from December 2003 to November 2004. This showed that cardiovascular system, and alimentary tract and metabolism prescriptions fell across the period. Most of the other therapeutic group pharmaceuticals dispensed were stable, although special foods group was rising from mid year onwards.
MidCentral 12 Monthly Dispensing Totals by Therapeutic Group December 2003 to November
2004
0
50,000
100,000
150,000
200,000
250,000
300,000
350,000
400,000
450,000
Dec-03 Jan-04 Feb-04 Mar-04 Apr-04 May-04 Jun-04 Jul-04 Aug-04 Sep-04 Oct-04 Nov-04
Alimentary Tract and Metabolism
Blood and Blood Forming Organs
Cardiovascular System
Dermatologicals
Genito-Urinary System
Hormone Preparations - Systemic excluding
Contraceptive Hormones
Infections - Agents for Systemic Use
Musculo-Skeletal System
Nervous System
Oncology Agents and Immunosuppressants
Respiratory System and Allergies
Sensory Organs
Special Foods
13.3 Total Pharmaceutical and Laboratory Use
MidCentral district and New Zealand community dispensed pharmaceuticals per capita were examined from 1998/1999 to 2003/2004. This information was sourced from Pharmhouse Data Warehouse (New Zealand Health Information Service) and processed by Central Region Technical Advisory Services. This showed rising number of medicines dispensed per capita for both MidCentral district (2.5 per person to 3 per person) and New Zealand (2.2 per person to 2.5 per person). MidCentral district per capita rate was higher than New Zealand throughout the period. The number of per capita laboratory tests increased for both MidCentral district and New Zealand from 1998/1999 to 2003/2004. The district had lower per capita use of laboratory tests than New Zealand and this gap was widening.

60
MidCentral Dispensed Pharmaceutical Items & Laboratory Tests per Capita,
Quarterly
0.8
1.0
1.2
1.4
1.6
1.8
2.0
2.2
2.4
2.6
2.8
3.0
3.2
Q3
1998/1999
Q3 Q3 Q3 Q3
Financial Years ending 30 June
Volume of items per capita
Laboratory - Central -
MidCentral
Laboratory - Total - NZ
Pharmaceuticals - Central -
MidCentral
Pharmaceuticals - Total - NZ
Linear (Laboratory - Total -
NZ)
Linear (Laboratory - Central
- MidCentral)
Linear (Pharmaceuticals -
Total - NZ)
Linear (Pharmaceuticals -
Central - MidCentral)
Q3
98/99
Q4
99/00 00/01 01/02 02/03 03/04
Q1Q2 Q3Q4 Q1Q2 Q3 Q4Q1Q2 Q3 Q4Q1Q2 Q3 Q4 Q1
MidCentral district and New Zealand expenditure on pharmaceuticals per capita for 1999/2000 to 2003/2004 was analysed. MidCentral district data were divided into its territorial authorities. This showed Palmerston North and Horowhenua both had higher than the national rates of pharmaceutical expenditure. Kapiti (MidCentral district portion) is similar to the national rates. Manawatu and Tararua are below the national per capita rate. The New Zealand and MidCentral district territorial pharmaceutical per capital expenditure rates were all rising gradually across the 1999/2000 to 2003/2004 period. Laboratory expenditure per capita for MidCentral district’s territorial authorities and New Zealand from 1999/2000 to 2003/2004 was analysed. Palmerston North expenditure rates were above the national rates. Per capita rates for all other MidCentral district’s territorial authorities were below national rates. The Palmerston North and national rates were slowly rising, but the other MidCentral territorial authority rates were relatively stable. Tararua per capita rate showed a small rise from $5.24 in the first quarter of 1999/2000 to $7.14 in the third quarter of 2000/2001, but remained stable afterwards.

61
MidCentral Territorial Authority Pharmaceutical and Laboratory Expenditure per
Capita, Quarterly
$-
$5
$10
$15
$20
$25
$30
$35
$40
$45
$50
$55
$60
$65
Q1
1999/2000
Q1
2000/2001
Q1
2001/2002
Q1
2002/2003
Q1
2003/2004
Financial Yrs Ending 30 June
$ per capita
Central - MidCentral -
Horow henua District -
Laboratory
Central - MidCentral -
Horow henua District -
Pharmaceuticals
Central - MidCentral - Kapiti
Coast District - MidCentral -
Laboratory
Central - MidCentral - Kapiti
Coast District - MidCentral -
Pharmaceuticals
Central - MidCentral -
Manaw atu District -
Laboratory
Central - MidCentral -
Manaw atu District -
Pharmaceuticals
Central - MidCentral -
Palmerston North City -
Laboratory
Central - MidCentral -
Palmerston North City -
Pharmaceuticals
Central - MidCentral -
Tararua District -
Laboratory
Central - MidCentral -
Tararua District -
Pharmaceuticals
Total - NZ - - - Laboratory
Total - NZ - - -
Pharmaceuticals
99/00 00/01 01/02 02/03 03/04
Q2 Q3Q4Q1 Q2 Q3Q1 Q1Q2Q3Q4 Q4 Q2Q3Q1 Q4 Q2 Q3Q1 Q4

62
14. CHILD HEALTH
Key Points
• MidCentral district hospital discharge rate for low birth weight infants was smaller than New Zealand’s rate (2003/2004 data).
• Children of Maori, Pacific peoples and Asian peoples have poorer dental health than children of other ethnicities.
• Children aged 5 from Horowhenua and Tararua showed poorer dental health than children from Manawatu (which includes Palmerston North).
• Children aged 5 living in fluoridated areas have better dental health than children aged 5 living in unfluoridated areas.
• Children of Maori and Pacific peoples ethnicities are more likely to fail school entry hearing tests than children of other ethnicities.
• MidCentral district childhood hospitalisation rates for injuries were similar to the New Zealand average, although non Maori, non Pacific ethnicities experienced 10% more hospitalisations than New Zealand non Maori, non Pacific ethnicities (1999 to 2003 data).
• MidCentral district yearly hospitalisation numbers for childhood injuries have been declining (1999 to 2003 data).
• MidCentral district childhood poisoning hospitalisation rate was 29% higher than New Zealand’s rate (1999 to 2003 data).
• Sudden infant death syndrome is the most common cause of death for Maori children. • Most childhood mortality (aged 0 to 14 years) occurs in infants less than one year old.
MidCentral district childhood mortality rate was similar, perhaps lower, than New Zealand’s (1997 to 2001 data).
• MidCentral district infant mortality rate was slightly lower than New Zealand’s rate (1999 to 2001 data).
• Infant mortality rates for MidCentral district Maori, and Horowhenua residents were higher than for MidCentral district overall (1999 to 2001 data).
14.1 Low Birth Weight Babies Babies with low birth weight are at higher risk of death, and health problems in later childhood and as adults. Low birth weight is defined as babies weighing less than 2,500 grams. Low birth weight babies data for MidCentral district and New Zealand were obtained for the year October 2003 to September 2004 from the New Zealand Health Information Service. The discharge rates are by hospital births and not total births. The data show discharge rates for low birth weight babies were smaller for all MidCentral district ethnic groupings compared to equivalent New Zealand groupings. An exception is for Pacific peoples. However, MidCentral district Pacific peoples discharge rate was calculated using only six births. Rates calculated from small numbers can be unstable, and therefore unreliable. In general, there were fewer low birth weight babies for New Zealand and MidCentral district in 2003/2004 compared to 1998/1999. An exception was for MidCentral district Pacific peoples, but the numbers were very small (6 in 2003/2004 and 2 in 1998/1999). The latter data were taken from MidCentral’s 2001 health needs assessment technical document.
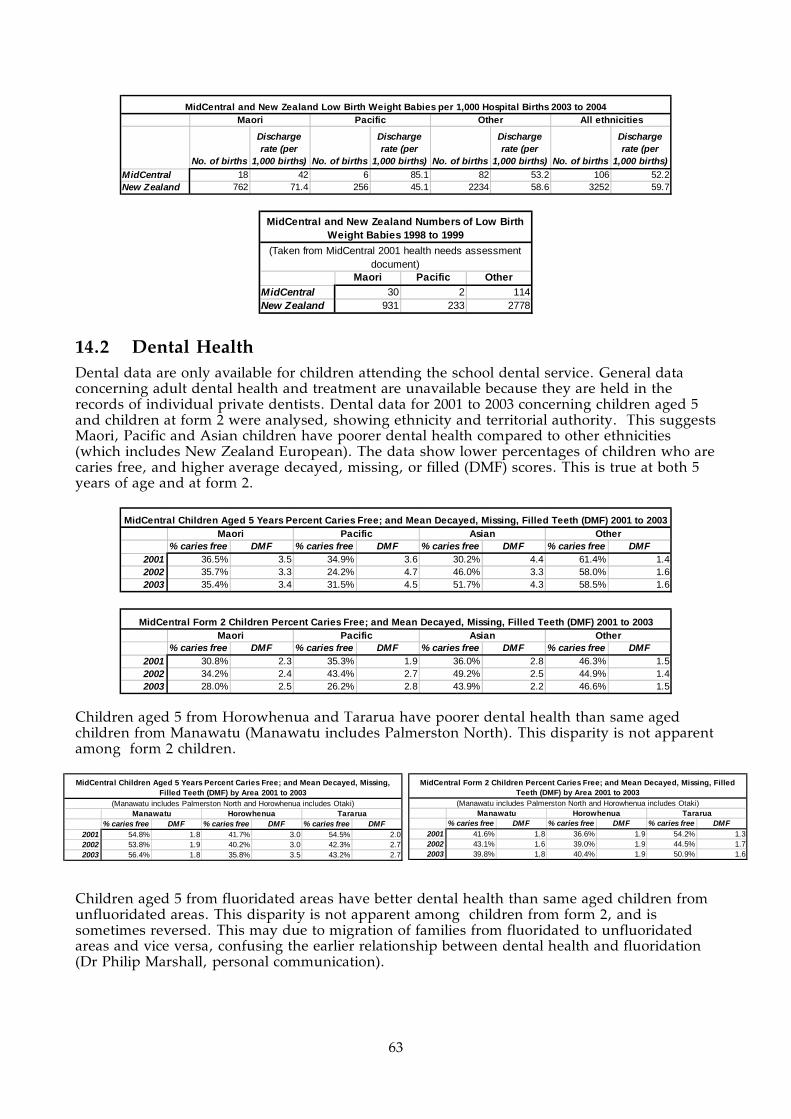
63
No. of births
Discharge rate (per
1,000 births) No. of births
Discharge rate (per
1,000 births) No. of births
Discharge rate (per
1,000 births) No. of births
Discharge rate (per
1,000 births)MidCentral 18 42 6 85.1 82 53.2 106 52.2New Zealand 762 71.4 256 45.1 2234 58.6 3252 59.7
MidCentral and New Zealand Low Birth Weight Babies per 1,000 Hospital Births 2003 to 2004Maori Pacific Other All ethnicities
Maori Pacific OtherMidCentral 30 2 114New Zealand 931 233 2778
MidCentral and New Zealand Numbers of Low Birth Weight Babies 1998 to 1999
(Taken from MidCentral 2001 health needs assessment document)
14.2 Dental Health Dental data are only available for children attending the school dental service. General data concerning adult dental health and treatment are unavailable because they are held in the records of individual private dentists. Dental data for 2001 to 2003 concerning children aged 5 and children at form 2 were analysed, showing ethnicity and territorial authority. This suggests Maori, Pacific and Asian children have poorer dental health compared to other ethnicities (which includes New Zealand European). The data show lower percentages of children who are caries free, and higher average decayed, missing, or filled (DMF) scores. This is true at both 5 years of age and at form 2.
% caries free DMF % caries free DMF % caries free DMF % caries free DMF2001 36.5% 3.5 34.9% 3.6 30.2% 4.4 61.4% 1.42002 35.7% 3.3 24.2% 4.7 46.0% 3.3 58.0% 1.62003 35.4% 3.4 31.5% 4.5 51.7% 4.3 58.5% 1.6
MidCentral Children Aged 5 Years Percent Caries Free; and Mean Decayed, Missing, Filled Teeth (DMF) 2001 to 2003Maori Pacific Asian Other
% caries free DMF % caries free DMF % caries free DMF % caries free DMF2001 30.8% 2.3 35.3% 1.9 36.0% 2.8 46.3% 1.52002 34.2% 2.4 43.4% 2.7 49.2% 2.5 44.9% 1.42003 28.0% 2.5 26.2% 2.8 43.9% 2.2 46.6% 1.5
MidCentral Form 2 Children Percent Caries Free; and Mean Decayed, Missing, Filled Teeth (DMF) 2001 to 2003Maori Pacific Asian Other
Children aged 5 from Horowhenua and Tararua have poorer dental health than same aged children from Manawatu (Manawatu includes Palmerston North). This disparity is not apparent among form 2 children.
Children aged 5 from fluoridated areas have better dental health than same aged children from unfluoridated areas. This disparity is not apparent among children from form 2, and is sometimes reversed. This may due to migration of families from fluoridated to unfluoridated areas and vice versa, confusing the earlier relationship between dental health and fluoridation (Dr Philip Marshall, personal communication).
% caries free DMF % caries free DMF % caries free DMF2001 54.8% 1.8 41.7% 3.0 54.5% 2.02002 53.8% 1.9 40.2% 3.0 42.3% 2.72003 56.4% 1.8 35.8% 3.5 43.2% 2.7
Manawatu Horowhenua Tararua
MidCentral Children Aged 5 Years Percent Caries Free; and Mean Decayed, Missing, Filled Teeth (DMF) by Area 2001 to 2003
(Manawatu includes Palmerston North and Horowhenua includes Otaki)
% caries free DMF % caries free DMF % caries free DMF2001 41.6% 1.8 36.6% 1.9 54.2% 1.32002 43.1% 1.6 39.0% 1.9 44.5% 1.72003 39.8% 1.8 40.4% 1.9 50.9% 1.6
MidCentral Form 2 Children Percent Caries Free; and Mean Decayed, Missing, Filled Teeth (DMF) by Area 2001 to 2003
Manawatu Horowhenua Tararua(Manawatu includes Palmerston North and Horowhenua includes Otaki)

64
14.3 Childhood Hearing Test Results The results of school entry childhood hearing tests are shown in the tables below. Although failure percentages can fluctuate from one year to the next, the results show Maori and Pacific peoples children are more likely to fail hearing tests than children of other ethnicities. This is also the national pattern. MidCentral district new school entrant hearing tests from 1992 to 2003 show a small improvement over ten years although failure percentages can fluctuate year to year. (Ref: National Audiology Centre. New Zealand Hearing Screening Statistics. 2003 and 2004 [2 issues one year apart].)
Overall Maori Pacific Pakeha Asian Other2001/2002 6.1% 9.5% 12.3% 4.7% 6.5% 4.4%2002/2003 5.1% 6.7% 13.7% 4.4% 2.8% 3.8%NZ 2002/2003 8.1% 12.6% 16.1% 5.6% 3.9% 7.2%
MidCentral Child New School Entrant Hearing Test Failure Rate 2002 & 2003
Overall Maori Pacific Pakeha Asian Other2001/2002 3.2% 8.3% 8.8% 2.0% 6.1% 2.1%2002/2003 3.1% 2.9% 10.0% 3.4% 1.4% 1.3%NZ 2002/2003 6.9% 11.1% 14.3% 5.7% 3.4% 4.4%
MidCentral Three Year Old Hearing Test Failure Rate 2002 & 2003
Year Failure Rate1992/93 8.1%1993/94 7.6%1994/95 6.2%1995/96 7.3%1996/97 5.6%1997/98 5.9%1998/99 5.7%2000/01 4.4%2001/02 6.1%2002/03 5.1%
MidCentral Overall New School Entrant Hearing Test Failure Rates 1991
14.4 Childhood Injuries MidCentral district childhood injuries hospitalisation data from 1999 to 2003 were examined. Yearly hospitalisations for combined ethnicities and other ethnicities (non Maori, non Pacific) were decreasing across the period. Maori yearly hospitalisations were approximately stable from 1999 to 2003. When analysed by crude rates, MidCentral district other ethnicities (non Maori, non Pacific) had higher rates than for Maori and Pacific peoples. Age adjusted analysis shows MidCentral district all ethnicities experienced around the
% caries free DMF % caries free DMF2001 55.8% 1.8 46.2% 2.52002 55.1% 1.7 41.4% 2.72003 55.8% 1.8 42.2% 2.9
Fluoridated Areas Non-Fluoridated Areas
MidCentral Children Aged 5 Years Percent Caries Free; and Mean Decayed, Missing, Filled Teeth (DMF) by Fluoridation
Status 2001 to 2003
% caries free DMF % caries free DMF2001 42.2% 1.8 41.9% 1.72002 43.0% 1.6 41.3% 1.82003 39.9% 1.8 43.6% 1.7
Fluoridated Areas Non-Fluoridated Areas
MidCentral Form 2 Children Percent Caries Free; and Mean Decayed, Missing, Filled Teeth (DMF) by Fluoridation Status
2001 to 2003

65
expected number of child injury hospitalisations compared to New Zealand all ethnicities. MidCentral district other ethnicities (non Maori, non Pacific) experienced 10% more than expected child injury hospitalisations compared to New Zealand all ethnicities. MidCentral district Maori experienced 26% less than expected number of hospitalisations compared to New Zealand all ethnicities. MidCentral district Pacific peoples experienced 44% less than the expected number of hospitalisations compared to New Zealand all ethnicities, but this calculation is based on small numbers. In contrast, New Zealand Maori experienced 9% more than expected child injury hospitalisations compared to New Zealand all ethnicities. Graphing hospitalisations by age group shows most child injury hospitalisations are for children aged older than 1 year old. The 5 to 9 years age band showed the highest rates of injury hospitalisation.
MidCentral Children All Cause Injuries Hospital
Discharges 1999 to 2003
0
50
100
150
200
250
300
1999 2000 2001 2002 2003
Year
Number of events
Maori
Pacif ic
Other
(includes
Asian)
All
ethnicities
Maori Pacific
Other
(includes
Asian)
All
ethnicities
1999 33 6 209 248
2000 35 5 169 209
2001 42 3 151 196
2002 47 2 124 173
2003 33 1 125 159
Total 190 17 778 985
MidCentral Children All Cause Injuries Hospital Discharges
1999 to 2003
Maori Pacific
Other
(includes
Asian)
All
ethnicities
MidCentral 2090 1560 3120 2800
New Zealand 3070 2350 2800 2830
NZ and MidCentral Children All Cause Injuries Crude (non-age
adjusted) Hospital Discharge Rates per 100,000 People 1999 to
2003
Ratio
95%
conf.limits Ratio
95%
conf.limits Ratio
95%
conf.limits Ratio
95%
conf.limits
MidCentral 0.74 0.63 - 0.84 0.56 0.29 - 0.82 1.1 1.03 - 1.18 0.99 0.93 - 1.05
New Zealand 1.09 1.06 - 1.12 0.84 0.8 - 0.88 0.99 0.97 - 1 1
MidCentral and NZ Child All Cause Injuries Indirect Age Adjusted Hospital Discharge Ratios 1999 to 2003
All ethnicitiesMaori Pacific
(New Zealand all ethnicities child all cause injuries hospital discharges 1999 to 2003 used as comparison)
Other (includes Asian)

66
MidCentral All Ethnicities Child All Cause Injuries Hospital Discharges by Age Group 1999 to 2003
0
50
100
150
200
250
300
350
400
450
00 01-04 05-09 10-14
Age group
Nu
mb
er o
f ev
ents
MidCentral All Ethnicities Child All Cause Injuries Hospital Discharge Age Specific Rates 1999 to
2003
0
500
1000
1500
2000
2500
3000
3500
4000
00 01-04 05-09 10-14
Age group
Ag
e sp
ecif
ic r
ate/
100,
000
peo
ple
14.5 Childhood Poisonings MidCentral district childhood hospitalisation for poisoning data from 1999 to 2003 were examined. A total of 185 hospitalisations were recorded for the five year period, around 26 to 48 hospital discharges per year. When analysed by crude rates, other ethnicities (non Maori, non Pacific) had higher rates than Maori and Pacific peoples. Age adjusted analysis shows MidCentral district combined ethnicities experienced 29% more than expected child poisoning hospitalisations compared to New Zealand all ethnicities. MidCentral other ethnicities (non Maori, non Pacific) experienced 45% more than expected child poisoning hospitalisations compared to New Zealand all ethnicities. MidCentral district Maori number of hospitalisations was around the expected number compared to New Zealand all ethnicities. The number of hospitalisations for Pacific peoples was too small for calculation of a reliable ratio. Graphing hospitalisations by age group shows most child poisoning hospitalisations are for children aged less than five years old.

67
Maori Pacific
Other (includes
Asian)All
ethnicities1999 6 2 40 482000 7 1 27 352001 9 0 27 362002 10 0 30 402003 8 0 18 26
Total 40 3 142 185
MidCentral Child Poisonings Hospital Discharges 1999 to 2003
Maori Pacific
Other (includes
Asian)All
ethnicitiesMidCentral 439 275 570 527New Zealand 426 300 423 414
NZ and MidCentral Child Poisonings Crude (non-age adjusted) Hospital Discharge Rates per 100,000 People 1999 to 2003
Ratio95%
conf.limits Ratio95%
conf.limits Ratio95%
conf.limits Ratio95%
conf.limits
MidCentral 0.99 0.68 - 1.29 0.61 -0.08 - 1.31 1.45 1.21 - 1.69 1.29 1.1 - 1.48New Zealand 0.98 0.91 - 1.04 0.68 0.59 - 0.77 1.05 1.01 - 1.09 1
MidCentral and NZ Child Poisonings Indirect Age Adjusted Hospital Discharge Ratios 1999 to 2003
All ethnicitiesMaori Pacific(New Zealand all ethnicities child poisonings hospital discharges 1999 to 2003 used as comparison)
Other (includes Asian)
MidCentral All Ethnicities Child Poisonings Hospital Discharge by Age Group 1999 to 2003
0
20
40
60
80
100
120
140
160
00 01-04 05-09 10-14
Age group
Nu
mb
er o
f ev
ents
MidCentral All Ethnicities Child Poisonings Hospital Discharge Age Specific Rates 1999 to
2003
0
200
400
600
800
1000
1200
1400
1600
1800
00 01-04 05-09 10-14
Age group
Ag
e sp
ecif
ic r
ate/
100,
000
peo
ple

68
14.6 Sudden Infant Death Syndrome The mortality from sudden infant death syndrome declined markedly from 1988 to 1994. Since then, the number of deaths has fluctuated between 2 to 5 per year. Sudden infant death syndrome is still the most common cause of death for Maori children.
Maori Other Pacific Total1988 1 13 0 141989 3 9 0 121990 5 3 0 81991 2 4 0 61992 2 3 0 51993 0 6 1 71994 1 3 1 51995 3 2 0 51996 2 1 0 31997 0 2 0 21998 2 1 0 31999 1 1 0 22000 4 1 0 52001 2 1 0 3
MidCentral Sudden Infant Death Syndrome 1988 to 2001
14.7 Childhood Mortality
14.7.1 Causes for Childhood Mortality
Childhood mortality from 1999 to 2001 was examined by diagnostic category and ethnicity to find the most common causes of mortality. For combined ethnicities, congenital conditions, external causes, perinatal diseases/disorders, and sudden infant death syndrome were the most common causes of death. External causes are unintentional and intentional injuries, including poisonings. Sudden infant death syndrome was the leading cause of childhood death among Maori. The mortality numbers for Pacific and Asian children were too small to draw any conclusions.
ICD Diagnostic GroupsNumber of
deaths PercentageCongenital malformations, deformations, and chromosomal abnormalities (Q00 - Q99) 15 28.8%External causes of morbidity and mortality (V01 - Y98) 10 19.2%Certain conditions originating in the perinatal period (P00 - P96) 10 19.2%Sudden infant death syndrome (R95) 10 19.2%Endocrine, nutritional, and metabolic diseases and immunity disorders (E00 - E07) 2 3.8%Neoplasms (cancers) (C00 - D48) 2 3.8%Diseases of the nervous system (G00 - G99) 1 1.9%Diseases of the respiratory system (J00 - J99) 1 1.9%Infections and parasitic diseases (A00 - B99) 1 1.9%Total 52 100.0%
MidCentral All Ethnicities Aged 0 to 14 Mortality by Diagnostic Categories 1999 to 2001
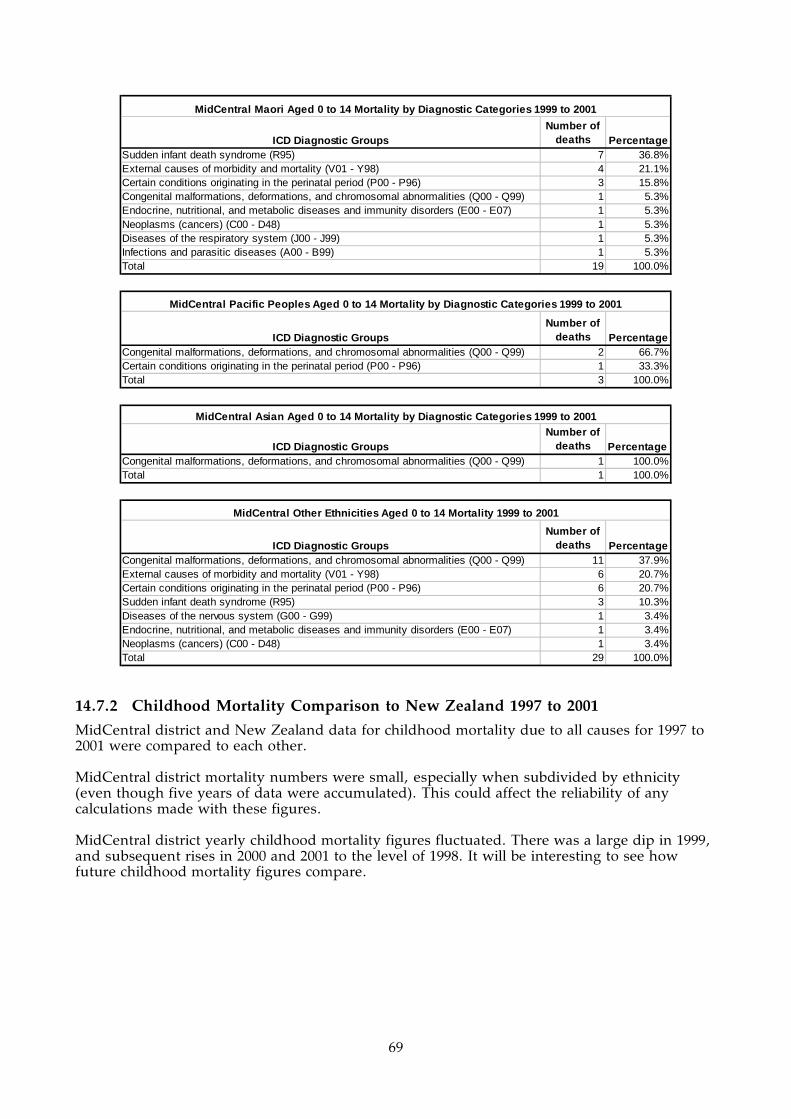
69
ICD Diagnostic GroupsNumber of
deaths PercentageSudden infant death syndrome (R95) 7 36.8%External causes of morbidity and mortality (V01 - Y98) 4 21.1%Certain conditions originating in the perinatal period (P00 - P96) 3 15.8%Congenital malformations, deformations, and chromosomal abnormalities (Q00 - Q99) 1 5.3%Endocrine, nutritional, and metabolic diseases and immunity disorders (E00 - E07) 1 5.3%Neoplasms (cancers) (C00 - D48) 1 5.3%Diseases of the respiratory system (J00 - J99) 1 5.3%Infections and parasitic diseases (A00 - B99) 1 5.3%Total 19 100.0%
MidCentral Maori Aged 0 to 14 Mortality by Diagnostic Categories 1999 to 2001
ICD Diagnostic GroupsNumber of
deaths PercentageCongenital malformations, deformations, and chromosomal abnormalities (Q00 - Q99) 2 66.7%Certain conditions originating in the perinatal period (P00 - P96) 1 33.3%Total 3 100.0%
MidCentral Pacific Peoples Aged 0 to 14 Mortality by Diagnostic Categories 1999 to 2001
ICD Diagnostic GroupsNumber of
deaths PercentageCongenital malformations, deformations, and chromosomal abnormalities (Q00 - Q99) 1 100.0%Total 1 100.0%
MidCentral Asian Aged 0 to 14 Mortality by Diagnostic Categories 1999 to 2001
ICD Diagnostic GroupsNumber of
deaths PercentageCongenital malformations, deformations, and chromosomal abnormalities (Q00 - Q99) 11 37.9%External causes of morbidity and mortality (V01 - Y98) 6 20.7%Certain conditions originating in the perinatal period (P00 - P96) 6 20.7%Sudden infant death syndrome (R95) 3 10.3%Diseases of the nervous system (G00 - G99) 1 3.4%Endocrine, nutritional, and metabolic diseases and immunity disorders (E00 - E07) 1 3.4%Neoplasms (cancers) (C00 - D48) 1 3.4%Total 29 100.0%
MidCentral Other Ethnicities Aged 0 to 14 Mortality 1999 to 2001
14.7.2 Childhood Mortality Comparison to New Zealand 1997 to 2001
MidCentral district and New Zealand data for childhood mortality due to all causes for 1997 to 2001 were compared to each other. MidCentral district mortality numbers were small, especially when subdivided by ethnicity (even though five years of data were accumulated). This could affect the reliability of any calculations made with these figures. MidCentral district yearly childhood mortality figures fluctuated. There was a large dip in 1999, and subsequent rises in 2000 and 2001 to the level of 1998. It will be interesting to see how future childhood mortality figures compare.

70
MidCentral Children's All Cause Mortality 1997 to
2001
0
5
10
15
20
25
1997 1998 1999 2000 2001
Year
Number of events Maori
Pacif ic
Other
(including
Asian)All ethnicities
Maori Pacific Asian Other
All
ethnicities
1997 6 0 0 14 20
1998 6 0 0 15 21
1999 5 1 0 7 13
2000 7 1 0 10 18
2001 7 1 1 12 21
Total 31 3 1 58 93
MidCentral Children's All Cause Mortality 1997 to 2001
Maori Pacific Asian Other
All
ethnicities
1997 253 69 17 266 605
1998 195 62 19 246 522
1999 210 53 26 227 516
2000 201 86 19 255 561
2001 190 66 21 224 501
Total 1049 336 102 1218 2705
New Zealand Children's All Cause Mortality 1997 to 2001
Indirect age adjusted ratios compensate for differing age structures in different populations. It avoids distortion of mortality rates due to different balances of ages. This is because the risk of death is not even across all age groups–it is higher in some age groups than others. For childhood mortality, New Zealand all ethnicities has been given the ratio of 1, and then the individual MidCentral district and New Zealand ethnic groupings have been compared to this ratio. Ratios exceeding 1 mean the ethnic group experienced more childhood deaths than expected when compared against New Zealand overall. Ratios below 1 mean the ethnic group experienced less than expected childhood deaths when compared against New Zealand overall. MidCentral district and New Zealand childhood mortality data were analysed using indirect age adjusted ratios. This showed New Zealand Maori and New Zealand Pacific peoples experienced higher than expected childhood deaths when compared to New Zealand all ethnicities, by 52% and 35% respectively. Most MidCentral district age adjusted ratios were better than their national equivalents. However, most of these did not reach statistical significance. An exception was MidCentral district other ethnicities (non Maori, non Pacific) which showed 22% fewer than expected deaths, when compared to New Zealand all ethnicities.

71
Ratio95%
conf.limits Ratio95%
conf.limits Ratio95%
conf.limits Ratio95%
conf.limits
MidCentral 0.97 0.63 - 1.32 0.77 - 0.78 0.58 - 0.98 0.83 0.66 - 1New Zealand 1.52 1.43 - 1.62 1.35 1.21 - 1.5 0.75 0.71 - 0.79 1
Other (includes Asian) All ethnicitiesMaori Pacific(New Zealand all ethnicities children's all cause mortality 1997 to 2001 used as comparison)
MidCentral and NZ Children's All Cause Indirect Age Adjusted Mortality Ratios 1997 to 2001
When childhood deaths were analysed across age groups, it showed that age band with the highest risk were infants aged less than one. MidCentral district age specific rate for infants aged less than 1 was lower than the corresponding New Zealand rate (2,300 deaths per 100,000 infants across 5 years for MidCentral district and 3,070 deaths per 100,000 infants across 5 years for New Zealand).
MidCentral All Ethnicities Children's All Cause Mortality by Age Group 1997 to 2001
0
10
20
30
40
50
60
00 01-04 05-09 10-14
Age group
Nu
mb
er o
f ev
ents
MidCentral All Ethnicities Children's All Cause Mortality Age Specific Rates 1997 to 2001
0
500
1000
1500
2000
2500
00 01-04 05-09 10-14
Age group
Ag
e sp
ecif
ic r
ate/
100,
000
peo
ple

72
NZ All Ethnicities Children's All Cause Mortality Age Specific Rates 1997 to 2001
0
500
1000
1500
2000
2500
3000
3500
00 01-04 05-09 10-14
Age group
Ag
e sp
ecif
ic r
ate/
100,
000
peo
ple
14.7.3 Children Aged 1 to 14 Mortality
Mortality data for children aged 1 to 14 years from 1997 to 2001 were analysed. MidCentral district mortality numbers were small, even when five years of data were accumulated. This should be kept in mind when reading this section, because health rates and ratios calculated using low numbers can be unstable or unreliable. Analysis using age adjusted ratios show New Zealand Maori experienced 45% more than expected deaths compared to New Zealand all ethnicities. New Zealand Pacific peoples experienced 20% more than expected deaths compared to New Zealand all ethnicities. New Zealand other ethnicities (non Maori, non Pacific) children aged 1 to 14 had 18% less than expected deaths compared to New Zealand all ethnicities. The concept of age adjusted ratios is explained in the section analysing mortality for children of all ages. MidCentral district age adjusted ratios did not reach statistical significance, probably because of small numbers. When the deaths were graphed across different age groups, it showed children aged 1 to 4 years had the highest mortality risk of the 1 to 14 age groups.
Maori Pacific
Other (includes
Asian)All
ethnicities1997 3 0 10 131998 2 0 5 71999 2 0 2 42000 2 1 4 72001 3 0 6 9
Total 12 1 27 40
MidCentral Children Aged 1 to 14 All Cause Mortality 1997 to 2001
Maori Pacific
Other (includes
Asian)All
ethnicitiesMidCentral 47.4 32.0 20.3 24.8New Zealand 61.7 48.2 18.1 26.1
NZ and MidCentral Children Aged 1 to 14 All Cause Crude (non-age adjusted) Mortality Rates per 100,000 People 1997 to 2001

73
Ratio95%
conf.limits Ratio95%
conf.limits Ratio95%
conf.limits Ratio95%
conf.limits
MidCentral 1.09 0.47 - 1.71 0.82 - 0.92 0.57 - 1.27 0.96 0.66 - 1.26New Zealand 1.45 1.29 - 1.6 1.2 0.96 - 1.43 0.82 0.75 - 0.89 1
MidCentral and NZ Children Aged 1 to 14 All Cause Indirect Age Adjusted Mortality Ratios 1997 to 2001
All ethnicitiesMaori Pacific(New Zealand all ethnicities children aged 1 to 14 all cause mortality 1997 to 2001 used as comparison)
Other (includes Asian)
NZ All Ethnicities Children Aged 1 to 14 All Cause Mortality by Age Group 1997 to 2001
0
50
100
150
200
250
300
350
400
450
01-04 05-09 10-14
Age group
Nu
mb
er o
f ev
ents
NZ All Ethnicities Children Aged 1 to 14 All Cause Mortality Age Specific Rates 1997 to 2001
0
20
40
60
80
100
120
140
160
180
200
01-04 05-09 10-14
Age group
Ag
e sp
ecif
ic r
ate/
100,
000
peo
ple
MidCentral All Ethnicities Children Aged 1 to 14 All Cause Mortality by Age Group 1997 to 2001
0
2
4
6
8
10
12
14
16
01-04 05-09 10-14
Age group
Nu
mb
er o
f ev
ents

74
MidCentral All Ethnicities Children Aged 1 to 14 All Cause Mortality Age Specific Rates 1997 to
2001
0
20
40
60
80
100
120
140
160
180
01-04 05-09 10-14
Age group
Ag
e sp
ecif
ic r
ate/
100,
000
peo
ple
14.7.4 Infant Mortality Rates
Average annual infant mortality rates were calculated using the infant death and live birth data from 1999 to 2001. Infants are regarded as children less than one year of age. MidCentral district average annual infant mortality rate for 1999 to 2001 was slightly lower than New Zealand’s rate (1.6 deaths per 1,000 live births versus 2.0 deaths per 1,000 live births respectively). When subdivided by ethnicity, MidCentral district Maori average annual infant mortality rate (1.9 deaths per 1,000 live births) was a slightly higher rate than MidCentral district but lower than New Zealand. MidCentral district Pacific peoples rate is also higher, but is based on only 2 infant deaths. When subdivided by territorial authority, Horowhenua’s rate (2.5 deaths per 1,000 live births) was higher than both MidCentral district and New Zealand. However, the number of MidCentral district infant deaths is small, especially when divided into sub groups. The ethnicity and territorial authority rates calculated here may be unstable. However, it is consistent with general patterns of ethnic and sub district health status disparity described in other parts of this document.
Maori Pacific Other MidCentral New ZealandNumber of births 2101 275 4253 6629 169457Number of infant deaths 12 2 18 32 1003Average annual infant mortality rate/1,000 live births 1.9 2.4 1.4 1.6 2.0
MidCentral Infant Mortality Rate by Ethnicity 1999 to 2001
Palmerston North Horowhenua Manawatu Tararua
Kapiti (MidCentral
portion) MidCentral New ZealandNumber of births 3189 1203 1123 786 328 6629 169457Number of infant deaths 14 9 5 3 1 32 1003Average annual infant mortality rate/1,000 live births 1.5 2.5 1.5 1.3 1.0 1.6 2.0
MidCentral Infant Mortality Rate by Territorial Authority 1999 to 2001

75
15. DISABILITY IN MIDCENTRAL DISTRICT
Key Points
• An estimated 32,000 MidCentral district residents experience some form of disability (based on 2001 data).
• The likelihood of disability increases with age. • Most disabled people live in private households. • Although the likelihood of requiring residential care increases with age, most disabled
people 65 years and older live in private households. • Most disabled people experience more than one form of disability. • The two most common forms of disability are physical (65%) and sensory (41%). • The leading causes of disability are disease or illness (39%), followed by accident or
injury (35%). The ageing process was the second most important cause for people aged 65 or over.
• Severity of disability increases with age. • The likelihood of needing special equipment increases with age. • Disabled people are less likely to be in the labour force (in work or looking for work)
than non disabled people, and are more likely to be unemployed.
15.1 Disability Overview
15.1.1 Information Sources
There has been no comprehensive survey of all the disabled people living in MidCentral district. The most important recent information about disabled people in New Zealand has come from Statistics New Zealand’s two surveys of disabilities carried out in 2001. One concerned disabled people living in households (2001 Household Disability Survey) and the other concerned disabled people over 15 living in residential facilities (2001 Disability Survey of Residential Facilities). Statistics New Zealand carried out similar surveys in 1996/1997. (Ref: Statistics New Zealand: 2002. Disability Counts 2001. Wellington: Statistics New Zealand.) A health needs assessment for MidCentral district disabled people 65 years and over was carried out in 2004. It examined existing data on disability and disability resource use, including Statistics New Zealand’s 2001 disability surveys. The Public Health Consultancy of the Wellington Medical School extrapolated the results of the 2001 national disability surveys on to MidCentral district 2001 population. Some of those results will be quoted here. (Ref: Public Health Consultancy: 2002. Description of MidCentral district population with disabilities: estimation from New Zealand Household Disability Survey 2001 and New Zealand Disability Survey of Residential Facilities. Wellington: Wellington School of Medicine.) For their disability surveys, Statistics New Zealand defined disability as: any self perceived limitation in activity resulting from a long term condition or health problem, lasting or expecting to last six months or more and not completely eliminated by an assistive device.
15.1.2 Disability in the Community
About one fifth of the general population suffer from a disability, approximately 32,135 people in MidCentral district in 2001. The likelihood of disability increases with age. Eleven percent of children (aged 0 to 14) experienced disability, compared to 13% of adults aged 15 to 44, 25% of adults aged 45 to 64, and 54% of adults aged 65 and over.

76
The proportion of disability among Pacific peoples is about one in seven. Maori disability percentages within some individual age groups are higher than for all New Zealanders, although overall percentage who are disabled is the same. Fifteen percent of Maori children experienced disability, 34% of adults aged 45 to 64, and 61% of adults aged 65 and over. Most disabled people live in private households. Although the likelihood of living in residential care increases with age, most older disabled people live in private households.
Proportion of Disabled People Living in Residential Care by Age Group 2001
0.0%
20.0%
40.0%
60.0%
80.0%
100.0%
120.0%
Under 65 65-74 75+
Age group
Per
cen
tag
e
Private Household
Residential Facility
Age group Maori PacificOther
ethnicities Total0-14 1324 131 2439 389415-44 2039 211 6336 858645-64 974 107 7282 836365+ 464 50 10776 11290
MidCentral Estimated Number of People With Disability 2001
15.2 Disability Characteristics Most disabled people have more than one disability, especially people living in residential care. Ninety six percent of people living in residential care experienced multiple disabilities compared to 59% of disabled people living in households.
15.2.1 Types of Disability
Physical disability is the most common type, affecting 65% of disabled people living in households. Physical disabilities are those affecting movement or agility. Sensory disabilities, affecting vision and hearing, were the second most common (41%), followed by “other” disabilities (39%), psychiatric/psychological (15%), and intellectual disability (5%). “Other” disabilities are mainly those which affect memory, learning, verbal communication, and disabilities not covered by the categories already mentioned. When more detailed disability types are considered, the most common types for combined age groups were: mobility (55.3%), agility (43.2%), other disability (39.2%), and hearing impairment (33.9%). The types of disability that increase in proportion with age were mobility, agility, hearing, and visions. The types of disability that decrease in proportion with age were psychological/psychiatric, intellectual, and other disability.
Disability typeEstimated Number
Sensory 11035Physical 17468Intellectual 1194Psychiatric/psychological 3909
Other 10328Total 26664
MidCentral Estimated Number of Adults by Disability Type Living in Households
2001

77
Mobility disability is defined as inability or difficulty walking about 350 metres without resting, walking up or down a flight of stairs, carrying a five kilogram object 10 metres, moving from one room to another, or standing for 20 minutes. Agility disability is defined as inability or difficulty with bending over, dressing, grasping, cutting own toenails, reaching, cutting up own food, or getting in and out of bed.
Disability Type Disabled People Living in Households by Age Group 2001
0.0%
10.0%
20.0%
30.0%
40.0%
50.0%
60.0%
70.0%
80.0%
90.0%
Under 65 65-74 75+ Total
Age group
Perc
enta
ge
Hearing impairment
Vision impairment
Mobility limitation
Agility limitation
Intellectual Disability
Psychological/PsychiatricDisabilityOther Disability
15.2.2 Causes of Disability
The leading cause of disability among adults living in households was disease or illness (39%), followed by accident or injury (35%), other causes (20%), the ageing process (18%), and disability existing since birth (10%). Eighteen percent did not specify a cause for their disability. When considering this data, it is important to keep in mind that more than one cause can be given for an individual’s disability. There were significant differences when comparing causes of disability for people aged 65 and over, and those of all ages. Disease/illness was the most common reason for disability for both age groups, but was more frequent for the 65 and over age group (50% versus 39%). For those aged 65 and over, the ageing process was the second most common cause (40%), and accident/injury the third (25.6%). For all age groups, the ageing process was only the fourth most common cause (16%), while accident/injury was the second (30%).
Causes of Disability by Age Group 2001
0.0%
10.0%
20.0%
30.0%
40.0%
50.0%
60.0%
65+ All ages
Age Group
Perc
ent
Disease/illness
Birth
Accident or injury
Ageing Process (adultsonly)Other cause
Not stated
15.2.3 Severity of Disability
The severity of disability tends to increase with age. In the younger (under 65 years) age groups most disabled experience mild disability. In age groups 65 and older, most disabled people are moderately or severely disabled.

78
The level of disability severity is higher in residential care homes. Most residents were severely disabled, and there were no residents with mild disability.
Severity of limitation Household ResidentialMild 11540 --Moderate 11914 188Severe 3210 1015Total 26664 1205
MidCentral Estimated Number of Adults by Severity of Limitation 2001
Disability Severity for All People in Private Households 2001
0.0%
10.0%
20.0%
30.0%
40.0%
50.0%
60.0%
70.0%
80.0%
90.0%
Under 65 65-74 75+ Total
Age group
Per
cen
tag
e
Mild
Moderate
Severe
No Disability
15.2.4 Disability and Household Size
People with disabilities were more likely to live in one person households than people without disabilities, and this likelihood increases with age. Overall, 18% of disabled people lived in one person households compared with 7% among non disabled people. This may be because most disabled people are older and older people are more likely to live alone.
Household Size for Disabled People Living in Private Households 2001
0%10%20%30%40%50%60%70%80%90%
100%
Under 65 65-74 75+ Total
Age group
Per
cen
tag
e
one personhousehold
householdsother than one-
15.2.5 Educational Qualifications
Disabled people were more likely to have no formal educational qualifications and less likely to have a post school qualifications than non disabled people. Thirty nine percent of disabled people had no qualifications compared with 24% of non disabled people. The margin for people with post school qualifications was smaller: 27% of disabled people versus 34% for non disabled people.

79
15.2.6 Participation in the Labour Force
Disabled people are less likely to be in the labour force than non disabled people. Of those in the labour force, disabled people are more likely to be unemployed than non disabled people. About 44% of disabled adults were in the labour force compared with 74% of non disabled people. People in the labour force are considered to be either in work or looking for work. Forty percent of disabled adults in the labour force were employed compared to 70% of non disabled adults.
15.2.7 Personal Income
In general, disabled people had lower personal incomes than non disabled people. Fifty six percent of disabled adults reported income of less than $15,000 in the previous twelve months, compared with 40% of non disabled adults.
15.2.8 Use of Special Equipment
Approximately a third of disabled adults used special equipment. The likelihood of requiring special equipment rose with increasing age, from 22% for disabled people less than 65 years to 65% for people aged 65 years and over. For disabled adults living in households, people with sensory disabilities are most likely to use special equipment–74% compared to 34% with other types of disabilities. This excludes glasses which can eliminate any vision defect. Most adults in residential care used special equipment (91%).
Disabled People in Households Use of Special Equipment 2001
0.0%
10.0%
20.0%
30.0%
40.0%
50.0%
60.0%
70.0%
80.0%
Under 65 65-74 75+ Total
Age group
Per
cen
tag
e
Use specialequipment
No use of specialequipment
Not specif ied
15.2.9 Help for Everyday Activities
The likelihood of needing help for every day activities increased with increasing age.
Disabled People Receipt of Help for Everyday Activities by Age Group 2001
0.0%
10.0%
20.0%
30.0%
40.0%
50.0%
60.0%
70.0%
Under 65 65-74 75+ Total
Age group
Per
cen
tag
e
Yes receivehelp
No help
Not specif ied orunstated

80
15.2.10 Unmet Health Need
Around 15% of adults living in households had an unmet need for one or more health services. The percentage of disabled adults with an unmet health need reduced with age, from 24% for people aged 15 to 44, to 6.5% for people aged 65 and older.
15.2.11 Unmet Need for Special Equipment
The percentage of disabled adults living in households with an unmet need for special equipment increased only slightly with age–from 11.7% for people under 65 to 13.9% for people aged 75 and over. This extrapolates to approximately 2,000 people under 65 years and 1,600 people 65 years and older in MidCentral district in 2001.
Unmet Need for Special Equipment Among Adult Disabled People in Households 2001
0.0%10.0%20.0%30.0%40.0%50.0%60.0%70.0%80.0%90.0%
Under 65 65-74 75+ Total
Age group
Perc
enta
ge Yes UnmetNeed
No Unmet Need
Not specif iedor unstated
15.2.12 Disability and Children
Around 11% of children experienced disability. More boys than girls were disabled: 13% of boys (estimated 2,300 in MidCentral district) and 9% of girls (estimated 1,486 in the district). Most children, around 58%, had an “other” category of disability. This includes problems speaking, learning and developmental difficulties, and children requiring special education. A third of disabled children experienced chronic health problems, and a third some type of sensory disability. Twenty five percent of disabled children had psychiatric/psychological disabilities, and 14% intellectual disabilities. A child can experience more than one cause of disability. Most disabled children (41%) have had their disability from birth. About a third of children’s
Unmet Health Need Among Adult Disabled People in Households 2001
0.0%
5.0%
10.0%
15.0%
20.0%
25.0%
15 - 44 45 - 64 65 and over Total
Age group
Per
cent
age
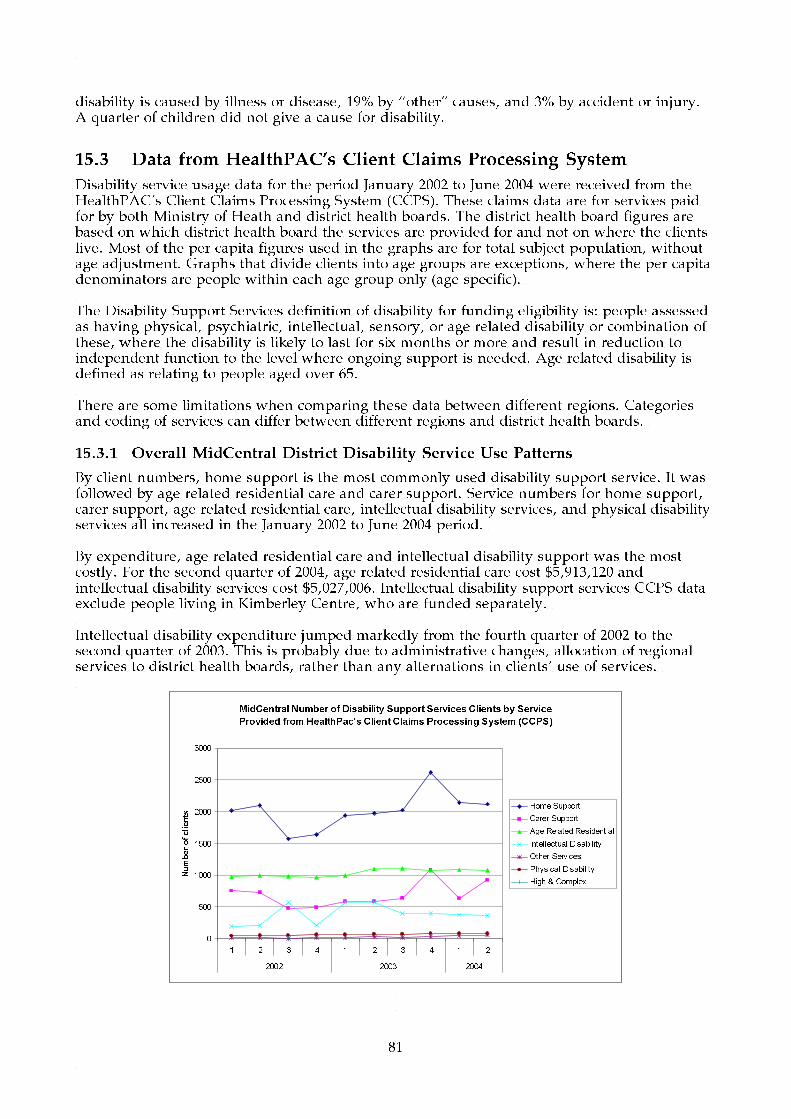
81
disability is caused by illness or disease, 19% by “other” causes, and 3% by accident or injury. A quarter of children did not give a cause for disability.
15.3 Data from HealthPAC’s Client Claims Processing System
Disability service usage data for the period January 2002 to June 2004 were received from the HealthPAC’s Client Claims Processing System (CCPS). These claims data are for services paid for by both Ministry of Heath and district health boards. The district health board figures are based on which district health board the services are provided for and not on where the clients live. Most of the per capita figures used in the graphs are for total subject population, without age adjustment. Graphs that divide clients into age groups are exceptions, where the per capita denominators are people within each age group only (age specific). The Disability Support Services definition of disability for funding eligibility is: people assessed as having physical, psychiatric, intellectual, sensory, or age related disability or combination of these, where the disability is likely to last for six months or more and result in reduction to independent function to the level where ongoing support is needed. Age related disability is defined as relating to people aged over 65. There are some limitations when comparing these data between different regions. Categories and coding of services can differ between different regions and district health boards.
15.3.1 Overall MidCentral District Disability Service Use Patterns
By client numbers, home support is the most commonly used disability support service. It was followed by age related residential care and carer support. Service numbers for home support, carer support, age related residential care, intellectual disability services, and physical disability services all increased in the January 2002 to June 2004 period. By expenditure, age related residential care and intellectual disability support was the most costly. For the second quarter of 2004, age related residential care cost $5,913,120 and intellectual disability services cost $5,027,006. Intellectual disability support services CCPS data exclude people living in Kimberley Centre, who are funded separately. Intellectual disability expenditure jumped markedly from the fourth quarter of 2002 to the second quarter of 2003. This is probably due to administrative changes, allocation of regional services to district health boards, rather than any alternations in clients’ use of services.
MidCentral Number of Disability Support Services Clients by Service
Provided from HealthPac's Client Claims Processing System (CCPS)
0
500
1000
1500
2000
2500
3000
1 2 3 4 1 2 3 4 1 2
2002 2003 2004
Number of clients
Home Support
Carer Support
Age Related Residential
Intellectual Disability
Other Services
Physical Disability
High & Complex

82
MidCentral Mix of Disability Support Services Paid via HealthPac's
Client Claims Processing System (CCPS)
$0
$2,000,000
$4,000,000
$6,000,000
$8,000,000
$10,000,000
$12,000,000
$14,000,000
$16,000,000
1 2 3 4 1 2 3 4 1 2
2002 2003 2004
Intel lectual Disability
Age Related Residential
Physical Disability
Home Support
Carer Support
High & Complex
Other Services
15.3.2 Age Related Residential Care
MidCentral district client number per 10,000 population is slightly higher than either New Zealand or Central Region district health boards’ rates. The MidCentral district figure also showed a small increase from the first quarter of 2003 to the second quarter of 2004. The MidCentral district number of people 65 and over was slightly higher than the national average at the 2001 Census (13.4% and 12.1% respectively). MidCentral district expenditure per capita is also growing faster than both the Central Region district health boards and New Zealand. Analysis of client ethnicity per capita shows low proportions of Maori and Pacific peoples. Most of this is likely to be due to lower proportions of older people in their populations compared to non Maori, non Pacific ethnicities. There may be some other factors too, such as cultural suitability, but the data are not capable of identifying such influences. The total population is used for the per capita calculations, and not just the 65 and over age groups. The graph displaying residential care clients by ethnicity and age group shows Maori residential care HealthPAC client numbers are similar to non Maori, non Pacific until the 85+ age group.
MidCentral and Central District Health Boards Number of
Age Related Residential Care Clients per Capita
0.0
10.0
20.0
30.0
40.0
50.0
60.0
70.0
80.0
1 2 3 4 1 2 3 4 1 2
2002 2003 2004
Clients per 100,000 population
MidCentral
Central Total
NZ Total

83
MidCentral and Central District Health Boards Age Related
Residential Care Expenditure per Capita
$0.00
$5.00
$10.00
$15.00
$20.00
$25.00
$30.00
$35.00
$40.00
$45.00
1 2 3 4 1 2 3 4 1 2
2002 2003 2004
Amount per capita
MidCentral
Central Total
NZ Total
MidCentral Age Related Residential Care Clients by
Ethnicity per Capita
0.0
10.0
20.0
30.0
40.0
50.0
60.0
70.0
80.0
90.0
1 2 3 4 1 2 3 4 1 2
2002 2003 2004
Clients per 10,000 population
MidCentral - Maori
MidCentral - Other
MidCentral - Pacific People
NZ Total - Maori
NZ Total - Other
NZ Total - Pacific People
MidCentral Age Related Residential Care Clients by
Ethnicity and Age Group (age specific rates)
0.0
500.0
1000.0
1500.0
2000.0
2500.0
3000.0
10-14 20-24 45-49 50-54 55-59 60-64 65-69 70-74 75-79 80-84 85+
Age group
Clients per 10,000 people
Maori
Other
Pacific People
15.3.3 Home Support
MidCentral and Central Region district health boards home support clients per unit population tended to fluctuate across the 2002 to 2004 period. MidCentral district client numbers per unit population was slightly greater than New Zealand’s at the end of the period, the second quarter of 2004 (129 per 10,000 people for MidCentral district and 120 per 10,000 people for New Zealand).

84
Per capita expenditure grew for both MidCentral district ($6.79 to $8.17 per capita) and New Zealand ($2.88 to $6.36 per capita). Central Region district health boards’ expenditure oscillated, but did end the period higher than at the start ($5.55 to $7.25). MidCentral district per capita expenditure was higher than either Central Region district health boards and New Zealand at the second quarter of 2004. The likelihood of use of home support services increase with increasing age. This pattern was true for MidCentral district, Central Region district health boards, and New Zealand. Maori and Pacific peoples per capita use of home support is much lower than for other ethnicities. This is true for both MidCentral district and New Zealand.
MidCentral and Central District Health Boards Home
Support Clients per Capita
0.0
20.0
40.0
60.0
80.0
100.0
120.0
140.0
160.0
180.0
200.0
1 2 3 4 1 2 3 4 1 2
2002 2003 2004
Clients per 10,000 population
MidCentral
Central Total
NZ Total
MidCentral and Central District Health Boards Home
Support Services Expenditure per Capita
$0.00
$1.00
$2.00
$3.00
$4.00
$5.00
$6.00
$7.00
$8.00
$9.00
$10.00
1 2 3 4 1 2 3 4 1 2
2002 2003 2004
Amount per capita
MidCentral
Central Total
NZ Total

85
MidCentral Home Support Service Clients by Ethnicity
(per Capita)
0.0
20.0
40.0
60.0
80.0
100.0
120.0
140.0
160.0
180.0
200.0
1 2 3 4 1 2 3 4 1 2
2002 2003 2004
Clients per 10,000 population
MidCentral - Maori
MidCentral - Other
MidCentral - Pacific People
NZ Total - Maori
NZ Total - Other
NZ Total - Pacific People
MidCentral and Central District Health Boards Home
Support Service Clients by Age and Gender (per capita)
4000300020001000010002000300040005000
00
01-04
05-09
10-14
15-19
20-24
25-29
30-34
35-39
40-44
45-49
50-54
55-59
60-64
65-69
70-74
75-79
80-84
85+
clients per 10,000 (in age group)
MidCentral - Female
MidCentral - Male
Central Total - Female
Central Total - Male
NZ Total - Female
NZ Total - Male
15.3.4 Intellectual Disability
There were some administrative and allocation changes to CCPS funded services in the 2002 to 2003 period. These changes altered the service use data, making it difficult to interpret. An effort has been made to analyse these data, but the potential for data distortion due to artefact, rather than true changes in client service use, should be kept in mind. The number of MidCentral district intellectual disability clients per 10,000 population fluctuated in 2002 and 2003. This may have been influenced by the administrative changes mentioned previously. The number of intellectual disability clients in the Central Region district health boards also fluctuated, but to a smaller extent. By the second quarter of 2004, MidCentral district had 22.4 clients per 10,000 population receiving intellectual disability services, compared to 29.1 clients per 10,000 for Central Region district health boards, and 19.1 clients per 10,000 population for New Zealand. These figures do not include intellectually disabled residents of Kimberley Centre in Levin. The per capita expenditure for intellectual disability services funded by CCPS was higher for MidCentral district than for Central Region district health boards and New Zealand. By the second quarter of 2004, the expenditure in MidCentral district was $30.58, $21.00 for Central Region district health boards, and $14.65 in New Zealand. However, MidCentral district per capita expenditure declined in the final year of the data. Central Region district health boards and New Zealand per capita expenditure rose over the same period.

86
Analysis of clients by ethnicity and age group per unit of population show people most like to use CCPS funded intellectual disability services were young adults through to people in middle age.
MidCentral and Central District Health Boards Number of
Intellectual Disability Clients per Capita
0.0
5.0
10.0
15.0
20.0
25.0
30.0
35.0
40.0
1 2 3 4 1 2 3 4 1 2
2002 2003 2004
Clients per 10,000 population
MidCentral
Central Total
NZ Total
MidCentral and Central District Health Boards Intellectual
Disability Services Expenditure per Capita
$0.00
$5.00
$10.00
$15.00
$20.00
$25.00
$30.00
$35.00
$40.00
1 2 3 4 1 2 3 4 1 2
2002 2003 2004
Amount per capita
MidCentral
Central Total
NZ Total
MidCentral Intellectual Disability Service Clients by
Ethnicity and Age Group
0.0
10.0
20.0
30.0
40.0
50.0
60.0
70.0
80.0
10-
14
15-
19
20-
24
25-
29
30-
34
35-
39
40-
44
45-
49
50-
54
55-
59
60-
64
65-
69
70-
74
75-
79
80-
84
Clients per 10,000 population
Maori
Other
Pacific People

87
15.3.5 Physical Disability
The data analysed here are for people receiving physical disability services funded through CCPS. The absolute numbers of people receiving services were small, especially for Maori and Pacific peoples. This can affect reliability of any rates and per capita calculations. The number of clients per unit of population receiving physical disability services increased for MidCentral district, Central Region district health boards, and New Zealand from January 2002 to June 2004. The Central Region rate levelled off for the last twelve months of this period. The MidCentral district clients per unit of population was higher than either Central Region district health boards or New Zealand. The per capita expenditure rate for MidCentral district and Central Region district health boards fluctuated across the period, but increased in general. The New Zealand rate also increased across the period. At the second quarter of 2004, the per capita expenditure was $2.80 for MidCentral district, $1.86 for Central Region district health boards, and $2.48 for New Zealand. When clients were examined across age groups and gender, MidCentral district clients showed higher age group specific rates among young adults through to early middle age. There was also a small increase among MidCentral district women aged 80 to 84. Examination of client data by ethnicity showed Maori had higher rates per unit population than MidCentral district non Maori, non Pacific ethnicities. MidCentral district Maori and other (non Maori, non Pacific) ethnicities had higher client rates than their New Zealand equivalents. All the ethnicity rates for MidCentral district and New Zealand were increasing from 2002 to 2004. When Maori and non Maori rates were examined across age groups, Maori showed peak in client rates in the 30 to 39 and 45 to 49 age groups.
MidCentral and Central District Health Boards Number of
Physical Disability Service Clients per Capita
0.0
1.0
2.0
3.0
4.0
5.0
6.0
1 2 3 4 1 2 3 4 1 2
2002 2003 2004
Clients per 10,000 population
MidCentral
Central Total
NZ Total
MidCentral and Central District Health Boards Physical
Disability Support Expenditure per Capita
$0.00
$0.50
$1.00
$1.50
$2.00
$2.50
$3.00
$3.50
$4.00
1 2 3 4 1 2 3 4 1 2
2002 2003 2004
Amount per capita
MidCentral
Central Total
NZ Total

88
MidCentral and Central District Health Boards Physical
Disability Services by Age and Gender (per capita)
30201001020
00
01-04
05-09
10-14
15-19
20-24
25-29
30-34
35-39
40-44
45-49
50-54
55-59
60-64
65-69
70-74
75-79
80-84
85+
clients per 10,000 (in age group)
MidCentral - Female
MidCentral - Male
Central Total - Female
Central Total - Male
NZ Total - Female
NZ Total - Male
MidCentral and NZ Physical Disability Clients by Ethnicity
(per capita)
0.0
1.0
2.0
3.0
4.0
5.0
6.0
7.0
8.0
1 2 3 4 1 2 3 4 1 2
2002 2003 2004
Clients per 10,000 population
MidCentral - Maori
MidCentral - Other
NZ Total - Maori
NZ Total - Other
NZ Total - Pacific People
MidCentral Physical Disability Service Clients by Ethnicity
and Age Group
0.0
5.0
10.0
15.0
20.0
25.0
30.0
15-19 20-24 25-29 30-34 35-39 40-44 45-49 50-54 55-59 60-64 80-84
Age group
Clients per 10,000 population
Maori
Other

89
16. MIDCENTRAL DISTRICT MORBIDITY AND MORTALITY
Key Points
• The organ systems (by Major Diagnostic Category) most commonly leading to hospitalisation for MidCentral district residents across all age groups were: circulatory system, digestive system, musculoskeletal system, and respiratory system. Newborn (newly born babies suffering illnesses and also in hospital as healthy boarders); and ear, mouth, nose, and throat were additional important hospitalisation causes for children. Pregnancy/birth; and female reproductive system were additional important hospitalisation causes for adults aged 15 to 64. Skin, breast were additional important reasons for hospitalisation for adults aged 65 and older.
• Maori disadvantage in health status is present in MidCentral district, but appears to be less than for New Zealand overall.
• For many diseases, MidCentral district Maori often have higher than expected hospitalisations compared to MidCentral district non Maori, non Pacific ethnicities.
• MidCentral district Pacific peoples health measures suggest they experience poorer health status, for example, higher mortality rates due to all causes and due to circulatory system disease.
• Circulatory system diseases was the second most common cause for hospitalisation for Maori adults, aged 15 to 64. Hospitalisation numbers increased from 1999/2000 to 2000/2001.
• Circulatory system disease is a major cause of illness and the most important cause of mortality, especially as people age. Circulatory system disease is responsible for around 40% of deaths.
• Ischaemic heart disease is the most common cause of circulatory system hospitalisation (40 to 45% of circulatory system hospitalisations).
• Stroke and diabetes yearly hospitalisations have been increasing. • Injuries are a major cause of musculoskeletal hospitalisations (60% in children, 45% in
adults aged 15 to 64, and 38% in adults aged 65+). • Although MidCentral district Maori have fewer than expected cancer registrations, they
have greater than expected deaths from cancer compared to non Maori, non Pacific ethnicities.
• Digestive and respiratory cancers are the two most common cancer groupings causing cancer deaths.
• Maori have higher than expected number of deaths due to digestive and respiratory cancers. Colorectal, liver, and stomach cancers are important causes of digestive system cancer deaths for Maori. Most (around 95%) respiratory cancers are cancers of the trachea, bronchus, or lung.
• MidCentral district overall mortality rate from 1999 to 2001 was 10% higher than New Zealand’s.
• The four most common causes of mortality are: (1) circulatory disease, (2) cancers, (3) respiratory disease, (4) external causes (unintentional and intentional injuries).
• MidCentral district mortality rates from circulatory disease and external causes were higher than New Zealand’s rates, by 15% and 20% respectively (1999 to 2001 data).
• MidCentral district Maori and New Zealand Maori experienced higher than expected numbers of deaths from: all causes, circulatory disease (over double the expected number), respiratory disease, and external causes (although MidCentral district Maori figures do not reach statistical significance for external causes).
• MidCentral Maori children’s hospitalisation rates for non-suppurative otitis media (glue ear) were lower than expected. This might indicate an access issue.
• MidCentral Maori have lower hospitalisation rates for injuries than MidCentral non Maori, non Pacific ethnicities. This contradicts injury mortality patterns where MidCentral Maori have higher mortality rates than non Maori, non Pacific ethnicities

90
(although this difference did not reach statistical significance).
16.1 Introduction This section looks at overall MidCentral district health data, mainly illness and mortality patterns. Much of these data is presented by ethnicity, and some by age group as well. The data used were: hospital discharges, cancer registration, and mortality.
16.1.1 Outline of Section Contents
The health information presented here is divided into:
• The most common causes of hospitalisation. • Ethnic comparisons of selected diseases for MidCentral district and New Zealand. • The most common cancers registered in MidCentral district, divided by ethnic group. • The most common cancers causing death in MidCentral district, divided by ethnicity. • The four most common causes of mortality, divided by ethnicity. • Ethnic comparisons of the incidence of the four most common causes of mortality.
Each of these is described in more detail below.
• The Most Common Causes of Hospitalisation
Hospitalisation data for this subsection are divided into three age groups: 0 to 14 years, 15 to 64 years, and 65 and older. The reason data were divided into age groups, rather than examining all data together, is because the disease patterns are different for different age groups. For example, circulatory diseases are more common in adults, especially older adults. After division by age group, the data are further subdivided by these ethnic groups: Maori, Pacific peoples, Asian peoples and other ethnicities (including NZ European). A shortcoming experienced with the hospital discharge data is that Asian ethnicities were incorporated into other ethnicities before the 2000/2001 year. The most common causes of hospitalisation are described firstly by body system (using Major Diagnostic Categories) and then by more detailed diagnoses within the top five Major Diagnostic Categories. Major Diagnostic Categories are groupings of diagnoses made for management and administrative purposes. They largely conform to body systems, for example, circulatory system; digestive system; pregnancy/birth. • Ethnic Comparisons of Selected Diseases
MidCentral district and New Zealand ethnic comparisons were made for certain diseases/disorders. The diseases/disorders selected were:
o Circulatory system diseases o Ischaemic heart disease o Stroke o Diabetes o Asthma o Respiratory infections o Chronic obstructive respiratory disease o All cause injuries o Digestive system diseases o Skin infections o Non-suppurative otitis media (glue ear) o Chronic diseases of tonsils and adenoids

91
o Suppurative otitis media (middle ear infection) o Immunisation preventable hospitalisations.
Asian ethnicities have had to be combined with other (non Maori, non Pacific, non Asian) ethnicities for these comparisons. That is because the population data used as inputs for the calculations do not separate out Asian peoples from other ethnicities. • The Most Common Cancers Registered Lists of the most common cancers registered from 1998 to 2000 with the Cancer Registry from MidCentral district residents are given here. The lists are divided into different ethnic groups. The Cancer Registry is a national record of newly diagnosed malignant primary cancers and has been running since 1948. Ethnicity comparisons for selected cancers, such as lung, breast, colorectal, melanoma, non Hodgkin’s lymphoma, and others have recently been described in MidCentral’s Cancer Service Plan 2005. This information has not been repeated for this document. • The Most Common Cancers Causing Mortality
Lists of the most common cancers causing mortality from 1999 to 2001 among MidCentral district residents, divided into different ethnic groups. Ethnicity comparisons for mortality of selected cancers were also described in MidCentral’s Cancer Service Plan 2005, so has not been repeated for this document. • Four Most Common Causes of Mortality
The four most common causes of mortality among MidCentral district residents from 1999 to 2001 are described, for each of the major ethnic groups. • Ethnic Comparisons for the Four Major Causes of Mortality
Ethnic comparisons for the each of the four most common causes of mortality were made using mortality data 1999 to 2001.
16.2 Ethnicity in MidCentral District The two main ethnic groups in MidCentral district are Maori (14%) and NZ European. The other two main ethnic groupings, Pacific peoples and Asian peoples, have much smaller proportions, about 6% each. There is a lack of direct measurement of morbidity in New Zealand. The only exception is the cancer registry, which registers each person in New Zealand for most cancers. The main measure of morbidity is indirect–examining hospital discharge data. Ethnicity classifications have been simplified to allow analysis. Many New Zealanders associate themselves with more than one ethnic group. However, ethnicity data here have been prioritised to only one ethnic group to simplify analysis.
16.3 Most Common Reasons for Hospitalisation The most common reasons for hospitalisation were found for MidCentral district residents. The population was divided into three age groups: children (0 to 14 years old), adults (15 to 64 years old), and older adults (65 years and older). Within these age groups, the hospitalisation data were then divided into four ethnicities: Maori, Pacific peoples, Asian peoples and other ethnicities (which includes NZ European).

92
The most common reasons for hospitalisation was sorted into the five most common Major Diagnostic Categories, and then the most common diagnoses within those categories. Major Diagnostic Categories are groupings of diagnoses made for management and administrative purposes. They generally follow body systems.
16.3.1 MidCentral District Children Aged 0 to 14 Years Hospitalisations
This section shows hospitalisation patterns for children aged 0 to 14 years old, firstly, all ethnicities together, then divided into individual ethnic groups (Maori, Pacific peoples, Asian peoples, and other ethnicities).
16.3.1.1 MidCentral District Children of All Ethnicities Aged 0 to 14 Years Hospitalisations
Yearly total hospital discharges for MidCentral district children aged 0 to 14 of all ethnicities fell 14.6% from 1999/2000 to 2002/2003 (from 4,392 to 3,751 discharges). When divided by Major Diagnostic Category, the main types of discharges were:
1. Newborns 2. ENMT (ear, nose, mouth, and throat) 3. Respiratory system 4. Digestive system 5. Musculoskeletal system.
When Major Diagnostic Categories hospital discharges were graphed across 1999/2000 to 2002/2003, yearly discharge numbers for most categories fell. An exception was “infections, parasites” which increased from 133 discharges in 1999/2000 to 155 in 2002/2003. This is a category that includes selected types of less common infections, or infections that do not fit easily within other body systems, for example, septicaemia (“blood poisoning”), glandular fever, and chickenpox. The most common infections associated with individual body systems are categorised within those systems, for example pneumonia is included in respiratory system category. The most common diagnoses within the top five Major Diagnostic Categories are shown in a table below. The main points from this table are:
• Of newborns Major Diagnostic Category, supervision of healthy child or infant made up a third of newborns Major Diagnostic Category. This was the largest diagnostic grouping. The next most frequent diagnostic grouping disorders related to length of gestation and foetal growth (25.6% of newborn).
• Non-suppurative otitis media (glue ear) and chronic diseases of the tonsils and adenoids made up over half of ear, nose, and throat disorders.
• Over half (57.7%) of disorders of the mouth hospitalisations were for dental caries. • Asthma and respiratory infections were the most dominant diagnostic groupings within
the respiratory Major Diagnostic Category. The respiratory infections considered included those with viruses, such as influenza virus.
• Intestinal infections was the most common diagnosis in the digestive system Major Diagnostic Category, making up 28.1% of hospitalisations.
• Symptoms, signs, and abnormal clinical and laboratory findings, not elsewhere classified was the second most common diagnostic grouping in the digestive system Major Diagnostic Category. These are hospitalisations for an abnormal digestive symptom or test result where there is insufficient evidence for a diagnosis by the time of discharge. This diagnostic grouping made up 24.5% of digestive system hospital discharges.
• Most (60.5%) musculoskeletal system hospitalisations are for injuries.

93
MidCentral Aged 0 to 14 Total Hospital
Discharges 1999 to 2003
0
500
1000
1500
2000
2500
3000
3500
4000
4500
5000
1999/2000 2000/2001 2001/2002 2002/2003
Years
Number of discharges
MidCentral Aged 0 to 14 Hospital Discharges by Major
Diagnostic Category 1999 to 2003
0
500
1000
1500
2000
2500
3000
3500
4000
Blood,
immun
ityBur
ns
Cance
r
Circul
atory
syste
m
Digesti
ve sy
stem
Endoc
rine,
nutri
tionENMT
Eye
Fem
ale re
prod
uctiv
e
Infec
tion,
para
sites
Injur
y, po
isonin
g
Kidney
, urin
ary
Liver
, pan
creas
Male re
prod
uctiv
e
Muscu
loske
letal
syste
m
Nervou
s sys
tem
Newbo
rns
Other c
ontac
ts
Pregn
ancy
, birt
h
Respi
ratory
Sys
tem
Skin, b
reast
Number of discharges
MidCentral Aged 0 to 14 Hospital Discharges by Major
Diagnostic Category 1999 to 2003
0
100
200
300
400
500
600
700
800
900
1000
1999/2000 2000/2001 2001/2002 2002/2003
Years
Number of discharges
Blood, immunity BurnsCancer Circulatory systemDigestive system Endocrine, nutritionENMT EyeFemale reproductive Infection, parasitesInjury, poisoning Kidney, urinaryLiver, pancreas Male reproductiveMusculoskeletal system Nervous systemNew borns Other contactsPregnancy, birth Respiratory SystemSkin, breast
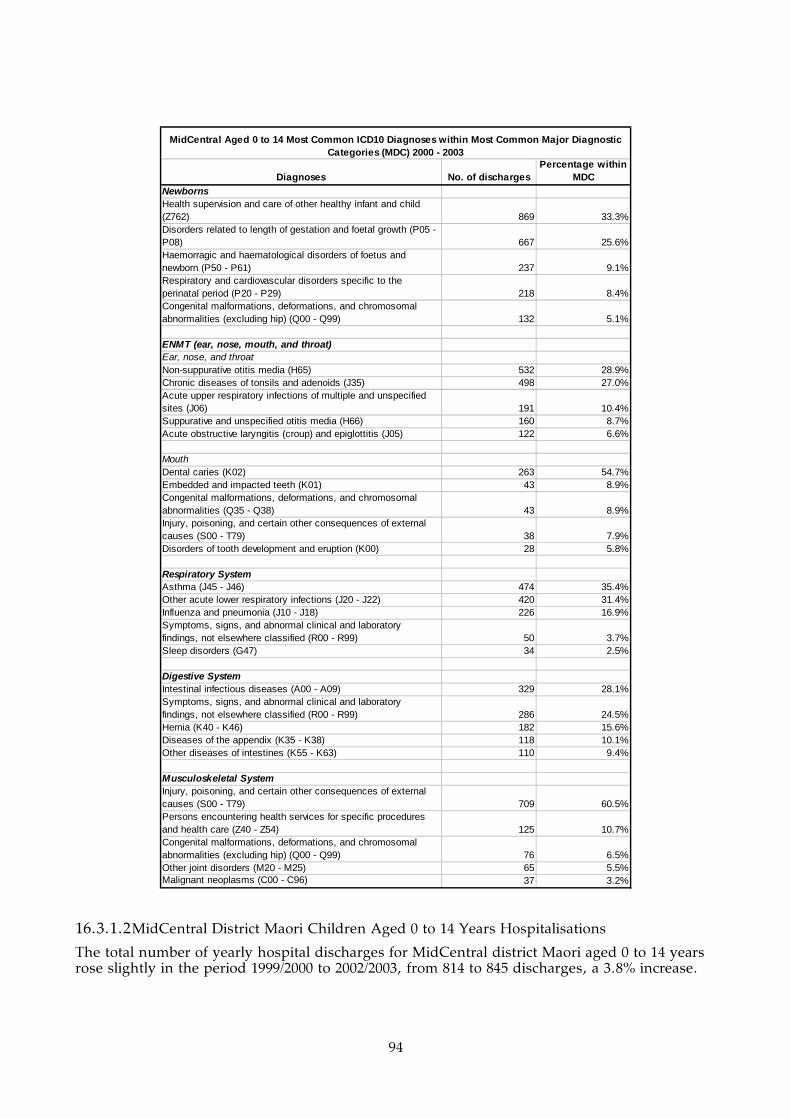
94
Diagnoses No. of dischargesPercentage within
MDCNewbornsHealth supervision and care of other healthy infant and child (Z762) 869 33.3%Disorders related to length of gestation and foetal growth (P05 - P08) 667 25.6%Haemorragic and haematological disorders of foetus and newborn (P50 - P61) 237 9.1%Respiratory and cardiovascular disorders specific to the perinatal period (P20 - P29) 218 8.4%Congenital malformations, deformations, and chromosomal abnormalities (excluding hip) (Q00 - Q99) 132 5.1%
ENMT (ear, nose, mouth, and throat)Ear, nose, and throatNon-suppurative otitis media (H65) 532 28.9%Chronic diseases of tonsils and adenoids (J35) 498 27.0%Acute upper respiratory infections of multiple and unspecified sites (J06) 191 10.4%Suppurative and unspecified otitis media (H66) 160 8.7%Acute obstructive laryngitis (croup) and epiglottitis (J05) 122 6.6%
MouthDental caries (K02) 263 54.7%Embedded and impacted teeth (K01) 43 8.9%Congenital malformations, deformations, and chromosomal abnormalities (Q35 - Q38) 43 8.9%Injury, poisoning, and certain other consequences of external causes (S00 - T79) 38 7.9%Disorders of tooth development and eruption (K00) 28 5.8%
Respiratory SystemAsthma (J45 - J46) 474 35.4%Other acute lower respiratory infections (J20 - J22) 420 31.4%Influenza and pneumonia (J10 - J18) 226 16.9%Symptoms, signs, and abnormal clinical and laboratory findings, not elsewhere classified (R00 - R99) 50 3.7%Sleep disorders (G47) 34 2.5%
Digestive SystemIntestinal infectious diseases (A00 - A09) 329 28.1%Symptoms, signs, and abnormal clinical and laboratory findings, not elsewhere classified (R00 - R99) 286 24.5%Hernia (K40 - K46) 182 15.6%Diseases of the appendix (K35 - K38) 118 10.1%Other diseases of intestines (K55 - K63) 110 9.4%
Musculoskeletal SystemInjury, poisoning, and certain other consequences of external causes (S00 - T79) 709 60.5%Persons encountering health services for specific procedures and health care (Z40 - Z54) 125 10.7%Congenital malformations, deformations, and chromosomal abnormalities (excluding hip) (Q00 - Q99) 76 6.5%Other joint disorders (M20 - M25) 65 5.5%Malignant neoplasms (C00 - C96) 37 3.2%
MidCentral Aged 0 to 14 Most Common ICD10 Diagnoses within Most Common Major Diagnostic Categories (MDC) 2000 - 2003
16.3.1.2 MidCentral District Maori Children Aged 0 to 14 Years Hospitalisations
The total number of yearly hospital discharges for MidCentral district Maori aged 0 to 14 years rose slightly in the period 1999/2000 to 2002/2003, from 814 to 845 discharges, a 3.8% increase.

95
When divided by Major Diagnostic Category, the main types of discharges were:
1. ENMT (ear, nose, mouth, and throat) 2. Newborns 3. Respiratory system 4. Musculoskeletal system, 5. Digestive system.
When the number of discharges by Major Diagnostic Category is tracked across the four year period, discharges for ear, nose, mouth, and throat seem to be rising. Most other category numbers appear stable (with some yearly fluctuation). The most common diagnoses within the top five Major Diagnostic Categories are shown in a table below. The main points from this table are:
• Non-suppurative otitis media (glue ear) is the most common ear, nose, and throat diagnosis, accounting for 38.3% of ear, nose, and throat discharges
• Dental caries is the most common diagnosis for disorders of the mouth hospitalisations (64.5%)
• Supervision of healthy infant and child is the most common reason for hospitalisation for newborns Major Diagnostic Category (35.0%). The second most common reason is for disorders related to length of gestation and foetal growth (26.7%)
• Respiratory infections and asthma are the two most dominant diagnostic groupings for respiratory system Major Diagnostic Category. Respiratory infections made up 54.8% and asthma 33.5% of respiratory system hospitalisations
• Over half (55.3%) of musculoskeletal system discharges were for injuries • Intestinal infections was the most common digestive system diagnostic grouping
(31.9%). The next most common diagnostic grouping for digestive system was “symptoms, signs, and abnormal clinical and laboratory findings, not elsewhere classified” (20.3%). These are hospitalisations for an abnormal digestive symptom or test result where there is insufficient evidence for a diagnosis by the time of discharge.
MidCentral Maori Aged 0 to 14 Total Hospital Discharges 1999 to 2003
0
100
200
300
400
500
600
700
800
900
1999/2000 2000/2001 2001/2002 2002/2003
Years
Nu
mb
er o
f d
isch
arg
es
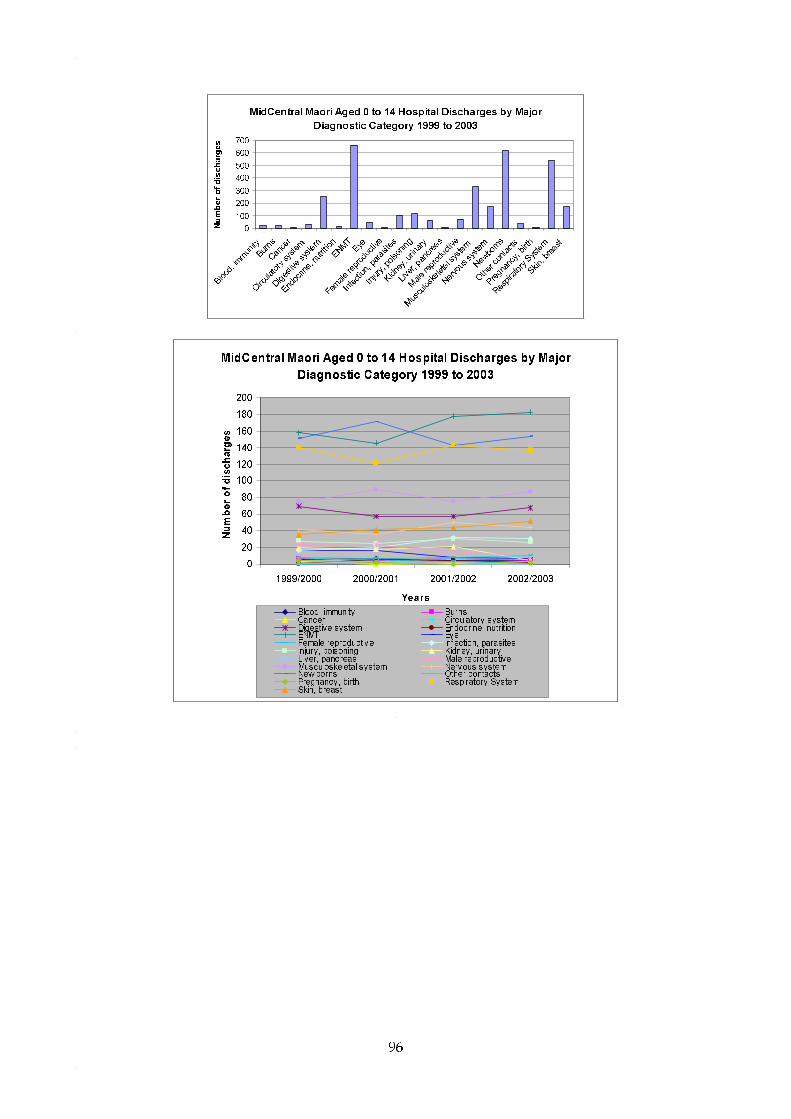
96
MidCentral Maori Aged 0 to 14 Hospital Discharges by Major
Diagnostic Category 1999 to 2003
0
100
200
300
400
500
600
700
Blood,
immun
ityBurn
s
Cance
r
Circula
tory s
ystem
Digestiv
e sys
tem
Endoc
rine, n
utritio
nENMT
Eye
Female
repro
ducti
ve
Infec
tion,
para
sites
Injury
, pois
oning
Kidney
, urin
ary
Liver,
pancre
as
Male re
prod
uctiv
e
Muscu
loske
letal s
ystem
Nervous
syste
m
Newborns
Other c
ontac
ts
Pregna
ncy,
birth
Respir
atory
System
Skin, b
reast
Number of discharges
MidCentral Maori Aged 0 to 14 Hospital Discharges by Major
Diagnostic Category 1999 to 2003
0
20
40
60
80
100
120
140
160
180
200
1999/2000 2000/2001 2001/2002 2002/2003
Years
Number of discharges
Blood, immunity BurnsCancer Circulatory sys temDigestive system Endocrine, nutritionENMT EyeFemale reproductive Infection, parasitesInjury, poisoning Kidney, urinaryLiver, pancreas Male reproductiveMusculoskeletal sys tem Nervous sys temNew borns Other contactsPregnancy, birth Respiratory SystemSkin, breast

97
Diagnoses No. of dischargesPercentage within
MDCENMT (ear, nose, mouth, and throat)Ear, nose, mouth, and throatNon-suppurative otitis media (H65) 153 38.3%
Chronic diseases of tonsils and adenoids (J35) 58 14.5%Acute upper respiratory infections of multiple and unspecified sites (J06) 43 10.8%Suppurative and unspecified otitis media (H66) 39 9.8%Acute obstructive laryngitis (croup) and epiglottitis (J05) 29 7.3%
MouthDental caries (K02) 69 64.5%Symptoms, signs, and abnormal clinical and laboratory findings, not elsewhere classified (R00 - R99) 12 11.2%Embedded and impacted teeth (K01) 6 5.6%
NewbornsHealth supervision and care of other healthy infant and child (Z762) 164 35.0%Disorders related to length of gestation and foetal growth (P05 - P08) 125 26.7%Haemorragic and haematological disorders of foetus and newborn (P50 - P61) 38 8.1%Respiratory and cardiovascular disorders specific to the perinatal period (P20 - P29) 35 7.5%
Congenital malformations, deformations, and chromosomal abnormalities (excluding hip) (Q00 - Q99) 28 6.0%
Respiratory SystemOther acute lower respiratory tract infections (J20 - J22) 162 40.2%Asthma (J45 - J46) 135 33.5%Influenza and pneumonia (J10 - J18) 59 14.6%Whooping cough (A37) 11 2.7%Symptoms, signs, and abnormal clinical and laboratory findings, not elsewhere classified (R00 - R99) 10 2.5%
Musculoskeletal SystemInjury, poisoning, and certain other consequences of external causes (S00 - T79) 140 55.3%Persons encountering health services for specific procedures and health care (Z40 - Z54) 31 12.3%Congenital malformations, deformations, and chromosomal abnormalities (excluding hip) (Q00 - Q99) 29 11.5%Other joint disorders (M20 - M25) 13 5.1%Chondropathies of hip/head of femur (M911, M930) 7 2.8%
Digestive SystemIntestinal infectious diseases (A00 - A09) 58 31.9%Symptoms, signs and abnormal clinical and laboratory findings, not elsewhere classified (R00 - R99) 37 20.3%Hernia (K40 - K46) 35 19.2%Other diseases of intestines (K55 - K63) 25 13.7%Diseases of the appendix (K32 - K38) 14 7.7%
MidCentral Maori Aged 0 to 14 Most Common ICD10 Diagnoses within Most Common Major Diagnostic Categories (MDC) 2000 - 2003
16.3.1.3 MidCentral District Pacific Children Aged 0 to 14 Years Hospitalisations
The number of young Pacific peoples discharges is much smaller, which limits analysis and interpretation. The Pacific peoples aged 0 to 14 total number of hospital discharges decreased across the period 1999/2000 to 2002/2003, with some yearly fluctuation.

98
The main Major Diagnostic Categories for young Pacific peoples discharges were:
1. Newborns 2. Respiratory system 3. ENMT (ear, nose, mouth, and throat) 4. Musculoskeletal system 5. Digestive system.
The discharge numbers per Major Diagnostic Category fluctuated when tracked across the 1999/2002 to 2002/2003 year period. The small numbers of discharges each year make it difficult to distinguish patterns from random fluctuation. The most common diagnoses within the top five Major Diagnostic Categories are shown in a table below. The main points from this table are:
• Low numbers could affect the reliability of any hospitalisation trends or patterns • Respiratory infections and asthma were the dominant diagnoses for respiratory system
Major Diagnostic Category • Non-suppurative otitis media (glue ear) was the most common ear, nose, and throat
diagnosis (32.6%). Acute upper respiratory infections was the second most common diagnosis (27.9%)
• Dental caries made up over half (58.3%) of hospitalisations for disorders of the mouth. • Half of musculoskeletal hospitalisations were for injuries • The most common digestive system diagnostic grouping was intestinal infections
(44.4%).
MidCentral Pacific People Aged 0 to 14 Total Hospital Discharges 1999 to 2003
0
20
40
60
80
100
120
140
160
1999/2000 2000/2001 2001/2002 2002/2003
Years
Nu
mb
er o
f d
isch
arg
es
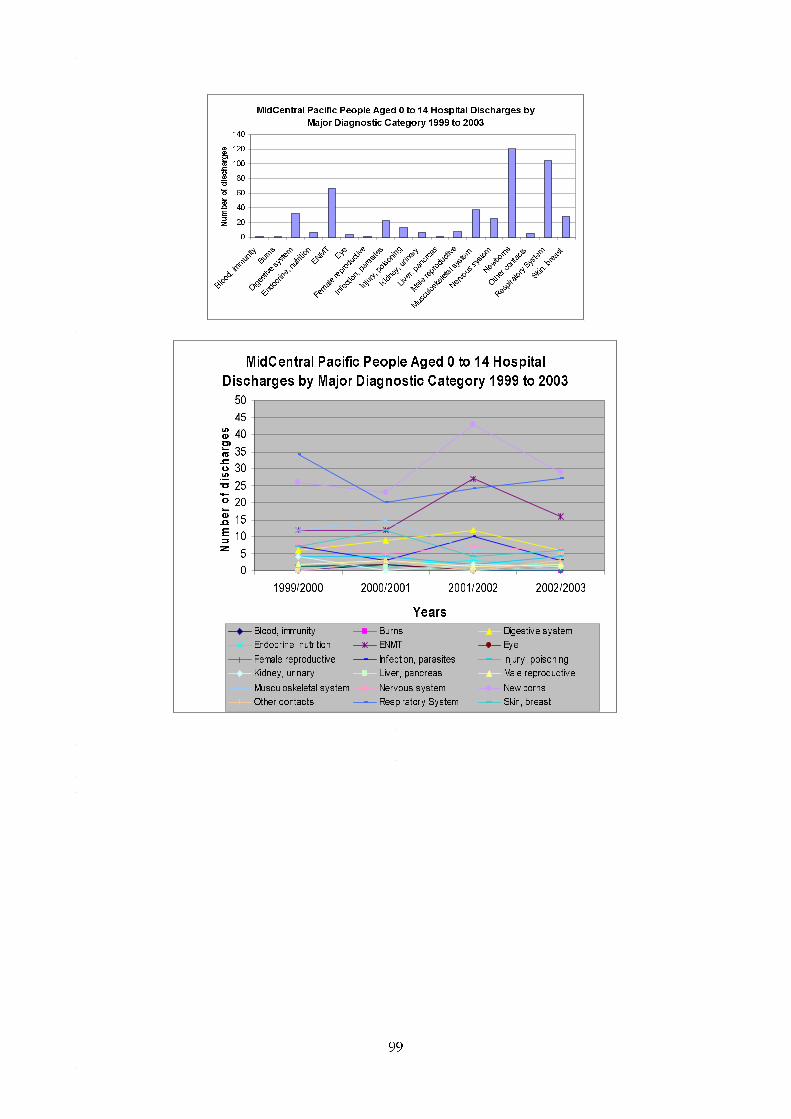
99
MidCentral Pacific People Aged 0 to 14 Hospital Discharges by
Major Diagnostic Category 1999 to 2003
0
20
40
60
80
100
120
140
Blood,
immun
ityBurn
s
Digesti
ve sy
stem
Endoc
rine, n
utritio
n
ENMTEye
Female
repro
ducti
ve
Infec
tion,
para
sites
Injury
, poiso
ning
Kidney
, urin
ary
Liver,
panc
reas
Male re
prod
uctiv
e
Muscu
loske
letal s
ystem
Nervous
syste
m
Newborns
Other c
ontac
ts
Respir
atory
System
Skin, b
reast
Number of discharges
MidCentral Pacific People Aged 0 to 14 Hospital
Discharges by Major Diagnostic Category 1999 to 2003
0
5
10
15
20
25
30
35
40
45
50
1999/2000 2000/2001 2001/2002 2002/2003
Years
Number of discharges
Blood, immunity Burns Digestive system
Endocrine, nutrition ENMT Eye
Female reproductive Infection, parasites Injury, poisoning
Kidney, urinary Liver, pancreas Male reproductive
Musculoskeletal system Nervous system New borns
Other contacts Respiratory System Skin, breast

100
Diagnoses No. of dischargesPercentage within
MDCNewbornsFetus and newborn affected by maternal factors and by complications of pregnancy, labour, and delivery (P00 - P04) 25 26.3%Health supervision and care of other healthy infant and child (Z762) 22 23.2%Haemorragic and haematological disorders of foetus and newborn (P50 - P61) 18 18.9%Transitory endocrine and metabolic disorders specific to foetus and newborn (P70 - P74) 5 5.3%Congenital malformations, deformations, and chromosomal abnormalities (excluding hip) (Q00 - Q99) 5 5.3%
Respiratory SystemOther acute lower respiratory tract infections (J20 - J22) 31 43.7%Asthma (J45 - J46) 22 31.0%Influenza and pneumonia (J10 - J18) 14 19.7%Whooping cough (A37) 2 2.8%Suppurative and necrotic conditions of lower respiratory tract (J85 - J86) 1 1.4%
ENMT (ear, nose, mouth, and throat)Ear, nose, and throatNon-suppurative otitis media (glue ear) (H65) 14 32.6%Acute upper respiratory infections of multiple and unspecified sites (J06) 12 27.9%
MouthDental caries (K02) 7 58.3%Other diseases of lip and oral mucosa (K13) 2 16.7%
Musculoskeletal SystemInjury, poisoning, and certain other consequences of external causes (S00 - T79) 13 50.0%Persons encountering health services for specific procedures and health care (Z40 - Z54) 5 19.2%Other osteopathies (M86 - M90) 3 11.5%
Digestive SystemIntestinal infectious diseases (A00 - A09) 12 44.4%Hernia (K40 - K46) 6 22.2%Symptoms, signs and abnormal clinical and laboratory findings, not elsewhere classified (R00 - R99) 4 14.8%Other diseases of intestines (K55 - K63) 2 7.4%Diseases of oesophagus, stomach, and duodenum (K20 - K31) 1 3.7%
MidCentral Pacific People Aged 0 to 14 Most Common ICD10 Diagnoses within Most Common Major Diagnostic Categories (MDC) 2000 - 2003
16.3.1.4 MidCentral District Asian Children Aged 0 to 14 Years Hospitalisations
The number of young Asian peoples discharges is small, which limits analysis. It becomes difficult to separate patterns of illness from random fluctuation. Also, before 2000, Asian peoples data were included among other ethnicities. The most common Major Diagnostic Categories were:
1. Newborns 2. ENMT (ear, nose, mouth, and throat) 3. Musculoskeletal system 4. Respiratory system 5. Nervous system 6. Infection/parasites.
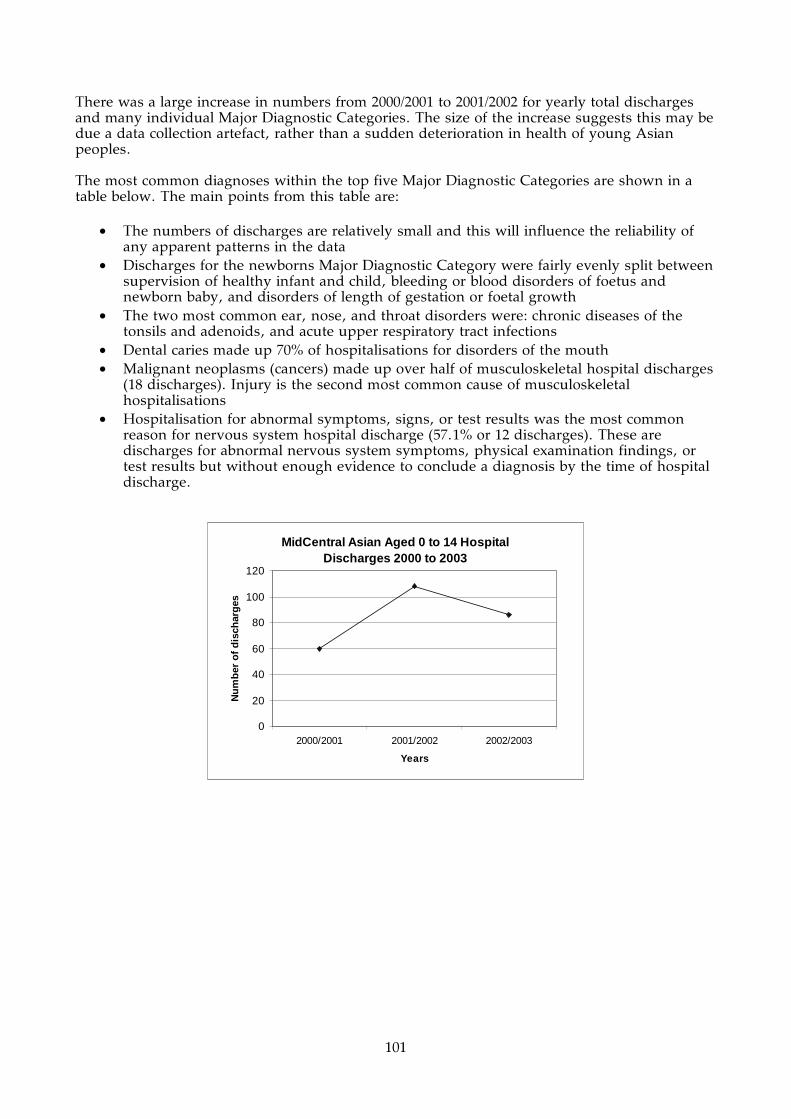
101
There was a large increase in numbers from 2000/2001 to 2001/2002 for yearly total discharges and many individual Major Diagnostic Categories. The size of the increase suggests this may be due a data collection artefact, rather than a sudden deterioration in health of young Asian peoples. The most common diagnoses within the top five Major Diagnostic Categories are shown in a table below. The main points from this table are:
• The numbers of discharges are relatively small and this will influence the reliability of any apparent patterns in the data
• Discharges for the newborns Major Diagnostic Category were fairly evenly split between supervision of healthy infant and child, bleeding or blood disorders of foetus and newborn baby, and disorders of length of gestation or foetal growth
• The two most common ear, nose, and throat disorders were: chronic diseases of the tonsils and adenoids, and acute upper respiratory tract infections
• Dental caries made up 70% of hospitalisations for disorders of the mouth • Malignant neoplasms (cancers) made up over half of musculoskeletal hospital discharges
(18 discharges). Injury is the second most common cause of musculoskeletal hospitalisations
• Hospitalisation for abnormal symptoms, signs, or test results was the most common reason for nervous system hospital discharge (57.1% or 12 discharges). These are discharges for abnormal nervous system symptoms, physical examination findings, or test results but without enough evidence to conclude a diagnosis by the time of hospital discharge.
MidCentral Asian Aged 0 to 14 Hospital Discharges 2000 to 2003
0
20
40
60
80
100
120
2000/2001 2001/2002 2002/2003
Years
Nu
mb
er o
f d
isch
arg
es

102
MidCentral Asian Aged 0 to 14 Hospital Discharges by Major
Diagnostic Category 2000 to 2003
0
10
20
30
40
50
60
70
Blood,
immun
ityBurn
s
Cance
r
Circula
tory s
ystem
Diges
tive sy
stem
Endoc
rine,
nutri
tion
ENMT
Infec
tion,
para
sites
Kidney
, urin
ary
Liver,
pan
creas
Male re
prod
uctive
Muscu
loske
letal s
ystem
Nervous
syste
m
Newbo
rns
Other c
onta
cts
Pregn
ancy
, birt
h
Respira
tory
System
Skin, b
reast
Number of discharges
MidCentral Asian Aged 0 to 14 Hospital
Discharges by Major Diagnostic Category 2000 to
2003
0
5
10
15
20
25
30
2000/2001 2001/2002 2002/2003
Years
Number of discharges
Blood, immunity Burns Cancer
Circulatory system Digestive system Endocrine, nutrition
ENMT Infection, parasites Kidney, urinary
Liver, pancreas Male reproductive Musculoskeletal system
Nervous system New borns Other contacts
Pregnancy, birth Respiratory System Skin, breast
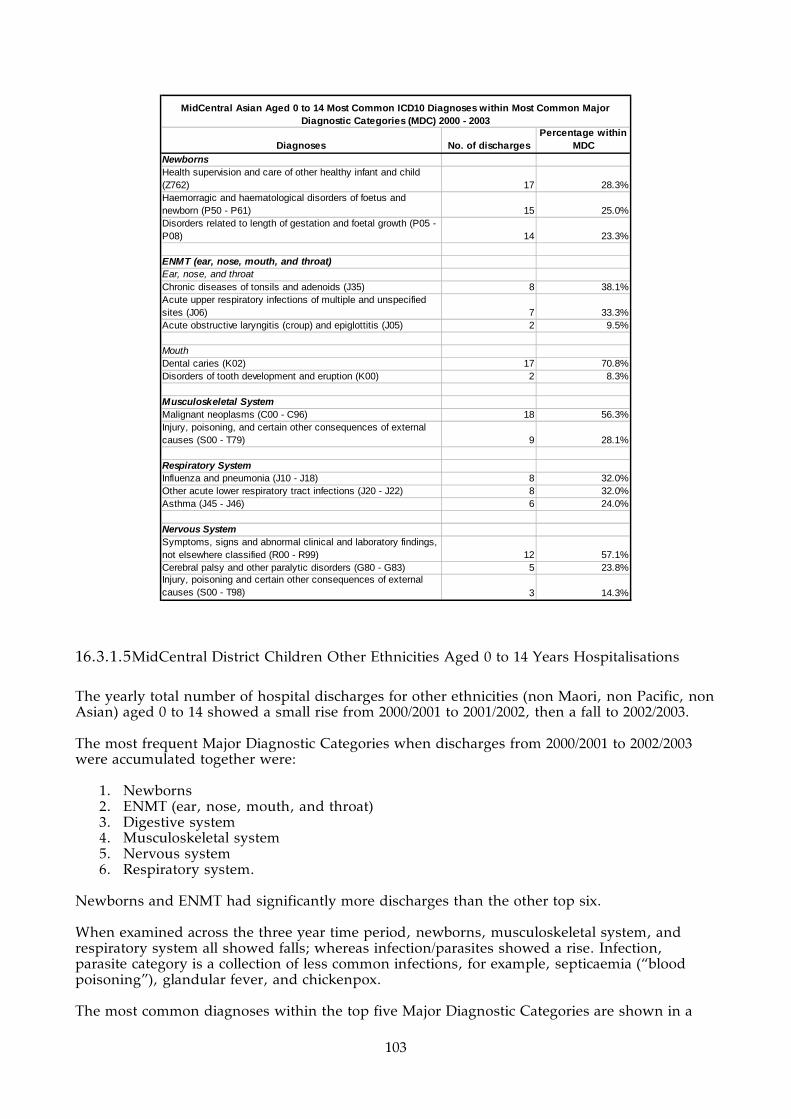
103
Diagnoses No. of dischargesPercentage within
MDCNewbornsHealth supervision and care of other healthy infant and child (Z762) 17 28.3%Haemorragic and haematological disorders of foetus and newborn (P50 - P61) 15 25.0%Disorders related to length of gestation and foetal growth (P05 - P08) 14 23.3%
ENMT (ear, nose, mouth, and throat)Ear, nose, and throatChronic diseases of tonsils and adenoids (J35) 8 38.1%Acute upper respiratory infections of multiple and unspecified sites (J06) 7 33.3%Acute obstructive laryngitis (croup) and epiglottitis (J05) 2 9.5%
MouthDental caries (K02) 17 70.8%Disorders of tooth development and eruption (K00) 2 8.3%
Musculoskeletal SystemMalignant neoplasms (C00 - C96) 18 56.3%Injury, poisoning, and certain other consequences of external causes (S00 - T79) 9 28.1%
Respiratory SystemInfluenza and pneumonia (J10 - J18) 8 32.0%Other acute lower respiratory tract infections (J20 - J22) 8 32.0%Asthma (J45 - J46) 6 24.0%
Nervous SystemSymptoms, signs and abnormal clinical and laboratory findings, not elsewhere classified (R00 - R99) 12 57.1%Cerebral palsy and other paralytic disorders (G80 - G83) 5 23.8%Injury, poisoning and certain other consequences of external causes (S00 - T98) 3 14.3%
MidCentral Asian Aged 0 to 14 Most Common ICD10 Diagnoses within Most Common Major Diagnostic Categories (MDC) 2000 - 2003
16.3.1.5 MidCentral District Children Other Ethnicities Aged 0 to 14 Years Hospitalisations
The yearly total number of hospital discharges for other ethnicities (non Maori, non Pacific, non Asian) aged 0 to 14 showed a small rise from 2000/2001 to 2001/2002, then a fall to 2002/2003. The most frequent Major Diagnostic Categories when discharges from 2000/2001 to 2002/2003 were accumulated together were:
1. Newborns 2. ENMT (ear, nose, mouth, and throat) 3. Digestive system 4. Musculoskeletal system 5. Nervous system 6. Respiratory system.
Newborns and ENMT had significantly more discharges than the other top six. When examined across the three year time period, newborns, musculoskeletal system, and respiratory system all showed falls; whereas infection/parasites showed a rise. Infection, parasite category is a collection of less common infections, for example, septicaemia (“blood poisoning”), glandular fever, and chickenpox. The most common diagnoses within the top five Major Diagnostic Categories are shown in a

104
table below. The main points from this table are:
• For newborns Major Diagnostic Category, supervision of healthy infant or child (33.6%), and disorders related to length of gestation and foetal growth (26.6%) are the two most prominent reasons for hospitalisation
• Chronic diseases of the tonsils and adenoids (31.1%) and non-suppurative otitis media (glue ear) (26.4%) are the two most common diagnoses for ear, nose, and throat hospitalisations
• Admission for treatment of dental caries made up half (50.4%) of hospitalisations for disorders of the mouth
• Intestinal infections (26.9%); and hospitalisations for abnormal symptoms, signs, and test findings (25.4%) are the dominant reasons for digestive system hospital discharges.
• Injuries were responsible for 63.5% of musculoskeletal system hospital discharges • Asthma (37.1%) and respiratory infections (43.4%) were the two most dominant causes
of respiratory system hospital discharges.
MidCentral Other Ethnicities Aged 0 to 14 Total Hospital Discharges 2000 to 2003 (Excludes Asian)
0
500
1000
1500
2000
2500
3000
3500
2000/2001 2001/2002 2002/2003
Years
Nu
mb
er o
f d
isch
arg
es
MidCentral Other Ethnicities Aged 0 to 14 Total Discharges by Major Diagnostic Category 2000 to 2003
0
500
1000
1500
2000
2500
Blood,
immun
ityBurn
s
Cancer
Circula
tory s
ystem
Digestiv
e syste
m
Endoc
rine, n
utrition
ENMTEye
Female
reprod
uctiv
e
Infec
tion,
para
sites
Injury
, poiso
ning
Kidney,
urina
ry
Liver,
pancrea
s
Male re
producti
ve
Musculo
skelet
a l sys
tem
Nervous
system
Newborns
Other c
ontac
ts
Pregna
ncy,
birth
Respira
tory Sys
tem
Skin, b
reast
Nu
mb
er o
f d
isch
arg
es

105
MidCentral Other Ethnicities Aged 0 to 14
Hospital Discharges by Major Diagnostic
Category 2000 to 2003
0
100
200
300
400
500
600
700
800
2000/2001 2001/2002 2002/2003
Years
Number of discharges
Blood, immunity BurnsCancer Circulatory systemDigestive system Endocrine, nutritionENMT EyeFemale reproductive Infection, parasitesInjury, poisoning Kidney, urinaryLiver, pancreas Male reproductiveMusculoskeletal system Nervous systemNew borns Other contactsPregnancy, birth Respiratory SystemSki b t

106
Diagnoses No. of dischargesPercentage within
MDCNewbornsHealth supervision and care of other healthy infant and child (Z762) 666 33.6%Disorders related to length of gestation and foetal growth (P05 - P08) 528 26.6%Respiratory and cardiovascular disorders specific to the perinatal period (P20 - P29) 176 8.9%Haemorragic and haematological disorders of foetus and newborn (P50 - P61) 166 8.4%Congenital malformations, deformations, and chromosomal abnormalities (excluding hip) (Q00 - Q99) 96 4.8%
ENMT (ear, nose, mouth, and throat)Ear, nose, and throatChronic diseases of tonsils and adenoids (J35) 430 31.1%Non-suppurative otitis media (glue ear) (H65) 365 26.4%Acute upper respiratory infections of multiple and unspecified sites (J06) 129 9.3%Suppurative and unspecified otitis media (middle ear infection) (H66) 116 8.4%Acute obstructive laryngitis (croup) and epiglottitis (J05) 89 6.4%
MouthDental caries (K02) 170 50.4%Congenital malformations, deformations, and chromosomal abnormalities (Q35 - Q38) 37 11.0%Embedded and impacted teeth (K01) 36 10.7%
Digestive SystemIntestinal infectious diseases (A00 - A09) 255 26.9%Symptoms, signs and abnormal clinical and laboratory findings, not elsewhere classified (R00 - R99) 241 25.4%Hernia (K40 - K46) 140 14.8%Diseases of the appendix (K32 - K38) 104 11.0%Other diseases of intestines (K55 - K63) 86 9.1%
Musculoskeletal SystemInjury, poisoning, and certain other consequences of external causes (S00 - T79) 547 63.5%Persons encountering health services for specific procedures and health care (Z40 - Z54) 89 10.3%Other joint disorders (M20 - M25) 49 5.7%Congenital malformations, deformations, and chromosomal abnormalities (excluding hip) (Q00 - Q99) 46 5.3%Disorders of synovium and tendon (M65 - M68) 17 2.0%
Respiratory SystemAsthma (J45 - J46) 311 37.1%Other acute lower respiratory tract infections (J20 - J22) 219 26.1%Influenza and pneumonia (J10 - J18) 145 17.3%Symptoms, signs, and abnormal clinical and laboratory findings, not elsewhere classified (R00 - R99) 40 4.8%Cystic fibrosis (E84) 26 3.1%
MidCentral Other Ethnicities Aged 0 to 14 Most Common ICD10 Diagnoses within Most Common Major Diagnostic Categories (MDC) 2000 - 2003
16.3.2 MidCentral District Adults of All Ethnicities Aged 15 to 64 Years Hospitalisations
The yearly number of hospital discharges for adults aged 15 to 64 years declined by 6.3% across the 1999/2000 to 2002/2003 period, from 11,433 to 10,710 discharges per year. When discharges for the four year period were accumulated together, the five most frequent Major Diagnostic Categories were:
1. Pregnancy/birth
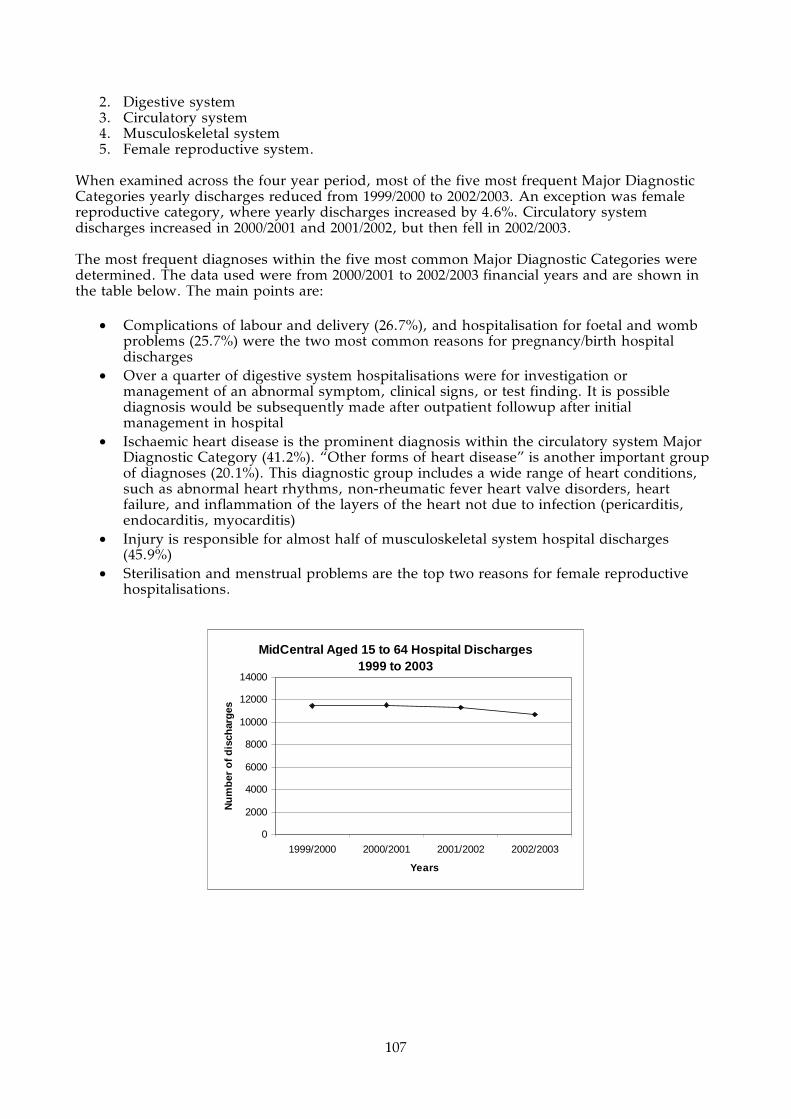
107
2. Digestive system 3. Circulatory system 4. Musculoskeletal system 5. Female reproductive system.
When examined across the four year period, most of the five most frequent Major Diagnostic Categories yearly discharges reduced from 1999/2000 to 2002/2003. An exception was female reproductive category, where yearly discharges increased by 4.6%. Circulatory system discharges increased in 2000/2001 and 2001/2002, but then fell in 2002/2003. The most frequent diagnoses within the five most common Major Diagnostic Categories were determined. The data used were from 2000/2001 to 2002/2003 financial years and are shown in the table below. The main points are:
• Complications of labour and delivery (26.7%), and hospitalisation for foetal and womb problems (25.7%) were the two most common reasons for pregnancy/birth hospital discharges
• Over a quarter of digestive system hospitalisations were for investigation or management of an abnormal symptom, clinical signs, or test finding. It is possible diagnosis would be subsequently made after outpatient followup after initial management in hospital
• Ischaemic heart disease is the prominent diagnosis within the circulatory system Major Diagnostic Category (41.2%). “Other forms of heart disease” is another important group of diagnoses (20.1%). This diagnostic group includes a wide range of heart conditions, such as abnormal heart rhythms, non-rheumatic fever heart valve disorders, heart failure, and inflammation of the layers of the heart not due to infection (pericarditis, endocarditis, myocarditis)
• Injury is responsible for almost half of musculoskeletal system hospital discharges (45.9%)
• Sterilisation and menstrual problems are the top two reasons for female reproductive hospitalisations.
MidCentral Aged 15 to 64 Hospital Discharges 1999 to 2003
0
2000
4000
6000
8000
10000
12000
14000
1999/2000 2000/2001 2001/2002 2002/2003
Years
Nu
mb
er o
f d
isch
arg
es

108
MidCentral Aged 15 to 64 Hospital Discharges by
Major Diagnostic Category 1999 to 2003
0
2000
4000
6000
8000
10000
12000
14000
Blood,
immun
ityBur
ns
Cance
r
Circula
tory
syste
m
Digesti
ve sy
stem
Endoc
rine, n
utritio
n
ENMT
Eye
Fem
ale re
produc
tive
Infe
ction
, par
asites
Injur
y, po
isonin
g
Kidney
, urin
ary
Liver
, pan
crea
s
Male re
produ
ctive
Mus
culos
kelet
al sy
stem
Nervous
sys
tem
Other
cont
acts
Pregna
ncy,
birth
Respira
tory
Sys
tem
Skin, b
reast
Number of discharges
MidCentral Aged 15 to 64 Hospital Discharges by
Major Diagnostic Category 1999 to 2003
0
500
1000
1500
2000
2500
3000
3500
1999/2000 2000/2001 2001/2002 2002/2003
Years
Number of discharges
Blood, immunity Burns
Cancer Circulatory system
Digestive system Endocrine, nutrition
ENMT Eye
Female reproductive Infection, parasites
Injury, poisoning Kidney, urinary
Liver, pancreas Male reproductive
Musculoskeletal system Nervous system
Other contacts Pregnancy, birth
Respiratory System Skin, breast

109
MidCentral Aged 15 to 64 Total Hospital
Discharges by MDC 1999 to 2003 (pregnancy
excluded)
0
200
400
600
800
1000
1200
1400
1999/2000 2000/2001 2001/2002 2002/2003
Years
Number of discharges
Blood, immunity Burns
Cancer Circulatory system
Digestive system Endocrine, nutrition
ENMT Eye
Female reproductive Infection, parasites
Injury, poisoning Kidney, urinary
Liver, pancreas Male reproductive
Musculoskeletal system Nervous system
Other contacts Respiratory System
Skin, breast

110
Diagnoses No. of dischargesPercentage within
MDCPregnancy, BirthComplications of labour and delivery (O60 - O75) 2351 26.7%Maternal care related to the foetus and amniotic cavity and possible delivery problems (O30 - O48) 2259 25.7%Delivery (vaginal or caesarean) (O80 - O82) 1045 11.9%Pregnancy with abortive outcome (eg. ectopic pregnancy, miscarriage, etc) (O00 - O08) 975 11.1%
Digestive SystemSymptoms, signs and abnormal clinical and laboratory findings, not elsewhere classified (R00 - R09) 1141 25.1%Other diseases of intestines (K55 - K63) 829 18.2%Hernia (K40 - K46) 468 10.3%Malignant neoplasms of digestive organs (C15 - C26) 401 8.8%Diseases of the appendix (K32 - K38) 394 8.7%
Circulatory SystemIschaemic heart disease (I20 - I25) 1281 41.2%Other forms of heart disease (I30 - I52) 624 20.1%Symptoms, signs and abnormal clinical and laboratory findings, not elsewhere classified (R00 - R09) 594 19.1%Diseases of veins, lympathic vessels and lymph nodes, not elsewhere classified (I80 - I89) 159 5.1%
Musculoskeletal SystemInjury, poisoning, and certain other consequences of external causes (S00 - T79) 1338 45.9%Other joint disorders (M20 - M25) 376 12.9%Arthrosis (M15 - M19) 195 6.7%
Female ReproductiveSterilization (Z302) 465 19.1%Excessive, frequent and irregular menstruation (N92) 382 15.7%Inflammatory diseases of female pelvic organs (N70 - N77) 195 8.0%Endometriosis (N80) 171 7.0%Benign neoplasms (D10 - D36) 164 6.7%
MidCentral All Ethnicities Aged 15 to 64 Most Common ICD10 Diagnoses within Most Common Major Diagnostic Categories (MDC) 2000/2001 to 2002/2003
16.3.2.1 MidCentral District Adult Maori Aged 15 to 64 Years Hospitalisations
The yearly total number of hospital discharges for MidCentral district Maori aged 15 to 64 was stable across the 1999/2000 to 2002/2003 period. The most prominent Major Diagnostic Categories over the 1999/2000 to 2002/2003 period were:
1. Pregnancy/birth 2. Circulatory system 3. Digestive system 4. Musculoskeletal system 5. Female reproductive system 6. Respiratory system.
When Major Diagnostic Category discharges were examined across the 1999/2000 to 2002/2003 time period, Pregnancy/birth was by far the most frequent category. Circulatory system, the second most frequent Major Diagnostic Category, and kidney/urinary system showed a rise in discharges over the period. Circulatory system discharges increased from 105 discharges in 1999/2002 to 135 discharges in 2002/2003, an increase of 22%. Kidney/urinary system discharges rose by 42.5%, from 47 discharges in 1999/2000 to 67 in 2002/2003. Smaller rises were seen in respiratory system (13%) and digestive system discharges (5.7%).

111
Musculoskeletal system discharges consistently dropped over the four year period from 138 discharges per year to 90 discharges per year, a 34.8% reduction. Female Reproductive discharges fell from 111 discharges per year to 94 discharges per year, a 15.3% decrease. The most common diagnoses within the top five Major Diagnostic Categories are shown in a table below. The main points are:
• Complications of labour and delivery (24.1%); and foetal, womb, and possible delivery problems (22.6%) were the two main diagnostic groupings for pregnancy/birth Major Diagnostic Category
• Ischaemic heart disease (33.3%) and “other forms of heart disease” (28.5%) were the main diagnostic groupings for circulatory system Major Diagnostic Category. “Other forms of heart disease” is a grouping that includes a mixture of heart conditions, including valve disease not due to rheumatic fever, abnormal heart rhythms, and inflammation of various layers of the heart (endocarditis, myocarditis, and pericarditis)
• “Symptoms, signs, and abnormal clinical and laboratory findings not elsewhere classified” (28.5%) is the most common digestive system diagnostic grouping. This grouping refers to hospitalisations for investigation or management of a digestive system abnormality where there is not enough evidence to conclude a diagnosis
• “Other diseases of the intestines” (15.7%) was the second most common digestive system diagnostic grouping. This grouping includes diverticular disease, anal or rectal abscesses, irritable bowel, and fissures or fistula. It excludes intestinal infections, non infective inflammation, and cancers
• Over half (50.6%) of musculoskeletal hospitalisations were for injuries • The top two reasons for female reproductive system hospitalisation were for sterilization
(29.8%) and for menstrual problems (17.6%).
MidCentral Maori Aged 15 to 64 Hospital Discharges 1999 to 2003
0
500
1000
1500
2000
1999/2000 2000/2001 2001/2002 2002/2003
Years
Nu
mb
er o
f d
isch
arg
es

112
MidCentral Maori Aged 15 to 64 Hospital Discharges by
Major Diagnostic Category 1999 to 2003
0
500
1000
1500
2000
2500
Blood,
immun
ityBurn
s
Cance
r
Circula
tory s
ystem
Digesti
ve sy
stem
Endoc
rine,
nutrit
ionENMT
Eye
Female
repro
ducti
ve
Infec
tion,
para
sites
Injury
, poiso
ning
Kidney
, urin
ary
Liver,
pancre
as
Male re
prod
uctiv
e
Muscu
loske
letal s
ystem
Nervous
syste
m
Other c
ontac
ts
Pregna
ncy,
birth
Respir
atory
System
Skin, b
reast
Number of discharges
MidCentral Maori Aged 15 to 64 Hospital
Discharges by Major Diagnostic Category 1999 to
2003
0
100
200
300
400
500
600
1999/2000 2000/2001 2001/2002 2002/2003
Years
Number of discharges
Blood, immunity Burns CancerCirculatory system Digestive system Endocrine, nutritionENMT Eye Female reproductiveInfection, parasites Injury, poisoning Kidney, urinaryLiver, pancreas Male reproductive Musculoskeletal systemNervous system Other contacts Pregnancy, birthRespiratory System Skin, breast

113
MidCentral Maori Aged 15 to 64 Hospital
Discharges by MDC (excluding pregnancy) 1999
to 2003
0
20
40
60
80
100
120
140
160
1999/2000 2000/2001 2001/2002 2002/2003
Years
Number of discharges
Blood, immunity Burns CancerCirculatory system Digestive system Endocrine, nutrition
ENMT Eye Female reproductiveInfection, parasites Injury, poisoning Kidney, urinaryLiver, pancreas Male reproductive Musculoskeletal system
Nervous system Other contacts Respiratory SystemSkin, breast

114
Diagnoses No. of dischargesPercentage within
MDCPregnancy, BirthComplications of labour and delivery (O60 - O75) 365 24.1%Maternal care related to the foetus and amniotic cavity and possible delivery problems (O30 - O48) 342 22.6%Delivery (vaginal or caesarean) (O80 - O82) 256 16.9%Pregnancy with abortive outcome (O00 - O08) (eg. Ectopic pregnancy, miscarriage) 174 11.5%Other maternal disorders predominantly related to pregnancy (O20 - O29) 109 7.2%
Circulatory SystemIschaemic heart disease (I20 - I25) 139 33.3%Other forms of heart disease (I30 - I52) 119 28.5%Symptoms, signs and abnormal clinical and laboratory findings, not elsewhere classified (R00 - R09) 69 16.5%Diseases of veins, lympathic vessels and lymph nodes, not elsewhere classified (I80 - I89) 19 4.5%Complications of surgical and medical care, not elsewhere classified (T80 - T88) 15 3.6%
Digestive SystemSymptoms, signs and abnormal clinical and laboratory findings, not elsewhere classified (R00 - R09) 134 28.5%Other diseases of intestines (K55 - K63) 74 15.7%Diseases of the appendix (K32 - K38) 56 11.9%Malignant neoplasms of digestive organs (C15 - C26) 35 7.4%Hernia (K40 - K46) 35 7.4%
Musculoskeletal SystemInjury, poisoning, and certain other consequences of external causes (S00 - T79) 165 50.6%Other joint disorders (M20 - M25) 26 8.0%Complications of surgical and medical care, not elsewhere classified (T80 - T88) 21 6.4%Other soft tissue disorders (M70 - M79) 15 4.6%Persons encountering health services for specific procedures and health care (Z40 - Z54) 15 4.6%
Female ReproductiveSterilization (Z302) 98 29.8%Excessive, frequent and irregular menstruation (N92) 58 17.6%Inflammatory diseases of female pelvic organs (N70 - N77) 36 10.9%Malignant neoplasms (C00 - C96) 26 7.9%Endometriosis (N80) 21 6.4%
MidCentral Maori Aged 15 to 64 Most Common ICD10 Diagnoses within Most Common Major Diagnostic Categories (MDC) 2000 - 2003
16.3.2.2 MidCentral District Adult Pacific Peoples Aged 15 to 64 Years Hospitalisations
The numbers of discharges for Pacific peoples aged 15 to 64 were small, limiting analysis and interpretation. The yearly total number of discharges has been relatively stable over the 1999/2000 to 2002/2003 period. The most frequent Major Diagnostic Categories for all the discharges for the period together were:
1. Pregnancy/birth 2. Digestive 3. Musculoskeletal 4. Circulatory system 5. Female reproductive system.

115
Over the four year period, pregnancy/birth discharges per year declined, 14.1% when the 2002/2003 year is compared to 1999/2000. It is difficult to discern patterns for the other Major Diagnostic Categories because discharge numbers were low and fluctuated widely year by year. The most common diagnoses within the top five Major Diagnostic Categories are shown in a table below. The main points are:
• The numbers of discharges are relatively small and this will influence the reliability of any apparent patterns in the data
• Admission for foetal or womb problems (25.3%), and complications of labour and delivery (24.6%) were the two most common diagnostic groupings for pregnancy/birth Major Diagnostic Category
• “Symptoms, signs, and abnormal clinical and laboratory findings not elsewhere classified” was the most common reason for digestive system hospitalisation (29.2% or 17 discharges). This grouping refers to hospitalisations for investigation or management of a digestive system abnormality where there is not enough evidence to conclude a diagnosis
• Almost 60% of circulatory system hospitalisations were for ischaemic heart disease (56.8%)
• Sterilization was the most common reason for female reproductive hospitalisations (29%). However, this came to only nine discharges.
MidCentral Pacific People Aged 15 to 64 Hospital Discharges 1999 to 2003
0
50
100
150
200
250
1999/2000 2000/2001 2001/2002 2002/2003
Years
Nu
mb
er o
f d
isch
arg
es

116
MidCentral Pacific People Aged 15 to 64 Hospital Discharges by
Major Diagnostic Category 1999 to 2003
0
50
100
150
200
250
300
350
400
450
Blood,
imm
unity
Burns
Cancer
Circula
tory s
ystem
Digestiv
e syste
m
Endoc
rine, n
utriti
on
ENMTEye
Female
repro
ductiv
e
Infecti
on, p
arasit
es
Injur
y, po
isonin
g
Kidney
, urin
ary
Liver,
pan
creas
Male re
produ
ctive
Muscu
loske
letal s
ystem
Nervous
syste
m
Other
cont
acts
Pregna
ncy,
birth
Respira
tory
Syste
m
Skin, b
reast
Number of discharges
MidCentral Pacific People Aged 15 to 64 Hospital
Discharges by Major Diagnostic Category 1999 to
2003
0
20
40
60
80
100
120
1999/2000 2000/2001 2001/2002 2002/2003
Years
Number of discharges
Blood, immunity Burns
Cancer Circulatory system
Digestive system Endocrine, nutrition
ENMT Eye
Female reproductive Infection, parasites
Injury, poisoning Kidney, urinary
Liver, pancreas Male reproductive
Musculoskeletal system Nervous system
Other contacts Pregnancy, birth
Respiratory System Skin, breast

117
MidCentral Pacific People Aged 15 to 64 Hospital
Discharges by MDC (excluding pregnancy) 1999
to 2003
0
5
10
15
20
25
30
1999/2000 2000/2001 2001/2002 2002/2003
Years
Number of discharges
Blood, immunity Burns CancerCirculatory system Digestive system Endocrine, nutritionENMT Eye Female reproductiveInfection, parasites Injury, poisoning Kidney, urinaryLiver, pancreas Male reproductive Musculoskeletal systemNervous system Other contacts Respiratory SystemSkin, breast
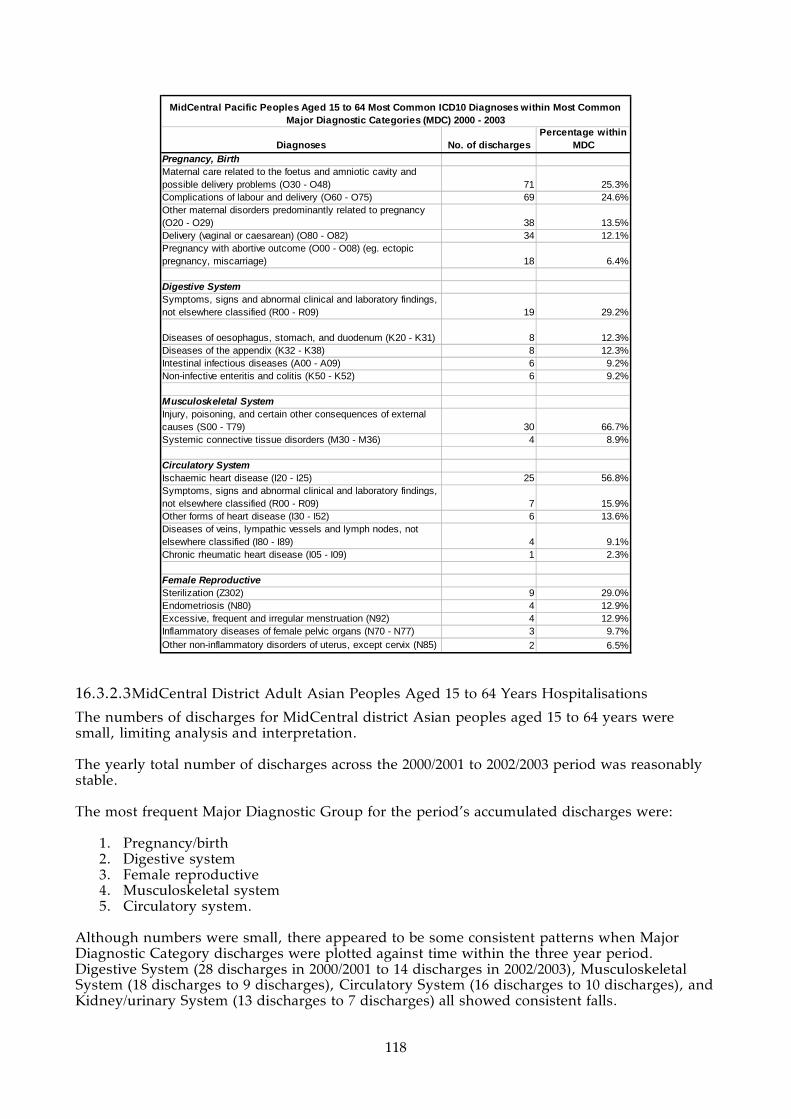
118
Diagnoses No. of dischargesPercentage within
MDCPregnancy, BirthMaternal care related to the foetus and amniotic cavity and possible delivery problems (O30 - O48) 71 25.3%Complications of labour and delivery (O60 - O75) 69 24.6%Other maternal disorders predominantly related to pregnancy (O20 - O29) 38 13.5%Delivery (vaginal or caesarean) (O80 - O82) 34 12.1%Pregnancy with abortive outcome (O00 - O08) (eg. ectopic pregnancy, miscarriage) 18 6.4%
Digestive SystemSymptoms, signs and abnormal clinical and laboratory findings, not elsewhere classified (R00 - R09) 19 29.2%
Diseases of oesophagus, stomach, and duodenum (K20 - K31) 8 12.3%Diseases of the appendix (K32 - K38) 8 12.3%Intestinal infectious diseases (A00 - A09) 6 9.2%Non-infective enteritis and colitis (K50 - K52) 6 9.2%
Musculoskeletal SystemInjury, poisoning, and certain other consequences of external causes (S00 - T79) 30 66.7%Systemic connective tissue disorders (M30 - M36) 4 8.9%
Circulatory SystemIschaemic heart disease (I20 - I25) 25 56.8%Symptoms, signs and abnormal clinical and laboratory findings, not elsewhere classified (R00 - R09) 7 15.9%Other forms of heart disease (I30 - I52) 6 13.6%Diseases of veins, lympathic vessels and lymph nodes, not elsewhere classified (I80 - I89) 4 9.1%Chronic rheumatic heart disease (I05 - I09) 1 2.3%
Female ReproductiveSterilization (Z302) 9 29.0%Endometriosis (N80) 4 12.9%Excessive, frequent and irregular menstruation (N92) 4 12.9%Inflammatory diseases of female pelvic organs (N70 - N77) 3 9.7%Other non-inflammatory disorders of uterus, except cervix (N85) 2 6.5%
MidCentral Pacific Peoples Aged 15 to 64 Most Common ICD10 Diagnoses within Most Common Major Diagnostic Categories (MDC) 2000 - 2003
16.3.2.3 MidCentral District Adult Asian Peoples Aged 15 to 64 Years Hospitalisations
The numbers of discharges for MidCentral district Asian peoples aged 15 to 64 years were small, limiting analysis and interpretation. The yearly total number of discharges across the 2000/2001 to 2002/2003 period was reasonably stable. The most frequent Major Diagnostic Group for the period’s accumulated discharges were:
1. Pregnancy/birth 2. Digestive system 3. Female reproductive 4. Musculoskeletal system 5. Circulatory system.
Although numbers were small, there appeared to be some consistent patterns when Major Diagnostic Category discharges were plotted against time within the three year period. Digestive System (28 discharges in 2000/2001 to 14 discharges in 2002/2003), Musculoskeletal System (18 discharges to 9 discharges), Circulatory System (16 discharges to 10 discharges), and Kidney/urinary System (13 discharges to 7 discharges) all showed consistent falls.

119
Pregnancy/birth, and Female Reproductive System both showed consistent increases in discharge numbers. The most common diagnoses within the top five Major Diagnostic Categories are shown in a table below. The main points are:
• The numbers of discharges are relatively small and this will influence the reliability of any apparent patterns in the data
• Complications of labour and delivery (34.7% or 91 hospital discharges) and problems of foetus or womb (21.8% or 57 hospital discharges) were the two most common diagnostic groupings for pregnancy/birth Major Diagnostic Category
• “Symptoms, signs, and abnormal clinical and laboratory findings not elsewhere classified” was the most common reason for digestive system hospitalisation (29.6% or 21 discharges). This grouping refers to hospitalisations for investigation or management of a digestive system abnormality where there is not enough evidence to conclude a diagnosis
• “Other diseases of the intestines” (18.3% or 13 discharges) was the second most common digestive system diagnostic grouping. This grouping includes diverticular disease, anal or rectal abscesses, irritable bowel, and fissures or fistula. It excludes intestinal infections, non infective inflammation, and cancers
• The top three diagnoses for female reproductive Major Diagnostic Category were: sterilization (15.2% or 7 discharges), inflammatory diseases of the female pelvic organs (13% or 6 discharges, and benign neoplasms (benign cancers) (10.9% or 5 discharges). The numbers were small, which could affect the reliability of the data
• Almost half of musculoskeletal system hospitalisations were for injury (45.5% or 20 discharges)
• Ischaemic heart disease was the most common circulatory system diagnostic grouping (42.5% or 17 discharges).
MidCentral Asian Aged 15 to 64 Total Hospital Discharges 2000 to 2003
0
50
100
150
200
250
2000/2001 2001/2002 2002/2003
Years
Num
ber
of dis
char
ges
MidCentral Asian Aged 15 to 64 Hospital Discharges by Major Diagnostic Category 2000 to 2003
0
50
100
150
200
250
300
Blood,
imm
unity
Cance
r
Circula
tory
syste
m
Diges
tive
syste
m
Endoc
rine,
nut
rition
ENMT
Eye
Fem
ale re
prod
uctiv
e
Infe
ction
, par
asite
s
Injur
y, po
isonin
g
Kidney
, urin
ary
Liver
, pan
crea
s
Mus
culos
kelet
al sy
stem
Nervo
us s
ystem
Other
cont
acts
Pregn
ancy
, birt
h
Respir
atory
Sys
tem
Skin, b
reast
Nu
mber
of d
isch
arges

120
MidCentral Asian Aged 15 to 64 Hospital
Discharges by Major Diagnostic Category 2000 to
2003
0
20
40
60
80
100
120
2000/2001 2001/2002 2002/2003
Years
Number of discharges
Blood, immunity Cancer Circulatory system
Digestive system Endocrine, nutrition ENMT
Eye Female reproductive Infection, parasites
Injury, poisoning Kidney, urinary Liver, pancreas
Musculoskeletal system Nervous system Other contacts
Pregnancy, birth Respiratory System Skin, breast
MidCentral Asian Aged 15 to 64 Hospital
Discharges by MDC (excluding pregnancy) 2000
to 2003
0
5
10
15
20
25
30
2000/2001 2001/2002 2002/2003
Year
Number of discharges
Blood, immunity Cancer Circulatory systemDigestive system Endocrine, nutrition ENMT
Eye Female reproductive Infection, parasitesInjury, poisoning Kidney, urinary Liver, pancreas
Musculoskeletal system Nervous system Other contactsRespiratory System Skin, breast

121
Diagnoses No. of dischargesPercentage within
MDCPregnancy, BirthComplications of labour and delivery (O60 - O75) 91 34.7%Maternal care related to the foetus and amniotic cavity and possible delivery problems (O30 - O48) 57 21.8%Pregnancy with abortive outcome (O00 - O08) (eg. ectopic pregnancy, miscarriage) 37 14.1%Delivery (vaginal or caesarean) (O80 - O82) 23 8.8%Other maternal disorders predominantly related to pregnancy (O20 - O29) 19 7.3%
Digestive SystemSymptoms, signs and abnormal clinical and laboratory findings, not elsewhere classified (R00 - R09) 21 29.6%Other diseases of intestines (K55 - K63) 13 18.3%
Diseases of oesophagus, stomach, and duodenum (K20 - K31) 8 11.3%Malignant neoplasms of digestive organs (C15 - C26) 7 9.9%Hernia (K40 - K46) 5 7.0%
Female ReproductiveSterilization (Z302) 7 15.2%Inflammatory diseases of female pelvic organs (N70 - N77) 6 13.0%Benign neoplasms (D10 - D36) 5 10.9%Polyp of female genital tract (N84) 4 8.7%Pain and other conditions associated with female genital organs and menstrual cycle (N94) 4 8.7%Congenital malformations, deformations and chromosomal abnormalities (Q00 - Q99) 4 8.7%
Musculoskeletal SystemInjury, poisoning, and certain other consequences of external causes (S00 - T79) 20 45.5%Persons encountering health services for specific procedures and health care (Z40 - Z54) 4 9.1%
Circulatory SystemIschaemic heart disease (I20 - I25) 17 42.5%Symptoms, signs and abnormal clinical and laboratory findings, not elsewhere classified (R00 - R09) 12 30.0%Diseases of veins, lympathic vessels and lymph nodes, not elsewhere classified (I80 - I89) 3 7.5%
MidCentral Asian Aged 15 to 64 Most Common ICD10 Diagnoses within Most Common Major Diagnostic Categories (MDC) 2000 - 2003
16.3.2.4 MidCentral District Adult Other Ethnicities Aged 15 to 64 Years Hospitalisations
Over the period 2000/2001 to 2002/2003, the yearly total number of discharges fell by 8.7%. When discharges for the period are accumulated together, the most frequent Major Diagnostic Categories were:
1. Pregnancy/birth 2. Digestive system 3. Circulatory system 4. Musculoskeletal system 5. Female reproductive system.
Pregnancy/birth was the dominant Major Diagnostic Category and showed a 12% fall in discharges from 2000/2001 to 2002/2003. When discharges for each Major Diagnostic Category were plotted against time, many showed mild but consistent falls in discharges. Major Diagnostic Categories that follow this pattern included Circulatory System, Digestive System, and Musculoskeletal System discharges.
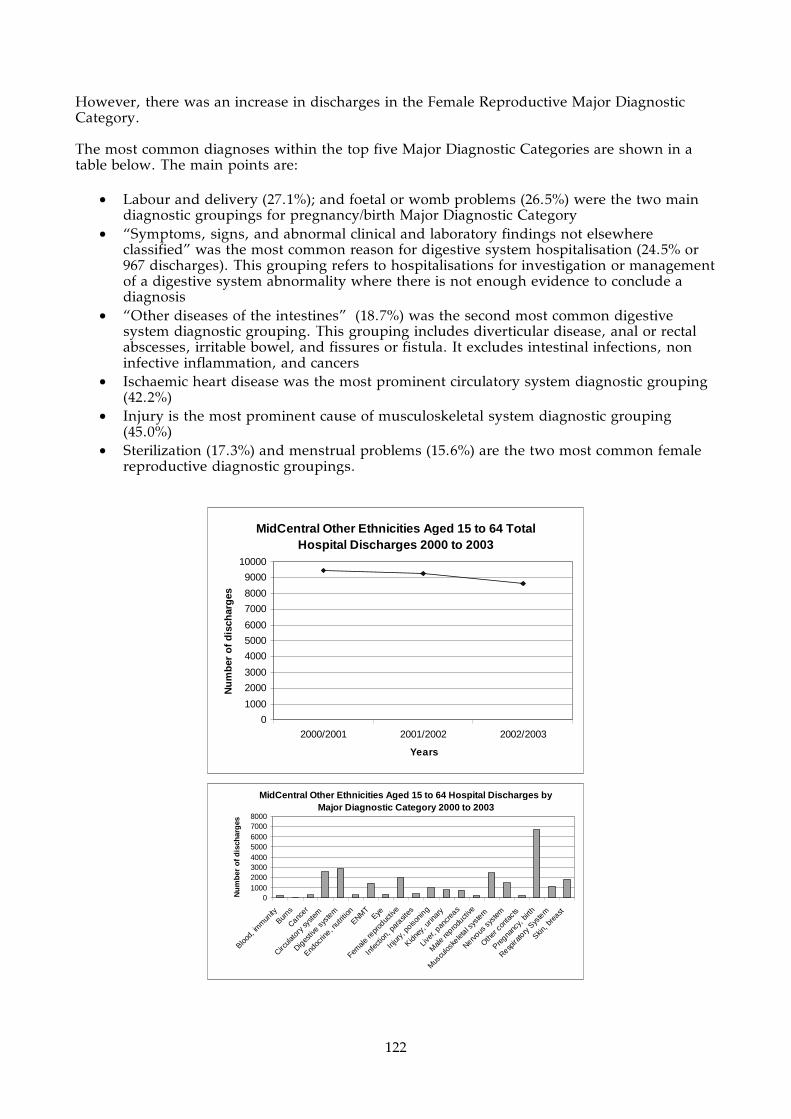
122
However, there was an increase in discharges in the Female Reproductive Major Diagnostic Category. The most common diagnoses within the top five Major Diagnostic Categories are shown in a table below. The main points are:
• Labour and delivery (27.1%); and foetal or womb problems (26.5%) were the two main diagnostic groupings for pregnancy/birth Major Diagnostic Category
• “Symptoms, signs, and abnormal clinical and laboratory findings not elsewhere classified” was the most common reason for digestive system hospitalisation (24.5% or 967 discharges). This grouping refers to hospitalisations for investigation or management of a digestive system abnormality where there is not enough evidence to conclude a diagnosis
• “Other diseases of the intestines” (18.7%) was the second most common digestive system diagnostic grouping. This grouping includes diverticular disease, anal or rectal abscesses, irritable bowel, and fissures or fistula. It excludes intestinal infections, non infective inflammation, and cancers
• Ischaemic heart disease was the most prominent circulatory system diagnostic grouping (42.2%)
• Injury is the most prominent cause of musculoskeletal system diagnostic grouping (45.0%)
• Sterilization (17.3%) and menstrual problems (15.6%) are the two most common female reproductive diagnostic groupings.
MidCentral Other Ethnicities Aged 15 to 64 Total Hospital Discharges 2000 to 2003
0
1000
2000
3000
4000
5000
6000
7000
8000
9000
10000
2000/2001 2001/2002 2002/2003
Years
Nu
mb
er o
f d
isch
arg
es
MidCentral Other Ethnicities Aged 15 to 64 Hospital Discharges by Major Diagnostic Category 2000 to 2003
010002000300040005000600070008000
Blood,
imm
unity
Burns
Cancer
Circula
tory
syste
m
Diges
tive sy
stem
Endoc
rine, n
utrit
ion
ENMT
Eye
Female
repr
oduc
tive
Infe
ction
, par
asites
Injur
y, po
isonin
g
Kidney
, urin
ary
Liver
, pan
crea
s
Male
repro
ducti
ve
Mus
culos
kelet
al sys
tem
Nervous
sys
tem
Other
cont
acts
Pregna
ncy,
birth
Respira
tory
Sys
tem
Skin, b
reast
Nu
mb
er o
f d
isch
arg
es

123
MidCentral Other Ethnicities Aged 15 to 64 Hospital
Admissions by Major Diagnostic Category (excluding
pregnancy) 2000 to 2003
0
200
400
600
800
1000
1200
2000/2001 2001/2002 2002/2003
Years
Number of discharges
Blood, immunity Burns Cancer
Circulatory system Digestive system Endocrine, nutrition
ENMT Eye Female reproductive
Infection, parasites Injury, poisoning Kidney, urinary
Liver, pancreas Male reproductive Musculoskeletal system
Nervous system Other contacts Respiratory System
Skin, breast
MidCentral Other Ethnicites Aged 15 to 64
Hospital Discharges by Major Diagnostic
Category 2000 to 2003
0
500
1000
1500
2000
2500
3000
2000/2001 2001/2002 2002/2003
Years
Number of discharges
Blood, immunity Burns CancerCirculatory system Digestive system Endocrine, nutritionENMT Eye Female reproductive
Infection, parasites Injury, poisoning Kidney, urinaryLiver, pancreas Male reproductive Musculoskeletal systemNervous system Other contacts Pregnancy, birthRespiratory System Skin, breast

124
Diagnoses No. of dischargesPercentage within
MDCPregnancy, BirthComplications of labour and delivery (O60 - O75) 1826 27.1%Maternal care related to the foetus and amniotic cavity and possible delivery problems (O30 - O48) 1789 26.5%Pregnancy with abortive outcome (eg. ectopic pregnancy, miscarriage, etc) (O00 - O08) 746 11.1%Delivery (vaginal or caesarean) (O80 - O82) 732 10.9%Persons encountering health services in circumstances related to reproduction (eg. Post-partum care) (Z30 - Z39) 532 7.9%
Digestive SystemSymptoms, signs and abnormal clinical and laboratory findings, not elsewhere classified (R00 - R09) 967 24.5%Other diseases of intestines (K55 - K63) 737 18.7%Hernia (K40 - K46) 425 10.8%Malignant neoplasms of digestive organs (C15 - C26) 356 9.0%Diseases of the appendix (K32 - K38) 328 8.3%
Circulatory SystemIschaemic heart disease (I20 - I25) 1100 42.2%Symptoms, signs and abnormal clinical and laboratory findings, not elsewhere classified (R00 - R09) 506 19.4%Other forms of heart disease (I30 - I52) 497 19.1%Diseases of veins, lympathic vessels and lymph nodes, not elsewhere classified (I80 - I89) 133 5.1%Atherosclerosis (I70) 77 3.0%
Musculoskeletal SystemInjury, poisoning, and certain other consequences of external causes (S00 - T79) 1123 45.0%Other joint disorders (M20 - M25) 195 7.8%Arthrosis (M15 - M19) 185 7.4%Other joint disorders (M20 - M25) 151 6.0%Other dorsopathies (M50 - M54) 136 5.4%
Female ReproductiveSterilization (Z302) 351 17.3%Excessive, frequent and irregular menstruation (N92) 317 15.6%Inflammatory diseases of female pelvic organs (N70 - N77) 150 7.4%Benign neoplasms (D10 - D36) 145 7.1%Endometriosis (N80) 143 7.0%
MidCentral Other Ethnicities Aged 15 to 64 Most Common ICD10 Diagnoses within Most Common Major Diagnostic Categories (MDC) 2000 - 2003
16.3.3 MidCentral District Adults of All Ethnicities Aged 65+ Years Hospitalisations
Over the period 1999/2000 to 2002/2003, the yearly hospital discharges declined by 8.8%. When discharges for the entire period are accumulated together, the most frequent Major Diagnostic Categories were:
1. Circulatory system 2. Digestive system 3. Musculoskeletal system 4. Respiratory system 5. Skin, breast.
Most of the top five Major Diagnostic Categories showed a fall in yearly hospital discharges, except for skin, breast. Circulatory system was the major category and showed a 7.1% fall in discharges when 2000/2001 year was compared to 2002/2003. Musculoskeletal system showed a large fall–30%. Digestive system yearly discharges decreased by 9.7% and respiratory system by 12.7%. Skin, breast Major Diagnostic Category yearly discharges increased by 6.7% when 2000/2001

125
year was compared to 2002/2003. The most frequent diagnoses within the five most common Major Diagnostic Categories were determined. The data used were from 2000/2001 to 2002/2003 financial years and is shown in the table below. The main points from this table are:
• The most prominent circulatory system diseases were ischaemic heart disease (45.6% of circulatory system discharges) and “other forms of heart disease” (26.9%). “Other forms of heart disease” diagnostic grouping includes a wide range of heart conditions, such as abnormal heart rhythms, non rheumatic fever heart valve disorders, heart failure, and inflammation of the layers of the heart not due to infection (pericarditis, endocarditis, myocarditis)
• Malignant neoplasms (cancers) are becoming prominent within the digestive system Major Diagnostic Category. “Other diseases of the intestines” is the most common diagnostic grouping. This includes diagnoses such as blood vessel disorders of the intestines, paralysed bowel (paralytic ileus) or other intestinal obstruction, diverticular disease, irritable bowel syndrome, abscesses, and fistulae. It excludes cancers and infections
• Injury is still the dominant cause of hospitalisation in musculoskeletal system Major Diagnostic Category (37.6%). However, arthrosis is the second most common diagnostic grouping (22%). Arthrosis is a disease of the joint, and in this context, excludes joint disease due to infection and inflammatory joint diseases (like gout, rheumatoid arthritis, and psoriatic arthritis). It would include osteoarthritis (“wear and tear” arthritis)
• Chronic respiratory diseases (excluding asthma) is the dominant diagnostic grouping (43.7%). This grouping includes respiratory conditions like chronic obstructive respiratory disease (CORD–emphysema and chronic bronchitis), and bronchiectasis. Respiratory tract infections is also a major cause of respiratory system hospitalisation (37.2%)
• Skin cancers is the most common cause of hospitalisation for skin, breast Major Diagnostic Category (43.7%). Skin infections (14.1%) and breast cancer (8.7%) are the next most common diagnoses.
MidCentral Aged 65+ Hospital Discharges by Major Diagnostic Category 1999 to 2003
0
1000
2000
3000
4000
5000
6000
7000
8000
Blood,
imm
unity
Burns
Cancer
Circula
tory
syste
m
Diges
tive s
yste
m
Endoc
rine, n
utrit
ion
ENMTEye
Female
repr
oduc
tive
Infec
tion,
para
sites
Injur
y, po
isonin
g
Kidney
, urin
ary
Liver
, pan
crea
s
Male
repro
ducti
ve
Men
tal h
ealth
Mus
culos
kelet
al sys
tem
Nervous
sys
tem
Newborns
Other c
onta
cts
Pregna
ncy,
birth
Respira
tory
Sys
tem
Skin, b
reast
Substa
nce us
e
Nu
mb
er o
f d
isch
arg
es
MidCentral Aged 65+ Hospital Discharges 1999 to 2003
0
1000
2000
3000
4000
5000
6000
7000
8000
1999_2000 2000_2001 2001_2002 2002_2003
Years
Nu
mb
er o
f d
isch
arg
es

126
MidCentral Aged 65+ Hospital Discharges by Major Diagnostic Category 1999 to 2003
0
200
400
600
800
1000
1200
1400
1600
1800
2000
1999_2000 2000_2001 2001_2002 2002_2003
Years
Num
ber of discharges
Blood, immunity
Burns
Cancer
Circulatory system
Digestive system
Endocrine, nutrition
ENMT
Eye
Female reproductive
Infection, parasites
Injury, poisoning
Kidney, urinary
Liver, pancreas
Male reproductive
Mental health
Musculoskeletal system
Nervous system
Newborns
Other contacts
Pregnancy, birth
Respiratory System
Skin, breast
Substance use

127
Diagnoses No. of dischargesPercentage within
MDCCirculatory SystemIschaemic heart diseases (I20 - I25) 2371 45.6%Other forms of heart disease (I30 - I52) 1400 26.9%Symptoms, signs, and abnormal clinical and laboratory findings, not elsewhere classified (R00 - R99) 546 10.5%Atherosclerosis (I70) 258 5.0%Diseases of arteries, arterioles, and capillaries (atherosclerosis excluded) (I71 - I79) 237 4.6%
Digestive SystemOther diseases of intestines (K55 - K63) 530 23.8%Malignant neoplasms (C15 - C96) 426 19.1%Symptoms, signs, and abnormal clinical and laboratory findings, not elsewhere classified (R00 - R99) 283 12.7%Diseases of the oesophagus, stomach, and duodenum (K20 - K31) 244 10.9%Hernia (K40 - K46) 241 10.8%
Musculoskeletal SystemInjury, poisoning, and certain other consequences of external causes (S00 - T79) 793 37.6%Arthrosis (M14 - M19) 464 22.0%Complications of surgical and medical care, not elsewhere classified (T80 - T88) 189 9.0%Other joint disorders (M20 - M25) 83 3.9%Other dorsopathies (M50 - M54) 82 3.9%
Respiratory SystemChronic lower respiratory diseases (excludes asthma) (J40 - J47) 647 30.1%Influenza and pneumonia (J10 - J18) 575 26.8%Malignant neoplasms (C00 - C96) 245 11.4%Other acute lower respiratory infections (J20 - J22) 223 10.4%Other diseases of the respiratory system (J95 - J99) 78 3.6%
Skin, BreastOther malignant neoplasms of the skin (C44) 674 43.7%Infections of the skin and subcutaneous tissue (L00 - L08) 217 14.1%Malignant neoplasms of the breast (C50) 134 8.7%
Other disorders of the skin and subcutaneous tissue (L80 - L99) 109 7.1%In situ neoplasms (D00 - D09) 84 5.5%
MidCentral Aged 65+ Most Common ICD10 Diagnoses within Most Common Major Diagnostic Categories (MDC) 2000 - 2003
16.3.3.1 MidCentral District Adult Maori Aged 65+ Years Hospitalisations
The yearly total number of hospital discharges for Maori aged 65+ was stable over the period 1999/2000 to 2002/2003, with some yearly fluctuation–around 230 to 270 discharges per year. The total number of discharges is relatively small, probably due to the lower proportion of older people in MidCentral district Maori population. The five most common Major Diagnostic Category discharges were:
1. Circulatory system 2. Respiratory system 3. Nervous system 4. Digestive system 5. Musculoskeletal system.
Circulatory system and respiratory system were especially prominent of the five most common Major Diagnostic Categories. Yearly discharges for both circulatory system and respiratory system Major Diagnostic Categories rose in the 1999/2000 to 2002/2003 period. Circulatory system discharges increased 21%, from 57 to 69 discharges per year. The number of discharges was even higher in the

128
2001/2002 year–77 discharges, or 35% higher than for 1999/2000. Respiratory system discharges rose 25% over the same period, from 43 to 54 discharges per year. The most common diagnoses within the top five Major Diagnostic Categories are shown in a table below. The main points are:
• Some of the discharge numbers are becoming small. Small changes in these numbers can create large swings in percentages
• “Other forms of heart disease” is the most common circulatory system diagnostic grouping (43.3% or 58 discharges). “Other forms of heart disease” diagnostic grouping includes a wide range of heart conditions, such as abnormal heart rhythms, non rheumatic fever heart valve disorders, heart failure, and inflammation of the layers of the heart not due to infection
• Ischaemic heart disease was the most prominent diagnostic grouping in the circulatory system Major Diagnostic Category (32.8% or 44 discharges)
• Chronic lower respiratory diseases (excluding asthma) was the dominant respiratory system diagnostic grouping (40.4% or 57 discharges). This is higher than MidCentral district people aged 65+ years of all ethnicities (30.1%) and individual ethnicities of the same age group
• Respiratory infections was responsible for a similar proportion of respiratory system hospitalisations (37.1% or 55 discharges)
• Cerebrovascular diseases (stroke) is the most dominant nervous system diagnostic grouping (32.8% or 20 discharges)
• Malignant neoplasms (cancers) (16.7% or 10 discharges); diseases of the oesophagus, stomach, and duodenum (16.7% or 10 discharges); and hernia (16.7% or 10 discharges) shared top position for most common digestive system hospitalisations
• Arthrosis has overtaken injury as the most common cause of musculoskeletal hospitalisation (27.1% or 16 discharges). Injuries is the second most common cause of musculoskeletal hospitalisation (16.9% or 10 discharges). Arthrosis is a disease of the joint, and in this context, excludes joint disease due to infection and inflammatory joint diseases (like gout, rheumatoid arthritis, and psoriatic arthritis). It would include osteoarthritis (“wear and tear arthritis”).
MidCentral Maori Aged 65+ Hospital Discharges 1999 to 2003
0
50
100
150
200
250
300
1999/2000 2000/2001 2001/2002 2002/2003
Years
Nu
mb
er o
f d
isch
arg
es

129
MidCentral Maori Aged 65+ Hospital Discharges by Major Diagnostic
Category 1999 to 2003
0
50
100
150
200
250
300
Blood,
immun
ity
Cancer
Circula
tory s
ystem
Digestiv
e syste
m
Endoc
rine, n
utritio
nENMT
Eye
Female
repro
ductiv
e
Infectio
n, pa
rasit
es
Injury
, poiso
ning
Kidney
, urin
ary
Liver,
pancre
as
Male re
producti
ve
Muscu
loske
letal s
ystem
Nervous
syste
m
Other c
ontac
ts
Respira
tory Sys
tem
Skin, b
reast
Number of discharges
MidCentral Maori Aged 65+ Hospital Discharges by Major
Diagnostic Category 1999 to 2003
0
10
20
30
40
50
60
70
80
90
1999/2000 2000/2001 2001/2002 2002/2003
Years
Number of discharges
Blood, immunity Cancer Circulatory system
Digestive system Endocrine, nutrition ENMT
Eye Female reproductive Infection, parasites
Injury, poisoning Kidney, urinary Liver, pancreas
Male reproductive Musculoskeletal system Nervous system
Other contacts Respiratory System Skin, breast

130
Diagnoses No. of dischargesPercentage within
MDCCirculatory SystemOther forms of heart disease (I30 - I52) 58 43.3%Ischaemic heart disease (I20 - I25) 44 32.8%Symptoms, signs and abnormal clinical and laboratory findings, not elsewhere classified (R00 - R09) 13 9.7%
Respiratory SystemChronic lower respiratory diseases (excludes asthma) (J40 - J47) 57 40.4%Influenza and pneumonia (J10 - J18) 38 27.0%Other acute lower respiratory tract infections (J20 - J22) 17 12.1%Malignant neoplasms (C00 - C96) 13 9.2%
Nervous SystemCerebrovascular diseases (I60 - I69) 20 32.8%Nerve, nerve root and plexus disorders (G50 - G59) 10 16.4%Polyneuropathies and other disorders of the peripheral nervous system (G60 - G64) 6 9.8%Malignant neoplasm (C00 - C96) 5 8.2%Episodic and paroxysmal disorders (includes epilepsy) (G40 - G47) 4 6.6%
Digestive SystemMalignant neoplasms of digestive organs (C15 - C26) 10 16.7%
Diseases of oesophagus, stomach, and duodenum (K20 - K31) 10 16.7%Hernia (K40 - K46) 10 16.7%Other diseases of intestines (K55 - K63) 7 11.7%Symptoms, signs and abnormal clinical and laboratory findings, not elsewhere classified (R00 - R09) 7 11.7%
Musculoskeletal SystemArthrosis (M15 - M19) 16 27.1%Injury, poisoning, and certain other consequences of external causes (S00 - T79) 10 16.9%Complications of surgical and medical care, not elsewhere classified (T80 - T88) 10 16.9%Inflammatory polyarthropathies (L405, M05 - M14) 8 13.6%
MidCentral Maori Aged 65+ Most Common ICD10 Diagnoses within Most Common Major Diagnostic Categories (MDC) 2000 - 2003
16.3.3.2 MidCentral District Adult Pacific Peoples Aged 65+ Years Hospitalisations
The numbers of yearly hospital discharges from 1999/2000 to 2002/2003 for MidCentral district Pacific peoples aged 65+ were small, limiting analysis and interpretation. The most prominent Major Diagnostic Categories for accumulated discharges 1999/2000 to 2002/2003 were:
1. Circulatory system 2. Respiratory system 3. Digestive system 4. Musculoskeletal system 5. Nervous system.
Circulatory system and respiratory system were the most prominent Major Diagnostic Categories, especially circulatory system. When diagnoses by Major Diagnostic Categories were plotted against time, discharges per year became too small to analyse. Numbers fluctuated widely year to year. The most common diagnoses within the top five Major Diagnostic Categories are shown in a

131
table below. The main points are:
• Some of the discharge numbers are small. Small changes in these numbers can create large swings in percentages
• Ischaemic heart disease is the most prominent circulatory system diagnostic grouping (63% or 17 discharges)
• Respiratory infections and chronic lower respiratory diseases were the most prominent respiratory system diagnostic groupings. However, discharge numbers were small
• Malignant neoplasms (cancers) is the most common digestive system diagnostic grouping, although numbers for the whole Major Diagnostic Category were small
• Injuries was the most common diagnostic grouping for the musculoskeletal Major Diagnostic Category, but numbers were small.
MidCentral Pacific Peoples Aged 65+ Hospital Discharges 1999 to 2003
0
5
10
15
20
25
30
35
40
1999/2000 2000/2001 2001/2002 2002/2003
Years
Nu
mb
er o
f d
isch
arg
es
MidCentral Pacific Peoples Aged 65+ Hospital Discharges by Major Diagnostic Category 1999 to 2003
0
5
10
15
20
25
30
35
Blood,
immun
ity
Circula
tory
syste
m
Diges
tive sy
stem
Endoc
rine, n
utrit
ion
ENMT
Eye
Female
repr
oduc
tive
Injur
y, po
isonin
g
Kidney
, urin
ary
Liver
, pan
crea
s
Male
repro
ducti
ve
Mus
culos
kelet
al sys
tem
Nervous
sys
tem
Other
cont
acts
Respira
tory S
yste
m
Skin, b
reast
Nu
mb
er o
f d
isch
arg
es
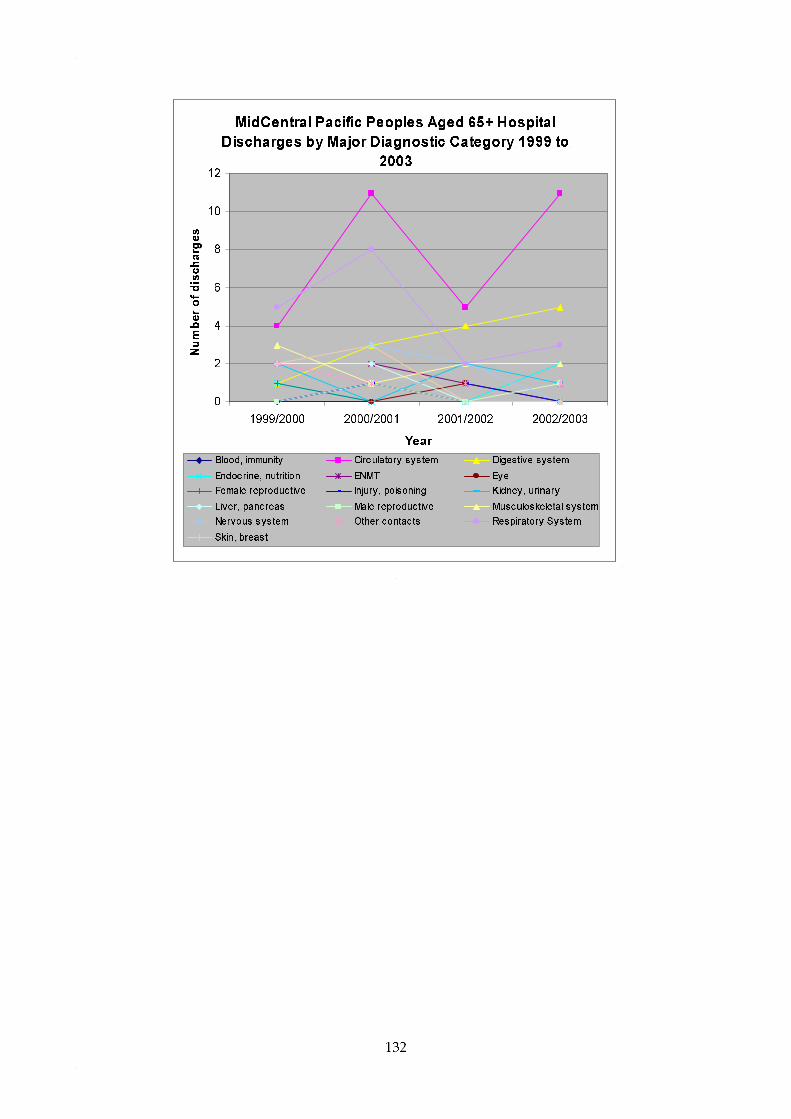
132
MidCentral Pacific Peoples Aged 65+ Hospital
Discharges by Major Diagnostic Category 1999 to
2003
0
2
4
6
8
10
12
1999/2000 2000/2001 2001/2002 2002/2003
Year
Number of discharges
Blood, immunity Circulatory system Digestive system
Endocrine, nutrition ENMT Eye
Female reproductive Injury, poisoning Kidney, urinary
Liver, pancreas Male reproductive Musculoskeletal system
Nervous system Other contacts Respiratory System
Skin, breast

133
Diagnoses No. of dischargesPercentage within
MDCCirculatory SystemIschaemic heart disease (I20 - I25) 17 63.0%Other forms of heart disease (I30 - I52) 5 18.5%Symptoms, signs and abnormal clinical and laboratory findings, not elsewhere classified (R00 - R09) 3 11.1%Diabetes circulatory complications (E1050, E1150, E1151) 1 3.7%Chronic rheumatic heart disease (I05 - I09) 1 3.7%
Respiratory SystemInfluenza and pneumonia (J10 - J18) 3 23.1%Chronic lower respiratory diseases (excludes asthma) (J40 - J47) 2 15.4%Other acute lower respiratory tract infections (J20 - J22) 2 15.4%Other diseases of the respiratory system (J95 - J99) 2 15.4%
Digestive SystemMalignant neoplasms of digestive organs (C15 - C26) 6 50.0%Hernia (K40 - K46) 2 16.7%Other diseases of the digestive system (K90 - K93) 2 16.7%
Musculoskeletal SystemInjury, poisoning, and certain other consequences of external causes (S00 - T79) 3 60.0%Spondylopathies (M45 - M49) 1 20.0%Other osteopathies (M86 - M90) 1 20.0%
Nervous SystemOther disorders of the nervous system (G90 - G99) 2 40.0%Malignant neoplasm (C00 - C96) 1 20.0%Episodic and paroxysmal disorders (includes epilepsy) (G40 - G47) 1 20.0%Cerebrovascular diseases (I60 - I69) 1 20.0%
MidCentral Pacific Peoples Aged 65+ Most Common ICD10 Diagnoses within Most Common Major Diagnostic Categories (MDC) 2000 - 2003
16.3.3.3 MidCentral District Adult Asian Peoples Aged 65+ Years Hospitalisations
The numbers of Asian peoples 65+ hospital discharges in the 2000/2001 to 2002/2003 period were small, limiting analysis. Over the three year period, the number of discharges increased from 37 per year in 2000/2001 to 44 per year in 2001/2002 and 2002/2003. The five most frequent Major Diagnostic Categories, when discharges for the three years were accumulated, were:
1. Circulatory system 2. Respiratory system 3. Digestive system 4. Musculoskeletal system 5. Eye.
When Major Diagnostic Categories were examined across the three year period, numbers were small and fluctuated widely. Discharges for Circulatory system may be increasing, but numbers were too small to be certain. The most common diagnoses within the top five Major Diagnostic Categories are shown in a table below. The main points are:
• The discharge numbers are small. Small changes in these numbers can create large swings in percentages. It was difficult to interpret most of the data because of this
• Ischaemic heart disease was responsible for almost half of circulatory system hospital discharges
• Injuries were responsible for over half of musculoskeletal hospital discharges.

134
MidCentral Asian Aged 65+ Hospital Discharges
2000 to 2003
0
5
10
15
20
25
30
35
40
45
50
2000/2001 2001/2002 2002/2003
Years
Number of discharges
MidCentral Asian Aged 65+ Hospital Discharges by Major Diagnostic Category
2000 to 2003
0
5
10
15
20
25
Cancer
Circula
tory s
ystem
Digestiv
e syste
m
Endoc
rine, n
utritio
nENMT
Eye
Female
repro
ductiv
e
Injury
, poiso
ning
Kidney
, urin
ary
Liver,
pancre
as
Muscu
loske
letal s
ystem
Nervous
syste
m
Other c
ontac
ts
Respira
tory Sys
tem
Skin, b
reast
Number of discharges
MidCentral Asian Aged 65+ Hospital Discharges
by Major Diagnostic Category
0
2
4
6
8
10
12
14
2000/2001 2001/2002 2002/2003
Years
Number of discharges
Cancer Circulatory system Digestive system
Endocrine, nutrition ENMT Eye
Female reproductive Injury, poisoning Kidney, urinary
Liver, pancreas Musculoskeletal system Nervous system
Other contacts Respiratory System Skin, breast

135
Diagnoses No. of dischargesPercentage within
MDCCirculatory SystemIschaemic heart disease (I20 - I25) 10 45.5%Other forms of heart disease (I30 - I52) 6 27.3%Symptoms, signs and abnormal clinical and laboratory findings, not elsewhere classified (R00 - R09) 5 22.7%Atherosclerosis (I70) 1 4.5%
Respiratory SystemMalignant neoplasms (C00 - C96) 3 15.8%Influenza and pneumonia (J10 - J18) 3 15.8%Injuries to the thorax (S20 - S29) 3 15.8%
Digestive System
Diseases of oesophagus, stomach, and duodenum (K20 - K31) 5 31.3%Malignant neoplasms of digestive organs (C15 - C26) 4 25.0%Other diseases of intestines (K55 - K63) 2 12.5%Other diseases of the digestive system (K90 - K93) 2 12.5%
Musculoskeletal SystemInjury, poisoning, and certain other consequences of external causes (S00 - T79) 7 53.8%Arthrosis (M15 - M19) 2 15.4%Other dorsopathies (M50 - M54) 2 15.4%Malignant neoplasms (C00 - C96) 1 7.7%Other osteopathies (M86 - M90) 1 7.7%
EyeDisorders of the lens (H25 - H28) 10 90.9%Disorders of the eyelid, lacrimal system, and orbit (H00 - H06) 1 9.1%
MidCentral Asian Aged 65+ Most Common ICD10 Diagnoses within Most Common Major Diagnostic Categories (MDC) 2000 - 2003
16.3.3.4 MidCentral District Adult Other Ethnicities Aged 65+ Years Hospitalisations
The number of hospital discharges for other ethnicities (non Maori, non Pacific, non Asian) aged 65+ from 2000/2001 to 2002/2003 decreased. The number of discharges declined from 6,478 to 5,917 discharges per year, or 8.7%. The most common Major Diagnostic Categories across the period were:
1. Circulatory system 2. Digestive system 3. Musculoskeletal system 4. Respiratory system 5. Skin, breast.
Circulatory system was especially prominent of these five Major Diagnostic Categories. When Major Diagnostic Categories discharges were examined across the period, most categories appeared stable. Circulatory System discharges were clearly the most prominent category, and seemed to be declining. The five most frequent Major Diagnostic Categories, when discharges for the three years were accumulated, were:
• Ischaemic heart disease (45.9%) and “other forms of heart disease” (26.5%) were the two dominant diagnostic grouping for circulatory system Major Diagnostic Category. “Other forms of heart disease” diagnostic grouping includes a wide range of heart conditions, such as abnormal heart rhythms, non rheumatic fever heart valve disorders, heart failure, and inflammation of the layers of the heart not due to infection
• “Other diseases of the intestines” (24.3%) and malignant cancers (neoplasms) (18.2%)

136
were the two most common digestive system diagnostic groupings. “Other diseases of the intestines” includes diseases such as blood vessel disorders of the intestines, paralysed bowel (paralytic ileus) or other intestinal obstruction, diverticular disease, irritable bowel syndrome, abscesses, and fistulae. It excludes cancers and infections
• Injuries are the most common cause of musculoskeletal hospitalisations (38.1%), but the percentage is less than younger age groups
• Arthrosis is the second most common cause of musculoskeletal hospitalisation (22%). Arthrosis has overtaken injury as the most common cause of musculoskeletal hospitalisation (27.1% or 16 discharges). Injuries is the second most common cause of musculoskeletal hospitalisation (16.9% or 10 discharges). Arthrosis is a disease of the joint, and in this context, excludes joint disease due to infection and inflammatory joint diseases (like gout, rheumatoid arthritis, and psoriatic arthritis). It would include osteoarthritis (“wear and tear arthritis”)
• Chronic diseases of the lower respiratory system (excluding asthma) is the most common cause of respiratory system hospitalisation (29.7%)
• Infections of the respiratory system is also a very important cause of respiratory system hospitalisation. “Influenza and pneumonia” and “other acute lower respiratory tract infections” together made up 37.2% of respiratory system hospital discharges. This is more than chronic diseases of the lower respiratory system, mentioned above
• Management or treatment of respiratory neoplasms (cancers) was also a major cause of respiratory system hospitalisation
• Skin cancers, skin infections, and breast cancer were major causes of hospitalisation for skin, breast Major Diagnostic Category.
MidCentral Other Ethnicities Aged 65+ Total Hospital Admissions 2000 to 2003
0
1000
2000
3000
4000
5000
6000
7000
2000/2001 2001/2002 2002/2003
Years
Nu
mb
er o
f d
isch
arg
es
MidCentral Other Ethnicities Aged 65+ Hospital Discharges by Major Diagnostic Category 2000 to 2003
0
1000
2000
3000
4000
5000
6000
Blood,
immun
ityBur
ns
Cancer
Circula
tory
syste
m
Diges
tive sy
stem
Endoc
rine, n
utriti
onENM
TEye
Female
repro
ductiv
e
Infe
ction
, par
asites
Injur
y, po
isonin
g
Kidney
, urin
ary
Liver
, pan
crea
s
Male
repro
ducti
ve
Mus
culos
kelet
al sys
tem
Nervous
sys
tem
Other
cont
acts
Respira
tory
Sys
tem
Skin, b
reast
Nu
mb
er o
f d
isch
arg
es
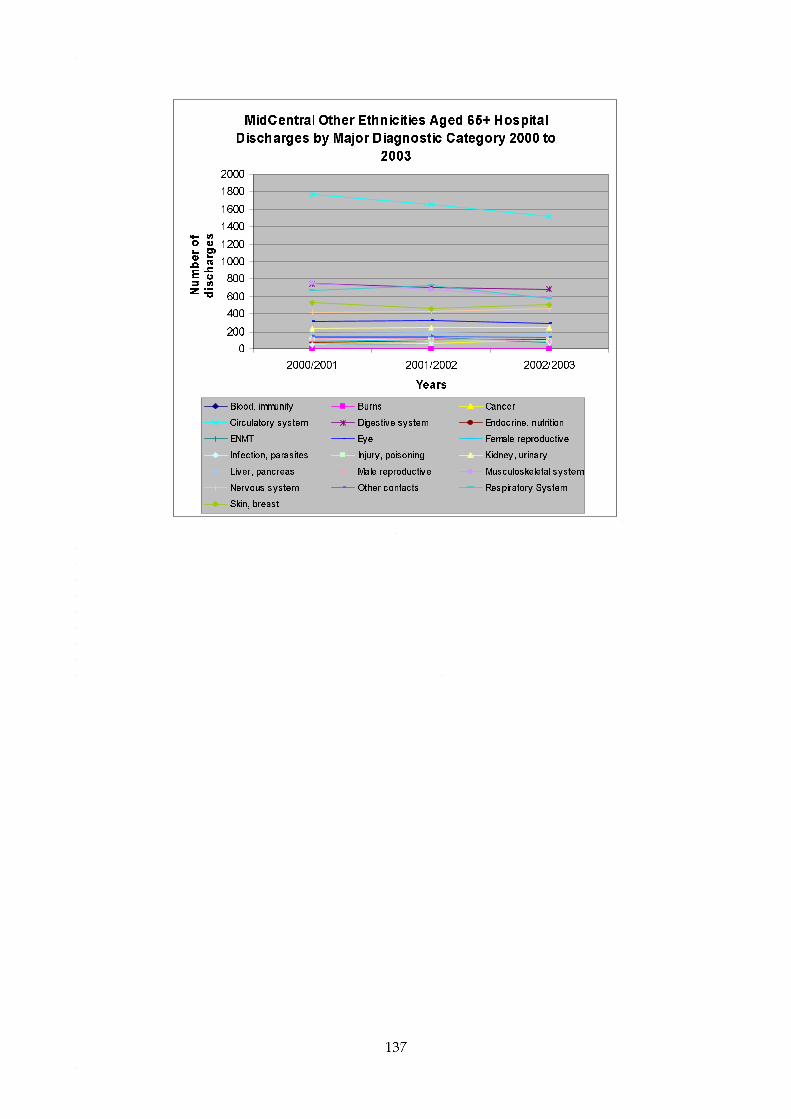
137
MidCentral Other Ethnicities Aged 65+ Hospital
Discharges by Major Diagnostic Category 2000 to
2003
0
200
400
600
800
1000
1200
1400
1600
1800
2000
2000/2001 2001/2002 2002/2003
Years
Number of
discharges
Blood, immunity Burns Cancer
Circulatory system Digestive system Endocrine, nutrition
ENMT Eye Female reproductive
Infection, parasites Injury, poisoning Kidney, urinary
Liver, pancreas Male reproductive Musculoskeletal system
Nervous system Other contacts Respiratory System
Skin, breast

138
Diagnoses No. of dischargesPercentage within
MDCCirculatory SystemIschaemic heart disease (I20 - I25) 2300 45.9%Other forms of heart disease (I30 - I52) 1331 26.5%Symptoms, signs and abnormal clinical and laboratory findings, not elsewhere classified (R00 - R09) 525 10.5%Atherosclerosis (I70) 253 5.0%Other diseases of arteries, arterioles, and capillaries (artherosclerosis excluded) (I71 - I79) 232 4.6%
Digestive SystemOther diseases of intestines (K55 - K63) 521 24.3%Malignant neoplasms of digestive organs (C15 - C26) 389 18.2%Symptoms, signs and abnormal clinical and laboratory findings, not elsewhere classified (R00 - R09) 274 12.8%Diseases of oesophagus, stomach, and duodenum (K20 - K31) 229 10.7%Hernia (K40 - K46) 228 10.6%
Musculoskeletal SystemInjury, poisoning, and certain other consequences of external causes (S00 - T79) 773 38.1%Arthrosis (M15 - M19) 446 22.0%Complications of surgical and medical care, not elsewhere classified (T80 - T88) 179 8.8%Other joint disorders (M20 - M25) 82 4.0%Other osteopathies (M86 - M90) 78 3.8%
Respiratory SystemChronic lower respiratory diseases (excludes asthma) (J40 - J47) 586 29.7%Influenza and pneumonia (J10 - J18) 531 26.9%Malignant neoplasms (C00 - C96) 229 11.6%Other acute lower respiratory tract infections (J20 - J22) 203 10.3%Other diseases of pleura (J90 - J94) 73 3.7%
Skin, BreastOther malignant neoplasms of the skin (C44) 670 44.6%Infections of the skin and subcutaneous tissue (L00 - L08) 205 13.6%Malignant neoplasms of the breast (C50) 128 8.5%
Other disorders of the skin and subcutaneous tissue (L80 - L99) 107 7.1%In situ neoplasms (D00 - D09) 84 5.6%
MidCentral Other Ethnicities Aged 65+ Most Common ICD10 Diagnoses within Most Common Major Diagnostic Categories (MDC) 2000 - 2003
16.4 MidCentral District Disease Specific Hospital Discharges This section looks at selected disease hospital discharges for residents of MidCentral district divided into ethnic groupings. They are for hospital discharge of MidCentral district residents from any hospital in New Zealand, but most will be from MidCentral Health hospitals. The diseases selected are:
• Circulatory system diseases • Ischaemic heart disease • Stroke • Diabetes • Asthma • Respiratory infections • Chronic obstructive respiratory disease (CORD) • All cause injuries • Digestive system Major Diagnostic Category discharges • Skin infections • Non-suppurative otitis media (glue ear)

139
• Chronic diseases of tonsils and adenoids • Suppurative otitis media (middle ear infection) • Immunisation preventable hospitalisations.
The hospitalisation data are examined in three ways:
• Absolute numbers • Crude rates • Age adjusted ratios.
Crude rates are the number of discharges divided by the total number of people in the population of interest. It does not take into account different age balances in different populations. Age adjusted ratios prevent dissimilar age balances in different populations distorting population rates of hospitalisation. This is because most diseases are more likely to occur in some age groups rather than others. Therefore, different rates of hospitalisation may be due to differences in population age structures and not because the risk of disease is higher or lower. An age adjusted ratio is a ratio of actual number of hospitalisations divided by expected number of hospitalisations. The expected number of hospitalisations is calculated using the hospitalisation rates from a comparison population. Age adjusted ratios therefore compare a target population to a predetermined comparison population, compensating for any differences in age structure at the same time. For hospital discharges, New Zealand all ethnicities is the comparison population and has been set the ratio of 1. The individual MidCentral district and New Zealand ethnic groupings have been compared to this ratio. Ethnic age adjusted ratios exceeding 1 mean the ethnic group experienced more discharges than expected when compared against New Zealand overall. Ratios below 1 mean the ethnic group experienced less discharges when compared against New Zealand overall.
16.4.1 Circulatory System Diseases
Circulatory System Major Diagnostic Category is a grouping of diagnoses for administrative and management purposes. It broadly follows body system, in this case, heart and circulation. When MidCentral district discharge numbers over the 1999 to 2003 period were examined:
• There is yearly oscillation in numbers, which makes it difficult to be confident about any apparent trend
• Total numbers of circulatory system discharges may have been falling across the period, but there is some yearly fluctuation
• Maori yearly number of discharges may be slowly rising • Pacific peoples yearly discharges are small, but seemed stable after an initial rise.
Crude discharge rates are the number of discharges divided by the total number of people in the population of interest. It does not take into account different age balances in different populations. When circulatory system crude discharge rates over 1999 to 2003 were examined:
• MidCentral district crude rates by ethnicity were lower than their New Zealand equivalents
• Crude rates for other ethnicities (non Maori, non Pacific) were higher than those for Maori and Pacific peoples. This is mostly because of the higher proportion of older adults among other ethnicities. Circulatory system diseases affect mostly older people
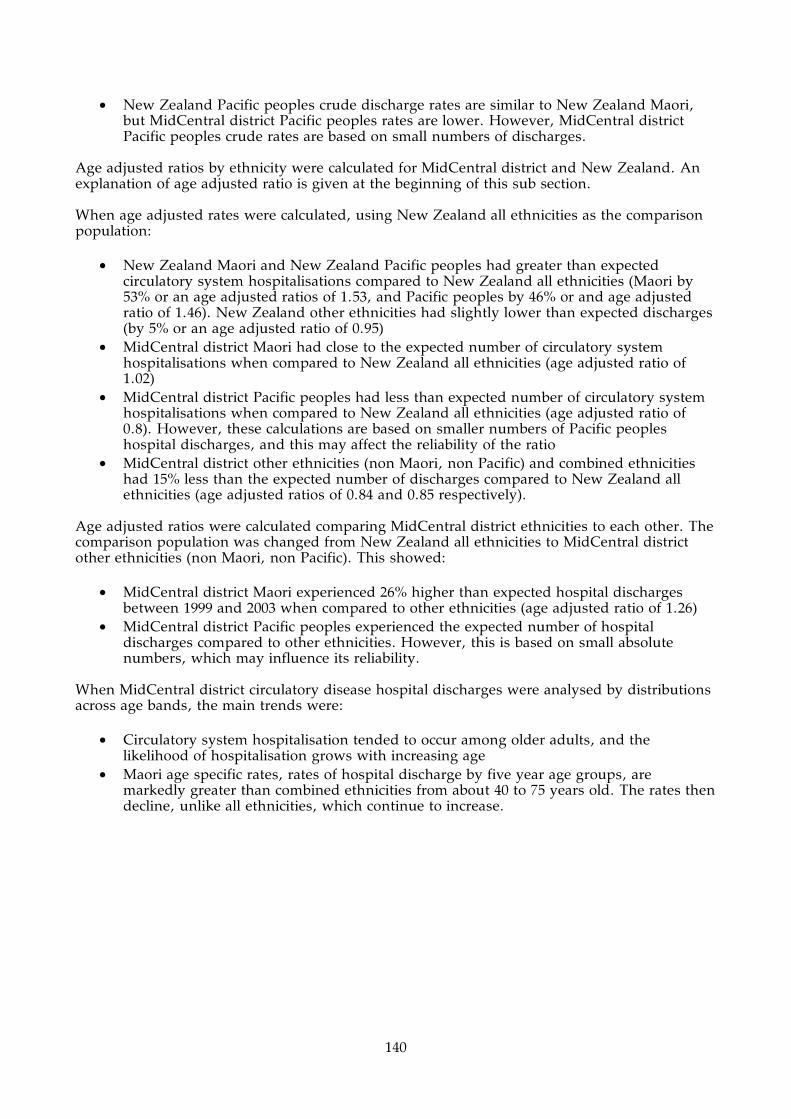
140
• New Zealand Pacific peoples crude discharge rates are similar to New Zealand Maori, but MidCentral district Pacific peoples rates are lower. However, MidCentral district Pacific peoples crude rates are based on small numbers of discharges.
Age adjusted ratios by ethnicity were calculated for MidCentral district and New Zealand. An explanation of age adjusted ratio is given at the beginning of this sub section. When age adjusted rates were calculated, using New Zealand all ethnicities as the comparison population:
• New Zealand Maori and New Zealand Pacific peoples had greater than expected circulatory system hospitalisations compared to New Zealand all ethnicities (Maori by 53% or an age adjusted ratios of 1.53, and Pacific peoples by 46% or and age adjusted ratio of 1.46). New Zealand other ethnicities had slightly lower than expected discharges (by 5% or an age adjusted ratio of 0.95)
• MidCentral district Maori had close to the expected number of circulatory system hospitalisations when compared to New Zealand all ethnicities (age adjusted ratio of 1.02)
• MidCentral district Pacific peoples had less than expected number of circulatory system hospitalisations when compared to New Zealand all ethnicities (age adjusted ratio of 0.8). However, these calculations are based on smaller numbers of Pacific peoples hospital discharges, and this may affect the reliability of the ratio
• MidCentral district other ethnicities (non Maori, non Pacific) and combined ethnicities had 15% less than the expected number of discharges compared to New Zealand all ethnicities (age adjusted ratios of 0.84 and 0.85 respectively).
Age adjusted ratios were calculated comparing MidCentral district ethnicities to each other. The comparison population was changed from New Zealand all ethnicities to MidCentral district other ethnicities (non Maori, non Pacific). This showed:
• MidCentral district Maori experienced 26% higher than expected hospital discharges between 1999 and 2003 when compared to other ethnicities (age adjusted ratio of 1.26)
• MidCentral district Pacific peoples experienced the expected number of hospital discharges compared to other ethnicities. However, this is based on small absolute numbers, which may influence its reliability.
When MidCentral district circulatory disease hospital discharges were analysed by distributions across age bands, the main trends were:
• Circulatory system hospitalisation tended to occur among older adults, and the likelihood of hospitalisation grows with increasing age
• Maori age specific rates, rates of hospital discharge by five year age groups, are markedly greater than combined ethnicities from about 40 to 75 years old. The rates then decline, unlike all ethnicities, which continue to increase.

141
MidCentral Circulatory System (Major Diagnostic
Category) Hospital Discharges 1999 to 2003
0
500
1000
1500
2000
2500
3000
3500
1999 2000 2001 2002 2003
Year
Number of events
Maori
Pacif ic
Other
(includes
Asian)All
ethnicities
New Zealand Circulatory System (Major
Diagnostic Category) Hospital Discharges 1999 to
2003
0
10000
20000
30000
40000
50000
60000
70000
80000
1999 2000 2001 2002 2003
Year
Number of events
Maori
Pacif ic
Other
(includes
Asian)All
ethnicities
Maori Pacific
Other
(includes
Asian)
All
ethnicities
1999 192 8 2563 2763
2000 173 29 2569 2771
2001 231 23 2773 3027
2002 225 21 2493 2739
2003 204 20 2206 2430
Total 1025 101 12604 13730
MidCentral Circulatory System (Major Diagnostic Category)
Hospital Discharges 1999 to 2003
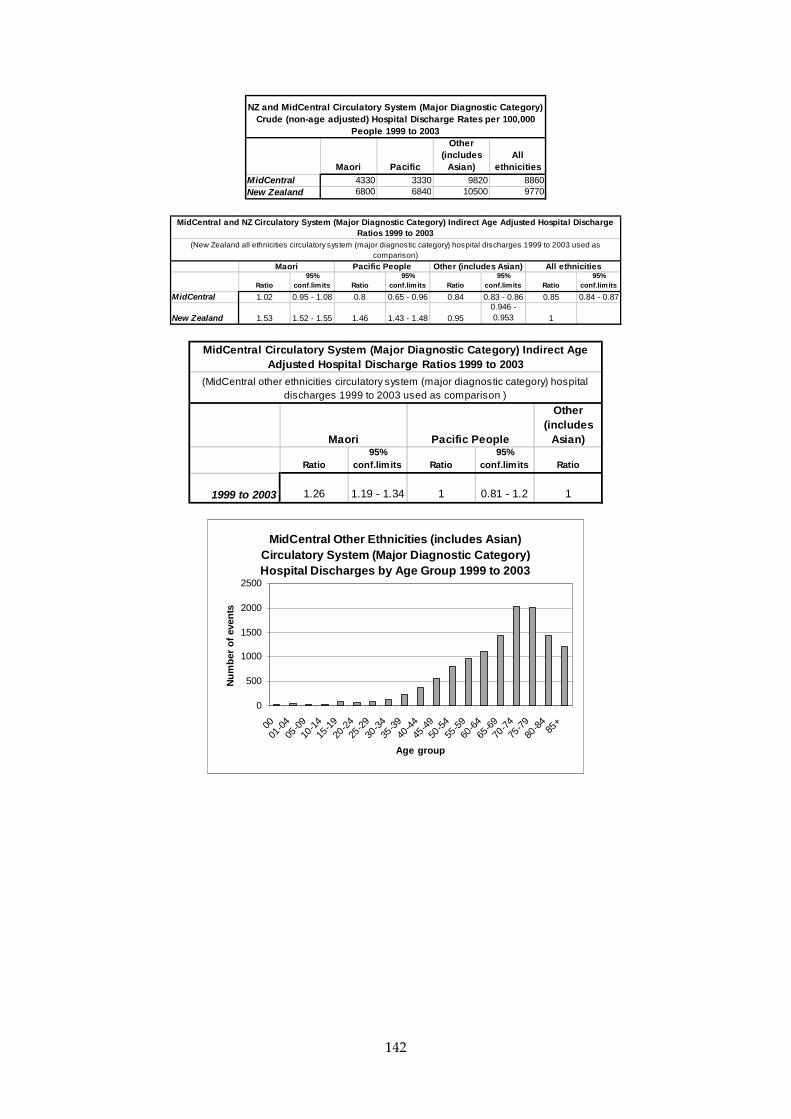
142
Maori Pacific
Other (includes
Asian)All
ethnicitiesMidCentral 4330 3330 9820 8860New Zealand 6800 6840 10500 9770
NZ and MidCentral Circulatory System (Major Diagnostic Category) Crude (non-age adjusted) Hospital Discharge Rates per 100,000
People 1999 to 2003
Ratio95%
conf.limits Ratio95%
conf.limits Ratio95%
conf.limits Ratio95%
conf.limits
MidCentral 1.02 0.95 - 1.08 0.8 0.65 - 0.96 0.84 0.83 - 0.86 0.85 0.84 - 0.87
New Zealand 1.53 1.52 - 1.55 1.46 1.43 - 1.48 0.950.946 - 0.953 1
MidCentral and NZ Circulatory System (Major Diagnostic Category) Indirect Age Adjusted Hospital Discharge Ratios 1999 to 2003
All ethnicitiesMaori Pacific People
(New Zealand all ethnicities circulatory system (major diagnostic category) hospital discharges 1999 to 2003 used as comparison)
Other (includes Asian)
Other (includes
Asian)
Ratio95%
conf.limits Ratio95%
conf.limits Ratio
1999 to 2003 1.26 1.19 - 1.34 1 0.81 - 1.2 1
Maori Pacific People
MidCentral Circulatory System (Major Diagnostic Category) Indirect Age Adjusted Hospital Discharge Ratios 1999 to 2003
(MidCentral other ethnicities circulatory system (major diagnostic category) hospital discharges 1999 to 2003 used as comparison )
MidCentral Other Ethnicities (includes Asian) Circulatory System (Major Diagnostic Category) Hospital Discharges by Age Group 1999 to 2003
0
500
1000
1500
2000
2500
0001
-0405
-0910
-1415
-1920
-2425
-2930
-3435
-3940
-4445
-4950
-5455
-5960
-6465
-6970
-7475
-7980
-84
85+
Age group
Nu
mb
er o
f ev
ents
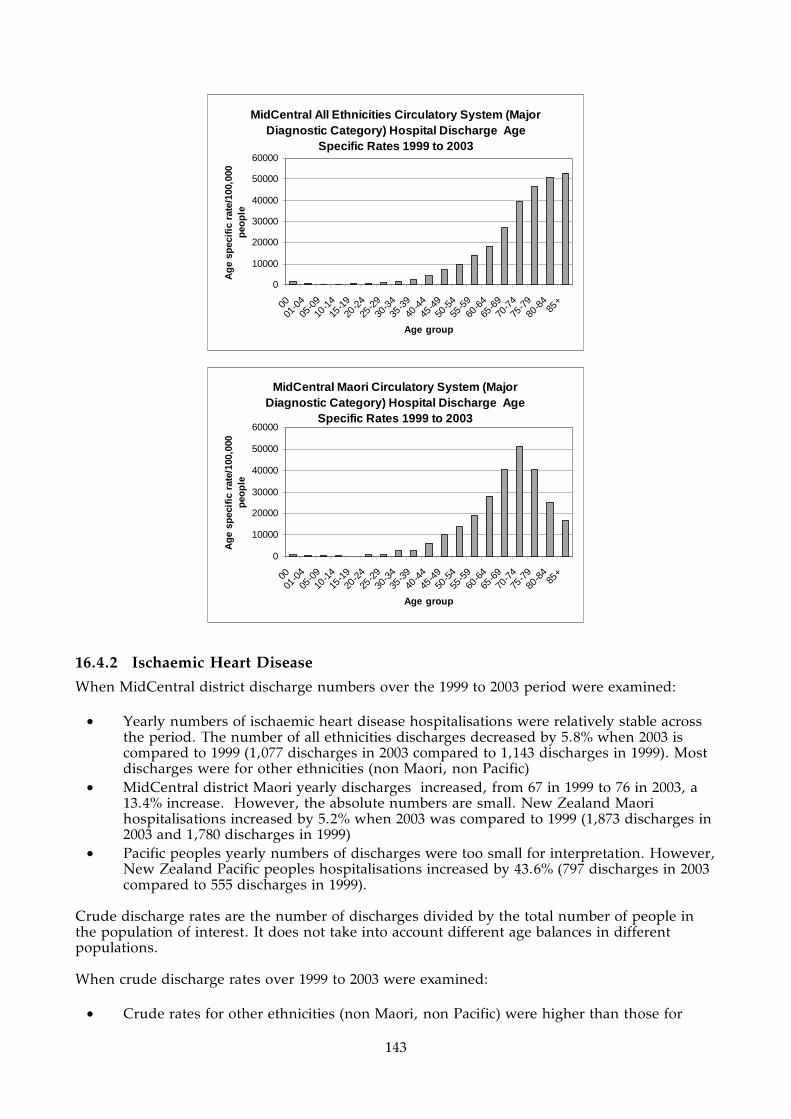
143
MidCentral All Ethnicities Circulatory System (Major Diagnostic Category) Hospital Discharge Age
Specific Rates 1999 to 2003
0
10000
20000
30000
40000
50000
60000
0001
-0405
-0910
-1415
-1920
-2425
-2930
-3435
-3940
-4445
-4950
-5455
-5960
-6465
-6970
-7475
-7980
-84
85+
Age group
Ag
e sp
ecif
ic r
ate/
100,
000
peo
ple
MidCentral Maori Circulatory System (Major Diagnostic Category) Hospital Discharge Age
Specific Rates 1999 to 2003
0
10000
20000
30000
40000
50000
60000
0001
-0405
-0910
-1415
-1920
-2425
-2930
-3435
-3940
-4445
-4950
-5455
-5960
-6465
-6970
-7475
-7980
-84
85+
Age group
Ag
e sp
ecif
ic r
ate/
100,
000
peo
ple
16.4.2 Ischaemic Heart Disease
When MidCentral district discharge numbers over the 1999 to 2003 period were examined:
• Yearly numbers of ischaemic heart disease hospitalisations were relatively stable across the period. The number of all ethnicities discharges decreased by 5.8% when 2003 is compared to 1999 (1,077 discharges in 2003 compared to 1,143 discharges in 1999). Most discharges were for other ethnicities (non Maori, non Pacific)
• MidCentral district Maori yearly discharges increased, from 67 in 1999 to 76 in 2003, a 13.4% increase. However, the absolute numbers are small. New Zealand Maori hospitalisations increased by 5.2% when 2003 was compared to 1999 (1,873 discharges in 2003 and 1,780 discharges in 1999)
• Pacific peoples yearly numbers of discharges were too small for interpretation. However, New Zealand Pacific peoples hospitalisations increased by 43.6% (797 discharges in 2003 compared to 555 discharges in 1999).
Crude discharge rates are the number of discharges divided by the total number of people in the population of interest. It does not take into account different age balances in different populations. When crude discharge rates over 1999 to 2003 were examined:
• Crude rates for other ethnicities (non Maori, non Pacific) were higher than those for

144
Maori and Pacific peoples. This is mostly because of the higher proportion of older adults among other ethnicities. The likelihood of ischaemic heart disease increases with age
• MidCentral district other ethnicities (non Maori, non Pacific) and all ethnicities crude rates were higher than their New Zealand equivalents
• MidCentral district Maori and Pacific peoples rates were lower than corresponding New Zealand ethnicity rates. However, MidCentral district Pacific peoples crude rates are based on small numbers of discharges.
Age adjusted ratios by ethnicity were calculated for MidCentral district and New Zealand. An explanation of age adjusted ratio is given at the beginning of this sub section. When age adjusted rates were calculated, using New Zealand all ethnicities as the comparison population:
• New Zealand Maori had 29% higher than expected ischaemic heart disease hospitalisations than New Zealand all ethnicities (age adjusted ratios of 1.29). MidCentral district Maori age adjusted ratio was not significantly different from the New Zealand all ethnicities ratio
• New Zealand Pacific peoples had 19% higher than expected ischaemic heart disease hospitalisations compared to New Zealand all ethnicities (age adjusted ratios of 1.19). MidCentral district Pacific peoples age adjusted ratio was similar, but was not statistically significant
• MidCentral district other ethnicities (non Maori, non Pacific) and combined ethnicities had similar to expected number of discharges compared to New Zealand all ethnicities (age adjusted ratios of 1.00 and 1.01 respectively).
Age adjusted ratios were calculated comparing MidCentral district ethnicities to each other. The comparison population was changed from New Zealand all ethnicities to MidCentral district other ethnicities (non Maori, non Pacific). This showed:
• MidCentral district Maori experienced higher than expected hospital discharges between 1999 and 2003 when compared to other ethnicities (age adjusted ratio of 1.09). However, this difference was not statistically significant
• MidCentral district Pacific peoples also had higher than expected number of discharges compared to other ethnicities (non Maori, non Pacific), but this was not statistically significant. The number of MidCentral district Pacific peoples discharges was small.
When MidCentral district ischaemic heart disease hospital discharges were analysed by distributions across five year age bands, the main trends were:
• Ischaemic heart disease hospitalisation tended to occur among older adults, and the likelihood of hospitalisation grows with increasing age
• Maori age specific rates, rates of hospital discharge by five year age group, were greater than other ethnicities (non Maori, non Pacific) from about 25 to 69 years old. The Maori rates then fell below those for other ethnicities from 70 years onwards
• Pacific peoples age specific rates were higher than those for other ethnicities (non Maori, non Pacific) from 60 to 74 years old. However, this is based on low absolute numbers of Pacific peoples hospitalisations, only 27 for the age groups mentioned.

145
MidCentral Ischaemic Heart Disease Hospital
Discharges 1999 to 2003
0
200
400
600
800
1000
1200
1400
1999 2000 2001 2002 2003
Year
Number of events
Maori
Pacif ic
Other
(includes
Asian)
All ethnicities
New Zealand Ischaemic Heart Disease Hospital
Discharges 1999 to 2003
0
5000
10000
15000
20000
25000
30000
1999 2000 2001 2002 2003
Year
Number of events
Maori
Pacif ic
Other
(includes
Asian)All ethnicities
Maori Pacific
Other
(includes
Asian)
All
ethnicities
1999 67 2 1074 1143
2000 46 11 1074 1131
2001 71 17 1175 1263
2002 74 11 1156 1241
2003 76 6 995 1077
Total 334 47 5474 5855
MidCentral Ischaemic Heart Disease Hospital Discharges
1999 to 2003
Maori Pacific
Other
(includes
Asian)
All
ethnicities
MidCentral 1410 1550 4270 3780
New Zealand 1810 1770 3930 3510
NZ and MidCentral Ischaemic Heart Disease Crude (non-age
adjusted) Hospital Discharge Rates per 100,000 People 1999 to
2003

146
Ratio95%
conf.limits Ratio95%
conf.limits Ratio95%
conf.limits Ratio95%
conf.limits
MidCentral 1.06 0.95 - 1.18 1.22 0.87 - 1.57 1 0.97 - 1.03 1.01 0.98 - 1.03New Zealand 1.29 1.27 - 1.32 1.19 1.15 - 1.23 0.98 0.97 - 0.98 1
MidCentral and NZ Ischaemic Heart Disease Indirect Age Adjusted Hospital Discharge Ratios 1999 to 2003
All ethnicitiesMaori Pacific(New Zealand all ethnicities ischaemic heart disease hospital discharges 1999 to 2003 used as comparison)
Other (includes Asian)
Other ethnicities (includes
Asian)
Ratio95%
conf.limits Ratio95%
conf.limits Ratio
1999 to 2003 1.09 0.97 - 1.2 1.25 0.89 - 1.6 1
Maori Pacific
MidCentral Ischaemic Heart Disease Indirect Age Adjusted Hospital Discharge Ratios 1999 to 2003
(MidCentral other ethnicities ischaemic heart disease hospital discharges 1999 to 2003 used as comparison )
MidCentral All Ethnicities Ischaemic Heart Disease Hospital Discharges by Age Group 1999 to 2003
0
200
400
600
800
1000
1200
0001
-0405
-0910
-1415
-1920
-2425
-2930
-3435
-3940
-4445
-4950
-5455
-5960
-6465
-6970
-7475
-7980
-84
85+
Age group
Nu
mb
er o
f ev
ents
MidCentral All Ethnicities Ischaemic Heart Disease Hospital Discharge Age Specific Rates 1999 to
2003
0
5000
10000
15000
20000
25000
0001
-0405
-0910
-1415
-1920
-2425
-2930
-3435
-3940
-4445
-4950
-5455
-5960
-6465
-6970
-7475
-7980
-84
85+
Age group
Ag
e sp
ecif
ic r
ate/
100,
000
peo
ple

147
MidCentral Other Ethnicities (includes Asian) Ischaemic Heart Disease Hospital Discharge Age
Specific Rates 1999 to 2003
0
5000
10000
15000
20000
25000
0001
-0405
-0910
-1415
-1920
-2425
-2930
-3435
-3940
-4445
-4950
-5455
-5960
-6465
-6970
-7475
-7980
-84
85+
Age group
Ag
e sp
ecif
ic r
ate/
100,
000
peo
ple
MidCentral Maori Ischaemic Heart Disease Hospital Discharge Age Specific Rates 1999 to
2003
0
20004000
60008000
1000012000
1400016000
18000
0001
-0405
-0910
-1415
-1920
-2425
-2930
-3435
-3940
-4445
-4950
-5455
-5960
-6465
-6970
-7475
-7980
-84
85+
Age group
Ag
e sp
ecif
ic r
ate/
100,
000
peo
ple
16.4.3 Stroke
When MidCentral district discharge numbers over the 1999 to 2003 period were examined:
• Yearly numbers of stroke discharges have been rising across the period. The yearly number of all ethnicities discharges rose by 80% between 1999 and 2003 (135 to 243 discharges). Most discharges were for other ethnicities (non Maori, non Pacific), which rose by 75% over the same period
• Maori yearly discharges also appeared to be increasing, from 7 in 1999 to 17 in 2003, a 142% increase. However, absolute numbers were small
• Pacific peoples numbers of yearly discharges were too small for interpretation. Crude discharge rates are the number of discharges divided by the total number of people in the population of interest. It does not take into account different age balances in different populations. When crude discharge rates over 1999 to 2003 were examined:
• Crude rates for other ethnicities (non Maori, non Pacific) were higher than those for Maori and Pacific peoples. This is mostly because of the higher proportion of older adults among other ethnicities. Stroke affects mostly older people
• MidCentral district crude rates by ethnicity were lower than their New Zealand equivalents. MidCentral district Maori and Pacific peoples rates are lower than
148
corresponding New Zealand ethnicity rates. However, MidCentral district Pacific peoples crude rate is based on a very small number of discharges and is probably of limited reliability.
Age adjusted ratios by ethnicity were calculated for MidCentral district and New Zealand. An explanation of age adjusted ratio is given at the beginning of this sub section. When age adjusted rates were calculated, using New Zealand all ethnicities as the comparison population:
• New Zealand and MidCentral district Maori had greater than expected numbers of stroke hospitalisation than New Zealand all ethnicities, although the difference is smaller for MidCentral district Maori (age adjusted ratios of 1.45 and 1.13 respectively). New Zealand Maori by 45% and MidCentral district Maori by 13%
• New Zealand Pacific peoples had over twice the expected number of stroke hospital discharges when compared to New Zealand all ethnicities (age adjusted ratio of 2.32). This pattern was not replicated among MidCentral district Pacific peoples, who had half the expected number of stroke discharges compared to New Zealand all ethnicities (age adjusted ratio of 0.48). The number of MidCentral district Pacific peoples stroke hospital discharges was very small, making the age adjusted ratio unreliable
• MidCentral district other ethnicities (non Maori, non Pacific) and all ethnicities had less than expected number of discharges compared to New Zealand all ethnicities, by 27% and 26% respectively (age adjusted ratios of 0.73 and 0.74).
Age adjusted ratios were calculated comparing MidCentral district ethnicities to each other. The comparison population was changed from New Zealand all ethnicities to MidCentral district other ethnicities (non Maori, non Pacific). This showed:
• MidCentral district Maori experienced 48% higher than expected number of stroke hospital discharges between 1999 and 2003 when compared to other ethnicities (age adjusted ratio of 1.48)
• MidCentral district Pacific peoples stroke hospital discharge numbers were much lower than expected, when compared against MidCentral district other ethnicities (age adjusted ratio of 0.65). However, the small numbers of discharges probably makes this figure unreliable.
When MidCentral district stroke hospital discharges were analysed by distributions across five year age bands, the main trends were:
• Stroke hospitalisation tended to occur among older adults, and the likelihood of hospitalisation grows with increasing age.
• The Maori stroke age distribution pattern is similar to that for combined ethnicities. Many of the Maori five year age specific rates in the peak hospitalisation years (50 to 85+ years), exceed the equivalent combined ethnicity age specific rate, especially from 50 to 64.

149
MidCentral Stroke Hospital Discharges 1999 to
2003
0
50
100
150
200
250
300
1999 2000 2001 2002 2003
Year
Number of events
Maori
Pacif ic
Other
(includes
Asian)All
ethnicities
New Zealand Stroke Hospital Discharges 1999 to
2003
0
1000
2000
3000
4000
5000
6000
7000
1999 2000 2001 2002 2003
Year
Number of events
Maori
Pacif ic
Other
(includes
Asian)All
ethnicities
Maori Pacific
Other
(includes
Asian)
All
ethnicities
1999 7 0 128 135
2000 5 1 110 116
2001 11 0 170 181
2002 16 0 214 230
2003 17 2 224 243
Total 56 3 846 905
MidCentral Stroke Hospital Discharges 1999 to 2003
Maori Pacific
Other
(includes
Asian)
All
ethnicities
MidCentral 237 98.9 659 584
New Zealand 318 559 797 716
NZ and MidCentral Stroke Crude (non-age adjusted) Hospital
Discharge Rates per 100,000 People 1999 to 2003

150
Ratio95%
conf.limits Ratio95%
conf.limits Ratio95%
conf.limits Ratio95%
conf.limits
MidCentral 1.13 0.83 - 1.42 0.48 - 0.73 0.68 - 0.78 0.74 0.7 - 0.79New Zealand 1.45 1.38 - 1.52 2.32 2.18 - 2.45 0.95 0.94 - 0.97 1
Other (includes Asian) All ethnicitiesMaori Pacific(New Zealand all ethnicities stroke hospital discharges 1999 to 2003 used as comparison)
MidCentral and NZ Stroke Indirect Age Adjusted Hospital Discharge Ratios 1999 to 2003
Other ethnicities (includes
Asian)
Ratio95%
conf.limits Ratio95%
conf.limits Ratio
1999 to 2003 1.48 1.1 - 1.87 0.65 - 1
Maori Pacific
MidCentral Stroke Indirect Age Adjusted Hospital Discharge Ratios 1999 to 2003
(MidCentral other ethnicities stroke hospital discharges 1999 to 2003 used as comparison )
MidCentral All Ethnicities Stroke Hospital Discharges by Age Group 1999 to 2003
0
20
40
60
80
100
120
140
160
180
0001
-0405
-0910
-1415
-1920
-2425
-2930
-3435
-3940
-4445
-4950
-5455
-5960
-6465
-6970
-7475
-7980
-84
85+
Age group
Nu
mb
er o
f ev
ents
MidCentral All Ethnicities Stroke Hospital Discharge Age Specific Rates 1999 to 2003
0
1000
2000
3000
4000
5000
6000
7000
0001
-0405
-0910
-1415
-1920
-2425
-2930
-3435
-3940
-4445
-4950
-5455
-5960
-6465
-6970
-7475
-7980
-84
85+
Age group
Ag
e sp
ecif
ic r
ate/
100,
000
peo
ple

151
MidCentral Maori Stroke Hospital Discharge Age Specific Rates 1999 to 2003
0
1000
2000
3000
4000
5000
6000
7000
0001
-0405
-0910
-1415
-1920
-2425
-2930
-3435
-3940
-4445
-4950
-5455
-5960
-6465
-6970
-7475
-7980
-84
85+
Age group
Ag
e sp
ecif
ic r
ate/
100,
000
peo
ple
16.4.4 Diabetes
When MidCentral district discharge numbers over the 1999 to 2003 period were examined:
• Yearly numbers of diabetes discharges have been rising across the period. The number of all ethnicities discharges rose by 64% between 1999 and 2003 (142 to 233 discharges). Most discharges were for other ethnicities (non Maori, non Pacific), which rose by the same percentage over the same period
• Maori yearly discharges also increased, from 21 in 1999 to 37 in 2003, a 76% increase. • Pacific peoples numbers of yearly discharges were too small for interpretation, although
seemed relatively stable. Crude discharge rates are the number of discharges divided by the total number of people in the population of interest. It does not take into account different age balances in different populations. When crude discharge rates over 1999 to 2003 were examined:
• Crude rates for Maori and Pacific peoples were higher than those for other ethnicities. This is the reverse of the usual relationship for diseases affecting mainly older age groups
• MidCentral district crude rates by ethnicity were lower than their New Zealand equivalents. MidCentral district Maori and Pacific peoples rates are lower than corresponding New Zealand ethnicity rates. However, MidCentral district Pacific peoples crude rate is based a small number of discharges, and may not be reliable.
Age adjusted ratios by ethnicity were calculated for MidCentral district and New Zealand. An explanation of age adjusted ratio is given at the beginning of this subsection. When age adjusted rates were calculated, using New Zealand all ethnicities as the comparison population:
• New Zealand and MidCentral district Maori have greater than expected numbers of diabetes hospitalisation than New Zealand all ethnicities, although the difference is smaller for MidCentral district Maori (age adjusted ratios of 2.23 and 1.47 respectively). New Zealand Maori experienced over twice the expected number of discharges compared to New Zealand all ethnicities, and MidCentral district Maori discharges were 47% higher than expected
• New Zealand Pacific peoples had two and a half times the expected number of diabetes hospital discharges when compared to New Zealand all ethnicities (age adjusted ratio of 2.54). The MidCentral district Pacific peoples disparity is not much smaller, with an age adjusted ratio of 2.35. However, MidCentral district Pacific ratio is based on a small
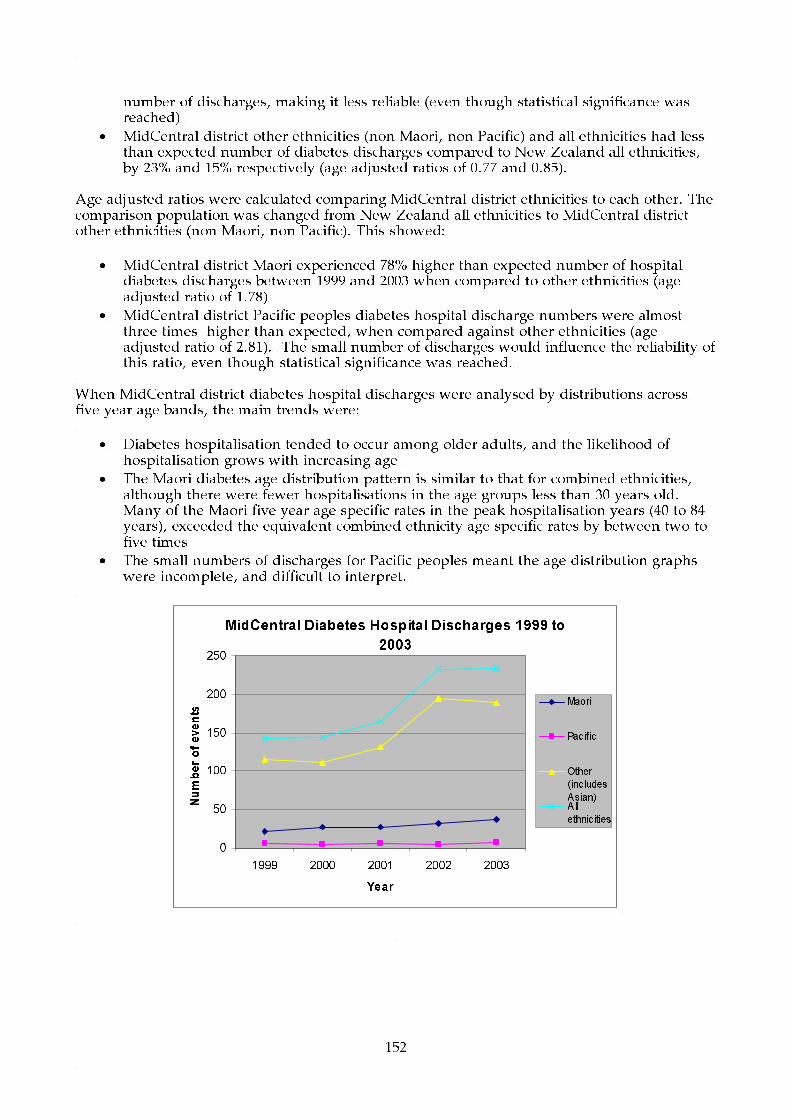
152
number of discharges, making it less reliable (even though statistical significance was reached)
• MidCentral district other ethnicities (non Maori, non Pacific) and all ethnicities had less than expected number of diabetes discharges compared to New Zealand all ethnicities, by 23% and 15% respectively (age adjusted ratios of 0.77 and 0.85).
Age adjusted ratios were calculated comparing MidCentral district ethnicities to each other. The comparison population was changed from New Zealand all ethnicities to MidCentral district other ethnicities (non Maori, non Pacific). This showed:
• MidCentral district Maori experienced 78% higher than expected number of hospital diabetes discharges between 1999 and 2003 when compared to other ethnicities (age adjusted ratio of 1.78)
• MidCentral district Pacific peoples diabetes hospital discharge numbers were almost three times higher than expected, when compared against other ethnicities (age adjusted ratio of 2.81). The small number of discharges would influence the reliability of this ratio, even though statistical significance was reached.
When MidCentral district diabetes hospital discharges were analysed by distributions across five year age bands, the main trends were:
• Diabetes hospitalisation tended to occur among older adults, and the likelihood of hospitalisation grows with increasing age
• The Maori diabetes age distribution pattern is similar to that for combined ethnicities, although there were fewer hospitalisations in the age groups less than 30 years old. Many of the Maori five year age specific rates in the peak hospitalisation years (40 to 84 years), exceeded the equivalent combined ethnicity age specific rates by between two to five times
• The small numbers of discharges for Pacific peoples meant the age distribution graphs were incomplete, and difficult to interpret.
MidCentral Diabetes Hospital Discharges 1999 to
2003
0
50
100
150
200
250
1999 2000 2001 2002 2003
Year
Number of events
Maori
Pacif ic
Other
(includes
Asian)All
ethnicities

153
New Zealand Diabetes Hospital Discharges 1999
to 2003
0
1000
2000
3000
4000
5000
6000
7000
1999 2000 2001 2002 2003
Year
Number of events
Maori
Pacif ic
Other
(includes
Asian)All
ethnicities
Maori Pacific
Other
(includes
Asian)
All
ethnicities
1999 21 6 115 142
2000 28 5 111 144
2001 27 6 132 165
2002 32 5 195 232
2003 37 7 189 233
Total 145 29 742 916
MidCentral Diabetes Hospital Discharges 1999 to 2003
Maori Pacific
Other
(includes
Asian)
All
ethnicities
MidCentral 613 956 578 591
New Zealand 942 1100 587 665
NZ and MidCentral Diabetes Crude (non-age adjusted) Hospital
Discharge Rates per 100,000 People 1999 to 2003
Ratio
95%
conf.limits Ratio
95%
conf.limits Ratio
95%
conf.limits Ratio
95%
conf.limits
MidCentral 1.47 1.23 - 1.71 2.35 1.49 - 3.2 0.77 0.71 - 0.82 0.85 0.8 - 0.91
New Zealand 2.23 2.16 - 2.29 2.54 2.43 - 2.65 0.81 0.8 - 0.82 1
Other (includes Asian) All ethnicitiesMaori Pacific
(New Zealand all ethnicities diabetes hospital discharges 1999 to 2003 used as comparison)
MidCentral and NZ Diabetes Indirect Age Adjusted Hospital Discharge Ratios 1999 to 2003
Other
ethnicities
(includes
Asian)
Ratio
95%
conf.limits Ratio
95%
conf.limits Ratio
1999 to 2003 1.78 1.49 - 2.07 2.81 1.79 - 3.83 1
Maori Pacific
MidCentral Diabetes Indirect Age Adjusted Hospital Discharge Ratios 1999
to 2003
(MidCentral other ethnicities diabetes hospital discharges 1999 to 2003 used as
comparison )

154
MidCentral All Ethnicities Diabetes Hospital Discharges by Age Group 1999 to 2003
0
20
40
60
80
100
120
0001
-0405
-0910
-1415
-1920
-2425
-2930
-3435
-3940
-4445
-4950
-5455
-5960
-6465
-6970
-7475
-7980
-84
85+
Age group
Nu
mb
er o
f ev
ents
MidCentral All Ethnicities Diabetes Hospital Discharge Age Specific Rates 1999 to 2003
0
500
1000
1500
2000
2500
3000
0001
-0405
-0910
-1415
-1920
-2425
-2930
-3435
-3940
-4445
-4950
-5455
-5960
-6465
-6970
-7475
-7980
-84
85+
Age group
Ag
e sp
ecif
ic r
ate/
100,
000
peo
ple
MidCentral Maori Diabetes Hospital Discharge Age Specific Rates 1999 to 2003
0
1000
2000
3000
4000
5000
6000
7000
0001
-0405
-0910
-1415
-1920
-2425
-2930
-3435
-3940
-4445
-4950
-5455
-5960
-6465
-6970
-7475
-7980
-84
85+
Age group
Ag
e sp
ecif
ic r
ate/
100,
000
peo
ple
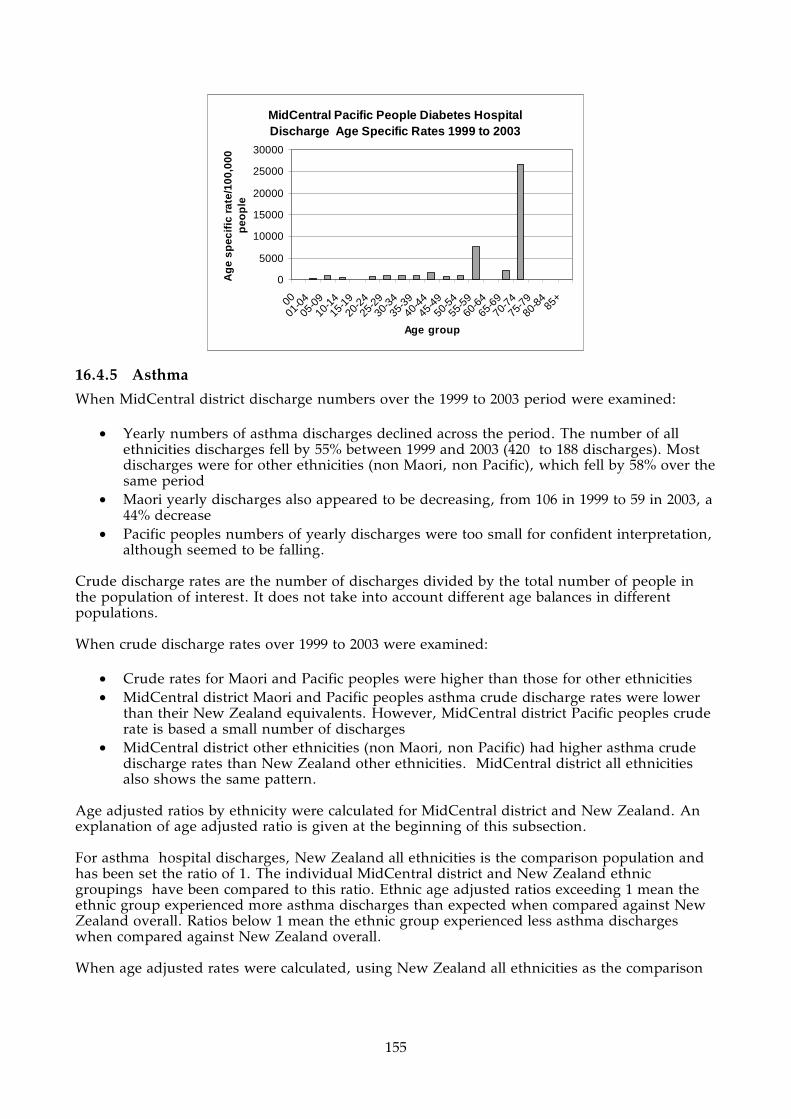
155
MidCentral Pacific People Diabetes Hospital Discharge Age Specific Rates 1999 to 2003
0
5000
10000
15000
20000
25000
30000
00
01-0
405
-0910
-1415
-1920
-2425
-2930
-3435
-3940
-4445
-4950
-5455
-5960
-6465
-6970
-7475
-7980
-84
85+
Age group
Ag
e sp
ecif
ic r
ate/
100,
000
peo
ple
16.4.5 Asthma
When MidCentral district discharge numbers over the 1999 to 2003 period were examined:
• Yearly numbers of asthma discharges declined across the period. The number of all ethnicities discharges fell by 55% between 1999 and 2003 (420 to 188 discharges). Most discharges were for other ethnicities (non Maori, non Pacific), which fell by 58% over the same period
• Maori yearly discharges also appeared to be decreasing, from 106 in 1999 to 59 in 2003, a 44% decrease
• Pacific peoples numbers of yearly discharges were too small for confident interpretation, although seemed to be falling.
Crude discharge rates are the number of discharges divided by the total number of people in the population of interest. It does not take into account different age balances in different populations. When crude discharge rates over 1999 to 2003 were examined:
• Crude rates for Maori and Pacific peoples were higher than those for other ethnicities • MidCentral district Maori and Pacific peoples asthma crude discharge rates were lower
than their New Zealand equivalents. However, MidCentral district Pacific peoples crude rate is based a small number of discharges
• MidCentral district other ethnicities (non Maori, non Pacific) had higher asthma crude discharge rates than New Zealand other ethnicities. MidCentral district all ethnicities also shows the same pattern.
Age adjusted ratios by ethnicity were calculated for MidCentral district and New Zealand. An explanation of age adjusted ratio is given at the beginning of this subsection. For asthma hospital discharges, New Zealand all ethnicities is the comparison population and has been set the ratio of 1. The individual MidCentral district and New Zealand ethnic groupings have been compared to this ratio. Ethnic age adjusted ratios exceeding 1 mean the ethnic group experienced more asthma discharges than expected when compared against New Zealand overall. Ratios below 1 mean the ethnic group experienced less asthma discharges when compared against New Zealand overall. When age adjusted rates were calculated, using New Zealand all ethnicities as the comparison

156
population:
• New Zealand and MidCentral district Maori had greater than expected numbers of asthma hospitalisation than New Zealand all ethnicities, although the difference is smaller for MidCentral district Maori (age adjusted ratios of 1.63 and 1.2 respectively). New Zealand Maori asthma hospitalisations were 63% higher than expected, and MidCentral district Maori hospitalisations were 20% higher than expected
• New Zealand Pacific peoples had 79% greater than expected asthma hospitalisations than New Zealand all ethnicities (age adjusted ratio of 1.79). MidCentral district Pacific peoples age adjusted ratio was not statistically significant
• MidCentral other ethnicities (non Maori, non Pacific) had 7% less than expected number of discharges compared to New Zealand all ethnicities (age adjusted ratio of 0.93)
• MidCentral district and New Zealand all ethnicities age adjusted ratios were almost the same. This indicates MidCentral district all ethnicities experienced the expected number of asthma hospital discharges from 1999 to 2003 compared to New Zealand all ethnicities.
Age adjusted ratios were calculated comparing MidCentral district ethnicities to each other. The comparison population was changed from New Zealand all ethnicities to MidCentral district other ethnicities (non Maori, non Pacific). This showed:
• MidCentral district Maori experienced 26% higher than expected number of asthma hospital discharges between 1999 and 2003 when compared to other ethnicities (age adjusted ratio of 1.26)
• MidCentral district Pacific peoples diabetes hospital discharge numbers were almost 35% higher than expected, when compared against other ethnicities (age adjusted ratio of 1.35), but this difference did not reach statistical significance.
When MidCentral district asthma hospital discharges were analysed by distributions across five year age bands, the main trends were:
• Asthma hospitalisation tended to occur among children and young adults, especially children aged 9 years or less
• The Maori asthma discharge age distribution pattern is similar to that for combined ethnicities, although age groups less than five years old had higher hospitalisation rates. MidCentral district Maori also had to additional age peaks that were not present for all ethnicities. The age groups affected were Maori aged 25 to 29 years and 50 to 69 years
• The small number of discharges for Pacific peoples meant the age distribution graphs were incomplete, and difficult to interpret.
The age distribution of asthma deaths from 1988 to 2001 was plotted on a graph. This showed:
• Asthma death was far less common than asthma hospitalisation • Most asthma deaths occurred among adults, especially older adults. This is in contrast to
the age distribution for asthma hospitalisation where most patients were children. The age distribution of asthma deaths emphasises the importance of good asthma management across all age groups and not just children.
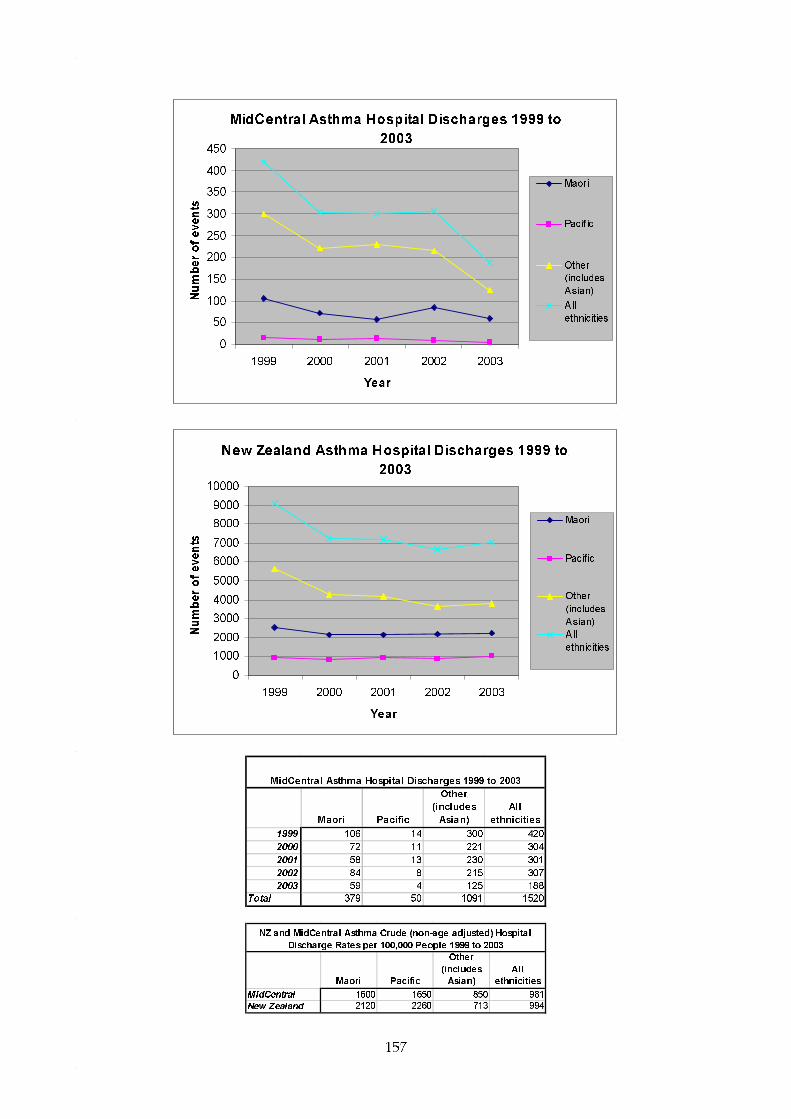
157
MidCentral Asthma Hospital Discharges 1999 to
2003
0
50
100
150
200
250
300
350
400
450
1999 2000 2001 2002 2003
Year
Number of events
Maori
Pacif ic
Other
(includes
Asian)
All
ethnicities
New Zealand Asthma Hospital Discharges 1999 to
2003
0
1000
2000
3000
4000
5000
6000
7000
8000
9000
10000
1999 2000 2001 2002 2003
Year
Number of events
Maori
Pacif ic
Other
(includes
Asian)
All
ethnicities
Maori Pacific
Other
(includes
Asian)
All
ethnicities
1999 106 14 300 420
2000 72 11 221 304
2001 58 13 230 301
2002 84 8 215 307
2003 59 4 125 188
Total 379 50 1091 1520
MidCentral Asthma Hospital Discharges 1999 to 2003
Maori Pacific
Other
(includes
Asian)
All
ethnicities
MidCentral 1600 1650 850 981
New Zealand 2120 2260 713 994
NZ and MidCentral Asthma Crude (non-age adjusted) Hospital
Discharge Rates per 100,000 People 1999 to 2003

158
Ratio95%
conf.limits Ratio95%
conf.limits Ratio95%
conf.limits Ratio95%
conf.limits
MidCentral 1.2 1.08 - 1.32 1.27 0.92 - 1.62 0.93 0.87 - 0.98 0.99 0.94 - 1.04New Zealand 1.63 1.6 - 1.66 1.79 1.73 - 1.84 0.77 0.76 - 0.78 1
MidCentral and NZ Asthma Indirect Age Adjusted Hospital Discharge Ratios 1999 to 2003
All ethnicitiesMaori Pacific(New Zealand all ethnicities asthma hospital discharges 1999 to 2003 used as comparison)
Other (includes Asian)
Other ethnicities (includes Asian)
Ratio95%
conf.limits Ratio95%
conf.limits Ratio
1999 to 2003 1.26 1.14 - 1.39 1.35 0.98 - 1.73 1
Maori Pacific
MidCentral Asthma Indirect Age Adjusted Hospital Discharge Ratios 1999 to 2003
(MidCentral other ethnicities asthma hospital discharges 1999 to 2003 used as comparison )
MidCentral All Ethnicities Asthma Hospital Discharges by Age Group 1999 to 2003
0
50
100
150
200
250
300
350
400
450
500
0001
-0405
-0910
-1415
-1920
-2425
-2930
-3435
-3940
-4445
-4950
-5455
-5960
-6465
-6970
-7475
-7980
-84
85+
Age group
Nu
mb
er o
f ev
ents
MidCentral All Ethnicities Asthma Hospital Discharge Age Specific Rates 1999 to 2003
0
1000
2000
3000
4000
5000
6000
0001
-0405
-0910
-1415
-1920
-2425
-2930
-3435
-3940
-4445
-4950
-5455
-5960
-6465
-6970
-7475
-7980
-84
85+
Age group
Ag
e sp
ecif
ic r
ate/
100,
000
peo
ple

159
NZ Other Ethnicities (includes Asian) Asthma Hospital Discharge Age Specific Rates 1999 to
2003
0
5001000
15002000
25003000
35004000
4500
0001
-0405
-0910
-1415
-1920
-2425
-2930
-3435
-3940
-4445
-4950
-5455
-5960
-6465
-6970
-7475
-7980
-84
85+
Age group
Ag
e sp
ecif
ic r
ate/
100,
000
peo
ple
MidCentral Maori Asthma Hospital Discharge Age Specific Rates 1999 to 2003
0
1000
2000
3000
4000
5000
6000
7000
0001
-0405
-0910
-1415
-1920
-2425
-2930
-3435
-3940
-4445
-4950
-5455
-5960
-6465
-6970
-7475
-7980
-84
85+
Age group
Ag
e sp
ecif
ic r
ate/
100,
000
peo
ple
MidCentral Asthma Deaths by Age Group 1988 to 2001
0
2
4
6
8
10
12
14
16
18
20
10-1
415
-19
20-2
425
-29
30-3
435
-39
40-4
445
-49
50-5
455
-59
60-6
465
-69
70-7
475
-79
80-8
485
+
Age group
Nu
mb
er o
f d
eath
s
Maori
Otherethnicities
Allethnicities

160
New Zealand Asthma Deaths by Age Group 1988 to 2001
0
50
100
150
200
250
300
00
01-04
05-09
10-14
15-19
20-24
25-29
30-34
35-39
40-44
45-49
50-54
55-59
60-64
65-69
70-74
75-79
80-8485+
Age group
Number of deaths
Maori
Other
ethnicities
Pacific
People
All
ethnicities
16.4.6 Respiratory Infections
MidCentral district residents’ respiratory infection hospitalisation data from 1999 to 2003 were analysed. Both upper and lower respiratory tract infections were included in this analysis. When MidCentral district discharge numbers over the 1999 to 2003 period were examined:
• Yearly numbers of respiratory infection discharges appeared to be declining across the period. The number of all ethnicities discharges fell by 16.6% between 1999 and 2003 (856 to 714 discharges). However, it is difficult to be certain this is a trend because of yearly fluctuation in discharge numbers. In contrast, New Zealand respiratory infection yearly hospitalisation numbers gradually increased from 1999 to 2003, by 11.5% (from 23,264 to 25,950)
• MidCentral district Maori yearly discharges fluctuated year to year without obvious trend. New Zealand Maori discharges rose by 11% (from 5,827 in 1999 to 6,466 in 2003)
• MidCentral district Pacific peoples yearly hospitalisations were too small for confident interpretation. New Zealand Pacific peoples yearly respiratory infection hospital discharges increased by 26.4% (from 2,904 in 1999 to 3,671 in 2003).
Crude discharge rates are the number of discharges divided by the total number of people living in the stated area. It does not take into account different age balances in different populations. When crude discharge rates over 1999 to 2003 were examined:
• New Zealand and MidCentral district crude rates for Maori and Pacific peoples were higher than those for other ethnicities. Crude rates for Pacific peoples were higher than for Maori
• MidCentral district crude rates by ethnicity were lower than their New Zealand equivalents.
Age adjusted ratios by ethnicity were calculated for MidCentral district and New Zealand. An explanation of age adjusted ratio is given at the beginning of this subsection. When age adjusted rates were calculated, using New Zealand all ethnicities as the comparison population:
• New Zealand Maori had 50% greater than expected respiratory infection hospitalisations

161
compared to New Zealand all ethnicities
• New Zealand Pacific peoples had over twice the expected number of respiratory infection hospitalisations when compared to New Zealand all ethnicities (age adjusted ratio of 2.14)
• MidCentral district Maori had 16% fewer than expected respiratory infection hospitalisations compared to New Zealand all ethnicities (age adjusted ratio of 0.84)
• MidCentral district other ethnicities (non Maori, non Pacific) and all ethnicities had 28% less than expected respiratory infection hospital discharges when compared to New Zealand all ethnicities.
Age adjusted ratios were calculated comparing MidCentral district ethnicities to each other. The comparison population was changed from New Zealand all ethnicities to MidCentral district other ethnicities (non Maori, non Pacific). This showed:
• MidCentral district Maori experienced 31% greater than expected hospital discharges between 1999 and 2003 when compared to other ethnicities (age adjusted ratio of 1.31)
• MidCentral district Pacific peoples respiratory infection hospital discharge numbers were 85% higher than expected, when compared against other ethnicities (age adjusted ratio of 1.85).
When MidCentral district respiratory infection hospital discharges were analysed by distributions across five year age bands, the main trends were:
• Respiratory infection hospitalisation tended to occur among young children and older adults, especially children aged 4 years or less
• The Maori respiratory infection discharges age distribution pattern is similar to that for combined ethnicities, although age groups less than one year old had a higher hospitalisation rate. MidCentral district Maori age groups from 45 to 84 years also had higher rates of respiratory infection hospitalisation compared to all ethnicities
• The respiratory distribution graph for MidCentral district Pacific peoples is incomplete due to lower absolute numbers. However, it does show higher rates of hospitalisation for children aged 0 to 4 years old and older adults from 50 to 69 years old.
MidCentral Respiratory Infection Hospital
Discharges 1999 to 2003
0
100
200
300
400
500
600
700
800
900
1000
1999 2000 2001 2002 2003
Year
Number of events
Maori
Pacif ic
Other
(includes
Asian)
All
ethnicities

162
New Zealand Respiratory Infection Hospital
Discharges 1999 to 2003
0
5000
10000
15000
20000
25000
30000
1999 2000 2001 2002 2003
Year
Number of events
Maori
Pacif ic
Other
(includes
Asian)All
ethnicities
Maori Pacific
Other
(includes
Asian)
All
ethnicities
1999 154 26 676 856
2000 141 23 531 695
2001 177 27 609 813
2002 183 37 653 873
2003 145 34 535 714
Total 800 147 3004 3951
MidCentral Respiratory Infection Hospital Discharges 1999 to
2003
Maori Pacific
Other
(includes
Asian)
All
ethnicities
MidCentral 3380 4850 2340 2550
New Zealand 5920 8290 2570 3350
NZ and MidCentral Respiratory Infection Crude (non-age adjusted)
Hospital Discharge Rates per 100,000 People 1999 to 2003
Ratio
95%
conf.lim its Ratio
95%
conf.lim its Ratio
95%
conf.lim its Ratio
95%
conf.lim its
MidCentral 0.84 0.78 - 0.9 1.18 0.99 - 1.37 0.72 0.69 - 0.74 0.75 0.73 - 0.78
New Zealand 1.5 1.48 - 1.51 2.14 2.11 - 2.18 0.8 0.8 - 0.81 1
MidCentral and NZ Respiratory Infection Indirect Age Adjusted Hospital Discharge Ratios 1999 to 2003
All ethnicitiesMaori Pacific
(New Zealand all ethnicities respiratory infection hospital discharges 1999 to 2003 used as comparison)
Other (includes Asian)
Other
ethnicities
(includes
Asian)
Ratio
95%
conf.limits Ratio
95%
conf.limits Ratio
1999 to 2003 1.31 1.22 - 1.4 1.85 1.55 - 2.15 1
Maori Pacific People
MidCentral Respiratory Infection Indirect Age Adjusted Hospital Discharge
Ratios 1999 to 2003
(MidCentral other ethnicities respiratory infection hospital discharges 1999 to 2003 used
as comparison )

163
MidCentral All Ethnicities Respiratory Infection Hospital Discharges by Age Group 1999 to 2003
0
100
200
300
400
500
600
700
800
900
0001
-0405
-0910
-1415
-1920
-2425
-2930
-3435
-3940
-4445
-4950
-5455
-5960
-6465
-6970
-7475
-7980
-84
85+
Age group
Nu
mb
er o
f ev
ents
MidCentral All Ethnicities Respiratory Infection Hospital Discharge Age Specific Rates 1999 to
2003
0
5000
10000
15000
20000
25000
30000
35000
40000
0001
-0405
-0910
-1415
-1920
-2425
-2930
-3435
-3940
-4445
-4950
-5455
-5960
-6465
-6970
-7475
-7980
-84
85+
Age group
Ag
e sp
ecif
ic r
ate/
100,
000
peo
ple
MidCentral Maori Respiratory Infection Hospital Discharge Age Specific Rates 1999 to 2003
0
10000
20000
30000
40000
50000
60000
0001
-0405
-0910
-1415
-1920
-2425
-2930
-3435
-3940
-4445
-4950
-5455
-5960
-6465
-6970
-7475
-7980
-84
85+
Age group
Ag
e sp
ecif
ic r
ate/
100,
000
peo
ple

164
MidCentral Pacific Peoples Respiratory Infection Hospital Discharge Age Specific Rates 1999 to
2003
0
10000
20000
30000
40000
50000
60000
70000
0001
-0405
-0910
-1415
-1920
-2425
-2930
-3435
-3940
-4445
-4950
-5455
-5960
-6465
-6970
-7475
-7980
-84
85+
Age group
Ag
e sp
ecif
ic r
ate/
100,
000
peo
ple
16.4.7 Chronic Obstructive Respiratory Disease (CORD)
When MidCentral district chronic obstructive respiratory disease (CORD) hospital discharge numbers over the 1999 to 2003 period were examined:
• Yearly numbers of MidCentral district chronic obstructive respiratory disease discharges declined across the period. The number of all ethnicities discharges fell by 19% between 1999 and 2003 (301 to 244 discharges). In contrast, New Zealand total yearly chronic obstructive respiratory disease discharges increased by 17%, from 8,351 to 9,744
• Maori yearly discharges appeared to be relatively stable, although absolute yearly discharge numbers were small (28 to 40)
• Pacific peoples numbers of yearly discharges were too small for analysis or interpretation.
Crude discharge rates are the number of discharges divided by the total number of people in the population of interest. It does not take into account different age balances in different populations. When crude discharge rates over 1999 to 2003 were examined:
• New Zealand and MidCentral district crude rates for Maori and Pacific peoples were lower than those for other ethnicities. This is most likely due to lower proportions of older adults in Maori and Pacific peoples populations. CORD affects mainly older adults.
• MidCentral district Pacific peoples crude discharge rates were much lower than New Zealand Pacific peoples. However, the MidCentral district Pacific peoples rates were based on a small number of discharges
• MidCentral district crude rates by ethnicity were lower than their New Zealand equivalents.
Age adjusted ratios by ethnicity were calculated for MidCentral district and New Zealand. An explanation of age adjusted ratio is given at the beginning of this subsection. When age adjusted rates were calculated, using New Zealand all ethnicities as the comparison population:
• New Zealand Maori had almost three times the expected number of CORD hospitalisations compared to New Zealand all ethnicities (age adjusted ratio of 2.89)
• New Zealand Pacific peoples had 2.5 times the expected number of CORD hospitalisations when compared to New Zealand all ethnicities (age adjusted ratio of 2.53)
165
• MidCentral district Maori had 57% more than the expected number of hospitalisations compared to New Zealand all ethnicities (age adjusted ratio of 1.57)
• MidCentral district Pacific peoples experienced 43% less than expected hospital discharges for CORD compared to New Zealand all ethnicities. However, there were only 7 discharges across five years. Such low numbers could make rates or ratios calculated from them unstable or unreliable
• MidCentral district other ethnicities (non Maori, non Pacific) and all ethnicities had approximately 30% less than expected respiratory infection discharges when compared to New Zealand all ethnicities (age adjusted ratios of 0.68 and 0.72 respectively).
Age adjusted ratios were calculated comparing MidCentral district ethnicities to each other. The comparison population was changed from New Zealand all ethnicities to MidCentral district other ethnicities (non Maori, non Pacific). This showed:
• MidCentral district Maori experienced over twice the expected number of hospital discharges between 1999 and 2003 when compared to other ethnicities (age adjusted ratio of 2.33)
• MidCentral district Pacific peoples CORD hospital discharges were 13% lower than expected, when compared against other ethnicities (age adjusted ratio of 0.87), but this result did not reach statistical significance. MidCentral district Pacific peoples discharge numbers were very small, making analysis difficult, and affecting the reliability of any calculated results.
When MidCentral district chronic obstructive respiratory disease (CORD) hospital discharges were analysed by distributions across five year age bands, the main trends were:
• CORD hospitalisations tended to occur among older adults, and the likelihood of hospitalisation increases with age to a peak at around 70 to 75 years of age
• The Maori chronic obstructive respiratory disease discharges age distribution pattern is similar to that for combined ethnicities. However, MidCentral district Maori age groups from 45 to 79 years had much higher rates of CORD hospitalisation compared to all ethnicities corresponding age groups–between two to four times higher.
The higher than expected numbers of Maori CORD discharges is consistent with higher proportions of cigarette smoking among Maori. Pacific peoples in New Zealand also have higher smoking rates, and this is consistent with higher than expected hospitalisations for CORD. Pacific peoples living in the MidCentral district were estimated to have higher rates of smoking too, which contradicts the lower than expected numbers of CORD hospital discharges.

166
MidCentral Chronic Obstructive Respiratory
Disease Hospital Discharges 1999 to 2003
0
50
100
150
200
250
300
350
1999 2000 2001 2002 2003
Year
Number of events
Maori
Pacif ic
Other
(includes
Asian)All ethnicities
New Zealand Chronic Obstructive Respiratory
Disease Hospital Discharges 1999 to 2003
0
2000
4000
6000
8000
10000
12000
1999 2000 2001 2002 2003
Year
Number of events
Maori
Pacif ic
Other
(includes
Asian)All
ethnicities
Maori Pacific
Other
(includes
Asian)
All
ethnicities
1999 28 3 270 301
2000 28 1 259 288
2001 40 1 273 314
2002 38 0 245 283
2003 29 2 213 244
Total 163 7 1260 1430
MidCentral Chronic Obstructive Respiratory Disease
Hospital Discharges 1999 to 2003

167
Maori Pacific
Other (includes
Asian)All
ethnicitiesMidCentral 689 231 982 923New Zealand 1310 1230 1160 1180
NZ and MidCentral Chronic Obstructive Respiratory Disease Crude (non-age adjusted) Hospital Discharge Rates per 100,000 People
1999 to 2003
Ratio95%
conf.limits Ratio95%
conf.limits Ratio95%
conf.limits Ratio95%
conf.limits
MidCentral 1.57 1.33 - 1.81 0.57 0.15 - 0.99 0.68 0.64 - 0.71 0.72 0.68 - 0.76New Zealand 2.89 2.82 - 2.96 2.53 2.43 - 2.63 0.85 0.84 - 0.86 1
Other (includes Asian) All ethnicitiesMaori Pacific(New Zealand all ethnicities chronic obstructive respiratory disease hospital discharges 1999 to 2003 used as comparison)
MidCentral and NZ Chronic Obstructive Respiratory Disease Indirect Age Adjusted Hospital Discharge Ratios 1999 to 2003
Other ethnicities (includes
Asian)
Ratio95%
conf.limits Ratio95%
conf.limits Ratio
1999 to 2003 2.33 1.97 - 2.69 0.86 0.22 - 1.49 1
Maori Pacific
MidCentral Chronic Obstructive Respiratory Disease Indirect Age Adjusted Hospital Discharge Ratios 1999 to 2003
(MidCentral other ethnicities chronic obstructive respiratory disease hospital discharges 1999 to 2003 used as comparison )
MidCentral All Ethnicities Chronic Obstructive Respiratory Disease Hospital Discharges by Age
Group 1999 to 2003
0
50
100
150
200
250
300
350
0001
-0405
-0910
-1415
-1920
-2425
-2930
-3435
-3940
-4445
-4950
-5455
-5960
-6465
-6970
-7475
-7980
-84
85+
Age group
Nu
mb
er o
f ev
ents

168
MidCentral All Ethnicities Chronic Obstructive Respiratory Disease Hospital Discharge Age
Specific Rates 1999 to 2003
0
1000
2000
3000
4000
5000
6000
0001
-0405
-0910
-1415
-1920
-2425
-2930
-3435
-3940
-4445
-4950
-5455
-5960
-6465
-6970
-7475
-7980
-84
85+
Age group
Ag
e sp
ecif
ic r
ate/
100,
000
peo
ple
MidCentral Maori Chronic Obstructive Respiratory Disease Hospital Discharge Age
Specific Rates 1999 to 2003
0
2000
4000
6000
8000
10000
12000
14000
0001
-0405
-0910
-1415
-1920
-2425
-2930
-3435
-3940
-4445
-4950
-5455
-5960
-6465
-6970
-7475
-7980
-84
85+
Age group
Ag
e sp
ecif
ic r
ate/
100,
000
peo
ple
16.4.8 Chronic Obstructive Respiratory Disease Mortality
MidCentral district and New Zealand CORD mortality data from 1997 to 2001 were examined. This showed the MidCentral district yearly number of deaths increased across the period–by 30.2% when 2001 is compared to 1997. New Zealand yearly number of deaths showed the same trend. The number of New Zealand CORD deaths in 2001 was 10.6% higher compared to 1997. When the combined 1997 to 2001 data were examined using age adjusted ratios, MidCentral district experienced close to the expected number of deaths when compared to New Zealand all ethnicities (age adjusted ratio of 0.94 which was not statistically significant). New Zealand Maori and New Zealand Pacific peoples both experienced higher than expected number of deaths compared to New Zealand all ethnicities–Maori by almost two and a half times and Pacific peoples by 76%. MidCentral district Maori age adjusted ratio was slightly higher than New Zealand all ethnicities (1.26) and was not statistically significant. The number of MidCentral district Maori deaths from CORD were small (16). There were no MidCentral district Pacific peoples deaths from CORD over the five year period.
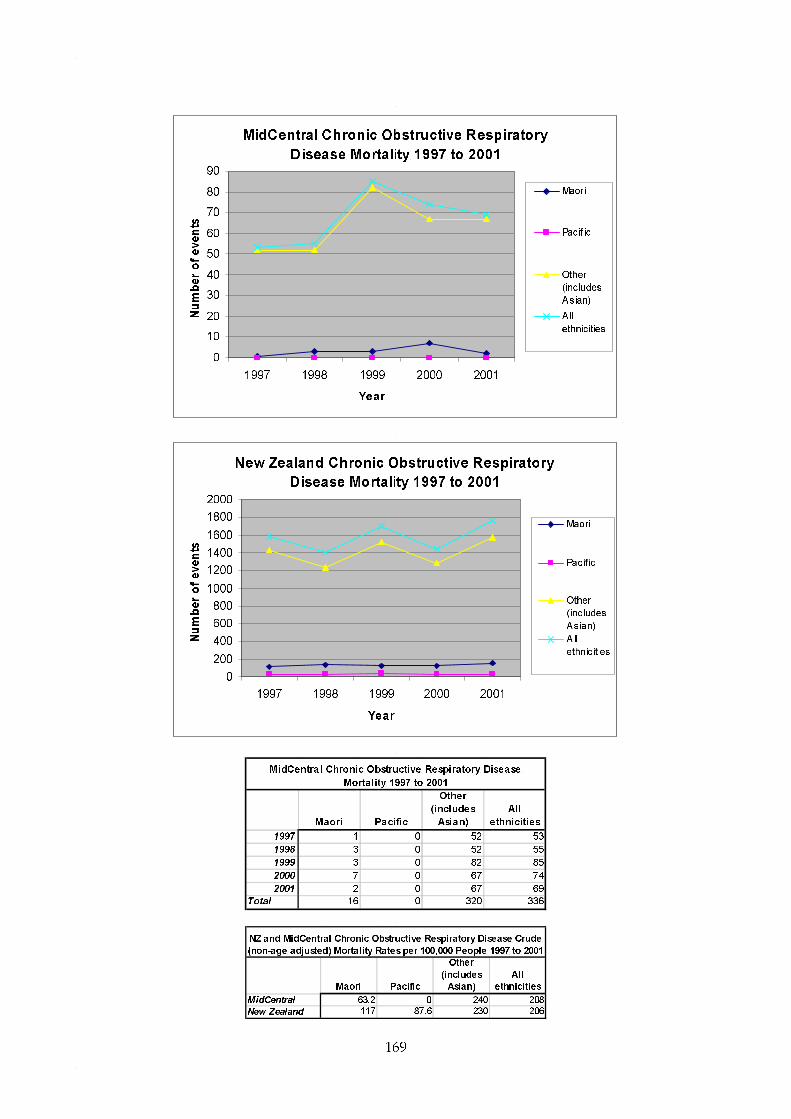
169
MidCentral Chronic Obstructive Respiratory
Disease Mortality 1997 to 2001
0
10
20
30
40
50
60
70
80
90
1997 1998 1999 2000 2001
Year
Number of events
Maori
Pacif ic
Other
(includes
Asian)
All
ethnicities
New Zealand Chronic Obstructive Respiratory
Disease Mortality 1997 to 2001
0
200
400
600
800
1000
1200
1400
1600
1800
2000
1997 1998 1999 2000 2001
Year
Number of events
Maori
Pacif ic
Other
(includes
Asian)
All
ethnicities
Maori Pacific
Other
(includes
Asian)
All
ethnicities
1997 1 0 52 53
1998 3 0 52 55
1999 3 0 82 85
2000 7 0 67 74
2001 2 0 67 69
Total 16 0 320 336
MidCentral Chronic Obstructive Respiratory Disease
Mortality 1997 to 2001
Maori Pacific
Other
(includes
Asian)
All
ethnicities
MidCentral 63.2 0 240 208
New Zealand 117 87.6 230 206
NZ and MidCentral Chronic Obstructive Respiratory Disease Crude
(non-age adjusted) Mortality Rates per 100,000 People 1997 to 2001

170
Ratio95%
conf.limits Ratio95%
conf.limits Ratio95%
conf.limits Ratio95%
conf.limits
MidCentral 1.26 0.64 - 1.88 0 - 0.93 0.83 - 1.03 0.94 0.84 - 1.04New Zealand 2.38 2.2 - 2.56 1.76 1.5 - 2.02 0.94 0.92 - 0.96 1
Other (includes Asian) All ethnicitiesMaori Pacific(New Zealand all ethnicities chronic obstructive respiratory disease mortality 1997 to 2001 used as comparison)
MidCentral and NZ Chronic Obstructive Respiratory Disease Indirect Age Adjusted Mortality Ratios 1997 to 2001
16.4.9 All Cause Injuries
When MidCentral district discharge numbers over the 1999 to 2003 period were examined:
• Yearly numbers of MidCentral district all cause injuries discharges declined across the period. The number of all ethnicities discharges fell by 45% between 1999 and 2003 (981 to 537 discharges). New Zealand total yearly all cause injuries discharges fell by 27%, from 20,894 to 15,199
• Maori yearly discharges also fell, by 35% (121 to 79) • Pacific peoples numbers of yearly discharges were too small for confident interpretation,
although also appeared to be falling.
Crude discharge rates are the number of discharges divided by the total number of people in the population of interest. It does not take into account different age balances in different populations. When crude discharge rates over 1999 to 2003 were examined:
• New Zealand Maori crude discharge rates were higher than the rest of the ethnic groupings, including MidCentral district Maori
• MidCentral district Maori crude rates were lower than New Zealand and MidCentral other ethnicities (non Maori, non Pacific)
• MidCentral district Pacific peoples crude discharge rates were smaller than the rest of the ethnic groupings, including New Zealand Pacific peoples
• Crude discharge rates for New Zealand and MidCentral district ethnicities were close to each other.
Age adjusted ratios by ethnicity were calculated for MidCentral district and New Zealand. An explanation of age adjusted ratio is given at the beginning of this subsection. When age adjusted rates were calculated, using New Zealand all ethnicities as the comparison population:
• New Zealand Maori had 12% more than expected hospitalisations due to injuries compared to New Zealand all ethnicities (age adjusted ratio of 1.12)
• New Zealand Pacific peoples had 23% less than the expected number of hospitalisations due to injuries when compared to New Zealand all ethnicities (age adjusted ratio of 0.77)
• MidCentral district Maori had 25% less than expected hospitalisations for injuries compared to New Zealand all ethnicities (age adjusted ratio of 0.75)
• MidCentral district other ethnicities (non Maori, non Pacific) and all ethnicities had approximately the equivalent number of discharges when compared to New Zealand all ethnicities (age adjusted ratios of 1.03 and 0.98 respectively).
Age adjusted ratios were calculated comparing MidCentral district ethnicities to each other. The comparison population was changed from New Zealand all ethnicities to MidCentral district
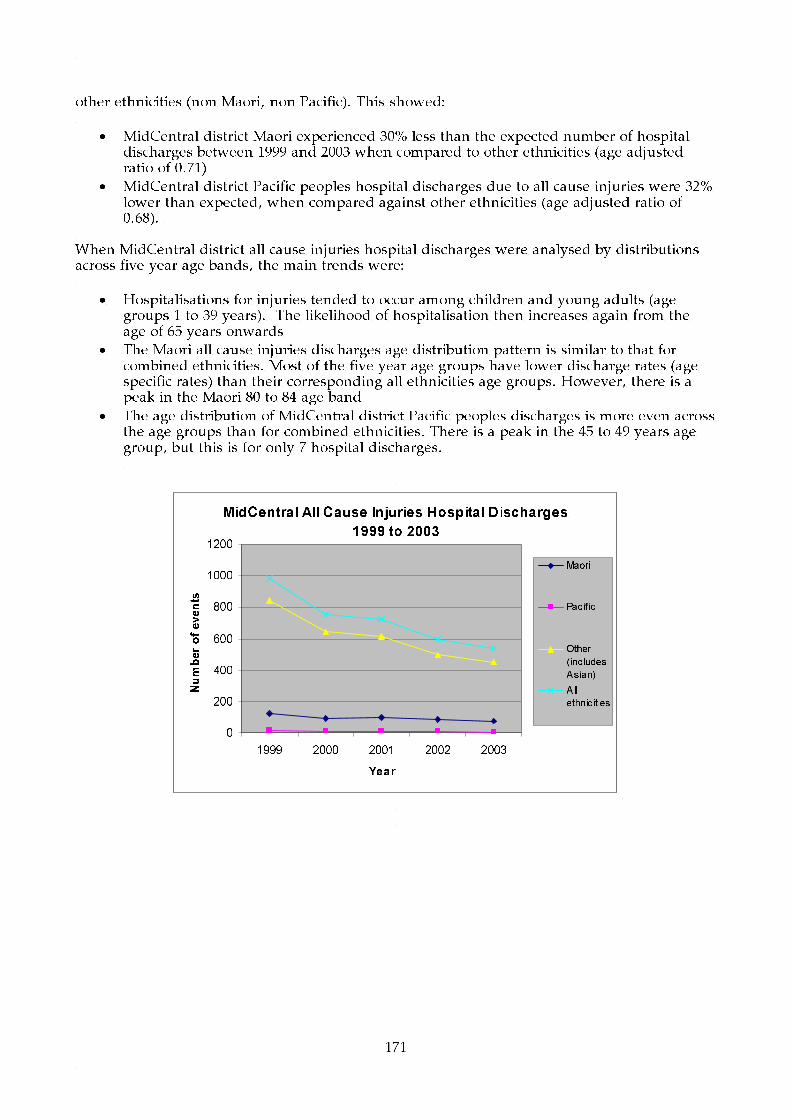
171
other ethnicities (non Maori, non Pacific). This showed:
• MidCentral district Maori experienced 30% less than the expected number of hospital discharges between 1999 and 2003 when compared to other ethnicities (age adjusted ratio of 0.71)
• MidCentral district Pacific peoples hospital discharges due to all cause injuries were 32% lower than expected, when compared against other ethnicities (age adjusted ratio of 0.68).
When MidCentral district all cause injuries hospital discharges were analysed by distributions across five year age bands, the main trends were:
• Hospitalisations for injuries tended to occur among children and young adults (age groups 1 to 39 years). The likelihood of hospitalisation then increases again from the age of 65 years onwards
• The Maori all cause injuries discharges age distribution pattern is similar to that for combined ethnicities. Most of the five year age groups have lower discharge rates (age specific rates) than their corresponding all ethnicities age groups. However, there is a peak in the Maori 80 to 84 age band
• The age distribution of MidCentral district Pacific peoples discharges is more even across the age groups than for combined ethnicities. There is a peak in the 45 to 49 years age group, but this is for only 7 hospital discharges.
MidCentral All Cause Injuries Hospital Discharges
1999 to 2003
0
200
400
600
800
1000
1200
1999 2000 2001 2002 2003
Year
Number of events
Maori
Pacif ic
Other
(includes
Asian)
All
ethnicities

172
New Zealand All Cause Injuries Hospital
Discharges 1999 to 2003
0
5000
10000
15000
20000
25000
1999 2000 2001 2002 2003
Year
Number of events
Maori
Pacif ic
Other
(includes
Asian)All
ethnicities
Maori Pacific
Other
(includes
Asian)
All
ethnicities
1999 121 18 842 981
2000 95 13 645 753
2001 99 13 616 728
2002 88 9 500 597
2003 79 6 452 537
Total 482 59 3055 3596
MidCentral All Cause Injuries Hospital Discharges 1999 to
2003
Maori Pacific
Other
(includes
Asian)
All
ethnicities
MidCentral 2040 1950 2380 2320
New Zealand 2990 2060 2290 2370
NZ and MidCentral All Cause Injuries Crude (non-age adjusted)
Hospital Discharge Rates per 100,000 People 1999 to 2003
Ratio
95%
conf.limits Ratio
95%
conf.limits Ratio
95%
conf.limits Ratio
95%
conf.limits
MidCentral 0.75 0.68 - 0.82 0.72 0.53 - 0.9 1.03 0.99 - 1.07 0.98 0.94 - 1.01
New Zealand 1.12 1.1 - 1.13 0.77 0.75 - 0.8 0.99 0.99 - 1 1
MidCentral and NZ All Cause Injuries Indirect Age Adjusted Hospital Discharge Ratios 1999 to 2003
All ethnicitiesMaori Pacific
(New Zealand all ethnicities all cause injuries hospital discharges 1999 to 2003 used as comparison)
Other (includes Asian)
Other
ethnicities
(includes
Asian)
Ratio
95%
conf.limits Ratio
95%
conf.limits Ratio
1999 to 2003 0.71 0.65 - 0.78 0.68 0.51 - 0.86 1
Maori Pacific
MidCentral All Cause Injuries Indirect Age Adjusted Hospital Discharge
Ratios 1999 to 2003
(MidCentral other ethnicities all cause injuries hospital discharges 1999 to 2003 used
as comparison )

173
MidCentral All Ethnicities All Cause Injuries Hospital Discharge by Age Group 1999 to 2003
0
100
200
300
400
500
600
0001
-0405
-0910
-1415
-1920
-2425
-2930
-3435
-3940
-4445
-4950
-5455
-5960
-6465
-6970
-7475
-7980
-84
85+
Age group
Nu
mb
er o
f ev
ents
MidCentral All Ethnicities All Cause Injuries Hospital Discharge Age Specific Rates 1999 to
2003
0
500
1000
1500
2000
2500
3000
3500
4000
4500
0001
-0405
-0910
-1415
-1920
-2425
-2930
-3435
-3940
-4445
-4950
-5455
-5960
-6465
-6970
-7475
-7980
-84
85+
Age group
Ag
e sp
ecif
ic r
ate/
100,
000
peo
ple
MidCentral Maori All Cause Injuries Hospital Discharge Age Specific Rates 1999 to 2003
0
500
1000
1500
2000
2500
3000
3500
0001
-0405
-0910
-1415
-1920
-2425
-2930
-3435
-3940
-4445
-4950
-5455
-5960
-6465
-6970
-7475
-7980
-84
85+
Age group
Ag
e sp
ecif
ic r
ate/
100,
000
peo
ple
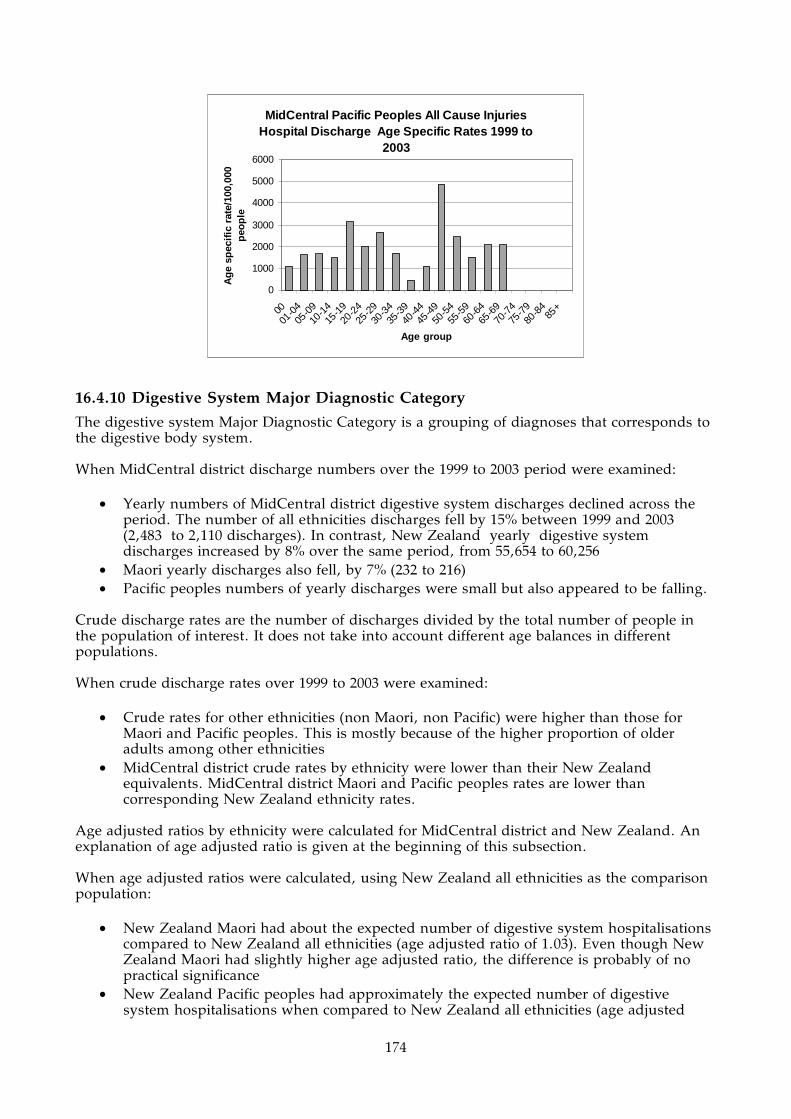
174
MidCentral Pacific Peoples All Cause Injuries Hospital Discharge Age Specific Rates 1999 to
2003
0
1000
2000
3000
4000
5000
6000
0001
-0405
-0910
-1415
-1920
-2425
-2930
-3435
-3940
-4445
-4950
-5455
-5960
-6465
-6970
-7475
-7980
-84
85+
Age group
Ag
e sp
ecif
ic r
ate/
100,
000
peo
ple
16.4.10 Digestive System Major Diagnostic Category
The digestive system Major Diagnostic Category is a grouping of diagnoses that corresponds to the digestive body system. When MidCentral district discharge numbers over the 1999 to 2003 period were examined:
• Yearly numbers of MidCentral district digestive system discharges declined across the period. The number of all ethnicities discharges fell by 15% between 1999 and 2003 (2,483 to 2,110 discharges). In contrast, New Zealand yearly digestive system discharges increased by 8% over the same period, from 55,654 to 60,256
• Maori yearly discharges also fell, by 7% (232 to 216) • Pacific peoples numbers of yearly discharges were small but also appeared to be falling.
Crude discharge rates are the number of discharges divided by the total number of people in the population of interest. It does not take into account different age balances in different populations. When crude discharge rates over 1999 to 2003 were examined:
• Crude rates for other ethnicities (non Maori, non Pacific) were higher than those for Maori and Pacific peoples. This is mostly because of the higher proportion of older adults among other ethnicities
• MidCentral district crude rates by ethnicity were lower than their New Zealand equivalents. MidCentral district Maori and Pacific peoples rates are lower than corresponding New Zealand ethnicity rates.
Age adjusted ratios by ethnicity were calculated for MidCentral district and New Zealand. An explanation of age adjusted ratio is given at the beginning of this subsection. When age adjusted ratios were calculated, using New Zealand all ethnicities as the comparison population:
• New Zealand Maori had about the expected number of digestive system hospitalisations compared to New Zealand all ethnicities (age adjusted ratio of 1.03). Even though New Zealand Maori had slightly higher age adjusted ratio, the difference is probably of no practical significance
• New Zealand Pacific peoples had approximately the expected number of digestive system hospitalisations when compared to New Zealand all ethnicities (age adjusted

175
ratio of 0.98)
• MidCentral district Maori had 30% less than expected number of digestive system hospitalisations compared to New Zealand all ethnicities (age adjusted ratio of 0.70)
• MidCentral district Pacific peoples had 22% less than expected digestive system hospital discharges when compared to New Zealand all ethnicities (age adjusted ratio of 0.78)
• MidCentral district other ethnicities (non Maori, non Pacific) experienced approximately the expected number of hospital discharges when compared to New Zealand all ethnicities (age adjusted ratios of 0.96).
Age adjusted ratios were calculated comparing MidCentral district ethnicities to each other. The comparison population was changed from New Zealand all ethnicities to MidCentral district other ethnicities (non Maori, non Pacific). This showed:
• MidCentral district Maori experienced 30% less than the expected number of hospital discharges between 1999 and 2003 when compared to other ethnicities (age adjusted ratio of 0.7)
• MidCentral district Pacific peoples digestive system hospitalisation was 22% lower than expected, when compared against other ethnicities (age adjusted ratio of 0.78).
When MidCentral district digestive system hospital discharges were analysed by distributions across five year age bands, the main trends were:
• Digestive system hospitalisations were fairly evenly distributed across the age groups, with a moderate peak in the 65 to 80 age bands. However, when expressed as age specific rates–discharge rates for each five year age group–infants less than one year old and people aged 55 and older had higher rates of digestive system hospitalisation
• Maori and Pacific peoples have lower proportions of discharges among older adults, but the age specific rate distribution is similar to all ethnicities, with rising rates among older adults.
MidCentral Digestive System Major Diagnostic
Category Hospital Discharges 1999 to 2003
0
500
1000
1500
2000
2500
3000
1999 2000 2001 2002 2003
Year
Number of events
Maori
Pacif ic
Other
(includes
Asian)
All ethnicities

176
New Zealand Digestive System Major Diagnostic
Category Hospital Discharges 1999 to 2003
0
10000
20000
30000
40000
50000
60000
70000
1999 2000 2001 2002 2003
Year
Number of events
Maori
Pacif ic
Other
(includes
Asian)
All
ethnicities
Maori Pacific
Other
(includes
Asian)
All
ethnicities
1999 232 33 2218 2483
2000 223 29 2161 2413
2001 211 39 2167 2417
2002 219 29 1941 2189
2003 216 26 1868 2110
Total 1101 156 10355 11612
MidCentral Digestive System Major Diagnostic Category
Hospital Discharges 1999 to 2003
Maori Pacific
Other
(includes
Asian)
All
ethnicities
MidCentral 4660 5140 8070 7490
New Zealand 6820 6600 8170 7900
NZ and MidCentral Digestive System Major Diagnostic Category
Crude (non-age adjusted) Hospital Discharge Rates per 100,000
People 1999 to 2003
Ratio
95%
conf.limits Ratio
95%
conf.limits Ratio
95%
conf.limits Ratio
95%
conf.limits
MidCentral 0.7 0.66 - 0.75 0.78 0.65 - 0.9 0.96 0.94 - 0.98 0.93 0.91 - 0.94
New Zealand 1.03 1.02 - 1.04 0.99 0.97 - 1 1 0.99 - 1 1
MidCentral and NZ Digestive System Major Diagnostic Category Indirect Age Adjusted Hospital Discharge
Ratios 1999 to 2003
All ethnicitiesMaori Pacific
(New Zealand all ethnicities digestive system major diagnostic category hospital discharges 1999 to 2003 used as
comparison)
Other (includes Asian)
Other
ethnicities
(includes
Asian)
Ratio
95%
conf.limits Ratio
95%
conf.limits Ratio
1999 to 2003 0.7 0.66 - 0.75 0.78 0.65 - 0.9 1
Maori Pacific
MidCentral Digestive System Major Diagnostic Category Indirect Age
Adjusted Hospital Discharge Ratios 1999 to 2003
(MidCentral other ethnicities digestive system major diagnostic category hospital
discharges 1999 to 2003 used as comparison )
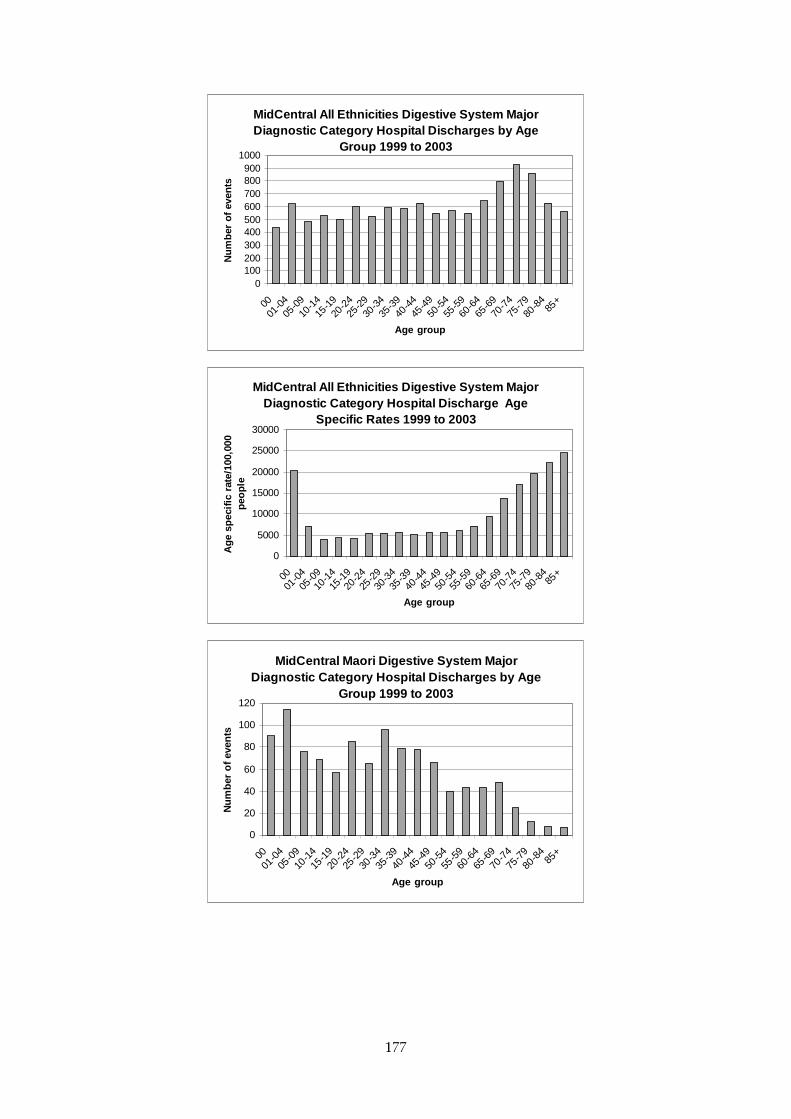
177
MidCentral All Ethnicities Digestive System Major Diagnostic Category Hospital Discharges by Age
Group 1999 to 2003
0100200300400500600700800900
1000
0001
-0405
-0910
-1415
-1920
-2425
-2930
-3435
-3940
-4445
-4950
-5455
-5960
-6465
-6970
-7475
-7980
-84
85+
Age group
Nu
mb
er o
f ev
ents
MidCentral All Ethnicities Digestive System Major Diagnostic Category Hospital Discharge Age
Specific Rates 1999 to 2003
0
5000
10000
15000
20000
25000
30000
0001
-0405
-0910
-1415
-1920
-2425
-2930
-3435
-3940
-4445
-4950
-5455
-5960
-6465
-6970
-7475
-7980
-84
85+
Age group
Ag
e sp
ecif
ic r
ate/
100,
000
peo
ple
MidCentral Maori Digestive System Major Diagnostic Category Hospital Discharges by Age
Group 1999 to 2003
0
20
40
60
80
100
120
0001
-0405
-0910
-1415
-1920
-2425
-2930
-3435
-3940
-4445
-4950
-5455
-5960
-6465
-6970
-7475
-7980
-84
85+
Age group
Nu
mb
er o
f ev
ents
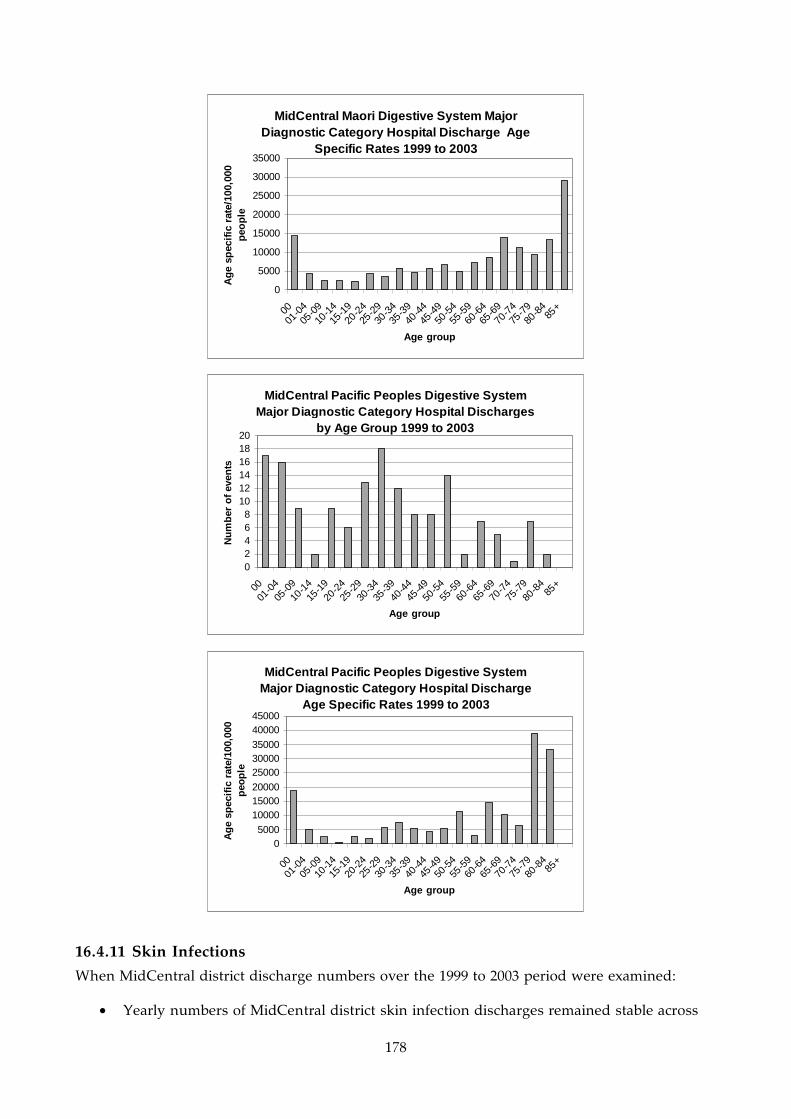
178
MidCentral Maori Digestive System Major Diagnostic Category Hospital Discharge Age
Specific Rates 1999 to 2003
0
5000
10000
15000
20000
25000
30000
35000
0001
-0405
-0910
-1415
-1920
-2425
-2930
-3435
-3940
-4445
-4950
-5455
-5960
-6465
-6970
-7475
-7980
-84
85+
Age group
Ag
e sp
ecif
ic r
ate/
100,
000
peo
ple
MidCentral Pacific Peoples Digestive System Major Diagnostic Category Hospital Discharges
by Age Group 1999 to 2003
02468
101214161820
0001
-0405
-0910
-1415
-1920
-2425
-2930
-3435
-3940
-4445
-4950
-5455
-5960
-6465
-6970
-7475
-7980
-84
85+
Age group
Nu
mb
er o
f ev
ents
MidCentral Pacific Peoples Digestive System Major Diagnostic Category Hospital Discharge
Age Specific Rates 1999 to 2003
05000
100001500020000
250003000035000
4000045000
0001
-0405
-0910
-1415
-1920
-2425
-2930
-3435
-3940
-4445
-4950
-5455
-5960
-6465
-6970
-7475
-7980
-84
85+
Age group
Ag
e sp
ecif
ic r
ate/
100,
000
peo
ple
16.4.11 Skin Infections
When MidCentral district discharge numbers over the 1999 to 2003 period were examined:
• Yearly numbers of MidCentral district skin infection discharges remained stable across

179
the period. The number of all ethnicities discharges initially rose from 1999/2000 to 2001/2002, then fell in 2002/2003 almost to the original levels. In contrast, New Zealand yearly skin infection discharges increased consistently over the same period, from 10,402 to 11,920 (15%)
• Maori yearly discharges also rose, by 15% (59 to 68) • Pacific peoples numbers of yearly discharges were small and fluctuated without
apparent trend. Crude discharge rates are the number of discharges divided by the total number of people in the population of interest. It does not take into account different age balances in different populations. When crude discharge rates over 1999 to 2003 were examined:
• New Zealand and MidCentral district crude rates for Maori and Pacific peoples were higher than those for other ethnicities
• MidCentral district crude rates by ethnicity were lower than their New Zealand counterparts.
Age adjusted ratios by ethnicity were calculated for MidCentral district and New Zealand. An explanation of age adjusted ratio is given at the beginning of this subsection. When age adjusted rates were calculated, using New Zealand all ethnicities as the comparison population:
• New Zealand Maori experienced 66% higher than expected number of skin infection hospitalisations compared to New Zealand all ethnicities (age adjusted ratio of 1.66)
• New Zealand Pacific peoples had over twice the expected skin infection hospitalisations when compared to New Zealand all ethnicities (age adjusted ratio of 2.17)
• MidCentral district Maori had 14% less than expected skin infection hospitalisations compared to New Zealand all ethnicities (age adjusted ratio of 0.86)
• MidCentral district Pacific peoples had 21% higher than expected skin infection hospital discharges when compared to New Zealand all ethnicities (age adjusted ratio of 1.21). However, this ratio was not statistically significant
• MidCentral district other ethnicities (non Maori, non Pacific) experienced 29% lower than expected number of skin infection hospital discharges when compared to New Zealand all ethnicities (age adjusted ratio of 0.71).
Age adjusted ratios were calculated comparing MidCentral district ethnicities to each other. The comparison population was changed from New Zealand all ethnicities to MidCentral district other ethnicities (non Maori, non Pacific). This showed:
• MidCentral district Maori experienced 26% more than the expected number of hospital discharges between 1999 and 2003 when compared to MidCentral other ethnicities (age adjusted ratio of 1.26)
• MidCentral district Pacific peoples skin infection hospital discharges were 75% more than expected, when compared against other ethnicities (age adjusted ratio of 1.75).
When MidCentral skin infection hospital discharges were analysed by distributions across five year age bands, the main trends were:
• Skin infection hospitalisations were fairly evenly distributed across the age groups, with a moderate peak in the 1 to 44 age bands. However, when expressed as age specific rates–discharge rates for each five year age group–children less than four years old and people aged 65 and older had higher rates of skin infection hospitalisation. There was also a milder peak in the 15 to 39 age bands

180
• Maori had higher discharge rates in the less than five, 30 to 39 years, and many of the 55 years and older age groups
• Pacific peoples had higher general discharge across most age bands, and particularly the 70 to 74 years age group.
MidCentral Skin Infection Hospital Discharges
1999/2000 to 2002/2003
0
50
100
150
200
250
300
350
400
450
1999/2000 2000/2001 2001/2002 2002/2003
Year
Number of events
Maori
Pacif ic
Other
(includes
Asian)All
ethnicities
New Zealand Skin Infection Hospital Discharges
1999/2000 to 2002/2003
0
2000
4000
6000
8000
10000
12000
14000
1999/2000 2000/2001 2001/2002 2002/2003
Year
Number of events
Maori
Pacif ic
Other
(includes
Asian)All
ethnicities
Maori Pacific
Other
(includes
Asian)
All
ethnicities
1999/2000 59 9 249 317
2000/2001 45 15 294 354
2001/2002 71 11 330 412
2002/2003 68 9 254 331
Total 243 44 1127 1414
MidCentral Skin Infection Hospital Discharges 1999/2000 to
2002/2003

181
Maori Pacific
Other (includes
Asian)All
ethnicitiesMidCentral 1030 1450 878 912New Zealand 1970 2570 987 1210
NZ and MidCentral Skin Infection Crude (non-age adjusted) Hospital Discharge Rates per 100,000 People 1999/2000 to 2002/2003
Ratio95%
conf.limits Ratio95%
conf.limits Ratio95%
conf.limits Ratio95%
conf.limits
MidCentral 0.86 0.76 - 0.97 1.21 0.86 - 1.57 0.71 0.67 - 0.76 0.75 0.71 - 0.79New Zealand 1.66 1.63 - 1.69 2.17 2.11 - 2.22 0.81 0.8 - 0.82 1
MidCentral and NZ Skin Infection Indirect Age Adjusted Hospital Discharge Ratios 1999/2000 to 2002/2003
All ethnicitiesMaori Pacific(New Zealand all ethnicities skin infection hospital discharges 1999/2000 to 2002/2003 used as comparison)
Other (includes Asian)
Other ethnicities (includes
Asian)
Ratio95%
conf.limits Ratio95%
conf.limits Ratio
1999/2000 to 2002/2003 1.26 1.1 - 1.41 1.75 1.23 - 2.26 1
Maori Pacific
MidCentral Skin Infection Indirect Age Adjusted Hospital Discharge Ratios 1999/2000 to 2002/2003
(MidCentral other ethnicities skin infection hospital discharges 1999/2000 to 2002/2003 used as comparison )
MidCentral All Ethnicities Skin Infection Hospital Discharges by Age Group 1999/2000 to
2002/2003
0
20
40
60
80
100
120
140
0001
-0405
-0910
-1415
-1920
-2425
-2930
-3435
-3940
-4445
-4950
-5455
-5960
-6465
-6970
-7475
-7980
-84
85+
Age group
Nu
mb
er o
f ev
ents
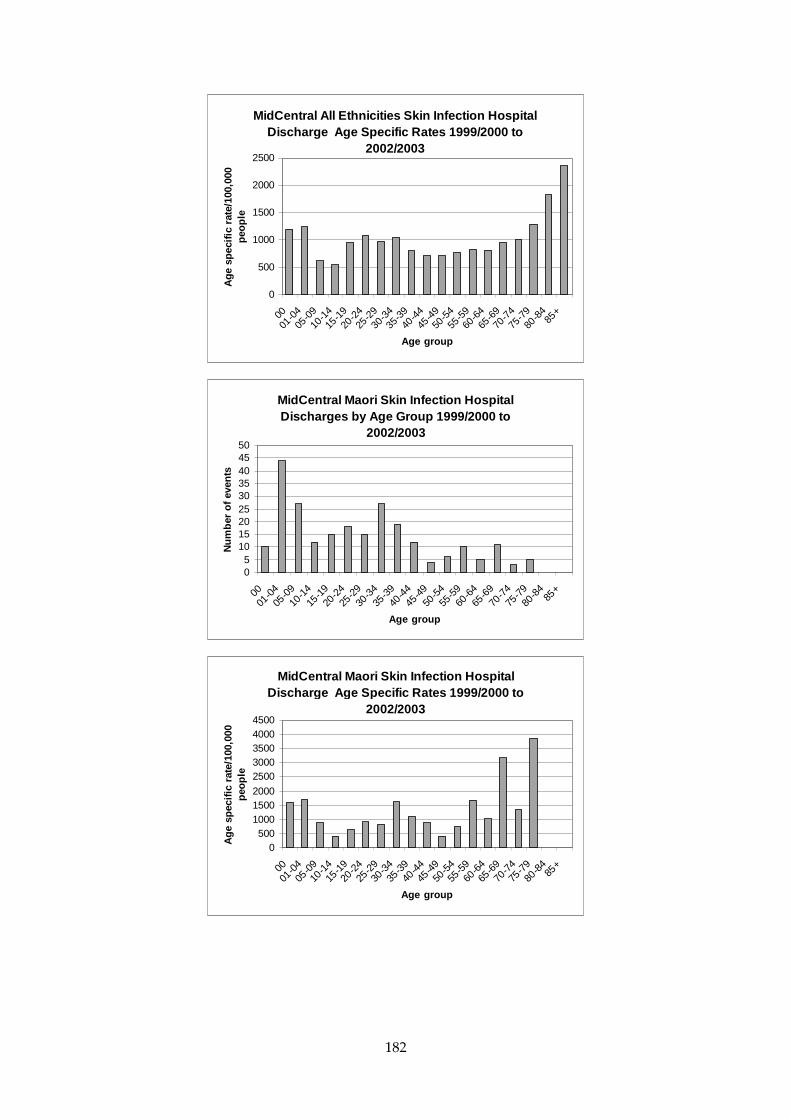
182
MidCentral All Ethnicities Skin Infection Hospital Discharge Age Specific Rates 1999/2000 to
2002/2003
0
500
1000
1500
2000
2500
0001
-0405
-0910
-1415
-1920
-2425
-2930
-3435
-3940
-4445
-4950
-5455
-5960
-6465
-6970
-7475
-7980
-84
85+
Age group
Ag
e sp
ecif
ic r
ate/
100,
000
peo
ple
MidCentral Maori Skin Infection Hospital Discharges by Age Group 1999/2000 to
2002/2003
05
101520253035404550
0001
-0405
-0910
-1415
-1920
-2425
-2930
-3435
-3940
-4445
-4950
-5455
-5960
-6465
-6970
-7475
-7980
-84
85+
Age group
Nu
mb
er o
f ev
ents
MidCentral Maori Skin Infection Hospital Discharge Age Specific Rates 1999/2000 to
2002/2003
0500
100015002000
25003000350040004500
0001
-0405
-0910
-1415
-1920
-2425
-2930
-3435
-3940
-4445
-4950
-5455
-5960
-6465
-6970
-7475
-7980
-84
85+
Age group
Ag
e sp
ecif
ic r
ate/
100,
000
peo
ple

183
MidCentral Pacific Peoples Skin Infection Hospital Discharges by Age Group 1999/2000 to
2002/2003
0
2
4
6
8
10
12
0001
-0405
-0910
-1415
-1920
-2425
-2930
-3435
-3940
-4445
-4950
-5455
-5960
-6465
-6970
-7475
-7980
-84
85+
Age group
Nu
mb
er o
f ev
ents
MidCentral Pacific Peoples Skin Infection Hospital Discharge Age Specific Rates
1999/2000 to 2002/2003
0
2000
4000
6000
8000
10000
12000
14000
0001
-0405
-0910
-1415
-1920
-2425
-2930
-3435
-3940
-4445
-4950
-5455
-5960
-6465
-6970
-7475
-7980
-84
85+
Age group
Ag
e sp
ecif
ic r
ate/
100,
000
peo
ple
16.4.12 Non-Suppurative Otitis Media (Glue Ear)
When MidCentral district discharge numbers over the 1999 to 2003 period were examined:
• Yearly numbers of MidCentral district discharges remained relatively stable across the period, with some oscillation. In contrast, New Zealand yearly non-suppurative otitis media (glue ear) discharges decreased consistently over the same period, from 6,019 to 5,379 (11%)
• MidCentral district Maori yearly discharges rose, by 59% (42 to 67) • Pacific peoples numbers of yearly discharges were too small for reliable interpretation.
Crude discharge rates are the number of discharges divided by the total number of people in the population of interest. It does not take into account different age balances in different populations. When crude discharge rates over 1999 to 2003 were examined:
• New Zealand and MidCentral district crude rates for Maori and Pacific peoples were higher than those for other ethnicities (non Maori, non Pacific)
• MidCentral district crude rates by ethnicity were lower than their New Zealand corresponding ethnic groups.

184
Age adjusted ratios by ethnicity were calculated for MidCentral district and New Zealand. An explanation of age adjusted ratio is given at the beginning of this subsection. When age adjusted rates were calculated, using New Zealand all ethnicities as the comparison population:
• New Zealand Maori experienced 17% higher than expected hospitalisations compared to New Zealand all ethnicities (age adjusted ratio of 1.17)
• New Zealand Pacific peoples had 9% more than the expected non-suppurative otitis media (glue ear) hospitalisations when compared to New Zealand all ethnicities (age adjusted ratio of 1.09)
• MidCentral district Maori had 21% fewer than expected non-suppurative otitis media (glue ear) hospitalisations compared to New Zealand all ethnicities (age adjusted ratio of 0.79)
• MidCentral district Pacific peoples had 39% lower than expected non-suppurative otitis media (glue ear) discharges when compared to New Zealand all ethnicities (age adjusted ratio of 0.61). However, this calculation was based on low numbers (18 discharges over 5 years) and may not be stable
• MidCentral district other ethnicities (non Maori, non Pacific) experienced 15% fewer than expected number of non-suppurative otitis media (glue ear) hospital discharges when compared to New Zealand all ethnicities (age adjusted ratio of 0.85).
Age adjusted ratios were calculated comparing MidCentral district ethnicities to each other. The comparison population was changed from New Zealand all ethnicities to MidCentral district other ethnicities (non Maori, non Pacific). This showed both Maori and Pacific peoples experienced less than expected discharges compared to other ethnicities, but the difference did not reach statistical significance. When MidCentral district non-suppurative otitis media (glue ear) hospital discharges were analysed by distributions across five year age bands, the main trends were:
• The majority of hospitalisations were within the ages of 0 to 14 years. Maori had the same age distribution pattern, but had lower discharge rates in the 1 to 4 year old age group
• Pacific peoples showed the same pattern as Maori, with lower rates of hospital discharge for the 1 to 9 year old age groups.
The pattern of MidCentral district school hearing test results do not match MidCentral district non-suppurative otitis media (glue ear) hospital discharge patterns. Maori children have consistently had higher hearing test failure rates compared to non Maori children. Possible reasons for this discrepancy between hearing test and hospital discharge patterns could be:
• More effective treatment at primary care level, reducing need for hospital treatment • Maori children not accessing hospital services because of under diagnosis, or other
reasons. If so, Maori increasing yearly hospitalisation numbers may indicate improving access to hospital services or improving rates of diagnosis.

185
MidCentral Non-Suppurative Otitis Media (Glue
Ear) Hospital Discharges 1999/2000 to 2002/2003
0
50
100
150
200
250
1999/2000 2000/2001 2001/2002 2002/2003
Year
Number of events
Maori
Pacif ic
Other
(includes
Asian)
All
ethnicities
New Zealand Non-Suppurative Otitis Media (Glue
Ear) Hospital Discharges 1999/2000 to 2002/2003
0
1000
2000
3000
4000
5000
6000
7000
1999/2000 2000/2001 2001/2002 2002/2003
Year
Number of events
Maori
Pacif ic
Other
(includes
Asian)All
ethnicities
Maori Pacific
Other
(includes
Asian)
All
ethnicities
1999/2000 42 4 153 199
2000/2001 37 4 109 150
2001/2002 49 4 143 196
2002/2003 67 6 129 202
Total 195 18 534 747
MidCentral Non-Suppurative Otitis Media (Glue Ear) Hospital
Discharges 1999/2000 to 2002/2003
Maori Pacific
Other
(includes
Asian)
All
ethnicities
MidCentral 825 593 416 482
New Zealand 1160 1020 463 591
NZ and MidCentral Non-Suppurative Otitis Media (Glue Ear) Crude
(non-age adjusted) Hospital Discharge Rates per 100,000 People
1999/2000 to 2002/2003

186
Ratio95%
conf.limits Ratio95%
conf.limits Ratio95%
conf.limits Ratio95%
conf.limits
MidCentral 0.79 0.68 - 0.9 0.61 0.33 - 0.89 0.85 0.77 - 0.92 0.82 0.77 - 0.88New Zealand 1.17 1.14 - 1.2 1.09 1.04 - 1.14 0.93 0.91 - 0.94 1
MidCentral and NZ Non-Suppurative Otitis Media (Glue Ear) Indirect Age Adjusted Hospital Discharge Ratios 1999/2000 to 2002/2003
All ethnicitiesMaori Pacific
(New Zealand all ethnicities non-suppurative otitis media (glue ear) hospital discharges 1999/2000 to 2002/2003 used as comparison)
Other (includes Asian)
Other ethnicities (includes Asian)
Ratio95%
conf.limits Ratio95%
conf.limits Ratio
1999/2000 to 2002/2003 0.94 0.81 - 1.07 0.73 0.39 - 1.06 1
Maori Pacific
MidCentral Non-Suppurative Otitis Media (Glue Ear) Indirect Age Adjusted Hospital Discharge Ratios 1999/2000 to 2002/2003
(MidCentral other ethnicities non-suppurative otitis media (glue ear) hospital discharges 1999/2000 to 2002/2003 used as comparison )
MidCentral All Ethnicities Non-Suppurative Otitis Media (Glue Ear) Hospital Discharges by Age
Group 1999/2000 to 2002/2003
050
100
150200250300
350400450
0001
-0405
-0910
-1415
-1920
-2425
-2930
-3435
-3940
-4445
-4950
-5455
-5960
-6465
-6970
-7475
-7980
-84
85+
Age group
Nu
mb
er o
f ev
ents
MidCentral All Ethnicities Non-Suppurative Otitis Media (Glue Ear) Hospital Discharge Age Specific
Rates 1999/2000 to 2002/2003
0500
100015002000250030003500400045005000
0001
-0405
-0910
-1415
-1920
-2425
-2930
-3435
-3940
-4445
-4950
-5455
-5960
-6465
-6970
-7475
-7980
-84
85+
Age group
Ag
e sp
ecif
ic r
ate/
100,
000
peo
ple
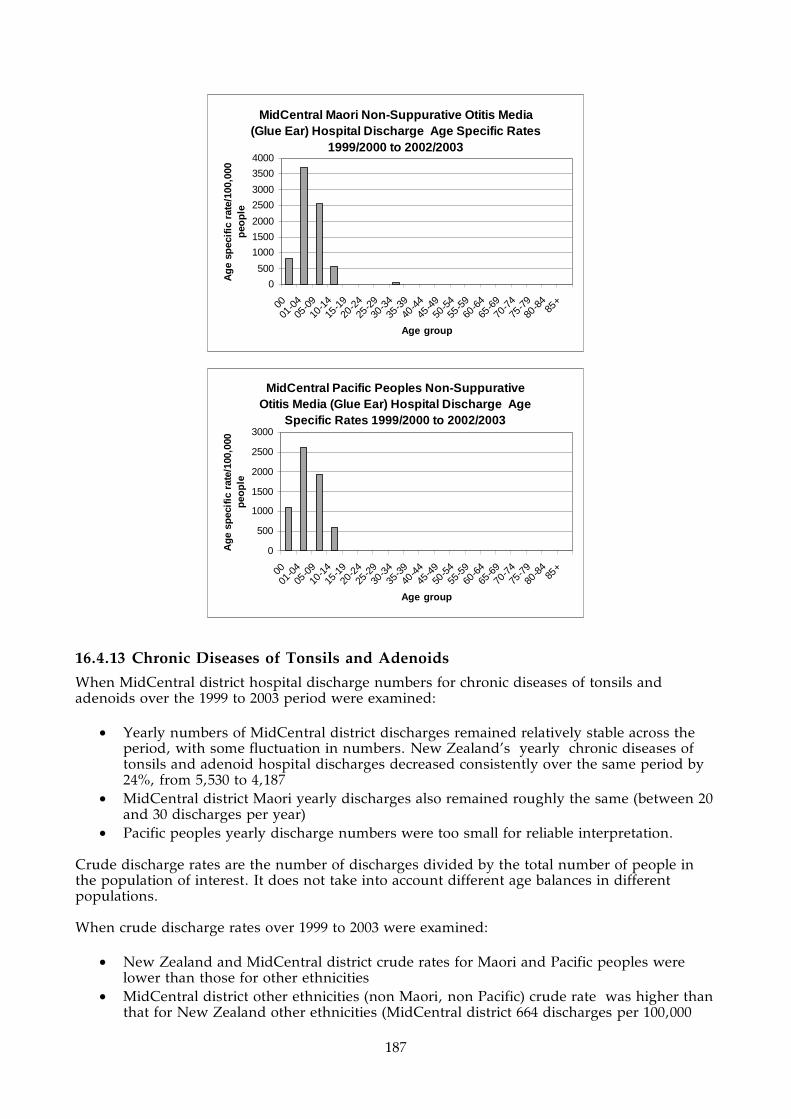
187
MidCentral Maori Non-Suppurative Otitis Media (Glue Ear) Hospital Discharge Age Specific Rates
1999/2000 to 2002/2003
0
500
1000
1500
2000
2500
3000
3500
4000
0001
-0405
-0910
-1415
-1920
-2425
-2930
-3435
-3940
-4445
-4950
-5455
-5960
-6465
-6970
-7475
-7980
-84
85+
Age group
Ag
e sp
ecif
ic r
ate/
100,
000
peo
ple
MidCentral Pacific Peoples Non-Suppurative Otitis Media (Glue Ear) Hospital Discharge Age
Specific Rates 1999/2000 to 2002/2003
0
500
1000
1500
2000
2500
3000
0001
-0405
-0910
-1415
-1920
-2425
-2930
-3435
-3940
-4445
-4950
-5455
-5960
-6465
-6970
-7475
-7980
-84
85+
Age group
Ag
e sp
ecif
ic r
ate/
100,
000
peo
ple
16.4.13 Chronic Diseases of Tonsils and Adenoids
When MidCentral district hospital discharge numbers for chronic diseases of tonsils and adenoids over the 1999 to 2003 period were examined:
• Yearly numbers of MidCentral district discharges remained relatively stable across the period, with some fluctuation in numbers. New Zealand’s yearly chronic diseases of tonsils and adenoid hospital discharges decreased consistently over the same period by 24%, from 5,530 to 4,187
• MidCentral district Maori yearly discharges also remained roughly the same (between 20 and 30 discharges per year)
• Pacific peoples yearly discharge numbers were too small for reliable interpretation. Crude discharge rates are the number of discharges divided by the total number of people in the population of interest. It does not take into account different age balances in different populations. When crude discharge rates over 1999 to 2003 were examined:
• New Zealand and MidCentral district crude rates for Maori and Pacific peoples were lower than those for other ethnicities
• MidCentral district other ethnicities (non Maori, non Pacific) crude rate was higher than that for New Zealand other ethnicities (MidCentral district 664 discharges per 100,000

188
people over four years versus 503 discharges per 100,000 people over four years for New Zealand).
Age adjusted ratios by ethnicity were calculated for MidCentral district and New Zealand. An explanation of age adjusted ratio is given at the beginning of this subsection. When age adjusted rates were calculated, using New Zealand all ethnicities as the comparison population:
• New Zealand Maori experienced 36% fewer than expected hospitalisations compared to New Zealand all ethnicities (age adjusted ratio of 0.64)
• New Zealand Pacific peoples had 52% fewer than expected chronic diseases of tonsil and adenoid hospitalisations when compared to New Zealand all ethnicities (age adjusted ratio of 0.48)
• MidCentral district Maori had 46% fewer than expected hospitalisations compared to New Zealand all ethnicities (age adjusted ratio of 0.54)
• MidCentral district Pacific peoples had 82% fewer than expected number of hospital discharges when compared to New Zealand all ethnicities (age adjusted ratio of 0.18). The small number (four) of hospital discharges may affect the stability or reliability of this ratio
• MidCentral district other ethnicities (non Maori, non Pacific) experienced 52% greater than expected number of chronic diseases of tonsils and adenoid hospital discharges when compared to New Zealand all ethnicities (age adjusted ratio of 1.52)
• MidCentral district all ethnicities experienced 25% greater than expected number of hospital discharges when compared to New Zealand all ethnicities (age adjusted ratio of 1.25).
Age adjusted ratios were calculated comparing MidCentral district ethnicities to each other. The comparison population was changed from New Zealand all ethnicities to MidCentral district other ethnicities (non Maori, non Pacific). This showed:
• MidCentral district Maori experienced 65% fewer hospital discharges than expected when compared to other ethnicities
• Pacific peoples experienced 88% fewer hospital discharges than expected when compared to MidCentral district other ethnicities. Again, the small number (four) of hospital discharges may affect the stability or reliability of this ratio.
When MidCentral district chronic diseases of tonsils and adenoid hospital discharges were analysed by distributions across five year age bands, the main trends were:
• The number of hospital discharges peaks in the 5 to 9 years age group, and then progressively declines across the childhood and young adult years. Maori had the same age distribution pattern, but had lower discharge rates in all age groups
• There are too few discharges for MidCentral district Pacific peoples to determine a reliable age distribution pattern.
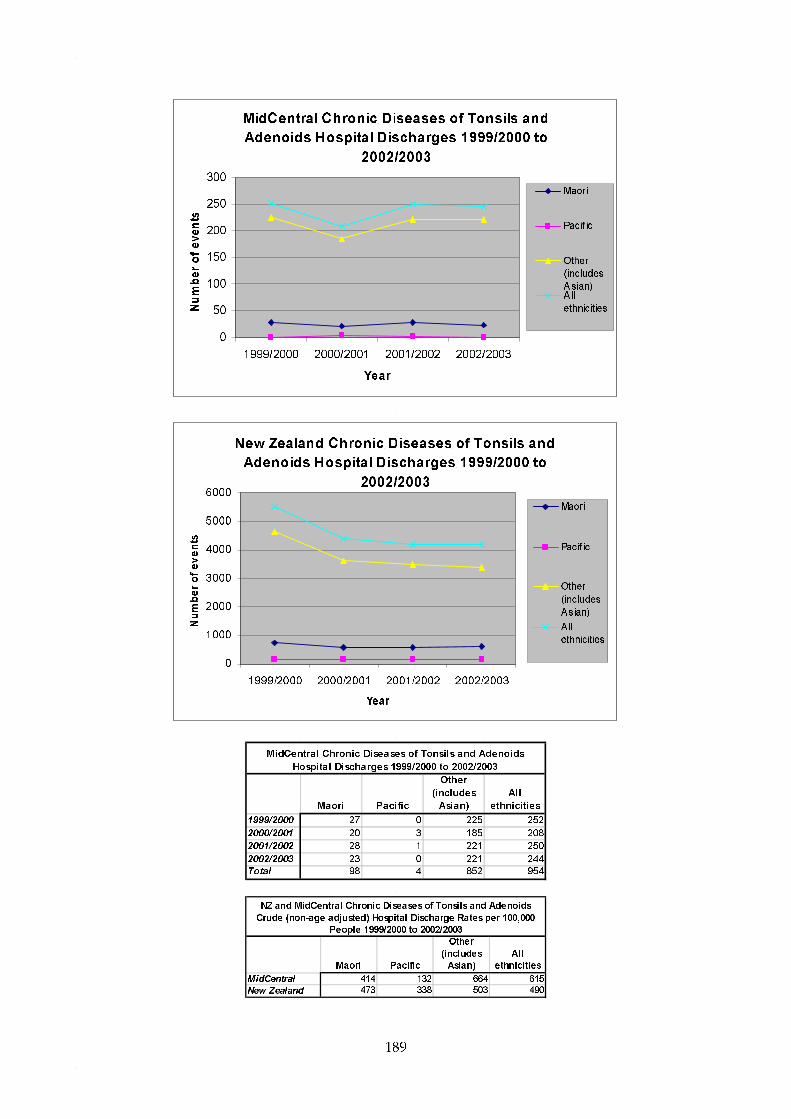
189
MidCentral Chronic Diseases of Tonsils and
Adenoids Hospital Discharges 1999/2000 to
2002/2003
0
50
100
150
200
250
300
1999/2000 2000/2001 2001/2002 2002/2003
Year
Number of events
Maori
Pacif ic
Other
(includes
Asian)A ll
ethnicities
New Zealand Chronic Diseases of Tonsils and
Adenoids Hospital Discharges 1999/2000 to
2002/2003
0
1000
2000
3000
4000
5000
6000
1999/2000 2000/2001 2001/2002 2002/2003
Year
Number of events
Maori
Pacif ic
Other
(includes
Asian)
All
ethnicities
Maori Pacific
Other
(includes
Asian)
All
ethnicities
1999/2000 27 0 225 252
2000/2001 20 3 185 208
2001/2002 28 1 221 250
2002/2003 23 0 221 244
Total 98 4 852 954
MidCentral Chronic Diseases of Tonsils and Adenoids
Hospital Discharges 1999/2000 to 2002/2003
Maori Pacific
Other
(includes
Asian)
All
ethnicities
MidCentral 414 132 664 615
New Zealand 473 338 503 490
NZ and MidCentral Chronic Diseases of Tonsils and Adenoids
Crude (non-age adjusted) Hospital Discharge Rates per 100,000
People 1999/2000 to 2002/2003
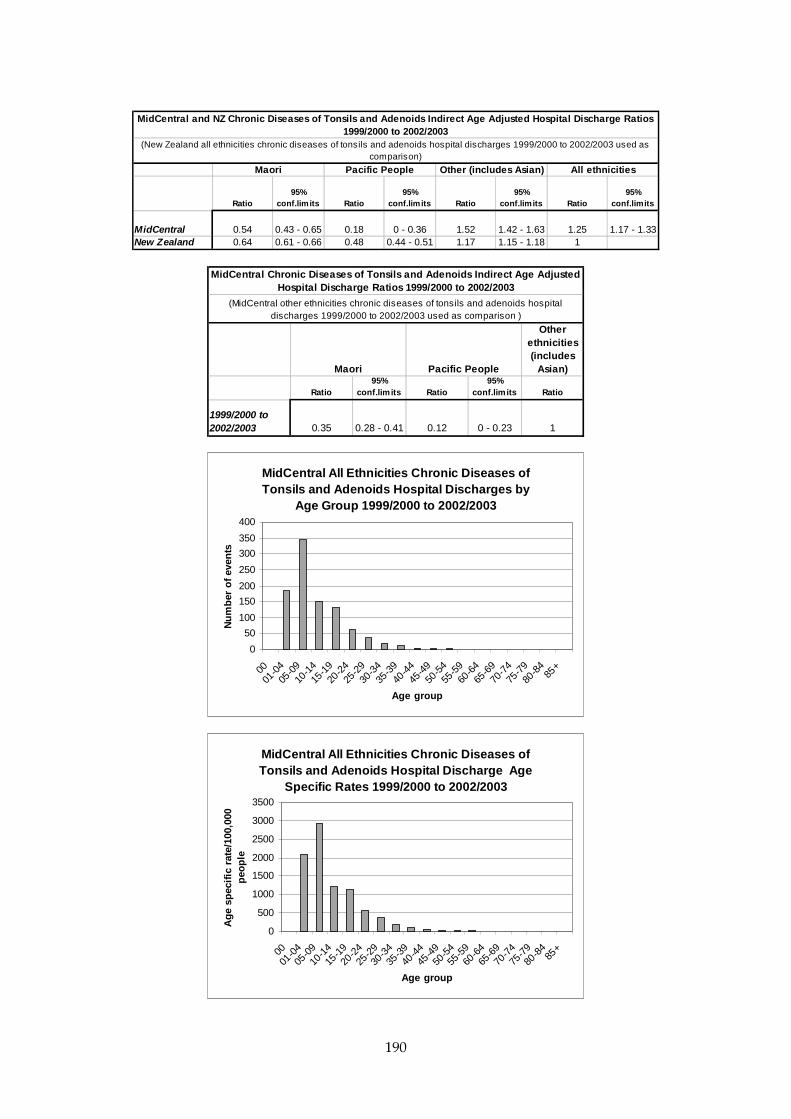
190
Ratio95%
conf.limits Ratio95%
conf.limits Ratio95%
conf.limits Ratio95%
conf.limits
MidCentral 0.54 0.43 - 0.65 0.18 0 - 0.36 1.52 1.42 - 1.63 1.25 1.17 - 1.33New Zealand 0.64 0.61 - 0.66 0.48 0.44 - 0.51 1.17 1.15 - 1.18 1
MidCentral and NZ Chronic Diseases of Tonsils and Adenoids Indirect Age Adjusted Hospital Discharge Ratios 1999/2000 to 2002/2003
All ethnicitiesMaori Pacific People
(New Zealand all ethnicities chronic diseases of tonsils and adenoids hospital discharges 1999/2000 to 2002/2003 used as comparison)
Other (includes Asian)
Other ethnicities (includes
Asian)
Ratio95%
conf.limits Ratio95%
conf.limits Ratio
1999/2000 to 2002/2003 0.35 0.28 - 0.41 0.12 0 - 0.23 1
Maori Pacific People
MidCentral Chronic Diseases of Tonsils and Adenoids Indirect Age Adjusted Hospital Discharge Ratios 1999/2000 to 2002/2003
(MidCentral other ethnicities chronic diseases of tonsils and adenoids hospital discharges 1999/2000 to 2002/2003 used as comparison )
MidCentral All Ethnicities Chronic Diseases of Tonsils and Adenoids Hospital Discharges by
Age Group 1999/2000 to 2002/2003
0
50
100
150
200
250
300
350
400
0001
-0405
-0910
-1415
-1920
-2425
-2930
-3435
-3940
-4445
-4950
-5455
-5960
-6465
-6970
-7475
-7980
-84
85+
Age group
Nu
mb
er o
f ev
ents
MidCentral All Ethnicities Chronic Diseases of Tonsils and Adenoids Hospital Discharge Age
Specific Rates 1999/2000 to 2002/2003
0
500
1000
1500
2000
2500
3000
3500
0001
-0405
-0910
-1415
-1920
-2425
-2930
-3435
-3940
-4445
-4950
-5455
-5960
-6465
-6970
-7475
-7980
-84
85+
Age group
Ag
e sp
ecif
ic r
ate/
100,
000
peo
ple

191
MidCentral Maori Chronic Diseases of Tonsils and Adenoids Hospital Discharge Age Specific
Rates 1999/2000 to 2002/2003
0
200
400
600
800
1000
1200
1400
1600
0001
-0405
-0910
-1415
-1920
-2425
-2930
-3435
-3940
-4445
-4950
-5455
-5960
-6465
-6970
-7475
-7980
-84
85+
Age group
Ag
e sp
ecif
ic r
ate/
100,
000
peo
ple
16.4.14 Suppurative Otitis Media (Middle Ear Infection)
When MidCentral district suppurative otitis media (middle ear infection) hospital discharge numbers over the 1999/2000 to 2002/2003 period were examined:
• Yearly numbers of MidCentral district discharges declined by 13% across the period, with some yearly fluctuation (63 discharges in 1999/2000 to 55 discharges in 2002/2003). New Zealand’s yearly suppurative otitis media (middle ear infection) discharges decreased consistently over the same period by 18%, from 2,501 to 2,058
• MidCentral district Maori yearly hospital discharges remained roughly the same (about 16 discharges per year)
• Pacific peoples numbers of yearly discharges were too small, 1 to 2 per year, for reliable interpretation.
Crude discharge rates are the number of discharges divided by the total number of people in the population of interest. It does not take into account different age balances in different populations. When crude discharge rates over 1999/2000 to 2002/2003 were examined:
• New Zealand and MidCentral district crude rates for Maori and Pacific peoples were higher than those for other ethnicities (non Maori, non Pacific). Most of this is probably because most suppurative otitis media (middle ear infection) discharges were for children. Maori and Pacific peoples populations have higher proportions of children than other ethnicities
• MidCentral district crude rates by ethnicities were lower than their New Zealand equivalents, especially for Maori and Pacific peoples.
Age adjusted ratios by ethnicity were calculated for MidCentral district and New Zealand. An explanation of age adjusted ratio is given at the beginning of this subsection. When age adjusted rates were calculated, using New Zealand all ethnicities as the comparison population:
• New Zealand Maori experienced 10% more than expected hospitalisations compared to New Zealand all ethnicities (age adjusted ratio of 1.1)
• New Zealand Pacific peoples had 32% more than the expected suppurative otitis media (middle ear infection) hospitalisations when compared to New Zealand all ethnicities (age adjusted ratio of 1.32).
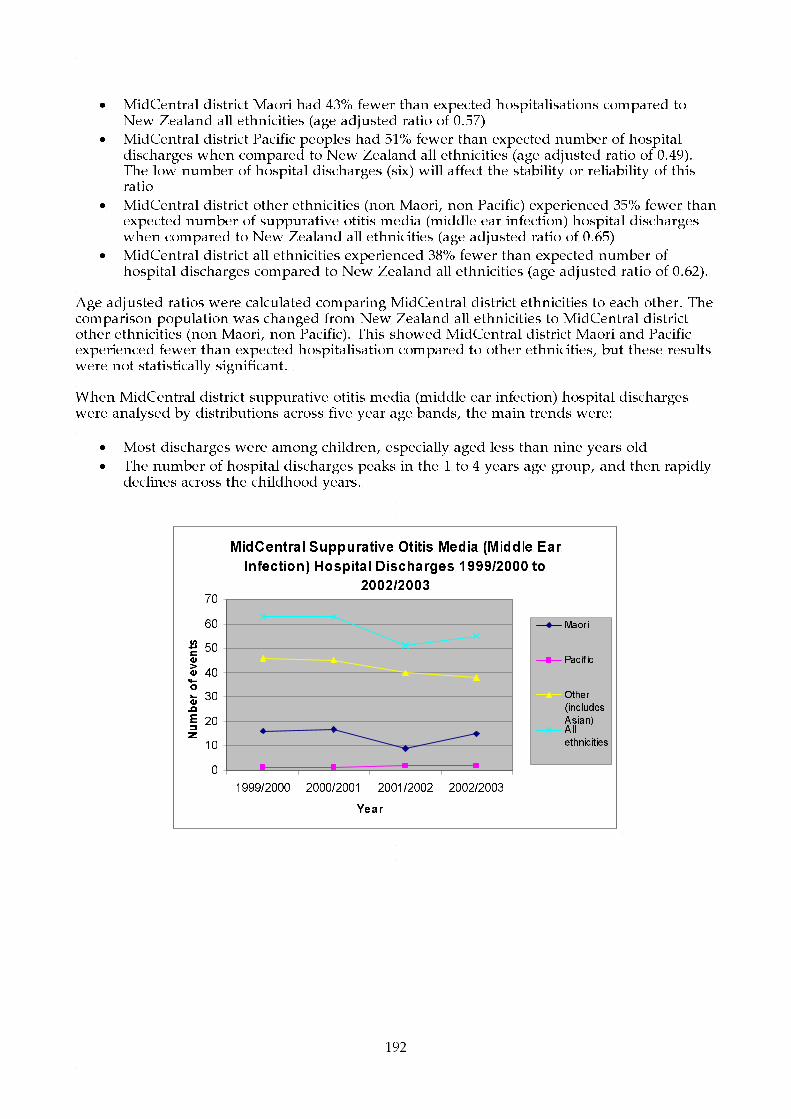
192
• MidCentral district Maori had 43% fewer than expected hospitalisations compared to New Zealand all ethnicities (age adjusted ratio of 0.57)
• MidCentral district Pacific peoples had 51% fewer than expected number of hospital discharges when compared to New Zealand all ethnicities (age adjusted ratio of 0.49). The low number of hospital discharges (six) will affect the stability or reliability of this ratio
• MidCentral district other ethnicities (non Maori, non Pacific) experienced 35% fewer than expected number of suppurative otitis media (middle ear infection) hospital discharges when compared to New Zealand all ethnicities (age adjusted ratio of 0.65)
• MidCentral district all ethnicities experienced 38% fewer than expected number of hospital discharges compared to New Zealand all ethnicities (age adjusted ratio of 0.62).
Age adjusted ratios were calculated comparing MidCentral district ethnicities to each other. The comparison population was changed from New Zealand all ethnicities to MidCentral district other ethnicities (non Maori, non Pacific). This showed MidCentral district Maori and Pacific experienced fewer than expected hospitalisation compared to other ethnicities, but these results were not statistically significant. When MidCentral district suppurative otitis media (middle ear infection) hospital discharges were analysed by distributions across five year age bands, the main trends were:
• Most discharges were among children, especially aged less than nine years old
• The number of hospital discharges peaks in the 1 to 4 years age group, and then rapidly declines across the childhood years.
MidCentral Suppurative Otitis Media (Middle Ear
Infection) Hospital Discharges 1999/2000 to
2002/2003
0
10
20
30
40
50
60
70
1999/2000 2000/2001 2001/2002 2002/2003
Year
Number of events
Maori
Pacif ic
Other
(includes
Asian)All
ethnicities

193
New Zealand Suppurative Otitis Media (Middle Ear
Infection) Hospital Discharges 1999/2000 to
2002/2003
0
500
1000
1500
2000
2500
3000
1999/2000 2000/2001 2001/2002 2002/2003
Year
Number of events
Maori
Pacif ic
Other
(includes
Asian)
All
ethnicities
Maori Pacific
Other
(includes
Asian)
All
ethnicities
1999/2000 16 1 46 63
2000/2001 17 1 45 63
2001/2002 9 2 40 51
2002/2003 15 2 38 55
Total 57 6 169 232
MidCentral Suppurative Otitis Media (Middle Ear Infection)
Hospital Discharges 1999/2000 to 2002/2003
Maori Pacific
Other
(includes
Asian)
All
ethnicities
MidCentral 241 198 132 150
New Zealand 450 510 190 244
NZ and MidCentral Suppurative Otitis Media (Middle Ear Infection)
Crude (non-age adjusted) Hospital Discharge Rates per 100,000
People 1999/2000 to 2002/2003
Ratio
95%
conf.limits Ratio
95%
conf.limits Ratio
95%
conf.limits Ratio
95%
conf.limits
MidCentral 0.57 0.42 - 0.71 0.49 0.1 - 0.88 0.65 0.56 - 0.75 0.62 0.54 - 0.7
New Zealand 1.1 1.06 - 1.15 1.32 1.24 - 1.4 0.92 0.9 - 0.95 1
Other (includes Asian) All ethnicitiesMaori Pacific
(New Zealand all ethnicities suppurative otitis media (middle ear infection) hospital discharges 1999/2000 to 2002/2003
used as comparison)
MidCentral and NZ Suppurative Otitis Media (Middle Ear Infection) Indirect Age Adjusted Hospital Discharge
Ratios 1999/2000 to 2002/2003

194
Other ethnicities (includes
Asian)
Ratio95%
conf.limits Ratio95%
conf.limits Ratio
1999/2000 to 2002/2003 0.86 0.64 - 1.09 0.74 0.15 - 1.34 1
Maori Pacific
MidCentral Suppurative Otitis Media (Middle Ear Infection) Indirect Age Adjusted Hospital Discharge Ratios 1999/2000 to 2002/2003
(MidCentral other ethnicities suppurative otitis media (middle ear infection) hospital discharges 1999/2000 to 2002/2003 used as comparison )
MidCentral All Ethnicities Suppurative Otitis Media (Middle Ear Infection) Hospital Discharge
by Age Group 1999/2000 to 2002/2003
0
20
40
60
80
100
120
140
160
0001
-0405
-0910
-1415
-1920
-2425
-2930
-3435
-3940
-4445
-4950
-5455
-5960
-6465
-6970
-7475
-7980
-84
85+
Age group
Nu
mb
er o
f ev
ents
MidCentral All Ethnicities Suppurative Otitis Media (Middle Ear Infection) Hospital Discharge
Age Specific Rates 1999/2000 to 2002/2003
0200400600800
10001200140016001800
0001
-0405
-0910
-1415
-1920
-2425
-2930
-3435
-3940
-4445
-4950
-5455
-5960
-6465
-6970
-7475
-7980
-84
85+
Age group
Ag
e sp
ecif
ic r
ate/
100,
000
peo
ple
16.4.15 Immunisation Preventable Hospitalisations
Immunisation preventable hospitalisations are hospitalisations for diseases which routine childhood vaccinations are available. They include conditions such as measles, mumps, tetanus, whooping cough, polio, Haemophilus influenzae type B, and hepatitis B. Immunisation preventable hospital discharges for 1999 to 2003 were examined for MidCentral district and New Zealand. The numbers of discharges, especially for MidCentral district, were small which affects the reliability and stability of rates and ratios calculated from them. There were only 39 MidCentral district hospitalisations for the whole five year period.

195
When MidCentral district discharge numbers over the 1999 to 2003 period were examined:
• Yearly numbers of MidCentral district discharges were small and fluctuated year by year, from 6 to 11 discharges per year
• New Zealand’s yearly immunisation preventable discharges appeared to be decreasing after an initial rise from 1999 to 2000.
Crude discharge rates are the number of discharges divided by the total number of people in the population of interest. It does not take into account different age balances in different populations. When crude discharge rates over 1999 to 2003 were examined:
• New Zealand and MidCentral district crude rates for Maori and Pacific peoples were higher than those for other ethnicities
• MidCentral district ethnicity crude discharge rates were lower than the corresponding New Zealand crude rates.
Age adjusted ratios by ethnicity were calculated for MidCentral district and New Zealand. An explanation of age adjusted ratio is given at the beginning of this subsection. When age adjusted rates were calculated, using New Zealand all ethnicities as the comparison population:
• New Zealand Maori experienced 31% greater than expected hospitalisations compared to New Zealand all ethnicities (age adjusted ratio of 1.31)
• New Zealand Pacific peoples had 83% greater than the expected immunisation preventable hospitalisations when compared to New Zealand all ethnicities (age adjusted ratio of 1.83)
• New Zealand other ethnicities (non Maori, non Pacific) had 22% less than expected number of discharges when compared to New Zealand all ethnicities (age adjusted ratio of 0.78)
• MidCentral district other ethnicities (non Maori, non Pacific) experienced 33% fewer than expected discharges compared to New Zealand all ethnicities (age adjusted ratio of 0.67)
• MidCentral district Maori, Pacific peoples, and combined ethnicities age adjusted ratios did not reach statistically significant levels due to small number of discharges.
Age adjusted ratios were calculated comparing MidCentral district ethnicities to each other. The comparison population was changed from New Zealand all ethnicities to MidCentral district other ethnicities (non Maori, non Pacific). Although the pattern shown was similar to New Zealand, the numbers of discharges were too low to reach statistical significance. When MidCentral district immunisation preventable hospital discharges were distributed across five year age bands, most discharges were in the 0 to 4 age group.

196
MidCentral Immunisation Preventable Hospital
Discharges 1999 to 2003
0
2
4
6
8
10
12
1999 2000 2001 2002 2003
Year
Number of events
Maori
Pacif ic
Other
(includes
Asian)All
ethnicities
New Zealand Immunisation Preventable Hospital
Discharges 1999 to 2003
0
50
100
150
200
250
300
350
400
450
500
1999 2000 2001 2002 2003
Year
Number of events
Maori
Pacif ic
Other
(includes
Asian)All
ethnicitie
s
Maori Pacific
Other
(includes
Asian)
All
ethnicities
1999 4 0 2 6
2000 3 0 6 9
2001 2 0 4 6
2002 4 2 5 11
2003 2 0 5 7
Total 15 2 22 39
MidCentral Immunisation Preventable Hospital Discharges
1999 to 2003
Maori Pacific
Other
(includes
Asian)
All
ethnicities
MidCentral 63.4 65.9 17.1 25.2
New Zealand 70.9 95.4 20.6 31.7
NZ and MidCentral Immunisation Preventable Crude (non-age
adjusted) Hospital Discharge Rates per 100,000 People 1999 to
2003

197
Ratio95%
conf.limits Ratio95%
conf.limits Ratio95%
conf.limits Ratio95%
conf.limits
MidCentral 1.16 0.57 - 1.75 1.13 - 0.67 0.39 - 0.95 0.82 0.56 - 1.08New Zealand 1.31 1.18 - 1.44 1.83 1.57 - 2.09 0.78 0.72 - 0.84 1
Other (includes Asian) All ethnicitiesMaori Pacific(New Zealand all ethnicities immunisation preventable hospital discharges 1999 to 2003 used as comparison)
MidCentral and NZ Immunisation Preventable Indirect Age Adjusted Hospital Discharge Ratios 1999 to 2003
Other ethnicities (includes
Asian)
Ratio95%
conf.limits Ratio95%
conf.limits Ratio
1999 to 2003 1.68 0.83 - 2.53 1.59 - 1
Maori Pacific
MidCentral Immunisation Preventable Indirect Age Adjusted Hospital Discharge Ratios 1999 to 2003
(MidCentral other ethnicities immunisation preventable hospital discharges 1999 to 2003 used as comparison )
MidCentral All Ethnicities Immunisation Preventable Hospital Discharges by Age Group
1999 to 2003
0
5
10
15
20
25
30
35
0001
-0405
-0910
-1415
-1920
-2425
-2930
-3435
-3940
-4445
-4950
-5455
-5960
-6465
-6970
-7475
-7980
-84
85+
Age group
Nu
mb
er o
f ev
ents
MidCentral All Ethnicities Immunisation Preventable Hospital Discharge Age Specific
Rates 1999 to 2003
0
200
400
600
800
1000
1200
1400
1600
0001
-0405
-0910
-1415
-1920
-2425
-2930
-3435
-3940
-4445
-4950
-5455
-5960
-6465
-6970
-7475
-7980
-84
85+
Age group
Ag
e sp
ecif
ic r
ate/
100,
000
peo
ple

198
MidCentral Maori Immunisation Preventable Hospital Discharges by Age Group 1999 to 2003
0
2
4
6
8
10
12
14
0001
-0405
-0910
-1415
-1920
-2425
-2930
-3435
-3940
-4445
-4950
-5455
-5960
-6465
-6970
-7475
-7980
-84
85+
Age group
Nu
mb
er o
f ev
ents
16.5 Cancer This section lists MidCentral district cancer registrations 1998 to 2000 and MidCentral district cancer mortality 1999 to 2001.
16.5.1 Cancer Registrations 1998 to 2000
Lists of the 1998 to 2000 registrations in the New Zealand Cancer Registry for people living in the MidCentral district are given in the following tables. The New Zealand Cancer Registry is a register of all primary malignant cancers (neoplasms) diagnosed in New Zealand, excluding some specific forms of skin cancer (basal cell and squamous cell carcinomas). The most common cancers registered are given for MidCentral district overall, and then by ethnicity (Maori, Pacific peoples, Asian peoples, and other ethnicities).
16.5.2 MidCentral District Cancer Registrations 1998 to 2000
The most frequent malignant cancers registered from 1998 to 2000 for people living in MidCentral district were:
1. Digestive organs 2. Male genital organs 3. Breast 4. Respiratory and intrathoracic organs (lungs and organs inside the chest) 5. Blood and lymphoid systems.
A full listing, with percentages, is given in the table below.
Cancer typeNumber of
people PercentageMalignant neoplasms of digestive organs (C15 - C26) 525 23.5%Malignant neoplasms of male genital organs (C60 - C63) 356 15.9%Malignant neoplasms of the breast (C50) 279 12.5%Malignant neoplasms of respiratory and intrathoracic organs (C00 - C14) 236 10.6%Malignant neoplasms, stated or presumed to be primary, of lymphoid, haemopoietic and related tissue (C81 - C96) 179 8.0%Melanoma and other malignant neoplasms of skin (C43 - C44) 168 7.5%Malignant neoplasms of urinary tract (C64 - C68) 136 6.1%Malignant neoplasms of female genital organs (C51 - C58) 121 5.4%Malignant neoplasms of ill-defined, secondary and unspecified sites (C76 - C80) 101 4.5%Malignant neoplasms of eye, brain, and other parts of central nervous system (C69 - C72) 46 2.1%Malignant neoplasms of lip, oral cavity, and pharynx (C00 - C14) 33 1.5%Malignant neoplasms of thyroid and other endocrine glands (C73 - C75) 28 1.3%Malignant neoplasms of mesothelial and soft tissue (C45 - C49) 20 0.9%Malignant neoplasms of bone and articular cartilage (C40 - C41) 5 0.2%Grand Total 2233 100.0%
MidCentral Cancer Registrations 1998 to 2000

199
16.5.3 MidCentral District Maori Cancer Registrations 1998 to 2000
The most frequent malignant cancers registered from 1998 to 2000 for Maori people living in MidCentral district were:
1. Respiratory and intrathoracic organs (lungs and organs inside the chest) 2. Breast 3. Digestive organs 4. Female genital organs 5. Male genital organs.
A full listing, with percentages, is given in the table below.
Cancer typeNumber of
people PercentageMalignant neoplasms of respiratory and intrathoracic organs (C00 - C14) 25 20.7%Malignant neoplasms of the breast (C50) 22 18.2%Malignant neoplasms of digestive organs (C15 - C26) 18 14.9%Malignant neoplasms of female genital organs (C51 - C58) 15 12.4%Malignant neoplasms of male genital organs (C60 - C63) 15 12.4%Malignant neoplasms of ill-defined, secondary and unspecified sites (C76 - C80) 6 5.0%Malignant neoplasms, stated or presumed to be primary, of lymphoid, haemopoietic and related tissue (C81 - C96) 5 4.1%Malignant neoplasms of urinary tract (C64 - C68) 4 3.3%Malignant neoplasms of lip, oral cavity, and pharynx (C00 - C14) 3 2.5%Malignant neoplasms of mesothelial and soft tissue (C45 - C49) 3 2.5%Malignant neoplasms of thyroid and other endocrine glands (C73 - C75) 2 1.7%Melanoma and other malignant neoplasms of skin (C43 - C44) 2 1.7%Malignant neoplasms of eye, brain, and other parts of central nervous system (C69 - C72) 1 0.8%Total 121 100.0%
MidCentral Maori Cancer Registrations 1998 to 2000
16.5.4 MidCentral District Pacific Peoples Cancer Registrations 1998 to 2000
MidCentral district Pacific peoples cancer registration numbers for 1998 to 2000 were small, and probably unreliable for revealing trends. The most frequent malignant cancers registered from 1998 to 2000 for Pacific peoples living in MidCentral district were:
1. Breast 2. Digestive organs 3. Melanoma and other skin cancers 4. Eye, brain, and nervous system 5. Lips, mouth, and throat.
Cancer typeNumber of
people PercentageMalignant neoplasms of the breast (C50) 4 28.6%Malignant neoplasms of digestive organs (C15 - C26) 2 14.3%Melanoma and other malignant neoplasms of skin (C43 - C44) 2 14.3%Malignant neoplasms of eye, brain, and other parts of central nervous system (C69 - C72) 1 7.1%Malignant neoplasms of lip, oral cavity, and pharynx (C00 - C14) 1 7.1%Malignant neoplasms of male genital organs (C60 - C63) 1 7.1%Malignant neoplasms of respiratory and intrathoracic organs (C00 - C14) 1 7.1%Malignant neoplasms of thyroid and other endocrine glands (C73 - C75) 1 7.1%Malignant neoplasms of urinary tract (C64 - C68) 1 7.1%Grand Total 14 100.0%
MidCentral Pacific People Cancer Registrations 1998 to 2000
16.5.5 MidCentral District Asian Peoples Cancer Registrations 1998 to 2000
MidCentral district Asian peoples cancer registration numbers for 1998 to 2000 were small, and probably unreliable for revealing trends. The most frequent malignant cancers registered from 1998 to 2000 for Pacific peoples living in MidCentral district were:
1. Breast 2. Digestive organs 3. Female genital organs

200
4. Blood or lymphoid tissues 5. Site uncertain.
A full listing, with percentages, is given in the table below.
Cancer typeNumber of
people PercentageMalignant neoplasms of the breast (C50) 5 26.3%Malignant neoplasms of digestive organs (C15 - C26) 4 21.1%Malignant neoplasms of female genital organs (C51 - C58) 3 15.8%Malignant neoplasms, stated or presumed to be primary, of lymphoid, haemopoietic and related tissue (C81 - C96) 3 15.8%Malignant neoplasms of ill-defined, secondary and unspecified sites (C76 - C80) 1 5.3%Malignant neoplasms of male genital organs (C60 - C63) 1 5.3%Malignant neoplasms of thyroid and other endocrine glands (C73 - C75) 1 5.3%Malignant neoplasms of urinary tract (C64 - C68) 1 5.3%Total 19 100.0%
MidCentral Asian Cancer Registrations 1998 to 2000
16.5.6 MidCentral District Other Ethnicities Cancer Registrations 1998 to 2000
The most frequent malignant cancers registered from 1998 to 2000 for Maori people living in MidCentral district were:
1. Digestive organs 2. Male genital organs 3. Breast 4. Respiratory and intrathoracic organs (lungs and organs inside the chest) 5. Blood and lymphoid systems.
A full listing, with percentages, is given in the table below.
Cancer typeNumber of
people PercentageMalignant neoplasms of digestive organs (C15 - C26) 501 24.1%Malignant neoplasms of male genital organs (C60 - C63) 339 16.3%Malignant neoplasms of the breast (C50) 248 11.9%Malignant neoplasms of respiratory and intrathoracic organs (C00 - C14) 210 10.1%Malignant neoplasms, stated or presumed to be primary, of lymphoid, haemopoietic and related tissue (C81 - C96) 171 8.2%Melanoma and other malignant neoplasms of skin (C43 - C44) 164 7.9%Malignant neoplasms of urinary tract (C64 - C68) 130 6.3%Malignant neoplasms of female genital organs (C51 - C58) 103 5.0%Malignant neoplasms of ill-defined, secondary and unspecified sites (C76 - C80) 94 4.5%Malignant neoplasms of eye, brain, and other parts of central nervous system (C69 - C72) 44 2.1%Malignant neoplasms of lip, oral cavity, and pharynx (C00 - C14) 29 1.4%Malignant neoplasms of thyroid and other endocrine glands (C73 - C75) 24 1.2%Malignant neoplasms of mesothelial and soft tissue (C45 - C49) 17 0.8%Malignant neoplasms of bone and articular cartilage (C40 - C41) 5 0.2%Total 2079 100.0%
MidCentral Other Ethnicities (non-Maori, non-Pacific, non-Asian) Cancer Registrations 1998 to 2000
16.6 Cancer Registration Ethnic Comparisons When MidCentral district cancer registration numbers over the 1998 to 2000 period were examined:
• Yearly numbers of cancer registrations for MidCentral district all ethnicities was much the same from 1998 to 2000. New Zealand all ethnicities increased by 6.3% over the same period
• MidCentral district other ethnicities (non Maori, non Pacific) yearly numbers of cancer registrations reduced by 2% across the 1998 to 2000 period. New Zealand other ethnicities increased by 5.8% over the same period
• MidCentral district Maori yearly registration numbers appeared to be increasing, from 28 in 1998 to 49 in 2000, a 42% increase. Most of this increase was in the first year of the period, and there may be an element of yearly fluctuation to this trend. New Zealand Maori cancer registrations increased yearly from 1998 to 2001, a 16% rise when 2001 is compared to 1998

201
• MidCentral district Pacific peoples numbers of yearly discharges were too small for interpretation, but appeared stable.
Crude discharge rates are the number of discharges divided by the total number of people in the population of interest. It does not take into account different age structures in populations. When crude discharge rates over 1999 to 2003 were examined:
• Crude rates for other ethnicities (non Maori, non Pacific) were higher than those for Maori and Pacific peoples. This is mostly because of the higher proportion of older adults among other ethnicities. The risk of cancer increases with age.
Age adjusted ratios prevent dissimilar age balances in different populations distorting population rates of hospitalisation. This is because most diseases are more likely to occur in some age groups rather than others. Therefore, different rates of hospitalisation may be due to differences in age structure and not because the risk of disease is higher or lower. An age adjusted ratio is a ratio of actual number of hospitalisations divided by expected number of hospitalisations. The expected number of hospitalisations is calculated using the hospitalisation rates from a comparison population. Age adjusted ratios therefore compare a target population to a predetermined comparison population, compensating for any differences in age structure at the same time. For cancer registrations, New Zealand all ethnicities is the comparison population and has been set the ratio of 1. The individual MidCentral district and New Zealand ethnic groupings have been compared to this ratio. Ethnic age adjusted ratios exceeding 1 mean the ethnic group experienced more cancer registrations than expected when compared against New Zealand overall. Ratios below 1 mean the ethnic group experienced less cancer registrations when compared against New Zealand overall. When age adjusted rates were calculated, using New Zealand all ethnicities as the comparison population:
• New Zealand Maori experienced the expected number of cancer registrations when compared to New Zealand all ethnicities (age adjusted ratio of 1)
• MidCentral district Maori experienced 13% fewer cancer registrations than expected when compared to New Zealand all ethnicities (age adjusted ratio of 0.87)
• New Zealand Pacific peoples had close to the expected number of cancer registrations when compared to New Zealand all ethnicities (age adjusted ratio of 1.02)
• MidCentral district Pacific peoples age adjusted ratio was not statistically significant. The absolute numbers were small, and the age adjusted ratio close to 1 (0.94)
• New Zealand other ethnicities (non Maori, non Pacific) and MidCentral district other ethnicities both experienced close to the expected number of cancer registrations when compared to New Zealand all ethnicities (age adjusted ratios of 1 and 1.02 respectively).
Maori Pacific
Other (includes
Asian)All
ethnicities1998 28 5 715 7481999 46 5 708 7592000 49 4 698 751
Total 123 14 2121 2258
MidCentral Cancer Registrations 1998 to 2000

202
Maori Pacific
Other (includes
Asian)All
ethnicities1998 996 422 15258 166761999 1083 382 15355 168202000 1154 430 16149 17733
Total 3233 1234 46762 51229
New Zealand Cancer Registrations 1998 to 2000
Maori Pacific
Other (includes
Asian)All
ethnicitiesMidCentral 486 450 1590 1400New Zealand 575 601 1520 1340
NZ and MidCentral Cancer Crude (non-age adjusted) Registration Rates per 100,000 People 1998 to 2000
Ratio95%
conf.limits Ratio95%
conf.limits Ratio95%
conf.limits Ratio95%
conf.limits
MidCentral 0.87 0.71 - 1.02 0.94 0.45 - 1.44 1.02 0.98 - 1.06 1.01 0.97 - 1.05New Zealand 1 0.97 - 1.04 1.03 0.97 - 1.08 1 0.99 - 1.01 1
Other (includes Asian) All ethnicitiesMaori Pacific(New Zealand all ethnicities cancer registrations 1998 to 2000 used as comparison)
MidCentral and NZ Cancer Indirect Age Adjusted Registration Ratios 1998 to 2000
16.7 Cancer Mortality 1999 to 2001 Lists of the 1999 to 2001 cancer mortality for people living in MidCentral district are given in the following tables. The most common cancers causing death are given for MidCentral district overall, and then by ethnicity (Maori, Pacific peoples, Asian peoples, and other ethnicities).
16.7.1 MidCentral District Cancer Mortality 1999 to 2001
The most frequent causes of malignant cancers deaths from 1999 to 2001 for people living in MidCentral district were:
1. Digestive organs 2. Respiratory and intrathoracic organs (lungs and organs inside the chest) 3. Blood and lymphoid systems 4. Breast 5. Male genital organs.
A full listing, with percentages, is given in the following table.

203
Cancer typeNumber of
people PercentageMalignant neoplasms of digestive organs (C15 - C26) 303 28.0%Malignant neoplasms of respiratory and intrathoracic organs (C00 - C14) 225 20.8%Malignant neoplasms, stated or presumed to be primary, of lymphoid, haemopoietic and related tissue (C81 - C96) 105 9.7%Malignant neoplasms of the breast (C50) 86 8.0%Malignant neoplasms of male genital organs (C60 - C63) 68 6.3%Malignant neoplasms of ill-defined, secondary and unspecified sites (C76 - C80) 64 5.9%Malignant neoplasms of female genital organs (C51 - C58) 49 4.5%Melanoma and other malignant neoplasms of skin (C43 - C44) 43 4.0%Malignant neoplasms of urinary tract (C64 - C68) 42 3.9%Malignant neoplasms of eye, brain, and other parts of central nervous system (C69 - C72) 35 3.2%Malignant neoplasms of mesothelial and soft tissue (C45 - C49) 18 1.7%Malignant neoplasms of lip, oral cavity, and pharynx (C00 - C14) 15 1.4%Neoplasms of uncertain or unknown behaviour (D37 - D48) 15 1.4%Malignant neoplasms of bone and articular cartilage (C40 - C41) 5 0.5%Malignant neoplasms of thyroid and other endocrine glands (C73 - C75) 5 0.5%Benign neoplasms (D10 - D36) 3 0.3%Total 1081 100.0%
MidCentral Cancer Mortality by Cancer Type 1999 to 2001
16.7.2 MidCentral District Maori Cancer Mortality 1999 to 2001
The most frequent causes of malignant cancers deaths from 1999 to 2001 for Maori people living in MidCentral district were:
1. Digestive organs 2. Respiratory and intrathoracic organs (lungs and organs inside the chest) 3. Breast 4. Site uncertain 5. Male genital organs.
A full listing, with percentages, is given in the table below.
Cancer typeNumber of
people PercentageMalignant neoplasms of digestive organs (C15 - C26) 20 26.3%Malignant neoplasms of respiratory and intrathoracic organs (C00 - C14) 19 25.0%Malignant neoplasms of the breast (C50) 13 17.1%Malignant neoplasms of ill-defined, secondary and unspecified sites (C76 - C80) 6 7.9%Malignant neoplasms of male genital organs (C60 - C63) 5 6.6%Malignant neoplasms, stated or presumed to be primary, of lymphoid, haemopoietic and related tissue (C81 - C96) 4 5.3%Malignant neoplasms of female genital organs (C51 - C58) 3 3.9%Malignant neoplasms of urinary tract (C64 - C68) 3 3.9%Malignant neoplasms of lip, oral cavity, and pharynx (C00 - C14) 1 1.3%Malignant neoplasms of mesothelial and soft tissue (C45 - C49) 1 1.3%Melanoma and other malignant neoplasms of skin (C43 - C44) 1 1.3%Total 76 100.0%
MidCentral Maori Cancer Mortality by Cancer Type 1999 to 2001
16.7.3 MidCentral District Pacific Peoples Cancer Mortality 1999 to 2001
MidCentral district Pacific peoples mortality numbers for 1999 to 2001 were small, and probably unreliable for revealing trends. The most frequent causes of malignant cancers deaths from 1999 to 2001 for Pacific peoples living in MidCentral district were:
1. Breast 2. Eye, brain, and nervous system 3. Respiratory and intrathoracic organs (lung and organs inside the chest) 4. Blood and lymphoid systems.
A full listing, with percentages, is given in the table below.
Cancer typeNumber of
people PercentageMalignant neoplasms of the breast (C50) 2 40.0%Malignant neoplasms of eye, brain, and other parts of central nervous system (C69 - C72) 1 20.0%Malignant neoplasms of respiratory and intrathoracic organs (C00 - C14) 1 20.0%Malignant neoplasms, stated or presumed to be primary, of lymphoid, haemopoietic and related tissue (C81 - C96) 1 20.0%Total 5 100.0%
MidCentral Pacific People Cancer Mortality by Cancer Type 1999 to 2001

204
16.7.4 MidCentral District Asian Peoples Cancer Mortality 1999 to 2001
MidCentral district Asian peoples mortality numbers for 1999 to 2001 were small, and probably unreliable for revealing trends. The most frequent causes of malignant cancers deaths from 1999 to 2001 for Asian peoples living in MidCentral district were:
1. Female genital organs 2. Respiratory and intrathoracic organs (lung and organs inside the chest) 3. Blood and lymphoid systems 4. Digestive organs 5. Site uncertain.
A full listing, with percentages, is given in the table below.
Cancer typeNumber of
people PercentageMalignant neoplasms of female genital organs (C51 - C58) 2 20.0%Malignant neoplasms of respiratory and intrathoracic organs (C00 - C14) 2 20.0%Malignant neoplasms, stated or presumed to be primary, of lymphoid, haemopoietic and related tissue (C81 - C96) 2 20.0%Malignant neoplasms of digestive organs (C15 - C26) 1 10.0%Malignant neoplasms of ill-defined, secondary and unspecified sites (C76 - C80) 1 10.0%Malignant neoplasms of lip, oral cavity, and pharynx (C00 - C14) 1 10.0%Malignant neoplasms of urinary tract (C64 - C68) 1 10.0%Total 10 100.0%
MidCentral Asian Cancer Mortality by Cancer Type 1999 to 2001
16.7.5 MidCentral District Other Ethnicities Cancer Mortality 1999 to 2001
The most frequent causes of malignant cancers deaths from 1999 to 2001 for people of other ethnicities living in MidCentral district were:
1. Digestive organs 2. Respiratory and intrathoracic organs (lungs and organs inside the chest) 3. Blood and lymphoid systems 4. Breast 5. Male genital organs.
A full listing, with percentages, is given in the table below.
Cancer typeNumber of
people PercentageMalignant neoplasms of digestive organs (C15 - C26) 282 28.5%Malignant neoplasms of respiratory and intrathoracic organs (C00 - C14) 203 20.5%Malignant neoplasms, stated or presumed to be primary, of lymphoid, haemopoietic and related tissue (C81 - C96) 98 9.9%Malignant neoplasms of the breast (C50) 71 7.2%Malignant neoplasms of male genital organs (C60 - C63) 63 6.4%Malignant neoplasms of ill-defined, secondary and unspecified sites (C76 - C80) 57 5.8%Malignant neoplasms of female genital organs (C51 - C58) 44 4.4%Melanoma and other malignant neoplasms of skin (C43 - C44) 42 4.2%Malignant neoplasms of urinary tract (C64 - C68) 38 3.8%Malignant neoplasms of eye, brain, and other parts of central nervous system (C69 - C72) 34 3.4%Malignant neoplasms of mesothelial and soft tissue (C45 - C49) 17 1.7%Neoplasms of uncertain or unknown behaviour (D37 - D48) 15 1.5%Malignant neoplasms of lip, oral cavity, and pharynx (C00 - C14) 13 1.3%Malignant neoplasms of bone and articular cartilage (C40 - C41) 5 0.5%Malignant neoplasms of thyroid and other endocrine glands (C73 - C75) 5 0.5%Benign neoplasms (D10 - D36) 3 0.3%Total 990 100.0%
MidCentral Other Ethnicities (non-Maori, non-Pacific, non-Asian) Cancer Mortality by Cancer Type 1999 to 2001
16.8 Digestive and Respiratory Cancer Analysis by Ethnicity Digestive cancers and respiratory cancers were the two most common cancer groupings causing mortality among MidCentral district residents. Further analysis of these groupings is given below. The analysis describes registration (incidence) and mortality broken down by ethnicity.

205
16.8.1 Digestive Cancer Mortality
New Zealand Maori have higher than expected number of deaths from digestive system cancers (by 56%) compared against New Zealand all ethnicities. This is despite having similar level of digestive cancer registrations compared to New Zealand all ethnicities. MidCentral district Maori digestive cancer mortality analysis did not reach statistical significance, although trends were similar. New Zealand Pacific peoples also had higher than expected deaths from digestive cancers (by 35%), but had similar levels of registrations to New Zealand all ethnicities. There were differences between Maori and non Maori when digestive cancers causing death were broken down to different types of cancer. Digestive cancer deaths from 1997 to 2001 was used for this breakdown. Colorectal cancer was responsible for half the digestive cancer deaths for New Zealand all ethnicities (50.4%) and MidCentral district other ethnicities (non Maori, non Pacific) (54.5%). However, colorectal cancers formed around a quarter of Maori digestive cancer deaths. This pattern is seen for both New Zealand Maori and MidCentral district Maori. New Zealand Maori had higher proportions of both stomach (23.8%) and liver cancers (15.1%) compared to New Zealand all ethnicities. Stomach cancers were responsible for 13.5% of digestive cancer deaths for New Zealand all ethnicities. Liver cancers caused 5.8% of digestive cancer deaths for New Zealand all ethnicities. MidCentral district Maori had a higher proportion of liver cancer (17.2%) but not stomach cancer (10.3%). The number of MidCentral district Maori digestive cancer deaths was small (29), and this may affect the reliability of patterns found. Both stomach and liver cancers have higher risk of death compared to colorectal cancer. According to the Ministry of Health publication Cancer New Registrations and Deaths 2000, there was almost one death from cancer of the colorectum and anus for every 2 registrations in 2000 (the actual fatality/case ratio was 0.45). This compares with a fatality/case ratio of 0.86 for stomach cancer, almost twice that of colorectal and anal cancer. The fatality/case ratio for liver cancer is 0.99–one death for every one registration in 2000. (Ref: Ministry of Health. Cancer New Registrations and Deaths 2000, Ministry of Health, Wellington 2004.) New Zealand research has shown Maori have between two to five times higher risk of developing stomach cancer compared to non Maori. Maori risk of liver cancer is between two to four times higher than non Maori. (Ref: Public Health Intelligence. Cancer in New Zealand: Trends and Projections. Ministry of Health, Wellington Nov.2002.) Risk factors for stomach cancer include infection with Helicobacter pylori bacteria. Helicobacter pylori is the bacteria that causes most gastric and duodenal ulcers. Obesity increases the risk of a particular kind of stomach cancer–cancer of the oesophageal-gastric junction. The risk of cancer of the join between the oesophagus (gullet) and stomach (oesophago-gastric junction) is increased by gastro-oesophageal reflux. Gastro-oesophageal reflux is when stomach contents can run upwards into the oesophagus (gullet), passing through a muscular valve that usually stops this from happening. This is more common in people who are overweight. (Ref: Public Health Intelligence. Cancer in New Zealand: Trends and Projections. Ministry of Health, Wellington Nov.2002.) Risk factors for liver cancer include chronic hepatitis B infection and cirrhosis (for example, from hepatitis C or alcohol).
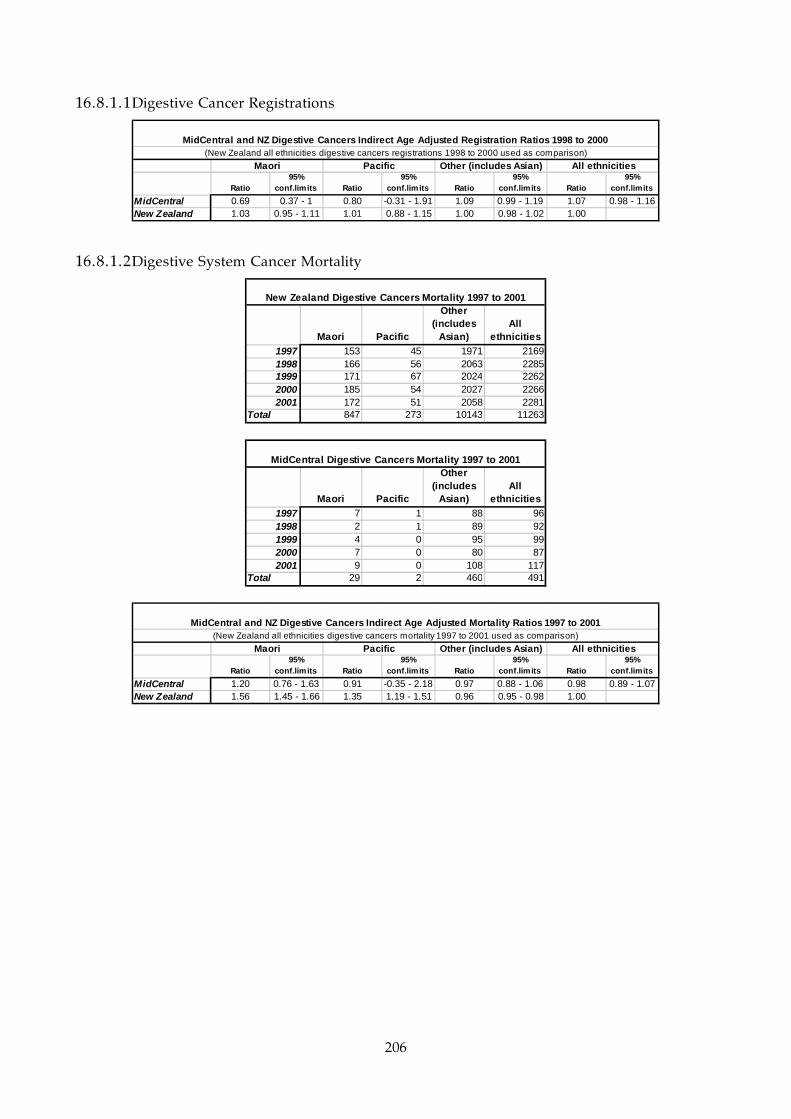
206
16.8.1.1 Digestive Cancer Registrations
Ratio95%
conf.limits Ratio95%
conf.limits Ratio95%
conf.limits Ratio95%
conf.limits
MidCentral 0.69 0.37 - 1 0.80 -0.31 - 1.91 1.09 0.99 - 1.19 1.07 0.98 - 1.16New Zealand 1.03 0.95 - 1.11 1.01 0.88 - 1.15 1.00 0.98 - 1.02 1.00
MidCentral and NZ Digestive Cancers Indirect Age Adjusted Registration Ratios 1998 to 2000
All ethnicitiesMaori Pacific(New Zealand all ethnicities digestive cancers registrations 1998 to 2000 used as comparison)
Other (includes Asian)
16.8.1.2 Digestive System Cancer Mortality
Maori Pacific
Other (includes
Asian)All
ethnicities1997 153 45 1971 21691998 166 56 2063 22851999 171 67 2024 22622000 185 54 2027 22662001 172 51 2058 2281
Total 847 273 10143 11263
New Zealand Digestive Cancers Mortality 1997 to 2001
Maori Pacific
Other (includes
Asian)All
ethnicities1997 7 1 88 961998 2 1 89 921999 4 0 95 992000 7 0 80 872001 9 0 108 117
Total 29 2 460 491
MidCentral Digestive Cancers Mortality 1997 to 2001
Ratio95%
conf.limits Ratio95%
conf.limits Ratio95%
conf.limits Ratio95%
conf.limits
MidCentral 1.20 0.76 - 1.63 0.91 -0.35 - 2.18 0.97 0.88 - 1.06 0.98 0.89 - 1.07New Zealand 1.56 1.45 - 1.66 1.35 1.19 - 1.51 0.96 0.95 - 0.98 1.00
MidCentral and NZ Digestive Cancers Indirect Age Adjusted Mortality Ratios 1997 to 2001
All ethnicitiesMaori Pacific(New Zealand all ethnicities digestive cancers mortality 1997 to 2001 used as comparison)
Other (includes Asian)

207
MidCentral and NZ Maori Digestive Cancer Deaths 1997 to
2001 by Percentage of Cancer Types
0.0%
10.0%
20.0%
30.0%
40.0%
50.0%
60.0%
NZ all
ethnicities
NZ Maori MidCentral
other
ethnicities
(non-Maori,
non-Pacific)
MidCentral
Maori
Percentage
Oesophagus
Stomach
Small intestine
Colorectal
Liver
Gallbladder &
bile ductPancreas
Other
Deaths Percentages Deaths Percentages Deaths Percentages Deaths Percentages
Oesophagus 945 8.4% 70 8.3% 41 8.9% 4 13.8%
Stomach 1517 13.5% 202 23.8% 52 11.3% 3 10.3%
Small intestine 124 1.1% 21 2.5% 3 0.7% 0 0.0%
Colorectal 5659 50.2% 225 26.6% 250 54.5% 7 24.1%
Liver 636 5.6% 128 15.1% 18 3.9% 5 17.2%
Gallbladder & bile duct 292 2.6% 25 3.0% 14 3.1% 3 10.3%
Pancreas 1522 13.5% 133 15.7% 64 13.9% 4 13.8%
Other 568 5.0% 43 5.1% 17 3.7% 3 10.3%
Total 11263 100.0% 847 100.0% 459 100.0% 29 100.0%
MidCentral and NZ Maori Digestive Cancer Deaths 1997 to 2001 Broken Down to Cancer Types
NZ all ethnicities NZ Maori
MidCentral other
ethnicities (non-
Maori, non-Pacific) MidCentral Maori
16.8.2 Respiratory Cancer
Overall, MidCentral district Maori and New Zealand Maori were over represented in both respiratory cancer incidence (registration) and mortality by two to three times that of New Zealanders of all ethnicities. New Zealand Pacific peoples also had higher than expected registrations and deaths from respiratory cancers compared to New Zealand all ethnicities–by 69% for registrations and 75% for mortality. These findings are consistent with national data on Maori and Pacific peoples smoking prevalence. The New Zealand Health Survey 2003 found Maori and Pacific peoples had higher percentages of current smokers than non Maori, non Pacific ethnicities. (Ref: Ministry of Health, 2004. A Portrait of Health: Key results of the 2002/03 New Zealand Health Survey. Wellington, Ministry of Health.) When respiratory cancers deaths are broken down to the different cancer types within this category, most cancers (95%) were of the trachea, bronchi, or lung. The trachea and bronchi are the large tubes that carry air from the throat to the lungs.

208
16.8.2.1 Respiratory Cancer Registrations Table
Ratio95%
conf.lim its Ratio95%
conf.lim its Ratio95%
conf.lim its Ratio95%
conf.lim its
M idCentral 2.04 1.24 - 2.84 0.85 -0.82 - 2.53 1.00 0.86 - 1.13 1.06 0.92 - 1.19New Zealand 2.51 2.32 - 2.69 1.69 1.44 - 1.94 0.90 0.87 - 0.92 1
MidCentral and NZ Respiratory Cancers Indirect Age Adjusted Registration Ratios 1998 to 2000
All ethnicitiesMaori Pacific(New Zealand all ethnicities respiratory cancers regis trations 1998 to 2000 used as comparison)
Other (includes Asian)
16.8.2.2 Respiratory Cancer Mortality Data
Maori Pacific
Other (includes
Asian)All
ethnicities1997 213 38 1249 15001998 225 57 1203 14851999 223 52 1277 15522000 219 48 1193 14602001 250 55 1187 1492
Total 1130 250 6109 7489
New Zealand Respiratory and Intrathoracic Cancers Mortality 1997 to 2001
Maori Pacific
Other (includes
Asian)All
ethnicities1997 6 0 55 611998 8 1 44 531999 5 0 78 832000 6 0 72 782001 8 1 55 64
Total 33 2 304 339
MidCentral Respiratory and Intrathoracic Cancers Mortality 1997 to 2001
Ratio95%
conf.limits Ratio95%
conf.limits Ratio95%
conf.limits Ratio95%
conf.limits
MidCentral 1.92 1.26 - 2.57 1.26 -0.49 - 3.01 0.97 0.86 - 1.08 1.02 0.91 - 1.13New Zealand 2.95 2.77 - 3.12 1.75 1.54 - 1.97 0.88 0.86 - 0.9 1
MidCentral and NZ Respiratory and Intrathoracic Cancers Indirect Age Adjusted Mortality Ratios 1997 to 2001
All ethnicitiesMaori Pacific(New Zealand all ethnicities respiratory and intrathoracic cancers mortality 1997 to 2001 used as comparison)
Other (includes Asian)
Cancer Type Number Percent Number Percent Number Percent Number Percent Number PercentLarynx 8 1.2% 3 1.9% 0 0.0% 85 2.4% 96 2.1%Nasal cavity, middle ear, accessory sinuses 3 0.4% 1 0.6% 0 0.0% 25 0.7% 29 0.6%Thymus, heart, mediastinum, pleura 10 1.4% 4 2.6% 1 1.6% 80 2.2% 95 2.1%Trachea, bronchus, and lung 671 97.0% 147 94.8% 63 98.4% 3402 94.7% 4283 95.1%Other 0 0.0% 0 0.0% 0 0.0% 1 0.0% 1 0.0%Total 692 100.0% 155 100.0% 64 100.0% 3593 100.0% 4504 100.0%
New Zealand Mortality Causing Respiratory and Intrathoracic Cancers Breakdown 1999 to 2001Maori Pacific Asian Other Total
Cancer Type Number Percent Number Percent Number Percent Number Percent Number PercentLarynx 0 0.0% 0 0.0% 0 0.0% 6 3.0% 6 2.7%Nasal cavity, middle ear, accessory sinuses 0 0.0% 0 0.0% 0 0.0% 1 0.5% 1 0.4%Thymus, heart, mediastinum, pleura 0 0.0% 0 0.0% 0 0.0% 4 2.0% 4 1.8%Trachea, bronchus, and lung 19 100.0% 1 100.0% 2 100.0% 192 94.6% 214 95.1%Other 0 0.0% 0 0.0% 0 0.0% 0 0.0% 0 0.0%Total 19 100.0% 1 100.0% 2 100.0% 203 100.0% 225 100.0%
MidCentral Mortality Causing Respiratory and Intrathoracic Cancers Breakdown 1999 to 2001Maori Pacific Asian Other Total
16.9 MidCentral District Mortality by Ethnicity The most common MidCentral district ICD10 diagnostic chapters for mortality in the period 1999 to 2001 were: circulatory system diseases, neoplasms (cancers), respiratory diseases, and

209
illnesses/injuries due to external causes. The Pacific peoples and Asian peoples mortality numbers were small, limiting analysis and interpretation. However, circulatory system diseases and cancers (neoplasms) were still the top two causes of death for these two ethnic groups.
Cause No of deaths % of deathsMaori
Diseases of the circulatory system (I00 - I95) 113 37.8%Neoplasms (C00 - D48) 76 25.4%External causes of morbidity and mortality (V01 - Y98) 37 12.4%Diseases of the respiratory system (J00 - J99) 21 7.0%
Pacific PeopleDiseases of the circulatory system (I00 - I95) 13 39.4%Neoplasms (C00 - D48) 5 15.2%External causes of morbidity and mortality (V01 - Y98) 4 12.1%Congenital malformations, deformations, and chromosomal abnormalities (Q00 - Q99) 3 9.1%
AsianNeoplasms (C00 - D48) 10 33.3%Diseases of the circulatory system (I00 - I95) 8 26.7%External causes of morbidity and mortality (V01 - Y98) 7 23.3%Diseases of the genitourinary system (N00 - N99) 2 6.7%
Other ethnicitiesDiseases of the circulatory system (I00 - I95) 1610 43.8%Neoplasms (C00 - D48) 990 27.0%Diseases of the respiratory system (J00 - J99) 322 8.8%External causes of morbidity and mortality (V01 - Y98) 206 5.6%
MidCentralDiseases of the circulatory system (I00 - I95) 1744 43.2%Neoplasms (C00 - D48) 1081 26.8%Diseases of the respiratory system (J00 - J99) 345 8.6%External causes of morbidity and mortality (V01 - Y98) 254 6.3%
Top Four Causes of MidCentra l Morta lity by Ethnicity 1999 to 2001
16.10 MidCentral District and New Zealand Comparisons for Major Causes of Mortality
This subsection compares mortality rates and ratios for MidCentral district and its ethnic groups to New Zealand ethnicities. Comparisons are made for the following causes of mortality:
• All causes • Circulatory system disorders • Cancers • Respiratory system disorders • External causes (unintentional and intentional injuries).
Circulatory system disorders, cancers, respiratory system disorders, and external causes are the top four causes of mortality for MidCentral district. Both crude mortality rates and age adjusted ratios are used in these comparisons. Both are explained here. Crude rates are the number of deaths divided by the total number of people in the population of interest. It does not take into account different age structures in populations. Age adjusted ratios prevent dissimilar age balances in different populations distorting population rates of mortality. This is because most diseases causing death are more likely to occur in some age groups than others. Therefore, different rates of mortality may be due to differences in age structure and not because the risk of death is higher or lower. An age adjusted ratio is a ratio of actual number of deaths divided by expected number of deaths. The expected number of deaths is calculated using the mortality rates from a comparison population. Age adjusted ratios therefore compare a target population to a predetermined comparison population, compensating for any differences in age structure at the same time.

210
For mortality, New Zealand all ethnicities is the comparison population and has been set the ratio of 1. The individual MidCentral district and New Zealand ethnic groupings have been compared to this ratio. Ethnic age adjusted ratios exceeding 1 mean the ethnic group experienced more deaths than expected when compared against New Zealand overall. Ratios below 1 mean the ethnic group experienced less deaths when compared against New Zealand overall.
16.10.1 Mortality from All Causes
Mortality data from all causes 1999 to 2001 for MidCentral district and New Zealand were analysed. MidCentral district yearly mortality from 1999 to 2001 was reasonably stable. MidCentral district Maori yearly mortality increased from 88 in 1999 to just over 100 per year for 2000 and 2001. For New Zealand, Maori and other ethnicities (non Maori, non Pacific, non Asian) yearly mortality reduced; whereas Pacific peoples and Asian peoples increased from 1999 to 2001. Crude mortality rates are the number of deaths divided by the total number of people in the population of interest. It does not take into account different age structures in populations. When MidCentral district crude rates of mortality are compared to New Zealand, MidCentral district Maori and Pacific peoples had lower rates than New Zealand corresponding ethnicities. MidCentral district other ethnicities (non Maori, non Pacific, but including Asian) and MidCentral district all ethnicities crude rates are greater than New Zealand corresponding ethnicities. Maori and Pacific peoples crude mortality rates are less than other ethnicities (non Maori, non Pacific). This is mostly likely because Maori and Pacific peoples populations have smaller proportions of older people compared to other ethnicities. The risk of death is higher at older age groups. MidCentral district crude mortality rates for 1999 to 2001 have increased slightly compared to 1996 to 1998 (2,500 versus 2,360 deaths per 100,000 people over 3 years). New Zealand’s crude rates have slightly reduced over the same period (2,150 versus 2,200 deaths per 100,000 people over 3 years). Crude rates do not take into consideration differences in population age balances; however, this is not as troublesome when the same population is compared to itself for different periods. The 1996 to 1998 data used were taken from the MidCentral 2001 health needs assessment report. (Ref: Public Health Consultancy. 2001. An Assessment of Health Needs in the MidCentral District Health Board Region: Technical Report. Wellington School of Medicine and Health Sciences, Wellington.) Age adjusted ratios by ethnicity were calculated for MidCentral district and New Zealand. An explanation of age adjusted ratio is given at the beginning of this subsection. Age adjusted ratios were created using New Zealand all ethnicities as the comparison (ratio set to 1). The ratios showed MidCentral district all ethnicities experienced 10% more than expected deaths compared to New Zealand all ethnicities. This equates to an extra 355 deaths over 3 years, or 118 deaths per year. MidCentral district other ethnicities (non Maori, non Pacific) experienced 6% more than expected deaths compared to New Zealand all ethnicities. Both New Zealand and MidCentral district Maori experienced more than expected deaths compared to New Zealand all ethnicities–by 90% (almost double) for New Zealand Maori and 66% for MidCentral district Maori. Both New Zealand and MidCentral district Pacific peoples experienced more than expected deaths compared to New Zealand all ethnicities, and by a similar amount–60% to 70%.

211
Mortality distribution across age groups was examined, both by numbers of deaths and also by age specific rates. Age specific rates are the number of deaths per number of people within each five year age group. Most deaths occur in older age groups. This is shown when mortality numbers are distributed across age groups. When age specific rates are compared for New Zealand Maori against New Zealand all ethnicities, most Maori age groups have higher mortality rates than New Zealand equivalent age groups. There is a peak at ages 40 to 69 where the difference is between 114% to 163% (2.1 to 2.6 times) more than corresponding New Zealand all ethnicities age groups. The Maori difference in age specific rates for ten years either side of this peak (ages 30 to 39 and 70 to 80) also show very high differences–between 76% to 98% more than New Zealand all ethnicities. A similar pattern is seen when MidCentral district Maori is compared to MidCentral district all ethnicities. There is a peak at ages 45 to 59, where the differences in age specific rates is 134% to 199% (almost 2.3 to 3 times) more than corresponding MidCentral district all ethnicities age groups. The differences in age specific rates ten to twenty years either side of this peak (ages 35 to 44 and 70 to 79) are also high–78% higher for ages 35 to 44 and 35% to 89% higher for ages 60 to 79. New Zealand Pacific peoples show a similar peak from ages 40 to 79, where the differences range from 68% to 125% more than New Zealand all ethnicities equivalent rates. MidCentral district Pacific peoples numbers are small, causing gaps in the graphed data.
Maori Pacific Asian OtherAll
ethnicities1999 88 11 14 1268 13812000 104 10 2 1164 12802001 107 12 14 1241 1374
Total 299 33 30 3673 4035
MidCentral All Cause Mortality 1999 to 2001
Maori Pacific Asian OtherAll
ethnicities1999 2666 835 403 24320 282242000 2583 861 453 22826 267232001 2588 904 473 24162 28127
Total 7837 2600 1329 71308 83074
New Zealand All Cause Mortality 1999 to 2001
Maori Pacific
Other (includes
Asian)All
ethnicitiesMidCentral 1160 1020 2800 2500New Zealand 1370 1230 2360 2150
NZ and MidCentral All Cause Crude (non-age adjusted) Mortality Rates per 100,000 People 1999 to 2001
Ratio95%
conf.lim its Ratio95%
conf.lim its Ratio95%
conf.lim its Ratio95%
conf.lim its
MidCentral 1.66 1.47 - 1.85 1.62 1.07 - 2.17 1.06 1.03 - 1.1 1.10 1.06 - 1.13New Zealand 1.9 1.86 - 1.95 1.68 1.62 - 1.74 0.94 0.93 - 0.95 1
Other (includes Asian) All ethnicitiesMaori Pacific(New Zealand all ethnicities all cause mortality 1999 to 2001 used as comparison)
MidCentral and NZ All Cause Indirect Age Adjusted Mortality Ratios 1999 to 2001

212
NZ All Ethnicities All Cause Mortality by Age Group 1999 to 2001
0
5000
10000
15000
20000
25000
0001
-0405
-0910
-1415
-1920
-2425
-2930
-3435
-3940
-4445
-4950
-5455
-5960
-6465
-6970
-7475
-7980
-84
85+
Age group
Nu
mb
er o
f ev
ents
NZ All Ethnicities All Cause Mortality Age Specific Rates 1999 to 2001
0
5000
10000
15000
20000
25000
30000
35000
40000
45000
50000
0001
-0405
-0910
-1415
-1920
-2425
-2930
-3435
-3940
-4445
-4950
-5455
-5960
-6465
-6970
-7475
-7980
-84
85+
Age group
Ag
e sp
ecif
ic r
ate/
100,
000
peo
ple
NZ Maori All Cause Mortality by Age Group 1999 to 2001
0
100
200
300
400
500
600
700
800
900
1000
0001
-0405
-0910
-1415
-1920
-2425
-2930
-3435
-3940
-4445
-4950
-5455
-5960
-6465
-6970
-7475
-7980
-84
85+
Age group
Nu
mb
er o
f ev
ents

213
NZ Maori All Cause Mortality Age Specific Rates 1999 to 2001
0
10000
20000
30000
40000
50000
60000
0001
-0405
-0910
-1415
-1920
-2425
-2930
-3435
-3940
-4445
-4950
-5455
-5960
-6465
-6970
-7475
-7980
-84
85+
Age groups
Ag
e sp
ecif
ic r
ate/
100,
000
peo
ple
MidCentral All Ethnicities All Cause Mortality by Age Group 1999 to 2001
0
200
400
600
800
1000
1200
0001
-0405
-0910
-1415
-1920
-2425
-2930
-3435
-3940
-4445
-4950
-5455
-5960
-6465
-6970
-7475
-7980
-84
85+
Age group
Nu
mb
er o
f ev
ents
MidCentral All Ethnicities All Cause Mortality Age Specific Rates 1999 to 2001
0
10000
20000
30000
40000
50000
60000
0001
-0405
-0910
-1415
-1920
-2425
-2930
-3435
-3940
-4445
-4950
-5455
-5960
-6465
-6970
-7475
-7980
-84
85+
Age group
Ag
e sp
ecif
ic r
ate/
100,
000
peo
ple
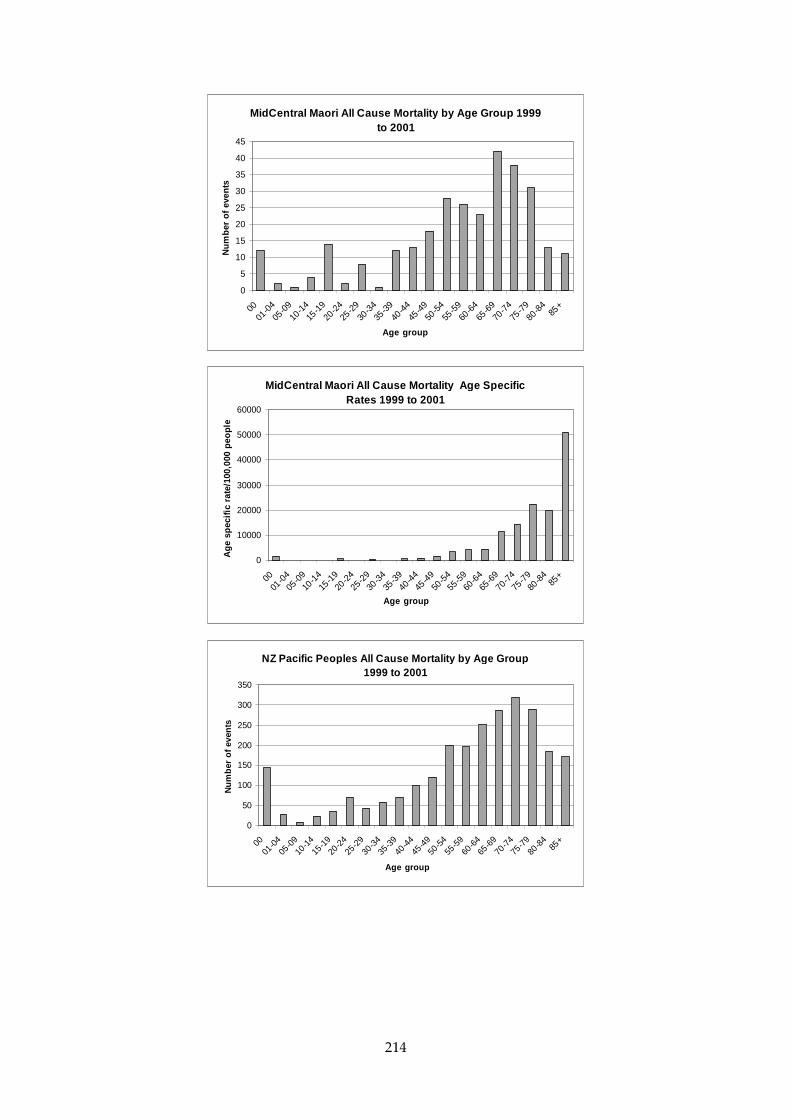
214
MidCentral Maori All Cause Mortality by Age Group 1999 to 2001
0
5
10
15
20
25
30
35
40
45
0001
-0405
-0910
-1415
-1920
-2425
-2930
-3435
-3940
-4445
-4950
-5455
-5960
-6465
-6970
-7475
-7980
-84
85+
Age group
Nu
mb
er o
f ev
ents
MidCentral Maori All Cause Mortality Age Specific Rates 1999 to 2001
0
10000
20000
30000
40000
50000
60000
0001
-0405
-0910
-1415
-1920
-2425
-2930
-3435
-3940
-4445
-4950
-5455
-5960
-6465
-6970
-7475
-7980
-84
85+
Age group
Ag
e sp
ecif
ic r
ate/
100,
000
peo
ple
NZ Pacific Peoples All Cause Mortality by Age Group 1999 to 2001
0
50
100
150
200
250
300
350
0001
-0405
-0910
-1415
-1920
-2425
-2930
-3435
-3940
-4445
-4950
-5455
-5960
-6465
-6970
-7475
-7980
-84
85+
Age group
Nu
mb
er o
f ev
ents

215
NZ Pacific Peoples All Cause Mortality Age Specific Rates 1999 to 2001
0
10000
20000
30000
40000
50000
60000
70000
0001
-0405
-0910
-1415
-1920
-2425
-2930
-3435
-3940
-4445
-4950
-5455
-5960
-6465
-6970
-7475
-7980
-84
85+
Age group
Ag
e sp
ecif
ic r
ate/
100,
000
peo
ple
MidCentral Pacific Peoples All Cause Mortality Age Specific Rates 1999 to 2001
0
10000
20000
30000
40000
50000
60000
0001
-0405
-0910
-1415
-1920
-2425
-2930
-3435
-3940
-4445
-4950
-5455
-5960
-6465
-6970
-7475
-7980
-84
85+
Age group
Ag
e sp
ecif
ic r
ate/
100,
000
peo
ple
16.10.2 Circulatory System Mortality
Circulatory system mortality data from 1999 to 2001 were analysed. The MidCentral district yearly number of circulatory system deaths was stable across the three year period. Crude mortality rates are the number of deaths divided by the total number of people in the population of interest. It does not take into account different age structures in populations. The crude mortality rates were much lower for Maori and Pacific peoples, compared to other ethnicities (non Maori, non Pacific). Most of this is probably due to the smaller proportions of older people in their populations. Circulatory system mortality increases with age. Age adjusted ratios by ethnicity were calculated for MidCentral district and New Zealand. An explanation of age adjusted ratio is given at the beginning of this subsection. The age adjusted ratio for MidCentral district all ethnicities combined was 1.15, meaning MidCentral district all ethnicities experienced 15% more circulatory system deaths than expected compared to New Zealand all ethnicities from 1999 to 2001. MidCentral district Maori and New Zealand Maori mortality is over twice the expected number, compared to New Zealand all ethnicities (age adjusted ratios of 2.16 and 2.19 respectively). New Zealand Pacific peoples experienced almost twice the expected number of deaths compared to New Zealand all ethnicities (age adjusted ratio of 1.98). MidCentral district Pacific peoples had a similar age adjusted ratio (2.41), but this is based on a low number of deaths (13)
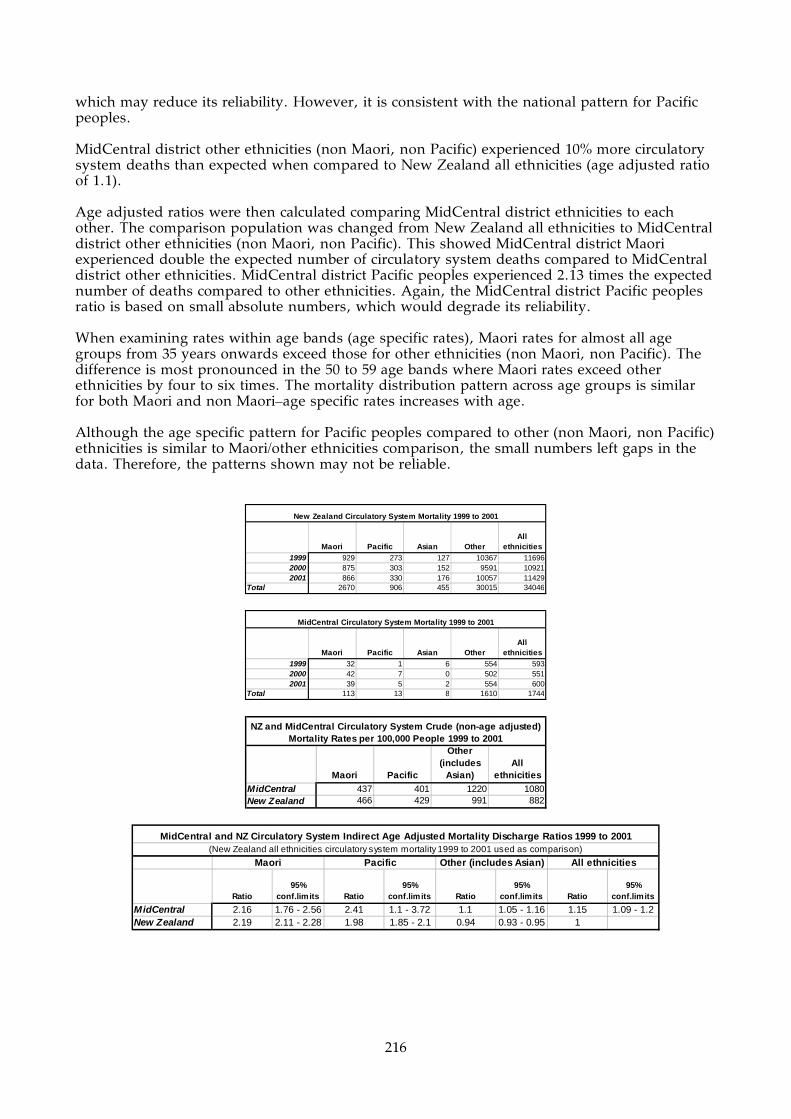
216
which may reduce its reliability. However, it is consistent with the national pattern for Pacific peoples. MidCentral district other ethnicities (non Maori, non Pacific) experienced 10% more circulatory system deaths than expected when compared to New Zealand all ethnicities (age adjusted ratio of 1.1). Age adjusted ratios were then calculated comparing MidCentral district ethnicities to each other. The comparison population was changed from New Zealand all ethnicities to MidCentral district other ethnicities (non Maori, non Pacific). This showed MidCentral district Maori experienced double the expected number of circulatory system deaths compared to MidCentral district other ethnicities. MidCentral district Pacific peoples experienced 2.13 times the expected number of deaths compared to other ethnicities. Again, the MidCentral district Pacific peoples ratio is based on small absolute numbers, which would degrade its reliability. When examining rates within age bands (age specific rates), Maori rates for almost all age groups from 35 years onwards exceed those for other ethnicities (non Maori, non Pacific). The difference is most pronounced in the 50 to 59 age bands where Maori rates exceed other ethnicities by four to six times. The mortality distribution pattern across age groups is similar for both Maori and non Maori–age specific rates increases with age. Although the age specific pattern for Pacific peoples compared to other (non Maori, non Pacific) ethnicities is similar to Maori/other ethnicities comparison, the small numbers left gaps in the data. Therefore, the patterns shown may not be reliable.
Maori Pacific Asian OtherAll
ethnicities1999 929 273 127 10367 116962000 875 303 152 9591 109212001 866 330 176 10057 11429
Total 2670 906 455 30015 34046
New Zealand Circulatory System Mortality 1999 to 2001
Maori Pacific Asian OtherAll
ethnicities1999 32 1 6 554 5932000 42 7 0 502 5512001 39 5 2 554 600
Total 113 13 8 1610 1744
MidCentral Circulatory System Mortality 1999 to 2001
Maori Pacific
Other (includes
Asian)All
ethnicitiesMidCentral 437 401 1220 1080New Zealand 466 429 991 882
NZ and MidCentral Circulatory System Crude (non-age adjusted) Mortality Rates per 100,000 People 1999 to 2001
Ratio95%
conf.limits Ratio95%
conf.limits Ratio95%
conf.limits Ratio95%
conf.limits
MidCentral 2.16 1.76 - 2.56 2.41 1.1 - 3.72 1.1 1.05 - 1.16 1.15 1.09 - 1.2New Zealand 2.19 2.11 - 2.28 1.98 1.85 - 2.1 0.94 0.93 - 0.95 1
MidCentral and NZ Circulatory System Indirect Age Adjusted Mortality Discharge Ratios 1999 to 2001
All ethnicitiesMaori Pacific(New Zealand all ethnicities circulatory system mortality 1999 to 2001 used as comparison)
Other (includes Asian)
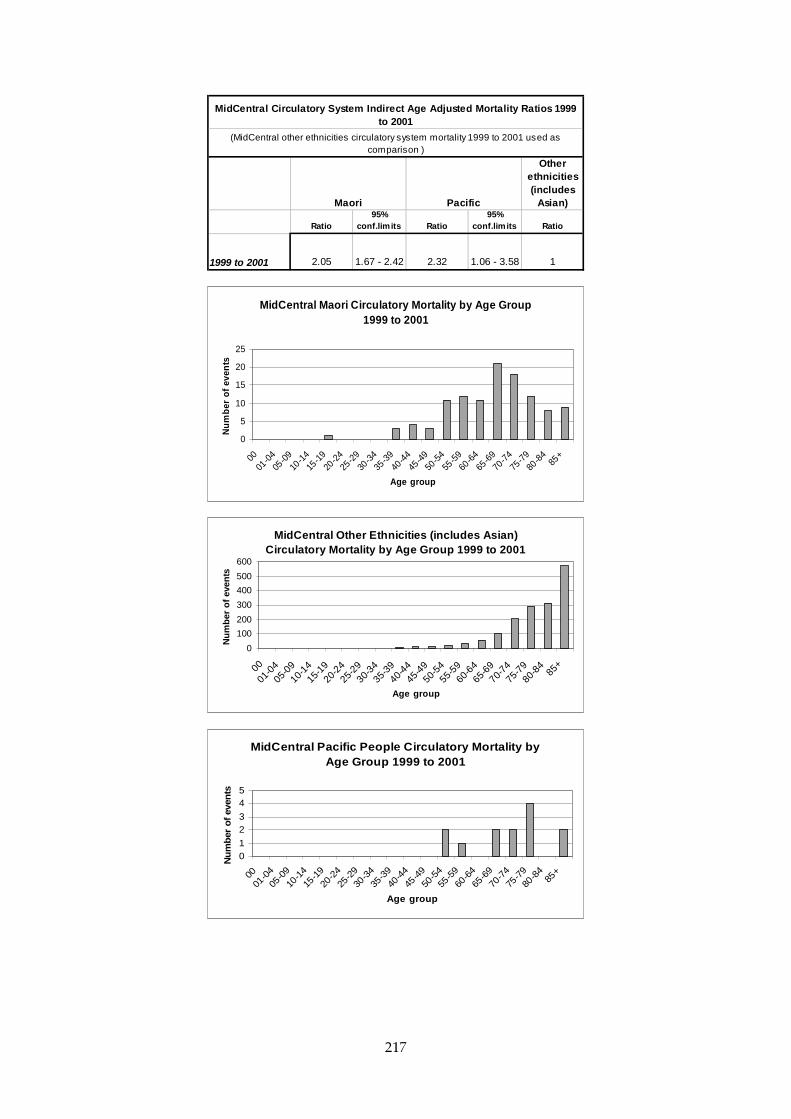
217
Other ethnicities (includes
Asian)
Ratio95%
conf.limits Ratio95%
conf.limits Ratio
1999 to 2001 2.05 1.67 - 2.42 2.32 1.06 - 3.58 1
Maori Pacific
MidCentral Circulatory System Indirect Age Adjusted Mortality Ratios 1999 to 2001
(MidCentral other ethnicities circulatory system mortality 1999 to 2001 used as comparison )
MidCentral Maori Circulatory Mortality by Age Group 1999 to 2001
0
5
10
15
20
25
0001
-0405
-0910
-1415
-1920
-2425
-2930
-3435
-3940
-4445
-4950
-5455
-5960
-6465
-6970
-7475
-7980
-84
85+
Age group
Nu
mb
er o
f ev
ents
MidCentral Other Ethnicities (includes Asian) Circulatory Mortality by Age Group 1999 to 2001
0
100
200
300
400
500
600
00
01-0
405
-0910
-1415
-1920
-2425
-2930-
3435
-3940
-4445
-4950
-5455
-5960
-6465
-6970-
7475
-7980
-84
85+
Age group
Nu
mb
er o
f ev
ents
MidCentral Pacific People Circulatory Mortality by Age Group 1999 to 2001
01
23
45
0001
-04
05-0
9
10-1
4
15-1
9
20-2
4
25-2
9
30-3
4
35-3
9
40-4
4
45-4
9
50-5
4
55-5
9
60-6
4
65-6
9
70-7
4
75-7
9
80-8
485
+
Age group
Nu
mb
er o
f ev
ents

218
MidCentral Maori Circulatory Mortality Age Specific Rates 1999 to 2001
05000
1000015000200002500030000350004000045000
0001
-04
05-0
9
10-1
4
15-1
9
20-2
4
25-2
9
30-3
4
35-3
9
40-4
4
45-4
9
50-5
4
55-5
9
60-6
4
65-6
9
70-7
4
75-7
9
80-8
485
+
Age group
Ag
e sp
ecif
ic r
ate/
100,
000
peo
ple
MidCentral Other Ethnicities (includes Asian) Circulatory Mortality Age Specific Rates 1999 to 2001
0
5000
10000
15000
20000
25000
30000
0001
-0405
-0910
-1415
-1920
-2425
-2930
-3435
-3940
-4445
-4950
-5455
-5960
-6465
-6970
-7475
-7980
-84
85+
Age group
Ag
e sp
ecif
ic r
ate/
100,
000
peo
ple
16.10.3 Cancer Mortality
Cancer mortality data from 1999 to 2001 were analysed. The MidCentral district yearly number of cancer deaths was stable across the three year period. There was an increase in the number of MidCentral district Maori deaths in the last year (21 to 33). New Zealand Maori yearly cancer deaths rose each year of the three years (from 687 in 1999 to 745 in 2001). Crude mortality rates are the number of deaths divided by the total number of people in the population of interest. It does not take into account different age structures in populations. The crude mortality rates were lower for Maori and Pacific peoples, compared to other ethnicities (non Maori, non Pacific). Most of this is probably due to the smaller proportions of older people in their populations. Cancer mortality increases with age. Age adjusted ratios by ethnicity were calculated for MidCentral district and New Zealand. An explanation of age adjusted ratio is given at the beginning of this subsection. The age adjusted ratio for MidCentral district all ethnicities combined was 1.04, meaning MidCentral district all ethnicities experienced 4% more cancer deaths than expected compared to New Zealand all ethnicities. However, this difference is not statistically significant. Both MidCentral district Maori and New Zealand Maori experienced higher than expected cancer deaths compared to New Zealand all ethnicities. MidCentral district Maori cancer deaths were 39% more than expected (age adjusted ratio of 1.39), while New Zealand Maori cancer deaths were 72% more than expected (age adjusted ratio of 1.72).

219
New Zealand Pacific peoples experienced 58% more deaths than expected compared to New Zealand all ethnicities (age adjusted ratio of 1.58). Only five deaths were recorded for MidCentral district Pacific peoples–too small to calculate statistically significant or reliable ratios. Age adjusted ratios were then calculated comparing MidCentral district ethnicities to each other. The comparison population was changed from New Zealand all ethnicities to MidCentral district other ethnicities (non Maori, non Pacific). This showed MidCentral district Maori experienced 37% more than the expected number of cancer deaths compared to MidCentral district other ethnicities. Looking at cancer mortality distribution across age groups show the risk of death increases with age. When cancer deaths rates per five year age group are examined (age specific rates), MidCentral district Maori mortality rates were higher for all age bands compared to other ethnicities (non Maori, non Pacific) equivalents, except for 80 to 84 and 85+ years old.
Maori Pacific Asian OtherAll
ethnicities1999 687 260 102 6788 78372000 694 231 127 6719 77712001 745 242 132 6853 7972
Total 2126 733 361 20360 23580
New Zealand Neoplasms (Cancers) Mortality 1999 to 2001
Maori Pacific Asian OtherAll
ethnicities1999 22 3 6 333 3642000 21 0 1 335 3572001 33 2 3 322 360
Total 76 5 10 990 1081
MidCentral Neoplasms (Cancers) Mortality 1999 to 2001
Maori Pacific
Other (includes
Asian)All
ethnicitiesMidCentral 294 154 756 670New Zealand 371 347 674 611
NZ and MidCentral Neoplasms (Cancers) Crude (non-age adjusted) Mortality Rates per 100,000 People 1999 to 2001
Ratio95%
conf.limits Ratio95%
conf.limits Ratio95%
conf.limits Ratio95%
conf.limits
MidCentral 1.39 1.08 - 1.71 0.81 0.1 - 1.53 1.03 0.96 - 1.09 1.04 0.98 - 1.11New Zealand 1.72 1.64 - 1.79 1.58 1.46 - 1.69 0.95 0.93 - 0.96 1
MidCentral and NZ Neoplasms (Cancers) Indirect Age Adjusted Mortality Discharge Ratios 1999 to 2001
All ethnicitiesMaori Pacific(New Zealand all ethnicities neoplasms (cancers) mortality 1999 to 2001 used as comparison)
Other (includes Asian)
Other ethnicities (includes
Asian)
Ratio95%
conf.limits Ratio95%
conf.limits Ratio
1999 to 2001 1.37 1.06 - 1.67 0.8 0.1 - 1.49 1
Maori Pacific
MidCentral Neoplasms (Cancers) Indirect Age Adjusted Mortality Ratios 1999 to 2001
(MidCentral other ethnicities neoplasms (cancers) mortality 1999 to 2001 used as comparison)
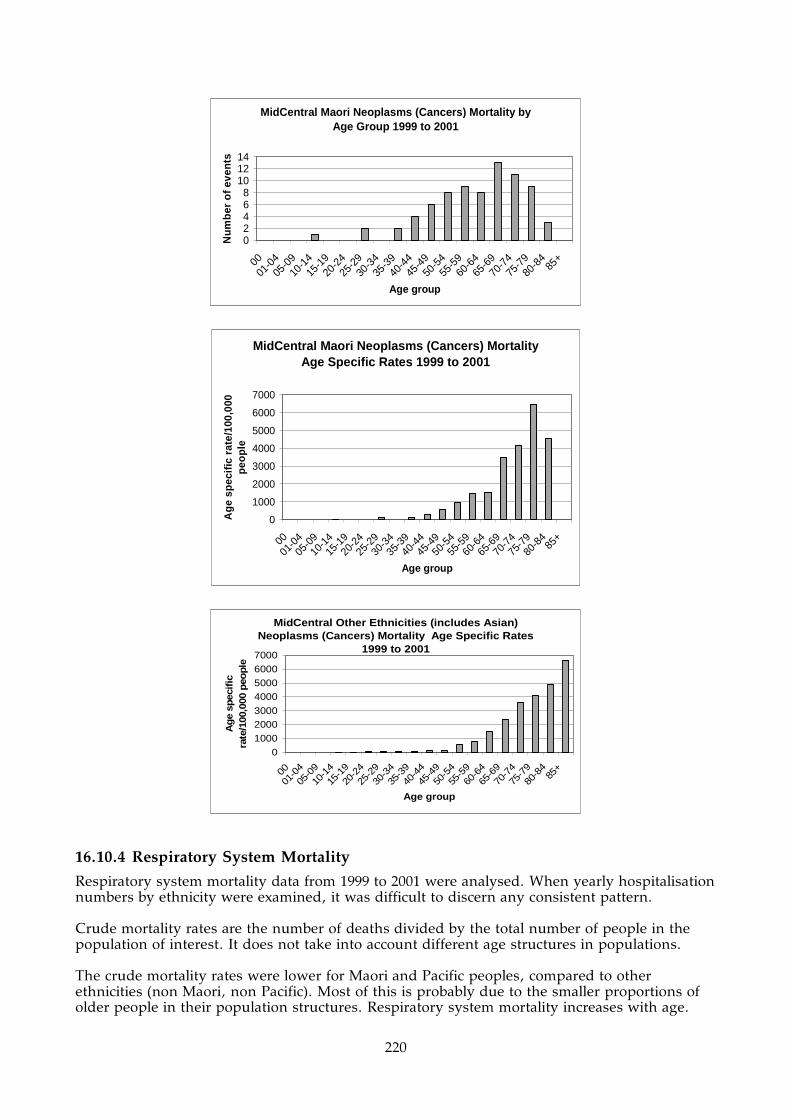
220
MidCentral Maori Neoplasms (Cancers) Mortality by Age Group 1999 to 2001
02468
101214
0001
-0405
-0910
-1415
-1920
-2425
-2930
-3435
-3940
-4445
-4950
-5455
-5960
-6465
-6970
-7475
-7980
-84
85+
Age group
Nu
mb
er o
f ev
ents
MidCentral Maori Neoplasms (Cancers) Mortality Age Specific Rates 1999 to 2001
0
1000
2000
3000
4000
5000
6000
7000
0001
-0405
-0910
-1415
-1920
-2425
-2930
-3435
-3940
-4445
-4950
-5455
-5960
-6465
-6970
-7475
-7980
-84
85+
Age group
Ag
e sp
ecif
ic r
ate/
100,
000
peo
ple
MidCentral Other Ethnicities (includes Asian) Neoplasms (Cancers) Mortality Age Specific Rates
1999 to 2001
0100020003000
4000500060007000
0001
-04
05-0
9
10-1
4
15-1
9
20-2
4
25-2
9
30-3
4
35-3
9
40-4
4
45-4
9
50-5
4
55-5
9
60-6
4
65-6
9
70-7
4
75-7
9
80-8
485
+
Age group
Ag
e sp
ecif
ic
rate
/100
,000
peo
ple
16.10.4 Respiratory System Mortality
Respiratory system mortality data from 1999 to 2001 were analysed. When yearly hospitalisation numbers by ethnicity were examined, it was difficult to discern any consistent pattern. Crude mortality rates are the number of deaths divided by the total number of people in the population of interest. It does not take into account different age structures in populations. The crude mortality rates were lower for Maori and Pacific peoples, compared to other ethnicities (non Maori, non Pacific). Most of this is probably due to the smaller proportions of older people in their population structures. Respiratory system mortality increases with age.

221
Age adjusted ratios by ethnicity were calculated for MidCentral district and New Zealand. An explanation of age adjusted ratio is given at the beginning of this subsection. The age adjusted ratio for MidCentral district all ethnicities combined was 1.07, meaning MidCentral district all ethnicities experienced 7% more respiratory system deaths than expected compared to New Zealand all ethnicities. However, this difference is not statistically significant. The age adjusted ratio for MidCentral district other ethnicities (non Maori, non Pacific) was 1.04. This difference was not statistically significance and has the same interpretation as for MidCentral district all ethnicities. When analysed using age adjusted ratios, both MidCentral district Maori and New Zealand Maori experienced greater than expected numbers of respiratory system deaths when compared to New Zealand all ethnicities. The disparity was worse for New Zealand Maori than for MidCentral district Maori. New Zealand Maori experienced between two and two and a half times more deaths than expected (age adjusted ratio of 2.21). MidCentral district Maori experienced 83% more deaths than expected (age adjusted ratio of 1.83). New Zealand Pacific peoples experienced 75% higher than expected mortality from respiratory system diseases compared to New Zealand all ethnicities. However, MidCentral district Pacific peoples number of respiratory deaths was too small (only one) for reliable ratios or rates. Looking at respiratory system mortality distribution across age groups show the risk of death increases with age. When respiratory system mortality rate per five year age group are examined (age specific rates), MidCentral district Maori mortality rates were higher for most age bands compared to other ethnicities (non Maori, non Pacific) equivalents, from 45 to 79 years old.
Maori Pacific Asian OtherAll
ethnicities1999 193 71 26 2440 27302000 186 58 16 1793 20532001 201 44 23 2158 2426
Total 580 173 65 6391 7209
New Zealand Respiratory Mortality 1999 to 2001
Maori Pacific Asian OtherAll
ethnicities1999 5 1 0 136 1422000 11 0 0 92 1032001 5 0 1 94 100
Total 21 1 1 322 345
MidCentral Respiratory Mortality 1999 to 2001
Maori Pacific
Other (includes
Asian)All
ethnicitiesMidCentral 81.3 30.9 244 214New Zealand 101 82 210 187
NZ and MidCentral Respiratory Crude (non-age adjusted) Mortality Rates per 100,000 People 1999 to 2001
Ratio95%
conf.limits Ratio95%
conf.limits Ratio95%
conf.limits Ratio95%
conf.limits
MidCentral 1.83 1.05 - 2.62 0.85 -0.81 - 2.5 1.04 0.93 - 1.15 1.07 0.95 - 1.18
New Zealand 2.21 2.03 - 2.39 1.75 1.49 - 2.01 0.94 0.92 - 0.97 1
MidCentral and NZ Respiratory Indirect Age Adjusted Mortality Ratios 1999 to 2001
All ethnicitiesMaori Pacific(New Zealand all ethnicities respiratory mortality 1999 to 2001 used as comparison)
Other (includes Asian)
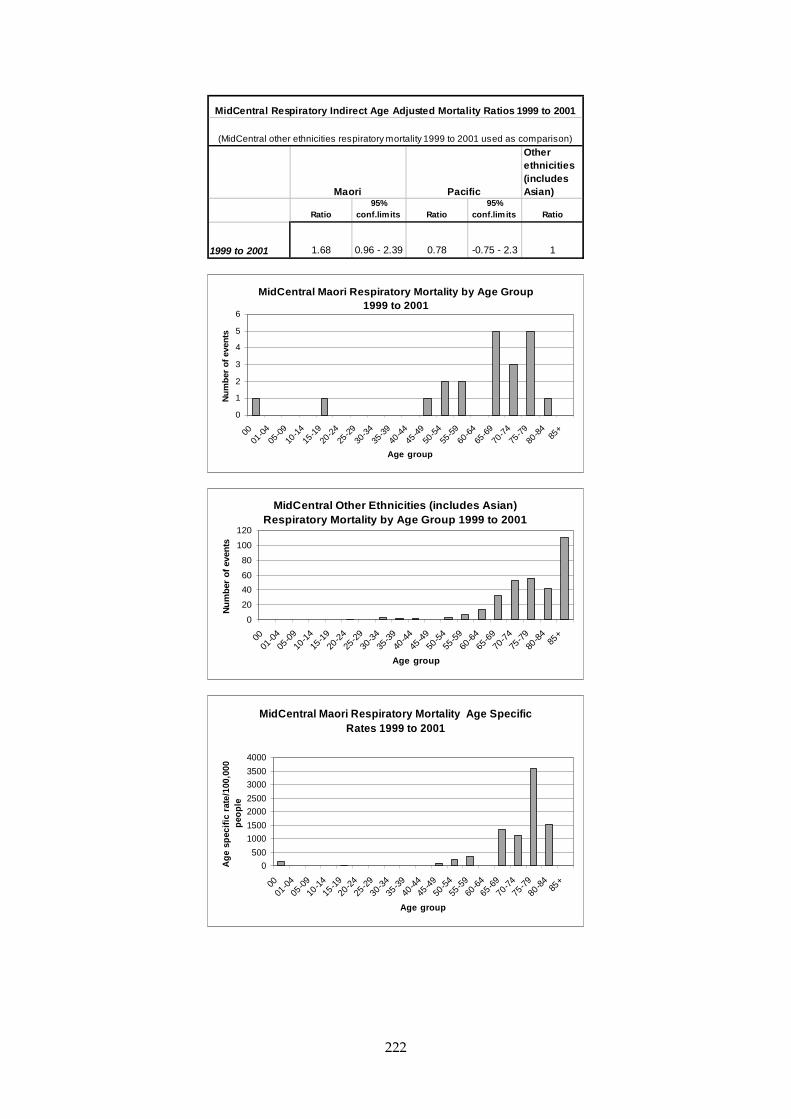
222
Other ethnicities (includes Asian)
Ratio95%
conf.limits Ratio95%
conf.limits Ratio
1999 to 2001 1.68 0.96 - 2.39 0.78 -0.75 - 2.3 1
Maori Pacific
MidCentral Respiratory Indirect Age Adjusted Mortality Ratios 1999 to 2001
(MidCentral other ethnicities respiratory mortality 1999 to 2001 used as comparison)
MidCentral Maori Respiratory Mortality by Age Group 1999 to 2001
0
1
2
3
4
5
6
0001
-04
05-0
910
-1415
-1920
-24
25-2
930
-34
35-3
940
-4445
-49
50-5
455
-59
60-6
465
-69
70-7
475
-7980
-84
85+
Age group
Nu
mb
er o
f ev
ents
MidCentral Other Ethnicities (includes Asian) Respiratory Mortality by Age Group 1999 to 2001
0
20
40
60
80
100
120
0001
-04
05-0
9
10-1
4
15-1
9
20-2
4
25-2
9
30-3
4
35-3
9
40-4
4
45-4
9
50-5
4
55-5
9
60-6
4
65-6
9
70-7
4
75-7
9
80-8
485
+
Age group
Nu
mb
er o
f ev
ents
MidCentral Maori Respiratory Mortality Age Specific Rates 1999 to 2001
0
500
1000
1500
2000
2500
3000
3500
4000
0001
-0405
-0910
-1415
-1920
-2425
-2930
-3435
-3940
-4445
-4950
-5455
-5960
-6465
-6970
-7475
-7980
-84
85+
Age group
Ag
e sp
ecif
ic r
ate/
100,
000
peo
ple

223
MidCentral Other Ethnicities (includes Asian) Respiratory Mortality Age Specific Rates 1999 to 2001
0
1000
2000
3000
4000
5000
6000
0001
-0405
-0910
-1415
-1920
-2425
-2930
-3435
-3940
-4445
-4950
-5455
-5960
-6465
-6970
-7475
-7980
-84
85+
Age group
Ag
e sp
ecif
ic r
ate/
100,
000
peo
ple
16.10.5 Mortality Due to External Causes
Mortality from external causes data from 1999 to 2001 were analysed. Deaths due to external causes include accidents, intentional self harm, assault, poisoning, and complications of medical and surgical care. Even though external causes is the fourth most common cause of death in the MidCentral district, absolute mortality numbers are becoming small. This is especially true when data are subdivided, for example, by ethnicity. This affects the reliability of calculated health measures and widens the confidence limits. It was difficult to discern a consistent pattern from MidCentral district yearly ethnicity mortality numbers. MidCentral district Maori number of deaths was consistent across the three year period. Other ethnicities (non Maori, non Pacific) yearly mortality figures fluctuated without a clear pattern. MidCentral district yearly mortality numbers for Pacific peoples and Asian peoples were too low for interpretation. Crude mortality rates are the number of deaths divided by the total number of people in the population of interest. It does not take into account different age structures in populations. Crude mortality rates from external causes for MidCentral district other ethnicities (non Maori, non Pacific) and all ethnicities were higher than corresponding New Zealand ethnicities. New Zealand Maori crude mortality rates were higher than New Zealand other ethnicities (non Maori, non Pacific); and New Zealand Pacific peoples crude rates were lower. MidCentral district crude mortality rates by ethnicity are based on low absolute numbers and may not be reliable for interpretation. Age adjusted ratios by ethnicity were calculated for MidCentral district and New Zealand. An explanation of age adjusted ratio is given at the beginning of this subsection. The age adjusted ratio for MidCentral district all ethnicities combined was 1.2, meaning MidCentral district all ethnicities experienced 20% more deaths from external causes than expected compared to New Zealand all ethnicities. MidCentral district other ethnicities (non Maori, non Pacific) had 17% more deaths than expected compared to New Zealand all ethnicities (age adjusted ratio of 1.17). The age adjusted ratios for MidCentral district Maori and Pacific peoples did not reach statistical significance. The absolute mortality numbers were small. New Zealand Maori experienced 52% more than expected deaths from external causes compared to New Zealand all ethnicities (age adjusted ratio of 1.52). New Zealand Pacific peoples experienced 19% less than expected deaths from external causes compared to New

224
Zealand all ethnicities (age adjusted ratio of 0.81). When the MidCentral district deaths for all ethnicities is shown distributed across the age bands, the middle age groups, 15 to 55 years, have the highest number of deaths from external causes. The number of deaths peak in the 15 to 39 year age bands. The number of deaths rises to another peak in the 85+ age group. When external causes death rates per age group are examined (age specific rates), MidCentral district mortality gradually rises from 75 years onwards. It then peaks in the 85+ age group. This is shown clearly in the mortality age specific rates graph. The New Zealand Maori and Pacific peoples age distributions show similar patterns to each other. Although the absolute number of deaths were low in the older age groups, when mortality rates are calculated for each age group, the 80 to 85+ age bands have very high rates. MidCentral district Maori and Pacific peoples number of deaths from external causes were too small to form a pattern when distributed across age groups. The small peak in the less than 1 age band age specific rate seen in the national Maori and Pacific peoples graphs is not seen in those for MidCentral district.
Maori Pacific Asian OtherAll
ethnicities1999 312 53 65 1265 16952000 303 64 71 1175 16132001 285 64 57 1242 1648
Total 900 181 193 3682 4956
New Zealand External Cause Mortality 1999 to 2001
Maori Pacific Asian OtherAll
ethnicities1999 12 1 2 74 892000 13 1 1 58 732001 12 2 4 74 92
Total 37 4 7 206 254
MidCentral External Cause Mortality 1999 to 2001
Maori Pacific
Other (includes
Asian)All
ethnicitiesMidCentral 143 123 161 157New Zealand 157 85.8 126 128
NZ and MidCentral External Cause Crude (non-age adjusted) Mortality Rates per 100,000 People 1999 to 2001
Ratio95%
conf.limits Ratio95%
conf.limits Ratio95%
conf.limits Ratio95%
conf.limits
MidCentral 1.38 0.94 - 1.83 1.14 0.02 - 2.25 1.17 1.02 - 1.33 1.2 1.05 - 1.35New Zealand 1.52 1.42 - 1.62 0.81 0.69 - 0.92 0.94 0.91 - 0.97 1
Other (includes Asian) All ethnicitiesMaori Pacific(New Zealand all ethnicities external cause mortality 1999 to 2001 used as comparison)
MidCentral and NZ External Cause Indirect Age Adjusted Mortality Discharge Ratios 1999 to 2001

225
MidCentral All Ethnicities External Cause Mortality by Age Group 1999 to 2001
0
5
10
15
20
25
30
35
0001
-0405
-0910
-1415
-1920
-2425
-2930
-3435
-3940
-4445
-4950
-5455
-5960
-6465
-6970
-7475
-7980
-84
85+
Age group
Nu
mb
er o
f ev
ents
MidCentral All Ethnicities External Cause Mortality Age Specific Rates 1999 to 2001
0
200
400
600
800
1000
1200
1400
1600
0001
-04
05-0
9
10-1
4
15-1
9
20-2
4
25-2
9
30-3
4
35-3
9
40-4
4
45-4
9
50-5
4
55-5
9
60-6
4
65-6
9
70-7
4
75-7
9
80-8
485
+
Age group
Ag
e sp
ecif
ic r
ate/
100,
000
peo
ple
NZ Maori External Cause Mortality by Age Group 1999 to 2001
0
20
40
60
80
100
120
140
0001
-0405
-0910
-1415
-1920
-2425
-2930
-3435
-3940
-4445
-4950
-5455
-5960
-6465
-6970
-7475
-7980
-84
85+
Age group
Nu
mb
er o
f ev
ents

226
NZ Maori External Cause Mortality Age Specific Rates 1999 to 2001
0
100
200
300
400
500
600
700
0001
-0405
-0910
-1415
-1920
-2425
-2930
-3435
-3940
-4445
-4950
-5455
-5960
-6465
-6970
-7475
-7980
-84
85+
Age groups
Ag
e sp
ecif
ic r
ate/
100,
000
peo
ple
MidCentral Maori External Cause Mortality by Age Group 1999 to 2001
0
2
4
6
8
10
12
0001
-0405
-0910
-1415
-1920
-2425
-2930
-3435
-3940
-4445
-4950
-5455
-5960
-6465
-6970
-7475
-7980
-84
85+
Age group
Nu
mb
er o
f ev
ents
MidCentral Pacific Peoples External Cause Mortality by Age Group 1999 to 2001
0
0.5
1
1.5
2
2.5
0001
-0405
-0910
-1415
-1920
-2425
-2930
-3435
-3940
-4445
-4950
-5455
-5960
-6465
-6970
-7475
-7980
-84
85+
Age group
Nu
mb
er o
f ev
ents
Transport accidents and intentional self harm are the top two causes when mortality in the MidCentral district 15 to 49 age bands was examined. Falls is the major cause of mortality for the MidCentral district 85+ age band. Twenty two of the 23 deaths from external causes in 2000 and 2001 were from falls.

227
Cause of death No of deathsTransport accidents (V01 - V99) 41Intentional self-harm (X60 - X84) 24Assault (X85 - Y09) 3Accidental exposure to other and unspecified factors (X58 - X59) 2Accidental poisoning by and exposure to noxious substances (X40 - X49) 2Exposure to inanimate mechanical forces (W20 - W49) 2Exposure to smoke, fire, and flames (X00 - X09) 2Accidental drowning and submersions (W65 - W75) 1Event of undetermind intent (Y10 - Y34) 1Exposure to electric current, radiation, and extreme ambient air temperature and pressure (W85 - W99) 1Falls (W00 - W19) 1Other accidental threats to breathing (W75 - W84) 1Sequelae of external causes of morbidity and mortality (Y85 - Y89) 1Total 82
MidCentral External Causes of Mortality Aged 15 to 49, 2000 and 2001
Cause of death No of deathsBus occupant injured in non-collision transport accident 1Fall on same level from slipping, tripping, and stumbling (W01) 6Fall involving bed (W06) 2Fall involving chair (W07) 3Other fall on same level (W18) 2Unspecified fall (W19) 9Total 23
MidCentral External Causes of Mortality Aged 85+ 2000 and 2001
Age Groups 1997 1998 1999 2000 200100 0 0 0 0 001-04 0 0 0 0 005-14 0 0 0 0 015-24 2 1 2 0 225-44 2 1 0 2 045-64 0 0 0 1 065-74 0 0 0 0 075-84 0 0 0 0 085+ 0 0 0 0 0Total 4 2 2 3 2
MidCentral Maori Suicide by Age Group 1997 to 2001
Age Groups 1997 1998 1999 2000 200100 0 0 0 0 001-04 0 0 0 0 005-14 0 0 1 0 015-24 4 8 4 0 325-44 9 7 11 6 1045-64 2 7 9 2 265-74 0 2 0 3 175-84 1 2 2 0 285+ 0 0 0 0 0Total 16 26 27 11 18
MidCentral Other Ethnicities Suicide by Age Group 1997 to 2001

228
17. MIDCENTRAL DISTRICT TERRITORIAL AUTHORITY MORBIDITY AND MORTALITY ANALYSIS
Key Points
• The most common reasons for hospitalisation, by Major Diagnostic Category (mainly organ system), were: (1) pregnancy/birth; (2) circulatory system; (3) digestive system; (4) musculoskeletal system; and (5) respiratory system.
• The Horowhenua appears to be an area of poorer health status, compared to MidCentral district overall. It experiences higher than expected hospitalisations for many diseases, and also higher than expected deaths from all causes and from the top three causes of mortality (circulatory disease, cancer, and respiratory disease).
• The Manawatu appears to be an area of better health status, compared to MidCentral district overall, with fewer than expected hospitalisations for many diseases. However, its mortality ratios from all causes and from the top four causes of death are similar or not significantly different to MidCentral district overall.
• Palmerston North experienced fewer than expected deaths from all causes and from the four most common causes of mortality (circulatory disease, cancer, respiratory disease, and external causes).
• Kapiti Coast (MidCentral district portion) also experienced less than expected hospitalisations for many illnesses but it is uncertain whether this reflects better health status or data instability due to small numbers.
17.1 Introduction This section examines hospital discharges, cancer registrations, and mortality data for the five territorial authorities within MidCentral district. The five territorial authorities are: Palmerston North, Horowhenua, Manawatu, Tararua, and the MidCentral district portion of Kapiti Coast. Otaki, Otaki Forks, and Te Horo are Kapiti Coast District Council census area units that are within MidCentral’s coverage. These area units had a population of 7,764 at the 2001 Census compared with the Kapiti Coast Districts total population of 42,435. The Capital and Coast District Health Board covers the remainder of the Kapiti Coast District. Mental health and substance abuse hospital discharges were filtered out of the hospitalisation datasets before they were supplied for use in this health needs assessment project. The populations of the territorial authorities at the 2001 Census are given in the table below.
Territorial AuthorityNo. all age groups
No. people 65+ years
Percentage 65+ years
Palmerston North 72069 8109 11.3%Horowhenua 29808 5538 18.6%Manawatu 27468 3303 12.0%Tararua 17811 2331 13.1%Kapiti (MidCentral portion) 7764 1539 19.8%MidCentral 154920 20820 13.4%New Zealand 3736551 450369 12.1%
MidCentral Territorial Authorities Population 65+ Years 2001
17.2 Hospital Discharges “Cancer Registrations and Cancer Mortality” for Territorial Authorities
Hospital discharges, by residents of MidCentral district’s territorial authorities, were sorted into different Major Diagnostic Categories for analysis. Major Diagnostic Categories are groupings of diagnoses for health administration and management purposes. The groupings broadly conform to body systems, for example, circulatory system, respiratory system, and so on.

229
Hospital discharge data from a four year period, 1999/2000 to 2002/2003, were examined.
17.2.1 Common Patterns Across Territorial Authorities
There were five prominent hospital discharge Major Diagnostic Categories across the territorial authorities. They were:
• Pregnancy/birth • Circulatory system • Digestive system • Musculoskeletal system • Respiratory system.
There were also common diagnoses within these Major Diagnostic Categories. For Pregnancy/birth, the top two types of diagnoses were:
• Complications of labour and delivery (ICD10 codes O60–O75) • Maternal care related to the foetus and amniotic cavity and possible delivery problems
(ICD10 codes O30–O48). This grouping includes hospitalisation for maternal care for various problems (for example, malpresentation of foetus, foetal abnormality or damage); placental problems; polyhydramnios (excessive amniotic fluid); false labour; prolonged labour; or premature rupture of membranes.
For Circulatory System, the top two diagnoses were:
• Ischaemic heart disease (ICD10 codes I20–I25). This is heart disease due to blockage of the arteries supplying the heart muscle, and includes myocardial infarction (heart attack), and angina
• Other forms of heart disease (ICD10 codes I30–I52) This is a mixture of heart conditions, including valve disease not due to rheumatic fever, abnormal heart rhythms, inflammation of various layers of the heart (endocarditis, myocarditis, and pericarditis).
For Digestive System, the top diagnoses were:
• “Symptoms, signs, and abnormal clinical and laboratory findings, not elsewhere classified” (R00–R99). This is where the patient experiences an abnormal symptom, examination abnormality, or test result, but without enough evidence to conclude a diagnosis
• Other diseases of intestines (ICD10 codes K55–K63) This is a mixture of intestinal conditions, including diverticular disease, anal or rectal abscesses, irritable bowel, and fissures or fistula. The grouping excludes intestinal infections, non infective inflammation, and cancers
• Other common digestive system disorders were hernia (ICD10 codes K40–K46) and malignant neoplasms (cancers).
For Musculoskeletal System (muscle and skeleton), the top diagnoses were:
• “Injury, poisoning, and certain other consequences of external causes” (ICD10 codes S00–T98). This was by far the most dominant musculoskeletal diagnostic grouping, almost reaching 50% of Musculoskeletal System discharges for some territorial authorities. Some examples of musculoskeletal injuries are: wounds, fractures, joint dislocations. There were no poisonings for the Musculoskeletal System (despite the name of the grouping)
• Arthrosis (ICD10 codes M15–M19).

230
These are diseases of the joints, such as osteoarthritis (wear and tear arthritis), but exclude inflammatory joint diseases (like rheumatoid arthritis, juvenile arthritis, psoriatic arthritis, gout, other forms of arthritis) and joint infections.
For Respiratory System, the top diagnoses were:
• Infections of the respiratory tract. This consisted of “influenza and pneumonia” (ICD10 codes J10–J18) and “other acute lower respiratory infections” (ICD10 codes J20–J22)
• Asthma (ICD10 codes J45–J46) • Chronic lower respiratory diseases (ICD10 codes J40–J47, excluding asthma). This
grouping includes chronic obstructive respiratory disease (emphysema, chronic bronchitis), and bronchiectasis. Chronic obstructive respiratory disease (CORD) is also known as chronic obstructive pulmonary disease (COPD).
17.2.2 Palmerston North
Palmerston North’s yearly total hospital discharges were stable across the four year period, with a small decline in the final year.
Unlike other MidCentral district’s territorial authorities, ENMT (ear, nose, mouth, throat) Major Diagnostic Category is the fifth most prominent category. Chronic diseases of tonsils and adenoids (ICD10 code J35), non-suppurative otitis media (glue ear) (ICD10 code H65), dental caries (K02), and embedded and impacted teeth (ICD10 code K01) were the most common diagnoses within the ENMT category.
When Palmerston North discharges by Major Diagnostic Category were plotted across the 1999/2000 to 2002/2003 period, digestive system, and musculoskeletal system discharges showed a mild decline. Circulatory system discharges rose and then dropped to their original numbers. Respiratory system discharge numbers fluctuated without an obvious trend.
Palmerston North Total Hospital Admissions 1999 to 2003
0
1000
2000
3000
4000
5000
6000
7000
8000
9000
10000
11000
1999 to 2000 2000 to 2001 2001 to 2002 2002 to 2003
Years
Nu
mb
er o
f d
isch
arg
es
Palmerston North Hospital Discharges by Major Diagnostic Category 1999 to 2003
0
1000
2000
3000
4000
5000
6000
7000
Blood,
imm
unity
Burns
Cancer
Circula
tory
syste
m
Diges
tive sy
stem
Endoc
rine, n
utrit
ion
ENMT
Eye
Female
repr
oduc
tive
Infe
ction
, par
asites
Injur
y, po
isonin
g
Kidney
, urin
ary
Liver
, pan
crea
s
Male
repro
ducti
ve
Mus
culos
kelet
al sys
tem
Nervous
sys
tem
Newborn
s
Other
cont
acts
Pregna
ncy,
birth
Respira
tory
Sys
tem
Skin, b
reast
Nu
mb
er o
f d
isch
arg
es

231
Palmerston North Hospital Discharges by Major Diagnostic Category 1999 to 2003
0
200
400
600
800
1000
1200
1400
1600
1999 to 2000 2000 to 2001 2001 to 2002 2002 to 2003
Years
Num
ber of discharges
Blood, immunity
Burns
Cancer
Circulatory system
Digestive system
Endocrine, nutrition
ENMT
Eye
Female reproductive
Infection, parasites
Injury, poisoning
Kidney, urinary
Liver, pancreas
Male reproductive
Musculoskeletal system
Nervous system
Newborns
Other contacts
Pregnancy, birth
Respiratory System
Skin, breast
Diagnoses No. of discharges Percentage within MDC
Pregnancy, birth
Complications of labour and delivery (O60 - O75) 1385 31.0%
Maternal care related to the foetus and amniotic cavity and
possible delivery problems (O30 - O48) 1204 26.9%
Pregnancy with abortive outcome (O00 - O08) 525 11.7%
Delivery (O80 - O82) 465 10.4%
Other maternal disorders predominantly related to pregnancy
(O20 - O29) 325 7.3%
Circulatory System
Ischaemic heart diseases (I20 - I25) 1614 42.4%
Other forms of heart disease (I30 - I52) 936 24.6%
Symptoms, signs, and abnormal clinical and laboratory findings,
not elsewhere classified (R00 - R99) 589 15.5%
Digestive System
Symptoms, signs, and abnormal clinical and laboratory findings,
not elsewhere classified (R00 - R99) 750 23.7%
Other diseases of intestines (K55 - K63) 544 17.2%
Hernia (K40 - K46) 327 10.3%
Malignant neoplasms (cancers) (C15 - C96) 268 8.5%
Musculoskeletal System
Injury, poisoning, and certain other consequences of external
causes (S00 - T79) 1328 48.9%
Arthrosis (M15 - M19) 224 8.2%
ENMT
Ear, nose, and throat
Chronic diseases of tonsils and adenoids (J35) 327 14.5%
Non-suppurative otitis media (H65) 274 12.2%
Acute upper respiratory infections of multiple and unspecified
sites (J06) 113 5.0%
Mouth
Dental caries (K02) 291 12.9%
Embedded and impacted teeth (K01) 171 7.6%
Respiratory
Influenza and pneumonia (J10 - J18) 482 22.4%
Asthma (J45 - J46) 419 19.5%
Other acute lower respiratory tract infections (J20 - J22) 328 15.2%
Chronic lower respiratory diseases (J40 - J47) 306 14.2%
Malignant neoplasms (cancers) (C00 - C96) 162 7.5%
Palmerston North Most Common ICD10 Diagnoses within Most Common Major Diagnostic Categories
(MDC) 2000 - 2003
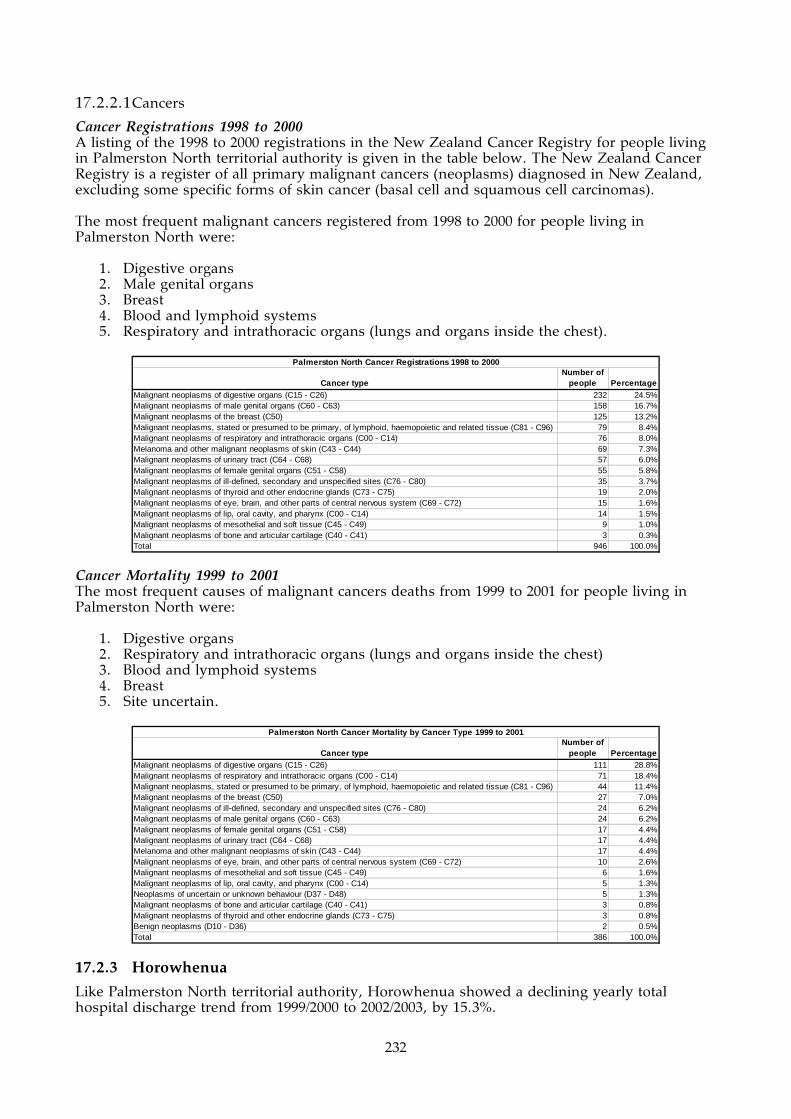
232
17.2.2.1 Cancers
Cancer Registrations 1998 to 2000 A listing of the 1998 to 2000 registrations in the New Zealand Cancer Registry for people living in Palmerston North territorial authority is given in the table below. The New Zealand Cancer Registry is a register of all primary malignant cancers (neoplasms) diagnosed in New Zealand, excluding some specific forms of skin cancer (basal cell and squamous cell carcinomas). The most frequent malignant cancers registered from 1998 to 2000 for people living in Palmerston North were:
1. Digestive organs 2. Male genital organs 3. Breast 4. Blood and lymphoid systems 5. Respiratory and intrathoracic organs (lungs and organs inside the chest).
Cancer typeNumber of
people PercentageMalignant neoplasms of digestive organs (C15 - C26) 232 24.5%Malignant neoplasms of male genital organs (C60 - C63) 158 16.7%Malignant neoplasms of the breast (C50) 125 13.2%Malignant neoplasms, stated or presumed to be primary, of lymphoid, haemopoietic and related tissue (C81 - C96) 79 8.4%Malignant neoplasms of respiratory and intrathoracic organs (C00 - C14) 76 8.0%Melanoma and other malignant neoplasms of skin (C43 - C44) 69 7.3%Malignant neoplasms of urinary tract (C64 - C68) 57 6.0%Malignant neoplasms of female genital organs (C51 - C58) 55 5.8%Malignant neoplasms of ill-defined, secondary and unspecified sites (C76 - C80) 35 3.7%Malignant neoplasms of thyroid and other endocrine glands (C73 - C75) 19 2.0%Malignant neoplasms of eye, brain, and other parts of central nervous system (C69 - C72) 15 1.6%Malignant neoplasms of lip, oral cavity, and pharynx (C00 - C14) 14 1.5%Malignant neoplasms of mesothelial and soft tissue (C45 - C49) 9 1.0%Malignant neoplasms of bone and articular cartilage (C40 - C41) 3 0.3%Total 946 100.0%
Palmerston North Cancer Registrations 1998 to 2000
Cancer Mortality 1999 to 2001 The most frequent causes of malignant cancers deaths from 1999 to 2001 for people living in Palmerston North were:
1. Digestive organs 2. Respiratory and intrathoracic organs (lungs and organs inside the chest) 3. Blood and lymphoid systems 4. Breast 5. Site uncertain.
Cancer typeNumber of
people PercentageMalignant neoplasms of digestive organs (C15 - C26) 111 28.8%Malignant neoplasms of respiratory and intrathoracic organs (C00 - C14) 71 18.4%Malignant neoplasms, stated or presumed to be primary, of lymphoid, haemopoietic and related tissue (C81 - C96) 44 11.4%Malignant neoplasms of the breast (C50) 27 7.0%Malignant neoplasms of ill-defined, secondary and unspecified sites (C76 - C80) 24 6.2%Malignant neoplasms of male genital organs (C60 - C63) 24 6.2%Malignant neoplasms of female genital organs (C51 - C58) 17 4.4%Malignant neoplasms of urinary tract (C64 - C68) 17 4.4%Melanoma and other malignant neoplasms of skin (C43 - C44) 17 4.4%Malignant neoplasms of eye, brain, and other parts of central nervous system (C69 - C72) 10 2.6%Malignant neoplasms of mesothelial and soft tissue (C45 - C49) 6 1.6%Malignant neoplasms of lip, oral cavity, and pharynx (C00 - C14) 5 1.3%Neoplasms of uncertain or unknown behaviour (D37 - D48) 5 1.3%Malignant neoplasms of bone and articular cartilage (C40 - C41) 3 0.8%Malignant neoplasms of thyroid and other endocrine glands (C73 - C75) 3 0.8%Benign neoplasms (D10 - D36) 2 0.5%Total 386 100.0%
Palmerston North Cancer Mortality by Cancer Type 1999 to 2001
17.2.3 Horowhenua
Like Palmerston North territorial authority, Horowhenua showed a declining yearly total hospital discharge trend from 1999/2000 to 2002/2003, by 15.3%.

233
Unlike other territorial authorities, the most common Major Diagnostic Category is not pregnancy/birth, but circulatory system disorders. Also, there are some changes in order of diagnoses within Respiratory System Major Diagnostic Category. Chronic lower respiratory diseases (ICD10 codes J40–J47) are the most common diagnoses, perhaps reflecting the older population structure.
Horowhenua
Total Hospital Discharges 1999 to 2003
0
1000
2000
3000
4000
5000
6000
1999 to 2000 2000 to 2001 2001 to 2002 2002 to 2003
Years
Number of discharges
Horowhenua Hospital Discharges by Major Diagnostic Category
1999 to 2003
0
500
1000
1500
2000
2500
3000
Blood,
immun
ityBurn
s
Cancer
Circula
tory s
yste
m
Digesti
ve sy
stem
Endoc
rine,
nutrit
ion
ENMTEye
Female
repr
oduc
tive
Infec
tion,
para
sites
Injur
y, po
isonin
g
Kidney
, urin
ary
Liver
, pan
crea
s
Male re
produ
ctive
Muscu
loske
letal s
yste
m
Nervous
syste
m
Newbo
rns
Other c
onta
cts
Pregn
ancy
, birt
h
Respira
tory S
ystem
Skin, b
reas
t
Number of discharges
Horowhenua Hospital Discharges by Major Diagnostic Category 1999 - 2003
0
100
200
300
400
500
600
700
800
1999 to 2000 2000 to 2001 2001 to 2002 2002 to 2003
Years
Num
ber of discharges
Blood, immunity
Burns
Cancer
Circulatory system
Digestive system
Endocrine, nutrition
ENMT
Eye
Female reproductive
Infection, parasites
Injury, poisoning
Kidney, urinary
Liver, pancreas
Male reproductive
Musculoskeletal system
Nervous system
Newborns
Other contacts
Pregnancy, birth
Respiratory System
Skin, breast

234
Diagnoses No. of discharges Percentage within MDCCirculatory SystemIschaemic heart diseases (I20 - I25) 939 45.3%Other forms of heart disease (I30 - I52) 484 23.3%Symptoms, signs, and abnormal clinical and laboratory findings, not elsewhere classified (R00 - R99) 240 11.6%
Pregnancy, birthComplications of labour and delivery (O60 - O75) 373 22.9%Maternal care related to the foetus and amniotic cavity and possible delivery problems (O30 - O48) 334 20.5%Delivery (O80 - O82) 268 16.5%Persons encountering health services in circumstances related to reproduction (eg. post-partum care) (Z30 - Z39) 221 13.6%
Digestive SystemSymptoms, signs, and abnormal clinical and laboratory findings, not elsewhere classified (R00 - R99) 271 18.3%Other diseases of intestines (K55 - K63) 264 17.9%Malignant neoplasms (cancers) (C15 - C96) 209 14.2%Hernia (K40 - K46) 186 12.6%
Musculoskeletal SystemInjury, poisoning, and certain other consequences of external causes (S00 - T79) 585 40.9%Arthrosis (M15 - M19) 208 14.5%
RespiratoryChronic lower respiratory diseases (excludes asthma) (J40 - J47) 280 23.2%Influenza and pneumonia (J10 - J18) 257 21.3%Other acute lower respiratory infections (J20 - J22) 174 14.4%Asthma (J45 - J46) 167 13.8%Malignant neoplasms (cancers) (C00 - C96) 128 10.6%
Horowhenua Most Common ICD10 Diagnoses within Most Common Major Diagnostic Categories (MDC) 2000 - 2003
17.2.3.1 Cancers
Cancer Registrations 1998 to 2000 A listing of the 1998 to 2000 registrations in the New Zealand Cancer Registry for people living in Horowhenua territorial authority is given in the table below. The New Zealand Cancer Registry is a register of all primary malignant cancers (neoplasms) diagnosed in New Zealand, excluding some specific forms of skin cancer (basal cell and squamous cell carcinomas). The most frequent malignant cancers registered from 1998 to 2000 for people living in Horowhenua were:
1. Digestive organs 2. Male genital organs 3. Respiratory and intrathoracic organs (lungs and organs inside the chest) 4. Breast 5. Blood and lymphoid systems.
Cancer typeNumber of
people PercentageMalignant neoplasms of digestive organs (C15 - C26) 130 22.5%Malignant neoplasms of male genital organs (C60 - C63) 84 14.5%Malignant neoplasms of respiratory and intrathoracic organs (C00 - C14) 80 13.8%Malignant neoplasms of the breast (C50) 75 13.0%Malignant neoplasms, stated or presumed to be primary, of lymphoid, haemopoietic and related tissue (C81 - C96) 48 8.3%Melanoma and other malignant neoplasms of skin (C43 - C44) 45 7.8%Malignant neoplasms of urinary tract (C64 - C68) 33 5.7%Malignant neoplasms of female genital organs (C51 - C58) 27 4.7%Malignant neoplasms of ill-defined, secondary and unspecified sites (C76 - C80) 26 4.5%Malignant neoplasms of eye, brain, and other parts of central nervous system (C69 - C72) 16 2.8%Malignant neoplasms of mesothelial and soft tissue (C45 - C49) 6 1.0%Malignant neoplasms of lip, oral cavity, and pharynx (C00 - C14) 5 0.9%Malignant neoplasms of thyroid and other endocrine glands (C73 - C75) 4 0.7%Total 579 100.0%
Horowhenua Cancer Registrations 1998 to 2000

235
Cancer Mortality 1999 to 2001 The most frequent causes of malignant cancer deaths from 1999 to 2001 for people living in Horowhenua were:
1. Digestive organs 2. Respiratory and intrathoracic organs (lungs and organs inside the chest) 3. Breast 4. Blood and lymphoid systems 5. Site uncertain.
Cancer typeNumber of
people PercentageMalignant neoplasms of digestive organs (C15 - C26) 89 27.5%Malignant neoplasms of respiratory and intrathoracic organs (C00 - C14) 77 23.8%Malignant neoplasms of the breast (C50) 33 10.2%Malignant neoplasms, stated or presumed to be primary, of lymphoid, haemopoietic and related tissue (C81 - C96) 31 9.6%Malignant neoplasms of ill-defined, secondary and unspecified sites (C76 - C80) 17 5.2%Malignant neoplasms of male genital organs (C60 - C63) 14 4.3%Malignant neoplasms of eye, brain, and other parts of central nervous system (C69 - C72) 12 3.7%Malignant neoplasms of female genital organs (C51 - C58) 11 3.4%Malignant neoplasms of urinary tract (C64 - C68) 11 3.4%Melanoma and other malignant neoplasms of skin (C43 - C44) 11 3.4%Malignant neoplasms of lip, oral cavity, and pharynx (C00 - C14) 5 1.5%Malignant neoplasms of mesothelial and soft tissue (C45 - C49) 5 1.5%Neoplasms of uncertain or unknown behaviour (D37 - D48) 5 1.5%Malignant neoplasms of thyroid and other endocrine glands (C73 - C75) 2 0.6%Malignant neoplasms of bone and articular cartilage (C40 - C41) 1 0.3%Total 324 100.0%
Horowhenua Cancer Deaths by Cancer Type 1999 to 2001
17.2.4 Manawatu
Yearly total hospital discharges of Manawatu territorial authority residents declined by 11.7% across the 1999/2000 to 2002/2003 period. The most common Major Diagnostic Categories followed the general pattern: (1) Pregnancy/ birth; (2) Circulatory system; (3) Digestive system; (4) Musculoskeletal system; and (5) Respiratory system. The most common diagnoses within each Major Diagnostic Category also follows the common pattern, with some minor variations. When examining the number of discharges for specific Major Diagnostic Categories across the four year (1999 to 2003) period, pregnancy/birth; circulatory system; musculoskeletal system all reduced. Respiratory system discharges fluctuated year to year. Digestive system discharges declined by 13% from 1999/2000 to 2000/2001, then remained stable to 2002/2003. Female reproductive system discharges increased by 38%.

236
Manawatu Total Hospital Discharges 1999 to 2003
0
1000
2000
3000
4000
1999 to 2000 2000 to 2001 2001 to 2002 2002 to 2003
Years
Number of discharges
Manawatu Hospital Discharges by Major Diagnostic Category
1999 to 2003
0
200
400
600
800
1000
1200
1400
1600
1800
2000
Blood,
imm
unity
Burns
Cancer
Circula
tory
syste
m
Diges
tive
syste
m
Endoc
rine, n
utriti
on
ENMT
Eye
Female
repr
oduc
tive
Infec
tion,
para
sites
Injur
y, po
isonin
g
Kidney
, urin
ary
Liver,
pancre
as
Male re
producti
ve
Mus
culos
kelet
al sys
tem
Nervo
us s
ystem
Newborns
Other
cont
acts
Pregna
ncy,
birth
Respir
atory
Syste
m
Skin, b
reast
Number of discharges
Manawatu Hospital Discharges by Major Diagnostic Category 1999 to 2003
0
50
100
150
200
250
300
350
400
450
500
1999 to 2000 2000 to 2001 2001 to 2002 2002 to 2003
Years
Num
ber of discharges
Blood, immunity
Burns
Cancer
Circulatory system
Digestive system
Endocrine, nutrition
ENMT
Eye
Female reproductive
Infection, parasites
Injury, poisoning
Kidney, urinary
Liver, pancreas
Male reproductive
Musculoskeletal system
Nervous system
Newborns
Other contacts
Pregnancy, birth
Respiratory System
Skin, breast

237
Diagnoses No. of discharges Percentage within MDCPregnancy, birthMaternal care related to the foetus and amniotic cavity and possible delivery problems (O30 - O48) 330 26.2%Complications of labour and delivery (O60 - O75) 284 22.5%Persons encountering health services in circumstances related to reproduction (eg. post-partum care) (Z30 - Z39) 196 15.5%Delivery (O80 - O82) 150 11.9%
Circulatory SystemIschaemic heart diseases (I20 - I25) 505 42.9%Other forms of heart disease (I30 - I52) 286 24.3%Symptoms, signs, and abnormal clinical and laboratory findings, not elsewhere classified (R00 - R99) 157 13.3%
Digestive SystemSymptoms, signs, and abnormal clinical and laboratory findings, not elsewhere classified (R00 - R99) 231 22.8%Other diseases of intestines (K55 - K63) 206 20.3%Hernia (K40 - K46) 118 11.6%
Musculoskeletal SystemInjury, poisoning, and certain other consequences of external causes (S00 - T79) 441 48.7%Arthrosis (M15 - M19) 99 10.9%
RespiratoryInfluenza and pneumonia (J10 - J18) 158 22.1%Asthma (J45 - J46) 128 17.9%Chronic lower respiratory diseases (J40 - J47) 125 17.5%Other acute lower respiratory infections (J20 - J22) 114 16.0%Malignant neoplasms (cancers) (C00 - C96) 45 6.3%
Manawatu Most Common ICD10 Diagnoses within Most Common Major Diagnostic Categories (MDC) 2000 - 2003
17.2.4.1 Cancers
Cancer Registrations 1998 to 2000 A listing of the 1998 to 2000 registrations in the New Zealand Cancer Registry for people living in Manawatu territorial authority is given in the table below. The New Zealand Cancer Registry is a register of all primary malignant cancers (neoplasms) diagnosed in New Zealand, excluding some specific forms of skin cancer (basal cell and squamous cell carcinomas). The most frequent malignant cancers registered from 1998 to 2000 for people living in Manawatu were:
1. Digestive organs 2. Male genital organs 3. Breast 4. Respiratory and intrathoracic organs (lungs and organs inside the chest) 5. Blood and lymphoid systems.
Cancer typeNumber of
people PercentageMalignant neoplasms of digestive organs (C15 - C26) 67 20.5%Malignant neoplasms of male genital organs (C60 - C63) 60 18.3%Malignant neoplasms of the breast (C50) 42 12.8%Malignant neoplasms of respiratory and intrathoracic organs (C00 - C14) 32 9.8%Malignant neoplasms, stated or presumed to be primary, of lymphoid, haemopoietic and related tissue (C81 - C96) 30 9.2%Melanoma and other malignant neoplasms of skin (C43 - C44) 22 6.7%Malignant neoplasms of female genital organs (C51 - C58) 20 6.1%Malignant neoplasms of urinary tract (C64 - C68) 19 5.8%Malignant neoplasms of ill-defined, secondary and unspecified sites (C76 - C80) 14 4.3%Malignant neoplasms of eye, brain, and other parts of central nervous system (C69 - C72) 8 2.4%Malignant neoplasms of lip, oral cavity, and pharynx (C00 - C14) 8 2.4%Malignant neoplasms of thyroid and other endocrine glands (C73 - C75) 3 0.9%Malignant neoplasms of bone and articular cartilage (C40 - C41) 1 0.3%Malignant neoplasms of mesothelial and soft tissue (C45 - C49) 1 0.3%Total 327 100.0%
Manawatu Cancer Registrations 1998 to 2000

238
Cancer Mortality 1999 to 2001 The most frequent causes of malignant cancers deaths from 1999 to 2001 for people living in Manawatu were:
1. Digestive organs 2. Respiratory and intrathoracic organs (lungs and organs inside the chest) 3. Blood and lymphoid systems 4. Male genital organs 5. Female genital organs.
Cancer typeNumber of
people PercentageMalignant neoplasms of digestive organs (C15 - C26) 51 30.4%Malignant neoplasms of respiratory and intrathoracic organs (C00 - C14) 34 20.2%Malignant neoplasms, stated or presumed to be primary, of lymphoid, haemopoietic and related tissue (C81 - C96) 16 9.5%Malignant neoplasms of male genital organs (C60 - C63) 12 7.1%Malignant neoplasms of female genital organs (C51 - C58) 11 6.5%Malignant neoplasms of the breast (C50) 10 6.0%Melanoma and other malignant neoplasms of skin (C43 - C44) 9 5.4%Malignant neoplasms of ill-defined, secondary and unspecified sites (C76 - C80) 8 4.8%Malignant neoplasms of eye, brain, and other parts of central nervous system (C69 - C72) 6 3.6%Malignant neoplasms of urinary tract (C64 - C68) 4 2.4%Malignant neoplasms of lip, oral cavity, and pharynx (C00 - C14) 2 1.2%Malignant neoplasms of mesothelial and soft tissue (C45 - C49) 2 1.2%Neoplasms of uncertain or unknown behaviour (D37 - D48) 2 1.2%Malignant neoplasms of bone and articular cartilage (C40 - C41) 1 0.6%Total 168 100.0%
Manawatu Cancer Mortality by Cancer Type 1999 to 2001
17.2.5 Tararua
Tararua yearly total hospital discharges declined by 11.2% across the 1999/2000 to 2002/2003 period. The main Major Diagnostic Categories were the same, and in the same order, as the territorial authorities common pattern described previously. They were:
1. Pregnancy/birth 2. Circulatory system 3. Digestive system 4. Musculoskeletal system 5. Respiratory system.
The most common diagnoses within those Major Diagnostic Categories generally follows the territorial authorities common pattern mentioned earlier. Many of the most common Major Diagnostic Categories declined in discharge numbers in the 1999/2000 to 2002/2003 period. Pregnancy/birth numbers fell by 7.4%. Circulatory System discharges initially rose from 319 discharges in 1999/2000 to 361 discharges the following year, but then fell to 285 discharges for 2002/2003–an overall decline of 11.5% across the four year period. Digestive System discharges fell by 20.7% and Respiratory System discharges by 22.8%.

239
Tararua Total Hospital Discharges 1999 to 2003
0
1000
2000
3000
4000
1999 to 2000 2000 to 2001 2001 to 2002 2002 to 2003
Years
Number of discharges
Tararua Hospital Discharges by Major Diagnostic Category 1999
to 2003
0
200
400
600
800
1000
1200
1400
1600
1800
Blood,
imm
unity
Burns
Cancer
Circula
tory
syste
m
Diges
tive sy
stem
Endoc
rine,
nutri
tion
ENMT
Eye
Female
repr
oduc
tive
Infec
tion,
para
sites
Injur
y, po
isonin
g
Kidney
, urin
ary
Liver,
pancre
as
Male re
produ
ctive
Mus
culos
kelet
al sys
tem
Nervous
sys
tem
Newbo
rns
Other c
ontac
ts
Pregna
ncy,
birth
Respir
atory
Sys
tem
Skin, b
reast
Number of discharges
Tararua Hospital Discharges by Major Diagnostic Category 1999 to 2003
0
50
100
150
200
250
300
350
400
450
500
1999 to 2000 2000 to 2001 2001 to 2002 2002 to 2003
Years
Num
ber of discharges
Blood, immunity
Burns
Cancer
Circulatory system
Digestive system
Endocrine, nutrition
ENMT
Eye
Female reproductive
Infection, parasites
Injury, poisoning
Kidney, urinary
Liver, pancreas
Male reproductive
Musculoskeletal system
Nervous system
Newborns
Other contacts
Pregnancy, birth
Respiratory System
Skin, breast

240
Diagnoses No. of discharges Percentage within MDCPregnancy, birthMaternal care related to the foetus and amniotic cavity and possible delivery problems (O30 - O48) 321 26.5%Complications of labour and delivery (O60 - O75) 250 20.7%Delivery (O80 - O82) 141 11.7%
Circulatory SystemIschaemic heart diseases (I20 - I25) 433 44.2%Other forms of heart disease (I30 - I52) 236 24.1%Symptoms, signs, and abnormal clinical and laboratory findings, not elsewhere classified (R00 - R99) 133 13.6%
Digestive SystemSymptoms, signs, and abnormal clinical and laboratory findings, not elsewhere classified (R00 - R99) 194 22.1%Other diseases of intestine (K55 - K63) 180 20.5%Malignant neoplasms (cancers) (C15 - C96) 99 11.3%
Musculoskeletal SystemInjury, poisoning, and certain other consequences of external causes (S00 - T79) 382 46.0%Arthrosis (M15 - M19) 89 10.7%
RespiratoryInfluenza and pneumonia (J10 - J18) 140 19.9%Chronic lower respiratory diseases (J40 - 47) 117 16.6%Asthma (J45 - J46) 110 15.6%Other acute lower respiratory infections (J20 - J22) 102 14.5%Other diseases of the respiratory system (J95 - J99) 56 8.0%Malignant neoplasms (cancers) (C00 - C96) 48 6.8%
Tararua Most Common ICD10 Diagnoses within Most Common Major Diagnostic Categories (MDC) 2000 - 2003
17.2.5.1 Cancers
Cancer Registrations 1998 to 2000 A listing of the 1998 to 2000 registrations in the New Zealand Cancer Registry for people living in Tararua territorial authority is given in the table below. The New Zealand Cancer Registry is a register of all primary malignant cancers (neoplasms) diagnosed in New Zealand, excluding some specific forms of skin cancer (basal cell and squamous cell carcinomas). The most frequent malignant cancers registered from 1998 to 2000 for people living in Tararua were:
1. Digestive organs 2. Male genital organs 3. Respiratory and intrathoracic organs (lungs and organs inside the chest) 4. Breast 5. Blood and lymphoid systems.
Cancer typeNumber of
people PercentageMalignant neoplasms of digestive organs (C15 - C26) 67 27.3%Malignant neoplasms of male genital organs (C60 - C63) 32 13.1%Malignant neoplasms of respiratory and intrathoracic organs (C00 - C14) 28 11.4%Malignant neoplasms of the breast (C50) 21 8.6%Malignant neoplasms, stated or presumed to be primary, of lymphoid, haemopoietic and related tissue (C81 - C96) 18 7.3%Malignant neoplasms of female genital organs (C51 - C58) 17 6.9%Malignant neoplasms of ill-defined, secondary and unspecified sites (C76 - C80) 17 6.9%Melanoma and other malignant neoplasms of skin (C43 - C44) 16 6.5%Malignant neoplasms of urinary tract (C64 - C68) 15 6.1%Malignant neoplasms of eye, brain, and other parts of central nervous system (C69 - C72) 5 2.0%Malignant neoplasms of mesothelial and soft tissue (C45 - C49) 4 1.6%Malignant neoplasms of lip, oral cavity, and pharynx (C00 - C14) 3 1.2%Malignant neoplasms of bone and articular cartilage (C40 - C41) 1 0.4%Malignant neoplasms of thyroid and other endocrine glands (C73 - C75) 1 0.4%Total 245 100.0%
Tararua Cancer Registrations 1998 to 2000
Cancer Mortality 1999 to 2001 The most frequent causes of malignant cancers deaths from 1999 to 2001 for people living in

241
Tararua were:
1. Digestive organs 2. Respiratory and intrathoracic organs (lungs and organs inside the chest) 3. Male genital organs 4. Female genital organs/ breast/blood and lymphoid systems (equal numbers).
Cancer typeNumber of
people PercentageMalignant neoplasms of digestive organs (C15 - C26) 36 28.6%Malignant neoplasms of respiratory and intrathoracic organs (C00 - C14) 25 19.8%Malignant neoplasms of male genital organs (C60 - C63) 10 7.9%Malignant neoplasms of female genital organs (C51 - C58) 9 7.1%Malignant neoplasms of the breast (C50) 9 7.1%Malignant neoplasms, stated or presumed to be primary, of lymphoid, haemopoietic and related tissue (C81 - C96) 9 7.1%Malignant neoplasms of ill-defined, secondary and unspecified sites (C76 - C80) 8 6.3%Malignant neoplasms of eye, brain, and other parts of central nervous system (C69 - C72) 5 4.0%Malignant neoplasms of urinary tract (C64 - C68) 5 4.0%Malignant neoplasms of mesothelial and soft tissue (C45 - C49) 4 3.2%Malignant neoplasms of lip, oral cavity, and pharynx (C00 - C14) 3 2.4%Melanoma and other malignant neoplasms of skin (C43 - C44) 2 1.6%Neoplasms of uncertain or unknown behaviour (D37 - D48) 1 0.8%Total 126 100.0%
Tararua Cancer Mortality by Cancer Type 1999 to 2001
17.2.6 Kapiti Coast (MidCentral District Portion)
Kapiti Coast’s yearly total discharges reduced by 6.9% over the 1999/2000 to 2002/2003 period. Kapiti Coast’s most common Major Diagnostic Categories are the same as the other territorial authorities although the order is different. Circulatory system is the most common category, while pregnancy/birth (usually the most common category) is third. The top five Major Diagnostic Categories, in descending order of frequency are:
1. Circulatory system 2. Musculoskeletal system 3. Pregnancy/birth 4. Respiratory system 5. Digestive system.
It was more difficult to detect trends when Kapiti Coast Major Diagnostic Category discharges were examined over time. The numbers of discharges tended to fluctuate, probably because of the smaller absolute numbers. However, there were some Major Diagnostic Categories that appeared to show consistent patterns. Musculoskeletal system discharges fell by 35.6%, while pregnancy/birth discharges fell by 41.6%. Circulatory system discharges increased by 5% across the four year period, digestive system discharges increased by 12%, and Respiratory system discharges reduced by 19.6%, but it is difficult to tell whether this is a trend or chance fluctuation. Discharge numbers tended to oscillate year by year for those categories.
Kapiti (MidCentral Portion) Total Hospital Discharges 1999 to 2003
0
100
200
300
400
500
600
700
800
900
1000
1100
1999 to 2000 2000 to 2001 2001 to 2002 2002 to 2003
Years
Nu
mb
er o
f d
isch
arg
es

242
Kapiti (MidCentral portion) Hospital Discharges by Major
Diagnostic Category 1999 to 2003
0
100
200
300
400
500
600
Blood,
imm
unity
Burns
Cancer
Circula
tory
syste
m
Diges
tive sy
stem
Endoc
rine, n
utriti
on
ENMT
Eye
Female
repr
oduc
tive
Infec
tion,
para
sites
Injur
y, po
isonin
g
Kidney
, urin
ary
Liver
, pan
creas
Male re
prod
uctive
Mus
culos
kelet
al sys
tem
Nervous
sys
tem
Newborns
Other c
ontac
ts
Pregna
ncy,
birth
Respira
tory
Sys
tem
Skin, b
reast
Number of discharges
Kapiti (MidCentral Portion) Hospital Discharges by Major Diagnostic Category 1999 to 2003
0
20
40
60
80
100
120
140
160
1999 to 2000 2000 to 2001 2001 to 2002 2002 to 2003
Years
Number of discharges
Blood, immunity
Burns
Cancer
Circulatory system
Digestive system
Endocrine, nutrition
ENMT
Eye
Female reproductive
Infection, parasites
Injury, poisoning
Kidney, urinary
Liver, pancreas
Male reproductive
Musculoskeletal system
Nervous system
Newborns
Other contacts
Pregnancy, birth
Respiratory System
Skin, breast

243
Diagnoses No. of discharges Percentage within MDCCirculatory SystemIschaemic heart diseases (I20 - I25) 162 42.3%Other forms of heart disease (I30 - I52) 95 24.8%Symptoms, signs, and abnormal clinical and laboratory findings, not elsewhere classified (R00 - R99) 39 10.2%
Musculoskeletal SystemInjury, poisoning, and certain other consequences of external causes (S00 - T79) 104 33.9%Arthrosis (M15 - M19) 40 13.0%Other joint disorders (M20 - M25) 34 11.1%
Pregnancy, birthMaternal care related to the foetus and amniotic cavity and possible delivery problems (O30 - O48) 71 29.2%Complications of labour and delivery (O60 - O75) 62 25.5%Persons encountering health services in circumstances related to reproduction (eg. post-partum care) (Z30 - Z39) 32 13.2%Pregnancy with abortive outcome (O00 - O008) 30 12.3%Delivery (O80 - O82) 21 8.6%
RespiratoryChronic lower respiratory diseases (J40 - J47) 57 22.0%Influenza and pneumonia (J10 - J18) 47 18.1%Malignant neoplasms (cancers) (C00 - C96) 34 13.1%Other acute lower respiratory infections (J20 - J22) 29 11.2%Cystic fibrosis (E84) 19 7.3%Asthma (J45 - J46) 19 7.3%
Digestive SystemOther diseases of intestines (K55 - K63) 56 22.3%Symptoms, signs, and abnormal clinical and laboratory findings, not elsewhere classified (R00 - R99) 39 15.5%
Kapiti Most Common ICD10 Diagnoses within Most Common Major Diagnostic Categories (MDC) 2000 - 2003
17.2.6.1 Cancers
Cancer Registrations 1998 to 2000 A listing of the 1998 to 2000 registrations in the New Zealand Cancer Registry for people living in Kapiti Coast territorial authority (MidCentral district portion) is given in the table below. The New Zealand Cancer Registry is a register of all primary malignant cancers (neoplasms) diagnosed in New Zealand, excluding some specific forms of skin cancer (basal cell and squamous cell carcinomas). The most frequent malignant cancers registered from 1998 to 2000 for people living in Kapiti Coast (MidCentral district portion) were:
1. Digestive organs 2. Male genital organs 3. Respiratory and intrathoracic organs (lungs and organs inside the chest) 4. Breast 5. Melanoma and other skin cancers.
Cancer typeNumber of
people PercentageMalignant neoplasms of digestive organs (C15 - C26) 29 21.3%Malignant neoplasms of male genital organs (C60 - C63) 22 16.2%Malignant neoplasms of respiratory and intrathoracic organs (C00 - C14) 20 14.7%Malignant neoplasms of the breast (C50) 16 11.8%Melanoma and other malignant neoplasms of skin (C43 - C44) 16 11.8%Malignant neoplasms of urinary tract (C64 - C68) 12 8.8%Malignant neoplasms of ill-defined, secondary and unspecified sites (C76 - C80) 9 6.6%Malignant neoplasms, stated or presumed to be primary, of lymphoid, haemopoietic and related tissue (C81 - C96) 4 2.9%Malignant neoplasms of lip, oral cavity, and pharynx (C00 - C14) 3 2.2%Malignant neoplasms of eye, brain, and other parts of central nervous system (C69 - C72) 2 1.5%Malignant neoplasms of female genital organs (C51 - C58) 2 1.5%Malignant neoplasms of thyroid and other endocrine glands (C73 - C75) 1 0.7%Total 136 100.0%
Kapiti (MidCentral portion) Cancer Registrations 1998 to 2000
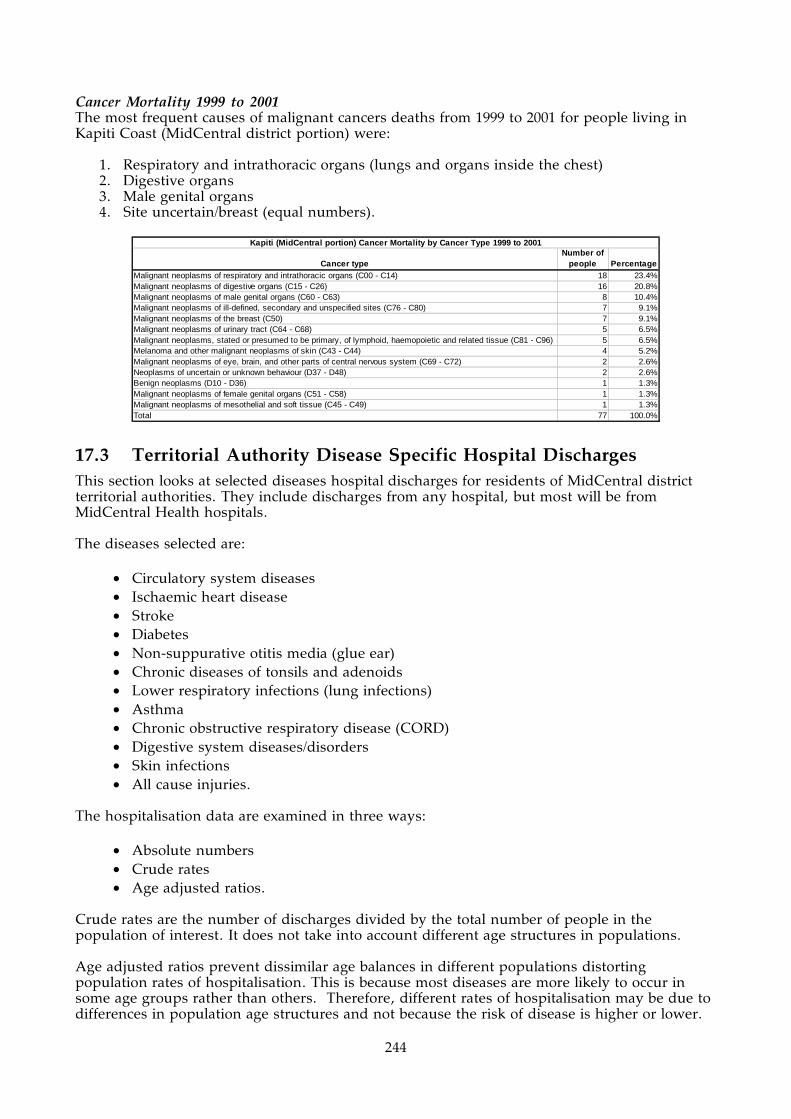
244
Cancer Mortality 1999 to 2001 The most frequent causes of malignant cancers deaths from 1999 to 2001 for people living in Kapiti Coast (MidCentral district portion) were:
1. Respiratory and intrathoracic organs (lungs and organs inside the chest) 2. Digestive organs 3. Male genital organs 4. Site uncertain/breast (equal numbers).
Cancer typeNumber of
people PercentageMalignant neoplasms of respiratory and intrathoracic organs (C00 - C14) 18 23.4%Malignant neoplasms of digestive organs (C15 - C26) 16 20.8%Malignant neoplasms of male genital organs (C60 - C63) 8 10.4%Malignant neoplasms of ill-defined, secondary and unspecified sites (C76 - C80) 7 9.1%Malignant neoplasms of the breast (C50) 7 9.1%Malignant neoplasms of urinary tract (C64 - C68) 5 6.5%Malignant neoplasms, stated or presumed to be primary, of lymphoid, haemopoietic and related tissue (C81 - C96) 5 6.5%Melanoma and other malignant neoplasms of skin (C43 - C44) 4 5.2%Malignant neoplasms of eye, brain, and other parts of central nervous system (C69 - C72) 2 2.6%Neoplasms of uncertain or unknown behaviour (D37 - D48) 2 2.6%Benign neoplasms (D10 - D36) 1 1.3%Malignant neoplasms of female genital organs (C51 - C58) 1 1.3%Malignant neoplasms of mesothelial and soft tissue (C45 - C49) 1 1.3%Total 77 100.0%
Kapiti (MidCentral portion) Cancer Mortality by Cancer Type 1999 to 2001
17.3 Territorial Authority Disease Specific Hospital Discharges This section looks at selected diseases hospital discharges for residents of MidCentral district territorial authorities. They include discharges from any hospital, but most will be from MidCentral Health hospitals. The diseases selected are:
• Circulatory system diseases • Ischaemic heart disease • Stroke • Diabetes • Non-suppurative otitis media (glue ear) • Chronic diseases of tonsils and adenoids • Lower respiratory infections (lung infections) • Asthma • Chronic obstructive respiratory disease (CORD) • Digestive system diseases/disorders • Skin infections • All cause injuries.
The hospitalisation data are examined in three ways:
• Absolute numbers • Crude rates • Age adjusted ratios.
Crude rates are the number of discharges divided by the total number of people in the population of interest. It does not take into account different age structures in populations. Age adjusted ratios prevent dissimilar age balances in different populations distorting population rates of hospitalisation. This is because most diseases are more likely to occur in some age groups rather than others. Therefore, different rates of hospitalisation may be due to differences in population age structures and not because the risk of disease is higher or lower.
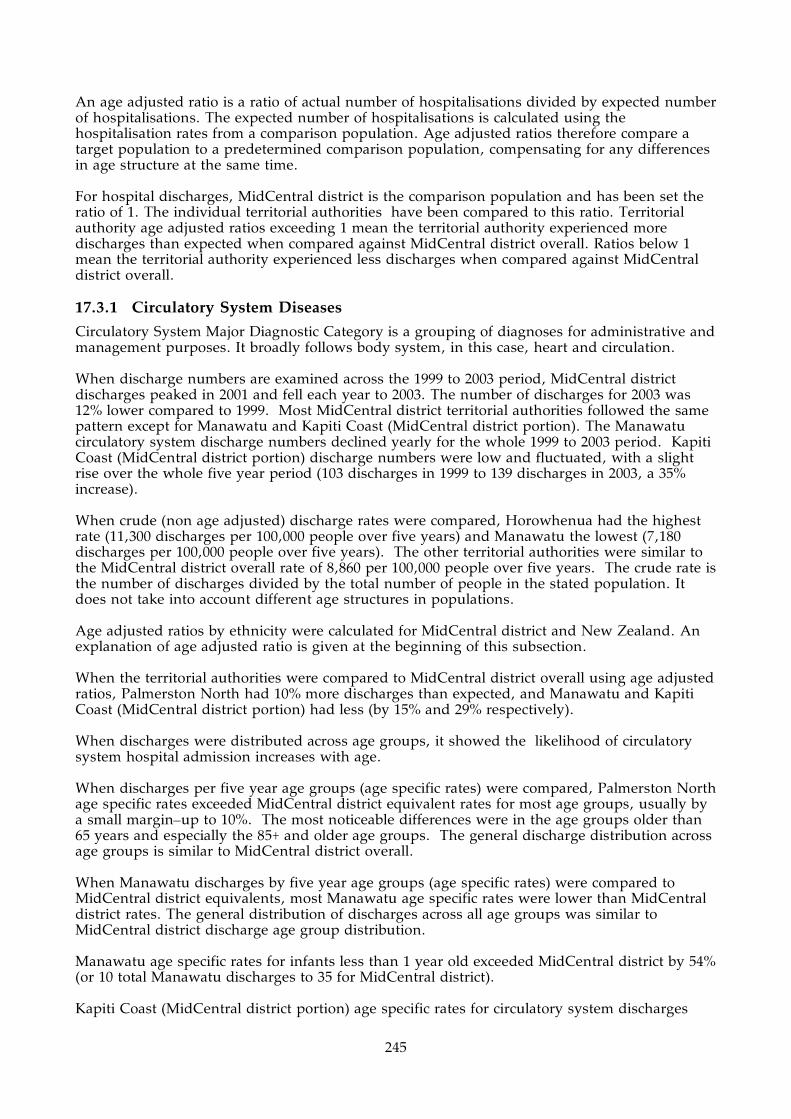
245
An age adjusted ratio is a ratio of actual number of hospitalisations divided by expected number of hospitalisations. The expected number of hospitalisations is calculated using the hospitalisation rates from a comparison population. Age adjusted ratios therefore compare a target population to a predetermined comparison population, compensating for any differences in age structure at the same time. For hospital discharges, MidCentral district is the comparison population and has been set the ratio of 1. The individual territorial authorities have been compared to this ratio. Territorial authority age adjusted ratios exceeding 1 mean the territorial authority experienced more discharges than expected when compared against MidCentral district overall. Ratios below 1 mean the territorial authority experienced less discharges when compared against MidCentral district overall.
17.3.1 Circulatory System Diseases
Circulatory System Major Diagnostic Category is a grouping of diagnoses for administrative and management purposes. It broadly follows body system, in this case, heart and circulation. When discharge numbers are examined across the 1999 to 2003 period, MidCentral district discharges peaked in 2001 and fell each year to 2003. The number of discharges for 2003 was 12% lower compared to 1999. Most MidCentral district territorial authorities followed the same pattern except for Manawatu and Kapiti Coast (MidCentral district portion). The Manawatu circulatory system discharge numbers declined yearly for the whole 1999 to 2003 period. Kapiti Coast (MidCentral district portion) discharge numbers were low and fluctuated, with a slight rise over the whole five year period (103 discharges in 1999 to 139 discharges in 2003, a 35% increase). When crude (non age adjusted) discharge rates were compared, Horowhenua had the highest rate (11,300 discharges per 100,000 people over five years) and Manawatu the lowest (7,180 discharges per 100,000 people over five years). The other territorial authorities were similar to the MidCentral district overall rate of 8,860 per 100,000 people over five years. The crude rate is the number of discharges divided by the total number of people in the stated population. It does not take into account different age structures in populations. Age adjusted ratios by ethnicity were calculated for MidCentral district and New Zealand. An explanation of age adjusted ratio is given at the beginning of this subsection. When the territorial authorities were compared to MidCentral district overall using age adjusted ratios, Palmerston North had 10% more discharges than expected, and Manawatu and Kapiti Coast (MidCentral district portion) had less (by 15% and 29% respectively). When discharges were distributed across age groups, it showed the likelihood of circulatory system hospital admission increases with age. When discharges per five year age groups (age specific rates) were compared, Palmerston North age specific rates exceeded MidCentral district equivalent rates for most age groups, usually by a small margin–up to 10%. The most noticeable differences were in the age groups older than 65 years and especially the 85+ and older age groups. The general discharge distribution across age groups is similar to MidCentral district overall. When Manawatu discharges by five year age groups (age specific rates) were compared to MidCentral district equivalents, most Manawatu age specific rates were lower than MidCentral district rates. The general distribution of discharges across all age groups was similar to MidCentral district discharge age group distribution. Manawatu age specific rates for infants less than 1 year old exceeded MidCentral district by 54% (or 10 total Manawatu discharges to 35 for MidCentral district). Kapiti Coast (MidCentral district portion) age specific rates for circulatory system discharges

246
were also lower than MidCentral district equivalents for most age groups.
MidCentral Number of Circulatory System (Major Diagnostic
Category) Hospital Discharges by Territorial Authority 1999 to 2003
0
500
1000
1500
2000
2500
3000
3500
1999 2000 2001 2002 2003
Years
Number of events
Palmerston
North
Horow henua
Manaw atu
Tararua
Kapiti
(MidCentral
portion)MidCentral
1999 2000 2001 2002 2003
Palmerston North 1207 1196 1360 1267 1099
Horowhenua 696 656 769 632 629
Manawatu 457 422 423 371 300
Tararua 300 349 350 337 261
Kapiti (MidCentral portion) 103 148 124 132 139
MidCentral 2763 2771 3026 2739 2428
MidCentral Number of Circulatory System (Major Diagnostic Category) Hospital
Discharges by Territorial Authority 1999 to 2003
No. of
events
Crude
rate/100,000
people
Age
adjusted
ratio
95%
confidence
limits
Palmerston North 6129 8510 1.10 1.07 - 1.13
Horowhenua 3382 11300 1.01 0.98 - 1.05
Manawatu 1973 7180 0.85 0.81 - 0.89
Tararua 1597 8920 1.00 0.96 - 1.05
Kapiti (MidCentral portion) 646 8320 0.71 0.66 - 0.76
MidCentral 13727 8860 1
MidCentral Indirect Age Adjusted Ratios (MidCentral overall as comparison)
Circulatory System (Major Diagnostic Category) Hospital Discharges by
Territorial Authority 1999 to 2003
MidCentral Circulatory System (Major Diagnostic
Category) Hospital Discharges by Age Bands 1999 to
2003
0
500
1000
1500
2000
2500
00
01-04
05-09
10-14
15-19
20-24
25-29
30-34
35-39
40-44
45-49
50-54
55-59
60-64
65-69
70-74
75-79
80-8485+
Age Groups
Number of events

247
MidCentral Circulatory System (Major Diagnostic Category) Hospital Discharges Age Specific Rates
1999 to 2003
0
10000
20000
30000
40000
50000
60000
0001
-0405
-0910
-1415
-1920
-2425
-2930
-3435
-3940
-4445
-4950
-5455
-5960
-6465
-6970
-7475
-7980
-84
85+
Age Groups
Ag
e sp
ecif
ic r
ates
/100
,000
p
eop
le
Palmerston North Circulatory System (Major Diagnostic Category) Hospital Discharges Age
Specific Rates 1999 to 2003
0
10000
20000
30000
40000
50000
60000
70000
0001
-0405
-0910
-1415
-1920
-2425
-2930
-3435
-3940
-4445
-4950
-5455
-5960
-6465
-6970
-7475
-7980
-84
85+
Age Groups
Ag
e sp
ecif
ic r
ates
/100
,000
peo
ple
Horowhenua Circulatory System (Major Diagnostic Category) Hospital Discharges Age Specific Rates
1999 to 2003
0
10000
20000
30000
40000
50000
60000
0001
-0405
-0910
-1415
-1920
-2425
-2930
-3435
-3940
-4445
-4950
-5455
-5960
-6465
-6970
-7475
-7980
-84
85+
Age Groups
Ag
e sp
ecif
ic r
ates
/100
,000
p
eop
le
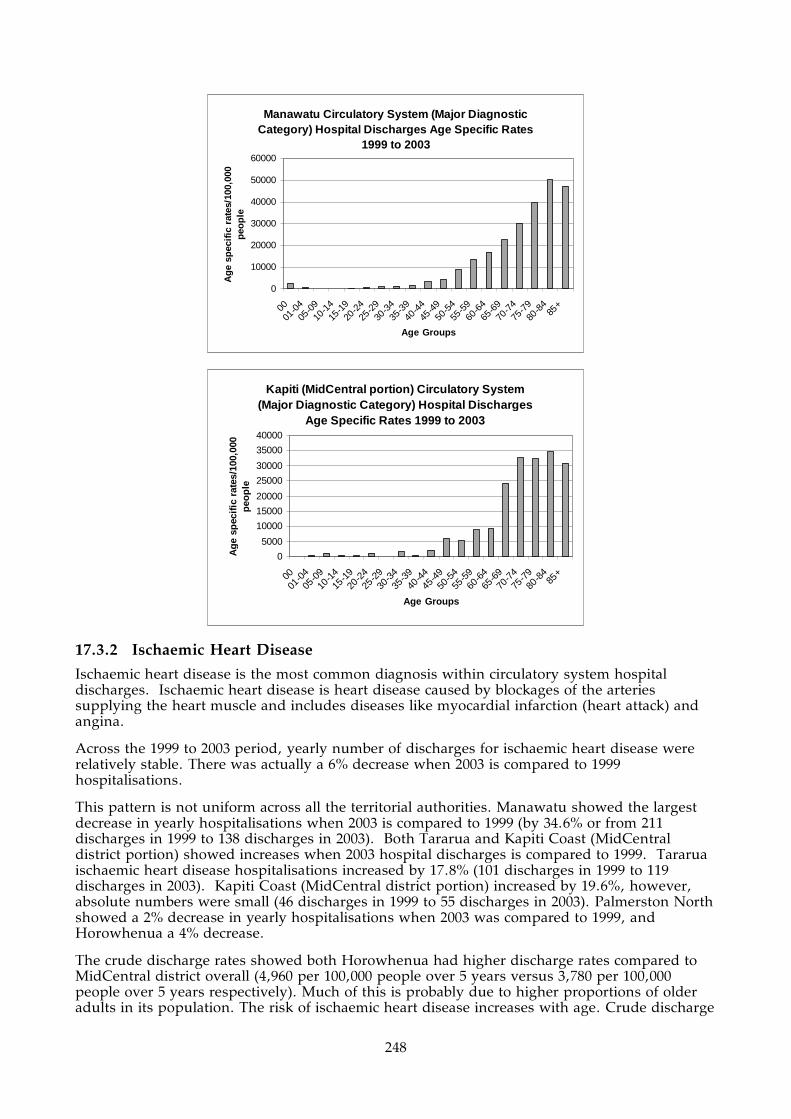
248
Manawatu Circulatory System (Major Diagnostic Category) Hospital Discharges Age Specific Rates
1999 to 2003
0
10000
20000
30000
40000
50000
60000
0001
-0405
-0910
-1415
-1920
-2425
-2930
-3435
-3940
-4445
-4950
-5455
-5960
-6465
-6970
-7475
-7980
-84
85+
Age Groups
Ag
e sp
ecif
ic r
ates
/100
,000
p
eop
le
Kapiti (MidCentral portion) Circulatory System (Major Diagnostic Category) Hospital Discharges
Age Specific Rates 1999 to 2003
0
5000
10000
15000
20000
25000
30000
35000
40000
0001
-0405
-0910
-1415
-1920
-2425
-2930
-3435
-3940
-4445
-4950
-5455
-5960
-6465
-6970
-7475
-7980
-84
85+
Age Groups
Ag
e sp
ecif
ic r
ates
/100
,000
p
eop
le
17.3.2 Ischaemic Heart Disease
Ischaemic heart disease is the most common diagnosis within circulatory system hospital discharges. Ischaemic heart disease is heart disease caused by blockages of the arteries supplying the heart muscle and includes diseases like myocardial infarction (heart attack) and angina.
Across the 1999 to 2003 period, yearly number of discharges for ischaemic heart disease were relatively stable. There was actually a 6% decrease when 2003 is compared to 1999 hospitalisations.
This pattern is not uniform across all the territorial authorities. Manawatu showed the largest decrease in yearly hospitalisations when 2003 is compared to 1999 (by 34.6% or from 211 discharges in 1999 to 138 discharges in 2003). Both Tararua and Kapiti Coast (MidCentral district portion) showed increases when 2003 hospital discharges is compared to 1999. Tararua ischaemic heart disease hospitalisations increased by 17.8% (101 discharges in 1999 to 119 discharges in 2003). Kapiti Coast (MidCentral district portion) increased by 19.6%, however, absolute numbers were small (46 discharges in 1999 to 55 discharges in 2003). Palmerston North showed a 2% decrease in yearly hospitalisations when 2003 was compared to 1999, and Horowhenua a 4% decrease.
The crude discharge rates showed both Horowhenua had higher discharge rates compared to MidCentral district overall (4,960 per 100,000 people over 5 years versus 3,780 per 100,000 people over 5 years respectively). Much of this is probably due to higher proportions of older adults in its population. The risk of ischaemic heart disease increases with age. Crude discharge

249
rates are the number of discharges divided by the total number of people living in the stated area, and does not take into account different age structures in different populations. Age adjusted ratios by ethnicity were calculated for MidCentral district and New Zealand. An explanation of age adjusted ratio is given at the beginning of this subsection. Palmerston North and Horowhenua showed slightly higher age adjusted ratios, when compared against MidCentral district overall. However, only Palmerston North’s difference reached statistical significance. From 1999 to 2003, Palmerston North experienced 10% more than expected ischaemic heart disease hospitalisations compared to MidCentral district overall. Both Manawatu and Kapiti Coast (MidCentral district portion) showed lower age adjusted ratios when compared against the district overall. Manawatu’s ratio indicates Manawatu experienced 13% fewer than expected ischaemic heart disease hospitalisations compared to MidCentral district overall (age adjusted ratio of 0.87). Kapiti Coast (MidCentral district portion) experienced 34% fewer than expected hospitalisations compared to the district overall (age adjusted ratio of 0.66). MidCentral district ischaemic heart disease hospital discharges gradually increase with increasing age, starting in early middle age. This is demonstrated in the graphs showing number of discharges across five year age groups, and also in the graph showing age specific rates. Age specific rates are the number of discharges per number of people within each five year age band. Palmerston North distribution of age specific rates follow a similar general pattern to MidCentral district overall. Palmerston North five year age group rates were higher than MidCentral district equivalents from 55 to 85+ years by 8% to 29%, although the 80 to 84 year rate was similar to the district 80 to 84 year olds. Although Manawatu’s distribution of discharges across age groups is similar to MidCentral district, age specific rates for age bands between 45 and 79 years old were lower by 5% to 28%. Kapiti Coast (MidCentral district portion) distribution of discharges across age groups is also similar to MidCentral district. Five year age specific rates for age bands between 45 and 85+ years (especially 50 to 64 years) are lower than corresponding MidCentral district rates by 13% to 62%.
MidCentral Number of Ischaemic Heart Disease Hospital Discharges
by Territorial Authority 1999 to 2003
0
200
400
600
800
1000
1200
1400
1999 2000 2001 2002 2003
Years
Number of events
Palmerston
North
Horow henua
Manaw atu
Tararua
Kapiti
(MidCentral
portion)MidCentral

250
1999 2000 2001 2002 2003Palmerston North 491 514 532 563 481Horowhenua 294 250 342 312 282Manawatu 211 180 188 146 138Tararua 101 131 152 162 119Kapiti (MidCentral portion) 46 56 49 58 55MidCentral 1143 1131 1263 1241 1075
MidCentral Number of Ischaemic Heart Disease Hospital Discharges by Territorial Authority 1999 to 2003
No. of events
Crude rate/100,000
people
Age adjusted
ratio
95% confidence
limitsPalmerston North 2581 3580 1.10 1.06 - 1.15Horowhenua 1480 4960 1.02 0.97 - 1.07Manawatu 863 3140 0.87 0.81 - 0.93Tararua 665 3720 0.98 0.91 - 1.05Kapiti (MidCentral portion) 264 3400 0.66 0.58 - 0.74MidCentral 5853 3780 1
MidCentral Indirect Age Adjusted Ratios (MidCentral overall as comparison) Ischaemic Heart Disease Hospital Discharges by Territorial Authority 1999 to
2003
MidCentral Ischaemic Heart Disease Hospital Discharges by Age Bands 1999 to 2003
0
200
400
600
800
1000
1200
0001
-0405
-0910
-1415
-1920
-2425
-2930
-3435
-3940
-4445
-4950
-5455
-5960
-6465
-6970
-7475
-7980
-84
85+
Age Groups
Nu
mb
er o
f ev
ents
MidCentral Ischaemic Heart Disease Hospital Discharges Age Specific Rates 1999 to 2003
0
5000
10000
15000
20000
25000
0001
-0405
-0910
-1415
-1920
-2425
-2930
-3435
-3940
-4445
-4950
-5455
-5960
-6465
-6970
-7475
-7980
-84
85+
Age Groups
Ag
e sp
ecif
ic r
ates
/100
,000
p
eop
le

251
Palmerston North Ischaemic Heart Disease Hospital Discharges Age Specific Rates 1999 to
2003
0
5000
10000
15000
20000
25000
30000
0001
-0405
-0910
-1415
-1920
-2425
-2930
-3435
-3940
-4445
-4950
-5455
-5960
-6465
-6970
-7475
-7980
-84
85+
Age Groups
Ag
e sp
ecif
ic r
ates
/100
,000
p
eop
le
Manawatu Ischaemic Heart Disease Hospital Discharges Age Specific Rates 1999 to 2003
0
5000
10000
15000
20000
25000
30000
0001
-0405
-0910
-1415
-1920
-2425
-2930
-3435
-3940
-4445
-4950
-5455
-5960
-6465
-6970
-7475
-7980
-84
85+
Age Groups
Ag
e sp
ecifi
c ra
tes/
100,
000
peo
ple
Kapiti (MidCentral portion) Ischaemic Heart Disease Hospital Discharges Age Specific Rates
1999 to 2003
0
5000
10000
15000
20000
25000
0001
-0405
-0910
-1415
-1920
-2425
-2930
-3435
-3940
-4445
-4950
-5455
-5960
-6465
-6970
-7475
-7980
-8485
+
Age Groups
Ag
e sp
ecif
ic r
ates
/100
,000
p
eop
le
17.3.3 Stroke
MidCentral district yearly hospital discharge numbers for stroke a experienced small fall from 1999 to 2000 and then a steady rise from 2000 to 2003. Overall, MidCentral district stroke hospital discharges increased by 80% from 1999 to 2003. All territorial authorities, except for

252
Kapiti Coast (MidCentral district portion) showed similar changes. Kapiti Coast stroke discharges were low, between three and 12 a year, and fluctuated with no obvious pattern. When crude discharge rates were examined, Horowhenua and Tararua had higher crude rates than MidCentral district overall. Manawatu had a lower crude rate (455 discharges per 100 000 people over 5 years). Crude discharge rates are the number of discharges divided by the total number of people living in the stated area. It does not take into account different age structures in populations. Age adjusted ratios by ethnicity were calculated for MidCentral district and New Zealand. An explanation of age adjusted ratio is given at the beginning of this subsection. Tararua, Horowhenua, and Palmerston North all had higher all cause injuries hospital discharge age adjusted ratios (1.18, 1.02, and 1.05 respectively) when compared to MidCentral district overall. However, none of these ratios reached statistical significance. The Horowhenua and Palmerston North ratios were close to 1, so were probably of no clinical or practical significance. This suggests Horowhenua’s higher crude (non age adjusted) rate is mainly due to older age structure of the population, stroke being more common among older adults. Manawatu and Kapiti Coast (MidCentral district portion) had lower ratios (0.85 and 0.67 respectively), with only Kapiti Coast ratio reaching statistical significance. MidCentral district stroke hospital discharges gradually increase with increasing age, starting in mid to late middle age. This is demonstrated in the graphs showing number of discharges across five year age groups, and also in the graph showing age specific rates. Age specific rates are the number of discharges per number of people within each five year age band.
MidCentral Number of Stroke Hospital Discharges by Territorial
Authority 1999 to 2003
0
50
100
150
200
250
300
1999 2000 2001 2002 2003
Years
Number of events
Palmerston
North
Horow henua
Manaw atu
Tararua
Kapiti
(MidCentral
portion)MidCentral
1999 2000 2001 2002 2003
Palmerston North 58 56 83 94 90
Horowhenua 28 22 42 72 71
Manawatu 20 13 23 26 43
Tararua 20 22 21 29 31
Kapiti (MidCentral portion) 9 3 12 9 8
MidCentral 135 116 181 230 243
MidCentral Number of Stroke Hospital Discharges by Territorial Authority 1999 to 2003

253
No. of events
Crude rate/100,000
people
Age adjusted
ratio
95% confidence
limitsPalmerston North 381 529 1.05 0.94 - 1.15Horowhenua 235 787 1.02 0.89 - 1.16Manawatu 125 455 0.85 0.7 - 1Tararua 123 687 1.18 0.97 - 1.39Kapiti (MidCentral portion) 41 528 0.67 0.47 - 0.88MidCentral 905 584 1
MidCentral Indirect Age Adjusted Ratios (MidCentral overall as comparison) Stroke Hospital Discharges by Territorial Authority 1999 to 2003
MidCentral Stroke Hospital Discharges by Age Bands 1999 to 2003
0
20
40
60
80
100
120
140
160
180
0001
-0405
-0910
-1415
-1920
-2425
-2930
-3435
-3940
-4445
-4950
-5455
-5960
-6465
-6970
-7475
-7980
-84
85+
Age Groups
Nu
mb
er o
f ev
ents
MidCentral Stroke Hospital Discharges Age Specific Rates 1999 to 2003
0
1000
2000
3000
4000
5000
6000
7000
0001
-0405
-0910
-1415
-1920
-2425
-2930
-3435
-3940
-4445
-4950
-5455
-5960
-6465
-6970
-7475
-7980
-84
85+
Age Groups
Ag
e sp
ecif
ic r
ates
/100
,000
p
eop
le
17.3.4 Diabetes
Hospital inpatient admission data for diabetes do not directly measure the total workload or morbidity associated with diabetes, but are broadly indicative of the population health status due to diabetes. There are some factors to keep in mind when considering these data. Most care for people with diabetes is delivered as outpatients, which hospital discharge data will not capture. Also, these data do not include hospital admission for diseases that are possible complications of diabetes, for example, ischaemic heart disease, stroke, peripheral vascular disease (progressive artery blockage to the limbs), or kidney disease. However, hospital diabetes discharge data are useful for comparing across different time periods, or comparing different subpopulations to each other (like ethnic groups or territorial authorities) as a general indication of the effect of diabetes on those groups. When diabetes yearly hospital discharges across the district for 1999 to 2003 were examined, the number of discharges for MidCentral district overall and most territorial authorities increased.

254
There was some levelling out of discharge numbers from 2002 to 2003. Kapiti Coast total discharges across the five year period was especially low, only 14 discharges. The crude discharge rates showed both Horowhenua had higher diabetes discharge rates compared to MidCentral district overall; and Manawatu and Kapiti Coast had lower rates. Crude discharge rates are the number of discharges divided by the total number of people living in the stated area. It does not take into account different age balances in different populations. The Kapiti Coast crude discharge rate is especially low. Age adjusted ratios by ethnicity were calculated for MidCentral district and New Zealand. An explanation of age adjusted ratio is given at the beginning of this subsection. When differing age structures were compensated for using age related ratios, Horowhenua still has 39% higher than expected number of discharges when compared to MidCentral district overall (Horowhenua age adjusted ratio of 1.39). Manawatu and Kapiti Coast have both lower than expected number of diabetes hospital discharges when compared with MidCentral district overall (by 30% and 75% respectively). The Kapiti Coast age adjusted ratio was based only 14 discharges so may not be reliable. When calculating age adjusted ratios, MidCentral district has been set the ratio of 1 and then the territorial authorities ratio are compared to it. Ratios greater than 1 indicate greater than expected hospital discharges; while ratios less than one indicate less than expected hospital discharges compared with MidCentral district overall. When hospital discharges are examined across five year age groups, MidCentral district distribution shows increasing likelihood of hospital admission with age. Horowhenua age specific rates show a difference compared to MidCentral district equivalents. Age specific rates are rates of hospital discharge within each five year age band. There is a peak in the 30 to 44 age groups. Also, the older age groups show higher age specific rates than their MidCentral district equivalents. In contrast, Manawatu age specific rates do not show a peak in the 30 to 44 age groups, and generally lower rates in the older age groups. Kapiti Coast age distributions graphs are affected by the low absolute number of discharges, with incomplete data across the age groups.
MidCentral Number of Diabetes Hospital Discharges by Territorial
Authority 1999 to 2003
0
50
100
150
200
250
1999 2000 2001 2002 2003
Years
Number of events
Palmerston
North
Horow henua
Manaw atu
Tararua
Kapiti
(MidCentral
portion)MidCentral
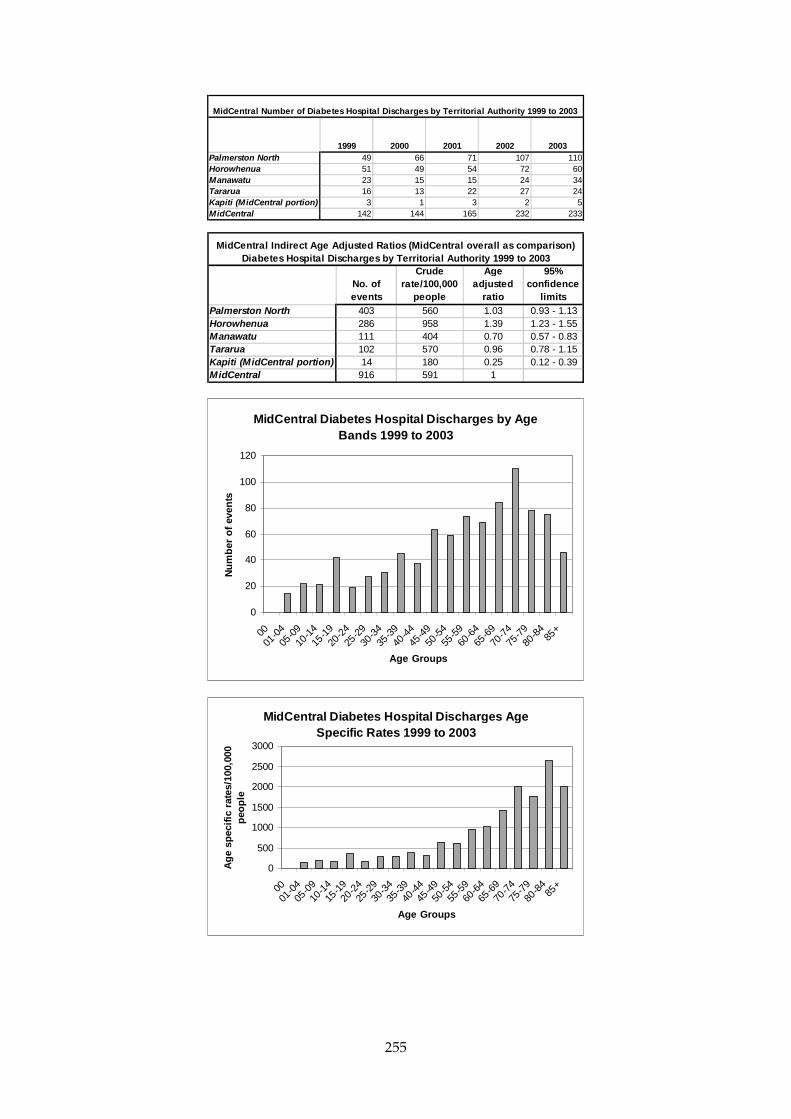
255
1999 2000 2001 2002 2003Palmerston North 49 66 71 107 110Horowhenua 51 49 54 72 60Manawatu 23 15 15 24 34Tararua 16 13 22 27 24Kapiti (MidCentral portion) 3 1 3 2 5MidCentral 142 144 165 232 233
MidCentral Number of Diabetes Hospital Discharges by Territorial Authority 1999 to 2003
No. of events
Crude rate/100,000
people
Age adjusted
ratio
95% confidence
limitsPalmerston North 403 560 1.03 0.93 - 1.13Horowhenua 286 958 1.39 1.23 - 1.55Manawatu 111 404 0.70 0.57 - 0.83Tararua 102 570 0.96 0.78 - 1.15Kapiti (MidCentral portion) 14 180 0.25 0.12 - 0.39MidCentral 916 591 1
MidCentral Indirect Age Adjusted Ratios (MidCentral overall as comparison) Diabetes Hospital Discharges by Territorial Authority 1999 to 2003
MidCentral Diabetes Hospital Discharges by Age Bands 1999 to 2003
0
20
40
60
80
100
120
0001
-0405
-0910
-1415
-1920
-2425
-2930
-3435
-3940
-4445
-4950
-5455
-5960
-6465
-6970
-7475
-7980
-84
85+
Age Groups
Nu
mb
er o
f ev
ents
MidCentral Diabetes Hospital Discharges Age Specific Rates 1999 to 2003
0
500
1000
1500
2000
2500
3000
0001
-0405
-0910
-1415
-1920
-2425
-2930
-3435
-3940
-4445
-4950
-5455
-5960
-6465
-6970
-7475
-7980
-84
85+
Age Groups
Ag
e sp
ecif
ic r
ates
/100
,000
p
eop
le

256
Horowhenua Diabetes Hospital Discharges Age Specific Rates 1999 to 2003
0
500
1000
1500
2000
2500
3000
3500
0001
-0405
-0910
-1415
-1920
-2425
-2930
-3435
-3940
-4445
-4950
-5455
-5960
-6465
-6970
-7475
-7980
-84
85+
Age Groups
Ag
e sp
ecif
ic r
ates
/100
,000
p
eop
le
Manawatu Diabetes Hospital Discharges Age Specific Rates 1999 to 2003
0
500
1000
1500
2000
2500
3000
3500
0001
-0405
-0910
-1415
-1920
-2425
-2930
-3435
-3940
-4445
-4950
-5455
-5960
-6465
-6970
-7475
-7980
-84
85+
Age Groups
Ag
e sp
ecif
ic r
ates
/100
,000
p
eop
le
Kapiti (MidCentral portion) Diabetes Hospital Discharges Age Specific Rates 1999 to 2003
0
100200
300
400500
600
700800
900
0001
-0405
-0910
-1415
-1920
-2425
-2930
-3435
-3940
-4445
-4950
-5455
-5960
-6465
-6970
-7475
-7980
-84
85+
Age Groups
Ag
e sp
ecif
ic r
ates
/100
,000
p
eop
le

257
17.3.5 Non-Suppurative Otitis Media (Glue Ear)
Yearly hospital discharge numbers for non-suppurative otitis media (glue ear) were relatively stable, with some yearly fluctuation, across MidCentral district in the 1999/2000 to 2002/2003 period. Kapiti Coast (MidCentral district portion) showed an increase but the absolute numbers of discharges are very small. When crude discharge rates are examined, Tararua showed a mildly higher rate than MidCentral overall. The other territorial authorities crude discharge rates are similar to MidCentral overall. Crude discharge rates are the number of discharges divided by the total number of people living in the stated area. It does not take into account different age structures in populations. Age adjusted ratios by ethnicity were calculated for MidCentral district and New Zealand. An explanation of age adjusted ratio is given at the beginning of this subsection. Both Manawatu and Kapiti Coast (MidCentral district portion) showed lower age adjusted ratios when compared to MidCentral district overall (0.83 and 0.69 respectively). This means Manawatu and Kapiti Coast had fewer than expected number of hospital discharges compared to MidCentral district overall, by 17% and 31% respectively. Although Palmerston North and Horowhenua had slightly greater than expected hospital discharges, this was not statistically significant. Most MidCentral district hospital discharges are concentrated in the less than 15 years old age groups. This demonstrated in the graphs showing number of discharges across age groups, and age specific rates for all age bands. Age specific rates are the number of discharges per number of people within each five year age band. The age distribution of Manawatu and Kapiti Coast (MidCentral district portion) discharges is the similar to MidCentral district although the age specific rates are smaller.
MidCentral Number of Non-Suppurative Otitis Media (Glue Ear)
Hospital Discharges by Territorial Authority 1999/2000 to 2002/2003
0
50
100
150
200
250
1999/2000 2000/2001 2001/2002 2002/2003
Years
Number of events
Palmerston
North
Horow henua
Manaw atu
Tararua
Kapiti
(MidCentral
portion)MidCentral

258
1999/2000 2000/2001 2001/2002 2002/2003Palmerston North 83 82 99 93Horowhenua 44 28 42 39Manawatu 33 20 31 32Tararua 34 16 18 28Kapiti (MidCentral portion) 5 4 6 10MidCentral 199 150 196 202
MidCentral Number of Non-Suppurative Otitis Media (Glue Ear) Hospital Discharges by Territorial Authority 1999/2000 to 2002/2003
No. of events
Crude rate/100,000
people
Age adjusted
ratio
95% confidence
limitsPalmerston North 357 496 1.09 0.97 - 1.2Horowhenua 153 513 1.05 0.88 - 1.21Manawatu 116 422 0.83 0.68 - 0.99Tararua 96 536 1.00 0.8 - 1.19Kapiti (MidCentral portion) 25 322 0.69 0.42 - 0.95MidCentral 747 482 1
MidCentral Indirect Age Adjusted Ratios (MidCentral overall as comparison) Non-Suppurative Otitis Media (Glue Ear) Hospital Discharges by Territorial
Authority 1999/2000 to 2002/2003
MidCentral Non-Suppurative Otitis Media (Glue Ear) Hospital Discharges by Age Bands 1999/2000 to
2002/2003
0
50100
150200
250300
350400
450
0001
-0405
-0910
-1415
-1920
-2425
-2930
-3435
-3940
-4445
-4950
-5455
-5960
-6465
-6970
-7475
-7980
-84
85+
Age Groups
Nu
mb
er o
f ev
ents
MidCentral Non-Suppurative Otitis Media (Glue Ear) Hospital Discharges Age Specific Rates
1999/2000 to 2002/2003
0
1000
2000
3000
4000
5000
0001
-0405
-0910
-1415
-1920
-2425
-2930
-3435
-3940
-4445
-4950
-5455
-5960
-6465
-6970
-7475
-7980
-84
85+
Age Groups
Ag
e sp
ecif
ic
rate
s/10
0,00
0 p
eop
le
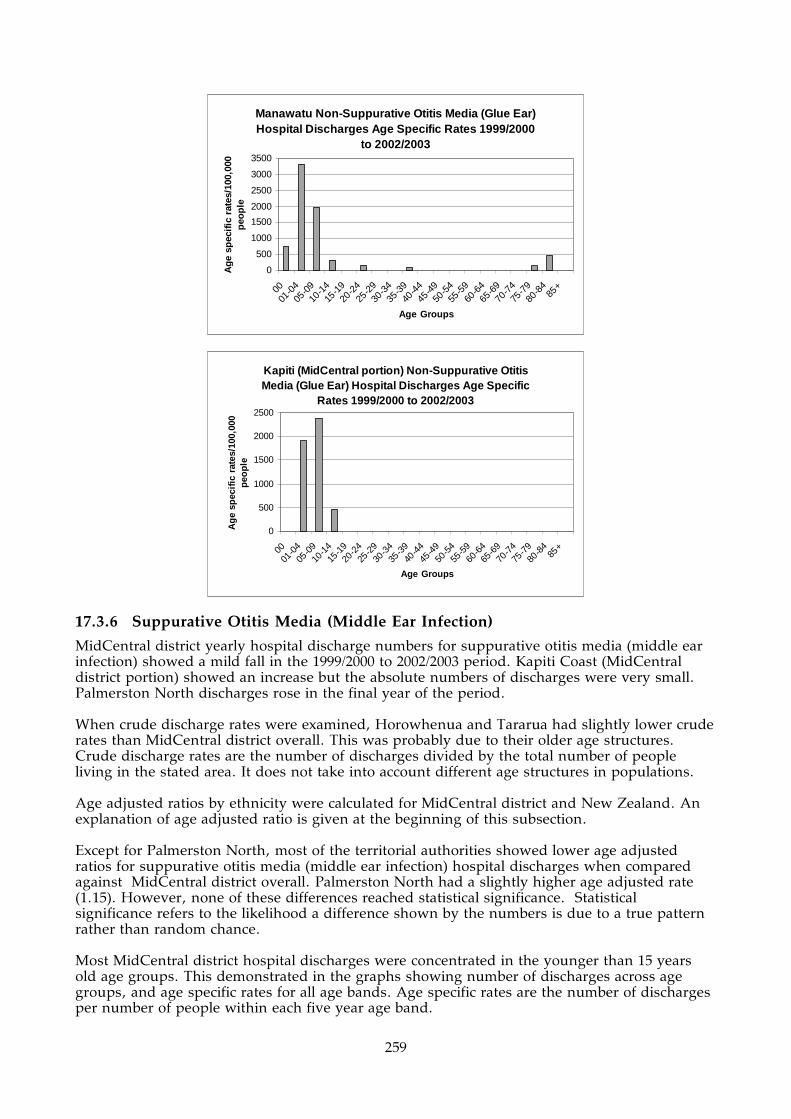
259
Manawatu Non-Suppurative Otitis Media (Glue Ear) Hospital Discharges Age Specific Rates 1999/2000
to 2002/2003
0
500
1000
1500
2000
2500
3000
3500
0001
-0405
-0910
-1415
-1920
-2425
-2930
-3435
-3940
-4445
-4950
-5455
-5960
-6465
-6970
-7475
-7980
-84
85+
Age Groups
Ag
e sp
ecif
ic r
ates
/100
,000
p
eop
le
Kapiti (MidCentral portion) Non-Suppurative Otitis Media (Glue Ear) Hospital Discharges Age Specific
Rates 1999/2000 to 2002/2003
0
500
1000
1500
2000
2500
0001
-0405
-0910
-1415
-1920
-2425
-2930
-3435
-3940
-4445
-4950
-5455
-5960
-6465
-6970
-7475
-7980
-84
85+
Age Groups
Ag
e sp
ecif
ic r
ates
/100
,000
p
eop
le
17.3.6 Suppurative Otitis Media (Middle Ear Infection)
MidCentral district yearly hospital discharge numbers for suppurative otitis media (middle ear infection) showed a mild fall in the 1999/2000 to 2002/2003 period. Kapiti Coast (MidCentral district portion) showed an increase but the absolute numbers of discharges were very small. Palmerston North discharges rose in the final year of the period. When crude discharge rates were examined, Horowhenua and Tararua had slightly lower crude rates than MidCentral district overall. This was probably due to their older age structures. Crude discharge rates are the number of discharges divided by the total number of people living in the stated area. It does not take into account different age structures in populations. Age adjusted ratios by ethnicity were calculated for MidCentral district and New Zealand. An explanation of age adjusted ratio is given at the beginning of this subsection. Except for Palmerston North, most of the territorial authorities showed lower age adjusted ratios for suppurative otitis media (middle ear infection) hospital discharges when compared against MidCentral district overall. Palmerston North had a slightly higher age adjusted rate (1.15). However, none of these differences reached statistical significance. Statistical significance refers to the likelihood a difference shown by the numbers is due to a true pattern rather than random chance. Most MidCentral district hospital discharges were concentrated in the younger than 15 years old age groups. This demonstrated in the graphs showing number of discharges across age groups, and age specific rates for all age bands. Age specific rates are the number of discharges per number of people within each five year age band.

260
MidCentral Number of Suppurative Otitis Media (Middle Ear Infection)
Hospital Discharges by Territorial Authority 1999/2000 to 2002/2003
0
10
20
30
40
50
60
70
1999/2000 2000/2001 2001/2002 2002/2003
Years
Number of events
Palmerston
North
Horow henua
Manaw atu
Tararua
Kapiti
(MidCentral
portion)MidCentral
1999/2000 2000/2001 2001/2002 2002/2003
Palmerston North 29 29 27 34
Horowhenua 8 10 10 8
Manawatu 15 11 10 6
Tararua 8 9 3 5
Kapiti (MidCentral portion) 3 4 1 2
MidCentral 63 63 51 55
MidCentral Number of Suppurative Otitis Media (Middle Ear Infection)
Hospital Discharges by Territorial Authority 1999/2000 to 2002/2003
No. of
events
Crude
rate/100,000
people
Age
adjusted
ratio
95%
confidence
limits
Palmerston North 119 165 1.15 0.94 - 1.35
Horowhenua 36 121 0.80 0.54 - 1.06
Manawatu 42 153 0.99 0.69 - 1.28
Tararua 25 140 0.85 0.52 - 1.19
Kapiti (MidCentral portion) 10 129 0.89 0.34 - 1.44
MidCentral 232 150 1
MidCentral Indirect Age Adjusted Ratios (MidCentral overall as comparison)
Suppurative Otitis Media (Middle Ear Infection) Hospital Discharges by
Territorial Authority 1999/2000 to 2002/2003
MidCentral Suppurative Otitis Media (Middle Ear
Infection) Hospital Discharges by Age Bands
1999/2000 to 2002/2003
0
20
40
60
80
100
120
140
160
00
01-04
05-09
10-14
15-19
20-24
25-29
30-34
35-39
40-44
45-49
50-54
55-59
60-64
65-69
70-74
75-79
80-8485+
Age Groups
Number of events

261
MidCentral Suppurative Otitis Media (Middle Ear Infection) Hospital Discharges Age Specific Rates
1999/2000 to 2002/2003
0
200
400
600
800
1000
1200
1400
1600
1800
0001
-0405
-0910
-1415
-1920
-2425
-2930
-3435
-3940
-4445
-4950
-5455
-5960
-6465
-6970
-7475
-7980
-84
85+
Age Groups
Ag
e sp
ecif
ic r
ates
/100
,000
p
eop
le
17.3.7 Chronic Diseases of the Tonsils and Adenoids
MidCentral district yearly hospital discharge numbers for chronic diseases of tonsils and adenoids showed relatively stable numbers in the 1999/2000 to 2002/2003 period. Kapiti Coast (MidCentral district portion) showed an increase but the absolute numbers of discharges were very small, while Tararua showed a steady fall. When crude discharge rates are examined, Horowhenua had higher crude rates than MidCentral district overall; and Manawatu lower crude rate. Crude discharge rates are the number of discharges divided by the total number of people living in the stated area. It does not take into account different age structures in populations. Age adjusted ratios by ethnicity were calculated for MidCentral district and New Zealand. An explanation of age adjusted ratio is given at the beginning of this subsection. Horowhenua age adjusted ratio was 1.19. This indicates Horowhenua experienced 19% more than expected hospital discharges compared to MidCentral district overall. Manawatu had mildly lower age adjusted ratio (0.86), meaning it experienced 14% fewer than expected discharges compared to MidCentral district overall. Most MidCentral district hospital discharges were concentrated in the younger age groups, especially aged 9 years old or younger. This demonstrated in the graphs showing number of discharges across age groups, and age specific rates for all age bands. Age distributions for Horowhenua and Manawatu were similar to MidCentral district although the individual age specific rates were higher, especially in the 9 or less age groups. Age specific rates are the number of discharges per number of people within each five year age band.
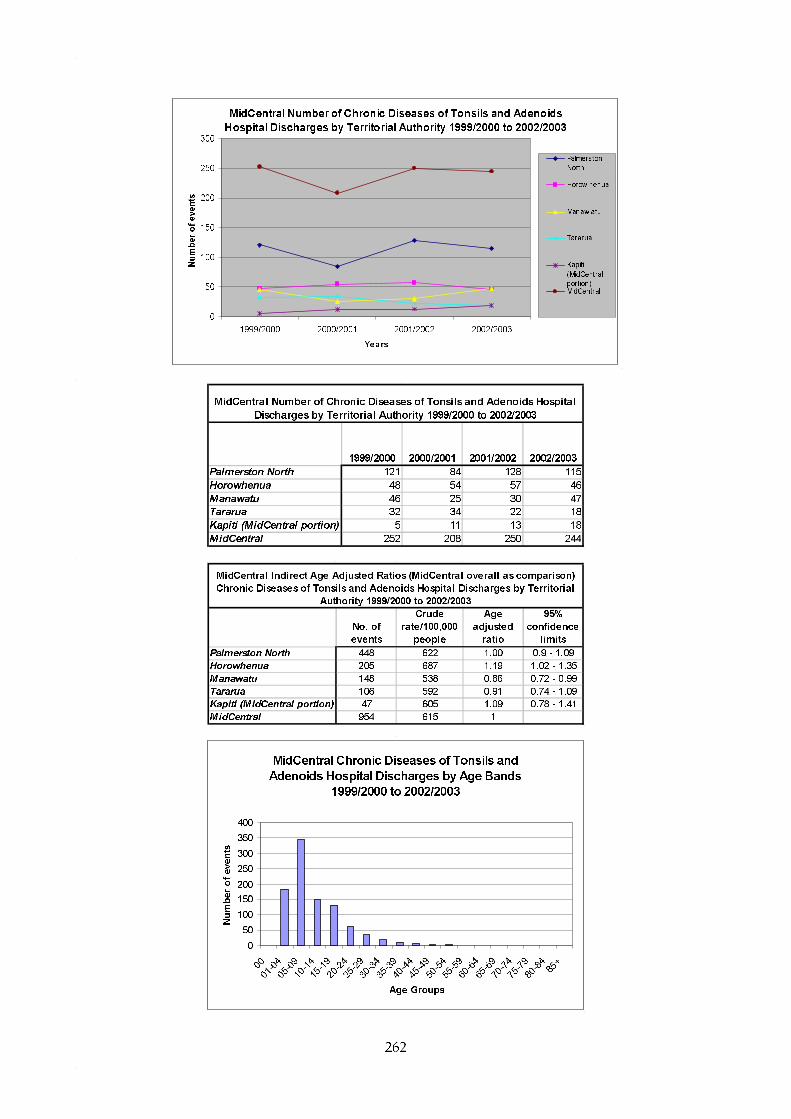
262
MidCentral Number of Chronic Diseases of Tonsils and Adenoids
Hospital Discharges by Territorial Authority 1999/2000 to 2002/2003
0
50
100
150
200
250
300
1999/2000 2000/2001 2001/2002 2002/2003
Years
Number of events
Palmerston
North
Horow henua
Manaw atu
Tararua
Kapiti
(MidCentral
portion)MidCentral
1999/2000 2000/2001 2001/2002 2002/2003
Palmerston North 121 84 128 115
Horowhenua 48 54 57 46
Manawatu 46 25 30 47
Tararua 32 34 22 18
Kapiti (MidCentral portion) 5 11 13 18
MidCentral 252 208 250 244
MidCentral Number of Chronic Diseases of Tonsils and Adenoids Hospital
Discharges by Territorial Authority 1999/2000 to 2002/2003
No. of
events
Crude
rate/100,000
people
Age
adjusted
ratio
95%
confidence
limits
Palmerston North 448 622 1.00 0.9 - 1.09
Horowhenua 205 687 1.19 1.02 - 1.35
Manawatu 148 538 0.86 0.72 - 0.99
Tararua 106 592 0.91 0.74 - 1.09
Kapiti (MidCentral portion) 47 605 1.09 0.78 - 1.41
MidCentral 954 615 1
MidCentral Indirect Age Adjusted Ratios (MidCentral overall as comparison)
Chronic Diseases of Tonsils and Adenoids Hospital Discharges by Territorial
Authority 1999/2000 to 2002/2003
MidCentral Chronic Diseases of Tonsils and
Adenoids Hospital Discharges by Age Bands
1999/2000 to 2002/2003
0
50
100
150
200
250
300
350
400
00
01-04
05-09
10-14
15-19
20-24
25-29
30-34
35-39
40-44
45-49
50-54
55-59
60-64
65-69
70-74
75-79
80-8485+
Age Groups
Number of events

263
MidCentral Chronic Diseases of Tonsils and Adenoids Hospital Discharges Age Specific Rates
1999/2000 to 2002/2003
0
500
1000
1500
2000
2500
3000
3500
00
01-0
405
-0910
-1415
-1920
-2425
-2930
-3435
-3940
-4445
-4950
-5455
-5960
-6465
-6970
-7475
-7980
-84
85+
Age Groups
Age
spe
cific
rat
es/1
00,0
00 p
eopl
e
Horowhenua Chronic Diseases of Tonsils and Adenoids Hospital Discharges Age Specific Rates
1999/2000 to 2002/2003
0
500
1000
1500
2000
2500
3000
3500
0001
-0405
-0910
-1415
-1920
-2425
-2930
-3435
-3940
-4445
-4950
-5455
-5960
-6465
-6970
-7475
-7980
-84
85+
Age Groups
Ag
e sp
ecif
ic r
ates
/100
,000
p
eop
le
Manawatu Chronic Diseases of Tonsils and Adenoids Hospital Discharges Age Specific Rates 1999/2000 to
2002/2003
0
500
1000
1500
2000
2500
3000
0001
-0405
-0910
-1415
-1920
-2425
-2930
-3435
-3940
-4445
-4950
-5455
-5960
-6465
-6970
-7475
-7980
-84
85+
Age Groups
Ag
e sp
ecif
ic r
ates
/100
,000
p
eop
le
17.3.8 Respiratory Infections
MidCentral district respiratory infection hospitalisation data from 1999 to 2003 were analysed by territorial authority. Both upper and lower respiratory tract infections were included in this analysis. MidCentral district yearly hospital discharge numbers for respiratory infections fluctuated in the

264
1999 to 2003 period. The yearly hospitalisations may be trending downwards although it is difficult to be sure due to year to year fluctuation. Yearly hospital discharges by territorial authority also showed yearly fluctuations. Tararua was the only territorial authority where the number of hospital discharges in 2003 was higher than 1999 (91 discharges in 1999 to 125 in 2003, or a 37.4% increase). When crude discharge rates were examined, Horowhenua and Tararua had higher crude rates than MidCentral district overall (3,036 per 100,000 people over 5 years, and 2,995 per 100,000 people over 5 years respectively). The MidCentral district crude discharge rate was 2,549 discharges per 100,000 people over 5 years. Both Manawatu and Kapiti Coast (MidCentral district portion) had lower crude rates than MidCentral district (2,040 discharges per 100,000 people over 5 years, and 2,090 per 100,000 people over 5 years respectively). Crude discharge rates are the number of discharges divided by the total number of people living in the stated area. It does not take into account different age structures in populations. Age adjusted ratios by ethnicity were calculated for MidCentral district and New Zealand. An explanation of age adjusted ratio is given at the beginning of this subsection. Horowhenua and Tararua had mildly higher age adjusted ratios (1.09 and 1.14 respectively). This suggests Horowhenua had 9% and Tararua 14% more than expected hospitalisations for respiratory infections compared to MidCentral district overall. Manawatu and Kapiti Coast (MidCentral district portion) had lower ratios (0.82 and 0.74 respectively). This indicates Manawatu had 18% and Kapiti Coast (MidCentral district portion) 21% fewer than expected hospital discharges for lower respiratory infections compared to MidCentral district overall. Most MidCentral district respiratory infection hospital discharges were concentrated in the 0 to 9 years age groups and age groups from about 50 years old onwards. This demonstrated in the graphs showing number of discharges across age groups, and age specific rates for all age bands. Age specific rates are the number of discharges per number of people within each five year age band. Both Horowhenua and Tararua demonstrated a similar age distribution to MidCentral district, although Horowhenua had much higher age specific rate for infants aged less than 1. Manawatu showed lower age specific rates for children. Kapiti Coast (MidCentral district portion) showed lower age specific rates for children and older adults.
MidCentral Number of Respiratory Infections Hospital Discharges by
Territorial Authority 1999 to 2003
0
100
200
300
400
500
600
700
800
900
1000
1999 2000 2001 2002 2003
Years
Number of events
Palmerston
North
Horow henua
Manaw atu
Tararua
Kapiti
(MidCentral
portion)MidCentral
Linear (Kapiti

265
1999 2000 2001 2002 2003Palmerston North 385 324 358 425 293Horowhenua 213 139 176 200 178Manawatu 130 89 119 129 95Tararua 91 108 116 96 125Kapiti (MidCentral portion) 37 35 44 23 23MidCentral 856 695 813 873 714
MidCentral Number of Respiratory Infections Hospital Discharges by Territorial Authority 1999 to 2003
No. of events
Crude rate/100,000
people
Age adjusted
ratio
95% confidence
limitsPalmerston North 1785 2480 1.02 0.98 - 1.07Horowhenua 906 3040 1.09 1.02 - 1.16Manawatu 562 2040 0.82 0.75 - 0.89Tararua 536 3000 1.14 1.04 - 1.24Kapiti (MidCentral portion) 162 2090 0.74 0.63 - 0.85MidCentral 3951 2550 1
MidCentral Indirect Age Adjusted Ratios (MidCentral overall as comparison) Respiratory Infections Hospital Discharges by Territorial Authority 1999 to 2003
MidCentral Respiratory Infections Hospital Discharges by Age Bands 1999 to 2003
0
100
200
300
400
500
600
700
800
900
0001
-0405
-0910
-1415
-1920
-2425
-2930
-3435
-3940
-4445
-4950
-5455
-5960
-6465
-6970
-7475
-7980
-84
85+
Age Groups
Nu
mb
er o
f ev
ents
MidCentral Respiratory Infections Hospital Discharges Age Specific Rates 1999 to 2003
0
5000
10000
15000
20000
25000
30000
35000
40000
0001
-0405
-0910
-1415
-1920
-2425
-2930
-3435
-3940
-4445
-4950
-5455
-5960
-6465
-6970
-7475
-7980
-84
85+
Age Groups
Ag
e sp
ecif
ic r
ates
/100
,000
p
eop
le
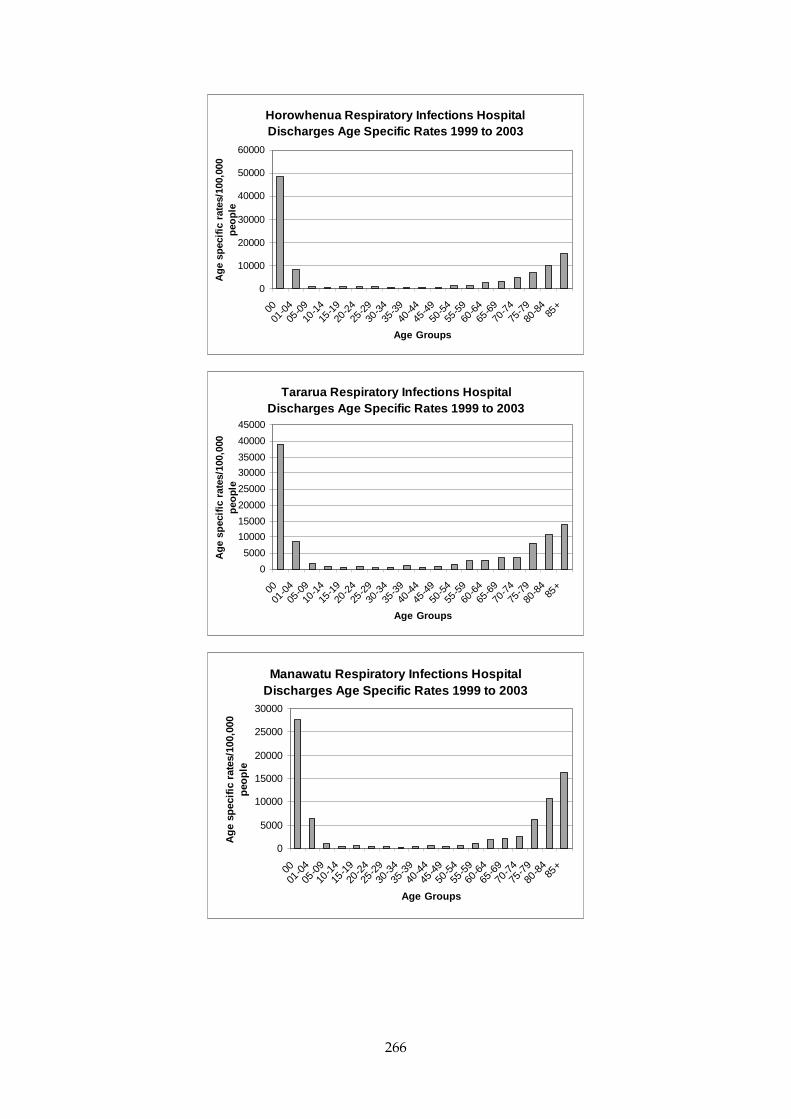
266
Horowhenua Respiratory Infections Hospital Discharges Age Specific Rates 1999 to 2003
0
10000
20000
30000
40000
50000
60000
0001
-0405
-0910
-1415
-1920
-2425
-2930
-3435
-3940
-4445
-4950
-5455
-5960
-6465
-6970
-7475
-7980
-84
85+
Age Groups
Ag
e sp
ecif
ic r
ates
/100
,000
p
eop
le
Tararua Respiratory Infections Hospital Discharges Age Specific Rates 1999 to 2003
0
5000
10000
15000
20000
25000
30000
35000
40000
45000
0001
-0405
-0910
-1415
-1920
-2425
-2930
-3435
-3940
-4445
-4950
-5455
-5960
-6465
-6970
-7475
-7980
-84
85+
Age Groups
Ag
e sp
ecif
ic r
ates
/100
,000
p
eop
le
Manawatu Respiratory Infections Hospital Discharges Age Specific Rates 1999 to 2003
0
5000
10000
15000
20000
25000
30000
0001
-0405
-0910
-1415
-1920
-2425
-2930
-3435
-3940
-4445
-4950
-5455
-5960
-6465
-6970
-7475
-7980
-84
85+
Age Groups
Ag
e sp
ecif
ic r
ates
/100
,000
p
eop
le

267
Kapiti (MidCentral portion) Respiratory Infections Hospital Discharges Age Specific Rates 1999 to
2003
0
5000
10000
15000
20000
25000
30000
35000
0001
-0405
-0910
-1415
-1920
-2425
-2930
-3435
-3940
-4445
-4950
-5455
-5960
-6465
-6970
-7475
-7980
-84
85+
Age Groups
Ag
e sp
ecif
ic r
ates
/100
,000
p
eop
le
17.3.9 Asthma
MidCentral district yearly hospital discharges for asthma showed a fall of 58% in the 1999 to 2003 period–from 214 discharges in 1999 to 90 in 2003. All territorial authorities showed a fall in asthma yearly hospital discharges over that time period. When crude discharge rates were examined, Palmerston North and Tararua had higher crude rates than MidCentral district overall of 980 discharges per 100,000 people over 5 years (1,059 per 100,000 people over 5 years, and 1,128 per 100,000 people over 5 years respectively). Both Manawatu and Kapiti Coast (MidCentral district portion) had lower crude rates than MidCentral district (826 discharges per 100,000 people over 5 years, and 477 per 100,000 people over 5 years respectively). Crude discharge rates are the number of discharges divided by the total number of people living in the stated area. It does not take into account different age structures in populations. Age adjusted ratios by ethnicity were calculated for MidCentral district and New Zealand. An explanation of age adjusted ratio is given at the beginning of this subsection. Palmerston North experienced 9% more asthma hospital discharges than expected when compared to MidCentral district overall (age adjusted ratios of 1.09). Tararua also had a similar age adjusted ratio, but the difference was not statistically significant. Palmerston North and Tararua had mildly higher asthma hospital discharge age adjusted ratios (1.09 and 1.11 respectively) when compared to MidCentral district overall. However, the Tararua ratio did not reach statistical significance. Manawatu experienced 17% fewer asthma hospitalisations when compared to MidCentral district. Kapiti Coast (MidCentral district portion) experienced 50% fewer than expected hospital discharges compared to MidCentral district, but this calculation is based on only 37 discharges and may be unreliable. MidCentral district asthma hospital discharges peak in the 1 to 14 years old age groups, and then drop to a relatively lower level across the adult years. This is demonstrated in the graphs showing number of discharges across age groups, and age specific rates for all age bands. Age specific rates are the number of discharges per number of people within each five year age band. Palmerston North demonstrated a similar age distribution to MidCentral district, but the hospital discharge rates for children aged 1 to 14 are higher than MidCentral district equivalent

268
age specific rates. Although Manawatu had a lower age adjusted ratio, compared to MidCentral district overall, it had a second peak of hospital discharges in the 25 to 29 years age band (using age specific rates). Kapiti Coast (MidCentral district portion) asthma hospitalisation age distribution generally followed a similar pattern to MidCentral district, but was affected by low numbers of hospital discharges.
MidCentral Number of Asthma Hospital Discharges by Territorial
Authority 1999 to 2003
0
50
100
150
200
250
300
350
400
450
1999 2000 2001 2002 2003
Years
Number of events
Palmerston
North
Horow henua
Manaw atu
Tararua
Kapiti
(MidCentral
portion)MidCentral
1999 2000 2001 2002 2003
Palmerston North 214 155 147 157 90
Horowhenua 81 51 69 57 32
Manawatu 52 55 41 40 39
Tararua 61 33 38 49 21
Kapiti (MidCentral portion) 12 10 6 4 5
MidCentral 420 304 301 307 187
MidCentral Number of Asthma Hospital Discharges by Territorial Authority 1999 to 2003
No. of
events
Crude
rate/100,000
people
Age
adjusted
ratio
95%
confidence
limits
Palmerston North 763 1060 1.09 1.02 - 1.17
Horowhenua 290 972 1.00 0.88 - 1.11
Manawatu 227 826 0.83 0.72 - 0.94
Tararua 202 1130 1.11 0.95 - 1.26
Kapiti (MidCentral portion) 37 477 0.50 0.34 - 0.66
MidCentral 1519 980 1
MidCentral Indirect Age Adjusted Ratios (MidCentral overall as comparison)
Asthma Hospital Discharges by Territorial Authority 1999 to 2003

269
MidCentral Asthma Hospital Discharges by Age Bands 1999 to 2003
0
50
100
150
200
250300
350
400
450
500
0001
-0405
-0910
-1415
-1920
-2425
-2930
-3435
-3940
-4445
-4950
-5455
-5960
-6465
-6970
-7475
-7980
-84
85+
Age Groups
Nu
mb
er o
f d
isch
arg
es
MidCentral Asthma Hospital Discharges Age Specific Rates 1999 to 2003
0
1000
2000
3000
4000
5000
6000
0001
-0405
-0910
-1415
-1920
-2425
-2930
-3435
-3940
-4445
-4950
-5455
-5960
-6465
-6970
-7475
-7980
-84
85+
Age Groups
Ag
e sp
ecif
ic r
ates
/100
,000
p
eop
le
Palmerston North Asthma Hospital Discharges Age Specific Rates 1999 to 2003
0
1000
2000
3000
4000
5000
6000
7000
0001
-0405
-0910
-1415
-1920
-2425
-2930
-3435
-3940
-4445
-4950
-5455
-5960
-6465
-6970
-7475
-7980
-84
85+
Age Groups
Ag
e sp
ecif
ic r
ates
/100
,000
p
eop
le
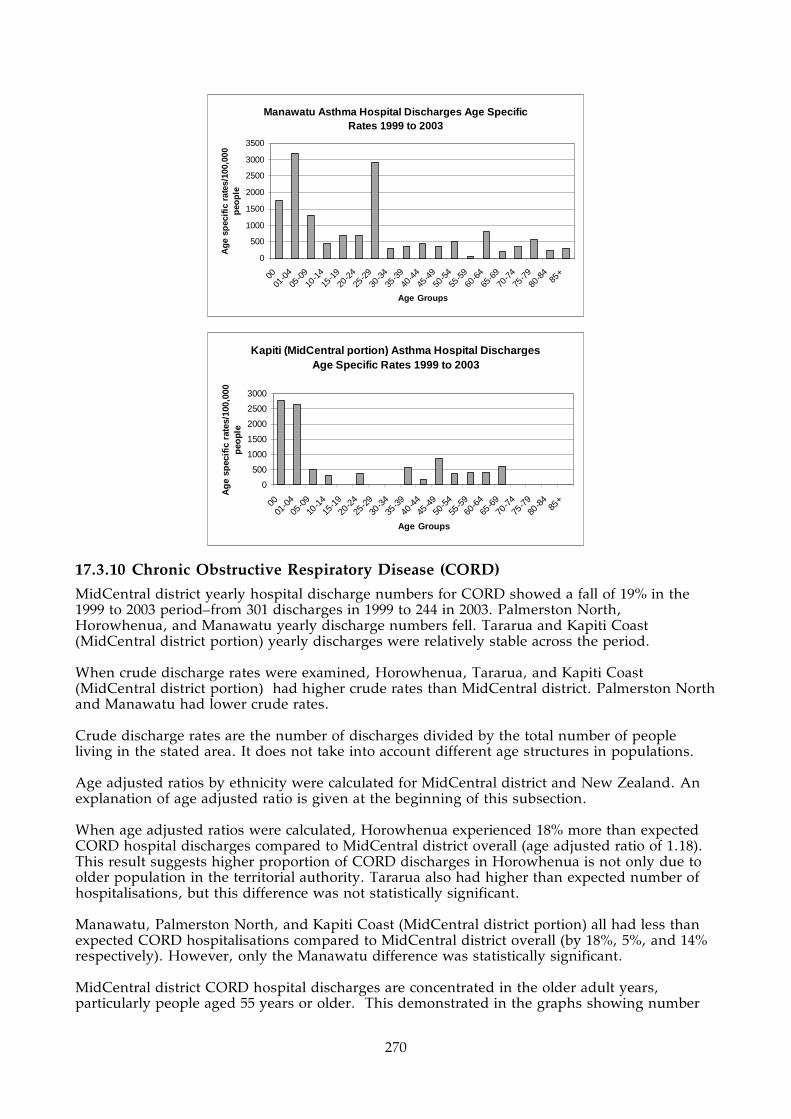
270
Manawatu Asthma Hospital Discharges Age Specific Rates 1999 to 2003
0
500
1000
1500
2000
2500
3000
3500
0001
-0405
-0910
-1415
-1920
-2425
-2930
-3435
-3940
-4445
-4950
-5455
-5960
-6465
-6970
-7475
-7980
-84
85+
Age Groups
Ag
e sp
ecif
ic r
ates
/100
,000
p
eop
le
Kapiti (MidCentral portion) Asthma Hospital Discharges Age Specific Rates 1999 to 2003
0
500
1000
1500
2000
2500
3000
0001
-0405
-0910
-1415
-1920
-2425
-2930
-3435
-3940
-4445
-4950
-5455
-5960
-6465
-6970
-7475
-7980
-84
85+
Age Groups
Ag
e sp
ecif
ic r
ates
/100
,000
p
eop
le
17.3.10 Chronic Obstructive Respiratory Disease (CORD)
MidCentral district yearly hospital discharge numbers for CORD showed a fall of 19% in the 1999 to 2003 period–from 301 discharges in 1999 to 244 in 2003. Palmerston North, Horowhenua, and Manawatu yearly discharge numbers fell. Tararua and Kapiti Coast (MidCentral district portion) yearly discharges were relatively stable across the period. When crude discharge rates were examined, Horowhenua, Tararua, and Kapiti Coast (MidCentral district portion) had higher crude rates than MidCentral district. Palmerston North and Manawatu had lower crude rates. Crude discharge rates are the number of discharges divided by the total number of people living in the stated area. It does not take into account different age structures in populations. Age adjusted ratios by ethnicity were calculated for MidCentral district and New Zealand. An explanation of age adjusted ratio is given at the beginning of this subsection. When age adjusted ratios were calculated, Horowhenua experienced 18% more than expected CORD hospital discharges compared to MidCentral district overall (age adjusted ratio of 1.18). This result suggests higher proportion of CORD discharges in Horowhenua is not only due to older population in the territorial authority. Tararua also had higher than expected number of hospitalisations, but this difference was not statistically significant. Manawatu, Palmerston North, and Kapiti Coast (MidCentral district portion) all had less than expected CORD hospitalisations compared to MidCentral district overall (by 18%, 5%, and 14% respectively). However, only the Manawatu difference was statistically significant. MidCentral district CORD hospital discharges are concentrated in the older adult years, particularly people aged 55 years or older. This demonstrated in the graphs showing number

271
of discharges across age groups, and age specific rates for all age bands. Age specific rates are the number of discharges per number of people within each five year age band. Horowhenua demonstrated a similar age distribution to MidCentral district, but the hospital discharge rates for people aged up to 79 years are higher than MidCentral district equivalent age specific rates. The Manawatu age distribution for CORD hospitalisations has a similar pattern to the MidCentral district one, although most age specific discharge rates are smaller than the MidCentral district equivalents. An exception is for the 80 to 84 years age band, which is higher than for MidCentral district 80 to 84 years old.
MidCentral Number of Chronic Obstructive Respiratory Disease
Hospital Discharges by Territorial Authority 1999 to 2003
0
50
100
150
200
250
300
350
1999 2000 2001 2002 2003
Years
Number of events
Palmerston
North
Horow henua
Manaw atu
Tararua
Kapiti
(MidCentral
portion)MidCentral
1999 2000 2001 2002 2003
Palmerston North 127 111 101 102 96
Horowhenua 86 90 99 81 74
Manawatu 43 40 40 44 27
Tararua 32 31 55 34 30
Kapiti (MidCentral portion) 13 16 19 22 17
MidCentral 301 288 314 283 244
MidCentral Number of Chronic Obstructive Respiratory Disease Hospital Discharges by
Territorial Authority 1999 to 2003
No. of
events
Crude
rate/100,000
people
Age
adjusted
ratio
95%
confidence
limits
Palmerston North 537 746 0.95 0.87 - 1.04
Horowhenua 430 1440 1.18 1.07 - 1.29
Manawatu 194 706 0.82 0.7 - 0.93
Tararua 182 1020 1.11 0.95 - 1.27
Kapiti (MidCentral portion) 87 1120 0.86 0.68 - 1.04
MidCentral 1430 923 1
MidCentral Indirect Age Adjusted Ratios (MidCentral overall as comparison)
Chronic Obstructive Respiratory Disease Hospital Discharges by Territorial
Authority 1999 to 2003
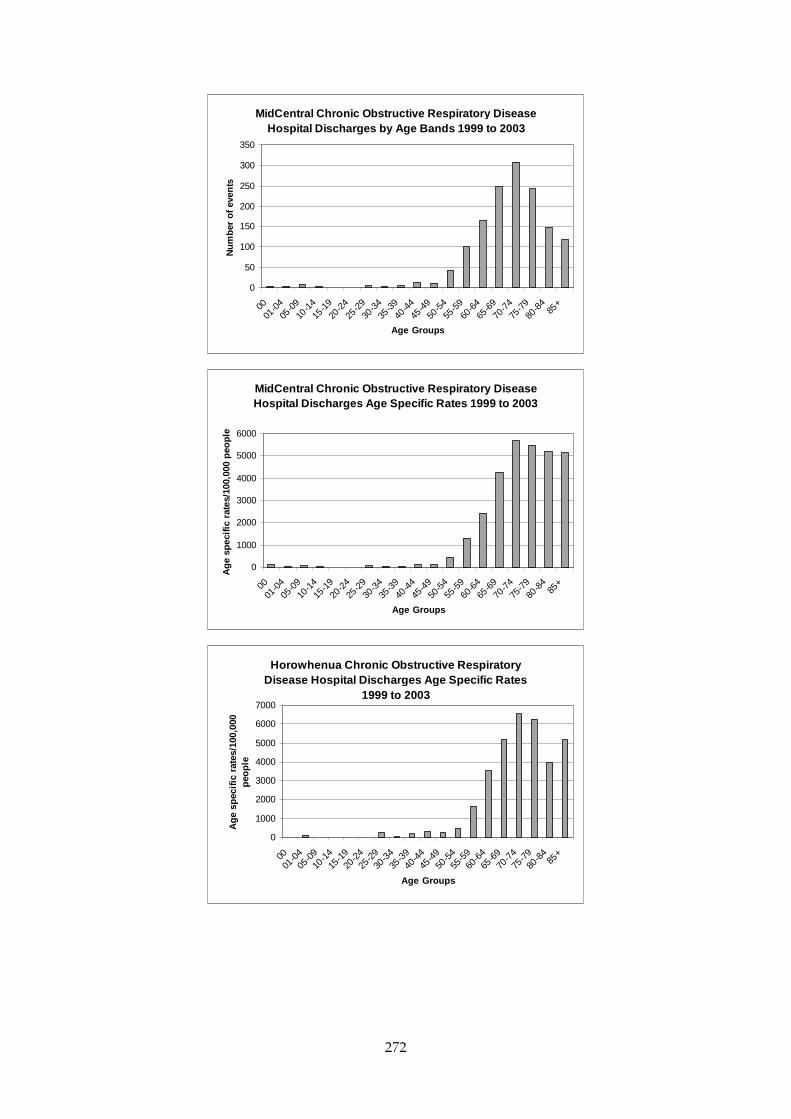
272
MidCentral Chronic Obstructive Respiratory Disease Hospital Discharges by Age Bands 1999 to 2003
0
50
100
150
200
250
300
350
0001
-0405
-0910
-1415
-1920
-2425
-2930
-3435
-3940
-4445
-4950
-5455
-5960
-6465
-6970
-7475
-7980
-84
85+
Age Groups
Nu
mb
er o
f ev
ents
MidCentral Chronic Obstructive Respiratory Disease Hospital Discharges Age Specific Rates 1999 to 2003
0
1000
2000
3000
4000
5000
6000
0001
-0405
-0910
-1415
-1920
-2425
-2930
-3435
-3940
-4445
-4950
-5455
-5960
-6465
-6970
-7475
-7980
-84
85+
Age Groups
Ag
e sp
ecif
ic r
ates
/100
,000
peo
ple
Horowhenua Chronic Obstructive Respiratory Disease Hospital Discharges Age Specific Rates
1999 to 2003
0
1000
2000
3000
4000
5000
6000
7000
0001
-0405
-0910
-1415
-1920
-2425
-2930
-3435
-3940
-4445
-4950
-5455
-5960
-6465
-6970
-7475
-7980
-84
85+
Age Groups
Ag
e sp
ecif
ic r
ates
/100
,000
p
eop
le
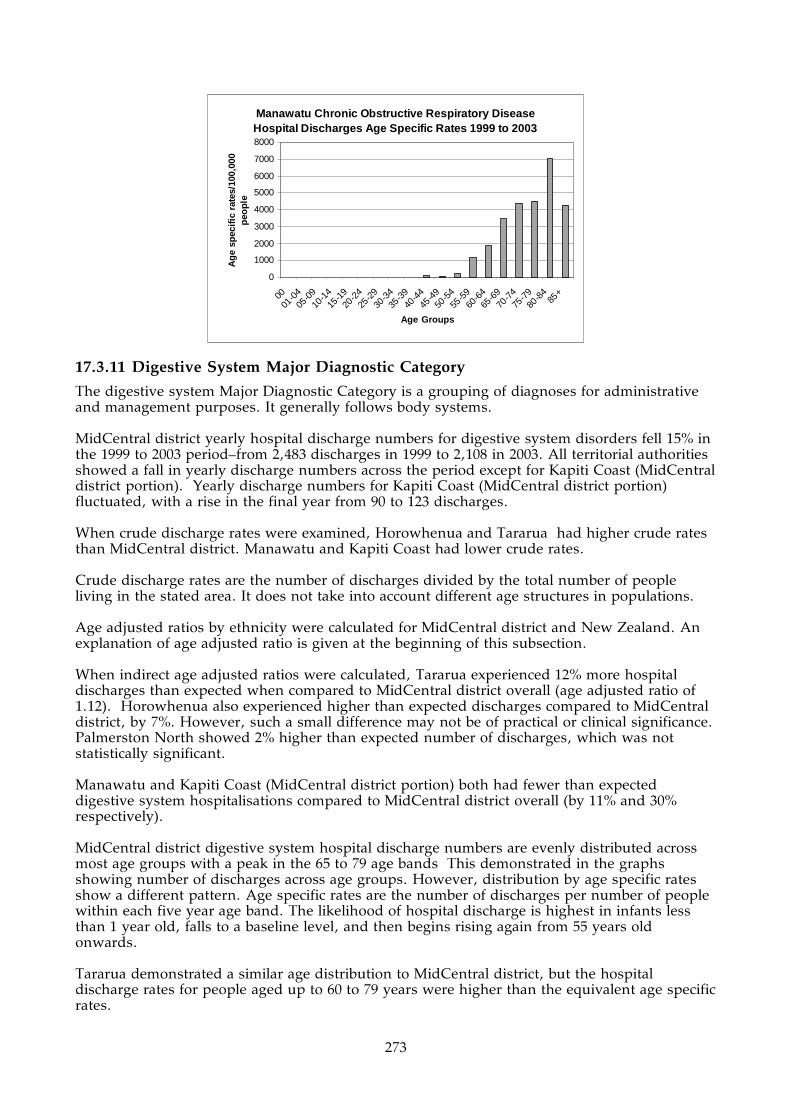
273
Manawatu Chronic Obstructive Respiratory Disease Hospital Discharges Age Specific Rates 1999 to 2003
0
1000
2000
3000
4000
5000
6000
7000
8000
0001
-0405
-0910
-1415
-1920
-2425
-2930
-3435
-3940
-4445
-4950
-5455
-5960
-6465
-6970
-7475
-7980
-84
85+
Age Groups
Ag
e sp
ecif
ic r
ates
/100
,000
p
eop
le
17.3.11 Digestive System Major Diagnostic Category
The digestive system Major Diagnostic Category is a grouping of diagnoses for administrative and management purposes. It generally follows body systems. MidCentral district yearly hospital discharge numbers for digestive system disorders fell 15% in the 1999 to 2003 period–from 2,483 discharges in 1999 to 2,108 in 2003. All territorial authorities showed a fall in yearly discharge numbers across the period except for Kapiti Coast (MidCentral district portion). Yearly discharge numbers for Kapiti Coast (MidCentral district portion) fluctuated, with a rise in the final year from 90 to 123 discharges. When crude discharge rates were examined, Horowhenua and Tararua had higher crude rates than MidCentral district. Manawatu and Kapiti Coast had lower crude rates. Crude discharge rates are the number of discharges divided by the total number of people living in the stated area. It does not take into account different age structures in populations. Age adjusted ratios by ethnicity were calculated for MidCentral district and New Zealand. An explanation of age adjusted ratio is given at the beginning of this subsection. When indirect age adjusted ratios were calculated, Tararua experienced 12% more hospital discharges than expected when compared to MidCentral district overall (age adjusted ratio of 1.12). Horowhenua also experienced higher than expected discharges compared to MidCentral district, by 7%. However, such a small difference may not be of practical or clinical significance. Palmerston North showed 2% higher than expected number of discharges, which was not statistically significant. Manawatu and Kapiti Coast (MidCentral district portion) both had fewer than expected digestive system hospitalisations compared to MidCentral district overall (by 11% and 30% respectively). MidCentral district digestive system hospital discharge numbers are evenly distributed across most age groups with a peak in the 65 to 79 age bands This demonstrated in the graphs showing number of discharges across age groups. However, distribution by age specific rates show a different pattern. Age specific rates are the number of discharges per number of people within each five year age band. The likelihood of hospital discharge is highest in infants less than 1 year old, falls to a baseline level, and then begins rising again from 55 years old onwards. Tararua demonstrated a similar age distribution to MidCentral district, but the hospital discharge rates for people aged up to 60 to 79 years were higher than the equivalent age specific rates.

274
The Manawatu age distribution for digestive system hospitalisations has a similar pattern to the MidCentral district one, although there were some age specific rates within the peak discharge age groups that were smaller than the MidCentral district equivalents.
MidCentral Number of Digestive System (Major Diagnostic Category)
Hospital Discharges by Territorial Authority 1999 to 2003
0
500
1000
1500
2000
2500
3000
1999 2000 2001 2002 2003
Years
Number of events
Palmerston
North
Horow henua
Manaw atu
Tararua
Kapiti
(MidCentral
portion)MidCentral
1999 2000 2001 2002 2003
Palmerston North 1101 1100 1162 970 948
Horowhenua 568 580 503 501 449
Manawatu 412 365 337 341 329
Tararua 310 298 336 287 259
Kapiti (MidCentral portion) 92 70 79 90 123
MidCentral 2483 2413 2417 2189 2108
MidCentral Number of Digestive System (Major Diagnostic Category) Hospital Discharges
by Territorial Authority 1999 to 2003
No. of
events
Crude
rate/100,000
people
Age
adjusted
ratio
95%
confidence
limits
Palmerston North 5281 7330 1.02 0.99 - 1.05
Horowhenua 2601 8710 1.07 1.02 - 1.11
Manawatu 1784 6490 0.89 0.85 - 0.93
Tararua 1490 8330 1.12 1.06 - 1.17
Kapiti (MidCentral portion) 454 5850 0.70 0.64 - 0.77
MidCentral 11610 7490 1
MidCentral Indirect Age Adjusted Ratios (MidCentral overall as comparison)
Digestive System (Major Diagnostic Category) Hospital Discharges by
Territorial Authority 1999 to 2003

275
MidCentral Digestive System (Major Diagnostic Category) Hospital Discharges by Age Bands
1999 to 2003
0
200
400
600
800
1000
0001
-0405
-0910
-1415
-1920
-2425
-2930
-3435
-3940
-4445
-4950
-5455
-5960
-6465
-6970
-7475
-7980
-84
85+
Age Groups
Nu
mb
er o
f ev
ents
MidCentral Digestive System (Major Diagnostic Category) Hospital Discharges Age Specific Rates
1999 to 2003
0
5000
10000
15000
20000
25000
30000
0001
-0405
-0910
-1415
-1920
-2425
-2930
-3435
-3940
-4445
-4950
-5455
-5960
-6465
-6970
-7475
-7980
-84
85+
Age Groups
Ag
e sp
ecif
ic r
ates
/100
,000
p
eop
le
Tararua Digestive System (Major Diagnostic Category) Hospital Discharges Age Specific Rates
1999 to 2003
0
5000
10000
15000
20000
25000
30000
35000
0001
-0405
-0910
-1415
-1920
-2425
-2930
-3435
-3940
-4445
-4950
-5455
-5960
-6465
-6970
-7475
-7980
-84
85+
Age Groups
Ag
e sp
ecif
ic r
ates
/100
,000
p
eop
le
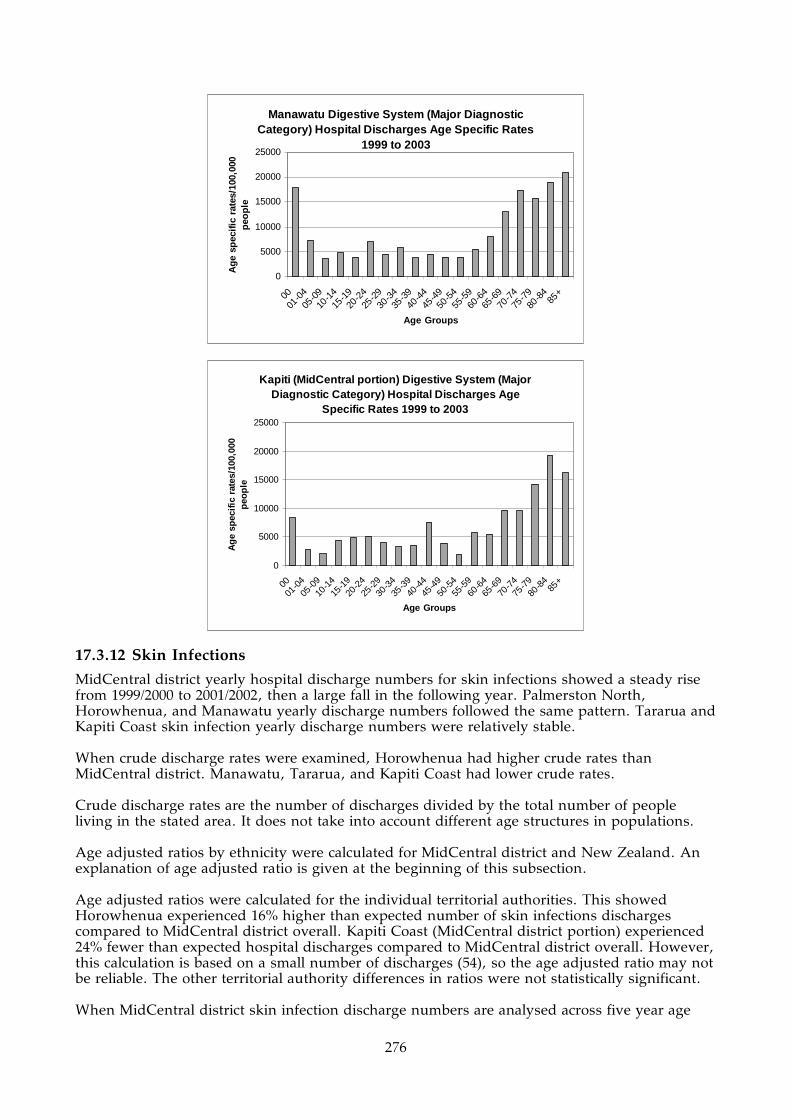
276
Manawatu Digestive System (Major Diagnostic Category) Hospital Discharges Age Specific Rates
1999 to 2003
0
5000
10000
15000
20000
25000
0001
-0405
-0910
-1415
-1920
-2425
-2930
-3435
-3940
-4445
-4950
-5455
-5960
-6465
-6970
-7475
-7980
-84
85+
Age Groups
Ag
e sp
ecif
ic r
ates
/100
,000
p
eop
le
Kapiti (MidCentral portion) Digestive System (Major Diagnostic Category) Hospital Discharges Age
Specific Rates 1999 to 2003
0
5000
10000
15000
20000
25000
0001
-0405
-0910
-1415
-1920
-2425
-2930
-3435
-3940
-4445
-4950
-5455
-5960
-6465
-6970
-7475
-7980
-84
85+
Age Groups
Ag
e sp
ecif
ic r
ates
/100
,000
p
eop
le
17.3.12 Skin Infections
MidCentral district yearly hospital discharge numbers for skin infections showed a steady rise from 1999/2000 to 2001/2002, then a large fall in the following year. Palmerston North, Horowhenua, and Manawatu yearly discharge numbers followed the same pattern. Tararua and Kapiti Coast skin infection yearly discharge numbers were relatively stable. When crude discharge rates were examined, Horowhenua had higher crude rates than MidCentral district. Manawatu, Tararua, and Kapiti Coast had lower crude rates. Crude discharge rates are the number of discharges divided by the total number of people living in the stated area. It does not take into account different age structures in populations. Age adjusted ratios by ethnicity were calculated for MidCentral district and New Zealand. An explanation of age adjusted ratio is given at the beginning of this subsection. Age adjusted ratios were calculated for the individual territorial authorities. This showed Horowhenua experienced 16% higher than expected number of skin infections discharges compared to MidCentral district overall. Kapiti Coast (MidCentral district portion) experienced 24% fewer than expected hospital discharges compared to MidCentral district overall. However, this calculation is based on a small number of discharges (54), so the age adjusted ratio may not be reliable. The other territorial authority differences in ratios were not statistically significant. When MidCentral district skin infection discharge numbers are analysed across five year age
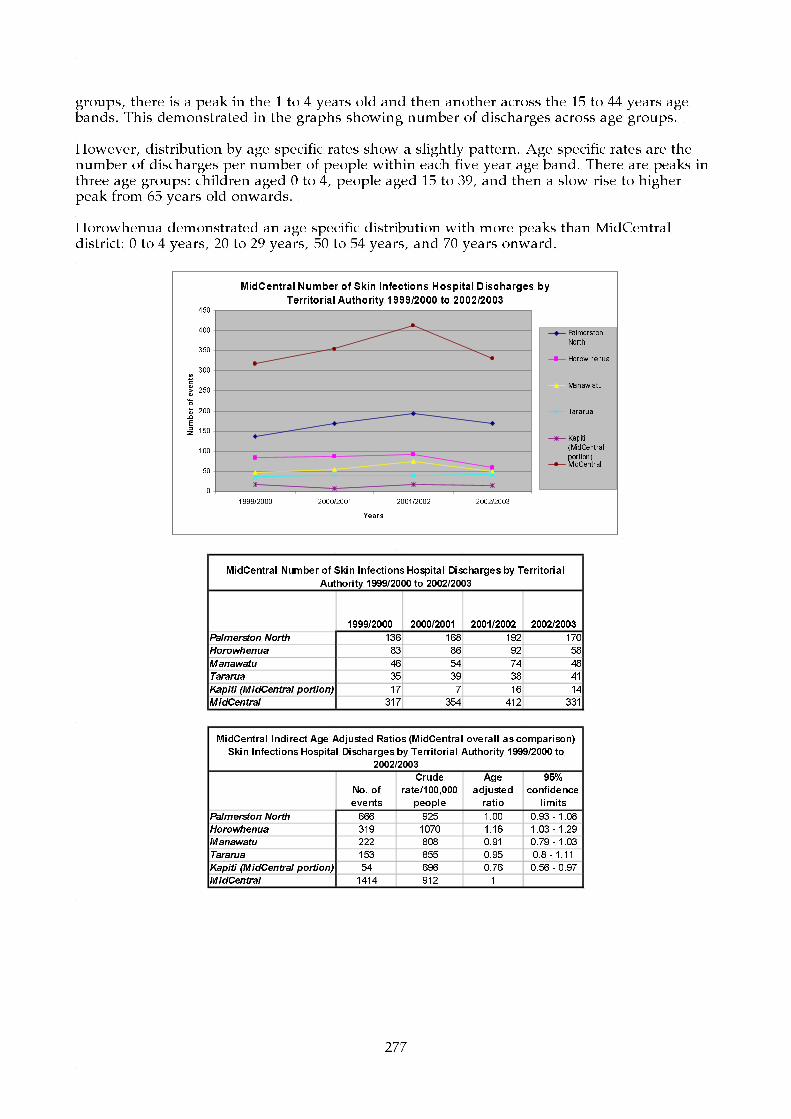
277
groups, there is a peak in the 1 to 4 years old and then another across the 15 to 44 years age bands. This demonstrated in the graphs showing number of discharges across age groups. However, distribution by age specific rates show a slightly pattern. Age specific rates are the number of discharges per number of people within each five year age band. There are peaks in three age groups: children aged 0 to 4, people aged 15 to 39, and then a slow rise to higher peak from 65 years old onwards. Horowhenua demonstrated an age specific distribution with more peaks than MidCentral district: 0 to 4 years, 20 to 29 years, 50 to 54 years, and 70 years onward.
MidCentral Number of Skin Infections Hospital Discharges by
Territorial Authority 1999/2000 to 2002/2003
0
50
100
150
200
250
300
350
400
450
1999/2000 2000/2001 2001/2002 2002/2003
Years
Number of events
Palmerston
North
Horow henua
Manaw atu
Tararua
Kapiti
(MidCentral
portion)MidCentral
1999/2000 2000/2001 2001/2002 2002/2003
Palmerston North 136 168 192 170
Horowhenua 83 86 92 58
Manawatu 46 54 74 48
Tararua 35 39 38 41
Kapiti (MidCentral portion) 17 7 16 14
MidCentral 317 354 412 331
MidCentral Number of Skin Infections Hospital Discharges by Territorial
Authority 1999/2000 to 2002/2003
No. of
events
Crude
rate/100,000
people
Age
adjusted
ratio
95%
confidence
limits
Palmerston North 666 925 1.00 0.93 - 1.08
Horowhenua 319 1070 1.16 1.03 - 1.29
Manawatu 222 808 0.91 0.79 - 1.03
Tararua 153 855 0.95 0.8 - 1.11
Kapiti (MidCentral portion) 54 696 0.76 0.56 - 0.97
MidCentral 1414 912 1
MidCentral Indirect Age Adjusted Ratios (MidCentral overall as comparison)
Skin Infections Hospital Discharges by Territorial Authority 1999/2000 to
2002/2003

278
MidCentral Skin Infections Hospital Discharges by Age Bands 1999/2000 to 2002/2003
0
20
40
60
80
100
120
140
0001
-0405
-0910
-1415
-1920
-2425
-2930
-3435
-3940
-4445
-4950
-5455
-5960
-6465
-6970
-7475
-7980
-84
85+
Age Groups
Nu
mb
er o
f ev
ents
MidCentral Skin Infections Hospital Discharges Age Specific Rates 1999/2000 to 2002/2003
0
500
1000
1500
2000
2500
0001
-0405
-0910
-1415
-1920
-2425
-2930
-3435
-3940
-4445
-4950
-5455
-5960
-6465
-6970
-7475
-7980
-84
85+
Age Groups
Ag
e sp
ecif
ic r
ates
/100
,000
p
eop
le
Horowhenua Skin Infections Hospital Discharges Age Specific Rates 1999/2000 to 2002/2003
0
500
1000
1500
2000
2500
0001
-0405
-0910
-1415
-1920
-2425
-2930
-3435
-3940
-4445
-4950
-5455
-5960
-6465
-6970
-7475
-7980
-84
85+
Age Groups
Ag
e sp
ecif
ic r
ates
/100
,000
p
eop
le
17.3.13 All Cause Injuries
The number of hospital discharges for all cause injuries fell by large proportions for MidCentral district and all territorial authorities. Tararua has the largest per capita rate of hospital discharge for all cause injuries (crude discharge rate). Manawatu and Kapiti Coast had lowest crude discharge rates. When differing population age structures were compensated for (using age adjusted ratios), Tararua and Horowhenua had higher than expected number of discharges compared to MidCentral district. When MidCentral district all cause injuries hospital discharge

279
data were analysed across five year age bands, people aged 1 to 44 years and 70 and older were more likely to experience hospitalisation. MidCentral district yearly hospital discharge numbers for all cause injuries fell 49% in the 1999 to 2003 period–from 981 discharges in 1999 to 537 in 2003. All territorial authorities showed a fall in yearly discharge numbers across the period. When crude discharge rates were examined, Tararua had higher crude rates than MidCentral district. Manawatu and Kapiti Coast had lower crude rates. Crude discharge rates are the number of discharges divided by the total number of people living in the stated area. It does not take into account different age structures in populations. Age adjusted ratios by ethnicity were calculated for MidCentral district and New Zealand. An explanation of age adjusted ratio is given at the beginning of this subsection. When age adjusted ratios were calculated, Tararua and Horowhenua both experienced higher than expected number of discharges compared to MidCentral district overall. Tararua by 26% and Horowhenua by 10% (age adjusted ratios of 1.26 and 1.1 respectively). Manawatu experienced 13% and Kapiti Coast (MidCentral district portion) 31% fewer than expected hospitalisations compared to MidCentral district overall (age adjusted ratios of 0.87 and 0.69 respectively). MidCentral district all cause injuries hospital discharge numbers peak in the age bands encompassing children and young adults–1 to 44 years old. This is demonstrated in the graphs showing number of discharges across age groups. However, distribution by age specific rates show a slightly altered pattern. Age specific rates are the number of discharges per number of people within each five year age band. The likelihood of hospitalisation is highest in people aged 1 to 44, as previously mentioned. It then falls to a baseline level, and begins rising again from 70 years old onwards. Tararua demonstrated a similar age distribution to MidCentral district, but the age specific rates for the peak five year age groups are often higher than MidCentral district equivalent age specific rates. Horowhenua distribution of age specific rates is similar to MidCentral district except there is no peak in the 70 and older age bands. Many of the 1 to 44 age specific rates are higher than their MidCentral district equivalents. Manawatu distribution of age specific rates is similar to MidCentral district but with a smaller peak in older adult age groups. Many of the 1 to 44 peak age specific rates are lower than corresponding MidCentral district age groups.

280
MidCentral Number of All Cause Injuries Hospital Discharges by
Territorial Authority 1999 to 2003
0
200
400
600
800
1000
1200
1999 2000 2001 2002 2003
Years
Number of events
Palmerston
North
Horow henua
Manaw atu
Tararua
Kapiti
(MidCentral
portion)MidCentral
1999 2000 2001 2002 2003
Palmerston North 485 351 343 283 248
Horowhenua 179 155 158 115 109
Manawatu 144 118 100 102 79
Tararua 144 110 93 82 84
Kapiti (MidCentral portion) 29 19 34 15 17
MidCentral 981 753 728 597 537
MidCentral Number of All Cause Injuries Hospital Discharges by Territorial Authority 1999
to 2003
No. of
events
Crude
rate/100,000
people
Age
adjusted
ratio
95%
confidence
limits
Palmerston North 1710 2370 0.98 0.93 - 1.03
Horowhenua 716 2400 1.10 1.01 - 1.18
Manawatu 543 1980 0.87 0.79 - 0.94
Tararua 513 2870 1.26 1.15 - 1.37
Kapiti (MidCentral portion) 114 1470 0.69 0.57 - 0.82
MidCentral 3596 2320 1
MidCentral Indirect Age Adjusted Ratios (MidCentral overall as comparison)
All Cause Injuries Hospital Discharges by Territorial Authority 1999 to 2003
MidCentral All Cause Injuries Hospital Discharges by
Age Bands 1999 to 2003
0
100
200
300
400
500
600
00
01-04
05-09
10-14
15-19
20-24
25-29
30-34
35-39
40-44
45-49
50-54
55-59
60-64
65-69
70-74
75-79
80-8485+
Age Groups
Number of events
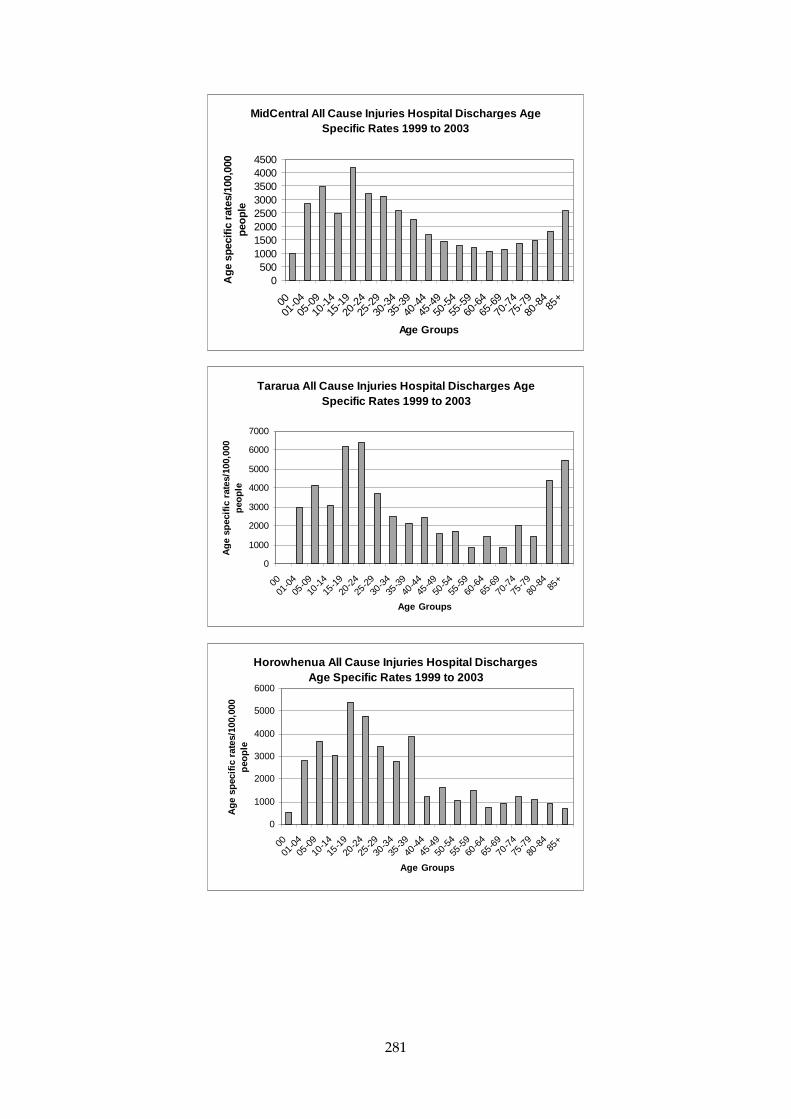
281
MidCentral All Cause Injuries Hospital Discharges Age Specific Rates 1999 to 2003
0500
10001500200025003000350040004500
0001
-0405
-0910
-1415
-1920
-2425
-2930
-3435
-3940
-4445
-4950
-5455
-5960
-6465
-6970
-7475
-7980
-84
85+
Age Groups
Ag
e sp
ecif
ic r
ates
/100
,000
p
eopl
e
Tararua All Cause Injuries Hospital Discharges Age Specific Rates 1999 to 2003
0
1000
2000
3000
4000
5000
6000
7000
0001
-0405
-0910
-1415
-1920
-2425
-2930
-3435
-3940
-4445
-4950
-5455
-5960
-6465
-6970
-7475
-7980
-84
85+
Age Groups
Ag
e sp
ecif
ic r
ates
/100
,000
p
eop
le
Horowhenua All Cause Injuries Hospital Discharges Age Specific Rates 1999 to 2003
0
1000
2000
3000
4000
5000
6000
0001
-0405
-0910
-1415
-1920
-2425
-2930
-3435
-3940
-4445
-4950
-5455
-5960
-6465
-6970
-7475
-7980
-84
85+
Age Groups
Ag
e sp
ecif
ic r
ates
/100
,000
p
eop
le

282
Manawatu All Cause Injuries Hospital Discharges Age Specific Rates 1999 to 2003
0
500
1000
1500
2000
2500
3000
3500
4000
0001
-0405
-0910
-1415
-1920
-2425
-2930
-3435
-3940
-4445
-4950
-5455
-5960
-6465
-6970
-7475
-7980
-84
85+
Age Groups
Ag
e sp
ecif
ic r
ates
/100
,000
p
eop
le
17.4 Cancer Registration Territorial Authority Comparison Horowhenua and Kapiti Coast (MidCentral district portion) had higher crude registration rates. This is probably due to their older age structures. Crude registration rates are the number of cancer registrations divided by the total number of people living in the stated area. It does not take into account different age structures in different populations. Age adjusted ratios prevent dissimilar age balances in different populations distorting population rates of cancer registration. This is because cancer is most likely to occur in older than younger age groups. Therefore, different non age adjusted rates of cancer registration may be due to differences in population age structures and not because the risk of cancer is higher or lower. An age adjusted ratio is a ratio of actual number of cancer registrations divided by the expected number of cancer registrations. The expected number of registrations is calculated using the registration rates from a comparison population. Age adjusted ratios therefore compare a target population to a predetermined comparison population, compensating for any differences in age structure at the same time. MidCentral district overall has been set as the comparison population and has been set the ratio of 1. The individual territorial authorities cancer registrations have been compared to this ratio. Territorial authority age adjusted ratios exceeding 1 mean the territorial authority experienced more registrations than expected when compared against MidCentral district overall. Ratios below 1 mean the territorial authority experienced less cancer registrations when compared against MidCentral district overall. When territorial authority cancer registration data were examined using age adjusted ratios, Manawatu’s cancer registrations were 13% lower than expected when compared against MidCentral district overall. Registration numbers for the other territorial authorities were close to expected when compared against MidCentral district overall.
1998 1999 2000Palmerston North 312 324 310Horowhenua 182 185 212Manawatu 116 120 91Tararua 62 89 94Kapiti (MidCentral portion) 51 41 44MidCentral 723 759 751
MidCentral Number of Neoplasm (Cancer) Registration by Territorial Authority 1998 to 2000
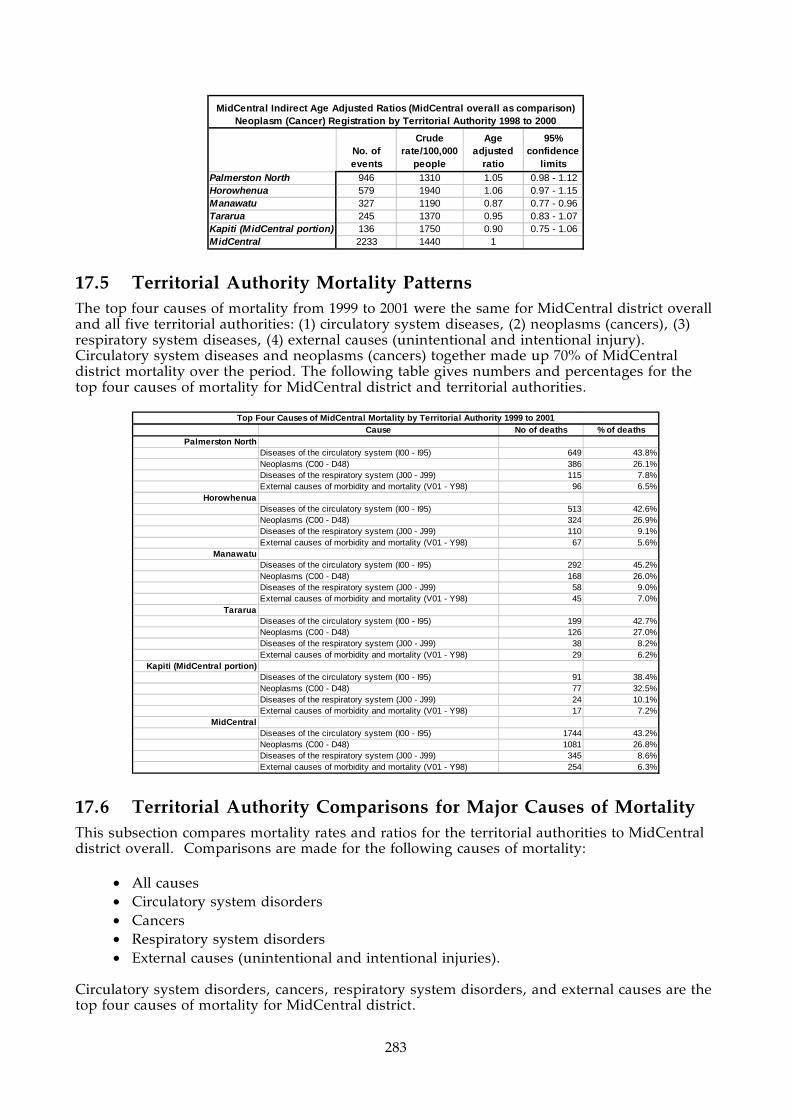
283
No. of events
Crude rate/100,000
people
Age adjusted
ratio
95% confidence
limitsPalmerston North 946 1310 1.05 0.98 - 1.12Horowhenua 579 1940 1.06 0.97 - 1.15Manawatu 327 1190 0.87 0.77 - 0.96Tararua 245 1370 0.95 0.83 - 1.07Kapiti (MidCentral portion) 136 1750 0.90 0.75 - 1.06MidCentral 2233 1440 1
MidCentral Indirect Age Adjusted Ratios (MidCentral overall as comparison) Neoplasm (Cancer) Registration by Territorial Authority 1998 to 2000
17.5 Territorial Authority Mortality Patterns The top four causes of mortality from 1999 to 2001 were the same for MidCentral district overall and all five territorial authorities: (1) circulatory system diseases, (2) neoplasms (cancers), (3) respiratory system diseases, (4) external causes (unintentional and intentional injury). Circulatory system diseases and neoplasms (cancers) together made up 70% of MidCentral district mortality over the period. The following table gives numbers and percentages for the top four causes of mortality for MidCentral district and territorial authorities.
Cause No of deaths % of deathsPalmerston North
Diseases of the circulatory system (I00 - I95) 649 43.8%Neoplasms (C00 - D48) 386 26.1%Diseases of the respiratory system (J00 - J99) 115 7.8%External causes of morbidity and mortality (V01 - Y98) 96 6.5%
HorowhenuaDiseases of the circulatory system (I00 - I95) 513 42.6%Neoplasms (C00 - D48) 324 26.9%Diseases of the respiratory system (J00 - J99) 110 9.1%External causes of morbidity and mortality (V01 - Y98) 67 5.6%
ManawatuDiseases of the circulatory system (I00 - I95) 292 45.2%Neoplasms (C00 - D48) 168 26.0%Diseases of the respiratory system (J00 - J99) 58 9.0%External causes of morbidity and mortality (V01 - Y98) 45 7.0%
TararuaDiseases of the circulatory system (I00 - I95) 199 42.7%Neoplasms (C00 - D48) 126 27.0%Diseases of the respiratory system (J00 - J99) 38 8.2%External causes of morbidity and mortality (V01 - Y98) 29 6.2%
Kapiti (MidCentral portion)Diseases of the circulatory system (I00 - I95) 91 38.4%Neoplasms (C00 - D48) 77 32.5%Diseases of the respiratory system (J00 - J99) 24 10.1%External causes of morbidity and mortality (V01 - Y98) 17 7.2%
MidCentralDiseases of the circulatory system (I00 - I95) 1744 43.2%Neoplasms (C00 - D48) 1081 26.8%Diseases of the respiratory system (J00 - J99) 345 8.6%External causes of morbidity and mortality (V01 - Y98) 254 6.3%
Top Four Causes of MidCentral Mortality by Territorial Authority 1999 to 2001
17.6 Territorial Authority Comparisons for Major Causes of Mortality This subsection compares mortality rates and ratios for the territorial authorities to MidCentral district overall. Comparisons are made for the following causes of mortality:
• All causes • Circulatory system disorders • Cancers • Respiratory system disorders • External causes (unintentional and intentional injuries).
Circulatory system disorders, cancers, respiratory system disorders, and external causes are the top four causes of mortality for MidCentral district.

284
Both crude mortality rates and age adjusted ratios are used in these comparisons. Both are explained here. Crude rates are the number of deaths divided by the total number of people in the population of interest. It does not take into account different age structures in populations. Age adjusted ratios prevent dissimilar age balances in different populations distorting population rates of mortality. This is because most diseases causing death are more likely to occur in some age groups than others. Therefore, different rates of mortality may be due to differences in age structure and not because the risk of death is higher or lower. An age adjusted ratio is a ratio of actual number of deaths divided by expected number of deaths. The expected number of deaths is calculated using the mortality rates from a comparison population. Age adjusted ratios therefore compare a target population to a predetermined comparison population, compensating for any differences in age structure at the same time. For mortality, MidCentral district is the comparison population and has been set the ratio of 1. The individual territorial authorities have been compared to this ratio. Territorial authority age adjusted ratios exceeding 1 mean the territorial authority experienced more deaths than expected when compared against MidCentral district overall. Ratios below 1 mean the territorial authority experienced less deaths when compared against MidCentral district overall.
17.6.1 Mortality Due to All Causes
MidCentral district mortality due to all causes from 1999 to 2001 was analysed by territorial authority. Palmerston North had the highest number of deaths (1,481) from 1999 to 2001, followed by Horowhenua (1,205), Manawatu (646), Tararua (466), and Kapiti Coast (MidCentral district portion) (237). When the mortality numbers are expressed as crude rates, Horowhenua has the highest rate of deaths (4,040 deaths per 100,000 people over three years). Palmerston North has the lowest (2,060 deaths per 100,000 over three years). The crude rate for MidCentral district overall was 2,600 deaths per 100,000 people over three years. Crude rates are the number of deaths divided by the total number of people living in the stated area. It does not take into account different age structures in different populations. Age adjusted ratios were calculated for the territorial authorities. An explanation of age adjusted ratio is given at the beginning of this subsection. When different population age structures have been compensated for using age adjusted ratios, Horowhenua experienced 20% higher than expected number of deaths compared to MidCentral district overall (age adjusted ratio of 1.20). Palmerston North experienced 11% less than expected number of deaths compared to MidCentral district overall (age adjusted ratio of 0.89). Kapiti Coast (MidCentral district portion) also had a lower than expected age adjusted ratio, but this figure did not reach statistical significance.
1999 2000 2001Palmerston North 504 473 504Horowhenua 422 384 399Manawatu 230 190 226Tararua 144 156 166Kapiti (MidCentral portion) 81 77 79MidCentral 1381 1280 1374
MidCentral Number of All Cause Mortality by Territorial Authority 1999 to 2001

285
No. of events
Crude rate/100,000
people
Age adjusted
ratio
95% confidence
limitsPalmerston North 1481 2060 0.89 0.84 - 0.94Horowhenua 1205 4040 1.20 1.13 - 1.27Manawatu 646 2350 1.00 0.92 - 1.08Tararua 466 2600 1.01 0.91 - 1.1Kapiti (MidCentral portion) 237 3050 0.91 0.8 - 1.03MidCentral 4035 2600 1
MidCentral Indirect Age Adjusted Ratios (MidCentral overall as comparison) All Cause Mortality by Territorial Authority 1999 to 2001
When MidCentral district all cause mortality was analysed by age group, it showed the risk of mortality increases with increasing age. This pattern is the same across all territorial authorities. When Horowhenua age specific rates (number of deaths divided by the number of people within each age band) were compared to MidCentral district equivalents, it showed that Horowhenua rates were higher than MidCentral district ones across most five year age bands from 15 to 79. When Palmerston North age specific rates (number of deaths divided by the number of people within each age band) were compared to MidCentral district equivalents, it showed almost exactly the opposite pattern to Horowhenua. Palmerston North rates were lower than MidCentral district for most, but not all, age groups.
MidCentral All Cause Mortality by Age Bands 1999 to 2001
0
200
400
600
800
1000
1200
0001
-0405
-0910
-1415
-1920
-2425
-2930
-3435
-3940
-4445
-4950
-5455
-5960
-6465
-6970
-7475
-7980
-84
85+
Age Groups
Nu
mb
er o
f ev
ents

286
MidCentral All Cause Mortality Age Specific Rates 1999 to 2001
0
10000
20000
30000
40000
50000
60000
0001
-0405
-0910
-1415
-1920
-2425
-2930
-3435
-3940
-4445
-4950
-5455
-5960
-6465
-6970
-7475
-7980
-84
85+
Age Groups
Ag
e sp
ecif
ic r
ates
/100
,000
p
eop
le
Horowhenua All Cause Mortality Age Specific Rates 1999 to 2001
0
10000
20000
30000
40000
50000
60000
0001
-0405
-0910
-1415
-1920
-2425
-2930
-3435
-3940
-4445
-4950
-5455
-5960
-6465
-6970
-7475
-7980
-84
85+
Age Groups
Ag
e sp
ecif
ic r
ates
/100
,000
p
eop
le
Palmerston North All Cause Mortality Age Specific Rates 1999 to 2001
0
5000
10000
15000
20000
25000
30000
35000
40000
45000
0001
-0405
-0910
-1415
-1920
-2425
-2930
-3435
-3940
-4445
-4950
-5455
-5960
-6465
-6970
-7475
-7980
-8485
+
Age Groups
Ag
e sp
ecif
ic r
ates
/100
,000
p
eop
le
17.6.2 Circulatory System Mortality
Circulatory System disease is the biggest cause of mortality for all territorial authorities, and for MidCentral district overall.
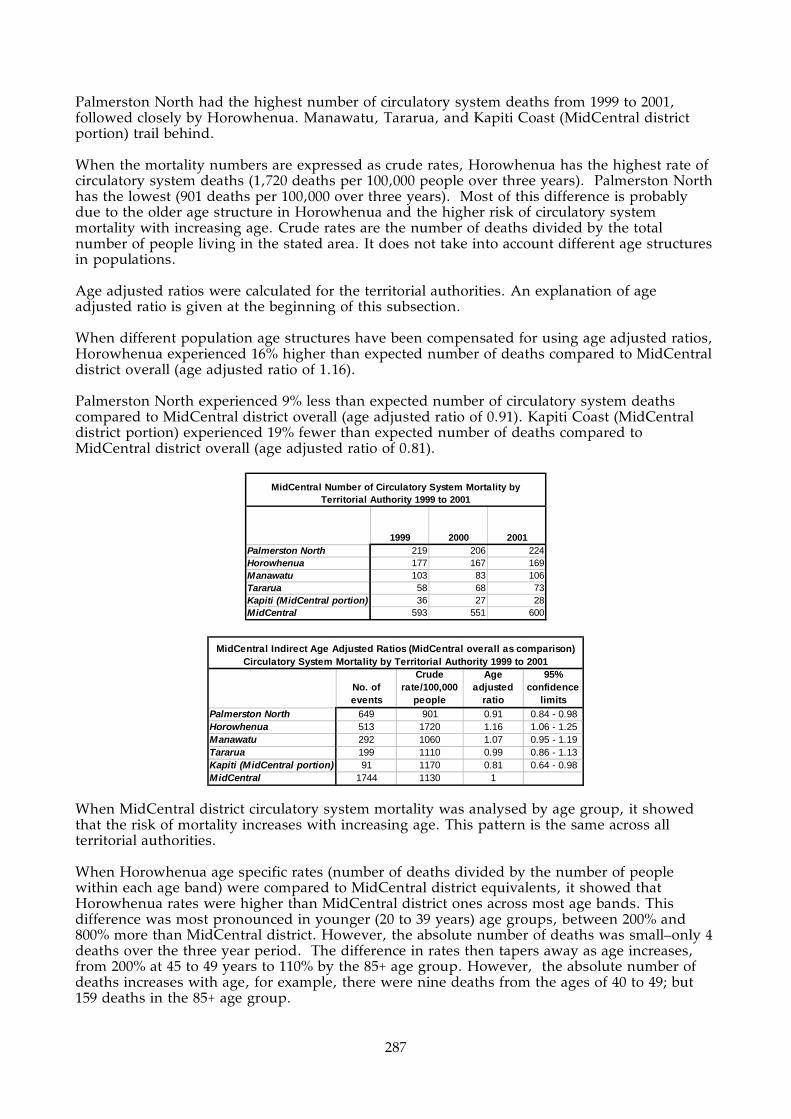
287
Palmerston North had the highest number of circulatory system deaths from 1999 to 2001, followed closely by Horowhenua. Manawatu, Tararua, and Kapiti Coast (MidCentral district portion) trail behind. When the mortality numbers are expressed as crude rates, Horowhenua has the highest rate of circulatory system deaths (1,720 deaths per 100,000 people over three years). Palmerston North has the lowest (901 deaths per 100,000 over three years). Most of this difference is probably due to the older age structure in Horowhenua and the higher risk of circulatory system mortality with increasing age. Crude rates are the number of deaths divided by the total number of people living in the stated area. It does not take into account different age structures in populations. Age adjusted ratios were calculated for the territorial authorities. An explanation of age adjusted ratio is given at the beginning of this subsection. When different population age structures have been compensated for using age adjusted ratios, Horowhenua experienced 16% higher than expected number of deaths compared to MidCentral district overall (age adjusted ratio of 1.16). Palmerston North experienced 9% less than expected number of circulatory system deaths compared to MidCentral district overall (age adjusted ratio of 0.91). Kapiti Coast (MidCentral district portion) experienced 19% fewer than expected number of deaths compared to MidCentral district overall (age adjusted ratio of 0.81).
1999 2000 2001Palmerston North 219 206 224Horowhenua 177 167 169Manawatu 103 83 106Tararua 58 68 73Kapiti (MidCentral portion) 36 27 28MidCentral 593 551 600
MidCentral Number of Circulatory System Mortality by Territorial Authority 1999 to 2001
No. of events
Crude rate/100,000
people
Age adjusted
ratio
95% confidence
limitsPalmerston North 649 901 0.91 0.84 - 0.98Horowhenua 513 1720 1.16 1.06 - 1.25Manawatu 292 1060 1.07 0.95 - 1.19Tararua 199 1110 0.99 0.86 - 1.13Kapiti (MidCentral portion) 91 1170 0.81 0.64 - 0.98MidCentral 1744 1130 1
MidCentral Indirect Age Adjusted Ratios (MidCentral overall as comparison) Circulatory System Mortality by Territorial Authority 1999 to 2001
When MidCentral district circulatory system mortality was analysed by age group, it showed that the risk of mortality increases with increasing age. This pattern is the same across all territorial authorities. When Horowhenua age specific rates (number of deaths divided by the number of people within each age band) were compared to MidCentral district equivalents, it showed that Horowhenua rates were higher than MidCentral district ones across most age bands. This difference was most pronounced in younger (20 to 39 years) age groups, between 200% and 800% more than MidCentral district. However, the absolute number of deaths was small–only 4 deaths over the three year period. The difference in rates then tapers away as age increases, from 200% at 45 to 49 years to 110% by the 85+ age group. However, the absolute number of deaths increases with age, for example, there were nine deaths from the ages of 40 to 49; but 159 deaths in the 85+ age group.

288
When Palmerston North age specific rates (number of deaths divided by the number of people within each age band) were compared to MidCentral district equivalents, it showed almost exactly the opposite pattern to Horowhenua. Palmerston North rates were lower than MidCentral district for most, but not all, age groups. The difference was largest for younger age groups and then narrowed with increasing age. For example, Palmerston North circulatory system deaths were 27% of MidCentral district in the 35 to 39 age band (one death) and 96% in the 80 to 84 age band (127 deaths). Like Horowhenua, the absolute number of deaths escalates with increasing age. There were some young Palmerston North age groups with higher age specific rates than MidCentral district, but the number of deaths was small–four in three years.
MidCentral Circulatory System Mortality by Age Bands 1999 to 2001
0
100
200
300
400
500
600
700
0001
-0405
-0910
-1415
-1920
-2425
-2930
-3435
-3940
-4445
-4950
-5455
-5960
-6465
-6970
-7475
-7980
-84
85+
Age Groups
Nu
mb
er o
f ev
ents
MidCentral Circulatory System Mortality Age Specific Rates 1999 to 2001
0
5000
10000
15000
20000
25000
30000
0001
-0405
-0910
-1415
-1920
-2425
-2930
-3435
-3940
-4445
-4950
-5455
-5960
-6465
-6970
-7475
-7980
-8485
+
Age Groups
Ag
e sp
ecif
ic r
ates
/100
,000
p
eop
le

289
Horowhenua Circulatory System Mortality Age Specific Rates 1999 to 2001
0
5000
10000
15000
20000
25000
30000
0001
-0405
-0910
-1415
-1920
-2425
-2930
-3435
-3940
-4445
-4950
-5455
-5960
-6465
-6970
-7475
-7980
-8485
+
Age Groups
Ag
e sp
ecif
ic r
ates
/100
,000
p
eop
le
Palmerston North Circulatory System Mortality Age Specific Rates 1999 to 2001
0
5000
10000
15000
20000
25000
0001
-0405
-0910
-1415
-1920
-2425
-2930
-3435
-3940
-4445
-4950
-5455
-5960
-6465
-6970
-7475
-7980
-84
85+
Age Groups
Ag
e sp
ecif
ic r
ates
/100
,000
peo
ple
17.6.3 Neoplasm (Cancer) Mortality
Neoplasm (or cancer) is the biggest cause of mortality for all territorial authorities, and for MidCentral district overall. About 27% of deaths in the 1999 to 2001 period was due to neoplasm (cancer). Palmerston North had the highest number of deaths from 1999 to 2001 due to neoplasms (cancers) with Horowhenua not far behind (386 and 324 respectively). Manawatu, Tararua, and Kapiti Coast (MidCentral district portion) follow (168, 126, and 77). Palmerston North showed a small decline in yearly deaths due to neoplasms (cancers) across the period. Manawatu, Tararua, and Kapiti Coast showed small increases. Horowhenua and Kapiti Coast had higher crude mortality rates compared to MidCentral district. Most of this is probably due to the higher proportion of older people in their population. The risk of cancer increases with age. Palmerston North and Manawatu had lower crude mortality rates compared to MidCentral district.

290
Crude rates are the number of deaths divided by the total number of people living in the stated area. It does not take into account different age structures in populations. Age adjusted ratios were calculated for the territorial authorities. An explanation of age adjusted ratio is given at the beginning of this subsection. The age adjusted ratios showed Horowhenua experienced 19% higher than expected neoplasm (cancer) deaths compared to MidCentral district overall. Palmerston North experienced 11% fewer than expected neoplasm (cancer) deaths compared to MidCentral district overall.
1999 2000 2001Palmerston North 142 123 121Horowhenua 111 105 108Manawatu 49 62 57Tararua 39 42 45Kapiti (MidCentral portion) 23 25 29MidCentral 364 357 360
MidCentral Number of Neoplasm (Cancer) Mortality by Territorial Authority 1999 to 2001
No. of events
Crude rate/100,000
people
Age adjusted
ratio
95% confidence
limitsPalmerston North 386 536 0.89 0.8 - 0.98Horowhenua 324 1090 1.19 1.06 - 1.32Manawatu 168 611 0.94 0.8 - 1.09Tararua 126 704 1.01 0.84 - 1.19Kapiti (MidCentral portion) 77 992 1.04 0.81 - 1.28MidCentral 1081 697 1
MidCentral Indirect Age Adjusted Ratios (MidCentral overall as comparison) Neoplasm (Cancer) Mortality by Territorial Authority 1999 to 2001
When MidCentral district deaths from neoplasms (cancers) is plotted against age bands, it shows the number of deaths increases until the 70 to 79, and then declines. However, when population numbers within each age band is taken into account (age specific rates), the risk of death from neoplasm continues rising with increasing age. The distribution of Horowhenua deaths across age bands was similar to MidCentral district. When age specific rates are compared, most age bands from 60 onwards have rates between five and 30% higher than MidCentral district equivalents. Some age bands from 20 to 50 show much higher percentage difference compared to MidCentral district, but the absolute numbers of deaths were small. For example, Horowhenua 20 to 24 age specific rate was 500% higher than the MidCentral district equivalent, but this equates to three deaths in Horowhenua and five in MidCentral district. Palmerston North/MidCentral district age specific rate comparisons are less clear cut. Some Palmerston North rates are higher; some lower. However, most 60 years plus age specific rates are about 12% to 20% lower than MidCentral district equivalents.

291
MidCentral Neoplasm (Cancer) Mortality by Age Bands 1999 to 2001
0
50
100
150
200
250
0001
-04
05-09
10-14
15-19
20-24
25-29
30-34
35-39
40-44
45-49
50-5
4
55-59
60-64
65-69
70-74
75-79
80-84
85+
Age Groups
Num
ber
of ev
ents
MidCentral Neoplasm (Cancer) Mortality Age Specific Rates 1999 to 2001
0
1000
2000
3000
4000
5000
6000
7000
0001
-0405
-0910
-1415
-1920
-2425
-2930
-3435
-3940
-4445
-4950
-5455
-5960
-6465
-6970
-7475
-7980
-84
85+
Age Groups
Ag
e sp
ecif
ic r
ates
/100
,000
p
eop
le
Horowhenua Neoplasm (Cancer) Mortality Age Specific Rates 1999 to 2001
0
1000
2000
3000
4000
5000
6000
7000
8000
0001
-0405
-0910
-1415
-1920
-2425
-2930
-3435
-3940
-4445
-4950
-5455
-5960
-6465
-6970
-7475
-7980
-84
85+
Age Groups
Ag
e sp
ecif
ic r
ates
/100
,000
p
eop
le

292
Palmerston North Neoplasm (Cancer) Mortality Age Specific Rates 1999 to 2001
0
1000
2000
3000
4000
5000
6000
0001
-04
05-09
10-14
15-19
20-24
25-29
30-34
35-39
40-44
45-49
50-54
55-59
60-64
65-69
70-74
75-79
80-84
85+
Age Groups
Age
spec
ific
rat
es/1
00,0
00 p
eople
17.6.4 Respiratory System Mortality
Respiratory system mortality was responsible for 8.6% of deaths in MidCentral district, the third most common cause of death in the 1999 to 2001 period. Palmerston North recorded the most respiratory system deaths in the three year period followed closely by Horowhenua (115 and 110 deaths respectively). Manawatu, Tararua, and Kapiti Coast trail. Most territorial authorities experienced a fall in yearly respiratory system deaths from 1999 to 2000, the exception being Kapiti Coast. Kapiti Coast deaths reduced by 50% (or five deaths) from 2000 to 2001. Both Horowhenua and Kapiti Coast had higher crude respiratory system mortality rates compared to MidCentral district overall. Most of this is probably due to the higher proportions of older people in their populations. The risk of death due to respiratory illness increases with age. Palmerston North had lower crude respiratory system mortality rates compared to overall MidCentral district. Crude rates are the number of deaths divided by the total number of people living in the stated area. It does not take into account different age structures in populations. Age adjusted ratios were calculated for the territorial authorities. An explanation of age adjusted ratio is given at the beginning of this subsection. When differences in population age structures were compensated for (using indirect age adjusted ratios), Horowhenua still had 25% higher than expected deaths compared to MidCentral district overall. Palmerston North had 18% fewer than expected deaths compared to overall MidCentral district. Both ratios just reached statistical significance. Kapiti Coast age adjusted ratio was similar to MidCentral district, suggesting its higher crude mortality rate is due to greater proportions of older people in its population.
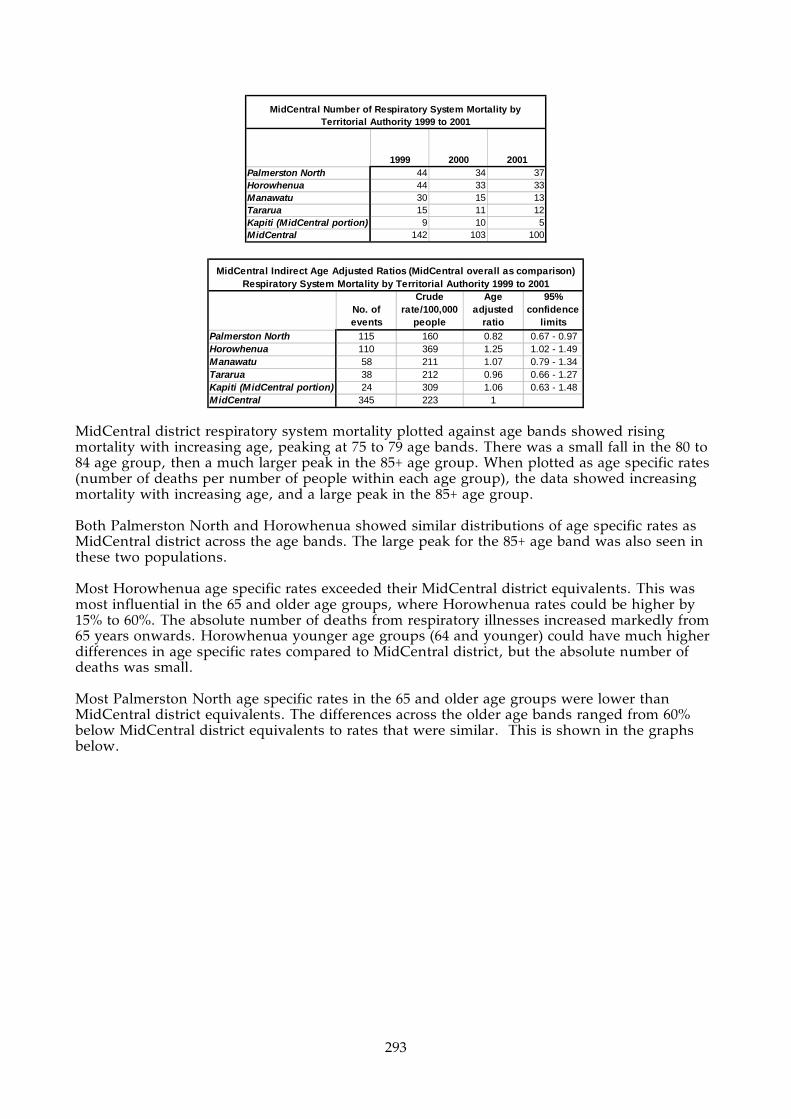
293
1999 2000 2001Palmerston North 44 34 37Horowhenua 44 33 33Manawatu 30 15 13Tararua 15 11 12Kapiti (MidCentral portion) 9 10 5MidCentral 142 103 100
MidCentral Number of Respiratory System Mortality by Territorial Authority 1999 to 2001
No. of events
Crude rate/100,000
people
Age adjusted
ratio
95% confidence
limitsPalmerston North 115 160 0.82 0.67 - 0.97Horowhenua 110 369 1.25 1.02 - 1.49Manawatu 58 211 1.07 0.79 - 1.34Tararua 38 212 0.96 0.66 - 1.27Kapiti (MidCentral portion) 24 309 1.06 0.63 - 1.48MidCentral 345 223 1
MidCentral Indirect Age Adjusted Ratios (MidCentral overall as comparison) Respiratory System Mortality by Territorial Authority 1999 to 2001
MidCentral district respiratory system mortality plotted against age bands showed rising mortality with increasing age, peaking at 75 to 79 age bands. There was a small fall in the 80 to 84 age group, then a much larger peak in the 85+ age group. When plotted as age specific rates (number of deaths per number of people within each age group), the data showed increasing mortality with increasing age, and a large peak in the 85+ age group. Both Palmerston North and Horowhenua showed similar distributions of age specific rates as MidCentral district across the age bands. The large peak for the 85+ age band was also seen in these two populations. Most Horowhenua age specific rates exceeded their MidCentral district equivalents. This was most influential in the 65 and older age groups, where Horowhenua rates could be higher by 15% to 60%. The absolute number of deaths from respiratory illnesses increased markedly from 65 years onwards. Horowhenua younger age groups (64 and younger) could have much higher differences in age specific rates compared to MidCentral district, but the absolute number of deaths was small. Most Palmerston North age specific rates in the 65 and older age groups were lower than MidCentral district equivalents. The differences across the older age bands ranged from 60% below MidCentral district equivalents to rates that were similar. This is shown in the graphs below.

294
MidCentral Respiratory System Mortality by Age Bands 1999 to 2001
0
20
40
60
80
100
120
0001
-0405
-0910
-1415
-1920
-2425
-2930
-3435
-3940
-4445
-4950
-5455
-5960
-6465
-6970
-7475
-7980
-84
85+
Age Groups
Nu
mb
er o
f ev
ents
MidCentral Respiratory System Mortality Age Specific Rates 1999 to 2001
0
1000
2000
3000
4000
5000
6000
0001
-0405
-0910
-1415
-1920
-2425
-2930
-3435
-3940
-4445
-4950
-5455
-5960
-6465
-6970
-7475
-7980
-84
85+
Age Groups
Ag
e sp
ecif
ic r
ates
/100
,000
peo
ple
Horowhenua Respiratory System Mortality Age Specific Rates 1999 to 2001
0
1000
2000
3000
4000
5000
6000
0001
-0405
-0910
-1415
-1920
-2425
-2930
-3435
-3940
-4445
-4950
-5455
-5960
-6465
-6970
-7475
-7980
-84
85+
Age Groups
Ag
e sp
ecif
ic r
ates
/100
,000
p
eop
le

295
Palmerston North Respiratory System Mortality Age Specific Rates 1999 to 2001
0
500
1000
1500
2000
2500
3000
3500
4000
0001
-0405
-0910
-1415
-1920
-2425
-2930
-3435
-3940
-4445
-4950
-5455
-5960
-6465
-6970
-7475
-7980
-84
85+
Age Groups
Ag
e sp
ecif
ic r
ates
/100
,000
p
eop
le
17.6.5 External Causes of Mortality
“External Causes of Morbidity and Mortality” is an ICD10 category which groups together causes of death due to unintentional or intentional injury. Examples include: transport accidents, accidental injury, drowning, exposure to smoke and fire, poisoning from venomous animals or plants, intentional self harm, assault, incidents of unclear intent, war, complications of surgical and medical care, and consequences of unintentional and intentional injury. External causes was the fourth largest cause of mortality in MidCentral district, responsible for 6.3% (or 254 deaths) from 1999 to 2001. However, the absolute mortality numbers are becoming small enough to limit analysis and interpretation, especially when subdivided further into territorial authorities. With small numbers, it becomes difficult to separate patterns of morbidity from random fluctuation. This should be kept in mind when reading this section. The yearly number of deaths due to external causes was reasonably stable across MidCentral district during the 1999 to 2001 period. There was some fluctuation in numbers for both MidCentral district and territorial authorities. Tararua appeared to experience a drop in yearly deaths from 1999 to 2001, but the numbers were small and might be due to random change. Palmerston North recorded the most deaths from external causes (96), followed by Horowhenua (67), Manawatu (45), Tararua (29), and Kapiti Coast (17). Horowhenua and Kapiti Coast had the highest crude mortality rate. Horowhenua experienced 224 deaths per 100,000 people over three years, and Kapiti Coast (MidCentral district portion) 219 deaths per 100,000 people over three years. Palmerston North had a lower crude mortality rate (133 deaths per 100,000 people over three years). Age adjusted ratios were calculated for the territorial authorities. An explanation of age adjusted ratio is given at the beginning of this subsection. When age adjusted ratios were calculated, Horowhenua and Kapiti Coast had higher than expected number of deaths compared with MidCentral district overall (age adjusted ratios of 1.29 and 1.28 respectively). However, these differences were not statistically significant. Palmerston North had 18% fewer than expected deaths compared with MidCentral district overall, which was statistically significant.

296
1999 2000 2001Palmerston North 30 34 32Horowhenua 24 17 26Manawatu 15 9 21Tararua 14 7 8Kapiti (MidCentral portion) 6 6 5MidCentral 89 73 92
MidCentral Number of External Causes Mortality by Territorial Authority 1999 to 2001
No. of events
Crude rate/100,000
people
Age adjusted
ratio
95% confidence
limitsPalmerston North 96 133 0.82 0.65 - 0.98Horowhenua 67 224 1.29 0.98 - 1.6Manawatu 45 164 1.05 0.74 - 1.36Tararua 29 162 1.02 0.65 - 1.39Kapiti (MidCentral portion) 17 219 1.28 0.67 - 1.9MidCentral 254 164 1
MidCentral Indirect Age Adjusted Ratios (MidCentral overall as comparison) External Causes Mortality by Territorial Authority 1999 to 2001
MidCentral district mortality from external causes plotted against age groups shows a peak in numbers from the ages of 15 to 44. The number of deaths begin to rise again from 70 onwards, with a very tall peak in the 85+ age group. There was some fluctuation between neighbouring age bands. Although most people who suffered death from external causes were young, the risk of death was greater for older people. Examining MidCentral district mortality by age specific rates (taking into consideration the population numbers within each age band), reduces the emphasis of the 15 to 44 age bands. The rising mortality rates in the 70 and older age groups was more pronounced. Palmerston North mortality numbers peaked in the 15 to 39 age groups, with another peak from 80 years onwards. Examination of age specific rates show higher risk for the 80 years and older age groups. When Palmerston North age specific rates are compared to MidCentral district equivalents, many age bands have lower rates, especially in the peak 15 to 29 and 70 to 85+ years. Horowhenua distribution of deaths across age bands is similar to the MidCentral district pattern, but with greater emphasis on the older age groups, from 75 onwards. Kapiti Coast absolute number of deaths were too small to create a consistent pattern when plotted on an age distribution graph.

297
MidCentral External Causes Mortality by Age Bands 1999 to 2001
0
5
10
15
20
25
30
35
0001
-0405
-0910
-1415
-1920
-2425
-2930
-3435
-3940
-4445
-4950
-5455
-5960
-6465
-6970
-7475
-7980
-84
85+
Age Groups
Nu
mb
er o
f ev
ents
MidCentral External Causes Mortality Age Specific Rates 1999 to 2001
0
200
400
600
800
1000
1200
1400
1600
0001
-0405
-0910
-1415
-1920
-2425
-2930
-3435
-3940
-4445
-4950
-5455
-5960
-6465
-6970
-7475
-7980
-84
85+
Age Groups
Ag
e sp
ecif
ic r
ates
/100
,000
p
eop
le
Palmerston North External Causes Mortality by Age Bands 1999 to 2001
0
2
4
6
8
10
12
14
0001
-0405
-0910
-1415
-1920
-2425
-2930
-3435
-3940
-4445
-4950
-5455
-5960
-6465
-6970
-7475
-7980
-84
85+
Age Groups
Nu
mb
er o
f ev
ents

298
Palmerston North External Causes Mortality Age Specific Rates 1999 to 2001
0
200
400
600
800
1000
1200
1400
0001
-0405
-0910
-1415
-1920
-2425
-2930
-3435
-3940
-4445
-4950
-5455
-5960
-6465
-6970
-7475
-7980
-84
85+
Age Groups
Ag
e sp
ecif
ic r
ates
/100
,000
peo
ple
Horowhenua External Causes Mortality by Age Bands 1999 to 2001
0
2
4
6
8
10
12
0001
-0405
-0910
-1415
-1920
-2425
-2930
-3435
-3940
-4445
-4950
-5455
-5960
-6465
-6970
-7475
-7980
-84
85+
Age Groups
Nu
mb
er o
f ev
ents
Horowhenua External Causes Mortality Age Specific Rates 1999 to 2001
0200400600800
100012001400160018002000
0001
-0405
-0910
-1415
-1920
-2425
-2930
-3435
-3940
-4445
-4950
-5455
-5960
-6465
-6970
-7475
-7980
-84
85+
Age Groups
Ag
e sp
ecif
ic r
ates
/100
,000
p
eop
le

299
Kapiti (MidCentral portion) External Causes Mortality by Age Bands 1999 to 2001
0
0.5
1
1.5
2
2.5
3
3.5
0001
-0405
-0910
-1415
-1920
-2425
-2930
-3435
-3940
-4445
-4950
-5455
-5960
-6465
-6970
-7475
-7980
-84
85+
Age Groups
Nu
mb
er o
f ev
ents
Kapiti (MidCentral portion) External Causes Mortality Age Specific Rates 1999 to 2001
0
200400
600
8001000
1200
14001600
1800
0001
-0405
-0910
-1415
-1920
-2425
-2930
-3435
-3940
-4445
-4950
-5455
-5960
-6465
-6970
-7475
-7980
-84
85+
Age Groups
Ag
e sp
ecif
ic r
ates
/100
,000
p
eop
le
300
18. MIDCENTRAL DISTRICT MOST SOCIOECONOMICALLY DISADVANTAGED CENSUS AREA UNITS
Key Points
• The most common causes of hospitalisation for people living in socioeconomically disadvantaged areas are similar to those for MidCentral district overall.
• The data analysed here suggest Maori health status disparity is worse in socioeconomically disadvantaged areas than for Maori living in MidCentral district overall.
• Hospitalisation rates for ischaemic heart disease, asthma, respiratory infections, chronic obstructive respiratory disease, skin infections, glue ear, and injuries were worse for socioeconomically disadvantaged areas compared to MidCentral district overall.
• The mortality rate from all causes combined is higher for socioeconomically disadvantaged people compared to MidCentral district overall.
• The mortality rates from the four most common causes of mortality are higher for socioeconomically disadvantaged people compared to MidCentral district overall. The four most common causes of mortality are: (1) circulatory disease, (2) cancers, (3) respiratory disease, and (4) external causes (unintentional and intentional injury).
18.1 Introduction This section analyses hospital discharge, cancer, and mortality data for the combined NZDep2001 9 and 10 graded MidCentral district census area units. These are the most socioeconomically disadvantaged areas in MidCentral district. NZDep2001 is a measure of socioeconomic difference between different areas in New Zealand. It grades small areas on a scale according to certain socioeconomic criteria. The scale runs from one to ten, with ten the most socioeconomically deprived. A variety of different studies have shown an association between disadvantaged NZDep scores and poorer health status (Ref: Crampton P, Salmond C, Kirkpatrick R. Degrees of Deprivation in New Zealand 2nd Edition. David Bateman, Auckland, 2004.) It is important to keep in mind that NZDep2001 grades areas and not individuals. A deprived area will have people who are not disadvantaged, and relatively non deprived areas will have people who are socioeconomically disadvantaged. The census area units by territorial authority are listed below.
Palmerston North • Awapuni North • Palmerston North Central • Massey University • Roslyn • Highbury
Horowhenua • Foxton • Foxton Beach • Levin South • Levin West • Playford Park • Shannon
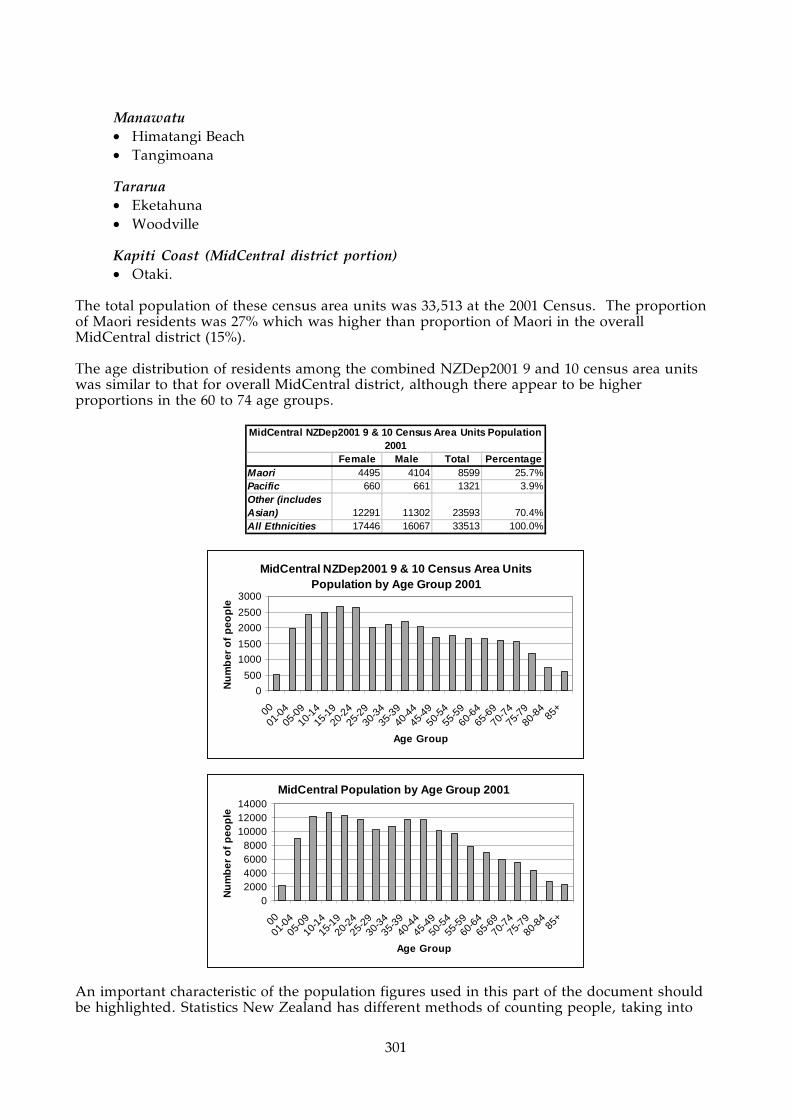
301
Manawatu • Himatangi Beach • Tangimoana
Tararua • Eketahuna • Woodville
Kapiti Coast (MidCentral district portion) • Otaki.
The total population of these census area units was 33,513 at the 2001 Census. The proportion of Maori residents was 27% which was higher than proportion of Maori in the overall MidCentral district (15%). The age distribution of residents among the combined NZDep2001 9 and 10 census area units was similar to that for overall MidCentral district, although there appear to be higher proportions in the 60 to 74 age groups.
Female Male Total PercentageMaori 4495 4104 8599 25.7%Pacific 660 661 1321 3.9%Other (includes Asian) 12291 11302 23593 70.4%All Ethnicities 17446 16067 33513 100.0%
MidCentral NZDep2001 9 & 10 Census Area Units Population 2001
MidCentral NZDep2001 9 & 10 Census Area Units Population by Age Group 2001
0
500
1000
1500
2000
2500
3000
00
01-0
405
-0910
-1415
-1920
-2425
-2930
-3435
-3940
-4445
-4950
-5455
-5960
-6465
-6970
-7475
-7980
-84
85+
Age Group
Nu
mb
er o
f p
eop
le
MidCentral Population by Age Group 2001
02000400060008000
100001200014000
00
01-0
405
-0910
-1415
-1920
-2425
-2930
-3435
-3940
-4445
-4950
-5455
-5960
-6465
-6970
-7475
-7980
-84
85+
Age Group
Nu
mb
er o
f p
eop
le
An important characteristic of the population figures used in this part of the document should be highlighted. Statistics New Zealand has different methods of counting people, taking into

302
account different factors. The population figures used in this section are “estimated resident population”. This type of count excludes overseas visitors and excludes:
• Residents temporarily overseas on census night • Residents who were missed or counted more than once by the census • Births, deaths, and net migration between census night and the given date of the
estimate. Population figures are used to calculate many of the disease and mortality rates and ratios used in this section. Because a different type of population count was used for this, there could be some small differences for the same rate in this section compared to elsewhere in the document. However, this does not affect comparisons between different groups of people within this section, because they are all based on estimated resident population.
18.2 Hospital Discharges Analysis The total number of yearly hospital discharges for the disadvantaged census area units declined by approximately 14% across the 1999/2000 to 2002/2003 period. When the hospital discharges were divided into Major Diagnostic Categories, which broadly correspond to body systems, the five most common were:
1. Circulatory system (13.5%) 2. Pregnancy/birth (12.4%) 3. Digestive system (10.3%) 4. Musculoskeletal system (9.3%) 5. Respiratory system (9.0%).
When the Major Diagnostic Category discharges were examined over the 1999/2000 to 2002/2003 period, most of the common categories showed a decline in number of yearly discharges. Circulatory system discharges showed a small decrease, 7.8%. There was a 31% reduction in the number of “pregnancy/birth” discharges. Musculoskeletal system discharges also showed a large fall over period–26.5%. Respiratory system discharges for 2002/2003 were 23.4% lower than for 1999/2000, but it is unclear whether this reduction is a trend or just random fluctuation. Respiratory system discharges across the four year period tended to undulate. The most common diagnoses within the Major Diagnostic Categories were:
• For Circulatory system, the top three diagnoses were (with ICD10 codes in parentheses):
o Ischaemic heart disease (I20–I25) This is by far the most dominant circulatory system diagnosis, and is heart disease due to blockage of the arteries supplying the heart muscle. It includes myocardial infarction (heart attack), and angina
o Other forms of heart disease (I30–I52) This is a mixture of heart conditions, including valve disease not due to rheumatic fever, abnormal heart rhythms, inflammation of various layers of the heart (endocarditis, myocarditis, and pericarditis)
o Symptoms, signs, and abnormal clinical and laboratory findings, not elsewhere classified (R00–R99). This is where the patient experiences an abnormal circulatory system symptom, examination abnormality, or test result, but without enough evidence to reach a diagnosis.
• For pregnancy/birth, the top four types of diagnoses were:
o Complications of labour and delivery (ICD10 codes O60–O75) o Maternal care related to the foetus and amniotic cavity and possible delivery

303
problems (ICD10 codes O30–O48) This grouping includes hospitalisation for maternal care for various problems (for example, malpresentation of foetus, foetal abnormality or damage); placental problems; polyhydramnios (excessive amniotic fluid); false labour; prolonged labour; or premature rupture of membranes
o Delivery (O80–O82) This is delivery of a normal baby
o Pregnancy with abortive outcome (for example, miscarriage) (O00–O08) The medical and lay understanding of the word abortion differs. Medically, abortion covers what laypeople would call miscarriage.
• For digestive system, the top diagnoses were:
o “Symptoms, signs, and abnormal clinical and laboratory findings, not elsewhere classified” (R00–R99) This is where the patient experiences an abnormal symptom, examination abnormality, or test result, but without enough evidence to conclude a diagnosis
o Other diseases of intestines (K55–K63) This is a mixture of intestinal conditions, including diverticular disease, anal or rectal abscesses, irritable bowel, and fissures or fistula. This grouping excludes intestinal infections, non infective inflammation, and cancers
o Other common digestive system disorders were malignant neoplasms (cancers) (C15–C96) and hernia (K40–K46).
• For musculoskeletal system (muscle and skeleton), the top diagnoses were:
o “Injury, poisoning, and certain other consequences of external causes” (S00–T98) This was by far the most dominant musculoskeletal diagnostic grouping, almost reaching 41% of musculoskeletal system discharges. Some examples of musculoskeletal injuries are: wounds, fractures, and joint dislocations. There were no poisonings for the Musculoskeletal system (despite the name of the grouping)
o Arthrosis (M15–M19) These are diseases of the joints, but exclude inflammatory joint diseases (like rheumatoid arthritis, juvenile arthritis, psoriatic arthritis, gout, other forms of arthritis) and joint infections. This grouping would include osteoarthritis (wear and tear arthritis)
o Other joint disorders (M20–M25) This is a mixture of joint and bone disorders not mentioned in the other ICD10 musculoskeletal groupings, for example, acquired deformities, disorders of patella (kneecap), internal derangements of the knee, and other joint disorders not mentioned in the other groupings. It excludes inflammatory joint disease, joint infections, arthrosis, and spinal disorders.
• For Respiratory system, the top diagnoses were:
o Chronic lower respiratory diseases (J40–J47, excluding asthma) These diagnoses include chronic bronchitis, emphysema, and bronchiectasis. It should also include asthma, but this condition has been treated separately for this report
o Infections of the respiratory tract (lung) This consisted of “influenza and pneumonia” (J10–J18) and “other acute lower respiratory infections” (J20–J22)
o Asthma (J45–J46) o Malignant neoplasms (C00–C96).

304
MidCentral NZDep2001 9 and 10 CAUs Total Hospital Discharges 1999 to 2003
0
1000
2000
3000
4000
5000
6000
7000
1999_2000 2000_2001 2001_2002 2002_2003
Years
Numbers of discharges (note: truncated scale)
MidCentral NZDep2001 9 and 10 CAUs Hospital Discharges by Major Diagnostic Category 1999 to
2003
0
500
1000
1500
2000
2500
3000
3500
Blood,
immun
ityBurn
s
Cance
r
Circula
tory
syste
m
Diges
tive sy
stem
Endoc
rine, n
utriti
on
ENMT
Eye
Female
repr
oduc
tive
Infec
tion,
para
sites
Injur
y, po
isonin
g
Kidney
, urin
ary
Liver,
pancre
as
Male
reprod
uctive
Mus
culos
kelet
al sys
tem
Nervous s
ystem
Newborns
Other c
ontacts
Pregna
ncy,
birth
Respir
atory S
ystem
Skin, b
reast
Major Diagnostic Category
Number of discharges
MidCentral NZDep2001 Score
9 and 10 CAUs Hospital Discharges by Major Diagnostic Category 1999 to 2003
0
100
200
300
400
500
600
700
800
900
1000
1999_2000 2000_2001 2001_2002 2002_2003
Years
Num
ber of discharges
Blood, immunity
Burns
Cancer
Circulatory system
Digestive system
Endocrine, nutrition
ENMT
Eye
Female reproductive
Infection, parasites
Injury, poisoning
Kidney, urinary
Liver, pancreas
Male reproductive
Musculoskeletal system
Nervous system
Newborns
Other contacts
Pregnancy, birth
Respiratory System
Skin, breast

305
Diagnoses No. of discharges Percentage w ithin MDCCirculatory SystemIschaemic heart diseases (I20 - I25) 1008 43.5%Other forms of heart disease (I30 - I52) 550 23.7%Symptoms, signs, and abnormal clinical and laboratory findings, not elsewhere classified (R00 - R99) 307 13.2%
Pregnancy, birthComplications of labour and delivery (O60 - O75) 533 26.8%Maternal care related to the foetus and amniotic cavity and possible delivery problems (O30 - O48) 482 24.2%Delivery (O80 - O82) 267 13.4%Pregnancy with abortive outcome (eg. miscarriage) (O00 - O08) 225 11.3%
Digestive SystemSymptoms, signs, and abnormal clinical and laboratory findings, not elsewhere classified (R00 - R99) 367 21.2%Other diseases of intestines (K55 - K63) 313 18.1%Malignant neoplasms (C15 - C96) 204 11.8%Hernia (K40 - K46) 196 11.3%
Musculoskeletal SystemInjury, poisoning, and certain other consequences of external causes (S00 - T79) 629 41.3%Arthrosis (M15 - M19) 194 12.7%Other joint disorders (M20 - M25) 99 6.5%
RespiratoryChronic lower respiratory diseases (excluding asthma) (J40 - J47) 335 22.4%Influenza and pneumonia (J10 - J18) 324 21.7%Other acute lower respiratory infections (J20 - J22) 213 14.3%Asthma (J45 - J46) 211 14.1%Malignant neoplasms (C00 - C96) 134 9.0%
MidCentral NZDep2001 9 & 10 Census Area Units Most Common ICD10 Diagnoses within Most Common Major Diagnostic Categories (MDC) 2000 - 2003
18.3 MidCentral District NZDep2001 9 and 10 Census Area Units Disease Specific Hospital Discharges
This section looks at selected disease hospital discharges for residents of MidCentral district census area units with an NZDep2001 score of 9 or 10–areas that are socioeconomically disadvantaged. They include discharges from any hospital in New Zealand, but most will be from MidCentral Health hospitals. The diseases selected are:
• Ischaemic heart disease • Asthma • Respiratory infections • Chronic obstructive respiratory disease • Diabetes • Skin infections • Non-suppurative otitis media (glue ear) • All cause injuries.
The hospitalisation data are examined in three ways:
• Absolute numbers • Crude rates • Age adjusted ratios.
Crude rates are the number of discharges divided by the total number of people in the population of interest. It does not take into account different age structures in populations.

306
Age adjusted ratios prevent dissimilar age balances in different populations distorting population rates of hospitalisation. This is because most diseases are more likely to occur in some age groups rather than others. Therefore, different rates of hospitalisation may be due to differences in population age structures and not because the risk of disease is higher or lower. An age adjusted ratio is a ratio of actual number of hospitalisations divided by expected number of hospitalisations. The expected number of hospitalisations is calculated using the hospitalisation rates from a comparison population. Age adjusted ratios therefore compare a target population to a predetermined comparison population, compensating for any differences in age structure at the same time. For hospital discharges, MidCentral district all ethnicities is the comparison population and has been set the ratio of 1. The individual ethnic groupings, divided into disadvantaged areas and MidCentral district overall, have been compared to this ratio. Ethnic age adjusted ratios exceeding 1 mean the ethnic group experienced more discharges than expected when compared against MidCentral district overall. Ratios below 1 mean the ethnic group experienced less discharges when compared against MidCentral district overall.
18.3.1 Ischaemic Heart Disease
Ischaemic heart disease is the most common diagnostic grouping within circulatory system hospital discharges. Ischaemic heart disease is heart disease caused by blockages of the arteries supplying the heart muscle and includes diseases like myocardial infarction (heart attack) and angina. The yearly number of ischaemic heart disease discharges in socioeconomically disadvantaged areas may be increasing. Hospital discharges in 2003 were 13.1% higher compared to 1999 (353 and 312 discharges respectively). However, year to year fluctuation which makes it difficult to be completely certain this is a trend rather than random change. The crude discharge rates for other ethnicities (non Maori, non Pacific) living in disadvantaged census area units was higher than for MidCentral district other ethnicities and also for Maori and Pacific peoples. Crude discharge rates for Maori living in disadvantaged areas was also higher than for overall MidCentral district Maori. Crude discharge rates are the number of discharges divided by the total number of people living in the stated area. It does not take into account different age structures in different populations. Age adjusted ratios by ethnicity were calculated for disadvantaged areas and MidCentral district overall. An explanation of age adjusted ratio is given at the beginning of this subsection. When differing population age structures are compensated for using age adjusted ratios, all ethnic groups, except for Pacific peoples, living in disadvantaged census area units had greater than expected ischaemic heart disease discharges compared to MidCentral district all ethnicities. However, these differences only reach statistical significance for other ethnicities (non Maori, non Pacific) and all ethnicities. The age adjusted ratios for both were 1.17, or 17% higher than the expected number of hospitalisations compared to MidCentral district all ethnicities. Ischaemic heart disease hospital discharges gradually increase with increasing age, starting in the 30s. This is demonstrated in the graphs showing number of discharges across five year age groups, and also in the graph showing age specific rates. Age specific rates are the number of discharges per number of people within each five year age band. When age specific rates are shown across five year age bands, the people living in socioeconomically disadvantaged area’s 30 to 64 year age bands exceed MidCentral district corresponding age bands by the greatest amount–between 32% to 125%.
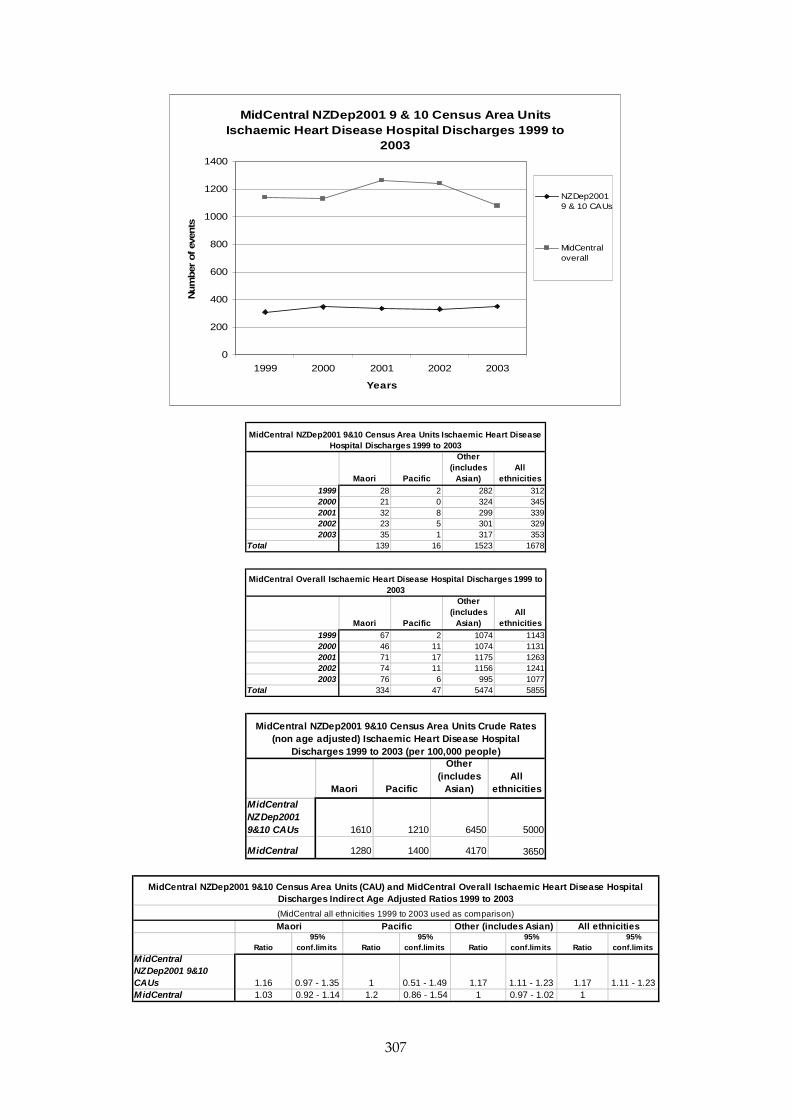
307
MidCentral NZDep2001 9 & 10 Census Area Units Ischaemic Heart Disease Hospital Discharges 1999 to
2003
0
200
400
600
800
1000
1200
1400
1999 2000 2001 2002 2003
Years
Num
ber
of ev
ents
NZDep20019 & 10 CAUs
MidCentraloverall
Maori Pacific
Other (includes
Asian)All
ethnicities1999 28 2 282 3122000 21 0 324 3452001 32 8 299 3392002 23 5 301 3292003 35 1 317 353
Total 139 16 1523 1678
MidCentral NZDep2001 9&10 Census Area Units Ischaemic Heart Disease Hospital Discharges 1999 to 2003
Maori Pacific
Other (includes
Asian)All
ethnicities1999 67 2 1074 11432000 46 11 1074 11312001 71 17 1175 12632002 74 11 1156 12412003 76 6 995 1077
Total 334 47 5474 5855
MidCentral Overall Ischaemic Heart Disease Hospital Discharges 1999 to 2003
Maori Pacific
Other (includes
Asian)All
ethnicities
MidCentral NZDep2001 9&10 CAUs 1610 1210 6450 5000
MidCentral 1280 1400 4170 3650
MidCentral NZDep2001 9&10 Census Area Units Crude Rates (non age adjusted) Ischaemic Heart Disease Hospital
Discharges 1999 to 2003 (per 100,000 people)
Ratio95%
conf.limits Ratio95%
conf.limits Ratio95%
conf.limits Ratio95%
conf.limits
MidCentral NZDep2001 9&10 CAUs 1.16 0.97 - 1.35 1 0.51 - 1.49 1.17 1.11 - 1.23 1.17 1.11 - 1.23MidCentral 1.03 0.92 - 1.14 1.2 0.86 - 1.54 1 0.97 - 1.02 1
Maori Pacific Other (includes Asian) All ethnicities
MidCentral NZDep2001 9&10 Census Area Units (CAU) and MidCentral Overall Ischaemic Heart Disease Hospital Discharges Indirect Age Adjusted Ratios 1999 to 2003
(MidCentral all ethnicities 1999 to 2003 used as comparison)

308
18.3.2 Asthma
The number of asthma yearly hospital discharges decreased markedly from 1999 to 2003 for both MidCentral district and the NZDep 9 and 10 census area units. All ethnicities asthma yearly discharges dropped by 68% for disadvantaged census area units and 55% for MidCentral district overall. The decrease was greater for Maori living in socioeconomically disadvantaged census area units–74% or 50 discharges in 1999 to 13 in 2003. MidCentral district Maori experienced a large drop in asthma hospital discharges (44%), although not as great as for Maori living in disadvantaged census area units. Pacific peoples asthma discharges also fell by large proportions, but the absolute numbers are small. The crude discharge rates for Maori and Pacific peoples were higher than for other ethnicities. Much of this is probably because of the higher proportion of younger people among Maori and Pacific peoples populations. A high percentage of people hospitalised for asthma are children. Maori living in disadvantaged census area units and Maori living in MidCentral district overall had similar crude discharge rates. However, there was a difference between crude discharge rates for other ethnicities, with the disadvantaged census area unit rates higher than MidCentral district ones. This pattern also existed for Pacific peoples, but the absolute numbers are small. This may affect the reliability of rates or ratios calculated for Pacific peoples. Crude discharge rates are the number of discharges divided by the total number of people living in the stated area. It does not take into account different age structures in populations. Age adjusted ratios by ethnicity were calculated for disadvantaged areas and MidCentral district overall. An explanation of age adjusted ratio is given at the beginning of this subsection. When differing population age structures are compensated for (using age adjusted ratios), all ethnic groups living in disadvantaged census area units had greater than expected asthma discharges compared to MidCentral district all ethnicities. However, these differences only reached statistical significance for disadvantaged area’s other ethnicities (non Maori, non Pacific) and all ethnicities. Other ethnicities (non Maori, non Pacific) living in disadvantaged areas experienced 15% greater than expected asthma discharges compared to MidCentral district all ethnicities (age adjusted ratio of 1.15). All ethnicities combined living in disadvantaged areas experienced 16% greater than expected asthma discharges compared to MidCentral district all ethnicities (age adjusted ratio also of 1.16). This is similar to the age adjusted ratio for Maori living in disadvantaged census area units (1.15), suggesting there is no disparity between Maori and other ethnicity in asthma hospital discharges for disadvantaged census area units. Maori living in MidCentral district overall had 12% greater than expected number of asthma hospital discharges compared to MidCentral district all ethnicities (age adjusted ratio of 1.12). The MidCentral district Pacific peoples age adjusted ratio was also higher than expected, but did not reach statistical significance.

309
MidCentral NZDep2001 9 & 10 Census Area Units Asthma Hospital Discharges 1999 to 2003
0
50
100
150
200
250
300
350
400
450
1999 2000 2001 2002 2003
Years
Num
ber
of ev
ents
NZDep20019 & 10CAUs
MidCentraloverall
Maori Pacific
Other (includes
Asian)All
ethnicities1999 50 10 59 1192000 29 4 56 892001 21 7 47 752002 15 2 34 512003 13 1 24 38
Total 128 24 220 372
MidCentral NZDep2001 9&10 Census Area Units Asthma Hospital Discharges 1999 to 2003
Maori Pacific
Other (includes
Asian)All
ethnicities1999 106 14 300 4202000 72 11 221 3042001 58 13 230 3012002 84 8 215 3072003 59 4 125 188
Total 379 50 1091 1520
MidCentral Overall Asthma Hospital Discharges 1999 to 2003
Maori Pacific
Other (includes
Asian)All
ethnicities
MidCentral NZDep2001 9&10 CAUs 1490 1810 931 1110
MidCentral 1450 1480 832 947
MidCentral NZDep2001 9&10 Census Area Units Crude Rates (non age adjusted) Asthma Hospital Discharges 1999 to 2003
(per 100,000 people)
Ratio95%
conf.limits Ratio95%
conf.limits Ratio95%
conf.limits Ratio95%
conf.limits
MidCentral NZDep2001 9&10 CAUs 1.15 0.95 - 1.35 1.34 0.8 - 1.87 1.15 1 - 1.3 1.16 1.04 - 1.28MidCentral 1.12 1.01 - 1.24 1.18 0.86 - 1.51 0.96 0.9 - 1.01 1
Maori Pacific Other (includes Asian) All ethnicities
MidCentral NZDep2001 9&10 Census Area Units (CAU) and MidCentral Overall Asthma Hospital Discharges Indirect Age Adjusted Ratios 1999 to 2003
(MidCentral all ethnicities 1999 to 2003 used as comparison)

310
18.3.3 Respiratory Infections
Respiratory infection hospitalisation data from 1999 to 2003 were analysed for MidCentral district socioeconomically disadvantaged areas. Both upper and lower respiratory tract infections were included in this analysis. The number of respiratory infection yearly discharges decreased consistently from 1999 to 2003 for the NZDep2001 9 and 10 census area units (socioeconomically disadvantaged areas). Individual ethnicity yearly discharge numbers fluctuated year to year, making it difficult to discern a pattern. All crude discharge rates (Maori, Pacific peoples, other ethnicities, and all ethnicities) for disadvantaged census area units were higher than their MidCentral district equivalents. Crude discharge rates are the number of discharges divided by the total number of people living in the stated area. It does not take into account different age structures in different populations. Age adjusted ratios by ethnicity were calculated for disadvantaged areas and MidCentral district overall. An explanation of age adjusted ratio is given at the beginning of this subsection. When differing population age structures are compensated for (using age adjusted ratios), all ethnic groups living in disadvantaged census area units had greater than expected respiratory infection hospital discharges compared to MidCentral district all ethnicities. Combined ethnicities living in disadvantaged areas experienced 27% more than expected discharges compared to MidCentral district all ethnicities. Other ethnicities (non Maori, non Pacific) living in disadvantaged areas experienced 22% higher than expected respiratory infection hospitalisations compared to MidCentral district all ethnicities. Maori living in disadvantaged areas experienced 26% higher than expected respiratory infection hospital discharges compared to MidCentral district all ethnicities (age adjusted ratio of 1.26). This is similar to all ethnicities and other ethnicities living in disadvantaged areas. Pacific peoples living in disadvantaged areas experienced over twice the expected number of discharges compared to MidCentral district all ethnicities (age adjusted ratios of 2.15).
MidCentral NZDep2001 9 & 10 Census Area Units Respiratory Infection Hospital Discharges 1999 to
2003
0
100
200
300
400
500
600
700
800
900
1000
1999 2000 2001 2002 2003
Years
Num
ber
of ev
ents
NZDep20019 & 10CAUs
MidCentraloverall

311
Maori Pacific
Other (includes
Asian)All
ethnicities1999 70 17 185 2722000 52 18 143 2132001 76 17 159 2522002 54 17 150 2212003 50 13 143 206
Total 302 82 780 1164
MidCentral NZDep2001 9&10 Census Area Units Respiratory Infections Hospital Discharges 1999 to 2003
Maori Pacific
Other (includes
Asian)All
ethnicities1999 154 26 676 8562000 141 23 531 6952001 177 27 609 8132002 183 37 653 8732003 145 34 535 714
Total 800 147 3004 3951
MidCentral Overall Respiratory Infections Hospital Discharges 1999 to 2003
Maori Pacific
Other (includes
Asian)All
ethnicities
MidCentral NZDep2001 9&10 CAUs 3510 6190 3300 3470
MidCentral 3070 4360 2290 2460
MidCentral NZDep2001 9&10 Census Area Units Crude Rates (non age adjusted) Respiratory Infections Hospital Discharges
1999 to 2003 (per 100,000 people)
Ratio95%
conf.limits Ratio95%
conf.limits Ratio95%
conf.limits Ratio95%
conf.limits
MidCentral NZDep2001 9&10 CAUs 1.26 1.12 - 1.41 2.15 1.68 - 2.62 1.22 1.13 - 1.31 1.27 1.2 - 1.34MidCentral 1.15 1.07 - 1.23 1.66 1.39 - 1.93 0.95 0.91 - 0.98 1
MidCentral NZDep2001 9&10 Census Area Units (CAU) and MidCentral Overall Respiratory Infections Hospital Discharges Indirect Age Adjusted Ratios 1999 to 2003
(MidCentral all ethnicities 1999 to 2003 used as comparison)
Maori Pacific Other (includes Asian) All ethnicities
18.3.4 Chronic Obstructive Respiratory Disease (CORD)
The number of chronic obstructive respiratory disease (CORD) yearly discharges decreased from 1999 to 2003 for both MidCentral district and the NZDep 9 and 10 census area units, however the fall was greater for the disadvantaged census area units. CORD yearly discharges fell by 46% for disadvantaged census area units and 19% for MidCentral district. Yearly hospital discharges for Maori living in disadvantaged census area units fell by 57% compared with no change for MidCentral district Maori, however, the absolute numbers are small. This could affect the reliability of any perceived trends. All crude discharge rates (Maori, Pacific peoples, other ethnicities, and all ethnicities) for disadvantaged census area units were higher than their MidCentral district equivalents. This is especially so for other ethnicities (non Maori, non Pacific) in disadvantaged areas. Older age structure of other ethnicities in both disadvantaged areas and MidCentral district overall is probably responsible for most of the high crude discharge rate. Maori and Pacific peoples have lower proportions of older people in their populations, and CORD affects mainly older people. Crude discharge rates are the number of discharges divided by the total number of people living in the stated area. It does not take into account different age structures in populations.
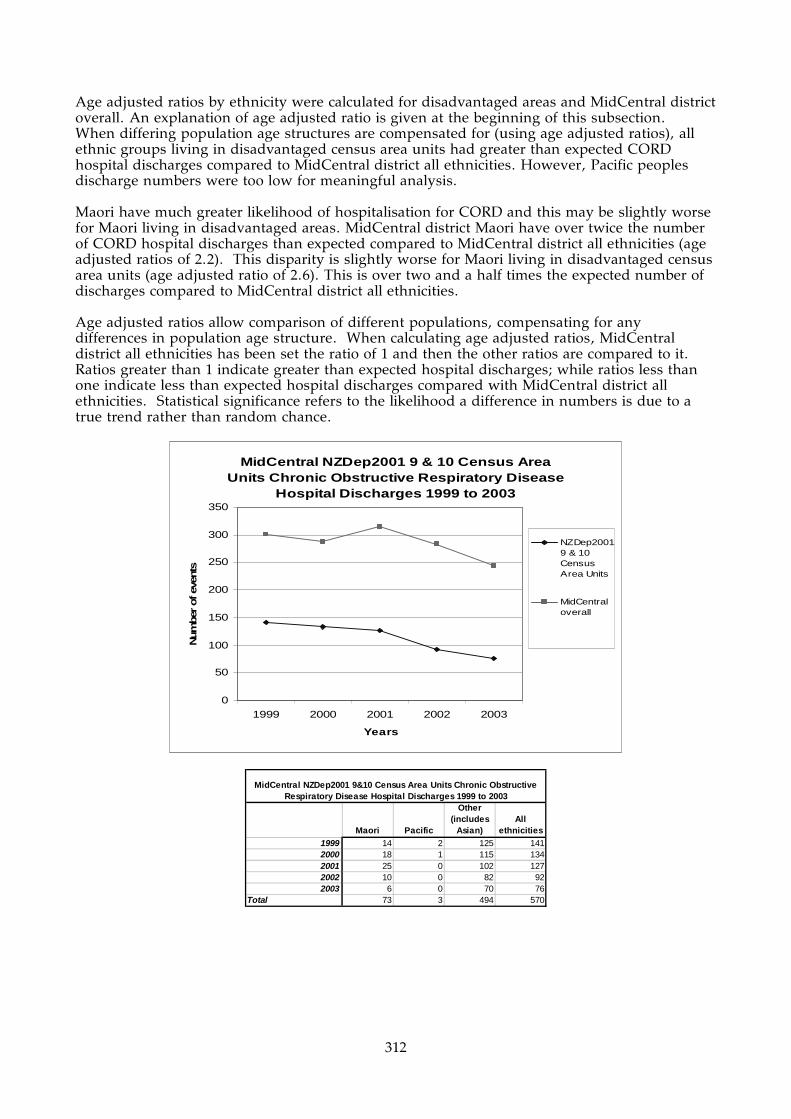
312
Age adjusted ratios by ethnicity were calculated for disadvantaged areas and MidCentral district overall. An explanation of age adjusted ratio is given at the beginning of this subsection. When differing population age structures are compensated for (using age adjusted ratios), all ethnic groups living in disadvantaged census area units had greater than expected CORD hospital discharges compared to MidCentral district all ethnicities. However, Pacific peoples discharge numbers were too low for meaningful analysis. Maori have much greater likelihood of hospitalisation for CORD and this may be slightly worse for Maori living in disadvantaged areas. MidCentral district Maori have over twice the number of CORD hospital discharges than expected compared to MidCentral district all ethnicities (age adjusted ratios of 2.2). This disparity is slightly worse for Maori living in disadvantaged census area units (age adjusted ratio of 2.6). This is over two and a half times the expected number of discharges compared to MidCentral district all ethnicities. Age adjusted ratios allow comparison of different populations, compensating for any differences in population age structure. When calculating age adjusted ratios, MidCentral district all ethnicities has been set the ratio of 1 and then the other ratios are compared to it. Ratios greater than 1 indicate greater than expected hospital discharges; while ratios less than one indicate less than expected hospital discharges compared with MidCentral district all ethnicities. Statistical significance refers to the likelihood a difference in numbers is due to a true trend rather than random chance.
MidCentral NZDep2001 9 & 10 Census Area Units Chronic Obstructive Respiratory Disease
Hospital Discharges 1999 to 2003
0
50
100
150
200
250
300
350
1999 2000 2001 2002 2003
Years
Num
ber
of ev
ents
NZDep20019 & 10CensusArea Units
MidCentraloverall
Maori Pacific
Other (includes
Asian)All
ethnicities1999 14 2 125 1412000 18 1 115 1342001 25 0 102 1272002 10 0 82 922003 6 0 70 76
Total 73 3 494 570
MidCentral NZDep2001 9&10 Census Area Units Chronic Obstructive Respiratory Disease Hospital Discharges 1999 to 2003

313
Maori Pacific
Other (includes
Asian)All
ethnicities1999 28 3 270 3012000 28 1 259 2882001 40 1 273 3142002 38 0 245 2832003 29 2 213 244
Total 163 7 1260 1430
MidCentral Overall Chronic Obstructive Respiratory Disease Hospital Discharges 1999 to 2003
Maori Pacific
Other (includes
Asian)All
ethnicities
MidCentral NZDep2001 9&10 CAUs 848 227 2090 1700
MidCentral 625 208 961 890
MidCentral NZDep2001 9&10 Census Area Units Crude Rates (non age adjusted) Chronic Obstructive Respiratory Disease
Hospital Discharges 1999 to 2003 (per 100,000 people)
Ratio95%
conf.limits Ratio95%
conf.limits Ratio95%
conf.limits Ratio95%
conf.limits
MidCentral NZDep2001 9&10 CAUs 2.6 2.01 - 3.2 0.86 -- 1.48 1.35 - 1.61 1.56 1.43 - 1.69MidCentral 2.2 1.86 - 2.54 0.83 0.21 - 1.44 0.94 0.88 - 0.99 1
Maori Pacific Other (includes Asian) All ethnicities
MidCentral NZDep2001 9&10 Census Area Units (CAU) and MidCentral Overall Chronic Obstructive Respiratory Disease Hospital Discharges Indirect Age Adjusted Ratios 1999 to 2003
(MidCentral all ethnicities 1999 to 2003 used as comparison)
18.3.5 Diabetes
The number of diabetes yearly hospital discharges increased from 1999 to 2003 for both MidCentral district and the NZDep 9 and 10 census area units–by 82% and 56% respectively. Increases in Maori diabetes yearly discharges were also high–76% for MidCentral district and 64% for disadvantaged census area units. All crude discharge rates (Maori, Pacific peoples, other ethnicities, and all ethnicities) for disadvantaged census area units were higher than their MidCentral district equivalents. This is especially so for other ethnicities (non Maori, non Pacific) in disadvantaged areas. Older age structure of other ethnicities in both disadvantaged areas and MidCentral district overall is probably responsible for most of the high crude discharge rate. Non Maori, non Pacific ethnicities living in socioeconomically disadvantaged census area units have a greater proportion of older adults than the same ethnicities in MidCentral district overall. Maori and Pacific peoples have lower proportions of older people in their populations, and diabetes affects mainly older people. Crude discharge rates are the number of discharges divided by the total number of people living in the stated area. It does not take into account different age structures in populations. Age adjusted ratios by ethnicity were calculated for disadvantaged areas and MidCentral district overall. An explanation of age adjusted ratio is given at the beginning of this subsection. People of all ethnicities living in socioeconomically disadvantaged areas experienced 32% higher than expected diabetes hospitalisations compared to MidCentral district people of all ethnicities. When differences in population age structure were accounted for (using age adjusted ratios), MidCentral district Maori had 65% more than the expected number of discharges for diabetes compared to MidCentral all ethnicities (age adjusted ratio of 1.65). This disparity was worse for
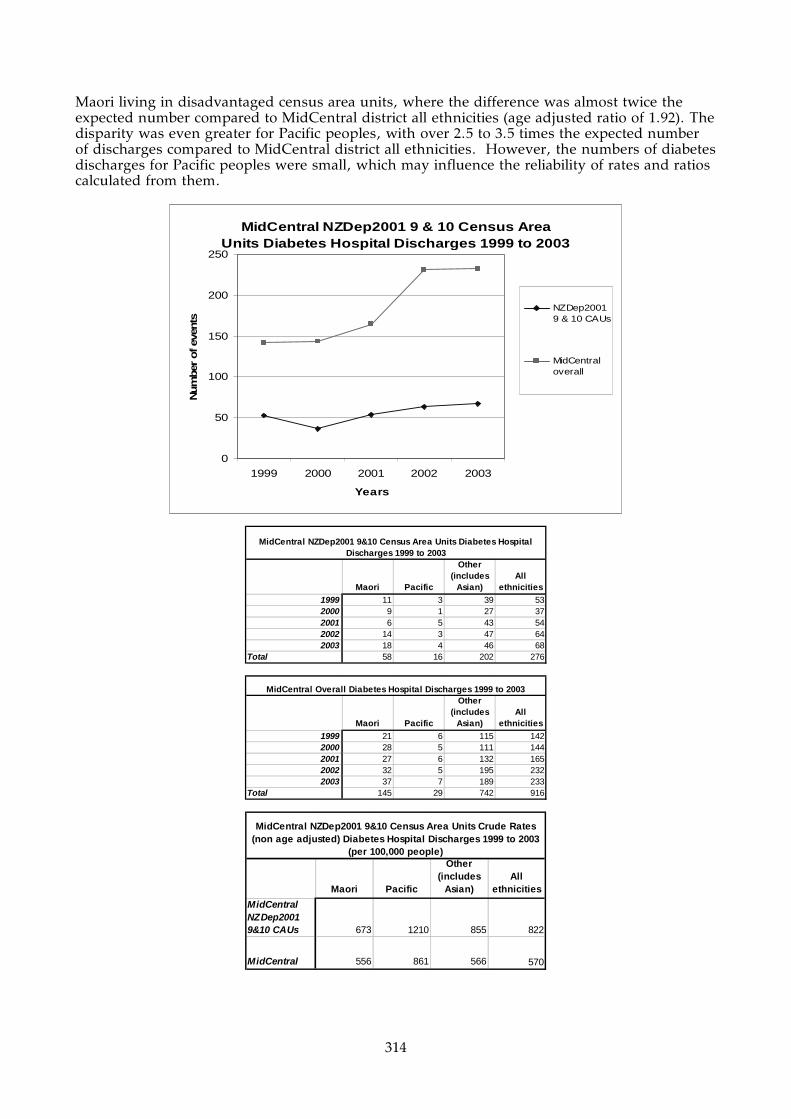
314
Maori living in disadvantaged census area units, where the difference was almost twice the expected number compared to MidCentral district all ethnicities (age adjusted ratio of 1.92). The disparity was even greater for Pacific peoples, with over 2.5 to 3.5 times the expected number of discharges compared to MidCentral district all ethnicities. However, the numbers of diabetes discharges for Pacific peoples were small, which may influence the reliability of rates and ratios calculated from them.
MidCentral NZDep2001 9 & 10 Census Area Units Diabetes Hospital Discharges 1999 to 2003
0
50
100
150
200
250
1999 2000 2001 2002 2003
Years
Num
ber
of ev
ents
NZDep20019 & 10 CAUs
MidCentraloverall
Maori Pacific
Other (includes
Asian)All
ethnicities1999 11 3 39 532000 9 1 27 372001 6 5 43 542002 14 3 47 642003 18 4 46 68
Total 58 16 202 276
MidCentral NZDep2001 9&10 Census Area Units Diabetes Hospital Discharges 1999 to 2003
Maori Pacific
Other (includes
Asian)All
ethnicities1999 21 6 115 1422000 28 5 111 1442001 27 6 132 1652002 32 5 195 2322003 37 7 189 233
Total 145 29 742 916
MidCentral Overall Diabetes Hospital Discharges 1999 to 2003
Maori Pacific
Other (includes
Asian)All
ethnicities
MidCentral NZDep2001 9&10 CAUs 673 1210 855 822
MidCentral 556 861 566 570
MidCentral NZDep2001 9&10 Census Area Units Crude Rates (non age adjusted) Diabetes Hospital Discharges 1999 to 2003
(per 100,000 people)
315
Ratio95%
conf.limits Ratio95%
conf.limits Ratio95%
conf.limits Ratio95%
conf.limits
MidCentral NZDep2001 9&10 CAUs 1.92 1.42 - 2.41 3.67 1.87 - 5.46 1.15 0.99 - 1.31 1.32 1.16 - 1.47MidCentral 1.65 1.38 - 1.91 2.61 1.66 - 3.56 0.91 0.84 - 0.97 1
MidCentral NZDep2001 9&10 Census Area Units (CAU) and MidCentral Overall Diabetes Hospital Discharges Indirect Age Adjusted Ratios 1999 to 2003
(MidCentral all ethnicities 1999 to 2003 used as comparison)
Maori Pacific Other (includes Asian) All ethnicities
18.3.6 Skin Infections
Skin infection hospital discharge data were examined for the years 1999/2000 to 2002/2003. There was a small increase in yearly hospital discharges for skin infection from 1999/2000 to 2002/2003, 4% for both disadvantaged census area units and MidCentral district overall. The increase in Maori yearly hospital discharges were greater than this for both disadvantaged census area units and MidCentral district (46% and 15% respectively). All crude discharge rates (Maori, Pacific peoples, other ethnicities, and all ethnicities) for disadvantaged census area units were higher than their MidCentral district equivalents. Crude discharge rates are the number of discharges divided by the total number of people living in the stated area. It does not take into account different age structures in populations. Age adjusted ratios by ethnicity were calculated for disadvantaged areas and MidCentral district overall. An explanation of age adjusted ratio is given at the beginning of this subsection. People of all ethnicities living in disadvantaged areas experienced 41% more than expected skin infection hospital discharges compared to MidCentral district all ethnicities. The disparity for other ethnicities (non Maori, non Pacific) living in disadvantaged areas was similar–37% greater than expected discharges compared to MidCentral district all ethnicities. When differences in population age structure were accounted for (using age adjusted ratios) Maori in MidCentral district had approximately 10% more than the expected number of discharges for skin infections compared to MidCentral district all ethnicities. This disparity was worse for Maori living in disadvantaged census area units, where the difference was about 40% greater than the expected number compared to MidCentral district all ethnicities. The disparity was even greater for Pacific peoples, with over 1.5 to 2.2 times the expected number of discharges compared to MidCentral district all ethnicities. The disparity was greater for Pacific peoples living in disadvantaged areas. However, the numbers of skin infection discharges for Pacific peoples were small, which may influence the reliability of rates and ratios calculated from them.

316
MidCentral NZDep2001 9 & 10 Census Area Units Skin Infection Hospital Discharges 1999/2000 to
2002/2003
0
50
100
150
200
250
300
350
400
450
1999/2000 2000/2001 2001/2002 2002/2003
Years
Nu
mb
er o
f ev
ents
NZDep20019 & 10 CAUs
MidCentraloverall
Maori Pacific
Other (includes
Asian)All
ethnicities1999/2000 24 6 64 942000/2001 16 9 85 1102001/2002 27 6 92 1252002/2003 35 4 59 98Total 102 25 300 427
MidCentral NZDep2001 9&10 Census Area Units Skin Infections Hospital Discharges 1999/2000 to 2002/2003
Maori Pacific
Other (includes
Asian)All
ethnicities1999/2000 59 9 249 3172000/2001 45 15 294 3542001/2002 71 11 330 4122002/2003 68 9 254 331Total 243 44 1127 1414
MidCentral Overall Skin Infections Hospital Discharges 1999/2000 to 2002/2003
Maori Pacific
Other (includes
Asian)All
ethnicities
MidCentral NZDep2001 9&10 CAUs 1180 1890 1270 1270
MidCentral 932 1310 859 880
MidCentral NZDep2001 9&10 Census Area Units Crude Rates (non age adjusted) Skin Infections Hospital Discharges
1999/2000 to 2002/2003 (per 100,000 people)
Ratio95%
conf.limits Ratio95%
conf.limits Ratio95%
conf.limits Ratio95%
conf.limits
MidCentral NZDep2001 9&10 CAUs 1.4 1.13 - 1.68 2.22 1.35 - 3.09 1.37 1.21 - 1.52 1.41 1.27 - 1.54MidCentral 1.11 0.97 - 1.25 1.54 1.09 - 2 0.97 0.91 - 1.02 1
Maori Pacific Other (includes Asian) All ethnicities
MidCentral NZDep2001 9&10 Census Area Units (CAU) and MidCentral Overall Skin Infections Hospital Discharges Indirect Age Adjusted Ratios 1999/2000 to 2002/2003
(MidCentral all ethnicities 1999/2000 to 2002/2003 used as comparison)
317
18.3.7 Non-Suppurative Otitis Media (Glue Ear)
Non-suppurative otitis media (glue ear) hospital discharge data were examined for the years 1999/2000 to 2002/2003. There was a 25% decrease in yearly discharges for non-suppurative otitis media (glue ear) from 1999/2000 to 2002/2003 for disadvantaged census area units, but the yearly numbers are small (56 in 1999/2000 to 41 in 2002/2003). MidCentral district all ethnicity yearly discharges were relatively stable across the same period. Maori yearly discharges for both MidCentral district overall and disadvantaged census area units my be increasing but is difficult to tell because of yearly fluctuation. Maori and Pacific peoples crude discharge rates were higher than for other ethnicities (non Maori, non Pacific). This is most likely due to the higher proportion of children in their populations. Non-suppurative otitis media (glue ear) affects mostly children. Most ethnicities living in disadvantaged census area units had higher crude discharge rates than corresponding MidCentral district ethnicities. An exception is Maori living in disadvantaged census area units, who had a lower crude discharge rate compared to MidCentral district Maori. Crude discharge rates are the number of discharges divided by the total number of people living in the stated area. It does not take into account different age structures in populations. Age adjusted ratios by ethnicity were calculated for disadvantaged areas and MidCentral district overall. An explanation of age adjusted ratio is given at the beginning of this subsection. When differences in population age structure were accounted for (using age adjusted ratios) other ethnicities (non Maori, non Pacific) living in disadvantaged areas had 50% more discharges than expected, compared to MidCentral district all ethnicities. In contrast, Maori living in disadvantaged areas had 25% less discharges than expected, compared to MidCentral district all ethnicities. Pacific peoples, in both disadvantaged areas and MidCentral district overall, also had lower than expected discharges for non-suppurative otitis media (glue ear), but the ratios did not reach statistical significance due to small absolute numbers. These results suggests either lower rates of non-suppurative otitis media (glue ear) among Maori living in disadvantaged areas, under diagnosis, or poorer access to hospital based services. School hearing test results have consistently shown Maori have higher test failure rates, contradicting the hospital discharge data presented here. This suggests either lower rates of non-suppurative otitis media among Maori living in disadvantaged areas, or significant under diagnosis (and therefore lower treatment and hospital admission numbers).

318
MidCentral NZDep2001 9 & 10 Census Area Units Non-Suppurative Otitis Media (Glue Ear) Hospital
Discharges 1999/2000 to 2002/2003
0
50
100
150
200
250
1999/2000 2000/2001 2001/2002 2002/2003
Years
Num
ber
of ev
ents
NZDep20019 & 10CAUs
MidCentraloverall
Maori Pacific
Other (includes
Asian)All
ethnicities1999/2000 14 4 38 562000/2001 11 1 27 392001/2002 10 0 31 412002/2003 18 3 20 41Total 53 8 116 177
MidCentral NZDep2001 9&10 Census Area Units Non-Suppurative Otitis Media (Glue Ear) Hospital Discharges 1999/2000 to 2002/2003
Maori Pacific
Other (includes
Asian)All
ethnicities1999/2000 42 4 153 1992000/2001 37 4 109 1502001/2002 49 4 143 1962002/2003 67 6 129 202Total 195 18 534 747
MidCentral Overall Non-Suppurative Otitis Media (Glue Ear) Hospital Discharges 1999/2000 to 2002/2003
Maori Pacific
Other (includes
Asian)All
ethnicities
MidCentral NZDep2001 9&10 CAUs 615 604 491 527
MidCentral 748 534 407 465
MidCentral NZDep2001 9&10 Crude Census Area Units Rates (non age adjusted) Non-Suppurative Otitis Media (Glue Ear)
Hospital Discharges 1999/2000 to 2002/2003 (per 100,000 people)
Ratio95%
conf.limits Ratio95%
conf.limits Ratio95%
conf.limits Ratio95%
conf.limits
MidCentral NZDep2001 9&10 CAUs 0.76 0.56 - 0.97 0.7 0.22 - 1.19 1.51 1.23 - 1.78 1.12 0.96 - 1.29MidCentral 0.92 0.79 - 1.05 0.7 0.38 - 1.02 1.05 0.96 - 1.14 1
Maori Pacific Other (includes Asian) All ethnicities
MidCentral NZDep2001 9&10 Census Area Units (CAU) and MidCentral Overall Non-Suppurative Otitis Media (Glue Ear) Hospital Discharges Indirect Age Adjusted Ratios 1999/2000 to 2002/2003
(MidCentral all ethnicities 1999/2000 to 2002/2003 used as comparison)

319
18.3.8 All Cause Injuries
Hospital discharge data for all cause injuries were examined for the years 1999 to 2003. The number of yearly hospital discharges due to injuries decreased markedly from 1999 to 2003 for both MidCentral district and the socioeconomically disadvantaged census area units (by 45% and 52% respectively). The fall was slightly greater for the disadvantaged census area units. Yearly discharges for all ethnic groups, both MidCentral district overall and disadvantaged areas, were falling. Ethnicities living in disadvantaged census area units had higher hospital discharge crude rates for all cause injuries than corresponding MidCentral ethnicities. Maori and Pacific peoples had lower crude discharge rates than other ethnicities (non Maori, non Pacific). This applies to both MidCentral district and disadvantaged census area units. Crude discharge rates are the number of discharges divided by the total number of people living in the stated area. It does not take into account different age structures in different populations. Age adjusted ratios by ethnicity were calculated for disadvantaged areas and MidCentral district overall. An explanation of age adjusted ratio is given at the beginning of this subsection. When differences in population age structure were accounted for (using age adjusted ratios), other ethnicities (non Maori, non Pacific) living in disadvantaged areas had 44% more discharges than expected, compared to MidCentral district all ethnicities. Maori living in disadvantaged areas had 20% less discharges than expected, compared to MidCentral district all ethnicities. Maori in MidCentral district overall experienced 8% fewer than expected discharges compared to MidCentral district all ethnicities. Pacific peoples also had lower than expected discharges for injuries, but there were only 20 discharges, affecting reliability of rates and ratios. Fluctuations in small numbers can cause large shifts in ratios or rates. When all ethnicities living in disadvantaged areas were combined together, the number of hospital discharges for all cause injuries was 22% higher than expected compared to MidCentral district all ethnicities.
MidCentral NZDep2001 9 & 10 Census Area Units All Cause Injuries Hospital Discharges 1999 to 2003
0
200
400
600
800
1000
1200
1999 2000 2001 2002 2003
Years
Num
ber
of ev
ents NZDep2001
9 & 19CAUs
MidCentraloverall

320
Maori Pacific
Other (includes
Asian)All
ethnicities1999 48 7 218 2732000 40 6 146 1922001 36 5 166 2072002 22 1 83 1062003 29 1 102 132
Total 175 20 715 910
MidCentral NZDep2001 9&10 Census Area Units All Cause Injuries Hospital Discharges 1999 to 2003
Maori Pacific
Other (includes
Asian)All
ethnicities1999 121 18 842 9812000 95 13 645 7532001 99 13 616 7282002 88 9 500 5972003 79 6 452 537
Total 482 59 3055 3596
MidCentral Overall All Cause Injuries Hospital Discharges 1999 to 2003
Maori Pacific
Other (includes
Asian)All
ethnicities
MidCentral NZDep2001 9&10 CAUs 2030 1510 3030 2710
MidCentral 1850 1750 2330 2240
MidCentral NZDep2001 9&10 Census Area Units Crude Rates (non age adjusted) All Cause Injuries Hospital Discharges 1999
to 2003 (per 100,000 people)
Ratio95%
conf.limits Ratio95%
conf.limits Ratio95%
conf.limits Ratio95%
conf.limits
MidCentral NZDep2001 9&10 CAUs 0.81 0.69 - 0.93 0.6 0.34 - 0.87 1.44 1.33 - 1.54 1.22 1.14 - 1.3MidCentral 0.72 0.66 - 0.79 0.69 0.51 - 0.86 1.07 1.04 - 1.11 1
MidCentral NZDep2001 9&10 Census Area Units (CAU) and MidCentral Overall All Cause Injuries Hospital Discharges Indirect Age Adjusted Ratios 1999 to 2003
(MidCentral all ethnicities 1999 to 2003 used as comparison)
Maori Pacific Other (includes Asian) All ethnicities
18.4 Cancer Cancer Registrations 1998 to 2000 A listing of the 1998 to 2000 registrations in the New Zealand Cancer Registry for people living in MidCentral district NZDep2001 9 and 10 census area units is given in the table below. The New Zealand Cancer Registry is a register of all primary malignant cancers (neoplasms) diagnosed in New Zealand, excluding some specific forms of skin cancer (basal cell and squamous cell carcinomas). The most frequent malignant cancers registered from 1998 to 2000 for people living in MidCentral district NZDep2001 9 and 10 census area units were:
1. Digestive organs 2. Male genital organs 3. Respiratory and intrathoracic organs (lungs and organs inside the chest) 4. Breast.

321
Cancer typeNumber of
people PercentageMalignant neoplasms of digestive organs (C15 - C26) 153 24.5%Malignant neoplasms of male genital organs (C60 - C63) 103 16.5%Malignant neoplasms of respiratory and intrathoracic organs (C00 - C14) 77 12.3%Malignant neoplasms of the breast (C50) 71 11.4%Malignant neoplasms, stated or presumed to be primary, of lymphoid, haemopoietic and related tissue (C81 - C96) 47 7.5%Melanoma and other malignant neoplasms of skin (C43 - C44) 46 7.4%Malignant neoplasms of ill-defined, secondary and unspecified sites (C76 - C80) 37 5.9%Malignant neoplasms of urinary tract (C64 - C68) 37 5.9%Malignant neoplasms of female genital organs (C51 - C58) 23 3.7%Malignant neoplasms of eye, brain, and other parts of central nervous system (C69 - C72) 11 1.8%Malignant neoplasms of lip, oral cavity, and pharynx (C00 - C14) 8 1.3%Malignant neoplasms of mesothelial and soft tissue (C45 - C49) 8 1.3%Malignant neoplasms of thyroid and other endocrine glands (C73 - C75) 3 0.5%Malignant neoplasms of bone and articular cartilage (C40 - C41) 1 0.2%Total 625 100.0%
MidCentral NZDep2001 9 and 10 Census Area Units Cancer Registrations 1998 to 2000
Cancer Mortality 1999 to 2001 The most frequent cause of malignant cancer deaths from 1999 to 2001 for people living in MidCentral district socioeconomically disadvantaged census area units were:
1. Digestive organs 2. Respiratory and intrathoracic organs (lung and organs inside the chest) 3. Blood and lymphoid systems 4. Male genital organs 5. Breast.
Cancer typeNumber of
people PercentageMalignant neoplasms of digestive organs (C15 - C26) 98 27.6%Malignant neoplasms of respiratory and intrathoracic organs (C00 - C14) 83 23.4%Malignant neoplasms, stated or presumed to be primary, of lymphoid, haemopoietic and related tissue (C81 - C96) 30 8.5%Malignant neoplasms of male genital organs (C60 - C63) 29 8.2%Malignant neoplasms of the breast (C50) 26 7.3%Malignant neoplasms of ill-defined, secondary and unspecified sites (C76 - C80) 24 6.8%Malignant neoplasms of urinary tract (C64 - C68) 17 4.8%Malignant neoplasms of eye, brain, and other parts of central nervous system (C69 - C72) 11 3.1%Melanoma and other malignant neoplasms of skin (C43 - C44) 10 2.8%Malignant neoplasms of mesothelial and soft tissue (C45 - C49) 8 2.3%Malignant neoplasms of female genital organs (C51 - C58) 7 2.0%Neoplasms of uncertain or unknown behaviour (D37 - D48) 5 1.4%Malignant neoplasms of lip, oral cavity, and pharynx (C00 - C14) 4 1.1%Malignant neoplasms of thyroid and other endocrine glands (C73 - C75) 2 0.6%Benign neoplasms (D10 - D36) 1 0.3%Total 355 100.0%
MidCentral NZDep2001 9 & 10 Census Area Units Cancer Mortality by Cancer Type 1999 to 2001
18.5 Cancer Registration for Socioeconomically Disadvantaged Areas Crude rates are the number of discharges divided by the total number of people in the population of interest. It does not take into account different age structures in the population. When cancer registrations are examined using crude rates, ethnicities living in socioeconomically disadvantaged areas have higher rates than corresponding ethnicities for MidCentral district overall. The exception is for Maori living in socioeconomically disadvantaged areas. Maori and Pacific peoples have lower crude cancer registration rates than non Maori, non Pacific ethnicities. This is probably because of lower proportions of older people in their populations. The risk of cancer increases with age, so is less common among younger people and more common among older people. Age adjusted ratios prevent dissimilar age balances in different populations distorting population rates of cancer registration. This is because most diseases are more likely to occur in some age groups rather than others. Therefore, different non age adjusted rates of cancer registration may be due to differences in population age structures and not because the risk of disease is higher or lower. An age adjusted ratio is a ratio of actual number of cancer registrations divided by the expected number of registrations. The expected number of cancer registrations is calculated using the registration rates from a comparison population. Age

322
adjusted ratios therefore compare a target population to a predetermined comparison population, compensating for any differences in age structure at the same time. MidCentral district all ethnicities is the comparison population and has been set the ratio of 1. The individual ethnic groupings, divided into disadvantaged areas and MidCentral district overall, have been compared to this ratio. Ethnic age adjusted ratios exceeding 1 mean the ethnic group experienced more discharges than expected when compared against MidCentral district overall. Ratios below 1 mean the ethnic group experienced less discharges when compared against MidCentral district overall. When analysed using age adjusted ratios, people living in socioeconomically disadvantaged areas experienced 14% more than expected cancer registrations compared to MidCentral district overall (age adjusted ratio of 1.14). Maori living in socioeconomically disadvantaged areas experienced 28% lower than expected number of cancer registrations compared to MidCentral district overall (age adjusted ratio of 0.72).
Maori Pacific Asian
Other (excludes
Asian)All
ethnicities1998 6 4 1 199 2101999 13 1 3 189 2062000 17 2 4 186 209
Total 36 7 8 574 625
MidCentral NZDep2001 9&10 Census Area Units Neoplasm (Cancer) Registration 1998 to 2000
Maori Pacific
Other (includes
Asian)All
ethnicities
MidCentral NZDep2001 9&10 CAUs 418 529 2460 1860
MidCentral 464 416 1600 1390
MidCentral NZDep2001 Census Area Units 9&10 Crude Rates (non age adjusted) Neoplasm (Cancer) Registration 1998 to 2000 per
100,000 people
Ratio95%
conf.limits Ratio95%
conf.limits Ratio95%
conf.limits Ratio95%
conf.limits
MidCentral NZDep2001 9&10 CAUs 0.72 0.49 - 0.96 1.03 0.27 - 1.79 1.19 1.09 - 1.29 1.14 1.05 - 1.23MidCentral 0.88 0.72 - 1.04 0.84 0.4 - 1.28 1.01 0.97 - 1.05 1
Maori Pacific Other (includes Asian) All ethnicities
MidCentral NZDep2001 9&10 Census Area Units (CAU) and MidCentral Neoplasm (Cancer) Registration Indirect Age Adjusted Ratios 1998 to 2000
(MidCentral all ethnicities 1998 to 2000 used as comparison)
18.6 Mortality Analysis This subsection outlines the four most common causes of death in disadvantaged areas. It also compares mortality rates and ratios for socioeconomically disadvantaged areas (census area units with NZDep2001 of 9 or 10) to MidCentral district overall. Comparisons are made for the following causes of mortality:
• All causes • Circulatory system disorders • Cancers • Respiratory system disorders • External causes (unintentional and intentional injuries).
Circulatory system disorders, cancers, respiratory system disorders, and external causes are the top four causes of mortality for both the MidCentral district and for disadvantaged areas.

323
Circulatory system disease and neoplasms (cancers) were the two most common causes of death among residents of MidCentral district census area units with NZDep2001 score of 9 or 10 (42.4% and 27.6% respectively). Diseases of the respiratory system (10.1%) and deaths due to external causes (5.8%) follow. “External Causes of Morbidity and Mortality” is an ICD10 category which groups together causes of death due to unintentional or intentional injury. Examples include: transport accidents, accidental injury, drowning, exposure to smoke and fire, poisoning from venomous animals or plants, intentional self harm, assault, incidents of unclear intent, war, complications of surgical and medical care, and consequences of unintentional and intentional injury. Both crude mortality rates and age adjusted ratios are used in these comparisons. Both are explained here. Crude rates are the number of deaths divided by the total number of people in the population of interest. It does not take into account different age structures in populations. Age adjusted ratios prevent dissimilar age balances in different populations distorting population rates of mortality. This is because most diseases causing death are more likely to occur in some age groups than others. Therefore, different rates of mortality may be due to differences in age structure and not because the risk of death is higher or lower. An age adjusted ratio is a ratio of actual number of deaths divided by expected number of deaths. The expected number of deaths is calculated using the mortality rates from a comparison population. Age adjusted ratios therefore compare a target population to a predetermined comparison population, compensating for any differences in age structure at the same time. For mortality, MidCentral district all ethnicities is the comparison population and has been set the ratio of 1. The individual disadvantaged areas and MidCentral district ethnic groupings have been compared to this ratio. Ethnic age adjusted ratios exceeding 1 mean the ethnic group experienced more deaths than expected when compared against MidCentral district overall. Ratios below 1 mean the ethnic group experienced less deaths when compared against New Zealand overall.
ICD10 ChapterNumber of
deaths PercentageDiseases of the circulatory system (I00 - I95) 545 42.4%Neoplasms (cancers) (C00 - D48) 355 27.6%Diseases of the respiratory system (J00 - J99) 130 10.1%External causes of morbidity and mortality (V01 - Y98) 75 5.8%Endocrine, nutritional and metabolic diseases and immunity disorders (E00 - E07) 38 3.0%Mental disorders (F00 - F99) 33 2.6%Diseases of the digestive system (K00 - K93) 25 1.9%Diseases of the nervous system (G00 - G9999) 25 1.9%Diseases of the genitourinary system (N00 - N99) 24 1.9%Congenital malformations, deformations, and chromosomal abnormalities (Q00 - Q99) 9 0.7%Diseases of the musculoskeletal system and connective tissue (M00 - M99) 8 0.6%Symptoms, signs,and ill-defined conditions (R00 - R99) 5 0.4%Diseases of the skin and subcutaneous tissue (L00 - L99) 4 0.3%Certain conditions originating in the perinatal period (P00 - P96) 3 0.2%Infections and parasitic diseases (A00 - B99) 3 0.2%Complications of pregnancy, childbirth, and the puerperium (O00 - O99) 1 0.1%Grand Total 1284 100.0%
MidCentral NZDep2001 9 and 10 Census Area Units Mortality Ranked by ICD Chapter 1999 to 2001
18.6.1 Mortality Due to All Causes
Analysis of 1999 to 2001 mortality data show that the risk of mortality is higher among MidCentral district socioeconomically disadvantaged census area units compared to the district overall. Maori and Pacific peoples disparity is even worse in socioeconomically disadvantaged census area units than for MidCentral district overall. The crude mortality rates are higher across all and combined ethnic groups, in disadvantaged

324
areas compared to their MidCentral district equivalent measures. Crude mortality rates are the number of deaths divided by the total number of people living in the stated area. It does not take into account different age structures in different populations. Age adjusted ratios by ethnicity were calculated for disadvantaged areas and MidCentral district overall. An explanation of age adjusted ratio is given at the beginning of this subsection. The age adjusted ratios, which take into consideration different age structures of different populations, show all ethnicities mortality was 27% higher in the socioeconomically disadvantaged areas when compared with overall MidCentral district all ethnicities. This difference is statistically significant. Maori people living in both MidCentral district overall and disadvantaged areas had greater than expected deaths from all causes compared to MidCentral district all ethnicities. This disparity was greater for Maori living in disadvantaged areas. MidCentral district Maori experienced 50% more than the expected number of deaths compared to MidCentral district all ethnicities. Maori living in disadvantaged areas experienced 68% more deaths. Pacific peoples living in disadvantaged areas experienced over twice the expected number of deaths compared to MidCentral district all ethnicities. MidCentral district Pacific peoples ratio did not reach statistical significance. The numbers of Pacific peoples deaths were small and this may affect the reliability of these figures. Other ethnicities (non Maori, non Pacific) living in disadvantaged areas experienced 23% higher than expected deaths compared to MidCentral district all ethnicities (age adjusted ratio of 1.23).
Maori Pacific Asian
Other (excludes
Asian)All
ethnicities1999 35 6 7 384 4322000 38 9 0 360 4072001 48 4 7 386 445
Total 121 19 14 1130 1284
MidCentral NZDep2001 9&10 Census Area Units All Cause Mortality 1999 to 2001
Maori Pacific Asian
Other (excludes
Asian)All
ethnicities1999 88 11 14 1268 13812000 104 10 2 1164 12802001 107 12 14 1241 1374
Total 299 33 30 3673 4035
MidCentral All Cause Mortality 1999 to 2001
Maori Pacific
Other (includes
Asian)All
ethnicities
MidCentral NZDep2001 9&10 CAUs 1410 1440 4840 3830
MidCentral 1150 980 2820 2510
MidCentral NZDep2001 9&10 Census Area Unit Crude Rates (non age adjusted) All Cause Mortality 1999 to 2001 (per 100,000 people)
Ratio95%
conf.limits Ratio95%
conf.limits Ratio95%
conf.limits Ratio95%
conf.limits
MidCentral NZDep2001 9&10 1.68 1.38 - 1.98 2.07 1.14 - 3 1.23 1.15 - 1.3 1.27 1.2 - 1.33MidCentral 1.5 1.33 - 1.67 1.47 0.97 - 1.97 0.97 0.94 - 1 1
Maori Pacific Other (includes Asian) All ethnicities
MidCentral NZDep2001 9&10 Census Area Units (CAU) and MidCentral All Cause Mortality Indirect Age Adjusted Ratios 1999 to 2001
(MidCentral all ethnicities 1999 to 2001 used as comparison)

325
Other ethnicities (includes Asian)
Ratio95%
conf.limits Ratio95%
conf.limits Ratio
1999 to 2001 1.42 1.17 - 1.67 1.74 0.96 - 2.52 1
Maori Pacific
MidCentral NZDep2001 9&10 Census Area Units (CAU) All Cause Mortality Indirect Age Adjusted Ratios by Ethnicity 1999 to 2001
(MidCentral NZDep2001 9&10 CAUs 'Other' ethnicities 1999 to 2001 used as comparison)
All Causes Mortality Age Distribution The distribution of mortality across age groups is similar when disadvantaged census area units are compared to overall MidCentral district. However, there are differences when age specific rates (rates of mortality within each age group) are compared. There were many age groups where the disadvantaged census area units age specific rates were higher than overall MidCentral district. The most prominent are:
• less than one age group (78% higher, or 13 deaths versus 32 for overall MidCentral district)
• 45 to 54 age groups (50% to 90% higher, or 59 deaths versus 203 for overall MidCentral district)
• 25 to 29 age group (50% higher or 13 deaths versus 43 for overall MidCentral district) • 85+ age group (57% higher, or 285 deaths versus 705 for overall MidCentral district).
There were also some age groups where the age specific rates for the disadvantaged census area units were less than overall MidCentral district equivalents. The 1 to 14 age groups were between 35% to 40% lower than overall MidCentral district equivalents (4 deaths versus 32 deaths).
MidCentral All Ethnicities All Cause Mortality by Age Group 1999 to 2001
0
100
200
300
400
500
600
700
800
900
0001
-0405
-0910
-1415
-1920
-2425
-2930
-3435
-3940
-4445
-4950
-5455
-5960
-6465
-6970
-7475
-7980
-84
85+
Age group
Nu
mb
er o
f ev
ents

326
MidCentral All Ethnicities All Cause Mortality Age Specific Rates 1999 to 2001
0
5000
10000
15000
20000
25000
30000
35000
0001
-0405
-0910
-1415
-1920
-2425
-2930
-3435
-3940
-4445
-4950
-5455
-5960
-6465
-6970
-7475
-7980
-84
85+
Age group
Ag
e sp
ecif
ic r
ate/
100,
000
peo
ple
MidCentral All Ethnicities NZDep2001 9&10 CAU All Cause Mortality Age Specific Rates 1999 to
2001
0
10000
20000
30000
40000
50000
60000
0001
-0405
-0910
-1415
-1920
-2425
-2930
-3435
-3940
-4445
-4950
-5455
-5960
-6465
-6970
-7475
-7980
-84
85+
Age group
Ag
e sp
ecif
ic r
ate/
100,
000
peo
ple
18.6.2 Circulatory System Mortality
Circulatory system deaths from 1999 to 2001 were analysed for MidCentral district and its socioeconomically disadvantaged areas. Circulatory system mortality rates and ratios were higher in MidCentral district socioeconomically disadvantaged census area units compared to the equivalent measures. MidCentral district Maori and Pacific peoples disparities in circulatory system mortality appear worse in disadvantaged areas. The circulatory system mortality crude rates for 1999 to 2001 were all higher for individual ethnic groups in disadvantaged areas than their MidCentral district equivalents. However, the number of Pacific peoples who died from circulatory system disease was low–nine. This low number might affect the reliability of any calculations based on it. Crude rates are the number of deaths divided by the total number of people in the population of interest. It does not take into account different age balances in different populations. Age adjusted ratios by ethnicity were calculated for disadvantaged areas and MidCentral district overall. An explanation of age adjusted ratio is given at the beginning of this subsection. Calculation of age adjusted ratios show that combined ethnicities living in disadvantaged areas had 21% more than expected deaths from circulatory disease compared to MidCentral district all ethnicities. All individual ethnic groups living in disadvantaged areas had higher than expected number of

327
deaths compared to MidCentral district all ethnicities. Maori were higher than expected by two and a quarter times; Pacific peoples by almost four times; and other ethnicities (non Maori, non Pacific) by 15%. However, Pacific peoples absolute mortality numbers were very small, and this could affect the reliability of age adjusted ratios calculated from them.
Maori Pacific Asian
Other (excludes
Asian)All
ethnicities1999 13 1 3 166 1832000 15 6 0 145 1662001 18 2 1 175 196
Total 46 9 4 486 545
MidCentral NZDep2001 9&10 Census Area Units Circulatory System Mortality 1999 to 2001
Maori Pacific Asian
Other (excludes
Asian)All
ethnicities1999 32 1 6 554 5932000 42 7 0 502 5512001 39 5 2 554 600
Total 113 13 8 1610 1744
MidCentral Circulatory System Mortality 1999 to 2001
Maori Pacific
Other (includes
Asian)All
ethnicities
MidCentral NZDep2001 9&10 CAUs 534 680 2070 1620
MidCentral 433 386 1230 1090
MidCentral NZDep2001 9&10 Census Area Units Crude Rates (non age adjusted) Circulatory System Mortality 1999 to 2001 (per
100,000 people)
Ratio95%
conf.limits Ratio95%
conf.limits Ratio95%
conf.limits Ratio95%
conf.limits
MidCentral NZDep2001 9&10 2.25 1.6 - 2.91 3.97 1.38 - 6.56 1.15 1.05 - 1.25 1.21 1.11 - 1.32MidCentral 2.07 1.68 - 2.45 2.43 1.11 - 3.75 0.96 0.91 - 1.01 1
MidCentral NZDep2001 9&10 Census Area Units (CAU) and MidCentral Circulatory System Mortality Indirect Age Adjusted Ratios 1999 to 2001
(MidCentral all ethnicities 1999 to 2001 used as comparison)
Maori Pacific Other (includes Asian) All ethnicities
Circulatory System Mortality Age Distribution Circulatory system mortality age distribution for socioeconomically disadvantaged census area units and MidCentral district overall showed a similar pattern. The number of deaths increased with increasing age. The age specific rates (mortality rates within age bands) showed some differences when disadvantaged areas were compared to MidCentral district overall. There were some disadvantaged areas age specific rates that were higher than corresponding MidCentral district age specific rates. These were:
• 40 to 64 years age groups showed from 30 to 90% greater age specific rates (63 deaths versus 173 for overall MidCentral district). The 45 to 49 age group showed the greatest variance, 170%, although the absolute numbers were small (6 deaths versus 13 for overall MidCentral district)
• 70 to 79 age bands age specific rates were 30% higher than MidCentral district equivalents (191 deaths versus 527 for the district overall).
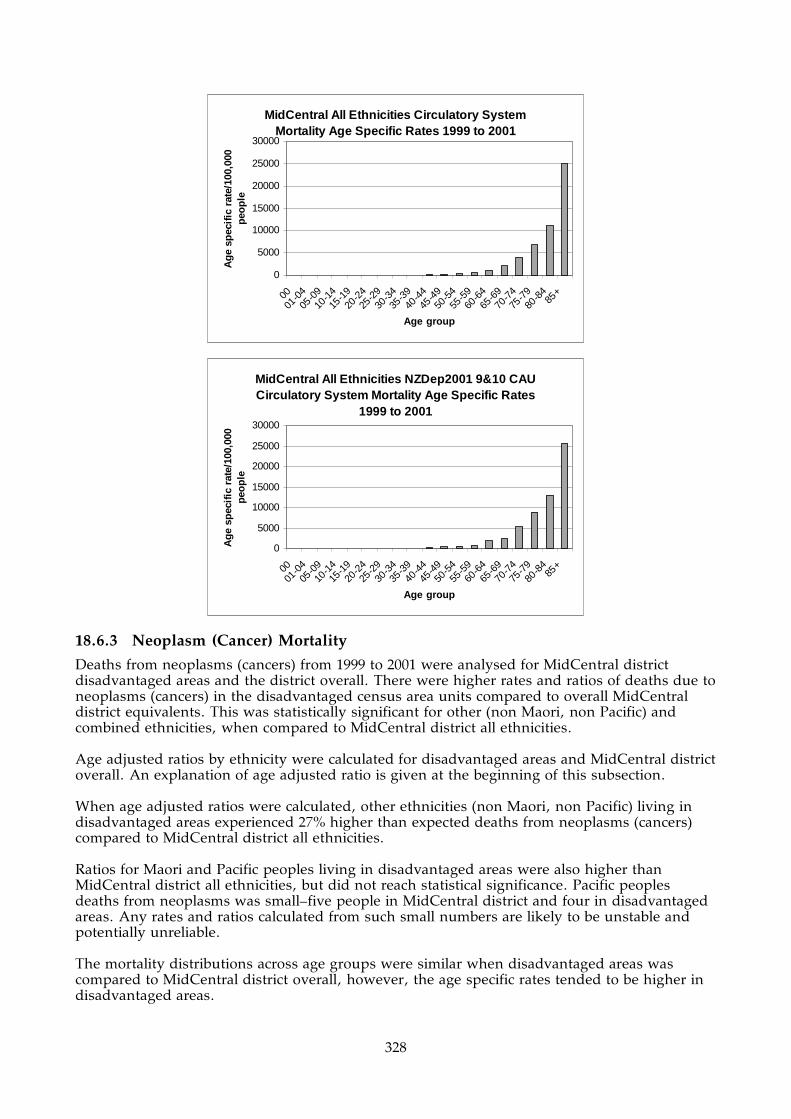
328
MidCentral All Ethnicities Circulatory System Mortality Age Specific Rates 1999 to 2001
0
5000
10000
15000
20000
25000
30000
0001
-0405
-0910
-1415
-1920
-2425
-2930
-3435
-3940
-4445
-4950
-5455
-5960
-6465
-6970
-7475
-7980
-84
85+
Age group
Ag
e sp
ecif
ic r
ate/
100,
000
peo
ple
MidCentral All Ethnicities NZDep2001 9&10 CAU Circulatory System Mortality Age Specific Rates
1999 to 2001
0
5000
10000
15000
20000
25000
30000
0001
-0405
-0910
-1415
-1920
-2425
-2930
-3435
-3940
-4445
-4950
-5455
-5960
-6465
-6970
-7475
-7980
-84
85+
Age group
Ag
e sp
ecif
ic r
ate/
100,
000
peo
ple
18.6.3 Neoplasm (Cancer) Mortality
Deaths from neoplasms (cancers) from 1999 to 2001 were analysed for MidCentral district disadvantaged areas and the district overall. There were higher rates and ratios of deaths due to neoplasms (cancers) in the disadvantaged census area units compared to overall MidCentral district equivalents. This was statistically significant for other (non Maori, non Pacific) and combined ethnicities, when compared to MidCentral district all ethnicities. Age adjusted ratios by ethnicity were calculated for disadvantaged areas and MidCentral district overall. An explanation of age adjusted ratio is given at the beginning of this subsection. When age adjusted ratios were calculated, other ethnicities (non Maori, non Pacific) living in disadvantaged areas experienced 27% higher than expected deaths from neoplasms (cancers) compared to MidCentral district all ethnicities. Ratios for Maori and Pacific peoples living in disadvantaged areas were also higher than MidCentral district all ethnicities, but did not reach statistical significance. Pacific peoples deaths from neoplasms was small–five people in MidCentral district and four in disadvantaged areas. Any rates and ratios calculated from such small numbers are likely to be unstable and potentially unreliable. The mortality distributions across age groups were similar when disadvantaged areas was compared to MidCentral district overall, however, the age specific rates tended to be higher in disadvantaged areas.

329
Maori Pacific Asian
Other (excludes
Asian)All
ethnicities1999 9 3 4 105 1212000 5 0 0 110 1152001 16 1 0 102 119
Total 30 4 4 317 355
MidCentral NZDep2001 9&10 Census Area Units Neoplasm (Cancer) Mortality 1999 to 2001
Maori Pacific Asian
Other (excludes
Asian)All
ethnicities1999 22 3 6 333 3642000 21 0 1 335 3572001 33 2 3 322 360
Total 76 5 10 990 1081
MidCentral Neoplasm (Cancer) Mortality 1999 to 2001
Maori Pacific
Other (includes
Asian)All
ethnicities
MidCentral NZDep2001 9&10 CAUs 348 302 1360 1060
MidCentral 292 148 762 673
MidCentral NZDep2001 Census Area Units 9&10 Crude Rates (non age adjusted) Neoplasm (Cancer) Mortality 1999 to 2001 per
100,000 people
Ratio95%
conf.limits Ratio95%
conf.limits Ratio95%
conf.limits Ratio95%
conf.limits
MidCentral NZDep2001 9&10 CAUs 1.5 0.96 - 2.03 1.57 0.03 - 3.11 1.29 1.15 - 1.43 1.31 1.17 - 1.44MidCentral 1.41 1.09 - 1.72 0.8 0.1 - 1.5 0.98 0.92 - 1.04 1
MidCentral NZDep2001 9&10 Census Area Units (CAU) and MidCentral Neoplasm (Cancer) Mortality Indirect Age Adjusted Ratios 1999 to 2001
(MidCentral all ethnicities 1999 to 2001 used as comparison)
Maori Pacific Other (includes Asian) All ethnicities
MidCentral All Ethnicities Neoplasm (Cancer) Mortality by Age Group 1999 to 2001
0
50
100
150
200
250
0001
-04
05-0
9
10-1
4
15-1
9
20-2
4
25-2
9
30-3
4
35-3
9
40-4
4
45-4
9
50-5
4
55-5
9
60-6
4
65-6
9
70-7
4
75-7
9
80-8
485
+
Age group
Nu
mb
er o
f ev
ents

330
MidCentral All Ethnicities Neoplasm (Cancer) Mortality Age Specific Rates 1999 to 2001
0
1000
2000
3000
4000
5000
6000
7000
0001
-0405
-0910
-1415
-1920
-2425
-2930
-3435
-3940
-4445
-4950
-5455
-5960
-6465
-6970
-7475
-7980
-84
85+
Age group
Ag
e sp
ecif
ic r
ate/
100,
000
peo
ple
MidCentral All Ethnicities NZDep2001 9&10 CAU Neoplasm (Cancer) Mortality Age Specific Rates
1999 to 2001
010002000300040005000600070008000
0001
-0405
-0910
-1415
-1920
-2425
-2930
-3435
-3940
-4445
-4950
-5455
-5960
-6465
-6970
-7475
-7980
-84
85+
Age group
Ag
e sp
ecif
ic
rate
/100
,000
peo
ple
MidCentral All Ethnicities NZDep2001 9&10 CAU Neoplasm (Cancer) Mortality by Age Group 1999
to 2001
0
10
20
3040
50
60
70
80
0001
-0405
-0910
-1415
-1920
-2425
-2930
-3435
-3940
-4445
-4950
-5455
-5960
-6465
-6970
-7475
-7980
-84
85+
Age group
Nu
mb
er o
f ev
ents
18.6.4 Respiratory System Mortality
Deaths from respiratory system diseases from 1999 to 2001 were analysed for MidCentral district disadvantaged areas and the district overall. There were higher rates and ratios of respiratory system deaths in the disadvantaged census area units compared to overall MidCentral district equivalents. The number of Maori and Pacific peoples deaths were too small for reliable interpretation.

331
Age adjusted ratios by ethnicity were calculated for disadvantaged areas and MidCentral district overall. An explanation of age adjusted ratio is given at the beginning of this subsection. MidCentral district NZDep2001 9 and 10 census area units showed higher crude mortality rates (non age adjusted) and age adjusted ratios when compared to overall MidCentral district. The age adjusted ratio shows people of all ethnicities living in disadvantaged areas experienced 45% higher than expected respiratory system deaths compared to MidCentral district all ethnicities. Maori and Pacific peoples absolute number of deaths were too small for calculation of reliable rates and ratios. The mortality distributions across age groups were similar when disadvantaged areas was compared to MidCentral district overall, however, the age specific rates tended to be higher in disadvantaged areas.
Maori Pacific Asian
Other (excludes
Asian)All
ethnicities1999 2 1 0 49 522000 6 0 0 29 352001 3 0 1 39 43
Total 11 1 1 117 130
MidCentral NZDep2001 9&10 Census Area Units Respiratory Mortality 1999 to 2001
Maori Pacific Asian
Other (excludes
Asian)All
ethnicities1999 5 1 0 136 1422000 11 0 0 92 1032001 5 0 1 94 100
Total 21 1 1 322 345
MidCentral Respiratory Mortality 1999 to 2001
No. of events
Crude rate (non-age adjusted)/100,000
peopleAge adjusted
ratio
95% confidence
limits for age adjusted ratio
MidCentral NZDep2001 9 & 10 CAUs 130 387 1.45 1.2 - 1.7MidCentral 345 215 1
MidCentral NZDep 9&10 Census Area Units (CAU) and MidCentral Respiratory Mortality Indirect Age Adjusted Ratios 1999 to 2001
(MidCentral used as comparison for age adjusted ratio)
MidCentral All Ethnicities Respiratory Mortality by Age Group 1999 to 2001
0
20
40
60
80
100
120
0001
-0405
-0910
-1415
-1920
-2425
-2930
-3435
-3940
-4445
-4950
-5455
-5960
-6465
-6970
-7475
-7980
-84
85+
Age group
Nu
mb
er o
f ev
ents

332
MidCentral All Ethnicities Respiratory Mortality Age Specific Rates 1999 to 2001
0500
100015002000250030003500400045005000
0001
-0405
-0910
-1415
-1920
-2425
-2930
-3435
-3940
-4445
-4950
-5455
-5960
-6465
-6970
-7475
-7980
-84
85+
Age group
Ag
e sp
ecif
ic r
ate/
100,
000
peo
ple
MidCentral All Ethnicities NZDep2001 9&10 CAU Respiratory Mortality Age Specific Rates 1999 to
2001
0500
100015002000250030003500400045005000
0001
-0405
-0910
-1415
-1920
-2425
-2930
-3435
-3940
-4445
-4950
-5455
-5960
-6465
-6970
-7475
-7980
-84
85+
Age group
Ag
e sp
ecif
ic r
ate/
100,
000
peo
ple
MidCentral All Ethnicities NZDep2001 9&10 CAU Respiratory Mortality by Age Group 1999 to 2001
0
5
10
15
20
25
30
35
0001
-0405
-0910
-1415
-1920
-2425
-2930
-3435
-3940
-4445
-4950
-5455
-5960
-6465
-6970
-7475
-7980
-84
85+
Age group
Nu
mb
er o
f ev
ents
18.6.5 External Causes Mortality
Deaths from external causes from 1999 to 2001 were analysed for MidCentral district disadvantaged areas and the district overall. External causes are unintentional and intentional injuries. There were higher rates and ratios of external cause deaths in the disadvantaged census area units compared to overall MidCentral district equivalents. The number of Maori

333
and Pacific peoples deaths were too small for reliable interpretation. Age adjusted ratios by ethnicity were calculated for disadvantaged areas and MidCentral district overall. An explanation of age adjusted ratio is given at the beginning of this subsection. MidCentral district disadvantaged areas experienced 34% more than expected deaths from external causes compared to MidCentral district overall (age adjusted ratio of 1.34). Analysis by individual ethnic groups was not done because the small absolute number of deaths would make calculated rates and ratios unreliable. MidCentral district NZDep2001 9 and 10 census area units showed higher combined ethnicities crude mortality rates (non age adjusted) and age adjusted ratios when compared to overall MidCentral district. The difference in age adjusted ratios reached statistical significance. Maori and Pacific peoples absolute number of deaths for socioeconomically disadvantaged areas were small and calculations made using them are likely to be unreliable. The mortality distributions across age groups were similar when disadvantaged areas was compared to MidCentral district overall, however, the age specific rates tended to be higher in disadvantaged areas. The disadvantaged areas had an isolated peak in the 25 to 29 age group.
Maori Pacific Asian
Other (excludes
Asian) All ethnicities1999 4 0 0 22 262000 4 1 0 19 242001 5 0 2 18 25
Total 13 1 2 59 75
MidCentral NZDep2001 9&10 Census Area Units External Causes Mortality 1999 to 2001
Maori Pacific Asian
Other (excludes
Asian) All ethnicities1999 12 1 2 74 892000 13 1 1 58 732001 12 2 4 74 92
Total 37 4 7 206 254
MidCentral External Causes Mortality 1999 to 2001
No. of events
Crude rate (non-age adjusted)/100,000
people
Age adjusted
ratio
95% confidence
limits for age adjusted ratio
MidCentral NZDep2001 9 & 10 CAUs 75 223 1.34 1.03 - 1.64MidCentral 254 158 1
MidCentral NZDep2001 9&10 Census Area Units (CAU) and MidCentral External Causes Mortality Indirect Age Adjusted Ratios 1999 to 2001
(MidCentral used as comparison for age adjusted ratio)

334
MidCentral All Ethnicities External Causes Mortality by Age Group 1999 to 2001
0
5
10
15
20
25
30
35
0001
-0405
-0910
-1415
-1920
-2425
-2930
-3435
-3940
-4445
-4950
-5455
-5960
-6465
-6970
-7475
-7980
-84
85+
Age group
Nu
mb
er o
f ev
ents
MidCentral All Ethnicities External Causes Mortality Age Specific Rates 1999 to 2001
0
200
400
600
800
1000
1200
1400
1600
0001
-0405
-0910
-1415
-1920
-2425
-2930
-3435
-3940
-4445
-4950
-5455
-5960
-6465
-6970
-7475
-7980
-84
85+
Age group
Ag
e sp
ecifi
c ra
te/1
00,0
00
peo
ple
MidCentral All Ethnicities NZDep2001 9&10 CAU External Causes Mortality Age Specific Rates
1999 to 2001
0
200
400
600
800
1000
1200
1400
0001
-0405
-0910
-1415
-1920
-2425
-2930
-3435
-3940
-4445
-4950
-5455
-5960
-6465
-6970
-7475
-7980
-84
85+
Age group
Ag
e sp
ecif
ic r
ate/
100,
000
peo
ple

335
MidCentral All Ethnicities NZDep2001 9&10 CAU External Causes Mortality by Age Group 1999 to
2001
0
2
4
6
8
10
12
0001
-0405
-0910
-1415
-1920
-2425
-2930
-3435
-3940
-4445
-4950
-5455
-5960
-6465
-6970
-7475
-7980
-84
85+
Age group
Nu
mb
er o
f ev
ents

336
19. APPENDIX ONE: DATA SOURCES Chapter 2: MidCentral District Demography Population figures provided by Central Region Technical Advisory Services, sourced from Statistics New Zealand. Life expectancy data and processing provided by Public Health Intelligence, Ministry of Health. Chapter 3: Socioeconomic Factors NZDep2001 population distributions provided by Central Region Technical Advisory Services. Map of NZDep2001 distribution provided by Public Health Observatory, Public Health Intelligence, Ministry of Health. Income, education, housing, telephone access, car access data sourced from Statistics New Zealand online facilities (www.stats.govt.nz). Welfare benefit data provided by Central Region Technical Advisory Services, sourced from the Ministry of Social Development, Information Analysis and Monitoring Unit. Chapter 4: Health Risks and Protective Factors Data and information concerning health risks and protective factors came from two sources. They were:
• MidCentral Health Public Health Service’s report “The Health Knowledge, Attitudes and Practices of the Residents of MidCentral District Health Board 2003”
• “2002/2003 New Zealand Health Survey, District Health Board estimates” provided by Public Health Intelligence, Ministry of Health.
Chapter 5: MidCentral District Road Traffic Issues Territorial authority road traffic issues were obtained from Land Transport Safety Authority “Safety Issue” documents, downloadable from the Land Transport Safety Authority’s web site (www.ltsa.govt.nz). Alcohol related traffic casualties data provided by Central Advisory Technical Services, sourced from Land Transport Safety Authority. Road traffic injury hospitalisation data provided by Central Region Technical Advisory Services, sourced from Ministry of Health health needs assessment datasets for district health boards. The authors carried out the processing into health status measures. Central Region Technical Advisory Services provided the population data, originally sourced from Statistics New Zealand. Chapter 6: Notifiable Diseases Notifiable diseases data and information provided by Central Region Technical Advisory Services, sourced from Environmental Science and Research Ltd (ESR). Chapter 7: Environment as an Influence on Health This chapter was written by Peter Wood, Senior Health Protection Officer, MidCentral Health Public Health Unit.

337
Chapter 8: Meningococcal Disease Meningococcal disease notifications provided by Central Region Technical Advisory Services, sourced from Environmental Science and Research Ltd (ESR). Chapter 9: Suicide Suicide data provided by Central Region Technical Advisory Services, sourced from Ministry of Health health needs assessment datasets. Chapter 10: Reproductive Health Birth and teenage birth data provided by Central Region Technical Advisory Services, sourced from Statistics New Zealand. Caesarean section, pregnancy complication, and complications of birth data were extracted from Ministry of Health health needs assessment datasets by the authors. The authors carried out the processing into health measures. Central Region Technical Advisory Services provided the population data, originally sourced from Statistics New Zealand. Chapter 11: Sexual Health Sexually transmitted infection data sourced from STI Surveillance Team reports. The STI Surveillance Team are a part of Environmental Science and Research Ltd. Chapter 12: MidCentral District Mental Health Information National Collection Data Mental Health Information National Collection data were provided by Central Region Technical Advisory Services, sourced from New Zealand Health Information Service. Chapter 13: Primary Care Data Primary care data were provided and processed by Central Region Technical Advisory Services, sourced from New Zealand Health Information Services (Pharmhouse Data Warehouse and Labs Data Warehouse). Chapter 14: Child Health New Zealand Health Information Service provided the low birth weight baby data and information. Dental data were provided by Dr Philip Marshall, MidCentral Health Dental Services. Childhood hearing test results were sourced from National Audiology Centre, New Zealand Hearing Test Statistics reports, 2003 and 2004. Childhood injury, and child poisonings hospitalisation data were provided by Central Region Technical Advisory Services and processed by the authors. Original source of these data was the Ministry of Health health needs assessment datasets. Sudden infant death syndrome data were provided by Central Region Technical Advisory Services and processed by the authors. Original source of these data was the Ministry of Health health needs assessment datasets. Childhood and infant mortality data were extracted from the Ministry of Health health needs assessment datasets. Data processing was by the authors.

338
Central Region Technical Advisory Services provided the population data, originally sourced from Statistics New Zealand. Chapter 15: Disability in MidCentral District Disability data were provided by both Central Region Technical Advisory Services and the Public Health Consultancy of the Wellington Medical School. The original sources of both sets of data were Statistics New Zealand’s 2001 Household Disability Survey and 2001 Disability Survey of Residential Facilities. Disability service use data were provided by Central Region Technical Advisory Services. They also did the data processing. The original source of the data was HealthPAC’s Client Claims Processing System. Chapter 16: MidCentral District Morbidity and Mortality Ministry of Health health needs assessment datasets were the original source for the data in this chapter. Data extraction was done by both the authors and Central Region Technical Advisory Services. The authors processed these data into health measures and ranked lists. Central Region Technical Advisory Services provided the population data, originally sourced from Statistics New Zealand. Chapter 17: MidCentral District Territorial Authority Morbidity and Mortality Analysis Ministry of Health health needs assessment datasets were the original source for the data in this chapter. Data extraction was done by both the authors and Central Region Technical Advisory Services. The authors processed these data into health measures and ranked lists. Central Region Technical Advisory Services provided the population data, originally sourced from Statistics New Zealand. Chapter 18: MidCentral District Most Socioeconomically Disadvantaged Census Area Units Ministry of Health health needs assessment datasets were the original source for the data in this chapter. Data extraction was done by both the authors and Central Region Technical Advisory Services. The authors processed these data into health measures and ranked lists. Central Region Technical Advisory Services provided the population data, originally sourced from Statistics New Zealand.

339
20. APPENDIX TWO: FILTERING CRITERIA USED IN HOSPITALISATION DATA
Most of the hospitalisation data used in this report originated from the Ministry of Health, specifically for district health board health needs assessment work. The Ministry of Health has filtered these data using 19 exclusion criteria. The 19 criteria are listed below.
• Non treated patients Events where no treatment is provided. This includes boarders or cancelled operations.
• Error DRGs • Renal dialysis • Same day chemotherapy and radiotherapy • Sleep apnoea
Sleep apnoea events where the patient stays overnight for tests. • Lithotripsy
Same day lithotripsy events. • Colposcopies
Same day colposcopy events. • Cystoscopies
Same day cystoscopy events. • ERCP
Same day ERCP (endoscopic retrograde cholangiopancreatography). • Colonoscopies
Same day colonoscopies. • Gastroscopies
Same day gastroscopies. • Bronchoscopies
Same day bronchoscopies. • Day case blood transfusions • Inconsistent stays
More than one hospitalisation for the same person for the same time. • Well babies
Different hospitals have considered well babies differently. Some have recorded them as a separate hospitalisation in addition to their mother; while others have not.
• Mental health cases • Disability Support Service cases • Transfers
Patients admitted to one hospital and then transferred to another have their records rationalised so this counts as only one discharge and not two.
• A&E day cases

340
21. APPENDIX THREE: ICD CODES USED IN SELECTED DISEASE COMPARISONS
This appendix lists the ICD codes used to extract disease data for the selected disease comparisons in this report. These codes do not apply to the ranked lists, where the ICD codes are given within the tables.
Chronic obstructive respiratory disease (CORD) J410 Simple chronic bronchitis J411 Mucopurulent chronic bronchitis J418 Mixed simple and mucopurulent chronic bronchitis J42 Unspecified chronic bronchitis J430 MacLeod's syndrome J431 Panlobular emphysema J432 Centrilobular emphysema J438 Other emphysema J439 Emphysema, unspecified J440 Chronic obstructive pulmonary disease with acute lower respiratory
infection J441 Chronic obstructive pulmonary disease with acute exacerbation,
unspecified J448 Other specified chronic obstructive pulmonary disease J449 Chronic obstructive pulmonary disease, unspecified J47 Bronchiectasis Diabetes E10 Type 1 diabetes mellitus E11 Type 2 diabetes mellitus E13 Other specified diabetes mellitus E14 Unspecified diabetes mellitus Immunisation preventable hospitalisations A33 Tetanus neonatorum A35 Other tetanus A360 Pharyngeal diphtheria A361 Nasopharyngeal diphtheria A362 Laryngeal diphtheria A363 Cutaneous diphtheria A368 Other diphtheria A369 Diphtheria, unspecified A370 Whooping cough due to Bordetella pertussis A371 Whooping cough due to Bordetella parapertussis A378 Whooping cough due to other Bordetella species A379 Whooping cough, unspecified A803 Acute paralytic poliomyelitis, other and unspecified A804 Acute nonparalytic poliomyelitis A809 Acute poliomyelitis, unspecified B050 Measles complicated by encephalitis (G05.1*) B052 Measles complicated by pneumonia (J17.1*) B053 Measles complicated by otitis media (H67.1*) B058 Measles with other complications B059 Measles without complication B060 Rubella with neurological complications B068 Rubella with other complications B069 Rubella without complication B260 Mumps orchitis (N51.1*) B261 Mumps meningitis (G02.0*) B262 Mumps encephalitis (G05.1*) B263 Mumps pancreatitis (K87.1*) B268 Mumps with other complications
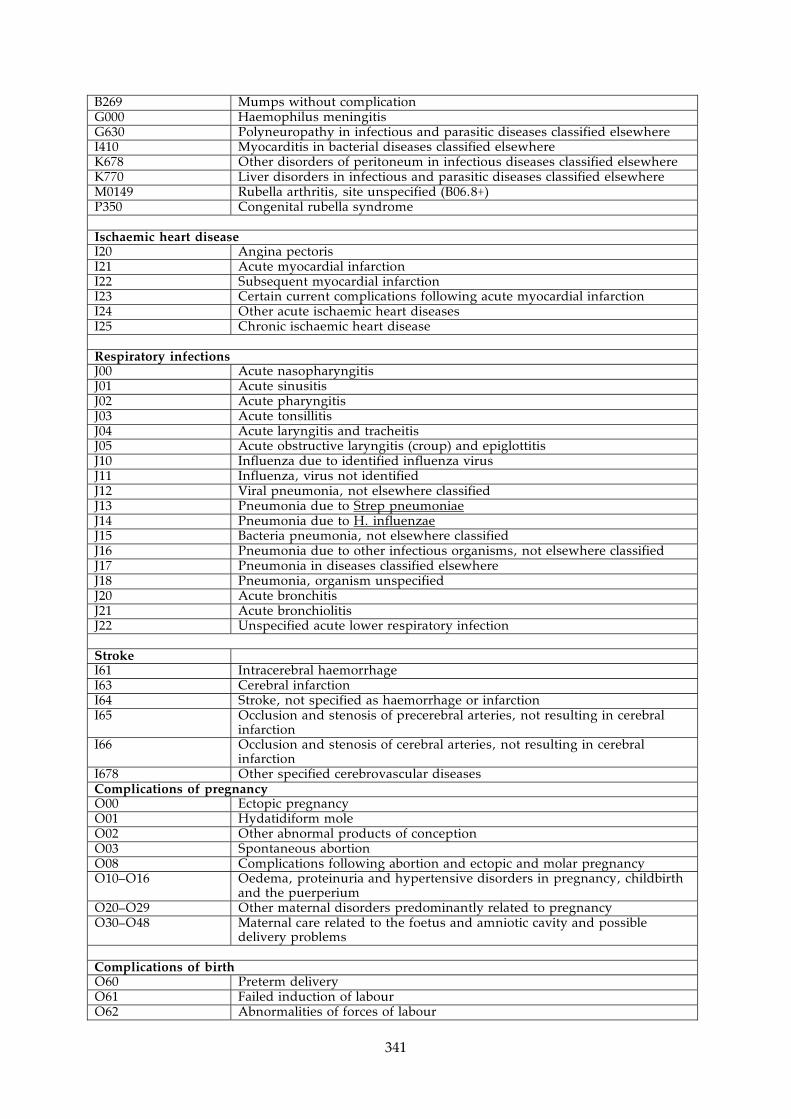
341
B269 Mumps without complication G000 Haemophilus meningitis G630 Polyneuropathy in infectious and parasitic diseases classified elsewhere I410 Myocarditis in bacterial diseases classified elsewhere K678 Other disorders of peritoneum in infectious diseases classified elsewhere K770 Liver disorders in infectious and parasitic diseases classified elsewhere M0149 Rubella arthritis, site unspecified (B06.8+) P350 Congenital rubella syndrome Ischaemic heart disease I20 Angina pectoris I21 Acute myocardial infarction I22 Subsequent myocardial infarction I23 Certain current complications following acute myocardial infarction I24 Other acute ischaemic heart diseases I25 Chronic ischaemic heart disease Respiratory infections J00 Acute nasopharyngitis J01 Acute sinusitis J02 Acute pharyngitis J03 Acute tonsillitis J04 Acute laryngitis and tracheitis J05 Acute obstructive laryngitis (croup) and epiglottitis J10 Influenza due to identified influenza virus J11 Influenza, virus not identified J12 Viral pneumonia, not elsewhere classified J13 Pneumonia due to Strep pneumoniae J14 Pneumonia due to H. influenzae J15 Bacteria pneumonia, not elsewhere classified J16 Pneumonia due to other infectious organisms, not elsewhere classified J17 Pneumonia in diseases classified elsewhere J18 Pneumonia, organism unspecified J20 Acute bronchitis J21 Acute bronchiolitis J22 Unspecified acute lower respiratory infection Stroke I61 Intracerebral haemorrhage I63 Cerebral infarction I64 Stroke, not specified as haemorrhage or infarction I65 Occlusion and stenosis of precerebral arteries, not resulting in cerebral
infarction I66 Occlusion and stenosis of cerebral arteries, not resulting in cerebral
infarction I678 Other specified cerebrovascular diseases Complications of pregnancy O00 Ectopic pregnancy O01 Hydatidiform mole O02 Other abnormal products of conception O03 Spontaneous abortion O08 Complications following abortion and ectopic and molar pregnancy O10–O16 Oedema, proteinuria and hypertensive disorders in pregnancy, childbirth
and the puerperium O20–O29 Other maternal disorders predominantly related to pregnancy O30–O48 Maternal care related to the foetus and amniotic cavity and possible
delivery problems Complications of birth O60 Preterm delivery O61 Failed induction of labour O62 Abnormalities of forces of labour

342
O63 Long labour O64 Obstructed labour due to malposition and malpresentation of foetus O65 Obstructed labour due to maternal pelvic abnormality O66 Other obstructed labour O67 Labour and delivery complicated by intrapartum haemorrhage, not
elsewhere classified O68 Labour and delivery complicated by foetal stress (distress) O70 Perineal laceration during delivery O71 Other obstetric trauma O72 Postpartum haemorrhage O73 Retained placenta and membranes O74 Complications of anaesthesia during labour and delivery O75 Other complications of labour and delivery, not elsewhere classified Skin infections ICD10: L00 Staphylococcal scaled skin syndrome L01 Impetigo L02 Cutaneous abscess, furuncle and carbuncle L03 Cellulitis L04 Acute lymphadenitis L05 Pilonidal cyst L08 Other local infections of skin and subcutaneous tissue ICD9: 680 Carbuncle and furuncle 681 Cellulitis and abscess of finger and toe 682 Other cellulitis and abscess 683 Acute lymphadenitis 684 Impetigo 685 Pilonidal cyst 686 Other local infections of skin and subcutaneous tissue Non-suppurative otitis media (glue ear) H65 (ICD10), 3810–3814 (ICD9)
Non-suppurative otitis media
Suppurative otitis media H66 (ICD10), 382 (ICD9)
Suppurative and unspecified otitis media
Poisoning X40–X49 Accidental poisoning by and exposure to noxious substances Road transport accidents V10–V19 Pedal cyclist injured in transport accident V20–V29 Motorcycle rider injured in transport accident V30–V39 Occupant of three wheeled motor vehicle injured in transport accident V40–V49 Car occupant injured in transport accident V50–V59 Occupant of pickup truck or van injured in transport accident V60–V69 Occupant of heavy transport vehicle injured in transport accident V70–V79 Bus occupant injured in transport accident V80, V81, V82, V87 Other land transport accidents