The Health of Morrison County: A Community Health Needs ...
44
The Health of Morrison County: A Community Health Needs Assessment May 2, 2013
-
Upload
khangminh22 -
Category
Documents
-
view
3 -
download
0
Transcript of The Health of Morrison County: A Community Health Needs ...
The Health of Morrison County: A Community Health Needs Assessment
May 2, 2013

2

3
TABLE OF CONTENTS Table of Contents . . . . . . . . . . page 3 Acknowledgements . . . . . . . . . . page 3 Executive Summary . . . . . . . . . . page 4 Introduction . . . . . . . . . . . page 6 Section I: What the People Told Us . . . . . . . page 8 Section II: What the Stakeholders Told Us . . . . . . page 14 Section III: What the Secondary Data Told Us . . . . . . page 18 Section IV: What’s Available – Community Health Assets and Other Resources . page 32 Section V: Summary and Conclusions . . . . . . . page 39 Section VI: Implementation Strategy/Action Plan . . . . . . page 40 Appendices: I.A through III.O . . . . . . . pages A-1 to A-116 Acknowledgements Special thanks are extended to the multiple individuals who assisted with the completion of this community health needs assessment, both those from within Unity Family Healthcare as well as our collaborators—Morrison County Public Health and Morrison County Social Services— and other several community partners. In particular, I would like to recognize the Initiative Foundation, notably Karen Stay, Chris Fastner, and Kathy Gaalswyk, for their help and “community-mindedness” with the stakeholder interviews. I also want to thank Ann March for helping me summarize the Minnesota Student Survey results for Morrison County and Kathy Lange for helping to compile the community resources list. I also would like to recognize Vicki Maleski from our accounting department and Robine Mayer from medical staff services for their expertise with Excel tables and graphs. Finally, I would like to acknowledge our Steering Committee—Chad Cooper, Bonnie Paulsen, Brad Vold, Kate Bjorge, and Kathy Lange, as well as the additional community and Unity Family Healthcare participants who helped us develop our Implementation Strategy—Rhonda Buckallew, Louise Welle, Andrea Foote, Steve Jones, Deb Boelz, Ann March, Paul Bukovich and Dr. Karilyn Avery. The assessment has truly been a community endeavor. Patrick Rioux Coordinator, Community Health Needs Assessment Manager of Communications, St. Gabriel’s Hospital

4
Executive Summary The Health of Morrison County is a comprehensive community health needs assessment (CHNA) conducted by three partners—Morrison County Public Health (MCPH), Morrison County Social Services (MCSS) and St. Gabriel’s Hospital. It is modeled after the assessment process outlined in Assessing and Addressing Community Health Needs, a publication developed by the Catholic Health Association, with additional evidence-based practices offered by Catholic Health Initiatives—the parent organization for St. Gabriel’s Hospital. The Health of Morrison County has six sections: 1) a report on a written/email survey that was mailed to county residents and distributed via various email lists throughout the county (Section I – What the People Told Us); 2) a report on the results of more than 20 face-to-face interviews with community stakeholders (Section II: What Stakeholders Told Us); 3) a report on secondary data sources containing information on the health of the people of Morrison County (Section III: What the Secondary Data Told Us); 4) a directory listing of the health system capabilities for addressing the health needs of the people of Morrison County, including both system capacity as well as some of the gaps in the health resources available in the county; 5) a brief summary and conclusions based on the previous first four sections (Section V: Summary and Conclusions); and a three-year action plan for improving the health of Morrison County residents (Section VI: Implementation Strategy - Our Three-Year Action Plan). The written survey provided useful information on community perceptions of the health of Morrison County, including what respondents thought were the most serious community health issues that were impacting the quality of life in the county. Obesity was listed as the most serious health issue by respondents. In addition, several of the top 12 issues were related to chemical use and abuse or mental health. Chronic disease was also a concern as were stress-related and socioeconomic issues. While the overall respondents to the survey are slightly younger and more affluent than the county population as a whole, we believe the written survey provides an accurate view of public perceptions of the health issues facing the county. The stakeholder interviews confirmed a lot of the data from the written survey. Stakeholders with close contact to the “poor” were specifically sought out for their opinions to ensure that the needs of individuals in poverty in the county had a “voice” in the survey process. In addition, local health leaders and others with in-depth knowledge of the local health care environment were included in the interviews, which were conducted “gratis” by the Initiative Foundation. Stakeholders spoke of eight common themes related to the health issues facing the county. Obesity, mental health and chronic disease were common topics of the interviewees. The stakeholder interviews provided qualitative and more in-depth information surrounding community health issues, including their perceptions of what may be helpful in addressing the health needs in the county. The search for secondary data (data, in most cases, collected by someone other than the community partners through a written survey or personal interviews) again confirmed the perceptions of written survey respondents and stakeholders. The list of county-specific data sources included in the CHNA is extensive (see Appendices III.A – M, pages A-21 through A-89). The County Health Rankings is one of the data sources that will be utilized to measure our progress toward achieving improved health in the county. People with interests in a specific health topic are encouraged to review the List of Appendices (page A-). Data for Morrison County is included in the individual appendices. High points and summaries of the various secondary data are included in Section III of the CHNA. An easy-to-use comprehensive directory of health care resources in Morrison County doesn’t exist. Such a directory was compiled as part of the CHNA, in order to determine what assets are available to address the primary community health issues and where there are “gaps” in the resources available. The county has fewer primary care providers, mental health providers and dentists per capita than state and national benchmarks. The county also doesn’t have inpatient treatment facilities for either mental health or chemical dependency, although
5
both services are available approximately 30 minutes from the county seat in Little Falls and not presenting a significant barrier to accessing services. Domestic violence resources—such as a women’s shelter and a child visitation center are also not available in the county. Generally speaking, Morrison County has sufficient resources to care for the people of Morrison County, with the exceptions noted previously (primary care, mental health and dental services). A summary of all information sources—written survey, stakeholder interviews, secondary data collection and health assets directory—shows that community agencies, including the hospital, need to be more effective in utilizing their health care assets to improve the health of the people in the county. There needs to be better coordination among the various entities working on health issues and shortages of primary care, mental health and dental providers need to be addressed in some fashion. The County Health Rankings will be among the data sources CHNA collaborators will be utilizing to determine how effective our strategies are in addressing community health needs. The implementation strategy is our blueprint for improving the health of Morrison County over the next three years. It was developed in collaboration with a variety of community individuals representing several organizations. The implementation strategy will primarily address three core areas: chronic disease, obesity and mental health. In a more supportive role, St. Gabriel’s Hospital will explore with its community health partners (Morrison County Public Health, Morrison County Social Services and others) how the hospital can assist in addressing access to chemical dependency and dental services as well as poverty in the community. A collective and integrated effort is needed to address these broader, societal concerns. The Patient-Centered Medical Home (PCMH) is both the cornerstone and foundation of the St. Gabriel’s Hospital (community) implementation strategy. It is what aligns the hospital’s strategic plan with the CHNA. It is also the base from which all health improvement activities are derived. We believe the PCMH will favorably impact the health of the people of Morrison County in a variety of ways, marshalling resources needed to make health improvements on a case-by-case basis. Success in achieving the goals and objectives in the CHNA action plan depends upon further developing the relationships with the communities we serve and the continued participation in health improvement activities and strategies by individuals and organizations throughout Morrison County. The CHNA is a vital first step toward improving The Health of Morrison County.
6
Introduction The Health of Morrison County is a comprehensive community health needs assessment (CHNA) developed by St. Gabriel’s Hospital in partnership with Morrison County Public health and Morrison County Social Services. Brief descriptions of the six sections of the CHNA are contained in this introduction after the following explanation on The Patient Protection and Affordable Care Act (PPACA) and its CHNA requirements for community hospitals. The Patient Protection and Affordable Care Act CHNA Implications for Community Hospitals One of the driving forces for conducting a CHNA was passage of the Patient Protection and Affordable Care Act (PPACA), sometimes referred to as Obamacare, and its requirements for community hospitals. The parent organization of St. Gabriel’s Hospital—Catholic Health Initiatives—conducted education on the PPACA for its hospitals across the country in order to ensure that each of them meet the requirements in the law and avoid the $50,000 penalty for NOT completing a CHNA within the timeframe identified in the legislation, specifically to conduct a CHNA every three years and adopt an implementation strategy that addresses the issues identified in the assessment. Several more-specific requirements identified in the law and how this CHNA meets those requirements are identified in the following “dot points”:
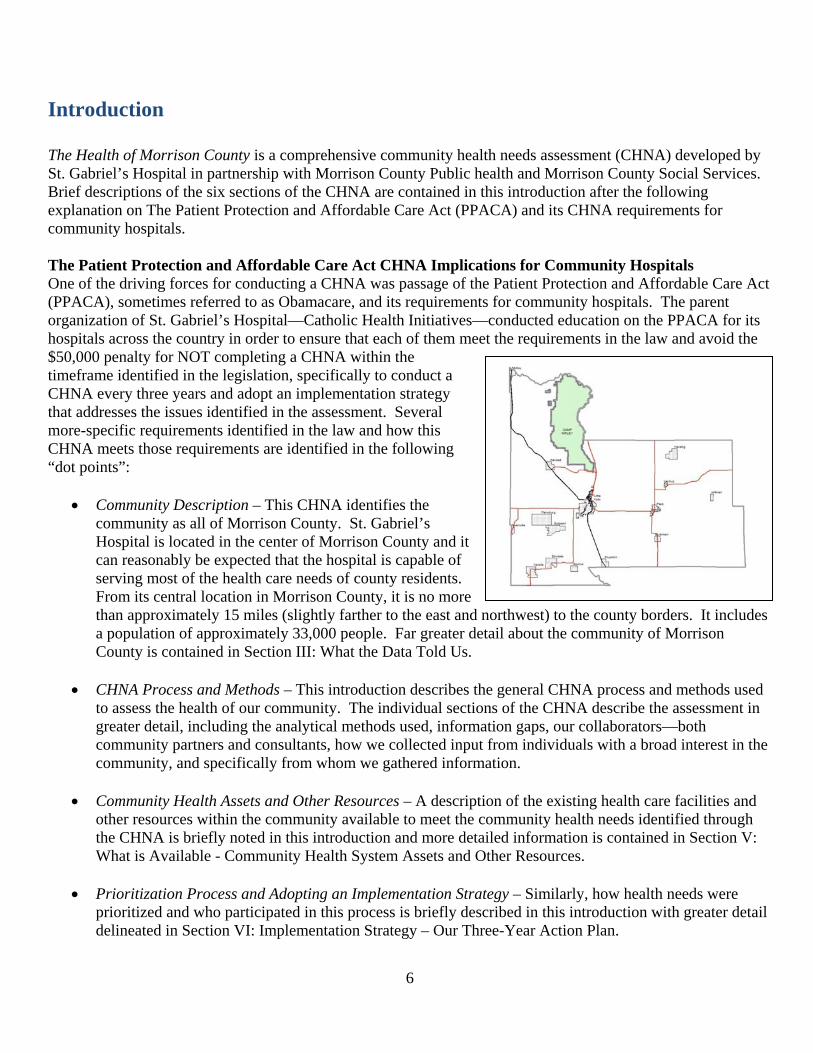
Community Description – This CHNA identifies the community as all of Morrison County. St. Gabriel’s Hospital is located in the center of Morrison County and it can reasonably be expected that the hospital is capable of serving most of the health care needs of county residents. From its central location in Morrison County, it is no more than approximately 15 miles (slightly farther to the east and northwest) to the county borders. It includes a population of approximately 33,000 people. Far greater detail about the community of Morrison County is contained in Section III: What the Data Told Us.
CHNA Process and Methods – This introduction describes the general CHNA process and methods used
to assess the health of our community. The individual sections of the CHNA describe the assessment in greater detail, including the analytical methods used, information gaps, our collaborators—both community partners and consultants, how we collected input from individuals with a broad interest in the community, and specifically from whom we gathered information.
Community Health Assets and Other Resources – A description of the existing health care facilities and
other resources within the community available to meet the community health needs identified through the CHNA is briefly noted in this introduction and more detailed information is contained in Section V: What is Available - Community Health System Assets and Other Resources.
Prioritization Process and Adopting an Implementation Strategy – Similarly, how health needs were
prioritized and who participated in this process is briefly described in this introduction with greater detail delineated in Section VI: Implementation Strategy – Our Three-Year Action Plan.

7
Section I: What the People Told Us The three collaborating agencies—Morrison County Public Health, Morrison County Social Services and St. Gabriel’s Hospital—contracted with Invitation Health, a Twin Cities-based research and planning organization, to conduct the written survey for the CHNA. Invitation Health, although under different names in prior years, conducted very similar surveys for the CHNA partners in 1999, 2004 and 2009. The survey included both a traditional mail survey through the U.S. Postal Service and an email survey distributed via Survey Monkey, primarily through most of the major employers in the county. Invitation Health conducted the written survey and provided a written report. It was not responsible for any other aspect related to the CHNA. Section II: What Stakeholders Told Us The Initiative Foundation, a not-for-profit entity dedicated to improving the quality of life in central Minnesota, agreed to provide staff resources to conduct and summarize one-on-one stakeholder interviews with 20-plus members of the greater Morrison County community. Stakeholders were individuals that came from two groups—systems people, individuals whose jobs or volunteer activities had significant relevance to the broad spectrum of health care throughout the county, and community-minded individuals who were not necessarily involved in any aspect of health care but possessed a genuine concern for improving the health of the people of Morrison County. The selection process was driven by the CHNA sponsors and their recommendations of people with knowledge of health or thoughtful, verbal individuals willing to state their opinions about improving health in the county. Special consideration was given to the PPACA requirements, in order to ensure that input was gathered from several individuals representative of the broader community and also knowledgeable about people in poverty and their specific health needs. Section III: What the Secondary Data Told Us A thorough secondary data review was conducted utilizing documents available via the internet and from the CHNA sponsors themselves. Several resources were utilized. Some of the primary data sources included the U.S. Census Bureau, County Health Tables and other documents available through the Minnesota Department of Health, the Minnesota Department of Human Services, The County Health Rankings (through the University of Wisconsin and Robert Wood Johnson Foundation) and the Minnesota Student Survey. Additional information was gathered from sources such as annual reports from area not-for-profits, etc. The secondary data was grouped into several subsections based on whether they were aggregate data (The County Health Rankings, the Community Health Status Indicators, some U.S. Census Bureau Reports, etc.), specific demographic data, local agency statistics, financial information, and student/school district information. There may be sources of additional information which were not discovered after a fairly exhaustive search. Section IV: What is Available – Community Health System Assets and Other Resources This section addresses overall capacity of the local health care system from a “global” perspective and whether these community “assets” are appropriate to serve the health care needs of Morrison County now and in the future. The data was compiled using a variety of sources—telephone and internet directory listings, agency listings (United Way, MinnesotaHelp.info, etc.), CHNA sponsor lists, and others. We recognize that a directory of this nature is likely to contain errors or omissions. Changes can be sent the St. Gabriel’s Hospital. Section VI: Summary and Conclusions Section VI is self-explanatory. It summarizes the data sources, including the community assets and resources section, and makes some conclusions about what the data tells us about the health of Morrison County residents. Section VI: Implementing Strategy - A Three-Year Action Plan to Improve Health in Morrison County Finally, Section VI delineates what the hospital and its collaborators intend to do over a three-year period to improve the health of the people of Morrison County. It was developed in an action planning session (involving not only the three collaborating entities (MCPH, MCSS, St. Gabriel’s Hospital) but several additional individuals representing other key constituencies in the community.
8
Section I: What the People Told Us Methodology The 2012 Morrison County Health Services Survey used both an internet-based survey and a paper/pencil survey (see Appendix I.A). A stratified random sample of 800 Morrison County residents were surveyed, with 200 of the total 800 representing residents aged 18-24. (Despite the oversampling of the 18-24 age group, an increased number of respondents among this age group did not materialize.) The methods chosen to gather residents’ perceptions included a mail survey based on zip code; a small number of paper surveys distributed at the local public library, Morrison County Government Center and St. Gabriel’s Hospital; and an online survey distributed mainly through major employers in the county. For the mail-based survey, a pre-notification individually addressed letter was sent to each selected resident. The purpose of this letter was to inform residents that the survey would be coming to them, that it was important, and that the results would be used to help the give Morrison County policy and decision-makers information that is useful in responding to health care issues. A week later, a survey packet was mailed to each member of the sample. It contained:
The survey instrument A link to the online survey A self-addressed postage-paid envelope A cover letter from the Invitation Health Institute
One week following the mailing of the survey packet, a reminder postcard was mailed to each member of the sample. If a potential respondent had lost or misplaced their survey, they were invited to call Invitation Health Institute’s 800-number to request a second survey. The overall response rate for the Morrison County Health Services Survey was 72%. Statisticians would likely have objections with the inflated response rate, obviously elevated due the combination methodology of using both the random mail survey and the online SurveyMonkey. A more “palatable” (to statisticians) response rate of 37.6% can be calculated by dividing the number of written surveys returned by the number mailed out to the random sample (800). A few written surveys were returned from those distributed by means other than the mail. By any measure, even the most conservative (37.6%), the response rate was impressive given a response rate greater than 20% is considered excellent for a traditional mail survey. Fifty-two percent (of the 72% response rate) or 301 completed surveys were from the paper survey, while 48% or 278 completed surveys were from the online version.
Analysis of Findings Perceptions Regarding Access to Health Care Systems The intent of this report is to give Morrison County policy and decision-makers information that is useful in responding to health care issues. Through the survey, county residents had an opportunity to provide their perceptions about health services, with emphasis on access and use of health care systems, accessing health insurance, as well as information on personal, family and community health concerns. The 2012 Morrison County Health Services Survey results provide key information regarding county residents’ access to health care services, utilization of health care services for personal and family health, motor vehicle safety, mental health services (and comfort level accessing those services), and perceptions of community health problems. Access to Health Care Services In 2012, 66% of survey respondents indicated that their access to health care services had stayed the same since 2009, 24% indicated that access had improved, while 7% stated that their access had become worse since 2009.

9
All survey respondents (100%) strongly agreed/agreed with the statement that they have access to a pharmacy to get their prescriptions filled; 97% strongly agreed/agreed that they have access to primary care physicians for routine care; and access to dental care scored very high (93%) as well. Lower percentages of respondents identified having access to urgent care (83%), specialty care (82%), mental health services (67%) and chemical dependency services (58%). Access to health care services also involves getting time off work to attend appointments, transportation to and from the appointment, as well as having relief for caregivers to enable them to attend appointments. Seventy-six percent of respondents strongly agreed/agreed that they can get off work for medical appointments, while 61% indicated that they have access to reliable transportation. Access to caregiver relief had the lowest percentage of respondents strongly agreeing/agreeing with only 44% indicating they had such access. Insurance Coverage Ninety-seven percent of respondents indicated they, as well as all members of their household, had some form of health insurance. Most (87%) respondents were covered by private insurance, followed by Medicare (26%). Smaller percentages were covered by TRICARE/CHAMPUS (7%), South Country Health Alliance (4%), Medicaid or GMAC/MA Managed Care (4%), and MinnesotaCare (1%). The fact that 97% of respondents had some form of health insurance is a little surprising, given that Morrison County consistently ranks among the bottom dozen counties in Minnesota in per capita income and other economic measures. Medical Service Use by Location Respondents were asked about their use of 20 specific health care services and where they had received the services. Most health services were provided in Little Falls or St. Cloud. However, a slightly higher percentage received services in St. Cloud or Brainerd for emotional/mental health and chemical dependency counseling or treatment. Another service more likely to be used in Brainerd was cancer therapy such as radiation or treatment. Surgery requiring hospitalization was another service that was heavily utilized in St. Cloud. Personal and Family Health Usage Over half (53%) of the respondents reported that they or someone in their immediate family needed care for a physical illness in the past three years. Most had received care from a family practice specialist (88%). The most frequently mentioned problems among children in the respondent family included: sexually transmitted diseases (6%), hunger (5%), asthma by (4%), and ADD/ADHD by (4%). Among adults 19 years of age and over in the respondents’ family, the health conditions mentioned most frequently were physical inactivity (32% of respondents), overweight/obesity (25%), high blood pressure (16%), followed by sex texting (14%). Gaining a greater understanding of perceptions surrounding breastfeeding was an additional objective of the 2012 CHNA. A majority of mothers in Morrison County reported breastfeeding all of their children (41%) or some of their children (16%), while 29% did not breastfeed their children. Fifteen percent did not have children. Most breastfeed their child(ren) for 6-12 months (25%); 3-6 months (23%); 1-3 months (17%). Eighty-three percent indicated they worked at a place that supported breastfeeding mothers; however, 66% did not have a designated breastfeeding room, other than the women’s bathroom. A majority of mothers (63%) reported having adequate time at work to pump breast milk. Among the 29% that did not breastfeed, the primary reasons were a) they did not feel comfortable using their breasts to feed an infant (31%); and b) general mother or infant concerns (28%).
10
Motor Vehicle Safety Participants were asked if they use car seat belts, require their passengers to use seat belts and use age-appropriate car seats for transporting children. Over nine in ten respondents (92%) indicated that they always used a seatbelt; this percentage is down from 2009 when 96% of respondents indicated that they always use a seat belt. Ninety percent of respondents indicated they require their passengers to use a seat belt, while 89% require the use of age-appropriate child safety seats for children under 4 feet 9 inches tall. Sufficient Mental Health Services and Comfort Level Seeing Local Mental Health Providers In the 2012 survey, 25% answered “yes,” there were sufficient mental health services in Morrison County, 18% responded “no,” while 57% said “they don’t know.” For the question about whether the respondent would be comfortable seeing a mental health provider in Morrison County, 35% said “yes,” 29% said “maybe,” 14% said “no,” and 22% said “they don’t know.” Perceptions of Community Health Problems The 12 most serious community problems selected by the respondents include obesity (68% reported it to be very serious or serious), followed by chemical dependency (62%), families not able to earn a livable wage (61%), underage drinking (58.8%), smoking (56.1), illicit drug use (54.9%), methamphetamine (54%), stress (51.7%), marijuana use (43.3%); domestic violence (43.1%); chewing tobacco (40.7%); and depression (40.1%). The perception of community health problems is perhaps the single most important information provided by the survey. How the public perceives the significance of health issues tells us many things such as: a) have stakeholders/media/public and private health agencies done a good job of communicating county health issues; b) what significant issues have been “ineffectively communicated;” and c) how, in general, grounded in reality are the public’s perceptions of community health problems. These issues, and others, will be addressed in Sections III-VI as we work toward the over-arching goal of developing an implementation strategy/action plan to improve the health of Morrison County.
Methodology and Demographics 2012 Survey Method The methods chosen to gather residents’ perceptions included a mail survey based on zip code, a purposeful distribution through public libraries and at hospitals, and an online survey distributed mainly by major employers in the county. The same survey instrument was used for all respondents and the cumulative responses for all three groups are used as the basis for this report. The total number of respondents to the 2012 survey is described in Table 1. There were slight variations in individual responses to some of the questions based on the survey type. These differences are delineated in the Morrison County Comparison Table (see Appendix I.D). Table 1: Respondents by Survey Method
Type of survey Responses Response Rate Percent of Total Mailed Random sample 301 37.6% 52% Online survey 278 34.8% 48% TOTAL N=800 surveys distributed
579 72.4% 100%
There were some noteworthy differences found in the demographics of those who responded to the three methods. These variables include age, gender, health status, education, income, number of adults in household and parental status. These changes had an effect on the 2012 combined cohort of residents described in this

11
report who are compared to respondents in previous years. Some of the differences among the respondents to the two methods in 2012 are highlighted in this demographic section. Overall, 2012 Morrison County survey respondents were female (67%), aged 45-64 (47%), possessed a college degree (32%) or had some post-graduate/graduate degree (26%), and 88% rated their health as good/excellent. A majority had two adults residing in the household (65%) and did not have children under the age of 18 residing with them (69%). The following table shows the percentages of respondents that lived in Morrison County over the three most recent survey implementations. General Demographics: Residency, Gender, Age, Education Table 2: Residency by Year
2004 2009 2012 95% 93% 98%
A majority (62%) of the respondents indicated they resided in Little Falls, followed by Pierz (13%), Randall (6%), and Royalton (5%). Table 3: Length of Residency by Year Length of Residency 2004 2009 2012 More than 10 years 78% 79% 83.6% 6 to 10 years 8% 9% 7.8% 1 to 5 years 12% 10% 7.1% Less than 1 year 2% 0% 1.5%
Additional comparison between the past three CHNAs are outlined in Tables 4-6 which follow. Table 4: Gender Distribution by Year 2004 2009 2012 Male 41% 30% 33% Female 60% 70% 67%
Table 5: Age Distribution by Year 2004 2009 2012 18-24 2% 3% 2% 25-44 30% 28% 27% 45-64 41% 54% 47% 65-74 14% 13% 13% 75+ 14% 2% 10%

12
Table 6: Education Level by Year 2004 2009 2012 8th grade or less 7% 1% 1% Some high school 5% 2% 2% High school graduate or GED 29% 21% 16% Some post high school studies 23% 25% 23% College graduate 22% 30% 32% Some post college studies 14% 21% 26%
Household Demographics: Adults, Children and Income The percentage of respondents who said they lived alone increased while the number with two adults remained the same since 2009. Table 7: Number of Adults in Household by Year 2004 2009 2012 1 (myself) 22% 13% 16% 2 69% 65% 65% 3 6% 13% 11% 4 1% 6% 5% 5 or more 1% 3% 3%
The percentage of respondents who said they had children in the household has decreased from 36% in 2009 to 31% in 2012. Table 8: Children in Household by Year 2004 2009 2012 None 66% 64% 69% One or more 35% 36% 31%
The age breakdown of those households that had children is contained in Table 9. Table 9: Ages of Children in Household 2012 Yes, children in household
31%
Ages 0-6 11% Ages 7 to 12 15% Ages 13 to 17 17%

13
Health Status of Morrison County Residents The self-reported health status of Morrison County residents appears to be improving based on the 2012 survey results. Table 10: Health Status in the Past Year by Year of CHNA 2004 2009 2012 Excellent 18% 20% 23% Good 61% 61% 65% Fair or Poor 21% 19% 12%
Summary The health survey results identified in this section of the CHNA represent only one of three components in the data-collection efforts included in this document. At the same time, that is not to downplay the role the public plays in providing input into the CHNA. The survey process is the only step in our data collection when the people of Morrison County provide direct feedback on the community’s health system and their perceptions of our health issues. Certainly, public perceptions of the health status impact many facets of individual well-being and overall public health. We want and need community input and engagement so they understand the roles they play as individuals in the reality of our community’s health “status” by whatever measure is chosen. We want this engagement not only on the “front end,” as this section on survey results identifies, but throughout the CHNA process including understanding our action plans and what we are doing to try to improve the health of them and their neighbors. Section II: What the Stakeholders Told Us on the following pages picks up where the community survey leaves off. Our goal for the second triad in our data-collection efforts was to add some substance to the survey numbers by conducting one-on-one interviews with a variety of community stakeholders. We wanted to “broaden” our understanding of what the survey identified by adding some “qualitative information” beyond the numbers. Section III: What the Data Told Us will follow the Stakeholder Interviews summary report, completing the three data-collection components of our CHNA by reporting on health data from a wide range of internet sources.
14
Section II: What the Stakeholders Told Us Methodology The Initiative Foundation, a not-for-profit entity, exists for one purpose, to improve the quality of life in central Minnesota. Its mission is to unlock the power of central Minnesota people to build and sustain healthy communities. At the core of the Initiative’s work is the belief that local people possess the talent, passion and ability to achieve a brighter future. The Initiative Foundation’s office is located in Little Falls and it serves a 14-county area of central Minnesota. The foundation graciously agreed to provide staff resources to conduct and summarize the one-on-one stakeholder interviews. This approach was utilized in order to avoid having one of the sponsoring organizations conduct the interviews and risk impartiality being compromised or answers being less than frank or complete due to the interviewee’s feelings/relationship with one of the sponsors. Karen Stay, a VISTA (Volunteers In Service To America) volunteer at the Initiative Foundation conducted the interviews. A total of 22 interviews were scheduled with individuals throughout the Morrison County community (see APPENDIX II.A). The questions asked of participants are contained in APPENDIX II.B. Questions were developed, in part, based on the results of the written survey. Stakeholders were individuals that came from two groups—systems people, individuals whose jobs or volunteer activities had significant relevance to the broad spectrum of health care throughout the county, and community-minded individuals who were not necessarily involved in any aspect of health care but possessed a genuine concern for improving the health of the people of Morrison County. The selection process was driven by the CHNA sponsors and their recommendations of people with knowledge of health or thoughtful, verbal individuals willing to state their opinions about improving health in the county. Despite the “hand-picked” nature of the selection process, every effort was made to separate any potential feelings the interviewees may have about the sponsors from their value in providing input to the CHNA process. Several individuals required by the PPACA to provide input into the CHNA process were among the “Stakeholders.” These PPACA-related individuals included:
Bonnie Paulsen, Director of Morrison County Public Health – Bonnie has been director of MCPH since 2008 and served in a variety of positions with the department 1992-2000 and again from 2003 until assuming the interim director position in 2007. She holds a bachelor of science degree in nursing from the College of St. Benedict in St. Joseph, MN. Bonnie was chosen for her “expertise” in public health. One of Bonnie’s staff members—Ann March—who serves as community health educator and regularly interacts with underserved populations was also included in the stakeholder interviews.
Brad Vold, Director of Morrison County Social Services (MCSS) – Brad recently rejoined MCSS. He holds a bachelor’s degree in psychology and social services from St. Cloud State University in St. Cloud, MN, and has over 20 years of experience in social service administration and delivery. He served as a social worker with MCSS from 1990-1996 and, after supervising other social services programs, rejoined MCSS as director in 2011. His department works closely with individuals who are “medically underserved,” people with low-income, and other special populations (individuals with mental health and chemical dependency needs, etc.). Two of Brad’s staff members—Karen Szczodroski, lead eligibility worker, and Lynette Gessell, mental health worker—also participated in the interviews.
Bridget Britz, Executive Director of Horizon Health in Pierz and also chair of the board of directors for the Healthy Communities Collaborative of Morrison County, was interviewed.
Mary Klinker, MD, Chief of the Medical Staff at St. Gabriel’s Hospital and a Morrison County native, was also interviewed.
Stephenie Och, Director of Hands of Hope Resource Center, a victim advocacy agency serving the needs of individuals (almost exclusively women) who have been victims of domestic violence was included in the interviews.
15
Very few individuals asked to participate in the stakeholder interviews chose not to do so. Of those who said “no,” it was exclusively related to scheduling issues with respect to the two days set aside for the interviews (January 9-10, 2013). The interviews were held in a meeting room at St. Gabriel’s Hospital and were digitally recorded after first asking the interviewee if such a recording of the conversation could be made. For a complete list of the interviewees as well as their roles in the community, please see APPENDIX II.A. Results Common Themes and Issues The interviewer provided a document summarizing the Stakeholder Interviews, specifically identifying any common themes that surfaced during the discussion and then noting any additional relevant information related to the health care issues discussed. The summary, and the digital recording themselves, provided the “data” for this section of the CHNA. Morrison County Organizations and Individuals Need to Invest in Healthy Living Facilities Many of the stakeholders made comments related to the recreational and other “healthy living’ facilities in the community (Morrison County). The collective feeling was that more investment needs to be made in recreational facilities—anything that could make people more active and help them “connect” with their own or other families. One specific need stated was the Boys and Girls Club of Morrison County facilities need to be improved (“they do great work over there, but their facilities are inadequate” would be a common sentiment expressed in the interviews by multiple participants). Other expressed needs included:
Walking trails Skate park Community pool Increased gym space Community gardens
There weren’t a lot of suggestions as to identifying resources or suggested approaches to improving recreational facilities, only that there is an overwhelming need, especially in comparison to some other locations in central Minnesota or throughout the state. Obesity Results from the Lack of Facilities, Community Stigmas and Norms, and Lifestyle Choices Since obesity was identified on the written survey as the community’s most serious health care issue, stakeholders were asked their perceptions of obesity and what could be done to address the issue locally. One of the more common responses to this probing question was that “physical activity and nutrition education and practice can diminish the high concern and incidence of obesity in the community.” Another stakeholder believes education related to health needs to start at an early age, perhaps as young as third grade. Another stated that social stigmas contribute to the lack of investment in strategies that could potentially impact issues like obesity. “There is a focus on the problem, rather than building capacity, which leads to answering questions about spending money on youth-focused initiatives.” Another stakeholder held that issues, like obesity, are driven by a societal norm that seeks other “gratification” at the expense of healthy living. Finally, it was noted that “obesity is an issue that needs to be faced ‘head on.’ Ignoring it is not going to change it.” Obesity and diabetes are chronic conditions and looking at them as “moral issues,” where the condition is the result of individual behaviors, is not helpful to resolving the problem. Chemical Use/Abuse of all Kinds Impacts the Health of the Community in Many Ways It’s not surprising that the stakeholders share perceptions from the general public outlined in the written survey that chemical dependency and drug use and abuse was mentioned by over half of those interviewed. Stakeholder concerns with this issue ranged from the prevalence and growth in prescription drug use/abuse, especially among
16
youth; the lack of inpatient treatment facilities in the county; shame/stigma concerns regarding seeking treatment; long-held tolerance/acceptance of the use of alcohol, in particular, exemplified by youth emulating behaviors of their parents; tobacco use, including the use of smokeless tobacco; and a culture of acceptance of tobacco and alcohol use at public events (Dam Festival). Three stakeholders used almost exact language in describing the impact of alcohol and tobacco use on the health of the community, saying, “tobacco and alcohol use and abuse are the biggest factors for determining health;” most everything can be traced back to drug and alcohol use/abuse;” and “our culture enables youth to drink and use, which is core to many health problems in the community.” Many interviewees identified education, especially targeting youth, and strengthening families as the best ways to combat chemical use/abuse issues. Additional Mental Health and Dental Services Are Needed One of the questions on the interview asked stakeholders what one service they believe needs to be added in the community. By a wide margin, mental health and chemical dependency services were most frequently mentioned, especially the need for inpatient services and perhaps an outpatient mental health clinic. Beyond mental health, especially, and chemical dependency services, additional dental care was noted as being needed by several stakeholders. Other desired services, in addition to the aforementioned need for recreation facilities, that stakeholders identified included: internal medicine, work-site wellness, a satellite clinic in Swanville, and a county-wide health coordinator to bring various groups/initiatives together. Health Improvement Plans Should Target Youth, Employ Other “Upstream” Strategies While the stakeholder interviews sought out opinions on the participants’ perceptions on the prevalence of various health issues, it also pursued their opinions on strategies to address the issues. The most frequent comments suggested that the plan target strategies and actions toward youth, such as building youth recreation facilities or employing education strategies and, secondly, develop incentives that reward healthy behaviors. There weren’t a lot of concrete ideas as to how to develop or “incentivize” healthy behaviors, only that they are needed. A few comments on this topic helps define their perceptions such as, “the pain of change needs to be less than the pain of staying the same,” “TIME is important in the investment of youth and health,” “change occurs when it is either too painful not to change or when there is something to be gained by changing,” “the pain of change needs to be less than the pain of staying the same” (incentives, mindsets and habits); and “reward and promote good models of health.” Family Strengthening and Community Building Approaches Needed Another question discussed the concept of strengthening families to improve health and what can/should be done to help families in this way. Stakeholders said great focus should be made on maintaining the family and preparing families for children. Family-friendly activities should be encouraged and offered to families at little or no charge was a common concept as was the need for strategies that address the family as a unit, not just youth or adults. The recommendation was made to eliminate alcohol entirely from community activities for families or downplay its significance in community celebrations/activities. There also was mention of strengthening the family in order to encourage parental involvement in the community, well after their own children have grown and no longer participating in community activities. Activities/strategies that address the Live Better! Live Longer! triad of Eat, Move, Belong, will help build Morrison County into a healthier community. Family strengthening and community-building actions hold great promise was a common stakeholder sentiment. Finally, it was suggested by multiple stakeholders that fundamental policy and system changes are the only ways to really affect health. We need to incorporate systems/policies that embrace the Spectrum of Prevention model for improving community health.

17
Socioeconomic Issues Contribute to Poor Health in the County Section III: What the Data Told Us will offer a great deal of information about the specific demographics of Morrison County. Relevant to this section is the fact that Morrison County is among the 10 poorest counties in Minnesota. Similarly, the written survey identified “livable wage jobs” as the third most serious community health issue. Stakeholders share this sentiment. Many believe that socioeconomic issues contribute to health problems in our community in several ways. They believe they add stress to individuals and families and indirectly contribute to alcohol and drug use. It was stated that “every health concern is inter-related/intertwined with other (health concerns) and with socioeconomic factors.” Another stakeholder suggested that the book, Bridges out of Poverty, offers insights into understanding this community and how to make it better. Others talked about a “culture of dependence” in the community whereby receiving county assistance is too common, too often pursued as an acceptable lifestyle. It was stated that literacy issues contribute to local poverty. Finally, many of the stigmas associated with getting help for health issues (especially mental health and chemical dependency) also apply to people who are living in poverty. Also, that there is a certain group of people in the county who live above the poverty level and thus, not eligible for assistance, who could benefit from a “gap” program to which serves only people of this population segment, who are not quite capable of “making it on their own.” We may need to embrace different strategies to effectively reach people in poverty, who may not respond to traditional approaches. One stakeholder comment sums up this section nicely, it reads, “unemployment is a big problem concerning health; the economy of Morrison County should be diversified to employ Morrison County residents and create jobs between St. Cloud and Brainerd.” Improved Health Intertwined with Education Although this topic has been indirectly stated in many of the previous paragraphs, it deserves to be addressed as a separate item as well. Stakeholders believe that many suggestions and solutions to health care concerns have an educational component. For examples, that nutrition education is critical to effectively addressing obesity and diabetes; and that parenting skills and family development improvements require an education component. One nurse stated, “Education is the single factor relating to everything that affects health and socioeconomic status.” Stakeholder Interviews Summary Although these eight themes were the most common expressed by stakeholders interviewed as part of the CHNA, other topics were discussed as well. Domestic violence was mentioned on several occasions as an issue with negative impacts on families, children and the community. Empowerment and other strategies to increase self-esteem, accomplishments, etc., were expressed as things that could be beneficial to improving local health. Despite the limitations in drafting a summary that relates the entire record of the interviews, it’s important to note the aforementioned eight themes and their implications with respect to the entire CHNA. The stakeholders’ thoughts, perceptions and opinions provide depth to the CHNA record. Their input was extremely valuable to the process. Section III: What the Data Told Us, contained on the following pages, will tackle the equally daunting challenge of examining and summarizes the vast array of secondary data available that is available with respect to the health of Morrison County.

18
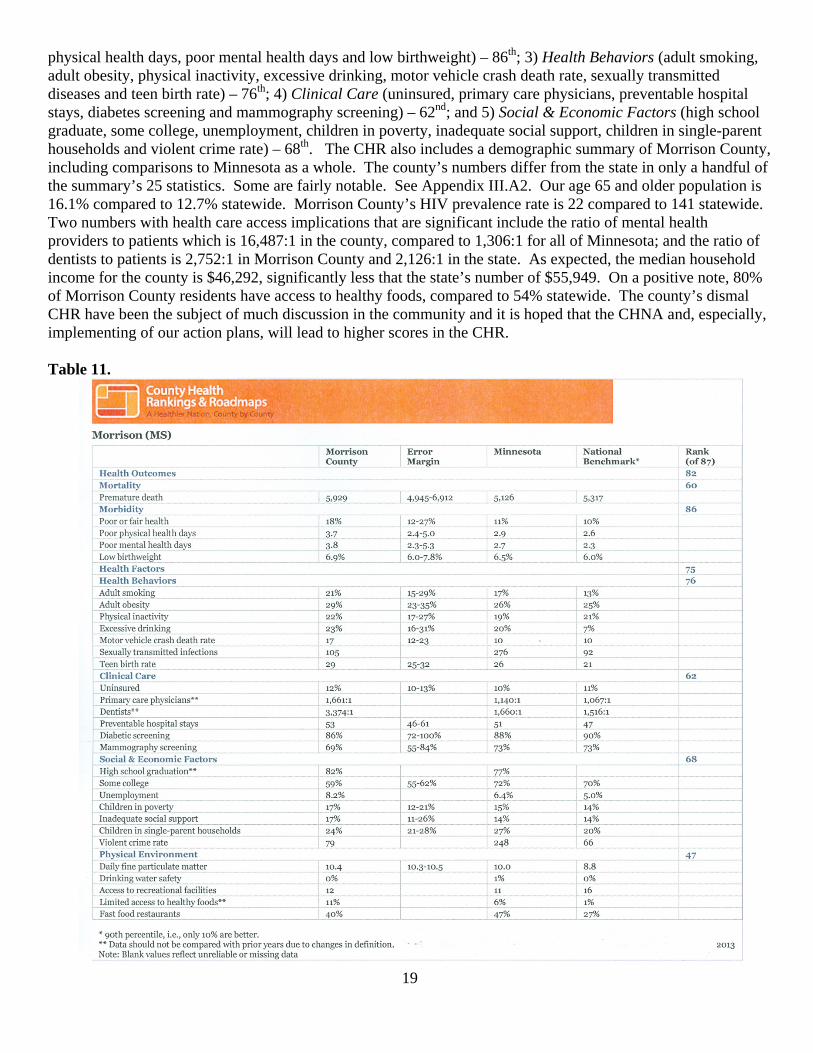
Section III: What the Secondary Data Told Us Introduction A thorough secondary data review was conducted utilizing documents available through the internet. A multitude of resources were utilized. The primary data sources included the U.S. Census Bureau, County Health Tables and other documents available through the Minnesota Department of Health, the Minnesota Department of Human Services, The County Health Rankings (through the University of Wisconsin) and the Minnesota Student Survey. Additional information was utilized from other sources. The secondary data was grouped into several subsections based on whether they were aggregate data (County Health Rankings, the Community Health Status Indicators, some U.S. Census Bureau Reports, etc.), specific demographic data, financial information, and student/school district information, unemployment data, violence information, etc. There may be sources of additional information, which were not discovered after a fairly exhaustive search. Aggregate Data Many governmental agencies and private organizations collect health data and produce summaries of the results. These reports may include “rankings” and are referred to as aggregate data in this CHNA. The following subsections discuss the aggregate data and their implications in regard to the health of Morrison County. 2013 County Health Rankings (Appendix III.A) The County Health Rankings & Roadmaps program helps communities create solutions that make it easier for people to be healthy in their own communities, focusing on specific factors that we know affect health, such as education and income. Having health insurance and quality health care are important to our health, but we need leadership and action beyond health care. Ranking the health of nearly every county in the nation, the County Health Rankings illustrate what we know when it comes to what’s making people sick or healthy. The County Health Roadmaps show what we can do to create healthier places to live, learn, work and play. The Robert Wood Johnson Foundation collaborates with the University of Wisconsin Population Health Institute to bring this groundbreaking program to cities, counties and states across the nation. The County Health Rankings (CHR) are based on two overall measures—Health Outcomes and Health Factors. In the most recent (2013) CHR, all 87 Minnesota counties were ranked according to their scores on the Health Outcomes and Health Factors. In the Health Outcomes category, Morrison County ranked 82nd out of the 87 counties. Health Factors scores were not much better as Morrison County’s ranking was 75th. Morrison County ranks 60th or worse in all six subcategories of the CHR except the “Physical Environment” category (air pollution, access to recreational facilities, limited access to healthy foods, and fast food restaurants) where we rank 47th. The other five subcategories (the specific measures included) and the county’s respective rankings are as follows: 1) Mortality (premature death) – 60th; 2) Morbidity (poor or fair health, poor
19
physical health days, poor mental health days and low birthweight) – 86th; 3) Health Behaviors (adult smoking, adult obesity, physical inactivity, excessive drinking, motor vehicle crash death rate, sexually transmitted diseases and teen birth rate) – 76th; 4) Clinical Care (uninsured, primary care physicians, preventable hospital stays, diabetes screening and mammography screening) – 62nd; and 5) Social & Economic Factors (high school graduate, some college, unemployment, children in poverty, inadequate social support, children in single-parent households and violent crime rate) – 68th. The CHR also includes a demographic summary of Morrison County, including comparisons to Minnesota as a whole. The county’s numbers differ from the state in only a handful of the summary’s 25 statistics. Some are fairly notable. See Appendix III.A2. Our age 65 and older population is 16.1% compared to 12.7% statewide. Morrison County’s HIV prevalence rate is 22 compared to 141 statewide. Two numbers with health care access implications that are significant include the ratio of mental health providers to patients which is 16,487:1 in the county, compared to 1,306:1 for all of Minnesota; and the ratio of dentists to patients is 2,752:1 in Morrison County and 2,126:1 in the state. As expected, the median household income for the county is $46,292, significantly less that the state’s number of $55,949. On a positive note, 80% of Morrison County residents have access to healthy foods, compared to 54% statewide. The county’s dismal CHR have been the subject of much discussion in the community and it is hoped that the CHNA and, especially, implementing of our action plans, will lead to higher scores in the CHR. Table 11.
20
2010-11 U.S. Census Bureau QuickFacts (Appendix III.B) The demographic profile available through the American Fact Finder arm of the Census Bureau provides a concise “snapshot” of basic statistics about Morrison County. The QuickFacts summary has statewide numbers as well. The data shows that the county is very “white” with nearly 97% of the population Caucasian, compared to 82.8% for all of Minnesota. The percentage of people age 25 and older who have a bachelor’s degree is 14.8% (2007-2011) in the county versus 31.8% for all of Minnesota. Similar to the CHR, this data source shows per capita and median household income at $23,154 and $46,054 respectively for Morrison County compared to $30,310 and $58,476 in the state. The percentage of people living below the federal poverty level is listed at 13.1% in our community compared to 11% for Minnesota. Finally, it’s not surprising that the persons per square mile is 29.5 for our rural county compared to the statewide number of 66.6 person per square mile. Community Health Status Indicators (Appendix III.C) The Community Health Status Indicators (CHSI) use several measures collected by a variety of governmental agencies to produce reports on topics such as Access to Care; Leading Causes of Death, Measures of Birth and Death. CHSI reports utilize statistics that are a little older than both the CHR and the Census Bureau QuickFacts. Still, they produce brief summaries on these specific issues. Appendix III.C contains the most recent CHSI reports. Some interesting numbers on the access report shows the primary care physicians per 100,000 population for Morrison County at 63.8 and dentists per 100,000 population at 39.5. The CHSI report on leading causes of death by age group doesn’t have data for all causes. Injuries were the highest cause of death for people age 15-24, with 52%. For ages 25-44, top four leading causes of death were injuries (32%), suicide (16%), cancer (14%) and heart disease (12%). Cancer and heart disease are the two leading causes of death in age groups 45-64 and ages 65+. In the younger age group (45-64) cancer represents 36% and heart disease (21%). Heart disease increases to 28% as a cause of death for 65+ and cancer decrease to 23%. Finally, the last report looks at birth measures, infant mortality and death measures. Since the data is from 2001-2005, no additional commentary is being included in the CHNA. Minnesota Department of Health reports such as County Health Tables provide more current information on many of the same subjects as the CHSI reports. County Health Tables - Minnesota Department of Health The Minnesota Department of Health (MDH) collects a lot of county-specific data on the health of the people of Morrison County. This data includes several tables on number topics such as population demographics, mortality, morbidity, natality, leading causes of death, asthma hospitalizations, chemical health, heart attack hospitalizations, etc. Population Demographics (Appendix III.D) Complete tables regarding the MDH’s population demographics are contained in Appendix III.D. A closer review of the data shows that, as indicated in previous aggregate data, Morrison County is largely white with an estimated 32,426 of the total population (33,198) or 97.7% white. Similar to the rest of the state (6.7%), only 6.8% are children under age 5 and all children ages 0-19 in Morrison County comprise 27% of the total population, identical to the state percentage. MDH shows the percentage of residents age 65 and older at 16%, well above the statewide percentage of 12.1% (Table 5). Demographic Tables 6-9 have numbers of residents enrolled in various programs for people in poverty. This information is more thoroughly discussed in Minnesota Department of Human Services data later in this section of the CHNA. The child maltreatment information in Demographic Table 8 shows a maltreatment rate of 14.9 per 1000, well below the statewide rate of 17.6. Children in out of home care per 1000 shows Morrison County’s rate at 10.5, slightly above the state rate of 8.8 per 1000 children.
21
Natality Tables (Appendix III.E) MDH collects and publishes a variety of information regarding births, babies and their mothers. Much of this information is contained in MDH’s nine natality tables. Natality Table 1 shows that 408 babies were born to Morrison County mothers in 2010. The county has a fertility rate of 72.1 (live births per 1,000 population ages 15-44 years) compared to a statewide rate of 65.4. The county’s death rate (deaths per 1,000 population) is 8.0 compared to a statewide rate of 7.3. Natality Table 2 focuses on prematurity and the size of babies. Morrison County had 33 pre-term births (8.7%), which is slightly higher than the state percentage of 8.1%. The percentages of low birth weight babies in the county was 3.6% and very low birth weight babies was 0.9 (in MN the percentages were 4.8 and 0.8, respectively). The percentages of small for gestational age babies were 1.6% in the county and 3.1% statewide. There were 51 infant deaths (see Natality Table 3) in Morrison County from 1990-2009. Natality Table 4 shows that 90.7% of women received prenatal care in their first trimester (MN - 86.3); the adequacy of that care was rated (via GINDEX) as 85.3% adequate or better in Morrison County (MN - 80.0%), 13.2% intermediate (MN - 16.9%), and 1.6% inadequate or none (MN - 3.1%). Table 5 address caesarian births. The percentage of caesarian births in Morrison County in 2010 was 28.2% (MN - 27.5%), with first-time caesarian births at 15.2% (MN - 15.6%), and repeat caesarian births at 91.4% (MN - 88.4%). Fertility and family planning numbers are reported in Natality Table 6. Morrison County had 434 pregnancies in 2010 and a rate (pregnancies per 1,000 women in the county) of 76.7 (MN - 5.9), 25 abortions and an abortion rate of 4.4 (in MN, there were 10,641 abortions and a rate of 10.2). The percent of women who gave birth to their 4th or greater child was 5.9% in the county (MN - 5.4%), which was 5.6% of all births (MN - 3.7%). Natality Table 7 addresses the issue of teen birth and pregnancy rates. From 2008-2010, the number of births to teens age 15-17 was less than 20 in the county so a rate was not included in the table. Statewide the teen birth rate (births per 1,000 population) for 15-17 year olds is 11.5. For 18-19 year olds in Morrison County the teen birth rate (2008-10) was 61.5 (MN - 43.6) and for teens 15-19, it was 26.2 (MN - 24.6). Teen pregnancy rates in the county for the three ages groups were as follows: 15-17 year olds - 9.4% (MN - 16.0%), 18-19 year olds - 69.7% (MN - 58.1%) and 15-19 year olds – 29.9% (MN - 33.2%). The final two natality tables deal with socio-demographic factors and race. Natality Table 8 shows that the percentage of births to unmarried mothers in the county in 2010 was 29.9% (MN - 33.1%), percentage with no father on birth certificate at 5.1% (MN - 9.3%), and percentage of mothers who smoked during pregnancy at 17.4% (MN – 10.0%). Maternal education was identified as low in the county at 3.2% (MN – 9.2%), medium at 36.5% (MN – 24.7%) and high at 60.3% (MN – 66.1%). In Morrison County, Natality Table 9 shows that 98.0% of new mothers were white (MN – 74.8) and no other category had more than 0.5% (American Indian). Statewide numbers shows 9.6% of mothers were African-American, 7.5% Hispanic, 7.2% Asian, and 6.3% other. Morbidity Statistics (Appendix III.F) Many of the morbidity statistics have little meaning because of the small numbers associated with the individual tables. Where the numbers are adequate, they have both positive and negative implications. For example, our rate of children who are current with immunizations is 95.5% compared to the statewide percentage of 90.8%. Morbidity Table 4 shows that there were 703 motor vehicle accidents in the county with 531 having no injuries and only one death in 2010. Seat belt use may be a factor as Table 5 shows that of 165 accidents in which someone was injured or killed in the county, 82.4% were wearing seat belts, very similar to the statewide rate of 82.3%. County cancer diagnosis numbers show breast cancer most prevalent of all cancers diagnosed (among women only) at 29.6% (30.6% in MN); colon and rectal cancer at 9.6% for men (9.1% in MN) and 8.2% for women (10.2% in MN); lung cancer at 8.7% for men (11.3% in MN) and 11.1% for women (11.9% in MN); prostate cancer at 31.5% (33.5% in MN); and other cancers 49.8% for men (45.8% in MN) and 51.0% for women (47.4% in MN). Morbidity Table 9 – Women, Infant, Children (WIC) indicators show that of the 1,743 children ages 2-5 in the WIC program, 14.7% were overweight (16.7% of 230,000+ in MN), 9.2% were obese (13.1% in MN), and 67.2% were breastfed ever (73.7% in MN). Of the pregnant women, 53.9% were identified as overweight (54.2% in MN). Finally, the rate of dentists per capita is 39.5 per 100,000 population in Morrison County (73.9 per 100,000 in MN).

22
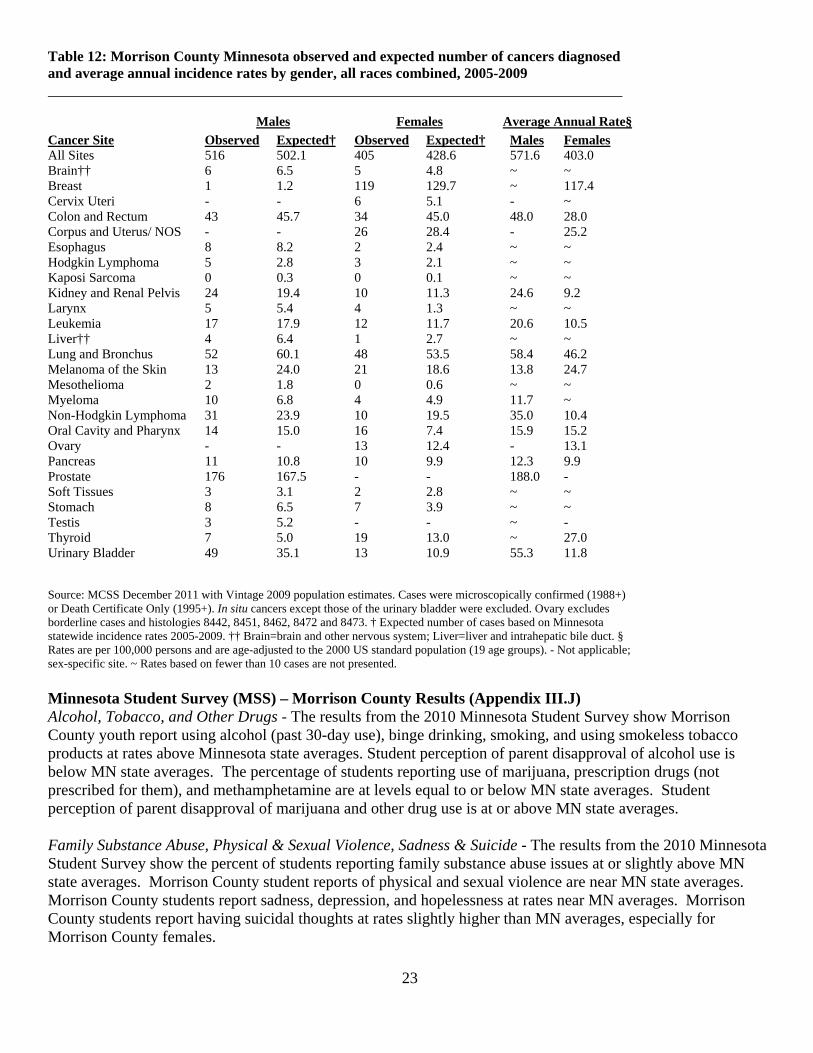
Mortality Tables (Appendix III.G) The top six leading causes of death (LCOD) in Morrison County for 2010 were cancer (59), heart disease (58), Alzheimer’s Disease (19), unintentional injury (13), stroke (12) and diabetes (11). No other LCOD had more than 8. Not surprisingly, cancer was the LCOD in all age groups from age 45 and older, while suicide and unintentional injury were higher for people under age 45. There were 13 unintentional injury deaths, 0 homicides and 8 suicides in Morrison County in 2010. There were 13 deaths from falls, 2 motor vehicle deaths and 0 pedestrian deaths. The percentage of breast cancer deaths of all cancer deaths was 15.7% in Morrison County (14.3% in MN), colon and rectal cancer 12.5% in men and 10.2% among women (9.0% and 9.3% respectively in MN), lung cancer 26.8% for men and 24.1% for women (27.2% and 24.7% in MN), prostate cancer 7.1% (10.7% in MN), and other cancers 53.6% for men and 50.0% for women (53.0% and 51.7%, respectively in MN). Chemical Health Tables (Appendix III.H) Chemical Health Table 1 shows that Morrison County only had one motor vehicle fatality, which was not alcohol related, and 171 injury crashes, 20 of which (11.7%) were alcohol related. Statewide 31.9% of fatal crashes involved alcohol and 8% of injury crashes involved alcohol. The cost of such crashes is more than $480,000 county-wide and more than $280 million in Minnesota. Chemical Health Table 2 shows that the rate of impaired driving incidents occurring in Morrison County at 59.0 (DWI violations per 10,000) over the four-year period from 2006-10 compared to 68.4 statewide. The rate of similar incidents to drivers residing in Morrison County was 65.9 (65.1 in MN). Hospitalization and Incidence Rates – Heart Attack, COPD, Asthma and Cancer (Appendix III.I) MDH also keeps county-specific data on certain hospitalizations. This data shows that from 2008-2010 for all ages and sexes age 35 and up in Morrison County, there were 184 heart attack hospitalizations, producing a hospitalization rate (per 100,000 population) of 33.0 (MN - 30.7 rate on 25,665 total hospitalizations). For Chronic Obstructive Pulmonary Disease (COPD) during the same time frame, Morrison County had 188 hospitalizations for all ages and sexes age 45 and older for a rate of 43 (MN – 32.6 on 20,413 total COPD hospitalizations). In regard to asthma, Morrison County had 70 asthma hospitalizations (all ages and sexes from 2008-2010) and a rate of 7 (MN – 7.4 on 11,682 asthma hospitalizations). Finally, from 2005-2009, Morrison County had 921 cancers and an incidence rate of 475.1, which is slightly higher than the state rate (474.6 based on 127,904 cancers). Cancer in Minnesota 1988-2009 Another recent (December 2012) publication, Cancer in Minnesota 1988-2009, has a detailed summary table (see the following page) that lists the various cancer types and breaks the information down by males and females, observed and expected as well as the average annual rate. The publication contains a table for each county in Minnesota as well as eight regions. The Morrison County table shows that in a few of the cancer sites, county residents have observed cancer rates well below the expected rate, notably (for women) breast cancer, colon/rectum, liver, lung/bronchus, and non-Hodgkin lymphoma, and (for men) liver, lung/bronchus and melanoma (skin). A lot more cancer rates, however, are quite a bit higher than the expected rate especially among men. Excluding those sites which involved very small numbers or very small variations, men in Morrison County had a higher than expected cancer rate for all cancers (516 observed to 502.1 expected) and for the following individual sites: colon/rectum, Hodgkin lymphoma, myeloma, non-Hodgkin lymphoma, prostate, stomach, thyroid and urinary/bladder. For women, higher than expected rates occurred for cancers of the larynx, melanoma/skin, oral cavity/pharynx, stomach, thyroid, and urinary/bladder. Overall, women had a lower than expected rate for all sites (405 compared to 428.6).
23
Table 12: Morrison County Minnesota observed and expected number of cancers diagnosed and average annual incidence rates by gender, all races combined, 2005-2009
Cancer Site Observed Expected† Observed Expected† Males Females All Sites 516 502.1 405 428.6 571.6 403.0 Brain†† 6 6.5 5 4.8 ~ ~ Breast 1 1.2 119 129.7 ~ 117.4 Cervix Uteri - - 6 5.1 - ~ Colon and Rectum 43 45.7 34 45.0 48.0 28.0 Corpus and Uterus/ NOS - - 26 28.4 - 25.2 Esophagus 8 8.2 2 2.4 ~ ~ Hodgkin Lymphoma 5 2.8 3 2.1 ~ ~ Kaposi Sarcoma 0 0.3 0 0.1 ~ ~ Kidney and Renal Pelvis 24 19.4 10 11.3 24.6 9.2 Larynx 5 5.4 4 1.3 ~ ~ Leukemia 17 17.9 12 11.7 20.6 10.5 Liver†† 4 6.4 1 2.7 ~ ~ Lung and Bronchus 52 60.1 48 53.5 58.4 46.2 Melanoma of the Skin 13 24.0 21 18.6 13.8 24.7 Mesothelioma 2 1.8 0 0.6 ~ ~ Myeloma 10 6.8 4 4.9 11.7 ~ Non-Hodgkin Lymphoma 31 23.9 10 19.5 35.0 10.4 Oral Cavity and Pharynx 14 15.0 16 7.4 15.9 15.2 Ovary - - 13 12.4 - 13.1 Pancreas 11 10.8 10 9.9 12.3 9.9 Prostate 176 167.5 - - 188.0 - Soft Tissues 3 3.1 2 2.8 ~ ~ Stomach 8 6.5 7 3.9 ~ ~ Testis 3 5.2 - - ~ - Thyroid 7 5.0 19 13.0 ~ 27.0 Urinary Bladder 49 35.1 13 10.9 55.3 11.8 Source: MCSS December 2011 with Vintage 2009 population estimates. Cases were microscopically confirmed (1988+) or Death Certificate Only (1995+). In situ cancers except those of the urinary bladder were excluded. Ovary excludes borderline cases and histologies 8442, 8451, 8462, 8472 and 8473. † Expected number of cases based on Minnesota statewide incidence rates 2005-2009. †† Brain=brain and other nervous system; Liver=liver and intrahepatic bile duct. § Rates are per 100,000 persons and are age-adjusted to the 2000 US standard population (19 age groups). - Not applicable; sex-specific site. ~ Rates based on fewer than 10 cases are not presented.
Minnesota Student Survey (MSS) – Morrison County Results (Appendix III.J) Alcohol, Tobacco, and Other Drugs - The results from the 2010 Minnesota Student Survey show Morrison County youth report using alcohol (past 30-day use), binge drinking, smoking, and using smokeless tobacco products at rates above Minnesota state averages. Student perception of parent disapproval of alcohol use is below MN state averages. The percentage of students reporting use of marijuana, prescription drugs (not prescribed for them), and methamphetamine are at levels equal to or below MN state averages. Student perception of parent disapproval of marijuana and other drug use is at or above MN state averages. Family Substance Abuse, Physical & Sexual Violence, Sadness & Suicide - The results from the 2010 Minnesota Student Survey show the percent of students reporting family substance abuse issues at or slightly above MN state averages. Morrison County student reports of physical and sexual violence are near MN state averages. Morrison County students report sadness, depression, and hopelessness at rates near MN averages. Morrison County students report having suicidal thoughts at rates slightly higher than MN averages, especially for Morrison County females.
Males Females Average Annual Rate§
24
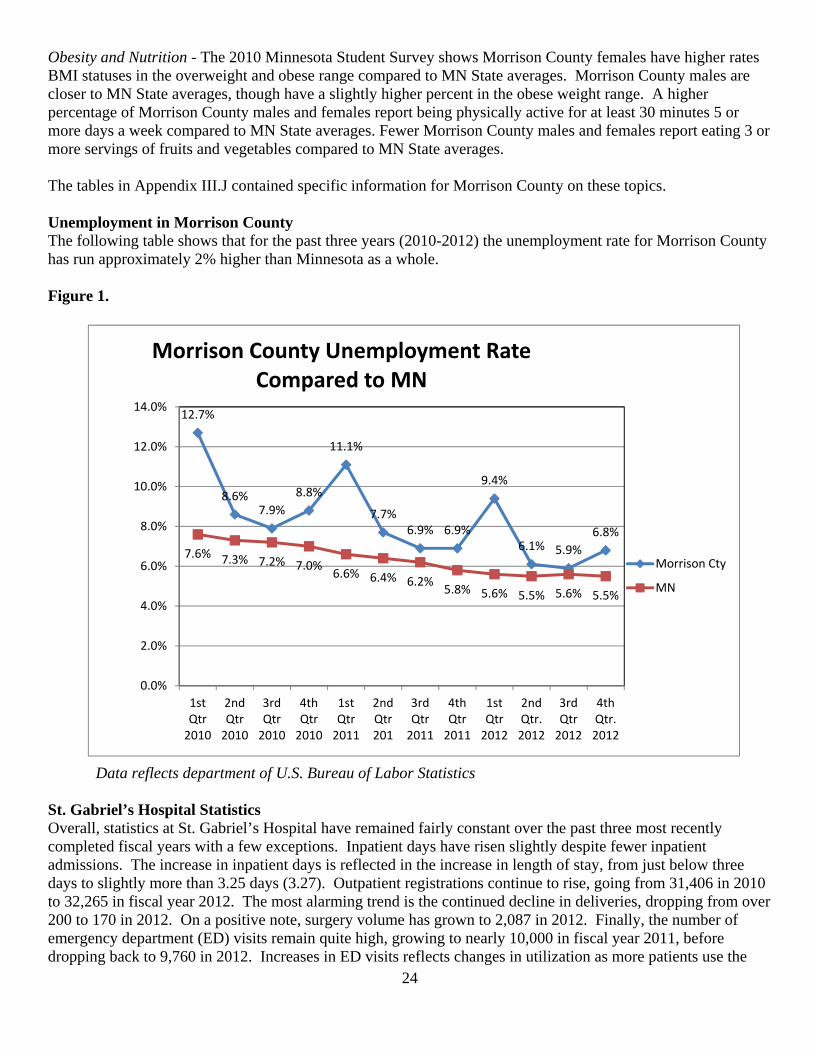
Obesity and Nutrition - The 2010 Minnesota Student Survey shows Morrison County females have higher rates BMI statuses in the overweight and obese range compared to MN State averages. Morrison County males are closer to MN State averages, though have a slightly higher percent in the obese weight range. A higher percentage of Morrison County males and females report being physically active for at least 30 minutes 5 or more days a week compared to MN State averages. Fewer Morrison County males and females report eating 3 or more servings of fruits and vegetables compared to MN State averages. The tables in Appendix III.J contained specific information for Morrison County on these topics. Unemployment in Morrison County The following table shows that for the past three years (2010-2012) the unemployment rate for Morrison County has run approximately 2% higher than Minnesota as a whole. Figure 1.
Data reflects department of U.S. Bureau of Labor Statistics St. Gabriel’s Hospital Statistics Overall, statistics at St. Gabriel’s Hospital have remained fairly constant over the past three most recently completed fiscal years with a few exceptions. Inpatient days have risen slightly despite fewer inpatient admissions. The increase in inpatient days is reflected in the increase in length of stay, from just below three days to slightly more than 3.25 days (3.27). Outpatient registrations continue to rise, going from 31,406 in 2010 to 32,265 in fiscal year 2012. The most alarming trend is the continued decline in deliveries, dropping from over 200 to 170 in 2012. On a positive note, surgery volume has grown to 2,087 in 2012. Finally, the number of emergency department (ED) visits remain quite high, growing to nearly 10,000 in fiscal year 2011, before dropping back to 9,760 in 2012. Increases in ED visits reflects changes in utilization as more patients use the
12.7%
8.6%7.9%
8.8%
11.1%
7.7%6.9% 6.9%
9.4%
6.1% 5.9%
6.8%
7.6% 7.3% 7.2% 7.0%6.6% 6.4% 6.2%
5.8% 5.6% 5.5% 5.6% 5.5%
0.0%
2.0%
4.0%
6.0%
8.0%
10.0%
12.0%
14.0%
1st Qtr 2010
2nd Qtr 2010
3rd Qtr 2010
4th Qtr 2010
1st Qtr 2011
2nd Qtr 201
3rd Qtr 2011
4th Qtr 2011
1st Qtr 2012
2nd Qtr. 2012
3rd Qtr 2012
4th Qtr. 2012
Morrison County Unemployment Rate Compared to MN
Morrison Cty
MN
25
ED for primary care and may also reflect the fact that the hospital doesn’t turn patients away, which lead to increased bad debt and other expenses. Table 13. Selected St. Gabriel’s Hospital Statistics –
2010 2011 2012 Inpatient Admissions 1,411 1,419 1,372 Inpatient Days 4,205 4,340 4,490 Average Length of Stay 2.98 3.06 3.27 Outpatient Registrations 31,406 32,535 33,265 Deliveries 205 189 170 Surgeries 1,871 1,915 2,087 Emergency Department Visits 9,657 9,921 9,760 Family Medical Center Visits 65,311 62,808 Little Falls Orthopedics Visit 19,333 20,332 18,819 Community Benefit Summary – The Community Benefits Summary on the following page categorizes the services that St. Gabriel’s Hospital provides to the community at no cost or reduced cost. Community benefit costs are calculated according to guidelines developed by the Catholic Health Association and embraced by Catholic Health Initiatives—the parent organization of St. Gabriel’s Hospital. Community benefit expenses for St. Gabriel’s Hospital include un-reimbursed costs for government programs as well as charity care and several community benefit activities provided to the general community. Community benefit activities are broken into two categories: 1) benefits to low-income individuals and 2) benefits provided to the general community. Over the past three years, benefits to low-income individuals have ranged from $4.2 million to over $6.2 million. The largest portion of these benefits comes from the un-reimbursed cost of Medical Assistance, which has been over $5.5 million the past two years. The cost of community benefits provided to the broader community over the past three years ranged from over $725,000 in 2012 to nearly $1.2 million in 2010. St. Gabriel’s Hospital is a critical access hospital and, as such, receives cost-based reimbursement for its Medicare patients. The other “broader community benefits” involve the cost for providing health fairs, meeting rooms, screening, and a variety of other activities. See the following table for more information. Table 14 – Community Benefit Summary Benefits for Low Income 2010 2011 2012 Cost of Charity Care $377,842 $554,104 $388,733 Un-reimbursed Cost of Medical Assistance $3,853,018 $5,624,530 $5,545,952 Non-Billed Services for Low Income $21,874 $36,635 $26,309 Total for Low Income $4,252,734 $6,215,269 $5,960,994 Benefits for the Broader Community Un-reimbursed Cost of Medicare $0 $0 $0 Non-Billed Services to the Community $173,136 $204,691 $153,754 Education & Research $25,485 $13,642 $14,127 Other Community Benefits $993,135 $887,238 $560,626 Total Benefits to the Broader Community $1,191,756 $1,105,571 $728,507 Total Community Benefits $5,444,490 $7,320,840 $6,689,501 Bad Debt Expense $2,219,049 $2,529,000 $2,581,515
26
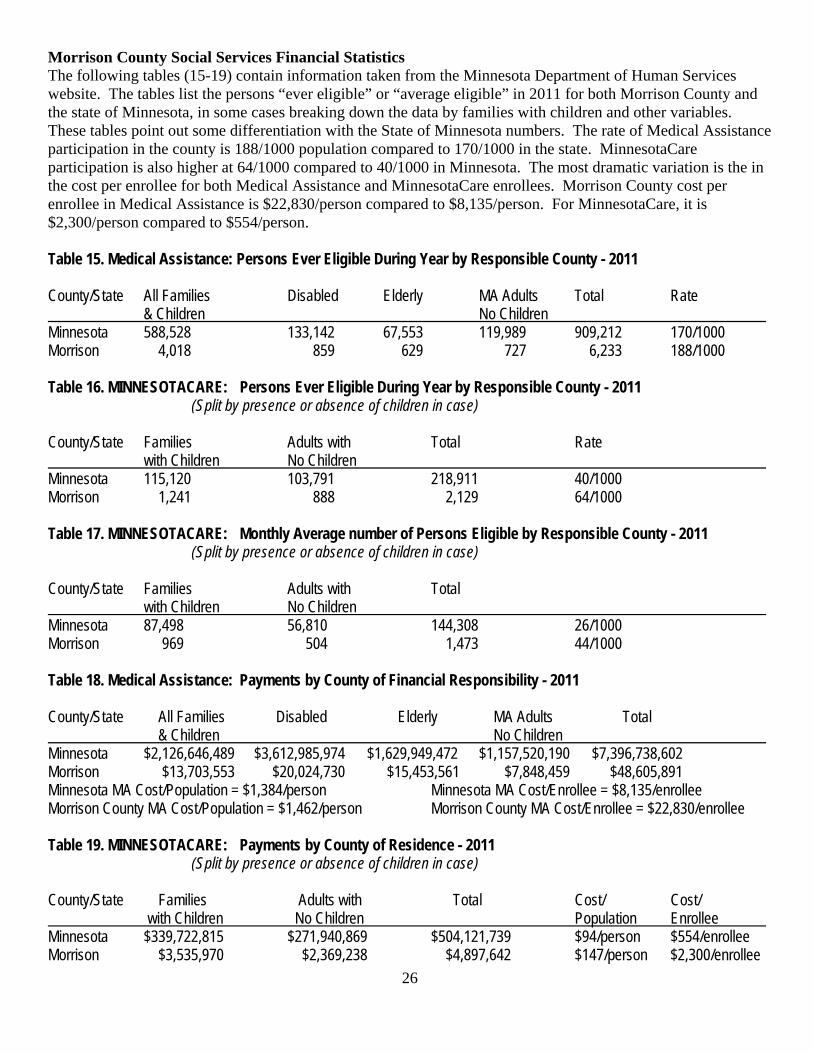
Morrison County Social Services Financial Statistics The following tables (15-19) contain information taken from the Minnesota Department of Human Services website. The tables list the persons “ever eligible” or “average eligible” in 2011 for both Morrison County and the state of Minnesota, in some cases breaking down the data by families with children and other variables. These tables point out some differentiation with the State of Minnesota numbers. The rate of Medical Assistance participation in the county is 188/1000 population compared to 170/1000 in the state. MinnesotaCare participation is also higher at 64/1000 compared to 40/1000 in Minnesota. The most dramatic variation is the in the cost per enrollee for both Medical Assistance and MinnesotaCare enrollees. Morrison County cost per enrollee in Medical Assistance is $22,830/person compared to $8,135/person. For MinnesotaCare, it is $2,300/person compared to $554/person. Table 15. Medical Assistance: Persons Ever Eligible During Year by Responsible County - 2011 County/State All Families Disabled Elderly MA Adults Total Rate & Children No Children Minnesota 588,528 133,142 67,553 119,989 909,212 170/1000 Morrison 4,018 859 629 727 6,233 188/1000 Table 16. MINNESOTACARE: Persons Ever Eligible During Year by Responsible County - 2011 (Split by presence or absence of children in case) County/State Families Adults with Total Rate with Children No Children Minnesota 115,120 103,791 218,911 40/1000 Morrison 1,241 888 2,129 64/1000 Table 17. MINNESOTACARE: Monthly Average number of Persons Eligible by Responsible County - 2011 (Split by presence or absence of children in case) County/State Families Adults with Total with Children No Children Minnesota 87,498 56,810 144,308 26/1000 Morrison 969 504 1,473 44/1000 Table 18. Medical Assistance: Payments by County of Financial Responsibility - 2011 County/State All Families Disabled Elderly MA Adults Total & Children No Children Minnesota $2,126,646,489 $3,612,985,974 $1,629,949,472 $1,157,520,190 $7,396,738,602 Morrison $13,703,553 $20,024,730 $15,453,561 $7,848,459 $48,605,891 Minnesota MA Cost/Population = $1,384/person Minnesota MA Cost/Enrollee = $8,135/enrollee Morrison County MA Cost/Population = $1,462/person Morrison County MA Cost/Enrollee = $22,830/enrollee Table 19. MINNESOTACARE: Payments by County of Residence - 2011 (Split by presence or absence of children in case) County/State Families Adults with Total Cost/ Cost/ with Children No Children Population Enrollee Minnesota $339,722,815 $271,940,869 $504,121,739 $94/person $554/enrollee Morrison $3,535,970 $2,369,238 $4,897,642 $147/person $2,300/enrollee

27
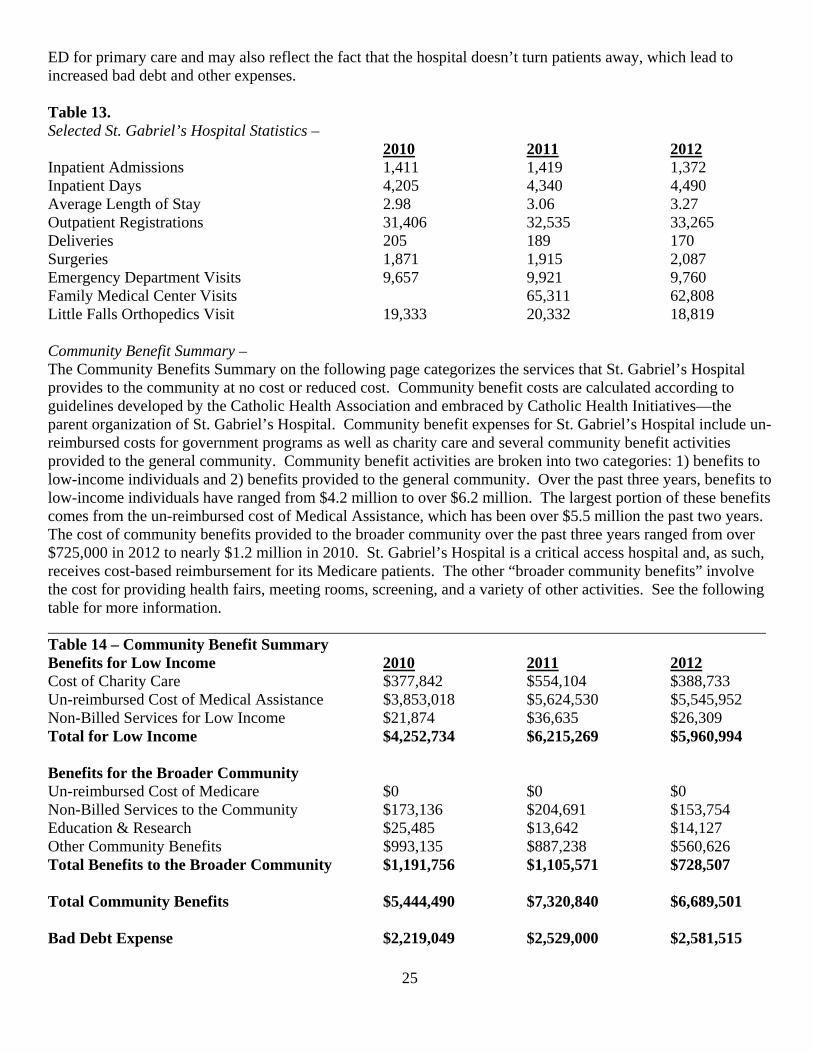
Domestic Violence & Crime Statistics Violence Prevention Initiative of Morrison County - St. Gabriel’s Hospital has a three-year Catholic Health Initiatives Mission & Ministry Fund (MMF) Violence Prevention grant to reduce the prevalence of partner violence (domestic violence) in Morrison County. The grant initiative employs a variety of “spectrum of prevention” strategies aimed at moving violence prevention “upstream” in the Morrison County community. The initiative has three measures: 1) number of domestic assaults; 2) Orders for Protection issued (OFPs); and 3) OFP violations. The strategies seek to reduce the number of domestic assaults by 10% over the three-year grant period from a baseline of 62; the number of OFPs issued by 5% over the three-year period from a baseline of 35; and the number of OFP violations by 10% over the grant period from a baseline of 30. The following graph illustrates the progress toward the three measures since tracking began in the first quarter of calendar year 2010. Figure 2.
Hands of Hope Resource Center Annual Report (Appendix III.K) Hands of Hope Resource Center (HOHRC), the victim’s advocacy organization in Morrison County and St. Gabriel’s Hospital’s partner in the violence prevention initiative, collects a variety of additional statistics related to domestic violence, sexual violence, child abuse and other violence in Morrison County through its annual report. The most recent annual report information is contained in Appendix III.K. It shows that in the fiscal year ending September 30, 2012, HOHRC provided services to 330 primary clients and 332 secondary clients of domestic violence in Morrison County. Of the primary clients, 316 (95.7%) were women. In regard to HOHRC’s sexual assault program, primary victims included 83 adults and 48 children and all 97 secondary victims were adults. A much smaller majority of the victims of child abuse were female, 184 out of 349 (52.7%). (See the full HOHRC report on page A-69).
12 12 12 12
17
10
6
21
15
9
910
5 7
10
6 6
17
12
7
4
65 5
7
3
51
2 2
0
5
10
15
20
25
Violence Prevention Statistics
Domestic Assaults
OFP'S Issued
OFP Violations

28
Crime Rates – The Minnesota Department of Public Safety keeps a variety of crime-related statistics. The following table shows how Morrison County compares to the state in “combined crime rate,” which is crimes per 100,000 population, over the past three years as well as the percent of crimes cleared over the same timeframe. In addition, due to concerns identified in the written survey and stakeholder interviews, the number of narcotic arrests for the county and state as well as a rate (per 1,000 population) was calculated for the same three-year period (2009-2011). Table 20. Combined Crime Rate Per 100,000 Population by Year and Percentage Cleared 2009 % Cleared 2010 % Cleared 2011 % Cleared Minnesota 7547 49% 6607 48% 6979 50% Morrison County 5542 70% 5081 72% 4409 73% Table 21. Narcotics Arrests by Year and Rate Per 1,000 Population 2009 Rate 2010 Rate 2011 Rate Minnesota 17,346 3.2 17,572 3.3 17,729 3.3 Morrison County 62 1.9 44 1.3 63 1.9 Injury Accidents (MIDAS) -
The Minnesota Department of Health's Injury and Violence Prevention Unit (IVPU) supports comprehensive programs that help reduce the risk of injury and violence. The mission of the IVPU is to strengthen Minnesota's communities in injury and violence prevention. The Unit collects and interprets data on injury and violence, develops and evaluates prevention programs and policies, and provides tools, technical assistance, and information to others. One of the IVPU’s standard reports is called the Minnesota Injury Data Access System (MIDAS) report. The following table shows the injury reports based on hospital data for the state and county.
Table 22. Minnesota Department of Health Injury & Violence Prevention Unit MIDAS Report – 2011 All Injuries, All Ages/Genders, etc. per 1,000 Population 2009 Rate 2010 Rate 2011 Rate Minnesota 326,754 61.1 338,886 63.4 313,788 58.7 Morrison County 2,420 72.8 2,417 72.7 2,325 69.9 Figure 3. Tick-Borne Disease Map
Lyme Rate – Morrison County is located in the heart of Lyme Disease (and other tick-borne) prevalence in Minnesota (see map at left). Minnesota has an annual Lyme Disease rate of 22.2 per 100,000 population, according to the Centers of Disease Control. Morrison County has a rate of 75.2/100,000, more than three times the statewide rate. DAANES Report – Chemical Dependency (Appendix III.L) The DAANES Report provides county-specific information gathered by the Minnesota Department of Human Services related to chemical dependency admissions (311 total) as well as other characteristics of users. The most recent information available is in regard to calendar year 2011. Appendix III.L contains the first
29
eight pages of the lengthy (90-plus pages) report. The complete document is available upon request from Morrison County Social Services. Morrison County statistics contained in the DAANES Report are, in many ways, quite similar to the statewide data. In regard to the treatment environment, individuals receiving treatment for chemical dependency are more likely to be admitted to a “non-residency program” (64.3%) than such individuals statewide (52.5%). Interestingly, there is considerable balance with respect to the month of admission. Statewide, each month approximately 8.5% (7.5%-9.5%) of clients were admitted in each month of 2011. In Morrison County, the highest month was December (10.6%) and the lowest months were February, August and September (5.8%). Clients are funded through CCDTF (the public funding mechanism for individuals seeking chemical dependency treatment) at a slightly higher rate (55.6%) in Morrison County versus statewide (49.8%). Both in Minnesota (49.2%) and in Morrison County (54.0%), half of those admitted for treatment are self-referred (at least in part). A much higher percentage (43.7%) of Morrison County residents receives treatment as a condition of probation/parole compared to clients statewide (31.2%). Over two-thirds (72.1%) of Morrison County residents received treatment in 2011 through three programs (Effective Living – 23.2%, Haven Recovery Center – 28.9%, and St Cloud Hospital’s Recovery Plus – 20.3) of the county’s 311 admissions. Of the people receiving treatment, statewide more are single (63.5%) compared to Morrison County (54.0%). Nearly three-quarters (73.3%) of county residents lives independently compared to 58.2% statewide. Despite the presence of Camp Ripley in Morrison County, only 92.0% of those receiving treatment were veterans, slightly less than the statewide percentage (94.6%). Both statewide (66.0%) and locally (69.5%), about two-thirds of those receiving treatment are male and one-third female. Morrison County had both a higher percentage of employed (24.1%) individuals and unemployed (29.3%) than the state as a whole (17.5% and 26.3%, respectively). In Morrison County, nearly two-thirds (61.1%) of those in treatment were under jurisdiction of the court, compared to Minnesota (49.5%). Oddly, a higher percentage (91.3%) of county residents had zero arrests in the past 30 days than statewide (88.8%). This anomaly may be the result of the clients driver’s license status as 34.4% of county residents in treatment were currently under revocation compared to 26.5% in Minnesota. Nearly 10% (9.5) of Morrison County women in treatment were pregnant, compared to only 4.6% statewide. A higher percentage (65.6%) of county residents receiving treatment in 2011 had “never” been in detox, compared 55.9% of Minnesotans. In both the county and statewide, approximately 25% had never undergone treatment and similar percentages had received treatment once, twice and three times or more, although in Minnesota, the percentage (34.6%) of those who received treatment three or more times is higher than in the county (31.2%). Kids Count (Appendix III.M) Kids Count®, a project of the Annie E. Casey Foundation, is a national and state-by-state effort to track the well-being of children in the United States. By providing high-quality data and trend analysis, Kids Count seeks to enrich local, state and national discussions concerning ways to secure better futures for all children — and to raise the visibility of children's issues through a nonpartisan, evidence-based lens. The Kids Count data for Morrison County is contained in Appendix III.M. The data provides an in-depth examination about the children of Morrison County. The birth rate for Morrison County in 2010 was 12.3 compared to 12.9 for Minnesota. Births to Morrison County mothers who received late or inadequate prenatal care was 1.6%, just over half (3.1%) when compared to Minnesota. Of concern is the percentage of mothers who smoked during their pregnancy, which was 17% for Morrison County compared to 10% in the state. Another statistic in which Morrison County “underperforms” is in regard to center-based child care participating in the USDA Food Program, which shows that only half as many (11%) of such centers participate, compared to 22% in Minnesota, despite more poverty in the county versus the state. The percentage of children completing their vaccine series in the county was 65% in 2011 (up from 33% in 2010) compared to 55.7% in Minnesota. The percentage of children (ages 0-19) without health insurance was 7.7% in the county compared to 6.7% statewide. The 2011 child abuse/neglect rate for Morrison County was 3.8, very close to the Minnesota rate (3.5). The percentage of children born at low birth rate in the county was 3.6%, compared to Minnesota’s rate of 4.8%. Nearly a third (29.9%) of children in Morrison County were born to unmarried mothers, which compares to 33.1% of all

30
Minnesota mothers in 2010. The percentage of births without a father listed on the birth certificate in Morrison County was 5.1% in 2010, compared to 9.3% in Minnesota. Kids Count lists the rate of children in out-of-home placements in Morrison County at 8.4, slightly less than the statewide rate of 8.9. The percentage of children in poverty in 2011 was 16.8% for Morrison County slightly more than the statewide percentage of 15.3%. In Morrison County, 42.3% of children received free/reduced price lunch, while the percentage statewide was 38.3%. The four-year high school graduation rate for the county was 84.9%, compared to 77.6% for all of Minnesota. The percentage of students enrolled in special education for Morrison County (2012) was 13.7%, slightly more than the statewide rate of 13.4%. Finally, the percentage of pre-term births in Morrison County was 8.7% in 2010, while the Minnesota rate was 8.1%. The Kids Count report contains a lot of additional county-specific information which provides an in-depth profile of children in the county and state. Morrison County Sheriff’s Report (Appendix III.N) Each March, the Morrison County Sheriff’s Office publishes an annual report on county-wide crime. The 2012 report indicates that homicide was a significant issue in comparison to year’s past. In fact, there were 6 homicides in Morrison County in 2012, up from 1 in 2011 and, in most years, there are zero homicides in the county. To put 2012’s numbers in perspective, since 1990 there have been 19 homicides total in the county (including 2012) and in over half (13 out of 24) of the years since 1990, there were no homicides reported in the county. Before 2012, the highest number of homicides in the county since 1990 was 3 and only three years (2008, 2007 and 1996) had more than 1 homicide. In many other crime categories, the county is doing better, there were no armed robberies and in the felony assault category, the number of assaults with a weapon in 2012 was three, the same as in 2011, while assaults involving hands, fist, feet, and strangulation dropped from 78 in 2011 to just 10 last year. At the same time, however, domestic assaults and misdemeanor assault both showed increases, with domestic assaults rising from 27 to 33 and misdemeanor assault increasing from 15 to 21 over 2011. Another area of concern is the increase in both adult and child criminal assault, with adult reports increasing from 5 in 2011 to 10 in 2012 and child reports going from 17 to 24. In regard to family offenses, reports of neglect increased to 7 in 2012 from 4 the prior year and malicious punishment reports from 1 in 2011 to 4 in 2012. Child endangerment reports dropped to 10 in 2012 from 16 in 2011. Larceny numbers from the two years are relatively similar, although personal theft reports and thefts from yards, streets and parking lots increased. For the most part, drug reports decreased, although there with 4 reports of methamphetamine selling in 2012 compared to 2 in 2011. Prescription drug selling reports dropped from 7 in 2011 to 2 in 2012. Most of the other crime report statistics for the county are unremarkable, although violations of others for protection (as noted previously) increased in 2012 (17) from 2011 (10). Monthly crime reports range from 629 in January and February to over 800 (811 and 848, respectively) in May and July, Last year, there were 250 more complaints to the Morrison County Sheriff’s Office over the prior year, going from 8,376 in 2011 to 8,626 in 2012. Institute of Medicine (IOM) Study on the Effects of Deployment (Appendix III.O) Congress commissioned the Institute of Medicine to do a comprehensive assessment and analysis of the effects of deployment on soldiers, their families and their communities. The legislation specifically stated that one of the communities to be studied needed to be where a National Guard facility was located. Camp Ripley was selected. The 1000+ page report contains several observations and recommendations such as the need for evidence-based practices related to treating military personnel, mental health is a bigger health concern than physical health, and there is little published data on the effects of deployment. Most relevant to The Health of Morrison County community health needs assessment is an appendix to the report which specifically outlines the findings for Camp Ripley, Little Falls and the Minnesota National Guard (see Appendix III.O). The Little Falls, Minnesota summary states that it is difficult to ascertain the impact of multiple deployments on Little Falls/Morrison County because units that deploy from Camp Ripley come from all over the state and sometimes from out of state. A few of the most interesting notes, observations, conclusions and recommendations from the summary follow:
Minnesota has 13,000 National Guard members, making it the 5th largest national guard in the country, while Minnesota ranks 26th nationwide in population.

31
“Compassion fatigue” is an issue in the community, with too few extremely compassionate volunteers and paid staff addressing the needs of far too many military personnel and their families.
The relationship between Camp Ripley and Little Falls/Morrison County is a good one. The town is, by all accounts, “military-friendly.” An example provided was of the number people who lined the streets of town on multiple occasions to welcome home soldiers.
The Family Assistance Center (FAC) at Camp Ripley is the key resource for addressing health and family issues for military personnel.
Mental health and behavioral health issues “dwarf all other concerns.” Resources are available to address most physical health needs locally. Access to psychiatric services is limited. Stressors on children and other family members is significant. Resources to address stressors on children are an “unmet need.”
Soldiers don’t self-report medical or mental health issues because of the risk of losing their military positions because they may be identified as non-deployable.
Churches do NOT play a central role in addressing the impact of multiple deployments. The FAC and the Veterans Service Office (Paul Froncak in the Government Center) are both viewed very
favorably. Community members view alcohol use/abuse as an issue, although it may be related more to community
norms rather than the effects of deployment. In regard to domestic violence, law enforcement personnel perceive it to be only a minimal issue, while
human service agencies believe it is a big issue and one that is related to deployment. Having access to mental health counselors with a military background would be advantageous in the
community. A summary, which includes “what’s working,” community needs and suggestions, is found on the last three pages (A-114 to A-116) of Appendix III.O. The entire IOM study is available National Academies website at: http//:www.nap.edu/catalog.php?record_id=13499. St. Gabriel’s Hospital received permission to include the portion of the copyrighted study’s Appendix E related to Little Falls as Appendix III.O of the CHNA. Secondary Data Summary There is a wealth of secondary data available related to the health of Morrison County residents. The data confirms many of the perceptions from the public in the written/online survey as well as the opinions expressed by individuals in the stakeholder interviews. Among them are the following: 1) chemical dependency (as well as illegal and prescription drug use/abuse) and alcohol issues are a significant community health issue; 2) mental health access (and to chemical dependency treatment) is a concern; 3) obesity, chronic disease and many other conditions could be addressed more effectively through a more coordinated effort at the community level; 4) in addition to access to mental health services, Morrison County is underserved in regarding to dental providers; 5) domestic violence is a concern, although probably not more so than many other rural communities; and 6) if Morrison County is going to improve its numbers on aggregate data sources (such as the County Health Rankings), community health resources (including St. Gabriel’s Hospital, Morrison County Public Health and Morrison County Social Services) need to develop a comprehensive Implementation Strategy (see Section VI) that results in a three-year action plan with specific goals and objectives to improve the health of the people of Morrison County. Such an implementation strategy must be able to capitalize on the assets and other community health resources (see Section IV) available throughout the Morrison County community and address how to overcome the lack of resources in certain areas (mental health specifically). While The Health of Morrison County community health needs assessment, specifically in this section, contains a great deal of secondary data, undoubtedly additional data sources are available. Anyone reviewing this CHNA who would like to see additional data included in this section of assessment should contact St. Gabriel’s Hospital. All suggested data sources will be considered in future CHNAs.

32
Section IV: What’s Available - Community Health Assets and Other Resources Introduction The following information on the assets and resources available in Morrison County to address community health is presented in list/directory format. It is a comprehensive listing of identified potential health resources and assets in Morrison County. It’s likely that some resources have been missed, or may be duplicative in some manner. Please submit any changes or additions to St. Gabriel’s Hospital. Community Health Assets and Other Resources in Morrison County Ambulance/Emergency Transport
- Gold Cross - Lifelink - NorthAir
Acupuncture
- Health Source of Little Falls Adult Day Care
- Pierz Villa - St. Otto’s Care Center
Alcohol & Drug Assessment/Treatment
- Alcoholics Anonymous - Effective Living Center - Haven Recovery Center - Kevin Maurer
Anesthesia
- Little Falls Anesthesia Apartments (Seniors)
- Alverna Apartments - Country Place – Pierz - Eagle Court – Randall - Falls Meadowbridge - Kamnic Lane – Pierz - Marantha Inn – Royalton - Partners Senior Living Options - Pierz - Pine Grove Manor
Arts/History
- Great River Arts Association - Heartland Symphony Orchestra - St. Francis Music Center - Morrison County Historical Society
Assisted Living (see Residential Care)
Chaplain Services - Morrison County Chaplaincy - Morrison County Ministerial Association
Charities/Foundations
- Bank of the West - Catholic Charities - Crow Wing Power - Franciscan Sisters of Little Falls - Initiative Foundation - Musser Estate - St. Gabriel’s Healthcare Foundation - US Bankcorp - Wells Fargo
Children & Youth Services
- Big Brothers – Big Sisters of Central Minnesota
- Boys & Girls Club of 10,000 Lakes - Community Services of Little Falls - Early Childhood Family Education - Early Childhood Interagency Intervention - Kinship of Morrison County - Mid-State Education District - Morrison County Child Protection Team - Morrison County Learning Center Day
Treatment - United Way of Morrison County - Youth As Resources
Chiropractors
- Broadway Chiropractic Center - Grunst, John – Pierz - Health Source of Little Falls - Little Falls Chiropractic Center - Pierz Chiropractic Center - Preferred Choice Chiropractic - Rich Prairie Chiropractic - Speer Chiropractic
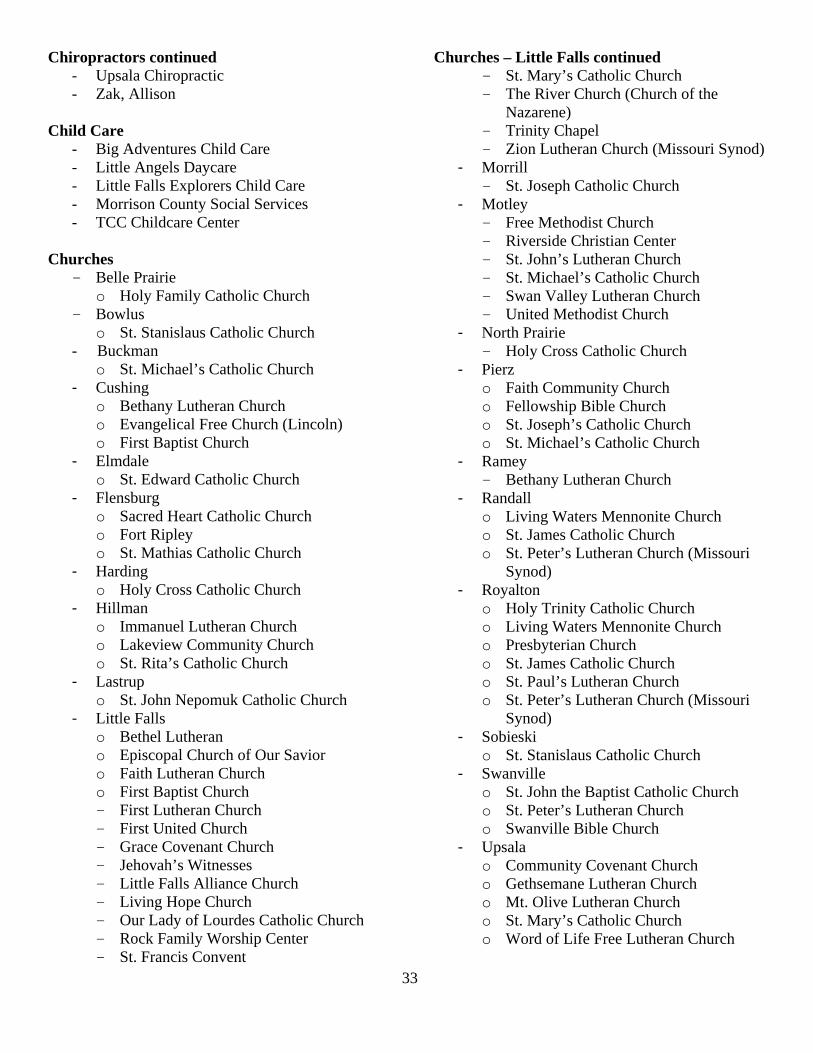
33
Chiropractors continued - Upsala Chiropractic - Zak, Allison
Child Care
- Big Adventures Child Care - Little Angels Daycare - Little Falls Explorers Child Care - Morrison County Social Services - TCC Childcare Center
Churches
- Belle Prairie o Holy Family Catholic Church
- Bowlus o St. Stanislaus Catholic Church
- Buckman o St. Michael’s Catholic Church
- Cushing o Bethany Lutheran Church o Evangelical Free Church (Lincoln) o First Baptist Church
- Elmdale o St. Edward Catholic Church
- Flensburg o Sacred Heart Catholic Church o Fort Ripley o St. Mathias Catholic Church
- Harding o Holy Cross Catholic Church
- Hillman o Immanuel Lutheran Church o Lakeview Community Church o St. Rita’s Catholic Church
- Lastrup o St. John Nepomuk Catholic Church
- Little Falls o Bethel Lutheran o Episcopal Church of Our Savior o Faith Lutheran Church o First Baptist Church - First Lutheran Church - First United Church - Grace Covenant Church - Jehovah’s Witnesses - Little Falls Alliance Church - Living Hope Church - Our Lady of Lourdes Catholic Church - Rock Family Worship Center - St. Francis Convent
Churches – Little Falls continued - St. Mary’s Catholic Church - The River Church (Church of the
Nazarene) - Trinity Chapel - Zion Lutheran Church (Missouri Synod)
- Morrill - St. Joseph Catholic Church
- Motley - Free Methodist Church - Riverside Christian Center - St. John’s Lutheran Church - St. Michael’s Catholic Church - Swan Valley Lutheran Church - United Methodist Church
- North Prairie - Holy Cross Catholic Church
- Pierz o Faith Community Church o Fellowship Bible Church o St. Joseph’s Catholic Church o St. Michael’s Catholic Church
- Ramey - Bethany Lutheran Church
- Randall o Living Waters Mennonite Church o St. James Catholic Church o St. Peter’s Lutheran Church (Missouri
Synod) - Royalton
o Holy Trinity Catholic Church o Living Waters Mennonite Church o Presbyterian Church o St. James Catholic Church o St. Paul’s Lutheran Church o St. Peter’s Lutheran Church (Missouri
Synod) - Sobieski
o St. Stanislaus Catholic Church - Swanville
o St. John the Baptist Catholic Church o St. Peter’s Lutheran Church o Swanville Bible Church
- Upsala o Community Covenant Church o Gethsemane Lutheran Church o Mt. Olive Lutheran Church o St. Mary’s Catholic Church o Word of Life Free Lutheran Church

34
Clinics (Medical)
- CentraCare Specialty Clinics - Collis, Noel – Internal Medicine - Community Medical Center - Pierz - Essentia Health – Pierz Clinic - Family Medical Center - Little Falls Orthopedics - Mille Lacs Health System – Hillman Family
Clinic - Randall Lakes Area Clinic - Upper Mississippi Surgical Associates
(George Fortier IV, MD) Clothing
- Clothes Review - The Clothes Hanger
Coalitions (Community Initiatives)
- Circle of Parents - Healthy Communities Collaborative - Love & Logic - Meth Task Force - Morrison County Housing Coalition - Morrison County Interagency Coordinating
Council - Pierz Area Coalition (Teen alcohol – Pierz) - Prescription Drug Task Force - Safe Roads Coalition - Stand Up 4U (Teen alcohol – LF) - Violence Prevention Council
Community Centers (see Senior Centers) Counseling (see Mental Health) Dentists
- Falls Court Dental - First Avenue Dental - Gessell, Lyle - Pierz Family Dentistry (Andrea/Chris
McGrew) - Miller, Robert - Oral & Maxillofacial Surgery
Developmentally Disabled Services
- Employment Enterprises, Inc. - REM of Central Lakes - St. Camillus Place
Domestic Violence
- Hands of Hope Resource Center - Violence Prevention Council of Morrison
County Drug Testing
- Mid-Minnesota Drug Testing - St. Gabriel’s Hospital
Economic Development (Tourism)
- Community Development Corporation of Morrison County
- Job Service - Lincoln Area Business Association - Little Falls Chamber of Commerce - Little Falls Convention & Visitors Bureau - Pierz Commercial Club
Employment
- Employment Enterprises, Inc. - Experience Works - MN Dept of Jobs & Training - MN Division of Rehabilitation Services - Productive Alternatives - Rural MN CEP
Environmental Organizations
- Nature Conservancy – Cushing - Spirit Creek Environmental Learning Center
Foster Care
- Amazing Days Elderly Care – Randall - Horizon Health - Morrison County Social Services
Foundations (see Charities/Foundations) Fuel Assistance
- Morrison County Chaplaincy (FEMA) - Morrison County Social Services
Government Health Resources
- Morrison County Public Health - Morrison County Social Services
Grants
- Community Transformation Grant (MCPH) - Rural Hospital Planning & Transition Grant
(St. Gabriel’s)

35
Grants continued - Small Hospital Improvement Program (St.
Gabriel’s) - Statewide Health Improvement Program
(MCPH) - Violence Prevention Initiative (St. Gabriel’s)
Health Care Miscellaneous
- Horizon Health – Pierz - Rural AIDS Action Network (RAAN)
Health & Fitness
- Amp Fitness – Pierz - Anytime Fitness - Curves - Fitness Connection - Little Falls Taekwondo - The Hub – Randall - St. Francis Health & Recreation
Hearing Aids
- Accurate Hearing Service - Avada Audiology - Belltone
Home Health
- Comfort Keepers - Divine Home Care - Home Instead - Horizon Health - Knute Nelson - Nouis Home Care - Unity Family Home Care & Hospice
Hospitals
- St. Gabriel’s Hospital Housing (All)
- Alverna Apartments - Avonlea Apartments - Birch Villa Apartments – Royalton - Bridgeway Estates - Brott’s Boarding Homes - Buckman Apartments - Central MN Housing Partnership - Circle Pines Apartments - Common Bond Communities - Corner Apartments – Upsala - Cornerstone Eldercare - Country Place Apartments – Pierz
Housing (All) continued - Country Terrace Apartments – Motley - Courtyard Apartments - Courtyard Townhomes - Driftwood Apartments – Royalton - Eagle Court Apartments – Randall - Eastwood Apartments – Motley - Edgewater Terrace Townhomes - Eldercare, Inc. - Elder Heights - Falls Cottages - Falls Manor Apartments & Townhomes - Falls Meadowbridge Townhouses - Habitat for Humanity - Harding Place – Harding - Harmony House - Harmony House Motley - Harmony House – Pierz - Highland Court Townhomes - Kamnic Lane Apartments – Pierz - Ken Mar Apartments - Key Row Apartments - Little Falls Cottages - Marantha Inn – Royalton - Meadow Ponds – Pierz - Park Place Apartments - Park Place Apartments - Randall - Pierz Townhomes - Pine Grove Manor - Prairie Manor – Pierz - Randall Apartments - Rich Prairie Apartments – Pierz - River Walk Apartments – Randall - Riverside Mobile Homes – Motley - Rose Court – Pierz - Schoenes – Haus Townhomes – Pierz - Suburban Mobile Home Park - Sunburst II Apartments - Sunny Pines Apartments – Motley - Swanville Apartments - Tower View Apartments – Upsala - Town & Country Manor - Upsala Apartments - Upsala Valley View Apartments - Willow Apartments
Libraries
- Great River Regional Library (Carnegie Library)

36
Massage - Fresh Hair - Hair Design Unlimited - Relaxing Results Massage - Relaxing Sensations - St. Francis Health & Rec Center - Zvyoloski Massage
Medical Supplies
- Lin Care Mental Health
- Caritas - Mid-State Education District - Northern Pines - Oak Ridge Crisis Bed - Quiet Waters Christian Counseling - River Therapy - Rising Star Equine Therapy - True Balance
Nursing Homes
- Clare Residence (FSLF) - Lutheran Care Center - Pierz Villa - St. Otto’s Care Center
Nutrition (Senior Sites, Home-Delivered Meals, WIC, Etc.)
- Buckman Senior Dining– on-site and delivery
- Food Shelf – Little Falls - Food Shelf – Motley - Food Shelf – Pierz - LF Senior Center – on-site and delivery - Morrison County WIC - Motley Senior Nutrition Site – on-site and
delivery - Oasis Share-A-Meal - Pierz Senior Center – on-site only - Royalton Senior Center – on-site and
delivery - Swanville Senior Center – on-site and
delivery - Upsala Senior Center – on-site only
Occupational Therapy
- Select Therapy – Pierz - St. Gabriel’s Hospital
Optometry/Ophthalmology - Falls Optical (Northern EC) - Little Falls Eye Care Center - Midwest Vision Center - Northern Eye Center - Pierz Eye Care - RT Vision - Vision Cents Optical
Pharmacies
- Coborns Pharmacy - St. Gabriel’s Hospital Pharmacy - Walgreens Pharmacy - Wal-Mart Pharmacy - White Pharmacy – Pierz
Physical Therapy
- Advance Physical Therapy - Phenomenal Rehab - Select Therapy – Pierz - St. Gabriel’s Hospital
Physicians (see Clinics - Medical) Podiatry
- Little Falls Orthopedics Psychologists (see Mental Health) Residential Care/Foster Care, Assisted Living,
- ALC Homes - Alverna Apartments (HUD) - Bridgeway Estates - Central MN Senior Care West - Diamond Willow - Harmony House – Little Falls - Harmony House – Pierz - Highland Senior Living - Nouis Home Care - Riverside Assisted Living
Resources – General/Local, Call Centers, Etc.
- Alcoholics Anonymous & Narcotics - American Cancer Society - American Red Cross - Catholic Charities - Child Care Choices - Child Care Resource & Referral - Deaf & Hard of Hearing Services - Disability Linkage Line

37
Resources – General/Local, Etc. continued - Eldercare Locator - First Call for Help - Habitat for Humanity - Legal Services of Central MN - Long Term Care Ombudsman - Lutheran Social Services - Paint-A-Thon - Retired & Senior Volunteer Program - Salvation Army - Senior Advocates - Senior Linkage Line - Social Security Administration - State Services for the Blind - United Way - Veteran’s Linkage Line
Resources – Websites
- www.cmcoa.org - www.medicare.gov - www.MinnesotaHelp.info - www.mnaging.org -
Schools - Children First Christian Pre-School (First
Lutheran – Little Falls) - Holy Trinity School – Pierz - Little Falls Community Schools
o Continuing Education Center o Knight (S.G.) Elementary o Lincoln Elementary o Lindbergh Elementary o LFCHS o LFCMS
- Mary of Lourdes Schools o Mary of Lourdes Elementary o Mary of Lourdes Middle School
- Molly Creek Area Learning Center - Swanville
- North Star Christian Academy - Pierz Public Schools
o Healy Secondary School o Pierz Alternative Program o Pioneer Elementary School
- Royalton Public Schools o Royalton Alternative Program o Royalton Elementary School o Royalton Secondary School
Schools continued - Staples-Motley School
o Motley Elementary School o Motley-Staples Middle School
- Swanville Public Schools o Swanville Elementary School o Swanville Secondary School
- Upsala Public Schools
o Upsala Elementary School o Upsala Secondary School
Senior Centers/Community Centers
- Chi Rho (Key Row) Community Center - Elmdale Community Center - Little Falls Senior Center - Pierz Senior Center - Swanville Senior Center - Upsala Community Center
Sexual Assault
- Hands of Hope Resource Center Special Education
- Mid-State Education District Transportation
- Medcab - MorrTrans (Morrison County Transit) - Little Falls Taxi - Sober Ride - Tuxedo Taxi
Volunteers
- Morrison County Volunteer Network

Community Assets and Resources Summary As the previous pages illustrate, Morrison County has many resources to address health issues in the county. There are some notable resources that are unavailable locally. For example, with respect to domestic violence, there isn’t a women’s shelter, where women can safely go to “escape” a potentially dangerous family situation. Nor is there a visitation/exchange center where children can safely meet with their fathers (and in some cases, mothers). In addition, the community doesn’t have inpatient facilities for either mental health or chemical dependency treatment. The secondary data also indicated that mental health services, in particular, are below what national standards to treat a population of 33,000+. The availability of dentistry services, as measured by the number of dentists per capita, similarly, is less than what is needed to serve the community. In regard to access to other medical specialties, St. Gabriel’s Hospital is actively recruiting additional physicians in the specialties of pediatrics and internal medicine and may need an additional general surgeon to serve community health needs. In general, most of the resources needed to address most of area residents’ health concerns are available in the county. On the other hand, better coordination of available resources could favorably impact the health of the people of Morrison County.
39
Section V. Summary & Conclusions Developing a comprehensive community health needs assessment for Morrison County has been an ambitious effort. The assessment included a written survey which collected information from the public on their perceptions of health issues and access to services. It also included interviews with various stakeholders either familiar with the local health system or who were willing to offer their insights into several health issues affecting the community. The Minnesota Department of Health and many other government and non-government collect county-level data on the health of the residents who live here. This information was contained in the Section: III – What the Secondary Data Tells Us. The data supports some of the perceptions from both the community and the stakeholders. Similarly, a review of community health assets and other resources shows that, overall, the people of Morrison County have access to a wide range of services. In addition, there appears to be a genuine willingness for people and various organizations in the community to collaborate to improve community health as demonstrated by the wide range of community coalitions working on health initiatives. To support these coalitions, several entities (notably Morrison County and St. Gabriel’s Hospital) have received grant funding. The results from the CHNA will be used to develop an implementation strategy (action plan) to improve the health of Morrison County over the next three years. The implementation strategy, how it was developed as well as its specific goals, objectives and measures/indicators, is outlined in Section VI.

40
Section VI. Implementation Strategy Introduction Simply put, the implementation strategy for The Health of Morrison County community health needs assessment (CHNA) is the hospital’s (community’s) plan for addressing community health needs. It is sometimes referred to as a community benefit plan. It is the “how” and “when” of the CHNA. Internal Revenue Service Notice 2011-52 provides further direction on what a community hospital needs to include in the implementation strategy. It states that the strategy is a plan that addresses the community health needs identified through a CHNA both: 1) how the hospital intends to meet identified health needs and 2) why a hospital doesn’t intend to address an identified health need. The St. Gabriel’s Hospital (Morrison County) implementation strategy also includes the following: a) the hospital’s (CHI) mission and vision; b) prioritized geographic areas/populations; c) a description of how the implementation strategy was developed; d) how major needs and priorities were determined; and e) what existing hospital services and programs will be used to meet priority needs. The mission of St. Gabriel’s Hospital and Catholic Health Initiatives is “to nurture the healing ministry of the Church by bringing it new life, energy and vitality in the 21st century. Fidelity to the Gospel urges us to emphasize human dignity and social justice as we move toward the creation of healthier communities.” The vision for St. Gabriel’s Hospital is “to create the best health care experience by igniting the spirit for superior care and service.” The implementation strategy is designed to address the health care needs of the people of Morrison County, who have unique demographics, socioeconomic factors and health care needs. County residents are overwhelmingly Caucasian and poorer and older than most people in Minnesota (see Section III for additional details). The implementation strategy was developed with input from a wide range of individuals including representatives from the local medical/health care community affiliated with St. Gabriel’s Hospital (and St. Gabriel’s Healthcare Foundation), from Morrison County Public Health and Morrison County Social Services, Little Falls Community Schools, Camp Ripley, the Little Falls Chamber, and the Healthy Communities Collaborative of Morrison County. The implementation strategy team identified the health priorities and intends to assist in monitoring progress toward the implementation strategy goals and objectives as outlined in the three-year action plan. The implementation strategy will also identify how existing and planned St. Gabriel’s Hospital services and programs will be utilized to help achieve the goals and objectives. Health Care Priorities The CHNA identified several community health priorities. The major health priorities are chronic disease/conditions (especially diabetes, chronic obstructive pulmonary disease-COPD, and heart disease), obesity, mental health, chemical dependency, dental services and poverty. This implementation strategy will address three of the six major health issues. Except on a limited scale, the implementation strategy will not address access to chemical dependency and dental services nor will it address poverty. Although many hospitals are in a position to specifically address chemical dependency in their communities, St. Gabriel’s Hospital does not have a behavioral health department and is ill-equipped to directly impact chemical dependency. The hospital intends, however, to address chemical dependency in a limited way by expanding hospital participation on community coalitions addressing chemical dependency and alcohol in the county (see Implementation Strategy Summary). Similarly, St. Gabriel’s Hospital also does not have resources to address access to dental services, which was identified as a community health issue through both the stakeholder interviews and the secondary data review. Poverty is a broad societal issue beyond the capabilities of a small, rural community hospital with limited resources. It is driven by a wide range of factors including the lack of well-paying jobs and other economic issues. The absence of a behavioral health program also limits what St. Gabriel’s Hospital may be able to do to positively impact mental health issues; however, the hospital will have certain resources, such as the Patient-Centered Medical Home, which may be utilized or expanded to potentially impact mental health. Specific actions related to improving community mental health are identified in the three-year action plan on the following pages as are the plans for addressing the other community health priorities.

41
Three-Year Action Plan Goal 1: Reduce the impact of chronic illnesses (specifically, diabetes, COPD and heart disease) on the people of Morrison County. Objectives: 1A) Reduce the percentage of individuals in Morrison County with diabetes from a baseline rate of 8% (County Health Rankings - CHR) to the Minnesota rate of 7% June 30, 2016. 1B) Reduce the percentage of adults in Morrison County who smoke from 21% to under 20% (2013 CHR) by June 30, 2016. 1C) Reduce the hospitalization rate for COPD in Morrison County from the baseline of 43 per 10,000
to under 40 per 10,000 (MN rate = 32.6) by June 30, 2016. 1D) Reduce the hospitalization rate for heart attacks in Morrison County from the baseline of 33 per 10,000 (2013 CHR) to the Minnesota rate (30.2) by June 30, 2016. 1E) Increase the number of clients served by the St. Gabriel’s Diabetes Education Center from a baseline of 869
clients (FY 2012) to 900 annually by June 30, 2016. 1F) Increase the diabetes screening percentage for Morrison County from a baseline of 86% (2013 CHR) to the
Minnesota percentage (88%) by June 30, 2016. 1G) Implement a Patient-Centered Medical Home (PCMH) at St. Gabriel’s Hospital by April 30, 2014. 1H) Decrease youth smoking percentage (Minnesota Student Survey baseline=11%) to the Minnesota rate (10%)
and chewing tobacco/snuff use percentage among males from the Morrison County baseline of 16% to under 15% by June 30, 2016.
Measures/Indicators: 1A.1) The County Health Rankings Morrison County Profile/MDH County Health Tables 1B.1) The County Health Rankings Morrison County Profile/MDH County Health Tables 1C.1) The County Health Rankings Morrison County Profile/MDH County Health Tables 1D.1) The County Health Rankings Morrison County Profile/MDH County Health Tables 1E.1) Diabetes Education Center/St. Gabriel’s Hospital annual statistics 1F.1) The County Health Rankings Morrison County Profile/MDH County Health Tables 1G.1) PCMH becomes operational by January 31, 2014, and receives certification from the Minnesota
Department of Health by April 30, 2014. 1H.1) Minnesota Student Survey results. Specific Actions/Strategies/Resources: 1a) Submit Catholic Health Initiatives Mission and Ministry Fund Grant application for a Patient-Centered Medical Home. 1b) Support and collaborate with Morrison County Public Health (MCPH) in implementing Community
Transformation Grant (CTG) strategies to reduce tobacco use, diabetes and heart disease in the county. 1c) Utilize Rural Hospital Planning and Transition Grant funding ($50,000) to implement a PCMH at
St. Gabriel’s Hospital/Family Medical Center. 1d) Use the PCMH to direct patients to available resources for smoking cessation, diabetes, etc. 1e) Support and collaborate with CTG efforts to create smoke-free, multi-unit housing/foster care in the county. 1f) Support and collaborate in further restricting tobacco point-of-sale communications and policies. 1g) Support and collaborate with HCC’s Live Better! Live Longer! strategies that align with overall CHNA Implementation Strategy surrounding chronic disease and “active” lifestyles. 1h) Support and collaborate with CTG efforts to increase diabetes clinic referrals by formalizing the referral process. 1i) Support and collaborate with BLEND Fit Kids Club objective to increase youth exercise in the county.
42
Three-Year Action Plan Goal 2: Reduce the percentage of individuals (both adults and youth – 9th to 12th grade students) in
Morrison County who are overweight and obese. Objectives: 2A) Reduce the percentage of adults who are obese in the county from the baseline of 29% (2013 CHR) to the
current Minnesota rate (26%) by June 30, 2016. 2B) Reduce the percentage of adults reporting that they are physically inactive from the baseline of 22% (2013
CHR) to the current Minnesota rate (19%) by June 30, 2016. 2C) Reduce the percentages of high school females who are overweight and obese (as measured by Body Mass Index – BMI) in the county from a baseline of 17% to the overall (male and female students)
Minnesota rate (13.7%) by June 30, 2016. 2D) Increase the percentage of Morrison County female high school students that report being physically active
for at least 30 minutes five or more days per week from a baseline of 46.5% to the overall (male and female) Minnesota rate (49.9%) by June 30, 2016.
2E) Increase the percentage of Morrison County high school students that report having three or more servings of fruits or vegetables “yesterday” from a baseline of 55.2% (MSS) to the Minnesota rate (59.8%)
by June 30, 2016. 2F) Conduct motivational interviewing workshops for Morrison County clinicians by September 30, 2013,
with a minimum of 12 UFH/St. Gabriel’s Hospital clinicians attending. 2G) Utilize the PCMH to enroll clinic patients of all ages in care plans through a deliberate motivational
interviewing approach that addresses weight-management issues, enrolling a minimum of 100 patients by June 30, 2016.
Measures/Indicators: 2A.1) The County Health Rankings Morrison County Profile/MDH County Health Tables 2B.1) The County Health Rankings Morrison County Profile/MDH County Health Tables 2C.1) Minnesota Student Survey results. 2D.1) Minnesota Student Survey results. 2E.1) Minnesota Student Survey results. 2F.1) Motivational Interviewing Workshop attendance logs. 2G.1) Allscripts patient electronic medical record data for Family Medical Center patients. Specific Actions/Strategies/Resources: 2a) Using Community Transformation Grant (CTG) funding, develop communication materials with consistent messaging that address Morrison County norms, and the community’s acceptance of unhealthy
weight-related behaviors. 2b) Use the PCMH to direct patients to available resources for weight management, etc. 2c) Support and collaborate with Live Better! Live Longer! strategies that align with overall CHNA
Implementation Strategy surrounding chronic disease and “active” lifestyles. 2d) Support and collaborate with BLEND Fit Kids Club strategies to increase youth exercise in the county. 2e) Support and collaborate with CTG initiatives in implementing Active School Day strategies. 2f) Support and collaborate with CTG initiatives in implementing Active and Safe Routes to School strategies. 2g) Support and collaborate with CTG initiatives in implementing Minnesota Food Charter strategies. 2h) Support and collaborate with CTG initiatives in implementing Healthy Food Access Plans for Schools and
Institutions strategies. 2i) Support and collaborate with CTG initiatives in implementing strategies to develop resources for weight
management in the community so that residents can access resources in the county. 2j) Implement motivational interviewing techniques among St. Gabriel’s hospital clinicians.

43
Three-Year Action Plan Goal 3: Reduce the impact of mental illness on the people of Morrison County. Objectives: 3A) Increase the number of mental health referrals to Morrison County residents from a baseline to be
established by Morrison County Social Services by 5% by June 30, 2016. 3B) Establish a telepsych program, if feasible, at St. Gabriel’s Hospital by June 30, 2016. 3C) Explore the possibility of utilizing an Advance Practice Nurse in the delivery of mental health services,
possibly at Family Medical Center, by January 31, 2014. 3D) Determine unused capacity of mental health services in Morrison County by June 30, 2014. 3E) Reduce the percentage of female Morrison County high school students reporting that they agree with the statement “I am often unhappy, depressed or tearful” from a baseline of 20.5% (MSS) to below the
current Minnesota rate of 19.8% by June 30, 2013. 3F) Reduce the percentage of Morrison County high school students reporting “ever having suicidal thoughts” from a baseline (2010 MSS) of 23.5% to the current rate (20.8%) by June 30, 2016. Measures/Indicators: 3A.1) Morrison County Social Services statistics. 3B.1) Telepsych program is developed or deemed unfeasible. 3C.1) Family Medical Center will determine how (or if) an Advance Practice Psychology Nurse may be utilized at the clinic. 3D.1) Morrison County Social Services will develop and distribute a report on mental health capacity in the county. 3E.1) Minnesota Student Survey Results. 3F.1) Minnesota Student Survey Results. Specific Actions/Strategies/Resources: 3a) Establish baseline of mental health utilization in Morrison County. 3b) Determine how/if St. Gabriel’s Hospital can potentially assist Certified Family Nurse Practitioner Libbie
Stokke in achieving Advance Practice Nurse in Psychology certification. 3c) Send questionnaire to mental health practitioners in Morrison County to assist in determining mental health capacity in the county. 3d) Support and collaborate in the development of communication materials that address “stigma” issues
surrounding mental illness. 3e) Support and collaborate with Morrison County school districts (and other community partners) in addressing depression and other mental health issues. 3f) Support and collaborate with Morrison County school districts (and other community partners) in addressing
teen suicide in the county.
44
Implementation Strategy Summary St. Gabriel’s Hospital and its community health partners will focus its implementation strategy around three primary goal areas: 1) reducing the impact of chronic illnesses (specifically, diabetes, COPD and heart disease) on the people of Morrison County; 2) reducing the percentage of individuals (both adults and youth – 9th to 12th grade students) in Morrison County who are overweight and obese; and 3) reducing the impact of mental illness in Morrison County. The previous pages identify the specific action plans to address these three goal areas. In some cases, St. Gabriel’s Hospital will take the lead in implementing certain strategies and in other ways, the hospital will provide a supportive and collaborative role. As stated in the introduction to Section VI: Implementation Strategy/Action Plan, St. Gabriel’s Hospital is ill-equipped to address chemical dependency, dental access and poverty, even though they were identified as significant issues in the community. Despite not having resources to address chemical dependency and poverty in direct ways through its action plans, the hospital will continue to support and collaborate with community partners to address these issues. This support and collaboration will take place in a variety of ways. First, with respect to chemical dependency, the hospital will explore having clinician participation on community coalitions that are addressing chemical (tobacco, alcohol and drug) use and abuse in the county, such as the StandUp4U initiatives in Pierz and Little Falls. In addition, the hospital will collaborate in the development of consistent messaging around chemical use/abuse and employing those messages in the delivery of health care services. Several community partners are developing the messages in order to: a) address social stigmas around receiving treatment for chemical dependency, and b) reduce the social acceptance and tolerance of chemical use in the county. Secondly, the hospital does not have dental providers or other resources that can be utilized to improve access to dental care. It is willing to provide a supportive role as other community partners investigate how to increase access to dental services in the community. With respect to the issue of poverty, St. Gabriel’s Hospital will contact a neighboring hospital, which is working on a “Bridges Out of Poverty” initiative, to learn more about how the hospital is accessing resources and implementing strategies to reduce poverty in the community. The hospital will provide a report on the conversations with the neighboring facility with the Implementation Strategy Development Team. The Patient-Centered Medical Home (PCMH) is both the cornerstone and foundation of the St. Gabriel’s Hospital (community) implementation strategy. It is what aligns the hospital’s strategic plan with the CHNA. It is also the base from which all health improvement activities are derived. We believe the PCMH will favorably impact the health of the people of Morrison County in a variety of ways, marshalling resources needed to make health improvements on a case-by-case basis. Finally, St. Gabriel’s Hospital will continue to play a leadership role with the Implementation Strategy Development Team and will host biannual (twice per year) meetings to monitor progress on the action plans and make adjustments to the individual strategies as needed.