Greater Norwich Homeless Health Needs Audit 2016
25
GREATER NORWICH HOMELESS HEALTH NEEDS AUDIT 2016
-
Upload
khangminh22 -
Category
Documents
-
view
0 -
download
0
Transcript of Greater Norwich Homeless Health Needs Audit 2016
Font: Humanist
Greater Norwich homeless health Needs audit 2016
1
Greater Norwich homeless health needs audit 2016 1. What is the issue and why is it important for Norwich and Norfolk? “People who are homeless experience some of the worst health problems in society.”1
People who are homeless often have multiple and complex health needs:
73% of homeless people report a physical health problem
80% report a mental health problem2
The average age of people who die while homeless is 47; for females it is only 43.
Despite this, people who are homeless often struggle to access healthcare. Changes to how health and housing support is provided can make a significant difference. The annual cost of hospital treatment for homeless people is at least £85m a year. Failure to support homeless people to get the healthcare they need when they need it, before they require urgent hospital treatment, comes at great cost to the health sector, and for homeless people themselves. There is mounting evidence of a number of health interventions that can bring significant financial savings.”3 Norfolk’s Joint Strategic Needs Assessment www.norfolkinsight.org.uk/jsna provides a picture of the Health and Wellbeing of the people of the county and the issues that effect their needs, inequalities and services, aiming to inform and improve their health and wellbeing through providing this information for such as the Health and Wellbeing board, commissioners and strategies for change. Currently there is little data in the current Joint Strategic Needs Assessment (JSNA) about the health needs of this population. This report goes some way to address that.
The health needs audit should identify the needs of this population and identify particular health inequalities. This audit will provide a benchmark for any future surveys and will show if the health needs of single homeless people has improved or worsened. The aim of the health needs audit was to assess the needs of single homeless adults across greater Norwich. Greater Norwich survey – Greater Norwich Homeless Health Needs Audit National survey – Homeless link Health Needs Audit GNP – Greater Norwich adult population (15+) – ONS population predictions 2015 4
1 The unhealthy state of homelessness: Health needs audit, (Homeless Link, 2014)
2 87% of respondents to the Greater Norwich Homeless Health Needs Audit said that they had a
diagnosed mental health condition. 3 Homeless health matters, The case for change, (St Mungos Broadway, 2014)
4
https://www.ons.gov.uk/peoplepopulationandcommunity/populationandmigration/populationestimates
2
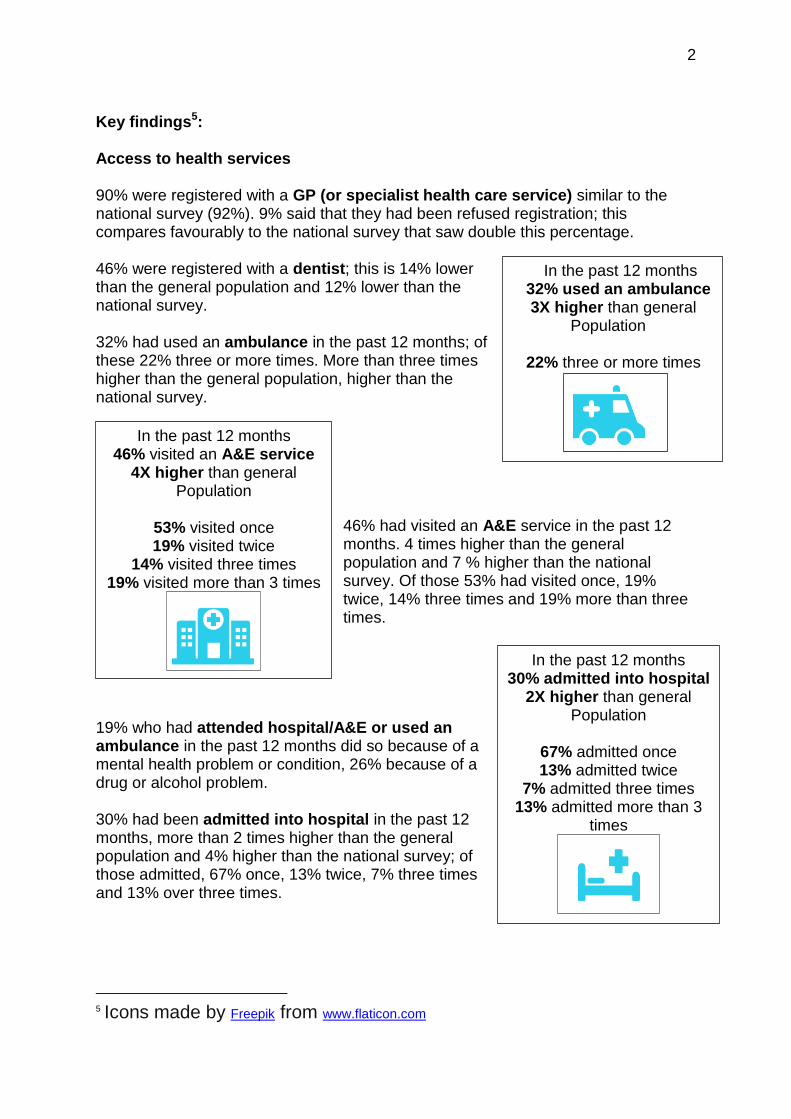
In the past 12 months 46% visited an A&E service
4X higher than general Population
53% visited once 19% visited twice
14% visited three times 19% visited more than 3 times
In the past 12 months 30% admitted into hospital
2X higher than general Population
67% admitted once 13% admitted twice
7% admitted three times 13% admitted more than 3
times
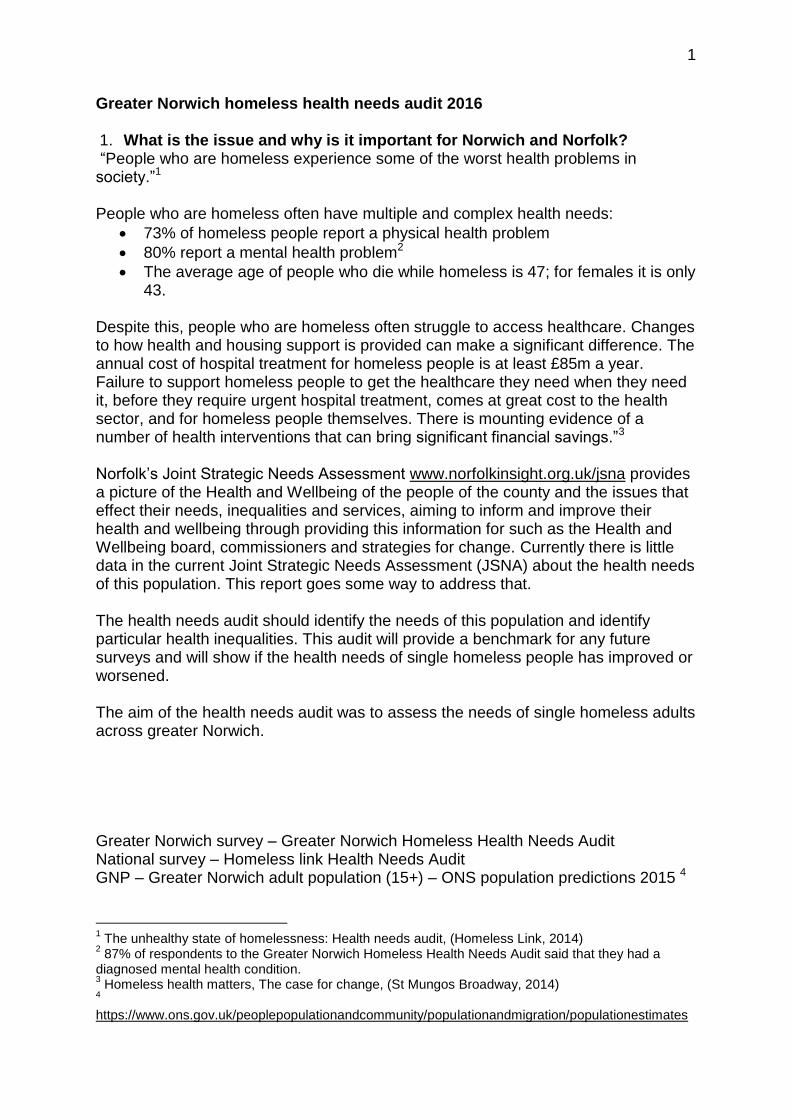
In the past 12 months 32% used an ambulance 3X higher than general Population 22% three or more times
Key findings5: Access to health services
90% were registered with a GP (or specialist health care service) similar to the national survey (92%). 9% said that they had been refused registration; this compares favourably to the national survey that saw double this percentage. 46% were registered with a dentist; this is 14% lower than the general population and 12% lower than the national survey. 32% had used an ambulance in the past 12 months; of these 22% three or more times. More than three times higher than the general population, higher than the national survey.
46% had visited an A&E service in the past 12 months. 4 times higher than the general population and 7 % higher than the national survey. Of those 53% had visited once, 19% twice, 14% three times and 19% more than three times.
19% who had attended hospital/A&E or used an ambulance in the past 12 months did so because of a mental health problem or condition, 26% because of a drug or alcohol problem. 30% had been admitted into hospital in the past 12 months, more than 2 times higher than the general population and 4% higher than the national survey; of those admitted, 67% once, 13% twice, 7% three times and 13% over three times.
5 Icons made by Freepik from www.flaticon.com
3
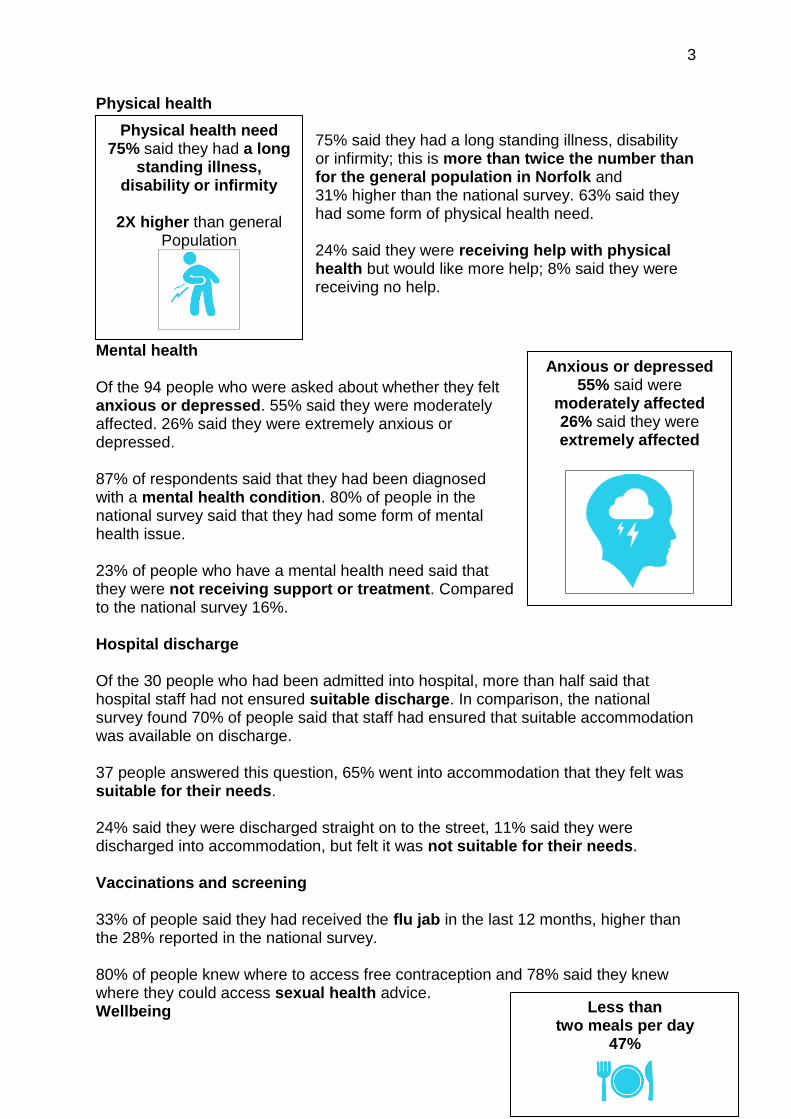
Physical health need 75% said they had a long
standing illness, disability or infirmity
2X higher than general
Population
Physical health 75% said they had a long standing illness, disability or infirmity; this is more than twice the number than for the general population in Norfolk and 31% higher than the national survey. 63% said they had some form of physical health need. 24% said they were receiving help with physical health but would like more help; 8% said they were receiving no help.
Mental health Of the 94 people who were asked about whether they felt anxious or depressed. 55% said they were moderately affected. 26% said they were extremely anxious or depressed. 87% of respondents said that they had been diagnosed with a mental health condition. 80% of people in the national survey said that they had some form of mental health issue. 23% of people who have a mental health need said that they were not receiving support or treatment. Compared to the national survey 16%. Hospital discharge Of the 30 people who had been admitted into hospital, more than half said that hospital staff had not ensured suitable discharge. In comparison, the national survey found 70% of people said that staff had ensured that suitable accommodation was available on discharge. 37 people answered this question, 65% went into accommodation that they felt was suitable for their needs. 24% said they were discharged straight on to the street, 11% said they were discharged into accommodation, but felt it was not suitable for their needs. Vaccinations and screening 33% of people said they had received the flu jab in the last 12 months, higher than the 28% reported in the national survey. 80% of people knew where to access free contraception and 78% said they knew where they could access sexual health advice. Wellbeing
Anxious or depressed 55% said were
moderately affected 26% said they were extremely affected
Less than two meals per day
47%
4
Alcohol Drugs 6% have or are recovering from 30%
34% are in recovery 47%
The number who drink 10 or more units of alcohol in a day is
4X higher than general Population
Smoking 3X higher than the general population
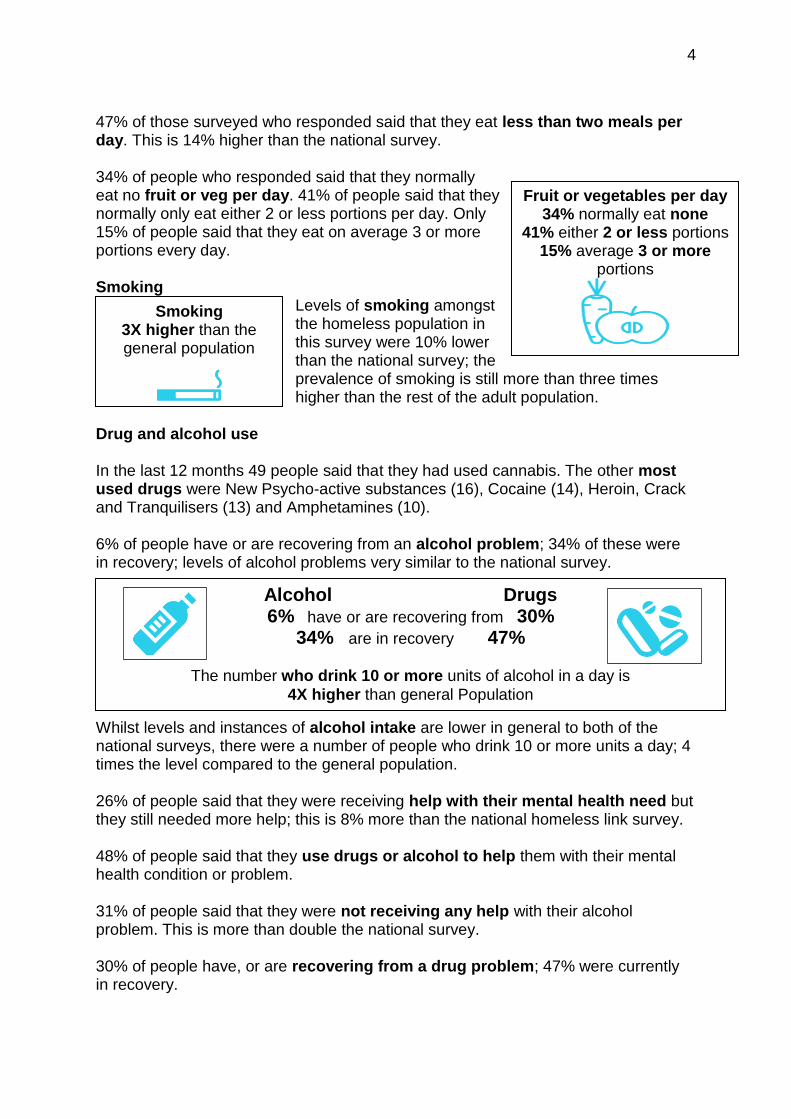
47% of those surveyed who responded said that they eat less than two meals per day. This is 14% higher than the national survey. 34% of people who responded said that they normally eat no fruit or veg per day. 41% of people said that they normally only eat either 2 or less portions per day. Only 15% of people said that they eat on average 3 or more portions every day. Smoking
Levels of smoking amongst the homeless population in this survey were 10% lower than the national survey; the prevalence of smoking is still more than three times higher than the rest of the adult population.
Drug and alcohol use In the last 12 months 49 people said that they had used cannabis. The other most used drugs were New Psycho-active substances (16), Cocaine (14), Heroin, Crack and Tranquilisers (13) and Amphetamines (10).
6% of people have or are recovering from an alcohol problem; 34% of these were in recovery; levels of alcohol problems very similar to the national survey.
Whilst levels and instances of alcohol intake are lower in general to both of the national surveys, there were a number of people who drink 10 or more units a day; 4 times the level compared to the general population. 26% of people said that they were receiving help with their mental health need but they still needed more help; this is 8% more than the national homeless link survey. 48% of people said that they use drugs or alcohol to help them with their mental health condition or problem. 31% of people said that they were not receiving any help with their alcohol problem. This is more than double the national survey. 30% of people have, or are recovering from a drug problem; 47% were currently in recovery.
Fruit or vegetables per day 34% normally eat none
41% either 2 or less portions 15% average 3 or more
portions
5
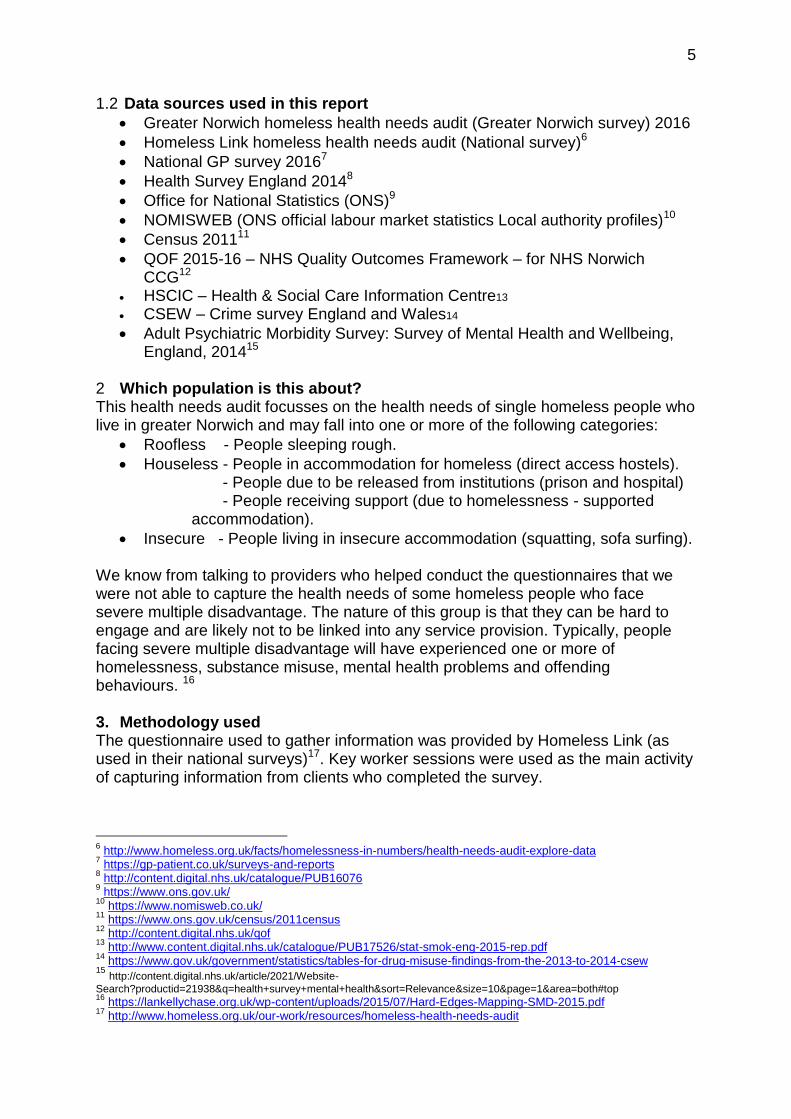
1.2 Data sources used in this report
Greater Norwich homeless health needs audit (Greater Norwich survey) 2016
Homeless Link homeless health needs audit (National survey)6
National GP survey 20167
Health Survey England 20148
Office for National Statistics (ONS)9
NOMISWEB (ONS official labour market statistics Local authority profiles)10
Census 201111
QOF 2015-16 – NHS Quality Outcomes Framework – for NHS Norwich CCG12
HSCIC – Health & Social Care Information Centre13
CSEW – Crime survey England and Wales14
Adult Psychiatric Morbidity Survey: Survey of Mental Health and Wellbeing, England, 201415
2 Which population is this about? This health needs audit focusses on the health needs of single homeless people who live in greater Norwich and may fall into one or more of the following categories:
Roofless - People sleeping rough.
Houseless - People in accommodation for homeless (direct access hostels). - People due to be released from institutions (prison and hospital) - People receiving support (due to homelessness - supported accommodation).
Insecure - People living in insecure accommodation (squatting, sofa surfing). We know from talking to providers who helped conduct the questionnaires that we were not able to capture the health needs of some homeless people who face severe multiple disadvantage. The nature of this group is that they can be hard to engage and are likely not to be linked into any service provision. Typically, people facing severe multiple disadvantage will have experienced one or more of homelessness, substance misuse, mental health problems and offending behaviours. 16 3. Methodology used The questionnaire used to gather information was provided by Homeless Link (as used in their national surveys)17. Key worker sessions were used as the main activity of capturing information from clients who completed the survey.
6 http://www.homeless.org.uk/facts/homelessness-in-numbers/health-needs-audit-explore-data
7 https://gp-patient.co.uk/surveys-and-reports
8 http://content.digital.nhs.uk/catalogue/PUB16076
9 https://www.ons.gov.uk/
10 https://www.nomisweb.co.uk/
11 https://www.ons.gov.uk/census/2011census
12 http://content.digital.nhs.uk/qof
13 http://www.content.digital.nhs.uk/catalogue/PUB17526/stat-smok-eng-2015-rep.pdf
14 https://www.gov.uk/government/statistics/tables-for-drug-misuse-findings-from-the-2013-to-2014-csew
15 http://content.digital.nhs.uk/article/2021/Website-
Search?productid=21938&q=health+survey+mental+health&sort=Relevance&size=10&page=1&area=both#top 16
https://lankellychase.org.uk/wp-content/uploads/2015/07/Hard-Edges-Mapping-SMD-2015.pdf 17
http://www.homeless.org.uk/our-work/resources/homeless-health-needs-audit
6
4. Socio demographics of the respondents to the Greater Norwich health
needs audit (Greater Norwich survey) 2016
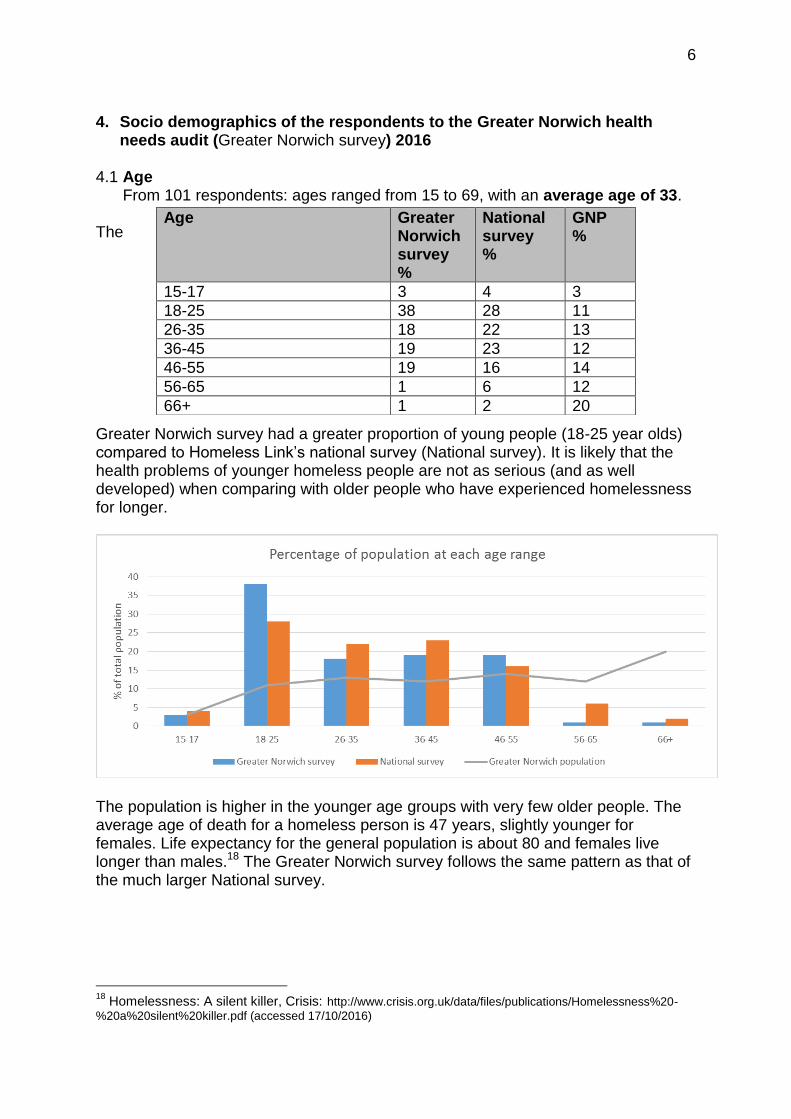
4.1 Age From 101 respondents: ages ranged from 15 to 69, with an average age of 33.
The
Greater Norwich survey had a greater proportion of young people (18-25 year olds) compared to Homeless Link’s national survey (National survey). It is likely that the health problems of younger homeless people are not as serious (and as well developed) when comparing with older people who have experienced homelessness for longer.
The population is higher in the younger age groups with very few older people. The average age of death for a homeless person is 47 years, slightly younger for females. Life expectancy for the general population is about 80 and females live longer than males.18 The Greater Norwich survey follows the same pattern as that of the much larger National survey.
18
Homelessness: A silent killer, Crisis: http://www.crisis.org.uk/data/files/publications/Homelessness%20-
%20a%20silent%20killer.pdf (accessed 17/10/2016)
Age Greater Norwich survey %
National survey %
GNP %
15-17 3 4 3
18-25 38 28 11
26-35 18 22 13
36-45 19 23 12
46-55 19 16 14
56-65 1 6 12
66+ 1 2 20
7
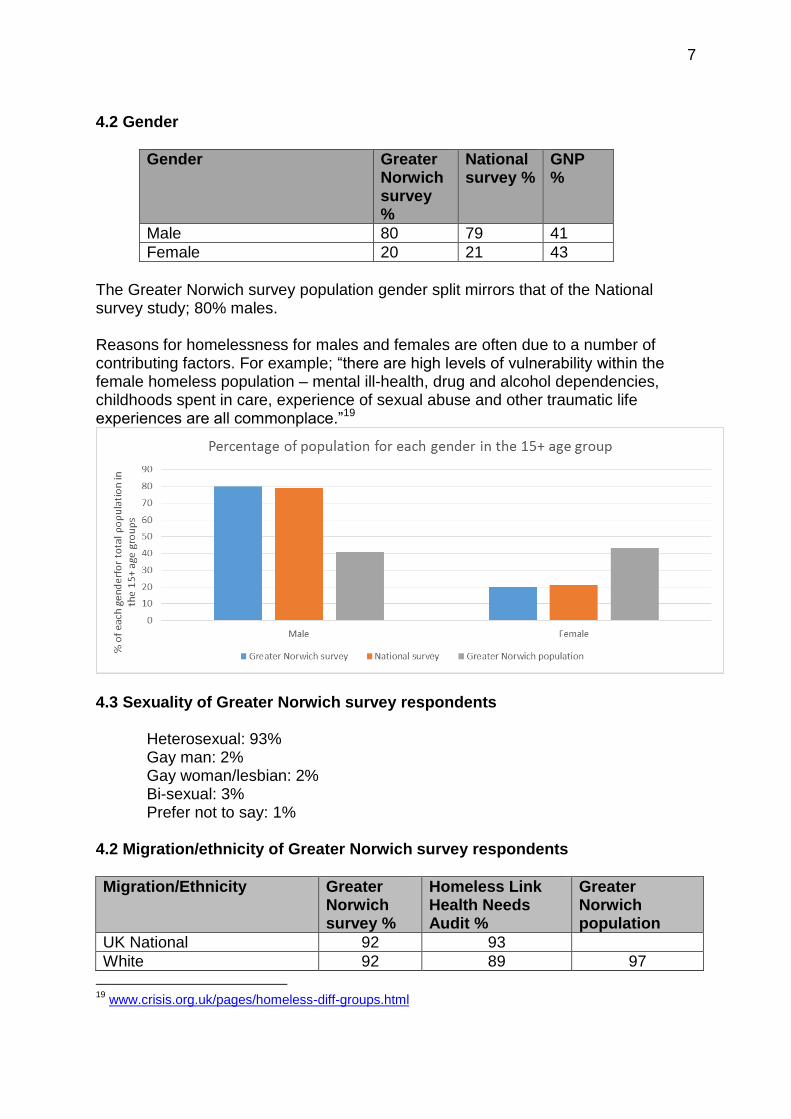
4.2 Gender
Gender Greater Norwich survey %
National survey %
GNP %
Male 80 79 41
Female 20 21 43
The Greater Norwich survey population gender split mirrors that of the National survey study; 80% males. Reasons for homelessness for males and females are often due to a number of contributing factors. For example; “there are high levels of vulnerability within the female homeless population – mental ill-health, drug and alcohol dependencies, childhoods spent in care, experience of sexual abuse and other traumatic life experiences are all commonplace.”19
4.3 Sexuality of Greater Norwich survey respondents
Heterosexual: 93% Gay man: 2% Gay woman/lesbian: 2% Bi-sexual: 3% Prefer not to say: 1%
4.2 Migration/ethnicity of Greater Norwich survey respondents
Migration/Ethnicity Greater Norwich survey %
Homeless Link Health Needs Audit %
Greater Norwich population
UK National 92 93
White 92 89 97
19
www.crisis.org.uk/pages/homeless-diff-groups.html
8
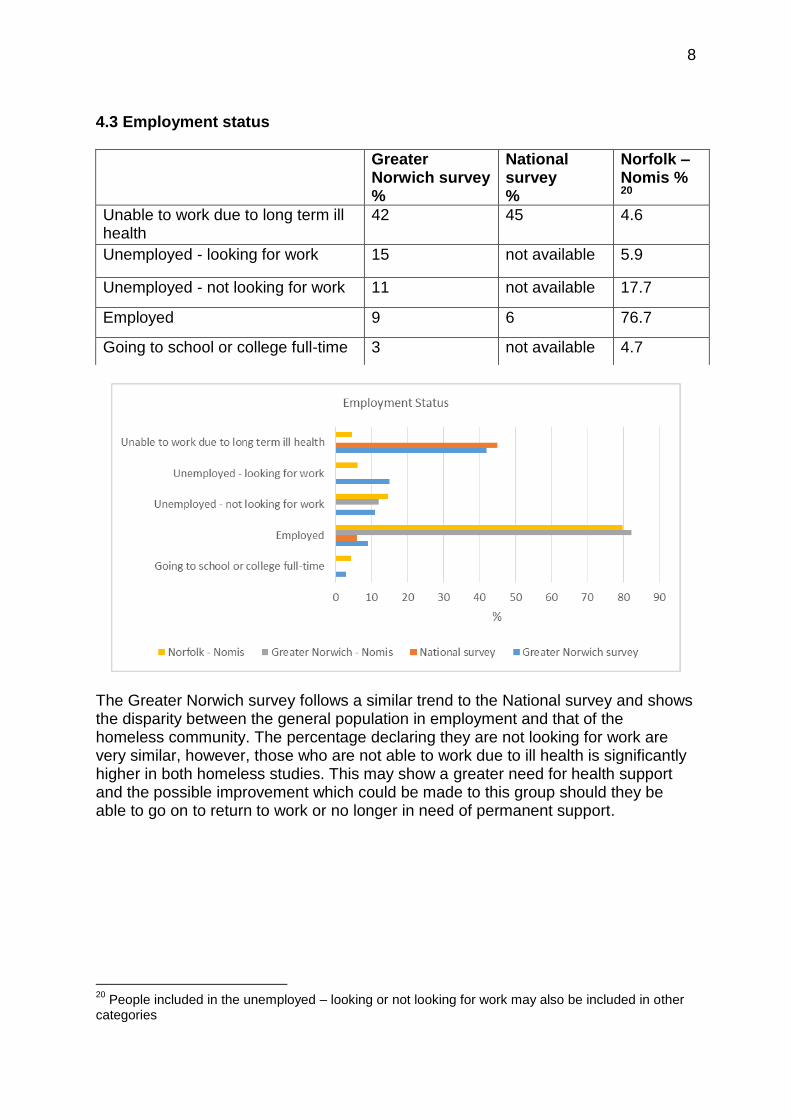
4.3 Employment status
Greater Norwich survey %
National survey %
Norfolk – Nomis % 20
Unable to work due to long term ill health
42 45 4.6
Unemployed - looking for work 15 not available 5.9
Unemployed - not looking for work 11 not available 17.7
Employed 9 6 76.7
Going to school or college full-time 3 not available 4.7
The Greater Norwich survey follows a similar trend to the National survey and shows the disparity between the general population in employment and that of the homeless community. The percentage declaring they are not looking for work are very similar, however, those who are not able to work due to ill health is significantly higher in both homeless studies. This may show a greater need for health support and the possible improvement which could be made to this group should they be able to go on to return to work or no longer in need of permanent support.
20
People included in the unemployed – looking or not looking for work may also be included in other categories
9
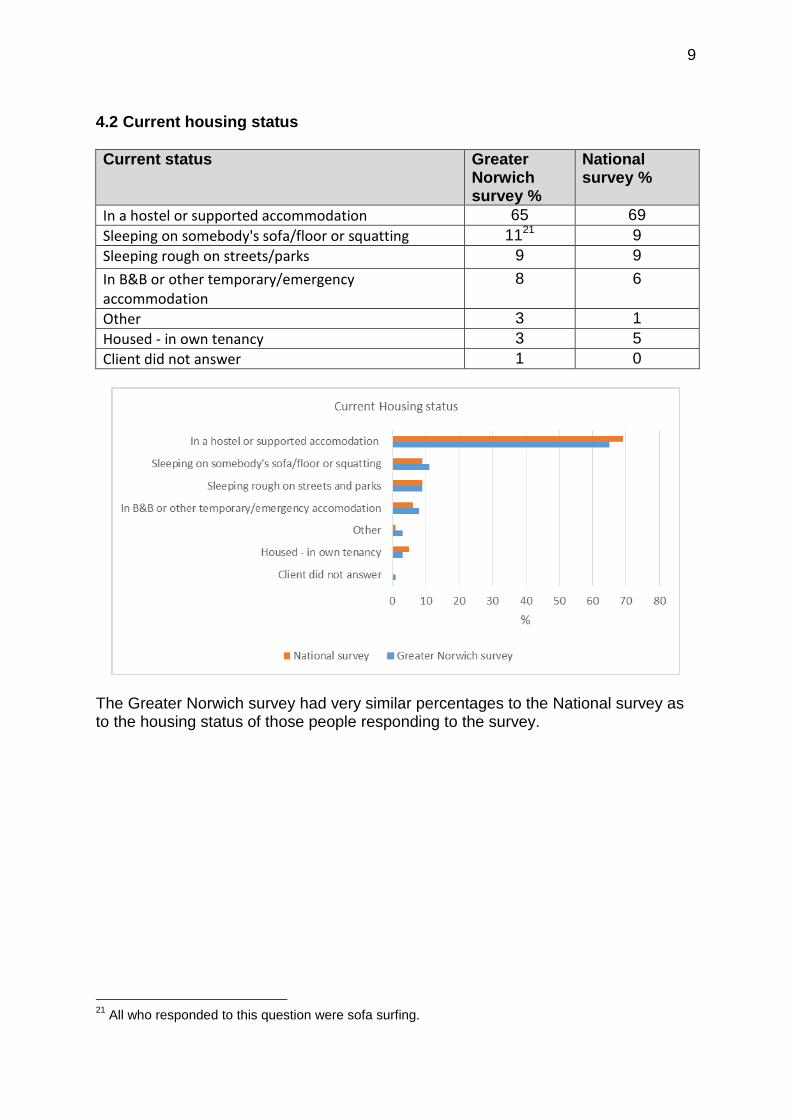
4.2 Current housing status
Current status Greater Norwich survey %
National survey %
In a hostel or supported accommodation 65 69
Sleeping on somebody's sofa/floor or squatting 1121 9
Sleeping rough on streets/parks 9 9
In B&B or other temporary/emergency accommodation
8 6
Other 3 1
Housed - in own tenancy 3 5
Client did not answer 1 0
The Greater Norwich survey had very similar percentages to the National survey as to the housing status of those people responding to the survey.
21
All who responded to this question were sofa surfing.
10
4.4 Background of respondents
Background (can be more than one) Greater Norwich survey %22
Spent time in prison 40
None of these backgrounds 25
Spent time in local authority care 21
Admitted to hospital because of a mental health issue 20
Been a victim of domestic violence 16
Spent time in a secure unit or young offender institution 5
Spent time in the armed forces 2
There is a link between people leaving prison and becoming homeless. The Greater Norwich survey demonstrates this high proportion of those whom responded having spent some time in prison. An increase has been seen in the numbers of people within Norwich who are no fixed abode following leaving prison. In the last year (16/17) our Norwich rough sleeper outreach service saw 111 individuals who had left prison with no fixed address; double the number we saw in 2013/14.23 5. Access to health services 5.1 GP or specialist health care service 90% of respondents were registered with a GP or specialist homeless health care service. This is about the same as the national survey with 92% registered.
Registered with: Greater Norwich survey %
National survey %
GP 90 92
Dentist 46 58
5.2 Of those registered with a GP or specialist health care service how many times did you use this service? 78% of people had used a GP or specialist health care service in the last 12 months; 62% of those people registered had used their local service 3 or more times in the last 12 months. 21% of those registered had only used their local service once or not all during the same time period. 5.3 Dentist 46% of people were registered with a dentist; this is 14% lower than the general population and 12% lower than the national survey. 24
22
These percentages will not add up to 100% because the respondent could choose more than one response. 23
Source, St Martins Housing Trust. 24
It is estimated that 60% of the general population are registered.
11
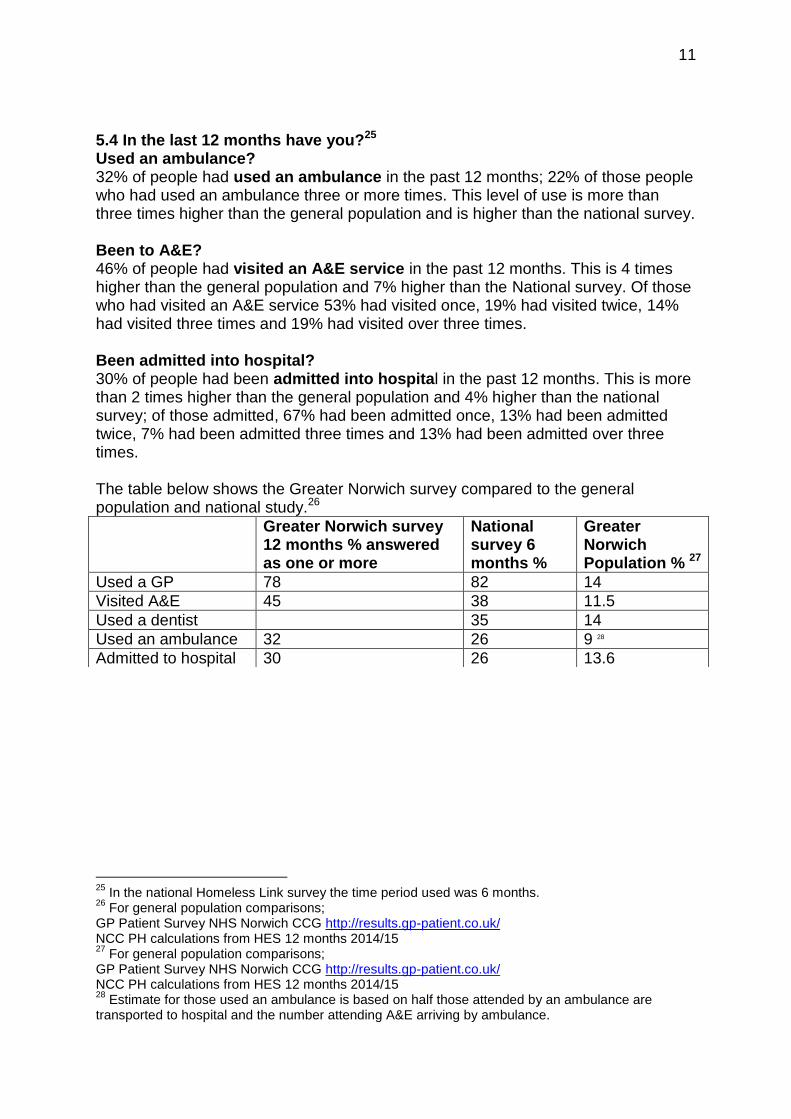
5.4 In the last 12 months have you?25 Used an ambulance? 32% of people had used an ambulance in the past 12 months; 22% of those people who had used an ambulance three or more times. This level of use is more than three times higher than the general population and is higher than the national survey. Been to A&E? 46% of people had visited an A&E service in the past 12 months. This is 4 times higher than the general population and 7% higher than the National survey. Of those who had visited an A&E service 53% had visited once, 19% had visited twice, 14% had visited three times and 19% had visited over three times. Been admitted into hospital? 30% of people had been admitted into hospital in the past 12 months. This is more than 2 times higher than the general population and 4% higher than the national survey; of those admitted, 67% had been admitted once, 13% had been admitted twice, 7% had been admitted three times and 13% had been admitted over three times. The table below shows the Greater Norwich survey compared to the general population and national study.26
25
In the national Homeless Link survey the time period used was 6 months. 26
For general population comparisons; GP Patient Survey NHS Norwich CCG http://results.gp-patient.co.uk/ NCC PH calculations from HES 12 months 2014/15 27
For general population comparisons; GP Patient Survey NHS Norwich CCG http://results.gp-patient.co.uk/ NCC PH calculations from HES 12 months 2014/15 28
Estimate for those used an ambulance is based on half those attended by an ambulance are transported to hospital and the number attending A&E arriving by ambulance.
Greater Norwich survey 12 months % answered as one or more
National survey 6 months %
Greater Norwich Population % 27
Used a GP 78 82 14
Visited A&E 45 38 11.5
Used a dentist 35 14
Used an ambulance 32 26 9 28
Admitted to hospital 30 26 13.6
12
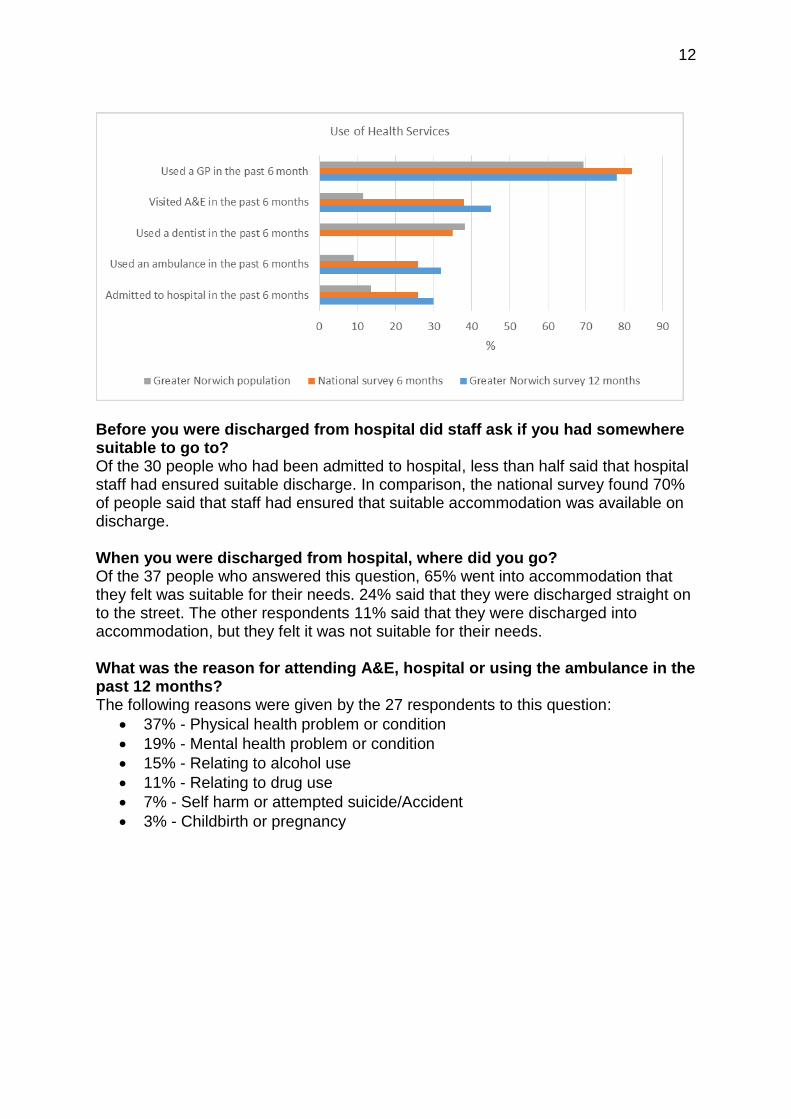
Before you were discharged from hospital did staff ask if you had somewhere suitable to go to? Of the 30 people who had been admitted to hospital, less than half said that hospital staff had ensured suitable discharge. In comparison, the national survey found 70% of people said that staff had ensured that suitable accommodation was available on discharge. When you were discharged from hospital, where did you go? Of the 37 people who answered this question, 65% went into accommodation that they felt was suitable for their needs. 24% said that they were discharged straight on to the street. The other respondents 11% said that they were discharged into accommodation, but they felt it was not suitable for their needs. What was the reason for attending A&E, hospital or using the ambulance in the past 12 months? The following reasons were given by the 27 respondents to this question:
37% - Physical health problem or condition
19% - Mental health problem or condition
15% - Relating to alcohol use
11% - Relating to drug use
7% - Self harm or attempted suicide/Accident
3% - Childbirth or pregnancy
13
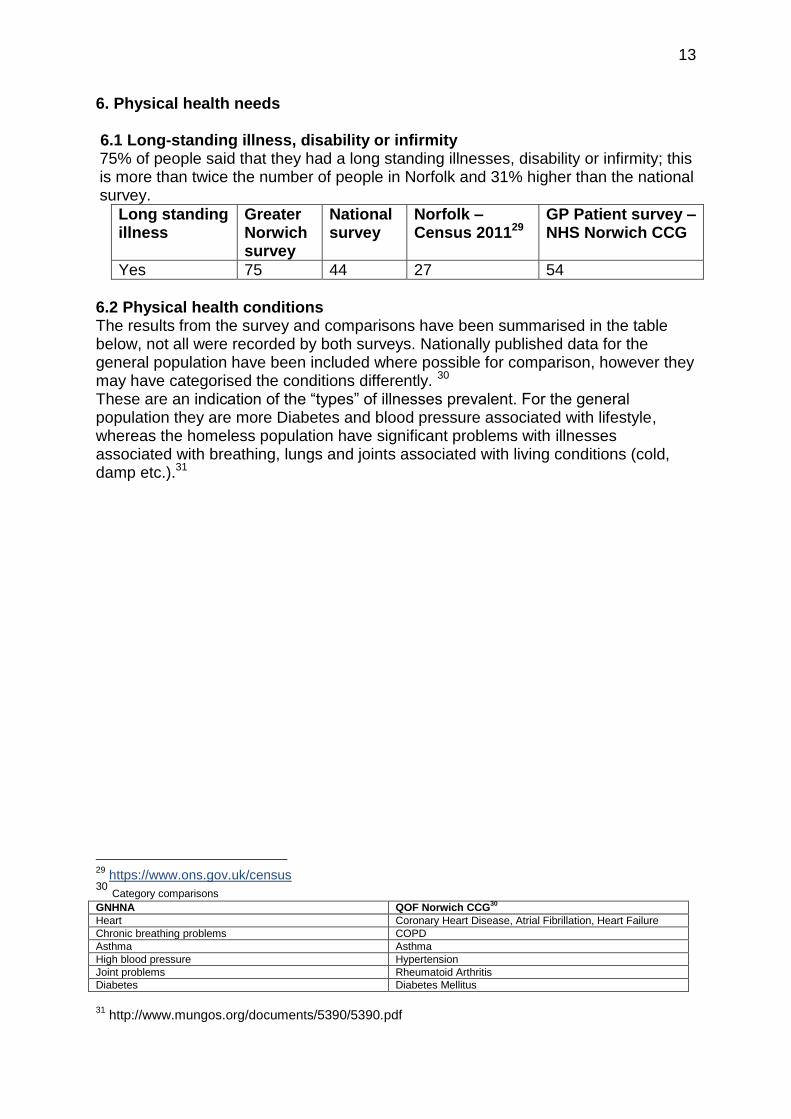
6. Physical health needs 6.1 Long-standing illness, disability or infirmity 75% of people said that they had a long standing illnesses, disability or infirmity; this is more than twice the number of people in Norfolk and 31% higher than the national survey.
Long standing illness
Greater Norwich survey
National survey
Norfolk – Census 201129
GP Patient survey – NHS Norwich CCG
Yes 75 44 27 54
6.2 Physical health conditions The results from the survey and comparisons have been summarised in the table below, not all were recorded by both surveys. Nationally published data for the general population have been included where possible for comparison, however they may have categorised the conditions differently. 30 These are an indication of the “types” of illnesses prevalent. For the general population they are more Diabetes and blood pressure associated with lifestyle, whereas the homeless population have significant problems with illnesses associated with breathing, lungs and joints associated with living conditions (cold, damp etc.).31
29
https://www.ons.gov.uk/census 30 Category comparisons
GNHNA QOF Norwich CCG30
Heart Coronary Heart Disease, Atrial Fibrillation, Heart Failure
Chronic breathing problems COPD
Asthma Asthma
High blood pressure Hypertension
Joint problems Rheumatoid Arthritis
Diabetes Diabetes Mellitus
31
http://www.mungos.org/documents/5390/5390.pdf
14
32
http://www.content.digital.nhs.uk/catalogue/PUB22266 Diagnosed conditions
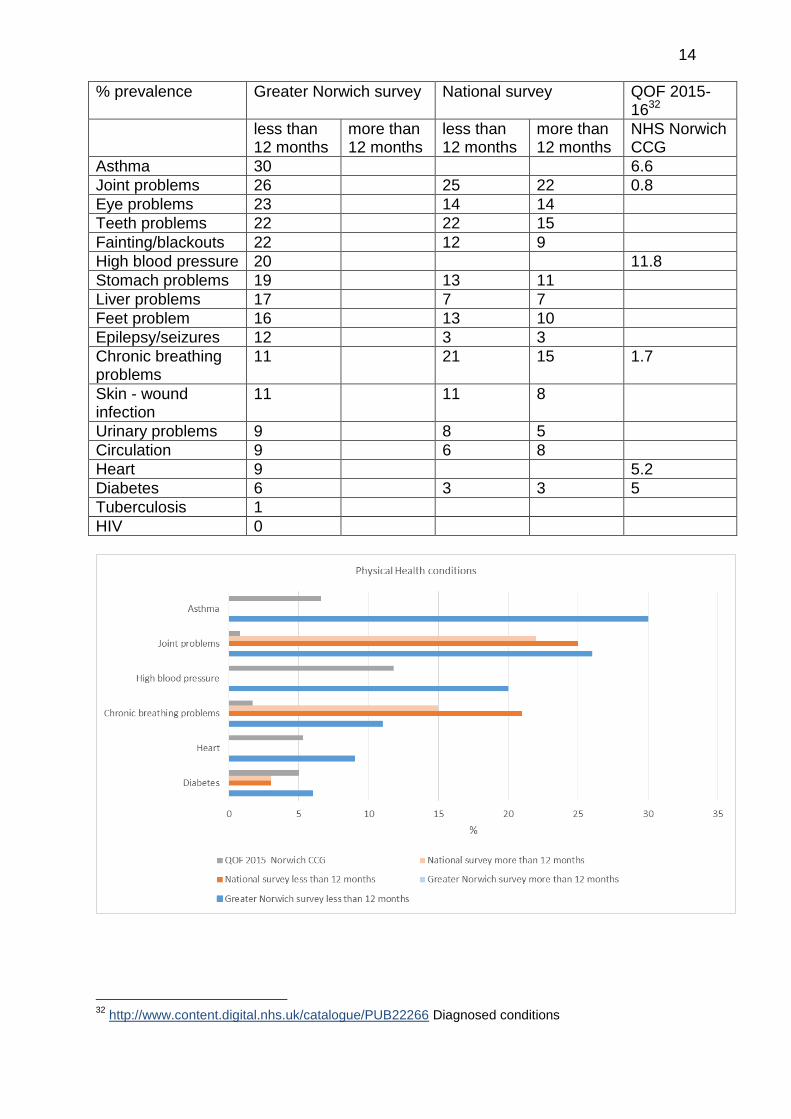
% prevalence Greater Norwich survey National survey QOF 2015-1632
less than 12 months
more than 12 months
less than 12 months
more than 12 months
NHS Norwich CCG
Asthma 30 6.6
Joint problems 26 25 22 0.8
Eye problems 23 14 14
Teeth problems 22 22 15
Fainting/blackouts 22 12 9
High blood pressure 20 11.8
Stomach problems 19 13 11
Liver problems 17 7 7
Feet problem 16 13 10
Epilepsy/seizures 12 3 3
Chronic breathing problems
11 21 15 1.7
Skin - wound infection
11 11 8
Urinary problems 9 8 5
Circulation 9 6 8
Heart 9 5.2
Diabetes 6 3 3 5
Tuberculosis 1
HIV 0
15
6.3 Receiving help with your physical health need If respondents answered yes to any physical need, they were asked if they were receiving support/treatment to help them with their physical health problem.
63 of the 101 people who responded to the survey said that they had some form of physical health problem.
8% said they were receiving no help but it would help them
19% said that they did not need any help
49% said they were receiving help and it met their needs
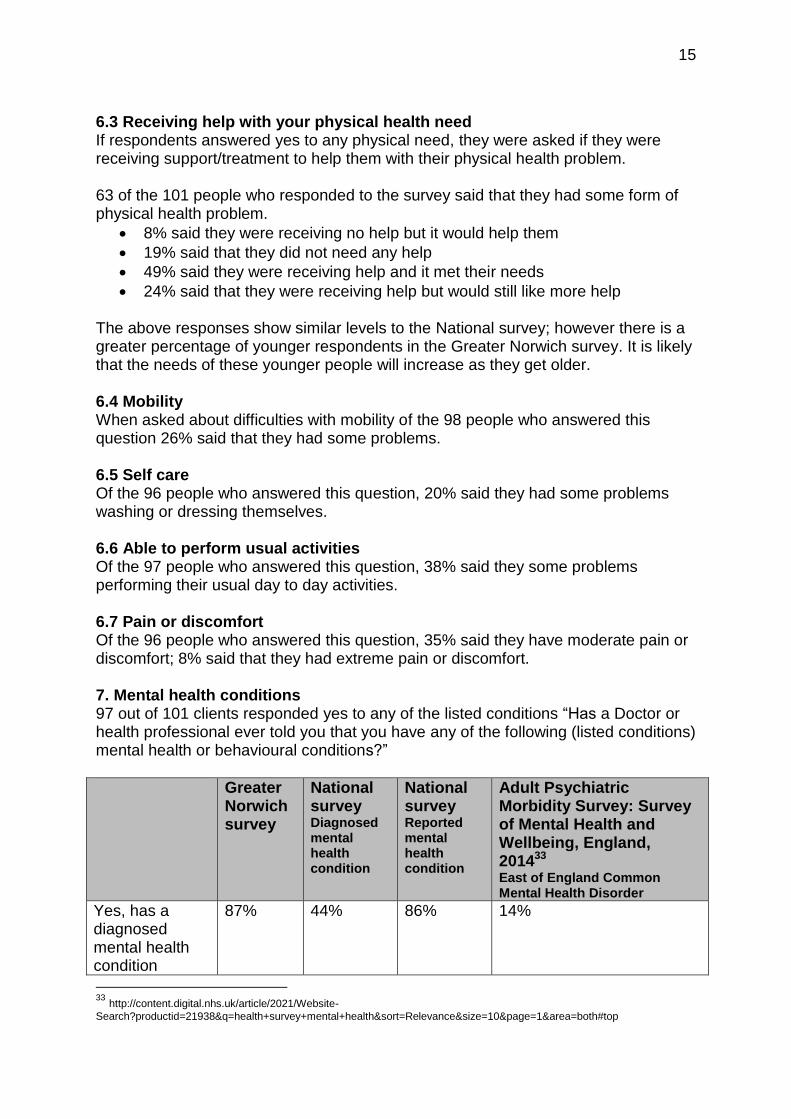
24% said that they were receiving help but would still like more help The above responses show similar levels to the National survey; however there is a greater percentage of younger respondents in the Greater Norwich survey. It is likely that the needs of these younger people will increase as they get older. 6.4 Mobility When asked about difficulties with mobility of the 98 people who answered this question 26% said that they had some problems. 6.5 Self care Of the 96 people who answered this question, 20% said they had some problems washing or dressing themselves. 6.6 Able to perform usual activities Of the 97 people who answered this question, 38% said they some problems performing their usual day to day activities. 6.7 Pain or discomfort Of the 96 people who answered this question, 35% said they have moderate pain or discomfort; 8% said that they had extreme pain or discomfort. 7. Mental health conditions 97 out of 101 clients responded yes to any of the listed conditions “Has a Doctor or health professional ever told you that you have any of the following (listed conditions) mental health or behavioural conditions?”
Greater Norwich survey
National survey Diagnosed mental health condition
National survey Reported mental health condition
Adult Psychiatric Morbidity Survey: Survey of Mental Health and Wellbeing, England, 201433 East of England Common Mental Health Disorder
Yes, has a diagnosed mental health condition
87% 44% 86% 14%
33
http://content.digital.nhs.uk/article/2021/Website-
Search?productid=21938&q=health+survey+mental+health&sort=Relevance&size=10&page=1&area=both#top
16
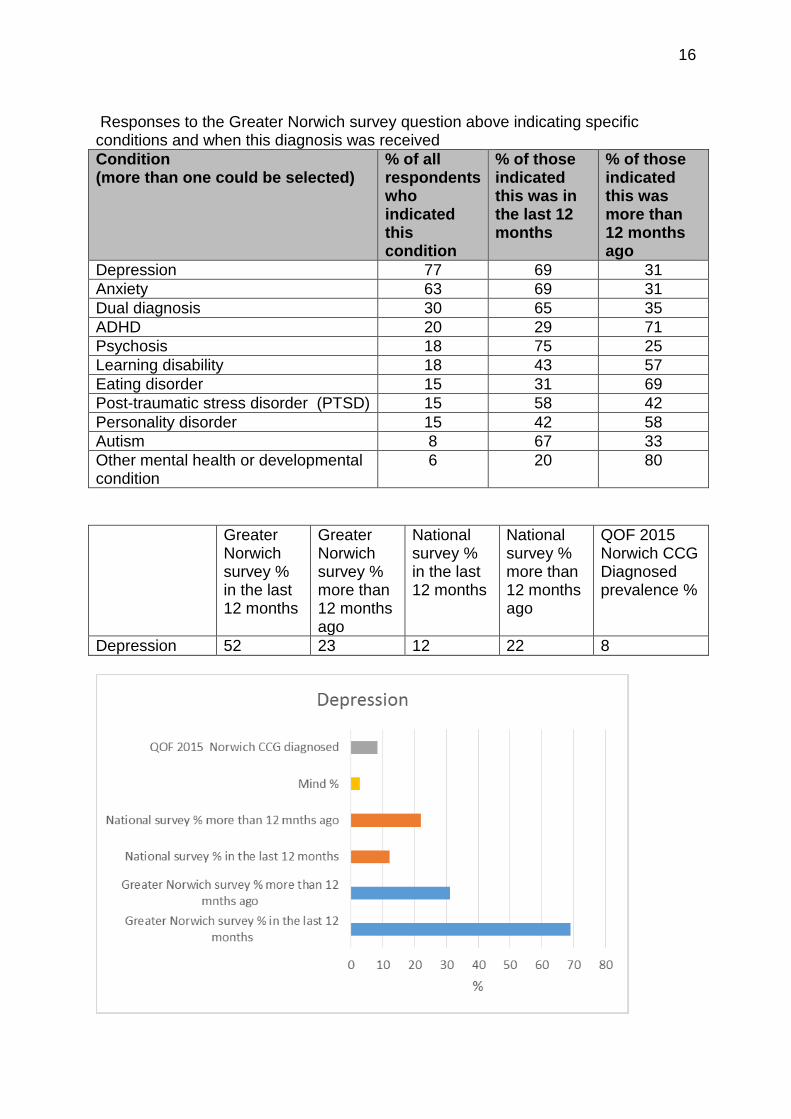
Responses to the Greater Norwich survey question above indicating specific conditions and when this diagnosis was received
Condition (more than one could be selected)
% of all respondents who indicated this condition
% of those indicated this was in the last 12 months
% of those indicated this was more than 12 months ago
Depression 77 69 31
Anxiety 63 69 31
Dual diagnosis 30 65 35
ADHD 20 29 71
Psychosis 18 75 25
Learning disability 18 43 57
Eating disorder 15 31 69
Post-traumatic stress disorder (PTSD) 15 58 42
Personality disorder 15 42 58
Autism 8 67 33
Other mental health or developmental condition
6 20 80
Greater Norwich survey % in the last 12 months
Greater Norwich survey % more than 12 months ago
National survey % in the last 12 months
National survey % more than 12 months ago
QOF 2015 Norwich CCG Diagnosed prevalence %
Depression 52 23 12 22 8
17
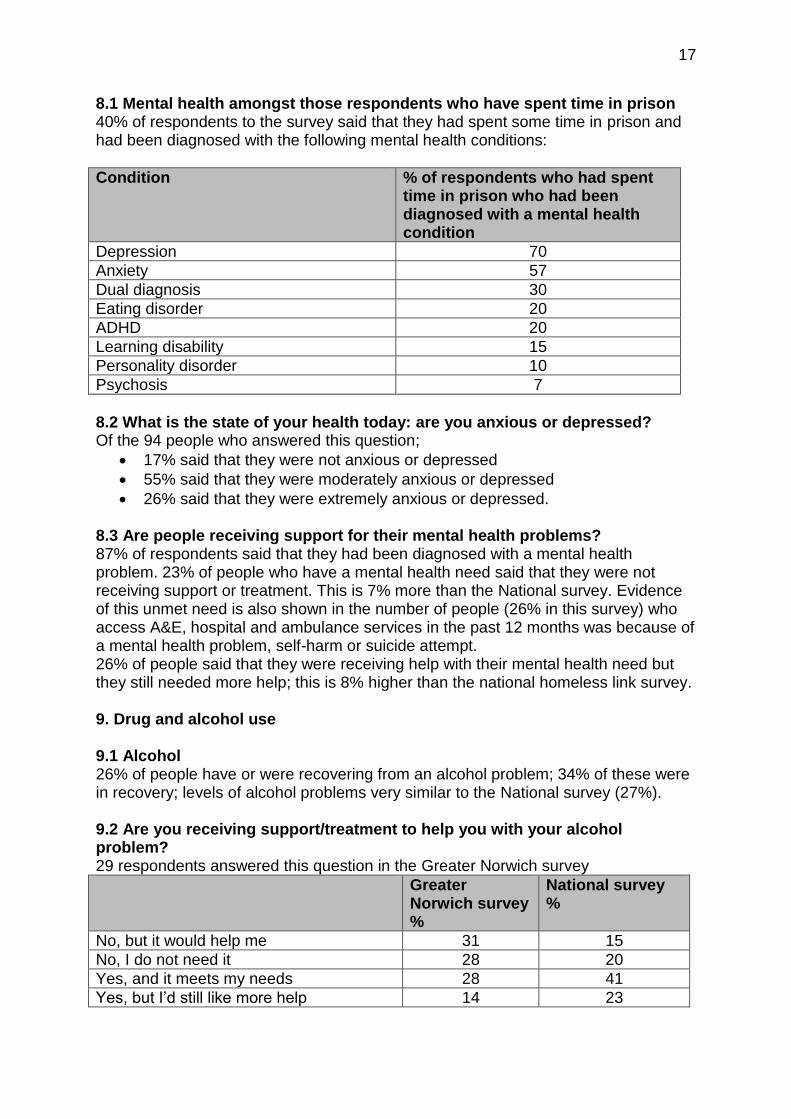
8.1 Mental health amongst those respondents who have spent time in prison 40% of respondents to the survey said that they had spent some time in prison and had been diagnosed with the following mental health conditions:
Condition % of respondents who had spent time in prison who had been diagnosed with a mental health condition
Depression 70
Anxiety 57
Dual diagnosis 30
Eating disorder 20
ADHD 20
Learning disability 15
Personality disorder 10
Psychosis 7
8.2 What is the state of your health today: are you anxious or depressed? Of the 94 people who answered this question;
17% said that they were not anxious or depressed
55% said that they were moderately anxious or depressed
26% said that they were extremely anxious or depressed. 8.3 Are people receiving support for their mental health problems? 87% of respondents said that they had been diagnosed with a mental health problem. 23% of people who have a mental health need said that they were not receiving support or treatment. This is 7% more than the National survey. Evidence of this unmet need is also shown in the number of people (26% in this survey) who access A&E, hospital and ambulance services in the past 12 months was because of a mental health problem, self-harm or suicide attempt. 26% of people said that they were receiving help with their mental health need but they still needed more help; this is 8% higher than the national homeless link survey. 9. Drug and alcohol use 9.1 Alcohol 26% of people have or were recovering from an alcohol problem; 34% of these were in recovery; levels of alcohol problems very similar to the National survey (27%). 9.2 Are you receiving support/treatment to help you with your alcohol problem? 29 respondents answered this question in the Greater Norwich survey
Greater Norwich survey %
National survey %
No, but it would help me 31 15
No, I do not need it 28 20
Yes, and it meets my needs 28 41
Yes, but I’d still like more help 14 23
18
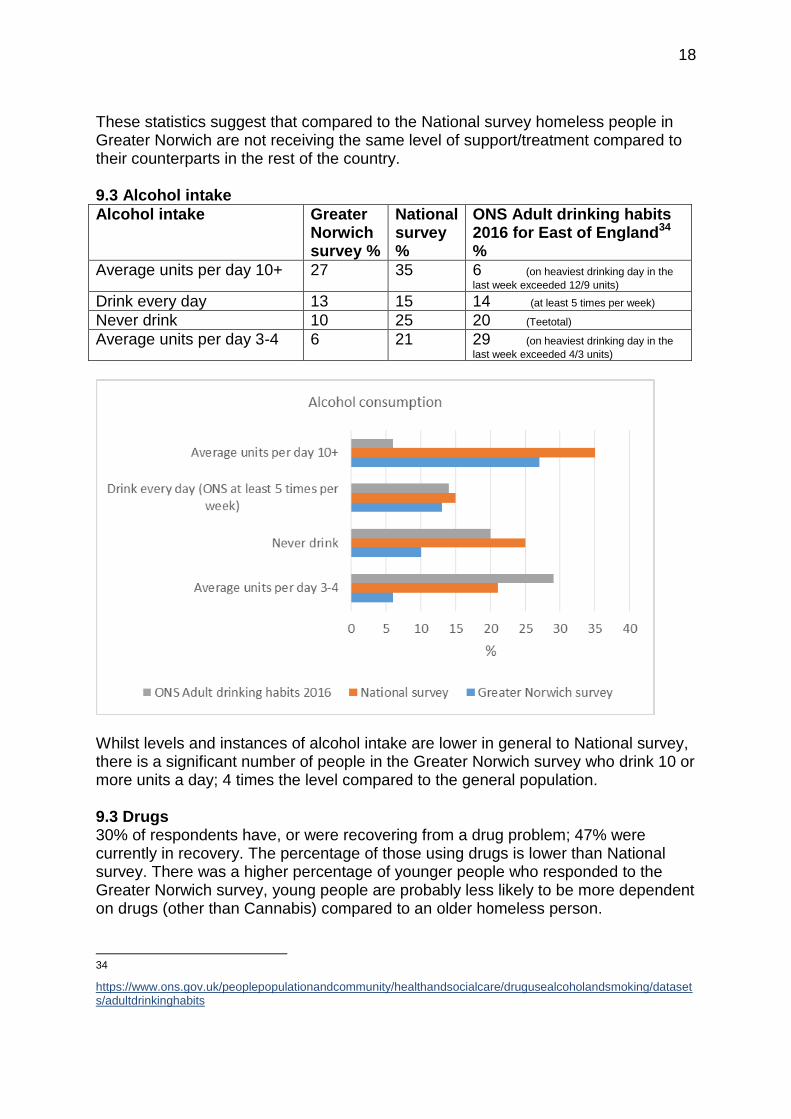
These statistics suggest that compared to the National survey homeless people in Greater Norwich are not receiving the same level of support/treatment compared to their counterparts in the rest of the country. 9.3 Alcohol intake
Alcohol intake Greater Norwich survey %
National survey %
ONS Adult drinking habits 2016 for East of England34 %
Average units per day 10+ 27 35 6 (on heaviest drinking day in the
last week exceeded 12/9 units) Drink every day 13 15 14 (at least 5 times per week)
Never drink 10 25 20 (Teetotal)
Average units per day 3-4 6 21 29 (on heaviest drinking day in the
last week exceeded 4/3 units)
Whilst levels and instances of alcohol intake are lower in general to National survey, there is a significant number of people in the Greater Norwich survey who drink 10 or more units a day; 4 times the level compared to the general population. 9.3 Drugs 30% of respondents have, or were recovering from a drug problem; 47% were currently in recovery. The percentage of those using drugs is lower than National survey. There was a higher percentage of younger people who responded to the Greater Norwich survey, young people are probably less likely to be more dependent on drugs (other than Cannabis) compared to an older homeless person.
34 https://www.ons.gov.uk/peoplepopulationandcommunity/healthandsocialcare/drugusealcoholandsmoking/datasets/adultdrinkinghabits
19
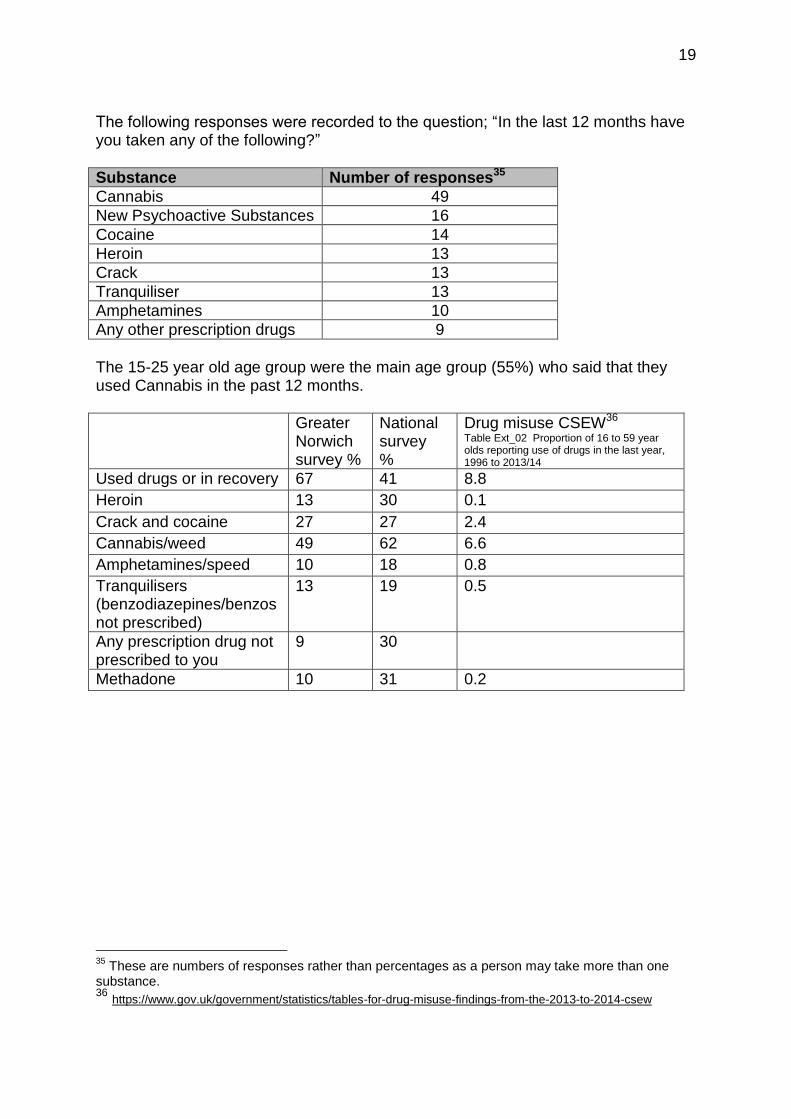
The following responses were recorded to the question; “In the last 12 months have you taken any of the following?”
Substance Number of responses35
Cannabis 49
New Psychoactive Substances 16
Cocaine 14
Heroin 13
Crack 13
Tranquiliser 13
Amphetamines 10
Any other prescription drugs 9
The 15-25 year old age group were the main age group (55%) who said that they used Cannabis in the past 12 months.
Greater Norwich survey %
National survey %
Drug misuse CSEW36 Table Ext_02 Proportion of 16 to 59 year olds reporting use of drugs in the last year, 1996 to 2013/14
Used drugs or in recovery 67 41 8.8
Heroin 13 30 0.1
Crack and cocaine 27 27 2.4
Cannabis/weed 49 62 6.6
Amphetamines/speed 10 18 0.8
Tranquilisers (benzodiazepines/benzos not prescribed)
13 19 0.5
Any prescription drug not prescribed to you
9 30
Methadone 10 31 0.2
35
These are numbers of responses rather than percentages as a person may take more than one substance. 36 https://www.gov.uk/government/statistics/tables-for-drug-misuse-findings-from-the-2013-to-2014-csew
20
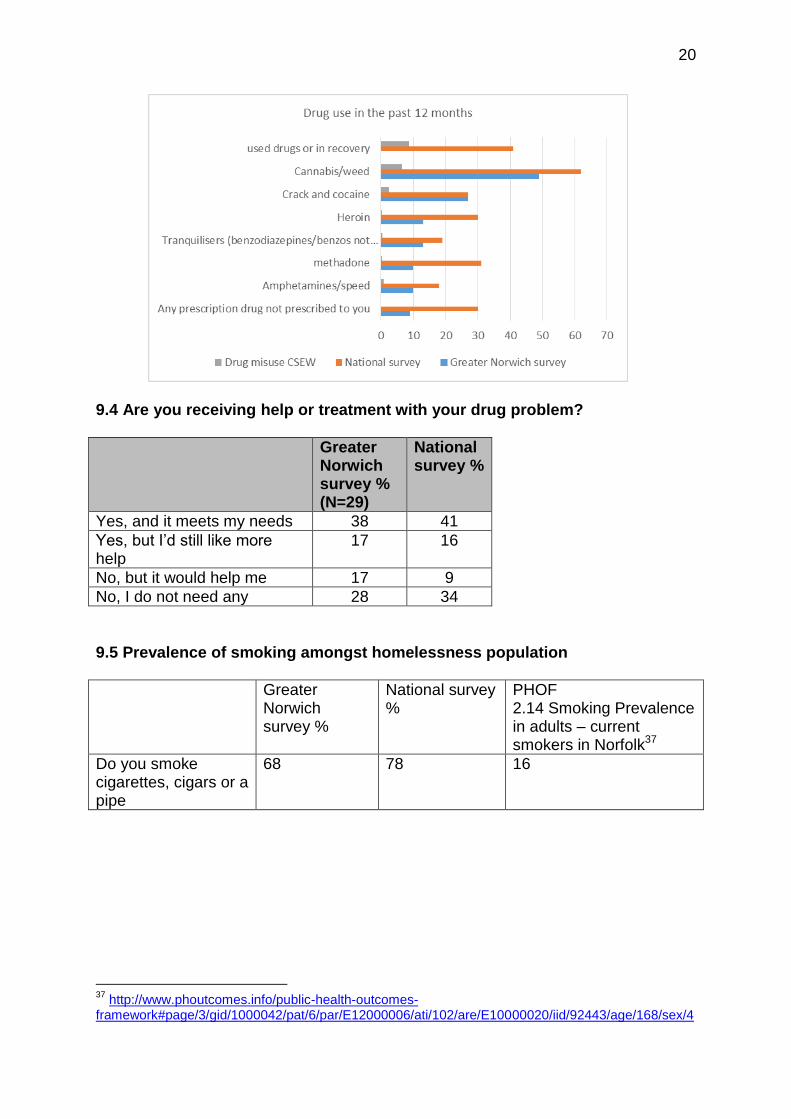
9.4 Are you receiving help or treatment with your drug problem?
Greater Norwich survey % (N=29)
National survey %
Yes, and it meets my needs 38 41
Yes, but I’d still like more help
17 16
No, but it would help me 17 9
No, I do not need any 28 34
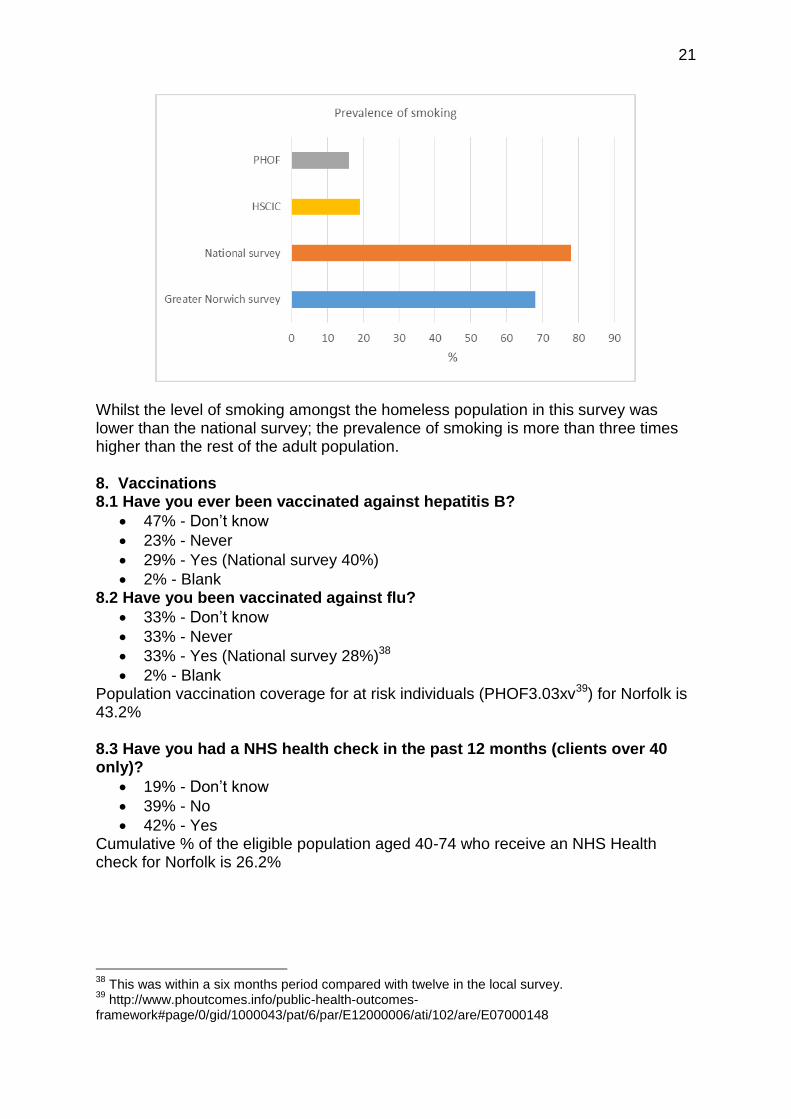
9.5 Prevalence of smoking amongst homelessness population
Greater Norwich survey %
National survey %
PHOF 2.14 Smoking Prevalence in adults – current smokers in Norfolk37
Do you smoke cigarettes, cigars or a pipe
68 78 16
37
http://www.phoutcomes.info/public-health-outcomes-framework#page/3/gid/1000042/pat/6/par/E12000006/ati/102/are/E10000020/iid/92443/age/168/sex/4
21
Whilst the level of smoking amongst the homeless population in this survey was lower than the national survey; the prevalence of smoking is more than three times higher than the rest of the adult population. 8. Vaccinations 8.1 Have you ever been vaccinated against hepatitis B?
47% - Don’t know
23% - Never
29% - Yes (National survey 40%)
2% - Blank 8.2 Have you been vaccinated against flu?
33% - Don’t know
33% - Never
33% - Yes (National survey 28%)38
2% - Blank Population vaccination coverage for at risk individuals (PHOF3.03xv39) for Norfolk is 43.2% 8.3 Have you had a NHS health check in the past 12 months (clients over 40 only)?
19% - Don’t know
39% - No
42% - Yes Cumulative % of the eligible population aged 40-74 who receive an NHS Health check for Norfolk is 26.2%
38
This was within a six months period compared with twelve in the local survey. 39
http://www.phoutcomes.info/public-health-outcomes-framework#page/0/gid/1000043/pat/6/par/E12000006/ati/102/are/E07000148
22
8.4 Have you had a sexual health check in the past 12 months?
9% - Don’t know
45% - No
33% - Yes
14% - Blank
8.5 Do you know where to access free contraception?
10% - N/A
10% - No
80% - Yes
8.6 Do you know where to access advice about sexual health?
10% - N/A
12% - No
78% - Yes 9. Diet It is widely accepted that being homeless makes it difficult for a homeless person to lead a healthy lifestyle: “High levels of smoking and poor diets are likely to make existing physical and mental health more difficult to overcome and could lead to health issues in later life.”40 9.1 How many meals do you eat a day? 47% of those surveyed who responded said that they eat less than two meals per day. This is 14% higher than the national survey. 9.2 How many portions of fruit and veg do you usually eat per day?
34% of those surveyed who responded said that they normally eat no fruit or vegetables per day.
41% of people said that they normally only eat either 2 or less portions per day.
15% of people said that they eat on average 3 or more portions every day. For the Norfolk population in general the average portions of fruit consumed daily (adults)41 is 2.68 portions and for Vegetables this is 2.4142. The proportion of adults in Norfolk who meet the recommended ‘5-a-day’ on a ‘usual day’ is 59.8%.
40
Page9, The unhealthy state of homelessness: Health audit results (Homeless Link, 2014) 41
http://www.phoutcomes.info/public-health-outcomes-framework#page/3/gid/1000042/pat/6/par/E12000006/ati/102/are/E10000020/iid/91478/age/164/sex/4 42
http://www.phoutcomes.info/public-health-outcomes-framework#page/3/gid/1000042/pat/6/par/E12000006/ati/102/are/E10000020/iid/91479/age/164/sex/4
23
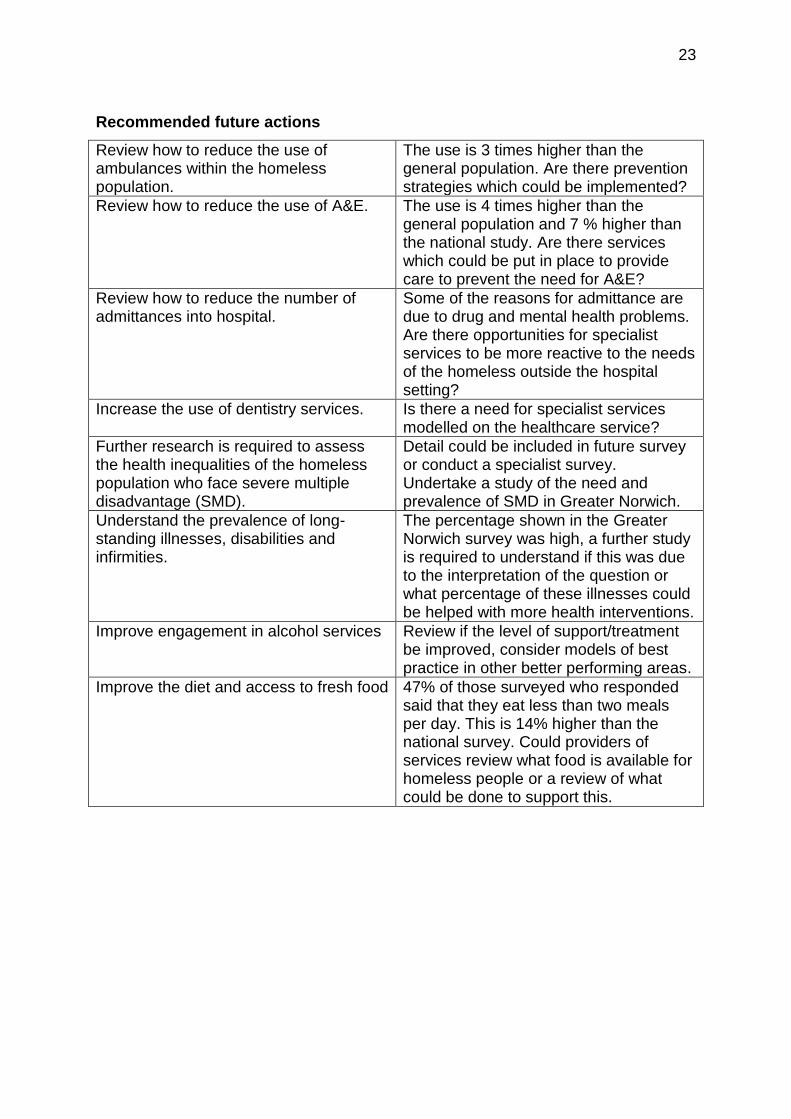
Recommended future actions
Review how to reduce the use of ambulances within the homeless population.
The use is 3 times higher than the general population. Are there prevention strategies which could be implemented?
Review how to reduce the use of A&E. The use is 4 times higher than the general population and 7 % higher than the national study. Are there services which could be put in place to provide care to prevent the need for A&E?
Review how to reduce the number of admittances into hospital.
Some of the reasons for admittance are due to drug and mental health problems. Are there opportunities for specialist services to be more reactive to the needs of the homeless outside the hospital setting?
Increase the use of dentistry services. Is there a need for specialist services modelled on the healthcare service?
Further research is required to assess the health inequalities of the homeless population who face severe multiple disadvantage (SMD).
Detail could be included in future survey or conduct a specialist survey. Undertake a study of the need and prevalence of SMD in Greater Norwich.
Understand the prevalence of long-standing illnesses, disabilities and infirmities.
The percentage shown in the Greater Norwich survey was high, a further study is required to understand if this was due to the interpretation of the question or what percentage of these illnesses could be helped with more health interventions.
Improve engagement in alcohol services Review if the level of support/treatment be improved, consider models of best practice in other better performing areas.
Improve the diet and access to fresh food 47% of those surveyed who responded said that they eat less than two meals per day. This is 14% higher than the national survey. Could providers of services review what food is available for homeless people or a review of what could be done to support this.
If you would like this information in another language or format such as large print, CD or Braille please email [email protected] or call 0344 980 3333
With thanks to all the people who took the time to share information about their health needs and to the following organisations who took part in the audit: Genesis Housing AssociationHomegroup LeewayMancroft Advice ProjectNHS City ReachOrwell Housing AssociationPublic Health - Norfolk County CouncilSolo housingSt Martins Housing TrustYMCA Norfolk