D.3.2.7. Mobility needs and gaps in Primorsko-Goranska County
Upload
khangminh22Category
view
4download
0
1
Photo credit: Brian Strickland
Wilson County
2019 Community Health Needs
Assessment
A collaboration of:
Healthcare Foundation of Wilson,
Wilson County Health Department, and
Wilson Medical Center
2
Table of Contents Executive Summary ........................................................................................................................... 5
Service Area ...................................................................................................................................................... 5 Methods for Identifying Community Health Needs ............................................................................................ 5
Primary Data ...................................................................................................................................................................................... 5 Secondary Data .................................................................................................................................................................................. 5
Summary of Findings ........................................................................................................................................ 5 Selected Priority Areas – Top three significant health needs ............................................................................. 6 Executive Summary Conclusion ........................................................................................................................ 6
Introduction ...................................................................................................................................... 7 Regional Collaboration ...................................................................................................................................... 7
Member Organizations ....................................................................................................................................................................... 7 Steering Committee ........................................................................................................................................................................... 9
HealthENC.org ................................................................................................................................................ 10 Consultants ..................................................................................................................................................... 10 Healthcare Foundation of Wilson-Wilson County Health Department-Wilson Medical Center Collaborative ... 11
Community Selected for Assessment .................................................................................................................................................11 Wilson Medical Center Patients - 2015 ..............................................................................................................................................11 Community Health Team Structure ....................................................................................................................................................11
Distribution .....................................................................................................................................................12
Evaluation of Progress since Prior CHNA ........................................................................................ 13 Community Feedback on Prior CHNA ..............................................................................................................13
Methodology ................................................................................................................................... 13 Overview ..........................................................................................................................................................13 Primary Data Collection & Analysis ..................................................................................................................13
Community Survey ............................................................................................................................................................................14 Focus Group Discussions ...................................................................................................................................................................17 Community Health Summit ...............................................................................................................................................................18
Secondary Data Sources & Analysis ................................................................................................................. 19 Health and Quality of Life Topic Areas Table 4. ............................................................................................... 19 Health ENC Region Comparison ...................................................................................................................... 20 Data Considerations ........................................................................................................................................ 20 Prioritization ...................................................................................................................................................21
Overview of Wilson County .............................................................................................................. 23 About Wilson County ...................................................................................................................................... 23 Demographic Profile ....................................................................................................................................... 23
Population ........................................................................................................................................................................................23 Age and Gender ................................................................................................................................................................................24 Birth Rate ..........................................................................................................................................................................................27 Race/Ethnicity ...................................................................................................................................................................................28 Tribal Distribution of Population .......................................................................................................................................................29 Military Population ...........................................................................................................................................................................29 Veteran Population ...........................................................................................................................................................................30
Socioeconomic Profile ......................................................................................................................................31 NC Department of Commerce Tier Designation ..................................................................................................................................31 Income ..............................................................................................................................................................................................31 Poverty .............................................................................................................................................................................................34 Housing .............................................................................................................................................................................................36 Food Insecurity .................................................................................................................................................................................37 Employment .....................................................................................................................................................................................38 Major employers ...............................................................................................................................................................................38 SocioNeeds Index ..............................................................................................................................................................................38
Educational Profile ......................................................................................................................................... 40 Educational Attainment ....................................................................................................................................................................40 High School Dropouts ........................................................................................................................................................................42 High School Suspension Rate .............................................................................................................................................................42 Wilson County Public Schools ............................................................................................................................................................43
Environmental Profile ..................................................................................................................................... 43 Transportation Profile .................................................................................................................................... 44 Crime and Safety ............................................................................................................................................. 46
3
Violent Crime and Property Crime .....................................................................................................................................................46 Juvenile Crime ...................................................................................................................................................................................47 Child Abuse .......................................................................................................................................................................................48 Incarceration .....................................................................................................................................................................................48
Access to Healthcare, Insurance and Health Resources Information ............................................................... 49 Assessment and Analysis of Community Resources ......................................................................................... 50 Civic Activity ................................................................................................................................................... 50
Findings .......................................................................................................................................... 52 Secondary Data Scoring Results ...................................................................................................................... 52 Primary Data ................................................................................................................................................... 52
Community Survey ............................................................................................................................................................................52 Focus Group Discussions ...................................................................................................................................................................54
Data Synthesis ................................................................................................................................................. 55 Topic Areas Examined in This Report .................................................................................................................................................56 Navigation Within Each Topic ............................................................................................................................................................56
Maternal, Fetal & Infant Health ....................................................................................................................... 57 Key Issues .........................................................................................................................................................................................57 Secondary Data .................................................................................................................................................................................57 Primary Data .....................................................................................................................................................................................58
Education ........................................................................................................................................................ 58 Key Issues .........................................................................................................................................................................................58 Secondary Data .................................................................................................................................................................................59 Primary Data .....................................................................................................................................................................................60
Heart Disease & Stroke .................................................................................................................................... 60 Key Issues .........................................................................................................................................................................................60 Secondary Data .................................................................................................................................................................................60 Primary Data .....................................................................................................................................................................................61
Diabetes .......................................................................................................................................................... 61 Key Issues .........................................................................................................................................................................................61 Secondary Data .................................................................................................................................................................................61 Primary Data .....................................................................................................................................................................................62
Public Safety
........................................................................................................................................................................ 63 Key Issues .........................................................................................................................................................................................63 Secondary Data .................................................................................................................................................................................63 Primary Data .....................................................................................................................................................................................64
Mortality ......................................................................................................................................................... 65
Data Analysis on Significant Health Needs ...................................................................................... 66 Access to Health Services ................................................................................................................................ 66 Exercise, Nutrition, Weight & Obesity – Top health need identified ................................................................. 66 Economy ......................................................................................................................................................... 67 Substance Abuse ............................................................................................................................................. 68
Disparities by Age, Gender and Race/Ethnicity ............................................................................... 68 Geographic Disparities .................................................................................................................................... 69
Conclusion and Dissemination of the Plan ....................................................................................... 70
Appendix A. Impact since Prior CHNA ............................................................................................. 71
Appendix B. Secondary Data Scoring ............................................................................................... 74 Overview ......................................................................................................................................................... 74
Comparison Score .............................................................................................................................................................................74 Indicator Score ..................................................................................................................................................................................74 Topic Score........................................................................................................................................................................................74
Comparison Scores ......................................................................................................................................... 75 Comparison to a Distribution of North Carolina Counties and U.S. Counties .......................................................................................75 Comparison to North Carolina Value and U.S. Value ..........................................................................................................................75 Comparison to Healthy People 2020 and Healthy North Carolina 2020 Targets ..................................................................................75 Trend Over Time ...............................................................................................................................................................................76 Missing Values ..................................................................................................................................................................................76
Indicator Scoring ............................................................................................................................................ 76 Topic Scoring .................................................................................................................................................. 76 Age, Gender and Race/Ethnicity Disparities .....................................................................................................77
4
Topic Scoring Table ......................................................................................................................................... 78 Indicator Scoring Table ................................................................................................................................... 79 Sources ........................................................................................................................................................... 95
Appendix C. Primary Data .............................................................................................................. 96
Appendix D. Community Resources ................................................................................................. 97 Community Resource Guide Link: ................................................................................................................... 97 Crime Prevention/Law Enforcement/Victim Assistance .................................................................................. 97
List of Figures ................................................................................................................................ 98
List of Tables ................................................................................................................................. 100 Addendum to Appendix C - Surveys ................................................................................................................ 101 English Survey ............................................................................................................................................... 101 Spanish Survey ............................................................................................................................................... 123 Focus Group Questions ................................................................................................................................. 148
Photo credit: S. Larkin
5
Executive Summary Wilson County is pleased to present its 2019 Community Health Needs Assessment. This report provides an overview of the methods and process used to identify and prioritize significant health needs in Wilson County. Healthcare Foundation of Wilson, Wilson County Health Department and Wilson Medical Center collaborated together to complete one comprehensive assessment
Service Area The service area for this report is defined as the geographical boundary of Wilson County, North Carolina. Wilson County is located inland from the coastal area of the state and covers an area of 23.3 square miles, of which only a small portion is water.
Methods for Identifying Community Health Needs
Primary Data The primary data used in this assessment consisted of (1) a community survey distributed through online and paper submissions, three (3) focus group discussions, and a community health summit. Over 600 Wilson County residents contributed their input on the community’s health and health-related needs, barriers, and opportunities, with special focus on the needs of vulnerable and underserved populations. See Appendix C for all primary data collection tools used in this assessment.
Secondary Data Secondary data used for this assessment were collected and analyzed from Conduent HCI’s community indicator database. The database, maintained by researchers and analysts at Conduent HCI, includes over 100 community indicators from various state and national data sources such as the North Carolina Department of Health and Human Services, the Centers for Disease Control and Prevention and the American Community Survey. See Appendix B for a full list of data sources used. Indicator values for Wilson County were compared to North Carolina counties and U.S. counties to identify relative need. Other considerations in weighing relative areas of need included comparisons to North Carolina state values, comparisons to national values, trends over time, Healthy People 2020 targets and Healthy North Carolina 2020 targets. Based on these seven different comparisons, indicators were systematically ranked from high to low need. For a detailed methodology of the analytic methods used to rank secondary data indicators see Appendix B.
Summary of Findings The CHNA findings are drawn from an analysis of an extensive set of secondary data (over 100 indicators from national and state data sources) and in-depth primary data from community leaders, health and non-health professionals who serve the community at large, vulnerable populations, and populations with unmet health needs. Through a synthesis of the primary and secondary data the significant health needs were determined for Wilson County and are displayed in Table 1.
6
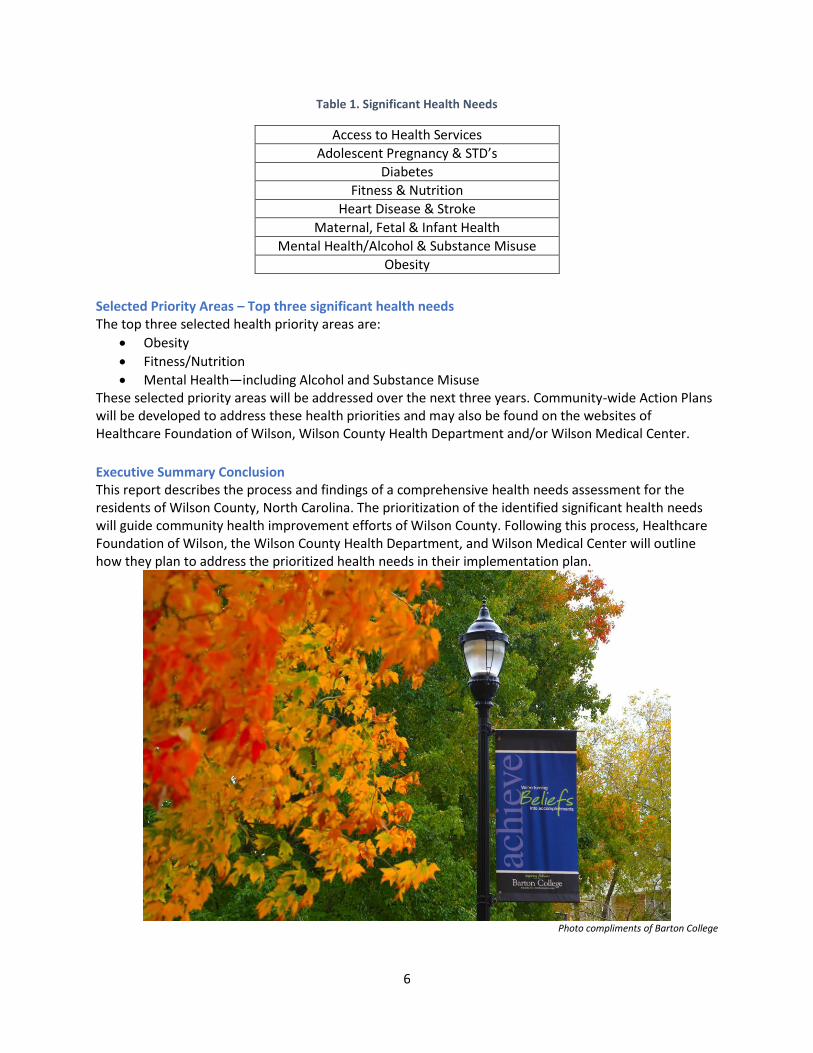
Table 1. Significant Health Needs
Access to Health Services
Adolescent Pregnancy & STD’s
Diabetes
Fitness & Nutrition
Heart Disease & Stroke
Maternal, Fetal & Infant Health
Mental Health/Alcohol & Substance Misuse
Obesity
Selected Priority Areas – Top three significant health needs The top three selected health priority areas are:
Obesity
Fitness/Nutrition
Mental Health—including Alcohol and Substance Misuse These selected priority areas will be addressed over the next three years. Community-wide Action Plans will be developed to address these health priorities and may also be found on the websites of Healthcare Foundation of Wilson, Wilson County Health Department and/or Wilson Medical Center.
Executive Summary Conclusion This report describes the process and findings of a comprehensive health needs assessment for the residents of Wilson County, North Carolina. The prioritization of the identified significant health needs will guide community health improvement efforts of Wilson County. Following this process, Healthcare Foundation of Wilson, the Wilson County Health Department, and Wilson Medical Center will outline how they plan to address the prioritized health needs in their implementation plan.
Photo compliments of Barton College
7
Introduction Wilson County is pleased to present the 2019 Community Health Needs Assessment, which provides an overview of the significant community health needs identified in Wilson County, North Carolina. The goal of this report is to offer a meaningful understanding of the most pressing health needs across Wilson County, as well as to guide planning efforts to address those needs. Special attention has been given to the needs of vulnerable populations, unmet health needs or gaps in services, and input gathered from the community. Findings from this report will be used to identify, develop and target initiatives to provide and connect community members with resources to improve the health challenges in their communities. The 2019 Wilson County Community Health Needs Assessment was developed through a partnership between the Healthcare Foundation of Wilson, the Wilson County Health Department, and Wilson Medical Center. These organizations also participated in a regional eastern NC collaborative with Health ENC, Conduent Healthy Communities Institute, and with The Duke Endowment serving as the fiscal sponsor.
Regional Collaboration
Health ENC, now a program of the Foundation for Health Leadership and Innovation (FHLI), coordinates a regional CHNA in 33 counties of eastern North Carolina. Initiated in 2015 by the Office of Health Access at the Brody School of Medicine at East Carolina University, Health ENC grew out of conversations with health care leaders about improving the community health needs assessment (CHNA) process in eastern North Carolina.
As part of the Affordable Care Act, not for profit and government hospitals are required to conduct CHNAs every three years. Similarly, local health departments in North Carolina are required by the Division of Public Health (DPH) in the NC Department of Health and Human Services (DHHS) to conduct periodic community health assessments as well. Local health departments have been required to submit their community health needs assessments once every four years. The particular year CHNA submissions are made by hospitals within a three-year cycle or by local health departments within a four-year cycle is not uniform across the state or region.
Health care leaders across eastern North Carolina have partnered to standardize the CHNA process for health departments and hospitals in the region. This effort will also sync all participant organizations on to the same assessment cycle. Combining efforts of local health departments and hospitals in a regional CHNA will ultimately lead to an improvement in the quality and utility of population health data, the ability to compare and contrast information and interventions across geographic boundaries, and the reduction of costs for everyone involved, while maintaining local control and decision-making with regard to the selection of health priorities and interventions chosen to address those priorities. Simultaneously, it will create opportunities for new and better ways to collaborate and partner with one another.
Member Organizations Health ENC is comprised of more than 40 organizations. Twenty-two hospitals, twenty-one health departments, two health districts, and one health care foundation participated in the regional CHNA.
8
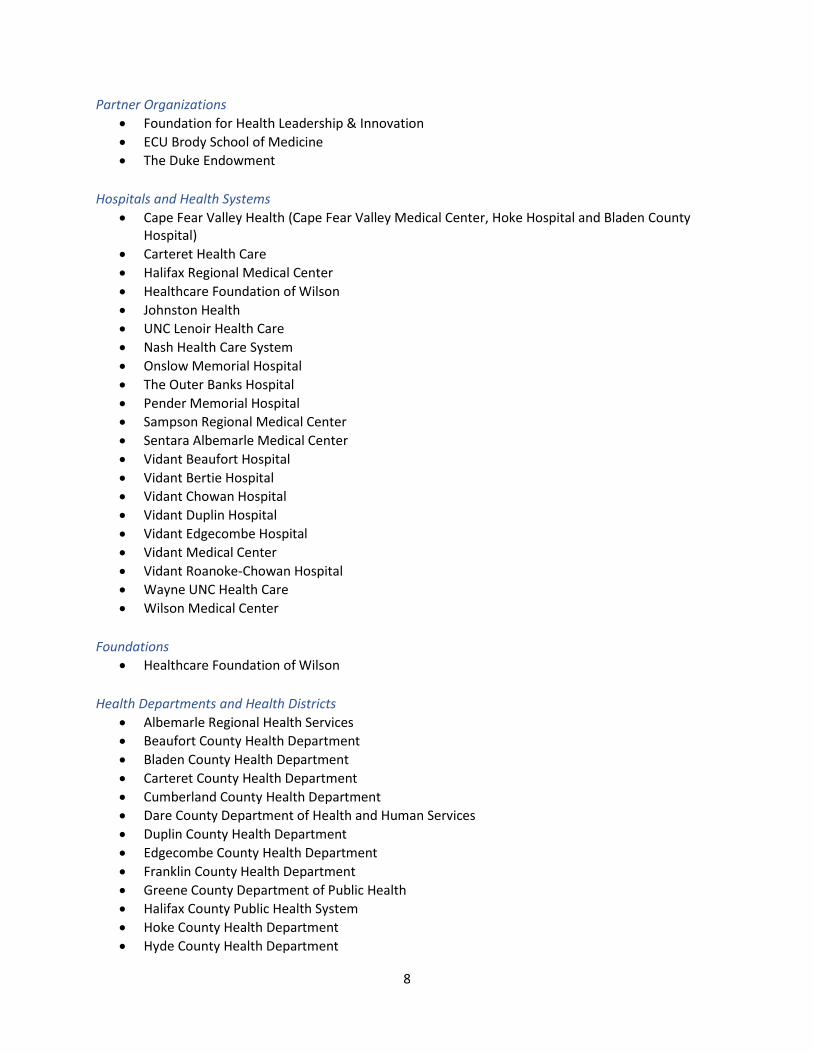
Partner Organizations
Foundation for Health Leadership & Innovation
ECU Brody School of Medicine
The Duke Endowment
Hospitals and Health Systems
Cape Fear Valley Health (Cape Fear Valley Medical Center, Hoke Hospital and Bladen County Hospital)
Carteret Health Care
Halifax Regional Medical Center
Healthcare Foundation of Wilson
Johnston Health
UNC Lenoir Health Care
Nash Health Care System
Onslow Memorial Hospital
The Outer Banks Hospital
Pender Memorial Hospital
Sampson Regional Medical Center
Sentara Albemarle Medical Center
Vidant Beaufort Hospital
Vidant Bertie Hospital
Vidant Chowan Hospital
Vidant Duplin Hospital
Vidant Edgecombe Hospital
Vidant Medical Center
Vidant Roanoke-Chowan Hospital
Wayne UNC Health Care
Wilson Medical Center
Foundations
Healthcare Foundation of Wilson
Health Departments and Health Districts
Albemarle Regional Health Services
Beaufort County Health Department
Bladen County Health Department
Carteret County Health Department
Cumberland County Health Department
Dare County Department of Health and Human Services
Duplin County Health Department
Edgecombe County Health Department
Franklin County Health Department
Greene County Department of Public Health
Halifax County Public Health System
Hoke County Health Department
Hyde County Health Department
9
Johnston County Public Health Department
Lenoir County Health Department
Martin-Tyrrell-Washington District Health Department
Nash County Health Department
Onslow County Health Department
Pamlico County Health Department
Pitt County Health Department
Sampson County Health Department
Wayne County Health Department
Wilson County Health Department
Steering Committee Health ENC is advised by a Steering Committee whose membership is comprised of health department and hospital representatives participating in the regional CHNA, as well as other health care stakeholders from eastern North Carolina. The program manager oversees daily operations of the regional community health needs assessment and Health ENC.
Health ENC Program Manager
Will Broughton, MA, MPH, CPH - Foundation for Health Leadership & Innovation
Health ENC Steering Committee Members
Constance Hengel, RN, BSN, HNB-BC - Director, Community Programs and Development, UNC Lenoir Health Care
James Madson, RN, MPH - Steering Committee Chair, Health Director, Beaufort County Health Department
Battle Betts - Director, Albemarle Regional Health Services
Caroline Doherty - Chief Development and Programs Officer, Roanoke Chowan Community Health Center
Melissa Roupe, RN, MSN - Sr Administrator, Community Health Improvement, Vidant Health
Davin Madden – Heath Director, Wayne County Health Department
Angela Livingood – Pharmacy Manager, Pender Memorial Hospital
Lorrie Basnight, MD, FAAP - Executive Director, Eastern AHEC, Associate Dean of CME, Brody School of Medicine
Anne Thomas- President/CEO, Foundation for Health Leadership & Innovation
10
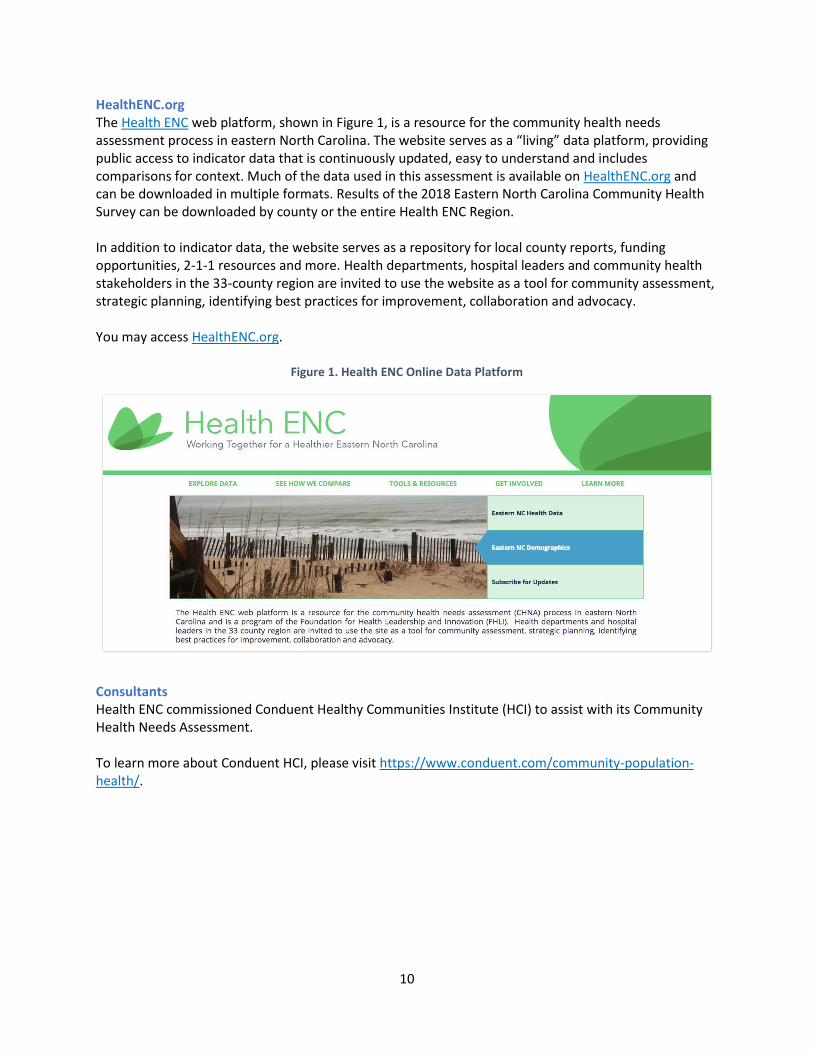
HealthENC.org The Health ENC web platform, shown in Figure 1, is a resource for the community health needs assessment process in eastern North Carolina. The website serves as a “living” data platform, providing public access to indicator data that is continuously updated, easy to understand and includes comparisons for context. Much of the data used in this assessment is available on HealthENC.org and can be downloaded in multiple formats. Results of the 2018 Eastern North Carolina Community Health Survey can be downloaded by county or the entire Health ENC Region. In addition to indicator data, the website serves as a repository for local county reports, funding opportunities, 2-1-1 resources and more. Health departments, hospital leaders and community health stakeholders in the 33-county region are invited to use the website as a tool for community assessment, strategic planning, identifying best practices for improvement, collaboration and advocacy. You may access HealthENC.org.
Figure 1. Health ENC Online Data Platform
Consultants Health ENC commissioned Conduent Healthy Communities Institute (HCI) to assist with its Community Health Needs Assessment. To learn more about Conduent HCI, please visit https://www.conduent.com/community-population-health/.
11
Healthcare Foundation of Wilson-Wilson County Health Department-Wilson Medical Center Collaborative The 2019 Community Health Needs Assessment (CHNA) is a collaboration of Healthcare Foundation of Wilson, Wilson County Health Department and Wilson Medical Center. Collaboratively these three organizations engaged the community to define priorities for health improvement, created a collaborative environment to engage stakeholders and provided an open and transparent process to listen and truly understand the health needs of Wilson County, NC.
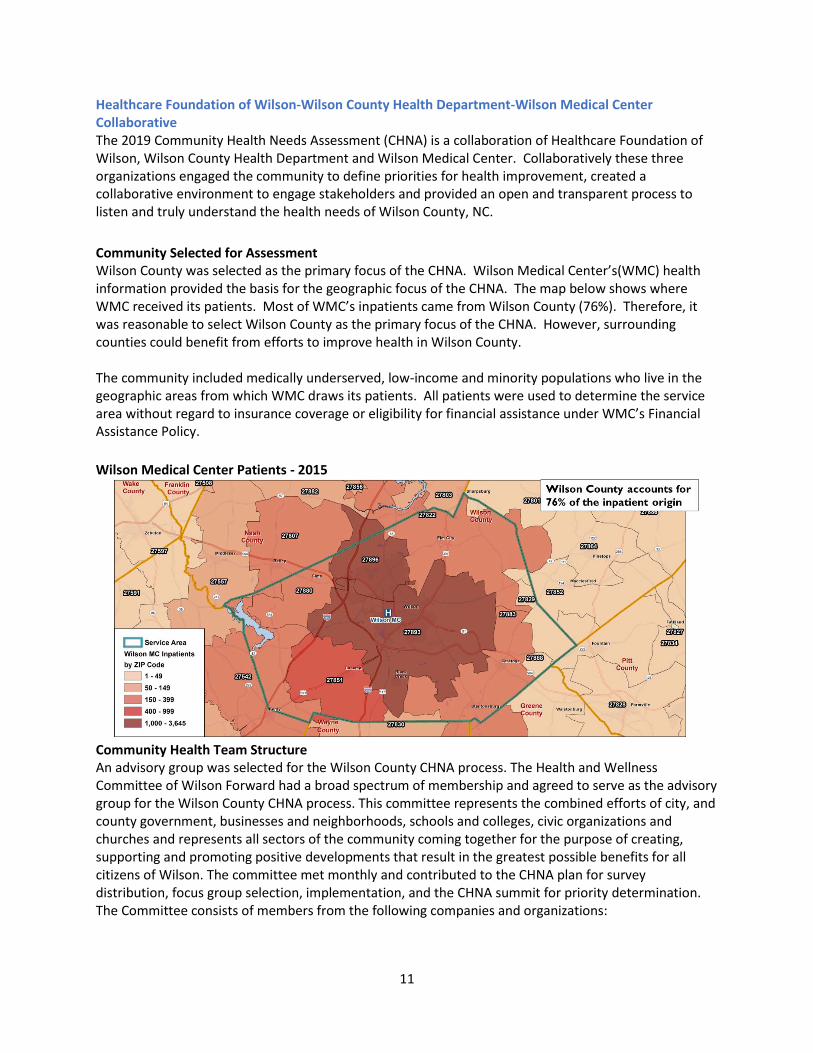
Community Selected for Assessment Wilson County was selected as the primary focus of the CHNA. Wilson Medical Center’s(WMC) health information provided the basis for the geographic focus of the CHNA. The map below shows where WMC received its patients. Most of WMC’s inpatients came from Wilson County (76%). Therefore, it was reasonable to select Wilson County as the primary focus of the CHNA. However, surrounding counties could benefit from efforts to improve health in Wilson County. The community included medically underserved, low-income and minority populations who live in the geographic areas from which WMC draws its patients. All patients were used to determine the service area without regard to insurance coverage or eligibility for financial assistance under WMC’s Financial Assistance Policy.
Wilson Medical Center Patients - 2015
Community Health Team Structure An advisory group was selected for the Wilson County CHNA process. The Health and Wellness Committee of Wilson Forward had a broad spectrum of membership and agreed to serve as the advisory group for the Wilson County CHNA process. This committee represents the combined efforts of city, and county government, businesses and neighborhoods, schools and colleges, civic organizations and churches and represents all sectors of the community coming together for the purpose of creating, supporting and promoting positive developments that result in the greatest possible benefits for all citizens of Wilson. The committee met monthly and contributed to the CHNA plan for survey distribution, focus group selection, implementation, and the CHNA summit for priority determination. The Committee consists of members from the following companies and organizations:
12
Area L AHEC
Barton College
Boy Scouts of America
Carolina Family Health Center
City of Wilson
Eastpointe
EMS
Healthcare Foundation of Wilson
Hope Station
Minister's Association
N.C. Cooperative Extension, Wilson County Center
NC Parent Resource Center
Options Industry Council (OIC)
Poe Health Center
Recovery Concepts Community Center (RC3)
Retired Community Members
Salvation Army Boys & Girls Club of Wilson
Save-A-Youth
Seeds of Hope
St. John CDC
The SPOT Wilson Youth United
The Urban Farmer
United Way of Wilson County, Inc.
Upper Coastal Plains
Veterans Residential Service of Wilson
Wesley Shelter
Wilson Co. 4H Youth Development
Wilson Community College
Wilson Community Health Center
Wilson County DSS
Wilson County Health Department
Wilson County Partnership for Children
Wilson County Schools Wilson County Substance Prevention Coalition
Wilson Family YMCA
Wilson Medical Center
Wilson Police Department
Wilson Pregnancy Center
Wilson Value Drug
Distribution An electronic copy of this report is available at the locations below. A hard copy of this document may also be obtained at:
Healthcare Foundation of Wilson - www.healthcarefoundationofwilson.org, 2505-A Nash Street NW, Wilson, NC 27896, 252.281.2105
Wilson County Health Department - www.wilson-co.com/85/Health-Department, 1801 Glendale Drive, Wilson, NC 27893, Contact: Jessica Williams 252.237.3141 ext. 6657
Wilson Medical Center- http://www.wilsonmedical.com/ or 1705 Tarboro St W, Wilson, NC 27893, 252.399.8040
Photo credit: A. Walker
13
Evaluation of Progress since Prior CHNA The community health improvement process should be viewed as an iterative cycle. An important piece of that cycle is revisiting the progress made on priority health topics set forth in the preceding community health needs assessment. By reviewing the actions taken to address priority health issues and evaluating the impact those actions have made in the community, it is possible to better target resources and efforts during the next round of the CHNA cycle. As part of the 2016 Community Health Needs Assessment Obesity, Mental Health, Substance Use, Adolescent Pregnancy and Sexually Transmitted Diseases were selected as prioritized health needs. A detailed table describing the strategies/action steps and indicators of improvement for each priority area can be found in Appendix A.
Community Feedback on Prior CHNA The 2016 Wilson County Community Health Needs Assessment was made available to the public via the three following websites:
https://www.wilsonmedical.com/community/community-health-needs-assessment
http://www.wilson-co.com/Home/ShowDocument?id=4836
https://healthcarefoundationofwilson.org/wp-content/uploads/2016/12/Wilson-County-Community-Health-Needs-Assessment-Final.pdf
Community members were invited to submit feedback via the contact link on each of the websites listed above. No comments had been received on the preceding CHNA at the time this report was written. However, one community member requested and was invited to join the advisory group to provide input.
Methodology
Overview Two types of data are analyzed for this Community Health Needs Assessment: primary data and secondary data. Primary data has been collected directly as a part of this report while secondary data is data that has been collected from other sources. Each type of data is analyzed using a unique methodology, and findings are organized by health topic areas. These findings are then synthesized for a comprehensive overview of the health needs in Wilson County.
Primary Data Collection & Analysis Primary data used in this assessment consists of focus groups, a community survey, both in English and Spanish-languages, and a community Summit. All community input tools are available in Appendix C.
The top areas were identified and helped to prioritize the most significant health needs in the community for the next three-year period. The top three selected health priority areas are:
Obesity
Fitness/Nutrition
Mental Health – including Alcohol and Substance Misuse
14
Community Survey Community input was collected via a 57-question online and paper survey available in both English and Spanish. Survey Monkey was the tool used to distribute and collect responses for the community survey. Completed paper surveys were entered into the Survey Monkey tool. The community survey was distributed across Health ENC’s entire survey area from April 18, 2018 – June 30, 2018.
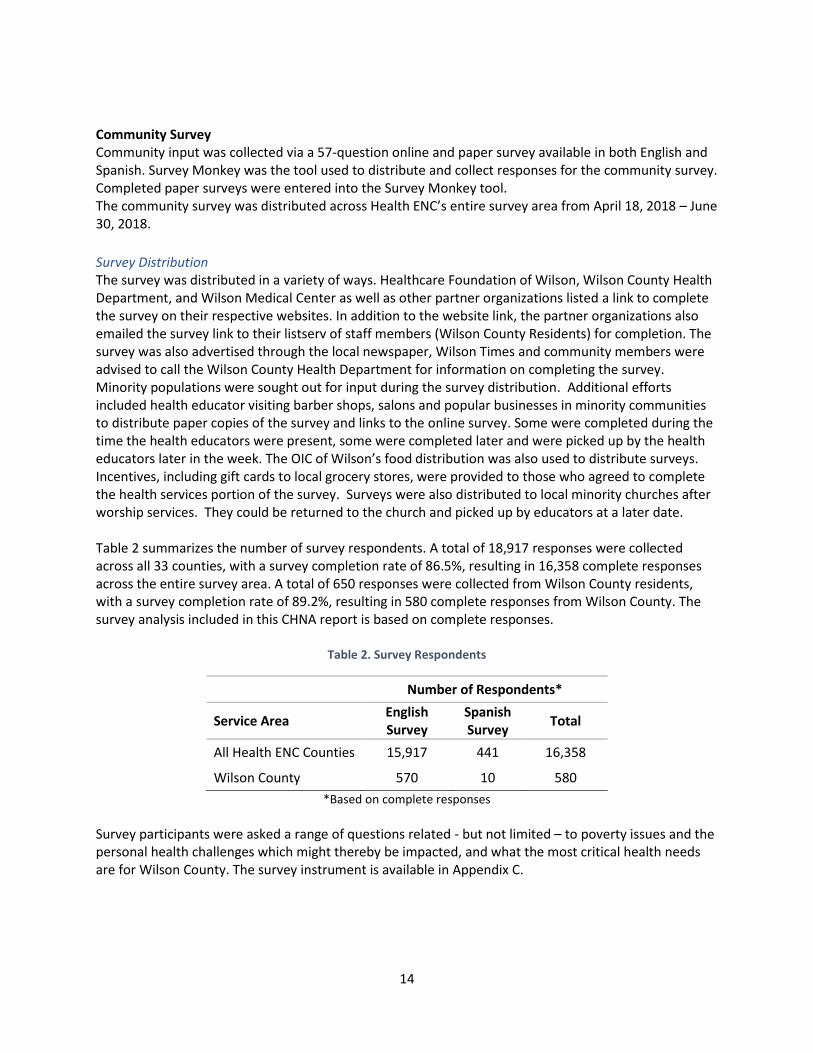
Survey Distribution The survey was distributed in a variety of ways. Healthcare Foundation of Wilson, Wilson County Health Department, and Wilson Medical Center as well as other partner organizations listed a link to complete the survey on their respective websites. In addition to the website link, the partner organizations also emailed the survey link to their listserv of staff members (Wilson County Residents) for completion. The survey was also advertised through the local newspaper, Wilson Times and community members were advised to call the Wilson County Health Department for information on completing the survey. Minority populations were sought out for input during the survey distribution. Additional efforts included health educator visiting barber shops, salons and popular businesses in minority communities to distribute paper copies of the survey and links to the online survey. Some were completed during the time the health educators were present, some were completed later and were picked up by the health educators later in the week. The OIC of Wilson’s food distribution was also used to distribute surveys. Incentives, including gift cards to local grocery stores, were provided to those who agreed to complete the health services portion of the survey. Surveys were also distributed to local minority churches after worship services. They could be returned to the church and picked up by educators at a later date. Table 2 summarizes the number of survey respondents. A total of 18,917 responses were collected across all 33 counties, with a survey completion rate of 86.5%, resulting in 16,358 complete responses across the entire survey area. A total of 650 responses were collected from Wilson County residents, with a survey completion rate of 89.2%, resulting in 580 complete responses from Wilson County. The survey analysis included in this CHNA report is based on complete responses.
Table 2. Survey Respondents
Number of Respondents*
Service Area English Survey
Spanish Survey
Total
All Health ENC Counties 15,917 441 16,358
Wilson County 570 10 580
*Based on complete responses
Survey participants were asked a range of questions related - but not limited – to poverty issues and the personal health challenges which might thereby be impacted, and what the most critical health needs are for Wilson County. The survey instrument is available in Appendix C.
15
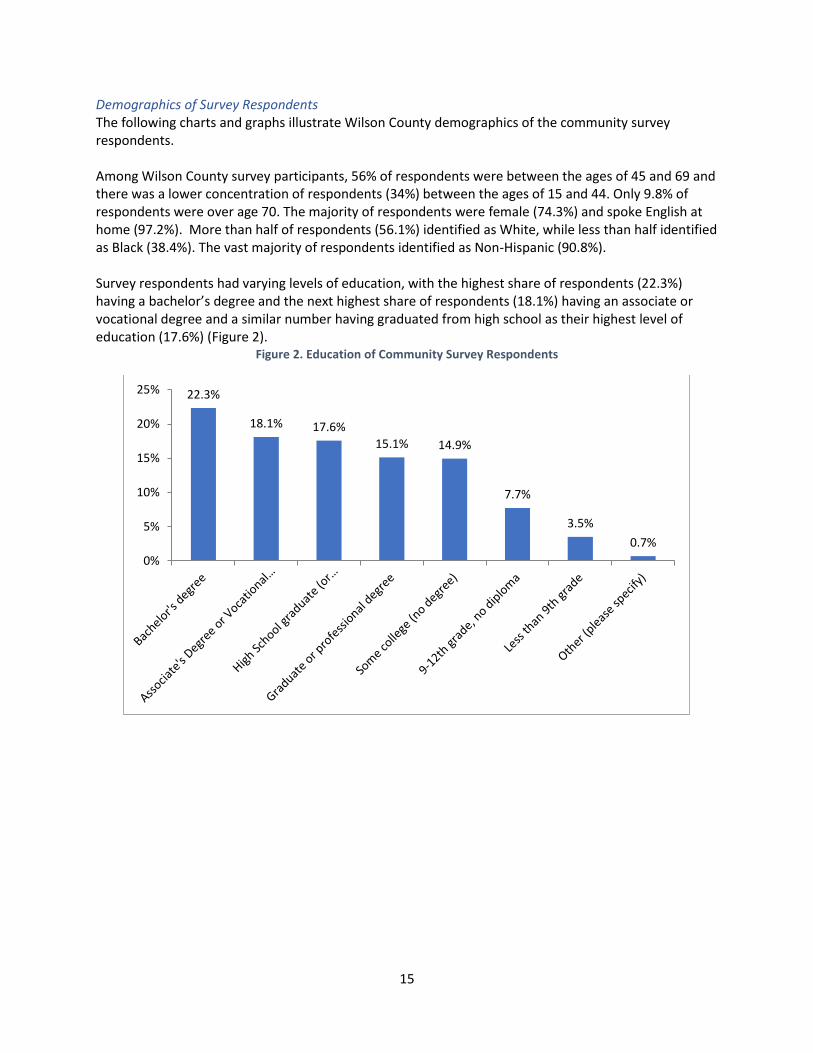
Demographics of Survey Respondents The following charts and graphs illustrate Wilson County demographics of the community survey respondents. Among Wilson County survey participants, 56% of respondents were between the ages of 45 and 69 and there was a lower concentration of respondents (34%) between the ages of 15 and 44. Only 9.8% of respondents were over age 70. The majority of respondents were female (74.3%) and spoke English at home (97.2%). More than half of respondents (56.1%) identified as White, while less than half identified as Black (38.4%). The vast majority of respondents identified as Non-Hispanic (90.8%). Survey respondents had varying levels of education, with the highest share of respondents (22.3%) having a bachelor’s degree and the next highest share of respondents (18.1%) having an associate or vocational degree and a similar number having graduated from high school as their highest level of education (17.6%) (Figure 2).
Figure 2. Education of Community Survey Respondents
22.3%
18.1% 17.6%
15.1% 14.9%
7.7%
3.5%
0.7%
0%
5%
10%
15%
20%
25%
16
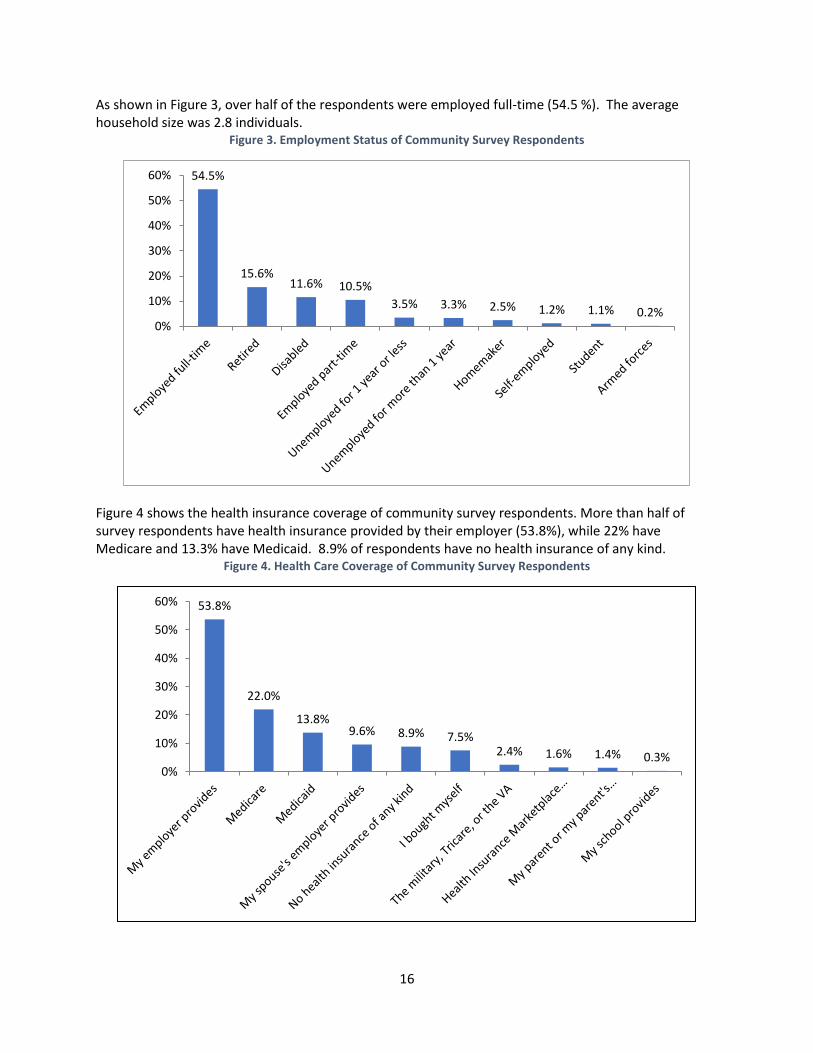
As shown in Figure 3, over half of the respondents were employed full-time (54.5 %). The average household size was 2.8 individuals.
Figure 3. Employment Status of Community Survey Respondents
Figure 4 shows the health insurance coverage of community survey respondents. More than half of survey respondents have health insurance provided by their employer (53.8%), while 22% have Medicare and 13.3% have Medicaid. 8.9% of respondents have no health insurance of any kind.
Figure 4. Health Care Coverage of Community Survey Respondents
54.5%
15.6%11.6% 10.5%
3.5% 3.3% 2.5% 1.2% 1.1% 0.2%0%
10%
20%
30%
40%
50%
60%
53.8%
22.0%
13.8%9.6% 8.9% 7.5%
2.4% 1.6% 1.4% 0.3%0%
10%
20%
30%
40%
50%
60%
17
Overall, the community survey participant population consisted of white or black women that are employed or retired. The survey was a convenience sample survey, and thus the results may not be representative of the community population as a whole. Key findings from select questions on the community survey are integrated into this report by theme or topic area, with an emphasis on the most significant needs as evidenced by both primary and secondary data. This approach is intended to offer a meaningful understanding of health needs. A summary of full survey results (all 57 questions) is available on HealthENC.org. Full results can be downloaded by county or for the entire Health ENC Region.
Focus Group Discussions Another form of community input was collected through three (3) focus groups. Focus groups were given carefully constructed dialogues that invited diverse groups of people to discuss important and pressing issues. Focus groups provided community members an opportunity to engage in productive learning and sharing sessions. The Focus group discussions focused on community strengths, opportunities for improvement, existing resources, health needs, and possible solutions for improving the health of Wilson County. A list of questions asked at the focus groups is available in Appendix C. The purpose of the focus groups for the 2019 CHNA was to engage with a broad cross-section of individuals from our county, such as the Hispanic population, African American population, and community service/health groups. Facilitator Training was provided. Topics included facilitation techniques, moderator and note taker roles, as well as tips and expectations for documenting focus group discussions. Focus group questions were reviewed and a transcript was provided for documentation purposes. To ensure adequate representation of the Wilson Community, two focus groups sought input from minorities (African-American and Latino). A local African American church hosted one focus group. The pastor selected members of the church as well as other people from the surrounding community and other churches to participate. Health educators sought input from Latino participants in a diabetes prevention class offered through the Wilson County Health Department. The participants from this class invited other family members. An interpreter from the Wilson County Health Department assisted during the discussion. Incentives were provided to both minority focus groups to encourage participation. The third focus group consisted of stakeholders of the community. All attendees were invited via email, and no incentives were used for this group. This group consisted of individuals from many partner organizations who are included below:
Americorps Vista (Wilson representatives)
Barton College
City of Wilson (Fire/Rescue)
Healthcare Foundation of Wilson
Retired Wilson County Schools Teacher
Retired WMC Board & HFW Board Chair
United Way of Wilson
Wilson Business Community (local business owners)
18
Wilson Chamber of Commerce
Wilson County Department of Social Services
Wilson Community College
Wilson County
Wilson County Health Department
Wilson County Schools
Wilson Forward
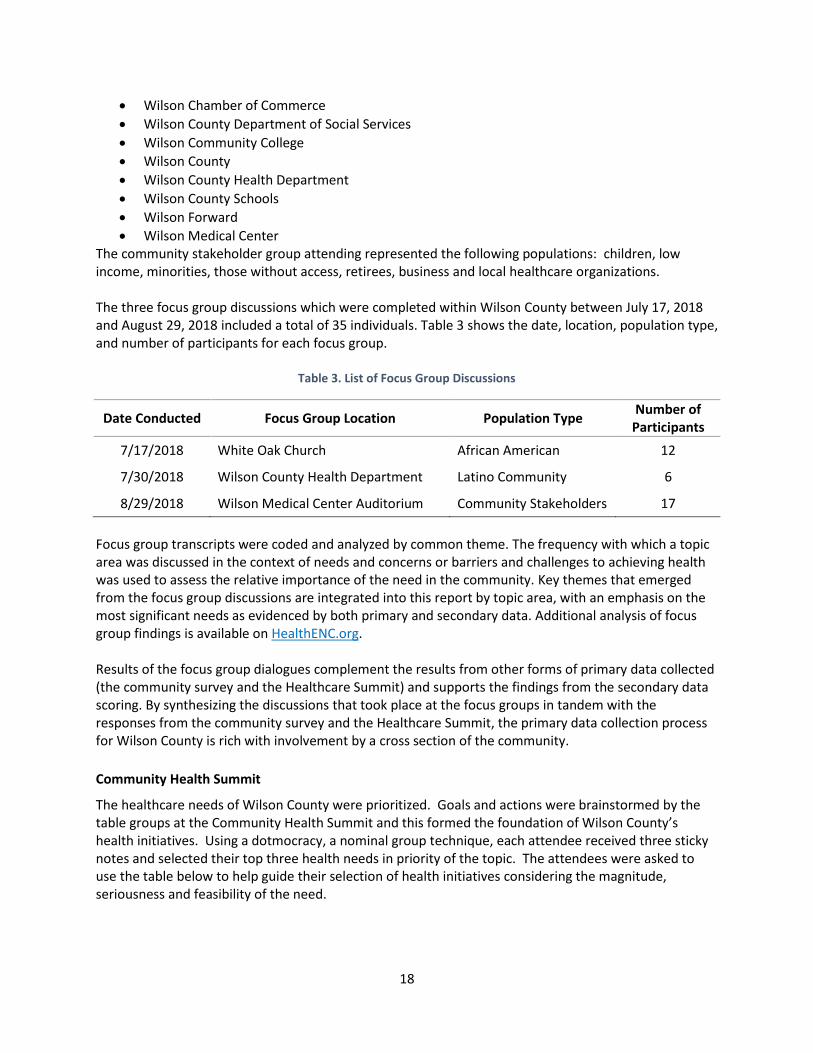
Wilson Medical Center The community stakeholder group attending represented the following populations: children, low income, minorities, those without access, retirees, business and local healthcare organizations. The three focus group discussions which were completed within Wilson County between July 17, 2018 and August 29, 2018 included a total of 35 individuals. Table 3 shows the date, location, population type, and number of participants for each focus group.
Table 3. List of Focus Group Discussions
Date Conducted Focus Group Location Population Type Number of
Participants
7/17/2018 White Oak Church African American 12
7/30/2018 Wilson County Health Department Latino Community 6
8/29/2018 Wilson Medical Center Auditorium Community Stakeholders 17
Focus group transcripts were coded and analyzed by common theme. The frequency with which a topic area was discussed in the context of needs and concerns or barriers and challenges to achieving health was used to assess the relative importance of the need in the community. Key themes that emerged from the focus group discussions are integrated into this report by topic area, with an emphasis on the most significant needs as evidenced by both primary and secondary data. Additional analysis of focus group findings is available on HealthENC.org. Results of the focus group dialogues complement the results from other forms of primary data collected (the community survey and the Healthcare Summit) and supports the findings from the secondary data scoring. By synthesizing the discussions that took place at the focus groups in tandem with the responses from the community survey and the Healthcare Summit, the primary data collection process for Wilson County is rich with involvement by a cross section of the community.
Community Health Summit
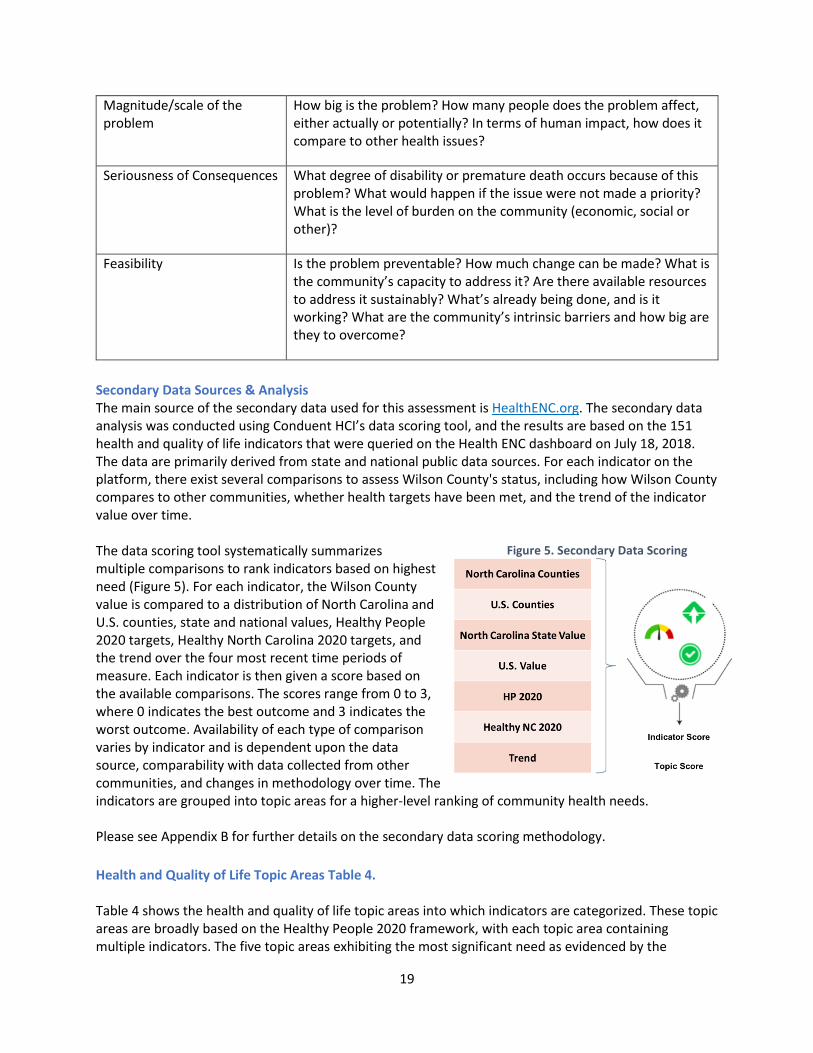
The healthcare needs of Wilson County were prioritized. Goals and actions were brainstormed by the table groups at the Community Health Summit and this formed the foundation of Wilson County’s health initiatives. Using a dotmocracy, a nominal group technique, each attendee received three sticky notes and selected their top three health needs in priority of the topic. The attendees were asked to use the table below to help guide their selection of health initiatives considering the magnitude, seriousness and feasibility of the need.
19
Magnitude/scale of the problem
How big is the problem? How many people does the problem affect, either actually or potentially? In terms of human impact, how does it compare to other health issues?
Seriousness of Consequences What degree of disability or premature death occurs because of this problem? What would happen if the issue were not made a priority? What is the level of burden on the community (economic, social or other)?
Feasibility Is the problem preventable? How much change can be made? What is the community’s capacity to address it? Are there available resources to address it sustainably? What’s already being done, and is it working? What are the community’s intrinsic barriers and how big are they to overcome?
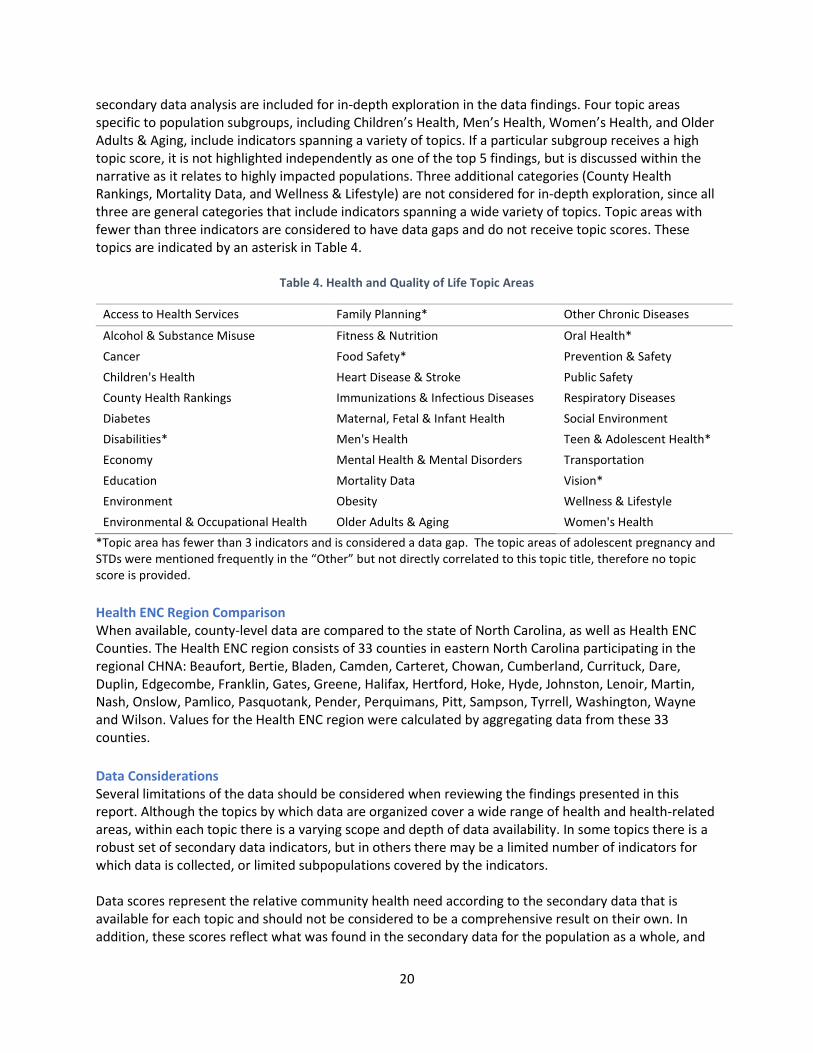
Secondary Data Sources & Analysis The main source of the secondary data used for this assessment is HealthENC.org. The secondary data analysis was conducted using Conduent HCI’s data scoring tool, and the results are based on the 151 health and quality of life indicators that were queried on the Health ENC dashboard on July 18, 2018. The data are primarily derived from state and national public data sources. For each indicator on the platform, there exist several comparisons to assess Wilson County's status, including how Wilson County compares to other communities, whether health targets have been met, and the trend of the indicator value over time. The data scoring tool systematically summarizes multiple comparisons to rank indicators based on highest need (Figure 5). For each indicator, the Wilson County value is compared to a distribution of North Carolina and U.S. counties, state and national values, Healthy People 2020 targets, Healthy North Carolina 2020 targets, and the trend over the four most recent time periods of measure. Each indicator is then given a score based on the available comparisons. The scores range from 0 to 3, where 0 indicates the best outcome and 3 indicates the worst outcome. Availability of each type of comparison varies by indicator and is dependent upon the data source, comparability with data collected from other communities, and changes in methodology over time. The indicators are grouped into topic areas for a higher-level ranking of community health needs. Please see Appendix B for further details on the secondary data scoring methodology.
Health and Quality of Life Topic Areas Table 4. Table 4 shows the health and quality of life topic areas into which indicators are categorized. These topic areas are broadly based on the Healthy People 2020 framework, with each topic area containing multiple indicators. The five topic areas exhibiting the most significant need as evidenced by the
Figure 5. Secondary Data Scoring
20
secondary data analysis are included for in-depth exploration in the data findings. Four topic areas specific to population subgroups, including Children’s Health, Men’s Health, Women’s Health, and Older Adults & Aging, include indicators spanning a variety of topics. If a particular subgroup receives a high topic score, it is not highlighted independently as one of the top 5 findings, but is discussed within the narrative as it relates to highly impacted populations. Three additional categories (County Health Rankings, Mortality Data, and Wellness & Lifestyle) are not considered for in-depth exploration, since all three are general categories that include indicators spanning a wide variety of topics. Topic areas with fewer than three indicators are considered to have data gaps and do not receive topic scores. These topics are indicated by an asterisk in Table 4.
Table 4. Health and Quality of Life Topic Areas
Access to Health Services Family Planning* Other Chronic Diseases
Alcohol & Substance Misuse Fitness & Nutrition Oral Health*
Cancer Food Safety* Prevention & Safety
Children's Health Heart Disease & Stroke Public Safety
County Health Rankings Immunizations & Infectious Diseases Respiratory Diseases
Diabetes Maternal, Fetal & Infant Health Social Environment
Disabilities* Men's Health Teen & Adolescent Health*
Economy Mental Health & Mental Disorders Transportation
Education Mortality Data Vision*
Environment Obesity Wellness & Lifestyle
Environmental & Occupational Health Older Adults & Aging Women's Health
*Topic area has fewer than 3 indicators and is considered a data gap. The topic areas of adolescent pregnancy and STDs were mentioned frequently in the “Other” but not directly correlated to this topic title, therefore no topic score is provided.
Health ENC Region Comparison When available, county-level data are compared to the state of North Carolina, as well as Health ENC Counties. The Health ENC region consists of 33 counties in eastern North Carolina participating in the regional CHNA: Beaufort, Bertie, Bladen, Camden, Carteret, Chowan, Cumberland, Currituck, Dare, Duplin, Edgecombe, Franklin, Gates, Greene, Halifax, Hertford, Hoke, Hyde, Johnston, Lenoir, Martin, Nash, Onslow, Pamlico, Pasquotank, Pender, Perquimans, Pitt, Sampson, Tyrrell, Washington, Wayne and Wilson. Values for the Health ENC region were calculated by aggregating data from these 33 counties.
Data Considerations Several limitations of the data should be considered when reviewing the findings presented in this report. Although the topics by which data are organized cover a wide range of health and health-related areas, within each topic there is a varying scope and depth of data availability. In some topics there is a robust set of secondary data indicators, but in others there may be a limited number of indicators for which data is collected, or limited subpopulations covered by the indicators. Data scores represent the relative community health need according to the secondary data that is available for each topic and should not be considered to be a comprehensive result on their own. In addition, these scores reflect what was found in the secondary data for the population as a whole, and
21
do not factor in the health or socioeconomic need that is much greater for some subpopulations. In addition, many of the secondary data indicators included in the findings are collected by survey, and though methods are used to best represent the population at large, these measures are subject to instability—especially among smaller populations.
The disparities analysis, used to analyze the secondary data, is also limited by data availability. In some instances, data sources do not provide subpopulation data for some indicators, and for other indicators, values are only available for a select number of race/ethnic groups. Due to these limitations, it is not possible to draw conclusions about subpopulation disparities for all indicators.
The breadth of primary data findings is dependent on several factors. Focus group discussion findings were limited by which community members were able to attend focus group discussions. Because the survey was a convenience sample survey, results are vulnerable to selection bias, making findings less generalizable for the population as whole.
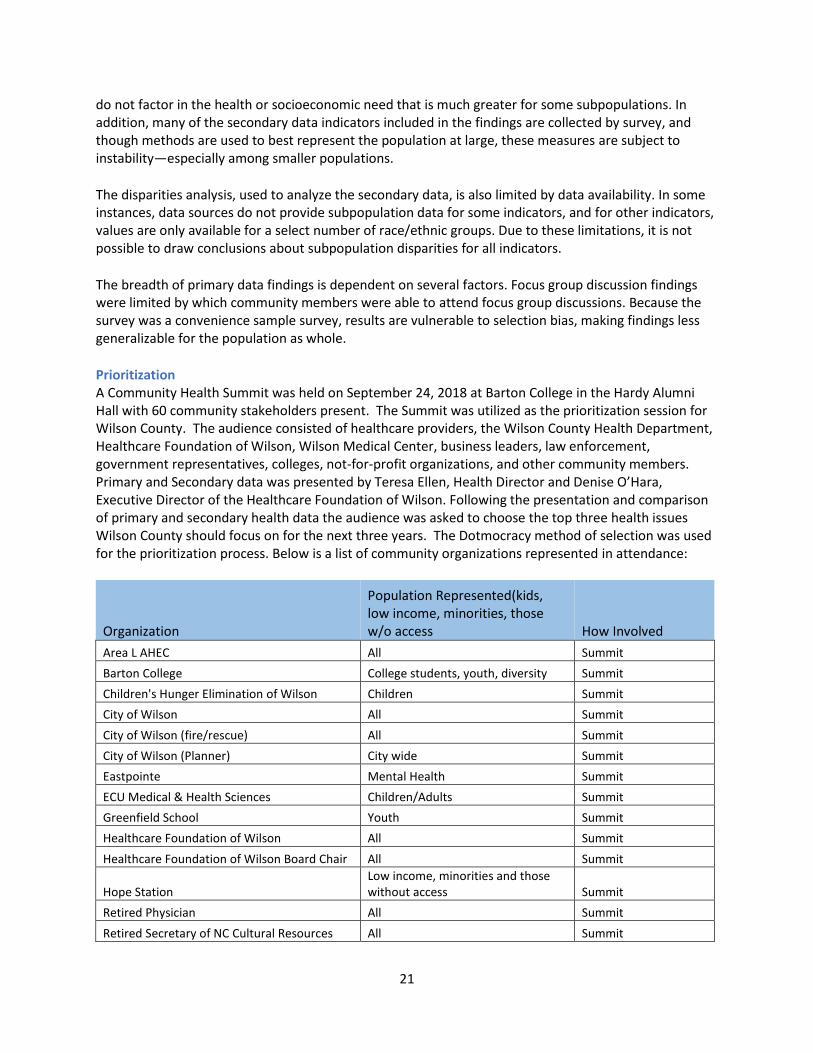
Prioritization A Community Health Summit was held on September 24, 2018 at Barton College in the Hardy Alumni Hall with 60 community stakeholders present. The Summit was utilized as the prioritization session for Wilson County. The audience consisted of healthcare providers, the Wilson County Health Department, Healthcare Foundation of Wilson, Wilson Medical Center, business leaders, law enforcement, government representatives, colleges, not-for-profit organizations, and other community members. Primary and Secondary data was presented by Teresa Ellen, Health Director and Denise O’Hara, Executive Director of the Healthcare Foundation of Wilson. Following the presentation and comparison of primary and secondary health data the audience was asked to choose the top three health issues Wilson County should focus on for the next three years. The Dotmocracy method of selection was used for the prioritization process. Below is a list of community organizations represented in attendance:
Organization
Population Represented(kids, low income, minorities, those w/o access How Involved
Area L AHEC All Summit
Barton College College students, youth, diversity Summit
Children's Hunger Elimination of Wilson Children Summit
City of Wilson All Summit
City of Wilson (fire/rescue) All Summit
City of Wilson (Planner) City wide Summit
Eastpointe Mental Health Summit
ECU Medical & Health Sciences Children/Adults Summit
Greenfield School Youth Summit
Healthcare Foundation of Wilson All Summit
Healthcare Foundation of Wilson Board Chair All Summit
Hope Station Low income, minorities and those without access Summit
Retired Physician All Summit
Retired Secretary of NC Cultural Resources All Summit
22
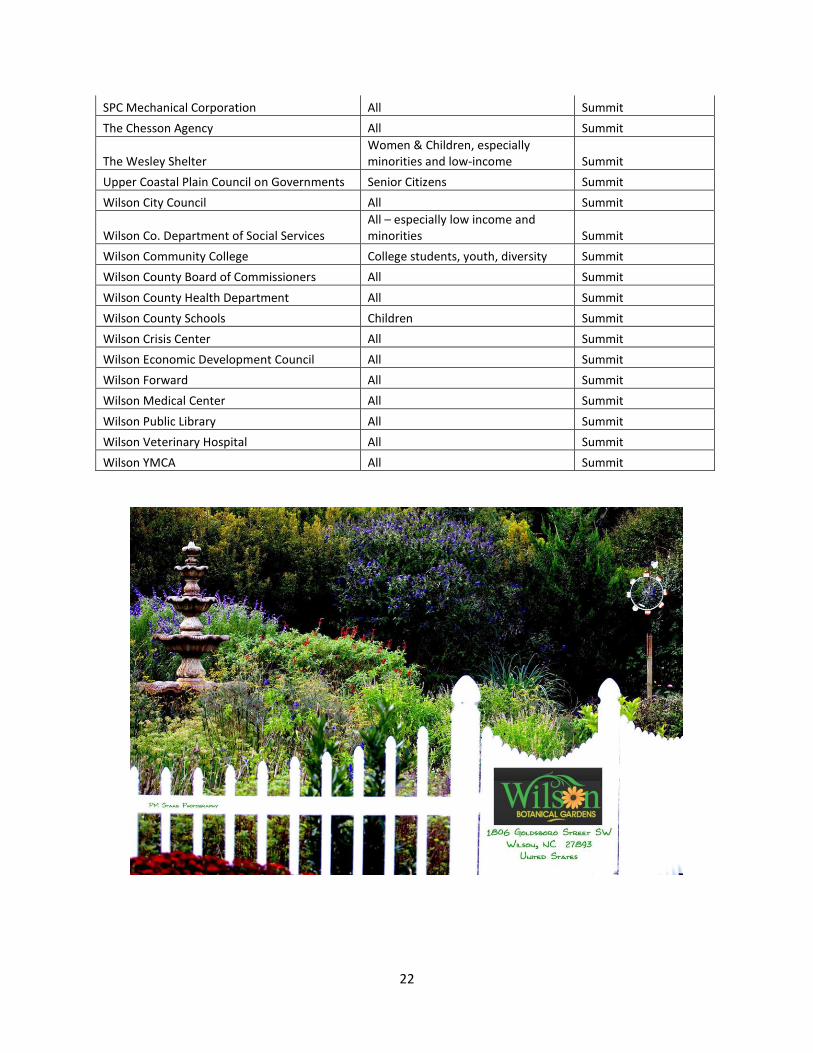
SPC Mechanical Corporation All Summit
The Chesson Agency All Summit
The Wesley Shelter Women & Children, especially minorities and low-income Summit
Upper Coastal Plain Council on Governments Senior Citizens Summit
Wilson City Council All Summit
Wilson Co. Department of Social Services All – especially low income and minorities Summit
Wilson Community College College students, youth, diversity Summit
Wilson County Board of Commissioners All Summit
Wilson County Health Department All Summit
Wilson County Schools Children Summit
Wilson Crisis Center All Summit
Wilson Economic Development Council All Summit
Wilson Forward All Summit
Wilson Medical Center All Summit
Wilson Public Library All Summit
Wilson Veterinary Hospital All Summit
Wilson YMCA All Summit
23
Overview of Wilson County
About Wilson County Wilson County is located roughly on the fall line that separates the Piedmont and the Coastal Plain. Though the majority of the county is level, there are rolling hills in the west which are characteristic of the Piedmont. Traveling in an easterly direction within the county, the geography becomes flat as the land quickly transitions into the Coastal Plain. There are no major rivers that flow through Wilson County. This may have contributed to the county’s slower development, as rivers were thoroughfares for transportation in the absence of good roads during the early history of North Carolina. Contentnea Creek is a large creek that spans the county and is a tributary to the Neuse River. Wilson County is comprised of one city (county seat) and eight smaller towns within the county. Wilson has unique advantages of proximity, located near one of the fastest-growing areas in the country, with great access to major highways. Wilson has also had the foresight to make strategic investments like Buckhorn Reservoir, the Wilson Corporate Park and Greenlight Community Broadband to ensure current needs and future opportunities are available in Wilson. This encourages growth from individuals and businesses. Additional demographics for Wilson County are listed below.
Demographic Profile The demographics of a community significantly impact its health profile. Population growth has an influence on the county’s current and future needs. Specific population subgroups, including veterans and different age, gender, race and ethnic groups, may have unique needs and require varied approaches to health improvement efforts. The following section explores the demographic profile of Wilson County, North Carolina.
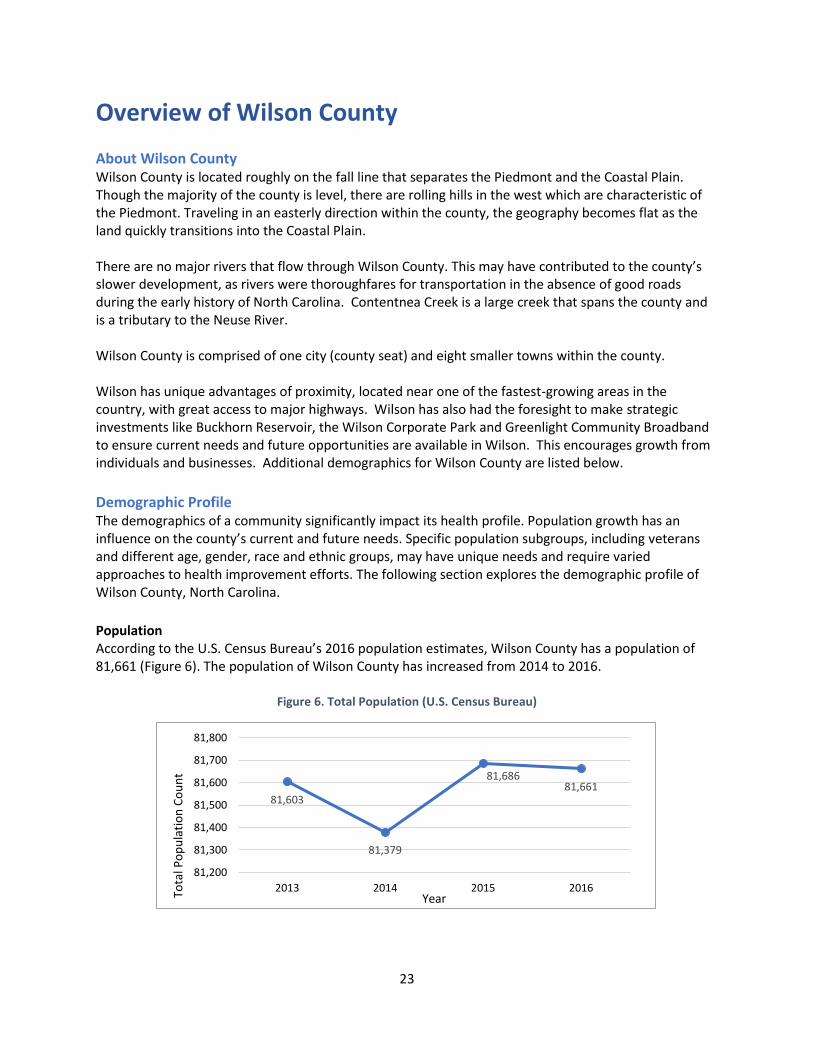
Population According to the U.S. Census Bureau’s 2016 population estimates, Wilson County has a population of 81,661 (Figure 6). The population of Wilson County has increased from 2014 to 2016.
Figure 6. Total Population (U.S. Census Bureau)
81,603
81,379
81,68681,661
81,200
81,300
81,400
81,500
81,600
81,700
81,800
2013 2014 2015 2016Tota
l Po
pu
lati
on
Co
un
t
Year
24
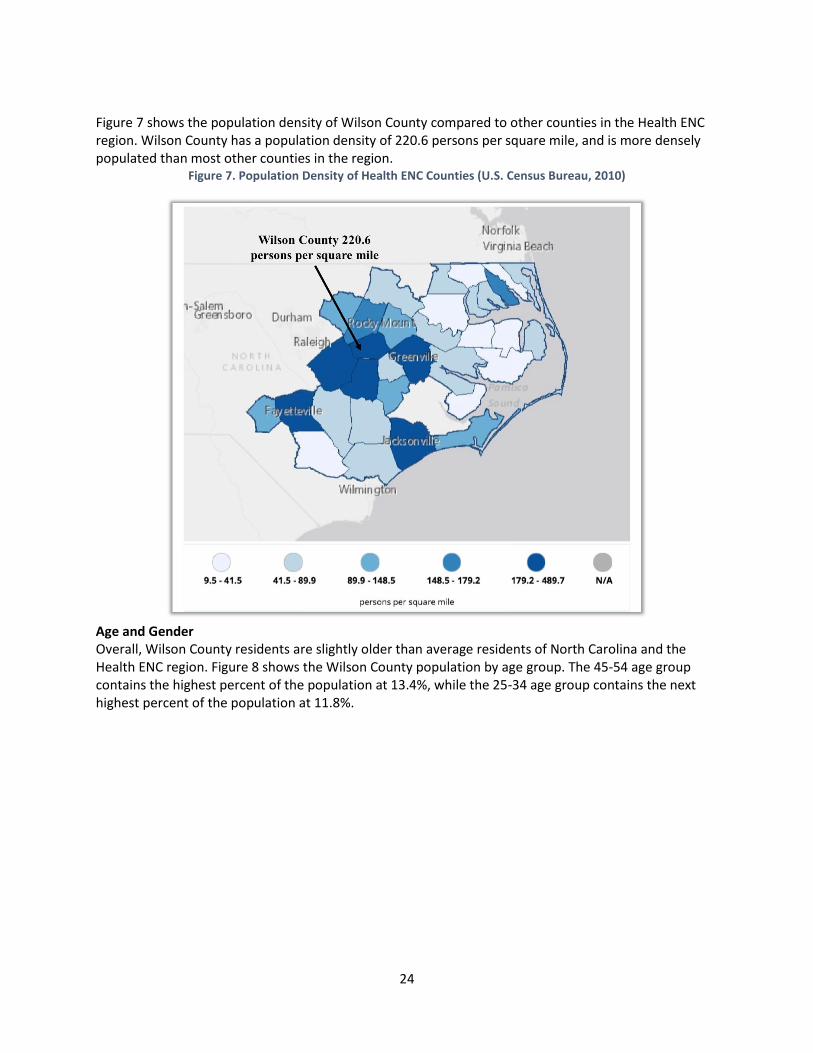
Figure 7 shows the population density of Wilson County compared to other counties in the Health ENC region. Wilson County has a population density of 220.6 persons per square mile, and is more densely populated than most other counties in the region.
Figure 7. Population Density of Health ENC Counties (U.S. Census Bureau, 2010)
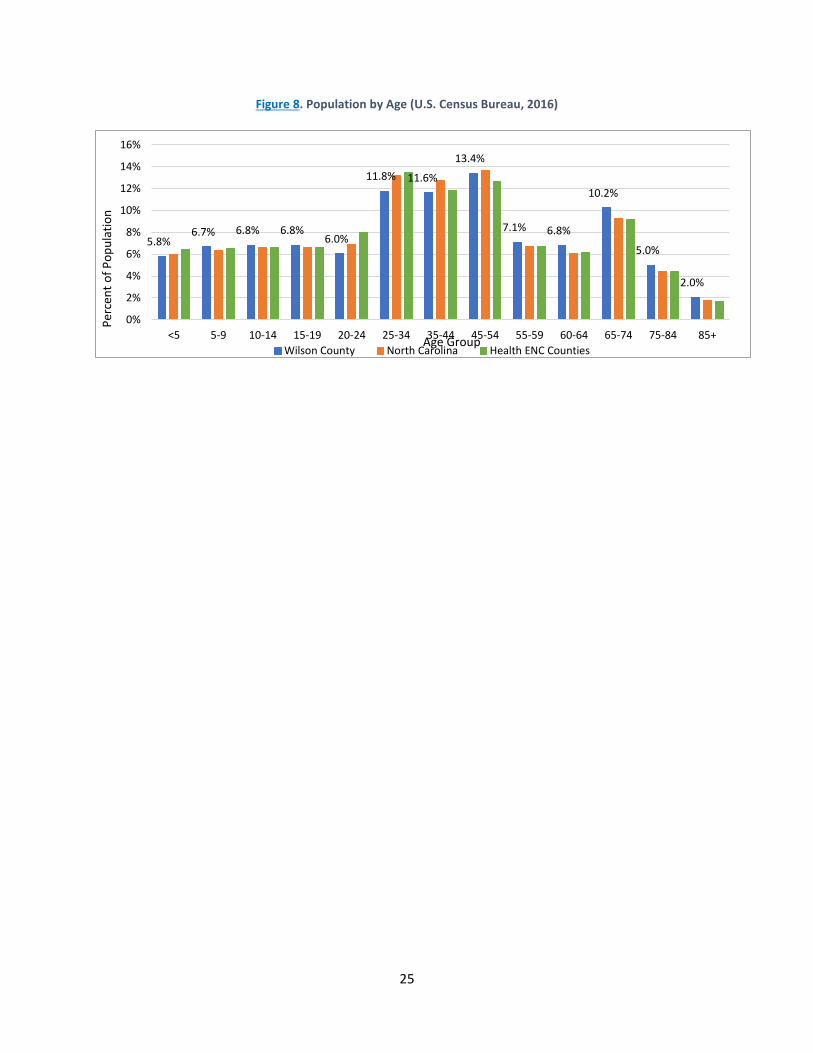
Age and Gender Overall, Wilson County residents are slightly older than average residents of North Carolina and the Health ENC region. Figure 8 shows the Wilson County population by age group. The 45-54 age group contains the highest percent of the population at 13.4%, while the 25-34 age group contains the next highest percent of the population at 11.8%.
25
Figure 8. Population by Age (U.S. Census Bureau, 2016)
5.8%6.7% 6.8% 6.8%
6.0%
11.8% 11.6%
13.4%
7.1% 6.8%
10.2%
5.0%
2.0%
0%
2%
4%
6%
8%
10%
12%
14%
16%
<5 5-9 10-14 15-19 20-24 25-34 35-44 45-54 55-59 60-64 65-74 75-84 85+
Per
cen
t o
f P
op
ula
tio
n
Age GroupWilson County North Carolina Health ENC Counties
26
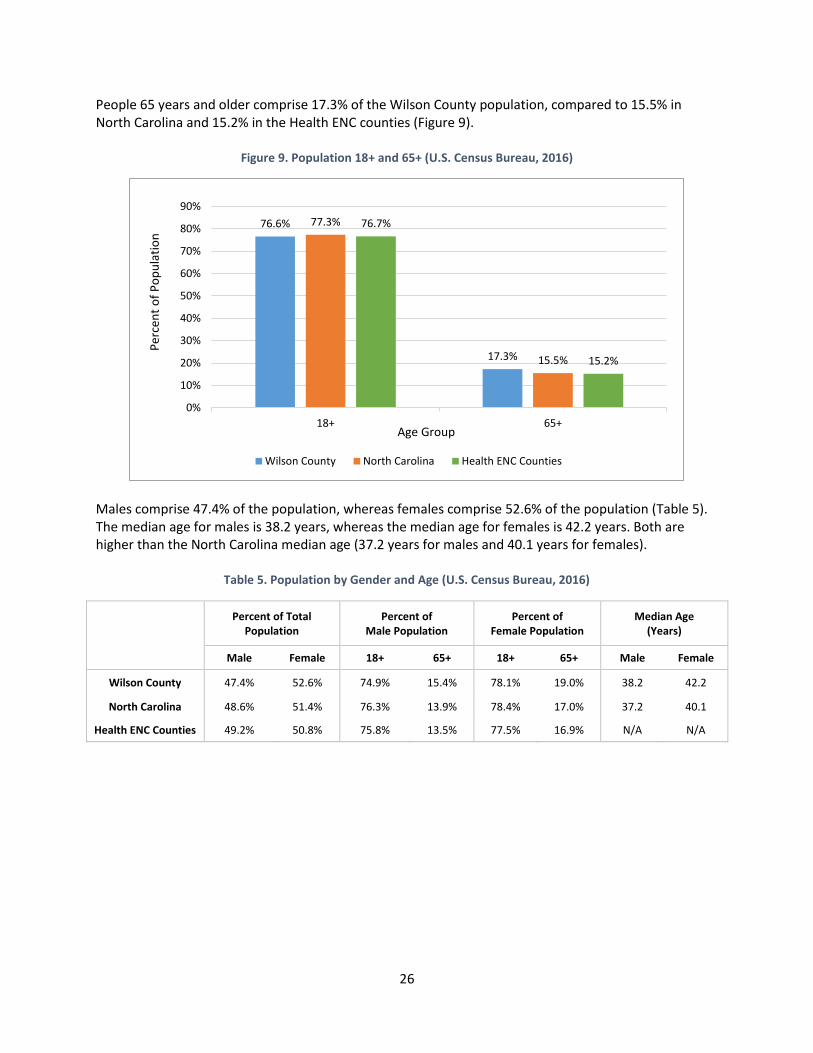
People 65 years and older comprise 17.3% of the Wilson County population, compared to 15.5% in North Carolina and 15.2% in the Health ENC counties (Figure 9).
Figure 9. Population 18+ and 65+ (U.S. Census Bureau, 2016)
Males comprise 47.4% of the population, whereas females comprise 52.6% of the population (Table 5). The median age for males is 38.2 years, whereas the median age for females is 42.2 years. Both are higher than the North Carolina median age (37.2 years for males and 40.1 years for females).
Table 5. Population by Gender and Age (U.S. Census Bureau, 2016)
Percent of Total
Population Percent of
Male Population Percent of
Female Population Median Age
(Years)
Male Female 18+ 65+ 18+ 65+ Male Female
Wilson County 47.4% 52.6% 74.9% 15.4% 78.1% 19.0% 38.2 42.2
North Carolina 48.6% 51.4% 76.3% 13.9% 78.4% 17.0% 37.2 40.1
Health ENC Counties 49.2% 50.8% 75.8% 13.5% 77.5% 16.9% N/A N/A
76.6%
17.3%
77.3%
15.5%
76.7%
15.2%
0%
10%
20%
30%
40%
50%
60%
70%
80%
90%
18+ 65+
Per
cen
t o
f P
op
ula
tio
n
Age Group
Wilson County North Carolina Health ENC Counties
27
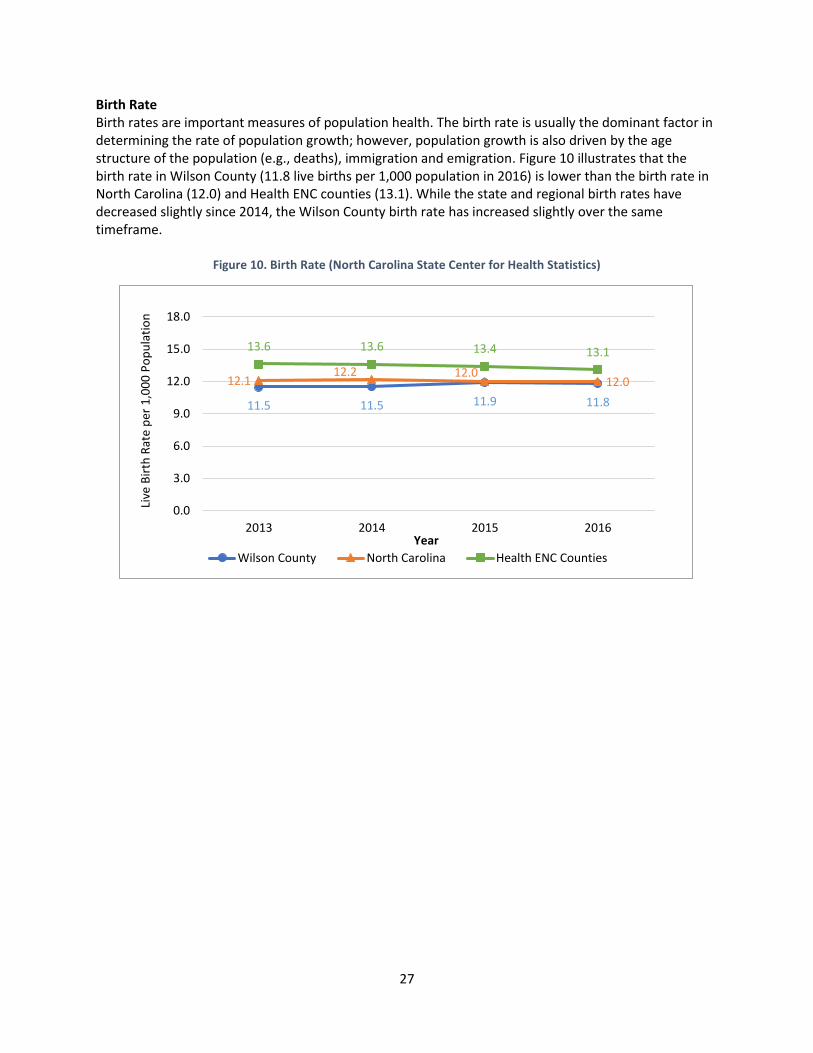
Birth Rate Birth rates are important measures of population health. The birth rate is usually the dominant factor in determining the rate of population growth; however, population growth is also driven by the age structure of the population (e.g., deaths), immigration and emigration. Figure 10 illustrates that the birth rate in Wilson County (11.8 live births per 1,000 population in 2016) is lower than the birth rate in North Carolina (12.0) and Health ENC counties (13.1). While the state and regional birth rates have decreased slightly since 2014, the Wilson County birth rate has increased slightly over the same timeframe.
Figure 10. Birth Rate (North Carolina State Center for Health Statistics)
11.5 11.5 11.9 11.8
12.112.2 12.0
12.0
13.6 13.6 13.4 13.1
0.0
3.0
6.0
9.0
12.0
15.0
18.0
2013 2014 2015 2016
Live
Bir
th R
ate
per
1,0
00
Po
pu
lati
on
Year
Wilson County North Carolina Health ENC Counties
28
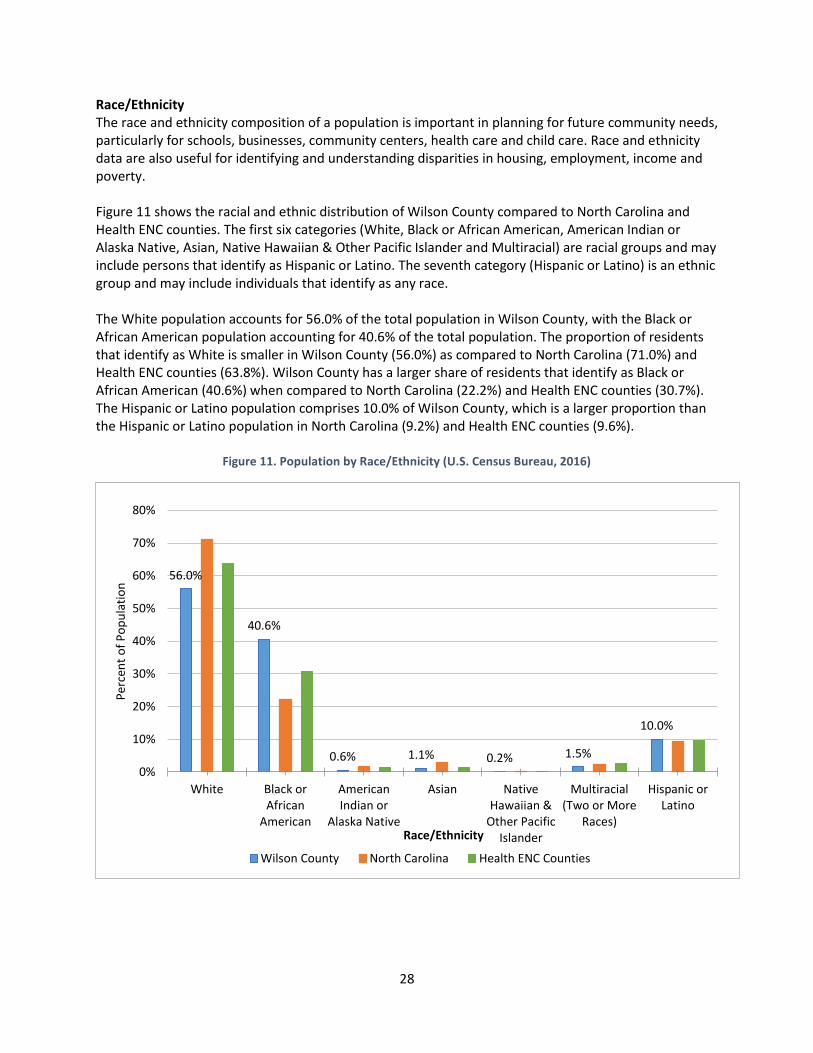
Race/Ethnicity The race and ethnicity composition of a population is important in planning for future community needs, particularly for schools, businesses, community centers, health care and child care. Race and ethnicity data are also useful for identifying and understanding disparities in housing, employment, income and poverty. Figure 11 shows the racial and ethnic distribution of Wilson County compared to North Carolina and Health ENC counties. The first six categories (White, Black or African American, American Indian or Alaska Native, Asian, Native Hawaiian & Other Pacific Islander and Multiracial) are racial groups and may include persons that identify as Hispanic or Latino. The seventh category (Hispanic or Latino) is an ethnic group and may include individuals that identify as any race. The White population accounts for 56.0% of the total population in Wilson County, with the Black or African American population accounting for 40.6% of the total population. The proportion of residents that identify as White is smaller in Wilson County (56.0%) as compared to North Carolina (71.0%) and Health ENC counties (63.8%). Wilson County has a larger share of residents that identify as Black or African American (40.6%) when compared to North Carolina (22.2%) and Health ENC counties (30.7%). The Hispanic or Latino population comprises 10.0% of Wilson County, which is a larger proportion than the Hispanic or Latino population in North Carolina (9.2%) and Health ENC counties (9.6%).
Figure 11. Population by Race/Ethnicity (U.S. Census Bureau, 2016)
56.0%
40.6%
0.6% 1.1% 0.2% 1.5%
10.0%
0%
10%
20%
30%
40%
50%
60%
70%
80%
White Black orAfrican
American
AmericanIndian or
Alaska Native
Asian NativeHawaiian &
Other PacificIslander
Multiracial(Two or More
Races)
Hispanic orLatino
Per
cen
t o
f P
op
ula
tio
n
Race/Ethnicity
Wilson County North Carolina Health ENC Counties
29
Tribal Distribution of Population The U.S. Census Bureau collects population estimates for various American Indian and Alaska Native (AIAN) tribes. While population estimates of tribal data are not available at the county level, Table 6 shows the population estimates of eight tribal areas throughout the state of North Carolina.
Table 6. Named Tribes in North Carolina (American Community Survey, 2012-2016)
State Designated Tribal Statistical Area (SDTSA)
Total Population
Coharie SDTSA 62,160
Eastern Cherokee Reservation 9,613
Haliwa-Saponi SDTSA 8,700
Lumbee SDTSA 502,113
Meherrin SDTSA 7,782
Occaneechi-Saponi SDTSA 8,938
Sappony SDTSA 2,614
Waccamaw Siouan SDTSA 2,283
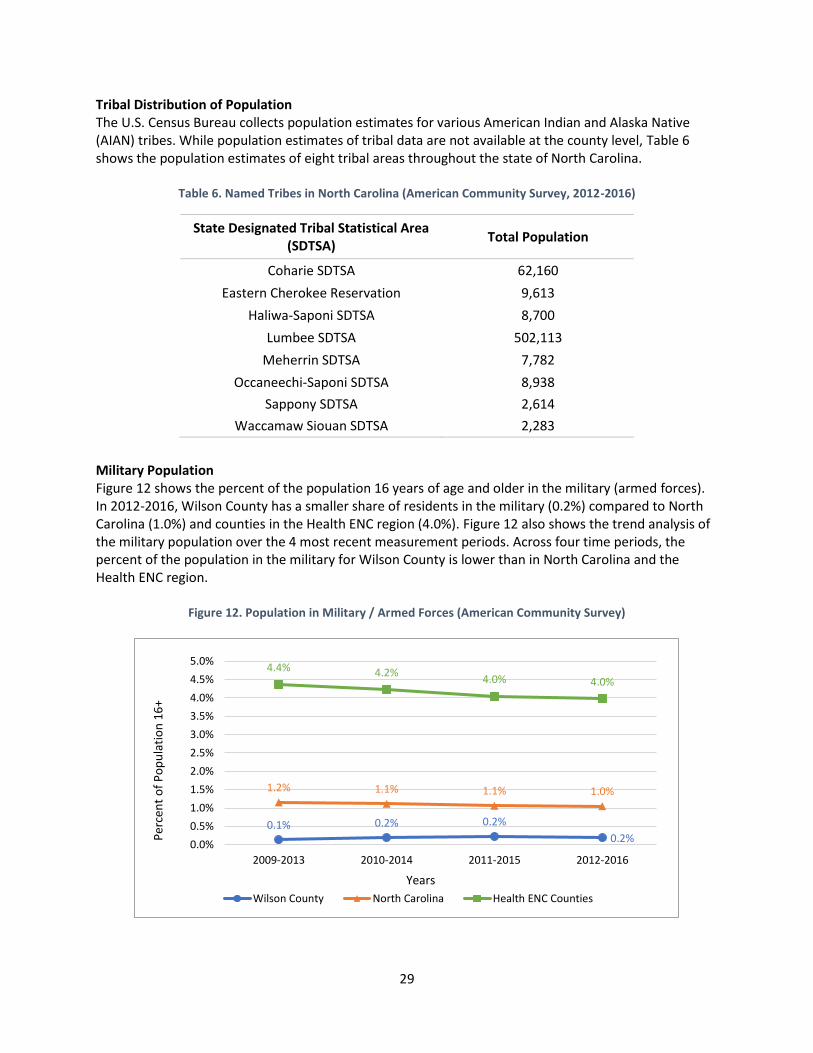
Military Population Figure 12 shows the percent of the population 16 years of age and older in the military (armed forces). In 2012-2016, Wilson County has a smaller share of residents in the military (0.2%) compared to North Carolina (1.0%) and counties in the Health ENC region (4.0%). Figure 12 also shows the trend analysis of the military population over the 4 most recent measurement periods. Across four time periods, the percent of the population in the military for Wilson County is lower than in North Carolina and the Health ENC region.
Figure 12. Population in Military / Armed Forces (American Community Survey)
0.1% 0.2% 0.2%
0.2%
1.2% 1.1% 1.1% 1.0%
4.4% 4.2%4.0% 4.0%
0.0%
0.5%
1.0%
1.5%
2.0%
2.5%
3.0%
3.5%
4.0%
4.5%
5.0%
2009-2013 2010-2014 2011-2015 2012-2016
Per
cen
t o
f P
op
ula
tio
n 1
6+
Years
Wilson County North Carolina Health ENC Counties
30
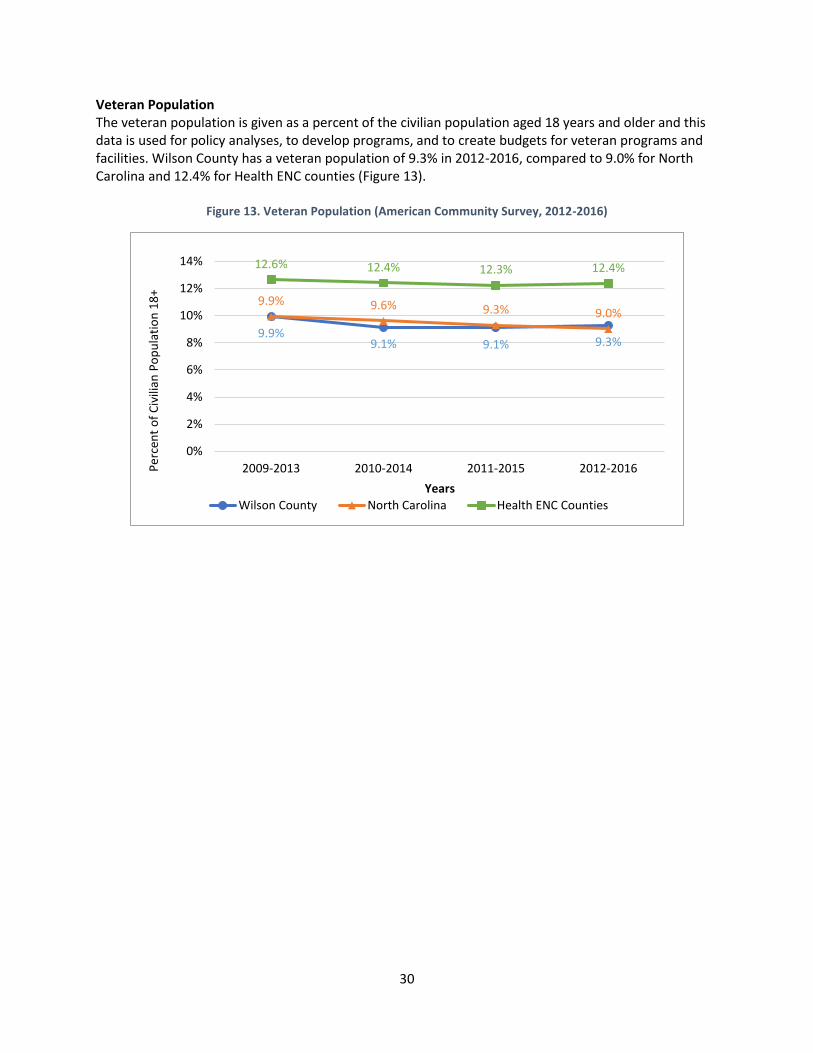
Veteran Population The veteran population is given as a percent of the civilian population aged 18 years and older and this data is used for policy analyses, to develop programs, and to create budgets for veteran programs and facilities. Wilson County has a veteran population of 9.3% in 2012-2016, compared to 9.0% for North Carolina and 12.4% for Health ENC counties (Figure 13).
Figure 13. Veteran Population (American Community Survey, 2012-2016)
9.9%9.1% 9.1% 9.3%
9.9% 9.6% 9.3% 9.0%
12.6% 12.4% 12.3% 12.4%
0%
2%
4%
6%
8%
10%
12%
14%
2009-2013 2010-2014 2011-2015 2012-2016Per
cen
t o
f C
ivili
an P
op
ula
tio
n 1
8+
Years
Wilson County North Carolina Health ENC Counties
31
Socioeconomic Profile Social and economic factors are well known to be strong determinants of health outcomes – those with a low socioeconomic status are more likely to suffer from chronic conditions such as diabetes, obesity and cancer. Community health improvement efforts must determine which subpopulations are most in need in order to effectively focus services and interventions.
NC Department of Commerce Tier Designation The North Carolina Department of Commerce annually ranks the state’s 100 counties based on economic well-being and assigns each a Tier designation. The 40 most distressed counties are designated as Tier 1, the next 40 as Tier 2 and the 20 least distressed as Tier 3. Wilson County was assigned a Tier 2 designation for 2018; however this changed to a Tier 1 designation in 2019.
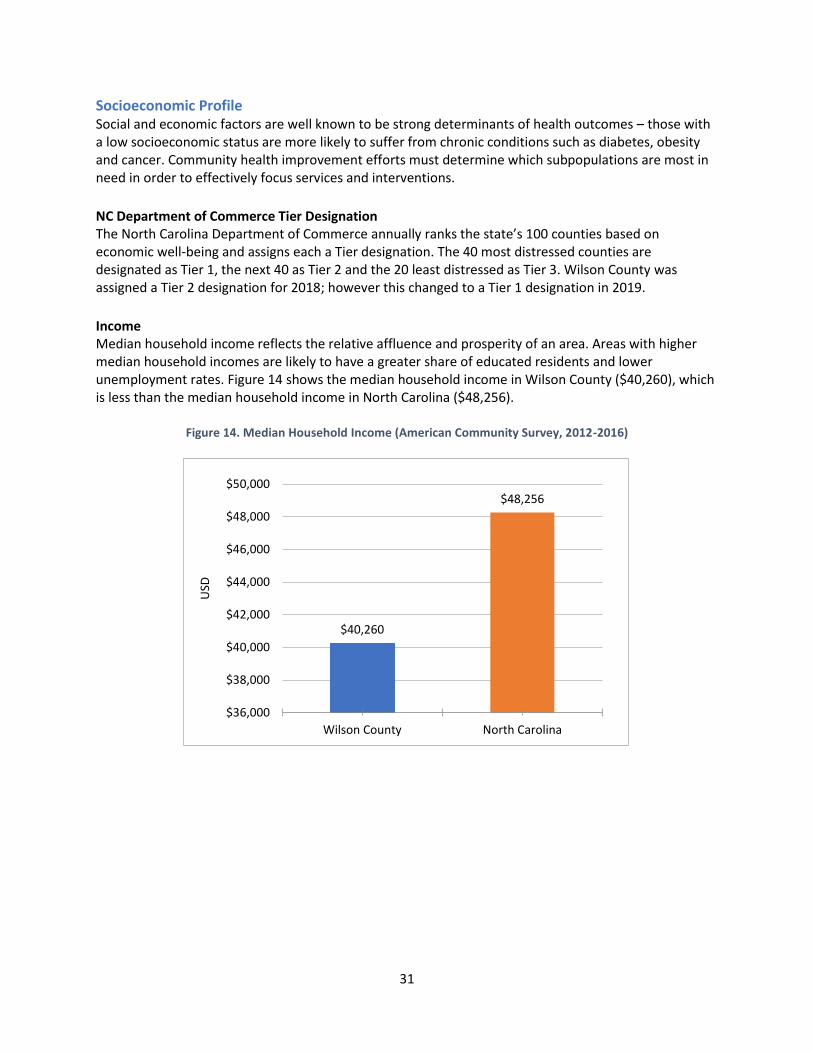
Income Median household income reflects the relative affluence and prosperity of an area. Areas with higher median household incomes are likely to have a greater share of educated residents and lower unemployment rates. Figure 14 shows the median household income in Wilson County ($40,260), which is less than the median household income in North Carolina ($48,256).
Figure 14. Median Household Income (American Community Survey, 2012-2016)
$40,260
$48,256
$36,000
$38,000
$40,000
$42,000
$44,000
$46,000
$48,000
$50,000
Wilson County North Carolina
USD
32
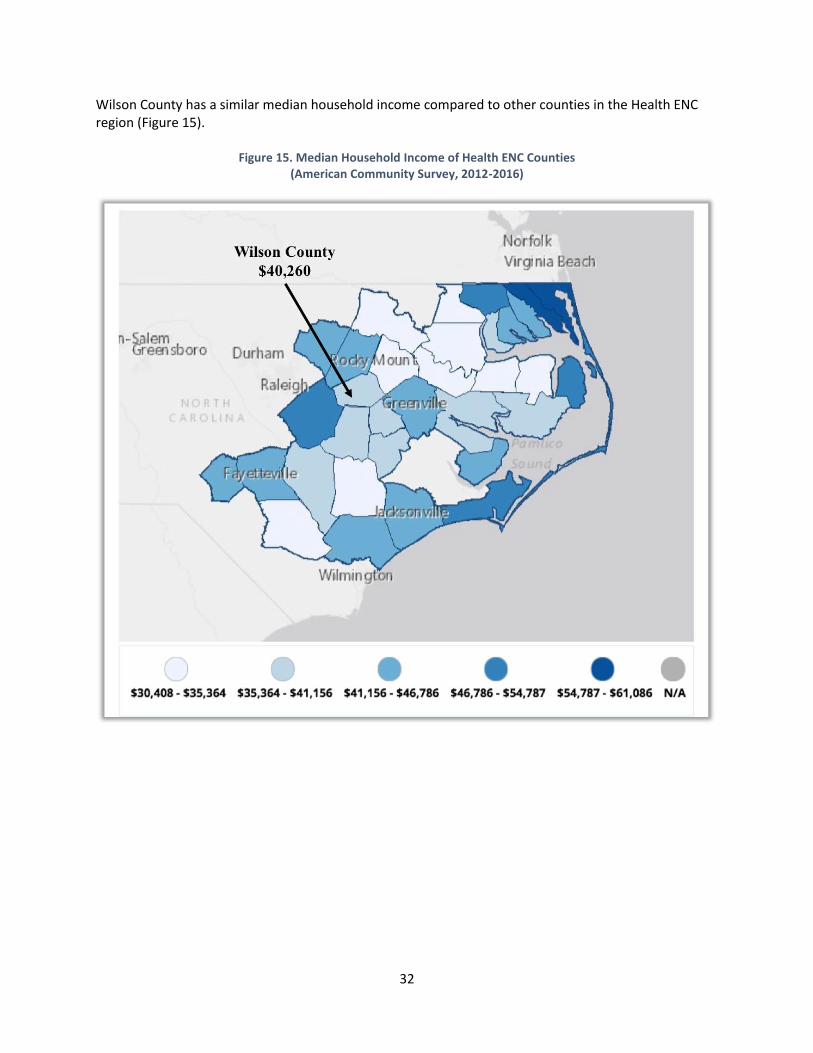
Wilson County has a similar median household income compared to other counties in the Health ENC region (Figure 15).
Figure 15. Median Household Income of Health ENC Counties (American Community Survey, 2012-2016)
33
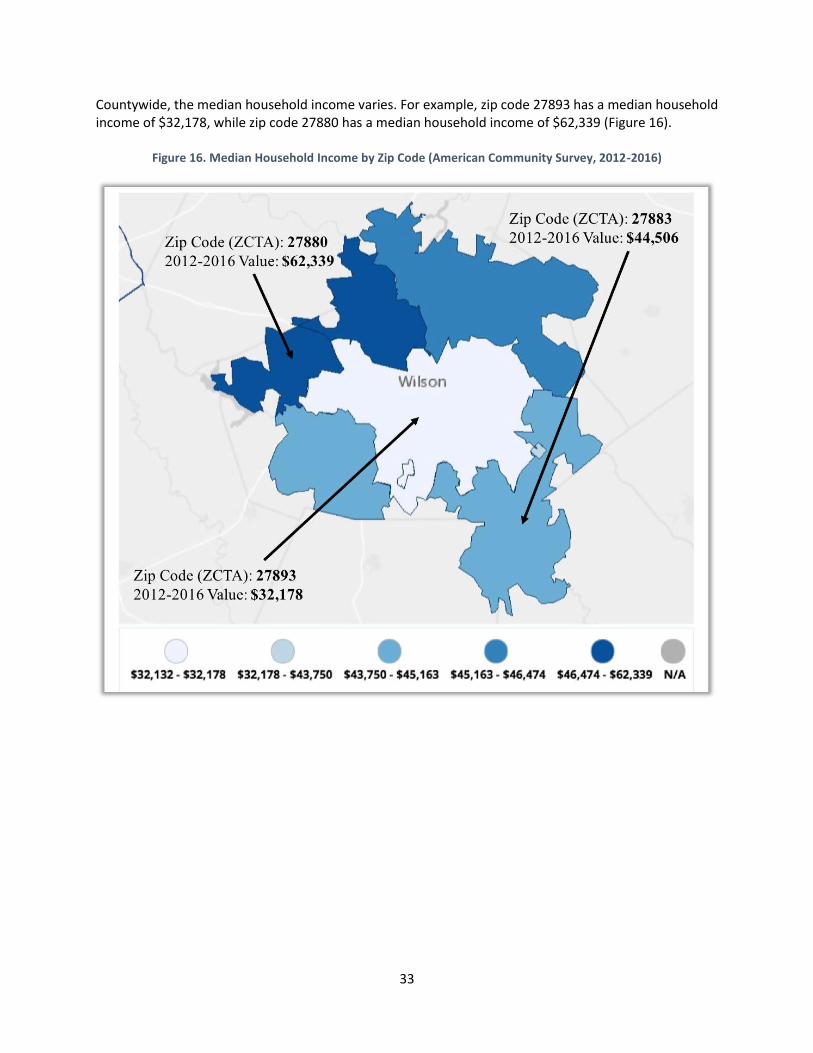
Countywide, the median household income varies. For example, zip code 27893 has a median household income of $32,178, while zip code 27880 has a median household income of $62,339 (Figure 16).
Figure 16. Median Household Income by Zip Code (American Community Survey, 2012-2016)
34
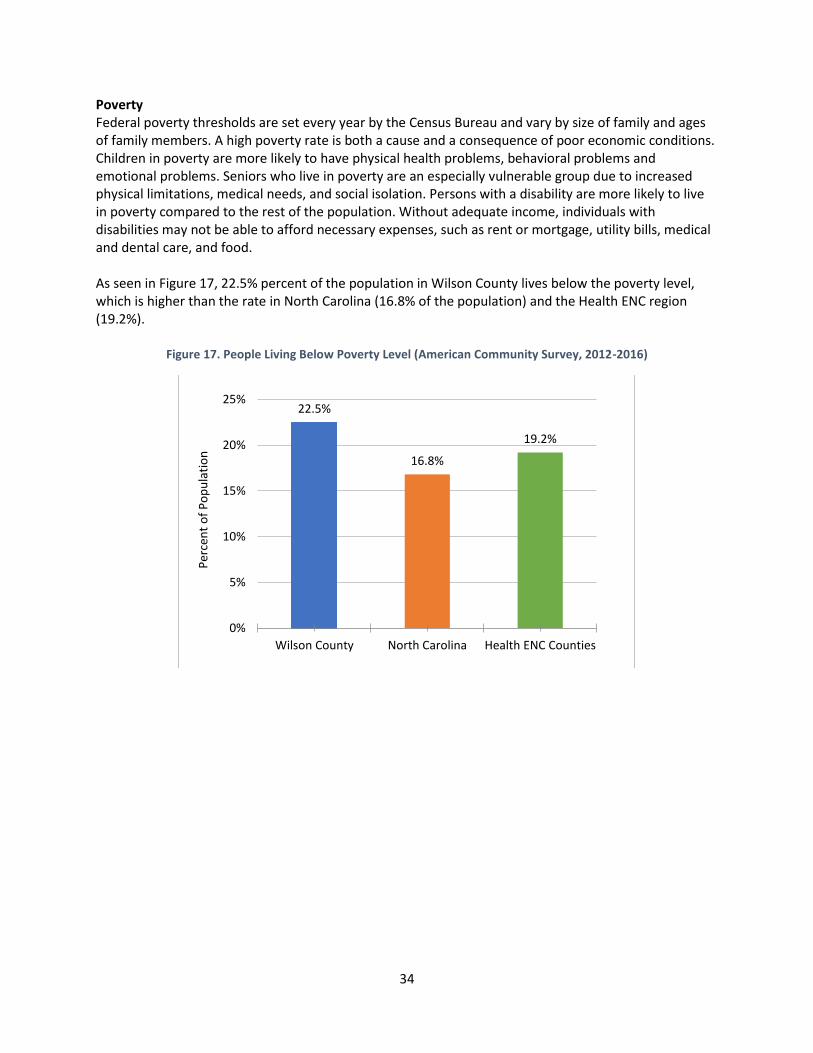
Poverty Federal poverty thresholds are set every year by the Census Bureau and vary by size of family and ages of family members. A high poverty rate is both a cause and a consequence of poor economic conditions. Children in poverty are more likely to have physical health problems, behavioral problems and emotional problems. Seniors who live in poverty are an especially vulnerable group due to increased physical limitations, medical needs, and social isolation. Persons with a disability are more likely to live in poverty compared to the rest of the population. Without adequate income, individuals with disabilities may not be able to afford necessary expenses, such as rent or mortgage, utility bills, medical and dental care, and food. As seen in Figure 17, 22.5% percent of the population in Wilson County lives below the poverty level, which is higher than the rate in North Carolina (16.8% of the population) and the Health ENC region (19.2%).
Figure 17. People Living Below Poverty Level (American Community Survey, 2012-2016)
22.5%
16.8%
19.2%
0%
5%
10%
15%
20%
25%
Wilson County North Carolina Health ENC Counties
Per
cen
t o
f P
op
ula
tio
n
35
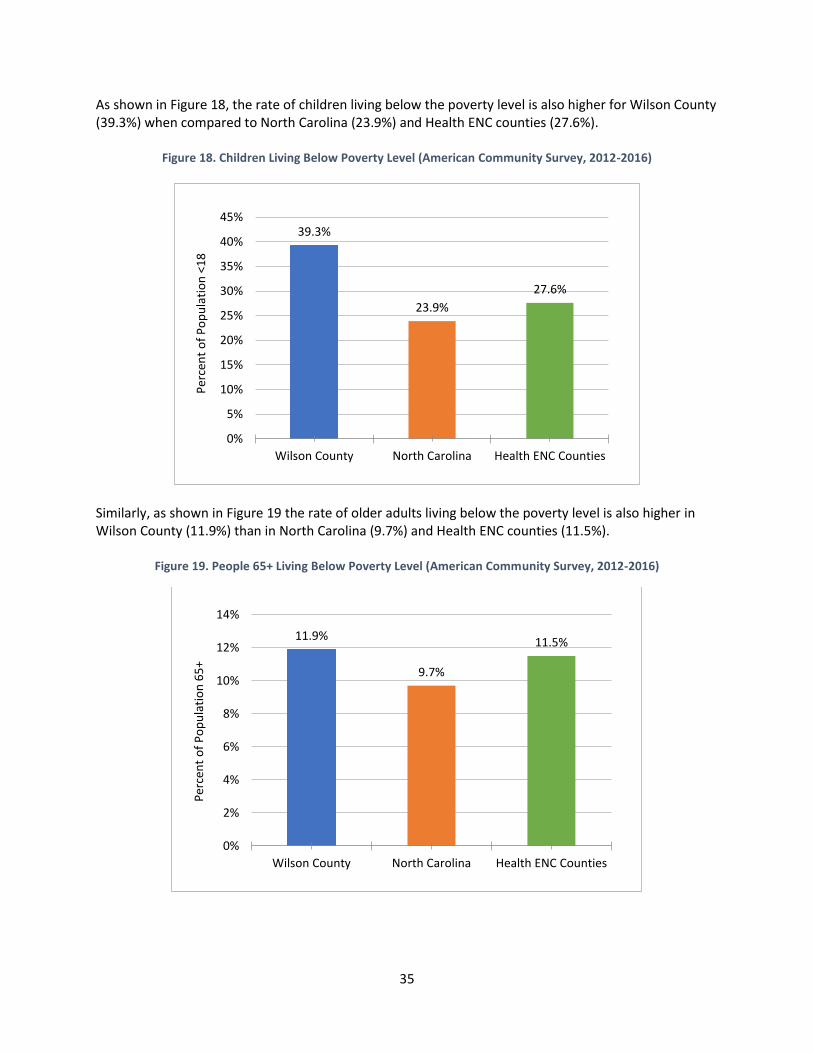
As shown in Figure 18, the rate of children living below the poverty level is also higher for Wilson County (39.3%) when compared to North Carolina (23.9%) and Health ENC counties (27.6%).
Figure 18. Children Living Below Poverty Level (American Community Survey, 2012-2016)
Similarly, as shown in Figure 19 the rate of older adults living below the poverty level is also higher in Wilson County (11.9%) than in North Carolina (9.7%) and Health ENC counties (11.5%).
Figure 19. People 65+ Living Below Poverty Level (American Community Survey, 2012-2016)
39.3%
23.9%
27.6%
0%
5%
10%
15%
20%
25%
30%
35%
40%
45%
Wilson County North Carolina Health ENC Counties
Per
cen
t o
f P
op
ula
tio
n <
18
11.9%
9.7%
11.5%
0%
2%
4%
6%
8%
10%
12%
14%
Wilson County North Carolina Health ENC Counties
Per
cen
t o
f P
op
ula
tio
n 6
5+
36
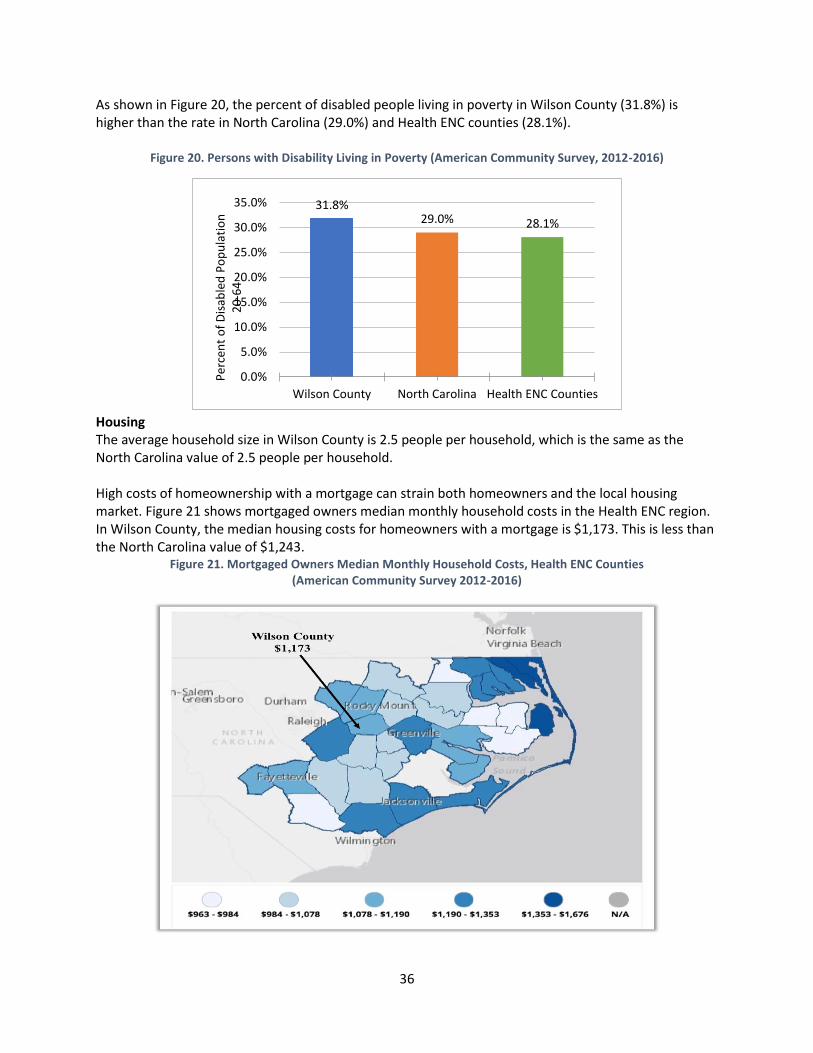
As shown in Figure 20, the percent of disabled people living in poverty in Wilson County (31.8%) is higher than the rate in North Carolina (29.0%) and Health ENC counties (28.1%).
Figure 20. Persons with Disability Living in Poverty (American Community Survey, 2012-2016)
Housing The average household size in Wilson County is 2.5 people per household, which is the same as the North Carolina value of 2.5 people per household. High costs of homeownership with a mortgage can strain both homeowners and the local housing market. Figure 21 shows mortgaged owners median monthly household costs in the Health ENC region. In Wilson County, the median housing costs for homeowners with a mortgage is $1,173. This is less than the North Carolina value of $1,243.
Figure 21. Mortgaged Owners Median Monthly Household Costs, Health ENC Counties (American Community Survey 2012-2016)
31.8%29.0% 28.1%
0.0%
5.0%
10.0%
15.0%
20.0%
25.0%
30.0%
35.0%
Wilson County North Carolina Health ENC Counties
Per
cen
t o
f D
isab
led
Po
pu
lati
on
2
0-6
4
37
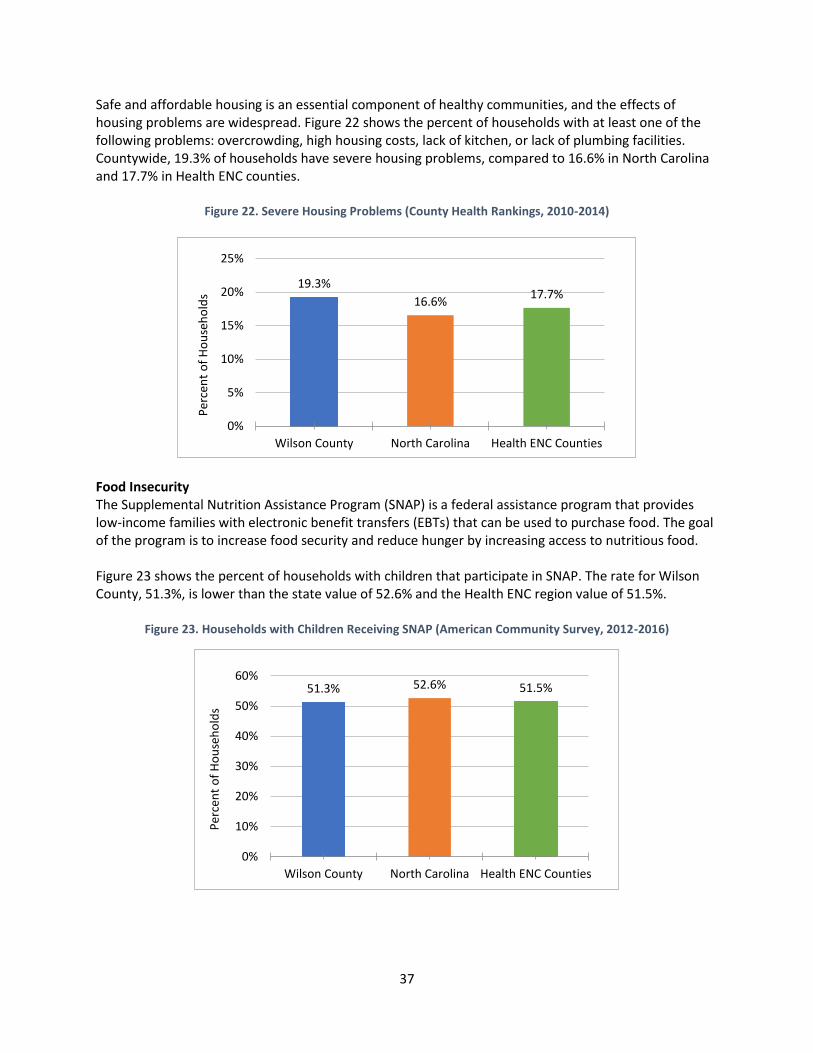
Safe and affordable housing is an essential component of healthy communities, and the effects of housing problems are widespread. Figure 22 shows the percent of households with at least one of the following problems: overcrowding, high housing costs, lack of kitchen, or lack of plumbing facilities. Countywide, 19.3% of households have severe housing problems, compared to 16.6% in North Carolina and 17.7% in Health ENC counties.
Figure 22. Severe Housing Problems (County Health Rankings, 2010-2014)
Food Insecurity The Supplemental Nutrition Assistance Program (SNAP) is a federal assistance program that provides low-income families with electronic benefit transfers (EBTs) that can be used to purchase food. The goal of the program is to increase food security and reduce hunger by increasing access to nutritious food. Figure 23 shows the percent of households with children that participate in SNAP. The rate for Wilson County, 51.3%, is lower than the state value of 52.6% and the Health ENC region value of 51.5%.
Figure 23. Households with Children Receiving SNAP (American Community Survey, 2012-2016)
19.3%
16.6%17.7%
0%
5%
10%
15%
20%
25%
Wilson County North Carolina Health ENC Counties
Per
cen
t o
f H
ou
seh
old
s
51.3% 52.6% 51.5%
0%
10%
20%
30%
40%
50%
60%
Wilson County North Carolina Health ENC Counties
Per
cen
t o
f H
ou
seh
old
s
38
Employment
Major employers
Branch Bank & Trust – Financial
Wilson County Schools – Education
Bridgestone Americas – Manufacturing
Wilson Medical Center – Healthcare Services
S.T. Wooten Construction Co, Inc – Construction
City of Wilson – Public Administration
County of Wilson – Public Administration
Smithfield Foods, Inc - Manufacturing
Kidde Aerospace/Fenway Safety Systems – Manufacturing
Merck Manufacturing – Manufacturing
Alliance One International – Manufacturing
NC Department of Health & Human Services – Public Administration
Wal-Mart Associates, Inc – Trade, Transportation & Utilities
Wilson Community College – Education
Barton College – Education
SocioNeeds Index Multiple socioeconomic factors across geographies were compared through Conduent’s SocioNeeds Index®. This index incorporates estimates for six different social and economic determinants of health – income, poverty, unemployment, occupation, educational attainment, and linguistic barriers – that are associated with poor health outcomes including preventable hospitalizations and premature death. Zip codes within Wilson County are assigned an index value from 0 (low need) to 100 (high need), based on how those zip codes compare to others in the U.S. Within Wilson County, the zip codes are then ranked from 1 (low need) to 5 (high need) to identify the relative level of need. Zip codes with populations under 300 persons are excluded. Zip code 27893, with an index value of 91.4, has the highest level of socioeconomic need within Wilson County. This is illustrated in Figure 24. Index values and the relative ranking of each zip code within Wilson County are provided in Table 7.
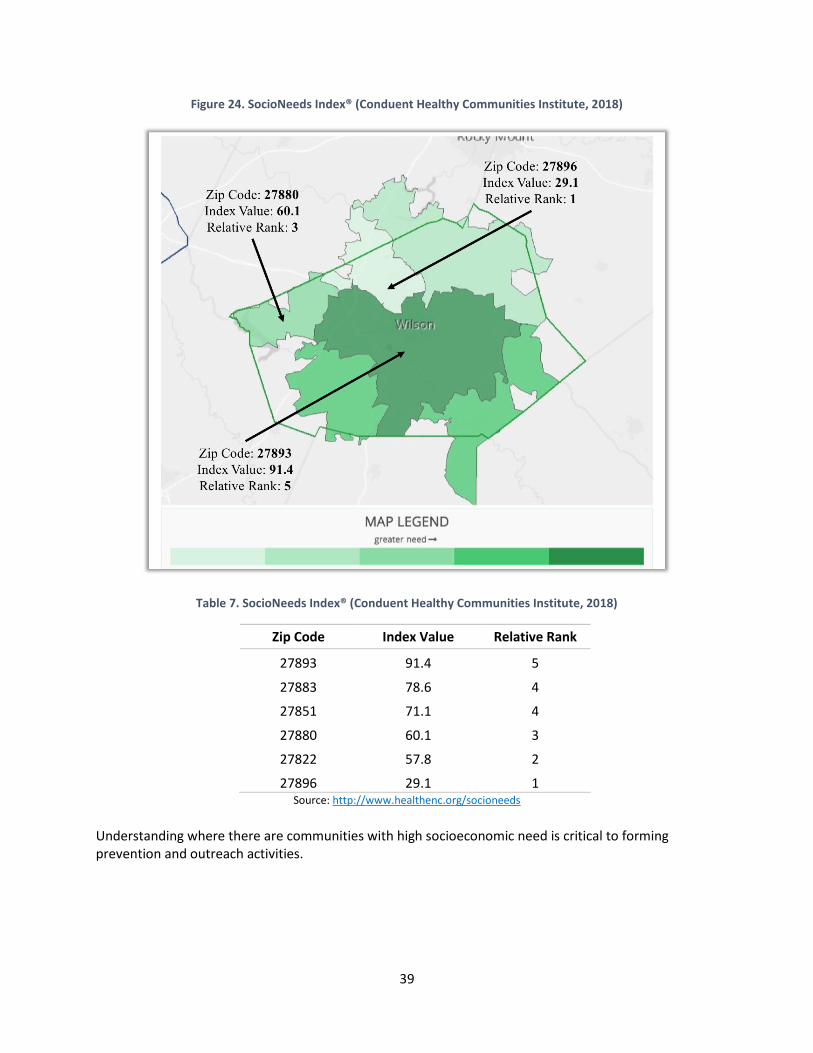
39
Figure 24. SocioNeeds Index® (Conduent Healthy Communities Institute, 2018)
Table 7. SocioNeeds Index® (Conduent Healthy Communities Institute, 2018)
Zip Code Index Value Relative Rank
27893 91.4 5
27883 78.6 4
27851 71.1 4
27880 60.1 3
27822 57.8 2
27896 29.1 1 Source: http://www.healthenc.org/socioneeds
Understanding where there are communities with high socioeconomic need is critical to forming prevention and outreach activities.
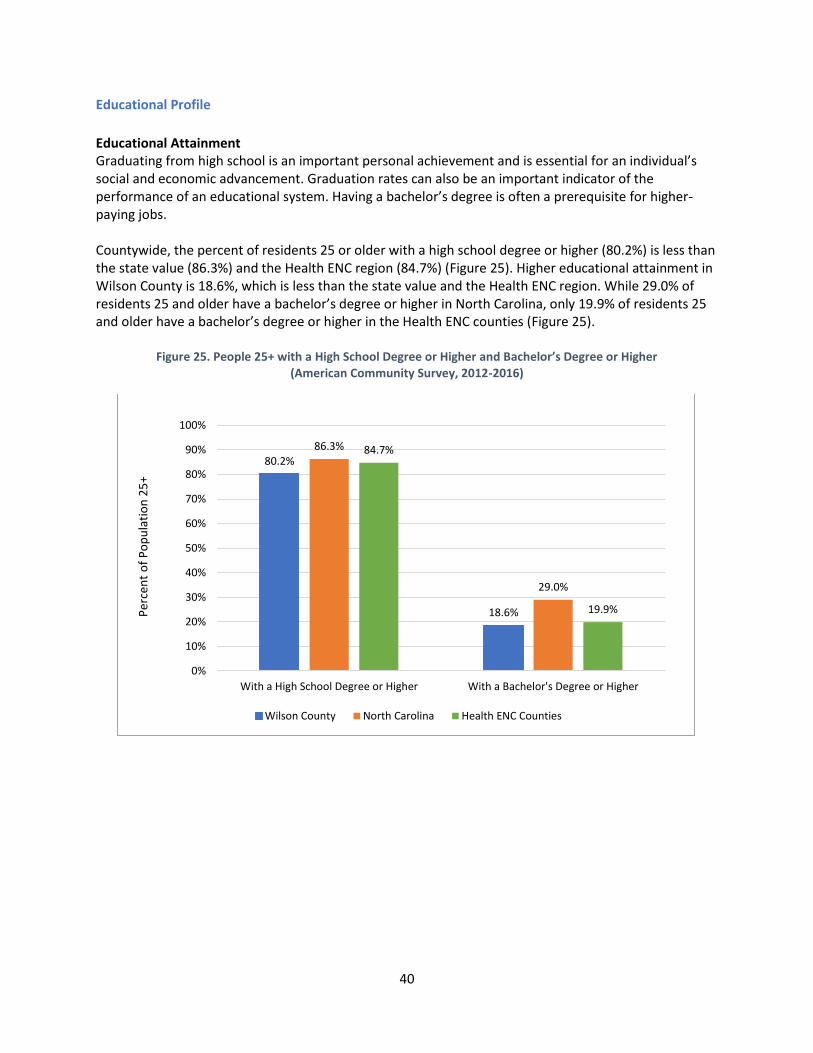
40
Educational Profile
Educational Attainment Graduating from high school is an important personal achievement and is essential for an individual’s social and economic advancement. Graduation rates can also be an important indicator of the performance of an educational system. Having a bachelor’s degree is often a prerequisite for higher-paying jobs. Countywide, the percent of residents 25 or older with a high school degree or higher (80.2%) is less than the state value (86.3%) and the Health ENC region (84.7%) (Figure 25). Higher educational attainment in Wilson County is 18.6%, which is less than the state value and the Health ENC region. While 29.0% of residents 25 and older have a bachelor’s degree or higher in North Carolina, only 19.9% of residents 25 and older have a bachelor’s degree or higher in the Health ENC counties (Figure 25).
Figure 25. People 25+ with a High School Degree or Higher and Bachelor’s Degree or Higher (American Community Survey, 2012-2016)
80.2%
18.6%
86.3%
29.0%
84.7%
19.9%
0%
10%
20%
30%
40%
50%
60%
70%
80%
90%
100%
With a High School Degree or Higher With a Bachelor's Degree or Higher
Per
cen
t o
f P
op
ula
tio
n 2
5+
Wilson County North Carolina Health ENC Counties
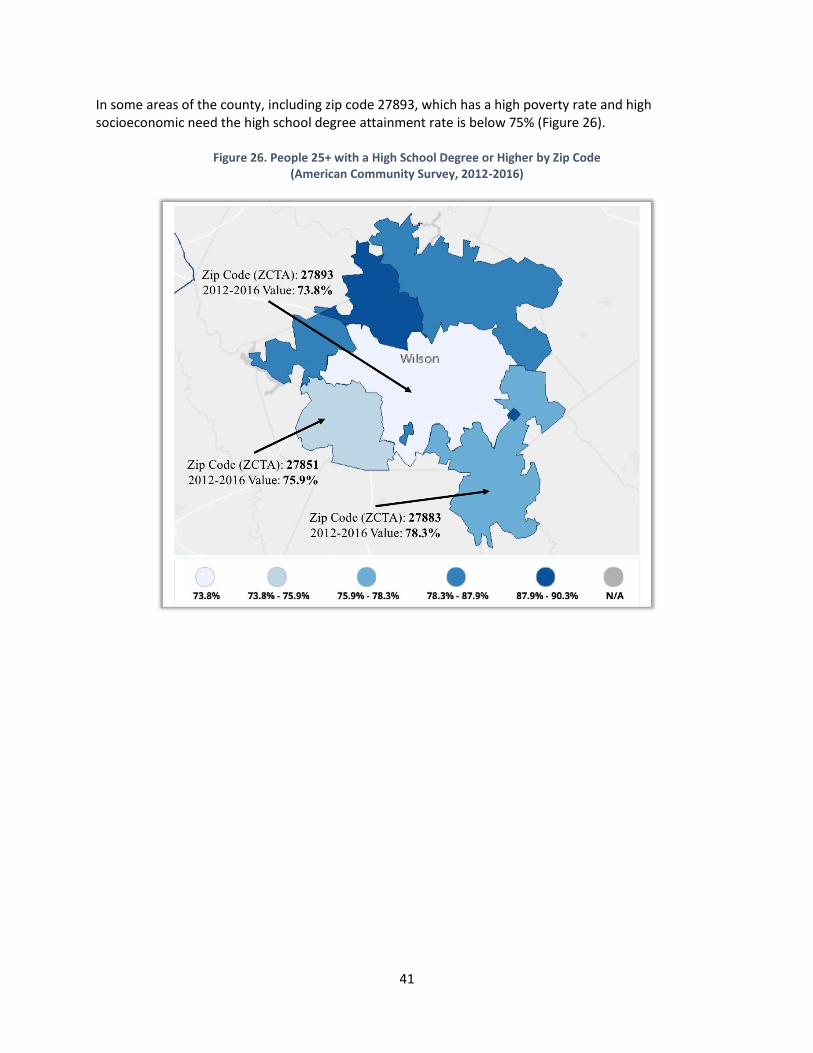
41
In some areas of the county, including zip code 27893, which has a high poverty rate and high socioeconomic need the high school degree attainment rate is below 75% (Figure 26).
Figure 26. People 25+ with a High School Degree or Higher by Zip Code (American Community Survey, 2012-2016)
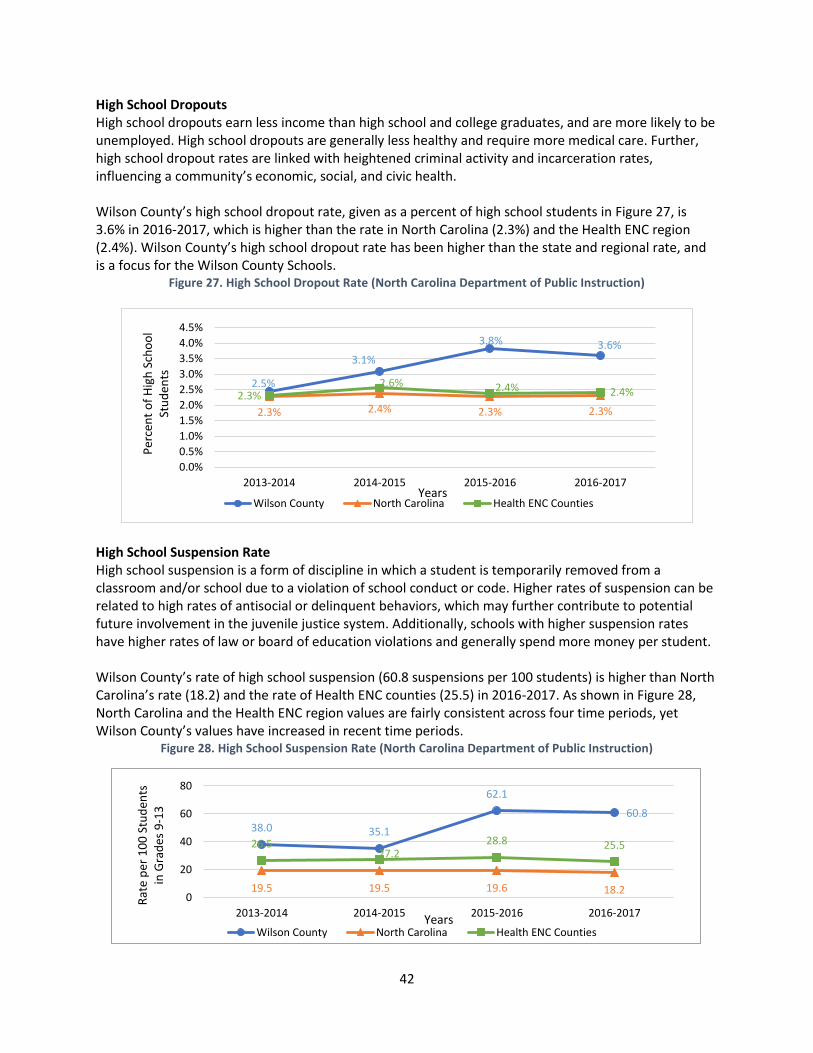
42
High School Dropouts High school dropouts earn less income than high school and college graduates, and are more likely to be unemployed. High school dropouts are generally less healthy and require more medical care. Further, high school dropout rates are linked with heightened criminal activity and incarceration rates, influencing a community’s economic, social, and civic health. Wilson County’s high school dropout rate, given as a percent of high school students in Figure 27, is 3.6% in 2016-2017, which is higher than the rate in North Carolina (2.3%) and the Health ENC region (2.4%). Wilson County’s high school dropout rate has been higher than the state and regional rate, and is a focus for the Wilson County Schools.
Figure 27. High School Dropout Rate (North Carolina Department of Public Instruction)
High School Suspension Rate High school suspension is a form of discipline in which a student is temporarily removed from a classroom and/or school due to a violation of school conduct or code. Higher rates of suspension can be related to high rates of antisocial or delinquent behaviors, which may further contribute to potential future involvement in the juvenile justice system. Additionally, schools with higher suspension rates have higher rates of law or board of education violations and generally spend more money per student. Wilson County’s rate of high school suspension (60.8 suspensions per 100 students) is higher than North Carolina’s rate (18.2) and the rate of Health ENC counties (25.5) in 2016-2017. As shown in Figure 28, North Carolina and the Health ENC region values are fairly consistent across four time periods, yet Wilson County’s values have increased in recent time periods.
Figure 28. High School Suspension Rate (North Carolina Department of Public Instruction)
2.5%
3.1%
3.8% 3.6%
2.3% 2.4% 2.3% 2.3%
2.3%2.6% 2.4% 2.4%
0.0%
0.5%
1.0%
1.5%
2.0%
2.5%
3.0%
3.5%
4.0%
4.5%
2013-2014 2014-2015 2015-2016 2016-2017
Per
cen
t o
f H
igh
Sch
oo
l St
ud
ents
YearsWilson County North Carolina Health ENC Counties
38.0 35.1
62.1
60.8
19.5 19.5 19.6 18.2
26.527.2
28.8 25.5
0
20
40
60
80
2013-2014 2014-2015 2015-2016 2016-2017
Rat
e p
er 1
00
Stu
den
ts
in G
rad
es 9
-13
YearsWilson County North Carolina Health ENC Counties
43
The Wilson County Educational System includes:
Wilson County Public Schools B.O. Barnes Elementary School Beddingfield High School Charles H. Darden Middle School Elm City Middle School Fike High School Forest Hills Middle School Frederick Douglass Elementary School Gardners Elementary School James Hunt High School John W. Jones Elementary School Lee Woodard Elementary School Lucama Elementary School Margaret Hearne Elementary School Milton Daniels Learning Center New Hope Elementary School Rock Ridge Elementary School Speight Middle School
Springfield Middle School Stantonsburg Elementary School Toisnot Middle School Vick Elementary School Vinson-Bynum Elementary School Wells Elementary School Winstead Elementary School Charter Schools/Specialty Eastern NC School for the Deaf Sallie B. Howard School Wilson Preparatory Academy Wilson Early College Academy Private / Specialty Schools Community Christian School Greenfield School Wilson Christian Academy Colleges Barton College Wilson Community College
Environmental Profile Water Quality There are ten community water systems in Wilson County that serve people year-round. The majority of Wilson County’s drinking water is obtained from Contentnea Creek and the Tar River. The Wilson County Health Department’s Environmental Health Division maintains the quality and safety of water and water systems through inspections and permits and the N.C. Department of Environmental Quality Division of Water Resources oversees their process. On September 28, 2018, the N.C. Department of Environmental Quality Division of Water Resources issued a notice of deficiency to the town of Lucama citing high iron and manganese levels in the water being sold to residents. Further research showed that the water treatment provided was not adequately removing or controlling the concentration of iron and manganese and providing trouble-free, satisfactorily water to customers. The town has received two grants from the state. The first grant in the amount of $500,000 will fund the renovation of a well and replace a filter at the water treatment plant and the second grant in the amount of $2.2 million will replace waterlines and make additional improvements to the water treatment plant. Air Quality The North Carolina Department of Environment and Natural Resources’ (NCDENR) Division of Air Quality monitors ambient (outdoor) air quality throughout the State to protect the public from harmful ozone and fine particle pollutants. The Environmental Protection Agency’s (EPA) Air Quality Index Color Code Guide is used to inform and alert the public of air quality issues related to these pollutants. Air pollution levels in the green category are satisfactory and pose little or no health effects. Air pollution levels in the yellow, orange, red, purple and maroon categories exceed the Environmental Protection Agency’s standard and may pose health risks to some or all populations.
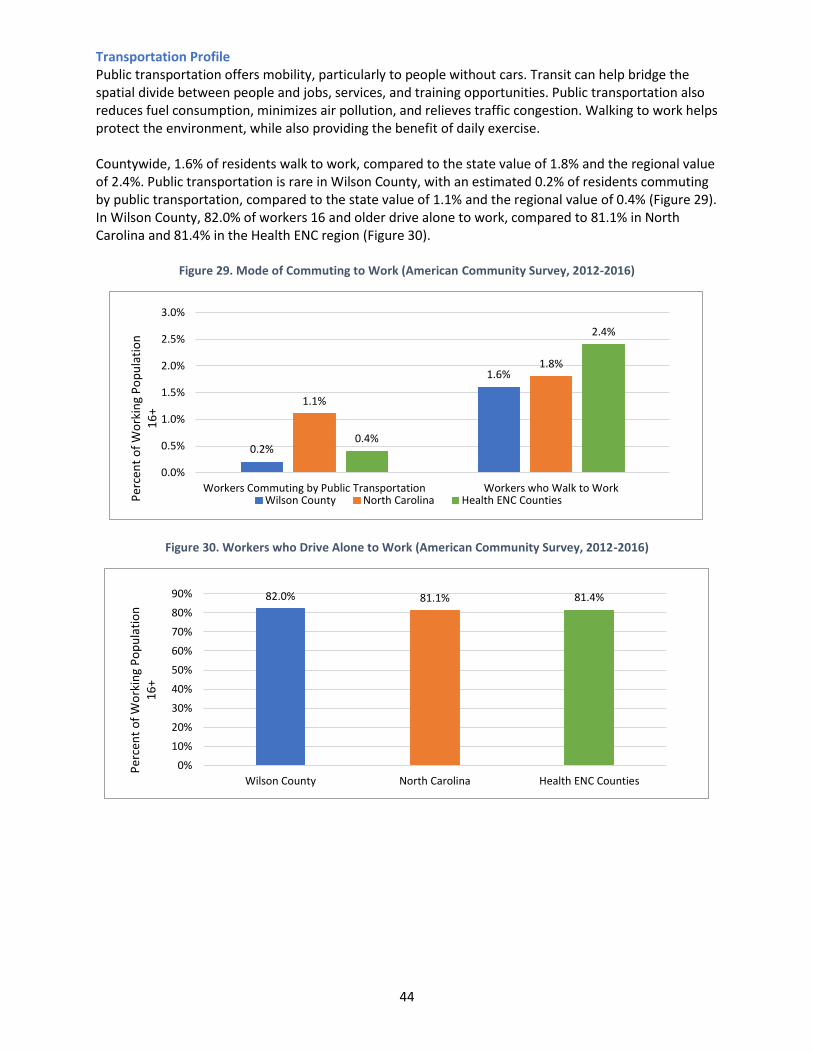
44
Transportation Profile Public transportation offers mobility, particularly to people without cars. Transit can help bridge the spatial divide between people and jobs, services, and training opportunities. Public transportation also reduces fuel consumption, minimizes air pollution, and relieves traffic congestion. Walking to work helps protect the environment, while also providing the benefit of daily exercise. Countywide, 1.6% of residents walk to work, compared to the state value of 1.8% and the regional value of 2.4%. Public transportation is rare in Wilson County, with an estimated 0.2% of residents commuting by public transportation, compared to the state value of 1.1% and the regional value of 0.4% (Figure 29). In Wilson County, 82.0% of workers 16 and older drive alone to work, compared to 81.1% in North Carolina and 81.4% in the Health ENC region (Figure 30).
Figure 29. Mode of Commuting to Work (American Community Survey, 2012-2016)
Figure 30. Workers who Drive Alone to Work (American Community Survey, 2012-2016)
0.2%
1.6%
1.1%
1.8%
0.4%
2.4%
0.0%
0.5%
1.0%
1.5%
2.0%
2.5%
3.0%
Workers Commuting by Public Transportation Workers who Walk to Work
Per
cen
t o
f W
ork
ing
Po
pu
lati
on
1
6+
Wilson County North Carolina Health ENC Counties
82.0% 81.1% 81.4%
0%
10%
20%
30%
40%
50%
60%
70%
80%
90%
Wilson County North Carolina Health ENC Counties
Per
cen
t o
f W
ork
ing
Po
pu
lati
on
1
6+
45
Transportation System Amtrak Amtrak travels all the way to New York City. Both the Piedmont and the Carolinas will transport passengers to and from the Queen City of Charlotte and the state capital of Raleigh. Wilson Industrial Air Center The Wilson Industrial Air Center is located five miles from I-95. Wilson Industrial Air Center offers onsite industrial lots with taxi-way access available for immediate development. Zoned for light industrial, flexible site plan has been developed for the Air Center. The runway has three 4,500 foot runways, one which is lighted, the airport is used extensively by industrial, commercial, governmental, medical, law enforcement, military, and recreation. Businesses in Wilson County like the idea of having the proximity of the Wilson Industrial Air Center because of saving time and money. Frequently the North Carolina Department of Commerce uses the facility to bring industrial prospects to visit Wilson. Aerial tours of sites and buildings, as well as of the city itself, are taken from the Air Center. “The Wilson Industrial Air Center”, according to former Governor Jim Hunt is a tremendous asset for this community and benefit to any company that locates here. Wilson Transit System Wilson Transit System, or WTS, operates fixed- route buses and provides taxicab shuttle services within the city of Wilson. Hours of operation are 6:30 am to 6:30 pm., Monday through Friday, with limited service on Saturday. Wilson County Transportation Service has a fleet of fourteen vehicles, including nine specially modified vans to accommodate the elderly and handicapped, four standard vans and one mini-van. These services are currently available to citizens twenty-four hours per day, three-hundred sixty-four days per year, closing only on Christmas Day. Services include the following sites:
Wilson County Department of Social Services
Diversified Opportunities
Wilson Transit System
Wilson County Office of Senior Citizens Affairs
Wilson County Services for the Blind
Highway Systems There are major highways that intersect in Wilson.
U.S. Highways include: US 117, US 264, US 264 Alt, US 301
State Highways include: NC 42, NC 58, NC 111, NC 222, NC 581
Interstates: I-95, I-795 Raleigh Durham International Airport Raleigh Durham International Airport is conveniently located forty-five minutes west of Wilson, NC.
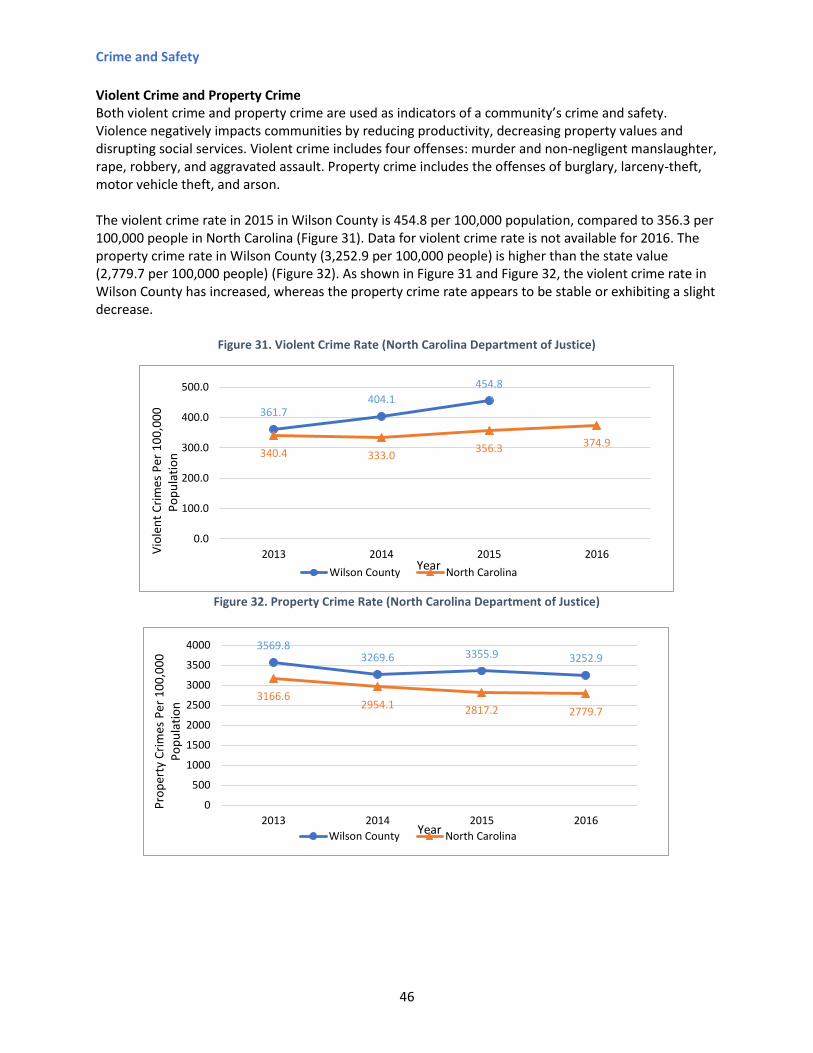
46
Crime and Safety
Violent Crime and Property Crime Both violent crime and property crime are used as indicators of a community’s crime and safety. Violence negatively impacts communities by reducing productivity, decreasing property values and disrupting social services. Violent crime includes four offenses: murder and non-negligent manslaughter, rape, robbery, and aggravated assault. Property crime includes the offenses of burglary, larceny-theft, motor vehicle theft, and arson. The violent crime rate in 2015 in Wilson County is 454.8 per 100,000 population, compared to 356.3 per 100,000 people in North Carolina (Figure 31). Data for violent crime rate is not available for 2016. The property crime rate in Wilson County (3,252.9 per 100,000 people) is higher than the state value (2,779.7 per 100,000 people) (Figure 32). As shown in Figure 31 and Figure 32, the violent crime rate in Wilson County has increased, whereas the property crime rate appears to be stable or exhibiting a slight decrease.
Figure 31. Violent Crime Rate (North Carolina Department of Justice)
Figure 32. Property Crime Rate (North Carolina Department of Justice)
361.7404.1
454.8
340.4 333.0356.3 374.9
0.0
100.0
200.0
300.0
400.0
500.0
2013 2014 2015 2016Vio
len
t C
rim
es P
er 1
00
,00
0
Po
pu
lati
on
YearWilson County North Carolina
3569.83269.6 3355.9 3252.9
3166.62954.1 2817.2 2779.7
0
500
1000
1500
2000
2500
3000
3500
4000
2013 2014 2015 2016
Pro
per
ty C
rim
es P
er 1
00
,00
0
Po
pu
lati
on
YearWilson County North Carolina
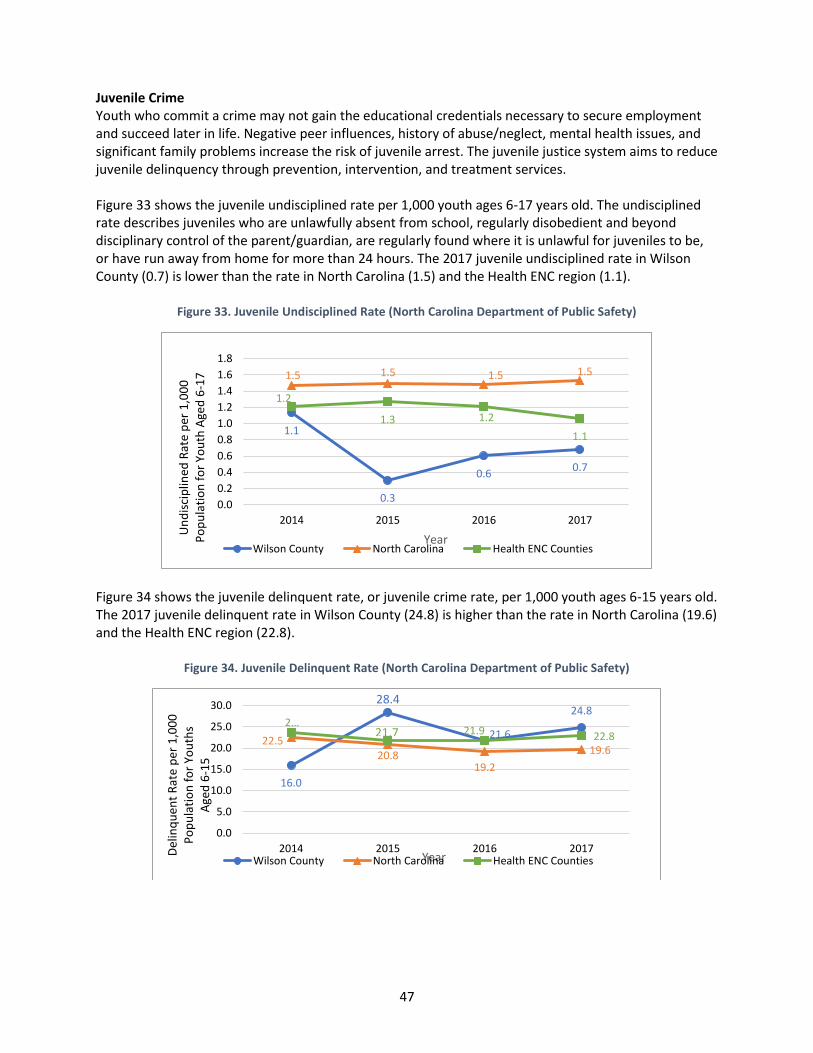
47
Juvenile Crime Youth who commit a crime may not gain the educational credentials necessary to secure employment and succeed later in life. Negative peer influences, history of abuse/neglect, mental health issues, and significant family problems increase the risk of juvenile arrest. The juvenile justice system aims to reduce juvenile delinquency through prevention, intervention, and treatment services. Figure 33 shows the juvenile undisciplined rate per 1,000 youth ages 6-17 years old. The undisciplined rate describes juveniles who are unlawfully absent from school, regularly disobedient and beyond disciplinary control of the parent/guardian, are regularly found where it is unlawful for juveniles to be, or have run away from home for more than 24 hours. The 2017 juvenile undisciplined rate in Wilson County (0.7) is lower than the rate in North Carolina (1.5) and the Health ENC region (1.1).
Figure 33. Juvenile Undisciplined Rate (North Carolina Department of Public Safety)
Figure 34 shows the juvenile delinquent rate, or juvenile crime rate, per 1,000 youth ages 6-15 years old. The 2017 juvenile delinquent rate in Wilson County (24.8) is higher than the rate in North Carolina (19.6) and the Health ENC region (22.8).
Figure 34. Juvenile Delinquent Rate (North Carolina Department of Public Safety)
1.1
0.3
0.60.7
1.5 1.5 1.5 1.5
1.2
1.3 1.2
1.1
0.0
0.2
0.4
0.6
0.8
1.0
1.2
1.4
1.6
1.8
2014 2015 2016 2017
Un
dis
cip
lined
Rat
e p
er 1
,00
0
Po
pu
lati
on
fo
r Yo
uth
Age
d 6
-17
YearWilson County North Carolina Health ENC Counties
16.0
28.4
21.6
24.8
22.520.8
19.2
19.6
2…21.7 21.9 22.8
0.0
5.0
10.0
15.0
20.0
25.0
30.0
2014 2015 2016 2017Del
inq
uen
t R
ate
per
1,0
00
P
op
ula
tio
n f
or
You
ths
Age
d 6
-15
YearWilson County North Carolina Health ENC Counties
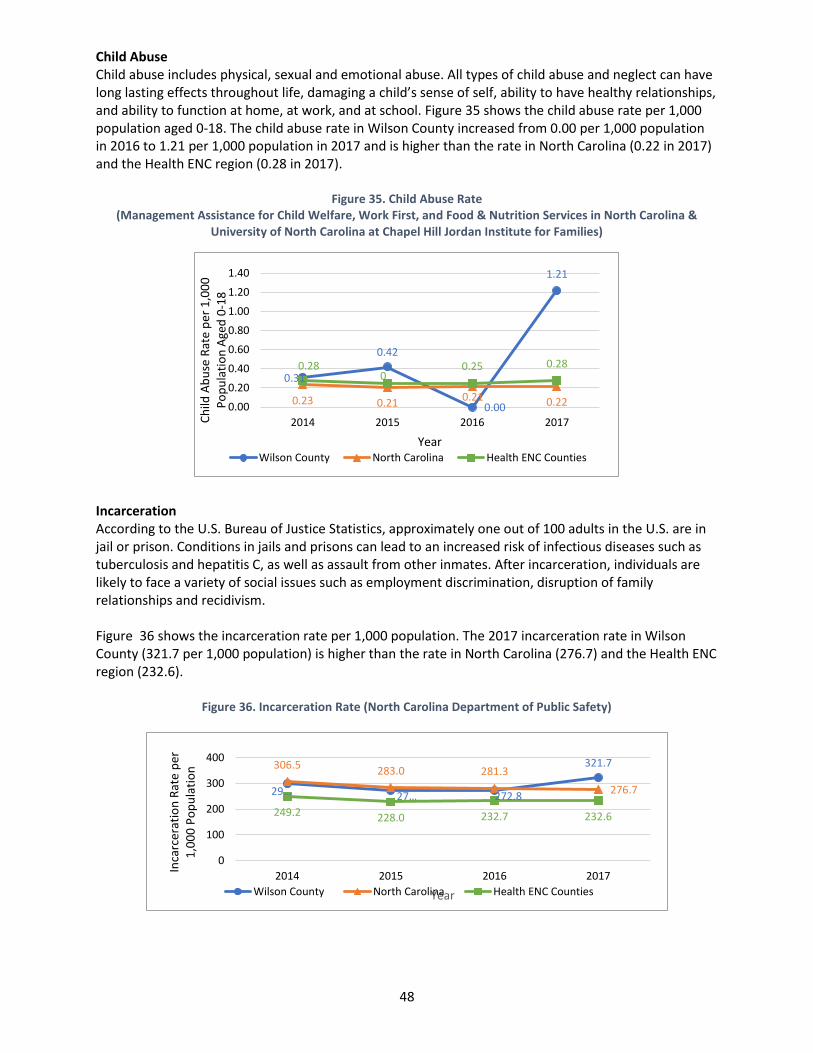
48
Child Abuse Child abuse includes physical, sexual and emotional abuse. All types of child abuse and neglect can have long lasting effects throughout life, damaging a child’s sense of self, ability to have healthy relationships, and ability to function at home, at work, and at school. Figure 35 shows the child abuse rate per 1,000 population aged 0-18. The child abuse rate in Wilson County increased from 0.00 per 1,000 population in 2016 to 1.21 per 1,000 population in 2017 and is higher than the rate in North Carolina (0.22 in 2017) and the Health ENC region (0.28 in 2017).
Figure 35. Child Abuse Rate (Management Assistance for Child Welfare, Work First, and Food & Nutrition Services in North Carolina &
University of North Carolina at Chapel Hill Jordan Institute for Families)
Incarceration According to the U.S. Bureau of Justice Statistics, approximately one out of 100 adults in the U.S. are in jail or prison. Conditions in jails and prisons can lead to an increased risk of infectious diseases such as tuberculosis and hepatitis C, as well as assault from other inmates. After incarceration, individuals are likely to face a variety of social issues such as employment discrimination, disruption of family relationships and recidivism. Figure 36 shows the incarceration rate per 1,000 population. The 2017 incarceration rate in Wilson County (321.7 per 1,000 population) is higher than the rate in North Carolina (276.7) and the Health ENC region (232.6).
Figure 36. Incarceration Rate (North Carolina Department of Public Safety)
0.31
0.42
0.00
1.21
0.23 0.210.21 0.22
0.280
0.25 0.28
0.00
0.20
0.40
0.60
0.80
1.00
1.20
1.40
2014 2015 2016 2017Ch
ild A
bu
se R
ate
per
1,0
00
P
op
ula
tio
n A
ged
0-1
8
YearWilson County North Carolina Health ENC Counties
29… 27… 272.8
321.7306.5283.0 281.3
276.7
249.2 228.0 232.7 232.6
0
100
200
300
400
2014 2015 2016 2017
Inca
rcer
atio
n R
ate
per
1
,00
0 P
op
ula
tio
n
YearWilson County North Carolina Health ENC Counties
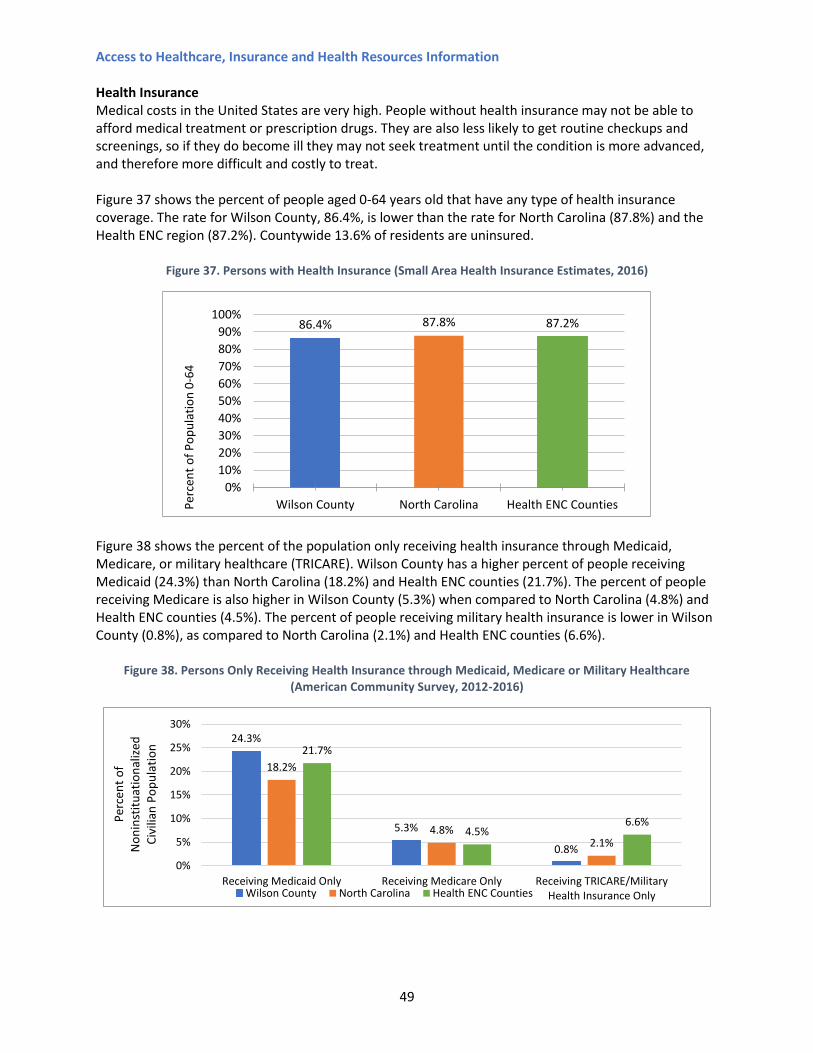
49
Access to Healthcare, Insurance and Health Resources Information Health Insurance Medical costs in the United States are very high. People without health insurance may not be able to afford medical treatment or prescription drugs. They are also less likely to get routine checkups and screenings, so if they do become ill they may not seek treatment until the condition is more advanced, and therefore more difficult and costly to treat. Figure 37 shows the percent of people aged 0-64 years old that have any type of health insurance coverage. The rate for Wilson County, 86.4%, is lower than the rate for North Carolina (87.8%) and the Health ENC region (87.2%). Countywide 13.6% of residents are uninsured.
Figure 37. Persons with Health Insurance (Small Area Health Insurance Estimates, 2016)
Figure 38 shows the percent of the population only receiving health insurance through Medicaid, Medicare, or military healthcare (TRICARE). Wilson County has a higher percent of people receiving Medicaid (24.3%) than North Carolina (18.2%) and Health ENC counties (21.7%). The percent of people receiving Medicare is also higher in Wilson County (5.3%) when compared to North Carolina (4.8%) and Health ENC counties (4.5%). The percent of people receiving military health insurance is lower in Wilson County (0.8%), as compared to North Carolina (2.1%) and Health ENC counties (6.6%).
Figure 38. Persons Only Receiving Health Insurance through Medicaid, Medicare or Military Healthcare (American Community Survey, 2012-2016)
86.4% 87.8% 87.2%
0%
10%
20%
30%
40%
50%
60%
70%
80%
90%
100%
Wilson County North Carolina Health ENC CountiesPer
cen
t o
f P
op
ula
tio
n 0
-64
24.3%
5.3%
0.8%
18.2%
4.8%2.1%
21.7%
4.5%6.6%
0%
5%
10%
15%
20%
25%
30%
Receiving Medicaid Only Receiving Medicare Only Receiving TRICARE/MilitaryHealth Insurance Only
Per
cen
t o
f N
on
inst
itu
atio
nal
ized
C
ivili
an P
op
ula
tio
n
Wilson County North Carolina Health ENC Counties
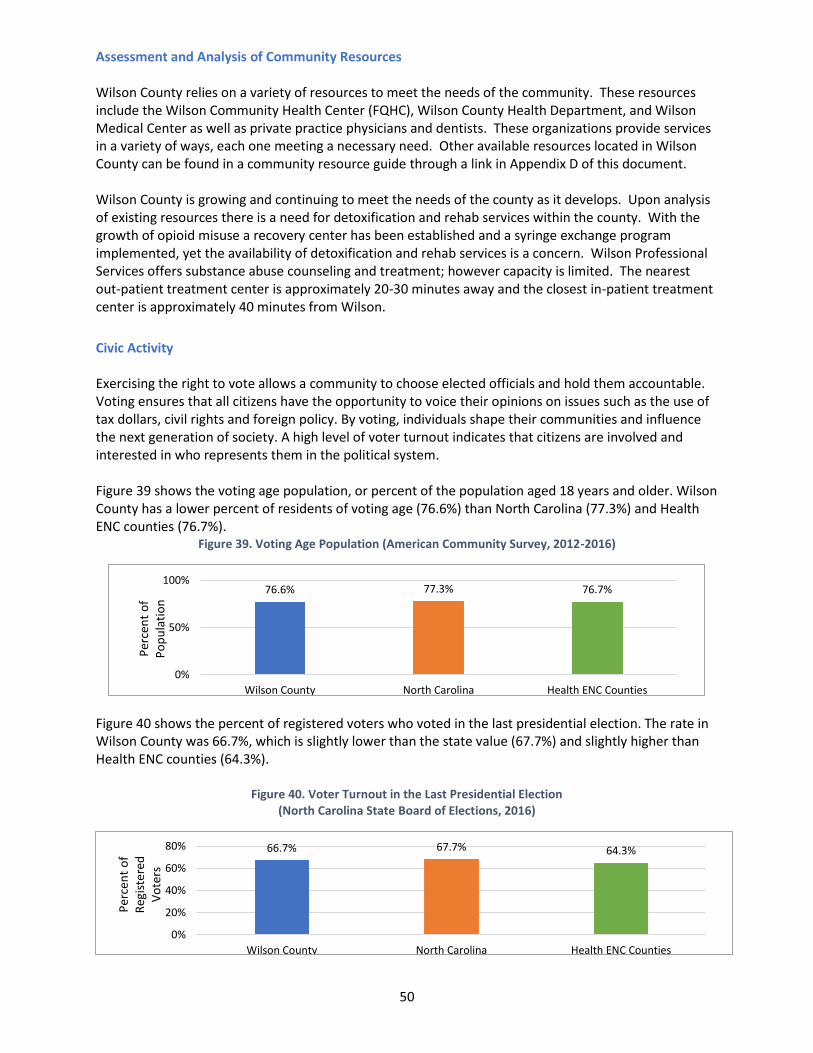
50
Assessment and Analysis of Community Resources Wilson County relies on a variety of resources to meet the needs of the community. These resources include the Wilson Community Health Center (FQHC), Wilson County Health Department, and Wilson Medical Center as well as private practice physicians and dentists. These organizations provide services in a variety of ways, each one meeting a necessary need. Other available resources located in Wilson County can be found in a community resource guide through a link in Appendix D of this document. Wilson County is growing and continuing to meet the needs of the county as it develops. Upon analysis of existing resources there is a need for detoxification and rehab services within the county. With the growth of opioid misuse a recovery center has been established and a syringe exchange program implemented, yet the availability of detoxification and rehab services is a concern. Wilson Professional Services offers substance abuse counseling and treatment; however capacity is limited. The nearest out-patient treatment center is approximately 20-30 minutes away and the closest in-patient treatment center is approximately 40 minutes from Wilson.
Civic Activity Exercising the right to vote allows a community to choose elected officials and hold them accountable. Voting ensures that all citizens have the opportunity to voice their opinions on issues such as the use of tax dollars, civil rights and foreign policy. By voting, individuals shape their communities and influence the next generation of society. A high level of voter turnout indicates that citizens are involved and interested in who represents them in the political system. Figure 39 shows the voting age population, or percent of the population aged 18 years and older. Wilson County has a lower percent of residents of voting age (76.6%) than North Carolina (77.3%) and Health ENC counties (76.7%).
Figure 39. Voting Age Population (American Community Survey, 2012-2016)
Figure 40 shows the percent of registered voters who voted in the last presidential election. The rate in Wilson County was 66.7%, which is slightly lower than the state value (67.7%) and slightly higher than Health ENC counties (64.3%).
Figure 40. Voter Turnout in the Last Presidential Election (North Carolina State Board of Elections, 2016)
76.6% 77.3% 76.7%
0%
50%
100%
Wilson County North Carolina Health ENC Counties
Per
cen
t o
f P
op
ula
tio
n
66.7% 67.7% 64.3%
0%
20%
40%
60%
80%
Wilson County North Carolina Health ENC Counties
Per
cen
t o
f R
egis
tere
d
Vo
ters
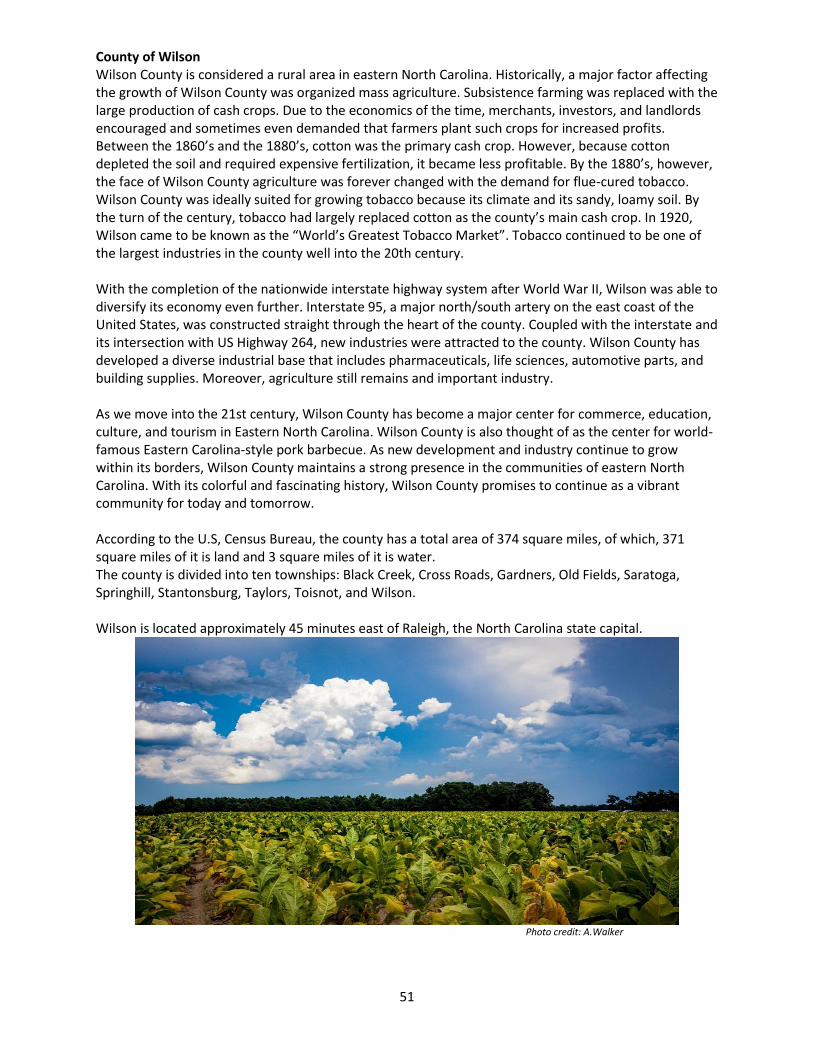
51
County of Wilson Wilson County is considered a rural area in eastern North Carolina. Historically, a major factor affecting the growth of Wilson County was organized mass agriculture. Subsistence farming was replaced with the large production of cash crops. Due to the economics of the time, merchants, investors, and landlords encouraged and sometimes even demanded that farmers plant such crops for increased profits. Between the 1860’s and the 1880’s, cotton was the primary cash crop. However, because cotton depleted the soil and required expensive fertilization, it became less profitable. By the 1880’s, however, the face of Wilson County agriculture was forever changed with the demand for flue-cured tobacco. Wilson County was ideally suited for growing tobacco because its climate and its sandy, loamy soil. By the turn of the century, tobacco had largely replaced cotton as the county’s main cash crop. In 1920, Wilson came to be known as the “World’s Greatest Tobacco Market”. Tobacco continued to be one of the largest industries in the county well into the 20th century. With the completion of the nationwide interstate highway system after World War II, Wilson was able to diversify its economy even further. Interstate 95, a major north/south artery on the east coast of the United States, was constructed straight through the heart of the county. Coupled with the interstate and its intersection with US Highway 264, new industries were attracted to the county. Wilson County has developed a diverse industrial base that includes pharmaceuticals, life sciences, automotive parts, and building supplies. Moreover, agriculture still remains and important industry. As we move into the 21st century, Wilson County has become a major center for commerce, education, culture, and tourism in Eastern North Carolina. Wilson County is also thought of as the center for world-famous Eastern Carolina-style pork barbecue. As new development and industry continue to grow within its borders, Wilson County maintains a strong presence in the communities of eastern North Carolina. With its colorful and fascinating history, Wilson County promises to continue as a vibrant community for today and tomorrow. According to the U.S, Census Bureau, the county has a total area of 374 square miles, of which, 371 square miles of it is land and 3 square miles of it is water. The county is divided into ten townships: Black Creek, Cross Roads, Gardners, Old Fields, Saratoga, Springhill, Stantonsburg, Taylors, Toisnot, and Wilson. Wilson is located approximately 45 minutes east of Raleigh, the North Carolina state capital.
Photo credit: A.Walker
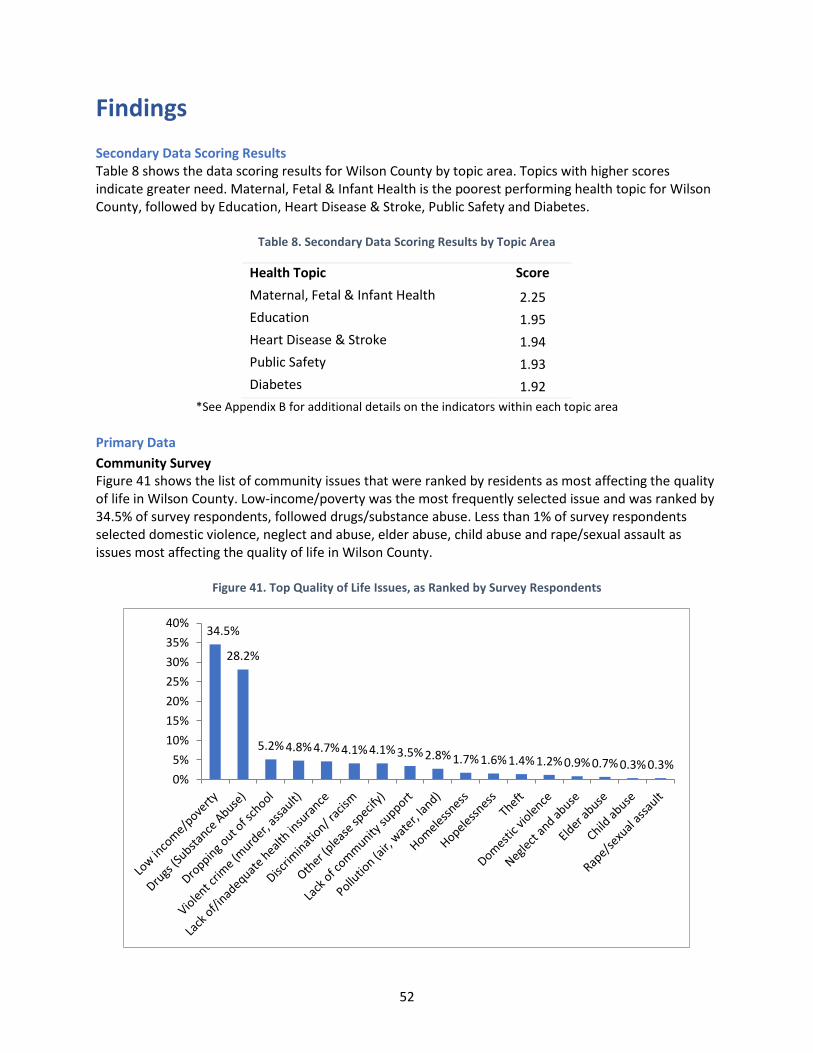
52
Findings
Secondary Data Scoring Results Table 8 shows the data scoring results for Wilson County by topic area. Topics with higher scores indicate greater need. Maternal, Fetal & Infant Health is the poorest performing health topic for Wilson County, followed by Education, Heart Disease & Stroke, Public Safety and Diabetes.
Table 8. Secondary Data Scoring Results by Topic Area
Health Topic Score
Maternal, Fetal & Infant Health 2.25
Education 1.95
Heart Disease & Stroke 1.94
Public Safety 1.93
Diabetes 1.92
*See Appendix B for additional details on the indicators within each topic area
Primary Data
Community Survey Figure 41 shows the list of community issues that were ranked by residents as most affecting the quality of life in Wilson County. Low-income/poverty was the most frequently selected issue and was ranked by 34.5% of survey respondents, followed drugs/substance abuse. Less than 1% of survey respondents selected domestic violence, neglect and abuse, elder abuse, child abuse and rape/sexual assault as issues most affecting the quality of life in Wilson County.
Figure 41. Top Quality of Life Issues, as Ranked by Survey Respondents
34.5%
28.2%
5.2% 4.8% 4.7% 4.1% 4.1% 3.5% 2.8% 1.7% 1.6% 1.4% 1.2% 0.9% 0.7% 0.3% 0.3%0%
5%
10%
15%
20%
25%
30%
35%
40%
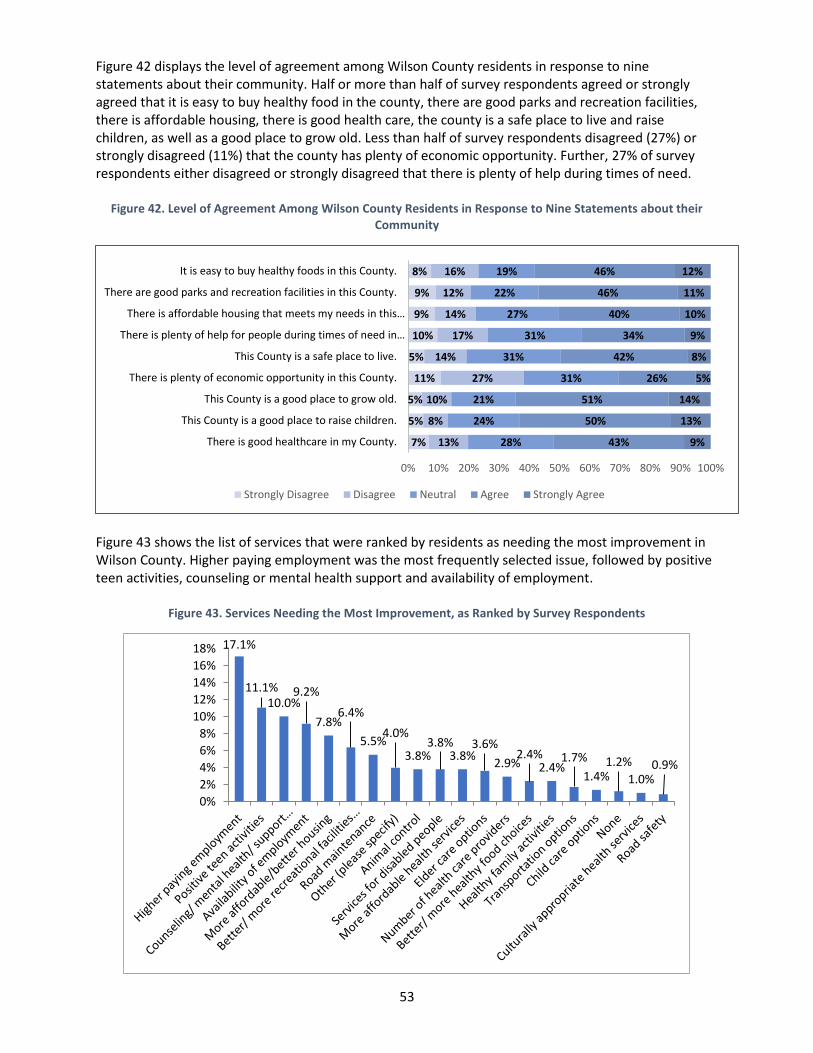
53
Figure 42 displays the level of agreement among Wilson County residents in response to nine statements about their community. Half or more than half of survey respondents agreed or strongly agreed that it is easy to buy healthy food in the county, there are good parks and recreation facilities, there is affordable housing, there is good health care, the county is a safe place to live and raise children, as well as a good place to grow old. Less than half of survey respondents disagreed (27%) or strongly disagreed (11%) that the county has plenty of economic opportunity. Further, 27% of survey respondents either disagreed or strongly disagreed that there is plenty of help during times of need.
Figure 42. Level of Agreement Among Wilson County Residents in Response to Nine Statements about their Community
Figure 43 shows the list of services that were ranked by residents as needing the most improvement in Wilson County. Higher paying employment was the most frequently selected issue, followed by positive teen activities, counseling or mental health support and availability of employment.
Figure 43. Services Needing the Most Improvement, as Ranked by Survey Respondents
7%
5%
5%
11%
5%
10%
9%
9%
8%
13%
8%
10%
27%
14%
17%
14%
12%
16%
28%
24%
21%
31%
31%
31%
27%
22%
19%
43%
50%
51%
26%
42%
34%
40%
46%
46%
9%
13%
14%
5%
8%
9%
10%
11%
12%
There is good healthcare in my County.
This County is a good place to raise children.
This County is a good place to grow old.
There is plenty of economic opportunity in this County.
This County is a safe place to live.
There is plenty of help for people during times of need in…
There is affordable housing that meets my needs in this…
There are good parks and recreation facilities in this County.
It is easy to buy healthy foods in this County.
0% 10% 20% 30% 40% 50% 60% 70% 80% 90% 100%
Strongly Disagree Disagree Neutral Agree Strongly Agree
17.1%
11.1%10.0%
9.2%
7.8%6.4%
5.5%4.0%
3.8%3.8%
3.8%3.6%
2.9%2.4%
2.4%1.7%
1.4%1.2%
1.0%0.9%
0%
2%
4%
6%
8%
10%
12%
14%
16%
18%
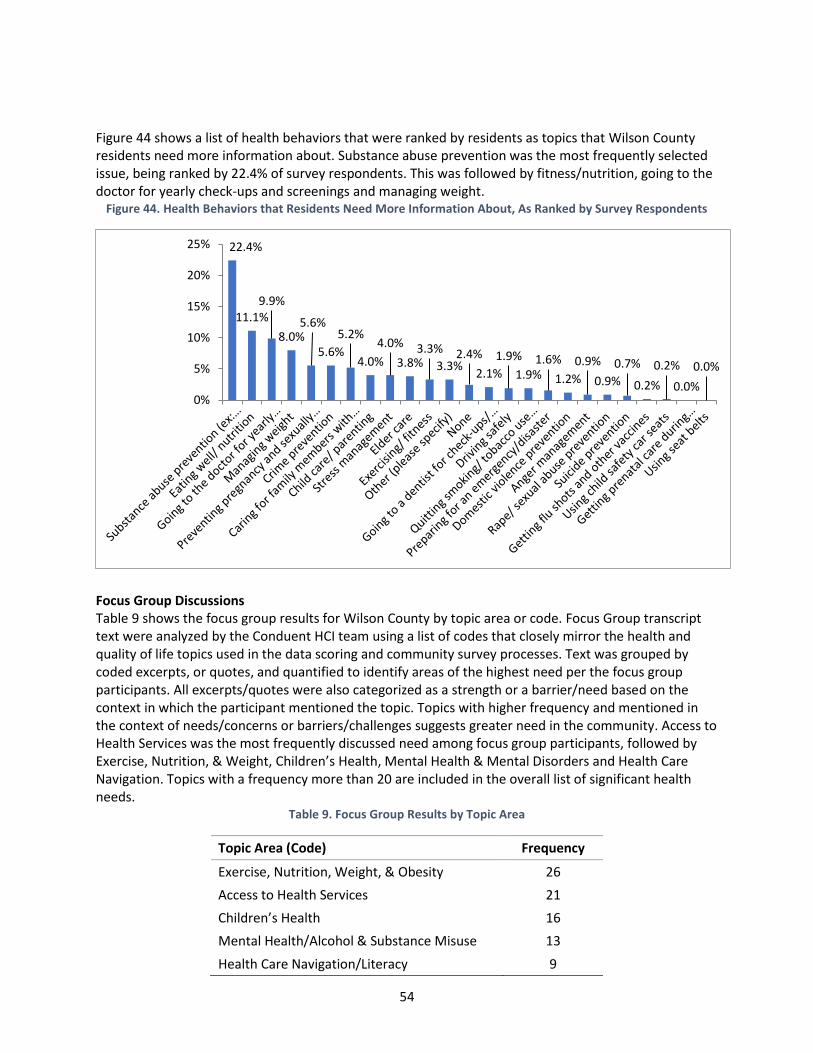
54
Figure 44 shows a list of health behaviors that were ranked by residents as topics that Wilson County residents need more information about. Substance abuse prevention was the most frequently selected issue, being ranked by 22.4% of survey respondents. This was followed by fitness/nutrition, going to the doctor for yearly check-ups and screenings and managing weight.
Figure 44. Health Behaviors that Residents Need More Information About, As Ranked by Survey Respondents
Focus Group Discussions Table 9 shows the focus group results for Wilson County by topic area or code. Focus Group transcript text were analyzed by the Conduent HCI team using a list of codes that closely mirror the health and quality of life topics used in the data scoring and community survey processes. Text was grouped by coded excerpts, or quotes, and quantified to identify areas of the highest need per the focus group participants. All excerpts/quotes were also categorized as a strength or a barrier/need based on the context in which the participant mentioned the topic. Topics with higher frequency and mentioned in the context of needs/concerns or barriers/challenges suggests greater need in the community. Access to Health Services was the most frequently discussed need among focus group participants, followed by Exercise, Nutrition, & Weight, Children’s Health, Mental Health & Mental Disorders and Health Care Navigation. Topics with a frequency more than 20 are included in the overall list of significant health needs.
Table 9. Focus Group Results by Topic Area
Topic Area (Code) Frequency
Exercise, Nutrition, Weight, & Obesity 26
Access to Health Services 21
Children’s Health 16
Mental Health/Alcohol & Substance Misuse 13
Health Care Navigation/Literacy 9
22.4%
11.1%9.9%
8.0%5.6%
5.6%
5.2%
4.0%
4.0%
3.8%3.3%
3.3%2.4%
2.1%
1.9%
1.9%1.6%
1.2%
0.9%
0.9%
0.7%
0.2%
0.2%
0.0%
0.0%
0%
5%
10%
15%
20%
25%
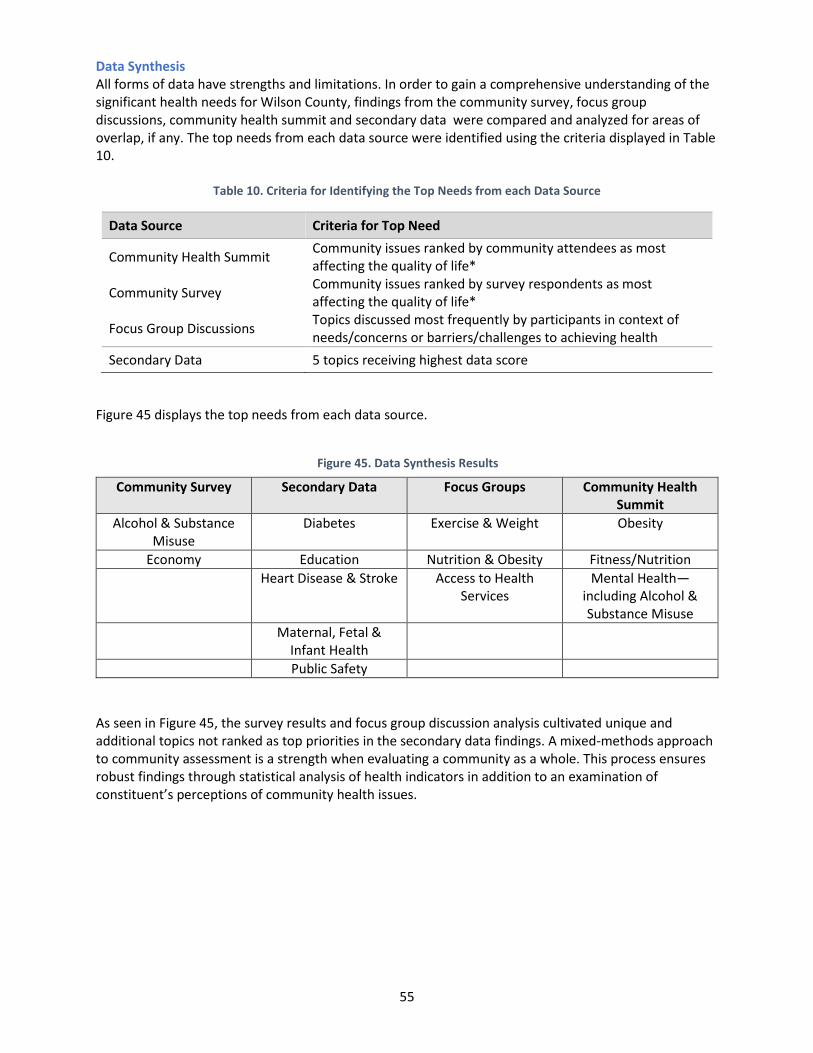
55
Data Synthesis All forms of data have strengths and limitations. In order to gain a comprehensive understanding of the significant health needs for Wilson County, findings from the community survey, focus group discussions, community health summit and secondary data were compared and analyzed for areas of overlap, if any. The top needs from each data source were identified using the criteria displayed in Table 10.
Table 10. Criteria for Identifying the Top Needs from each Data Source
Data Source Criteria for Top Need
Community Health Summit Community issues ranked by community attendees as most affecting the quality of life*
Community Survey Community issues ranked by survey respondents as most affecting the quality of life*
Focus Group Discussions Topics discussed most frequently by participants in context of needs/concerns or barriers/challenges to achieving health
Secondary Data 5 topics receiving highest data score
Figure 45 displays the top needs from each data source.
Community Survey Secondary Data Focus Groups Community Health Summit
Alcohol & Substance Misuse
Diabetes Exercise & Weight Obesity
Economy Education Nutrition & Obesity Fitness/Nutrition
Heart Disease & Stroke Access to Health Services
Mental Health—including Alcohol & Substance Misuse
Maternal, Fetal & Infant Health
Public Safety
As seen in Figure 45, the survey results and focus group discussion analysis cultivated unique and additional topics not ranked as top priorities in the secondary data findings. A mixed-methods approach to community assessment is a strength when evaluating a community as a whole. This process ensures robust findings through statistical analysis of health indicators in addition to an examination of constituent’s perceptions of community health issues.
Figure 45. Data Synthesis Results
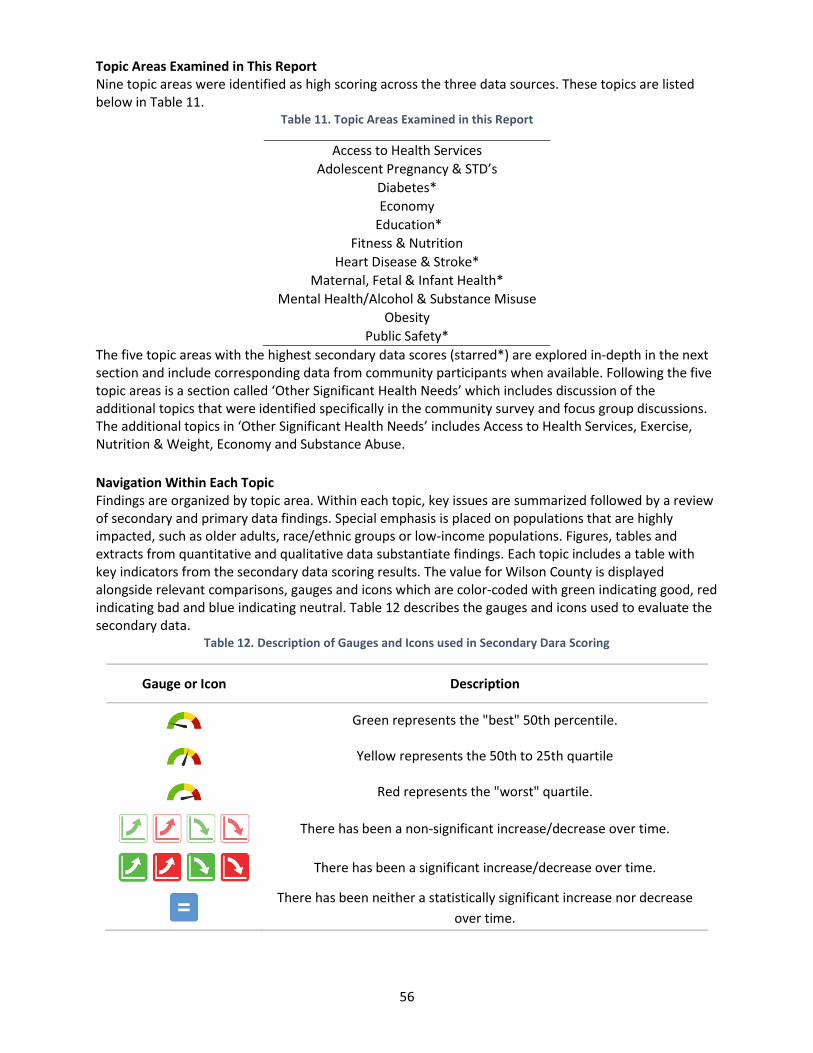
56
Topic Areas Examined in This Report Nine topic areas were identified as high scoring across the three data sources. These topics are listed below in Table 11.
Table 11. Topic Areas Examined in this Report
Access to Health Services
Adolescent Pregnancy & STD’s
Diabetes*
Economy
Education*
Fitness & Nutrition
Heart Disease & Stroke*
Maternal, Fetal & Infant Health*
Mental Health/Alcohol & Substance Misuse
Obesity
Public Safety*
The five topic areas with the highest secondary data scores (starred*) are explored in-depth in the next section and include corresponding data from community participants when available. Following the five topic areas is a section called ‘Other Significant Health Needs’ which includes discussion of the additional topics that were identified specifically in the community survey and focus group discussions. The additional topics in ‘Other Significant Health Needs’ includes Access to Health Services, Exercise, Nutrition & Weight, Economy and Substance Abuse.
Navigation Within Each Topic Findings are organized by topic area. Within each topic, key issues are summarized followed by a review of secondary and primary data findings. Special emphasis is placed on populations that are highly impacted, such as older adults, race/ethnic groups or low-income populations. Figures, tables and extracts from quantitative and qualitative data substantiate findings. Each topic includes a table with key indicators from the secondary data scoring results. The value for Wilson County is displayed alongside relevant comparisons, gauges and icons which are color-coded with green indicating good, red indicating bad and blue indicating neutral. Table 12 describes the gauges and icons used to evaluate the secondary data.
Table 12. Description of Gauges and Icons used in Secondary Dara Scoring
Gauge or Icon Description
Green represents the "best" 50th percentile.
Yellow represents the 50th to 25th quartile
Red represents the "worst" quartile.
There has been a non-significant increase/decrease over time.
There has been a significant increase/decrease over time.
There has been neither a statistically significant increase nor decrease
over time.
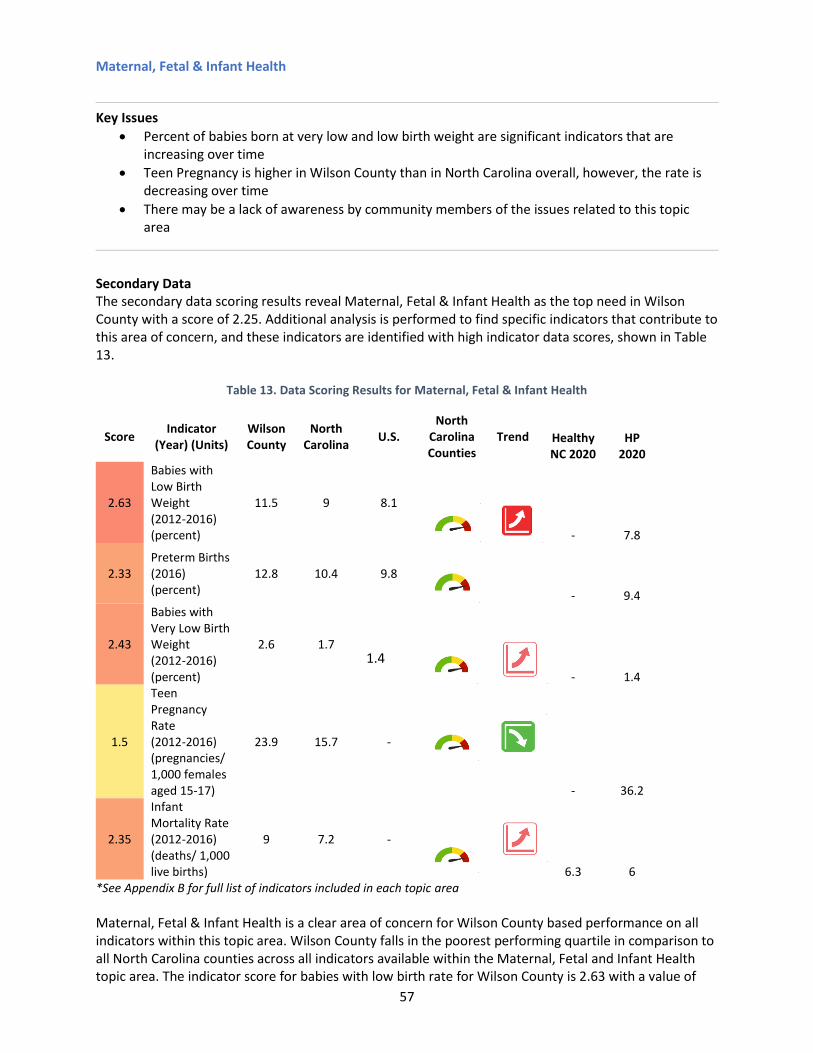
57
Maternal, Fetal & Infant Health
Key Issues
Percent of babies born at very low and low birth weight are significant indicators that are increasing over time
Teen Pregnancy is higher in Wilson County than in North Carolina overall, however, the rate is decreasing over time
There may be a lack of awareness by community members of the issues related to this topic area
Secondary Data The secondary data scoring results reveal Maternal, Fetal & Infant Health as the top need in Wilson County with a score of 2.25. Additional analysis is performed to find specific indicators that contribute to this area of concern, and these indicators are identified with high indicator data scores, shown in Table 13.
Table 13. Data Scoring Results for Maternal, Fetal & Infant Health
Score Indicator
(Year) (Units) Wilson County
North Carolina
U.S. North
Carolina Counties
Trend Healthy NC 2020
HP 2020
2.63
Babies with Low Birth Weight (2012-2016) (percent)
11.5 9 8.1
- 7.8
2.33 Preterm Births (2016) (percent)
12.8 10.4 9.8
- 9.4
2.43
Babies with Very Low Birth Weight (2012-2016) (percent)
2.6 1.7 1.4
- 1.4
1.5
Teen Pregnancy Rate (2012-2016) (pregnancies/ 1,000 females aged 15-17)
23.9 15.7 -
- 36.2
2.35
Infant Mortality Rate (2012-2016) (deaths/ 1,000 live births)
9 7.2 -
6.3 6 *See Appendix B for full list of indicators included in each topic area
Maternal, Fetal & Infant Health is a clear area of concern for Wilson County based performance on all indicators within this topic area. Wilson County falls in the poorest performing quartile in comparison to all North Carolina counties across all indicators available within the Maternal, Fetal and Infant Health topic area. The indicator score for babies with low birth rate for Wilson County is 2.63 with a value of
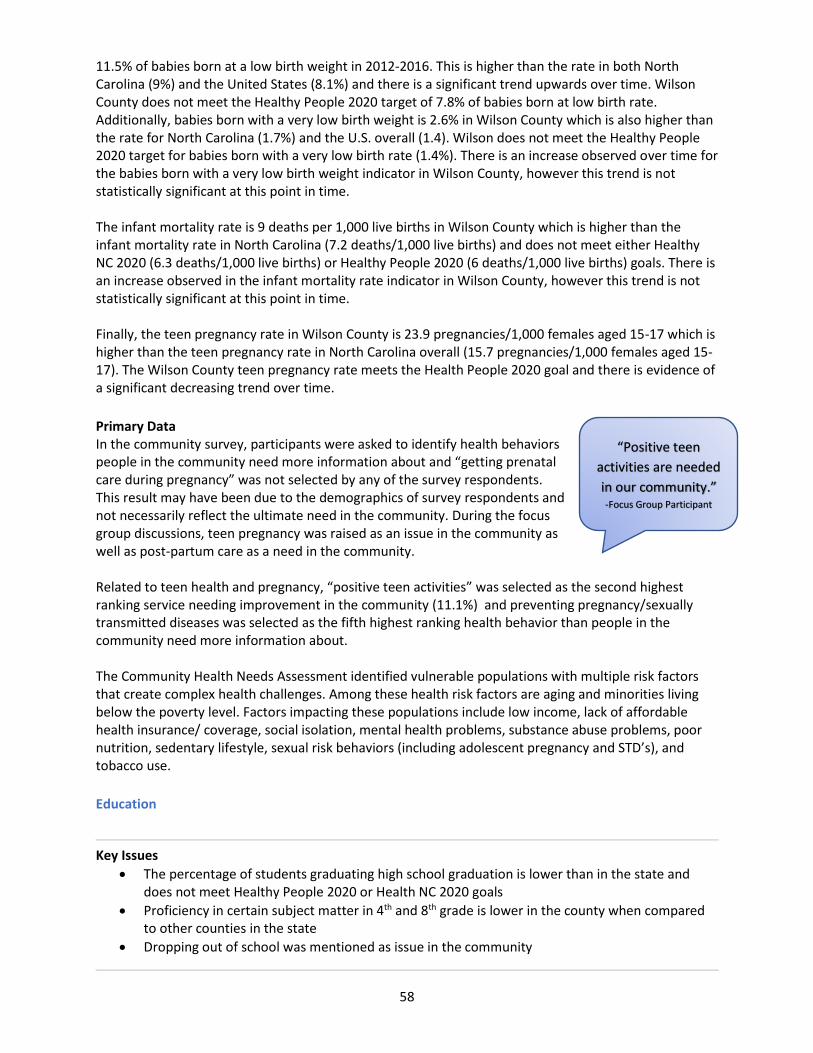
58
11.5% of babies born at a low birth weight in 2012-2016. This is higher than the rate in both North Carolina (9%) and the United States (8.1%) and there is a significant trend upwards over time. Wilson County does not meet the Healthy People 2020 target of 7.8% of babies born at low birth rate. Additionally, babies born with a very low birth weight is 2.6% in Wilson County which is also higher than the rate for North Carolina (1.7%) and the U.S. overall (1.4). Wilson does not meet the Healthy People 2020 target for babies born with a very low birth rate (1.4%). There is an increase observed over time for the babies born with a very low birth weight indicator in Wilson County, however this trend is not statistically significant at this point in time. The infant mortality rate is 9 deaths per 1,000 live births in Wilson County which is higher than the infant mortality rate in North Carolina (7.2 deaths/1,000 live births) and does not meet either Healthy NC 2020 (6.3 deaths/1,000 live births) or Healthy People 2020 (6 deaths/1,000 live births) goals. There is an increase observed in the infant mortality rate indicator in Wilson County, however this trend is not statistically significant at this point in time. Finally, the teen pregnancy rate in Wilson County is 23.9 pregnancies/1,000 females aged 15-17 which is higher than the teen pregnancy rate in North Carolina overall (15.7 pregnancies/1,000 females aged 15-17). The Wilson County teen pregnancy rate meets the Health People 2020 goal and there is evidence of a significant decreasing trend over time.
Primary Data In the community survey, participants were asked to identify health behaviors people in the community need more information about and “getting prenatal care during pregnancy” was not selected by any of the survey respondents. This result may have been due to the demographics of survey respondents and not necessarily reflect the ultimate need in the community. During the focus group discussions, teen pregnancy was raised as an issue in the community as well as post-partum care as a need in the community. Related to teen health and pregnancy, “positive teen activities” was selected as the second highest ranking service needing improvement in the community (11.1%) and preventing pregnancy/sexually transmitted diseases was selected as the fifth highest ranking health behavior than people in the community need more information about. The Community Health Needs Assessment identified vulnerable populations with multiple risk factors that create complex health challenges. Among these health risk factors are aging and minorities living below the poverty level. Factors impacting these populations include low income, lack of affordable health insurance/ coverage, social isolation, mental health problems, substance abuse problems, poor nutrition, sedentary lifestyle, sexual risk behaviors (including adolescent pregnancy and STD’s), and tobacco use.
Education
Key Issues
The percentage of students graduating high school graduation is lower than in the state and does not meet Healthy People 2020 or Health NC 2020 goals
Proficiency in certain subject matter in 4th and 8th grade is lower in the county when compared to other counties in the state
Dropping out of school was mentioned as issue in the community
“Positive teen
activities are needed
in our community.” -Focus Group Participant
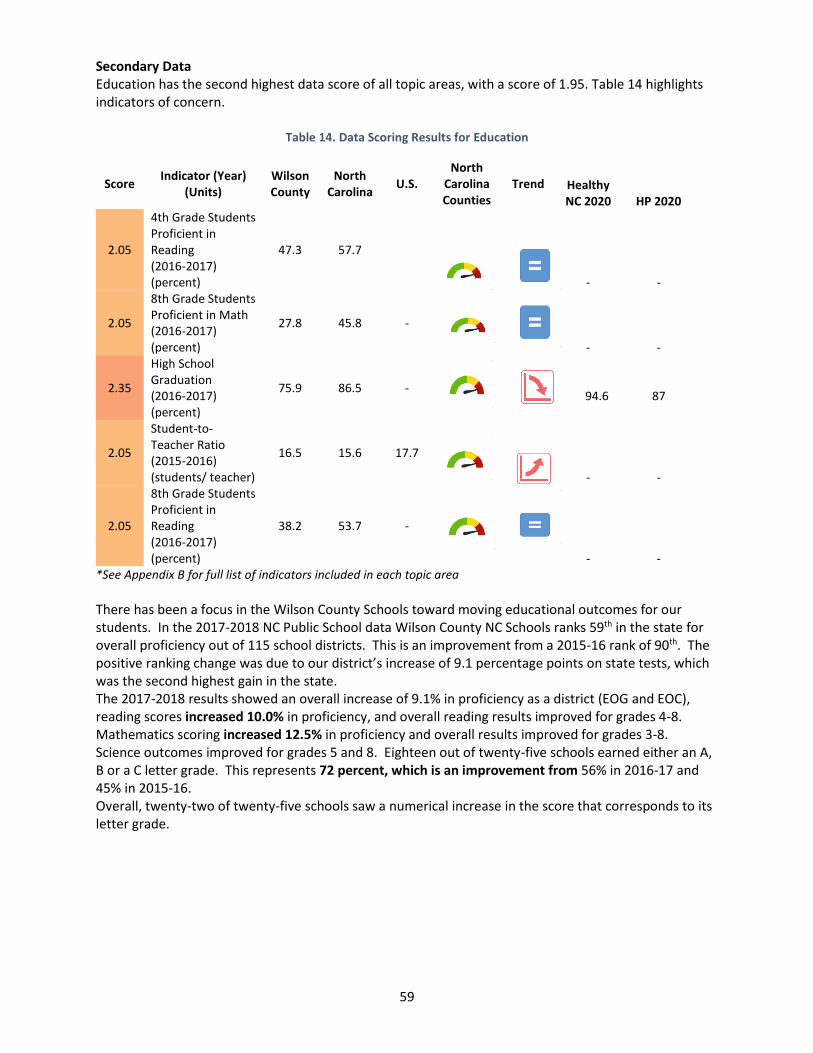
59
Secondary Data Education has the second highest data score of all topic areas, with a score of 1.95. Table 14 highlights indicators of concern.
Table 14. Data Scoring Results for Education
Score Indicator (Year)
(Units) Wilson County
North Carolina
U.S. North
Carolina Counties
Trend Healthy NC 2020 HP 2020
2.05
4th Grade Students Proficient in Reading (2016-2017) (percent)
47.3 57.7
- -
2.05
8th Grade Students Proficient in Math (2016-2017) (percent)
27.8 45.8 -
- -
2.35
High School Graduation (2016-2017) (percent)
75.9 86.5 -
94.6
87
2.05
Student-to-Teacher Ratio (2015-2016) (students/ teacher)
16.5 15.6 17.7
- -
2.05
8th Grade Students Proficient in Reading (2016-2017) (percent)
38.2 53.7 -
- - *See Appendix B for full list of indicators included in each topic area There has been a focus in the Wilson County Schools toward moving educational outcomes for our students. In the 2017-2018 NC Public School data Wilson County NC Schools ranks 59th in the state for overall proficiency out of 115 school districts. This is an improvement from a 2015-16 rank of 90th. The positive ranking change was due to our district’s increase of 9.1 percentage points on state tests, which was the second highest gain in the state. The 2017-2018 results showed an overall increase of 9.1% in proficiency as a district (EOG and EOC), reading scores increased 10.0% in proficiency, and overall reading results improved for grades 4-8. Mathematics scoring increased 12.5% in proficiency and overall results improved for grades 3-8. Science outcomes improved for grades 5 and 8. Eighteen out of twenty-five schools earned either an A, B or a C letter grade. This represents 72 percent, which is an improvement from 56% in 2016-17 and 45% in 2015-16. Overall, twenty-two of twenty-five schools saw a numerical increase in the score that corresponds to its letter grade.
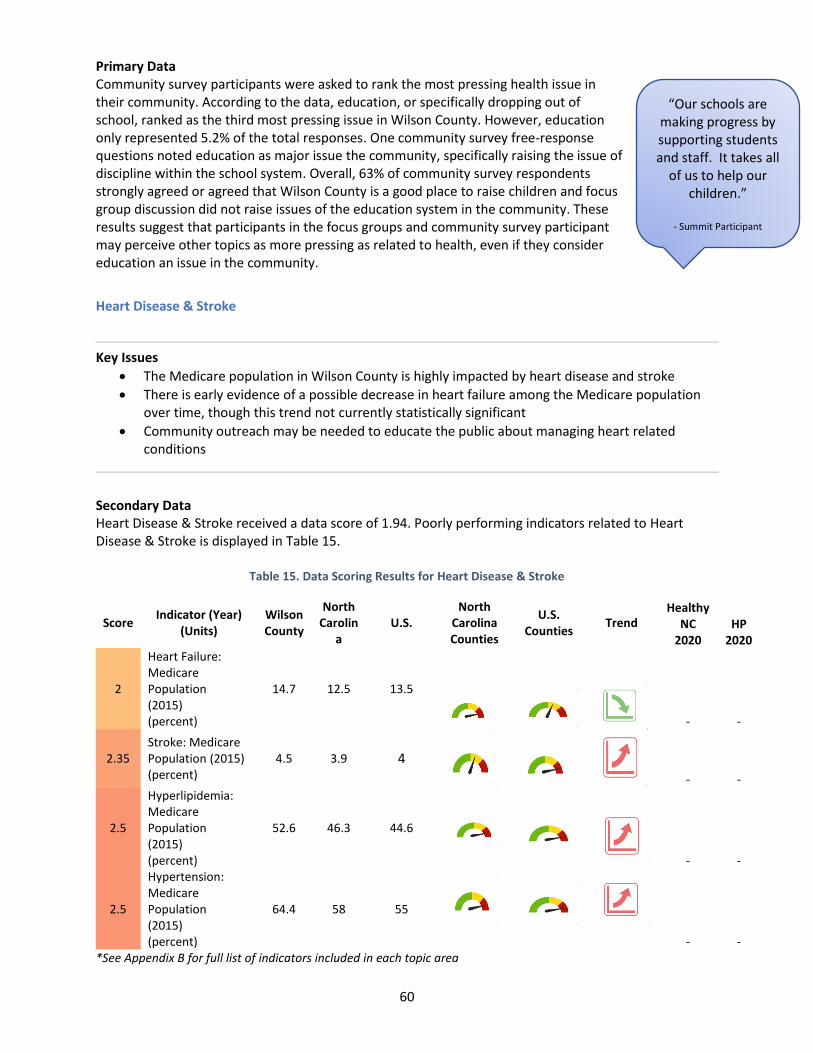
60
Primary Data Community survey participants were asked to rank the most pressing health issue in their community. According to the data, education, or specifically dropping out of school, ranked as the third most pressing issue in Wilson County. However, education only represented 5.2% of the total responses. One community survey free-response questions noted education as major issue the community, specifically raising the issue of discipline within the school system. Overall, 63% of community survey respondents strongly agreed or agreed that Wilson County is a good place to raise children and focus group discussion did not raise issues of the education system in the community. These results suggest that participants in the focus groups and community survey participant may perceive other topics as more pressing as related to health, even if they consider education an issue in the community.
Heart Disease & Stroke
Key Issues
The Medicare population in Wilson County is highly impacted by heart disease and stroke
There is early evidence of a possible decrease in heart failure among the Medicare population over time, though this trend not currently statistically significant
Community outreach may be needed to educate the public about managing heart related conditions
Secondary Data Heart Disease & Stroke received a data score of 1.94. Poorly performing indicators related to Heart Disease & Stroke is displayed in Table 15.
Table 15. Data Scoring Results for Heart Disease & Stroke
Score Indicator (Year)
(Units) Wilson County
North Carolin
a U.S.
North Carolina Counties
U.S. Counties
Trend Healthy
NC 2020
HP 2020
2
Heart Failure: Medicare Population (2015) (percent)
14.7 12.5 13.5
- -
2.35 Stroke: Medicare Population (2015) (percent)
4.5 3.9 4
- -
2.5
Hyperlipidemia: Medicare Population (2015) (percent)
52.6 46.3 44.6
- -
2.5
Hypertension: Medicare Population (2015) (percent)
64.4 58 55
- - *See Appendix B for full list of indicators included in each topic area
“Our schools are making progress by supporting students and staff. It takes all
of us to help our children.”
- Summit Participant
61
The poorest performing indicators for Heart Disease & Stroke specifically impact the Medicare population. From 2012 to 2016, 5.3% of the population in Wilson County received their health care benefits through the Medicare program. The percentage of Hyperlipidemia (52.6%) and Hypertension (64.4%) are particularly high amongst the Medicare population in 2015, when compared to state and U.S. overall Medicare populations. For both the Hyperlipidemia and Hypertension indicators, Wilson County is in the poorest performing quartile when compared against other North Carolina and U.S. counties and there is an observed increasing trend, though this trend is not statistically significant at this point in time. The percentage of stroke within the Wilson County Medicare population (4.5%) is higher than in the state (3.9%) and U.S. (4%) overall. There is an observed increasing trend of stroke within the Medicare population, though this trend is not statistically significant at this point in time. The percentage of heart failure within the Wilson County Medicare population (14.7%) is higher than in the state (12.5%) and U.S. (13.5%) overall. Of note, there is an observed decreasing trend of heart failure within the Medicare population, though this trend is not statistically significant at this point in time.
Primary Data Heart Disease and Stroke came up in all three focus groups and was mentioned specifically by four participants as a primary concern in the community. One participant discussed their own experience with a high prevalence of strokes in the community as a medical provider. The importance of changing habits was discussed instead of taking more medication. Of the community survey respondents, 22% reported that they received their health insurance coverage through the Medicare benefit which is a much higher percentage than in the overall population of Wilson County. When asked about challenges to accessing health services for themselves or a family member, 13.9% community survey respondents indicated that they had an issue in the past 12 months accessing health care services or provider. For those respondents who had experienced challenges accessing health care services or providers in the past 12 months, 23.3% indicated that they had trouble accessing a specialist. Indirectly related, community survey respondents rated eating well/nutrition, going to the doctor for yearly checkups and screenings and managing weight as topics the community needs more information about which may impact the Medicare population living with conditions related to heart disease and stroke.
Diabetes
Key Issues
Diabetes highly impacts adults over 20 and the Medicare population
Age-adjusted death rate due to diabetes is higher in Wilson County than other areas of the state, some indication that this may be decreasing over time
Community members are benefitting from current programs, more education and outreach may benefit the community overall
Secondary Data Diabetes received an overall data score of 1.92. Indicators of concern are displayed in Table 16.
“Changing behavior and lifestyle is hard but
necessary for long term health.”
- Focus Group Participant
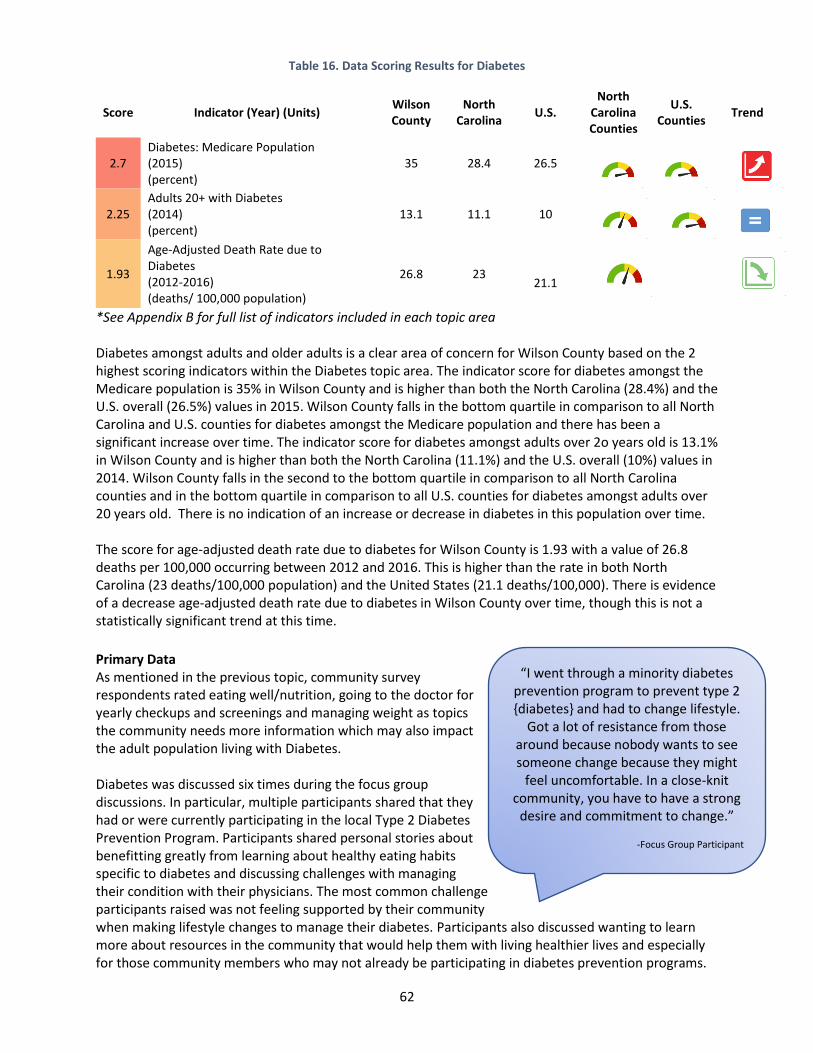
62
Table 16. Data Scoring Results for Diabetes
Score Indicator (Year) (Units) Wilson County
North Carolina
U.S. North
Carolina Counties
U.S. Counties
Trend
2.7 Diabetes: Medicare Population (2015) (percent)
35 28.4 26.5
2.25 Adults 20+ with Diabetes (2014) (percent)
13.1 11.1 10
1.93
Age-Adjusted Death Rate due to Diabetes (2012-2016) (deaths/ 100,000 population)
26.8 23
21.1
*See Appendix B for full list of indicators included in each topic area Diabetes amongst adults and older adults is a clear area of concern for Wilson County based on the 2 highest scoring indicators within the Diabetes topic area. The indicator score for diabetes amongst the Medicare population is 35% in Wilson County and is higher than both the North Carolina (28.4%) and the U.S. overall (26.5%) values in 2015. Wilson County falls in the bottom quartile in comparison to all North Carolina and U.S. counties for diabetes amongst the Medicare population and there has been a significant increase over time. The indicator score for diabetes amongst adults over 2o years old is 13.1% in Wilson County and is higher than both the North Carolina (11.1%) and the U.S. overall (10%) values in 2014. Wilson County falls in the second to the bottom quartile in comparison to all North Carolina counties and in the bottom quartile in comparison to all U.S. counties for diabetes amongst adults over 20 years old. There is no indication of an increase or decrease in diabetes in this population over time. The score for age-adjusted death rate due to diabetes for Wilson County is 1.93 with a value of 26.8 deaths per 100,000 occurring between 2012 and 2016. This is higher than the rate in both North Carolina (23 deaths/100,000 population) and the United States (21.1 deaths/100,000). There is evidence of a decrease age-adjusted death rate due to diabetes in Wilson County over time, though this is not a statistically significant trend at this time.
Primary Data As mentioned in the previous topic, community survey respondents rated eating well/nutrition, going to the doctor for yearly checkups and screenings and managing weight as topics the community needs more information which may also impact the adult population living with Diabetes. Diabetes was discussed six times during the focus group discussions. In particular, multiple participants shared that they had or were currently participating in the local Type 2 Diabetes Prevention Program. Participants shared personal stories about benefitting greatly from learning about healthy eating habits specific to diabetes and discussing challenges with managing their condition with their physicians. The most common challenge participants raised was not feeling supported by their community when making lifestyle changes to manage their diabetes. Participants also discussed wanting to learn more about resources in the community that would help them with living healthier lives and especially for those community members who may not already be participating in diabetes prevention programs.
“I went through a minority diabetes prevention program to prevent type 2 {diabetes} and had to change lifestyle.
Got a lot of resistance from those around because nobody wants to see someone change because they might
feel uncomfortable. In a close-knit community, you have to have a strong
desire and commitment to change.”
-Focus Group Participant
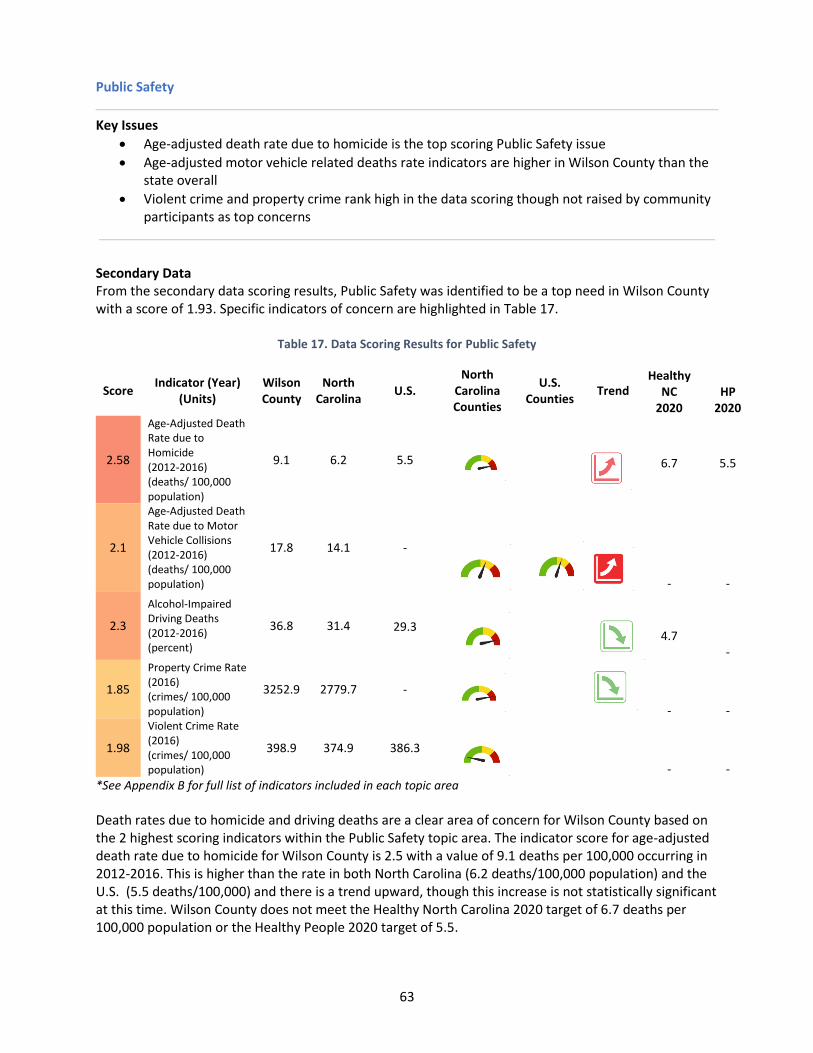
63
Public Safety
Key Issues
Age-adjusted death rate due to homicide is the top scoring Public Safety issue
Age-adjusted motor vehicle related deaths rate indicators are higher in Wilson County than the state overall
Violent crime and property crime rank high in the data scoring though not raised by community participants as top concerns
Secondary Data From the secondary data scoring results, Public Safety was identified to be a top need in Wilson County with a score of 1.93. Specific indicators of concern are highlighted in Table 17.
Table 17. Data Scoring Results for Public Safety
Score Indicator (Year)
(Units) Wilson County
North Carolina
U.S. North
Carolina Counties
U.S. Counties
Trend Healthy
NC 2020
HP 2020
2.58
Age-Adjusted Death Rate due to Homicide (2012-2016) (deaths/ 100,000 population)
9.1 6.2 5.5
6.7
5.5
2.1
Age-Adjusted Death Rate due to Motor Vehicle Collisions (2012-2016) (deaths/ 100,000 population)
17.8 14.1 -
- -
2.3
Alcohol-Impaired Driving Deaths (2012-2016) (percent)
36.8 31.4
29.3
4.7 -
1.85
Property Crime Rate (2016) (crimes/ 100,000 population)
3252.9 2779.7 -
- -
1.98
Violent Crime Rate (2016) (crimes/ 100,000 population)
398.9 374.9 386.3
- - *See Appendix B for full list of indicators included in each topic area
Death rates due to homicide and driving deaths are a clear area of concern for Wilson County based on the 2 highest scoring indicators within the Public Safety topic area. The indicator score for age-adjusted death rate due to homicide for Wilson County is 2.5 with a value of 9.1 deaths per 100,000 occurring in 2012-2016. This is higher than the rate in both North Carolina (6.2 deaths/100,000 population) and the U.S. (5.5 deaths/100,000) and there is a trend upward, though this increase is not statistically significant at this time. Wilson County does not meet the Healthy North Carolina 2020 target of 6.7 deaths per 100,000 population or the Healthy People 2020 target of 5.5.
64
The age-adjusted death rate due to motor vehicle collision for Wilson County in 2012-2016 is 17.8 deaths per 100,000 population, which is higher than the rate for North Carolina (14.1 deaths/100,000). There is an increasing trend for this indicator that is statistically significant. Additionally, the percentage of alcohol-impaired driving deaths from 2012-2016 in Wilson County is 36.8% which is higher than North Carolina (31.4%) and the U.S. (29.3) though there is some evidence that this indicator is decreasing over time, though this is not statistically significant at this time. Property crime is also an area of concern for Wilson County with 3,252.9 crimes per 100,000 population which is higher than in North Carolina (2,779.7/100,000 population). There is some evidence that this indicator is decreasing over time, though this is not statistically significant. Although the violent crime indicator ranked high in data scoring (1.98), the Wilson County rate (398.9 crimes/100,000 population) is comparable to North Carolina and the U.S. overall.
Primary Data According to survey results, Public Safety did not rank high as one of the quality of life topics individuals in Wilson County felt effected their lives. Only 5% selected violent crime as a top issue and less than 2% selected theft as a top issue. The demographics of survey participants was skewed towards those who are employed with moderate to high household incomes. This may suggest that survey participants are not adversely effected in the same way others in the community are by higher rates of crime. 50% of participants shared that they strongly agreed or agreed that Wilson County is a safe place to live, while only 19% strongly disagreed or disagreed. Similarly, focus group discussion did not reveal any needs or concerns related to safety overall though this may have been related to the direction of the conversations.
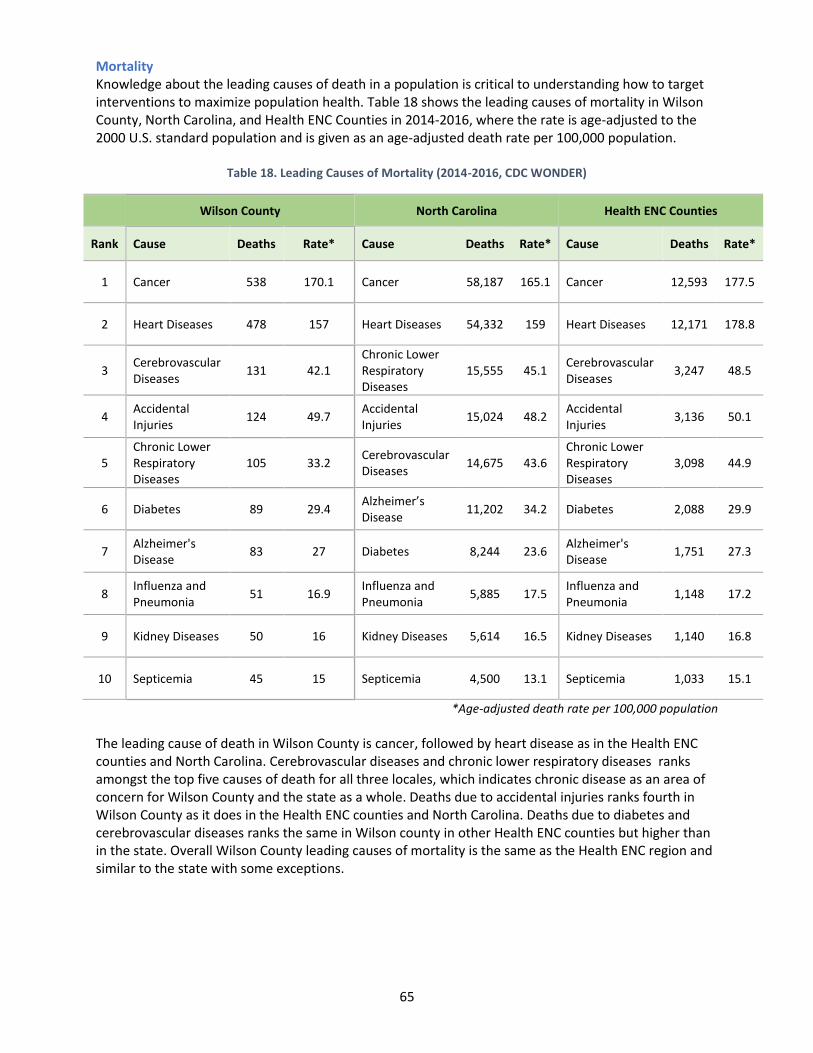
65
Mortality Knowledge about the leading causes of death in a population is critical to understanding how to target interventions to maximize population health. Table 18 shows the leading causes of mortality in Wilson County, North Carolina, and Health ENC Counties in 2014-2016, where the rate is age-adjusted to the 2000 U.S. standard population and is given as an age-adjusted death rate per 100,000 population.
Table 18. Leading Causes of Mortality (2014-2016, CDC WONDER)
Wilson County North Carolina Health ENC Counties
Rank Cause Deaths Rate* Cause Deaths Rate* Cause Deaths Rate*
1 Cancer 538 170.1 Cancer 58,187 165.1 Cancer 12,593 177.5
2 Heart Diseases 478 157 Heart Diseases 54,332 159 Heart Diseases 12,171 178.8
3 Cerebrovascular Diseases
131 42.1 Chronic Lower Respiratory Diseases
15,555 45.1 Cerebrovascular Diseases
3,247 48.5
4 Accidental Injuries
124 49.7 Accidental Injuries
15,024 48.2 Accidental Injuries
3,136 50.1
5 Chronic Lower Respiratory Diseases
105 33.2 Cerebrovascular Diseases
14,675 43.6 Chronic Lower Respiratory Diseases
3,098 44.9
6 Diabetes 89 29.4 Alzheimer’s Disease
11,202 34.2 Diabetes 2,088 29.9
7 Alzheimer's Disease
83 27 Diabetes 8,244 23.6 Alzheimer's Disease
1,751 27.3
8 Influenza and Pneumonia
51 16.9 Influenza and Pneumonia
5,885 17.5 Influenza and Pneumonia
1,148 17.2
9 Kidney Diseases 50 16 Kidney Diseases 5,614 16.5 Kidney Diseases 1,140 16.8
10 Septicemia 45 15 Septicemia 4,500 13.1 Septicemia 1,033 15.1
*Age-adjusted death rate per 100,000 population
The leading cause of death in Wilson County is cancer, followed by heart disease as in the Health ENC counties and North Carolina. Cerebrovascular diseases and chronic lower respiratory diseases ranks amongst the top five causes of death for all three locales, which indicates chronic disease as an area of concern for Wilson County and the state as a whole. Deaths due to accidental injuries ranks fourth in Wilson County as it does in the Health ENC counties and North Carolina. Deaths due to diabetes and cerebrovascular diseases ranks the same in Wilson county in other Health ENC counties but higher than in the state. Overall Wilson County leading causes of mortality is the same as the Health ENC region and similar to the state with some exceptions.
66
Data Analysis on Significant Health Needs Access to Health Services Secondary Data From the secondary data scoring results, the Access to Health Services topic had a score of 1.75 and was the 11th highest scoring health and quality of life topic. High scoring related indicators include: Preventable Hospital Stays: Medicare Population (2.15) and Primary Care Provider Rate (2.00). A list of all secondary indicators within this topic area is available in Appendix B. Primary Data As previously summarized, the majority of community survey respondents have health insurance through an employer (54.6%) followed by Medicare (22.2%) and Medicaid (14%) benefit programs. Participants were asked where they most often go to seek medical treatment, the majority sought care at a doctor’s office 62.1% and 14.4% sought care at an urgent care center. The majority of participants did not report any problems getting the health care they needed in the past 12 months (83.6%). For those who reported have difficulties accessing health care services, the most common reported providers that they had trouble getting services from were a dentist (43.3%), specialist (23.3%), pharmacy/prescriptions (22.2%), eye care/optometrist (20%) or a general practitioner (17.8%). The top reasons participants reported not being able to get the necessary health care they needed were not having health insurance (40.4%), insurance did not cover services (24.7%), share of their costs were too high (24.7%), the wait was too long (19.1%) or they couldn’t get an appointment (13.5%). 77.1% of participants reported being able to see the medical provider they needed within Wilson County. Focus Group participants frequently discussed difficulties scheduling appointments with primary care providers and specialists due to transportation and language barriers.
Exercise, Nutrition, Weight & Obesity – Top health need identified Secondary Data From the secondary data scoring results, the Exercise, Nutrition, Weight & Obesity topic had a score of 1.54 and was the 21st highest scoring health and quality of life topic. High scoring related indicators include: Food Insecurity Rate (2.30), Workers who Walk to Work (2.20), Child Food Insecurity Rate (2.10) and Adults 20+ who are Obese (2.05). Primary Data Among community survey respondents, 43% rated their health is good and 28.2% rated their health as very good. However, 46.7% of respondents reported being told by a health professional that they were overweight and/or obese. This was closely followed by high reports of high blood pressure (43.3%), high cholesterol (37.5%) and diabetes (19.5%). Moreover, reported physical activity is very low for Wilson County. Additionally, data from the community survey participants show that 36.5% of community members do not engage in any physical activity or exercise during the week that lasts at least 30 minutes. Among individuals that do not exercise, respondents reported not having enough time (31.4%), being too tired to exercise (31.1%) and not liking exercise (19.9%). For those individuals that do exercise, 64.1% reported exercising or engaging in physical activity at home while 23.9% do so at the YMCA followed by a public park (18.4%) or private gym (18.4%). Exercise, Nutrition & Weight was discussed in all three focus groups. Participants shared their concerns for obesity amongst both young people and adults in the community. One participant shared concerns
“Living in East Wilson, I would like to see more fitness
opportunities.”
-Focus Group Participant
67
with food served at schools for young children and described the need to intervene early with influencing eating habits. Suggestions included providing more services or activities to help families stay physically active in the community. They shared that they struggled with not knowing how to eat healthy or what to select as healthy food choices when eating away from home. To emphasize this point, when community members were asked about specific topic areas they were interested in learning more about in the community survey, weight-loss, nutrition, and diabetes/diabetic food preparation were high frequency responses.
Economy Secondary Data From the secondary data scoring results, the Economy was the 9th ranked health and quality of life need in Wilson County with a score of 1.84. Top related indicators include: Households with Supplemental Security Income (2.70), Children Living Below Poverty Level (2.50), Students Eligible for the Free Lunch Program (2.35), Families Living Below Poverty Level (2.30), Food Insecurity Rate (2.30), People Living Below Poverty Level (2.30), People Living 200% Above Poverty Level (2.25), People 65+ Living Below Poverty Level (2.20), Severe Housing Problems (2.15), Child Food Insecurity Rate (2.10), Total Employment Change (2.10), Unemployed Workers in Civilian Labor Force (2.10) and Young Children Living Below Poverty Level (2.10). Primary Data Community survey participants were asked to rank the issues most negatively affecting their community’s quality of life. According to the data, both poverty and the economy were the top issues in Wilson County that negatively impact quality of life. Community survey participants were also asked to weigh-in on areas of community services that needed the most improvement. With the highest share of responses, higher paying employment ranked first (17.1%), availability of employment ranked fourth (9.2%) and more affordable/better housing ranked fifth (7.8%). When asked to expand on services that could be improved, participants mentioned non-temporary employment, the need for more economic activity in the community, higher salaries and more jobs for women. Focus group participants also touched on key economic stressors: maintaining or achieving a work-life balance, challenges with being able to afford healthy behaviors or activities, delays in seeking health care due to costs and affordability of housing. One participant specifically identified the area of East Wilson as needing economic support and investment.
“…early childhood intervention is important in order to
communicate the healthy (well)being and wellness of a child, getting enough sleep, drinking water, playing outside for an hour.”
-Focus Group Participant
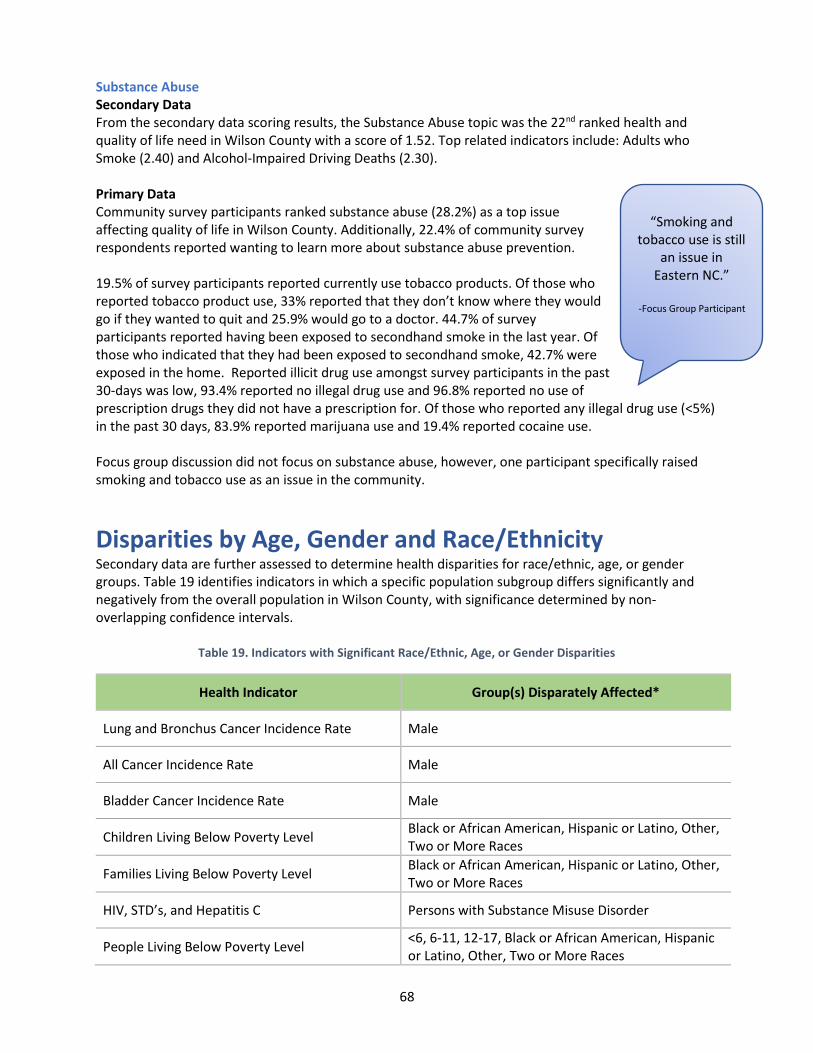
68
Substance Abuse Secondary Data From the secondary data scoring results, the Substance Abuse topic was the 22nd ranked health and quality of life need in Wilson County with a score of 1.52. Top related indicators include: Adults who Smoke (2.40) and Alcohol-Impaired Driving Deaths (2.30). Primary Data Community survey participants ranked substance abuse (28.2%) as a top issue affecting quality of life in Wilson County. Additionally, 22.4% of community survey respondents reported wanting to learn more about substance abuse prevention. 19.5% of survey participants reported currently use tobacco products. Of those who reported tobacco product use, 33% reported that they don’t know where they would go if they wanted to quit and 25.9% would go to a doctor. 44.7% of survey participants reported having been exposed to secondhand smoke in the last year. Of those who indicated that they had been exposed to secondhand smoke, 42.7% were exposed in the home. Reported illicit drug use amongst survey participants in the past 30-days was low, 93.4% reported no illegal drug use and 96.8% reported no use of prescription drugs they did not have a prescription for. Of those who reported any illegal drug use (<5%) in the past 30 days, 83.9% reported marijuana use and 19.4% reported cocaine use. Focus group discussion did not focus on substance abuse, however, one participant specifically raised smoking and tobacco use as an issue in the community.
Disparities by Age, Gender and Race/Ethnicity Secondary data are further assessed to determine health disparities for race/ethnic, age, or gender groups. Table 19 identifies indicators in which a specific population subgroup differs significantly and negatively from the overall population in Wilson County, with significance determined by non-overlapping confidence intervals.
Table 19. Indicators with Significant Race/Ethnic, Age, or Gender Disparities
Health Indicator Group(s) Disparately Affected*
Lung and Bronchus Cancer Incidence Rate Male
All Cancer Incidence Rate Male
Bladder Cancer Incidence Rate Male
Children Living Below Poverty Level Black or African American, Hispanic or Latino, Other, Two or More Races
Families Living Below Poverty Level Black or African American, Hispanic or Latino, Other, Two or More Races
HIV, STD’s, and Hepatitis C Persons with Substance Misuse Disorder
People Living Below Poverty Level <6, 6-11, 12-17, Black or African American, Hispanic or Latino, Other, Two or More Races
“Smoking and tobacco use is still
an issue in Eastern NC.”
-Focus Group Participant
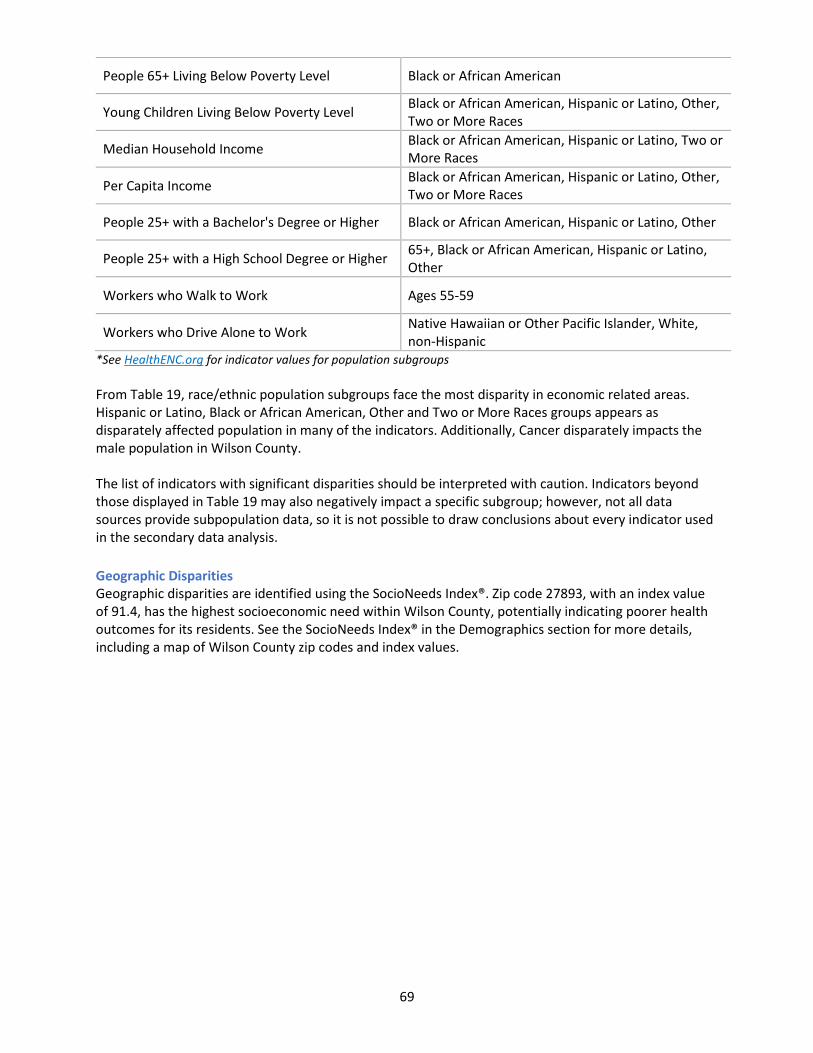
69
People 65+ Living Below Poverty Level Black or African American
Young Children Living Below Poverty Level Black or African American, Hispanic or Latino, Other, Two or More Races
Median Household Income Black or African American, Hispanic or Latino, Two or More Races
Per Capita Income Black or African American, Hispanic or Latino, Other, Two or More Races
People 25+ with a Bachelor's Degree or Higher Black or African American, Hispanic or Latino, Other
People 25+ with a High School Degree or Higher 65+, Black or African American, Hispanic or Latino, Other
Workers who Walk to Work Ages 55-59
Workers who Drive Alone to Work Native Hawaiian or Other Pacific Islander, White, non-Hispanic
*See HealthENC.org for indicator values for population subgroups
From Table 19, race/ethnic population subgroups face the most disparity in economic related areas. Hispanic or Latino, Black or African American, Other and Two or More Races groups appears as disparately affected population in many of the indicators. Additionally, Cancer disparately impacts the male population in Wilson County. The list of indicators with significant disparities should be interpreted with caution. Indicators beyond those displayed in Table 19 may also negatively impact a specific subgroup; however, not all data sources provide subpopulation data, so it is not possible to draw conclusions about every indicator used in the secondary data analysis.
Geographic Disparities Geographic disparities are identified using the SocioNeeds Index®. Zip code 27893, with an index value of 91.4, has the highest socioeconomic need within Wilson County, potentially indicating poorer health outcomes for its residents. See the SocioNeeds Index® in the Demographics section for more details, including a map of Wilson County zip codes and index values.
70
Conclusion and Dissemination of the Plan The Community Health Needs Assessment represents a great collaboration of work between Healthcare Foundation of Wilson, Wilson County Health Department, Wilson Medical Center, along with Health ENC, Conduent Healthy Communities Institute, and many of our Wilson County community partners. Through a comprehensive process of gathering survey data from our county residents, three community focus groups, a County Healthcare Summit and a comprehensive set of secondary data indicators measuring the health and quality of life needs for Wilson County the following health priorities have been selected as the focus for the next three years.
Obesity
Fitness/Nutrition
Mental Health – including Alcohol and Substance Misuse
Each of the three primary organizations in Wilson County will outline how it plans to address these health needs in its implementation plan. Starting on April 1, 2019, the full CHNA report will be made widely available to the community via: Healthcare Foundation of Wilson - http://www.healthcarefoundationofwilson.org/ 2505-A Nash Street NW, Wilson, NC 27896252.281.2105, Wilson County Health Department - http://www.wilson-co.com/home/showdocument?id=5233 1801 Glendale Drive, Wilson, NC 27893, 252-237-3141 Wilson Medical Center- https://www.wilsonmedical.com/community/community-health-needs-assessment or 1705 Tarboro St W, Wilson, NC 27893, 252-399-8040 Paper copies are available free of charge at the above addresses. We hope to incorporate any feedback on this report into the next CHNA process. Please send your feedback and comments to:
Healthcare Foundation of Wilson - [email protected]
Wilson County Health Department – [email protected]
Wilson Medical Center - [email protected]
We would like to express our thanks to all of the community partners and citizens whose efforts made this document possible.
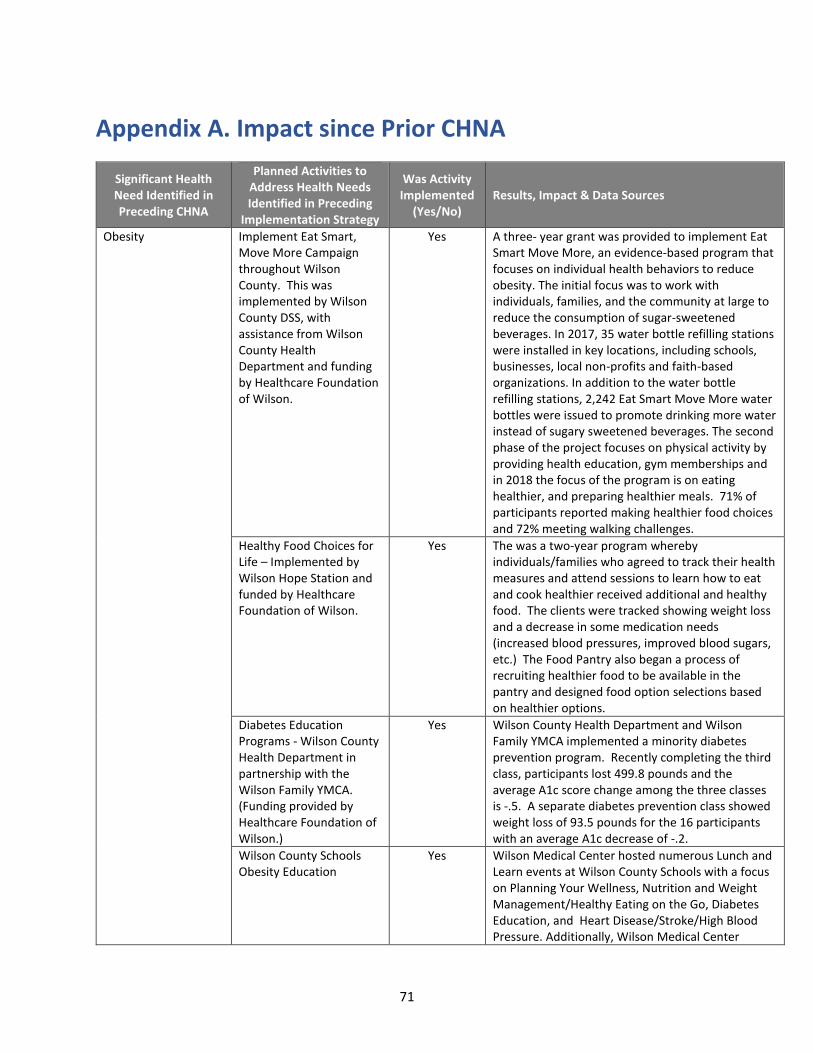
71
Appendix A. Impact since Prior CHNA
Significant Health Need Identified in Preceding CHNA
Planned Activities to Address Health Needs Identified in Preceding
Implementation Strategy
Was Activity Implemented
(Yes/No) Results, Impact & Data Sources
Obesity Implement Eat Smart, Move More Campaign throughout Wilson County. This was implemented by Wilson County DSS, with assistance from Wilson County Health Department and funding by Healthcare Foundation of Wilson.
Yes A three- year grant was provided to implement Eat Smart Move More, an evidence-based program that focuses on individual health behaviors to reduce obesity. The initial focus was to work with individuals, families, and the community at large to reduce the consumption of sugar-sweetened beverages. In 2017, 35 water bottle refilling stations were installed in key locations, including schools, businesses, local non-profits and faith-based organizations. In addition to the water bottle refilling stations, 2,242 Eat Smart Move More water bottles were issued to promote drinking more water instead of sugary sweetened beverages. The second phase of the project focuses on physical activity by providing health education, gym memberships and in 2018 the focus of the program is on eating healthier, and preparing healthier meals. 71% of participants reported making healthier food choices and 72% meeting walking challenges.
Healthy Food Choices for Life – Implemented by Wilson Hope Station and funded by Healthcare Foundation of Wilson.
Yes The was a two-year program whereby individuals/families who agreed to track their health measures and attend sessions to learn how to eat and cook healthier received additional and healthy food. The clients were tracked showing weight loss and a decrease in some medication needs (increased blood pressures, improved blood sugars, etc.) The Food Pantry also began a process of recruiting healthier food to be available in the pantry and designed food option selections based on healthier options.
Diabetes Education Programs - Wilson County Health Department in partnership with the Wilson Family YMCA. (Funding provided by Healthcare Foundation of Wilson.)
Yes Wilson County Health Department and Wilson Family YMCA implemented a minority diabetes prevention program. Recently completing the third class, participants lost 499.8 pounds and the average A1c score change among the three classes is -.5. A separate diabetes prevention class showed weight loss of 93.5 pounds for the 16 participants with an average A1c decrease of -.2.
Wilson County Schools Obesity Education
Yes Wilson Medical Center hosted numerous Lunch and Learn events at Wilson County Schools with a focus on Planning Your Wellness, Nutrition and Weight Management/Healthy Eating on the Go, Diabetes Education, and Heart Disease/Stroke/High Blood Pressure. Additionally, Wilson Medical Center
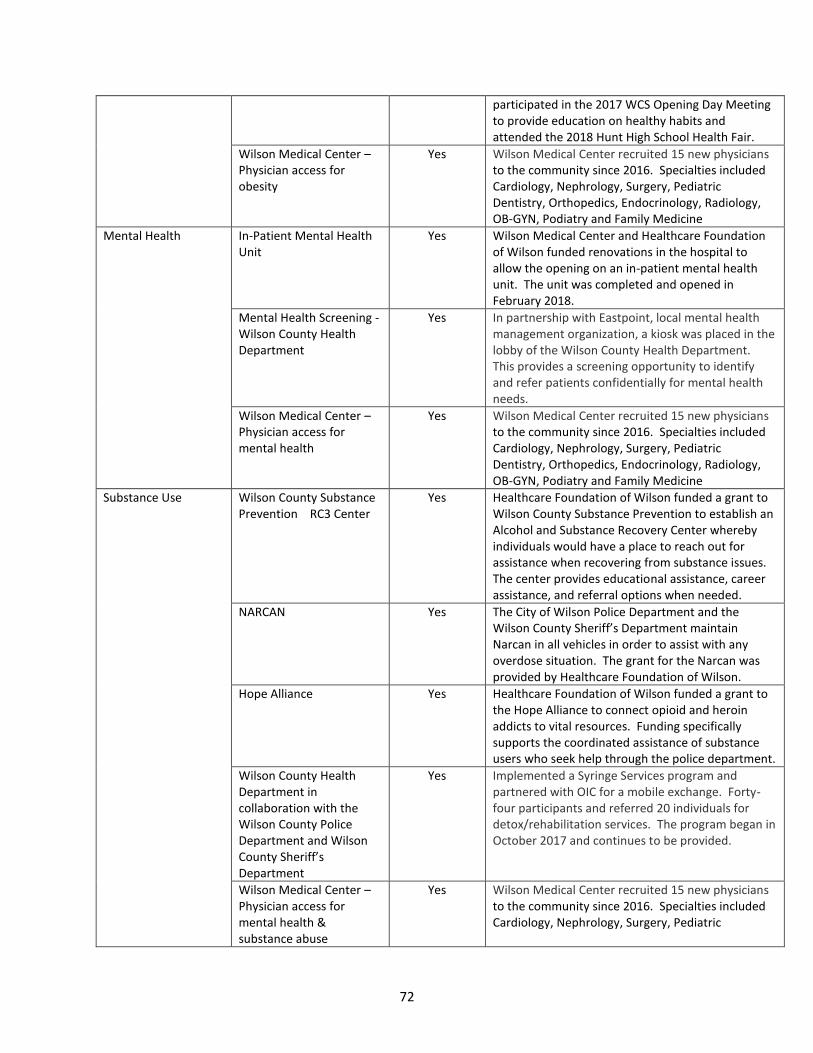
72
participated in the 2017 WCS Opening Day Meeting to provide education on healthy habits and attended the 2018 Hunt High School Health Fair.
Wilson Medical Center – Physician access for obesity
Yes Wilson Medical Center recruited 15 new physicians to the community since 2016. Specialties included Cardiology, Nephrology, Surgery, Pediatric Dentistry, Orthopedics, Endocrinology, Radiology, OB-GYN, Podiatry and Family Medicine
Mental Health In-Patient Mental Health Unit
Yes Wilson Medical Center and Healthcare Foundation of Wilson funded renovations in the hospital to allow the opening on an in-patient mental health unit. The unit was completed and opened in February 2018.
Mental Health Screening - Wilson County Health Department
Yes In partnership with Eastpoint, local mental health management organization, a kiosk was placed in the lobby of the Wilson County Health Department. This provides a screening opportunity to identify and refer patients confidentially for mental health needs.
Wilson Medical Center – Physician access for mental health
Yes Wilson Medical Center recruited 15 new physicians to the community since 2016. Specialties included Cardiology, Nephrology, Surgery, Pediatric Dentistry, Orthopedics, Endocrinology, Radiology, OB-GYN, Podiatry and Family Medicine
Substance Use Wilson County Substance Prevention RC3 Center
Yes Healthcare Foundation of Wilson funded a grant to Wilson County Substance Prevention to establish an Alcohol and Substance Recovery Center whereby individuals would have a place to reach out for assistance when recovering from substance issues. The center provides educational assistance, career assistance, and referral options when needed.
NARCAN Yes The City of Wilson Police Department and the Wilson County Sheriff’s Department maintain Narcan in all vehicles in order to assist with any overdose situation. The grant for the Narcan was provided by Healthcare Foundation of Wilson.
Hope Alliance Yes Healthcare Foundation of Wilson funded a grant to the Hope Alliance to connect opioid and heroin addicts to vital resources. Funding specifically supports the coordinated assistance of substance users who seek help through the police department.
Wilson County Health Department in collaboration with the Wilson County Police Department and Wilson County Sheriff’s Department
Yes Implemented a Syringe Services program and partnered with OIC for a mobile exchange. Forty-four participants and referred 20 individuals for detox/rehabilitation services. The program began in October 2017 and continues to be provided.
Wilson Medical Center – Physician access for mental health & substance abuse
Yes Wilson Medical Center recruited 15 new physicians to the community since 2016. Specialties included Cardiology, Nephrology, Surgery, Pediatric
73
Dentistry, Orthopedics, Endocrinology, Radiology, OB-GYN, Podiatry and Family Medicine
Adolescent Pregnancy and STDs
Long Acting Reversible Contraceptives
Yes Healthcare Foundation of Wilson funded a grant to the Wilson County Health Department for Long Acting Reversible Contraceptives. The Health Department has provided 25 Nexplanons to uninsured woman between the ages of 15 and 26 during the 2017-2018 fiscal year and we plan to provide the same number this fiscal year and next fiscal year.
Wilson Area School Health Clinic
Yes The Wilson County Health Department, along with assistance from Wilson County Department of Social Services, and funding from Healthcare Foundation of Wilson, established a school health clinic in a middle school, with plans to expand to a high school. The clinic addresses all types of issues and concerns, not limited to adolescent pregnancy and STD. The clinic is staffed with a Nurse Practitioner.
Photo credit: A. Walker
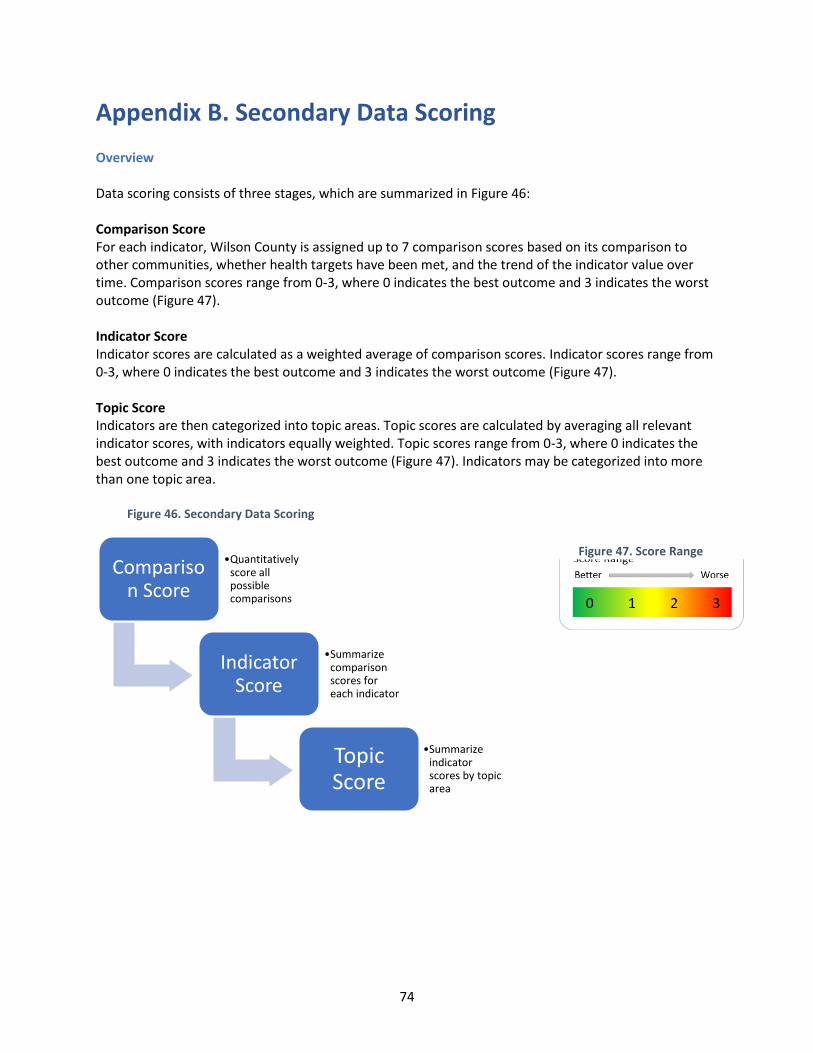
74
Appendix B. Secondary Data Scoring
Overview Data scoring consists of three stages, which are summarized in Figure 46: Comparison Score For each indicator, Wilson County is assigned up to 7 comparison scores based on its comparison to other communities, whether health targets have been met, and the trend of the indicator value over time. Comparison scores range from 0-3, where 0 indicates the best outcome and 3 indicates the worst outcome (Figure 47).
Indicator Score Indicator scores are calculated as a weighted average of comparison scores. Indicator scores range from 0-3, where 0 indicates the best outcome and 3 indicates the worst outcome (Figure 47). Topic Score Indicators are then categorized into topic areas. Topic scores are calculated by averaging all relevant indicator scores, with indicators equally weighted. Topic scores range from 0-3, where 0 indicates the best outcome and 3 indicates the worst outcome (Figure 47). Indicators may be categorized into more than one topic area.
Comparison Score
•Quantitatively score all possible comparisons
Indicator Score
•Summarize comparison scores for each indicator
Topic Score
•Summarize indicator scores by topic area
Figure 46. Secondary Data Scoring Overview
Figure 47. Score Range
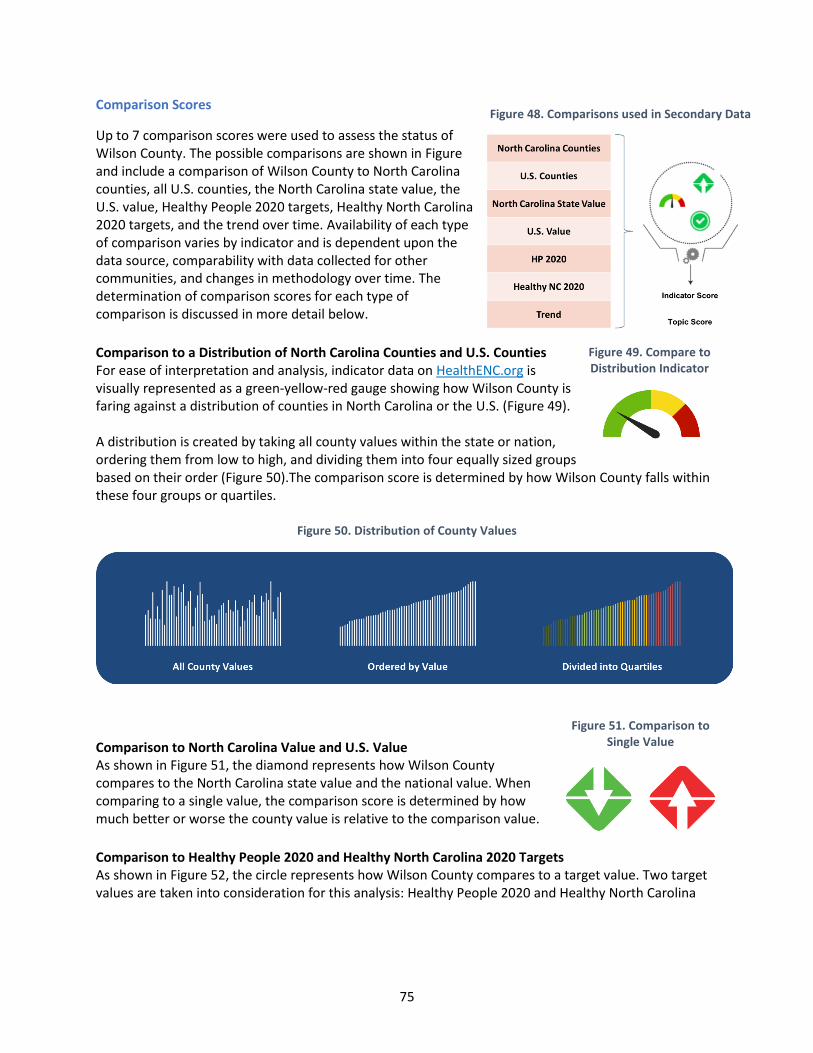
75
Comparison Scores
Up to 7 comparison scores were used to assess the status of Wilson County. The possible comparisons are shown in Figure and include a comparison of Wilson County to North Carolina counties, all U.S. counties, the North Carolina state value, the U.S. value, Healthy People 2020 targets, Healthy North Carolina 2020 targets, and the trend over time. Availability of each type of comparison varies by indicator and is dependent upon the data source, comparability with data collected for other communities, and changes in methodology over time. The determination of comparison scores for each type of comparison is discussed in more detail below.
Comparison to a Distribution of North Carolina Counties and U.S. Counties For ease of interpretation and analysis, indicator data on HealthENC.org is visually represented as a green-yellow-red gauge showing how Wilson County is faring against a distribution of counties in North Carolina or the U.S. (Figure 49). A distribution is created by taking all county values within the state or nation, ordering them from low to high, and dividing them into four equally sized groups based on their order (Figure 50).The comparison score is determined by how Wilson County falls within these four groups or quartiles.
Figure 50. Distribution of County Values
Comparison to North Carolina Value and U.S. Value As shown in Figure 51, the diamond represents how Wilson County compares to the North Carolina state value and the national value. When comparing to a single value, the comparison score is determined by how much better or worse the county value is relative to the comparison value.
Comparison to Healthy People 2020 and Healthy North Carolina 2020 Targets As shown in Figure 52, the circle represents how Wilson County compares to a target value. Two target values are taken into consideration for this analysis: Healthy People 2020 and Healthy North Carolina
Figure 49. Compare to Distribution Indicator
Gauge
Figure 51. Comparison to Single Value
Figure 48. Comparisons used in Secondary Data Scoring
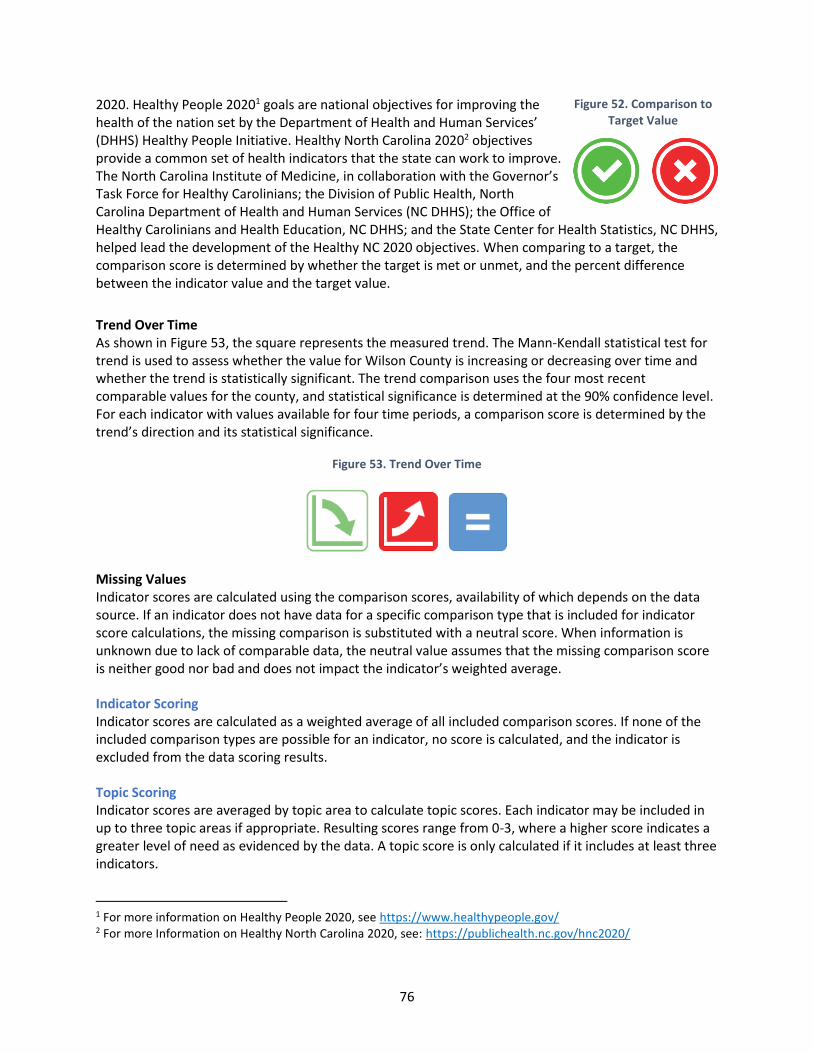
76
2020. Healthy People 20201 goals are national objectives for improving the health of the nation set by the Department of Health and Human Services’ (DHHS) Healthy People Initiative. Healthy North Carolina 20202 objectives provide a common set of health indicators that the state can work to improve. The North Carolina Institute of Medicine, in collaboration with the Governor’s Task Force for Healthy Carolinians; the Division of Public Health, North Carolina Department of Health and Human Services (NC DHHS); the Office of Healthy Carolinians and Health Education, NC DHHS; and the State Center for Health Statistics, NC DHHS, helped lead the development of the Healthy NC 2020 objectives. When comparing to a target, the comparison score is determined by whether the target is met or unmet, and the percent difference between the indicator value and the target value.
Trend Over Time As shown in Figure 53, the square represents the measured trend. The Mann-Kendall statistical test for trend is used to assess whether the value for Wilson County is increasing or decreasing over time and whether the trend is statistically significant. The trend comparison uses the four most recent comparable values for the county, and statistical significance is determined at the 90% confidence level. For each indicator with values available for four time periods, a comparison score is determined by the trend’s direction and its statistical significance.
Figure 53. Trend Over Time
Missing Values Indicator scores are calculated using the comparison scores, availability of which depends on the data source. If an indicator does not have data for a specific comparison type that is included for indicator score calculations, the missing comparison is substituted with a neutral score. When information is unknown due to lack of comparable data, the neutral value assumes that the missing comparison score is neither good nor bad and does not impact the indicator’s weighted average.
Indicator Scoring Indicator scores are calculated as a weighted average of all included comparison scores. If none of the included comparison types are possible for an indicator, no score is calculated, and the indicator is excluded from the data scoring results.
Topic Scoring Indicator scores are averaged by topic area to calculate topic scores. Each indicator may be included in up to three topic areas if appropriate. Resulting scores range from 0-3, where a higher score indicates a greater level of need as evidenced by the data. A topic score is only calculated if it includes at least three indicators.
1 For more information on Healthy People 2020, see https://www.healthypeople.gov/ 2 For more Information on Healthy North Carolina 2020, see: https://publichealth.nc.gov/hnc2020/
Figure 52. Comparison to Target Value
77
Age, Gender and Race/Ethnicity Disparities When a given indicator has data available for population subgroups – such as age, gender and race/ethnicity – and values for these subgroups include confidence intervals, we are able to determine if there is a significant difference between the subgroup’s value and the overall value. A significant difference is defined as two values with non-overlapping confidence intervals. Confidence intervals are not available for all indicators. In these cases, disparities cannot be determined because there is not enough data to conclude whether two values are significantly different from each other.
Photo Credit: Brian Strickland
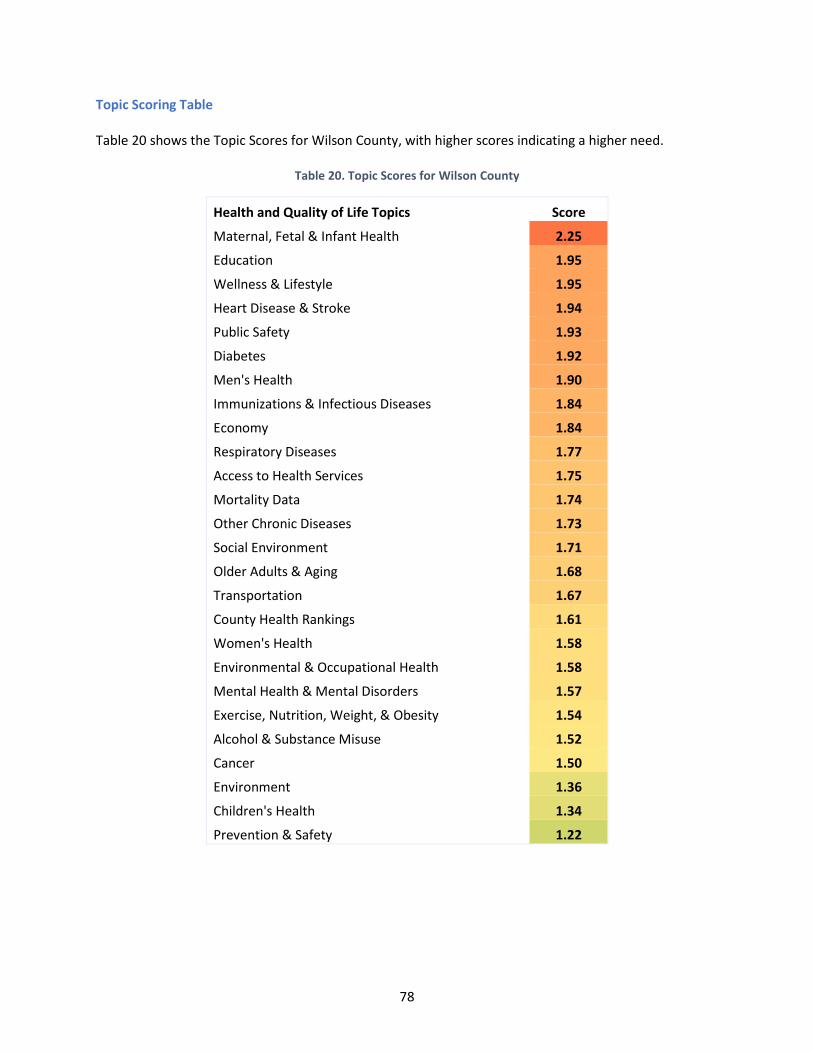
78
Topic Scoring Table Table 20 shows the Topic Scores for Wilson County, with higher scores indicating a higher need.
Table 20. Topic Scores for Wilson County
Health and Quality of Life Topics Score
Maternal, Fetal & Infant Health 2.25
Education 1.95
Wellness & Lifestyle 1.95
Heart Disease & Stroke 1.94
Public Safety 1.93
Diabetes 1.92
Men's Health 1.90
Immunizations & Infectious Diseases 1.84
Economy 1.84
Respiratory Diseases 1.77
Access to Health Services 1.75
Mortality Data 1.74
Other Chronic Diseases 1.73
Social Environment 1.71
Older Adults & Aging 1.68
Transportation 1.67
County Health Rankings 1.61
Women's Health 1.58
Environmental & Occupational Health 1.58
Mental Health & Mental Disorders 1.57
Exercise, Nutrition, Weight, & Obesity 1.54
Alcohol & Substance Misuse 1.52
Cancer 1.50
Environment 1.36
Children's Health 1.34
Prevention & Safety 1.22
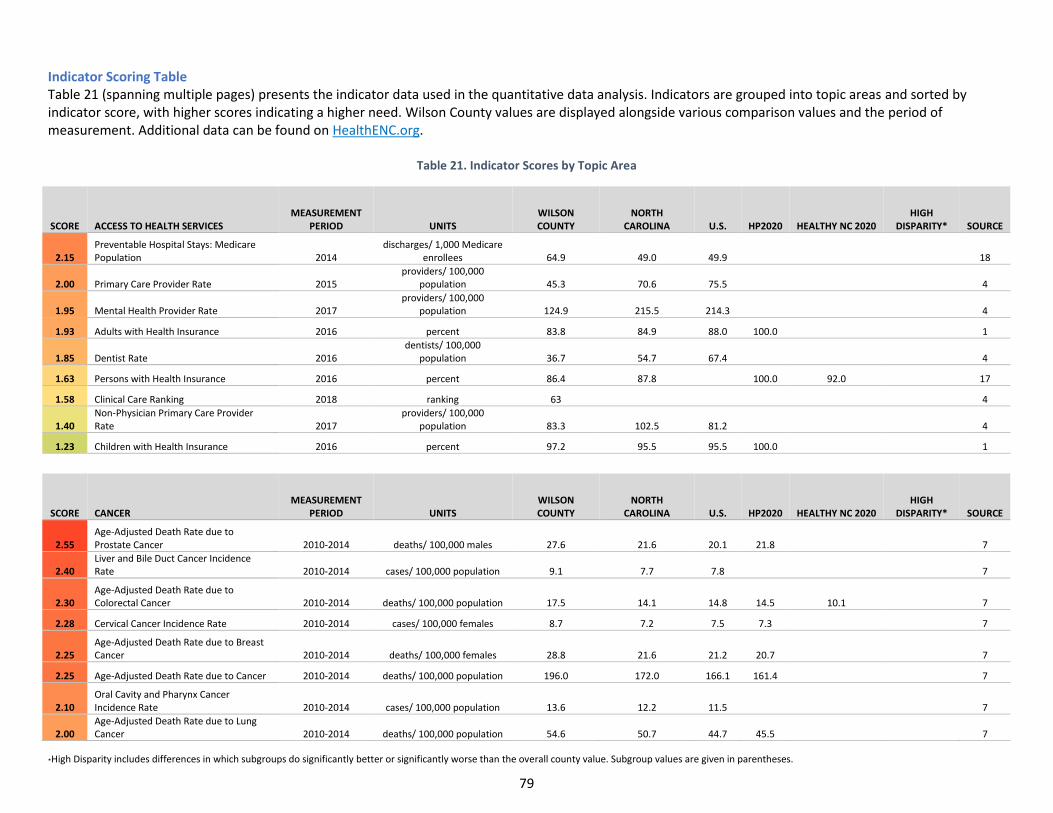
*High Disparity includes differences in which subgroups do significantly better or significantly worse than the overall county value. Subgroup values are given in parentheses.
79
Indicator Scoring Table Table 21 (spanning multiple pages) presents the indicator data used in the quantitative data analysis. Indicators are grouped into topic areas and sorted by indicator score, with higher scores indicating a higher need. Wilson County values are displayed alongside various comparison values and the period of measurement. Additional data can be found on HealthENC.org.
Table 21. Indicator Scores by Topic Area
SCORE ACCESS TO HEALTH SERVICES MEASUREMENT
PERIOD UNITS WILSON COUNTY
NORTH CAROLINA U.S. HP2020 HEALTHY NC 2020
HIGH DISPARITY* SOURCE
2.15 Preventable Hospital Stays: Medicare Population 2014
discharges/ 1,000 Medicare enrollees 64.9 49.0 49.9 18
2.00 Primary Care Provider Rate 2015 providers/ 100,000
population 45.3 70.6 75.5 4
1.95 Mental Health Provider Rate 2017 providers/ 100,000
population 124.9 215.5 214.3 4
1.93 Adults with Health Insurance 2016 percent 83.8 84.9 88.0 100.0 1
1.85 Dentist Rate 2016 dentists/ 100,000
population 36.7 54.7 67.4 4
1.63 Persons with Health Insurance 2016 percent 86.4 87.8 100.0 92.0 17
1.58 Clinical Care Ranking 2018 ranking 63 4
1.40 Non-Physician Primary Care Provider Rate 2017
providers/ 100,000 population 83.3 102.5 81.2 4
1.23 Children with Health Insurance 2016 percent 97.2 95.5 95.5 100.0 1
SCORE CANCER MEASUREMENT
PERIOD UNITS WILSON COUNTY
NORTH CAROLINA U.S. HP2020 HEALTHY NC 2020
HIGH DISPARITY* SOURCE
2.55 Age-Adjusted Death Rate due to Prostate Cancer 2010-2014 deaths/ 100,000 males 27.6 21.6 20.1 21.8 7
2.40 Liver and Bile Duct Cancer Incidence Rate 2010-2014 cases/ 100,000 population 9.1 7.7 7.8 7
2.30 Age-Adjusted Death Rate due to Colorectal Cancer 2010-2014 deaths/ 100,000 population 17.5 14.1 14.8 14.5 10.1 7
2.28 Cervical Cancer Incidence Rate 2010-2014 cases/ 100,000 females 8.7 7.2 7.5 7.3 7
2.25 Age-Adjusted Death Rate due to Breast Cancer 2010-2014 deaths/ 100,000 females 28.8 21.6 21.2 20.7 7
2.25 Age-Adjusted Death Rate due to Cancer 2010-2014 deaths/ 100,000 population 196.0 172.0 166.1 161.4 7
2.10 Oral Cavity and Pharynx Cancer Incidence Rate 2010-2014 cases/ 100,000 population 13.6 12.2 11.5 7
2.00 Age-Adjusted Death Rate due to Lung Cancer 2010-2014 deaths/ 100,000 population 54.6 50.7 44.7 45.5 7
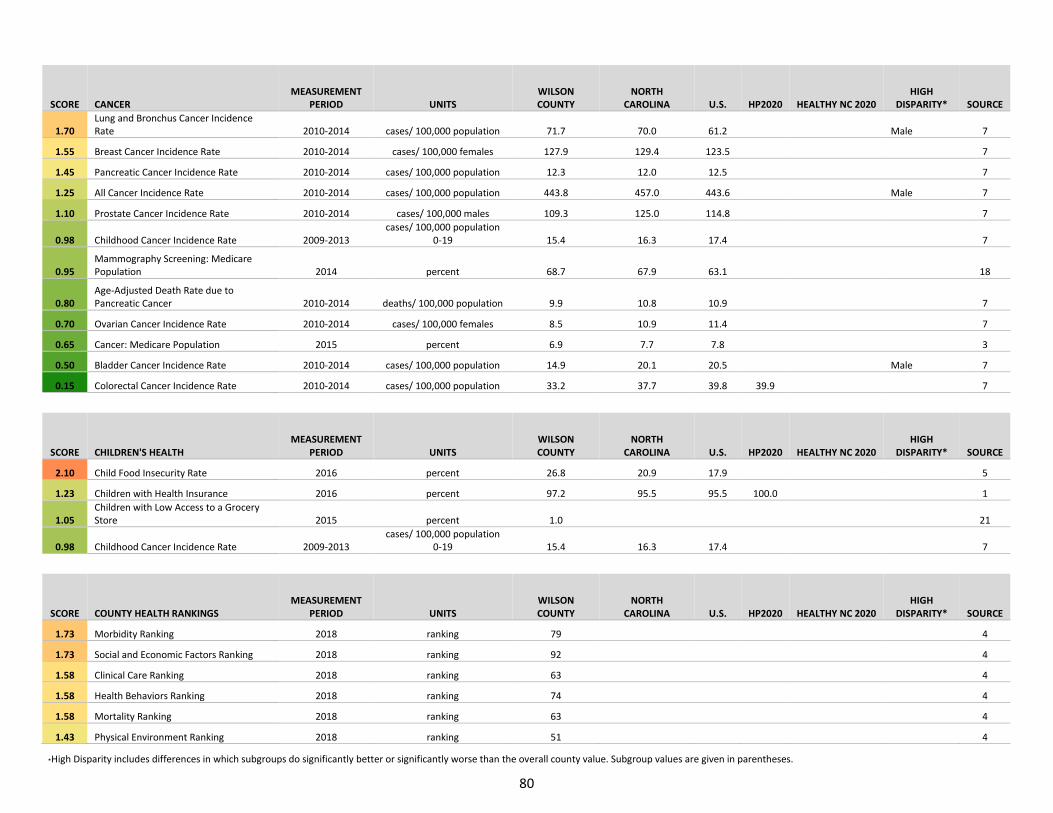
*High Disparity includes differences in which subgroups do significantly better or significantly worse than the overall county value. Subgroup values are given in parentheses.
80
SCORE CANCER MEASUREMENT
PERIOD UNITS WILSON COUNTY
NORTH CAROLINA U.S. HP2020 HEALTHY NC 2020
HIGH DISPARITY* SOURCE
1.70 Lung and Bronchus Cancer Incidence Rate 2010-2014 cases/ 100,000 population 71.7 70.0 61.2 Male 7
1.55 Breast Cancer Incidence Rate 2010-2014 cases/ 100,000 females 127.9 129.4 123.5 7
1.45 Pancreatic Cancer Incidence Rate 2010-2014 cases/ 100,000 population 12.3 12.0 12.5 7
1.25 All Cancer Incidence Rate 2010-2014 cases/ 100,000 population 443.8 457.0 443.6 Male 7
1.10 Prostate Cancer Incidence Rate 2010-2014 cases/ 100,000 males 109.3 125.0 114.8 7
0.98 Childhood Cancer Incidence Rate 2009-2013 cases/ 100,000 population
0-19 15.4 16.3 17.4 7
0.95 Mammography Screening: Medicare Population 2014 percent 68.7 67.9 63.1 18
0.80 Age-Adjusted Death Rate due to Pancreatic Cancer 2010-2014 deaths/ 100,000 population 9.9 10.8 10.9 7
0.70 Ovarian Cancer Incidence Rate 2010-2014 cases/ 100,000 females 8.5 10.9 11.4 7
0.65 Cancer: Medicare Population 2015 percent 6.9 7.7 7.8 3
0.50 Bladder Cancer Incidence Rate 2010-2014 cases/ 100,000 population 14.9 20.1 20.5 Male 7
0.15 Colorectal Cancer Incidence Rate 2010-2014 cases/ 100,000 population 33.2 37.7 39.8 39.9 7
SCORE CHILDREN'S HEALTH MEASUREMENT
PERIOD UNITS WILSON COUNTY
NORTH CAROLINA U.S. HP2020 HEALTHY NC 2020
HIGH DISPARITY* SOURCE
2.10 Child Food Insecurity Rate 2016 percent 26.8 20.9 17.9 5
1.23 Children with Health Insurance 2016 percent 97.2 95.5 95.5 100.0 1
1.05 Children with Low Access to a Grocery Store 2015 percent 1.0 21
0.98 Childhood Cancer Incidence Rate 2009-2013 cases/ 100,000 population
0-19 15.4 16.3 17.4 7
SCORE COUNTY HEALTH RANKINGS MEASUREMENT
PERIOD UNITS WILSON COUNTY
NORTH CAROLINA U.S. HP2020 HEALTHY NC 2020
HIGH DISPARITY* SOURCE
1.73 Morbidity Ranking 2018 ranking 79 4
1.73 Social and Economic Factors Ranking 2018 ranking 92 4
1.58 Clinical Care Ranking 2018 ranking 63 4
1.58 Health Behaviors Ranking 2018 ranking 74 4
1.58 Mortality Ranking 2018 ranking 63 4
1.43 Physical Environment Ranking 2018 ranking 51 4
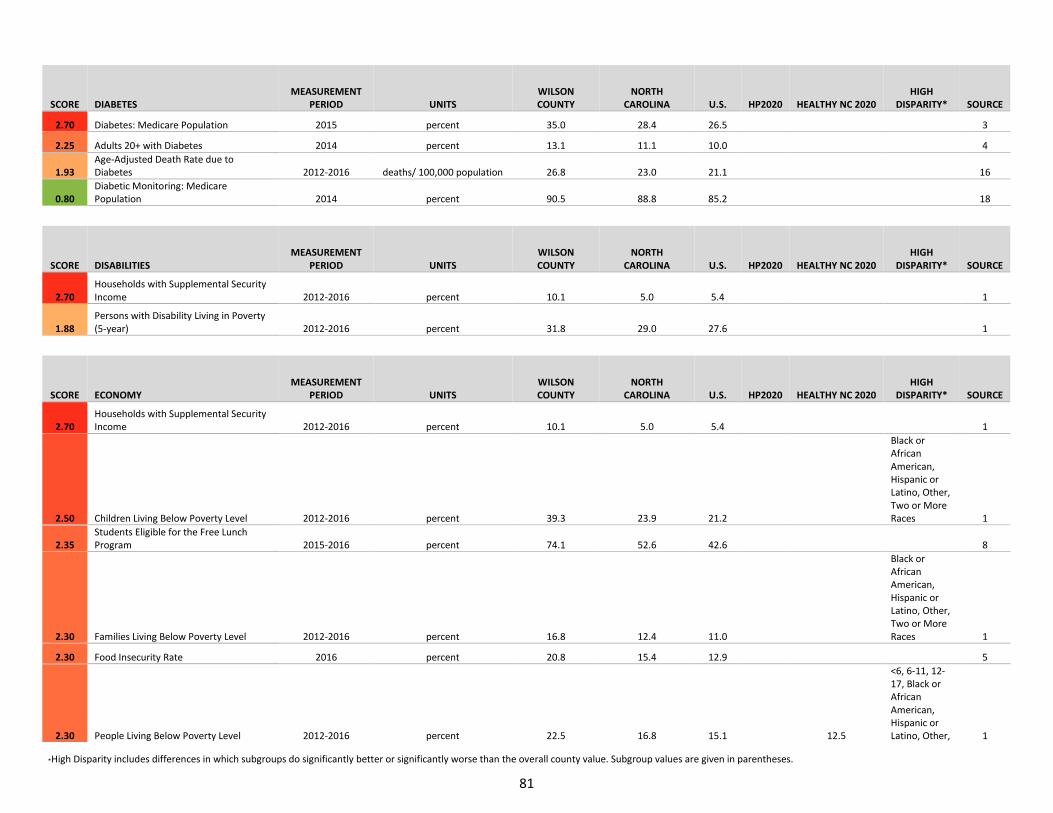
*High Disparity includes differences in which subgroups do significantly better or significantly worse than the overall county value. Subgroup values are given in parentheses.
81
SCORE DIABETES MEASUREMENT
PERIOD UNITS WILSON COUNTY
NORTH CAROLINA U.S. HP2020 HEALTHY NC 2020
HIGH DISPARITY* SOURCE
2.70 Diabetes: Medicare Population 2015 percent 35.0 28.4 26.5 3
2.25 Adults 20+ with Diabetes 2014 percent 13.1 11.1 10.0 4
1.93 Age-Adjusted Death Rate due to Diabetes 2012-2016 deaths/ 100,000 population 26.8 23.0 21.1 16
0.80 Diabetic Monitoring: Medicare Population 2014 percent 90.5 88.8 85.2 18
SCORE DISABILITIES MEASUREMENT
PERIOD UNITS WILSON COUNTY
NORTH CAROLINA U.S. HP2020 HEALTHY NC 2020
HIGH DISPARITY* SOURCE
2.70 Households with Supplemental Security Income 2012-2016 percent 10.1 5.0 5.4 1
1.88 Persons with Disability Living in Poverty (5-year) 2012-2016 percent 31.8 29.0 27.6 1
SCORE ECONOMY MEASUREMENT
PERIOD UNITS WILSON COUNTY
NORTH CAROLINA U.S. HP2020 HEALTHY NC 2020
HIGH DISPARITY* SOURCE
2.70 Households with Supplemental Security Income 2012-2016 percent 10.1 5.0 5.4 1
2.50 Children Living Below Poverty Level 2012-2016 percent 39.3 23.9 21.2
Black or African American, Hispanic or Latino, Other, Two or More Races 1
2.35 Students Eligible for the Free Lunch Program 2015-2016 percent 74.1 52.6 42.6 8
2.30 Families Living Below Poverty Level 2012-2016 percent 16.8 12.4 11.0
Black or African American, Hispanic or Latino, Other, Two or More Races 1
2.30 Food Insecurity Rate 2016 percent 20.8 15.4 12.9 5
2.30 People Living Below Poverty Level 2012-2016 percent 22.5 16.8 15.1 12.5
<6, 6-11, 12-17, Black or African American, Hispanic or Latino, Other, 1
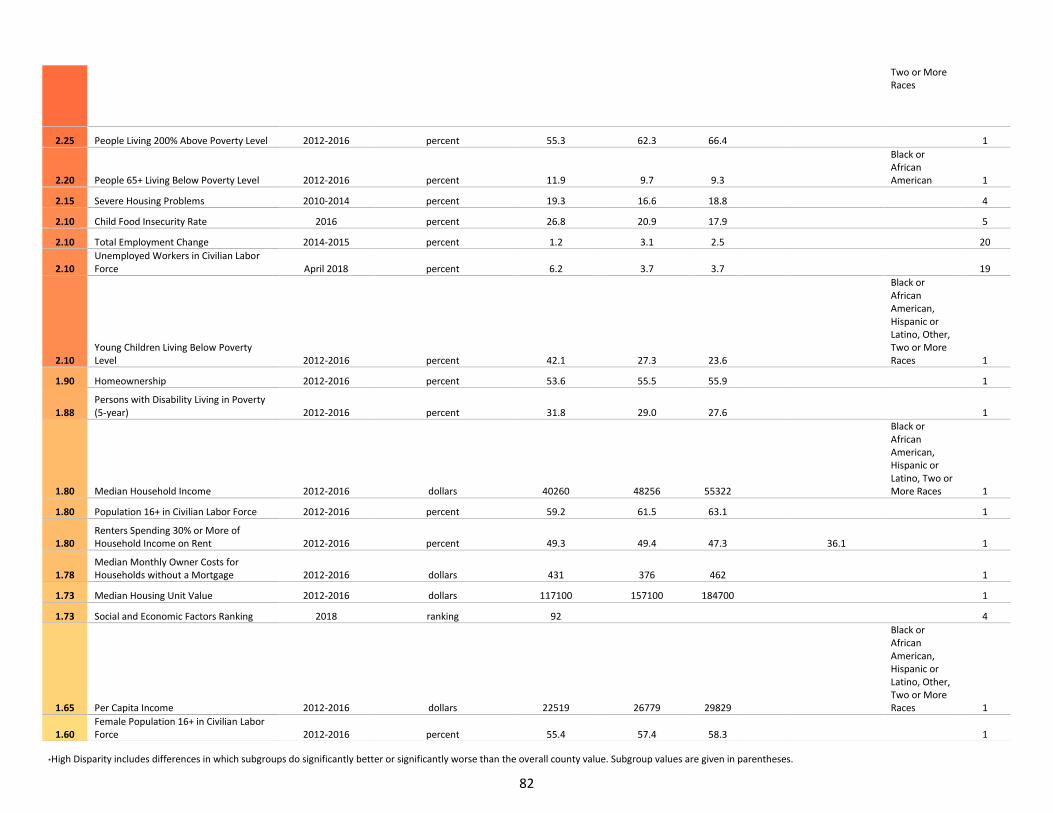
*High Disparity includes differences in which subgroups do significantly better or significantly worse than the overall county value. Subgroup values are given in parentheses.
82
Two or More Races
2.25 People Living 200% Above Poverty Level 2012-2016 percent 55.3 62.3 66.4 1
2.20 People 65+ Living Below Poverty Level 2012-2016 percent 11.9 9.7 9.3
Black or African American 1
2.15 Severe Housing Problems 2010-2014 percent 19.3 16.6 18.8 4
2.10 Child Food Insecurity Rate 2016 percent 26.8 20.9 17.9 5
2.10 Total Employment Change 2014-2015 percent 1.2 3.1 2.5 20
2.10 Unemployed Workers in Civilian Labor Force April 2018 percent 6.2 3.7 3.7 19
2.10 Young Children Living Below Poverty Level 2012-2016 percent 42.1 27.3 23.6
Black or African American, Hispanic or Latino, Other, Two or More Races 1
1.90 Homeownership 2012-2016 percent 53.6 55.5 55.9 1
1.88 Persons with Disability Living in Poverty (5-year) 2012-2016 percent 31.8 29.0 27.6 1
1.80 Median Household Income 2012-2016 dollars 40260 48256 55322
Black or African American, Hispanic or Latino, Two or More Races 1
1.80 Population 16+ in Civilian Labor Force 2012-2016 percent 59.2 61.5 63.1 1
1.80 Renters Spending 30% or More of Household Income on Rent 2012-2016 percent 49.3 49.4 47.3 36.1 1
1.78 Median Monthly Owner Costs for Households without a Mortgage 2012-2016 dollars 431 376 462 1
1.73 Median Housing Unit Value 2012-2016 dollars 117100 157100 184700 1
1.73 Social and Economic Factors Ranking 2018 ranking 92 4
1.65 Per Capita Income 2012-2016 dollars 22519 26779 29829
Black or African American, Hispanic or Latino, Other, Two or More Races 1
1.60 Female Population 16+ in Civilian Labor Force 2012-2016 percent 55.4 57.4 58.3 1
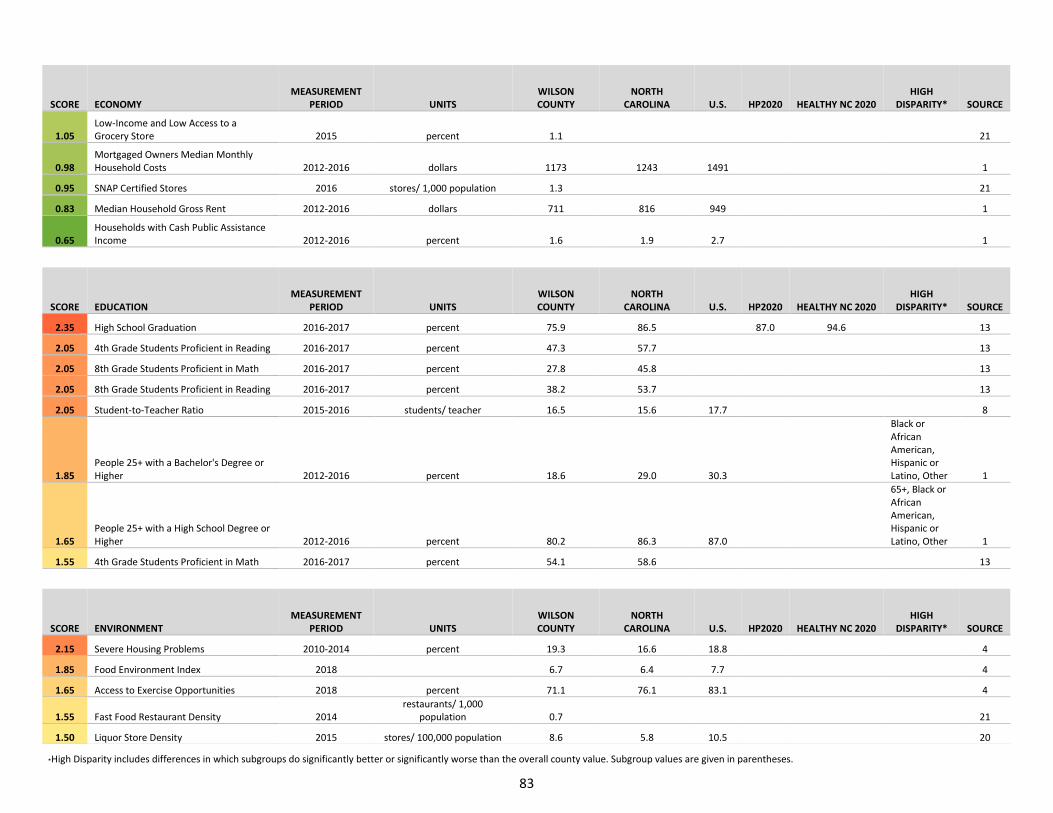
*High Disparity includes differences in which subgroups do significantly better or significantly worse than the overall county value. Subgroup values are given in parentheses.
83
SCORE ECONOMY MEASUREMENT
PERIOD UNITS WILSON COUNTY
NORTH CAROLINA U.S. HP2020 HEALTHY NC 2020
HIGH DISPARITY* SOURCE
1.05 Low-Income and Low Access to a Grocery Store 2015 percent 1.1 21
0.98 Mortgaged Owners Median Monthly Household Costs 2012-2016 dollars 1173 1243 1491 1
0.95 SNAP Certified Stores 2016 stores/ 1,000 population 1.3 21
0.83 Median Household Gross Rent 2012-2016 dollars 711 816 949 1
0.65 Households with Cash Public Assistance Income 2012-2016 percent 1.6 1.9 2.7 1
SCORE EDUCATION MEASUREMENT
PERIOD UNITS WILSON COUNTY
NORTH CAROLINA U.S. HP2020 HEALTHY NC 2020
HIGH DISPARITY* SOURCE
2.35 High School Graduation 2016-2017 percent 75.9 86.5 87.0 94.6 13
2.05 4th Grade Students Proficient in Reading 2016-2017 percent 47.3 57.7 13
2.05 8th Grade Students Proficient in Math 2016-2017 percent 27.8 45.8 13
2.05 8th Grade Students Proficient in Reading 2016-2017 percent 38.2 53.7 13
2.05 Student-to-Teacher Ratio 2015-2016 students/ teacher 16.5 15.6 17.7 8
1.85 People 25+ with a Bachelor's Degree or Higher 2012-2016 percent 18.6 29.0 30.3
Black or African American, Hispanic or Latino, Other 1
1.65 People 25+ with a High School Degree or Higher 2012-2016 percent 80.2 86.3 87.0
65+, Black or African American, Hispanic or Latino, Other 1
1.55 4th Grade Students Proficient in Math 2016-2017 percent 54.1 58.6 13
SCORE ENVIRONMENT MEASUREMENT
PERIOD UNITS WILSON COUNTY
NORTH CAROLINA U.S. HP2020 HEALTHY NC 2020
HIGH DISPARITY* SOURCE
2.15 Severe Housing Problems 2010-2014 percent 19.3 16.6 18.8 4
1.85 Food Environment Index 2018 6.7 6.4 7.7 4
1.65 Access to Exercise Opportunities 2018 percent 71.1 76.1 83.1 4
1.55 Fast Food Restaurant Density 2014 restaurants/ 1,000
population 0.7 21
1.50 Liquor Store Density 2015 stores/ 100,000 population 8.6 5.8 10.5 20
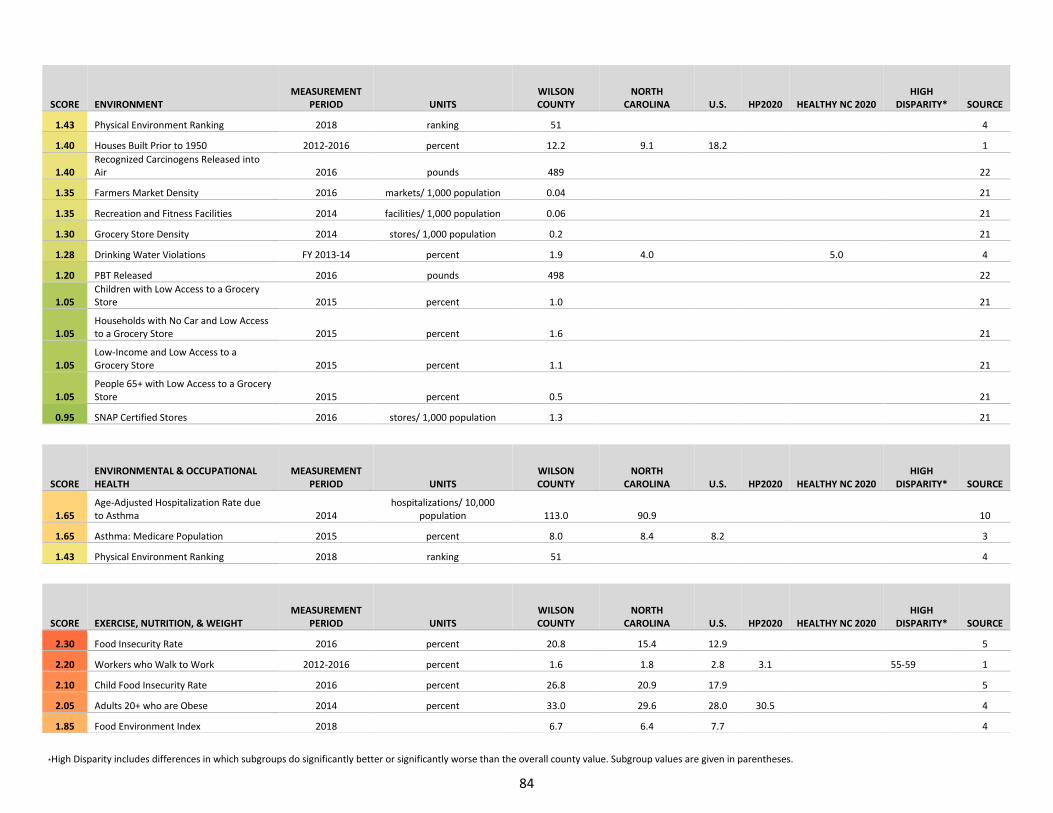
*High Disparity includes differences in which subgroups do significantly better or significantly worse than the overall county value. Subgroup values are given in parentheses.
84
SCORE ENVIRONMENT MEASUREMENT
PERIOD UNITS WILSON COUNTY
NORTH CAROLINA U.S. HP2020 HEALTHY NC 2020
HIGH DISPARITY* SOURCE
1.43 Physical Environment Ranking 2018 ranking 51 4
1.40 Houses Built Prior to 1950 2012-2016 percent 12.2 9.1 18.2 1
1.40 Recognized Carcinogens Released into Air 2016 pounds 489 22
1.35 Farmers Market Density 2016 markets/ 1,000 population 0.04 21
1.35 Recreation and Fitness Facilities 2014 facilities/ 1,000 population 0.06 21
1.30 Grocery Store Density 2014 stores/ 1,000 population 0.2 21
1.28 Drinking Water Violations FY 2013-14 percent 1.9 4.0 5.0 4
1.20 PBT Released 2016 pounds 498 22
1.05 Children with Low Access to a Grocery Store 2015 percent 1.0 21
1.05 Households with No Car and Low Access to a Grocery Store 2015 percent 1.6 21
1.05 Low-Income and Low Access to a Grocery Store 2015 percent 1.1 21
1.05 People 65+ with Low Access to a Grocery Store 2015 percent 0.5 21
0.95 SNAP Certified Stores 2016 stores/ 1,000 population 1.3 21
SCORE ENVIRONMENTAL & OCCUPATIONAL HEALTH
MEASUREMENT PERIOD UNITS
WILSON COUNTY
NORTH CAROLINA U.S. HP2020 HEALTHY NC 2020
HIGH DISPARITY* SOURCE
1.65 Age-Adjusted Hospitalization Rate due to Asthma 2014
hospitalizations/ 10,000 population 113.0 90.9 10
1.65 Asthma: Medicare Population 2015 percent 8.0 8.4 8.2 3
1.43 Physical Environment Ranking 2018 ranking 51 4
SCORE EXERCISE, NUTRITION, & WEIGHT MEASUREMENT
PERIOD UNITS WILSON COUNTY
NORTH CAROLINA U.S. HP2020 HEALTHY NC 2020
HIGH DISPARITY* SOURCE
2.30 Food Insecurity Rate 2016 percent 20.8 15.4 12.9 5
2.20 Workers who Walk to Work 2012-2016 percent 1.6 1.8 2.8 3.1 55-59 1
2.10 Child Food Insecurity Rate 2016 percent 26.8 20.9 17.9 5
2.05 Adults 20+ who are Obese 2014 percent 33.0 29.6 28.0 30.5 4
1.85 Food Environment Index 2018 6.7 6.4 7.7 4
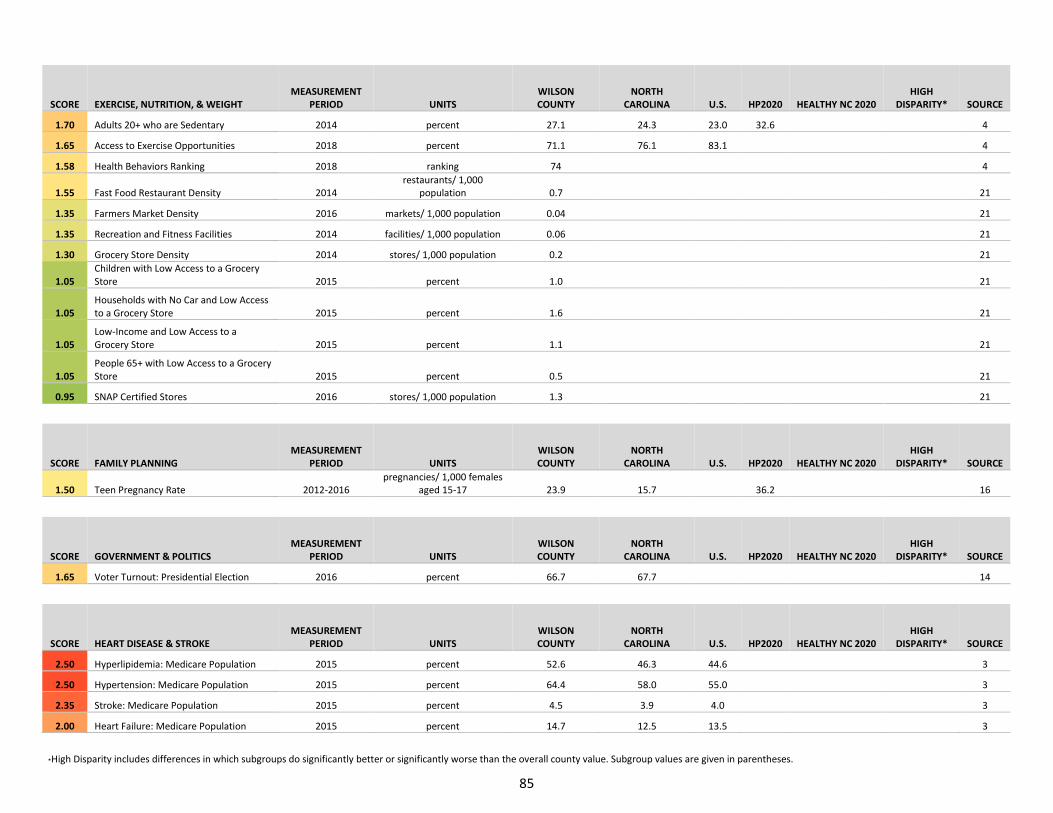
*High Disparity includes differences in which subgroups do significantly better or significantly worse than the overall county value. Subgroup values are given in parentheses.
85
SCORE EXERCISE, NUTRITION, & WEIGHT MEASUREMENT
PERIOD UNITS WILSON COUNTY
NORTH CAROLINA U.S. HP2020 HEALTHY NC 2020
HIGH DISPARITY* SOURCE
1.70 Adults 20+ who are Sedentary 2014 percent 27.1 24.3 23.0 32.6 4
1.65 Access to Exercise Opportunities 2018 percent 71.1 76.1 83.1 4
1.58 Health Behaviors Ranking 2018 ranking 74 4
1.55 Fast Food Restaurant Density 2014 restaurants/ 1,000
population 0.7 21
1.35 Farmers Market Density 2016 markets/ 1,000 population 0.04 21
1.35 Recreation and Fitness Facilities 2014 facilities/ 1,000 population 0.06 21
1.30 Grocery Store Density 2014 stores/ 1,000 population 0.2 21
1.05 Children with Low Access to a Grocery Store 2015 percent 1.0 21
1.05 Households with No Car and Low Access to a Grocery Store 2015 percent 1.6 21
1.05 Low-Income and Low Access to a Grocery Store 2015 percent 1.1 21
1.05 People 65+ with Low Access to a Grocery Store 2015 percent 0.5 21
0.95 SNAP Certified Stores 2016 stores/ 1,000 population 1.3 21
SCORE FAMILY PLANNING MEASUREMENT
PERIOD UNITS WILSON COUNTY
NORTH CAROLINA U.S. HP2020 HEALTHY NC 2020
HIGH DISPARITY* SOURCE
1.50 Teen Pregnancy Rate 2012-2016 pregnancies/ 1,000 females
aged 15-17 23.9 15.7 36.2 16
SCORE GOVERNMENT & POLITICS MEASUREMENT
PERIOD UNITS WILSON COUNTY
NORTH CAROLINA U.S. HP2020 HEALTHY NC 2020
HIGH DISPARITY* SOURCE
1.65 Voter Turnout: Presidential Election 2016 percent 66.7 67.7 14
SCORE HEART DISEASE & STROKE MEASUREMENT
PERIOD UNITS WILSON COUNTY
NORTH CAROLINA U.S. HP2020 HEALTHY NC 2020
HIGH DISPARITY* SOURCE
2.50 Hyperlipidemia: Medicare Population 2015 percent 52.6 46.3 44.6 3
2.50 Hypertension: Medicare Population 2015 percent 64.4 58.0 55.0 3
2.35 Stroke: Medicare Population 2015 percent 4.5 3.9 4.0 3
2.00 Heart Failure: Medicare Population 2015 percent 14.7 12.5 13.5 3
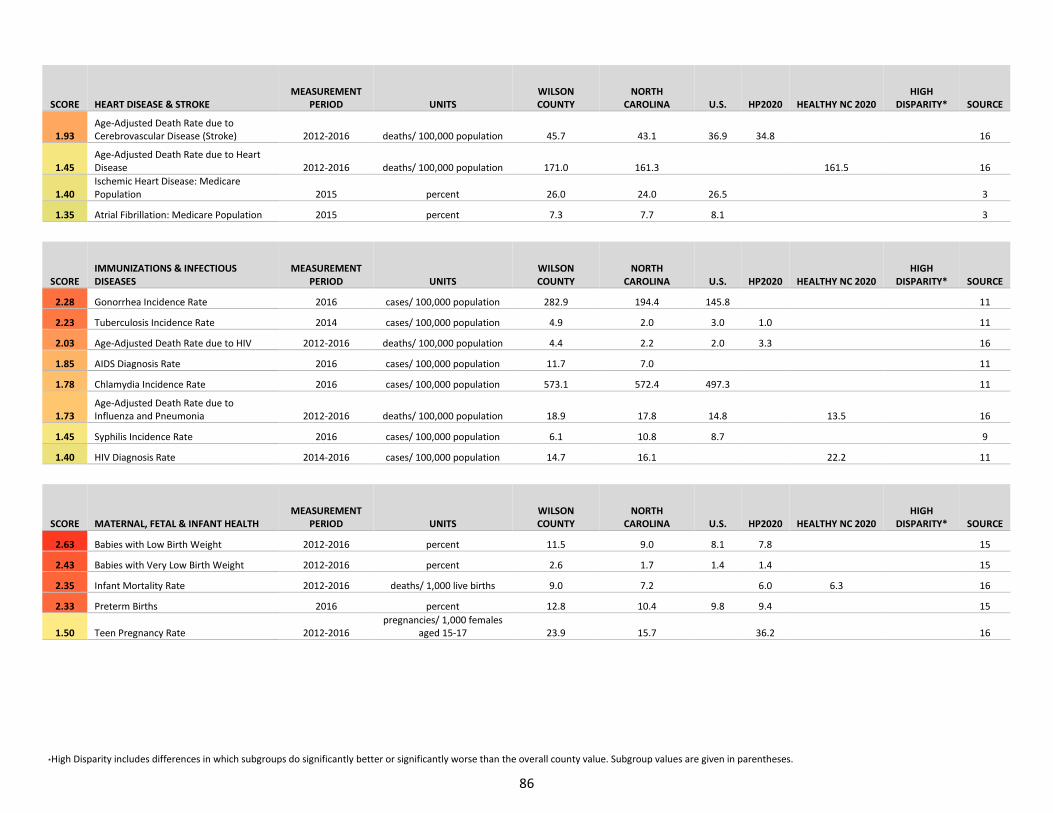
*High Disparity includes differences in which subgroups do significantly better or significantly worse than the overall county value. Subgroup values are given in parentheses.
86
SCORE HEART DISEASE & STROKE MEASUREMENT
PERIOD UNITS WILSON COUNTY
NORTH CAROLINA U.S. HP2020 HEALTHY NC 2020
HIGH DISPARITY* SOURCE
1.93 Age-Adjusted Death Rate due to Cerebrovascular Disease (Stroke) 2012-2016 deaths/ 100,000 population 45.7 43.1 36.9 34.8 16
1.45 Age-Adjusted Death Rate due to Heart Disease 2012-2016 deaths/ 100,000 population 171.0 161.3 161.5 16
1.40 Ischemic Heart Disease: Medicare Population 2015 percent 26.0 24.0 26.5 3
1.35 Atrial Fibrillation: Medicare Population 2015 percent 7.3 7.7 8.1 3
SCORE IMMUNIZATIONS & INFECTIOUS DISEASES
MEASUREMENT PERIOD UNITS
WILSON COUNTY
NORTH CAROLINA U.S. HP2020 HEALTHY NC 2020
HIGH DISPARITY* SOURCE
2.28 Gonorrhea Incidence Rate 2016 cases/ 100,000 population 282.9 194.4 145.8 11
2.23 Tuberculosis Incidence Rate 2014 cases/ 100,000 population 4.9 2.0 3.0 1.0 11
2.03 Age-Adjusted Death Rate due to HIV 2012-2016 deaths/ 100,000 population 4.4 2.2 2.0 3.3 16
1.85 AIDS Diagnosis Rate 2016 cases/ 100,000 population 11.7 7.0 11
1.78 Chlamydia Incidence Rate 2016 cases/ 100,000 population 573.1 572.4 497.3 11
1.73 Age-Adjusted Death Rate due to Influenza and Pneumonia 2012-2016 deaths/ 100,000 population 18.9 17.8 14.8 13.5 16
1.45 Syphilis Incidence Rate 2016 cases/ 100,000 population 6.1 10.8 8.7 9
1.40 HIV Diagnosis Rate 2014-2016 cases/ 100,000 population 14.7 16.1 22.2 11
SCORE MATERNAL, FETAL & INFANT HEALTH MEASUREMENT
PERIOD UNITS WILSON COUNTY
NORTH CAROLINA U.S. HP2020 HEALTHY NC 2020
HIGH DISPARITY* SOURCE
2.63 Babies with Low Birth Weight 2012-2016 percent 11.5 9.0 8.1 7.8 15
2.43 Babies with Very Low Birth Weight 2012-2016 percent 2.6 1.7 1.4 1.4 15
2.35 Infant Mortality Rate 2012-2016 deaths/ 1,000 live births 9.0 7.2 6.0 6.3 16
2.33 Preterm Births 2016 percent 12.8 10.4 9.8 9.4 15
1.50 Teen Pregnancy Rate 2012-2016 pregnancies/ 1,000 females
aged 15-17 23.9 15.7 36.2 16
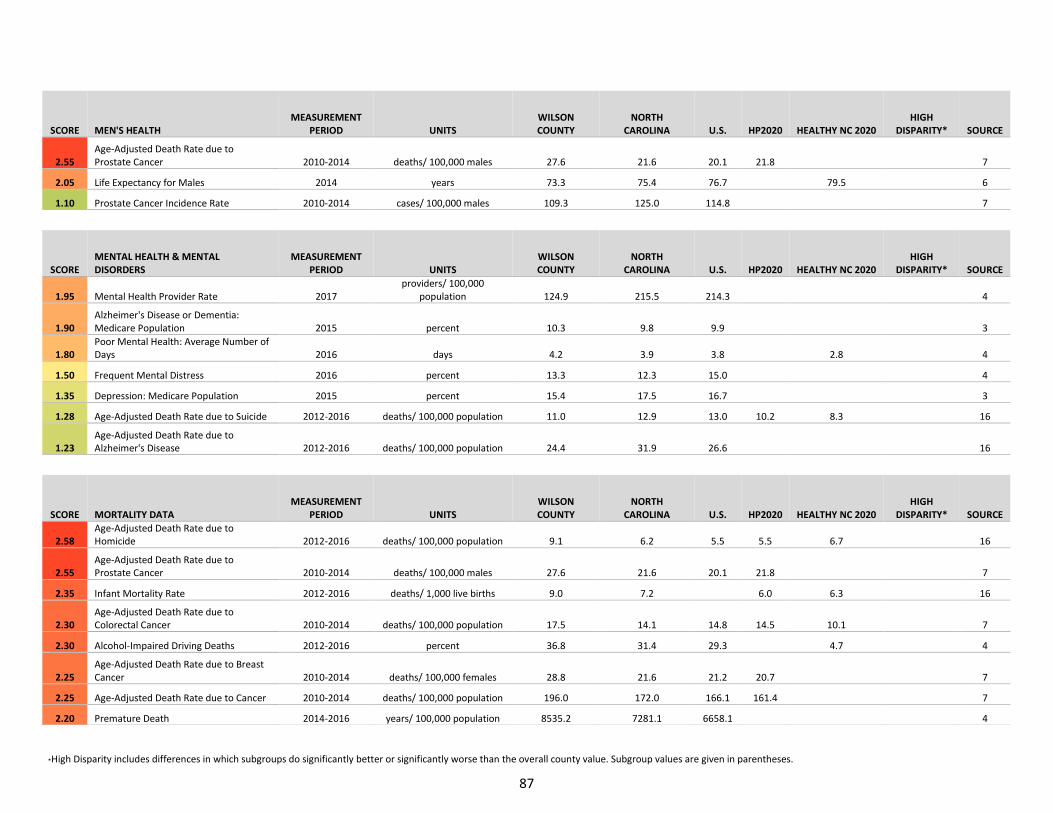
*High Disparity includes differences in which subgroups do significantly better or significantly worse than the overall county value. Subgroup values are given in parentheses.
87
SCORE MEN'S HEALTH MEASUREMENT
PERIOD UNITS WILSON COUNTY
NORTH CAROLINA U.S. HP2020 HEALTHY NC 2020
HIGH DISPARITY* SOURCE
2.55 Age-Adjusted Death Rate due to Prostate Cancer 2010-2014 deaths/ 100,000 males 27.6 21.6 20.1 21.8 7
2.05 Life Expectancy for Males 2014 years 73.3 75.4 76.7 79.5 6
1.10 Prostate Cancer Incidence Rate 2010-2014 cases/ 100,000 males 109.3 125.0 114.8 7
SCORE MENTAL HEALTH & MENTAL DISORDERS
MEASUREMENT PERIOD UNITS
WILSON COUNTY
NORTH CAROLINA U.S. HP2020 HEALTHY NC 2020
HIGH DISPARITY* SOURCE
1.95 Mental Health Provider Rate 2017 providers/ 100,000
population 124.9 215.5 214.3 4
1.90 Alzheimer's Disease or Dementia: Medicare Population 2015 percent 10.3 9.8 9.9 3
1.80 Poor Mental Health: Average Number of Days 2016 days 4.2 3.9 3.8 2.8 4
1.50 Frequent Mental Distress 2016 percent 13.3 12.3 15.0 4
1.35 Depression: Medicare Population 2015 percent 15.4 17.5 16.7 3
1.28 Age-Adjusted Death Rate due to Suicide 2012-2016 deaths/ 100,000 population 11.0 12.9 13.0 10.2 8.3 16
1.23 Age-Adjusted Death Rate due to Alzheimer's Disease 2012-2016 deaths/ 100,000 population 24.4 31.9 26.6 16
SCORE MORTALITY DATA MEASUREMENT
PERIOD UNITS WILSON COUNTY
NORTH CAROLINA U.S. HP2020 HEALTHY NC 2020
HIGH DISPARITY* SOURCE
2.58 Age-Adjusted Death Rate due to Homicide 2012-2016 deaths/ 100,000 population 9.1 6.2 5.5 5.5 6.7 16
2.55 Age-Adjusted Death Rate due to Prostate Cancer 2010-2014 deaths/ 100,000 males 27.6 21.6 20.1 21.8 7
2.35 Infant Mortality Rate 2012-2016 deaths/ 1,000 live births 9.0 7.2 6.0 6.3 16
2.30 Age-Adjusted Death Rate due to Colorectal Cancer 2010-2014 deaths/ 100,000 population 17.5 14.1 14.8 14.5 10.1 7
2.30 Alcohol-Impaired Driving Deaths 2012-2016 percent 36.8 31.4 29.3 4.7 4
2.25 Age-Adjusted Death Rate due to Breast Cancer 2010-2014 deaths/ 100,000 females 28.8 21.6 21.2 20.7 7
2.25 Age-Adjusted Death Rate due to Cancer 2010-2014 deaths/ 100,000 population 196.0 172.0 166.1 161.4 7
2.20 Premature Death 2014-2016 years/ 100,000 population 8535.2 7281.1 6658.1 4
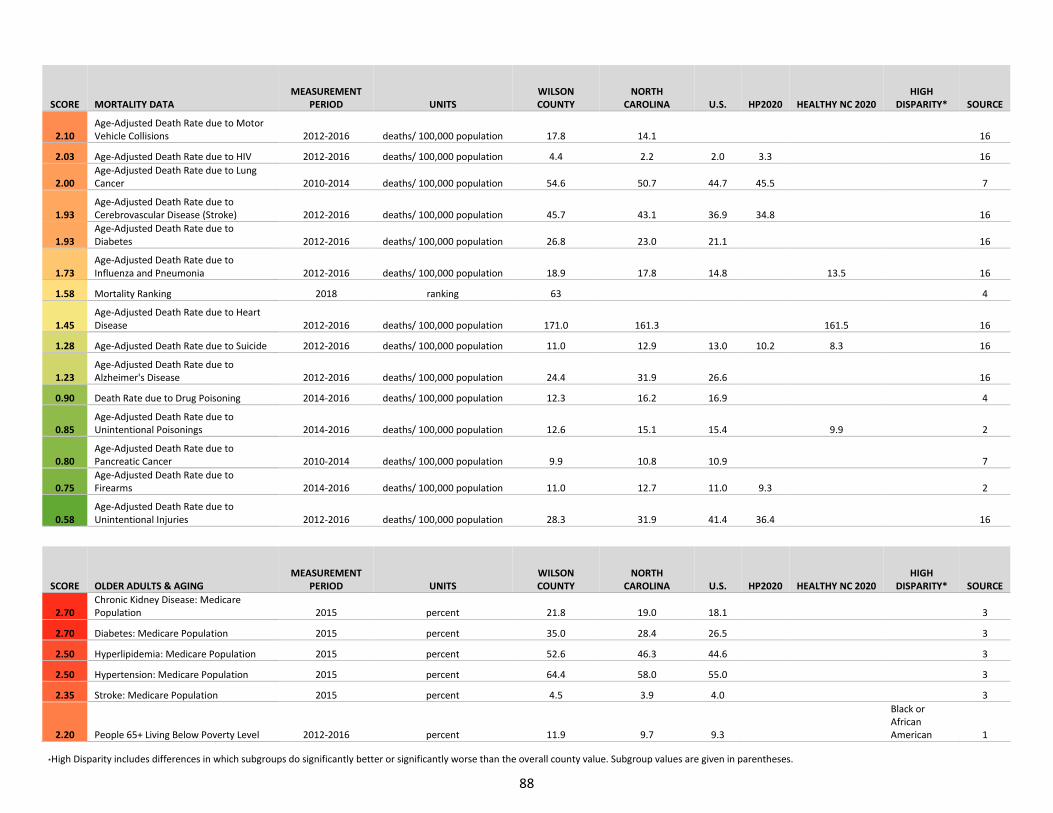
*High Disparity includes differences in which subgroups do significantly better or significantly worse than the overall county value. Subgroup values are given in parentheses.
88
SCORE MORTALITY DATA MEASUREMENT
PERIOD UNITS WILSON COUNTY
NORTH CAROLINA U.S. HP2020 HEALTHY NC 2020
HIGH DISPARITY* SOURCE
2.10 Age-Adjusted Death Rate due to Motor Vehicle Collisions 2012-2016 deaths/ 100,000 population 17.8 14.1 16
2.03 Age-Adjusted Death Rate due to HIV 2012-2016 deaths/ 100,000 population 4.4 2.2 2.0 3.3 16
2.00 Age-Adjusted Death Rate due to Lung Cancer 2010-2014 deaths/ 100,000 population 54.6 50.7 44.7 45.5 7
1.93 Age-Adjusted Death Rate due to Cerebrovascular Disease (Stroke) 2012-2016 deaths/ 100,000 population 45.7 43.1 36.9 34.8 16
1.93 Age-Adjusted Death Rate due to Diabetes 2012-2016 deaths/ 100,000 population 26.8 23.0 21.1 16
1.73 Age-Adjusted Death Rate due to Influenza and Pneumonia 2012-2016 deaths/ 100,000 population 18.9 17.8 14.8 13.5 16
1.58 Mortality Ranking 2018 ranking 63 4
1.45 Age-Adjusted Death Rate due to Heart Disease 2012-2016 deaths/ 100,000 population 171.0 161.3 161.5 16
1.28 Age-Adjusted Death Rate due to Suicide 2012-2016 deaths/ 100,000 population 11.0 12.9 13.0 10.2 8.3 16
1.23 Age-Adjusted Death Rate due to Alzheimer's Disease 2012-2016 deaths/ 100,000 population 24.4 31.9 26.6 16
0.90 Death Rate due to Drug Poisoning 2014-2016 deaths/ 100,000 population 12.3 16.2 16.9 4
0.85 Age-Adjusted Death Rate due to Unintentional Poisonings 2014-2016 deaths/ 100,000 population 12.6 15.1 15.4 9.9 2
0.80 Age-Adjusted Death Rate due to Pancreatic Cancer 2010-2014 deaths/ 100,000 population 9.9 10.8 10.9 7
0.75 Age-Adjusted Death Rate due to Firearms 2014-2016 deaths/ 100,000 population 11.0 12.7 11.0 9.3 2
0.58 Age-Adjusted Death Rate due to Unintentional Injuries 2012-2016 deaths/ 100,000 population 28.3 31.9 41.4 36.4 16
SCORE OLDER ADULTS & AGING MEASUREMENT
PERIOD UNITS WILSON COUNTY
NORTH CAROLINA U.S. HP2020 HEALTHY NC 2020
HIGH DISPARITY* SOURCE
2.70 Chronic Kidney Disease: Medicare Population 2015 percent 21.8 19.0 18.1 3
2.70 Diabetes: Medicare Population 2015 percent 35.0 28.4 26.5 3
2.50 Hyperlipidemia: Medicare Population 2015 percent 52.6 46.3 44.6 3
2.50 Hypertension: Medicare Population 2015 percent 64.4 58.0 55.0 3
2.35 Stroke: Medicare Population 2015 percent 4.5 3.9 4.0 3
2.20 People 65+ Living Below Poverty Level 2012-2016 percent 11.9 9.7 9.3
Black or African American 1
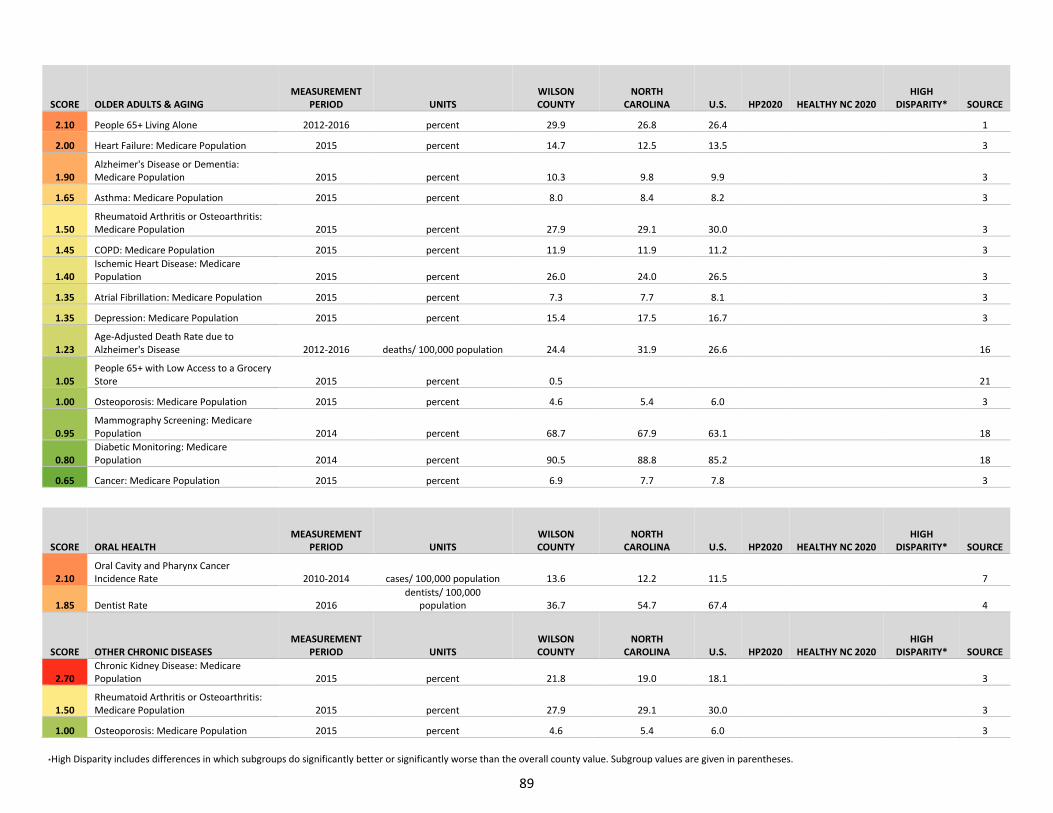
*High Disparity includes differences in which subgroups do significantly better or significantly worse than the overall county value. Subgroup values are given in parentheses.
89
SCORE OLDER ADULTS & AGING MEASUREMENT
PERIOD UNITS WILSON COUNTY
NORTH CAROLINA U.S. HP2020 HEALTHY NC 2020
HIGH DISPARITY* SOURCE
2.10 People 65+ Living Alone 2012-2016 percent 29.9 26.8 26.4 1
2.00 Heart Failure: Medicare Population 2015 percent 14.7 12.5 13.5 3
1.90 Alzheimer's Disease or Dementia: Medicare Population 2015 percent 10.3 9.8 9.9 3
1.65 Asthma: Medicare Population 2015 percent 8.0 8.4 8.2 3
1.50 Rheumatoid Arthritis or Osteoarthritis: Medicare Population 2015 percent 27.9 29.1 30.0 3
1.45 COPD: Medicare Population 2015 percent 11.9 11.9 11.2 3
1.40 Ischemic Heart Disease: Medicare Population 2015 percent 26.0 24.0 26.5 3
1.35 Atrial Fibrillation: Medicare Population 2015 percent 7.3 7.7 8.1 3
1.35 Depression: Medicare Population 2015 percent 15.4 17.5 16.7 3
1.23 Age-Adjusted Death Rate due to Alzheimer's Disease 2012-2016 deaths/ 100,000 population 24.4 31.9 26.6 16
1.05 People 65+ with Low Access to a Grocery Store 2015 percent 0.5 21
1.00 Osteoporosis: Medicare Population 2015 percent 4.6 5.4 6.0 3
0.95 Mammography Screening: Medicare Population 2014 percent 68.7 67.9 63.1 18
0.80 Diabetic Monitoring: Medicare Population 2014 percent 90.5 88.8 85.2 18
0.65 Cancer: Medicare Population 2015 percent 6.9 7.7 7.8 3
SCORE ORAL HEALTH MEASUREMENT
PERIOD UNITS WILSON COUNTY
NORTH CAROLINA U.S. HP2020 HEALTHY NC 2020
HIGH DISPARITY* SOURCE
2.10 Oral Cavity and Pharynx Cancer Incidence Rate 2010-2014 cases/ 100,000 population 13.6 12.2 11.5 7
1.85 Dentist Rate 2016 dentists/ 100,000
population 36.7 54.7 67.4 4
SCORE OTHER CHRONIC DISEASES MEASUREMENT
PERIOD UNITS WILSON COUNTY
NORTH CAROLINA U.S. HP2020 HEALTHY NC 2020
HIGH DISPARITY* SOURCE
2.70 Chronic Kidney Disease: Medicare Population 2015 percent 21.8 19.0 18.1 3
1.50 Rheumatoid Arthritis or Osteoarthritis: Medicare Population 2015 percent 27.9 29.1 30.0 3
1.00 Osteoporosis: Medicare Population 2015 percent 4.6 5.4 6.0 3
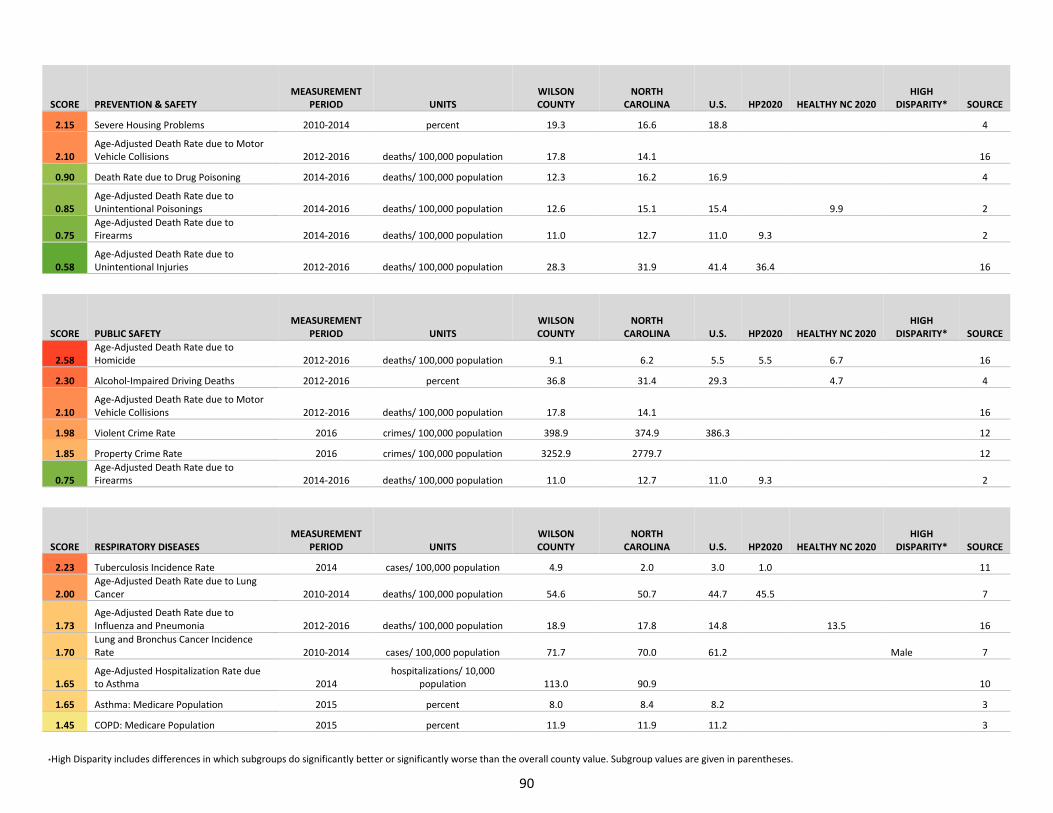
*High Disparity includes differences in which subgroups do significantly better or significantly worse than the overall county value. Subgroup values are given in parentheses.
90
SCORE PREVENTION & SAFETY MEASUREMENT
PERIOD UNITS WILSON COUNTY
NORTH CAROLINA U.S. HP2020 HEALTHY NC 2020
HIGH DISPARITY* SOURCE
2.15 Severe Housing Problems 2010-2014 percent 19.3 16.6 18.8 4
2.10 Age-Adjusted Death Rate due to Motor Vehicle Collisions 2012-2016 deaths/ 100,000 population 17.8 14.1 16
0.90 Death Rate due to Drug Poisoning 2014-2016 deaths/ 100,000 population 12.3 16.2 16.9 4
0.85 Age-Adjusted Death Rate due to Unintentional Poisonings 2014-2016 deaths/ 100,000 population 12.6 15.1 15.4 9.9 2
0.75 Age-Adjusted Death Rate due to Firearms 2014-2016 deaths/ 100,000 population 11.0 12.7 11.0 9.3 2
0.58 Age-Adjusted Death Rate due to Unintentional Injuries 2012-2016 deaths/ 100,000 population 28.3 31.9 41.4 36.4 16
SCORE PUBLIC SAFETY MEASUREMENT
PERIOD UNITS WILSON COUNTY
NORTH CAROLINA U.S. HP2020 HEALTHY NC 2020
HIGH DISPARITY* SOURCE
2.58 Age-Adjusted Death Rate due to Homicide 2012-2016 deaths/ 100,000 population 9.1 6.2 5.5 5.5 6.7 16
2.30 Alcohol-Impaired Driving Deaths 2012-2016 percent 36.8 31.4 29.3 4.7 4
2.10 Age-Adjusted Death Rate due to Motor Vehicle Collisions 2012-2016 deaths/ 100,000 population 17.8 14.1 16
1.98 Violent Crime Rate 2016 crimes/ 100,000 population 398.9 374.9 386.3 12
1.85 Property Crime Rate 2016 crimes/ 100,000 population 3252.9 2779.7 12
0.75 Age-Adjusted Death Rate due to Firearms 2014-2016 deaths/ 100,000 population 11.0 12.7 11.0 9.3 2
SCORE RESPIRATORY DISEASES MEASUREMENT
PERIOD UNITS WILSON COUNTY
NORTH CAROLINA U.S. HP2020 HEALTHY NC 2020
HIGH DISPARITY* SOURCE
2.23 Tuberculosis Incidence Rate 2014 cases/ 100,000 population 4.9 2.0 3.0 1.0 11
2.00 Age-Adjusted Death Rate due to Lung Cancer 2010-2014 deaths/ 100,000 population 54.6 50.7 44.7 45.5 7
1.73 Age-Adjusted Death Rate due to Influenza and Pneumonia 2012-2016 deaths/ 100,000 population 18.9 17.8 14.8 13.5 16
1.70 Lung and Bronchus Cancer Incidence Rate 2010-2014 cases/ 100,000 population 71.7 70.0 61.2 Male 7
1.65 Age-Adjusted Hospitalization Rate due to Asthma 2014
hospitalizations/ 10,000 population 113.0 90.9 10
1.65 Asthma: Medicare Population 2015 percent 8.0 8.4 8.2 3
1.45 COPD: Medicare Population 2015 percent 11.9 11.9 11.2 3
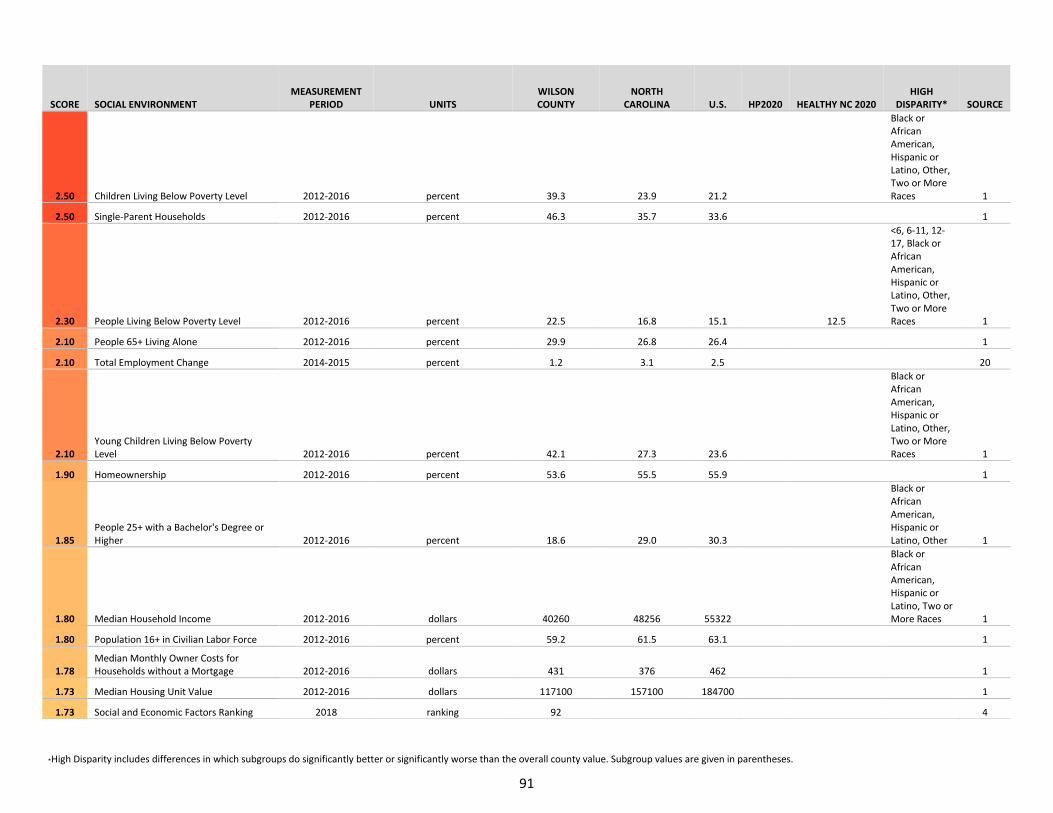
*High Disparity includes differences in which subgroups do significantly better or significantly worse than the overall county value. Subgroup values are given in parentheses.
91
SCORE SOCIAL ENVIRONMENT MEASUREMENT
PERIOD UNITS WILSON COUNTY
NORTH CAROLINA U.S. HP2020 HEALTHY NC 2020
HIGH DISPARITY* SOURCE
2.50 Children Living Below Poverty Level 2012-2016 percent 39.3 23.9 21.2
Black or African American, Hispanic or Latino, Other, Two or More Races 1
2.50 Single-Parent Households 2012-2016 percent 46.3 35.7 33.6 1
2.30 People Living Below Poverty Level 2012-2016 percent 22.5 16.8 15.1 12.5
<6, 6-11, 12-17, Black or African American, Hispanic or Latino, Other, Two or More Races 1
2.10 People 65+ Living Alone 2012-2016 percent 29.9 26.8 26.4 1
2.10 Total Employment Change 2014-2015 percent 1.2 3.1 2.5 20
2.10 Young Children Living Below Poverty Level 2012-2016 percent 42.1 27.3 23.6
Black or African American, Hispanic or Latino, Other, Two or More Races 1
1.90 Homeownership 2012-2016 percent 53.6 55.5 55.9 1
1.85 People 25+ with a Bachelor's Degree or Higher 2012-2016 percent 18.6 29.0 30.3
Black or African American, Hispanic or Latino, Other 1
1.80 Median Household Income 2012-2016 dollars 40260 48256 55322
Black or African American, Hispanic or Latino, Two or More Races 1
1.80 Population 16+ in Civilian Labor Force 2012-2016 percent 59.2 61.5 63.1 1
1.78 Median Monthly Owner Costs for Households without a Mortgage 2012-2016 dollars 431 376 462 1
1.73 Median Housing Unit Value 2012-2016 dollars 117100 157100 184700 1
1.73 Social and Economic Factors Ranking 2018 ranking 92 4
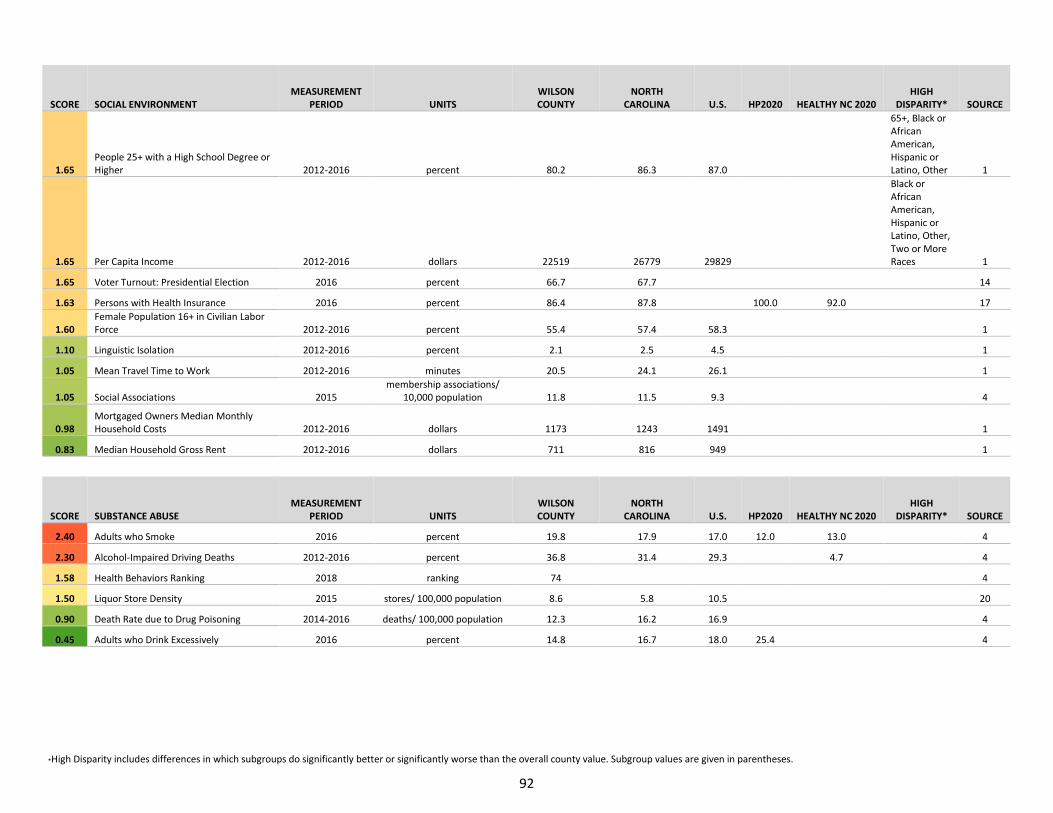
*High Disparity includes differences in which subgroups do significantly better or significantly worse than the overall county value. Subgroup values are given in parentheses.
92
SCORE SOCIAL ENVIRONMENT MEASUREMENT
PERIOD UNITS WILSON COUNTY
NORTH CAROLINA U.S. HP2020 HEALTHY NC 2020
HIGH DISPARITY* SOURCE
1.65 People 25+ with a High School Degree or Higher 2012-2016 percent 80.2 86.3 87.0
65+, Black or African American, Hispanic or Latino, Other 1
1.65 Per Capita Income 2012-2016 dollars 22519 26779 29829
Black or African American, Hispanic or Latino, Other, Two or More Races 1
1.65 Voter Turnout: Presidential Election 2016 percent 66.7 67.7 14
1.63 Persons with Health Insurance 2016 percent 86.4 87.8 100.0 92.0 17
1.60 Female Population 16+ in Civilian Labor Force 2012-2016 percent 55.4 57.4 58.3 1
1.10 Linguistic Isolation 2012-2016 percent 2.1 2.5 4.5 1
1.05 Mean Travel Time to Work 2012-2016 minutes 20.5 24.1 26.1 1
1.05 Social Associations 2015 membership associations/
10,000 population 11.8 11.5 9.3 4
0.98 Mortgaged Owners Median Monthly Household Costs 2012-2016 dollars 1173 1243 1491 1
0.83 Median Household Gross Rent 2012-2016 dollars 711 816 949 1
SCORE SUBSTANCE ABUSE MEASUREMENT
PERIOD UNITS WILSON COUNTY
NORTH CAROLINA U.S. HP2020 HEALTHY NC 2020
HIGH DISPARITY* SOURCE
2.40 Adults who Smoke 2016 percent 19.8 17.9 17.0 12.0 13.0 4
2.30 Alcohol-Impaired Driving Deaths 2012-2016 percent 36.8 31.4 29.3 4.7 4
1.58 Health Behaviors Ranking 2018 ranking 74 4
1.50 Liquor Store Density 2015 stores/ 100,000 population 8.6 5.8 10.5 20
0.90 Death Rate due to Drug Poisoning 2014-2016 deaths/ 100,000 population 12.3 16.2 16.9 4
0.45 Adults who Drink Excessively 2016 percent 14.8 16.7 18.0 25.4 4
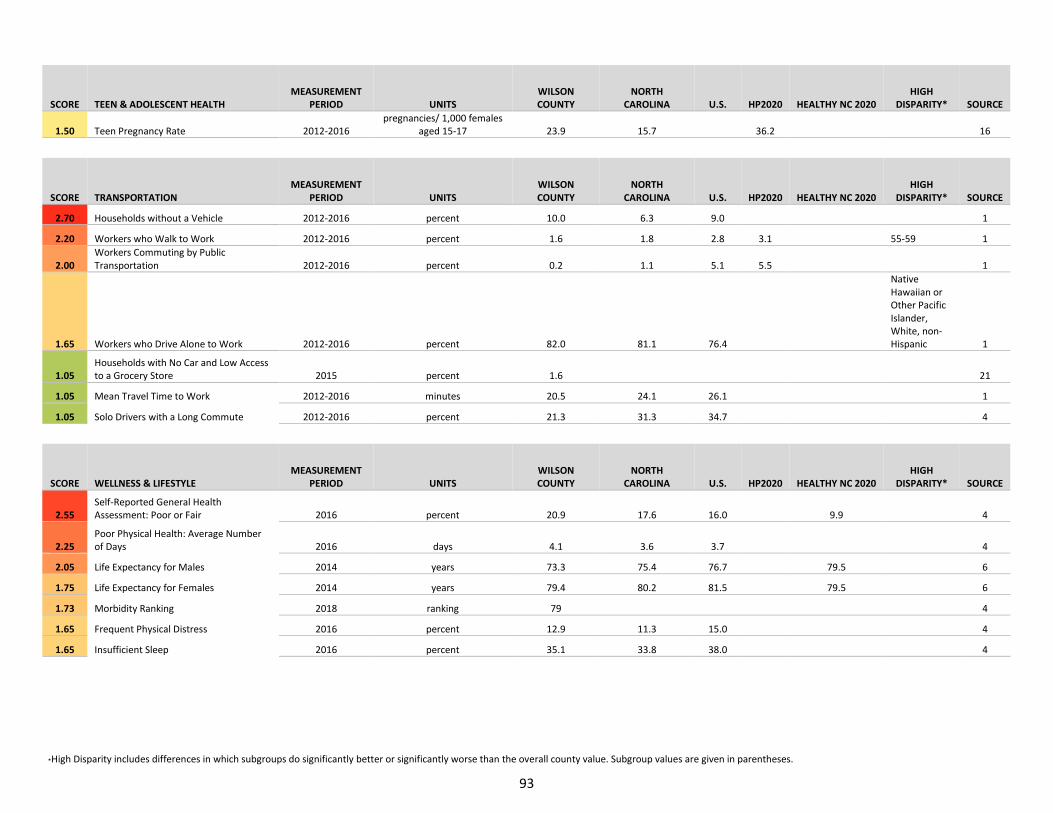
*High Disparity includes differences in which subgroups do significantly better or significantly worse than the overall county value. Subgroup values are given in parentheses.
93
SCORE TEEN & ADOLESCENT HEALTH MEASUREMENT
PERIOD UNITS WILSON COUNTY
NORTH CAROLINA U.S. HP2020 HEALTHY NC 2020
HIGH DISPARITY* SOURCE
1.50 Teen Pregnancy Rate 2012-2016 pregnancies/ 1,000 females
aged 15-17 23.9 15.7 36.2 16
SCORE TRANSPORTATION MEASUREMENT
PERIOD UNITS WILSON COUNTY
NORTH CAROLINA U.S. HP2020 HEALTHY NC 2020
HIGH DISPARITY* SOURCE
2.70 Households without a Vehicle 2012-2016 percent 10.0 6.3 9.0 1
2.20 Workers who Walk to Work 2012-2016 percent 1.6 1.8 2.8 3.1 55-59 1
2.00 Workers Commuting by Public Transportation 2012-2016 percent 0.2 1.1 5.1 5.5 1
1.65 Workers who Drive Alone to Work 2012-2016 percent 82.0 81.1 76.4
Native Hawaiian or Other Pacific Islander, White, non-Hispanic 1
1.05 Households with No Car and Low Access to a Grocery Store 2015 percent 1.6 21
1.05 Mean Travel Time to Work 2012-2016 minutes 20.5 24.1 26.1 1
1.05 Solo Drivers with a Long Commute 2012-2016 percent 21.3 31.3 34.7 4
SCORE WELLNESS & LIFESTYLE MEASUREMENT
PERIOD UNITS WILSON COUNTY
NORTH CAROLINA U.S. HP2020 HEALTHY NC 2020
HIGH DISPARITY* SOURCE
2.55 Self-Reported General Health Assessment: Poor or Fair 2016 percent 20.9 17.6 16.0 9.9 4
2.25 Poor Physical Health: Average Number of Days 2016 days 4.1 3.6 3.7 4
2.05 Life Expectancy for Males 2014 years 73.3 75.4 76.7 79.5 6
1.75 Life Expectancy for Females 2014 years 79.4 80.2 81.5 79.5 6
1.73 Morbidity Ranking 2018 ranking 79 4
1.65 Frequent Physical Distress 2016 percent 12.9 11.3 15.0 4
1.65 Insufficient Sleep 2016 percent 35.1 33.8 38.0 4
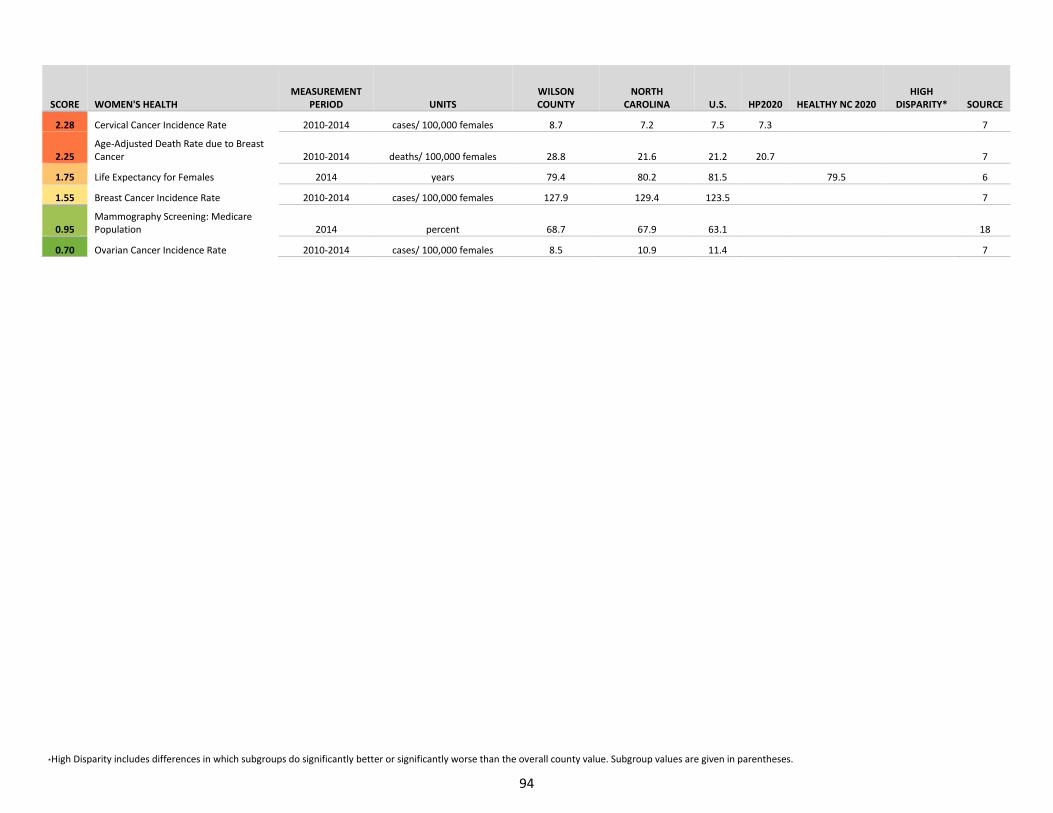
*High Disparity includes differences in which subgroups do significantly better or significantly worse than the overall county value. Subgroup values are given in parentheses.
94
SCORE WOMEN'S HEALTH MEASUREMENT
PERIOD UNITS WILSON COUNTY
NORTH CAROLINA U.S. HP2020 HEALTHY NC 2020
HIGH DISPARITY* SOURCE
2.28 Cervical Cancer Incidence Rate 2010-2014 cases/ 100,000 females 8.7 7.2 7.5 7.3 7
2.25 Age-Adjusted Death Rate due to Breast Cancer 2010-2014 deaths/ 100,000 females 28.8 21.6 21.2 20.7 7
1.75 Life Expectancy for Females 2014 years 79.4 80.2 81.5 79.5 6
1.55 Breast Cancer Incidence Rate 2010-2014 cases/ 100,000 females 127.9 129.4 123.5 7
0.95 Mammography Screening: Medicare Population 2014 percent 68.7 67.9 63.1 18
0.70 Ovarian Cancer Incidence Rate 2010-2014 cases/ 100,000 females 8.5 10.9 11.4 7
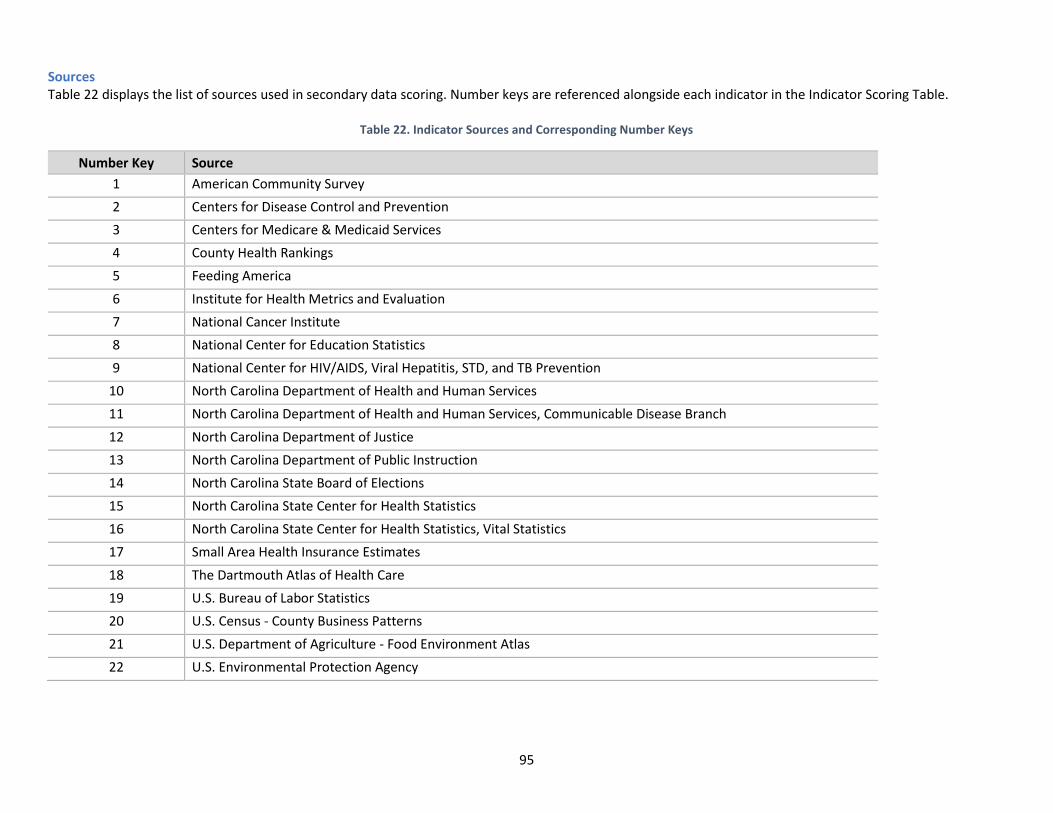
95
Sources Table 22 displays the list of sources used in secondary data scoring. Number keys are referenced alongside each indicator in the Indicator Scoring Table.
Table 22. Indicator Sources and Corresponding Number Keys
Number Key Source
1 American Community Survey
2 Centers for Disease Control and Prevention
3 Centers for Medicare & Medicaid Services
4 County Health Rankings
5 Feeding America
6 Institute for Health Metrics and Evaluation
7 National Cancer Institute
8 National Center for Education Statistics
9 National Center for HIV/AIDS, Viral Hepatitis, STD, and TB Prevention
10 North Carolina Department of Health and Human Services
11 North Carolina Department of Health and Human Services, Communicable Disease Branch
12 North Carolina Department of Justice
13 North Carolina Department of Public Instruction
14 North Carolina State Board of Elections
15 North Carolina State Center for Health Statistics
16 North Carolina State Center for Health Statistics, Vital Statistics
17 Small Area Health Insurance Estimates
18 The Dartmouth Atlas of Health Care
19 U.S. Bureau of Labor Statistics
20 U.S. Census - County Business Patterns
21 U.S. Department of Agriculture - Food Environment Atlas
22 U.S. Environmental Protection Agency
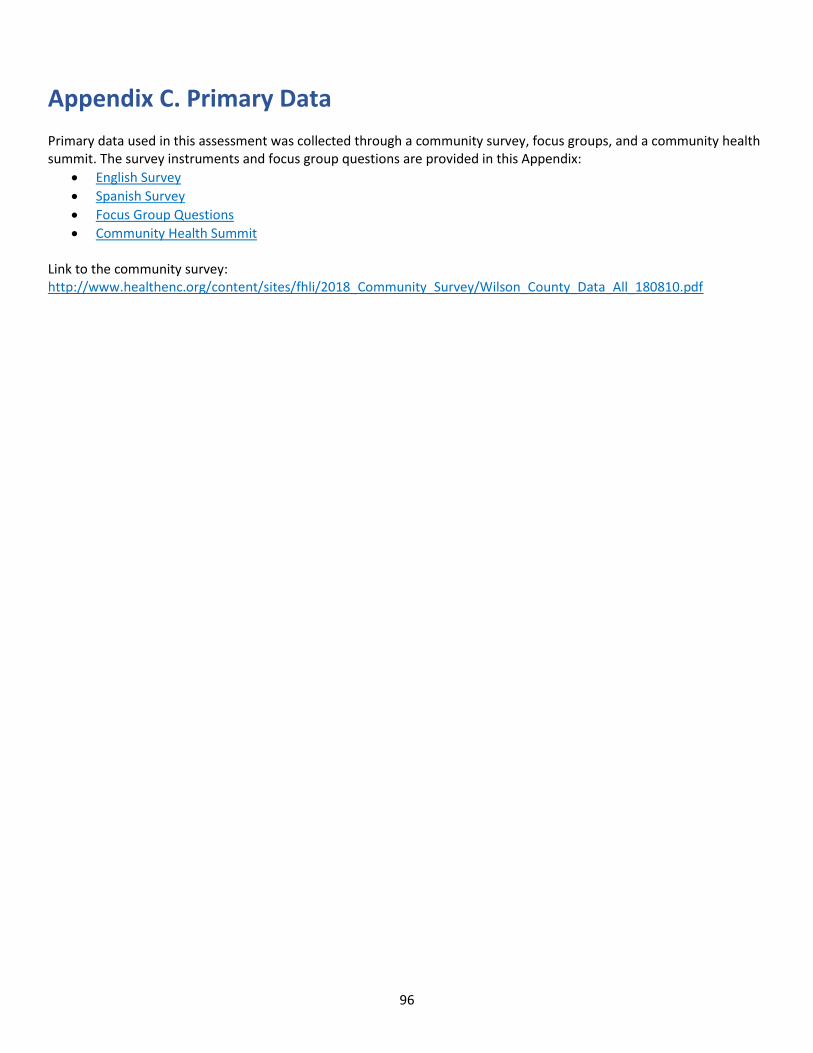
96
Appendix C. Primary Data Primary data used in this assessment was collected through a community survey, focus groups, and a community health summit. The survey instruments and focus group questions are provided in this Appendix:
English Survey
Spanish Survey
Focus Group Questions
Community Health Summit Link to the community survey: http://www.healthenc.org/content/sites/fhli/2018_Community_Survey/Wilson_County_Data_All_180810.pdf
97
Appendix D. Community Resources Community Resource Guide Link:
https://www.unitedwayofwilson.org/sites/unitedwayofwilson.org/files/United%20Way%20Community%20Resource%20Guide_4.192017.pdf
Crime Prevention/Law Enforcement/Victim Assistance City of Wilson Police Wilson County Sheriff’s Department (Several Satellite offices throughout city) (Several satellite offices throughout county) 120 Goldsboro Street, N 100 Green Street, E Wilson, NC 27893 Wilson, NC 27893 252.399.2323 252.237.2118 NC Highway Patrol Wilson Crisis Center 1822 Goldsboro Street, SW P.O. Box 8026 Wilson, NC 27893 Wilson, NC 27893 252.243.6439 252.237.5156 Black Creek Police Department Stantonsburg Police Department 112 W. Center Street 114 E Commercial Ave Black Creek, NC 27813 Stantonsburg, North Carolina 27883 252.243.6439 252.238.3534 Fire Safety/Rescue Services:
City of Wilson Fire Departments/Rescue Services Station 1: 307 Hines Street W Wilson, NC 27893 252.399.2890 Station 2: 1807 Forest Hills Rd, W Wilson, NC 27893 252.399.2895 Station 3: 6111 Ward Blvd Wilson, NC 27893 252.399.2891 Station 4: 109 Forest Hills Rd, NW Wilson, NC 27893 252.399.2897 Station 5: 3530 Airport Blvd Wilson, NC 27896 County of Wilson - Volunteer Fire Departments Bakertown VFD 6505 Webb Lake Road Elm City, NC 27822 252.291.2535 Black Creek VFD Center Street Black Creek, NC 27813 252.291.8373 Contentnea VFD 4146 NC Hwy 42 W Wilson, NC 27893 Crossroads VFD 102 Grove St Lucama, NC 27851 East Nash VFD 4117 US Hwy 264 Alt E Wilson, NC 27893 Rock Ridge VFD 6501 Rock Ridge School Rd Wilson, NC 27893 Sanoca VFD Hwy 222 Saratoga, NC 27873 252.238.2392 Silver Lake VFD 5207 Hornes Church Rd Wilson, NC 27893 252.237.2780 Sims VFD 6217 US 264 Alt W Sims, NC 27880 252.243.0680 Stantonsburg-Moyton VFD 105 N. Saratoga St. Stantonsburg, NC 27883
Physician Directory: https://www.wilsonmedical.com/need-a-doctor/find-a-doctor/?
Wilson County Elected Officials Mayor: Bruce Rose Chief of Police: Thomas P. Hopkins
98
Sheriff: Calvin Woodard, Jr. Wilson City Council Wilson County Commissioners District 1 – A.P. Coleman District 1 – Leslie Atkinson, Vice Chair District 2 – Michael Bell District 2 – Sherry Lucas District 3 – William “Tom” Fyle District 3 – JoAnne Daniels District 4 – James M. Johnson District 4 – Roger Lucas District 5 – Donald Evans District 5 – Rob Boyette, Chair District 6 – Logan Liles District 6 – Chris Hill District 7 – Derrick Creech District 7 – Bill Blackman Wilson County Board of Education District 1 – Debora Powell District 2 – Velma Barnes District 3 – Dr. Christine Fitch, Chair District 4 – Henry Mercer, Vice Chair District 5 – Beverly Boyette District 6 – Gary Farmer District 7 – Rhyan Breen United Way of Wilson United Way of Wilson 509 Nash Street Wilson, NC 27893 252.237.3194 North Carolina 2-1-1 (NC 2-1-1) is a United Way and local partner-based system with two call centers and a dedicated team of database coordinators that partner to collaboratively maintain a robust database of health and human services resources available by dialing 2-1-1 or through on-line search at nc211.org. No matter where you live in NC, you can call 2-1-1 and a trained 2-1-1 agent will help you to find available human services resources in your community. United Way of Wilson County has updated the contact for Wilson County resources.
List of Figures Figure 1. Health ENC Online Data Platform ................................................................................................ 10 Figure 2. Education of Community Survey Respondents ............................................................................ 19 Figure 3. Employment Status of Community Survey Respondents ............................................................ 15 Figure 4. Health Care Coverage of Community Survey Respondents ......................................................... 16 Figure 5. Secondary Data Scoring ............................................................................................................... 16 Figure 6. Total Population (U.S. Census Bureau) ........................................................................................ 23 Figure 7. Population Density of Health ENC Counties (U.S. Census Bureau, 2010) .................................... 24 Figure 8. Population by Age (U.S. Census Bureau, 2016)............................................................................ 25 Figure 9. Population 18+ and 65+ (U.S. Census Bureau, 2016) ................................................................... 26 Figure 10. Birth Rate (North Carolina State Center for Health Statistics) ................................................... 27 Figure 11. Population by Race/Ethnicity (U.S. Census Bureau, 2016) ........................................................ 28 Figure 12. Population in Military / Armed Forces (American Community Survey) .................................... 29 Figure 13. Veteran Population (American Community Survey, 2012-2016) .............................................. 30 Figure 14. Median Household Income (American Community Survey, 2012-2016) .................................. 31
99
Figure 15. Median Household Income of Health ENC Counties (American Community Survey, 2012-2016)32 Figure 16. Median Household Income by Zip Code (American Community Survey, 2012-2016) .............. 33 Figure 17. People Living Below Poverty Level (American Community Survey, 2012-2016) ....................... 34 Figure 18. Children Living Below Poverty Level (American Community Survey, 2012-2016) ..................... 35 Figure 19. People 65+ Living Below Poverty Level (American Community Survey, 2012-2016) ................ 35 Figure 20. Persons with Disability Living in Poverty (American Community Survey, 2012-2016) .............. 36 Figure 21. Mortgaged Owners Median Monthly Household Costs, Health ENC Counties (American Community Survey 2012-2016) .................................................................................................................................................. 36 Figure 22. Severe Housing Problems (County Health Rankings, 2010-2014) ............................................. 37 Figure 23. Households with Children Receiving SNAP (American Community Survey, 2012-2016) .......... 37 Figure 24. SocioNeeds Index® (Conduent Healthy Communities Institute, 2018) ..................................... 39 Figure 25. People 25+ with a High School Degree or Higher and Bachelor’s Degree or Higher (American Community Survey, 2012-2016) ..................................................................................................................................... 40 Figure 26. People 25+ with a High School Degree or Higher by Zip Code (American Community Survey, 2012-2016) .................................................................................................................................................................... 41 Figure 27. High School Dropout Rate (North Carolina Department of Public Instruction) ......................... 42 Figure 28. High School Suspension Rate (North Carolina Department of Public Instruction) .................... 42 Figure 29. Mode of Commuting to Work (American Community Survey, 2012-2016) .............................. 44 Figure 30. Workers who Drive Alone to Work (American Community Survey, 2012-2016) ...................... 44 Figure 31. Violent Crime Rate (North Carolina Department of Justice) ..................................................... 46 Figure 32. Property Crime Rate (North Carolina Department of Justice) ................................................... 46 Figure 33. Juvenile Undisciplined Rate (North Carolina Department of Public Safety) .............................. 47 Figure 34. Juvenile Delinquent Rate (North Carolina Department of Public Safety) .................................. 47 Figure 35. Child Abuse Rate (Management Assistance for Child Welfare, Work First, and Food & Nutrition Services in North Carolina & University of North Carolina at Chapel Hill Jordan Institute for Families) ..................... 48 Figure 36. Incarceration Rate (North Carolina Department of Public Safety) ............................................ 48 Figure 37. Persons with Health Insurance (Small Area Health Insurance Estimates, 2016) ....................... 49 Figure 38. Persons Only Receiving Health Insurance through Medicaid, Medicare or Military Healthcare (American Community Survey, 2012-2016) ................................................................................................................. 49 Figure 39. Voting Age Population (American Community Survey, 2012-2016) .......................................... 50 Figure 40. Voter Turnout in the Last Presidential Election (North Carolina State Board of Elections, 2016)50 Figure 41. Top Quality of Life Issues, as Ranked by Survey Respondents .................................................. 52 Figure 42. Level of Agreement Among Wilson County Residents in Response to Nine Statements about their Community .................................................................................................................................................................... 53 Figure 43. Services Needing the Most Improvement, as Ranked by Survey Respondents ........................ 53 Figure 44. Health Behaviors that Residents Need More Information About, As Ranked by Survey Respondents 54 Figure 45. Data Synthesis Results ............................................................................................................... 55 Figure 46. Secondary Data Scoring ............................................................................................................ 74 Figure 47. Score Range ................................................................................................................................ 74 Figure 48. Comparisons used in Secondary Data Scoring ........................................................................... 75 Figure 49. Compare to Distribution Indicator Gauge .................................................................................. 75 Figure 50. Distribution of County Values .................................................................................................... 75 Figure 51. Comparison to Single Value ....................................................................................................... 75 Figure 52. Comparison to Target Value ...................................................................................................... 76 Figure 53. Trend Over Time ........................................................................................................................ 76
100
List of Tables
Table 1. Significant Health Needs ........................................................................................................................................... 6 Table 2. Survey Respondents ................................................................................................................................................ 14 Table 3. List of Focus Group Discussions .............................................................................................................................. 18 Table 4. Health and Quality of Life Topic Areas .................................................................................................................... 20 Table 5. Population by Gender and Age (U.S. Census Bureau, 2016) ................................................................................... 26 Table 6. Named Tribes in North Carolina (American Community Survey, 2012-2016) ........................................................ 29 Table 7. SocioNeeds Index® (Conduent Healthy Communities Institute, 2018) ................................................................... 39 Table 8. Secondary Data Scoring Results by Topic Area ....................................................................................................... 52 Table 9. Focus Group Results by Topic Area ......................................................................................................................... 54 Table 10. Criteria for Identifying the Top Needs from each Data Source ............................................................................. 55 Table 11. Topic Areas Examined in this Report ..................................................................................................................... 56 Table 12. Description of Gauges and Icons used in Secondary Dara Scoring ....................................................................... 56 Table 13. Data Scoring Results for Maternal, Fetal & Infant Health ..................................................................................... 57 Table 14. Data Scoring Results for Education ....................................................................................................................... 59 Table 15. Data Scoring Results for Heart Disease & Stroke .................................................................................................. 60 Table 16. Data Scoring Results for Diabetes ......................................................................................................................... 62 Table 17. Data Scoring Results for Public Safety ................................................................................................................... 63 Table 18. Leading Causes of Mortality (2014-2016, CDC WONDER) .................................................................................... 65 Table 19. Indicators with Significant Race/Ethnic, Age, or Gender Disparities .................................................................... 68 Table 20. Topic Scores for Wilson County............................................................................................................................. 78 Table 21. Indicator Scores by Topic Area .............................................................................................................................. 79 Table 22. Indicator Sources and Corresponding Number Keys ............................................................................................ 95
101
Addendum to Appendix C - Surveys
English Survey
Eastern North Carolina Community Health Survey 2018
Welcome to the Community Health Survey for Eastern North Carolina! We are conducting a Community Health Assessment for your county. This assessment is being undertaken by a partnership of 33 counties, hospitals, health systems, and health departments in Eastern North Carolina. It allows these partners to better understand the health status and needs of the community they serve and use the knowledge gained to implement programs that will benefit the community. We can better understand community needs by gathering voices from the community. This survey allows community members like you to tell us about what you feel are important issues for your community. We estimate that it will take about 20 minutes to complete this ~60 question survey. Your answers to these questions will be kept confidential and anonymous. Thank you very much for your input and your time! If you have questions about this survey, please contact Will Broughton at [email protected].
Part 1: Quality of Life
First, tell us a little bit about yourself...
1. Where do you currently live?
ZIP/Postal Code
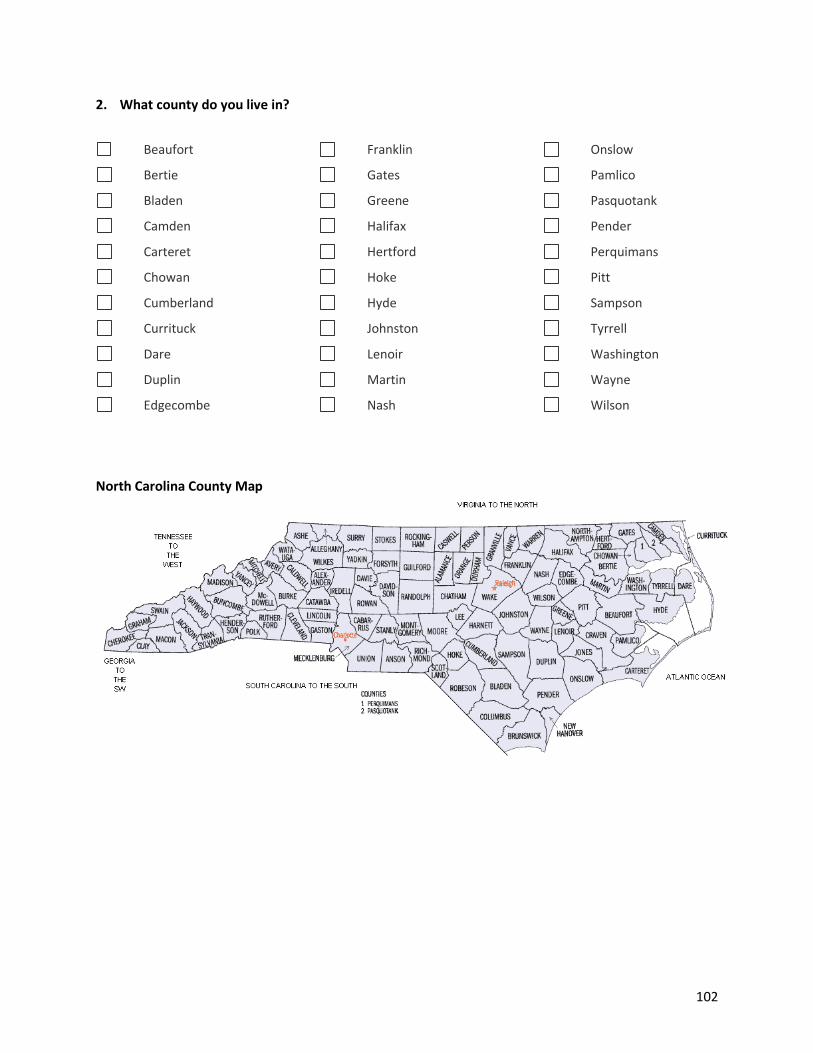
102
2. What county do you live in?
Beaufort
Bertie
Bladen
Camden
Carteret
Chowan
Cumberland
Currituck
Dare
Duplin
Edgecombe
Franklin
Gates
Greene
Halifax
Hertford
Hoke
Hyde
Johnston
Lenoir
Martin
Nash
Onslow
Pamlico
Pasquotank
Pender
Perquimans
Pitt
Sampson
Tyrrell
Washington
Wayne
Wilson
North Carolina County Map
103
3. Think about the county that you live in. Please tell us whether you “strongly disagree”, “disagree”, “neutral”, “agree” or “strongly agree” with each of the next 9 statements.
Statements
Strongly Strongly Disagree Disagree Neutral Agree Agree
There is good healthcare in my County.
This County is a good place to raise children.
This County is a good place to grow old.
There is plenty of economic opportunity in this County.
This County is a safe place to live.
There is plenty of help for people during times of need in this County.
There is affordable housing that meets my needs in this County.
There are good parks and recreation facilities in this County.
It is easy to buy healthy foods in this County.
104
PART 2: Community Improvement
The next set of questions will ask about community problems, issues, and services that are important to you. Remember your choices will not be linked to you in any way.
4. Please look at this list of community issues. In your opinion, which one issue most affects the quality of life in this County? (Please choose only one.)
Pollution (air, water,
land)
Dropping out of
school
Low income/poverty
Homelessness
Lack of/inadequate
health insurance
Hopelessness
Discrimination/racism
Lack of community
support
Drugs (Substance
Abuse)
Neglect and abuse
Elder abuse
Child abuse
Domestic violence
Violent crime
(murder, assault)
Theft
Rape/sexual assault
Other (please specify)
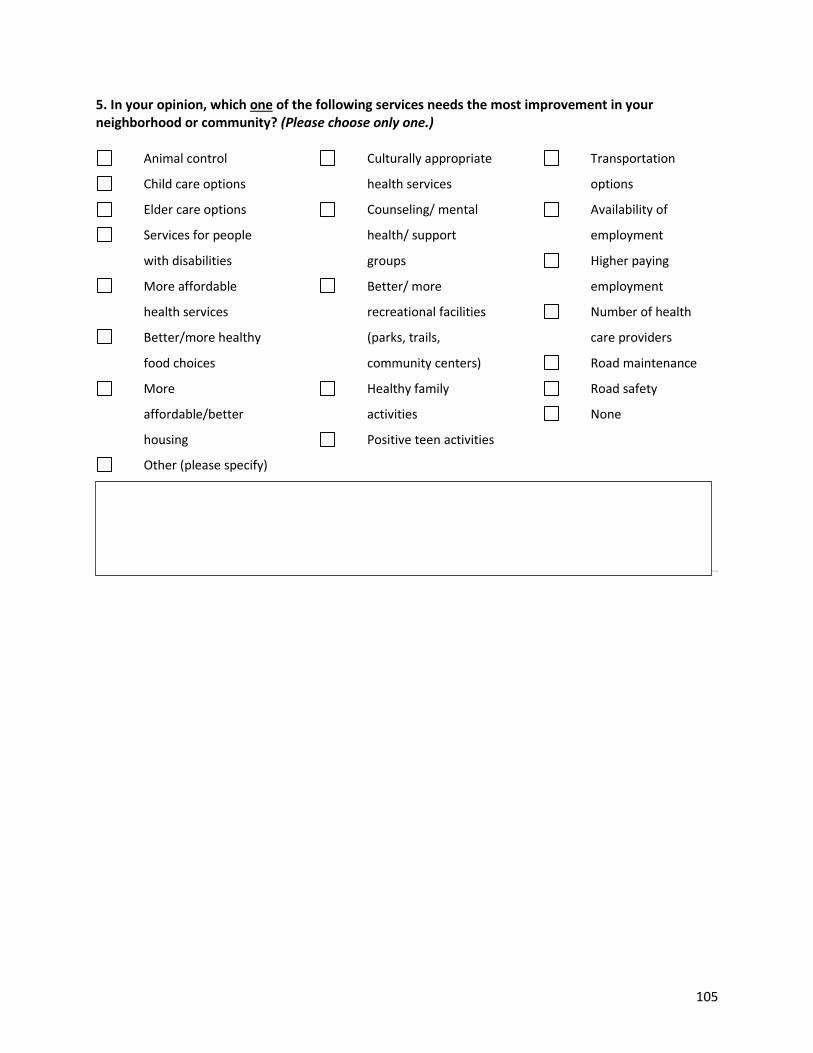
105
5. In your opinion, which one of the following services needs the most improvement in your neighborhood or community? (Please choose only one.)
Animal control
Child care options
Elder care options
Services for people
with disabilities
More affordable
health services
Better/more healthy
food choices
More
affordable/better
housing
Culturally appropriate
health services
Counseling/ mental
health/ support
groups
Better/ more
recreational facilities
(parks, trails,
community centers)
Healthy family
activities
Positive teen activities
Transportation
options
Availability of
employment
Higher paying
employment
Number of health
care providers
Road maintenance
Road safety
None
Other (please specify)
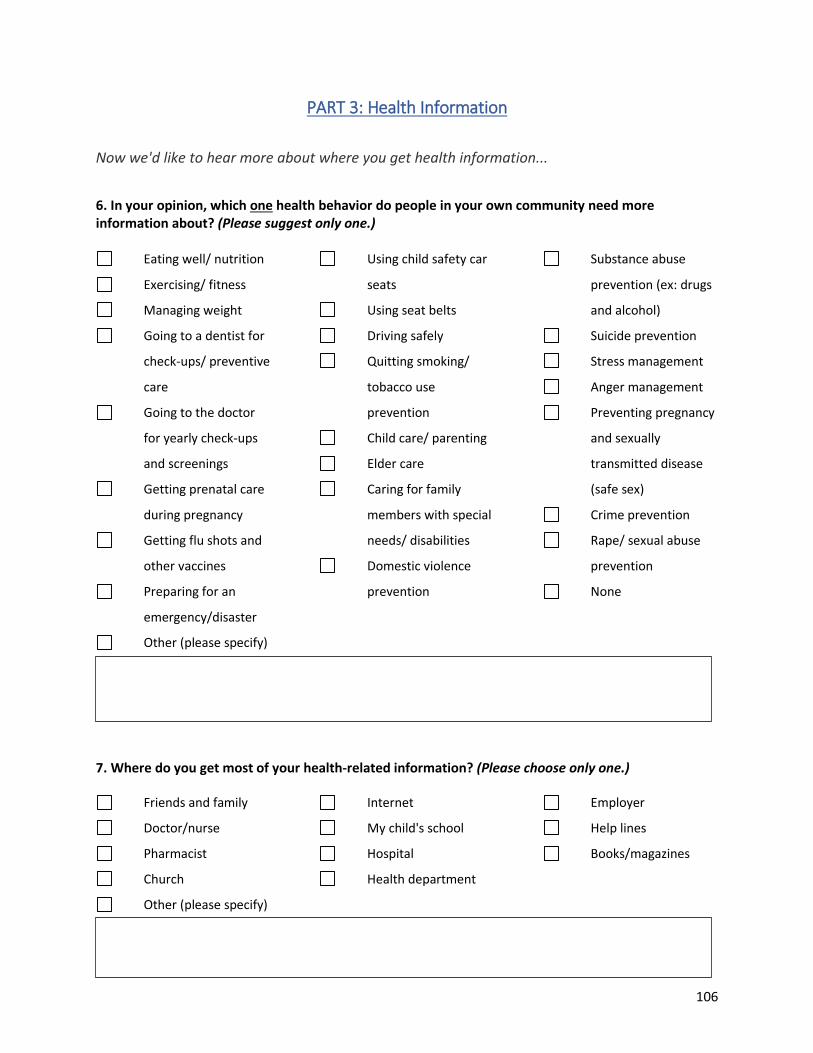
106
PART 3: Health Information
Now we'd like to hear more about where you get health information...
6. In your opinion, which one health behavior do people in your own community need more information about? (Please suggest only one.)
Eating well/ nutrition
Exercising/ fitness
Managing weight
Going to a dentist for
check-ups/ preventive
care
Going to the doctor
for yearly check-ups
and screenings
Getting prenatal care
during pregnancy
Getting flu shots and
other vaccines
Preparing for an
emergency/disaster
Using child safety car
seats
Using seat belts
Driving safely
Quitting smoking/
tobacco use
prevention
Child care/ parenting
Elder care
Caring for family
members with special
needs/ disabilities
Domestic violence
prevention
Substance abuse
prevention (ex: drugs
and alcohol)
Suicide prevention
Stress management
Anger management
Preventing pregnancy
and sexually
transmitted disease
(safe sex)
Crime prevention
Rape/ sexual abuse
prevention
None
Other (please specify)
7. Where do you get most of your health-related information? (Please choose only one.)
Friends and family
Doctor/nurse
Pharmacist
Church
Internet
My child's school
Hospital
Health department
Employer
Help lines
Books/magazines
Other (please specify)
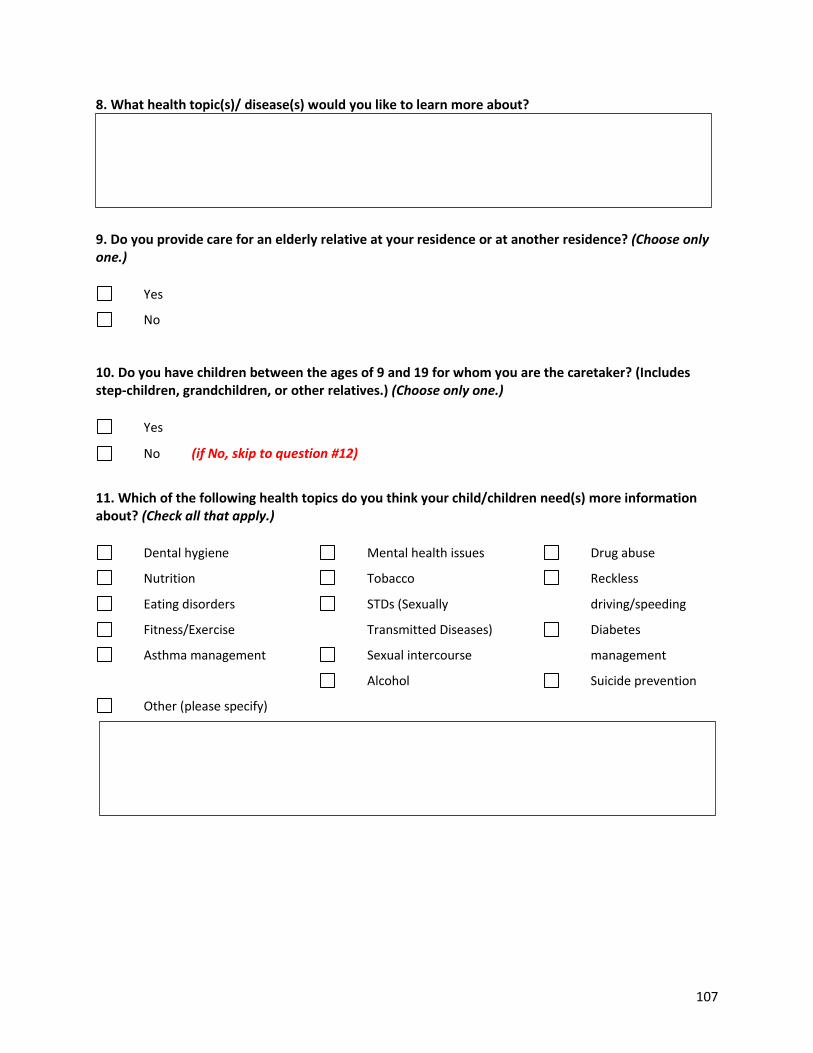
107
8. What health topic(s)/ disease(s) would you like to learn more about?
9. Do you provide care for an elderly relative at your residence or at another residence? (Choose only one.)
Yes
No
10. Do you have children between the ages of 9 and 19 for whom you are the caretaker? (Includes step-children, grandchildren, or other relatives.) (Choose only one.)
Yes
No (if No, skip to question #12)
11. Which of the following health topics do you think your child/children need(s) more information about? (Check all that apply.)
Dental hygiene
Nutrition
Eating disorders
Fitness/Exercise
Asthma management
Mental health issues
Tobacco
STDs (Sexually
Transmitted Diseases)
Sexual intercourse
Alcohol
Drug abuse
Reckless
driving/speeding
Diabetes
management
Suicide prevention
Other (please specify)
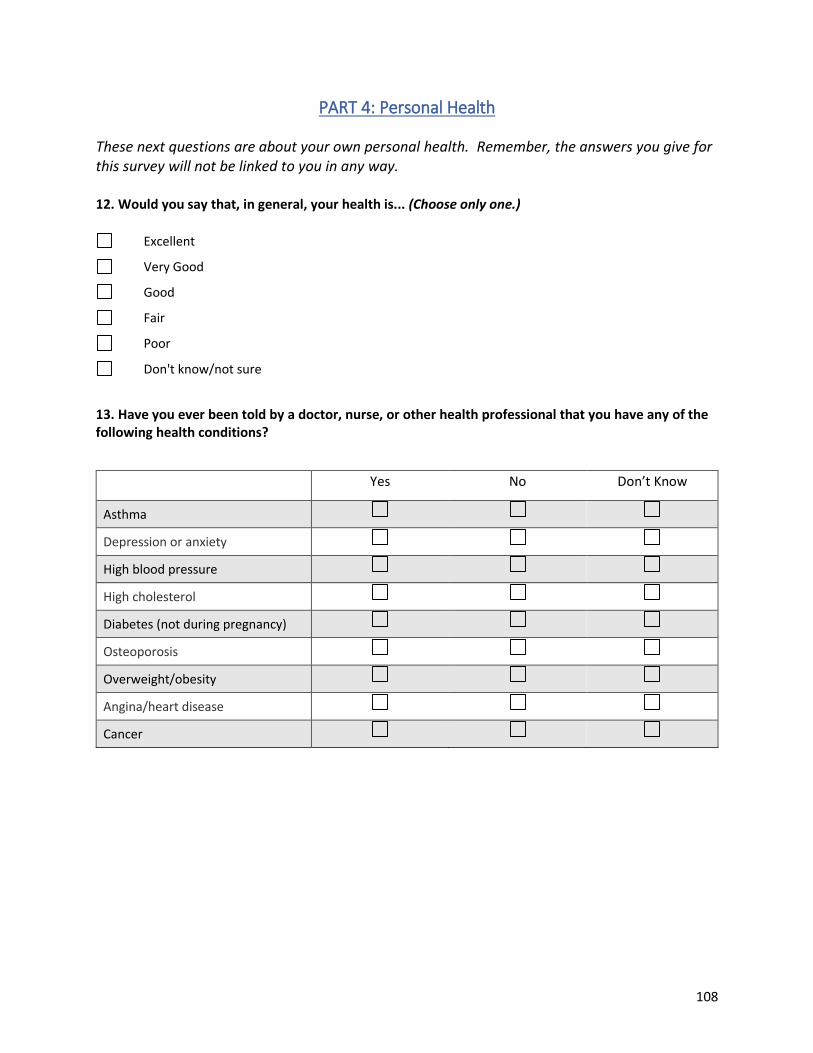
108
PART 4: Personal Health
These next questions are about your own personal health. Remember, the answers you give for this survey will not be linked to you in any way. 12. Would you say that, in general, your health is... (Choose only one.)
Excellent
Very Good
Good
Fair
Poor
Don't know/not sure
13. Have you ever been told by a doctor, nurse, or other health professional that you have any of the following health conditions?
Yes No Don’t Know
Asthma
Depression or anxiety
High blood pressure
High cholesterol
Diabetes (not during pregnancy)
Osteoporosis
Overweight/obesity
Angina/heart disease
Cancer
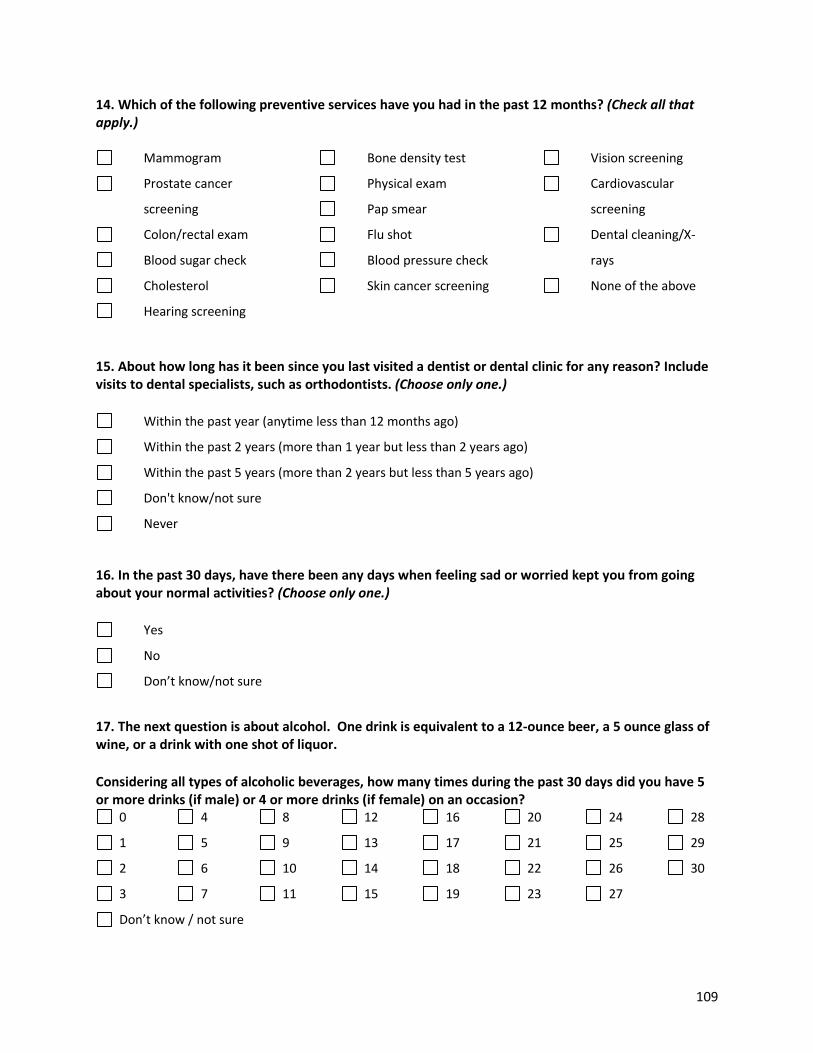
109
14. Which of the following preventive services have you had in the past 12 months? (Check all that apply.)
Mammogram
Prostate cancer
screening
Colon/rectal exam
Blood sugar check
Cholesterol
Hearing screening
Bone density test
Physical exam
Pap smear
Flu shot
Blood pressure check
Skin cancer screening
Vision screening
Cardiovascular
screening
Dental cleaning/X-
rays
None of the above
15. About how long has it been since you last visited a dentist or dental clinic for any reason? Include visits to dental specialists, such as orthodontists. (Choose only one.)
Within the past year (anytime less than 12 months ago)
Within the past 2 years (more than 1 year but less than 2 years ago)
Within the past 5 years (more than 2 years but less than 5 years ago)
Don't know/not sure
Never
16. In the past 30 days, have there been any days when feeling sad or worried kept you from going about your normal activities? (Choose only one.)
Yes
No
Don’t know/not sure
17. The next question is about alcohol. One drink is equivalent to a 12-ounce beer, a 5 ounce glass of wine, or a drink with one shot of liquor.
Considering all types of alcoholic beverages, how many times during the past 30 days did you have 5 or more drinks (if male) or 4 or more drinks (if female) on an occasion?
0
1
2
3
4
5
6
7
8
9
10
11
12
13
14
15
16
17
18
19
20
21
22
23
24
25
26
27
28
29
30
Don’t know / not sure
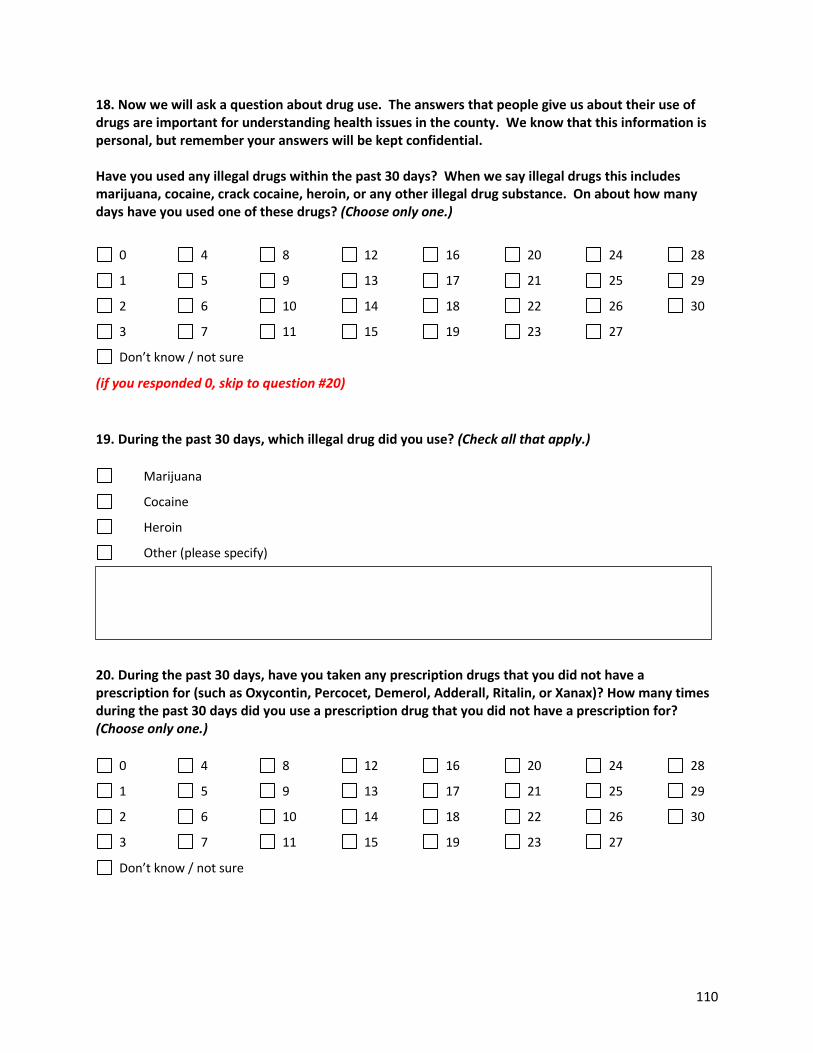
110
18. Now we will ask a question about drug use. The answers that people give us about their use of drugs are important for understanding health issues in the county. We know that this information is personal, but remember your answers will be kept confidential. Have you used any illegal drugs within the past 30 days? When we say illegal drugs this includes marijuana, cocaine, crack cocaine, heroin, or any other illegal drug substance. On about how many days have you used one of these drugs? (Choose only one.)
0
1
2
3
4
5
6
7
8
9
10
11
12
13
14
15
16
17
18
19
20
21
22
23
24
25
26
27
28
29
30
Don’t know / not sure
(if you responded 0, skip to question #20)
19. During the past 30 days, which illegal drug did you use? (Check all that apply.)
Marijuana
Cocaine
Heroin
Other (please specify)
20. During the past 30 days, have you taken any prescription drugs that you did not have a prescription for (such as Oxycontin, Percocet, Demerol, Adderall, Ritalin, or Xanax)? How many times during the past 30 days did you use a prescription drug that you did not have a prescription for? (Choose only one.)
0
1
2
3
4
5
6
7
8
9
10
11
12
13
14
15
16
17
18
19
20
21
22
23
24
25
26
27
28
29
30
Don’t know / not sure
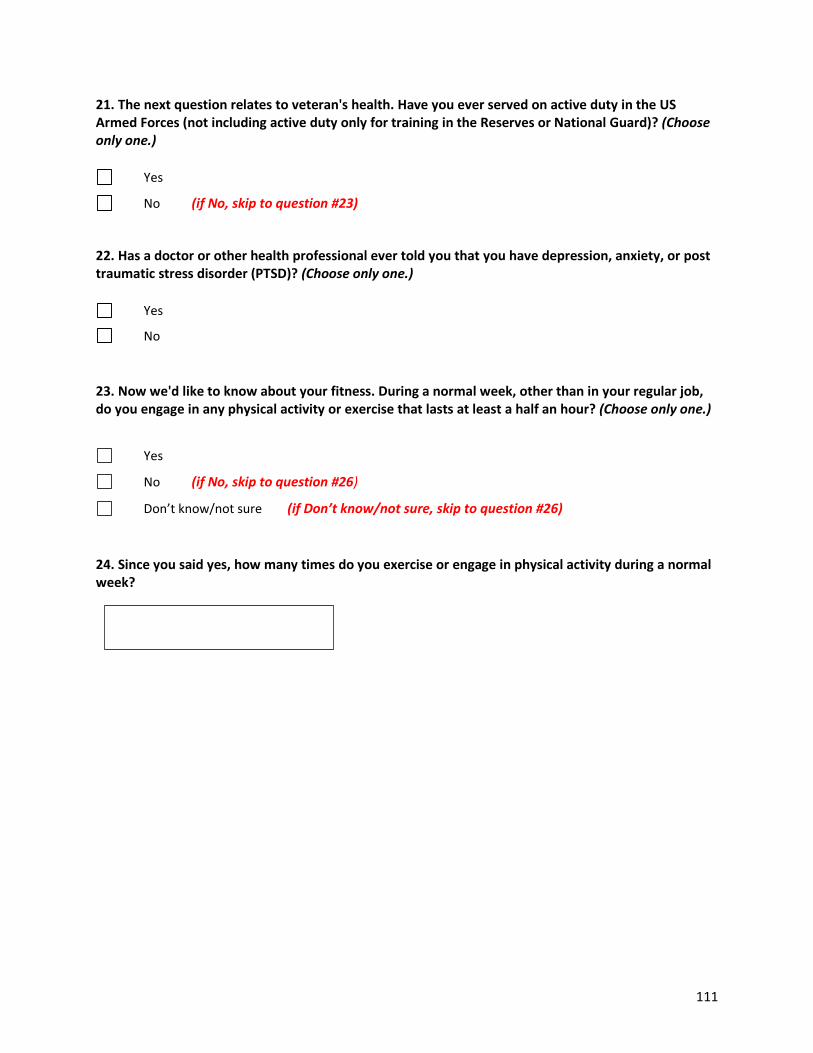
111
21. The next question relates to veteran's health. Have you ever served on active duty in the US Armed Forces (not including active duty only for training in the Reserves or National Guard)? (Choose only one.)
Yes
No (if No, skip to question #23)
22. Has a doctor or other health professional ever told you that you have depression, anxiety, or post traumatic stress disorder (PTSD)? (Choose only one.)
Yes
No
23. Now we'd like to know about your fitness. During a normal week, other than in your regular job, do you engage in any physical activity or exercise that lasts at least a half an hour? (Choose only one.)
Yes
No (if No, skip to question #26)
Don’t know/not sure (if Don’t know/not sure, skip to question #26)
24. Since you said yes, how many times do you exercise or engage in physical activity during a normal week?
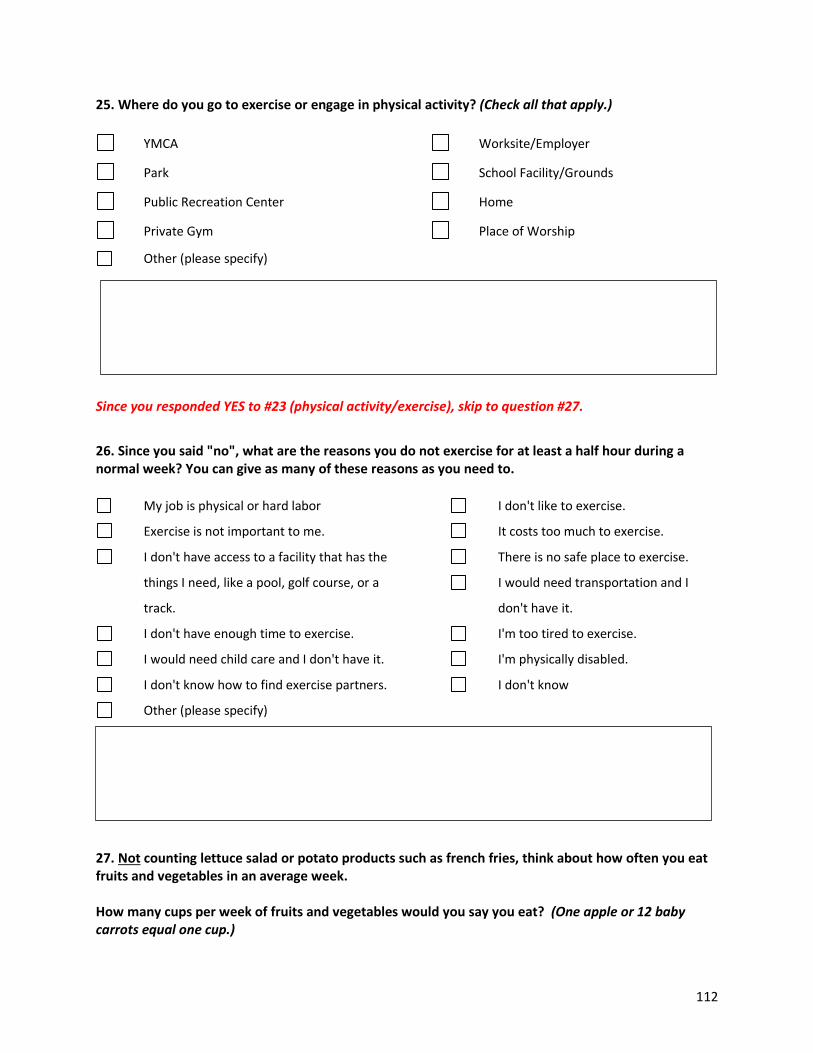
112
25. Where do you go to exercise or engage in physical activity? (Check all that apply.)
YMCA
Park
Public Recreation Center
Private Gym
Worksite/Employer
School Facility/Grounds
Home
Place of Worship
Other (please specify)
Since you responded YES to #23 (physical activity/exercise), skip to question #27.
26. Since you said "no", what are the reasons you do not exercise for at least a half hour during a normal week? You can give as many of these reasons as you need to.
My job is physical or hard labor
Exercise is not important to me.
I don't have access to a facility that has the
things I need, like a pool, golf course, or a
track.
I don't have enough time to exercise.
I would need child care and I don't have it.
I don't know how to find exercise partners.
I don't like to exercise.
It costs too much to exercise.
There is no safe place to exercise.
I would need transportation and I
don't have it.
I'm too tired to exercise.
I'm physically disabled.
I don't know
Other (please specify)
27. Not counting lettuce salad or potato products such as french fries, think about how often you eat fruits and vegetables in an average week. How many cups per week of fruits and vegetables would you say you eat? (One apple or 12 baby carrots equal one cup.)
113
Number of Cups of Fruit
Number of Cups of Vegetables
Number of Cups of 100% Fruit Juice
28. Have you ever been exposed to secondhand smoke in the past year? (Choose only one.)
Yes
No (if No, skip to question #30)
Don’t know/not sure (if Don’t know/not sure, skip to question #30)
29. If yes, where do you think you are exposed to secondhand smoke most often? (Check only one.)
Home
Workplace
Hospitals
Restaurants
School
I am not exposed to secondhand smoke.
Other (please specify)
30. Do you currently use tobacco products? (This includes cigarettes, electronic cigarettes, chewing tobacco and vaping.) (Choose only one.)
Yes
No (if No, skip to question #32)
31. If yes, where would you go for help if you wanted to quit? (Choose only one).
114
Quit Line NC
Doctor
Pharmacy
Private counselor/therapist
Health Department
I don't know
Not applicable; I don't want to quit Other (please specify)
32. Now we will ask you questions about your personal flu vaccines. An influenza/flu vaccine can be a "flu shot" injected into your arm or spray like "FluMist" which is sprayed into your nose. During the past 12 months, have you had a seasonal flu vaccine? (Choose only one.)
Yes, flu shot
Yes, flu spray
Yes, both
No
Don’t know/not sure
Part 5: Access to Care/Family Health
33. Where do you go most often when you are sick? (Choose only one.)
Doctor’s office
Health department
Hospital
Medical clinic
Urgent care center
Other (please specify)
34. Do you have any of the following types of health insurance or health care coverage? (Choose all that apply.)
115
Health insurance my employer provides
Health insurance my spouse's employer provides
Health insurance my school provides
Health insurance my parent or my parent's employer provides
Health insurance I bought myself
Health insurance through Health Insurance Marketplace (Obamacare)
The military, Tricare, or the VA
Medicaid
Medicare
No health insurance of any kind
35. In the past 12 months, did you have a problem getting the health care you needed for you personally or for a family member from any type of health care provider, dentist, pharmacy, or other facility? (Choose only one.)
Yes
No (if No, skip to question #38)
Don’t know/not sure
36. Since you said "yes," what type of provider or facility did you or your family member have trouble getting health care from? You can choose as many of these as you need to.
Dentist
General practitioner
Eye care/ optometrist/
ophthalmologist
Pharmacy/ prescriptions
Pediatrician
OB/GYN
Health
department
Hospital
Urgent Care Center
Medical Clinic
Specialist
Other (please specify)
37. Which of these problems prevented you or your family member from getting the necessary health care? You can choose as many of these as you need to.
116
No health insurance.
Insurance didn't cover what I/we needed.
My/our share of the cost (deductible/co-pay) was too high.
Doctor would not take my/our insurance or Medicaid.
Hospital would not take my/our insurance.
Pharmacy would not take my/our insurance or Medicaid.
Dentist would not take my/our insurance or Medicaid.
No way to get there.
Didn't know where to go.
Couldn't get an appointment.
The wait was too long.
The provider denied me care or treated me in a discriminatory manner because of my HIV status, or
because I am an LGBT individual.
38. In what county are most of the medical providers you visit located? (Choose only one.)
Beaufort
Bertie
Bladen
Brunswick
Camden
Carteret
Chowan
Columbus
Craven
Cumberland
Currituck
Dare
Duplin
Edgecombe
Franklin
Gates
Granville
Greene
Halifax
Harnett
Hertford
Hoke
Hyde
Johnston
Jones
Lenoir
Martin
Moore
Nash
New Hanover
Northampton
Onslow
Pamlico
Pasquotank
Pender
Perquimans
Pitt
Richmond
Robeson
Sampson
Scotland
Tyrrell
Vance
Wake
Warren
Washington
Wayne
Wilson
The State of Virginia
Other (please specify)
117
North Carolina County Map
39. In the previous 12 months, were you ever worried about whether your family's food would run out before you got money to buy more? (Choose only one.)
Yes
No
Don’t know/not sure
40. If a friend or family member needed counseling for a mental health or a drug/alcohol abuse problem, who is the first person you would tell them to talk to? (Choose only one.)
Private counselor or therapist
Support group (e.g., AA. Al-Anon)
School counselor
Don't know
Doctor
Pastor/Minister/Clergy
Other (please specify)
Part 6: Emergency Preparedness 41. Does your household have working smoke and carbon monoxide detectors? (Choose only one.)
Yes, smoke detectors only
Yes, both
Don't know/not sure
Yes, carbon monoxide detectors only
No
118
42. Does your family have a basic emergency supply kit? (These kits include water, non-perishable food, any necessary prescriptions, first aid supplies, flashlight and batteries, non-electric can opener, blanket, etc.)
Yes
No
Don't know/not sure
If yes, how many days do you have supplies for? (Write number of days)
43. What would be your main way of getting information from authorities in a large-scale disaster or emergency? (Check only one.)
Television
Radio
Internet
Telephone (landline)
Cell Phone
Print media (ex: newspaper)
Social networking site
Neighbors
Family
Text message (emergency alert system)
Don't know/not sure
Other (please specify)
44. If public authorities announced a mandatory evacuation from your neighborhood or community due to a large-scale disaster or emergency, would you evacuate? (Check only one.)
Yes (if Yes, skip to question #46)
No
Don’t know/not sure
45. What would be the main reason you might not evacuate if asked to do so? (Check only one.)
Lack of transportation
Lack of trust in public officials
Concern about leaving property behind
Concern about personal safety
119
Concern about family safety
Concern about leaving pets
Concern about traffic jams and inability to
get out
Health problems (could not be moved)
Don't know/not sure
Other (please specify)
Part 7: Demographic Questions The next set of questions are general questions about you, which will only be reported as a summary of all answers given by survey participants. Your answers will remain anonymous. 46. How old are you? (Choose only one.)
15-19
20-24
25-29
30-34
35-39
40-44
45-49
50-54
55-59
60-64
65-69
70-74
75-79
80-84
85 or older
47. What is your gender? (Choose only one.)
Male
Female
Transgender
Gender non-conforming
Other
48. Are you of Hispanic, Latino, or Spanish origin? (Choose only one).
I am not of Hispanic, Latino or Spanish origin
Mexican, Mexican American, or Chicano
Puerto Rican
Cuban or Cuban American
120
Other Hispanic or Latino (please specify)
49. What is your race? (Choose only one).
White or Caucasian
Black or African American
American Indian or Alaska Native
Asian Indian
Other Asian including Japanese, Chinese, Korean, Vietnamese, and Filipino/a
Other Pacific Islander including Native Hawaiian, Samoan, Guamanian/Chamorro
Other race not listed here (please specify)
50. Is English the primary language spoken in your home? (Choose only one.)
Yes
No. If no, please specify the primary language spoken in your home.
51. What is your marital status? (Choose only one.)
Never married/single
Married
Unmarried partner
Divorced
Widowed
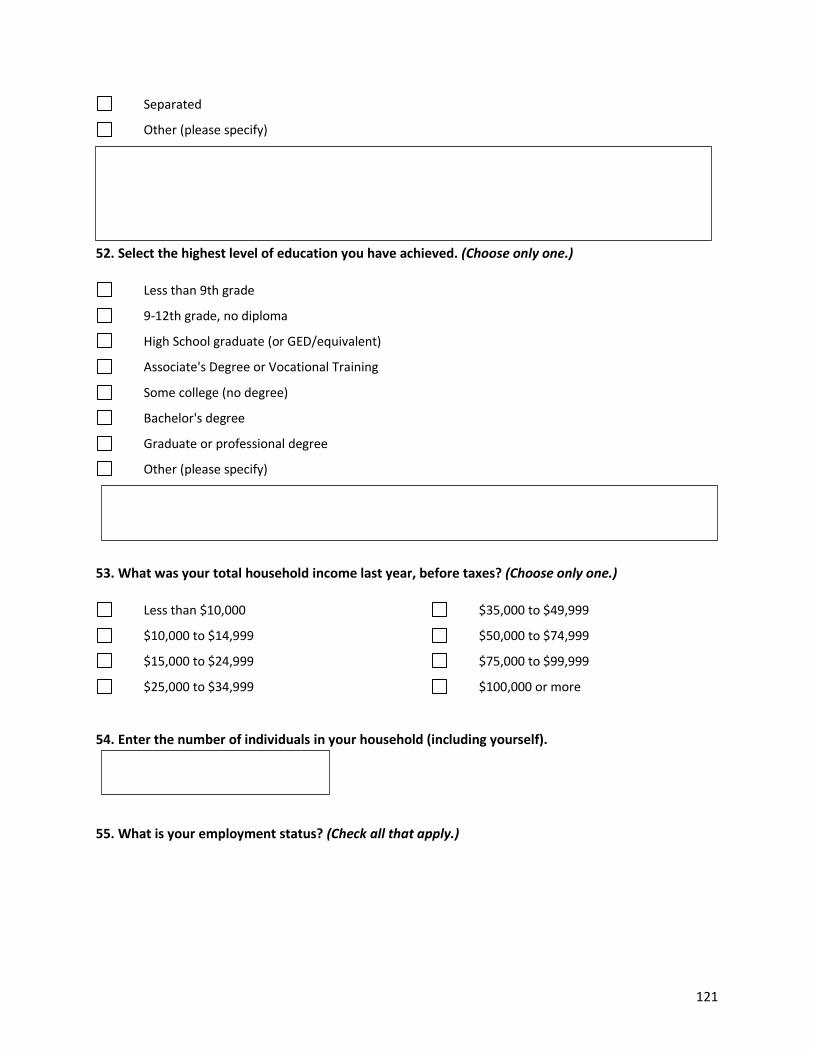
121
Separated
Other (please specify)
52. Select the highest level of education you have achieved. (Choose only one.)
Less than 9th grade
9-12th grade, no diploma
High School graduate (or GED/equivalent)
Associate's Degree or Vocational Training
Some college (no degree)
Bachelor's degree
Graduate or professional degree
Other (please specify)
53. What was your total household income last year, before taxes? (Choose only one.)
Less than $10,000
$10,000 to $14,999
$15,000 to $24,999
$25,000 to $34,999
$35,000 to $49,999
$50,000 to $74,999
$75,000 to $99,999
$100,000 or more
54. Enter the number of individuals in your household (including yourself).
55. What is your employment status? (Check all that apply.)
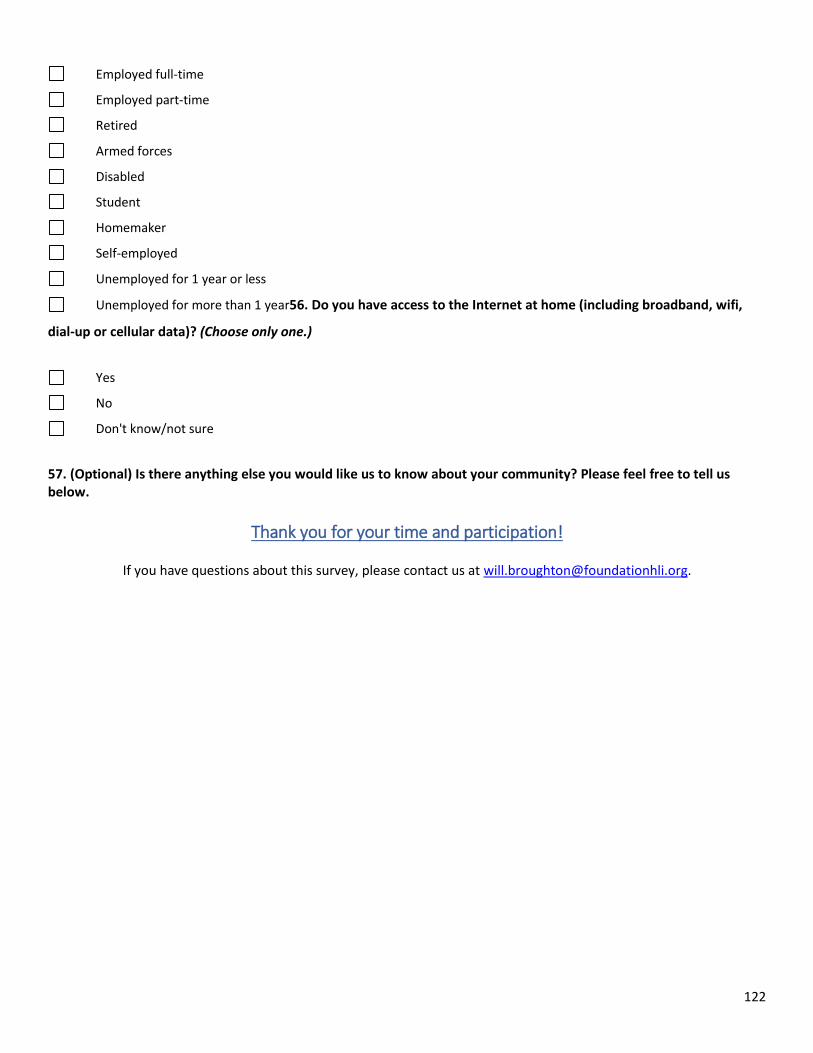
122
Employed full-time
Employed part-time
Retired
Armed forces
Disabled
Student
Homemaker
Self-employed
Unemployed for 1 year or less
Unemployed for more than 1 year56. Do you have access to the Internet at home (including broadband, wifi,
dial-up or cellular data)? (Choose only one.)
Yes
No
Don't know/not sure
57. (Optional) Is there anything else you would like us to know about your community? Please feel free to tell us below.
Thank you for your time and participation!
If you have questions about this survey, please contact us at [email protected].
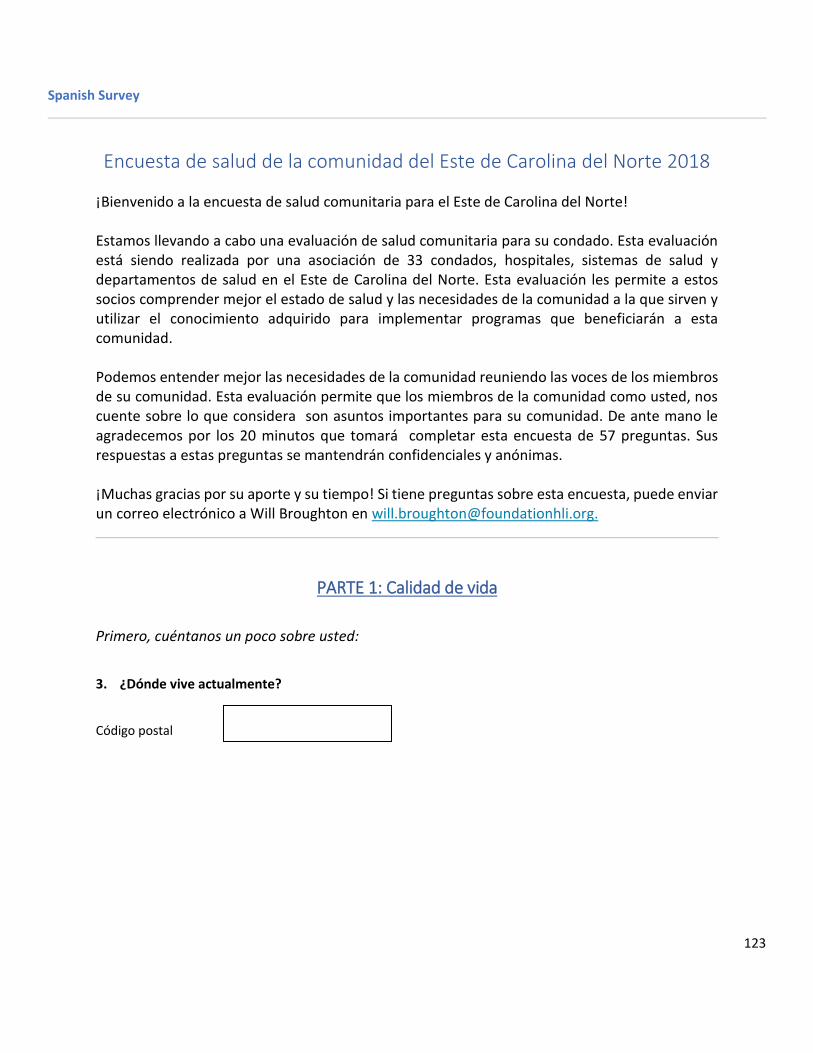
123
Spanish Survey
Encuesta de salud de la comunidad del Este de Carolina del Norte 2018
¡Bienvenido a la encuesta de salud comunitaria para el Este de Carolina del Norte! Estamos llevando a cabo una evaluación de salud comunitaria para su condado. Esta evaluación está siendo realizada por una asociación de 33 condados, hospitales, sistemas de salud y departamentos de salud en el Este de Carolina del Norte. Esta evaluación les permite a estos socios comprender mejor el estado de salud y las necesidades de la comunidad a la que sirven y utilizar el conocimiento adquirido para implementar programas que beneficiarán a esta comunidad. Podemos entender mejor las necesidades de la comunidad reuniendo las voces de los miembros de su comunidad. Esta evaluación permite que los miembros de la comunidad como usted, nos cuente sobre lo que considera son asuntos importantes para su comunidad. De ante mano le agradecemos por los 20 minutos que tomará completar esta encuesta de 57 preguntas. Sus respuestas a estas preguntas se mantendrán confidenciales y anónimas. ¡Muchas gracias por su aporte y su tiempo! Si tiene preguntas sobre esta encuesta, puede enviar un correo electrónico a Will Broughton en [email protected].
PARTE 1: Calidad de vida
Primero, cuéntanos un poco sobre usted:
3. ¿Dónde vive actualmente?
Código postal
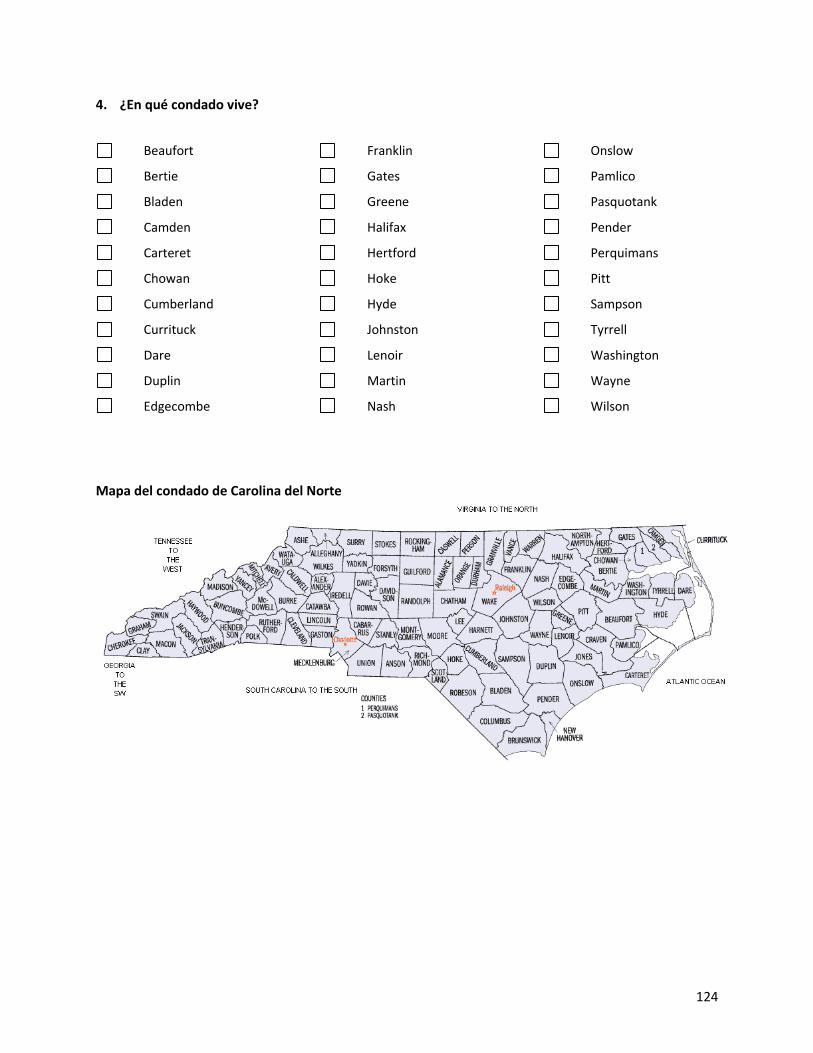
124
4. ¿En qué condado vive?
Beaufort
Bertie
Bladen
Camden
Carteret
Chowan
Cumberland
Currituck
Dare
Duplin
Edgecombe
Franklin
Gates
Greene
Halifax
Hertford
Hoke
Hyde
Johnston
Lenoir
Martin
Nash
Onslow
Pamlico
Pasquotank
Pender
Perquimans
Pitt
Sampson
Tyrrell
Washington
Wayne
Wilson
Mapa del condado de Carolina del Norte
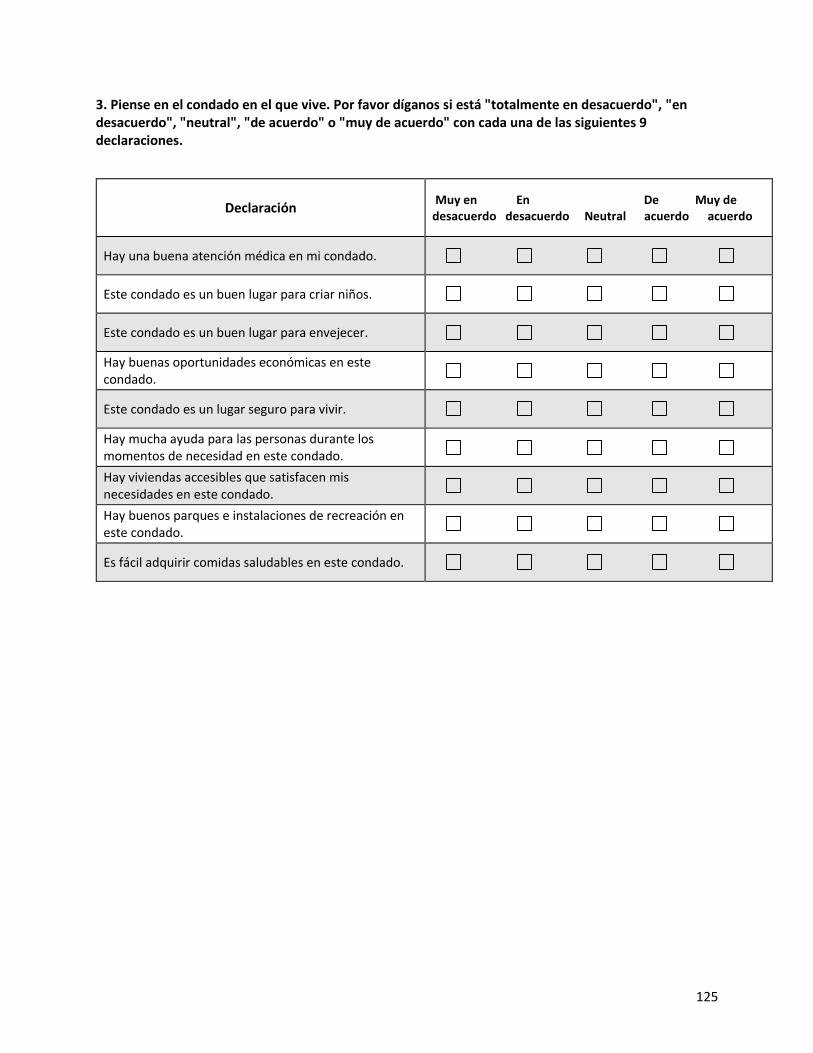
125
3. Piense en el condado en el que vive. Por favor díganos si está "totalmente en desacuerdo", "en desacuerdo", "neutral", "de acuerdo" o "muy de acuerdo" con cada una de las siguientes 9 declaraciones.
Declaración
Muy en En De Muy de desacuerdo desacuerdo Neutral acuerdo acuerdo
Hay una buena atención médica en mi condado.
Este condado es un buen lugar para criar niños.
Este condado es un buen lugar para envejecer.
Hay buenas oportunidades económicas en este condado.
Este condado es un lugar seguro para vivir.
Hay mucha ayuda para las personas durante los momentos de necesidad en este condado.
Hay viviendas accesibles que satisfacen mis necesidades en este condado.
Hay buenos parques e instalaciones de recreación en este condado.
Es fácil adquirir comidas saludables en este condado.
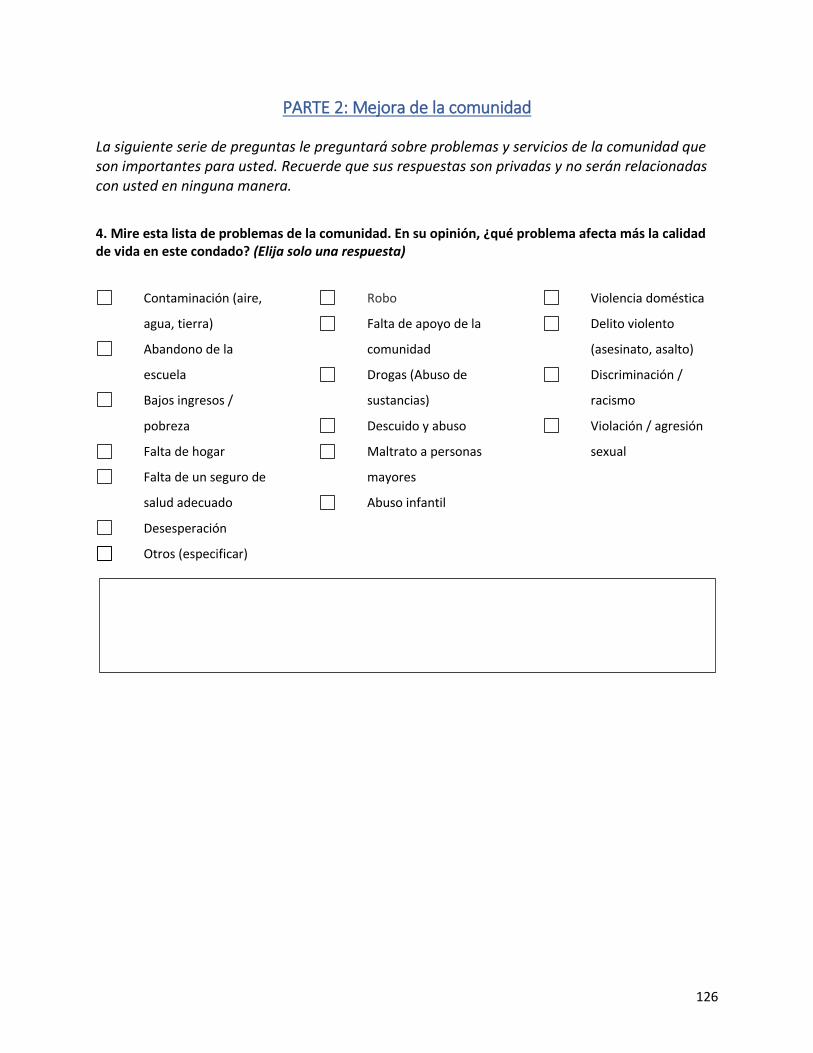
126
PARTE 2: Mejora de la comunidad
La siguiente serie de preguntas le preguntará sobre problemas y servicios de la comunidad que son importantes para usted. Recuerde que sus respuestas son privadas y no serán relacionadas con usted en ninguna manera.
4. Mire esta lista de problemas de la comunidad. En su opinión, ¿qué problema afecta más la calidad de vida en este condado? (Elija solo una respuesta)
Contaminación (aire,
agua, tierra)
Abandono de la
escuela
Bajos ingresos /
pobreza
Falta de hogar
Falta de un seguro de
salud adecuado
Desesperación
Robo
Falta de apoyo de la
comunidad
Drogas (Abuso de
sustancias)
Descuido y abuso
Maltrato a personas
mayores
Abuso infantil
Violencia doméstica
Delito violento
(asesinato, asalto)
Discriminación /
racismo
Violación / agresión
sexual
Otros (especificar)
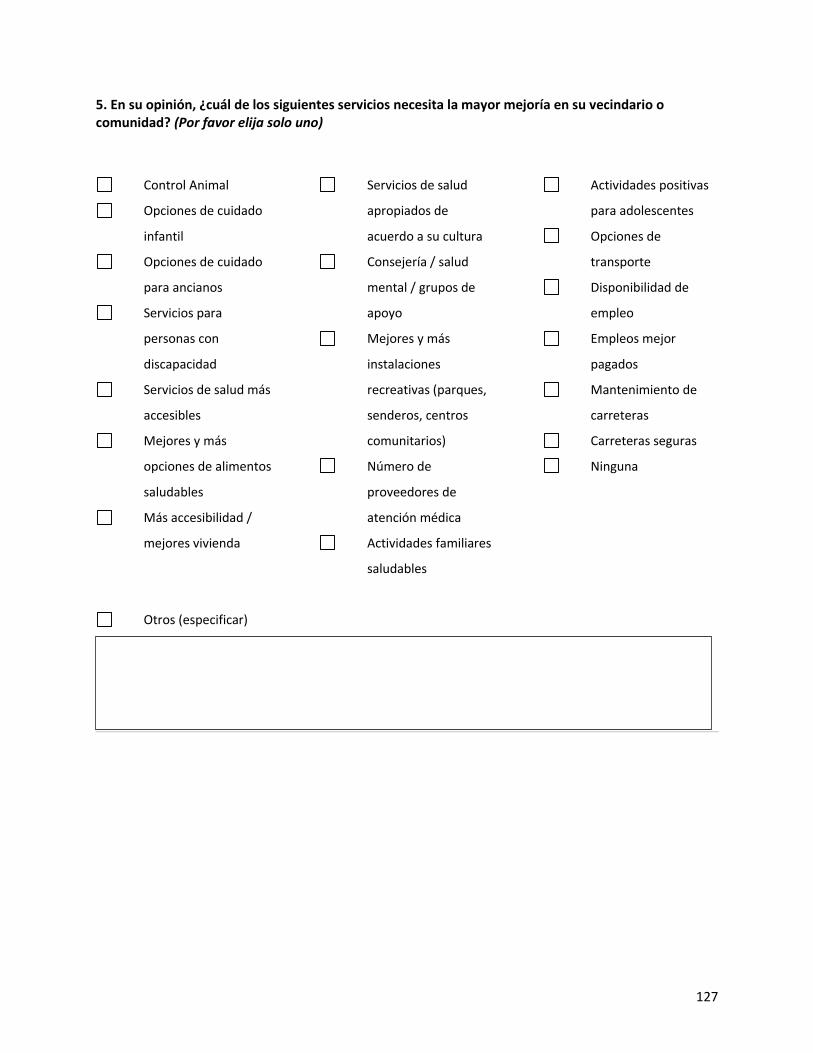
127
5. En su opinión, ¿cuál de los siguientes servicios necesita la mayor mejoría en su vecindario o comunidad? (Por favor elija solo uno)
Control Animal
Opciones de cuidado
infantil
Opciones de cuidado
para ancianos
Servicios para
personas con
discapacidad
Servicios de salud más
accesibles
Mejores y más
opciones de alimentos
saludables
Más accesibilidad /
mejores vivienda
Servicios de salud
apropiados de
acuerdo a su cultura
Consejería / salud
mental / grupos de
apoyo
Mejores y más
instalaciones
recreativas (parques,
senderos, centros
comunitarios)
Número de
proveedores de
atención médica
Actividades familiares
saludables
Actividades positivas
para adolescentes
Opciones de
transporte
Disponibilidad de
empleo
Empleos mejor
pagados
Mantenimiento de
carreteras
Carreteras seguras
Ninguna
Otros (especificar)
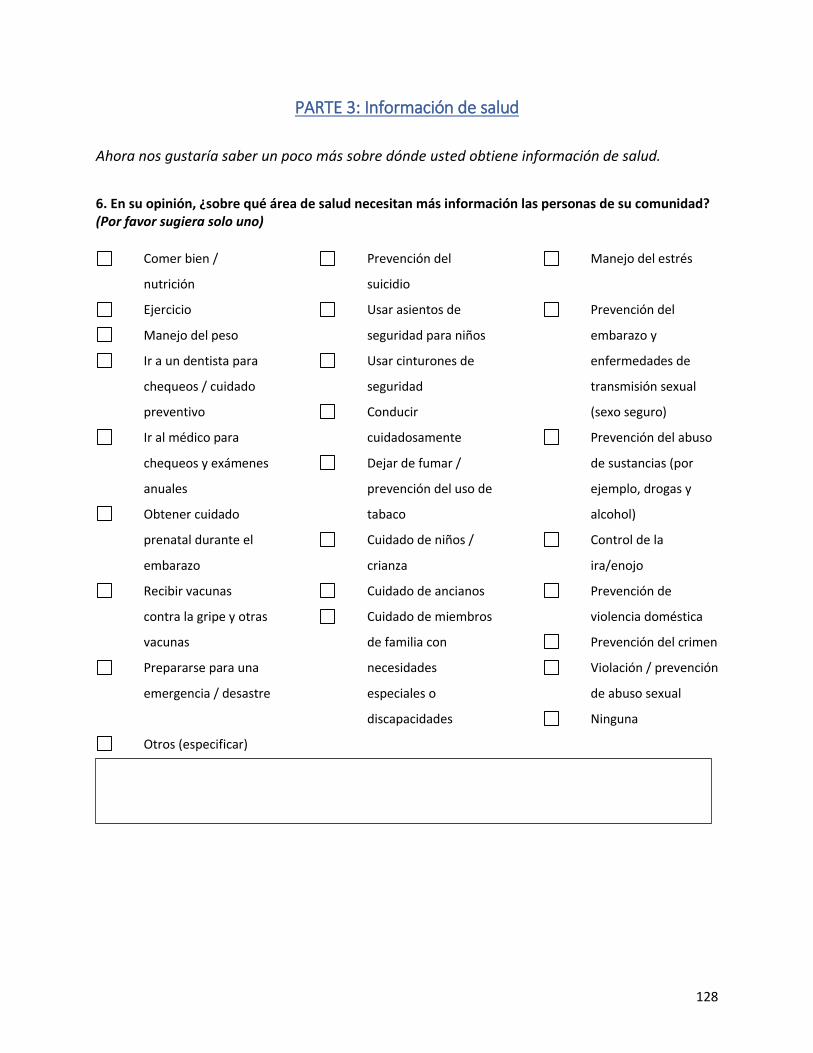
128
PARTE 3: Información de salud
Ahora nos gustaría saber un poco más sobre dónde usted obtiene información de salud.
6. En su opinión, ¿sobre qué área de salud necesitan más información las personas de su comunidad? (Por favor sugiera solo uno)
Comer bien /
nutrición
Ejercicio
Manejo del peso
Ir a un dentista para
chequeos / cuidado
preventivo
Ir al médico para
chequeos y exámenes
anuales
Obtener cuidado
prenatal durante el
embarazo
Recibir vacunas
contra la gripe y otras
vacunas
Prepararse para una
emergencia / desastre
Prevención del
suicidio
Usar asientos de
seguridad para niños
Usar cinturones de
seguridad
Conducir
cuidadosamente
Dejar de fumar /
prevención del uso de
tabaco
Cuidado de niños /
crianza
Cuidado de ancianos
Cuidado de miembros
de familia con
necesidades
especiales o
discapacidades
Manejo del estrés
Prevención del
embarazo y
enfermedades de
transmisión sexual
(sexo seguro)
Prevención del abuso
de sustancias (por
ejemplo, drogas y
alcohol)
Control de la
ira/enojo
Prevención de
violencia doméstica
Prevención del crimen
Violación / prevención
de abuso sexual
Ninguna
Otros (especificar)
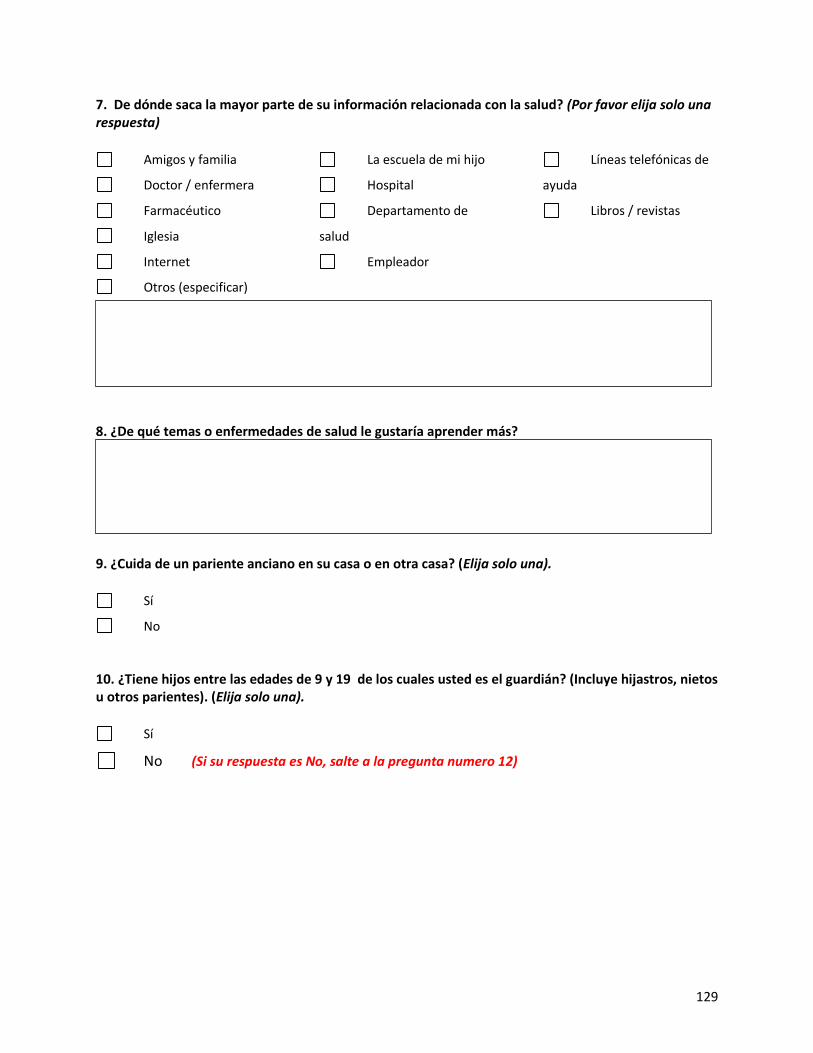
129
7. De dónde saca la mayor parte de su información relacionada con la salud? (Por favor elija solo una respuesta)
Amigos y familia
Doctor / enfermera
Farmacéutico
Iglesia
Internet
La escuela de mi hijo
Hospital
Departamento de
salud
Empleador
Líneas telefónicas de
ayuda
Libros / revistas
Otros (especificar)
8. ¿De qué temas o enfermedades de salud le gustaría aprender más?
9. ¿Cuida de un pariente anciano en su casa o en otra casa? (Elija solo una).
Sí
No
10. ¿Tiene hijos entre las edades de 9 y 19 de los cuales usted es el guardián? (Incluye hijastros, nietos u otros parientes). (Elija solo una).
Sí
No (Si su respuesta es No, salte a la pregunta numero 12)
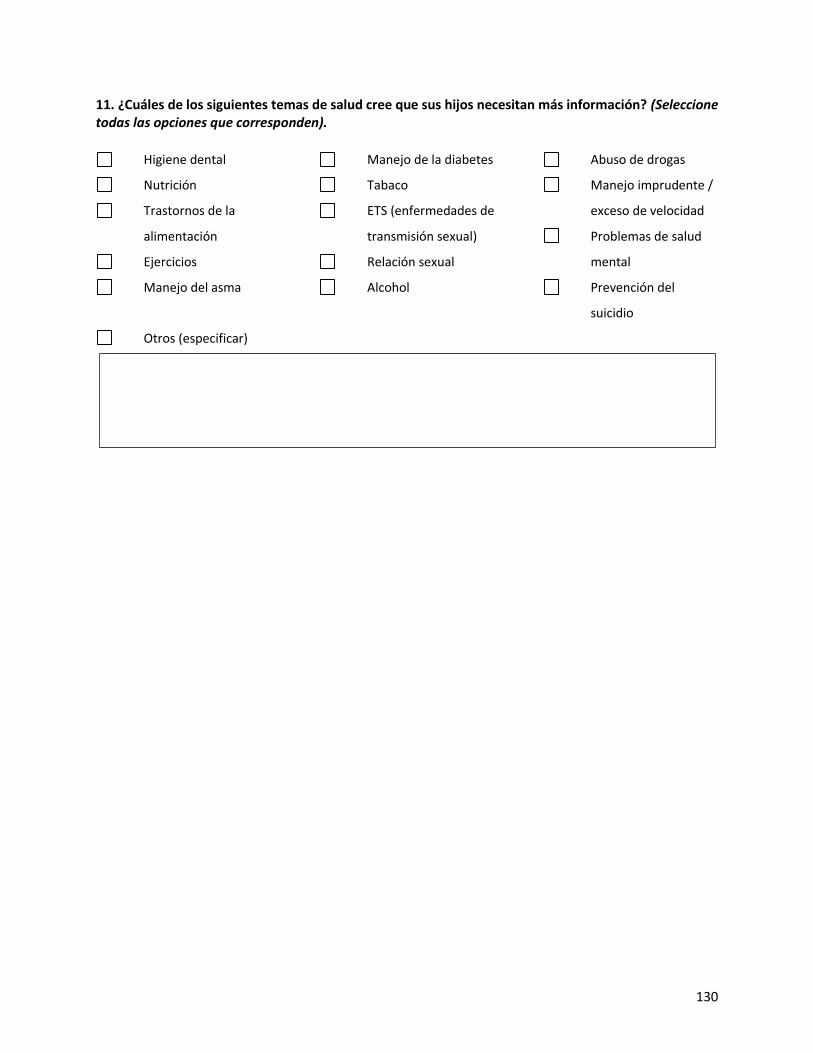
130
11. ¿Cuáles de los siguientes temas de salud cree que sus hijos necesitan más información? (Seleccione todas las opciones que corresponden).
Higiene dental
Nutrición
Trastornos de la
alimentación
Ejercicios
Manejo del asma
Manejo de la diabetes
Tabaco
ETS (enfermedades de
transmisión sexual)
Relación sexual
Alcohol
Abuso de drogas
Manejo imprudente /
exceso de velocidad
Problemas de salud
mental
Prevención del
suicidio
Otros (especificar)
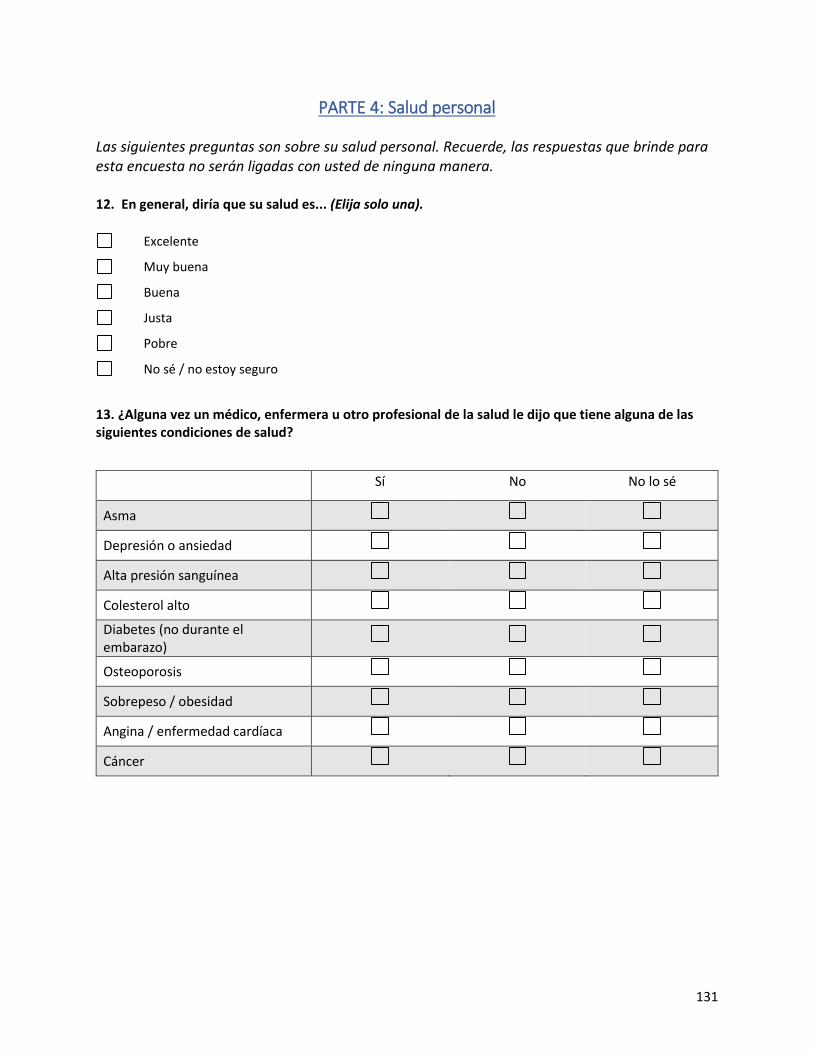
131
PARTE 4: Salud personal
Las siguientes preguntas son sobre su salud personal. Recuerde, las respuestas que brinde para esta encuesta no serán ligadas con usted de ninguna manera. 12. En general, diría que su salud es... (Elija solo una).
Excelente
Muy buena
Buena
Justa
Pobre
No sé / no estoy seguro
13. ¿Alguna vez un médico, enfermera u otro profesional de la salud le dijo que tiene alguna de las siguientes condiciones de salud?
Sí No No lo sé
Asma
Depresión o ansiedad
Alta presión sanguínea
Colesterol alto
Diabetes (no durante el embarazo)
Osteoporosis
Sobrepeso / obesidad
Angina / enfermedad cardíaca
Cáncer
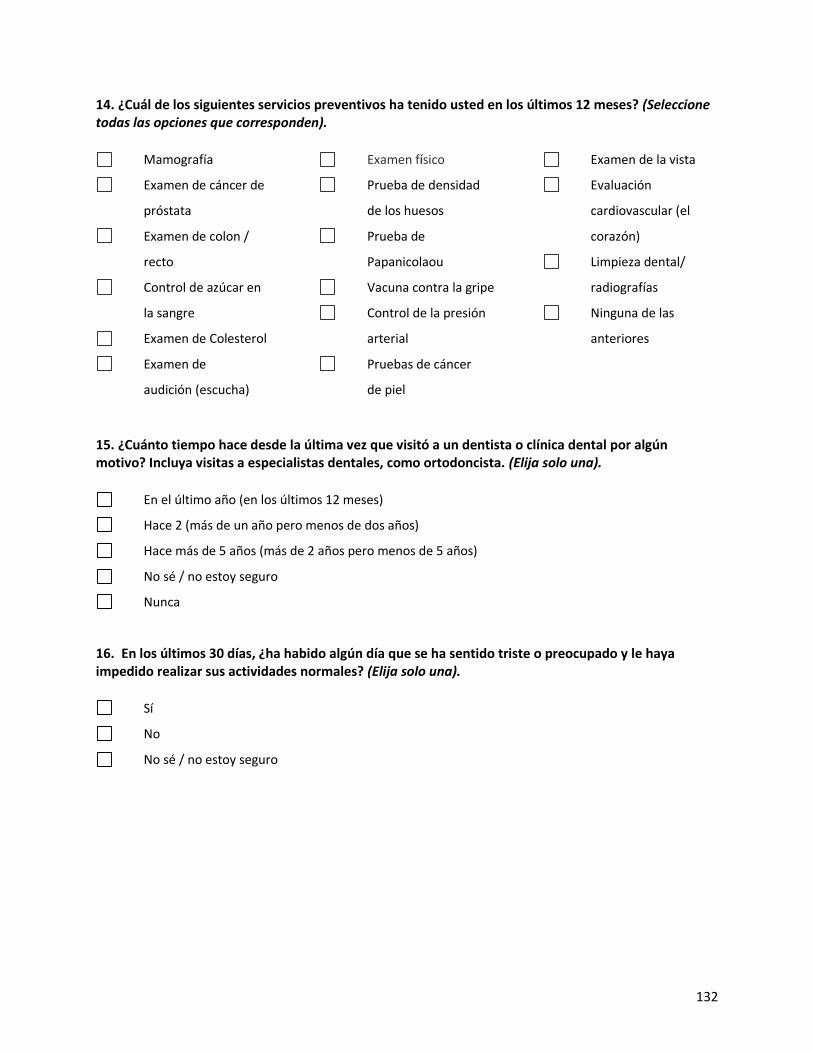
132
14. ¿Cuál de los siguientes servicios preventivos ha tenido usted en los últimos 12 meses? (Seleccione todas las opciones que corresponden).
Mamografía
Examen de cáncer de
próstata
Examen de colon /
recto
Control de azúcar en
la sangre
Examen de Colesterol
Examen de
audición (escucha)
Examen físico
Prueba de densidad
de los huesos
Prueba de
Papanicolaou
Vacuna contra la gripe
Control de la presión
arterial
Pruebas de cáncer
de piel
Examen de la vista
Evaluación
cardiovascular (el
corazón)
Limpieza dental/
radiografías
Ninguna de las
anteriores
15. ¿Cuánto tiempo hace desde la última vez que visitó a un dentista o clínica dental por algún motivo? Incluya visitas a especialistas dentales, como ortodoncista. (Elija solo una).
En el último año (en los últimos 12 meses)
Hace 2 (más de un año pero menos de dos años)
Hace más de 5 años (más de 2 años pero menos de 5 años)
No sé / no estoy seguro
Nunca
16. En los últimos 30 días, ¿ha habido algún día que se ha sentido triste o preocupado y le haya impedido realizar sus actividades normales? (Elija solo una).
Sí
No
No sé / no estoy seguro
133
17. La siguiente pregunta es sobre el alcohol. Un trago es equivalente a una cerveza de 12 onzas, una copa de vino de 5 onzas o una bebida con un trago de licor. Considerando todos los tipos de bebidas alcohólicas, ¿cuántas veces durante los últimos 30 días tomó 5 o más bebidas (si es hombre) o 4 o más bebidas (si es mujer) en una ocasión?
0
1
2
3
4
5
6
7
8
9
10
11
12
13
14
15
16
17
18
19
20
21
22
23
24
25
26
27
28
29
30
No sé / no estoy seguro
18. Ahora le vamos a hacer una pregunta sobre el uso de drogas. Las respuestas que nos dan las personas sobre su uso de drogas son importantes para comprender los problemas de salud en el condado. Sabemos que esta información es personal, pero recuerde que sus respuestas se mantendrán confidenciales. ¿Has usado alguna droga ilegal en los últimos 30 días? Cuando decimos drogas, incluimos marihuana, cocaína, crack, heroína o cualquier otra sustancia ilegal. ¿Aproximadamente cuántos días has usado una de estas drogas ilegales? (Elija solo una).
0
1
2
3
4
5
6
7
8
9
10
11
12
13
14
15
16
17
18
19
20
21
22
23
24
25
26
27
28
29
30
No sé / no estoy seguro
(Si su respuesta es 0, salte a la pregunta numero 20)
19. Durante los últimos 30 días, ¿qué droga ilegal ha usado? (Marque todas las que corresponden).
Mariguana
Cocaína
Heroína
Otros (especificar)
134
20. Durante los últimos 30 días, ¿ha tomado algún medicamento recetado para el que no tenía una receta (por ejemplo, Oxycontin, Percocet, Demerol, Adderall, Ritalin o Xanax)? ¿Cuántas veces durante los últimos 30 días usó un medicamento recetado para el cual no tenía una receta? (Elija solo una).
0
1
2
3
4
5
6
7
8
9
10
11
12
13
14
15
16
17
18
19
20
21
22
23
24
25
26
27
28
29
30
No sé / no estoy seguro
21. La siguiente pregunta se relaciona con la salud de una persona que ha servido en las fuerzas Armadas. ¿Alguna vez ha estado en servicio activo en las Fuerzas Armadas de los Estados Unidos (Sin incluir el servicio activo de solo entrenamientos en las Reservas o la Guardia Nacional)? (Elija solo una).
Sí
No (Si su respuesta es No, salte a la pregunta numero 23)
22. ¿Alguna vez un médico u otro profesional de la salud le ha dicho que tiene depresión, ansiedad o trastorno por estrés postraumático (TEPT)? (Elija solo una).
Sí
No
23. Ahora nos gustaría saber sobre su estado físico. Durante una semana normal, aparte de su trabajo habitual, ¿realiza alguna actividad física o ejercicio que dure al menos media hora? (Elija solo una).
Sí
No (Si su respuesta es No, salte a la pregunta numero 26)
No sé / no estoy seguro
(Si su respuesta es No se / no estoy seguro, salte a la pregunta numero 26)
24. Como dijo que sí, ¿cuántas veces hace ejercicio o se involucra en alguna actividad física durante una semana normal?
135
25. ¿A dónde va a hacer ejercicio o participa en actividad físicas? (Marque todas las que corresponden).
YMCA
Parque
Centro de Recreación Pública
Gimnasio privado
Sitio de trabajo / Empleador
Terrenos escolares / instalaciones
Casa
Iglesia
Otros (especificar)
Como su respuesta fue Si a la pregunta 23 (actividad física / ejercicio), salte a la pregunta numero 27 26. Ya que dijo "no", ¿cuáles son las razones por las que no hace ejercicio por media hora durante una semana normal? Puedes dar tantos de estos motivos como necesite.
Mi trabajo es trabajo físico o trabajo duro
El ejercicio no es importante para mí.
No tengo acceso a una instalación que tenga
las cosas que necesito, como una piscina, un
campo de golf o una pista.
No tengo suficiente tiempo para hacer
ejercicio.
Necesitaría cuidado de niños y no lo tengo.
No sé cómo encontrar compañeros de
ejercicio.
No me gusta hacer ejercicio
Me cuesta mucho hacer ejercicio.
No hay un lugar seguro para hacer
ejercicio.
Necesito transporte y no lo tengo.
Estoy demasiado cansado para hacer
ejercicio.
Estoy físicamente deshabilitado.
No lo sé.
Otros (especificar)
136
27. Sin contar ensalada de lechuga o productos de papa como papas fritas, piense en la frecuencia con la que come frutas y verduras en una semana normal. ¿Cuántas tazas por semana de frutas y vegetales dirías que comes? (Una manzana o 12 zanahorias pequeñas equivalen a una taza).
Cantidad de tazas de fruta
Número de tazas de verduras
Cantidad de tazas de jugo de fruta 100%
28. ¿Alguna vez estuvo expuesto al humo del cigarro de alguien que fumó cerca de usted durante el último año? (Elija solo una).
Sí
No (Si su respuesta es No, salte a la pregunta numero 30)
No sé / no estoy seguro
(Si su respuesta es No se / no estoy seguro, salte a la pregunta numero 30)
29. En caso afirmativo, ¿dónde cree que está expuesto al humo de segunda mano con mayor frecuencia? (Marque solo uno)
Casa
Lugar de trabajo
Hospitales
Restaurantes
Colegio
No estoy expuesto al humo de segunda mano.
Otros (especificar)
137
30. ¿Actualmente usa algún producto que contiene tabaco? (Esto incluye cigarros, cigarros electrónicos, masticar tabaco o cigarro de vapor.) (Elija solo una).
Sí
No (Si su respuesta es No, salte a la pregunta numero 32)
31. En caso afirmativo, ¿a dónde iría en busca de ayuda si quisiera dejar de fumar? (Elija solo una).
QUITLINE NC (ayuda por teléfono)
Doctor
Farmacia
Consejero / terapeuta privado
Departamento de salud
No lo sé
No aplica; No quiero renunciar
Otros (especificar)
32. Ahora le haremos preguntas sobre sus vacunas personales contra la gripe. Una vacuna contra la influenza / gripe puede ser una "inyección contra la gripe" inyectada en su brazo o también el espray "FluMist" que se rocía en su nariz. Durante los últimos 12 meses, ¿se vacunó contra la gripe o se puso el espray “FluMist? (Elija solo una).
Sí, vacuna contra la gripe
Sí, FluMist
Si ambos
No
No sé / no estoy seguro
138
PARTE 5: Acceso a la atención / Salud familiar
33. ¿A dónde va más a menudo cuando está enfermo? (Elija solo uno)
Oficina del doctor
Departamento de salud
Hospital
Clínica Médica
Centro de cuidado urgente
Otros (especificar)
34. ¿Tiene alguno de los siguientes tipos de seguro de salud o cobertura de atención médica? (Elija todos los que aplique)
Seguro de salud que mi empleador proporciona
Seguro de salud que proporciona el empleador de mi cónyuge
Seguro de salud que mi escuela proporciona
Seguro de salud que proporciona mi padre o el empleador de mis padres
Seguro de salud que compré
Seguro de salud a través del Mercado de Seguros Médicos (Obamacare)
Seguro Militar, Tricare o él VA
Seguro de enfermedad
Seguro médico del estado
Sin plan de salud de ningún tipo
35. En los últimos 12 meses, ¿tuvo problemas para obtener la atención médica que necesitaba para usted o para un familiar de cualquier tipo de proveedor de atención médica, dentista, farmacia u otro centro? (Elija solo uno)
Sí
No (Si su respuesta es No, salte a la pregunta numero 38)
No sé / no estoy seguro
139
36. Dado que usted dijo "sí", ¿Con cual tipo de proveedor o institución tuvo problemas para obtener atención médica? Puede elegir tantos de estos como necesite.
Dentista
Médico general
Cuidado de los ojos/
optometrista/
oftalmólogo
Farmacia / recetas
médicas
Pediatra
Ginecologo
Departamento de
salud
Hospital
Centro de atención
urgente
Clínica Médica
Especialista
Otros (especificar)
37. ¿Cuáles de estos problemas le impidieron a usted o a su familiar obtener la atención médica necesaria? Puede elegir tantos de estos como necesite.
No tiene seguro medico
El seguro no cubría lo que necesitaba
El costo del deducible del seguro era demasiado alto
El doctor no aceptaba el seguro ni el Medicaid.
El hospital no aceptaba el seguro.
La farmacia no aceptaba el seguro ni el Medicaid.
El dentista no aceptaba el seguro ni el Medicaid.
No tengo ninguna manera de llegar allí.
No sabía a dónde ir.
No pude conseguir una cita.
La espera fue demasiado larga.
El proveedor me negó atención o me trató de manera discriminatoria debido a mi estado de VIH, o
porque soy lesbiana, gay, bisexual o trangenero.
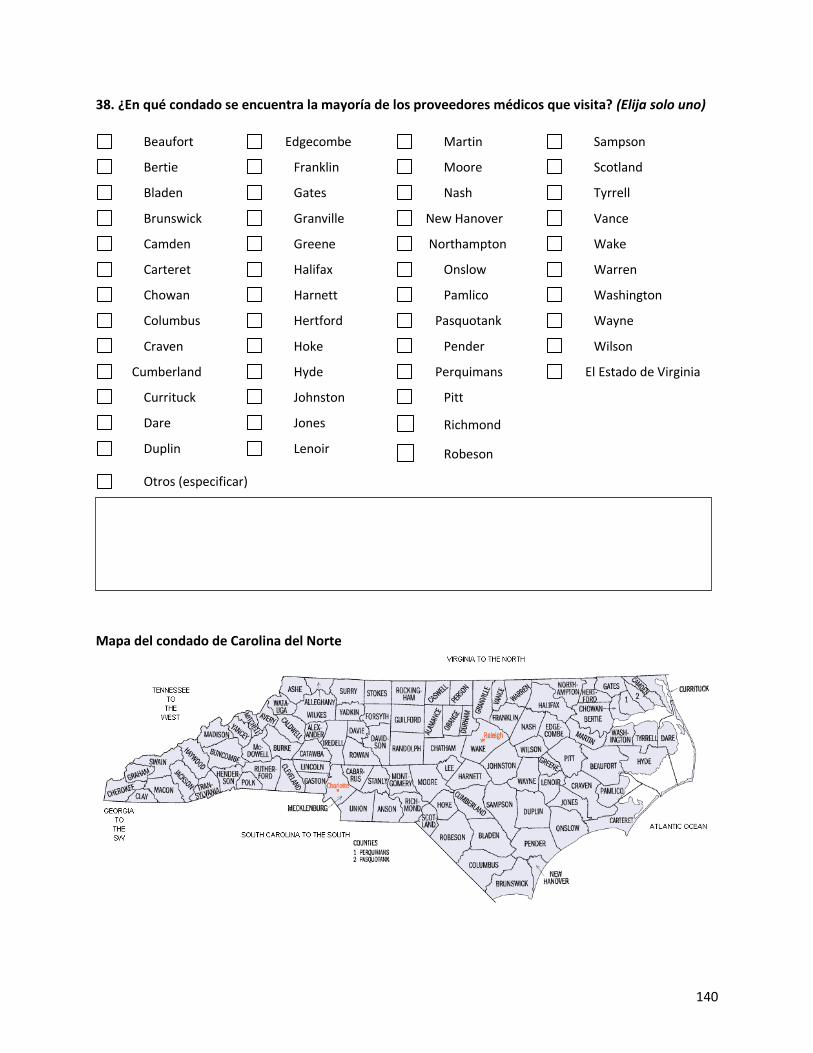
140
38. ¿En qué condado se encuentra la mayoría de los proveedores médicos que visita? (Elija solo uno)
Beaufort
Bertie
Bladen
Brunswick
Camden
Carteret
Chowan
Columbus
Craven
Cumberland
Currituck
Dare
Duplin
Edgecombe
Franklin
Gates
Granville
Greene
Halifax
Harnett
Hertford
Hoke
Hyde
Johnston
Jones
Lenoir
Martin
Moore
Nash
New Hanover
Northampton
Onslow
Pamlico
Pasquotank
Pender
Perquimans
Pitt
Richmond
Robeson
Sampson
Scotland
Tyrrell
Vance
Wake
Warren
Washington
Wayne
Wilson
El Estado de Virginia
Otros (especificar)
Mapa del condado de Carolina del Norte
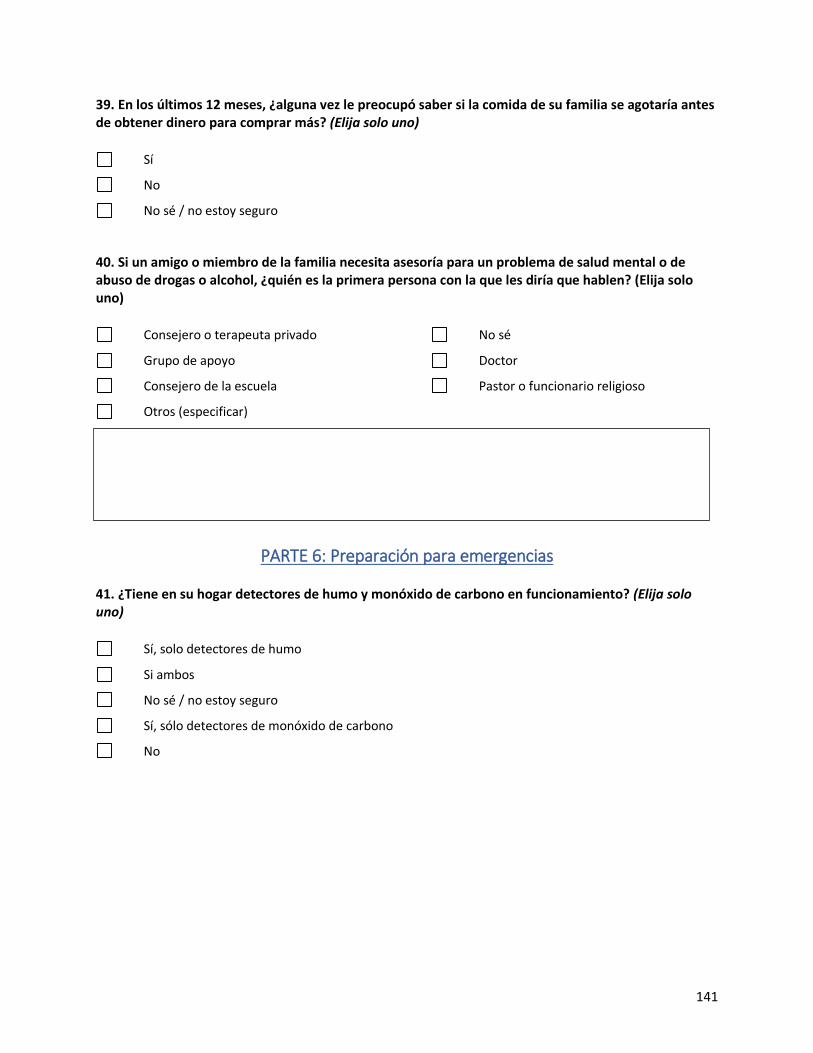
141
39. En los últimos 12 meses, ¿alguna vez le preocupó saber si la comida de su familia se agotaría antes de obtener dinero para comprar más? (Elija solo uno)
Sí
No
No sé / no estoy seguro
40. Si un amigo o miembro de la familia necesita asesoría para un problema de salud mental o de abuso de drogas o alcohol, ¿quién es la primera persona con la que les diría que hablen? (Elija solo uno)
Consejero o terapeuta privado
Grupo de apoyo
Consejero de la escuela
No sé
Doctor
Pastor o funcionario religioso
Otros (especificar)
PARTE 6: Preparación para emergencias
41. ¿Tiene en su hogar detectores de humo y monóxido de carbono en funcionamiento? (Elija solo uno)
Sí, solo detectores de humo
Si ambos
No sé / no estoy seguro
Sí, sólo detectores de monóxido de carbono
No
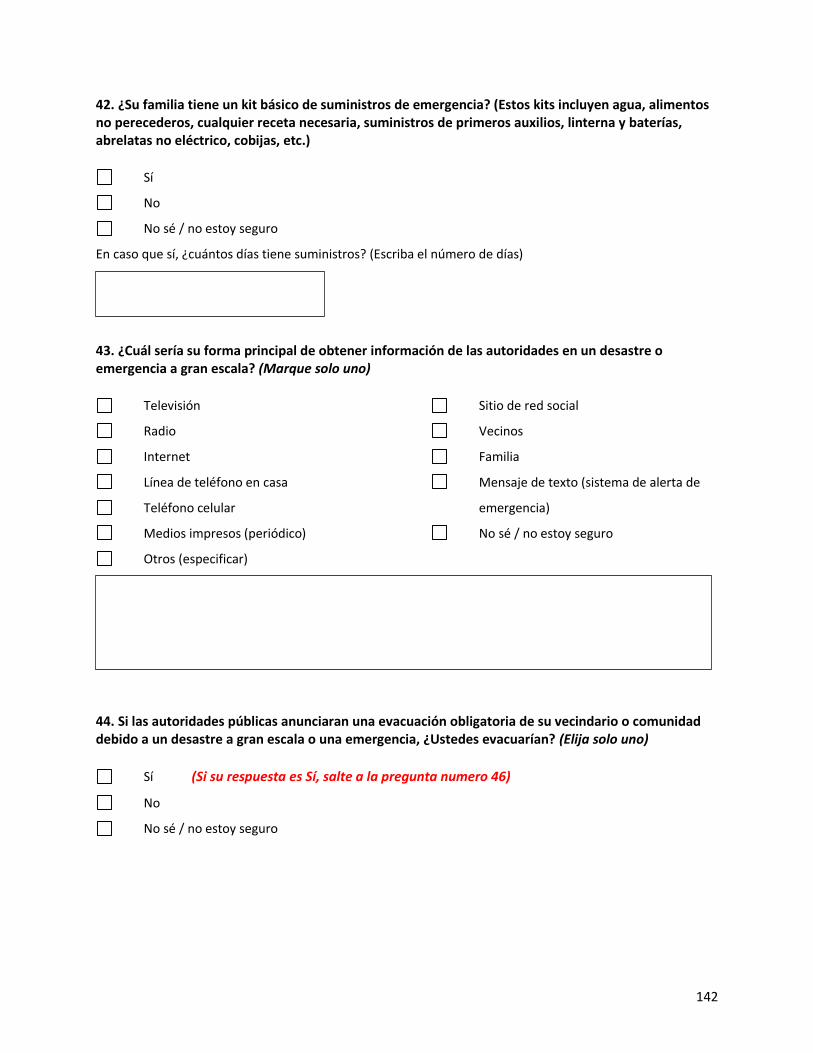
142
42. ¿Su familia tiene un kit básico de suministros de emergencia? (Estos kits incluyen agua, alimentos no perecederos, cualquier receta necesaria, suministros de primeros auxilios, linterna y baterías, abrelatas no eléctrico, cobijas, etc.)
Sí
No
No sé / no estoy seguro
En caso que sí, ¿cuántos días tiene suministros? (Escriba el número de días)
43. ¿Cuál sería su forma principal de obtener información de las autoridades en un desastre o emergencia a gran escala? (Marque solo uno)
Televisión
Radio
Internet
Línea de teléfono en casa
Teléfono celular
Medios impresos (periódico)
Sitio de red social
Vecinos
Familia
Mensaje de texto (sistema de alerta de
emergencia)
No sé / no estoy seguro
Otros (especificar)
44. Si las autoridades públicas anunciaran una evacuación obligatoria de su vecindario o comunidad debido a un desastre a gran escala o una emergencia, ¿Ustedes evacuarían? (Elija solo uno)
Sí (Si su respuesta es Sí, salte a la pregunta numero 46)
No
No sé / no estoy seguro
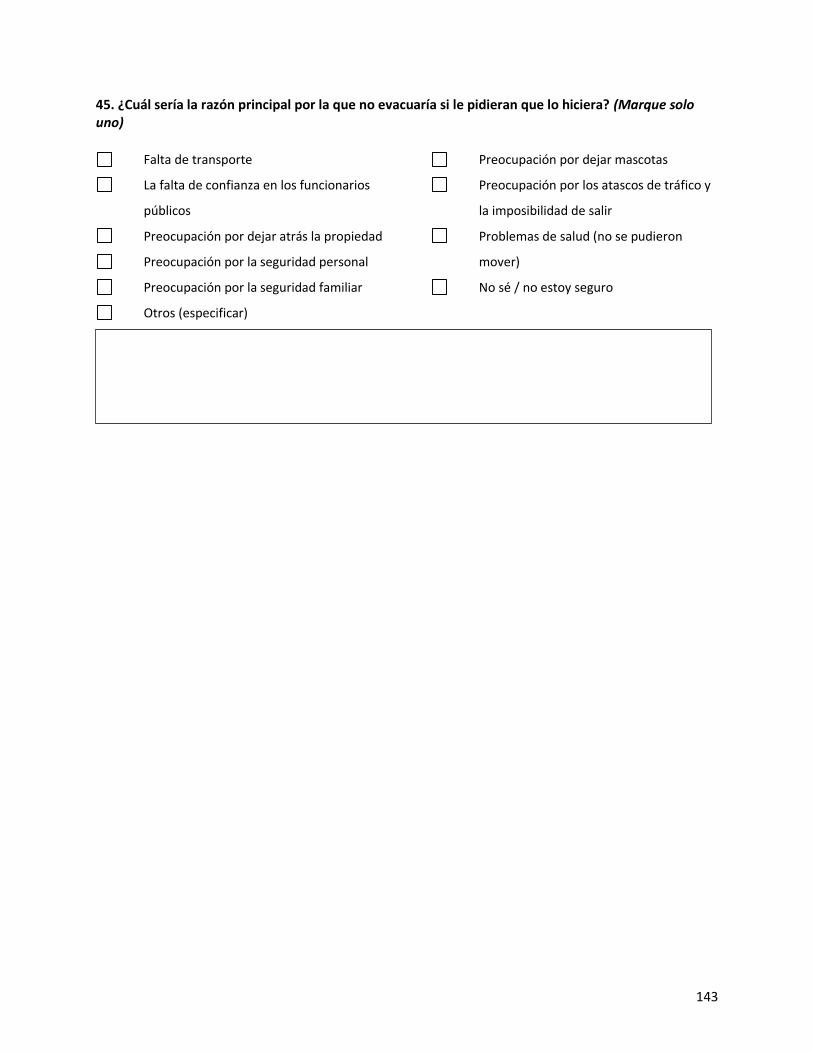
143
45. ¿Cuál sería la razón principal por la que no evacuaría si le pidieran que lo hiciera? (Marque solo uno)
Falta de transporte
La falta de confianza en los funcionarios
públicos
Preocupación por dejar atrás la propiedad
Preocupación por la seguridad personal
Preocupación por la seguridad familiar
Preocupación por dejar mascotas
Preocupación por los atascos de tráfico y
la imposibilidad de salir
Problemas de salud (no se pudieron
mover)
No sé / no estoy seguro
Otros (especificar)
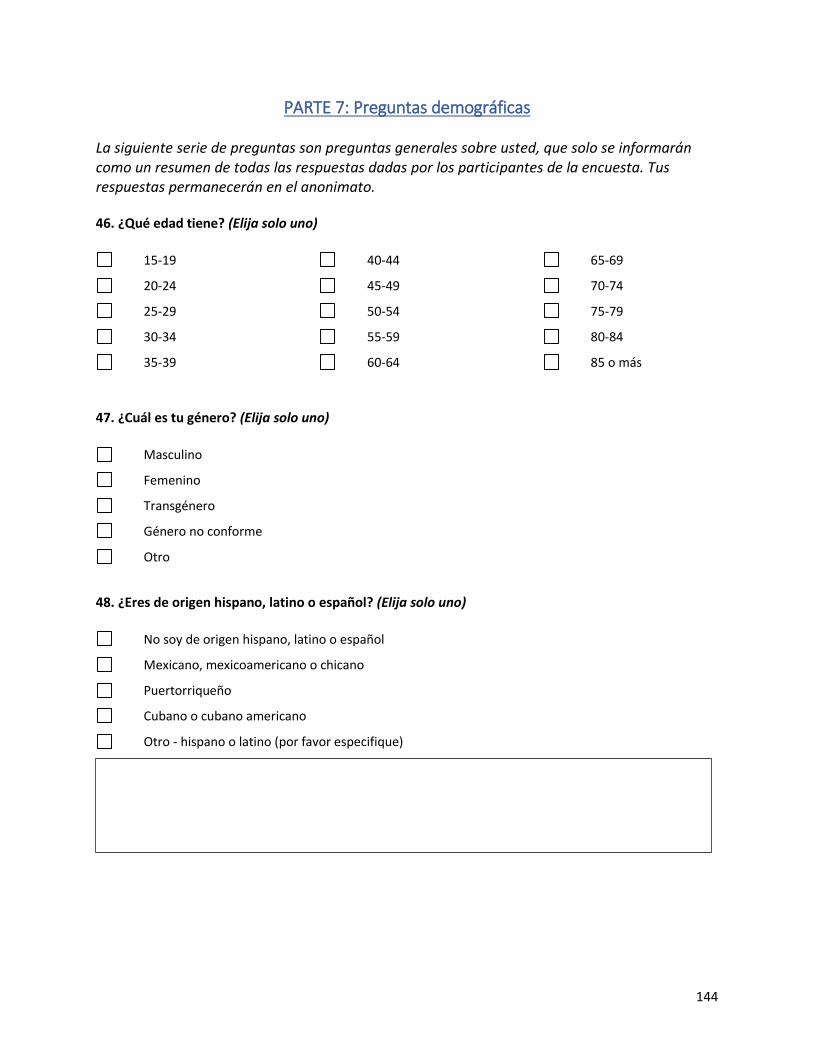
144
PARTE 7: Preguntas demográficas La siguiente serie de preguntas son preguntas generales sobre usted, que solo se informarán como un resumen de todas las respuestas dadas por los participantes de la encuesta. Tus respuestas permanecerán en el anonimato. 46. ¿Qué edad tiene? (Elija solo uno)
15-19
20-24
25-29
30-34
35-39
40-44
45-49
50-54
55-59
60-64
65-69
70-74
75-79
80-84
85 o más
47. ¿Cuál es tu género? (Elija solo uno)
Masculino
Femenino
Transgénero
Género no conforme
Otro
48. ¿Eres de origen hispano, latino o español? (Elija solo uno)
No soy de origen hispano, latino o español
Mexicano, mexicoamericano o chicano
Puertorriqueño
Cubano o cubano americano
Otro - hispano o latino (por favor especifique)
145
49. ¿Cuál es su raza? (Elija solo uno)
Blanco
Negro o Afroamericano
Indio Americano o nativo de Alaska
Indio Asiático
Otros- Asiáticos, incluidos Japonés, Chino, Coreano, Vietnamita y Filipino
Otros isleños del Pacífico, incluidos los nativos de Hawaii, Samoa, Guamanian / Chamorro
Otra raza no incluida aquí (especifique)
50. ¿El inglés es el idioma principal que se habla en su hogar? (Elija solo uno)
Sí
No. En caso negativo, especifique el idioma principal que se habla en su hogar.
51. ¿Cuál es tu estado civil? (Elija solo uno)
Nunca casado / soltero
Casado
Pareja- soltera
Divorciado
Viudo
Separado
Otros (especificar)
146
52. Seleccione el nivel más alto de educación que ha alcanzado. (Elija solo uno)
Menos de 9no grado
9-12 grado, sin diploma
Graduado de secundaria (o GED / equivalente)
Grado Asociado o Formación Profesional
Un poco de universidad (sin título)
Licenciatura
Licenciado o título profesional
Otros (especificar)
53. ¿Cuál fue el ingreso total de su hogar el año pasado, antes de impuestos? (Elija solo uno)
Menos de $10,000
$10,000 a $14,999
$15,000 a $24,999
$25,000 a $34,999
$35,000 a $49,999
$50,000 a $74,999
$75,000 a $99,999
$100,000 o más
54. Ingrese el número de personas en su hogar (incluyéndose a usted) 55. ¿Cuál es su estado laboral? (Seleccione todas las opciones que corresponden).
Empleado de tiempo
completo
Empleado a tiempo
parcial
Retirado
Fuerzas Armadas
Discapacitado
Estudiante
Ama de casa
Trabajadores por cuenta propia
Desempleado 1 año o menos
Desempleado por más de 1 año
147
56. ¿Tiene acceso al internet es su casa (Esto incluye alta velocidad, wifi, acceso telefónico o datos móviles)? (Elija solo uno)
Sí
No
No sé / no estoy seguro
57. (Opcional) ¿Hay algo más que le gustaría que sepamos sobre su comunidad? Por favor, siéntase libre de decirnos a continuación.
¡Gracias por su tiempo y participación!
Si tiene preguntas sobre esta encuesta, envíenos un correo electrónico a [email protected].
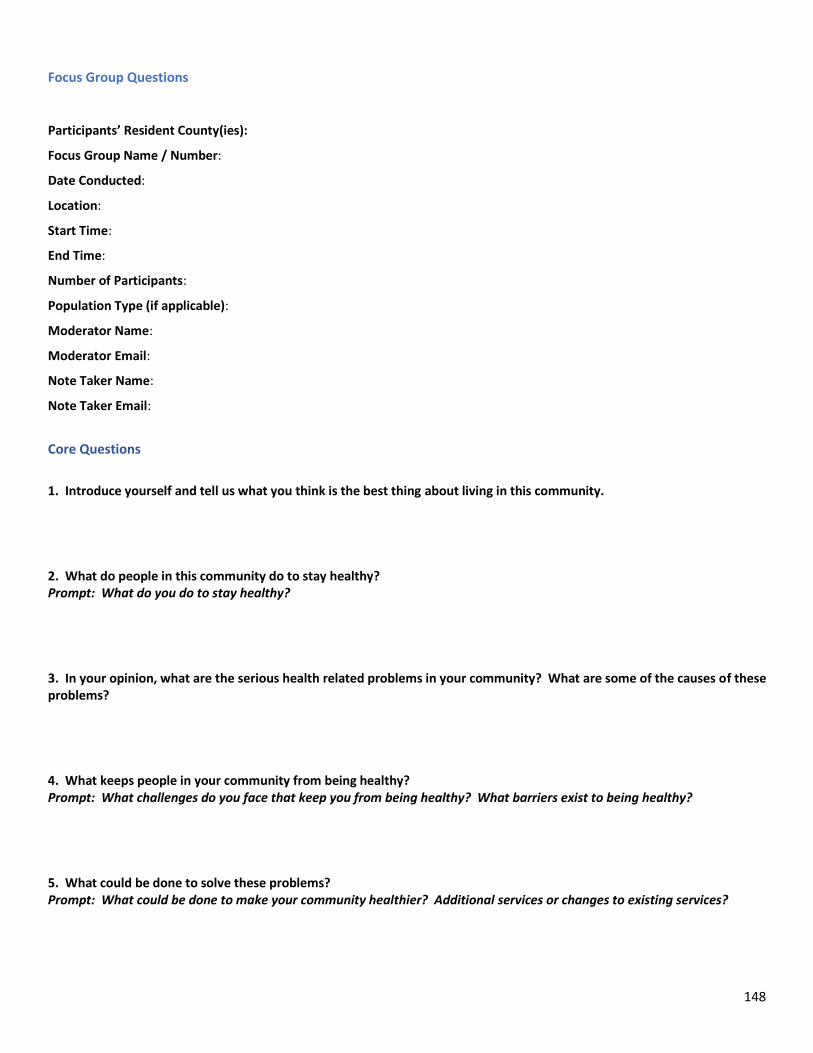
148
Focus Group Questions Participants’ Resident County(ies):
Focus Group Name / Number:
Date Conducted:
Location:
Start Time:
End Time:
Number of Participants:
Population Type (if applicable):
Moderator Name:
Moderator Email:
Note Taker Name:
Note Taker Email:
Core Questions
1. Introduce yourself and tell us what you think is the best thing about living in this community. 2. What do people in this community do to stay healthy? Prompt: What do you do to stay healthy? 3. In your opinion, what are the serious health related problems in your community? What are some of the causes of these problems? 4. What keeps people in your community from being healthy? Prompt: What challenges do you face that keep you from being healthy? What barriers exist to being healthy? 5. What could be done to solve these problems? Prompt: What could be done to make your community healthier? Additional services or changes to existing services?
149
6. Is there any group not receiving enough health care? If so, what group? And why?
7. Is there anything else you would like us to know?
Additional Questions
1. How do people in this community get information about health? How do you get information about health? 2. Have you or someone close to you ever experienced any challenges in trying to get healthcare services? If so, what happened? 3. What is the major environmental issue in the county? 4. Describe collaborative efforts in the community. How can we improve our level of collaboration? 5. What are the strengths related to health in your community? Prompt: Specific strengths related to healthcare? Prompt: Specific strengths to a healthy lifestyle? 6. If you had $100,000 to spend on a healthcare project in the county, how would you spend it?

150
Key Themes
Summarize the top 2-3 themes from this focus group discussion.
1.
2.
3.
Copyright © 2022 FDOKUMEN