The Planetary Nebula System of M33
45
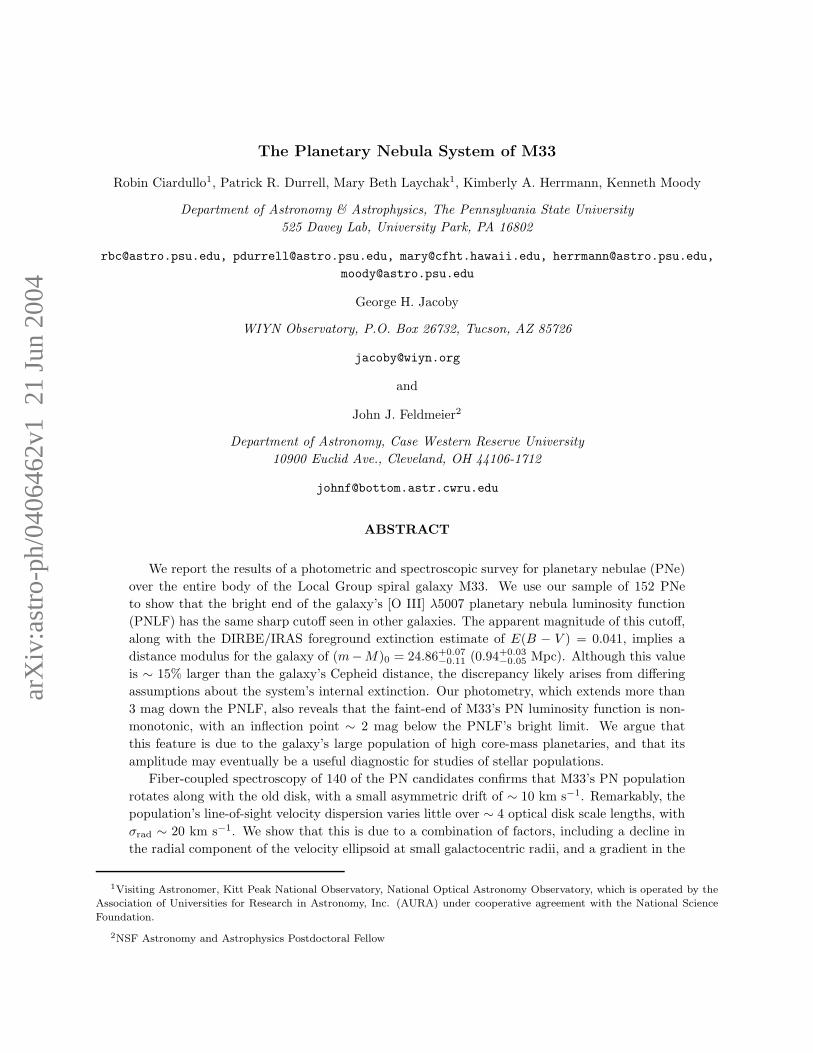
arXiv:astro-ph/0406462v1 21 Jun 2004 The Planetary Nebula System of M33 Robin Ciardullo 1 , Patrick R. Durrell, Mary Beth Laychak 1 , Kimberly A. Herrmann, Kenneth Moody Department of Astronomy & Astrophysics, The Pennsylvania State University 525 Davey Lab, University Park, PA 16802 [email protected], [email protected], [email protected], [email protected], [email protected] George H. Jacoby WIYN Observatory, P.O. Box 26732, Tucson, AZ 85726 [email protected] and John J. Feldmeier 2 Department of Astronomy, Case Western Reserve University 10900 Euclid Ave., Cleveland, OH 44106-1712 [email protected] ABSTRACT We report the results of a photometric and spectroscopic survey for planetary nebulae (PNe) over the entire body of the Local Group spiral galaxy M33. We use our sample of 152 PNe to show that the bright end of the galaxy’s [O III] λ5007 planetary nebula luminosity function (PNLF) has the same sharp cutoff seen in other galaxies. The apparent magnitude of this cutoff, along with the DIRBE/IRAS foreground extinction estimate of E(B − V )=0.041, implies a distance modulus for the galaxy of (m − M ) 0 = 24.86 +0.07 −0.11 (0.94 +0.03 −0.05 Mpc). Although this value is ∼ 15% larger than the galaxy’s Cepheid distance, the discrepancy likely arises from differing assumptions about the system’s internal extinction. Our photometry, which extends more than 3 mag down the PNLF, also reveals that the faint-end of M33’s PN luminosity function is non- monotonic, with an inflection point ∼ 2 mag below the PNLF’s bright limit. We argue that this feature is due to the galaxy’s large population of high core-mass planetaries, and that its amplitude may eventually be a useful diagnostic for studies of stellar populations. Fiber-coupled spectroscopy of 140 of the PN candidates confirms that M33’s PN population rotates along with the old disk, with a small asymmetric drift of ∼ 10 km s −1 . Remarkably, the population’s line-of-sight velocity dispersion varies little over ∼ 4 optical disk scale lengths, with σ rad ∼ 20 km s −1 . We show that this is due to a combination of factors, including a decline in the radial component of the velocity ellipsoid at small galactocentric radii, and a gradient in the 1 Visiting Astronomer, Kitt Peak National Observatory, National Optical Astronomy Observatory, which is operated by the Association of Universities for Research in Astronomy, Inc. (AURA) under cooperative agreement with the National Science Foundation. 2 NSF Astronomy and Astrophysics Postdoctoral Fellow
-
Upload
youngstown -
Category
Documents
-
view
0 -
download
0
Transcript of The Planetary Nebula System of M33
arX
iv:a
stro
-ph/
0406
462v
1 2
1 Ju
n 20
04
The Planetary Nebula System of M33
Robin Ciardullo1, Patrick R. Durrell, Mary Beth Laychak1, Kimberly A. Herrmann, Kenneth Moody
Department of Astronomy & Astrophysics, The Pennsylvania State University
525 Davey Lab, University Park, PA 16802
[email protected], [email protected], [email protected], [email protected],
George H. Jacoby
WIYN Observatory, P.O. Box 26732, Tucson, AZ 85726
and
John J. Feldmeier2
Department of Astronomy, Case Western Reserve University
10900 Euclid Ave., Cleveland, OH 44106-1712
ABSTRACT
We report the results of a photometric and spectroscopic survey for planetary nebulae (PNe)
over the entire body of the Local Group spiral galaxy M33. We use our sample of 152 PNe
to show that the bright end of the galaxy’s [O III] λ5007 planetary nebula luminosity function
(PNLF) has the same sharp cutoff seen in other galaxies. The apparent magnitude of this cutoff,
along with the DIRBE/IRAS foreground extinction estimate of E(B − V ) = 0.041, implies a
distance modulus for the galaxy of (m−M)0 = 24.86+0.07−0.11 (0.94+0.03
−0.05 Mpc). Although this value
is ∼ 15% larger than the galaxy’s Cepheid distance, the discrepancy likely arises from differing
assumptions about the system’s internal extinction. Our photometry, which extends more than
3 mag down the PNLF, also reveals that the faint-end of M33’s PN luminosity function is non-
monotonic, with an inflection point ∼ 2 mag below the PNLF’s bright limit. We argue that
this feature is due to the galaxy’s large population of high core-mass planetaries, and that its
amplitude may eventually be a useful diagnostic for studies of stellar populations.
Fiber-coupled spectroscopy of 140 of the PN candidates confirms that M33’s PN population
rotates along with the old disk, with a small asymmetric drift of ∼ 10 km s−1. Remarkably, the
population’s line-of-sight velocity dispersion varies little over ∼ 4 optical disk scale lengths, with
σrad ∼ 20 km s−1. We show that this is due to a combination of factors, including a decline in
the radial component of the velocity ellipsoid at small galactocentric radii, and a gradient in the
1Visiting Astronomer, Kitt Peak National Observatory, National Optical Astronomy Observatory, which is operated by the
Association of Universities for Research in Astronomy, Inc. (AURA) under cooperative agreement with the National Science
Foundation.
2NSF Astronomy and Astrophysics Postdoctoral Fellow
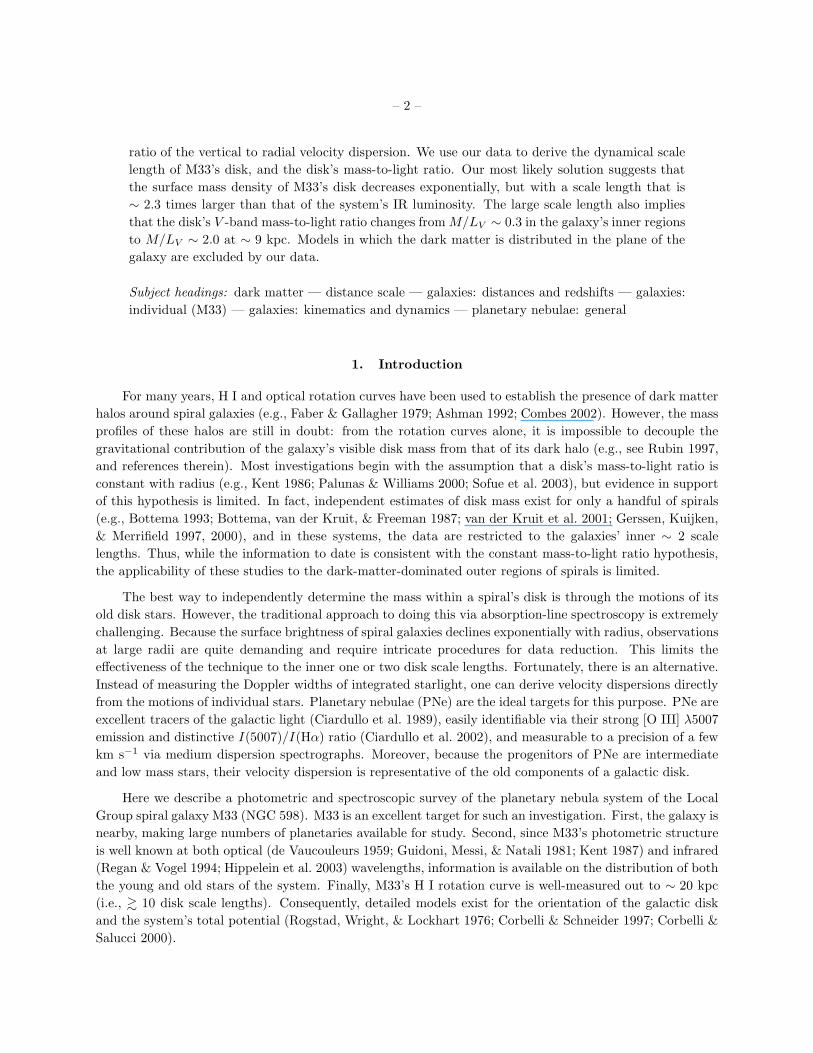
– 2 –
ratio of the vertical to radial velocity dispersion. We use our data to derive the dynamical scale
length of M33’s disk, and the disk’s mass-to-light ratio. Our most likely solution suggests that
the surface mass density of M33’s disk decreases exponentially, but with a scale length that is
∼ 2.3 times larger than that of the system’s IR luminosity. The large scale length also implies
that the disk’s V -band mass-to-light ratio changes from M/LV ∼ 0.3 in the galaxy’s inner regions
to M/LV ∼ 2.0 at ∼ 9 kpc. Models in which the dark matter is distributed in the plane of the
galaxy are excluded by our data.
Subject headings: dark matter — distance scale — galaxies: distances and redshifts — galaxies:
individual (M33) — galaxies: kinematics and dynamics — planetary nebulae: general
1. Introduction
For many years, H I and optical rotation curves have been used to establish the presence of dark matter
halos around spiral galaxies (e.g., Faber & Gallagher 1979; Ashman 1992; Combes 2002). However, the mass
profiles of these halos are still in doubt: from the rotation curves alone, it is impossible to decouple the
gravitational contribution of the galaxy’s visible disk mass from that of its dark halo (e.g., see Rubin 1997,
and references therein). Most investigations begin with the assumption that a disk’s mass-to-light ratio is
constant with radius (e.g., Kent 1986; Palunas & Williams 2000; Sofue et al. 2003), but evidence in support
of this hypothesis is limited. In fact, independent estimates of disk mass exist for only a handful of spirals
(e.g., Bottema 1993; Bottema, van der Kruit, & Freeman 1987; van der Kruit et al. 2001; Gerssen, Kuijken,
& Merrifield 1997, 2000), and in these systems, the data are restricted to the galaxies’ inner ∼ 2 scale
lengths. Thus, while the information to date is consistent with the constant mass-to-light ratio hypothesis,
the applicability of these studies to the dark-matter-dominated outer regions of spirals is limited.
The best way to independently determine the mass within a spiral’s disk is through the motions of its
old disk stars. However, the traditional approach to doing this via absorption-line spectroscopy is extremely
challenging. Because the surface brightness of spiral galaxies declines exponentially with radius, observations
at large radii are quite demanding and require intricate procedures for data reduction. This limits the
effectiveness of the technique to the inner one or two disk scale lengths. Fortunately, there is an alternative.
Instead of measuring the Doppler widths of integrated starlight, one can derive velocity dispersions directly
from the motions of individual stars. Planetary nebulae (PNe) are the ideal targets for this purpose. PNe are
excellent tracers of the galactic light (Ciardullo et al. 1989), easily identifiable via their strong [O III] λ5007
emission and distinctive I(5007)/I(Hα) ratio (Ciardullo et al. 2002), and measurable to a precision of a few
km s−1 via medium dispersion spectrographs. Moreover, because the progenitors of PNe are intermediate
and low mass stars, their velocity dispersion is representative of the old components of a galactic disk.
Here we describe a photometric and spectroscopic survey of the planetary nebula system of the Local
Group spiral galaxy M33 (NGC 598). M33 is an excellent target for such an investigation. First, the galaxy is
nearby, making large numbers of planetaries available for study. Second, since M33’s photometric structure
is well known at both optical (de Vaucouleurs 1959; Guidoni, Messi, & Natali 1981; Kent 1987) and infrared
(Regan & Vogel 1994; Hippelein et al. 2003) wavelengths, information is available on the distribution of both
the young and old stars of the system. Finally, M33’s H I rotation curve is well-measured out to ∼ 20 kpc
(i.e., & 10 disk scale lengths). Consequently, detailed models exist for the orientation of the galactic disk
and the system’s total potential (Rogstad, Wright, & Lockhart 1976; Corbelli & Schneider 1997; Corbelli &
Salucci 2000).

– 3 –
We begin our study by describing our photometric survey of the galaxy, and comparing our [O III] λ5007
and Hα PN measurements to those of Magrini et al. (2000, 2001). We demonstrate that there is generally
good agreement between the samples, although our [O III] λ5007 magnitudes are systematically brighter
than the Magrini et al. (2000) values by ∼ 0.12 mag. In Section 3, we present M33’s [O III] λ5007 planetary
nebula luminosity function (PNLF) and show that at faint magnitudes, the function has the same non-
monotonic behavior as the PNLF of the Small Magellanic Cloud. We interpret this turnover as a population
effect and speculate on how the shape of the PNLF can be used to probe the mix of stellar populations
within a galaxy. In Section 4, we use our data to derive a new PNLF-based distance to the galaxy, and
discuss a possible reason for the 2 σ difference between our measurement and that inferred from the galaxy’s
Cepheid variables.
After analyzing the photometric data, we describe our spectroscopic survey of the galaxy’s planetary
nebula system. In Section 5, we detail our observing and reduction procedures, and quantify the errors in
our velocity measurements. In Sections 6 and 7, we use these data to examine the stellar kinematics of
the galaxy. We present the system’s line-of-sight velocity dispersion, estimate the stellar asymmetric drift,
and use the epicyclic approximation to model the galaxy’s velocity ellipsoid. We show that the line-of-sight
velocity dispersion of M33’s planetaries varies very little with galactic radius, and that this is due to a
combination of factors, including a decline in the system’s radial velocity dispersion at small galactocentric
distances and a gradient in the ratio of the system’s vertical to radial velocity dispersion. We also show
that M33’s vertical velocity dispersion decreases with a scale length that is greater than that of the galaxy’s
infrared light. In Section 8, we discuss possible systematic errors which may effect our result, including the
variation of the PN scale height with galactocentric distance. Finally, we use our results to estimate the
surface mass density of M33’s disk, and constrain the radial profile of the galaxy’s dark halo.
2. Identification of Planetary Nebulae
M33’s PN candidates were identified on Kitt Peak 4 m telescope MOSAIC CCD images taken as part of
the NOAO Local Group Galaxies survey program (Massey et al. 2002). This dataset consists of deep broad-
(UBVRI) and narrow- ([O III], [S II], and Hα + [N II]) band images of 10 star-forming galaxies of the Local
Group. Our program made use of the survey’s M33 frames in [O III] λ5007, Hα, B, and V . These data cover
a 72′ × 36′ region of the galaxy in three overlapping 36′ × 36′ fields, and extend out to a radius of ∼ 10 kpc,
or four times the galaxy’s disk scale length in blue light (de Vaucouleurs 1959). Our survey region is shown
in Figure 1; the properties of the survey frames are summarized in Table 1.
To place the Massey et al. (2002) survey frames on a standard system, additional exposures in [O III]
λ5007 (900 s) and Hα (600 s) were taken with the same telescope/instrument setup on the UT nights of 2001
Dec 22 and 24. The seeing during these observations was moderately poor, 1.′′4 in [O III] and 1.′′2 in Hα,
but the sky was photometric, and images of the Stone (1977) spectrophotometric standards BD+28 4211
and Feige 110 were acquired immediately before and after the exposures. These supplemental images were
bias-subtracted, flat-fielded, and remapped onto the tangent plane using the mscred routines within IRAF
(Valdes 1998). The latter two steps were performed after the iterative subtraction of the telescope’s ghost
pupil from the nights’ dome flats.
PN candidates were identified by blinking the on-band [O III] λ5007 and Hα survey images against their
V -band counterparts. All spatially unresolved emission-line objects with little or no continuum flux were
classified as planetary nebula candidates. Because medium band-width continuum images were not part of

– 4 –
the Massey et al. (2002) survey, this condition effectively meant that all PN candidates had to be either
invisible in V , or have an instrumental V − λ5007 color less than ∼ 3 (the ratio of the filters’ bandpasses,
corrected for transmission differences and the inclusion of [O III] λ4959 in the V filter). Since the seeing
on the survey frames was generally very good, . 1.′′0 (∼ 4 pc) in [O III] λ5007 and 0.′′8 (or ∼ 3 pc) in Hα,
this simple classification scheme was generally unambiguous. To confirm the nature of the few sources with
instrumental colors uncomfortably close to the discrimination threshold, i.e., with 2 < V − λ5007 < 3, we
also examined their appearance on the survey’s B frames. Those objects with B-band fluxes close to that
expected from a B main sequence star were classified as H II regions and eliminated from the analysis. We
note that under these criteria, the two objects closest to our B-magnitude threshold are ∼ 1.5 mag brighter
in B than any other PN in our sample.
Once found, the PN candidates on each [O III] frame were measured astrometrically using a grid of
∼ 200 reference stars from the USNO-A2.0 catalog (Monet et al. 1998). The formal internal errors of
our plate solutions were ∼ 0.′′3 in both right ascension and declination. However, since M33’s nuclear
field overlapped the survey’s northern and southern fields by 50%, almost two-thirds of our PN candidates
appeared in two (or three) frames, and thus could be measured multiple times. The standard astrometric
error between these measurements, ∼ 0.′′15, is slightly better than the internal errors of the individual plate
solutions. This suggests that part of ∼ 0.′′3 scatter in the solutions comes from the proper motions of the
reference stars, and that our relative astrometry is probably good to better than ∼ 0.′′2.
Relative [O III] λ5007 and Hα photometry of the PN candidates and several bright field stars was
accomplished using the daophot point-spread-function fitting (PSF) routines within IRAF (Stetson 1987;
Stetson, Davis, & Crabtree 1990; Stetson 1992). Our photometry was then checked by using daophot’s
substar option to subtract off a scaled-PSF representation of each PN from its position on the frame. An
examination of the residuals revealed that, while the vast majority of the subtractions were excellent, a few
objects in or near the galaxy’s spiral arms were slightly under- or over-subtracted, typically by ∼ 0.1 mag.
The cause of this error was an incorrect estimate of the galactic background, which (particularly in Hα) often
included irregular H II regions, supernova remnants, and diffuse knots of emission. When this occurred, the
PN magnitudes were manually adjusted until the residuals of the subtractions appeared reasonable.
After determining the raw PN instrumental magnitudes on each frame, the data were merged onto
a common system by solving the least-squares condition required to match the magnitudes of stars in the
regions of field overlap (Ciardullo et al. 1987). The instrumental magnitudes were then placed on the standard
AB system by using the Dec 2001 data to compare large aperture measurements of field stars to similar
measurements made of the Stone (1977) spectrophotometric standards. We estimate the error associated
with this step to be ∼ 0.03 mag. Finally, to transform the measured AB magnitudes to monochromatic fluxes,
we blue-shifted the transmission curves of the [O III] λ5007 and Hα filters to correct for their temperature at
the telescope, and applied the photometric procedures for emission-line objects described in Jacoby, Quigley,
& Africano (1987) and Jacoby et al. (1989). In doing so, we assumed that M33’s PNe have a mean heliocentric
radial velocity of −180 km s−1 and a dispersion of ∼ 85 km s−1 about that mean. Of course, the latter value
is not strictly applicable to a rotating disk galaxy, but the error introduced by the peculiar velocity of an
individual PNe is never more than 0.01 mag.
Table 2 lists the positions and emission-line strengths of our 152 PN candidates. The [O III] λ5007
magnitudes in the table are related to monochromatic flux by
m5007 = −2.5 logF5007 − 13.74 (1)
where the flux is given in ergs cm−2 s−1 (Jacoby 1989). Our typical photometric errors, as derived internally

– 5 –
from daophot and externally from objects with multiple measurements, are given in Table 3.
We note that a catalog of M33 PNe has previously been published (Magrini et al. 2000, 2001). The
two datasets agree reasonably well. Except for a few anomalous outliers, the positions of PNe common
to the two surveys are virtually identical: in right ascension and declination, our values are systematically
larger than the Magrini et al. (2001) measurements by 0.′′07 ± 0.′′06 and 0.′′04 ± 0.′′04, respectively, and the
overall dispersion between individual coordinates is 0.′′7. Similarly, in Hα, there is little systematic difference
between the photometry of the two surveys. On average, our Hα+[N II] log fluxes are 0.06 ± 0.05 mag
fainter than those of Magrini et al. (2001), and, while the dispersion between the measurements is rather
large (∼ 0.25 mag for objects with log fluxes greater than −15), this may partly be due to the differing
contributions of [N II] within the filters’ bandpasses. In fact, the only significant difference between the
two surveys is in the [O III] λ5007 zero point. Although our [O III] λ5007 magnitudes agree with those of
Magrini et al. (2001) in the relative sense (the dispersion between the two measurements is ∼ 0.1 mag for
objects brighter than m5007 ∼ 23), the zero point of our system is systematically brighter by 0.12±0.05 mag.
This offset and the dispersion between the measurements is shown in Figure 2.
Those Magrini et al. (2001) PN candidates that were not recovered in our survey are listed in Table 4,
along with the probable reason for the discrepancy. The implied fraction of contaminants (∼ 22%) is consis-
tent with the 28% contamination rate estimated by Magrini et al. (2003) from follow-up spectrophotometry
of the Hα, [N II], and [S II] lines of 36 PN candidates. However, we note that there are some discrepancies
for individual objects. Specifically, Magrini et al. (2001) object #8, which is classified by Magrini et al.
(2003) as a planetary nebula, is excluded from our sample on the basis of its detectable continuum emission
and [O III] λ5007 to Hα+[N II] line ratio (see below). Conversely, Magrini et al. (2001) objects #41 and
42 are included in our study, even though they are classified by Magrini et al. (2003) as probable supernova
remnants.
Are all the PN candidates listed in Table 2 genuine? At M33’s Cepheid distance of ∼ 820 kpc (Freedman
et al. 2001), our typical seeing of 1.′′0 in [O III] λ5007 and 0.′′8 in Hα + [N II] implies that all H II regions
or supernova remnants greater than ∼ 3 pc in size are resolved. This is significantly better than the limit of
∼ 7 pc associated with the poorer seeing exposures of the Magrini et al. (2000) survey, and as the catalog
of Hodge et al. (1999) demonstrates, the density of H II regions in M33 decreases rapidly over this range.
Moreover, since the Massey et al. (2002) survey frames reach a limiting magnitude of V ∼ 23.2, all of M33’s
stars brighter than MV ∼ −1.3 are visible via their continuum. Consequently, unless an H II region is excited
by a lone main sequence star with spectral type B3 or later, it will not make it into our sample. Finally, at
the bright end of the [O III] λ5007 luminosity function, the excitation properties of our objects demonstrate
that the fraction of contaminants is negligible. As pointed out by Ciardullo et al. (2002), planetary nebulae
inhabit a distinctive cone in [O III] λ5007-Hα+[N II] emission-line space. While faint PNe (those more
than ∼ 3 mag down the [O III] λ5007 luminosity function) can have [O III] λ5007 to Hα + [N II] line ratios
anywhere between 0.3 < R < 3, PNe in the top ∼ 1 mag of the PNLF all have R & 2. This contrasts with the
great majority of compact H II regions and supernova remnants, which typically have R < 1 (Shaver et al.
1983). As Figure 3 illustrates, all of our [O III]-bright PN candidates are high-excitation objects. Late-type
B-stars cannot create nebulae with such high [O III] to Hα ratios: the central stars of all our candidates
must be extremely hot, and optically faint. Taken together, the above arguments strongly suggest that the
contamination fraction in our sample is extremely low.

– 6 –
3. The Planetary Nebula Luminosity Function
The top panel of Figure 4 displays M33’s [O III] λ5007 planetary nebula luminosity function. The
sharp cutoff at the bright end of the distribution is obvious, as is the function’s slow decline at fainter
magnitudes. Remarkably, both features are consistent throughout the galaxy. M33 has a sizable metallicity
gradient (−0.11 ± 0.02 dex kpc−1; Garnett et al. 1997), and the mean oxygen abundance of PNe in the
galaxy’s inner disk (R < 15′) is likely to be ∼ 0.5 dex larger than that of PNe outside this radius. Yet, as
the middle and lower panels of Figure 4 show, the [O III] λ5007 luminosity functions of the two samples
are statistically identical. This constancy supports the conclusion of Ciardullo et al. (2002) that the PNLF
cutoff is independent of metallicity for all but the most metal poor systems.
A second interesting feature exhibited in Figure 4 is the decline in the PNLF at magnitudes fainter than
m5007 ∼ 22.5. This roll over is partially real, and partially due to photometric incompleteness. To determine
the effect of incompleteness, we began by excluding PNe located within 210′′ of the galaxy’s nucleus; object
detections in this region are difficult due to the bright, irregular features of the galactic background. We
then measured the local sky associated with each remaining object, identified the worst (most uncertain)
background in the sample, and computed the signal-to-noise each PN would have if it were projected on
that background. Artificial star experiments have shown that PN identifications become incomplete when
the signal-to-noise of a detection drops below ∼ 10 (Ciardullo et al. 1987; Hui et al. 1993). Our putative
signal-to-noise measurements therefore translate directly into a completeness limit. Our completeness limit,
m5007 ∼ 23.75, is more than a magnitude fainter than the point where the observed PNLF begins to decline.
We can confirm the reality of the dip at m5007 ∼ 23 by comparing the radial distribution of “bright”
PNe (m5007 ≤ 22.5) to a similar distribution for PNe with 23.0 ≤ m5007 ≤ 23.75. If incompleteness were
important, then we might expect the latter sample to be missing PNe at small radii, where detections are more
difficult due to the brighter surface brightness of the underlying galaxy. As Figure 5 (and the Kolmogorov-
Smirnov statistic) show, this is not the case: outside of the inner ∼ 210′′, the cumulative radial distributions
for “bright” and “faint” PNe are identical. The agreement between the two distributions demonstrates that
our estimate of the detection limit is reasonable and the decline in the luminosity function at m5007 ∼ 23 is
real.
The decrease in the luminosity function at fainter magnitudes, though unexpected, is not difficult to
explain. In fact, there are at least two possible mechanisms which, in theory, can produce a non-monotonic
PNLF. The first is internal extinction in the host galaxy. The central extinction in M33 is AV ∼ 0.9 mag and
there is a significant amount of dust distributed throughout the galaxy’s disk (Regan & Vogel 1994; Hippelein
et al. 2003). Because the scale height of PNe should be larger than that of the interstellar medium (Mihalas
& Binney 1981), one would expect the bright end of the PNLF to be dominated by objects foreground to the
dust layer. The observation of bright PNe above the dust lanes of the edge-on spirals NGC 891 (Ciardullo,
Jacoby, & Harris 1991) and NGC 4565 (Jacoby, Ciardullo, & Harris 1996) support this idea. However, at
fainter magnitudes, the contribution of extincted PNe may conceivably be enough to distort the shape of
the PNLF and cause the observed luminosity function to turn over.
To investigate this possibility, we modeled the disk of M33 as an isothermal sheet of stars (scale height
zs) containing an embedded layer of dust (scale height zd). We then adopted the analytic form of the PNLF
proposed by Ciardullo et al. (1989)
N(M) ∝ e0.307M{1 − e3(M∗−M)} (2)
and performed a series of Monte Carlo experiments, in which the ratio of the two scale heights was allowed

– 7 –
to vary between 0.1 < zd/zs < 0.5, and the total extinction ranged between 0.3 < AV < 1.5. In no case
did the mixture of dust and stars produce a non-monotonic PNLF. If the layer of dust is thick enough and
if the total amount of extinction is large, then both the number of PNe and the apparent magnitude of
the PNLF cutoff may be affected by extinction. However, our analysis suggests that internal extinction, by
itself, cannot turn the exponentially increasing PNLF of equation (2) into the peaked luminosity function
displayed in Figure 4.
An alternative explanation for M33’s PNLF comes from stellar evolution. According to the initial-
mass final-mass relation (Weidemann 2000), old stellar populations produce low-mass central stars with
evolutionary timescales much longer than the timescale for nebular expansion (Vassiliadis & Wood 1994).
To a first approximation, such objects can be modeled as non-evolving central stars surrounded by freely
expanding gaseous envelopes. The [O III] λ5007 emission of these PNe will decrease with time, t, following
the relation
F5007 ∝ NO Ne V ∝ Ne ∝1
R3∝
1
t3(3)
where NO is the number density of O++ ions, Ne is the electron density, V , the volume of the nebula, and R,
the nebular radius. For an ensemble of objects, the number of PNe with [O III] λ5007 magnitudes between
M and M + dM will then be
N(M5007) ∝dt
dm∝ e0.307M (4)
This is the exponential law first proposed by Henize & Westerlund (1963) and used by Ciardullo et al. (1989)
in their PNLF calculations. However, it may not be applicable for younger stellar populations. In these
systems, the typical planetary nebula will have a higher mass core, and a much shorter timescale for stellar
evolution. If this timescale is comparable to, or shorter than, the timescale for envelope expansion, then
a PN’s [O III] λ5007 evolution will be driven by the luminosity evolution of its central star, rather than
the expansion of its nebula. Since post-AGB stars spend a relatively long time at high luminosity (as they
cross they HR diagram at the end of shell burning), a short time at intermediate luminosity (when nuclear
reactions stop), and a long time at low luminosity (as their cooling rate slows), the PNLF of high-mass
objects will be double-peaked, and similar to that calculated for post-AGB stars by Vassiliadis & Wood
(1994).
Of course, in order to model real systems, one must include central star evolution, nebular expansion,
and gas dynamics in the analysis, as well as the mix of stellar populations within a galaxy (see Marigo et al.
2004). Nevertheless, these simple arguments do explain the different PNLFs found in Local Group galaxies.
As Figure 6 demonstrates, the low-mass stars of M31’s bulge have a PNLF that is well-represented at the
faint end by an exponential (Ciardullo et al. 2002). Conversely, M33 and the SMC are actively forming
stars and their PNLFs are consistent with the bimodal distribution of Vassiliadis & Wood (1994). Given the
distinctive nature of the two limiting cases, it is possible that the strength of the “dip” in the luminosity
function may someday be a useful probe of stellar populations which are otherwise difficult to observe.
4. The Distance to M33
Although the shape of the PNLF at fainter magnitudes may change with time, the absolute magnitude
of the function’s bright-end cutoff stays amazingly constant (Jacoby et al. 1992; Ciardullo 2003). Whether
this is due to convergence in the initial mass-final mass relation (Jacoby 1997), a fortuitous correlation
between central star UV flux and circumstellar extinction (Ciardullo & Jacoby 1999; Ciardullo 2003), or the
contribution of some other PN-like object (Marigo et al. 2004) is unclear. Nevertheless, the insensitivity of

– 8 –
the PNLF cutoff to population age and metallicity makes the feature extremely useful as an extragalactic
standard candle.
To derive M33’s PNLF distance and its formal uncertainty, we followed the procedures of Ciardullo et al.
(1989). We took the analytic form of the PNLF given in equation (2), convolved it with the photometric
error vs. magnitude relation of Table 3, and fit the resultant curve to the data via the method of maximum
likelihood. Since this empirical law assumes a monotonically increasing PNLF at faint magnitudes, we limited
the range of the fit to m5007 < 22.5. In addition, in order to correct for foreground Galactic extinction, we
adopted the DIRBE/IRAS-based reddening value of E(B − V ) = 0.041 (Schlegel, Finkbeiner, & Davis
1998) and used the relation of Cardelli, Clayton, & Mathis (1989) with RV = 3.1 to go from differential to
total λ5007 extinction. Assuming an absolute magnitude for the PNLF cutoff of M∗ = −4.47 (Ciardullo
et al. 2002), the most likely distance to M33 is (m − M)0 = 24.86 (0.94 Mpc) with a formal fitting error of
+0.05/−0.10 mag. When we include the systematic errors associated with the observation’s photometric zero
point (0.03 mag), the filter response curve (0.03 mag), and the Galactic foreground extinction (0.16 E(B−V );
Schlegel, Finkbeiner, & Davis 1998), M33’s most likely PNLF distance modulus becomes (m − M)0 =
24.86+0.07−0.11, or 0.94+0.03
−0.05 Mpc.
Our PNLF distance modulus of (m−M)0 = 24.86+0.07−0.11 is 0.30 mag larger than M33’s Cepheid distance
modulus of 24.56 ± 0.10. If these uncertainties are accurate, then a simple propagation of errors (i.e.,
Bevington 1969) implies that the two measurements are discrepant at the ∼ 2 σ level. There are two possible
explanations for this discrepancy.
The first involves a metallicity dependence in either (or both) of the distance indicators. Thirteen
galaxies have both PNLF and Cepheid distance measurements, and a detailed analysis of these data has been
performed by Ciardullo et al. (2002). Their results are striking: except for the most metal-poor systems, the
distance residuals are perfectly consistent with the internal uncertainties of the methods. Moreover, although
a systematic shift is seen in low-metallicity ([O/H] . −0.5) systems, the offset is exactly that predicted for
the PNLF by Dopita, Jacoby, & Vassiliadis (1992). This agreement leaves little room for further metallicity
corrections in either the PNLF or Cepheid methods.
Nevertheless, since our distance estimate to M33 assumes M∗ = −4.47, it is possible that metallicity
does play a role in the distance discrepancy. However, in order to do so, the mean oxygen abundance of the
PNe in our sample must be ∼ 0.2 dex below that of the Large Magellanic Cloud. The data of Garnett et al.
(1997) show that this is unlikely: only in the outermost regions of the galaxy do the H II region abundances
drop to this level. Moreover, if M∗ were being affected by metallicity, the strong abundance gradient across
the galaxy would cause our measurement of m∗ in M33’s outer disk to be fainter than that of the inner
disk. As Figure 4 demonstrates, this is not observed. In fact, the PNLF cutoff for the sample of PNe with
R > 15′ is marginally brighter than that for the PNe inside this radius (by 0.15±0.17 mag). This constancy
strongly suggests that the low metallicity of M33 is not causing us to overestimate M∗ and the distance to
the galaxy.
As pointed out by Ciardullo et al. (2002), a more likely explanation for M33’s distance discrepancy
involves divergent assumptions about the galaxy’s internal reddening. M33’s Cepheid distance uses an
extinction estimate that is derived from multicolor photometry of the Cepheids themselves (Freedman,
Wilson, & Madore 1991; Freedman et al. 2001), while the PNLF method assumes the DIRBE/IRAS Galactic
value. The difference between these values, E(B − V ) = 0.17, is one of the largest observed for any Cepheid
galaxy. If we were simply to adopt the Cepheid reddening estimate of E(B − V ) = 0.21 (as did Magrini
et al. 2000), or if the internal reddening were reduced to one typical of other Cepheid galaxies, the PNLF

– 9 –
and Cepheid distance indicators would be in much better agreement. Additional support for this hypothesis
comes from the galaxy’s red giant stars. The distance moduli derived by Kim et al. (2002) using the tip of the
red giant branch (24.81± 0.04 (random) ±0.13 (systematic)) and the location of the red clump (24.80± 0.04
(random) ±0.05 (systematic)) are both consistent with the PNLF value.
5. Planetary Nebula Spectroscopy
The radial velocities of M33’s planetary nebulae were measured with the WIYN telescope, the HYDRA
bench spectrograph, and a 600 lines mm−1 grating blazed at 10.◦1 in first order. Most of the PNe were
observed on the photometric nights of 2002 Oct 3-5, with the 2′′ red fiber cable and a telescope-instrument
combination which produced spectra with 2.8 A (168 km s−1) resolution and 1.4 A pixel−1 dispersion over
the wavelength range between 4500 A and 7000 A. The data were taken using six fiber setups, each of
which targeted ∼ 50 PNe with ∼ 5 fibers devoted to the sky. The total exposure time for each setup was
∼ 3.5 hours, and, in order to allow for the removal of cosmic rays and other instrumental artifacts, the
integrations were subdivided into a series of 30 min exposures. To provide a check on the repeatability of the
measurements, ∼ 75% of the PNe were observed multiple times, and 7 PNe, ranging in brightness between
21.0 < m5007 < 25.0 were targeted in four or more setups.
To supplement these data, additional spectra for 24 PN candidates were obtained by R. Chandar and
H. Ford on the nights of 2003 Jan 3-5 using HYDRA’s 3′′ blue fiber cable and a 400 lines mm−1 grating
blazed in first order at 4.◦2. These data, which covered the wavelength range between 3660 A and 6860 A,
had a slightly lower dispersion than the Oct 2002 data (∼ 6 A resolution at 1.56 A pixel−1), but longer
(∼ 5 hr) exposure times partially compensated for this drawback. These Jan 2003 observations yielded three
additional PN velocities, and reduced the measurement errors of 21 other objects.
Data reduction was accomplished with the dohydra task within IRAF. Flat-fielding was performed using
dome flat exposures obtained at the beginning of each night, and wavelength calibrations were found using
a series of CuAr comparison arcs taken before, during, and after the science exposures of each setup. The
solutions derived from these comparison arcs had a rms dispersion of ∼ 0.03 A (∼ 2 km s−1) and were stable
throughout each setup. Next, the spectra were linearized to a common wavelength scale, and sky subtracted
using an average sky spectrum determined from the setup’s sky fibers. Because our observations focussed
on regions of the spectrum well away from any airglow emission, and were performed during dark time at
moderately high (R ∼ 2000) dispersion, the details of this subtraction make very little difference to the final
result. After sky subtraction, the individual exposures of each setup were co-added and shifted into the
barycentric rest frame to produce a single summed spectrum for each object.
PN radial velocities were derived in a two step process. First we obtained an interim velocity for each
PNe using the centroids of the bright emission lines of [O III] λλ4959, 5007, Hα, Hβ, and (when possible)
[N II] λλ6548, 6584. We then used these velocities to create an ultra-high signal-to-noise PN template by
shifting all of the spectra into the rest frame and co-adding the data. Using this template, we then determined
our final PN velocities by cross-correlating the individual spectra against the template spectrum with the
xcsao task of the rvsao package (Kurtz & Mink 1998) of IRAF. Generally speaking, for faint emission-line
objects, velocities derived in this way are slightly more accurate than velocities found from the weighted
average of individual emission-line measurements. In the case of our M33 survey, where most of the PNe
are bright, the improvement to our measurements was marginal. The mean difference between velocities
determined via cross-correlation and those found by the line-centroiding (emsao) task within rvsao was only

– 10 –
+0.15 ± 0.34 km s−1.
At this stage, we verified the internal consistency of our velocity measurements by cross-correlating
the spectra of each individual setup against the template spectrum, and intercomparing the results for the
113 PNe with multiple measurements. Table 5 summarizes the results of this analysis by listing the mean
velocity offset of each setup with respect to the others, and the number of velocity pairs used to derive
these values. From the table, it is clear that systematic setup-to-setup velocity differences are minimal: the
only setup whose offset is not consistent with zero is that of Setup 4, and its velocities are low by only
∼ 2.9 km s−1. Table 5 also lists the standard error between the individual pairs of PN measurements. This
error provides an upper limit to the internal accuracy of our measurements.
Column 10 of Table 2 lists our velocity measurements for M33’s PNe. Column 9 of the table gives the
number of fiber setups employed for each object, excluding the observations of January 2003. Those PNe
targeted in January are identified in Column 13, and their velocities are the weighted mean of the results
from the two observing runs. In total, of the 152 PN candidates identified on our survey frames, 151 were
targeted by WIYN, and 140 were detected via their emission lines. (Of the 11 objects that were not detected,
7 are extremely faint.) Note that the errors quoted in Column 8 are the internal uncertainties of the cross-
correlation technique and do not include any setup-to-setup systematic uncertainty. As demonstrated in
Table 5, such errors are small, . 3 km s−1.
6. The M33 Planetary Nebula Velocity Field
The large scale velocity distribution of M33’s PNe is illustrated in Figure 1. The most obvious feature
displayed in the figure is the galaxy’s rotation. M33 is inclined ∼ 56◦ to the line-of-sight (see Zaritsky,
Elston, & Hill 1989, and references therein), and this inclination is reflected in the radial velocities of the
planetaries. In fact, since M33’s spheroid-to-disk ratio is extremely small, S/D ∼ 0.02 (Bothun 1992; Regan
& Vogel 1994), all but ∼ 2 PNe should be rotating along with the galactic disk.
To explore the dynamics of M33’s PN population, we began by assuming that, in the mean, the system’s
PNe are confined to the disk and move in circular orbits about the galactic nucleus, which is at α(2000) =
1:33:50.915, δ(2000) = +30:39:36.79 (Massey et al. 1996). We then defined the inclination and orientation
of this disk. On average, M33 is inclined i ∼ 56◦ to the line-of-sight and has a major-axis position angle of
θ = 23◦ (Kent 1987; Zaritsky, Elston, & Hill 1989); these values are consistent with the isophotal contours
of the inner parts of the galaxy (Kent 1987), as well as the kinematics of the system’s H II regions (Zaritsky,
Elston, & Hill 1989). However, such a model is probably too simplistic. The kinematics of M33’s H I
gas demonstrates the presence of a significant warp in the galaxy’s outer regions (Rogstad, Wright, &
Lockhart 1976; Corbelli & Schneider 1997; Corbelli & Salucci 2000). This warping is also confirmed by the
asymmetrical shape of the galaxy’s spiral arms (Sandage & Humphreys 1980). To include this effect, we
therefore adopted the model of Corbelli & Salucci (2000), in which the inclination and position angle of
M33’s disk varies with galactocentric distance. Fortunately, our analysis depends very little on the details
of this assumption: over the inner ∼ 30′ of the galaxy (i.e., over most of our survey region), the difference
between the Corbelli & Salucci (2000) model and the simple i = 56◦ θ = 23◦ geometry is slight (no more
than 4◦ in inclination and 5◦ in position angle). Nevertheless, since M33’s warp does become important
outside this range, and since a few of our PNe do have large isophotal radii, we prefer this approach over
the less sophisticated flat-disk assumption.
After defining M33’s inclination and position angle, we deprojected the position of each PN to determine
– 11 –
its galactocentric radius (R) and position angle with respect to the galaxy’s major axis (φ). The rotation
speeds of the PNe, V∗, were then inferred from the line-of-sight radial velocities, Vrad, via
V∗ =(Vrad − Vsys)
sin i cosφ(5)
For the systematic velocity, we used Vsys = −180 km s−1; this value is based on both radio (de Vaucouleurs
et al. 1991) and optical (Huchra, Vogeley, & Geller 1999) observations of the galaxy, and is comfortably close
to the mean radial velocity of 〈Vrad〉 = −176 km s−1 found from the PNe of this study.
The top panel of Figure 7 compares our PN rotational velocities with the rotation curve of M33’s atomic
(H I) and molecular (CO) gas (Corbelli 2003). All objects except 14 PNe within 10◦ of the minor axis have
been plotted. Overall, the agreement is quite good. The data display some amount of scatter, but this is
due to the peculiar radial, tangential, and vertical velocities of the PNe. When these non-circular motions
are amplified by the cosφ division, the result is the dispersion seen in the figure. Also apparent is the small,
but significant, offset between the mean circular velocity of the PNe and the rotation speed of the gas. The
bottom panel of the figure shows this offset more clearly by binning the data by galactocentric radius with
18 objects per bin. The amplitude of the velocity lag, or asymmetric drift, is ∼ 10 km s−1, less than half the
drift velocity observed for old-disk stars in the vicinity of the Sun (Ratnatunga & Upgren 1997; Dehnen &
Binney 1998). However, since the ratio of M33’s drift speed to rotation velocity is approximately the same
as that for the solar neighborhood, our measurement suggests that the dynamical state of M33’s disk is not
too dissimilar to that of the Milky Way. We will return to the issue of asymmetric drift in Section 7, where
we use it to help constrain the shape of the system’s velocity ellipsoid.
Another way to examine the motion of M33’s PNe is to plot their line-of-sight velocities after removing
the contribution of the rotating stellar disk (defined as the H I + CO gas velocity minus the asymmetric
drift). This is done in Figure 8; the top panel of the figure shows the individual PN velocities, while the
lower panel bins the velocities to show the line-of-sight velocity dispersion. The figure again demonstrates
that the non-circular motions of the PNe are significant, with σrad ∼ 25 km s−1. This is more than twice
the 9± 4 km s−1 dispersion found for the galaxy’s H II regions (Brandt 1965; Zaritsky, Elston, & Hill 1989).
In addition, our innermost measurement of σrad = 22+5−3 km s−1 is very close to the galaxy’s central value
of 24.0 ± 1.2 km s−1 found from absorption line spectroscopy (Gebhardt et al. 2001). Since M33 shows no
dynamical evidence for a central black hole or mass concentration, this agreement confirms that we are,
indeed, measuring a velocity dispersion that is representative of old disk stars.
Figure 8 also supports our contention that there are very few non-disk PNe in our sample. Of the
140 PNe surveyed, only two objects, PN 67 and PN 24, have velocities that are more than 2.3 σ from the
galactic rotation. These planetaries, which deviate by 2.8 and 3.0 σ respectively, may possibly belong to
M33’s spheroidal component. On the other hand, in a normally distributed population of 140 PNe, we
should expect to find ∼ 2 objects with velocities more than ∼ 2.5 σ away from the mean. Thus, it is possible
that none of our PNe belong to M33’s halo, and all are rotating along with the disk. This confirms the
photometric results of Bothun (1992), Regan & Vogel (1994), and Tiede, Sarajedini, & Barker (2004) that
M33’s spheroidal component is negligible compared to its disk.
The most surprising aspect of Figure 8 is how little the line-of-sight velocity dispersion depends on
galactocentric distance. In the K-band, where internal extinction presumably is unimportant, M33’s disk
scale length is ∼ 5.′8 (Regan & Vogel 1994). Our observations, which extend out to a distance of 34′,
therefore sample ∼ 6 scale lengths of the galaxy. If M33’s disk is isothermal, then the galaxy’s vertical
velocity dispersion should decline significantly over this range. Specifically, if z0 is the scale height of the

– 12 –
planetaries and Σ the disk-mass surface density, then under the isothermal disk approximation
σ2z(R) = πGΣ(R)z0 (6)
Since M33’s stellar and gas surface density both decline exponentially (Guidoni, Messi, & Natali 1981; Regan
& Vogel 1994; Corbelli 2003), it is reasonable to expect Σ, and therefore σ2z , to do the same. Unless the
shape of the galaxy’s velocity ellipsoid changes dramatically, or M33’s disk is significantly flared, σrad should
decrease by more than a factor of 20 over our survey region. Figure 8 clearly demonstrates that it does not.
7. Modeling the Velocity Ellipsoid
Because the disk of M33 is inclined ∼ 56◦ to the line-of-sight, peculiar stellar motions in the radial (σR),
tangential (σφ), and vertical (σz) directions all contribute to the scatter seen in Figure 8. Specifically, the
line-of-sight velocity dispersion is related to the galaxy’s velocity ellipsoid through
σ2rad = σ2
R sin2 φ sin2 i + σ2φ cos2 φ sin2 i + σ2
z cos2 i (7)
Consequently, in order to interpret the figure, the shape of M33’s velocity ellipsoid needs to be constrained.
To do this, we began by using the epicyclic approximation to write σφ in terms of σR
σ2φ = σ2
R
(
1
2+
1
2
∂ lnVc
∂ lnR
)
(8)
(Binney & Tremaine 1987), where the circular rotation velocity, Vc, is known from the motion of the system’s
H I gas. We then parameterized equation (7) in terms of the two remaining unknowns, σz and σR, and,
for each radial bin, we computed the relative probability of observing the given set of PN velocities as a
function of these two variables. Once these probabilities were established, we normalized their values to one
to generate the likelihood of each solution.
Note that this type of calculation requires that limits be placed on the variables, so that outside the
range of analysis, the probability of a solution is identically zero. For σz , our analysis included all values
between 0 < σz < 100 km s−1; given the ∼ 100 km s−1 rotation speed of the galaxy, the true value of σz
certainly falls within this range. Our choice of limits for σR was more difficult. In the vicinity of the Sun,
the ratio of the vertical to radial velocity dispersion for old disk stars is σz/σR ∼ 0.5 (Bienayme 1999), and
surveys of other spirals consistently find ratios in the range 0.3 < σz/σR < 0.9 (e.g., Gerssen, Kuijken, &
Merrifield 1997, 2000; Bottema 1993; van der Kruit & de Grijs 1999). Unfortunately, almost all these data
are for stars between ∼ 1 and ∼ 2 disk scale lengths from the galactic center: there are no measurements
of σR or σz over the entire range of radii considered in this paper. Thus, our only guidance on the shape
of M33’s velocity ellipsoid comes from numerical simulations. According to the models of Villumsen (1985)
and Jenkins & Binney (1990), disk heating by molecular clouds and spiral structure should drive an initially
isotropic velocity dispersion towards values of σz/σR as low as ∼ 0.4. For a lower limit on σR, we can therefore
demand that σR > σz . For the upper limit on this quantity, we can use the requirement that M33’s disk be
stable against buckling instabilities, which occur when σz/σR . 0.3 (Toomre 1966; Araki 1985; Merritt &
Sellwood 1994). To be slightly conservative, we therefore limited our analysis to 0.25 < σz/σR < 1.0.
Figure 9 displays the likelihood contours produced by our data. As is obvious from the figure, σR
is better constrained than σz . This is understandable: not only did our boundary conditions ensure that
σR > σz, but the former variable also receives the contribution of σφ, via the epicyclic approximation. As a

– 13 –
result, the line-of-sight velocity dispersion largely reflects the behavior of σR; our limits on σz come primarily
from the constraints placed on the shape of the velocity ellipsoid, and secondarily from the fits.
The more important property shown in Figure 9 is the absence of an obvious radial gradient. There
is very little difference between the fits for PNe near the center of M33 and PNe at & 4 disk scale lengths.
If the shape of the galaxy’s velocity ellipsoid is roughly constant with radius, then the data imply that σz
must also be very nearly constant. On the other hand, if the vertical velocity dispersion truly declines with
radius (as it must in a constant mass-to-light ratio disk), the dispersion ratio σz/σR must also decline.
To make further progress, we can apply two additional constraints to our data. The first is the require-
ment that M33’s disk be stable. According to Toomre (1964), in order for a thin stellar disk to be stable
against axisymmetric perturbations, its radial velocity dispersion must satisfy the condition
σR >3.36 G Σ
κ(9)
where the epicyclic frequency, κ, is obtainable from the rotation curve via
κ =Vc
R
(
2 + 2∂ lnVc
∂ lnR
)1/2
(10)
(Binney & Tremaine 1987). In addition, for stability against non-axisymmetric perturbations (i.e., bar
formation), the disk must also satisfy the (slightly more stringent) condition
σR >3.36 G Σ
κ·2Vc
R κ(11)
(Morosov 1980, 1981a,b). If we combine this equation with the isothermal disk approximation given by
equation (6), we obtain a constraining relationship between the vertical and radial velocity dispersions
σz < κ
(
πz0R σR
6.72 Vc
)1/2
(12)
To use this relation, we need to know z0, the scale height of PNe in M33’s disk. Our probability contours
of Figure 9, in combination with the buckling instability condition, allow us to exclude values of z0 . 90 pc
in M33’s outer regions (R > 6 kpc). To improve upon this number, however, we must turn to other galaxies.
In the Milky Way, measurements of z0 are notoriously uncertain, with published values ranging all the way
from 90 pc to 300 pc (e.g., Pottasch 1984; Maciel 1989; Zijlstra & Pottasch 1991; Corradi & Schwarz 1995;
Phillips 2003). Unfortunately, in other galaxies the situation is worse: internal extinction in the planes of
edge-on galaxies make reliable measurements of the PN distribution nearly impossible (see Ciardullo, Jacoby,
& Harris 1991; Jacoby, Ciardullo, & Harris 1996). For lack of a better alternative, we were therefore forced
to adopt an intermediate value of z0 ∼ 175 pc as the most-likely scale height of our test particles. This value
has two justifications. First, a Milky Way scale height of z0 ∼ 175 pc implies a vertical PN distribution
similar to that of Galactic main-sequence F-stars (Mihalas & Binney 1981) and a total PN population that
is consistent with PN observations in other galaxies (Peimbert 1993). Second, Bizyaev & Mitronova (2002)
have found a correlation between the infrared (Ks) central surface brightness of a galaxy and the ratio
between the galaxy’s vertical and radial scale lengths. If one applies this relation to M33 (Regan & Vogel
1994) and normalizes the result using the ratio of our Galaxy’s PN scale height to the total “old thin disk”
scale height (Chen et al. 2001), then z0 again becomes ∼ 175 pc. Obviously, this value carries a substantial
uncertainty of at least ∼ 25%.

– 14 –
We note that, in theory, the scale height of a galactic disk may change with radius. If it does, then
the effect of the stability criterion will also have a radial dependence. In practice, however, this is not of
great concern. Numerous studies of late-type edge-on spirals in the optical and infrared (e.g., van der Kruit
& Searle 1982; Shaw & Gilmore 1990; de Grijs & van der Kruit 1996; de Grijs & Peletier 1997; Fry et al.
1999; Bizyaev & Mitronova 2002) have found that radial variations in the vertical scale heights of stars are
always small, . 10%. This is true even when the galaxies are tidally interacting: a study by Schwarzkopf &
Dettmar (2001) shows that the fractional variation of z0 in disturbed edge-on systems is typically less than
14%. Thus, even if M33’s disk is warped at large radii, our assumption of a constant value for the scale
height should be acceptable.
The solid lines of Figure 9 show the effect the stability requirement has on our probability contours. In
the inner regions of the galaxy, the requirement is satisfied almost everywhere: virtually all the solutions lie
below the stability cutoff. However, at large radii, the criterion severely limits the allowable values for the
vertical velocity dispersion. Such an effect is unavoidable: if M33’s disk is stable and isothermal, then the
vertical velocity dispersion at large distances from the nucleus must be small.
Figure 10 applies the stability criterion and marginalizes Figure 9’s remaining probability contours over
the parameters σR (the middle panel) and σz (the lower panel). The top panel of the figure shows the
behavior of σz if one asserts that M33’s stellar disk is at the limit of stability; this solution also represents
the largest values of σz possible under the isothermal disk approximation. In the figure, we have illustrated
the shapes of the non-Gaussian errors via the widths of the shaded areas. The figure contains several features
of note.
First, as anticipated, the requirement of stability produces a radial gradient in the vertical velocity
dispersion. Remarkably, this gradient is much shallower than that expected from a constant mass-to-light
ratio disk. In the V -band, M33’s disk scale length is ∼ 9.′1 (Guidoni, Messi, & Natali 1981); in the infrared,
where the effects of extinction gradients are less, the scale length shrinks to ∼ 5.′8 (Regan & Vogel 1994).
Our kinematic measurements imply a physical scale length for M33’s disk that is ∼ 13′ or ∼ 3.5 kpc. This
scale length does not change much, even if one requires that the disk be pressing the limits of stability.
The other notable feature of Figure 10 is the behavior of the radial component of M33’s velocity ellipsoid.
Outside of ∼ 2.5 kpc, σR declines with a scale length that is more than 3 times greater than that of the
galaxy’s optical light; this is slightly larger than the scale length one would expect from the survey data of
Bottema (1993), but not exceptionally so. However, inside of ∼ 2.5 kpc, σR levels off, and may even decline
at small galactocentric radii. Although such behavior is not common, neither is it unique: the line-of-sight
velocity dispersions of NGC 3198 and NGC 6503 suggest that these galaxies also have low central values of
σR (Bottema 1993).
The turnover of M33’s radial velocity dispersion is most likely a manifestation of the requirement that
σR be much less than the galaxy’s rotation speed. M33’s rotation velocity increases from zero near the
galactic center to ∼ 90 km s−1 at ∼ 3 kpc. If σR did not turn over, it would dominate galactic rotation
within ∼ 1.5 kpc of the nucleus, and the result would be a “hot” stellar population in the galaxy’s central
regions. If such a population exists in M33, it is extremely weak (Bothun 1992; Regan & Vogel 1994).
The turnover of the radial velocity dispersion explains why the system’s line-of-sight dispersion is so
flat: the increase in σz near the center of the galaxy is offset by the decline in σR. This flattening, however,
does not affect the large scale trend in the dispersion ratio. In the interior of the galaxy, σz/σR ∼ 0.6; by
∼ 9 kpc, the ratio has dropped to . 0.4. This range of values is consistent with the numerical models of
disk heating computed by Villumsen (1985) and Jenkins & Binney (1990). More importantly, our inferred
– 15 –
σz/σR gradient agrees with the analytic results of Carlberg (1987), who showed that the velocity ellipsoid of
a disk must become rounder as the stellar velocity dispersion increases. Our recovery of this result supports
the validity of our σz-σR decomposition.
There is one more constraint that can be applied to M33’s stellar kinematics. From the Jean’s equation,
the rotational velocity of stars in a stellar disk is related to the circular velocity of the system’s gas by
V 2c − 〈V∗〉
2 = σ2R
(
σ2φ
σ2R
− 2∂ lnσR
∂ lnR−
∂ ln ν
∂ lnR− 1
)
− R∂σRz
∂z−
R
ν
∂ν
∂z(13)
where ν is the stellar density (Binney & Tremaine 1987). If we use the epicyclic approximation, and assume
that M33’s PNe are scattered throughout a constant scale height isothermal disk, then this equation for
asymmetric drift simplifies to
V 2c − 〈V∗〉
2 ≃ σ2R
(
1
2
∂ lnVc
∂ lnR− 2
∂ lnσR
∂ lnR− 2
∂ lnσz
∂ lnR−
1
2
)
(14)
This equation, when combined with a model for the radial dependence of σz and σR, places a further
constraint on M33’s galactic kinematics.
Based on the galaxy’s luminosity profile and the data displayed in Figure 10, it is reasonable to param-
eterize the radial dependence of M33’s vertical velocity dispersion with a simple exponential of scale length
Rz. An exponential function with scale length RR can also be used to fit the galaxy’s radial velocity disper-
sion, as long as the measurements are restricted to galactocentric distances greater than ∼ 2.5 kpc. Inside
this radius, however, the exponential law breaks down, and the form of the σR vs. R relation is unknown.
Rather than guess the radial dependence of σR in M33’s inner regions, we elected instead to exclude
from the analysis all measurements of σR and asymmetric drift within 2.5 kpc of the nucleus. This allowed
us to parameterize the radial dependence of both σz and σR with exponentials and re-write (14) as
V 2c − 〈V∗〉
2 ≃ σ2R
(
2R
Rz+
2R
RR−
1
2+
1
2
∂ lnVc
∂ lnR
)
(15)
Using this equation, we simultaneously solved for the values of Rz , RR, σR(R = 0), and σz(R = 0) which
best fit both the velocity dispersions of Figure 10 and the asymmetric drift data of Figure 7. To perform
this fit, we minimized the χ2-like statistic
χ2 = −2∑
i
ln
{
P (yi)
P (ym)
}
(16)
where P (yi) is the probability of observing value yi from a probability distribution P , and P (ym) is the
probability of observing the most-likely value. This statistic, which reduces to the standard χ2 value for
normally distributed errors, enabled us to consider the non-Gaussian uncertainties associated with σR and
σz , and the asymmetric drift errors in a consistent manner. It also permitted us to estimate the uncertainties
in our scale lengths via a modified jackknife analysis. In this procedure, we repeatedly removed one planetary
nebula at random from each of the bins, and re-fit the data. When analyzed in this way, the best fit scale
length for σ2z became 13.′5 (with 90% of the simulations lying between 12.′2 and 14.′9), and the most likely
value for the scale length of σR was 33.′5 (with 90% of the simulations between 30.′5 and 38.′6). The results
do not change much if one forces the disk to marginal stability: under this condition, the derived scale length
of σ2z declines by less than ∼ 5%. Once again, these scale lengths are significantly larger than the 5.′8 value
found from K-band photometry. In fact, our 3 σ limits on M33’s dynamical scale length lie between 10.′8

– 16 –
and 16.′0, and none of our 20,000 simulations produced a scale length as low as the galaxy’s optical scale
length of 9.′1. Our best fit solution is illustrated in Figures 7b and 10 by dotted lines.
If the disk of M33 is indeed isothermal, then we can substitute the vertical velocity dispersions of
Figure 10 into equation (6) to produce estimates for the galaxy’s disk mass surface density. These densities
can then be combined with optical (Guidoni, Messi, & Natali 1981) and infrared (Regan & Vogel 1994)
surface photometry to generate values for the total disk mass-to-light ratio. Finally, we can remove the
contribution of M33’s interstellar medium from the mass-to-light values by subtracting the surface mass
density of galactic H I and H2 gas (Heyer et al. 2004) from the total mass density, and applying a first-
order correction for internal extinction, using the central extinction value (AV = 0.9 mag) and extinction
scale length (∼ 10.′2) derived by Regan & Vogel (1994). These mass estimates and mass-to-light ratios are
presented in Table 6.
The errors quoted in Table 6 reflect only the formal uncertainties associated with our measurement
of σz ; not included are the systematic errors associated with our adopted value of z0 and the use of the
isothermal disk approximation. The former uncertainty is small: a 25% increase in the PN scale height
(from 175 pc to 220 pc) results in only a ∼ 5% decrease in the derived values for M33’s disk mass surface
density and scale length.
The error associated with the isothermal disk approximation is slightly more formidable. Overall, the
isothermal approximation provides an adequate fit to the vertical structure of edge-on spirals (van der Kruit
& Searle 1982) and the stellar kinematics of the solar neighborhood (e.g., Wielen 1977). However, near the
galactic plane, the approximation breaks down: the stellar density distribution is more sharply peaked than
the isothermal model would predict (Fuchs & Wielen 1987; de Grijs & van der Kruit 1996). This has led
van der Kruit (1988) to consider a family of alternative models, which have isothermal (sech2(z/z0)) and
exponential (exp(−z/ze)) spatial distributions as their limiting cases. According to these models, M33’s
surface mass can be up to 33% larger than that derived using the simple isothermal assumption.
The final systematic uncertainty that is not included in Table 6 is one that affects our mass-to-light ratio
measurements in M33’s outer regions. Reliable optical and infrared surface photometry exist only for M33’s
inner ∼ 20′; outside of this region, one must extrapolate the galaxy’s surface brightness from its measured
scale length. The length of this extrapolation is significant, so a small error in scale length propagates into a
large error in M/L. Moreover, if M33’s disk is truncated (e.g., Kregel, van der Kruit, & de Grijs 2002), or if
a small amount of excess luminosity is left over from a tidal interaction, then the derived mass-to-light ratios
will be seriously in error. In fact, the extrapolated V − K color for the outer disk of M33 is not consistent
of any population synthesis model (e.g., Maraston 1998). Given the uncertainties associated with infrared
photometry, our anomalously large values for M/LK in the outer disk of the galaxy are almost certainly due
to errors in the extrapolated K-band surface photometry.
8. The Scale Length of M33’s Disk
Our value for M33’s disk scale length is more than twice that of the galaxy’s infrared light, and 1.5 times
that of the galaxy’s V light. This discrepancy implies a gradient in the galaxy’s disk mass-to-light ratio.
Specifically, our observations imply that M33’s disk M/L slowly increases with radius. Part of this increase
is due to the growing contribution of M33’s interstellar medium, which has a density distribution that is
much flatter than that of the stars (Heyer et al. 2004). However, even when this component is taken into
account, a positive gradient the disk mass-to-light ratio remains. The sign of this gradient runs contrary to

– 17 –
expectations: in most models of galaxy formation, it is the inner regions of a galaxy that form first, and
contain the older, higher mass-to-light ratio stars (e.g., Eggen, Lynden-Bell, & Sandage 1962; Searle & Zinn
1978; Fall & Efstathiou 1980; Steinmetz & Muller 1994). Moreover, multi-color imaging (Bell & de Jong
2000) and Hα surface photometry (Ryder & Dopita 1994) tend to support this picture: most disks appear to
possess significant age gradients that are consistent with the inside-out scenario. Thus, we must consider the
possibility that our mass measurements are biased. In fact, there are several effects which could conceivably
introduce a systematic error into our estimates of σz . If any of these exist, then our value for the galaxy’s
kinematic scale length could be in error.
The first possible bias comes from contamination by emission-line objects that are not planetary nebulae.
In M33, H II regions and supernova remnants far outnumber planetary nebulae, and, as Population I objects,
their velocity dispersions are significantly less than that of the PNe (e.g., Zaritsky, Elston, & Hill 1989). If
the fraction of contaminants is higher near the center of M33 than it is at large radii, then a systematic error
in the scale length will be the result. Some support for this hypothesis comes from the image quality of the
[O III] λ5007 frame of M33’s central field: the seeing on that image (1.′′05) is the poorest of any frame in the
Massey et al. (2002) survey.
Still, for all the reasons detailed in Section 2, contamination is unlikely to be a significant problem in
our survey. All of our PN candidates were detected both in [O III] λ5007 and in Hα, and the excellent seeing
on the latter image (and on the broadband V frame) should have excluded virtually all H II regions from
our sample. Similarly, given the survey’s image quality, and the intrinsic ratio of PNe to supernovae, it is
difficult to envision how the fraction of faint compact supernova remnants could be large enough to cause a
systematic error in Rz. At worst, contamination should cause only a slightly underestimate in σz throughout
the galaxy.
A second possible explanation for the large kinematic scale length involves a selection effect. The inner
regions of M33 are quite dusty, with internal extinction values of AV ∼ 1 mag (Israel & Kennicutt 1980;
Berkhuijsen 1983; Regan & Vogel 1994; Petersen & Gammelgaard 1997). Consequently, PN surveys in this
area are biased against objects in, and on the far side of the galactic plane. Under the isothermal disk
approximation, this bias is irrelevant, since the velocity dispersion of such a disk is independent of galactic
latitude. However, high above the plane, where the stellar orbits reach turn-around, the approximation must
break down. If most of the PNe in our sample are high latitude objects, then it is possible that our PN
velocities are not representative of the true kinematic structure of the disk.
Since M33’s internal extinction declines rapidly with radius (Israel & Kennicutt 1980; Berkhuijsen 1983;
Regan & Vogel 1994; Petersen & Gammelgaard 1997), the above selection effect has the potential for creating
an artificial gradient in σz. However, the effect goes in the wrong direction. If extinction is to produce an
overestimate of the disk’s kinematic scale length, the PNe at high galactic latitude must have a lower
dispersion that those near the plane. Yet models developed to fit the luminosity profiles of edge-on galaxies
all have vertical velocity dispersions that increase with galactic latitude (van der Kruit 1988). So while
internal extinction may indeed be censoring our data, the effect cannot produce the observed discrepancy.
A third way of explaining our large value of Rz involves our basic assumptions about the kinematics of
M33’s disk and the stability criteria. As Figure 9 demonstrates, the PN velocities, by themselves, do not fix
σz . Instead, it is the velocity dispersion measurements, in combination with the requirements of dynamic
stability, that produce the galaxy’s dispersion gradient. If our warped-disk model for M33 is incorrect, or if
the stability criteria have an additional radial dependence, or if the isothermal approximation breaks down
at large radii, then an error in the scale length could be the result.

– 18 –
The first of these possibilities can quickly be excluded: in the area covered by our survey, the effects
of M33’s warp are minimal. In fact, if we were to model the galaxy using a simple flat-disk geometry, the
derived kinematic scale length of the system would increase by ∼ 10%.
The latter two uncertainties are more difficult to assess. Certainly, the stability criterion given by (11)
is only an approximation, as it assumes spiral-arm pitch angles that are close to zero, and neglects (among
other things) the thickness of the disk and the existence of gaseous sub-systems. Nevertheless, numerical
experiments suggest that the formulation is approximately correct (e.g., Griv et al. 1999; Khoperskov, Zasov,
& Tyurina 2003). Similarly, though the limit on σz/σR from the buckling (or fire-hose) instability is not
precisely known, the numerical experiments to date all indicate that a dispersion ratio of ∼ 0.3 is reasonable
(Araki 1985; Merritt & Sellwood 1994; Sellwood 1996). Finally, though one expects the isothermal approxi-
mation to become less accurate at large radii (due to the longer timescales for stellar interactions), surface
photometry of edge-on spirals suggests otherwise (e.g., van der Kruit & Searle 1982; Fry et al. 1999; Bizyaev
& Mitronova 2002).
The final way of creating an artificial gradient in M33’s disk mass-to-light ratio is through the introduc-
tion of a radial gradient in the PN scale height. Our measurement of the disk scale length assumes that z0 is
constant throughout the galaxy, and, for disks in general, this is a good assumption (e.g., Shaw & Gilmore
1990; de Grijs & van der Kruit 1996; de Grijs & Peletier 1997). However, our analysis also assumes that
PNe belong to the thin disk system and that the PN scale height does not change with radius.
The former assumption is certainly valid. Although deep observations of edge-on galaxies often reveal
the existence of red “thick disk” envelopes (e.g., Dalcanton & Bernstein 2002), the amount of luminosity
in this component is small enough so that thick disk PNe should be exceedingly rare. PN surveys of the
edge-on spirals NGC 891 (Ciardullo, Jacoby, & Harris 1991) and NGC 4565 (Jacoby, Ciardullo, & Harris
1996) confirm this fact: very few objects are found in the thick disk region. Still, within the thin disk,
the scale height of PNe could still change. For example, in the solar neighborhood, the vertical velocity
dispersion of a stellar population is roughly proportional to the square root of the population’s age (e.g.,
Wielen 1977; Jahreiß & Wielen 1983). Since planetary nebulae are derived from a mix of populations with
turnoff masses between 1M⊙ . M . 5M⊙, their dispersion is a weighted average over the age range which
corresponds to these masses, i.e., from t1 ∼ 1010 yr to t2 ∼ 108 yr. In other words,
〈σ2z〉 =
∫ t2
t1
Φ(t)dN
dmtn
dmtn
dtσ2
z(t) dt (17)
where Φ(t) is the region’s star formation rate history, and mtn is the main-sequence turnoff mass of a
population with age t. Since velocity dispersion is related to scale height via equation (6), this means that a
gradient in a galaxy’s star-formation rate history can produce an artificial gradient in the PN scale height.
Figure 11 quantifies this effect for the case where Φ declines exponentially with scale time τ . In late-type
spirals such as M33, the evidence suggests that the rate of star formation has been roughly constant over a
Hubble time (Kennicutt, Tamblyn, & Congdon 1994). If this is the case, then τ ≫ 1, and the dependence of
σz on Φ is weak. Nevertheless, if the star-formation rate history of M33’s inner disk is substantially different
from that of its outer disk, a systematic error in our mass determinations may be the result.
Unfortunately, the effect shown in Figure 11 is much too small to explain M33’s large kinematic scale
length: in order to be consistent with a constant M/LV disk, the scale height of M33’s PNe would have
to change by almost an order of magnitude, from & 500 pc near the galactic center, to . 100 pc at 8 kpc.
Not only is this many times greater than what can be achieved by changing the galaxy’s star formation
rate history, but the direction of the effect is wrong. If the stars of M33’s interior are systematically older

– 19 –
than the stars of the outer disk (as might be expected from an inside-out galaxy formation scenario), then
our assumption of a constant z0 would produce an overestimate of the surface mass in the inner regions of
the galaxy, and an underestimate of surface mass in the outer disk. This would cause us to underestimate
the scale length of the system. Moreover, the discrepancy between the galaxy’s photometric and dynamical
scale lengths would be exacerbated by the reaction of the system’s infrared light to such a gradient. While
the K-band is far superior to the optical when in comes to viewing stellar luminosity through the veil of
interstellar extinction, it is not immune from population effects. Just as the OB stars of present day star
formation distort surface brightness measurements made in B, red supergiants left over from star-formation
of the recent past contaminate data taken in K. Although photometric enhancements in the infrared are
less than those in the optical, they are still substantial (Regan & Vogel 1994), and if the interior regions of
M33 are older than the stars of the outer disk, the galaxy’s IR luminosity profile will appear more diffuse
that the mass. This is the opposite of what is seen.
We note that, in principle, the question of M33’s star formation history can be answered via planetary
nebula spectrophotometry. Kaler & Jacoby (1990) have shown that the ratio of nitrogen to oxygen in a
planetary nebula correlates with its core mass: objects with Mc < 0.65M⊙ have N/O ∼ 0.2, while higher
mass objects have 1 . N/O . 2. Consequently, this discontinuity, which is most likely caused by dredge-
up in AGB stars with M & 3M⊙ (Iben & Renzini 1983), can be used to identify the PNe of high mass
progenitors. Furthermore, Dopita et al. (1997) have shown that one can estimate PN central star masses
directly by using deep spectrophotometry to locate the stars on the HR diagram, and then comparing their
locations to post-AGB evolutionary models. This technique, when combined with an initial-mass final-mass
relation (i.e., Weidemann 2000), can allow us to trace the star-formation history of different parts of M33’s
disk, and test for the presence of age gradients in the PN sample.
9. M33’s Disk and Halo
There have been numerous efforts to probe the radial distribution of M33’s dark halo via the shape of
the galaxy’s rotation curve (e.g., Giraud 2000; Corbelli & Salucci 2000; Corbelli 2003). However, these efforts
have all been limited by the unknown mass-to-light ratio of the galaxy’s disk. The disk-mass estimates of
Table 6 provide a new constraint on M33’s mass distribution, and help break the disk-halo degeneracy.
To demonstrate this constraint, we began by fitting a smooth Brandt (1960) curve to the H I and CO
rotation measurements of Corbelli (2003). We then used our mass model to infer a rotation curve of the disk
alone. The radial profile of the dark halo was then estimated by simply differencing the two components.
Figure 12 illustrates this disk-halo decomposition.
From the rotation curves of Figure 12 and the mass-to-light ratios of Table 6, it is clear that there is
very little dark matter in M33’s central regions. Based on our PN velocity dispersion measurements, the
disk mass-to-light ratios for M33’s central ∼ 2 kpc are M/LK ∼ 0.2 and M/LV ∼ 0.3. Both these values are
close to those predicted for stellar populations dominated by young (τ ∼ 150 Myr old) stars (Maraston 1998;
Bell & de Jong 2001). More importantly, these numbers are statistically identical to those obtained using
the galaxy’s H I and CO rotation curve, and are also similar to the central mass-to-light ratios derived from
the rotation curves of other spirals (e.g., Moriondo, Giovanardi, & Hunt 1998). This consistency implies
that the constant mass-to-light approach of “maximal disk” models is tenable, at least in the inner regions
of galaxies.
Outside of ∼ 2 kpc, M33’s disk mass-to-light ratio exhibits a small, but distinct gradient, going from

– 20 –
M/LV ∼ 0.3 at ∼ 2 kpc to M/LV ∼ 1.5 at ∼ 8.5 kpc. Since this appears to be in conflict with the inside-out
model of galaxy formation, one possible explanation is the presence of dark matter associated with M33’s
disk. Indeed, M33’s disk-mass alone produces a rotation curve that is more-or-less flat with radius.
Another explanation is the increasing importance of M33’s gaseous disk. The surface density of M33’s gas
declines more slowly than that of galaxy’s optical light (Regan & Vogel 1994; Corbelli 2003). Consequently,
at large radii, this component can be expected to dominate the disk’s mass budget. However, as summarized
in Table 6, the radius where this occurs lies significantly outside the region of our survey. Even in our
outermost bin, M33’s interstellar medium comprises only ∼ 25% of the disk mass.
One final explanation for the behavior of M33’s disk mass-to-light ratio lies in the vigorous star for-
mation occurring in M33’s inner regions. It is entirely possible that, near the center of the galaxy, the
mass contributed by the region’s older, higher mass-to-light ratio populations is being overwhelmed by the
luminosity of present-day stars. Evidence for this possibility comes from the results of Corbelli (2003) and
Heyer et al. (2004), who demonstrate that star formation rate of M33’s disk has a steeper radial dependence
than the galaxy’s V -light.
Whatever the reason for M33’s increasing disk mass-to-light ratio, the fact that the galaxy’s disk mass-
to-light ratios are consistent with those expected from young stellar populations strongly suggests that dark
matter is not an important constituent of the disk. Models, such as the molecular gas hypothesis of Pfenniger,
Combes, & Martinet (1994), are certainly ruled out.
Our analysis is based on the velocities of only 140 PNe, so the spatial resolution of our measurements
is poor. However, if we assume that M33’s disk has an exponential profile, and that our surface mass
densities are accurate, then we can use our disk/halo decomposition to place limits on the radial profile
of the galaxy’s dark matter. According to Cold Dark Matter models of galaxy formation, systems such as
M33 should contain “cusps” of dark matter at their center, with power-law density profiles in the range
−1 > α > −1.5, where ρh ∝ rα (e.g., Navarro, Frenk, & White 1996; Moore et al. 1998; Dave et al. 2001;
Klypin et al. 2001; Power et al. 2003). As is illustrated in the lower panel of Figure 12, our central slope is
much shallower than this, with α & −0.5. This result is robust: if we alter the PN scale height by 50%, or
change the disk scale length by 25%, or increase the total disk mass 33% (either by adopting an exponential
law for the disk’s vertical profile, or by changing the central value of σz), the slope of M33’s dark matter core
remains low. The result also agrees with the conclusions of Corbelli (2003), who ruled out the presence of a
steep dark matter core in M33 on the basis of the galaxy’s rotation curve, and the assumption of a constant
(K-band) mass-to-light ratio disk. Our analysis removes the latter assumption, but is otherwise similar.
If our analysis is correct, then M33 is another example of a galaxy whose interior dark matter profile
is flat. High resolution rotation curves now exist for a large number of low-luminosity and low-surface
brightness spirals and dwarfs, and every one is consistent with a value of α > −1 (e.g., Borriello & Salucci
2001; Swaters et al. 2003). It is still unclear whether this shallow a slope is a critical problem for the Cold
Dark Matter paradigm (de Blok, Bosma, & McGaugh 2003), or whether the discrepancy can be explained
by the limitations in the measurements or the models (Swaters et al. 2003; Spekkens, & Giovanelli 2003).
Nevertheless, M33 appears to be another example this problem.
Outside of ∼ 1 kpc, our analysis suggests that M33’s dark matter halo obeys the inverse-square law
density dependence that is expected from isothermal and Navarro, Frenk, & White (1996) distributions.
Because the dynamical scale length of the disk is larger than the photometric scale length, the system’s total
disk mass is larger than that expected from the maximal disk hypothesis. Within a radius of 10 kpc, our
velocity dispersion measurements yield a disk mass ∼ 9.1 × 10⁹M⊙. This is ∼ 2.5 times larger than one

– 21 –
would obtain using V -band surface photometry and the maximum disk hypothesis, and ∼ 6 times larger
than one would derive from a similar analysis in K. Still, within this radius, M33’s disk contains only ∼ 30%
of the total mass of the galaxy.
Of course, M33’s disk does not end at 10 kpc. Although our planetary nebula detections end near
this 10 kpc limit, observations of M33’s H I gas extend to nearly twice that distance (Corbelli 2003). The
interpretation of the extended H I data is made slightly more difficult by the increasing importance of the
galactic warp at large radii. Nevertheless, if the models of Corbelli & Schneider (1997) and Corbelli & Salucci
(2000) are accurate, then M33’s rotational velocity increases from ∼ 110 km s−1 to ∼ 135 km s−1 between
10 kpc and 20 kpc. This suggests that the bulk of M33’s dark matter halo still resides outside the region of
our survey.
10. Conclusions
Until now, our knowledge of the stellar kinematics of spiral galaxies has come principally from obser-
vations of stars in the solar neighborhood, and secondarily from absorption-line measurements in the inner
regions of face-on and edge-on spirals. Our planetary nebula observations have improved upon this situa-
tion. For the first time, we have been able to measure the shape of the stellar velocity ellipsoid throughout
a galactic disk, and directly measure the variation in a galaxy’s disk mass surface density. Our data suggest
that, in the inner regions of galaxies, maximal disk models for the rotation curve are appropriate, and the
contribution of dark matter is negligible. However, the data also show that the mass-to-light ratios of galactic
disks do change with radius, and the M/L of the inner disk may be a factor of & 4 smaller than that of the
outer disk. Still, the existence of this gradient does not change the fact that most of a galaxy’s material lies
well away from the disk in a dark halo that roughly follows an inverse square density law. Models in which
the dark matter is in the form of molecular gas are excluded by our observations.
We would like to thank E. Corbelli for providing M33’s rotation curve in digital form, D. Willmarth for
assisting in the setup for our PN spectroscopy, and R. Chandar for providing additional PN spectra for our
analysis. In addition, we would like to the thank M. Bershady, J. Sellwood, S. Sigurdsson, and S. McGaugh
for useful comments during the preparation of this paper. This work was supported by NSF grant AST
00-71238.

– 22 –
REFERENCES
Araki, S. 1985, Ph.D. thesis, Massachusetts Institute of Technology
Ashman, K.M. 1992, PASP, 104, 1109
Bell, E.F., & de Jong, R.S. 2000, ApJ, 312, 497
Bell, E.F., & de Jong, R.S. 2001, ApJ, 550, 212
Berkhuijsen, E.M. 1983, A&A, 127, 395
Bevington, P.R. 1969, Data Reduction and Error Analysis for the Physical Sciences (New York: McGraw-
Hill)
Bienayme, O. 1999, A&A, 341, 86
Binney, J., & Tremaine, S. 1987, Galactic Dynamics, (Princeton: Princeton Univ. Press)
Bizyaev, D., & Mitronova, S. 2002, A&A, 389, 795
Borriello, A., & Salucci, P. 2001, MNRAS, 323, 285
Bothun, G.D. 1992, AJ, 103, 104
Bottema, R. 1993, A&A, 275, 16
Bottema, R., van der Kruit, P.C., & Freeman, K.C. 1987, A&A, 178, 77
Brandt, J.C. 1960, ApJ, 131, 293
Brandt, J.C. 1965, MNRAS, 129, 309
Cardelli, J.A., Clayton, G.C., & Mathis, J.S. 1989, ApJ, 345, 245
Carlberg, R.G. 1987, ApJ, 322, 59
Chen, B., Stoughton, C., Smith, J.A., Uomoto, A., Pier, J.R., Yanny, B., Ivezic, Z, York, D.G., Anderson,
J.E., Annis, J., Brinkmann, J., Csabai, I., Fukugita, M., Hindsley, R., Lupton, R., & Munn, J.A.
2001, ApJ, 553, 184
Ciardullo, R. 2003 in Lecture Notes in Physics: Stellar Candles for the Extragalactic Distance Scale, ed. W.
Gieren & D. Alloin (Heidelberg: Springer-Verlag), 243
Ciardullo, R., Ford, H.C., Neill, J.D., Jacoby, G.H., & Shafter, A.W. 1987, ApJ, 318, 520
Ciardullo, R., Feldmeier, J.J., Jacoby, G.H., de Naray, R.K., Laychak, M.B., & Durrell, P.R. 2002, ApJ, 577,
31
Ciardullo, R., & Jacoby, G.H. 1999, ApJ, 515, 191
Ciardullo, R., Jacoby, G.H., Ford, H.C., & Neill, J.D. 1989, ApJ, 339, 53
Ciardullo, R., Jacoby, G.H., & Harris, W.E. 1991, ApJ, 383, 487
Combes, F. 2002, New Astronomy Reviews, 46, 755

– 23 –
Corbelli, E. 2003, MNRAS, 342, 199
Corbelli, E., & Salucci, P. 2000, MNRAS, 311, 441
Corbelli, E., & Schneider, S.E. 1997, ApJ, 479, 244
Corradi, R.L.M., & Schwarz, H.E. 1995, A&A, 293, 871
Dalcanton, J.J., & Bernstein, R.A. 2002, AJ, 124, 1328
Dave, R., Spergel, D.N., Steinhardt, P.J., & Wandelt, B.D. 2001, ApJ, 547, 574
de Blok, W.J.G., Bosma, A., & McGaugh, S. 2003, MNRAS, 340, 657
de Grijs, R., & Peletier, R.F. 1997, A&A, 320, L21
de Grijs, R., & van der Kruit, P.C. 1996, A&AS, 117, 19
de Vaucouleurs, G. 1959, ApJ, 130, 728
de Vaucouleurs, G., de Vaucouleurs, A., Corwin, H.G. Jr., Buta, R.J., Paturel, G., & Fouque, P. 1991, Third
Reference Catalog of Bright Galaxies, (New York: Springer-Verlag)
Dehnen, W., & Binney, J.J. 1998, MNRAS, 298, 387
Dopita, M.A., Jacoby, G.H., & Vassiliadis, E. 1992, ApJ, 389, 27
Dopita, M.A., Vassiliadis, E., Wood, P.R., Meatheringham, S.J., Harrington, J.P., Bohlin, R.C., Ford, H.C.,
Stecher, T.P., & Maran, S.P. 1997, ApJ, 474, 188
Eggen, O.J., Lynden-Bell, D., & Sandage, A.R. 1962, ApJ, 136, 748
Faber, S.M., & Gallagher, J.S. 1979, ARA&A, 17, 135
Fall, S.M., & Efstathiou, G. 1980, MNRAS, 193, 189
Freedman, W.L., Madore, B.F., Gibson, B.K., Ferrarese, L., Kelson, D.D., Sakai, S., Mould, J.R., Kennicutt,
R.C. Jr., Ford, H.C., Graham, J.A., Huchra, J.P., Hughes, S.M.G., Illingworth, G.D., Macri, L.M., &
Stetson, P.B. 2001, ApJ, 553, 47
Freedman, W.L., Wilson, C.D., & Madore, B.F. 1991, ApJ, 372, 455
Fry, A.M., Morrison, H.L., Harding, P., & Boroson, T.A. 1999, AJ, 118, 1209
Fuchs, B., & Wielen, R. 1987, in NATO ASIC Proc. 207, The Galaxy, ed. G. Gilmore & B. Carswell
(Dordrecht: Reidel), 375
Garnett, D.R., Shields, G.A., Skillman, E.D., Sagan, S.P., & Dufour, R.J. 1997, ApJ, 489, 63
Gebhardt, K., Lauer, T.R., Kormendy, J., Pinkney, J., Bower, G.A., Green, R., Gull, T., Hutchings, J.B.,
Kaiser, M.E., Nelson, C.H., Richstone, D., & Weistrop, D. 2001, AJ, 122, 2469
Gerssen, J., Kuijken, K., & Merrifield, M.R. 1997, MNRAS, 288, 618
Gerssen, J., Kuijken, K., & Merrifield, M.R. 2000, MNRAS, 317, 545

– 24 –
Giraud, E. 2000, ApJ, 539, 155
Griv, E., Rosenstein, B., Gedalin, M., & Eichler, D. 1999, A&A, 347, 821
Guidoni, U., Messi, R., & Natali, G. 1981, A&A, 96, 215
Henize, K.G., & Westerlund, B.E. 1963, ApJ, 137, 747
Heyer, M.H., Corbelli, E., Schneider, S.E., & Young, J.S. 2004, ApJ, 602, 723
Hippelein, H., Haas, M., Tuffs, R.J., Lemke, D., Stickel, M., Klaas, U., & Volk, H.J. 2003, A&A, 407, 137
Hodge, P.W., Balsley, J., Wyder, T.K., & Skelton, B.P. 1999, PASP, 111, 685
Huchra, J.P., Vogeley, M.S., & Geller, M.J. 1999, ApJS, 121, 287
Hui, X., Ford, H.C., Ciardullo, R., & Jacoby, G.H. 1993, ApJ, 414, 463
Iben, I., Jr., & Laughlin, G. 1989, ApJ, 341, 312
Iben, I., Jr., & Renzini, A. 1983, ARA&A, 21, 271
Israel, F.P., & Kennicutt, R.C. 1980, Astrophys. Lett., 21, 1
Jacoby, G.H. 1989, ApJ, 339, 39
Jacoby, G.H. 1997, in The Extragalactic Distance Scale, Space Telescope Science Institute Series, ed. M.
Livio (Cambridge: Cambridge University Press), 197
Jacoby, G.H., Branch, D., Ciardullo, R., Davies, R.L., Harris, W.E., Pierce, M.J., Pritchet, C.J., Tonry, J.L.,
& Welch, D.L. 1992, PASP, 104, 599
Jacoby, G.H., Ciardullo, R., Ford, H.C., & Booth, J. 1989, ApJ, 344, 70
Jacoby, G.H., Ciardullo, R., & Harris, W.E. 1996, ApJ, 462, 1
Jacoby, G.H., & De Marco, O. 2002, AJ, 123, 269
Jacoby, G.H., Quigley, R.J., & Africano, J.L. 1987, PASP, 99, 672
Jahreiß, H., & Wielen, R. 1983, IAU Colloq. 76, Nearby Stars and the Stellar Luminosity Function, ed. A.G.D.
Philip & A.R. Upgren (Schenectady: L. Davis Press), 277
Jenkins, A., & Binney, J. 1990, MNRAS, 245, 305
Kaler, J.B., & Jacoby, G.H. 1990, ApJ, 362, 491
Kennicutt, R.C., Tamblyn, P., & Congdon, C.E. 1994, ApJ, 435, 22
Kent, S.M. 1986, AJ, 91, 1301
Kent, S.M. 1987, AJ, 94, 306
Khoperskov, A.V., Zasov, A.V., & Tyurina, N.V. 2003, Astronomy Reports, 47, 357
Kim, M., Kim, E., Lee, M.G., Sarajedini, A., & Geisler, D. 2002, AJ, 123, 244

– 25 –
Klypin, A., Kravtsov, A.V., Bullock, J.S., & Primack, J.R. 2001, ApJ, 554, 903
Kregel, M., van der Kruit, P.C., & de Grijs, R. 2002, MNRAS, 334, 646
Kurtz, M.J., & Mink, D.J. 1998, PASP, 110, 934
Maciel, W.J. 1989, in IAU Symp. 131, Planetary Nebulae, ed. S. Torres-Peimbert (Dordrecht: Kluwer), 73
Magrini, L., Cardwell, A., Corradi, R.L.M., Mampaso, A., & Perinotto, M. 2001, A&A, 367, 498
Magrini, L., Corradi, R.L.M., Mampaso, A., & Perinotto, M. 2000, A&A, 355, 713
Magrini, L., Perinotto, M., Corradi, R.L.M., & Mampaso, A. 2003, A&A, 400, 511
Maraston, C. 1998, MNRAS, 300, 872
Marigo, P., Girardi, L., Weiss, A., Groenewegen, M.A.T., & Chiosi, C. 2004, A&A, in press
Massey, P., Bianchi, L., Hutchings, J.B., & Stecher, T.P. 1996, ApJ, 469, 629
Massey, P., Hodge, P.W., Holmes, S., Jacoby, J., King, N.L., Olsen, K., Smith, C., & Saha, A. 2002, BAAS,
34, 1272
Merritt, D., & Sellwood, J.A. 1994, ApJ, 425, 567
Mihalas, D., & Binney, J. 1981 Galactic Astronomy (New York: Freeman)
Monet, D., Bird, A., Canzian, B., Dahn, C., Guetter, H., Harris, H., Henden, A., Levine, S., Luginbuhl,
C., Monet, A.K.B., Rhodes, A., Riepe, B., Sell, S., Stone, R., Vrba, F., & Walker, R. 1998, PMM
USNO-A2.0: A Catalogue of Astrometric Standards (Washington, DC: US Naval Obs.)
Moore, B., Governato, F., Quinn, T., Stadel, J., & Lake, G. 1998, ApJ, 499, L5
Moriondo, G., Giovanardi, C., & Hunt, L.K. 1998, A&A, 339, 409
Morozov, A.G. 1980, SvA, 24, 391
Morozov, A.G. 1980, SvA, 25, 19
Morozov, A.G. 1980, SvA, 25, 421
Navarro, J.F., Frenk, C.S., & White, S.D.M. 1996, ApJ, 462, 563
Palunas, P., & Williams, T.B. 2000, AJ, 120, 2884
Peimbert, M. 1993, in IAU Symp. 155, Planetary Nebulae, ed. R. Weinberger & A. Acker (Dordrecht:
Kluwer), 523
Petersen, L., & Gammelgaard, P. 1997, A&A, 323, 697
Pfenniger, D., Combes, F., & Martinet, L. 1994, A&A, 285, 79
Phillips, J.P. 2003, New Astronomy, 8, 29
Pottasch, S.R. 1984, Planetary Nebulae, (Dordrecht: Reidel), Chapter 5

– 26 –
Power, C., Navarro, J.F., Jenkins, A., Frenk, C.S., White, S.D.M., Springel, V., Stadel, J., & Quinn, T.
2003, MNRAS, 338, 14
Ratnatunga, K.U., & Upgren, A.R. 1997, ApJ, 476, 811
Regan, M.W., & Vogel, S.N. 1994, ApJ, 434, 536
Rogstad, D.H., Wright, M.C.H., & Lockhart, I.A. 1976, ApJ, 204, 703
Rubin, V. 1997, Bright Galaxies, Dark Matters, (Woodbury, NY: American Institute of Physics)
Ryder, S.D., & Dopita, M.A. 1994, ApJ, 430, 142
Sandage, A., & Humphreys, R.M. 1980, ApJ, 263, L1
Scalo, J.M. 1986, FCPh, 11, 1
Schlegel, D.J., Finkbeiner, D.P., & Davis, M. 1998, ApJ, 500, 525
Schwarzkopf, U., & Dettmar, R.-J. 2001, A&A, 373, 402
Searle, L., & Zinn, R. 1978, ApJ, 225, 357
Sellwood, J.A. 1996, ApJ, 473, 733
Shaver, P.A., McGee, R.X., Newton, L.M., Danks, A.C., & Pottasch, S.R. 1983, MNRAS, 204, 53
Shaw, M.A., & Gilmore, G. 1990, MNRAS, 242, 59
Sofue, Y., Koda, J., Nakanishi, H., & Onodera, S. 2003, PASJ, 55, 59,
Spekkens, K., & Giovanelli, R. 2003, in IAU Symp. 220, Dark Matter in Galaxies, ed. S. Ryder, D.J. Pisano,
M. Walker, & K. Freeman (San Francisco: ASP), in press
Steinmetz, M., & Muller, E. 1994, A&A, 281, 97
Stetson, P.B. 1987, PASP, 99, 191
Stetson, P.B. 1992, in ASP Conf. Ser. 25, Astronomical Data Analysis Software and Systems I., ed. D.M.
Worral, C. Biemesderfer, & J. Barnes (San Francisco: ASP), 297
Stetson, P.B., Davis, L.E., & Crabtree, D.R. 1990, in ASP Conf. Ser. 8, CCDs in Astronomy, ed. G.H. Jacoby
(San Francisco: ASP), 289
Stone, R.P.S. 1977, ApJ, 218, 767
Swaters, R.A., Madore, B.F., van den Bosch, F.C., & Balcells, M. 2003, ApJ, 583, 732
Tiede, G.P., Sarajedini, A., & Barker, M.K. 2004, AJ, in press
Toomre, A. 1964, ApJ, 139, 1217
Toomre, A. 1966, in Notes on the 1966 Summer Study Program in Geophysical Fluid Dynamics at the Woods
Hole Oceanographic Institution (Woods Hole: Woods Hole Oceanographic Institute), 111
Udalski, A., Szymanski, M., Kubiak, M., Pietrzynski, G., Soszynski, I., Wozniak, P., & Zebrun, K. 1999,
Act. Astr., 49, 201

– 27 –
Valdes, F.G. 1998, in ASP Conf. Ser. 145, Astronomical Data Analysis Software and Systems VII, ed. R.
Albrecht, R.N. Hook, & H.A. Bushhouse (San Francisco: ASP), 53
van der Kruit, P.C. 1988, A&A, 192, 117
van der Kruit, P.C., & de Grijs, R. 1999, A&A, 352, 129
van der Kruit, P.C., & Searle, L. 1982, A&A, 110, 61
van der Kruit, P.C., Jimenez-Vicente, J., Kregel, M., & Freeman, K.C. 2001, A&A, 379, 374
Vassiliadis, E., & Wood, P.R. 1994, ApJS, 92, 125
Villumsen, J.V. 1985, ApJ, 290, 75
Weidemann, V. 2000, A&A, 363, 647
Wielen, R. 1977, A&A, 60, 263
Zaritsky, D., Elston, R., & Hill, J.M. 1989, AJ, 97, 97
Zijlstra, A.A., & Pottasch, S.R. 1991, A&A, 243, 478
This preprint was prepared with the AAS LATEX macros v5.2.

– 28 –
Table 1. M33 Survey
Number of Total Exp
Field α(2000) δ(2000) Filter Bandpass Exposures Time (min) Seeing
M33 Center 1:33:49.0 +30:40:00 [O III] 55 A 5 25 1.′′05
M33 Center 1:33:49.0 +30:40:00 Hα 80 A 5 25 0.′′90
M33 Center 1:33:49.0 +30:40:00 V 940 A 5 1 0.′′95
M33 Center 1:33:49.0 +30:40:00 B 990 A 5 1 0.′′95
M33 North 1:34:00.0 +30:55:37 [O III] 55 A 5 25 0.′′90
M33 North 1:34:00.0 +30:55:37 Hα 80 A 5 25 0.′′70
M33 North 1:34:00.0 +30:55:37 V 940 A 5 1 1.′′05
M33 North 1:34:00.0 +30:55:37 B 990 A 5 1 1.′′05
M33 South 1:33:10.5 +30:22:30 [O III] 55 A 5 25 0.′′95
M33 South 1:33:10.5 +30:22:30 Hα 80 A 5 25 0.′′75
M33 South 1:33:10.5 +30:22:30 V 940 A 5 1 0.′′85
M33 South 1:33:10.5 +30:22:30 B 990 A 5 1 0.′′85

– 29 –
Table 2. M33 Planetary Nebula Candidates
ID α(2000) δ(2000) m5007 npa log(FHα)b F ([O III])
F (Hα)err ns
c v⊙ σv M01d Notes
1 1:32:09.04 30:22:05.7 23.51 1 −15.321 2.628 0.176 2 −139.2 3.6
2 1:32:26.54 30:25:49.8 23.53 2 −15.390 3.042 0.204 2 −127.7 1.9 1 O
3 1:32:38.03 30:24:00.6 21.82 2 −14.243 1.046 0.019 2 −130.3 1.6 2 O
4 1:32:39.80 30:37:41.0 22.07 2 −14.602 1.891 0.047 3 −208.4 1.7 3
5 1:32:40.08 30:35:15.3 23.38 2 −15.343 3.125 0.154 2 −160.4 2.7
6 1:32:42.72 30:12:25.5 22.63 1 −14.895 2.218 0.085 2 −106.7 2.0 4
7 1:32:44.29 30:43:25.9 24.74 2 −15.655 1.837 0.153 3 −185.9 3.0 6
8 1:32:49.16 30:51:09.1 21.45 2 −14.526 2.826 0.042 3 −192.2 2.0 7
9 1:32:52.96 30:41:57.7 22.49 2 −14.778 1.930 0.041 2 −167.3 3.0 9
10 1:32:53.72 30:32:25.8 23.73 2 −14.720 0.541 0.023 3 −136.3 5.4 12 O
11 1:32:55.04 30:09:52.9 21.34 1 −14.437 2.549 0.048 2 −88.5 1.1 13
12 1:32:55.11 30:14:01.5 22.23 1 −14.859 2.948 0.090 2 −121.1 3.0
13 1:32:58.80 30:27:38.0 22.28 2 −14.887 3.009 0.089 2 −136.0 1.8 14
14 1:32:59.40 30:10:24.0 22.84 1 −14.459 0.671 0.019 2 −94.5 5.6 15
15 1:33:01.25 30:15:31.1 23.42 1 −15.210 2.212 0.171 2 −114.7 3.6 16 O
16 1:33:05.62 30:42:15.1 23.43 2 −15.323 2.863 0.132 0 −136.6 8.4 O
17 1:33:05.86 30:50:44.2 23.48 2 −15.574 4.848 0.239 3 −201.8 2.9
18 1:33:06.11 30:31:04.5 20.72 2 −14.289 3.203 0.050 3 −145.1 2.0 18 O
19 1:33:06.20 31:00:56.1 24.14 1 −15.823 4.669 0.513 4 −195.5 4.4
20 1:33:07.44 30:54:23.2 21.14 2 −14.396 2.769 0.038 5 −187.1 2.3 17
21 1:33:08.55 30:34:38.5 23.96 2 −15.705 4.211 0.526 2 −145.1 5.1
22 1:33:08.99 30:13:58.6 23.78 1 −15.304 1.973 0.205 2 −91.1 3.7 19 O
23 1:33:11.96 30:30:48.2 22.74 2 −14.954 2.301 0.095 3 −156.8 1.3
24 1:33:14.12 30:40:42.7 21.68 2 −14.630 2.897 0.065 5 −188.3 2.9 22
25 1:33:15.50 30:17:53.7 24.51 1 −15.594 1.972 0.236 1 −133.0 12.8 25
26 1:33:16.89 30:29:59.9 22.81 2 −14.928 2.025 0.060 3 −119.0 1.5 26
27 1:33:17.01 30:29:59.8 24.53 1 −15.848 3.464 0.536 1 −120.6 7.2 29
28 1:33:18.48 30:12:38.8 23.23 1 −15.276 3.076 0.174 2 −110.6 2.8 27
29 1:33:19.25 30:29:40.2 20.93 2 −14.417 3.522 0.057 2 −141.1 1.4 28
30 1:33:19.73 30:43:05.5 22.19 2 −14.476 1.273 0.023 3 −108.7 1.5 35 H, O
31 1:33:21.16 31:06:44.0 22.83 1 −15.104 3.006 0.113 2 −231.1 2.5 30 O
32 1:33:21.18 30:41:14.6 21.78 2 −14.534 2.116 0.051 2 −216.5 1.4 31
33 1:33:21.59 30:36:57.2 23.22 2 −14.760 0.944 0.032 2 −112.8 7.0 32
34 1:33:22.85 30:13:41.0 22.59 1 −14.791 1.823 0.067 2 −134.9 4.2 33
35 1:33:23.65 30:19:39.8 23.59 1 −15.419 3.076 0.223 3 −120.1 4.9
36 1:33:24.23 30:16:14.5 23.65 1 −15.214 1.813 0.141 3 −90.2 1.6 36
37 1:33:25.11 30:45:06.2 24.45 2 −14.523 0.176 0.013 4 −192.4 8.8 130
38 1:33:26.33 30:41:45.2 22.36 2 −14.490 1.118 0.024 2 −153.3 3.4 41
39 1:33:26.59 30:35:50.3 22.41 2 −14.308 0.705 0.019 4 −135.4 7.6 38
40 1:33:27.29 30:40:51.3 22.79 2 −14.390 0.598 0.014 2 −163.1 6.2 37 O
41 1:33:27.79 30:34:29.2 22.65 2 −14.442 0.771 0.020 3 −120.2 9.3 40
42 1:33:27.89 31:06:22.3 25.45 1 −15.899 1.673 0.236 3 · · · O
43 1:33:28.50 30:37:45.8 22.24 2 −14.901 3.239 0.098 2 −120.8 1.1 39
44 1:33:31.25 30:40:04.9 24.11 2 −15.767 4.238 0.698 0 NT
45 1:33:31.88 30:30:32.6 22.53 2 −14.604 1.245 0.035 3 −155.9 1.6 45
46 1:33:32.17 30:28:20.2 20.95 2 −14.247 2.344 0.030 2 −123.8 2.4 42
47 1:33:32.21 30:31:46.1 23.22 2 −14.564 0.603 0.032 2 −170.6 8.0
48 1:33:32.34 30:42:40.4 21.89 2 −14.607 2.264 0.063 2 −229.4 2.4 49
49 1:33:32.69 30:26:42.3 22.53 2 −14.409 0.794 0.019 3 −93.7 7.2 43
50 1:33:33.15 30:37:34.4 22.15 2 −14.235 0.759 0.015 3 −144.3 6.0
51 1:33:36.79 30:31:40.5 22.91 2 −15.218 3.611 0.205 2 −115.9 3.0 48
52 1:33:36.83 30:38:45.6 23.68 3 −15.160 1.549 0.096 1 −146.9 7.0
53 1:33:37.00 30:26:33.1 21.19 2 −14.309 2.170 0.031 2 −117.4 1.7 46
54 1:33:38.56 30:33:02.3 22.50 2 −14.736 1.738 0.047 3 −107.5 2.3 51
55 1:33:40.16 30:37:49.5 21.81 3 −14.572 2.249 0.040 1 −165.2 0.6

– 30 –
Table 2—Continued
ID α(2000) δ(2000) m5007 npa log(FHα)b F ([O III])
F (Hα)err ns
c v⊙ σv M01d Notes
56 1:33:42.30 30:37:39.7 21.70 2 −14.433 1.813 0.049 2 −171.0 2.0 54
57 1:33:42.76 30:49:05.6 23.21 2 −14.802 1.053 0.035 5 −222.7 5.0 58 O
58 1:33:43.48 30:59:41.1 24.42 1 −14.583 0.209 0.012 3 −254.6 10.1 57
59 1:33:43.75 30:33:26.6 22.67 2 −14.920 2.257 0.085 2 −122.7 4.7
60 1:33:44.38 30:20:23.7 21.15 1 −14.409 2.844 0.060 2 −115.7 1.6 59
61 1:33:44.62 31:04:03.5 25.21 1 −15.886 2.023 0.225 2 · · · O
62 1:33:45.12 31:08:33.5 25.54 1 −16.032 2.085 0.342 3 · · · O
63 1:33:45.62 30:25:56.3 23.54 2 −15.389 3.001 0.179 0 · · · O
64 1:33:46.09 30:33:35.8 23.11 2 −14.854 1.307 0.074 1 −106.4 4.7
65 1:33:46.45 30:26:55.4 22.40 2 −14.884 2.682 0.079 3 −140.1 3.0 60
66 1:33:46.73 30:17:33.5 21.15 1 −14.426 2.940 0.069 2 −107.1 2.2 61
67 1:33:48.27 30:33:15.7 22.05 2 −14.412 1.246 0.028 1 −136.2 7.9
68 1:33:48.57 30:35:47.9 21.65 2 −14.548 2.475 0.055 1 −95.5 1.7 62
69 1:33:49.36 30:32:28.4 24.23 2 −14.381 0.156 0.009 1 −119.5 7.8
70 1:33:49.41 30:32:06.6 21.73 2 −14.718 3.398 0.088 2 −159.5 2.9 65
71 1:33:50.02 30:14:25.2 21.25 1 −14.444 2.818 0.056 2 −103.2 4.0 63
72 1:33:50.82 30:18:43.8 23.90 1 −14.815 0.575 0.029 3 −93.2 6.2 64
73 1:33:51.06 30:45:38.8 21.28 2 −14.361 2.247 0.050 3 −253.2 2.1 95
74 1:33:52.05 30:48:56.3 23.63 1 −14.927 0.954 0.072 0 · · · O
75 1:33:52.64 30:16:54.2 21.05 1 −14.340 2.642 0.045 2 −112.4 4.7 67
76 1:33:52.77 30:37:38.9 20.78 2 −14.279 2.948 0.045 2 −157.4 1.0 68 O
77 1:33:52.78 30:44:32.7 24.04 2 −15.304 1.556 0.171 3 −229.6 3.4 88
78 1:33:54.68 30:36:05.7 21.59 2 −14.206 1.186 0.019 1 −147.4 6.0 69
79 1:33:54.93 30:47:13.4 23.42 2 −15.170 2.023 0.141 2 −240.6 1.7
80 1:33:55.58 30:16:02.9 23.94 1 −14.933 0.728 0.033 1 −97.2 8.0 71 O
81 1:33:56.22 30:41:57.0 23.60 2 −15.057 1.324 0.084 1 −157.1 3.4 H, O
82 1:33:56.97 30:54:12.5 21.21 2 −14.451 2.970 0.053 1 −260.8 2.2 72
83 1:33:57.18 30:36:47.6 22.09 2 −14.871 3.471 0.096 1 −134.7 1.9 73
84 1:33:57.55 30:42:50.0 23.05 2 −15.145 2.679 0.125 2 −230.6 1.5
85 1:33:58.38 30:55:05.2 22.91 2 −14.812 1.415 0.072 1 −247.5 3.6
86 1:33:59.97 30:40:28.7 21.62 2 −14.627 3.039 0.096 2 −212.8 2.0 74
87 1:34:00.93 30:37:08.1 22.93 2 −15.668 9.972 1.821 1 −156.4 1.4
88 1:34:01.12 30:50:27.3 20.95 2 −14.270 2.484 0.031 2 −248.1 2.4 75 O
89 1:34:02.04 30:50:41.3 23.37 2 −14.741 0.788 0.025 3 −253.6 7.9 76
90 1:34:02.57 30:40:00.5 22.04 3 −14.782 2.959 0.069 2 −188.3 0.6 84
91 1:34:02.61 30:23:25.5 24.24 2 −15.551 2.278 0.203 2 −161.2 7.5 77
92 1:34:02.77 30:38:33.3 21.29 3 −14.328 2.064 0.065 1 −192.3 0.8 O
93 1:34:03.05 30:38:13.4 23.54 3 −15.014 1.266 0.060 2 −190.8 4.3
94 1:34:03.54 30:39:15.6 21.25 3 −14.465 2.930 0.050 2 −169.6 2.5 79 O
95 1:34:03.64 30:52:39.7 22.52 2 −14.910 2.544 0.078 2 −258.6 0.7 80
96 1:34:03.65 30:45:58.9 23.20 2 −14.484 0.508 0.019 2 −205.8 5.6 113
97 1:34:05.54 31:12:30.1 25.17 1 −15.752 1.549 0.232 2 · · ·
98 1:34:05.82 30:36:13.9 24.14 2 −15.111 0.910 0.072 1 −149.9 8.8
99 1:34:06.56 30:48:23.3 22.05 2 −14.724 2.563 0.051 3 −263.2 1.3 83
100 1:34:06.76 31:00:29.3 23.66 1 −15.246 1.941 0.130 2 −279.8 2.9 81
101 1:34:08.65 30:43:33.5 23.16 2 −14.495 0.544 0.025 3 −213.7 5.6 106
102 1:34:09.07 30:49:07.6 23.71 2 −14.784 0.639 0.035 2 −239.5 6.5 85
103 1:34:09.57 30:36:24.8 22.32 2 −14.720 1.966 0.056 2 −173.5 2.2
104 1:34:11.74 31:07:31.4 22.84 1 −14.431 0.627 0.023 1 −223.9 7.0 86
105 1:34:11.91 30:45:00.9 21.32 2 −14.522 3.145 0.054 1 −235.0 2.1 119
106 1:34:12.15 30:28:57.1 23.86 2 −14.848 0.641 0.030 0 −101.6 11.3 O
107 1:34:13.34 30:45:01.2 21.00 2 −14.403 3.227 0.052 1 −241.9 1.8 111
108 1:34:13.40 30:33:50.7 21.21 2 −14.458 3.006 0.046 2 −115.9 1.5 O
109 1:34:13.98 30:22:36.5 20.63 1 −14.222 2.981 0.067 2 −127.8 1.6 91 O
110 1:34:14.23 30:17:03.3 22.27 1 −14.483 1.196 0.031 2 −125.1 2.4 92

– 31 –
Table 2—Continued
ID α(2000) δ(2000) m5007 npa log(FHα)b
F ([O III])F (Hα) err ns
c v⊙ σv M01d Notes
111 1:34:14.79 30:31:49.6 21.39 2 −14.410 2.285 0.036 2 −159.0 3.0 94
112 1:34:15.15 30:44:57.4 22.67 2 −14.244 0.480 0.009 3 −211.0 12.1 123
113 1:34:15.48 30:32:20.3 20.96 2 −14.389 3.221 0.053 1 −153.5 1.1 96
114 1:34:15.72 31:08:12.5 21.72 1 −14.648 2.903 0.082 1 −276.1 2.9 89
115 1:34:15.88 30:24:54.5 21.47 2 −14.499 2.597 0.038 2 −160.4 1.0 93
116 1:34:16.61 30:41:10.4 22.01 2 −14.817 3.272 0.076 2 −225.8 2.1 105
117 1:34:18.54 30:58:30.5 21.90 1 −14.696 2.752 0.074 2 −287.0 2.6 97
118 1:34:19.21 30:44:57.0 21.13 2 −14.417 2.940 0.055 2 −257.2 1.9
119 1:34:20.18 30:51:25.6 23.71 2 −15.070 1.225 0.059 3 −265.6 4.0 98
120 1:34:20.50 31:10:52.0 22.57 1 −14.370 0.701 0.022 1 · · ·
121 1:34:22.92 31:10:38.6 25.91 1 −16.085 1.686 0.442 1 · · ·
122 1:34:22.96 30:59:32.9 24.07 1 −15.120 0.988 0.067 1 −242.7 12.7 100
123 1:34:23.01 30:42:06.0 23.84 2 −14.931 0.794 0.040 2 −216.1 6.3 116
124 1:34:23.26 30:46:27.5 21.45 2 −14.529 2.842 0.049 3 −259.7 1.3 134
125 1:34:24.26 30:27:54.4 20.98 2 −14.401 3.263 0.041 1 −135.4 1.4 101 O
126 1:34:25.09 30:39:39.7 22.27 3 −14.624 1.652 0.033 1 −240.7 1.5 103
127 1:34:25.53 30:17:30.0 25.16 1 −15.568 1.017 0.123 3 −145.7 11.6
128 1:34:25.55 30:40:10.9 21.23 3 −14.429 2.764 0.095 3 −175.3 2.6 104 O
129 1:34:25.83 31:07:44.5 24.28 1 −14.895 0.486 0.032 1 −252.1 9.6 102
130 1:34:27.71 30:42:32.5 22.25 2 −14.598 1.585 0.044 3 −254.7 2.7 126
131 1:34:28.00 30:47:45.8 25.00 2 −15.721 1.672 0.255 4 −237.7 9.0
132 1:34:30.57 30:38:27.3 22.05 3 −14.524 1.607 0.032 2 −154.3 1.3 109
133 1:34:31.49 31:05:24.0 22.37 1 −14.507 1.158 0.035 1 −252.3 1.7 108
134 1:34:31.52 31:06:51.3 22.33 1 −14.940 3.242 0.145 2 −262.7 3.2 107
135 1:34:32.84 30:41:10.6 21.49 2 −14.376 1.916 0.035 2 −188.4 1.0 125
136 1:34:33.42 30:39:23.7 21.95 2 −14.700 2.657 0.060 2 −208.2 2.2 118
137 1:34:37.24 30:29:14.3 24.05 1 −15.321 1.605 0.120 1 −145.9 4.7
138 1:34:37.50 30:40:12.4 24.38 2 −15.255 1.020 0.062 3 −205.8 4.3 129
139 1:34:37.89 30:27:00.7 21.57 2 −14.432 2.038 0.038 2 −116.8 1.4
140 1:34:40.70 30:52:08.6 22.84 2 −14.405 0.594 0.015 3 −274.0 5.9 117
141 1:34:41.96 30:56:49.7 22.41 2 −14.642 1.512 0.029 3 −239.4 1.4 121
142 1:34:43.57 31:06:10.7 22.51 1 −14.506 1.012 0.033 3 −251.9 4.6 120
143 1:34:44.72 30:49:36.3 22.11 2 −14.160 0.660 0.012 2 −250.0 8.9 124
144 1:34:45.50 31:01:11.7 25.81 1 −16.095 1.891 0.363 2 · · ·
145 1:34:46.18 30:44:41.7 22.50 2 −14.960 2.900 0.122 0 −226.8 26.8 O
146 1:34:47.28 30:27:27.5 24.09 1 −14.617 0.307 0.021 2 −160.6 16.9
147 1:34:58.18 31:06:47.5 22.51 1 −14.634 1.355 0.052 3 −256.1 3.4
148 1:35:04.92 30:58:42.1 22.54 1 −14.802 1.943 0.068 3 −221.0 1.6
149 1:35:08.63 30:49:32.8 21.13 2 −14.435 3.062 0.056 1 −213.9 3.7
150 1:35:09.19 30:51:36.6 21.94 2 −14.752 3.012 0.070 3 −255.0 1.9
151 1:35:10.50 31:05:14.9 24.41 1 −15.415 1.430 0.128 1 · · ·
152 1:35:13.63 31:00:48.7 21.61 1 −14.467 2.120 0.075 0 · · · O
aNumber of photometric measurements of the PN
bHα+[N II] flux in units erg cm−2 s−1
cNumber of HYDRA setups in which PN was targeted (Oct 2002)
dID number from Magrini et al. (2001)
Note. — O – object also observed in Jan. 2003 observing run; NT – object not targeted spectroscopically; H – possible halo
PN

– 32 –
Table 3. Mean Photometric Errors
[O III] Photometry Hα Photometry
m5007 σ(mag) Nobj log Flux σ(mag) Nobj
20.75 0.011 9 −14.2 0.012 10
21.25 0.012 21 −14.4 0.018 40
21.75 0.016 16 −14.6 0.022 24
22.25 0.018 24 −14.8 0.026 26
22.75 0.027 24 −15.0 0.035 13
23.25 0.034 14 −15.2 0.051 12
23.75 0.049 19 −15.4 0.072 9
24.25 0.065 14 −15.6 0.100 6
24.75 0.079 3 −15.8 0.133 8
Table 4. Unconfirmed Magrini et al. (2001) Objects
ID α (2000) δ (2000) Reason
5 1:32:44.04 30:22:04.5 Excess flux in V and B
8 1:32:48.66 30:25:53.2 Excess flux in V and B
10 1:32:54.20 30:37:29.7 Excess flux in V
11 1:33:05.74 30:14:23.3 Non-stellar in [O III]; excess flux in V
20 1:33:09.61 30:29:13.6 Excess flux in V
21 1:33:08.43 30:21:07.2 Nothing at this location; non-stellar object at Magrini et al. (2000) position
23 1:33:13.58 30:22:36.3 Non-stellar in V ; excess flux in B
24 1:33:12.25 30:30:49.1 Excess flux in V
34 1:33:24.96 30:38:48.7 Non-stellar in [O III]
44 1:33:33.59 30:39:24.0 Non-stellar in Hα
47 1:34:25.55 30:40:10.7 Coordinates identical to Magrini 104
50 1:33:39.53 30:55:47.1 Excess flux in V
52 1:33:37.37 30:40:54.8 Non-stellar in Hα
53 1:33:41.73 30:37:24.1 Excess flux in V
55 1:33:41.88 30:08:31.3 Excess flux in V
56 1:33:42.80 30:54:04.3 Non-stellar in V ; excess flux in V x
66 1:33:50.88 30:37:12.3 Excess flux in V
70 1:33:54.97 30:37:44.8 Non-stellar in Hα
78 1:34:02.59 30:58:10.2 Non-stellar in [O III]; excess flux in V
87 1:34:12.05 30:39:10.1 Excess flux in V
90 1:34:12.82 30:47:18.1 Non-stellar in Hα
99 1:34:20.61 30:16:47.5 Non-stellar in Hα
114 1:34:16.39 30:43:26.5 Non-stellar in Hα; excess flux in V
115 1:34:09.90 30:45:07.8 Non-stellar in [O III]
122 1:33:37.89 30:39:34.8 Non-stellar in [O III] and V ; excess flux in V
127 1:34:47.13 30:59:36.9 Non-stellar in Hα; excess flux in V
128 1:34:48.86 31:05:14.8 Non-stellar in Hα; excess flux in V
131 1:34:51.19 30:59:34.8 Non-stellar in Hα; excess flux in V
132 1:34:49.20 30:37:27.7 Excess flux in V and B
133 1:34:35.30 30:43:56.5 Excess flux in V
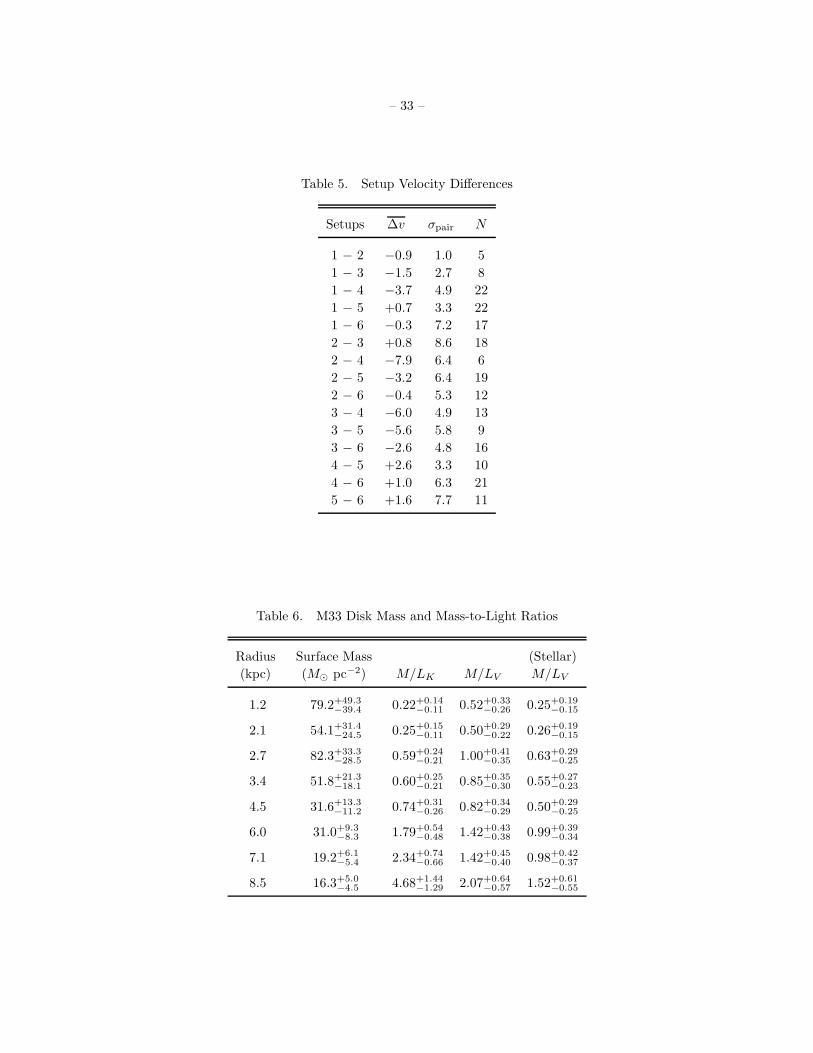
– 33 –
Table 5. Setup Velocity Differences
Setups ∆v σpair N
1 − 2 −0.9 1.0 5
1 − 3 −1.5 2.7 8
1 − 4 −3.7 4.9 22
1 − 5 +0.7 3.3 22
1 − 6 −0.3 7.2 17
2 − 3 +0.8 8.6 18
2 − 4 −7.9 6.4 6
2 − 5 −3.2 6.4 19
2 − 6 −0.4 5.3 12
3 − 4 −6.0 4.9 13
3 − 5 −5.6 5.8 9
3 − 6 −2.6 4.8 16
4 − 5 +2.6 3.3 10
4 − 6 +1.0 6.3 21
5 − 6 +1.6 7.7 11
Table 6. M33 Disk Mass and Mass-to-Light Ratios
Radius Surface Mass (Stellar)
(kpc) (M⊙ pc−2) M/LK M/LV M/LV
1.2 79.2+49.3−39.4 0.22+0.14
−0.11 0.52+0.33−0.26 0.25+0.19
−0.15
2.1 54.1+31.4−24.5 0.25+0.15
−0.11 0.50+0.29−0.22 0.26+0.19
−0.15
2.7 82.3+33.3−28.5 0.59+0.24
−0.21 1.00+0.41−0.35 0.63+0.29
−0.25
3.4 51.8+21.3−18.1 0.60+0.25
−0.21 0.85+0.35−0.30 0.55+0.27
−0.23
4.5 31.6+13.3−11.2 0.74+0.31
−0.26 0.82+0.34−0.29 0.50+0.29
−0.25
6.0 31.0+9.3−8.3 1.79+0.54
−0.48 1.42+0.43−0.38 0.99+0.39
−0.34
7.1 19.2+6.1−5.4 2.34+0.74
−0.66 1.42+0.45−0.40 0.98+0.42
−0.37
8.5 16.3+5.0−4.5 4.68+1.44
−1.29 2.07+0.64−0.57 1.52+0.61
−0.55

– 34 –
Fig. 1.— A Digital Sky Survey image of M33. North is up and east is to the left; the image is 1.◦1 (18 kpc)
on a side. The positions of our 152 PN candidates are marked with boxes. PNe measured spectroscopically
with WIYN are color-coded to show their heliocentric radial velocity.
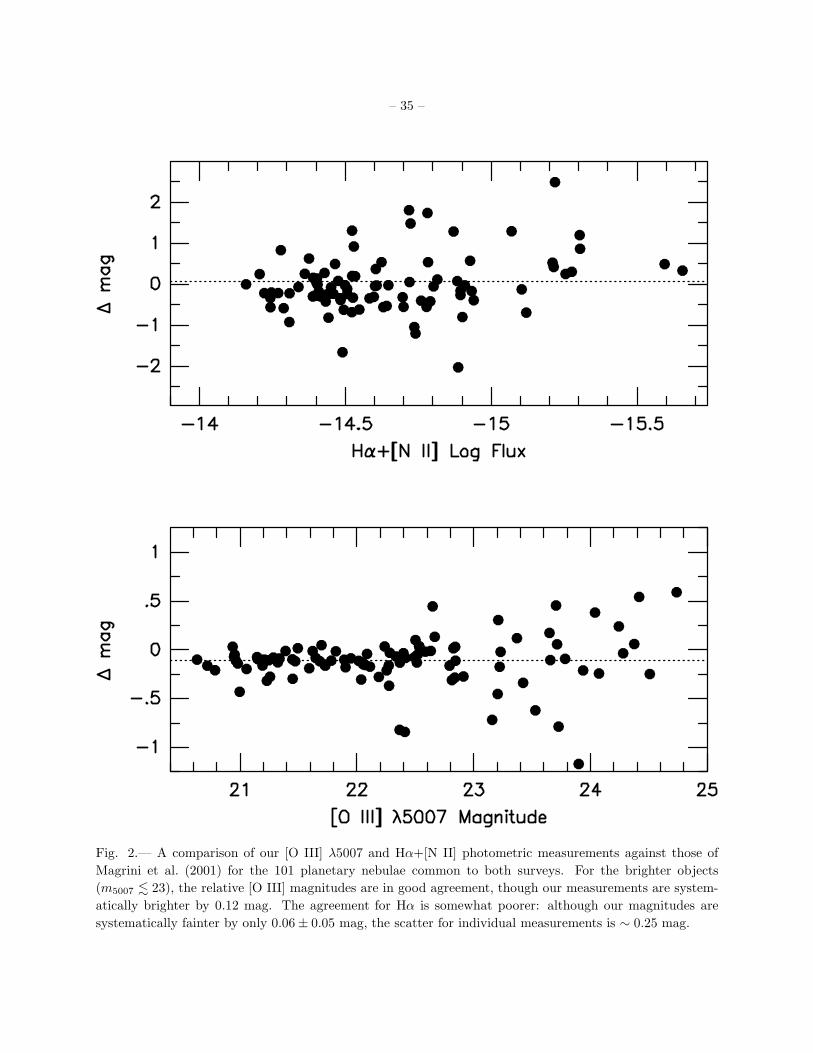
– 35 –
Fig. 2.— A comparison of our [O III] λ5007 and Hα+[N II] photometric measurements against those of
Magrini et al. (2001) for the 101 planetary nebulae common to both surveys. For the brighter objects
(m5007 . 23), the relative [O III] magnitudes are in good agreement, though our measurements are system-
atically brighter by 0.12 mag. The agreement for Hα is somewhat poorer: although our magnitudes are
systematically fainter by only 0.06 ± 0.05 mag, the scatter for individual measurements is ∼ 0.25 mag.

– 36 –
Fig. 3.— The [O III] λ5007 to Hα+[N II] line ratios for PNe in M33. The measurements have been corrected
for the effects of foreground Galactic extinction, but not circumstellar extinction or extinction internal to
M33. For most PNe, the photometric uncertainties are smaller than the size of the plotted points and have
not been displayed. The region of emission-line space occupied by planetary nebulae has a distinctive shape
that is the same for all stellar populations.

– 37 –
Fig. 4.— The [O III] λ5007 planetary nebula luminosity function of M33. The top panel displays the
entire PN sample, the middle panel shows only those PNe within 15′ of M33’s nucleus, and the lower panel
includes only the PNe outside this isophotal radius. The curve shows the analytic PNLF convolved with the
photometric error function and shifted to the most-likely distance of the galaxy. The open circles represent
points past the completeness limit. Note that the luminosity functions of M33’s inner and outer disk are
statistically indistinguishable, and that the PNLF turns over well before the completeness limit is reached.
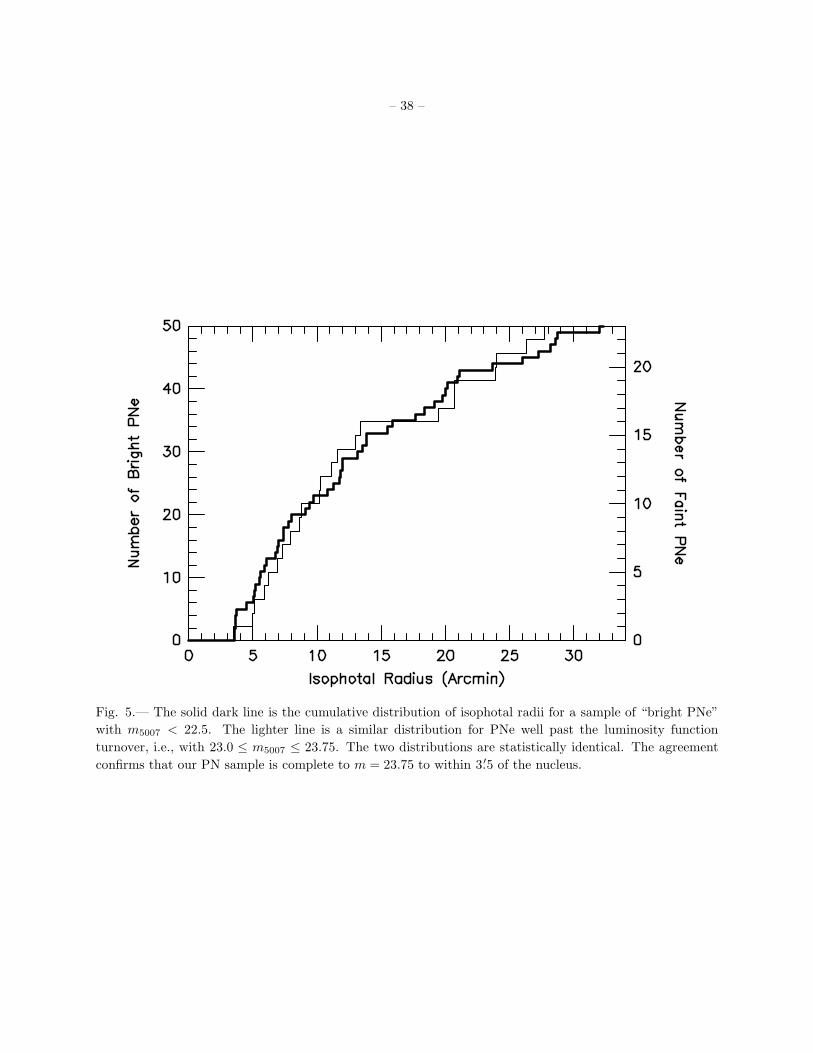
– 38 –
Fig. 5.— The solid dark line is the cumulative distribution of isophotal radii for a sample of “bright PNe”
with m5007 < 22.5. The lighter line is a similar distribution for PNe well past the luminosity function
turnover, i.e., with 23.0 ≤ m5007 ≤ 23.75. The two distributions are statistically identical. The agreement
confirms that our PN sample is complete to m = 23.75 to within 3.′5 of the nucleus.

– 39 –
10
3
30 M31 Bulge
1
10
3
M33
−4 −2 0 2
1
10
3
SMC
Absolute λ5007 Magnitude
Num
ber
of P
lane
tarie
s
Fig. 6.— The [O III] λ5007 planetary nebula luminosity functions of three Local Group stellar populations.
The data for M31’s bulge are taken from Ciardullo et al. (2002); the SMC luminosity function comes from
Jacoby & De Marco (2002). The absolute magnitudes are derived using the Cepheid distances to the galaxies
(Freedman et al. 2001; Udalski et al. 1999) and the Galactic extinctions given by Schlegel, Finkbeiner, &
Davis (1998). While the PNLF of M31’s bulge is a monotonically increasing function, the luminosity functions
of the two star forming systems decline at fainter magnitudes.

– 40 –
Fig. 7.— The upper panel compares the inferred rotation speeds of M31’s planetaries with the rotation of
the galaxy’s H I and CO gas. The colors denote the azimuthal position of the PNe: the color sequence
blue through green through red through yellow through blue represents angles of 0◦ through 90◦ through
180◦ through 270◦ through 360◦ from the approaching major axis. Fourteen PNe projected within 10◦ of
the system’s minor axis have not been plotted. Note that the scatter in the diagram is significantly larger
than the measurement errors for individual objects. Note also that, in the mean, the PNe rotate slightly
slower than the gas; this is due to asymmetric drift. The lower panel bins the data (with 18 PNe per bin)
to show the variation of the drift velocity with galactocentric radius. Here, the error-bars in y represent the
1 σ uncertainty, as determined via a bootstrap analysis, while the error bars in x illustrate the size of the
bin. The dotted line is our best-fit model for regions outside 2.5 kpc (see Section 7).

– 41 –
Fig. 8.— The upper panel plots the PN radial velocities with the galaxy’s systemic velocity and disk rotation
(defined as the H I rotation speed minus asymmetric drift) removed. Error bars have only been plotted for
objects with random velocity uncertainties greater than 3 km s−1; the two possible halo planetaries are
shown as open squares. As in Figure 7, the colors represent the azimuthal position of each planetary, with
the color sequence blue through green through red through yellow through blue denoting angles of 0◦ through
360◦ (referenced from the approaching major axis). The lower panel bins the data (with 18 PNe per bin)
to show how the line-of-sight velocity dispersion varies with galactocentric radius. The errors in y represent
90% confidence intervals, while the error bars in x illustrate the size of each bin.

– 42 –
Fig. 9.— Maximum likelihood solutions for the light-of-sight radial velocity dispersions in the 8 radial bins
displayed in Figure 8. From dark to light, the shaded regions enclose 38% (0.5σ), 68% (1σ), 86% (1.5σ), and
95% (2σ) of the probability. The solid line displays the limits placed on the solutions by the requirement
that the disk be stable against axisymmetric and non-axisymmetric perturbations; the dotted lines show the
limits of our analysis. Note that at large radii, the stability criterion strongly constrains the shape of the
velocity ellipsoid and σz .

– 43 –
Fig. 10.— The likelihoods of Figure 9, constrained by the requirement of stability, and marginalized into
one-dimensional plots in σz and σR. The non-Gaussian uncertainties are illustrated by the width of the lines.
The dotted lines show the best-fit exponentials, when the additional constraints provided by our asymmetric
drift measurements are imposed (see text). The middle and lower panels show total likelihoods; the upper
panel illustrates the solution for a marginally stable (maximum mass) disk. The implied scale length of σ2z
is more than twice as large as that of the K-band light.

– 44 –
Fig. 11.— The vertical velocity dispersion of disk planetary nebulae as a function of the exponential decay
time of star formation. The plot assumes a Scalo (1986) initial mass function that is constant with time,
the Iben & Laughlin (1989) initial mass-stellar lifetime relation, and that σz ∝ t1/2. The y-axis has been
arbitrarily normalized to 20 km s−1 at 1010 yr. Note that disks with a constant star formation rate (τ ≫ 1)
have velocity dispersions that are a third smaller than disks whose star formation has long ago decayed away.

– 45 –
Fig. 12.— The upper panel compares M33’s H I and CO rotation curve to the rotation curve which would
be produced from the disk alone. The solid line is a Brandt (1960) law fit to the H I and CO velocity
measurements; the shaded regions indicated the 1, 2, and 3 σ uncertainties about our best-fit mass model
(as determined from a jackknife analysis). The lower panel shows the density law inferred for the galaxy’s
dark halo (under the assumption of spherical symmetry), again with 1, 2, and 3 σ uncertainties.