Planetary boundaries - Precaution.org
53
RESEARCH ARTICLE SUMMARY ◥ SUSTAINABILITY Planetary boundaries: Guiding human development on a changing planet Will Steffen,* Katherine Richardson, Johan Rockström, Sarah E. Cornell, Ingo Fetzer, Elena M. Bennett, Reinette Biggs, Stephen R. Carpenter, Wim de Vries, Cynthia A. de Wit, Carl Folke, Dieter Gerten, Jens Heinke, Georgina M. Mace, Linn M. Persson, Veerabhadran Ramanathan, Belinda Reyers, Sverker Sörlin INTRODUCTION: There is an urgent need for a new paradigm that integrates the continued development of human societies and the main- tenance of the Earth system (ES) in a resilient and accommodating state. The planetary bound- ary (PB) framework contributes to such a paradigm by providing a science-based analysis of the risk that human perturbations will de- stabilize the ES at the planetary scale. Here, the scientific underpinnings of the PB framework are updated and strengthened. RATIONALE: The relatively stable, 11,700-year- long Holocene epoch is the only state of the ES that we know for certain can support contem- porary human societies. There is increasing evi- dence that human activities are affecting ES functioning to a degree that threatens the re- silience of the ES—its ability to persist in a Holocene-like state in the face of increasing human pressures and shocks. The PB frame- work is based on critical processes that reg- ulate ES functioning. By combining improved scientific understanding of ES functioning with the precautionary principle, the PB framework identifies levels of anthropogenic perturbations below which the risk of destabilization of the ES is likely to remain low—a “safe operating space” for global societal development. A zone of uncertainty for each PB highlights the area of increasing risk. The current level of anthro- pogenic impact on the ES, and thus the risk to the stability of the ES, is assessed by compar- ison with the proposed PB (see the figure). RESULTS: Three of the PBs (climate change, stratospheric ozone depletion, and ocean acid- ification) remain essentially unchanged from the earlier analysis. Regional-level boundaries as well as globally aggregated PBs have now been developed for biosphere integrity (earlier “biodiversity loss”), biogeochemical flows, land- system change, and freshwater use. At present, only one regional boundary (south Asian mon- soon) can be established for atmospheric aerosol loading. Although we cannot identify a single PB for novel entities (here de- fined as new substances, new forms of existing sub- stances, and modified life forms that have the po- tential for unwanted geo- physical and/or biological effects), they are included in the PB framework, given their potential to change the state of the ES. Two of the PBs—climate change and bio- sphere integrity—are recognized as “core” PBs based on their fundamental importance for the ES. The climate system is a manifestation of the amount, distribution, and net balance of energy at Earth’ s surface; the biosphere regulates ma- terial and energy flows in the ES and increases its resilience to abrupt and gradual change. Anthropogenic perturbation levels of four of the ES processes/features (climate change, bio- sphere integrity, biogeochemical flows, and land- system change) exceed the proposed PB (see the figure). CONCLUSIONS: PBs are scientifically based levels of human perturbation of the ES beyond which ES functioning may be substantially altered. Transgression of the PBs thus creates substantial risk of destabilizing the Holocene state of the ES in which modern societies have evolved. The PB framework does not dictate how societies should develop. These are po- litical decisions that must include considera- tion of the human dimensions, including equity, not incorporated in the PB framework. Never- theless, by identifying a safe operating space for humanity on Earth, the PB framework can make a valuable contribution to decision- makers in charting desirable courses for socie- tal development. ▪ RESEARCH 736 13 FEBRUARY 2015 • VOL 347 ISSUE 6223 sciencemag.org SCIENCE Current status of the control variables for seven of the planetary boundaries. The green zone is the safe operating space, the yellow represents the zone of uncertainty (increasing risk), and the red is a high-risk zone.The planetary boundary itself lies at the intersection of the green and yellow zones. The control variables have been normalized for the zone of uncertainty; the center of the figure therefore does not represent values of 0 for the control variables.The control variable shown for climate change is atmospheric CO 2 concentration. Processes for which global-level boundaries cannot yet be quantified are represented by gray wedges; these are atmospheric aerosol loading, novel entities, and the functional role of biosphere integrity. The list of author affiliations is available in the full article online. *Corresponding author. E-mail: [email protected] Cite this article as W. Steffen et al., Science 347, 1259855 (2015). DOI: 10.1126/science.1259855 ON OUR WEB SITE ◥ Read the full article at http://dx.doi. org/10.1126/ science.1259855 .................................................. (This page is a summary; the full research article begins on the next page.)
-
Upload
khangminh22 -
Category
Documents
-
view
1 -
download
0
Transcript of Planetary boundaries - Precaution.org

RESEARCH ARTICLE SUMMARY
SUSTAINABILITY
Planetary boundaries Guidinghuman development on achanging planetWill Steffen Katherine Richardson Johan Rockstroumlm Sarah E Cornell Ingo FetzerElena M Bennett Reinette Biggs Stephen R Carpenter Wim de VriesCynthia A de Wit Carl Folke Dieter Gerten Jens Heinke Georgina M MaceLinn M Persson Veerabhadran Ramanathan Belinda Reyers Sverker Soumlrlin
INTRODUCTION There is an urgent need fora new paradigm that integrates the continueddevelopment of human societies and the main-tenance of the Earth system (ES) in a resilientandaccommodating state Theplanetarybound-ary (PB) framework contributes to such aparadigm by providing a science-based analysisof the risk that human perturbations will de-stabilize the ES at the planetary scale Here thescientific underpinnings of the PB frameworkare updated and strengthened
RATIONALE The relatively stable 11700-year-longHolocene epoch is the only state of the ES
that we know for certain can support contem-porary human societies There is increasing evi-dence that human activities are affecting ESfunctioning to a degree that threatens the re-silience of the ESmdashits ability to persist in aHolocene-like state in the face of increasinghuman pressures and shocks The PB frame-work is based on critical processes that reg-ulate ES functioning By combining improvedscientific understanding of ES functioningwiththe precautionary principle the PB frameworkidentifies levels of anthropogenic perturbationsbelow which the risk of destabilization of theES is likely to remain lowmdasha ldquosafe operating
spacerdquo for global societal development A zoneof uncertainty for each PB highlights the areaof increasing risk The current level of anthro-pogenic impact on the ES and thus the risk tothe stability of the ES is assessed by compar-ison with the proposed PB (see the figure)
RESULTS Three of the PBs (climate changestratospheric ozone depletion and ocean acid-ification) remain essentially unchanged fromthe earlier analysis Regional-level boundariesas well as globally aggregated PBs have nowbeen developed for biosphere integrity (earlierldquobiodiversity lossrdquo) biogeochemical flows land-system change and freshwater use At presentonly one regional boundary (south Asian mon-soon) can be established for atmospheric aerosolloading Althoughwe cannot identify a single PB
for novel entities (here de-fined as new substancesnew forms of existing sub-stances and modified lifeforms that have the po-tential for unwanted geo-physical andor biological
effects) they are included in the PB frameworkgiven their potential to change the state of theES Two of the PBsmdashclimate change and bio-sphere integritymdashare recognized as ldquocorerdquo PBsbased on their fundamental importance for theES The climate system is a manifestation of theamount distribution and net balance of energyat Earthrsquos surface the biosphere regulates ma-terial and energy flows in the ES and increasesits resilience to abrupt and gradual changeAnthropogenic perturbation levels of four ofthe ES processesfeatures (climate change bio-sphere integrity biogeochemical flows and land-system change) exceed the proposed PB (see thefigure)
CONCLUSIONS PBs are scientifically basedlevels of human perturbation of the ES beyondwhich ES functioning may be substantiallyaltered Transgression of the PBs thus createssubstantial risk of destabilizing the Holocenestate of the ES in which modern societies haveevolved The PB framework does not dictatehow societies should develop These are po-litical decisions that must include considera-tion of the human dimensions including equitynot incorporated in the PB framework Never-theless by identifying a safe operating spacefor humanity on Earth the PB frameworkcan make a valuable contribution to decision-makers in charting desirable courses for socie-tal development
RESEARCH
736 13 FEBRUARY 2015 bull VOL 347 ISSUE 6223 sciencemagorg SCIENCE
Current status of the control variables for seven of the planetary boundariesThe green zoneis the safe operating space the yellow represents the zone of uncertainty (increasing risk) and thered is a high-risk zoneThe planetary boundary itself lies at the intersection of the green and yellowzones The control variables have been normalized for the zone of uncertainty the center of thefigure therefore does not represent values of 0 for the control variablesThe control variable shownfor climate change is atmospheric CO2 concentration Processes for which global-level boundariescannot yet be quantified are represented by gray wedges these are atmospheric aerosol loadingnovel entities and the functional role of biosphere integrity
The list of author affiliations is available in the full article onlineCorresponding author E-mail willsteffenanueduauCite this article as W Steffen et al Science 347 1259855(2015) DOI 101126science1259855
ON OUR WEB SITE
Read the full articleat httpdxdoiorg101126science1259855
(This page i s a summary the fu l l research art ic le begins on the next page )
RESEARCH ARTICLE
SUSTAINABILITY
Planetary boundaries Guidinghuman development on achanging planetWill Steffen12 Katherine Richardson3 Johan Rockstroumlm1 Sarah E Cornell1
Ingo Fetzer1 Elena M Bennett4 Reinette Biggs15 Stephen R Carpenter6
Wim de Vries78 Cynthia A de Wit9 Carl Folke110 Dieter Gerten11 Jens Heinke111213
Georgina M Mace14 Linn M Persson15 Veerabhadran Ramanathan1617
Belinda Reyers118 Sverker Soumlrlin19
The planetary boundaries framework defines a safe operating space for humanity basedon the intrinsic biophysical processes that regulate the stability of the Earth systemHere we revise and update the planetary boundary framework with a focus on theunderpinning biophysical science based on targeted input from expert researchcommunities and on more general scientific advances over the past 5 years Several of theboundaries now have a two-tier approach reflecting the importance of cross-scaleinteractions and the regional-level heterogeneity of the processes that underpin theboundaries Two core boundariesmdashclimate change and biosphere integritymdashhave beenidentified each of which has the potential on its own to drive the Earth system into a newstate should they be substantially and persistently transgressed
The planetary boundary (PB) approach (1 2)aims to define a safe operating space forhumansocieties to develop and thrive basedon our evolving understanding of the func-tioning and resilience of the Earth system
Since its introduction the framework has beensubject to scientific scrutiny [eg (3ndash7)] and hasattracted considerable interest and discussionswithin the policy governance and business sec-tors as an approach to inform efforts toward glob-al sustainability (8ndash10)In this analysis we further develop the basic
PB framework by (i) introducing a two-tier ap-proach for several of the boundaries to accountfor regional-level heterogeneity (ii) updating thequantification ofmost of the PBs (iii) identifyingtwo core boundaries and (iv) proposing a regional-level quantitative boundary for one of the twothat were not quantified earlier (1)
The basic framework Defininga safe operating space
Throughout history humanity has faced environ-mental constraints at local and regional levelswith some societies dealing with these challengesmore effectively than others (11 12) More recent-ly early industrial societies often used local water-ways and airsheds as dumping grounds for theirwaste and effluent from industrial processes Thiseroded local and regional environmental qualityand stability threatening to undermine the pro-gress made through industrialization by damag-ing human health and degrading ecosystemsEventually this led to the introduction of localor regional boundaries or constraints on what
could be emitted to and extracted from the en-vironment (eg chemicals that pollute airshedsor waterways) and on howmuch the environmentcould be changed by direct human modification(land-usecover change in natural ecosystems)(13) The regulation of some human impacts onthe environmentmdashfor example the introductionof chemical contaminantsmdashis often framed inthe context of ldquosafe limitsrdquo (14)These issues remain but in addition we now
face constraints at the planetary level where themagnitude of the challenge is vastly differentThe humanenterprise has grown so dramaticallysince themid-20th century (15) that the relativelystable 11700-year-long Holocene epoch the onlystate of the planet that we know for certain cansupport contemporary human societies is nowbeing destabilized (figs S1 and S2) (16ndash18) Infact a new geological epoch the Anthropocenehas been proposed (19)The precautionary principle suggests that hu-
man societies would be unwise to drive the Earthsystem substantially away from a Holocene-likecondition A continuing trajectory away from theHolocene could lead with an uncomfortably highprobability to a very different state of the Earthsystem one that is likely to be much less hos-pitable to the development of human societies(17 18 20) The PB framework aims to help guidehuman societies away from such a trajectory bydefining a ldquosafe operating spacerdquo inwhichwe cancontinue to develop and thrive It does this byproposing boundaries for anthropogenic pertur-bation of critical Earth-systemprocesses Respect-ing these boundaries would greatly reduce the
risk that anthropogenic activities could inadver-tently drive the Earth system to a much less hos-pitable stateNine processes each of which is clearly being
modified by human actions were originally sug-gested to form the basis of the PB framework (1)Although these processes are fundamental toEarth-system functioning there are many otherways that Earth-system functioning could be de-scribed including potentially valuable metricsfor quantifying the human imprint on it Thesealternative approaches [eg (4)] often representways to explore and quantify interactions amongthe boundaries They can provide a valuable com-plement to the original approach (1) and furtherenrich the broader PB concept as it continues toevolve
The planetary boundaryframework Thresholds feedbacksresilience uncertainties
A planetary boundary as originally defined (1) isnot equivalent to a global threshold or tippingpoint As Fig 1 shows even when a global- orcontinentalocean basinndashlevel threshold in anEarth-system process is likely to exist [eg (20 21)]the proposed planetary boundary is not placedat the position of the biophysical threshold butrather upstream of itmdashie well before reachingthe threshold This buffer between the boundary(the end of the safe operating space the greenzone in Fig 1) and the threshold not only ac-counts for uncertainty in the precise position ofthe threshold with respect to the control variable
RESEARCH
SCIENCE sciencemagorg 13 FEBRUARY 2015 bull VOL 347 ISSUE 6223 1259855-1
1Stockholm Resilience Centre Stockholm University 10691Stockholm Sweden 2Fenner School of Environment andSociety The Australian National University Canberra ACT 2601Australia 3Center for Macroecology Evolution and ClimateUniversity of Copenhagen Natural History Museum of DenmarkUniversitetsparken 15 Building 3 2100 Copenhagen Denmark4Department of Natural Resource Sciences and McGill School ofEnvironment McGill University 21 111 Lakeshore Road Ste-Anne-de-Bellevue QC H9X 3V9 Canada 5Centre for Studies inComplexity Stellenbosch University Private Bag X1Stellenbosch 7602 South Africa 6Center for LimnologyUniversity of Wisconsin 680 North Park Street Madison WI53706 USA 7Alterra Wageningen University and ResearchCentre PO Box 47 6700AA Wageningen Netherlands8Environmental Systems Analysis Group Wageningen UniversityPO Box 47 6700 AA Wageningen Netherlands 9Departmentof Environmental Science and Analytical Chemistry StockholmUniversity 10691 Stockholm Sweden 10Beijer Institute ofEcological Economics Royal Swedish Academy of SciencesSE-10405 Stockholm Sweden 11Research Domain EarthSystem Analysis Potsdam Institute for Climate ImpactResearch (PIK) Telegraphenberg A62 14473 PotsdamGermany 12International Livestock Research Institute POBox 30709 Nairobi 00100 Kenya 13CSIRO (CommonwealthScientific and Industrial Research Organization) St LuciaQLD 4067 Australia 14Centre for Biodiversity andEnvironment Research (CBER) Department of GeneticsEvolution and Environment University College London GowerStreet London WC1E 6BT UK 15Stockholm EnvironmentInstitute Linneacutegatan 87D SE-10451 Stockholm Sweden16Scripps Institution of Oceanography University of Californiaat San Diego 8622 Kennel Way La Jolla CA 92037 USA17TERI (The Energy and Resources Institute) University 10Institutional Area Vasant Kunj New Delhi Delhi 110070India 18Natural Resources and the Environment CSIR POBox 320 Stellenbosch 7599 South Africa 19Division ofHistory of Science Technology and Environment KTH RoyalInstitute of Technology SE-10044 Stockholm SwedenCorresponding author E-mail willsteffenanueduau
but also allows society time to react to early warn-ing signs that it may be approaching a thresh-old and consequent abrupt or risky changeThe developing science of early-warning signs
can warn of an approaching threshold or a de-crease in the capability of a system to persistunder changing conditions Examples includeldquocritical slowing downrdquo in a process (22) in-creasing variance (23) and flickering betweenstates of the system (24ndash26) However for suchscience to be useful in a policy context it mustprovide enough time for society to respond inorder to steer away from an impending thresh-old before it is crossed (27 28) The problem ofsystem inertiamdashfor example in the climate sys-tem (18)mdashneeds to be taken into account in as-sessing the time needed for society to react toearly-warning signsNot all Earth-system processes included in the
PBapproachhave singular thresholds at the globalcontinentalocean basin level (1) Nevertheless itis important that boundaries be established forthese processes They affect the capacity of theEarth system to persist in a Holocene-like stateunder changing conditions (henceforth ldquoresiliencerdquo)by regulating biogeochemical flows (eg the ter-restrial andmarine biological carbon sinks) or byproviding the capacity for ecosystems to tolerateperturbations and shocks and to continue func-tioning under changing abiotic conditions (29 30)Examples of such processes are land-systemchange freshwater use change in biosphere in-tegrity [rate of biodiversity loss in (1 2)] andchanges in other biogeochemical flows in addi-tion to carbon (eg nitrogen and phosphorus)Placing boundaries for these processes is more
difficult than for those with known large-scalethresholds (21) but is nevertheless important formaintaining the resilience of the Earth system asa whole As indicated in Fig 1 these processesmany of which show threshold behavior at localand regional scales can generate feedbacks tothe processes that do have large-scale thresholdsThe classic example is the possible weakening ofnatural carbon sinks which could further de-stabilize the climate system and push it closer tolarge thresholds [eg loss of the Greenland icesheet (18)] An interesting research question ofrelevance to the PB framework is how small-scale regime shifts can propagate across scalesand possibly lead to global-level transitions (31 32)A zone of uncertainty sometimes large is as-
sociatedwith each of the boundaries (yellow zonein Fig 1) This zone encapsulates both gaps andweaknesses in the scientific knowledge base andintrinsic uncertainties in the functioning of theEarth system At the ldquosaferdquo end of the zone of un-certainty current scientific knowledge suggeststhat there is very low probability of crossing acritical threshold or substantially eroding the re-silience of the Earth system Beyond the ldquodangerrdquoend of the zone of uncertainty current knowl-edge suggests a much higher probability of achange to the functioning of the Earth systemthat could potentially be devastating for humansocieties Application of the precautionary prin-ciple dictates that the planetary boundary is setat the ldquosaferdquo end of the zone of uncertainty Thisdoes notmean that transgressing a boundarywillinstantly lead to an unwanted outcome but thatthe farther the boundary is transgressed thehigher the risk of regime shifts destabilized sys-
tem processes or erosion of resilience and thefewer the opportunities to prepare for suchchanges Observations of the climate system showthis principle in action by the influence of in-creasing atmospheric greenhouse gas concentra-tions on the frequency and intensity of manyextreme weather events (17 18)
Linking global and regional scales
PB processes operate across scales from oceanbasinsbiomes or sourcessinks to the level of theEarth system as a whole Here we address thesubglobal aspects of the PB framework Rock-stroumlm et al (1) estimated global boundaries on-ly acknowledging that the control variables formany processes are spatially heterogeneous Thatis changes in control variables at the subgloballevel can influence functioning at the Earth-system level which indicates the need to definesubglobal boundaries that are compatible withthe global-level boundary definition Avoidingthe transgression of subglobal boundaries wouldthus contribute to an aggregate outcome withina planetary-level safe operating spaceWe focus on the five PBs that have strong re-
gional operating scales biosphere integrity biogeo-chemical flows [earlier termed ldquophosphorus (P)andnitrogen (N) cyclesrdquo (12)] land-systemchangefreshwater use and atmospheric aerosol loadingTable S1 describes how transgression of any ofthe proposed boundaries at the subglobal levelaffects the Earth system at the global levelFor those processes where subglobal dynamics
potentially play a critical role in global dynamicsthe operational challenge is to capture the im-portance of subglobal change for the functioning
1259855-2 13 FEBRUARY 2015 bull VOL 347 ISSUE 6223 sciencemagorg SCIENCE
Fig 1 The conceptual framework for the planetary boundary approach showing the safe operating space the zone of uncertainty the position ofthe threshold (where one is likely to exist) and the area of high riskModified from (1)
RESEARCH | RESEARCH ARTICLE
of the Earth system To do this we propose thedevelopment of a two-level set of control var-iables and boundaries The subglobal-level unitsof analysis for these six boundaries are notidentical they vary according to the role that theprocesses play in the Earth system (i) changesin biosphere integrity occur at the level of land-based biomes large freshwater ecosystems ormajor marine ecosystems as the largest sub-global unit (ii) the role of direct human-drivenland-system change in biophysical climate regu-lation is primarily related to changes in forestbiomes (iii) freshwater flows and use occur atthe largest subglobal level in the major riverbasins around the world and (iv) changes inbiogeochemical flows exemplified by phospho-rus and nitrogen cycling aggregate from rela-tively localized but very severe perturbationsin intensive agricultural zones to affect globalflows of nutrients We recognize these as crit-ical regions for Earth-system functioningWhereappropriate the updates of the individual bound-aries (see below) (33) now contain both the glob-ally aggregated boundary value of the controlvariable and its regional distribution functionFigure 2 shows the distributions and currentstatus of the control variables for three of theboundaries where subglobal dynamics are crit-
ical biogeochemical cycles land-system changeand freshwater useWe emphasize that our subglobal-level focus is
based on the necessity to consider this level tounderstand the functioning of the Earth systemas awhole The PB framework is thereforemeantto complement not replace or supersede effortsto address local and regional environmental issues
Updates of the individual boundaries
Brief updates of all nine of the PBs are given inthis section and more detailed descriptions ofthe updates for three of the PBs that have under-gone more extensive revision can be found in (33)The geographical distribution issues discussedabove are particularly important for five of thePBs and their control variables and boundarieshave been revised accordingly (Table 1) Figure 3shows the current status of the seven bounda-ries that can be quantified at the global level
Climate change
We retain the control variables and boundariesoriginally proposedmdashie an atmospheric CO2 con-centration of 350 parts per million (ppm) and anincrease in top-of-atmosphere radiative forcing of+10 W mndash2 relative to preindustrial levels (1)The radiative forcing control variable is the more
inclusive and fundamental although CO2 is im-portant because of its long lifetime in the atmo-sphere and the very large human emissionsHuman-driven changes to radiative forcing in-clude all anthropogenic factors CO2 other green-house gases aerosols and other factors thataffect the energy balance (18) Radiative forcingis generally the more stringent of the two bound-aries although the relationship between it andCO2 can vary through time with changes in therelative importance of the individual radiativeforcing factorsEvidence has accumulated to suggest that the
zone of uncertainty for the CO2 control variableshould be narrowed from 350 to 550 ppm to 350to 450 ppm CO2 (17 18) while retaining the cur-rent zone of uncertainty for radiative forcing of+10 to 15 W mndash2 relative to preindustrial levelsCurrent values of the control variables are 399ppmCO2 (annual average concentration for 2014) (34)and +23Wmndash2 (11 to 33Wmndash2) in 2011 relativeto 1750 (18) Observed changes in climate at cur-rent levels of the control variables confirm theoriginal choice of the boundary values and thenarrowing of the zone of uncertainty for CO2 Forexample there has already been an increase inthe intensity frequency and duration of heatwaves globally (35) the number of heavy rainfall
SCIENCE sciencemagorg 13 FEBRUARY 2015 bull VOL 347 ISSUE 6223 1259855-3
Fig 2The subglobal distributions and current status of the control variables for (A) biogeochemical flows of P (B) biogeochemical flows of N (C) land-system change and (D) freshwater use In each panel green areas are within the boundary (safe) yellow areas are within the zone of uncertainty (increasingrisk) and red areas are beyond the zone of uncertainty (high risk) Gray areas in (A) and (B) are areas where P and N fertilizers are not applied in (C) they areareas not covered by major forest biomes and in (D) they are areas where river flow is very low so that environmental flows are not allocated See Table 1 forvalues of the boundaries and their zones of uncertainty and (33) for more details on methods and results
RESEARCH | RESEARCH ARTICLE
1259855-4 13 FEBRUARY 2015 bull VOL 347 ISSUE 6223 sciencemagorg SCIENCE
Table 1 The updated control variables and their current values along with the proposed boundaries and zones of uncertainty for all nine planetaryboundaries In the first column the name for the Earth-system process used in the original PB publication (R2009 reference 1) is given for comparison
Earth-systemprocess
Controlvariable(s)
Planetary boundary(zone of uncertainty)
Current value ofcontrol variable
Climatechange(R2009same)
Atmospheric CO2
concentration ppm
Energy imbalanceat top-of-atmosphere W mndash2
350 ppm CO2 (350ndash450 ppm)
+10 W mndash2 (+10ndash15 W mndash2)
3985 ppm CO2
23 W mndash2
(11ndash33 W mndash2)
Change inbiosphereintegrity(R2009Rate ofbiodiversityloss)
Genetic diversityExtinction rate
Functional diversityBiodiversityIntactness Index (BII)
Note These areinterim controlvariables until moreappropriate ones aredeveloped
lt 10 EMSY (10ndash100 EMSY)but with an aspirational goal ofca 1 EMSY (the backgroundrate of extinction loss) EMSY =extinctions per million species-years
Maintain BII at 90 (90ndash30)or above assessedgeographically by biomeslargeregional areas (eg southernAfrica) major marineecosystems (eg coral reefs) orby large functional groups
100ndash1000 EMSY
84 applied tosouthern Africaonly
Stratosphericozonedepletion(R2009 same)
Stratospheric O3
concentration DUlt5 reduction from pre-industrial level of 290 DU(5ndash10) assessed bylatitude
Only transgressedover Antarctica inAustral spring(~200 DU)
Oceanacidification(R2009same)
Carbonate ionconcentrationaverage globalsurface oceansaturation state withrespect to aragonite(Warag)
ge80 of the pre-industrialaragonite saturation state ofmean surface ocean includingnatural diel and seasonalvariability (ge80ndash ge70)
~84 of thepre-industrialaragonitesaturation state
Biogeochemicalflows (P andN cycles)(R2009Biogeochemicalflows (interferencewith P and Ncycles))
P Global P flowfrom freshwatersystems into theocean
P Regional P flowfrom fertilizers toerodible soils
N Global Industrialand intentionalbiological fixationof N
11 Tg P yrndash1 (11ndash100 Tg P yrndash1)
62 Tg yrndash1 mined and applied toerodible (agricultural) soils(62-112 Tg yrndash1) Boundary is aglobal average but regionaldistribution is critical forimpacts
62 Tg N yrndash1 (62ndash82 Tg N yrndash1)Boundary acts as a globallsquovalversquo limiting introduction ofnew reactive N to Earth Systembut regional distribution offertilizer N is critical forimpacts
~22 Tg P yrndash1
~14 Tg P yrndash1
~150 Tg N yrndash1
RESEARCH | RESEARCH ARTICLE
events inmany regions of the world is increasing(17) changes in atmospheric circulation patternshave increased drought in some regions of theworld (17) and the rate of combined mass lossfrom the Greenland and Antarctic ice sheets isincreasing (36)
Changes in biosphere integrity
We propose a two-component approach address-ing two key roles of the biosphere in the Earthsystem The first captures the role of geneticallyunique material as the ldquoinformation bankrdquo thatultimately determines the potential for life to
continue to coevolve with the abiotic componentof the Earth system in the most resilient waypossible Genetic diversity provides the long-termcapacity of the biosphere to persist under andadapt to abrupt and gradual abiotic change Thesecond captures the role of the biosphere inEarth-system functioning through the value rangedistribution and relative abundance of the func-tional traits of the organisms present in an eco-system or biota (7)For the first role the concept of phylogenetic
species variability (PSV) (7 33 37) would be anappropriate control variable However because
global data are not yet available for PSV we re-tain the global extinction rate as an interim con-trol variable although it is measured inaccuratelyand with a time lag There may be a considerablerisk in using extinction rate as a control variablebecause phylogenetic (and functional) diversitymay be more sensitive to human pressures thanspecies-level diversity (38) In principle the bound-ary should be set at a rate of loss of PSV no greaterthan the rate of evolution of new PSV during theHolocene Because that is unknown wemust fallback on the (imperfectly) known extinction rateof well-studied organisms over the past several
SCIENCE sciencemagorg 13 FEBRUARY 2015 bull VOL 347 ISSUE 6223 1259855-5
Earth-systemprocess
Controlvariable(s)
Planetary boundary(zone of uncertainty)
Current value ofcontrol variable
Land-systemchange(R2009same)
Global Area offorested land as of original forestcover
Biome Area offorested land as of potential forest
Global 75 (75ndash54) Valuesare a weighted average of thethree individual biomeboundaries and their uncertaintyzones
BiomeTropical 85 (85ndash60)Temperate 50 (50ndash30)Boreal 85 (85ndash60)
62
Freshwateruse(R2009Globalfreshwateruse)
Global Maximumamount ofconsumptive bluewater use (km3yrndash1)
Basin Blue waterwithdrawal as ofmean monthly riverflow
Global 4000 km3 yrndash1
(4000ndash6000 km3 yrndash1)
Basin Maximum monthlywithdrawal as a percentageof mean monthly river flowFor low-flow months 25(25ndash55) for intermediate-flow months 30 (30ndash60)for high-flow months 55(55ndash85)
~2600 km3 yrndash1
Atmosphericaerosolloading(R2009same)
Global AerosolOptical Depth(AOD) but muchregional variation
Regional AOD asa seasonal averageover a region SouthAsian Monsoonused as a case study
Regional (South AsianMonsoon as a case study)anthropogenic total (absorbingand scattering) AOD overIndian subcontinent of 025(025ndash050) absorbing(warming) AOD less than 10of total AOD
030 AOD overSouth Asianregion
Introductionof novel entities(R2009 Chemicalpollution)
No control variablecurrently defined
No boundary currentlyidentified but see boundaryfor stratospheric ozone for anexample of a boundaryrelated to a novel entity (CFCs)
RESEARCH | RESEARCH ARTICLE
million yearsmdashabout 1 per million species-years(39)mdashand add a large uncertainty bound raisingthe boundary to 10 permillion species-years Therisk is that although the Earth system can tol-erate a higher-than-background level of extinc-tions for a time we do not knowwhat levels of ortypes of biodiversity lossmay possibly trigger non-linear or irreversible changes to the Earth systemThe second control variable aims to capture the
role of the biosphere in Earth-system functioningand measures loss of biodiversity components atboth global and biomelarge ecosystem levels Al-though several variables have been developed atlocal scales for measuring functional diversity[eg (40)] finding an appropriate control varia-ble at regional or global levels is challenging Forthe present we propose an interim control var-iable the Biodiversity Intactness Index (BII) (41)BII assesses change in population abundance as aresult of human impacts such as land or resourceuse across a wide range of taxa and functionalgroups at a biome or ecosystem level using pre-industrial era abundance as a reference point Theindex typically ranges from 100 (abundancesacross all functional groups at preindustrial levels)to lower values that reflect the extent and degreeof human modification of populations of plantsand animals BII values for particular functionalgroups can go above 100 if humanmodificationsto ecosystems lead to increases in the abundanceof those speciesDue to a lack of evidence on the relationship
between BII and Earth-system responses we pro-
pose a preliminary boundary at 90 of the BIIbut with a very large uncertainty range (90 to30) that reflects the large gaps in our knowl-edge about the BIIndashEarth-system functioningrelationship (42 43) BII has been so far appliedto southern Africarsquos terrestrial biomes only (seefig S3 for an estimation of aggregated humanpressures on the terrestrial biosphere globally)where the index (not yet disaggregated to func-tional groups) was estimated to be 84 BIIranged from 69 to 91 for the seven countrieswhere it has been applied (41) Observations acrossthese countries suggest that decreases in BII ad-equately capture increasing levels of ecosystemdegradation defined as land uses that do not al-ter the land-cover type but lead to a persistentloss in ecosystem productivity (41)In addition to further work on functional mea-
sures such as BII in the longer term the conceptof biome integritymdashthe functioning and persist-ence of biomes at broad scales (7)mdashoffers a prom-ising approach and with further research couldprovide a set of operational control variables (oneper biome) that is appropriate robust and scien-tifically based
Stratospheric ozone depletion
We retain the original control variable [O3 con-centration in DU (Dobson units)] and boundary(275 DU) This boundary is only transgressedover Antarctica in the austral spring when O3
concentration drops to about 200 DU (44) How-ever the minimum O3 concentration has been
steady for about 15 years and is expected to riseover the coming decades as the ozone hole isrepaired after the phasing out of ozone-depletingsubstances This is an example in which after aboundary has been transgressed regionally hu-manity has taken effective action to return theprocess back to within the boundary
Ocean acidification
This boundary is intimately linked with one ofthe control variables CO2 for the climate changePB The concentration of free H+ ions in the sur-face ocean has increased by about 30 over thepast 200 years due to the increase in atmosphericCO2 (45) This in turn influences carbonate chem-istry in surface ocean waters Specifically it lowersthe saturation state of aragonite (Warag) a form ofcalcium carbonate formed by many marine orga-nisms At Warag lt 1 aragonite will dissolve Nonew evidence has emerged to suggest that theoriginally proposed boundary (ge80 of the pre-industrial average annual global Warag) shouldbe adjusted although geographical heterogeneityin Warag is important in monitoring the state ofthe boundary around the worldrsquos oceans (fig S4)Currently Warag is approximately equal to 84 ofthe preindustrial value (46) This boundary wouldnot be transgressed if the climate-change bound-ary of 350 ppm CO2 were to be respected
Biogeochemical flows
The original boundary was formulated for phos-phorus (P) and nitrogen (N) only but we nowpropose a more generic PB to encompass humaninfluence on biogeochemical flows in general Al-though the carbon cycle is covered in the climate-change boundary other elements such as silicon(47 48) are also important for Earth-system func-tioning Furthermore there is increasing evidencethat ratios between elements in the environmentmay have impacts on biodiversity on land and inthe sea (49ndash51) Thus we may ultimately need todevelop PBs for other elements and their ratiosalthough for now we focus on P and N onlyA two-level approach is now proposed for the
P component of the biogeochemical flows bound-ary (see also the supplementary materials) Theoriginal global-level boundary based on the pre-vention of a large-scale ocean anoxic event isretained with the proposed boundary set at asustained flow of 11 Tg P yearndash1 from freshwatersystems into the ocean Based on the analysis ofCarpenter and Bennett (3) we now propose anadditional regional-level P boundary designedto avert widespread eutrophication of freshwatersystems at a flow of 62 Tg P yearndash1 from fer-tilizers (mined P) to erodible soilsGiven that the addition of P to regional
watersheds is almost entirely from fertilizers theregional-level boundary applies primarily to theworldrsquos croplands The current global rate of ap-plication of P in fertilizers to croplands is 142 TgP yearndash1 (52 53) Observations point toward a fewagricultural regions of very high P applicationrates as the main contributors to the transgres-sion of this boundary (Fig 2 and fig S5A) andsuggest that a redistribution of P from areas
1259855-6 13 FEBRUARY 2015 bull VOL 347 ISSUE 6223 sciencemagorg SCIENCE
Fig 3The current status of the control variables for seven of the nine planetary boundaries Thegreen zone is the safe operating space (below the boundary) yellow represents the zone of uncertainty(increasing risk) and red is the high-risk zoneThe planetary boundary itself lies at the inner heavy circleThe control variables have been normalized for the zone of uncertainty (between the two heavy circles)the center of the figure therefore does not represent values of 0 for the control variables The controlvariable shown for climate change is atmospheric CO2 concentration Processes for which global-levelboundaries cannot yet be quantified are represented by gray wedges these are atmospheric aerosolloading novel entities and the functional role of biosphere integrity Modified from (1)
RESEARCH | RESEARCH ARTICLE
where it is currently in excess to areas where thesoil is naturally P-poormay simultaneously boostglobal crop production and reduce the transgres-sion of the regional-level P boundary (3 52 54)The N boundary has been taken from the com-
prehensive analysis of de Vries et al (5) whichproposed a PB for eutrophication of aquatic eco-systems of 62 Tg N yearndash1 from industrial andintentional biological N fixation using the moststringent water quality criterion As for the Pboundary a few agricultural regions of very highN application rates are the main contributors tothe transgression of this boundary (Fig 2 andfig S5B) This suggests that a redistribution of Ncould simultaneously boost global crop produc-tion and reduce the transgression of the regional-level boundaryBecause the major anthropogenic perturba-
tion of both the N and P cycles arises from fertil-izer application we can analyze the links betweenthe independently determined N and P bounda-ries in an integrated way based on the NP ratioin the growing plant tissue of agricultural cropsApplying this ratio which is on average 118 (55)to the P boundary (62 Tg P yearndash1) gives an Nboundary of 73 Tg N yearndash1 Conversely applyingthe ratio to theN boundary (62 TgN yearndash1) givesa P boundary of 53 Tg P yearndash1 The small dif-ferences between the boundaries derived usingthe NP ratio and those calculated independent-ly which are likely nonsignificant differencesgiven the precision of the data available for thecalculations show the internal consistency inour approach to the biogeochemical boundariesMore detail on the development of the P andN
boundaries is given in (33) where we also em-phasize that the proposed P and N boundariesmay be larger for an optimal allocation of N (andP) over the globe
Land-system change
The updated biosphere integrity boundary pro-vides a considerable constraint on the amountand pattern of land-system change in all ter-restrial biomes forests woodlands savannasgrasslands shrublands tundra and so on Theland-system change boundary is now focusedmore tightly on a specific constraint the biogeo-physical processes in land systems that directlyregulate climatemdashexchange of energy water andmomentum between the land surface and theatmosphere The control variable has been changedfrom the amount of cropland to the amount offorest cover remaining as the three major forestbiomesmdashtropical temperate and borealmdashplay astronger role in land surfacendashclimate couplingthan other biomes (56 57) In particular we fo-cus on those land-system changes that can in-fluence the climate in regions beyond the regionwhere the land-system change occurredOf the forest biomes tropical forests have sub-
stantial feedbacks to climate through changes inevapotranspiration when they are converted tononforested systems and changes in the distribu-tion of boreal forests affect the albedo of the landsurface and hence regional energy exchange Bothhave strong regional and global teleconnections
The biome-level boundary for these two types offorest have been set at 85 (Table 1 and thesupplementary materials) and the boundary fortemperate forests has been proposed at 50 ofpotential forest cover because changes to tem-perate forests are estimated to have weaker in-fluences on the climate system at the global levelthan changes to the other two major forestbiomes (56) These boundaries would almostsurely be met if the proposed biosphere integ-rity boundary of 90 BII were respectedEstimates of the current status of the land-
system change boundary are given in Figs 2 and3 and fig S6 and in (58)
Freshwater use
The revised freshwater use boundary has retainedconsumptive use of blue water [from rivers lakesreservoirs and renewable groundwater stores(59)] as the global-level control variable and4000 km3year as the value of the boundaryThis PB may be somewhat higher or lower de-pending on riversrsquo ecological flow requirements(6) Therefore we report here a new assessmentto complement the PB with a basin-scale bound-ary for the maximum rate of blue water with-drawal along rivers based on the amount of waterrequired in the river system to avoid regime shiftsin the functioning of flow-dependent ecosystemsWe base our control variable on the concept ofenvironmental water flows (EWF) which definesthe level of river flows for different hydrologicalcharacteristics of river basins adequate to main-tain a fair-to-good ecosystem state (60ndash62)The variable monthly flow (VMF) method
(33 63) was used to calculate the basin-scaleboundary for water This method takes accountof intra-annual variability by classifying flow re-gimes into high- intermediate- and low-flowmonths and allocating EWF as a percentage ofthe mean monthly flow (MMF) Based on thisanalysis the zones of uncertainty for the river-basin scale water boundary were set at 25 to 55of MMF for the low-flow regime 40 to 70 forthe intermediate-flow regime and 55 to 85 forthe high-flow regime (table S2) The boundarieswere set at the lower end of the uncertaintyranges that encompass average monthly EWFOur new estimates of the current status of thewater use boundarymdashcomputed based on gridcellndashspecific estimates of agricultural industrialand domestic water withdrawalsmdashare shown inFigs 2 and 3 with details in figs S7 and S8
Atmospheric aerosol loading
Aerosols have well-known serious human healtheffects leading to about 72 million deaths peryear (64) They also affect the functioning of theEarth system in many ways (65) (fig S9) Herewe focus on the effect of aerosols on regionalocean-atmosphere circulation as the rationalefor a separate aerosols boundary We adopt aero-sol optical depth (AOD) (33) as the control var-iable and use the south Asian monsoon as a casestudy based on the potential of widespread aero-sol loading over the Indian subcontinent to switchthe monsoon system to a drier state
The background AOD over south Asia is ~015and can be as high as 04 during volcanic events(66) Emissions of black carbon and organic car-bon from cooking and heating with biofuels andfrom diesel transportation and emission of sul-fates and nitrates from fossil fuel combustioncan increase seasonal mean AODs to as high as04 (larger during volcanic periods) leading todecreases of 10 to 15 of incident solar radiationat the surface (fig S9) A substantial decrease inmonsoon activity is likely around an AOD of 050an increase of 035 above the background (67)Taking a precautionary approach toward uncer-tainties surrounding the position of the tippingpoint we propose a boundary at an AOD of 025(an increase due to human activities of 01) witha zone of uncertainty of 025 to 050 The annualmean AOD is currently about 03 (66) within thezone of uncertainty
Introduction of novel entities
We define novel entities as new substances newforms of existing substances and modified lifeforms that have the potential for unwanted geo-physical andor biological effects Anthropogenicintroduction of novel entities to the environmentis of concern at the global level when these en-tities exhibit (i) persistence (ii) mobility acrossscales with consequent widespread distributionsand (iii) potential impacts on vital Earth-systemprocesses or subsystems These potentially in-clude chemicals and other new types of engi-neered materials or organisms [eg (68ndash71)] notpreviously known to the Earth system as well asnaturally occurring elements (for example heavymetals) mobilized by anthropogenic activitiesThe risks associated with the introduction ofnovel entities into the Earth system are exempli-fied by the release of CFCs (chlorofluorocarbons)which are very useful synthetic chemicals thatwere thought to be harmless but had unexpecteddramatic impacts on the stratospheric ozone layerIn effect humanity is repeatedly running suchglobal-scale experiments but not yet applying theinsights from previous experience to new appli-cations (72 73)Today there aremore than 100000 substances
in global commerce (74) If nanomaterials andplastic polymers that degrade to microplasticsare included the list is even longer There is alsoa ldquochemical intensificationrdquo due to the rapidlyincreasing global production of chemicals theexpanding worldwide distribution as chemicalproducts or in consumer goods and the exten-sive global trade in chemical wastes (75)In recent years there has been a growing de-
bate about the global-scale effects of chemicalpollution leading to calls for the definition ofcriteria to identify the kinds of chemical sub-stances that are likely to be globally problematic(76 77) Persson et al (73) proposed that there arethree conditions that need to be fulfilled for achemical to pose a threat to the Earth system (i)the chemical has an unknown disruptive effecton a vital Earth-systemprocess (ii) the disruptiveeffect is not discovered until it is a problem at theglobal scale and (iii) the effect is not readily
SCIENCE sciencemagorg 13 FEBRUARY 2015 bull VOL 347 ISSUE 6223 1259855-7
RESEARCH | RESEARCH ARTICLE
reversible The challenge to the research commu-nity is to develop the knowledge base that allowsthe screening of chemicals before they are re-leased into the environment for properties thatmay predispose them toward becoming globalproblemsAs a first step toward meeting this challenge
the three conditions outlined above have beenused as the basis for identifying scenarios ofchemical pollution that fulfill the conditions andas a next step for pinpointing chemical profilesthat fit the scenarios (28) This proposal consti-tutes a first attempt at adding the Earth-systemperspective when assessing hazard and risk ofchemicals and offers a vision for a systematic ap-proach to a complex management situation withmany unknownsDespite this progress in developing an Earth-
systemndashoriented approach there is not yet anaggregate global-level analysis of chemical pol-lution on which to base a control variable or aboundary value It may also serve little purposeto define boundary values and control varia-bles for a planetary boundary of this complexityNevertheless there is a potential threat fromnovel entities to disrupt the functioning of theEarth-system and society needs to learn how tomitigate these unknown risks and manage chem-icals under uncertainty (28 73)Some precautionary and preventive actions
can be considered These may include a strongerfocus on green chemistry (78) finding synergieswith risk-reducing interventions in other fieldssuch as occupational health (79) paying moreattention to learning from earlier mistakes (8081) and investing in science to better under-stand and monitor vital Earth-system processesin order to be able to detect disruptive effectsfrom novel entities as early as possible
Hierarchy of boundaries
An analysis of the many interactions among theboundaries (table S3 and fig S10) suggests thattwo of themmdashclimate change and biosphereintegritymdashare highly integrated emergent system-level phenomena that are connected to all of theother PBs They operate at the level of the wholeEarth system (7) and have coevolved for nearly4 billion years (82) They are regulated by theother boundaries and on the other hand pro-vide the planetary-level overarching systems with-in which the other boundary processes operateFurthermore large changes in the climate or inbiosphere integrity would likely on their ownpush the Earth system out of the Holocene stateIn fact transitions between time periods in Earthhistory have often been delineated by substantialshifts in climate the biosphere or both (82 83)These observations suggest a two-level hierar-
chy of boundaries in which climate change andbiosphere integrity should be recognized as coreplanetary boundaries through which the otherboundaries operate The crossing of one or moreof the other boundaries may seriously affect hu-man well-being and may predispose the trans-gression of a core boundary(ies) but does not byitself lead to a new state of the Earth system This
hierarchical approach to classifying the bounda-ries becomes clearer by examining inmore detailthe roles of climate and biosphere integrity in thefunctioning of the Earth systemThe climate system is a manifestation of the
amount distribution and net balance of energyat Earthrsquos surface The total amount of energysets the overall conditions for life In Earthrsquos cur-rent climate a range of global surface temper-atures and atmospheric pressures allows the threephases of water to be present simultaneouslywith ice and water vapor playing critical roles inthe physical feedbacks of the climate system Thedistribution of energy by latitude over the landand sea surfaces and within the ocean plays amajor role in the circulation of the two greatfluids the ocean and the atmosphere These sys-temic physical characteristics are key spatial de-terminants of the distribution of the biota andthe structure and functioning of ecosystems andare controllers of biogeochemical flowsBiosphere integrity is also crucial to Earth-
system functioning where the biosphere is de-fined as the totality of all ecosystems (terrestrialfreshwater andmarine) on Earth and their biota(32) These ecosystems and biota play a criticalrole in determining the state of the Earth systemregulating its material and energy flows and itsresponses to abrupt and gradual change (7) Di-versity in the biosphere provides resilience toterrestrial and marine ecosystems (83 84) Thebiosphere not only interacts with the other plan-etary boundaries but also increases the capacityof theEarth system topersist in a given state underchanges in these other boundaries The ultimatebasis for the many roles that the biosphere playsin Earth-system dynamics is the genetic code ofthe biota the basic information bank that de-fines the biospherersquos functional role and its ca-pacity to innovate and persist into the future
Planetary boundaries in asocietal context
A proposed approach for sustainable develop-ment goals (SDGs) (85) argues that the stablefunctioning of the Earth system is a prereq-uisite for thriving societies around the world Thisapproach implies that the PB framework orsomething like it will need to be implementedalongside the achievement of targets aimed atmore immediate human needs such as provi-sion of clean affordable and accessible energyand the adequate supply of food World devel-opment within the biophysical limits of a stableEarth system has always been a necessity [eg(86 87)] However only recently for a numberof reasons has it become possible to identifyevaluate and quantify risks of abrupt planetary-and biome-level shifts due to overshoot of keyEarth-system parameters (i) the emergence ofglobal-change thinking and Earth-system think-ing (88) (ii) the rise of ldquothe Planetaryrdquo as a rel-evant level of complex system understanding(89ndash92) and (iii) observable effects of the rapidincrease in human pressures on the planet (16)The PB approach is embedded in this emerg-
ing social context but it does not suggest how to
maneuver within the safe operating space in thequest for global sustainability For example thePB framework does not as yet account for the re-gional distribution of the impact or its histor-ical patterns Nor does the PB framework takeinto account the deeper issues of equity and cau-sation The current levels of the boundary pro-cesses and the transgressions of boundaries thathave already occurred are unevenly caused bydifferent human societies and different socialgroups The wealth benefits that these trans-gressions have brought are also unevenly distrib-uted socially and geographically It is easy toforesee that uneven distribution of causation andbenefits will continue and these differentialsmust surely be addressed for a Holocene-likeEarth-system state to be successfully legitimatedand maintained However the PB framework ascurrently construed provides no guidance as tohow this may be achieved [although some po-tential synergies have been noted (54)] and itcannot readily be used tomake choices betweenpathways for piecemeal maneuvering withinthe safe operating space ormore radical shifts ofglobal governance (93)The nature of the PB framework implies that
two important cautions should be observedwhenapplication of the framework to policy or man-agement is proposed boundary interactions andscale
Boundary interactions
The planetary boundaries framework arises fromthe scientific evidence that Earth is a singlecomplex integrated systemmdashthat is the bound-aries operate as an interdependent set [eg(94)] (table S1 and fig S10) Although a system-atic quantitative analysis of interactions amongall of the processes for which boundaries areproposed remains beyond the scope of currentmodeling and observational capacity the Earthsystem clearly operates in well-defined states inwhich these processes and their interactionscan create stabilizing or destabilizing feedbacks(16 90 95) This has profound implications forglobal sustainability because it emphasizes theneed to address multiple interacting environ-mental processes simultaneously (eg stabilizingthe climate system requires sustainable forestmanagement and stable ocean ecosystems)
Scale
The PB framework is not designed to be ldquodown-scaledrdquo or ldquodisaggregatedrdquo to smaller levels suchas nations or local communities That said thePB framework recognizes the importance ofchanges at the level of subsystems in the Earthsystem (eg biomes or large river basins) on thefunctioning of the Earth system as a whole Alsothere are strong arguments for an integrated ap-proach coupling boundary definitions at region-al and global levels with development goals toenable the application of ldquoPB thinkingrdquo at lev-els (nations basins and regions) where policyaction most commonly occurs [eg (85 96)]This update of the PB framework is one step on
a longer-term evolution of scientific knowledge to
1259855-8 13 FEBRUARY 2015 bull VOL 347 ISSUE 6223 sciencemagorg SCIENCE
RESEARCH | RESEARCH ARTICLE
inform and support global sustainability goalsand pathways This evolution is needed morethan ever before there are severe implementa-tion gaps inmany global environmental policiesrelating to the PB issues where problematictrends are not being halted or reversed despiteinternational consensus about the urgency of theproblems The prospect of tighter resource con-straints and rising environmental hazards is alsounavoidably turning the focus onto global socialequity and the planetary stewardship of Earthrsquoslife-support system There is a need for a trulyglobal evidence base with much greater integra-tion among issues in order to respond to theseglobal challenges New research initiatives [egFuture Earth (wwwfutureearthorg)] provide evi-dence that science can respond to this need byapplying Earth-system research to advance a newgeneration of integrated global analyses and toexplore options for transformations toward sus-tainability This is a clear sign that as the risksof the Anthropocene to human well-being be-come clearer research is maturing to a pointwhere a systemic step-change is possiblemdashandnecessarymdashin exploring and defining a safe andjust planetary operating space for the furtherdevelopment of human societies
Methods summary
Our approach to building the planetary bound-aries framework is described above We haveimplemented the framework through an ex-pert assessment and synthesis of the scientificknowledge of intrinsic biophysical processes thatregulate the stability of the Earth system Ourprecautionary approach is based on the main-tenance of a Holocene-like state of the Earthsystem and on an assessment of the level ofhuman-driven change that would risk destabi-lizing this state For the climate change PB thereis already much literature on which to basesuch an assessment For others such as strato-spheric ozone ocean acidification extinctionrates and P andN cycles we have used estimatesof preindustrial values of the control variableas a Holocene baseline Where large undesira-ble thresholds exist and have been studied (egpolar ice sheets Amazon rainforest aragonitedissolution atmospheric aerosols and the southAsian monsoon) quantitative boundaries can bereadily proposed For others where the focus ison erosion of Earth-system resilience the bound-aries are more difficult (but not impossible) toquantify as reflected in larger uncertainty zonesWe used large-scale assessments of the impacts
of human activities on Earth-system functioning[eg Intergovernmental Panel on Climate Change(17 18) the International Geosphere-BiosphereProgramme synthesis (16) and chemicals (75 80)]as sources of community-level understandingon which to propose PBs Our update has alsorelied on post-2009 assessments of individualboundaries by the relevant expert research com-munities examples include phosphorus (3) ni-trogen (5) biosphere integrity (7) freshwater use(5 63) and novel entities [with a focus on chem-icals (28 73)] Finally some new analyses have
been undertaken specifically for this paper (i) afreshwater-use PB based on the EWF approach(33 63) (ii) the linkage of the phosphorus andnitrogen boundaries via the NP ratio in grow-ing crop tissue (33) and (iii) the use of majorforest biomes as the basis for the land-systemchange PB (33)
REFERENCES AND NOTES
1 J Rockstroumlm et al Planetary boundaries Exploring the safeoperating space for humanity Ecol Soc 14 32 (2009)httpwwwecologyandsocietyorgvol14iss2art32
2 J Rockstroumlm et al A safe operating space for humanityNature 461 472ndash475 (2009) doi 101038461472apmid 19779433
3 S R Carpenter E M Bennett Reconsideration of theplanetary boundary for phosphorus Environ Res Lett 6014009 (2011) doi 1010881748-932661014009
4 S W Running Ecology A measurable planetary boundaryfor the biosphere Science 337 1458ndash1459 (2012)doi 101126science1227620 pmid 22997311
5 W de Vries J Kros C Kroeze S P Seitzinger Assessingplanetary and regional nitrogen boundaries related to foodsecurity and adverse environmental impacts Curr OpinionEnviron Sust 5 392ndash402 (2013) doi 101016jcosust201307004
6 D Gerten et al Towards a revised planetary boundary forconsumptive freshwater use Role of environmental flowrequirements Curr Opinion Environ Sust 5 551ndash558 (2013)doi 101016jcosust201311001
7 G M Mace et al Approaches to defining a planetary boundaryfor biodiversity Glob Environ Change 28 289ndash297 (2014)doi 101016jgloenvcha201407009
8 V Galaz Global Environmental Governance Technology andPolitics The Anthropocene Gap (Edward Elgar CheltenhamUK 2014)
9 UN GSP (UN High-Level Panel on Global Sustainability)Resilient People Resilient Planet A Future Worth Choosing(Report for the 2012 Rio+20 Earth Summit United NationsNew York 2012)
10 WBCSD (World Business Council on Sustainable Development)Action 2020 Overview (WBCSD Geneva Switzerlandhttpaction2020org accessed 18 June 2014)
11 R Costanza L Graumlich W Steffen Eds Integrated Historyand Future of People on Earth (MIT Press CambridgeMA USA 2006)
12 S Soumlrlin P Warde in Naturersquos End History and theEnvironment S Soumlrlin P Warde Eds (Palgrave MacMillanLondon 2009) pp 1ndash19
13 R C Bishop Endangered species and uncertainty Theeconomics of a safe minimum standard Am J Agric Econ 6110ndash18 (1978) doi 1023071240156
14 T M Crowards Safe minimum standards Costs andopportunities Ecol Econ 25 303ndash314 (1998) doi 101016S0921-8009(97)00041-4
15 W Steffen J Crutzen J R McNeill The Anthropocene Arehumans now overwhelming the great forces of NatureAmbio 36 614ndash621 (2007) doi 1015790044-7447(2007)36[614TAAHNO]20CO2 pmid 18240674
16 W Steffen et al Global Change and the Earth System A PlanetUnder Pressure (The IGBP Book Series Springer-VerlagBerlin Heidelberg New York 2004)
17 IPCC (Intergovernmental Panel on Climate Change) Managingthe risks of extreme events and disasters to advanceclimate change adaptation A special report of Working GroupsI and II of the IPCC CB Field et al Eds (CambridgeUniversity Press Cambridge UK (2012) doi 101017CBO9781139177245
18 IPCC (Intergovernmental Panel on Climate Change) ClimateChange 2013 The Physical Science Basis Summary forPolicymakers L Alexander et al Eds (IPCC SecretariatGeneva Switzerland 2013) doi 101017CBO9781107415324
19 P J Crutzen Geology of mankind Nature 415 23 (2002)doi 101038415023a pmid 11780095
20 K Richardson W Steffen D Liverman Climate Change GlobalRisks Challenges and Decisions (Cambridge Univ PressCambridge UK 2011)
21 T M Lenton et al Tipping elements in the Earthrsquos climatesystem Proc Natl Acad Sci USA 105 1786ndash1793 (2008)doi 101073pnas0705414105 pmid 18258748
22 M Scheffer et al Early-warning signals for criticaltransitions Nature 461 53ndash59 (2009) doi 101038nature08227 pmid 19727193
23 S R Carpenter W A Brock Rising variance A leadingindicator of ecological transition Ecol Lett 9 311ndash318 (2006)doi 101111j1461-0248200500877x pmid 16958897
24 J Bakke et al Rapid oceanic and atmospheric changes duringthe Younger Dryas cold period Nat Geosci 2 202ndash205(2009) doi 101038ngeo439
25 M Scheffer et al Anticipating critical transitions Science338 344ndash348 (2012) doi 101126science1225244pmid 23087241
26 R Wang et al Flickering gives early warning signals of acritical transition to a eutrophic lake state Nature 492419ndash422 (2012) doi 101038nature11655 pmid 23160492
27 R Biggs S R Carpenter W A Brock Turning back fromthe brink Detecting an impending regime shift in time to avertit Proc Natl Acad Sci USA 106 826ndash831 (2009)doi 101073pnas0811729106 pmid 19124774
28 M MacLeod et al Identifying chemicals that are planetaryboundary threats Environ Sci Technol 48 11057ndash11063(2014) doi 101021es501893m pmid 25181298
29 C S Holling Resilience and stability of ecological systemsAnnu Rev Ecol Syst 4 1ndash23 (1973) doi 101146annureves04110173000245
30 C Folke et al Resilience thinking Integrating resilienceadaptability and transformability Ecol Soc 15 20 (2010)wwwecologyandsocietyorgvol15iss4art20
31 T P Hughes S Carpenter J Rockstroumlm M SchefferB Walker Multiscale regime shifts and planetary boundariesTrends Ecol Evol 28 389ndash395 (2013) doi 101016jtree201305019 pmid 23769417
32 T M Lenton H T P Williams On the origin of planetary-scaletipping points Trends Ecol Evol 28 380ndash382 (2013)doi 101016jtree201306001 pmid 23777818
33 Supplementary text figures and tables are available onScience Online
34 NOAA (National Oceanic and Atmospheric Administration)NOAA-ESRL Annual CO2 Data accessed at httpco2noworgCurrent-CO2CO2-Nowannual-co2html (2014)
35 S E Perkins L V Alexander J Nairn Increasing frequencyintensity and duration of observed global heat waves and warmspells Geophys Res Lett 39 L20714 (2012) doi 1010292012GL053361
36 A Shepherd et al A reconciled estimate of ice-sheet massbalance Science 338 1183ndash1189 (2012) doi 101126science1228102 pmid 23197528
37 M R Helmus T J Bland C K Williams A R IvesPhylogenetic measures of biodiversity Am Nat 169 E68ndashE83(2007) doi 101086511334 pmid 17230400
38 S Drsquoagata et al Human-mediated loss of phylogeneticand functional diversity in coral reef fishes Curr Biol24 555ndash560 (2014) doi 101016jcub201401049pmid 24560574
39 A D Barnosky et al Has the Earthrsquos sixth mass extinctionalready arrived Nature 471 51ndash57 (2011) doi 101038nature09678 pmid 21368823
40 N W Mason F de Bello D Mouillot S Pavoine S Dray Aguide for using functional diversity indices to reveal changesin assembly processes along ecological gradients J VegSci 24 794ndash806 (2013) doi 101111jvs12013
41 R J Scholes R Biggs A biodiversity intactness index Nature434 45ndash49 (2005) doi 101038nature03289pmid 15744293
42 B Cardinale Ecology Impacts of biodiversity loss Science336 552ndash553 (2012) doi 101126science1222102pmid 22556243
43 D U Hooper et al A global synthesis reveals biodiversityloss as a major driver of ecosystem change Nature 486105ndash108 (2012) doi 101038nature11118pmid 22678289
44 BAS (British Antarctic Survey) ldquoAntarctic ozonerdquo wwwantarcticaacukmetjdsozoneindexhtmldata J ShanklinBritish Antarctic Survey (2013)
45 Royal Society Ocean Acidification Due to IncreasingAtmospheric Carbon Dioxide Policy Document 1205 (TheRoyal Society London 2005)
46 J M Guinotte V J Fabry Ocean acidification and its potentialeffects on marine ecosystems Ann N Y Acad Sci 1134320ndash342 (2008) doi 101196annals1439013pmid 18566099
47 D J Conley Terrestrial ecosystems and the globalbiogeochemical silica cycle Global Biogeochem Cycles 16681ndash688 (2002) doi 1010292002GB001894
SCIENCE sciencemagorg 13 FEBRUARY 2015 bull VOL 347 ISSUE 6223 1259855-9
RESEARCH | RESEARCH ARTICLE
48 F Vandevenne E Struyf W Clymans P Meire Agriculturalsilica harvest Have humans created a new loop in the globalsilica cycle Front Ecol Environ 10 243ndash248 (2012)doi 101890110046
49 S E Gress T D Nichols C C Northcraft W T PeterjohnNutrient limitation in soils exhibiting differing nitrogenavailabilities What lies beyond nitrogen saturation Ecol 88119ndash130 (2007) doi 1018900012-9658(2007)88[119NLISED]20CO2 pmid 17489460
50 H Hillebrand V Lehmpfuhl Resource stoichiometry andconsumers control the biodiversity-productivity relationship inpelagic metacommunities Am Nat 178 171ndash181 (2011)doi 101086660831 pmid 21750381
51 C M Moore et al Processes and patterns of oceanic nutrientlimitation Nat Geosci 6 701ndash710 (2013) doi 101038ngeo1765
52 G K MacDonald E M Bennett P A Potter N RamankuttyAgronomic phosphorus imbalances across the worldrsquoscroplands Proc Natl Acad Sci USA 108 3086ndash3091 (2011)doi 101073pnas1010808108 pmid 21282605
53 L Bouwman et al Exploring global changes in nitrogen andphosphorus cycles in agriculture induced by livestockproduction over the 1900-2050 period Proc Natl AcadSci USA 110 20882ndash20887 (2013) doi 101073pnas1012878108 pmid 21576477
54 W Steffen M Stafford Smith Planetary boundaries equityand global sustainability Why wealthy countries could benefitfrom more equity Curr Opinion Environ Sust 5 403ndash408(2013) doi 101016jcosust201304007
55 D J Greenwood et al A unifying concept for the dependenceof whole-crop N P ratio on biomass theory and experimentAnn Bot (Lond) 102 967ndash977 (2008) doi 101093aobmcn188 pmid 18840873
56 P K Snyder C Delire J A Foley Evaluating the influence ofdifferent vegetation biomes on the global climate Clim Dyn23 279ndash302 (2004) doi 101007s00382-004-0430-0
57 P C West G T Narisma C C Barford C J KucharikJ A Foley An alternative approach for quantifying climateregulation by ecosystems Front Ecol Environ 9 126ndash133(2010) doi 101890090015
58 EPI (Earth Policy Institute) ldquoForest coverrdquo wwwearthpolicyorgindicatorsC56forests_2012_ (2014)
59 M Falkenmark Meeting water requirements of an expandingworld population Philos Trans R Soc Lond B Biol Sci 352929ndash936 (1997) doi 101098rstb19970072
60 J S Wallace M C Acreman C A Sullivan The sharing ofwater between society and ecosystems From conflict tocatchment-based co-management Philos Trans R Soc LondB Biol Sci 358 2011ndash2026 (2003) doi 101098rstb20031383 pmid 14728795
61 N L Poff et al The natural flow regime A paradigm for riverconservation and restoration BioSci 47 769ndash784 (1997)doi 1023071313099
62 N L Poff J K H Zimmerman Ecological responses to alteredflow regimes A literature review to inform the science andmanagement of environmental flows Biol 55 194ndash205 (2010)doi 101111j1365-2427200902272x
63 A V Pastor F Ludwig H Biemans H Hoff P KabatAccounting for environmental flow requirements in globalwater assessments Hydrol Earth Syst Sci 18 5041ndash5059(2014) doi 105194hess-18-5041-2014
64 WHO (World Health Organization) Burden of Disease from theJoint Effects of Household and Ambient Air Pollution for 2012(wwwwhointphehealth_topicsoutdoorairdatabasesFINAL_HAP_AAP_BoD24March2014pdf accessed 23 June 2014httpwwwwhointphehealth_topicsoutdoorairdatabasesen)
65 O Boucher et al in Climate Change 2013 The Physical ScienceBasis IPCC AR5 WGI report T Stocker et al Eds (CambridgeUniv Press Cambridge UK 2013) chap 7 pp 571ndash657
66 M Chin et al Multi-decadal aerosol variations from 1980 to2009 A perspective from observations and a global modelAtmos Chem Phys 14 3657ndash3690 (2014) doi 105194acp-14-3657-2014
67 V Ramanathan et al Atmospheric brown clouds Impacts onSouth Asian climate and hydrological cycle Proc Natl AcadSci USA 102 5326ndash5333 (2005) doi 101073pnas0500656102 pmid 15749818
68 M Cole P Lindeque C Halsband T S Galloway Microplasticsas contaminants in the marine environment A review MarPollut Bull 62 2588ndash2597 (2011) doi 101016jmarpolbul201109025 pmid 22001295
69 EEA (European Environment Agency) Genetically ModifiedOrganisms (GMOs) The Significance of Gene Flow ThroughPollen Transfer (Environmental Issue Report 28 EuropeanEnvironment Agency Copenhagen Denmark 2002)
70 J A Ivar do Sul M F Costa The present and future ofmicroplastic pollution in the marine environment Environ Pollut185 352ndash364 (2014) doi 101016jenvpol201310036pmid 24275078
71 R Kessler Engineered nanoparticles in consumer productsUnderstanding a new ingredient Environ Health Perspect 119a120ndasha125 (2011) doi 101289ehp119-a120 pmid 21356630
72 M Rees Our Final Century Will Civilisation Survive theTwenty-first Century (Arrow Books London 2003)
73 L M Persson et al Confronting unknown planetary boundarythreats from chemical pollution Environ Sci Technol 4712619ndash12622 (2013) doi 101021es402501c pmid 23980998
74 P P Egeghy et al The exposure data landscape formanufactured chemicals Sci Total Environ 414 159ndash166(2012) doi 101016jscitotenv201110046 pmid 22104386
75 UNEP (United Nations Environment Programme) GCOGlobal Chemicals Outlook Towards Sound Management ofChemicals (United Nations Environment ProgrammeNairobi Kenya 2013)
76 S Strempel M Scheringer C A Ng K HungerbuumlhlerScreening for PBT chemicals among the ldquoexistingrdquo andldquonewrdquo chemicals of the EU Environ Sci Technol 465680ndash5687 (2012) doi 101021es3002713pmid 22494215
77 M Scheringer et al How many persistent organic pollutantsshould we expect Atmos Poll Res 3 383ndash391 (2012)doi 105094APR2012044
78 K Sanderson Chemistry Itrsquos not easy being green Nature469 18ndash20 (2011) doi 101038469018a pmid 21209638
79 P A Schulte et al Occupational safety and health greenchemistry and sustainability A review of areas ofconvergence Environ Health 12 31 (2013) doi 1011861476-069X-12-31 pmid 23587312
80 EEA (European Environment Agency) Late Lessons from EarlyWarnings The Precautionary Principle 1896-2000 (EnvironmentalIssue Report 222001 Copenhagen Denmark 2001)
81 D Gee Late lessons from early warnings Toward realism andprecaution with endocrine-disrupting substances EnvironHealth Perspect 114 (suppl 1) 152ndash160 (2006) doi 101289ehp8134 pmid 16818262
82 T Lenton A Watson A Revolutions That Made the Earth(Oxford Univ Press Oxford UK 2011)
83 R Biggs et al Toward principles for enhancing the resilienceof ecosystem services Annu Rev Environ Resour 37421ndash448 (2012) doi 101146annurev-environ-051211-123836
84 G S Cumming P Olsson F S Chapin III C S HollingResilience experimentation and scale mismatches in social-ecological systems Landscape Ecol 28 1139ndash1150 (2013)doi 101007s10980-012-9725-4
85 D Griggs et al Policy Sustainable development goals forpeople and planet Nature 495 305ndash307 (2013) doi 101038495305a pmid 23518546
86 R Costanza Ed Ecological Economics The Science andManagement of Sustainability (Columbia Univ PressNew York 1991)
87 C Folke in Linking the Natural Environment and the EconomyEssays from the Eco-Eco Group C Folke T Karingberger Eds(Kluwer Academic Publishers Dordrecht Netherlands 1991)pp 77ndash94
88 L Robin S Soumlrlin P Warde Eds The Future of NatureDocuments of Global Change (Yale Univ Press New Haven CT2013)
89 U Heise Sense of Place and Sense of Planet TheEnvironmental Imagination of the Global (Oxford Univ PressOxford 2008)
90 M Scheffer Critical Transitions in Nature and Society(Princeton Univ Press Princeton NJ 2009)
91 J Masco Bad weather On planetary crisis Soc Stud Sci 407ndash40 (2010) doi 1011770306312709341598
92 G Paacutelsson et al Reconceptualizing the lsquoAnthroposrsquo in theAnthropocene Integrating the social sciences and humanitiesin global environmental change research Environ Sci Policy28 4 (2013) doi 101016jenvsci201211004
93 N Castree et al Changing the intellectual climate NatureClim Change 4 763ndash768 (2014) doi 101038nclimate2339
94 J M Anderies S R Carpenter W Steffen J Rockstroumlm Thetopology of non-linear global carbon dynamics From tippingpoints to planetary boundaries Environ Res Lett 8 044048(2013) doi 1010881748-932684044048
95 S E Cornell I C Prentice J I House C J DownyUnderstanding the Earth System Global Change Science forApplication (Cambridge Univ Press Cambridge 2012)
96 J A Dearing et al Safe and just operating spaces for regionalsocial-ecological systems Glob Environ Change 28 227ndash238(2014) doi 101016jgloenvcha201406012
ACKNOWLEDGMENTS
We thank J Foley and N Ramunkutty for contributions to theland-system change boundary A Pastor for analytical work on thePB for freshwater B Armstrong C Butler T McMichael andA Woodward for contributions to the novel entities boundary andB Scholes for comments on an earlier version of the manuscriptData associated with the paper are located at the StockholmResilience Centre Sweden (httpwwwstockholmresilienceorg21researchresearch-programmesplanetary-boundarieshtml)The planetary boundaries research at the Stockholm ResilienceCentre is made possible through a core grant from MISTRA(Swedish Foundation for Strategic Environmental Research) SECis supported by the Swedish Research Council EMB is supportedby the Natural Sciences and Engineering Research Council ofCanada and by the Trottier Institute for Science and Public PolicyRB is supported by a Branco Weiss Fellowship CF is supportedby the Family Erling Persson Academy Programme on GlobalEconomic Dynamics and the Biosphere IF is supported by theStordalen Foundation (Norway) SS is supported by theRiksbanken Jubileumsfond and the Institute for Advanced StudyPrinceton NJ and SRC and VR are supported bythe US National Science Foundation
SUPPLEMENTARY MATERIALS
wwwsciencemagorgcontent34762231259855supplDC1MethodsFigs S1 to S10Tables S1 to S3References (97ndash158)
11 August 2014 accepted 8 January 2015Published online 15 January 2015101126science1259855
1259855-10 13 FEBRUARY 2015 bull VOL 347 ISSUE 6223 sciencemagorg SCIENCE
RESEARCH | RESEARCH ARTICLE
wwwsciencemagorgcgicontentfullscience1259855DC1
Supplementary Materials for
Planetary boundaries Guiding human development on a changing planet
Will Steffen Katherine Richardson Johan Rockstroumlm Sarah E Cornell Ingo Fetzer Elena M Bennett R Biggs Stephen R Carpenter Wim de Vries Cynthia A de Wit
Carl Folke Dieter Gerten Jens Heinke Georgina M Mace Linn M Persson Veerabhadran Ramanathan B Reyers Sverker Soumlrlin
Corresponding author E-mail willsteffenanueduau
Published 15 January 2015 on Science Express DOI 101126science1259855
This PDF file includes
Methods Figs S1 to S10 Tables S1 to S3 References
1
Supplementary Materials for
Planetary Boundaries Guiding human development on a changing
planet
Authors Will Steffen12 Katherine Richardson3 Johan Rockstroumlm1 Sarah E Cornell1 Ingo Fetzer1 Elena M Bennett4 R Biggs15 Stephen R Carpenter6 Wim de Vries78 Cynthia A de Wit9 Carl Folke110 Dieter Gerten11 Jens Heinke111213 Georgina M
Mace14 Linn M Persson15 Veerabhadran Ramanathan1617 B Reyers118 Sverker Soumlrlin19 Affiliations 1 Stockholm Resilience Centre Stockholm University SE-10691 Stockholm Sweden 2 Fenner School of Environment and Society The Australian National University Canberra ACT 2601 Australia 3 Center for Macroecology Evolution and Climate University of Copenhagen Natural History Museum of Denmark Universitetsparken 15 Building 3 DK-2100 Copenhagen Denmark 4 Department of Natural Resource Sciences and McGill School of Environment McGill University 21 111 Lakeshore Rd Ste-Anne-de-Bellevue QC H9X 3V9 Canada 5 Centre for Studies in Complexity University of Stellenbosch Private Bag X1 Stellenbosch 7602 South Africa 6 Center for Limnology University of Wisconsin 680 North Park Street Madison WI 53706 USA 7 Alterra Wageningen University and Research Centre PO Box 47 6700AA Wageningen The Netherlands 8 Environmental Systems Analysis Group Wageningen University PO Box 47 6700 AA Wageningen The Netherlands 9 Department of Environmental Science and Analytical Chemistry Stockholm University SE-10691 Stockholm Sweden 10 Beijer Institute of Ecological Economics Royal Swedish Academy of Sciences SE-10405 Stockholm Sweden
2
11 Research Domain Earth System Analysis Potsdam Institute for Climate Impact Research (PIK) Telegraphenberg A62 14473 Potsdam Germany 12 International Livestock Research Institute PO Box 30709 Nairobi 00100 Kenya 13 CSIRO (Commonwealth Scientific and Industrial Research Organization) St Lucia QLD 4067 Australia 14 Centre for Biodiversity and Environment Research (CBER) Department of Genetics Evolution and Environment University College London Gower Street London WC1E 6BT UK 15 Stockholm Environment Institute Linneacutegatan 87D SE-10451 Stockholm Sweden 16 Scripps Institution of Oceanography University of California at San Diego 8622 Kennel Way La Jolla CA 92037 USA 17 UNESCO Professor TERI University 10 Institutional Area Vasant Kunj New Delhi Delhi 110070 India 18 Natural Resources and the Environment CSIR PB Box 320 Stellenbosch 7599 South Africa 19 Division of History of Science Technology and Environment KTH Royal Institute of Technology SE-10044 Stockholm Sweden
correspondence to willsteffenanueduau This PDF file includes
Methods Figs S1 to S10 Tables S1 to S3
3
Methods Biogeochemical flows phosphorus Control variables Ocean anoxia (global) For this component of the P boundary we retain as the control variable the inflow of P to the ocean as compared to the natural background weathering rate Freshwater eutrophication (regionalcroplands) Carpenter and Bennett (3) proposed three possible control variables the flow of P from land to freshwater the flow of P to erodible soils and the total mass of erodible P on the continents They computed the planetary boundary and its sensitivities to different water quality criteria and to a range of assumed flow rates of P to the sea The water quality criterion they propose is based on a relationship (Carlsonrsquos index) that connects several metrics of water quality including P concentration to phytoplankton biomass (97) A water quality criterion of 160 mg mminus3 is appropriate for rivers while a level of 24 mg P mminus3 avoids the eutrophication of freshwater lakes and reservoirs We adopt a flow rate of P to the sea consistent with the ocean anoxia boundary We then adopt the flow of P to erodible soil as the control variable It would arguably be more appropriate to use the flow of P from soil to the freshwater system as the control variable as this is more directly related to eutrophication but this component is more difficult to measure than the application of P to soils and is also less amenable to management control However a drawback of using P application rate to soil is that the estimated boundary is based on an assumed and constant flow rate of P to the sea This is unlikely to be the case as erosion rates have changed dramatically since pre-historic times (98) Also we assume here that all cropland soils are in principle ldquoerodiblerdquo in terms of flow of P from soil to freshwater but that actual erodibility will in practice vary considerably depending on the nature of the soil and the tillage practice Proposed boundary values Ocean anoxia (global) We assume a relatively low natural background rate of P inflow to the ocean of about 11 Tg P yr-1 which implies a boundary of about 12 to 13 Tg P yr-
1(1) However even larger increases would have to be maintained for 10000 years or more to double the amount of P in the oceans Approaching a human-induced threshold for an ocean anoxic event would probably be at least 1000 years in the future at present rates of P inflow (8 or 9 Tg P yr-1) and much longer at inflows of about 13 Tg P yr-1 Given these very long timeframes the original P boundary was set at about 10 times the natural background weathering rate or 11 Tg P yr-1 with a zone of uncertainty of 11 to 100 Tg P yr-1 (1)
4
Freshwater eutrophication (regionalcroplands) Based on the Carpenter and Bennett (3) analysis we adopt the riverine water quality criterion of 160 mg mminus3 and a flow rate to the ocean of 9 Tg P yr-1 For this water quality criterion to be appropriate we assume that sedimentation will reduce the P concentration in lakes below the lake water quality criterion of 24 mg mminus3 That is we are not proposing a lake and reservoir water quality criterion of 160 mg mminus3 These parameters give a boundary of 262 Tg P yr-1 (Table A1 in (3)) This boundary also includes the fluxes from natural and human-induced weathering which are estimated to be 15-20 Tg P yr-1 (3) Subtracting these fluxes then gives a lower boundary in terms of fertilizer-P flux to soil of 62 Tg P yr-1 and a zone of uncertainty of 62-112 Tg P yr-1 This can be converted to a uniform rate of P addition to croplands of ca 41 kg ha-1 yr-1 assuming a total global cropland area of 1494 x 106 ha (99) Applying the zone of uncertainty gives a range of 41 kg ha-1 yr-1 to 75 kg ha-1 yr-1 for the P addition rate (Fig S5A) For the P planetary boundary we focus on mined P applied to soils as a fertilizer Significant amounts of P are also applied as manure (50100) However we differentiate them here because manure is P recycled internally in the agricultural system while fertilizer P represents additional P added to agricultural systems from an inert source It is important however in the context of this component of the P planetary boundary to recognize that more effective recycling of manure P can reduce P runoff and will also reduce the demand for fertilizer P Biogeochemical flows nitrogen Control variable Anthropogenic input of reactive N to the Earth System occurs through (i) the anthropogenic industrial fixation of nitrogen from atmospheric N2 via the Haber-Bosch process (ii) intended biological N fixation and (iii) unintended N fixation due to the emission of nitrogen oxides (NOx) from transport and industry (5) N fixation via the Haber-Bosch process is by far the quantitatively most important mode of the intended anthropogenic N-fixation As suggested by De Vries et al (5) the combined input of N from intended human fixation processes ((i) and (ii) above) is proposed as the control variable for the planetary N-boundary The unintended N fixation is not included in the control variable Proposed boundary value De Vries et al (5) estimated individual boundaries for nitrogen fixation based on critical limits for four major environmental concerns atmospheric NH3 concentrations radiative forcing by N2O drinking water contamination by NO3
- and eutrophication of aquatic ecosystems Depending on which of the environmental concerns was being addressed the De Vries et al (5) calculations suggest boundaries ranging from 20 to gt 130 Tg N yr-1
5
Applying a climatic (N2O) constraint results in the most stringent of these estimates (20 Tg N yr-1) based on a climate change boundary set at a +1 W m-2 change in radiative forcing (1) All of the other potential N boundaries fall in the range 62-133 Tg N yr-1 (5) Assuming that this stringent climatic-based potential N boundary is addressed in the climate change boundary we then consider eutrophication of aquatic ecosystems as the environmental concern being addressed as for P Also as for P the appropriate control variable for the N boundary is the flow of N from soil to the freshwater system as this is directly related to the risk of eutrophication However again for pragmatic reasons we adopt the application rate of intentionally fixed reactive N to the agricultural system This control variable is easier to measure and track and is more directly amenable to policy and management interventions On this basis the proposed boundary is 62-82 Tg N yr-1 depending on the critical N concentration used (5) We take the lower value 62 Tg N yr-
1 as the boundary itself and set the zone of uncertainty at 62-82 Tg N yr-1 As for P this range can be converted to a uniform rate of N addition to croplands of 41-55 kg ha-1 yr-1 based on the total global cropland area (99 Fig S5B) In their analysis of potential planetary boundaries for N De Vries et al (5) also considered the human needs for food production They projected a baseline human need for N fixation for a population of nine billion people of ~50-80 Tg N yr-1 with the higher number assuming current N-use efficiency in agriculture and the lower a 25 increase in N-use efficiency (5) Their results are in the same order of magnitude as a recent global model analysis by Bodirsky et al (2014) (101) who estimated the N amount required to satisfy a given future demand for agricultural products under different assumptions regarding consumption patterns and production technology Using a combination of dietary changes (less consumption of animal products) and mitigation actions including increased household waste recycling reduced losses in animal waste management and increased efficiencies in fertilization and livestock management they showed that food requirements can be fulfilled at an N input of 95 Tg N yr-1 The analysis of De Vries et al (5) is even lower but assumes even more rigorous mitigation approaches Our proposed boundary and zone of uncertainty calculated on environmental criteria of 62-82 Tg N yr-
1 compares well with these ldquoN needsrdquo estimates Biogeochemical flows linkage between phosphorus and nitrogen boundaries Our approach to exploring the links between the P and N boundaries is based on the coupling of these elements in plant growth The average NP ratio in growing plant tissue is approximately 1181 (55) Currently the global NP input ratio based on N and P fertilizer application rates and agricultural N fixation is approximately 861 (12114 Tg y-1) based on estimates for the year 2000 (53) This is lower than the ratio of approximately 1181 in growing plant tissue We consider that an application rate of N and P in fertilizers somewhat nearer the ratio that the crop takes up would be desirable Using this approach would require the ratio of losses of N and P to the environment via leaching and emissions to the atmosphere to be equivalent to the NP input ratio
6
Currently the global NP loss ratio is approximately 1121 (138 vs 12 Tg y-1) based on estimates for the year 2000 (53) thus being close to 1181 Using the lower P boundary as the basis the N boundary would be 62 x 118 = 73 Tg N yr-1 while using the upper end of the zone of uncertainty for P would lead to 112 x 118 = 132 Tg N yr-1 Conversely using the lower and upper values of the N zone of uncertainty (62 and 82 Tg N yr-1 respectively) as the basis the P boundary would be 53ndash69 Tg P yr-1 being near the lower range of the P boundary Comparing the two boundary values for each of P and N shows the high level of consistency between the two approaches P (independent) 62 Tg P yr-1 P (from N and NP ratio) 53 Tg P yr-1 N (independent) 62 Tg N yr-1 N (from P and NP ratio) 73 Tg N yr-1 The differences in these values are likely to be non-significant given the level of precision of the data available for the calculations We realize that use of an NP ratio of 118 for the N to P inputs based on crop uptake could potentially lead to an overloading of aquatic systems with P relative to N since the typical aquatic NP mass ratio is near 14 The aquatic NP ratio represents the net outcome of input and loss processes including denitrification and sedimentation The ratio of N and P deposited on agricultural ecosystems is however different from the NP ratio in runoff that flows into freshwaters due to differences in the behavior of N and P in soil N storage in agriculture soils is limited to biological process (net immobilization) and in general the N surplus (N input minus N removal by crops) is predominantly lost to air (NH3 N2O NOx and N2 emissions) and water On the other hand P storage in agriculture soils is predominantly due to physicochemical processes (adsorption) and in general the P surplus is predominantly accumulated in soil while only a small fraction is lost to water Consequently the current ratio of NP loading to water is near 14 whereas the input ratio is near 8 (53) In summary even though the NP ratio of 118 is below 14 it does not necessarily lead to an overloading of aquatic systems with P relative to N due to differences in N and P retention in soils and processing in aquatic ecosystems The current pattern of P and N addition to agricultural areas is highly uneven with a few areas of very high rates of usage (eg central North America western Europe and northern China) and large areas of very low rates of usage (Fig S5AB) In this context it is important to note that De Vries et al (5) derived the planetary N boundaries of 62-82 Tg N yr-1 to avoid eutrophication of surface waters by reducing present N inputs in agricultural areas where N losses currently exceed critical limits for N in surface water Inversely they did not elevate the N inputs in areas where current concentrations were below critical limits (mostly in remote areas with less intense agriculture) In nitrogen-poor areas agricultural production can be increased by allowing an increase in N input while still remaining well below the critical limits for eutrophication Including such an increase would have raised the planetary boundary calculated by De Vries et al (5) First indicative calculations indicate that this could be as high as the N boundary derived from the upper P boundary ie near 132 Tg N yr-1 The proposed N boundaries here are thus
7
likely an underestimate if an optimal allocation of N (and P) can be achieved across the planet The current globally aggregated rates of P and N application are 14 Tg P yr-1 (52) and 150 Tg N yr-1 (100) respectively Thus even if complete optimal allocation of P and N can be achieved across the planet current loadings of P and N exceed environmental limits and thus are transgressing our proposed planetary boundaries (see Fig 3 in main text) Land-system change Control variables Global The area of forested land that is maintained on the ice-free land surface expressed as a percentage of the potential area of forested land in the Holocene (that is the area of forest assuming no human land-cover change) Biome The area of forested land that is maintained in each of the three major forest biomes ndash tropical temperate boreal ndash expressed as a percentage of the potential forest area in each of these three biomes Proposed boundary values Global 75 of potential forest cover should be maintained (or approximately 479 million km2 of the ice-free land surface of Earth based on areal estimates (56)) This boundary has been constructed as a weighted aggregate of the three individual biome boundaries as described below Biome The estimated boundary for each of the biomes is based on (i) the relative potential of land cover change within each biome to influence the climate system remotely especially at the global level (102) and (ii) the potential for a threshold within each of the forest biomes in which land-cover change beyond a certain area activates self-reinforcing feedbacks that lead to land-cover change across a much larger area Tropical Forest 85 of potential forest cover should be maintained (approximately 193 million km2) based on the following rationale There are well-founded arguments that a threshold of land-cover change exists that if crossed would trigger the widespread conversion of the Amazon Basin tropical forest to a savanna or grassland (103-106) The self-reinforcing feedback mechanism involved in the threshold is the reduction of evapotranspiration resulting from the conversion of forest to cropland or grazing land which beyond a certain point leads to a reduction in rainfall which triggers further conversion of forested land to savanna or grassland
8
A more difficult question is where this threshold might lie For the present a boundary at 15 conversion of the rainforest (85 forest remaining) has been suggested which is approximately the present amount of deforestation There is no strong evidence that the biome-level threshold has been crossed although there is some evidence of regional regime shifts (107-109) There is also a suggestion that in the last decade the Amazon forests have become more vulnerable to drought and wildfire (110) which could be a harbinger of conversion to drier ecosystems Temperate Forest 50 of potential forest cover should be maintained (approximately 95 million km2) This is a provisional boundary only based on sensitivity studies that evaluate the influence of the worldrsquos terrestrial biomes on the global climate (5657) Both tropical forests (changing evapotranspiration) and boreal forests (changing albedo) have strong impacts on the climate system with global teleconnections from the regional changes while temperate forests are assessed to have only moderate influence on the global climate Boreal Forest 85 of potential forest cover should be maintained (approximately 191 million km2) This is also a provisional boundary as there is no equivalent research on the boreal forest biome (as for tropical forests) exploring where thresholds might lie in terms of the fraction of forest converted before self-reinforcing feedback mechanisms are activated such as changes in fire regimes Figure S6 shows the area of forest cover remaining in the worldrsquos major forest biomes compared to the potential forest cover color-coded to show the position of the control variable (area of forest land remaining) with respect to the boundary The results shown in Figure S6 need to be interpreted with considerable caution The database used to define the potential area of the forest biomes and that used to estimate the area of forest remaining do not use identical definitions of various forest types or what constitutes a forest compared to a woodland In using the ESA GlobCover 2009 database (111) to estimate current forest cover we used the 100-40 cover category of remaining forest to define where forest was present in a given area This category would also include some degraded or partially cleared forests as ldquoremaining forestrdquo as well as some plantation forests such as palm oil This category thus probably overestimates the actual amount of original forest cover remaining This would lead to somewhat high percentages of remaining forest and thus to an optimistic estimate of the actual position of the control variable with respect to the boundary Aggregating the forest remaining compared to the potential forest for all of the biomes gives a global value of 62 forest remaining The global boundary is 75 with a zone of uncertainty between 75 and 54 Thus the current value transgresses the boundary but lies within the zone of uncertainty An independent estimate of the overall status of the land-system change boundary which includes all forests yields a value of 68 cover remaining (58) consistent with our estimate based on major contiguous forest biomes only
9
Freshwater Use Control Variables Global At the planetary scale the control variable is defined as the maximum amount of consumptive blue water use (km3yr) River basin scale The control variable is the maximum allowed amount of blue water withdrawal from a river basin defined as average of mean monthly flow (MMF) The river basin control variable is based on the concept of ldquoenvironmental water flowrdquo EWF (112) which is defined as the minimum amount of blue water that must remain within a river basin (as an average of mean monthly flow) to sustain ecosystem processes and resilience of inland and coastal landscapes Thus the withdrawal of water from a river basin and the EWF must add up to the mean monthly flow Determining EWF for a hydrological regime is complex and specific to spatial eco-hydrological conditions (113) This complexity is reflected by the proposal of over 200 methods based on hydrological hydraulic habitation simulation and holistic approaches to estimate EWF (63) Nevertheless a set of generic ldquorulesrdquo can be defined based on key characteristics of different river basins EWFs are based on the characterization of the quantity timing duration frequency and quality of blue water flows required to sustain freshwater estuarine and near-shore ecosystems and the human livelihoods and well-being that depend on them (60114) EWF includes both baseflow and stormflow ie low and high flow requirements to sustain ecosystem functions in river basins (115116) EWF thus provides a reasonable aggregate proxy on which to base sustainable water use in a river basin Proposed boundary values Global A global consumptive water use of blue water not exceeding 4000 km3 yr-1 (uncertainty range 4000-6000 km3 yr-1) River basin A maximum amount of average monthly blue water withdrawals in river basinssegments of 25 of mean monthly flow for periods of low flow (25ndash55) 40 for periods of intermediate flow (40ndash70) and 55 for periods of high flow (55ndash85) Methodology for estimating river basin boundary The boundary definition of allowed blue water withdrawals at river basin scale is calculated based on the EWF requirements River basin water withdrawal boundary () =
10
(MMFndash(EWF+015MMF))MMF100 where MMF is mean monthly river flow analyzed for each river segment The rationale for the factor of 015MMF added to EWF to determine the boundary is explained below MMF is relatively well quantified from hydrological observations assessments and models (117-119) The challenge is to define EWF Different river types and river stretches have different minimum water requirements according to their seasonal hydrographs For example there are differences between rivers characterized by stable flow regimes (with year-round baseflow) monsoon rivers with gt80 runoff flows concentrated in a 3-4 month rainy season and ephemeral and unpredictable rainfed rivers with long periods of low or no flow River basins may therefore be classified according to similarity in hydrological regime (61) Despite these difficulties several hydrological methods have been advanced to estimate EWFs (120-123 reviewed by (63))1 We acknowledge that other methods and metrics may be used to assess the effect of human water withdrawals and flow modifications on rivers and their ecosystems such as those used in Nilsson et al (124) and Voumlroumlsmarty et al (125) Pastor et al (63) have developed the new Variable Monthly Flow (VMF) method which we have used in calculating the basin scale planetary boundary for water The VMF method takes into consideration the need to sustain natural variable flow regimes while it can also be aggregated and validated at basin and global scale It classifies flow regimes into high- intermediate- and low-flow months by taking into account intra-annual variability It then allocates EWF as a percentage of mean monthly flow (MMF) following the natural variability of river flow Specifically it allocates 30 of MMF as EWF during high flow seasons (when MMF is gt 80 of MAF where MAF is mean annual flow) 45 of MMF during intermediate-flow seasons (when MMF is 40ndash80 of MAF) and 60 of MMF during low-flow seasons (when MMF lt 40 of MAF) In extremely dry conditions (MMF lt 1 m3 s-1) there is no EWF allocation Table S2 shows EWF calculated by the VMF methodology and the average maximum withdrawals (1 ndash EWF) that emerge from these estimates A range of uncertainty is added to reflect the variability in EWF estimates from different EWF methodologies (as compared to the VMF method 63) The planetary boundary level is placed at the lower end of the uncertainty range for each flow regime (lowintermediatehigh) necessitating the term 015MMF to be added to EWF to determine the boundary value as MMF ndash (EWF+015MMF) The estimate of monthly and annual EWF requirements is based on simulations of ldquopristinerdquo river discharge conditions in the absence of current anthropogenic land use irrigation and reservoir storage Note however that irrigation land use reservoir storage
1 For instance the Tessmann method allocates a percentage of mean monthly flow varying from 40 of MMF during high flow seasons to 100 of MMF during low flow seasons The Tennant method allocates 20 of mean annual flow (MAF) during low flow seasons and 40 of MAF during high flow seasons The Smakhtin method allocates Q90 as a base flow and an additional percentage of MAF during high flow seasons
11
and reservoir operation were considered in the analysis of withdrawals in order to derive their aggregate (including possible downstream) impacts on the naturalized flow conditions We carried out a new analysis for this paper using the dynamic global vegetation and water balance model LPJmL ((126) with an updated version of the land use patterns in (127)) The model was used to simulate river flow globally at a spatial resolution of 05ordm by 05ordm on a daily time step over the period 1981-2000 (after (63) as in (6)) The model runs were forced by the GPCC full reanalysis dataset version 5 for precipitation (128) with a synthetic number of wet days per month (129) and the CRU TS310 climatology for cloudiness and temperature (130) These flow volumes were translated into monthly EWFs and averaged over the 20-yr period River basins are delineated according to the STN-30p drainage network (httpwwwwsagunheduStn-30stn-30html) The range of average maximum withdrawals for different flow regimes based on EWF (from 40 at high flow to 70 at low flow) is a reflection of different eco-hydrologic characteristics of rivers The scientific uncertainty which is estimated at plusmn15 for each flow regime (Table S2) originates from an assessment of the variability in EWF estimates when applying different EWF methods (see 663) It is this uncertainty range (Table S2) and not the average maximum allowed withdrawal based directly on EWF itself that determines the boundaries and zones of uncertainty in Table 1 (main text) The LPJmL simulations applying the VMF methodology result in a global average EWF of 33 of MAF for the ndash15 and +15 cases EWFs are 18 and 48 of MAF respectively This compares well with other EWF methodologies where a comparison of five different methods in LPJmL resulted in a global average EWF of 25ndash46 of MAF with variable flow regimes such as the Nile having lower EWFs (ranging from 12 to 48 of MAF depending on the EWF estimation method) than stable tropical regimes such as the Amazon (ranging from 30 to 67 of MAF) (details in 63) In order to assess the current status of (non)-transgression of EWF (ie the degree to which average monthly water withdrawals already exceed the allowed volumes) daily water withdrawals for irrigated agriculture (summed up to mean monthly values) were calculated using LPJmL for each 05deg grid cell and month over the period 1981-2000 (following (126) and (131)) Domestic manufacturing thermoelectric and livestock water use were accounted for using data available annually for 1981ndash2000 from (132) and disaggregated to 20-yr monthly averages Figure S7 shows the results of this assessment For each cell an annual monthly average EWF is calculated based on the three boundary definitions in Table S2 which together with the withdrawal estimates gives an annual average value of actual (non)-exceedance of allowed withdrawal as compared to EWF Note that this figure presents the average situation for months with transgression only (see complementary analysis below) The differentiation between a safe operating space (in green) entering a danger zone (in yellow) and entering a high risk zone (in red) are defined by including the plusmn15 uncertainty range for different EWF methods as shown in Table S2 (that is MMF ndash (EWF+015MMF) defines the boundary for water withdrawals and MMF ndash (EWF-
12
015MMF) defines the other end of the uncertainty zone) The patterns shown in Figure S7 support an earlier analysis by Smakhtin et al (122) who used a method based on annual flow values determined at river outlets We stress that our results reflect the regionally and temporally variable patterns of environmental flows compared to the patterns of withdrawals which enables us to identify fractions of a river and its basin with transgressions Thus our analysis demonstrates a ldquodanger zonerdquo or ldquohigh risk zonerdquo only for some yet rather extensive parts of the Murray-Darling and Colorado basins rather than for the entire basins We note that model uncertainties may affect results in some regions such as in the Nile basin where macroscale hydrological models generally tend to overestimate flows (which may lead to an underestimation of transgressions) Overall though our results correspond well with other estimates of withdrawal limits based on EWF A recent assessment of a wide spectrum of different river basins indicate an average EWF of 37 of mean annual flow (63) An earlier study (122) indicated an EWF range of 30-50 of mean annual flow with maximum allowed withdrawals of 50-80 The number of months when the various thresholds are crossed is of importance in understanding the implications of water withdrawals for ecosystems Figure S8 displays the data according to how many months each year the water thresholds are exceeded The upper panel corresponds to the analysis shown in Fig S7 in the sense that it shows the duration of exceedance of the freshwater withdrawal boundary (MMF ndash (EWF+015MMF)) The lower panel shows the combination of these features ie duration (number of months) of transgression and severity of transgression into one index This map indicates extensive areas where transgression of the freshwater boundary occurs during more than half of the year A first analysis applying the river basin-scale boundary approach described above to the global level (6) shows that the proposed boundary of a maximum withdrawal of blue water (25ndash55 of mean monthly flow) corresponds on average to a global-level withdrawal of 2800 km3 yr-1 with an uncertainty range of 1100 ndash 4500 km3 yr-1 This compares fairly well with the proposed global freshwater boundary of 4000 km3 yr-1 (4000ndash6000 km3 yr-1) but also suggests that it may be lower if estimation methods yielding high EWF values are used
13
Fig S1 The 420000-year Vostok (Antarctica) ice core record showing the regular pattern of atmospheric CO2 and CH4 concentration and inferred temperature through four glacial-interglacial cycles (16 adapted from 133) Anatomically modern humans evolved around 200000 ndash 250000 years ago (134)
14
Fig S2 Record of δ18O per mil (scale on left) from the Greenland Ice Sheet Project (GRIP) ice core a proxy for atmospheric temperature over Greenland (approximate temperature range on oC relative to Holocene average is given on the right showing the relatively stable Holocene climate during the past ca 10000 years and Dansgaard-Oeschger events (numbered) during the preceding colder glacial climate (135) Note the relative stability of temperature for the last 11700 years (the Holocene) compared to the earlier ice age period
15
Fig S3 The global distribution of combined relative mean species abundance of original species (MSA) as an approximation of the aggregated human pressure on the terrestrial biosphere (136)
16
Fig S4 The ocean acidification boundary values of the control variable aragonite saturation state (Ωarag) under (a) 280 (pre-industrial state) (b) 380 (c) 400 (approximately current state) (d) 450 (e) 500 and (f) 550 ppm atmospheric CO2 concentrations Green represents regions where Ωarag is below the boundary yellow where it has transgressed the boundary but is still within the zone of uncertainty and red where it is beyond the zone of uncertainty Based on data from (137)
17
Fig S5A Geographical distribution of the control variable for phosphorus for the biogeochemical flows boundary highlighting large agricultural zones where the P boundary is transgressed The control variable is expressed as the uniform application rate of P in kg ha-1 yr-1 (see 33) Green represents regions where the application rate is below the boundary yellow where it has transgressed the boundary but is still within the zone of uncertainty and red where it is beyond the zone of uncertainty Only cropland areas are color-coded non-cropland areas are grey Application rates of P from (138) cropland area data from (99) The down-scaled boundaries shown here are derived from the global boundary assuming a uniform rate of addition of P local and regional pollution limits may deviate significantly from these boundaries
18
Fig S5B Geographical distribution of the control variable for nitrogen for the biogeochemical flows boundary highlighting large agricultural zones where the N boundary is transgressed The control variable is expressed as the uniform application rates of N in kg ha-1 yr-1 (see 33) Green represents regions where the application rate is below the boundary yellow where it has transgressed the boundary but is still within the zone of uncertainty and red where it is beyond the zone of uncertainty Only cropland areas are colour-coded non-cropland areas are grey Application rates of N are from (138) cropland area data are from (99) The down-scaled boundaries shown here are derived from the global boundary assuming a uniform rate of addition of N local and regional pollution limits may deviate significantly from these boundaries
19
Fig S6 Area of forest cover remaining in the worldrsquos major forest biomes compared to the potential forest cover color-coded to show the position of the control variable (area of forest land remaining) with respect to the boundary Areas not covered by major forest biomes are shown in grey The lighter-colored background areas represent the area of potential forest biomes as estimated by (139) Only large contiguous areas of forest have been used here to define the major biomes Much smaller isolated areas of forest (eg temperate forests in the northwest of the USA or along the east coast of Australia) have not been included in the analysis The area of forest remaining in each of the biomes is represented by the deeper colors overlain on the light background These areas have been calculated from the ESA GlobCover 2009 project database (111)
20
Fig S7 Transgression of the allowed monthly water withdrawals defined by EWF plotted as the degree of exceedance (fraction of maximum allowed level) during months that show such an exceedance For example green (within safe space) means that average exceedance in the respective months is still below the uncertainty range The results are shown for all river stretches on a global 05deg spatial grid computed for this study with the LPJmL model based on 1981ndash2000 monthly averages of MMF EWF (VMF method from (63) plusmn an uncertainty range to account for other methods) as well as agricultural industrial and domestic water withdrawals (see 33) Major river basins are delineated
21
Fig S8 Upper panel Number of months per year with a transgression (by any degree) of allowed water withdrawals corresponding to Figure S7 Lower panel Risk index defined as the product of duration and severity of transgression EWF is estimated according to the VMF method by the method of Pastor et al (63) here based on a different model setup and a new risk metric (see 33 for details)
22
Fig S9 Heating of the air by black and brown carbon (top panel) and dimming of the surface by all aerosols including co-emitted aerosols (bottom panel) The impacts of human emissions of aerosols include weakening the monsoons and melting HimalayanTibetan glaciers From (140)
23
Fig S10 The interaction between the biosphere integrity planetary boundary and other planetary boundaries As a given factor (ie boundary type such as biosphere integrity or climate change) moves further away from its own safe space the arrows indicate changes in the factor (another boundary type) In all cases positive feedbacks exist so a change in the factor away from the safe space will also move the affected factor away from the safe space Thicker arrows denote stronger and more closely related effects Thinner arrows indicate weaker and less closely related effects while dashed arrows indicate a weak andor complex effect with large uncertainties Adapted from (7)
24
Table S1 Transgression of one or more of the six of the PBs at the sub-global level would have consequences for the functioning of the Earth System at the global level (adapted from 50) Planetary boundary
Regional impacts with global implications if the boundary is transgressed
Biosphere Integrity
The loss or degradation of entire biomes (eg coral reefs) or of the biodiversity components associated with large-scale ecological processes (eg predation nutrient cycling) would have substantial impacts on regional and distant socialecological systems (141142) Changes in these biospheric processes could be large enough to compromise the Earthrsquos ability to sustain human societies as we know them especially through impacts on ecosystem goods and services such as food production and climate regulation
Novel entities Chemical pollutants can damage health and disrupt ecosystem functioning over large areas which can result in global scale impacts (80143-145) or affect abiotic processes such as the greenhouse effect (18) or stratospheric ozone chemistry (146)
Biogeochemical flows (P and N cycles)
Widespread eutrophication of freshwater bodies affects the freshwater boundary through reduced availability of water that is fit for human use which drives further modification of the global hydrological cycle (35147) Coastal eutrophication creates dead zones and harmful algae blooms that disrupt food webs and fisheries (148)
Land-system change
Deforestation of the Amazon basin has teleconnections to global climate (56103-105149) regional land-system change affects rainfall patterns at the continental scale (150)
Freshwater Use Human diversion of (i) water vapor (green water) flows disrupts climate regulation (103151) and (ii) liquid (blue) water flows induces collapse of aquatic ecosystems (152)
Atmospheric aerosols
Aerosol loading alters the hydrological cycle radiative balance albedo and biosphere processes Aerosol loading over the Indian sub-continent can trigger an abrupt shift of the Indian monsoon to a drier state influence Asian monsoon circulation and could also accelerate the melting of the Himalayan glaciers (67153-157)
25
Table S2 Environmental water flow (EWF) requirements ( of mean monthly runoff) for different flow regimes (low flow intermediate and high flow) and the associated maximum allowed withdrawals The river basin-scale water boundary is placed at the lower end of the uncertainty range (marked in the table in grey cells) The average values are based on the VMF method (63) while the uncertainty range approximates the uncertainty among different EWF calculation methods That is for the low flow regime for example the uncertainty range for an EWF of 60 (45-75) gives a range of maximum allowed withdrawals of 25-55 an average maximum allowed withdrawal of 40 and a boundary set at 25 (lower end of uncertainty range) Flow13 Regime13 EWF13 Maximum13 Allowed13 Withdrawal13
13 13 Average13 Uncertainty13 Range13
13 13 13 Low13 High13 Low13 Flow13 6013 4013 2513 5513 Intermediate13 4513 5513 4013 7013 High13 Flow13 3013 7013 5513 8513
26
Table S3 Examples of significant interactions between both of the core boundaries ndash climate change and biosphere integrity ndash and all of the other boundaries Earth System process
Interaction with Climate Change boundary
Interaction with Biosphere Integrity boundary
Climate change NA Many changes in ecosystem functioning at many scales from changes in temperature rainfall patterns extreme events and other changes in the physical climate system Large-scale changes in the distribution and composition of biomes Projected large increases in extinction rates of many taxa from rapid climate change In the other direction biospheric sinks of carbon are important in reducing radiative forcing due to human activities
Biosphere integrity (earlier ldquobiodiversity lossrdquo)
Erosion of resilience in both terrestrial and marine ecosystems results in higher risk of climate-induced tipping points in ecosystems and hence reducing their capacity to act as carbon sinks (eg loss of methane from melting permafrost)
NA
Novel entities (earlier ldquochemical pollutionrdquo)
CFCs and some of their replacements like HFCs are strong GHGs
Many adverse effects on organisms ndash eg toxicity population declines increased rate of biodiversity loss (POPs EDCs organometallics radiation etc) Flow-on effects of species alterations and loss to ecosystem functioning
Stratospheric ozone depletion
Affects atmospheric circulation in the southern hemisphere with consequences for storm tracks and rainfall patterns possible implications for uptake of
Increases UV-B at Earthrsquos surface especially in southern high latitudes in austral spring impacts on the functioning and composition of marine ecosystems
27
CO2 in the southern ocean cools the surface and the stratosphere
Ocean acidification Weakening of marine carbon sink increases airborne fraction of CO2 amplifying feedback to warming
Threat to coral reefs and other calcifying organisms likely flow-on effects up marine food chains
Biogeochemical flows interference with P and N cycles
Atmospheric N species affect radiative forcing N2O is a strong long-lived GHG NH3NH4
+ and NOx contribute to aerosol formation and alter hydrological cycling
Impacts on ecosystem functioning through the increase and redistribution of many important nutrients especially N and P Implications for biodiversity distribution on land and ocean (habitat change) The biosphere also absorbs and transforms many P and N compounds decreasing the perturbation in flows Eutrophication reduces positive effects of biodiversity on ecosystem stability (158)
Land-system change
Deforestation forest degradation and agricultural practices can all emit CO2 (and CH4 and N2O) to the atmosphere amplifying warming Conversely forest preservation reforestation and better agricultural practices can reduce emissions and absorb C from the atmosphere into vegetation and soils Historically 15-20 of GHG emissions come from land system change
Conversion of natural to human-dominated ecosystems changes functioning and in general leads to less resilient ecosystems Habitat fragmentation and conversion of habitats for human use is historically the largest driver of biodiversity loss in terrestrial ecosystems There can also be indirect effects through changes in disturbance regimes alteration of water vapour flows at continental scales introduction of invasive species etc
Freshwater use Reduction of growth in natural ecosystems reducing carbon sink in standing vegetation and soils Increase in CH4 emissions from pondages and irrigation
Changes in functioning and species loss in river wetland and lake ecosystems through diversion of water for human use This lead to losses in regulating and other
28
decrease in carbon transport from land to ocean via rivers
ecosystem services such as buffering during extreme events
Atmospheric aerosol loading
Affects radiative forcing in complex ways (mainly cooling but black and brown carbon cause warming) Alters tropical atmospheric circulation Also affects precipitation amounts (eg cooling aerosols reduce global precipitation) and patterns and hence land C sink strengths Black and brown carbon deposited on snow and ice cause melting of glaciers and sea ice
All aerosols natural and anthropogenic cause surface dimming and thus slow the hydrological cycle Acidic aerosols (sulfate nitrate) can damage freshwater ecosystems and soil biota Heavy smoke from excessive biomass burning and other combustion can be harmful and toxic to plants and animals Dust loadings alter the distribution of nutrients and light availability affecting primary production The biosphere can also remove many aerosols from the atmosphere
References 1 J Rockstroumlm W Steffen K Noone Aring Persson F S Chapin III E Lambin T M Lenton
M Scheffer C Folke H J Schellnhuber B Nykvist C A de Wit T Hughes S van der Leeuw H Rodhe S Soumlrlin P K Snyder R Costanza U Svedin M Falkenmark L Karlberg R W Corell V J Fabry J Hansen B Walker D Liverman K Richardson P Crutzen J Foley Planetary boundaries Exploring the safe operating space for humanity Ecol Soc 14 32 (2009) httpwwwecologyandsocietyorgvol14iss2art32
2 J Rockstroumlm W Steffen K Noone A Persson F S Chapin 3rd E F Lambin T M Lenton M Scheffer C Folke H J Schellnhuber B Nykvist C A de Wit T Hughes S van der Leeuw H Rodhe S Soumlrlin P K Snyder R Costanza U Svedin M Falkenmark L Karlberg R W Corell V J Fabry J Hansen B Walker D Liverman K Richardson P Crutzen J A Foley A safe operating space for humanity Nature 461 472ndash475 (2009) 101038461472a Medline doi101038461472a
3 S R Carpenter E M Bennett Reconsideration of the planetary boundary for phosphorus Environ Res Lett 6 014009 (2011) 1010881748-932661014009 doi1010881748-932661014009
4 S W Running Ecology A measurable planetary boundary for the biosphere Science 337 1458ndash1459 (2012) 101126science1227620 Medline doi101126science1227620
5 W de Vries J Kros C Kroeze S P Seitzinger Assessing planetary and regional nitrogen boundaries related to food security and adverse environmental impacts Curr Opinion Environ Sust 5 392ndash402 (2013) 101016jcosust201307004 doi101016jcosust201307004
6 D Gerten H Hoff J Rockstroumlm J Jaumlgermeyr M Kummu A V Pastor Towards a revised planetary boundary for consumptive freshwater use Role of environmental flow requirements Curr Opinion Environ Sust 5 551ndash558 (2013) 101016jcosust201311001 doi101016jcosust201311001
7 G M Mace B Reyers R Alkemade R Biggs F S Chapin III S E Cornell S Diacuteaz S Jennings P Leadley P J Mumby A Purvis R J Scholes A W R Seddon M Solan W Steffen G Woodward Approaches to defining a planetary boundary for biodiversity Glob Environ Change 28 289ndash297 (2014) 101016jgloenvcha201407009 doi101016jgloenvcha201407009
8 V Galaz Global Environmental Governance Technology and Politics The Anthropocene Gap (Edward Elgar Cheltenham UK 2014)
9 UN GSP (UN High-level Panel on Global Sustainability) Resilient People Resilient Planet a future worth choosing (Report for the 2012 Rio+20 Earth Summit United Nations New York 2012)
10 WBCSD (World Business Council on Sustainable Development) Action 2020 Overview (WBCSD Geneva Switzerland httpaction2020org accessed 18 June 2014)
11 R Costanza L Graumlich W Steffen (eds) Integrated History and Future of People on Earth (The MIT Press Cambridge MA USA 2006)
29
12 S Soumlrlin P Warde in Naturersquos End History and the Environment S Soumlrlin P Warde (eds) pp 1-19 (Palgrave MacMillan London 2009)
13 R C Bishop Endangered Species and Uncertainty The Economics of a Safe Minimum Standard Am J Agric Econ 61 10ndash18 (1978) 1023071240156 doi1023071240156
14 T M Crowards Safe Minimum Standards Costs and opportunities Ecol Econ 25 303ndash314 (1998) 101016S0921-8009(97)00041-4 doi101016S0921-8009(97)00041-4
15 W Steffen J Crutzen J R McNeill The Anthropocene Are humans now overwhelming the great forces of Nature Ambio 36 614ndash621 (2007) 1015790044-7447(2007)36[614TAAHNO]20CO2 Medline doi1015790044-7447(2007)36[614TAAHNO]20CO2
16 W Steffen et al Global Change and the Earth System A Planet Under Pressure (The IGBP Book Series Springer-Verlag Berlin Heidelberg New York 2004)
17 IPCC (Intergovernmental Panel on Climate Change) Managing the risks of extreme events and disasters to advance climate change adaptation A special report of Working Groups I and II of the IPCC CB Field et al (Eds) (Cambridge University Press Cambridge UK (2012) doi 101017CBO9781139177245)
18 IPCC (Intergovernmental Panel on Climate Change) Climate Change 2013 The Physical Science Basis Summary for Policymakers L Alexander et al (IPCC Secretariat Geneva Switzerland 2013) doi101017CBO9781107415324
19 P J Crutzen Geology of mankind Nature 415 23 (2002) 101038415023a Medline doi101038415023a
20 K Richardson W Steffen D Liverman Climate change Global risks challenges and decisions (Cambridge University Press Cambridge UK 2011)
21 T M Lenton H Held E Kriegler J W Hall W Lucht S Rahmstorf H J Schellnhuber Tipping elements in the Earthrsquos climate system Proc Natl Acad Sci USA 105 1786ndash1793 (2008) 101073pnas0705414105 Medline doi101073pnas0705414105
22 M Scheffer J Bascompte W A Brock V Brovkin S R Carpenter V Dakos H Held E H van Nes M Rietkerk G Sugihara Early-warning signals for critical transitions Nature 461 53ndash59 (2009) 101038nature08227 Medline doi101038nature08227
23 S R Carpenter W A Brock Rising variance A leading indicator of ecological transition Ecol Lett 9 311ndash318 (2006) 101111j1461-0248200500877x Medline doi101111j1461-0248200500877x
24 J Bakke Oslash Lie E Heegaard T Dokken G H Haug H H Birks P Dulski T Nilsen Rapid oceanic and atmospheric changes during the Younger Dryas cold period Nat Geosci 2 202ndash205 (2009) 101038ngeo439 doi101038ngeo439
25 M Scheffer S R Carpenter T M Lenton J Bascompte W Brock V Dakos J van de Koppel I A van de Leemput S A Levin E H van Nes M Pascual J Vandermeer Anticipating critical transitions Science 338 344ndash348 (2012) 101126science1225244 Medline doi101126science1225244
30
26 R Wang J A Dearing P G Langdon E Zhang X Yang V Dakos M Scheffer Flickering gives early warning signals of a critical transition to a eutrophic lake state Nature 492 419ndash422 (2012) 101038nature11655 Medline doi101038nature11655
27 R Biggs S R Carpenter W A Brock Turning back from the brink Detecting an impending regime shift in time to avert it Proc Natl Acad Sci USA 106 826ndash831 (2009) 101073pnas0811729106 Medline doi101073pnas0811729106
28 M MacLeod M Breitholtz I T Cousins C A de Wit L M Persson C Rudeacuten M S McLachlan Identifying chemicals that are planetary boundary threats Environ Sci Technol 48 11057ndash11063 (2014) 101021es501893m Medline doi101021es501893m
29 C S Holling Resilience and stability of ecological systems Annu Rev Ecol Syst 4 1ndash23 (1973) 101146annureves04110173000245 doi101146annureves04110173000245
30 C Folke S R Carpenter B Walker M Scheffer T Chapin J Rockstroumlm Resilience Thinking Integrating Resilience Adaptability and Transformability Ecol Soc 15 20 (2010) wwwecologyandsocietyorgvol15iss4art20
31 T P Hughes S Carpenter J Rockstroumlm M Scheffer B Walker Multiscale regime shifts and planetary boundaries Trends Ecol Evol 28 389ndash395 (2013) 101016jtree201305019 Medline doi101016jtree201305019
32 T M Lenton H T P Williams On the origin of planetary-scale tipping points Trends Ecol Evol 28 380ndash382 (2013) 101016jtree201306001 Medline doi101016jtree201306001
33 Supplementary text figures and tables are available on Science Online
34 NOAA (National Oceanic and Atmospheric Administration) NOAA-ESRL Annual CO2 Data accessed at httpco2noworgCurrent-CO2CO2-Nowannual-co2html (2014)
35 S E Perkins L V Alexander J Nairn Increasing frequency intensity and duration of obersved global heat waves and warm spells Geophys Res Lett 39 na (2012) 1011752008EI2601 doi1010292012GL053361
36 A Shepherd E R Ivins G A V R Barletta M J Bentley S Bettadpur K H Briggs D H Bromwich R Forsberg N Galin M Horwath S Jacobs I Joughin M A King J T Lenaerts J Li S R Ligtenberg A Luckman S B Luthcke M McMillan R Meister G Milne J Mouginot A Muir J P Nicolas J Paden A J Payne H Pritchard E Rignot H Rott L S Soslashrensen T A Scambos B Scheuchl E J Schrama B Smith A V Sundal J H van Angelen W J van de Berg M R van den Broeke D G Vaughan I Velicogna J Wahr P L Whitehouse D J Wingham D Yi D Young H J Zwally A reconciled estimate of ice-sheet mass balance Science 338 1183ndash1189 (2012) 101126science1228102 Medline doi101126science1228102
37 M R Helmus T J Bland C K Williams A R Ives Phylogenetic measures of biodiversity Am Nat 169 E68ndashE83 (2007) 101086511334 Medline doi101086511334
38 S Drsquoagata D Mouillot M Kulbicki S Andreacutefoueumlt D R Bellwood J E Cinner P F Cowman M Kronen S Pinca L Vigliola Human-mediated loss of phylogenetic and
31
functional diversity in coral reef fishes Curr Biol 24 555ndash560 (2014) 101016jcub201401049 Medline doi101016jcub201401049
39 A D Barnosky N Matzke S Tomiya G O Wogan B Swartz T B Quental C Marshall J L McGuire E L Lindsey K C Maguire B Mersey E A Ferrer Has the Earthrsquos sixth mass extinction already arrived Nature 471 51ndash57 (2011) 101038nature09678 Medline doi101038nature09678
40 N W Mason F de Bello D Mouillot S Pavoine S Dray A guide for using functional diversity indices to reveal changes in assembly processes along ecological gradients J Veg Sci 24 794ndash806 (2013) doi101111jvs12013
41 R J Scholes R Biggs A biodiversity intactness index Nature 434 45ndash49 (2005) 101038nature03289 Medline doi101038nature03289
42 B Cardinale Ecology Impacts of biodiversity loss Science 336 552ndash553 (2012) 101126science1222102 Medline doi101126science1222102
43 D U Hooper E C Adair B J Cardinale J E Byrnes B A Hungate K L Matulich A Gonzalez J E Duffy L Gamfeldt M I OrsquoConnor A global synthesis reveals biodiversity loss as a major driver of ecosystem change Nature 486 105ndash108 (2012) 101038nature11118 Medline
44 BAS (British Antarctic Survey) ldquoAntarctic ozonerdquo httpwwwantarcticaacukmetjdsozoneindexhtmldata J Shanklin British Antarctic Survey (2013)
45 Royal Society Ocean Acidification Due to Increasing Atmospheric Carbon Dioxide Policy Document 1205 (The Royal Society London 2005)
46 J M Guinotte V J Fabry Ocean acidification and its potential effects on marine ecosystems Ann N Y Acad Sci 1134 320ndash342 (2008) 101196annals1439013 Medline doi101196annals1439013
47 D J Conley Terrestrial ecosystems and the global biogeochemical silica cycle Global Biogeochem Cycles 16 681ndash688 (2002) doi1010292002GB001894
48 F Vandevenne E Struyf W Clymans P Meire Agricultural silica harvest Have humans created a new loop in the global silica cycle Front Ecol Environ 10 243ndash248 (2012) 101890110046 doi101890110046
49 S E Gress T D Nichols C C Northcraft W T Peterjohn Nutrient limitation in soils exhibiting differing nitrogen availabilities What lies beyond nitrogen saturation Ecol 88 119ndash130 (2007) 1018900012-9658(2007)88[119NLISED]20CO2 Medline doi1018900012-9658(2007)88[119NLISED]20CO2
50 H Hillebrand V Lehmpfuhl Resource stoichiometry and consumers control the biodiversity-productivity relationship in pelagic metacommunities Am Nat 178 171ndash181 (2011) 101086660831 Medline doi101086660831
51 C M Moore M M Mills K R Arrigo I Berman-Frank L Bopp P W Boyd E D Galbraith R J Geider C Guieu S L Jaccard T D Jickells J La Roche T M Lenton N M Mahowald E Marantildeoacuten I Marinov J K Moore T Nakatsuka A Oschlies M
32
A Saito T F Thingstad A Tsuda O Ulloa Processes and patterns of oceanic nutrient limitation Nat Geosci 6 701ndash710 (2013) doi101038ngeo1765
52 G K MacDonald E M Bennett P A Potter N Ramankutty Agronomic phosphorus imbalances across the worldrsquos croplands Proc Natl Acad Sci USA 108 3086ndash3091 (2011) 101073pnas1010808108 Medline doi101073pnas1010808108
53 L Bouwman K K Goldewijk K W Van Der Hoek A H W Beusen D P Van Vuuren J Willems M C Rufino E Stehfest Exploring global changes in nitrogen and phosphorus cycles in agriculture induced by livestock production over the 1900-2050 period Proc Natl Acad Sci USA 110 20882ndash20887 (2013) Medline doi101073pnas1012878108
54 W Steffen M Stafford Smith Planetary boundaries equity and global sustainability Why wealthy countries could benefit from more equity Curr Opinion Environ Sust 5 403ndash408 (2013) doi101016jcosust201304007
55 D J Greenwood T V Karpinets K Zhang A Bosh-Serra A Boldrini L Karawulova A unifying concept for the dependence of whole-crop N P ratio on biomass theory and experiment Ann Bot (Lond) 102 967ndash977 (2008) 101093aobmcn188 Medline doi101093aobmcn188
56 P K Snyder C Delire J A Foley Evaluating the influence of different vegetation biomes on the global climate Clim Dyn 23 279ndash302 (2004) doi101007s00382-004-0430-0
57 P C West G T Narisma C C Barford C J Kucharik J A Foley An alternative approach for quantifying climate regulation by ecosystems Front Ecol Environ 9 126ndash133 (2010) doi101890090015
58 EPI (Earth Policy Institute) ldquoForest coverrdquo wwwearthpolicyorgindicatorsC56forests_2012_ (2014)
59 M Falkenmark Meeting water requirements of an expanding world population Philos Trans R Soc Lond B Biol Sci 352 929ndash936 (1997) 101098rstb19970072 doi101098rstb19970072
60 J S Wallace M C Acreman C A Sullivan The sharing of water between society and ecosystems From conflict to catchment-based co-management Philos Trans R Soc Lond B Biol Sci 358 2011ndash2026 (2003) 101098rstb20031383 Medline doi101098rstb20031383
61 N L Poff J D Allan M B Bain J R Karr K L Prestegaard B D Richter R E Sparks J C Stromberg The natural flow regime A paradigm for river conservation and restoration BioSci 47 769ndash784 (1997) doi1023071313099
62 N L Poff J K H Zimmerman Ecological Responses to altered flow regimes A literature review to inform the science and management of environmental flows Biol 55 194ndash205 (2010) doi101111j1365-2427200902272x
63 A V Pastor F Ludwig H Biemans H Hoff P Kabat Accounting for environmental flow requirements in global water assessments Hydrol Earth Syst Sci 18 5041ndash5059 (2014) doi105194hess-18-5041-2014
33
64 WHO (World Health Organization) Burden of disease from the joint effects of Household and Ambient Air Pollution for 2012 (wwwwhointphehealth_topicsoutdoorairdatabasesFINAL_HAP_AAP_BoD24March2014pdf accessed 23 June 2014 httpwwwwhointphehealth_topicsoutdoorairdatabasesen)
65 O Boucher et al Clouds and aerosols In Climate Change 2013 The Physical Science Basis IPCC AR5 WGI report T Stocker et al (Eds) (Cambridge University Press Cambridge UK 2013)
66 M Chin T Diehl Q Tan J M Prospero R A Kahn L A Remer H Yu A M Sayer H Bian I V Geogdzhayev B N Holben S G Howell B J Huebert N C Hsu D Kim T L Kucsera R C Levy M I Mishchenko X Pan P K Quinn G L Schuster D G Streets S A Strode O Torres X-P Zhao Multi-decadal aerosol variations from 1980 to 2009 A perspective from observations and a global model Atmos Chem Phys 14 3657ndash3690 (2014) 105194acp-14-3657-2014 doi105194acp-14-3657-2014
67 V Ramanathan C Chung D Kim T Bettge L Buja J T Kiehl W M Washington Q Fu D R Sikka M Wild Atmospheric brown clouds Impacts on South Asian climate and hydrological cycle Proc Natl Acad Sci USA 102 5326ndash5333 (2005) 101073pnas0500656102 Medline doi101073pnas0500656102
68 M Cole P Lindeque C Halsband T S Galloway Microplastics as contaminants in the marine environment A review Mar Pollut Bull 62 2588ndash2597 (2011) 101016jmarpolbul201109025 Medline doi101016jmarpolbul201109025
69 EEA (European Environment Agency) Genetically modified organisms (GMOs) The significance of gene flow through pollen transfer (Environmental Issue Report 28 European Environment Agency Copenhagen Denmark 2002)
70 J A Ivar do Sul M F Costa The present and future of microplastic pollution in the marine environment Environ Pollut 185 352ndash364 (2014) 101016jenvpol201310036 Medline doi101016jenvpol201310036
71 R Kessler Engineered nanoparticles in consumer products Understanding a new ingredient Environ Health Perspect 119 a120ndasha125 (2011) 101289ehp119-a120 Medline doi101289ehp119-a120
72 M Rees Our Final Century Will Civilisation Survive the Twenty-first Century (Arrow Books London 2003)
73 L M Persson M Breitholtz I T Cousins C A de Wit M MacLeod M S McLachlan Confronting unknown planetary boundary threats from chemical pollution Environ Sci Technol 47 12619ndash12622 (2013) 101021es402501c Medline doi101021es402501c
74 P P Egeghy R Judson S Gangwal S Mosher D Smith J Vail E A Cohen Hubal The exposure data landscape for manufactured chemicals Sci Total Environ 414 159ndash166 (2012) 101016jscitotenv201110046 Medline doi101016jscitotenv201110046
75 UNEP (United Nations Environment Programme) GCO Global Chemicals Outlook Towards sound management of chemicals (United Nations Environment Programme Nairobi Kenya 2013)
34
76 S Strempel M Scheringer C A Ng K Hungerbuumlhler Screening for PBT chemicals among the ldquoexistingrdquo and ldquonewrdquo chemicals of the EU Environ Sci Technol 46 5680ndash5687 (2012) 101021es3002713 Medline doi101021es3002713
77 M Scheringer S Strempel S Hukari C A Ng M Blepp K Hungerbuhler How many persistent organic pollutants should we expect Atmos Poll Res 3 383ndash391 (2012) doi105094APR2012044
78 K Sanderson Chemistry Itrsquos not easy being green Nature 469 18ndash20 (2011) 101038469018a Medline doi101038469018a
79 P A Schulte L T McKernan D S Heidel A H Okun G S Dotson T J Lentz C L Geraci P E Heckel C M Branche Occupational safety and health green chemistry and sustainability A review of areas of convergence Environ Health 12 31 (2013) 1011861476-069X-12-31 Medline doi1011861476-069X-12-31
80 EEA (European Environment Agency) Late Lessons from Early Warnings The Precautionary Principle 1896-2000 (Environmental Issue Report 222001 Copenhagen Denmark 2001)
81 D Gee Late lessons from early warnings Toward realism and precaution with endocrine-disrupting substances Environ Health Perspect 114 (Suppl 1) 152ndash160 (2006) 101289ehp8134 Medline doi101289ehp8134
82 T Lenton A Watson A Revolutions that made the Earth (Oxford University Press Oxford UK 2011)
83 R Biggs M Schluumlter D Biggs E L Bohensky S BurnSilver G Cundill V Dakos T M Daw L S Evans K Kotschy A M Leitch C Meek A Quinlan C Raudsepp-Hearne M D Robards M L Schoon L Schultz P C West Toward Principles for Enhancing the Resilience of Ecosystem Services Toward Principles for Enhancing the Resilience of Ecosystem Services Annu Rev Environ Resour 37 421ndash448 (2012) 101146annurev-environ-051211-123836 doi101146annurev-environ-051211-123836
84 G S Cumming P Olsson F S Chapin III C S Holling Resilience experimentation and scale mismatches in social-ecological systems Landscape Ecol 28 1139ndash1150 (2013) 101007s10980-012-9725-4 doi101007s10980-012-9725-4
85 D Griggs M Stafford-Smith O Gaffney J Rockstroumlm M C Ohman P Shyamsundar W Steffen G Glaser N Kanie I Noble Policy Sustainable development goals for people and planet Nature 495 305ndash307 (2013) 101038495305a Medline doi101038495305a
86 R Costanza Ed Ecological Economics The Science and Management of Sustainability (Columbia Univ Press New York 1991)
87 C Folke Socio-economic dependence on the life-supporting environment In Linking the Natural Environment and the Economy Essays from the Eco-Eco Group C Folke T Karingberger (Eds) (Kluwer Academic Publishers Dordrecht The Netherlands 1991)
88 L Robin S Soumlrlin P Warde (eds) The Future of Nature Documents of Global Change (Yale University Press New Haven CT USA 2013)
89 U Heise Sense of Place and Sense of Planet The Environmental Imagination of the Global (Oxford University Press Oxford 2008)
35
90 M Scheffer Critical transitions in nature and society (Princeton University Press Princeton 2009)
91 J Masco Bad weather On planetary crisis Soc Stud Sci 40 7ndash40 (2010) 1011770306312709341598 doi1011770306312709341598
92 G Paacutelsson B Szerszynski S Soumlrlin J Marks B Avril C Crumley H Hackmann P Holm J Ingram A Kirman M P Buendiacutea R Weehuizen Reconceptualizing thelsquoAnthroposrsquo in the Anthropocene Integrating the social sciences and humanities in global environmental change research Environ Sci Policy 28 4 (2013) 101016jenvsci201211004 doi101016jenvsci201211004
93 N Castree W M Adams J Barry D Brockington B Buumlscher E Corbera D Demeritt R Duffy U Felt K Neves P Newell L Pellizzoni K Rigby P Robbins L Robin D B Rose A Ross D Schlosberg S Soumlrlin P West M Whitehead B Wynne Changing the intellectual climate Nature Clim Change 4 763ndash768 (2014) doi101038nclimate2339
94 J M Anderies S R Carpenter W Steffen J Rockstroumlm The topology of non-linear global carbon dynamics From tipping points to planetary boundaries Environ Res Lett 8 044048 (2013) 1010881748-932684044048 doi1010881748-932684044048
95 S E Cornell I C Prentice J I House C J Downy Understanding the Earth System Global Change Science for Application (Cambridge University Press Cambridge UK 2012)
96 J A Dearing R Wang K Zhang J G Dyke H Haberl M S Hossain P G Langdon T M Lenton K Raworth S Brown J Carstensen M J Cole S E Cornell T P Dawson C P Doncaster F Eigenbrod M Floumlrke E Jeffers A W Mackay B Nykvist G M Poppy Safe and just operating spaces for regional social-ecological systems Glob Environ Change 28 227ndash238 (2014) 101016jgloenvcha201406012 doi101016jgloenvcha201406012
97 R E Carlson A trophic state index for lakes Limnol Oceanogr 22 361ndash369 (1977) doi104319lo19772220361
98 E M Bennett S R Carpenter N Caraco Human impact on erodible phosphorus and eutrophication A global perspective BioSci 51 227ndash234 (2001) doi1016410006-3568(2001)051[0227HIOEPA]20CO2
99 A F Bouwman G van Drecht KW van der Hoek Global and regional surface nitrogen balances in intensive agricultural production systems for the period 1970-2030 Pedosphere 15 137 (2005)
100 D Fowler M Coyle U Skiba M A Sutton J N Cape S Reis L J Sheppard A Jenkins B Grizzetti J N Galloway P Vitousek A Leach A F Bouwman K Butterbach-Bahl F Dentener D Stevenson M Amann M Voss The global nitrogen cycle in the 21st century Phil Trans Roy Soc Lond Ser B 368 20130164 (2013) doi101098rstb20130164
101 B L Bodirsky A Popp H Lotze-Campen J P Dietrich S Rolinski I Weindl C Schmitz C Muumlller M Bonsch F Humpenoumlder A Biewald M Stevanovic Reactive
36
nitrogen requirements to feed the world in 2050 and potential to mitigate nitrogen pollution Nat Commun 5 3858 (2014) Medline doi101038ncomms4858
102 G B Bonan Forests and climate change Forcings feedbacks and the climate benefits of forests Science 320 1444ndash1449 (2008) 101126science1155121 Medline doi101126science1155121
103 M D Oyama C A Nobre CA A new climate-vegetation equilibrium state for tropical South America Geophys Res Lett 30 2199 (2003) 1010292003GL018600 doi1010292003GL018600
104 P Good C Jones J Lowe R Betts N Gedney Comparing tropical forest projections from two generations of Hadley Centre Earth System Models HadGEM2-ES and HadCM3LC J Clim 26 495ndash511 (2013) 101175JCLI-D-11-003661 doi101175JCLI-D-11-003661
105 M Hirota M Holmgren E H Van Nes M Scheffer Global resilience of tropical forest and savanna to critical transitions Science 334 232ndash235 (2011) 101126science1210657 Medline doi101126science1210657
106 J A Foley G P Asner M H Costa M T Coe R DeFries H K Gibbs E A Howard S Olson J Patz N Ramankutty P Snyder Amazonia revealed Forest degradation and loss of ecosystem goods and services in the Amazon Basin Front Ecol Environ 5 25ndash32 (2007) doi1018901540-9295(2007)5[25ARFDAL]20CO2
107 Y Malhi J T Roberts R A Betts T J Killeen W Li C A Nobre Climate change deforestation and the fate of the Amazon Science 319 169ndash172 (2008) 101126science1146961 Medline doi101126science1146961
108 G Sampaio C Nobre M H Costa P Satyamurty B S Soares-Filho M Cardoso Regional climate change over eastern Amazonia caused by pasture and soybean cropland expansion Geophys Res Lett 34 L17709 (2007) 1010292007GL030612 doi1010292007GL030612
109 P Nobre M Malagutti D F Urbano R A F de Almeida E Giarolla Amazon deforestation and climate change in a coupled model simulation J Clim 22 5686ndash5697 (2009) 1011752009JCLI27571 doi1011752009JCLI27571
110 S L Lewis P M Brando O L Phillips G M F van der Heijden D Nepstad The 2010 Amazon drought Science 331 554 (2011) 101126science1200807 Medline doi101126science1200807
111 O Arino et al Global Land Cover Map for 2009 (GlobCover 2009) (European Space Agency amp Universiteacute Catholique de Louvain 2012) doi101594PANGAEA787668
112 B D Richter J V Baumgartner R Wigington D P Braun How much water does a river need Freshw Biol 37 231ndash249 (1997) 101046j1365-2427199700153x doi101046j1365-2427199700153x
113 J King D Louw Instream flow assessments for regulated rivers in South Africa using Building Block Methodology Aquat Ecosyst Health Manage 1 109ndash124 (1998) 101016S1463-4988(98)00018-9
37
114 J H OrsquoKeefe Sustaining river ecosystems Balancing use and protection Prog Phys Geogr 33 339ndash357 (2009) 1011770309133309342645 doi1011770309133309342645
115 P Knights Environmental flows lessons from an Australian experience (Proc Int Conf Dialog on Water Food and Environment Hanoi Vietnam 2002 httpwwwbvsdepahoorgbvsacddialogoknightspdf accessed 20 June 2014)
116 V Smakhtin C Revenga P Doumlll P Taking into account environmental water requirements in global-scale water resources assessments (Comprehensive Assessment of Water Management Agriculture Research Report 2 International Water Management Institute Colombo Sri Lanka 2004)
117 L A Shiklomanov ldquoWorld water resources and water use Present assessment and outlook for 2025rdquo in World Water Scenarios Analyses RJ Rijsberman (ed) (Earthscan Publications London 2000)
118 C J Voumlroumlsmarty P Green J Salisbury R B Lammers Global water resources Vulnerability from climate change and population growth Science 289 284ndash288 (2000) 101126science2895477284 Medline doi101126science2895477284
119 D Gerten S Rost W von Bloh W Lucht Causes of change in 20th century global river discharge Geophys Res Lett 35 L20405 (2008) 1010292008GL035258 doi1010292008GL035258
120 D L Tennant Instream flow regimens for fish wildlife recreation and related environmental resources Fisheries (Bethesda Md) 1 6ndash10 (1976) doi1015771548-8446(1976)001lt0006IFRFFWgt20CO2
121 S Tessmann ldquoEnvironmental assessmentrdquo Technical Appendix E in Environmental use sector reconnaissance elements of the Western Dakotas region of South Dakota study (Water Resources Institute South Dakota State University Brookings South Dakota USA 1980)
122 V Smakhtin C Revenga P Doumlll Pilot global assessment of environmental water requirements and scarcity Water Int 29 307ndash317 (2004) 10108002508060408691785 doi10108002508060408691785
123 E G R Davies S P Simonovic Global water resources modeling with an integrated model of the socialndasheconomicndashenvironmental system Adv Water Resour 34 684ndash700 (2011) 101016jadvwatres201102010 doi101016jadvwatres201102010
124 C Nilsson C A Reidy M Dynesius C Revenga Fragmentation and flow regulation of the worldrsquos large river systems Science 308 405ndash408 (2005) 101126science1107887 Medline doi101126science1107887
125 C J Voumlroumlsmarty P B McIntyre M O Gessner D Dudgeon A Prusevich P Green S Glidden S E Bunn C A Sullivan C R Liermann P M Davies Global threats to human water security and river biodiversity Nature 467 555ndash561 (2010) 101038nature09440 Medline doi101038nature09440
38
126 S Rost D Gerten A Bondeau W Lucht J Rohwer S Schaphoff Agricultural green and blue water consumption and its influence on the global water system Water Resour Res 44 W09405 (2008) 1010292007WR006331 doi1010292007WR006331
127 M Fader S Rost C Muumlller A Bondeau D Gerten Virtual water content of temperate cereals and maize Present and potential future patterns J Hydrol (Amst) 384 218ndash231 (2010) 101016jjhydrol200912011 doi101016jjhydrol200912011
128 B Rudolf A Becker U Schneider A Meyer-Christoffer M Ziese GPCC Status Report December 2010 New gridded global data set by the Global Precipitation Climatology Centre (GPCC) (DWDGPCC Technical Report 2010 httpwwwdwddebvbwgeneratorDWDWWWContentOeffentlichkeitKUKU4KU42enReports__PublicationsGPCC__status__report__2010templateId=rawproperty=publicationFilepdfGPCC_status_report_2010pdf)
129 J Heinke S Ostberg S Schaphoff K Frieler C Muumlller D Gerten M Meinshausen W Lucht A new dataset for systematic assessments of climate change impacts as a function of global warming Geosci Model Develop 6 1689ndash1703 (2013) doi105194gmd-6-1689-2013
130 I Harris P D Jones T J Osborne D H Lister Updated high-resolution grids of monthly climatic observations ndash the CRU TS310 Dataset Int J Climatol 34 623ndash642 (2014) doi101002joc3711
131 H Biemans I Haddeland P Kabat F Ludwig R W A Hutjes J Heinke W von Bloh D Gerten Impact of reservoirs on river discharge and irrigation water supply during the 20th century Water Resour Res 47 W03509 (2011) doi1010292009WR008929
132 M Floumlrke E Kynast I Baumlrlund S Eisner F Wimmer J Alcamo Domestic and industrial water uses of the past 60 years as a mirror of socio-economic development A global simulation study Glob Environ Change 23 144ndash156 (2013) doi101016jgloenvcha201210018
133 J R Petit J Jouzel D Raynaud N I Barkov J-M Barnola I Basile M Bender J Chappellaz M Davis G Delaygue M Delmotte V M Kotlyakov M Legrand V Y Lipenkov C Lorius L PEacutepin C Ritz E Saltzman M Stievenard Climate and atmospheric history of the past 420000 years from the Vostok ice core Antarctica Nature 399 429ndash436 (1999) 10103820859 doi10103820859
134 S Oppenheimer Out of Eden The Peopling of the World (Constable London 2004)
135 A Ganopolski S Rahmstorf Rapid changes of glacial climate simulated in a coupled climate model Nature 409 153ndash158 (2001) 10103835051500 Medline doi10103835051500
136 R Alkemade M van Oorschot L Miles C Nellemann M Bakkenes B ten Brink GLOBIO3 A framework to investigate options for reducing global terrestrial biodiversity loss Ecosys 12 374ndash390 (2009) doi101007s10021-009-9229-5
137 O Hoegh-Guldberg P J Mumby A J Hooten R S Steneck P Greenfield E Gomez C D Harvell P F Sale A J Edwards K Caldeira N Knowlton C M Eakin R Iglesias-Prieto N Muthiga R H Bradbury A Dubi M E Hatziolos Coral reefs under rapid
39
climate change and ocean acidification Science 318 1737ndash1742 (2007) Medline doi101126science1152509
138 P Potter N Ramankutty E M Bennett S D Donner Characterizing the spatial patterns of global fertilizer application and manure production Earth Interact 14 1ndash22 (2010) doi1011752009EI2881
139 N Ramankutty J A Foley Estimating historical changes in global land cover Croplands from 1700 to 1992 Global Biogeochem Cycles 13 997ndash1027 (1999) doi1010291999GB900046
140 V Ramanathan G Carmichael Global and regional climate changes due to black carbon Nat Geosci 1 221ndash227 (2008) doi101038ngeo156
141 A D Barnosky E A Hadly J Bascompte E L Berlow J H Brown M Fortelius W M Getz J Harte A Hastings P A Marquet N D Martinez A Mooers P Roopnarine G Vermeij J W Williams R Gillespie J Kitzes C Marshall N Matzke D P Mindell E Revilla A B Smith Approaching a state shift in Earthrsquos biosphere Nature 486 52ndash58 (2012) Medline doi101038nature11018
142 P Leadley et al Biodiversity Scenarios Projections of 21st Century Change in Biodiversity and Associated Ecosystem Services (Technical Report for the Global Biodiversity Outlook 3 CBD Technical Series No 50 Secretariat of the Convention on Biological Diversity Montreal Canada httpwwwcbdintts 2011)
143 D B Peakall DDE-induced eggshell thinning An environmental detective story Environ Rev 1 13ndash20 (1993) 101139a93-002 doi101139a93-002
144 J A Estes J Terborgh J S Brashares M E Power J Berger W J Bond S R Carpenter T E Essington R D Holt J B Jackson R J Marquis L Oksanen T Oksanen R T Paine E K Pikitch W J Ripple S A Sandin M Scheffer T W Schoener J B Shurin A R Sinclair M E Souleacute R Virtanen D A Wardle Trophic downgrading of planet Earth Science 333 301ndash306 (2011) Medline doi101126science1205106
145 D Gee et al Late Lessons from Early Warnings Science Precaution Innovation (European Environment Agency Copenhagen 2013)
146 F S Rowland Stratospheric ozone depletion Phil Trans Roy Soc Lond Ser B 361 769ndash790 (2006) Medline doi101098rstb20051783
147 S P Seitzinger E Mayorga A F Bouwman C Kroeze A H W Beusen G Billen G Van Drecht E Dumont B M Fekete J Garnier J A Harrison Global river nutrient export A scenario analysis of past and future trends Global Biogeochem Cycles 24 na (2010) doi1010292009GB003587
148 V Smith S B Joye R Howarth Eutrophication of freshwater and marine ecosystems Limnol Oceanogr 51 351ndash355 (2006) doi104319lo2006511_part_20351
149 P K Snyder J A Foley M H Hitchman C Delire Analyzing the effects of complete tropical forest removal on the regional climate using a detailed three-dimensional energy budget An application to Africa J Geophys Res Atmos 109 (D21) D21 (2004) doi1010292003JD004462
40
150 J Rockstroumlm et al Water Resilience for Human Prosperity (Cambridge University Press Cambridge UK 2014)
151 J Rockstroumlm L Gordon C Folke M Falkenmark M Engwall Linkages among water vapor flows food production and terrestrial ecosystem services Cons Ecol 3 5 (1999) httpwwwecologyandsocietyorgvol3iss2art5
152 V Smakhtin Basin closure and environmental flow requirements Int J Water Resour Dev 24 227ndash233 (2008) 10108007900620701723729 doi10108007900620701723729
153 K Zickfeld B Knopf V Petoukhov H J Schellnhuber Is the Indian summer monsoon stable against global change Geophys Res Lett 32 L15707 (2005) 1010292005GL022771 doi1010292005GL022771
154 V Ramanathan M V Ramana G Roberts D Kim C Corrigan C Chung D Winker Warming trends in Asia amplified by brown cloud solar absorption Nature 448 575ndash578 (2007) 101038nature06019 Medline doi101038nature06019
155 K M Lau S C Tsay C Hsu M Chin V Ramanathan G-X Wu Z Li R Sikka B Holben D Lu H Chen G Tartari P Koudelova Y Ma J Huang K Taniguchi R Zhang The Joint Aerosol-Monsoon Experiment A new challenge for monsoon climate research Bull Am Meteorol Soc 89 369ndash383 (2008) 101175BAMS-89-3-369 doi101175BAMS-89-3-369
156 A Levermann J Schewe V Petoukhov H Held Basic mechanism for abrupt monsoon transitions Proc Natl Acad Sci USA 106 20572ndash20577 (2009) 101073pnas0901414106 Medline doi101073pnas0901414106
157 A Menon A Levermann J Schewe J Lehmann K Frieler Consistent increase in Indian monsoon rainfall and its variability across CMIP-5 models Earth Sys Dyn 4 287ndash300 (2013) doi105194esd-4-287-2013
158 Y Hautier E W Seabloom E T Borer P B Adler W S Harpole H Hillebrand E M Lind A S MacDougall C J Stevens J D Bakker Y M Buckley C Chu S L Collins P Daleo E I Damschen K F Davies P A Fay J Firn D S Gruner V L Jin J A Klein J M Knops K J La Pierre W Li R L McCulley B A Melbourne J L Moore L R OrsquoHalloran S M Prober A C Risch M Sankaran M Schuetz A Hector Eutrophication weakens stabilizing effects of diversity in natural grasslands Nature 508 521ndash525 (2014) Medline doi101038nature13014
41
- steffen_planetary_boundariesQqYrb7150213
- steffen_supplementary_to_planetary_boundaries150213
-
- Steffen SM cover pagepdf
-
- Planetary boundaries Guiding human development on a changing planet
-
- Steffen refs for SMpdf
-
- References
-
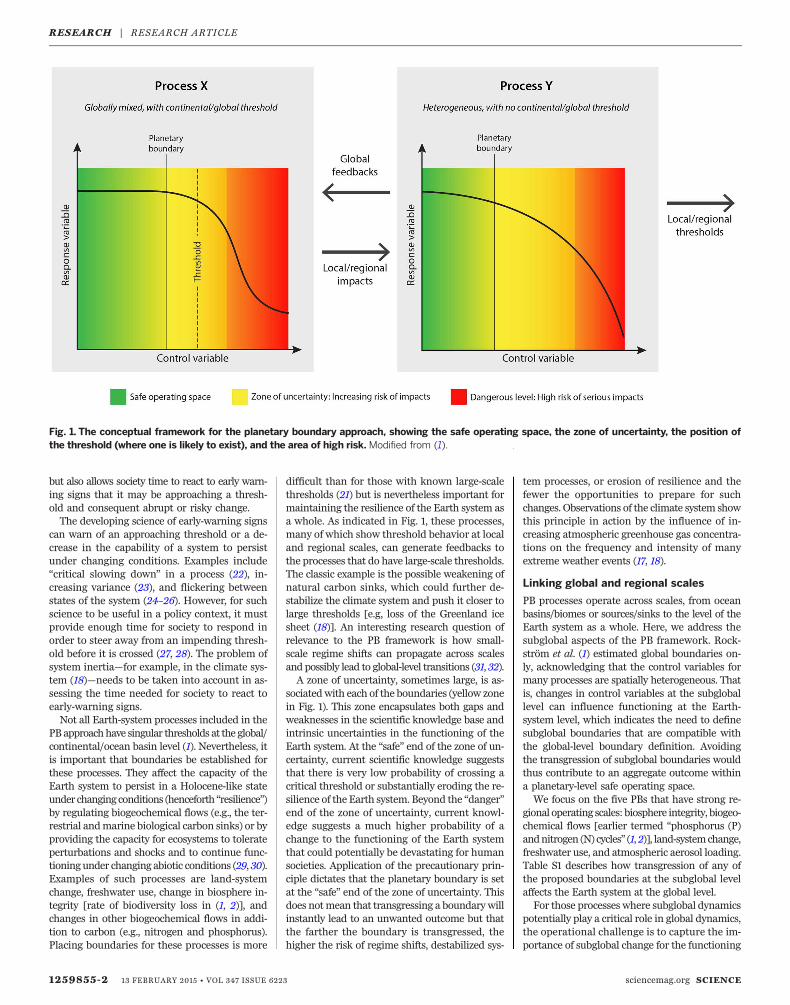
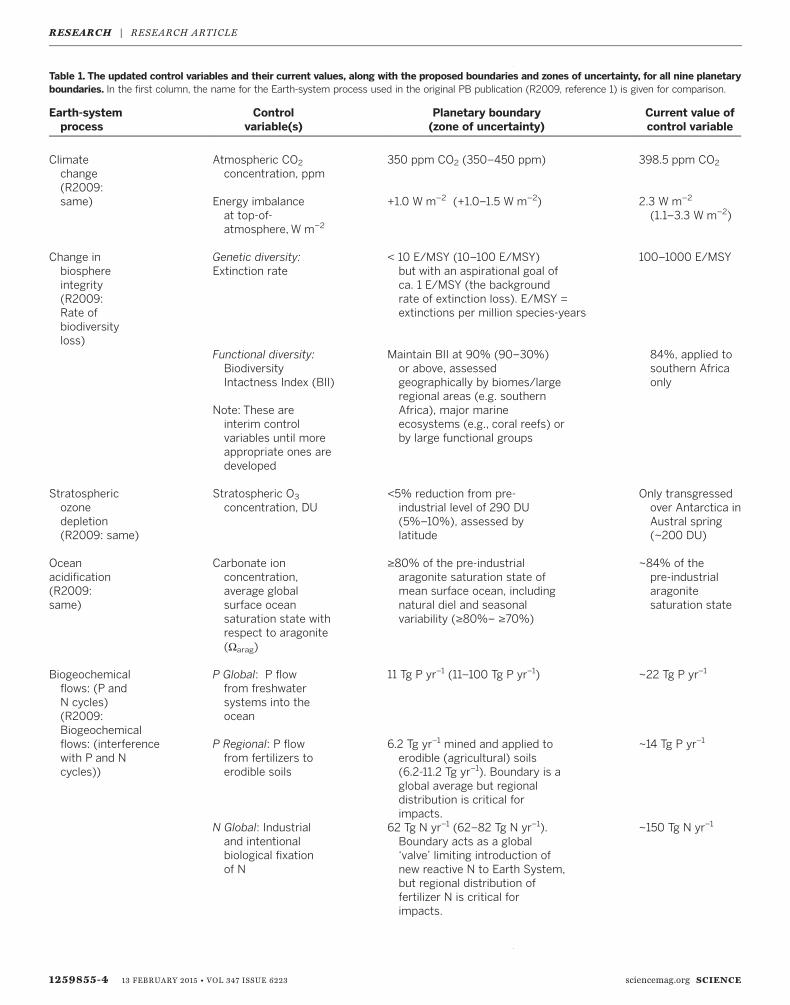
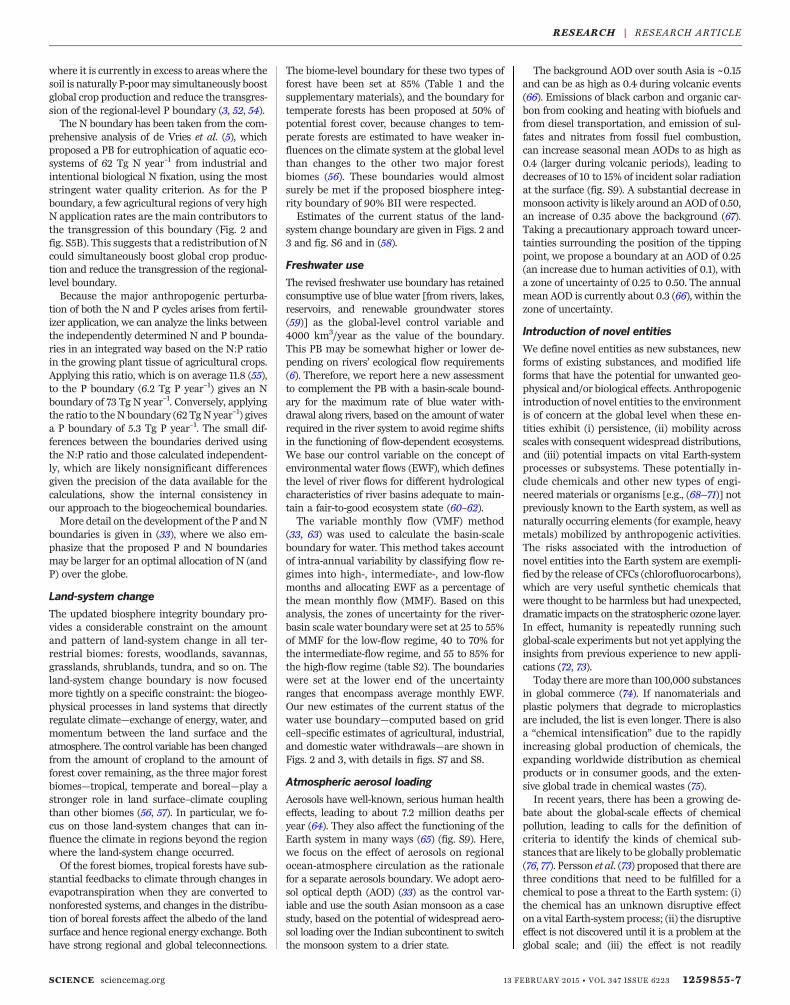
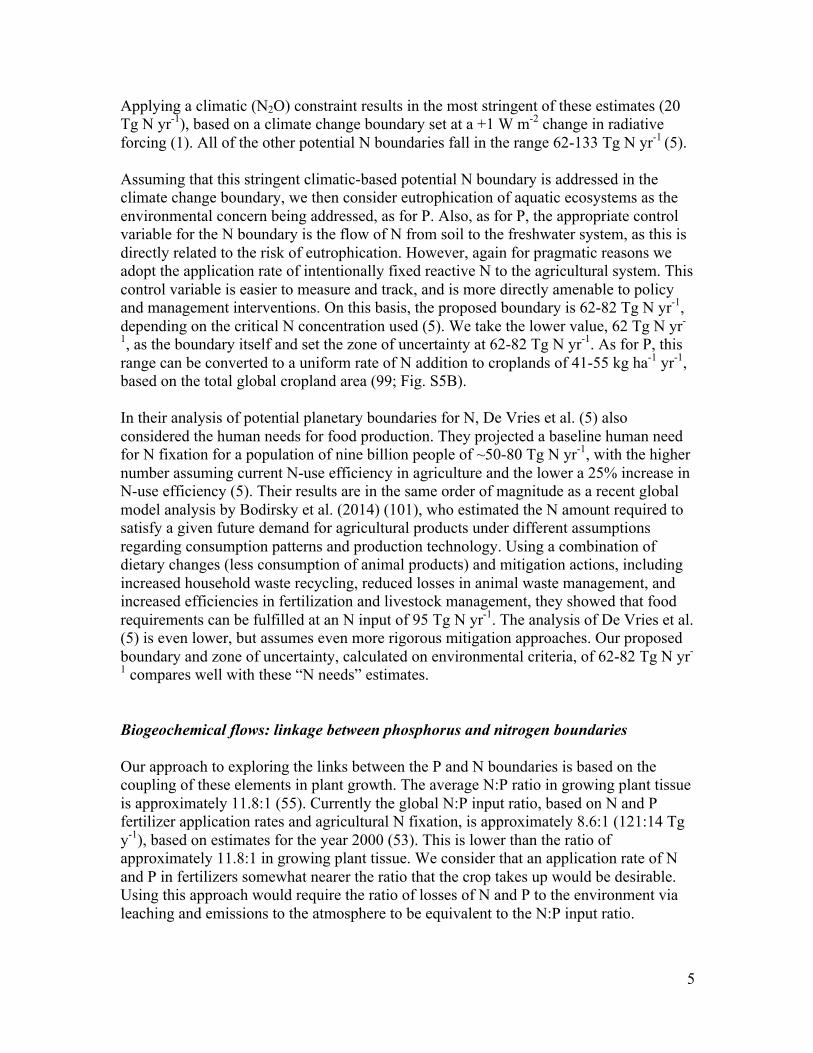
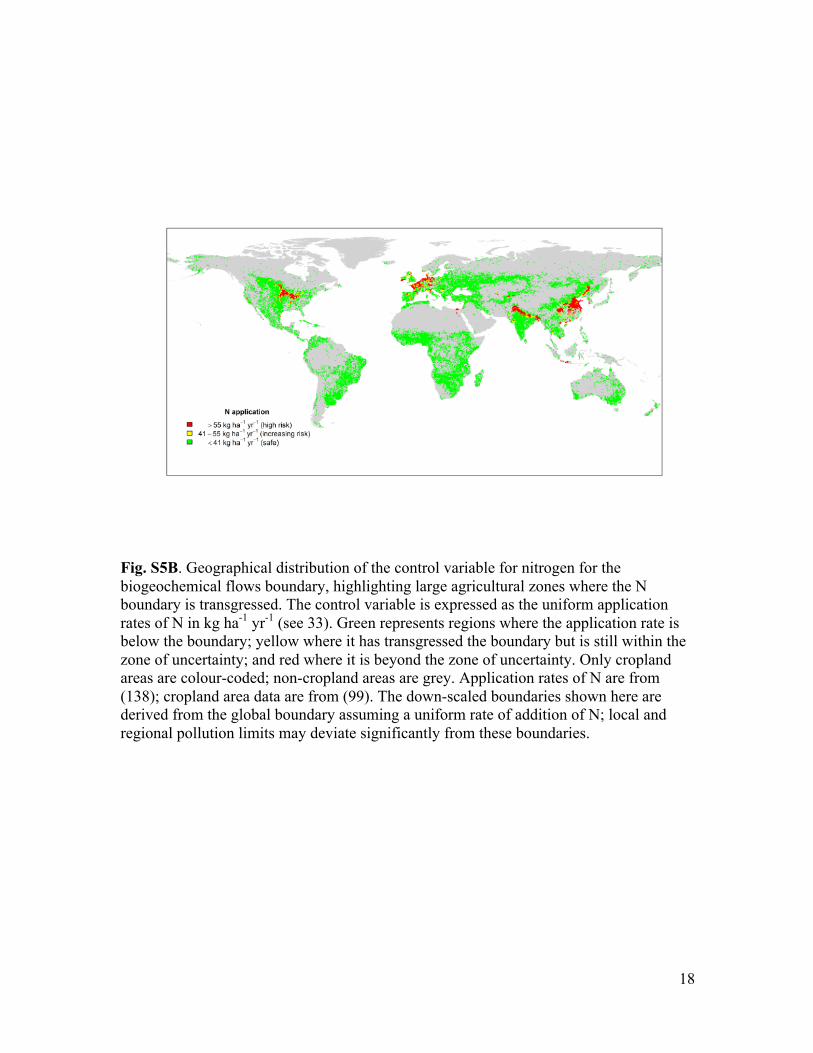
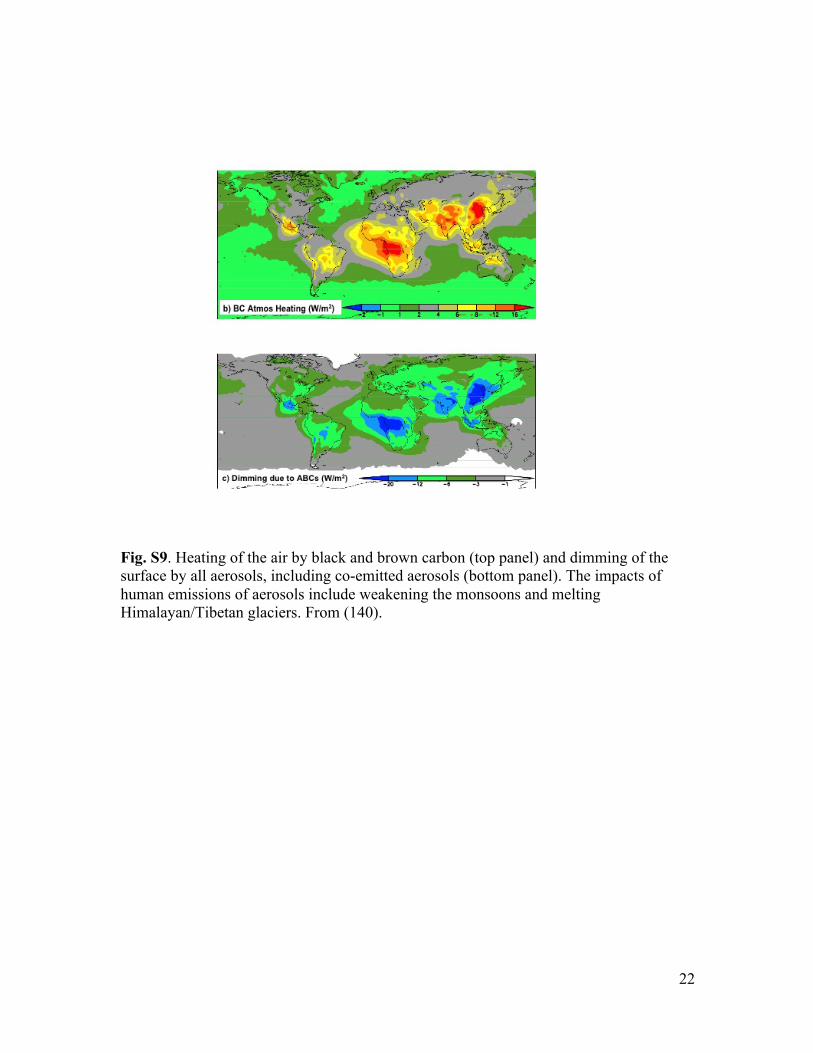