Optical identification of the 3C 58 pulsar wind nebula
12
Astronomy & Astrophysics manuscript no. 3C58-opt1 c ESO 2013 November 25, 2013 Optical identification of the 3C 58 pulsar wind nebula Yu. A. Shibanov 1 , N. Lundqvist 2 , P. Lundqvist 2 , J. Sollerman 2,3 , and D. Zyuzin 4 1 Ioffe Physical Technical Institute, Politekhnicheskaya 26, St. Petersburg, 194021, Russia 2 Stockholm Observatory, AlbaNova Science Center, Department of Astronomy, SE-106 91 Stockholm, Sweden 3 Dark Cosmology Center, Copenhagen, Denmark 4 Academical Physical Technical University, Khlopina 8, St. Petersburg, 195220, Russia Preprint online version: November 25, 2013 ABSTRACT Aims. 3C 58 is a Crab-like supernova remnant containing the young pulsar PSR J0295+6449, which powers a radio plerion and a compact torus-like pulsar wind nebula visible in X-rays. We have performed a deep optical imaging of the 3C 58 field with the Nordic Optical Telescope in the B and V bands to detect the optical counterpart of the pulsar and its wind nebula. Methods. We analyzed our data together with the archival data obtained with the Chandra/ACIS and HRC in X-rays and with the Spitzer/IRAC in the mid-infrared. Results. We detect a faint extended elliptical optical object with B=24. m 06±0.08 and V =23. m 11±0.04 whose peak brightness and center position are consistent at the sub-arcsecond level with the position of the pulsar. The morphology and orientation of the object are in excellent agreement with the torus region of the pulsar wind nebula, seen almost edge on in the X-rays, although its extension is only about a half of that in X-rays. This suggests that in the optical we see only the brightest central part of the torus with the pulsar. The object is also practically identical to the counterpart of the torus region recently detected in the mid-infrared. We estimate that the contribution of the pulsar to the observed optical flux is < ∼ 10%. Combinig the optical/mid-infrared fluxes and the X-ray power-law spectrum extracted from the spatial region constrained by the optical/infrared source extent we compile a tentative multi-wavelength spectrum of the central part of the nebula. Within the uncertainties of the interstellar extinction towards 3C 58 it is reminiscent of either the Crab or PSR B0540-69 pulsar wind nebula spectra. Conclusions. The properties of the detected object strongly suggest it to be the optical counterpart of the 3C 58 pulsar + its wind nebula system. This makes 3C 58 the third member of such a class of the torus-like pulsar+nebula systems identified in the optical and mid-infrared. Key words. pulsars – pulsar wind nebulae – optical identification 1. Introduction The “Crab-like” supernova remnant (SNR) 3C 58 was first dis- covered in the radio (Weiler & Seielstad, 1971) and then identi- fied in the optical by observations in Hα (van den Bergh, 1978). Just as the Crab nebula, this SNR has a plerionic, or filled cen- ter. It shows a filamentary structure in the Hα emission and in the radio with a flat radio spectrum of synchrotron origin. The distance, d = 3.2 kpc, and size, ∼ 6 0 × 9 0 of 3C 58 is also similar to that of the Crab SNR. What makes SNR 3C 58 par- ticularly interesting is its possible association (Stephenson & Green, 2002) with the historical supernova SN 1181. The de- duced age of ∼ 830 yr is consistent with the remnant being of roughly the same size as the Crab nebula, but this has been questioned on another grounds (see below). It was long suspected that 3C 58 contains a pulsar in its cen- ter (Becker, Helfand & Szymkoviak, 1982), and after several years of searching in X-rays and radio, the pulsar J0205+6449 with a period of P = 65.68 ms was discovered with the Chandra X-ray observatory at the center of the SNR plerion (Murray et al., 2002). It was directly confirmed also in the radio (Malofeev et al., 2001; Camilo et al., 2002; Malofeev et al., 2003). Deeper Chandra exposures revealed a Crab-like X-ray torus+jet pulsar wind nebula (PWN) in the center of the pulsar powered plerion (Slane et al., 2004). One of the puzzles of the 3C 58 system is that, unlike for the Crab, the characteristic age of the 3C 58 pulsar, τ = P/2 ˙ P ≈ 5400 yr, is considerably higher than the historical age of 830 yr. This can perhaps be understood by assuming a larger ini- tial spin period of the neutron star (NS). However, the fac- tor of ∼ 2 lower radial velocities of the optical (Fesen, 1983; Fesen et al., 2008) and radio (Bietenholz, Kassim, Weiler, 2001; Bietenholz, 2007) filaments than for the Crab, i.e., < ∼ 900 km s -1 , either would require a larger actual age of 3C 58, a weaker SN explosion, or a substantial deceleration of the rem- nant (Chevalier, 2004). Furthermore, the radio emission of 3C 58 is about 10 times fainter than for the Crab while its X-ray nebula is about 2000 times weaker. The latter is surprising and does not match the present spin-down power of the pulsar: the spindown luminosity of PSR J0205+6449 is ˙ E = 2.7 × 10 37 erg s -1 , and thus 5% of that of the Crab (this is actually the third arXiv:0802.2386v1 [astro-ph] 17 Feb 2008
-
Upload
independent -
Category
Documents
-
view
3 -
download
0
Transcript of Optical identification of the 3C 58 pulsar wind nebula

Astronomy & Astrophysics manuscript no. 3C58-opt1 c© ESO 2013November 25, 2013
Optical identification of the 3C 58 pulsar wind nebula
Yu. A. Shibanov1, N. Lundqvist2, P. Lundqvist2, J. Sollerman2,3, and D. Zyuzin4
1 Ioffe Physical Technical Institute, Politekhnicheskaya 26, St. Petersburg, 194021, Russia2 Stockholm Observatory, AlbaNova Science Center, Department of Astronomy, SE-106 91 Stockholm, Sweden3 Dark Cosmology Center, Copenhagen, Denmark4 Academical Physical Technical University, Khlopina 8, St. Petersburg, 195220, Russia
Preprint online version: November 25, 2013
ABSTRACT
Aims. 3C 58 is a Crab-like supernova remnant containing the young pulsar PSR J0295+6449, which powers a radio plerion and a compacttorus-like pulsar wind nebula visible in X-rays. We have performed a deep optical imaging of the 3C 58 field with the Nordic Optical Telescopein the B and V bands to detect the optical counterpart of the pulsar and its wind nebula.Methods. We analyzed our data together with the archival data obtained with the Chandra/ACIS and HRC in X-rays and with the Spitzer/IRACin the mid-infrared.Results. We detect a faint extended elliptical optical object with B=24.m06±0.08 and V=23.m11±0.04 whose peak brightness and center positionare consistent at the sub-arcsecond level with the position of the pulsar. The morphology and orientation of the object are in excellent agreementwith the torus region of the pulsar wind nebula, seen almost edge on in the X-rays, although its extension is only about a half of that in X-rays.This suggests that in the optical we see only the brightest central part of the torus with the pulsar. The object is also practically identical tothe counterpart of the torus region recently detected in the mid-infrared. We estimate that the contribution of the pulsar to the observed opticalflux is <∼ 10%. Combinig the optical/mid-infrared fluxes and the X-ray power-law spectrum extracted from the spatial region constrained by theoptical/infrared source extent we compile a tentative multi-wavelength spectrum of the central part of the nebula. Within the uncertainties ofthe interstellar extinction towards 3C 58 it is reminiscent of either the Crab or PSR B0540-69 pulsar wind nebula spectra.Conclusions. The properties of the detected object strongly suggest it to be the optical counterpart of the 3C 58 pulsar + its wind nebula system.This makes 3C 58 the third member of such a class of the torus-like pulsar+nebula systems identified in the optical and mid-infrared.
Key words. pulsars – pulsar wind nebulae – optical identification
1. Introduction
The “Crab-like” supernova remnant (SNR) 3C 58 was first dis-covered in the radio (Weiler & Seielstad, 1971) and then identi-fied in the optical by observations in Hα (van den Bergh, 1978).Just as the Crab nebula, this SNR has a plerionic, or filled cen-ter. It shows a filamentary structure in the Hα emission and inthe radio with a flat radio spectrum of synchrotron origin. Thedistance, d = 3.2 kpc, and size, ∼ 6′ × 9′ of 3C 58 is alsosimilar to that of the Crab SNR. What makes SNR 3C 58 par-ticularly interesting is its possible association (Stephenson &Green, 2002) with the historical supernova SN 1181. The de-duced age of ∼ 830 yr is consistent with the remnant beingof roughly the same size as the Crab nebula, but this has beenquestioned on another grounds (see below).
It was long suspected that 3C 58 contains a pulsar in its cen-ter (Becker, Helfand & Szymkoviak, 1982), and after severalyears of searching in X-rays and radio, the pulsar J0205+6449with a period of P = 65.68 ms was discovered with the ChandraX-ray observatory at the center of the SNR plerion (Murray etal., 2002). It was directly confirmed also in the radio (Malofeev
et al., 2001; Camilo et al., 2002; Malofeev et al., 2003). DeeperChandra exposures revealed a Crab-like X-ray torus+jet pulsarwind nebula (PWN) in the center of the pulsar powered plerion(Slane et al., 2004).
One of the puzzles of the 3C 58 system is that, unlike for theCrab, the characteristic age of the 3C 58 pulsar, τ = P/2P ≈5400 yr, is considerably higher than the historical age of 830yr. This can perhaps be understood by assuming a larger ini-tial spin period of the neutron star (NS). However, the fac-tor of ∼ 2 lower radial velocities of the optical (Fesen, 1983;Fesen et al., 2008) and radio (Bietenholz, Kassim, Weiler,2001; Bietenholz, 2007) filaments than for the Crab, i.e., <∼ 900km s−1, either would require a larger actual age of 3C 58, aweaker SN explosion, or a substantial deceleration of the rem-nant (Chevalier, 2004). Furthermore, the radio emission of 3C58 is about 10 times fainter than for the Crab while its X-raynebula is about 2000 times weaker. The latter is surprising anddoes not match the present spin-down power of the pulsar: thespindown luminosity of PSR J0205+6449 is E = 2.7 × 1037
erg s−1, and thus 5% of that of the Crab (this is actually the third
arX
iv:0
802.
2386
v1 [
astr
o-ph
] 1
7 Fe
b 20
08

2 Yu. Shibanov et al.: Optical identification of the 3C 58 PWN
largest spin-down power for all known pulsars in the Galaxy).Deeper studies of PSR J0205+6449 and its PWN at differentwavelengths may help to establish a link between the proper-ties of this Crab-like SNR and its pulsar activity.
Multiwavelength studies of PSR J0205+6449 are still rare.Its radio luminosity is lower than for 99% of all known pulsarsand actually the lowest among known young pulsars (Camiloet al., 2002). The X-ray properties of the nonthermal emissionof the pulsar (spectral slope, pulse shape) are similar to thoseof the Crab. However, an important difference is the presenceof a thermal blackbody-like component from the surface ofthe cooling NS with a temperature of about 106 K (Slane etal., 2004). Assuming an age of 830 yr, this temperature fallsfar below the predictions of the standard NS cooling theoriesand could suggests an enhanced cooling provided by the pres-ence of exotic matter (like pion condensates) in the NS interior.The spectral index of the X-ray synchrotron emission from thetorus-like PWN is compatible with that of the Crab, but the lu-minosity, ∼ 5.3×1033 erg s−1, is about 4000 times smaller. Thesize of the plerion core visible in X-rays, <∼0.55 pc, is only afactor of 3 smaller than that of the Crab.
There have been few studies of the 3C 58 field in the opticalrange, and we are not aware of any deep broadband imaging ofthe remnant. Such studies, carried out to reveal the continuumemission from the pulsar and the PWN and thus to constrainthe properties of the multiwavelength spectral energy distri-bution, have been performed for the Crab and its twin in theLMC, PSR B0540-69 (e.g., Sollerman, 2003; Serafimovich etal., 2004). The latter two systems show a strong spectral breakbetween the optical and X-rays leading to a smaller optical fluxthan would be expected from a simple extrapolation of the ob-served X-ray spectrum toward the optical range. The detectionof the 3C 58 PWN in the mid-infrared (mid-IR) recently re-ported by Slane et al. (2008) also suggests a break between theinfrared and X-rays, and perhaps multiple breaks. Optical stud-ies are necessery to constrain the position and the number ofthe breaks.
Here we report on deep optical imaging of the centralpart of 3C 58 in the B and V bands with the Nordic OpticalTelescope (NOT) on La Palma. These observations allowed usto find a likely candidate for the optical counterpart of the pul-sar+PWN system. We compare our data with X-ray and mid-IRdata retrieved from the Chandra and Spitzer archives. The ob-servations and data reduction are described in Sect. 2. In Sect. 3we present the results which are finally discussed in Sect. 4.
2. Observations and data reduction
2.1. Observations
The field of 3C 58 was observed on the night of October 22-23 2006 with the Andalucia Faint Object Spectrograph andCamera (ALFOSC1) at the NOT during a service mode ob-servation (program P34-026). ALFOSC was equipped with a2048× 2048 pixel CCD providing a field-of-view of 6′.5× 6′.5with the pixel size on the sky of 0.′′19. The center of 3C 58 was
1 www.not.iac.es/instruments/alfosc
imaged in the B- and V-band filters which have throughputssimilar to the Bessel system. Sets of 10 min dithered exposureswere obtained in each of the filters at an airmass varied in a nar-row range of ∼1.24–1.35. The total exposure time was 5400 sin the B and 6600 s in the V bands. The PG0231+051 stan-dard field (Landolt, 1992) was used for the photometric cali-bration, and was observed immediately after the 3C 58 field ata similar airmass. The observing conditions were rather stablewith the seeing varying from ∼ 0.′′6 to ∼ 0.′′9 and with meanvalues of ∼ 0.′′84 and ∼ 0.′′71 in the B and V bands, respec-tively. Standard data reduction including bias subtraction, flat-fielding and cosmic ray rejection was performed making use ofthe IRAF ccdred package and crrej task. The individual imagesin each band were aligned and combined with the imcombinetask.
2.2. Astrometric referencing
The astrometric referencing of the NOT images was done mak-ing use of the USNO-B1.0 catalog (Monet et al., 2002) andthe IRAF tasks ccmap/cctran. We chose the resulting B-bandimage as a primary for the referencing since this image havefewer saturated stars in the field. To minimize any geometricaldistortion effects we used the positions of eleven unsaturatedreference stars2 located within an arcminute from the center ofthe image. The nominal catalog position errors of the selectedstars are less than 0.′′1. These stars show no considerable propermotions within a few mas yr−1. Formal rms errors of the astro-metric fit for the RA and Dec were ≈ 0.′′059 and ≈ 0.′′062,respectively, and maximal residuals of any reference star were<∼ 0.′′1 for both coordinates. Using a set of stars with good PointSpread Functions (PSFs) the V band image was aligned to theB band image with an accuracy of better than ≈ 0.1 pixel, or≈ 0.′′019. Combining the errors, a conservative estimate of our1σ astrometric referencing accuracy is <∼ 0.′′1 in both RA andDec for both bands.
2.3. Photometric calibration
The observing night was photometric. The photometric cal-ibration was carried out using six standard stars from theLandolt field PG0231+051 (Landolt, 1992) and the IRAF pack-ages daophot and photcal. The small variations of the air-mass during our observations did not allow us to estimatethe atmospheric extinction coefficients from our own data. Wetherefore fixed the extinction coefficients at their mean val-ues adopted from the NOT homepage: kB=0.m22 and kV=0.m12.Since the target and the standard stars had small airmass dif-ferences the uncertainties in the airmass correction has a neg-ligible effect on our photometry. As a result of the photomet-ric fit, we obtained the following zeropoints BZP=25.m62±0.01and VZP=25.m51±0.01, and color terms BVb=0.m036±0.011 andBVv = −0.m068±0.014.
2 USNO-B1.0 stars used for the astrometric transformation ofthe 3C 58 field: 1548-0060227, 1548-0060191, 1548-0060258,1548-0060348, 1548-0060300, 1548-0060306 1548-0060264, 1548-0060155, 1548-0060199, 1547-0060002, 1547-0060015.

Yu. Shibanov et al.: Optical identification of the 3C 58 PWN 3
Fig. 1. Overview (∼6′×6′) of the center of the supernova remnant 3C 58 in the B-band, as obtained with NOT/ALFOSC. An outercontour of X-ray emission of the 3C 58 plerion is overlaid from the Chandra/ACIS-S image. A bold ellipse in the plerion centermarks the position where the pulsar J0205+6449 powering the nebula is located. The central region is enlarged in Fig. 2. Whitearrows marked “A”, “B” and “C” point at some filaments belonging to the remnant. Filament A is discussed further in Fig. 2.
3. Results
3.1. Overview of the 3C 58 field
The NOT/ALFOSC overview of the 3C 58 field in the B band isshown in Fig. 1. The field is crowded with stars which makes itdifficult to immediately identify any optical counterpart of theplerion’s X-ray emission, whose outer contour from an archivalChandra/ACIS-S image3 is overlaid. Nevertheless, one can re-solve several bright optical filaments likely associated with theSNR, e.g., a long filament extending from the center of the neb-ula in the E-W direction. The brightness of the extended optical
3 The X-ray data were retrieved from the Chandra archive (Obs ID4382,2003-04-23, 170 ks exposure, PI P. Slane).
emission increases toward the X-ray tail west of the plerion.The same is seen in our V image and in a red Palomar plate(van den Bergh, 1978; Fesen, 1983). The long E-W filamentalso correlates with this tail and it is clearly detected in narrowband Hα and [O III] images (Fesen et al., 2008). Optical spec-tra of some central parts of the filament have been obtained byFesen (1983) and reveal a radial velocity of up to 900 km s−1
confirming that it belongs to the SNR. Whether the other smallscale optical BV filaments and knots are associated with simi-lar structures detected in the radio, narrow band optical, and/orX-rays is outside the scope of this paper. Here we concentrateon the faint extended emission located in the center of the im-age near/within the region marked in Fig. 1 by a bold ellipsethat contains the pulsar.

4 Yu. Shibanov et al.: Optical identification of the 3C 58 PWN
Fig. 2. Central ∼1.′1×1.′1 part of 3C 58 containing the pulsar and the PWN. Top-Left and Top-Middle panels are NOT/ALFOSC Band V band images, respectively, where unsaturated field stars have been subtracted to better reveal the suggested pulsar/PWN op-tical counterpart. Other panels show images of the same field but in X-rays, mid-IR and radio, as obtained with the Chandra/HRCand Chandra/ACIS, Spitzer/IRAC and VLA, respectively, as indicated in the images. The optical and X-ray images have beensmoothed with a Gaussian kernel of three pixels. The X-ray contours outlining the boundary and PWN brightness distribution inX-rays on the HRC and ACIS images are overlaid on the B, 3.6 µm and on the V, 5.8 µm and VLA images, respectively. TheVLA contours are shown in the 8 µm image. The white cross (”+”) in all panels marks the Chandra/HRC position of the pulsar(Murray et al., 2002). Filament “A” in Fig. 1 is clearly seen in both B and V to the west of the white cross.
3.2. Detection of the pulsar/PWN optical counterpart
The region containing the pulsar is enlarged in Fig. 2, wherewe compare our optical B and V images with available archivalimages obtained in other spectral domains: Chandra/ACIS-Sand HRC-S4 X-ray images, mid-infrared images obtained with
4 The X-ray data were retrieved from the Chandra archive (Obs ID1848, 2002-01-09, 33.5 ks exposure, PI S. Murray).
Spitzer/IRAC5, and a 1.4 GHz VLA radio image (Bietenholz,2007). The unsaturated stars closest to the pulsar were sub-tracted in the optical images. The dynamical range of the ACISimage was changed compared to the contour shown in Fig. 1to reveal the structure of the torus-like PWN with its possiblewestern jet (assuming the torus is seen edge-on).
In both optical bands (Top Left and Middle panels of Fig. 2)we detect a faint extended, elliptical structure at the pulsar po-
5 Program ID 3647, exposure 5.4 ks, PI P. Slane

Yu. Shibanov et al.: Optical identification of the 3C 58 PWN 5
Fig. 3. The 13′′×6′′ central region of 3C 58 with the suggested optical counterpart of the pulsar/PWN system in the B (Left) andV (Right) bands and results of the B band surface brightness fit with elliptical isophotes (Middle). As in Fig. 2, the white plussign marks the HRC-S X-ray position of the pulsar while ”×” shows the position of the center of the brightest part of the opticalsource obtained from the fit. The difference between the plus and × is ≈0.′′6, which is about twice smaller than the 1-σ uncertaintyof the pulsar X-ray position combined from ∼1′′ HRC pointing accuracy and ∼0.′′1 uncertainty of the astrometric referencing ofthe optical images. The B and V images were smoothed with a Gaussian kernel of three pixels. The bright source at the bottomleft corner of the B and V images is the remains of a poorly subtracted field star.
sition and we have marked this by a white plus sign. Its mor-phology matches the structure seen in the HRC image, whichreveals only the brightest part of the PWN in X-rays. Both theextent of this elliptical optical source and the orientation of itsmajor axis are similar to what is found in X-rays. This suggeststhat the detected source is the optical counterpart of the PWNof PSR J0295+6449, with perhaps also a contribution from thepulsar itself. The source is also clearly visible in all four IRACmid-IR bands at the same position and with the same ellipti-cal morphology and orientation. An 8 µm image of this fieldwas presented by Slane (2007) and Slane et al. (2008). The as-trometric accuracy of the pipeline produced mid-IR post-BCD(Basic Calibrated Data) images shown in Fig. 2 is ∼0.′′2, whichallows us to state that structures we see in the optical and IRrepresent the same source. The mid-IR counterpart appears tobe slightly blurred in comparison with the optical structures.This is because of the lower spatial resolution of the IRAC im-ages (pixel size of 1.′′2) compared to that in the optical (pixelsize of 0.′′19).
In the optical we also see two knots on an extended fila-ment west of the pulsar (called Filament “A” in Fig. 1). Theycoincide spatially with an elongated X-ray structure seen in theACIS image that has been interpreted as a possible jet emanat-ing from the pulsar (Slane et al., 2002). However, in the opticalimages we do not see the “beginning” of the jet. The same istrue for the mid-IR where we see both faint emission from thefilament and the knots, in particular the western-most of thetwo optical knots. The filament, and especially the knots, arebest seen at the longest IR wavelengths. These structures seenin the optical and mid-IR are likely parts of a long curved SNRfilament clearly visible in the VLA radio image (Bottom-Rightpanel of Fig. 2). To emphasize this, we have overlaid the radio
contours on the 8 µm image. The 8 µm emission traces the radiostructure well. At shorter wavelengths, and in particular in theoptical, the full structure of the radio emission becomes lessobvious. That the emission becomes stronger, is less clumpy,and traces the radio structure progressively better as the wave-length increases from the B-band to 8 µm, makes us confidentthat we have indeed identified the optical/IR counterpart to theradio filament. The X-ray contours overlaid on the radio imagealso show that at least the distant part of the elongated X-raystructure is likely of the same origin as the radio filament. Thisrules out the interpretation of this part of the structure as thepulsar jet.
To compare the suggested optical counterpart to the X-rayPWN torus structure, we have fitted the spatial intensity distri-bution with a simple two-dimensional model (using the IRAFisophotes package) accounting for the brightness distributionby elliptical isophotes and taking into account the backgroundlevel. The same was done by Murray et al. (2002) for the ex-tended part of the X-ray source in the HRC image, using CIAOSherpa tools. The results of the spatial fits are presented inFig. 3 and in Table 1.
The fit shows that the brightest part of the optical nebula,within 1′′–2′′ of the center, has almost a circular shape andemits only <∼ 10% of the total flux. If our identification is cor-rect, this can be considered as an upper limit of the pulsar con-tribution to the total pulsar+PWN optical flux. This is consis-tent with what was found for two known pulsar+PWN systemsin the optical range (Serafimovich et al., 2004). The coordi-nates of the center defined from the fit are RA=02:05:37.88and DEC=64:49:40.7 (marked by ”×” in Fig. 3). This is inagreement with the pulsar X-ray coordinates (marked by plus),RA=02:05:37.8 and DEC=64:49:41 (Murray et al., 2002),

6 Yu. Shibanov et al.: Optical identification of the 3C 58 PWN
Table 1. Parameters of the elliptical fit to the surface brightnessof the PSR J0295+6449+PWN optical counterpart ordered bythe major ellipse axis length (c.f., Middle panel of Fig. 3).
Centera Centera Major Ellip- PAc B-bandRA DEC axis -ticityb N to E fluxd
length02:05:* 64:49:* arcsec degrees %37.88 40.7 0.84 0.28 −7.29 3.1(0.8)37.88 40.7 1.26 0.28 −7.29 7.6(1.2)37.88 40.7 1.9 0.28 −7.29 17.4(1.7)37.88 40.7 2.86 0.56 −16.13 22.9(2.2)37.88 40.7 4.28 0.62 −3.68 40.9(3.1)38.00 40.8 6.42 0.48 −3.68 86.3(6.6)38.00 40.5 9.62 0.59 −5.40 100a coordinates of centers of the ellipses (J2000);b defined as 1 − lmin/lmax, where lmin and lmax are the minor andmajor ellipse axes lengths, respectively;c positional angle of the major axis;d flux from the elliptical aperture normalized to the flux from thelargest aperture in this set. Numbers in brackets are 1σ uncertainties.
when accounting for our astrometrical uncertainty, <∼ 0.′′1, andthe typical HRC pointing uncertainty, <∼ 1′′. The ellipticity in-creases up to ∼ 0.5–0.6 for the outer optical nebula regions,and the major axis is slightly tilted towards the North-West bya few degrees, which is also in a good agreement with what wasfound in X-rays (Murray et al., 2002; Slane et al., 2002). In ad-dition, the optical nebula is elongated in the north-south direc-tion almost symmetrically around its center with a total lengthof ∼9.′′6, which agrees with the ∼10′′ extent of the brightest partof the nebula in the HRC-S data. Finally, assuming that we seea tilted torus-like shaped nebula, our elliptical fit suggests thatthe angle of the torus symmetry axis to the sky plane is in therange of 53◦- 66◦. This is close to the value of ∼70◦ estimatedfrom the X-ray data by Slane et al. (2002).
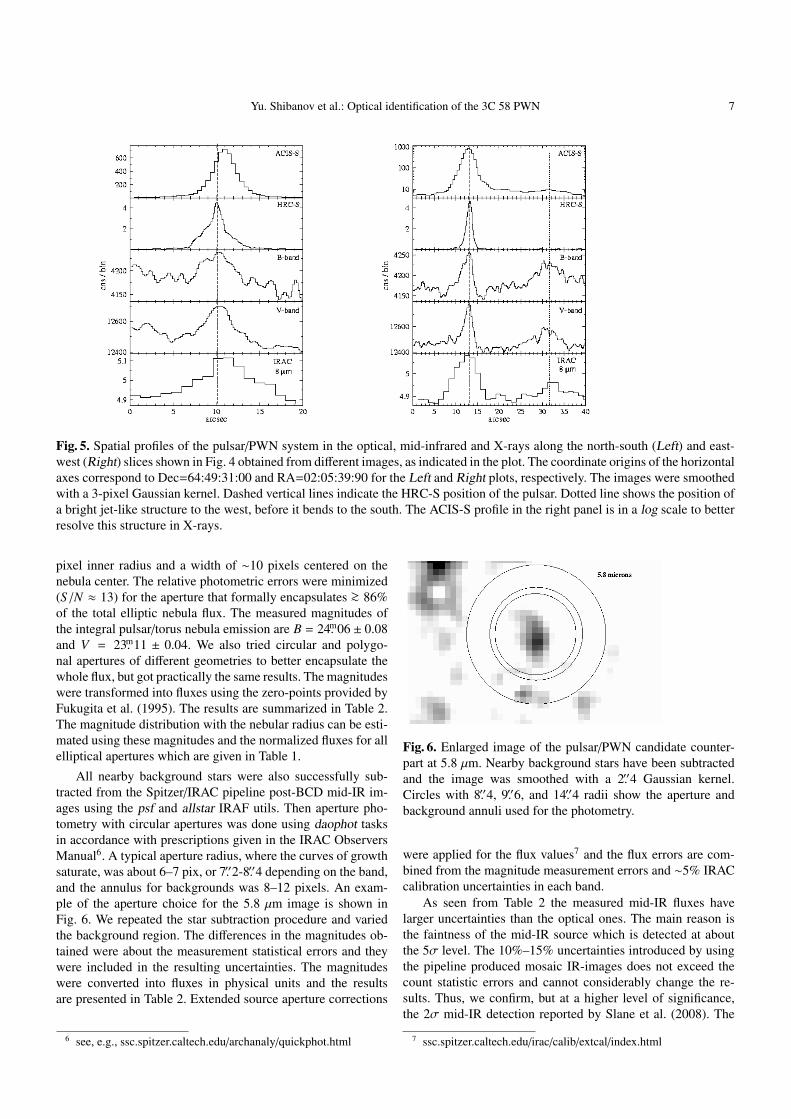
To bring out more details of the structure of the nebulain the optical/mid-IR and in X-rays, we considered also 1D-spatial profiles of the presented images along two slices shownin Fig. 4. The slices are 2′′ wide with PA 0◦ and 90◦, both cen-tered on the HRC-S pulsar position. The first slice is 20′′ longto include the most north-south extent of the nebula as seenin the ACIS-S image and was placed symmetrically over thecenter of the nebula. The second slice is 40′′ long and extendstoward the west to cover also the region supposed to be an X-ray emitting jet. The X-ray, optical and mid-IR spatial profilesalong these slices are presented in Fig. 5. The horizontal axis inthe Left panel is directed from south to north, and in the Rightpanel from east to west.
This figure shows the coincidence of the positions of themain peak of the nebula in the optical, mid-IR and in X-rays.The ACIS-S peak is broader than that of the HRC because ofthe lower spatial resolution of ACIS. The same is true for theinfrared where we show only the 8 µm profile. The 5.8 µmprofile is practically the same, while the 3.6 µm and 4.6 µmprofiles are contaminated by the nearby star east of the pulsar.In the Left panel the ACIS-S peak has an apparent offset to-ward north by roughly an arcsecond, but this may be related
Fig. 4. ACIS-S image with positions of two slices of40′′ (black) and 20′′ (white) lengths and of 2′′ widths used forthe comparison of the X-ray and optical spatial profiles of thepulsar+PWN system in Fig. 5.
to errors in the astrometrical referencing of the ACIS-S image(Slane et al., 2002, 2004).The profiles confirm that we see thesame source in all three spectral domains. Although the po-sition of the main optical and IR peaks coincide with the pul-sar X-ray position, we do not resolve any point-like object inthe center of the nebula in our optical and the archival IR im-ages. The FWHM of the optical PSF is ∼0.′′7-0.′′85 (Sect. 2.1),while for the mid-infrared it varies with the wavelength from∼2.′′1 to 2.′′5. The brightest part of the PWN, which subtendsseveral arcseconds, is clearly resolved (Fig. 5). To resolve thepoint-like pulsar from the nebula in the optical/IR would re-quire deeper imaging at high spatial resolution, or alternativelytime resolved observations.
We also note a broad secondary peak west of the pulsar seenin the east-west optical and IR profiles and which is marked bya vertical dotted line in the Right panel plot of Fig. 5. It co-incides with a shallow secondary peak seen in the ACIS pro-file. This is Filament “A” in Fig. 1 with its knots, and whichis projected on the extended X-ray structure which was earlysupposed to be the pulsar jet.
To summarize this part, we conclude that the coincidence ofthe center positions of the detected optical/mid-IR nebula withthat of the pulsar/PWN X-ray source, the optical/mid-IR/X-raymorphology and the spatial surface brightness profiles in thesewavelength regions, strongly support that we have indeed de-tected the optical/mid-IR counterpart of the pulsar/PWN sys-tem in the 3C 58 supernova remnant.
3.3. Optical and mid-IR photometry
Optical photometry of the suggested counterpart was per-formed on the star subtracted images. We used the ellipticalapertures from the surface brightness fit described in Sect. 3.2.The parameters of the ellipses are presented in Table 1. Thebackgrounds were estimated from a circular annulus with a ∼20
Yu. Shibanov et al.: Optical identification of the 3C 58 PWN 7
Fig. 5. Spatial profiles of the pulsar/PWN system in the optical, mid-infrared and X-rays along the north-south (Left) and east-west (Right) slices shown in Fig. 4 obtained from different images, as indicated in the plot. The coordinate origins of the horizontalaxes correspond to Dec=64:49:31:00 and RA=02:05:39:90 for the Left and Right plots, respectively. The images were smoothedwith a 3-pixel Gaussian kernel. Dashed vertical lines indicate the HRC-S position of the pulsar. Dotted line shows the position ofa bright jet-like structure to the west, before it bends to the south. The ACIS-S profile in the right panel is in a log scale to betterresolve this structure in X-rays.
pixel inner radius and a width of ∼10 pixels centered on thenebula center. The relative photometric errors were minimized(S/N ≈ 13) for the aperture that formally encapsulates >∼ 86%of the total elliptic nebula flux. The measured magnitudes ofthe integral pulsar/torus nebula emission are B = 24.m06 ± 0.08and V = 23.m11 ± 0.04. We also tried circular and polygo-nal apertures of different geometries to better encapsulate thewhole flux, but got practically the same results. The magnitudeswere transformed into fluxes using the zero-points provided byFukugita et al. (1995). The results are summarized in Table 2.The magnitude distribution with the nebular radius can be esti-mated using these magnitudes and the normalized fluxes for allelliptical apertures which are given in Table 1.
All nearby background stars were also successfully sub-tracted from the Spitzer/IRAC pipeline post-BCD mid-IR im-ages using the psf and allstar IRAF utils. Then aperture pho-tometry with circular apertures was done using daophot tasksin accordance with prescriptions given in the IRAC ObserversManual6. A typical aperture radius, where the curves of growthsaturate, was about 6–7 pix, or 7.′′2-8.′′4 depending on the band,and the annulus for backgrounds was 8–12 pixels. An exam-ple of the aperture choice for the 5.8 µm image is shown inFig. 6. We repeated the star subtraction procedure and variedthe background region. The differences in the magnitudes ob-tained were about the measurement statistical errors and theywere included in the resulting uncertainties. The magnitudeswere converted into fluxes in physical units and the resultsare presented in Table 2. Extended source aperture corrections
6 see, e.g., ssc.spitzer.caltech.edu/archanaly/quickphot.html
Fig. 6. Enlarged image of the pulsar/PWN candidate counter-part at 5.8 µm. Nearby background stars have been subtractedand the image was smoothed with a 2.′′4 Gaussian kernel.Circles with 8.′′4, 9.′′6, and 14.′′4 radii show the aperture andbackground annuli used for the photometry.
were applied for the flux values7 and the flux errors are com-bined from the magnitude measurement errors and ∼5% IRACcalibration uncertainties in each band.
As seen from Table 2 the measured mid-IR fluxes havelarger uncertainties than the optical ones. The main reason isthe faintness of the mid-IR source which is detected at aboutthe 5σ level. The 10%–15% uncertainties introduced by usingthe pipeline produced mosaic IR-images does not exceed thecount statistic errors and cannot considerably change the re-sults. Thus, we confirm, but at a higher level of significance,the 2σ mid-IR detection reported by Slane et al. (2008). The
7 ssc.spitzer.caltech.edu/irac/calib/extcal/index.html

8 Yu. Shibanov et al.: Optical identification of the 3C 58 PWN
Table 2. Observed magnitudes and fluxes for the presumedoptical/infrared pulsar/PWN counterpart of 3C 58, as well asdereddened fluxes for different values of AV .
λe f f Mag. log Flux log Flux(band) obs.a obs.a dered.a
AV=1.9 2.9 3.4(µm) (mag) (µJ) (µJ) (µJ) (µJ)440(B) 24.06(8) −0.02(3) 0.99(3) 1.52(3) 1.78(3)530(V) 23.11(4) 0.31(2) 1.10(2) 1.52(2) 1.73(2)650(R)b >22.5(5) 0.48(20) 1.11(20) 1.44(20) 1.61(20)3.6 15.8(4) 2.14(16) 2.19(16) 2.22(16) 2.23(16)4.5 15.2(4) 2.16(14) 2.20(14) 2.22(14) 2.22(14)5.8 14.3(3) 2.34(11) 2.38(11) 2.40(11) 2.41(11)8.0 13.5(2) 2.42(9) 2.46(9) 2.48(9) 2.49(9)a numbers in brackets are 1σ uncertainties referring to last significantdigits quotedb upper limit for the pulsar magnitude taken from Fesen et al. (2008)
difference between the mid-IR and the optical fluxes is quitesignificant, and allows us to draw conclusions on the multi-wavelength spectral energy distribution (SED) of the suggestedcounterpart.
3.4. Multiwavelength spectrum of the pulsar+PWNsource
We can use our fluxes estimated for the pulsar/PWN counter-part candidate together with the X-ray data to construct a ten-tative multiwavelength spectrum for the central part of the neb-ula. When compiling data from the IR to X-rays one has to takeinto account that the PWN torus size in the optical and IR ap-pears smaller than in the X-rays. Future deeper optical and IRstudies will probably reveal fainter outer parts of the torus inthese ranges, as has been seen for the Crab and PSR B0540-69PWNe. These fainter but more extended outer parts can con-tribute considerably to the total flux of the system.
At the current stage it is reasonable to compare the mea-sured optical and infrared fluxes with the X-ray spectrum ex-tracted from the same physical region. To do that we extractedthe X-ray spectrum for the central part of the torus region fromthe ACIS-S data making use of the CIAO acisspec tool and thesame elliptic aperture we applied for the optical source pho-tometry. This gave ∼30200 source counts. The spectral datawere grouped to provide a minimum of 20 counts per spectralbin and fitted by an absorbed power-law model using standardXSPEC tools. We obtained a statistically acceptable fit with thephoton spectral index Γ = 1.88 ± 0.08, the absorbing columndensity NH = (4.34 ± 0.08) × 1021 cm−2, and a normalizationconstant C = (4.39 ± 0.17) × 10−4 photons cm−2 s−1 keV−1.The fit had χ2 = 0.95 per degree of freedom. Within the un-certainties the Γ and NH values obtained are in agreement withthose obtained for the entire torus by Slane et al. (2004), whilethe unabsorbed integral flux, 1.68×10⁻¹² erg cm−2 s−1 (0.5–10keV range), is only ∼ 40% of that from the entire X-ray torusregion. The derived unabsorbed X-ray spectra for both the in-ner region and the entire torus regions are shown in Fig. 7.
Before comparing with the X-ray spectrum we need to cor-rect the optical and IR data for interstellar reddening. The in-terstellar color excess towards 3C 58 is, however, not well con-strained. Fesen (1983) estimated, based on the Hα/Hβ decre-ment obtained from spectral observations of a part of the brightlong E-W filament discussed in Sect. 3.1, that E(B−V) = 0.6±0.3 mag, assuming an intrinsic Hα/Hβ ratio of 3.0. This corre-sponds to the V-band reddening correction of AV ≈ 1.9 ± 1.0,adopting the standard ratio AV/E(B − V) = 3.1. Later spec-troscopy of a sample of the remnant emission knots provideda more stringent constraint, E(B − V) = 0.68 ± 0.08 mag(Fesen et al., 1988). Recent spectroscopy of three brightest Hα-filaments in the northern part of the SNR yielded a similar re-sult, E(B − V) = 0.6 ± 0.1 mag (Fesen et al., 2008).
We also know that 3C 58 sits within the Galactic disk(l≈130.◦4, b≈3.◦04) and that the entire Galactic excess in thisdirection provided by Schlegel et al. (1998) is E(B − V) ≈0.99 mag. This is consistent with the fact that the Galactic discedge in this direction of the sky is roughly 1–2 kpc more dis-tant from us than 3C 58. Assuming a linear color excess in-crease with the distance from the Sun with a mean gradient of∼0.2 mag kpc−1 applicable within 3–4 kpc of the solar neigh-bourhood (e.g., Bohlin et al., 1978), we obtain E(B − V) ∼ 0.6for 3C 58 and ∼1 mag as the entire excess, respectively, pro-vided that the distances to 3C 58 and the disc edge are 3.2 kpcand ∼5 kpc. This is in good agreement with the estimatesabove.
On the other hand, using NH=(4.34 ± 0.08) × 1021 cm−2,derived from the above X-ray spectral fit, and the empirical re-lation NH/E(B − V) = 4.8 × 1021 cm−2 mag−1 applicable forthe Milky Way (Bohlin et al., 1978), we obtain E(B − V) =
0.9±0.02 mag (AV = 2.8±0.06). Another empirical relation be-tween the effective NH of the X-ray absorbing gas and the dustextinction, NH/E(B − V) = (5.55 ± 0.093) × 1021 cm−2 mag−1
(Predehl & Schmitt, 1995), gives a smaller value, E(B − V) =
0.78 ± 0.03 mag. The color excesses based on the NH value,derived from the X-ray spectral fit of the torus emission, aresystematically higher than the mean excess obtained from theoptical studies. This may be explained by intrinsic reddeningvariations over the remnant area resulted from a nonuniformdistribution of the SN ejecta.
Summarizing all the uncertainties of the color excess weselect for our further analysis AV = 1.9 mag as a most plau-sible reddening consistent with the mean excess given by theoptical studies. We also perform the analysis for AV = 2.9which is compatible with the X-ray spectral estimates dis-cussed above. Dereddened optical/IR fluxes are presented inTable 2. For dereddening we used a standard optical extinc-tion curve (Cardelli et al., 1989) and average Aλ/AK ratios pro-vided especially for the Spitzer/IRAC bands by Indebetouw etal. (2005).
We have combined dereddened optical/IR fluxes for thepulsar/PWN system with the unabsorbed X-ray spectrum inFig. 7. As expected, the shape of the multiwavelength spec-trum strongly depends on AV . To emphasize this we havealso included an even higher value for the extinction towards3C 58, with AV=3.4 mag. This value corresponds to the up-per limit of Galactic extinction in the given direction as de-

Yu. Shibanov et al.: Optical identification of the 3C 58 PWN 9
Fig. 7. Tentative unabsorbed multiwavelength spectrum for the inner part of the torus region of the 3C 58 pulsar/PWN systemcompiled from data obtained with different telescopes, as indicated in the plots. Different panels demonstrate the dependence ofthe spectrum on the adopted interstellar extinction AV . The Lower and Upper panels show the whole IR/X-ray spectral range andits enlarged optical/IR part, respectively. Both the optical/IR and X-ray data are fitted with power laws with different spectralindices (defined as Fν ∝ ν
αν ). The derived indices for the optical/IR part are shown in the Upper panels and dashed lines constrain1σ uncertainties of the respective fits. For the X-ray part, the lower power law is for the inner part of the torus (i.e., same as forthe optical/IR emission), whereas the upper power law is for the entire torus. The power-law indices for these X-ray data are−0.88 ± 0.08 and −0.87 ± 0.02, respectively. Dotted lines show extensions from the optical/IR part and the X-ray part. Greypolygons (barely resolved) are 1σ uncertainties of the X-ray fits. For the optical/IR range the steepness of an assumed power lawdepends strongly on AV , with an upper limit of αν ∼ −0.5. For 2.9 ≤ AV ≤ 3.4, the optical/infrared spectrum can be joined withthe X-ray spectrum using only one spectral break. Lower extinctions suggest a more complicated multiwavelength spectrum. Theupper limit for the pulsar flux in the R band (Fesen et al., 2008) is included. Its possible uncertainty (0.5 mag) is marked by adashed errorbar. See text for further details.
rived from the total neutral hydrogen Galactic column density,NH = 5.34 × 1021 cm−2 (Kalberla et al., 2005), making useof the relation by Bohlin et al. (1978). This higher value ofextinction is included becasue it represents an interesting limit-ing case for the dereddened spectral energy distribution (seebelow). In Fig. 7 we have plotted the power-law describingthe X-ray spectrum from the entire PWN torus (upper X-raypower law). We also show the X-ray spectrum from the onlysame physical region as for the optical/IR emission (lower X-ray power law).
In all cases the optical/IR SED can be fitted by a power law(Fν ∝ ναν ) and the spectral indices, αν, of the fits are shownin the upper panels of Fig. 7. For the most plausible AV value
of 1.9 the fit residuals are minimal and we see a monotonousdecline in flux from the IR to the optical, suggesting a non-thermal nature of the detected optical/IR counterpart candi-date. This implies a synchrotron emission mechanism for thedetected nebula, normally considered to be the main radiativeprocess for PWNe. For higher extinction values, particularlyfor AV = 3.4, the spectrum becomes flatter.
The upper limit of the pulsar point source flux in the R-band obtained by Fesen et al. (2008) is also shown in the plotsfor comparison. It was not included in the fits and we estimatethat its uncertainty can be as large as half a stellar magnitude.This is becasue it was derived from a comparison with ratheruncertain catalogue magnitudes of USNO stars in the 3C 58

10 Yu. Shibanov et al.: Optical identification of the 3C 58 PWN
field. We included the possible flux uncertainty in Table 2 andFig. 7. The pulsar R-band flux upper limit is a factor of a fewlower than the expected nebula flux in this band, which is com-patible with our estimates for the pulsar flux contributions inthe B and V bands (see Sect. 3.2).
Extending the X-ray spectral fits (dotted lines) toward theoptical/IR bands, and vice versa, we see that at any adopted AV
the X-ray extension overshoots the IR fluxes. For the AV rangeof ∼2.9 –3.4 the multiwavelength spectrum from the IR throughX-rays can be modeled by a power law with a single break anda flatter slope in the IR/optical range. In the optical/IR rangethe spectrum cannot be shallower than that with αν ∼ −0.5,as follows from the largest value of AV = 3.4 (Right panels),when the break occurs directly in the B optical band. For lowerAV the break moves toward the X-ray range and at AV = 2.9,it meets the low-energy boundary of the X-ray range (Middlepanels). In this case the optical/IR slope with αν ≈ −0.8 isclose to that in X-rays with αν ≈ −0.9. For lower values ofAV the intrinsic optical/IR spectrum becomes steeper and wemust invoke more breaks to connect the optical/IR SED withthe X-ray spectrum. For example, at AV = 1.9, the optical/IRspectral index, αν ≈ −1.2, is significantly lower than that inX-rays (Left panels).
The Crab and PSR B0540-69 are the only two PWNe pre-viously detected in the optical and mid-IR ranges. Even withinthe large uncertainties of the interstellar extinction toward3C 58, the tentative multiwavelength spectrum of the 3C 58PWN can be similar to either the Crab PWN (for AV >∼ 2.9),or the PWN of PSR B0540-69 (for AV <∼ 2.9). The Crab PWNchanges smoothly its spectral slope from negative in X-rayswith αν∼ −1 to a flatter value in the optical, whereas thespectrum of the PSR B0540-69 PWN demonstrates a double-knee structure at the transition from the optical to X-rays (e.g.,Serafimovich et al., 2004). Our preferred value of AV ∼ 1.9suggests that the 3C 58 PWN is likely similar to the latter case.
We emphasize the importance of using the same spatial re-gion in all spectral domains when constructing the multiwave-length spectrum. As seen from the Bottom panels of Fig. 7,using the entire torus X-ray spectrum, instead of its inner re-gion, would lead to different conclusions. To make a meaning-ful multiwavelength plot for the entire X-ray emitting PWNtorus, we would need deeper optical/IR observations to con-strain the emission in the outer parts of the torus, and to makea more detailed comparison with the entire PWNe of the Craband PSR B0540-69 and with available theoretical models.
4. Discussion
The properties of the detected source indeed suggest it to bethe optical/mid-IR counterpart of the 3C 58 pulsar/PWN torussystem. The alternative could be a SNR filament, or possibly afaint background spiral galaxy seen edge on and coinciding bychance with the pulsar position. However, the positional coinci-dence with the X-ray PWN torus and the remarkable similarityof the object morphology and orientation with those in X-raysis reassuring. The multiwavelenght spectrum shows that the op-tical and mid-infrared magnitudes of the proposed counterpartare at least consistent with the spectra seen in other PWNe. We
argue that this makes the alternative interpretations rather un-likely.
There are no significant radio filaments at the PWN po-sition (Bietenholz, 2007) The nearest bright and sharp longfilament known as a “wisp” (Frail & Moffett, 1993) is a fewarcseconds west of the PWN torus and the optical/IR sourceboundaries. Some signs of a faint radio counterpart of the PWNtorus and/or the optical source may be present in the latest VLA1.4 GHz image published by Bietenholz (2007, Fig. 2).
For an AV value consistent with the NH column density de-rived from the X-ray spectral fit there are ∼ 1σ deviations ofthe B and V fluxes from the best power law fit line describ-ing the optical and mid-IR SED of the suggested counterpart(see Middle panels of Fig. 7). Additional optical observationsare in progress to extend the SED toward the red and UV op-tical bands and to see if these deviations are significant and ifthey can better constrain the extinction value, assuming a sin-gle power-law fit of the optical/IR SED. Higher spatial and/ortiming resolution are necessary to measure reliably the opti-cal emission from the point-like pulsar embedded in the centerof the PWN torus and to confirm finally the suggested iden-tification. Longer wavelength mid-infrared imaging with theSpitzer/MIPS is needed to see if there is a break toward theradio to support the apparent absence/presence of the putativePWN torus counterpart in the radio range.
At larger spatial scales the spectrum from the whole 3C 58plerion region from radio through X-rays is described by apower law with a single low frequency break near ∼50 GHz.Below this frequency the spectral slope is significantly flatterthan in X-rays (cf. Slane et al., 2008). This is in contrast tothe plerion core near the pulsar. For the PWN torus our opticaldata suggest at least one break at much shorter wavelenghts,somewhere between the optical and X-ray ranges. This im-plies a different spectrum of the relativistic particles in the ple-rion core at distances from the pulsar comparable to the pulsarwind termination shock radius where the PWN torus structureis formed. At any reasonable assumption on the interstellar ex-tinction value, the optical/IR part of the power-law torus spec-trum cannot be flatter than that with αν = −0.5 and steeper thanthat with αν = −1.2. Comparison with the radio flux from thetorus or its upper limit would provide additional constraints ofthe spectrum of the emitting particles.
Assuming that we have indeed detected the optical/IRcounterpart of the torus-shaped PWN, we compare in Table 3its parameters with the parameters of the other two young pul-sar/PWN systems which have been detected in the optical, in-frared and X-rays. We also include the older Vela pulsar whosePWN has not yet been identified in the optical or IR (e.g.,Shibanov et al., 2003). For 3C 58 we adopt a distance of 3.2kpc (Slane et al., 2004). Its optical luminosity uncertainty ismainly due to the uncertainty in the interstellar extinction. Theratio of the pulsar to PWN optical luminosity reflects the pos-sible contribution of the pulsar to the total pulsar/PWN opticalemission, as was estimated in Sect. 3.2. The principal rankingin Table 3 is the characteristic age and/or spindown luminos-ity E. The age of 3C 58 and its association with the histori-cal supernova event of 1181 A.D. is still debated (e.g., Slaneet al., 2004). We have used the characteristic age of the pul-

Yu. Shibanov et al.: Optical identification of the 3C 58 PWN 11
Table 3. Comparison of the optical and X-ray spectral indices (αOν , αX
ν ) luminosities (LO, LX), efficiencies (ηO, ηX) of the threeyoung PWNe detected in the optical/IR and X-rays. Information on the Vela PWN, not yet detected in the optical, as well as onthe pulsar characteristic ages (τ), spindown pulsar luminosities (E), PWN sizes, and the ratios of the pulsar to PWN luminosityin the optical and X-rays are also included.
PWN τ E size −αOν LO,a ηO −αX
ν LX,b ηX LOpsr/L
Opwn LX
psr/LXpwn
kyr 1037erg s−1 pc 1033erg s−1 10−5 1036erg s−1 10−3
Crabc 1.24 46 1.5 0.92 4240 920 1.14 21.8 47.5 0.0017 0.0460540c 1.66 50.2 0.6-0.9 1.5 366 245 1.04 12 79.7 0.03 0.263C 58d 5.38 2.6 0.08-0.19 0.7-1.2 0.08-0.21 0.3-0.75 0.88 5 × 10⁻³ 0.19 <∼ 0.1 0.23Velac 11 0.069 0.14 – – – 0.5 6.8 × 10⁻⁴ 9.8 × 10⁻² – 0.34
a For the optical range 1.57–3.68 eV. c Data are taken from Serafimovich et al. (2004).b For the X-ray range 0.6–10 keV. d This paper. The distance is assumed to be 3.2 kpc.
sar defined in the standard way as τ = P/2P (Murray et al.,2002). We see that the 3C 58 PWN nicely fits its position inTable 3 in terms of other physical parameters. Its size, X-rayluminosity and efficiency of transformation of the pulsar ro-tational loss to PWN emission, ηX = LX/E, and the ratio ofpulsar to PWN X-ray luminosity trace the general evolutiontendency where the “strength” of a PWN correlates with thespindown luminosity and fades with pulsar age. Interestingly,the luminosity of 3C 58 has faded an order of a magnitudemore in the optical than in X-rays, if we take the Crab PWNas a reference. For PSR 0540-69 and 3C 58 both luminositieshave decreased by approximately the same factor. This perhapsmeans that the old estimates of the Crab PWN optical contin-uum luminosity based on low spatial resolution observationsVeron-Cetty & Woltjer (1993) need a revision using recentlyavailable high resolution observations of this PWN. There isno strong difference for the efficiency of the 3C 58 PWN in theoptical and X-rays. The same situation applies to the youngerPSR 0540-69 PWN, although 3C 58 is much less efficient, asexpected from its age. For the Crab, the difference is exception-ally strong, probably for the same reasons we have mentionedabove. Thus, the properties of the likely optical/IR counterpartof the 3C 58 PWN suggest that the real age of the associatedSNR is close to the pulsar characteristic age, but not to the his-torical event of 1181 A.D, as has been discussed from otherpoints of view by Chevalier (2004) and Bietenholz (2007).
The long extended structure seen in X-rays west of the3C 58 pulsar has been suggested to be the jet part of its PWN(Slane et al., 2004). A similar axisymmetrical jet structure ofthe Crab PWN has a clear optical counterpart (e.g. Hester etal. , 2002). Some hints of a less pronounced X-ray jet of thePSR 0540-69 PWN are also seen in the optical (Serafimovichet al., 2004). For 3C 58 we also see a bright optical filamentprojected on the X-ray jet where it bends southward. However,a comparison of the optical, infrared and radio images suggeststhat this is not an optical jet counterpart. It may also be that thisdistant part of the X-ray structure does not relate to the PWNjet at all. Instead, it is most likely a long curved SNR filament,which is also clearly seen in VLA images (Bietenholz, 2007).Its position is marked in the 8 µm images of Fig. 2. Most likely,
the part of the filament we have detected in our images, is thesame as was studied spectroscopically by Fesen (1983) (posi-tion 1 in his notation) using a 4′′ circle aperture. Based on Hα,he estimated a radial velocity of ∼ 900 km s−1, which is sim-ilar to the overall expansion of the remnant, and to motions inthe Crab. Detailed imaging and spectral studies are necessaryto confirm this and to study if this extended structure is a partof the real PWN jet or not. Deeper spectral observations willalso set more stringent constraints on the interstellar extinc-tion, which is the main source of uncertainty of the estimatedintrinsic optical flux of the PWN.
In conclusion, our observations have, with high probabil-ity, increased the number of the optically identified Crab-likePWNe from two to three, which should help to constrain mod-els of these unique objects and to understand their nature.
Acknowledgements. The work was partially supported by RFBR(grants 05-02-16245, 05-02-22003), the Swedish Research Counciland Nsh 9879.2006.2. The Dark Cosmology Centre is funded by theDanish National Research Foundation. The projected started while PLwas still a Research Fellow at the Royal Swedish Academy, supportedby a grant from the Wallenberg Foundation. The data presented herehave been taken using ALFOSC, which is owned by the Instituto deAstrofisica de Andalucia (IAA) and operated at the Nordic OpticalTelescope.
References
Becker, R., Helfand, D., & Szymkoviek, A., 1982, ApJ, 255,537
Bietenholz, M., Kassim, N., Weiler, K. 2001, ApJ, 360, 772Bietenholz, M., 2007, ApJ,Bohlin R.C., Savage B.D., Drake, J.F. 1978, ApJ, 224, 132Camilo, F., Stairs, I.H., Lorimer, D.R., et al. 2002, ApJ, 571,
L41Cardelli, J. A., Clayton, G. C., Mathis, J. S. 1989, ApJ, 345,
245Chevalier, R. 2004, ApJ, 619, 839Fesen, R. 1983, ApJ, 270, L53Fesen, R., Kirshner, R., & Becker, R, 1988, IAU Colloq. 101:
Supernova Remnants and the Interstellar Medium, 55

12 Yu. Shibanov et al.: Optical identification of the 3C 58 PWN
Fesen, R., Rudie, G., Hurford, A., & Soto, A. 2008, ApJS, 174,379
Frail, D. A.& Moffett, D. A. 1993, ApJ, 408, 637Fukugita, M., Shimasaku, K., Ichikawa, T. 1995, PASP, 107,
945Hester, J.J., Mori, K., Barrows, D., et al. 2002, ApJ, 577, L49Indebetouw, R., Mathis, J.J., Babler, B.L. et al. 2005, ApJ, 619,
931Kalberla, P.M.W., Burton, W.B., Hartmann, D., et al 2005,
A&A, 440, 775Landolt, A. U. 1992, AJ, 104, 340Malofeev, V., Malov, O., Glushak, A. 2001, IAU Circ., 7775, 2.
Edited by Green, D. W. E.Malofeev, V. M.; Malov, I. F.; Malov, O. I.; Glushak, A. P. 2003,
ARep, 47, 413Monet, D., Levine, S., Canzian, B., et al. 2002, BAAS, 34, 1104
(astro-ph/0210694)Murray, S., Slane, P.O., Seward, F.D., et al. 2002, ApJ, 568,
226Predehl, P. & Schmitt, J.H.M.M. 1995, A&A, 293, 889Schlegel, D. J., Finkbeiner, D. P., Davis, M. 1998, ApJ, 500,
525Serafimovich, N., Shibanov, Yu.A., Lundqvist, P., Sollerman,
J. 2004, A&A, 425, 1041Shibanov, Yu.A., Koptsevich, A.B., Sollerman, J., Lundqvist,
P. 2003, A&A, 406, 645Slane, P., Helfand D.J., & Murray, S.S. 2002, ApJ, 571, L45Slane, P., Helfand D.J., van der Swaluw, E. & Murray, S.S.
2004, ApJ, 616, 403Slane, P. 2007, conference proceedings, ”Astrophysics
of Compact Objects,” 2007, Huangshan, China (astro-ph:0711.1002)
Slane, P., Helfand, D. J., Reynolds. S.P., et al. 2008, ApJ, (ac-cepted, astro-ph 0802.0206v1)
Sollerman, J. 2003, A&A, 406, 639Stephenson, F., & Green, D. 2002,
Historical Supernovae and their Remnants (Oxford,Clarendon)
van den Bergh, S. 1978, ApJ, 220, L9Veron-Cetty, M. P., & Woltjer, P. 1993, ApJ, 270, 370Weiler, K. & Seielstad, G. 1971, ApJ, 163, 455