The AG Carinae nebula: abundant evidence for a red supergiant progenitor

VHE �-RAY OBSERVATION OF THE CRAB NEBULA AND ITS PULSAR WITH THE MAGIC TELESCOPE
J. Albert,1E. Aliu,
2H. Anderhub,
3P. Antoranz,
4A. Armada,
2C. Baixeras,
5J. A. Barrio,
4H. Bartko,
6D. Bastieri,
7
J. K. Becker,8W. Bednarek,
9K. Berger,
1C. Bigongiari,
7A. Biland,
3R. K. Bock,
6,7P. Bordas,
10V. Bosch-Ramon,
10
T. Bretz,1I. Britvitch,
3M. Camara,
4E. Carmona,
6A. Chilingarian,
11J. A. Coarasa,
6S. Commichau,
3
J. L. Contreras,4J. Cortina,
2M. T. Costado,
12V. Curtef,
8V. Danielyan,
11F. Dazzi,
7A. De Angelis,
13
C. Delgado,12
R. de los Reyes,4B. De Lotto,
13E. Domingo-Santamarıa,
2D. Dorner,
1M. Doro,
7
M. Errando,2M. Fagiolini,
14D. Ferenc,
15E. Fernandez,
2R. Firpo,
2J. Flix,
2M. V. Fonseca,
4
L. Font,5M. Fuchs,
6N. Galante,
6R. Garcıa-Lopez,
12M. Garczarczyk,
6M. Gaug,
7
M. Giller,9F. Goebel,
6D. Hakobyan,
11M. Hayashida,
6T. Hengstebeck,
16
A. Herrero,12
D. Hohne,1J. Hose,
6C. C. Hsu,
6P. Jacon,
9T. Jogler,
6R. Kosyra,
6
D. Kranich,3R. Kritzer,
1A. Laille,
15E. Lindfors,
17S. Lombardi,
7F. Longo,
13
J. Lopez,2M. Lopez,
4E. Lorenz,
3,6P. Majumdar,
6G. Maneva,
18K. Mannheim,
1
O. Mansutti,13
M. Mariotti,7M. Martınez,
2D. Mazin,
6C. Merck,
6M. Meucci,
14
M. Meyer,1J. M. Miranda,
4R. Mirzoyan,
6S. Mizobuchi,
6A. Moralejo,
2D. Nieto,
4
K. Nilsson,17
J. Ninkovic,6E. Ona-Wilhelmi,
2N. Otte,
6,16I. Oya,
4D. Paneque,
6
M. Panniello,12
R. Paoletti,14
J. M. Paredes,10
M. Pasanen,17
D. Pascoli,7
F. Pauss,3R. Pegna,
14M. Persic,
13, 19L. Peruzzo,
7A. Piccioli,
14M. Poller,
1
E. Prandini,7N. Puchades,
2A. Raymers,
11W. Rhode,
8M. Ribo,
10J. Rico,
2
M. Rissi,3A. Robert,
5S. Rugamer,
1A. Saggion,
7A. Sanchez,
5P. Sartori,
7
V. Scalzotto,7V. Scapin,
13R. Schmitt,
1T. Schweizer,
6M. Shayduk,
6, 16
K. Shinozaki,6S. N. Shore,
20N. Sidro,
2A. Sillanpaa,
17
D. Sobczynska,9A. Stamerra,
14L. S. Stark,
3L. Takalo,
17
P. Temnikov,18
D. Tescaro,2M. Teshima,
6N. Tonello,
6
D. F. Torres,2, 21
N. Turini,14
H. Vankov,18
V. Vitale,13
R. M. Wagner,6T. Wibig,
9W. Wittek,
6
F. Zandanel,7R. Zanin,
2and J. Zapatero
5
Received 2007 May 18; accepted 2007 October 31
ABSTRACT
We report about very high energy (VHE) �-ray observations of the Crab Nebula with the MAGIC telescope. The�-ray flux from the nebulawasmeasured between 60GeVand 9TeV. The energy spectrum can be described by a curvedpower law dF /dE ¼ f0(E/300 GeV)
½aþb log10(E=300 GeV)� with a flux normalization f0 of (6:0 � 0:2stat) ; 10�10 cm�2 s�1
TeV�1, a ¼ �2:31 � 0:06stat, and b ¼ �0:26 � 0:07stat. The peak in the spectral energy distribution is estimated at77 � 35 GeV. Within the observation time and the experimental resolution of the telescope, the �-ray emission issteady and pointlike. The emission’s center of gravity coincides with the position of the pulsar. Pulsed �-ray emissionfrom the pulsar could not be detected. We constrain the cutoff energy of the pulsed spectrum to be less than 27 GeV,assuming that the differential energy spectrumhas an exponential cutoff. For a superexponential shape, the cutoff energycan be as high as 60 GeV.
Subject headinggs: acceleration of particles — gamma rays: observations — pulsars: individual (PSR B0531+21) —radiation mechanisms: nonthermal
1. INTRODUCTION
The Crab Nebula is the remnant of a supernova explosion thatoccurred in AD 1054 (e.g., Collins et al. 1999 and referencestherein) at a distance of �2 kpc. It is one of the best-studiednonthermal celestial objects in almost all wavelength bands of
the electromagnetic spectrum from 10�5 eV (radio) to nearly1014 eV (�-rays). There is little doubt that the engine of the nebulais the pulsar PSR B0531+21 (hereafter Crab pulsar) in its center.
In very high energy (VHE) �-ray astronomy the Crab Nebulawas first detected with large significance at TeVenergies by thepioneeringWhipple telescope (Weekes et al. 1989). The nebula
1 Universitat Wurzburg, D-97074 Wurzburg, Germany.2 Institut de Fısica d’Altes Energies, E-08193 Bellaterra (Barcelona), Spain.3 ETH Zurich, CH-8093 Zurich, Switzerland.4 Universidad Complutense, E-28040 Madrid, Spain.5 Universitat Autonoma de Barcelona, E-08193 Bellaterra, Spain.6 Max-Planck-Institut fur Physik, D-80805 Munchen, Germany.7 Universita di Padova and INFN, I-35131 Padova, Italy.8 Universitat Dortmund, D-44227 Dortmund, Germany.9 University of xodz, PL-90236 Lodz, Poland.10 Universitat de Barcelona, E-08028 Barcelona, Spain.11 Yerevan Physics Institute, AM-375036 Yerevan, Armenia.12 Instituto de Astrofisica de Canarias, E-38200, La Laguna, Tenerife, Spain.
13 Universita di Udine and INFN Trieste, I-33100 Udine, Italy.14 Universita di Siena and INFN Pisa, I-53100 Siena, Italy.15 University of California, Davis, CA 95616-8677.16 Humboldt-Universitat zu Berlin, D-12489 Berlin, Germany.17 Tuorla Observatory, Turku University, FI-21500 Piikkio, Finland.18 Institute for Nuclear Research and Nuclear Energy, BG-1784 Sofia,
Bulgaria.19 INAF/Osservatorio Astronomico and INFN Trieste, I-34131 Trieste, Italy.20 Universita di Pisa and INFN Pisa, I-56126 Pisa, Italy.21 ICREA and Institut de Ciencies de l’Espai, IEEC-CSIC, E-08193Bellaterra,
Spain.
1037
The Astrophysical Journal, 674:1037Y1055, 2008 February 20
# 2008. The American Astronomical Society. All rights reserved. Printed in U.S.A.

turned out to be the strongest source of steady VHE �-ray emis-sion in the Galaxy. It is therefore used as the standard ‘‘calibrationcandle’’ for ground-based �-ray experiments. Apart from testingthe performance of �-ray instruments, another aim of measuringthe Crab Nebula is to increase the measurement precision of theCrabNebula flux and the energy range covered. These continuousefforts provide insights necessary for the understanding of thevery details of the emission mechanisms of VHE �-rays in theCrab Nebula and pulsar. Important questions remain to be an-swered concerning the emission mechanisms of the nebula, ofthe pulsar at GeV energies, and of the nebula around PeV en-ergies. Since its discovery, detailed studies of the VHE emis-sion energy spectrum, ranging from several hundred GeV up to80 TeV, have been carried out (e.g., Akerlof et al. 1990; Vacantiet al. 1991; Baillon et al. 1991; Goret et al. 1993; Konopelko et al.1996; Tanimori et al. 1998; Hillas et al. 1998; Amenomori et al.1999; Majumdar et al. 2002; Aharonian et al. 2004, 2006). Be-tween 10 and �200 GeV, observations are sparse. A few resultsare provided by converted solar concentrator arrays that use thewave front sampling technique (Oser et al. 2001; de Naurois et al.2002; Arqueros et al. 2002; Smith et al. 2006). However, thewavefront sampling suffers from relatively large uncertainties in thecalculation of the effective area and of the energy, as well as frompoor �/hadron discrimination, which make it difficult to performdifferential flux measurements.
A good explanation of the nebular dynamics and the observedenergy spectrum below GeV energies can be obtained with themagnetohydrodynamic model suggested first by Rees & Gunn(1974) and developed further by Kennel & Coroniti (1984a,1984b). In this framework, the pulsar provides a continuousflow of charged particles (pulsar wind) with Lorentz factors of106Y107. A standing reverse shock forms where the wind rampressure balances the total pressure of the nebula. Wind par-ticles accelerate in the shock to ultrarelativistic energies andsubsequently lose their energy by synchrotron emission. Thepresence of synchrotron emission up to a few hundred MeV inconjunction with the observed �-ray spectrum at TeVenergiesshows that particle acceleration takes place up to energies of�1015Y1016 eV. From the total luminosity of the synchrotronemission, it can be inferred that about 10% of the pulsar’s energyloss rate is converted into the kinetic energy of particles.
Above 1 GeV the dominant source of �-ray emission is mostlikely inverse Compton (IC) scattering of synchrotron photonsby the synchrotron-emitting electrons in the shocked wind region(synchrotron self-Compton model [SSC]; Gould 1965; Weekeset al. 1989; de Jager & Harding 1992). To explain the observedVHE �-ray spectrum, several other seed photon fields are alsobelieved to contribute to the inverse Compton scattering, namely,far-infrared excess, cosmic microwave background, and milli-meter photons (e.g., Aharonian et al. 2004).
Although the IC mechanism gives a good description of theobserved energy spectrum between 500 GeVand about 10 TeV,other processes may contribute in part to the VHE �-ray emission.It is likely that a significant fraction of the mechanical energy lostby the pulsar is taken away by a hadronic component in the wind.Following interactions of this component with the interstellarmedium, VHE �-rays are emitted by decaying �0’s, which mod-ify the energy spectrum at TeVenergies and beyond (Atoyan &Aharonian 1996; Bednarek & Protheroe 1997; Bednarek &Bartosik 2003; Amato et al. 2003). Atoyan &Aharonian (1996)discuss the possibility of an ‘‘amplified’’ bremsstrahlung flux atGeVenergies, which could account for the discrepancy betweenthe measured GeV �-ray flux and predictions within the SSCframework (de Jager et al. 1996). If this is true, one should
observe, in good approximation, a power-law spectrum between100 GeV and 10 TeV with a spectral index 2.5Y2.7. Anothermechanism to be mentioned is IC scattering of relativistic elec-trons in the unshocked pulsar wind. If the target photons areemitted by the pulsar, a pulsed component could extend to �-rayenergies of several 100 GeV (Bogovalov & Aharonian 2000).An independent measurement in the intervening region between60 and 400 GeV would constrain further the parameters of var-ious models. The MAGIC imaging atmospheric Cerenkov tele-scope (IACT) has a low-energy trigger threshold (�50 GeV)and is currently the only experiment capable of exploring thisenergy regime.The spatially resolved morphology of the nebula is of a com-
plex nature. Its size in optical bandwidths is about 40 ; 60. Dueto synchrotron losses, the high-energy electrons will have shortercooling times and only the lower energy electrons will reach outfarther into the nebula. Thus, the effective source size is expectedto shrink with increasing energy of the radiation. The radio emis-sion is expected to extend up to and beyond the filaments opticallyvisible, whereas X-ray and multi-TeV �-rays should be producedin the vicinity of the shock.On the other hand, the expected sourcesize would increase if the presence of an ionic component isestablished. In a special study the HEGRA collaboration con-cluded that the rms size of the VHE �-ray emission region is<1.50 for energies above 1 TeV (Aharonian et al. 2000). A sim-ilar study at energies below 1 TeV has not been performed up tonow.The Crab pulsar is a source of pulsed radiation and has been
detected up to GeV energies. The Crab pulsar has a period of33 ms and was first discovered in radio (Staelin & Reifenstein1968) and shortly afterward as the first pulsar in the optical domain(Cocke et al. 1969). Since then, pulsed emission from the Crabpulsar has been detected at all accessible energies up to �-rays (fora compilation of the broadband emission see Thompson et al.1999). EGRET detected the Crab pulsar in �-rays up to energiesof 10 GeV with a hint of a cutoff in the energy spectrum in thehighest energy bin at 6 GeV (Nolan et al. 1993). Despite variousefforts, observations from the ground at higher energies have,so far, failed to detect pulsed emission (e.g., Musquere 1999;Aharonian et al. 1999, 2004; Lessard et al. 2000; de Nauroiset al. 2002). Some experiments reported episodic pulsed emission(Gibson et al. 1982; Bhat et al. 1986; Acharya et al. 1992) andpersistent pulsed emission over a 1 yr period (Downthwaite et al.1984), but these observations have not been confirmed by otherexperiments.The high-energy emission from the pulsar is assumed to be due
to curvature and synchrotron radiation from relativistic chargedparticles that are forced to move along magnetic field lines insidethe magnetosphere of the pulsar. The question of where the par-ticles are being accelerated is the subject of ongoing theoreticalactivities. In the two most popular models, the production ofelectrons and positrons and their acceleration take place eitherabove the polar cap of the neutron star (e.g., Harding et al. 1978;Daugherty &Harding 1982) or in outer gaps in between the nullsurface and the light cylinder of the magnetosphere (e.g., Chenget al. 1986a, 1986b; Chiang & Romani 1992). We should notomit the slot gapmodel, which places the acceleration zone at theouter rim of the polar cap (Arons 1983; Muslimov & Harding2003). These models differ in the predicted shape and cutoff ofthe energy spectrum at the highest energies. Ameasurement of theturnover in the spectrum would shed light on the possible sitesof the particle acceleration and can constrain models.In this paper we report about the observation of the Crab
Nebula and pulsar with the MAGIC telescope between 2005
ALBERT ET AL.1038 Vol. 674
October and December. After describing the MAGIC telescopeand the performed observations in xx 2 and 3, we present theanalysis chain in x 4. In x 5 we present our results on the steadyemission comprising the differential flux between 60 GeV and9 TeV, a study of the morphology of the emission region, andthe measured integral flux above 150 GeV. In x 5.4 we presentthe results of our search for pulsed emission, and we close witha discussion of our results in x 6.
2. THE MAGIC TELESCOPE
TheMAGIC (Major Atmospheric Gamma Imaging Cerenkov)telescope (see Lorenz 2004) is located on the Canary Island,La Palma (2200 m asl, 28:45� north, 17:54� west). MAGIC iscurrently the largest single-dish IACT. It has a 17 m diametertessellated reflector consisting of 964 0:5 ; 0:5 m2 diamond-milled aluminum mirrors, which are grouped onto support panelsin units of four. Depending on the elevation of the telescope, theposition of every panel is adjusted by computer-controlled ac-tuators of the so-called Active Mirror Control, thus providingoptimal focusing. About 80% of the light from a point source isfocused within a radius of 0.05� in the focal plane. TheMAGICtelescope is focused to a distance of 10 km, the most likely lo-cation of the shower maximum for 50 GeV �-ray air showers atsmall zenith angles.
The faint Cerenkov light flashes produced in air showers arerecorded by a camera comprising 577 photomultiplier tubes(PMTs). The inner part of the camera (radius �1.1�) is equippedwith 397 PMTs (type ET 9116A; 100 diameter fromElectron TubesLtd [ET]) with a diameter of 0.1� each. The outer part of the cam-era is equipped with 180 PMTs (type ET 9117A; 1.500 diameter)with a diameter of 0.2
�. The central PMT is modified for optical
pulsar studies (Lucarelli et al. 2005). Hollow hexagonal non-imaging light concentrators (often called light catchers) are placedin front of all photomultipliers to compensate for the dead spacebetween them and in order to shrink the observation solid angleto the reflector. The entrance window of the PMTs is coated witha diffuse lacquer doped with a wavelength shifter (WLS; Panequeet al. 2003). The combination of the hemispherically shapedPMT,the light catcher, the diffuse coating, and the WLS results in a15%Y25% higher quantum efficiency compared to flat windowPMTs. For protection purposes (humidity, dust) a thin entrancewindowmade of Plexiglas (typeUG-218,with aUVcutoff around290 nm) is placed in front of the camera.
The PMTs have 6 dynodes and operate at a gain of roughly30,000 to slow down aging and damage from high currents bylight during observations close to the Galactic plane and duringmoonshine. After amplification, the fast analog signals are con-verted to optical signals and transported by 160 m long opticalfibers to the counting house. There the optical signal is convertedback and split. Part of the signal is routed to the trigger. Thecurrent configuration of theMAGIC camera has a trigger regionof 2.0� in diameter (Cortina et al. 2005). This provides a �-raytrigger collection area of the order of 105 m2 (at 200 GeV for asource close to zenith). Presently, the trigger energy range spansfrom 50Y60 GeV (peak in the differential trigger rates at smallzenith angles for a �-ray source with a spectral slope of �2.6)up to tens of TeV. An event is triggered if the signals in each of4 neighboring pixels exceed a threshold of �7 photoelectrons(phe) within a coincidence time window of 6 ns.
Before being digitized by an 8 bit, 300 MSamples/s FADCsystem, each signal is stretched to an FWHM of about 6 ns. TheFADC continuously writes the digitized amplitude informationinto a ring buffer. In case of a trigger the digitization stops andthe corresponding part of the ring buffer is written onto a disk.
The dead time introduced by the readout is 25 �s. In order toexpand the dynamic range to�1000, the signal of every PMT issplit into two branches, differing by a factor of 10 in gain. Thehigher gain branch is read out for a 50 ns time interval. When thesignal amplitude exceeds a preset threshold, the delayed lowergain is routed to the same FADC channel and recorded in thefollowing 50 ns. Otherwise, the signal from the high gain branchcontinues to be recorded and is used to determine the pedestaloffset of each PMT channel.
The accuracy in reconstructing the direction of incoming �-rayson an event-by-event basis, hereafter �-ray point-spread func-tion or �-PSF, is about 0.1�, depending on the energy. With theinformation provided by a starguider camera, mispointing is cor-rected to an absolute precision of about 10. A �-ray source withan absolute intensity of �2% of the Crab Nebula and similarspectrum can be detected with MAGIC within 50 hr at energies>200 GeVon a significance level of 5 �.
3. OBSERVATIONS AND DATA SELECTION
Observations of the Crab Nebula withMAGIC are conductedon a regular basis, as a means to monitor the performance of thetelescope. In this report we restrict ourselves to the analysis ofdata obtained in the first observation cycle of the MAGIC tele-scope between 2005 October and December. The observationswere performed in the so-called ON/OFF mode. The telescopewas pointed toward the Crab pulsar (ON) for about 16 hr. AnOFF source position, a sky region where no �-ray source isknown, was observed in the same range of zenith angles as theON source. For the background estimation we used OFF datacollected for over 19 hr.
One of the main objectives of this analysis was to explorethe lower energy range of accessible �-ray energies. The energythreshold of IACTs depends strongly on the zenith angle of ob-servation. Restriction to events with low zenith angles providesthe lowest possible energy threshold. Therefore, we select eventswith zenith angles P20�. For any given night the data affectedby technical problems or fluctuations in the data rate in excessof 10%were rejected. The atmospheric conditions were judgedfrom the nightly averaged and publicly available atmosphericextinction coefficients from the nearby Carlsberg Meridian tele-scope.22 Within the selected nights, the atmospheric light trans-mission changed by less than 5%. The nights with data thatsurvived all the selection criteria, together with the correspondingobservation times, trigger rates, and zenith angle range, are listedin Table 1. The selected data sample comprises 14 nights amount-ing to a total ON observation time of 955 minutes (�16 hr).
4. DATA ANALYSIS
The data analysis was carried out using the standard MAGICanalysis and reconstruction software MARS (Bretz & Wagner2003). After removing faulty and unstable camera channels,which amount to 3%Y5% of the total number of PMTs, the signalamplitudes, extracted with the digital filtering method (Albertet al. 2006), were converted to phe by using the F-factor method(Mirzoyan & Lorenz 1997). Using calibration events recordedinterlaced to normal events (Gaug et al. 2005), the conversionfactors were updated every 10 s. There is a 10% systematic un-certainty in the calibration that directly propagates to the un-certainty of the event energy scale (point 7 in Table 4 below).Time offsets between pixels are corrected with a precision ofbetter than 1 ns.
22 See http://www.ast.cam.ac.uk /~dwe/SRF/camc_extinction.html.
VHE �-RAY OBSERVATION OF CRAB NEBULA AND PULSAR 1039No. 2, 2008
After calibrating the data, pixels with faulty reconstructed sig-nal amplitudes and times were rejected and the correspondingamplitude and time information was interpolated from the signalsand times of neighboring pixels. Before image parameterization, atail-cut cleaning of the image was performed, requiring signalshigher than a predefined absolute amplitude level and time co-incidences (3.3 ns) with neighboring channels. The time coinci-dence effectively suppresses pixels containing only a signal fromthe night sky. Formost of the analysis theminimum required pixelcontent is 6 phe for so-called core pixels and 4 phe for boundarypixels. For the morphology studies the minimum pixel contentswere raised to 10 phe (core) and 8 phe (boundary), respectively,which improves the angular resolution, albeit at the expense ofan increased analysis threshold.
Every cleaned event was parameterized by a principal com-ponent analysis, commonly referred to as Hillas parameterization(Hillas 1985). The parameterization was later used to separatebetween �-ray event candidates and background event candi-dates. The Hillas parameters DIST, LENGTH, WIDTH, and also
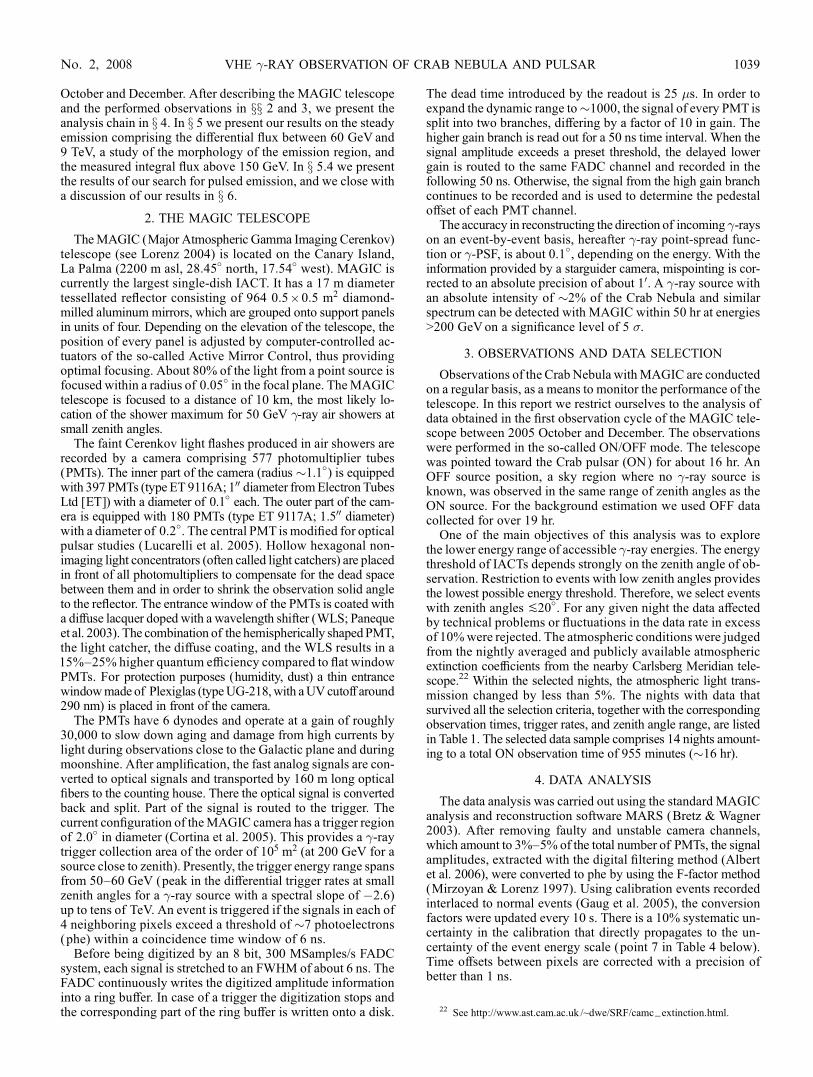
ALPHA are illustrated for a recorded shower image in Figure 1.Another useful parameter is the SIZE of a shower image, theintensity of the image after image cleaning in units of recordedphotoelectrons. Note that SIZE depends on the applied tail cuts.SIZE is a good estimate of the primary particle energy, providedthat the shower impact distance to the telescope principal axis isbelow �120 m. An event preselection was performed by dis-carding event candidates affected by noise and pickup (e.g., carflashes) and event candidates with a low number of pixels (aftertail cuts typically a minimum number of 5 core pixels wererequested). In addition, an image SIZE of at least�100 phe wasrequested. Figure 2 shows the energy distribution of simulated�-ray events with SIZE > 100 phe. The distribution peaks at anenergy of 75 GeV. The simulated �-ray source has a power-lawspectrum with an index of �2.6.AMonte Carlo (MC) simulation properly describing data is a
necessary requisite for a ground-based �-ray experiment. In Fig-ure 3 the image parameter WIDTH is shown for simulated �-raysand �-rays extracted from data. The four panels are for con-secutive bins in SIZE covering the entire range of analyzed �-rayenergies. For an unbiased comparison, loose cuts have been ap-plied in the �/hadron separation (explained in the next section).The �-ray excess was obtained by subtracting the scaled dis-tribution of the OFF-data sample from the distribution of theON-data sample. The scaling factor was found by normalizingthe jALPHAj distributions of both samples between jALPHAj ¼30� and 70�. The comparison was done by selecting events withsmall jALPHAj (typically less than 10
�). A small jALPHAj is
expected for �-rays from the Crab Nebula, as explained later.The agreement of the MC simulated distributions and the dis-tributions extracted from data is acceptable in all four SIZEbins. However, it is evident from the figures that the agreementworsens at large SIZE. In the analysis, a possible bias intro-duced by this behavior is avoided by applying rather loose cutsat energies above several TeV.
4.1. Gamma Hadron Separation
Only a small fraction between 10�3 and 10�4 of the recordeddata are �-ray showers. The major fraction of the recorded eventsare cosmic rays of hadronic origin. This unwanted backgroundhas to be suppressed offline. For this purpose we applied a multi-variate method, the random forest (Breiman 2001; Bock et al.2004; Albert et al. 2008), which uses the image parameters tocompute the HADRONNESS of an event. The HADRONNESSFig. 1.—Parameterization of a shower image with Hillas parameters.
Fig. 2.—Energy distribution of MC �-ray events with SIZE > 100 phe for asimulated �-ray source with spectral slope �2.6.
TABLE 1
Data Selected for Analysis
Date
(MJD)
Rates
(Hz)
On Time
(minutes)
Zd Range
(deg)
53,648......................... 130 73 7Y2353,655......................... 115 100 7Y1953,671......................... 122 105 7Y2353,672......................... 105 61 8Y2053,679......................... 115 51 7Y2053,684......................... 95 50 7Y2053,707......................... 98 53 7Y1153,709......................... 105 48 7Y1053,711......................... 105 48 7Y1053,713......................... 108 50 7Y1453,727......................... 92 44 7Y1353,729......................... 97 61 7Y1353,731......................... 100 107 7Y1453,735......................... 92 104 7Y15
Note.—The second column lists the average event rate after tail cutsand a cut in SIZE > 100 phe (for the definition of SIZE see text).
ALBERT ET AL.1040 Vol. 674

of an event quantifies the probability of an event to be ‘‘�-like’’ or‘‘hadron-like.’’ The random forest is trained with MC simulated�-ray events and eitherwith simulated hadronic cosmic-ray eventsor, as in the present case, with background events recorded byMAGIC. In this study, we used for the training of the randomforest the image parameters SIZE, DIST,WIDTH, and LENGTH,as well as the third moment along the major axis of a showerimage and a parameter describing the CONCENTRATION of ashower image.
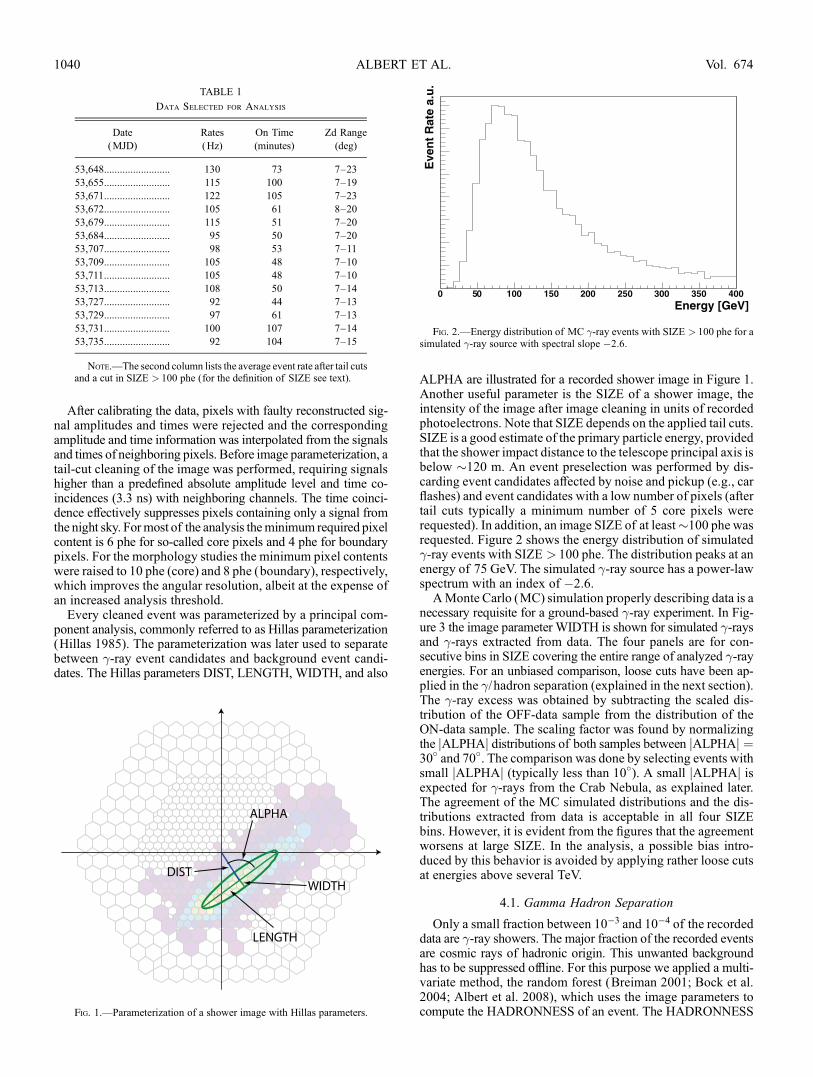
Figure 4 shows the HADRONNESS for MC simulated �-rayshowers (red) and for recorded background (blue) as a func-tion of SIZE. A clear separation between both populations isvisible for SIZE k300 phe, corresponding to �-ray energiesk150 GeV. Below 300 phe both populations start to overlapuntil, at �200 phe (�100 GeV), no more separation is possible.
The bottom panel in the figure shows the maximum quality fac-tor Q (�� /�1
=2B ) for each SIZE interval obtained for an optimized
HADRONNESS cut. Parameter �� is the fraction of retained�-ray events and �B the fraction of retained background events.The corresponding HADRONNESS cut is shown by the starsin the top panel of the figure.
The random forest method is also used to estimate the energy ofeach event (Albert et al. 2008). An energy resolution of�25% isachieved for events with energies >200 GeV. The energy reso-lution reduces to �40% around 70 GeV.
4.2. Signal Extraction
After � /hadron separation and energy estimation, the �-raysignal is extracted from an jALPHAj distribution. ALPHA isthe angle between the major axis of the recorded shower and the
Fig. 3.—Distribution of the image parameter WIDTH for �-ray events extracted from data and for MC simulated �-rays in four consecutive bins of SIZE coveringthe full analyzed energy range.
VHE �-RAY OBSERVATION OF CRAB NEBULA AND PULSAR 1041No. 2, 2008
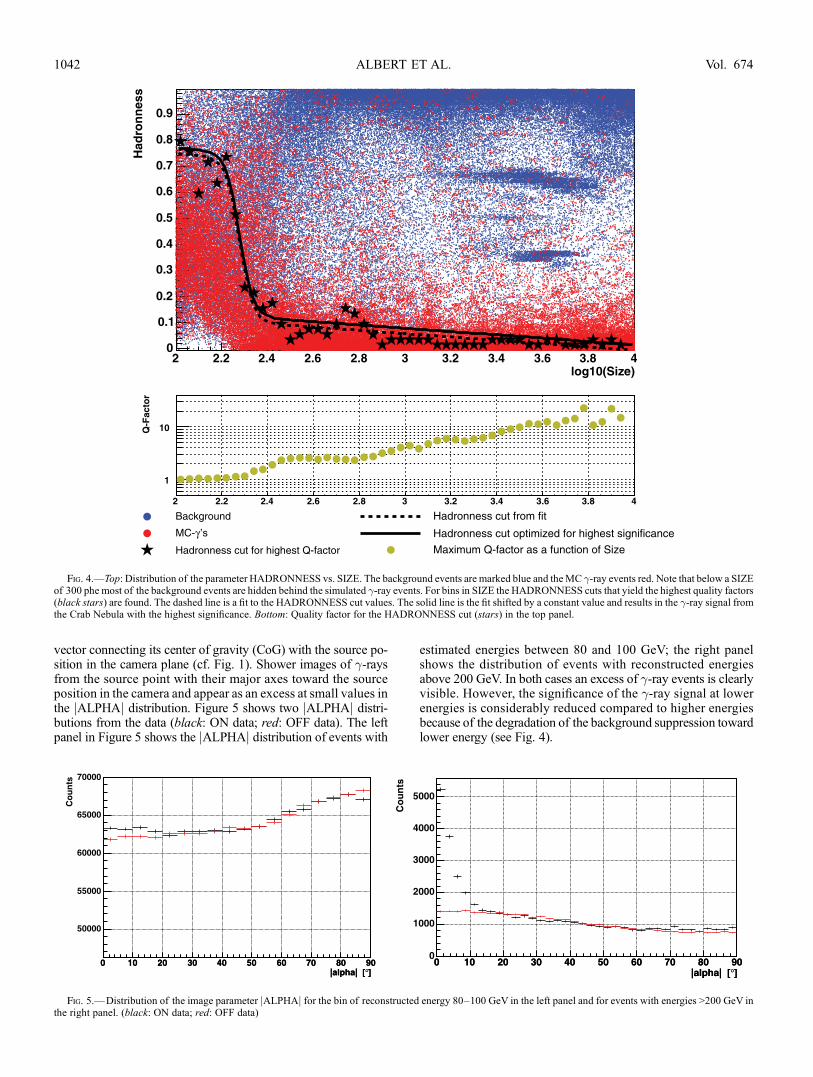
vector connecting its center of gravity (CoG) with the source po-sition in the camera plane (cf. Fig. 1). Shower images of �-raysfrom the source point with their major axes toward the sourceposition in the camera and appear as an excess at small values inthe jALPHAj distribution. Figure 5 shows two jALPHAj distri-butions from the data (black: ON data; red: OFF data). The leftpanel in Figure 5 shows the jALPHAj distribution of events with
estimated energies between 80 and 100 GeV; the right panelshows the distribution of events with reconstructed energiesabove 200 GeV. In both cases an excess of �-ray events is clearlyvisible. However, the significance of the �-ray signal at lowerenergies is considerably reduced compared to higher energiesbecause of the degradation of the background suppression towardlower energy (see Fig. 4).
Fig. 4.—Top: Distribution of the parameter HADRONNESS vs. SIZE. The background events are marked blue and theMC �-ray events red. Note that below a SIZEof 300 phe most of the background events are hidden behind the simulated �-ray events. For bins in SIZE the HADRONNESS cuts that yield the highest quality factors(black stars) are found. The dashed line is a fit to the HADRONNESS cut values. The solid line is the fit shifted by a constant value and results in the �-ray signal fromthe Crab Nebula with the highest significance. Bottom: Quality factor for the HADRONNESS cut (stars) in the top panel.
Fig. 5.—Distribution of the image parameter jALPHAj for the bin of reconstructed energy 80Y100 GeV in the left panel and for events with energies >200 GeV inthe right panel. (black: ON data; red: OFF data)
ALBERT ET AL.1042 Vol. 674

At the lowest energies ALPHA is currently the onlymeans bywhich it is possible to separate �-rays and background events.This is illustrated in Figure 6, which shows the quality factor asa function of SIZE separate for an optimized ALPHA cut andoptimized HADRONNESS cut, as well as the combination ofboth cuts. Below SIZE 250 phe a cut in HADRONNESS doesnot improve �/hadron separation and reduces only statistics. Onthe other hand, with ALPHA a quality factor of 2 is still possible.
4.3. Sensitivity
The highest integral sensitivity for �-ray emission from theCrabNebula is obtained above�250 GeV. The integral sensitivities forenergies above 250 GeVobtained on a daily basis are listed inTable 2. The sensitivities are calculated in units of �LiMa /(hours)
1=2;the significance �LiMa is calculated using equation (17) from Li& Ma (1983). In the last column of the table, the sensitivity isexpressed as the minimum flux, normalized to the Crab flux thatcan be measured with 5 � significance23 in a 50 hr observation.The day-by-day sensitivities vary by about 10%, indicating astable telescope performance throughout the observations.
The energy dependence of the sensitivity was studied by cal-culating the integral sensitivity for several analysis thresholds.The SIZE-dependent HADRONNESS cut (Fig. 4, black solidline) was used for �/hadron separation, and the ALPHA cut wastightened with increasing energy based on studies from MC sim-ulations. The integral sensitivity for a 50 hr observation is 13%Crab at 75 GeVand improves continuously with increasing theanalysis threshold to about 2.2% above�250 GeV (see Table 3).Note that above 1.6 TeV the background is estimated from onlytwo events, which results in an uncertainty of more than 70% onthe integral sensitivity.
4.4. Systematic Uncertainties
Apart from statistical errors, many results in cosmic-ray exper-iments are affected by rather large systematic errors. One of themain problems is the lack of test beams that allow calibration ofthe entire instrument in combination with the showering processin the atmosphere. The standard replacement for a test beam cali-bration is the use of MC simulation based on many linked pro-cesses either using physical models (example: the simulation ofelectromagnetic showers) or calibrating them in separatemeasure-ments (example: the spectral mirror reflectivity). In some cases
one has to make reasonable guesses (example: photoelectroncollection efficiency in the PMT front-end volume). The calibra-tion of individual effects suffers partly from cross-correlations,which are not always well understood. Currently, the best ap-proach is to estimate the systematic uncertainties (commonlycalled systematic errors) of the various parameters separatelyand to combine them to a global systematic error. Here wefollow the general practice of adding these individual errors inquadrature although this will result in a slight underestimate ofthe total systematic error. Table 4 lists the dominant systematicerror contributions (�2%) for the spectral parameters (flux,slopes, cutoffs, etc.). The systematic errors influence the spec-trum in different ways. Some (Nr 1Y7, 10, 11) result in anuncertainty of the energy scale and thus can enter as a largefactor in the flux at a given energy in case of steep spectra withslopes<3; others (Nr 8, 9, 12Y13, 15Y17) linearly influence theflux normalization for the spectrum.
The most critical contributions to the systematic error comefrom the uncertainties in the conversion of photons to mea-surable photoelectrons (combined under item 7), the so-calledphoton detection efficiency (PDE). The PDE is a combinationof many small effects such as the reflectivity variation of thelight catchers, tolerances in the light catcher geometry, angulareffects on the PMTsurface, nonuniformity of the diffuse lacquercoating, the QE spread and cathode nonuniformity of the PMTs,the photoelectron collection efficiency in the PMT front-endvolume, and gain variations of the first dynode. Also somecontribution of the signal transmission to the DAQ is included.
Fortunately, the PDE can normally be measured with a lightsource uniformly illuminating the camera with short blue or UVlight pulses. Obviously, the light pulser itself introduces somesystematic errors such as in the absolute light flux determina-tion, small deviations from uniformity in the illumination, some(small) temperature drift, and amplitude jitter. Also, the usedmethod of determining the number of detected photoelectrons,the above-mentioned so-called F-factor method, introduces someuncertainty.
Another rather big uncertainty is the effective reflectivity ofthe mirrors defined as the light from a source at infinity being
Fig. 6.—Size dependence of the Q-factor for optimized jALPHAj cut andHADRONNESS cut, and the Q-factor for the combination of jALPHAj cut andHADRONNESS cut.
TABLE 2
MAGIC Integral Sensitivities to �-Ray Emission
from the Crab Nebula for �-Ray Energies above 250 GeV
Date
(MJD)
Sensitivity in
[�LiMa /(hours)1=2]
Sensitivity in
(% Crab, 50 hr, 5 �)
53,648............................. 18.1 2.4
53,655............................. 19.6 2.1
53,671............................. 19.9 2.1
53,672............................. 19.1 2.2
53,679............................. 19.4 2.2
53,684............................. 21.1 1.8
53,707............................. 23.6 2.0
53,709............................. 16.1 2.7
53,711............................. 18.9 2.2
53,713............................. 18.7 2.2
53,727............................. 19.1 2.3
53,729............................. 17.5 2.3
53,731............................. 18.0 2.3
53,735............................. 18.7 2.1
Average ...................... 19.1 � 0.5 (1.7) 2.21 � 0.05 (0.2)
Notes.—Average values of each column are given in the last row with thecorresponding rms value in parentheses. Note that different definitions of sig-nificance are used in the two columns.
23 Note that in this case the significance is calculated as excess/(background)1/2.
VHE �-RAY OBSERVATION OF CRAB NEBULA AND PULSAR 1043No. 2, 2008

focused onto the area of a pixel. Comparing the measured bright-ness of a star and its image back-reflected by a high-quality diffusereflector in the camera plane allows one to carry out a routinereflectivity measurement (see Fig. 7), with an uncertainty ofabout 7%. A similarly large error contribution was estimated forthe event reconstruction. Again, many small effects contributeto the reconstruction losses or to the wrong assignment of events.In contrast to the procedure to limit the uncertainty as in the ex-ample of the PDE, no simple method to cross-check the errorrange of the reconstruction efficiency is possible and a reasonableguess had to be made.
Effects that influence the slope of reconstructed �-ray energyspectra (class C effects in Table 4) are mostly dominating at thelowest and highest accessible energies. The estimate of the sys-tematic slope error is rather difficult. In case of a power law ormoderately curved power law we estimate an uncertainty on theslope of 0.2. We note that measurements by current second-generation telescopes of the spectral slope of the Crab Nebulaagree better than 0.1 in the overlapping energy range.
In summary, we obtain a systematic energy scale error of 16%,a systematic error of 11% on the flux normalization (without theenergy scale error), and a systematic slope error of �0.2 (which isa combination of error 13 and the other relevant class A errorsaveraged over the energy).
5. ANALYSIS RESULTS
5.1. Differential Energy Spectrum of the Crab Nebula
By extracting the �-ray signal in each bin of the reconstructedenergy Erec, a spectrum Ni of �-rays in each Erec bin i can beconstructed. The reconstructed energy is subject to a bias. Beforedetermining a differential �-ray flux in true energy Etrue bins, thespectrum Ni has, therefore, to be converted into a spectrumMj of�-rays in bins of Etrue. This is done by applying an unfoldingprocedure with regularization (Anykeyev et al. 1991). An essen-tial input for the unfolding procedure is the migration matrix,which describes the migration of events from bin i in Erec into abin j of Etrue. The migration matrix is determined fromMC sim-ulated �-ray showers. The unfolding is done independently fordifferent regularization schemes (Tikhonov & Arsenin 1979;Bertero 1989; Schmelling 1994; Albert et al. 2007b). Figure 8shows one distribution of excess events from the Crab Nebulaafter unfolding by the method of Bertero (1989). The integralrate of excess events is 0.4 Hz. The differences between the un-folded pointsMj obtainedwith the different regularization schemesare used to estimate a systematic error due to the unfolding. Fig-ure 10 shows the differential �-ray flux, which was obtained withthe regularization scheme proposed byBertero (1989) and by nor-malizing the unfolded spectrum Mj, to the effective collectionarea (Fig. 9), the effective observation time, and the bin width
of Etrue (given by the horizontal bars at each flux point in thefigure). The average differential flux for each energy bin is pre-sented in Table 5.The influence of different choices for tail cuts, HADRONNESS
cuts, DIST cuts, and core pixel cuts on the measured flux is in-dicated in Figure 10 by the shaded region and quoted as system-atic uncertainty in Table 5. Due to analysis uncertainties, the bandbroadens at low energies, mostly because of limited �/hadrondiscrimination power. It broadens at the highest energies due tolow event statistics.The energy spectrum is parameterized with both a power-law
and a curved power-law Ansatz. The fit takes into account cor-relations between the spectral points that are introduced by theunfolding procedure. A correlated fit with a power law
dF
dE¼ f0 E=300 GeVð Þ� ð1Þ
provides a flux normalization f0 of (5:7 � 0:2stat) ; 10�10 cm�2
s�1 TeV�1 and a spectral index � of �2:48 � 0:03stat � 0:2syst.The �2 of the fit is 24 for 8 degrees of freedom, which disfavorsa pure power-law description of the spectrum. The energy spec-trum is better described by a curved power-law Ansatz
dF
dE¼ f0 E=300 GeVð Þ aþb log10 E=300 GeVð Þ½ �; ð2Þ
yielding aflux normalization f0 of (6:0 � 0:2stat) ; 10�10 cm�2 s�1
TeV�1, a ¼ �2:31 � 0:06stat, and b ¼ �0:26 � 0:07stat � 0:2syst.The �2 of the fit is 8 for 7 degrees of freedom.Figure 11 shows the differential flux measurements multi-
plied by the energy squared, i.e., the spectral energy distribution(SED). In the figure we compare our measurement with thosefrom other experiments. For energies above 400 GeV the derivedspectrum is in good agreement with measurements of other airCerenkov telescopes (Hillas et al. 1998; Aharonian et al. 2004,2006; Tanimori et al. 1998). At energies <400 GeV, below thethreshold of previous measurements by IACTs, we compare ourresults with those obtained by CELESTE (de Naurois et al. 2002;Smith et al. 2006) and STACEE (Oser et al. 2001), i.e., measure-ments performed by converted solar tower experiments. It shouldbe noted that the integral flux values of these experiments had tobe converted to differential ones by assuming a shape of thesource spectrum, which causes an additional bias.Above 1 TeV up to about 10 TeV the measured energy spec-
trum is well described by a pure power law (Weekes et al. 1989;Aharonian et al. 2004). Going to lower energies, one expects acontinuous hardening of the spectrum. However, this could notbe demonstrated by earlier measurements. The change of the
TABLE 3
Integral Sensitivities of the MAGIC Telescope to the �-Ray Emission
from the Crab Nebula for Several Analysis Thresholds
Energy
(GeV)
jALPHAj Cut(deg) ON Events OFF Events Excess Events
Sensitivity
(% Crab, 50 hr, 5 �)
>75 ............................. <10 232505 221751 10754 13.0
>110 ........................... <10 58600 49702 8898 7.5
>200 ........................... <10 11399 4960 6439 3.3
>400 ........................... <7.5 2866 348 2518 2.2
>800 ........................... <5 613 20 593 2.3
>1600 ......................... <5 43 2 41 1.0
ALBERT ET AL.1044

TABLE 4
Contribution to the Systematic Uncertainties
Item Source of Uncertainty Class
Uncertainty
(%) Comments
1................. Parametrization of atmosphere in MC simulation A 3 Deviations due to yearly and daily pressure changes, deviations of real density distribution
and standard atmosphere model
2................. Atmospheric transmission losses due to Mie scattering A, (C) 5 Lack of good measurements; short-term unpredictable changes possible
3................. Incorrect NSB simulation A 3 MC assumes uniform NSB; variations due to source location, air glow, variations
due to man-made light; stars in the FOV
4................. Reflectivity of main mirror A 7 From measurements of reflected star images
5................. Variation of the useful mirror area A 3 Malfunctions of active mirror control resulting in focusing losses
6................. Day-to-day reflectivity changes A 2 Due to dust deposit variations and occasional dew deposit
7................. Photon detection efficiency of the PMT/light catcher system A, C 10Y12 See text
8................. Unusable camera channels B 3 Dead PMTs (5Y10 channels), problems in calibration (5Y10 channels)
9................. Trigger inefficiencies B, C 4 Due to discriminator dead time, baseline shifts/drifts, level differences trigger branch and FADC branch, etc.
10............... Signal drift in camera due to temperature drifts A, C 2 Combination of PMT QE change (small), amplifier and optical transmitter drifts
11............... Camera flat-fielding A, B 2 Calibration problem
12............... Signal extractor B 5 Complex effect due to trigger jitter (early pulses from PEs generated on first dynode), etc.;
baseline jitter, shifts in FADCs
13............... Cuts and methods used in the analysis B, C 5Y30 Energy dependent; see discussion of differential energy spectrum
14............... Losses of events during reconstruction B(A) 8 Simplifications in MC simulation
15............... Estimate of BG under source B(A) 4 Camera nonuniformity not included in MC; hadronic events not perfectly simulated in MC
16............... Small tracking instabilities B 2 Source jitters around nominal camera position due to small tracking errors, small camera oscillations
due to gusts, etc., resulting in a wider signal spread than predicted by MC
17............... Nonlinearities in the analog signal chain (PMT-FADC) C(A) 3Y10 Saturation and nonlinearities of electronic and optoelectronic components
Notes.—Class A: contributions to the uncertainty on the energy scale. Class B: contributions to the uncertainty in the event rate. Class B(A): error contributes more to the leading term. Some of the uncertainties are energydependent and are averaged. Class C: contribution affecting the spectral slope.

slope of the spectrum (spectral index) �0 was tested for variouspoints of the measured spectrum �0:
�0(E )¼ d ln (F )
d ln (E )� � ln (F )
� ln (E )� ln Fi � ln Fj
ln Ei � ln Ej
; ð3Þ
E ¼ exp 0:5( ln Ei þ ln Ej)� �
; ð4Þ
where Fi; j is the differential flux measured at Ei; j. The fourderived spectral indices at�150 GeV,�300 GeV,�1 TeV, and�2.5 TeV shown in Figure 12 indicate a clear softening of thespectrumwith increasing energy. The spectral index�0 was alsoderived from the aforementioned results of the curved power-law fit,
�0 ¼ aþ 2b log10 E=300 GeVð Þ; ð5Þ
and is shown by the solid black line, and the�1� confidence bandis shown by the dashed black lines. A systematic uncertainty onthe slope can cause an additional vertical shift of the measurementby�0.2. Within uncertainties, the measured spectral index variesin good agreement with predictions by Aharonian et al. (2004)(blue line), who, in addition to the IC scattering on synchrotronphotons, included several other soft photon fields such as milli-meter photons, CMB, and far-IR photons from dust and stars.
The predicted GeV �-ray emission has a peak in the SEDrepresentation (see Fig. 11). If one assumes that the energy spec-trum around the peak can be described with a curved power law,the position of the peak can be determined from the measurementof the spectral index obtained from the result of the curved power-law fit. A necessary condition for the peak in the SED is that thespectral index�0 is�2.With this condition the peak is determinedat 77 � 47stat
þ107�46 syst GeV (Fig. 12, triangle).
5.2. VHE �-Ray Light Curve of the Nebula Emission
In the VHE �-ray astronomy community it is assumed thatthe Crab Nebula is a constant and stable �-ray source and cantherefore be used as a standard candle. However, withmore sen-sitive measurements it is necessary to check the stability of the�-ray source. Below we present a time-resolved measurementof the VHE �-ray flux, i.e., the light curve for the Crab Nebula.Depending on the source strength and the analysis threshold, thetime intervals can be as short as a few minutes.We calculated light curves in bins of 10 minutes from events
with estimated energies above 200 GeV. The light curves of all14 selected nights are shown in Figure 13.Note that the same loosecuts are used for the �/hadron separation as for the calculationof the energy spectrum, which reduces the sensitivity of the mea-surement. The probability that the light curve is described by a
Fig. 7.—Measurement of the reflectivity of the main mirror; the effectivemirror area is shown by the blue points (Garczarczyk 2006). The measurementscover the Crab observation period from 2005 October to December.
Fig. 8.—Unfolded distribution of excess events from the Crab Nebula. Theintegral rate of excess events is 0.4 Hz.
Fig. 9.—Collection area after image cleaning and after cuts for low zenith angleobservations (<20�).
TABLE 5
Mean Energy and Differential Flux of the Spectral Points
Shown in Figure 10
Mean Energy
(GeV)
Differential Flux
(cm�2 s�1 TeV�1)
77...................................... (1:14 � 0:27stat � 0:34syst) ; 10�8
127.................................... (3:65 � 0:38stat � 0:55syst) ; 10�9
210.................................... (1:41 � 0:09stat � 0:28syst) ; 10�9
346.................................... (4:37 � 0:23stat � 0:87syst) ; 10�10
570.................................... (1:32 � 0:07stat � 0:20syst) ; 10�10
940.................................... (3:55 � 0:23stat � 0:18syst) ; 10�11
1550.................................. (9:88 � 0:74stat � 0:49syst) ; 10�12
2554.................................. (2:69 � 0:29stat � 0:27syst) ; 10�12
4212.................................. (6:80 � 1:10stat � 1:00syst) ; 10�13
6943.................................. (1:15 � 0:53stat � 0:12syst) ; 10�13
Note.—The systematic errors are derived from different appliedcuts and unfolding procedures.
ALBERT ET AL.1046 Vol. 674

constant flux level is >10% in all nights except the first night,where the probability of the fit is 0.8%. The average statisticaluncertainty of each flux measurement is�20%. Figure 14 showsthe average flux of each night. The dashed line in the figuredenotes the average flux from all nights, and the shaded regionshows the statistical error in the flux. The average integral meanflux F>200 GeV is
F>200 GeV ¼ (1:96 � 0:05stat) ; 10�10 cm�2 s�1: ð6Þ
There is a probability of 67% that the measured daily flux valuesare compatible with a constant flux. We can, therefore, concludethat the reconstructed flux of the Crab Nebula, within statisticaluncertainties, was constant over the entire observation period.
5.3. Morphology of the �-RayYemitting Region
The morphology of the �-ray emission was studied by gen-erating sky maps in three uncorrelated bins of SIZE. The re-construction of the origin of a �-ray event with a single telescopeis possible with the so-called DISP method (Fomin et al. 1994;Lessard et al. 2001). For the studies presented here we used thefollowing parameterization for DISP:
DISP ¼ a SIZEð Þ þ b SIZEð Þ WIDTH
LENGTH; ð7Þ
where a and b are second-order polynomials found by fitting MCsimulated �-ray showers (Domingo-Santamarıa et al. 2005). Strongtail cuts of 10 and 8 phe were used in the image cleaning for coreand boundary pixels, respectively, and a tight HADRONNESScut<0.1 was applied, resulting in improved angular resolution.
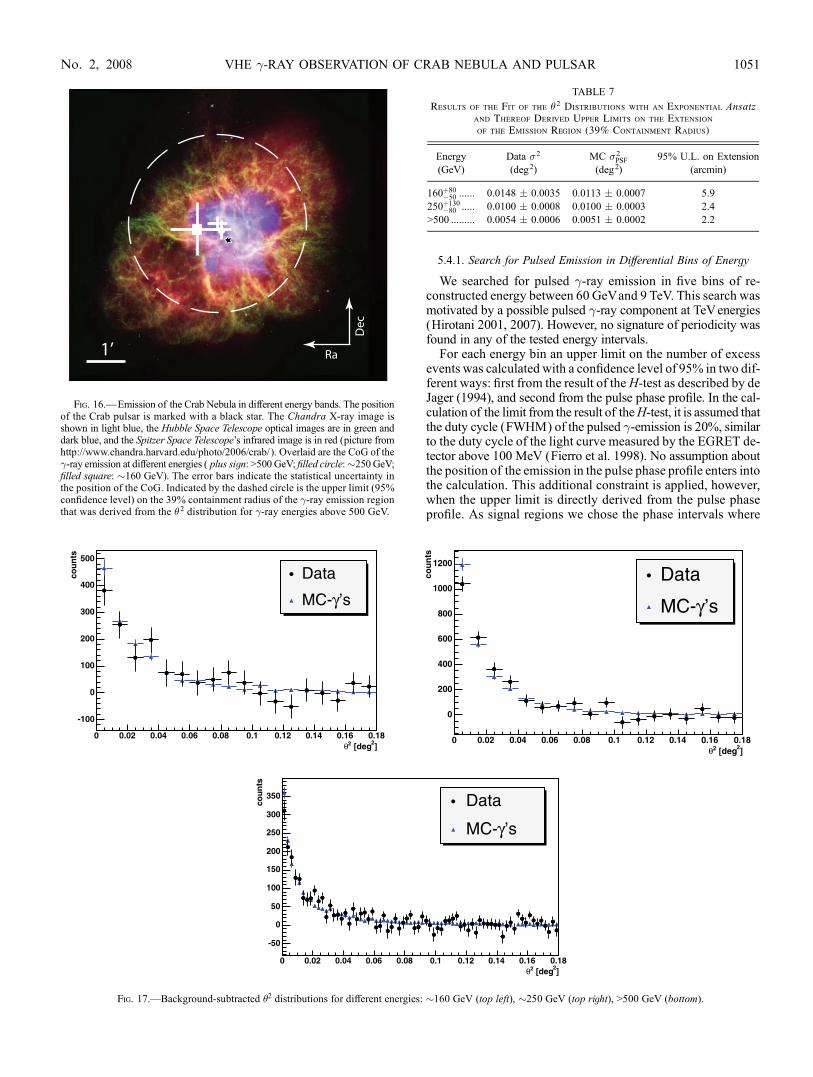
The reconstructed event origins were corrected for possiblemispointing by using the information from the starguider camera.Two-dimensional (2D) histograms with bin sizes of 0:057� ;0:057� were filled with the corrected event origins (events withenergies <500 GeV). A 4 times finer binning was chosen forthe sky map filled by events with energies above 500 GeV. Fig-ure 15 shows the background-subtracted sky maps of excessevents from the Crab Nebula for �-ray energies �160, �250,and >500 GeV.
5.3.1. Center of Gravity of the �-Ray Emission
The CoG of the �-ray emission was derived from the sky mapsof the excess events shown in Figure 15 by fitting them with a 2DGaussian of the form
F x; yð Þ ¼ Fres þ a exp � x� xð Þ2 þ y� yð Þ2
2�2
" #; ð8Þ
Fig. 11.—SED of the �-ray emission of Crab Nebula. The measurementsshown below 10 GeVare by EGRET (de Jager et al. 1996). In VHE �-rays, mea-surements are from ground-based experiments. Above 400 GeVour measurementis in agreement with measurements by other IACTs. The dashed line is a modelprediction by Aharonian et al. (2004).
Fig. 10.—Differential energy spectrum of the Crab Nebula. The spectrumwas unfolded with the method of Bertero (1989). The results of a fit of the spec-trum with a power law and a broken power law are also shown. The bottom panelshows the relative residuals between the fit and the data points. See text for furtherdiscussion.
Fig. 12.—Measured spectral index derived from differential flux points ( filledcircles) and from the curved power-law fit (black solid line; the dashed line givesthe 1 � confidence interval). Predictions by Aharonian et al. (2004) (blue line),Atoyan & Aharonian (1996) (green line), and Aharonian & Atoyan (1998) (redline) are also shown.
VHE �-RAY OBSERVATION OF CRAB NEBULA AND PULSAR 1047No. 2, 2008
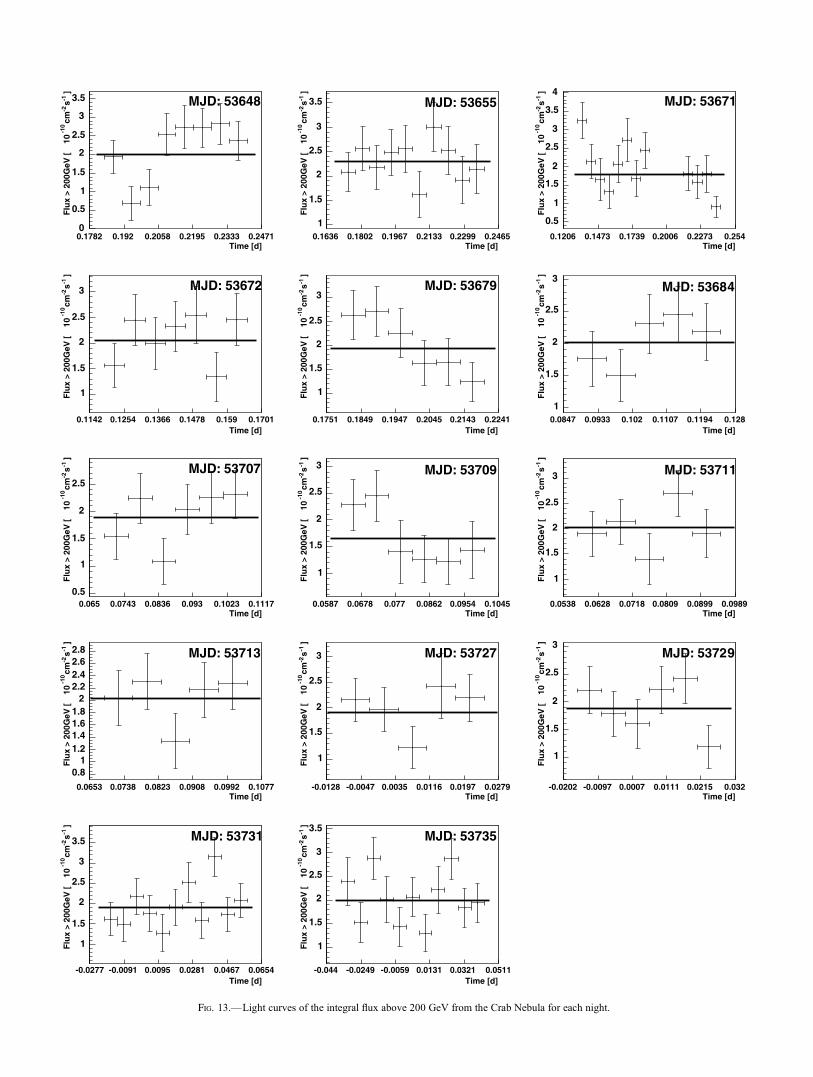
Fig. 13.—Light curves of the integral flux above 200 GeV from the Crab Nebula for each night.

where Fres is introduced to account for a possible constant off-set of the background-subtracted sky map. In this representa-tion � defines the 39% containment radius of the observed �-rayemission. Here we assume that the distribution of excess eventsis rotationally symmetric, i.e., �x ¼ �y ¼ �. It is further as-sumed that � is the convolution of the response of the detector�PSF (point-spread function) and the apparent size of the �-rayemission region �src, i.e., �2 ¼ �2
PSF þ �2src. Note that here it is
assumed that the �-ray emission region follows the shape de-scribed by equation (8), which in reality is not necessarily thecase.
The CoGs obtained from the fitted x and y are listed in Table 6and shown in Figure 16 superimposed on the composite imageof optical, IR, and X-ray observations of the Crab Nebula. Thethree measured CoGs are compatible among each other and co-incide with the position of the pulsar. Note that the systematicuncertainty of the position is �10.
5.3.2. Extension of the �-Ray Emission Region
The extension of the �-ray emission region was studied bycomparing the width of the excess event distribution with thatobtained for a simulated �-ray point source. The simulated dis-tributions were verified by comparing them to the distributionsextracted from an observation of Mrk 421, an extragalactic �-raysource that can be considered a point source for our purpose. TheMrk 421 data set is the same as in Albert et al. (2007a). The widthof the �-ray excess extracted from Mrk 421 and the simulatedwidth for a point source agree within statistical uncertainties.
In the following, the average position of the CoGs obtainedfrom the three sky maps is assumed as the �-ray source position.The angular distance squared (�2) between the reconstructedorigin and the assumed source position is calculated for everyevent. The background-subtracted �2 distributions obtained forthe three energy ranges are shown in Figure 17. Data (black) andMC (blue) are compatible within statistical uncertainties in allthree �2 distributions.
An exponential function of the form
F �2� �
¼ a exp � �2
2�2
� �ð9Þ
describes the expected �2 distribution, where a is a normalizationand � is the same as in equation (8). Values for �2 and �2
PSF foundby fitting the corresponding �2 distributions with equation (9) areshown in Table 7. Upper limits on �src were calculated with a con-fidence level of 95% following the procedure outlined inYao et al.(2006) for one-sided confidence intervals and Gaussian errors.The results are presented in Table 7. For energies above 500 GeVthe limit is shown in Figure 16. The limits obtained for �-rayenergies above 500 GeVand about 250 GeV constrain the �-rayemission to a region within the optical synchrotron nebula.
5.4. Search for Pulsed �-Ray Emission
Among the most challenging tasks of ground-based �-ray ex-periments is the detection of a pulsar. Several experiments havetried but failed. Currently MAGIC is the only ground-baseddetector with threshold settings below 100GeV that is appropriatefor a search of pulsed �-ray emission from the Crab pulsar. Forthe data a periodicity analysis was performed after �/hadron sep-aration and selection of events with small jALPHAj value. Thecuts were chosen byMC simulations to optimize the sensitivity ofthe analysis. After event selection, the event times24 were trans-formed to the barycenter of the solar system with the TEMPOtiming package (Taylor et al. 200025). Then, the correspondingphase �j of the Crab pulsar was calculated for each transformedarrival time tj :
�j ¼ tj � t0� �
þ 1
2 tj � t0� �2
; ð10Þ
where , , and t0 are values of contemporary ephemerides ofthe Crab pulsar provided by the Jodrell Bank Radio Telescope26
(see Table 8). We tested for periodicity with theH-test (de Jager
Fig. 14.—Nightly average flux from the Crab Nebula above 200 GeVof eachobserved night. The dashed blue line gives the average flux of all nights, and theblue shaded region gives the corresponding statistical error.
24 The time of each event was derived from the time signal of a GPS-controlled rubidium clock with a precision of �200 ns.
25 Available at http://www.atnf.csiro.au /research/pulsar/tempo/.26 See http://www.jb.man.ac.uk /pulsar/crab.html.
VHE �-RAY OBSERVATION OF CRAB NEBULA AND PULSAR 1049

et al. 1989), the Pearson’s �2-test, and a test from Gregory &Loredo (1992) that is based on Bayesian statistics.The analysis chain was tested by optical observations of the
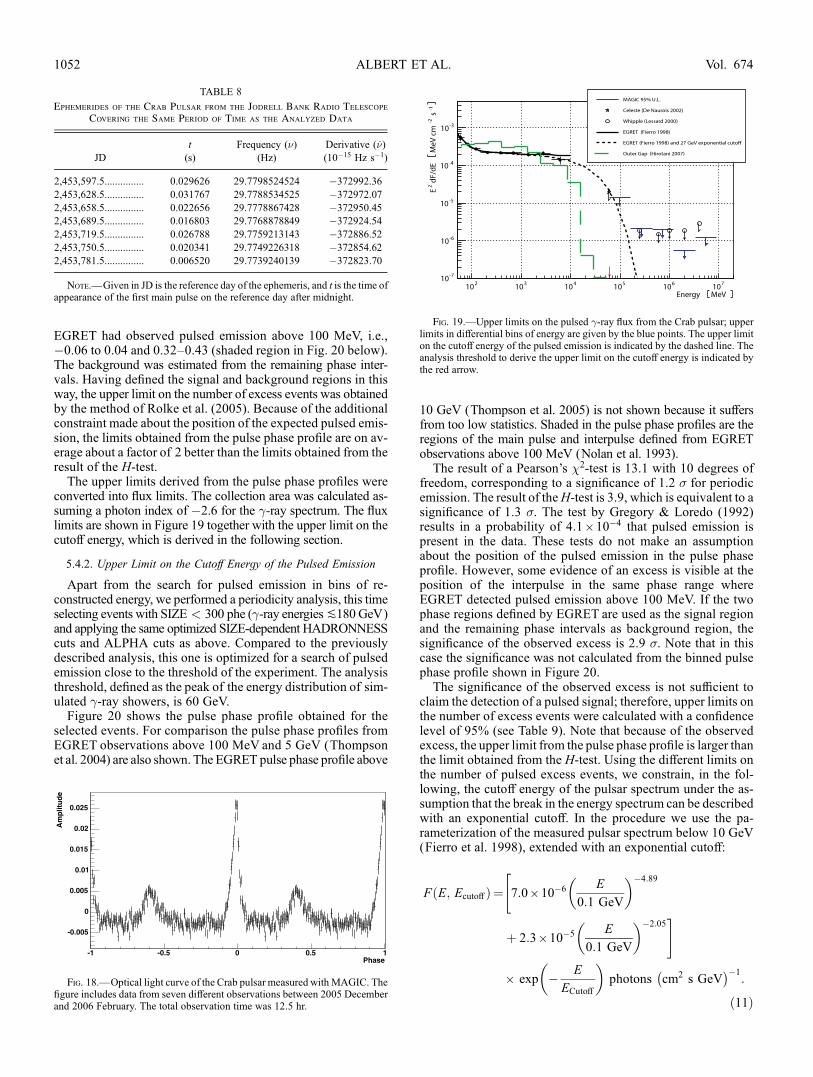
Crab pulsar with the MAGIC telescope. Within this 12.5 hr ob-servation, every time the readout of MAGIC was triggered by acosmic-ray shower, the signal of the pixel in the center of theMAGIC camera was recorded by the MAGIC DAQ for 100 ns.Along with an average trigger rate of 200 Hz, the effective obser-vation time was only about 1 s. Figure 18 shows the reconstructedoptical light curve of the Crab pulsar with the familiar main pulseand interpulse. For better readability the light curve is showntwice. The position of the main pulse is shifted with respect to theposition of the main pulse in radio by�252 � 64 �s, which is inagreement with the contemporary measurement of Oosterbroeket al. (2006).
Fig. 15.—Sky maps of excess events from the Crab Nebula for different �-ray energies (�160, �250, and >500 GeV). The position of the pulsar is marked by theblack plus sign, and the angular resolution is indicated by the circle.
TABLE 6
Center of Gravity of the �-Ray Emission of the Crab Nebula
Obtained for Different Energies
SIZE
(phe)
Energy
(GeV)
Right Ascension
(hr)
Declination
(deg)
200Y300 ............................. 160þ80�50 5.5766 � 0.0009 22.019 � 0.011
300Y700 ............................. 250þ130�80 5.5758 � 0.0003 22.019 � 0.004
>700 ................................... >500 5.5759 � 0.0003 22.022 � 0.003
Position of the pulsar..... . . . 5.5755 22.015
Notes.— In the first column the applied SIZE cut is stated. The second columnshows the corresponding range of �-ray energies covered (peak value and FWHMof the distribution of MC �-ray events). The last two columns give the fittedposition of the CoG and the statistical uncertainty.
ALBERT ET AL.1050 Vol. 674
5.4.1. Search for Pulsed Emission in Differential Bins of Energy
We searched for pulsed �-ray emission in five bins of re-constructed energy between 60 GeVand 9 TeV. This search wasmotivated by a possible pulsed �-ray component at TeVenergies(Hirotani 2001, 2007). However, no signature of periodicity wasfound in any of the tested energy intervals.
For each energy bin an upper limit on the number of excessevents was calculated with a confidence level of 95% in two dif-ferent ways: first from the result of theH-test as described by deJager (1994), and second from the pulse phase profile. In the cal-culation of the limit from the result of theH-test, it is assumed thatthe duty cycle (FWHM) of the pulsed �-emission is 20%, similarto the duty cycle of the light curve measured by the EGRET de-tector above 100 MeV (Fierro et al. 1998). No assumption aboutthe position of the emission in the pulse phase profile enters intothe calculation. This additional constraint is applied, however,when the upper limit is directly derived from the pulse phaseprofile. As signal regions we chose the phase intervals where
Fig. 16.—Emission of the Crab Nebula in different energy bands. The positionof the Crab pulsar is marked with a black star. The Chandra X-ray image isshown in light blue, the Hubble Space Telescope optical images are in green anddark blue, and the Spitzer Space Telescope’s infrared image is in red (picture fromhttp://www.chandra.harvard.edu/photo/2006/crab/). Overlaid are the CoG of the�-ray emission at different energies ( plus sign: >500 GeV; filled circle:�250 GeV;filled square: �160 GeV). The error bars indicate the statistical uncertainty inthe position of the CoG. Indicated by the dashed circle is the upper limit (95%confidence level) on the 39% containment radius of the �-ray emission regionthat was derived from the �2 distribution for �-ray energies above 500 GeV.
Fig. 17.—Background-subtracted �2 distributions for different energies: �160 GeV (top left), �250 GeV (top right), >500 GeV (bottom).
TABLE 7
Results of the Fit of the �2Distributions with an Exponential Ansatz
and Thereof Derived Upper Limits on the Extension
of the Emission Region (39% Containment Radius)
Energy
(GeV)
Data �2
(deg2)
MC �2PSF
(deg2)
95% U.L. on Extension
(arcmin)
160þ80�50 ...... 0.0148 � 0.0035 0.0113 � 0.0007 5.9
250þ130�80 ..... 0.0100 � 0.0008 0.0100 � 0.0003 2.4
>500 ......... 0.0054 � 0.0006 0.0051 � 0.0002 2.2
VHE �-RAY OBSERVATION OF CRAB NEBULA AND PULSAR 1051No. 2, 2008
EGRET had observed pulsed emission above 100 MeV, i.e.,�0.06 to 0.04 and 0.32Y0.43 (shaded region in Fig. 20 below).The background was estimated from the remaining phase inter-vals. Having defined the signal and background regions in thisway, the upper limit on the number of excess events was obtainedby the method of Rolke et al. (2005). Because of the additionalconstraint made about the position of the expected pulsed emis-sion, the limits obtained from the pulse phase profile are on av-erage about a factor of 2 better than the limits obtained from theresult of the H-test.
The upper limits derived from the pulse phase profiles wereconverted into flux limits. The collection area was calculated as-suming a photon index of �2.6 for the �-ray spectrum. The fluxlimits are shown in Figure 19 together with the upper limit on thecutoff energy, which is derived in the following section.
5.4.2. Upper Limit on the Cutoff Energy of the Pulsed Emission
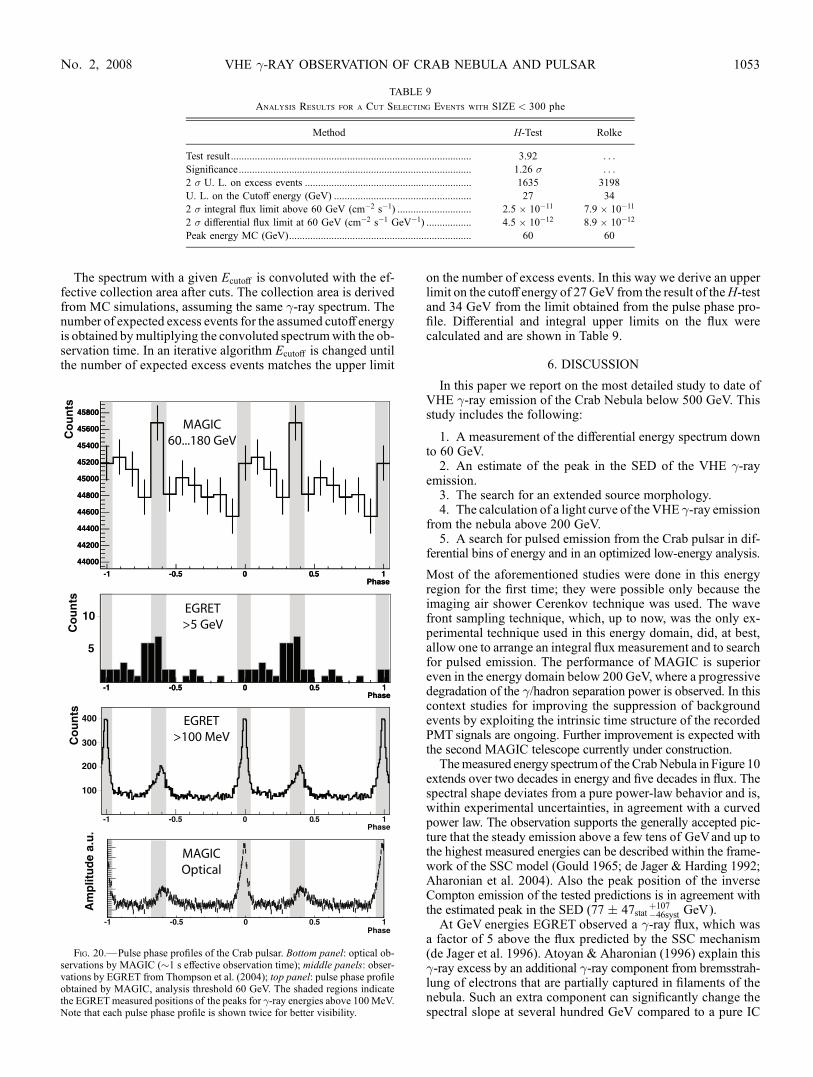
Apart from the search for pulsed emission in bins of re-constructed energy, we performed a periodicity analysis, this timeselecting events with SIZE < 300 phe (�-ray energiesP180 GeV)and applying the same optimized SIZE-dependent HADRONNESScuts and ALPHA cuts as above. Compared to the previouslydescribed analysis, this one is optimized for a search of pulsedemission close to the threshold of the experiment. The analysisthreshold, defined as the peak of the energy distribution of sim-ulated �-ray showers, is 60 GeV.
Figure 20 shows the pulse phase profile obtained for theselected events. For comparison the pulse phase profiles fromEGRET observations above 100 MeV and 5 GeV (Thompsonet al. 2004) are also shown. The EGRET pulse phase profile above
10 GeV (Thompson et al. 2005) is not shown because it suffersfrom too low statistics. Shaded in the pulse phase profiles are theregions of the main pulse and interpulse defined from EGRETobservations above 100 MeV (Nolan et al. 1993).The result of a Pearson’s �2-test is 13.1 with 10 degrees of
freedom, corresponding to a significance of 1.2 � for periodicemission. The result of theH-test is 3.9, which is equivalent to asignificance of 1.3 �. The test by Gregory & Loredo (1992)results in a probability of 4:1 ; 10�4 that pulsed emission ispresent in the data. These tests do not make an assumptionabout the position of the pulsed emission in the pulse phaseprofile. However, some evidence of an excess is visible at theposition of the interpulse in the same phase range whereEGRET detected pulsed emission above 100 MeV. If the twophase regions defined by EGRET are used as the signal regionand the remaining phase intervals as background region, thesignificance of the observed excess is 2.9 �. Note that in thiscase the significance was not calculated from the binned pulsephase profile shown in Figure 20.The significance of the observed excess is not sufficient to
claim the detection of a pulsed signal; therefore, upper limits onthe number of excess events were calculated with a confidencelevel of 95% (see Table 9). Note that because of the observedexcess, the upper limit from the pulse phase profile is larger thanthe limit obtained from the H-test. Using the different limits onthe number of pulsed excess events, we constrain, in the fol-lowing, the cutoff energy of the pulsar spectrum under the as-sumption that the break in the energy spectrum can be describedwith an exponential cutoff. In the procedure we use the pa-rameterization of the measured pulsar spectrum below 10 GeV(Fierro et al. 1998), extended with an exponential cutoff:
F E; EcutoAð Þ ¼"7:0 ; 10�6 E
0:1 GeV
� ��4:89
þ 2:3 ; 10�5 E
0:1 GeV
� ��2:05#
; exp � E
ECutoA
� �photons cm2 s GeV
� ��1:
ð11Þ
TABLE 8
Ephemerides of the Crab Pulsar from the Jodrell Bank Radio Telescope
Covering the Same Period of Time as the Analyzed Data
JD
t
(s)
Frequency ()(Hz)
Derivative ()(10�15 Hz s�1)
2,453,597.5............... 0.029626 29.7798524524 �372992.36
2,453,628.5............... 0.031767 29.7788534525 �372972.07
2,453,658.5............... 0.022656 29.7778867428 �372950.45
2,453,689.5............... 0.016803 29.7768878849 �372924.54
2,453,719.5............... 0.026788 29.7759213143 �372886.52
2,453,750.5............... 0.020341 29.7749226318 �372854.62
2,453,781.5............... 0.006520 29.7739240139 �372823.70
Note.—Given in JD is the reference day of the ephemeris, and t is the time ofappearance of the first main pulse on the reference day after midnight.
Fig. 18.—Optical light curve of the Crab pulsar measured with MAGIC. Thefigure includes data from seven different observations between 2005 Decemberand 2006 February. The total observation time was 12.5 hr.
Fig. 19.—Upper limits on the pulsed �-ray flux from the Crab pulsar; upperlimits in differential bins of energy are given by the blue points. The upper limiton the cutoff energy of the pulsed emission is indicated by the dashed line. Theanalysis threshold to derive the upper limit on the cutoff energy is indicated bythe red arrow.
ALBERT ET AL.1052 Vol. 674
The spectrum with a given EcutoA is convoluted with the ef-fective collection area after cuts. The collection area is derivedfrom MC simulations, assuming the same �-ray spectrum. Thenumber of expected excess events for the assumed cutoff energyis obtained bymultiplying the convoluted spectrumwith the ob-servation time. In an iterative algorithm EcutoA is changed untilthe number of expected excess events matches the upper limit
on the number of excess events. In this way we derive an upperlimit on the cutoff energy of 27 GeV from the result of theH-testand 34 GeV from the limit obtained from the pulse phase pro-file. Differential and integral upper limits on the flux werecalculated and are shown in Table 9.
6. DISCUSSION
In this paper we report on the most detailed study to date ofVHE �-ray emission of the Crab Nebula below 500 GeV. Thisstudy includes the following:
1. A measurement of the differential energy spectrum downto 60 GeV.
2. An estimate of the peak in the SED of the VHE �-rayemission.
3. The search for an extended source morphology.4. The calculation of a light curve of the VHE �-ray emission
from the nebula above 200 GeV.5. A search for pulsed emission from the Crab pulsar in dif-
ferential bins of energy and in an optimized low-energy analysis.
Most of the aforementioned studies were done in this energyregion for the first time; they were possible only because theimaging air shower Cerenkov technique was used. The wavefront sampling technique, which, up to now, was the only ex-perimental technique used in this energy domain, did, at best,allow one to arrange an integral flux measurement and to searchfor pulsed emission. The performance of MAGIC is superioreven in the energy domain below 200 GeV, where a progressivedegradation of the �/hadron separation power is observed. In thiscontext studies for improving the suppression of backgroundevents by exploiting the intrinsic time structure of the recordedPMT signals are ongoing. Further improvement is expected withthe second MAGIC telescope currently under construction.
Themeasured energy spectrumof the CrabNebula in Figure 10extends over two decades in energy and five decades in flux. Thespectral shape deviates from a pure power-law behavior and is,within experimental uncertainties, in agreement with a curvedpower law. The observation supports the generally accepted pic-ture that the steady emission above a few tens of GeVand up tothe highest measured energies can be described within the frame-work of the SSC model (Gould 1965; de Jager & Harding 1992;Aharonian et al. 2004). Also the peak position of the inverseCompton emission of the tested predictions is in agreement withthe estimated peak in the SED (77 � 47stat
þ107�46syst GeV).
At GeV energies EGRET observed a �-ray flux, which wasa factor of 5 above the flux predicted by the SSC mechanism(de Jager et al. 1996). Atoyan & Aharonian (1996) explain this�-ray excess by an additional �-ray component from bremsstrah-lung of electrons that are partially captured in filaments of thenebula. Such an extra component can significantly change thespectral slope at several hundred GeV compared to a pure IC
TABLE 9
Analysis Results for a Cut Selecting Events with SIZE < 300 phe
Method H-Test Rolke
Test result ........................................................................................... 3.92 . . .
Significance........................................................................................ 1.26 � . . .
2 � U. L. on excess events ............................................................... 1635 3198
U. L. on the Cutoff energy (GeV) .................................................... 27 34
2 � integral flux limit above 60 GeV (cm�2 s�1) ............................ 2.5 ; 10�11 7.9 ; 10�11
2 � differential flux limit at 60 GeV (cm�2 s�1 GeV�1) ................. 4.5 ; 10�12 8.9 ; 10�12
Peak energy MC (GeV)..................................................................... 60 60
Fig. 20.—Pulse phase profiles of the Crab pulsar. Bottom panel: optical ob-servations by MAGIC (�1 s effective observation time); middle panels: obser-vations by EGRET from Thompson et al. (2004); top panel: pulse phase profileobtained by MAGIC, analysis threshold 60 GeV. The shaded regions indicatethe EGRETmeasured positions of the peaks for �-ray energies above 100MeV.Note that each pulse phase profile is shown twice for better visibility.
VHE �-RAY OBSERVATION OF CRAB NEBULA AND PULSAR 1053No. 2, 2008

scenario (cf. blue and red lines in Fig. 12) and results in analmost pure power-law behavior of the energy spectrum between�100 GeV and 10 TeV (constant �). At several hundred GeV,where the measurement is most sensitive, the measured slope(black line and data point) is considerably harder than predictedby Atoyan&Aharonian (1996). It is, therefore, unlikely that the�-ray excess at GeVenergies can be explained by bremsstrahlungas proposed. Later predictions by Aharonian & Atoyan (1998)that also include the mentioned bremsstrahlung mechanism arein agreement with the presented measurement (red line). How-ever, all above-mentioned predictions agree with the measure-ment if the measured slope is shifted by 0.2 to more negativevalues, which is within the range of the systematic uncertaintyof the measurement. In the prediction by Aharonian & Atoyan(1998) also a �-ray component from �0-decay is included, whichresults in a considerable harder spectrum above a few TeV com-pared to the pure IC scenario (cf. Fig. 12). However, given thelimited statistics above 1 TeV of our measurement, one cannotexclude any such prediction from the measurement.
Studies about the morphology of the �-rayYemitting region ofthe Crab Nebula have been performed by Aharonian et al. (2000,2004) for �-ray energies above 1 TeV. In both cases it was foundthat within the resolution of the experiment the emission regionis pointlike. They placed an upper limit on the source size of�20 at energies between 1 and 10 TeV. In the VHE domain, themorphology of the emission region has not yet been studied atenergies below 1 TeV. With the resolution of MAGIC it was pos-sible to constrain the origin of the �-ray emission to be within theoptical synchrotron nebula (see Fig. 16). The upper limit on thesize of the emission region is�20, which is about 4 times largerthan the predicted size of the inverse Compton surface brightnessfor �-ray energies below 500 GeV (de Jager & Harding 1992).
X-ray observations indicate variabilities in the acceleration andcooling times of electrons on timescale of months (e.g., Hesteret al. 2002). However, variations in �-rays could not be detectedso far. The sensitivity of MAGIC allowed us to study the var-iability of the �-ray emission above 150 GeVon timescales asshort as a few minutes up to months. We measured a flux that iswithin statistics compatible with steady emission. During theobservation the stability of the integral flux was better than 10%on all tested timescales.
In a search for pulsed VHE �-ray emission with MC optimizedcuts in HADRONNESS and ALPHA an excess was found in thepulse phase profile at the same position where EGRET detectedpulsed emission above 100MeV. The significance of the excess is
2.9 � if the phase regions where EGRET detected pulsed emissionwere chosen as signal regions and the remaining phase intervalsare considered as background regions. The similarity of the dis-tribution of excess events in the EGRET >5 GeV and MAGICdata and the monotonic increase of the number of excess eventswith increasing upper SIZE cut are strong indications that theobserved excess is not a random fluctuation.With the result of the H-test an upper limit on the cutoff energy
of 27 GeV was derived, assuming that the power-law spectrum ofthe pulsar at GeVenergies is attenuated by an exponential cutoff.However, if the cutoff of the spectrum has a superexponentialshape, a cutoff energy almost as high as the analysis threshold(�60 GeV) cannot be excluded.With the derived upper limit we constrain not only the �-ray
emission from within the light cylinder but also the predictedpulsed �-ray emission in the unshocked wind region (Bogovalov&Aharonian 2000). The predicted �-ray flux strongly depends (1)on the distance from the light cylinder where the kinetic energyYdominated wind forms and (2) on the wind’s Lorentz factor. Bycomparing our observational limits on the pulsed emission withthe predicted spectra by Bogovalov & Aharonian (2000), wecan exclude the formation of a particle-dominated wind within afew light cylinder radii. Following the argumentation of the sameauthors, the particle-dominated pulsar wind must therefore beformed farther out, most likely at distances of more than 30 lightcylinder radii.Also, no pulsed emission was detected for energies above
100 GeV, which could have its origin in IC upscattering of IRphotonswithin the light cylinder. Despite earlier claims of a strongcomponent (Hirotani & Shibata 2001), latest models (Hirotani2007) seem to disfavor a pulsed TeV component from the Crabpulsar due to dominant �-� absorption processes. In the future,detailed spectroscopic studies of the pulsed emission by, e.g.,GLAST and ground-based experiments with lower thresholdsand higher sensitivities likeMAGIC II (under construction) andCTA (projected) will hopefully resolve the long-standing ques-tion of the origin of the pulsed emission.
We are grateful for discussions with Kouichi Hirotani. We alsowould like to thank the IAC for the excellent working conditionsat the ORM in La Palma. The support of the German BMBF andMPG, the Italian INFN, the Spanish CICYT, ETH research grantTH 34/04 3, and the Polish MNiI grant 1P03D01028 is gratefullyacknowledged.
REFERENCES
Acharya, B. S., Bhat, P. N., Gandhi, V. N., RamanaMurthy, P. V., Sathyanarayana,G. P., & Vishwanath, P. R. 1992, A&A, 258, 412
Aharonian, F. et al. 1999, A&A, 346, 913———. 2004, ApJ, 614, 897———. 2006, A&A, 457, 899Aharonian, F. A., & Atoyan, A. M. 1998, in Neutron Stars and Pulsars: ThirtyYears after the Discovery, ed. N. Shibazaki (Tokyo: Universal Academy), 439
Aharonian, F. A., et al. 2000, A&A, 361, 1073Akerlof, C., Dimarco, J., Levy, H., MacCallum, C., Meyer, D., Radusewicz, P.,Tschirhart, R., & Yama, Z. 1990, in Proc. 21st Int. Cosmic Ray Conf.(Adelaide), 135
Albert, J., et al. 2006, preprint (astro-ph/0612385)———. 2007a, ApJ, 663, 125———. 2007b, Nucl. Instrum. Methods A, 583, 494———. 2008, Nucl. Instrum. Methods A, in press (arXiv: 0709.3719)Amato, E., Guetta, D., & Blasi, P. 2003, A&A, 402, 827Amenomori, M., et al. 1999, ApJ, 525, L93Anykeyev, V. B., Spiridonov, A. A., & Zhigunov, V. P. 1991, Nucl. Instrum.Methods Phys. Res. A, 303, 350
Arons, J. 1983, ApJ, 266, 215
Arqueros, F., et al. 2002, Astropart. Phys., 17, 293Atoyan, A. M., & Aharonian, F. A. 1996, MNRAS, 278, 525Baillon, P., et al. 1991, in Proc. 22nd Int. Cosmic Ray Conf. (Dublin), 220Bednarek, W., & Bartosik, M. 2003, A&A, 405, 689Bednarek, W., & Protheroe, R. J. 1997, Phys. Rev. Lett., 79, 2616Bertero, M. 1989, Electronics and Electron Phys., 75, 1989Bhat, P. N., Ramanamurthy, P. V., Sreekantan, B. V., & Vishwanath, P. R. 1986,Nature, 319, 127
Bock, R. K., et al. 2004, Nucl. Instrum. Methods Phys. Res. A, 516, 511Bogovalov, S. V., & Aharonian, F. A. 2000, MNRAS, 313, 504Breiman, L. 2001, Machine Learning, 45, 5Bretz, T., & Wagner, R. M. 2003, in Proc. 5th Int. Cosmic Ray Conf., 2947Cheng, K. S., Ho, C., & Ruderman, M. 1986a, ApJ, 300, 500———. 1986b, ApJ, 300, 522Chiang, J., & Romani, R. W. 1992, ApJ, 400, 629Cocke, W. J., Disney, M. J., & Taylor, D. J. 1969, Nature, 221, 525Collins, G. W., II, Claspy, W. P., & Martin, J. C. 1999, PASP, 111, 871Cortina, J., et al. 2005, in Proc. 29th Int. Cosmic Ray Conf. (Pune), 359Daugherty, J. K., & Harding, A. K. 1982, ApJ, 252, 337de Jager, O. C. 1994, ApJ, 436, 239
ALBERT ET AL.1054 Vol. 674
de Jager, O. C., & Harding, A. K. 1992, ApJ, 396, 161de Jager, O. C., Harding, A. K., Michelson, P. F., Nel, H. I., Nolan, P. L.,Sreekumar, P., & Thompson, D. J. 1996, ApJ, 457, 253
de Jager, O. C., Raubenheimer, B. C., & Swanepoel, J.W. H. 1989, A&A, 221, 180de Naurois, M., et al. 2002, ApJ, 566, 343Domingo-Santamarıa, E., et al. 2005, in Proc. 29th Int. Cosmic Ray Conf.(Pune), 363
Downthwaite, J. C., Harrison, A. B., Kirkman, I. W., Macrae, H. J., McComb,T. J. L., Orford, K. J., Turver, K. E., & Walmsley, M. 1984, ApJ, 286, L35
Fierro, J. M., Michelson, P. F., Nolan, P. L., & Thompson, D. J. 1998, ApJ, 494,734
Fomin, V. P., Stepanian, A. A., Lamb, R. C., Lewis, D. A., Punch, M., &Weekes, T. C. 1994, Astropart. Phys., 2, 137
Garczarczyk, M. 2006, Ph.D. thesis, Univ. RostockGaug, M., Bartko, H., Cortina, J., & Rico, J. 2005, in Proc. 29th Int. CosmicRay Conf. (Pune), 375
Gibson, A. I., Harrison, A. B., Kirkman, I. W., Lotts, A. P., Macrae, J. H.,Orford, K. J., Turver, K. E., & Walmsley, M. 1982, Nature, 296, 833
Goret, P., Palfrey, T., Tabary, A., Vacanti, G., & Bazer-Bachi, R. 1993, A&A,270, 401
Gould, R. J. 1965, Phys. Rev. Lett., 15, 577Gregory, P. C., & Loredo, T. J. 1992, ApJ, 398, 146Harding, A. K., Tademaru, E., & Esposito, L. W. 1978, ApJ, 225, 226Hester, J. J., et al. 2002, ApJ, 577, L49Hillas, A. M. 1985, in Proc. 19th Int. Cosmic Ray Conf. (La Jolla), 445Hillas, A. M., et al. 1998, ApJ, 503, 744Hirotani, K. 2001, ApJ, 549, 495———. 2007, ApJ, 662, 1173Hirotani, K., & Shibata, S. 2001, ApJ, 558, 216Kennel, C. F., & Coroniti, F. V. 1984a, ApJ, 283, 694———. 1984b, ApJ, 283, 710Konopelko, A., et al. 1996, Astropart. Phys., 4, 199Lessard, R.W., Buckley, J. H., Connaughton, V., & LeBohec, S. 2001, Astropart.Phys., 15, 1
Lessard, R. W., et al. 2000, ApJ, 531, 942
Li, T.-P., & Ma, Y.-Q. 1983, ApJ, 272, 317Lorenz, E. 2004, NewA Rev., 48, 339Lucarelli, F., et al. 2005, in Proc. 29th Int. Cosmic Ray Conf. (Pune), 367Majumdar, P., et al. 2002, in The Universe Viewed in Gamma-Rays, ed. R.Enomoto, M. Mori, & S. Yanagita (Tokyo: Universal Academy)
Mirzoyan, R., & Lorenz, E. 1997, in Proc. 25th Int. Cosmic Ray Conf.(Durban), 265
Muslimov, A. G., & Harding, A. K. 2003, ApJ, 588, 430Musquere, A. 1999, in Proc. 26th Int. Cosmic Ray Conf. (Salt Lake City), 460Nolan, P. L., et al. 1993, ApJ, 409, 697Oosterbroek, T., de Bruijne, J. H. J., Martin, D., Verhoeve, P., Perryman, M. A. C.,Erd, C., & Schulz, R. 2006, A&A, 456, 283
Oser, S., et al. 2001, ApJ, 547, 949Paneque, D., Gebauer, H. J., Lorenz, E., Martinez, M., Mase, K., Mirzoyan, R.,Ostankov, A., & Schweizer, T. 2003, Nucl. Instrum. Methods Phys. Res. A,504, 109
Rees, M. J., & Gunn, J. E. 1974, MNRAS, 167, 1Rolke, W. A., Lopez, A. M., & Conrad, J. 2005, Nucl. Instrum. Methods Phys.Res. A, 551, 493
Schmelling, M. 1994, Nucl. Instrum. Methods Phys. Res. A, 340, 400Smith, D. A., et al. 2006, A&A, 459, 453Staelin, D. H., & Reifenstein, E. C. 1968, Science, 162, 1481Tanimori, T., et al. 1998, ApJ, 492, L33Taylor, J. H., Manchester, R. N., Nice, D. J., Weisberg, J. M., Irwin, A., & Wex,N. 2000, Tempo Pulsar Timing Package
Thompson, D. J., et al. 1999, ApJ, 516, 297———. 2004, in Cosmic Gamma-Ray Sources, ed. K. S. Cheng & G. E.Romero (Dordrecht: Kluwer), 149
———. 2005, ApJS, 157, 324Tikhonov, A. N., & Arsenin, V. J. 1979, Methods of Solution of Ill-posedProblems (Washington: Winston & Sons)
Vacanti, G., et al. 1991, ApJ, 377, 467Weekes, T. C., et al. 1989, ApJ, 342, 379Yao, W.-M., et al. 2006, J. Phys. G, 33, 1
VHE �-RAY OBSERVATION OF CRAB NEBULA AND PULSAR 1055No. 2, 2008
Copyright © 2022 FDOKUMEN