
Destruction of the Environment of the BN-KL Nebula
14
THE ASTROPHYSICAL JOURNAL, 511 : 822È835, 1999 February 1 1999. The American Astronomical Society. All rights reserved. Printed in U.S.A. ( DESTRUCTION OF THE ENVIRONMENT OF THE BN-KL NEBULA1 LUIS SALAS,MARGARITA ROSADO,IRENE CRUZ-GONZA LEZ,LEONEL GUTIE RREZ,JORGE VALDEZ,ABEL BERNAL, ESTEBAN LUNA,ELFEGO RUIZ, AND FRANCISCO LAZO Instituto de UNAM, Apdo. Postal 70-264, C.U., D.F. 04510, Observatorio Nacional, Apdo. Postal 877, Astronom•a, Me xico, Me xico; Astrono mico Ensenada, B.C. 22830, Me xico Received 1998 January 30 ; accepted 1998 September 3 ABSTRACT We describe observations of the 2.12 km molecular hydrogen emission in Orion using an IR Fabry- Perot interferometer with a spectral resolution of 24 km s~1 and a 2A spatial resolution covering a region of (0.46 ] 0.46 pc2) that contains the Ðlamentary Ðnger system located to the north- 3@ .6 ] 3@ .6 H 2 west of the Trapezium. We develop a simple model to explain the observed low-velocity structure as described by its radial moments : intensity, velocity centroid, velocity dispersion, and skewness. We assume a strong wind of 230 km s~1 produced by IRc2 interacting with a set of molecular clumps with density of 5.6 ] 105 cm~3. This simple model provides a good match to the observed moments, gives clues to the development of Ðlaments or Ðngers and entrainment of the molecular material, and associ- ates the observed high-velocity blueshifted emission to the region. The driving source of the wind requires a high mass-loss rate and thus is likely IRc2. The line emission is produced by a slow J-type H 2 shock (20 km s~1) in the clumps with an emissivity proportional to v1.8. Estimates for the total wind mass and clump mass yield 0.5 and 15 inside a radius of 1@ (0.1 pc). The individual clumps have M _ masses and sizes of few and 0.007 pc, respectively. We conclude that the central 0.1 pc ] 10~3M _ region surrounding the BN-KL nebula in front of OMC-1 is in the process of being disrupted by the strong wind of IRc2 on a timescale of 2000 yr. Subject headings : infrared : ISM : continuum È ISM : individual (OMC-1) 1. INTRODUCTION The BN-KL nebula was discovered as an infrared reÑec- tion nebulosity through historical 2 km observations (Becklin & Neugebauer 1967 ; Kleinmann & Low 1967). Later on, molecular hydrogen emission was found to be very prominent (Gautier et al. 1976) and increased the size of the nebula 20A to the northwest of BN (peak 1) and a set of elongated features Ðngers ; ÏÏ Taylor et al. 1984) (““ H 2 extending even farther to the north and northwest. The core of OMC-1 lies in the same direction as the apparent centers of the nebula (BN/IRc2). However, the large mass (150È200 and column densities inferred for OMC-1 (Genzel & M _ ) Stutzki 1989 and references therein) precludes the BN-KL nebula being located at the core. The BN-KL infrared nebula is thus probably located 0.1È 0.2 pc behind h1C near the front surface of OMC-1, as Zuckerman (1973) proposed. The presence of emission in BN-KL motivated the H 2 study of shocks in molecular clouds (Kwan 1977, hereafter K77 ; Hollenbach & Shull 1977). Later on, a series of facts made indisputable the presence of strong dynamical pro- cesses : nebular regions such as peak 1 show blueshifted features in the line proÐles (Nadeau & Geballe 1979), H 2 indicating velocities as high as [100 km s~1. The absence of a redshifted component was proposed as an inclination e†ect of the velocity source (Geballe et al. 1986) in favor of a bipolar shell structure. Axon & Taylor (1984) discovered a set of Herbig-Haro objects (HH201 to HH210), mostly con- tained in a cone with apex near BN, which later on has been shown to have proper motions consistent with ejection from a source near BN and IRc2 (e.g., Jones & Walker 1985) at velocities of a few hundred km s~1. Radial velocities of 1 Based on observations obtained at the Observatorio Astronomico Nacional at San Pedro B.C., Martir, Me xico. these HH objects also reach a few hundred km s~1, esti- mated from the blueshifted wings in the spectra of optical forbidden lines (Axon & Taylor 1984 ; Hu 1996 ; OÏDell et al. 1997). Recent images of Allen & Burton (1993, hereafter AB93) have shown a deÐnite association of the HH objects and the Ðngers and that [Fe II] emitting bullets are also H 2 present in the region and are associated with both. They concentrate on the structure of the Ðngers and propose H 2 that an explosive event in the BN-IRc2 region caused the ejecta of dense clumps into the molecular environment. This is sustained by the fact that [Fe II] is seen at the tips of several Ðngers, while traces back the wakes of the overall H 2 structure. Alternatively, Stone, Xu, & Mundy (1995) propose that fragmentation of a spherical wind by hydrody- namical instabilities may produce the observed structure (see also McCaughrean & MacLow 1997, hereafter MM97). To explain the intensities and proÐles of lines, two H 2 main approaches have been presented. One of them tries to explain intensities and proÐles of selected regions in an inte- gral way, while the second separates the velocity structure of the line into components at low and high velocities. In the Ðrst line of investigations, Brand (1995) has concluded that J-type shocks are able to explain the relative intensities of lines of di†erent excitations, while C-type shocks fail H 2 completely (Brand et al. 1988). However, the line proÐles cannot be reproduced by J-type shocks, either planar or bow shocks, while very highly magnetized C-type shocks (Smith, Brand, & Moorhouse 1991) can succeed, and thus the situation is really unclear. As to the second line of inves- tigations, separating the line velocity structure into two components, Scoville et al. (1982, hereafter SHRK82) pro- posed that a low-velocity structure close to the rest velocity of OMC-1 (8 km s~1) resembled an expanding shell (with km s~1, and that the high-velocity V exp \ 27 R shell \ 25A) features should come from a higher extinction region, 822
Transcript of Destruction of the Environment of the BN-KL Nebula
THE ASTROPHYSICAL JOURNAL, 511 :822È835, 1999 February 11999. The American Astronomical Society. All rights reserved. Printed in U.S.A.(
DESTRUCTION OF THE ENVIRONMENT OF THE BN-KL NEBULA1LUIS SALAS, MARGARITA ROSADO, IRENE CRUZ-GONZA� LEZ, LEONEL GUTIE� RREZ, JORGE VALDEZ, ABEL BERNAL,
ESTEBAN LUNA, ELFEGO RUIZ, AND FRANCISCO LAZO
Instituto de UNAM, Apdo. Postal 70-264, C.U., D.F. 04510, Observatorio Nacional, Apdo. Postal 877,Astronom•� a, Me� xico, Me� xico ; Astrono� micoEnsenada, B.C. 22830, Me� xico
Received 1998 January 30 ; accepted 1998 September 3
ABSTRACTWe describe observations of the 2.12 km molecular hydrogen emission in Orion using an IR Fabry-
Perot interferometer with a spectral resolution of 24 km s~1 and a 2A spatial resolution covering aregion of (0.46] 0.46 pc2) that contains the Ðlamentary Ðnger system located to the [email protected]] [email protected] H2west of the Trapezium. We develop a simple model to explain the observed low-velocity structure asdescribed by its radial moments : intensity, velocity centroid, velocity dispersion, and skewness. Weassume a strong wind of 230 km s~1 produced by IRc2 interacting with a set of molecular clumps withdensity of 5.6] 105 cm~3. This simple model provides a good match to the observed moments, givesclues to the development of Ðlaments or Ðngers and entrainment of the molecular material, and associ-ates the observed high-velocity blueshifted emission to the region. The driving source of the windrequires a high mass-loss rate and thus is likely IRc2. The line emission is produced by a slow J-typeH2shock (20 km s~1) in the clumps with an emissivity proportional to v1.8. Estimates for the total windmass and clump mass yield 0.5 and 15 inside a radius of 1@ (0.1 pc). The individual clumps haveM
_masses and sizes of few and 0.007 pc, respectively. We conclude that the central 0.1 pc] 10~3M_region surrounding the BN-KL nebula in front of OMC-1 is in the process of being disrupted by the
strong wind of IRc2 on a timescale of 2000 yr.Subject headings : infrared : ISM: continuum È ISM: individual (OMC-1)
1. INTRODUCTION
The BN-KL nebula was discovered as an infrared reÑec-tion nebulosity through historical 2 km observations(Becklin & Neugebauer 1967 ; Kleinmann & Low 1967).Later on, molecular hydrogen emission was found to bevery prominent (Gautier et al. 1976) and increased the sizeof the nebula 20A to the northwest of BN (peak 1) and a setof elongated features Ðngers ; ÏÏ Taylor et al. 1984)(““ H2extending even farther to the north and northwest. The coreof OMC-1 lies in the same direction as the apparent centersof the nebula (BN/IRc2). However, the large mass (150È200
and column densities inferred for OMC-1 (Genzel &M_
)Stutzki 1989 and references therein) precludes the BN-KLnebula being located at the core. The BN-KL infrarednebula is thus probably located 0.1È0.2 pc behind h1C nearthe front surface of OMC-1, as Zuckerman (1973) proposed.
The presence of emission in BN-KL motivated theH2study of shocks in molecular clouds (Kwan 1977, hereafterK77 ; Hollenbach & Shull 1977). Later on, a series of factsmade indisputable the presence of strong dynamical pro-cesses : nebular regions such as peak 1 show blueshiftedfeatures in the line proÐles (Nadeau & Geballe 1979),H2indicating velocities as high as [100 km s~1. The absenceof a redshifted component was proposed as an inclinatione†ect of the velocity source (Geballe et al. 1986) in favor of abipolar shell structure. Axon & Taylor (1984) discovered aset of Herbig-Haro objects (HH201 to HH210), mostly con-tained in a cone with apex near BN, which later on has beenshown to have proper motions consistent with ejection froma source near BN and IRc2 (e.g., Jones & Walker 1985) atvelocities of a few hundred km s~1. Radial velocities of
1 Based on observations obtained at the Observatorio Astrono� micoNacional at San Pedro B.C.,Ma� rtir, Me� xico.
these HH objects also reach a few hundred km s~1, esti-mated from the blueshifted wings in the spectra of opticalforbidden lines (Axon & Taylor 1984 ; Hu 1996 ; OÏDell et al.1997). Recent images of Allen & Burton (1993, hereafterAB93) have shown a deÐnite association of the HH objectsand the Ðngers and that [Fe II] emitting bullets are alsoH2present in the region and are associated with both. Theyconcentrate on the structure of the Ðngers and proposeH2that an explosive event in the BN-IRc2 region caused theejecta of dense clumps into the molecular environment. Thisis sustained by the fact that [Fe II] is seen at the tips ofseveral Ðngers, while traces back the wakes of the overallH2structure. Alternatively, Stone, Xu, & Mundy (1995)propose that fragmentation of a spherical wind by hydrody-namical instabilities may produce the observed structure(see also McCaughrean & MacLow 1997, hereafter MM97).
To explain the intensities and proÐles of lines, twoH2main approaches have been presented. One of them tries toexplain intensities and proÐles of selected regions in an inte-gral way, while the second separates the velocity structureof the line into components at low and high velocities. Inthe Ðrst line of investigations, Brand (1995) has concludedthat J-type shocks are able to explain the relative intensitiesof lines of di†erent excitations, while C-type shocks failH2completely (Brand et al. 1988). However, the line proÐlescannot be reproduced by J-type shocks, either planar orbow shocks, while very highly magnetized C-type shocks(Smith, Brand, & Moorhouse 1991) can succeed, and thusthe situation is really unclear. As to the second line of inves-tigations, separating the line velocity structure into twocomponents, Scoville et al. (1982, hereafter SHRK82) pro-posed that a low-velocity structure close to the rest velocityof OMC-1 (8 km s~1) resembled an expanding shell (with
km s~1, and that the high-velocityVexp\ 27 Rshell\ 25A)features should come from a higher extinction region,
822

ENVIRONMENT DESTRUCTION OF THE BN-KL NEBULA 823
behind the BN-KL nebula and more deeply embedded intoOMC-1, and would thus be unrelated. Later on, Sugai et al.(1995, hereafter S95), based on Fabry-Perot (FP) obser-vations of the 2.12 line, reached the same conclusions butwith a di†erent km s~1. More recently, Chryso-Vexp\ 8stomou et al. (1997, hereafter C97), based on FP spectros-copy at higher spatial resolution, proposed that thelow-velocity Ðeld could be due in part to an expandingbubble but that it was also loosely collimated into a bipolarÑow, with a small (5 km s~1) velocity di†erence for the blue-and redshifted lobes. Concerning the high-velocity structurein the lines, they identiÐed high-velocity regions with dis-crete condensations, the so-called bullets (AB93), andshowed a set of bow J-type shock models that producesimilar line proÐles if no dissociation of the moleculeH2occurs.
In this paper we study a region centered on [email protected] ] [email protected] contains the entire Ðnger system with an imagingH2FP interferometer in (° 2). Our spectral and spatialH2resolution are 24 km s~1 and 2A. This is half the resolutionof C97 but has the advantage of covering the entire regionin a single image, avoiding calibration, recentering, andtiling problems. Furthermore, their images do not provide acomplete view of the Ðnger system. The velocity maps of theregion (° 3) provide evidence to separate the velocity struc-ture into two components, since we Ðnd that the very highblueshifted emission arises in part from Ðlamentary struc-tures other than the Ðngers but that trace back to the sameorigin near the BN/IRc2 region. In contrast, emission atH2the wakes of the Ðngers is revealed as part of the low-velocity structure, although high velocities must be presentto explain [Fe II] bullets and HH objects. We Ðnd that adescription of the low-velocity structure in terms of themoments of the intensity-velocity distribution overrules theshell model proposed so far. We develop a model thatwould explain this low-velocity structure while admittingthe coexistence of a high-velocity wind. This model involvesa two-component interstellar medium (ISM) around thecentral object (IRc2) : a spherical low-density and high-velocity wind emanating from IRc2 and a collection of high-density molecular clumps (° 4). The model is used tocalculate the expected line proÐles, which allow us toH2obtain the radial moments of the velocity distribution : lineintensity, velocity centroid, velocity dispersion, and velocityskewness. The good Ðt obtained with the model allows us todraw conclusions (°° 5 and 6) about the physical propertiesof the region and its consequence on the evolution of theBN-KL nebula.
2. INFRARED SCANNING FABRY-PEROT OBSERVATIONS
2.1. Instrumental SetupA Queensgate FP interferometer was placed in the
optical bench of the CAMILA IR spectrograph (Cruz-et al. 1994). The ET-50 FP etalon has a spectralGonza� lez
range of 1È2.5 km and a Ðnesse of about 9 for K-bandobservations. The scanning is controlled by piezoelectricactuators and a Queensgate controller (Model CS100),which performs movements as required by the PC in chargeof controlling the IR camera. The etalon is placed in thecollimated beam near the exit pupil of the telescope, close tothe Lyot stop. During the observations, the parallelism ofthe etalon was obtained by observing an extended mono-chromatic light source at di†erent positions. The etalon was
operated at a controlled temperature of [20¡ C in a drynitrogen atmosphere, thus ensuring the stability of theparallelism, which was nevertheless veriÐed several timesduring the observing run. By observing an argon compari-son lamp through a di†user in the focal plane, we deter-mined the necessary number of steps to scan along an orderat the required observing wavelength of 2.1212544 S(1)(H21È0). The number of steps was divided into an integernumber of channels that would allow 9.82 km s~1 perchannel in The free spectral range was determined to beH2.255 km s~1. The observing order of interference was deter-mined to be 1181 for by observing several lines from theH2Ar lamp through a di†raction grating and scanning theetalon. At the end of the optical train an f/4.5 camera re-images the focal plane onto a NICMOS 3 detector, in frontof which the interference Ðlter is used to restrict the spectralrange for v\ 1È0 S(1) (2.122 km, *j\ 0.02 km). TheH2bandwidth of this Ðlter allows 11 orders of interference.Only one of these orders contains the 2.122 km line inH2the observed channels, while the remaining orders contrib-ute to the observed continuum. The intensities of line andcontinuum will thus be a†ected by di†erent factors (1 and11). The background noise is incremented by A ÐnalJ11.version of this instrument is under development and isdescribed in detail in Rosado et al. (1998a).
2.2. OMC-1 ObservationsThe observations were carried out at the f/13.5 Casse-
grain focus of the 2.1 m telescope of the ObservatorioAstronomico Nacional at San Pedro Martir, B.C., Mexico.Images under photometric conditions were taken on 1997January 19 with a FWHM of 2A. The plate scale of per0A.86pixel allowed coverage of a region centered [email protected] ] [email protected], which corresponds to 0.46] 0.46 pc2 at theadopted distance of 430 pc. A set of images was obtained at26 etalon positions (channels) that scan a single order at9.82 km s~1 per channel.
The Trapezium stars were positioned at one corner of theÐeld so that the reÑective ghosts of these bright stars wouldfall at the opposite corner of the detector and far enoughfrom the Ðnger system. ReÑective ghosts from otherH2bright sources have been carefully checked. The Ñux in theTrapezium starsÏ ghosts amounts to only 0.3% of the stellarÑuxes. A ghost from BN that amounts to only 0.4% of BNÏsbrightness fortunately lies just northwest of the Ðngers.Ghosts from other features and stars are so dim that wecannot locate them in our images, but we expect that theywould also amount to 0.3%.
The observing sequence consisted of alternative imagingof the region and a blank sky region 5@ to the east (see Fig. 4in MM97) for each etalon position. The telescope allowedthat the on-source image was accurately positioned backwithin 1A, eliminating recentering problems. On-source andsky integration times were 60 s for which is sufficientlyH2,short to guarantee the cancellation of atmospheric lines ateach etalon position, yet enough to acquire a good signal-to-noise ratio. The typical 1 p noise in any image is 0.1counts s~1 pixel~1, while the intensity in extended emissionregions of interest, such as the Ðngers, goes up to severalcounts s~1 pixel~1. A series of high- and low-illuminationsky Ñats at each etalon position were obtained at sunset.
The 2.1332885 km line of the Ar lamp was observed ateach etalon position for calibration, before and after thesource and sky images. The spectral response was Ðtted by a
824 SALAS ET AL. Vol. 511
Lorentzian
L (x)\ 11 ] (x/s)2 , (1)
where 2s is the FWHM. We derived FWHM\ 2.4 channels(23.5 km s~1) and determined that the wings extend for 5channels (49 km s~1) in each direction. The system wave-length repeatability was found to be 0.05 channels, or 0.52km s~1, by observing the Ar lamp several times and evalu-ating the centroid of the Ar line in each case. The accuracyof the instrument was estimated by the errors in the Ðttingof the velocity paraboloid (see next section) to phase correctthe data cubes. The 1 p errors in this Ðtting are of 0.28channels or 2.8 km s~1 in a circle of 100 pixels from thecenter, which covers the whole observed region.
2.3. ReductionThe Ðrst step in the reduction was sky subtraction for
each etalon position. Flat Ðelds were obtained by median-combining all the high- and low-illumination sky Ñats inde-pendently. The Ðnal Ñat is the subtraction of these twoimages. The sky-subtracted on-source images were dividedby the normalized Ñat, obtaining a prereduced data cube.
The second step consists of obtaining velocity maps fromthe data cubes. To verify the Ðnal results, the reduction wasdone by using two packages of routines, the CIGALEpackage developed in the Marseilles Observatory, France(Le Coarer 1992 ; Le Coarer et al. 1993), and another devel-oped by us using IRAF tasks and specially developedFORTRAN programs. Our routines allow Ðnding theparameters of the velocity paraboloid on the comparisonlamp data cube interactively. These parameters are thenused on the prereduced data cubes to phase correct theimages at each spatial position using linear interpolation toobtain the velocity cube, velocity channel images, or j-mapsof the region. The velocity corresponding to each channelwas referred to as the LSR, and all velocities in this paperwill be referred to this way.
In order to enhance structures and eliminate stars in theregion, a continuum image subtraction was carried out forsome analysis, as is a common practice in radio obser-vations. The continuum level at each pixel was determinedas the median of the 8 lower intensity channels. Thisallowed us to see faint structures, nearby bright stars, orstrong nebular-reÑected light. No absolute calibration ofline intensities was attempted, so we refer to intensity inrelative units.
3. KINEMATICS OF THE MOLECULAR HYDROGEN GAS
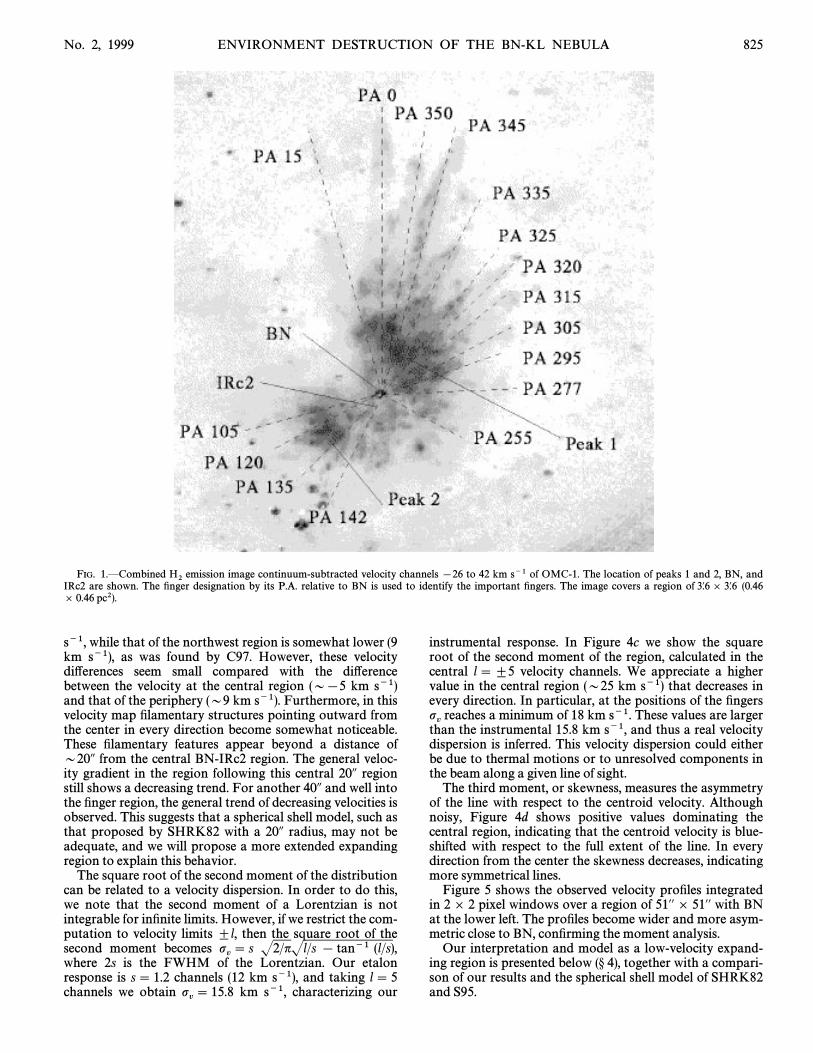
In order to clarify the Ðnger system designation and thecorrespondence to HH objects, we present in Figure 1 thecombined images of emission. This image is the additionH2of continuum-subtracted velocity channels [26È42 kms~1, where the bulk of the emission is observed. The imageshows the location of peaks 1 and 2, BN, IRc2, and the H2Ðnger system. The most prominent Ðngers are indicated byits position angle (P.A.) relative to BN.
Figure 2 shows 24 velocity channels spaced by 9.8 kms~1. The maximum of intensity occurs at 9 km s~1, close tothe rest velocity of OMC-1. We distinguish two com-ponents with di†erent kinematics : the central region at lowradial velocities km s~1) with the Ðnger([36 \VLSR \ 42system and the central region at high blue shifted velocities.
The detailed kinematics of the Ðnger system will be pre-sented in Rosado, Salas, & (1998b).Cruz-Gonza� lez
3.1. T he L ow-V elocity FieldFigure 3 shows a color composite image of the emis-H2sion taking 3 consecutive velocity channels around the
central velocity as blue-green-red. Most of the low-velocitystructure is illustrated there. The region around BN-IRc2appears blueshifted, while the nebula becomes redshifted asone progresses to the southeast region of KL (peak 2), aswell as in the northwest direction (peak 1), although peak 1emission is not as redshifted as peak 2. These results havebeen previously interpreted as a spherical shell in expansion(SHRK82; S95) and the velocity di†erence between peaks 1and 2 as an inclination e†ect of a bipolar outÑow (C97).
To study the kinematics of the region in a quantitativeway, we have calculated the moments of the intensity-velocity distribution. We have generated a mask to excludepixels with signal less than 3 times the typical noise ofp
Ncounts s~1 pixel~1. These moments are presentedpN
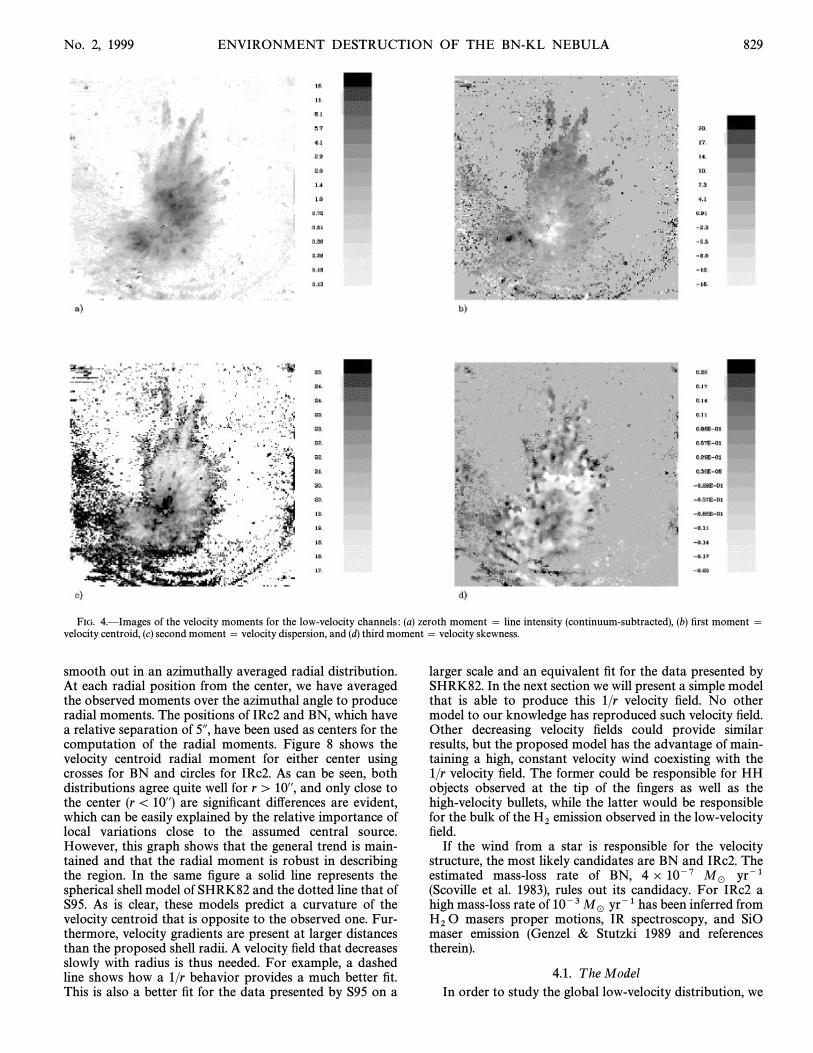
\ 0.1in Figure 4 : (a) zeroth moment \ continuum subtractedline intensity, (b) Ðrst moment \ velocity centroid, (c)square root of second moment, mathematically equivalentto the velocity dispersion, and (d) third moment equal tovelocity skewness. We have evaluated these moments fromthe 11 velocity channels centered on the rest velocity of thecloud, therefore limiting our study to the low radial velocityÐeld.
The morphology of the Ðngers (Fig. 4a) shows knotty andbent elongated structures, as is well known (see AB93).Most Ðngers have internal features that resemble a set ofbow shocks. The length of the Ðngers decreases as one prog-resses from the north to the west. As was noted by Wiseman& Ho (1996), the north and northwestern Ðnger systemseems to be conÐned by a cone of high-density Ðlamentarystructures detected in ammonia, where the eastern wall is at10 km s~1, and the western most wall is at 6 km s~1. In anoverlap of and (see Fig. 2 in their paper), it isH2 NH3evident that the Ðlaments are conÐned to the low-H2density medium. To the southeast of BN-IRc2 at least twoshort Ðngers are also detected (PA\ 105circ andPA\ 120circ), which also coincide with a cavity-like struc-ture in and so are also in a low-density medium.NH3The barycentric velocity Ðeld (Fig. 4b) shows that theÐngers in the northern region (PA \ 15cIRc, 0cIRc,[10cIRc, and [15cIRc) have velocities of 12È13 km s~1along the extension of the Ðnger, while the Ðngers atPA\ [25cIRc, [40cIRc, and 55cIRc become redder attheir tips reaching higher velocities in some spots. The twosoutheastern Ðngers (PA \ 120cIRc and 105cIRc) behave asthe northern ones, with velocities close to 10 km s~1. Thecentral region, close to BN, appears blueshifted, and thevelocities turn redder as one progresses outward in all direc-tions. This image is remarkably similar to the peak velocityimage presented by C97, although the velocity scalingquoted in their paper is reversed. Furthermore, in contrastto the ““ complex gas motions ÏÏ that they see about BN, werecover a systematic blueshifted velocity in that region as acentral tendency. The reddest spots are located in thesoutheast region, mainly in three knots at positions(05 :32 :48.53, [05 :24 :22.3), (05 :32 :49.22, [05 :24 :27.2)and (05 :32 :47.92, [05 :24 :30.7) (1950), which do not coin-cide with peak 2 but surround it. Apart from these extremespots the typical velocity of the southeast region is 13 km
No. 2, 1999 ENVIRONMENT DESTRUCTION OF THE BN-KL NEBULA 825
FIG. 1.ÈCombined emission image continuum-subtracted velocity channels [26 to 42 km s~1 of OMC-1. The location of peaks 1 and 2, BN, andH2IRc2 are shown. The Ðnger designation by its P.A. relative to BN is used to identify the important Ðngers. The image covers a region of ([email protected]] [email protected]] 0.46 pc2).
s~1, while that of the northwest region is somewhat lower (9km s~1), as was found by C97. However, these velocitydi†erences seem small compared with the di†erencebetween the velocity at the central region (D[5 km s~1)and that of the periphery (D9 km s~1). Furthermore, in thisvelocity map Ðlamentary structures pointing outward fromthe center in every direction become somewhat noticeable.These Ðlamentary features appear beyond a distance ofD20A from the central BN-IRc2 region. The general veloc-ity gradient in the region following this central 20A regionstill shows a decreasing trend. For another 40A and well intothe Ðnger region, the general trend of decreasing velocities isobserved. This suggests that a spherical shell model, such asthat proposed by SHRK82 with a 20A radius, may not beadequate, and we will propose a more extended expandingregion to explain this behavior.
The square root of the second moment of the distributioncan be related to a velocity dispersion. In order to do this,we note that the second moment of a Lorentzian is notintegrable for inÐnite limits. However, if we restrict the com-putation to velocity limits ^l, then the square root of thesecond moment becomes p
v\ s J2/nJl/s [ tan~1 (l/s),
where 2s is the FWHM of the Lorentzian. Our etalonresponse is s \ 1.2 channels (12 km s~1), and taking l \ 5channels we obtain km s~1, characterizing ourp
v\ 15.8
instrumental response. In Figure 4c we show the squareroot of the second moment of the region, calculated in thecentral l \ ^5 velocity channels. We appreciate a highervalue in the central region (D25 km s~1) that decreases inevery direction. In particular, at the positions of the Ðngers
reaches a minimum of 18 km s~1. These values are largerpvthan the instrumental 15.8 km s~1, and thus a real velocity
dispersion is inferred. This velocity dispersion could eitherbe due to thermal motions or to unresolved components inthe beam along a given line of sight.
The third moment, or skewness, measures the asymmetryof the line with respect to the centroid velocity. Althoughnoisy, Figure 4d shows positive values dominating thecentral region, indicating that the centroid velocity is blue-shifted with respect to the full extent of the line. In everydirection from the center the skewness decreases, indicatingmore symmetrical lines.
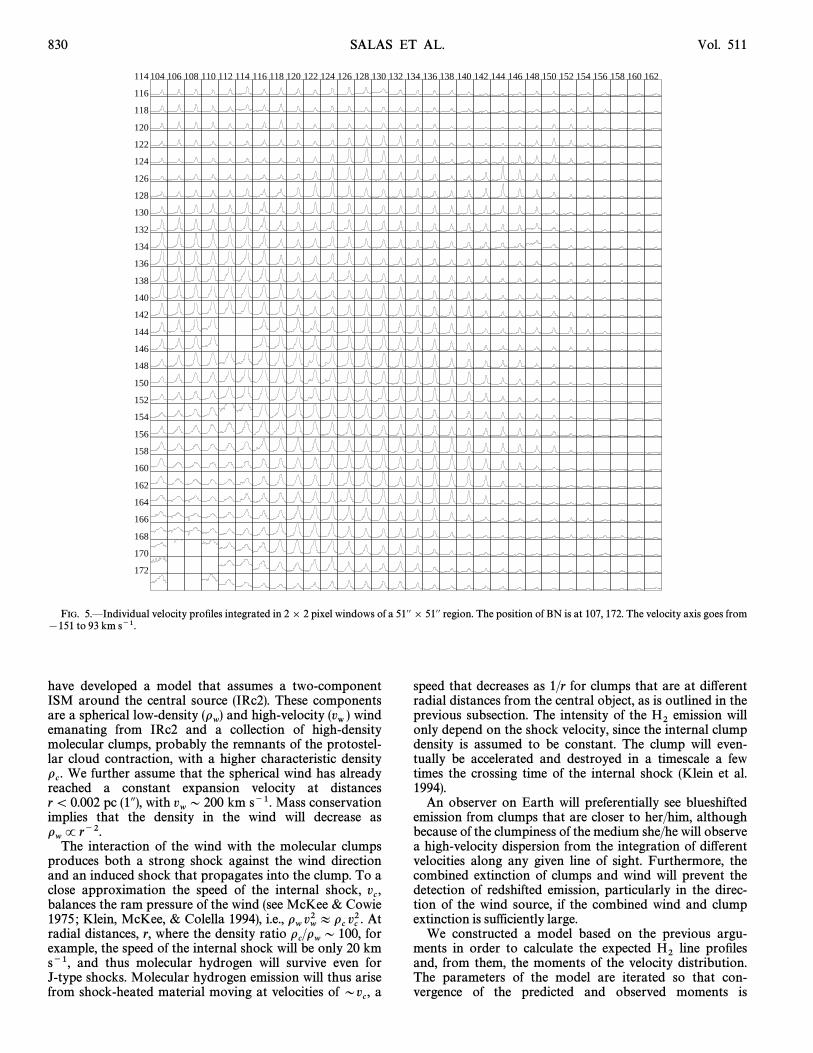
Figure 5 shows the observed velocity proÐles integratedin 2 ] 2 pixel windows over a region of 51@@] 51@@ with BNat the lower left. The proÐles become wider and more asym-metric close to BN, conÐrming the moment analysis.
Our interpretation and model as a low-velocity expand-ing region is presented below (° 4), together with a compari-son of our results and the spherical shell model of SHRK82and S95.
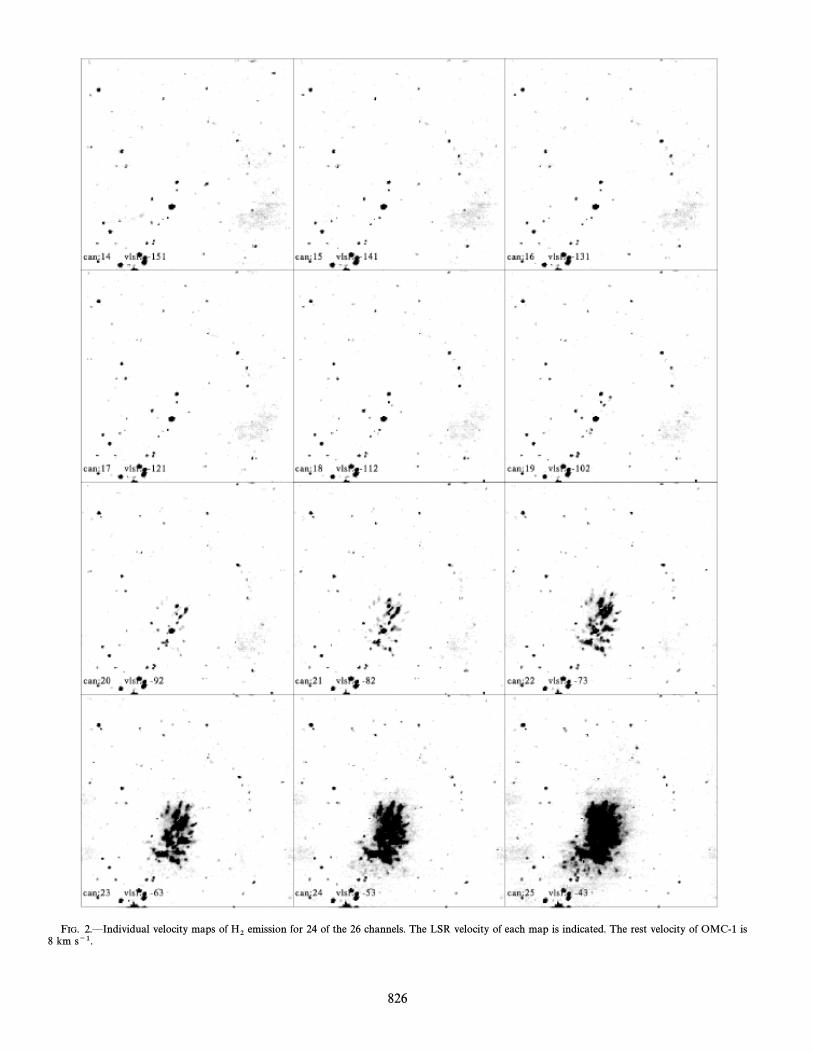
FIG. 2.ÈIndividual velocity maps of emission for 24 of the 26 channels. The LSR velocity of each map is indicated. The rest velocity of OMC-1 isH28 km s~1.
826
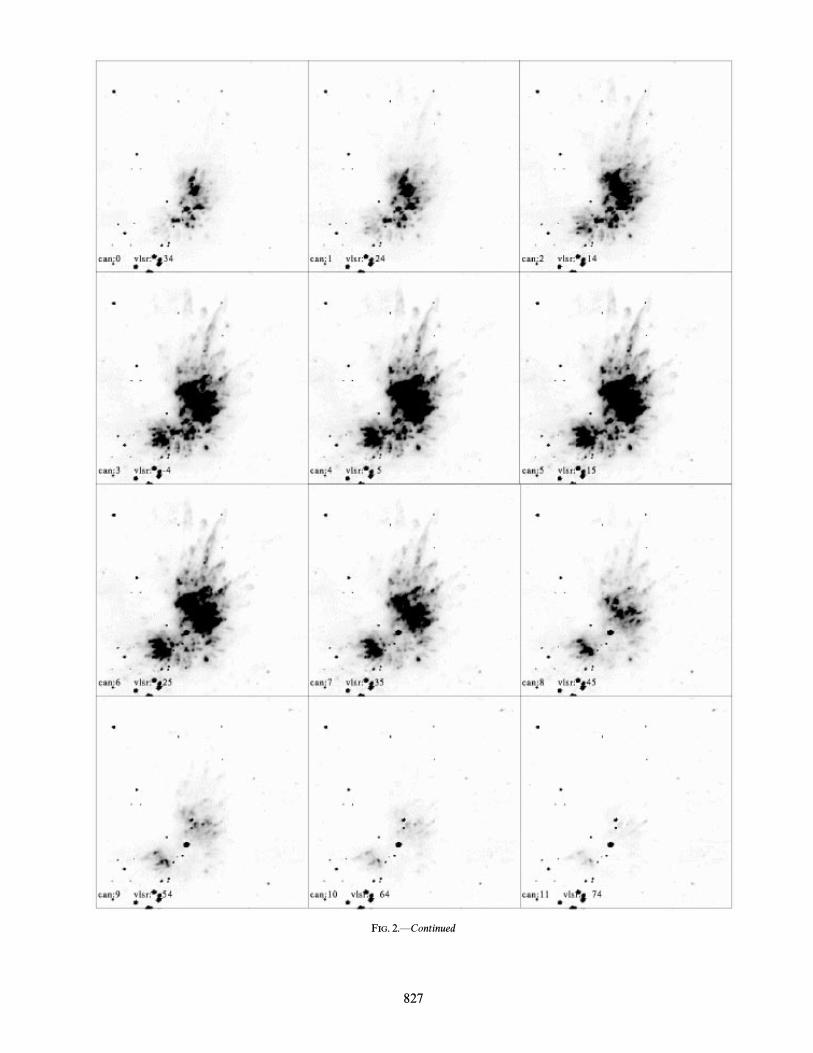
FIG. 2.ÈContinued
827

828 SALAS ET AL. Vol. 511
FIG. 3.ÈColor composite image of the emission taking 3 consecutive velocity channels 4.4, 14.2 km s~1) around the central velocity asH2 (vLSR\ [5.3,blue-green-red.
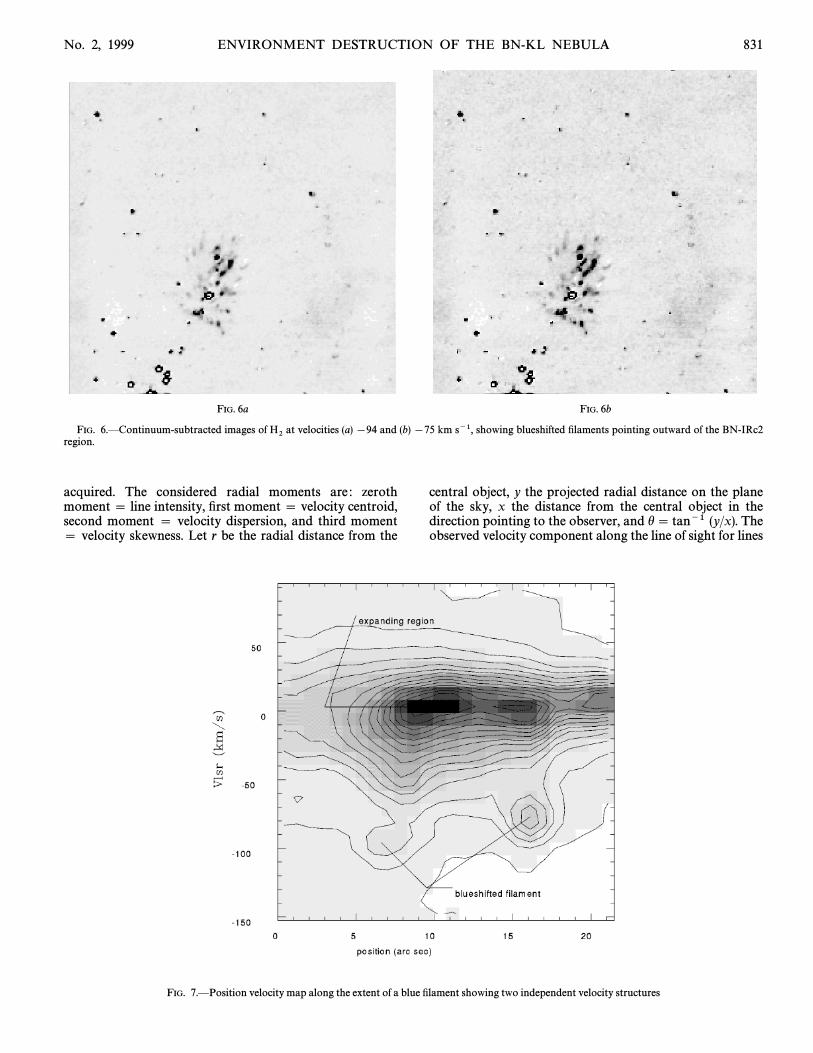
3.2. T he Blueshifted FilamentsIt is known that the lines are highly asymmetric inH2certain regions, showing blueshifted wings that reach up to
[100 km s~1 (e.g., SHRK82; C97). Figure 6 shows thecontinuum-subtracted emission, adding channels [94H2to [75 km s~1. In this image we can appreciate that thestructures responsible for the very high blueshifted emissionare Ðlamentary and pointing outward of the BN-IRc2region, indicating an association to it. These blueshiftedÐlaments lie within a radius of 30A centered on BN. Thevelocity structure of these Ðlaments appears clearly resolvedfrom the velocity structure of the expanding region intro-duced above (Fig. 7). We interpret the blueshifted Ðlamentsas molecular material plunging through the expandingregion with a larger component toward the observer. In this
view, these Ðlaments would be similar to the well-developednorthern Ðngers.
Other high-velocity features in Figure 6 can be identiÐedwith the ““ bullets ÏÏ described by C97. We recover the samevelocity proÐles for these bullets. The velocity structuresshow double peaks, with one component close to theambient velocity and a more or less separated blueshiftedcomponent.
4. THE BN-KL EXPANDING REGIONH2The geometry of the image moments presented in ° 3.1H2strongly suggests a spherical symmetry for the velocity
Ðelds only broken by the ammonia walls (Wiseman & Ho1996). Local variations from this trend seem to arise in theform of clumpy and Ðlamentary structures, which should
No. 2, 1999 ENVIRONMENT DESTRUCTION OF THE BN-KL NEBULA 829
FIG. 4.ÈImages of the velocity moments for the low-velocity channels : (a) zeroth moment \ line intensity (continuum-subtracted), (b) Ðrst moment \velocity centroid, (c) second moment \ velocity dispersion, and (d) third moment \ velocity skewness.
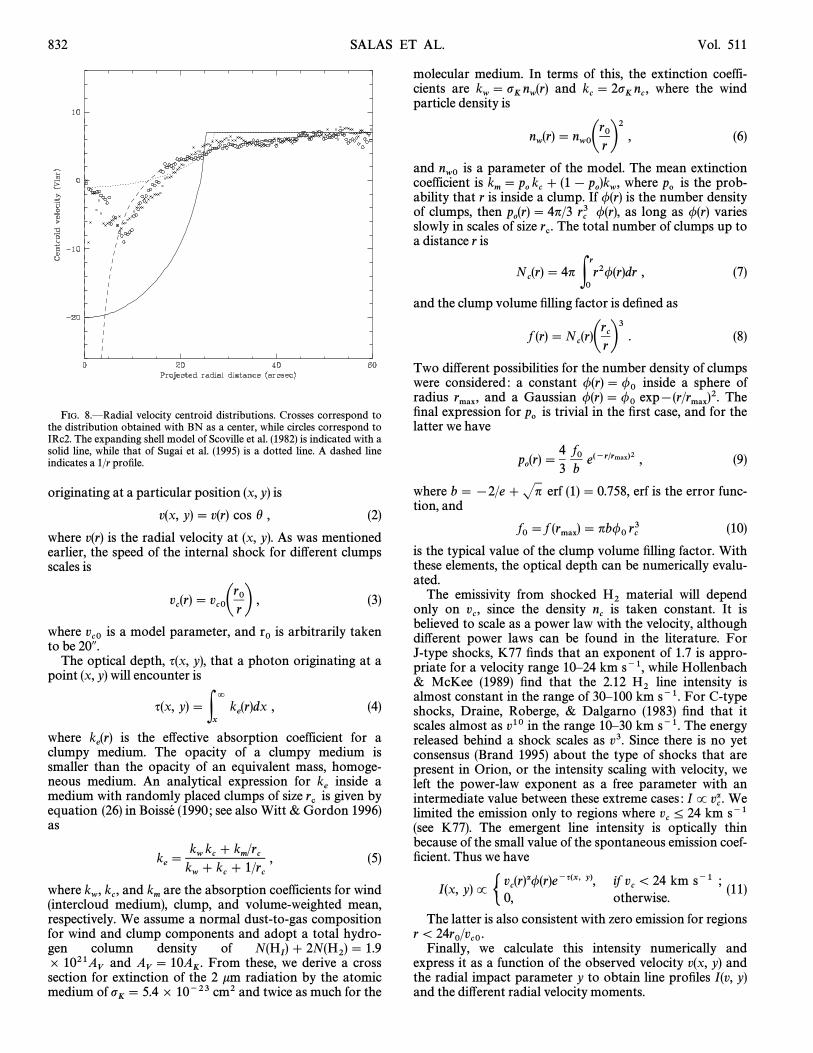
smooth out in an azimuthally averaged radial distribution.At each radial position from the center, we have averagedthe observed moments over the azimuthal angle to produceradial moments. The positions of IRc2 and BN, which havea relative separation of 5A, have been used as centers for thecomputation of the radial moments. Figure 8 shows thevelocity centroid radial moment for either center usingcrosses for BN and circles for IRc2. As can be seen, bothdistributions agree quite well for r [ 10@@, and only close tothe center (r \ 10@@) are signiÐcant di†erences are evident,which can be easily explained by the relative importance oflocal variations close to the assumed central source.However, this graph shows that the general trend is main-tained and that the radial moment is robust in describingthe region. In the same Ðgure a solid line represents thespherical shell model of SHRK82 and the dotted line that ofS95. As is clear, these models predict a curvature of thevelocity centroid that is opposite to the observed one. Fur-thermore, velocity gradients are present at larger distancesthan the proposed shell radii. A velocity Ðeld that decreasesslowly with radius is thus needed. For example, a dashedline shows how a 1/r behavior provides a much better Ðt.This is also a better Ðt for the data presented by S95 on a
larger scale and an equivalent Ðt for the data presented bySHRK82. In the next section we will present a simple modelthat is able to produce this 1/r velocity Ðeld. No othermodel to our knowledge has reproduced such velocity Ðeld.Other decreasing velocity Ðelds could provide similarresults, but the proposed model has the advantage of main-taining a high, constant velocity wind coexisting with the1/r velocity Ðeld. The former could be responsible for HHobjects observed at the tip of the Ðngers as well as thehigh-velocity bullets, while the latter would be responsiblefor the bulk of the emission observed in the low-velocityH2Ðeld.
If the wind from a star is responsible for the velocitystructure, the most likely candidates are BN and IRc2. Theestimated mass-loss rate of BN, 4 ] 10~7 yr~1M
_(Scoville et al. 1983), rules out its candidacy. For IRc2 ahigh mass-loss rate of 10~3 yr~1 has been inferred fromM
_masers proper motions, IR spectroscopy, and SiOH2Omaser emission (Genzel & Stutzki 1989 and referencestherein).
4.1. T he ModelIn order to study the global low-velocity distribution, we
114 104 106 108 110 112 114 116 118 120 122 124 126 128 130 132 134 136 138 140 142 144 146 148 150 152 154 156 158 160 162
116
118
120
122
124
126
128
130
132
134
136
138
140
142
144
146
148
150
152
154
156
158
160
162
164
166
168
170
172
830 SALAS ET AL. Vol. 511
FIG. 5.ÈIndividual velocity proÐles integrated in 2] 2 pixel windows of a 51@@] 51@@ region. The position of BN is at 107, 172. The velocity axis goes from[151 to 93 km s~1.
have developed a model that assumes a two-componentISM around the central source (IRc2). These componentsare a spherical low-density and high-velocity wind(o
w) (vw )
emanating from IRc2 and a collection of high-densitymolecular clumps, probably the remnants of the protostel-lar cloud contraction, with a higher characteristic density
We further assume that the spherical wind has alreadyoc.
reached a constant expansion velocity at distancesr \ 0.002 pc (1A), with km s~1. Mass conservationv
wD 200
implies that the density in the wind will decrease asow
P r~2.The interaction of the wind with the molecular clumps
produces both a strong shock against the wind directionand an induced shock that propagates into the clump. To aclose approximation the speed of the internal shock, v
c,
balances the ram pressure of the wind (see McKee & Cowie1975 ; Klein, McKee, & Colella 1994), i.e., Ato
wvw2 Bo
cvc2.
radial distances, r, where the density ratio foroc/o
wD 100,
example, the speed of the internal shock will be only 20 kms~1, and thus molecular hydrogen will survive even forJ-type shocks. Molecular hydrogen emission will thus arisefrom shock-heated material moving at velocities of aDv
c,
speed that decreases as 1/r for clumps that are at di†erentradial distances from the central object, as is outlined in theprevious subsection. The intensity of the emission willH2only depend on the shock velocity, since the internal clumpdensity is assumed to be constant. The clump will even-tually be accelerated and destroyed in a timescale a fewtimes the crossing time of the internal shock (Klein et al.1994).
An observer on Earth will preferentially see blueshiftedemission from clumps that are closer to her/him, althoughbecause of the clumpiness of the medium she/he will observea high-velocity dispersion from the integration of di†erentvelocities along any given line of sight. Furthermore, thecombined extinction of clumps and wind will prevent thedetection of redshifted emission, particularly in the direc-tion of the wind source, if the combined wind and clumpextinction is sufficiently large.
We constructed a model based on the previous argu-ments in order to calculate the expected line proÐlesH2and, from them, the moments of the velocity distribution.The parameters of the model are iterated so that con-vergence of the predicted and observed moments is
No. 2, 1999 ENVIRONMENT DESTRUCTION OF THE BN-KL NEBULA 831
FIG. 6a FIG. 6b
FIG. 6.ÈContinuum-subtracted images of at velocities (a) [94 and (b) [75 km s~1, showing blueshifted Ðlaments pointing outward of the BN-IRc2H2region.
acquired. The considered radial moments are : zerothmoment \ line intensity, Ðrst moment \ velocity centroid,second moment \ velocity dispersion, and third moment\ velocity skewness. Let r be the radial distance from the
central object, y the projected radial distance on the planeof the sky, x the distance from the central object in thedirection pointing to the observer, and h \ tan~1 (y/x). Theobserved velocity component along the line of sight for lines
FIG. 7.ÈPosition velocity map along the extent of a blue Ðlament showing two independent velocity structures
832 SALAS ET AL. Vol. 511
FIG. 8.ÈRadial velocity centroid distributions. Crosses correspond tothe distribution obtained with BN as a center, while circles correspond toIRc2. The expanding shell model of Scoville et al. (1982) is indicated with asolid line, while that of Sugai et al. (1995) is a dotted line. A dashed lineindicates a 1/r proÐle.
originating at a particular position (x, y) is
v(x, y)\ v(r) cos h , (2)
where v(r) is the radial velocity at (x, y). As was mentionedearlier, the speed of the internal shock for di†erent clumpsscales is
vc(r)\ v
c0Ar0
rB
, (3)
where is a model parameter, and is arbitrarily takenvc0 r0to be 20A.
The optical depth, q(x, y), that a photon originating at apoint (x, y) will encounter is
q(x, y)\Px
=ke(r)dx , (4)
where is the e†ective absorption coefficient for ake(r)
clumpy medium. The opacity of a clumpy medium issmaller than the opacity of an equivalent mass, homoge-neous medium. An analytical expression for inside ak
emedium with randomly placed clumps of size is given byrcequation (26) in (1990 ; see also Witt & Gordon 1996)Boisse�as
ke\ k
wkc] k
m/r
ckw
] kc] 1/r
c, (5)
where and are the absorption coefficients for windkw, k
c, k
m(intercloud medium), clump, and volume-weighted mean,respectively. We assume a normal dust-to-gas compositionfor wind and clump components and adopt a total hydro-gen column density of N(H
I) ] 2N(H2) \ 1.9
and From these, we derive a cross] 1021AV
AV
\ 10AK.
section for extinction of the 2 km radiation by the atomicmedium of cm2 and twice as much for thep
K\ 5.4] 10~23
molecular medium. In terms of this, the extinction coeffi-cients are and where the windk
w\ p
Knw(r) k
c\ 2p
Knc,
particle density is
nw(r) \ n
w0Ar0
rB2
, (6)
and is a parameter of the model. The mean extinctionnw0coefficient is where is the prob-k
m\ p
okc] (1[ p
o)k
w, poability that r is inside a clump. If /(r) is the number density
of clumps, then /(r), as long as /(r) variespo(r) \ 4n/3 r
c3
slowly in scales of size The total number of clumps up torc.a distance r is
Nc(r) \ 4n
P0
rr2/(r)dr , (7)
and the clump volume Ðlling factor is deÐned as
f (r) \ Nc(r)Ar
crB3
. (8)
Two di†erent possibilities for the number density of clumpswere considered : a constant inside a sphere of/(r) \/0radius and a Gaussian Thermax, /(r) \/0 exp[(r/rmax)2.Ðnal expression for is trivial in the Ðrst case, and for thepolatter we have
po(r) \ 4
3f0b
e(~r@rmax)2 , (9)
where erf (1)\ 0.758, erf is the error func-b \[2/e ] Jntion, and
f0\ f (rmax) \ nb/0 rc3 (10)
is the typical value of the clump volume Ðlling factor. Withthese elements, the optical depth can be numerically evalu-ated.
The emissivity from shocked material will dependH2only on since the density is taken constant. It isvc, n
cbelieved to scale as a power law with the velocity, althoughdi†erent power laws can be found in the literature. ForJ-type shocks, K77 Ðnds that an exponent of 1.7 is appro-priate for a velocity range 10È24 km s~1, while Hollenbach& McKee (1989) Ðnd that the 2.12 line intensity isH2almost constant in the range of 30È100 km s~1. For C-typeshocks, Draine, Roberge, & Dalgarno (1983) Ðnd that itscales almost as v10 in the range 10È30 km s~1. The energyreleased behind a shock scales as v3. Since there is no yetconsensus (Brand 1995) about the type of shocks that arepresent in Orion, or the intensity scaling with velocity, weleft the power-law exponent as a free parameter with anintermediate value between these extreme cases : WeIP v
ca.
limited the emission only to regions where km s~1vc¹ 24
(see K77). The emergent line intensity is optically thinbecause of the small value of the spontaneous emission coef-Ðcient. Thus we have
I(x, y) P qrs
vc(r)a/(r)e~q(x, y), if v
c\ 24 km s~1 ;
0, otherwise.(11)
The latter is also consistent with zero emission for regionsr \ 24r0/vc0.Finally, we calculate this intensity numerically andexpress it as a function of the observed velocity v(x, y) andthe radial impact parameter y to obtain line proÐles I(v, y)and the di†erent radial velocity moments.

No. 2, 1999 ENVIRONMENT DESTRUCTION OF THE BN-KL NEBULA 833
4.2. Results
The line proÐles I(v, y) obtained in the previous sectionfor a given set of parameters are used to calculate the Ðrstfour moments of the velocity-intensity distribution. Thesemoments are then compared with the observed radialmoments, and the procedure is iterated varying the valuesof the parameters until the best Ðt of the four moments isobtained. The best Ðt of the model is obtained with the twoparameters km s~1 for the wind and kmv
w\ 230 v
c0\ 20s~1 for the internal shock, which correspond to densities of
and cm~3 for a wind mass-nc\ 5.6] 105 n
w0\ 8.4] 103loss rate of yr~2.M0 \ 10~3 M
_The best exponent for the intensity power-law depen-dence in velocity turns out to be a \ 1.8. Larger valuesproduce a steep decline in intensity for large radii (momentzero), while smaller values produce an increase.
The Ðlling factor of clumps is taken as a Gaussian withA constant Ðlling factor produces a very slowrmax \ 40A.
change in opacity, which gave rather poor Ðts to theobserved Ðrst moment. Three clump radii were considered
1.5A, and 2A), which correspond to sizes of clumpy(rc\ 1A,
structures seen in the continuum-subtracted images and inthe third-moment images (see also images in MM97; Schild,Miller, & Tennyson 1997). For each clump size a di†erentvolume Ðlling factor provides a best Ðt : 0.09, andf0 \ 0.08,0.11, respectively.
The convergence of the model is very critical on theparameters, and variations of 10% produce signiÐcantlypoorer Ðts. Figure 9 shows line proÐles at di†erent project-ed radial distances y for From the top of the Ðgurer
c\ 2A.
(y \ 50A), we see a double-peaked line proÐle (solid line)around zero radial velocity and a dotted line that shows theproÐle convolved with our instrumental response. A blackdot shows the position of the velocity centroid, and a black
FIG. 9.ÈModeled line proÐles at di†erent radial distances (solid lines).Velocity centroids of the line are indicated with black dots, and the blacktriangle shows the velocity at which q\ 1. The dotted line represents theconvolved line proÐle with our instrumental response. Crosses indicate theobserved radial velocity centroids.
triangle shows the velocity at which the expanding windand clumps region becomes optically thin (q\ 1 at 2km).We see that the velocity centroid is near zero, while theoutÑow is mostly optically thin, allowing us to observesmall redshifted velocities that come from the outer backregions. As one progresses to smaller radial distances(y \ 50AÈ35A), the redshifted component is progressivelyattenuated, the velocity centroid shifts to the blue, and theq\ 1 point goes to higher redshifted (spatially closer)velocities. Eventually (y \ 15A), the redshifted component iscompletely attenuated with the q\ 1 condition going intothe blueshifted region. The crosses in the Ðgure representthe observed velocity centroid from Figure 8, showing avery good match with the calculated velocity centroids.
The four radial moments have been similarly calculatedfrom the data and are shown in Figure 10 (circles are forIRc2 and crosses for BN as centers). The upper panel in theÐgure shows the intensity, with a solid line representing theintensity predicted by our model scaled to the observed one.The match is very good. The maximum of intensity is pre-dicted for a distance of 20A, which corresponds to theminimum radial distance where molecular hydrogen sur-vives the shock. This distance also corresponds roughly tothe position 4A southeast of peak 1, which is indeed a high-intensity region, but where the foreground extinction issomewhat larger (see SHRK82), which could easily explainthe small di†erence between the model and the observeddata. The second panel shows the observed velocity cen-troids compared directly with the model (solid line) shiftedto the LSR velocity of the OMC-1 cloud and also shows agood match. The third panel shows the velocity dispersionas calculated from the model results after convolution withthe instrumental Lorentzian response over the ^5 channelsdescribed in ° 3. A good match is also observed for r \ 30@@,while an increment in the data beyond 30A seems to indicate
FIG. 10.ÈRadial velocity moments obtained from the observationstaking BN (crosses) or IRc2 (circles) as a center. Solid lines represent themodel predictions. The radial moments shown are : (a) zeroth moment \line intensity, (b) Ðrst moment \ velocity centroid, (c) second moment \velocity dispersion, and (d) third moment \ velocity skewness.
834 SALAS ET AL. Vol. 511
a source of greater dispersion in the external regions. Thelast panel shows the skewness of the velocity distributionwith respect to the centroid. Redshifted asymmetries withrespect to this centroid are seen in the data close to thecenter, while the proÐle clearly becomes more symmetricalat larger distances. This behavior is also found in the modelprediction for which additional scaling has been performed,although a faster decay is seen in the data that is probablydue to the low signal-to-noise ratio in the data for the com-putation of the third moment.
5. DISCUSSION
The derived wind density allow us to calculate a totalwind mass of 0.5 inside a radius of 1@ (0.1 pc). The totalM
_clumps mass amounts to 11, 13, or 16 for each value ofM_of which D1 is in r \ 20@@, 2 in r \ 25@@, etc. Ther
c, M
_M
_mass of individual clumps results in 1, 3, and 5] 10~3 M_and thus a number of clumps of a few thousand. These
clumps will block out the spherical wind up to a distancerelated to the mean free path of the wind. This mean freepath, can be calculated using the conditionr
m,
1 \P0
rm/(r)nr
c2 dr , (12)
which leads to
erf cA r
mrmax
B\ 1 [ 2b
Jnrc
rmax
1f0
, (13)
and we obtain values of for each This is halfrm
\ 7AÈ15A rc .the distance at which the Ðngers become noticeable. TheÐngers could then be due to the few streams of unimpededwind that would plunge through the clump medium. Thiscould explain why a small number of Ðngers are observedand the high velocities inferred from HH objects associatedwith them. The high-excitation lines present in the HHobjects can then be explained as the wind moving at fullvelocity and striking a medium of higher density.
The clump crossing time for km s~1 would be ofvcB 20
the order of 300 yr and larger for clumps farther away fromthe wind source. The destruction time for clumps could thenbe of the order of 1000È2000 yr (Klein et al. 1994). Thesetimescales are comparable with the estimated age of theÐngers of 1000 yr (AB93). Some clumps should have alreadybeen destroyed, and their molecular material must havebeen entrained by the wind (i.e., gone with the wind). Thiscan explain the high-velocity blueshifted ÐlamentsH2described in ° 3.2. The wind properties will also be greatlymodiÐed by this mass-loading e†ect. The wind density cango up to when the clumps are completelyn
m\ n
cf0destroyed, a factor even as large as 10 times the original
wind density. The speed of the wind would decrease accord-ingly. If kinetic energy were conserved, the wind speedwould decrease a factor of 3.6 (to some 63 km s~1).However, the induced shocks inside the remaining clumpswould still approach 20 km s~1 and thus(Jn
m/n
c] 63),
the line velocity distributions and momentums would stillbe as has been described here. A proper treatment of thismass-loading problem unfortunately escapes the scope ofthis paper but should provide important implications forthe future development of this region, which may ultimatelyevolve into a shell.
The model presented here provides an alternative expla-nation for the development of the Ðngers as well. The bullet
model (AB93) has several drawbacks, including the onespresented by MM97, regarding the permanence of coherentbullet structures or the difficulties in accelerating and ejec-tion over a wide fan, and are unable to explain the bulk ofthe observed emission. However, the bulletsÏ masses andH2densities correspond to 1% of clump masses and densitiesintroduced by our model, so they could arise from clumpfragments entrained by the wind. The fragmentation modelby Stone et al. (1995), and further developed by MM97,requires a spherical shell of dense material being driven by astellar wind that becomes unstable to Rayleigh-Taylorinstabilities and thus producing structures similar to theÐngers observed. However, the velocity Ðeld produced bythe wind bubble should be similar to the one proposed bySHRK82, which we have ruled out on the basis of theobserved radial moments.
The emissivity power law obtained from our model (1.8)matches very closely with that originally predicted by K77(1.7) for slow (v between 10 and 24 km s~1) J-type shocks inOrion. This is also consistent with the results for the ratiosof higher excitation lines (Brand et al. 1988), reinforcingH2the evidence in favor of J-type shocks in Orion. The fullexplanation of detailed proÐles in particular regions such aspeak 1 (Brand et al. 1989) should include the e†ects ofmolecular material from destroyed clumps being entrainedby the wind. We have not attempted to do that in thispaper. However, the survival of in a fast jet has beenH2recently studied by Suttner et al. (1997). They present three-dimensional numerical simulations of a jet that contains asmuch molecular hydrogen as the ambient medium,assuming a very dense and heavy jet. They show that isH2able to survive traveling at full speed in the jet and also inzones just outside the jet. The line proÐles for showH2double peaks, one slightly accelerated (20 km s~1) and theother close to the jetÏs full speed because of the moleculargas traveling within. It is thus possible to envisage that aproper modeling of our particular problem should be ableto reproduce the observed line proÐles in detail.
6. CONCLUSIONS
We have obtained velocity maps of the emission inH2Orion that allowed us to provide a qualitative picture of theobserved low-velocity structure as described by its radialmoments : intensity, velocity centroid, velocity dispersion,and skewness. We developed a model to explain theobserved behavior that assumes a strong wind of 230 kms~1 produced by IRc2 impelling on a set of D5.6] 105cm~3 density molecular clumps. This simple model pro-vides a good match to the observed moments and givesclues to the development of the Ðngers, entrainment of themolecular material, and to the association of the high-velocity blueshifted emission with the region. The drivingsource of the wind requires a high mass-loss rate and thus islikely IRc2. The line emission is produced by a slowH2shock (20 km s~1) in the clumps with an emissivity pro-portional to v1.8, as is expected for a J-type shock. Higherspatial resolution observations should allow us to study theinternal shock inside individual clumps.2 The individualclumps have masses and sizes of few ]10~3 and 0.007M
_pc, respectively. The total wind mass and clump mass yield
2 Nested arcs in NICMOS observations, published by Stolovy et al.(1998) after this paper was submitted, seem to correspond to the expectedstructures.
No. 2, 1999 ENVIRONMENT DESTRUCTION OF THE BN-KL NEBULA 835
0.5 and 15 inside a radius of 1@ (0.1 pc). This is largerM_than the mass estimated to be in the ““ plateau ÏÏ sourceH2(Kwan & Scoville 1976) but smaller than the 150 esti-M
_mated in the central 0.1 pc region of OMC-1. We concludethat the 0.1 pc region surrounding the BN-KL nebula is inthe process of being disrupted by the strong wind of IRc2 ina timescale of 2000 yr.
We are grateful to J. Franco, G. and A.Garc•� a-Segura,Raga for stimulating discussions and to L. F. forRodr•� guez
a critical revision. An anonymous referee has raised veryimportant questions that have greatly improved the qualityof this paper, for which we are in debt. The support work ofthe OAN/SPM technical group, in particular F. Montalvo,O. Harris, B. and J. Palomares, during the obser-Garc•� a,vations is greatly appreciated. This work has been Ðnancedby grant IN-501694 from DGAPA (UNAM).
REFERENCESAllen, D. A., & Burton, M. G. 1993, Nature, 363, 54 (AB93)Axon, D. J., & Taylor, K. 1984, MNRAS, 207, 241Becklin, E. E., & Neugebauer, G. 1967, ApJ, 147, 799
P. 1990, A&A, 228, 483Boisse� ,Brand, P. W. J. L. 1995, Ap&SS, 233, 27Brand, P. W. J. L., Moorhouse, A., Burton, M. G., Geballe, T. R., Bird, M.,
& Wade, R. 1988, ApJ, 334, L103Brand, P. W. J. L., Toner, M. P., Geballe, T. R., & Webster, A. S. 1989,
MNRAS, 237, 1009Chrysostomou, A., Burton, M. G., Axon, D. J., Brand, P. W. J. L., Hough,
J. H., Bland-Hawthorn, J., & Geballe, T. R. 1997, MNRAS, 289, 65 (C97)I., et al. 1994, Proc. SPIE, 2198, 774Cruz-Gonza� lez,
Draine, B. T., Roberge, W. G., & Dalgarno, A. 1983, ApJ, 264, 485Gautier, T. N., III, Fink, U., Tre†ers, R. R., & Larson, H. P. 1976, ApJ, 207,
L129Geballe, T. R., Persson, S. E., McGregor, P. J., Simon, T., & Longsdale,
C. J. 1986, ApJ, 302, 693Genzel, R., & Stutzki, J. 1989, ARA&A, 27, 41Hollenbach, D. J., & McKee, C. F. 1989, ApJ, 342, 306Hollenbach, D. J., & Shull, M. 1977, ApJ, 216, 419Hu, X. 1996, AJ, 112, 271Jones, B. F., & Walker, M. F. 1985, AJ, 90, 1320Klein, R. I., McKee, C. F., & Colella, P. 1994, ApJ, 420, 213Kleinmann, D. E., & Low, F. J. 1967, ApJ, 149, L1Kwan, J. 1977, ApJ, 216, 713 (K77)Kwan, J., & Scoville, N. Z. 1976, ApJ, 210, L39Le Coarer, E. 1992, PhD thesis, Univ. Paris VII
Le Coarer, E., Rosado, M., Georgelin, Y. P., Viale, A., & Goldes, G. 1993,A&A, 280, 365
McCaughrean, M., & Mac Low, M. 1997, AJ, 113, 391 (MM97)McKee, C. F., & Cowie, L. L. 1975, ApJ, 195, 715Nadeau, D., & Geballe, T. R. 1979, ApJ, 230, L169OÏDell, C. R., Hartigan, P., Lane, W. M., Wong, S. K., Burton, M. G.,
Raymond, J., & Axon, D. J. 1997, AJ, 114, 730Rosado, M., et al. 1998a, Proc. SPIE, 3354, in pressRosado, M., Salas, L., & I. 1998b, in preparationCruz-Gonza� lez,Schild, H., Miller, S., & Tennyson, J. 1997, A&A, 318, 608Scoville, N. Z., Hall, D. N. B., Ridgway, S. T., & Kleinmann, S. G. 1982,
ApJ, 253, 136 (SHRK82)Scoville, N. Z., Kleinmann, S. G., Hall, D. N. B., & Ridgway, S. T. 1983,
ApJ, 275, 201Smith, M. D., Brand, P. W. J. L., & Moorhouse, A. 1991, MNRAS, 248, 730Stolovy, S. R., et al. 1998, ApJ, 492, L151Stone, J. M., Xu, J., & Mundy, L. G. 1995, Nature, 377, 315Sugai, H., Kawabata, H., Usuda, T., Inoue, M. Y., Kataza, H., & Tanaka,
M. 1995, ApJ, 442, 674Suttner, G., Smith, M. D., Yorke, H. W., & Zinnecker, H. 1997, A&A, 318,
595Taylor, K. N. R., Storey, J. W. V., Sandell, G., Williams, P. M., & Zealey,
W. J. 1984, Nature, 311, 236Wiseman, J. J., & Ho, P. T. P. 1996, Nature, 382, 139Witt, A. N., & Gordon, K. D. 1996, ApJ, 463, 681Zuckerman, B. 1973, ApJ, 183, 863