Fermi Large Area Telescope Observations of the Vela Pulsar
12
arXiv:0812.2960v1 [astro-ph] 16 Dec 2008 TO APPER IN The Astrophysical Journal Preprint typeset using L A T E X style emulateapj v. 03/07/07 FERMI LAT OBSERVATIONS OF THE VELA PULSAR A. A. ABDO 1,2 , M. ACKERMANN 3 , W. B. ATWOOD 4 , R. BAGAGLI 5 , L. BALDINI 5 , J. BALLET 6 , D. L. BAND 7,8 , G. BARBIELLINI 9,10 , M. G. BARING 11 , J. BARTELT 3 , D. BASTIERI 12,13 , B. M. BAUGHMAN 14 , K. BECHTOL 3 , F. BELLARDI 5 , R. BELLAZZINI 5 , B. BERENJI 3 , D. BISELLO 12,13 , R. D. BLANDFORD 3 , E. D. BLOOM 3 , J. R. BOGART 3 , E. BONAMENTE 15,16 , A. W. BORGLAND 3 , A. BOUVIER 3 , J. BREGEON 5 , A. BREZ 5 , M. BRIGIDA 17,18 , P. BRUEL 19 , T. H. BURNETT 20 , G. A. CALIANDRO 17,18 , R. A. CAMERON 3 , F. CAMILO 21 , P. A. CARAVEO 22 , J. M. CASANDJIAN 6 , M. CECCANTI 5 , C. CECCHI 15,16 , E. CHARLES 3 , A. CHEKHTMAN 23,2 , C. C. CHEUNG 8 , J. CHIANG 3 , S. CIPRINI 15,16 , R. CLAUS 3 , I. COGNARD 24 , J. COHEN-TANUGI 25 , L. R. COMINSKY 26 , J. CONRAD 27,28 , R. CORBET 8 , L. CORUCCI 5 , S. CUTINI 29 , D. S. DAVIS 8,30 , M. DEKLOTZ 31 , C. D. DERMER 2 , A. DE ANGELIS 32 , F. DE PALMA 17,18 , S. W. DIGEL 3 , M. DORMODY 4 , E. DO COUTO E SILVA 3 , P. S. DRELL 3 , R. DUBOIS 3 , D. DUMORA 33,34 , C. ESPINOZA 35 , C. FARNIER 25 , C. FAVUZZI 17,18 , D. L. FLATH 3 , P. FLEURY 19 , W. B. FOCKE 3 , M. FRAILIS 32 , P. C. C. FRIERE 36 , Y. FUKAZAWA 37 , S. FUNK 3 , P. FUSCO 17,18 , F. GARGANO 18 , D. GASPARRINI 29 , N. GEHRELS 8,38 , S. GERMANI 15,16 , R. GIANNITRAPANI 32 , B. GIEBELS 19 , N. GIGLIETTO 17,18 , F. GIORDANO 17,18 , T. GLANZMAN 3 , G. GODFREY 3 , E. V. GOTTHELF 21 , I. A. GRENIER 6 , M.-H. GRONDIN 33,34 , J. E. GROVE 2 , L. GUILLEMOT 33,34 , S. GUIRIEC 25 , G. HALLER 3 , A. K. HARDING 8 , P. A. HART 3 , R. C. HARTMAN 8 , E. HAYS 8 , G. HOBBS 39 , R. E. HUGHES 14 , G. J ´ OHANNESSON 3 , A. S. J OHNSON 3 , R. P. J OHNSON 4 , T. J. J OHNSON 8,38 , W. N. J OHNSON 2 , S. J OHNSTON 39 , T. KAMAE 3 , G. KANBACH 40 , V. M. KASPI 41 , H. KATAGIRI 37 , J. KATAOKA 42 , A. KAVELAARS 3 , N. KAWAI 43,42 , H. KELLY 3 , M. KERR 20 , B. KIZILTAN 44 , W. KLAMRA 27 , J. KN ¨ ODLSEDER 45 , M. KRAMER 35 , F. KUEHN 14 , M. KUSS 5 , J. LANDE 3 , D. LANDRIU 6 , L. LATRONICO 5 , B. LEE 46 , S.-H. LEE 3 , M. LEMOINE-GOUMARD 33,34 , M. LIVINGSTONE 41 , F. LONGO 9,10 , F. LOPARCO 17,18 , B. LOTT 33,34 , M. N. LOVELLETTE 2 , P. LUBRANO 15,16 , A. G. LYNE 35 , G. M. MADEJSKI 3 , A. MAKEEV 23,2 , R. N. MANCHESTER 39 , B. MARANGELLI 17,18 , M. MARELLI 22 , M. N. MAZZIOTTA 18 , J. E. MCENERY 8 , S. MCGLYNN 27 , M. A. MCLAUGHLIN 47 , N. MENON 5,31 , C. MEURER 28 , P. F. MICHELSON 3 , T. MINEO 48 , N. MIRIZZI 17,18 , W. MITTHUMSIRI 3 , T. MIZUNO 37 , A. A. MOISEEV 7 , M. MONGELLI 18 , C. MONTE 17,18 , M. E. MONZANI 3 , E. MORETTI 9,10 , A. MORSELLI 49,50 , I. V. MOSKALENKO 3 , S. MURGIA 3 , T. NAKAMORI 42 , P. L. NOLAN 3 , A. NOUTSOS 35 , E. NUSS 25 , T. OHSUGI 37 , N. OMODEI 5 , E. ORLANDO 40 , J. F. ORMES 51 , M. OZAKI 52 , A. PACCAGNELLA 12,53 , D. PANEQUE 3 , J. H. PANETTA 3 , D. PARENT 33,34 , M. PEARCE 27 , M. PEPE 15,16 , M. PERCHIAZZI 18 , M. PESCE-ROLLINS 5 , L. PIERI 12 , M. PINCHERA 5 , F. PIRON 25 , T. A. PORTER 4 , S. RAIN ` O 17,18 , R. RANDO 12,13 , S. M. RANSOM 54 , E. RAPPOSELLI 5 , M. RAZZANO 5,55 , A. REIMER 3 , O. REIMER 3 , T. REPOSEUR 33,34 , L. C. REYES 56 , S. RITZ 8,38 , L. S. ROCHESTER 3 , A. Y. RODRIGUEZ 57 , R. W. ROMANI 3,55 , M. ROTH 20 , F. RYDE 27 , A. SACCHETTI 18 , H. F.-W. SADROZINSKI 4 , N. SAGGINI 5 , D. SANCHEZ 19 , A. SANDER 14 , P. M. SAZ PARKINSON 4 , K. N. SEGAL 8 , A. SELLERHOLM 28 , C. SGR ` O 5 , E. J. SISKIND 58 , D. A. SMITH 33,34 , P. D. SMITH 14 , G. SPANDRE 5 , P. SPINELLI 17,18 , M. STAMATIKOS 8 , J.-L. STARCK 6 , F. W. STECKER 8 , T. E. STEPHENS 8 , M. S. STRICKMAN 2 , A. W. STRONG 40 , D. J. SUSON 59 , H. TAJIMA 3 , H. TAKAHASHI 37 , T. TAKAHASHI 52 , T. TANAKA 3 , A. TENZE 5 , J. B. THAYER 3 , J. G. THAYER 3 , G. THEUREAU 24 , D. J. THOMPSON 8 , S. E. THORSETT 4 , L. TIBALDO 12,13 , O. TIBOLLA 60 , D. F. TORRES 61,57 , A. TRAMACERE 62,3 , M. TURRI 3 , T. L. USHER 3 , L. VIGIANI 5 , N. VILCHEZ 45 , V. VITALE 49,50 , A. P. WAITE 3 , P. WANG 3 , K. WATTERS 3 , P. WELTEVREDE 39 , B. L. WINER 14 , K. S. WOOD 2 , T. YLINEN 63,27 , M. ZIEGLER 4 To apper in The Astrophysical Journal ABSTRACT The Vela pulsar is the brightest persistent source in the GeV sky and thus is the traditional first target for new γ -ray observatories. We report here on initial Fermi Large Area Telescope observations during verification phase pointed exposure and early sky survey scanning. We have used the Vela signal to verify Fermi timing and angular resolution. The high quality pulse profile, with some 32,400 pulsed photons at E ≥ 0.03 GeV, shows new features, including pulse structure as fine as 0.3 ms and a distinct third peak, which shifts in phase with energy. We examine the high energy behavior of the pulsed emission; initial spectra suggest a phase- averaged power law index of Γ=1.51 +0.05 −0.04 with an exponential cut-off at E c =2.9 ± 0.1 GeV. Spectral fits with generalized cut-offs of the form e −(E/Ec) b require b ≤ 1, which is inconsistent with magnetic pair attenuation, and thus favor outer magnetosphere emission models. Finally, we report on upper limits to any unpulsed component, as might be associated with a surrounding synchrotron wind nebula (PWN). Subject headings: gamma rays: general; pulsars: individual: PSR B0833-45 1 National Research Council Research Associate 2 Space Science Division, Naval Research Laboratory, Washington, DC 20375 3 W. W. Hansen Experimental Physics Laboratory, Kavli Institute for Parti- cle Astrophysics and Cosmology, Department of Physics and Stanford Linear Accelerator Center, Stanford University, Stanford, CA 94305 4 Santa Cruz Institute for Particle Physics, Department of Physics and De- partment of Astronomy and Astrophysics, University of California at Santa Cruz, Santa Cruz, CA 95064 5 Istituto Nazionale di Fisica Nucleare, Sezione di Pisa, I-56127 Pisa, Italy 6 Laboratoire AIM, CEA-IRFU/CNRS/Universit´ e Paris Diderot, Service d’Astrophysique, CEA Saclay, 91191 Gif sur Yvette, France 7 Center for Research and Exploration in Space Science and Technology (CRESST), NASA Goddard Space Flight Center, Greenbelt, MD 20771 8 NASA Goddard Space Flight Center, Greenbelt, MD 20771 9 Istituto Nazionale di Fisica Nucleare, Sezione di Trieste, I-34127 Trieste, Italy 10 Dipartimento di Fisica, Universit` a di Trieste, I-34127 Trieste, Italy 11 Rice University, Department of Physics and Astronomy, MS-108, P. O. Box 1892, Houston, TX 77251, USA 12 Istituto Nazionale di Fisica Nucleare, Sezione di Padova, I-35131 Padova, Italy 13 Dipartimento di Fisica “G. Galilei”, Universit` a di Padova, I-35131 Padova, Italy 14 Department of Physics, Center for Cosmology and Astro-Particle Physics, The Ohio State University, Columbus, OH 43210 15 Istituto Nazionale di Fisica Nucleare, Sezione di Perugia, I-06123 Peru- gia, Italy 16 Dipartimento di Fisica, Universit` a degli Studi di Perugia, I-06123 Peru- gia, Italy
Transcript of Fermi Large Area Telescope Observations of the Vela Pulsar

arX
iv:0
812.
2960
v1 [
astr
o-ph
] 16
Dec
200
8TO APPER INThe Astrophysical JournalPreprint typeset using LATEX style emulateapj v. 03/07/07
FERMILAT OBSERVATIONS OF THE VELA PULSAR
A. A. A BDO1,2, M. ACKERMANN3, W. B. ATWOOD4, R. BAGAGLI 5, L. BALDINI 5, J. BALLET 6, D. L. BAND7,8, G. BARBIELLINI 9,10,M. G. BARING11, J. BARTELT3, D. BASTIERI12,13, B. M. BAUGHMAN 14, K. BECHTOL3, F. BELLARDI 5, R. BELLAZZINI 5, B. BERENJI3,
D. BISELLO12,13, R. D. BLANDFORD3, E. D. BLOOM3, J. R. BOGART3, E. BONAMENTE15,16, A. W. BORGLAND3, A. BOUVIER3,J. BREGEON5, A. BREZ5, M. BRIGIDA17,18, P. BRUEL19, T. H. BURNETT20, G. A. CALIANDRO 17,18, R. A. CAMERON3, F. CAMILO 21,
P. A. CARAVEO22, J. M. CASANDJIAN6, M. CECCANTI5, C. CECCHI15,16, E. CHARLES3, A. CHEKHTMAN 23,2, C. C. CHEUNG8,J. CHIANG3, S. CIPRINI15,16, R. CLAUS3, I. COGNARD24, J. COHEN-TANUGI25, L. R. COMINSKY26, J. CONRAD27,28, R. CORBET8,
L. CORUCCI5, S. CUTINI 29, D. S. DAVIS8,30, M. DEKLOTZ31, C. D. DERMER2, A. DE ANGELIS32, F. DE PALMA 17,18, S. W. DIGEL3,M. DORMODY4, E. DO COUTO E SILVA 3, P. S. DRELL3, R. DUBOIS3, D. DUMORA33,34, C. ESPINOZA35, C. FARNIER25, C. FAVUZZI 17,18,
D. L. FLATH 3, P. FLEURY19, W. B. FOCKE3, M. FRAILIS32, P. C. C. FRIERE36, Y. FUKAZAWA 37, S. FUNK3, P. FUSCO17,18,F. GARGANO18, D. GASPARRINI29, N. GEHRELS8,38, S. GERMANI15,16, R. GIANNITRAPANI 32, B. GIEBELS19, N. GIGLIETTO17,18,
F. GIORDANO17,18, T. GLANZMAN 3, G. GODFREY3, E. V. GOTTHELF21, I. A. GRENIER6, M.-H. GRONDIN33,34, J. E. GROVE2,L. GUILLEMOT 33,34, S. GUIRIEC25, G. HALLER3, A. K. HARDING8, P. A. HART3, R. C. HARTMAN 8, E. HAYS8, G. HOBBS39,
R. E. HUGHES14, G. JOHANNESSON3, A. S. JOHNSON3, R. P. JOHNSON4, T. J. JOHNSON8,38, W. N. JOHNSON2, S. JOHNSTON39,T. KAMAE 3, G. KANBACH40, V. M. K ASPI41, H. KATAGIRI 37, J. KATAOKA 42, A. KAVELAARS3, N. KAWAI 43,42, H. KELLY 3, M. KERR20,
B. K IZILTAN 44, W. KLAMRA 27, J. KNODLSEDER45, M. KRAMER35, F. KUEHN14, M. KUSS5, J. LANDE3, D. LANDRIU6,L. L ATRONICO5, B. LEE46, S.-H. LEE3, M. LEMOINE-GOUMARD33,34, M. L IVINGSTONE41, F. LONGO9,10, F. LOPARCO17,18,
B. LOTT33,34, M. N. LOVELLETTE2, P. LUBRANO15,16, A. G. LYNE35, G. M. MADEJSKI3, A. MAKEEV23,2, R. N. MANCHESTER39,B. MARANGELLI 17,18, M. MARELLI 22, M. N. MAZZIOTTA 18, J. E. MCENERY8, S. MCGLYNN 27, M. A. M CLAUGHLIN 47, N. MENON5,31,C. MEURER28, P. F. MICHELSON3, T. MINEO48, N. MIRIZZI 17,18, W. MITTHUMSIRI3, T. MIZUNO37, A. A. M OISEEV7, M. MONGELLI18,
C. MONTE17,18, M. E. MONZANI3, E. MORETTI9,10, A. MORSELLI49,50, I. V. M OSKALENKO3, S. MURGIA3, T. NAKAMORI 42,P. L. NOLAN3, A. NOUTSOS35, E. NUSS25, T. OHSUGI37, N. OMODEI5, E. ORLANDO40, J. F. ORMES51, M. OZAKI 52,
A. PACCAGNELLA12,53, D. PANEQUE3, J. H. PANETTA3, D. PARENT33,34, M. PEARCE27, M. PEPE15,16, M. PERCHIAZZI18,M. PESCE-ROLLINS5, L. PIERI12, M. PINCHERA5, F. PIRON25, T. A. PORTER4, S. RAIN O17,18, R. RANDO12,13, S. M. RANSOM54,
E. RAPPOSELLI5, M. RAZZANO5,55, A. REIMER3, O. REIMER3, T. REPOSEUR33,34, L. C. REYES56, S. RITZ8,38, L. S. ROCHESTER3,A. Y. RODRIGUEZ57, R. W. ROMANI 3,55, M. ROTH20, F. RYDE27, A. SACCHETTI18, H. F.-W. SADROZINSKI4, N. SAGGINI5,
D. SANCHEZ19, A. SANDER14, P. M. SAZ PARKINSON4, K. N. SEGAL8, A. SELLERHOLM28, C. SGRO5, E. J. SISKIND58,D. A. SMITH 33,34, P. D. SMITH 14, G. SPANDRE5, P. SPINELLI17,18, M. STAMATIKOS 8, J.-L. STARCK6, F. W. STECKER8,
T. E. STEPHENS8, M. S. STRICKMAN 2, A. W. STRONG40, D. J. SUSON59, H. TAJIMA 3, H. TAKAHASHI 37, T. TAKAHASHI 52,T. TANAKA 3, A. TENZE5, J. B. THAYER3, J. G. THAYER3, G. THEUREAU24, D. J. THOMPSON8, S. E. THORSETT4, L. TIBALDO 12,13,
O. TIBOLLA 60, D. F. TORRES61,57, A. TRAMACERE62,3, M. TURRI3, T. L. USHER3, L. V IGIANI 5, N. VILCHEZ45, V. V ITALE 49,50,A. P. WAITE3, P. WANG3, K. WATTERS3, P. WELTEVREDE39, B. L. WINER14, K. S. WOOD2, T. YLINEN63,27, M. ZIEGLER4
To apper in The Astrophysical Journal
ABSTRACTThe Vela pulsar is the brightest persistent source in the GeVsky and thus is the traditional first target for
newγ-ray observatories. We report here on initialFermiLarge Area Telescope observations during verificationphase pointed exposure and early sky survey scanning. We have used the Vela signal to verifyFermi timingand angular resolution. The high quality pulse profile, withsome 32,400 pulsed photons atE ≥ 0.03GeV,shows new features, including pulse structure as fine as 0.3 ms and a distinct third peak, which shifts in phasewith energy. We examine the high energy behavior of the pulsed emission; initial spectra suggest a phase-averaged power law index ofΓ = 1.51+0.05
−0.04 with an exponential cut-off atEc = 2.9 ± 0.1 GeV. Spectral
fits with generalized cut-offs of the forme−(E/Ec)b
requireb ≤ 1, which is inconsistent with magnetic pairattenuation, and thus favor outer magnetosphere emission models. Finally, we report on upper limits to anyunpulsed component, as might be associated with a surrounding synchrotron wind nebula (PWN).Subject headings:gamma rays: general; pulsars: individual: PSR B0833−45
1 National Research Council Research Associate2 Space Science Division, Naval Research Laboratory, Washington, DC
203753 W. W. Hansen Experimental Physics Laboratory, Kavli Institute for Parti-
cle Astrophysics and Cosmology, Department of Physics and Stanford LinearAccelerator Center, Stanford University, Stanford, CA 94305
4 Santa Cruz Institute for Particle Physics, Department of Physics and De-partment of Astronomy and Astrophysics, University of California at SantaCruz, Santa Cruz, CA 95064
5 Istituto Nazionale di Fisica Nucleare, Sezione di Pisa, I-56127 Pisa, Italy6 Laboratoire AIM, CEA-IRFU/CNRS/Universite Paris Diderot, Service
d’Astrophysique, CEA Saclay, 91191 Gif sur Yvette, France7 Center for Research and Exploration in Space Science and Technology
(CRESST), NASA Goddard Space Flight Center, Greenbelt, MD 207718 NASA Goddard Space Flight Center, Greenbelt, MD 20771
9 Istituto Nazionale di Fisica Nucleare, Sezione di Trieste,I-34127 Trieste,Italy
10 Dipartimento di Fisica, Universita di Trieste, I-34127 Trieste, Italy11 Rice University, Department of Physics and Astronomy, MS-108, P. O.
Box 1892, Houston, TX 77251, USA12 Istituto Nazionale di Fisica Nucleare, Sezione di Padova, I-35131
Padova, Italy13 Dipartimento di Fisica “G. Galilei”, Universita di Padova, I-35131
Padova, Italy14 Department of Physics, Center for Cosmology and Astro-Particle
Physics, The Ohio State University, Columbus, OH 4321015 Istituto Nazionale di Fisica Nucleare, Sezione di Perugia,I-06123 Peru-
gia, Italy16 Dipartimento di Fisica, Universita degli Studi di Perugia, I-06123 Peru-
gia, Italy

2
1. INTRODUCTION
Radio pulsations atP=89 ms from PSR B0833−45 (=PSRJ0835−4510) in the Vela supernova remnant were discoveredby Large, Vaughan & Mills (1968). This pulsar is bright(S1.4 GHz ≈ 1.5 Jy), young (characteristic ageτc = P/2P =
11 kyr), and energetic (ESD = 6.9 × 1036I45 ergs/s, for aneutron star moment of inertia1045I45 g cm2). It is embed-ded in a flat spectrum radio synchrotron nebula (see Frail et
17 Dipartimento di Fisica “M. Merlin” dell’Universita e del Politecnico diBari, I-70126 Bari, Italy
18 Istituto Nazionale di Fisica Nucleare, Sezione di Bari, 70126 Bari, Italy19 Laboratoire Leprince-Ringuet,Ecole polytechnique, CNRS/IN2P3,
Palaiseau, France20 Department of Physics, University of Washington, Seattle,WA 98195-
156021 Columbia Astrophysics Laboratory, Columbia University, New York,
NY 1002722 INAF-Istituto di Astrofisica Spaziale e Fisica Cosmica, I-20133 Milano,
Italy23 George Mason University, Fairfax, VA 2203024 Laboratoire de Physique et Chemie de l’Environnement, LPCEUMR
6115 CNRS, F-45071 Orleans Cedex 02, and Station de radioastronomie deNancay, Observatoire de Paris, CNRS/INSU, F-18330 Nancay, France
25 Laboratoire de Physique Theorique et Astroparticules, Universite Mont-pellier 2, CNRS/IN2P3, Montpellier, France
26 Department of Physics and Astronomy, Sonoma State University, Rohn-ert Park, CA 94928-3609
27 Department of Physics, Royal Institute of Technology (KTH), Al-baNova, SE-106 91 Stockholm, Sweden
28 Department of Physics, Stockholm University, AlbaNova, SE-106 91Stockholm, Sweden
29 Agenzia Spaziale Italiana (ASI) Science Data Center, I-00044 Frascati(Roma), Italy
30 Center for Space Sciences and Technology, University of Maryland,Baltimore County, Baltimore, MD 21250, USA
31 Stellar Solutions Inc., 250 Cambridge Avenue, Suite 204, Palo Alto, CA94306
32 Dipartimento di Fisica, Universita di Udine and Istituto Nazionale diFisica Nucleare, Sezione di Trieste, Gruppo Collegato di Udine, I-33100Udine, Italy
33 CNRS/IN2P3, Centre d’Etudes Nucleaires Bordeaux Gradignan, UMR5797, Gradignan, 33175, France
34 Universite de Bordeaux, Centre d’Etudes Nucleaires Bordeaux Gradig-nan, UMR 5797, Gradignan, 33175, France
35 Jodrell Bank Centre for Astrophysics, University of Manchester,Manchester M13 9PL, UK
36 Arecibo Observatory, Arecibo, Puerto Rico 0061237 Department of Physical Science and Hiroshima Astrophysical Science
Center, Hiroshima University, Higashi-Hiroshima 739-8526, Japan38 University of Maryland, College Park, MD 2074239 Australia Telescope National Facility, CSIRO, PO Box 76, Epping NSW
1710, Australia40 Max-Planck-Institut fur Extraterrestrische Physik, Giessenbachstraße,
85748 Garching, Germany41 Department of Physics, McGill University, Montreal, PQ, Canada H3A
2T842 Department of Physics, Tokyo Institute of Technology, Meguro City,
Tokyo 152-8551, Japan43 Cosmic Radiation Laboratory, Institute of Physical and Chemical Re-
search (RIKEN), Wako, Saitama 351-0198, Japan44 UCO/Lick Observatories, 1156 High Street, Santa Cruz, CA 95064,
USA45 Centre d’Etude Spatiale des Rayonnements, CNRS/UPS, BP 44346, F-
30128 Toulouse Cedex 4, France46 Orbital Network Engineering, 10670 North Tantau Avenue, Cupertino,
CA 9501447 Department of Physics, West Virginia University, Morgantown, WV
2650648 IASF Palermo, 90146 Palermo, Italy49 Istituto Nazionale di Fisica Nucleare, Sezione di Roma “TorVergata”,
I-00133 Roma, Italy50 Dipartimento di Fisica, Universita di Roma “Tor Vergata”,I-00133
Roma, Italy
al. 1997) and is surrounded by a bright X-ray wind nebula dis-playing remarkable toroidal symmetry (Helfand et al. 2001;Pavlov et al. 2003). A VLBI parallax measurement providesa well-determined distance ofD = 287+19
−17pc (Dodson et al.2003), improving on earlier optical HST measurements (Car-aveo et al. 2001). This proximity means that the spindownenergy flux at Earth,ESD/4πd2, is second only to that of theCrab pulsar and ensures that Vela is among the most intenselystudied neutron stars, particularly at high energies.
Pulsedγ-ray emission from Vela was first detected duringtheSAS-2mission (Thompson et al. 1975); it is, in fact, thebrightest persistent source of celestialγ-rays and has been theproving ground of GeV observatories ever since. The ba-sic source properties discovered bySAS-2were elaboratedusing observations byCOS-B(Kanbach et al. 1980), andCGRO/EGRET (Kanbach et al. 1994): the source is∼100%pulsed with no convincing evidence for year-scale variations,the twoγ-ray peaks are separated by 0.42 in pulsar phase andthe first peak lags the radio peak by 0.12 in phase. The sourcespectrum is hard with an average photon indexΓ = 1.7 withevidence of a cut-off above 2–4 GeV. The most detailed study,to date, of theγ-ray pulsations is that of Fierro et al. (1998),which produced a high signal-to-noise pulse profile and evi-dence for phase-resolved spectral variations. As the presentwork was being prepared for submission, the AGILE teamreported their initial results onγ-ray pulsars, including Vela(Pellizoni et al. 2008); the results, given the more limitedcount rates and energy resolution, are broadly consistent withour conclusions described below.
With the successful launch of theFermi Gamma-ray SpaceTelescope, formerly GLAST, observatory on June 11, 2008,we have a new opportunity to examine the high energy be-havior of the Vela pulsar and to study this archetype of theyoung, energetic pulsars in detail. During Launch and EarlyOperations phase (L&EO) theFermimission targeted the Velapulsar for a number of pointed observations, in addition tocoverage during initial tests of the sky survey mode. In thelatter mode the instrument axis is offset North and South ofthe zenith during alternate orbits to provide near-uniformskycoverage every three hours. One main purpose of these earlyobservations was to tune the Large Area Telescope (LAT) per-
51 Department of Physics and Astronomy, University of Denver,Denver,CO 80208
52 Institute of Space and Astronautical Science, JAXA, 3-1-1 Yoshinodai,Sagamihara, Kanagawa 229-8510, Japan
53 Dipartimento di Ingegneria dell’Informazione, Universita di Padova, I-35131 Padova, Italy
54 National Radio Astronomy Observatory (NRAO), Charlottesville, VA22903
55 Corresponding authors: M. Razzano, [email protected];R. W. Romani, [email protected].
56 Kavli Institute for Cosmological Physics, University of Chicago,Chicago, IL 60637
57 Institut de Ciencies de l’Espai (IEEC-CSIC), Campus UAB, 08193Barcelona, Spain
58 NYCB Real-Time Computing Inc., 18 Meudon Drive, Lattingtown, NY11560-1025
59 Department of Chemistry and Physics, Purdue University Calumet,Hammond, IN 46323-2094
60 Landessternwarte, Universitat Heidelberg, Konigstuhl, D 69117 Heidel-berg, Germany
61 Institucio Catalana de Recerca i Estudis Avancats (ICREA), Barcelona,Spain
62 Consorzio Interuniversitario per la Fisica Spaziale (CIFS), I-10133Torino, Italy
63 School of Pure and Applied Natural Sciences, University of Kalmar,SE-391 82 Kalmar, Sweden

3
formance on celestialγ-ray sources. However, the initial re-sults on Vela itself are of interest, including new high energyfeatures in the pulse profile, an improved measurement of thehigh energy cut-off in the pulsar spectrum, and a search forassociated pulsar wind nebula (PWN) emission at GeV ener-gies.
2. RADIO TIMING OBSERVATIONS
The Vela pulsar is young and exhibits substantial timing ir-regularities. This means that the optimal use of the Velaγ-rayphotons, which arrive at an orbit-averaged rate of one every4 minutes during LAT sky survey observations, requires a si-multaneous radio ephemeris. The radio ephemeris is obtainedusing observations made with the 64-m Parkes radio telescopeas part of the overall program for pulsar monitoring in supportof theFermi mission (Smith et al. 2008). A total of 27 times-of-arrival (TOAs) were obtained at a frequency of 1.4 GHzover the period of the LAT observations. The median error ineach TOA is 1.7µs. Fits to the TOAs were made with the pul-sar’s rotational frequency and frequency derivative as free pa-rameters and the ephemeris created from these data maintainsphase with an rms residual of 90µs, or10−3 of pulsar phase,throughout the LAT observations. No large timing irregular-ities or glitches were detected. An accurate determinationofthe pulsar’s dispersion measure of67.95 ± 0.03 cm−3pc wasobtained by measuring the delay in the TOAs of the pulseacross the 256 MHz bandpass of the 1.4 GHz receiver. Thisallows extrapolation of the radio ephemeris to infinite fre-quency with an error of∼60µs. Photon arrival times werereferred to the Solar-System barycenter and pulse phases wereassigned using the standard pulsar timing software TEMPO2(Hobbs et al. 2006).
We thus can assign a pulsar phase to theγ-ray photons ref-erenced to the radio with high confidence. Gamma-ray eventsrecorded with the LAT have timestamps that derive from aGPS clock on theFermi satellite. Pre-launch ground timingmeasurements using cosmic muons seen coincidentally in theLAT and in an independent counting system demonstratedthat the LAT measures event times relative to the spacecraftclock with a resolution of better than 300 ns. On orbit, satel-lite telemetry indicates a comparable resolution. The contri-bution to the barycenter times from uncertainty in the LAT’sposition is negligible. It is also useful to confirm the absolutetiming using celestial signals; as of this writing the six clas-sical pulsars detected by EGRET have provided good qualityLAT pulse profiles. The phasing of the radio andγ-ray peaksis consistent with the best EGRET results, ensuring absolutetiming relative to the radio time system better than∼ 1ms.
3. GAMMA-RAY OBSERVATIONS
The LAT instrument onFermi is described by Atwood etal. (2008) and references therein. The LAT is an electron-positron pair production telescope featuring solid state silicontrackers sensitive to photons from< 30 MeV to > 300GeV.It has a large∼2.4sr field of view, and compared to earlierγ-ray missions, has a large effective area (∼ 8000 cm2 onaxis), improved resolution (∼ 0.5, 68% containment radiusat 1 GeV for events collected in the ‘front’ section with thinradiator foils) and small dead time (∼ 25 µs/event). We reporthere on the LAT’s initial observations of the Vela pulsar, usingdata collected during 35 days of on-orbit verification testsandthe initial ∼ 40 days of the on-going first year sky survey.These data already suffice to illustrate the power of the LATfor astronomical observations and, indeed, show several new
features in the radiation of this well-knownγ-ray pulsar.Table 1 contains a journal of the Vela coverage, along with
numbers of photons with measured energy above0.03GeVrecorded within a radius of 5 of the pulsar, including back-ground photons. For both pointed and survey observationswe exclude events within8 of the Earth’s limb to minimizecontamination by ‘Earth albedo’ photons.
During the L&EO period, the instrument configuration wasbeing tuned for optimum performance. Accordingly, theknowledge of the energy scale and effective area are morelimited than for routine operations. We discuss how these dataverify the LAT photon selection, effective area, timing, pho-ton energy measurement and the variation of the point spreadfunction (PSF) with energy. These results may be of use to re-searchers seeking to predictFermi capabilities during longerexposures of fainter sources, in both sky survey and pointedmode.
4. RESULTS
4.1. Pulse Profiles
After calibration of the LAT pointing axis on a large set ofidentified high latitudeγ-ray sources, we find that the best fitposition of the Vela point source is within 0.5′ of the radiopulsar position with a statistical error of 0.4′(95%); the LAThas unprecedented accuracy for localization of bright hardγ-ray sources, although some systematic uncertainties remain.
The Vela pulsar is embedded in the brightγ-ray emissionof the Galactic plane, which is particularly strong at low en-ergies. Further, the LAT, like all pair production telescopes,has an angular resolution dominated by scattering at low pho-ton energiesθ68 ≈ 0.8E−0.75
GeV (see below). Thus selectionof photons from an energy-dependent region of interest (ROI)around Vela is important; the best selection depends on thedesired product. Here, we seek pulse profiles with good sig-nal to noise over a broad energy range, so we select photonswithin an angleθ < Max[1.6 − 3Log10(EGeV), 1.3] deg ofthe pulsar position. This includes a larger fraction of the PSFat high energies, where the background is relatively faint.Weuse ‘Diffuse’ class events, those reconstructed events havingthe highest probability of being photons.
In this energy-dependent aperture we have 32,400±242pulsed photons and2780±53 background photons with mea-sured energy> 0.03 GeV. Figure 1 shows the 0.1-10GeVpulse profile from this ROI with the peak of the radio pul-sar signal at phase 0. To highlight the fine structure we plot inFigure 1 the pulse profile using variable-width bins, each con-taining 200 counts. These counts, divided by the bin width,give the photon flux in each phase interval; these phase binfluxes thus have a1σ Poisson statistical error of 7%. Thepulse profile is normalized to 100 at the pulse peak. Three in-sets show structure near the first peak (P1), second peak (P2)and ‘off-pulse’ window at a finer scale. These peaks are atpulsar phasesφ = 0.130 ± 0.001 andφ = 0.562 ± 0.002,respectively.
The peaks are asymmetric. In particular P2 has a slow riseand a fast fall. P1 also has a steep outer edge with the fallsomewhat slower. We fit each peak in Figure 1 with twohalf-Lorentzian functions (with different widths for the lead-ing and trailing sides) over phase intervals which avoided thecomplex bridge flux (0.11 < φ < 0.16 for P1,0.53 < φ <0.59 for P2). The outer edges of the two peaks had consistentLorentzian half-widths ofφ = 0.012± 0.001. Extra structureat the pulse peaks made the half maximum widths somewhat

4
TABLE 1EARLY LAT OBSERVATIONS OFPSR B0833−45
Date MJD Primary mode N (E>0.03GeV)a Notes2008 Jun 30–Jul 4 54647.40–54651.36 Sky survey 1859 LAT First light.2008 Jul 4–Jul 15 54651.38–54662.10 Survey+Pointings 5172 LAT Calibrations.2008 Jul 15–Jul 19 54662.12–54666.08 Pointings+Survey+limb Following 1170 Pointed Obs. Tuning2008 Jul 19–Jul 22*b 54666.10–54669.14 Pointed Vela+ 2nd Target 7751 Pointed Obs. Tuning2008 Jul 22–Jul 24 54669.16–54671.41 Pointed Vela+ 2nd Target 3212 Pointed Obs. Tuning2008 Jul 24–Jul 30* 54671.36–54677.45 Pointed Vela+ 2nd Target 7607 Pointed Obs. Tuning2008 Jul 30–Aug 3 54677.45–54681.66 Polar study + Sky SurveyTuning 886 Nominal Ops.2008 Aug 3–Sep 14* 54687.68–54723.91 Sky Survey 26680 Nominal Ops.caAll photons (pulsed and background) within 5 of PSR B0833-45, zenith anglez <105, event classPass6-Diffuse.bObservations marked by asterisk are those used for spectralstudies.cL&EO ended on Aug.11.
FIG. 1.— Vela broad band (E = 0.1 − 10 GeV) pulse profile for all photons from an energy dependent ROI. Two pulse periods are shown. The peak of theradio pulse is at phaseφ = 0. The count rate is shown in variable width phase bins with a constant number of counts. The dashed line shows the backgroundlevel, as estimated from a surrounding annulus during the off-pulse phase. Insets show the pulse shape near the peaks andin the off-pulse region.

5
smaller (φ = 0.009 ± 0.002; 0.8 ms). The falling edge ofpeak 1 has a Lorentzian half width ofφ = 0.017 ± 0.0015,while the rising edge of P2 has a widthφ = 0.027 ± 0.005.Both peaks show apparently significant structure on scales assmall asδφ ≈ 0.003 (∼ 300 µs), but additional counts arerequired to fully probe the pulse profile at this scale. We alsoshow an inset of the ‘off pulse region’ (φ = 0.65 − 1.05),with 50 counts/bin to show fine structure. Here and in themain panel, the dashed line shows the estimated residual un-pulsed background counts in our energy-dependent ROI, asmeasured from the pulse minimum. This is in good agree-ment with a background level estimated from3 − 5 aroundthe pulsar. We see that, as for other non-radio Vela pulse pro-files, there is a faint tail of pulsed emission in this region,reaching non-detectability only nearφ = 0.8 − 1.0. We es-timate that this ‘off pulse’ window contains 235±15 pulsedphotons (7.3 × 10⁻³ of the pulsed flux).
There is dramatic energy evolution in theγ-ray pulse pro-file. Figure 2 shows pulse profiles from six energy bins, cov-ering three decades of the LAT data, drawn from our energy-dependent aperture. Note that the relatively large apertureat low energies leads to larger off-pulse flux from the sur-rounding background. We should also caution that, withthe present limited accuracy in energy measurement below0.1 GeV, some higher energy photons may leak into the lowestenergy bin. The most prominent pulse feature is a decrease ofP1 relative to P2 with increasing energy; P1 is not detectableabove∼10 GeV (Figure 2). This confirms a trend seen in theEGRET data for the Crab, Vela and Geminga pulsars – thesecond pulse dominates at the highest energies (Thompson2001). Interestingly, at the lower energies, below∼ 120MeV,the trend is reversed with P1 weakening again with respect toP2. We do not find any statistically significant evidence forshifts in the phases of the narrow P1 and P2 pulse componentswith energy. These structures, spanning together< 0.07 ofthe rotational phase, contain emission dominating over threedecades of the pulsar photon output.
The ‘bridge’ region between the peaks also shows appre-ciable structure with a trailing shoulder of P1 shifting to laterphase. At>1 GeV it is clear that this is a distinct pulse com-ponent (P3) with a peak atφ ∼ 0.27 in the 3-10 GeV band(Figure 2). Note that this peak shifts in phase byδφ ≈ 0.14between 0.2 and 15 GeV (Figure 3).
To compare with the lower energy structure, we show atbottom left of Figure 2 the 8-16 keV non-thermal X-ray pulsemeasured byRXTE(Harding et al. 2002). On the right wesimilarly show the 4.1-6.5eV NUVHSTSTIS/MAMA pulseprofile of Romani et al. (2005). The 1.4 GHz radio pulse pro-file, whose peak defines phaseφ = 0, runs across the bot-tom two panels. Both the optical/UV and the hard X-rays aredominated by non-thermal magnetospheric emission. In con-trast, the< 1 keV soft X-ray flux is dominated by thermalemission from the neutron star surface (e.g. Manzali, de Luca& Caraveo 2008), making it much more difficult to trace thenon-thermal peaks through this intermediate energy band.
We may compare components in the UV and hard X-raypulse profiles shown with those of the non-thermalγ-ray pul-sations. In particular, we should note that theγ-ray P1 compo-nent is dominant in the non-thermal X-rays. This componentis absent in the optical/UV, but pulse profiles at these ener-gies have a strong peak in the bridge region atφ ∼ 0.25, wellmatched in phase to the P3 structure in the> GeV pulse pro-files. This possible connection between optical pulses and theγ-ray bridge emission was already noted by Kanbach et al.
(1980). Note that the profile for UV energies has a distinctsharp pulse coincident with the radio atφ = 0. While thegeneral slope of the faintφ = 0.65 − 1.05 γ-ray emissionmatches that of the UV, no sharpγ-ray pulse components areyet visible in this phase interval.
4.2. The PSF and a Search for Unpulsed Emission
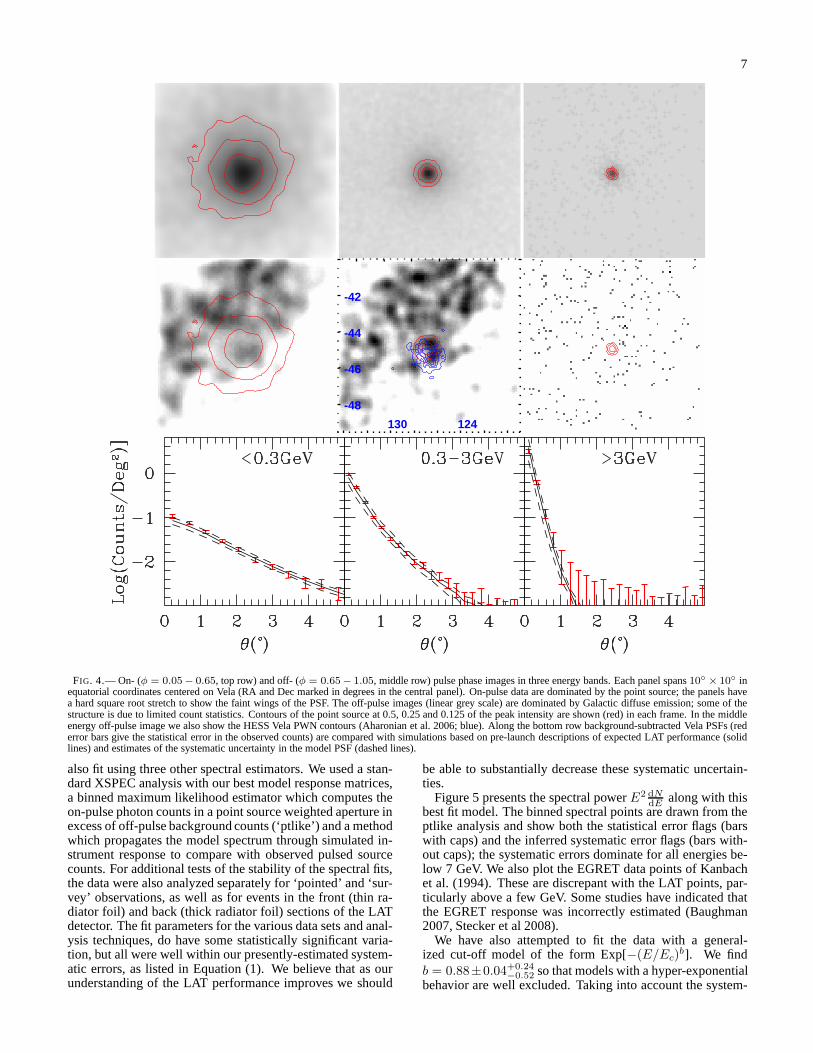
Figure 1 makes it clear that the Vela extraction region isstrongly dominated by the pulsed emission. However thereare substantial phase windows where the pulsar is very faint.Figure 4 presentsFermi γ-ray images of the Vela pulsar inthree energy bands in the LAT range separated into the on-(φ = 0.05− 0.65) and off- (φ = 0.65− 1.05) pulse phase re-gions. The images (except for the low count high energy off-pulse frame) are smoothed by Gaussians (withFWHM =1.2, 0.7 and0.2 for the low to high energy images, respec-tively). The off-pulse images show the bright diagonal bandof the Galactic diffuse emission, with appreciable structure.Comparison with the PSF contours (red) show that this is re-solved in the vicinity of Vela at the higher energies. While aclump of extended emission surrounds the pulsar position onthe few degree scale, it is at present not possible to associatethis flux with known Vela PWN structures (e.g. the Vela-XTeV PWN, contours in the middle energy band).
We have subtracted these off- pulse images (scaled by1.5×to normalize exposure) from the on- pulse images and plotted(error bars) the profile of the resulting point source (bottompanels). The lines show simulations of the expected PSF frompre-launch calibrations (‘Pass6’), computed for a source witha Vela-like spectrum and off-axis angles similar to the actualobservations. The agreement is quite good.
As a first attempt at constraining unpulsed (e.g. PWN)emission from Vela we have attempted to fit for a pointsource in the off-pulse phase window, fixed at the positionof the pulsar. Using 0.1–10GeV photons in an8 ROI in theφ = 0.65 − 1.05 phase interval, we derive a 95% CL upperlimit on the flux of 1.8 × 10⁻⁷γ/cm2/s. After subtractingthe estimated remnant pulsed flux in this window (0.73% ofthe phase-averaged flux) and scaling to the full pulse phase,this provides a limit on an unpulsed point source at the posi-tion of Vela of 2.8% of theE > 100MeV pulsed emissioncount-rate. More photons, especially at higher energy, willbe required to search for a resolved PWN correlated with theTeV or radio structures.
4.3. Energy Spectrum
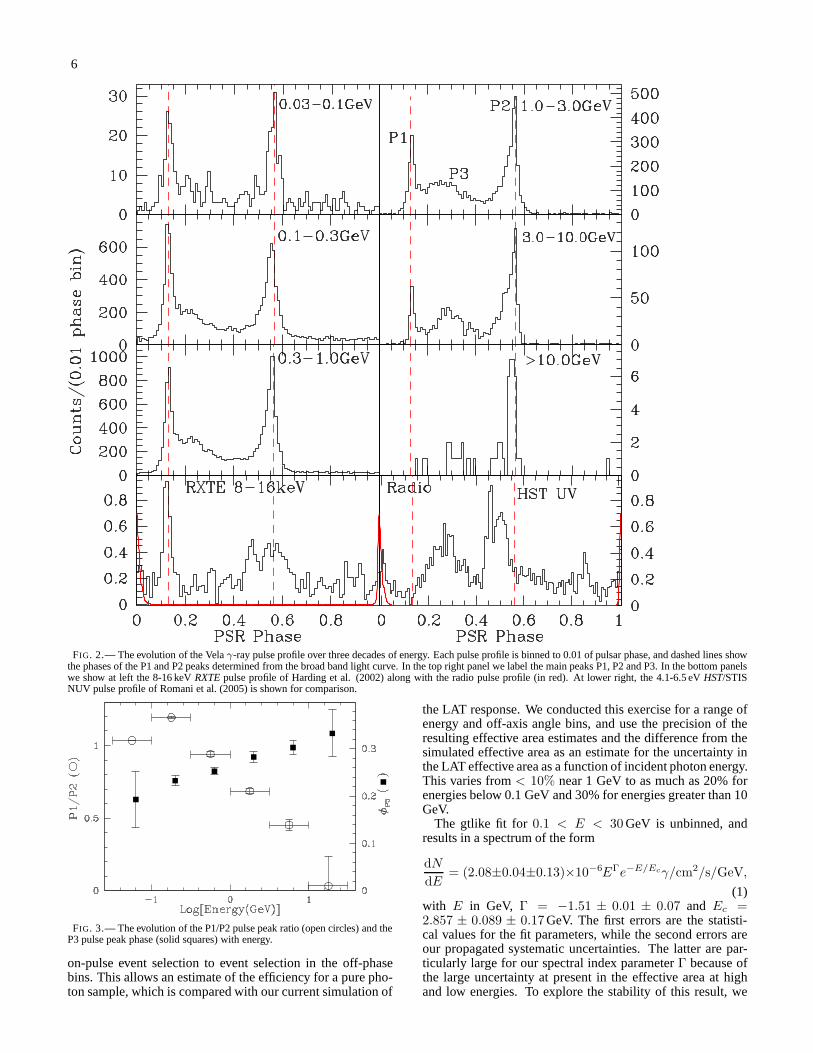
To study the phase-averaged spectrum of Vela, we used thestandard maximum-likelihood spectral estimator ‘gtlike’to beprovided with theFermi SSC science tools. This fits a sourcemodel to the data, along with models for the isotropic (in-strumental and extragalactic) and structured Galactic back-grounds. The instrumental background was comparable toestimates from pre-launch simulation (Atwood et al. 2008).We used data from the observation spans indicated in Table 1,selecting photons withE > 0.1 GeV within 15 of Vela. Ourbasic model for the spectrum of Vela is a simple power-lawwith an exponential cut-off.
With the large number of events collected for Vela, the sta-tistical errors are very small. Systematic errors for the LATare still under investigation (Abdo et al. 2009). Here we adoptconservative estimates of the systematic uncertainty in theLAT effective area, derived from the on-orbit estimation ofthe photon selection efficiency as function of energy and off-axis angle. This estimation has been made by comparing Vela
6
FIG. 2.— The evolution of the Velaγ-ray pulse profile over three decades of energy. Each pulse profile is binned to 0.01 of pulsar phase, and dashed lines showthe phases of the P1 and P2 peaks determined from the broad band light curve. In the top right panel we label the main peaks P1, P2 and P3. In the bottom panelswe show at left the 8-16 keVRXTEpulse profile of Harding et al. (2002) along with the radio pulse profile (in red). At lower right, the 4.1-6.5 eVHST/STISNUV pulse profile of Romani et al. (2005) is shown for comparison.
FIG. 3.— The evolution of the P1/P2 pulse peak ratio (open circles) and theP3 pulse peak phase (solid squares) with energy.
on-pulse event selection to event selection in the off-phasebins. This allows an estimate of the efficiency for a pure pho-ton sample, which is compared with our current simulation of
the LAT response. We conducted this exercise for a range ofenergy and off-axis angle bins, and use the precision of theresulting effective area estimates and the difference fromthesimulated effective area as an estimate for the uncertaintyinthe LAT effective area as a function of incident photon energy.This varies from< 10% near 1 GeV to as much as 20% forenergies below 0.1 GeV and 30% for energies greater than 10GeV.
The gtlike fit for 0.1 < E < 30 GeV is unbinned, andresults in a spectrum of the form
dN
dE= (2.08±0.04±0.13)×10−6EΓe−E/Ecγ/cm2/s/GeV,
(1)with E in GeV, Γ = −1.51 ± 0.01 ± 0.07 and Ec =2.857 ± 0.089 ± 0.17GeV. The first errors are the statisti-cal values for the fit parameters, while the second errors areour propagated systematic uncertainties. The latter are par-ticularly large for our spectral index parameterΓ because ofthe large uncertainty at present in the effective area at highand low energies. To explore the stability of this result, we
7
136 130 124
-42
-44
-46
-48
FIG. 4.— On- (φ = 0.05− 0.65, top row) and off- (φ = 0.65− 1.05, middle row) pulse phase images in three energy bands. Each panel spans10 × 10 inequatorial coordinates centered on Vela (RA and Dec marked in degrees in the central panel). On-pulse data are dominatedby the point source; the panels havea hard square root stretch to show the faint wings of the PSF. The off-pulse images (linear grey scale) are dominated by Galactic diffuse emission; some of thestructure is due to limited count statistics. Contours of the point source at 0.5, 0.25 and 0.125 of the peak intensity areshown (red) in each frame. In the middleenergy off-pulse image we also show the HESS Vela PWN contours (Aharonian et al. 2006; blue). Along the bottom row background-subtracted Vela PSFs (rederror bars give the statistical error in the observed counts) are compared with simulations based on pre-launch descriptions of expected LAT performance (solidlines) and estimates of the systematic uncertainty in the model PSF (dashed lines).
also fit using three other spectral estimators. We used a stan-dard XSPEC analysis with our best model response matrices,a binned maximum likelihood estimator which computes theon-pulse photon counts in a point source weighted aperture inexcess of off-pulse background counts (‘ptlike’) and a methodwhich propagates the model spectrum through simulated in-strument response to compare with observed pulsed sourcecounts. For additional tests of the stability of the spectral fits,the data were also analyzed separately for ‘pointed’ and ‘sur-vey’ observations, as well as for events in the front (thin ra-diator foil) and back (thick radiator foil) sections of the LATdetector. The fit parameters for the various data sets and anal-ysis techniques, do have some statistically significant varia-tion, but all were well within our presently-estimated system-atic errors, as listed in Equation (1). We believe that as ourunderstanding of the LAT performance improves we should
be able to substantially decrease these systematic uncertain-ties.
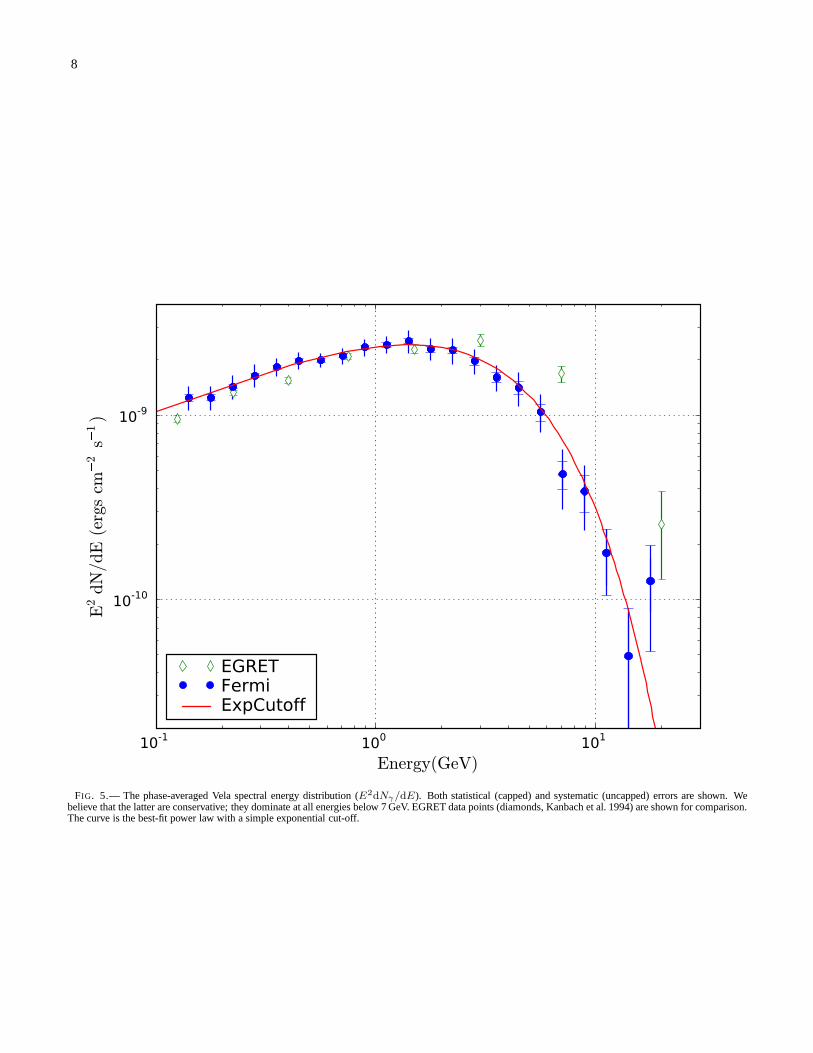
Figure 5 presents the spectral powerE2 dNdE along with this
best fit model. The binned spectral points are drawn from theptlike analysis and show both the statistical error flags (barswith caps) and the inferred systematic error flags (bars with-out caps); the systematic errors dominate for all energies be-low 7 GeV. We also plot the EGRET data points of Kanbachet al. (1994). These are discrepant with the LAT points, par-ticularly above a few GeV. Some studies have indicated thatthe EGRET response was incorrectly estimated (Baughman2007, Stecker et al 2008).
We have also attempted to fit the data with a general-ized cut-off model of the form Exp[−(E/Ec)
b]. We findb = 0.88±0.04+0.24
−0.52 so that models with a hyper-exponentialbehavior are well excluded. Taking into account the system-
8
10-1 100 101
Energy(GeV)
10-10
10-9
E2dN/dE(ergscm
2 s1 )
EGRETFermiExpCutoff
FIG. 5.— The phase-averaged Vela spectral energy distribution(E2dNγ/dE). Both statistical (capped) and systematic (uncapped) errors are shown. Webelieve that the latter are conservative; they dominate at all energies below 7 GeV. EGRET data points (diamonds, Kanbach et al. 1994) are shown for comparison.The curve is the best-fit power law with a simple exponential cut-off.

9
atic errors the spectrum is fully consistent with the simpleex-ponentialb = 1 cut-off. To check the exclusion of a givenhyper-exponential model we compute the probability of in-correct rejection of a givenb value using the likelihood ratiotest. For example, if only statistical errors are includedb = 2is rejected at 16.5σ; inflating the errors to the level of our es-timated systematic uncertainty leads to a small, but not negli-gible, 0.29% chance of incorrectly rejecting theb = 2 model.
The analyses of Kanbach et al. (1980), Grenier et al. (1988)and Fierro et al. (1995) already showed that there is signifi-cant spectral variation through the pulse, with the bridge re-gion harder than the peaks. Clearly, in Figure 2 we see thatthe situation is even more complicated, with three or moreoverlapping physical components contributing to the energy-dependent pulse profiles. Also, in Figure 5, one sees that theremay be emission in the highest energy bins in excess of asimple exponentially cut-off model. This likely arises fromthe extended hard spectrum of the P2 component, and drivesthe best-fit value forb below 1. Clearly the phase-averagedspectrum is a superposition of emission from a variety of dis-tinct physical regions, and we cannot expect a simple cut-offpower-law spectral model to be an exact representation of thedata. Reduced systematic errors and the photons of a yearor more of LAT data will be required to explore the phase-resolved spectral structure.
5. DISCUSSION
5.1. Light Curve
The early LAT data have already greatly clarified theγ-rayemission of the Vela pulsar and, even before detailed phase-resolved spectral measurements and model comparisons, sig-nificantly constrain the origin of high energy pulsar emission.Pulsar particle acceleration is believed to occur in the openzone, on the field lines above each magnetic pole which ex-tend through the light cylinder. These subtend∼ 0.5 of pul-sar phase at high altitude, so with a total phase in the narrowpulses of∼ 0.06 one would expect a comparable fraction ofthe open zone, and hence fraction of the spin-down power, tocontribute to theγ-ray emission. The narrow peaks are ofteninterpreted as caustics (Morini 1983; Romani & Yadigaroglu1995, Dyks et al. 2004), where the combination of field re-tardation, aberration and time delay causes emission from theboundary of an acceleration zone (gap) to pile up in pulsarphase. A simple pulse from a 1-D fold caustic would increaseto a maximum asI(φ) ∝ (φ − φ0)
−1/2θ[φ − φ0] as one ap-proaches the destruction of an image pair at phaseφ0 or falloff in mirror form after image pair creation. Vela’s P2 struc-ture with a slow rise and abrupt fall looks like a trailing (imagepair destruction) caustic, albeit with a steeper increase to themaximum, suggesting intensity variation along the emissionsurface or a higher-order catastrophe. The shape of P1 is lessclear, but the apparent fast rise and slow fall would indicate aleading (image pair creation) caustic (Figure 1).
The broad structure of the P3 interpulse region suggestsa beam of emission from a bundle of field lines bracketedby the two caustic-forming zones. The similarity betweentheγ-ray P3 phase structure and that of the lower frequencyoptical/UV emission atφ ≈ 0.25 suggests a common ori-gin – they both cover similar phase intervals and the peakshifts to later phase at higher energy. One appealing possibil-ity is to associate the optical/UV P3 with synchrotron emis-sion from relatively low altitude pair cascades produced bythe few-GeV curvature radiation dominating theνFν spec-
tral energy distribution (SED). Theseγγ −→ e± pairs, withelectron energyγe ∼ 2 GeV/mec
2 ∼ 103.5, will producesynchrotron emission with characteristic peak energyǫ ∼
12B12γesinΨ−1 keV as they radiate away their pitch angle∼ 0.1Ψ−1 radians in a magnetic field of1012 G. For Vela,we haveB12 ∼ 3(r/R∗)
−3, so to produceǫ ∼ 5 eV pho-tons the pairs would reside atr ∼ 80Ψ
−1/3−1 R∗, whereR∗ is
the neutron star radius. If the synchrotron emission is outwardbeamed, along with the pairs, then the Compton scattered fluxwould appear at∼ Ψγ2
eǫ ∼ 5 GeV, matching the LAT P3component. This suggests that the pulse of seed photons atIR to UV energies should have energy-dependent phase shiftstracking their Compton-up-scattered P3 progeny.
5.2. Luminosity and Beaming
While the VLBI parallax provides a well-determined dis-tance ofD = 287+19
−17 pc, the pattern of theγ-ray beam andhence the trueγ-ray luminosity are uncertain. To compute thetrue luminosity
Lγ = 4πfΩFE,obsD2 (2)
we need a correction factorfΩ from the observed phase-averaged energy flux FE,obs at the Earth line of sight (at angleζE to the rotation axis) to an average over the sky. For a givenmodel, the correction depends on the geometry, so we have
fΩ(α, ζE) =
∫Fγ(α, ζ, φ)dΩ/(Fexp4π), (3)
where the model for a given magnetic inclinationα from therotation axis givesFγ(α, ζ, φ), the pulse profile as a func-tion of phaseφ seen at viewing angleζ. Fexp is the ex-pected phase-averaged flux for the actual Earth line-of-sightζE . In general highly-aligned models, such as the polar capscenario, have small sky coverage andfΩ < 0.1, whileouter-magnetosphere models have much largerfΩ (Romani& Yadigaroglu 1995). For Vela, the viewing angle is esti-mated to beζ ≈ 63 from the geometry of theChandra X-ray Observatory-measured X-ray torus (Ng & Romani 2008).The magnetic impact angleβ = ζ−α is constrained by the ra-dio polarization data. Together, these allow us to compute thehigh energy beam shape (assuming uniform emissivity alonggap surfaces). For the outer gap (OG) picture we computefΩ = 1.0 for ζ = 64. For the two-pole caustic (TPC) modelappropriate to the slot gap picture, we findfΩ = 1.1 (Watterset al. 2008).
The observed energy flux obtained by integratingEγ timesthe photon number flux in Equation (1) over the range0.1−10GeV is (7.87±0.33 ± 1.57)×10−9 ergs/cm2/s. For adistance of 0.287 kpc, theγ-ray luminosity of Vela is then7.8× 1034fΩ ergs/s. Thus the observedγ-ray flux implies anefficiency ofηγ = 0.011fΩ/I45 with fΩ ≥ 1 for both the OGand TPC models. Note that this is a substantial fraction ofthe geometrical bound on the efficiency from the peak widthsnoted above.
5.3. Gamma-Ray Pulsar Models
Three general classes of models have been discussed forγ-ray pulsars. In polar cap models (Daugherty & Harding 1994,1996; Sturner & Dermer 1995; Harding & Muslimov 2004),the particle acceleration andγ-ray production takes place inthe open field line region within one stellar radius of the mag-netic pole of the neutron star. In outer gap models (Cheng, Ho
10
& Ruderman 1986; Romani 1996; Hirotani 2005), the inter-action region lies in the outer magnetosphere in vacuum gapsassociated with the last open field line. Other recent mod-els hark back to the ‘slot-gap’ picture of Arons (1983), withthe polar cap rim acceleration extending to many stellar radii(Harding & Muslimov 2004).
The appreciable offset from the radio peak, coupled withthe presence of only one radio pulse, suggests that theγ-raysarise at high altitude. This is also supported by the lack ofhyper-exponential absorption in the spectrum, which is a sig-nature ofγ-B pair attenuation of low altitude emission. Theremaining two geometrical models can produce the generaldouble peak profile of Vela (and many otherγ-ray pulsars).In ‘Outer gap’ models emission starts near the ‘null charge’Ω · B = 0 surface at radiusrNC and extends toward thelight cylinder rLC = cP/2π. One magnetic pole dominatesthe emission in each hemisphere and the two peaks representleading and trailing edges of the hollow cone of emission fromthis pole. If on the other hand emission extends well belowthe null charge surface toward the neutron star, both magneticpoles can contribute toward emission in a given hemisphere.This is the two-pole caustic model of Dyks & Rudak (2003)which might be realized in ‘slot gap’ acceleration models. Inthis case the leading ‘image pair creation’ caustic from highaltitudes should not be visible, and the firstγ-ray pulse repre-sents the trailing caustic from emission atr < rNC below thenull-charge surface (the radio magnetic pole) while the secondpulse represents a trailing caustic at higher altitudes from theopposite pole; both pulses should generally show a slow riseand steeper fall. Detailedγ-ray pulse profiles and, especially,phase resolved spectra can help distinguish these scenarios.
Another geometric difference in the two scenarios is the ori-gin of the emission outside the main pulse. Low altitude fieldlines in the two-pole model tend to produce emission alongall lines of sight. In the outer gap picture high altitude fieldlines can contribute faint emission extending through the offpulse region.
Further, as noted above, the energy spectrum also presentschallenges for near-surface emission. In the polar cap mod-els, a sharp turnover is expected in the few to 10 GeV en-ergy range due to attenuation of theγ-ray flux in the mag-netic field (Daugherty & Harding 1996). The spectral changeat∼2.9 GeV does not appear to fit this model. We concludethat low altitude radiation subject toγ-B pair production can-not account for the bulk of the Velaγ-ray emission. Indeedwe can use the observed cut-off to estimate a minimum emis-sion height asr ≈ (ǫmaxB12/1.76GeV)2/7P−1/7R∗, whereǫmax is the unabsorbed photon energy,P is the spin periodand the surface field is1012B12 G (Baring 2004). Using Velaparameters (P = 0.089 s,B12 = 3.4) we see that our cut-offimplies that the bulk of the emission arises from> 2.2R∗.Since we see pulsed photons up toǫmax = 17 GeV, this emis-sion must arise atr > 3.8R∗. A similar conclusion has beenrecently made for the Crab pulsar by the MAGIC team, whoobserve pulsedE > 25 GeV emission, using the imaging airCerenkov technique (Aliu et al. 2008). Finally, it should benoted that while typical radio pulsar emission is inferred toarise at relatively low altitudes, for Vela-type pulsars recentradio models infer emission heights of as much as100R∗
(Karastergiou & Johnston 2007). All of these factors pointto a high-altitude origin of the Velaγ-ray emission.
6. SUMMARY
The early LAT observations of Vela serve to show thatthe instrument is performing very well, with effective areacomparable to expectations, good PSFs and excellent sourcelocalization, especially at high energies. The time-taggingof events is excellent and our pulse profile reconstruction islimited primarily by the accuracy of the radio-derived pul-sar ephemeris. This presently has an accuracy of∼100µsover our analyzed data span. The energy response and ef-fective area calibration are currently being validated, but areat present known to∼ 5% near 1 GeV, with uncertainties in-creasing to∼ 20% at≤ 0.1 GeV and∼ 30% at≥ 10 GeV.
These data also substantially improve our knowledge of thepulse properties of the Vela pulsar (PSR B0833−45) and arenow placing important constraints on theoretical models. Al-ready in these data we see:
1. The pulse profile is complex, with P1 and P2 dominatedby very narrow components and substantial structure in the‘bridge’ region.
2. Although the P1 and P2 phases are very stable across theγ-ray band, the the P1/P2 ratio decreases with energy. Thereis a distinct third peak in the ‘bridge’ component which sharp-ens and moves to later pulsar phase with increasing energy.
3. While faint emission appears within∼ 1 of the pulsarin the off-pulse phase, association if any with Vela is stillun-clear, due to the bright Galactic background in the vicinity.We thus quote an upper limit on the unpulsed point sourceflux, at 2.8% of the phase-averaged pulsed flux. A true PWNassociation will require additional data, allowing resolution athigher energies and a match to the radio and TeV images.
4. The phase-averagedγ-ray energy spectrum can berepresented by a power law, with a exponential cut-off at2.9 ± 0.1 GeV. The hyper-exponential cut-off indexb =0.88 ± 0.04+0.24
−0.52 is not significantly different from the sim-ple exponential valueb = 1. Large values ofb, as expectedfor models radiating from the near-surface polar cap zone, areexcluded.
During the first-year sky survey, we expect to collect ap-proximately1.3 × 105 additional pulsed Vela photons. Thiswill allow a substantial increase in sensitivity to narrow pulsecomponents. We also expect improvements in our under-standing of the instrument that will allow us to significantlyreduce systematic errors. These two improvements will al-low derivation of high accuracy spectral properties in morethan 100 bins of pulsar phase. These are the observationalresults that should let us pin down the location and energydistribution of the radiating particles. In turn this should helpus ‘reverse-engineer’ thisγ-ray machine and should providesubstantial insight into the physics of pulsar magnetospheres.
The GLAST LAT Collaboration acknowledges the gener-ous support of a number of agencies and institutes that havesupported the development of the LAT. These include theNational Aeronautics and Space Administration and the De-partment of Energy in the United States, the Commissariat al’Energie Atomique and the Centre National de la RechercheScientifique / Institut National de Physique Nucleaire et dePhysique des Particules in France, the Agenzia Spaziale Ital-iana, the Istituto Nazionale di Fisica Nucleare, and the Isti-tuto Nazionale di Astrofisica in Italy, the Ministry of Educa-tion, Culture, Sports, Science and Technology (MEXT), HighEnergy Accelerator Research Organization (KEK) and JapanAerospace Exploration Agency (JAXA) in Japan, and the K.

11
A. Wallenberg Foundation and the Swedish National SpaceBoard in Sweden.
The Australia Telescope is funded by the Commonwealth
of Australia for operation as a National Facility managed bythe CSIRO.
REFERENCES
Abdo, A., et al. 2009, in prep.Aharonian, F., et al. 2006, A&A, 448, L43Aliu, E., et al. 2008, Science Express, 10.1126Arons, J. 1983, ApJ, 266, 215Atwood, W. B., et al. 2008, ApJ, in prep.Baring, M.G. 2004, Adv. Sp. Res., 33, 552Baughman, B. 2007, Ph.D. Thesis, USCSCaraveo, P. et al. 2001, ApJ, 561, 487Cheng, K. S., Ho, C. & Ruderman, M. 1986, ApJ, 300, 522Daugherty, J. K., & Harding, A. K. 1996, A&AS, 120, 107Dodson, R., et al. 2003, ApJ, 596, 1137Dyks, J., & Rudak, B. 2003, ApJ, 598, 1201Dyks, J., et al. 2004, ApJ, 607, 939Edwards, R.T., et al. 2006, MNRAS, 372, 1549Fierro, J. M. 1995, Ph. D. Thesis, Stanford U.Fierro, J. M., et al. 1998, ApJ, 494, 734Frail, D.A., et al. 1997, ApJ, 475, 224Grenier, I. A., Hermsen, W., & Clear, J. 1988, A&A, 204, 117Harding, A. K., et al. 2002, ApJ, 576, 376Helfand, D.J., Gotthelf, E.V. & Halpern, J.P. 2001, ApJ, 556, 380Hirotani, K. 2005, Ap&SS, 297, 81Hobbs, G. B., Edwards, R. T., & Manchester, R. N. 2006, MNRAS,369, 655Johnston, S., et al. 2008, ApJ, in prep.
Kanbach, G. et al., 1980, A&A, 90, 163Kanbach, G. et al., 1994, A&A, 289, 855Karastergiou, A. & Johnston, S. 2007, MNRaS, 380, 1678Large, M.I., Vaughan, A.E. & Mills, B.Y. 1968, Nature, 220 340.Manzali, De Luca, A., Caraveo, P. A. 2008, ApJ, in prep.Morini, M. 1983, MNRAS, 202, 495Muslimov, A. G., & Harding, A. K. 2004, ApJ, 606, 1143Ng, C.-Y., & Romani, R. W. 2008, A. K. 2004, ApJ, 606, 1143Pavlov, G.G., et al. 2003, ApJ, 591, 1157Pellizoni, A., et al. 2008, ApJ, in pressRomani, R. W. & Yadigaroglu, I.-A. 1995, ApJ, 438, 314Romani, R. W. 1996, ApJ, 470, 469Romani, R. W., Kargaltsev, O., & Pavlov, G. G. 2005, ApJ, 627,383Smith, D.A. et al. 2008. A&A, submitted; arXiv:0810.1637Stecker, F.W., Hunter, S.D. & Kniffen, D.A. 2008, Astropart. Phys. 29, 25Sturner, S. J., & Dermer, C. D. 1995, Adv. Sp. Res., 15, 77Thompson, D. J. et al. 1975, ApJ, 200, 79LThompson, D. J. 2001, in ”High Energy Gamma Ray Astronomy” ed. F. A.
Aharonian, H. J. Volk, AIP Conf. Proc. 558 (Melville, NY), p.103Watters, K. et al. 2008, ApJ, submitted
12
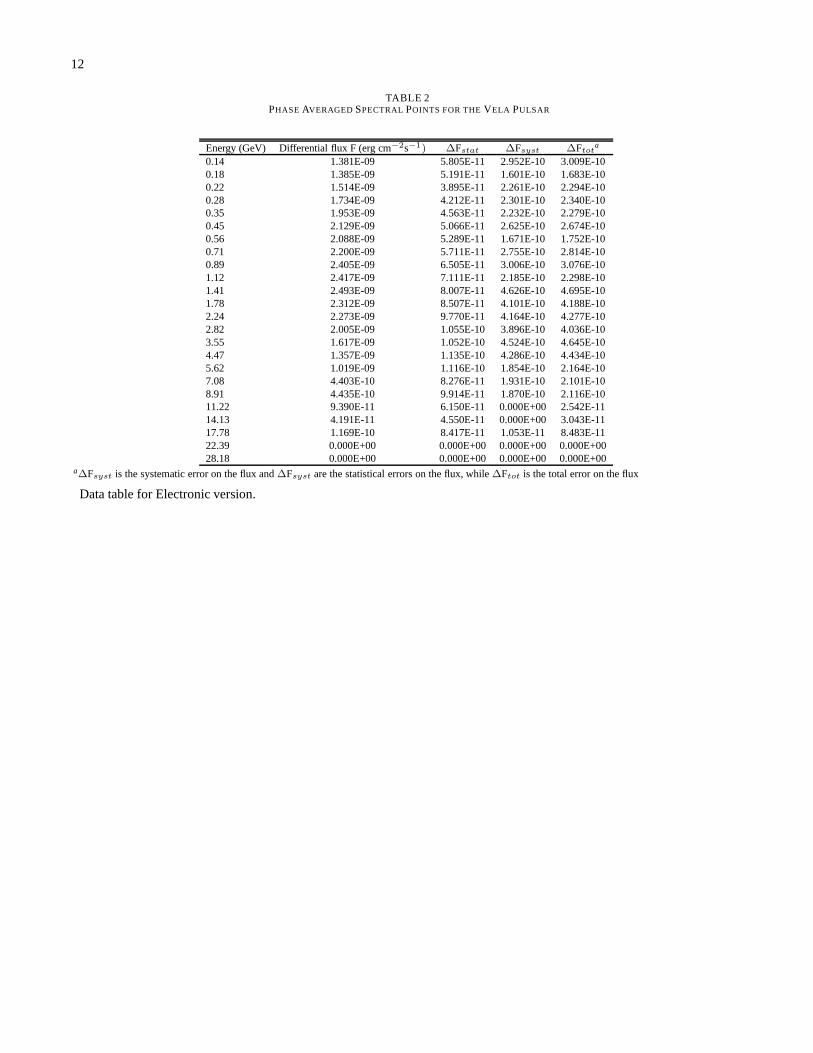
TABLE 2PHASE AVERAGED SPECTRALPOINTS FOR THEVELA PULSAR
Energy (GeV) Differential flux F (erg cm−2s−1) ∆Fstat ∆Fsyst ∆Ftota
0.14 1.381E-09 5.805E-11 2.952E-10 3.009E-100.18 1.385E-09 5.191E-11 1.601E-10 1.683E-100.22 1.514E-09 3.895E-11 2.261E-10 2.294E-100.28 1.734E-09 4.212E-11 2.301E-10 2.340E-100.35 1.953E-09 4.563E-11 2.232E-10 2.279E-100.45 2.129E-09 5.066E-11 2.625E-10 2.674E-100.56 2.088E-09 5.289E-11 1.671E-10 1.752E-100.71 2.200E-09 5.711E-11 2.755E-10 2.814E-100.89 2.405E-09 6.505E-11 3.006E-10 3.076E-101.12 2.417E-09 7.111E-11 2.185E-10 2.298E-101.41 2.493E-09 8.007E-11 4.626E-10 4.695E-101.78 2.312E-09 8.507E-11 4.101E-10 4.188E-102.24 2.273E-09 9.770E-11 4.164E-10 4.277E-102.82 2.005E-09 1.055E-10 3.896E-10 4.036E-103.55 1.617E-09 1.052E-10 4.524E-10 4.645E-104.47 1.357E-09 1.135E-10 4.286E-10 4.434E-105.62 1.019E-09 1.116E-10 1.854E-10 2.164E-107.08 4.403E-10 8.276E-11 1.931E-10 2.101E-108.91 4.435E-10 9.914E-11 1.870E-10 2.116E-1011.22 9.390E-11 6.150E-11 0.000E+00 2.542E-1114.13 4.191E-11 4.550E-11 0.000E+00 3.043E-1117.78 1.169E-10 8.417E-11 1.053E-11 8.483E-1122.39 0.000E+00 0.000E+00 0.000E+00 0.000E+0028.18 0.000E+00 0.000E+00 0.000E+00 0.000E+00
a∆Fsyst is the systematic error on the flux and∆Fsyst are the statistical errors on the flux, while∆Ftot is the total error on the flux
Data table for Electronic version.