PSR J1907+0602: A Radio-Faint Gamma-Ray Pulsar Powering a Bright TeV Pulsar Wind Nebula
28
arXiv:1001.0792v1 [astro-ph.HE] 6 Jan 2010 PSR J1907+0602: A Radio-Faint Gamma-Ray Pulsar Powering a 1 Bright TeV Pulsar Wind Nebula 2 A. A. Abdo 2,3,1 , M. Ackermann 4 , M. Ajello 4 , L. Baldini 5 , J. Ballet 6 , G. Barbiellini 7,8 , 3 D. Bastieri 9,10 , B. M. Baughman 11 , K. Bechtol 4 , R. Bellazzini 5 , B. Berenji 4 , 4 R. D. Blandford 4 , E. D. Bloom 4 , E. Bonamente 12,13 , A. W. Borgland 4 , J. Bregeon 5 , 5 A. Brez 5 , M. Brigida 14,15 , P. Bruel 16 , T. H. Burnett 17 , S. Buson 10 , G. A. Caliandro 14,15 , 6 R. A. Cameron 4 , F. Camilo 18 , P. A. Caraveo 19 , J. M. Casandjian 6 , C. Cecchi 12,13 , 7 ¨ O. C ¸ elik 20,21,22 , A. Chekhtman 2,23 , C. C. Cheung 20 , J. Chiang 4 , S. Ciprini 12,13 , R. Claus 4 , 8 I. Cognard 24 , J. Cohen-Tanugi 25 , L. R. Cominsky 26 , J. Conrad 27,28,29 , S. Cutini 30 , 9 A. de Angelis 31 , F. de Palma 14,15 , S. W. Digel 4 , B. L. Dingus 32 , M. Dormody 33 , 10 E. do Couto e Silva 4 , P. S. Drell 4 , R. Dubois 4 , D. Dumora 34,35 , C. Farnier 25 , C. Favuzzi 14,15 , 11 S. J. Fegan 16 , W. B. Focke 4 , P. Fortin 16 , M. Frailis 31 , P. C. C. Freire 36,63 , Y. Fukazawa 37 , 12 S. Funk 4 , P. Fusco 14,15 , F. Gargano 15 , D. Gasparrini 30 , N. Gehrels 20,38 , S. Germani 12,13 , 13 G. Giavitto 39 , B. Giebels 16 , N. Giglietto 14,15 , F. Giordano 14,15 , T. Glanzman 4 , G. Godfrey 4 , 14 I. A. Grenier 6 , M.-H. Grondin 34,35 , J. E. Grove 2 , L. Guillemot 34,35 , S. Guiriec 40 , 15 Y. Hanabata 37 , A. K. Harding 20 , E. Hays 20 , R. E. Hughes 11 , M. S. Jackson 27,28,41 , 16 G. J´ ohannesson 4 , A. S. Johnson 4 , T. J. Johnson 20,38 , W. N. Johnson 2 , S. Johnston 42 , 17 T. Kamae 4 , H. Katagiri 37 , J. Kataoka 43,44 , N. Kawai 43,45 , M. Kerr 17 , J. Kn¨ odlseder 46 , 18 M. L. Kocian 4 , M. Kuss 5 , J. Lande 4 , L. Latronico 5 , M. Lemoine-Goumard 34,35 , F. Longo 7,8 , 19 F. Loparco 14,15 , B. Lott 34,35 , M. N. Lovellette 2 , P. Lubrano 12,13 , A. Makeev 2,23 , 20 M. Marelli 19 , M. N. Mazziotta 15 , J. E. McEnery 20 , C. Meurer 27,28 , P. F. Michelson 4 , 21 W. Mitthumsiri 4 , T. Mizuno 37 , A. A. Moiseev 21,38 , C. Monte 14,15 , M. E. Monzani 4 , 22 A. Morselli 47 , I. V. Moskalenko 4 , S. Murgia 4 , P. L. Nolan 4 , J. P. Norris 48 , E. Nuss 25 , 23 T. Ohsugi 37 , N. Omodei 5 , E. Orlando 49 , J. F. Ormes 48 , D. Paneque 4 , D. Parent 34,35 , 24 V. Pelassa 25 , M. Pepe 12,13 , M. Pesce-Rollins 5 , F. Piron 25 , T. A. Porter 33 , S. Rain` o 14,15 , 25 R. Rando 9,10 , P. S. Ray 2 , M. Razzano 5 , A. Reimer 50,4 , O. Reimer 50,4 , T. Reposeur 34,35 , 26 S. Ritz 33 , M. S. E. Roberts 2,23,51,1 , L. S. Rochester 4 , A. Y. Rodriguez 52 , R. W. Romani 4 , 27 M. Roth 17 , F. Ryde 41,28 , H. F.-W. Sadrozinski 33 , D. Sanchez 16 , A. Sander 11 , 28 P. M. Saz Parkinson 33,1 , J. D. Scargle 53 , C. Sgr` o 5 , E. J. Siskind 54 , D. A. Smith 34,35 , 29 P. D. Smith 11 , G. Spandre 5 , P. Spinelli 14,15 , M. S. Strickman 2 , D. J. Suson 55 , H. Tajima 4 , 30 H. Takahashi 37 , T. Tanaka 4 , J. B. Thayer 4 , J. G. Thayer 4 , G. Theureau 24 , 31 D. J. Thompson 20 , L. Tibaldo 9,6,10 , O. Tibolla 56 , D. F. Torres 57,52 , G. Tosti 12,13 , 32 A. Tramacere 4,58 , Y. Uchiyama 59,4 , T. L. Usher 4 , A. Van Etten 4 , V. Vasileiou 20,21,22 , 33 C. Venter 20,60 , N. Vilchez 46 , V. Vitale 47,61 , A. P. Waite 4 , P. Wang 4 , K. Watters 4 , 34 B. L. Winer 11 , M. T. Wolff 2 , K. S. Wood 2,1 , T. Ylinen 41,62,28 , M. Ziegler 33 35
-
Upload
independent -
Category
Documents
-
view
1 -
download
0
Transcript of PSR J1907+0602: A Radio-Faint Gamma-Ray Pulsar Powering a Bright TeV Pulsar Wind Nebula

arX
iv:1
001.
0792
v1 [
astr
o-ph
.HE
] 6
Jan
201
0
PSR J1907+0602: A Radio-Faint Gamma-Ray Pulsar Powering a1
Bright TeV Pulsar Wind Nebula2
A. A. Abdo2,3,1, M. Ackermann4, M. Ajello4, L. Baldini5, J. Ballet6, G. Barbiellini7,8,3
D. Bastieri9,10, B. M. Baughman11, K. Bechtol4, R. Bellazzini5, B. Berenji4,4
R. D. Blandford4, E. D. Bloom4, E. Bonamente12,13, A. W. Borgland4, J. Bregeon5,5
A. Brez5, M. Brigida14,15, P. Bruel16, T. H. Burnett17, S. Buson10, G. A. Caliandro14,15,6
R. A. Cameron4, F. Camilo18, P. A. Caraveo19, J. M. Casandjian6, C. Cecchi12,13,7
O. Celik20,21,22, A. Chekhtman2,23, C. C. Cheung20, J. Chiang4, S. Ciprini12,13, R. Claus4,8
I. Cognard24, J. Cohen-Tanugi25, L. R. Cominsky26, J. Conrad27,28,29, S. Cutini30,9
A. de Angelis31, F. de Palma14,15, S. W. Digel4, B. L. Dingus32, M. Dormody33,10
E. do Couto e Silva4, P. S. Drell4, R. Dubois4, D. Dumora34,35, C. Farnier25, C. Favuzzi14,15,11
S. J. Fegan16, W. B. Focke4, P. Fortin16, M. Frailis31, P. C. C. Freire36,63, Y. Fukazawa37,12
S. Funk4, P. Fusco14,15, F. Gargano15, D. Gasparrini30, N. Gehrels20,38, S. Germani12,13,13
G. Giavitto39, B. Giebels16, N. Giglietto14,15, F. Giordano14,15, T. Glanzman4, G. Godfrey4,14
I. A. Grenier6, M.-H. Grondin34,35, J. E. Grove2, L. Guillemot34,35, S. Guiriec40,15
Y. Hanabata37, A. K. Harding20, E. Hays20, R. E. Hughes11, M. S. Jackson27,28,41,16
G. Johannesson4, A. S. Johnson4, T. J. Johnson20,38, W. N. Johnson2, S. Johnston42,17
T. Kamae4, H. Katagiri37, J. Kataoka43,44, N. Kawai43,45, M. Kerr17, J. Knodlseder46,18
M. L. Kocian4, M. Kuss5, J. Lande4, L. Latronico5, M. Lemoine-Goumard34,35, F. Longo7,8,19
F. Loparco14,15, B. Lott34,35, M. N. Lovellette2, P. Lubrano12,13, A. Makeev2,23,20
M. Marelli19, M. N. Mazziotta15, J. E. McEnery20, C. Meurer27,28, P. F. Michelson4,21
W. Mitthumsiri4, T. Mizuno37, A. A. Moiseev21,38, C. Monte14,15, M. E. Monzani4,22
A. Morselli47, I. V. Moskalenko4, S. Murgia4, P. L. Nolan4, J. P. Norris48, E. Nuss25,23
T. Ohsugi37, N. Omodei5, E. Orlando49, J. F. Ormes48, D. Paneque4, D. Parent34,35,24
V. Pelassa25, M. Pepe12,13, M. Pesce-Rollins5, F. Piron25, T. A. Porter33, S. Raino14,15,25
R. Rando9,10, P. S. Ray2, M. Razzano5, A. Reimer50,4, O. Reimer50,4, T. Reposeur34,35,26
S. Ritz33, M. S. E. Roberts2,23,51,1, L. S. Rochester4, A. Y. Rodriguez52, R. W. Romani4,27
M. Roth17, F. Ryde41,28, H. F.-W. Sadrozinski33, D. Sanchez16, A. Sander11,28
P. M. Saz Parkinson33,1, J. D. Scargle53, C. Sgro5, E. J. Siskind54, D. A. Smith34,35,29
P. D. Smith11, G. Spandre5, P. Spinelli14,15, M. S. Strickman2, D. J. Suson55, H. Tajima4,30
H. Takahashi37, T. Tanaka4, J. B. Thayer4, J. G. Thayer4, G. Theureau24,31
D. J. Thompson20, L. Tibaldo9,6,10, O. Tibolla56, D. F. Torres57,52, G. Tosti12,13,32
A. Tramacere4,58, Y. Uchiyama59,4, T. L. Usher4, A. Van Etten4, V. Vasileiou20,21,22,33
C. Venter20,60, N. Vilchez46, V. Vitale47,61, A. P. Waite4, P. Wang4, K. Watters4,34
B. L. Winer11, M. T. Wolff2, K. S. Wood2,1, T. Ylinen41,62,28, M. Ziegler3335
– 2 –
1Corresponding authors: A. A. Abdo, [email protected]; M. S. E. Roberts, [email protected];
P. M. Saz Parkinson, [email protected]; K. S. Wood, [email protected].
2Space Science Division, Naval Research Laboratory, Washington, DC 20375, USA
3National Research Council Research Associate, National Academy of Sciences, Washington, DC 20001,
USA
4W. W. Hansen Experimental Physics Laboratory, Kavli Institute for Particle Astrophysics and Cosmol-
ogy, Department of Physics and SLAC National Accelerator Laboratory, Stanford University, Stanford, CA
94305, USA
5Istituto Nazionale di Fisica Nucleare, Sezione di Pisa, I-56127 Pisa, Italy
6Laboratoire AIM, CEA-IRFU/CNRS/Universite Paris Diderot, Service d’Astrophysique, CEA Saclay,
91191 Gif sur Yvette, France
7Istituto Nazionale di Fisica Nucleare, Sezione di Trieste, I-34127 Trieste, Italy
8Dipartimento di Fisica, Universita di Trieste, I-34127 Trieste, Italy
9Istituto Nazionale di Fisica Nucleare, Sezione di Padova, I-35131 Padova, Italy
10Dipartimento di Fisica “G. Galilei”, Universita di Padova, I-35131 Padova, Italy
11Department of Physics, Center for Cosmology and Astro-Particle Physics, The Ohio State University,
Columbus, OH 43210, USA
12Istituto Nazionale di Fisica Nucleare, Sezione di Perugia, I-06123 Perugia, Italy
13Dipartimento di Fisica, Universita degli Studi di Perugia, I-06123 Perugia, Italy
14Dipartimento di Fisica “M. Merlin” dell’Universita e del Politecnico di Bari, I-70126 Bari, Italy
15Istituto Nazionale di Fisica Nucleare, Sezione di Bari, 70126 Bari, Italy
16Laboratoire Leprince-Ringuet, Ecole polytechnique, CNRS/IN2P3, Palaiseau, France
17Department of Physics, University of Washington, Seattle, WA 98195-1560, USA
18Columbia Astrophysics Laboratory, Columbia University, New York, NY 10027, USA
19INAF-Istituto di Astrofisica Spaziale e Fisica Cosmica, I-20133 Milano, Italy
20NASA Goddard Space Flight Center, Greenbelt, MD 20771, USA
21Center for Research and Exploration in Space Science and Technology (CRESST), NASA Goddard Space
Flight Center, Greenbelt, MD 20771, USA
22University of Maryland, Baltimore County, Baltimore, MD 21250, USA
23George Mason University, Fairfax, VA 22030, USA
24Laboratoire de Physique et Chemie de l’Environnement, LPCE UMR 6115 CNRS, F-45071 Orleans
Cedex 02, and Station de radioastronomie de Nancay, Observatoire de Paris, CNRS/INSU, F-18330 Nancay,

– 3 –
France
25Laboratoire de Physique Theorique et Astroparticules, Universite Montpellier 2, CNRS/IN2P3, Mont-
pellier, France
26Department of Physics and Astronomy, Sonoma State University, Rohnert Park, CA 94928-3609, USA
27Department of Physics, Stockholm University, AlbaNova, SE-106 91 Stockholm, Sweden
28The Oskar Klein Centre for Cosmoparticle Physics, AlbaNova, SE-106 91 Stockholm, Sweden
29Royal Swedish Academy of Sciences Research Fellow, funded by a grant from the K. A. Wallenberg
Foundation
30Agenzia Spaziale Italiana (ASI) Science Data Center, I-00044 Frascati (Roma), Italy
31Dipartimento di Fisica, Universita di Udine and Istituto Nazionale di Fisica Nucleare, Sezione di Trieste,
Gruppo Collegato di Udine, I-33100 Udine, Italy
32Los Alamos National Laboratory, Los Alamos, NM 87545, USA
33Santa Cruz Institute for Particle Physics, Department of Physics and Department of Astronomy and
Astrophysics, University of California at Santa Cruz, Santa Cruz, CA 95064, USA
34Universite de Bordeaux, Centre d’Etudes Nucleaires Bordeaux Gradignan, UMR 5797, Gradignan, 33175,
France
35CNRS/IN2P3, Centre d’Etudes Nucleaires Bordeaux Gradignan, UMR 5797, Gradignan, 33175, France
36Arecibo Observatory, Arecibo, Puerto Rico 00612, USA
37Department of Physical Sciences, Hiroshima University, Higashi-Hiroshima, Hiroshima 739-8526, Japan
38University of Maryland, College Park, MD 20742, USA
39Istituto Nazionale di Fisica Nucleare, Sezione di Trieste, and Universita di Trieste, I-34127 Trieste, Italy
40University of Alabama in Huntsville, Huntsville, AL 35899, USA
41Department of Physics, Royal Institute of Technology (KTH), AlbaNova, SE-106 91 Stockholm, Sweden
42Australia Telescope National Facility, CSIRO, Epping NSW 1710, Australia
43Department of Physics, Tokyo Institute of Technology, Meguro City, Tokyo 152-8551, Japan
44Waseda University, 1-104 Totsukamachi, Shinjuku-ku, Tokyo, 169-8050, Japan
45Cosmic Radiation Laboratory, Institute of Physical and Chemical Research (RIKEN), Wako, Saitama
351-0198, Japan
46Centre d’Etude Spatiale des Rayonnements, CNRS/UPS, BP 44346, F-30128 Toulouse Cedex 4, France
47Istituto Nazionale di Fisica Nucleare, Sezione di Roma “Tor Vergata”, I-00133 Roma, Italy
48Department of Physics and Astronomy, University of Denver, Denver, CO 80208, USA
49Max-Planck Institut fur extraterrestrische Physik, 85748 Garching, Germany
– 4 –
ABSTRACT36
37 We present multiwavelength studies of the 106.6 ms γ-ray pulsar PSR38
J1907+06 near the TeV source MGRO J1908+06. Timing observations with39
Fermi result in a precise position determination for the pulsar of R.A. =40
19h07m54.s7(2), decl. = +0602′16(2)′′ placing the pulsar firmly within the TeV41
source extent, suggesting the TeV source is the pulsar wind nebula of PSR42
J1907+0602. Pulsed γ-ray emission is clearly visible at energies from 100 MeV to43
above 10 GeV. The phase-averaged power-law index in the energy range E > 0.144
GeV is Γ = 1.76 ± 0.05 with an exponential cutoff energy Ec = 3.6 ± 0.5 GeV.45
We present the energy-dependent γ-ray pulsed light curve as well as limits on off-46
pulse emission associated with the TeV source. We also report the detection of47
very faint (flux density of ≃ 3.4µJy) radio pulsations with the Arecibo telescope48
at 1.5 GHz having a dispersion measure DM = 82.1 ± 1.1 cm−3pc. This indi-49
cates a distance of 3.2± 0.6 kpc and a pseudo-luminosity of L1400 ≃ 0.035 mJy50
kpc2. A Chandra ACIS observation revealed an absorbed, possibly extended,51
compact ( <∼ 4′′) X-ray source with significant non-thermal emission at R.A. =52
19h07m54.s76, decl. = +0602′14.6′′ with a flux of 2.3+0.6−1.4 × 10⁻¹⁴erg cm−2s−1.53
From archival ASCA observations, we place upper limits on any arcminute scale54
2–10 keV X-ray emission of ∼ 1×10⁻¹³erg cm−2s−1. The implied distance to the55
pulsar is compatible with that of the supernova remnant G40.5−0.5, located on56
the far side of the TeV nebula from PSR J1907+0602, and the S74 molecular57
cloud on the nearer side which we discuss as potential birth sites.58
Subject headings: pulsars: individual: PSR J1907+0602 — gamma rays: obser-59
vations60
1. Introduction61
The TeV source MGRO J1908+06 was discovered by the Milagro collaboration at a me-62
dian energy of 20 TeV in their survey of the northern Galactic Plane (Abdo et al. 2007) with63
a flux ∼ 80% of the Crab at these energies. It was subsequently detected in the 300 GeV –64
20 TeV range by the HESS (Aharonian et al. 2009) and VERITAS (Ward 2008) experiments.65
The HESS observations show the source HESS J1908+063 to be clearly extended, spanning66
∼0.3 of a degree on the sky with hints of energy-dependent substructure. A decade earlier67
Lamb & Macomb (1997) cataloged a bright source of GeV emission from the EGRET data,68
GeV J1907+0557, which is positionally consistent with MGRO J1908+06. It is near, but69
50Institut fur Astro- und Teilchenphysik and Institut fur Theoretische Physik, Leopold-Franzens-
Universitat Innsbruck, A-6020 Innsbruck, Austria
51Eureka Scientific, Oakland, CA 94602, USA
52Institut de Ciencies de l’Espai (IEEC-CSIC), Campus UAB, 08193 Barcelona, Spain

– 5 –
inconsistent with, the third EGRET catalog (Hartman et al. 1999) source 3EG J1903+055070
(Roberts et al. 2001). The Large Area Telescope (LAT) (Atwood et al. 2009) aboard the71
Fermi Gamma-Ray Space Telescope has been operating in survey mode since soon after its72
launch on 2008 June 11, carrying out continuous observations of the GeV sky. The Fermi73
Bright Source List (Abdo et al. 2009b), based on 3 months of survey data, contains 0FGL74
J1907.5+0602 which is coincident with GeV J1907+0557. The 3EG J1903+0550 source loca-75
tion confidence contour stretches between 0FGL J1907.5+0602 and the nearby source 0FGL76
J1900.0+0356, suggesting it was a conflation of the two sources.77
The Fermi LAT collaboration recently reported the discovery of 16 previously-unknown78
pulsars by using a time differencing technique on the LAT photon data above 300 MeV79
(Abdo et al. 2009a). 0FGL J1907.5+0602 was found to pulse with a period of 106.6 ms,80
have a spin-down energy of ∼ 2.8 × 1036 erg s−1, and was given a preliminary designation81
of PSR J1907+06. In this paper we derive a coherent timing solution using 14 months82
of data which yields a more precise position for the source, allowing detailed follow-up at83
other wavelengths, including the detection of radio pulsations using the Arecibo 305-m radio84
telescope. Energy resolved light curves, the pulsed spectrum, and off-pulse emission limits at85
the positions of the pulsar and PWN centroid are presented. We then report the detection of86
an X-ray counterpart with the Chandra X-ray Observatory and an upper limit from ASCA.87
Finally, we discuss the pulsar’s relationship to the TeV source and to the potential birth88
sites SNR G40.5−0.5 and the S74 Hii region.89
2. Gamma-ray Pulsar Timing and Localization90
The discovery and initial pulse timing of PSR J1907+06 was reported by Abdo et al.91
(2009a). The source position used in that analysis (R.A. = 286.965, Decl. = 6.022) was92
derived from an analysis of the measured directions of LAT-detected photons in the on-pulse93
phase interval from observations made from 2008 August 4 through December 25. Here, we94
make use of a longer span of data and also apply improved analysis methods to derive an95
improved timing ephemeris for the pulsar as well as a more accurate source position.96
For the timing and localization analysis, we selected “diffuse” class photons (events97
that passed the tightest background rejection criteria (Atwood et al. 2009)) with zenith98
angle < 105 as is standard practice and chose the minimum energy and extraction radius99
to optimize the significance of pulsations. We accepted photons with E > 200 MeV from100
within a radius of 0.7 of the nominal source direction. We corrected these photon arrival101

– 6 –
times to terrestrial time (TT) at the geocenter using the LAT Science Tool 1 gtbary in its102
geocenter mode.103
We fitted a timing model using Tempo2(Hobbs et al. 2006) to 23 pulse times of arrival104
(TOAs) covering the interval 2008 June 30 to 2009 September 18. We note that during105
the on-orbit checkout period (before 2008 August 4) several instrument configurations were106
tested that affected the energy resolution and event reconstruction but had no effect on the107
LAT timing. To determine the TOAs, we generated pulse profiles by folding the photon times108
according to a provisional ephemeris using polynomial coefficients generated by Tempo2 in109
its predictive mode (assuming a fictitious observatory at the geocenter). The TOAs were110
measured by cross correlating each pulse profile with a kernel density template that was111
derived from fitting the full mission dataset (Ray et al. 2009). Finally, we fitted the TOAs112
to a timing model that included position, frequency, and frequency derivative. The resulting113
timing residuals are 0.4ms and are shown in Figure 1. The best-fit model is displayed in114
Table 1. The numbers in parentheses are the errors in the last digit of the fitted parameters.115
The errors are statistical only, except for the position error, as described below. The derived116
parameters of E, B, and τc are essentially unchanged with respect to those reported by117
Abdo et al. (2009a), but the position has moved by 1.2′.118
The statistical error on the position fit is < 1′′; however, this is an underestimate of the119
true error. For example, with only one year of data, timing noise can perturb the position120
fit. We have performed a Monte Carlo analysis of these effects by simulating fake residuals121
using the fake plugin for Tempo2. We generated models with a range of frequency second122
derivatives (±2 × 10⁻²²s−3, the allowed magnitude for ν in our fits) to simulate the effects123
of timing noise and fitted them to timing models. Based on these simulations, we assigned124
an additional systematic error on the position of 2′′, which we added in quadrature to the125
statistical error in Table 1. As a result of the improved position estimate provided by this126
timing analysis, we have adopted a more precise name for the pulsar of PSR J1907+0602.127
3. Detection of Radio Pulsations128
To search for radio pulsations, we observed the timing position of PSR J1907+0602129
with the L-wide receiver on the Arecibo 305-m radio telescope. On 2009 August 21 we made130
a 55-minute pointing with center frequency 1.51 GHz and total bandwidth of 300 MHz,131
provided by three Wideband Arecibo Pulsar Processors (WAPPs, Dowd et al. (2000)), each132
individually capable of processing 100 MHz. We divided this band into 512-channel spectra133
1http://fermi.gsfc.nasa.gov/ssc/data/analysis/documentation/index.html

– 7 –
accumulated every 128 µs. The small positional uncertainty of PSR J1907+0602 derived from134
the LAT timing means that a single Arecibo pointing covers the whole region of interest.135
After excising strong sources of radio-frequency interference with rfifind, one of the136
routines of the PRESTO signal analysis package (Ransom et al. 2002), we performed a search137
by folding the raw data with the Fermi timing model into 128-bin pulse profiles. We then138
used the PRESTO routine prepfold to search trial dispersion measures between 0 and 1000139
pc cm−3. We found a pulsed signal with a signal-to-noise ratio S/N = 9.42 and duty cycle140
of about 0.03 at a dispersion measure DM = 82.1± 1.1 cm−3 pc. This value was estimated141
by dividing the detection data into 3 sub-bands and making TOAs for each sub-band and142
fitting for the DM with tempo.143
We applied the same technique for 4 different time segments of 12.5 minutes each and144
created a time of arrival for each of them. We then estimated the barycentric periodicity of145
the detected signal from these times of arrival. This differs from the periodicity predicted146
by the LAT ephemeris for the time of the observation by (−0.000005 ± 0.000020) ms, i.e.,147
the signals have the same periodicity.148
Subsequent radio observations showed that the phase of the radio pulses is exactly as149
predicted by the LAT ephemeris, apart from a constant phase offset (depicted in Figure 2)150
A confirmation observation with twice the integration time (1.8 hr) was made on 2009151
September 4. The radio profile is shown in the bottom panel of Figure. 2 with an arbitrary152
intensity scale. The pulsar is again detected with S/N of 3.4, 5.1, 7.3 and 8.6 at 1170, 1410,153
1510 and 1610 MHz. The higher S/N at the higher frequencies suggest a positive spectral154
index, similar to what has been observed for PSR J1928+1746 (Cordes et al. 2006). However,155
this might instead be due to scattering degrading the S/N at the lowest frequencies— for156
the band centered at 1610 MHz the pulse profile is distinctively narrower (about 2% at 50%157
power) than at 1410 or 1510 MHz (about 3%). At 1170 MHz the profile is barely detectable158
but very broad. This suggests an anomalously large scattering timescale for the DM of the159
pulsar. Observations at higher frequencies will settle the issue of the positive spectral index.160
For the 300 MHz centered at 1410 MHz, where the detection is clear, we obtain a total S/N161
of 12.4.162
With an antenna Tsys = 33 K (given by the frequency-dependent antenna temperature of163
2This was estimated using another software package, SIGPROC (a package developed by Duncan Lorimer,
see http://sigproc.sourceforge.net/), which processes the bands separately and produced S/N of 4.2, 6.3 and
5.5 for the WAPPs centered at 1410, 1510 and 1610 MHz. Although S/N = 9.4 is close to the detection
threshold for pulsars in a blind search, it is much more significant in this case because of the reduced number
of trials in this search relative to a blind search.
– 8 –
25–27 K off the plane of the Galaxy plus 6 K of Galactic emission in the specific direction of164
the pulsar Haslam et al. 1982), Gain = 10.5 K Jy−1 and 2 polarizations, and an inefficiency165
factor of 12% due to the 3-level sampling of the WAPP correlators, we obtain for the first166
detection a flux density at 1.4 GHz of S1400 ≃ 4.1µJy and for the second detection S1400 ≃167
3.1µJy. These values are consistent given the large relative uncertainties in the S/N estimates168
and the varying effect of radio frequency interference; at this DM, scintillation is not likely169
to cause a large variation in the flux density.170
The time-averaged flux density is ≃ 3.4µJy. Using the NE2001 model for the electron171
distribution in the Galaxy (Cordes & Lazio 2002), we obtain from the pulsar’s position and172
DM a distance of 3.2 kpc with a nominal error of 20%(Cordes & Lazio 2002). The time-173
averaged flux density thus corresponds to a pseudo-luminosity L1400 ≃ 0.035 mJy kpc2. This174
is fainter than the least luminous young pulsar in the ATNF catalog (PSR J0205+6449, with175
a 1.4 GHz pseudo-luminosity of 0.5 mJy kpc2). It is, however, more luminous than the radio176
pulsations discovered through a deep search of another pulsar first discovered by Fermi, PSR177
J1741−2054 which has L1400 ∼ 0.025 mJy kpc2 (Camilo et al. 2009). These two detections178
clearly demonstrate that some pulsars, as seen from the Earth, can have extremely low179
apparent radio luminosities; i.e., similarly deep observations of other γ-ray selected pulsars180
might detect additional very faint radio pulsars. We note that these low luminosities, which181
may well be the result of only a faint section of the radio beam crossing the Earth, are much182
lower than what has often been termed “radio quiet” in population synthesis models used to183
estimate the ratio of “radio-loud” to “radio quiet” γ-ray pulsars (eg. Gonthier et al. 2004).184
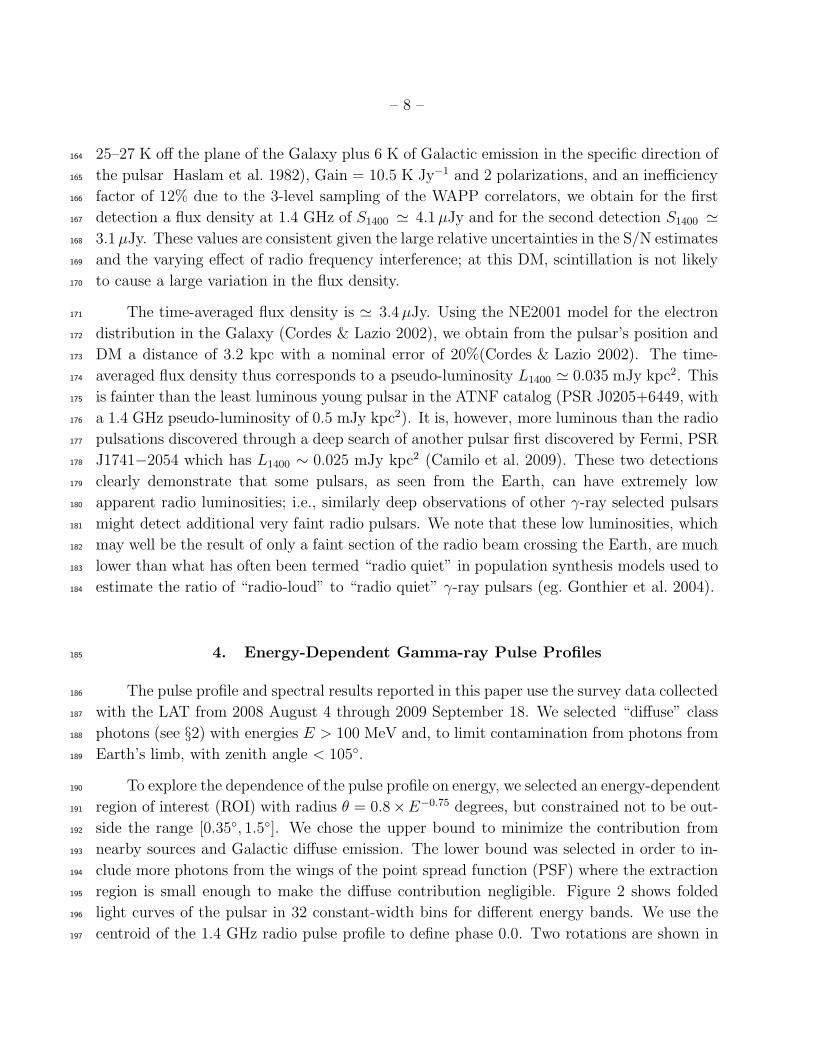
4. Energy-Dependent Gamma-ray Pulse Profiles185
The pulse profile and spectral results reported in this paper use the survey data collected186
with the LAT from 2008 August 4 through 2009 September 18. We selected “diffuse” class187
photons (see §2) with energies E > 100 MeV and, to limit contamination from photons from188
Earth’s limb, with zenith angle < 105.189
To explore the dependence of the pulse profile on energy, we selected an energy-dependent190
region of interest (ROI) with radius θ = 0.8×E−0.75 degrees, but constrained not to be out-191
side the range [0.35, 1.5]. We chose the upper bound to minimize the contribution from192
nearby sources and Galactic diffuse emission. The lower bound was selected in order to in-193
clude more photons from the wings of the point spread function (PSF) where the extraction194
region is small enough to make the diffuse contribution negligible. Figure 2 shows folded195
light curves of the pulsar in 32 constant-width bins for different energy bands. We use the196
centroid of the 1.4 GHz radio pulse profile to define phase 0.0. Two rotations are shown in197

– 9 –
each case. The top panel of the figure shows the folded light curve for photons with E > 0.1198
GeV. The γ-ray light curve shows two peaks, P1 at phase 0.220 ± 0.002 which determines199
the offset with the radio peak, δ. The second peak in the γ-ray, P2, occurs at phase 0.580200
± 0.003. The phase separation between the two peaks is ∆ = 0.360 ± 0.004. The radio201
lead δ and gamma peak separation ∆ values are in good agreement with the correlation202
predicted for outer magnetosphere models, (Romani & Yadigaroglu 1995) and observed for203
other young pulsars (Figure 3 of Abdo et al. (2009c)).204
Pulsed emission from the pulsar is clearly visible for energies E > 5 GeV with a chance205
probability of ∼ 4 × 10⁻⁸. Pulsed emission is detected for energies above 10 GeV with a206
confidence level of 99.8%. We have measured the integral and widths of the peaks as a207
function of energy and have found no evidence for significant evolution in shape or P1/P2208
ratio with energy. We note that the pulsar is at low Galactic latitude (b ∼ −0.89 ) where209
the Galactic γ-ray diffuse emission is bright ( it has not been subtracted from the light curves210
shown.)211
Figure 3 shows the observed LAT counts map of the region around PSR J1907+0602.212
We defined the “on” pulse as pulse phases 0.12 ≤ φ ≤ 0.68 and the “off” pulse as its213
complement (0.0 ≤ φ < 0.12 and 0.68 < φ ≤ 1.0). We produced on-pulse (left panel) and214
off-pulse (right panel) images, scaling the off-pulse image by 1.27. The figure indicates the215
complexity of the region that must be treated in spectral fitting. Besides the pulsar there216
are multiple point sources, Galactic, and extragalactic diffuse contributions.217
5. Energy Spectrum218
The phase-averaged flux of the pulsar was obtained by performing a maximum likelihood219
spectral analysis using the Fermi LAT science tool gtlike. Starting from the same data set220
described in §4, we selected photons from an ROI of 10 degrees around the pulsar position.221
Sources from a preliminary version (based on 11 months of data) of the first Fermi LAT222
γ−ray catalog (Abdo et al. 2009c) that are within 15 degree ROI around the pulsar were223
modeled in this analysis. Spectra of sources farther away than 5 from the pulsar were fixed224
at the cataloged values. Sources within 5 degrees of the pulsar were modeled with a simple225
power law. For each of the sources in the 5 degree region around the pulsar, we fixed the226
spectral index at the value in the catalog and fitted for the normalization. Two sources227
that are at a distance > 5 showed strong emission and were treated the same way as the228
sources within 5. The Galactic diffuse emission (gll iemv02) and the extragalactic diffuse229

– 10 –
background (isotropic iem v02) were modeled as well3.230
The assumed spectral model for the pulsar is an exponentially cut-off power law: dN/dE =
No (E/Eo)−Γ exp(−E/Ec). The resulting spectrum gives the total emission for the pulsar
assuming that the γ-ray emission is 100% pulsed. The unbinned gtlike fit, using P6 v3
instrument response functions (Atwood et al. 2009), for the energy range E ≥ 100 MeV
gives a phase-averaged spectrum of the following form:
dN
dE= (7.06± 0.43stat. + (+0.004
−0.064)sys.)× 10−11E−Γe−E/Ec γ cm−2 s−1 MeV−1 (1)
where the photon index Γ = 1.76 ± 0.05stat. + (+0.271−0.287)sys. and the cutoff energy Ec = 3.6 ±231
0.5stat. + (+0.72−0.36)sys. GeV.232
The integrated energy flux from the pulsar in the energy range E ≥ 100 MeV is Fγ =233
(3.12 ± 0.15stat. + (+0.16−0.15)sys.) × 10−10ergs cm−2s−1. This yields a γ-ray luminosity of Lγ =234
4πfΩFγd2 = 3.8×1035fΩd
23.2ergs s
−1 above 100 MeV, where fΩ is an effective beaming factor235
and d3.2 = d/(3.2)kpc. This corresponds to an efficiency of η = Lγ/E = 0.13Fγd23.2 for236
conversion of spin-down power into γ−ray emission in this energy band.237
We set a 2σ flux upper limit on γ-ray emission from the pulsar in the off-pulse part238
of Foff < 8.31 × 10⁻⁸ cm−2 s−1. In addition to the γ-ray spectrum from the point-source239
pulsar PSR J1907+0602, we measured upper limits on γ-ray flux from the extended source240
HESS J1908+063 in the energy range 0.1–25 GeV. We performed binned likelihood analysis241
using the Fermi Science Tool gtlike. In this analysis we assumed an extended source242
with gaussian width of 0.3 and γ-ray spectral index of −2.1 at the location of the HESS243
source. The upper limits suggest that the spectrum of HESS J1908+063 has a low energy244
turnover between 20 GeV and 300 GeV. Figure 4 shows the phase-averaged spectral energy245
distribution for PSR J1907+0602 (green circles). On the same figure we show data points246
from HESS for the TeV source HESS J1908+063 (blue circles) and the 2σ upper limits from247
Fermi for emission from this TeV source. Figure 5 shows an off pulse residual map of the248
region around PSR J1907+0602. The timing position of the pulsar is marked by the green249
cross. The 5σ contours from Milagro (outer) and HESS (inner) are overlaid. As can be seen250
from the residual map, there is no gamma-ray excess at the location of either the pulsar or251
the PWN.252
3Descriptions of the models are available at http://fermi.gsfc.nasa.gov/

– 11 –
6. X-ray Counterpart253
A 23 ks ASCA GIS exposure of the EGRET source GeV J1907+0557 revealed an ∼254
8′×15′ region of possible extended hard emission surrounding two point-like peaks lying ∼ 15′255
to the southwest of PSR J1907+0602 (Roberts et al. 2001) and no other significant sources256
in the 44′ ASCA FOV. A 10 ks Chandra ACIS-I image of the ASCA emission (ObsID 7049)257
showed it to be dominated by a single hard point source, CXOU J190718.6+054858 with no258
compact nebular structure and just a hint of the several arcminute-scale emission seen by259
ASCA. CXOU J190718.6+054858 seemed to turn off for ∼ 2 ks during the Chandra exposure,260
suggesting that it may be a binary of some sort or else a variable extragalactic source. There261
is no obvious optical counterpart in the digital sky survey optical or 2MASS near infrared262
images, nor in a I band image taken with the 2.4m Hiltner telescope at MDM (Jules Halpern,263
private communication). This strongly suggests that it is not a nearby source. An absorbed264
power law fits the spectrum of this source well, with absorption nH = 1.8+1.3−0.9 × 1022cm−2
265
(90% confidence region), a photon spectral index Γ = 0.9+0.6−0.4, and an average 2–10 keV flux266
of 4.4+0.7−1.8 × 10⁻¹³erg cm−2 s−1 (68% confidence region). The fit absorption is similar to the267
estimated total Galactic absorption from the HEASARC nH tool of 1.6 × 1022cm−2 based268
on the Dickey and Lockman (1990) HI survey (Dickey & Lockman 1990), suggesting that269
an nH of ∼ 2× 1022cm−2 is a reasonably conservative estimate of interstellar absorption for270
sources deep in the plane along this line of sight.271
The timing position of LAT PSR J1907+0602 is in the central 20′ of the ASCA GIS272
FOV (Figure 6). There is no obvious emission in the ASCA image at the pulsar position.273
Using the methodology of Roberts et al. (2001), a 24 pixel radius extraction region (∼ 6′),274
and assuming an absorbed power law spectrum with nH = 2 × 1022cm−2 and Γ = 1.5, we275
place a 90% confidence upper limit on the 2–10 keV flux Fx < 5 × 10⁻¹⁴erg cm−2 s−1. This276
suggests that for any reasonable absorption, the total unabsorbed X-ray flux from the pulsar277
plus any arcminute-scale nebula is less than 10−13erg cm−2 s−1.278
PSR J1907+0602 was well outside of the FOV of the first Chandra observation, and279
so we proposed for an observation centered on the pulsar. We obtained a 19 ks exposure280
with the ACIS-S detector (ObsID 11124). The time resolution of the ACIS-S detector on281
board Chandra does not allow for pulse studies. The only source within an arcminute282
of the timing position and the brightest source in the FOV of the S3 chip is shown in283
Figure 7. It is well within errors of the timing position. Examination of the X-ray image284
in different energy bands showed virtually no detected flux below ∼ 1keV and significant285
flux above 2.5 keV, suggesting a non-thermal emission mechanism for much of the flux.286
A comparison of the spatial distribution of counts between 0.75 keV and 2 keV to those287
between 2keV and 8keV shows some evidence for spatial extent beyond the point spread288

– 12 –
function for the harder emission but not for the softer emission. This would be consistent289
with an interpretation as predominantly absorbed but thermal emission from a neutron star290
surface surrounded by non-thermal emission from a compact pulsar wind nebula, which is291
the typical situation for young pulsars (see Kaspi et al. 2006, and references therein). We292
plot the Chandra 0.75-2keV, 2-8keV, and 0.75-8 keV images with an ellipse showing the293
timing position uncertainty, and a circle with a radius of 0.8′′. From a modeled PSF, we294
estimate 80% of the counts should be contained within this circle. While this seems to be295
the case for the soft image, only roughly half the counts in the harder image are contained296
within that radius. With only ∼ 12 source counts in the 0.75-2 keV image within 6′′ and297
∼ 30 source counts in the 2-8 keV image, quantitative statements about source size and298
spectrum are difficult to make. We obtain a best fit position for the nominal point source of299
R.A. = 19h07m54.s76, decl. = +0602′14.6′′ and estimated error of 0.7′′ (an additional 0.1′′300
centroid fitting uncertainty added to the nominal Chandra 0.6′′ uncertainty). Using a 6′′301
radius extraction region and an annulus between 6′′ and 24′′ for background, we extracted302
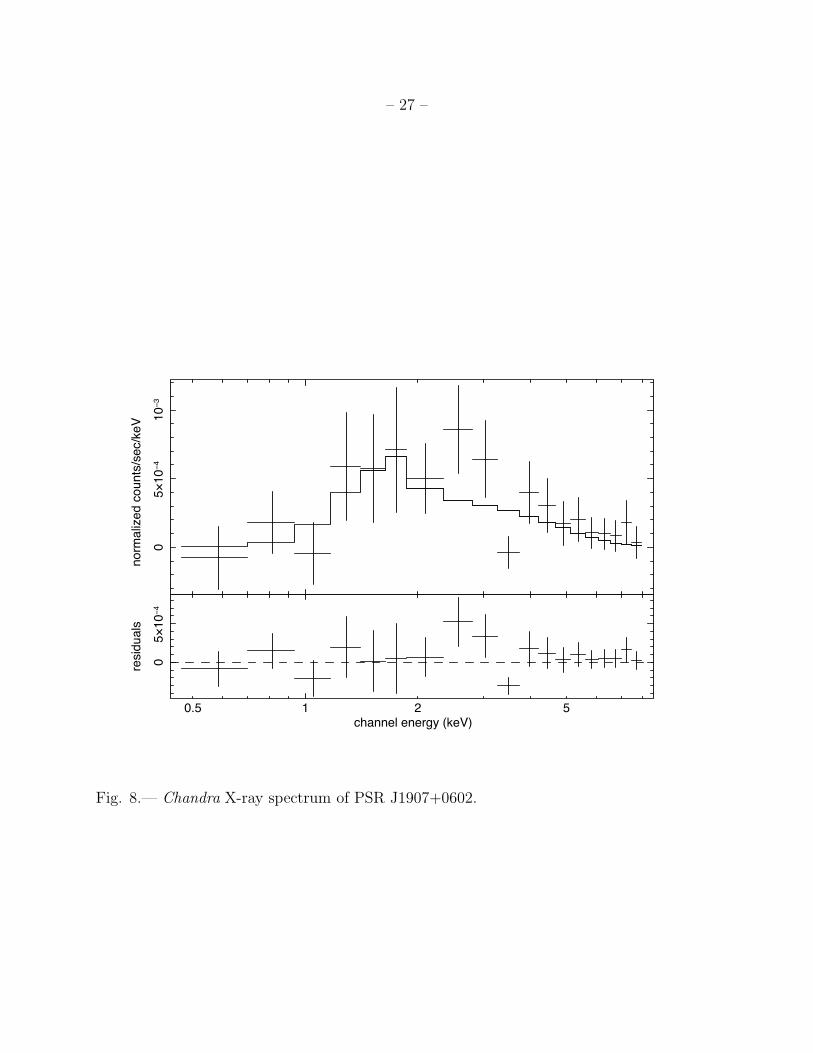
source and background spectra and fit them within XSPEC (Figure 8). A simple power law303
plus absorption model fit the data well in the energy range 2-10 KeV, with best fit values304
nH = 1.3 × 1022cm−2 and Γ = 1.6, with a total flux of 2.3+0.6−1.4 × 10⁻¹⁴erg cm−2s−1. The305
low count rates and covariance between the absorption and photon index meant the spectral306
parameters could not be simultaneously meaningfully constrained. Fixing the spectral index307
Γ = 1.6, a typical value for compact pulsar wind nebulae (Kaspi et al. 2006), we obtain a308
90% confidence region for the absorption of 0.7− 2.5× 1022cm−2, consistent with a source a309
few kilo parsecs or more away and with CXOU J190718.6+054858 discussed above. We note310
that with such an absorption a significant thermal component in the below 2 keV emission311
is neither required nor ruled out by the spectral fitting.312
7. Discussion313
The dispersion measure from the radio detection suggests a distance of 3.2 kpc, with314
a nominal error of 20%. However, there are many outliers to the DM error distribution,315
although the largest fractional errors tend to be from pulsars at high Galactic latitudes or316
very low DMs (Deller et al. 2009; Chatterjee et al. 2009). For PSR J1907+0602, at a latitude317
b = −0.9 with a moderate DM, the distance estimate is likely to be reasonable. Since the318
apparent γ-ray pulsed efficiency in the Fermi pass-band is well above the median for other319
gamma-ray pulsars in Abdo et al. (2009d) (13% compared to 7.5%), it is worth checking320
secondary distance indicators to see if the DM measure could be a significant overestimate321
of the true distance. We can use the X-ray observations of PSR J1907+0602 to do this.322
Several authors have noted a correlation between the X-ray luminosity of young pulsars and323

– 13 –
their spin-down power (eg. Saito 1998, Possenti et al. 2002, Li, Lu and Li 2007). Most324
of these have the problem of using X-ray fluxes derived from the literature using a variety325
of instruments with no uniform way of choosing spectral extraction regions. This can be326
especially problematic with Chandra data, since faint, arcminute scale emission can easily be327
overlooked. We compare our ASCA GIS upper limits to Figure 1 of Cheng, Taam and Wang328
(2004) who used only ASCA GIS data to derive their X-ray luminosity relationships. We see329
that the typical X-ray luminosity in the ASCA band for a pulsar with E = 2 × 1036erg s−1330
is Lx ∼ 1033 − 1034erg s−1 with all of the pulsars used in their analysis with E > 1036erg s−1331
having Lx > 1032erg s−1. From these values and the ASCA upper limit, we derive a lower332
limit for the distance to LAT PSR J1907+0602 of ∼ 3 kpc. From Figure 2 of Li, Lu and333
Li (2007), who used XMM-Newton and Chandra derived values, we see we can expect the334
luminosity to be between ∼ 1031.5 − 1034.5erg s−1. From our detection with Chandra, we335
again estimate a lower distance limit of ∼ 3 kpc. The “best guess” estimate from their336
relationship would result in a distance of ∼ 13kpc. We note that if we assume the pulsed337
emission to be apparently isotropic (i.e. fΩ = 1 as simple outer gap models suggest should338
approximately be the case, see Watters et al. (2009)), a distance of 9 kpc would result in339
100% γ-ray efficiency.340
The derived timing position of PSR J1907+0602 is well inside the extended HESS source,341
although ∼ 14′ southwest of the centroid. The TeV source is therefore plausibly the wind342
nebula of PSR J1907+0602. The physical size of this nebula is then >∼ 40 pc, and the343
integrated luminosity above 1 TeV is >∼ 40% that of the Crab, and in the MILAGRO band344
(∼ 20 TeV) at least twice that of the Crab. There is a hint of some spatial dependence of345
the TeV spectrum in the HESS data, with the harder emission (> 2.5 TeV) peaking nearer346
the pulsar than the softer emission (Aharonian et al. 2009). If confirmed, this would be347
consistent with the hardening of the TeV emission observed towards PSR B1823−13, thought348
to be the pulsar powering HESS J1825−137 (Aharonian et al. 2006). This latter pulsar has349
a spin period, characteristic age, and spin-down energy similar to PSR J1907+0602, and350
is also located near the edge of its corresponding TeV nebula. We also note that HESS351
J1825−137 subtends ∼ 1 on the sky and has a flux level above 1 TeV of around 20% of the352
Crab. While the overall spectrum of HESS J1825−137 is somewhat softer than the spectrum353
of HESS J1908+063, near the pulsar its spectrum is similarly hard. At a distance of ∼ 4 kpc,354
HESS J1825−137 has a luminosity similar to the Crab TeV nebula, but with a much larger355
physical size of ∼ 70pc. Given the distance implied above and a flux above 1 TeV ∼ 17% of356
the Crab, HESS J1908+063 is similar in size and luminosity to HESS J1825−137.357
At 20 TeV, HESS J1908+063 has a flux ∼80% of the Crab, and so at a distance >∼ 1.5358
times that of the Crab, is much more luminous at the highest energies. This is because there359
is no sign of a high-energy cutoff or break, as is seen in many other TeV nebulae. Aharonian360

– 14 –
et al. (2009) place a lower limit of 19.1 TeV on any exponential cutoff to the spectrum.361
This implies that either the spectrum is uncooled due to a very low nebular magnetic field362
( <∼ 3µG, see, eg. de Jager (2008)), an age much less than the characteristic age of 19.5 kyr,363
or else there is a synchrotron cooling break below the HESS band.364
Our upper limits above a few GeV (Figure 4) requires there to be a low energy turnover365
between 20 GeV and 300 GeV. Given the nominal PWN spectrum, we constrain the overall366
PWN flux to be ≤ 25% of that of the pulsar. If only the HESS band is considered, and367
assuming the DM distance, the TeV luminosity LPWN = 5− 8%E. However, since the TeV368
emission is generally thought to come from a relic population of electrons the luminosity is369
likely a function of the spin-down history of the pulsar rather than the current spin-down370
luminosity (eg. de Jager 2008). These numbers support consistency of the association of the371
TeV source with the pulsar, in the weak sense of not being discrepant with other similar372
systems.373
7.1. On the possible association with SNR G40.5−0.5374
The bulk of HESS J1908+063 is between PSR J1907+0602 and the young radio SNR375
G40.5−0.5, suggesting a possible association. The distance estimate (∼ 3.4 kpc Yang et al.376
2006) and age (Downes et al. 1980) estimates of SNR G40.5−0.5 are also consistent with377
those of PSR J1907+0602. If we use the usually assumed location for SNR G40.5-0.5 given378
by Langston et al. (2000) (RA=19h07m11.s9, Dec=635′15′′), we get an angular separation of379
∼ 35′ between the timing position for the pulsar and the SNR. However, this position for the380
SNR is from single dish observations that were offset towards one bright side of the nominal381
shell. We use the VLA Galactic Plane Survey 1420 MHz image (Stil et al. 2006) of this region382
to estimate the SNR center to be RA=19h07m08.s6, Dec=629′53′′ (Figure 9) which, for an383
assumed distance of 3.2 kpc, would give a separation of ∼28 pc. Given the characteristic age384
of 19.5 kyr years, this would require an average transverse velocity of ∼ 1400 km/s. While385
velocities about this high are seen in some cases (eg. PSR B1508+55 has a transverse velocity386
of ∼ 1100 km/s, Chatterjee et al. 2005 ), it is several times the average pulsar velocity and387
many times higher than the local sound speed. We note that pulsars with a braking index388
significantly less than n = 3 assumed in the derivation of the characteristic age could have389
ages as much as a factor of two greater (see eg. Kaspi et al. 2001), and thus a space velocity390
around half the above value may be all that is required. But with any reasonable assumption391
of birthplace, distance, and age, if the pulsar was born in SNR G40.5−0.5, any associated392
X-ray or radio PWN should show a bow-shock and trail morphology, with the trail likely393
pointing back towards the SNR center. Unfortunately, the compactness and low number of394

– 15 –
counts in our Chandra image precludes any definite statement about the PWN morphology.395
One arrives at a different, and lower, minimum velocity if one assumes the pulsar was born396
at the center of the TeV PWN and moved to its present position, but the resulting velocity397
would still require a bow shock.398
One can also get a pulsar offset towards the edge of a relic PWN if there is a significant399
density gradient in the surrounding ISM. A gradient will cause the supernova blast wave to400
propagate asymmetrically. Where the density is higher, the reverse shock propagating back401
to the explosion center will also be asymmetric. This will tend to push the PWN away from402
the region of higher density (Blondin et al. 2001; Ferreira & de Jager 2008). This has been403
invoked to explain the offsets in the Vela X and HESS J1825−137 nebulae as well as several404
others. Infrared and radio imaging of the region shows that HESS J1908+063 borders on405
a shell of material surrounding the S74 HII region, also known as the Lynds Bright Nebula406
352. Russeil (2003) gives a kinematic distance of 3.0 ± 0.3 kpc for this star forming region,407
compatible with the pulsar distance. In this scenario, the pulsar would not have to be highly408
supersonic to be at the edge of a relic nebula, and would not have to be traveling away from409
the center of the TeV emission.410
A third, hybrid possibility is that SNR G40.5−0.5 is only a bright segment of a much411
larger remnant, whose emission from the side near the pulsar is confused with that from the412
molecular cloud. The asymmetry would be explained by the difference in propagation speed413
in the lower density ISM away from the molecular cloud.414
Our current Chandra data are insufficient to distinguish between the above scenarios.415
However, there is also the possibility of a compact cometary radio nebula, such as is seen416
around PSR B1853+01 in SNR W44 (Frail et al. 1996) and PSR B0906−49 (Gaensler et al.417
1998). In addition, sensitive long wavelength radio imaging could reveal any larger, faint418
SNR shells. Imaging with the EVLA and LOFAR of this region is therefore highly desirable.419
The connection between the pulsar and the TeV nebula could be further strengthened by a420
confirmation of the spatio-spectral dependence of the nebula where the spectrum hardens421
nearer to the pulsar.422
The Fermi LAT Collaboration acknowledges the generous support of a number of agen-423
cies and institutes that have supported the Fermi LAT Collaboration. These include the424
National Aeronautics and Space Administration and the Department of Energy in the United425
States, the Commissariat a l’Energie Atomique and the Centre National de la Recherche Sci-426
entifique / Institut National de Physique Nucleaire et de Physique des Particules in France,427
the Agenzia Spaziale Italiana and the Istituto Nazionale di Fisica Nucleare in Italy, the428
Ministry of Education, Culture, Sports, Science and Technology (MEXT), High Energy Ac-429
– 16 –
celerator Research Organization (KEK) and Japan Aerospace Exploration Agency (JAXA)430
in Japan, and the K. A. Wallenberg Foundation and the Swedish National Space Board in431
Sweden. The Arecibo Observatory is part of the National Astronomy and Ionosphere Center,432
which is operated by Cornell University under a cooperative agreement with the National433
Science Foundation. The National Radio Astronomy Observatory is a facility of the National434
Science Foundation Operated under cooperative agreement by Associated Universities, Inc.435
Support for this work was provided by the National Aeronautics and Space Administration436
through Chandra Award Number GO6-7136X issued by the Chandra X-Ray Observatory437
Center, which is operated by the Smithsonian Astrophysical Observatory for and on behalf438
of NASA under contract NAS8-03060. This research has made use of software provided439
by the Chandra X-Ray Center in the application package CIAO. This research has made440
use of data obtained from the High Energy Astrophysics Science Archive Research Center441
(HEASARC), provided by NASA’s Goddard Space Flight Center.442
REFERENCES443
Abdo, A. A. et al. 2009a, Science, 325, 840, (Blind Search Pulsars)444
—. 2009b, ApJS, 183, 46, (Bright Source List)445
—. 2009c, in prep (1st Fermi LAT Gamma-Ray Catalog)446
—. 2009d, Submitted to ApJ (Fermi Catalog of Gamma-ray Pulsars)447
—. 2007, ApJ, 664, L91, (The Milagro Collaboration)448
Aharonian, F. et al. 2009, A&A, 499, 723449
—. 2006, A&A, 460, 365450
Atwood, W. B. et al. 2009, ApJ, 697, 1071, (LAT)451
Blondin, J. M., Chevalier, R. A., & Frierson, D. M. 2001, ApJ, 563, 806452
Camilo, F. et al. 2009, ApJ, in press (arXiv:0908.2626) - Radio detection of two gamma-ray453
pulsars454
Chatterjee, S. et al. 2009, ApJ, 698, 250455
—. 2005, ApJ, 630, L61456
Cordes, J. M. et al. 2006, ApJ, 637, 446457

– 17 –
Cordes, J. M., & Lazio, T. J. W. 2002, ArXiv e-prints, (arXiv:astro-ph/0207156)458
de Jager, O. C. 2008, ApJ, 678, L113459
Deller, A. T., Tingay, S. J., Bailes, M., & Reynolds, J. E. 2009, ApJ, 701, 1243460
Dickey, J. M., & Lockman, F. J. 1990, ARA&A, 28, 215461
Dowd, A., Sisk, W., & Hagen, J. 2000, in Astronomical Society of the Pacific Conference Se-462
ries, Vol. 202, IAU Colloq. 177: Pulsar Astronomy - 2000 and Beyond, ed. M. Kramer,463
N. Wex, & R. Wielebinski, 275464
Downes, A. J. B., Salter, C. J., & Pauls, T. 1980, A&A, 92, 47465
Ferreira, S. E. S., & de Jager, O. C. 2008, A&A, 478, 17466
Frail, D. A., Giacani, E. B., Goss, W. M., & Dubner, G. 1996, ApJ, 464, L165+467
Gaensler, B. M., Stappers, B. W., Frail, D. A., & Johnston, S. 1998, ApJ, 499, L69+468
Gonthier, P. L., Van Guilder, R., & Harding, A. K. 2004, ApJ, 604, 775469
Hartman, R. C. et al. 1999, ApJS, 123, 79470
Haslam, C. G. T., Salter, C. J., Stoffel, H., & Wilson, W. E. 1982, A&AS, 47, 1471
Hobbs, G., Edwards, R., & Manchester, R. 2006, Chinese Journal of Astronomy and Astro-472
physics Supplement, 6, 189473
Kaspi, V. M., Roberts, M. E., Vasisht, G., Gotthelf, E. V., Pivovaroff, M., & Kawai, N.474
2001, ApJ, 560, 371475
Kaspi, V. M., Roberts, M. S. E., & Harding, A. K. 2006, in Compact stellar X-ray sources,476
ed. W. H. G. Lewin & M. van der Klis, 279–339477
Lamb, R. C., & Macomb, D. J. 1997, ApJ, 488, 872478
Langston, G., Minter, A., D’Addario, L., Eberhardt, K., Koski, K., & Zuber, J. 2000, AJ,479
119, 2801480
Ransom, S. M., Eikenberry, S. S., & Middleditch, J. 2002, AJ, 124, 1788481
Ray, P. S., et al. 2009, ApJ, in prep (Precise Timing of Fermi Gamma-Ray Pulsars)482
Roberts, M. S. E., Romani, R. W., & Kawai, N. 2001, ApJS, 133, 451483

– 18 –
Romani, R. W., & Yadigaroglu, I.-A. 1995, ApJ, 438, 314484
Russeil, D. 2003, A&A, 397, 133485
Stil, J. M. et al. 2006, AJ, 132, 1158486
Ward, J. E. 2008, in American Institute of Physics Conference Series, Vol. 1085, American487
Institute of Physics Conference Series, ed. F. A. Aharonian, W. Hofmann, & F. Rieger,488
301–303489
Watters, K. P., Romani, R. W., Weltevrede, P., & Johnston, S. 2009, ApJ, 695, 1289490
Yang, J., Zhang, J.-L., Cai, Z.-Y., Lu, D.-R., & Tan, Y.-H. 2006, Chinese Journal of Astron-491
omy and Astrophysics, 6, 210492
493
This preprint was prepared with the AAS LATEX macros v5.2.

– 19 –
Table 1: Measured and Derived timing parameters of PSR J1907+0602
Fit and data-set
Pulsar name . . . . . . . . . . . . . . . . . . . . . . . . . . . . . . . J1907+0602
MJD range . . . . . . . . . . . . . . . . . . . . . . . . . . . . . . . . 54647–55074
Number of TOAs . . . . . . . . . . . . . . . . . . . . . . . . . . 23
Rms timing residual (µs). . . . . . . . . . . . . . . . . . . 404
Measured Quantities
Right ascension, α . . . . . . . . . . . . . . . . . . . . . . . . . 19:07:54.71(14)
Declination, δ . . . . . . . . . . . . . . . . . . . . . . . . . . . . . . +06:02:16.1(23)
Pulse frequency, ν (s−1) . . . . . . . . . . . . . . . . . . . . 9.3780713067(19)
First derivative of pulse frequency, ν (s−2) . . −7.6382(4)×10−12
Second derivative of pulse frequency, ν (s−3) 2.5(6)×10−22
Epoch of frequency determination (MJD) . . 54800
Dispersion measure, DM (cm−3pc) . . . . . . . . . 82.1(11)
Derived Quantities
Characteristic age (kyr) . . . . . . . . . . . . . . . . . . . 19.5
Surface magnetic field strength (G) . . . . . . . . 3.1× 10¹²
E (erg s−1) . . . . . . . . . . . . . . . . . . . . . . . . . . . . . . . . 2.8× 1036
Assumptions
Time units . . . . . . . . . . . . . . . . . . . . . . . . . . . . . . . . . TDB
Solar system ephemeris model . . . . . . . . . . . . . . DE405
Note. — The numbers in parentheses are the errors in the last digit of the fitted parameters. The errors
are statistical only, except for the position error, as described in §2. The derived parameters of E, B, and τc
are essentially unchanged with respect to those reported by (Abdo et al. 2009a), but the position has moved
by 1.2 arcmin.

– 20 –
Fig. 1.— Post-fit timing residuals for PSR J1907+0602. The reduced chi-square of the fit is
0.5.

– 21 –
300
350
400
450
500
550
Counts
0.1-0.3 GeV
400
500
600
700
800
Counts
0.3-1.0 GeV
20
40
60
80
100
120
140
Counts
1.0-3.0 GeV0
5
10
15
20
25
30
Counts
> 3.0 GeV
> 5.0 GeV
700800900
100011001200130014001500
Counts
P1 P2 P1 P2
0.0 0.2 0.4 0.6 0.8 1.0 1.2 1.4 1.6 1.8 2.0Pulse Phase
0.0
0.2
0.4
0.6
0.8
1.0
Am
plit
ude (
arb
. unit
s)
Fig. 2.— Folded light curves of PSR J1907+0602 in 32 constant-width bins for different
energy bands and shown over two pulse periods with the 1.4 GHz radio pulse profile plotted
in the bottom panel. The top panel of the figure shows the folded light curve for photons
with E > 0.1 GeV. The other panels show the pulse profiles in exclusive energy ranges:
E > 3.0 GeV (with E > 5.0 GeV in black) in the second panel from the top; 1.0 to 3.0 GeV
in the next panel; 0.3 to 1.0 GeV in the fourth panel; and 0.1 to 0.3 GeV in the fifth panel.

– 22 –
Fig. 3.— The observed Fermi -LAT counts map of the region around PSR J1907+0602. Left:
“on” pulse image, right: “off” pulse image. The open cross-hair marks the location of the
pulsar. Color scale shows the counts per pixel.
– 23 –
10-2 10-1 100 101 102 103 104 105
E(GeV)
10-13
10-12
10-11
10-10
10-9
E2dN/dE
(erg
cm
2s
1)
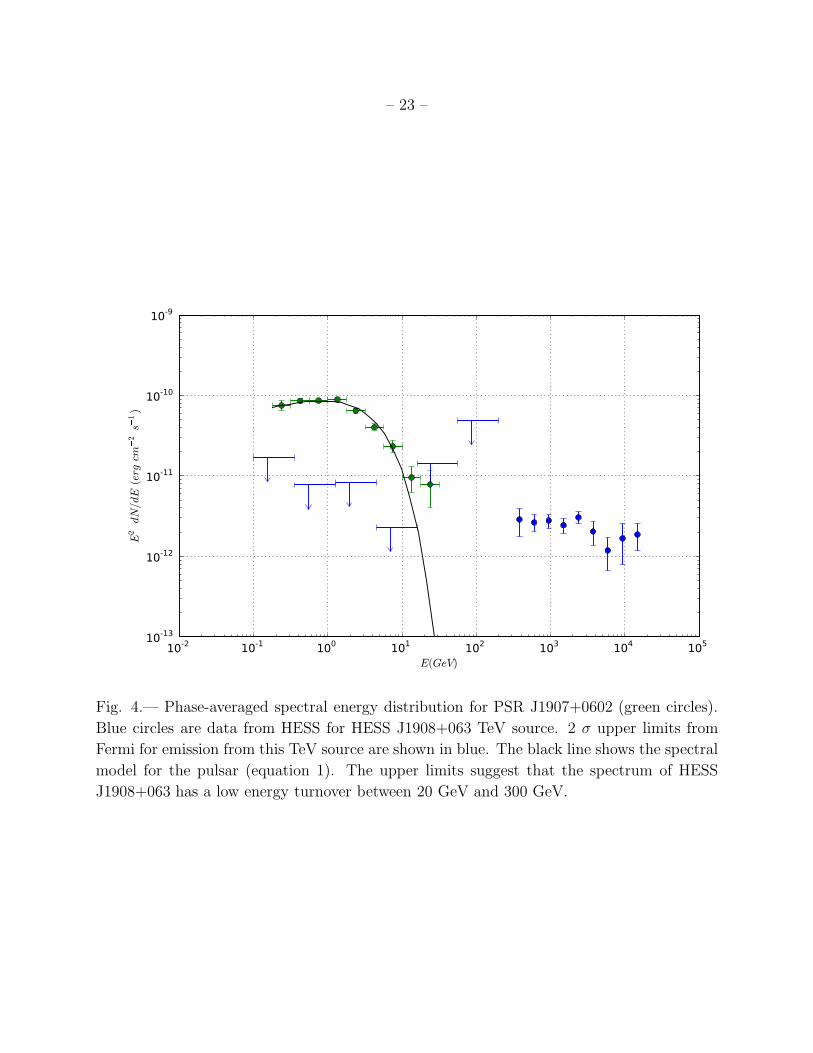
Fig. 4.— Phase-averaged spectral energy distribution for PSR J1907+0602 (green circles).
Blue circles are data from HESS for HESS J1908+063 TeV source. 2 σ upper limits from
Fermi for emission from this TeV source are shown in blue. The black line shows the spectral
model for the pulsar (equation 1). The upper limits suggest that the spectrum of HESS
J1908+063 has a low energy turnover between 20 GeV and 300 GeV.

– 24 –
-8 -6 -4 -2 0 2 4 6 8
42.0 41.5 41.0 40.5 40.0 39.5 39.0 38.5
0.5
0.0
-0.5
-1.0
-1.5
-2.0
Gal
acti
c L
atit
ude
(deg
.)
Galactic Longitude (deg.)
Fig. 5.— Residual map of the region around PSR J1907+0602 in the off-pulse. The timing
position of the pulsar is marked by the cross. The 5 σ contours from Milagro (outer) and
HESS (inner) are overlaid.

– 25 –
40.6 40.4 40.2 40.0 39.8 39.6 39.4
-0.2
-0.4
-0.6
-0.8
-1.0
-1.2
-1.4
Galactic Longitude (deg.)
Gal
acti
c L
atit
ud
e (d
eg.)
PSR J1907+0602
Fig. 6.— ASCA GIS 2-10 keV image of the region around PSR J1907+0602. The green
contours are the 4-7 σ significance contours from HESS.

– 26 –
0 0.2 0.4 0.6 0.8 1 1.2 1.4 1.6 1.8
R.A. (J2000)55.2 19:07:55.0 54.8 54.6 54.4
25.0
6:02:20.0
Dec
l. (J
2000
)
15.0
10.0
05.0
Fig. 7.— Chandra ACIS images of PSR J1907+0602. The blue ellipse shows the uncertainty
in the timing position. The green circle of radius 0.8′′ is twice the FWHM of the 5keV PSF
at this position, and should contain roughly 80% of the counts. The image at 0.75-2 keV
(Left), 2-8 keV (Center) and 0.75-8 keV (right) is shown. Color scale shows the counts per
pixel.
– 27 –
!"#$!!%
$!!&
'()*+,-./012(3'4565/267/8
$!9" : "
!"#$!!%
)/5-03+,5
2;+''/,1/'/)<=1>7/8?
Fig. 8.— Chandra X-ray spectrum of PSR J1907+0602.
– 28 –
41.0 40.8 40.6 40.4 40.2 40.0 39.8
-0.2
-0.4
-0.6
-0.8
-1.0
-1.2
-1.4
S74
HESS J1908+063
SNR G40.5-0.5
This paper
PSR J1907+0602
Langston et al. position
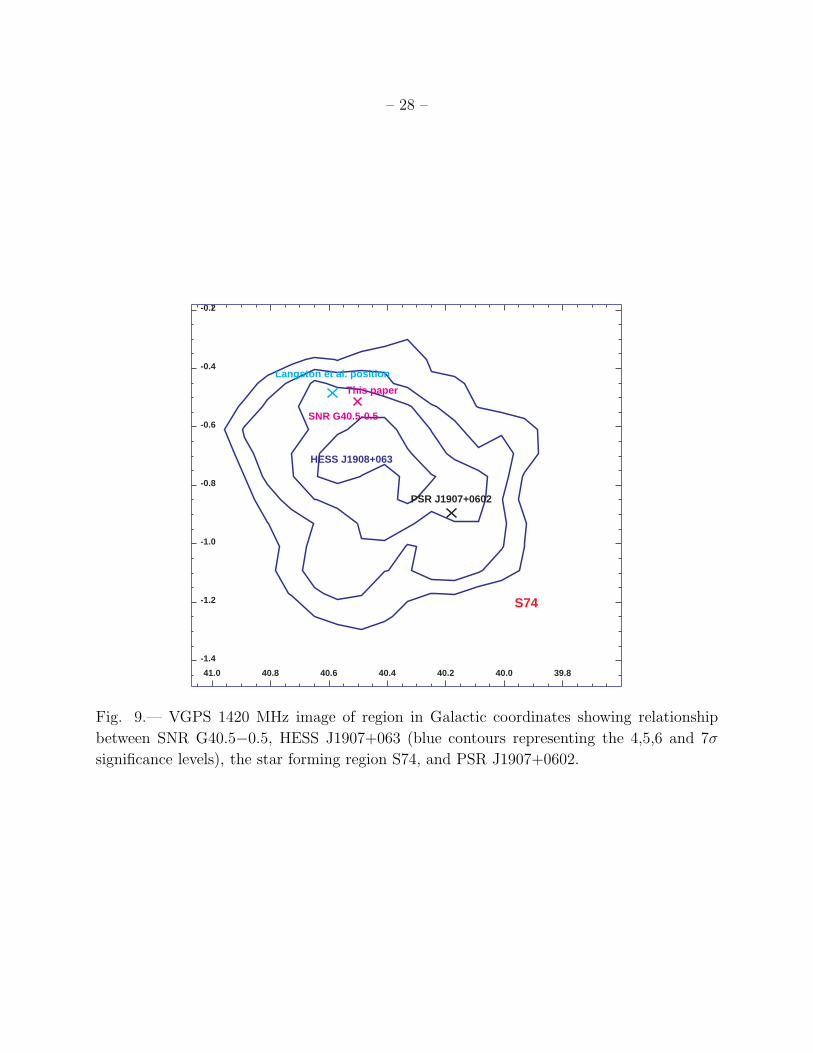
Fig. 9.— VGPS 1420 MHz image of region in Galactic coordinates showing relationship
between SNR G40.5−0.5, HESS J1907+063 (blue contours representing the 4,5,6 and 7σ
significance levels), the star forming region S74, and PSR J1907+0602.