Galaxy populations in the Antlia cluster - III. Properties of faint early-type galaxies
19
arXiv:1109.6004v1 [astro-ph.CO] 27 Sep 2011 Mon. Not. R. Astron. Soc. 000, 000–000 (0000) Printed 15 December 2013 (MN L A T E X style file v2.2) Galaxy populations in the Antlia cluster - III. Properties of faint early-type galaxies ⋆ Anal´ ıa V. Smith Castelli 1,2,3 † , Sergio A. Cellone 1,2,3 , Favio R. Faifer 1,2,3 , Lilia P. Bassino 1,2,3 , Tom Richtler 4 , Gisela A. Romero 3,5 , Juan Pablo Calder´ on 1,2,3 and Juan Pablo Caso 1,2,3 1 Consejo Nacional de Investigaciones Cient´ ıficas y T´ ecnicas, Rivadavia 1917, Buenos Aires, Argentina 2 Instituto de Astrof´ ısica de La Plata (CCT La Plata - CONICET - UNLP), La Plata, Argentina 3 Facultad de Ciencias Astron´ omicas y Geof´ ısicas, Universidad Nacional de La Plata, Paseo del Bosque, B1900FWA La Plata, Argentina 4 Departamento de Astronom´ ıa, Universidad de Concepci´ on, Casilla 160-C, Concepci´ on, Chile 5 Departamento de F´ ısica y Astronom´ ıa, Universidad de Valpara´ ıso, Valpara´ ıso, Chile Accepted . Received ; in original form ABSTRACT We present a new analysis of the early-type galaxy population in the central region of the Antlia cluster, focusing on the faint systems like dwarf ellipticals (dE) and dwarf spheroidals (dSph). The colour–magnitude relation (CMR) and the relation between luminosity and mean effective surface brightness for galaxies in the central region of Antlia have been previously studied in Paper I of the present series. Now we confirm 22 early-type galaxies as Antlia members, using GEMINI–GMOS and MAGELLAN–MIKE spectra. Among them, 15 are dEs from the FS90 Antlia Group catalogue, 2 belong to the rare type of compact ellipticals (cE), and 5 are new faint dwarfs that had never been catalogued before. In addition, we present 16 newly identified low surface brightness galaxy candidates, almost half of them displaying morphologies consistent with being Antlia’s counterparts of Local Group dSphs, that extend the faint luminosity limit of our study down to M B = -10.1(B T = 22.6) mag. With these new data, we built an improved CMR in the Washington photometric system, i.e. integrated T 1 magnitudes versus (C - T 1 ) colours, which extends ∼ 4 mag faintwards the limit of spec- troscopically confirmed Antlia members. When only confirmed early-type members are con- sidered, this relation extends over 10 mag in luminosity with no apparent change in slope or increase in colour dispersion towards its faint end. The intrinsic colour scatter of the relation is compared with those reported for other clusters of galaxies; we argue that it is likely that the large scatter of the CMR, usually reported at faint magnitudes, is mostly due to photo- metric errors along with an improper membership/morphological classification. The distinct behaviour of the luminosity versus mean effective surface brightness relation at the bright and faint ends is analyzed, while it is confirmed that dE galaxies on the same relation present a very similar effective radius, regardless of their colour. The projected spatial distribution of the member sample confirms the existence of two groups in Antlia, each one dominated by a giant elliptical galaxy and with one cE located close to each giant. Size and position, with re- spect to massive galaxies, of the dSph candidates are estimated and compared to Local Group couterparts. Key words: galaxies: clusters: general – galaxies: clusters: individual: Antlia – galaxies: elliptical and lenticular – galaxies: dwarf – galaxies: photometry – galaxies: spectroscopy ⋆ Based on observations carried out at the Cerro Tololo Inter–American Observatory (Chile), at Las Campanas Observatory (Chile), and at the Eu- ropean Southern Observatory, Paranal (Chile). Also based on observations obtained at the Gemini Observatory, which is operated by the Associa- tion of Universities for Research in Astronomy, Inc., under a cooperative agreement with the NSF on behalf of the Gemini partnership: the National Science Foundation (United States), the Science and Technology Facilities Council (United Kingdom), the National Research Council (Canada), CON- ICYT (Chile), the Australian Research Council (Australia), Ministerio da Ciencia e Tecnologia (Brazil) and Ministerio de Ciencia, Tecnolog´ ıa e In- novaci´ on Productiva (Argentina). † E-mail: [email protected]
Transcript of Galaxy populations in the Antlia cluster - III. Properties of faint early-type galaxies
arX
iv:1
109.
6004
v1 [
astr
o-ph
.CO
] 27
Sep
201
1
Mon. Not. R. Astron. Soc.000, 000–000 (0000) Printed 15 December 2013 (MN LATEX style file v2.2)
Galaxy populations in the Antlia cluster - III. Properties of faintearly-type galaxies⋆
Analıa V. Smith Castelli1,2,3 † , Sergio A. Cellone1,2,3, Favio R. Faifer1,2,3, Lilia P. Bassino1,2,3,Tom Richtler4, Gisela A. Romero3,5, Juan Pablo Calderon1,2,3 and Juan Pablo Caso1,2,31Consejo Nacional de Investigaciones Cientıficas y Tecnicas, Rivadavia 1917, Buenos Aires, Argentina2Instituto de Astrofısica de La Plata (CCT La Plata - CONICET- UNLP), La Plata, Argentina3Facultad de Ciencias Astronomicas y Geofısicas, Universidad Nacional de La Plata, Paseo del Bosque, B1900FWA La Plata, Argentina4Departamento de Astronomıa, Universidad de Concepcion,Casilla 160-C, Concepcion, Chile5Departamento de Fısica y Astronomıa, Universidad de Valparaıso, Valparaıso, Chile
Accepted . Received ; in original form
ABSTRACT
We present a new analysis of the early-type galaxy population in the central region of theAntlia cluster, focusing on the faint systems like dwarf ellipticals (dE) and dwarf spheroidals(dSph). The colour–magnitude relation (CMR) and the relation between luminosity and meaneffective surface brightness for galaxies in the central region of Antlia have been previouslystudied in Paper I of the present series. Now we confirm 22 early-type galaxies as Antliamembers, using GEMINI–GMOS and MAGELLAN–MIKE spectra. Among them, 15 aredEs from the FS90 Antlia Group catalogue, 2 belong to the raretype of compact ellipticals(cE), and 5 are new faint dwarfs that had never been catalogued before. In addition, we present16 newly identified low surface brightness galaxy candidates, almost half of them displayingmorphologies consistent with being Antlia’s counterpartsof Local Group dSphs, that extendthe faint luminosity limit of our study down toMB = −10.1 (BT = 22.6) mag. With thesenew data, we built an improved CMR in the Washington photometric system, i.e. integratedT1 magnitudes versus(C − T1) colours, which extends∼ 4mag faintwards the limit of spec-troscopically confirmed Antlia members. When only confirmedearly-type members are con-sidered, this relation extends over 10 mag in luminosity with no apparent change in slope orincrease in colour dispersion towards its faint end. The intrinsic colour scatter of the relationis compared with those reported for other clusters of galaxies; we argue that it is likely thatthe large scatter of the CMR, usually reported at faint magnitudes, is mostly due to photo-metric errors along with an improper membership/morphological classification. The distinctbehaviour of the luminosity versus mean effective surface brightness relation at the bright andfaint ends is analyzed, while it is confirmed that dE galaxieson the same relation present avery similar effective radius, regardless of their colour.The projected spatial distribution ofthe member sample confirms the existence of two groups in Antlia, each one dominated by agiant elliptical galaxy and with one cE located close to eachgiant. Size and position, with re-spect to massive galaxies, of the dSph candidates are estimated and compared to Local Groupcouterparts.
Key words: galaxies: clusters: general – galaxies: clusters: individual: Antlia – galaxies:elliptical and lenticular – galaxies: dwarf – galaxies: photometry – galaxies: spectroscopy
⋆ Based on observations carried out at the Cerro Tololo Inter–AmericanObservatory (Chile), at Las Campanas Observatory (Chile),and at the Eu-ropean Southern Observatory, Paranal (Chile). Also based on observationsobtained at the Gemini Observatory, which is operated by theAssocia-tion of Universities for Research in Astronomy, Inc., undera cooperativeagreement with the NSF on behalf of the Gemini partnership: the NationalScience Foundation (United States), the Science and Technology Facilities
Council (United Kingdom), the National Research Council (Canada), CON-ICYT (Chile), the Australian Research Council (Australia), Ministerio daCiencia e Tecnologia (Brazil) and Ministerio de Ciencia, Tecnologıa e In-novacion Productiva (Argentina).† E-mail: [email protected]
2 Smith Castelli et al.
1 INTRODUCTION
The fact that early-type galaxies in clusters and groups definesequences in the colour-magnitude and surface brightness-luminosity diagrams has been known for a long time(e.g. Baum 1959; Sandage 1972; Visvanathan & Sandage1977; Sandage & Visvanathan 1978; Kormendy 1977a, b;Caldwell & Bothun 1987; Ferguson & Binggeli 1994). Theserelations are expected to provide clues about the evolution-ary status of the galaxies that follow them and they seem tobe universal. Such universality led several authors to suggesttheir use as reliable distance indicators (e.g. Sandage 1972;Binggeli & Jerjen 1998; Cellone 1999) and to set membershipcriteria (e.g. Chiboucas & Mateo 2006).
The faint end of these photometric relations is popu-lated by very faint dwarf elliptical (dE) and dwarf spheroidal(dSph) galaxies. Despite morphological criteria have beenprovenuseful for identifying dwarf galaxies in nearby clusters andgroups (e.g. Binggeli, Sandage & Tammann 1985; Ferguson 1989;Ferguson & Sandage 1990, hereafter FS90), background galax-ies may mimic dwarf morphologies if they are not observedwith sufficient spatial resolution (see, for example, object 27 inConselice, Gallagher & Wyse 2003 and Penny & Conselice 2008).This fact may introduce a significant contamination into theob-served relations and may cause disagreements in their interpre-tation. Examples of discrepancies that deserve some analysis arethose related with the linearity and the scatter of the colour–magnitude relation (CMR).
Most CMRs show no perceptible change of slope from lu-minous galaxies to the dwarf regime (Secker, Harris & Plummer1997; Terlevich et al. 1999; Lopez-Cruz, Barkhouse & Yee 2004;Andreon et al. 2006; Smith Castelli et al. 2008a, hereafter Pa-per I; Price et al. 2009) except, perhaps, at the very brightend (see fig. 8b in Misgeld, Mieske & Hilker 2008 and fig. 3 inMisgeld, Hilker & Mieske 2009). However, non-linear trendsforthe CMR of the Virgo cluster have been found (Ferrarese et al.2006; Janz & Lisker 2009). In addition, there is a considerable in-crease in the scatter of all CMRs towards their faint end in com-parison to that displayed by the brightest galaxies. It is still un-der discussion whether such increase has a physical origin point-ing to differences in ages, metal abundances or formation scenar-ios among dwarf galaxies (e.g. Conselice, Gallagher & Wyse 2002,2003; Penny & Conselice 2008; Jaffe et al. 2011), or whetherit canbe accounted for by photometric errors (e.g. Secker et al. 1997;Misgeld et al. 2008, 2009; Janz & Lisker 2009) and/or backgroundgalaxies contamination (e.g. Lopez-Cruz et al. 2004).
Now, we have spectroscopically confirmed new dwarf Antliamembers and we have identified previously non catalogued dwarfcandidates. We revisit the relations analyzed in Paper I, i.e.the colour–magnitude and the luminosity–mean effective surfacebrightness relations, regarding particularly the behaviour of theirfaint ends. In order to analyze the structure of the Antlia cluster, westudy the projected spatial distribution of the whole galaxy sample.
In addition, we have confirmed the existence of two compactelliptical (cE) galaxies in Antlia (Smith Castelli et al. 2008b, here-after Paper II; Smith Castelli et al. 2009). These are rare low-masssystems; about only a dozen have been identified within a dis-tance of∼ 100 Mpc (Chilingarian & Bergond 2010 and referencestherein; Huxor et al. 2011) and a similar amount at larger distances(Chilingarian et al. 2009). We include these two peculiar confirmedmembers in our analysis thus contributing to the discussionof thealleged dichotomy between bright and faint elliptical galaxies (e.g.
Graham & Guzman 2003; Kormendy et al. 2009; Graham 2011),as cEs are thought to be either the extension to low luminosities ofthe family of giant ellipticals (Kormendy et al. 2009 and referencestherein) or not (Graham 2002).
Finally, physical characteristics of the dSph candidates arecompared to galaxies of the same type in other groups and clus-ters. The dSphs are particularly interesting as they are supposedto be the faintest systems containing dark matter and can be usedto constrain cold dark matter (CDM) models of galaxy formation(e.g. Penarrubia, Navarro & McConnachie 2008, Penarrubia et al.2009). Due to their low surface brightness, they have mostlybeenstudied in detail within the Local Group, like the ones surroundingthe Milky Way or Andromeda galaxies (e.g. Belokurov et al. 2008;Kalirai et al. 2010).
This paper is based on photometric data obtained fromCTIO-MOSAIC and VLT-FORS1 images of the central re-gion of Antlia, and radial velocities measured from GEMINI-GMOS and MAGELLAN-MIKE spectra. Antlia is the thirdnearest well populated galaxy cluster after Virgo and Fornax.Before our studies on Antlia (Dirsch, Richtler & Bassino 2003;Bassino, Richtler & Dirsch 2008; Paper I; Paper II), the photo-graphic work of FS90 was the last major effort devoted to study thefaint galaxy content in this cluster. They identified, by visual in-spection on photographic plates, 375 galaxies in their Antlia GroupCatalogue down toMB = −14.7 (BT = 18) mag. Among them,252 are classified as dwarf galaxies or probable dwarf objects, 71of which are found in our frames. Only 15 of these 71 galaxieshad measured radial velocities at that moment. Our spectra haveallowed us to add 23 new radial velocities to this sample (16 early-type and 3 late-type members plus 4 background galaxies), and todetect 5 previously unclassified new Antlia members. In addition,we have visually identified 16 unclassified galaxies displaying dEand dSph morphologies, extending the luminosity range of proba-ble Antlia members down toMB = −10.1 (BT = 22.6) mag.
Throughout this paper we will adopt(m − M) = 32.73 asthe Antlia distance modulus (Dirsch et al. 2003). It corresponds toa distance of 35.2 Mpc at which 1 arcsec subtends 170 pc. The pa-per is organized as follows. Section 2 describes our observationaldata and Section 3 presents our galaxy sample. In Section 4 were-visit the photometric relations of early-type Antlia galaxies includ-ing the new confirmed members and new dwarf galaxy candidates,and analyze the projected spatial distribution of the wholesample.Section 5 presents a discussion of the results and Section 6 our con-clusions.
2 OBSERVATIONAL DATA
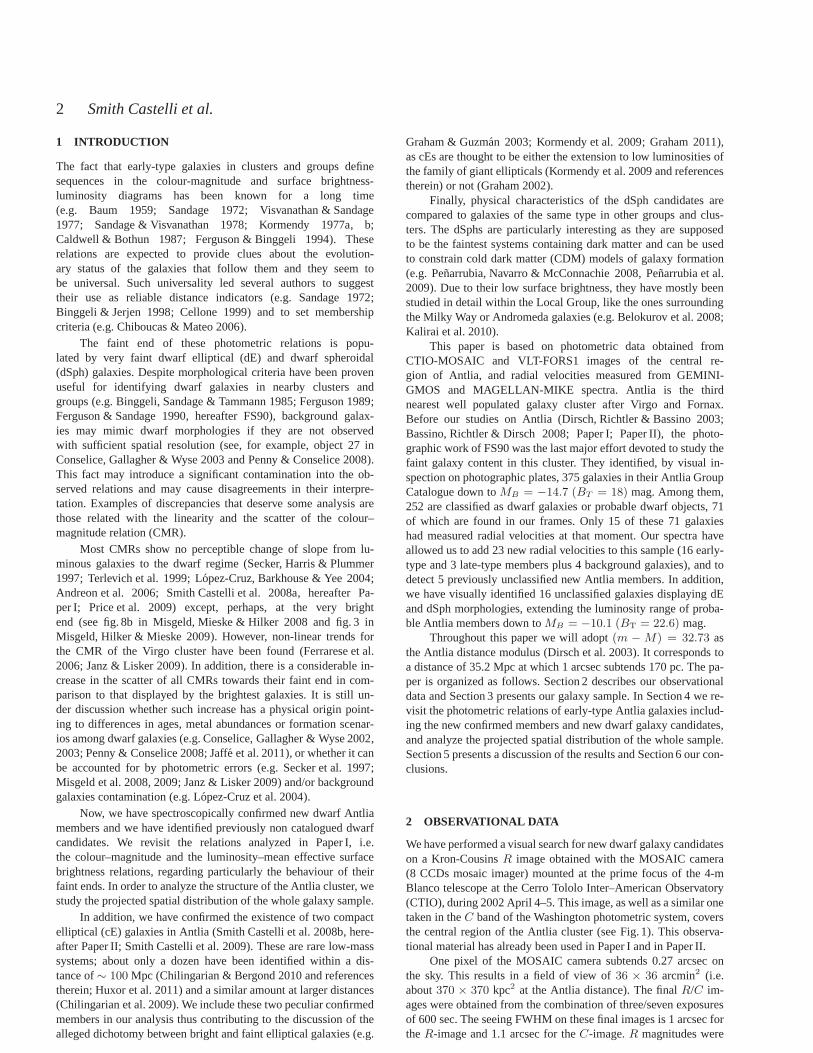
We have performed a visual search for new dwarf galaxy candidateson a Kron-CousinsR image obtained with the MOSAIC camera(8 CCDs mosaic imager) mounted at the prime focus of the 4-mBlanco telescope at the Cerro Tololo Inter–American Observatory(CTIO), during 2002 April 4–5. This image, as well as a similar onetaken in theC band of the Washington photometric system, coversthe central region of the Antlia cluster (see Fig. 1). This observa-tional material has already been used in Paper I and in Paper II.
One pixel of the MOSAIC camera subtends 0.27 arcsec onthe sky. This results in a field of view of36 × 36 arcmin2 (i.e.about370 × 370 kpc2 at the Antlia distance). The finalR/C im-ages were obtained from the combination of three/seven exposuresof 600 sec. The seeing FWHM on these final images is 1 arcsec fortheR-image and 1.1 arcsec for theC-image.R magnitudes were
Galaxy populations in Antlia - III 3
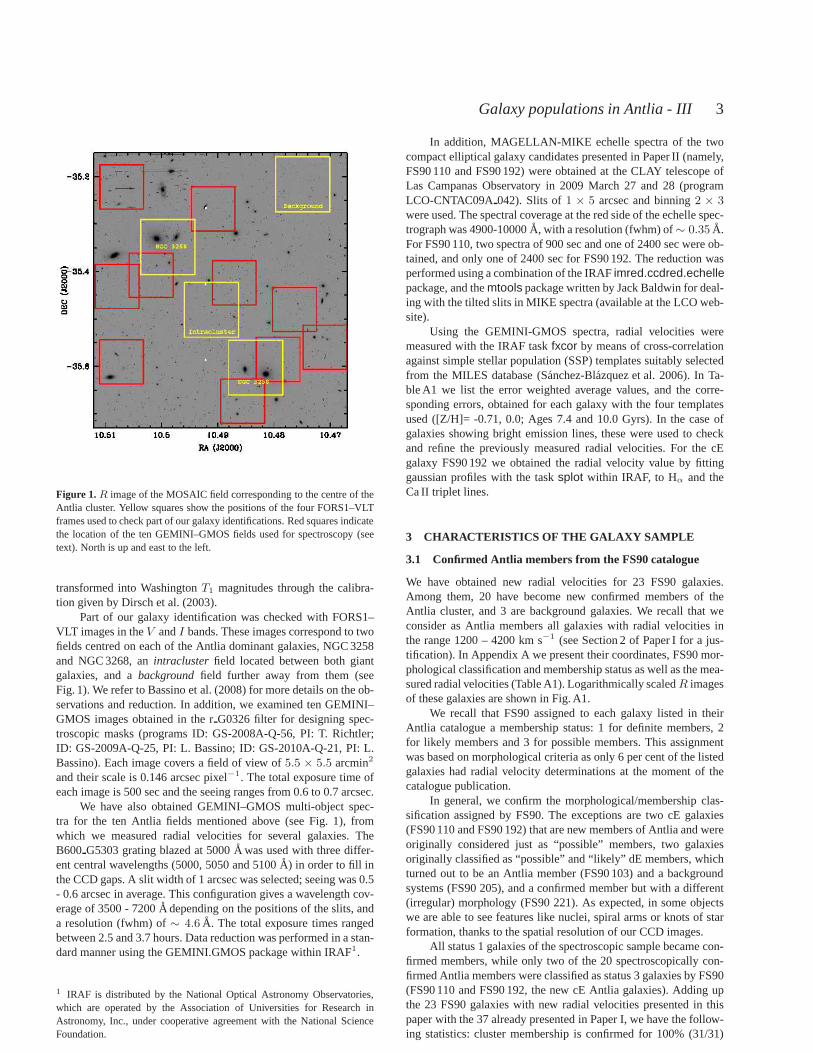
Figure 1.R image of the MOSAIC field corresponding to the centre of theAntlia cluster. Yellow squares show the positions of the four FORS1–VLTframes used to check part of our galaxy identifications. Red squares indicatethe location of the ten GEMINI–GMOS fields used for spectroscopy (seetext). North is up and east to the left.
transformed into WashingtonT1 magnitudes through the calibra-tion given by Dirsch et al. (2003).
Part of our galaxy identification was checked with FORS1–VLT images in theV andI bands. These images correspond to twofields centred on each of the Antlia dominant galaxies, NGC 3258and NGC 3268, anintracluster field located between both giantgalaxies, and abackgroundfield further away from them (seeFig. 1). We refer to Bassino et al. (2008) for more details on the ob-servations and reduction. In addition, we examined ten GEMINI–GMOS images obtained in the rG0326 filter for designing spec-troscopic masks (programs ID: GS-2008A-Q-56, PI: T. Richtler;ID: GS-2009A-Q-25, PI: L. Bassino; ID: GS-2010A-Q-21, PI: L.Bassino). Each image covers a field of view of5.5 × 5.5 arcmin2
and their scale is 0.146 arcsec pixel−1. The total exposure time ofeach image is 500 sec and the seeing ranges from 0.6 to 0.7 arcsec.
We have also obtained GEMINI–GMOS multi-object spec-tra for the ten Antlia fields mentioned above (see Fig. 1), fromwhich we measured radial velocities for several galaxies. TheB600 G5303 grating blazed at 5000A was used with three differ-ent central wavelengths (5000, 5050 and 5100A) in order to fill inthe CCD gaps. A slit width of 1 arcsec was selected; seeing was0.5- 0.6 arcsec in average. This configuration gives a wavelength cov-erage of 3500 - 7200A depending on the positions of the slits, anda resolution (fwhm) of∼ 4.6 A. The total exposure times rangedbetween 2.5 and 3.7 hours. Data reduction was performed in a stan-dard manner using the GEMINI.GMOS package within IRAF1.
1 IRAF is distributed by the National Optical Astronomy Observatories,which are operated by the Association of Universities for Research inAstronomy, Inc., under cooperative agreement with the National ScienceFoundation.
In addition, MAGELLAN-MIKE echelle spectra of the twocompact elliptical galaxy candidates presented in Paper II(namely,FS90 110 and FS90 192) were obtained at the CLAY telescope ofLas Campanas Observatory in 2009 March 27 and 28 (programLCO-CNTAC09A 042). Slits of1 × 5 arcsec and binning2 × 3were used. The spectral coverage at the red side of the echelle spec-trograph was 4900-10000A, with a resolution (fwhm) of∼ 0.35 A.For FS90 110, two spectra of 900 sec and one of 2400 sec were ob-tained, and only one of 2400 sec for FS90 192. The reduction wasperformed using a combination of the IRAFimred.ccdred.echellepackage, and themtools package written by Jack Baldwin for deal-ing with the tilted slits in MIKE spectra (available at the LCO web-site).
Using the GEMINI-GMOS spectra, radial velocities weremeasured with the IRAF taskfxcor by means of cross-correlationagainst simple stellar population (SSP) templates suitably selectedfrom the MILES database (Sanchez-Blazquez et al. 2006). In Ta-ble A1 we list the error weighted average values, and the corre-sponding errors, obtained for each galaxy with the four templatesused ([Z/H]= -0.71, 0.0; Ages 7.4 and 10.0 Gyrs). In the case ofgalaxies showing bright emission lines, these were used to checkand refine the previously measured radial velocities. For the cEgalaxy FS90 192 we obtained the radial velocity value by fittinggaussian profiles with the tasksplot within IRAF, to Hα and theCa II triplet lines.
3 CHARACTERISTICS OF THE GALAXY SAMPLE
3.1 Confirmed Antlia members from the FS90 catalogue
We have obtained new radial velocities for 23 FS90 galaxies.Among them, 20 have become new confirmed members of theAntlia cluster, and 3 are background galaxies. We recall that weconsider as Antlia members all galaxies with radial velocities inthe range 1200 – 4200 km s−1 (see Section 2 of Paper I for a jus-tification). In Appendix A we present their coordinates, FS90 mor-phological classification and membership status as well as the mea-sured radial velocities (Table A1). Logarithmically scaledR imagesof these galaxies are shown in Fig. A1.
We recall that FS90 assigned to each galaxy listed in theirAntlia catalogue a membership status: 1 for definite members, 2for likely members and 3 for possible members. This assignmentwas based on morphological criteria as only 6 per cent of the listedgalaxies had radial velocity determinations at the moment of thecatalogue publication.
In general, we confirm the morphological/membership clas-sification assigned by FS90. The exceptions are two cE galaxies(FS90 110 and FS90 192) that are new members of Antlia and wereoriginally considered just as “possible” members, two galaxiesoriginally classified as “possible” and “likely” dE members, whichturned out to be an Antlia member (FS90 103) and a backgroundsystems (FS90 205), and a confirmed member but with a different(irregular) morphology (FS90 221). As expected, in some objectswe are able to see features like nuclei, spiral arms or knots of starformation, thanks to the spatial resolution of our CCD images.
All status 1 galaxies of the spectroscopic sample became con-firmed members, while only two of the 20 spectroscopically con-firmed Antlia members were classified as status 3 galaxies by FS90(FS90 110 and FS90 192, the new cE Antlia galaxies). Adding upthe 23 FS90 galaxies with new radial velocities presented inthispaper with the 37 already presented in Paper I, we have the follow-ing statistics: cluster membership is confirmed for 100% (31/31)
4 Smith Castelli et al.
of FS90 status 1 galaxies, 81% (13/16) of status 2 ones, and 54%(7/13) of status 3 objects. This agrees with previous works in theNGC 5044 Group (Cellone & Buzzoni 2005; Mendel et al. 2008),showing that morphologically assigned memberships are still reli-able (mainly for diffuse dwarfs) out to distances of∼ 35Mpc.
With the addition of the new data, we will revisit the photo-metric relations of early-type galaxies in the central region of Antliaconsidering spectroscopically confirmed FS90 members and FS90galaxies with membership status 1 displaying early-type morpholo-gies. This criterion will allow us to extend the CMR relationdownto MT1
≈ −13mag, minimizing contamination by backgroundgalaxies lacking radial velocities in this subsample.
We have measured with the task ELLIPSE within IRAF somegalaxies presented with SExtractor (Bertin & Arnouts 1996)pho-tometry in Paper I (see Table C1) in order to compare the mea-surements obtained with these two softwares (see Appendix C). Asbright galaxies were all measured with ELLIPSE due to saturationin their central regions (see Paper I for details), we will considerthese new photometry in our diagrams and in the different fitsper-formed to the photometric relations.
3.2 New dE members
We have obtained radial velocities for five new Antlia members thatwere not in the FS90 catalogue. Their radial velocities and photo-metric parameters are given in Table B1. In Fig. B1 we show thelogarithmically scaledR images of these galaxies.
All of them show what seems to be a nucleus. This is a se-lection effect, as a bright central nucleus turns out to be necessaryfor obtaining reliable radial velocities from absorption-line spec-tra of faint diffuse galaxies. Our spectroscopic data include otherlow-surface brightness objects without nuclei for which itwas notpossible to obtain a redshift. Their photometric data were obtainedthrough SExtractor or ELLIPSE, depending if the object was de-tected by the former software or not.
The new members are not catalogued in NED. Therefore,we will refer to them with the acronym ANTL followed by theJ2000 coordinates, that isANTL Jhhmmss−ddmmss, accordingto the IAU recommendations for designating new sources (seehttp://vizier.u-strasbg.fr/Dic/how.html).
3.3 New dE and dSph candidates without redshifts
We have performed a visual search on theR MOSAIC image fornew dwarf galaxy candidates based on morphological criteria. Welooked for extended objects displaying low-surface brightnesses,that do not show substructure or evidence of star formation in theC MOSAIC frame. For those objects falling into the deeper FORSand GMOS frames, we have also checked their morphologies byexamining their appearance in these deeper images.
As these galaxies are not included in NED, we will designatethem in the same way as new dE Antlia members. We present theirimages in Fig. B2. We obtained integrated magnitudes and coloursfor all but one of the 16 new dwarf systems (see Table B2). Thesemeasurements were performed in the way described in section2of Paper I through SExtractor and ELLIPSE, or with PHOT withinIRAF. The seven candidates that have no structural parameters de-terminations are either too faint and diffuse, or are located nearbright galaxies or stars which prevented a more exhaustive photo-metric analysis.
In particular, we are interested in identifying counterparts of
0.5 1 1.5 2 2.5
20
15
10
-10
-15
-20
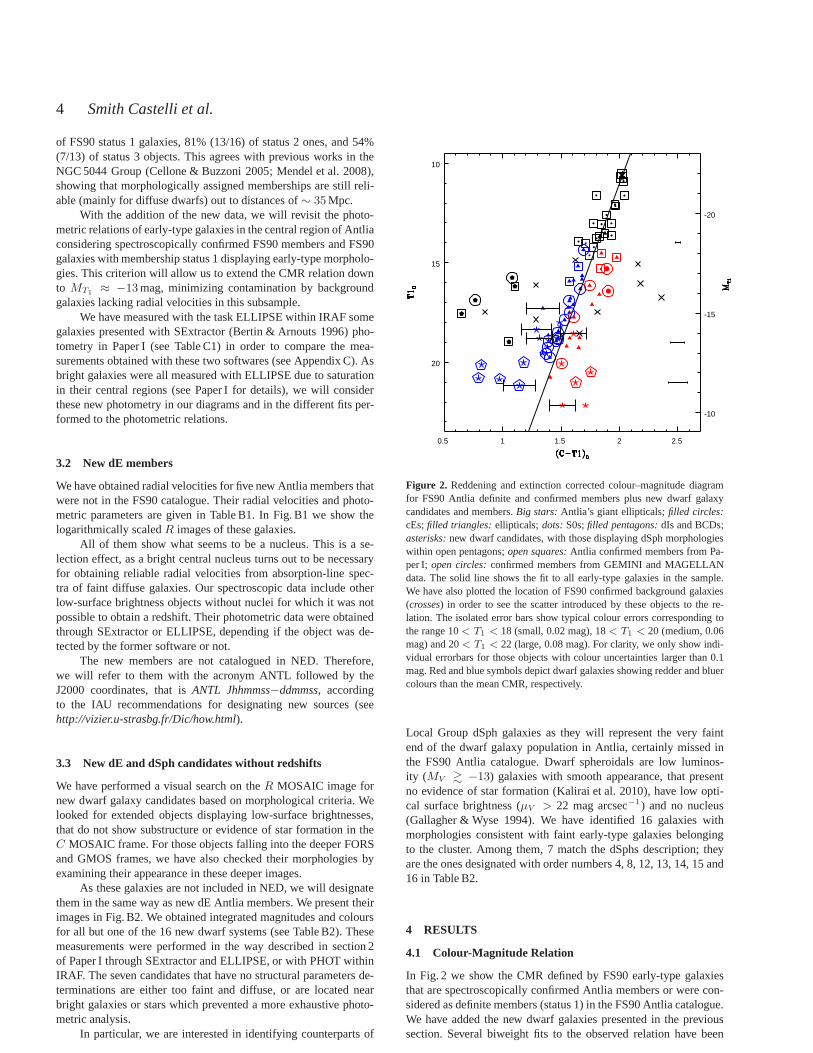
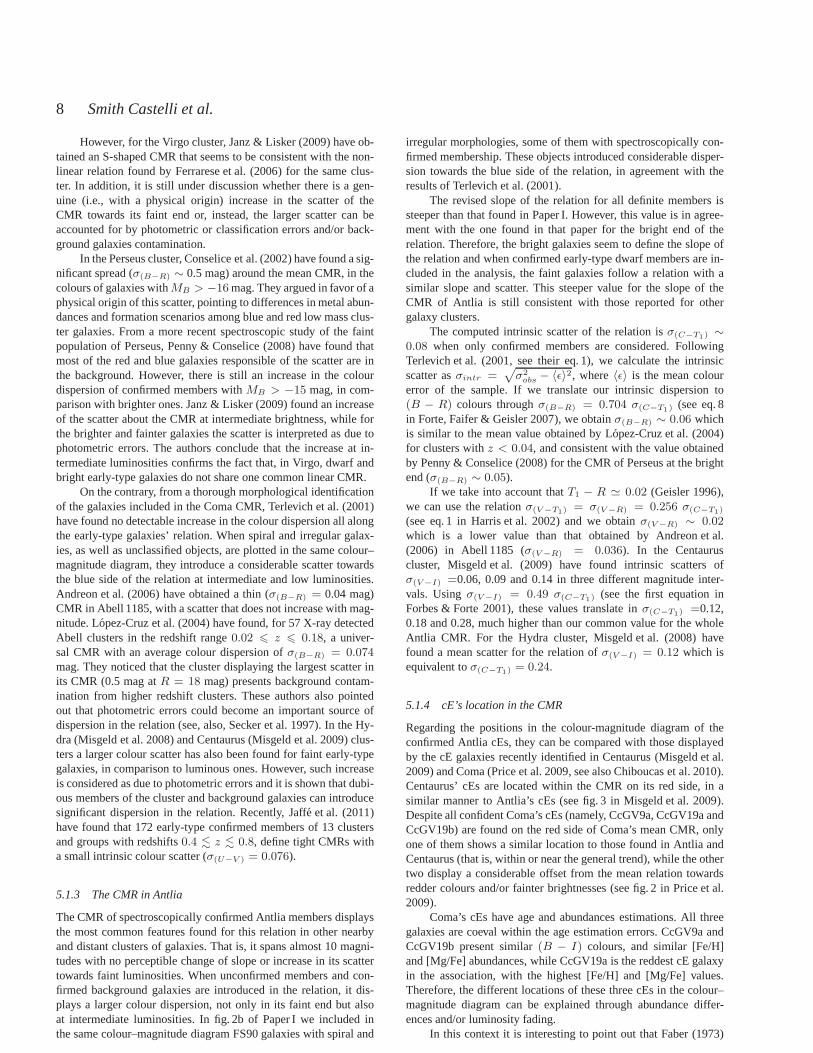
Figure 2. Reddening and extinction corrected colour–magnitude diagramfor FS90 Antlia definite and confirmed members plus new dwarf galaxycandidates and members.Big stars:Antlia’s giant ellipticals;filled circles:cEs;filled triangles:ellipticals; dots:S0s;filled pentagons:dIs and BCDs;asterisks:new dwarf candidates, with those displaying dSph morphologieswithin open pentagons;open squares:Antlia confirmed members from Pa-per I; open circles:confirmed members from GEMINI and MAGELLANdata. The solid line shows the fit to all early-type galaxies in the sample.We have also plotted the location of FS90 confirmed background galaxies(crosses) in order to see the scatter introduced by these objects to the re-lation. The isolated error bars show typical colour errors corresponding tothe range 10< T1 < 18 (small, 0.02 mag), 18< T1 < 20 (medium, 0.06mag) and 20< T1 < 22 (large, 0.08 mag). For clarity, we only show indi-vidual errorbars for those objects with colour uncertainties larger than 0.1mag. Red and blue symbols depict dwarf galaxies showing redder and bluercolours than the mean CMR, respectively.
Local Group dSph galaxies as they will represent the very faintend of the dwarf galaxy population in Antlia, certainly missed inthe FS90 Antlia catalogue. Dwarf spheroidals are low luminos-ity (MV & −13) galaxies with smooth appearance, that presentno evidence of star formation (Kalirai et al. 2010), have lowopti-cal surface brightness (µV > 22 mag arcsec−1) and no nucleus(Gallagher & Wyse 1994). We have identified 16 galaxies withmorphologies consistent with faint early-type galaxies belongingto the cluster. Among them, 7 match the dSphs description; theyare the ones designated with order numbers 4, 8, 12, 13, 14, 15and16 in Table B2.
4 RESULTS
4.1 Colour-Magnitude Relation
In Fig. 2 we show the CMR defined by FS90 early-type galaxiesthat are spectroscopically confirmed Antlia members or werecon-sidered as definite members (status 1) in the FS90 Antlia catalogue.We have added the new dwarf galaxies presented in the previoussection. Several biweight fits to the observed relation havebeen

Galaxy populations in Antlia - III 5
Table 1. Results of least-square biweight fitsT10 = a + b · (C − T1)0 performed to the absorption and extinction corrected CMR ofearly-type definitemembers of Antlia (i.e. FS90 early-type status 1 objects andearly-type galaxies with radial velocities). The first column indicates the different samples andthe second column gives the number of data points. Slopes andzero-points given in the third and four columns correspond to reddening and extinctioncorrected mean CMRs. In the fifth column we show the observed scatter around the mean relation for each sample. In the sixthcolumn we indicate thecorresponding mean colour error〈ǫ〉. Following Terlevich, Caldwell & Bower (2001, see their eq.1), we calculate the intrinsic scatter, given in the last
column, asσintr =√
σ2obs
− 〈ǫ〉2, where〈ǫ〉 is the mean colour error of the sample. The adopted limiting magnitude to separate bright and dwarf galaxies
(T1 = 14 mag) corresponds toMV ∼ −18 mag (Grebel 2005).
Sample Data a b σ(C−T1)0 〈ǫ(C−T1)0 〉 σ(C−T1)0observed intrinsic
All definite+confirmed members 58 43.2± 2.7 −16.1± 1.5 0.10 0.03 0.09Dwarf definite+confirmed members 43 44.7± 5.7 −17.0± 3.5 0.11 0.04 0.10E definite+confirmed members 42 41.6± 3.3 −15.1± 1.9 0.10 0.04 0.09All confirmed members 42 43.0± 3.4 −16.0± 1.9 0.09 0.03 0.08Bright confirmed members 15 44.5± 10.4 −16.7± 4.8 0.06 0.02 0.06Dwarf confirmed members 27 43.6± 8.0 −16.4± 4.3 0.10 0.03 0.09Dwarf confirmed members no cEs 25 42.2± 5.9 −15.8± 3.3 0.08 0.03 0.07E confirmed members 26 41.2± 4.2 −14.8± 2.3 0.09 0.03 0.08E confirmed members no cEs 24 39.7± 2.9 −14.2± 1.6 0.07 0.03 0.06S0 confirmed members 16 40.4± 8.5 −14.7± 4.1 0.08 0.02 0.07
performed, some of them considering only spectroscopically con-firmed members (see Table 1). Following Grebel (2005), we willconsider as dwarf galaxies those withMV ∼ −18 mag, which cor-responds toT1 > 14 mag at the Antlia distance (see table 3a fromFukugita, Shimasaku & Ichikawa 1995). In order to test the resultsfound by Barazza et al. (2009) in Abell 901/902 regarding theex-istence of a colour–density relation in the projected radial distribu-tion, we divided our dwarf galaxy sample into systems displayingredder and bluer colours than the mean CMR.
From Fig. 2 and Table 1, we can see that spectroscopicallyconfirmed members define a tight relation down toT10 = 20 magwith no change of slope or increase in the scatter. The new dwarfgalaxy candidates seem to extend the relation down toT10 > 22mag, although introducing a considerable dispersion in theCMR atits very faint end. In particular, dSph candidates tend to increase thescatter towards bluer colours than the mean relation. In comparisonwith the results presented in Paper I, the CMR gets slightly steeperwith the addition of the new confirmed members. When FS90 nonconfirmed members are included in the fit, both the slope of theCMR and its scatter increase.
The selection of the spectroscopic targets was performed in-dependently of their location in the photometric relationsanalyzedin this paper. The GEMINI-GMOS fields were chosen to includeas many FS90 galaxy candidates as possible. Therefore, it isre-markable that all early-type confirmed members suite so wellinthe CMR. In addition, we can see that spectroscopically confirmedbackground galaxies included in the FS90 Antlia catalogue,as wellas dI and BCD confirmed members, would introduce a substantialdispersion to the relation if they were wrongly considered as early-type cluster members.
The new confirmed cE galaxies share the same CMR as “nor-mal” early-type dwarf galaxies. However, as can be seen fromthedata included in Table 1, they increase the dispersion of therela-tion defined by dwarf confirmed members towards the red side ofthe colour-magnitude diagram. When these peculiar galaxies areexcluded from the fit, faint early-type members define a CMR with
a similar scatter to that traced by bright ones. The locationof bothcEs in the CMR diagram is consistent with a luminosity fading(≈ 2.8mag for FS90 110, and≈ 3.7mag for FS90 192) at con-stant colour.
4.2 Surface brightness-Luminosity Relation
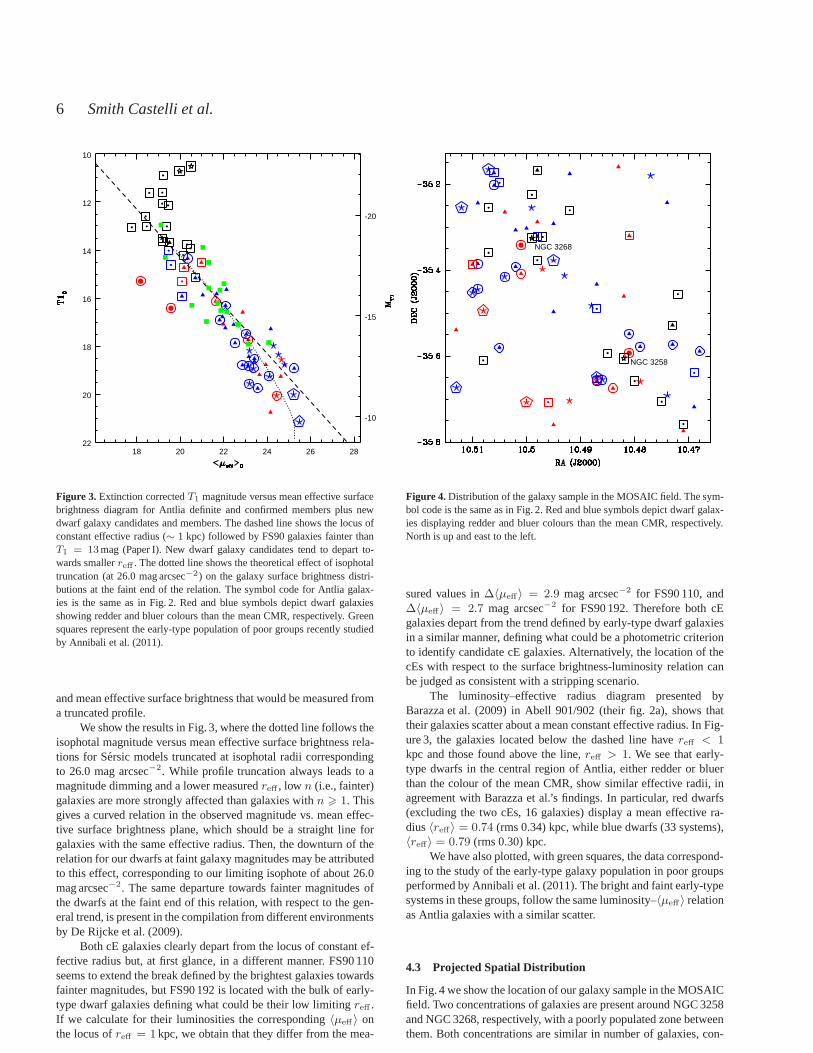
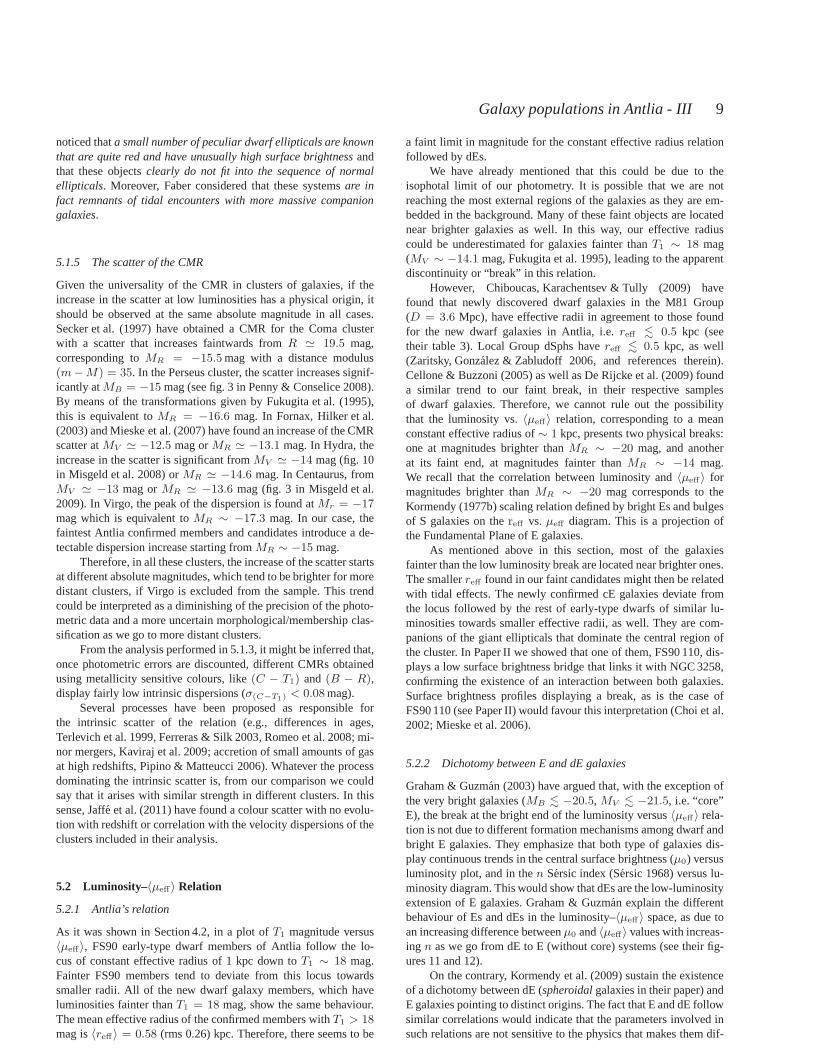
In Fig. 3 we present the revised luminosity–〈µeff 〉 relation of FS90Antlia definite and confirmed members, and new dwarf candidatesand members. We show, as a dashed line, the locus of constanteffective radius (reff ∼ 1 kpc) found for galaxies fainter thanT10 = 13 mag in Paper I. Recall that lines parallel to this locustowards fainter luminosities correspond to smaller effective radii(see eq. 1 in Paper I).
For our new sample of dwarf early-type members and candi-dates, we obtain a mean effective radius of〈reff〉 = 0.81 (rms 0.31)kpc, considering 57 galaxies withT10 > 13 mag and excluding thetwo cEs which represent extreme cases. However, we see that bothFS90 and new confirmed members fainter thanT10 ∼ 18 mag tendto depart from the linear relation towards smaller effective radii.When only dwarf galaxies in the range13 < T10 < 18 are con-sidered, the mean effective radius increases to〈reff〉 = 0.93 (rms0.28) kpc.
One possible explanation for the faint break is that it arisesdue to the isophotal limit of our photometry, which causes differ-ent fractions of galaxy luminosity to be lost outside the limitingisophote for galaxies with different profile shapes. In order to quan-tify this effect, we considered a set of Sersic models spanning an ap-propriate magnitude range, with shape parameters (n) following theluminosity – shape relation given by Graham & Guzman (2003,seetheir fig. 10). We fixed the effective radii of all the models at1 kpc(5.87 arcsec at the Antlia cluster distance), and we then computedfor each model the fraction of light lost outside the limiting ra-dius, and the effective radius “measured” from the truncated profile(see Trujillo, Graham & Caon 2001, for the relevant expressions).We thus obtained for each model the values of isophotal magnitude
6 Smith Castelli et al.
18 20 22 24 26 2822
20
18
16
14
12
10
-10
-15
-20
Figure 3. Extinction correctedT1 magnitude versus mean effective surfacebrightness diagram for Antlia definite and confirmed membersplus newdwarf galaxy candidates and members. The dashed line shows the locus ofconstant effective radius (∼ 1 kpc) followed by FS90 galaxies fainter thanT1 = 13mag (Paper I). New dwarf galaxy candidates tend to depart to-wards smallerreff . The dotted line shows the theoretical effect of isophotaltruncation (at 26.0 mag arcsec−2) on the galaxy surface brightness distri-butions at the faint end of the relation. The symbol code for Antlia galax-ies is the same as in Fig. 2. Red and blue symbols depict dwarf galaxiesshowing redder and bluer colours than the mean CMR, respectively. Greensquares represent the early-type population of poor groupsrecently studiedby Annibali et al. (2011).
and mean effective surface brightness that would be measured froma truncated profile.
We show the results in Fig. 3, where the dotted line follows theisophotal magnitude versus mean effective surface brightness rela-tions for Sersic models truncated at isophotal radii correspondingto 26.0 mag arcsec−2. While profile truncation always leads to amagnitude dimming and a lower measuredreff , low n (i.e., fainter)galaxies are more strongly affected than galaxies withn > 1. Thisgives a curved relation in the observed magnitude vs. mean effec-tive surface brightness plane, which should be a straight line forgalaxies with the same effective radius. Then, the downturnof therelation for our dwarfs at faint galaxy magnitudes may be attributedto this effect, corresponding to our limiting isophote of about 26.0mag arcsec−2. The same departure towards fainter magnitudes ofthe dwarfs at the faint end of this relation, with respect to the gen-eral trend, is present in the compilation from different environmentsby De Rijcke et al. (2009).
Both cE galaxies clearly depart from the locus of constant ef-fective radius but, at first glance, in a different manner. FS90 110seems to extend the break defined by the brightest galaxies towardsfainter magnitudes, but FS90 192 is located with the bulk of early-type dwarf galaxies defining what could be their low limitingreff .If we calculate for their luminosities the corresponding〈µeff〉 onthe locus ofreff = 1 kpc, we obtain that they differ from the mea-
NGC 3268
NGC 3258
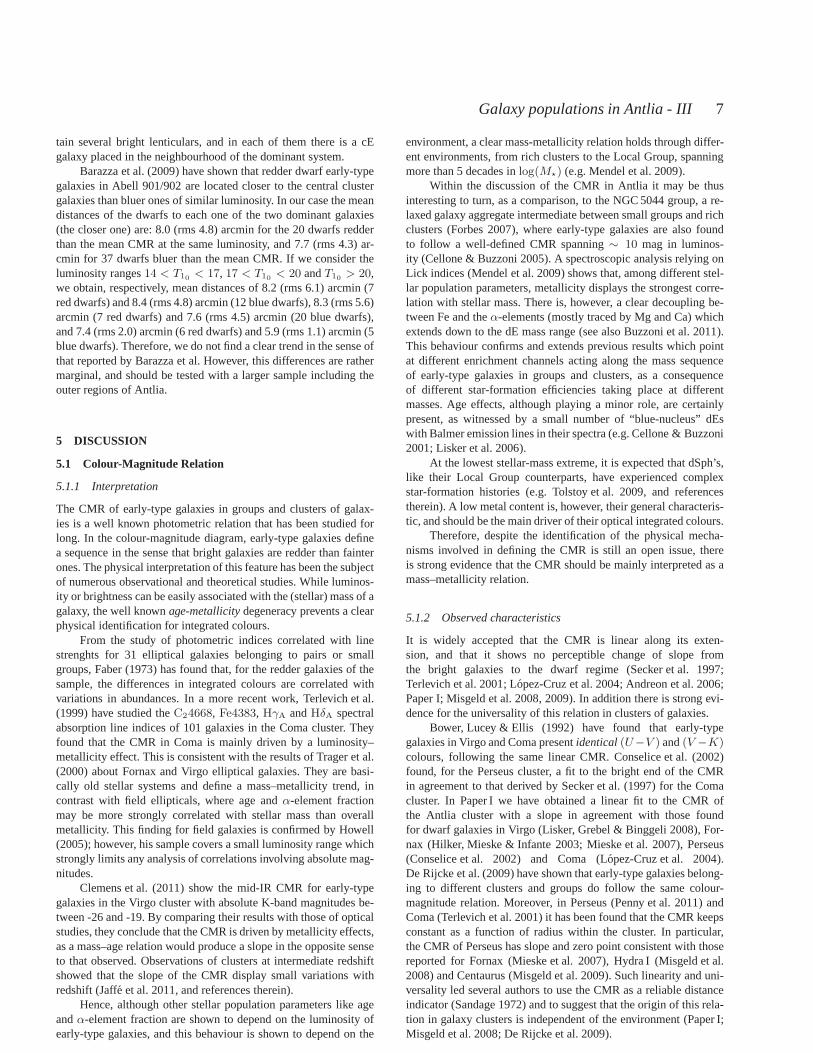
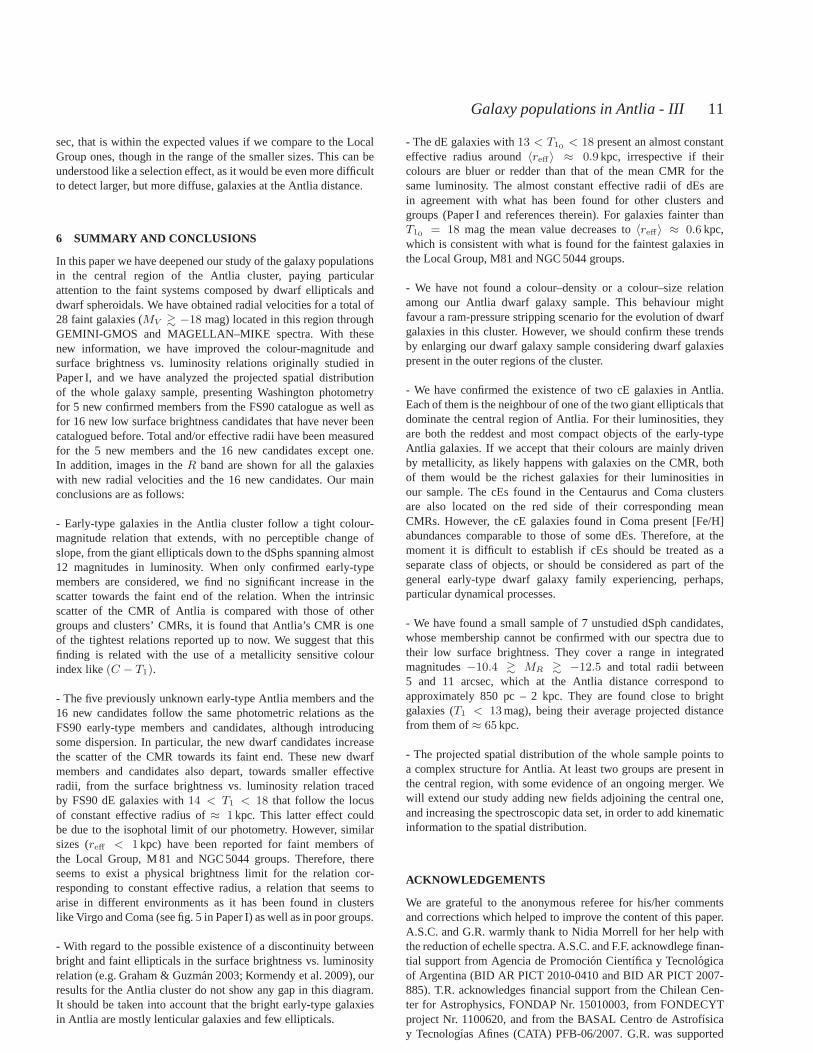
Figure 4.Distribution of the galaxy sample in the MOSAIC field. The sym-bol code is the same as in Fig. 2. Red and blue symbols depict dwarf galax-ies displaying redder and bluer colours than the mean CMR, respectively.North is up and east to the left.
sured values in∆〈µeff〉 = 2.9 mag arcsec−2 for FS90 110, and∆〈µeff〉 = 2.7 mag arcsec−2 for FS90 192. Therefore both cEgalaxies depart from the trend defined by early-type dwarf galaxiesin a similar manner, defining what could be a photometric criterionto identify candidate cE galaxies. Alternatively, the location of thecEs with respect to the surface brightness-luminosity relation canbe judged as consistent with a stripping scenario.
The luminosity–effective radius diagram presented byBarazza et al. (2009) in Abell 901/902 (their fig. 2a), shows thattheir galaxies scatter about a mean constant effective radius. In Fig-ure 3, the galaxies located below the dashed line havereff < 1kpc and those found above the line,reff > 1. We see that early-type dwarfs in the central region of Antlia, either redder orbluerthan the colour of the mean CMR, show similar effective radii, inagreement with Barazza et al.’s findings. In particular, reddwarfs(excluding the two cEs, 16 galaxies) display a mean effective ra-dius〈reff〉 = 0.74 (rms 0.34) kpc, while blue dwarfs (33 systems),〈reff〉 = 0.79 (rms 0.30) kpc.
We have also plotted, with green squares, the data correspond-ing to the study of the early-type galaxy population in poor groupsperformed by Annibali et al. (2011). The bright and faint early-typesystems in these groups, follow the same luminosity–〈µeff 〉 relationas Antlia galaxies with a similar scatter.
4.3 Projected Spatial Distribution
In Fig. 4 we show the location of our galaxy sample in the MOSAICfield. Two concentrations of galaxies are present around NGC3258and NGC 3268, respectively, with a poorly populated zone betweenthem. Both concentrations are similar in number of galaxies, con-
Galaxy populations in Antlia - III 7
tain several bright lenticulars, and in each of them there isa cEgalaxy placed in the neighbourhood of the dominant system.
Barazza et al. (2009) have shown that redder dwarf early-typegalaxies in Abell 901/902 are located closer to the central clustergalaxies than bluer ones of similar luminosity. In our case the meandistances of the dwarfs to each one of the two dominant galaxies(the closer one) are: 8.0 (rms 4.8) arcmin for the 20 dwarfs redderthan the mean CMR at the same luminosity, and 7.7 (rms 4.3) ar-cmin for 37 dwarfs bluer than the mean CMR. If we consider theluminosity ranges14 < T10 < 17, 17 < T10 < 20 andT10 > 20,we obtain, respectively, mean distances of 8.2 (rms 6.1) arcmin (7red dwarfs) and 8.4 (rms 4.8) arcmin (12 blue dwarfs), 8.3 (rms 5.6)arcmin (7 red dwarfs) and 7.6 (rms 4.5) arcmin (20 blue dwarfs),and 7.4 (rms 2.0) arcmin (6 red dwarfs) and 5.9 (rms 1.1) arcmin (5blue dwarfs). Therefore, we do not find a clear trend in the sense ofthat reported by Barazza et al. However, this differences are rathermarginal, and should be tested with a larger sample including theouter regions of Antlia.
5 DISCUSSION
5.1 Colour-Magnitude Relation
5.1.1 Interpretation
The CMR of early-type galaxies in groups and clusters of galax-ies is a well known photometric relation that has been studied forlong. In the colour-magnitude diagram, early-type galaxies definea sequence in the sense that bright galaxies are redder than fainterones. The physical interpretation of this feature has been the subjectof numerous observational and theoretical studies. While luminos-ity or brightness can be easily associated with the (stellar) mass of agalaxy, the well knownage-metallicitydegeneracy prevents a clearphysical identification for integrated colours.
From the study of photometric indices correlated with linestrenghts for 31 elliptical galaxies belonging to pairs or smallgroups, Faber (1973) has found that, for the redder galaxiesof thesample, the differences in integrated colours are correlated withvariations in abundances. In a more recent work, Terlevich et al.(1999) have studied theC24668, Fe4383, HγA andHδA spectralabsorption line indices of 101 galaxies in the Coma cluster.Theyfound that the CMR in Coma is mainly driven by a luminosity–metallicity effect. This is consistent with the results of Trager et al.(2000) about Fornax and Virgo elliptical galaxies. They arebasi-cally old stellar systems and define a mass–metallicity trend, incontrast with field ellipticals, where age andα-element fractionmay be more strongly correlated with stellar mass than overallmetallicity. This finding for field galaxies is confirmed by Howell(2005); however, his sample covers a small luminosity rangewhichstrongly limits any analysis of correlations involving absolute mag-nitudes.
Clemens et al. (2011) show the mid-IR CMR for early-typegalaxies in the Virgo cluster with absolute K-band magnitudes be-tween -26 and -19. By comparing their results with those of opticalstudies, they conclude that the CMR is driven by metallicityeffects,as a mass–age relation would produce a slope in the opposite senseto that observed. Observations of clusters at intermediateredshiftshowed that the slope of the CMR display small variations withredshift (Jaffe et al. 2011, and references therein).
Hence, although other stellar population parameters like ageandα-element fraction are shown to depend on the luminosity ofearly-type galaxies, and this behaviour is shown to depend on the
environment, a clear mass-metallicity relation holds through differ-ent environments, from rich clusters to the Local Group, spanningmore than 5 decades inlog(M⋆) (e.g. Mendel et al. 2009).
Within the discussion of the CMR in Antlia it may be thusinteresting to turn, as a comparison, to the NGC 5044 group, are-laxed galaxy aggregate intermediate between small groups and richclusters (Forbes 2007), where early-type galaxies are alsofoundto follow a well-defined CMR spanning∼ 10 mag in luminos-ity (Cellone & Buzzoni 2005). A spectroscopic analysis relying onLick indices (Mendel et al. 2009) shows that, among different stel-lar population parameters, metallicity displays the strongest corre-lation with stellar mass. There is, however, a clear decoupling be-tween Fe and theα-elements (mostly traced by Mg and Ca) whichextends down to the dE mass range (see also Buzzoni et al. 2011).This behaviour confirms and extends previous results which pointat different enrichment channels acting along the mass sequenceof early-type galaxies in groups and clusters, as a consequenceof different star-formation efficiencies taking place at differentmasses. Age effects, although playing a minor role, are certainlypresent, as witnessed by a small number of “blue-nucleus” dEswith Balmer emission lines in their spectra (e.g. Cellone & Buzzoni2001; Lisker et al. 2006).
At the lowest stellar-mass extreme, it is expected that dSph’s,like their Local Group counterparts, have experienced complexstar-formation histories (e.g. Tolstoy et al. 2009, and referencestherein). A low metal content is, however, their general characteris-tic, and should be the main driver of their optical integrated colours.
Therefore, despite the identification of the physical mecha-nisms involved in defining the CMR is still an open issue, thereis strong evidence that the CMR should be mainly interpretedas amass–metallicity relation.
5.1.2 Observed characteristics
It is widely accepted that the CMR is linear along its exten-sion, and that it shows no perceptible change of slope fromthe bright galaxies to the dwarf regime (Secker et al. 1997;Terlevich et al. 2001; Lopez-Cruz et al. 2004; Andreon et al. 2006;Paper I; Misgeld et al. 2008, 2009). In addition there is strong evi-dence for the universality of this relation in clusters of galaxies.
Bower, Lucey & Ellis (1992) have found that early-typegalaxies in Virgo and Coma presentidentical(U−V ) and(V −K)colours, following the same linear CMR. Conselice et al. (2002)found, for the Perseus cluster, a fit to the bright end of the CMRin agreement to that derived by Secker et al. (1997) for the Comacluster. In Paper I we have obtained a linear fit to the CMR ofthe Antlia cluster with a slope in agreement with those foundfor dwarf galaxies in Virgo (Lisker, Grebel & Binggeli 2008), For-nax (Hilker, Mieske & Infante 2003; Mieske et al. 2007), Perseus(Conselice et al. 2002) and Coma (Lopez-Cruz et al. 2004).De Rijcke et al. (2009) have shown that early-type galaxies belong-ing to different clusters and groups do follow the same colour-magnitude relation. Moreover, in Perseus (Penny et al. 2011) andComa (Terlevich et al. 2001) it has been found that the CMR keepsconstant as a function of radius within the cluster. In particular,the CMR of Perseus has slope and zero point consistent with thosereported for Fornax (Mieske et al. 2007), Hydra I (Misgeld etal.2008) and Centaurus (Misgeld et al. 2009). Such linearity and uni-versality led several authors to use the CMR as a reliable distanceindicator (Sandage 1972) and to suggest that the origin of this rela-tion in galaxy clusters is independent of the environment (Paper I;Misgeld et al. 2008; De Rijcke et al. 2009).
8 Smith Castelli et al.
However, for the Virgo cluster, Janz & Lisker (2009) have ob-tained an S-shaped CMR that seems to be consistent with the non-linear relation found by Ferrarese et al. (2006) for the sameclus-ter. In addition, it is still under discussion whether thereis a gen-uine (i.e., with a physical origin) increase in the scatter of theCMR towards its faint end or, instead, the larger scatter canbeaccounted for by photometric or classification errors and/or back-ground galaxies contamination.
In the Perseus cluster, Conselice et al. (2002) have found a sig-nificant spread (σ(B−R) ∼ 0.5 mag) around the mean CMR, in thecolours of galaxies withMB > −16 mag. They argued in favor of aphysical origin of this scatter, pointing to differences inmetal abun-dances and formation scenarios among blue and red low mass clus-ter galaxies. From a more recent spectroscopic study of the faintpopulation of Perseus, Penny & Conselice (2008) have found thatmost of the red and blue galaxies responsible of the scatter are inthe background. However, there is still an increase in the colourdispersion of confirmed members withMB > −15 mag, in com-parison with brighter ones. Janz & Lisker (2009) found an increaseof the scatter about the CMR at intermediate brightness, while forthe brighter and fainter galaxies the scatter is interpreted as due tophotometric errors. The authors conclude that the increaseat in-termediate luminosities confirms the fact that, in Virgo, dwarf andbright early-type galaxies do not share one common linear CMR.
On the contrary, from a thorough morphological identificationof the galaxies included in the Coma CMR, Terlevich et al. (2001)have found no detectable increase in the colour dispersion all alongthe early-type galaxies’ relation. When spiral and irregular galax-ies, as well as unclassified objects, are plotted in the same colour–magnitude diagram, they introduce a considerable scatter towardsthe blue side of the relation at intermediate and low luminosities.Andreon et al. (2006) have obtained a thin (σ(B−R) = 0.04 mag)CMR in Abell 1185, with a scatter that does not increase with mag-nitude. Lopez-Cruz et al. (2004) have found, for 57 X-ray detectedAbell clusters in the redshift range0.02 6 z 6 0.18, a univer-sal CMR with an average colour dispersion ofσ(B−R) = 0.074mag. They noticed that the cluster displaying the largest scatter inits CMR (0.5 mag atR = 18 mag) presents background contam-ination from higher redshift clusters. These authors also pointedout that photometric errors could become an important source ofdispersion in the relation (see, also, Secker et al. 1997). In the Hy-dra (Misgeld et al. 2008) and Centaurus (Misgeld et al. 2009)clus-ters a larger colour scatter has also been found for faint early-typegalaxies, in comparison to luminous ones. However, such increaseis considered as due to photometric errors and it is shown that dubi-ous members of the cluster and background galaxies can introducesignificant dispersion in the relation. Recently, Jaffe etal. (2011)have found that 172 early-type confirmed members of 13 clustersand groups with redshifts0.4 . z . 0.8, define tight CMRs witha small intrinsic colour scatter (σ(U−V ) = 0.076).
5.1.3 The CMR in Antlia
The CMR of spectroscopically confirmed Antlia members displaysthe most common features found for this relation in other nearbyand distant clusters of galaxies. That is, it spans almost 10magni-tudes with no perceptible change of slope or increase in its scattertowards faint luminosities. When unconfirmed members and con-firmed background galaxies are introduced in the relation, it dis-plays a larger colour dispersion, not only in its faint end but alsoat intermediate luminosities. In fig. 2b of Paper I we included inthe same colour–magnitude diagram FS90 galaxies with spiral and
irregular morphologies, some of them with spectroscopically con-firmed membership. These objects introduced considerable disper-sion towards the blue side of the relation, in agreement withtheresults of Terlevich et al. (2001).
The revised slope of the relation for all definite members issteeper than that found in Paper I. However, this value is in agree-ment with the one found in that paper for the bright end of therelation. Therefore, the bright galaxies seem to define the slope ofthe relation and when confirmed early-type dwarf members arein-cluded in the analysis, the faint galaxies follow a relationwith asimilar slope and scatter. This steeper value for the slope of theCMR of Antlia is still consistent with those reported for othergalaxy clusters.
The computed intrinsic scatter of the relation isσ(C−T1) ∼0.08 when only confirmed members are considered. FollowingTerlevich et al. (2001, see their eq. 1), we calculate the intrinsicscatter asσintr =
√
σ2obs − 〈ǫ〉2, where〈ǫ〉 is the mean colour
error of the sample. If we translate our intrinsic dispersion to(B − R) colours throughσ(B−R) = 0.704 σ(C−T1) (see eq. 8in Forte, Faifer & Geisler 2007), we obtainσ(B−R) ∼ 0.06 whichis similar to the mean value obtained by Lopez-Cruz et al. (2004)for clusters withz < 0.04, and consistent with the value obtainedby Penny & Conselice (2008) for the CMR of Perseus at the brightend (σ(B−R) ∼ 0.05).
If we take into account thatT1 − R ≃ 0.02 (Geisler 1996),we can use the relationσ(V −T1) = σ(V −R) = 0.256 σ(C−T1)
(see eq. 1 in Harris et al. 2002) and we obtainσ(V −R) ∼ 0.02which is a lower value than that obtained by Andreon et al.(2006) in Abell 1185 (σ(V −R) = 0.036). In the Centauruscluster, Misgeld et al. (2009) have found intrinsic scatters ofσ(V −I) =0.06, 0.09 and 0.14 in three different magnitude inter-vals. Usingσ(V −I) = 0.49 σ(C−T1) (see the first equation inForbes & Forte 2001), these values translate inσ(C−T1) =0.12,0.18 and 0.28, much higher than our common value for the wholeAntlia CMR. For the Hydra cluster, Misgeld et al. (2008) havefound a mean scatter for the relation ofσ(V −I) = 0.12 which isequivalent toσ(C−T1) = 0.24.
5.1.4 cE’s location in the CMR
Regarding the positions in the colour-magnitude diagram oftheconfirmed Antlia cEs, they can be compared with those displayedby the cE galaxies recently identified in Centaurus (Misgeldet al.2009) and Coma (Price et al. 2009, see also Chiboucas et al. 2010).Centaurus’ cEs are located within the CMR on its red side, in asimilar manner to Antlia’s cEs (see fig. 3 in Misgeld et al. 2009).Despite all confident Coma’s cEs (namely, CcGV9a, CcGV19a andCcGV19b) are found on the red side of Coma’s mean CMR, onlyone of them shows a similar location to those found in Antlia andCentaurus (that is, within or near the general trend), whilethe othertwo display a considerable offset from the mean relation towardsredder colours and/or fainter brightnesses (see fig. 2 in Price et al.2009).
Coma’s cEs have age and abundances estimations. All threegalaxies are coeval within the age estimation errors. CcGV9a andCcGV19b present similar(B − I) colours, and similar [Fe/H]and [Mg/Fe] abundances, while CcGV19a is the reddest cE galaxyin the association, with the highest [Fe/H] and [Mg/Fe] values.Therefore, the different locations of these three cEs in thecolour–magnitude diagram can be explained through abundance differ-ences and/or luminosity fading.
In this context it is interesting to point out that Faber (1973)
Galaxy populations in Antlia - III 9
noticed thata small number of peculiar dwarf ellipticals are knownthat are quite red and have unusually high surface brightness andthat these objectsclearly do not fit into the sequence of normalellipticals. Moreover, Faber considered that these systemsare infact remnants of tidal encounters with more massive companiongalaxies.
5.1.5 The scatter of the CMR
Given the universality of the CMR in clusters of galaxies, iftheincrease in the scatter at low luminosities has a physical origin, itshould be observed at the same absolute magnitude in all cases.Secker et al. (1997) have obtained a CMR for the Coma clusterwith a scatter that increases faintwards fromR ≃ 19.5 mag,corresponding toMR = −15.5mag with a distance modulus(m−M) = 35. In the Perseus cluster, the scatter increases signif-icantly atMB = −15 mag (see fig. 3 in Penny & Conselice 2008).By means of the transformations given by Fukugita et al. (1995),this is equivalent toMR = −16.6 mag. In Fornax, Hilker et al.(2003) and Mieske et al. (2007) have found an increase of the CMRscatter atMV ≃ −12.5 mag orMR ≃ −13.1 mag. In Hydra, theincrease in the scatter is significant fromMV ≃ −14 mag (fig. 10in Misgeld et al. 2008) orMR ≃ −14.6 mag. In Centaurus, fromMV ≃ −13 mag orMR ≃ −13.6 mag (fig. 3 in Misgeld et al.2009). In Virgo, the peak of the dispersion is found atMr = −17mag which is equivalent toMR ∼ −17.3 mag. In our case, thefaintest Antlia confirmed members and candidates introducea de-tectable dispersion increase starting fromMR ∼ −15 mag.
Therefore, in all these clusters, the increase of the scatter startsat different absolute magnitudes, which tend to be brighterfor moredistant clusters, if Virgo is excluded from the sample. Thistrendcould be interpreted as a diminishing of the precision of thephoto-metric data and a more uncertain morphological/membershipclas-sification as we go to more distant clusters.
From the analysis performed in 5.1.3, it might be inferred that,once photometric errors are discounted, different CMRs obtainedusing metallicity sensitive colours, like(C − T1) and (B − R),display fairly low intrinsic dispersions (σ(C−T1) < 0.08mag).
Several processes have been proposed as responsible forthe intrinsic scatter of the relation (e.g., differences inages,Terlevich et al. 1999, Ferreras & Silk 2003, Romeo et al. 2008; mi-nor mergers, Kaviraj et al. 2009; accretion of small amountsof gasat high redshifts, Pipino & Matteucci 2006). Whatever the processdominating the intrinsic scatter is, from our comparison wecouldsay that it arises with similar strength in different clusters. In thissense, Jaffe et al. (2011) have found a colour scatter with no evolu-tion with redshift or correlation with the velocity dispersions of theclusters included in their analysis.
5.2 Luminosity–〈µeff〉 Relation
5.2.1 Antlia’s relation
As it was shown in Section 4.2, in a plot ofT1 magnitude versus〈µeff〉, FS90 early-type dwarf members of Antlia follow the lo-cus of constant effective radius of 1 kpc down toT1 ∼ 18 mag.Fainter FS90 members tend to deviate from this locus towardssmaller radii. All of the new dwarf galaxy members, which haveluminosities fainter thanT1 = 18 mag, show the same behaviour.The mean effective radius of the confirmed members withT1 > 18mag is〈reff〉 = 0.58 (rms 0.26) kpc. Therefore, there seems to be
a faint limit in magnitude for the constant effective radiusrelationfollowed by dEs.
We have already mentioned that this could be due to theisophotal limit of our photometry. It is possible that we arenotreaching the most external regions of the galaxies as they are em-bedded in the background. Many of these faint objects are locatednear brighter galaxies as well. In this way, our effective radiuscould be underestimated for galaxies fainter thanT1 ∼ 18 mag(MV ∼ −14.1 mag, Fukugita et al. 1995), leading to the apparentdiscontinuity or “break” in this relation.
However, Chiboucas, Karachentsev & Tully (2009) havefound that newly discovered dwarf galaxies in the M81 Group(D = 3.6 Mpc), have effective radii in agreement to those foundfor the new dwarf galaxies in Antlia, i.e.reff . 0.5 kpc (seetheir table 3). Local Group dSphs havereff . 0.5 kpc, as well(Zaritsky, Gonzalez & Zabludoff 2006, and references therein).Cellone & Buzzoni (2005) as well as De Rijcke et al. (2009) founda similar trend to our faint break, in their respective samplesof dwarf galaxies. Therefore, we cannot rule out the possibilitythat the luminosity vs.〈µeff〉 relation, corresponding to a meanconstant effective radius of∼ 1 kpc, presents two physical breaks:one at magnitudes brighter thanMR ∼ −20 mag, and anotherat its faint end, at magnitudes fainter thanMR ∼ −14 mag.We recall that the correlation between luminosity and〈µeff〉 formagnitudes brighter thanMR ∼ −20 mag corresponds to theKormendy (1977b) scaling relation defined by bright Es and bulgesof S galaxies on thereff vs. µeff diagram. This is a projection ofthe Fundamental Plane of E galaxies.
As mentioned above in this section, most of the galaxiesfainter than the low luminosity break are located near brighter ones.The smallerreff found in our faint candidates might then be relatedwith tidal effects. The newly confirmed cE galaxies deviate fromthe locus followed by the rest of early-type dwarfs of similar lu-minosities towards smaller effective radii, as well. They are com-panions of the giant ellipticals that dominate the central region ofthe cluster. In Paper II we showed that one of them, FS90 110, dis-plays a low surface brightness bridge that links it with NGC 3258,confirming the existence of an interaction between both galaxies.Surface brightness profiles displaying a break, as is the case ofFS90 110 (see Paper II) would favour this interpretation (Choi et al.2002; Mieske et al. 2006).
5.2.2 Dichotomy between E and dE galaxies
Graham & Guzman (2003) have argued that, with the exceptionofthe very bright galaxies (MB . −20.5, MV . −21.5, i.e. “core”E), the break at the bright end of the luminosity versus〈µeff〉 rela-tion is not due to different formation mechanisms among dwarf andbright E galaxies. They emphasize that both type of galaxiesdis-play continuous trends in the central surface brightness (µ0) versusluminosity plot, and in then Sersic index (Sersic 1968) versus lu-minosity diagram. This would show that dEs are the low-luminosityextension of E galaxies. Graham & Guzman explain the differentbehaviour of Es and dEs in the luminosity–〈µeff 〉 space, as due toan increasing difference betweenµ0 and〈µeff〉 values with increas-ing n as we go from dE to E (without core) systems (see their fig-ures 11 and 12).
On the contrary, Kormendy et al. (2009) sustain the existenceof a dichotomy between dE (spheroidalgalaxies in their paper) andE galaxies pointing to distinct origins. The fact that E and dE followsimilar correlations would indicate that the parameters involved insuch relations are not sensitive to the physics that makes them dif-

10 Smith Castelli et al.
ferent. Therefore, these authors consider that to distinguish galaxytypes it is necessary to use all parameter correlations and find outwhich ones are sensitive to formation mechanisms. From an exten-sive analysis, Kormendy et al. conclude that E galaxies formviamergers being cE galaxies their low luminosity counterparts, whiledE are late-type galaxies transformed by environmental effects andby energy feedback from supernovae.
In this context it is interesting to point out the top panel offigure 1 in the work by Chilingarian et al. (2009). There the au-thors show the location in the〈µeff〉–luminosity diagram of allcEs detected by them with the Virtual Observatory (21 objects),along other confirmed cEs and early-type systems. It can be seenthat M 32 seems to extend the locus defined by bright early-typegalaxies towards brighter values of〈µeff〉 (or smallerreff). But therest of the cEs included in the plot seem to define a parallel se-quence to that of dEs and dS0s, towards brighter〈µeff 〉. Simulat-ing the interaction of a disk galaxy with a galaxy cluster potential,Chilingarian et al. (2009) also found that tidal stripping can reducethe stellar mass of the galaxy and speculate that low-luminosityobjects could be the progenitors of cEs. Considering that most (ifnot all) cEs are companions of brighter galaxies, it might bein-terpreted that the offset of different cE galaxies from the dE/dS0sequence depends on the degree of interaction experienced by thesystem and/or on the morphology of the progenitor. In this sense,cE galaxies would not be thought as the natural extension of thefamily of giant ellipticals towards low luminosities, as the originsof both populations would be quite different. It is worth noting thatour two cE galaxies also seem to lie along a sequence paralleltothat of dEs rather than to follow the trend of bright ellipticals.
It is clear that the interpretation of the behaviour of bright anddwarf early-type galaxies in the luminosity–〈µeff 〉 diagram is anopen question. Our present results for the Antlia cluster donot showany discontinuity between bright and dwarf ones in this diagram,but it should be taken into account that bright early-type galaxies inAntlia are mainly lenticulars, not ellipticals. In addition, we shouldenlarge the photometric sample at the low-luminosity end beforearriving at sensible conclusions.
At the moment, it is not possible to discern if〈µeff 〉 keepsalmost constant from the faint break towards fainter magnitudes,or if the effective surface brightness increases with decreasing lu-minosity, showing a similar trend to that displayed by E galaxies.However, it is remarkable the good match showed by the galaxiesbelonging to poor groups to the locus of constant effective radiusdefined by Antlia’s systems. This fact is pointing to a relation thatarises with similar characteristics in very different environments.
5.3 Projected Galaxy Distribution
X-ray observations of the Antlia cluster(Pedersen, Yoshii & Sommer-Larsen 1997; Nakazawa et al.2000), have shown that the X-ray diffuse emission is elongatedin the direction defined by a line joining both dominant galax-ies. Studies of the globular cluster systems of NGC 3258 andNGC 3268 (Dirsch et al. 2003; Bassino et al. 2008) have revealedthat these systems display an elongated distribution in thesamedirection. These results may be the consequence of tidal forcesbetween both galaxies, which may be ultimately pointing to anongoing merger in the central region of Antlia. Thus, the twostructures found in this region (Fig. 4) might be two groups ininteraction: one with NGC 3258 as dominant galaxy, and otherwith NGC 3268 as the central galaxy, both of them containing acE
galaxy. More radial velocities from galaxies in the outer regions ofAntlia are needed to confirm this hypothesis.
We have shown in Section 4.3 that there is no conclusive evi-dence of the existence of a colour–density relation in Antlia in thesense reported by Barazza et al. (2009) for Abell 901/902. Theseauthors propose that the existence of this relation in the projectedradial distribution is an indication that the formation of dEs isclosely related to the processes that affect the cluster itself, likeram-pressure stripping and harassment. The ram-pressure strippingwould remove more efficiently (and faster) the interstellarmediumof galaxies located closer to cluster centres. That may affect starformation in a way that these galaxies would have, on the average,an older stellar population and thus be redder than galaxieslocatedfurther away from the cluster centres.
The harassment scenario predicts a colour gradient in termsofeffective radius (Mastropietro et al. 2005), in the sense that bluer(outskirts) galaxies display largerreff than the redder (central) ones.In agreement with Barazza et al. results, we do not find a relationbetween colour and effective radius. In this context, as theearly-type dwarf galaxy populations of Antlia and Abell 901/902 donotshow such a gradient, the harassment process seems not to be adominant one in these associations. Bosselli et al. (2008) have alsofound that the lack of correlations with clustercentric distances inthe scaling relations favours a ram-pressure stripping scenario forthe evolution of the galaxies.
5.4 dSph candidates in Antlia
Our selection of the low luminosity dSph candidates in Antliawas mainly based on their limiting magnitude (MV & −13 mag,Kalirai et al. 2010) and morphology (diffuse appearance andno nu-cleus). Local Group counterparts of these objects are also devoidof gas and dominated by old and intermediate-age stars. Their ex-tended sizes, low luminosity and measured velocity dispersions, aswell as their large mass-to-light ratios, point to dSph being objectswith large amounts of dark matter (e.g. Mateo 1998).
Our new dSph candidates have integrated magnitudes in therangeT1 = 20.2 − 22.3 mag, which corresponds to−10.4 &
MR & −12.5. In agreement with the tidal origin proposed for dSphgalaxies (e.g. Penarrubia et al. 2009) they appear to cluster tightlyaround massive galaxies. In the Local Group, most dSphs are lo-cated within a radius of 300 kpc from the Milky Way and M 31(Gallagher & Wyse 1994; Grebel 2005). Though our dSph candi-dates sample in Antlia is in fact small, their positions displayed inFig. 4 and identified by open pentagons, place them close to thetwo giant dominant galaxies or to bright lenticulars, all ofthemconfirmed cluster members. Their average projected distance to theclosest bright galaxy (withT1 < 13 mag) is6.4 ± 1.3 arcmin,which at the Antlia distance correponds to about≈ 65 kpc.
Regarding their sizes, the study of dSphs in M 31 byMcConnachie & Irwin (2006b) has shown that their tidal radii(≈1.2 − 7 kpc) are about twice as extended as their counterparts inthe Milky Way. The classical dSphs (i.e., not including the newlydiscovered ultra faint dwarfs) surrounding the Milky Way havetidal radii in the range∼ 0.5 kpc to 3 kpc (Irwin & Hatzidimitriou1995). Even their spatial distribution is different, beingthe MilkyWay satellites more clustered around their host than those of M 31(McConnachie & Irwin 2006a).
Globally, we can consider that tidal radii of Local GroupdSphs range from∼ 0.5 to 7 kpc, which correspond to≈ 3 - 45arcsec at the Antlia distance. From Table B2, we can see that theAntlia dSph candidates display total radii in the range 5 - 11arc-
Galaxy populations in Antlia - III 11
sec, that is within the expected values if we compare to the LocalGroup ones, though in the range of the smaller sizes. This canbeunderstood like a selection effect, as it would be even more difficultto detect larger, but more diffuse, galaxies at the Antlia distance.
6 SUMMARY AND CONCLUSIONS
In this paper we have deepened our study of the galaxy populationsin the central region of the Antlia cluster, paying particularattention to the faint systems composed by dwarf ellipticals anddwarf spheroidals. We have obtained radial velocities for atotal of28 faint galaxies (MV & −18 mag) located in this region throughGEMINI-GMOS and MAGELLAN–MIKE spectra. With thesenew information, we have improved the colour-magnitude andsurface brightness vs. luminosity relations originally studied inPaper I, and we have analyzed the projected spatial distributionof the whole galaxy sample, presenting Washington photometryfor 5 new confirmed members from the FS90 catalogue as well asfor 16 new low surface brightness candidates that have neverbeencatalogued before. Total and/or effective radii have been measuredfor the 5 new members and the 16 new candidates except one.In addition, images in theR band are shown for all the galaxieswith new radial velocities and the 16 new candidates. Our mainconclusions are as follows:
- Early-type galaxies in the Antlia cluster follow a tight colour-magnitude relation that extends, with no perceptible change ofslope, from the giant ellipticals down to the dSphs spanningalmost12 magnitudes in luminosity. When only confirmed early-typemembers are considered, we find no significant increase in thescatter towards the faint end of the relation. When the intrinsicscatter of the CMR of Antlia is compared with those of othergroups and clusters’ CMRs, it is found that Antlia’s CMR is oneof the tightest relations reported up to now. We suggest thatthisfinding is related with the use of a metallicity sensitive colourindex like(C − T1).
- The five previously unknown early-type Antlia members and the16 new candidates follow the same photometric relations as theFS90 early-type members and candidates, although introducingsome dispersion. In particular, the new dwarf candidates increasethe scatter of the CMR towards its faint end. These new dwarfmembers and candidates also depart, towards smaller effectiveradii, from the surface brightness vs. luminosity relationtracedby FS90 dE galaxies with14 < T1 < 18 that follow the locusof constant effective radius of≈ 1 kpc. This latter effect couldbe due to the isophotal limit of our photometry. However, similarsizes (reff < 1 kpc) have been reported for faint members ofthe Local Group, M 81 and NGC 5044 groups. Therefore, thereseems to exist a physical brightness limit for the relation cor-responding to constant effective radius, a relation that seems toarise in different environments as it has been found in clusterslike Virgo and Coma (see fig. 5 in Paper I) as well as in poor groups.
- With regard to the possible existence of a discontinuity betweenbright and faint ellipticals in the surface brightness vs. luminosityrelation (e.g. Graham & Guzman 2003; Kormendy et al. 2009),ourresults for the Antlia cluster do not show any gap in this diagram.It should be taken into account that the bright early-type galaxiesin Antlia are mostly lenticular galaxies and few ellipticals.
- The dE galaxies with13 < T10 < 18 present an almost constanteffective radius around〈reff〉 ≈ 0.9 kpc, irrespective if theircolours are bluer or redder than that of the mean CMR for thesame luminosity. The almost constant effective radii of dEsarein agreement with what has been found for other clusters andgroups (Paper I and references therein). For galaxies fainter thanT10 = 18 mag the mean value decreases to〈reff〉 ≈ 0.6 kpc,which is consistent with what is found for the faintest galaxies inthe Local Group, M81 and NGC 5044 groups.
- We have not found a colour–density or a colour–size relationamong our Antlia dwarf galaxy sample. This behaviour mightfavour a ram-pressure stripping scenario for the evolutionof dwarfgalaxies in this cluster. However, we should confirm these trendsby enlarging our dwarf galaxy sample considering dwarf galaxiespresent in the outer regions of the cluster.
- We have confirmed the existence of two cE galaxies in Antlia.Each of them is the neighbour of one of the two giant ellipticals thatdominate the central region of Antlia. For their luminosities, theyare both the reddest and most compact objects of the early-typeAntlia galaxies. If we accept that their colours are mainly drivenby metallicity, as likely happens with galaxies on the CMR, bothof them would be the richest galaxies for their luminositiesinour sample. The cEs found in the Centaurus and Coma clustersare also located on the red side of their corresponding meanCMRs. However, the cE galaxies found in Coma present [Fe/H]abundances comparable to those of some dEs. Therefore, at themoment it is difficult to establish if cEs should be treated asaseparate class of objects, or should be considered as part ofthegeneral early-type dwarf galaxy family experiencing, perhaps,particular dynamical processes.
- We have found a small sample of 7 unstudied dSph candidates,whose membership cannot be confirmed with our spectra due totheir low surface brightness. They cover a range in integratedmagnitudes−10.4 & MR & −12.5 and total radii between5 and 11 arcsec, which at the Antlia distance correspond toapproximately 850 pc – 2 kpc. They are found close to brightgalaxies (T1 < 13mag), being their average projected distancefrom them of≈ 65 kpc.
- The projected spatial distribution of the whole sample points toa complex structure for Antlia. At least two groups are present inthe central region, with some evidence of an ongoing merger.Wewill extend our study adding new fields adjoining the centralone,and increasing the spectroscopic data set, in order to add kinematicinformation to the spatial distribution.
ACKNOWLEDGEMENTS
We are grateful to the anonymous referee for his/her commentsand corrections which helped to improve the content of this paper.A.S.C. and G.R. warmly thank to Nidia Morrell for her help withthe reduction of echelle spectra. A.S.C. and F.F. acknowdlege finan-tial support from Agencia de Promocion Cientıfica y Tecnologicaof Argentina (BID AR PICT 2010-0410 and BID AR PICT 2007-885). T.R. acknowledges financial support from the Chilean Cen-ter for Astrophysics, FONDAP Nr. 15010003, from FONDECYTproject Nr. 1100620, and from the BASAL Centro de Astrofısicay Tecnologıas Afines (CATA) PFB-06/2007. G.R. was supported
12 Smith Castelli et al.
by ALMA/Conicyt (grant 31070021) and ESO/comite mixto. Thiswork was also funded with grants from Consejo Nacional de Inves-tigaciones Cientıficas y Tecnicas de la Republica Argentina, Agen-cia Nacional de Promocion Cientıfica y Tecnologica and Univer-sidad Nacional de La Plata (Argentina). Part of the data usedinthis paper were obtained under GEMINI programs GS-2008A-Q-56, GS-2009A-Q-25 and GS-2010A-Q-21.
REFERENCES
Andreon S., Cuillandre J.-C., Puddu E., Mellier Y., 2006, MN-RAS, 372, 60
Annibali F., Grutzbauch R., Rampazzo R., Bressan A., ZeilingerW. W., 2011, A&A, 528A, 19
Barazza F. D. et al., 2009, A&A, 508, 665Bassino L. P., Richtler T., Dirsch B., 2008, MNRAS, 386, 1145Baum W., 1959, PASP, 71, 106Belokurov V. et al., 2008, ApJ, 686L, 83BBertin E., Arnouts S., 1996, A&AS, 117, 393Binggeli B., Jerjen H., 1998, A&A, 333, 17Binggeli B., Sandage A., Tammann G. A., 1985, AJ, 90, 1681Boselli A., Boissier S., Cortese L., Gavazzi G., 2008, A&A, 489,1015
Bower R. G., Lucey J. R., Ellis R. S., 1992, MNRAS, 254, 601Buzzoni A., Cellone S., Saracco P., Zucca E., 2011, MNRAS, sub-mitted
Caldwell N., Bothun G. D., 1987, AJ, 94, 1126Cellone S. A., 1999, A&A, 345, 403Cellone S. A., Buzzoni A., 2001, A&A, 369, 742Cellone S. A., Buzzoni A., 2005, MNRAS, 356, 41Chiboucas K., Mateo. M., 2006, AJ, 132, 347Chiboucas K., Karachentsev I. D., Tully R. B., 2009, AJ, 137,3009
Chiboucas K., Tully R. B., Marzke R. O., Trentham N., FergusonH. C., Hammer D., Carter D., Khosroshahi H., 2010, ApJ, 723,251
Chilingarian I., Cayatte V., Revaz Y., Dodonov S., Durand D.,Durret F., Micol A., Slezak E., 2009, Sci, 326, 1379
Chilingarian I. V., Bergond G., 2010, MNRAS, 405, L11Choi P. I., Guhathakurta P., Johnston K. V., 2002, AJ, 124, 310Clemens M., Panuzzo P., Rampazzo R., Vega O., Bressan A.,2011, MNRAS, 412, 2063
Conselice C. J., Gallagher J. S., Wyse R. F. G., 2002, AJ, 123,2246
Conselice C. J., Gallagher J. S., Wyse R. F. G., 2003, AJ, 125,66De Rijcke S., Penny S. J., Conselice C. J., Valcke S., Held E. V.,2009, MNRAS, 393, 798
Dirsch B., Richtler T., Bassino L. P., 2003, A&A, 408, 929Faber S. M., 1973, ApJ, 179, 731Ferguson H. C., 1989, Ap&SS, 157, 227Ferguson H. C., Binggeli B., 1994, A&ARv, 6, 67Ferguson H. C., Sandage A., 1990, AJ, 100, 1 (FS90)Ferrarese L., et al., 2006, ApJS, 164, 334Ferreras I., Silk J., 2003, MNRAS, 344, 455Forbes D., 2007, inGroups of Galaxies in the Nearby Universe,Eso Astrophysics Symposia, eds. I. Saviane, V. D. Ivanov, J.Borissova, Springer-Verlag, 97
Forbes D., Forte J. C., 2001, MNRAS, 322, 257Forte J. C., Faifer F. R., Geisler D., 2007, MNRAS, 382, 1947Fukugita M., Shimasaku K., Ichikawa T., 1995, PASP, 107, 945Gallagher J. S., Wyse R. F. G., 1994, PASP, 106, 1225
Geisler D., 1996, AJ, 111, 480Graham A. W., 2002, ApJ, 568, L13Graham A. W., 2011, EAS, 48, 231Graham A. W., Guzman R., 2003, AJ, 125, 2936Grebel E.K., 2005, inNear-Field Cosmology with Dwarf Ellipti-cal Galaxies, Proceedings IAU Colloquium 198, eds. H. Jerjen& B. Binggeli (Cambridge: Cambridge Univ. Press), 1
Harris W. E., Harris G. L. H., Holland S. T., McLaughlin D. E.,2002, AJ, 124, 1435
Howell J., 2005, AJ, 130, 2065Hilker M., Mieske S., Infante L., 2003, A&A, 397, L9Huxor A. P., Phillipps S., Price J., Harniman R., 2011, MNRAS,414, 3557
Irwin M., Hatzidimitriou D., 1995, MNRAS, 277, 1354Jaffe Y. L., Aragon-Salamanca A., De Lucia G., Jablonka P., Rud-nick G., Saglia R., Zaritsky D., 2011, MNRAS, 410, 280
Janz J., Lisker T., 2009, ApJ, 696, L102Kalirai J. S. et al., 2010, ApJ, 711, 671Kaviraj S., Peirani S., Khochfar S., Silk J., Kay S., 2009, MNRAS,394, 1713
Koppen J., Weidner C., Kroupa P., 2007, MNRAS, 375, 673Kormendy J., 1977a, ApJ, 217, 406Kormendy J., 1977b, ApJ, 218, 333Kormendy J., Fisher D. B., Cornell M. E., Bender R., 2009, ApJS,182, 216
Kuntschner H., 2000, MNRAS, 315, 184Lisker T., Glatt K., Westera P., Grebel E., 2006, AJ, 132, 2432Lisker T., Grebel E. K., Binggeli B., 2008, AJ, 135, 380Lopez-Cruz O., Barkhouse W. A., Yee H. K. C., 2004, ApJ, 614,679
Mateo M. L., 1998, ARA&A, 36, 435Mastropietro C., Moore B., Mayer L., Debattista V. P., PiffarettiR., Stadel J., 2005, MNRAS, 364, 607
McConnachie A. W., Irwin M. J., 2006a, MNRAS, 365, 902McConnachie A. W., Irwin M. J., 2006b, MNRAS, 365, 1263Mendel J. T., Proctor R. N., Forbes D. A., Brough S., 2008, MN-RAS, 389, 749
Mendel J. T., Proctor R. N., Rasmussen J., Brough S., Forbes D.,2009, MNRAS, 396, 2103
Mieske S. et al., 2006, ApJ, 653, 193Mieske S., Hilker M., Infante L., Mendes de Oliveira C., 2007,A&A, 463, 503
Misgeld I., Mieske S., Hilker M., 2008, A&A, 486, 697Misgeld I., Hilker M., Mieske S., 2009, A&A, 496, 683Nakazawa K., Makishima K., Fukazawa Y., Tamura T., 2000,PASJ, 52, 623
Pedersen K., Yoshii Y., Sommer-Larsen J., 1997, ApJ, 485, L17Penny S. J., Conselice C., 2008, MNRAS, 383, 247Penny S. J., Conselice C., De Rijcke S., Held E., Gallagher III J.S., O’Connell R. W., 2011, MNRAS, 410, 1076
Penarrubia J., Navarro J. F., McConnachie A. W., 2008, ApJ,673,226
Penarrubia J., Navarro J. F., McConnachie A. W., Martin N.,2009,ApJ, 698, 222
Pipino A., Matteucci F., 2006, MNRAS, 365, 1114Price J. et al., 2009, MNRAS, 397, 1816Rakos K., Schombert J., Maitzen H. M., Prugovecki S., Odell A.,2001, AJ, 121, 1974
Romeo A. D., Napolitano N. R., Covone G., Sommer-Larsen J.,Antonuccio-Delogu V., Capaccioli M., 2008, MNRAS, 389, 13
Sanchez-Blazquez P. et al., 2006, MNRAS, 371, 703Sandage A., 1972, ApJ, 176, 21
Galaxy populations in Antlia - III 13
Sandage A., Visvanathan N., 1978, ApJ, 223, 707Secker J., Harris W. E., Plummer J. D., 1997, PASP, 109, 1377Sersic J. L., 1968, Atlas de Galaxias Australes (Cordoba:Obs.Astron., Univ. Nac. Cordoba)
Smith Castelli A. V., Bassino L. P., Richtler T., Cellone S. A.,Aruta C., Infante L., 2008a, MNRAS, 386, 2311 (Paper I)
Smith Castelli A. V., Faifer F., Richtler T., Bassino L. P., 2008b,MNRAS, 391, 685 (Paper II)
Smith Castelli A. V., Faifer F. R., Bassino L. P., Romero G. A.,Cellone S. A., Richtler T., 2009, BAAA, 52, 229
Terlevich A. I., Kuntschner H., Bower R. G., Caldwell, N.,Sharples R. M., 1999, MNRAS, 310, 445
Terlevich A. I., Caldwell, Bower R. G., 2001, MNRAS, 326, 1547Trager S., Faber S., Worthey G., Jesus Gonzalez J., 2000, AJ, 120,165
Trujillo I., Graham A. W., Caon N., 2001, MNRAS, 326, 869Tolstoy E., Hill V., Tosi M., 2009, ARA&A, 47, 371Vazdekis A., Kuntschner H., Davies R. L., Arimoto N., NakamuraO., Peletier R., 2001, ApJ, 551, L127
Visvanathan N., Sandage A., 1977, ApJ, 216, 214Zaritsky D., Gonzalez A. H., Zabludoff A. I., 2006, ApJ, 642,L37
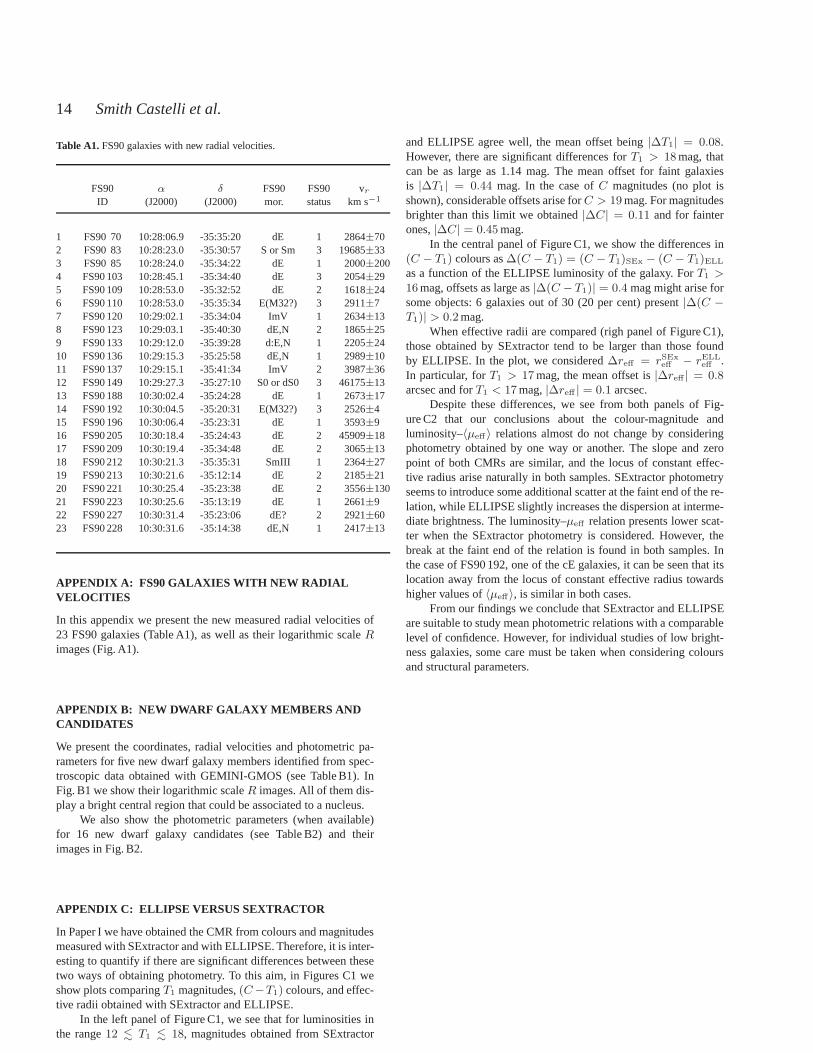
14 Smith Castelli et al.
Table A1. FS90 galaxies with new radial velocities.
FS90 α δ FS90 FS90 vrID (J2000) (J2000) mor. status km s−1
1 FS90 70 10:28:06.9 -35:35:20 dE 1 2864±702 FS90 83 10:28:23.0 -35:30:57 S or Sm 3 19685±333 FS90 85 10:28:24.0 -35:34:22 dE 1 2000±2004 FS90 103 10:28:45.1 -35:34:40 dE 3 2054±295 FS90 109 10:28:53.0 -35:32:52 dE 2 1618±246 FS90 110 10:28:53.0 -35:35:34 E(M32?) 3 2911±77 FS90 120 10:29:02.1 -35:34:04 ImV 1 2634±138 FS90 123 10:29:03.1 -35:40:30 dE,N 2 1865±259 FS90 133 10:29:12.0 -35:39:28 d:E,N 1 2205±2410 FS90 136 10:29:15.3 -35:25:58 dE,N 1 2989±1011 FS90 137 10:29:15.1 -35:41:34 ImV 2 3987±3612 FS90 149 10:29:27.3 -35:27:10 S0 or dS0 3 46175±1313 FS90 188 10:30:02.4 -35:24:28 dE 1 2673±1714 FS90 192 10:30:04.5 -35:20:31 E(M32?) 3 2526±415 FS90 196 10:30:06.4 -35:23:31 dE 1 3593±916 FS90 205 10:30:18.4 -35:24:43 dE 2 45909±1817 FS90 209 10:30:19.4 -35:34:48 dE 2 3065±1318 FS90 212 10:30:21.3 -35:35:31 SmIII 1 2364±2719 FS90 213 10:30:21.6 -35:12:14 dE 2 2185±2120 FS90 221 10:30:25.4 -35:23:38 dE 2 3556±13021 FS90 223 10:30:25.6 -35:13:19 dE 1 2661±922 FS90 227 10:30:31.4 -35:23:06 dE? 2 2921±6023 FS90 228 10:30:31.6 -35:14:38 dE,N 1 2417±13
APPENDIX A: FS90 GALAXIES WITH NEW RADIALVELOCITIES
In this appendix we present the new measured radial velocities of23 FS90 galaxies (Table A1), as well as their logarithmic scale R
images (Fig. A1).
APPENDIX B: NEW DWARF GALAXY MEMBERS ANDCANDIDATES
We present the coordinates, radial velocities and photometric pa-rameters for five new dwarf galaxy members identified from spec-troscopic data obtained with GEMINI-GMOS (see Table B1). InFig. B1 we show their logarithmic scaleR images. All of them dis-play a bright central region that could be associated to a nucleus.
We also show the photometric parameters (when available)for 16 new dwarf galaxy candidates (see Table B2) and theirimages in Fig. B2.
APPENDIX C: ELLIPSE VERSUS SEXTRACTOR
In Paper I we have obtained the CMR from colours and magnitudesmeasured with SExtractor and with ELLIPSE. Therefore, it isinter-esting to quantify if there are significant differences between thesetwo ways of obtaining photometry. To this aim, in Figures C1 weshow plots comparingT1 magnitudes,(C−T1) colours, and effec-tive radii obtained with SExtractor and ELLIPSE.
In the left panel of Figure C1, we see that for luminosities inthe range12 . T1 . 18, magnitudes obtained from SExtractor
and ELLIPSE agree well, the mean offset being|∆T1| = 0.08.However, there are significant differences forT1 > 18mag, thatcan be as large as 1.14 mag. The mean offset for faint galaxiesis |∆T1| = 0.44 mag. In the case ofC magnitudes (no plot isshown), considerable offsets arise forC > 19mag. For magnitudesbrighter than this limit we obtained|∆C| = 0.11 and for fainterones,|∆C| = 0.45mag.
In the central panel of Figure C1, we show the differences in(C − T1) colours as∆(C − T1) = (C − T1)SEx − (C − T1)ELL
as a function of the ELLIPSE luminosity of the galaxy. ForT1 >
16mag, offsets as large as|∆(C −T1)| = 0.4 mag might arise forsome objects: 6 galaxies out of 30 (20 per cent) present|∆(C −T1)| > 0.2mag.
When effective radii are compared (righ panel of Figure C1),those obtained by SExtractor tend to be larger than those foundby ELLIPSE. In the plot, we considered∆reff = rSEx
eff − rELLeff .
In particular, forT1 > 17mag, the mean offset is|∆reff | = 0.8arcsec and forT1 < 17mag,|∆reff | = 0.1 arcsec.
Despite these differences, we see from both panels of Fig-ure C2 that our conclusions about the colour-magnitude andluminosity–〈µeff 〉 relations almost do not change by consideringphotometry obtained by one way or another. The slope and zeropoint of both CMRs are similar, and the locus of constant effec-tive radius arise naturally in both samples. SExtractor photometryseems to introduce some additional scatter at the faint end of the re-lation, while ELLIPSE slightly increases the dispersion atinterme-diate brightness. The luminosity–µeff relation presents lower scat-ter when the SExtractor photometry is considered. However,thebreak at the faint end of the relation is found in both samples. Inthe case of FS90 192, one of the cE galaxies, it can be seen thatitslocation away from the locus of constant effective radius towardshigher values of〈µeff〉, is similar in both cases.
From our findings we conclude that SExtractor and ELLIPSEare suitable to study mean photometric relations with a comparablelevel of confidence. However, for individual studies of low bright-ness galaxies, some care must be taken when considering coloursand structural parameters.
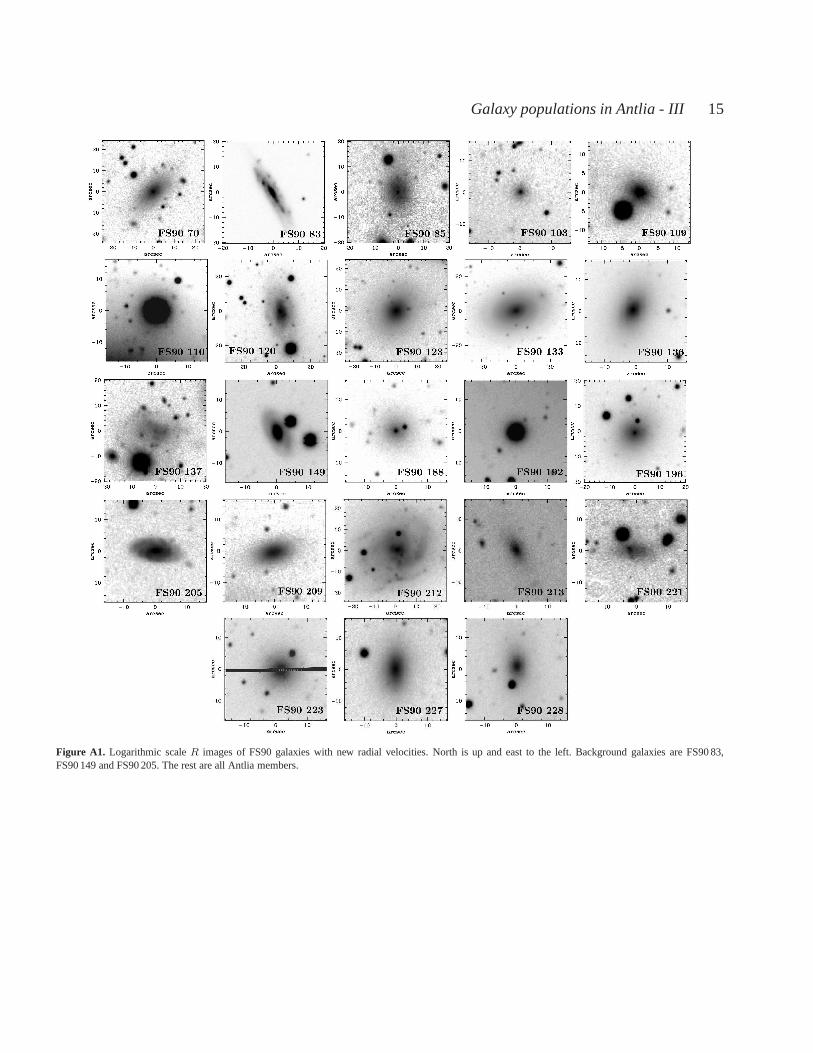
Galaxy populations in Antlia - III 15
Figure A1. Logarithmic scaleR images of FS90 galaxies with new radial velocities. North isup and east to the left. Background galaxies are FS90 83,FS90 149 and FS90 205. The rest are all Antlia members.
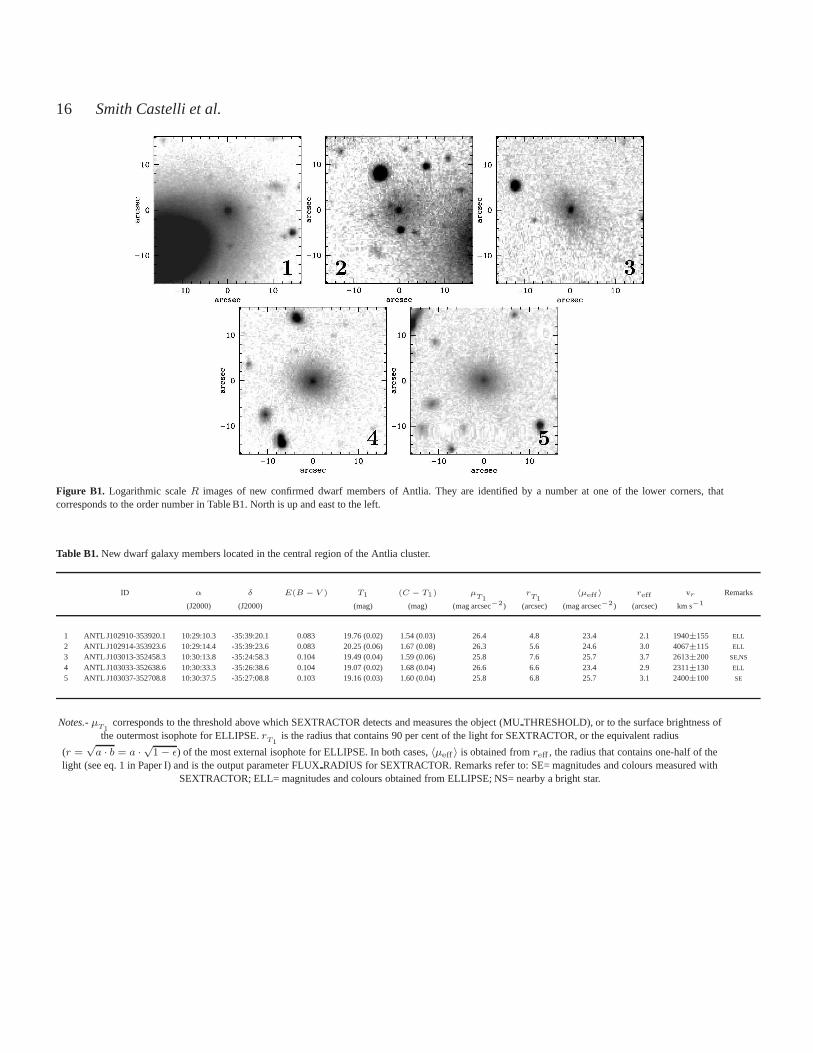
16 Smith Castelli et al.
Figure B1. Logarithmic scaleR images of new confirmed dwarf members of Antlia. They are identified by a number at one of the lower corners, thatcorresponds to the order number in Table B1. North is up and east to the left.
Table B1.New dwarf galaxy members located in the central region of theAntlia cluster.
ID α δ E(B − V ) T1 (C − T1) µT1
rT1
〈µeff 〉 reff vr Remarks
(J2000) (J2000) (mag) (mag) (mag arcsec−2) (arcsec) (mag arcsec−2) (arcsec) km s−1
1 ANTL J102910-353920.1 10:29:10.3 -35:39:20.1 0.083 19.76 (0.02) 1.54 (0.03) 26.4 4.8 23.4 2.1 1940±155 ELL
2 ANTL J102914-353923.6 10:29:14.4 -35:39:23.6 0.083 20.25 (0.06) 1.67 (0.08) 26.3 5.6 24.6 3.0 4067±115 ELL
3 ANTL J103013-352458.3 10:30:13.8 -35:24:58.3 0.104 19.49 (0.04) 1.59 (0.06) 25.8 7.6 25.7 3.7 2613±200 SE,NS
4 ANTL J103033-352638.6 10:30:33.3 -35:26:38.6 0.104 19.07 (0.02) 1.68 (0.04) 26.6 6.6 23.4 2.9 2311±130 ELL
5 ANTL J103037-352708.8 10:30:37.5 -35:27:08.8 0.103 19.16 (0.03) 1.60 (0.04) 25.8 6.8 25.7 3.1 2400±100 SE
Notes.-µT1
corresponds to the threshold above which SEXTRACTOR detects and measures the object (MUTHRESHOLD), or to the surface brightness ofthe outermost isophote for ELLIPSE.r
T1is the radius that contains 90 per cent of the light for SEXTRACTOR, or the equivalent radius
(r =√a · b = a ·
√1− ǫ) of the most external isophote for ELLIPSE. In both cases,〈µeff 〉 is obtained fromreff , the radius that contains one-half of the
light (see eq. 1 in Paper I) and is the output parameter FLUXRADIUS for SEXTRACTOR. Remarks refer to: SE= magnitudes andcolours measured withSEXTRACTOR; ELL= magnitudes and colours obtained from ELLIPSE; NS= nearby a bright star.
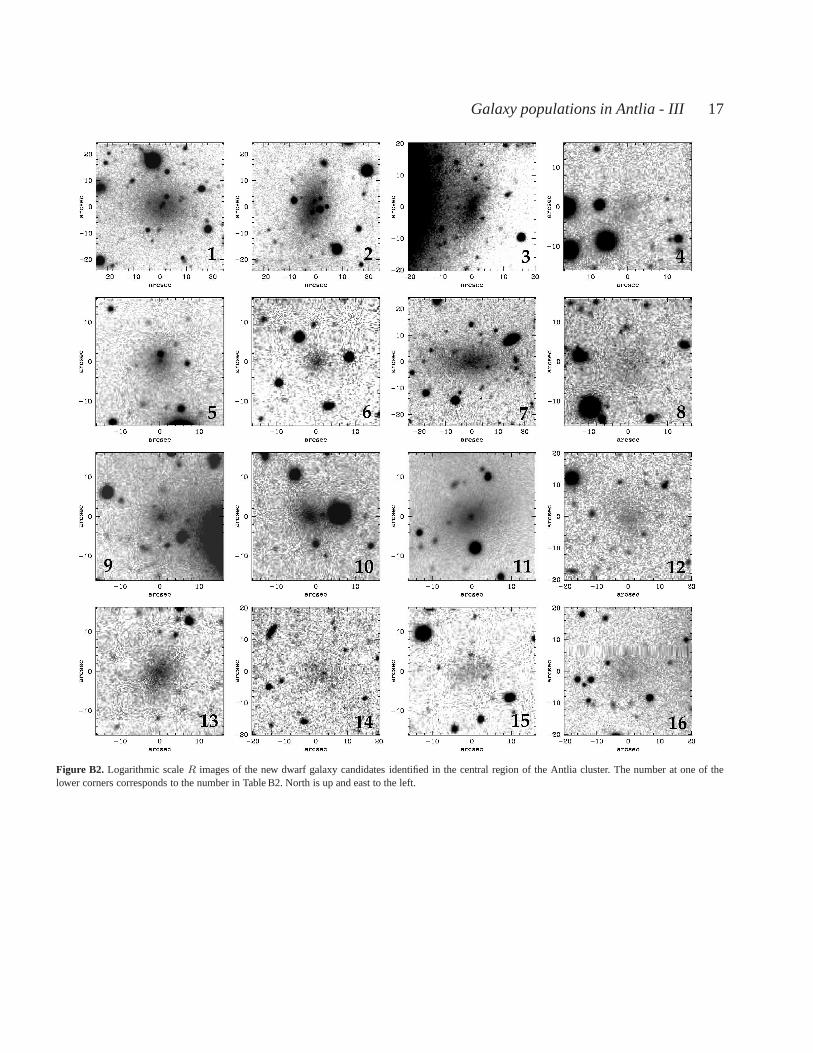
Galaxy populations in Antlia - III 17
Figure B2. Logarithmic scaleR images of the new dwarf galaxy candidates identified in the central region of the Antlia cluster. The number at one of thelower corners corresponds to the number in Table B2. North isup and east to the left.
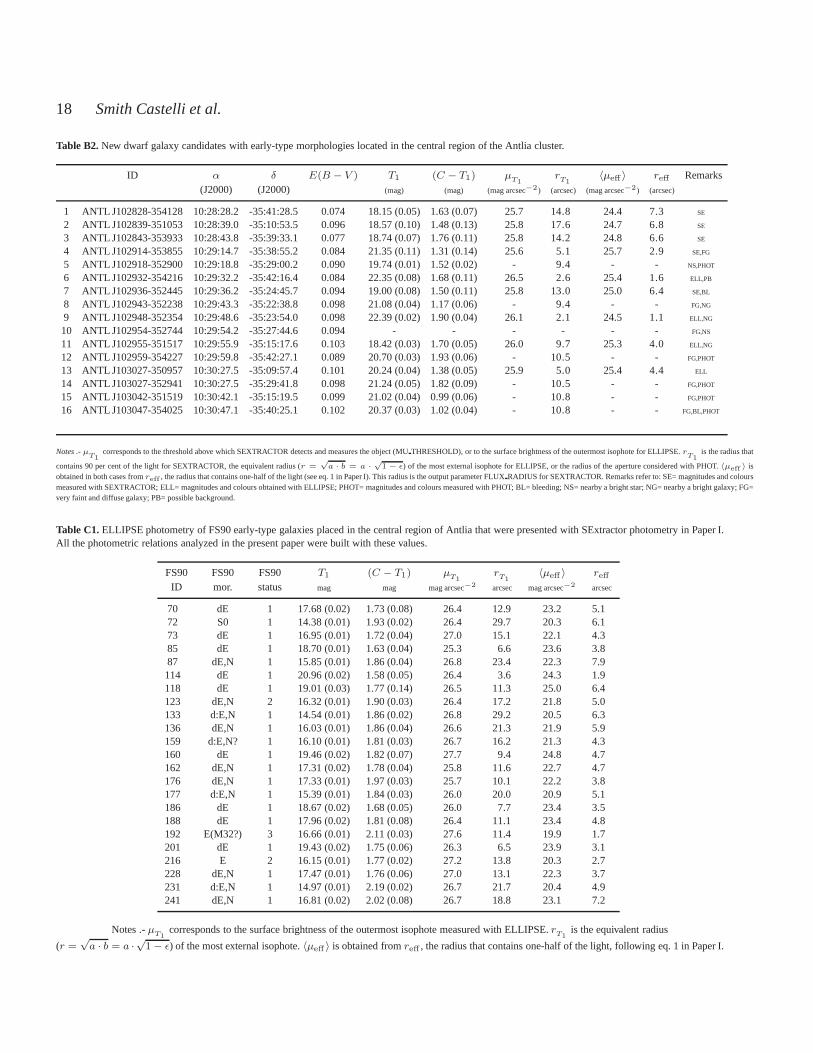
18 Smith Castelli et al.
Table B2.New dwarf galaxy candidates with early-type morphologies located in the central region of the Antlia cluster.
ID α δ E(B − V ) T1 (C − T1) µT1
rT1
〈µeff 〉 reff Remarks(J2000) (J2000) (mag) (mag) (mag arcsec−2) (arcsec) (mag arcsec−2) (arcsec)
1 ANTL J102828-354128 10:28:28.2 -35:41:28.5 0.074 18.15 (0.05) 1.63 (0.07) 25.7 14.8 24.4 7.3 SE
2 ANTL J102839-351053 10:28:39.0 -35:10:53.5 0.096 18.57 (0.10) 1.48 (0.13) 25.8 17.6 24.7 6.8 SE
3 ANTL J102843-353933 10:28:43.8 -35:39:33.1 0.077 18.74 (0.07) 1.76 (0.11) 25.8 14.2 24.8 6.6 SE
4 ANTL J102914-353855 10:29:14.7 -35:38:55.2 0.084 21.35 (0.11) 1.31 (0.14) 25.6 5.1 25.7 2.9 SE,FG
5 ANTL J102918-352900 10:29:18.8 -35:29:00.2 0.090 19.74 (0.01) 1.52 (0.02) - 9.4 - - NS,PHOT
6 ANTL J102932-354216 10:29:32.2 -35:42:16.4 0.084 22.35 (0.08) 1.68 (0.11) 26.5 2.6 25.4 1.6 ELL,PB
7 ANTL J102936-352445 10:29:36.2 -35:24:45.7 0.094 19.00 (0.08) 1.50 (0.11) 25.8 13.0 25.0 6.4 SE,BL
8 ANTL J102943-352238 10:29:43.3 -35:22:38.8 0.098 21.08 (0.04) 1.17 (0.06) - 9.4 - - FG,NG
9 ANTL J102948-352354 10:29:48.6 -35:23:54.0 0.098 22.39 (0.02) 1.90 (0.04) 26.1 2.1 24.5 1.1 ELL,NG
10 ANTL J102954-352744 10:29:54.2 -35:27:44.6 0.094 - - - - - - FG,NS
11 ANTL J102955-351517 10:29:55.9 -35:15:17.6 0.103 18.42(0.03) 1.70 (0.05) 26.0 9.7 25.3 4.0 ELL,NG
12 ANTL J102959-354227 10:29:59.8 -35:42:27.1 0.089 20.70(0.03) 1.93 (0.06) - 10.5 - - FG,PHOT
13 ANTL J103027-350957 10:30:27.5 -35:09:57.4 0.101 20.24(0.04) 1.38 (0.05) 25.9 5.0 25.4 4.4 ELL
14 ANTL J103027-352941 10:30:27.5 -35:29:41.8 0.098 21.24(0.05) 1.82 (0.09) - 10.5 - - FG,PHOT
15 ANTL J103042-351519 10:30:42.1 -35:15:19.5 0.099 21.02(0.04) 0.99 (0.06) - 10.8 - - FG,PHOT
16 ANTL J103047-354025 10:30:47.1 -35:40:25.1 0.102 20.37(0.03) 1.02 (0.04) - 10.8 - - FG,BL,PHOT
Notes .-µT1
corresponds to the threshold above which SEXTRACTOR detects and measures the object (MUTHRESHOLD), or to the surface brightness of the outermost isophote for ELLIPSE.rT1
is the radius that
contains 90 per cent of the light for SEXTRACTOR, the equivalent radius (r =√
a · b = a ·√
1 − ǫ) of the most external isophote for ELLIPSE, or the radius of the aperture considered with PHOT.〈µeff 〉 isobtained in both cases fromreff , the radius that contains one-half of the light (see eq. 1 in Paper I). This radius is the output parameter FLUXRADIUS for SEXTRACTOR. Remarks refer to: SE= magnitudes andcoloursmeasured with SEXTRACTOR; ELL= magnitudes and colours obtained with ELLIPSE; PHOT= magnitudes and colours measured with PHOT; BL= bleeding; NS= nearby a bright star; NG= nearby a bright galaxy; FG=very faint and diffuse galaxy; PB= possible background.
Table C1.ELLIPSE photometry of FS90 early-type galaxies placed in the central region of Antlia that were presented with SExtractor photometry in Paper I.All the photometric relations analyzed in the present paperwere built with these values.
FS90 FS90 FS90 T1 (C − T1) µT1
rT1
〈µeff 〉 reff
ID mor. status mag mag mag arcsec−2 arcsec mag arcsec−2 arcsec
70 dE 1 17.68 (0.02) 1.73 (0.08) 26.4 12.9 23.2 5.172 S0 1 14.38 (0.01) 1.93 (0.02) 26.4 29.7 20.3 6.173 dE 1 16.95 (0.01) 1.72 (0.04) 27.0 15.1 22.1 4.385 dE 1 18.70 (0.01) 1.63 (0.04) 25.3 6.6 23.6 3.887 dE,N 1 15.85 (0.01) 1.86 (0.04) 26.8 23.4 22.3 7.9114 dE 1 20.96 (0.02) 1.58 (0.05) 26.4 3.6 24.3 1.9118 dE 1 19.01 (0.03) 1.77 (0.14) 26.5 11.3 25.0 6.4123 dE,N 2 16.32 (0.01) 1.90 (0.03) 26.4 17.2 21.8 5.0133 d:E,N 1 14.54 (0.01) 1.86 (0.02) 26.8 29.2 20.5 6.3136 dE,N 1 16.03 (0.01) 1.86 (0.04) 26.6 21.3 21.9 5.9159 d:E,N? 1 16.10 (0.01) 1.81 (0.03) 26.7 16.2 21.3 4.3160 dE 1 19.46 (0.02) 1.82 (0.07) 27.7 9.4 24.8 4.7162 dE,N 1 17.31 (0.02) 1.78 (0.04) 25.8 11.6 22.7 4.7176 dE,N 1 17.33 (0.01) 1.97 (0.03) 25.7 10.1 22.2 3.8177 d:E,N 1 15.39 (0.01) 1.84 (0.03) 26.0 20.0 20.9 5.1186 dE 1 18.67 (0.02) 1.68 (0.05) 26.0 7.7 23.4 3.5188 dE 1 17.96 (0.02) 1.81 (0.08) 26.4 11.1 23.4 4.8192 E(M32?) 3 16.66 (0.01) 2.11 (0.03) 27.6 11.4 19.9 1.7201 dE 1 19.43 (0.02) 1.75 (0.06) 26.3 6.5 23.9 3.1216 E 2 16.15 (0.01) 1.77 (0.02) 27.2 13.8 20.3 2.7228 dE,N 1 17.47 (0.01) 1.76 (0.06) 27.0 13.1 22.3 3.7231 d:E,N 1 14.97 (0.01) 2.19 (0.02) 26.7 21.7 20.4 4.9241 dE,N 1 16.81 (0.02) 2.02 (0.08) 26.7 18.8 23.1 7.2
Notes .-µT1
corresponds to the surface brightness of the outermost isophote measured with ELLIPSE.rT1
is the equivalent radius
(r =√a · b = a ·
√1− ǫ) of the most external isophote.〈µeff 〉 is obtained fromreff , the radius that contains one-half of the light, following eq. 1 in Paper I.
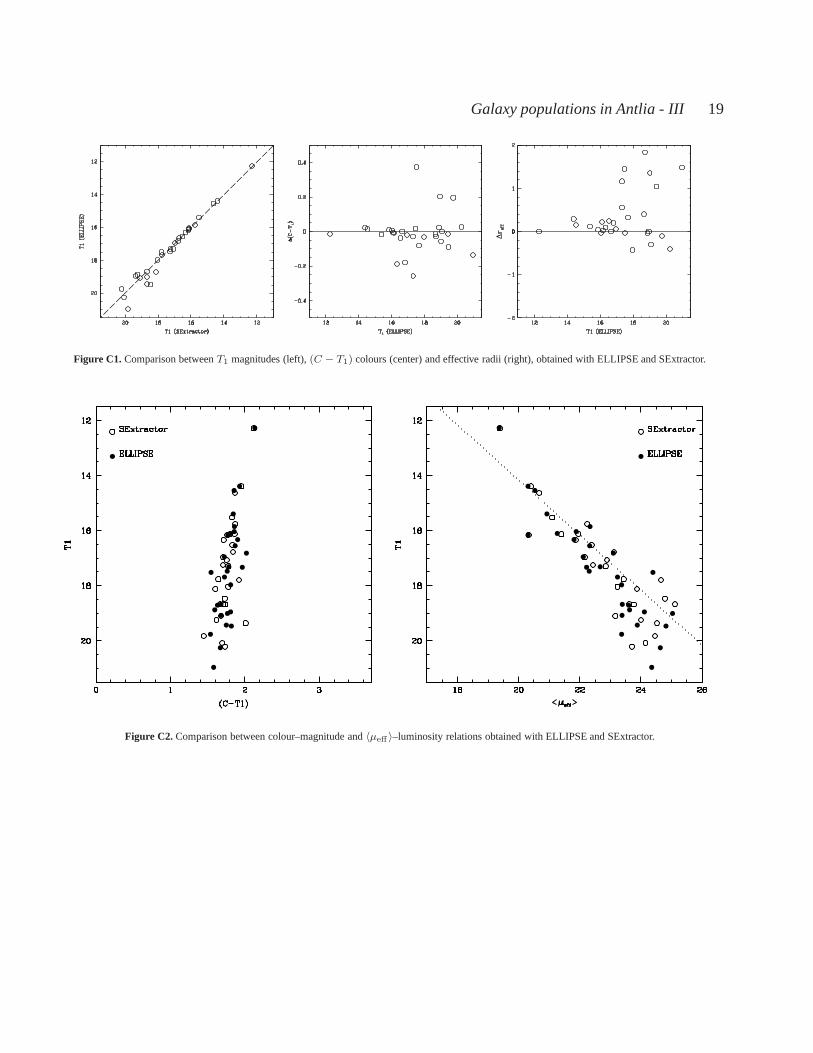
Galaxy populations in Antlia - III 19
Figure C1. Comparison betweenT1 magnitudes (left),(C − T1) colours (center) and effective radii (right), obtained with ELLIPSE and SExtractor.
Figure C2. Comparison between colour–magnitude and〈µeff 〉–luminosity relations obtained with ELLIPSE and SExtractor.