GALAXY ZOO: THE FUNDAMENTALLY DIFFERENT CO-EVOLUTION OF SUPERMASSIVE BLACK HOLES AND THEIR EARLY-...
23
arXiv:1001.3141v1 [astro-ph.CO] 18 Jan 2010 Accepted for publication in the Astrophysical Journal Preprint typeset using L A T E X style emulateapj v. 11/10/09 GALAXY ZOO: THE FUNDAMENTALLY DIFFERENT CO-EVOLUTION OF SUPERMASSIVE BLACK HOLES AND THEIR EARLY- AND LATE-TYPE HOST GALAXIES 1 Kevin Schawinski, 2,3,18 C. Megan Urry, 2,3,4 Shanil Virani, 3,4 Paolo Coppi, 3,4 Steven P. Bamford, 5 Ezequiel Treister, 6,19 Chris J. Lintott, 7 Marc Sarzi, 8 William C. Keel, 9 Sugata Kaviraj, 7,10 Carolin N. Cardamone, 3,4 Karen L. Masters, 11 Nicholas P. Ross, 12 Dan Andreescu, 13 Phil Murray, 14 Robert C. Nichol, 11 M. Jordan Raddick, 15 Anˇ ze Slosar, 16 Alex S. Szalay, 15 Daniel Thomas 11 and Jan Vandenberg 15 Accepted for publication in the Astrophysical Journal ABSTRACT We use data from the Sloan Digital Sky Survey and visual classifications of morphology from the Galaxy Zoo project to study black hole growth in the nearby Universe (z< 0.05) and to break down the AGN host galaxy population by color, stellar mass and morphology. We find that black hole growth at luminosities L[O iii] > 10 40 ergs −1 in early- and late-type galaxies is fundamentally different. AGN host galaxies as a population have a broad range of stellar masses (10 10 - 10 11 M ⊙ ), reside in the green valley of the color-mass diagram and their central black holes have median masses around 10 6.5 M ⊙ . However, by comparing early- and late-type AGN host galaxies to their non-active counterparts, we find several key differences: in early-type galaxies, it is preferentially the galaxies with the least massive black holes that are growing, while late-type galaxies, it is preferentially the most massive black holes that are growing. The duty cycle of AGN in early-type galaxies is strongly peaked in the green valley below the low-mass end (10 10 M ⊙ ) of the red sequence at stellar masses where there is a steady supply of blue cloud progenitors. The duty cycle of AGN in late-type galaxies on the other hand peaks in massive (10 11 M ⊙ ) green and red late-types which generally do not have a corresponding blue cloud population of similar mass. At high Eddington ratios (L/L Edd > 0.1), the only population with a substantial fraction of AGN are the low-mass green valley early-type galaxies. Finally, the Milky Way likely resides in the “sweet spot” on the color-mass diagram where the AGN duty cycle of late-type galaxies is highest. We discuss the implications of these results for our understanding of the role of AGN in the evolution of galaxies. Subject headings: galaxies: evolution; galaxies: formation galaxies: Seyfert; galaxies: active [email protected] 1 This publication has been made possible by the partici- pation of more than 250,000 volunteers in the Galaxy Zoo project. Their contributions are individually acknowledged at http://www.galaxyzoo.org/Volunteers.aspx. 2 Department of Physics, Yale University, New Haven, CT 06511, U.S.A. 3 Yale Center for Astronomy and Astrophysics, Yale University, P.O. Box 208121, New Haven, CT 06520, U.S.A. 4 Department of Astronomy, Yale University, New Haven, CT 06511, U.S.A. 5 Centre for Astronomy and Particle Theory, University of Not- tingham, University Park, Nottingham, NG7 2RD, UK 6 Institute for Astronomy, 2680 Woodlawn Drive, University of Hawaii, Honolulu, HI 96822, U.S.A. 7 Department of Physics, University of Oxford, Keble Road, Ox- ford, OX1 3RH, UK 8 Centre for Astrophysics Research, University of Hertfordshire, College Lane, Hatfield, Herts AL10 9AB, UK 9 Department of Physics & Astronomy, 206 Gallalee Hall, 514 University Blvd., University of Alabama, Tuscaloosa, AL 35487- 0324, U.S.A. 10 Blackett Laboratory, Imperial College London, South Kens- ington Campus, London SW7 2AZ, UK 11 Institute of Cosmology and Gravitation, University of Portsmouth, Mercantile House, Hampshire Terrace, Portsmouth, PO1 2EG, UK 12 Department of Astronomy and Astrophysics, 525 Davey Lab- oratory, Pennsylvania State University, University Park, PA 16802. 13 LinkLab, 4506 Graystone Ave., Bronx, NY 10471, U.S.A. 14 Fingerprint Digital Media, 9 Victoria Close, Newtownards, Co. Down, Northern Ireland, BT23 7GY, UK 15 Department of Physics and Astronomy, The Johns Hopkins University, Homewood Campus, Baltimore, MD 21218, USA 16 Berkeley Center for Cosmological Physics, Lawrence Berkeley Nat. Lab & Phys. Dept, University of California, Berkeley, CA 94720, U.S.A 17 Faculty of Mathematics & Physics, University of Ljubljana, Slovenia 18 Einstein Fellow 19 Chandra Fellow
-
Upload
independent -
Category
Documents
-
view
0 -
download
0
Transcript of GALAXY ZOO: THE FUNDAMENTALLY DIFFERENT CO-EVOLUTION OF SUPERMASSIVE BLACK HOLES AND THEIR EARLY-...

arX
iv:1
001.
3141
v1 [
astr
o-ph
.CO
] 1
8 Ja
n 20
10Accepted for publication in the Astrophysical JournalPreprint typeset using LATEX style emulateapj v. 11/10/09
GALAXY ZOO: THE FUNDAMENTALLY DIFFERENT CO-EVOLUTION OF SUPERMASSIVE BLACKHOLES AND THEIR EARLY- AND LATE-TYPE HOST GALAXIES1
Kevin Schawinski,2,3,18 C. Megan Urry,2,3,4 Shanil Virani,3,4 Paolo Coppi,3,4 Steven P. Bamford,5 EzequielTreister,6,19 Chris J. Lintott,7 Marc Sarzi,8 William C. Keel,9 Sugata Kaviraj,7,10 Carolin N. Cardamone,3,4
Karen L. Masters,11 Nicholas P. Ross,12 Dan Andreescu,13 Phil Murray,14 Robert C. Nichol,11 M. JordanRaddick,15 Anze Slosar,16 Alex S. Szalay,15 Daniel Thomas11 and Jan Vandenberg15
Accepted for publication in the Astrophysical Journal
ABSTRACT
We use data from the Sloan Digital Sky Survey and visual classifications of morphology from theGalaxy Zoo project to study black hole growth in the nearby Universe (z < 0.05) and to breakdown the AGN host galaxy population by color, stellar mass and morphology. We find that blackhole growth at luminosities L[O iii] > 1040 ergs−1 in early- and late-type galaxies is fundamentallydifferent. AGN host galaxies as a population have a broad range of stellar masses (1010 − 1011M⊙),reside in the green valley of the color-mass diagram and their central black holes have median massesaround 106.5M⊙. However, by comparing early- and late-type AGN host galaxies to their non-activecounterparts, we find several key differences: in early-type galaxies, it is preferentially the galaxieswith the least massive black holes that are growing, while late-type galaxies, it is preferentially themost massive black holes that are growing. The duty cycle of AGN in early-type galaxies is stronglypeaked in the green valley below the low-mass end (1010M⊙) of the red sequence at stellar masseswhere there is a steady supply of blue cloud progenitors. The duty cycle of AGN in late-type galaxieson the other hand peaks in massive (1011M⊙) green and red late-types which generally do not havea corresponding blue cloud population of similar mass. At high Eddington ratios (L/LEdd > 0.1),the only population with a substantial fraction of AGN are the low-mass green valley early-typegalaxies. Finally, the Milky Way likely resides in the “sweet spot” on the color-mass diagram wherethe AGN duty cycle of late-type galaxies is highest. We discuss the implications of these results forour understanding of the role of AGN in the evolution of galaxies.Subject headings: galaxies: evolution; galaxies: formation galaxies: Seyfert; galaxies: active
[email protected] This publication has been made possible by the partici-
pation of more than 250,000 volunteers in the Galaxy Zooproject. Their contributions are individually acknowledged athttp://www.galaxyzoo.org/Volunteers.aspx.
2 Department of Physics, Yale University, New Haven, CT 06511,U.S.A.
3 Yale Center for Astronomy and Astrophysics, Yale University,P.O. Box 208121, New Haven, CT 06520, U.S.A.
4 Department of Astronomy, Yale University, New Haven, CT06511, U.S.A.
5 Centre for Astronomy and Particle Theory, University of Not-tingham, University Park, Nottingham, NG7 2RD, UK
6 Institute for Astronomy, 2680 Woodlawn Drive, University ofHawaii, Honolulu, HI 96822, U.S.A.
7 Department of Physics, University of Oxford, Keble Road, Ox-ford, OX1 3RH, UK
8 Centre for Astrophysics Research, University of Hertfordshire,College Lane, Hatfield, Herts AL10 9AB, UK
9 Department of Physics & Astronomy, 206 Gallalee Hall, 514University Blvd., University of Alabama, Tuscaloosa, AL 35487-0324, U.S.A.
10 Blackett Laboratory, Imperial College London, South Kens-ington Campus, London SW7 2AZ, UK
11 Institute of Cosmology and Gravitation, University ofPortsmouth, Mercantile House, Hampshire Terrace, Portsmouth,PO1 2EG, UK
12 Department of Astronomy and Astrophysics, 525 Davey Lab-oratory, Pennsylvania State University, University Park, PA 16802.
13 LinkLab, 4506 Graystone Ave., Bronx, NY 10471, U.S.A.14 Fingerprint Digital Media, 9 Victoria Close, Newtownards,
Co. Down, Northern Ireland, BT23 7GY, UK15 Department of Physics and Astronomy, The Johns Hopkins
University, Homewood Campus, Baltimore, MD 21218, USA16 Berkeley Center for Cosmological Physics, Lawrence Berkeley
Nat. Lab & Phys. Dept, University of California, Berkeley, CA
94720, U.S.A17 Faculty of Mathematics & Physics, University of Ljubljana,
Slovenia18 Einstein Fellow19 Chandra Fellow

2 Schawinski et al.
1. INTRODUCTION
The nature of the co-evolution between galaxies andtheir supermassive black holes is still a mystery adecade after the discovery of the relationship betweenspheroid mass and black hole mass (Magorrian et al.1998; Gebhardt et al. 2000; Ferrarese & Merritt 2000;Tremaine et al. 2002; Haring & Rix 2004). Even moremysterious is its connection to the phenomenon ofdownsizing, the anti-hierarchical growth of galaxies andblack holes. While dark matter grows and assembles ina strictly hierarchical fashion, with the most massivedark matter haloes continuing to grow over cosmictime by accretion of smaller haloes, the formation andgrowth of galaxies inside those halos proceeds differently(e.g., Silk 1977; Rees & Ostriker 1977; White & Rees1978; Fall & Efstathiou 1980; Blumenthal et al. 1984;Cole & Lacey 1996) . Baryonic matter is convertedinto stars within dark matter haoles and regulated byfeedback processes. The stars in the most massivegalaxies were not only formed first, but also on theshortest time scales, with further star formation atlater epochs being suppressed. Less massive galax-ies have increasingly more extended star formationhistories as star formation in them, and their progen-itors, proceeded over increasingly longer timescales.This picture has been verified both by “archeologicalstudies” of local galaxies, and by probing ongoingstar formation at increasing redshifts (Cowie et al.1996; Heavens et al. 2004; Thomas et al. 2005;Nelan et al. 2005; Bernardi et al. 2006; Bundy et al.2006; Jimenez et al. 2007; Perez-Gonzalez et al. 2008;Collins et al. 2009; Thomas et al. 2009), and has alter-natively been called ‘downsizing’ or ‘anti-hierarchical’growth.The growth of supermassive black holes seems to
broadly mirror the anti-hierarchical trend of their hostgalaxies. Quasars powered by ∼ 109M⊙ black holes arealready observed about 1 Gyr after the Big Bang, im-plying that they must have reached these masses in avery brief, intense growth phase (e.g., Fan et al. 2001,2003, 2004; Fan 2006). Studies of the luminosity func-tion of optical- and X-ray-selected active galactic nu-clei (AGN) in deep fields observed by Chandra andXMM-Newton have revealed that the most luminousAGN were most common in the early Universe, whilethe lower-luminosity AGN peak later (Ueda et al. 2003;Merloni 2004; Barger et al. 2005; La Franca et al. 2005;Croom et al. 2009). In other words, the pattern of blackhole growth inferred from the luminosity evolution ofAGN seems to exhibit a qualitatively similar trend asgalaxy growth. Studies attempting to recover the historyof black hole growth support this picture (Marconi et al.2004; Shankar et al. 2009).It has been suggested in recent years that energy in-
put from AGN not only self-regulates the growth of bothblack holes and their host galaxies (Silk & Rees 1998;King 2003) to give rise to the observed MBH − σ re-lation (Gebhardt et al. 2000; Ferrarese & Merritt 2000),but that this AGN feedback also, as Bower et al. (2006)described it, “breaks the hierarchy of galaxy formation”giving rise to the observed anti-hierarchical nature ofgalaxy star formation histories. However, the precise na-ture of this connection is not understood, and it is not
clear if all or only some AGN phases affect their hostgalaxies.In this paper, we explore properties of the host galax-
ies of AGN and the nature of their black hole growthin the local Universe (z < 0.05) and discuss what theseproperties imply for the role of AGN in the evolutionof the host galaxies. In our investigation, we go beyondcharacterizing AGN host galaxies as a single class, asin some previous studies (e.g., Kauffmann et al. 2003a;Heckman et al. 2004), and dissect the AGN host galaxypopulation into sub-populations by observed propertiessuch as mass, color and most importantly, morphology(e.g., Best et al. 2005; Hickox et al. 2009). We use thevisual classifications of morphology by citizen scientiststaking part in the Galaxy Zoo project (Lintott et al.2008) to divide both AGN host galaxies and their quies-cent counterparts into morphology classes to reveal sev-eral new and surprising properties of AGN host galaxiesthat have implications for our picture of the galaxy-blackhole co-evolution. Our main conclusion is that the early-and late-type host galaxies of AGN are, despite appar-ent similarities, very different populations, and that theAGN phases occurring in them play a very different rolein their co-evolution.In Section 2, we describe our sample selection and the
derivation of galaxy properties such as stellar masses andmorphologies. In Section 3, we motivate and describe theselection of AGN via emission line diagnostic diagramsand the derivation of accretion properties and black holemasses. We present our observational results in Section4, discuss their implications in Section 5 and summarizein Section 6.Throughout this work, we assume cosmological param-
eters (Ωm = 0.3,ΩΛ = 0.7, H0 = 70), consistent withthe Wilkinson Microwave Anisotropy Probe Third Yearresults in combination with other data (Spergel et al.2007).
2. DATA AND SAMPLE SELECTION
In this section, we describe the selection of both theparent galaxy population and the AGN host galaxy sam-ple we use in this paper.
2.1. SDSS Photometric and Spectroscopic Data
The photometric and spectroscopic data used here aretaken from the Sloan Digital Sky Survey (SDSS) DR7(York et al. 2000; Strauss et al. 2002; Abazajian et al.2009). Throughout the paper, we use modelMags forgalaxy colors, as they are derived from the best-fittingexponential or de Vaucouleurs galaxy profile and are thusbest suited for measuring galaxy colors.
2.2. Galaxy Sample Selection Criteria
Our sample selection criteria ensure a large and com-plete sample of galaxies to low stellar masses whose SDSSimages are suitable for detailed morphological classifica-tion. We select all galaxies with SDSS spectra classifiedas GALAXY (Strauss et al. 2002) in the redshift interval0.02 < z < 0.05 and limit our selection to galaxies withr < 17 AB mag. In order to create a magnitude-limitedsample that is close to a stellar mass-limited sample, wefurther limit this sample to Mz,Petro < −19.5 AB mag.We choose the z-band rather than the r-band since the
Galaxy Zoo: AGN Host Galaxies 3
Fig. 1.— Example images of AGN host galaxies in three morphology classes. The top two rows are late-type host galaxies, the middlerows are indeterminate-type and the bottom two rows are early-type host galaxies. In the top left of each image, we show a bar of 5 kpclength at the redshift of the object. In the bottom, we provide the SDSS object ID.
redder z-band is closer to stellar mass. This yields a totalof 47,675 galaxies.The SDSS fibres are circular with a diameter of
3′′ (York et al. 2000; Strauss et al. 2002), which corre-sponds to a physical footprint of 1.2 – 2.9 kpc in diame-ter at the lower and upper redshift limits of our sample.The spectroscopic information used in this work thereforesamples only the central regions of galaxies, rather than
the bulk light which is sampled in more distant (z ∼ 0.1)galaxies. We describe the selection of AGN from thisparent sample in Section 3.
2.3. Galaxy Zoo Morphologies
In the past, obtaining accurate morphologies for largesamples of galaxies has been difficult. Only with the in-volvement of over 200,000 citizen scientists in the Galaxy

4 Schawinski et al.
TABLE 1Galaxy morphology statistics from Galaxy
Zoo
Galaxy morpholgy class Number Percentage
Late-type 16246 34.1Indeterminate-type 22483 47.2Early-type 8928 18.7All 47675 100
Zoo project (Lintott et al. 2008) have we been able togather multiple independent visual classifications for theentire SDSS main galaxy sample that are comparable tothose of professional astronomers. Galaxy Zoo providesa web interface20 where volunteers from the general pub-lic are shown randomly selected images from the SDSSmain galaxy sample. Since every object supplied for in-spection by Galaxy Zoo has been viewed multiple timesby independent classifiers, we are able to use the distri-bution of votes to choose the purity of the classificationsof individual galaxies by specifying the required level ofagreement among classifiers.We use the definition for the clean sample of
Land et al. (2008), which requires an 80% majorityagreement on the morphology of any object. We com-bine all spirals regardless of orientation into the late-type class and all the spheroids into the early-type class,while those objects without a consensus at the 80% levelare placed in the indeterminate class. We use the label‘early-type’ rather than ‘elliptical’, as we specifically in-clude lenticular galaxies in this class, while the late-typeclass contains anything with a discernible disk, from anSa to an Sd galaxy.We include merging galaxies with the indeterminate-
type class; in any case, major mergers in the local Uni-verse are rare (1-2%; Darg et al. 2009b, and referencestherein), and the incidence of emission-line AGN in themis not significantly enhanced over the general population(Darg et al. 2009a). In Table 1, we present the totalnumbers and population fractions of the various mor-phology classes defined by the Galaxy Zoo classifications.In order to give a sense what these three morphological
classes mean, we show in Figure 1 a randomly selectedsample of AGN host galaxies in each morphology classclass. We stress that these are AGN host galaxies andnot objects taken from the entire population. For exam-ples of images of normal galaxies, we refer the reader toLintott et al. (2008).
2.4. Stellar Mass Measurements
We measure stellar masses for all objects in this sam-ple by fitting the five SDSS photometric bands to a li-brary of 6.8 × 10⁶ model star formation histories gen-erated from Maraston (1998, 2005) stellar models. Thestar formation histories are parameterized as two bursts(e.g., Schawinski et al. 2007; Kaviraj et al. 2007) of vary-ing ages and mass-fractions, fixed solar metallicity, vary-ing dust extinction (0 <E(B − V )< 0.5; Calzetti et al.2000) and exponential e-folding time (τ = 10, 100, 1000Myr); all models assume a Salpeter (1955) initial mass
20 See http:// zoo1.galaxyzoo.org
function. Stellar masses are measured by finding the min-imum of the χ2 statistic in the parameter space probed,while the errors are determined from the range of stellarmasses within 1 − σ of the minimum. We do not varythe initial mass function.We test the reliability of our stellar mass measurements
for AGN host galaxies with the methodology describedin Appendix A. We find that our stellar mass measure-ments are robust for the AGN present in our sample.
3. AGN SELECTION
The selection and characterization of AGN is a chal-lenging problem, as no single wavelength regime al-lows for a perfectly unbiased sample. Various mid-infrared selection techniques have been proposed basedon Spitzer data (e.g., Lacy et al. 2004; Stern et al. 2005;Donley et al. 2005; Hickox et al. 2009), but these canbe inefficient depending on depth, missing a large frac-tion of genuine AGN while selecting a substantial num-ber of non-AGN (Cardamone et al. 2008). Hard X-rayselection (E > 10 keV) is the least biased selectiontechnique, as it can detect even the most heavily ob-scured, Compton-thick systems whose existence is re-quired by the X-ray background (Treister & Urry 2005;Treister et al. 2009a). However, current surveys of thehard X-ray sky remain too shallow or are confined tosmall areas compared to SDSS (e.g., Tueller et al. 2008;Winter et al. 2008; Treister et al. 2009a).For this reason, we resort to a less complete, but
more sensitive selection technique than hard X-raysby searching for galaxies exhibiting narrow emissionlines originating from a cone of radiation photoionizedby the central engine (e.g., Evans et al. 1991, 1993).First used by Baldwin, Phillips, & Terlevich (1981) andextended by Veilleux & Osterbrock (1987), emissionline diagrams have been improved and refined in theirinterpretation by many theorists using photoionisa-tion codes (e.g., Stasinska 1990; Leitherer & Heckman1995; Leitherer et al. 1999; Kewley et al. 2001, 2006;Groves et al. 2004a,b) and by observational work(e.g., Veilleux & Osterbrock 1987; Ho et al. 1995,1997a,b,c; Kauffmann et al. 2003a; Stasinska et al. 2006;Sarzi et al. 2006; Stasinska et al. 2008).The emission line selection we use in this work does
not include unobscured (Type 1) AGN with broad linesand may be biased against the most highly obscuredAGN. If the Unified Model of AGN (Antonucci 1993;Urry & Padovani 1995) is correct and these difference aredue to the orientation of the putative obscuring mediumin the central engine, and if the obscuration does notcover the narrow-line region, then narrow-line (Type 2)AGN are a fair sub-set of the entire AGN populationwithin the luminosity range covered.We now discuss in detail how we measure emission
lines, use them on emission line diagrams, and assessthe completeness of this selection. The final result of ourselection described in this Section is that of the high-luminosity end of the local AGN population, and there-fore of sites of substantial black hole growth. For rea-sons of completeness, a similar analysis of low-luminosityAGN with significantly sub-Eddington accretion rates isnot possible via emission line selection due to contami-nation from star formation (see Section 3.3 for details).

Galaxy Zoo: AGN Host Galaxies 5
3.1. Emission Line Measurement
We measure the emission line fluxes using an anal-ysis tool called Gas AND Absorption Line Fitting al-gorithm (GANDALF; Sarzi et al. 2006), which usesthe Penalized Pixel-Fitting method PPXF method ofCappellari & Emsellem (2004) to simultaneously fit thestellar continuum and nebular emission lines21. The ad-vantage of this tool is that it is designed to minimizetemplate mismatch, where emission and absorption linesare difficult to separate (see Falcon-Barroso et al. 2006and Sarzi et al. 2006 for example applications). We usea set of stellar templates from Tremonti et al. (2004)plus Gaussian emission line templates. We measure[O iii] λ5007 fluxes for each processed SDSS spectrumand compute the total luminosity L[O iii] by correctingfor extinction based on the measured Balmer decrement.GANDALF also provides measurements of the stellarvelocity dispersion. Since the fixed SDSS spectroscopicfibre samples the light out to a different fraction of theeffective radius, we use the empirical correction derivedby Cappellari et al. (2006) to correct the velocity disper-sion to the effective radius of the bulge surface-brightnessprofile.
3.2. Emission Line Diagnostics and AGN Selection
Our AGN selection technique is the same as usedby Schawinski et al. (2007): we first separate galaxieswhose narrow emission lines are dominated partiallyor wholly by star formation on the [N ii]/Hα diagram(Figure 2, left) by using the extreme starburst line ofKewley et al. (2001) to retain only those beyond thisline (i.e., the top-right of the diagram). Between thisextreme starburst line and the empirical pure starburstline of Kauffmann et al. (2003b), there is a substantialpopulation of composite objects where both AGN andstar formation are comparable in ionizing luminosity. Weexclude this class for this study and note that by remov-ing this class of potential AGN, we may be removing animportant phase in the AGN-galaxy co-evolution at lowredshift. The main problem with the composite class isthe lack of easily accessible spectral indicators that wouldallow a clean separation of AGN and star formation.We are thus left with galaxies whose emission lines
are dominated by sources of ionization other than youngstars. These sources may be AGN, but can also includeslow-moving shocks and gas excited by post-AGB starsand horizontal branch stars (see Ho 2008; Stasinska et al.2008; Sarzi et al. 2009). These non-stellar sources areempirically divided into two branches, a division that ismost obvious in the [O i]/Hα diagram (Figure 2, right).The lower branch of this population was first designatedas ‘low-ionization narrow emission-line regions’, or LIN-ERs, by Heckman (1980). The upper branch is identifiedwith galaxies hosting Type 2 (Seyfert) AGN.Originally thought to be low-luminosity AGN, the na-
ture of the LINER ionisation mechanism has since beendebated, and it is becoming increasingly clear that themajority of galaxies with LINER spectra are unlikely to
21 Both PPXF and GANDALF are available for downloadat http://www.strw.leidenuniv.nl/sauron/software.html.A version of GANDALF designed for use on SDSS spec-tra can be obtained at http://star-www.herts.ac.uk/∼sarzi/PaperV nutshell/PaperV nutshell.html
be low-luminosity AGN. The physical footprint of theline emitting area in nearby LINERs has been deter-mined to be extended on kpc scales (e.g., Keel 1983;Phillips et al. 1986; Sarzi et al. 2006) and thus is unlikelybe photoionized by a nuclear source. A detailed analysisof the distribution of this extended LINER emission innearby SAURON galaxies by Sarzi et al. (2009) demon-strates that the majority of LINERs are incompatiblewith an ionization source in the nucleus, even in thecase of galaxies known to host (X-ray or radio-detected)AGN, but instead are powered by some component ofthe underlying old stellar population. Sarzi et al. (2009)further show that this extended LINER emission is suf-ficiently strong to be detected in SDSS spectra of moredistant z ∼ 0.05 galaxies. Cid Fernandes et al. (2009)have recently similarly argued that many of the SDSSobjects in the LINER box are “retired” galaxies poweredby old stellar populations.While it is certainly the case that some X-ray
detected AGN exhibit nuclear LINER spectra (e.g.,Gonzalez-Martın et al. 2009), the presence of LINER-likeline ratios over the large physical footprint of the SDSSspectroscopic fiber does not imply the presence of a low-luminosity AGN. LINERs are thus potentially highly di-verse and the majority of them are not low-luminosityAGN. Even if a low-luminosity AGN were present, theL[O iii]emission sampled by the spectroscopic fiber can-not disentangle the relative contributions. We thereforedecided to eliminate them from our sample and to retainonly the definite AGN for our analysis.Since galaxies exhibiting LINER spectra are different
from those hosting Seyfert AGN, we verify that the inclu-sion of the small number of LINERs that are above theluminosity limit of L[O iii] ∼ 1040 ergs−1established inthe next Section does not significantly change our results,as most LINERs have substantially lower [O iii] λ5007luminosities and Eddington ratios compared to SeyfertAGN and are thus not sites of substantial black holegrowth (see Appendix B for details).The [O i]/Hα diagram allows for the best separation of
AGN and LINERs, so we use it for those spectra where[O i] λ6300 is detected with S/N > 3. In cases where[O i] λ6300 is not detected, but [S ii] λλ6717, 6731 is, weuse the [S ii]/Hα diagram (Figure 2, center). In bothcases, we use the AGN-LINER division of Kewley et al.(2006). If neither [O i] λ6300 nor [S ii] λλ6717, 6731 isdetected, but [N ii] λ6584 is, we make use of the original[N ii]/Hα diagram, where we use the empirical divisionline defined by Schawinski et al. (2007).Out of a parent sample of 47,675 galaxies, we thereby
select a sample of 942 narrow line AGN (Table 2). Thiscorresponds to a lower limit on the AGN fraction of 2%,as we do not include broad-line AGN, highly obscuredAGN or LINERs. As we show later in this paper, theAGN fraction is highly dependent on position in thecolor-mass diagram and ranges from effectively zero to∼ 10%.
3.3. Assessing the Completeness of Emission LineSelected AGN
Since we wish to study the properties of AGNhost galaxies as a class, we need to understandhow effective our AGN selection technique is andto what degree it is biased. Emission line selec-

6 Schawinski et al.
-1.5 -1.0 -0.5 0.0 log([NII] λ 6583/Hα)
-1.0
-0.5
0.0
0.5
1.0
log(
[OIII
] λ 5
007/
Hβ)
Ke01Ka03
S07
-1.0 -0.8 -0.6 -0.4 -0.2 0.0 0.2 log([SII] λ 6717,6731/Hα)
-2.0 -1.5 -1.0 -0.5 0.0log([OI] λ 6300/Hα)
Fig. 2.— The emission line diagnostic diagrams used for the selection of AGN from narrow-line fluxes. We use three different diagrams,all of which use the ratio of [O iii]/Hβ (vertical axis). From left to right, the horizontal axes are the ratios of [N ii]/Hα, [S ii]/Hα and[O i]/Hα. In each panel, we plot those objects that have S/N > 3 in each of the four lines required for the diagram. The gray shadingrepresent the entire galaxy sample, while the green points are the AGN sample selected using these diagrams. In the [N ii]/Hα diagram(left), the dashed line shows the empirical demarcation line between between purely star-forming galaxies and the composite region ofthe diagram determined by Kauffmann et al. (2003a, Ka03). The solid line, labelled Ke01, is the theoretical extreme starburst line ofKewley et al. (2001) beyond which the dominant source of ionization cannot be due to OB stars and must be due to a mechanism otherthan star formation (AGN, evolved stellar populations or shocks). The solid line labelled S07 is the empirical AGN-LINER distinctiondefined by Schawinski et al. (2007). The demarcation lines in the [S ii]/Hα and [O i]/Hα diagrams are taken from Kewley et al. (2006).We select AGN using these diagrams in the following way: if [O i] λ6300 is detected with S/N > 3, then we use the [O i]/Hα diagram. If[O i] λ6300 is not detected, but [S ii] λλ6717, 6731 is, then we use the [S ii]/Hα diagram. If neither [O i] λ6300 nor [S ii] λλ6717, 6731 aredetected, but [N ii] λ6584 is, we use the [N ii]/Hα diagram.
-1.5 -1.0 -0.5 0.0 log([NII] λ 6583/Hα)
-1.0
-0.5
0.0
0.5
1.0
log(
[OIII
] λ 5
007/
Hβ)
Ke01Ka03
S07
L[OIII] = 1039 erg s-1
-1.5 -1.0 -0.5 0.0 log([NII] λ 6583/Hα)
L[OIII] = 1040 erg s-1
-1.5 -1.0 -0.5 0.0 0.5log([NII] λ 6583/Hα)
L[OIII] = 1041 erg s-1
Fig. 3.— [N ii]/Hα emission line diagnostic diagrams for all galaxies (shaded) and simulated composite AGN plus star forming galaxies(red points). The simulated AGN luminosity increases from 1039 ergs−1in the left panel, to 1040 ergs−1in the center and 1041 ergs−1onthe right. See Section 3.3 for details. For low values of L[O iii] (left), the nebular emission from star formation can overwhelm the AGNsignature, and such low-luminosity AGN may be missed. At an AGN L[O iii]= 1040 ergs−1, 12.8% of AGN move below the empiricalstarburst line (dashed), while 54.4% move below the extreme starburst line (solid). The result of this test shows that at high luminosities,AGN are efficiently selected using emission line diagrams. However, at lower luminosities, star formation may overwhelm the AGN narrowline emission.
tion and characterisation of AGN has been success-fully employed in many works (e.g., Baldwin et al.1981; Veilleux & Osterbrock 1987; Ho et al. 1995,1997a,b,c; Kauffmann et al. 2003a; Schawinski et al.2007; Constantin et al. 2008; Kewley et al. 2006). DeepChandra studies of such emission-line selected AGN by
Ho et al. (2001) show that the majority of such AGN alsoexhibit a nuclear X-ray source. For emission line selec-tion of AGN to be reliable and reasonably complete, twoassumptions must be true:
1. the AGN must always excite a narrow-line region,

Galaxy Zoo: AGN Host Galaxies 7
0.0
0.1
0.2
0.3
[OIII] Luminosity log10(L[OIII]) (erg s-1)
dN/N
All AGN host galaxies
Early-type galaxies
38 39 40 41 42 0.0
0.1
0.2
Indeterminate-type galaxies
38 39 40 41 42 43
Late-type galaxies
0.0
0.1
0.2
0.3
0.4
Velocity dispersion log10(σ) (kms-1)
dN/N
All AGN host galaxies
Early-type galaxies
1.0 1.5 2.0 2.5 0.0
0.1
0.2
0.3
Indeterminate-type galaxies
1.0 1.5 2.0 2.5 3.0
Late-type galaxies
0.0
0.1
0.2
0.3
Eddington parameter log10 L[OIII]/MBH
dN/N
Edd
ingt
on li
mit
All AGN host galaxies
Edd
ingt
on li
mit
Early-type galaxies
-3 -2 -1 0 1 2 0.0
0.1
0.2
Edd
ingt
on li
mit
Indeterminate-type galaxies
-3 -2 -1 0 1 2 3
Edd
ingt
on li
mit
Late-type galaxies
Fig. 4.— Top left: The distribution of L[O iii] of our AGN sample. Top right: The distribution of stellar velocity dispersions of our AGNsample. Bottom: The distribution of the Eddington parameter L[O iii]/MBH, combining the values from the plots on the top row via theMBH −σ relation. We indicate the approximate value of the Eddington limit in each panel. In each of the panels, we show the distributionof the entire AGN population in the top-left, while the remaining panels show the L[O iii] distribution split by host morphology.
TABLE 2Typical [O iii] λ5007-luminosities, Eddington ratios and black hole masses of AGN by host galaxy morphology
Host galaxy Number Percentage of mean median mean median mean medianmorphology host galaxies log L[O iii] log L[O iii] log L[O iii]/σ4 log L[O iii]/σ4 log MBH log MBH
( ergs−1) ( ergs−1) (M⊙) (M⊙)
Late-types 402 42.68% 40.40 40.39 0.295 0.306 6.52 6.63Indeterminate-types 431 45.75% 40.40 40.39 0.456 0.442 6.52 6.63Early-types 109 11.57% 40.27 40.30 0.326 0.397 6.36 6.45All 942 100% 40.38 40.38 0.372 0.370 6.43 6.53
and
2. the emission lines from the narrow-line region mustnever be overwhelmed by lines excited by other pro-cesses, in particular star formation.
Many recent studies of AGN host galaxies have notedthat AGN tend to concentrate in the green valley on thecolor-mass diagram, i.e., at intermediate optical colors,and that there are very few AGN in the blue cloud and
the red sequence. This raises the possibility that AGNin star-forming blue cloud galaxies could be overwhelmedby emission from star formation. The lack of relativelyluminous AGN (LX ∼ 1043−45 ergs−1) in the blue cloudhas been recently been established by Schawinski et al.(2009c) using hard X-ray-selected AGN, demonstratingthat, at these luminosities, the absence of AGN is not aselection effect.
8 Schawinski et al.
But could there still be a population of low-luminosityemission line AGN in the blue cloud whose emissionlines are overwhelmed by star formation? For substan-tially lower luminosity AGN than those studied by bySchawinski et al. (2009c), any X-ray detection in bluecloud star-forming galaxies is likely ambiguous in the0.2–10 keV window accessed byXMM-Newton and Chan-dra as this could be due to star formation and X-raybinaries (e.g., Persic et al. 2004). Can we do any betterwith emission line diagnostics?In order to test whether emission line AGN similar
to those we select on BPT diagrams might be hiddenin blue cloud star-forming galaxies, we perform a sim-ple empirical experiment. We pair a randomly selectedstar-forming galaxy from our galaxy sample with anotherrandomly selected AGN. We rescale the AGN emissionline fluxes to a specific L[O iii] to simulate the effect ofadding a AGN of a certain luminosity. For example, wecompute the composite [N ii] λ6584 line from the line of arandom star-forming galaxy and the line from a randomAGN as:
[N ii]model = [N ii]SF +
(
Ls
LAGN
)
[N ii]AGN (1)
where Ls is the specific L[O iii] to which the AGN con-tribution to [N ii] λ6584 is scaled.We perform this pairing of star-forming and AGN host
galaxies 1,000 times scaling the AGN contribution to Ls
= 1039, 1040 and 1041 ergs−1 in L[O iii], to cover therange of star formation rates22 and line ratios of bluecloud star-forming galaxies and of AGN23. We show theresults of this exercise in Figure 3, where each panelshows a [N ii]/Hα diagram with the entire galaxy sam-ple as shades. On top of each, we plot the 1,000 com-posite objects scaled to the three specific L[O iii] values.This addition of an AGN component moves the posi-tion of a star-forming object off the star-forming locus,into the composite region and finally onto the AGN re-gion. For added Sefyerts with L[O iii] = 1041 ergs−1, wefind that only 1.4% remain below the Kauffmann et al.(2003a) empirical starburst line. However, for L[O iii]= 1040 ergs−1and = 1039 ergs−1, this fraction increasesto 12.8% and 56.6% respectively. Similarly, the fractionsof AGN that move below the Kewley et al. (2001) ex-treme starburst line into the composite region are 85.5%,54.4% and 12.9% respectively.From this experiment, we conclude that towards the
higher luminosities in our sample (∼ 1041 ergs−1), oursample is complete even in the blue cloud, and that thereis no substantial population of such blue-cloud AGN.For lower luminosities, L[O iii] . 1040 ergs−1, this isno longer true, and there may potentially be AGN inthe blue cloud whose narrow-line region is overwhelmedby current star formation. If there is such a popu-lation of AGN, they cannot be detected via emissionline diagnostics, just as selection in the X-rays would
22 The definition of “star forming” depends on the detection ofemission lines with sufficient signal-to-noise and does not directlycorrespond to a star formation rate. 95% of star-forming galaxieshave star formation rates greater than ∼ 0.2M⊙yr−1.
23 Each pairing of an AGN with a star-forming galaxy is random,but we only have 942 AGN, so some of the AGN are used morethan once.
be challenging. However, a recent search for for broad-line AGN hidden in star-forming galaxies by Mao et al.(2009) found only three such objects in a parent sampleof over 3,200 objects, establishing a lower limit on thevery low-luminosity AGN fraction in the blue cloud of∼ 0.1%, which suggests that the true abundance of suchobjects is very low, though broad lines may be similarlydiluted by host galaxy light.
3.4. Demographics of Black Hole Masses and AccretionEfficiencies
We diagnose the accretion state of the black hole us-ing the [O iii] λ5007 line. Observed correlations be-tween L[O iii] and other indicators of AGN luminos-ity imply that L[O iii] is a reasonably good indicatorof the current accretion rate, though with considerablescatter (Heckman et al. 2004). More recent work byDiamond-Stanic et al. (2009) comparing a variety of in-dicators of the intrinsic bolometric output of local AGNdo show that L[O iii] may not be an isotropic indicatorand that Type 2 AGN – such as those in our sample –are intrinsically more obscured, and therefore more lu-minous, than previously thought, even based on hard X-ray observations (Rigby et al. 2009; cf., Lamastra et al.2009). Given these caveats, L[O iii] will be used cau-tiously as a probe of black hole accretion in this work,and we restrict its use to statements about populationsand trends rather than about individual objects. L[O iii]is the only indicator of the current accretion rate in low-luminosity AGN available for large SDSS samples.We infer supermassive black hole masses indirectly
from the stellar velocity dispersion at the effectiveradius via the MBH − σ relation (Gebhardt et al.2000; Ferrarese & Merritt 2000; Tremaine et al. 2002;Haring & Rix 2004) using the slope and normalisationof Tremaine et al. (2002). While the resolution of theSDSS spectra and the templates used is approximately 60kms−1, we are able to use GANDALF to probe slightlybelow this resolution limit. Whenever we quote blackhole masses, we include all objects with velocity disper-sion measurements down to 40 kms−1, but caution thatin the range from 40 – 50 kms−1(log MBH= 5.3− 5.7),the quoted black hole masses are increasingly uncertain.The median error in this lowest velocity dispersion rangeis ∼ 10 kms−1, corresponding to an error of ∼ 0.4 dexin MBH.To estimate the Eddington ratio of the AGN, we
adopt the measure L[O iii]/MBH as a rough proxy(Kewley et al. 2006). Kauffmann & Heckman (2009)normalize the Eddington parameter to argue that theEddington limit corresponds to log(L[O iii]/MBH ) =1.7 dex. Our AGN sample contains 33 (3.5%) objectswith logL[O iii]/MBH > 1.7 dex, though the large scat-ter in L[O iii]/MBH makes it likely that none of our AGNare super-Eddington. Kauffmann & Heckman (2009) ar-gue that the bolometric correction for the extinction-corrected [O iii] λ5007 luminosity is a factor of 300 – 600,so the bolometric luminosities of the AGN in our sampleare between 2.5 and 2.8 dex higher than the [O iii] λ5007luminosities quoted throughout.We summarize some of the key AGN properties, in-
cluding the AGN fraction in each morphology class, inTable 2 and plot the distribution of the stellar velocitydispersion, L[O iii] and L[O iii]/MBH for both the entire
Galaxy Zoo: AGN Host Galaxies 9
AGN sample, and for each morphology class, in Figure4. We note that the majority of the AGN in our sample(∼ 90%) reside in indeterminate- and late-type hosts.
4. TWO DISTINCT MODES OF BLACK HOLE GROWTH INEARLY- AND LATE-TYPE AGN HOST GALAXIES
With the various observed and derived quantities as-sembled, we can now carry out a systematic investigationof the nature of AGN host galaxies and thus assess therole of AGN in the ongoing evolution of the low-redshiftgalaxy population. In Figure 5, we show the locationof AGN host galaxies on a color-mass diagram of u − rcolor vs. stellar mass as calculated in Section 2.4. Ineach panel, we show the entire normal galaxy popula-tion as contours. On top of the normal galaxy distribu-tion, we overplot the 942 AGN host galaxies as individ-ual green points to show their absolute distribution inthe color-mass diagram. The top left panel contains theentire sample regardless of morphology. Going clockwisearound the Figure, the top right panel shows only early-type galaxies, both for the normal galaxy population andthe AGN host galaxies. Below in the bottom-right, weshow only the late-types and finally in the bottom left, theindeterminate-types that did not receive a > 80% classi-fication. In the panels split by morphology, we overplotthe contours of the entire population from the top leftpanel as gray dotted contours to aid the eye in identify-ing the underlying blue cloud and red sequence.The absolute distribution of AGN host galaxies on the
color-mass diagram conveys the range of observed hostproperties, but can obscure the equally significant rela-tive incidence of AGN in various areas on the color-massdiagram. Previous studies have only used this absolutedistribution to interpret the role of AGN in galaxy evo-lution – and then only for the whole galaxy population,not for the two main morphology classes separately.The AGN fraction on the color-mass diagram (Fig-
ure 6) is more enlightening than the absolute distribu-tion because in any area on the color-mass diagram, theAGN fraction is a proxy for the duty cycle of AGN andtherefore for the importance of AGN for the evolutionof galaxies of specific masses, colors and morphologies.The duty cycle is the fraction of the time that a galaxyspends as a AGN in a specific population. The AGNfraction is a proxy of this because galaxies do not moverapidly on this diagram relative to the life time of AGNphases. Typical AGN lifetimes are estimated to be on theorder of 106 − 108 years, approaching 109 years only forthe most massive black holes which, in any case, are notactive in the local Universe (Martini & Weinberg 2001;Marconi et al. 2004; Martini 2004). The movement ofgalaxies on the color-mass diagram on the other handis slow: mass-doubling timescales due to star formationare on the order of 109 − 1010 years (Brinchmann et al.2004; Noeske et al. 2007) while major mergers are rarein the local Universe (Darg et al. 2009b). Stellar evolu-tion limits the pace of movement in the color direction.The most rapid color evolution possible is that of theinstantaneous shutdown of star formation resulting in amovement from blue to red in ∼ 1Gyr. Thus, the frac-tion of AGN in any area on the color-mass diagram isprobing the fraction of time that AGN are switched onin that population, and therefore it is a measure of theduty-cycle.
We present the AGN fraction for our sample in Fig-ure 6, which has a very similar layout as Figure 5. Wedo not fill the general galaxy population contours, butdo leave the gray dotted contours indicating the wholegalaxy population to guide the eye. We overplot thefraction of AGN host galaxies, with increasingly darkshades of green indicating a higher AGN fraction. It isimmediately apparent from Figures 5 and 6 that the ab-solute and relative distribution of AGN host galaxies aresubstantially different, and that this difference is a verystrong function of morphology.
4.1. The Importance of AGN Host Galaxy Morphology
Figures 5 and 6 suggest that the early-type and late-type host galaxies of AGN are fundamentally differentpopulations, and that analysing the entire AGN hostgalaxy population as a whole obscures these differences.There is no ‘typical’ AGN host galaxy.We note at this point that, out of the entire sample
of 942 AGN host galaxies, only 12 (1.3%) were classifiedas ongoing major mergers with serious disturbances byDarg et al. (2009b); the vast majority of emission-lineselected AGN in the local Universe are not hosted bygalaxies undergoing a major merger.From their distribution in Figure 5, we see that the
AGN host galaxies span nearly the entire observedrange of the general galaxy population (in this sample)in stellar mass. This is not the case for color; manyworks have already noted that AGN host galaxiespreferentially reside in the green valley at intermediatehost galaxy colors and that they are less common in theblue cloud and the red sequence (e.g., Schawinski et al.2007; Nandra et al. 2007; Wild et al. 2007; Salim et al.2007; Constantin et al. 2008; Martin et al. 2007;Georgakakis et al. 2008; Silverman et al. 2008;Schawinski et al. 2009c; Treister et al. 2009b).The concentration of AGN host galaxies in the green
valley is strongly dependent on whether we are consider-ing the relative or absolute AGN distribution. Figure 5shows that a substantial number of AGN lie on the red se-quence. However, when we consider the AGN fraction inFigure 6, this population is put into context – comparedto the total number of galaxies on the red sequence, theAGN population is lower by at least a factor of 10–20than in the peak regions, and therefore so is the dutycycle of these AGN. Hence, the importance of AGN togalaxy evolution on the red sequence is likely very small:we note that the population of AGN host galaxies atthe massive end of the red sequence is almost entirely ofindeterminate- and late-type morphology; massive early-type hosts are rare.The AGN fraction is strongly concentrated below the
red sequence and at relatively high host stellar masses ofM∗ ∼ 1011 M⊙. Furthermore, the AGN fraction rapidlydrops towards lower stellar masses and is very low to-wards the lower mass range.The absence of emission line AGN host galaxies on the
red sequence is significant, as the emission line signatureof even a very low-luminosity AGN superimposed on apassive stellar population would be detected. Interpret-ing the absence of AGN host galaxies from the blue cloudis more complex: As discussed in Section 3.3, their ab-sence is not significant for AGN at the lower end of theL[O iii] of AGN in our sample (see Figure 4), because

10 Schawinski et al.
1.0
1.5
2.0
2.5
3.0
Stellar Mass log M* (M O •)
u-r
colo
urAll galaxies
AGN host galaxy
Early-type galaxies
9.0 9.5 10.0 10.5 11.0 11.5
1.0
1.5
2.0
2.5
3.0Indeterminate-type galaxies
9.0 9.5 10.0 10.5 11.0 11.5 12.0
Late-type galaxies
Fig. 5.— The distribution of AGN host galaxies on the u − r color-mass diagram (green dots). Top left : galaxies of all morphologies;top right : early-type galaxies; bottom left : indeterminate-type galaxies; bottom right : late-type galaxies. The solid, shaded contours ineach case show the galaxy population, on top of which we plot the individual AGN as green points. The large points are those AGN withL[O iii]> 1041 ergs−1. In the panels for each specific morphology class, we only plot AGN host galaxies in that specific class. Furthermore,to guide the eye, we overplot the contours of all galaxies from the top left panel as gray dotted contours. The contour levels in all panelsare linear and represent the same contour levels. From this Figure, we see that AGN host galaxies preferentially have green host galaxycolors and a range of stellar masses – but that this range is clearly morphology-dependent. That is, AGN host galaxies are a very particularsub-set of normal galaxies, and the way in which they are separate depends on morphology.
the signature of the AGN narrow-line region could beoverwhelmed by star formation. At higher luminositiesof & 1041 ergs−1, the absence of blue cloud AGN ishighly significant, as we would have been able to detectthem. At even higher luminosities of LX & 1043 ergs−1,Schawinski et al. (2009c) have established the completeabsence of AGN in the blue cloud using hard X-ray ob-servations by the Swift satellite.What happens when we split the AGN population by
morphology? In the remaining panels of Figure 5 and6, a dramatically different picture emerges wherein theearly- and late-type AGN host galaxies are shown to besignificantly different populations. The absolute distri-bution of AGN host galaxies in Figure 5 already showsthat the typical host stellar mass early-type AGN hostsis lower than that of late-type AGN hosts.Turning to the AGN fraction and therefore to where
the AGN duty cycle is highest, this picture becomes evenmore extreme. The AGN fraction peaks at a stellar mass
of M∗ ∼ 1011M⊙ in the general population, and rangesfrom 109.5 − 1011.5M⊙. Once we split by morphologyin Figure 6, the difference between early- and late-typehosts becomes even more striking than for the absolutedistribution: while for the late-types the AGN fractionstill peaks strongly at 1011M⊙, the AGN fraction in theearly-type population peaks at M∗ ∼ 1010M⊙, an or-der of magnitude lower than in both the late-types andand the general population. This division has not beenapparent in previous works due to a lack reliable morpho-logical classification for very large numbers of galaxies.Because the early-type AGN make up only ∼ 11% of allAGN (see Table 2), their properties are overwhelmed bythe late-types in a general AGN host galaxies sample.The most striking aspect of the AGN fraction in Fig-
ure 6 is that in the early-type population, the AGN dutycycle is highest in an extreme population of early-typesthat do not reside on the red sequence, but rather belowit at the low-mass end and above the bulk of the blue

Galaxy Zoo: AGN Host Galaxies 11
1.0
1.5
2.0
2.5
3.0
Stellar Mass log M* (M O •)
u-r
colo
urAll galaxies
10% AGN8% AGN5% AGN3% AGN1%AGN
All AGN
Early-type galaxies
9.0 9.5 10.0 10.5 11.0 11.5
1.0
1.5
2.0
2.5
3.0Indeterminate-type galaxies
9.0 9.5 10.0 10.5 11.0 11.5 12.0
Late-type galaxies
Fig. 6.— The distribution of the fraction of galaxies that host AGN on the color-mass diagram. The layout of this figure is similar tothat in Figure 5, though for clarity, we do not shade the contours of the galaxy population. The filled contours represent the AGN fraction,which has been calculated in cells of size 0.175 dex in stellar mass and 0.125 mag in u− r color. We consider only cells that contain at least50 objects to minimize noise. The legend in the top left panel relates the shading level to the AGN fraction. As we argue in Section 4, theAGN fraction is a proxy for the AGN duty cycle. This Figure reveals in in stark terms that those galaxy populations that only very specificsub-populations of galaxies have a high AGN duty cycle: in the early-type population, it is only low-mass galaxies in the green valley thathave a high AGN duty cycle. Early-type galaxies on the red sequence, regardless of mass, do not have an appreciable duty cycle. In thelate-type population, it is massive galaxies that have a AGN high duty cycle. The duty cycle peaks strongly in a ‘sweet spot’ in the greenvalley. The high mass of late-type AGN host galaxies is somewhat misleading, as they have similar black hole masses, and therefore bulgemasses, to the early-type AGN hosts. Their higher stellar mass is therefore due to a disk, rather than a bulge (see Table 2). Exampleimages are shown in Figure 10. The Milky Way galaxy most likely resides in the ‘sweet spot’ for the AGN duty cycle in late-types.
cloud, i.e., in the green valley. Similarly, the AGN dutycycle for late-type galaxies is highest in objects that aremore massive and redder than the typical late-type pop-ulation. These red late-types will include a substantialfraction of inclined spirals with intrinsically blue colours,but dimmed and reddened by dust. If the detected AGNfraction is independent of host galaxy inclination, whichis expected if the bulk of the nuclear obscuration comesfrom the central regions orientated randomly with re-spect to the galaxy, then these contaminants to the redpart of the late-type colour-mass diagram from the partwith much lower AGN fractions will make this conclusioneven stronger.The indeterminate-type galaxies exhibit an AGN frac-
tion distribution similar to the late-types, though theirAGN fraction does not extend into the higher mass redsequence. This may be explained by the fact that the
incidence of indeterminate-type galaxies in the red se-quence is much higher than that of late-types. We there-fore tentatively conclude that the indeterminate-typeAGN, which are 45% of the AGN population after all,appear to behave more similar to the late-types than theearly-types.When we make a cut in Eddington parameter of
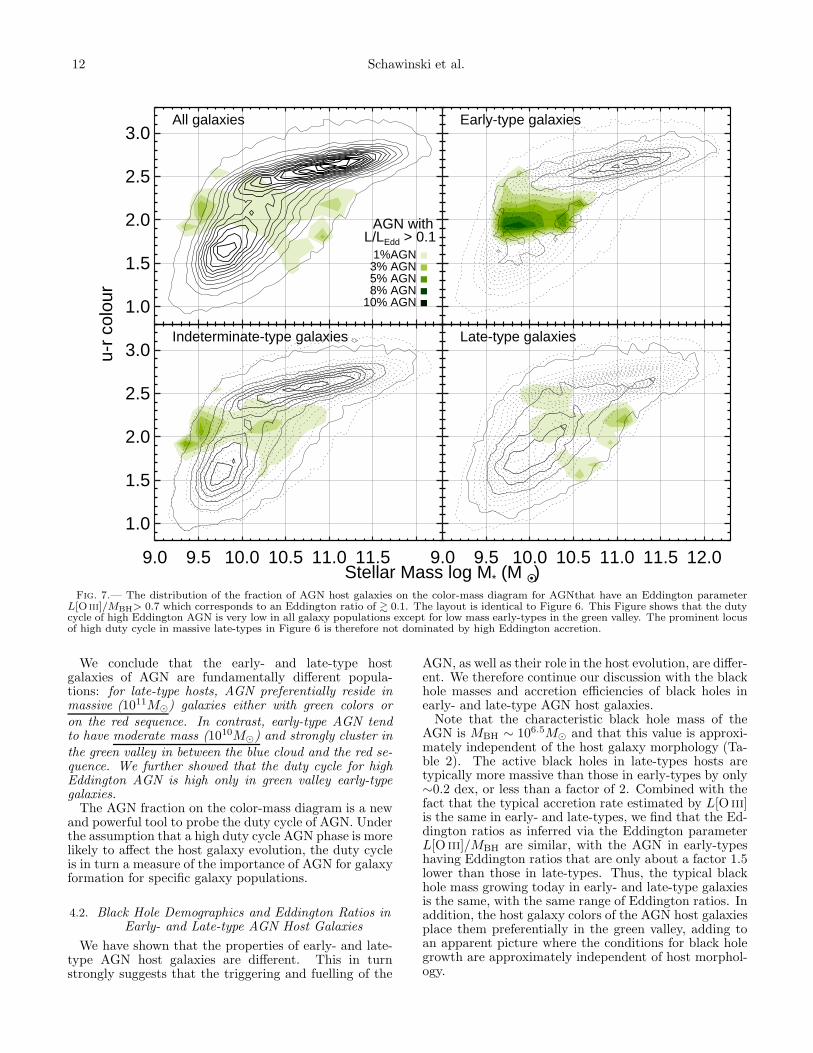
L[O iii]/MBH> 0.7, corresponding to an Eddington ratioof L/LEdd ∼ 0.1, an even more extreme picture occurs.By making a cut in Eddington ratio, we avoid any biastowards more massive black holes which radiate at higherluminosities at fixed L/LEdd than their low-mass coun-terparts. Figure 7 is identical to Figure 6 except for thecut in L/LEdd. This reveals that the duty cycle of highEddington AGN is significant in only one population oflow-redshift galaxies: low-mass early-type galaxies in thegreen valley.
12 Schawinski et al.
1.0
1.5
2.0
2.5
3.0
Stellar Mass log M* (M O •)
u-r
colo
urAll galaxies
10% AGN8% AGN5% AGN3% AGN1%AGN
AGN withL/LEdd > 0.1
Early-type galaxies
9.0 9.5 10.0 10.5 11.0 11.5
1.0
1.5
2.0
2.5
3.0Indeterminate-type galaxies
9.0 9.5 10.0 10.5 11.0 11.5 12.0
Late-type galaxies
Fig. 7.— The distribution of the fraction of AGN host galaxies on the color-mass diagram for AGNthat have an Eddington parameterL[O iii]/MBH> 0.7 which corresponds to an Eddington ratio of & 0.1. The layout is identical to Figure 6. This Figure shows that the dutycycle of high Eddington AGN is very low in all galaxy populations except for low mass early-types in the green valley. The prominent locusof high duty cycle in massive late-types in Figure 6 is therefore not dominated by high Eddington accretion.
We conclude that the early- and late-type hostgalaxies of AGN are fundamentally different popula-tions: for late-type hosts, AGN preferentially reside inmassive (1011M⊙) galaxies either with green colors oron the red sequence. In contrast, early-type AGN tendto have moderate mass (1010M⊙) and strongly cluster inthe green valley in between the blue cloud and the red se-quence. We further showed that the duty cycle for highEddington AGN is high only in green valley early-typegalaxies.The AGN fraction on the color-mass diagram is a new
and powerful tool to probe the duty cycle of AGN. Underthe assumption that a high duty cycle AGN phase is morelikely to affect the host galaxy evolution, the duty cycleis in turn a measure of the importance of AGN for galaxyformation for specific galaxy populations.
4.2. Black Hole Demographics and Eddington Ratios inEarly- and Late-type AGN Host Galaxies
We have shown that the properties of early- and late-type AGN host galaxies are different. This in turnstrongly suggests that the triggering and fuelling of the
AGN, as well as their role in the host evolution, are differ-ent. We therefore continue our discussion with the blackhole masses and accretion efficiencies of black holes inearly- and late-type AGN host galaxies.Note that the characteristic black hole mass of the
AGN is MBH ∼ 106.5M⊙ and that this value is approxi-mately independent of the host galaxy morphology (Ta-ble 2). The active black holes in late-types hosts aretypically more massive than those in early-types by only∼0.2 dex, or less than a factor of 2. Combined with thefact that the typical accretion rate estimated by L[O iii]is the same in early- and late-types, we find that the Ed-dington ratios as inferred via the Eddington parameterL[O iii]/MBH are similar, with the AGN in early-typeshaving Eddington ratios that are only about a factor 1.5lower than those in late-types. Thus, the typical blackhole mass growing today in early- and late-type galaxiesis the same, with the same range of Eddington ratios. Inaddition, the host galaxy colors of the AGN host galaxiesplace them preferentially in the green valley, adding toan apparent picture where the conditions for black holegrowth are approximately independent of host morphol-ogy.

Galaxy Zoo: AGN Host Galaxies 13
0.00
0.05
0.10
0.15
Black hole mass log MBH (M O • )
dN/N
All galaxies
Early-type galaxies
5 6 7 8 9 0.00
0.05
0.10
Indeterminate-type galaxies
5 6 7 8 9 10
Late-type galaxies
Fig. 8.— The distribution of supermassive black hole masses MBH for both normal galaxies and AGN host galaxies as a function ofmorphology. In each panel, we show histogram of MBH for the normal galaxy population (gray, solid) and the AGN only (colored, dashed).Both here and in Figure 9, we plot only objects where the measured velocity dispersion is greater than 40 kms−1(corresponding to log(MBH)∼ 5.3; Tremaine et al. 2002). The mean and median black hole masses of both early- and late-type AGN host galaxies are very similar (seeTable 2), but when their distributions are compared to those of normal galaxies, large differences become apparent. Among the early-typegalaxy population, it is preferentially those galaxies with lower black hole masses that are AGN, while the opposite is the case for thelate-type galaxies.
However, as we have shown in the previous section,the stellar masses of early- and late-type host galaxiesare very different, so taking only population averagesinto consideration can obscure crucial variations betweenpopulations. Similarly, it is not just relevant which blackholes are currently accreting, but also to what degreethese growing black holes are different from those in theirquiescent parent population, and crucially, how this dif-ference depends on host morphology.In Figure 8, we plot the distribution of inferred super-
massive black hole masses for both the AGN (striped)and the normal galaxy population (soild), both for theentire sample, and split by host morphology. These his-tograms highlight that taking the mean, and ignoringthe distribution of black hole masses in the parent pop-ulation masks intrinsically very different distributions ofblack hole growth. Even though the median black holemasses of active early- and late-type galaxies are compa-rable (Table 2), a Kolmogorov-Smirnov test shows thatthey are drawn from different parent distributions at the99.7% significance level.The distribution of active black holes in late-type hosts
skewed towards higher black hole mass, peaks at MBH
∼ 107M⊙ and cuts off above MBH ∼ 108M⊙. This con-trasts sharply with the distribution of black hole massesin all late-types galaxies, which decreases with increas-ing black hole mass. Plotting the fraction of active su-permassive black holes in late-type galaxies in Figure9, we find a strongly increasing fraction from ∼ 1% at
105.5M⊙to ∼ 8% at 107.25M⊙. At greater black holemasses, the fraction may begin to decline again, until werun out of number statistics.The black holes of early-type galaxies show a radically
different picture (Figure 8). The mass distribution of ac-tive black holes in early-type galaxies is skewed towardsthe lowest inferred masses in our sample. Plotting theactive fraction as for the late-types in Figure 9, we finda very different behaviour. The fraction of active blackholes in early-type galaxies is decreasing with increasingblack hole mass, but we run out of galaxies to provideadequate number statistics.These two very different trends in early- and late-type
hosts are unlikely to be selection effects. Since we areable to detect AGN in low-mass early-types down to hostgalaxies with stellar masses of 109.5M⊙; we do not seeAGN in late-type hosts where the lowest-mass hosts are∼ 109.5M⊙. In order to substantially change the trendof increasing AGN fraction with increasing black holemass, we would have to have missed a very large numberof AGN in low mass blue cloud late-type galaxies, morethan ten times the number in our sample. To changethe distribution to one skewed to low masses similar tothe distribution of the early-types, an increase by a fac-tor of ∼1000 would be required (Figure 6). At lumi-nosities above the ∼ 1040 ergs−1 completeness limit inSection 3.3, we are not missing any AGN in star-forminggalaxies that might change this trend. Since the major-ity of the AGN contributing to the trends in Figure 9

14 Schawinski et al.
5 6 7 8 9Black hole mass log MBH (M O • )
0.1
1.0
10.0P
erce
ntag
e of
gal
axie
s th
at h
ost A
GN
5 6 7 8 9
Early-type Late-type
All
50 100 150 200 250Velocity dispersion σ (kms-1)
Fig. 9.— The fraction of supermassive black holes that are growing in the local Universe. We plot the black hole mass MBH versus thefraction of galaxies that host an AGN. The errors on the fraction are Poisson errors. We plot the AGN fraction for the entire sample aswell as for galaxies of specific morphology classes: (red) all; (green) early-types; (blue) late-types. This plot elaborates on the trend seenin Figure 8 and shows the relative incidence of AGN in galaxies of early- and late-type morphology. The AGN fraction – and thereforethe duty cycle – in early-type galaxies is heavily skewed toward low black hole masses. In late-type galaxies, the AGN fraction is skewedtowards higher black hole masses, potentially with a drop at the highest masses.
are above this limit (see Figure 4), only lower-luminosityAGN might change these trends (see also B). Currently,there are no indications that such a large population oflow-luminosity AGN exists (factor of ∼1000 greater innumber than observed), but our results are an additionalmotivation to search for them.We restrict our AGN sample by Eddington ratio as
we did in Section 4.1 by limiting the AGN sample tothose AGN with L[O iii]/MBH> 0.7 (which correspondsto L/LEdd ∼ 0.1) in order to test whether the trend wesee in Figure 9 is due to a bias against low-mass blackholes at a fixed Eddington ratio. Such a bias is unlikelyto be the cause of the different trends we see for early-and late-type hosts as it would imply vastly different dis-tributions of Eddington ratios. Imposing this cut in Ed-dingto ratio to Figure 9 yields qualitatively the sametrend, though the increase in the AGN fraction for thelate-type hosts is less steep.In summary, dividing the local AGN host galaxy popu-
lation by morphology reveals that that there are two verydifferent modes of black hole growth: in early-types, it ispreferentially the least massive black holes that are ac-tively accreting material in an AGN phase. In late-typegalaxies, it is preferentially the most massive black holesthat are active, with a potential decline at the very highestmasses. Since the early-type AGN are only 11% of thepopulation, this effect can easily be masked by studies ofthe AGN population as a whole.
5. A NEW VIEW OF THE CO-EVOLUTION OF GALAXIESAND THEIR SUPERMASSIVE BLACK HOLES
Despite the differences discussed in the previous sec-tion, the velocity dispersion – and therefore the bulgemass and black hole mass – of AGN host galaxies is in-dependent of morphology (Table 2 and Figure 4). An-other common feature is the green host galaxy colors.This raises the possibility that these conditions are mostfavorable to fuelling a black hole, at least in low-redshiftgalaxies. The late-type AGN hosts are an order of mag-nitude more massive ∼ 1011M⊙ simply because of thepresence of a massive disks. The bulges of late-typesthat host AGN appear to be very similar to the low-mass, ∼ 1010M⊙, early-type galaxies that host AGN.However, as we have shown, the early- and late-type
host galaxies of AGN are fundamentally different popu-lations both in terms of which galaxies host AGN, andalso which black holes are growing. Only by comparingthe AGN hosts to normal galaxies not just of the samemass and color, but also morphology, does it becomeclear that the two populations differ from each other infundamental ways.What are the consequences of our findings for the role
of AGN in galaxy evolution in the local Universe? In thissection, we outline a new view of the impact of AGN ongalaxy evolution and make the case that AGN performvery different roles in early- and late-type host galaxies.
5.1. The Role of AGN in the Evolution of Early-typeGalaxies
As discussed in Section 4, while there are a numberof AGN in early-type galaxies on the red sequence, the

Galaxy Zoo: AGN Host Galaxies 15
Fig. 10.— Example SDSS gri images 80′′ × 80′′ in size of late-type AGN host galaxies with stellar masses above 1011M⊙. These imagesillustrate that massive late-type AGN hosts are not massive bulges with a small disk (S0 or Sa), but rather have small bulges and massivedisks.
fraction of early-type galaxies on the red sequence thathost AGN is very small, i.e., the duty cycle of AGN inthis population is small as well when compared to thepeak duty cycle in the green valley.We see from Figure 6 that the duty cycle of AGN in
early-type host galaxies is peaked in a well-defined bandat intermediate green colors precisely in the green val-ley above the blue cloud and below the low mass endof the red sequence. If the early-type AGN hosts in thegreen valley are post-starburst objects, then there clearlyis an ample supply of star-forming progenitor galaxies atthe same mass in the blue cloud.These progenitors wouldevolve to the green valley if star formation is suppressed,and will continue to fade onto the low-mass end of the redsequence. Such progenitors may already have early-typemorphology (e.g., Schawinski et al. 2009a), or they mayfirst transform their morphology in a major merger, assimulations seem to show (e.g., Toomre & Toomre 1972;Barnes 1992; Barnes & Hernquist 1996). Such a ma-jor merger may also fuel the black hole, giving rise tothe AGN phase observed at a later stage (Sanders et al.1988; Hopkins et al. 2006). Simulations by Kaviraj et al.(2009) show that minor mergers with a gas-rich dwarfare not sufficient to move a red early-type progenitor tothe optical blue cloud (though they may reach UV-bluecolors) and so are not a good candidate for the triggermechanism.Of course, it does not follow from the intermediate
optical colors of green valley galaxies that they mustbe in transition from blue to red. There are multiple,very different star formation histories that can result ingreen colors. A slightly enhanced dust screen coveringan actively star forming galaxy would suffice. More com-plex scenarios are also imaginable. That early-type AGNhosts galaxies genuinely are a transition population wasshown by Schawinski et al. (2007); however, this does notimply that the AGN phase in the green valley is necessar-ily the cause for the shutdown of star formation and thetransition from blue to red. Rather, the absence of activeblack hole accretion in blue cloud objects, establishedby Schawinski et al. (2009c), implies that there must bea significant time delay on the order of at least 100Myr, more likely more like 500 Myr, between whichever
process suppresses star formation and the onset of sub-stantial AGN radiation. Furthermore, Schawinski et al.(2009b) showed that the extremely rapid destruction ofthe molecular gas reservoir that fuels star formation co-incides with a very low-level of accretion preceding theAGN phase in so-called composite objects24 and that thisvery low-luminosity phase – perhaps accompanied by aradiatively inefficient kinetic outflow (e.g., Narayan & Yi1994) – may be responsible for the shutdown of star for-mation by removing the molecular gas reservoir.Regardless of whether any AGN phase is responsible
for the shutdown of star formation, the duty cycle ofAGN in the present day early-type galaxy population ishighest in low-mass green valley objects in which starformation has already been shut down and which are inthe process of moving to the red sequence. The dutycycle of AGN in massive, red sequence early-types onthe other hand is very low. The majority of black holegrowth in early-type galaxies at low redshift thus appearsto be a post-starburst phenomenon, rather than part ofa coeval starburst. Figure 7 furthermore illustrates thatit is only this population of low redshift galaxies that hasa substantial duty cycle of high Eddington accretion.
5.2. The Role of AGN in the Evolution of Late-typeGalaxies
The late-type AGN host galaxies are genuine late-typespirals, not S0/Sa galaxies that consist of a large bulgeand a small disk, even at the highest masses, where theduty cycle is highest. We show example images of mas-sive late-type AGN hosts in Figure 10. While the hostgalaxies are quite massive, their bulges are not – this isapparent from their bulge velocity dispersions, and there-fore their modest black hole masses, which are compara-ble to those of active early-type galaxies; they thereforemust have substantial disks which make up the remain-ing stellar mass (Figure 8 and Table 2). To put it an-other way, the typical black hole masses, bulge massesand Eddington ratios of early- and late-type AGN hosts
24 Composite objects lie on the BPT diagram in between thelocus of star forming galaxies and the non-stellar (AGN & LINER)locus and are usually interpreted as a combination of star formationand very low-level AGN activity.

16 Schawinski et al.
are similar, but the late-type hosts are substantially moremassive due to the presence of a massive disk.At the same time, the distribution of Eddington pa-
rameters (Figure 4 and Table 2) does not provide a com-prehensive picture: comparing Figure 6 shows that theduty cycle of AGN – as we are able to detect them viaemission line diagnostics – is high in high-mass, greenlate-types. However, Figure 7 shows that the duty cy-cle of high Eddington-rate accretion is low in those late-types, especially when compared to the green valleyearly-types.Given the distinct location of late-type AGN host
galaxies on the color-mass diagram, what role do theAGN play in the evolution of late-type galaxies? We ar-gued previously that the early-type AGN represent thetrue green valley transition population. The majority ofAGN hosted by late-type galaxies do not reside betweenthe blue cloud and the low-mass end of the green valleyand therefore cannot be part of the same blue-green-redtransition. A minority of the late-type AGN hosts dohowever have sufficiently low masses to plausibly origi-nate from the blue cloud. The absence of a substantialduty cycle for high Eddington accretion in these objectsfurther supports this, as the AGN of the early-type hostsdo have such a high duty cycle. There is also an absenceof AGN at the very highest masses & 1011.5M⊙ whichmay indicate a feedback process that has shut down ac-cretion in those objects, or this may be due to insufficientnumber statistics.We consider a number of scenarios that may account
for the presence of AGN in late-types; any such sce-nario must account for three observational character-istics: (i) characteristic host mass of ∼ 1011M⊙, (ii)late-type host galaxy morphology, and (iii) intermedi-ate/green host galaxy color.
5.2.1. Major Mergers of two Disk Galaxies
The first possible scenario for the origin of the late-type AGN hosts is the major merger of two diskgalaxies that results in the fuelling of the black hole(e.g., Springel & Hernquist 2005; Hopkins et al. 2005;Robertson et al. 2006). We know from the visual in-spection of merging galaxies in the SDSS Universe thatdisk-disk mergers at ∼ 1011M⊙ do occur (Darg et al.2009a,b). However, there is a lack of blue progenitorgalaxies at ∼ 1011M⊙ that might evolve toward the redsequence as star formation is suppressed (see Figure 6).Both factors thus make it unlikely that late-type AGNhosts are the product of such a merger and so we con-clude that this scenario does not account for criterion(i).Also, a major merger would likely have destroyed the
disk that is clearly visible in the SDSS images (Figure10). Simulations show that mergers involving particu-larly gas-rich progenitors can result in a disk-dominatedremnant (Springel & Hernquist 2005; Robertson et al.2006; Hopkins et al. 2009) , but only for particular orien-tation of the angular momentum vectors. Major mergersare already rare, and this requirement further reducesthat probability by a large factor. Moreover, such ex-tremely gas-rich, massive progenitor galaxies do not ex-ist in the low-redshift Universe (e.g., Kannappan 2004)and so major mergers are an unlikely channel for thetriggering of AGN in low redshift late-type galaxies.
5.2.2. Mixed-mergers of a Disk and a Spheroid Galaxy
One possible scenario for the origin of late-type AGNis a mixed merger between a disk- and a massivespheroid-dominated system, which is predicted to bevery common by some models of galaxy formation (e.g.,Khochfar & Burkert 2003; Khochfar & Silk 2006). Themixed merger scenario alleviates one of the problemswith major mergers, as there is an ample supply of mas-sive early-type, red progenitors available on the red se-quence. It also accounts to some extent for the greenhost galaxy colors (iii); while the red sequence progeni-tor does not have a ready supply of cold gas available forstar formation, the late-type progenitor does.However, this scenario also faces some problems: why
does the mixed merger result in green, rather than blueoptical colors? One explanation might be that the late-type progenitor originates from the blue cloud properand is substantially less massive (∼ 1010M⊙), bringing inonly a small amount of cold gas that can fuel only a minorstarburst. Simulations of minor mergers between pas-sive early-type galaxies and an ensemble of small gas-richgalaxies by Kaviraj et al. (2009) show that such eventscan produce the intermediate u − r colors exhibited bythe late-type AGN hosts.While a major mixed merger likely also destroys the
disk in the late-type progenitor, a minor merger mightnot, thus satisfying criterion (ii). However, another prob-lem is that the bulges of the late-type AGN hosts arecomparable in velocity dispersion to the significantly lessmassive early-type AGN hosts and therefore are predom-inantly disk-dominated systems; a mixed merger of thistype seems unlikely to build a massive disk (similar tothat of the Milky Way; see Section 5.5) around a smallbulge. Thus a contradiction arises: in order to accountfor the green colors, the early-type must be more massivethan the late-type, but in order to ensure the survival ofthe disk, the late-type must be more massive than theearly-type.Another possibility is that the AGN is regulating the
strength of the starburst and preventing it from movingthe host galaxy all the way to blue cloud colors, which iscommensurate with the idea that AGN are more commonin late-type galaxies with high black hole masses.
5.2.3. Concluding Remarks concerning Late-type AGN HostGalaxies
All the scenarios outlined here are problematic andnone of them account for all the observed properties oflate-type AGN host galaxies. Perhaps an AGN phase inlate-type galaxies does not significantly affect the evo-lution of the host galaxy, and all we see is secular evo-lution. A slight increase in the amount of gas in thebulge increases the odds for stochastic accretion of gas,perhaps driven by a bar (Hasan et al. 1993; Wyse 2004;Combes 2006) or more generally by disk-driven evolu-tion Kormendy & Kennicutt (2004). Other possibilitiesinclude mass loss from evolved stars (e.g., Davies et al.2007; Ho 2008), the infall of a minor dwarf galaxy orthe tidal disruption of a star by the black hole (e.g.,Gezari et al. 2006)As we have discussed, it is unlikely that the late-type
AGN hosts are involved in the same transition from theblue cloud to the red sequence that the early-types ap-

Galaxy Zoo: AGN Host Galaxies 17
pear to be involved in. The role of AGN in the evolutionof late-type galaxies must therefore be a different onefrom the early-types. A major difference between theearly- and late-type AGN hosts that highlights the dif-ferent nature of black hole accretion is that the late-typesdo not have any sub-population that has a high duty cy-cle of high Eddington accretion (Figure 7). Since thereare no major ongoing starbursts in late-type AGN hostsand the duty cycle for high Eddington accretion is low,perhaps all back hole growth has already taken place athigh redshift and all we are seeing is a minor re-activationdue to one of the processes mentioned above.Given that none of the scenario we outlined are satis-
factory explanations, the co-evolution of late-type galax-ies and their black holes – unlike in the case of early-types– remains an outstanding issue.
5.3. Parallels between Black Hole Growth in thePresent-day and Early Universe
The only part of the early-type galaxy population thatis experiencing a high duty cycle of black hole growth athigh efficiencies are low-mass post-starburst early-typegalaxies transitioning from the blue cloud to the low-mass end of the red sequence. This population is con-tinuing the build-up of the red sequence, so it is naturalto speculate that the process is a downsized version ofthe process that led to the formation and quenching ofmore massive early-type galaxies at high redshift whichare known to be older and to have formed on shortertime scales.The late-type AGN are not associated with the same
transition from blue cloud to the red sequence and theirrole in the evolution of their hosts is less clear. The ma-jority of the black hole growth in the local Universe isassociated with late-type hosts (at least ∼ 40%, and al-most 90%, if we include all indeterminate-types), andonly ∼11% is associated with early-types. Thus, themode of black hole growth at work in late-type galax-ies is significantly more common in the local Universethan the one at work in early-types, and so most blackhole growth is not associated with the blue–red transitionseen in early-types.Recent observations of X-ray-selected AGN host galax-
ies in deep fields by Georgakakis et al. (2009) sug-gest that the fraction of AGN host galaxies with late-type morphology is only ∼ 30% at z ∼ 1, indicat-ing a decrease of the late-type fraction with increas-ing redshift, though the AGN population studied byGeorgakakis et al. (2009) is somewhat more luminousthat in our sample. This decrease may suggest that theappearance of the mode of black hole growth at work inlate-type galaxies is relatively recent, perhaps becomingapparent only around z ∼ 1 when the assembly of theHubble sequence begins to finalize. Another possibilityis that this mode has always been active at a moderatelevel, but that the AGN host galaxy population at highredshift is dominated by the downsizing mode at workin the early-type population. The two modes at workin early- and late-type galaxies, respectively, change inimportance with cosmic time, the late-type mode mayaccount for the the observed peak at z ∼ 0.7 in the num-ber density of moderate-luminosity X-ray selected AGNat z ∼ 0.7, while the mode at work in late-types is re-sponsible for the high redshift peak of luminous AGN
(Giacconi et al. 2001; Alexander et al. 2001; Ueda et al.2003; Gilli et al. 2005). As star formation and black holegrowth moves to less massive early-type galaxies (e.g.,Thomas et al. 2005, 2009), the black hole growth mode inearly-type galaxies also becomes less luminous and thusby . 1 becomes overwhelmed by the late-type mode.Perhaps the local Universe does not tell us much
about the AGN-host galaxy connection because blackhole growth rates and and star formation rates havedeclined so substantially since z ∼ 1 except in a fewrare systems more reminiscent of activity at high redshift(e.g. NGC 6240)? Further work on the morphology ofAGN host galaxies at high redshift, in particular detailedrestframe optical morphological classification, will be re-quired to investigate these suggestion. Near-IR imagingdata from the new Wide Field Camera 3 on board Hubblecould be used to reproduce this work at z ∼ 2.
5.4. What about Indeterminate-type AGN HostGalaxies?
Throughout our entire discussion, we have mostly con-sidered the early- and late-type samples as the two mor-phological extremes. However, both in terms of the entiregalaxy sample and the AGN sample, the indeterminate-types are the most numerous class (45.3% of galaxies and44.5% of AGN; see Tables 1 and 2).Future imaging data,such as from PanSTARRS25, VST26 or LSST27, classi-fied via a future Galaxy Zoo project would enable us tobetter separate them into early- and late-types.
5.5. The Black Hole at the Center of the Milky Wayshould be Active!
Figure 6 shows that the duty cycle for AGN in late-type galaxies is very strongly peaked at a particular stel-lar mass and color. The Milky Way most likely occu-pies this sweet spot for late-type AGN. Estimates ofthe stellar mass of the Milky Way vary, but are around∼ 1011M⊙, while the current star formation rate isapproximately 3 M⊙yr
−1 (e.g., Scalo 1986; Diehl et al.2006; Calzetti et al. 2009). These parameters place theMilky Way right where the AGN fraction for late-typegalaxies is highest, between 5 and 10% and therefore theduty cycle is the highest. However, this also implies thatthe black holes in galaxies like the Milky Way are notactive ∼ 92 − 95% of the time at the luminosity of thetypical Seyfert in the SDSS Universe (∼ 1040 ergs−1, seeSection 3.3 and 3.4).The black hole at the center of the Milky Way at Sagit-
tarius A∗ (Sgr A∗) is, apart from occasional weak flares,remarkably quiet with an extremely sub-Eddington ac-cretion rate (e.g., Marrone et al. 2006, 2008). However,there is evidence that Sgr A∗ was substantially more ac-tive in the very recent past. Hard X-ray observationswith ASCA showed Fe Kα lines around Galactic Cen-ter emitted by the molecular cloud complex surroundingthe black hole. Follow-up observations with more recent
25 The Panoramic Survey Telescope & Rapid Response System;see http://pan-starrs.ifa.hawaii.edu/public/.
26 The V LT Survey Telescope ;http://www.eso.org/ sci/observing/policies/PublicSurveys/sciencePublicSurveys.html#VST.
27 The Large Synoptic Survey Telescope;http://www.lsst.org/lsst.

18 Schawinski et al.
TABLE 3A catalogue of AGN host galaxies
ID SDSS Object RA Dec GZ Redshift Mstellar σ u− r logL[O iii] logL[O iii]/σ4
ID (J2000) (J2000) class1 M⊙ kms−1 colour ergs−1
1 587722983902544102 14 17 04.4 +00 30 28.8 i 0.025730 10.01 69.9 ± 4.91 2.51 39.53 -0.1812 587724197207277638 01 31 01.1 +13 03 15.7 e 0.020734 10.80 115.5 ± 3.23 2.60 39.33 -1.3083 587722984428929165 12 40 53.6 +01 00 30.1 e 0.022932 10.76 73.7 ± 2.92 2.64 39.86 0.0334 587724232647704698 02 14 04.4 +13 11 56.4 i 0.041659 10.40 106.4 ± 6.18 2.16 41.25 0.8535 587724233712205954 00 47 30.3 +15 41 49.5 l 0.031463 11.21 128.8 ± 3.08 2.59 39.94 -0.8196 587724231569309775 01 30 06.2 +13 17 02.1 l 0.037992 10.16 36.6 ± 10.60 1.90 40.69 2.1537 587724234257924238 02 11 21.8 +14 30 15.5 l 0.041690 10.56 81.4 ± 5.73 2.44 40.72 0.876...
Note. — Table 3 is published in its entirety in the electronic edition of the Astrophysical Journal. A portion is shown here for guidance regardingits form and content.1 Galaxy Zoo morphology: e - early-type; l - late-type, i - indeterminate-type. See Section 2.3
hard X-ray facilities indicate that Sgr A∗ was orders ofmagnitude, perhaps 106 times more luminous in the lastfew hundred years than it is currently. Suzaku observa-tions by Nobukawa et al. (2008) detect a Kα luminosityconsistent with Sgr A∗ having been at 1038−39 ergs−1 amere 300 yrs ago, while Revnivtsev et al. (2004) used IN-TEGRAL data to argue that Sgr A∗ was at a 2–200 keVluminosity of L ∼ 1.5× 1039 ergs−1 just 300 to 400 yearsago. This is not quite the luminosity necessary to excitea narrow-line region sufficiently luminous to be detectedby an SDSS fibre at z ∼ 0.02, but these observationsclearly imply that Sgr A∗ is active at slightly lower lumi-nosity on short timescales. Together with the duty cyclefor Milky Way-like galaxies derived here, these observa-tions may give a first hint of the lifetime of AGN in suchgalaxies. A caveat to this statement is the fact that theluminosity of this very recent flare is still below the AGNluminosity limit of our sample.Under what conditions would the black hole at the
center of the Milky Way reach a sufficient luminosityso that it would be included in our AGN sample? Toreach a typical luminosity of a few percent Eddington(∼ few × 1042 ergs−1 bolometric luminosity) requiresa mass-accretion rate of only 10−3M⊙yr
−1. This onlya factor 100 higher than Bondi accretion rate inferredfrom simulations, and there are 104M⊙ of molecular gaswithin 2 pc of the central black hole (Herrnstein & Ho2002), with large clouds at further distances. It wouldnot necessarily be surprising if dynamical friction or a mi-nor merger, e.g., the swallowing of the Sagittarius dwarfgalaxy drove some of these clouds in, temporarily re-igniting the black hole at the center of the Milky Way.All the ingredients thus appear to be on hand for turningour galaxy into a Seyfert AGN. Indeed, the mystery mayrather be why is our central black hole so dark and whyis gas accretion is so infrequent?The implication of this work is that the Milky Way is
in a location on the color-mass diagram where late-typegalaxies have the highest duty cycle for AGN phases. Themass of the Milky Way black hole has been inferred tobe 4.1× 10⁶M⊙ (Ghez et al. 2008) which places it in thetypical range of black hole masses in late-type galaxiesthat are currently growing in the local Universe (Figure8 and 9). Thus, 5-10% duty cycle for galaxies like theMilky Way places into context the current quiescenceof Sgr A∗, together with the evidence for accretion inthe recent past and apparently favorable conditions for
a resumption of accretion.
6. SUMMARY
In order to understand the co-evolution of galaxies andthe supermassive black holes at their centers, we haveinvestigated which galaxies are more likely to host ac-tive black holes and how they differ systematically fromtheir normal counterparts, if at all. We use data fromthe Sloan Digital Sky Survey and visual classificationsof morphology from the Galaxy Zoo project to analyzeblack hole growth in the nearby Universe (z < 0.05) anddissect the AGN host galaxy population by color, stellarmass and morphology. We show for the first time the im-portance of host galaxy morphology for black hole growthand relate it to our understanding of the way in whichgalaxies and their supermassive black holes co-evolve. Insummary:
1. We confirm that the selection of AGN via emissionline diagnostic diagrams may miss low-luminosityAGN (L[O iii] < 1040 ergs−1) in star-forminggalaxies.
2. AGN host galaxies as a population have high stellarmasses around 1011M⊙ reside in the green valley,and have median black hole masses around MBH
∼ 106.5M⊙.
3. When we divide the AGN host galaxy popula-tion into early- and late-types, key differences ap-pear. While both early- and late-type AGN hostgalaxies have similar typical black hole masses andEddington ratios, their stellar masses are differ-ent, with the early-type hosts being significantlyless massive (∼ 1010M⊙) than the late-type hosts(∼ 1011M⊙). The late-type hosts nevertheless havethe same characteristic bulge masses, and thereforeblack hole masses, as the early-types. The differ-ence in stellar mass is due to the presence of a mas-sive stellar disk in the late-types.
4. We consider the fraction of galaxies hosting anAGN as a function of black hole mass. Dividing bymorphology into early- and late-type galaxies, wefind that in early-type galaxies, it is preferentiallythe galaxies with the least massive black holes thatare active. In late-type galaxies, it is preferentiallythe most massive black holes that are active, with
Galaxy Zoo: AGN Host Galaxies 19
a potential drop in the active fraction above (MBH
∼ 107.5M⊙).
5. We estimate the duty cycle of AGN on the color-mass diagram, split by morphology. While someearly-type galaxies lie on the red sequence that hostAGN, their duty cycle is negligible. The duty cycleof AGN in early-type galaxies is strongly peakedin the green valley below the low-mass end of thered sequence and above the blue cloud. The dutycycle of AGN in late-types, on the other hand, ishigh in massive green and red late-types. Whenwe impose a minimum Eddington ratio cut, we findthat only the green valley early-type AGN still havea substantial duty cycle. No part of the late-typepopulation has a high duty cycle of high-Eddingtonratio accretion.
6. We discuss the implications of these results for ourunderstanding of the role of AGN in the evolutionof galaxies. We conclude, in particular, that thereare two fundamentally different modes of black holegrowth at work in early- and late-type galaxies. Wenow have a good understanding of the role of AGNin early-type galaxies: The low-mass early-typeAGN hosts are post-starburst objects moving to-wards the low-mass end of the red sequence. Theymay represent a low-mass, low-luminosity or down-sized version of the mode of evolution that was in-volved in the formation of more massive early-typegalaxies at high redshift. The role of AGN in theevolution of the late-type galaxies is less clear andwe offer some possible scenarios. The high hoststellar masses and grand-design stellar disks makesit implausible that they are the product of recentmajor mergers moving from the blue cloud to thered sequence.
7. Finally, the Milky Way likely resides in the ‘sweetspot’ on the color-mass diagram where the dutycycle of AGN is highest amongst late-type galaxiesand that the AGN duty cycle for galaxies like theMilky Way is ∼ 5− 8%.
We provide the entire AGN host galaxy sample usedin this paper, including derived properties such as stellarmasses, black hole masses, [O iii] luminosities and Ed-dington parameters, in Table 3.
This work would not have been possible without thecontributions of citizen scientists as part of the GalaxyZoo project. We would like to thank Erin Bonning, Tim-othy Heckman, Guinevere Kauffmann, Taysun Kimm,John Parejko and Sukyoung Yi for helpful discussions.Support for the work of K.S. was provided by NASA
through Einstein Postdoctoral Fellowship grant number
PF9-00069 issued by the Chandra X-ray ObservatoryCenter, which is operated by the Smithsonian Astrophys-ical Observatory for and on behalf of NASA under con-tract NAS8-03060. K.S. gratefully acknowledges earliersupport from Yale University. Support from NSF grant#AST0407295 and Spitzer JPL Grant #RSA1288440is gratefully acknowledged. S.V. acknowledges supportfrom a graduate research scholarship awarded by theNatural Science and Engineering Research Council ofCanada (NSERC). Support for the work of E.T. was pro-vided by the National Aeronautics and Space Adminis-tration through Chandra Postdoctoral Fellowship AwardNumber PF8-90055 issued by the Chandra X-ray Ob-servatory Center, which is operated by the SmithsonianAstrophysical Observatory for and on behalf of the Na-tional Aeronautics Space Administration under contractNAS8-03060. S.K. acknowledges support through a Re-search Fellowship from the Royal Commission for the Ex-hibition of 1851, a Junior Research Fellowship from Im-perial College London and Senior Research Fellowshipfrom Worcester College, University of Oxford. K.L.M.acknowledges funding from the Peter and Patricia Gru-ber Foundation as the 2008 Peter and Patricia GruberFoundation International Astronomical Union Fellow.Funding for the SDSS and SDSS-II has been pro-
vided by the Alfred P. Sloan Foundation, the Partic-ipating Institutions, the National Science Foundation,the U.S. Department of Energy, the National Aeronau-tics and Space Administration, the Japanese Monbuka-gakusho, the Max Planck Society, and the Higher Educa-tion Funding Council for England. The SDSS Web Siteis http://www.sdss.org/.The SDSS is managed by the Astrophysical Research
Consortium for the Participating Institutions. The Par-ticipating Institutions are the American Museum of Nat-ural History, Astrophysical Institute Potsdam, Univer-sity of Basel, University of Cambridge, Case WesternReserve University, University of Chicago, Drexel Uni-versity, Fermilab, the Institute for Advanced Study, theJapan Participation Group, Johns Hopkins University,the Joint Institute for Nuclear Astrophysics, the KavliInstitute for Particle Astrophysics and Cosmology, theKorean Scientist Group, the Chinese Academy of Sci-ences (LAMOST), Los Alamos National Laboratory, theMax-Planck-Institute for Astronomy (MPIA), the Max-Planck-Institute for Astrophysics (MPA), New MexicoState University, Ohio State University, University ofPittsburgh, University of Portsmouth, Princeton Uni-versity, the United States Naval Observatory, and theUniversity of Washington.This research has made use of NASA’s Astrophysics
Data System Bibliographic Services.
REFERENCES
Abazajian, K. N. et al. 2009, ApJS, 182, 543Alexander, D. M., Brandt, W. N., Hornschemeier, A. E.,
Garmire, G. P., Schneider, D. P., Bauer, F. E., & Griffiths,R. E. 2001, AJ, 122, 2156
Antonucci, R. 1993, ARA&A, 31, 473Baldwin, J. A., Phillips, M. M., & Terlevich, R. 1981, PASP, 93, 5
Barger, A. J., Cowie, L. L., Mushotzky, R. F., Yang, Y., Wang,W.-H., Steffen, A. T., & Capak, P. 2005, AJ, 129, 578
Barnes, J. E. 1992, ApJ, 393, 484Barnes, J. E., & Hernquist, L. 1996, ApJ, 471, 115Bernardi, M., Nichol, R. C., Sheth, R. K., Miller, C. J., &
Brinkmann, J. 2006, AJ, 131, 1288

20 Schawinski et al.
Best, P. N., Kauffmann, G., Heckman, T. M., Brinchmann, J.,Charlot, S., Ivezic, Z., & White, S. D. M. 2005, MNRAS, 362,25,
Blumenthal, G. R., Faber, S. M., Primack, J. R., & Rees, M. J.1984, Nature, 311, 517
Bower, R. G., Benson, A. J., Malbon, R., Helly, J. C., Frenk,C. S., Baugh, C. M., Cole, S., & Lacey, C. G. 2006, MNRAS,370, 645
Brinchmann, J., Charlot, S., White, S. D. M., Tremonti, C.,Kauffmann, G., Heckman, T., & Brinkmann, J. 2004, MNRAS,351, 1151
Bundy, K. et al. 2006, ApJ, 651, 120Calzetti, D., Armus, L., Bohlin, R. C., Kinney, A. L., Koornneef,
J., & Storchi-Bergmann, T. 2000, ApJ, 533, 682Calzetti, D., Sheth, K., Churchwell, E., & Jackson, J. 2009, in
The Evolving ISM in the Milky Way and Nearby GalaxiesCappellari, M. et al. 2006, MNRAS, 366, 1126Cappellari, M., & Emsellem, E. 2004, PASP, 116, 138Cardamone, C. N. et al. 2008, ApJ, 680, 130Cid Fernandes, R., Stasinska, G., Schlickmann, M. S., Mateus, A.,
Vale Asari, N., Schoenell, W., & Sodre, Jr., L. 2009, MNRAS,in press, arXiv:0912.1643
Cole, S., & Lacey, C. 1996, MNRAS, 281, 716Collins, C. A. et al. 2009, Nature, 458, 603Combes, F. 2006, in Revista Mexicana de Astronomia y
Astrofisica Conference Series, Vol. 26, Revista Mexicana deAstronomia y Astrofisica Conference Series, 131–134
Conroy, C., Gunn, J. E., & White, M. 2009a, ApJ, 699, 486Conroy, C., White, M., & Gunn, J. E. 2009b, ApJ, in press,
arXiv:0904.0002Constantin, A., Hoyle, F., & Vogeley, M. S. 2008, ApJ, 673, 715Cowie, L. L., Songaila, A., Hu, E. M., & Cohen, J. G. 1996, AJ,
112, 839Croom, S. M. et al. 2009, MNRAS, 399, 1755, 0907.2727Darg, D. W. et al. 2009a, MNRAS, in press, arXiv:0903.5057——. 2009b, MNRAS, in press, arXiv:0903.4937Davies, R. I., Sanchez, F. M., Genzel, R., Tacconi, L. J., Hicks,
E. K. S., Friedrich, S., & Sternberg, A. 2007, ApJ, 671, 1388,0704.1374
Diamond-Stanic, A. M., Rieke, G. H., & Rigby, J. R. 2009, ApJ,698, 623
Diehl, R. et al. 2006, Nature, 439, 45Donley, J. L., Rieke, G. H., Rigby, J. R., & Perez-Gonzalez, P. G.
2005, ApJ, 634, 169Evans, I. N., Ford, H. C., Kinney, A. L., Antonucci, R. R. J.,
Armus, L., & Caganoff, S. 1991, ApJ, 369, L27Evans, I. N., Tsvetanov, Z., Kriss, G. A., Ford, H. C., Caganoff,
S., & Koratkar, A. P. 1993, ApJ, 417, 82Falcon-Barroso, J. et al. 2006, MNRAS, 369, 529Fall, S. M., & Efstathiou, G. 1980, MNRAS, 193, 189Fan, X. 2006, New Astronomy Review, 50, 665Fan, X. et al. 2004, AJ, 128, 515——. 2001, AJ, 122, 2833——. 2003, AJ, 125, 1649Ferrarese, L., & Merritt, D. 2000, ApJ, 539, L9Gebhardt, K. et al. 2000, ApJ, 539, L13Georgakakis, A. et al. 2009, MNRAS, 397, 623——. 2008, MNRAS, 385, 2049Gezari, S. et al. 2006, ApJ, 653, L25Ghez, A. M. et al. 2008, ApJ, 689, 1044Giacconi, R. et al. 2001, ApJ, 551, 624Gilli, R. et al. 2005, A&A, 430, 811Gonzalez-Martın, O., Masegosa, J., Marquez, I., Guainazzi, M., &
Jimenez-Bailon, E. 2009, A&A, 506, 1107Groves, B. A., Dopita, M. A., & Sutherland, R. S. 2004a, ApJS,
153, 9——. 2004b, ApJS, 153, 75Haring, N., & Rix, H.-W. 2004, ApJ, 604, L89Hasan, H., Pfenniger, D., & Norman, C. 1993, ApJ, 409, 91Heavens, A., Panter, B., Jimenez, R., & Dunlop, J. 2004, Nature,
428, 625Heckman, T. M. 1980, A&A, 87, 152Heckman, T. M., Kauffmann, G., Brinchmann, J., Charlot, S.,
Tremonti, C., & White, S. D. M. 2004, ApJ, 613, 109Herrnstein, R. M., & Ho, P. T. P. 2002, ApJ, 579, L83Hickox, R. C. et al. 2009, ApJ, 696, 891Ho, L. C. 2008, ARA&A, 46, 475
Ho, L. C. et al. 2001, ApJ, 549, L51Ho, L. C., Filippenko, A. V., & Sargent, W. L. 1995, ApJS, 98,
477Ho, L. C., Filippenko, A. V., & Sargent, W. L. W. 1997a, ApJS,
112, 315——. 1997b, ApJ, 487, 568Ho, L. C., Filippenko, A. V., Sargent, W. L. W., & Peng, C. Y.
1997c, ApJS, 112, 391Hopkins, P. F., Cox, T. J., Younger, J. D., & Hernquist, L. 2009,
ApJ, 691, 1168Hopkins, P. F., Hernquist, L., Cox, T. J., Di Matteo, T., Martini,
P., Robertson, B., & Springel, V. 2005, ApJ, 630, 705Hopkins, P. F., Hernquist, L., Cox, T. J., Di Matteo, T.,
Robertson, B., & Springel, V. 2006, ApJS, 163, 1Jimenez, R., Bernardi, M., Haiman, Z., Panter, B., & Heavens,
A. F. 2007, ApJ, 669, 947Kannappan, S. J. 2004, ApJ, 611, L89Kauffmann, G., & Heckman, T. M. 2009, MNRAS, 397, 135Kauffmann, G. et al. 2003a, MNRAS, 346, 1055——. 2003b, MNRAS, 341, 33Kaviraj, S., Peirani, S., Khochfar, S., Silk, J., & Kay, S. 2009,
MNRAS, 394, 1713Kaviraj, S. et al. 2007, ApJS, 173, 619Keel, W. C. 1983, ApJ, 268, 632Kewley, L. J., Dopita, M. A., Sutherland, R. S., Heisler, C. A., &
Trevena, J. 2001, ApJ, 556, 121Kewley, L. J., Groves, B., Kauffmann, G., & Heckman, T. 2006,
MNRAS, 372, 961Khochfar, S., & Burkert, A. 2003, ApJ, 597, L117Khochfar, S., & Silk, J. 2006, MNRAS, 370, 902King, A. 2003, ApJ, 596, L27Kormendy, J., & Kennicutt, Jr., R. C. 2004, ARA&A, 42, 603La Franca, F. et al. 2005, ApJ, 635, 864Lacy, M. et al. 2004, ApJS, 154, 166Lamastra, A., Bianchi, S., Matt, G., Perola, G. C., Barcons, X.,
& Carrera, F. J. 2009, A&A, 504, 73, 0905.4439Land, K. et al. 2008, MNRAS, 388, 1686Leitherer, C., & Heckman, T. M. 1995, ApJS, 96, 9Leitherer, C. et al. 1999, ApJS, 123, 3Lintott, C. J. et al. 2008, MNRAS, 389, 1179Magorrian, J. et al. 1998, AJ, 115, 2285Mao, Y., Wang, J., & Wei, J. 2009,arXiv:0904.4328Maraston, C. 1998, MNRAS, 300, 872——. 2005, MNRAS, 362, 799Maraston, C., Daddi, E., Renzini, A., Cimatti, A., Dickinson, M.,
Papovich, C., Pasquali, A., & Pirzkal, N. 2006, ApJ, 652, 85Marconi, A., Risaliti, G., Gilli, R., Hunt, L. K., Maiolino, R., &
Salvati, M. 2004, MNRAS, 351, 169Marrone, D. P. et al. 2008, ApJ, 682, 373Marrone, D. P., Moran, J. M., Zhao, J.-H., & Rao, R. 2006, ApJ,
640, 308Martin, D. C. et al. 2007, ApJS, 173, 342Martini, P. 2004, in Coevolution of Black Holes and Galaxies, ed.
L. C. Ho, 169–+Martini, P., & Weinberg, D. H. 2001, ApJ, 547, 12Merloni, A. 2004, MNRAS, 353, 1035Nandra, K. et al. 2007, ApJ, 660, L11Narayan, R., & Yi, I. 1994, ApJ, 428, L13Nelan, J. E., Smith, R. J., Hudson, M. J., Wegner, G. A., Lucey,
J. R., Moore, S. A. W., Quinney, S. J., & Suntzeff, N. B. 2005,ApJ, 632, 137
Nobukawa, M. et al. 2008, PASJ, 60, 191Noeske, K. G. et al. 2007, ApJ, 660, L43Perez-Gonzalez, P. G. et al. 2008, ApJ, 675, 234Persic, M., Rephaeli, Y., Braito, V., Cappi, M., Della Ceca, R.,
Franceschini, A., & Gruber, D. E. 2004, A&A, 419, 849Phillips, M. M., Jenkins, C. R., Dopita, M. A., Sadler, E. M., &
Binette, L. 1986, AJ, 91, 1062Rees, M. J., & Ostriker, J. P. 1977, MNRAS, 179, 541Revnivtsev, M. G. et al. 2004, A&A, 425, L49Rigby, J. R., Diamond-Stanic, A. M., & Aniano, G. 2009, ApJ,
700, 1878Robertson, B., Bullock, J. S., Cox, T. J., Di Matteo, T.,
Hernquist, L., Springel, V., & Yoshida, N. 2006, ApJ, 645, 986Salim, S. et al. 2007, ApJS, 173, 267Salpeter, E. E. 1955, ApJ, 121, 161
Galaxy Zoo: AGN Host Galaxies 21
Sanders, D. B., Soifer, B. T., Elias, J. H., Madore, B. F.,Matthews, K., Neugebauer, G., & Scoville, N. Z. 1988, ApJ,325, 74
Sarzi, M. et al. 2006, MNRAS, 366, 1151——. 2009, MNRAS, in press, arXiv:0912.0275Scalo, J. M. 1986, Fundamentals of Cosmic Physics, 11, 1Schawinski, K. et al. 2009a, MNRAS, 396, 818, 0903.3415——. 2009b, ApJ, 690, 1672Schawinski, K., Thomas, D., Sarzi, M., Maraston, C., Kaviraj, S.,
Joo, S.-J., Yi, S. K., & Silk, J. 2007, MNRAS, 382, 1415Schawinski, K., Virani, S., Simmons, B., Urry, C. M., Treister, E.,
Kaviraj, S., & Kushkuley, B. 2009c, ApJ, 692, L19Shankar, F., Bernardi, M., & Haiman, Z. 2009, ApJ, 694, 867Silk, J. 1977, ApJ, 211, 638Silk, J., & Rees, M. J. 1998, A&A, 331, L1Silverman, J. D. et al. 2008, ApJ, 675, 1025Spergel, D. N. et al. 2007, ApJS, 170, 377Springel, V., & Hernquist, L. 2005, ApJ, 622, L9Stasinska, G. 1990, A&AS, 83, 501Stasinska, G., Cid Fernandes, R., Mateus, A., Sodre, L., & Asari,
N. V. 2006, MNRAS, 371, 972Stasinska, G., Vale Asari, N., Cid Fernandes, R., Gomes, J. M.,
Schlickmann, M., Mateus, A., Schoenell, W., & Sodre, Jr., L.2008, MNRAS, 391, L29
Stern, D. et al. 2005, ApJ, 631, 163Strauss, M. A. et al. 2002, AJ, 124, 1810Thomas, D., Maraston, C., Bender, R., & Mendes de Oliveira, C.
2005, ApJ, 621, 673
Thomas, D., Maraston, C., Schawinski, K., Sarzi, M., & Silk, J.2009, MNRAS, submitted, arXiv:0912.0259
Toomre, A., & Toomre, J. 1972, ApJ, 178, 623Treister, E., & Urry, C. M. 2005, ApJ, 630, 115Treister, E., Urry, C. M., & Virani, S. 2009a, ApJ, 696, 110Treister, E. et al. 2009b, ApJ, 693, 1713Tremaine, S. et al. 2002, ApJ, 574, 740Tremonti, C. A. et al. 2004, ApJ, 613, 898Tueller, J., Mushotzky, R. F., Barthelmy, S., Cannizzo, J. K.,
Gehrels, N., Markwardt, C. B., Skinner, G. K., & Winter,L. M. 2008, ApJ, 681, 113
Ueda, Y., Akiyama, M., Ohta, K., & Miyaji, T. 2003, ApJ, 598,886
Urry, C. M., & Padovani, P. 1995, PASP, 107, 803Vanden Berk, D. E. et al. 2001, AJ, 122, 549Veilleux, S., & Osterbrock, D. E. 1987, ApJS, 63, 295White, S. D. M., & Rees, M. J. 1978, MNRAS, 183, 341Wild, V., Kauffmann, G., Heckman, T., Charlot, S., Lemson, G.,
Brinchmann, J., Reichard, T., & Pasquali, A. 2007, MNRAS,381, 543
Winter, L. M., Mushotzky, R. F., Tueller, J., & Markwardt, C.2008, ApJ, 674, 686
Wyse, R. F. G. 2004, ApJ, 612, L17York, D. G. et al. 2000, AJ, 120, 1579
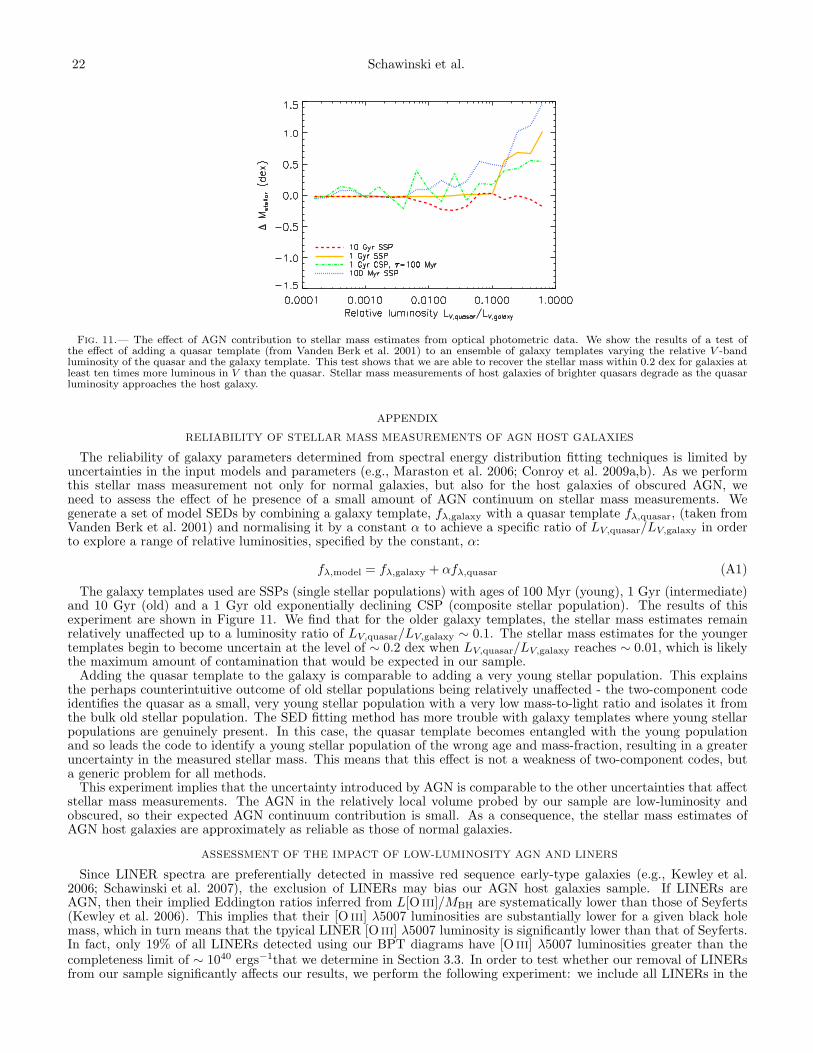
22 Schawinski et al.
Fig. 11.— The effect of AGN contribution to stellar mass estimates from optical photometric data. We show the results of a test ofthe effect of adding a quasar template (from Vanden Berk et al. 2001) to an ensemble of galaxy templates varying the relative V -bandluminosity of the quasar and the galaxy template. This test shows that we are able to recover the stellar mass within 0.2 dex for galaxies atleast ten times more luminous in V than the quasar. Stellar mass measurements of host galaxies of brighter quasars degrade as the quasarluminosity approaches the host galaxy.
APPENDIX
RELIABILITY OF STELLAR MASS MEASUREMENTS OF AGN HOST GALAXIES
The reliability of galaxy parameters determined from spectral energy distribution fitting techniques is limited byuncertainties in the input models and parameters (e.g., Maraston et al. 2006; Conroy et al. 2009a,b). As we performthis stellar mass measurement not only for normal galaxies, but also for the host galaxies of obscured AGN, weneed to assess the effect of he presence of a small amount of AGN continuum on stellar mass measurements. Wegenerate a set of model SEDs by combining a galaxy template, fλ,galaxy with a quasar template fλ,quasar, (taken fromVanden Berk et al. 2001) and normalising it by a constant α to achieve a specific ratio of LV,quasar/LV,galaxy in orderto explore a range of relative luminosities, specified by the constant, α:
fλ,model = fλ,galaxy + αfλ,quasar (A1)
The galaxy templates used are SSPs (single stellar populations) with ages of 100 Myr (young), 1 Gyr (intermediate)and 10 Gyr (old) and a 1 Gyr old exponentially declining CSP (composite stellar population). The results of thisexperiment are shown in Figure 11. We find that for the older galaxy templates, the stellar mass estimates remainrelatively unaffected up to a luminosity ratio of LV,quasar/LV,galaxy ∼ 0.1. The stellar mass estimates for the youngertemplates begin to become uncertain at the level of ∼ 0.2 dex when LV,quasar/LV,galaxy reaches ∼ 0.01, which is likelythe maximum amount of contamination that would be expected in our sample.Adding the quasar template to the galaxy is comparable to adding a very young stellar population. This explains
the perhaps counterintuitive outcome of old stellar populations being relatively unaffected - the two-component codeidentifies the quasar as a small, very young stellar population with a very low mass-to-light ratio and isolates it fromthe bulk old stellar population. The SED fitting method has more trouble with galaxy templates where young stellarpopulations are genuinely present. In this case, the quasar template becomes entangled with the young populationand so leads the code to identify a young stellar population of the wrong age and mass-fraction, resulting in a greateruncertainty in the measured stellar mass. This means that this effect is not a weakness of two-component codes, buta generic problem for all methods.This experiment implies that the uncertainty introduced by AGN is comparable to the other uncertainties that affect
stellar mass measurements. The AGN in the relatively local volume probed by our sample are low-luminosity andobscured, so their expected AGN continuum contribution is small. As a consequence, the stellar mass estimates ofAGN host galaxies are approximately as reliable as those of normal galaxies.
ASSESSMENT OF THE IMPACT OF LOW-LUMINOSITY AGN AND LINERS
Since LINER spectra are preferentially detected in massive red sequence early-type galaxies (e.g., Kewley et al.2006; Schawinski et al. 2007), the exclusion of LINERs may bias our AGN host galaxies sample. If LINERs areAGN, then their implied Eddington ratios inferred from L[O iii]/MBH are systematically lower than those of Seyferts(Kewley et al. 2006). This implies that their [O iii] λ5007 luminosities are substantially lower for a given black holemass, which in turn means that the tpyical LINER [O iii] λ5007 luminosity is significantly lower than that of Seyferts.In fact, only 19% of all LINERs detected using our BPT diagrams have [O iii] λ5007 luminosities greater than thecompleteness limit of ∼ 1040 ergs−1that we determine in Section 3.3. In order to test whether our removal of LINERsfrom our sample significantly affects our results, we perform the following experiment: we include all LINERs in the

Galaxy Zoo: AGN Host Galaxies 23
1.0
1.5
2.0
2.5
3.0
Stellar Mass log M* (M O •)
u-r
colo
urAll galaxies
10% AGN8% AGN5% AGN3% AGN1%AGN
All AGN
Early-type galaxies
9.0 9.5 10.0 10.5 11.0 11.5
1.0
1.5
2.0
2.5
3.0Indeterminate-type galaxies
9.0 9.5 10.0 10.5 11.0 11.5 12.0
Late-type galaxies
Fig. 12.— Same are Figure 6, but for all objects classified as Seyfert or LINER with L[O iii]> 1040 ergs−1. This Figure illustrates thatthe inclusion of the small fraction of LINERs that have high [O iii] λ5007 luminosities does not substantially change the results presentedin this work.
AGN sample, but remove all objects (whether classified Seyfert or LINER) with L[O iii]< 1040 ergs−1 (this removes∼20% of the Seyfert sample as well). When we then redo the analysis of this paper using this new sample, we findthat all the qualitative trends we describe remain unchanged, and that the quantitative differences are small.