The Bolocam Lockman Hole Millimeter-Wave Galaxy Survey: Galaxy Candidates and Number Counts
Upload
independentCategory
view
2download
0
arX
iv:a
stro
-ph/
0408
536v
1 2
9 A
ug 2
004
Mon. Not. R. Astron. Soc. 000, 000–000 (0000) Printed 23 July 2013 (MN LATEX style file v2.2)
The 2dF Galaxy Redshift Survey: the local E+A galaxy
population
Chris Blake1, Michael B. Pracy1, Warrick J. Couch1, Kenji Bekki1, Ian Lewis2, Karl
Glazebrook9, Ivan K. Baldry9, Carlton M. Baugh4, Joss Bland-Hawthorn3, Terry
Bridges3, Russell Cannon3, Shaun Cole4, Matthew Colless5, Chris Collins6, Gavin
Dalton2,15, Roberto De Propris5, Simon P. Driver5, George Efstathiou7, Richard S.
Ellis8, Carlos S. Frenk4, Carole Jackson16, Ofer Lahav7, Stuart Lumsden10, Steve
Maddox11, Darren Madgwick13, Peder Norberg14, John A. Peacock12, Bruce A.
Peterson5, Will Sutherland12, Keith Taylor8
1School of Physics, University of New South Wales, Sydney, NSW 2052, Australia2Astrophysics, University of Oxford, Keble Road, Oxford, OX1 3RH, UK3Anglo-Australian Observatory, P.O. Box 296, Epping, NSW 2111, Australia4Department of Physics, University of Durham, South Road, Durham DH1 3LE, UK5Research School of Astronomy & Astrophysics, The Australian National University, Weston Creek, ACT 2611, Australia6Astrophysics Research Institute, Liverpool John Moores University, Twelve Quays House, Birkenhead, L14 1LD, UK7Institute of Astronomy, University of Cambridge, Madingley Road, Cambridge CB3 0HA, UK8Department of Astronomy, California Institute of Technology, Pasadena, CA 91025, USA9Department of Physics & Astronomy, Johns Hopkins University, Baltimore, MD 21118-2686, USA10Department of Physics, University of Leeds, Woodhouse Lane, Leeds, LS2 9JT, UK11School of Physics & Astronomy, University of Nottingham, Nottingham NG7 2RD, UK12Institute for Astronomy, University of Edinburgh, Royal Observatory, Blackford Hill, Edinburgh EH9 3HJ, UK13Lawrence Berkeley National Laboratory, 1 Cyclotron Road, Berkeley, CA 94720, USA14ETHZ Institut fur Astronomie, HPF G3.1, ETH Honggerberg, CH-8093 Zurich, Switzerland15Rutherford Appleton Laboratory, Chilton, Didcot, OX11 0QX, UK16CSIRO Australia Telescope National Facility, PO Box 76, Epping, NSW 1710, Australia
23 July 2013
ABSTRACT
We select a sample of low-redshift (z ∼ 0.1) E+A galaxies from the 2dF Galaxy Red-shift Survey (2dFGRS). The spectra of these objects are defined by strong hydrogenBalmer absorption lines (Hδ, Hγ, Hβ) combined with a lack of [OII] 3727 A emission,together implying a recently-truncated burst of star formation. The E+A spectrum isthus a signpost to galaxies in the process of evolution.
We quantify the local environments, clustering properties and luminosity functionof the E+A galaxies. We find that the environments are consistent with the ensembleof 2dFGRS galaxies: low-redshift E+A systems are located predominantly in the field,existing as isolated objects or in poor groups. However, the luminosity distribution ofgalaxies selected using three Balmer absorption lines Hδγβ appears more typical ofellipticals. Indeed, morphologically these galaxies are preferentially spheroidal (E/S0)systems. In a small but significant number we find evidence for recent major merg-ers, such as tidal tails. We infer that major mergers are one important formationmechanism for E+A galaxies, as suggested by previous studies. At low redshift themerger probability is high in the field and low in clusters, thus these recently-formedspheroidal systems do not follow the usual morphology-density relation for ellipticals.
Regarding the selection of E+A galaxies: we find that basing the Balmer-linecriterion solely on Hδ absorption leads to a significant sub-population of disk systemswith detectable Hα emission. In these objects the [OII] emission is presumably eitherobscured by dust or present with a low signal-to-noise ratio, whilst the (Hγ, Hβ)absorption features are subject to emission-filling.
Key words: galaxies: interactions – galaxies: formation – surveys

2 Chris Blake et al.
1 INTRODUCTION
E+A galaxies possess a characteristic spectral signature de-fined by strong hydrogen Balmer absorption lines (Hδ, Hγ,Hβ) combined with a lack of optical emission lines such as[OII] 3727 A (Dressler & Gunn 1983). The Balmer absorp-tion lines are imprinted in the galaxy spectrum by A stars,indicating the presence of a young (< 1 Gyr old) stellarpopulation. However, the absence of [OII] 3727 A emissionsuggests that star formation is no longer ongoing. The in-ference is that these galaxies have previously undergone aburst of star formation, which has recently been truncatedrather suddenly (Dressler & Gunn 1983; Couch & Sharples1987). For this reason, these systems are also known as ‘post-starburst galaxies’.
The physical mechanisms governing the triggering andcessation of this starburst are not yet fully understood, butundoubtedly reflect the interaction of the galaxy with itsenvironment. In general, this can occur through interactionwith other galaxies (mergers or tidal gravitational effects) or,for those galaxies residing in clusters, through effects specificto that environment; involving either the hot intracluster gas(ram-pressure effects) or the cluster gravitational potential.Theoretical modelling of all these scenarios is not yet com-plete, although it is known that a major galaxy merger canproduce the characteristic E+A spectral signature (Bekki,Shioya & Couch 2001). In practice, more than one of theabove mechanisms is probably responsible for the overallpopulation of E+A galaxies, with different mechanisms op-erating in different environments. As such, these galaxies arean interesting probe of environmental influences on galaxyevolution.
The population of E+A galaxies exhibits dramatic evo-lution with redshift. These galaxies are commonplace inintermediate-redshift clusters, where they were first identi-fied and studied (Dressler & Gunn 1983): ‘E’ and ‘A’ repre-senting respectively the assumed morphology and the dom-inant stellar lines of the spectrum, although high-resolutionHubble Space Telescope (HST) imaging of such clusters laterrevealed that these galaxies were predominantly early-typedisk systems (Couch et al. 1998; Dressler et al. 1999). WhilstE+A galaxies are prevalent in intermediate-redshift clusters(e.g. Tran et al. 2003), they only constitute about 1 percent of the members of nearby clusters (Fabricant, McClin-tock & Bautz 1991). As a fraction of the overall zero-redshiftgalaxy population, E+A objects comprise significantly lessthan 1 per cent (Zabludoff et al. 1996). This rarity has ren-dered environmentally-unbiased studies of low-redshift E+Agalaxies in statistically significant numbers difficult until therecent advent of large-scale galaxy surveys.
The first such study was that of Zabludoff et al. (1996)who identified 21 low-redshift (0.05 < z < 0.13) E+A sys-tems from 11113 galaxies in the Las Campanas Redshift Sur-vey. Interestingly, 75 per cent of these objects were located inthe field, well outside the rich clusters in which E+A galax-ies were originally studied, implying that a cluster-specificmechanism is not essential for E+A galaxy formation. Fur-thermore, the ground-based morphologies of these galaxiesshowed evidence for tidal features in 5 out of the 21 cases,implicating galaxy-galaxy mergers or interactions as a for-mation mechanism. HST imaging (Yang et al. 2004) laterstrengthed these hints by revealing the detailed morpholog-
ical picture of a gas-rich merger. The Zabludoff et al. sam-ple was also investigated via spatially-resolved spectroscopy(Norton et al. 2001), probing the kinematics of the compo-nent stellar populations, and providing further evidence thatE+A galaxies in the field represent a transitional phase be-tween disk-dominated, rotationally-supported systems andspheroid-dominated, pressure-supported galaxies.
In this paper we extend the study of Zabludoff et al.(1996) by selecting a low-redshift E+A sample from the221000 galaxy spectra which form part of the final data re-lease of the 2dF Galaxy Redshift Survey (2dFGRS; Collesset al. 2001, 2003). We use two different selection techniques,the first based on three Balmer absorption lines (Hδ, Hγ,Hβ) and the second utilizing solely the Hδ line. These twomethods yield samples of 56 and 243 galaxies respectively.The significantly increased size of these catalogues (with re-spect to Zabludoff et al.) allows us to measure statisticalproperties of the E+A galaxy population, such as the lumi-nosity function and the clustering properties, and providesa wider database for exploring morphologies. We note thatsimilar low-redshift populations of E+A galaxies have beenselected from the Sloan Digital Sky Survey (SDSS): Goto etal. (2002) presented a catalogue of Hδ-selected SDSS galax-ies and Quintero et al. (2004) fitted a linear sum of A-starand K-star spectra to SDSS galaxies, analyzing the photo-metric properties of the sub-sample with an excess ratio ofA-star to K-star components. We compare our results to thiswork where possible.
The plan of this paper is as follows: in Section 2 wedescribe the selection of our 2dFGRS E+A galaxy samples,compare the selected populations to theoretical tracks in the[colour, EW(Hδ)]–plane, and use Hα emission to test for anyongoing but obscured star formation. In Section 3 we use Su-percosmos Sky Survey images to investigate the E+A galaxymorphologies. In Sections 4, 5 and 6 we measure various sta-tistical properties of the E+A galaxy population: the localenvironments, clustering properties and luminosity function.Throughout this paper, we convert redshifts to physical dis-tances using cosmological parameters Ωm = 0.3, ΩΛ = 0.7,h = H0/(100 km s−1 Mpc−1) = 0.7.
2 SAMPLE SELECTION
2.1 The 2dF Galaxy Redshift Survey
We selected E+A galaxies from the final data release of the2-degree Field Galaxy Redshift Survey (2dFGRS), a majorspectroscopic survey of about 221000 galaxies undertakenusing the 2dF facility at the Anglo-Australian Observatory.The 2dFGRS covers an area of approximately 1500 deg2 inthree regions: an North Galactic Pole (NGP) strip, a SouthGalactic Pole (SGP) strip and a series of random fields scat-tered around the SGP strip. The 2dFGRS input cataloguewas selected in the photographic bJ band from the Auto-matic Plate Measuring facility (APM) galaxy survey (and itssubsequent extensions), with a nominal extinction-correctedmagnitude limit bJ = 19.45. The survey spectra were ob-tained through 2-arcsecond fibres and cover the wavelengthrange 3600 − 8000 A at a resolution of 9 A. This wide wave-length range is made possible by the use of an atmosphericdispersion compensator (ADC) within the 2dF instrument.

E+A galaxies in the 2dFGRS 3
Each spectrum is visually assigned a redshift quality flagQ which ranges from Q = 1 (unreliable) to Q = 5 (high-est quality). The spectra are not flux calibrated and thusconsist of a sequence of ‘counts’ as a function of wave-length. The 2dFGRS is described in detail in Colless et al.(2001, 2003) and the database may be accessed online athttp://msowww.anu.edu.au/2dFGRS/.
2.2 The 2dFGRS spectral line catalogue
Our sample selection is based on the 2dFGRS spectral linecatalogue prepared by Ian Lewis. In this Section we brieflysummarize the generation of the spectral line catalogue; forfull details see Lewis et al. (2002). After removal of the con-tinuum by subtracting the median over windows of width133 A, Lewis et al. fitted up to twenty absorption or emissionlines, corresponding to standard galaxy spectral features.The line profiles were assumed to be Gaussian, parameter-ized by an amplitude and width. The wavelength spacings ofthe line centres were fixed at their known laboratory values,with a variable overall offset to accommodate redshifting.The quality of each line fit was classified by a flag deter-mined by the rms residuals, ranging from 0 (bad fit) to 5(good fit), and a signal-to-noise parameter was computedfor each line (relative to the continuum). Where possible,equivalent widths were then deduced using the fitted lineflux and the value of the continuum flux in the local 133 Awindow. This does not require absolute flux calibration ofthe spectra, although we must assume that there is no sig-nificant additive error in the continuum due to effects suchas scattered light. We corrected all equivalent widths for cos-mological effects by dividing by a factor (1 + z), where z isthe galaxy redshift.
2.3 E+A galaxy selection criteria
Galaxies exhibit a continuum of properties and thus thechoice of selection criteria for a specific sub-class is some-what arbitrary. Zabludoff et al. (1996) performed the firstenvironmentally-unbiased selection of E+A galaxies, ob-tained from the Las Campanas Redshift Survey (LCRS).Their sample was defined by requiring the equivalent widthof [OII] 3727 A emission to be less than 2.5 A, and the aver-age of the equivalent widths of the Balmer lines Hδ, Hγ andHβ to exceed 5.5 A in absorption. These criteria are strict,selecting an extreme class of objects corresponding to 0.2per cent (21/11113) of LCRS galaxies. Zabludoff et al. onlyconsidered spectra possessing a signal-to-noise ratio exceed-ing 8.0 in the continua about the Hδ, Hγ and Hβ lines.
We based our E+A galaxy sample selection criteriaon those of Zabludoff et al., but with several adjustments.Firstly, the 2dFGRS line fits catalogue (Section 2.2) param-eterizes the quality of the fit to each spectral line using adifferent method to that of Zabludoff et al.; thus we can-not employ an identical selection criterion as regards signal-to-noise ratio. In our analysis we considered an equivalentwidth measurement to be reliable if the signal-to-noise pa-rameter of the line exceeded 1.0 and the flag parameter of theline was equal to 4 or 5 (these flags are classified as a ‘good’fit). Note that a ‘signal-to-noise parameter’ equal to 1.0 isin fact a high-quality detection: this parameter is defined
Figure 1. Distribution of equivalent widths in absorption of Hγ
and Hδ for the 2dFGRS spectral line catalogue. Galaxies are onlyplotted if they possess redshift z > 0.002, high-quality 2dFGRSspectra (defined by redshift quality flag Q ≥ 3 and ADC flag = 1)and ‘good’ measurements of each of these equivalent widths (de-fined by a signal-to-noise parameter > 1.0 and a flag parameter≥ 4). The straight line is a minimum chi-squared linear fit to thedata. This is generated by assuming an error of 1 A in both equiv-alent widths and using a standard fitting routine. We restrictedthe fit to equivalent widths between 0 A and 10 A in absorption.
as the mean signal-to-noise ratio of the resolution elementsof the line, averaged over three line-widths. The choice of aminimum value of 1.0 is fairly arbitrary, but serves to selectan extreme class of galaxies as required.
Furthermore, rather than using the average of Balmerequivalent widths, we introduced a weighting scheme. Therelative equivalent widths of the Balmer absorption lines(Hδγβ) in a given galaxy spectrum are determined partlyby fundamental atomic physics and are hence expected todisplay some level of correlation. We fitted empirical linearrelations to the distributions of (Hγ,Hδ) and (Hβ,Hδ) equiv-alent widths for objects with reliable measurements of theselines in absorption (see Fig. 1 for more details of our fit-ting procedure). We thereby derived empirical best-fittingcorrelations:
EW(Hδ) = 0.50 + 1.03 × EW(Hγ) (1)
EW(Hδ) = −3.53 + 1.67 × EW(Hβ) (2)
where all equivalent widths are measured in A in absorption.We used these linear fitting formulae to convert Hβ and Hγequivalent widths to ‘effective’ Hδ values. For each spectrumwe averaged these values for the Hδγβ absorption lines. Fig.1 displays the scatter plot for the case of (Hγ,Hδ).
We selected catalogues of E+A galaxies using two dif-ferent methods; this allowed us to ascertain the effects of theselection criteria on the properties of the sample. The firstselection method was based on the average of the weightedBalmer ‘effective Hδ’ equivalent widths described above, thevalue of which was required to exceed 5.5 A in absorption.The second selection was based solely on the Hδ equivalentwidth, which was required to exceed 5.5 A. We emphasizeagain that as there is no sign of bimodality in the sample,the choice of the value 5.5 A is fairly arbitrary. All E+Aobjects were required to have no detection of [OII] 3727 A

4 Chris Blake et al.
emission. Non-detection was defined either by an [OII] flagparameter equal to zero, or by a flag parameter ≥ 4 and an[OII] equivalent width less than 2.5 A in emission.
In more detail: the catalogue of 2dFGRS spectral linefits compiled by Lewis et al. (2002) contains 264765 spectra,including repeat observations of the same source. We onlyused high-quality 2dFGRS galaxy spectra defined by:
• 2dFGRS redshift quality flag Q ≥ 3• ADC flag = 1 (spectra observed earlier than August
1999 are afflicted by problems with the ADC, resulting insevere depletion of counts at the blue end of the spectrum,and are assigned ADC flag = 0)
• Redshift z > 0.002 (in order to exclude stars)
These cuts left a total of 161437 high-quality galaxy spectra.We next required that there was little or no detectable [OII]3727 A line emission, defined by either
• Flag parameter of [OII] 3727 A = 0
or
• Flag parameter of [OII] 3727 A ≥ 4• Equivalent width of [OII] 3727 A emission < 2.5 A
This requirement was satisfied by 66422 galaxies. For thefirst of our two E+A galaxy catalogues, we made the selec-tion for Balmer absorption based on the Hδγβ lines:
• Signal-to-noise parameter of each of Hδγβ > 1.0• Flag parameter of each of Hδγβ ≥ 4• The average ‘effective Hδ’ equivalent width (where Hγβ
equivalent widths are weighted by the fitted conversion fac-tors) > 5.5 A in absorption
This produced a final sample of 56 galaxies (0.03 per centof high-quality galaxy spectra). We refer to this sample asthe ‘average-Balmer E+A catalogue’ (Table 2).
Fig. 2 plots the first ten 2dFGRS spectra from this cat-alogue, with wavelengths corrected to the galaxy rest frame(there is no bias induced by plotting the first ten; this isa representative sub-sample). Important spectral featuresare indicated. Weak emission lines are occasionally evident([OIII] 5007 A in spectrum #6 and [NII] 6584 A in #8 and#9) that are potentially due to weak star formation (seeSection 2.5) or to AGN activity.
We note that the Hβ line is fitted with both an emis-sion and an absorption Gaussian component in the spectralline catalogue. We only considered the absorption compo-nent; in almost all relevant cases the emission componentwas negligible.
For the second of our two E+A galaxy catalogues, wemade the Balmer absorption line selection based purely onthe equivalent width of Hδ:
• Signal-to-noise parameter of Hδ > 1.0• Flag parameter of Hδ ≥ 4• Hδ equivalent width > 5.5 A in absorption
This resulted in a sample of 243 galaxies (0.15 per cent ofhigh-quality spectra). We refer to this sample as the ‘HδE+A catalogue’. We note that this sample contains 36 ofthe 56 average-Balmer catalogue members.
Fig. 3 plots the first ten 2dFGRS spectra from this cat-alogue. We note that selecting objects by requiring a sig-nificant detection of solely Hδ, rather than three Balmer
absorption lines, results in more examples of spectra withlow median signal-to-noise ratios, in which the measuredHδ equivalent width may be an over-estimate due to noise.Interestingly, a significant fraction of spectra (#11, #14,#16, #20) contain Hα emission indicative of ongoing starformation, even though no measurement of [OII] 3727 A waspossible. We discuss this issue further in Section 2.5.
Unsurprisingly, in the presence of noise, a significantlylarger subset of objects results if we stipulate a good mea-surement of only one Balmer absorption line rather than ofthree. We consider that the average-Balmer E+A catalogueprovides the highest-fidelity selection of ‘true E+A galax-ies’. This statement is justified further below. We note thatboth selection techniques used here are stricter than thatof Zabludoff et al. (1996) in terms of the fraction of objectschosen from the parent catalogue. This is due to the differentrequirements on signal-to-noise ratios in the two analyses.
2.4 Colours
Fig. 4 plots the Hδ equivalent widths of objects in thetwo E+A galaxy catalogues against their photographicbJ − rF colour. The equivalent widths were re-measured forthese samples using the HδA line-strength index defined byWorthey & Ottaviani (1997) in place of the Gaussian-fittingresult, to facilitate a consistent comparison with theoreticalmodels. The bJ and rF magnitudes of the 2dFGRS galaxiesare listed in the publicly-accessible 2dFGRS online database;we used the Supercosmos Sky Survey magnitudes. In gener-ating Fig. 4 we K-corrected these magnitudes to their rest-frame values using the formulae listed in Wild et al. (2004),which produce K-corrections appropriate to each 2dFGRSgalaxy’s redshift z and colour, and which are accurate to0.01 mag in almost all cases (ignoring galaxy evolution):
Kb = [−1.63 + 4.53x] y + [−4.03− 2.01x] y2 − z
1 + (10z)4(3)
Kr = [−0.08 + 1.45x] y + [−2.88 − 0.48x] y2 (4)
where x = bJ − rF and y = z/(1 + z).It is interesting to observe in Fig. 4 that despite their
starburst origin, not all our E+A galaxies are blue, butrather cover quite a broad range in colour: for both E+Acatalogues, the mean value of bJ − rF is within 0.05 magof that of the entire 2dFGRS. The reddest E+A galax-ies are only ∼ 0.3 mag bluer than a passive E/S0 galaxy[(bJ − rF)z=0 ≃ 1.6]. Indeed their distribution in the [colour,EW(Hδ)]–plane is similar to that of the E+A populationsobserved in distant clusters (e.g. Couch & Sharples 1987;Dressler et al. 1998), apart from our sample not extendingall the way to the E/S0 fiducial colour.
Extensive modelling of this distribution observed forE+A galaxies in distant clusters has shown that it is bestreproduced by starburst models, where the galaxies are seenat different times after a substantial but abruptly truncatedepisode of star formation (Barger et al. 1996; Poggianti etal. 1999). Models of this type have been run for our presentsample, and these are represented by the various tracks plot-ted in Fig. 4. Here we have used the stellar population syn-thesis models of Bruzual & Charlot (2003). Their code out-puts at a series of time-steps the B − R colour and HδA
line-strength index, computed directly from high-resolution

E+A galaxies in the 2dFGRS 5
Figure 2. 2dFGRS spectra of the first ten objects in the average-Balmer E+A catalogue (Table 2), with wavelengths corrected to thegalaxy rest frame. Positions of important spectral features are indicated by the vertical dotted lines. The wavelength ranges of prominentnight-sky emission or absorption features have been excised and interpolated over.
Figure 3. 2dFGRS spectra of the first ten objects in the Hδ E+A catalogue, displayed in the same manner as Fig. 2.
6 Chris Blake et al.
Figure 4. The HδA line-strength index (Worthey & Ottaviani1997) and photographic bJ − rF colours of objects in the twoE+A galaxy catalogues. The overplotted lines are evolutionarytracks calculated using the stellar population synthesis models ofBruzual & Charlot (2003), as described in the text. The two largeplotted triangles on each track indicate time points 0.5 Gyr and1 Gyr after the starburst. The errors in the line-strength indexmeasurements (omitted for clarity) are typically 0.5 → 1 A forthe average-Balmer E+A catalogue, but can range up to 4 A forthe Hδ E+A catalogue (particularly for measured line strengthsexceeding 10 A).
model spectra; we transformed the outputted B − R colourinto a photographic bJ−rF colour using the equation (Couch1981):
bJ − rF = −0.017 + 1.059 (B − R) − 0.027 (B − R)2 (5)
The results are overplotted in Fig. 4 for various cases ofinterest. In all models we assumed an exponentially-decaying‘background’ rate of star formation with e-folding time τ = 3Gyr (our results do not depend significantly on the valueof τ ). At time t = 10 Gyr we superimposed a δ-functionstarburst creating 10 per cent of the total stellar mass of themodel galaxy. The solid line in Fig. 4 tracks the subsequentevolution of this galaxy from t = 10.1 Gyr to t = 13 Gyr.The other two lines plot variations in the model: the dashedline corresponds to the (extreme) assumption that the δ-function starburst forms 50 per cent of the stellar mass of thegalaxy; the dot-dashed line replaces the δ-function starburstwith a ‘flat’ starburst of duration 1 Gyr (creating 10 percent of the total stellar mass). Invoking a reasonable modelof dust extinction within Bruzual & Charlot’s code (Charlot& Fall 2000) reddens the bJ − rF colour of these tracks by≈ 0.1 mag, using the default dust model parameters.
It is of note that a small number of observed galaxies inFig. 4 (viz., the reddest E+A galaxies with the strongest Hδabsorption) cannot be accounted for by the model tracksthrough reasonable variations in the starburst pattern orin the dust model. For example, the reddest average-BalmerE+A galaxy possesses colour bJ−rF = 1.24 and line-strengthindex 6.8±0.2 A (although those line-strength measurementsexceeding 10 A for some Hδ-selected galaxies have associatederrors ranging up to 4 A). This difficulty that the starburstmodels have in reproducing the colours and Hδ equivalentwidths of some ‘red Hδ-strong’ galaxies was first recognisedby Couch & Sharples (1987) in their study of distant clus-
ters, and to this day the explanation has remained an un-solved puzzle. The only viable possibilities in this contextwould seem to be very heavy dust extinction and/or an un-usual stellar initial mass function (Shioya, Bekki & Couch2004).
2.5 Obscured star formation?
In some cases, ongoing star formation in E+A galaxies maybe hidden by dust obscuration. Smail et al. (1999) discov-ered examples of distant cluster galaxies that were classi-fied as E+A objects on the basis of their optical spectra,yet possessed radio fluxes indicative of current massive starformation. However, only 2 out of 15 E+A galaxies in theZabludoff et al. (1996) sample could be detected in radiocontinuum measurements (Miller & Owen 2001; the radiocontinuum luminosity is a tracer of ongoing star formationthat is unbiased by dust). Furthermore, just 1 out of 5 ofthese objects yielded a detection of neutral hydrogen gasvia 21 cm emission (Chang et al. 2001; the non-detectedsystems have upper limits of neutral hydrogen content of1 → 2 × 10⁹ h−2 M⊙). The presence of neutral hydrogenwould indicate the existence of a gas reservoir that may fuelongoing or future star formation (and the large-scale spatialdistribution and kinematics of this gas can encode informa-tion about any merger event). This evidence suggests thatlow-redshift E+A galaxies are predominantly not undergo-ing dust-enshrouded star formation.
In order to test this assertion further, for each E+Agalaxy spectrum in our 2dFGRS samples we inspected theequivalent width of Hα emission, which is less sensitive toextinction by dust than [OII] 3727 A emission. For the pur-pose of this Section, we assume that any Hα emission iscaused by star formation activity, although we note thatthe presence of an AGN is an alternative explanation andmore detailed consideration of spectral line ratios is requiredto distinguish between these two cases (e.g. Kauffmann etal. 2003). As a second caveat, we note that we are subjectto aperture effects owing to the 2′′ angular diameter of the2dF spectrograph fibres: we may not be measuring the cor-rect global Hα equivalent width of the entire galaxy.
Although the 2dFGRS spectra are not flux-calibrated,we can still deduce a star-formation rate from an Hα equiv-alent width if we use each galaxy’s rF magnitude to es-timate the continuum flux at about 6000 A. In detail, wetransformed the rF magnitude to an AB-magnitude usingthe conversions stated in Cross et al. (2004, equations A12and A16), where the effective wavelength of the AB magni-tude is λeff = 5595 A (Blanton et al. 2003). The expressionfor the continuum luminosity per unit wavelength is thenLcont = (4.18× 1024 W A
−1)× 10−0.4M (using e.g. Blanton
et al. 2003, equation 15) where M is the absolute AB magni-tude. The Hα luminosity follows as LHα = Lcont× EW(Hα),and finally we use a standard conversion to star formationrate, SFR(M⊙ yr−1) = 8.2 × 10⁻³⁵LHα(W) (e.g. Sullivanet al. 2001, equation 1).
We considered a galaxy spectrum to have a reliable Hαmeasurement if the line possessed a signal-to-noise param-eter > 1.0 and a flag parameter ≥ 4. We note that Hαmeasurements are only possible for galaxies with redshiftsz < 0.15, owing to the poor sensitivity of the 2dF systembeyond about 7500 A (see Figs. 2 and 3).

E+A galaxies in the 2dFGRS 7
In the average-Balmer E+A catalogue, of the 37 galaxyspectra with z < 0.15, only three yielded a reliable mea-surement of Hα emission, with the highest deduced star-formation rate being 0.17 M⊙ yr−1. In strong contrast, ofthe Hδ-selected sample, 96 of the 166 spectra with z < 0.15contained measurable Hα emission, although in only 5 casesdid the star formation rate exceed 1 M⊙ yr−1 (with the high-est rate being 1.9 M⊙ yr−1). We conclude that the average-Balmer method is considerably more effective in selecting asample with negligible Hα emission, that has truly ceasedstar formation (this result is also evident by comparing Figs.2 and 3). E+A galaxies selected on the basis of Hδ absorp-tion alone show evidence for measurable ongoing star for-mation in ≈ 60 per cent of cases; the [OII] 3727 A emis-sion presumably being either obscured by dust or presentwith a low signal-to-noise ratio. The magnitude of the star-formation rates in these objects is not large, being consis-tent with the pedestrian levels observed in spiral disks. TheHγ and Hβ absorption features are presumably subject toemission-filling and the object is consequently not selectedin the average-Balmer catalogue. The Hδ E+A cataloguemay thus contain an additional galaxy population: dustydisk galaxies.
We also checked for inclusion of E+A galaxy cataloguemembers in the list of 2dFGRS radio sources compiled byE.Sadler (priv. comm.) after careful cross-matching of the2dFGRS catalogue and the 1.4 GHz NRAO VLA Sky Survey(NVSS) (Sadler et al. 2002). The NVSS is complete to aradio flux-density limit of S1.4 GHz ≈ 3 mJy, correspondingto a radio luminosity L1.4 GHz ≈ 6 × 10²¹ W Hz−1 at thetypical redshift of a 2dFGRS galaxy, z = 0.1 (assuming apower-law radio spectrum Sν ∝ ν−0.8). This level of radiocontinuum flux density is generated by a star-formation rateof about 7M⊙ yr−1 (using the conversion stated in Sullivanet al. 2001, equation 3), therefore the Hα emission is a probeof lower star formation rates in the present study. In theaverage-Balmer (or Hδ) E+A catalogue, just 1 out of 56 (2out of 243) objects was listed as an NVSS radio detection.
3 MORPHOLOGIES
We inspected Supercosmos Sky Survey (SSS) images of ob-jects in our E+A galaxy catalogues. The SSS has digi-tized sky survey plates taken with the UK Schmidt tele-scope, using a pixel size of 0.67 arcseconds. Three dif-ferent photographic colours are available (approximatingB, R and I) and the data were accessed using the web-site http://www-wfau.roe.ac.uk/sss/pixel.html. An in-troduction to the SSS is presented by Hambly et al. (2001).
Table 1 displays the results of our visual morphologicalclassification of our E+A galaxy samples, based on inspec-tion of the blue SSS images. All the galaxies in the average-Balmer catalogue were classified, and a comparable number(selected at random) from the Hδ sample were also clas-sified. Galaxies were assigned one of the following broad‘Hubble’ types: E, E/S0, S0, Spiral (early), Spiral (late), orIrr(egular); unless they were too distant to be sufficiently-well resolved. Any evidence for tidal interactions and merg-ers (e.g. tidal tails, coalescing pairs, disturbed appearance)was also noted.
As can be seen from Table 1, there is a clear difference in
the typical morphologies between these catalogues. Average-Balmer E+A galaxies are predominantly early-type sphero-dial E/S0 systems. There is evidence of a disk componentin some objects, but this contribution is never dominant. Incontrast, Hδ-selected E+A galaxies are predominantly late-type spiral galaxies. This result is consistent with our anal-ysis of the star formation rates in Section 2.5: the Hδ E+Acatalogue contains an additional population of star-formingdisk systems that is not present in the average-Balmer cat-alogue. In this sense, the latter catalogue provides a higher-fidelity selection of ‘true E+A galaxies’.
Images of the eight lowest-redshift average-Balmer E+Agalaxies are displayed in Fig. 5, using the blue SSS datato match the selection colour of the 2dFGRS. Note thatthere is no morphological selection imposed for this Figure,only the original spectral selection together with proximity.The plots are labelled with the absolute magnitude of eachgalaxy: these nearby objects are in all cases fainter than L∗
(M∗b − 5 log10 h = −19.66, Norberg et al. 2002).
Our visual inspection of the SSS images also revealedthat a small but significant number of the E+A galaxiespossess disturbed morphologies or tidal features indicativeof a late stage of a major merger, in agreement with thefindings of Zabludoff et al. (1996). For example, in Fig. 5we classified images #3 and #6 as providing ‘strong’ evi-dence for a recent merger, and images #4, #7 and #8 as‘possible’ candidates (see the last two columns of Table 1).Fig. 6 displays some other examples of possible mergers orinteractions drawn from both catalogues; image #11 fea-tures a bright tidal tail extending for a physical distance of∼ 50 kpc. Theoretical modelling has indeed shown that ma-jor mergers can produce the characteristic E+A spectrum(Bekki et al. 2001), and space-based high-resolution imag-ing of E+A galaxies (Yang et al. 2004) has provided furthersupport for this scenario. We note that merger events havea relatively short ‘duty cycle’ (∼ 108 yr) compared to thetimescale of the E+A phase (∼ 109 yr): we expect morpho-logical evidence for mergers to be rare.
As already indicated, the Hδ-selected E+A galaxies dis-play a wider range of morphologies than the average-Balmercatalogue. We discover plausible merger remnants, but wealso identify low-luminosity disk systems which display noevidence of recent or current interactions with other galax-ies. Major mergers cannot produce such disk systems: onepossible alternative formation mechanism for such an E+Agalaxy is a tidal interaction with a companion that passedby ∼ 1 Gyr ago. Dwarf galaxies are particularly susceptibleto such tidal interactions, which can transform a late-typespiral galaxy into a barred S0 galaxy that still preserves theedge-on appearance of a disk system. The dynamics of thebar drives gas to the centre of the system, triggering a star-burst (e.g. Kennicutt 1998); the rapid consumption of thisgas naturally produces a characteristic E+A spectrum.
It is important to note that the angular diameter of eachfibre of the 2dF spectrograph (2 arcseconds) is significantlysmaller than the angular size of most of these galaxies. TheE+A galaxy selection is therefore subject to aperture ef-fects: we can only assert that the small portion of the galaxysampled by the fibre possesses an E+A spectrum. This ob-viously does not preclude ongoing star formation in otherregions of the galaxy. However, a starburst triggered by amajor galaxy merger or interaction will typically reside in

8 Chris Blake et al.
Table 1. Results of a visual morphological classification of galaxies in the two E+A catalogues, based on Supercosmos Sky Survey bluephotographic images. The fractions of galaxies classified as types (E, E/S0, S0, early spiral, late spiral, irregular) are shown, togetherwith the number of cases in which strong (or possible) evidence was found for a previous or ongoing merger or interaction.
Sample Number Number E E/S0 S0 Spiral Spiral Irregular Strong evidence Possible evidenceinspected classified (early) (late) for interaction for interaction
Average-Balmer 56 40 15% 40% 23% 20% 0% 2% 5 (9%) 7 (13%)Hδ 71 57 14% 7% 11% 17% 44% 7% 3 (4%) 4 (6%)
Figure 5. Supercosmos Sky Survey images of the eight lowest-redshift average-Balmer E+A galaxies (titled by 2dFGRS names). Thesize of each image is 1 × 1 arcmin, which corresponds to a co-moving transverse width of 14 kpc at redshift z = 0.01 for our assumedcosmological parameters. The pixel scale is 0.67 arcsec/pixel. The absolute magnitude of each galaxy is displayed in the bottom left-hand corner of the plot (as the value of Mb − 5 log10 h); the small circle in the top right-hand corner indicates the diameter of a 2dFspectrograph fibre (2 arcseconds, which corresponds to 0.4 kpc at z = 0.01).
the centre of the system, where gas is driven by the dynam-ics: thus such a starburst should co-exist with the highestoptical surface brightness, where the spectrograph fibre isusually positioned.
4 ENVIRONMENTS
We quantified the local environments of the E+A galaxysamples using a variety of techniques:
4.1 Cross-correlation with the cluster distribution
We first investigated whether our samples of low-redshiftE+A galaxies are located predominantly in the field, asfound in the seminal study of Zabludoff et al. (1996), orin the proximity of rich clusters. A catalogue of galaxy clus-ters within the 2dFGRS observed sky areas was compiled byde Propris et al. (2002), sourced from the Abell, APM andEdinburgh-Durham Cluster (EDCC) catalogues. The 2dF-GRS was utilized by de Propris et al. to measure preciseredshifts, velocity dispersions and centroids for these clus-ters.
We simply measured the vector separation of each E+Agalaxy and the catalogued clusters. Two components of sep-aration were measured: the transverse (i.e. projected) phys-ical distance Dt = (r × ∆θ)/(1 + z), where r is the ra-dial co-moving distance to the E+A galaxy at redshift zand ∆θ is the angular separation of the galaxy and clustercentroid; and the radial (redshift-space) physical distanceDr = (c ∆z/H)/(1 + z), where H is the Hubble constantat the E+A galaxy redshift and ∆z is the redshift sepa-ration of the galaxy and cluster centroid. The radial sep-aration was considered independently because its apparentvalue can be significantly enhanced by line-of-sight peculiarvelocities. An E+A galaxy was considered a ‘cluster’ objectif both Dt < r0 and Dr <
√
(r0)2 + (2σ/H)2, where σ isthe velocity dispersion of the cluster in question, typicallyσ ∼ 1000 km s−1. The selection volume is thus broadened inthe radial direction to allow for peculiar velocities. The crit-ical physical scale r0 was taken as 5 Mpc (chosen to exceedcomfortably the virial radius of a typical rich cluster).
We restricted our cluster analysis to the SGP regionof the galaxy survey; the NGP region is only covered bythe Abell catalogue thus the catalogued cluster distributionis much sparser. Using the average-Balmer (or Hδ) E+A

E+A galaxies in the 2dFGRS 9
Figure 6. Supercosmos Sky Survey images of eight possible merging or interacting E+A galaxies, displayed in the same manner as Fig.5. The bottom right-hand corner records the E+A catalogue(s) to which each galaxy belongs: ‘AB’ (average Balmer), ‘Hδ’ or ‘Both’.
catalogue: of 37 (122) galaxies in the SGP region, 4 (20)were classified as cluster objects using the method describedabove. We conclude that the 2dFGRS E+A galaxies typicallylie in the field, outside clusters, in agreement with the find-ings of Zabludoff et al. (1996).
4.2 Cross-correlation with remaining 2dFGRS
galaxies
As a second means of quantifying the environments of theE+A galaxy samples, we counted the number of objects inthe 2dFGRS within a co-moving radius r0 = 8 h−1 Mpc ofeach E+A galaxy, making no attempt to correct for pecu-liar velocities. By integrating the measured 2dFGRS bJ-bandluminosity function (Norberg et al. 2002) to the survey ap-parent magnitude limit, we can determine the average num-ber of objects expected within this sphere at any given red-shift (in the absence of clustering) and hence obtain a localoverdensity (e.g. on a scale r0 = 8 h−1 Mpc) for each E+Agalaxy. We then compared the average local overdensity ofE+A galaxies with that of a sample of randomly-drawn 2dF-GRS objects, for which we applied an identical technique.
Using the average-Balmer (or Hδ) E+A catalogue, theaverage overdensity δ within a sphere of co-moving ra-dius r0 = 8 h−1 Mpc centred on an E+A galaxy wasδ = 0.96±0.27 (1.03±0.15). The quoted error was derived asthe error in the mean of the overdensity distribution, σ/
√N ,
where σ is the standard deviation of the distribution and Nis the number of E+A galaxies in the sample. Measuringthe average overdensity of 10000 randomly-drawn 2dFGRScatalogue members by an identical method yielded δ = 1.18(with a negligible error).
Motivated by the spheroidal morphologies of many ofthe average-Balmer E+A galaxies (Section 3), we also de-fined a ‘control sample’ of 2dFGRS ‘elliptical’ galaxies.These were selected based on the classification system devel-
oped for 2dFGRS spectra using principal-component analy-sis (Madgwick et al. 2002). This procedure assigns a param-eter η to each spectrum based upon the strength of nebularemission; the value of this continuous variable η turns outto correlate relatively well with the galaxy bJ-band morphol-ogy (Madgwick 2003). Following Magdwick et al. (2002) wedefine a ‘relatively quiescent’ (i.e. early-type) sub-sample bythe cut η < −1.4. We found that the average overdensity of10000 2dFGRS ‘ellipticals’, selected in this manner, to beδ = 1.22.
We repeated this analysis for other co-moving radii r0
(Fig. 7), finding that on all scales the mean overdensity at thelocations of the E+A galaxies is statistically consistent withthe ensemble of 2dFGRS galaxies. This result is in agreementwith the findings of Quintero et al. (2004) based on SDSSspectra containing an excess signature of A stars relative toK stars. Furthermore, the overdensity pattern around ellip-tical galaxies is not favoured as a description of E+A galaxyenvironments, even though many average-Balmer E+A sys-tems possess spheroidal morphologies. As illustrated by Fig.7, we recover the well-known result that elliptical galaxies in-habit denser local environments than the ensemble of galax-ies.
4.3 Cross-correlation with 2dFGRS galaxy groups
catalogue
Eke et al. (2004a) have constructed a catalogue of galaxygroups from the 2dFGRS, by means of a friends-of-friendspercolation algorithm. The data are publicly available onlineat http://www.mso.anu.edu.au/2dFGRS/Public/2PIGG/
and consist of two tables. For each 2dFGRS galaxy, the firsttable lists the group ID or a flag indicating that the galaxywas ungrouped. For each group, the second table records thenumber of group members and details such as the projectedlinear size and velocity dispersion of the group.

10 Chris Blake et al.
Figure 7. The overdensity at the locations of the E+A galaxies,obtained by counting the number of 2dFGRS catalogue entrieswithin a sphere of co-moving radius r0 and comparing the resultto that obtained by integrating the 2dFGRS luminosity functionto the survey apparent magnitude limit. A similar analysis wasperformed for 10000 randomly-drawn 2dFGRS catalogue mem-bers (solid line) and the same number of 2dFGRS ‘ellipticals’(dashed line), the latter sample selected by requiring the spectralclassification parameter η < −1.4.
For each galaxy in our E+A catalogues, we first con-sidered the number of members of the group in which thatgalaxy resides. The distributions of group membership num-bers for E+A galaxies and for randomly-drawn 2dFGRSgalaxies were statistically consistent. As such, approximately50 per cent of our E+A galaxies are isolated, not linked toany companion by the percolation algorithm.
However, group membership is a poor indicator of groupsize: massive groups can have low membership simply be-cause they are at high redshift. A better quantity to consideris the corrected total luminosity of the group (see Eke et al.2004b). This is the summed, weighted luminosities of thegalaxies in the group, divided by an incompleteness factorcompensating for those galaxies falling beneath the appar-ent magnitude threshold at the group redshift. Fig. 8 plotsthe distribution of these group luminosities for the E+A cat-alogues. We overplot the results of an identical analysis forsamples of randomly-drawn 2dFGRS galaxies and ellipticals:the latter inhabit preferentially more luminous groups. Wefind no evidence that E+A galaxies inhabit groups of a differ-ent nature to the overall galaxy population. Furthermore, thegroups containing E+A galaxies appear dissimilar to thosehosting elliptical galaxies; the elliptical model is rejected bythe average-Balmer (or Hδ) data with a confidence of 99.7%(98.0%), based on the value of the chi-squared statistic.
4.4 Cross-correlation with Supercosmos Sky
Survey catalogues
As a final method of investigating the environment of 2dF-GRS E+A galaxies, we obtained the Supercosmos SkySurvey (SSS) photometric catalogues for the regions sur-rounding each E+A galaxy. The approximate magnitudelimits of the photographic plates which are scanned toproduce the SSS are bJ = 22.5 and rF = 21.5. We
Figure 8. The distribution of group luminosities for the average-Balmer (solid circles) and Hδ (open circles) E+A galaxy cata-logues. The luminosities are corrected by a factor compensatingfor those galaxies falling beneath the apparent magnitude thresh-old at the group redshift. The error in the number of objects N
in each bin was taken as the Poisson error√
N . The solid anddashed lines represent the distribution of group luminosities ob-tained for 1000 randomly-drawn 2dFGRS galaxies and ellipticals,respectively.
downloaded SSS object catalogues using the web interfacehttp://www-wfau.roe.ac.uk/sss/obj batch email.html
specifying a circular extraction with radius 5 arcmin.Using the 2dFGRS bJ-band luminosity function (Nor-
berg et al. 2002), we can deduce the apparent magnitudeb∗J(z) corresponding to an absolute magnitude M∗
b at theredshift z of a sample E+A galaxy. We then define a ‘brightneighbour’ as a nearby SSS galaxy with bJ < b∗J(z) + 1.We define a ‘faint neighbour’ as a nearby SSS galaxy withb∗J(z) + 1 < bJ < 22.5. The presence of a nearby ‘bright’or ‘faint’ neighbour may indicate, respectively, an imminentmajor or minor merger.
Using the known E+A galaxy redshift we can convertangular separations into transverse physical separations. Foreach E+A galaxy we derived:
• The transverse physical separation (in kpc) of the near-est faint neighbour.
• The transverse physical separation (in kpc) of the near-est bright neighbour.
• The physical surface density (in Mpc−2) defined bythe five nearest bright neighbours (Σ = 5/πd2
5, where d5 isthe transverse physical separation of the fifth nearest brightneighbour).
Note that each of these quantities is insensitive to the effectsof peculiar velocities. We compared these statistics to thosedetermined for a sample of 1000 randomly-drawn 2dFGRSgalaxies (restricted to redshifts 0.002 < z < 0.25 to elim-inate stellar contamination). The results for the two E+Agalaxy catalogues are displayed in Figs. 9 and 10, with theresults for the random sample overplotted in each case.
We used the Kolmogorov-Smirnov (K-S) statistical testto ascertain whether the local environments of the E+Agalaxy samples were drawn from a different parent distri-bution to the local environments of the random 2dFGRS
E+A galaxies in the 2dFGRS 11
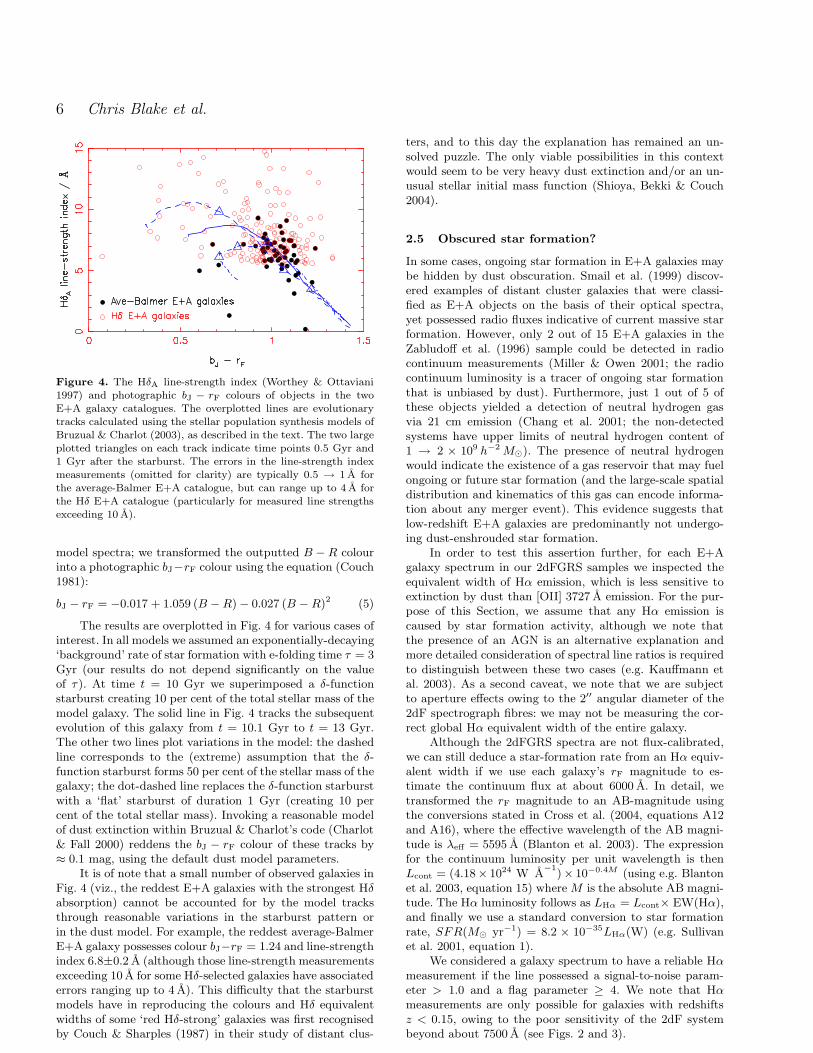
Figure 9. The solid histograms plot the distribution of localenvironments of the average-Balmer E+A galaxy sample (56 ob-
jects), derived by overlaying the E+A galaxy positions on the Su-percosmos Sky Survey (SSS) catalogue. The panels illustrate thelocal environment quantified by the nearest faint neighbour, thenearest bright neighbour and the local surface density of brightneighbours. The dashed line displays the same statistics deter-mined for 1000 randomly-selected 2dFGRS galaxies. See Section4.4 for more details.
sample. Let p be the probability that the K-S statistic couldexceed the observed value by random chance, if the two dis-tributions were drawn from the same parent distribution.The values of p for the distributions of nearest faint neigh-bour, nearest bright neighbour and local surface density, forthe average-Balmer (Hδ) E+A catalogue, were 0.58 (0.35),0.32 (0.11) and 0.21 (0.06). We conclude that there is nosignificant evidence that the distribution of E+A galaxy localenvironments is different from that of the 2dFGRS sampleas a whole.
5 CLUSTERING PROPERTIES
We quantified the clustering properties of 2dFGRS E+Agalaxies using a spatial correlation function analysis. Suchan analysis yields information about the bias of these galax-ies with respect to the underlying matter density field, whichwe can compare to the bias of other classes of galaxy. In theapproximation that E+A galaxies possess a linear bias be,
Figure 10. The same statistics as Fig. 9, determined for the Hδ
E+A galaxy sample (243 objects).
their spatial auto-correlation function ξee as a function ofspatial separation r takes the form
ξee(r) = b2
e ξmm(r) , (6)
where ξmm is the spatial auto-correlation function of theunderlying matter density field.
As our samples contain insufficient E+A galaxies toperform an auto-correlation function analysis (there is onlyone pair of objects in the average-Balmer catalogue with aredshift-space separation less than 20 h−1 Mpc), we insteaddetermined the cross-correlation function ξeg of the E+Agalaxy samples with the rest of the 2dFGRS catalogue. Inthe approximation of linear bias,
ξeg(r) = be bg ξmm(r) , (7)
where bg is the bias factor for an average 2dFGRS galaxy.If we additionally measure the spatial auto-correlation func-tion of 2dFGRS galaxies, ξgg, we can estimate the relativebias of E+A galaxies as
be
bg
=ξeg(r)
ξgg(r). (8)
We measured all correlation functions in redshift space,making no attempt to correct for peculiar velocities. Thecross-correlation function is measured by comparing thecross-pair counts of the E+A sample with, respectively, the
12 Chris Blake et al.
full 2dFGRS catalogue (containing ng galaxies) and a ran-dom distribution of nr points possessing the same selec-tion function as the full catalogue. The random distribu-tions were generated using the publicly-available 2dFGRSmask software written by Peder Norberg and Shaun Cole(see http://msowww.anu.edu.au/2dFGRS/). Denoting theserespective cross-pair counts as Neg(s) and Ner(s), with sdenoting a redshift-space separation, we used the standardestimator for the cross-correlation function ξeg:
ξeg(s) =nr
ng
Neg(s)
Ner(s)− 1 . (9)
When determining the auto-correlation function of 2dFGRSgalaxies ξgg for comparison, we used the standard estimatorequivalent to equation 9:
ξgg(s) =2nr
ng
Ngg(s)
Ngr(s)− 1 . (10)
The extra factor of 2 in equation 10 arises because Ngg is aauto-pair count rather than a cross-pair count (thus containshalf the number of unique pairs).
We included the 2dFGRS NGP and SGP regions, butnot the random fields, in our clustering analysis. The totalnumbers of galaxies analyzed were 50, 201 and 195188 forthe average-Balmer catalogue, the Hδ catalogue and the en-tire 2dFGRS, respectively. The results are displayed in Fig.11. Poisson error bars are often assigned to correlation func-tion measurements, but these are known to underestimatethe true variance of the estimators of equations 9 and 10by a significant factor (e.g. Landy & Szalay 1993). Instead,we estimated a realistic statistical variance using the ‘jack-knife’ approach. We divided both the NGP and SGP stripsinto four quadrants and repeated the correlation functionestimation 8 times, keeping 7 quadrants; the error for eachseparation bin is then estimated by multiplying by
√8 the
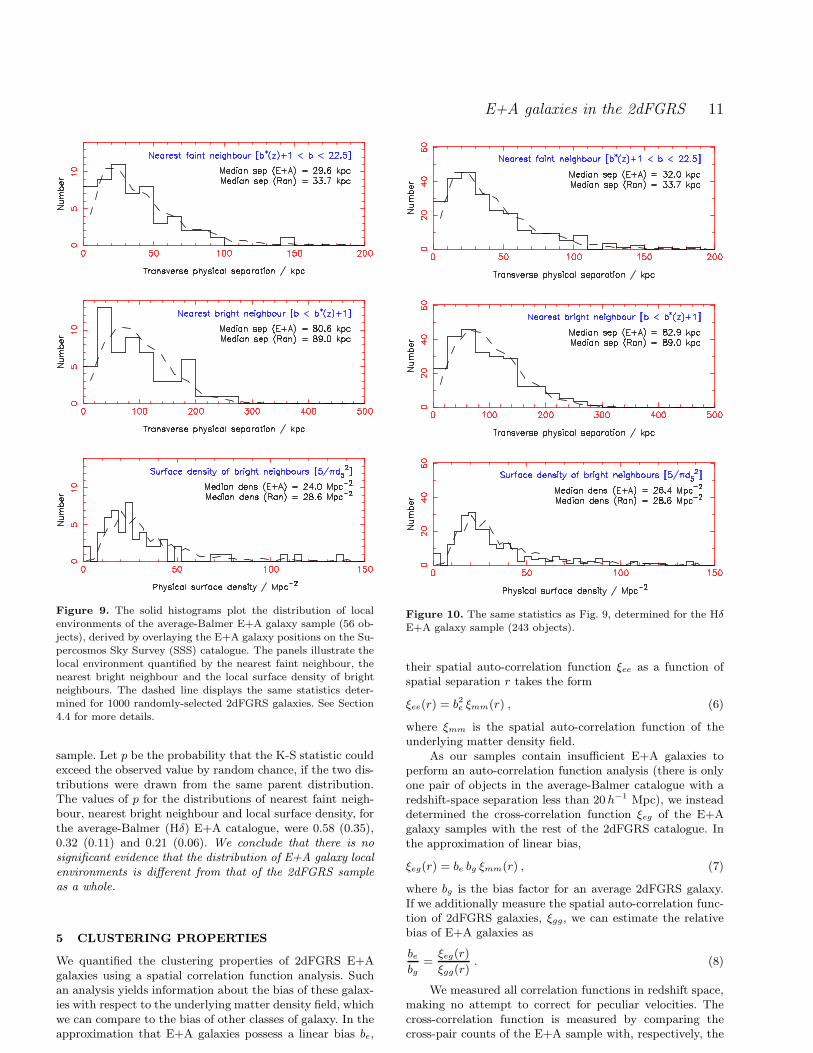
resulting standard deviation across the eight sub-samples.The correlation function estimate for the Hδ sample
agrees well with that for the entire 2dFGRS (implyingbe ≈ bg) but there is evidence that the average-Balmer cata-logue is somewhat less clustered. Considering the small sizeof this sample (50 objects) and the strong statistical corre-lation between neighbouring bins of the ξ(r) estimator, weconsider this result to be tentative. On scales where ξ ≪ 1,systematic errors probably dominate the uncertainities inthe correlation functions. In particular, there is a well-knownsystematic effect (the ‘integral constraint’) caused by theuncertainty in estimating the mean density of the galaxysample. This effect distorts the measured values of ξ sys-tematically downwards on large scales (in a similar way forall jack-knife re-samples).
6 LUMINOSITY FUNCTION
The distribution of luminosities of E+A galaxies may encodeinformation about the physical mechanisms responsible fortheir formation. If, for example, E+A galaxies possess below-average luminosities, then they would be more susceptibleto tidal interactions, which would then be implicated as aformation mechanism.
We determined the bJ-band luminosity function, φ(M),of the two samples of E+A galaxies using the step-wise
Figure 11. Spatial correlation function measurements for theE+A galaxy samples. The solid and open circles plot the cross-correlation function of respectively the average-Balmer and theHδ E+A galaxies with the remainder of the 2dFGRS catalogue,measured using equation 9. The error bar for each separation binis estimated using the jack-knife re-sampling technique, as de-scribed in the text. The solid line is the auto-correlation functionof the entire 2dFGRS catalogue, derived employing equation 10.The error in this function (not shown) is negligible compared tothe error in the other measurements.
maximum likelihood (SWML) method (Efstathiou, Ellis &Peterson 1988). We also measured the bJ-band luminosityfunction of the full 2dFGRS catalogue and the ellipticalssample (see Section 4), using an identical method. In orderto limit the effects of incompletenesses, we restricted ouranalysis to the apparent magnitude range 14 < bJ < 19.2.The total numbers of galaxies analyzed were respectively 53,174, 166243 and 60640 for the average-Balmer catalogue, theHδ catalogue, the entire 2dFGRS and the ellipticals sam-ple. When evaluating the luminosity function we used theSupercosmos Sky Survey magnitudes, together with the K-correction described in Section 2.4 combined with an ‘E-correction’ for the luminosity evolution of an average 2dF-GRS galaxy (Norberg et al. 2002). The fractional error inthe measurement of φ(M) in each luminosity band is takenas a Poisson error 1/
√N , where N is the number of objects
falling in that band.The SWML estimator is unnormalized; we normalized
each luminosity function to an equivalent source surface den-sity σ which we fixed as follows. In the absolute magnitudeinterval −16.5 > M −5 log10 h > −22 the 2dFGRS luminos-ity function is accurately described by a Schechter functionwith parameters M∗ − 5 log10 h = −19.66, α = −1.21 andΦ∗ = 1.61 × 10⁻² h3 Mpc−3 (Norberg et al. 2002). We ob-tained a normalization σ = 141.4 deg−2 by integrating thisSchechter function over the redshift interval 0.002 < z < 0.3and the apparent magnitude interval 14 < bJ < 19.2. Byapplying a consistent normalization in this manner, we areable to investigate any difference of shape between the lu-minosity functions for the 2dFGRS and for the E+A galaxysamples. The results are displayed in Fig. 12.
At brighter luminosities (M − 5 log10 h < −20), Fig.12 hints that the average-Balmer sample may possess a lu-minosity distribution more consistent with that of ellipticalgalaxies than average 2dFGRS galaxies (although formally,

E+A galaxies in the 2dFGRS 13
Figure 12. The luminosity functions of the average-Balmer E+Agalaxy sample (53 objects, solid circles), the Hδ E+A sample (174objects, open circles), the whole 2dFGRS catalogue (166243 ob-jects, solid line) and the ellipticals sample (60640 objects, dashedline). All measurements have been derived using a step-wise max-imum likelihood code and normalized to a consistent source sur-face density σ = 141.4 deg−2. The errors in the luminosity func-tion measurements for the 2dFGRS catalogues are not muchgreater than the thickness of the lines and are omitted for clarity.
the luminosity functions of both E+A catalogues are sta-tistically consistent with the whole 2dFGRS database; thechi-squared probabilities in the two cases are 0.09 and 0.06,considering bins containing ≥ 2 objects). Investigating fur-ther, we lowered the absorption equivalent width thresholdfor E+A catalogue selection from 5.5 A to 4.5 A, in order tocreate larger samples. The luminosity functions of these ex-tended catalogues are displayed in Fig. 13. The luminositydistribution of the average-Balmer E+A galaxies is now in-consistent with that of the overall 2dFGRS catalogue (withsignificance > 99.99%) and consistent with the luminosityfunction of ellipticals (the chi-squared probability is 0.19).The result for the Hδ-selected sample remains consistentwith that for the ensemble of 2dFGRS galaxies. This findingseems very reasonable given the morphological distributionsdetermined in Section 3: the average-Balmer catalogue isdominated by spheroidal galaxies, whereas the Hδ samplecontains a significant admixture of disk galaxies.
We conclude that the distribution of luminosities of Hδ-selected galaxies is consistent with the entire 2dFGRS pop-ulation, but there is evidence to suggest that the luminosityfunction of the average-Balmer sample better matches thatof (spectroscopically-defined) ‘elliptical’ galaxies.
We repeated the statistical analyses of local environ-ment (Section 4) and clustering (Section 5) for the lower(4.5 A) absorption equivalent width threshold, and foundthat the conclusions remain unchanged.
7 DISCUSSION
We have selected samples of low-redshift E+A galaxies from161000 high-quality spectra in the 2dFGRS, constituting alarge-scale environmentally-unbiased study of E+A systemsin the local Universe. We used two different selection tech-
Figure 13. The luminosity functions of extended E+A galaxycatalogues, for which the absorption equivalent width thresholdhas been reduced from 5.5 A to 4.5 A. The numbers of average-Balmer and Hδ E+A galaxies analyzed in this plot were respec-tively 87 and 292. The results are displayed in the same style asFig. 12.
niques: the first utilizing three Balmer absorption lines (Hδ,Hγ, Hβ) together with the [OII] 3727 A feature, and the sec-ond technique employing solely the Hδ and [OII] lines. Thesemethods resulted in the selection of 56 and 243 galaxies, re-spectively.
We inspected the morphologies of the E+A galaxies us-ing images drawn from the Supercosmos Sky Survey (SSS),finding that:
• The largest sub-population of ‘average-Balmer’ E+Agalaxies is E/S0 systems. There are no disk-dominatedgalaxies. In contrast, the largest sub-sample of Hδ-selectedobjects is late-type spirals.
• In a small but significant number of cases, the SSS im-ages reveal evidence of recent major galaxy mergers, suchas disturbed morphologies, coalescing disks and tidal tailsor envelopes. We detect a notable (50 kpc) tidal tail associ-ated with one object.
• Further study (i.e. spatially-resolved spectroscopy) isnecessary to establish the influence of aperture effects dueto the 2′′ angular diameter of the 2dF spectrograph fibresbeing significantly smaller than the angular size of most ofthe galaxies.
The individual catalogues resulting from the two E+Aselection techniques contain a different distribution of galaxypopulations. Less than 10% of average-Balmer E+A galaxiesyield any detection of Hα emission, with the highest deducedstar-formation rate being 0.17 M⊙ yr−1. In contrast, 60% ofspectra selected by strong Hδ absorption (and no [OII] emis-sion) contain a measurable Hα line (although only rarelydoes the inferred star-formation rate exceed 1 M⊙ yr−1).
These samples permitted a statistical investigation ofthe environments and luminosities of low-redshift E+Agalaxies. We compared the two E+A catalogues to both theentire 2dFGRS database and a sub-population of 2dFGRS‘ellipticals’, the latter selected using the spectral classifica-

14 Chris Blake et al.
tion parameter η. With regard to the environments of E+Agalaxies, we found that:
• E+A galaxies at low redshift lie predominantly in thefield rather than in clusters, in agreement with the analysisof Zabludoff et al. (1996).
• Cross-matching E+A galaxies with the 2dFGRS galaxygroups catalogue of Eke et al. (2004), we determined thatthe distribution of membership and luminosity of the groupsin which E+A systems reside was consistent with that ofthe overall galaxy population. In particular, approximately50 per cent of E+A objects are classified as isolated galax-ies. The distribution of groups containing E+A systems isdissimilar to those hosting elliptical galaxies.
• Nearest-neighbour and correlation-function analysesconfirmed the conclusion that the local environments of E+Agalaxies are consistent with those of the ensemble of 2dFGRSgalaxies.
• These conclusions hold true for both E+A galaxy cat-alogues.
Concerning the luminosity function of E+A galaxies:
• Average-Balmer E+A galaxies possess a luminosity dis-tribution matching that of elliptical galaxies, and disagree-ing with the overall 2dFGRS luminosity function (althoughthis result only became statistically significant when theequivalent width selection threshold was reduced from 5.5 Ato 4.5 A).
• The luminosity distribution of Hδ E+A galaxiesmatches that of the full 2dFGRS population.
What can we conclude from these results? Consider-ing first the average-Balmer E+A catalogue: the preferencefor spheroidal morphologies, the incidence of identifiablemerger remnants, and the match of the luminosity distri-bution to that of elliptical galaxies is all consistent withmajor galaxy mergers being an important formation processfor these galaxies. Indeed, this model has proven success-ful in theoretical simulations (Bekki et al. 2001). Thus itis interesting that the distribution of local environments ofthese E+A systems matches that of the ensemble of galax-ies; for example, there is no correlation with the propertiesof galaxy groups. This in part reflects the fact that at lowredshift the merger probability is enhanced in the field withrespect to clusters. Elliptical galaxies forming today do notfollow the classic morphology-density relation, because therelative velocities of galaxies in denser environments is toohigh to permit mergers: cluster sub-structure has becomedynamically relaxed.
The impressive manner in which the distribution of localenvironments of E+A systems traces that of the ensembleof 2dFGRS galaxies implies that the E+A galaxy forma-tion mechanism is driven by very local encounters, withoutreference to the wider group environment. Theoretical sim-ulations indicate that an E+A spectrum marks a late stageof a merger, when the cores of the merging systems havecoalesced and the merging companion is no longer identifi-able (Bekki et al. 2001): we would not expect a surplus ofclose companions. Furthermore, we note a consistency of ourfindings with the dependence of star formation upon envi-ronment (e.g. Balogh et al. 2004). In such studies, the onlyenvironmentally-selected population at low redshift to show
enhancements of star formation are close galaxy pairs, whichare no longer distinguishable at the onset of the E+A phase.
Turning now to galaxies selected by Hδ absorptionalone: the greater incidence of disk-like morphologies anddetectable Hα emission demonstrates that star formation isstill ongoing in many of these objects, albeit at a relativelylow level (< 1 M⊙ yr−1). Such systems therefore cannot beconsidered ‘true E+A galaxies’. In these cases, [OII] emis-sion may either be suppressed by dust obscuration or presentwith a low signal-to-noise ratio, and the Hγ and Hβ absorp-tion features are presumably subject to emission-filling.
Our E+A galaxy catalogues represent a useful databasefor follow-up studies. In particular, spatially-resolved spec-troscopy is a critical probe of the formation mechanism (e.g.Norton et al. 2001), mapping the kinematics of the stellarpopulations and the star-formation history of the galaxiesas a function of position. In addition, high-resolution opti-cal imaging can define the morphologies with greater fidelity,and imaging in 21 cm neutral hydrogen emission yields thelarge-scale distribution and kinematics of remaining gas, en-coding information about any merger event.
ACKNOWLEDGMENTS
We thank Elaine Sadler for useful conversations about thiswork. CB, WJC and KB acknowledge the financial supportof the Australian Research Council throughout the course ofthis work. MBP was supported by an Australian Postgrad-uate Award.
REFERENCES
Balogh M. et al. 2004, MNRAS, 348, 1355Barger A.J., Aragon-Salamanca A., Ellis R.S., Couch W.J., Smail
I., Sharples R.M., 1996, MNRAS, 279, 1Bekki K., Shioya Y., Couch W.J., 2001, ApJL, 547, 17
Blanton M.R. et al., 2003, ApJ, 592, 819Bruzual G., Charlot S., 2003, MNRAS, 344, 1000Chang T.-C., van Gorkom J.H., Zabludoff A.I., Zaritsky D., Mi-
hos J.C., 2001, ApJ, 121, 1965Charlot S., Fall M.S., 2000, ApJ, 539, 718Colless M. et al., 2001, MNRAS, 328, 1039
Colless M. et al., 2003, astro-ph/0306581Couch W.J., 1981, PhD thesis, Australian National UniversityCouch W.J., Sharples R.M., 1987, MNRAS, 229, 423Couch W.J., Barger A.J., Smail I., Ellis R.S., Sharples R.M., 1998,
ApJ, 497, 188Cross N.J.G., Driver S.P., Liske J., Lemon D.J., Peacock J.A.,
Cole S., Norberg P., Sutherland W.J., 2004, MNRAS, 349,576
De Propris R. et al., 2002, MNRAS, 2002, 329, 87Dressler A., Gunn J.E., 1983, ApJ, 270, 7Dressler A., Smail I., Poggianti B.M., Butcher H., Couch W.J.,
Ellis R.S., Oemler A. Jr., 1999, ApJS, 122, 51Eke V.R. et al., 2004a, MNRAS, 348, 866
Eke V.R. et al., 2004b, MNRAS submitted (astro-ph/0402566)Efstathiou G., Ellis R.S., Peterson B.A., 1988, MNRAS, 232, 431Fabricant D.G., McClintock J.E., Bautz M.W., 1991, ApJ, 381,
33Goto T. et al., 2003, PASJ, 55, 771Hambly N.C. et al., 2001, MNRAS, 326, 1279
Kauffmann G. et al., 2003, MNRAS, 346, 1055Kennicutt R.C., 1998, ARA&A, 36, 189

E+A galaxies in the 2dFGRS 15
Landy S.D., Szalay A.S., 1993, ApJ, 412, 64
Lewis I. et al., 2002, MNRAS, 334, 673
Madgwick D.S., 2003, MNRAS, 338, 197
Madgwick D.S. et al., 2002, MNRAS, 333, 133
Miller N.A., Owen F.N., 2001, ApJL, 554, 25
Norberg P. et al., 2002, MNRAS, 336, 907
Norton S.A., Gebhardt K., Zabludoff A.I., Zaritsky D., 2001, ApJ,557, 150
Poggianti B.M., Smail I., Dressler A., Couch W.J., Barger A.J.,Butcher H., Ellis R.S., Oemler A., 1999, ApJ, 518, 576
Quintero A.D. et al., 2004, ApJ, 602, 190
Sadler E.M. et al., 2002, MNRAS, 329, 227
Shioya Y., Bekki K., Couch W.J., 2004, ApJ, 601, 805
Smail I., Morrison G., Gray M.E., Owen F.N., Ivison R.J., KneibJ.-P7, Ellis R.S., 1999, ApJ, 525, 609
Sullivan M., Mobasher B., Chan B., Cram L., Ellis R., Treyer M.,Hopkins A., 2001, ApJ, 558, 7
Tran K.H., Franx M., Illingworth G., Kelson D.D., van DokkumP., 2003, ApJ, 599, 865
Wild V. et al., 2004, MNRAS submitted (astro-ph/0404275)
Worthey G., Ottaviani D.L., 1997, ApJS, 111, 377
Yang Y., Zabludoff A.I., Zaritsky D., Lauer T.R., Mihos J.C.,2004, ApJ, 607, 258
Zabludoff A.I., Zaritsky D., Lin H., Tucker D., Hashimoto Y.,Shectman S.A., Oemler A., Kirshner R.P., 1996, ApJ, 466,104
16 Chris Blake et al.
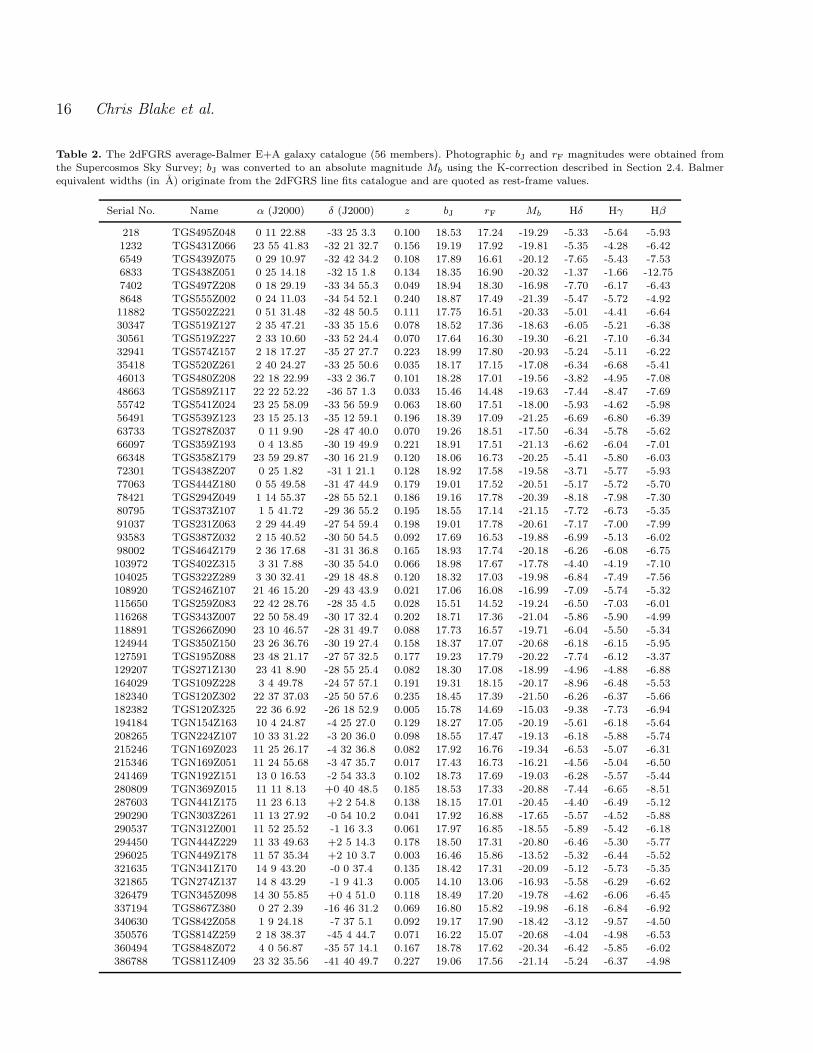
Table 2. The 2dFGRS average-Balmer E+A galaxy catalogue (56 members). Photographic bJ and rF magnitudes were obtained fromthe Supercosmos Sky Survey; bJ was converted to an absolute magnitude Mb using the K-correction described in Section 2.4. Balmerequivalent widths (in A) originate from the 2dFGRS line fits catalogue and are quoted as rest-frame values.
Serial No. Name α (J2000) δ (J2000) z bJ rF Mb Hδ Hγ Hβ
218 TGS495Z048 0 11 22.88 -33 25 3.3 0.100 18.53 17.24 -19.29 -5.33 -5.64 -5.931232 TGS431Z066 23 55 41.83 -32 21 32.7 0.156 19.19 17.92 -19.81 -5.35 -4.28 -6.426549 TGS439Z075 0 29 10.97 -32 42 34.2 0.108 17.89 16.61 -20.12 -7.65 -5.43 -7.536833 TGS438Z051 0 25 14.18 -32 15 1.8 0.134 18.35 16.90 -20.32 -1.37 -1.66 -12.757402 TGS497Z208 0 18 29.19 -33 34 55.3 0.049 18.94 18.30 -16.98 -7.70 -6.17 -6.438648 TGS555Z002 0 24 11.03 -34 54 52.1 0.240 18.87 17.49 -21.39 -5.47 -5.72 -4.9211882 TGS502Z221 0 51 31.48 -32 48 50.5 0.111 17.75 16.51 -20.33 -5.01 -4.41 -6.6430347 TGS519Z127 2 35 47.21 -33 35 15.6 0.078 18.52 17.36 -18.63 -6.05 -5.21 -6.3830561 TGS519Z227 2 33 10.60 -33 52 24.4 0.070 17.64 16.30 -19.30 -6.21 -7.10 -6.3432941 TGS574Z157 2 18 17.27 -35 27 27.7 0.223 18.99 17.80 -20.93 -5.24 -5.11 -6.2235418 TGS520Z261 2 40 24.27 -33 25 50.6 0.035 18.17 17.15 -17.08 -6.34 -6.68 -5.4146013 TGS480Z208 22 18 22.99 -33 2 36.7 0.101 18.28 17.01 -19.56 -3.82 -4.95 -7.0848663 TGS589Z117 22 22 52.22 -36 57 1.3 0.033 15.46 14.48 -19.63 -7.44 -8.47 -7.6955742 TGS541Z024 23 25 58.09 -33 56 59.9 0.063 18.60 17.51 -18.00 -5.93 -4.62 -5.9856491 TGS539Z123 23 15 25.13 -35 12 59.1 0.196 18.39 17.09 -21.25 -6.69 -6.80 -6.3963733 TGS278Z037 0 11 9.90 -28 47 40.0 0.070 19.26 18.51 -17.50 -6.34 -5.78 -5.6266097 TGS359Z193 0 4 13.85 -30 19 49.9 0.221 18.91 17.51 -21.13 -6.62 -6.04 -7.0166348 TGS358Z179 23 59 29.87 -30 16 21.9 0.120 18.06 16.73 -20.25 -5.41 -5.80 -6.0372301 TGS438Z207 0 25 1.82 -31 1 21.1 0.128 18.92 17.58 -19.58 -3.71 -5.77 -5.9377063 TGS444Z180 0 55 49.58 -31 47 44.9 0.179 19.01 17.52 -20.51 -5.17 -5.72 -5.7078421 TGS294Z049 1 14 55.37 -28 55 52.1 0.186 19.16 17.78 -20.39 -8.18 -7.98 -7.3080795 TGS373Z107 1 5 41.72 -29 36 55.2 0.195 18.55 17.14 -21.15 -7.72 -6.73 -5.35
91037 TGS231Z063 2 29 44.49 -27 54 59.4 0.198 19.01 17.78 -20.61 -7.17 -7.00 -7.9993583 TGS387Z032 2 15 40.52 -30 50 54.5 0.092 17.69 16.53 -19.88 -6.99 -5.13 -6.0298002 TGS464Z179 2 36 17.68 -31 31 36.8 0.165 18.93 17.74 -20.18 -6.26 -6.08 -6.75103972 TGS402Z315 3 31 7.88 -30 35 54.0 0.066 18.98 17.67 -17.78 -4.40 -4.19 -7.10104025 TGS322Z289 3 30 32.41 -29 18 48.8 0.120 18.32 17.03 -19.98 -6.84 -7.49 -7.56108920 TGS246Z107 21 46 15.20 -29 43 43.9 0.021 17.06 16.08 -16.99 -7.09 -5.74 -5.32115650 TGS259Z083 22 42 28.76 -28 35 4.5 0.028 15.51 14.52 -19.24 -6.50 -7.03 -6.01116268 TGS343Z007 22 50 58.49 -30 17 32.4 0.202 18.71 17.36 -21.04 -5.86 -5.90 -4.99118891 TGS266Z090 23 10 46.57 -28 31 49.7 0.088 17.73 16.57 -19.71 -6.04 -5.50 -5.34124944 TGS350Z150 23 26 36.76 -30 19 27.4 0.158 18.37 17.07 -20.68 -6.18 -6.15 -5.95127591 TGS195Z088 23 48 21.17 -27 57 32.5 0.177 19.23 17.79 -20.22 -7.74 -6.12 -3.37129207 TGS271Z130 23 41 8.90 -28 55 25.4 0.082 18.30 17.08 -18.99 -4.96 -4.88 -6.88164029 TGS109Z228 3 4 49.78 -24 57 57.1 0.191 19.31 18.15 -20.17 -8.96 -6.48 -5.53182340 TGS120Z302 22 37 37.03 -25 50 57.6 0.235 18.45 17.39 -21.50 -6.26 -6.37 -5.66182382 TGS120Z325 22 36 6.92 -26 18 52.9 0.005 15.78 14.69 -15.03 -9.38 -7.73 -6.94194184 TGN154Z163 10 4 24.87 -4 25 27.0 0.129 18.27 17.05 -20.19 -5.61 -6.18 -5.64208265 TGN224Z107 10 33 31.22 -3 20 36.0 0.098 18.55 17.47 -19.13 -6.18 -5.88 -5.74215246 TGN169Z023 11 25 26.17 -4 32 36.8 0.082 17.92 16.76 -19.34 -6.53 -5.07 -6.31215346 TGN169Z051 11 24 55.68 -3 47 35.7 0.017 17.43 16.73 -16.21 -4.56 -5.04 -6.50241469 TGN192Z151 13 0 16.53 -2 54 33.3 0.102 18.73 17.69 -19.03 -6.28 -5.57 -5.44280809 TGN369Z015 11 11 8.13 +0 40 48.5 0.185 18.53 17.33 -20.88 -7.44 -6.65 -8.51287603 TGN441Z175 11 23 6.13 +2 2 54.8 0.138 18.15 17.01 -20.45 -4.40 -6.49 -5.12290290 TGN303Z261 11 13 27.92 -0 54 10.2 0.041 17.92 16.88 -17.65 -5.57 -4.52 -5.88290537 TGN312Z001 11 52 25.52 -1 16 3.3 0.061 17.97 16.85 -18.55 -5.89 -5.42 -6.18294450 TGN444Z229 11 33 49.63 +2 5 14.3 0.178 18.50 17.31 -20.80 -6.46 -5.30 -5.77296025 TGN449Z178 11 57 35.34 +2 10 3.7 0.003 16.46 15.86 -13.52 -5.32 -6.44 -5.52321635 TGN341Z170 14 9 43.20 -0 0 37.4 0.135 18.42 17.31 -20.09 -5.12 -5.73 -5.35321865 TGN274Z137 14 8 43.29 -1 9 41.3 0.005 14.10 13.06 -16.93 -5.58 -6.29 -6.62326479 TGN345Z098 14 30 55.85 +0 4 51.0 0.118 18.49 17.20 -19.78 -4.62 -6.06 -6.45337194 TGS867Z380 0 27 2.39 -16 46 31.2 0.069 16.80 15.82 -19.98 -6.18 -6.84 -6.92340630 TGS842Z058 1 9 24.18 -7 37 5.1 0.092 19.17 17.90 -18.42 -3.12 -9.57 -4.50350576 TGS814Z259 2 18 38.37 -45 4 44.7 0.071 16.22 15.07 -20.68 -4.04 -4.98 -6.53360494 TGS848Z072 4 0 56.87 -35 57 14.1 0.167 18.78 17.62 -20.34 -6.42 -5.85 -6.02386788 TGS811Z409 23 32 35.56 -41 40 49.7 0.227 19.06 17.56 -21.14 -5.24 -6.37 -4.98
Copyright © 2022 FDOKUMEN