
The Anglo-Australian Observatory's 2dF Facility
21
arXiv:astro-ph/0202175v1 8 Feb 2002 Mon. Not. R. Astron. Soc. 000, 1–21 (2001) Printed 1 February 2008 (MN L A T E X style file v1.4) The Anglo-Australian Observatory’s 2dF Facility I. J. Lewis, 1⋆ R. D. Cannon, 1 K. Taylor, 1,2 K. Glazebrook, 1,3 J. A. Bailey, 1 I. K. Baldry, 1,3 J. R. Barton, 1 T. J. Bridges, 1 G. B. Dalton, 4 T. J. Farrell, 1 P. M. Gray, 1,5 A. Lankshear, 1 C. McCowage, 1 I. R. Parry, 1,6 R. M. Sharples, 7 K. Shortridge, 1 G. A. Smith, 1 J. Stevenson, 1 J. O. Straede, 1 L. G. Waller, 1 J. D. Whittard, 1 J. K. Wilcox 1 and K. C. Willis 1,8 1 Anglo-Australian Observatory, PO Box 296, Epping, NSW 1710, Australia 2 Department of Astronomy, California Institute of Technology, Pasadena California 91125-2400, USA 3 Department of Physics and Astronomy, Johns Hopkins University, 3400 North Charles Street Baltimore, MD 21218-2686, USA 4 Department of Physics, Keble Road, Oxford OX1 3RH, UK 5 ESO Paranal Observatory, PO Box 540, Antofagasta, Chile 6 Institute of Astronomy, Madingley Road, Cambridge CB3 0HA, UK 7 Department of Physics, University of Durham, South Road, Durham DH1 3LE, UK 8 Australian Centre for Field Robotics, Rose Street, Building J04, University of Sydney, NSW 2006, Australia 1 February 2008 ABSTRACT The 2dF (Two-degree Field) facility at the prime focus of the Anglo-Australian Telescope provides multiple object spectroscopy over a 2 ◦ field of view. Up to 400 target fibres can be independently positioned by a complex robot. Two spectrographs provide spectra with resolutions of between 500 and 2000, over wavelength ranges of 440nm and 110nm respectively. The 2dF facility began routine observations in 1997. 2dF was designed primarily for galaxy redshift surveys and has a number of in- novative features. The large corrector lens incorporates an atmospheric dispersion compensator, essential for wide wavelength coverage with small diameter fibres. The instrument has two full sets of fibres on separate field plates, so that re-configuring can be done in parallel with observing. The robot positioner places one fibre every 6 seconds, to a precision of 0.3 arcsec (20 μm) over the full field. All components of 2dF, including the spectrographs, are mounted on a 5-m diameter telescope top-end ring for ease of handling and to keep the optical fibres short in order to maximise UV throughput. There is a pipeline data reduction system which allows each data set to be fully analysed while the next field is being observed. 2dF has achieved its initial astronomical goals. The redshift surveys obtain spectra at the rate of 2500 galaxies per night, yielding a total of about 200,000 objects in the first four years. Typically a B= 19 galaxy gives a spectrum with signal to noise ratio of better than 10 per pixel in less than an hour; redshifts are derived for about 95 per cent of all galaxies, with 99 per cent reliability or better. Total system throughput is about 5 per cent. The failure rate of the positioner and fibre system is about 1:10,000 moves or once every few nights and recovery time is usually short. In this paper we provide the historical background to the 2dF facility, the de- sign philosophy, a full technical description and a summary of the performance of the instrument. We also briefly review its scientific applications and possible future developments. Key words: instrumentation: spectrographs – techniques: spectroscopic – surveys – galaxies: distances and redshifts – large-scale structure of Universe ⋆ Correspondence address: Department of Physics, Keble Road, Oxford OX1 3RH, UK. E-mail: [email protected] c 2001 RAS
-
Upload
independent -
Category
Documents
-
view
2 -
download
0
Transcript of The Anglo-Australian Observatory's 2dF Facility

arX
iv:a
stro
-ph/
0202
175v
1 8
Feb
200
2Mon. Not. R. Astron. Soc. 000, 1–21 (2001) Printed 1 February 2008 (MN LATEX style file v1.4)
The Anglo-Australian Observatory’s 2dF Facility
I. J. Lewis,1⋆ R. D. Cannon,1 K. Taylor,1,2 K. Glazebrook,1,3 J. A. Bailey,1
I. K. Baldry,1,3 J. R. Barton,1 T. J. Bridges,1 G. B. Dalton,4 T. J. Farrell,1
P. M. Gray,1,5 A. Lankshear,1 C. McCowage,1 I. R. Parry,1,6 R. M. Sharples,7
K. Shortridge,1 G. A. Smith,1 J. Stevenson,1 J. O. Straede,1 L. G. Waller,1
J. D. Whittard,1 J. K. Wilcox1 and K. C. Willis1,8
1Anglo-Australian Observatory, PO Box 296, Epping, NSW 1710, Australia2Department of Astronomy, California Institute of Technology, Pasadena California 91125-2400, USA3Department of Physics and Astronomy, Johns Hopkins University, 3400 North Charles Street Baltimore, MD 21218-2686, USA4Department of Physics, Keble Road, Oxford OX1 3RH, UK5ESO Paranal Observatory, PO Box 540, Antofagasta, Chile6Institute of Astronomy, Madingley Road, Cambridge CB3 0HA, UK7Department of Physics, University of Durham, South Road, Durham DH1 3LE, UK8Australian Centre for Field Robotics, Rose Street, Building J04, University of Sydney, NSW 2006, Australia
1 February 2008
ABSTRACT
The 2dF (Two-degree Field) facility at the prime focus of the Anglo-AustralianTelescope provides multiple object spectroscopy over a 2◦ field of view. Up to 400target fibres can be independently positioned by a complex robot. Two spectrographsprovide spectra with resolutions of between 500 and 2000, over wavelength ranges of440nm and 110nm respectively. The 2dF facility began routine observations in 1997.
2dF was designed primarily for galaxy redshift surveys and has a number of in-novative features. The large corrector lens incorporates an atmospheric dispersioncompensator, essential for wide wavelength coverage with small diameter fibres. Theinstrument has two full sets of fibres on separate field plates, so that re-configuringcan be done in parallel with observing. The robot positioner places one fibre every6 seconds, to a precision of 0.3 arcsec (20 µm) over the full field. All components of2dF, including the spectrographs, are mounted on a 5-m diameter telescope top-endring for ease of handling and to keep the optical fibres short in order to maximise UVthroughput.
There is a pipeline data reduction system which allows each data set to be fullyanalysed while the next field is being observed.
2dF has achieved its initial astronomical goals. The redshift surveys obtain spectraat the rate of 2500 galaxies per night, yielding a total of about 200,000 objects in thefirst four years. Typically a B= 19 galaxy gives a spectrum with signal to noise ratioof better than 10 per pixel in less than an hour; redshifts are derived for about 95 percent of all galaxies, with 99 per cent reliability or better. Total system throughput isabout 5 per cent. The failure rate of the positioner and fibre system is about 1:10,000moves or once every few nights and recovery time is usually short.
In this paper we provide the historical background to the 2dF facility, the de-sign philosophy, a full technical description and a summary of the performance ofthe instrument. We also briefly review its scientific applications and possible futuredevelopments.
Key words: instrumentation: spectrographs – techniques: spectroscopic – surveys –galaxies: distances and redshifts – large-scale structure of Universe
⋆ Correspondence address: Department of Physics, Keble Road,Oxford OX1 3RH, UK. E-mail: [email protected]© 2001 RAS
2 Lewis et al.
1 INTRODUCTION
The value of equipping telescopes with a large field of viewhas been recognised for some time. In 1986 the Royal As-tronomical Society report “Review of Scientific Priorities forUK Astronomical Research 1990–2000” (RAS Report 1986)put a wide-field multi-object spectroscopic facility at the topof its priority list for new projects. Subsequently the UKLarge Telescope Panel recommended that a wide-field sur-vey facility be pursued in tandem with an 8 metre telescopeproject.
The general scientific case for a wide-field spectroscopicfacility on a 4m telescope was two-fold: to provide spectra forlarge samples of objects found in the multi-colour imagingsurveys from the UK, ESO and Oschin (Palomar) Schmidttelescopes; and to generate targets for the coming genera-tion of 8-10m optical telescopes. The biggest specific sciencedriver was to obtain redshifts of tens or even hundreds ofthousands of galaxies and quasars, to elucidate the three-dimensional structure and evolution of the universe. Othermajor projects required spectra for large samples of stars, todetermine their kinematics and composition and hence thedynamical and chemical history of our Galaxy; for similarstudies of the Magellanic Clouds; and for detailed studies ofstar clusters and clusters of galaxies.
One possibility was to provide a multi-fibre upgrade tothe 3.9 metre Anglo-Australian Telescope (AAT). This wasparticularly advantageous for two reasons. Firstly, the opti-cal design of the telescope (a hyperboloidal primary mirrorand relatively slow f-ratio of f/3.3 at prime focus) enabled awide field of 2◦ to be achieved using a large but straight-forward optical corrector. Secondly, the Anglo-AustralianObservatory (AAO) already had extensive experience withmulti-object fibre spectroscopy. This dates from the pioneer-ing days of optical fibres and its brass plug-plate systemFOCAP (Gray 1983) and more recently the fully automatedAUTOFIB fibre positioner system (Parry & Gray 1986).
At the end of 1988 the AAT Board (AATB) commis-sioned a full design study of a wide-field fibre-optic spectro-scopic facility for the AAT (Taylor & Gray 1990). Followingfurther detailed investigations into cost and budgets, andin the expectation of some additional funding from boththe Australian and UK Governments, the AATB gave itsapproval to begin the Two-degree Field (or 2dF) projectin March 1990. Initially the direct budget allocated wasA$2.25M (for components and certain specific tasks whichcould not be done in-house) and it was expected to take4-5 years to complete. Since the project would dominatethe AAO’s activities for several years, a Project Manage-ment Committee was established with several external ex-pert members.
In developing the 2dF facility the AAO wished to buildon the techniques already used for the fully automated AUT-OFIB instrument in use at the Cassegrain focus of the AAT.Since 2dF would offer almost an order of magnitude increasein multiplex advantage over AUTOFIB and would be lo-cated at the more challenging prime focus, several technicalproblems had to be solved before final approval was givenfor commencement of the project.
The technical problems were addressed in the initial de-sign study reports and covered areas such as the accuracyrequired of the robotic positioner, the design of the fibre
retraction systems, location and design of the fibre spectro-graphs and the requirement for a double fieldplate systemto maximise observing time.
The mechanical constraints were eased by the strengthand rigidity of the telescope tube structure and the size ofthe dome, which meant that a large instrument could behoused at prime focus without clearance and flexure prob-lems.
Commissioning of the 2dF facility began with the newprime focus corrector in the latter part of 1993. The in-strument was officially declared open at a ceremony on 1995November 20, and the first spectroscopic data were obtainedin mid-1996. The facility began to provide scheduled scien-tific observations in September 1997 with almost full func-tionality. The project ran about 40 per cent over the orig-inal time estimate and 20 per cent over budget (these twoare linked, in that 2dF could have been completed soonerhad more funds been available). The effective total cost wassubsequently estimated to have been about A$8M, includ-ing all staff costs and overheads. The bulk of the designand construction work was eventually done in-house usingthe AAO’s facilities in Sydney and Coonabarabran, partlybecause many aspects involved innovative design featureswhich could not be easily specified or contracted out, andpartly to contain costs.
Progress reports describing the evolution of the designof 2dF have been published (Gray & Taylor 1990; Gray et al.1993; Taylor, Cannon & Watson 1996; Cannon 1997; Lewis,Glazebrook & Taylor 1998a; Lewis, Glazebrook & Taylor1998b) and project updates have featured regularly in thequarterly AAO Newsletter.
In this paper we provide a full technical descriptionof the 2dF facility and its performance. Section 2 givesan overview of the instrumentation and its relationship toother multiple object fibre spectroscopy systems. In section3, a detailed description of the individual components ofthe 2dF facility is given. Operation of the 2dF facility iscovered in section 4 and actual performance is detailed insection 5. Sections 6 and 7 describe the range of projectsbeing done with 2dF and some scientific possibilities forthe future. Up to date technical information and signal tonoise calculators are available on the 2dF WWW pages(http://www.aao.gov.au/2df/).
2 OVERVIEW OF INSTRUMENT
2.1 Objectives and design philosophy
The 2dF facility was developed with the aim of providingthe AAT with a dedicated prime focus spectroscopy facility,with order of magnitude improvements over existing sys-tems in terms of the field area and number of objects thatit is possible to observe simultaneously (the multiplex ad-vantage). While 2dF was designed from the outset to be aversatile common-user instrument, suitable for a wide rangeof astronomical projects on an international research facil-ity, it was always clear that the dominant project would beto obtain redshifts and hence distances for a very large sam-ple of galaxies (a few times 105 objects), to map out thethree-dimensional structure of the relatively local universe.
Two separate but linked large redshift surveys where
c© 2001 RAS, MNRAS 000, 1–21

The AAO’s 2dF Facility 3
the initial main projects with 2dF: one for 250,000 galaxiesbrighter than bJ=19.45 with a median redshift of 0.1 (Col-less et al. 2001) and one for 30,000 colour-selected quasarscovering redshifts up to 4 (Croom et al. 2001). This meantthat 2dF had to be optimised to obtain low dispersion spec-tra of a few thousand targets per night, over a wide wave-length range, for mainly non-stellar objects which were inthe magnitude range 15 < B < 20 and spread across morethan 1000 square degrees of sky. These requirements are verywell met by a system providing two sets of 400 fibres cover-ing 3 square degrees of sky, and capable of reconfiguring oneset of fibres in about an hour, which happens to be equalto the time needed to take adequate signal-to-noise ratiospectra of 19-20 magnitude galaxies.
Whenever choices had to be made on design features,instrument parameters or priorities, the driver was to max-imise 2dF’s efficiency as a redshift engine. The requirementsof other projects, such as taking higher resolution spectra ofstars, doing longer integrations on fainter galaxies, or work-ing on densely clustered targets, were incorporated wherepossible, but not if they involved any compromise of perfor-mance for the redshift surveys.
2.2 Other multi-fibre systems
Previous multi-object fibre spectroscopy systems on 4 me-tre class telescopes have used smaller fields of view andsignificantly smaller multiplex advantage. For example theWilliam Herschel Telescope’s AUTOFIB-2 (Parry et al.1994) and WYFFOS (Jenkins et al. 1993) instruments pro-vide fibre spectroscopy of up to 150 objects over a 1◦ field (40arcminutes unvignetted). The HYDRA instrument (Bardenet al. 1994) on the 3.5m WIYN telescope uses approximately100 optical fibres to cover an unvignetted field of 1◦. Earlierfibre instruments on the AAT were FOCAP with 50 fibres(Gray 1983) and AUTOFIB with 64 fibres (Parry & Gray1986), both covering a 40 arcminute field at the Cassegrainfocus.
Some smaller telescopes offer a larger field of view orlarger multiplex advantage. For example, the 2.5m DuPonttelescope at Las Campanas with a 2.1◦ field and up to 200optical fibres (Shectman 1993) has been used for the largestprevious galaxy redshift survey. At the 1.2-m UK SchmidtTelescope the FLAIR fibre system with 92 fibres covereda 6◦ field (Watson et al. 1993). FLAIR has now been re-placed by a semi-automatic successor: 6dF (Parker, Watson& Miziarski 1998) with 150 fibres. The 2.5m Sloan DigitalSky Survey (SDSS) telescope has a 3◦ field of view and 640optical fibres; this is a dedicated telescope carrying out bothmulti-colour imaging and a spectrosopic survey of a milliongalaxies (York et al. 1998). Multi-object systems are alsobeing built for several of the new 8-10m class telescopes;these will be able to observe fainter objects but cover muchsmaller fields of view.
2.3 Key features of 2dF
Multi-object fibre systems come in three varieties: plugplates or other off-line field preparation, for example theSDSS fibre system; ‘fishermen around the pond’ type in-struments with separate remotely controlled mechanisms
Figure 1. The effect of differential atmospheric refraction atthe latitude of the AAT (-31◦ ). The contours show the maximumpossible observation times for 2dF fields centred at different HourAngles and declinations, if all targets are to remain within onethird of a diameter of the centre of their fibres.
to simultaneously place each fibre at a target position, forexample MX (Hill & Lesser 1986) and MEFOS (Guerinet al. 1993); and ‘pick and place’ systems involving consec-utive placement of fibres with a single complex robot. Themost versatile are the single robot systems, but they havethe drawback that placing the fibres consumes a significantamount of observing time. 2dF gets around this drawbackby having two independent sets of 400 fibres and two fieldplates, mounted back-to-back on a tumbler assembly withinthe instrument. While one set of fibres is being used for ob-servations, the second set is being reconfigured for the nexttarget field.
In order to give an unvignetted field of over 2◦ with aflat focal plane, a special corrector lens system had to bedesigned and manufactured (Taylor & Gray 1994).
Any wide field multi-fibre system must be able to copewith two separate atmospheric refraction effects, the vari-able distortion of the field as the telescope tracks acrossthe sky, and variation of distortion with wavelength, whichturns point images into very low dispersion spectra as zenithdistance increases.
The first effect means that for any one target field con-figuration, there is a maximum exposure time after whichsome of the target objects move out of the fixed fibre aper-tures. If we specify that a target field must be reconfiguredonce the target objects have moved more than a third ofthe fibre diameter (0.7 arcsec in the case of 2dF), this de-fines the maximum time available for the robotic positionerto reconfigure the next set of fibres. The effect of differen-tial refraction is dependent on hour angle and declination asshown in Fig. 1. Evidently a reconfiguration time of at mostan hour is required for an efficient system which can accessmost of the sky with minimal loss of observing time.
The second effect arises because the atmosphere is arefracting medium whose refractive index depends on wave-length. For example, at a zenith distance of 60◦, the lightfrom a point source with wavelengths between 365–1100nmis spread out over 4.2 arcsec, which would make it impossi-ble to use 2 arcsec fibres for low dispersion spectroscopy over
c© 2001 RAS, MNRAS 000, 1–21
4 Lewis et al.
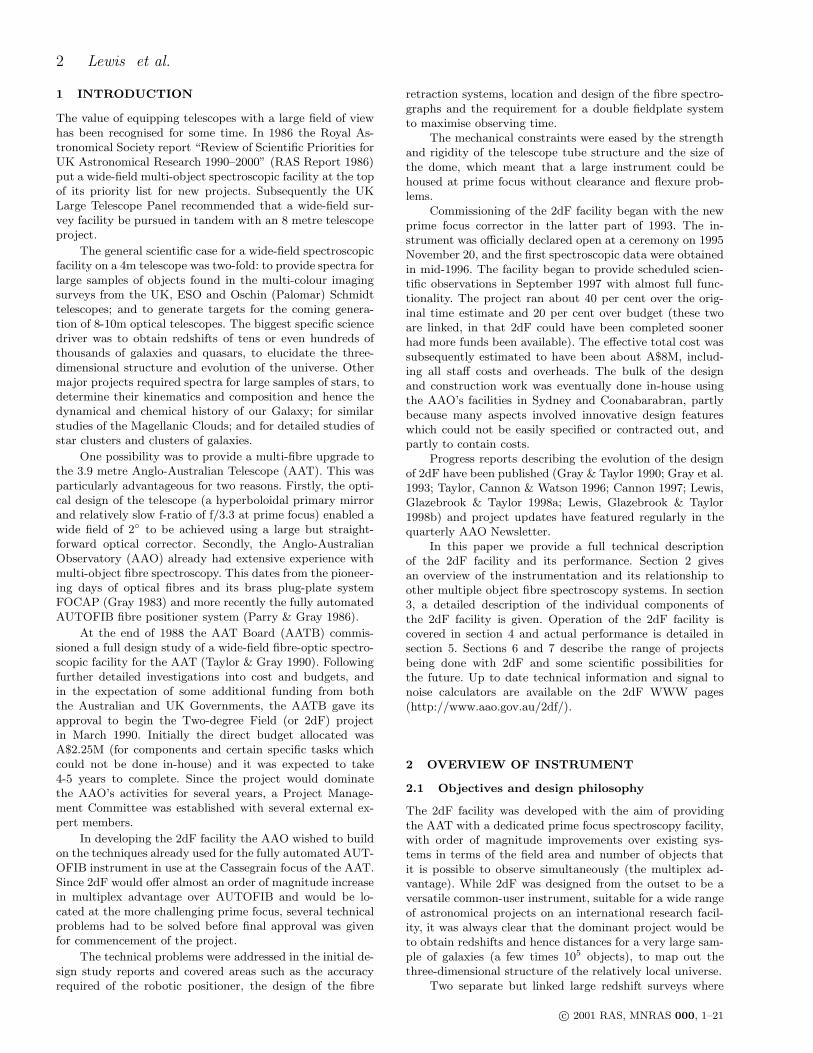
Figure 2. Schematic diagram of the 2dF top end showing themain components located on the mounting ring.
a wide wavelength range. 2dF has an atmospheric disper-sion compensator (ADC) built into the front two elementsof the corrector. These two elements are slightly prismaticand are automatically counter-rotated during observationsto provide an equal but opposite dispersion, to counteractthe atmosphere as the telescope tracks across the sky.
The fibres feed a pair of spectrographs which aremounted at the top of the AAT near the prime focus, tokeep the fibres short and maximise the UV throughput. Eachspectrograph takes 200 spectra simultaneously, with reso-lutions of between 500 and 2000, on Tektronix 1024 pixelsquare CCD detectors. Mechanisms inside the spectrographsswitch the fibre feeds in phase with the tumbling of the fieldplates.
All of the hardware making up the 2dF facility, includ-ing the spectrographs and electronics racks, is mounted ona purpose-built top end ring allowing straightforward inter-change with the other three original alternative top ends ofthe AAT. In particular, the entire fibre system can be leftassembled and available for maintenance when 2dF is notscheduled on the telescope.
3 MAIN COMPONENTS OF 2DF
This section contains technical descriptions of the main com-ponents of the 2dF facility. At the end of this section table1 summarises the main instrument properties.
3.1 Top End Ring
The new 2dF top end ring (Fig. 2) is a direct copy of thethree original AAT top end rings (f/8 and f/15 + f/35 secon-daries and f/3 prime focus) (AAO Observing Guide 1991).This allows a fast (<1 hour) interchange between top endsusing the semi-automated mechanisms built into the AATdome.
3.2 Design constraints on the prime focus
corrector
At the heart of the 2dF facility is the corrector lens systemwhich provides the 2.1◦ diameter field of view at the AATprime focus. The development of a corrector was initiatedwith a design by C.G. Wynne (Wynne 1989) offering a 2◦
field with 1.5 arcsec images using a 4-element corrector. Fur-ther work by D. Jones and R.G. Bingham emphasised theneed for an atmospheric dispersion compensator, the im-portance of chromatic variation in distortion (CVD) and ofthe telecentricity of the optical design. A relatively flat focalsurface was also a requirement.
The atmospheric dispersion of uncorrected images whensampled with a small fixed aperture size (an optical fibre)will reduce the throughput of the system significantly, by anamount which varies strongly with wavelength and zenithdistance. When combined with small positioning and astro-metric errors this will place severe limits on the ability toflux calibrate the resulting data. In order to minimise thiseffect an atmospheric dispersion compensator built into thecorrector optics must provide a variable amount of disper-sion in the opposite direction to the atmospheric dispersion,for as large as possible a range of zenith distances.
All of the initial designs (except for a significantly as-pheric design by Bingham) exhibited chromatic variationof distortion (CVD) to some extent. This effect causes off–axis, broadband images to be spread radially by up to about2 arcsec for the 350–1000 nm wavelength range, with maxi-mum effect at about 0.5◦ field radius. This is a smaller effectthan that of atmospheric dispersion and is independent ofzenith distance; it determines the ultimate limit to spectro-photometric accuracy with 2dF.
The telecentricity of an optical corrector design defineshow the principal ray of each cone of light reaches the focalplane of the telescope. For an ideal fibre system the principalray should be orthogonal to the focal surface. If the inputlight cone is not perpendicular to the focal surface then evenin the absence of fibre focal ratio degradation (FRD) the ef-fective focal ratio of the output beam is decreased. In initialdesigns the angle of the principal ray varied across the field(usually increasing towards the edge of the field) by as muchas 4◦ from the normal to the focal plane. This variation ininput angle is effectively the same as reducing the input fo-cal ratio of light to the fibre from f/3.5 to f/2.3. Note thatthis is a much more severe effect that that of FRD withinthe fibre itself, which is minimal when working at this inputfocal ratio.
If the spectrograph collimator is oversized to allow forthis decrease in focal ratio, then we will reduce the spectralresolution for a fixed spectrograph beam size and camerafocal ratio. Alternatively, if the collimator is sized correctlyfor the f/3.5 beam, fibres accepting light from near the edgeof the field (the worst affected) will be severely vignetted.Unfortunately, the non-telecentricity of the final optical de-sign means that the principal ray varies by up to 4◦ fromthe orthogonal case. This effect is partly compensated forin the design of the fibre probes (detailed in section 3.4). Aslight oversizing of the spectrograph collimator also reducesthe effect of the non-telecentricity and any fibre FRD.
The design of corrector finally selected (Jones 1994)contains counter-rotating prismatic doublets as the first two
c© 2001 RAS, MNRAS 000, 1–21

The AAO’s 2dF Facility 5
lens elements (see Fig. 3). These provide atmospheric dis-persion compensation for zenith distances of up to 67◦. Theprismatic lenses are designed to give zero deviation of theoptical path. CVD is maintained below 1.0 arcsec across thefield for the maximum bandbass used by the spectrographs.The CVD is zero at the centre and edges of the field andreaches its maximum value at 30 arcmin field radius.
The 2dF project is exceptional in that the scientific im-peratives drove the design towards a large field and highmultiplex advantage, while the fixed fibre size, realistic as-trometric errors and relatively poor average site seeing (me-dian value 1.5 arcsec) all reduce the importance of the abso-lute imaging performance of the corrector optics. In responseto these criteria and the three design issues raised above, ex-tensive system modelling was performed on the design (Tay-lor & Gray 1993). This allowed not only the quantitativeassessment of performance issues, but also the evaluation ofthe cost and risk implications of each potential design aswork proceeded.
3.3 Building the corrector lens
At 0.9 metre diameter, the corrector optics contain someof the largest refracting elements made for an astronomicaltelescope.
The glass blanks for the corrector were manufacturedby Ohara (Japan). Since some of the corrector lenses areof a deep meniscus shape, a technique known as slumpingwas used to avoid a large and expensive wastage of glassand prolonged grinding. Instead of cutting a lens from athick blank, a thinner glass blank was heated and allowedto soften and slump under gravity over a convex mould. Thistechnique does have the risk of increased internal stress andhence variable refractive index within the slumped blank.Tests before and after slumping showed that any variationsin refractive index were within specification.
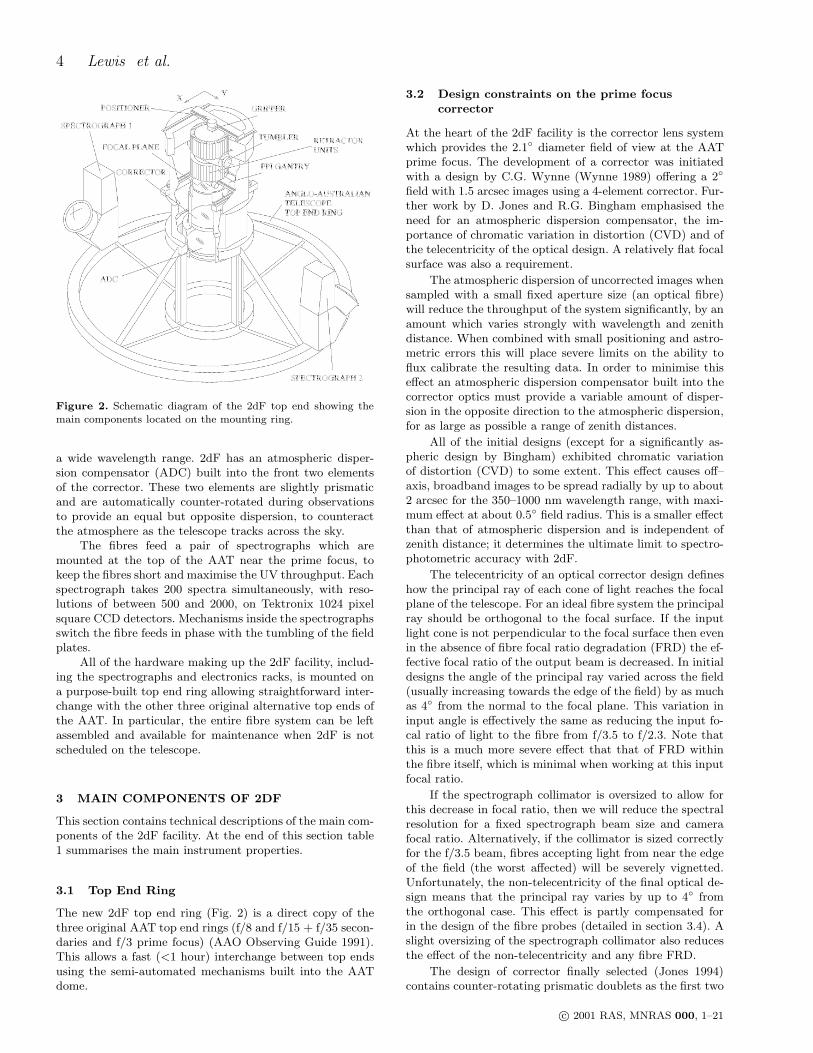
The internal transmittance, particularly in the UV andblue, was also an important consideration in selection ofthe glass. The catalogue specification of UV and blue trans-mittance of BK7 and F2 glass types is significantly worsethan that of UBK7 and LLF6 glass. However, discussionswith the glass manufacturers revealed that the actual meltvalues were likely to be substantially better than the cat-alogue specification. Fig. 4 shows the corrector throughputusing actual glass melt transmittance measurements, com-pared to the catalogue values for the glasses used in the 2dFcorrector.
The glass blanks were figured, coated with a MgF2 quar-ter wavelength anti-reflection coating (optimised for 500 nm)and mounted by Contraves (USA).
The two ADC elements are prismatic doublet lenseswith the BK7 and F2 elements in contact to reduce thenumber of air-glass surfaces. An optical coupling compoundis used between each of the lenses making up the doublets.
After optical alignment in the corrector cells using tem-porary adjustment screws, the glass elements were mountedusing flexible silicone rubber which allows for the differen-tial thermal expansion of the steel corrector housing and theglass.
The two lens elements that form the atmospheric dis-persion compensator are rotated using stepper motors.These automatically move the ADC elements to the required
Figure 3. Schematic diagram of the 2dF prime focus corrector incross-section. The lower two lens elements are the prismatic dou-blets making up the ADC, these are the first and second elementsof the corrector in the light path.
position whenever the telescope is slewed and then trackcontinuously during observations. A mechanical switch actsas an index mark for each ADC element. Step counting isused to measure the position angle of the dispersing element.Each long slew of the ADC elements takes up to 3 minutesand includes a pass through the index marks to ensure thatlost steps in the stepper motor do not accumulate and con-tribute to incorrect positioning of the lens elements.
The optical corrector was received from Contraves asa complete unit and commissioned on the AAT betweenJuly 1993 and October 1993, by taking direct night skyimages with photographic plates and both cooled and un-cooled CCD detectors (Taylor & Gray 1994). These tests in-cluded verification of the broad band imaging performanceand the operation of the atmospheric dispersion compen-sator, as well as the initial distortion mapping of the correc-tor and telescope optics.
c© 2001 RAS, MNRAS 000, 1–21
6 Lewis et al.
Figure 4. The wavelength dependence of the optical correctortransmission. This is based on measured and catalogue values ofthe bulk glass transmission and the predicted transmission of 8air–glass surfaces with quarter wavelength MgF2 anti–reflectioncoatings tuned for 500 nm. The actual transmission exceeds 80per cent for wavelengths between 385 and 700 nm, falls to 60 percent at 360 nm and is negligible below 340 nm.
3.4 Optical fibres and retractor units
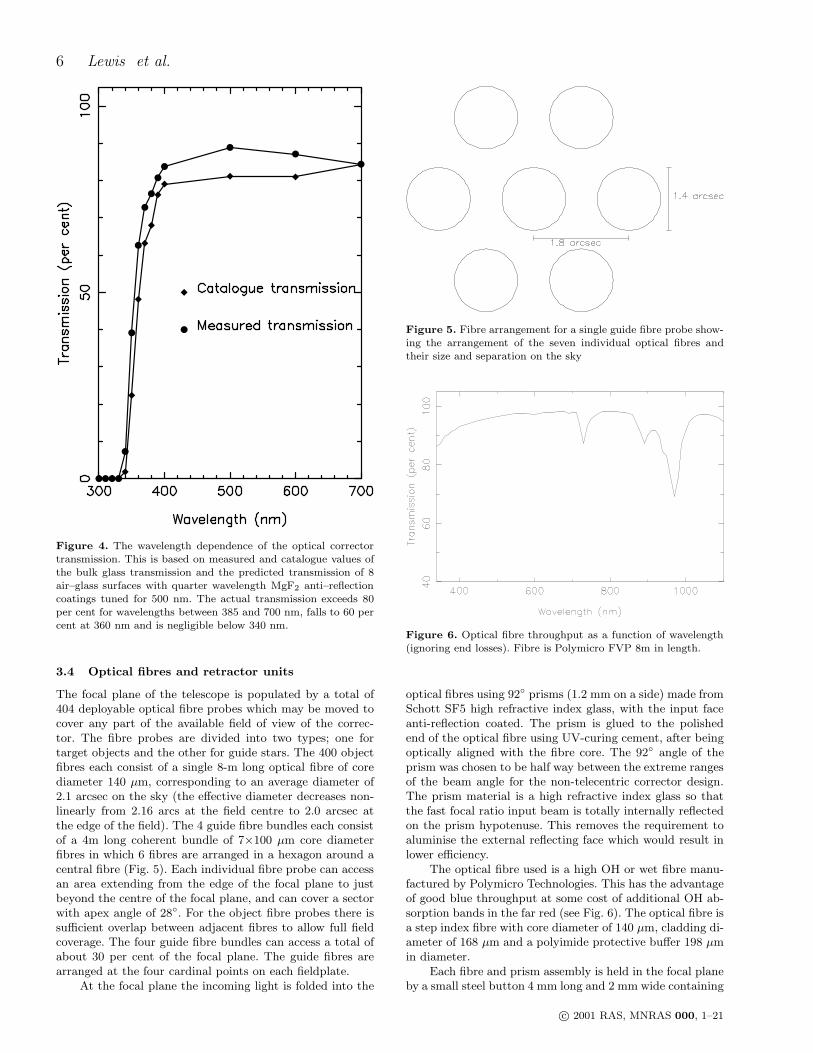
The focal plane of the telescope is populated by a total of404 deployable optical fibre probes which may be moved tocover any part of the available field of view of the correc-tor. The fibre probes are divided into two types; one fortarget objects and the other for guide stars. The 400 objectfibres each consist of a single 8-m long optical fibre of corediameter 140 µm, corresponding to an average diameter of2.1 arcsec on the sky (the effective diameter decreases non-linearly from 2.16 arcs at the field centre to 2.0 arcsec atthe edge of the field). The 4 guide fibre bundles each consistof a 4m long coherent bundle of 7×100 µm core diameterfibres in which 6 fibres are arranged in a hexagon around acentral fibre (Fig. 5). Each individual fibre probe can accessan area extending from the edge of the focal plane to justbeyond the centre of the focal plane, and can cover a sectorwith apex angle of 28◦. For the object fibre probes there issufficient overlap between adjacent fibres to allow full fieldcoverage. The four guide fibre bundles can access a total ofabout 30 per cent of the focal plane. The guide fibres arearranged at the four cardinal points on each fieldplate.
At the focal plane the incoming light is folded into the
Figure 5. Fibre arrangement for a single guide fibre probe show-ing the arrangement of the seven individual optical fibres andtheir size and separation on the sky
Figure 6. Optical fibre throughput as a function of wavelength(ignoring end losses). Fibre is Polymicro FVP 8m in length.
optical fibres using 92◦ prisms (1.2 mm on a side) made fromSchott SF5 high refractive index glass, with the input faceanti-reflection coated. The prism is glued to the polishedend of the optical fibre using UV-curing cement, after beingoptically aligned with the fibre core. The 92◦ angle of theprism was chosen to be half way between the extreme rangesof the beam angle for the non-telecentric corrector design.The prism material is a high refractive index glass so thatthe fast focal ratio input beam is totally internally reflectedon the prism hypotenuse. This removes the requirement toaluminise the external reflecting face which would result inlower efficiency.
The optical fibre used is a high OH or wet fibre manu-factured by Polymicro Technologies. This has the advantageof good blue throughput at some cost of additional OH ab-sorption bands in the far red (see Fig. 6). The optical fibre isa step index fibre with core diameter of 140 µm, cladding di-ameter of 168 µm and a polyimide protective buffer 198 µmin diameter.
Each fibre and prism assembly is held in the focal planeby a small steel button 4 mm long and 2 mm wide containing
c© 2001 RAS, MNRAS 000, 1–21
The AAO’s 2dF Facility 7
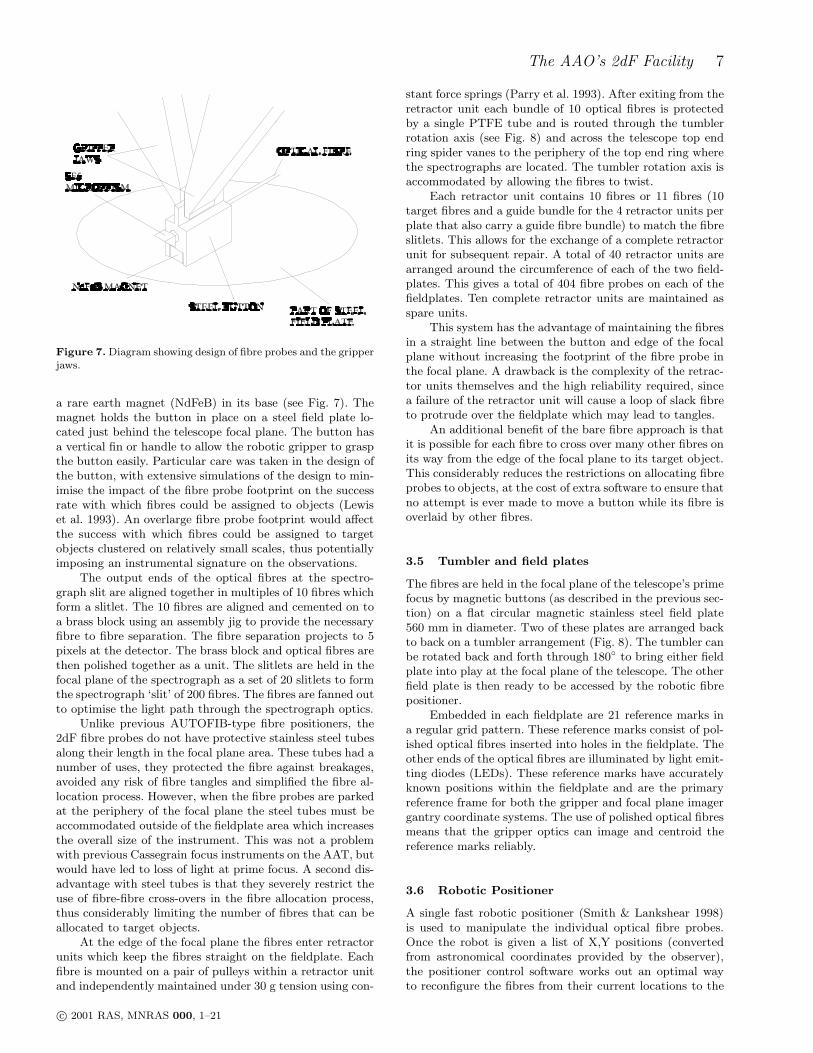
Figure 7. Diagram showing design of fibre probes and the gripperjaws.
a rare earth magnet (NdFeB) in its base (see Fig. 7). Themagnet holds the button in place on a steel field plate lo-cated just behind the telescope focal plane. The button hasa vertical fin or handle to allow the robotic gripper to graspthe button easily. Particular care was taken in the design ofthe button, with extensive simulations of the design to min-imise the impact of the fibre probe footprint on the successrate with which fibres could be assigned to objects (Lewiset al. 1993). An overlarge fibre probe footprint would affectthe success with which fibres could be assigned to targetobjects clustered on relatively small scales, thus potentiallyimposing an instrumental signature on the observations.
The output ends of the optical fibres at the spectro-graph slit are aligned together in multiples of 10 fibres whichform a slitlet. The 10 fibres are aligned and cemented on toa brass block using an assembly jig to provide the necessaryfibre to fibre separation. The fibre separation projects to 5pixels at the detector. The brass block and optical fibres arethen polished together as a unit. The slitlets are held in thefocal plane of the spectrograph as a set of 20 slitlets to formthe spectrograph ‘slit’ of 200 fibres. The fibres are fanned outto optimise the light path through the spectrograph optics.
Unlike previous AUTOFIB-type fibre positioners, the2dF fibre probes do not have protective stainless steel tubesalong their length in the focal plane area. These tubes had anumber of uses, they protected the fibre against breakages,avoided any risk of fibre tangles and simplified the fibre al-location process. However, when the fibre probes are parkedat the periphery of the focal plane the steel tubes must beaccommodated outside of the fieldplate area which increasesthe overall size of the instrument. This was not a problemwith previous Cassegrain focus instruments on the AAT, butwould have led to loss of light at prime focus. A second dis-advantage with steel tubes is that they severely restrict theuse of fibre-fibre cross-overs in the fibre allocation process,thus considerably limiting the number of fibres that can beallocated to target objects.
At the edge of the focal plane the fibres enter retractorunits which keep the fibres straight on the fieldplate. Eachfibre is mounted on a pair of pulleys within a retractor unitand independently maintained under 30 g tension using con-
stant force springs (Parry et al. 1993). After exiting from theretractor unit each bundle of 10 optical fibres is protectedby a single PTFE tube and is routed through the tumblerrotation axis (see Fig. 8) and across the telescope top endring spider vanes to the periphery of the top end ring wherethe spectrographs are located. The tumbler rotation axis isaccommodated by allowing the fibres to twist.
Each retractor unit contains 10 fibres or 11 fibres (10target fibres and a guide bundle for the 4 retractor units perplate that also carry a guide fibre bundle) to match the fibreslitlets. This allows for the exchange of a complete retractorunit for subsequent repair. A total of 40 retractor units arearranged around the circumference of each of the two field-plates. This gives a total of 404 fibre probes on each of thefieldplates. Ten complete retractor units are maintained asspare units.
This system has the advantage of maintaining the fibresin a straight line between the button and edge of the focalplane without increasing the footprint of the fibre probe inthe focal plane. A drawback is the complexity of the retrac-tor units themselves and the high reliability required, sincea failure of the retractor unit will cause a loop of slack fibreto protrude over the fieldplate which may lead to tangles.
An additional benefit of the bare fibre approach is thatit is possible for each fibre to cross over many other fibres onits way from the edge of the focal plane to its target object.This considerably reduces the restrictions on allocating fibreprobes to objects, at the cost of extra software to ensure thatno attempt is ever made to move a button while its fibre isoverlaid by other fibres.
3.5 Tumbler and field plates
The fibres are held in the focal plane of the telescope’s primefocus by magnetic buttons (as described in the previous sec-tion) on a flat circular magnetic stainless steel field plate560 mm in diameter. Two of these plates are arranged backto back on a tumbler arrangement (Fig. 8). The tumbler canbe rotated back and forth through 180◦ to bring either fieldplate into play at the focal plane of the telescope. The otherfield plate is then ready to be accessed by the robotic fibrepositioner.
Embedded in each fieldplate are 21 reference marks ina regular grid pattern. These reference marks consist of pol-ished optical fibres inserted into holes in the fieldplate. Theother ends of the optical fibres are illuminated by light emit-ting diodes (LEDs). These reference marks have accuratelyknown positions within the fieldplate and are the primaryreference frame for both the gripper and focal plane imagergantry coordinate systems. The use of polished optical fibresmeans that the gripper optics can image and centroid thereference marks reliably.
3.6 Robotic Positioner
A single fast robotic positioner (Smith & Lankshear 1998)is used to manipulate the individual optical fibre probes.Once the robot is given a list of X,Y positions (convertedfrom astronomical coordinates provided by the observer),the positioner control software works out an optimal wayto reconfigure the fibres from their current locations to the
c© 2001 RAS, MNRAS 000, 1–21

8 Lewis et al.
Figure 8. General arrangement of tumbler unit, fieldplates andfibre retractors. Drawing deliberately not to scale to show de-tail, only one of forty retractor units shown on each fieldplate forclarity.
required positions. This usually requires moving a number ofthe fibres out of the way (i.e. parking them at the peripheryof the field) before moving the majority of the fibres directlyto their target position. This is at least 50 per cent fasterthan the more simplistic approach of parking all of the fibresbefore moving each fibre to its new target position.
The robot consists of a complex gripper unit mountedon an X-Y Cartesian gantry, mounted above the tumblerfield plate at the top of the 2dF central section (Fig. 2). Thegripper gantry has two X axes and a Y axis cross-beam inan ‘H’ configuration. The axes are driven by linear AC servomotors. The use of linear motors over the more conventionalleadscrews allows faster and more accurate motor controland eliminates the effects of backlash. Positional informationis determined from independent linear optical encoders foreach axis, with a resolution of 1.25 µm.
All movements of the XY gantry are balanced by coun-terweights that move in the opposite direction to the gantry,resulting in zero net momentum at the prime focus when thepositioner is operational. With these precautions there is nomeasureable effect on the tracking of the telescope due tothe movement of the gripper gantry during observations.
The gripper unit contains a rotational θ axis to allowthe gripper to be aligned with the (approximately radiallyaligned) off-axis button handle, a Z axis to raise and lowerthe gripper unit and a set of jaws to grasp the individualbutton handles. The handling of the fibre probes is moni-tored by a small video CCD camera and optics built intothe gripper unit. The optical fibres are back-illuminated bylight projected into the optical fibre from the spectrographs.The robotic positioner can ‘see’ the illuminated end of thefibre and knows the physical offset to the button handle
which it grasps. This system allows the gripper to monitorfibre placement at the new target position, measure any po-sitioning errors and if necessary correct those errors if theyare deemed to be too large (Lewis & Parry 1990; Parry et al.1993). This has the advantage that the robot positions thefibre core at the required position regardless of any actualmanufacturing or assembly errors in the fibre button assem-bly. Note that for the guide fibre bundles only the centralfibre in the coherent bundle of 7 fibres is back-illuminatedduring the positioning process.
The gripper unit was built under contract by the Uni-versity of Durham to an AAO design, following earlier de-velopment work for the initial 2dF design study.
The design of the gripper jaws used in this process isparticularly important and went through several prototyp-ing stages (Wilcox 1993) in order to achieve repeatability ata level better than the overall accuracy requirements. Oneof the pair of gripper jaws is fixed to the XY-θ gantry andforms a reference surface while the second jaw is movable.To grasp a fibre button the fixed jaw is positioned againstthe button handle using the XY-θ gantry, then the movablejaw is closed on to the handle to avoid knocking the fibrebutton unnecessarily. Releasing the button requires the mov-able jaw to be moved away from the button handle slightlybefore the fixed jaw is backed away from the button handleusing the XY-θ gantry.
The robotic positioner is capable of configuring a fulltarget field of 404 fibres in about an hour. This requires onaverage a total of 600 fibre movements to untangle the pre-vious field and configure the new target field, at a speed ofunder 6 seconds per move. The average positioning error is11 µm (0.16 arcsec ) with all fibres required to be placedwithin 20 µm (0.3 arcsec) of the demanded position; if nec-essary, the robot picks up and replaces the button until theposition is within tolerance.
The effect of any offset due to flexure between the grip-per gantry and fieldplate is removed using the grid of refer-ence marks embedded in each fieldplate. These are measuredwith the gripper CCD video camera before positioning thefibres on the fieldplate. This survey process is always per-formed after a tumble operation or after the telescope hasbeen slewed to a new position, before any fibres are moved.
3.7 Fibre Spectrographs
With a fibre-linked spectrograph one has to balance the mer-its of using long fibres to feed a remotely located bench spec-trograph, against using very short fibres and mounting thespectrographs close to the fibre positioner. Each approachhas its merits and drawbacks. The remotely mounted spec-trograph has the advantage of providing a stable spectro-graph and making the engineering much simpler but withthe drawback of the lower UV throughput of long opticalfibres (30 metres). Using short fibres with a locally mountedspectrograph reduces the UV light losses due to the fibrelength but increases the mechanical design difficulties andsubjects the spectrograph to variable gravitational flexure,and ambient temperature variations, as the telescope tracksacross the sky.
The choice between a single monolithic spectrograph ac-cepting all 400 optical fibres compared to a pair of smallerspectrographs each accepting 200 optical fibres was largely
c© 2001 RAS, MNRAS 000, 1–21
The AAO’s 2dF Facility 9
determined by the availability of Tektronix 1024 pixel squareCCD detectors. These limit each detector to 200 fibresspaced by 5 pixels on the detector. Larger detectors werepromised but not available during the predicted time frameof the instrument construction. Limiting each spectrographto 200 fibres also eased the optical design somewhat, sinceit required a shorter slit assembly.
The decision was made to keep the fibre lengths as shortas practicable by locating the spectrographs at the top end ofthe telescope (Smith & Lankshear 1998). Initially they wereto be mounted above the robot positioner (Taylor & Gray1990) with an extremely short fibre length. The final design,however, was constrained by the available space envelopeand the spectrographs were mounted at the edge of the topend ring as shown in Fig. 2. This resulted in a fibre lengthof 8 metres.
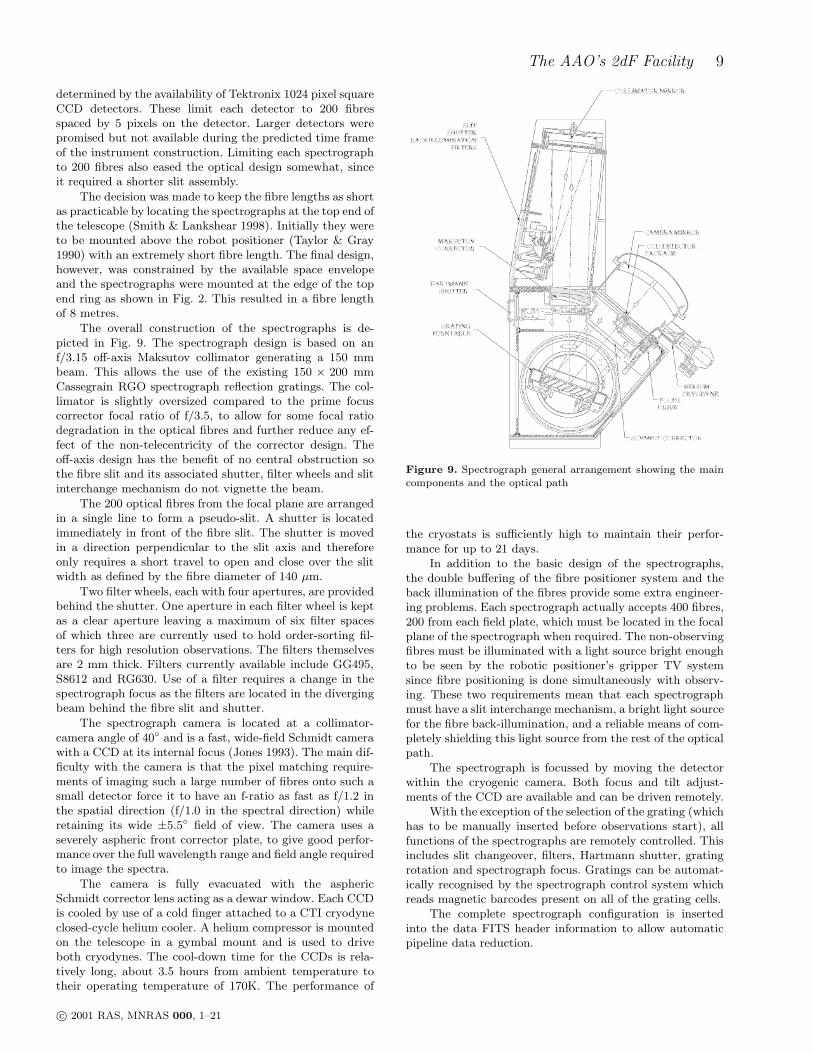
The overall construction of the spectrographs is de-picted in Fig. 9. The spectrograph design is based on anf/3.15 off-axis Maksutov collimator generating a 150 mmbeam. This allows the use of the existing 150 × 200 mmCassegrain RGO spectrograph reflection gratings. The col-limator is slightly oversized compared to the prime focuscorrector focal ratio of f/3.5, to allow for some focal ratiodegradation in the optical fibres and further reduce any ef-fect of the non-telecentricity of the corrector design. Theoff-axis design has the benefit of no central obstruction sothe fibre slit and its associated shutter, filter wheels and slitinterchange mechanism do not vignette the beam.
The 200 optical fibres from the focal plane are arrangedin a single line to form a pseudo-slit. A shutter is locatedimmediately in front of the fibre slit. The shutter is movedin a direction perpendicular to the slit axis and thereforeonly requires a short travel to open and close over the slitwidth as defined by the fibre diameter of 140 µm.
Two filter wheels, each with four apertures, are providedbehind the shutter. One aperture in each filter wheel is keptas a clear aperture leaving a maximum of six filter spacesof which three are currently used to hold order-sorting fil-ters for high resolution observations. The filters themselvesare 2 mm thick. Filters currently available include GG495,S8612 and RG630. Use of a filter requires a change in thespectrograph focus as the filters are located in the divergingbeam behind the fibre slit and shutter.
The spectrograph camera is located at a collimator-camera angle of 40◦ and is a fast, wide-field Schmidt camerawith a CCD at its internal focus (Jones 1993). The main dif-ficulty with the camera is that the pixel matching require-ments of imaging such a large number of fibres onto such asmall detector force it to have an f-ratio as fast as f/1.2 inthe spatial direction (f/1.0 in the spectral direction) whileretaining its wide ±5.5◦ field of view. The camera uses aseverely aspheric front corrector plate, to give good perfor-mance over the full wavelength range and field angle requiredto image the spectra.
The camera is fully evacuated with the asphericSchmidt corrector lens acting as a dewar window. Each CCDis cooled by use of a cold finger attached to a CTI cryodyneclosed-cycle helium cooler. A helium compressor is mountedon the telescope in a gymbal mount and is used to driveboth cryodynes. The cool-down time for the CCDs is rela-tively long, about 3.5 hours from ambient temperature totheir operating temperature of 170K. The performance of
Figure 9. Spectrograph general arrangement showing the maincomponents and the optical path
the cryostats is sufficiently high to maintain their perfor-mance for up to 21 days.
In addition to the basic design of the spectrographs,the double buffering of the fibre positioner system and theback illumination of the fibres provide some extra engineer-ing problems. Each spectrograph actually accepts 400 fibres,200 from each field plate, which must be located in the focalplane of the spectrograph when required. The non-observingfibres must be illuminated with a light source bright enoughto be seen by the robotic positioner’s gripper TV systemsince fibre positioning is done simultaneously with observ-ing. These two requirements mean that each spectrographmust have a slit interchange mechanism, a bright light sourcefor the fibre back-illumination, and a reliable means of com-pletely shielding this light source from the rest of the opticalpath.
The spectrograph is focussed by moving the detectorwithin the cryogenic camera. Both focus and tilt adjust-ments of the CCD are available and can be driven remotely.
With the exception of the selection of the grating (whichhas to be manually inserted before observations start), allfunctions of the spectrographs are remotely controlled. Thisincludes slit changeover, filters, Hartmann shutter, gratingrotation and spectrograph focus. Gratings can be automat-ically recognised by the spectrograph control system whichreads magnetic barcodes present on all of the grating cells.
The complete spectrograph configuration is insertedinto the data FITS header information to allow automaticpipeline data reduction.
c© 2001 RAS, MNRAS 000, 1–21
10 Lewis et al.
3.8 Focal plane imager
A second XY gantry, almost identical to the gripper gantry,is located immediately behind the final element of the opticalcorrector (Fig. 2) and in front of the observing fieldplate.Instead of a gripper unit, this gantry carries a pair of CCDcameras. One camera is a simple video CCD camera whichcan only view the back-illuminated fibres and field plate,while the second is a Peltier cooled Princeton InstrumentsCCD camera, facing in the opposite direction, which canview the sky when its gantry is appropriately positioned.This gantry system is known as the Focal Plane Imaging(FPI) system and is the primary means of determining therelationship between RA,Dec and X,Y on the field plates.This sky viewing camera can also be used for target fieldacquisition and seeing measurements. The image scale ofthe focal plane imager CCD is 0.3 arcsec per pixel.
The focal plane imager gantry also surveys the referencemarks embedded in the field plates, in a similar manner tothe gripper gantry, to correct for registration and flexurebefore centroiding the images of reference stars.
3.9 Calibration systems
2dF contains its own remotely controlled calibration sys-tems. Two white flaps may be inserted into the telescopebeam below the corrector, blocking off sky light and form-ing a reflective screen. A variety of calibration lamps can beused to illuminate this screen, with the resulting scatteredlight travelling through the 2dF corrector and illuminatingthe focal plane. Two intensities of quartz lamps for fibre flatsand a variety of hollow cathode arc lamps (Copper-Argon,Copper-Helium and Iron-Argon) are provided.
Requesting an arc or fibre flat exposure will result in thecontrol system automatically inserting the reflective flapsand turning on the requested calibration lamps. At the endof the exposure the lamps are turned off and the flaps eitherremoved from the telescope beam or left in place if furthercalibration exposures are required. This automation avoidsaccidentally leaving calibration lamps turned on and reducesobserving overheads.
All calibration exposures have appropriate FITS headeritems added to the data frames as an aid to the pipelinereduction of the data.
3.10 Software Control systems
The 2dF facility uses the AAO drama software infrastruc-ture (Farrell, Bailey & Shortridge 1995) to build a fully in-tegrated control system across several computers and oper-ating systems.
The graphical user interface is written using Tcl/Tk andprovides for control of all aspects of the positioner system,the spectrographs, ADC and CCD control, all from one sim-ple to use interface. The same interface allows the observerto control the telescope directly, for example when slewingto a new target field. The graphical user interface is providedby several windows spread across two computer screens withcontrols arranged by subsystem.
Individual parts of the 2dF facility are controlled bysoftware tasks which are running on the most appropriate
control computer (VxWorks, Solaris, VMS) and drama al-lows the many separate tasks to communicate and work to-gether seamlessly.
3.11 CCD operation.
The two Tektronix 1024 CCDs are controlled using the stan-dard AAO controller hardware, the AAO External Mem-ory (XMEM) and OBSERVER software interface on aVAX/VMS computer system. With a slight adaptation, theOBSERVER software communicates with the rest of the2dF control system (running on Solaris and VxWorks com-puter systems) using DRAMA to enable it to add all of themore specialised 2dF FITS header items from the 2dF con-trol system to the data files for archiving. The two CCDsare operated and read out simultaneously, but using sepa-rate controllers and data links.
3.12 Acquisition and Guiding systems
On each fieldplate there are four guide fibre bundles whichdo not feed to the spectrographs. These guide fibres consistof a coherent bundle of seven individual fibres with six fi-bres in a hexagon pattern surrounding a central fibre (Fig.5). The separation of the individual fibres in a guide bundleat the input end is 1.8 arcsec. Each guide bundle may bepositioned on a guide star in the focal plane to allow for ac-quisition of the target field. The output from the four guidefibre bundles is collected by a Quantex intensified TV sys-tem, with its output visible to the telescope night assistantand observer. A guide star is accurately centred when thecentral fibre of a guide fibre appears brightest on the TVdisplay and the six surrounding fibres are uniformly illumi-nated.
A minimum of two guide fibres are recommended foreach target field, although it is preferable that all four areused in case of inaccurate stellar positions. The QuantexTV system can detect stars down to a magnitude limit ofV = 15.5 in average conditions. The system was designed toinclude an option to rotate the field plates for target acquisi-tion and, if necessary, during tracking. However, this has notyet been implemented. It turns out that the instrument issufficiently stable, and the flexure is small and predictable,so that it is easier to remove any overall field rotation in thepositioner software. Often, larger errors would be introducedby attempting to use the fiducial stars to correct rotation,especially since the surface density of usable stars meansthat it is difficult to obtain enough stars close to the edgeof the field to allow rotation to be determined.
The pointing of the AAT is normally good enough (bet-ter than 2 arcsec) that target field acquisition is a simpleprocedure of slewing the telescope and the guide stars willbe visible somewhere in at least one of the guide fibres. Fineacquisition is performed manually by offsetting the telescopeby very small amounts until all four guide stars are well cen-tred in their respective guide fibres.
If for any reason the guide stars cannot be seen afterslewing the telescope or there is any ambiguity in the guidestar acquisition (for example due to a very crowded field ina globular cluster or due to poor guide star positions) thefocal plane imager CCD camera can be used to image a small
c© 2001 RAS, MNRAS 000, 1–21

The AAO’s 2dF Facility 11
section of sky around each guide star to verify acquisition.A simple offset will then place the guide stars onto the guidebundles, after which the focal plane imager can be removedfrom the focal plane.
Once a target field is acquired, guiding can be donein one of two ways. The normal guiding method is manualguiding using the excellent tracking of the AAT and makingsmall adjustments every 10 minutes or so.
An automatic autoguider has also been developed whichuses the video output from the Quantex TV system to feeda video frame grabber. The digitised video can then be anal-ysed to determine the average centroid of each guide fibreand determine the correct telescope offset to restore the tele-scope pointing. Initially however, the extra calibration re-quired and problems with the dimensional stability of theQuantex TV image at different gain levels meant that auto-guiding was not generally used. A simplified version of theautoguider system was implemented in 2001 under the con-trol of the telescope night assistant and this is now in regularuse.
4 OPERATION OF 2DF
4.1 Input data, astrometry and guide stars
The successful operation of a robotic fibre system dependson the provision of accurate positions for the target objectsin a known reference frame. Target positions are usuallymeasured from Schmidt telescope photographic plates, us-ing the Automatic Plate Measuring (APM) or SuperCOS-MOS plate measuring machines, although more recently as-trometry from CCD mosaics is becoming more common andreliable. With care, these provide astronomical coordinateswith a relative accuracy of 0.2–0.3 arcsec across the full 2◦
field of 2dF. This involves using a reliable modern astromet-ric catalogue of reference stars and taking full account ofproper motions.
To place optical fibres on target objects, 2dF needs toknow the conversion from astronomical coordinates to phys-ical coordinates in the focal plane. This conversion is deter-mined by measuring the X,Y positions of sets of astromet-ric standard stars, using the FPI CCD camera and sets offiducial marks on the fieldplate, using the FPI TV camera.The observed centroids of the star images are matched totheir expected positions, as corrected for atmospheric re-fraction, known telescope pointing errors and the distortionintroduced by the 2dF corrector lens. A least-squares min-imisation determines the fitting parameters; the six free pa-rameters are the scales in X and Y, the overall rotation andskewness of the field, and any offset of the centre of theoptical distortion pattern from the optical axis. Any non-perpendicularity of the axes of the gantries, or mechanicalshifts between the gantries and the field plates, should beautomatically removed by the survey of the fiducial referencepoints on the field plates (section 3.8).
For calibrating 2dF it was not a trivial task to find as-trometric data with the required accuracy (current rms po-sitions to better than 0.25 arcsec across 2◦ of sky) for largeenough samples of stars. Initially, the PPM catalogue wasused (Roeser & Bastian 1988); currently the Tycho-2 cata-logue (Høg et al. 2000) is the most suitable. Originally the
astrometric calibration involved taking data for sets of starsat a range of declinations, for both field plates, and the fullprocess had to be repeated on the first night of every 2dFobserving run. Different sets of astrometric parameters werestored and used as appropriate for each target field. How-ever, it appears that the behaviour of 2dF is sufficiently sta-ble and repeatable that the flexure terms can be predicted.All that is now needed is to take at least one set of cali-bration data whenever 2dF is re-mounted on the telescope,to determine any rotation or offset zero-point errors. Thereare also small plate scale variations which are temperature-dependent. The remaining errors in the process should bebelow the 0.5 arcsec level at the edge of the field, wheremost effects are worst.
The fiducial or guide star positions should be as accu-rate as the target object positions and on the same astro-metric system. However, for a number of reasons this maynot be the case. Firstly fiducial stars are usually in the mag-nitude range V = 13− 15.5 so that the Quantex TV systemis able to detect them. Stars as bright as this can suffer ha-los and diffraction spikes on the photographic plates whichaffect their astrometry. Secondly, proper motions of starscan increase the positional errors, particularly when usingold plates. Using fiducial stars towards the faint end of theavailable range, restricting the colour range and comparingtwo plates of different epochs can reduce both these effects.A good solution is to use stars drawn from the target ob-ject list, where feasible. Alternatively, a prescription for theselection of guide stars is given by Colless et al. (2001).
4.2 Fibre allocation procedures
Fibres are allocated to target objects using an off-linesoftware program configure (see the 2dF WWW pageshttp://www.aao.gov.au/2df/ for details of manuals and todownload this software) to preplan each target field. An ex-ample target field configuration is shown in Fig. 10, which isa reproduction of the mimic display at the telescope. Whenprovided with a field centre and a list of target, fiducial starand blank sky positions, the configure program assigns fi-bres to objects, taking account of the hardware constraints(limited fibre extension and deviation from the radial di-rection) and avoiding illegal hardware collisions. Given thesize and shape of the fibre buttons, the minimum separa-tion between two targets is ≃ 30 arcsec on the sky, but thisis a strong function of location in the field and of targetdistribution.
Various options in configure allow the user to assignrelative priorities to targets and set other parameters, in-cluding the planned Hour Angle of the observations, in or-der to optimise the allocation of fibres. The program worksiteratively making a number of random swaps at each iter-ation to try to maximise the number of observable targetsand minimise the number of fibre crossovers. The config-
ure utility includes an option for automatic allocation offibres to sky positions and allows manual editing of the finalfibre configuration, before saving as a file to be used withthe 2dF control system at a later stage. One (or more, if thesame field is to be tracked for several hours) of these config-uration files is required for each target field to be observedduring the course of a night.
If the user wishes to observe a field with more than 400
c© 2001 RAS, MNRAS 000, 1–21

12 Lewis et al.
Table 1. Summary of 2dF instrument specifications
Telescope 3.9m AAT f/3.3 Prime focusCorrector field of view 2.1◦
Corrector focal ratio f/3.5ADC recommissioned 31 August 1999Image scale 67µm/arcsecNumber of spectroscopic fibres 400 (on each fieldplate)Number of guide fibres 4 (on each fieldplate)Fibre diameter 140µmFibre size on sky (mean) 2.1 arcsecReconfiguration time 55 minutes (typical)Fieldplate exchange and acquistion 3 minutes (typical)Robot positioning accuracy 11µm(mean) 20µm(maximum)Overall positioning accuracy 0.3arcsec RMSLength of fibres 8.0mSpectrograph Collimator f/3.15 Off-axis Maksutov 150mm beamsizeSpectrograph Camera Modified Schmidt camera f/1.2 (spatial)
f/1.0 (spectral)Detector Tektronix 1024 × 1024 pixel CCDCCD inverse gain (NORMAL and SLOW) 2.79 – 1.4 e−/ADUCCD readout times 74 – 120 secondsCCD readout noise 5.2 – 3.6 e−
Pixel size 24µmSecond science grade CCD installed 31 August 1999Dispersive elements Plane ruled reflection gratings 205 × 152mmRange of available dispersions 4.8A/pixel to 1.1A/pixelRange of effective resolutions 9A to 2.2AAchievable velocity accuracy1 10 kms−1
Spacing of spectra at detector 5 pixelsFibre size at detector 1.9 – 2.1 pixelsOrder sorting filters GG495, RG630, S8612
Number of spectra/spectrograph 200System throughput2 5 per centMinimum object separation in focal plane 1.6mm (approximately 20arcsec)
1 This is a typical external accuracy for the 1200 lines permm gratings and is very dependent on the spectral type ofthe data.2 Total system throughput including atmosphere and tele-scope at 600nm with 300B gratings.
targets, the input list must be split into a series of man-ageable field configurations. It is usually best to restrict themagnitude range of targets in a given field, since bright tar-gets may become saturated or scatter light on to faintertargets in adjacent fibres in the spectrographs.
To efficiently cover an area larger than the 2◦ field ofview with high completeness requires simultaneous configu-ration of multiple fields and adjustment of their field centres,this process is known as ‘tiling’. A description is the tilingprocedure used in the 2dF galaxy redshift survey is given byColless et al. (2001).
The offline planning process is usually done well in ad-vance and a set of configuration files sent to the telescope.Before a set of configuration files are used they are normallychecked for legality using the current astrometric parame-ters.
4.3 Observing procedures
This section describes the standard observing procedure asused for the major redshift surveys, although many of thesteps are similar for all 2dF programmes. Observing with2dF is somewhat different from most other observing on the
AAT. The corollary to the complexity of the instrument,and the need for a great deal of preparatory work beforecoming to the telescope, is that is is difficult to make signif-icant changes to the program during the night. Thus thereis usually little scope for interactive decision-making by theobservers.
Another fundamental constraint is the fact that it isnecessary to keep planning ahead, since the configuring ofa set of targets takes about one hour, about the same asthe time needed for one set of observations for the redshiftsurveys. Thus the observing and re-configuring have to becarried out simultaneously and almost continuously, so thatany time lost in one aspect will lead to problems in theother. Not only that, but the fibres have to be configuredfor the expected mean HA of the observations to minimiseatmospheric refraction losses. One consequence is that if aset of observations is delayed for any reason, it is rarelypossible to catch up; the best strategy is to abandon thatset and move on to the next set. Having two field platesalso introduces extra constraints: in the case of the redshiftsurveys, the configurations for each field are prepared forone or other specific field plate. Thus if one field is lost, it isnot possible to simply move on to the next one; quite often
c© 2001 RAS, MNRAS 000, 1–21

The AAO’s 2dF Facility 13
Figure 10. An example target field configuration using almost all400 fibre probes. Unallocated target objects are shown by unfilledcircles. A few fibres remain parked at the edge of the field becausethey cannot access any of the unallocated targets. Small circlesrepresent targets and large circles are potential guide stars. Fibresapparently on blank areas have been allocated to sky positions.
the consequence of losing one field is an overall loss of twohours of observing, since the target configurations that havebeen prepared are no longer the appropriate ones.
The solution to these constraints is to prepare a de-tailed observing plan for each night. This plan must includeall necessary exposures, including calibrations, with realisticestimates of the necessary elapsed time for each operation.
Before observing starts, and usually well before sunset,the first two configurations of the night have their fibres setup on the two field plates. Depending on the declinationand hour angle, and on the distribution of targets (centrallyconcentrated fields can be observed over a much wider rangeof hour angle), a target field may have to be observed withmultiple configurations to remove atmospheric refraction ef-fects, as demonstrated in Fig. 1.
For each target field a minimum set of CCD exposuresconsists of a fibre flat (quartz lamp) exposure, an arc expo-sure and a set of target object exposures. The fibre flat isused for locating the spectra on the CCD during the datareduction stage, the arc exposure is for wavelength calibra-tion of the spectra. Optional CCD exposures may includeoffset sky exposures and twilight sky flat exposures, bothused for calibrating the fibre-to-fibre throughput variation.
If these special exposures are not taken, the fibre to fi-bre throughput calibration can often be done using the nightsky emission lines in the object data frames; in fact, thereis evidence that this method actually gives the best results,since the calibration data are simultaneous with the obser-vations, use exactly the same optical path and do not involvemoving the telescope. The night sky line method works bestin the near-infrared part of the spectrum which has manyemission features, or when particularly strong night sky lines
are present, such as [OI] at 5577A and 6300A (Bailey et al.2001).
Between target fields, the fieldplates must be exchangedusing the tumbler, and the telescope and dome must beslewed to the new target field position. The ADC automati-cally tracks the telescope position thus removing this compli-cation for the observer. A straight-forward field changeovertakes under three minutes. Once the telescope is tracking atthe new target field location the robot positioner can startmoving the fibres for the subsequent target field.
Observations of single standard stars (radial velocitystandards, metallicity standards etc) are possible withoutreconfiguring all of the fibres. A calculation tool is providedto allow blind offsetting of a standard star into a single spec-troscopic fibre, using a nearby guide fibre. This process ishowever not suitable for observing flux standards, due tothe uncertain nature of the final blind offset and the smallsize of the fibre aperture.
It is not yet clear how accurately it is possible to cali-brate the fluxes in 2dF spectra, especially when taken overa wide wavelength range. Absolute fluxes can never be veryaccurate, since the fibre diameters (2 arcsec) are comparableto the typical ‘seeing’ disk size, and the overall accuracy offibre positioning is often no better than 0.5 arcsec. Relativefluxes, i.e. as a function of wavelength, can be determinedto higher precision. However, here the CVD inherent in the2dF corrector lens (see section 3.2) limits the accuracy at-tainable. Repeatable results should be obtainable for starsnear the field centre, where the CVD is small, but over mostof the field the combination of fibre positioning errors, CVDand variable seeing means that the slope of stellar spectravaries substantially, even between consecutive short expo-sures (Cannon 2000).
4.4 Data reduction software
During the design stages of 2dF it was clear that a dedicatedpipeline data reduction package would be required to dealwith the enormous amounts of data, up to 3000 spectra,which 2dF would be capable of generating during a singlenight.
A completely new data reduction software package(2dfdr) has been developed for 2dF (Taylor et al. 1996;Bailey et al. 2001). The design philosophy of the 2dfdr
package is to make as much use of known instrumental pa-rameters as possible. In particular, 2dfdr uses the knownoptical properties of the spectrographs to predict the formatof the data (location of the spectra and dispersion). Thefits headers of the data contain all the information neededto identify the different types of data frame, the location ofall the target objects, details of the telescope and spectro-graph parameters, and the appropriate calibration framesto be associated with each data frame. The 2dfdr packagepreserves the integrity of the data headers, together with thestatistical variance of each spectrum and the sky spectrumthat was associated with each object.
The 2dfdr program can be run automatically and isable to reduce an entire night’s data in an hour or less.However, it is normally better to do at least some of thesteps interactively, especially the initial determination of the‘tramline’ extraction maps for the spectra, and to verify thatthe results are sensible at each stage. The software package
c© 2001 RAS, MNRAS 000, 1–21

14 Lewis et al.
provides several options and many parameters which can beset, and includes a number of diagnostics for assessing dataquality.
The data for a particular target field are reduced as twoseparate sets of data, one for each spectrograph containing200 individual spectra. For the large redshift surveys, it isnormal procedure to analyse the data as the night proceeds,with all observations fully reduced and all redshifts deter-mined by the end of the night’s observing.
The data reduction software package 2dfdr isavailable for download from the 2dF WWW pages(http://www.aao.gov.au/2df/).
5 PERFORMANCE OF 2DF
5.1 Corrector optics
The initial imaging tests (Taylor & Gray 1994) showed thatthe 2dF corrector lens optics met their design specification.The imaging performance was also checked in May 2001, af-ter some evidence of apparently variable throughput acrossthe 2dF field (see section 5.6 below). A series of spectra of aset of standard stars was taken, stepping through focus be-tween exposures. These were somewhat inconclusive, giventhe fibre diameter of 2 arcsec and the sensitivity to ‘seeing’variations. A better check was provided by taking a series ofexposures on a sheet of photographic film, stuck on a sheetof magnetic material which was then mounted on one of thefield plates. These showed that the focus is constant acrossthe 2dF field to within 30 microns; there is no tilt of thefocal surface and no serious variations in PSF across the fullfield.
5.2 Atmospheric Dispersion Compensator
The effectiveness of the ADC has been demonstrated usingthe focal plane imager CCD camera to take an image of astar at a zenith distance of 67◦. A filter glass (Schott BG1)was inserted in the optical path which absorbs the visiblelight and passes UV and near–IR. The results are shown inFig. 11. The image taken with the ADC nulled (no correctionof atmospheric dispersion) shows a slight separation of theUV and near IR images, the image taken with the ADCoperating shows a circular superimposed set of images.
The ADC was was shown to work well for imaging dur-ing the corrector lens acceptance tests in 1993. For thesetests the ADC elements were manually driven to the correctposition. However, later checks on the spectra of some brightstars at large zenith distance revealed a decrease instead ofan increase in UV flux when the ADC was activated. Thisturned out to be due to a combination of software and zero-point errors in driving the two counter-rotating elements ofthe ADC. Since the pointing and guiding of 2dF is done atan effective wavelength of about 500nm, this means that alllow-dispersion 2dF spectra taken up until August 1999 areliable to have been degraded by an effectively random loss ofUV and (to a much lesser extent) near-IR flux, even for fieldsobserved near the zenith. The effect is less serious for mosthigh dispersion spectra since they cover a shorter wavelengthrange. This problem was corrected in August 1999 and allsubsequent data have the ADC operating correctly.
Figure 11. Operation of the ADC at 67◦ zenith distance. Theleft hand image shows the image quality with the ADC nulled,the right hand image shows the same stellar image with the ADCtracking at the appropriate orientation. Both images were takenin 1.5 arcseond seeing. The left hand image shows the faint UVstellar image offset to the upper left of the brighter red image.Each image is 66 pixels (20 arcsec) on a side.
Figure 12. The ratio of two spectra of a star observed at a zenithdistance of 50◦, one taken with the ADC tracking and the otherwith it nulled. In this example, about 65 per cent of the UV lightand 50 per cent of the near infrared flux missed the 2 arcsecdiameter fibre when the ADC was nulled. See text for details.
Direct tests on stellar spectra confirm the effectivenessof the ADC, which can increase the UV throughput by fac-tors of 3 or more (Cannon 2000). Fig. 12 shows the ratioof two consecutive short exposure (5s) spectra of a brighthot star, observed in good seeing (0.9 arcsec) at a zenithdistance of 50◦; a spectrum taken with the ADC nulled hasbeen divided by an otherwise identical spectrum taken withthe ADC tracking. The star was the ninth magnitude WolfRayet star HD76536, which has broad emission lines up toten times stronger than the continuum. The virtually per-fect cancellation of these dominant features demonstratesthat the spectra have been well calibrated in wavelength. Inthis case, the spectrum taken without the ADC misses up to65 per cent of the UV flux and 50 per cent of the IR flux. Thenumerical losses depend strongly on the effective wavelengthat which the uncorrected image is acquired, the seeing andany positioning errors, as well as the zenith distance.
c© 2001 RAS, MNRAS 000, 1–21
The AAO’s 2dF Facility 15
5.3 Positioner
The accuracy, speed and reliability of the positioner are allcrucial for efficient operation of 2dF.
The positioner internal precision is set to 20 microns(0.3 arcsec) by requiring that the robot keep repeating theplacement of each button until the actual position is within20 µm of the demanded position (section 3.6); normally theaverage number of iterations per fibre move is much lessthan unity. The external accuracy actually achieved is muchharder to assess since it depends on many factors: the re-liability of the input target positions (which in turn caninvolve several effects such as proper motions, magnitude orcolour-dependent astrometric errors, and inaccurate trans-formations from some original x,y coordinate system to RAand Dec); the accuracy with which the 2dF gantry systemhas been calibrated (section 4.1); and the stability of therobot during the hour or so required to do a full configura-tion, which itself may be a function of the zenith angle of thetelescope (since configuring is usually done while observingthe previous field).
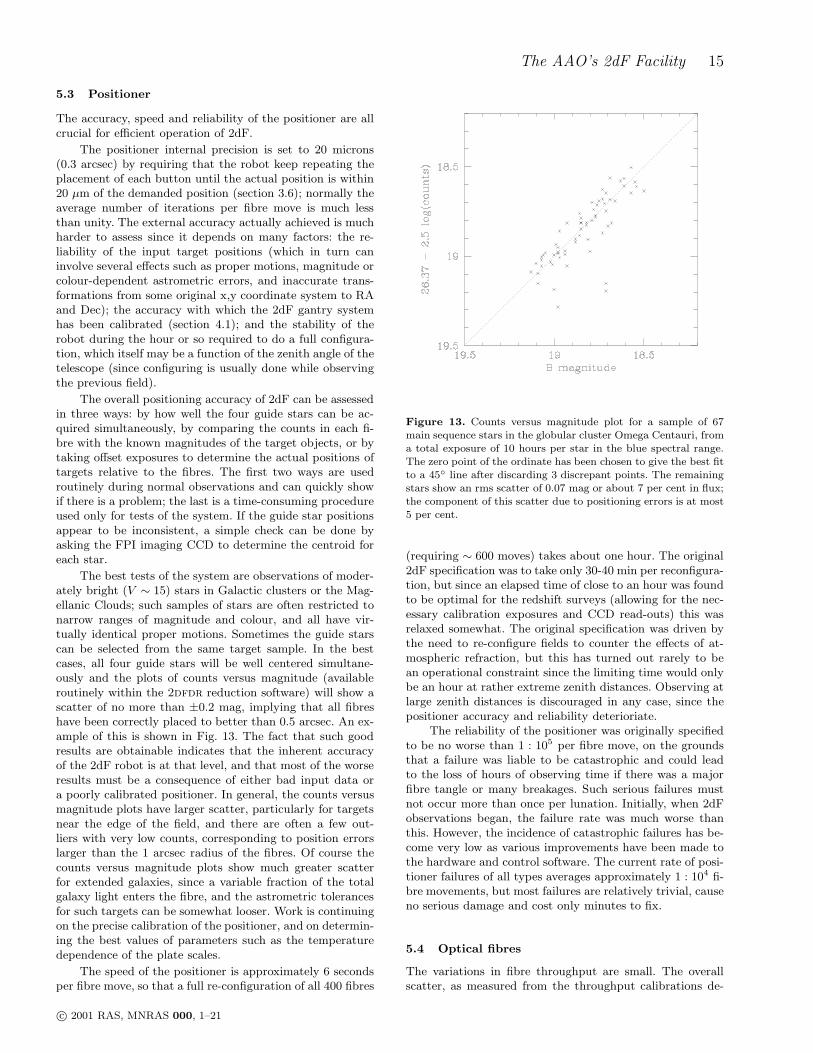
The overall positioning accuracy of 2dF can be assessedin three ways: by how well the four guide stars can be ac-quired simultaneously, by comparing the counts in each fi-bre with the known magnitudes of the target objects, or bytaking offset exposures to determine the actual positions oftargets relative to the fibres. The first two ways are usedroutinely during normal observations and can quickly showif there is a problem; the last is a time-consuming procedureused only for tests of the system. If the guide star positionsappear to be inconsistent, a simple check can be done byasking the FPI imaging CCD to determine the centroid foreach star.
The best tests of the system are observations of moder-ately bright (V ∼ 15) stars in Galactic clusters or the Mag-ellanic Clouds; such samples of stars are often restricted tonarrow ranges of magnitude and colour, and all have vir-tually identical proper motions. Sometimes the guide starscan be selected from the same target sample. In the bestcases, all four guide stars will be well centered simultane-ously and the plots of counts versus magnitude (availableroutinely within the 2dfdr reduction software) will show ascatter of no more than ±0.2 mag, implying that all fibreshave been correctly placed to better than 0.5 arcsec. An ex-ample of this is shown in Fig. 13. The fact that such goodresults are obtainable indicates that the inherent accuracyof the 2dF robot is at that level, and that most of the worseresults must be a consequence of either bad input data ora poorly calibrated positioner. In general, the counts versusmagnitude plots have larger scatter, particularly for targetsnear the edge of the field, and there are often a few out-liers with very low counts, corresponding to position errorslarger than the 1 arcsec radius of the fibres. Of course thecounts versus magnitude plots show much greater scatterfor extended galaxies, since a variable fraction of the totalgalaxy light enters the fibre, and the astrometric tolerancesfor such targets can be somewhat looser. Work is continuingon the precise calibration of the positioner, and on determin-ing the best values of parameters such as the temperaturedependence of the plate scales.
The speed of the positioner is approximately 6 secondsper fibre move, so that a full re-configuration of all 400 fibres
Figure 13. Counts versus magnitude plot for a sample of 67main sequence stars in the globular cluster Omega Centauri, froma total exposure of 10 hours per star in the blue spectral range.The zero point of the ordinate has been chosen to give the best fitto a 45◦ line after discarding 3 discrepant points. The remainingstars show an rms scatter of 0.07 mag or about 7 per cent in flux;the component of this scatter due to positioning errors is at most5 per cent.
(requiring ∼ 600 moves) takes about one hour. The original2dF specification was to take only 30-40 min per reconfigura-tion, but since an elapsed time of close to an hour was foundto be optimal for the redshift surveys (allowing for the nec-essary calibration exposures and CCD read-outs) this wasrelaxed somewhat. The original specification was driven bythe need to re-configure fields to counter the effects of at-mospheric refraction, but this has turned out rarely to bean operational constraint since the limiting time would onlybe an hour at rather extreme zenith distances. Observing atlarge zenith distances is discouraged in any case, since thepositioner accuracy and reliability deterioriate.
The reliability of the positioner was originally specifiedto be no worse than 1 : 105 per fibre move, on the groundsthat a failure was liable to be catastrophic and could leadto the loss of hours of observing time if there was a majorfibre tangle or many breakages. Such serious failures mustnot occur more than once per lunation. Initially, when 2dFobservations began, the failure rate was much worse thanthis. However, the incidence of catastrophic failures has be-come very low as various improvements have been made tothe hardware and control software. The current rate of posi-tioner failures of all types averages approximately 1 : 104 fi-bre movements, but most failures are relatively trivial, causeno serious damage and cost only minutes to fix.
5.4 Optical fibres
The variations in fibre throughput are small. The overallscatter, as measured from the throughput calibrations de-
c© 2001 RAS, MNRAS 000, 1–21

16 Lewis et al.
termined by 2dfdr, is less than 20 per cent for most ofthe fibres and this includes the variations of 15 per cent infibre cross-section from field centre to edge, plus any vari-ations in the prisms at the input ends. A few fibres havelower transmission by factors of about two, presumably dueto misaligned prisms, dirt or other accidents (parked fibresappear to have systematically lower transmission, less thanhalf the normal value, but this is simply due to vignetting).The throughputs appear to be stable with time. There is lit-tle evidence for differences in fibre transmission with wave-length: any such variations are essentially trivial, comparedwith the differences in spectral shape introduced by the ra-dial variations (CVD) intrinsic to the 2dF optics (see section3.2) combined with fibre positioning errors.
Occasionally, spectra appear with a marked saw-toothintensity variation of amplitude up to 20 per cent; the num-ber of oscillations can range from two or three to a dozen ormore, with the period of the variations increasing linearlywith actual wavelength. These appear to be an effect of in-terference fringing, probably due to cracks in the fibres orsome fault at their terminations. The variations are usuallyremoved or much reduced by the standard flat-fielding pro-cedure in 2dfdr but this sometimes fails, either because thefibres are unstable or through some error in the flat fieldingprocess.
5.5 Spectrographs
The optical quality of the spectrographs is such that eachfibre image is focussed to a resolution of about two pixels.Typical values of arc line widths are a FWHM of 2.1 pixelsfor spectrograph No. 1 and 1.9 pixels for spectrograph No.2. These values yield resolutions with the various gratingsas shown in Table 2. There is some variation in spectral res-olution across the CCDs, due to a deterioration of imagequality in the corners of the field; this affects in particularthe spectral resolution at the UV and near-IR ends of spec-tra in the first and last slit blocks (spectrum numbers 1-10and 191-200). This variation in PSF across the field sets onelimit to the accuracy of sky subtraction; even if the intensi-ties are calculated correctly, the changes in line profile leadto residual P Cygni-type dips and spikes at the locations ofstrong night sky emission lines. The change in image qualityalso leads to poorer spatial resolution, and hence to occa-sional problems with fitting the tramline map which is usedto extract the 1-D spectra.
The optical imaging quality of the spectrographs doeslimit their usefulness in some ways. There is significant astig-matism at high grating angles, making it impossible to usethem effectively in second order and degrading their perfor-mance with the 1200 lines per mm gratings at the near-IRend of the wavelength range (e.g. for the Ca II triplet near8600A ). It is possible to set good focus in either the spatialor the spectral direction, but not both simultaneously.
The focus of the spectrographs is quite strongly depen-dent on temperature, sometimes necessitating re-focussingduring the course of the night if the ambient temperaturechanges by more than a few degrees.
Flexure in the spectrographs is at the level of ∼ 0.2pixels per hour. For most observing programs, individualexposures are for at most 30 or 40 minutes in order to con-trol cosmic ray contamination and it is standard practice to
take calibration arc exposures every hour or so. For the mainredshift surveys, which are done at low resolution with the300B gratings, the accuracy of velocity determinations forgalaxies (determined from repeat observations of the sametargets) is about 65 kms−1 for the best quality data andaround 100 kms−1 on average (Colless et al, 2001). Muchhigher accuracies are attainable for stars observed at highresolution with the 1200 lines per mm gratings: typical val-ues are in the range 5-10 kms−1.
The throughput of the spectrographs is reasonably uni-form across the full field of view, with a scatter of about 10per cent with no drop off towards the edges of the CCD,much superior to the earlier AUTOFIB system when usedwith the RGO Cassegrain spectrograph. Scattered light ishowever a significant problem which manifests itself in vari-ous ways. Direct measurement of scattered light can be donein the spectral direction by looking at the profiles of isolatedstrong arc lines, or in the spatial direction by illuminating asingle fibre. Alternatively, the total scattered light in a dataframe can be estimated from the residual signal in broken ormasked-off fibres. All these methods give consistent results.The total amount of light scattered from a single illumi-nated pixel to other pixels on the CCD is between 10 and20 per cent of the input signal; the exact amount varies withwavelength and location in the field. Another measure is thatabout 1 per cent of the light in a single fibre is scattered intoeach of the immediately adjacent fibre locations on the CCD(note that this virtually all occurs within the spectrograph,there is no detectable ‘cross-talk’ between fibres before theyreach the spectrographs). A practical consequence of this isthat it is inadvisable to try to observe stars with too widea range in magnitude simultaneously, and it is important toavoid accidentally hitting any bright stars when observingfaint targets.
Correction for any scattered light is important for theproper determination of relative fibre throughputs and foraccurate sky subtraction. It is also of course essential forthe measurement of the equivalent widths of absorption fea-tures. For fields of relatively faint targets, or whenever therange of signal strengths in different fibres is small, the to-tal scattered light distribution can be approximated by asmoothly varying function across the CCD. This is the ap-proach used in the redshift surveys and is the default optionwithin 2dfdr; a mean background map is determined byfitting to the signal in broken fibres and at the edge of theframe, and this is then subtracted from the data (Baileyet al. 2001). The accuracy of sky subtraction in the red-shift surveys is typically 2–5 per cent, although much worsevalues are sometimes reported.
A special type of scattered light arises in the case ofhalation, which is sometimes a serious problem especiallyin spectrograph camera No. 2. A condensate slowly buildsup on the field flattener lens in front of the CCD and causesthe formation of haloes around bright sources. These usuallyappear as shoulders or a pedestal at the base of strong emis-sion lines, or adjacent to bright stars in the spatial direction.In some early 2dF data this halation could contribute a fur-ther 10–15 per cent to the total scattered light. This thensubstantially degraded the data, since it gave rise to both aloss of signal (the total amount lost to scattering must beconsiderably larger than the numbers reported here, whichrefer only to the light which lands on the CCD) and an in-
c© 2001 RAS, MNRAS 000, 1–21

The AAO’s 2dF Facility 17
Table 2. Properties of pairs of gratings available for use with2dF
Grating ρ λb dispersion (nm/pixel) resolution (nm)300B 300 420 0.43 0.90270R1 270 760 0.48 1.0316R1 316 750 0.41 0.85600V 600 500 0.22 0.441200B 1200 430 0.11 0.221200V 1200 500 0.11 0.221200R 1200 750 0.11 0.22
λb is the Littrow blaze wavelength. The resolution is the effectiveinstrumental resolution, either the projection of the fibre onto thedetector or 2 pixels, whichever is the larger. ρ is the ruling density(lines per mm).1 The 270R grating is paired with a 316R grating since the 270Rgrating master was no longer available when a duplicate was or-dered.
crease in noise. However, it can be kept to much lower limitsby careful monitoring and regular pumping of the cryogenicCCD cameras.
The level of light leaking from the fibre back-illumination within the spectrograph is a potential causefor concern. This can be tested by illuminating the fibrescontinuously while taking a dark CCD exposure and mea-suring the excess signal over a similar length exposure withno fibre back illumination. This has to be repeated for bothspectrographs and both plate combinations. Typically <1ADU of additional diffuse background signal is measuredfrom the permanently back illuminated case in a 5 minutedark exposure. In normal use the back illumination is onlyswitched on when the positioner robot requires to see thefibre. This results in a duty cycle of less than 10 per centso the light leaking from the back illumination is insignifi-cant for the typical length exposures of 20–40 minutes. Truedark current in the 2dF CCDs is at a negligible level formost purposes.
The quality and stability of the CCDs and controllersare very good and there is normally no need to take biasframes. The bias counts are well subtracted by using datafrom the overscan region of the data frames.
Details of the characteristics and performance ofthe CCDs can be obtained from the 2dF WWW pages(http://www.aao.gov.au/2df/). The two Tek 1024 CCDs inuse in 2dF are very similar in all respects. Prior to September1999 an engineering-grade CCD was in use in spectrographcamera No. 2; this too had similar characteristics, but witha few bad columns and some other cosmetic defects.
5.6 Data reduction and calibration
The pipeline data reduction system 2dfdr is a crucial com-ponent of 2dF, enabling observers to assess data quickly dur-ing the night and to come away at the end of an observingrun with fully reduced data. This was essential for the red-shift surveys, where it was necessary to keep pace with theincoming data and the quasi-on-line data reductions had tobe the final output. For most other projects, the many op-tions within 2dfdr make it a very powerful and convenienttool for producing high quality reduced data, providing it isused carefully and with a full understanding of the proce-dures.
Table 3. Broadband total efficiency measurements
Passband wavelength electrons/s/A efficiencyand magnitude (nm) (per cent)B = 17 440 0.6 2.8V = 17 550 0.6 4.3R =17 700 0.4 4.7
Aspects of the performance of 2dfdr are discussed inthe 2dF User Guide (http://www.aao.gov.au/2df/), by Bai-ley et al. (2001), by Colless et al. (2001) in the context ofthe redshift survey and in preceding sections of this paper.
There remain some situations where it is not initiallyclear whether a particular problem is a feature of the 2dFinstrument itself or an artefact of the data reduction pro-cess. A good example was afforded by the demonstrationby Croom et al. (2001) that there are apparent systematicvariations in throughput across the 2dF field. Their fig. 5is a contour plot, showing the difference between the ac-tual counts obtained and the expected magnitudes for over20,000 quasar candidates in the 2dF Quasar Redshift Sur-vey survey. It appears that the 2dF throughput is system-atically low at the western edge of the field, and that thepeak throughput is offset towards the eastern edge, wellaway from the field centre; the amplitude of the effect is±0.4 mag or about a factor of two. This result led to a rapidchecking of the astrometric and imaging performance of 2dF,but it seemed that neither positioning errors nor variationsin focus or image structure could explain the effect. A simi-lar effect, but at somewhat lower amplitude, was seen in thecorresponding galaxy redshift survey data.
It transpired that the cause lay in a partial failure ofthe sky subtraction procedure, combined with some detailsof the way in which the software calibrates the relative fibrethroughputs. Spectra near the edges of the CCD frame inthe 2dF spectrographs have slightly poorer resolution thanthe majority; this led to an underestimate of the strength ofnight sky lines in the spectra and an over-correction of thefibre throughput. Both effects led to an artificial increase inthe photon counts for spectra near the edges of the CCDs,which happen to come from fibres which populate the east-ern part of the 2dF field; conversely, spectra near the centreof the CCD which correspond to the western part of thefield (and which are actually the best quality spectra) ap-peared to be giving fewer counts. Correction of the originalsky subtraction error led to a much more symmetrical plotof counts versus magnitude, in which the peak is at the fieldcentre and there is some decrease all round the periphery, asexpected given the larger astrometric errors and somewhatworse imaging towards the edge of the 2dF field.
5.7 System throughput
The total system throughput (including atmosphere, tele-scope, fibres, instrumentation and detector quantum effi-ciency) has been determined by observing fields of severaldozen photometric standard stars to allow an average to bedetermined over a large number of fibres. With the 300Bgrating we measured the absolute efficiency (corrected to1.0 arcsec seeing) with typical values as given in Table 3.
Since the wavelength information in these broad-band measurements was insufficient, an improved relative
c© 2001 RAS, MNRAS 000, 1–21

18 Lewis et al.
throughput calibration was derived using about one hundredstars observed simultaneously with 2dF (Fig. 14). The rela-tive efficiency versus wavelength was determined by dividingthe observed spectra by model spectra that were chosen tobest match the stars’ broadband magnitudes.
Of course these efficiencies change with choice of grat-ing, the best performance comes with the use of the lowresolution 270R and 316R gratings where the blaze of thegrating matches the peak of the CCD quantum efficiency. Inthis case the system efficiency peaks at 9 per cent. For moredetails and signal to noise calculations see the 2dF WWWpages (http://www.aao.gov.au/cgi-bin/2dfsn.cgi).
5.8 Special sky subtraction techniques
While the main effort has gone into optimising the use of 2dFfor the large redshift surveys, i.e. for very large numbers oflow dispersion observations of relatively bright targets, it isclear that 2dF can be used in many other ways. Some of thescientific programs are described in the following section.Here we mention some technical factors relevant to otherapplications of 2dF.
The biggest questions are how faint can 2dF observa-tions be pushed, and what is the best way of maximising thesignal to noise ratio in a given observing time? This comesdown to two further questions: what is the best way of do-ing sky subtraction, and for how long can observations becontinued and still give a useful gain?
The redshift survey data, on which many of the perfor-mance figures quoted above are based, typically consist ofsets of 3×1100s integrations on sets of galaxies to B ∼ 19.5.The mean dark sky signal is approximately equal to 20 percent or less of the signal for most galaxies. For such obser-vations, the standard procedure is to allocate a fraction (atleast 5 per cent) of the fibres to random sky positions, derivea mean sky and scale this for each fibre. The same techniquewill work for total integration times of several hours andshould produce similar quality data for targets up to one ortwo magnitudes fainter. Beyond that, the observations willbe sky limited and the gains will go as the square root ofthe observing time, at best.
Two alternative techniques are classical beam switch-ing, in which pairs of fibres are placed equal distances apartand each target is observed alternately in either fibre, and‘nod & shuffle’ (Glazebrook et al. 1999; Glazebrook & Bland-Hawthorn 2001) where the image is moved rapidly (‘shuf-fled’) between an active and a storage area on the CCD,exactly in phase with the nodding of the telescope betweentargets and an offset sky position. Experiments with bothmethods were done with 2dF in January 2001. In theory, the‘nod & shuffle’ method should give the best results since theidentical optical path is used for the target and sky observa-tions, and because the switching is very fast compared withthe timescale of night sky line variations. Beam switchingshould be almost as good when time variations are not crit-ical and has the advantage that the target is always beingobserved, whereas ‘nod & shuffle’ is off-source for half thetime. Both types of switching are inefficient compared withconventional observing, in terms of the number of targetsobservable.
In practice neither mode gave dramatic gains in themagnitude range accessible to 2dF although sky subtraction
Figure 14. Figure showing the total 2dF system efficiency with300B gratings as a function of wavelength. The squares and di-amonds represent broadband absolute efficiency measurementsfrom 1997 January and 1999 November, respectively. The solidline was obtained from a relative throughput calibration usingdata from 2001 January scaled to approximately match the broad-band measurements.
can be improved to below 1 per cent using these methods.A serious drawback of any target-sky switching technique isthat it depends on finding clean sky apertures at the samefixed distance from every target. This becomes harder asthe number of targets increases. Moreover, to avoid dam-aging the signal for an object at say magnitude 21 requireshaving no objects in the sky aperture which are brighterthan magnitude 24 or 25, well below the detection limit ofthe Schmidt sky surveys or most wide field CCD images.
Essentially, it depends on whether the limit to the ac-curacy of sky subtraction is set by the photon statistics andfaint object contamination in the sky, or by the systematicerrors involved in transferring the sky from other fibres. Inthe case of 2dF, it seems that the operational complicationsand target losses inherent in beam switching mean that it isusually better to try to minimise the systematic errors andto continue to use the mean sky approach.
A more fruitful line may be to exploit the large num-bers of objects observable with 2dF to create mean spec-tra, rather than trying to increase the signal to noise ratioin each individual spectrum. One approach is to take largenumbers of targets selected to be almost identical from otherevidence (e.g. photometry, or an automatic spectral classi-fication scheme) and combine their spectra; a second is tosubdivide samples according to one or more strong spec-troscopic features, and then to combine the subsets to lookfor weaker features which may correlate with the strong fea-tures. Either way, spectra can be created with signal to noiseratio levels corresponding to hundreds or even thousands ofhours of observation.
5.9 Configuration efficiency
The current version of the configure software, which al-locates fibres to targets, has been optimised for the galaxyredshift survey (Colless et al. 2001). This is characterisedby having a mean target density of about 180 per squaredegree, fairly uniformly distributed across the sky, so that
c© 2001 RAS, MNRAS 000, 1–21

The AAO’s 2dF Facility 19
it was necessary to have an algorithm which could achieve avery high yield in allocating all 400 fibres when there wereoften only about 400 targets in the 2dF field. The galaxyredshift survey is able to allocate fibres to 94 per cent of theoriginal input target list (Colless et al. 2001).
Somewhat different constraints arise in other applica-tions, e.g. in crowded globular star clusters, in deep fieldsfrom CCD images, or when there are many fewer than 400targets. configure has several options for different waysof allocating fibres to targets and these can sometimes givesubstantially higher yields than running the default param-eters. For example, in crowded compact fields, it is best tocentre the targets and to limit the pivot angle through whichfibres can move. However, the maximum yields in very com-pact fields are not high, due to the size and shape of the2dF buttons and the requirement to leave safe clearance be-tween buttons and fibres. Over 300 fibres can be allocatedto targets within a 1◦ diameter field and approximately 100fibres can be allocated to objects in a 20 arcmin diameterfield, based on observations of dense globular clusters.
For sparse fields with fewer than 200 targets, it is oftenmore efficient to restrict the fibres to a single spectrograph,if only for ease of data reduction. For covering a wide rangeof magnitudes, e.g. in Galactic open star clusters, the targetsshould be split into subsets covering only 2 or 3 magnitudeseach. Note that the reconfiguration time becomes very shortfor small samples of stars, so it is not inefficient to use 2dFfor observations of relatively small numbers of bright stars(50 stars take about 5 minutes to configure).
Other techniques have also been used with the CON-
FIGURE software to send the light from blue objects toone spectrograph with a blue grating and red objects to thesecond spectrograph with a red optimised grating. A goodexample of this is given by Glazebrook et al. (2001).
2dF is not very efficient for doing short observationsof single targets such as standard stars. There is a proce-dure for placing a star down any desired fibre in an existingconfiguration, but it is rather slow and cumbersome, and itdepends on blind offsetting from a guide fibre to a targetfibre. If it is desired to measure many such stars, a betterprocedure is to prepare a special configuration with just afew fibres in a simple pattern at the field centre. For longobservations of single targets where accurate centering isimportant, it is necessary to have one or more bright guidestars in the same way as for a full 2dF configuration. Thisapplies especially to faint ‘targets of opportunity’ where itis essential to supply a target position, sky positions and anearby guide star.
A key design feature of 2dF, which has been little ex-ploited up to now, is the ability to keep track of differentialatmospheric refraction by setting up the same configura-tion on both field plates, but corrected for different hourangles. To observe the same field all night one should tum-ble between the two plates every hour or two, dependingon telescope attitude (see Fig. 1). However, setting up suchconfigurations is not trivial because there are small but sig-nificant geometrical differences between the two 2dF fieldplates. These mean that a configuration which is valid onone plate will fail on the other because of button and fibrecollisions, and because limits on fibre extensions and pivotangles are exceeded. These effects can be largely avoidedby setting up the starting configuration with extra clear-
ance around the buttons and reduced limits on the pivotangle. The minimum clearance, set by the 2dF hardware, is400 µm; setting this to 800 µm and setting the maximumpivot angle to 10◦ instead of the default 14◦ largely avoidscollisions when switching field plates or changing the con-figuration HA. There may be a decreased target yield sincethe fibres cannot be placed so close together, but in practicesuch losses are generally only a few per cent.
6 2DF SCIENCE
While the main science driver for the design of 2dF has beenthe large redshift surveys (Colless et al. 2001; Croom et al.2001), the inherent flexibility in the design of 2dF meansthat it is a unique facility for many other types of astronomy.
A diverse range of both galactic and extra-galacticastronomy problems have already been tackled using theunique area coverage and multiplex advantage of 2dF. Someof these are described briefly in this section. Some examplespectra obtained with 2dF are shown in Fig. 15.
Gilmore, Wyse, Norris and Freeman are using 2dF tomeasure radial velocities to an accuracy of 10 km−1 for sev-eral thousand F/G main sequnce stars at distances of 3−7kpc from the Sun in several sightlines through the Galaxy(Gilmore & Wyse 2001). These data will allow the statis-tical study of the kinematics and metallicity distributionsof stars in the Galactic thick disk and halo. Initial resultsinclude a new population of low metallicity stars with disk-like kinematics, possibly representing debris from a mergedsatellite.
Spectroscopy of large samples of faint stars in globularclusters have been obtained by Cannon, Croke, Da Costaand Norris (private comm.). Their objective is to comparethe chemical abundance variations seen in red giant starswith unevolved main sequence stars to determine whetherthese variations are due to self-enrichment during evolutionor are primordial. In the case of 47 Tucanae, the spectrashow clear separation into CN-strong and CN-weak stars.Combining the spectra for 50–100 stars in each class yieldsvery high signal to noise ratio spectra with more than 105
counts per pixel, making it possible to detect extremely weakfeatures and to look for correlations with other abundanceparameters.
Hatzidimitriou et al. (2000) have been using 2dF tostudy carbon stars in the Magellanic Clouds. Two observingruns yielded over 2000 carbon star spectra in both Clouds.These spectra have been used to map in fine detail the rota-tion and velocity dispersion across the LMC. The data arealso being used to classify and determine chemical abun-dances for the carbon stars.
Evans and Howarth (private comm.) are using 2dF toundertake a spectroscopic survey of massive stars in theSMC from an unbiased sample of bright blue field starsobtained from APM photometry. Over 4000 intermediateresolution spectra have already been obtained and used togenerate an observational H-R diagram. This can be com-pared with population synthesis models to investigate thefield star initial mass function for the SMC.
Drinkwater et al. (2000) are carrying out a complete,unbiased survey of the Fornax cluster by obtaining 2dF spec-tra for all objects down to Bj=19.7 in a 12 square degree
c© 2001 RAS, MNRAS 000, 1–21
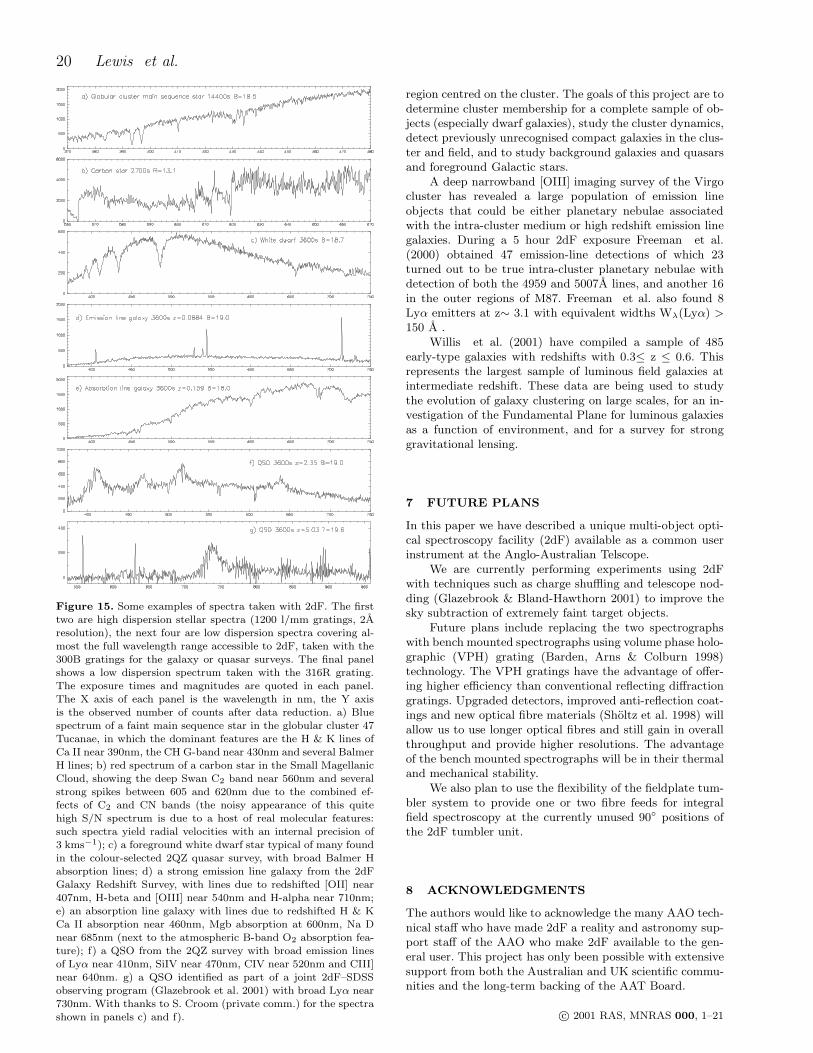
20 Lewis et al.
Figure 15. Some examples of spectra taken with 2dF. The firsttwo are high dispersion stellar spectra (1200 l/mm gratings, 2Aresolution), the next four are low dispersion spectra covering al-most the full wavelength range accessible to 2dF, taken with the300B gratings for the galaxy or quasar surveys. The final panelshows a low dispersion spectrum taken with the 316R grating.The exposure times and magnitudes are quoted in each panel.The X axis of each panel is the wavelength in nm, the Y axisis the observed number of counts after data reduction. a) Bluespectrum of a faint main sequence star in the globular cluster 47Tucanae, in which the dominant features are the H & K lines ofCa II near 390nm, the CH G-band near 430nm and several BalmerH lines; b) red spectrum of a carbon star in the Small MagellanicCloud, showing the deep Swan C2 band near 560nm and severalstrong spikes between 605 and 620nm due to the combined ef-fects of C2 and CN bands (the noisy appearance of this quitehigh S/N spectrum is due to a host of real molecular features:such spectra yield radial velocities with an internal precision of3 kms−1); c) a foreground white dwarf star typical of many foundin the colour-selected 2QZ quasar survey, with broad Balmer Habsorption lines; d) a strong emission line galaxy from the 2dFGalaxy Redshift Survey, with lines due to redshifted [OII] near407nm, H-beta and [OIII] near 540nm and H-alpha near 710nm;e) an absorption line galaxy with lines due to redshifted H & KCa II absorption near 460nm, Mgb absorption at 600nm, Na Dnear 685nm (next to the atmospheric B-band O2 absorption fea-ture); f) a QSO from the 2QZ survey with broad emission linesof Lyα near 410nm, SiIV near 470nm, CIV near 520nm and CIII]near 640nm. g) a QSO identified as part of a joint 2dF–SDSSobserving program (Glazebrook et al. 2001) with broad Lyα near730nm. With thanks to S. Croom (private comm.) for the spectrashown in panels c) and f).
region centred on the cluster. The goals of this project are todetermine cluster membership for a complete sample of ob-jects (especially dwarf galaxies), study the cluster dynamics,detect previously unrecognised compact galaxies in the clus-ter and field, and to study background galaxies and quasarsand foreground Galactic stars.
A deep narrowband [OIII] imaging survey of the Virgocluster has revealed a large population of emission lineobjects that could be either planetary nebulae associatedwith the intra-cluster medium or high redshift emission linegalaxies. During a 5 hour 2dF exposure Freeman et al.(2000) obtained 47 emission-line detections of which 23turned out to be true intra-cluster planetary nebulae withdetection of both the 4959 and 5007A lines, and another 16in the outer regions of M87. Freeman et al. also found 8Lyα emitters at z∼ 3.1 with equivalent widths Wλ(Lyα) >
150 A .Willis et al. (2001) have compiled a sample of 485
early-type galaxies with redshifts with 0.3≤ z ≤ 0.6. Thisrepresents the largest sample of luminous field galaxies atintermediate redshift. These data are being used to studythe evolution of galaxy clustering on large scales, for an in-vestigation of the Fundamental Plane for luminous galaxiesas a function of environment, and for a survey for stronggravitational lensing.
7 FUTURE PLANS
In this paper we have described a unique multi-object opti-cal spectroscopy facility (2dF) available as a common userinstrument at the Anglo-Australian Telscope.
We are currently performing experiments using 2dFwith techniques such as charge shuffling and telescope nod-ding (Glazebrook & Bland-Hawthorn 2001) to improve thesky subtraction of extremely faint target objects.
Future plans include replacing the two spectrographswith bench mounted spectrographs using volume phase holo-graphic (VPH) grating (Barden, Arns & Colburn 1998)technology. The VPH gratings have the advantage of offer-ing higher efficiency than conventional reflecting diffractiongratings. Upgraded detectors, improved anti-reflection coat-ings and new optical fibre materials (Sholtz et al. 1998) willallow us to use longer optical fibres and still gain in overallthroughput and provide higher resolutions. The advantageof the bench mounted spectrographs will be in their thermaland mechanical stability.
We also plan to use the flexibility of the fieldplate tum-bler system to provide one or two fibre feeds for integralfield spectroscopy at the currently unused 90◦ positions ofthe 2dF tumbler unit.
8 ACKNOWLEDGMENTS
The authors would like to acknowledge the many AAO tech-nical staff who have made 2dF a reality and astronomy sup-port staff of the AAO who make 2dF available to the gen-eral user. This project has only been possible with extensivesupport from both the Australian and UK scientific commu-nities and the long-term backing of the AAT Board.
c© 2001 RAS, MNRAS 000, 1–21
The AAO’s 2dF Facility 21
REFERENCES
Bailey J.A., Glazebrook K., Offer A.R., Taylor K., 2001, MNRAS,submitted
Barden S.C., Armandroff T., Muller G., Rudeen A.C., Lewis J.,Groves L., 1994, in Crawford D.L., Craine E.L., eds, Proc.SPIE 2198, Instrumentation in Astronomy VIII, p. 87
Barden S.C., Arns J.A., Colburn W.S., 1998, in D’Odorico S.,ed., Proc. SPIE 3355, Optical Astronomical Instrumentation,p. 866
Cannon R.D., 1997, in Kontizas E. et al. , eds, Proc. IAU Com-mission 9, Widefield Spectroscopy 40, p. 33
Cannon R.D., 2000, AAO Newsletter, 92, 14
Colless M., et al. , 2001, MNRAS, in press
Croom S.M., Smith R.J., Boyle B.J., Shanks T., Loaring N.,Miller L., Lewis I.J., 2001, MNRAS, 322 ,L29
Drinkwater M., et al. , 2000, A&A, 355, 900
Farrell T.J., Bailey J.A., Shortridge K., 1995, in Shaw R.A., andHayes J.J.E., eds, ASP Conf. Ser. Vol. 77, Astronomical DataAnalysis and Systems IV, Astron. Soc. Pac., San Francisco,p. 133
Freeman K.C. et al. , 2000, in Combes F., Mamon G.A., Char-mandaris V., eds, ASP Conf. Ser. Vol. 197, Dynamics ofGalaxies; 15th AIP Meeting, Astron. Soc. Pac., San Francisco,p. 389
Gilmore G., Wyse R.F.G., 2001, in Deiters S., Fuchs B., JustA., Spurzem R., Wielen R., eds, ASP Conf. Ser. Vol. 228,Dynamics of Star Clusters and the Milky Way, Astron. Soc.Pac., San Francisco, in press
Glazebrook K, Bland-Hawthorn J., Farrell T.J., Waller L.G., Bar-ton J.R., Lewis I.J., 1999, AAO Newsletter, 90, 11
Glazebrook K., Bland-Hawthorn J., 2001, PASP, 113, 197
Glazebrook K., Tsvetanov Z., Zheng W., Hoversten E., Chiu K.,Bridges T., Boyle B., 2001, AAO Newsletter, 98, 4
Gray P. M., Taylor K., 1990, in Crawford D.L., ed., Proc. SPIE1235, Instrumentation in Astronomy VII, p. 709
Gray P. M., 1983, in Boksenberg A., Crawford D.L., eds, Proc.SPIE 445, Instrumentation in Astronomy V, p. 57
Gray P. M., Taylor K., Parry I. R., Lewis I. J., Sharples R. M.,1993, in Gray P.M., ed., ASP Conf. Ser. Vol. 37, Fibre Opticsin Astronomy II, Astron. Soc. Pac., San Francisco, p. 145
Guerin J., Bellenger R., Dreux M., Felenbok P., Fernandez A.,Rousset G., Schmidt R., 1993, in Gray P.M., ed., ASP Conf.Ser. Vol. 37, Fiber Optics in Astronomy II, Astron. Soc. Pac.,San Francisco, p. 138
Hatzidimitriou D., Cannon R.D., Croke B.F., Morgan D.H., 2000,in Combes F., Mamon G.A., Charmandaris V., eds, ASPConf. Ser. Vol. 197, Dynamics of Galaxies; 15th AIP Meeting,Astron. Soc. Pac., San Francisco, p. 347
Hill J.M., Lesser M.P., 1986, in Crawford D.L., ed., Proc. SPIE627, Instrumentation in Astronomy VI, p. 303
Høg, E., Fabricius, C., Makarov, V. V., Bastian, U., Schwek-endiek, P., Wicenec, A., Urban, S., Corbin, T., Wycoff, G.,2000, A&A, 357, 367
Jenkins C.R., Gellatly D.W., Bingham R.G., Worswick S.P., 1993,in Gray P.M., ed., ASP Conf. Ser. Vol. 37, Fiber Optics inAstronomy II, Astron. Soc. Pac., San Francisco, p. 209
Jones D. J. A., 1993, in Gray P.M., ed., ASP Conf. Ser. Vol. 37,Fibre Optics in Astronomy II, Astron. Soc. Pac., San Fran-cisco, p. 355
Jones D. J. A., 1994, Applied Optics, 33, 7362
Lewis I. J., Parry I. R., 1990, in Crawford D.L., ed., Proc. SPIE1235, Instrumentation in Astronomy VII, p. 745
Lewis I. J., Parry I. R., Sharples R. M., Taylor K., 1993, in GrayP.M., ed., ASP Conf. Ser. Vol. 37, Astron. Soc. Pac., SanFrancisco, p. 249
Lewis I.J., Glazebrook K., Taylor K., 1998a, in Arribas S., Me-diavilla E.,Watson F.G., eds, ASP Conf. Ser. Vol. 152, Fibre
optics in Astronomy III, Astron. Soc. Pac., San Francisco, p.
71Lewis I.J., Glazebrook K., Taylor K., 1998b, in D’Odorico S., ed.,
Proc. SPIE 3355, Optical Astronomical Instrumentation, p.828
Parker Q.A., Watson F.G., Miziarski S., 1998, in Arribas S., Me-diavilla E., Watson F.G., eds, ASP Conf. Ser. Vol. 152, Fibreoptics in Astronomy III, Astron. Soc. Pac., San Francisco, p.80
Parry I.R., Gray P.M., 1986, in Crawford D.L., ed., Proc. SPIE627, Instrumentation in Astronomy VI, p. 118
Parry I. R., Sharples R. M., Lewis I. J., Gray P. M., 1993, in GrayP.M., ed., ASP Conf. Ser. Vol. 37, Fibre Optics in AstronomyII, Astron. Soc. Pac., San Francisco, p. 36
Parry I.R., Lewis I.J., Sharples R.M., Dodsworth G.N., WebsterJ., Gellatly D.W., Jones L.R., Watson F.G., 1994, in CrawfordD.L., Craine E.L., eds, Proc. SPIE 2198, Instrumentation inAstronomy VIII, p. 125
Royal Astronomical Society Report, 1986, Review of ScientificPriorities for UK Astronomical Research, 1990 to 2000, Lon-don, RAS
Roeser S., Bastian U., 1988, A&AS, 74, 449Sadler E.M., Harrison S., Lee S., 1991, AAO Observing Guide
UM1.4Shectman S.A., 1993, in Gray P.M., ed., ASP Conf. Ser. Vol. 37,
Fibre Optics in Astronomy II, Astron. Soc. Pac., San Fran-cisco, p. 26
Sholtz G.F., Vydra J., Lu G., Fabricant D., 1998, in Arribas S.,Mediavilla E., Watson F.G., eds, ASP Conf. Ser. Vol. 152, Fi-bre optics in Astronomy III, Astron. Soc. Pac., San Francisco,p. 20
Smith G., Lankshear A., 1998, in D’Odorico S., ed., Proc. SPIE3355, Optical Astronomical Instrumentation, p. 905
Taylor K., Gray P.M., 1990, in Barr L.D., ed., Proc SPIE 1236,Advanced Technology Optical Telescopes IV, p. 290
Taylor K., Gray P.M., 1993, in Gray P.M., ed., ASP Conf. Ser.Vol. 37, Fiber Optics in Astronomy II, Astron. Soc. Pac., SanFrancisco, p. 379
Taylor K., Gray P.M., 1994, in Crawford D.L., Craine E.L., eds,Proc. SPIE 2198, Instrumentation in Astronomy VIII, p. 136
Taylor K., Bailey J.A., Wilkins T., Glazebrook K., 1996, in JacobyG.H., Barnes J., eds, ASP Conf. Ser. Vol 101, AstronomicalData Analysis and Systems V, Astron. Soc. Pac., San Fran-cisco, p. 195
Taylor K., Cannon R.D., Watson F.G., 1996, in Ardeberg A., ed.,Proc SPIE 2871, Optical Telescopes of Today and Tomorrow,p. 145
Watson F.G, Gray P.M., Oates A.P., Lankshear A., Dean R.G.,1993, in Gray P.M., ed., ASP Conf. Ser. Vol 37, Fibre Opticsin Astronomy II, Astron. Soc. Pac., San Francisco, p. 171
Wilcox J.K., 1993, in Gray P.M., ed., ASP Conf. Ser. Vol. 37,Fiber Optics in Astronomy II, Astron. Soc. Pac., San Fran-cisco, p. 51
Willis J.P., Hewett P.C., Warren S.J., 2001, MNRAS, 325, 1002Wynne C.G., 1989, MNRAS, 165, 47pYork D.G. et al. , 2000, AJ, 120, 1579
This paper has been produced using the Royal AstronomicalSociety/Blackwell Science LATEX style file.
c© 2001 RAS, MNRAS 000, 1–21