The Bolocam Lockman Hole Millimeter-Wave Galaxy Survey: Galaxy Candidates and Number Counts
Upload
independentCategory
view
2download
0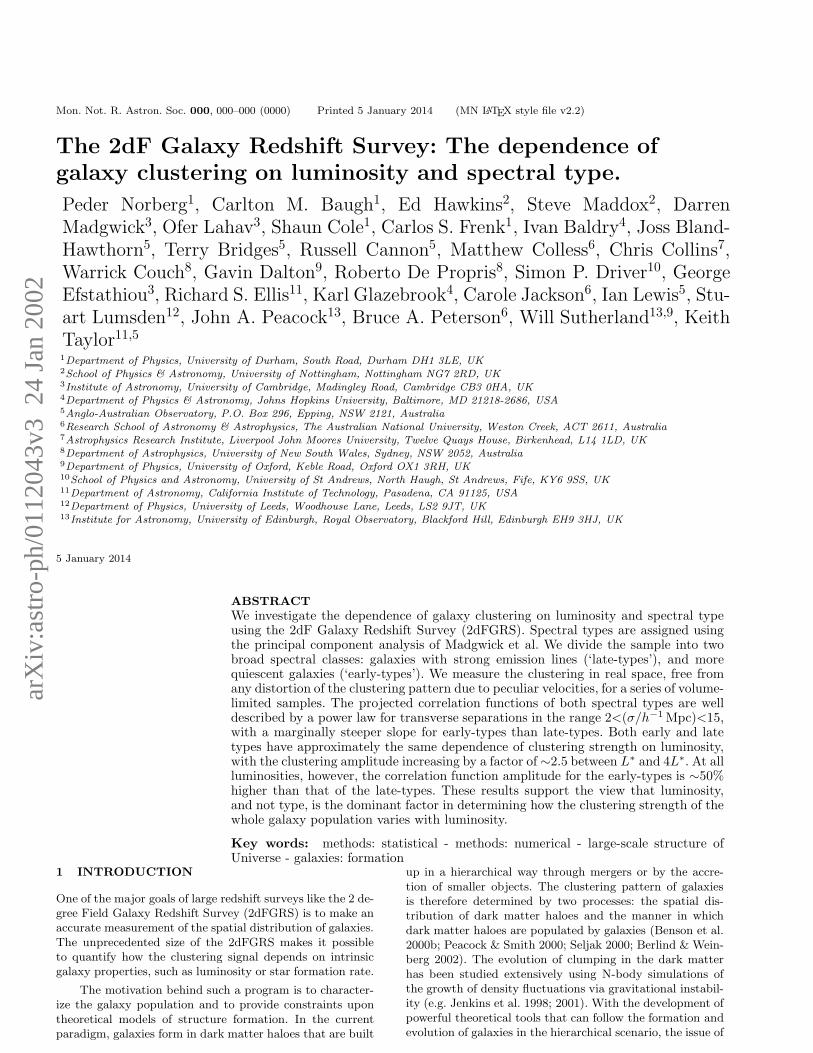
arX
iv:a
stro
-ph/
0112
043v
3 2
4 Ja
n 20
02
Mon. Not. R. Astron. Soc. 000, 000–000 (0000) Printed 5 January 2014 (MN LATEX style file v2.2)
The 2dF Galaxy Redshift Survey: The dependence of
galaxy clustering on luminosity and spectral type.
Peder Norberg1, Carlton M. Baugh1, Ed Hawkins2, Steve Maddox2, Darren
Madgwick3, Ofer Lahav3, Shaun Cole1, Carlos S. Frenk1, Ivan Baldry4, Joss Bland-
Hawthorn5, Terry Bridges5, Russell Cannon5, Matthew Colless6, Chris Collins7,
Warrick Couch8, Gavin Dalton9, Roberto De Propris8, Simon P. Driver10, George
Efstathiou3, Richard S. Ellis11, Karl Glazebrook4, Carole Jackson6, Ian Lewis5, Stu-
art Lumsden12, John A. Peacock13, Bruce A. Peterson6, Will Sutherland13,9, Keith
Taylor11,5
1Department of Physics, University of Durham, South Road, Durham DH1 3LE, UK2School of Physics & Astronomy, University of Nottingham, Nottingham NG7 2RD, UK3Institute of Astronomy, University of Cambridge, Madingley Road, Cambridge CB3 0HA, UK4Department of Physics & Astronomy, Johns Hopkins University, Baltimore, MD 21218-2686, USA5Anglo-Australian Observatory, P.O. Box 296, Epping, NSW 2121, Australia6Research School of Astronomy & Astrophysics, The Australian National University, Weston Creek, ACT 2611, Australia7Astrophysics Research Institute, Liverpool John Moores University, Twelve Quays House, Birkenhead, L14 1LD, UK8Department of Astrophysics, University of New South Wales, Sydney, NSW 2052, Australia9Department of Physics, University of Oxford, Keble Road, Oxford OX1 3RH, UK10School of Physics and Astronomy, University of St Andrews, North Haugh, St Andrews, Fife, KY6 9SS, UK11Department of Astronomy, California Institute of Technology, Pasadena, CA 91125, USA12Department of Physics, University of Leeds, Woodhouse Lane, Leeds, LS2 9JT, UK13Institute for Astronomy, University of Edinburgh, Royal Observatory, Blackford Hill, Edinburgh EH9 3HJ, UK
5 January 2014
ABSTRACT
We investigate the dependence of galaxy clustering on luminosity and spectral typeusing the 2dF Galaxy Redshift Survey (2dFGRS). Spectral types are assigned usingthe principal component analysis of Madgwick et al. We divide the sample into twobroad spectral classes: galaxies with strong emission lines (‘late-types’), and morequiescent galaxies (‘early-types’). We measure the clustering in real space, free fromany distortion of the clustering pattern due to peculiar velocities, for a series of volume-limited samples. The projected correlation functions of both spectral types are welldescribed by a power law for transverse separations in the range 2<(σ/h−1 Mpc)<15,with a marginally steeper slope for early-types than late-types. Both early and latetypes have approximately the same dependence of clustering strength on luminosity,with the clustering amplitude increasing by a factor of ∼2.5 between L∗ and 4L∗. At allluminosities, however, the correlation function amplitude for the early-types is ∼50%higher than that of the late-types. These results support the view that luminosity,and not type, is the dominant factor in determining how the clustering strength of thewhole galaxy population varies with luminosity.
Key words: methods: statistical - methods: numerical - large-scale structure ofUniverse - galaxies: formation
1 INTRODUCTION
One of the major goals of large redshift surveys like the 2 de-gree Field Galaxy Redshift Survey (2dFGRS) is to make anaccurate measurement of the spatial distribution of galaxies.The unprecedented size of the 2dFGRS makes it possibleto quantify how the clustering signal depends on intrinsicgalaxy properties, such as luminosity or star formation rate.
The motivation behind such a program is to character-ize the galaxy population and to provide constraints upontheoretical models of structure formation. In the currentparadigm, galaxies form in dark matter haloes that are built
up in a hierarchical way through mergers or by the accre-tion of smaller objects. The clustering pattern of galaxiesis therefore determined by two processes: the spatial dis-tribution of dark matter haloes and the manner in whichdark matter haloes are populated by galaxies (Benson et al.2000b; Peacock & Smith 2000; Seljak 2000; Berlind & Wein-berg 2002). The evolution of clumping in the dark matterhas been studied extensively using N-body simulations ofthe growth of density fluctuations via gravitational instabil-ity (e.g. Jenkins et al. 1998; 2001). With the development ofpowerful theoretical tools that can follow the formation andevolution of galaxies in the hierarchical scenario, the issue of

2 The 2dFGRS collaboration
how galaxies are apportioned amongst dark matter haloescan be addressed, and detailed predictions of the clusteringof galaxies are now possible (Kauffmann, Nusser & Stein-metz 1997; Kauffmann et al. 1999; Benson et al. 2000a,b;Somerville et al. 2001).
The first attempt to quantify the difference betweenthe clustering of early and late-type galaxies was made us-ing a shallow angular survey, the Uppsala catalogue, withmorphological types assigned from visual examination of thephotographic plates (Davis & Geller 1976). Elliptical galax-ies were found to have a higher amplitude angular corre-lation function than spiral galaxies. In addition, the slopeof the correlation function of ellipticals was steeper thanthat of spiral galaxies at small angular separations. Morerecently, the comparison of clustering for different types hasbeen extended to three dimensions using redshift surveys.Again, similar conclusions have been reached in these stud-ies, namely that ellipticals have a stronger clustering ampli-tude than spirals (Lahav & Saslaw 1992; Santiago & Strauss1992; Iovino et al. 1993; Hermit et al. 1996; Loveday et al.1995; Guzzo et al. 1997; Willmer et al. 1998).
The subjective process of visual classification can nowbe superseded by objective, automated algorithms to quan-tify the shape of a galaxy. One recent example of such ascheme can be found in Zehavi et al. (2002), who measureda “concentration parameter” for 30 000 galaxy images fromthe Sloan Digital Sky Survey, derived from the radii of differ-ent isophotes. Again, based upon cuts in the distribution ofconcentration parameter, early-types are found to be moreclustered than late-types.
In this paper, we employ a different method to classifygalaxies, based upon a principal component analysis (PCA)of galaxy spectra, which is better suited to the 2dFGRSdata (Madgwick et al. 2002). This technique has a numberof attractive features. First, the PCA approach is completelyobjective and reproducible. An equivalent analysis can, forexample, be applied readily to spectra produced by theo-retical models of galaxy formation or to spectra obtainedin an independent redshift survey. Secondly, the PCA canbe applied over the full magnitude range of the 2dFGRS,whenever the spectra are of sufficient signal to noise (seeSection 2.2). For the 2dFGRS, the image quality is adequateto permit a visual determination of morphological type onlyfor galaxies brighter than bJ ≃ 17, which comprise a mere5% of the spectroscopic sample.
Two previous clustering studies have used spectral in-formation to select galaxy samples. Loveday, Tresse & Mad-dox (1999) grouped galaxies in the Stromlo-APM redshiftsurvey into three classes based upon the equivalent widthof either the Hα or OII lines, and found that galaxieswith prominent emission lines display weaker clustering thanmore quiescent galaxies. Tegmark & Bromley (1999) mea-sured the relative bias between different spectral classes inthe Las Campanas redshift survey (Shectman et al. 1996),using a classification derived from PCA analysis (Bromley etal. 1998), and also found that early spectral types are morestrongly clustered than late spectral types. (See also Blan-ton 2000 for a revision of Tegmark & Bromley’s analysis,which takes into account the effect of errors in the surveyselection function.)
Here, we use the 2dFGRS survey to measure the depen-dence of galaxy clustering jointly on luminosity and spectral
type, adding an extra dimension to the analysis carried outby Norberg et al. (2001). Previously, a pioneering study ofbivariate galaxy clustering, in terms of luminosity and mor-phological type, was carried out using the Stromlo-APMredshift survey (Loveday et al. 1995). To place the analy-sis presented here in context, the samples that we considercover a larger volume and, despite being volume-limited (seeSection 2.4), typically contain over an order of magnitudemore galaxies than those available to Loveday et al.
We give a brief overview of the 2dFGRS in Section 2,along with details of the spectral classification and an ex-planation of how the samples used in the clustering analy-sis were constructed. The estimation of the redshift spacecorrelation function and its real space counterpart, the pro-jected correlation function, are outlined in Section 3. A briefoverview of the clustering of 2dFGRS galaxies in redshiftspace, selected by luminosity and spectral type, is given inSection 4; a more detailed analysis of the redshift space clus-tering can be found in Hawkins et al. (2002). We present themain results of the paper in Section 5 and conclude in Sec-tion 6.
2 THE DATA
2.1 The 2dFGRS sample
Detailed descriptions of the construction of the 2dFGRS andits properties are given by Colless et al. (2001). In summary,galaxies are selected down to a magnitude limit of bJ ≈
19.45 from the APM Galaxy Survey (Maddox et al. 1990a,b,1996, 2002). The sample considered in this paper consists ofover 160 000 redshifts measured prior to May 2001. We focusour attention on the two large contiguous volumes of thesurvey, one centred on the Southern Galactic Pole (hereafterSGP) and the other close to the direction of the NorthernGalactic Pole (NGP).
2.2 Spectral classification of 2dFGRS galaxies
The spectral properties of 2dFGRS galaxies are charac-terized using the principal component analysis (PCA) de-scribed by Madgwick et al. (2002). This analysis makes useof the spectral information in the rest-frame wavelengthrange 3700A to 6650A, thereby including all the major op-tical diagnostics between OII and Hα. For galaxies withz > 0.15, sky absorption bands contaminate the Hα line.Since this can affect the stability of the classification, we re-strict our analysis to galaxies with z < 0.15 following Madg-wick et al. (2002).
The 2dFGRS spectra are classified by a single parame-ter, η, which is a linear combination of the first and secondprincipal components. This combination has been chosenspecifically to isolate the relative strength of emission andabsorption lines present in each galaxy’s spectrum, therebyproviding a diagnostic which is robust to the instrumentaluncertainties that affect the calibration of the continuum.Physically, this parameter is related to the star formationrate in a galaxy, as is apparent from the tight correlationof η with the equivalent width of Hα in emission line galax-ies (Bland-Hawthorn et al. 2002). In this paper, we divide
The 2dF Galaxy Redshift Survey: The dependence of galaxy clustering on luminosity and spectral type. 3
Figure 1. A comparison between the morphological classificationof bright (bJ < 17.0) APM galaxies by Loveday (1996) with the2dFGRS spectral classification, as quantified by the continuousvariable η (see text and Madgwick et al. 2002 for the definition).The morphological classification distinguishes between elliptical(Ell), lenticular (S0), spiral (Sp) and irregular (Irr) galaxies. Allgalaxies with both a morphological classification and a spectralclassification are plotted. The Non-classified (Nc) class containsobjects for which morphological classification was attempted butfor which Loveday was unable to assign a type. The squares showthe median value of η for each morphological class defined byLoveday, and the error bars show the 10-90 percentile range.
Figure 2. The histograms, plotted with Poisson error bars, showthe success rate for assigning a spectral type to a targeted galaxyas a function of apparent magnitude. Two field completeness (cF,defined in text) ranges are shown, as indicated by the values atthe top of each panel. The redshift completeness, i.e. the fractionof targeted galaxies for which a redshift is measured, is shown bythe dotted lines. The spectral classification completeness, i.e. thefraction of galaxies with measured redshifts below z = 0.15 thathave spectra of sufficient signal-to-noise to be used in the PCA,is shown by the dashed lines. (The dotted and dashed curvesshow parametric fits to the inferred redshift completeness andspectral classification completeness respectively.) The model forthe spectral classification success rate, shown by the solid lines,is the product of the dotted and dashed lines in each panel, andis a good fit to the histogram in each case.
the 2dFGRS sample into two broad, distinct classes: galax-ies with spectra for which the PCA returns η < −1.4, andwhich we refer to, for the sake of brevity, as early-type, andgalaxies with η > −1.4, which we call late-type. The distri-bution of η for 2dFGRS spectra displays a shoulder featureat this value (see Fig. 4 of Madgwick et al. 2002).
The spectral type of a galaxy, as given by the value ofη, clearly depends upon its physical properties and is there-fore a useful and effective way in which to label galaxies.Nevertheless, it is still instructive to see how well, if at all,η correlates with the morphogical type assigned in a sub-jective fashion from a galaxy image. Madgwick et al. (2002)show that there is a reasonable correspondence between ηand morphological type, using high signal-to-noise spectraand photometry taken from Kennicutt (1992); η ≃ −1.4approximately delineates the transition between early andlate morphological types in bJ. We revisit the comparisonbetween classifications based on spectral and morphologicaltypes in Fig. 1, this time using 2dFGRS spectra and UKSchmidt images. The horizontal axis shows the morpholog-ical type assigned to a subset of bright APM galaxies byLoveday (1996). Although there is a substantial amount ofscatter in the η values of spectra that lie within a givenmorphological class, it is reassuring to see that the medianη does correlate with morphological class. Moreover, the me-dian η values match up well with the broad division that weemploy to separate early and late types. Galaxies denoted“early-type” on the basis of their morphology have a medianη that is smaller than our fiducial value of η = −1.4 and vice-versa for late-types. In practice, for the samples analysed inthis paper, the correspondence between morphological typeand spectral class will be better than suggested by Fig. 1.This is because the sample used in the comparison in Fig. 1consists of nearby extended galaxies, and so the distributionof spectral types is distorted somewhat by aperture effects(see e.g. Kochanek, Pahre & Falco 2002; Madgwick et al.2002). This effect arises because the fibres used to collectthe galaxy spectra are of finite size (subtending 2” on thesky). For this reason, when we measure the spectrum of anearby galaxy it is possible that a disproportionate amountof light will be sampled from the bulge, thereby making thegalaxy appear systematically redder or “earlier” in type. Wefind that this effect is only significant for the most nearbygalaxies (z < 0.05) and should be completely negligible be-yond z ∼ 0.1 (Madgwick et al. 2002).
2.3 Sample Selection
In order to construct an optimal sample for the measure-ment of the two point correlation function, we select regionswith high completeness in terms of measured redshifts, us-ing a redshift completeness mask for the 2dFGRS, similar tothe one described in Colless et al. (2001; see also Norberg etal. 2002). Such a mask is required because of the tiling strat-egy adopted to make the best use of the allocated telescopetime, along with the fact that the survey is not yet finished.An additional consideration is the success rate with whichspectral types have been assigned to galaxies, which dependsupon the signal-to-noise ratio of the galaxy spectrum.
In Fig. 2, we show histograms of the spectral classi-fication success rate for two different ranges of field com-pleteness, cF, which is defined as the ratio of the number
4 The 2dFGRS collaboration
of measured redshifts in a given 2dF field to the numberof targets. The spectral classification success rate has twocontributions. The first of these is the redshift complete-ness, shown by the dotted curve. This incompleteness arisesbecause we do not always succeed in measuring a redshiftfor a targeted object. The redshift incompleteness is nec-essarily small for the high completeness fields contributingto the histograms. The second contribution is the spectralclassification completeness. Galaxies do not recieve a spec-tral classification when a redshift is measured with z ≤ 0.15(and is therefore within the redshift range over which thePCA can be carried out), but the spectrum has too smalla signal-to-noise ratio for the PCA to be applied success-fully (typically S/N < 10). The spectral classification suc-cess rate is given by the product of these two contributions.Our model for this effect, plotted as the solid curves in eachpanel of Fig. 2, is in good agreement with the success raterealised in the 2dFGRS, shown by the histograms.
Rather than weight the data to compensate for a spec-tral classification success rate below 100%, we instead mod-ulate the number of unclustered or random points laid downin each field in the clustering analysis to take into accountthe varying success rate. We have conducted a number oftests in which we varied the completeness thresholds used,adopted different weighting schemes using samples of highercompleteness, and we have also compared our results withthose from Norberg et al. (2001), whose samples are not sub-ject to spectral classification incompleteness. The results ofthese tests confirm that our clustering measurements arerobust to changes to the details of how we model the incom-pleteness; this is largely due to our practice of restricting theanalysis to high completeness fields. Excluding areas belowour relatively high sector completeness threshold (see Collesset al. 2001 for a definition), we estimate that the effectivesolid angle used in the SGP region is ∼ 380
, and in theNGP 250
.
2.4 Constructing a volume-limited sample
We analyse a series of volume-limited samples drawn fromthe 2dFGRS, following the strategy adopted by Norberg etal. (2001). The chief advantage of this approach is simplic-ity; the radial distribution of galaxies is uniform apart frommodulations in space density due to clustering. Therefore,the complication of modelling the radial selection function ina flux-limited survey is avoided. This is particularly appeal-ing for the current analysis, as separate selection functionswould be required for each class of spectral type studied,since Madgwick et al. (2002) have demonstrated that galax-ies with different spectral types have different luminosityfunctions.
The disadvantage of using volume-limited samples isthat a large fraction of galaxies in the flux-limited cata-logue do not satisify the selection criteria. As Norberg etal. (2001) point out, a volume-limited sample specified bya range in absolute magnitude has both a lower (zmin) andan upper redshift cut (zmax), because the flux-limited cata-logue has, in practice, bright and faint apparent magnitudelimits. This seemingly profligate use of galaxy redshifts wasa serious problem for previous generations of redshifts sur-veys. This is not, however, the case for the 2dFGRS, whichcontains sufficient galaxies to permit the construction of
large volume-limited samples defined both by luminosity andspectral type. As we demonstrate in section 5, the volume-limited samples we analyse are large enough, both in termsof volume and number of galaxies, to give extremely robustclustering measurements.
To construct a volume-limited sample, it is necessaryto estimate the absolute magnitude that each galaxy wouldhave at z = 0. This requires assumptions about the variationof galaxy luminosity with wavelength and with redshift, orequivalently, with cosmic time. We make use of the classdependent k-corrections derived by Madgwick et al. (2002).The mean weighted k-corrections are given by the followingexpressions:
k(z) = 2.6z + 4.3z2 (early − types) (1)
k(z) = 1.5z + 2.1z2 (late − types) (2)
k(z) = 1.9z + 2.7z2 (full sample). (3)
These k-corrections have the appeal that they are extracteddirectly in a self-consistent way from 2dFGRS spectra. How-ever, no account is taken of evolution in the galaxy spectrum.The explicit inclusion of evolution could lead to the am-biguous situation whereby a galaxy’s spectral type changeswith redshift. We have checked that our results are, in fact,insensitive to the precise choice of k-correction, comparingclustering results obtained with the spectral type dependentk-corrections given above with those obtained when a globalk + e-correction (i.e. making an explicit attempt to accountfor galaxy evolution, albeit in an average sense) is applied(as in Norberg et al. 2001).
Since the k-corrections are class dependent, the zmin
and zmax values corresponding to a given absolute magni-tude range are also slightly class dependent. Hence, the vol-umes defining the samples for two different spectral classesfor the same bin in absolute magnitude will not coincide ex-actly. In addition to this subtle class dependent definition ofthe volumes, the values of zmin and zmax vary slightly withposition on the sky. This is due to revisions made to the mapof galactic extinction (Schlegel, Finkbeiner & Davis 1998)and to the CCD recalibration of APM plate zero-points sincethe definition of the original input catalogue.
Finally, throughout the paper, we adopt an Ω0 = 0.3,Λ0 = 0.7 cosmology to convert redshift into comoving dis-tance. The relative clustering strength of our samples is in-sensitive to this choice.
3 ESTIMATING THE TWO-POINT
CORRELATION FUNCTION
The galaxy correlation function is estimated on a two dimen-sional grid of pair separation parallel (π) and perpendicular(σ) to the line-of-sight. To estimate the mean density ofgalaxy pairs, a catalogue of randomly positioned points isgenerated with the same angular distribution and the samevalues of zmin and zmax as the data, taking into account thecompleteness of the survey as a function of position on thesky, as described in Section 2.3. The correlation function isestimated using
ξH =DD RR
DR2− 1 , (4)

The 2dF Galaxy Redshift Survey: The dependence of galaxy clustering on luminosity and spectral type. 5
(a) −18.0 ≥ MbJ − 5 log10 h ≥ −19.0
(b) −20.0 ≥ MbJ − 5 log10 h ≥ −21.0
Figure 3. The spatial distribution of 2dFGRS galaxies in the SGP. The panels show the redshift and right ascension of galaxies in athree degree thick strip in declination for different magnitude ranges. To expand the scale of the plot, the redshift range shown has beenrestricted; note that the redshift scales are different in the two panels. Blue stars mark the locations of late-type galaxies and red circlesthe positions of early-type galaxies. The boxes show the two structures which are referred to in the text.

6 The 2dFGRS collaboration
where DD, DR and RR are the numbers of data-data, data-random and random-random pairs respectively in each bin(Hamilton 1993). This estimator does not require an explicitestimate of the mean galaxy density. We have also cross-checked our results using the estimator proposed by Landy& Szalay (1993):
ξLS =DD − 2DR + RR
RR, (5)
where, this time DD, DR and RR are the suitably nor-malised numbers of data-data, data-random and random-random pairs. We find that the two estimators give the sameresults over the range of pair separations in which we are in-terested.
The clustering pattern of galaxies is distorted when ra-dial positions are inferred from redshifts, as expected in thegravitational instability theory of structure formation (e.g.Kaiser 1987; Cole, Fisher & Weinberg 1994). Clear evidencefor this effect is seen in the shape of the two point cor-relation function when plotted as ξ(σ, π), as demonstratedclearly for galaxies in the 2dFGRS by Peacock et al. (2001)and for groups of galaxies in the Zwicky catalogue by Padillaet al. (2001). After giving a brief flavour of the clustering of2dFGRS galaxies in redshift space in Section 4, we focusour attention on clustering in real space in the remainder ofthe paper. The clustering signal in real space is inferred byintegrating ξ(σ, π) in the π direction (i.e. along the line ofsight):
Ξ(σ)
σ=
1
σ
∫
∞
−∞
ξ(σ, π)dπ. (6)
For the samples that we consider, the integral converges bypair separations of π ≥ 50 h−1Mpc. The projected corre-lation function can then be written as an integral over thespherically averaged real space correlation function, ξ(r),
Ξ(σ)
σ=
2
σ
∫
∞
σ
ξ(r)rdr
(r2 − σ2)1/2, (7)
(Davis & Peebles 1983). If we assume that the real spacecorrelation function is a power law (which is a fair ap-proximation for APM galaxies out to separations aroundr ∼ 10 h−1 Mpc, see e.g. Baugh 1996), then Eq. 7 can bewritten as
Ξ(σ)
σ=
(
r0
σ
)γ Γ(1/2)Γ([γ − 1]/2)
Γ(γ/2)=
(
r0
σ
)γ
A(γ), (8)
where Γ(x) is the usual Gamma function, and we have usedξ(r) = (r0/r)γ , where r0 is the real space correlation lengthand γ is equal to the slope of the projected correlation func-tion Ξ(σ)/σ. As we demonstrate in Section 4.2, the projectedcorrelation function is well described by a power law.
We study a range of samples containing different num-bers of galaxies and covering different volumes of the Uni-verse. It is imperative to include sampling fluctuations whenestimating the errors on the measured correlation function,to allow a meaningful comparison of the results obtainedfrom different samples. This contribution to the errors hasoften been neglected in previous work. Following Norberget al. (2001), we employ a sample of 22 mock 2dFGRS cat-alogues drawn from the ΛCDM Hubble Volume simulation(Evrard et al. 2002) to estimate the error bars on the mea-sured correlation functions. The construction of these mock
catalogues is explained in Baugh et al. (2002, in preparation;see also Cole et al. 1998 and Norberg et al. 2002). These cat-alogues have the same selection criteria and the same clus-tering amplitude as measured for galaxies in the flux-limited2dFGRS. We have experimented with ensembles of mockcatalogues constructed with different clustering strengths toascertain how best to assign error bars when the measuredclustering has a different amplitude from that of our fiducialsample of 22 2dFGRS mocks. We found that the error barsobtained directly by averaging over a test ensemble of mocksare reproduced most closely by using the scaled fractionalrms scatter derived from the fiducial ensemble of 22 mocks,rather than by taking the absolute error.
4 CLUSTERING IN REDSHIFT SPACE
In this section we give a brief overview of the clustering of2dFGRS galaxies in redshift space, for samples selected byluminosity and spectral type. First, in Section 4.1, we give aqualitative impression of the clustering differences by plot-ting the spatial distribution of galaxies in volume-limitedsamples. Then we quantify these differences by measuringthe spherically averaged correlation function, ξ(s). A morecomprehensive analysis of the clustering of 2dFGRS galaxiesin redshift space will be presented by Hawkins et al. (2002).
4.1 Spatial distribution of 2dFGRS galaxies
It is instructive to gain a visual impression of the spa-tial distribution of 2dFGRS galaxies before interpreting themeasured correlation functions. In Fig. 3, we show the spa-tial distribution of galaxies in two ranges of absolute mag-nitude: in panel (a) we show a sample of faint galaxies(−18.0 ≥ MbJ −5 log10 h ≥ −19.0) and in panel (b) a sam-ple of bright galaxies (−20.0 ≥ MbJ − 5 log10 h ≥ −21.0).Within each panel, early and late type galaxies, as distin-guished by their spectral types, are plotted with differentsymbols; the positions of early-types are indicated by circlesand the late-types are marked by stars. For clarity, we showonly a three degree slice in declination cut from the SGP re-gion and we have sparsely sampled the galaxies, so that thespace densities of the two spectral classes are equal. In orderto expand the scale of the plot, the range of redshifts shownis restricted, taking a subset of the full volume-limited sam-ple in each case. (Note also that the redshift ranges differbetween the two panels.)
A hierarchy of structures is readily apparent in theseplots, ranging from isolated objects, to groups of a handfulof galaxies and on through to rich clusters containing overa hundred members. It is interesting to see how structuresare traced by galaxies in the different luminosity bins bycomparing common structures between the two panels. Forexample, the prominent structure (possibly a superclusterof galaxies) seen at α ≃ 0h and z ≃ 0.061 is clearly visiblein both panels. The same is true for the overdensity seen atα ≃ 03h15′ at z ≃ 0.068.
This is the first time that a large enough survey hasbeen available, both in terms of the volume spanned andthe number of measured redshifts, to allow a comparisonof the clustering of galaxies of different spectral types and
The 2dF Galaxy Redshift Survey: The dependence of galaxy clustering on luminosity and spectral type. 7
luminosities in representative volume-limited samples, with-out the complication of the strong radial gradient in numberdensity seen in flux-limited samples.
It is apparent from a comparison of the distributionof the different spectral types in Fig. 3(a), that the faintearly-type galaxies tend to be grouped into structures onsmall scales whereas the faint late-types are more spread out.One would therefore anticipate that the early-types shouldhave a stronger clustering amplitude than the late-types, anexpectation that is borne out in Section 4.2.
In Fig. 3(b), the distinction between the distribution ofthe spectral types is less apparent. This is partly due to thegreater importance of projection effects in the declinationdirection, as the cone extends to a greater redshift than inFig. 3(a). However, close examination of the largest struc-tures suggests that early-types are more abundant in themthan late-types, again implying a stronger clustering ampli-tude.
4.2 ξ(s) as function of luminosity and spectral
type
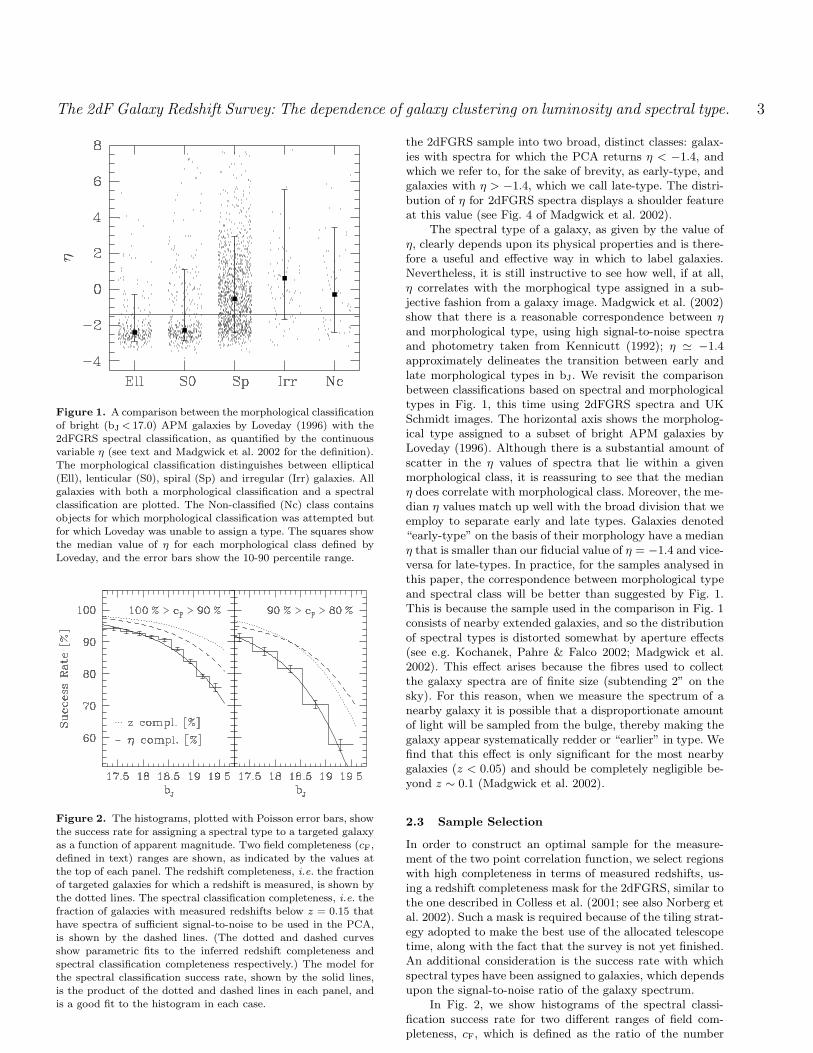
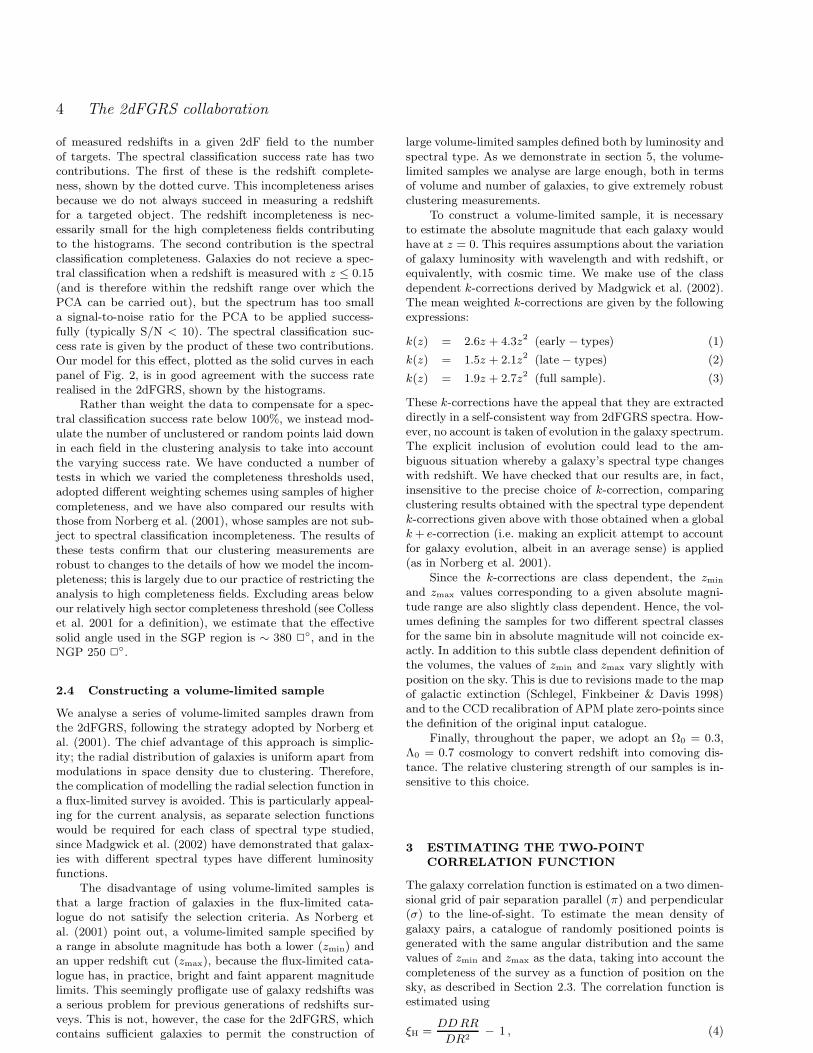
In Fig. 4, we show the spherically averaged redshift spacecorrelation function, ξ(s), as a function of luminosity andspectral type. Results are shown for samples selected in binsof width one magnitude, as indicated by the legend in eachpanel. The top panel shows the correlation functions of allgalaxies that have been assigned a spectral type, the mid-dle panel shows results for galaxies classified as early-types(η < −1.4) and the bottom panel shows results for late-types(η > −1.4). Note that, at present, there are insufficient num-bers of late-type galaxies to permit a reliable measurementof the correlation function for the brightest magnitude bin−21.0 ≥ MbJ − 5 log10 h ≥ −22.0.
Several deductions can be made immediately fromFig. 4. In all cases, the redshift space correlation func-tion is well described by a power-law only over a fairlylimited range of scales. The correlation functions of early-type galaxies are somewhat steeper than those of late-types. However, the main difference is that the early-typegalaxies have a stronger clustering amplitude than the late-type galaxies. The correlation length, defined here as thepair separation for which ξ(s0) = 1, varies for early-types from s0 = 7.1 ± 0.7 h−1Mpc for galaxies with ab-solute magnitudes around MbJ − 5 log10 h ∼ −19.5 tos0 = 8.9 ± 0.7h−1Mpc for the brightest sample with−21.0 ≥ MbJ −5 log10 h ≥ −22.0. The faintest early-types,with magnitudes −17.5 ≥ MbJ −5 log10 h ≥ −18.5, displaya clustering amplitude that is similar to that of the bright-est early-types. However, the measurement of the correlationfunction for this faint sample is relatively noisy, as the vol-ume in which galaxies are selected is small compared withthe volumes used for brighter samples. The late-type galax-ies show, by contrast, little change in clustering amplitudewith increasing luminosity, with a redshift space correlationlength of s0 = 5.6 ± 0.6 h−1Mpc. Only a slight steepen-ing of the redshift space correlation function is apparentwith increasing luminosity, until the brightest sample, whichdisplays a modest increase in the redshift space correlationlength. The correlation lengths of all our samples of early-type galaxies are larger than those of late-type galaxies.
Figure 4. The spherically averaged redshift space correlationfunction of galaxies in disjoint absolute magnitude bins, as in-dicated by the key in each panel. The panels show the resultsfor different samples: the top panel shows the correlation func-tions for all galaxies that have been assigned a spectral type,the middle panel show the clustering of galaxies with η < −1.4and the lower panel shows ξ(s) for galaxies with η > −1.4. The
error bars are obtained using 2dFGRS mock catalogues, as de-scribed in the text. For clarity, error bars are plotted only on the−18.5 ≥ MbJ − 5 log10 h ≥ −19.5 sample curve and for thebrightest sample in each panel.
5 CLUSTERING IN REAL SPACE
5.1 Robustness of clustering results
The approach adopted to study the dependence of galaxyclustering on luminosity relies upon being able to comparecorrelation functions measured in different volumes. It is im-portant to ensure that there are no systematic effects, such
8 The 2dFGRS collaboration14 The 2dFGRS ollaboration
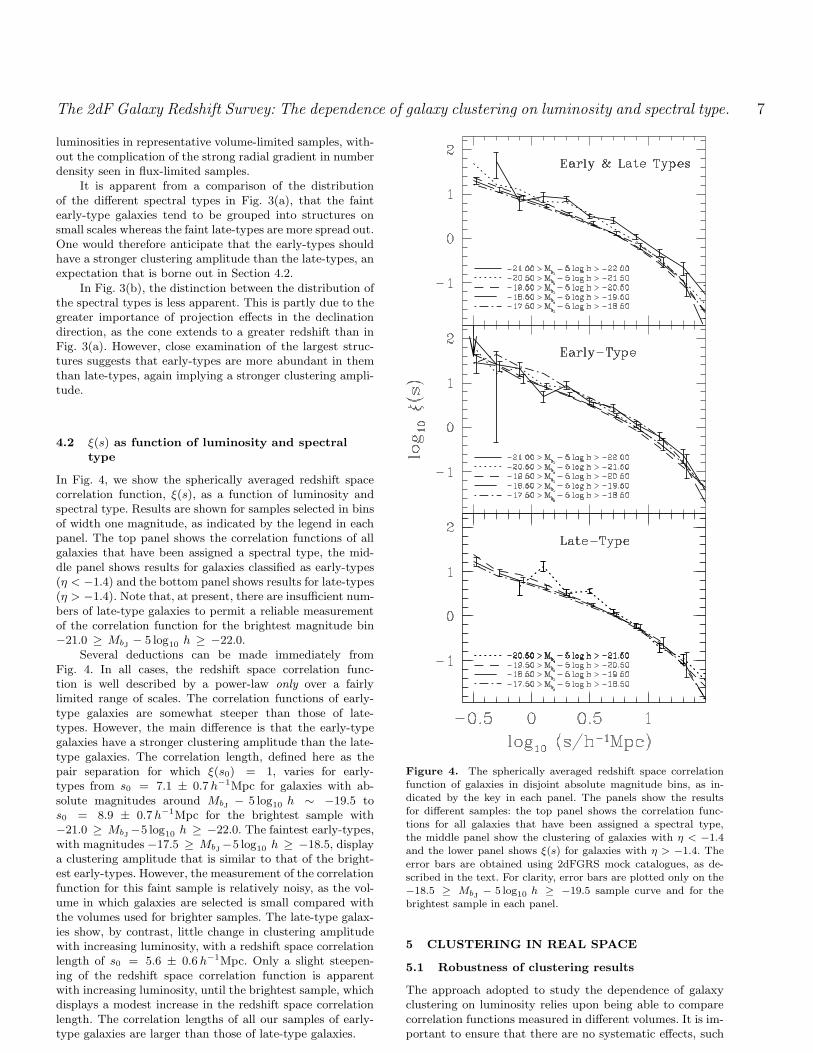
Table 1. Properties of the ombined NGP & SGP volume-limited samples for all galaxies with a spe tral type. Column 1 lists the
absolute magnitude range whi h denes the volume-limited samples. Columns 2 and 3 list the median magnitude and the number of
galaxies in the sample. Columns 4 and 5 give the redshift limits of the sample. Columns 6 and 7 list the best tting orrelation length,
r
0
, and power-law slope, , of the real spa e orrelation fun tion, and olumn 8 gives A( ), as dened by Eq. 8.
Mag. range Median magnitude N
gal
z
min
z
max
r
0
A( )
M
b
J
5 log
10
h M
b
J
5 log
10
h (h
1
Mp )
17:5 18:5 17:98 8510 0.0164 0.0724 5:19 0:95 1:68 0:12 4.14
18:0 19:0 18:46 13795 0.0204 0.0886 4:36 0:89 1:83 0:10 3.58
18:5 19:5 18:93 19207 0.0255 0.1077 4:65 0:61 1:80 0:08 3.68
19:0 20:0 19:40 24675 0.0317 0.1302 4:93 0:50 1:79 0:10 3.71
19:5 20:5 19:85 22555 0.0394 0.1500 4:89 0:48 1:79 0:05 3.71
20:0 21:0 20:30 10399 0.0487 0.1500 5:37 0:61 1:78 0:11 3.75
20:5 21:5 20:74 3423 0.0602 0.1500 6:57 0:83 1:83 0:23 3.58
21:0 22:0 21:19 751 0.0739 0.1500 8:47 0:97 1:80 0:29 3.68
Table 2. Properties of the ombined NGP & SGP volume-limited samples of early-type galaxies. See Table 1 for olumn denitions.
Mag. range Median magnitude N
gal
z
min
z
max
r
0
A( )
M
b
J
5 log
10
h M
b
J
5 log
10
h (h
1
Mp )
17:5 18:5 18:05 1909 0.0163 0.0707 8:33 1:82 1:87 0:23 3.46
18:0 19:0 18:53 3717 0.0203 0.0861 6:28 1:46 1:98 0:11 3.19
18:5 19:5 18:98 6405 0.0253 0.1041 5:92 1:00 1:83 0:10 3.58
19:0 20:0 19:44 10135 0.0314 0.1249 5:71 0:57 1:87 0:09 3.46
19:5 20:5 19:89 11346 0.0388 0.1486 5:66 0:56 1:87 0:09 3.46
20:0 21:0 20:33 6434 0.0480 0.1500 6:10 0:72 1:80 0:12 3.68
20:5 21:5 20:77 2587 0.0590 0.1500 7:60 1:02 1:87 0:26 3.46
21:0 22:0 21:21 686 0.0722 0.1500 9:74 1:16 1:95 0:37 3.26
Table 3. Properties of the ombined NGP & SGP volume-limited samples of late-type galaxies. See Table 1 for olumn denitions. Note
that the brightest sample listed ontains too few galaxies to permit a reliable measurement of the proje ted orrelation fun tion.
Mag. range Median magnitude N
gal
z
min
z
max
r
0
A( )
M
b
J
5 log
10
h M
b
J
5 log
10
h (h
1
Mp )
17:5 18:5 17:96 6674 0.0164 0.0734 4:27 0:81 1:65 0:12 4.29
18:0 19:0 18:44 9992 0.0205 0.0901 3:71 0:77 1:76 0:11 3.82
18:5 19:5 18:90 12619 0.0256 0.1099 4:17 0:64 1:79 0:10 3.71
19:0 20:0 19:37 14420 0.0319 0.1333 4:45 0:47 1:76 0:09 3.82
19:5 20:5 19:82 11122 0.0397 0.1500 4:59 0:44 1:76 0:07 3.82
20:0 21:0 20:26 4300 0.0492 0.1500 5:52 0:88 1:87 0:13 3.46
20:5 21:5 20:71 1118 0.0608 0.1500 6:33 1:01 2:01 0:29 3.12
21:0 22:0 21:17 198 0.0749 0.1500
0000 RAS, MNRAS 000, 000000
as significant sampling fluctuations, that could underminesuch an analysis. In Norberg et al. (2001) we demonstratedthe robustness of this approach in two ways. First, we con-structed a volume-limited sample defined using a broad mag-nitude range, that could be divided into co-spatial subsam-ples of galaxies in different luminosity bins, i.e. subsampleswithin the same volume and therefore subject to the samelarge-scale structure fluctuations. A clear increase in clus-tering amplitude was found for the brightest galaxies in thevolume, establishing the dependence of clustering on galaxyluminosity (see Fig. 1a of Norberg et al. 2001). Secondly,we demonstrated that measuring the correlation function ofgalaxies in a fixed luminosity bin, but using samples takenfrom different volumes, gave consistent results (see Fig. 1bof Norberg et al. 2001).
In this section we repeat these tests. The motivationfor this exercise is that the samples considered here containfewer galaxies than those used by Norberg et al. (2001) as
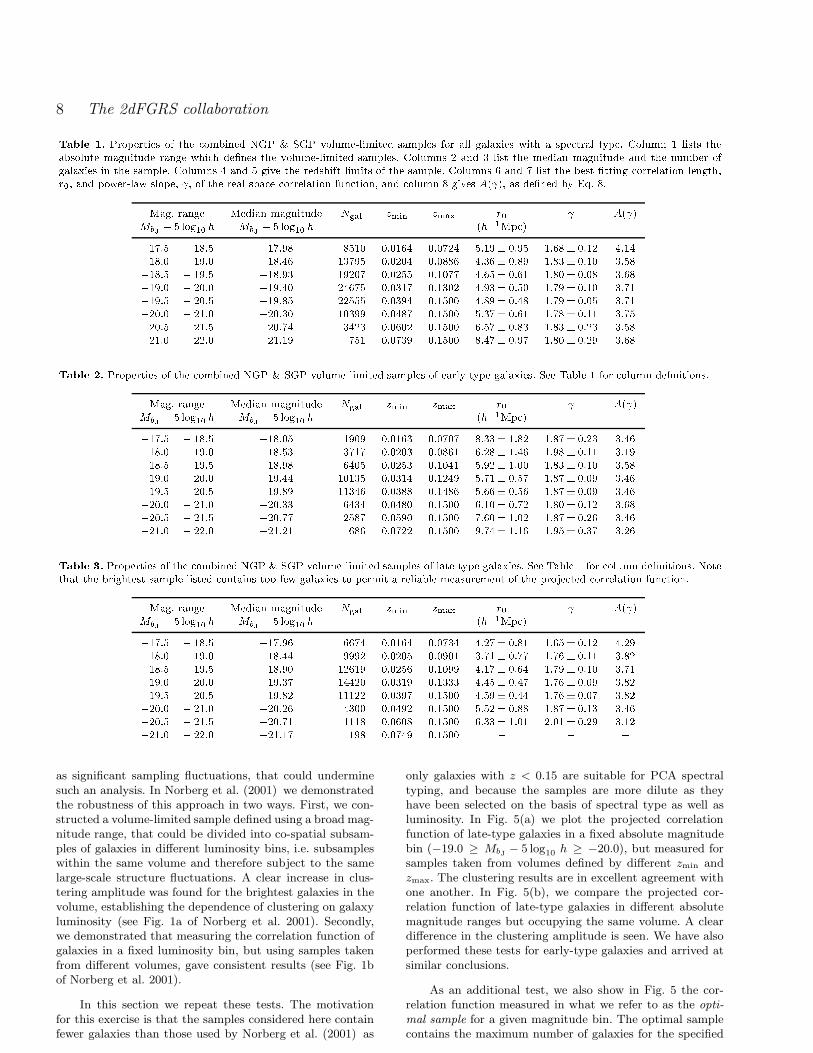
only galaxies with z < 0.15 are suitable for PCA spectraltyping, and because the samples are more dilute as theyhave been selected on the basis of spectral type as well asluminosity. In Fig. 5(a) we plot the projected correlationfunction of late-type galaxies in a fixed absolute magnitudebin (−19.0 ≥ MbJ − 5 log10 h ≥ −20.0), but measured forsamples taken from volumes defined by different zmin andzmax. The clustering results are in excellent agreement withone another. In Fig. 5(b), we compare the projected cor-relation function of late-type galaxies in different absolutemagnitude ranges but occupying the same volume. A cleardifference in the clustering amplitude is seen. We have alsoperformed these tests for early-type galaxies and arrived atsimilar conclusions.
As an additional test, we also show in Fig. 5 the cor-relation function measured in what we refer to as the opti-
mal sample for a given magnitude bin. The optimal samplecontains the maximum number of galaxies for the specified
The 2dF Galaxy Redshift Survey: The dependence of galaxy clustering on luminosity and spectral type. 9
Figure 5. (a) The projected correlation function of late-typegalaxies in a fixed absolute magnitude bin taken from different,almost independent volumes. We show the correlation function ofgalaxies with −19.0 ≥ MbJ − 5 log10 h ≥ −20.0 taken fromvolumes defined by −18.0 ≥ MbJ − 5 log10 h ≥ −20.0 and−19.0 ≥ MbJ −5 log10 h ≥ −21.0 (both shown by heavy dashed
lines). The thin solid line shows the estimate from the optimalsample for the −19.0 ≥ MbJ − 5 log10 h ≥ −20.0 magnitudebin. The different measurements are in almost perfect agreement.(b) The projected correlation function measured for late-typegalaxies in two different absolute magnitude bins taken from thesame volume. The volume is defined by the magnitude range−19.0 ≥ MbJ − 5 log10 h ≥ −21.0. Within a fixed volume, thereis clear evidence for an increase (albeit small) in the clusteringamplitude with luminosity. The two thin solid lines show esti-mates obtained from the corresponding optimal samples for thestated magnitude bins. In both panels the error bars come fromthe analysis of mock 2dFGRS catalogues.
magnitude bin. The correlation functions of galaxies in op-timal samples are shown by thin solid lines in both panelsand are in excellent agreement with the other measurementsshown.
5.2 Projected correlation function
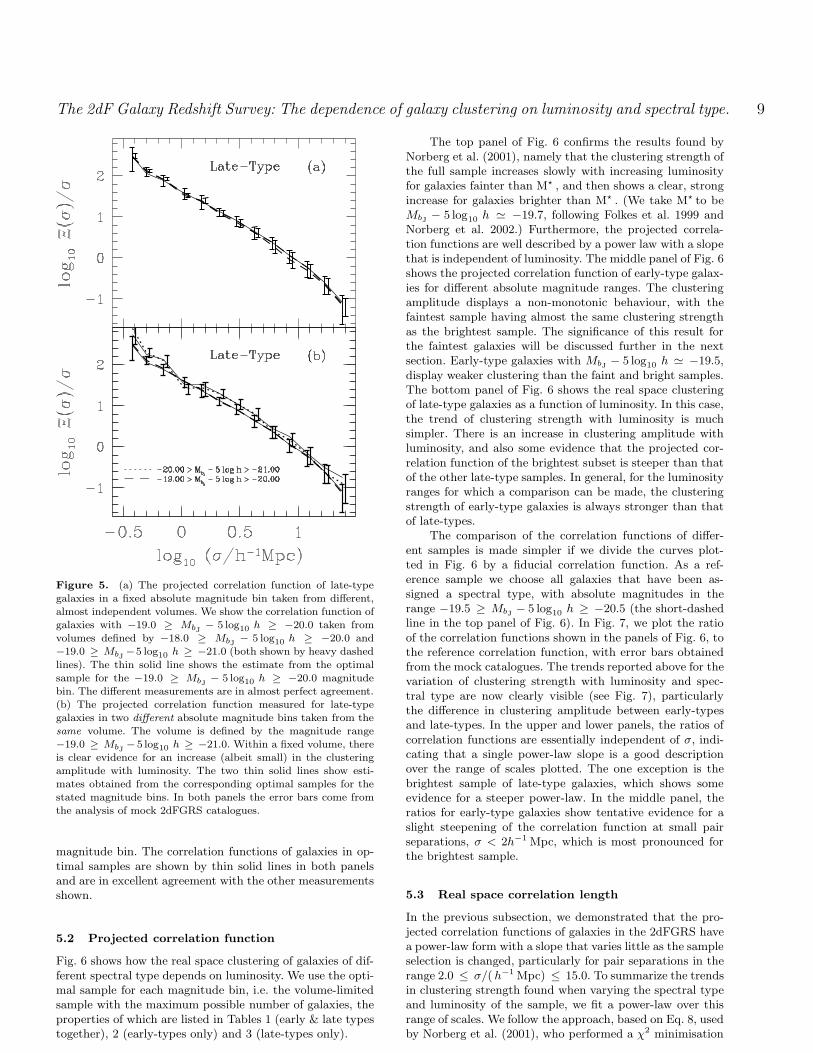
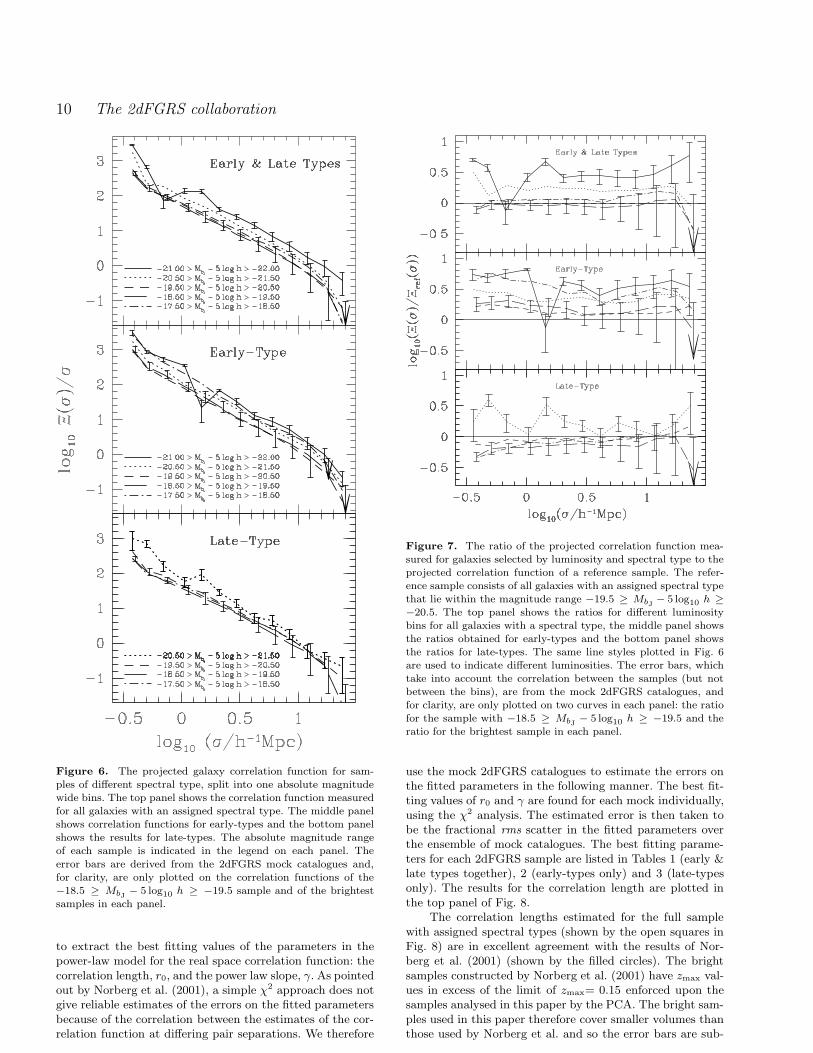
Fig. 6 shows how the real space clustering of galaxies of dif-ferent spectral type depends on luminosity. We use the opti-mal sample for each magnitude bin, i.e. the volume-limitedsample with the maximum possible number of galaxies, theproperties of which are listed in Tables 1 (early & late typestogether), 2 (early-types only) and 3 (late-types only).
The top panel of Fig. 6 confirms the results found byNorberg et al. (2001), namely that the clustering strength ofthe full sample increases slowly with increasing luminosityfor galaxies fainter than M⋆ , and then shows a clear, strongincrease for galaxies brighter than M⋆ . (We take M⋆ to beMbJ − 5 log10 h ≃ −19.7, following Folkes et al. 1999 andNorberg et al. 2002.) Furthermore, the projected correla-tion functions are well described by a power law with a slopethat is independent of luminosity. The middle panel of Fig. 6shows the projected correlation function of early-type galax-ies for different absolute magnitude ranges. The clusteringamplitude displays a non-monotonic behaviour, with thefaintest sample having almost the same clustering strengthas the brightest sample. The significance of this result forthe faintest galaxies will be discussed further in the nextsection. Early-type galaxies with MbJ − 5 log10 h ≃ −19.5,display weaker clustering than the faint and bright samples.The bottom panel of Fig. 6 shows the real space clusteringof late-type galaxies as a function of luminosity. In this case,the trend of clustering strength with luminosity is muchsimpler. There is an increase in clustering amplitude withluminosity, and also some evidence that the projected cor-relation function of the brightest subset is steeper than thatof the other late-type samples. In general, for the luminosityranges for which a comparison can be made, the clusteringstrength of early-type galaxies is always stronger than thatof late-types.
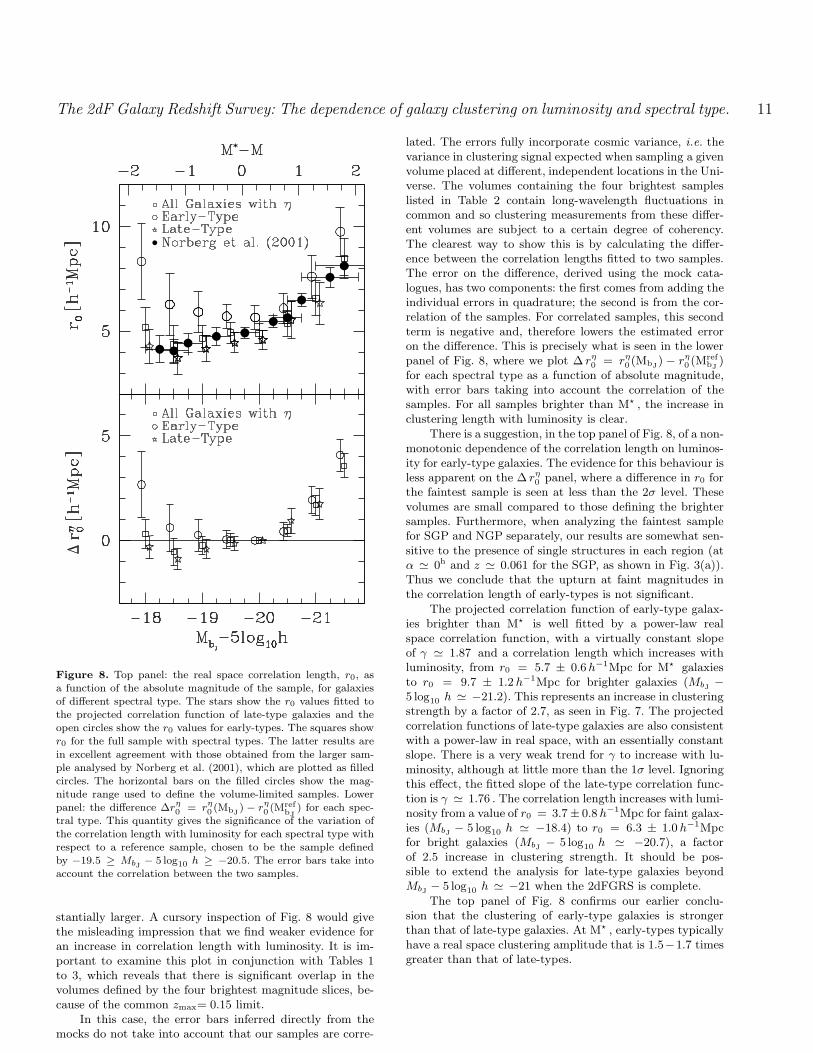
The comparison of the correlation functions of differ-ent samples is made simpler if we divide the curves plot-ted in Fig. 6 by a fiducial correlation function. As a ref-erence sample we choose all galaxies that have been as-signed a spectral type, with absolute magnitudes in therange −19.5 ≥ MbJ − 5 log10 h ≥ −20.5 (the short-dashedline in the top panel of Fig. 6). In Fig. 7, we plot the ratioof the correlation functions shown in the panels of Fig. 6, tothe reference correlation function, with error bars obtainedfrom the mock catalogues. The trends reported above for thevariation of clustering strength with luminosity and spec-tral type are now clearly visible (see Fig. 7), particularlythe difference in clustering amplitude between early-typesand late-types. In the upper and lower panels, the ratios ofcorrelation functions are essentially independent of σ, indi-cating that a single power-law slope is a good descriptionover the range of scales plotted. The one exception is thebrightest sample of late-type galaxies, which shows someevidence for a steeper power-law. In the middle panel, theratios for early-type galaxies show tentative evidence for aslight steepening of the correlation function at small pairseparations, σ < 2h−1 Mpc, which is most pronounced forthe brightest sample.
5.3 Real space correlation length
In the previous subsection, we demonstrated that the pro-jected correlation functions of galaxies in the 2dFGRS havea power-law form with a slope that varies little as the sampleselection is changed, particularly for pair separations in therange 2.0 ≤ σ/( h−1 Mpc) ≤ 15.0. To summarize the trendsin clustering strength found when varying the spectral typeand luminosity of the sample, we fit a power-law over thisrange of scales. We follow the approach, based on Eq. 8, usedby Norberg et al. (2001), who performed a χ2 minimisation
10 The 2dFGRS collaboration
Figure 6. The projected galaxy correlation function for sam-ples of different spectral type, split into one absolute magnitudewide bins. The top panel shows the correlation function measuredfor all galaxies with an assigned spectral type. The middle panelshows correlation functions for early-types and the bottom panelshows the results for late-types. The absolute magnitude rangeof each sample is indicated in the legend on each panel. The
error bars are derived from the 2dFGRS mock catalogues and,for clarity, are only plotted on the correlation functions of the−18.5 ≥ MbJ − 5 log10 h ≥ −19.5 sample and of the brightestsamples in each panel.
to extract the best fitting values of the parameters in thepower-law model for the real space correlation function: thecorrelation length, r0, and the power law slope, γ. As pointedout by Norberg et al. (2001), a simple χ2 approach does notgive reliable estimates of the errors on the fitted parametersbecause of the correlation between the estimates of the cor-relation function at differing pair separations. We therefore
Figure 7. The ratio of the projected correlation function mea-sured for galaxies selected by luminosity and spectral type to theprojected correlation function of a reference sample. The refer-ence sample consists of all galaxies with an assigned spectral typethat lie within the magnitude range −19.5 ≥ MbJ − 5 log10 h ≥
−20.5. The top panel shows the ratios for different luminositybins for all galaxies with a spectral type, the middle panel showsthe ratios obtained for early-types and the bottom panel showsthe ratios for late-types. The same line styles plotted in Fig. 6are used to indicate different luminosities. The error bars, whichtake into account the correlation between the samples (but notbetween the bins), are from the mock 2dFGRS catalogues, andfor clarity, are only plotted on two curves in each panel: the ratiofor the sample with −18.5 ≥ MbJ − 5 log10 h ≥ −19.5 and theratio for the brightest sample in each panel.
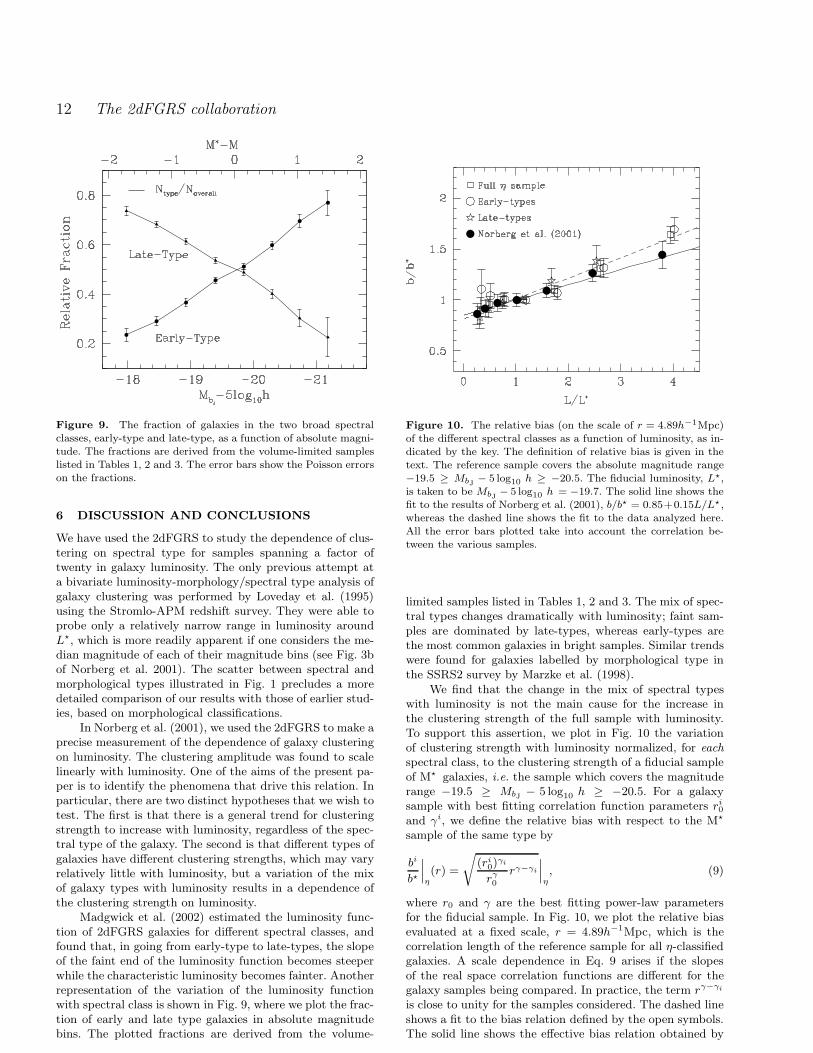
use the mock 2dFGRS catalogues to estimate the errors onthe fitted parameters in the following manner. The best fit-ting values of r0 and γ are found for each mock individually,using the χ2 analysis. The estimated error is then taken tobe the fractional rms scatter in the fitted parameters overthe ensemble of mock catalogues. The best fitting parame-ters for each 2dFGRS sample are listed in Tables 1 (early &late types together), 2 (early-types only) and 3 (late-typesonly). The results for the correlation length are plotted inthe top panel of Fig. 8.
The correlation lengths estimated for the full samplewith assigned spectral types (shown by the open squares inFig. 8) are in excellent agreement with the results of Nor-berg et al. (2001) (shown by the filled circles). The brightsamples constructed by Norberg et al. (2001) have zmax val-ues in excess of the limit of zmax= 0.15 enforced upon thesamples analysed in this paper by the PCA. The bright sam-ples used in this paper therefore cover smaller volumes thanthose used by Norberg et al. and so the error bars are sub-
The 2dF Galaxy Redshift Survey: The dependence of galaxy clustering on luminosity and spectral type. 11
Figure 8. Top panel: the real space correlation length, r0, asa function of the absolute magnitude of the sample, for galaxiesof different spectral type. The stars show the r0 values fitted tothe projected correlation function of late-type galaxies and theopen circles show the r0 values for early-types. The squares showr0 for the full sample with spectral types. The latter results are
in excellent agreement with those obtained from the larger sam-ple analysed by Norberg et al. (2001), which are plotted as filledcircles. The horizontal bars on the filled circles show the mag-nitude range used to define the volume-limited samples. Lowerpanel: the difference ∆rη
0 = rη0 (MbJ
) − rη0 (Mref
bJ) for each spec-
tral type. This quantity gives the significance of the variation ofthe correlation length with luminosity for each spectral type withrespect to a reference sample, chosen to be the sample definedby −19.5 ≥ MbJ − 5 log10 h ≥ −20.5. The error bars take intoaccount the correlation between the two samples.
stantially larger. A cursory inspection of Fig. 8 would givethe misleading impression that we find weaker evidence foran increase in correlation length with luminosity. It is im-portant to examine this plot in conjunction with Tables 1to 3, which reveals that there is significant overlap in thevolumes defined by the four brightest magnitude slices, be-cause of the common zmax= 0.15 limit.
In this case, the error bars inferred directly from themocks do not take into account that our samples are corre-
lated. The errors fully incorporate cosmic variance, i.e. thevariance in clustering signal expected when sampling a givenvolume placed at different, independent locations in the Uni-verse. The volumes containing the four brightest sampleslisted in Table 2 contain long-wavelength fluctuations incommon and so clustering measurements from these differ-ent volumes are subject to a certain degree of coherency.The clearest way to show this is by calculating the differ-ence between the correlation lengths fitted to two samples.The error on the difference, derived using the mock cata-logues, has two components: the first comes from adding theindividual errors in quadrature; the second is from the cor-relation of the samples. For correlated samples, this secondterm is negative and, therefore lowers the estimated erroron the difference. This is precisely what is seen in the lowerpanel of Fig. 8, where we plot ∆ rη
0 = rη0(MbJ
) − rη0 (Mref
bJ)
for each spectral type as a function of absolute magnitude,with error bars taking into account the correlation of thesamples. For all samples brighter than M⋆ , the increase inclustering length with luminosity is clear.
There is a suggestion, in the top panel of Fig. 8, of a non-monotonic dependence of the correlation length on luminos-ity for early-type galaxies. The evidence for this behaviour isless apparent on the ∆ rη
0 panel, where a difference in r0 forthe faintest sample is seen at less than the 2σ level. Thesevolumes are small compared to those defining the brightersamples. Furthermore, when analyzing the faintest samplefor SGP and NGP separately, our results are somewhat sen-sitive to the presence of single structures in each region (atα ≃ 0h and z ≃ 0.061 for the SGP, as shown in Fig. 3(a)).Thus we conclude that the upturn at faint magnitudes inthe correlation length of early-types is not significant.
The projected correlation function of early-type galax-ies brighter than M⋆ is well fitted by a power-law realspace correlation function, with a virtually constant slopeof γ ≃ 1.87 and a correlation length which increases withluminosity, from r0 = 5.7 ± 0.6h−1Mpc for M⋆ galaxiesto r0 = 9.7 ± 1.2 h−1Mpc for brighter galaxies (MbJ −
5 log10 h ≃ −21.2). This represents an increase in clusteringstrength by a factor of 2.7, as seen in Fig. 7. The projectedcorrelation functions of late-type galaxies are also consistentwith a power-law in real space, with an essentially constantslope. There is a very weak trend for γ to increase with lu-minosity, although at little more than the 1σ level. Ignoringthis effect, the fitted slope of the late-type correlation func-tion is γ ≃ 1.76 . The correlation length increases with lumi-nosity from a value of r0 = 3.7± 0.8 h−1Mpc for faint galax-ies (MbJ − 5 log10 h ≃ −18.4) to r0 = 6.3 ± 1.0 h−1Mpcfor bright galaxies (MbJ − 5 log10 h ≃ −20.7), a factorof 2.5 increase in clustering strength. It should be pos-sible to extend the analysis for late-type galaxies beyondMbJ − 5 log10 h ≃ −21 when the 2dFGRS is complete.
The top panel of Fig. 8 confirms our earlier conclu-sion that the clustering of early-type galaxies is strongerthan that of late-type galaxies. At M⋆ , early-types typicallyhave a real space clustering amplitude that is 1.5−1.7 timesgreater than that of late-types.
12 The 2dFGRS collaboration
Figure 9. The fraction of galaxies in the two broad spectralclasses, early-type and late-type, as a function of absolute magni-tude. The fractions are derived from the volume-limited sampleslisted in Tables 1, 2 and 3. The error bars show the Poisson errorson the fractions.
6 DISCUSSION AND CONCLUSIONS
We have used the 2dFGRS to study the dependence of clus-tering on spectral type for samples spanning a factor oftwenty in galaxy luminosity. The only previous attempt ata bivariate luminosity-morphology/spectral type analysis ofgalaxy clustering was performed by Loveday et al. (1995)using the Stromlo-APM redshift survey. They were able toprobe only a relatively narrow range in luminosity aroundL⋆, which is more readily apparent if one considers the me-dian magnitude of each of their magnitude bins (see Fig. 3bof Norberg et al. 2001). The scatter between spectral andmorphological types illustrated in Fig. 1 precludes a moredetailed comparison of our results with those of earlier stud-ies, based on morphological classifications.
In Norberg et al. (2001), we used the 2dFGRS to make aprecise measurement of the dependence of galaxy clusteringon luminosity. The clustering amplitude was found to scalelinearly with luminosity. One of the aims of the present pa-per is to identify the phenomena that drive this relation. Inparticular, there are two distinct hypotheses that we wish totest. The first is that there is a general trend for clusteringstrength to increase with luminosity, regardless of the spec-tral type of the galaxy. The second is that different types ofgalaxies have different clustering strengths, which may varyrelatively little with luminosity, but a variation of the mixof galaxy types with luminosity results in a dependence ofthe clustering strength on luminosity.
Madgwick et al. (2002) estimated the luminosity func-tion of 2dFGRS galaxies for different spectral classes, andfound that, in going from early-type to late-types, the slopeof the faint end of the luminosity function becomes steeperwhile the characteristic luminosity becomes fainter. Anotherrepresentation of the variation of the luminosity functionwith spectral class is shown in Fig. 9, where we plot the frac-tion of early and late type galaxies in absolute magnitudebins. The plotted fractions are derived from the volume-
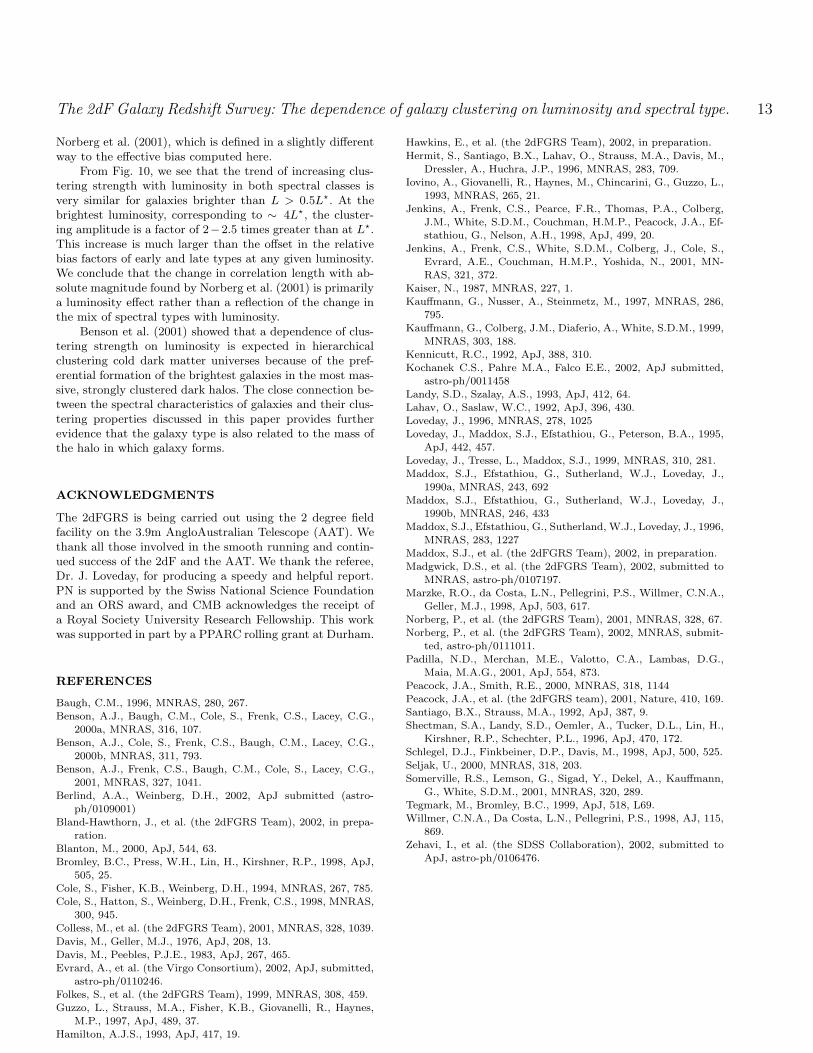
Figure 10. The relative bias (on the scale of r = 4.89h−1Mpc)of the different spectral classes as a function of luminosity, as in-dicated by the key. The definition of relative bias is given in thetext. The reference sample covers the absolute magnitude range−19.5 ≥ MbJ − 5 log10 h ≥ −20.5. The fiducial luminosity, L⋆,is taken to be MbJ − 5 log10 h = −19.7. The solid line shows thefit to the results of Norberg et al. (2001), b/b⋆ = 0.85+0.15L/L⋆ ,whereas the dashed line shows the fit to the data analyzed here.All the error bars plotted take into account the correlation be-tween the various samples.
limited samples listed in Tables 1, 2 and 3. The mix of spec-tral types changes dramatically with luminosity; faint sam-ples are dominated by late-types, whereas early-types arethe most common galaxies in bright samples. Similar trendswere found for galaxies labelled by morphological type inthe SSRS2 survey by Marzke et al. (1998).
We find that the change in the mix of spectral typeswith luminosity is not the main cause for the increase inthe clustering strength of the full sample with luminosity.To support this assertion, we plot in Fig. 10 the variationof clustering strength with luminosity normalized, for each
spectral class, to the clustering strength of a fiducial sampleof M⋆ galaxies, i.e. the sample which covers the magnituderange −19.5 ≥ MbJ − 5 log10 h ≥ −20.5. For a galaxysample with best fitting correlation function parameters ri
0
and γi, we define the relative bias with respect to the M⋆
sample of the same type by
bi
b⋆
∣
∣
∣
η(r) =
√
(ri0)
γi
rγ0
rγ−γi
∣
∣
∣
η, (9)
where r0 and γ are the best fitting power-law parametersfor the fiducial sample. In Fig. 10, we plot the relative biasevaluated at a fixed scale, r = 4.89h−1Mpc, which is thecorrelation length of the reference sample for all η-classifiedgalaxies. A scale dependence in Eq. 9 arises if the slopesof the real space correlation functions are different for thegalaxy samples being compared. In practice, the term rγ−γi
is close to unity for the samples considered. The dashed lineshows a fit to the bias relation defined by the open symbols.The solid line shows the effective bias relation obtained by
The 2dF Galaxy Redshift Survey: The dependence of galaxy clustering on luminosity and spectral type. 13
Norberg et al. (2001), which is defined in a slightly differentway to the effective bias computed here.
From Fig. 10, we see that the trend of increasing clus-tering strength with luminosity in both spectral classes isvery similar for galaxies brighter than L > 0.5L⋆. At thebrightest luminosity, corresponding to ∼ 4L⋆, the cluster-ing amplitude is a factor of 2−2.5 times greater than at L⋆.This increase is much larger than the offset in the relativebias factors of early and late types at any given luminosity.We conclude that the change in correlation length with ab-solute magnitude found by Norberg et al. (2001) is primarilya luminosity effect rather than a reflection of the change inthe mix of spectral types with luminosity.
Benson et al. (2001) showed that a dependence of clus-tering strength on luminosity is expected in hierarchicalclustering cold dark matter universes because of the pref-erential formation of the brightest galaxies in the most mas-sive, strongly clustered dark halos. The close connection be-tween the spectral characteristics of galaxies and their clus-tering properties discussed in this paper provides furtherevidence that the galaxy type is also related to the mass ofthe halo in which galaxy forms.
ACKNOWLEDGMENTS
The 2dFGRS is being carried out using the 2 degree fieldfacility on the 3.9m AngloAustralian Telescope (AAT). Wethank all those involved in the smooth running and contin-ued success of the 2dF and the AAT. We thank the referee,Dr. J. Loveday, for producing a speedy and helpful report.PN is supported by the Swiss National Science Foundationand an ORS award, and CMB acknowledges the receipt ofa Royal Society University Research Fellowship. This workwas supported in part by a PPARC rolling grant at Durham.
REFERENCES
Baugh, C.M., 1996, MNRAS, 280, 267.Benson, A.J., Baugh, C.M., Cole, S., Frenk, C.S., Lacey, C.G.,
2000a, MNRAS, 316, 107.Benson, A.J., Cole, S., Frenk, C.S., Baugh, C.M., Lacey, C.G.,
2000b, MNRAS, 311, 793.Benson, A.J., Frenk, C.S., Baugh, C.M., Cole, S., Lacey, C.G.,
2001, MNRAS, 327, 1041.Berlind, A.A., Weinberg, D.H., 2002, ApJ submitted (astro-
ph/0109001)Bland-Hawthorn, J., et al. (the 2dFGRS Team), 2002, in prepa-
ration.Blanton, M., 2000, ApJ, 544, 63.Bromley, B.C., Press, W.H., Lin, H., Kirshner, R.P., 1998, ApJ,
505, 25.Cole, S., Fisher, K.B., Weinberg, D.H., 1994, MNRAS, 267, 785.Cole, S., Hatton, S., Weinberg, D.H., Frenk, C.S., 1998, MNRAS,
300, 945.Colless, M., et al. (the 2dFGRS Team), 2001, MNRAS, 328, 1039.
Davis, M., Geller, M.J., 1976, ApJ, 208, 13.Davis, M., Peebles, P.J.E., 1983, ApJ, 267, 465.Evrard, A., et al. (the Virgo Consortium), 2002, ApJ, submitted,
astro-ph/0110246.Folkes, S., et al. (the 2dFGRS Team), 1999, MNRAS, 308, 459.Guzzo, L., Strauss, M.A., Fisher, K.B., Giovanelli, R., Haynes,
M.P., 1997, ApJ, 489, 37.Hamilton, A.J.S., 1993, ApJ, 417, 19.
Hawkins, E., et al. (the 2dFGRS Team), 2002, in preparation.
Hermit, S., Santiago, B.X., Lahav, O., Strauss, M.A., Davis, M.,Dressler, A., Huchra, J.P., 1996, MNRAS, 283, 709.
Iovino, A., Giovanelli, R., Haynes, M., Chincarini, G., Guzzo, L.,1993, MNRAS, 265, 21.
Jenkins, A., Frenk, C.S., Pearce, F.R., Thomas, P.A., Colberg,J.M., White, S.D.M., Couchman, H.M.P., Peacock, J.A., Ef-stathiou, G., Nelson, A.H., 1998, ApJ, 499, 20.
Jenkins, A., Frenk, C.S., White, S.D.M., Colberg, J., Cole, S.,Evrard, A.E., Couchman, H.M.P., Yoshida, N., 2001, MN-RAS, 321, 372.
Kaiser, N., 1987, MNRAS, 227, 1.Kauffmann, G., Nusser, A., Steinmetz, M., 1997, MNRAS, 286,
795.Kauffmann, G., Colberg, J.M., Diaferio, A., White, S.D.M., 1999,
MNRAS, 303, 188.Kennicutt, R.C., 1992, ApJ, 388, 310.Kochanek C.S., Pahre M.A., Falco E.E., 2002, ApJ submitted,
astro-ph/0011458Landy, S.D., Szalay, A.S., 1993, ApJ, 412, 64.Lahav, O., Saslaw, W.C., 1992, ApJ, 396, 430.Loveday, J., 1996, MNRAS, 278, 1025Loveday, J., Maddox, S.J., Efstathiou, G., Peterson, B.A., 1995,
ApJ, 442, 457.Loveday, J., Tresse, L., Maddox, S.J., 1999, MNRAS, 310, 281.Maddox, S.J., Efstathiou, G., Sutherland, W.J., Loveday, J.,
1990a, MNRAS, 243, 692Maddox, S.J., Efstathiou, G., Sutherland, W.J., Loveday, J.,
1990b, MNRAS, 246, 433Maddox, S.J., Efstathiou, G., Sutherland, W.J., Loveday, J., 1996,
MNRAS, 283, 1227Maddox, S.J., et al. (the 2dFGRS Team), 2002, in preparation.Madgwick, D.S., et al. (the 2dFGRS Team), 2002, submitted to
MNRAS, astro-ph/0107197.Marzke, R.O., da Costa, L.N., Pellegrini, P.S., Willmer, C.N.A.,
Geller, M.J., 1998, ApJ, 503, 617.Norberg, P., et al. (the 2dFGRS Team), 2001, MNRAS, 328, 67.Norberg, P., et al. (the 2dFGRS Team), 2002, MNRAS, submit-
ted, astro-ph/0111011.Padilla, N.D., Merchan, M.E., Valotto, C.A., Lambas, D.G.,
Maia, M.A.G., 2001, ApJ, 554, 873.Peacock, J.A., Smith, R.E., 2000, MNRAS, 318, 1144Peacock, J.A., et al. (the 2dFGRS team), 2001, Nature, 410, 169.Santiago, B.X., Strauss, M.A., 1992, ApJ, 387, 9.Shectman, S.A., Landy, S.D., Oemler, A., Tucker, D.L., Lin, H.,
Kirshner, R.P., Schechter, P.L., 1996, ApJ, 470, 172.Schlegel, D.J., Finkbeiner, D.P., Davis, M., 1998, ApJ, 500, 525.
Seljak, U., 2000, MNRAS, 318, 203.Somerville, R.S., Lemson, G., Sigad, Y., Dekel, A., Kauffmann,
G., White, S.D.M., 2001, MNRAS, 320, 289.Tegmark, M., Bromley, B.C., 1999, ApJ, 518, L69.Willmer, C.N.A., Da Costa, L.N., Pellegrini, P.S., 1998, AJ, 115,
869.Zehavi, I., et al. (the SDSS Collaboration), 2002, submitted to
ApJ, astro-ph/0106476.

14 The 2dFGRS collaboration
Table 1. Properties of the combined NGP & SGP volume-limited samples for all galaxies with a spectral type. Column 1 lists theabsolute magnitude range which defines the volume-limited samples. Columns 2 and 3 list the median magnitude and the number ofgalaxies in the sample. Columns 4 and 5 give the redshift limits of the sample. Columns 6 and 7 list the best fitting correlation length,r0, and power-law slope, γ, of the real space correlation function, and column 8 gives A(γ), as defined by Eq. 8.
Mag. range Median magnitude Ngal zmin zmax r0 γ A(γ)MbJ − 5 log10 h MbJ − 5 log10 h (h−1Mpc)
−17.5 − 18.5 −17.98 8510 0.0164 0.0724 5.19 ± 0.95 1.68 ± 0.12 4.14−18.0 − 19.0 −18.46 13795 0.0204 0.0886 4.36 ± 0.89 1.83 ± 0.10 3.58−18.5 − 19.5 −18.93 19207 0.0255 0.1077 4.65 ± 0.61 1.80 ± 0.08 3.68−19.0 − 20.0 −19.40 24675 0.0317 0.1302 4.93 ± 0.50 1.79 ± 0.10 3.71−19.5 − 20.5 −19.85 22555 0.0394 0.1500 4.89 ± 0.48 1.79 ± 0.05 3.71−20.0 − 21.0 −20.30 10399 0.0487 0.1500 5.37 ± 0.61 1.78 ± 0.11 3.75−20.5 − 21.5 −20.74 3423 0.0602 0.1500 6.57 ± 0.83 1.83 ± 0.23 3.58−21.0 − 22.0 −21.19 751 0.0739 0.1500 8.47 ± 0.97 1.80 ± 0.29 3.68
Table 2. Properties of the combined NGP & SGP volume-limited samples of early-type galaxies. See Table 1 for column definitions.
Mag. range Median magnitude Ngal zmin zmax r0 γ A(γ)MbJ − 5 log10 h MbJ − 5 log10 h (h−1Mpc)
−17.5 − 18.5 −18.05 1909 0.0163 0.0707 8.33 ± 1.82 1.87 ± 0.23 3.46−18.0 − 19.0 −18.53 3717 0.0203 0.0861 6.28 ± 1.46 1.98 ± 0.11 3.19−18.5 − 19.5 −18.98 6405 0.0253 0.1041 5.92 ± 1.00 1.83 ± 0.10 3.58−19.0 − 20.0 −19.44 10135 0.0314 0.1249 5.71 ± 0.57 1.87 ± 0.09 3.46−19.5 − 20.5 −19.89 11346 0.0388 0.1486 5.66 ± 0.56 1.87 ± 0.09 3.46−20.0 − 21.0 −20.33 6434 0.0480 0.1500 6.10 ± 0.72 1.80 ± 0.12 3.68−20.5 − 21.5 −20.77 2587 0.0590 0.1500 7.60 ± 1.02 1.87 ± 0.26 3.46−21.0 − 22.0 −21.21 686 0.0722 0.1500 9.74 ± 1.16 1.95 ± 0.37 3.26
Table 3. Properties of the combined NGP & SGP volume-limited samples of late-type galaxies. See Table 1 for column definitions.Note that the brightest sample listed contains too few galaxies to permit a reliable measurement of the projected correlation function.
Mag. range Median magnitude Ngal zmin zmax r0 γ A(γ)MbJ − 5 log10 h MbJ − 5 log10 h (h−1Mpc)
−17.5 − 18.5 −17.96 6674 0.0164 0.0734 4.27 ± 0.81 1.65 ± 0.12 4.29−18.0 − 19.0 −18.44 9992 0.0205 0.0901 3.71 ± 0.77 1.76 ± 0.11 3.82−18.5 − 19.5 −18.90 12619 0.0256 0.1099 4.17 ± 0.64 1.79 ± 0.10 3.71−19.0 − 20.0 −19.37 14420 0.0319 0.1333 4.45 ± 0.47 1.76 ± 0.09 3.82−19.5 − 20.5 −19.82 11122 0.0397 0.1500 4.59 ± 0.44 1.76 ± 0.07 3.82−20.0 − 21.0 −20.26 4300 0.0492 0.1500 5.52 ± 0.88 1.87 ± 0.13 3.46−20.5 − 21.5 −20.71 1118 0.0608 0.1500 6.33 ± 1.01 2.01 ± 0.29 3.12−21.0 − 22.0 −21.17 198 0.0749 0.1500 − − −
Copyright © 2022 FDOKUMEN