Dependence of Galaxy Structure on Rest‐Frame Wavelength and Galaxy Type
28
arXiv:astro-ph/0612558v2 19 Dec 2006 Draft version February 5, 2008 Preprint typeset using L A T E X style emulateapj v. 6/22/04 DEPENDENCE OF GALAXY STRUCTURE ON REST-FRAME WAVELENGTH AND GALAXY TYPE ∗ Violet A. Taylor-Mager 1,2 , Christopher J. Conselice 4 , Rogier A. Windhorst 3 , and Rolf A. Jansen 3 Draft version February 5, 2008 ABSTRACT We present a quantitative analysis of the morphologies for 199 nearby galaxies as parameterized with measurements of the concentration, asymmetry, and clumpiness (CAS) parameters at wavelengths from 0.15-0.85μm. We find that these CAS parameters depend on both galaxy type and the wavelength of observation. As such, we use them to obtain a quantitative measure of the ”morphological k- correction”, i.e., the change in appearance of a galaxy with rest-frame wavelength. Whereas early-type galaxies (E–S0) appear about the same at all wavelengths longward of the Balmer break, there is a mild but significantly-determined wavelength-dependence of the CAS parameters for galaxies types later than S0, which generally become less concentrated, and more asymmetric and clumpy toward shorter wavelengths. Also, as a merger progresses from pre-merger via major-merger to merger- remnant stages, it evolves through the CAS parameter space, becoming first less concentrated and more asymmetric and clumpy, and then returning towards the ”locus” of normal galaxies. The final merger products are, on average, much more concentrated than normal spiral galaxies. Subject headings: galaxies: evolution – galaxies: fundamental parameters – galaxies: structure 1. INTRODUCTION Deep, high-resolution imaging with telescopes such as the Hubble Space Telescope (HST ) has revealed that the majority of high redshift galaxies are morphologically dif- ferent from the majority of galaxies nearby. They appear to have morphologies similar to the relatively rare, low redshift irregular and peculiar galaxies (e.g., Driver et al. 1995, 1998; Glazebrook et al. 1995; Abraham et al. 1996; Odewahn et al. 1996; Ellis 1997; Im et al. 1999; van Dokkum et al. 1999; van den Bergh et al. 2000; Conselice et al. 2005; Papovich et al. 2005). The greater percentage of merging galaxies at high redshift suggests that there was an evolution in the number of merging and interacting galaxies throughout the history of the Universe, which supports models of hierarchical galaxy formation (e.g., White 1979; White & Frenk 1991; Cole et al. 1994; Kauffmann et al. 1997; Roukema et al. 1997; Baugh et al. 1998; Nagashima et al. 2001, 2002). To reveal how galaxies assemble and evolve over time, it is therefore essential to conduct detailed comparisons of galaxies as a function of redshift. To carry out these comparisons it is critical to have a representative base- line at z ∼ 0. We present in this paper a sample of 199 nearby galaxies, observed from the ultraviolet to the op- tical red, which can be used as an effective comparison to higher redshift sources. Morphology has also arisen in recent years as a ma- ∗ BASED ON OBSERVATIONS MADE WITH THE NASA/ESA HUBBLE SPACE TELESCOPE, OBTAINED AT THE SPACE TELESCOPE SCIENCE INSTITUTE, WHICH IS OPERATED BY THE ASSOCIATION OF UNIVERSITIES FOR RESEARCH IN ASTRONOMY, INC., UNDER NASA CONTRACT NAS 5- 26555. THESE OBSERVATIONS ARE ASSOCIATED WITH HST PROGRAMS #8645, AND 9124. 1 Department of Physics and Astronomy, Arizona State Univer- sity, Tempe, AZ 85287-1504 2 Carnegie Observatories, 813 Santa Barbara St., Pasadena, CA 91101 3 School of Earth and Space Exploration, Arizona State Univer- sity, Tempe, AZ 85287-1404 4 School of Physics and Astronomy, University of Nottingham, University Park, England NG7 2RD, UK jor method for findings major mergers between galaxies and understanding their role in galaxy formation (Con- selice 2006). Mergers are predicted to be the dominate factor in galaxy formation within the Cold Dark Matter model (e.g., Cole et al. 2000), and testing this concept in detail is of major importance. Extensive work has gone into improving on the traditional Hubble sequence, which does not distinguish between the large variety of galaxies that fall into the catch-all irregular class (e.g. irregular, peculiar and merging galaxies). It is of particular impor- tance, especially at high redshift, to find a method that quantifies the morphologies of both normal galaxies and the dominant population of irregular/peculiar galaxies. Hubble typing is also a somewhat subjective method of classification that requires visual inspection of each indi- vidual galaxy. With the advent of large deep sky surveys that produce images of hundreds to thousands of galax- ies at a time, it is essential to develop an automated method of objectively classifying galaxies, using a sys- tem that describes something about the physical proper- ties that shape their light distributions, independent of rest-frame wavelength. One of the parameters developed for use in auto- mated galaxy classification is the concentration index (C) (Abraham et al. 1994, 1996). This parameter mea- sures how centrally concentrated the light distribution is within a galaxy, which is a tracer of the disk-to-bulge ratio. Abraham et al. (1994, 1996) show that classi- fications through this parameter are less dependent on high spatial resolution than on Hubble type, and thus are more robust at high redshift and in poor ground- based seeing conditions. Schade et al. (1995), Abraham et al. (1996) and Conselice (1997) introduced very basic methods for measuring the rotational asymmetry index (A) to describe the degree of peculiarity and asymmetry in the light distribution of nearby galaxies and galaxies imaged with HST at redshifts of z ∼ 0.5 -1.2. The asym- metry index was later vastly improved through the use of standardized radii and centering techniques (Conselice et al. 2000). The asymmetry parameter is particularly
-
Upload
independent -
Category
Documents
-
view
1 -
download
0
Transcript of Dependence of Galaxy Structure on Rest‐Frame Wavelength and Galaxy Type

arX
iv:a
stro
-ph/
0612
558v
2 1
9 D
ec 2
006
Draft version February 5, 2008Preprint typeset using LATEX style emulateapj v. 6/22/04
DEPENDENCE OF GALAXY STRUCTURE ON REST-FRAME WAVELENGTH AND GALAXY TYPE∗
Violet A. Taylor-Mager1,2, Christopher J. Conselice4, Rogier A. Windhorst3, and Rolf A. Jansen3
Draft version February 5, 2008
ABSTRACT
We present a quantitative analysis of the morphologies for 199 nearby galaxies as parameterized withmeasurements of the concentration, asymmetry, and clumpiness (CAS) parameters at wavelengthsfrom 0.15-0.85µm. We find that these CAS parameters depend on both galaxy type and the wavelengthof observation. As such, we use them to obtain a quantitative measure of the ”morphological k-correction”, i.e., the change in appearance of a galaxy with rest-frame wavelength. Whereas early-typegalaxies (E–S0) appear about the same at all wavelengths longward of the Balmer break, there is amild but significantly-determined wavelength-dependence of the CAS parameters for galaxies typeslater than S0, which generally become less concentrated, and more asymmetric and clumpy towardshorter wavelengths. Also, as a merger progresses from pre-merger via major-merger to merger-remnant stages, it evolves through the CAS parameter space, becoming first less concentrated andmore asymmetric and clumpy, and then returning towards the ”locus” of normal galaxies. The finalmerger products are, on average, much more concentrated than normal spiral galaxies.Subject headings: galaxies: evolution – galaxies: fundamental parameters – galaxies: structure
1. INTRODUCTION
Deep, high-resolution imaging with telescopes such asthe Hubble Space Telescope (HST ) has revealed that themajority of high redshift galaxies are morphologically dif-ferent from the majority of galaxies nearby. They appearto have morphologies similar to the relatively rare, lowredshift irregular and peculiar galaxies (e.g., Driver etal. 1995, 1998; Glazebrook et al. 1995; Abraham et al.1996; Odewahn et al. 1996; Ellis 1997; Im et al. 1999;van Dokkum et al. 1999; van den Bergh et al. 2000;Conselice et al. 2005; Papovich et al. 2005). The greaterpercentage of merging galaxies at high redshift suggeststhat there was an evolution in the number of mergingand interacting galaxies throughout the history of theUniverse, which supports models of hierarchical galaxyformation (e.g., White 1979; White & Frenk 1991; Coleet al. 1994; Kauffmann et al. 1997; Roukema et al.1997; Baugh et al. 1998; Nagashima et al. 2001, 2002).To reveal how galaxies assemble and evolve over time,it is therefore essential to conduct detailed comparisonsof galaxies as a function of redshift. To carry out thesecomparisons it is critical to have a representative base-line at z ∼ 0. We present in this paper a sample of 199nearby galaxies, observed from the ultraviolet to the op-tical red, which can be used as an effective comparisonto higher redshift sources.
Morphology has also arisen in recent years as a ma-
∗BASED ON OBSERVATIONS MADE WITH THE NASA/ESAHUBBLE SPACE TELESCOPE, OBTAINED AT THE SPACETELESCOPE SCIENCE INSTITUTE, WHICH IS OPERATEDBY THE ASSOCIATION OF UNIVERSITIES FOR RESEARCHIN ASTRONOMY, INC., UNDER NASA CONTRACT NAS 5-26555. THESE OBSERVATIONS ARE ASSOCIATED WITHHST PROGRAMS #8645, AND 9124.
1 Department of Physics and Astronomy, Arizona State Univer-sity, Tempe, AZ 85287-1504
2 Carnegie Observatories, 813 Santa Barbara St., Pasadena, CA91101
3 School of Earth and Space Exploration, Arizona State Univer-sity, Tempe, AZ 85287-1404
4 School of Physics and Astronomy, University of Nottingham,University Park, England NG7 2RD, UK
jor method for findings major mergers between galaxiesand understanding their role in galaxy formation (Con-selice 2006). Mergers are predicted to be the dominatefactor in galaxy formation within the Cold Dark Mattermodel (e.g., Cole et al. 2000), and testing this concept indetail is of major importance. Extensive work has goneinto improving on the traditional Hubble sequence, whichdoes not distinguish between the large variety of galaxiesthat fall into the catch-all irregular class (e.g. irregular,peculiar and merging galaxies). It is of particular impor-tance, especially at high redshift, to find a method thatquantifies the morphologies of both normal galaxies andthe dominant population of irregular/peculiar galaxies.Hubble typing is also a somewhat subjective method ofclassification that requires visual inspection of each indi-vidual galaxy. With the advent of large deep sky surveysthat produce images of hundreds to thousands of galax-ies at a time, it is essential to develop an automatedmethod of objectively classifying galaxies, using a sys-tem that describes something about the physical proper-ties that shape their light distributions, independent ofrest-frame wavelength.
One of the parameters developed for use in auto-mated galaxy classification is the concentration index(C) (Abraham et al. 1994, 1996). This parameter mea-sures how centrally concentrated the light distribution iswithin a galaxy, which is a tracer of the disk-to-bulgeratio. Abraham et al. (1994, 1996) show that classi-fications through this parameter are less dependent onhigh spatial resolution than on Hubble type, and thusare more robust at high redshift and in poor ground-based seeing conditions. Schade et al. (1995), Abrahamet al. (1996) and Conselice (1997) introduced very basicmethods for measuring the rotational asymmetry index(A) to describe the degree of peculiarity and asymmetryin the light distribution of nearby galaxies and galaxiesimaged with HST at redshifts of z ∼ 0.5−1.2. The asym-metry index was later vastly improved through the useof standardized radii and centering techniques (Conseliceet al. 2000). The asymmetry parameter is particularly

2
useful for identifying merging and strongly interactinggalaxies, which tend to have very high asymmetries. An-other parameter, introduced by Isserstedt & Schindler(1986), quantifies the ratio of smoothly distributed lightto the clumped light distribution. This clumpiness index(S) compares the amount of light in star-forming clustersand associations to the light in a more diffuse older diskpopulation, which correlates with hydrogen recombina-tion lines (Hα) (Takamiya 1999), and gives an indicationof the recent star-formation activity within the galaxy(Conselice 2003).
Other authors proposed improved methods of mea-suring these concentration, asymmetry, and clumpi-ness (CAS) parameters, making them less sensitive tothe choice of galaxy center, surface-brightness cut-offs,signal-to-noise (S/N) ratio, and resolution effects (e.g.Bershady et al. 2000; Conselice et al. 2000; Conselice2003; Lotz et al. 2004). The CAS parameters werefound to correlate with each other, as well as other fun-damental parameters such as galaxy color, luminosity,size, surface-brightness, and star formation rate (Isserst-edt & Schindler 1986; Abraham et al. 1996; Takamiya1999; Bershady et al. 2000; Corbin et al. 2001). Galaxytypes are separated-out within parameter spaces involv-ing color, surface-brightness, and various combinationsof the CAS parameters, providing a method of galaxyclassification that is relatively robust over a large rangeof redshifts (Bershady et al. 2000; Conselice et al. 2000,Conselice et al. 2003; Conselice 2003).
Galaxies, however, can look substantially different atshorter wavelengths than at longer ones (e.g., Bohlin etal. 1991; Hill et al. 1992; Kuchinski et al. 2000, 2001;Marcum et al. 2001; Windhorst et al. 2002). Hence, ifthe morphological k-correction is significant, CAS mea-surements for low redshift galaxies in rest-frame opticallight and high redshift galaxies in rest-frame ultravio-let light may not be directly comparable. For exam-ple, Schade et al. (1995) found that their galaxies (z∼ 0.5−1.2) looked more irregular in their B images (rest-frame UV) than at longer wavelengths, which will allhave an effect on quantitative galaxy parameters. Jansen(2000) noted a similar systematic shift from U to R forgalaxies in the Nearby Field Galaxy Survey. We also ob-serve this effect when comparing HST/WFPC2 UV andnear-infrared (IR) images available for a subset of thegalaxies presented in Windhorst et al. (2002). In thepresent paper, we quantitatively analyze how the CASparameters vary as a function of rest-frame wavelengthand morphological type for a sample of 199 nearby galax-ies observed in a combination of nine pass-bands rang-ing from the far-UV to the near-IR. We will apply theseresults to the high redshift Universe in a future paper(Conselice, et al. 2007, in preparation).
2. OBSERVATIONS
As described in detail in Taylor et al. (2005), wehave selected for study a sample of 199 nearby galax-ies that consists mostly of late-type spiral, irregular, andpeculiar/merging galaxies. These late-types are amongthe galaxies at z ∼ 0 that most resemble the majorityof high redshift galaxies, and are less studied and lesswell-understood than nearby earlier-type galaxies. Also,Jansen (2000) found that most of the wavelength depen-dence of the asymmetry is due to galaxies of type Sbc
and later (de Vaucouleurs type, T & 4). Thus, mostof the difference in asymmetries between the U and R-band occurs for later morphological Hubble types. Assuch, late-type galaxies are more suited for this analysisthan early-type galaxies. The selected morphological dis-tribution for our sample is shown in Figure 1. For a dis-cussion of the effects of this deliberate type pre-selection,see Windhorst et al. (2002).
Of the 199 galaxies in our sample, 143 were ob-served with the Vatican Advanced Technology Telescope(VATT) in UBV R (λc = 3597, 4359, 5395, and 6338A,respectively). A total of 90 galaxies were observed withHST WFPC2 in the UV (F300W, λc = 2930A), 34 ofwhich also have VATT data. Of these 90 galaxies ob-served with HST, 37 were observed in our Cycle 9 GOprogram #8645 (Windhorst et al. 2002; Taylor et al.2005), and 53 were observed in our Cycle 10 SNAP-shotprogram #9124 (P.I.: R. Windhorst; Jansen et al. 2007,in preparation). During these programs, a subset of 11galaxies were also imaged with a shorter wavelength UVfilter (F255W, λc = 2550A), and 60 were observed in thered (F814W, λc = 8230A). Taylor et al. (2004, 2005) givea more detailed description of these observations. At thetime the present analysis was completed, 13 of the galax-ies in our sample had deep (texp & 670 s) GALEX mid-
UV (NUV, λc = 2275A) and far-UV (FUV, λc = 1550A)imaging available. A 14th galaxy, NGC0569, was ob-served only in the GALEX NUV filter. Of these, 4 wereobserved with our GALEX Cycle 1 SNAP program #036,and 10 were obtained from the archived Nearby Galax-ies Survey (NGS), Medium Imaging Survey (MIS), andDeep Imaging Survey (DIS) (Martin et al. 2005; Heck-man et al. 2005). Seven of the 14 galaxies observed withGALEX also have VATT data, and 10 also have HSTdata. Three of these galaxies have data from all of thesetelescopes (VATT, HST, and GALEX).
In Table 1 we identify the galaxies in our sample, andlist their relevant global properties. The first 25 galax-ies are listed here, with the full table available in theelectronic edition. Column (1) lists the galaxy identifica-tion numbers as used throughout this paper, while col-umn (2) gives the common catalog names, and columns(3) and (4) contain the equatorial coordinates (J2000.0).Column (6) and (7) lists the total (B − V ) color andtheir errors (respectively), as measured from the galax-ies for which we have B and V images, or from the RC3(de Vaucouleurs et al. 1991) otherwise. All recessionalvelocities with respect to the Galactic Standard of Rest(VGSR; column 8) are from the RC3. In column (9),we identified the edge-on spiral galaxies in our sample.The numeric types adopted throughout the present paperare listed in column (5), and were assigned as describedin section 4.1. Figure 1 shows the distribution of mor-phological types within our sample. Note the deliberateemphasis on late-type galaxies for the purposes of highredshift comparison.
3. DATA REDUCTION
The UBV R CCD images obtained at the VATT werereduced and calibrated as described in Taylor et al.(2004, 2005). For the data analysis in these previouspapers, all of the non-target objects in the images werereplaced with a constant local sky-level. This was suit-able for computing radial profiles of surface-brightness

Wavelength Dependence of Galaxy Structure 3
Fig. 1.— Distribution of types within the present sample of nearby galaxies. Since the vast majority of galaxies observed at high redshiftdisplay morphologies resembling those of nearby late-type spiral, irregular, and peculiar/merging galaxies, our sample is intentionallyheavily weighted toward such galaxy types. The subdivision of types later than 11 is discussed in the text, and in Hibbard et al. (2001).
and color, which are not sensitive to structure on smallscales within a galaxy. However, the deviations fromthe true underlying galaxy light distribution at the lo-cations of non-target objects, as replaced with the localsky-level, are larger than is acceptable for CAS measure-ments, which are particularly sensitive to high spatial fre-quency structure within the galaxy. Therefore, in thesecases we applied a more sophisticated means of removingthe non-target objects, interpolating from adjacent pix-els with valid data over these masked pixels along boththe vertical and horizontal directions (implemented byR. Jansen as task IMCLEAN
5 within IRAF6). This rou-tine preserves the surrounding sky properties as much aspossible inside the interpolated region.
We obtained stacked images for most of our HST Cy-cle 9 galaxies as type B associations from the Space Tele-scope Science Institute (STSCI) data archive.7 Seven ofthe Cycle 9 images do not have associations available forat least one of the filters. These individual images werethus combined and cosmic-ray rejected using an IDL rou-tine developed by Cohen et al. (2003). The HST Cy-cle 10 images were combined using an IRAF task devel-
5 http://www.public.asu.edu/∼rjansen/6 IRAF is distributed by the National Optical Astronomy Ob-
servatories, which are operated by the Association of Universitiesfor Research in Astronomy, Inc., under cooperative agreement withthe National Science Foundation.
7 http://archive.stsci.edu/hst/wfpc2/index.html
oped by R. Jansen, that rejects bad pixels based on thenoise characteristics of the images (Jansen et al. 2007,in preparation). For each galaxy, the stacked images forthe individual WFPC2 CCD’s were then mosaiced usingthe WMOSAIC task within the STSDAS package in IRAF.Non-target objects were interpolated-over with IMCLEAN.
We retrieved pipeline processed images of each of thesample galaxies observed by GALEX through the STSCIdata archive. Since GALEX has a field-of-view of 1.2◦,and most of our galaxies are only around 1′ in size, we cut512 × 512 pixel GALEX stamps centered on our targetgalaxy for use in the data analysis. This corresponds toan image size of about 12′, which is sufficient for viewingthe entire galaxy and measuring the sky from surround-ing regions that are far enough away from the galaxythat they are uncontaminated by its light. Non-targetobjects were interpolated-over with IMCLEAN, as before.
4. DATA ANALYSIS
4.1. Visual Classifications
We assigned visual types to these galaxies using the av-erage of three experienced classifiers to classify the galax-ies observed with the VATT (Taylor et al. 2005), and theaverage of two experienced classifiers (V. Taylor, and C.Conselice) for the galaxies observed with HST. For eachof the normal galaxies in our sample, we assigned mor-phological types on the numeric 16-step de Vaucouleurssystem, which ranges from T= −5 (Elliptical) through

4
TABLE 1Observed Galaxy List.
ID# Galaxy RA DEC Type B-V σB−V VGSR comment(1) (2) (3) (4) (5) (6) (7) (8) (9)
001 UGC00006 00:03:09.46 +21:57:37.6 15.0 0.370 0.040 6763 · · ·
002 NGC0014 00:08:46.32 +15:48:56.4 10.0 0.580 0.035 1012 · · ·
003 UGC00156 00:16:46.30 +12:21:13.1 9.3 0.576 0.042 1267 · · ·
004 NGC0178 00:39:08.25 -14:10:20.7 9.5 0.470 0.040 1496 · · ·
005 UGC00404 00:39:19.17 +13:06:40.3 13.0 0.362 0.030 10742 · · ·
006 Mrk960 00:48:35.44 -12:42:59.9 8.0 · · · 0.024 6447 · · ·
007 UGC00512 00:50:02.59 +07:54:55.3 15.0 -0.004 0.017 5496 · · ·
008 UGC00644 01:03:16.65 +14:02:01.6 13.0 0.662 0.013 · · · · · ·
009 UGC00685 01:07:22.29 +16:41:04.1 10.0 · · · 0.010 271 · · ·
010 UGC00749 01:11:30.28 +01:19:10.9 14.5 0.653 0.006 6882 · · ·
011 NGC0428 01:12:55.62 +00:58:52.2 9.0 0.440 0.014 1231 · · ·
012 UGC00849 01:19:23.03 +12:26:57.4 14.5 0.572 0.015 14410 · · ·
013 NGC0569 01:29:07.16 +11:07:53.3 13.0 · · · 0.013 5862 · · ·
014 UGC01104 01:32:43.47 +18:19:01.4 10.0 0.533 0.018 775 · · ·
015 UGC01133 01:35:00.85 +04:23:11.8 15.0 0.077 0.014 2031 · · ·
016 NGC0625 01:35:05.12 -41:26:08.9 10.0 0.560 0.016 312 · · ·
017 UGC01219 01:44:20.13 +17:28:42.9 3.0 0.709 0.015 4708 · · ·
018 UGC01240 01:46:19.56 +04:15:52.5 15.0 0.401 0.015 1862 · · ·
019 UGC01449 01:58:04.15 +03:05:57.2 14.0 0.487 0.015 5590 · · ·
020 UGC01753 02:16:34.98 +28:12:16.1 8.7 0.559 0.038 3098 · · ·
021 NGC0959 02:32:23.45 +35:29:20.1 7.0 0.588 0.009 715 · · ·
022 NGC1140 02:54:33.43 -10:01:42.4 15.0 0.350 0.008 1479 · · ·
023 NGC1156 02:59:41.41 +25:13:37.5 10.0 0.618 0.009 452 · · ·
024 NGC1311 03:20:06.66 -52:11:12.5 10.0 0.460 0.021 331 · · ·
025 ESO418-G008 03:31:30.58 -30:12:46.6 8.0 0.410 0.012 1146 · · ·
Note. — Columns: (1) ID number assigned to this galaxy, (2) galaxy name, (3) Right Ascension(J2000), (4) Declination (J2000), (5) classification (de Vaucouleurs numerical types were used for normalgalaxies, with the following types assigned to peculiar/merging galaxies (see text for details): 13.0=pre-merger, 13.5=minor merger,14.0=major merger,14.5=merger remnant, 15.0=peculiar), (6) total (B−V )color (mag), (7) uncertainty on (B−V ), (8) Galactic standard of rest velocity (km s−1), and (9) specialcomment for this galaxy. ”Edge-on” galaxies appear to be edge-on spiral galaxies. The full table isavailable only in the electronic edition.
T= 10 (irregular). The median difference between clas-sifications by individual classifiers was zero, with 75%of the classifications agreeing to within ±1 T-type-bin,and all agreeing to within ±4 bins. For merging andpeculiar galaxies, we used the following typing scheme,which was partially adapted from Hibbard et al. (2001).Pre-mergers (pM, T= 13.0) are galaxies that are tidallyinteracting with another nearby galaxy, but they are ata large enough distance from each other that the individ-ual galaxies can be easily distinguished and treated sep-arately. Minor mergers (mM, T= 13.5) are two or moregalaxies showing signs of merging, in which one of thegalaxies is much larger or brighter than the others (es-timated to be at least about 4 times larger or brighter).Major mergers (M, T= 14.0) are galaxies of apparentlysimilar mass or luminosity that are interacting or merg-ing. Major merger remnants (MR, T= 14.5) are objectsin the later stages of merging, such that it is difficultto say exactly what has merged, when, or how. Pecu-liar galaxies (P, T= 15.0) are abnormal or unclassifiablegalaxies which do not fit on the normal Hubble sequence,but were not obviously involved in a merger. A subset ofthese may, however, be late-stage merger remnants. Fig-ure 2 shows an example of each of the four major typesof merging galaxies.
4.2. CAS Parameter Measurements
We adopt the definitions of the CAS parameters ofConselice et al. (2000) and Conselice (2003), as de-
scribed below, and measured CAS parameters for ourgalaxy sample using the IRAF task CAS, developed byC. Conselice (Conselice et al. 2000; Conselice 2003).
The concentration index, C, is computed by determin-ing the total sky-subtracted light contained within 1.5×the Petrosian radius (rPet) (Petrosian 1976), and find-ing the logarithmic ratio of the radius within which 80%of this light is contained (r80) to the radius within which20% of this light is contained (r20) (Conselice et al. 2000).The concentration index is thus given by the formula:
C = 5 × log(r80/r20) (1)
Therefore, galaxies that are highly concentrated in theircenters (e.g., ellipticals) will have high values of C, andgalaxies that have less-centrally concentrated light dis-tributions (e.g., disk galaxies or low surface-brightnessgalaxies) will have lower values of C.
The asymmetry index, A, is computed by rotating thegalaxy by 180◦ from its center, and subtracting the lightwithin 1.5× rPet in the rotated image (I180) from thatin the original image (Io). The ratio of the residual sub-tracted flux to the original galaxy flux yields A:
A = min(Σ |Io − I180|
Σ |Io|) − min(
Σ |Bo − B180|
Σ |Io|) (2)
Noise corrections were applied by subtracting the asym-metry of an empty background region (B), and itera-tive centering corrections were applied to minimize A,since gross centering errors would artificially increase A.

Wavelength Dependence of Galaxy Structure 5
130 NGC 4644 pM 087 NGC 3445 mM
173 UGC10279 M 052 NGC 2623 MR
1’
Fig. 2.— Examples of the sub-classifications assigned to the merging galaxies in our sample. Each of the the B-filter VATT imagesmeasures 3.0′ × 2.4′. Top left: NGC4644 (the galaxy on the right) is in strong interaction with its neighbor NGC4644B (PGC42725),and is classified as a pre-merger (pM). Top right: NGC3445 appears to be accreting a smaller companion, PGC32784, and is classifiedas a minor merger (mM). Bottom left: UGC10279 represents a major merger event (M) between two galaxies of similar mass, Holmberg734A and B. Bottom right: in NGC2623 the properties of the galaxies that merged are no longer exactly discernible, so it is classified asa merger remnant (MR, early stage).
Asymmetries range from A = 0 to 2, with A = 0 cor-responding to a truly symmetric galaxy (e.g., some el-lipticals; see Jansen(2000) for an example of a highlysymmetric spiral galaxy), and A = 2 corresponding to acompletely asymmetric galaxy.
The clumpiness index, S, is defined as the ratio ofthe amount of light in high spatial frequency structureswithin 1.5× rPet to the total amount of light in the galaxywithin that radius (Conselice 2003). This was done bysubtracting a boxcar-smoothed image from the originalimage to produce an image that contains only the high-frequency structure. The central pixels within 1/20th ofthe total radius were set to zero to exclude them fromthe parameter measurements. S is given by the followingequation, where Ix,y is the intensity of light in a givenpixel, Isx,y is the intensity of that pixel in the imagesmoothed by 0.3×rPet, and Bs
x,y is an intensity valueof a pixel from a smoothed background region:
S = 10 × (ΣN,N
x,y=1,1 (Ix,y − Isx,y)
ΣN,Nx,y=1,1 Ix,y
−ΣN,N
x,y=1,1 Bsx,y
ΣN,Nx,y=1,1 Ix,y
) (3)
A clumpiness of S = 0 corresponds to a galaxy that hasno high frequency structure, and is therefore completely
smooth (e.g., some ellipticals that are far enough awaythat they are not resolved into their brightest stars).Galaxies with more high-frequency structure are morepatchy in appearance, and will have a higher value of S.
5. RESOLUTION AND SIGNAL-TO-NOISE EFFECTS
The effects of spatial resolution on the CAS parametersare discussed in detail in Conselice (2003) and Conseliceet al. (2000). Previous studies have shown that a spatialresolution (R) of ∼ 1 kpc is at the limit beyond whichpoorer resolution will affect the measurements, withasymmetry parameters determined with HST/WFPC2becoming unreliable for the more distant galaxies in theHubble Deep Field (Conselice et al. 2000; Lotz et al.2004). At resolutions better than this limit, Conselice(2003) found that the asymmetry index does not dependstrongly on the resolution or seeing of the image, with70% of the value of A, as measured in the optical, at-tributable to overall global distortions in the galaxy, and30% due to localized high-frequency structures, such asstar-forming regions. Low S/N ratios within the galaxycan also decrease the reliability of the CAS measurements(Conselice et al. 2000; Lotz et al. 2004). Conselice et al.(2000) found that asymmetries can be computed most

6
reliably when the integrated S/N ratio & 100 per ob-ject. These S/N and resolution reliability limits, how-ever, are rather conservative, and would result in poor(or no) number statistics in some of our galaxy type-bins. Therefore, in this section we will investigate theeffects of S/N and spatial resolution in our data, and de-termine the limits of each that are appropriate for ouranalysis. We determined the spatial resolution in kpcfrom the recessional velocities listed in the RC3 (usingVGSR when available, or Vhel otherwise). Total S/N ra-tios were measured within 1.5 times the Petrosian radius.
5.1. The Effects of Smoothing the HST data
For the UBV R images observed at the VATT, the im-ages of each galaxy were convolved to the worst seeingfor that galaxy (typically in the U -band), using a Gaus-sian of the appropriate width within the task GAUSS inIRAF. The seeing of each image was determined by find-ing the average FWHM (full width at half max) of allstars detected with SExtractor (Bertin & Arnouts 1996),as described in detail in Taylor et al. (2004).
In order to consistently compare images of a galaxywith ground-based seeing to those from HST/WFPC2(FWHM∼0.′′14), it may be necessary to convolve theHST images to the same resolution as the ground-baseddata. We test this by examining the effect on the CASparameter measurements after convolving the HST im-ages (as for the VATT) to the 1.′′75 average U-band see-ing at the VATT. The left three panels in Figure 3 showthe difference between the CAS measurements from theconvolved and unconvolved HST images in each filter vs.the measurements in the unconvolved images. The right-most panels show the median of these differences for eachfilter. Horizontal dotted lines indicate when convolutiondoes not affect the CAS parameters. Different symbolsin Figure 3 are used for measurements from images wherethe galaxy had low S/N (large open squares: S/N < 75,small open squares: 75 < S/N < 100), and where thegalaxy had low physical resolution (large open triangles:R > 1.25 kpc, small open triangles: 1.00 < R < 1.25kpc). There is no real trend with low S/N or spatial res-olution, although most of the extreme outliers have lowS/N or, in exceptional cases, low resolution.
The differences between CAS parameters at the twodifferent resolutions are most pronounced in the F255Wimages, which had the lowest S/N ratio, and thus thehighest uncertainties in these parameters. Convolvingthese images resulted in boosting the signal in each reso-lution element, as well as smoothing over high-frequencystructure in the noisy background, which is strongly af-fected by charge transfer effects (CTE). This results inmore reliable CAS values that are not as severely affectedby spikes in the sky background, as can be seen by con-sidering the A and S panels in Figure 3. Vertical dottedlines in these panels represent the limit below which theA and S values measured in the sky were higher thanthose measured in the galaxy (A < 0, S < 0). For theseextreme cases, convolving the images increased the sig-nal and decreased the noise, which resulted in increasingmost of the negative values of A and S into the posi-tive regime. CTE-noise effects are also present in thedata from the other WFPC2 filters, although it is not asstrong of a factor in the longer wavelength pass-bandsdue to the higher S/N ratio of the galaxies and the more
significant zodiacal sky-brightness filling in the low-levelCTE-traps. A combination of smoothing over the noiseand the high-frequency structure of the galaxy itself hasan effect on the CAS parameters in all filters, to varyingextents.
Overall, the concentration index does not change sig-nificantly with spatial resolution, especially at longerwavelengths. The median values of the change in Cafter convolving the HST images to the ground-basedseeing are 0.228, –0.002, and –0.028 in F255W, F300W,and F814W, respectively (these values will be given inthis filter order for the rest of this paragraph). This ismarginally greater than the median uncertainty on theindividual unconvolved values of C in F255W (0.209),and well within the median uncertainties in F300W andF814W (0.030 for both). The asymmetry index is moreaffected by convolution, although there is no trend in thiseffect with increasing A. This is likely due to a boostin S/N per resolution element, which improves the re-liability of the measurement (Lotz et al. 2004). Con-volving the images to the ground-based seeing changedA by a median value of 0.369, 0.083, and –0.021, re-spectively. Except for the noisy F255W images, this isroughly within the median uncertainties of 0.181, 0.078,and 0.044, respectively. The clumpiness index, however,was more strongly affected by the resolution change, withintrinsically clumpy galaxies showing a strong trend inall filters toward decreasing clumpiness with decreasingresolution. This is to be expected, as S is designed tomeasure high-frequency structure, and star clusters andassociations may be resolved in the unconvolved HST im-ages. Convolving the images changed the median S by0.840, –0.780, and –0.215, respectively. These are rela-tively significant differences, and much larger than themedian uncertainties on S of 0.249, 0.256, and 0.135, il-lustrating that real structure being smoothed over lowersthe measured S values.
With the above caveats, throughout the remainder ofthis paper we therefore use the CAS values measuredin HST images convolved to match the resolution ofour ground-based VATT images, to reduce the effectsof background noise and to offer a more systematic com-parison. We note that with the exception of F814W, thisdoes not do gross injustice to the high resolution HST im-ages, since the F255W and F300W filters are below theatmospheric cut-off, and therefore are unique data evenat lower resolution.
5.2. Determining a S/N and Resolution Reliability limit
Of the 143 galaxies observed with the VATT, 16 havespatial resolutions between 1.00 and 2.20 kpc in the U-band image, which is above the reliability limit of 1 kpcquoted in Conselice et al. (2000). Only one galaxy(UGC01133 in the V-band) was found to have a S/Nratio below the Conselice et al. (2000) reliability limitof 100. These limits (hereafter referred to as limit1) areconservative, however, so it may be acceptable to usemore relaxed limits in the interest of conserving highernumber statistics. If we relax the limits by 25% (definedas limit2), we find 9 galaxies with R > 1.25 kpc, and nogalaxies with S/N < 75.
Of the 90 galaxies observed with the HST in F300W(11 of which were also observed in F255W, and 60 inF814W), 6 have 1.00 < R < 1.44 kpc, and 2 have R

Wavelength Dependence of Galaxy Structure 7
Fig. 3.— The difference between CAS parameters measured from HST images convolved to the average VATT ground-based seeing of1.75′′ (Xc), and those measured from the original high resolution (0.14′′ FWHM) HST images (Xo), plotted versus the measurements inthe original images. Open square symbols represent galaxies with low S/N (large symbols: S/N < 75, small: 75 < S/N < 100). Opentriangle symbols represent galaxies with low spatial resolution (R) in the convolved images (large: R > 1.25 kpc, small: 1.00 kpc < R <
1.25 kpc). Left 3 panels: TOP: Change in concentration index, Cc− Co, versus Co. MIDDLE: Change in asymmetry index, Ac− Ao,versus Ao. BOTTOM: Change in clumpiness index, Sc− So, versus So. Each panel shows data from a different pass-band, as labeled inthe panels. The horizontal error bar in the lower left corner of each panel represents the median uncertainties for each parameter in theoriginal images. Right-most panels: Median difference in each filter between Cc and Co (top), Ac and Ao (middle), and Sc and So
(bottom). Error bars represent the 25% – 75% quartile range. Horizontal dotted lines indicate where the value of the CAS parameter didnot change between the convolved and unconvolved images. Vertical dotted lines in the A and S panels represent the cut-off below whichthe A and S measurements of the sky were larger than those of the galaxy. Most of these outlying values were increased to positive valuesafter convolving the images.
> 1.25 kpc. In F255W, 7 galaxies have S/N < 100, and3 have S/N < 75. In F300W, 5 galaxies have S/N < 100,and 2 have S/N < 75. All galaxies observed in F814Whave S/N > 100.
The GALEX images have a stellar FWHM of ∼5′′,which is ∼3× larger than that of the VATT and the con-volved HST data. The CAS values, however, should stillbe reliably determined, as long as the spatial resolutionsof the galaxies are within the above reliability limit. Ofthe 14 galaxies observed with GALEX, 7 have R > 1.00kpc, with resolutions between 1.41 and 2.37 kpc. One
additional galaxy (NGC1396) was barely detected in theFUV.
The main goal of this work is to determine the generaltrends of the CAS parameters, mainly through the useof the median values for each type-bin and filter. Forwell-populated bins of type and filter, imposing conser-vative reliability limits improves the significance of themedian values. In several of our sparsely populated bins,however, measurement uncertainties and peculiarities ofindividual galaxies would dominate. If we can relax theConselice et al. (2000) limits of S/N > 100 and R < 1.00

8
kpc (limit1) without having a significant effect on themedian CAS values, we can then improve the numberstatistics in our type-bins while still obtaining reason-ably high reliability. As such, we have tested the effectsof applying limit1 to our relatively well-sampled VATTand HST F300W and F814W data set against applying amore liberal limit of S/N > 75 and R < 1.25 kpc (limit2).Table 2 summarizes the results. The median CAS pa-rameters in each type-bin were calculated for the entiredata set (”all”), and separately for those data meetingeach of the reliability requirements we are considering(limit1 and limit2). Since we find little difference in theresults between filters for each telescope, we average themedians over U , B, V , and R for the VATT, and overF300W and F814W for HST. Table 2 lists the differencebetween these medians calculated with limit1 and all ofthe data, and also the difference between the medianscalculated with limit1 and limit2. The final column inTable 2 gives the average uncertainty on the differencebetween the medians for a given parameter observed withthe VATT or HST. These uncertainties were calculatedby taking the quadratic sum of the median range of CASvalues, averaged over the relevant filters, and normalizedby the square-root of the average number of galaxies pertype-bin. Although in a few individual sparsely popu-lated type-bins the median CAS values are affected atthe &1σ level, we find that for the vast majority of binsthe median values do not change by relaxing our limitson minimum S/N and spatial resolution from limit1 tolimit2. This is also the case for the GALEX and F255Wdata.
Applying limit1 results in an average change withrespect to no limit in the median C, A, and S val-ues, respectively, of 0.051 ± 0.035, 0.004 ± 0.018, and−0.002 ± 0.064. Within the uncertainty on these av-erages, only the concentration index is affected by theapplication of limit1. Applying limit2 results in an av-erage change from the values calculated with limit1 of−0.034 ± 0.035, 0.002 ± 0.018, and 0.013 ± 0.064, in C,A, and S, respectively. All of these are within the uncer-tainties, although only marginally so for C. Therefore,we find that it is acceptable to apply the somewhat morerelaxed reliability limits of limit2 to our analysis, in orderto retain adequate sample sizes. In the subsequent plots,data points that do not satisfy our S/N and resolutioncriteria (limit2) will be plotted using smaller symbols,but not used to calculate the presented trends. Apply-ing this limit results in the rejection of 8 of the 13 galaxiesin FUV, 7/14 in NUV, 3/11 in F255W, 4/90 in F300W,9/143 in UBV R, and 2/60 in F814W. It is clear that theFUV, NUV, and F255W data are barely adequate for thecurrent studies, and only instruments like WFC3 (to belaunched to HST in SM4) can significantly improve onthis.
6. RESULTS
6.1. Relating CAS Parameters to Galaxy Color andType
Tables 3, 4, and 5 list our C, A, and S measurementsand errors, respectively, for each galaxy in each pass-band. The first 25 galaxies are listed here, with the fulltables available in the electronic edition. Ellipsis indi-cate that there are no images available for that galaxyin that particular pass-band. Footnotes mark measure-
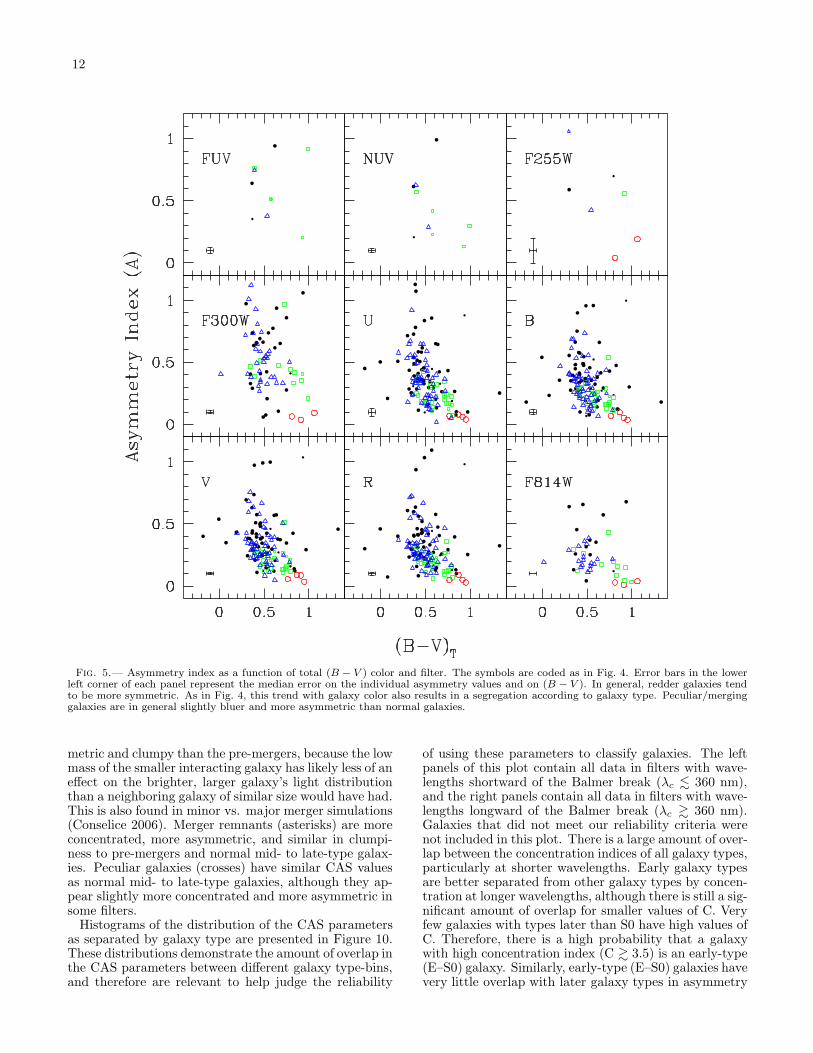
ments for images in which the galaxy did not meet theS/N or resolution requirements of our adopted limits(S/N< 75 or R> 1.25 kpc). Figures 4, 5, and 6 showthe C, A, and S parameters, respectively, versus the total(B − V ) color of each galaxy. Values for each pass-bandare shown in separate panels within each figure, withdifferent colored symbols used to designate early-type(E–S0), mid-type (Sa-Sc), late-type (Sd–Im), and pecu-liar/merging galaxies, as indicated by the legend in Fig-ure 4. Smaller symbols represent galaxies that are belowthe reliability limits adopted in Section 5.2 (S/N< 75,or R> 1.25 kpc). Representative error bars are shownin each panel with the median uncertainty in the CASparameters of the individual data points, and the av-erage (B − V ) uncertainty of 0.04 mag. These figuresshow a trend of galaxies becoming generally more con-centrated, less asymmetric, and less clumpy with red-der (B − V ) color. There is a large spread and over-lap of these parameters with galaxy type, so that galaxyclassifications made from these plots can only be usedas approximate indicators. Early-type galaxies are mostclearly separated from the later galaxy types, since theyare the reddest, the most concentrated, the least asym-metric, and the least clumpy. Later galaxy types areincreasingly bluer, less concentrated, more asymmetric,and more clumpy than earlier galaxy types. This resultis in agreement with previous authors (e.g. Takamiya1999; Bershady et al. 2000; Conselice et al. 2000, 2003;Conselice 2003). There is a much higher spread in S atshorter wavelengths, with a CAS-(B−V ) correlation thatchanges slope with filter, such that blue galaxies tend tobe more clumpy at shorter wavelengths than they are atlonger wavelengths, although the statistics in the UV arescarce. This logically results from bluer late-type galax-ies containing more recent star formation, and thereforehaving more blue knots from recently formed star clus-ters and associations that will increase the clumpiness inthe bluer filters. The CAS values of peculiar/merginggalaxies vary considerably, but their median values areslightly offset from the locus of normal galaxies, withpeculiar/merging galaxies being generally bluer (by 0.03mag), and slightly more concentrated (by ∼ 0.2) andasymmetric (by ∼ 0.1). These type-dependent offsetsand their overlap are discussed in more detail below.
Figures 7, 8, and 9 show the C, A, and S parame-ters, respectively, of each galaxy as a function of galaxytype. As for Figures 4–6, separate panels show resultsfrom different filters. Data-points from galaxies that didnot meet the reliability criteria (S/N< 75, or R> 1.25kpc) are indicated with small black points. Median val-ues of the CAS parameters in a particular filter within aparticular type-bin are indicated with large colored sym-bols, and the spread of the data points is indicated bythe 25–75% quartile range, represented by the verticalerror bars. These median C, A, and S values are alsolisted in Tables 6, 7, and 8, respectively. Data thatdid not meet the reliability criteria were not includedin the medians. Due to low S/N and significant CTEeffects (particularly in F255W) causing the clumpinessmeasured in the sky to be higher than that measuredin some galaxies, median values of S were only calcu-lated with data that had S> −0.2. In all three plots,the spread in the CAS parameters increases toward latergalaxy type. There are few objects in the GALEX FUV

Wavelength Dependence of Galaxy Structure 9
TABLE 2Change in Median CAS Parameters With Reliability Limits
Parameter Telescope Difference E–S0 Sa–Sc Sd–Im Pm mM M MR P σmed
(1) (2) (3) (4) (5) (6) (7) (8) (9) (10) (11) (12)
C VATT limit1−all 0.120 0.000 0.000 -0.005 0.358 0.183 -0.030 0.053 0.10C VATT limit1−limit2 -0.120 -0.015 0.000 0.000 -0.358 0.245 0.035 -0.053 0.10C HST limit1−all 0.000 0.045 -0.040 -0.195 0.000 0.435 -0.105 0.000 0.10C HST limit1−limit2 0.000 -0.065 0.020 0.195 0.000 -0.435 0.000 0.000 0.10A VATT limit1−all -0.008 -0.003 0.000 0.030 0.088 -0.113 0.008 0.003 0.04A VATT limit1−limit2 0.008 0.000 0.000 0.000 -0.088 0.115 -0.008 -0.003 0.04A HST limit1−all 0.000 -0.010 -0.005 0.005 0.000 0.010 0.055 0.000 0.06A HST limit1−limit2 0.000 0.015 0.005 -0.005 0.000 -0.010 0.000 0.000 0.06S VATT limit1−all 0.003 0.018 0.000 0.055 0.098 -0.273 0.020 0.000 0.06S VATT limit1−limit2 -0.003 0.015 0.000 0.000 -0.098 0.143 0.015 0.000 0.06S HST limit1−all 0.000 0.045 0.010 0.010 0.000 -0.160 0.140 0.000 0.25S HST limit1−limit2 0.000 -0.015 -0.005 -0.010 0.000 0.160 0.000 0.000 0.25
Note. — Columns: (1) Measured parameter (C, A, or S). (2) Mean values were determined within U , B, V ,and R (VATT), or F300W and F814W (HST). (3) Type of difference calculated: ”all” is the mean within the filterset described by column 2 of the median CAS parameter within each type-bin for all of the data; ”limit1” is thismedian when galaxies with S/N < 100 and resolution > 1.00 kpc are rejected; ”limit2” is this median when galaxieswith S/N < 75 and resolution > 1.25 kpc are rejected. (4–11) Median CAS parameter difference (as described incolumn 3) for each galaxy type-bin. (12) Average error on the median CAS parameter differences.
TABLE 3Concentration Index (C)
ID# FUV σF UV NUV σNUV F255W σF255W F300W σF300W U σU B σB V σV R σR F814W σF814W
001 2.6172 0.756 2.9502 0.728 · · · · · · 3.722 0.102 · · · · · · · · · · · · · · · · · · · · · · · · · · · · · ·
002 · · · · · · · · · · · · · · · · · · 2.254 0.023 · · · · · · · · · · · · · · · · · · · · · · · · 2.346 0.022003 · · · · · · · · · · · · · · · · · · · · · · · · 2.507 0.044 2.720 0.039 2.404 0.051 2.866 0.039 · · · · · ·
004 · · · · · · · · · · · · · · · · · · 2.247 0.025 · · · · · · · · · · · · · · · · · · · · · · · · 2.211 0.024005 · · · · · · · · · · · · · · · · · · · · · · · · 2.4882 0.126 2.6692 0.115 2.5812 0.122 2.3432 0.154 · · · · · ·
006 2.4872 0.487 2.7842 0.489 · · · · · · 2.704 0.043 · · · · · · · · · · · · · · · · · · · · · · · · 3.164 0.049007 · · · · · · · · · · · · · · · · · · · · · · · · 2.632 0.113 2.652 0.107 2.770 0.110 2.767 0.125 · · · · · ·
008 · · · · · · · · · · · · · · · · · · · · · · · · 2.1252 0.116 2.2752 0.116 2.5122 0.127 2.8512 0.122 · · · · · ·
009 · · · · · · · · · · · · · · · · · · 1.801 0.018 · · · · · · · · · · · · · · · · · · · · · · · · · · · · · ·
010 · · · · · · · · · · · · · · · · · · · · · · · · 4.426 0.165 4.242 0.143 4.088 0.147 4.195 0.140 · · · · · ·
011 · · · · · · · · · · · · · · · · · · 1.407 0.015 · · · · · · · · · · · · · · · · · · · · · · · · · · · · · ·
012 · · · · · · · · · · · · · · · · · · · · · · · · 2.8482 0.115 2.8602 0.106 2.9242 0.109 2.9372 0.113 · · · · · ·
013 · · · · · · 3.1502 0.378 · · · · · · 2.852 0.062 · · · · · · · · · · · · · · · · · · · · · · · · 3.060 0.064014 2.489 0.485 2.622 0.448 · · · · · · 2.510 0.032 2.490 0.112 2.682 0.105 2.785 0.096 3.341 0.072 2.571 0.026015 · · · · · · · · · · · · · · · · · · · · · · · · 2.373 0.062 2.442 0.064 2.537 0.080 2.528 0.114 · · · · · ·
016 · · · · · · · · · · · · · · · · · · 2.958 0.031 · · · · · · · · · · · · · · · · · · · · · · · · · · · · · ·
017 · · · · · · · · · · · · · · · · · · · · · · · · 3.022 0.096 3.399 0.113 3.816 0.135 3.997 0.147 · · · · · ·
018 · · · · · · · · · · · · · · · · · · · · · · · · 3.101 0.127 3.041 0.127 2.941 0.133 2.603 0.168 · · · · · ·
019 · · · · · · · · · · · · · · · · · · · · · · · · 1.602 0.058 1.665 0.057 1.629 0.057 1.548 0.057 · · · · · ·
020 · · · · · · · · · · · · · · · · · · · · · · · · 2.526 0.106 2.458 0.106 2.595 0.100 2.546 0.101 · · · · · ·
021 · · · · · · · · · · · · · · · · · · · · · · · · 2.133 0.044 2.250 0.042 2.363 0.042 2.420 0.043 · · · · · ·
022 · · · · · · · · · · · · · · · · · · 3.654 0.095 · · · · · · · · · · · · · · · · · · · · · · · · 3.488 0.051023 · · · · · · · · · · · · · · · · · · 1.905 0.018 2.760 0.034 2.745 0.032 2.718 0.031 2.681 0.030 1.790 0.017024 · · · · · · · · · · · · · · · · · · 1.970 0.021 · · · · · · · · · · · · · · · · · · · · · · · · 2.046 0.020025 · · · · · · · · · · · · · · · · · · 1.974 0.020 · · · · · · · · · · · · · · · · · · · · · · · · 2.271 0.023
Note. — Columns: Concentration indices in each filter and their uncertainties (σfilter). The ID# is the identification number assignedto each galaxy in Table 1. The full table is available only in the electronic edition.aGalaxy does not meet the S/N requirements for accurate CAS parameter measurements in this image (S/N < 75).bGalaxy does not meet the resolution requirements for accurate CAS parameter measurements in this image (R > 1.25 kpc).
and NUV filters, as well as the HST F255W filter, butthe other filters show a trend of decreasing C, and in-creasing A and S toward later type for normal galaxies(E through Im). The slope of the dependence of A andS on type for normal galaxies decreases toward longerwavelengths, such that late-type galaxies are more asym-metric and clumpy at shorter wavelengths than at longerwavelengths, which is also seen in Figures 4–6. The pe-culiar/merging galaxies are plotted as their sub-types, as
defined in Section 4.1, in Figures 7–9. Merging galaxies(solid triangles) tend to be in general much less concen-trated and much more asymmetric and clumpy than anyother galaxy type. Pre-merging galaxies (solid circles)have similar or slightly lower C and higher A and S val-ues than normal mid- to late-type galaxies, because thesegalaxies are currently only slightly distorted by the tidalinteractions with their neighbors. Minor mergers (solidsquares) are slightly more concentrated and less asym-

10
TABLE 4Asymmetry Index (A)
ID# FUV σF UV NUV σNUV F255W σF255W F300W σF300W U σU B σB V σV R σR F814W σF814W
001 0.3542 0.022 0.2082 0.006 · · · · · · 0.292 0.010 · · · · · · · · · · · · · · · · · · · · · · · · · · · · · ·
002 · · · · · · · · · · · · · · · · · · 0.383 0.013 · · · · · · · · · · · · · · · · · · · · · · · · 0.180 0.005003 · · · · · · · · · · · · · · · · · · · · · · · · 0.373 0.049 0.368 0.025 0.391 0.018 0.226 0.092 · · · · · ·
004 · · · · · · · · · · · · · · · · · · 0.745 0.005 · · · · · · · · · · · · · · · · · · · · · · · · 0.359 0.003005 · · · · · · · · · · · · · · · · · · · · · · · · 0.3092 0.069 0.4792 0.019 0.3712 0.017 0.2452 0.043 · · · · · ·
006 0.6352 0.001 0.5342 0.001 · · · · · · 0.668 0.005 · · · · · · · · · · · · · · · · · · · · · · · · 0.293 0.006007 · · · · · · · · · · · · · · · · · · · · · · · · 0.504 0.035 0.541 0.016 0.539 0.011 0.460 0.030 · · · · · ·
008 · · · · · · · · · · · · · · · · · · · · · · · · 0.3292 0.034 0.2732 0.026 0.2712 0.008 0.2482 0.006 · · · · · ·
009 · · · · · · · · · · · · · · · · · · 0.264 0.038 · · · · · · · · · · · · · · · · · · · · · · · · · · · · · ·
010 · · · · · · · · · · · · · · · · · · · · · · · · 0.424 0.021 0.416 0.016 0.379 0.009 0.407 0.006 · · · · · ·
011 · · · · · · · · · · · · · · · · · · 0.306 0.013 · · · · · · · · · · · · · · · · · · · · · · · · · · · · · ·
012 · · · · · · · · · · · · · · · · · · · · · · · · 0.4482 0.028 0.5242 0.004 0.4612 0.004 0.4442 0.007 · · · · · ·
013 · · · · · · 0.3482 0.064 · · · · · · 1.480 0.027 · · · · · · · · · · · · · · · · · · · · · · · · 0.620 0.004014 0.380 0.009 0.287 0.005 · · · · · · 0.323 0.041 0.235 0.024 0.150 0.036 0.157 0.021 0.171 0.022 0.132 0.018015 · · · · · · · · · · · · · · · · · · · · · · · · 0.211 0.176 0.235 0.118 0.350 0.074 0.073 0.129 · · · · · ·
016 · · · · · · · · · · · · · · · · · · 0.593 0.004 · · · · · · · · · · · · · · · · · · · · · · · · · · · · · ·
017 · · · · · · · · · · · · · · · · · · · · · · · · 0.250 0.008 0.162 0.011 0.132 0.006 0.119 0.004 · · · · · ·
018 · · · · · · · · · · · · · · · · · · · · · · · · 0.287 0.040 0.277 0.014 0.209 0.035 0.158 0.025 · · · · · ·
019 · · · · · · · · · · · · · · · · · · · · · · · · 0.837 0.023 0.956 0.004 0.991 0.003 1.034 0.004 · · · · · ·
020 · · · · · · · · · · · · · · · · · · · · · · · · 0.231 0.095 0.292 0.030 0.266 0.022 0.211 0.041 · · · · · ·
021 · · · · · · · · · · · · · · · · · · · · · · · · 0.268 0.025 0.188 0.021 0.166 0.012 0.156 0.010 · · · · · ·
022 · · · · · · · · · · · · · · · · · · 0.330 0.000 · · · · · · · · · · · · · · · · · · · · · · · · 0.132 0.001023 · · · · · · · · · · · · · · · · · · 0.385 0.007 0.402 0.035 0.409 0.008 0.392 0.007 0.373 0.005 0.219 0.003024 · · · · · · · · · · · · · · · · · · 0.341 0.022 · · · · · · · · · · · · · · · · · · · · · · · · 0.206 0.008025 · · · · · · · · · · · · · · · · · · 0.605 0.008 · · · · · · · · · · · · · · · · · · · · · · · · 0.198 0.002
Note. — Columns: Asymmetry indices in each filter and their uncertainties (σfilter). The ID# is the identification number assigned to eachgalaxy in Table 1. The full table is available only in the electronic edition.
aGalaxy does not meet the S/N requirements for accurate CAS parameter measurements in this image (S/N < 75).bGalaxy does not meet the resolution requirements for accurate CAS parameter measurements in this image (R > 1.25 kpc).
TABLE 5Clumpiness Index (S)
ID# FUV σF UV NUV σNUV F255W σF255W F300W σF300W U σU B σB V σV R σR F814W σF814W
001 0.002 0.000 0.002 0.000 · · · · · · -0.01 0.038 · · · · · · · · · · · · · · · · · · · · · · · · · · · · · ·
002 · · · · · · · · · · · · · · · · · · 0.16 0.194 · · · · · · · · · · · · · · · · · · · · · · · · 0.25 0.187003 · · · · · · · · · · · · · · · · · · · · · · · · 0.75 0.092 0.44 0.078 0.53 0.057 0.25 0.036 · · · · · ·
004 · · · · · · · · · · · · · · · · · · 0.57 0.256 · · · · · · · · · · · · · · · · · · · · · · · · 0.27 0.154005 · · · · · · · · · · · · · · · · · · · · · · · · 0.302 0.041 0.522 0.062 0.512 0.051 0.222 0.026 · · · · · ·
006 0.532 0.883 0.322 0.380 · · · · · · 0.63 0.225 · · · · · · · · · · · · · · · · · · · · · · · · 0.37 0.162007 · · · · · · · · · · · · · · · · · · · · · · · · 0.42 0.034 0.43 0.035 0.42 0.032 0.18 0.015 · · · · · ·
008 · · · · · · · · · · · · · · · · · · · · · · · · 0.502 0.037 0.322 0.030 0.322 0.021 0.342 0.017 · · · · · ·
009 · · · · · · · · · · · · · · · · · · -0.40 0.468 · · · · · · · · · · · · · · · · · · · · · · · · · · · · · ·
010 · · · · · · · · · · · · · · · · · · · · · · · · 0.67 0.019 0.61 0.028 0.53 0.019 0.64 0.018 · · · · · ·
011 · · · · · · · · · · · · · · · · · · 0.50 0.332 · · · · · · · · · · · · · · · · · · · · · · · · · · · · · ·
012 · · · · · · · · · · · · · · · · · · · · · · · · 0.272 0.023 0.402 0.031 0.352 0.022 0.382 0.017 · · · · · ·
013 · · · · · · 0.572 2.095 · · · · · · 1.01 0.628 · · · · · · · · · · · · · · · · · · · · · · · · 0.32 0.156014 0.81 1.873 0.28 0.619 · · · · · · 0.61 0.448 0.20 0.017 0.15 0.018 0.17 0.016 0.11 0.013 -0.10 0.144015 · · · · · · · · · · · · · · · · · · · · · · · · 0.18 0.048 0.38 0.090 0.44 0.082 -0.84 0.094 · · · · · ·
016 · · · · · · · · · · · · · · · · · · 0.71 0.188 · · · · · · · · · · · · · · · · · · · · · · · · · · · · · ·
017 · · · · · · · · · · · · · · · · · · · · · · · · 0.69 0.030 0.42 0.019 0.32 0.010 0.31 0.007 · · · · · ·
018 · · · · · · · · · · · · · · · · · · · · · · · · 0.58 0.038 0.38 0.034 0.31 0.025 0.08 0.010 · · · · · ·
019 · · · · · · · · · · · · · · · · · · · · · · · · 0.81 0.024 0.99 0.030 0.97 0.023 0.93 0.018 · · · · · ·
020 · · · · · · · · · · · · · · · · · · · · · · · · 0.36 0.037 0.40 0.045 0.38 0.036 0.31 0.027 · · · · · ·
021 · · · · · · · · · · · · · · · · · · · · · · · · 0.68 0.039 0.40 0.034 0.33 0.024 0.31 0.019 · · · · · ·
022 · · · · · · · · · · · · · · · · · · 0.30 0.035 · · · · · · · · · · · · · · · · · · · · · · · · 0.35 0.056023 · · · · · · · · · · · · · · · · · · 0.04 0.076 0.75 0.035 0.65 0.038 0.59 0.028 0.56 0.023 0.16 0.132024 · · · · · · · · · · · · · · · · · · 0.51 0.353 · · · · · · · · · · · · · · · · · · · · · · · · 0.15 0.162025 · · · · · · · · · · · · · · · · · · 0.77 0.265 · · · · · · · · · · · · · · · · · · · · · · · · 0.20 0.104
Note. — Columns: Clumpiness indices in each filter and their uncertainties (σfilter). The ID# is the identification number assigned to eachgalaxy in Table 1. The full table is available only in the electronic edition.
aGalaxy does not meet the S/N requirements for accurate CAS parameter measurements in this image (S/N < 75).bGalaxy does not meet the resolution requirements for accurate CAS parameter measurements in this image (R > 1.25 kpc).

Wavelength Dependence of Galaxy Structure 11
Fig. 4.— Concentration index as a function of total (B − V ) color for nine different pass-bands. The symbols are coded by galaxytype, as indicated in the upper left (FUV) panel. Smaller symbols represent galaxies that do not meet our adopted reliability criteria (seetext). Vertical error bars in the lower left corner of each panel represent the median error on the individual concentration index values.Horizontal error bars show the median error on (B − V ). In general, redder galaxies tend to be more concentrated. This trend also resultsin a segregation according to galaxy type.
12
Fig. 5.— Asymmetry index as a function of total (B − V ) color and filter. The symbols are coded as in Fig. 4. Error bars in the lowerleft corner of each panel represent the median error on the individual asymmetry values and on (B − V ). In general, redder galaxies tendto be more symmetric. As in Fig. 4, this trend with galaxy color also results in a segregation according to galaxy type. Peculiar/merginggalaxies are in general slightly bluer and more asymmetric than normal galaxies.
metric and clumpy than the pre-mergers, because the lowmass of the smaller interacting galaxy has likely less of aneffect on the brighter, larger galaxy’s light distributionthan a neighboring galaxy of similar size would have had.This is also found in minor vs. major merger simulations(Conselice 2006). Merger remnants (asterisks) are moreconcentrated, more asymmetric, and similar in clumpi-ness to pre-mergers and normal mid- to late-type galax-ies. Peculiar galaxies (crosses) have similar CAS valuesas normal mid- to late-type galaxies, although they ap-pear slightly more concentrated and more asymmetric insome filters.
Histograms of the distribution of the CAS parametersas separated by galaxy type are presented in Figure 10.These distributions demonstrate the amount of overlap inthe CAS parameters between different galaxy type-bins,and therefore are relevant to help judge the reliability
of using these parameters to classify galaxies. The leftpanels of this plot contain all data in filters with wave-lengths shortward of the Balmer break (λc . 360 nm),and the right panels contain all data in filters with wave-lengths longward of the Balmer break (λc & 360 nm).Galaxies that did not meet our reliability criteria werenot included in this plot. There is a large amount of over-lap between the concentration indices of all galaxy types,particularly at shorter wavelengths. Early galaxy typesare better separated from other galaxy types by concen-tration at longer wavelengths, although there is still a sig-nificant amount of overlap for smaller values of C. Veryfew galaxies with types later than S0 have high values ofC. Therefore, there is a high probability that a galaxywith high concentration index (C & 3.5) is an early-type(E–S0) galaxy. Similarly, early-type (E–S0) galaxies havevery little overlap with later galaxy types in asymmetry

Wavelength Dependence of Galaxy Structure 13
Fig. 6.— Clumpiness index as a function of total (B −V ) color and filter. The symbols are coded as in Fig. 4. Error bars on the left sideof each panel represent the median error on the individual clumpiness values, and on (B − V ). The large errors in S for FUV and NUVare due to the low resolution of the GALEX images (stellar FWHM & 5′′), while the large errors in F255W and F300W are due to poorS/N and CTE effects. In general, redder galaxies tend to be less clumpy. As in Figs. 4 and 5, this trend with galaxy color also results ina segregation according to galaxy type. There is a larger spread in S at shorter wavelengths, with blue galaxies appearing more clumpyat shorter wavelengths than they do at longer wavelengths. Peculiar/merging galaxies are in general slightly bluer and more clumpy thannormal galaxies.
index, particularly at longer wavelengths. Galaxies withA . 0.1 are likely early-types (E–S0), which is essen-tially true at all wavelengths. Although all early-type(E–S0) galaxies have low clumpiness indices, there is alarger overlap with later-type galaxies for this index thanfor the concentration and asymmetry indices. In general,almost all early-type (E–S0) galaxies have S . 0.2, butnot all galaxies with S . 0.2 are early-types. There isa single early-type galaxy with a high S measurement inthe NUV, but this is likely due to low S/N in the partsof the galaxy just outside its bright inner core. Althoughall of the later (Sa–Im and peculiar/merging) galaxy typedistributions are offset slightly from each other in meanC, A, and S, there is a large overlap between their CASparameter values. Therefore, the CAS parameters can-
not be used independently to classify individual galaxieswith types later than Sa, but they can be used to de-scribe something about the overall distribution of typesas a whole in a large sample. Nonetheless, it is note-worthy that a subset of the peculiar/merging galaxies,predominantly major mergers, display high asymmetryindices at longer wavelengths that are not seen for theother galaxy types. The next two sections discuss usinga combination of the CAS parameters as a more reli-able way of determining the morphological distributionswithin a galaxy sample.
6.2. The Distribution of Galaxies in CAS ParameterSpace

14
TABLE 6Median C For Each Galaxy Type Bin
Type FUV NUV F255W F300W U B V R F814W
E–S0 · · · 1.73(1) 2.63(2) 2.93(4) 3.90(4) 3.95(4) 3.98(4) 3.95(4) 3.65(4)· · · · · · 0.36 0.26 0.24 0.28 0.30 0.23 0.55
Sa–Sc 2.15(2) 1.88(2) 3.14(1) 2.06(11) 2.58(26) 2.71(26) 2.84(26) 2.90(26) 3.18(12)0.28 0.09 · · · 0.46 0.25 0.24 0.26 0.28 0.49
Sd–Im 2.47(2) 2.52(2) 2.23(1) 2.11(41) 2.50(55) 2.63(55) 2.67(55) 2.65(55) 2.35(25)0.02 0.10 · · · 0.35 0.26 0.27 0.29 0.32 0.28
pM 2.12(1) 2.05(1) · · · 2.22(8) 2.60(7) 2.77(7) 2.58(7) 2.63(7) 2.86(4)· · · · · · · · · 0.35 0.36 0.36 0.39 0.39 0.53
mM · · · · · · 1.89(1) 1.94(3) 3.03(3) 3.03(3) 3.08(3) 3.17(3) 2.56(3)· · · · · · · · · 0.79 0.94 0.91 0.81 0.76 1.25
M · · · · · · 2.30(2) 1.44(6) 2.61(3) 2.54(3) 2.37(3) 2.36(3) 1.47(4)· · · · · · 0.15 0.67 0.63 0.59 0.61 0.64 0.79
MR 3.29(1) 3.65(1) · · · 2.69(5) 3.04(15) 3.15(15) 3.21(15) 3.18(15) 3.19(2)· · · · · · · · · 0.34 0.20 0.26 0.31 0.44 0.54
P · · · · · · 2.09(1) 2.90(8) 2.67(21) 2.88(21) 2.93(21) 2.93(21) 3.13(4)· · · · · · · · · 0.59 0.28 0.17 0.18 0.22 0.50
Note. — Median concentration indices in each type-bin and filter. Galaxies that did not meet thereliability criteria (S/N< 75, or R> 1.25 kpc) were not included in the median. Values in parenthesisgive the number of galaxies used for that type-bin and filter. The second line for each type-bin lists halfthe range of the data within the 25 and 75% quartiles. When only one data point was available, the valuelisted is for that data point and the associated quartile range cannot be computed. The peculiar/merginggalaxies are broken up into sub-types as follows: pre-merger (pM), minor merger (mM), merger (M),merger remnant (MR), and peculiar (P). In general, C increases with increasing rest-frame wavelength.
TABLE 7Median A For Each Galaxy Type Bin
Type FUV NUV F255W F300W U B V R F814W
E–S0 · · · 0.19(1) 0.12(2) 0.08(4) 0.07(4) 0.06(4) 0.07(4) 0.05(4) 0.03(4)· · · · · · 0.08 0.04 0.01 0.02 0.02 0.02 0.01
Sa–Sc 0.84(2) 0.44(2) 0.56(1) 0.42(11) 0.23(26) 0.22(26) 0.20(26) 0.18(26) 0.15(12)0.08 0.14 · · · 0.07 0.07 0.06 0.06 0.05 0.06
Sd–Im 0.56(2) 0.46(2) 0.43(1) 0.50(41) 0.36(55) 0.32(55) 0.30(55) 0.27(55) 0.22(25)0.18 0.17 · · · 0.11 0.13 0.09 0.08 0.07 0.06
pM 0.94(1) 0.99(1) · · · 0.64(8) 0.36(7) 0.34(7) 0.33(7) 0.31(7) 0.34(4)· · · · · · · · · 0.24 0.16 0.11 0.11 0.13 0.15
mM · · · · · · 0.78(1) 0.74(3) 0.30(3) 0.29(3) 0.27(3) 0.27(3) 0.26(3)· · · · · · · · · 0.53 0.19 0.18 0.16 0.15 0.43
M · · · · · · 0.80(2) 1.09(6) 0.84(3) 0.96(3) 0.99(3) 1.03(3) 0.84(4)· · · · · · 0.19 0.14 0.04 0.10 0.13 0.23 0.07
MR 0.64(1) 0.62(1) · · · 0.66(5) 0.43(15) 0.43(15) 0.43(15) 0.41(15) 0.41(2)· · · · · · · · · 0.11 0.15 0.14 0.10 0.13 0.04
P · · · · · · 0.59(1) 0.37(8) 0.36(21) 0.30(21) 0.37(21) 0.30(21) 0.61(4)· · · · · · · · · 0.19 0.12 0.13 0.10 0.10 0.15
Note. — Median asymmetry indices in each type-bin and filter. Galaxies that did not meet thereliability criteria (S/N< 75, or R> 1.25 kpc) were not included in the median. Values in parenthesisgive the number of galaxies used for that type-bin and filter. The second line for each type-bin lists halfthe range of the data within the 25 and 75% quartiles. Median values that were only calculated from onedata point do not have an associated quartile range listed. The peculiar/merging galaxies are broken upinto sub-types as follows: pre-merger (pM), minor merger (mM), merger (M), merger remnant (MR),and peculiar (P). In general, A decreases with increasing rest-frame wavelength.
The CAS parameters have been shown to correlatewith each other to form parameter spaces that can beused to classify galaxies, distinguish between interactingand merging galaxies, and determine the extent of recentstar formation (Conselice 2003). We examine the distri-bution of the galaxies within our sample in the CAS pa-rameter space by plotting the three parameters againsteach other in Figures 11–15.
Figure 11 shows the concentration index for eachgalaxy as a function of asymmetry index and filter. Plotsymbols are coded according to galaxy type. In this fig-ure we do not separate the peculiar and merging galax-
ies into their sub-types. Smaller symbols are used forgalaxies that did not meet our reliability criteria (S/N< 75, R > 1.25 kpc). In order to examine the effects ofhigh physical resolution and dust lanes, we also indicatewhether galaxies are particularly nearby (R < 20 pc),or appear to be edge-on spirals. In general, galaxies be-come less concentrated toward higher asymmetry, whichagrees with the results of other studies (e.g., Conselice2003). Galaxy types overlap within this plot, but early-type galaxies (E–S0) are in general the most concentratedand the most symmetric, while later galaxy types be-come in general less concentrated and more asymmet-

Wavelength Dependence of Galaxy Structure 15
TABLE 8Median S For Each Galaxy Type Bin
Type FUV NUV F255W F300W U B V R F814W
E–S0 · · · 2.12(1) 0.10(1) 0.12(3) 0.13(4) 0.09(4) 0.10(4) 0.10(4) 0.05(4)· · · · · · · · · 0.09 0.10 0.04 0.04 0.04 0.03
Sa–Sc 1.99(2) 0.95(2) 0.17(1) 0.60(10) 0.35(26) 0.32(26) 0.24(26) 0.21(26) 0.16(12)0.81 0.50 · · · 0.17 0.21 0.13 0.10 0.11 0.12
Sd–Im 1.06(2) 0.65(2) · · · 0.55(37) 0.59(55) 0.50(55) 0.48(55) 0.44(55) 0.20(25)0.26 0.37 · · · 0.16 0.21 0.10 0.12 0.12 0.06
pM 0.74(1) 0.39(1) · · · 0.78(8) 0.36(7) 0.45(7) 0.41(7) 0.37(7) 0.35(4)· · · · · · · · · 0.38 0.30 0.18 0.12 0.18 0.06
mM · · · · · · · · · 0.12(3) 0.29(3) 0.19(3) 0.22(3) 0.18(3) 0.25(3)· · · · · · · · · 0.21 0.24 0.15 0.08 0.06 0.11
M · · · · · · 0.94(2) 1.22(6) 0.88(3) 0.99(3) 0.97(3) 0.93(3) 0.75(4)· · · · · · 0.25 0.32 0.27 0.26 0.27 0.32 0.30
MR 0.42(1) 0.70(1) · · · 0.91(5) 0.45(15) 0.46(15) 0.43(15) 0.42(15) 0.45(2)· · · · · · · · · 0.06 0.19 0.18 0.17 0.15 0.13
P · · · · · · · · · 0.35(8) 0.42(21) 0.38(21) 0.42(21) 0.36(20) 0.29(4)· · · · · · · · · 0.24 0.18 0.17 0.12 0.15 0.17
Note. — Median clumpiness indices in each type-bin and filter. Galaxies that did not meet thereliability criteria (S/N< 75, or R> 1.25 kpc) were not included in the median, as well as values ofS< −0.2. Values in parenthesis give the number of galaxies used for that type-bin and filter. Thesecond line for each type-bin lists half the range of the data within the 25 and 75% quartiles. Medianvalues that were only calculated from one data point do not have an associated quartile range listed.The peculiar/merging galaxies are broken up into sub-types as follows: pre-merger (pM), minor merger(mM), merger (M), merger remnant (MR), and peculiar (P). In general, S decreases with increasingrest-frame wavelength.
ric. The merging/peculiar galaxy trend is offset fromthe normal galaxy trend, with merging/peculiar galax-ies (black symbols) tending to be more asymmetric andmore concentrated than other galaxy types. The extremeoutliers from the general normal galaxy trend tend to befainter than our S/N limit of 75, and have large asso-ciated measurement uncertainties. An edge-on orienta-tion did not have a significant effect on the location ofa galaxy within this parameter space. On average, themore nearby galaxies tend to be slightly more asymmet-ric and less concentrated than their more distant coun-terparts, which results from their partial resolution intoindividual stars, as well as a possible selection bias favor-ing low luminosity dwarf systems at that distance. Nosystematic trend was noticed in the CAS parameters forgalaxies with a physical resolution of R < 20 pc.
Figure 12 also shows C vs. A for each galaxy, as inFigure 11, but here the separate sub-classes of pecu-liar/merging galaxies are represented by different sym-bols instead of the normal galaxy type-bins. Althoughthere is some overlap, peculiar galaxies tend to be moreasymmetric and more concentrated than normal galax-ies. For some of these peculiar galaxies, their high con-centration in the UV could be due to the presence ofan AGN. The pre-mergers tend to be less asymmetricthan the other types of mergers, and follow the generaltrend of normal galaxies except that they are on averageslightly more asymmetric. This is to be expected, as thepre-mergers are normal galaxies that are only beginningto be tidally affected by their neighbors, and may showsome enhanced star formation. There are very few minormergers in our sample, with a large scatter in distribu-tion on this plot, so any conclusions about that sub-classshould be regarded with caution. We only have four ma-jor mergers observed in UBV R in our sample, which isa result of the rarity of these types of galaxies in the
nearby Universe. Although further observations of othermergers are necessary to improve number statistics, mostof the major mergers in our sample are clearly separatedfrom the main trend, and are much more asymmetric andless concentrated than any other galaxy type. Mergerremnants, on the other hand, lie closer to the trend linefor normal galaxies, although they are more asymmetricand more concentrated than both normal galaxies andpre-mergers.
Figure 13 shows the clumpiness index versus the asym-metry index for each galaxy, using the same normalgalaxy type symbols as in Figure 11. Measurements ofS < 0 can occur for particularly smooth or faint galaxieswhere the sky was measured to be more clumpy thanthe galaxy itself. This is more likely to occur withHST/WFPC2, due to large noise spikes caused by localCTE effects. The degree to which these S measurementslie below zero is within the uncertainties on S, however.Galaxies tend on average to be more clumpy with higherasymmetry, which agrees with the results of other stud-ies (e.g., Conselice 2003). This relation is fairly tight,especially at longer wavelengths, as S and A are not en-tirely independent from each other. Early-type galaxies(E–S0) are the least asymmetric and clumpy, with latergalaxy types becoming progressively more asymmetricand more clumpy. Outliers from the general trend in theshorter wavelengths have particularly low S/N in the im-ages, while outliers in the longer wavelengths are eitheredge-on or are very nearby (with resolution, R < 20 pc).Due to the strong dust lanes visible in edge-on galaxies,they appear more clumpy than galaxies with lower incli-nations, and lie well above the general S vs. A relation.On the whole, nearby galaxies tend to appear to be onlyslightly more asymmetric and clumpy than their moredistant counterparts.
Figure 14 also shows S vs. A for each galaxy, but with

16
Fig. 7.— Concentration index as a function of galaxy type and filter. Small points represent galaxies that do not meet our adoptedreliability criteria (see text). The large colored symbols represent the median C values for a type-bin whose width is defined by thehorizontal error bars. The vertical error bars show the 25–75% quartile ranges. These same symbols are used in subsequent figures torepresent these galaxy types (as labeled in Fig. 15). There is a larger spread in C with later galaxy type, with galaxies tending on averageto be less concentrated with later normal galaxy type (E through Im). Merging galaxies (T = 14) are in general less concentrated than allother galaxy types.
peculiar/merging sub-classes highlighted with differentsymbols, as in Figure 12. The pre-mergers are not clearlydistinguished from normal galaxy types within the mea-surement uncertainties, but merging galaxies are muchmore asymmetric and show much more small scale struc-ture (clumpiness) than any other galaxy type. Mergerremnants tend to appear slightly smoother, but moreasymmetric on average than the pre-merger and normalgalaxies.
In Figure 15, we examine the average trends in thisCAS parameter space with a plot of the average of themedian values in each type-bin and filter of C and S asa function of A. The left panels contain the average ofthe median values in each filter shortward of the Balmerbreak (λc . 360 nm). The right panels contain the av-erage of the median values in each filter longward of the
Balmer break (λc & 360 nm). Galaxies that did notmeet our reliability criteria were not included in the me-dians. Type-bins in each filter with fewer than 2 galaxieswere not used in the average. The error bars are not theerrors on the averages, but rather the average value ofthe 25–75% quartile ranges for each filter used to cal-culate the average. Therefore, the error bars give anindication of how much an individual galaxy may varyin this parameter space from the average value. There isa much larger scatter in the CAS parameters at shorterwavelengths, which may partially be due to larger mea-surement uncertainties for these filters and smaller num-ber statistics. More, and higher quality data in the midto far-UV is needed to further constrain these values.There is a clear trend among normal galaxies to showa progression from early to late-type galaxies (E to Im)

Wavelength Dependence of Galaxy Structure 17
Fig. 8.— Asymmetry index as a function of galaxy type. Symbols are coded as in Fig. 7. The large colored symbols represent the medianA values for each galaxy type bin, with error bar as in Fig. 7. There is a larger spread in A for later galaxy types, with galaxies tending onaverage to be less symmetric with later normal galaxy type (E through Im). Late-type galaxies are less symmetric at shorter wavelengthsthan at longer wavelengths. Merging galaxies (T = 14) are in general less symmetric than all other galaxy types.
of increasing asymmetry and clumpiness and decreasingconcentration, particularly in the redder filters. The dif-ferent peculiar/merging galaxy types are each located atdifferent positions within this parameter space. Thereappears to be a general evolutionary trend from pre-mergers to mergers, and then to post-mergers, as shownby the dotted lines with arrows connecting the averageof the median values for each type-bin. Mergers be-come significantly less concentrated, more asymmetric,and more clumpy than pre-mergers, then progress backtoward the normal galaxy parameter space as they turninto merger remnants, which end up being more concen-trated than the pre-mergers, and slightly more asymmet-ric and clumpy. From there, galaxies may take differentpaths on the CAS parameter space depending on whetherthey turn into elliptical or spiral galaxies, which dependson the details of the merger and of the individual galaxies
taking part in that merger.
6.3. Quantitative Classification Using CAS in theOptical and Ultraviolet
One of the major goals of quantitative morphologicalstudies is to automatically distinguish galaxy types fromeach other. This has proven to be a difficult problem, andvarious pieces of information, such as colors, magnitudeand sizes, are needed in addition to the CAS parametersto fully classify galaxies into various Hubble types auto-matically. No perfect method has yet been developed.We can however determine how well basic CAS classifi-cation boundaries do in terms of automatically findinggalaxies of various types, without any other informationinvolved.
A revised CAS classification space can be defined asfollows for finding galaxies with early, mid, late and

18
Fig. 9.— Clumpiness index as a function of galaxy type. Symbols are coded as in Fig. 7. The large colored symbols represent the medianS values for each type bin, with error bars as in Fig. 7. An additional criteria that S> −0.2 was used in the calculation of the medianvalue. There is a larger spread in S with later galaxy type, with galaxies tending on average to be more clumpy with later normal galaxytype (E through Im). Late-type galaxies are more clumpy at shorter wavelengths than at longer wavelengths. Merging galaxies (T = 14)are in general more clumpy than any other galaxy type.
merger/peculiar morphologies in rest-frame optical im-ages (see Bershady et al. 2000). Early-types are systemswith A < 0.1 and typically C > 3.5, mid-types are thosewith 0.1 < A < 0.35 and C > 2.44 × logA + 5.49, latetypes with 0.1 < A < 0.35 and C < 2.44 × logA + 5.49,and finally mergers have A > 0.35 and A > S (Con-selice et al. 2004). To carry out the CAS reliability testwe examined the position in CAS space of each morphol-ogy type to determine what fraction of eye-ball estimatesof morphology match the CAS classification boundaries,that is the fraction that are correctly matched (fcorrect).We also measure the fraction of galaxies within each CAStype volume which do not belong to the assigned type,which we call the contamination fraction (fcont). We re-move the nearby galaxies from this analysis to avoid res-olution issues.
It turns out that the best results are within the opticalregion, where the CAS system was originally designed towork. We find that for early-types, fcorrect ∼ 1 in theUBV R and F814W bands. The F225W, NUV and FUVbands only have a few early-types which are too faint fora reliable CAS measurement, but their asymmetry valuestend to be a bit higher. The contamination is also verylow with fcont = 0 for early-types in the UBVR bands.Most of the contamination in the optical within the A <0.1 CAS space is largely due to mid-types. However, weonly have a few early-types and mid-types in our sample,and we are mainly interest in distinguishing late-typesfrom mergers/peculiars, as these galaxies dominate thehigh redshift population.
The separation of mergers from late-type galaxies canbe successfully done within CAS space, although there

Wavelength Dependence of Galaxy Structure 19
Fig. 10.— The distribution of C (upper panels), A (middle panels), and S (lower panels) for each galaxy type-bin as denoted in thelegend in the lower right panel. The left panels include all UV data from all filters shortward of the Balmer break (λc . 360 nm), andthe right panels include all data from all filters longward of the Balmer break (λc & 360 nm). Data that did not meet our reliabilitycriteria were not included in this plot. Early-type galaxies (E–S0) have the least amount of overlap with other galaxy types, particularly inlonger wavelengths, and particularly in A and S. Galaxies of type Sa and later, however, have considerable overlap in the CAS parameters,although their distributions are offset from each other. Asymmetry and clumpiness can therefore be used independently to classify individualearly-type galaxies (E–S0) with some limited degree of certainty, but not individual later-type galaxies. The overall distribution of theCAS parameter in a large sample, however, can be used to describe the population distribution as a whole.
is some overlap. The particular problem, first stated inConselice (2003), is that not all peculiar/mergers followthe CAS space definition of high asymmetry. Conselice(2003) made this conclusion based on the location of66 Ultra-Luminous Infrared Galaxies (ULIRGs) in CASspace. About half met the criteria A > 0.35, while theremainder were at lower asymmetry, with the systemsspread out amongst the concentration index. Using thestandard criteria listed above, we find that for late-types,fcorrect ∼ 0.5−0.9 in the UBV R and F814W bands, withthe lowest fraction fcorrect = 0.5 for the U band, and thehighest fcorrect ∼ 0.9 in F814W. Using the same CAScriteria for finding late-types, we find that the contam-ination ranges from 50% in the U-band, to 20% in the
F814W band, and about 40% in the BVR bands. A largepart of this contamination arises from peculiar and merg-ing galaxies, which have similar asymmetries. However70% of galaxies in the late-type regime are classified aslate-type by eye, which is a reasonable success rate.
The fraction of mergers found with the basic CAS cri-teria is not as high, with fcorrect ∼ 0.3 − 0.4 in theUBV R bands, and 0.6 in the F814W band. The con-tamination is also fairly low, with fcont ∼ 0.2. This re-sult shows that while most galaxies with a high asymme-try in the UBRI bands will be mergers/peculiars, not allmergers/peculiars have large asymmetries (see Conselice2003). Likewise, some high-A galaxies, particularly inthe bluer bands are not classified as a merger or peculiar.

20
Fig. 11.— Concentration index as a function of asymmetry index and filter. Small points represent galaxies that do not meet our adoptedreliability criteria (see text). Plot symbols are coded according to galaxy type as indicated in the legend in the upper left (FUV) panel.Here, we do not separate the peculiar and merging galaxies into their sub-types. We furthermore highlight nearby galaxies in images withparticularly high resolutions (R < 20 pc), as well as highly inclined/edge-on galaxies, by over-plotting larger symbols coded according tothe legend in the upper-middle (NUV) panel. In general, galaxies are less concentrated when they are less symmetric. Increasingly latergalaxy types become increasingly less concentrated and more asymmetric. The locus of merging/peculiar galaxies is offset from that ofthe normal galaxies toward higher asymmetries and concentrations. Extreme outliers from the general trend are usually fainter than ourS/N limit of 75, and have large associated measurement uncertainties. Particularly nearby galaxies, which tend to be partially resolvedinto their individual stars, are on average slightly less symmetric and less concentrated than more distant galaxies, due in part to spatialresolution effects.
It is worth noting that the best results are obtained usingthe reddest band, F814W, which suggests that measure-ments of galaxy structure are best done in the reddestwave-band possible.
A major goal of this paper is to test whether we cantell the difference between late-type star forming galaxiesand mergers through the CAS parameters in the ultravi-olet. It turns out that the ability to distinguish late-typesfrom mergers/peculiars is slightly worse in the UV thanin the optical, but not by much. Using the standard CASmethod, 50% of eye-ball classified late-types fall in theircorrect CAS region in the NUV. The late-types in the UVwhich do not fall in the correct UV-CAS region typically
have high asymmetries, A > 0.35 (Figure 11). Generally,these galaxies have high clumpiness values as well. Wecan use this fact to better automatically separate late-type galaxies from mergers/peculiars in the ultraviolet.If we take the following criteria:
A > 0.25 and C < 2.44 × logA + 5.49 and S > A, (4)
we acquire 60% of the late-types, with a 40% contamina-tion rate from mostly peculiars/mergers in the F300Wand U-bands. This contamination is again largely theresult of peculiar/mergers.
Using the standard revised optical CAS method for

Wavelength Dependence of Galaxy Structure 21
Fig. 12.— Concentration index vs. asymmetry index, as in Fig. 11, but with plot symbols highlighting the individual sub-classes ofmerging and peculiar galaxies rather than normal morphological types. Peculiar galaxies (P) are on average less symmetric and moreconcentrated than normal galaxies. For some of these peculiar galaxies, their high concentration in the UV could be due to the presence ofan AGN. Pre-mergers (pM) tend to be slightly less symmetric than normal galaxies. Major mergers (M) are much less symmetric and lessconcentrated than any other galaxy type. Merger remnants (MR) are less symmetric and more concentrated than both normal galaxiesand pre-mergers.
finding mergers (A > 0.35 and A > S) we find that allmergers/peculiars are identified in the FUV, 50% in theNUV, 75% in the F225W band and 40% in the F300Wband. The contamination rates within the area of CASfor mergers in the FUV, NUV, F225W and F300W are0%, 0%, 25%, and 33% respectively. It is clear from Fig-ures 11–14 that the asymmetry limit of A > 0.35 has acontamination from late-type galaxies. This is due to theincreased prominence of star formation in the UV, creat-ing high asymmetries which are sensitive to star forma-tion and merging activity (Conselice et al. 2000). How-ever, if we increase the limit to A = 0.6 in the UV, weare able to obtain a nearly clean sample of mergers. Thisnew UV-CAS criteria for finding mergers is:
A > 0.5 and A > S. (5)
Using equation (5) to find mergers in the F300W bandwe get fcorrect ∼ 0.4, while fcon = 0.25. In the F255Wband the contamination is also low, fcon = 0.25, andthe fcorrect ∼ 0.75, although there are too few merginggalaxies (3) in this pass-band to draw definite conclu-sions. The NUV and FUV bands have too few galaxiesto reliably compute these statistics. We suggest that fu-ture studies that use rest-frame UV morphologies of highredshift galaxies use the UV-CAS equations (4–5) to sep-arate late-types from mergers, although larger numberstatistics in the UV are needed to verify these results.
6.4. The Rest-frame Wavelength Dependence of theCAS Parameters.
Some of the galaxies in our sample appear different inthe UV than they do in the optical, while some galax-

22
Fig. 13.— Clumpiness index vs. asymmetry index. Symbols are coded as in Fig. 11. Galaxies are on average more clumpy when they areless symmetric. Increasingly later galaxy types become progressively less symmetric and more clumpy. Outliers in the shorter wavelengthstend to have S/N < 75, and large associated uncertainties. Edge-on spirals are well separated from the general trend, appearing moreclumpy than galaxies with lower inclinations. This is likely due to more visible dust-lanes that increase the clumpiness index. Particularlynearby galaxies tend to be slightly less symmetric and more clumpy than more distant galaxies, due to resolution effects.
ies appear very similar. This was discussed qualitativelyin detail in Windhorst et al. (2002). Figure 16 showsexamples of each of these cases. The upper image foreach galaxy was obtained with either the F814W near-IR filter, or the VATT R-band filter. The lower imagefor each galaxy was obtained with either the F300W UVfilter, or the VATT U-band filter. UGC05189 is a mergerremnant that has a large difference in asymmetries andclumpiness indices between the UV and the IR (AF300W
– AF814W = 0.182, and SF300W – SF814W = 0.49), mostlydue to bright star-forming knots that are more apparentin the UV image. UGC06816 is a late-type barred spiralgalaxy that has a large difference in A and S between thenear-UV and the red (AU – AR = 0.323, and SU – SR =0.64), which is also due to its UV-bright star-formatingknots, particularly at the ends of its bar and at two sites
of vigorous star formation along its poorly organized spi-ral pattern. Both of these galaxies have small differencesin concentration index between these filters (–0.178 forUGC05189, and –0.207 for UGC06816). UGC12808 is anearlier-type spiral galaxy that has about the same asym-metry and clumpiness index in both pass-bands (AF300W
– AF814W = –0.045, and SF300W – SF814W = –0.05).UGC06697 is a peculiar, highly inclined galaxy that alsohas about the same asymmetry and clumpiness indexin both pass-bands (AF300W – AF814W = 0.035, andSF300W – SF814W = 0.16). Both of these galaxies, how-ever, appear different in the UV than in the IR due to alarge difference in concentration index between the filters(–0.664 for UGC12808 and –0.515 for UGC06697), whichis largely due to the diminished appearance of their redbulges at shorter wavelengths. A quantitative discussion

Wavelength Dependence of Galaxy Structure 23
Fig. 14.— Clumpiness index vs. asymmetry index, with merging and peculiar galaxies separated into their sub-classes. Symbols arecoded as in Fig. 12. Merging galaxies are much less symmetric and more clumpy than any other galaxy type. Merger remnants tend to beslightly less clumpy and less symmetric than both pre-mergers and normal galaxies.
of the dependence of the CAS parameters on rest-framewavelength and galaxy type could serve as a zero-redshiftbenchmark for higher redshift galaxy classifications. Assuch, we present the results for our dataset below.
Figure 17 shows the median values of the CAS pa-rameters for each type-bin as a function of the centralwavelength (λc) of each filter in nm. Values of the CASparameters that were < −0.2 were not included in themedian, as well as values from galaxy images that didnot meet our reliability criteria. We do not include me-dians in this plot for filters and type-bins that have fewerthan 2 galaxies. Error bars that are the same color asthe data points indicate the 25–75% quartile range. Ma-genta error bars indicate the error on the median, whichis smaller for bins that contain larger number statistics.We find a large scatter among individual galaxies, butthere is a general trend of increasing C and decreas-ing A and S toward longer wavelengths. As in previ-
ous plots of the CAS parameters, on average, the early-type, late-type, and merging/peculiar galaxy classes areclearly separated in C, A, and S, although there is con-siderable overlap among individual galaxies within eachtype class. The CAS values of early-type galaxies (E–S0)are relatively constant with increasing rest-frame wave-length longward of the Balmer break. Shortward of theBalmer break, the S/N of these red objects is very low,and therefore the CAS parameter measurement uncer-tainties are high. Due to this effect and due to the lowernumber of early-type galaxies in our sample, we cannotdraw definite conclusions about whether the CAS param-eters of early-type galaxies would differ significantly atUV rest-frame wavelengths. Spiral, irregular, and pecu-liar/merging galaxies, however, all show a general trendof increasing C and decreasing S and A with increas-ing rest-frame wavelength. The concentrations measuredin the HST/WFPC2 F814W images appear somewhat

24
E-S0Sa-ScSd-ImpMmMMMRP
Fig. 15.— The median values of the concentration and clumpiness indices for each type bin vs. the median values of the asymmetryindex in that type-bin. Symbols are coded by type as described in the upper right panel. Left panels: The average of the median values ineach filter short-ward of the Balmer break (λc . 360 nm). Right panels: The average of the median values in each filter long-ward of theBalmer break (λc & 360 nm). Galaxies that did not meet our reliability criteria were not included in the medians. Type-bins in each filterwith fewer than 2 galaxies were not used in the average. The error bars show the 25–75% quartile ranges of the CAS parameters, averagedover each filter used in the average. There is a larger scatter in the CAS parameters at shorter wavelengths, which may partially be due tolower galaxy number statistics and lower S/N ratio within the GALEX and HST UV images. Normal galaxies become more asymmetricand clumpy and less concentrated toward later Hubble type (E to Im). Dotted lines connect the average of the medians for pre-mergers tomergers, and then to post-mergers. This shows a progression through the CAS parameter space as the merging process progresses, withmergers becoming significantly less concentrated, more asymmetric, and more clumpy than pre-mergers, before returning as post-mergersnear the locus of normal galaxies again. On average the merger remnants are more concentrated than the pre-mergers, and slightly moreasymmetric and clumpy. This may define a duty cycle for the merging process.
lower with respect to the general trend, which may bedue to the fact that our WFPC2 images are more sensi-tive to point-sources than extended sources, so that out-lying low surface-brightness material may not have beendetected in that particular filter.
Also, in Figure 17, linear-least-squares fits to the me-dian data points are shown as dashed lines. Linear fitsappear suitable for all but the wavelength dependenceof the concentration index of early-type (E-S0) galaxies(which shows more sharply decreasing C measurementsat wavelengths shortward of the Balmer break), and the
asymmetry and clumpiness indices of mid-type (Sa-Sc)galaxies (which show more sharply increasing A and Smeasurements shortward of the Balmer break). There-fore, we also include a 2nd order polynomial fit to thedata in these panels, shown as dotted lines. This strongdependence of C shortward of the Balmer break for theE–S0 galaxies may be mostly due to the very low S/N ofthese red galaxies in the UV images (see Windhorst etal. 2002 for the images). This 2nd order polynomial isgiven by:
C(E−S0) = −14.33 log(λc)2+78.21 log(λc)−102.6 (6)

Wavelength Dependence of Galaxy Structure 25
UGC 05189 UGC 06816 UGC 12808 UGC 06697
Fig. 16.— Examples of galaxies that have various differences in the CAS parameters as measured in the UV vs. the optical/near-IR. Theupper panels are the red (R-band) or near-IR (F814W) images for each galaxy. The lower panels are the UV (U-band or F300W) imagesfor these galaxies. From left to right: UGC05189 is a merger remnant with a large difference in A and S between the UV and the near-IR,but little difference in C. UGC06816 is a late-type spiral galaxy that also has a large difference in A and S between the near-UV and thered, but little difference in C. UGC12808 (NGC7769) is an early-type spiral galaxy that has little difference in A and S between the UVand the near-IR, but a large difference in C. UGC06697 is a peculiar galaxy that also has little difference in A and S between the UV andthe near-IR, but a large difference in C. See the text for the differences in CAS parameters for each of these galaxies.
This is a relatively good fit to the data, with 13% uncer-tainty on each of the coefficients (compared to a 39% er-ror on the slope of the linear fit, and an error larger thanthe value of the y-intercept). The strong dependence ofA and S shortward of the Balmer break for the Sa–Scgalaxies may be due to UV-bright star-forming regions,although the low number statistics in the bluest two fil-ters (2 galaxies) and the large uncertainties suggest thatthis may be insignificant. However, the general trend oflarger A and S values at shorter wavelengths is likely real,as the F300W filter contains 11 Sa–Sc galaxies, and alsoshows this trend. More far-UV data is needed to moreaccurately determine the trend in this wavelength range.The 2nd order polynomials for the dependence of A andS on wavelength for Sa–Sc galaxies are:
A(Sa − Sc) = 1.69 log(λc)2 − 9.48 log(λc) + 13.47 (7)
S(Sa− Sc) = 5.20 log(λc)2 − 28.82 log(λc) + 40.11 (8)
The uncertainties on these coefficients are . 18%, and. 10%, respectively, compared to an error on the slopeof the linear fits of 17% and 18%, respectively.
The coefficients for the linear-least-squares fit are givenin Table 9, where X = X1× log(λc) + X2, and where λc
is in units of nm. The variable X is the concentrationindex (C for columns 2–3), the asymmetry index (A forcolumns 4–5), or the clumpiness index (S for columns 6–7). As determined from these fits, the early to mid-typespiral galaxies (Sa–Sc) show a significant increase in con-centration index at longer rest-frame wavelengths. Thelate-type (Sd–Im) galaxies, however, have no trend withwavelength within the uncertainties, and there is only aslight trend with wavelength for peculiar/merging galax-ies. There is, however, a significant decrease in asymme-try toward longer wavelengths for all galaxy types. The
TABLE 9CAS Wavelength Dependence
Type-bin C1 C2 A1 A2 S1 S2
(1) (2) (3) (4) (5) (6) (7)
E–S0 · · · · · · -0.12 0.40 -0.14 0.48· · · · · · · · · 0.02 0.07 0.04 0.10Sa–Sc 1.74 -1.96 -0.87 2.57 -2.28 6.50· · · 0.28 0.73 0.15 0.38 0.42 1.09Sd–Im 0.17 2.05 -0.49 1.63 -0.94 2.97· · · 0.27 0.70 0.05 0.13 0.14 0.36Pec/merger 0.51 1.43 -0.59 2.08 -0.52 1.87· · · 0.36 0.94 0.17 0.44 0.21 0.55
Note. — Coefficients for the linear dependence of the CAS param-eters on the logarithm of the wavelength in nm. The second line foreach type-bin lists the uncertainties on these coefficients. The coeffi-cients are given for the linear-least-squares fit to the data within eachtype bin, resulting in the equation: X = X1× log(λc) + X2, where Xis the concentration index (C) for columns 2–3, the asymmetry index(A), for columns 4–5, and the clumpiness index (S) for columns 6–7.Note that better polynomial fits for C (E–S0), and for A and S (Sa–Sc)are given by Eq’s 6–8 in the text.
clumpiness index also decreases significantly with wave-length for all galaxy types. The reader should be advisedthat the linear fits of the wavelength dependence of A andS for Sa–Sc galaxies do not fit the data as well as the 2ndorder polynomial fits presented in Eq’s 7–8.
Because the same galaxies were not observed at allwavelengths, it is more meaningful to determine the de-pendence of the CAS parameters on wavelength by ex-amining the differences seen within individual galaxies,rather than fitting trends to the entire data set. There-fore, we also calculated the difference between the CASparameters in R and U for each individual galaxy thatmet our reliability criteria, and which have CAS values

26
Fig. 17.— The median CAS parameters as a function of the central wavelength in nm (λc) of each filter. The values for different type-binsare separated into different panels, from left to right. Error bars with the same color as the data points show the 25–75% quartile ranges.Magenta error bars show the error on the median. Data that did not meet our reliability criteria, and CAS values < −0.2 are not includedin the medians. Parameters for type-bins and filters with fewer than 2 galaxies are not plotted. Dashed lines are the linear-least-squares fitto the median CAS parameters. Dotted lines are the 2nd order polynomial fits to the data, shown only in the C panel for E–S0 galaxies,and the A and S panel for Sa–Sc galaxies. These may be the only panels where the trend is of higher order than linear. These fits showan increase in C, and a decrease in A and S with increasing rest-frame wavelength, although early-type galaxies (E–S0) are relativelyconstant in C, A, and S with increasing rest-frame wavelength longward of the Balmer break. Shortward of the Balmer break, the trendfor early-type galaxies is more uncertain due to the low S/N of these intrinsically red galaxies in the UV images.
> −0.2. We use these filters because we have highernumber statistics in the ground-based VATT data, andall of the 143 VATT galaxies were consistently observedin U and R, but not necessarily in the HST and GALEXfilter sets. We find median differences between C in theR- and U -band (CR – CU ) of 0.081, 0.378, 0.139, and0.135, for E–S0, Sa–Sc, Sd–Im, and peculiar/merginggalaxies, respectively. A positive number indicates anincrease in the index at longer wavelengths. This differ-ence in C is significant within the scatter for individualgalaxies (defined as half of the 25–75% quartile range ofCR – CU ) for E–S0 and Sa–Sc galaxies, which have ascatter of ± 0.048 and 0.121, respectively. This is less
significant for later-type galaxies, however as there is alarger range of possible CR – CU values for individualgalaxies (with a scatter of ± 0.162 for Sd–Im, and 0.152for peculiar/mergers). The asymmetry index only variessignificantly within the spread for E–S0 galaxies, with asmall decrease in A from U to R (AR – AU = –0.011), anda scatter in AR – AU of ±0.008. The difference betweenA in R and U is larger for the later-type galaxies, but sois the spread in values between individual galaxies. AR
– AU ± the scatter in AR – AU for Sa–Sc, Sd–Im, andmergers, respectively is: −0.057± 0.059, −0.064± 0.078,and −0.044± 0.071. The clumpiness parameter also de-creases at longer wavelengths, although the scatter is

Wavelength Dependence of Galaxy Structure 27
large. SR – SU ± the scatter in SR – SU for E–S0, Sa–Sc, Sd–Im, and mergers, respectively is: −0.030± 0.032,−0.160± 0.130, −0.140± 0.195, and −0.065± 0.160. So,even though there is a general increase in C and decreasein A and S toward longer wavelengths, the degree towhich this difference occurs varies significantly betweenindividual galaxies. The values presented here may beused as a correction to the general statistics of a largesample of galaxies, but cannot be applied with a largedegree of certainty to any one individual galaxy.
7. CONCLUSIONS
Concentration, asymmetry, and clumpiness (CAS) in-dices are basic structural parameters of galaxies. Be-cause the CAS parameters are based on the light distri-butions of galaxies, they describe quantifiable aspects oftheir morphologies. A difference in these parameters asa function of wavelength therefore contains informationabout how a galaxy’s appearance changes with rest-framewavelength, and leads to a measure of the morphologicalk-correction. This is important for high redshift stud-ies, because at high redshift these galaxies are observedin their rest-frame UV. To quantify this, we have pre-sented CAS parameter measurements for our sample of199 mostly late-type and merging/peculiar galaxies ob-served in various combinations of filters spanning the far-UV through the near-IR.
Our results confirm those of previous studies, but overa much wider wavelength range that includes the UV:galaxies are more concentrated, less asymmetric, andless clumpy with redder color and earlier galaxy type.We find that normal and merging/peculiar galaxy typeclasses occupy different locations within the CAS param-eter space, such that correlations between the CAS pa-rameters can be used for statistical galaxy classification,but in a limited sense due to both intrinsic and observa-tional scatter.
A general evolutionary trend as a merger progressesthrough its different stages can be drawn from these cor-relations, with mergers becoming significantly less con-centrated, more asymmetric, and more clumpy than pre-mergers, then progressing back toward the normal galaxyparameter space, where they become merger remnants,which are more concentrated and slightly more asymmet-ric and clumpy than pre-mergers.
We find no significant difference in the CAS parametersfor early-type galaxies (E–S0) at rest-frame wavelengthslongward of the Balmer break. We cannot measure thewavelength dependence of the CAS parameters of early-type galaxies shortward of the Balmer break with greatconfidence, because these red galaxies have very low S/Nin the GALEX and HST F255W and F300W filters, andbecause of the lack of good statistics in the far and mid-UV. However, we find that later type galaxies (S–Im andpeculiar/mergers) observed at shorter wavelengths ap-pear to be less concentrated, more asymmetric, and moreclumpy than they would appear to be at longer wave-lengths. Therefore, there is little to no morphological k-correction for the CAS parameters of early-type galaxies(E–S0) in the optical, but a more significant correctionfor all other later galaxy types at all wavelengths betweenthe far-UV and near-IR.
These nearby-galaxy results can be used as a bench-mark for interpreting the CAS morphological parameters
of high redshift galaxies observed in the rest-frame UV.The morphological k-correction derived here will helpus to determine how much of the difference we see inthe morphologies of high redshift galaxies is purely dueto band-pass shifting effects, and a comparison of thestructural CAS parameters between low and high red-shift galaxies will provide some understanding of galaxyevolution. We will address these aspects of the high red-shift Universe in a future paper (Conselice, et al. 2007,in preparation).
The current study shows that one cardinal improve-ment to this work would be to obtain a much largersample in the mid-UV at ∼ 100× the sensitivity, whichWFC3 will be able to do after SM4 is launched. Suchstudies will be critical to help interpret the 10’s of mil-lions of distant galaxy images JWST will observe after2013 in the rest-frame UV, at λ & 1µm and z & 2.
Based on observations with the VATT: the Alice P.Lennon Telescope and the Thomas J. Bannan Astro-physics Facility. This research was partially fundedby NASA grants GO-8645.01-A, GO-9124.01-A andGO-9824.01-A, awarded by STScI, which is operatedby AURA for NASA under contract NAS 5-26555.Additional funding was provided by GALEX grant#GALEXGI04-0000-0036, and the NASA Space GrantGraduate Fellowship at ASU. We wish to thank the entirestaff of Steward Observatory and the Vatican AdvancedTechnology Telescope for all of their help and support onthis project. We especially thank Drs. Richard Boyle,Matt Nelson, and Chris Corbally for offering so muchof their time and expertise during our VATT observingruns. CJC thanks the National Science Foundation forsupport through an Astronomy and Astrophysics Fellow-ship and PPARC for support at the University of Not-tingham. This research has made use of the NASA/IPACExtragalactic Database (NED) which is operated by theJet Propulsion Laboratory, California Institute of Tech-nology, under contract with the National Aeronauticsand Space Administration. This research has also madeuse of NASA’s Astrophysics Data System.

28
REFERENCES
Abraham, R. G., Valdes, F., Yee, H. K. C., van den Bergh, S. 1994,ApJ, 432, 75
Abraham, R. G., Tanvir, N. R., Santiago, B. X., Ellis, R. S.,Glazebrook, K., & van den Bergh, S. 1996, MNRAS, 279, L47
Baugh, C. M., Cole, S., Frenk, C. S., & Lacey, C. G. 1998, ApJ,498, 504
Bershady, M. A., Jangren, A., & Conselice, C. J. 2000, ApJ, 119,2645
Bertin, E., and Arnouts, S. 1996, AJ, 117,393Bohlin, R. C., et al. 1991, ApJ, 368, 12Cohen, S. H., Windhorst, R. A., Odewahn, S. C., Chiarenza, C. A.,
& Driver, S. P. 2003, AJ, 125, 1762Cohen, S. H., et al. 2006, ApJ, 639, 731Cole, S., Aragon-Salamanca, A., Frenk, C. S., Navarro, J. F., &
Zepf, S. E. 1994, MNRAS, 271, 781Conselice, C. J. 1997, PASP, 109, 1251Conselice, C. J., Bershady, M. A., & Jangren, A. 2000, ApJ, 529,
886Conselice, C. J., Bershady, M. A., Dickinson, M., & Papovich, C.
2003, AJ, 126, 1183Conselice, C. J. 2003, ApJS, 147, 1Conselice, C. J., et al. 2004, ApJ, 600, 139LConselice, C. J., Blackburne, J. A., & Papovich, C. 2005, ApJ, 620,
564Conselice, C. J. 2006, ApJ, 638, 686Corbin, M. R., Urban, A., Stobie, E., Thompson, R. I., & Schneider,
G. 2001, ApJ, 551, 23de Vaucouleurs, G., de Vaucouleurs, A., Corwin, H. G., Buta, R.
J., Paturel, G., & Fouque, P. 1991, Third Reference Catalogueof Bright Galaxies (Springer, New York)
Driver, S. P., Windhorst, R. A., Ostrander, E. J., Keel, W. C.,Griffiths, R. E., & Ratnatunga, K. U. 1995, ApJ, 449, L23
Driver, S. P., Fernandez-Soto, A., Couch, W. J., Odewahn, S. C.,Windhorst, R. A., Phillips, S., Lanzetta, K., & Yahil, A. 1998,ApJ 496, L93
Ellis, R. S. 1997 ARA&A, 35, 389Giavalisco, M., et al. 2004, ApJ, 600, 93Glazebrook, K., Ellis, R., Santiago, B., & Griffiths, R. 1995,
MNRAS, 275, L19Heckman, T. M., et al. 2005, 619, 35Hibbard, J. E., van Gorkom, J. H., Rupen, M. P., & Schiminovich,
D. 2001, ASPC, 240, 657
Hill, J. K., et al. 1992, ApJ, 395, L37Im, M., Griffiths, R. E., Naim, A., Ratnatunga, K. U., Roche, N.,
Green, R. F., & Sarajedini, V. 1999, ApJ, 510, 82Isserstedt, J. & Schindler, R. 1986, A&A, 167, 11Jansen, R. A. 2000, Ph.D. Thesis, University of GroningenKauffmann, G., Nusser, A., & Steinmetz, M. 1997, MNRAS, 286,
795Kuchinski, L. E., et al. 2000, ApJS, 131, 441Kuchinski L. E., Madore, B. F., Freedman, W. L., & Trewhella, M.
2001, AJ 122, 729Lotz, J. M., Primack, J., & Madau, P. 2004, AJ, 128, 163Marcum, P. M., et al. 2001, ApJS, 132, 129Martin, D. C., et al. 2005, ApJL, 619, 1Nagashima, M., Totani, T., Gouda, N., & Yoshii, Y. 2001, ApJ,
557, 505Nagashima, M., Yoshii, Y., Totani, T., & Gouda, N. 2002, ApJ,
578, 675Odewahn, S. C., Windhorst, R. A., Driver, S. P., & Keel, W. C.
1996, ApJ, 472, L13Papovich, C., Dickinson, M., Giavalisco, M., Conselice, C. J., &
Ferguson, H. C. 2005, ApJ, 631, 101Petrosian, V., ApJL, 209, 1Roukema, B. F., Quinn, P. J., Peterson, B. A., & Rocca-
Volmerange, B. 1997, MNRAS, 292, 835Schade, D., Lilly, S. J., Crampton, D., Hammer, F., Le Fevre, O.,
& Tresse, L. 1995, ApJL, 451, 1Takamiya, M. 1999, ApJS, 122, 109Taylor, V. A., Jansen, R. A., & Windhorst, R. A. 2004, PASP, 116,
762Taylor, V. A., Jansen, R. A., Windhorst, R. A., Odewahn, S. C.,
& Hibbard, J. E. 2005, ApJ, 630, 784
van den Bergh, S., Cohen, J. G., Hogg, D. W., & Blandford, R.2000, AJ, 120, 2190
van Dokkum, P. G., Franx, M., Fabricant, D., Kelson, D. D., &Illingworth, G. D. 1999, ApJ, 520, L95
White, S. D. M. 1979, MNRAS, 189, 831White, S. D., & Frenk, C. S. 1991, ApJ, 379, 52Windhorst, R. A., et al. 2002, ApJS, 143, 113