Rest Lake Dam Operating Order - Wisconsin DNR
228
State of Wisconsin DEPARTMENT OF NATURAL RESOURCES 810 W. Maple Street Spooner WI 54801 May 13,2013 ·Subject: Rest Lake Dam Environmental Assessment Dear Interested Patticipant: Scott Walker, Governor Cathy Stepp, Secretary Telephone 608-266-2621 Toll Free 1-888-936-7463 TTY Access via relay- 711 We have now completed the Environmental Assessment (EA) for the proposed new operating order on the Rest Lake Dam. During the public review period on the EA, you provided comments on that analysis. The purpose of this letter is to provide you with our feedback on those comments and convey our record of decision. Enclosed for your information are three items related to the EA process. The first item is the Record of Decision on compliance with the Wisconsin Environmental Policy Act. The second item is a copy of our EA cettification page which formally completes the EA process. The third item is the Depattment's response to public comments. That document contains the Depattment' s responses to all comments received as well as any formal amendments to the EA where noted. Thank you for your patticipation in the EA process on this project proposal. The next step for the Depattment will be to initiate development and public review of the new draft operating order. That step is being handled by other technical staff in the Depatiment who are responsible for the appropriate permitting actions. Sincerely, Bill Clark Environmental Review Supervisor w/ enclosures dnr.wi.gov wisconsin .gov Naturally WISCONSIN PRINTED ON RECYCLED PAPER
-
Upload
khangminh22 -
Category
Documents
-
view
3 -
download
0
Transcript of Rest Lake Dam Operating Order - Wisconsin DNR

State of Wisconsin DEPARTMENT OF NATURAL RESOURCES 810 W. Maple Street Spooner WI 54801
May 13,2013
·Subject: Rest Lake Dam Environmental Assessment
Dear Interested Patticipant:
Scott Walker, Governor Cathy Stepp, Secretary
Telephone 608-266-2621 Toll Free 1-888-936-7463
TTY Access via relay- 711
We have now completed the Environmental Assessment (EA) for the proposed new operating order on the Rest Lake Dam. During the public review period on the EA, you provided comments on that analysis. The purpose of this letter is to provide you with our feedback on those comments and convey our record of decision.
Enclosed for your information are three items related to the EA process. The first item is the Record of Decision on compliance with the Wisconsin Environmental Policy Act. The second item is a copy of our EA cettification page which formally completes the EA process. The third item is the Depattment's response to public comments. That document contains the Depattment' s responses to all comments received as well as any formal amendments to the EA where noted.
Thank you for your patticipation in the EA process on this project proposal. The next step for the Depattment will be to initiate development and public review of the new draft operating order. That step is being handled by other technical staff in the Depatiment who are responsible for the appropriate permitting actions.
Sincerely,
d#~ Bill Clark Environmental Review Supervisor
w/ enclosures
dnr.wi.gov wisconsin.gov Naturally WISCONSIN
PRINTED ON RECYCLED PAPER
RECORD OF DECISION
WISCONSIN DEPARTMENT OF NATURAL RESOURCES
WISCONSIN ENVIRONMENTAL POLICY ACT COMPLIANCE ON THE ENVIRONMENTAL ASSESSMENT
FOR THE PROPOSED REST LAKE DAM OPERATING ORDER
In November, 2006, the Depatiment ofNatural Resources (Depatiment) determined that an Environmental Assessment (EA) was needed, under s. 1.11, Wis. Stats., for a proposed new operating order on the Rest Lake Dam located in the Town of Manitowish Waters, Vilas County, Wisconsin. The Depatiment prepared an EA on the project proposal as pm·t of their responsibilities under the Wisconsin Environmental Policy Act (WEP A). This written decision completes that process and makes public the Depatiment's WEPA decision.
FINDINGS OF FACT
The Depmiment finds that: (1) The Depatiment has reviewed and considered the EA, the comments on it, and other information
provided by Xcel Energy, U.S. Geological Survey, other agencies, Great Lakes Indian Fish & Wildlife Commission, Chippewa Tribes, and the general public.
(2) The Depatiment has complied with the requirements of Chapter NR 150, Wisconsin Administrative Code, and Section 1.11, Wis. Stats., by: a. Holding an initial scoping meeting on August 25, 2007 at the Manitowish Waters Town Hall
to gather public input on issues to be addressed in the EA b. Preparing an EA that identified major issues, including a description of the purpose and need
for the proposal, a description of the proposal and affected environment, an evaluation of the probable environmental impacts ofthe proposal, and an evaluation of reasonable alternatives along with associated impacts
c. Sending a news release to local media on September 14, 2012 as well as notification to legislators, municipal officials, and other various entities on the established mailing list announcing availability of the EA and oppmiunity to comment on it
d. Providing a copy of the news release and EA on the Depatiment's web-site and distributing hard copies to the locallibrm·y and Nmih Lakeland Discovery Center for public viewing
e. Distributing hard copies of the EA on request during the public comment review period f. Receiving and considering comments on the EA through October 31,2012. This comment
period was further extended to December 31, 20 12 to accommodate those reviewers who did not have sufficient time to comment during the original review period.
g. Preparing and distributing a comprehensive response package for comments received on the EA during the public review period
(3) The proposed new operating order for levels and flows is not expected to result in significant adverse impacts (as defined in NR 150, Wis. Adm. Code) to air quality, surface or groundwater quality, flora or fauna including endangered/threatened species, historic/archaeologic resources, or Tribal treaty rights within the Ceded Territory.
(4) Consistent with social, economic, and other essential considerations, the Depatiment, in developing this EA, has analyzed reasonable alternatives (to the extent possible under existing statutory authorities) that would avoid or minimize environmental hatm.
1

CONCLUSION OF LAW
The Depatiment, under Chapter NR 150, Wisconsin Administrative Code and Section 1.11, Wis. Stats., has the responsibility to comply with WEP A and the authority to determine its compliance with the Act.
DECISION
The Depatiment has complied with the requirements of WEP A, Section 1.11, Wis. Stats., and Chapter NR 150, Wisconsin Administrative Code, for the proposed operating order to establish new levels and flows on the Rest Lake Dam project. The Depmiment has considered the EA as well as public, agency, and Tribal comments on the EA and the associated record to this point in the decision-making process. This compliance with WEP A applies to all subsequent Department decisions whose impacts are considered in the EA.
APPEAL RIGHTS
If you believe that you have a right to challenge this decision, you should know that the Wisconsin statutes and administrative rules establish time periods within which requests to review Depmiment decisions must be filed. For judicial review of a decision pmsuant to sections 227.52 and 227.53, Wis. Stats., you have 30 days after the decision is mailed, or otherwise served by the Depmiment, to file yom petition with the appropriate circuit comi and serve the petition on the Depmiment. Such a petition for judicial review must name the Department of Natural Resomces as the respondent.
To request a contested case hearing pmsuant to section 227.42, Wis. Stats., you have 30 days after the decision is mailed, or otherwise served by the Department, to serve a petition for hearing on the Secretary of the Department ofNatmal Resomces. All requests for contested case hearings must be made in accordance with NR 2.05(5), Wis. Adm. Code, and served on the Secretary in accordance with section NR 2.03, Wis. Adm. Code. The filing of a request for a contested case hearing does not extend the 30 day period for filing a petition for judicial review.
This notice was provided pursuant to Section227.48(2), Wis. Stats.
Dated at Spooner, Wisconsin this /££'dayof ~ STA~~ ~SC:SIN
'2013
Depmiment of Natural Resources For the Secretary
~b~ Supervisor, Environmental Analysis Nmthern Region Depmiment of Natural Resomces
2

RECORD OF DECISION
WISCONSIN DEPARTMENT OF NATURAL RESOURCES
WISCONSIN ENVIRONMENTAL POLICY ACT COMPLIANCE ON THE ENVIRONMENTAL ASSESSMENT
FOR THE PROPOSED REST LAKE DAM OPERATING ORDER
In November, 2006, the Depatiment ofNatural Resources (Depruiment) determined that an Environmental Assessment (EA) was needed, under s. 1.11, Wis. Stats., for a proposed new operating order on the Rest Lake Dam located in the Town of Manitowish Waters, Vilas County, Wisconsin. The Depruiment prepared an EA on the project proposal as prui of their responsibilities under the Wisconsin Environmental Policy Act (WEP A). This written decision completes that process and makes public the Depruiment's WEPA decision.
FINDINGS OF FACT
The Depruiment finds that: (1) The Depmiment has reviewed and considered the EA, the comments on it, and other infmmation
provided by Xcel Energy, U.S. Geological Survey, other agencies, Great Lakes Indian Fish & Wildlife Commission, Chippewa Tribes, and the general public.
(2) The Depmiment has complied with the requirements of Chapter NR 150, Wisconsin Administrative Code, and Section 1.11, Wis. Stats., by: a. Holding an initial scoping meeting on August 25, 2007 at the Manitowish Waters Town Hall
to gather public input on issues to be addressed in the EA b. Preparing an EA that identified major issues, including a description of the purpose and need
for the proposal, a description of the proposal and affected environment, an evaluation of the probable environmental impacts of the proposal, and an evaluation of reasonable alternatives along with associated impacts
c. Sending a news release to local media on September 14, 2012 as well as notification to legislators, municipal officials, and other various entities on the established mailing list announcing availability of the EA and oppmiunity to comment on it
d. Providing a copy of the news release and EA on the Depmiment's web-site and distributing hm·d copies to the local library and North Lakeland Discovery Center for public viewing
e. Distributing hard copies of the EA on request during the public comment review period f. Receiving and considering comments on the EA through October 31, 2012. This comment
period was fmiher extended to December 31, 20 12 to accommodate those reviewers who did not have sufficient time to comment during the original review period . .
g. Prepm·ing and distributing a comprehensive response package for comments received on the EA during the public review period
(3) The proposed new operating order for levels and flows is not expected to result in significant adverse impacts (as defined in NR 150, Wis. Adm. Code) to air quality, surface or groundwater quality, flora or fauna including endangered/threatened species, historic/ru·chaeologic resources, or Tribal treaty rights within the Ceded Territory.
(4) Consistent with social, economic, and other essential considerations, the Department, in developing this EA, has analyzed reasonable alternatives (to the extent possible under existing statutory authorities) that would avoid or minimize environmental harm.
1

CONCLUSION OF LAW
The Department, under Chapter NR 150, Wisconsin Administrative Code and Section 1.11, Wis. Stats., has the responsibility to comply with WEP A and the authority to determine its compliance with the Act.
DECISION
The Department has complied with the requirements of WEP A, Section 1.11, Wis. Stats., and Chapter NR 150, Wisconsin Administrative Code, for the proposed operating order to establish new levels and flows on the Rest Lake Dam project. The Department has considered the EA as well as public, agency, and Tribal comments on the EA and the associated record to this point in the decision-making process. This compliance with WEP A applies to all subsequent Department decisions whose impacts are considered in the EA.
APPEAL RIGHTS
If you believe that you have a right to challenge this decision, you should lmow that the Wisconsin statutes and administrative rules establish time periods within which requests to review Department decisions must be filed. For judicial review of a decision pursuant to sections 227.52 and 227.53, Wis. Stats., you have 30 days after the decision is mailed, or otherwise served by the Department, to file your petition with the appropriate circuit court and serve the petition on the Depruiment. Such a petition for judicial review must name the Depruiment ofNatural Resources as tht1 respondent.
To request a contested case hearing pursuant to section 227.42, Wis. Stats., you have 30 days after the decision is mailed, or otherwise served by the Depruiment, to serve a petition for heru·ing on the Secretru·y of the Depatiment ofNatural Resources. All requests for contested case hearings must be made in accordance with NR 2.05(5), Wis. Adm. Code, and served on the Secretary in accordance with section NR 2.03, Wis. Adm. Code. The filing of a request for a contested case hearing does not extend the 30 day period for filing a petition for judicial review.
This notice was provided pursuant to Section 227.48(2), Wis. Stats.
Dated at Spooner, Wisconsin this /,Pift'dayof ~ STAr~~ -SIN
'2013
Depatiment of Natural Resources For the Secretary
~~~ Supervisor, Environmental Analysis Nmihem Region Depatiment ofNatural Resources
2

Project Name: Evaluation of a New Operating Order for the Rest Lake Dam County: Vilas
DECISION (This decision is not final until certified by the appropriate authority)
In accordance with s. 1.11, Slats., and Ch. NR 150, Adm. Code, the Department is authorized and required to determine whether it has complied with s.1.11 , Slats. , and Ch. NR 150, Wis. Adm. Code.
Complete either A orB below:
A. EIS Process Not Required
The attached analysis of the expected impacts of this proposal is of sufficient scope and detail to conclude that this is not a major action which would significantly affect the quality of the human environment. In my opinion, therefore, an environmental impact statement is not required prior to final action by the Department.
B. Major Action Requiring the Full EIS Process D The proposal is of such magnitude and complexity with such considerable and important impacts on the quality of the human environment that it constitutes a major action significantly affecting the quality of the human environment.
Signature of Evalua r Date Signed
? ~II-- 2-o/.2
Number of responses to news release or other notice: "'-/~ r -/ /~ ~16'~~ . ~ ·
Certified to be in compliance with WEPA
NOTICE OF APPEAL RIGHTS
If you believe that you have a right to challenge this decision, you should know that the Wisconsin statutes and administrative rules establish time periods within wh ich requests to review Department decisions must be filed. For judicial review of a decision pursuant to sections 227.52 and 227.53, Wis. Slats., you have 30 days after the decision is mailed, or otherwise served by the Department, to file your petition with the appropriate circuit court and serve the petition on the Department. Such a petition for judicial review must name the Department of Natural Resources as the respondent.
To request a contested case hearing pursuant to section 227.42, Wis. Slats., you have 30 days after the decision is mailed, or otherwise served by the Department, to serve a petition for hearing on the Secretary of the Department of Natural Resources. All requests for contested case hearings must be made in accordance with section NR 2.05(5), Wis. Adm. Code, and served on the Secretary in accordance with section NR 2.03, Wis. Adm. Code. The filing of a request for a contested case hearing does not extend the 30 day period for fi ling a petition for judicial review.
83 Page

DEPARTMENT OF NATURAL RESOURCES
SUMMARY OF PUBLIC COMMENTS AND DEPARTMENT RESPONSES ON THE
INTRODUCTION
ENVIRONMENTAL ASSESSMENT FOR THE PROPOSED NEW OPERATING ORDER
ON THE REST LAKE DAM
The Environmental Assessment (EA) on the proposed issuance of a new operating order for the Rest Lake Dam was released for public review on September 14, 2012. Copies of the news release were provided to the local media for publication and to interested parties that had signed up to received information about the Rest Lake Dam via GovDelivery (a digital subscription service). Jhe EA and news release was .also provided to all individuals who requested either a hard copy or an electronic copy. Hard copies of the same were provided to the Manitowish Waters library and the North Lakeland Discovery Center. The EA and news release were made available for public viewing on the Department's external website for public review as well.
The formal public comment period for the EA was originally set to end on October 31, 2012 but was extended until December 31,2012 after multiple parties requested more time to review the EA. Approximately 167 individual parties provided comments on the EA (either by phone, in-person, or in writing via e-mail or hard copy letter). The Department received 16 contacts from individuals requesting a hard copy of the EA. Of the 167 individual parties, many sent comments directly to the DNR Secretary and/or the Governor's offices. Copies of these comments were provided to regional Department staff, and they were accepted as comments on the EA. Many individuals provided comments to the Manitowish Chain Defense Fund (MCDF) but not the DNR. Information from these comments were summarized by the MCDF and were considered comments from one individual party.
This summary document constitutes, where noted, any and all formal amendments to the EA that was published for public review. No further documentation will be developed or sent out. Copies of this summary document have been sent to every party who provided comments on the EA as well as those other individuals who requested a copy.

Page 2
RESPONSE TO GENERAL COMMENTS/ISSUES
Before responding to specific comments; it is important to address some co~mon themes ~ttendant to many of the general comments received. These issues are identified in bold type below. Outlined under each issue is the Department's response.
General opinions expressing support or opposition of a preferred alternative and/or general environmental concern for the proposed project
A number of comments were received that expressed general support/opposition or general concerns about the proposal to issue a new operating order for the Rest Lake D~m. We respect and appreciate these opinions . These comments, however, do not provide any substantive information relative to the clarity, accuracy, and scope of the Department's environmental analysis presented for public review. All of the general environmental issues identified in these comments have been addressed in the EA. While these comments have been made part of the official public record, this document does not include individual responses to these comments.
Manitowish Defense Fund Questionnaire
Many comments were received in the form of a survey questionnaire that was created by the Manitowish Chain Defense Fund (MCDF). The survey was sent to every property owner on the Chain (I ,226 parcels according to the MCDF) and approximately 300 of the survey forms were returned to MCDF which was a 24% response rate. The surveys that were submitted to the Department of Natural Resources (DNR) or the Governor's Office as well as the MCDF summary of survey responses were accepted as comments on the EA. The specific comments that were included in the survey forms are summarized and addressed in the next section of this document. While we appreciate that people took the time to send us information in this format, many of the comments were expressing general opposition to any changes to current operation and did not provide specific information relative to the clarity, accuracy, and scope of the environmental analysis. These general comments have been made part of the official public record and were addressed in the EA.
While not directly related to the environmental analysis process, it also should be noted here that current law limits the Department's ability to factor public opinion into every decision it makes. Many Department decisions, particularly on regulatory matters must, by law, be based entirely on a technical analysis of whether or not the proposed activity would meet the applicable standards established in the laws and administrative rules approved by the state legislature. In these decision-making circumstances, public opinion is not one of the factors the Department can consider. As part of the Executive Branch of state government, the Department cannot ignore or unilaterally change existing laws. We must operate within the constraints and standards of the law as provided to us by the Legislative Branch of state government.
---~XceLEne.:gy_andJhe_ChipJ1ewa_and..Riambeau1m(lf.OYement_C_omJl3Jl)' _________ _______ _ _
It is important to note that Xcel Energy and CFIC are part of the same company and both names are often used interchangeably when referring to the current owner of the Rest Lake Dam. Additional information regarding the difference between CFIC and Xcel Energy is addressed in more detail on page 40 of this document.
Perception that DNR has made a decision on a specific proposal
The language in the MCDF survey and in many individual comments made reference to a specific DNR plan or proposal. These statements are reflective of a misunderstanding of the WEPA process. The intent of the Department's environmental analysis process is to provide an information document that outlines the aspects of the

Page 3
affected environment, how those resources are impacted by current operations, and identify a range of alternative operating orders. The Department needs to use the information gathered in the WEPA process (which includes the comments received regarding the clarity, accuracy, and scope of the analysis) to be able to make informed decisions on a potential new operating order.
Misunderstanding of EA process and requirements
Some individuals who provided comments questioned why the Department did not provide more detailed analysis in the· EA on social and economic concerns. Other commenters questioned the general level of detail in the EA as well. As noted above, some commenters expressed their "vote" in favor or opposition to the proposed project. Lastly, some of those commenting conveyed disappointment that the EA did not clearly identify the Department's position on a preferred alternative.
The expression of these comments points to some misunderstanding of the purpose and intent of the environmental analysis process. The state's environmental policy is spelled out in the Wisconsin Environmental Policy Act (WEPA) and requires the Department, as well as other state agencies, to consider the environmental effects of their actions to the extent possible under their statutory authorities. WEP A imposes procedural and analytical responsibilities, but it does not provide authority to protect the environment. The Department has substantial authority to regulate environmental pollution and alteration to waterways. However, the standards we can apply in exercising these authorities are defmed in various regulatory statutes and administrative rules. For many Department regulatory programs, these standards do not include social or economic concerns. In turn, while the rules guiding development of environmental analysis documentation require general disclosure of social and economic concerns to the extent known or reasonably anticipated, the need for preparation of environmental analysis documents cannot be based solely on anticipated social or economic impacts.
RESPONSE TO SPECIFIC COMMENTS
Following is a synthesis of all the specific comments received on the EA along with the Department's responses. The responses take several forms including presentation of new information with associated revisions to the EA analysis (where noted) as well as explanations of the Department's perspective. To aid the reader, comments and responses have been grouped under several main issues or topics as indicated below. Each paragraph under the comment section represents a separate, individual comment for that issue.
1. Project summary
a. Purpose and need for project
Comments ---=F=--o::..:ur= to fiv~years ago the argu~ent to change dam o~rat~ns was only about the sturgeon.
There is much confusion and speculation regarding the reason this change is being considered. I hear it was to restore sturgeon habitat. If that is the sole goal, I personally do not think it is worth all the property damage that will occur with the changed lake levels.
Response To provide more detail regarding how the Department became involved in evaluation of the Rest Lake Dam, we hereby amend the EA to include the following narrative at the beginning of the first full paragraph on page 2: "Department staff began to study the Manitowish River system after being approached by members of the public who were concerned that the management of water levels and flows negatively affected Lake Sturgeon populations downstream of the Rest Lake Dam. Initially, much of the early work and discussion

J:>age4
regarding water levels and flows was focused on this one species. When Department staff began work on the environmental analysis, a much broader range of environmental and public water rights issues affected by water levels and flows, both upstream and downstream of the dam, were identified and evaluated."
Comments This section of the EA fails to provide any information regarding the action.
One individual commenting on the EA expressed support of the following directive from page 2. "The current operation of the dam creates surface water levels and flows that are substantially different compared to the natural, annual pattern of levels and flows on northern Wisconsin lakes, rivers, and wetlands. This change in hydrology negatively affects the Manitowish River system upstream of the dam on the Chain of Lakes and downstream of the dam to the confluence with the Bear River. The Department of Natural Resources proposes to issue a new operating order to the owners of the Rest Lake Dam which specifies water levels and flows that balance and protect public water resource rights as well as life, health, and property both upstream and downstream of the dam."
Perhaps the emphasis on sturgeon habitat and migration has been moved from the forefront, but the DNR's continued preoccupation with species downstream has taken what we feel is undue preference.
The EA seems to give preference to interests below the dam.
Response Pages 1 and 2 of the EA clearly describe that the DNR is proposing to issue a new operating order to better balance and protect public water resource rights as well as life, health, and property both upstream and downstream of the Rest Lake Dam. The analysis was written to give equal balance in describing upstream and downstream environmental and public water rights issues.
Comment Overall the affected environment is an interesting review of aquatic and wetland ecology, and I learned a lot from reading the information. However the section is plagued by the lack of purpose in the Purpose and Need
. section. The reason an environmental document should start with the purpose is to help identify what affected environment is relevant. I cannot discern for example why the section on water quality (page 17) is included. Similarly the Floristic Quality Index is identified as an issue in the affected environment but never referred to again in the alternatives and impact analysis. Some ofthe material almost feels like misdirection. What do the sections on Mussels and Dragonflies lend to the discussion? The environmental assessment with attachments is unfocused, and contains more information than a person can reasonably interpret during this short comment period.
Resuonse As stated in our responses above, the EA clearly describes the purpose and need for the DNR proposal to issue a new operating order. River, lake, and wetland systems are associated with a diversity of organisms and habitat tynes . . Water gyality, floristic guality, mussels, and dragonflies are all facto~ affected by curren1 and alternative operations. The effects of current and alternative dam operation on water quality and aquatic plants are described in the Alternatives and Environmental Consequences section that begins on page 51 of the EA. When discussing impacts, instead ofrelisting every species and habitat type under each alternative, the analysis focuses on key species and habitat types to help the reader understand the impacts on the entire system.
Comment In the affected environment on page 13, the magnificent Manitowish Water Chain of Lakes is referred to as the Rest Lake Reservoir. My magnificent Island Lake is now just a bay in the Rest Lake Reservoir. That is so discouraging, and it really isn't that subtle. Are we being reprogrammed to accept our magnificent Chain of

Page 5
Lakes as a drawdown reservoir- "in order to meet downstream needs?" It is stunning that the DNR can suggest that this change will not adversely affect property values.
Response On the first page of the environmental analysis we defme that the term "reservoir" simply refers to the fact that the Rest Lake Dam impounds water on the Manitowish Chain of Lakes. The use of the term "Rest Lake Reservoir" in the analysis is not intended to imply any predetermined outcome or to diminish the value that people see in the Manitowish Chain of Lakes and river system.
Comments Remarkably absent is any information regarding the purpose and need for this project. It becomes apparent that DNR has determined to maintain the downstream hydrograph in a run of the river natural flow by assuring that all water withdrawn from the Chain, notably from cranberry operations, is lost from the Manitowish Chain pool, and does not affect down stream flow. Perhaps the Chain is being reallocated to some unknown degree from a recreation based program to a hydropower draw down system. I can only guess, because the DNR fails to acknowledge the purpose of the action. It is incumbent upon the DNR to state the purpose in the Purpose and Need section rather than make the reader guess. At a minimum the DNR should extend the comment period to allow the public a reasonable time to read and consider what exactly is being proposed and for what purpose.
The EA fails to explain why changes are necessary. It fails to provide any information regarding the purpose and need for making changes to the operating order. If the DNR believes it would be in the public interest to modify the existing order, the DNR should explain why that is so rather than force the public to guess. Since the DNR has been studying modifications to the existing order for more than 10 years, it should be easy for the DNR to explain why changes are necessary.
On page 77, relating to Cumulative Effects, the DNR makes another ominous reference to hydropower. Is this the downstream value the DNR will occasionally prioritize? Is this the true purpose of all this?
Response The purpose and need for the proposal to issue a new operating order is described on page 2 in the section titled "Brief overview of the proposal including the DNR action". In this section the analysis clearly states that current operations create patterns of water levels and flows in flow through lakes, rivers, and associated riparian wetlands that are very different from natural conditions and therefore, current operations of the Rest Lake Dam are having a number of negative impacts on public trust water resources both upstream and downstream of the dam. The area of the affected lakes, rivers, and wetlands is identified in Figure 1 & 2. Similar purpose and need information is described in the Proposed Physical Changes section on page 49. To add clarity to the analysis, we hereby amend the Environmental Analysis to include the following on page 8 after the United States Geological Survey (USGS) web links.
"The natural pattern of water levels in flow-through lakes is associated with high water levels in April, May, and June. This natural pattern of water levels is much different when compared to the water elevations of the Chain of Lakes due to the current operation of lhe Rest Lake Da m. Low water level conditions on the Chain currently occur more than 6 months of the year from late fall through late May or early June. These conditions are caused by the 3.5 foot winter drawdown and refill that does not begin until after the water stored in the sno'Apack has passed downstream. With the extent of drawdown, in lower precipitation years the Chain does not reach the 8'6" level for most or all the summer season. These low water levels negatively affect public water interest through loss of recreation, dewatering wetlands critical to overwintering herps and mammals, and also exposing lakebed areas that are important for a wide variety offish, wildlife, and other aquatic species. On rivers, a natural flow pattern includes a high spring flow "flood pulse" followed by flows that gradually decrease through summer with the lowest flow occurring in late summer and early fall. Currently, downstream of the damJrom spring through fall, the flows discharged by the dam create severe drought conditions on the river and associated riparian wetlands on a regularly recurring basis. On
Page 6
an annual basis, these drought condition flows begin at the start of the growing season. These flows and associated low water conditions on the river below the dam negatively impact recreation, in-channel habitat needs, and riparian wetlands that are utilized by a wide variety offish, wildlife, and other aquatic species. The Chain of Lakes and Manitowish River are primarily utilized for recreational use and a drawdown of the reservoir is not needed for hydropower production. In order to better balance and protect public water rights both upstream and downstream of the dam, the Department is proposing to issue a new operating order that would result in water levels and flows that more closely match the natural pattern of water levels and flows of northern Wisconsinflow-through lakes, rivers, and associated riparian wetlands. "
b. Current operation works well and/or not enough consideration of upstream issues
Comments A number of comments reflected the perception that no changes are needed since the current operating order has been in place and has worked well for+/- 70 years. With these operations, many people also commented that the Chain of Lakes and river downstream of the dam currently have exceptional recreational and tourism value as well as high quality river, lake and wetland habitat that are inhabited by diverse and healthy fish and wildlife populations. Another issue commonly raised was the perception that with the long length of time that current operations have been implemented, fish and wildlife populations have been able to adapt to the current management of water levels and flows . Many comments that described these perceptions also included the opinion that changes should not be proposed since there would not be any meaningful improvements that were worth the anticipated economic and other impacts.
The number of residents below Rest Lake dam are very few compared to the Manitowish Waters Chain. They knew the summer/winter flow levels when they bought. They feel if the levels in summer are dropped that they'll have more constant water. Any water level that the dam would drop would only result in a temporary increase · and then would return to the constant flow at the level or any level the dam would hold back. We have problems with drought, low stream levels, cranberry growers, fish depletion from spearing, evaporation and AIS. Please do not add to the environment issues we already have affecting our Chain and change the 70 years of constant flow.
I disagree with the comment or conclusion that the current operation of the Dam creates surface water levels and flows that are substantially different compared to the natural annual pattern of levels and flows on northern Wisconsin lakes, rivers and wetlands. I strongly disagree that the flow of the water somehow negatively impacts the Manitowish river system and the Chain of Lakes which are affected by the Dam's operation.
Upstream water level changes should not be made to benefit a few who chose to build in a natural flood plain. The m~ority should rule here, not special interest groups.
The EA fails to give proper weight to the vested interests of the public above the dam and is therefore biased toward downstream resources.
While we agree with the fundamental goals of flow-regime restoration and endorse the underlying principles behind the desire to restore the ecological integrity of Wisconsin's rivers, the Manitowish Waters Chain of Lakes is today a heavy developed artificial waterway; the balance test needs to recognize both the needs of the natural resource with those of the public who are now part of the system. While a pure natural flowregime makes a lot of sense in an undeveloped watershed, managed flow-regimes needs to be based on both the needs of the resource and the public; the WDNR proposed regime is currently too biased towards the downstream resources. We feel with more rigorously applied science and better data, a balance of both needs could be reached. Unfortunately the EA does not provide the analyses necessary to determine if the proposed action achieves this balance.

Page 7
Page 77, Part 15 (a): This section addresses the long-term or short-term environmental consequences of the proposed project. The current write-up outlines the positive long-term benefits of the project in the eyes of WDNR. However, the flow regime on the Manitowish Waters Chain of Lakes has been in place for almost 100-years. During that time many species have adapted to the new system. In any major ecological change their will be winners and losers. This section of the EA addresses the potential winners but to be balanced should also identify those species that may be impacted by the proposed action. For example some wetland plant species will be enhanced by new flow condition others may be lost from the system. The EA needs to identify these winners and losers so a value judgment can be made as to the impacts.
On page 56 the DNR makes the following statement in the 1,500+ acres of riparian wetlands, oxbows, and backwater sloughs, the river's spring flood pulse is the driving force which sustains all life history needs of the plants and organisms (aquatic and terrestrial) that depend on these areas. Both the current operation and the 1939 order would result in disrupting this flood pulse each spring. Clearly these 1500+ acres are by now a product of the current operation, and there is nothing still being disrupted. Again it could be different, and better for some life forms, but the DNR does not have free reign to misrepresent plant succession and overstate environmental degradation to support its desire to make a change in the dam operation.
Response . The abstract of the USGS report (appendix II) notes that records are available from the CFIC for the water
levels on the Chain and the discharge at the dam from 1973 to current. Current operations can be shown to have been implemented .for at least 40 years. Those operations do not follow all of the provisions from the 1939 order and this issue will be described in more detail on page 38 of this document. Throughout the EA, the affected environment as it currently exists after many years of similar management of water levels and flows is described in detail. Some aspects of the affected environment may be considered to be working well or not working well depending on the individual's perspective. Many of the impacts described in the EA are based on field studies that documented the water depths needed at specific times of the year for navigation, the diverse assemblage of plants, fish, wildlife, and other aquatic organisms, and other aspects of the Manitowish system.
Another issue woven into the comments above is centered on the opinion that since there are many more homes located on the Chain of Lakes compared to downstream, that upstream water issues should carry more weight in any decisions that are made. It is important to understand that current law limits the Department's ability to factor in the number of people that live in certain areas of the affected project area. Many Department decisions, particularly on regulatory matters, must, by law, be based entirely on a technical analysis of whether or not the proposed activity would meet the applicable standards established in the laws and administrative rules. In these decision-making circumstances, the need to balance and protect public rights in navigable waters needs to consider public interests that are defined on a broad statewide perspective. Additionally, the environmental analysis needs to consider both upstream and downstream public interest with equal weight. The analysis describes the impacts that current and alternative operations have both upstream and downstream of the dam in considerable detail.
c. Water level expectations
Comments I live on the Turtle Flambeau Flowage and I believe that when people live on a water storage reservoir like the Manitowish Chain or the Turtle Flambeau Flowage, we do so with the understanding that water levels will fluctuate, especially in drought years .
As a property owner on the Waupaca Chain-0-Lakes and a Lakes Association Board member I would advocate for a more natural seasonal variation of water levels for my own community. We have been able to maintain the natural water level pattern throughout the years here on our Chain.

Downstream owners have clearly purchased, improved, maintained, and retained property with no expectation of changes in water management practices.
Page 8
Regardless of the original intent, generations have purchased property and made improvement based on that understanding, including; construction of permanent dock structures and boat houses that don't contemplate ice issues. Construction of riparian and other barriers along shorelines that don't contemplate being frozen in. Low weed densities along sandy shorelines due to winter freeze out. For those in shallow bays, less accumulation of decaying biomass (a.k.a. muck) that encourages parasites like Duck Itch.
The DNR is about to produce a new operating order with sole intention of increasing the winter water levels to have more water flow over the dam in the spring and summer. Over the decades the 1300 property owners have built their shorelines with permanent piers, boat houses and retaining walls all under the assumption that the lake levels would be dropped in the winter, this is the way it has always been since 1939.
The water in the Manitowish Chain is a public resource and it should not be managed to protect private docks and shoreline structures in the winter. In other words the current practice of managing the water flow levels; draw down in the winter and the narrow elevation in the summer is not consistent with the DNR mandate to protect natural resources for the benefit of all citizens.
Response When people buy property on waterways with water levels and flows that are controlled by a dam, there is no guarantee that the operation of the dam will always stay the same or that the dam will always remain in place. Many dams in Wisconsin have had order modifications that change water levels and flows and/or modify winter drawdowns. These changes are implemented either in response to proposals by the owner of the dam or issued by the DNR to address impacts to public water rights. As described in the EA on pages 3-8, the Rest Lake dam itself has had several order modifications prior to the current order as the purpose of the dam changed, including a petition by property owners to reduce the winter drawdown to prevent shoreline erosion and avoid fish stranding.
d. EA background I history section
Comment One commenter provided extensive historical information to describe the history of logging and the changes that occurred when timber was no longer transported on the Manitowish River but to different sawmills with the development of railroads in the Manitowish Waters area. Other notable historic sites were also described including local resorts and the fish hatchery on the Manitowish River just downstream of the dam.
Response We appreciate the time spent providing this historical information for the Manitowish Waters area. The detailed overview of rail line development and its effect on both dam operations and the establishment of r~sorj:s @c:LpJIIJlic recreatiQn OJ! ti!_e Chajp. c1~Il!Onstrate the_history and 12ackground infgrmation provided il! the EA (pages 3-5) is historically accurate. However, we do not believe this adds any new information that would be necessary to include in the analysis.
Comment Page 3, last paragraph: The second sentence states, "As the timber resources in the area were depleted, the water stored in the resen1oir above the Rest Lake dam began to be utilized for other uses including flood control, navigation, and hydropower generation." The paragraph should also state that recreation, such as fishing, boating, sightseeing and swimming, also are important activities that take place on the Chain of Lakes.
Page 9
Response The subject of the last paragraph on page 3 of the EA is to explain the purpose of the dam from the perspective of the dam owner (the Chippewa Lumber and Boom Company) between 1887 and the early 1900's. The fact that the popularity of the Chain for public recreational was already well established in the early 1900's is described on page 4 of the EA.
2. Issues on the Manitowish Chain of Lakes.
a. Higher water levels with ice
Comments Many comments were received that described the ice damage to shoreline structures that people expected to occur if water levels on the Chain were kept higher over the winter months. The types of shoreline structures described in the comments included seawalls, riprap, permanent piers, boat lifts, and wet boat houses. The extent of ice damage anticipated by different individuals ranged from damage requiring periodic maintenance to the complete destruction of all shoreline structures on the Chain. Other comments expressed concern of ice damage causing excessive erosion to natural vegetated shorelines.
A number of comments described the costs of replacing permanent piers with removable shuctures. Another cost associated with higher winter water levels that was described was associated with having to hire someone to remove and store piers and boatlifts in the fall and to install these structures in the spring. Estimates of these annual removal and installation costs ranged from $800 to $3000 per year. The concern with the costs to install and maintain aeration systems over the winter months was also expressed ..
Another issue raised was the concern that the value associated with a boathouse that is currently wet in the summer and dry in the winter would be lost with a higher winter water level. Other comments stated that there would be negative aesthetic impacts caused by storing piers and boat lifts on the shoreline as opposed to on the dewatered lakebed over winter. Another issue raised was the concept that any changes to winter water levels should be slowly phased in to allow people to compensate for any financial losses of their current expenditures in permanent structures over time.
Response We agree that the alternatives associated with an earlier refill with ice on the lakes or a reduced winter drawdown could cause increased potential for ice damage to shorelines and structures. This issue is addressed in the EA on page 62 and pages 75-76.
The numbers of structures on the Chain along with potential structure values, maintenance costs, and property values issues that are included in some of the comments are addressed in the economic impacts section of this document. The comments about shoreline erosion, aesthetic impacts, and phased implementation of alternatives are also addressed in other sections of this response to comments document.
Comment Many commenters described the limited space on their shorelines to store structures on their property due to steep banks, seawalls, zoning restrictions, and shoreline vegetation.
Response To address these observations, we hereby amend the EA on page 45 (Shoreline Structures) to.include the following. "The amount of space on a particular shoreline to store piers and boat lifts overwinter is quite variable. Many shorelines on the Manitowish Lakes, along with many Wisconsin lakes, have limited areas to store structures due to steep topography, vegetation, and/or narrow lot width. "

Page 10
Because of these physical shoreline factors, on page 75 the EA described that to avoid ice damage to structures that "more landowners would likely remove their piers at the end of the summer". The narrative did not state that the only option would be to store the structures on the landowner's shoreline. Some landowners may choose to have piers and boat lifts stored offsite, others may choose to modify or replace piers, and depending on the location, some owners may choose to leave their pier in place.
Comment There were a number of comments stating that seasonally removing piers and boathouses should not be considered a hardship since lake property owners all over the state have to contend with ice action to their shoreline structures. Others commented that wet boathouses and permanent piers are common (and not destroyed by ice) on many Wisconsin lakes with no winter drawdown. These comments also reflected the observation that the same methods to protect and maintain the structures on other lakes without a drawdown could be used by the owners of structures on the Manitowish Chain of Lakes.
Response We agree with the fact that many lake property owners in Wisconsin have permanent shoreline structures and there are feasible ways to protect and maintain those structures. A new operating order would not remove a landowner's right to protect their structures. This issue is addressed on page 75 and 76 of the EA.
Comment A number of comments were made to state that hiring people to remove piers and boatlifts and to maintain shoreline structures would create jobs and support the local economy.
Response We agree that this would likely occur and hereby amend the Social and Economic Environment section on page 75 of the EA as follows. "With a reduced or eliminated winter drawdown, it is likely that the businesses that remove and maintain shoreline structures would receive additional work compared to what occurs with current operations. "
Comment On page 75 the DNR shows callous disregard for both Chain property owners and the facts with the statements made about property values and ice damage. Some people on lakes with no winter drawdown have big roller systems where they can push their dock out and retract it. Some have winch systems where they lift the dock. Most have portable systems that can be disassembled. There is no question that Chain property owners will eventually adjust to the new norm. However neither the DNR's table on page 46 nor the condescending paragraph 75 even attempt to address the havoc that will be imposed on Chain property owners as 70 years of infrastructure is subjected to similar conditions that occur on the majority oflakes in Wisconsin. The systems people employ on natural lakes and impoundments entail an affront of their own. Many of these property owners have roads down to the shoreline to provide access for equipment needed for annual installation and removal of their docks. The absence of these roads on the Chain is an aesthetic positive. In the fall, piles of removable docks are stacked along the shoreline of natural lakes - a substantial yisu§l intrusion that the DNEc !mores in its <!_naly~s, it!_ addition to the aforementioned roads. What the DNR fails to acknowledge is that following the Public Interest Alternative, th~ Chainwill have a combfnation of - -existing permanent infrastructure, new removable infrastructure, and a volume of iced out broken infrastructure. The DNR's rosy assumption for analysis is that all property owners have the knowledge, resources and ability to retrofit aerations systems and "other methods." The DNR should estimate the energy use required to implement aeration systems, and evaluate the effect of the associated noise on the ecosystem and property values. It is one thing to build a structure with the need to address ice damage engineered into the original design. Retrofitting this need is an entirely different proposition, and it is bewildering that the DNR fails to make this distinction. It is assured that many property owners will be unable to do so, or will simply fail to see the need until it is too late. There will be a lot of nails in the water, and this is not reversible as specified on page 77. The DNR's statement on page 77 that all of this remediation will occur "within months" is solely the product of fertile imagination. It will be outright havoc, and it is incredible that the

Page 11
DNR thinks this will not affect property values. What is the aggregate value of all the docks the DNR acknowledges will have to be removed? How many property owners will sell rather than attempt to cope with the new reality? Will there be sufficient new buyers to fill that void? If not- and probably not- property values will decline. If the DNR implements the Public Interest or Pass Through Alternative, the state of Wisconsin should commit to carefully monitoring property values and automatically adjusting property tax valuations for a 20 year period following the decision.
Response The Department has a responsibility to protect and balance broad public interests in navigable waters. These are difficult issues to work through to fmd the proper balance of competing interests while also carrying out the standards of applicable state laws and administrative code regarding lakes and rivers. We disagree that the Department's analysis was written with a condescending tone for concerns that many people have with potential ice damage to shoreline structures. Those concerns are valid, are reflected in the EA, and are included in the scope and range of issues that the DNR needs to carefully consider when evaluating a potential new operating order.
To address the issues raised with respect to aesthetic impacts, we hereby amend the EA on page 75 as follows. "With the current winter drawdown, many people move their boat lifts and pier sections to the lake's edge in areas that are dewatered during the 3.5 foot winter drawdown. If the drawdown was reduced and structures were moved up onto shorelines, both would have a very similar aesthetic impact. Overall, a reduced winter drawdown would be considered to lessen aesthetic impacts by decreasing the amount of dewatered lake bed and stump fields that are current visible for more than 6 months out of the year. "
Although private roads to access shorelines do exist, DNR staff have not observed this as a common lake lot feature on water bodies that do not have a winter drawdown.
To address the issue of the structures potentially being built differently due to the current winter drawdown, we hereby amend the EA on page 75-76 to reflect the following. "There has not been any evidence provided or observed by DNR staff to indicate that the shoreline stntctures on the Chain were constructed differently compared to structures built on waterways that do not have a winter drawdown. Some structures may have been built to deal with ice at the 7' 3" elevation that would occur if this spring refill provision of the 1939 operating order was followed. Also, ice action is not the only force that can damage structures and the probability that a structure would be impacted by ice depends on the location and lake characteristics adjacent to the structure. All of these factors could affect the methods considered for construction or maintenance of shoreline structures. Each structure is different, and it is not feasible to have a stntctural engineer to try to guess why a stntcture was built the way it was. "
To address the concerns expressed regarding the ability of landowners to react to a new operating order, we hereby amend the analysis to include the following on page 49 under the section titled Manipulation of Aquatic Resources. "When a new operating order is issued, we anticipate that landowners with structures that would be susceptible to ice action could feasibly get their structures evaluated, systems permitted, and installed within a season. The Department may consider modifying the timing of implementation or could ~ consider a phased implementation to allow CFJC and affected landowners time to adjust to changes in water levels and flows . "
Another issue identified is that the Department's analysis failed to provide an evaluation of the impacts on energy use that would be required to install and run aeration systems to protect structures from ice damage. The response to this issue is addressed in the next section.

Page 12
b. Impacts of aerators
Comments Multiple individuals expressed the concern that the appeal of winter sports on the Chain such as cross country skiing, snowshoeing, ice skating, and ice fishing would be negatively affected by the number of aerators that would need to be installed to protect structures from ice damage. The safety concern associated with having aerators creating open water during the winter was also raised.
Response It is not feasible to be able to accurately predict the number, type, or size of aeration systems that landowners could choose to install. To more fully address the impacts of aeration systems we hereby amend the analysis on page 76 to reflect the following. "Additional property owners may choose to install aeration systems on the Chain. Aerators installed on existing legal structures (pier, retaining wall, piling, etc.) do not require a permit if sized and placed so that it does not disturb the bed sediment or impact a neighbors riparian rights. Electric aerators use energy and would be expected to minimally increase noise levels nearby when the lakes are frozen. Certain options could be employed to keep cost, noise, and energy impacts to a minimum including selecting the right size system, using a timer to operate for a few hours daily, installation of temporary "skirts" around the system, and correct system placement. This method of preventing ice damage would result in areas of open water and thin ice that can create safety hazards. These areas need to be adeqziately marked to prevent accidents from occurring. The open water areas would not extend much past the structures and would therefore not be expected to impact winter recreational activities such as cross country skiing, ice skating, snowshoeing, and ice fishing. "
c. Lake contour maps
Comment On Page 19, the third paragraph it states, "The one foot contour maps of the lakes on the Chain along with aerial photos taken at a range of water levels provide useful information to show the extent, location, and type of open water aquatic habitat." However, the DNR lake survey maps only show 5-foot contours. Is this a typo or does WDNR have more specific lake bathometric maps other than those provided?
Response Thank you for pointing out this error. The maps found in appendix lli of the analysis do not have 1-foot contours. With the exception of Alder Lake, which only has 5-foot contours, the other lakes on the Chain have a 3-foot elevation contour that can be used to visualize the approximate area and locations oflakebed that is dewatered as a result of the current winter drawdown. We hereby delete the sentence referenced above and amend the EA as follows: "The contour maps of the lakes on the Chain along with aerial photos taken at a range of water levels provide useful information to show the extent, location, and type of open water aquatic habitat."
- -
d. Pier registration
Comment Enclosed is a copy of an accepted registration issued by the WDNR for our pier. This registration allows me to include the pier as a permanent part of my property. Is the WDNR by raising or lowering the water levels differently from when this acceptance was given, responsible for any damage to my pier and boat lift?
Response Pier registration provides landowners with a self-registration process to document that existing piers were inplace and exempt from new permit requirements. Pier registration does not provide insurance for any pier damage, including damage caused by changing water levels.

Page 13
e. Low water levels on the Chain of Lakes
Comments Many comments appeared to reflect the perception that there was a specific DNR proposal that one of the alternatives described in the analysis was a preferred alternative that would lead to a high frequency of low summer water levels on the Chain.
Response The USGS analysis shows that the current 3.5 foot winter drawdown results in low water conditions on the Chain for more than half of the year (page 50 of the EA). The perception that the Public Interest or Passing Inflow alternatives would result in a more frequent occurrence of water levels below 8'0" compared to current operations is not accurate and is not reflected in the EA. As stated in the Department's overview of the proposal, a more balanced approach to managing water levels and flows would include reducing the frequent low water conditions that currently occur upstream and downstream of the dam.
Comments There's the problem of dealing with drought years. Whatever their frequency, the current 42 inch drawdown makes it much harder to fill the basin in the spring. Low water in the summer harms the recreation our tourist economy depends upon, harms property owners who live in shallow bays, harms the lakes by exposing shorelines that should be underwater. It makes sense to reduce the drawdown in order to have a better chance of fill-up, and of sending more water downstream.
We would welcome more water October through June. It is very difficult to get around the lakes for prime late season musky fishing as it stands. And most years this applies to the spring fishing opener as well. Our season is so short; it is a pity to limit use of the lakes in this manner.
Response We agree. The current operations result in low water conditions which often occur during the spring fishing opener, throughout the summer in low precipitation years, and in the fall when people target muskies or hunt for waterfowl. The EA also explains that the most important factor influencing the frequency and extent of low water conditions is the extent of the winter drawdown and waiting to refill after most of the spring flows have passed downstream (pages 7, 50, 53, & 70 of the EA).
Comment The EA does not even attempt to explain how often or how far summer water levels will fall below historic averages.
Response The EA explains that by eliminating or reducing the extent of winter draw down, lower summer water levels would be expected infrequently only during natural drought conditions when many regional lakes and rivers are also experiencing low water conditions. The anticipated frequency and extent of expected low summer wa!~lt~v~ls could be mCJ!~ pr~c~ely ~lculat(:cl wl1e_11 a !!raft oper~ting order is pre_pil~Q that outlines sp~~ific~ ___ _ water levels and flows.
Comments The EA grossly underestimates the adverse impacts to navigation that will be caused by the proposed order.
The MCDF survey results clearly indicate that if water levels are lowered in the summer, the Chain will experience a host of serious navigational problems.
Based on feedback that CFIC has received in the past, summer lake levels of less than 7'8" become problematic for the recreating public.

Page 14
A number of comments received raised concerns about the impacts of low summer water levels on the Chain. Specific issues that were raised included:
• the identification of specific navigational problem areas • the need to extend docks to launch boats and the associated cost • loss of the ability to navigate the entire Chain of Lakes • boat houses becoming unusable • concern for boating safety with rocks and tree stumps being exposed or close to the water surface • inability to use a mechanical weed harvester • inability to use the boat launch at Clear Lake • reduced property values with low water levels • increased weed growth with deeper light penetration • more exposed mud flats and wetlands that allow exposure to yeast and fungi
Response The low water concerns described in many of the comments above are accurate. It is unclear what data was used by CFIC to reference a specific water elevation. The EA describes the many negative impacts associated with low water conditions on the Chain of Lakes including impacts to navigation, recreation, safety, tourism, aesthetics of dewatered lakebeds, wild rice, dewatered lakebed and wetland areas, etc. With a more balanced approach to managing water levels and flows, the occurrence of low water conditions and associated navigational impacts would be largely avoided. There would also not be a need to extend piers as was mentioned in a number of comments.
There were also many useful comments which identified specific areas where navigation becomes difficult during low water conditions. To improve the accuracy of the analysis, we hereby amend the EA to include the following narrative on page 65. "While different types and sizes of watercraft have different draft and different water depth requirements to operate, some of the areas can become difficult to navigate with large craft during low water conditions include the shallow channel at the Clear Lake Road bridge (between Clear and Fawn Lakes), Papoose Bay on Rest Lake, the NW and SE bays of Rest lake, the new bridge on Alder Lake Rd, the channel between Rest and Stone Lakes, the channel between Stone and Fawn Lakes, the channel between Spider and Island Lakes, theSE side of Manitowish Lake, and the Trout River between Manitowish, Alder, and Wild Rice Lakes. Additional areas can be identified by reviewing the lake contour maps located in Appendix III"
f. Impacts to streams flowing into the Chain of Lakes.
Comment Draw down of the Chain to benefit the river flow and water depth below the darn will have a very detrimental affect not only on the Chain, but it will affect all streams flowing into the Chain.
Response We agree. Operation of the Rest Lake dam affects water levels not only on the Cliaifi ofLa.Kes-out also -portions of the streams flowing into the Chain. The extent of area affected by the frequent low water conditions created by current dam operation is described on page 11 of the EA.
g. Darns in the Manitowish River watershed.
Comments On page 14 the DNR makes reference to 3 darns on the Headwaters of Rest Lake Reservoir. I do not understand why this material is included in the document, but since the DNR brought it up, I argue that the statement misrepresents the Northwoods reality. The height of ~oulder Lake is augmented by the rock check
Page 15
dam visible upstream from Vilas County K. Whitney and Little Crooked Lake have little earthen works at their outlet that augment the size of the lake pool. There are little structures all over Northern Wisconsin that expand the pools of lakes. I'll accept the Rest Lake Dam's alteration of seasonal peak flows as the m~or difference, but the DNR should accept that it has become fixated on the Rest Lake Dam.
The only question I have on the analysis would be why no attention was given to the water flow on the Manitowish River above Hwy K. Is there not a dam upstream of Boulder Lake?
Response The nature and location of dams in the headwaters of the Manitowish River system were described to evaluate whether or not any of those structures may have a large influence on inflows to the Rest Lake Dam. A number of authorized dams were not included in this section of the analysis. We hereby amend the EA with the following narrative on page 14. "There are a number of dams located in the headwaters of the Rest Lake Reservoir including the Fish trap and Boulder Lake dams on the Manitowish River, the Whitney Lake dam (located on a tributary to Island Creek), Stevenson Creek dam (a tributary to Trout lake), and two dams on Mann Creek (a tributmy to the Trout River). There may also be other wate1way obstntctions located in
. the headwaters of the Rest Lake Chain as well. These structures have little to no measurable impact to the timing or extent of inflows to the Rest Lake Chain. "
h. Fish and Wildlife
Comment I would agree it is intuitive that more closely matching the annual stream flow hydrograph to the natural regime would also match the life cycles of the dependent life forms. However in the impact analysis the DNR fails to acknowledge that the system must have formed some sort of equilibrium over the last 70 years. If the fall drawdown adversely affects a certain species of frog, why are these frogs still present in the system? Are we talking about the anguish of an individual pumpkinseed stranded in the reeds, or are we talking population dynamics? Figures 35a, 35b, and 35c of the EA appear to be an emotional appeal to the animal rights crowd, more than scientific impact analysis. The truth is, changing the system now would benefit some life forms and adversely affect others. Instead of acknowledging this fact, the DNR overreaches on the negative. For example page 53 the EA specifies that spring fill would interfere with nesting loons, when there is no evidence that loons are currently enduring brood rearing problems sufficient to adversely impact full occupation of the season long habitat. The birds that occupy the Rice Creek side ofisland Lake have raised young consistently over the last 40 years. Is there any evidence that there are fewer loons on Chain Lakes compared with than other lakes in the region?
Resuonse To address the issues raised above, we hereby amend the EA on page 60 to include the following statements. "The Department's analysis of fish and wildlife impacts focuses primarily on types of habitat that require sufficient surface water to be utilized by a wide variety offish and wildlife at specific times of the year. These areas may be temporarily utilized by different upland species when they are drained of water. Even for these species, the current timing of water lev els and flows is verydtsruptive. If upland species tri to ne~feed, or utilize these areas for cover, they are forced to relocate once the water levels on the Chain rise. This may also occur below the dam when more flow is passed downstream after the Chain is refilled to the 8' 6" level. The species that require swface water in aquatic habitat as part of their life cycle simply cannot adapt to dewatered habitat areas during critical stages of their life cycles."
To address the comments centered on loons, we hereby amend page 53 of the EA to include the following. "In terms of loon nesting success, based on limited survey data, in some years (2007) the nest success rate was above average, and in other years (201 0) nest success was below typical. Extensive survey effort with frequent nest monitoring would be needed to determine the effect that current operations have on nesting success rates and overall loon populations. Such surveys have not been conducted. What is described in the

Page 16
Department's analysis is the habitat chosen by loons and the potential for nest failure with rising Chain water levels during their nesting period."
Comments I am strongly in favor of leaving the Chain at the higher level year round. Flooding the Manitowish River in the fall and our Chain in the spring serves no good purpose for the environment. We live on the Chain and this past spring, we watched a goose sit on a nest in front of our hose for nearly 3 weeks as the water in the Chain was rising. The water eventually inundated the nest and it was abandoned. How do we calculate how many nests fail along our shores as we manipulate the water in the spring? At the same time-downstream fish, vegetation and bird habitat is starved for water as we fill the Chain. What is the cost of that?
It is also clear that year after year, randomly varying water levels (on the Chain with existing operations) wreak havoc with fish spawning and wildlife habitats: some years under water, others high and dry.
Reduced water level fluctuations may increase biodiversity in the Chain of Lakes and be an overall benefit the fishery.
Don't change dam height unless for emergency. Keep it at 8'6" year round to help with fish spawn on Chain and river below dam, all fish! The Manitowish River used to have a great walleye run fi·om flowage every year.
Response We agree. The comments above are addressed in the Department's analysis on pages 53-55.
Comment The walleye population on the Chain appears to be dwindling and bass have pretty much taken over. Each spring, early walleye fishing grows less and less popular due to imposed limits and lack of stocking. It is difficult to justify why one resource takes precedence over another.
Response As described in the analysis on page 29, fisheries surveys have found that walleye are currently the most abundant gamefish on the Chain. There is no evidence to show that a strong shift in the fisheries community has occurred under the current operation of the dam or due to imposed limits or stocking efforts.
1. Wetlands
Comment I'm sure everyone will stipulate that the shallow aquatics zones get drained as shown in the EA Figures 31,32, 33, 34, and 36. But weren't many of these areas, notably at the star on figure 31, black spruce bogs prior to the installation of the dam? There is a stump in plain view in Figure 32. The text implies that before the dam was in place, these were all rare wetlands, now lost.
Response We agree. As described on page 20 of the analysis, many areas of submerged stump beds on the Chain were likely forested wetlands before the dam was constructed. To provide additional clarification, we hereby amend page 53 of the EA as follows. "When the dam was constructed, the hydrology of these areas changed substantially, and these forested wetlands were lost in the sense that they changed to exhibit characteristics and ecological functions of aquatic bed wetlands. Under the current operation of the dam, the ecological functions of these aquatic bed wetlands are negatively impacted by the current timing and extent of dewatering in these areas. "

Page 17
J. Invasives
Comments The more stable water level pools above the Dam associated with the DNR proposal would likely result in increased aquatic vegetation on the shoreline, an advantage trumpeted by the DNR. However the DNR's incredible assumption for analysis is that native aquatic plants will advance into the empty ecological niche the DNR's proposal will create. Completely absent is any consideration that curly pondweed or some other invasive will win the race to fill this newly created vacant habitat.
Will the higher winter water levels help spread the Curly leaf pond-weed, that is already established in my Chain-of-Lakes along with other invasive species. Seems to me you should be much more concerned about that.
What would be the impact on the growth of aquatic invasive species? We already have curly leafpondweed.
Page 70, first paragraph: The EA, "Additionally, increased organic matter accumulation would likely occur in the near shore zone and over time, a greater density of aquatic plants would likely become established. More vegetation in these areas would provide additional food and cover for a wide range of fish and wildlife species." While we agree that more vegetation will provide additional food and cover, the EA does not address the issues of what types of vegetation will be established and at what density. While we are sure WDNR's goal would be for the newly vegetated areas to be dominated by native vegetation, disturbed areas are often re-vegetated by pioneer species that include several exotics such as Eurasian watermilfoil (Myriophyllum spicatum), and Curly-leafpondweed (Potamogeton crispus). These exotic species are already in the Chain and could easily spread in the disturbed areas. In some areas vegetation could reach levels that management of nuisance conditions may be warranted. These issues and their cost of control should be addressed in the EA.
Any summertime draw down will also increase the speed of flow and also increase the movement of aquatic invasive species (A.I.S.) into the Chain. Rice creek is full of A.I.S.
Response We agree. The potential for the establishment of invasive species was only briefly addressed in the discussion of impacts associated with a reduced or eliminated winter drawdown. Because each lake and shoreline has unique characteristics, with a reduced or eliminated winter drawdown, it is not feasible to fully predict the exact composition and plant density that would establish in the current 3.5 foot drawdown zone. We hereby amend the Department's analysis in two areas to address the issues raised in the comments above.
Page 76. "Along the shorelines of the Manitowish Chain, reduced dewatering of the current 3. 5 foot drawdown zone would likely result in a higher density of aquatic plants becoming established 'Closer to the shoreline. The timing, density, and plant composition that would become established on a specific shoreline is based on many complex factors and is impossible to fully predict. While there is a chance that the near-sl}_or!!__d_!(lwdo1,1J!!_ ;_01_!£ ~ould be~ome i!!_hg_bfted fJJJ qql!_{J@_i_n_l/E._sives 1,1Jith__m(_J!e consis!£n_t inundation, thf!_ _ ____ _ likelihood of this is reduced the greater the distance ft·om the source of colonization. At this time there is no known presence of Eurasian water milfoi/ in the Chain, and curly-leaf pondweed generally prefers mucky substrate which is less common in the near-shore drawdown zone. With this in mind, it is more likely that the area will re-colonize with pioneer.native species and not with a monoculture of an invasive species.
Page 78. "If the winter drawdown were reduced or eliminated, the establishment and growth of aquatic plant species near shorelines is difficult to fully predict. To deal with potential problems with invasive species, adaptive management strategies or provisions for periodic drawdowns could be considered as part of a new operating order.

Page 18
k. Land use and tourism
Comment . On Page 45of the EA in the section describing tourism, we suggest that the first sentence of the first paragraph be changed as follows. "The high density of lakes, rivet'S, wetlands, and public recreational areas attract many people who visit the area to boat, fish, camp, hike, paddle, han,est wild rice, bird watch, or engage in other activities that the region offers. "
Response We agree and hereby amend the EA to include the changes noted above.
1. Water quality and mercury
Comments The mercury concern on page 61 is intermingled with some vague concern about "access" dangles on the page absent some supporting information. Is there a mercury problem on the Chain in Walleye relative to nearby lakes?
One individual commented that reduced water level fluctuations may reduce the bioavailability of mercury.
Response The paragraph on page 61 describes the research done to show that the current water level fluctuations may contribute to higher mercury levels in walleye. The paragraph also directs the reader to a different section for a description of lake access and navigation issues that occur during different harvest seasons for this species. As described on page 17 of the analysis, the Great Lakes Fish and Wildlife Commission does have specific fish consumption advisories for some of the lakes on the Manitowish Chain. The analysis, however, did not list any WI DNR safe-eating guidelines and we hereby amend page 17 to include the following information. "The WI DNR has not identified any lakes on the Manitowish Chain as having higher concentrations of contaminants where specific safe-eating guidelines would apply. " There are many factors involved in this issue and the analysis does not attempt to predict whether or not the mercury concentrations in walleye would reduce over time if the current winter drawdown was reduced or eliminated.
m. Shoreline stability
Comments On page 47 (paragraphs 2 through 4) the EA discusses shoreline stability and the issues of wind and ice on shore stability. Other factors that influence shore stability are the soils and shoreline slope. The soils around the Manitowish Waters Chain are predominately Rubicon sand, which is moderately erodible. The slopes at the shoreline are generally steep and due to the artificial water level on the Chain the shorelines are very erodi!:>le. The high degree of ~::rosiQiljs ~vident in the number of pmpeytie~ that have ~ho_HL()ro~~tio!!, Based _ ~~~on a survey by Ecological Research Partners, approximately 790 (65%) of the 1,226 parcels on the lakes have some form of shore protection. A discussion about soils, and slopes on the potential of increased shoreline erosion should be added to the discussion.
The EA also fails to consider that the lakes on the Chain have shorelines that are far more vulnerable to erosion than a typical Wisconsin lake. On the Chain, "the slopes at the shoreline are generally steep and ... very erodible," as evidenced by the significant percentage of properties that have some form of shoreline protection. Because the Chain's shorelines are so vulnerable, the increased winter water levels proposed by the DNR threaten the Chain with a double whammy. Property owners without shoreline protection will face the risk of increased erosion and property loss as their shores literally fall into the lakes. And, property owners with shoreline protection will face the risk of extensive damage to those structures, which could cost

Page 19
tens of millions of dollars to enhance or redo. Either way, the DNR's proposal will result in massive property damage to riparian owners.
I had a boat sunk in the past and must have a boat lift in the summer due to heavy waves. Also, the shoreline erosion is severe in places, thus the Vilas County assisted shoreline restoration on our property.
Response As summarized in the Department's analysis, there are many factors .that contribute to shoreline erosion including shoreline development, vegetation, slope, wave action, soil type, etc. Additionally, many people chose to install riprap, seawalls, or other shoreline landscaping for reasons other than shoreline stabilization. To provide more detail regarding the impacts that current operations, the 1939 operating order, and alternatives with a reduced or eliminated winter drawdown, we hereby amend the EA as follows:
"The Rest Lake Chain has been flooded since 1887, a period of 125 years. Flowage shorelines are inherently unstable. These changed water bodies all have a newly created shoreline and need time to fitlly stabilize through the development of the ordinary high water mark. This process includes the change in vegetation from upland vegetation to the vegetation which would normally be found at the ordinary high water mark (e.g. alder, willows, ntshes, sedges, mosses etc.). These shoreline species require a nearly constant wet, but not necessarily saturated environment. It also takes time for near-shore shallow water vegetation to develop on flowages. Those shallow water plants, once established, buffer the effects of wave erosion. Higher shoreline erosion occurs in most flowages until a consistent long term water level allows the growth and development of a mature shoreline buffer. The development of a natural buffer on the Rest Lake Chain is hindered by the current winter draw down of the flowage. The availability of the water needed to sustain many of the plants is eliminated, severely hindering the growth and development of the plant communities necessary for a stable shoreline. The sudden fluctuation of water levels associated with the winter draw down of the Chain, in addition to the abnormal/ow water level conditions in the flowage in the spring early growth period, affects the establishment and development of shallow water aquatic plants. Rest Lake Chain would continue to be subject to erosion at the 8' 6 "foot level unless the annual fluctuation of water levels was stabilized by reducing or eliminating the extent of the winter drawdown along with minimal summer water level fluctuations."
Comments Page 47, Shore Stability: While this section discusses "ice jacking" caused by expansion of ice sheets, it does not discuss other winter erosion activities such as "Breaks up" in the spring when large sheets of ice can be blown around by the wind or "Freeze-thaw cycles" in un-vegetated lakeshore soils which can cause displacement of soil particles (called ice heaving). The EA write-up attempts to make the point that winter shoreline damage only takes place on large lakes like Lake Winnebago, however ice damage can take place on just about any lake. Most lake shorelines are protected by natural armoring that has taken place over hundreds to thousands of year of erosion and natural sorting of materials. On lakes with artificial elevations the shorelines have not had enough time to reach stability. The discussion in the EA does not provide a balanced discussion that allows the reader the ability to balance the impacts of the proposed project against the benefits. The cost to redo or enhance shore protection on the Manitowish Waters Chain under the proposed water changes could be in the tens of millions of dollars. - -- - . - . --- - - --
Page 75, last paragraph: The EA states, "One potential impact to property would be the increased possibility of ice action to cause damage to permanent piers, wet boat houses, and other structures .... excessive damage would not be expected since the shorelines on the Chain are considered "low energy" shorelines for ice action due to the relatively small sizes of the lakes and limited fetch for wind to push the ice sheet." This statement assumes that most shoreline damage by ice is from wind movement of the ice. Ice can also damage shorelines by expansion of the ice sheet, by ice that has frozen into the shore and pulls away as the ice sheet pulls away from the shoreline, or by frost heaving as water within the soil expands and loosens the soil material. Just because a lake has a "low energy" classification based on a wave height index is not a good indicator of potential ice damage.

Page 20
Response The environmental analysis describes ice action caused by windblown ice on pages 47 and 75. This type of ice action would include windblown ice pushing against or pulling away from shorelines as described above. The force of ice expansion on the shorelines of the Chain is described on page 4 7 of the analysis. While expected to occur, it is not expected to exert anywhere near the ex:cessive force and wide spread damage that is found on larger lakes. As described on page 76 of the analysis, the amount of ice damage to structures is expected to be similar to other northern Wisconsin flowage lakes such as the Minocqua and Eagle River Chain of Lakes. There is no evidence that the action of ice on these systems has caused excessive, unavoidable, or irreparable damage to the numerous shoreline structures on these lake chains. Ice or frost heaving was not addressed in the analysis. We hereby amend the analysis to reflect the following. "Under current operations, many shoreline structures exhibit signs of being affected by fi·ost heaving. If the extent of the winter drawdown were reduced or eliminated, frost heaving conditions are expected to remain or may decrease if deeper water depths closer to the shoreline provided thermal insulation that reduced the number of freeze thmv cycles each year."
n. Archaeological and historic sites
Comments I would argue that any archaeological sites potentially impacted by 8' 6" water elevation have been long ago washed away. I realize the DNR cannot disclose locations of cultural sites that would dispute my argument. I would also suggest that shoreline erosion is in equilibrium with the current shorelines after 70 years. There may be exceptions to that on areas with steep shorelines. I'm having some erosion problems on my property on the north shore of Island Lake, but believe the culprit is boat wakes -with wake boarders the largest problem.
A suggestion was made that all of the Chippewa tribes need to be given the opportunity to review the EA and comment on potential impacts to cultural and historic sites. It was also suggested that references to coordinating with the Lac du Flambeau Tribe for cultural resources should be eliminated from the EA and replaced with reference to coordination with all of the Chippewa tribes. NPS NAGPRA is a database available to identify tribal area of interest for cultural sites.
The comment was made that higher winter water levels may increase shoreline disturbance from ice. Draw downs and the associated dewatering of sites, however, may increase site access and loss of artifacts. Less drawdown and more near shore aquatic plants can also help stabilize shorelines from wave action. Riprap as a form of cultural site protection can also be considered a disturbance to certain sites.
Page 61, last paragraph: The EA states, "If changes in operation would potentially cause erosion at an archaeological site, bank stabilization and shoreline protection techniques could be installed to prevent damage to these sites. Special techniques to protect archaeological sites have been developed for resen,oirs." But at what cost and who would be responsible for these costs? This should be addressed in the
______ _ EA.
Response As described in the EA, there are numerous archaeological sites on the Chain. While many have been affected by the 8 '6" water levels, these sites are still present and have not completely washed away.
We appreciate the comment to recognize that all of the Chippewa Tribes should be given the opportunity to review and comment on the Department's analysis. We hereby amend the EA on pages 61 and 75 and replace references to the Lac du Flambeau tribe with "all of the Chippewa Tribes".

Page 21
To improve the evaluation of potential impacts to cultural sites, we hereby amend the fourth paragraph on page 61 of the EA to include the following. "With current operations and the 1939 order, the 3.5 foot winter drawdown may increase site access and loss of artifacts. "
To acknowledge that riprap as a method to protect cultural sites may be associated with impacts, we hereby amend the fifth paragraph on page 61 of the EA to include the following. "Riprap as a form of cultural site protection can also be considered a disturbance to certain sites. "
Pages 61 and 75 of the EA are also hereby amended to include the following narrative to address the issue of funding that may be available to carry out shoreline protection efforts. "If shoreline stability issues are identified at cultural sites either under current operations or modified operations, there are landowner tax incentives, grants, and other sources that may be available help to fimd protection efforts at archaeological sites."
o. Cranberry operations
Comments One individual expressed concern that the withdrawals (loss) for lawn irrigation and cranberry operations are not required to be permitted, regulated, and monitored. The commenter also provided the perspective that 22 cfs to 35 cfs for losses to cranberry operations is substantial and growing.
I would support a comprehensive system wherein fair standards for removal of water from the Chain by any party are identified, including cranberry operations. I say this realizing that the point is beyond the scope of the environmental assessment because it would require legislation. I have spent much of my life in the desert of the American West and am familiar with water issues and rights. Clearly Wisconsin has reached the end of the era where we can no longer ignore water issues and the environmental assessment does a reasonable job of raising awareness. While I support the continued operation of all existing cranberry operations, it is time to ponder the consequences of unlimited withdraw of water from multiple sources, and the way it limits our options for management of the dam. It is too bad the DNR and the Chain property owners are going to battle over the dam proposal, rather than work together on this emerging water issue.
I encourage DNR to look more closely at the cranberry operation withdrawals it identified during this EA process. If so much water is being withdrawn that river flow is reversed, that is clearly a problem.
Some of the cranberry growers as individuals own extensive lake shore properties on the Manitowish Chain too and individual views on the various options for the new operating likely vary among them. For whatever reasons the Draft EA attempts to put the cranberry growers in the middle of what will likely be a very lively and divisive debate as to what plan the DNR fmally chooses on how to operate the Rest Lake Dam. We have no desire to be in that position and won't be the cause for division in this community .
. _The Chipp~wa and .fla!llbeau Imp.I'Qy~ment Com_p_11gy (CFIC) ~elieves tl!e wpl\!R's estimat~s ~fw~t~r u~e by farming operations (22 cfs) is greatly underestimated during certain times of the year.
Resnonse We agree that the Department has limited authority to regulate the water quality and quantity as it relates to cranberry operations as described on page 16 and 17 of the EA. The analysis objectively describes the quantity and timing of water use needed for cranberry operations based on the data available. The maximum instantaneous water withdrawal rate estimated in the analysis is 37 cfs. This amount can be a large percentage of inflows to the Manitowish lakes and river system especially during drought conditions. Therefore, as described in the EA, cranberry operations are clearly an important factor that should be considered when drafting a new operating order to better balance water levels and flows.

Page 22
Comments The Draft EA states that there are 960 acres of cranberry operations adjacent to Little Trout Lake when there are actually 580. The dikes involved in our land are neither flooded nor irrigated. Please correct this misstatement.
On page 16, there are 112 acres of cranberry beds, not 177 acres.
Page 14 should indicate that there are two cranberry marshes that withdrawal water out of Alder Lake. One is located on the south end by Town Line Lake Rd. that is approximately 20 acres in size.
Response We hereby amend the environmental analysis to more accurately reflect the current acreage of cranberry beds identified in the comments above.
Comments Cranberry operations utilize water to flood beds for cold temperature protection, for winter freezing of the beds, in the spring to help thaw the ice, and at fall harvest. During flooding, when cranberry vines are not dormant, water is periodically recirculated about every 7 to 10 days.
Part IT of the EA insinuates that our cranberry operations pumps regularly from the Chain; this is inaccurate and needs to be put into the proper perspective; our pu.nlp has probably not run for more than four or five months in total since its inception 65 years ago. The pump is used in times of extreme drought to keep Little Trout Lake from getting too low for us to pump to our farms, not to actually raise the level of Little Trout Lake, but to keep it at the same level or from falling further.
Response The general summary of when water is needed for cranberry operations is addressed on page 14 of the EA. Based on the information available, the frequency of pumping is also accurately reflected in the EA as generally being needed only during drought conditions.
Comments The cranberry discussion on page 76 fails to address water returned to the Chain through groundwater leaching and standard operations. I acknowledge that in drought years when water is drawn out to irrigate the vines, this return flow is limited. However other operations such as harvesting entail temporary flooding followed by the return of water to the original source. This distinction should be addressed in the environmental assessment.
Part IT pages 15-16 of the EA states that much of the water flowing away from Little Trout Lake over the surface and underground flows to the Bear River Watershed instead of the Manitowish Chain; this is very much wrong. Little Trout Lake is about 9 feet above the MW Chain and there are natural and manmade drains all along the south side of the Chain from the Little Trout Lake Watershed to the Manitowish Chain. There is a beaver dam ~m Wild Rice Lake that comes from Little TJOUt Lake. There is a drainage gitch into Alder Lake and Little Manitowish Lake (not made by the cranberry growers). Sullivan's pond drains into Manitowish Lake from the east half of Powell Marsh .. . There are underground springs all along Wild Rice, Alder, Little Manitowish and Manitowish Lakes that drain into the Chain from the Little Trout Lake watershed. Any water that is pumped from the Chain by the pump near Little Trout Lake is likely getting back to the source eventually and further, that water is temporarily, at least, prevented from flowing over the Rest Lake Dam where it will never come back. Furthermore, there are thousands of acres of lakes and swampland to the south and east in Lac Du Flambeau that are elevated above Little Trout Lake and draining toward it continually contributing water to the Manitowish Chain thru the above and below ground drainages. Yes, some water also flows to the Bear River watershed, but certainly not much or all of it. Additionally, State and Federal definitions of agricultural uses of water are considered "nonconsumptive" or borrowing of the water; it does not go away. The draft EA needs to be corrected to these ends accordingly.

Page 23
Water from the cranberry operation near the Coni Lakes discharges back to the Trout River after draining through a wetland area.
Response The issue of where water is taken and returned for cranberry operations is described on page 16 of the EA as being a return of water (minus losses due to evaporation and evapotranspiration) via surface water channels and groundwater. We agree that water does not go away, but as described in the analysis, cranberry operations do cause a temporary diversion that can have an impact on water levels and flows of the Manitowish system.
The operation near Great and Little Com lakes is accurately described in the EA as being returned via direct discharge and ground water flow (minus losses due to evaporation and evapotranspiration). The conclusion made in the analysis that most of the water used for the cranberry operations adjacent to the Little Trout Lake flows to the Bear River is based on the following factors: According to USGS maps, the elevation of the Little Trout Lake is 1610, the elevation of Alder Lake is 1601, and the elevation of Dead Pike Lake is 1596. Aerial photos and USGS mapping show drainage canals leading to both Alder Lake and to Dead Pike Lake. The USGS report titled "Hydrologic Investigation of Powell Marsh and its Relation to Dead Pike Lake, Vilas County, Wisconsin (Water-Resources Investigations Report 02-4034) indicates that groundwater around Little Trout Lake flows toward Dead Pike lake. Finally, DNR staff that manage the dams on Powell Marsh have frequently observed quick rises in surface water elevations in the absence of any precipitation events. The only known source of that surface water would be from the nearby cranberry operations. Although we still consider it likely that much of the surface and ground water from cranberry operations flows toward Powell Marsh and not the Manitowish Chain, the pathway of water is not clear and has not been studied in detail. To better reflect this issue, we hereby amend pages 15 and 16 the analysis to include the following. "There is a complex series of canals and wetland areas adjacent to Little Trout Lake. Some of these drainages lead to the Manitowish River system and some lead to the Bear River sub-watershed. When the cranberry beds discharge water, it likely flows both toward Powell Marsh (e.g. the Bear River subwatershed) and some also likely flows back to the Chain of Lakes. "
Comments With regard to the Draft EA, first a general comment and then some specifics to follow: The Draft EA, to a large extent, states that the cranberry producers are urging Option #3 or 4 for operating levels of the Dam over Option 1 or 2. This is simply not true. In the last 65 years the operations adjacent to Little Trout Lake has had no problem accessing water when needed in times of extreme drought to operate our pump under the existing Operating Order. With the possible exception of the summer of 2007 when the DNR erroneously required the dam operator to discharge more water than historically practiced in an extreme drought and the Chain went lower than the winter draw down level in mid-summer. Option 1 or 2, iffollowed, works for us and has done so for 65 years.
Adequate water levels are needed for water pumping at the cranberry operation near the Com Lakes in order to have enoug4 watet:_ pressure from the river to feed into tbe intake Pl.l01P~
Page 62, paragraph 2: The EA states, "Cranberry producers have indicated that pumping is difficult when water levels are low on the Chain because of the shallow water depths and the increased amount of plant material and other debris that is sucked into the pumps." However, the EA does hot address the issue that with a water level regime change there will likely be more aquatic plants in the Chain of Lakes, and that this will in turn impact pumping operations. This should be addressed on page 76 so as to provide a balanced picture of the potential impacts.
Response The analysis did not state that cranberry producers were pushing for a specific new operating order for the Rest Lake Dam but only that statements have been made by growers that pumping from the Chain is more

Page 24
difficult during low water level conditions. It is also important to note that the comments made above concerning summer operations in 2007 are not accurate, and information describing the monthly inflows to the Chain during this year is described on page 16 of the EA. Also, although not described in the analysis, water levels in 2007 did not reach the levels referenced in the comments above.
To address the potential impacts of aquatic plant establishment on pumps, we hereby amend page 76 of the EA to include the following. "In terms of the location of the cranberry pumps for water withdrawal, it is our understanding that the intake structures for most of the pumps are below the 5 '0" water level elevation. Therefore, the potential for aquatic vegetation to inte1jere with pumping would likely be similar under both existing operations and alternatives associated with a reduced or eliminated winter drawdown. "
Comment Where did the cranberry water diversion information come from? This is not in the USGS report.
Response To address this question, we hereby amend page 16 of the EA as follows. "The evaluation of cranberry water use was not part of the scope of the USGS study, and therefore, is not in the USGS report found in Appendix II. The data was based on pump capacity information and water flows at USGS stream gages located just upstream and downstream of the water intake structure adjacent to Great and little Corn Lakes."
3. Manitowish River below the Rest Lake Dam
a. Lake Sturgeon and Redhorse
Comment I can't tell one redhorse species from another, but the deeper pools within the riffles between Vance and Benson Lakes are sometimes stacked with redhorse. I particularly remember one day I floated the river in September of2007 when the water was particularly clear. I was amused to see one smallmouth bass in an incredible school of redhorse. I make this obscure point just in case the DNR is unaware of this key habitat. When I compare the text on page 74 to the hydrograph on page 50 it looks to me like we are within the preferred range for redhorse spawning of 75 to 150 cfs for late May and June, given the current management of the dam.
Response Between Vance and Benson Lakes there is a stretch of rocky riffle river habitat just below ·the Highway 51 bridge that is described extensively in the analysis. The graph of the discharge of the dam on page 50 shows the long term median flows downstream of the dam that provide sufficient flow for redhorse spawning needs in May and June. Since the timing of the spring refill varies from year to year, the long tetm median flows do not show the minimum flows that are currently passed every spring. However, when looking at dam discharges on an individual year, drought condition minimum flows (that do not provide sufficient spawning habitat) are common in May and June.
Comments There was never a self-sustaining population of lake sturgeon.
It is interesting that the DNR is concerned about the sturgeon spawning below the dam. At a meeting held by the DNR I did ask about the current population, however, they were unable to give me an answer to the question.

Page 25
One species likely being impacted by the current management practices is Lake Sturgeon, which travels upstream to seek rocky riffles to lay eggs. The Environmental Assessment provides no facts to prove or disprove that current management practices promote protection of this resource.
Response The information and field study described in the analysis on page 43 provides strong evidence that this species is attempting to reproduce and survive in the Manitowish River system downstream from the Rest Lake Dam.
Comments My chief concern is the low river water levels in the summer, and at times that sturgeon spawn.
I was appalled to learn that the sturgeon are not reproducing because the dam disrupts their spawn. Loss of a naturally reproducing species in the Manitowish is a tragedy that can be prevented by altering the current dam management practice.
The exhaustive report created by your staff is to be commended. And I believe the logical conclusion of the report is to create an order that recognizes the value of the fishery and wildlife habitat in the Manitowish River. An order that will moderate the water flow to more closely resemble what nature intended which is Alternative III in your report. It seems everyone can give a little to make sure important species are allowed to thrive. For example, this is especially true of the Lake Sturgeon, those poor fellows who have such a short and incredible spawning season.
Page 43 last paragraph: the EA states, "Detailed habitat models have been developed to quantifY the water velocity, depth, and substrate needed for suitable spawning habitat (figure 29)." On page 74 WDNR discusses the use of Habitat Suitability Index (HSI) models for sturgeon and greater redhorse but do not show the modeling results or the conditions under which the simulations were run. We feel that a more detailed habitat assessment is warranted for a project of this scope. We feel a more robust model such as the program RHABSIM or PHABSIM (Habitat Modeling and Weighted Usable Area) is needed to determine the potential weighed useable areas of existing or potential habitat.
Page 61, paragraph 3: The EA states " .. . both the current operation and the 1939 order would often pass 40 eft during the spring. This mininiumflow would continue to limit the spawning success of lake sturgeon." While it is likely that 40 cfs of flow is too low to provide sufficient suitable habitat for lake sturgeon, what flow regime would be optimum given the slopes, cross-sections and substrate available? As shown in the figure on Page 2 flows above 40 cfs in the spring are frequent. The EA indicates that a natural flow regime would be beneficial. But the question still remains - Is all of the spring flow required in order to support a successful sturgeon fishery, or could a compromise flow regime be determined? We feel that additional habitat modeling is needed before a spring flow regime is determined. We also need to point out that during most springs flows are well above 40 cfs under the current dam operation.
Page 74 paragraph 1: The EA states, "Suitable habitat for sturgeon and greater redhorse spawning was ~ - - - -- - . -
identified in the BOO foot section of rocky riffle stretch of river just below the Highway 51 Bridge. To determine the flow needs for both of these species, a river stage flow relationship was developed by measuring velocities and depths at five transects under various flow scenarios (figure 46). This information was used in habitat suitability models for each species and the following flow needs were developed. For sturgeon, river flows of 125 eft begin to provide adequate depth in a limited portion of the spawning area. At flows of 200 eft or more, almost the entire area of potential habitat provides conditions adequate for spawning. [. . .] The abundance and productivity of the both lake sturgeon and greater redhorse (state threatened) would be expected to increase with both the public interest and passing inflow alternatives since they are both expected to provide stdficient river flows downstream of the dam during the spawning period for both of these species." There are several well-established methods and models available for Flowdependent habitat suitability modeling, which could be used for evaluating necessary and sufficient flows to

Page 26
protect and promote sturgeon and redhorse populations. This paragraph provides an inadequate summary of what analyses were conducted; too little information on what results were found, and raises more questions than it purports to answer. Models such as RHABSJMTM or PHABSIM are designed specifically to address the question as to what incremental increase in weighted-useable-area (WUA) for a given fish species in given river reach can be expected with incremental increases in river flow. At minimum, suitable fish habitat in river systems is produced by a complex interaction among water depth, velocity, temperature, and substrate composition. Using a stage-flow relationship to determine the areal extent ofwater of sufficient depth for spawning is only one step in the process, and not sufficient for justifying the conclusions drawn in the EA. The EA should include a more thorough discussion of flow-dependent habitat parameters and how they interact with substrate and velocity profiles. Spatially-explicit models exist for Lake Sturgeon in Wisconsin [e.g. Daugherty, D., Sutton, T., & Elliot, R. (2009). Suitability Modeling of Lake Sturgeon Habitat in Five Northern Lake Michigan Tributaries: Implications for Population Rehabilitation. Restoration Ecology, 17(2), 245- 257.], and should be applied and analyzed in order to provide a better estimate for the expected improvement in sturgeon populations. These models also incorporate the consideration of other life-history stages (larvae & juveniles) which are essential to population success. We suspect that it is likely that there are other issues involved in limiting fish populations in addition to flow-related habitat. For example, an analysis of flows released from the Rest Lake Dam since the early 1970's (monthly medians calculated from daily flows recorded by the Dam Operator) show that river flows regularly are at or above the 125-200 cfs levels suggested in the EA. A more rigorous study of habitat suitability and analysis of limitations on sturgeon populations beyond spawning season appear to be warranted.
It would help to conduct a controlled study to see if more sturgeon spawn if the flow of the Manitowish River is suddenly increased. Salmon tend to run up into rivers and spawn only after a heavy rain and it makes sense that lake sturgeon would do the same, especially in the shallow rapids below Sturgeon Lake. The reason may be that there is a bigger chance that they'll all arrive at the spawning ground at once, instead of one-by-one. Releasing a bunch of water from the dam can simulate the effects of heavy rain.
We believe that the flows identified in the EA as necessary and sufficient to enhance sturgeon and redhorse populations and other benefits of the project are based on perfunctory science and cursory analysis of limited data. More rigorous tools for modeling .flow-dependent habitat quality and quantity are readily available, and given the magnitude and complexity of potential impacts of changes in flow-regime management, they should be applied. The EA is weighted heavily towards benefits of a few target species and does not address impacts to non-target species or the public. The current EA raises more questions than it answers.
Response To provide more information on the modeling done to evaluate Lake Sturgeon habitat needs, we hereby amend page 75 of the EA as follows. "The evaluation of sturgeon habitat needs is based on biological surveys and detailed flow-related habitat modeling using Physical Habitat Simulation Models (or PHABSJM). This model evaluates the habitat needs based on combined depth and water velocities associated with different river flow events and the outputs are in the form of weighted-useable-area (WUA) for Lake Sturgeon. The models were nm based on data taken over a range of river flows at 5 transects located in the rocky rif.lle area below the highway 51 bridge (Figure 46). The habitat suitability cun,es are based on the methods and information taken from "Development of a Habitat Suitability Index Mode/for Lake Sturgeon" by Threader, Pope and Schaap, January 1998. The habitat suitability cun,es were adjusted based on Lake Sturgeon work in Wisconsin. Additionally, the aging and radio telemetry work done show that the seasonal movements of Lake Sturgeon on the Manitowish River indicate that they use the rocky rif.lle area below Highway 51 for spawning when there are adequate river flows. Evaluation of the flows downstream of the dam on a year to year basis demonstrates that most years, river flows are reduced to drought conditions that do not provide any suitable habitat for sturgeon reproduction. The exact timing and duration of these low flows varies from year to year and is therefore not fiilly shown when looking at the long term monthly median flows."

Page 27
b. River shorelines and bank stability
Comments My husband and I own property downstream from the dam. Our property has flooded in the fall, our pier has floated away when the Chain has been flushed like a toilet, our pier has been high and dry in the summer, and we have had to go to different rivers to kayak in July. But I don't write because we have been negatively impacted by the ecologically backward management of the Chain. I write because DNR is poised to reverse this ecological backwardness, and I want to encourage the agency to continue forward. If that means our property floods in the spring, fme. That's what rivers are supposed to do. The plants and aquatic life need high water in the spring. The wetlands need water. The river and downstream ecosystems need appropriate seasonal flow. Alternatives Ill and IV both provide for this.
The river sometimes does not seem natural with erosion during period of high water followed by mud and reduced water quality as levels are lowered.
Downstream flows of ~600 cfs in fall of2010 were causing erosion and destruction of docks.
The current operation of the dam results in quickly changing flows and high flows downstream of the dam when winter drawdown is initiated. While the DNR alludes to the impacts of these actions on shoreland erosion and riverbank slumping (p.62), there should be discussion of this in the description of the physical environment (in the section titled AFFECTED ENVIRONMENT) since this is an important part of the ecosystem that is impacted by the operation of Rest Lake Dam.
Response We agree that a description of the river banks, especially in the higher gradient section of the Manitowish River, should be included in the analysis. To improve the accuracy of the EA, we hereby amend the document with the following narrative on page 23. "The first four river miles below the dam have a higher gradient with faster water velocities, a limited wetland fringe, and forested river banks that quickly rise above the floodplain elevation (Figure 14). Areas of eroding river bank can be observed in several locations along this section of the Manitowish River. River shoreline erosion is a natural process. Although not studied in detail, the rh1erbank erosion may be magnified due to the current quickly fluctuating river flows that occur in the spring and fall during the refill and drawdown of the Chain."
c. Downstream impacts
Comments The current fall drawdown and spring operation of the dam has caused damage to habitat and property below the dam. There is no doubt that the current policy favors Chain owner's above those who live below the dam. You get flooded in the fall and starved of water in the spring, just when Mother Nature has our neck of the woods flowing. The pictures show that it has led to environmental change over time, creating uplands where there were wetlands, messing with sturgeon reproduction, etc. I don't take these changes lightly. When we tamper with what Mother Nature createdover eons, we degrade the Northwood environment we all profess to care about so much.
The current practice of drawing down the 1 0-lake Manitowish Chain 3.5 feet every winter, with the lost water being recaptured in the spring after the ice is off seriously impacts the ecology of the river and other water bodies downstream. The current management practices of the Rest Lake Dam are seriously impacting the ecology of the Manitowish River.
A more natural seasonal variation in water levels will improve the fishery and boating activities on the river as well, thereby also adding to the state's economic health.

The EA is based upon an exaggerated claim that the dam is disrupting the "natural flow regime" and therefore overstates the ."benefits" of "restoring" the natural flow regime.
When the river water level is low fish will not have enough water to swim through.
Page 28
At times we have been shocked at the level of the river. It cannot be environmentally sound to have this great of a fluctuation. The birds and critters that live along and use the river must go through terrible trauma as the river is allowed do go up and down.
It has come to my attention that the Manitowish River lakes are being drawn down in ways that reverse the natural hydro period to the detriment of native plants and animals.
Response We appreciate these comments and believe that the issues raised are adequately described in the Department's analysis.
Comment Benson Lake is the thermometer for this hot topic. Over grown weed beds choke a once pristine environment, resulted from more famine than feast.
Response To address this issue, we hereby amend page 56 of the EA as follows. "With a small lake/river system such as Benson Lake, there are many factors that may influence the species and densities of aquatic plants. Lower water levels during the start of the growing season during the Chain refill period could lead to more emergent plants becoming established along the shorelines."
Comment Of special concern is the widely fluctuating level of water in the river which is negative to wildlife as well as aesthetics.
Response The aesthetic impacts. both upstream and downstream of the dam during low water conditions were not addressed in the EA. We hereby amend page 62 of the analysis as follows. "During low water conditions, there are negative aesthetic impacts on the Chain of Lakes caused by visible dewatered lakebed and wetland areas. There are similar negative aesthetic impacts downstream of the dam caused by dewatered wetland, backwater, and oxbow areas as well as increased visibility of reddish colored iron precipitate that builds up and becomes visible in many of the oxbow areas."
d. Wetlands
Comment Figures 18 & 19 show herbaceous meadow species on the wettest sites immediately adjacent to the stream. Shrubs occupy the next ecologic site up on a gradient from wet to dry. That pattern is standard virtually everywhere I've been, and I've taught riparian ecological site courses in the field in 13 States. My observation is that the riparian vegetation on a system is affected by water forces, gradient, confinement and human influences such as grazing that alter plant succession. In the case ofthe.Rest Lake Dam, only the water forces have been altered, and the hydrograph (Figure 30 in comparison to Figure 11) shows higher peak flows compared with the natural system, albeit at different times of the year. Regardless, these peak flows should be maintaining and creating oxbows and backwater sloughs. These are the product of peak flow induced channel morphology which does not care what season peak flows occur. The DNR cannot reasonably argue that the dam operation is eliminating these overflow channels. They are present, and the DNR has presented a hydrograph that would produce them. The DNR appears to be arguing the issues associated with a flood

Page 29
control irrigation dam where peak flows are precluded. Having floated the river between Rest Lake and the Flambeau Flowage many times, I feel confident that the vegetation is controlled by gradient in that system. Limited riparian vegetation occurs along the upper reaches with higher gradient and greater confinement. Sedge meadows occur in the low gradient, low confinement reaches near Highway 47. The Figure 30 hydro graph shows existing flows resemble a natural pattern in June through mid-September - the period where the influence of available water would most likely affect soil moisture in the growing seasons - and therefore species composition in these lowlands.
On page 70 the DNR states that it has been determined that a flow of 200 CFS or higher is needed to flood the entire study area and allow for a natural flood pulse in the associated riparian wetlands. In northern Wisconsin rivers, these high spring flows generally begin in March or early April and slowly subside over time into mid to late June. Again, the hydro graph (figure 30) shows that the flows of 200 CFS or higher necessary to create oxbows are present, and that the flows in late June are approximately natural. The DNR's argument fails . In figure 43 the DNR shows a photo of wonderful oxbow formation, the product of the last 70 years of the current management, and then tries to argue that continuing this management will eliminate the oxbows. Figures 44 &45 appear to demonstrate that there is less water depth in the River and the channel tends to be less full when there is less water in the River.
Response There is nothing in the analysis to indicate that oxbows downstream of the dam are disappearing. The formation of oxbows is a stream morphological process that is closely tied to annual peak flows. These peak flows occur with the current operation of the dam but occur in the fall as opposed to the spring as occurs on natural flowing rivers. The impact to these oxbows that is described in the analysis is centered on the fact that these areas are frequently dewatered, often at the start of the growing season, when these areas provide important habitat for a wide variety of fish and wildlife species. The floodplain and vegetation characteristics along different sections of the Manitowish River are also described in the EA.
Comment Page 25: The EA states, "Historic aerial photos and observations made by local people that are familiar with the river suggest that over the last 50 or 60 years, the wetland plant community downstream of the dam has gradually changed from a wetland dominated almost entirely by wet meadows to a wetland dominated with scntb!shntb species in many areas." With this statement WDNR is implying that the cause of increased shrub densities is the change in water regime. Invasion of shrubs into sedge meadows is a problem statewide, even in wetlands that do have not experienced water level changes.
When the DNR says on page 56 that, it is likely that over time, the wetlands along the river changed from being dominated by meadow species (sedges, grasses, forbs) to having a much higher density of shrubs (such as tag alder and willow), does the DNR suggest that this system has not fallen into dynamic equilibrium of the last 70 years and is still undergoing major change pursuant to the dam construction? That assumption warrants documentation.
Response The dominant wetland shrub species is described on page 25 of the analysis. To provide additional information regarding the impact of the dam operations downstream of the dam, we hereby amend the EA to include the following. "The native shrub species found along the river·corridor do not have the biological characteristics of rapidly spreading invasive species like glossy buckthorn. The historical obsen,ations, the hydrological needs of different wetland plant communities, and the high frequency of draining the riparian wetlands all support the finding tha( the operation of the dam has affected the wetland plant communities."
The changes to the riparian wetland community and the disruptive dewatering of instream and riparian wetland habitat are both linked to the current operation of the dam, but they are distinctly different issues. As described in the Department's analysis, field studies have documented that passing drought like conditions on the river dewaters the aquatic habitat for the fish, aquatic insects, and many other species

Page 30
described in the EA. Regardless of the length of current operations, these organisms are not able to adapt to the dewatering of the aquatic habitat areas on which they depend.
Comment Page 67, second paragraph: The EA states, "The target flows identified in this alternative were based on field studies conducted in important types of habitat downstream of the dam. These studies are described in greater detail in the anticipated impacts section below. "Below this statement the EA reviews a study by the USGS that estimates the natural flow regime for the Manitowish River if the Rest Dam was not in place. The target flows recommended by WDNR are based on frequency of natural flow, not habitat requirements of the downstream aquatic resource. It is our opinion that flow regime should be based on habitat needs using habitat suitability models and not simply on restoring natural hydrology. We feel this would provide better and ecologically-based science to support the decision making process.
Response The target flows were based on the surface water needed in important habitat types as determined through the field studies that are described on page 70- 74 of the analysis. By mimicking a more natural hydrograph, appropriate habitat availability for a variety of fish and wildlife species at different stages of their life cycle is addressed.
Comment Page 70, last paragraph: The EA states, "Through this study, it has been determined that a flow of 200 eft or higher is needed to flood the entire study area and allow for a natural flood pulse in the associated riparian wetlands. "This statement assumes that the flooding of the entire floodplain valley is necessary for wetland health and that the valley should be flooded every year. Natural wetlands experience a variety of flows from floods to droughts. It's this variability of flow that helps different species stay healthy. One option would be to do a soil survey of the valley and determine what plants communities historically inhabited each reach. This would require a soil scientist that specializes in wetland soil formation. Using the habitat requirements of the desired vegetation would be a better method to determine the depth, frequency and duration of flooding during different times of the year than just flooding the valley every year.
Response We agree that spring flooding of riparian wetlands may not occur every year. The USGS analysis provides very thorough science to better quantify the natural flow pattern of the Manitowish River system to help estimate the natural frequency of flooding in these wetland areas. Additionally, as described in the analysis, field study conducted by DNR staff links the flows identified in the USGS analysis with the surface water hydrology in important wetland habitat types. Together, these two pieces of information show that flooding of the entire riparian wetland valley is expected to occur most years during the start of the growing season. Additionally, conversations with USDA Natural Resources Conservation Service staff, who have studied the soils downstream of the dam, also support the conclusion that current operations of the dam have had an effect on downstream wetlands.
e. Invasives
Comment The Manitowish River below the Rest Lake Dam has had a known infestation of purple loosestrife, an invasive wetland plant. The Turtle Flambeau Flowage-Trude Lake Property Owners Association, the WDNR, and the Iron County Land and Water Conservation Department have been collaborating on monitoring and treatment efforts of this plant for over 15 years. During the time, there have been a few attempts to introduce the Galerucella beetle. The beetle specifically feeds on.purple loosestrife. This form ofbio-control has been quite successful across the state. However, on the Manitowish River the beetle population has never seemed to get established well enough to control the loosestrife population. In late summer, the beetle seeks shelter in wetland leaf duff or surrounding uplands. It is a good possibility that the

Page 31
beetles once in hibernation, are getting flooded out as the water levels rise in late fall to flood wetlands along the Manitowish River.
Response The current high flows in the fall may be a factor in the establishment of Galerucella beetle populations, but not enough is known to be able to provide a reasonable amount of evidence linking low beetle numbers to current or alternative operations of the Rest Lake Dam.
f. Water quality
Comment One individual expressed concern with low oxygen levels, and poor water quality below Rest Lake vs. above the lake Chain. Above the Chain, the water is very clear, has very little algae, and has a lot of minnows. Below the Chain, there is a thick coat of algae over every rock and log, there are few minnows, and the water is relatively murky. This is probably due to nitrates in the water because of fertilizer use, or septic tanks along the Manitowish Waters Chain, and nitrates/algae are associated with low oxygen levels after algae blooms. It is dangerous to have low water levels in the Chain at the same time when oxygen levels are low, especially in the summer. Sturgeon live at the bottom of Benson all summer, and low oxygen levels at significant depths, could harm sturgeon and hurt the species.
I think controlled studies should be done on oxygen levels below the dam during normal operation vs. when more water is released, and to see how long this effect persists.
Response Low oxygen levels are not expected in the River below the dam due to the type, ideation, and depth of the flow gates on the Rest Lake Dam. In addition, downstream water quality monitoring has not indicated low oxygen levels in the River. As described in the EA, many water quality parameters of the Manitowish River and lakes are considered good, however, the nutrient loading and associated problems on Benson Lake have not been extensively studied. Since the water quality factors are not closely linked to the operation of the Rest Lake dam, these issues were not evaluated in detail as part of the environmental analysis.
g. Navigation
Comments This summer I took a kayak down the river and my husband took the canoe. With current operations there were areas that he had to get out and push the canoe to an open spot.
The river is so beautiful and with current operations there are times it is hardly navigable.
Response Thank you for providing these comments. The navigational issues that are associated with current operations are addressed on page 66 of the analysis.
4. Cultural Resources
Comment It was suggested that the EA cultural resources include a description of the medicinal uses of the plant species surveyed upstream and downstream of the dam.

Page 32
Response We agree that this would be a useful addition to improve the accuracy of the analysis and hereby amend the EA to include the following table and text on page 42. "In addition to wild rice, there are a number of other wetland plant species that have been found above and below the dam that provide traditional medicinal and other important uses. A summmy of the uses associated with these plant species is summarized in the table below and the information was derived from the following reference. Meeker, James E., Joan E. Elias, and John A. Heim. (1993) Plants used by the Great Lakes Ojibwa. Odanah, WI: Great Lakes Indian Fish and Wildlife Commission".
Corrmon Name Scientific Name Cultural Uses American elm Ulmus americana fvledicinal use of bark Arrowhead Sagittaria sp. fvledicinal uses and use as food source Balsam fir Abies balsamea fvledicinal Uses, Hair Ointment, Wash, Use in Sweatbath Ceremony Black willow Sa)ixnigra . fvledicinal uses, basketmaking Broad Leaved Cattail Typha latifolia Food in early growth stage, fuzz used in war medicine Green ash Fraxinus pennsylvanica Inner bark used in compound tonic Hard Stem Bulrush Schoenoplectus acutus Likely has similar uses to softstem bulrush Leatherleaf Chamaedaphne calyculata Used fresh and dried leaves in beverages. fvleadowsweet Spirea alba fvledicinal uses Pickerel weed Pontederia cordata Fishing aid to help locate pike River birch Betula nigra fvledicinal use of bark Rush Juncus sp. Likely similar to spike rush Silver maple Acer saccharinum fvledicinal use of bark Soft Stem Bulrush Schoenoplectus tabernaemontan Matmaking and Toys Spatterdock Nuphar variegata fvledicinal use of root powder, tubers and seeds used for food Spike rush Juncus effusus Material for weaving mats, bags, etc. Sweet gale Myrica gale Tea making, seasoning for meat Tag alder Alnus incana fvledicinal uses of different parts, bark used to make dyes. Water horsetail Equisetum sp. Tea used medicinally Water smartweed Polygonum amphibium fvledicinal uses White birch Betula papyrifera fvledicinal use of bark, bark also used to make baskets and canoes While pine Pinus strobus fvledicinal uses of bark, pitch, and needles, Msc. uses of bark and cones White water lily Nymphaea odorata Leaves, flowers, and tubers used as food, medicinal use of pulverized roots Willow Salixsp. fvledicinal uses, basket weaving
Comment Suggest modification to the section of the EA entitled "Cultural Environment, b. Social/Economic (including ethnic and cultural groups) page 41. Natural Resources in the Ceded Territory". "The Manitowish River system is located in the ceded territory of the Lake Superior Chippewa, where tribal hunting, fishing, and gathering rights are accorded as a matter of federal treaty. Prior to the arrival of Europeans in North America, Indian tribes have been functioning as independent, sovereign nations. Although the Chippewa ceded lands in the northern one-third of Wisconsin to the United States government in the Treaties of 1837 and 1842, they retained their off-reservation rights to hunt, fish, and gather within the ceded territories. As a result, the Lake Superior Chippewa tribes of Wisconsin may legally hm11est walleyes and muskellunge using traditional methods, including spearing and gillnetting on designated waters in the ceded territory. A result of the proximity, the Lac du Flambeau Band of Lake Superior Chippewa Indians is the tribe that primarily utilizes the Manitowish system. The Lac du Flambeau Resen,ation has been a permanent settlement since 1745 when Chief Keeshkemun (Sharpened Stone) led his band to the Manitowish River area for wild rice, fish, and game. The Lac du Flambeau Reservation is located 12 miles northwest of Woodruff and Minocqua in southwestern Vilas County and the southeastern portion of adjacent Iron County. "
Response We hereby amend the environmental analysis on page 41 to reflect the information provided in the comment above.

Page 33
Comment On page 41 and 42, and then again on page 61 the DNR attempts to argue that the dam operation is adversely affecting wild rice. The DNR estimates that 92 acres currently exist in Rice and Papoose Creeks. When I was 15 those figures would have been near 0. In an effort to create duck hunting opportunities, Johnny McElrone (my high school employer and owner of the old Texaco station at the junction ofK and Wand Art Laha (former owner of the Bear Bar on County W) planted wild rice plugs in Papoose Creek in the early 1970s. I make this point not to suggest that their action is the source of the current stand. Rather I suggest that they were planting these plugs because there was no notable stand of wild rice at that time. No one would consider planting wild rice there now. Wild rice is rapidly filling the available habitat. Granted there was lowland habitat lost when the dam was originally put in operation, but there is virtually no question that the current acreage came from near 0 in the last 40 years. If wild rice is the objective, the current dam operation is a success story. It is interesting to note the DNR specifies on page 41 that, if water levels decrease, then the stalk can collapse. It is the DNR that is proposing to put these plants in jeopardy with its required mid-summer draw down.
Response We agree. There are established wild rice beds under current operations and the approximate acreage of these areas are described in the EA. The narrative on page 41, 42, and 61 of the analysis describes the current fluctuation of water levels during the floating leaf period (which may occur between May and June depending on the season) and that this may be detrimental to wild rice productivity. A required mid-summer drawdown is not descr;ibed or considered in the range of alternatives that are outlined in the analysis.
Comment The comment was made that it would be helpful to include the reference to the extent and timing of water level fluctuations at locations of wild rice bed under both current and proposed alternatives. Trying to get more accurate mapping of the location of the wild rice beds would likely help trying to determine the extent of current and proposed water fluctuations. Rice stands farther up the river arms, for example, may have less fluctuation compared to rice on the lake margins.
Response The description of the wild rice beds on page 42 of the Department's analysis described the acreage of rice beds on Island, Wild Rice, and Rest Lakes at peak years. To provide more detailed information regarding the location of the wild rice beds, we hereby amend the EA as follows. "On Island Lake, the wild rice beds occur on the southeast portion of the lake where the Manitowish River enters and on the northeast end where Rice Creek enters. There are two primary rice beds on Rest Lake, one the northeast part of the lake where Papoose Creek enters, and the other on the northwest bay of the lake. On Wild Rice Lake, the best rice beds are found in the vicinity of the Trout River inlet and outlet. Little if any rice is known to exist on other parts of the lake. Rice is also found on many section of the Trout River above Wild Rice Lake, between Wild Rice and Alder Lakes, and between Alder and Manitowish Lakes. The exact locations of the smaller beds are not well documented but this system appears to hold rice in most areas with suitable habitat. Many of the best beds are within the Lac du Flambeau Reservation, and are protected and managed by the tribe. Due to the low gradient lake and river systems, the annual 3. 5 foot water level fluctuations that occur with the current operation of the Rest Lake Dam would be mimicked in these areas with wild rice that are within the affected area described on page 11 of the EA. "
Comment Rice productivity is influenced by many factors, and it is very difficult to predict the impacts of current or alternative operations on rice. Additionally, wild rice is adapted to disturbance. The disturbance caused by the current drawdown could be a benefit to rice. Periodic drawdowns can also prevent establishment of perennial aquatic plants that could outcompete wild rice. The current potential for rising water levels during the floating leaf stage, however, can also negatively impact rice. This complexity should be clearly articulated in the EA and used to explain the importance of future monitoring and for provisions to be written into any new order to allow for periodic drawdowns for aquatic plant management.

Page 34
Response The complexity of predicting the response of wild rice to a reduced or eliminated winter drawdown and the importance of future monitoring to evaluate any potential changes is described on page 75 of the analysis. We hereby amend the first paragraph on page 75 of the EA to clarifY potential options for the management of wild rice and other aquatic plants that could be considered with a new order. "A new operating order could have provisions included that would allow for periodic winter drawdowns if necessary for wild rice. The need for drawdowns would be based on monitoring data and would occur after consultation between the owner of the dam, DNR, and Tribal natural resources staff."
Comment The paragraph under "Natural Resources in the Ceded Territory" gives the impression that only Native Americans are allowed to harvest wild rice. Same is true with the second sentence (as follows) under the Wild Rice section. "Wild rice (Zizania palustris}, or manoomin, has tremendous value both culturally and ecologically. Manoomin directed the Anishinabe to northern Wisconsin in their quest to find the place where the 'food grows on the water'. Today, larger rice beds are present above and below the dam on the Manitowish River system. In addition to being an important traditional food source, wild rice beds also provide an important food source for wate1jowl during fall migrations, good cover for brood rearing habitat for ducks, nursery areas for young fish and amphibians, and a food source for a number of bird species and herbivores such as muskrats. "
Resnonse . We hereby amend the Department's analysis to reflect the language outlined in the comment above.
Comment Tribal natural resources staff that have evaluated the wild rice on the river suggest the following edit on page 42, second paragraph. Delete the entire last sentence "The wild rice on the river is an important food source for waterfowl but is not commonly han,ested because the rice on the river is a shorter growing variety that is difficult to harvest in canoes"
Response We hereby amend the analysis to reflect the changes suggested in the comment above.
5. USGS study
Comment The winter base flow described on page 14 of the analysis includes base flow from the watershed up-gradient of the Chain of Lakes. It includes more than just groundwater discharge directly to the reservoir, which was estimated in the report. The sentences seem to incorporate additional flow that would be expected for direct ground water discharge, as described in the first 2 sentences of this paragraph.
Response To improve the accuracy of this section of the EA, we hereby amend the analysis as follows. "The extent of spring and other ground water inputs to the base flow of the Manitowish River system upstream of the Rest Lake Dam can be roughly estimated by looking at the winter base flow over the dam when there are no changes to water elevations on the Chain."
Comment On Page 17 there is a statement that "evaporation loss and groundwater inputs were estimated by USGS to essentially cancel each other out resulting in no net water loss or gain as part of their analysis". That's not correct. This appears to be a misinterpretation. The water budget method (not the adjusted drainage area ratio method) described how evaporation and ground water were ultimately "cancelled out" (by re-writing equations)

Page 35
for the final calculation of natural inflow at the dam, but the report did not indicate that evaporation and ground water values were equal.
Response To address this comment, we hereby delete the statement referenced above and amend the EA to reflect the following; "evaporation loss and groundwater inputs on an average monthly basis were estimated by USGS and these aspects of the water budget and drainage area methods are described in detail in the USGS report found in Appendix II. "
Comments I purchased this land because we use the Chain daily, weather permitting, from May to mid-October. The article in the Lakeland Times dated 10/5/12 stated the USGS had only two years of flow analysis, and quote stated "they'd feel more comfortable with data if they could have done 25 more years of monitoring" -- let's do it.
With regard to the raw stream flow data presented in the purpose and need section for no apparent purpose, we all recall the summer of 2007 when the DNR was requiring outflows of 50 cfs from the Chain, with no data whatsoever regarding inflows. Now it appears that the DNR is content to present 2 years of raw data in the purpose and need section of the document without a clear link to the proposed action. The relationship between this raw data and the hydro graph on page 50 is unclear.
Response The hydrograph on page 50 of the EA was based on more than two years of monitoring data. As described in the USGS report, the estimation of natural historical flows was based on two years of gaging upstream of the Manitowish Chain of Lakes and from two nearby long term gaging stations (with a flow record from 1991 -20ll). Additionally, after calibration of the water budget model, the model was used to compute natural flow at the dam from 1973 to 2011 using historical data for lake stage and discharge values provided by the dam operator. For a more detailed description on the methods used to estimate inflows, please refer to the USGS report found in Appendix IT of the EA. Gaging water flows could be considered as a component of a new operating order.
Comment The purpose ofthe USGS work was only to estimate natural flow at the outlet of the system. USGS was not asked by WDNR to do any work related to current or future water levels on the systeni under various flow regimes. However to check the applicability of the USGS numbers I did a comparison of their results with the flows measured by Xcel Energy at the Rest Lake Dam. When we compare the flow measured at the dam versus the estimated natural flows by the adjusted drainage-area ratio method and water budget methods they do not match well (see Figure 1). The adjusted drainage-area ratio method has a R2 of0.35, and water budget method has a R2 of0.58. A R2 value of 1.0 will indicate a perfect fit and value of0.5 indicates that the relationship only explains for 50% of the variance. That these two data sets do not match is not surprising as actual water flows are artificially influenced by the operation of the dam.
Response We agree. If the flows reported by CFIC were representative of the natural inflows to the dam, there would not have been a need for the USGS study. As described on page 14 of the USGS analysis, neither the drainage area nor water budget method can be directly evaluated against daily dam outflows because dam operation alters the natural flow pattern. The monthly error estimates for the water-budget and adjusted drainage area methods compared to measured streamflows are shown on page 16 of the USGS report. The USGS work makes it possible to evaluate expected Chain water levels with alternative operations by using inflow data, the monthly flow duration estimates, and the known volume of the Rest Lake Reservoir.

Page 36
Comments If we remove the months of May and October from the data set and re-pl9t natural flows by the water budget method versus measured flow at the Rest Lake Dam we see a much better relationship with at R2 of0.83. Figure 2 illustrates two conclusions: 1. With the exception of May and October when artificial opening and closing of the Rest Lake Dam influences flows, the USGS water budget method matches well with the measured data. This is not surprising since the water budget method was calibrated to the measured flow and lake stage data. 2. With the exception of May and October, Xcel Energy is currently operating the dam in such a manner as to pass through close to natural flow conditions. The Environmental Assessment (EA) prepared by the Wisconsin Department of Natural Resources and dated September 11, 2012 states, "When water levels drop below 8' 4 ",flows over the dam are quickly reduced to minimum flows." The EA implies that during extended periods of the summer the minimum flow of 40 cfs is routine. A review of the data provided by Xcel Energy, and used in the USGS's analysis (Figure 2), illustrates that during most years this drop to 40 cfs does not take place. Mean monthly flows approaching 40 cfs have only occurred in August and September or 1976 and 2005, two severe drought years.
Page 7, first paragraph: The EA states, "When water levels drop below 8 ' 4",flows over the dam are quickly reduced to minimum flows ." This entire paragraph and this sentence imply that during the summer season the minimum flow of 40 cfs is routine. However, a review of the data provided by Xcel Energy on historic discharges from December 1973 through November 2011, illustrated in the following figure, show that during most years this drop to 40 cfs does not take place. Of the record of 13,879 days of flows, on only 108 days did flows drop below 40 cfs (0.078% of the time). Fifty six of those days (52%) were in the drought of 1976 and 48 ( 44%) were during the drought of 2005. The data does not support this accusation.
The EA appears to be based on the premise that Xcel Energy is unnecessarily holding back water and routinely discharging at the minimum flow required by the current dam order. However, our analysis of the discharge data does not support this claim and in fact during most months and years since 1973, Xcel is discharging water near the natural flow regime as established by the USGS study used in the EA to determine natural flows.
The DNR suggests Xcel has routinely reduced flows far below the minimum cfs required under the Q7, 10 calculation noted above. But the data dating back to 1973 refutes the DNR's claim. Indeed, the available data shows that, out of 13,879 days of recorded flows, the flows dropped below 40cfs on only 108 days overall (0.078% of the time). ERP Letter Report, Paragraph 2. Out of those 108 days, 104 days occurred in the droughts of 1976 (56 days) and 2005 (48 days). Id. Thus, with the exception of the two most severe droughts of memory, flows have been reduced below 40 cfs on just 4 days out of 13,879 days (or 0.028%) of the time). Thus, the data belies the DNR's conclusion that minimum flows of 40 cfs are routine in the summer months.
Resuonse The comments above do not provide an accurate reflection of the water level and flow management that occurs with the current operation of the dam. It is important to consider that the Q7 -10 required minimum flow was 50 cfs for many years prior to 2007 and has not recently been less than 40 cfs. Therefore, the evaluation of discharge records from 1973 to 2011 that only look at flows below 40 cfs does not reflect the frequency that flows were reduced to the minimum required flow at the time. Additionally, there are a number of issues with the accuracy of the water budget method for low flow conditions that are described on page 18 of the USGS report.
As stated in the analysis, the operation of the dam discharges the minimum required flow downstream every spring to refill the Chain starting in mid to late April. On average, the minimum flow is passed until the Chain is filled in late May or early June. These minimum flows are passed during the summer months in many years as well and can be seen when evaluating each separate year of discharge records reported by the dam operator. As shown on table 6 of the USGS analysis, river flows below 40-50cfs are only expected to occur very infrequently (not on an annual basis) whether using the water budget or adjusted drainage area method.

Page 37
Comment There are inadequate water supplies to maintain reservoir and discharge requirements through the summer/early fall seasons during dry summers. Current USGS water quantity calculations assume that all water entering the reservoir would be available for use in the reservoir and downstream rivers. These calculations, however, have not taken into consideration the losses occurring from farming operations, lawn irrigation and evaporation ( 4-6" per summer month).
Response As described in the USGS report, losses occurring from farming operations and private use (such as lawn irrigation) are not known and were not part of their analysis. Natural evaporation, however was a factor estimated in their calculation of the flows reaching the Rest Lake Dam.
6. Dam Operation
a. Current operating order compliance
Comment CFIC disagrees with the WDNR's assertions that the Rest Lake dam was operated out of compliance. Furthermore, CFIC strongly recommends the WDNR remove any language from the draft EA that implies, asserts, or characterizes the Rest Lake dam was operated out of compliance with the Last Orders.
Response We disagree and believe it is clear that certain provisions of the current operating order are not being followed by CFIC.
Comment Page 52, second paragraph: The EA states that, "With current operations, spring refill does not begin until ice is 75% off of Rest Lake to avoid potential ice damage to permanent piers and boat houses. On average, refill begins on April 20th which is often after most of the high spring runoff events have passed through the dam." The first question is over what period is this average calculated? Recent climatic data and modeling done by the Wisconsin Initiative on Climate Change Impacts (WICCI) and Center for Climatic Research at the University of Wisconsin-Madison have indicated that spring temperatures are increasing due to global climatic change. John Magnuson, an aquatic ecologist and limnologist at the University of WisconsinMadison Center for Limnology, has predicted earlier ice off for lakes in the upper mid-west. Climate change may result in changes as to when the spring re-fill will happen at Rest Lake and this likely effect should be discussed in the EA.
Response The period over which the April 20th date was calculated was 1973 to 2008. Because of the uncertainty in predicting the effect that climate change could have on the range of alternatives discussed in the analysis, this information would not improve the clarity, accuracy, or scope of the EA.
Comment The EA exaggerates the degree to which Xcel Energy has departed from the existing order and the "natural flow regime." In making the claim that the existing order should be modified, the EA asserts that Xcel Energy is routinely holding back water in violation of the existing order and discharging only the minimum flow required by the DNR. In almost every respect, however, that is simply not true. First, the EA suggests Xcel violated the order by maintaining summer water levels in a narrow range between 8'4" and 8'6" in the summer months. However, the existing order does not require water levels to fall anywhere below 8'6" in the summer. Instead, the order gives Xcel the discretion to maintain water levels anywhere between 7'3" and 8'6". IfXcel wants to keep water levels at 8'6" all summer long, there is nothing in the order to prohibit that. (Indeed, maintaining a high water level would appear to be precisely in line with Xcel's interests, since Xcel

Page 38
values the Chain as a reservoir for downstream power generation). Second, the EA suggests Xcel violated the order by delaying the drawdown until after the Colorama festival occurs. However, the existing order does not require a drawdown to start on September 1 or any other time. Instead, the order gives Xcel the discretion to initiate a drawdown any time between September 1 and the time the ice sheet forms in the early winter, subject only to the limit that Xcel cannot lower the water at a rate of more than 2 inches per day. Because the order does not require any drawdown at any time, the DNR cannot claimXcel has violated the order by "delaying" the drawdown to later in the Fall. For these reasons, Xcel has followed the existing order in virtually every respect, with the only exception being that the Chain has not always reached the 7'3" minimum by April15 of each year. The DNR should revise the EA so that "deviations" from the order are not exaggerated and the public can make an informed decision about whether operating under the current order would be better than operating under the DNR's proposed alternatives.
Response Page 7 includes a summary of the differences between the 1939 order and current operations. The summary includes one aspect of current operation that clearly does not follow the requirements of the 1939 order: the refill of the Chain to 7' 3" by April151
h. The summary also describes aspects of the order that are not followed that provided evidence to show that the use of the dam has changed over time and is currently focused on accommodating a narrow range of water interests on the Chain of Lakes. One example includes the current July water level range between 8'4" and 8'6" compared to the 7'3" to 8' 6" that is allowed in the order. To improve the accuracy of the description of summer water levels, we hereby amend the following sentence on page 7 as follows. "During the summer months reservoir storage is not used to augment-low flows downstream as shown by the fact that water levels on the Chain are currently maintained in a narrow range of 8' 4"- 8' 6" and not between 7' 3"- 8' 6" as allowed in the 1939 order."
With this minor change, we believe the EA accurately describes how dam operations have changed as the purpose of dam operations has changed from hydropower and downstream flow augmentation to its current use primarily as a recreational reservoir. At this time, no enforcement actions have been initiated, and the EA does not make any judgment with regards to specific legal requirements or use the term violation.
b. Water level elevation
Comment On Page 11 the EA states that the, "The current maximum water elevation upstream of the dam is measured as 8' 6" on a gage at the Rest Lake Dam which corresponds to an elevation of 1601.0 NGVD (National Geodetic Vertical Datum)." The USGS report, Estimation of Natural Historical Flows for the Manitowish River near Manitowish Waters, Wisconsin, states that the maximum stage is "1,601.4 ft above NAVD 88". Which value is correct?
Response . NGVD and NA VD refer to different geodetic datums that are used for calculating the coordinates of points on the Earth. Whatever datum is applied is tied to the 8' 6" water level elevation at the Rest Lake Dam. In terms of managing the water elevations at the dam, there hasn't been any need to differentiate between the two datum sources. NGVD is the datum identified on the USGS topographic maps of the Manitowish Waters area and is the datum described on page 11 of the analysis. It is also our understanding that 1601.0 NGVD is what is used by CFIC. NA VD 88 is currently the standard geodetic datum used for work conducted by federal agencies. More information on geodetic datums can be found on the following website: http://www .ngs.noaa. gov/faq. shtrnl#Why VD29VD8 8

Page 39
c. Usefulness ofthe dam
Comment The Federal Energy Regulatory Commission's assessment that the Rest Lake dam was, " ... neither used and usefitl nor necessary or appropriate to maintain or operate ... ," solely for hydro power generation. The WDNR makes a similar statement to the perceived lack of value on page 76 of the draft EA. CFIC disagrees with this assertion. While its economic value might be small in comparison to the much larger TurtleFlambeau dam located downstream, there is still value added from the 3.5 ft. annual fall drawdown and the 13,000 acre-feet of water that is released into the Turtle-Flambeau Flowage. This water refills the TurtleFlambeau Flowage by approximately one-foot during the fall drawdown providing several downstream benefits. First, the additional water allows for an increase in electricity generation at downstream power plants. The increased electricity produced from this water is a qualifying renewable energy resource that can be used to satisfy the State's renewable energy portfolio standard, while at the same time avoiding emissions and other environmental impacts from fossil fuel fired generating plants. Second, the economic value of this enhanced hydropower generation helps pay for the operation and maintenance of the dam. Eliminating or reducing the depth of the drawdown will mean either no direct or decreased economic value to CFIC due to the lost revenue from the enhanced generation. Third, the same water that is used to generate electricity also contributes to the maintenance of the winter aquatic ecosystems on the downstream portions of the Flambeau and Chippewa Rivers and all the way to the Mississippi River. Fourth, some of the extra water from the fall drawdown helps maintain a higher winter reservoir level at the Turtle-Flambeau Flowage, which increases the likelihood of a near full reservoir by the fishing opener in early-May. All of these benefits should be identified. in the EA and should be considered as part of the benefits to the continuation of the existing operating regime at the Rest Lake dam.
Response These comments are addressed in the EA. The contribution of current management to downstream waterpower production (0.06%) is described on page 6 of the analysis, and the volume of water passed downstream (about li inches) to the Turtle Flambeau Flowage from the fall drawdown is described on page I7. The effect of alternative management of water levels and flows in terms of hydropower and the balance of water levels upstream and downstream of the Rest Lake Dam is described in the Alternatives and Environmental Consequences section of the EA. In addition, many of the environmental issues identified in the comments above such as water for navigation for the fishing opener are important not only for the Turtle Flambeau Flowage but also the Manitowish Chain. As described in the Department's analysis, this issue, as well as maintenance of aquatic resources above and below the dam, would be better accommodated with a more balanced management of water levels and flows at the Rest Lake Dam.
d. Relationship between water levels and downstream flows
Comment What is downstream flow if the upstream lakes are reduced 2" in a day and there is significant rain?
Response As described on page II of the USGS report, a drawdown of the Chain 2" in one day is equivalent to 342 cubic feet per second of discharge. The downstream flow of a 2" draw down during a rain event would depend on the size of the rain event. The graphs on page I9 of the USGS report show the downstream flows that have been passed in the fall during the drawdown in previous years.
Comment What is a more reasonable control for inches/day and drop in upstream lake levels on a design basis?

Page 40
Response As described on page 67 of the analysis, changes in water levels or flows related to any refill or drawdown would be based on ramping rates to avoid quickly changing water levels and flows upstream or downstream of the dam. These rates would need to be written in a way that would also allow the operator of the dam to adjust to large storm events and avoid the flooding of property.
e. Dam ownership
Comments I do not believe that the relationship between Xcel Energy and the Chippewa and Flambeau Improvement Company is accurately described on page 1 of the EA.
The CFIC is composed of several entities including the Dairy land Power Cooperative, Flambeau River Papers LLC, and Xcel Energy. The Rest Lake Dam is owned by CFIC and not Xcel Energy. As a result, any reference to Xcel Energy in the draft EA should be replaced with CFIC.
Response We hereby amend the analysis to replace any reference to Xcel Energy with the Chippewa and Flambeau Improvement Company or CFIC.
f. Dam abandonment and future dam operations
Comment CFIC is very concerned with changing operations at the Rest Lake dam. In addition to the potential loss of downstream ecosystem benefits, the loss of direct economic benefit could adversely impact the viability of the dam. With the loss of revenue from eliminating or reducing the fall draw down, there will be reduced or no funds available to carry on operation and maintenance activities, which include dam inspections, safety related activities and operational and maintenance expenses. As a result, there is little incentive or justification for CFIC to continue ownership and operation of the dam. CFIC would prefer to continue its current operating regime and public outreach efforts to minimize operational costs, risk and safety concerns. If the WDNR is intent on adopting Alternative 3 or 4, CFIC would likely examine transfer of ownership of all assets related to the dam to the state, county, township or local cranberry association. Alternatively, if no viable alternative owner can be found, CFIC would likely follow the state-required process for dam abandonment and removal.
Alternative 3 - WDNR Public Interest Flow. This alternative is largely defined by a greatly reduced fall drawdown (7'6" to 8'0" level), an immediate refill to 8'6 in early spring, and maintenance of summer reservoir levels between 7'0' and 8'6" while maintaining a high flow discharge rate. Alternative 3 is undesirable to CFIC for the following reasons. Reducing the drawdown level from 3.5 ft. down to 0.5 ft. or 1.0 ft. would greatly reduce or eliminate the direct economic value of the dam. As stated earlier, while the direct economic benefit is relatively small, the revenue from the increased electric generation does help pay for the maintenance and operation of the dam. Adoption of this alternative would force CFIC to look at options for alternative ownership and operation of the dam.
Eliminating the fall draw down would eliminate any economic benefit that CFIC receives from the Rest Lake dam. This alternative would force CFIC to look at options for future ownership and operation of the dam.
Response We appreciate CFIC's perspective. The owner of the Rest Lake Dam has the right to pursue transfer of ownership or dam abandonment at any time. Based on this information, we hereby amend the fourth paragraph of the analysis on page 76 as follows. "With any change to the winter drawdown levels, CFIC has

Page 41
indicated that they would likely consider seeking new ownership of the dam. They have also indicated that they may apply for dam abandonment and removal if no qualified group is willing to take on the cost and liability of dam ownership. "
g. Q7-10
Comments Click on Frequently Asked Questions about the Flow Measurements hoping that some light will be shed on the mysterious Q7-10 calculation and you get the 2008 Flow Reporting Discrepancy document- that essentially says no one knows what the flow is. Now after two seasons of USGS data collection, the picture is apparently so clear and so supportive of the DNR decision, that further data collection is no longer necessary. If the DNR is going to continue referring to the Q7-10, then the DNR should explain what it means and stop leaning on the USGS. In the 12/20/2007letter to the DNR, Rob Waschbush of the USGS makes the statement, "These values are the best estimates I could determine with the data available." A weaker endorsement could hardly be crafted, and the 2012 USGS Report Summary discusses the variation between the two flow calculation methods, but does not identify a definitive number. While the DNR says the USGS calculates the Q7 -10 the USGS report puts it back on the DNR saying, the WDNR has considered the Q7-l0 for the Rest Lake Dam to be 40 cubic feet per second (ft3/s) because this is the flow that the dam operator has used in documentation of dam operation. All along through my conversations with Tom Bashaw back in 2007, I was never connected with anyone from the DNR who could say what the Q7-10 is or means. I've put time into that. Yet there it is, still on the DNR website under the Frequently Asked Questions page 2, explaining why the DNR's new initiative is required under Wisconsin Statute- Section 31.34. The DNR seems desperate for an anchor point suitable for mooring this decision.
The EA suggests Xcel violated an implied 'condition of the order by failing to pass 40 cfs over the dam at all times. This suggestion is based entirely upon the DNR's interpretation of Wis. Stat. § 31.34. Under that statute, a darn operator is required to "pass at all times at least 25% of the natural low flow of water of such stream, except as otherwise provided by law." According to the DNR, "natural low flow" is calculated using the Q7-10 formula, with the most recent calculation having arrived at the 40 cfs figure. But the DNR's position is flawed in at least three respects: The statute does not define "natural low flow" with reference to the Q7-10 formula. That is just an interpretation the DNR has come up with on its own. The DNR's interpretation conflicts with the plain language of the statute since the DNR interprets a statute requiring a dam operator to pass 25% of the "natural low flow of water of such stream" to require the operator to pass more than 100% of the actual and existing flows over a darn in drought conditions. A more reasonable interpretation which avoids absurd results in drought conditions is that a dam operator must pass 25% of existing inflows over a dam at any time. Since there are at least two reasonable interpretations of the statute, and since the courts have not yet decided what the statute means, it is an exaggeration for the DNR to claim that Xcel has violated the law simply because it did not pass 40 cfs at all times. The statute says a dam operator must pass 25% of the natural low flow "except as otherwise provided by law." Here, the existing order has the force of law, and it does not require Xcel to pass 25% of the natural low flow. Thus, the order overrides the statutory requirement. Even if the Q7 -10 calculation supplies the correct definition of "25% of the natural low flow," the DNR itself has calculated three different Q7-10 figures. In 1975, the DNR said 25% of the natural low flow was 25 cfs. In the summer of2007, the DNR said it was 50 cfs. Then, months later, the USGS calculated that the Q7-10 figure is 40 cfs. The DNR can hardly be heard to claim that Xcel has violated the minimum flow requirement when the DNR has not been sure of what that requirement happens to be.
Response The analysis does not state that CFIC violated the law by not passing 40 cfs. We agree, the Q7 -10 at the dam has not always been 40 cfs and other Q7 -10 flows were followed in the past based on the best information available at the time. The authority for the Department of Natural Resources (DNR) to regulate dams, water levels and minimum flow discharges is contained in Chapter 31, Wisconsin Statutes. Section 31.02( 1) of that

Page 42
law states: "The department, in the interest of public rights in navigable waters or to promote safety and protect life, health and property may regulate and control the level and flow of water in all navigable waters ... .. " Section 31.34 requires that "Each person, firm or corporation maintaining a dam on any navigable stream shall pass at all times at least 25 percent of the natural low flow of water of such stream, except as otherwise provided by law." In administering these statutes, the DNR has interpreted and applied statewide, since the early 1980s, that 25 percent of the natural low flow equals the Q7-10, which is the lowest average flow of a stream over seven consecutive days during a 1 0-year period. This number differs by stream and is developed using a statistical analysis of stream gauging performed over many years. The Q 7-10 flow is not 25 percent of the flow coming into the Chain. The DNR often works with the USGS to set the Q7 -10 for rivers and dams. The USGS study represents the best available data and as described on page 20 of their report, the Q7-10 is equated with the annual FD 99.6 flow or 57 cfs for the Manitowish River below the Rest Lake Dam.
7. Alternatives
a. Adaptive management
Comment It is a recognizable challenge to balance competing interests on a managed river system. With time, additional data will be generated that allows the agency, dam owner and stakeholders to evaluate whether the prescribed flow order is meeting its goals and whether there are changes that need to be made. Any flow order issued for Rest Lake Dam should incorporate adaptive management and a commitment to revisit the order periodically (for example, every five years)to look at impacts to fisheries and aquatic habitat, sediment and erosion, ice damage to piers and access to the water in order to evaluate if changes need to be made to the flow regime. Such a process should inch:1de stakeholders beyond just the agency and Lake District.
Response Adaptive management can be considered when a new operating order is issued.
b. River dredging or construction of wing dams
Comments Since an extremely small area of total lake area is drastically affected by the current winter draw down (primarily the oxbow areas shown in the DNR study) it may be more economical for the DNR to dredge these areas a small amount to maintain water in those areas. This cost will be far less than the loss of value to the lake-front homes. This solution would greatly reduce the environmental damage show the DNR study, and at the same time the properties would not be devaluated.
Work on downstream river issues by channel dredging and constructing wing dams.
Response These suggested river modifications would not address the negative impacts associated with current operation of the dam. Additionally, due to the negative impacts and costs that would occur by attempting to dredge riparian wetlands or construct wing dams, these actions are not considered feasible alternatives to address the water level and flow issues that are identified in the environmental analysis.

Page 43
c. Gaging future levels and flows
Comments From the EA, it appears that the flow gauges will be discontinued. This should not be allowed to happen. Lack of adequate monitoring and data collection is a major reason why it has taken close to a decade to make a science-based decision on a flow order. Discontinuing the gauges will make it nearly impossible to monitor whether the new flow order is being followed because information will no longer be available to the dam owner, the DNR or the public. 401 Water Quality Certifications issued by the DNR for federally-licensed dams almost always contain provisions for flow and lake elevation data collection and for making that information publicly available. This site should have the same requirements.
Operating costs for four USGS gages would be expensive ($8,000 per gage times four gages= $32,000/year).
Who will be responsible for the ongoing expenses of operating USGS monitoring stations, tracking data, making calculations and determining when and how to change outflow?
Response The grant that funded the installation and annual operation costs for the USGS gaging had limited funds. The installation of water level and flow gages can be considered as a component of a new operating order. The owner of the dam would be responsible for funding any required gaging and the amount of gaging would be limited as much as possible. USGS has also developed methods to estimate the inflows to the Rest Lake Dam based on the inflows at regional USGS gages that could be used to help minimize potential gaging needs and associated costs.
d. Other suggested alternatives
Comments I was surprised and disappointed that there was no middle alternative. To me, that's a serious flaw in the EA and needs to be addressed.
In general, the EA attempts to build a strong biological case for changing the Operating Order from Option 1 or 2 to 3 or 4 because of harm to wildlife. We offer that 75 years of operating the MW Dam under either Option 1 or 2 has left us with very healthy and diverse wildlife populations and do not see the potential gain in healthy wildlife as legitimate reason for the drastic changes that Option 3 or 4 would bring. We think that more moderate solutions like slowing down the fall draw down and capturing more spring runoff even if there is still ice on the lakes will solve for the biological concerns, i.e. a modified or hybrid Option 1 or 2 will solve for these issues.
As an alternative, I strongly recommend that you consider altering the timing of the water level changes -begin raising the water level in the spring as soon as the ice goes out rather than on some specific date. Most years you will catch more of the spring runoff that way. Begin letting the water down earlier in the fall. Tourism won't be impacted much- the leaves will change for Coloramawith or without the lakes being full . Study the impact of the changes for the next 10 years or so and then revisit whether further ones are necessary.
Why can't the DNR come to a compromise with the people on the M.W. Chain and instead of the 42 inch drop of water go 21 inches? My opinion this will prevent a lot of ice damage. ·
However a 5th alternative, a hybrid of these alternatives may exist, which would allow partial drawdown in the winter to protect shorelines, but would increase the minimum flow downstream on a scale that would

Page 44
enhance downstream aquatic habitats. This additional alternative would be based on a HABSIM modeling of downstream river reaches and flow regime for the lake.
Response The analysis was intended to describe a broad range of alternatives and their associated impacts. There is nothing that ties the department to those specific alternatives. Any combination or modification of alternatives can be considered when a new order is drafted.
Comment What remains unclear - and will have a huge bearing on the final order - is how the agency will prioritize upstream (Chain of Lakes) interests versus downstream riverine interests at times of low flows. For example, a major difference between alternative III and IV is that Alternative III prioritizes a prescribed series of flow regimes recognizing they may impact lake levels, while Alternative IV focuses on lake levels but proposes a minimum downstTeam flow. This is further highlighted in the discussion in Alternative IV about passing "dam inflows" versus "gauged inflows" where the required minimum outflow will be determined after cranberry diversions (dam inflows) or regardless of cranberry diversions (gauged inflows). While these points may seem minor, they indeed reflect how the "devil is in the details" and can have a huge impact on the fmal flow order.
Response To provide more clarity regarding the differences between the Public Interest and Passing Inflow alternatives, we hereby amend the analysis to include the following narrative as part of the second paragmph on page 70. "When water levels and flows conflict, the Public Interest and Passing Inflow alternatives are different in the way they rank meeting upstream (Chain of Lakes) vs. downstream (Manitowish River) public water interests. The Public Interest alternative, for example, recognizes that certain target flows may affect lake levels at times of low flows. Passing dam inflows, however, prioritizes lake levels and this is reflected in that fact that water usage from the cranberry and private water withdrawals would be taken solely from downstream flows and not from the Chain water levels. In Wisconsin, a common prioritization of protecting upstream vs. downstream public interest issues that has been implemented in operating orders when water levels and flows conflict has been as follows. 1) Consideration offish and aquatic habitat below the dam. 2) Consideration offish and aquatic habitat above the dam. 3) Consideration of recreation below the dam. 4) Consideration of recreation above the dam. "
Comment Alternative IV- Passing Inflow (run of the river). This Alternative is intended to match water received from the upstream regions to outflows from the Rest Lake Dam. We see several significant problems in this Alternative: First, this option would only be acceptable to om members if the Memorandum of Understanding (MOU) between WI-DNR and CFIC (Xcel Energy) for the Tmtle Flambeau Flowage (TFF) Dam is modified to "run of the river" status. Changing the Rest Lake Dam operation to "run of the river" mode without the same changes to downstream water flow agTeements will have damaging impacts. For example, if the TFF Dam is required to continue discharging 300 cfs during a drought and the Rest Lake Dam has a very low outflow (due to very low inflows), low water conditions will develop very quickly on the TFF. Second, we believe it will be very difficult to publicly, politically, and legally justify switching to "run of the river" mode for only one part of the river and not the entire system. In this case, the rest of the system is governed by the Federal Energy Regulatory Commission (FERC). Modifying FERC license conditions at downstream facilities, including the recently licensed TFF Dam, to match operational changes at the Rest Lake Dam is very unlikely and would be very expensive.
Response Any changes to the operating order of the Rest Lake dam needs to consider the effects of those changes on the Turtle Flambeau Flowage. When compared to current operations, the public interest and passing inflow alternatives would pass more water downstream in the spring. When the Chain is full, current operations, the

1939 order, and the passing dam inflow alternatives would all pass a minimum required Q7-10 flow downstream to the Turtle Flambeau Flowage during severe drought conditions.
Comment
Page 45
.Page 68, third paragraph: The EA states, "If passing gaged inflows, measuring the inflow to the Rest Lake Chain upstream of the cranberry pumping locations would be needed (Figures 5 & 9), and the dam discharge would match the sum of the measured inflows." A problem with this method is that it does not account for losses in the Rest Lake Chain. Losses such as evaporation during the summer can be significant. One inch of evaporation per day off the 4,392 acre Chain would result in 366 ac-ft/day or 185 cfs ofloss. Between 0.5-inch and 1- inch of evaporation off a lake surface is not unusual during dry hot summer days. The calculation of volume of water to discharge downstream should be based on a detailed water budget, not simply on incoming flows.
"How" and "who" will calculate and measure inflow so there is a matching outflow? We envision lots of issues in measuring how much water comes "in" from what source, what comes from ground water, how much is lost to evaporation, how to account for water lost to cranberry operations, etc.
Response Inflows to the Rest Lake Dam can be estimated using models developed by USGS for the Rest Lake Chain that are based on regional USGS gages that are still ill operation. USGS has incorporated natural evaporation loss and groundwater inputs to estimate the inflows reaching the dam as described on pages 10-13 of their report. With a new operating order, different variables such as natural evaporation loss or ground water inputs are factors that could be included when determining the flows to pass downstream of the dam. To provide more clarity regarding the water inputs and outputs that can be incorporated in a new order, we hereby amend the analysis on page 68 as follows. "Water loss by natural evaporation and inputs from groundwater and precipitation could be factors that are incorporated in a new order when determining the flows that need to be passed downstream of the dam. USGS has estimated the long-term monthly averages for these aspects of the water budget as described on pages 10-13 of their report in Appendix II."
Comment On page 67, the DNR makes the statement; Water levels on the Chain would be operated close to 8 '6"but would occasionally need to be lowered in order to meet downstream flow needs. The downstream target flows would be reduced in low water conditions once the lakes reach a specified water level such as 7' 0". Once the Chain reaches that level, the owner of the dam would either need to consult with DNR to determine the required flow or a minimum flow would be specified in the order. I've made multiple references to the terms "occasionally" and "downstream flow needs" in my comments, because they are of critical importance, and stunningly vague in the context of this assessment and proposal. The two sentences in italics above give the DNR unlimited authority overrides the figures on Table 11 without notice or rationale. There is no · specified criterion of any kind to guide the DNRs decision making process. Need to spin a turbine anywhere downstream? No problem. Draw the water from the Rest Lake Reservoir. That is a down stream flow need that could be part of a negotiated resolution to any issue any time. How often will the DNR do this? Occasionally. Is the DNR's proposal to keep the reservoir full in the winter to assure that the water is always available when a "downstream need" is identified? Maybe I'm just paranoid. But the question must be asked because the DNR has so blatantly failed to identify purpose and need for this action, and the environmental justification presented is so overstated. A midsummer drawdown of 16 inches will be standard, but that is certainly not the floor. Once the 7' level is reached the DNR will specify the flow - and it could be anything. In the introduction to Table 11 on page 68, the DNR tells us that it will require outflows to exceed run of river 30% of the time. Is this are-designation of the Rest Lake Reservoir as a storage pool for some unstated purpose? It is really time for the DNR to tell the Chain property owners what this plan is, and who it is for. Who exactly is the "public" who's "interest" is being accommodated. The DNR needs to extend the comment period to allow Chain property owners the opportunity to grasp the potential magnitude of this proposal.

Page 46
Response To meet the spirit and intent of the environmental analysis process, no decisions can be made to choose a specific new operating order until the WEPA process is completed. This approach allows the Department to describe a range of feasible alternatives, consider their impacts, and receive public input in order to make an informed decision. Because of this, the alternatives in the EA were described in more general terms and did not outline specific dates, water levels, or flows. Additionally, a preferred alternative was not selected. Once the environmental analysis is complete, any new draft order would include specific dates as well as specific water level and flow information. Those levels and flows, along with the USGS analysis, would allow Department staff and the public to predict the frequency that certain flow events and water levels would be expected both upstream and downstream of the dam. When a new order is drafted, there will be options made available for public review and input.
e. Feasibility of alternative operations
Comments CFIC is very concerned about the liability of operating at full reservoir conditions (8'6") during the spring season. A heavy thunderstorm with several inches of rainfall would allow the reservoir to rise above the 8'6" level. This scenario is especially concerning prior to green-up where more water is made available to tributary streams and rivers.
Complying with a 'release equal inflow' requirement at all times would be impossible to meet. Calculating inflows on a continuous basis would be tedious work and require more effort (and cost) than the direct economic value. Current USGS water quantity calculations assume that all water entering the reservoir would be available for use in the reservoir and downstream river. These calculations, however, have not taken into consideration the losses occurring from farming operations, lawn irrigation and evaporation ( 4-6" per summer month). The gaged flows on inflowing tributary streams would be much greater than what is actually being observed at the dam.
Consulting with the DNR once the water elevation meets 7'0" would be problematic. And has a potential of causing inconsistent operation of the dam - the flows should be indicated in a comprehensive operating order.
Constantly changing the minimum flow requirement through the spring and summer seasons would be an administrative burden to both the WDNR and CFIC, or imy dam owner. It is doubtful that WDNR and dam owner representatives would want to convene on a daily or weekly basis to determine an appropriate minimum flow.
It is difficult to comment on the implementation of prescriptive ramping rates when their size or duration is unknown at this time. Nevertheless, CFIC is concerned that implementation of prescriptive ramping rates would reduce operational flexibility and increase dam safety concerns due to a potential inability to make the necessary discharge changes in a timely fashion.
Basing an operating order based on the monthly flow-duration values for the Manitowish River provided by the USGS (Table 12) that would provide adequate target flows 70% of the time, is most likely not sustainable.
Page 67, first paragraph: the EA states "Once the Chain reaches that level, the owner of the dam would either need to consult with DNR to determine the required flow or a minimum flow would be specified in the order." Dam operation is a complex process of evaluation current water levels, predicted rainfall and downstream conditions. Requiring the dam operator to contact WDNR every time they need to open or close the gates would be a tedious process that could cause delays and potentially serious impacts to upstream or downstream properties. The daily operation of the dam needs to be in the hands of a trained operator based

Page 47
on pre-described flow conditions. Dams operations cannot be handled by a committee, who could take days to weeks to assemble.
Response We agree. There are a number of operational issues involved with setting ramping rates, water level operating ranges, and consultation process that would need to be outlined with feasible means and methods. Page 76 of the analysis describes the level of complexity associated with the public interest and passing inflow alternatives in general terms. The owner of the dam would have the opportunity to comment on the feasibility of specific parts of a new operating order.
8. Economic impacts
a. Number and value of shoreline structures
Comments The information resulting from the 2004 survey and other observations on page 46 of the EA is suspect at best. I personally know three "dwellings" on Spider Lake alone as opposed to the ' 5 on the entire Chain' as indicated by your review. As noted in the previous letter, the assessed value of our dwelling alone is $70,000 and I fmd it unconscionable that your study and recommendations seem to belittle the dramatic damage to us and others. This is a serious matter and the economic impact to both individual residents and the entire community need to be given at least as much weight as the environmental matters!
One issue the DNR total ignored is economics. In my case, over the past 55 years of lake front ownership, I have invested $40,000 in waters edge infrastructure (boathouse, pier, shorestations, etc.). The family has spent endless hours utilizing natural materials (logs, driftwood, plants, and rocks) to reinforce the shoreline against storms and high water.
We feel the EA does not adequately identify and address the potential impacts to riparian residents on the Chain. Our field surveys and examination of aerial photos indicate that the numbers of piers, boathouses and shoreline structures that will be impacted by the proposed action are underestimated in the EA.
Page 46, Table 8: A study by Ecological Research Partners, LLC has surveyed the structures on the entire Manitowish Waters Chain. The inventory has identified the following number of structures: Winter lake bed structures (piers, decks, and boat lifts)= 1,195. Wet boathouses= 126. Dry boathouses= 65. The estimates made by DNR in the EA significantly under counts the number of structures and boathouses.
Page 49 Section 10: The EA discusses that higher proposed water levels in the winter will require "more piers would need to be taken out of the water in the fall. For stntctures that cannot be moved, it is likely that aeration systems, physical ice deflectors, or other methods would need to be installed to protect against possible ice damage." However, the EA does not discuss the cost of the recommended actions. On other lakes that don't drawdown in the winter, residents have designed their shore structures to be easily removable. With the history of winter drawdown on the Manitowish Waters Chain most residents have taken advantage of the situation and designed their piers, boat lifts and shore stations to be permanently left out all winter. Many of these residents will have to completely replace their shore structures. Based on our analysis there are approximately 1, 195 piers and associated structures on the bed of the Chain in the winter. Cost of a new pier can range from a few thousand dollars to tens of thousands of dollars depending on size and design. On the Manitowish Waters Chain this cost could range from $2,500,000 to as much as $20,000,000 depending on pier design. Cost of structure replacement should be included in the EA.
The EA does not adequately identify and quantify the positive and negative impacts of the proposed changes. The EA grossly understates and glosses over the nature and extent of property damage that will be caused by the DNR's preferred alternative. Under these circumstances, and especially given that the DNR has a
Page 48
statutory obligation to "protect property" when modifying operating orders for dams, it is unfathomable that the EA fails to quantify the nature and extent of the existing shoreline structures on the Chain, fails to acknowledge or quantify the damage that would be caused to those structures under the DNR's preferred alternative, and fails to estimate the costs that property owners on the Chain will be forced to incur to avoid that damage. To address this absolute void in the DNR's analysis, the Defense Fund commissioned a shoreline structure survey by ERP. Based upon its work to date, ERP has issued a preliminary report showing that: There are 1,226 parcels on the Chain. There are 1,022 permanent piers on the Chain which are not designed to be removed from the water each year. (The EA identifies zero.) There are 173 mobile piers on the Chain which can be removed from the water each year. (The EA identifies zero.) There are 65 dry boathouses on the Chain above the OHWM. There are 126 wet boathouses on the Chain below the OHWM. (The EA identifies 78.) There are 349 concrete seawalls, 379 stone/riprap seawalls, and 64 wood seawalls on the Chain. (The EA identifies zero.) Approximately 790 of the 1,226 parcels on the Chain (65%) have some form of shore protection. In addition to ERP's shoreline structure survey, the Defense Fund surveyed all the property owners on the Chain to determine the value of the shoreline structures noted above. Represent 75,316 feet of frontage, or nearly 1/4 of the total frontage on the Chain. Have invested $2.2 Million in 460 piers. This equates to $7,400 per respondent and $4,782 per pier. Have invested $2.8 Million in 318 boat lifts and 45 boathouses. Have invested over $1 Million in nearly 15,000 feet of seawall and nearly 14,000 feet of rock riprap, for a total of over 5.3 miles of hard armoring.
Response The Department respects the concerns about potential impacts to private structures submitted by lake residents. The potential impact to private structures will be a factor that is considered in order for the Department to make an informed decision. The Department is responsible to make decisions consistent with the legal authorities outlined on page 8 of the EA. To provide additional information to clarify the difference between public water rights and riparian rights, we hereby amend page 8 of the EA to include the following. "The foundation of Wisconsin water law includes protecting broad public water rights such as navigation, recreation, natural beauty, prevention of pollution, protection of water quality, and protection of shorelands and wetlands. Wisconsin law recognizes that owners of lands bordering lakes and rivers - "riparian" owners - hold rights in the water next to their property. These riparian rights include the use of the shoreline, reasonable use of the water, and a right to access the water. However, the Wisconsin Supreme Court has ruled that when conflicts occur between the rights of riparian owners and public rights, the public's rights are primary and the riparian owner's secondary. "
, The findings that there are many structures on the Chain, including boat houses, piers (permanent and mobile), boat lifts, riprap, seawalls, and other structures is described in the analysis on page 46. The numbers described in the EA were based on the best available data from tax assessment records and aerial photos. The analysis also discloses that depending on the choices that landowners make with their individual structures, there could be a cost for replacement or maintenance of shoreline structures if a winter drawdown were reduced or eliminated. The cost to an individual landowner would be difficult to determine because it is based on estimates of impacts from changes to winter drawdown, the condition of existing structures, and individual preferences for design and maintenance. Wet boat houses, permanent piers, boat shelters, and shore protection structures are installed and maintained on other Wisconsin lakes with a small to no winter drawdown. The analysis does conclude that structure costs and the effects of ice action are similar to what is found on other Wisconsin lakes with a small or no winter drawdown.
We appreciate the work done to help provide more information regarding the type and location of structures on the Chain along with estimated monetary values provided by a number of landowners. To reflect this additional data that is now available, we hereby amend the analysis on page 46 and 4 7 to include the following narrative. "The Manitowish Chain Defense Fund (MCDF) conducted shoreline surveys to record the number and type of stntctures on Little Star Lake, Manitowish Lake, Manitowish River, Rest Lake, Spider Lake and Stone Lake. Photos of all the shoreline structures were also submitted to the DNR. A statistical estimate of the number of structures on the un-surveyed areas on the Chain was made using a regression

Page 49
analysis between parcel number and shore structures on the sun1eyed lakes. The stntcture infonnation submitted by MCDF is as follows:
• 1022 stalionarypiers • 173 mobile piers • 65 dry boat houses • 126 wet boat houses • 349 concrete shorelines • 379 stone/riprap shorelines • 64 wood shorelines
Based on the photos submitted with the structure data, the different types of structures range from those that are currently in poor condition to those that well-maintained and in good condition. Stationary piers in particular had a large number of structures that appear to be in poor condition or that could be seasonally removed.
In addition to the shoreline stntcture survey, the Defense Fund surveyed a lithe property owners on the Chain to determine the value of the shoreline structures noted above. The response rate was less than 25%. Based on the survey information, landowners stated that they have invested $2.2 Million in 460 piers. This equates to $7,400 per respondent and $4,782 per pier. The respondents also invested $2.8 Million in-318 boat lifts and 45 boathouses and over $1 Million in seawall and rock riprap, for a total of over 5.3 miles of hard armoring. The stntcture values are based on landowner input and not a formal structural and real estate value assessment so the accuracy of these values are difficult to determine. This information is useful in that it shows that the Manitowish Chain of Lakes, like many Wisconsin lakes, contain many shoreline stntctures that are subject to a monetary cost to constntct and maintain."
b. Indirect economic impacts & broad economic impact analysis
Comments Rather than quantify and address the property damage that will be caused by the DNR's preferred alternative, the EA makes blithe assumptions that (1) the DNR's preferred alternative will not affect property values because the maximum summer water level would remain the same, and (2) any adverse impacts from ice damage "would be similar to the conditions that occur on the majority of lakes in Wisconsin, including natural lakes and impoundments."
If something has worked, why change something with so many unknowns? If this change takes place and things don't work, it effects people's investment in local business, people using the Chain and total enjoyment of this area.
There were many comments submitted that expressed concern that all property values and associated tax revenue would decrease if a new operating order were issued.
Other comments reflected the concern that any changes would cause low water levels on the Chain of Lakes in the summer that would negatively impact tourism and recreation. The issue commonly raised with these concerns included the related negative impact on the local economy.
The DNR is also silent regarding the contribution rock and sandy shores provide for recreation. These properties are highly sought for these values. Again, the DNR's bland statement on page 75 - that there would be no impact to property values- ignores that reality.
In the DNRs EA there is virtually no serious study as to the potential economic impact on the property owners or the local businesses. If the EA is implemented, however, there is potential for serious economic hardship for the property owners and businesses on the MW Chain. Despite this, we could find only a small

Page 50
paragraph addressing very general economic aspects of the study and a great number of"assumptions" on which the EA is based. There was nothing we could find in the study which outlined what the DNR's financial responsibility would be if the EA turns out to be a fmancial disaster like the last dam adjustment several years ago. In addition, if the DNR implements this plan, will it in essence be imposing a large tax on the local landowners and businesses because they bear the responsibility to protect seawalls, protect riprap, put new removable piers in, build new boathouses, protect home foundations, among other things? There is also the potential cost to local business if the economy slumps or to property owners if they suffer from real estate values declining, etc. But, like the last water management experiment on the MW Chain, the DNR seems to have no financial responsibility for their actions at all in implementing the EA and we don't understand that.
The EA does not provide an adequate consideration of the potential consequences of the proposed change in management of the water level regime for the Manitowish Waters Chain of Lakes, nor does it provide sufficient scientific analysis to support many of the conclusions reached. The proposed action is a significant and complex issue, and must be evaluated in light of a balanced and critically considered test that weighs both the benefits and negative impacts. The EA under Wisconsin Administrative Code NR 150 is the document that should provide to the public the information used in the balance test and should explain the reasoning for how the issues were balanced. The balance test must weigh the potential benefits to the natural resources with respect to the potential negative impacts to the area residents. The EA does not meet this standard.
Due to the economic impact such a proposal will have on the Town and lowering property values, I think an economic impact study is necessary.
Response As described in the EA, negative impacts to tourism, recreation, and the local economy are not anticipated since the range of alternatives considered would all reduce the frequency and duration of low water conditions on the Chain. Measureable negative impacts to property values are also not expected but as described in the analysis, the cost to protect and maintain shoreline structures is expected to increase and be similar to what lakeshore owners experience on other similar sized Wisconsin lakes.
Many of the comments above reflect the opinion that the Department should provide a more detailed analysis of economic concerns. As described in the general comments, the Department has substantial authority to . regulate environmental pollution and alteration to waterways. However, the standards we can apply in exercising these authorities are defined in various regulatory statute and administrative rules. For many Department regulatory programs, these standards do not include social or economic concerns. While rules guiding the development of environmental analysis documentation require general disclosure of direct social and economic concerns to the extent known or reasonably anticipated, a more formal economic impact analysis is not part of the WEP A process.
9. Adequacy of the analysis
a. Timing
Comment When your report came out a great majority of summer residents and visitors are not in the area. It is so important that all owners know of the Department's direction and impact it will have on their property.
Response The environmental analysis was first available for public review in mid-September and not during the winter or early spring months to ensure that local stakeholders had a reasonable opportunity to review and comment

Page 51
on the EA. Additionally, the EA was available electronically allowing for easy access for those not in the area during the public comment period.
b. Scope of analysis
Comments I do not believe the DNR has gathered sufficient data to reach the conclusions they have on the effects of the proposed changes to the operation of the dam. I do not believe the limited data provides for statistically significant conclusions and, therefore, the conclusions are speculative. Any changes to the operation should be gradual and thoroughly studied before any permanent changes are made.
The extensive studies submitted on the website make it quite difficult to get a grasp of what is actually happening "downstream".
I write to commend DNR on a thorough and thoughtful EA.
We would like to congratulate the DNR for its thorough look at the issue of the Rest Lake Dam and how it is being used to manipulate the river level.
We have seen firsthand the adverse effects the current operating policy of the dam has had on the environmental health of the river ad documented in the EA. The Department ofNatural Resources has done an outstanding job of investigating and documenting the effects of the current operation policy of the dam on the Manitowish River.
The effect on fish and wildlife above the dam should be thoroughly studied before considering such changes.
To begin, we are impressed with the thorough and informative environmental review of the current and proposed operating orders for Rest Lake Dam on the Manitowish River. The operation of Rest Lake Dam has been a controversial issue for many years and we acknowledge and appreciate the care the agency took with collecting the necessary data to complete an EA and propose alternatives to address the major concerns with the status quo in a way that balances multiple interests on the river and the Chain of Lakes.
The EA speculates that the DNR's preferred alternative will benefit the environment but does not provide any robust scientific analysis to support that speculation. In most instances, to the extent the EA tries to emphasize the positive effects of the DNR's preferred alternative or minimize its negative effects, the EA lacks sufficient scientific analysis to support the conclusions reached. When so many vital community interests are tied up in the dam, it is beyond poor practice for the DNR to propose sweeping changes to the operating order without having conducted the scientific analyses necessary to determine what the effects of the changes will be.
I appreciate the excellent and thorough job done with this Environmental Assessment (EA). The science and detail are excellent. The DNR is to be commended for this work.
Response A few commenters expressed the opinion that, overall, the EA was either too technical or too general. This is a difficult issue to address given the wide range of interest, knowledge, and understanding for potential reviews of an EA. Some people like and want lots of technical detail while others prefer general summaries in plain text. We are also legally bound under WEP A to provide certain technical details (e.g. the EA has to be an analytical document) as well as an analysis that is written in plain language. In developing the EA, Department staff tried to strike a balance for the target audiences. We tried to provide an explanation of technical terms in the narrative of the text where appropriate. We also referenced and attached more technical details in some attachments for those people who might want this information.

Page 52
c. Precedent
Comment Page 78, Part 18: The EA states that the, "The proposal to write a new operating order for the dam is not expected to influence fitture decisions orforeclose options that may additionally qffect the quality of the environment .. " However, only a few dams are operated to maintain a "Public Interest River Flow" or natural flow regime and almost all of these are dams that have a FERC license for power gen~ration. This project could be used by the WDNR to justify re-opening dam operation orders on other lakes in the state. I do not agree that the proposed action from a legal standpoint will not set a precedent for actions on other lakes.
Response The proposal to issue a new operating order for the Rest Lake Dam is not tied to any proposals to re-open other dam operation orders on other lakes. The Department must review each project on a case-by-case basis according to current water law in Wisconsin. In other words, each individual project must stand on its own merits.
d. EA vs. EIS
Comments A number of individuals commented that there needs to be an Economic Impact Statement to accurately evaluate the impact current and alternative operations of the Rest Lake dam.
To lower the water level on the Manitowish Chain to the point that navigation between these bodies of water is impossible, and lower the shoreline water level so that families such as ours could not swim, boat, fish and enjoy the wildlife as we know it constitutes a "major action significantly affecting the quality of the human environment" for every land owner on the Manitowish Chain.
The draft EA states that an EIS is not necessary because there will be little economic impact by changing from Option 1 or 2 to Option 3 or 4. This is an egregious overstatement, as there will undoubtedly be significant costs form many land owners, us included, for many years to come on many individual propetties. If there is serious movement to go to Option 3 or 4, there absolutely needs to be a full blown EIS that takes into account the full economic impact of such drastic change. This is a very big deal!
The WI DNR has proposed changes to the Rest Lake Operating Orders that will result in water levels changes that will significantly impact property owners, the local economy, and safety. We are not sure whether these changes are worth the ultimate "costs" to this beautiful area.
Resnonse It is a common public view that a particular problem would be solved if only the Department would prepare an Environmental Impact Statement (EIS). These particulate "problems" are usually some type of unwanted project being proposed. In reality, WEPA only provides an informational process through the development of environmental analysis documents. EIS's and EA's are designed to provide a full, factual disclosure of anticipated impacts and address alternatives- they don't stop projects, they don't approve projects, they don't modify projects- they inform. WEPA does not mandate particular results or decisions in specific cases but simply exists to ensure that environmental effects of a particular project are identified and evaluated during the planning stages. WEPA does not prohibit unwise decisions, only uninformed ones.
Another public view commonly expressed is that without an EIS the Department's environmental review is incomplete or inadequate. This perception has resulted in much unproductive debate and litigation. Preparation of an EIS does not give the' Department any additional authority. In many regulatory circumstances, an EIS would neither add anything of value to the Department's review taking place under the substantive environmental laws nor would it result in a different decision. .

Page 53
Lastly, since EA's and EIS's are similar in both content and process, the distinction between these two instruments has become quite blurred over time. There are numerous examples where the Department has prepared comprehensive EA's that in previous years would have had a cover which read EIS. Likewise, there are examples of situations where the Department has prepared EIS 's that would in other situations been labeled as an EA. The common sense approach that has been applied in more recent years is to develop an environmental analysis to the level of detail required to fully and adequately address anticipated impacts for a particular proposal, regardless of what we call it. We believe this approach is in keeping with the spirit and intent ofWEPA and results in a more efficient, productive, and useful environmental analysis process.
Chapter NR 150, Wisconsin Administrative Code, provides environmental analysis rules and procedures for Department actions to comply with WEPA. NR 150 indicated that an EIS is required on major actions that would significantly affect the quality of the human environment. The meaning of this threshold is clarified by the definition of terms in the code as follows:
• Human environment- "Human environment" means the natural or physical environment and the relationship of people with that environment.
• Major action- "Major action" means an action of such magnitude and complexity that the action will have significant effects upon the quality of the human' environment. It does not include actions whose significance is based only on economic or social effects.
• Significant effects- "Significant effects" means considerable and important impacts of major actions on the quality of the human environment.
Over time these terms have been further clarified through the courts, our own experiences, and guidelines provided by CEQ (President's Council on Environmental Quality guides and directs interpretation and application of the National Environmental Policy Act which WEPA was patterned after). The terms used to define "major action" have been interpreted as follows:
• Magnitude- the extent to which the action will cover various conditions-> What is the scope of the project and anticipated effects (i.e. the range within an action will display or manifest itself)?
• Complexity- the complexity is a matter of degree (relative) -Is the project inherently complex? Is the project made up of so many different, interrelated parts or elements that it requires study or expert knowledge to deal with it before an action can be fmalized (i.e. permit decisions)?
• Notable or serious -must only satisfy one or the other, not both -> Will the action attract attention to something of quality or significance? Is there anything about the action (eg. special features) that makes it worth remembering? If so, how much and are the attracting features worth pursuing in greater detail? Will the action require concern for management, policy, or ecological issues of consequence?
The key in making determinations on the need for an EIS rests with determining if significant effects (either beneficial or adverse) could result from a particular project proposal. As with defming what constitutes a "major action", terms used to define "significant effects" have likewise been interpreted over time as follows:
• Considerable - considerable impacts are those that are large in number and cover a broad range of resources (i.e. breadth) and the effects are evident to some degree on a scale of non-little-some-majorirreversible (i.e. depth).
• Important - determination of importance required a judgment by which you ascribe superior value or influence to a particular effect (ultimately in total).
• Long-term- effects are considered long-term if they are expected to persist for more than one generation (i.e. 20-25 years).
• Significance varies with the setting of a proposed action
Page 54
• Determination of significance requires a consideration ofboth context and intensity. Context means that the significance of an action must be analyzed in several contexts - society as a whole, the affected region, the affected interests locally. Intensity refers to the severity of the anticipated impact. Evaluation of intensity ofvarious impacts requires a consideration of the primary and secondary effects relative to whether they are long-term versus short-term, the effects on geographically scarce resources, cumulative effects, uncertain or unknown risks, precedent for future actions, and controversy over any environmental effects, particularly those that affect public health and safety (these questions are required to be addressed in the section on significance in our environmental analysis).
Many individuals commenting on the EA stated that they believed the proposed project would cause certain significant effects. From a particular individual's perspective, certain potential impacts may be viewed as significant. We do not deny that something may be significant to someone, particularly when it affects them directly and personally. However, for the purposes ofWEPA we must consider significance in a broader perspective as defmed above. There are many project proposals that will result in environmental effects for which the Department provides approval. WEPA simply requires that we identify those potential effects and determine which ones, if any, are likely to be significant. The proposed issuance of a new operating order would result in certain environmental impacts as disclosed in the environmental analysis presented. However, based on the EA and the subsequent amendments herein, we do not believe any of the anticipated environmental effects would be considered significant. Therefore, we conclude that an EIS is not necessary.
10. Future permitting process
Comment What is the process moving forward if the operating order is to be changed? Will there be a ~omment period or a public hearing on the exacting operating order that is implemented?
Response The Department plans to hold a public meeting on the draft operating order in the summer of 2013 to seek public input prior to finalizing an operating order for the Rest Lake Dam. Current updates can be found on the DNR website at: http://dnr.wi.gov/water/basin/upwis/restlakedam/
-Dated May 101h, 2013-

DATE: Friday, Sept. 14, 2012
CONTACT: Jon Simonsen, DNR environmental review coordinator, (715) 365-8916
SUBJECT: Rest Lake Dam Environmental Assessment Available for Public Review, Comment
Manitowish Waters, WI- The Department of Natural Resources is proposing to issue a new operating order to Xcel Energy for operation of the Rest Lake Dam located on County Trunk Highway "W" in the Town of Manitowish Waters, Vilas County. This dam controls water levels on a chain often natural lakes and river channels known as the Manitowish Chain of Lakes. Downstream, the Manitowish River flows for about 15 miles where it enters the Flambeau River.
The purpose of this new order would be to specify cetiain water levels on the Chain and river flows downstream. Changes in levels and flows are needed to better balance and protect natural resource as well as public use interests in the system.
Before a decision can be made on the new operating order, an Environmental Assessment (EA) must be completed. The purpose of the EA is to provide a factual disclosure of alternatives considered and anticipated environmental impacts. The EA does not provide any permitting decisions or approvals on the project. However, this analysis will be used to guide the Department's decision on a new operating order.
The Depmtment has prepared a draft EA and made a preliminary decision that an environmental impact statement will not be required. Copies of the draft EA can be obtained from Jon Simonsen, DNR Environmental Review Coordinator, DNR Service Center, 107 Sutliff A venue, Rhinelander, WI 54501, 715/365-8916, or by e-mail at: [email protected]. A copy of the EA can also be viewed on-line at: dm.wi.gov/water/basinlupwis/restlakedam.
Comments on the draft EA are welcome and should be focused on issues related to the clarity, accuracy, and level of detail of information presented in the analysis. Comments should be received by Mr. Simonsen no later than 4:30p.m., Wednesday, Oct. 31,2012. Comments may be submitted verbally, electronically, or in hard copy written form.
--30--

ENVIRONMENTAL ANALYSIS AND DECISION ON THE NEED FOR AN ENVIRONMENTAL IMPACT STATEMENT (EIS) Department of Natural Resources (DNR)
Form 1600-1 Rev. 6-2010
NOTE TO REVIEWERS: This document is a DNR environmental analysis that evaluates probable environmental effects and decides on the need for an EIS. The attached analysis includes a description of the proposal and the affected environment. The DNR has reviewed the attachments and, upon certification, accepts responsibility for their scope and content to fulfill requirements ins. NR 150.22, Wis. Adm. Code. Your comments should address completeness, accuracy or the EIS decision. For your comments to be considered , they must be received by the contact person before 4:30p.m. , Wednesday, October31, 2012.
Region or Bureau
Northern Type List Designation
NR 150.03(8)(f)8a
Contact Person:
Jon Simonsen
Title: Environmental Review Coordinator
Address: 107 Sutliff Ave.
Rhinelander, WI 54501
Telephone Number:
715-365-8916
Email:
Jonathan.Simonsen@wisconsin .gov
Title of Proposal: Evaluation of a New Operating Order for the Rest Lake Dam
Location: Vilas County, Town of Manitowish Waters
Township Range Section(s): NW1/ 4 , NW1
/ 4 , Section 9, Township 24 North , Range 5 East
PROJECT SUMMARY
1. Brief overview of the proposal including the DNR action
The Rest Lake Dam is located on the Manitowish River in Vilas County where the dam structure is incorporated into the County Highway 'W' bridge. The dam creates an impoundment, or reseNoir, upstream that controls the water level on a chain of ten natural lakes and river channels known as the Manitowish Chain of Lakes (Figure 1). The terms impoundment, reservoir, and Chain of Lakes will be used interchangeably when referring to the water held back by the dam. Downstream, the Manitowish River flows through three small lakes and then travels about 15 miles where the Manitowish and Bear Rivers combine to become the Flambeau River (Figure 2). The current owner of the Rest Lake Dam is Xcel Energy which is part of the Chippewa and Flambeau Improvement Company (CFIC) . The hydropower generated downstream resulting from the fall drawdown of the Manitowish Chain of Lakes has been evaluated by the Federal Energy Regulatory Commission (FERC). The Commission concluded that management of water levels and flows was "neither used and useful nor necessary or appropriate to maintain or operate" for hydro power generation. Currently, the operations of the Rest Lake Dam are
..... ·-···-· -···-·-- -------·--------- ·-········--- - --- ---- ... .... ····- ···- ------ ------ ······- ··----- ~-------- - .. -- · --- ------ ·-- ------1 I Page

0
focused primarily on upstream water interests including minimizing possible ice damage to piers and shoreline structures, as well as keeping water levels above the dam in a narrow operating range near the maximum water level from June through October.
The current operation of the dam creates surface water levels and flows that are substantially different compared to the natural, annual pattern of levels and flows on northern Wisconsin lakes, rivers, and wetlands. This change in hydrology negatively affects the Manitowish River system upstream of the dam on the Chain of Lakes and downstream of the dam to the confluence with the Bear River. The Department of Natural Resources proposes to issue a new operating order to the owners of the Rest Lake Dam which specifies water levels and flows that balance and protect public water resource rights as well as life, health, and property, both upstream and downstream of the dam.
Figure 1. Chain of Ten Lakes above the Rest Lake Dam
2 I Page

Figure 2. Manitowish River below the Rest Lake Dam
. .
Lake
2. Purpose and Need (include history and background as appropriate)
Rest Lake Dam
.-
The upper Manitowish River system was identified as a potential reservoir site over 130 years ago when officers from the United State Army Corps of Engineers were exploring the sources of the Mississippi, Saint Croix, Chippewa, and Wisconsin Rivers. Their report to Congress in 1879 identified the Rest Lake outlet as a potential site to raise water levels 25 feet to improve the navigation of the Flambeau and Chippewa River systems.
In 1887, a dam was built at the outlet of Rest Lake by the Chippewa Lumber and Boom Company for the purpose of storing water to release in the spring in order to float logs downstream. As the timber resources in the area were depleted, the water stored in the reservoir above the Rest Lake dam began to be utilized for other uses including flood control, navigation, and hydropower generation. In 1911 , the Chippewa and Flambeau Improvement Company (CFIC) was granted authority by the Wisconsin legislature to construct, .
. ·- .. ____ .................. _ .... .. ...... _ ............. · ........ j . .. j "" i?' age ............................ ___ ·-- ----·-- .. - ............... ............ ..................... ..

acquire, and operate dams on the upper portions of the Chippewa and Flambeau Rivers according to the provisions and legislative intent of Chapter 640, laws of 1911 which are now recorded as Chapter 182.71, Wis. Stat. as follows:
''The company shall produce as nearly a uniform flow of water as practicable in the Chippewa and Flambeau rivers, by storing in reservoirs surplus water for discharge when the water supply is low, to improve the usefulness of the rivers for all public purposes, and to reduce flood damage.
If maintaining uniform flow throughout the length of these rivers is impracticable, the company shall maintain as nearly a uniform flow in the upper portions of these rivers as is practicable."
It is important to note that the Upper portions of the river that are referred to in these laws are meant to describe the water flow below and not above the Rest Lake Dam. By the early 1900's, CFIC operated the Rest Lake dam to provide water for occasional log drives on the Flambeau River, but the reservoir was primarily managed to store water for hydropower generation downstream. During this time, water levels on the Chain were held as high as 15 feet as recorded on the Rest Lake dam gage. The fluctuations of reservoir water levels were reviewed in 1914 by the Wisconsin Railroad Commission, which, at the time, was the state agency responsible for reviewing dam operations. During this operating order review, the citizen testimony identified potential impacts to hunting and fishing , shoreline erosion, and damage to shoreline structures associated with water level management on the reservoir. Based on the review by engineering staff as well as testimony provided by citizens, an 8' 0" maximum and a 5' 6" minimum water level was established for the reservoir.
In 1915, CFIC requested a rehearing on the operating order and requested that water storage of the reservoir be increased with a maximum water level elevation of 1 0' 0" and a minimum water level of zero feet in order to increase downstream power generation . During these hearings, the Railroad Commission reinforced the need to consider impacts on the reservoir, and the agency found that the CFIC request would cause excessive damage to the fishery and to shoreline property in an area that was already considered "one of the most famous summer resort and fishing waters in the state of Wisconsin". The decision on the operating order was as follows:
"That the Chippewa and Flambeau Improvement Company maintain the level of the reservoir controlled by its Rest Lake dam located in section 9, township 42 north of range 5 east, in the town of Flambeau, Vilas county, Wis., with the least possible variation consistent with the proper use of said reservoir.
During all seasons of the year the Chippewa & Flambeau Improvement Company shall not permit the level of Rest Lake to exceed a point 14 feet below the top of the Railroad Commission's bench mark No.2 (8 feet 6 inches on the gauge board).
During all seasons of the year, except when the entire surface of Rest Lake is covered with ice, the Chippewa & Flambeau Improvement Company shall not permit the water to be drawn to a point lower than 17 feet below the top of the Railroad Commission's bench mark No.2, (5 feet 6 inches on the gauge board}, and during the season of the year when the entire surface of Rest Lake is covered with ice the Chippewa & Flambeau Improvement Company may draw the water to a point not lower than 20 feet below the Railroad Commission's bench mark No.2 (2 feet 6 inches on the gauge board)."
In 1928, the operating order was modified to outline the conditions that needed to be met to provide water for log drives on the Flambeau River.
A fish ladder was built at the dam in 1930 that operated for several years . Additionally, in the mid 1930's the state built a fish hatching station below the Rest Lake Dam (Figure 3) . The station was used into the
4 I Page
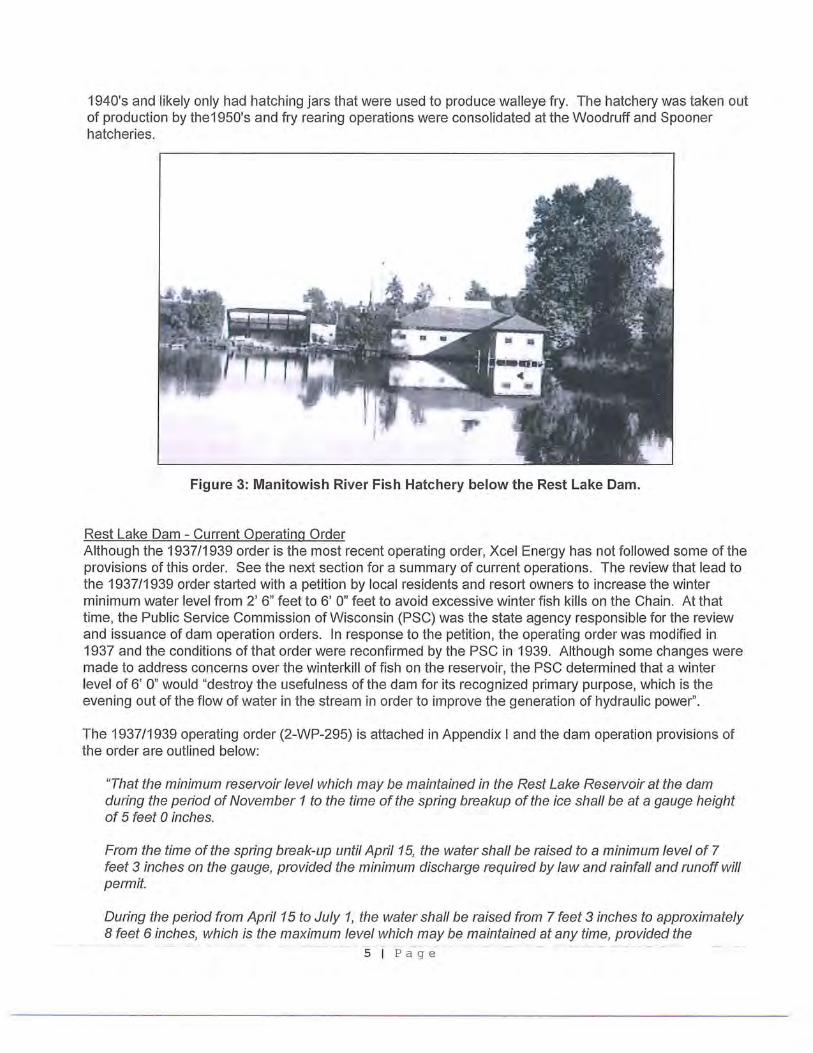
1940's and likely only had hatching jars that were used to produce walleye fry. The hatchery was taken out of production by the 1950's and fry rearing operations were consolidated at the Woodruff and Spooner hatcheries.
Figure 3: Manitowish River Fish Hatchery below the Rest Lake Dam.
Rest Lake Dam - Current Operating Order Although the 1937/1939 order is the most recent operating order, Xcel Energy has not followed some of the provisions of this order. See the next section for a summary of current operations. The review that lead to the 1937/1939 order started with a petition by local residents and resort owners to increase the winter minimum water level from 2' 6" feet to 6' 0" feet to avoid excessive winter fish kills on the Chain. At that time, the Public Service Commission of Wisconsin (PSC) was the state agency responsible for the review and issuance of dam operation orders. In response to the petition, the operating order was modified in 1937 and the conditions of that order were reconfirmed by the PSC in 1939. Although some changes were made to address concerns over the winterkill of fish on the reservoir, the PSC determined that a winter level of 6' 0" would "destroy the usefulness of the dam for its recognized primary purpose, which is the evening out of the flow of water in the stream in order to improve the generation of hydraulic power".
The 1937/1939 operating order (2-WP-295) is attached in Appendix I and the dam operation provisions of the order are outlined below:
"That the minimum reservoir level which may be maintained in the Rest Lake Reservoir at the dam during the period of November 1 to the time of the spring breakup of the ice shall be at a gauge height of 5 feet 0 inches.
From the time of the spring break-up until April15, the water shall be raised to a minimum level of 7 feet 3 inches on the gauge, provided the minimum discharge required by law and rainfall and runoff will permit.
During the period from April15 to July 1, the water shall be raised from 7 feet 3 inches to approximately 8 feet 6 inches, which is the maximum level which may be maintained at any time, provided the
- - .. .. -"···· . ... ---- .. - -5 I Page

minimum discharge required by law and rainfall and runoff will permit. From July 1 to September 1, the water may be drawn not lower than a gauge height of 7 feet 3 inches.
From September 1 to November 1, the water may be drawn to a stage not lower than 5 feet 0 inches on the gauge.
At no time shall the reservoir be lowered at a rate exceeding 2 inches per day. At no time shall the reservoir be lowered after the ice sheet forms in the early winter and before the ice breaks up the following spring. The water surface may exceed the minimum levels fixed for the various periods of the year at any time, provided that the rate of lowering the reservoir thereafter does not exceed 2 inches per day.
Table 1. Summary of the 1939 Operating Order
Dates Headwater Levels Required Flows November 1 to Spring thaw (initial runoff event, - 3rd week of March).
Minimum of 5'0" Run of River (1)
Spring thaw to April 15 (- ice out on Minimum of 7'3" 40 cfs of more Chain)
April 15 to July 1 7'3"- 8'6" 40 cfs or more
July 1 to September 1 No lower than 7'3"-8'6" 40 cfs or more
September 1 to November 1 No lower than 5'0" 40 cfs or more
(1) Outflow equals inflow.
Current Operation of the Rest Lake Dam After 1939, there was no further regulatory review of operations until the late 1990's when Federal Energy Regulatory Commission (FERC) studied the usefulness of the Rest Lake and Turtle Flambeau reservoirs for hydropower generation downstream. Even though the owners of the dam were a hydropower company, Chippewa and Flambeau Improvement Company argued that the operation of the Rest Lake Dam was not used for hydropower generation and , as such, should not be regulated by FERC. The following conclusions were made by FERC based on their evaluation of the usefulness of the Rest Lake and Turtle Flambeau reservoirs for downstream power generation. (FERC Docket Nos. UL96-16-006 and UL96-17-006, issued 2001).
"We have found that there are circumstances where a storage facility has an impact on generation at downstream licensed projects that is discernible, but nonetheless so insignificant that the storage facility cannot be found to be "used and useful" or "necessary or appropriate" for such generation and therefore is not subject to our jurisdiction.
We then applied that test to the facts at hand. We noted that in combination, operation of the Rest Lake and Turtle-Flambeau increases generation at downstream licensed hydro projects by 9 GWh, which is 5-6 percent of the total generation at those facilities. However, Rest Lake by itself increases generation by only 0.1 GWh, which amounts to approximately 0.06 percent of total downstream generation. We therefore conclude that Rest Lake is neither used and useful nor necessary or appropriate to maintain or operate the downstream projects. Accordingly, we granted rehearing and conclude that we have no jurisdiction over this reservoir."
6 I P a ge

Operating records of reservoir levels and dam discharge show that certain provisions and the overall intent of the 1939 operating order are not being followed. Based on the way the dam is currently being operated, it appears that water levels are being managed primarily for accommodating upstream water interests. By not capturing high spring runoff to bring the Chain to 7' 3" by April 15th as written in the 1939 order, the time needed to refill the Chain, the time that only minimum flows are passed downstream, and the probability that the Chain will not reach the 8'6" during low precipitation years are all increased. Spring refill, for example, does not begin until ice is 75% off of Rest Lake to avoid potential ice damage to permanent piers and boat houses. On average, refill begins on April 20th which is often after most of the high spring runoff events have passed through the dam. During the summer months, reservoir storage is not used to augment low flows downstream and water levels on the Chain are maintained in a narrow range between 8' 4" and 8' 6", not between 7'3" and 8'6" as specified in the 1939 cirder. When water levels drop below 8' 4", flows over the dam are quickly reduced to minimum flows. In the fall, to accommodate navigation during community events such as Colorama, the reservoir is maintained at 8' 6" until late September or early October. The drawdown to the target 5' 0" winter level could begin September 1st. By keeping the reservoir at the maximum level until late September or early October, the late draw down date combined with fall precipitation often results in the highest annual flow events below the dam.
Table 2. Summary of Current Annual Operations
Dates Headwater Levels Flows November 8 to Spring ice breakup or ice out Minimum of 5'0" Run of River (75% ice off of Rest Lake)(- April20).
Spring break-up (-April 20) to July 1 5'0"- 8'6" 40 cfs of more
July 1 to September 28 No lower than 8'4"-8'6" 40 cfs or more
September 28 to November 8 No lower than 5'0" 40 cfs of more
At any time of year, the minimum river flow required at the dam stems from Chapter 31 .34 Wis. Stat. which states that a dam must discharge at least 25% of the stream's natural low flow. This was calculated by estimating the 0 7_10 flow which is defined as the lowest average flow for a consecutive seven-day period with an average recurrence interval of ten years. The 0 7_10 is mainly used for the permitting of waste water discharges and these flows are not considered protective of aquatic life and habitat. In 2007, the USGS estimated the 0 7_10 at 40 cubic feet per second (cfs) .
. --~- . - . ····- ......... ··-··········· ·· - -- --- . --·---····---·-······ 7 I Pag e

Current Water Levels and Flows In November of 2009, the USGS placed gaging stations to record the f low on the three largest inflows to the Chain (the Manitowish River, Rice Creek, and Trout River), the water level elevation at the dam, and the river flows downstream of the dam (Figure 5). This information, along with historical dam operating records and nearby long term gaging stations on the Bear and Trout Rivers were used by USGS to develop inflow models for the Manitowish River at the Rest Lake Dam (the USGS report is included in Appendix II). The results of this study are described later in the section describing the natural pattern of flows on the Manitowish River system. The following web links can be used to view the data collected as well as the current water level and flow information. It is likely these stations will be discontinued in 2012 unless funding is found for their continued operation.
• Manitowish River near County Highway H http://waterdata.usgs.gov/wi/nwis/nwisman/?site no=05357157
• Rice Creek near County Highway K http ://waterdata. usgs. gov/wi/nwis/nwisman/?site no=05357182
• Trout River near Boulder Junction http://waterdata.usqs.gov/wi/nwis/nwisman/?site no=05357259
• Rest Lake Water Level at the Dam http://waterdata.usgs.gov/wi/nwis/nwisman/?site no=460819089530500
• Manitowish River at Highway 51 http://waterdata.usqs.gov/wi/nwis/nwisman/?site no=05357302
• Trout River at Trout Lake http://waterdata.usgs.gov/wi/nwis/nwisman/?site no=05357245
• Bear River near Manitowish Waters http://waterdata.usgs.gov/wi/nwis/nwisman/?site no=05357335
3. Authorities and Approvals (list local, state and federal permits or approvals required) • s. 31.02 Wis. Stats. Regulation of Dams and Bridges Affecting Navigable Waters: Powers and duty of
department. • s. 31.34 Wis. Stats. Regulation of Dams and Bridges Affecting Navigable Waters: Flow of water
regulated. • s. 182.71 Wis. Stats. Miscellaneous Corporate Provisions: The Chippewa and Flambeau Improvement
Company. History: 1979 c. 90s. 20; 1979 c. 177; 1985 a. 182 s. 57; 1995 a. 196; 1997 a. 140; 1999 a. 150. Annotation Legislative Council Note, 1979: The Chippewa and Flambeau Improvement Company was created by ch. 640, laws of 1911, for the purpose of building, maintaining and operating dams and reservoirs on the Chippewa and Flambeau rivers. These improvements on the river serve to improve navigation, decrease the hazard of flooding and provide a uniform flow for all public purposes.
• Wisconsin Constitution: Article IX, Section 1. The Public Trust Doctrine: Wisconsin's Public Trust Doctrine is a body of constitutional, common (court-interpreted), and statutory law establishing public rights and the State's obligation to protect them in navigable bodies of water. The Trust Doctrine is based on ideas found in the Northwest Ordinance of 1887 and is incorporated into the Wisconsin Constitution. The Wisconsin Supreme Court has declared that the State holds navigable waters in trust for all citizens. The Trust Doctrine establishes the concept that public water rights such as water quality, quantity, scenic beauty, and recreational use need to be protected for the benefit of current and future generations.
8 I P a ge

Figure 5. Map showing the extent of the Manitowish River flowage and the gaging stations installed by USGS (from USGS report).
Base map compiled and modified from digital data sources: U.S. Geological Su!Vey, 1:24,000
EXPLANATION
Cranberry bogs
[=:J Lakes and ponds
• Streamflow-gaging stations upstream ofthe Manitowish Chain of Lakes
r---1 . . . • Lake stage gaging station ......... Mamtow1sh Charn of lakes at the RestLake Dam and
streamflow-gaging station ~ · at State Highway 51, · Streamflow direction downstream of the -.. - - State Highway 51 Manitowish Chain of Lakes
---· County and town roads
--- Rivers EB Streamflow-gaging
stations used as part of the adjusted drainage-area ratio method
9 I P age
4 MILES 1 I
I I I I I I · I I
1 2 4 KILOMETERS

[This page intentionally left blank]
10 Page

AFFECTED ENVIRONMENT (describe existing features that may be affected by proposal)
4. Physical Environment (topography, soils, water, air)
Landscape The landscape of the Manitowish River system is characterized as a pitted outwash plain with a high density of lakes and wetlands that were created during the retreat of ice during the Wisconsin period of glaciation. The landscape is generally flat, 0 to 2 percent slopes, and the soils in the area are acidic, sandy, very well drained, and have a shallow organic layer horizon.
Surface Waters Affected by the Operation of the Dam The current maximum water elevation upstream of the dam is measured as 8' 6" on a gage at the Rest Lake Dam which corresponds to an elevation of 1601 .0 NGVD (National Geodetic Vertical Datum). The elevation of the apron below the water control gate and stop logs is 1593.5. If the dam were removed, depending on the removal techniques and outlet characteristics left in place, elevations upstream of the dam would be expected to drop to between 1591.8 (the tailwater elevation recorded downstream of the dam on October 29, 1980) and 1587.5 (the elevation of the lowest apron spillway on the dam). These elevations correspond to a drop in water levels upstream of the dam of 9.2 to 13.5 feet (Figure 6) .
. Figure 6. Schematic of the Rest Lake Dam
EL.•l592,S
l, ·' "'
25'·6'"
EL.=I602.5 . tlalMAI. Poet. El,;. ISOI.O
pea;" EL.ci5'3M _ _,.,_.,___110129/gQ)
STEEL SHEET Pli.ING
The current operation of the Rest Lake Dam affects lake levels upstream on Rest, Clear, Fawn, Stone, Spider, Island, Wild Rice, Alder, Manitowish, and Little Star Lakes (figure 1), and Vance, Sturgeon, and Benson Lakes, along with the Manitowish River downstream from the dam (figure 2). During the summer maximum water level of 8'6", aerial photographs of the reservoir show the backwater of the dam extends to approximately 3,000 feet upstream of CTH 'K' on Papoose Creek, to approximately 800 feet upstream of CTH 'K' on Rice Creek, to approximately one mile upstream of Island Lake on the Manitowish River, and to approximately Gresham Creek on the Trout River near CTH 'H' . The total surface water area of these lakes and connecting channels at the full pool 8' 6" elevation is 4,392.4 acres. At a 3 foot drawdown, based on USGS estimates, there are 3736.4 acres of surface water and 656 acres of dewatered lakebed. The Chain also has approximately 60 miles of shoreline, including islands. The physical characteristics of the Chain of Lakes above the dam and the lakes below the dam are summarized in table 3 on the following page.
11 I Page

Table 3. Characteristics of Lakes Affected by the Rest Lake Dam
Maximum Mean Depth Lake Acreage Depth (feet) (feet)
Above the dam· Rest Stone Fawn Clear Spider Island Manitowish
Little Star Alder Wild Rice
Below the dam· Vance Benson Sturgeon
Abbreviations:
SO= sand GR =gravel
808
139 74
555 272 1023
496 245 286 379
30 28 32
53
43 14 45 43 35
61 67 33 26
12
15 18
RK =rock . MK =muck
18 12 7 16 20 13 23
31
11
Miles of Shoreline (includes Islands)
7.99 3.56 2.76 7.05 5.92 16.75
7.6
3.79 3.9
3.71
DG = drainage SP =seepage
Lake Bed Lake Type
SO, GR, RK DG
SO, GR DG SO, GR DG SO, RK, GR SP SO, RK, GR DG SO, RK, GR, MK DG
SO, RK, GR, MK DG
SO, RK, GR, MK DG SO, RK, GR, MK DG SO, RK, GR, MK DG
SD, RK DG
SO, GR, RK DG
SO, RK, GR, MK DG
With the flat topography, water level fluctuations that occur at the dam are quickly mirrored throughout the Chain of Lakes. Survey field data have confirmed that a water level drop at the Rest Lake dam corresponds with a similar water level fluctuation on Rest, Island, Spider, Fawn, and Little Star Lakes (Figure 7). The water levels on two lakes, Wild Rice Lake and Clear Lake, did not decrease as much as the others on the Chain when the reservoir approaches current winter drawdown levels. When the survey was conducted, the amount of drawdown on Wild Rice Lake was still influenced by the Alder Lake Road culvert on the Trout River. The Township recently replaced this structure with a bottomless arch culvert, and it is likely that Wild Rice Lake will react to water level fluctuations similar to other lakes on the Chain . The extent of drawdown on Clear Lake is still affected by the elevation of the shallow streambed connection between Clear and Fawn Lakes.
Downstream of the Rest Lake Dam, the Manitowish River flows through three small lakes and then travels about 15 miles to where the Manitowish and Bear Rivers combine to become the Flambeau River (figure 2 & table 3). Along the River, there are small tributary inflows identified on USGS topographic maps at Circle Lilly Creek, a small unnamed tributary near the Highway 51 wayside park, and four other unnamed tributaries. There are dams on two of these tributaries, the Brandt Lake Dam and Circle Lily Dam. The majority of the river flow below the Rest Lake Dam down to the Turtle Flambeau Flowage comes from the flows discharged from the dam.
12 I Page

Figure 7: Drawdown Rates of the Lakes on the Chain
1602
-+-Wild Rice
-- Island
Spider 1601 ~Clear
-liE-Fawn
-+- Little Star
-+- Rest
g 1600
> (I)
w 1599
1598+---------------------~----------------------------------------~
1597+------+------+------+------+------+------r------r------r-----~~
9/30 10/5 10/10 10/15 10/20 10/25 10/30 11/4 11/9 11/14
2008 Date
Watershed and Reservoir Inflows The drainage area of the Rest Lake reservoir is about 231 square miles. The basin is composed of approximately 34 square miles of open water (e.g. the reservoir itself and other directly connected surface waters), 51 square miles of connected wetlands, 114 square miles of connected uplands, and 32 square miles of isolated waterways and wetlands (e.g. isolated areas that do not drain to the reservoir through surface waters or connected wetlands) (Rudolph, R.M., et. al.). On average, there is 34 inches of annual precipitation which includes 85 inches of annual snowfall in this watershed. The normal monthly precipitation for this area of the State is shown on Figure 8.
Figure 8. Rest Lake 1971-2000 Precipitation (Wisconsin State Climatology Office)
4
1--
II II
0.5
0 J.t..N FES MAR AFR ti.AY JUN J lA. 1-.UG SEP OCT ~.QV C£C
t.fonlh
... -· --·- ·- .. 13 I P a g e

There are three dams located in the headwaters of the Rest Lake Reservoir, the Fishtrap Dam on the Manitowish River, and the two dams on Mann Creek (a tributary to the Trout River) . All three dams have little to no measurable impact on the timing or extent of inflows to the Rest Lake Chain. The major inflow contributions to the reservoir (from largest to smallest inflows) come from the Manitowish River, Trout River, Rice Creek, Papoose Creek, Gresham Creek, and the groundwater flow from Clear Lake. The major inflow sources to the Chain were recorded monthly in 2009 and the percent contribution of each was:
• Manitowish River: 48% • Trout River: 28% • Rice Creek: 15% • Papoose Creek: 7% • Gresham Creek: 2%
Groundwater is another important source of water input to the reservoir, however, the amount of water that groundwater contributes to the system is very difficult to study and is not fully understood. The Inventory of Wisconsin's Springs identifies surface groundwater spring inputs on the western shore of Clear Lake, the lake bed of Clear Lake, and on the south shore of Manitowish Lake (Macholl , J.A, 2007). The extent of spring and other groundwater inputs to the reservoir can be roughly estimated by looking at the winter base flow over the dam. During frozen conditions, water levels are stable and there is no water loss from transpiration (the process of plants taking up water), evaporation, or water withdrawals . During this time, the water inputs come almost entirely from groundwater. On average, 120-150 cfs is passed over the dam during frozen conditions. Although groundwater inputs do not quickly fluctuate, they will vary based on dry or wet weather patterns. Winter base flow during drought years has averaged about 90 cfs.
Water Loss from the Chain of Lakes and River Downstream of the Dam The major sources of water loss from the Chain of Lakes and downstream flows include water withdrawals for cranberry operations, private irrigation, evaporation, and plant transpiration.
Private Irrigation and Cranberry Operations There are a number of water withdrawal structures and wells on the Chain that are likely used for watering lawns, drinking water, and other private uses. The amount of water diverted from the Chain and the river downstream for these uses would be very difficult to determine and is not known .
Cranberry production uses water to irrigate cranberries during the growing season, to flood beds for harvest in August, to flood beds in winter to protect the vines from freezing/drying, and to either flood beds or irrigate to protect the plants from frost in the spring. Current cranberry production practices can use substantial quantities of water, especially when flooding beds. Pumping and storing water in surface water lakes as opposed to using water directly on the cranberry beds results in a large amount of water being diverted from the Chain, especially in dry years.
There are currently three locations where local cranberry producers take water out of the Chain of Lakes and the river flows downstream of the dam. Water withdrawals take place at the following locations (shown as red arrows on Figure 9):
• Downstream of Wild Rice Lake where water is pumped to Little Trout Lake • Upstream of Wild Rice Lake where water is pumped to Great and Little Corn Lakes • Alder Lake where water is pumped directly to the cranberry beds
There is also a new cranberry operation that is currently under construction in the watershed that will have approximately 20 acres of cranberry beds. This operation will divert water from Lower Gresham Lake. The outlet of this lake is Gresham Creek which is a tributary to the Trout River upstream of Wild Rice Lake. Water will be pumped directly to cranberry beds and the water, minus losses due to evaporation and evapotranspiration, will be recycled back into Lower Gresham Lake.
14 I Page

Figure 9. Location of Cranberry Operations near Little Trout and Corn Lakes (red arrows indicate approximate locations of water diversions).
Little Trout Lake
Ike Waltor;~ Lake
The largest cranberry pumping location is downstream of Wild Rice Lake where the water diversion is used to keep water levels high on Little Trout Lake (Figure 1 0). From Little Trout Lake, the water is then pumped or flowed to individual cranberry beds. There are approximately 960 acres of cranberry production adjacent to little Trout Lake. Water diverted to these cranberry beds is likely not returned to the Manitowish Chain because it is located in the Bear River sub-watershed. The pumping station is only operated when water levels on Little Trout Lake are low during dry years. In 2007, for example, a year with very little precipitation, operating records indicate that pumping occurred 24 hours a day from June to October. In 2008, which
Figure 10. Aerial View of Cranberry Beds and Little Trout Lake
15 I Page

was dry but not as dry as the previous year, the pump was run 24 hours a day from August to late September. Based on the capacity of their pumps, 10 to 14 cubic feet per second of water was diverted at a time when the Chain and its tributaries were experiencing stress from drought. During the 2007 drought, USGS estimated the following inflows and the percent of flow that was diverted with the 10 to 14 cfs pumping rate from this operation. The amount of water withdrawn from the Chain and diverted to Little Trout Lake ranged from 11 to 27% of the natural inflow (Table 4).
Table 4. Little Trout Lake Cranberry Water Diversion in 2007
Month
June July August September
Inflow (cfs) 88 74 64 53
% of inflow diverted with pumping 11 to 16% 14 to 19% 16 to 22% 19 to 27%
Water Available for Chain storage (inflow minus 40 cfs minimum flow) 48 cfs 34 cfs 24 cfs 13 cfs
Another cranberry pumping location is upstream of Wild Rice Lake where the water diversion is used to keep water levels high on Great and Little Corn Lakes. There are approximately 177 acres of cranberry production in this location . Since it is unknown how much water is lost to evaporation and evapotranspiration, and unused water is directly and indirectly (through groundwater recharge) returned to the reservoir, it is difficult to determine what effect these operations have on water levels on the Chain and the river downstream of the dam. The effects of pumping at this location were observed by interpreting USGS data at a gage placed just downstream of the cranberry pumping location. It was determined that this cranberry operation diverts from 2 to 100 percent of the flow of the Trout River when the pumps are turned on . For example, on December 11, 2009, USGS measured 2.41 cfs below the pumps and 25.0 cfs upstream (a diversion of 22 cfs). This means that under low flow conditions, the pumping rates can and were measured by the USGS gage to temporarily reverse the direction of flow on the Trout River. The pump at this location cannot be operated continually because the pump exceeds the capacity of the river to provide water. Because of this, the pump is turned on for a period of time and is then turned off so that the Trout River can recover. In a 24 hour period, considering the time the pumps are turned on and off, a review of pumping records indicates that this operation pulls 3 to 8 cfs per day on average. The water from this operation, minus losses due to evaporation and evapotranspiration, is recycled back into the Manitowish system via direct discharge and ground water flow. The quantity of water diverted and the delay in returning it to the river at this location is expected to have an impact on aquatic life and habitat in the area immediately adjacent to this pumping area.
In total, when the pumps are operating at the two largest cranberry operations described above, up to 37 cfs can be instantaneously withdrawn from the Trout River inflows to the Chain of Lakes. Since the pumps that divert water to the Corn Lakes are turned on and off, on a daily average basis, total pumping rates at both of the large cranberry operations have averaged 13 to 22 cfs. These cranberry water withdrawals, along with the minimum flow of 40 cfs passed over the dam, was greater than the inflows coming into the Chain during the 2007 drought.
The third cranberry farm is much smaller compared to the Little Trout and Corn Lakes operations and has approximately 41 acres of cranberry beds. This operation takes water out of Alder Lake and recycles water directly back to where it was withdrawn minus losses due to evaporation and evapotranspiration. The fourth operation has not yet been fully constructed and is not operating at this time.
The Department has no regulatory authority over the removal of water from public waterways for cranberry operations. Section 94.26 Wisconsin Statutes reads "Cranberry culture; maintenance of dams, etc. Any person owning lands adapted to the culture of cranberries may build and maintain on any land owned by the person such dams upon any watercourse or ditch as shall be necessary for the purpose of flowing such lands, and construct and keep open upon, across and through any lands such drains and ditches as shall
- ...... --- ... ·- . 16 I Page

be necessary for the purpose of bringing and flooding or draining and carrying off the water from such cranberry growing lands, or for the purpose of irrigation, fertilization and drainage of any other lands owned by the person; provided, that no such dams or ditches shall injure any other dams or ditches theretofore lawfully constructed and maintained for a like purpose by any other person." Further a footnote in Section 30.18 Wisconsin Statutes which regulates water diversions "exempts cranberry growers from permit requirements" .
Evaporation and Transpiration The rates of evaporation and plant transpiration are variable and are dependent on environmental factors such as temperature and time of the growing season (Lenters, et. al. 2005). The amount of water lost through plant transpiration is difficult to estimate and is not known. The Wisconsin Valley Improvement Company (WVIC) has conducted studies to help estimate evaporation rates on Northern Wisconsin reservoirs. Their studies show that during the summer, evaporation rates can be as high as 4-6 inches of water surface elevation decrease per month. Five inches of evaporation in one month on the Manitowish Chain (-4, 100 acres) is equivalent to 28 cfs of water leaving the Manitowish River system in that time period. Another aspect of the water budget that is difficult to determine without extensive study is groundwater discharge and recharge . Groundwater movement is based on many factors including long term weather patterns and groundwater table fluctuations, as well as the height of surface water in the reservoir. Evaporation loss and groundwater inputs were estimated by USGS to essentially cancel each other out resulting in no net water loss or gain as part of their analysis. These aspects of the water budget are described in detail in the USGS report in Appendix II.
Reservoir Water Storage At the 5' 0" elevation, there are 8,035 acre-feet (350 million cubic feet) of water held in the Chain, and at the 8' 6" elevation there are 23,186 acre-feet (1 ,010 million cubic feet) of water held in the Chain. Therefore, under current operations, the reservoir capacity of the Chain is 15,151 acre-feet (660 million cubic feet) of water. Downstream, the Turtle Flambeau Flowage is raised about 11 inches during the fall drawdown of the Rest Lake Chain . Based on USGS estimates, to raise or lower the Chain 1 inch takes 14.8 million cubic feet of water. This amount of water translates to a daily flow of 171 cubic feet per second that is either taken from, or added to river flows downstream of the dam.
Water Quality Water quality of the Manitowish River system is generally good. A review of baseline water quality monitoring data indicates that environmental variables (Chlorophyll A, nutrients, and water clarity) of lakes within the Manitowish Chain are similar to other lakes in Northern Wisconsin with good water quality (Lillie and Mason, 1983). Water quality is affected by Mercury (Hg) which is a naturally occurring element released into the atmosphere through both natural processes and industrial air pollution. In aquatic systems, methylmercury (MeHg) is the primary form of mercury that enters the food chain and is also the major form that bioaccumulates in predatory game fish species. Bioaccumulation means that a chemical is able to accumulate at a faster rate than the body can eliminate it, and over time levels continue to increase. The other component of bioaccumulation is that there is an incremental increase in contamination levels at each level of the food chain. This effect is compounded the longer an organism lives. Certain species, such as larger predatory game fish, will likely have the highest mercury levels. There are a number of factors that influence the concentrations of mercury found in the predatory game fish in a particular lake. Because of the human health concerns related to mercury, in 2004 the Great Lakes Indian Fish & Wildlife Commission (GLIFWC) tested the levels found in predatory game fish on eight lakes on the Manitowish Chain . The mercury levels found were not high enough for the DNR to specify fish consumption advisories specific to these lakes, but the general statewide fish consumption advisory applies. In 2006 GLIFWC published more restrictive fish consumption advisories for some of the lakes on the Manitowish Chain. Additional information about the GLIFWC mercury maps can be found online at: http://www.glifwc.org/Mercurv/mercurv.html Natural Pattern of Water Levels in the Manitowish Chain of Lakes Most of the lakes on the Chain (with the exception of Clear lake) can be characterized as surface water
17 I Pag e

flow-through lakes. Long term gaging by USGS has shown that these lakes naturally experience seasonal lake level fluctuations (House, 1985). Surface water flow-through lakes can be expected to experience short term fluctuations following snowmelt or large storm events. The highest water levels generally occur in April, May, and June.
Natural Pattern of Manitowish River Flows The natural annual flow pattern of Northern Wisconsin rivers is characterized by high flows in the spring, when rain events often combine with the melting snowpack. The high spring flow periods were often called the "spring freshet" in the current and historic operating orders. Based on information provided by Wisconsin Valley Improvement Company staff who have studied many years of river hydrographs, March 25th is the average date for spring runoff in the Northwoods, and 75% or more of spring runoff has passed by April 15th. Over late spring and summer months, river flows gradually decrease with some fluctuations occurring as a result of storm events. The lowest flows of the season are generally found in late summer or early fall. In late fall, flows generally increase with more rain and less water loss through evaporation and plant transpiration, and stabilize over the winter months when inflows are primarily groundwater inputs.
Since there are no long term records or gages recording inflows into the Chain, the natural historic flow pattern (i.e. the hydrograph) for the Manitowish River at the Rest Lake Dam was modeled by the USGS (figure 11).
350
300
250
-n :: 200 0 u:: c ~ 150 aJ
2
100
50
0
Figure 11. Seasonal Pattern of Manitowish River Flows - (USGS data)
- Median water-budget 1973-2011 - Median water-budget 1991-2011
- Median adjusted drainage-area ratio 1991-2011
Two methods were used to estimate these flows. The first method involved placing stream gages upstream of the reservoir that measured inflows from 2009 to 2011. This data was tied to two local longterm gaging stations. Using a regression analysis that related stream flow divided by the watershed area, _____ _______ .. ____ · ·------------ -- · ·--··--·- -------------· --i-8 --I ·-p··a ·g -·e · ·---- · · -- · · · ------·· ·---·-··· ------ --- · · ··- · ·---------·· --····

the natural flows for the Manitowish River from 1991 to 2011 were calculated . The second method USGS applied was a water budget approach which used water level and discharge data provided by Xcel Energy to estimate natural inflows. This model was used to compute the natural flow at the dam from 1973 to 2011. The USGS study revealed that natural flows of the Manitowish River system exhibit a similar seasonal pattern as described above with high spring flows followed by low flows in late summer. The median historic natural flows are shown on Figure 11. The full USGS report can be found in Appendix II.
Throughout this document it is important to note that river flows will be described as "flows reported by Xcel" or "flows measured by DNR". River flows measured by USGS or DNR were routinely higher compared to the discharge recorded by Xcel on the same day. DNR measures river flows by measuring the velocity of water flowing through a measured cross-section of the Manitowish River below the USH 51 crossing. In the past, flows reported by Xcel were likely underestimated since dam leakage rates through boards and through groundwater have not been closely studied. Leakage rates likely vary and are expected to be highest when there is the greatest head (e.g. when the reservoir is at the maximum water level). Department of Transportation (DOT) soil borings at the bridge indicate the dam is located on top of cobbles and boulders and this type of substrate likely allows groundwater movement underneath the dam. In 2010, the DNR and Xcel Energy met to try to determine why Xcel discharge estimates were consistently lower compared to DNR and USGS measurements. DNR and USGS measured flows were consistently very close to each other. To improve the accuracy of Xcel discharge estimates, new stop logs were installed at the dam that were uniform in size and had fewer gaps between boards. More recently, a lift gate and a new stop log lifting hoist were installed at the dam which should further improve the accuracy of flows reported by Xcel. The relationship between DNR measured flows, USGS measured flows, and the reported discharge at the dam is described in detail in the USGS report.
5. Biological Environment (dominant aquatic and terrestrial plant and animal species and habitats including threatened/endangered resources; wetland amounts, types and hydraulic value)
Aquatic Habitat Above the Rest Lake Dam The one foot contour maps of the lakes on the Chain along with aerial photos taken at a range of water levels provide useful information to show the extent, location, and type of open water aquatic habitat. The major types of aquatic plant and animal habitat affected by the operation of the dam include the aquatic bed littoral zone (the area of a lake where light can penetrate and aquatic plants grow) and wetlands within and adjacent to the 3.5 foot draw down zone. Based on USGS calculations, there are about 656 acres of surface water resources dewatered when the Chain is lowered 3 feet. The lake contours are not accurate enough to be able to estimate the additional area dewatered at the full 3.5 foot drawdown water level. The locations and extent of lakebed that is currently dewatered at the 3.5 foot drawdown can be seen by following the 3 foot contour on the lake maps for each lake in the Chain (Appendix Ill).
Aquatic Bed Lake Littoral Zone The littoral zone is the area on a lake that is shallow enough for enough light to penetrate to support the growth of submergent (entirely underwater) and emergent (partially underwater and extending above the water surface) aquatic plants. Aquatic plant surveys on Rest Lake, Papoose Bay, Wild Rice Lake, Island Lake, and Rice Creek revealed that the species richness on each of these lakes ranged from 25 to 42 species. No endangered, threatened, or special concern species were recorded on these lakes. Curly leaf pondweed, an invasive species, has recently been documented in Rice Creek and Island Lake. On Rest Lake and Wild Rice Lake, the density and distribution of aquatic plant species were studied. Papoose Bay (part of Rest Lake) has a muckier lake bottom and constant water flow from Papoose Creek. Because of these differences, the common plant species lists were kept separate for each area. The five most common species on these two lakes are as follows: • Rest Lake: Common Waterweed or Elodea (Elodea canadensis), Fern Leaf Pondweed (Potamogeton
robbinsii} , Northern Water Milfoil (Myriophyllum sibiricum}, Wild Rice (Zizania palustris}, and Bushy Pondweed or Naiad (Najas flexilis).
19 Pa ge

• Papoose Bay: Muskgrass (Chara), Wild Rice, Elodea, Northern Water Milfoil, and Water Marigold (Bidens beckii).
• Wild Rice Lake: Fern Leaf Pondweed, Coontail (Ceratophyllum demersum), Naiad, Elodea, and Northern Water Milfoil.
The Floristic Quality Index (FQI) was determined for each lake. The FQI is an index meant to compare the overall floristic quality of a lake for comparison among many sites and for tracking change at a specific site over time. This assessment method is based on the sensitivity of different plant species to tolerate disturbance and reduced water quality. The FQI for the Chain was high, scoring 30.86 to 41 .9, and is greater than what Nichols found for flowages in the region (mean of 28.3). These scores are consistent with the baseline water quality monitoring data discussed previously.
There were differences in plant abundance and distribution between the lakes. On Rest Lake the maximum water depth that plants were found was nearly 12 feet, and within the zone of plant growth, 18% of sample points had vegetation . Wild Rice Lake had a maximum water depth of plant growth of 13 feet, and on that lake, 95% of the sample points had vegetation. Island Lake had a maximum water depth of plant growth of 10 feet, and within the zone of plant growth, nearly 26% of sample points had vegetation. The difference in plant density between the four areas is likely due to differences in the composition of the lakebed. The lakebed of Rest Lake is primarily sand and gravel that does not support dense plant growth while the lakebeds of Papoose Bay and Wild Rice lakes have more muck and organic material that can support dense stands of aquatic plants. The substrate of the littoral zone in Island Lake is somewhat evenly split between muck and sand/rock. The sample locations with higher densities of aquatic vegetation were predominantly muck. Although the other lakes on the Chain were not studied in detail, Clear, Alder, Manitowish, Little Star, Stone, and Spider Lakes likely have plant communities and densities similar to Rest Lake. Fawn Lake and the inlets of the Manitowish River and Rice Creek likely have plant communities and plant densities similar to Wild Rice Lake and Papoose Bay.
The portion of the littoral zone that is directly affected by the current operation of the dam is from the water's edge (at the full pool water level 8' 6"), to a depth of 3.5 feet. This zone becomes exposed lakebed during the current winter drawdown of the Chain and is subject to atypical annual freeze and thaw conditions for aquatic habitats. Since the lake bottom is periodically dewatered, the drawdown zone may also have reduced organic matter accumulation which may in-turn contribute to lower plant densities than would be expected if water levels remained constant. Areas that are repeatedly dewatered also tend to be dominated by annual pioneer species. Of the common plant species for each of the lake areas summarized above, the following list includes the plant species that exist in the drawdown zone: • Rest Lake: Elodea, Wild Rice, and Naiad. • Papoose Bay: Muskgrass, Wild Rice, Elodea, and Water marigold. • Wild Rice Lake: Elodea and Naiad. • Island Lake: Naiad, Water marigold, Small pondweed (Potamogeton pusillus), Clasping leaf pondweed
(Potamogeton richardsonii), and Wild celery (Vallisneria Americana). • Rice Creek: Wild Rice, Nitella sp., and Elodea
Wetlands Upstream of the Dam There are approximately 934 acres of mapped wetlands on the Wisconsin Wetland Inventory (Figure 12) that are in the current drawdown zone or connected to the Manitowish Chain of Lakes. The Wisconsin Wetland Inventory mapping is completed through interpretation of highly precise aerial photos by trained experts to determine which areas appear to be wetlands. Some wetlands can be missed through this procedure, especially wetlands smaller than 5 acres. Also, some field verifications done both upstream and downstream of the dam have shown that not all wetland types are accurate mapped. Land survey records from the 1800's and the tree stumps that can still be seen in many of the wetland areas on the Chain all suggest that the creation of the dam substantially altered the historic natural wetland hydrology and plant communities.
20 I Page

Figure 12. Wisconsin Wetland Inventory on the Chain of Lakes
Scrub I Shrub Wet
Acres 191.5950
12.9730 233.5010
63.8580 116.180
315.4180
- Manttowlch OflCm w.lte• n~.u 1G01elev UJl t.C Ul3 1ll wetl.ucd nur 1G01 foot elevation D ACJU<Itlc bctl 0 Dee, watcu l.lkc
E3 En'ICi gcnt ·wct me.ulow for ested
D Scrub:&luuh c:J Wet
Today, wetlands below the full-pool high water elevation can be described as aquatic bed wetlands that are periodically dewatered. With the current 3.5 foot winter drawdown, these wetlands are dewatered at the winter drawdown level (5' 0") and are flooded at the full pool elevation (8' 6") (Figure 13). Many of the aquatic plants found in this area are outlined in the Aquatic Bed Lake Littoral Zone section above. The wetland areas along the edge and adjacent to the full-pool water level can be described as emergent wet meadows. These wetlands have persistent vegetation with very saturated soils or shallow water at the 8' 6" water level. Fresh meadows typically represent younger plant communities that can tolerate disturbances such as drainage, siltation , cultivation , pasturing, peat fires, or temporary flooding (Minnesota Pollution Control Agency, 1997). Several of the dominant plant species in these wet meadow wetlands, such as lake sedge, bulrushes, and Pennsylvania bittercress, are associated with fluctuating water conditions. Other common plant species include cattails, wild rice, bur-reed, Canada bluejoint, three way sedge, water lily, and spike-rushes. Reed canary grass and purple loosestrife are present in many of the wetland areas but these invasive species have not been observed to be the dominant plant species at any site. The scrub/shrub wetland areas on the Chain of Lakes are generally limited to the non-flooded wetland fringes. The shrubs present include tag alder, leatherleaf, and sweet gale. Forested wetland areas are also generally limited to higher elevations that are not flooded during the 8' 6" water elevation. Common wetland tree species present are balsam fi r, white pine, and white birch .
············-· . --· ---21 P age

Figure 13. Shallow aquatic bed wetlands on Island Lake at the (8' 6") water level.
The wetlands on the Chain provide important habitat for foraging, nursery, spawning, cover, and other uses for the diverse assemblage of fish, wildlife, and other aquatic organisms that will be described in detail later in the analysis. On the Chain of lakes, important wetland habitat areas include the following locations: the north end of Rest Lake where Papoose Creek enters, the fringe of Fawn and Wild Rice Lakes, Island Lake where Rice Creek and the Manitowish River enters, and the marsh areas between Manitowish and Alder Lake. In addition to providing important aquatic habitat, these wetlands also provide other important ecological functions such as flood storage retention, water quality protection, scenic beauty, and shoreline protection.
22 I Page

Aquatic Habitat Below the Dam The tail water elevation at the Rest Lake dam is 1591 .5 and the elevation of the River is 1575.0 at the confluence of the Bear River according to USGS topographic maps. This drop in elevation corresponds to an average of a 1 foot drop per river mile. Important types of aquatic fish and wildlife habitat downstream of the dam that are affected by the timing and magnitude of flows on the river include: shallow rocky riverbed areas with moderate to swift current, oxbow and backwater areas, and riparian wetlands.
The river can be separated into two distinct sections based on the river gradient (e.g. the drop in the river elevation per mile of river). The first four river miles below the dam have a higher gradient with faster water velocities, a limited wetland fringe, and forested river banks that quickly rise above the floodplain elevation (Figure 14). This section has a sand dominated river bottom composition with a few areas dominated by more gravel, cobble, and boulders.
Figure 14. Aerial Photo of the High Gradient Section of the Manitowish River with steeper banks and a narrow wetland fringe.
Rocky River Bottom Habitat Stretches of river in this high gradient section have a rocky substrate with moderate to swift current. This type of river habitat (Figure 15) is very limited between the dam and the Turtle-Flambeau flowage. The area below Highway 51 is considered high quality, critical habitat for a number of fish species that require this type of habitat for spawning. Rocky habitat can also be found above Sturgeon Lake and at the confluence of the Manitowish and Bear rivers.
Rocky Riffle Section of the Manitowish River below the HWY 51 Bridge
23 I Page

Comparatively, from about four river miles below the dam to the Turtle Flambeau Flowage, there is less gradient (drop in river elevation per mile) and the river becomes sandier. This section of the Manitowish River has the characteristics of an alluvial river system. These types of rivers continually change their course by cutting through and redistributing sediment in the floodplain, natural levees are deposited at the side of the channel, and contain numerous pools, meanders (bends in the river), oxbows (old river channels) , backwater sloughs, and wetlands connected to the river (Figure 16).
Riparian Wetlands Below the Dam The land survey records from the 1800's indicate that the wetlands along the Manitowish River downstream of the dam have also undergone substantial changes over the last 145 years. Although there are limited reference points, the wetlands along the river were originally described as tamarack and black spruce swamps and as "low and swampy" areas. There are currently, approximately 1 ,558 acres of wetlands mapped on the Wisconsin Wetland Inventory that are connected to the Manitowish River below the dam as shown on Figure 17 below.
Based on DNR staff observation and surveys in these areas, the wetlands below the Rest Lake Dam can be characterized as wet meadow, scrub-scrub, aquatic bed, and forested wetlands. The areas identified as shrub/shrub on the wetland inventory map above are actually a mosaic of meadow and scrub-shrub wetlands. These patches of wet meadow areas are adapted to tolerate inundation of water for periods of time that inhibits the growth of wetland shrubs and trees. These areas flood more frequently and are generally found adjacent to the main river channel (Figure 18). Currently, many species found in the wet meadow areas have the ability to adapt to fluctuating water levels such as Canada bluejoint grass, lake sedge, rush species, tussock sedge, yellow pond-lily, bur reed, soft stem bulrush, and hard stem bulrush. There are areas of well-established reed canary grass patches established throughout the riparian river corridor. Although there are some patches that are dominated by this invasive, native species are dominant in most wet meadow wetland areas. Purple loosestrife is also established along the river corridor and is currently found two miles downstream and one quarter mile upstream of the Highway 47 Bridge. It is currently found as single plants or in small numbers along the steeper portions of the river bank and there are also approximately 10 to 20 patches of about 0.1 acres in shallow backwater areas. Annual control efforts take place to keep the population of purple loosestrife low along the river corridor.
24 I Page

s
Figure 17. Wisconsin Wetland Inventory of Wetlands below the Rest Lake Dam
- Manitowish open \Y'alet n@ar 1S01t!lev Dov.tnstr4!am ... ~lands r.e"1~d .shp
c::JFotested c=JRh-er c=JRoad 0 Scrub/shrub Class
Forested River Road
Scrub I Shrub
Acres 155.9880
3.809 0.6410
1397.6000
Historic aerial photos and observations made by local people that are familiar with the river suggest that over the last 50 or 60 years, the wetland plant community downstream of the dam has gradually changed from a wetland dominated almost entirely by wet meadows to a wetland dominated with scrub/shrub species in many areas . . These wetland areas flood less frequently than the meadow areas and are dominated by shrub species such as tag alder, willow, and meadowsweet. The understory in these areas is composed of grasses and sedges such as Canada bluejoint, lake sedge, and tussock sedge.
Figure 18. Wet Meadow and Scrub/Shrub Wetlands
Scrub/Shrub areas
Wet meadow areas adjacent to the r i ver channel
25 I Page

The aquatic bed wetlands are not identified on the Wisconsin Wetland Inventory Maps. These areas are comprised of the oxbow channels and backwater sloughs that are found along the river corridor in the lower gradient alluvial sections of the river (Figure 16). These wetlands are in the deeper portions of river oxbow and backwater areas that hold water during both high and low flows. Vegetation is a mosaic of both emergent and submergent vegetation. These wetland areas are dominated by floating leaf, submergent plants, and emergent plants including duckweed, coontail , spatterdock, water horsetail, and water smartweed. On the fringes of these areas, with shallower water depths, the sloughs and oxbows transition into emergent aquatic communities with plants like bulrush, bur-reed, arrowhead, marsh cinquefoil , lake sedge, river sedge, spike-rush, and pickerel weed. The picture below shows an oxbow wetland area under high flow river conditions (Figure 19).
Figure 19. River Oxbow Wetland (October 2009, Flow at 322 cfs- Water Depth= 29 3/8", DNR Measured)
. ·- ···· ··--······ ·· · 26 Pag e

Forested wetlands are the other major type of wetland located along the river below the dam. There are many areas of this wetland type along the Manitowish River that are not shown on the Wisconsin Wetland Inventory map. Forested wetlands are dominated by mature, deciduous hardwood trees growing on alluvial soils and are often associated with riverine systems. Along the Manitowish River, the forested wetlands are located in the depositional areas (areas where river sediment deposits during flood events) on the inside of river bends (Figure 20). These areas are inundated during flood events but are usually somewhat well drained for much of the growing season. Plant species typically include silver maple, green ash, river birch, American elm and black willow.
Figure 20. Floodplain forest along the Manitowish River.
The wet meadow, scrub/shrub, oxbow, and floodplain forest wetlands are valuable ecosystems that provide feeding, spawning, cover and other life history needs for the wide range offish and wildlife species that will be described in the following section of this analysis. These riparian wetlands also provide flood storage retention, protect shorelines, and provide water quality protection, and provide opportunities for recreational and scenic beauty.
Functions and Values of the Wetlands Above and Below the Dam
As summarized on the WI DNR website, wetlands have a number of important functions and values. The wetlands above and below the dam have the potential to support an abundance and variety of plants. These plants contribute to the earth's biodiversity and provide food and shelter for many animal species at critical times during their life cycles. Many of the rare and endangered plant species in Wisconsin are found in wetlands. The importance of floral diversity in a particular wetland is usually related to two factors. First, the more valuable wetlands usually support a greater variety of native plants (high diversity), than sites with little variety or large numbers of non-native species. Second, wetland communities that are regionally scarce are considered particularly valuable.
27 I Page

Many animals spend their whole lives in wetlands; for others, wetlands are critical habitat for feeding , breeding , resting, nesting , escape cover or travel corridors. Wetlands are spawning grounds for northern pike, nurseries for fish and ducklings, critical habitat for shorebirds and songbirds and lifelong habitat for some frogs and turtles. Wetlands also provide essential habitat for smaller aquatic organisms in the food web, including crustaceans, mollusks, insects, and plankton. Some of the most valuable wetlands for fish and wildlife provide diverse plant cover and open water within large, undeveloped tracts of land that exist both upstream and downstream of the dam. The fish, wildlife, and other aquatic organisms that are associated with these wetland areas will be described in greater detail in the following section of this analysis.
Due to dense vegetation, soil absorption capabilities, and location within the landscape, wetlands are important for retaining stormwater from rain and melting snow rushing toward rivers and lakes, floodwater from rising streams. Wetlands slow stormwater runoff and can provide storage areas for floods, thus minimizing harm to downstream areas.
Wetland plants and soils have the capacity to store and filter pollutants ranging from pesticides to animal wastes. Calm wetland waters, with their flat surface and flow characteristics, allow particles of toxins and nutrients to settle out of the water column. Plants take up certain nutrients from the water. Other substances can be stored or transformed to a less toxic state within wetlands. As a result, our lakes, rivers and streams are cleaner and our drinking water is safer. Larger wetlands and those which contain dense vegetation are most effective in protecting water quality.
Shoreland wetlands act as buffers between land and water. They protect against erosion by absorbing the force of waves and currents and by anchoring sediments. Roots of wetland plants bind lakeshores and streambanks, providing further protection. Benefits include the protection of habitat and structures, as well as land which might otherwise be lost to erosion. This function is especially important in waterways where boat traffic, water current and/or wind cause substantial water movement which would otherwise damage the shore. A wetland which reduces erosion can also reduce sedimentation to nearby waterways. If the waterway is a navigational channel, the reduction in sedimentation can help reduce the frequency of dredging to maintain the channel.
Groundwater recharge is the process by which water moves into the groundwater system. Although recharge usually occurs at higher elevations, some wetlands can provide a valuable service of replenishing groundwater supplies. The filtering capacity of wetland plants and substrates may also help protect groundwater quality. Groundwater discharge is the process by which groundwater is discharged to the surface. Groundwater discharge is a more common wetland function and can be important for stabilizing stream flows, especially during dry months.
Wetlands are also popular places to study, hike or just observe. They provide peaceful open spaces and have rich potential for hunters and anglers, scientists and students. Wetlands provide exceptional educational and scientific research opportunities because of their unique combination of terrestrial and aquatic life and physical/chemical processes.
28 Page

Fisheries of the Rest Lake Reservoir A review of historic WDNR survey files and more recent survey work conducted on the Chain between 2002 and 2005 indicates that 35 species of fish have been documented on the Chain of Lakes. A list can be found on Table 5. Two species (found both above and below the dam), the greater redhorse and the pugnose shiner, are state threatened species that are discussed in a separate section below focusing on scarce resources.
Fish Associated with Cobble-gravel Lake Bottom Habitat Walleye (Sander vitreus) are currently the most abundant gamefish in the Chain. In 2004, a WDNR survey determined that there were 10,418 adult walleye in the Chain (WDNR unpublished data) . This is equivalent to 2.6 walleye per acre which is an average number for natural walleye waters in the area. They spawn on cobble-gravel shorelines shortly after ice out when water temperatures are between 38 and 44" F (Becker, 1983). At this time of year, the lake levels are generally at or close to the 5' 0" winter drawdown elevation. Around June, the young of year fish move to weed edges and shallow sandy flats to feed on invertebrates.
Lake Herring (Cisco) (Coregonus artedii) are found throughout the Chain and are most common in the deeper lakes (WDNR unpublished data). This species is listed as a state species of special concern. Herring spawn in the fall when water temperatures fall below 43"and peaks at around 38"F (Becker, 1983). For northern Wisconsin this typically occurs in late November just prior to ice up. The current winter
drawdown is usually complete when this species will spawn. Spawning sites are located in shallow water (3 to 10 feet) over gravel or stony substrate. Eggs are scattered over the bottom and do not hatch out until ice out the following April.
Lake Whitefish (Coregonus c/upeaformis) are present in only a few inland lakes in Wisconsin (Lyons, et. al., 2000) and naturally sustained inland populations are rare in the U. S. This species was found during a fall 2011 seining survey of Little Star Lake (WDNR unpublished data). Four whitefish between 22 and 25 inches in length were captured along the northeast shore of the lake on the night of November 161
h . Little Star Lake is the deepest lake in the Chain at 67 feet and the most likely to support whitefish. Manitowish Lake which has a maximum depth of 61 feet and this lake may also have a whitefish population. There is only one other prior anecdotal report of this species occurring in Little Star Lake. This account comes from former Vilas County fisheries biologist Harland Carlson who captured 5 whitefish while seining for herring on the east shore of the lake. The fish were all between 20 and 28 inches in length. The very large size of these individuals may indicate that recruitment has been limited in recent years. The life history of whitefish is very similar to that of the lake herring. The only major difference is that they tend to spawn slightly earlier than herring at a water temperature around 46"F (Becker, 1983). These water temperatures are typically reached in early to mid-November in Vilas County.
Although some cobble-gravel areas are within the current drawdown zone on the Chain, there is abundant habitat available through a wide range of reservoir water levels. Consequently, the operation of the dam does not appear to be a major factor affecting the habitat availability or populations of any of the species referenced above associated with this habitat type.
Fish Associated with Seasonally Flooded Aquatic Bed Wetland Habitat Many of the species of fish found on the Chain are associated with shallow areas with submergent aquatic vegetation. These areas provide important feeding and cover habitat for the young of year of many different fish species, and non-game minnow species. Predators are commonly found in these areas because it provides an important forage base. Northern pike, muskellunge, and grass pickerel in particular require vegetated-type habitat for spawning and for survival of newly hatched and fingerlings. Northerns are one of the earliest fish to spawn in the Chain and spawning occurs right after ice out when water temperatures are between 38 and 54"F. The Chain has a low density but quality muskellunge fishery. The lakes are currently stocked by WDNR with about 1,800 large musky fingerlings (9 to 12 inches) in even numbered years. Fall electrofishing surveys also indicate that there is limited natural recruitment occurring
29 I P a g e

in the Chain. Muskellunge spawn later than walleye or northern pike when water temperatures are between 49 and 60°F (peak 55°F). These water temperatures are typically reached in mid-May. They prefer shallow bays with hard sand bottoms and limited vegetation. Other gamefish associated with this habitat type include panfish and bass.
Fisheries of the Manitowish River Forty-two fish species have been recorded between the dam and the Turtle Flambeau Flowage. A list can be found on Table 6. Overall, fish species richness in the Manitowish River is thought to be very good . However, the populations of resident gamefish such as smallmouth bass, walleye, muskellunge, and northern pike are believed to be relatively low in density based on catch rate statistics from past survey results. Lake Sturgeon will be discussed in detail in the Tribal resources section below.
Fish Associated with Rocky River Bottom Habitat There are a number of fish species that would not persist in the river system, or would be less common, if there were no areas of rocky riffle habitat in the river system as indicated in the table 6. This habitat is limited on the Manitowish River below the dam and is very important to the species that are dependent on sufficient water levels and flows in this habitat type. The section of river below the Highway 51 bridge provides the highest quality riffle habitat for these species.
Fish Associated with Aquatic Bed Wetlands in the Oxbows & Backwaters Various species and age classes of fish use backwater wetland sloughs that are connected to the river channel for spring spawning, feeding, and resting throughout the open water season. Northern pike, muskellunge, and grass pickerel in particular requ ire flooded vegetated-type habitat for spawning in the early spring just after ice out. Survival of newly hatched fry and fingerlings of these species are also dependent upon continuous surface water in the wetland sloughs in spring and early summer for food and hiding cover in order to survive. Most of the non-game minnow species and panfish species are dependent upon this type of habitat as well. These species provide an important forage base for a number of different fish and wildlife species.
30 I Page

Table 5. Fish on the Chain of Lakes. Presence is based on survey work completed in 2002-05. (Cisco is based on electrofishing surveys conducted since 1972) Wild Little
S12ecies Abundance Rice Alder Manitowish Star Sj2ider Stone Island Rest Clear S12ecies Notes: Muskellunge Common X X X X X X X X X Currently Stocked, known NR Northern Pike Common X X X X X X X X X Grass Pickerel Present X X X X X X X Walleye Abundant X X X X X X X X X Stocked in past, Good NR Yellow Perch Abundant X X X X X X X X X Johnny Darter Present X X X Iowa Darter Present X Log Perch Present X X X Largemouth Bass Common X X X X X X X X X Smallmouth Bass Common X X X X X X X X X Bluegill Common X X X X X X X X X Pumpkinseed Common X X X X X X X Longear Sunfish Rare X State Threatened Rock bass Common X X X X X X X X X Black Crappie Common X X X X X X X X X Burbot Present X X X X X X X X X Lake Herring (Cisco) Present X X X X X X State Special Concern White Sucker Abundant X X X X X X X X X Golden Redhorse ? ? ? ? IDissues Greater Redhorse Present X X X X State Threatened Silver Redhorse Present X X X X X Shorthead Redhorse Present X X X Black Bullhead Present X X X X X X Yellow Bullhead Present X X X X X X X X X Trout Perch Present X Central Mudminnow Present X Mottled Sculpin Present X X Blackchin Shiner Present X X Bluntnose Minnow Present X X Common Shiner Present X X X Creek Chub Present X X X X X X Emerald Shiner ? X ID issues (Rosyface Shiner?) Golden Shiner Common X X X X X X Mimic Shiner Present X X X X Spotail Shiner Present X X X X
31 I Page

Table 6. Fish Species Documented on the River Below the Rest Lake Dam
Spawn in Use rock riffle areas Species found on the Manitowish rock/riffle during non-spawn River downstream of the dam areas periods BLACK BULLHEAD No No BLACK CRAPPIE No No "strong" BLACKCHIN SHINER No No means the use is
BLACKNOSE DACE Strong Strong obligate - if rocky riffles
BLACKNOSE SHINER No No aren't present or
BLACKSIDE DARTER Moderate Moderate accessible/usable at the
BLUNTNOSE MINNOW Moderate No appropriate time of year
BRASSY MINNOW No No (i .e. dewatered), the species won't persist in
BROOK STICKELBACK No No the system BURBOT Moderate Moderate CENTRAL MUDMINNOW No No "moderate" COMMON SHINER Moderate Moderate means rocky riffles are CREEK CHUB Moderate Weak preferred but not critical
FANTAIL DARTER Strong Strong - without riffles the
GOLDEN REDHORSE Strong Moderate species could still be
GOLDEN SHINER No No viable in the system,
GRASS PICKERAL No No although it would likely be less common
GREATER REDHORSE Strong Moderate HORNYHEAD CHUB Strong Strong "weak" IOWA DARTER No No means the species will JOHNNY DARTER Weak No use riffles on occasion , LAKE STURGEON Strong No but they aren't preferred
LARGEMOUTH BASS No No or necessary
LOG PERCH Moderate Moderate MIMIC SHINER Weak No
"no"
MOTTLED SCULPIN Moderate Moderate means the species
MUSKELLUNGE No No typically doesn't use riffles
NORTHERN HOG SUCKER Strong Strong NORTHERN PIKE No No NORTHERN PIKE X MUSKELLUNGE No No PUGNOSE SHINER No No PUMPKINSEED No No ROCK BASS Moderate Moderate ROSYFACE SHINER Strong Moderate SHORTHEAD REDHORSE Strong Weak SILVER REDHORSE Strong Moderate SMALLMOUTH BASS Moderate Moderate SPOTFIN SHINER No No WALLEYE Strong No WHITE SUCKER Strong Weak YELLOW BULLHEAD No No YELLOW PERCH No No
32 I Page
Wildlife Upstream and Downstream of the Dam Wildlife most affected by the management of water levels and flows upstream and downstream of the dam includes species associated with wetlands connected to the affected lakes and river corridor or the shallow open water habitat of lake bays and river oxbows/backwater areas. One important source of food and cover for wildlife, wild rice, is discussed in the Tribal resources section of this document.
Waterfowl The species of waterfowl that are known to this system include Mallards, Wood Ducks, Common and Hooded Mergansers, Common Goldeneyes, Black Ducks, Trumpeter Swans, Canada Geese, Piedbilled Grebes, and Blue-winged Teal. These waterfowl species arrive shortly after ice-out from midMarch to early May, and shortly after arrival, they begin to search for and establish their nesting areas. Perhaps the earliest nesters are geese who begin to nest as soon as snow and ice cover have receded. If initial nests fail, they may produce a second nest. Mallards, geese, Black Ducks, and Blue-winged Teal nest in uplands and wet meadows adjacent to the rivers and lakes. Wood Ducks, Common and Hooded Mergansers, and Goldeneyes, prefer to nest in tree cavities and search out wooded areas next to a river or lake for nest sites. All species of waterfowl feed on invertebrates and/or vegetation found in emergent and submergent wetland areas. The abundance of invertebrates for waterfowl in these areas is especially important to hens in the spring when their diet is comprised almost entirely of insects to get the protein needed for egg production (Ring Ieman, 1990). Ducklings of all species feed heavily on aquatic invertebrates for the first two or three weeks after hatching. Broods are hatched between mid-May through June and are not able to fly until around July. The young of all the above mentioned species find cover and food in undercut banks, emergent wetlands, shallow bays, and backwater areas along lakes and the rivers. While ducklings are flightless, they require emergent vegetation to hide in and escape from predators and to provide shelter from the weather. Shallow flooded wetlands adjacent to lakes on the Chain and riparian wetland sloughs/oxbows that support wild-celery, sago pondweed, and other aquatic plants later in the growing season provide an important food source for waterfowl, particularly trumpeter swans and diving ducks. The waters and wetlands of the Manitowish River also serve as a travel corridor during the adult flightless period in the molting phase. This period occurs during the post-breeding period, and the timing varies among species and is regulated by the number of daylight hours, hormonal changes, and local nesting conditions. The flightless period is in May through July for Black Ducks, Mallards, and Mergansers and is June through August for Teal and Wood Ducks. During the molt, waterfowl use large expanses of open water as well as emergent vegetation to find adequate food resources and cover from predators. During this flightless period, waterfowl are dependent on the resources of a single wetland for about a month.
Loons Studies of the Common Loon territories in 2007 revealed that there were 10-12 loon territories on the Chain. Nest initiation usually begins around May 3, peaks May 21, and ends July 4. Loons are on nests for about 29 days. The majority of the nesting occurs May 15-June 30. In general, loons nest within 1 foot of existing water level, often level with the shoreline, or at most, on nests built up 8-12 inches.
Wetland Birds The extensive acreage of wetlands below the dam and on the Chain provide important feeding, cover, and nesting areas for a number of bird species. Birds that are strongly associated with open wet meadow habitat include the American Bittern, Least Bittern, Great Blue Heron, Spotted Sandpiper, Wilson's Snipe, Sedge Wren, Nelson's Sharp-tailed Sparrow, Northern Harrier, Piedbilled Grebe, Sora, Red-winged Blackbirds, and Swamp Sparrows. Common Yellowthroat, Yellow Warbler, Alder Flycatcher, Swamp Sparrow, Song Sparrow, Gray Catbird, Red-winged Blackbird, Eastern Kingbird, Golden-winged Warbler, American Goldfinch, Cedar Waxwing , Black-billed
33 I P age
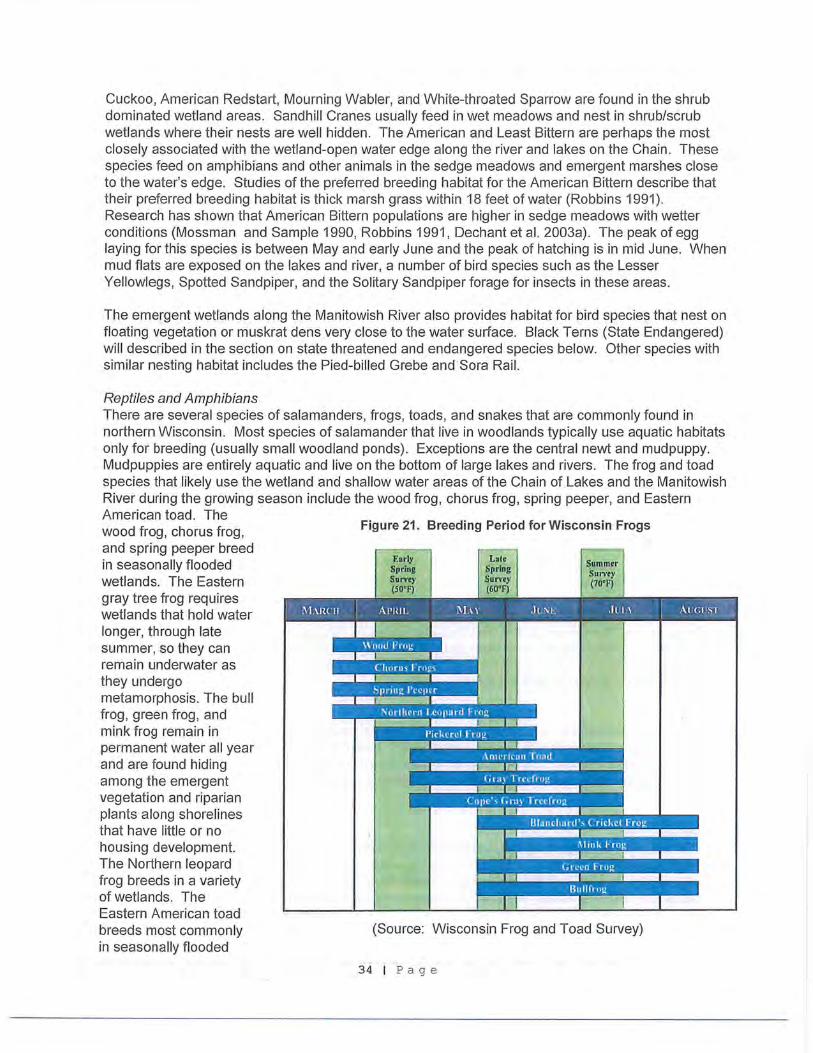
Cuckoo, American Redstart, Mourning Wabler, and White-throated Sparrow are found in the shrub dominated wetland areas. Sandhill Cranes usually feed in wet meadows and nest in shrub/scrub wetlands where their nests are well hidden. The American and Least Bittern are perhaps the most closely associated with the wetland-open water edge along the river and lakes on the Chain . These species feed on amphibians and other animals in the sedge meadows and emergent marshes close to the water's edge. Studies of the preferred breeding habitat for the American Bittern describe that their preferred breeding habitat is thick marsh grass within 18 feet of water (Robbins 1991). Research has shown that American Bittern populations are higher in sedge meadows with wetter conditions (Mossman and Sample 1990, Robbins 1991, Dechant et al. 2003a). The peak of egg laying for this species is between May and early June and the peak of hatching is in mid June. When mud flats are exposed on the lakes and river, a number of bird species such as the Lesser Yellowlegs, Spotted Sandpiper, and the Solitary Sandpiper forage for insects in these areas.
The emergent wetlands along the Manitowish River also provides habitat for bird species that nest on floating vegetation or muskrat dens very close to the water surface. Black Terns (State Endangered) will described in the section on state threatened and endangered species below. Other species with similar nesting habitat includes the Pied-billed Grebe and Sora Rail.
Reptiles and Amphibians There are several species of salamanders, frogs, toads, and snakes that are commonly found in northern Wisconsin . Most species of salamander that live in woodlands typically use aquatic habitats only for breeding (usually small woodland ponds). Exceptions are the central newt and mudpuppy. Mudpuppies are entirely aquatic and live on the bottom of large lakes and rivers. The frog and toad species that likely use the wetland and shallow water areas of the Chain of Lakes and the Manitowish River during the growing season include the wood frog , chorus frog, spring peeper, and Eastern American toad. The wood frog, chorus frog, and spring peeper breed in seasonally flooded wetlands. The Eastern gray tree frog requires wetlands that hold water longer, through late summer, so they can remain underwater as they undergo metamorphosis. The bull frog , green frog , and mink frog remain in permanent water all year and are found hiding among the emergent vegetation and riparian plants along shorelines that have little or no housing development. The Northern leopard frog breeds in a variety of wetlands. The Eastern American toad breeds most commonly in seasonally flooded
Figure 21. Breeding Period for Wisconsin Frogs
Earl,y Spring Survey (50°F)
Late Spring SJin-ey (60°F)
Summu SUI"Vf)'
(70°F)
(Source: Wisconsin Frog and Toad Survey)
34 I Pag e

wetlands, shallow bays of lakes, and river oxbow/backwater areas. Most frog species prefer to breed in seasonally flooded wetlands and ponds that are isolated from lakes and rivers to reduce fish predation on their eggs and tadpoles. The approximate breeding times for these species is shown on the figure 21. At the end of the growing season, around September and October, the chorus, northern leopard, bull, green, and mink frog will begin to look for suitable underwater over-wintering areas.
There is high quality habitat along the shoreline of the Chain of Lakes and along the river corridor for the four species of turtles that are commonly found in this part of the state: common snapping turtle, Eastern spiny softshell, painted turtle, and wood turtle. One species, the Wood turtle is a Statethreatened species and will be discussed separately in the Threatened and Endangered Resources section of this document. Although there is extensive habitat available, turtle populations appear to be low upstream and downstream of the dam. In general, turtles need aquatic habitat that has woody debris for basking and resting, access to uplands for egg laying, and shallow wetland areas with submergent and emergent vegetation where they feed on invertebrates and minnows and also hide from predators. Shallow wetland areas also warm more quickly compared to deeper water areas and the warmer water temperatures are especially sought out during early spring and late fall. All of the turtle species that would be present above and below the dam spend their winters under the ice either buried in, or on the surface of, lake and river bottom substrate. Similar to the species of frogs that overwinter underwater, turtles generally begin to seek out underwater overwintering areas around October 151
.
Many of Wisconsin's snakes such as northern water snakes, garter snakes, and fox snakes will use aquatic habitat in the spring and summer. These species spend the late fall and winter dormant in underground burrows. Those that chose overwintering sites in the floodplain of the Manitowish River below the dam may become flooded during the drawdown of the Chain.
Mammals With the large wetland acreage connected to the Chain of Lakes and the Manitowish River, there is abundant habitat for muskrats, but currently the populations are very low, especially on the Chain. These animals are active all year and feed primarily on wetland vegetation. Their chief food includes cattail , arrowhead, spike rush, water bulrush, pickerel weed, and large-leaved pondweed which are found in the lake bays and riparian wetland sloughs of the Manitowish River system. Muskrat dens are built in shallow water or on lake/river banks with the entrance and exit to the den site being underwater. If water levels drop, exposing a den entrance, there is increased predation and den abandonment. This species also feeds all winter on vegetation under the ice and adequate water depths are needed to allow movement
Figure 22. Muskrat Dens and patch work of open water/ aquatic vegetation in Wisconsin River wetlands.
between food sources and their den entrances. When present, their feeding and den building behavior creates areas of open water, and this patchwork of aquatic vegetative density provides habitat diversity for other plant and animal species. This habitat diversity created by muskrats can be seen on figure 22 which is a photo taken on a backwater of the Wisconsin River near Rhinelander, Wisconsin .
35 I Page

Mink use shallow wetland areas and are dependent on muskrat, crayfish, minnows, and mussels as the important components of their food base . . They also require adequate water levels to move about under the ice while seeking prey.
Beaver are continually attracted to the habitat provided by the rivers and lakes, but are only occasionally observed in the wetlands that are affected by the operation of the dam.
Mussels Mussels are an important component of aquatic ecosystems, and they are also an important source of food for otters, muskrat, herons, and other aquatic birds. Mussels are generally found in small to large groups, or 'beds', and although they are somewhat mobile, mussels cannot quickly respond to fluctuating water levels or other environmental hazards. Sixteen species of mussels have been documented on the Manitowish system above and below the dam as shown on the table 7. The species of mussels that would be least affected by the operation of the dam are those that are almost always found in deeper water such as the Round Pigtoe. Habitat availability of species associated with shallow waters is affected by the operation of the dam.
Table 7. Mussel Species Documented on the Manitowish River
Dragonflies
Scientific name Actinonaias ligamentina carinata (Common name: Mucket) Alasmidonta marginata (Common name: Elktoe) Amblema plicata plicata Andonta cataracta marginata Anodonta grandis form grandis Anodonta imbecil/is Anodontoides ferussacianus Elliptio dilatata Fusconaia f/ava Lampsilis si/iquoidea Lampsilis cardium Lasmigona compressa (Common name: Creek Heelsplitter) Lasmigona costata Ligumia recta (Common name: Black Sandshell) Pleurobema sintoxia (Common name: Round Pigtoe) Strophitus undulatus undulatus
The Green faced Clubtail (Gomphus viridifrons), Skillet Clubtail (Gomphus ventricosus), and Zebra Clubtail (Stylurus scudden) are all dragonfly species that have been recorded within the Manitowish River system and likely occur both above and below the dam (Northern Highland-American Legion State Forest Biotic Inventory, 1999). Originally listed by WDNR as a species of Special Concern Status, they have all been moved to the 'watch list', indicating that their statewide populations are no longer believed to be in decline. There have not been any formal dragonfly surveys of the Manitowish River or lakes so it is likely that many more species are present. All species of dragonflies require aquatic systems for breeding, but habitat requirements and breeding seasons vary according to species. Eggs are deposited into the water by free-flying adults and upon hatching, the larvae are exclusively aquatic, only leaving the water to undergo metamorphosis into adults. With respect to water levels, the most critical time in a dragonfly's life history is during the egg stage, when it is immobile. The habitat requirements of the different life stages vary from shallow, calm water
36 I P age

areas to deep free flowing areas of a stream depending on the specific species. The Green-faced Clubtail has the earliest flight period of the three species and is in flight from late May to early June. This species generally uses the shallow water adjacent to the stream banks for depositing eggs. Skillet Clubtails are also somewhat early in their breeding biology, but are about a week later than the Green-faced Clubtails. The habitat they seek for egg laying is more generalized, using both midstream habitat and water near the stream banks. The Zebra Clubtail has a flight period much later than the other two, extending from late June through the month of August. This species requires sand bottoms for egg deposition, and any depth of water within the stream is suitable for the eggs and larvae of this species.
Crayfish Rusty crayfish (Orconectes rusticus) is a non-native invasive species in Wisconsin (Hobbs, et. al., 1988). They have been present in the reservoir and the river downstream of the dam since the mid 1970's. Given the life history traits of this species, populations are not expected to be affected by the operation of the dam. Other species of crayfish have been documented but a comprehensive WDNR survey has not been conducted.
State Threatened and Endangered Resources Greater Redhorse (Moxostoma erythrurum) - State Threatened The Greater Redhorse (pictured below) is found throughout the Chain and also in the Manitowish River below the dam (WDNR unpublished data). The greater redhorse has recently been recommended for delisting as a threatened species in Wisconsin since the populations appear stable and are found in multiple watersheds (Lyons, et. al., 2000). This species is a late maturing, longlived fish that does not reach sexual maturity until after 5 or 6 years.
Figure 23. Greater Redhorse Similar to other species of redhorse, the Greater Redhorse spawns in rivers at rocky areas with higher water velocities during the spring or early summer. Lake inhabiting Greater Redhorse will either migrate up river tributaries or spawn in shallow areas of lakes (Kwak and Skelly 1992). Habitat models developed by the United States Forest Service (USFS)
indicate that spawning occurs at water temperatures between 62 and 66' F, and spawning is stimulated when highly variable spring flows begin to subside and stabilize (Healy 2002). This generally occurs in June. The primary spawning area for this species below the dam is located on the gravel, cobble, and boulder section of the Manitowish River between Sturgeon Lake and Highway 51 . The cross sections of this stretch of the river have been surveyed and the depth of water measured for a range of river flows. A flow of 75 to 150 cfs is needed to provide enough water to make the majority of the suitable, rocky spawning habitat accessible for this. The larval fish stage of this species occupies shallow vegetated areas near shore with slow water velocities (Scheidegger and Bain, 1995).
Pugnose Shiner (Notropis anogenus)- State Threatened The Pugnose Shiner is a state threatened species that is found on the Manitowish Chain, Trout River, and on the river below the Rest Lake dam (Lyons et. al., 2000). The species is characterized as a "secretive" fish that is closely associated with dense submergent vegetation in lake bays and low gradient river runs and backwaters (COSEWIC 2002). They feed on and among aquatic
37 I Page
Figure 24. Pugnose Shiner

plants, feeding on filamentous green algae and microorganisms. Spawning also takes place in these densely vegetated areas, occurring between May and July.
Longear Sunfish - State Threatened The Manitowish system is at the far northern range for this species. In Wisconsin there are only a few documented populations. The prefer streams that are clear, shallow, low current, moderately warm areas with aquatic vegetation. This species appears to be established and reproducing in the Manitowish Chain. The species was found in Stone Lake during surveys in 1981 and 2004. There is also a well-established population of this species in the Trout River that connects Trout Lake to Wild Rice Lake. They do not appear to be abundant in the Chain at this time.
Wood Turtle - State Threatened Wood turtles are semi aquatic species that prefer lowland hardwood forests and open wet meadows associated with moderate to fast current streams and rivers with sand or gravel substrates. With the good water quality and the extensive area of undeveloped riparian meadow, wooded, and shrub/scrub areas, the Manitowish River provides habitat for this threatened species. Wood turtles are a long-lived species that do not reach sexual maturity until 10-14 years. They are semi-aquatic and often forage in upland forests and meadows in the summer but are aquatic generally from March to April and October to November when most of the breeding occurs (Bowen, K.D. & Gillingham, J.C. 2004). Nesting usually occurs around mid-June, and eggs are laid on south facing river banks, sandy areas, and road shoulders. Juvenile wood turtles are associated with different types of habitat throughout the year, but studies of juvenile wood turtle habitat preferences in northern Wisconsin have shown that areas between alder thickets and open grassy areas near river channels consistently have the highest frequency of occurrence (Brewster and Brewster, 1991). Over the winter, this species is found in riverbanks or on the bottoms of streams and rivers.
Black Terns- State Endangered Black terns were previously listed as a species of special concern but where changed to State Endangered in 2012. This species has been documented nesting on the Manitowish River where it enters the Turtle Flambeau Flowage. Black terns prefer large shallow marshes with abundant vegetation adjacent to open water. Nests are built in Mid May through July on floating structures or near open water. Nests are susceptible to flooding when there are changes in water levels during the breeding season. Water levels that encourage the stability of emergent vegetation would improve habitat for Black Terns.
6. Cultural Environment
a. Land use (dominant features and uses including zoning if applicable)
Most of the residential and commercial land use in the Manitowish Waters area both above and below the dam is based on tourism. People visit the area for a number of reasons including fishing, hunting, and pursuing other recreational activities.
The majority of the Chain lies within the Township of Manitowish Waters, with the exception of parts of Clear, Island, and Wild Rice Lakes that reside in the Township of Boulder Junction, and the southern portion of Wild Rice Lake that is within the Lac du Flambeau Indian Reservation . On the Manitowish Chain of Lakes, there is dense residential lakeshore development and, according to information provided by the Manitowish Waters Lake Association, there are 1,378 private lake lots on the Chain (depicted in yellow on figure 25) . According to informc;1tion posted on the Manitowish Waters Chamber of Commerce website, there is one marina, one motel, one bed and breakfast, and twenty-four cabins and resorts located on the Chain. When accommodations and seasonal homes are occupied, along with an estimated 400 seasonal day visitors, the total
. ·- - . 38 I Page

population has been estimated to rise from 682 to 4,882 persons in the township (Town of Manitowish Waters Year 2022 Comprehensive Plan). In addition to residential development on the Chain, most lakes also have some portions of the shoreline that are public lands, mostly managed by the DNR as part of the Northern Highland American Legion State Forest. There is limited agricultural land use associated with cranberry production near Wild Rice and Alder Lakes.
The Manitowish River is also in the Township of Manitowish Waters from the dam to about a half mile past Benson Lake. From that point to the confluence of the Bear River, the Manitowish travels through the Townships of Mercer and Sherman. The majority of year-round and seasonal residential development on the river below the dam has occurred around Vance, Benson, and Sturgeon lakes, along the Highway 51 corridor, and smaller lots near the intersection of Highways 51 and 47. There are also a small number of resorts, restaurants, and businesses located downstream of the dam. Downstream of Highway 47, the river is surrounded almost entirely by public lands owned by the DNR.
39 P a ge

Figure 25. Land Parcel Types Based on Taxation
Transportation -- F'coc!er.;l/ Slate lilnhw;ll)'
-~· Callflf;;' Hlgtr.v:.y
-- Tcnm RoZid,
-- Privii!B Roads
-- lndi.:m/Tr;."b;:.l Rcod!l
·· · Fc~st Ooads
- ··- - ODltr Ro..acfs
- - AJrpl)rt Runv.'<Jys
- - Btidgu.
Watcrbodlcs
c=J t ake.s and Rivers
Manitowish Chain 9f Lakes Area
T3x Typo for Parcels
c:J T.tu~: E...empt La111b
0 Rec.i;:bnl1al
Comrnc:ci:JI
C=:J Manufactuf.ng
D Agrlcutturol
C=:I Undeve!c:p:~d
Pw.f fOfiJSiliiJ'IIfs
- 0\h<r ~ AgriOJitural Fare d
4 0 Page

b. Social/Economic (including ethnic and cultural groups)
Natural Resources in the Ceded Territory The Manitowish River system is located in the Ceded Territory of Wisconsin, and Tribal hunting, fishing, and gathering rights are accorded as a matter of federal treaty. Prior to the arrival of Europeans in North America, Indian tribes were independent, sovereign nations. Although the Chippewa tribes ceded their land in the northern one-third of Wisconsin to the United States government in the Treaties of 1837 and 1842, they reserved their off-reservation rights to hunt, fish, and gather within the Ceded Territory. As a result, the Lake Superior Chippewa tribes of Wisconsin are allowed to harvest rice and legally harvest walleyes and muskellunge using traditional methods, including spearing and gillnetting, on lakes within the Ceded Territory. The Lac du Flambeau Band of Lake Superior Chippewa Indians is the tribe that primarily practices their traditional hunting and fishing rights on the Manitowish River system. The Lac du Flambeau Chippewa Reservation has been a permanent settlement of the Lake Superior Chippewa Indians since 1745 when Chief Keeshkemun (Sharpened Stone) led his band to the Manitowish River area for wild rice, fish, and game. The Lac du Flambeau Indian Reservation is located 12 miles northwest of Woodruff and Minocqua in southwestern Vilas County and the southeastern portion of adjacent Iron County.
Wild Rice An important cultural resource on the Manitowish River system is wild rice (Zizania pa/ustris), and large beds are present above and below the dam. In addition to being an important traditional food source harvested by Native Americans, wild rice beds also provide an important food source for waterfowl during fall migrations, good cover for brood rearing habitat for ducks, nursery areas for young fish and amphibians, and a food source for a number of bird species and herbivores such as muskrats.
Figure 26. Harvesting Wild Rice
Rice is an annual plant that grows in about 0.5 to 3 feet of water, and it does best in the presence of flowing water including rivers and lakes with inlets and outlets. Winter drawdowns may benefit wild rice because it helps the annual wild rice plant to effectively compete against water shield and other perennial macrophyte species. Water level fluctuations in May and June are detrimental to wild rice because it is at a critical growth stage called the floating leaf stage. During this time, the wild rice plant is reaching the surface of the water and has started to grow a leaf that looks like a ribbon which floats on the water surface at a 90 degree angle to the stalk. If water levels rise, then the floating leaf can pull the wild rice root out of the lake bottom. The plants can also drown at this stage because the plant has begun a physiological change and has begun exchanging gases it needs from the air (Rogosin 1954, Kahl 1993, Fannucchi et al. 1986). If water levels decrease, then the stalk can collapse.
41 I Page

The wild rice acreage upstream of the Rest Lake Dam is mapped based on aerial surveys conducted by the Great Lakes Indian Fish and Wildlife Commission (GLIFWC). Over the past ten years, the average acreage at peak years is as follows:
• Island Lake (at Rice Creek) -80 acres • Island Lake (at Manitowish River) -60 acres • Rest Lake (at Papoose Creek) -12 acres • Wild Rice Lake and Trout River -15 acres
Figure 27. Photo taken by GLIFWC of the wild rice beds where the Manitowish River enters Island Lake
There are also a number of wild rice beds located on the Manitowish River below the dam, but the total acreage is not known because the wild rice primarily grows along the river's edge and the area of the beds are difficult to identify in aerial photos. The wild rice on the river is an important food source for waterfowl but is not commonly harvested because the rice on the river is a shorter growing variety that is difficult to harvest in canoes.
Walleye and Musky Harvest The six Chippewa tribes of Wisconsin are legally able to take walleye and muskellunge in the Ceded Territory using traditional harvest methods. Walleye, and to a lesser extent muskellunge, are harvested annually on most of the lakes on the Rest Lake Chain . The harvest during the walleye spawning period begins shortly after ice off, when the Chain is at the winter 5' 0" water level, and generally continues two to three weeks.
42 I Page

Lake Sturgeon (Acipenser fulvescens) The lake sturgeon is an important species to Native American culture as a traditional source of food, and also serves an important role in tribal ceremonies and creation stories. The restoration of Lake Sturgeon in the Manitowish River is a recommendation of the Wisconsin statewide sturgeon management plan which can be viewed at the following weblink: http://dnr.wi.gov/fish/sturgeon/mngtplan/ .
There are no official accounts of lake sturgeon occurring in any lakes or streams in the upper Manitowish system before or after the Rest Lake dam construction. However, it is likely that lake sturgeon were historically present above the dam and a few individuals may still be present (although no documentation of this currently exists). Since 1990, the Wisconsin DNR has been periodically sampling for, and studying, lake sturgeon in the Turtle Flambeau Flowage (TFF) and the Manitowish River system. Beginning in 1991, a radio telemetry study was initiated in order to monitor seasonal movements of lake sturgeon within the system. Sturgeon implanted with radio transmitters in Benson Lake and the TFF generally migrated between the flowage and the rocky area below the Highway 51 bridges. Many of the fish tagged in the TFF migrated to Benson Lake in the fall prior to spawning, and after spawning, returned to the TFF.
Lake·sturgeon have been observed spawning in the limited rocky areas below the highway 51 bridge. Although it is not certain, these observations, along with field observations of radiotagged fish, provide strong evidence that most spawning activity occurs in the rocky areas below
. the Highway 51 Bridge. It is also possible that some spawning could occur at the confluence of the Bear and Manitowish rivers where walleye are also known to spawn, or on other inflow tributaries to the TFF system· Neither of these areas are thought to provide the extent or quality of habitat compared to what exists below the Highway 51 bridge.
Detailed habitat models have been developed to quantify the water velocity, depth, and substrate needed for suitable spawning habitat (figure 29). Sturgeon require clear rock, cobble and boulder spawning habitat that is not covered with silt and that has adequate river flow to create sufficient water depth and clean interstitial spaces between rocks to keep incubating eggs well oxygenated. Spawning begins when higher spring flows and rising water temperatures cue sturgeon to begin
their movement into the spawning grounds. Optimum conditions include temperatures of 53 to 61 degrees Fahrenheit, water velocities between 1.64 to 4.92 feet per second, and a water depth of 18 inches or more. On the Manitowish River, these conditions are associated with river flows between 125 and 200 cfs or more. Based on three years of temperature data on the Manitowish River, suitable spawning water temperatures generally occur between May 1st and June 6th . After successful spawning, it takes approximately 5 to 8 days for eggs to hatch and young fish to begin to drift downstream. For the first year of life, young fish will use the main river channel in vegetated areas adjacent to sand and gravel bars. Adult sturgeon required adequate areas of water less than 30 feet deep where abundant food is produced. Below the Rest Lake Dam,
43 I P ag e

Vance Lake, Sturgeon Lake, Benson Lake, and the TFF offer suitable habitat for adults. Lake sturgeon have been found to primarily feed on small crustaceans, mollusks, and lakefly larvae (Schmitt et. al. 2009).
Figure 29. Lake Sturgeon Habitat Suitability Curves.
Veloc ity
1 2 ·----1
~ o a P..-#----~,-----__::::,.. ...... :::-
~ 06 ~~------~~----------~~-=~----------~ ~ 0 4 i -4------'-=---------- - --"'k--- -----i
0 .2
0~---~------~~~~------~----~----~~---~ 0 2 3 4 5 7
v c ii.A.!ily (rUs )
O iipth
I 2
I
~ 06 · 71 0 6 .. '§
0 .4 ., 0 <!
0
0 10 2 0 :10 40 !".0 60 70
d epth (ft)
Subst rate
Silt/Clay Sand Gravel Cobble Boulder Bedrock
44 I Page
nr>-._nino - juvoollo-tnmgo

Economics Tourism The high density of lakes, rivers, wetlands, and public recreational areas attract many people who visit the area to boat, fish, camp, hike, paddle, bird watch, or engage in other activities that the region offers. The money spent by tourists is an important base of the local economy, and the amount spent in Manitowish Waters was estimated in the Town's Year 2022 Comprehensive Plan. According to a study for the Wisconsin Department of Tourism, visitors to Vilas County spent $185.7 million dollars in 2000. To figure out the percent of this that was spent in Manitowish Waters, State of Wisconsin Division of Health records were used to determine the percentage of lodging accommodations available in the town versus the county. That percentage was applied to the total tourism spending in the County. I:Jsing this method, Manitowish Waters may benefit from an estimated $12.2 million of expenditures from visitors each year.
Seasonal Residents Another important part of the local economy comes from the money spent by seasonal residents for food and drink, recreation, construction, and other services. The amount of money spent by this group each year in Manitowish Waters was also roughly estimated in the Town's Comprehensive Plan. Based on a 1995 study of Recreational Homeowners in Wisconsin, there was an estimated $127 million spent by seasonal residents for goods and services in Vilas County. Manitowish Waters has an estimated 6.1% of the total seasonal housing units that are documented in the County. Using this percentage, seasonal residents spend roughly $7.75 million each year in Manitowish Waters.
Property Taxes The property taxes on the waterfront homes are an important source of revenue for the Township and County government. According to information submitted by the Manitowish Waters Lake Association, the total assessed value of the waterfront homes on the Chain is $418,695,300.
Property Ordinary High Water Mark Since 1915, the summer maximum water level at the dam has been set at 8'6", and this water level elevation has strongly influenced the location of the ordinary high water mark (OHWM). The OHWM is defined as the point on the bank or shore up to which the presence and action of the water is so continuous as to leave a distinct mark either by erosion, destruction of terrestrial vegetation, or other easily recognized characteristic. There are physical and biological field indicators of the OHWM, and this boundary is the separation between privately owned riparian lands and the areas where the public has the right to use the navigable portions of the waterway for activities such as fishing and boating . Since the maximum water level on the Chain has been established for over ninety years, the location of the OHWM has likely remained relatively stable and is located somewhat above the maximum summer water level.
Flowage Rights According to Xcel staff, the CFI C has limited non-flooded ownership of the flowage bottom on the Manitowish Chain. The company has maintained flowage rights over the submerged lands which give the owners of the dam the right to flood. It is likely that the flooded lands are owned by other parties, which can be public or private entities. A detailed picture of the ownership of the flowage bottom would have to be determined through reviewing the property deeds at the courthouse.
Shoreline Structures There are many structures such as boathouses, sea walls, piers (permanent and seasonal), riprap, and other shoreline structures located on the Manitowish Chain of Lakes. No formal evaluation has been done to compare the total number or value of structures on the Manitowish
45 I Page

to other northern Wisconsin lake chains. High numbers of shoreline structures can also be found on the Minocqua, Eagle River, and Three Lake chains.
To evaluate the potential for boathouses, sea walls, piers, riprap, and other shoreline structures to be affected by different winter water levels, the Chain was $Urveyed at the 6' 0" level in 2004 (table 8) . Structures included in the survey were picked at random and the height above the 6' 0" water level was recorded at each site as shown below. Based on this data, it was then determined if these structures would be wet or dry at different water levels.
Table 8. Structure Survey on the Chain of Lakes
Structure (%)dry (%) wet
Elevation 5.0 6.0 6.5 7.0 8.0 8.5
Dry Dry Dry Dry Dry Dry Wet Wet Wet Wet Wet Wet
Boathouse 84 42 29 24 13 11 16 58 71 76 87 89
Walls 97 86 80 56 0 0 3 14 20 44 100 100
Docks/piers 46 7 7 7 0 0 54 93 93 93 100 100
Rock Rip- 100 80 40 20 0 0 rap 0 20 60 80 100 100
Wood/Stone 100 100 100 0 0 0 Bldg. 0 0 0 100 100 100
Foot Bridge 0 0 0 0 0 0 100 1 00 100 100 100 100
Shed 100 100 100 0 0 0 0 0 0 100 100 100
Deck 1 00 100 100 10 0 100 100 0 0 0 0 0 0
Total 100% 83 55 44 32 7 6 17 45 56 68 93 94
The total number and value of permanent structures (other than riprap and seawalls) below the OHWM on the Chain was estimated using results from the 2004 survey, permit records, and aerial photographs. Based on these sources of information, there are approximately 78 wet boathouses, 5 dwellings, and 16 permanent boat shelters. Wet boathouses are structures designed for boat storage that have at least part of their foundation below the OHWM. Wet Dwellings are structures that were built or rebuilt for human habitation that have at least part of their foundation below the OHWM. Permanent Boat Shelters are similar to boathouses except that they have no walls. All three of these structure types are regulated by Chapter 30 (Wis. Stats.). Real estate assessment information was requested and received for wet boathouses,
46 I Page
dwellings, and permanent boat shelters located below the OHWM. Using parcel data common to both the DNR survey and the assessment records, 88 of the 99 observed structures (89%) were found to be in the assessment records. The 2008 assessed values and fair market values total $2,111,940 and $3,754,746, respectively.
Shoreline stability Wind and ice action can have an impact on the shorelines and structures on Wisconsin lakes. The energy that waves exert along the shorelines on the Chain is related to boat traffic, wind speed, depth of the lake adjacent to the shoreline, shoreline vegetation, aquatic vegetation, soil type, and fetch (the length that wind can carry a wave across a lake). The shorelines that receive the highest amount of wave action can be determined using the wave energy calculator found on the following DNR website: http://dnr.wi.gov/waterways/shoreline habitat/erosioncalculator.html
On average, 75% of the winter ice sheet is gone on the Chain of Lakes by April 201h. The primary
mechanisms of ice action are ice-jacking and wind pushing the ice sheet against a shoreline.
Ice-jacking is caused by the expansion of the ice sheet during a temperature rise followed by a contraction with an appreciable drop in temperature. During this expansion and contraction, the ice sheet cracks and those cracks fill with water which freezes and expands the ice a bit further. When a subsequent rise in temperature produces an expansion of the whole ice mass, a tremendous force can be exerted against the shore. Ice jacking primarily occurs on larger lakes such as Lakes Winnebago (137, 708 acres), Mendota (9,842 acres), and Koshkonong (1 0,460 acres) but does not exert much, if any, shoreline disturbance on lakes the size of those on the Manitowish Chain (from 74 to 1,043 acres).
The amount of shoreline disturbance caused by wind action pushing the ice sheet depends on the thickness and strength of the ice sheet, shoreline geometry, wind speed, and fetch. Areas may be more susceptible to this form of ice action if there are gradually sloped shorelines, long fetches and prevailing winds. Prevailing winds predominantly come from the northwest and then typically switch to the southwest during the late stages of the melt period. A wind generated ice push occurs more often on large lakes with long open water fetches of a mile or more. Most of the lakes on the Manitowish Chain of Lakes have a fetch of a mile or less.
Navigation The Manitowish Chain is heavily used by recreational boaters during the summer months. There is a wide range of recreational craft used including large power boats and pontoon boats. There are boat ramp access points on Rest, Clear, Island, and Wild Rice Lakes, and there is carry in access at Clear and Little Star Lakes.
The Manitowish River downstream of the dam is primarily used by small motor boats, canoes, and kayaks. Public access points on the river include the launch at Highway 51, Benson Lake Road, Manitowish River Access Road, the wayside on Highway 51, and the Highway 47 Bridge. Downstream of Highway 47, the-river is quite remote. The only access points are at the Turtle Flambeau Flowage at Murray's landing or from Highway 182 by traveling on the Bear River to reach the Manitowish.
~-
47 Page

c. · Archaeological/Historical
There are numerous archaeological sites on the Chain (Stiles, et.al. 1995). Site types include: Native American campsites and villages, Native American burial sites, and Euro-American homesteads and logging camps. Many of these sites are located near the shoreline and many are on islands and peninsulas. Some sites were likely flooded when the Rest Lake dam was originally constructed and some may be partially above and below the 8' 6" water elevation.
7. Other Special Resources (e.g., State Natural Areas, prime agricultural lands)
The Manitowish River system above and below the dam is recognized by many as a unique ecological resource. Above and below the dam, the Manitowish River is classified as an Outstanding Resource Water (ORW) or Exceptional Resource Water (ERW). Waters designated as ORW or ERW are surface waters which provide outstanding recreational opportunities, support valuable fisheries and wildlife habitat, have good water quality, and are not significantly impacted by human activities. Additionally, department biologists that frequently conduct aerial surveys for wild rice or bald eagle surveys have noted that the extensive floodplain wetland complex connected to the Manitowish River is unique to this river system. According to Wisconsin's Wildlife Action Plan, this area is designated as having ecological significance for conservation opportunities areas for wildlife species of greatest conservation need.
The Manitowish River below the dam from Benson Lake to STH 47 is designated as a scenic management area in the Northern Highland-American Legion State Forest Master Plan. As stated in the master plan, "this classification is applied to lands with outstanding scenic attractions, scenic lakes, rivers and stream with high values for water-based recreation". The management objective for this classification "is to protect, maintain, and enhance for long-term public enjoyment lands or water having unique aesthetic qualities or outstanding scenic beauty".
The Manitowish River Wilderness Area (which is downstream from the STH 47 bridge), consists of 6,265 acres with the Manitowish River running through the center. This Wild Resources Management Area is typically applied to "undeveloped areas that have the potential to be restored to a substantially wild condition . These locations are managed to provide land and water areas where natural ecological process predominate and evidence of human activities is low". Within this wilderness area is the Frog Lake and Pines State Natural Area (SNA), which borders the Manitowish River, and the Turtle-Flambeau Pattern Bog SNA located farther downstream.
48 I Page
PROPOSED PHYSICAL CHANGES (more fully describe the proposal)
8. Manipulation of Terrestrial Resources (include relevant quantities -sq. ft., cu. yard, etc.)
No changes to terrestrial resources are proposed.
9. Manipulation of Aquatic Resources (include relevant quantities - cfs, acre feet, MGD, etc.)
The natural pattern of water levels in flow-through lakes is associated with high water levels in April, May, and June due to the melting snowpack and water inflow from storm events. This natural pattern of water levels is much different when compared to the pattern of water elevations on the Chain of Lakes due to the current operation of the Rest Lake Dam (Figure 30). Low water levels on the Chain occur from late fall through the following summer (generally until late May or early June) because of the 3.5 foot winter drawdown and timing of the spring refill. In low precipitation years, the Chain does not reach the summer 8' 6" maximum water level because of the extent of the fall drawdown, the timing of the Chain refill, naturally low inflows, and pumping to irrigate cranberry beds.
Downstream of the dam, from spring through fall, the natural pattern of flows of the Manitowish River have mostly been eliminated and reversed due to the current operation of the dam. A natural flow pattern includes a high spring flow "flood pulse" followed by flows that gradually decrease through the summer, with the lowest flow occurring in late summer and early fall. The natural flow pattern for the Manitowish River was determined by USGS (figure 30). With current dam operations, water is typically held back to fill the Chain from April until June and during this time the minimum flows passed downstream create drought conditions on the river on an annual basis. During low precipitation years, these artificially low river flows may continue until fall while the chain is being refilled. The highest flows of the year are released downstream in late fall during the drawdown of the Chain of Lakes.
The Department is proposing to issue a new operating order that would result in water levels and flows upstream and downstream of the dam that closely match the natural pattern of levels and flows of northern Wisconsin flow-through lakes and rivers. To accomplish this, the extent and timing of the winter drawdown would need to be eliminated or greatly reduced, a more natural flow pattern would be passed downstream of the dam, and ramping rates would be specified for both Chain water levels and downstream flows to avoid quickly fluctuating water levels. On the Chain, this proposal would positively affect the hydrology of the 934 acres of wetlands mapped adjacent to the lakes, the shallow water areas identified on the lake maps (appendix Ill), and the lake shorelines. Downstream, the proposal would affect the instream river channel habitat, the 1500+ acres of riparian wetlands located adjacent to the river channel, and the banks of the river.
10. Buildings, Treatment Units, Roads and Other Structures (include size of facilities, road miles, etc.)
In order to restore a natural pattern of water levels and flows, water elevations on the Chain would need to be kept higher while ice is present. To avoid and minimize possible ice damage to structures, it is anticipated that more piers would need to be taken out of the water in the fall. For structures that cannot be moved, it is likely that aeration systems, physical ice deflectors, or other methods would need to be installed to protect against possible ice damage. These techniques to protect structures are used on the majority of lakes in Wisconsin, including natural lakes and impoundments.
11. Emissions and Discharges (include relevant characteristics and quantities)
No changes to emissions and discharges proposed.
12. Other Changes
No other changes are proposed.
49 Page

Figure 30. Natural Pattern of Manitowish River Flows in Relation to the Discharge at the Rest Lake Dam and Fi lling and Drawdown of the Chain of Lakes (from USGS report) .
400
"0 350 r:: 0 u Ql til .... 300 :g_ .... Ql 11) - 250 u :c :::> u .5 :i 200 0 = E <0 150 11)
~ ..:::-·;;;
100 "0
c ctl :0 Ql
~ 50
0
Chain refill causing low downstream flows
Fall drawdown causing high downstream flows and low water
conditions on the Chain
Jan. Feb.
Natural spring flood pulse
Mar. Apr. May June July Aug. Sept. Oct. Nov.
EXPLANATION
Median reported dam outflow (adjusted) 197~2011
Median computed streamflow from the water-budget 1973-2011
Median computed strea~flow from the adjusted drainage-area ratio 1991-201 .1
Median reported dam outflow (adjusted) 1991-2011
Median computed streamflow from tlie water-budget 1991-:2011
Median reported lake stage (adjusted) 1973-2011
50 I Page
1,602
1,600 Q) a:j' >co 0~
..o,._ ctl 0
1,598 10 E .:!?.a r:: ctl ·- c a)-CI<O
1,596 J9·e "' 11)
~> ctl c:
- <0 >u ::: ·c ctl Ql
1,594 "'CE ~<I: ~€ ~~
1,592
1,590 Dec.

ALTERNATIVES AND ENVIRONMENTAL CONSEQUENCES (probable adverse and beneficial impacts including indirect and secondary impacts)
14. Describe the impacts of no action and of alternatives that would decrease or eliminate adverse environmental effects.
The following alternatives were evaluated in this environmental assessment.
• Alternative I. Current operations (page 51)
• Alternative II. The 1939 operating order (page 52)
• Alternative Ill. Public Interest River Flow and Lake Stage (page 67)
• Alternative IV. Passing inflows (page 68)
Alternative I. Current Operation The current operation alternative means that the current management of water levels and flows would continue (Table 9). The current operation does not follow some of the provisions of the 1939 operating order. For this alternative, the Department would need to authorize a new operating order that follows the current management of water levels and flows.
Table 9: Summary of the Current Operation of the Rest Lake Dam Dates Headwater Levels Flows Winter: November 8 to 75% ice off Rest 5' 0" Run of River 11
>
Lake (-April 20)
Spring: -April 20 to July 1 12> Chain refill from 5'0" to 8'6" 40 cfs of more
Summer: July 1 to September 28 8'4"-8'6" 40 cfs or more 13>
Fall: September 28 to November 8 14> 5'0" (S) 40 cfs of more
<1> Outflow equals inflow.
(2
) Average refill (full pool) date is June 61h The total number of days to fill the Chain has ranged from 11 to 108 days.
There has not been enough precipitation to refill the reseNoir five times (1988, 2005, 2006, 2007, and 2009). During the spring refill period, the flows on the river are reduced to the Q7 -10, which is currently estimated to be 40 cfs, has ranged from 30 and 50 cfs in the past.
(3
) To maintain summer pool elevations between 8'4" and 8'6", flows have been reduced to 40 cfs or lower. <4
> In recent years, drawdown has started on- September 28 instead of September 1. (S) At no time shall the Chain be lowered at a rate exceeding 2 inches per day, or at no time shall the Chain be
lowered after ice forms.
51 I Page

Alternative II. 1939 Operating Order Records are available for the daily discharge over the dam and Rest Lake water levels from 1955-1961 and 1973 to current. These records show that certain provisions of the 1939 operating order are not currently being followed. The provisions of the 1939 order and the current minimum 0 7_10 flow are summarized in table 10.
Table 10. Summary of the 1939 Operating Order Dates Headwater Levels Minimum Flow November 1 to Spring thaw (initial Minimum of 5'0" Run of River runoff event, - 3rd week of March). (outflow equals inflow) Spring thaw to April 15 Minimum of 7'3" 07-10 = 40 cfs (- ice out on Chain) April 15 to July 1 7'3"- 8'6" 07-10 = 40 cfs July 1 to September 1 No lower than 7'3"- 07-1o = 40 cfs
8'6" September 1 to November 1 No lower than 5'0" 07-10 = 40 cfs
With current operations, spring refill does not begin until ice is 75% off of Rest Lake to avoid potential ice damage to permanent piers and boat houses. On average, refill begins on April 20th which is often after most of the high spring runoff events have passed through the dam. High spring runoff flows are not captured to bring the Chain to 7' 3" by April 15th as written in the 1939 order. Under current operations, during the summer months, reservoir storage is not used to augment low flows downstream and water levels are maintained in a narrow range between 8' 4" and 8' 6", not between 7'3" and 8'6" as specified in the 1939 operating order. Currently, when water levels drop below 8' 4", flows over the dam are quickly reduced to minimum flows (40 cfs). In the fall, to accommodate navigation during community events such as Colorama, the reservoir is maintained at 8' 6" until late September or early October. The 1939 order specifies that a drawdown to the target 5' 0" winter level could begin September 1st.
52 I Page

Impacts Associated with Current Operations and the 1939 Operating Order
Aquatic Habitat on the Chain Upstream of the dam, under both the current operations and the 1939 order, the 3.5 foot winter drawdown would continue to result in dewatering aquatic bed wetlands and shallow water habitat from the fall until the spring or early summer. In low precipitation years, low water in these areas would continue through the entire summer as occurred in 2007. The wetlands on natural flow through lake systems in northern Wisconsin do not experience the extent, timing, or duration of the low water levels that would occur with both of these alternatives. Both alternatives would continue to negatively impact the ability of wetlands and shallow water habitat to provide for the life history needs of the diverse community of mammals, waterfowl, loons, fish, herptiles (amphibians and reptiles), and aquatic insect life. The impacts of insufficient surface water in wetlands and shallow water areas are especially detrimental during the fall, winter, spring, and early summer. During fall, amphibians and reptiles move into these critical areas seeking out leaf debris and soft bottom sediments where they overwinter. With the timing of the fall drawdown, these habitats would be sought out before the water levels drop. After finding what would appear to be appropriate habitat, the animals enter a state of reduced metabolic activity and are unable to quickly relocate to appropriate habitat. As water levels drop, the amphibians and reptiles would be exposed to winter elements and most would not survive. Depending to the success of the early stages of refilling the Chain in spring, many of these shallow water areas would also not be available at the start of the growing season when aquatic habitat is needed for spawning, reproduction, and rearing. For example, depending on the timing and duration of the refill, increasing water levels may negatively affect the success of loon nesting. The month of May is a critical time period for nesting loons and would be associated with rising water levels with both alternatives. Once on the nest and incubating , depending on the nest location, some would likely encounter nest flooding with rising water levels during the refill period . The annual winter drawdown and associated water level fluctuations would also continue to be detrimental to the organisms that depend on habitat in the near shore shallow water zones, and to native plant communities trying to establish in these zones. Lower densities of aquatic plants and less organic matter build up in the near shore would continue which provide favorable conditions for walleye and perch populations. Since spawning occurs early in the spring while the Chain would be at or near the 5'0" water elevation, the drawdown associated with these alternatives would likely have only a small influence on populations.
Although both alternatives would continue to create annual low water conditions in aquatic habitat on the Chain, if the provisions and intent pertaining to the spring refill period of the 1939 operating order were followed, it would result in the capturing more of the high spring inflows to fill the Chain. This could reduce the time needed to fill the Chain and consequently reduce low water conditions in wetlands and shallow water areas during spring and early summer. The duration and timing of the spring refill would continue to be highly dependent on the extent of the snow pack and the timing of spring rainfall events. Although following the 1939 Order could reduce the duration of low water impacts compared to the current operation, the annual low water conditions caused by the drawdown would still be highly disruptive to wetland function and life history needs of a wide range of organisms that utilize these wetland areas.
The dewatering of the aquatic bed wetlands and shallow water areas on the Chain that would be associated with both current operations and the 1939 Order, along with additional descriptions of the associated environmental impacts, are shown on the following pages in Figures 31 and 32.
53 I Page

Figure 31. The picture above and below show the water level changes that occur in shallow aquatic bed wetlands on Island Lake at the 8' 6" (top picture) and 5' 9" (bottom picture) water level. The white stars identify the same area on each photo. The low water conditions in these areas has negative impacts on many wetland functional values including negative impacts to the diverse fish and wildlife species that need sufficient surface water in order to utilize these areas.
54 I Page

Figure 32. The picture above and below show an "on the ground" view of the water level changes that occur in shallow aquatic bed wetlands on Clear Lake at the 8' 3" and 6' 2" water level. The lack of water and low water conditions in these wetlands in the spring, throughout the summer, and to overwinter, negatively impacts the diverse fish and wildlife species that can only utilize this type of habitat when it is sufficiently flooded . The white star on each photo serves as a reference point for location identification .
55 I Pag e

Aquatic Habitat Downstream of the Dam With a 3.5 foot winter drawdown and a narrow Chain elevation operating range over the summer, both alternatives would cause a high occurrence of low water levels in the wet meadow and scrub/shrub wetlands, oxbows, backwater sloughs and rocky riffle areas during early spring. Based on USGS estimates, flows of 40 cfs in April and May represent flows that would naturally occur only very rarely on the river (less than 1% of the time). With both alternatives, in some years, drought river conditions would be carried through the entire summer growing season in order to fill and maintain the elevation of the Chain . Although these conditions would not be of the same duration from year to year, the unnatural low water levels and flow conditions would occur on a yearly basis. Even though drought is a natural phenomenon, the artificial manipulation of river flows mimicking these conditions on a yearly basis is not. This is considered to be highly disruptive to the river ecosystem. Following the 1939 order would somewhat reduce the duration and frequency of low flows on the river by starting to refill the Chain earlier, capturing the initial spring runoff, and utilizing a wider operating range in the summer to augment downstream flows.
The median reported outflows (Xcel discharge through the dam) shown in figure 30 depict the drought level flows that are currently discharged through the dam. On average, these flows generally occur from midApril to June. The plant and animal life associated with river systems have adapted to, and are dependent on, natural flow patterns. In the 1 ,500+ acres of riparian wetlands, oxbows, and backwater sloughs, the river's spring flood pulse is the driving force which sustains all life history needs of the plants and organisms (aquatic and terrestrial) that depend on these areas. Both the current operation and the 1939 order would result in disrupting this flood pulse each spring. This is a critical time period for the species associated with the riparian wetland habitat of the river, and both alternatives would continue to negatively impact the species described earlier in the analysis that depend on these areas. Current research has demonstrated that reducing spring flows during the early and mid-growing season on rivers negatively affects riparian wetlands, aquatic habitat, and the associated fish and wildlife species (Richter and Thomas, 2007, Richter et. al. 2006). The high occurrence of low water conditions on the river has also likely resulted in changes to the riparian wetland community. It is likely that over time, the wetlands along the river changed from being dominated by meadow species (sedges, grasses, forbs) to having a much higher density of shrubs (such as tag alder and willow).
In the rocky riffle spawning section of the river, both the current operation and the 1939 order would often pass 40 cfs during the spring. This minimum flow would continue to limit the habitat available for a number of aquatic organisms and limit the spawning success of greater redhorse and lake sturgeon.
The water levels of the river would also continue to quickly fluctuate. Many of the backwater and oxbow areas become dewatered and disconnected from the main river channel within 24 to 48 hours. These quickly changing water levels would continue to results in fish stranding as well as have direct impacts to other organisms dependent on these habitats. Fish and wildlife that are able to move out of these areas in time are forced to relocate from what otherwise would be excellent habitat for feeding and reproduction. During the fall , high flows associated with the drawdown of the Chain quickly floods the downstream wetlands and would continue to impact the over wintering success of a number of mammals, reptiles, amphibians, insects, and other aquatic and semi-aquatic organisms.
Figures 33 through 36 on the following pages show the low water conditions that would occur in the riparian wetlands and the rocky riffle area and also provide additional descriptions of the impacts associated with alternatives that have a 3.5 foot winter drawdown of the Chain.
56 I Page

Figure 33. The aerial picture above shows the river and connected riparian habitat at 455 cfs. The picture below was taken at 40 cfs and shows the effect the Chain refill has on downstream resources. The natural flood-pulse of the river has been eliminated, riparian wetlands are left dry, and many of the oxbow and backwater areas are dewatered and/or become disconnected from the main river channel. It is important to note that at 200 cfs, the entire riparian wetland zone from tree line to tree line is completely inundated with water. The white stars serve as reference points for location identification. (455 and 40 cfs were Xcel reported
57 I Pag e

October 2009 Flow at 322 cfs - Water Depth = 29 3/8 "
(DNR Measured)
Figure 34.The photos above and below show the "on the ground" conditions in the same river oxbow at high and low river flows. The above conditions are what is expected to typically occur during natural spring f lows. When the dam is shut down to 40 cfs, these old stream channels quickly dewater, leaving conditions depicted in the photo below. Available aquatic habitat is lost, along with the functional value of the associated wetlands. Fish and other aquatic organism stranding has been observed and documented in these areas along with loss of spawning, feeding, and nursery areas for fish , waterfowl , and furbearers. The white stars serve as reference points for location identification.
58 I Pag e
May 2008 - Flow at 40 cfs (DNR Measured)

Figure 35. Pictures of fish and other aquatic organism stranding in the wetlands along the Manitowish River after quickly changing river flows.
35a. Tadpoles
35b. Pumpkinseed
35c. Gravid brook stickleback
59 I Page

Figure 36. There are very limited areas of rocky riffle bottom habitat on the Manitowish River below the Rest Lake dam. The photos on this page were taken at high (240 cfs) and low (40 cfs) flows (Xcel reported flows). Portions of this rocky river bottom are dewatered or have very shallow water at the low flows that are passed each spring and early summer when a number of fish and wildlife species utilize this type of habitat.
60 I Page

Cultural Resources Wild rice productivity is likely negatively impacted by rising water levels during the floating leaf stage in May and June. On the Chain, both current operations and the 1939 order would be associated with rising water levels in May and June in low precipitation years when it takes longer to refill the winter drawdown. It is likely that the 1939 order would decrease the frequency of rising water levels during this time since the spring refill would occur earlier and would allow the Chain to fill more quickly.
As described earlier, the annual winter drawdown associated with both alternatives would provide conditions favorable to walleye. These fluctuations, however, may also be associated with higher mercury content in walleye and other predatory fish. The 3.5 foot drawdown and refill could increase the amount of mercury that can enter into the food chain. According to a report prepared by the Great Lakes Indian Fish and Wildlife Commission (Groetsch, et. al. 2003), "Dam operation regimes that result in fluctuating water levels in a reservoir likely cause water levels to change in back water bays and riparian wetlands. This water level change may result in increased production and (or) bioavailability of methylmercury (Snodgrass et at. 2000, Mucci eta/. 1995, Grondin eta/. 1995, Louchouarn eta/. 1993)". Access to the lakes to harvest walleye during their spring spawning period would be negatively affected by the winter drawdown. Lake access and navigation are described in more detail in the Social and Economic Environment section below.
As stated earlier, in the rocky riffle spawning section of the river, both the current operation and the 1939 order would often pass 40 cfs during the spring. This minimum flow would continue to limit the spawning success of lake sturgeon. Age estimates from captured lake sturgeon suggest that with current operations some level of natural reproduction has occurred within the system. The years of natural lake sturgeon reproduction correspond to high precipitation years when there was a quick refill and high flows were passed below the Dam during their spawning period. However, at this time, it is assumed that the level of natural reproduction is not sufficient to maintain a self-sustaining, naturally-reproducing population of this long lived species. Females do not reach sexual maturity until approximately 20 years old, while males will begin to spawn at 12 to 15 years old. Because of these factors, young lake sturgeon are periodically stocked in order to supplement natural reproduction. The Wisconsin DNR continues to study this lake sturgeon population, with the ultimate goal of a self-sustaining population of lake sturgeon, completely independent of stocking , becoming established in the Turtle Flambeau Flowage and the Manitowish River system. It is likely that the 1939 order would somewhat increase the years of successful reproduction since this alternative would be associated with refilling the Chain more quickly in the spring and higher downstream flows.
If any archaeological sites are currently affected by wave action at the 8' 6" water elevation, both the current operation and the 1939 order would continue to impact these resources . Wave action on the shoreline would not change under both alternatives because the 3.5 foot winter drawdown Would likely result in lower aquatic plant densities in the near shore zone. Aquatic plants in this area are important components of lakes that help protect shorelines from erosion caused by wave action. The primary difference between these two alternatives is that the 1939 order would be associated with rising water levels in early spring and some years this would be expected to occur while there is still ice on the lakes. This would increase the potential for ice to act on shorelines. More detailed description of the potential for ice action on shorelines is described in the Social and Economic Environment section below.
Before implementation of any changes to the operation of the dam, close coordination between DNR staff and Department and Lac du Flambeau archaeological staff would be needed. If changes in operation would potentially cause erosion at an archaeological site, bank stabilization and shoreline protection techniques could be installed to prevent damage to these sites. Special techniques to protect archaeological sites have been developed for reservoirs . Wisconsin Valley Improvement Company, for example, has successfully installed shoreline and bank stabilization to protect archeological sites on Rice Reservoir in northern Wisconsin, 16 miles southeast of Rhinelander.
61 Page

Social and Economic Environment Aspects of the social and economic environment that would be impacted by the current operation of the dam and the 1939 order include the pumping of water for cranberry production, shoreline erosion, and navigation.
Cranberry producers have indicated that pumping is difficult when water levels are low on the Chain because of the shallow water depths and the increased amount of plant material and other debris that is sucked into the pumps. The 3.5 foot drawdown would continue to cause periodic low water conditions on the Chain. This would be especially apparent during low water years if low water levels from June through fall similar to what occurred in 2007. As described earlier, the 1939 order would be expected to have a reduced frequency of low water levels due to the earlier spring refill period. Therefore, the problems with diverting water for cranberry operations would be expected to occur less frequently with this alternative.
Many shoreline structures are located above the water line at the 5' 0" water elevation. With current operations, piers and other structures on the Chain would not be damaged by ice action. The quickly changing flow and high flows downstream of the dam however, would continue to flood piers and cause shoreline erosion and slumping of river banks. By following the earlier refill period associated with the 1939 operating order, water levels would sometimes rise while there is still ice on the lakes. This would increase the potential for ice to act on structures and shorelines. Most of the lakes on the Manitowish Chain have a fetch of a mile or less and are considered low energy shorelines.
· As described earlier, aquatic plants in the near shore environment are important components of lakes that help protect shorelines from wave action. The influence of wave action on the Chain shoreline would not change under either alternative since the 3.5 foot winter drawdown and lower aquatic plant densities in the Chain would remain the same.
Recreation would continue to be negatively impacted by continued current operations or the 1939 operating order due to the impacts of the associated low water conditions on navigation. Upstream of the dam, the usability of some of the boat ramps is negatively affected at low water levels which would make access to the lakes more difficult in fall during the drawdown and early spring and summer during the refill period. The 1939 order would reduce the duration of low water due to an earlier spring refill. Figures 37 to 41 show the water elevations and depths at the major boat launches on the Chain. The cement planks of many of these launches are exposed or near the water's edge when the Chain is at the 5' 0" water level. Although conditions to launch a boat at the 5'0" water level may not be as good as it is during the full pool 8' 6" elevation, the launches at Rest, Clear, and Spider Lakes are considered usable given the relatively steep drop off along the shoreline and the stable sand lakebed substrate in these areas. The boat launches at Wild Rice and Island Lakes do become very difficult to use for trailered boats at the 5' 0" water level because of the shallow water conditions and muckier lakebed substrate at these launches. At Wild Rice Lake, there is also a potential navigational obstruction during low water due to the raised lakebed and scour at this launch that has likely been caused by power-loading boats onto trailers.
62 I Page

Figure 37. Rest Lake Boat Launch Profile
1602.
1601 .
1600.
1599.
28 26 24 22 20 18
Figure 38. Clear Lake Boat Launch Profile
1602 '
1601 .
1600 .
1599.
16 14
Distance (ft)
edge of water 9/30/08 8.2' on Rest gage
At the 8.35 water elevation, the edge of the planks is 11 .6 feet from the water's edge.
17% grade
12 10 8 6 4 2
edge of water. 9/30/08
At the 8.35 water elevation, the edge of the planks is 9.5 feet from the wate r's edge.
15% grade
28 26 24 22 20 18 16 14
distance (ft)
12 10 8 6 4 2
63 I Pa ge
0
0
c: 0
:;::; ra > <I> 4i
g > <I> jjj

Figure 39. Spider Lake Boat Launch Profile
1602'
1601 '
1600'
1599'
18% grade 1598' max drawdown 11/12/08
28 26 24 22 20 18 16 14 12 10 8 6 4 2
Distance (ft)
Figure 40. Island Lake Boat Launch Profile
1602'
1601 '
1600'
1598'
max. drawdown 11/12/08
18 16 14 12 10 8
Distance (ft)
64 I P a ge
edge of water 9/30/08
At the 8.35 water elevation, the edge of the planks is 19.7 feet from the water's edge.
10% grade
6 4 2 0
g :> "' iii
0
~
:> (I)
jjj

Figure 41. Wild Rice Lake Boat Launch Profile
1602'
1601'
1600'
1599'
1597'
70 60 50 40
distance (ft}
At the 8.35 water elevation, the edge of the planks is 9.5 feet from the water's edge.
30
edge of water 9/30/08
_,...-···· .~····
max drawao'~~ ;;/12/08 ... ····
(scour hole}
9% grade
20 10 0
The 3.5 foot winter drawdown associated with current operations and the 1939 order would continue to create low water conditions on the Chain. The areas that become shallow and difficult to navigate at different water levels can be best evaluated by reviewing the lake contour maps for each lake in the Chain (see appendix Ill). The majority of the lakes can be navigated at the 7'0" water level but certain areas become more difficult to navigate with larger boats at or below this water level (figure 42). Notable areas include the shallow channel at the Clear Lake Road bridge (between Clear and Fawn Lakes) and Papoose Bay on Rest Lake. Other areas shown on Figure 40 below were also identified by DNR staff on a boat tour of the Chain using a 17.5 foot deep V Sea Nymph Sidewinder with a 90 HP Evinrude outboard at the 7' 0" water level.
65 I Page

Figure 42. Areas on the Chain that are difficult to navigate at the 7'0" water level.
On the river downstream from the dam, navigation becomes difficult in shallow water areas when flows below 80 cfs are passed. With current operations and following the 1939 order, flows below 80 cfs would be passed each spring, often multiple times during the summer, and in some years, the entire summer. Shallow water areas include the rocky area above Sturgeon Lake, the 800 foot long rocky riffle area below the Highway 51 bridge, and the shallow sand bar area below the mouth of Circle Lily Creek. These low flows also increase the travel time between popular river access points like the Highway 51 Bridge, the Highway 51 wayside, and the Highway 47 Bridge.
66 I Page

Alternative Ill. Public Interest River Flow and Lake Stage Dam operations based on a public interest flows and lake stages would be a specific schedule of required river stages/flows that restore normative habitat conditions found in Northern Wisconsin lakes and rivers (Table 11). The winter drawdown would be eliminated or reduced in the range of six inches to one foot. If a winter drawdown were specified, the target would be to reach the drawdown level by October 1st and to refill the Chain by April 151
h at the latest. Water levels on the Chain would be operated close to 8' 6" but would occasionally need to be lowered in order to meet downstream flow needs. The downstream target flows would be reduced in low water conditions once the lakes reach a specified water level such as 7' 0". Once the Chain reaches that level, the owner of the dam would either need to consult with DNR to determine the required flow or a minimum flow would be specified in the order. Specific ramping rates would also need to be specified as part of the order to avoid quickly changing water levels and flows.
Table 11. Summary of an example public interest flow and stage alternative Dates Target Chain Elevation Target Flows Winter Minimum 7'6" or 8'0" Outflow equals inflow Late winter or early spring Fill Chain to 8' 6" 100 cfs or more
Spring thaw flood pulse Range of 7'0" to 8'6" 200 cfs or more
After the flood pulse to Range of 7'0" to 8'6" 150 cfs or more early/mid-summer Summer Range of 7'0" to 8'6" 1 00 cfs or more
Late summer and early fall Range of 7'0" to 8'6" 80 cfs or more
Fall Range of 7'0" to 8'6" 1 00 cfs of more (Any drawdown complete by October 151
.)
The target flows identified in this alternative were based on field studies conducted in important types of habitat downstream of the dam. These studies are described in greater detail in the anticipated impacts section below. The USGS hydrological study indicates that it would be feasible to meet the above target flows and Chain elevations the majority of the time if the winter drawdown were reduced or eliminated. The comparison of the target flows and the expected inflows to the Chain can be examined by looking at the flow-duration values for the Manitowish River that were calculated by USGS (Table 12). The designations (FD2 to FD99.6) in the left hand column identify exceedance flows . FD90, for example, means that 90% of the time, flows will be greater than or equal to the flow identified for each month. The target flow values identified in this alternative are close to the FD?O or 70% exceedance flow. Therefore, approximatly?O% of the time, the inflow to the dam is expected to be equal to or greater than the target flows . Approximately 30% of the time the Chain elevation would need to be lowered to meet the target flow.
67 I P age

Alternative IV. Passing Inflow With this alternative, the winter drawdown would be eliminated . A minimum required downstream flow would be specified to address drought conditions. Passing inflows can be defined in different ways. The two variations evaluated in this analysis will be referred to as "passing dam inflow" and "passing gaged inflows".
If passing dam inflow, the reservoir would be kept very close to the 8' 6" water elevation and the flow reaching the dam would immediately be passed downstream. Water diversions from cranberry operations and private use would cause downstream flows to drop and would only lower lake water elevations during drought conditions (when pumping and the minimum required flow are greater than the water coming into the Manitowish system). The pumping rate for cranberry operations was estimated at up to 22 cfs and this amount of water can be a substantial portion of downstream river flows during drought conditions (table 12).
If passing gaged inflows, measuring the inflow to the Rest Lake Chain upstream of the cranberry pumping locations would be needed (Figures 5 & 9), and the dam discharge would match the sum of the measured inflows. With this method of passing inflows, water diversions from pumping would result in lowering lake elevations. This would result in a quicker lowering of chain elevations than passing dam inflows but excessive changes to water elevations would not be expected to occur. At a pumping rate of 22 cfs, it would take three months of continuous pumping to result in lowering the chain elevation to the 7' 6" water elevation.
68 I Page

())
\0
'"0
OJ cq · ([)
[FD, flow duration, is follo~ by a number indicating the percentage of time that the computed value is equaled or exceeded]
Row duration
FD2 FD5 FD10 FD20
FD30 FD40 FD50 FD60
FD70 FD80 FD90 FD95 FD98 FD99.6
FD2 FD5 FDlO
FD20 FD30 FD40 FD50 FD60
FD70 FD80 FD90 FD95 FD98 FD99.6
Jan.
246 236 216 180
171 164 148 139
131 125 116
110
106 102
291 287 275 223 204
195 172 163 151 147 103 85.7 78.6 78.6
Feb.
217 208 201 168 157 145
138 133
125 118
111 108 107 105
291 287
231 213
201 194 168 159 150 134 100 85.7 78.6 78.6
Mar.
330 302 265 227 194 177 170 164
154 147 132 127 122 106
302 290 259 226 215 204 195 179 164 153 132 113 85.7 78.6
April
568 496 417
330 296 261 231 216 194 179 160 125 104 97.2
495 436 394 339 312 291 267 242
221 199
175 146 102 88.8
Row-duration value (cubic feet per second)
May June July
Adjusted drainage-area ratio method
423 354 315 258
236 214 198 168 154 129 112 94.6 87.3 81.2
302 272 246 213 189 176 164 151 142 127 106 94.5 87.5 8 .... ;),_)
Water~budget method
267 245 227 203 179
170 157 138 125 96.5
83.9 70.8 64.5 61.7
488 326 288 451 379 313 273 248 226
203
177 149 126 108 89.7 55.9
306 277 245
213
189 173 155
137 122 95.7 70.9 49.1 35.6
265 232 194 174 148 129 115
102 77.3 44.4
35.2
28.6
13.6
Aug.
330 251 219 183 166 155 142 107
91.0 82.6 71.4 63.0 56.4 51.3
305 232 201 163 132 121 106 90.6 79.7 65.0 43.4
23.5 16.0 3.6
SepL
366 225
207 178 151 133 114 92.0
81.8 72.9
64.8
60.2
57.2 51.6
419 344
289 215 184 149 118
100
78.6 61.3
44.3
29.3 10.5
1.0
Oct
328 299 270 222
178
157 140 118
109 103 94.2
80.7 71.1
64.0
488 431 345 271 242 213 185 163 138 111
79.9 54.8 14.0
-8.3
Nov.
349 308 275 243 218
193 172 148
136
125 116
110 107 96.5
357 322 297 260
221 206 193 184 162 144
109 89.2 76.6
63.3
Dec.
347 309 280 224
209 197 190 164
145 128 118 108 105 103
291 287 277 223
208 197 181 167 156 147 101 85.7 78.6 78.6
-I Q,) C" (!)
..... !'J
c CJ) G) CJ)
3 0 :::1 -:::r (!)
>< (") (!) (!) a. Q,) :::1 (") (!) -[ ~
d ::3 c:: (/) G) (/)
(il t:l 0 ~

Anticipated Impacts associated with the Public Interest and Passing Inflow Alternatives
Aquatic Habitat on the Chain By eliminating or reducing the 3.5 foot winter drawdown, both the public interest and passing inflow alternatives would greatly reduce the frequency of low water conditions in the wetlands and shallow water areas on the Chain . This would increase the wetland functionality, habitat availability, and plant and animal diversity in these areas. In many of the shallow wetlands and bays, there would be sufficient water early in the spring which would restore habitat during critical periods for fish and wildlife reproduction needs. Also, during winter, there would be enough water to provide appropriate habitat for furbearers, amphibian and reptile overwintering needs. For example, the impacted shallow water areas depicted in figures 31 and 32 would retain water to some extent over winter, thus providing appropriate overwintering habitat. Additionally, increased organic matter accumulation would likely occur in the near shore zone and over time, a greater density of aquatic plants would likely become established. More vegetation in these areas would provide additional food and cover for a wide range of fish and wildlife species. Impacts to loon nesting would be avoided since water levels would rarely increase during their nesting period. Northern pike populations may increase with more shallow marsh habitat available in the early spring. From a fish management perspective, however, the low pike abundance that is associated with current operations may be a benefit to muskellunge management. A reduced or eliminated drawdown would provide more favorable conditions for a bass, panfish, whitefish, long ear sunfish (state threatened), and numerous minnow species if the plant density increases in the near shore zone. A major change in the type of fishery on the Chain , however, would not be expected to occur.
There are some notable differences between the public interest and passing inflow alternatives. With the public interest alternative, the quantity and quality of available habitat would depend on how much of a fall drawdown is specified and the timing of the refill. Passing dam inflow would keep lake water levels very stable except for drought conditions if minimum required downstream flows were greater than inflows to the Chain and water withdrawals. If gaged inflows were passed, lake water levels would be more quickly lowered by cranberry and other water withdrawals .
Aquatic Habitat Downstream As river flow below the dam increases, the elevation of the river, or "stage" of the river increases. To determine if sufficient water would be expected with the public interest and passing inflow alternatives, water depths in important types of riparian habitats were measured at various flows.
To quantify wetland habitat water needs downstream of the dam, water level gauges were placed along an 850 foot transect through a wetland floodplain located just upstream from the Highway 47/182 Bridge. The gauges were placed in different types of wetland habitat, and water depth measurements were taken at various flows. The study area encompassed approximately 7.5 acres and is typical of the estimated 1 ,500+ acre wetland complex in the low gradient section of the Manitowish River. The white star on the aerial photo below shows conditions at 40 cfs and is also the location of on-the-ground photos of the oxbow area under high and low flows shown on figure 43. The numbers below represent sampling points where water level gages were placed. • # 1: open water connection from river channel to oxbow channel • #2 & 3: wet meadow wetland • #4 & 6: shrub dominated wetland • #5 & 7: open water oxbow sloughs • #8: shrub dominated wetland at the fringe of the floodplain
Through this study, it has been determined that a flow of 200 cfs or higher is needed to flood the entire study area and allow for a natural flood pulse in the associated riparian wetlands. In northern Wisconsin rivers, these high spring flows generally begin in March or early April and slowly subside over time into mid to late June. After this flood pulse, higher elevation wet meadows and shrub dominated wetlands along
70 I Page

rivers are no longer flooded, but old oxbows and old river channels remain wetted. Some of the lower elevation old river channels, as seen meandering around the top of the aerial photo on figure 43, will remain connected to the main-stem of the river. During this time, it is important that sufficient water depths and connections remain between the river and these complexes. In order for these areas to remain accessible to a variety of fish and wildlife species for their life cycle needs, flows of 100 or more cfs would be needed through the end of July. Later in the season, a flow of 80 cfs from August to September would still provide some water in these areas but water depths generally slowly recede during this time period as would be expected with a natural flow pattern. The water depths at various flows at the eight locations used in the wetland study are shown on figure 44. The locations with the fewest number of recorded water depths are those that are dry because they are slightly higher in elevation . These areas are the last to flood in spring and the first to drain as flood waters recede.
Figure 43. Wetland transect study area on the Manitowish River.
The target flows identified in the public interest alternative would provide sufficient water for the spring wetland flood pulse, and then provide enough surface water in the wetland areas and oxbow channels until mid to late summer. A similar pattern of flows would also be expected with the passing inflows alternative and is evident when looking at flows expected on an average year by looking at the FD50 (i.e. the 50 percent exceedance flow values) identified by USGS on table 12. Consequently, the extent and duration of low water conditions in wetland areas below the dam would be substantially reduced with both alternatives. By avoiding the drought-like river flow conditions that presently occur on an annual basis, more of these areas along the river would have sufficient surface water to be utilized by the fish and wildlife species described earlier in the analysis. Because of this, an increase in the abundance and productivity of fish and wildlife species would be expected. The abundance and productivity of the Pug nose shiner (state threatened) would also be expected to increase since both alternatives would ensure that there is sufficient surface water in shallow wetland areas on the Chain of Lakes and the oxbow and backwater areas downstream of the dam where this species is known to be found .
71 I Page

0 I • •
10 I •
20
Cii' ..J ~ 1\) J: u g
'"() = 30 OJ c. Q)
lQ Q (]) ....
~
'11i ~
40
50 I Note: entire study area covered in water at 201 CFS
60 I I I I 1
\ c29CFS •30CFS • 40.11 CFS c47.42CFS • 54.99CFS a 55.57CFS • 78.6CFS • 111 CFS c150.65CFS c201 CFS •228.78CFS •322CFS
, (Q s:: Cti
""" ~ s: Ill :::::s ;:::;: 0 :E iii" :::r :::0 <" (!) ... :E (!) = Ill :::::s c.. CJ) ..-+ s:: c.. '< )> ... (!) Ill
:E Ill ..-+ (!) ... c (!)
"C ..-+ :::r (/1
Ill ..-+
< Ill :::!. 0 s:: (/1
c · z :::0 s: (!) Ill (/1
s:: ... (!) c.. , 0 ~

River Channel Habitat Many fish and wildlife species also rely on in-stream channel habitat. The following two graphs are derived from data collected to measure instream conditions at different flows (Figure 45). Even though the two flows shown are not as far apart as natural spring flows (200+ cfs) and current minimum flows (40 cfs), they do represent substantial differences in wetted stream width and depth. These differences are directly correlated to a gain or loss of instream habitat. In areas of the river with shallower bottom contours, the difference in gain or loss is greater than steeper sloped contours. The shallower areas are the first habitats to dewater during reduced downstream flows. The following two graphs show that the entire river channel has at least 6 inches of surface water from bank to bank once flows reach 184 cfs. With a reduced or eliminated winter drawdown, the frequency of low water level conditions in the channel would be substantially reduced and there would be sufficient flows passed in the spring to fully submerge the river channel and to meet fish and wildlife life cycle needs.
Figure 45. lnstream Habitat at Different Flows.
0.00 0.50 1.00 1.50 2.00 2.50 3.00
0.0
0.5
1.0
1.5
2.0
2.5
~ c m
co co ¢::: -.::t (!) (J) _J "<"'"
..::.:: c C1J ll)
<!= -::t: (!) (") _j ..--
Manitowish River Downstream from STH-51 Crossing
Cross Section View of River
0 1'-- <0 1.0 -.::t ("') N ~ -.::t -.::t ~ -.::t -.::t -.::t 0 N 1.0 C() "<"'" ...t 1'-- "<"'" ("') -.::t 1.0 1'-- C() (J) "<"'"
(J) ("')
("') N "<"'"
I• Widths and depths at 184 CFS (DNR) 10/02/01
~hs and depths at 77 CFS (DNR) 9/19/03 i
Manitowish River
co ("')
<0 ("') "<"'"
Sand Flats Downstream from Circle Lily Creek Cross Section View
• Widths and depths at 184 CFS (DNR) 10/02/02
~ Widths and depths at 77 CFS (DNR) 9/19/03
73 I Page

Suitable habitat for sturgeon and greater red horse spawning was identified in the 800 foot section of rocky riffle stretch of the river just below the Highway 51 Bridge. To determine the flow needs for both of these species, a river stage flow relationship was developed by measuring velocities and depths at five transects under various flow scenarios (figure 46) . This information was used in habitat suitability models for each species and the following flow needs were developed. For sturgeon, river flows of 125 cfs begin to provide adequate depth in a limited portion of the spawning area. At flows of 200 cfs or more, almost the entire area of potential habitat provides conditions adequate for spawning . Sturgeon spawning generally occurs in late March to the end of May when water temperatures are 53 to 61 degrees. The target flow needed for greater redhorse spawning is 75 to 150 cfs . This species spawns when water temperatures are between 62 and 66 degrees in late May to June. The abundance and productivity of the both lake sturgeon and greater redhorse (state threatened) would be expected to increase with both the public interest and passing inflow alternatives since they are both expected to provide sufficient river flows downstream of the dam during the spawning period for both of these species.
Figure 46. Rocky riffle study area on the Manitowish River below the Highway 51 Bridge. The red lines show the transect locations.
74 I Page

Cultural Resources With the Public Interest and Passing Inflow alternatives, the influence of the reduced or eliminated winter drawdown on wild rice productivity would be difficult to predict. With a reduced drawdown, water level fluctuations during the critical floating leaf period would be less likely compared to what occurs with the current operation of the dam. This would be expected to help to improve productivity. Alternatively, a reduced drawdown could result in conditions favorable to perennial aquatic plants which would be expected to increase plant competition with wild rice. Since the wild rice stands exist near the inflow-rivers to the Chain of Lakes, and productive rice beds exist on many lake systems that do not have an annual drawdown, reducing or eliminating the winter drawdown is not expected to have a negative impact on wild rice productivity. Continued monitoring would be important to determine if any plant management strategies could be employed to help maintain rice productivity.
Access to the Chain of Lakes for harvesting walleye in the spring would be expected to improve after ice out since a reduced or eliminated winter drawdown would mean higher water levels at boat launches. With reduced annual water level fluctuations, there would be some changes to near shore zone that would be considered both favorable and unfavorable for walleye populations. With higher spring water levels, more gravel spawning areas would be under water. However, if more plants and organic matter established in the near shore zone, conditions in some areas may begin to favor bass and panfish. A substantial change to the walleye fishery would not be anticipated. The Eagle River Chain of Lakes, for example, has a fairly stable year round water level (+/- 0.3 feet) yet these lakes still maintain a good naturally reproducing walleye fishery. Additionally, plant growth on the Eagle Chain is fairly abundant but the bass/panfish population has not become dominant.
As described earlier, both the Public Interest and Passing Inflow alternatives would be expected to provide 200 or more cfs in May and June when lake sturgeon spawn in the rock riffle area. With sufficient flows during this time, natural reproduction would be expected to increase. Over time, it is likely that more age classes of fish would be documented.
Ice action on the shorelines caused by wind pushing ice sheets would be expected to increase with a reduced or eliminated winter drawdown. This would potentially have an impact on archaeological sites but excessive damage would not be expected since most of the lakes on the Manitowish Chain have a fetch of one mile or less and would be considered low energy shorelines. A reduced drawdown, however, would be expected to allow more aquatic plants to establish in the near shore littoral zone which would be a benefit to shoreline protection from erosion caused by wave action. As stated earlier, before a new operating order would be drafted or issued, staff would need to coordinate with archaeologists in the Department and in the Lac du Flambeau to review the location of known sites and determine if any protective measures would be needed.
Social and Economic Environment The public interest and passing inflow alternatives would not be expected to negatively impact property values since the maximum water level would remain the same and there would not be a change to the ordinary high water mark or additional lands flooded. One potential impact to property would be the increased possibility of ice action to cause damage to permanent piers, wet boat houses, and other structures. Based on the survey of structures on the Chain, it appears that many permanent structures would be wet with either a one foot drawdown or with no winter drawdown. The potential for impacts would be similar to the conditions that occur on the majority of lakes in Wisconsin, including natural lakes and impoundments. Also, excessive damage would not be expected since the shorelines on the Chain are considered "low energy" shorelines for ice action due to the relatively small sizes of the lakes and limited fetch for wind to push the ice sheet. To reduce or eliminate the potential impact of ice, more landowners would likely remove their piers at the end of the summer. For structures that cannot be moved, aeration systems and other methods to minimize ice damage would need to be installed by landowners. These
75 I P a g e

methods are commonly employed on thousands of other lakes and impoundments that have a minimal winter drawdown or no drawdown. Other lake chains in Northern Wisconsin, for example, also have numerous permanent structures at or below the ordinary high water mark such as the Eagle River Chain and the Minocqua Chain of Lakes. The Eagle River Chain is usually operated with only a 0.3 foot water level difference year round . The Minocqua Chain has a 1.05 foot difference between summer and winter water levels during years with low precipitation and minimal snow pack. Also, the refill of the Minocqua lakes often begins with the initial spring runoff while there is still ice on the lakes which has generally been in March but has been as early as the third week in February.
Along the shorelines of the Manitowish Chain, reduced dewatering of the current 3.5 foot drawdown zone would likely result in a higher density of aquatic plants becoming established closer to the shoreline. If this would occur, in addition to providing habitat to fish and other aquatic organisms, the vegetation would help to stabilize shorelines against wave erosion.
With reduced low water conditions upstream and downstream of the dam , lake access at boat launches, navigation on the Chain of Lakes, and navigation downstream of the dam on the river would substantially improve. Above the dam, target water levels would be operated at or near the 8' 6" elevation and downstream flows above 80 cfs would be expected the majority of the time. There would likely be an increase in the time people spend traveling to and using these resources and this would be expected to have a positive impact on the money spent at area businesses.
Since the current operation was found by the FERC analysis to be insignificant to augment downstream energy production, reducing the winter drawdown would be expected to have little to no impact on Xcel's hydropower production. In terms of operating the dam, passing dam inflows would be considered the simplest operationally for the dam tender. With the Public Interest alternative, the multiple target levels and flows would make dam operation more complicated but would still be feasible. Similarly, passing gaged inflows would be more involved for the dam tender and the operating order would need to specify a schedule of equalizing dam discharge based on inflow measurements. With this alternative, there would also be operational costs associated with keeping inflow gaging stations operating and making sure inflow recordings are accurate.
Higher water levels on the Chain would make pumping easier for cranberry operations. Under an operating order passing the gaged inflows, the water used for these operations would only be taken from the reservoir and would occasionally result in lowering the water elevations on the lakes. Excessive lake level changes and impacts to upstream resources or navigation would not be expected to occur. As described earlier in the analysis, it takes about 70 cfs to fill the Chain one foot in one month. Therefore, when considering a cranberry pumping rate of about 35 cfs, pumping would need to occur continuously for two months to drop water levels to the 7' 6" water level. This would only be expected to occur in severe drought conditions similar to what occurred in 2007. Alternatively, with the passing dam inflow operations, the water diverted from cranberry operation would only be taken from downstream flows. With this method of passing inflows, taking 35 cfs from downstream flows can have substantial negative impacts on downstream resources, especially during low precipitation periods.
Impacts to Special Resources A reduced or eliminated winter drawdown would make it possible to restore a more natural pattern of water flows and levels to the Manitowish River system upstream and downstream of the dam. Because of this, the overall habitat quality and function would be expected to improve. This would improve the overall environmental quality of the State Natural Areas and other designations that have been identified for the Manitowish River system.
76 I Page

DNR EVALUATION OF PROJECT SIGNIFICANCE (complete each item),
15. Environmental Effects and Their Significance
a. Discuss which of the primary and secondary environmental effects listed in the environmental consequences section are long-term or short-term.
The duration and extent of effects would last as long as the dam is operated in a way that would create a natural pattern of water levels and flows in lake and river systems. Certain impacts, such as changes to wetland plant communities downstream of the dam, the bioavailability of mercury in the aquatic food Chain, or the reestablishment of plants in the near shore littoral zone in the lakes upstream of the dam, could take a number of years to take effect. Fish and wildlife species would quickly begin to utilize the near shore and wetland habitat on the Chain as well as the rocky riffle river channel, the wetlands, oxbows, and backwater areas below the dam. The social economic impacts, including improved recreation and navigation, the installation of methods to avoid potential damage to piers and structures, and other impacts described in the analysis would also be considered short term effects that would occur within months of the implementation of a new operating order.
b. Discuss which of the primary and secondary environmental effects listed in the environmental consequences section are effects on geographically scarce resources (e.g. historic or cultural resources, scenic and recreational resources, prime agricultural lands, threatened or endangered resources or ecologically sensitive areas).
The restoration of a natural flow pattern below the dam and reducing the occurrence of low water conditions above the dam would reduce the current negative impacts to waterway and wetland habitat utilized by number of different scarce resources such as the greater redhorse, wood turtle, long ear sunfish, and the pugnose shiner. Impacts to culturally important resources such as wild rice and lake sturgeon would also be avoided and minimized by reducing water level fluctuations during the floating leaf stage of rice and providing for adequate river flows for the spawning of lake sturgeon.
c. Discuss the extent to which the primary and secondary environmental effects listed in the environmental consequences section are reversible.
The primary and secondary environmental effects would be largely reversible since they are directly tied to the operation of the dam and the way water levels and flows are managed.
16. Significance of Cumulative Effects
Discuss the significance of reasonably anticipated cumulative effects on the environment (and energy usage, if applicable). Consider cumulative effects from repeated projects of the same type. Would the cumulative effects ·be more severe or substantially change the quality of the environment? Include other activities planned or proposed in the area that would compound effects on the environment.
The proposal is unique to the project area and is not tied to other Department activities planned in the area or statewide. One aspect of the proposal, improving the conditions for lake sturgeon reproduction on the Manitowish River, is identified in the statewide sturgeon management plan. If all dams were operated according to the alternatives outlined in this analysis, it would be anticipated to have an impact on hydropower generation and flood control in Wisconsin. The proposal to change the operation of the Rest Lake Dam and the range of alternatives considered is closely tied to the recognized purpose and need of this particular dam and the impacts it has on the Manitowish Chain of Lakes and the Manitowish River system. The current proposal is site specific and not tied to proposals to issue new operating orders at other dams in Wisconsin.
77 I Pa ge

17. Significance of Risk
a. Explain the significance of any unknowns that create substantial uncertainty in predicting effects on the quality of the environment. What additional studies or analysis would eliminate or reduce these unknowns?
The growth and productivity of wild rice is complex and difficult to fully predict because each lake is unique and productivity is based on a number of site specific factors . Because of this complexity, there are no additional studies or analysis that would eliminate or reduce the uncertainty associated with a potential change in the operation of the dam. If a new operating order were issued, it would be important to continue to monitor wild rice productivity on the Chain. If changes started to occur, adaptive management strategies could be considered to support good conditions for the productivity of wild rice.
b. Explain the environmental significance of reasonably anticipated operating problems such as malfunctions, spills, fires or other hazards (particularly those relating to health or safety). Consider reasonable detection and emergency response, and discuss the potential for these hazards.
There are no known operational or dam failure hazards associated with the range of alternatives considered in this analysis.
18. Significance of Precedent
Would a decision on this proposal influence future decisions or foreclose options that may additionally affect the quality of the environment? Describe any conflicts the proposal has with plans or policy of local, state or federal agencies. Explain the significance of each.
The proposal to write a new operating order for the dam is not expected to influence future decisions or foreclose options that may additionally affect the quality of the environment. Each project needs to be evaluated on a case-by-case basis. There are no known conflicts between the Department's proposal and plans or policy of local, state, or federal agencies.
19. Significance of Controversy Over Environmental Effects
Discuss the effects on the quality of the environment, including socio-economic effects, that are (or are likely to be) highly controversial, and summarize the controversy.
The proposal to write a new operating order for the dam has been locally controversial. Many people that own property on the Chain of Lakes have expressed concern over a change to the lake water levels that they are used to. There is also concern with the potential damage that ice may cause if the extent of the winter drawdown is reduced or eliminated and a perception that a change in the operation of the dam would reduce property values. Downstream, there has been concern that the impacts with the current operation of the dam would not be addressed to reduce property damage, improve navigation, and reduce the occurrence of iow water conditions on the river especially during the spring and early summer months.
78 I Page

SUMMARY OF ISSUE IDENTIFICATION ACTIVITIES
20. List agencies, citizen groups and individuals contacted regarding the project (include DNR personnel and title) and summarize public contacts, completed or proposed).
2002-2006
Oct 25 2006
2007-2012
Aug 25 2007
Aug 12 2008
Nov3 2008
Nov 12 2008
Apr15 2011
Jun 17 2011
Jul20 2012
Rest Lake DNR Workgroup Meetings
Voigt Task Force (VTF)
Local stakeholders
Public Input Meeting
Lac du Flambeau Tribe
Great Lakes Indian Fish and Wildlife Commission (GLIFWC)
Vilas Cranberry Company
Lac du Flambeau Tribe
Environmental Overview Document
Voigt Task Force and Great Lakes Indian Fish and Wildlife Commission request for consultation
Comment Summary
Periodic meetings were held to discuss issues related to the operation of the Rest Lake Dam. Members included representatives from the DNR, Town of Manitowish Waters, Manitowish Waters Lakes Association, Manitowish Waters Alliance, and Friends of the Manitowish River.
Opportunity for formal consultation and asked for comments on potential wild rice impacts.
DNR administrative staff had numerous informal meetings with local stakeholders regarding concerns with the operation of the Rest Lake Dam.
A public meeting was held at the Manitowish Waters Town Hall from 2:00 to 6:00 p.m. to allow the public to identify issues that should be evaluated in the environmental analysis.
Meeting to discuss tribal interest issues that should be evaluated in the environmental analysis.
Opportunity for formal consultation and feedback regarding issues to consider in the environmental analysis.
Met with cranberry producers to discuss water withdrawals from the Trout River to Little Trout Lake
Preliminary draft of the environmental overview document provided to a representative from the Lac du Flambeau Tribe for review and comment.
Posted on the DNR website and copies provided on request.
Opportunity for formal consultation and a preliminary draft of the environmental analysis provided to a representative from the Lac du Flambeau Tribe and GLIFWC.
79 I Page
BIBLIOGRAPHY
Becker, G.C. 1883. Fishes of Wisconsin. The University of Wisconsin Press. Madison.
Brewster & Brewster. 1991 . Movement and microhabitat use by juvenile Wood turtles introduced into a riparian habitat. Journal of Herpetology 25:379-382.
Bowen, K.D. & Gillingham, J.C. 2004. R9 Species Conservation Assessment for Wood Turtle. Eastern Region U.S. Forest Service.
Brewster, C.M. 1985. Wood turtle, C/emmys insculpta, research in northern Wisconsin . Bulletin of the Chicago Herpetological Society 20:13-20.
Brewster, K.N., and Brewster, C.M. 1991 . Movement and microhabitat use by juvenile Wood turtles introduced into a riparian habitat. Journal of Herpetology. 25: 379-382,
COSEWIC. 2002. COSEWIC assessment and update status report on the Pug nose Shiner Notropis anogenus in Canada. Committee on the Status of Endangered Wildlife in Canada. Ottawa. vi + 15pp.
Coward in, L.M ., Go let, F.C., and LaRoe, E.T. 1979. Classification of Wetlands and Deepwater Habitats of the United States. U.S. Fish and Wildlife Service. FWS/OBS-79/31.
Dechant, J.A., Sondreal, D.H., Johnson, L.D., Goldade, C.M., Zimmerman, A.L., and Euliss, B.R. 2003a. Effects of management practices on grassland birds: American Bittern. Northern Prairie Wildlife Research Center, Jamestown, North Dakota.
Epstein E., Smith W., Dobberpuhl, J., and Galvin , A. 1999. Biotic Inventory and Analysis of the Northern Highland-American Legion State Forest. Wisconsin's Natural Heritage Inventory Program, Bureau of Endangered Resources, Department of Natural Resources. Madison, WI.
Fannucchi, G.T., Fannucci , W.A., Craven, S. 1986. Wild rice in Wisconsin : its ecology and cultivation. University of Wisconsin - Cooperative Extension publication. 7 pp.
Foth & Van Dyke, 2003. Town of Manitowish Waters Year 2022 Comprehensive Plan.
Groetsch, K., Brooke, L., Kolodezski , E. , Chiriboga, E., and Coleman, J. 2003. Investigations into Walleye Mercury Concentrations related to Long-Standing Reservoirs' Water Quality, Wetlands and Federal Energy Regulatory Licensed Dam Operation. Lake Superior Research Institute. University of Wisconsin, Superior. Project Report 03-02.
Grondin, A., Lucoote M., Mucci A., Fontin B. 1995. Mercury and lead profiles and burdens in soils of Quebec (Canada) before and after flooding. Canadian Journal of Fisheries and Aquatic Sciences. 52:2493-2506
Healy, B.D. 2002. Draft Conservation Assessment for the Greater Red horse (Moxostoma va/enciennes1) in the Great Lakes States National Forests. USDA Forest Service, Easter Region.
Hobbs, H.H. Ill and Jass, J.P. 1988. The crayfishes and shrimp of Wisconsin. Milwaukee Public Museum. Milwaukee, Wisconsin.
House, L.B. 1985. Stage Fluctuations of Wisconsin Lakes. U.S. Geological Survey Information Circular Number 49.
80 I Page

Juckem, P.F., Reneau, P.C., Robertson, D.M. 2012. Estimation of Natural Historic Flows for the Manitowish River near Manitowish Waters, Wisconsin , U.S. Geological Survey Scientific Investigations Report 2012-5135.
Kahl, R. 1993. Aquatic macrophyte ecology in the Upper Winnebago Pool Lakes, Wisconsin. Wisconsin Department of Natural Resources.
Kwak, T.J., and Skelly, T.M. 1992. Spawning habitat, behavior, and morphology as isolating mechanisms of the golden redhorse, Moxostoma valenciennesi, and the back redhorse, M. duquesnei, two syntopic fishes. Environmental Biology of Fishes 34:127-137.
Lenters, J.D., Kratz, T.K., and Bowser, C.J. 2005. Effects of climate variability on lake evaporation: Results from a long-term energy budget study of Sparkling Lake, northern Wisconsin. Journal of Hydrology 308. 168-195.
Lillie, R.A. and Mason, J.W. 1983. Limnological characteristics of Wisconsin lakes: Wisconsin Department of Natural Resources Tech . Bulletin No. 138, 116 p.
Louchouarn P., Lucette M., Mucci A., and Pichet P. 1993. Geochemistry of mercury in two hydroelectric reservoirs in Quebec, Canada. Canadian Journal of Fisheries and Aquatic Sciences. 50: 269-281.
Lyons, J., Cochran, P.A., and Fago, D. 2000. Wisconsin fishes 2000: status and distribution . University of Wisconsin Sea Grant Institute. Madison, Wisconsin . Publication Number WISCU-13-00.
Macholl, J.A., 2007, Inventory of Wisconsin's Springs: WGNHS Open File Report 2007-03, 20 p. plus appendices.
Minnesota Pollution Control Agency Wetlands Advisor Group. 1997. Storm-Water and Wetlands: Planning And Evaluation of Guidelines for Addressing Potential Impacts of Urban Storm-Water and Snow-Melt Runoff on Wetlands.
Mucci, A., Lucotte M. , Montgomery S., Plourde Y., Pichet P., and Van Tra H .. 1995. Mercury remobilization from flooded soils in a hydroelectric reservoir of northern Quebec, La Grande-2: results of a soil resuspension experiment. Canadian Journal of Fisheries and Aquatic Sciences 52: 2507-2517.
Nichols, S.A. 1999. Floristic quality assessment of Wisconsin lake plant communities with example applications. Journal of Lake and Reservoir Management 15(2):133-141.
Richter, B.D., and Thomas, G.A. 2007. Restoring Environmental Flows by Modifying Dam Operations. Ecology and Society 12(1): 12.
Richter, B.D., Warner, A.T. , Meyer, J.L., and Lutz, K. 2006. A collaborative and adaptive process for developing environmental flow recommendations . River Research and Applications. 22: 297-318.
Ringelman, J. K. 1990. Habitat management for molting waterfowl. U.S. Fish and Wildl. Serv., Fish Wildl. Leaflet 13.4.4.
Robbins, S.D., Jr. 1991. Wisconsin birdlife: Population and distribution past and present. University of Wisconsin Press. Madison, Wisconsin .
81 I P a ge

Rogosin, A. 1954. An ecological history of wild rice. Minnesota Committee on Wild Rice. Minnesota Department of Conservation. Division of Game and Fish. 29pp.
Rudolph, R.M ., Faulkner, E. B., Hampton, P.E., Tomlinson, E.M. 2004 Old Problems and New Technologies: Spatial Analysis Adds Value to Dam Safety Studies. Source: http://appliedweatherassociates.com/Wisconsin ASDSO 2004 paper.pdf
Sample, D.W. and Mossman, M.J . 1997. Managing habitat for grassland birds: a guide for Wisconsin. Bureau of Integrated Science Services, Department of Natural Resources, Madison , Wisconsin.
Scheidegger, K.J., and Bain, M.B. 1995. Larval fish distribution and microhabitat use in free-flowing and regulated rivers. Copeia 1995(1): 125-135.
Schmitt, K.K., Bruch, R.M., Binkowski, F.P .. 2009. People of the sturgeon: Wisconsin's love affair with an ancient fish. Wisconsin Historical Society Press. Madison, WI.
Snodgrass J. W ., Jagoe C. H. , Bryan A. L. Jr, Brant H. A., and Burger J: 2000. Effects of trophic status and wetland morphology, hydroperiod, and water chemistry on mercury concentrations in fish. Canadian Journal of Fisheries and Aquatic Sciences. 57: 171-180.
Stiles, C.M., Bokern, J.K., and Kolb, M.F. 1995. Report of the 1993-1994 Shoreline Survey Manitowish Waters Chain of Lakes. Vilas County, Wisconsin. Nicolet National Forest Archaeology Center. Report of Investigations No. 5. USDA Forest Service, Rhinelander, Wisconsin.
ATTACHMENTS
Appendix I. Copy of the 1937/1939 Rest Lake Dam operating order.
Appendix II. USGS report: "Estimation of Natural Historical Flows for the Manitowish River near Manitowish Waters, Wisconsin"
Appendix Ill. Lake contour maps for Alder, Clear, Fawn , Island, Little Star, Manitowish, Rest, Spider, Stone, and Wild Rice Lakes.
82 I Page

Appendix I - 1939 Operating Order

,;',: ·~ .• " I
}
,'/ '(
' - ! "/ ' f I ' ' ~ I ' I •. 1\ •.•. \·
BEFORE THE
-·· i · \
PUBLIC SERVICE COMMISSION OF WISCONSIN
In the Matter . of ·the· Petition of ) A. E, Mayer a.nd 73 Other. ·Persons ) for an Order Fix.:tng a Higher Min- ) imum Level for the Lakes Affected ) by the Rest Lake Dam in Vilas· · ) County Owned by the Chippewa and ) Flrumbeau Improvement Company )
ORDER UPON REOPENING
2-WP-295
On July ·s, 1937 the Commission entered an order rais
ing the winter minimum level of water to be maintained in the
Rest L9.ke resel.'Voir by the Rest la.k~ dam by Chippewa and Flam.:.
beau Improvement Company, prescribing minimum levels for other
seasons, ·ana . making certain requirements of the company with
·= . 1 ·~ rf
... .. ,.-. · ..... :.; o.: .. · :: .:·~ .··~ .. ~:~ ·p·~:c~t.- 't·~·,:~P:~~··~·&:l-"1!~~·--,~.fie · .. '~~t~~~,: .. ~r--'~~h~l.- ~-e~~~voi~.:;· :~a: ·iinp~~~.~~.\ :,:;>~:,:
the bed thereof in the -interest of' fish life therein.
ori July 28, 1937 petitioners .filed an a.ppl,.cation for
rehearing and reeonsideration o.f said order and a fixation of . . . .... . 1·, .. . ·, · . ·,· .
the minimum level .of ·water to be held ... fn the reservoir at 6 'ott
gauge height .froin November 1 until the spring break-up. , In re
sponse to said application rehearing was held in the Town of
Spider Lake~ Vilas oottnty, on Octobe:r 141 19381 ·oefore Chairman
Fred s. Hunt and Commissioner Robert A. Nixon.
The history of the · dam rund of the regulation of the
water levels impounded in the reservoir is outlined in our
opinion and order or, July 8, 1937 herein together with a. state
ment of the essential facts wl:;tich were shown by the testimony
in the hearings held prior to that order. For the most part

the_se matter~ need not be. repeated here. It perhaps should be
noted, however, that the orig:tnal eatablishment of maxinnun and
minimum levels was .~: presoribed 1 after reconsideration of an ' • I ' I . '
earlier order, by order of September 10~ 1915. This order fix
ed a maximum level of 8t6" gauge h~ight and a minimum level of
5'0" ga~ge .height, but permitted the water in the reservoir to
be lowered to a mintmum of 2'6" on the gauge when the entire
surface was covered with ice. In our last order now.under re-
o<:msideration we ,11'everted in effect to the original prescrlption
holding the minimum a.t·5'0" throughout the year, but provided
e.lao that from the time of the spring break-Up until April 15
the water should be raised to a minimum of 7'3 1' on the gauge
providing the :minimum discharge required by le.w ~d rainfail and . . .
. .. . r~u~:u;>tf , .-:woJlJ..d .: : P~rmit. ,, ~!Ilg ~:the. :periQd :.-,£~ ~ A~ril: T5 ~ July -1 .
we l'equired that the water be raised t0 a:ppr~)Cilnately 8' 6" _, the . . . . . '
maximum level, rainfall and ~off permitting, and from July 1
tQ September 1 the order permits the water to be drawn not lower
·than a gaug_~ he1{1;ht or q.1;" . From s _eptembe.r l to November 1 '
under the order the water may be drawn to a level not lower than
5'0"', and at no time may the res~.i<voir be lewered at a rate ex-
ceeding· 2 11 per day or lowered while llovered w~th ice. The order
also requires the company to pat~ol the reservoir and record the
location and elevation at which water begins filling potholes
and at Tihich th~se pothole8 a~8 cut off froru the main reservoir,
and to start a program of dredging the bars between the potholes
and the main reservoir so as to allow fish to escape from the
- potholes~ spending thereon not ·less than $11 000 per year and
continuing for a period · ·of five years or until the objectionable
.· -::·. ,'
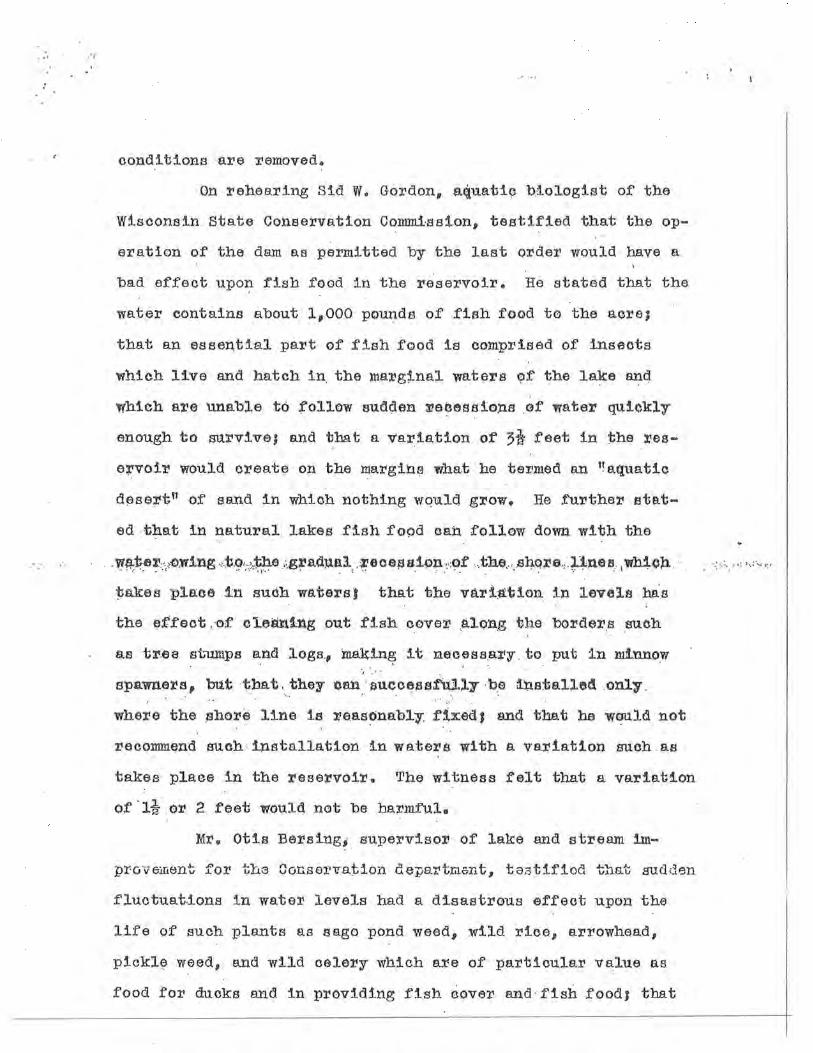
,·,
.... ,
conditions are removed .
On rehearing Sid w. Gordon, aquati~ biologist of the
Wisconsin State Conservation Commi·saion, testified that the op
eration of the dam as per.mitted by the last order would have a
bad effect upo~ fish food in the reservoir . He stated that the
water contains about 1,000 pout?-dB of fish food to the acre;
that a.n essential part of fish food is comprised of insects
which live and hatch in. the margtnal waters ~f the lake and
which a11e unable to follow sud<ten recessions .of water quickly
enough to survive; and that a variation of 3~ feet in the res
e:J;Voir would create on the margins what he termed an "aquatic
desert" of sand in which nothing would grow. He further stat
ed that in natural lakes fish food oan follow down with the
.. ~~~~':'/();wing .,.t.()'.-.\~ .. ;.g;radual, . r.ecel'Js.1QJ.l~,:~f , .. the,._ .s:Q,QJ:~e ., . ~nes .. 1wh,1.:C}l . · .
~akes place in such waters) that the vari~tion in levels bAs
the effect ,.of o~eaning out fish covel' .. along the borders such
a.s tree st"lllllps B:nd logs., ln.a.kin€? it :raecesas.11y . to put in minnow ·, .•·
spawne~s, but that . they nan·aueoessf'UJ.l:r be ~stalled .only . . ·.. . . . .
wheiie the ~hore line is reasonably fixed J and that he wou.ld not
recommend such · installation in waters with a variation such as
takes place in the reservoir . The witness felt that a variation
of'li or 2 feet would not be bariDrul.
Mr. Otis Bersing1 supervisor of lake and stream tm-
provement for thG Conservation depa!1tru\mt, taatifiod that sudd9n
fluctuat.iona in water levels had a disastrous effect upon the
life of such plants as sago pond weed 1 wild rice, arrowhead,
pickle weed, a.nd wild celery which are of particular value as
food for ducks and in providing fish cover and ·fish foodJ that
., ·' 1,,: ···:_,:• .

these plants grow in depths ranging from 1 to 10 feet; · a.nd t.ha.t '
when the ·water · recedes those growing in l'!hoal water dry up and.
die . He stated that when· fish food becomes scarce the fish ·are
smaller i1,1 slze · and in numbers because more apt to be eaten by
llll'ger fish.
1~. Lyman o. Wi1liamson1 area biologist for the Con
Bervation depa.rtment 1 testified ·that ·he. bad made an intensive
study of the spawning habits of wall.;. eyed ·pike 1n the Rest Lake
flowage during the· ·last two y:ea:rs ·. He stated that for spawning pike require a gravel or very coars~ sand bottom .whioh does not
carry silt, and water not ~ve~ 4 ~eet in -depth; that there is
no sui table spawning gro~d iil ·the Rest lake ru,tea 1 . beoauae the
Shore lines eenta.in too nru.eh silt and eggs become coated with
. o::,!·{.ok•· :~-::-: .. J•/• ... t:lil t and, ~.~~:. ,.dt~J .. ,;: .. ,;~~ t . 9 8..-,JPe~'~At .t~~: .. . ·the na ~.Sl.ly ... s.p_a~ed·! ,._~ ··'~:+~~W)f! .\,,. ,~::.~~,;·t ' • ' , . •• • ' • • • • • # • •
· eggs found in the ·flowag.e .W-ere .fertile but died a shor·t time
after deposition.- · The · witness attributed the lack of natuNil
spawning beds in the Rest lake chain to the recession of the
water ·and. the'. aot!on ·.of the vrEtvel1 in ; bringing' !11t . 'Snd other
matariS.:l ·doWn into the bed~ · Pika st9.ltt spa:wning in this area
aro1.md the i'iilst of May. A v&riation from 5 to 8i feet was
said to be not favorable bat a: .fluctuation o:f 1 or 1/2 foot
would not make lllUoh d1ffe.rence. 'In Rest lake light necessary
for the growth o:f plants penetrates but between 5 and 6 :feet
acoordir~ to the ~tness 1 but beca~se cf the permis31ble 7ari~
ation of 3i feot which prevents the growth of plant life in
waters shallower than that depth the area available :for plant
growth is reduced by the permissible fluctuation approximately
75 to So percent. A 1 or 2 :foot raise in the minimum would make

! \ • ·!
a 6o . or ·70 per dent greater area ava:;tlable for plant growth
around the shore line,
Other -witnesses testified ·to facts covered by the
testimony at the previous hearings and to damage to riparian
property caused by the fluctuation in the water level.
There was testfmoriy on ·both 'aides as to the relative ·
l';}uantity of fishing -in the flowag{; and the natural lakes • The
petitioners' wi tnesaea held the oppoaite opinion to that of the
reapond:en:t• .-s• None ot ,the ·w.ttnes~~ea :eXpr.&ased ·an ··opinion that. · .
. the fisbd~g on the flowage was Worse than it would have been in
these waters had the ·dam not been er.eeted ·at all, Ther.e is no
proof 1on this ~eoord which would justify a conclusion that the
.fishing would have been bettel' tl the waters had remained · in
..• ;-:_o!,.-::.•--:,;:;-.. \ .. ,- :· -v~eir. !18:~¥:· .: ~r~te::· · ~~ ... ,:it .. !l,a;¥-<P.~~:'·:·~tl?:-,,~f ·l?:~-:: .d.run :fn.:_·:~~~at,~.l.t~J~;r.·:.;.'">:·. ~ ;. __ .. : <i:-;t:. ·
.. . . . . ~· .
. .
and operation as has · been: he:t~e"tot'0re ·:permitted. It .i ·s ilidicated . . '
by the reeordj however·., tb.O.t while · the e·xi.stence and op·er·ation
of the dam in e:o~o.rd·anoe with: the nie·tJioda perinitted since 1915. . ' . . . . . .
obupled w~th ·:Propag·s.'\)ion ··ot: fish ··ey i;he ·.stat.e~ ·greatly ··imp~~·ved ·
and eriha.nGed t .he val.ue of f .i 'shtn·g fo; . aev·~l'B:l 'yett~a·, thoa.e ·fuprovementa have ·gradually been : d1minished · through the ba:nnf'lil
effects of· water fluc:tUat_ions described by the witnesses.
Whether such losses rui:ve now or will .in the future entirely
overcome the benefits to fishing ·created by ·the dam or will more
than offset the~ ie impooeib:!.e to sa:y.
· The nature-.. ruid extent· 'q.f' tlie ' jurisdiction of the Com
mission in the premises is to be resolved fr·om the terms · of the
enabling act under which Chippewa and Flambeau Improvement Com
pany operates the dam and the .pr·ovisions of Chapter 31, Stat-
r.
. .. :..: .

utes, '.covering the regulation of dams by ·the . Commission. The
enabling act, Chapter 64o~ Laws. ot · 1911, provides:·
"Section· .1. 1 .• Subjeo:t to· the supervision and eontro1 hereinafter provided for; authol'ity is hereby given unto the- Gh~ppewa. ,and Fla.mbQau Improvement C.o:mpany, in order to promote the purposes herein·after Bet forth, to· create, ·const;ruct.; a.cqui.re, · maintain, and operate a system.of water reservoirs
· • · •. • · and for that pur.pose said· ·;,..g;,.an.t:etir~'l't'ia'Y col1s·true·t, acquire, maintain; and operate all. such dams; boom.S·, sluicewa:ys,..: locks 11 and· other structures ' in, along .• or across any and all of said port!ons.of said rivers and their sa.id ,tributar~.el!J · t,ts m~'f be ~eo.esaary or reasonably conv~;nient to accomplish the pur-poses of this · g~ant; ·.and :may .. cl.eap. . outJ·· ,:a·p~a:J,ghten1 ·.·dElePell.l: or otherwise iinprov·e filly of Bald' -rf".ters and tr:tbutiU'ies in Ol,.'de+' to· 1,mprove the naviga.t:1on thereof and to prevent injury to property bordering on said waters."
"Section 2. 1. T.he :~· aid a:uthol'ity is gra:nt:ed. :for .the purpoa~ of . pl'o.d~~il;lg:: ~ .. :.ne,fillly.·a,u~.~form flow ot: water as practicabl:e in the ·Chi),)pewa and
·.'Flambea~.· rivers, . throlJ.gh ·alJ. s{3~aona 1 r ·'by ·:Q.G)lding :·back' and st'ol'ing up in said re·servoi~s ·the au:rplus wat·er
·~Y.t~Y~~~\ ... ·· · · ···~c.;,~ · · ' ··· .···~tnhl~'~B~f.·.:.~~fl~~~hlfaPf·~~~:ti~~~~~hei~~··· :~ ;·~:;e£;, ... · ·and by ·other means,. ,tmpravtng the ·~a'V'iga.t.ton 9f· sa~d Chippewa and ·.Flambeau rivers throughOut tbeir entire
·length; ·~ . .ror bOEJ.~s,. barges, · ~4.··P.'hh~r .. ·w:at¢-r.-·cl;'af~j' ·and for t;b.~ Y.mriing, d-rlving, " rafting~ . l;>~qmingi storing~ so~tm~; end di:)live;t<ing·'9:f\ logs,,·.· ·t:t:mher,, · ;~d :lumbe~~ and other .for.est product&, and ·f~r the purpose of 1m ...
· ... p;poy:tng ;t):le·:.·tta·Qf\lJ.ne.sa,-,:·ef: ·.~al<J..<:,;•~t~:altiilf$,.:,tQ11: ::all· . Pu~lio ··. pti.rposea,, tind or · dimi.niab,ing. ~he . dam~e .. fuld .bj~y by ·floods ·· .. and . freshets . to. p:roperty,~ : both public and :pr~-vate, located along alii d. waters. ·
; . \
"2. It shall be the duty of s~id Chippewa. and . Flambeau Improvement Cqmpany•. to . so lll!Uiage1 .. operat·e:; and maintain all of ita saic:i.' l'eservoira and othe1:' works tha.t the purposes. afOI'$i.Ht:ta· 3hi;tl pe a(l,complishE!d to the greatest practical extent and so that as nearly a uni:f6rm flow of water . a.s practicable shall be maintained at all times and at all points on said Chippewa and Flambeau. l'lve~:;q and· dn.ring . th0 thnes when it may be found impracticable to mainta!n, at the same time suah uniform flow of water throughout the ·enti~e. length of said ~ivers 6 the upper portions of said rivers shall be given preference."
"section 6., L • • • Such railroad connnissio:n shall cause the height to which. the water may be raiaed by any dam to be indicated by pe~manent monu-
. . ': .· .. . ~ ·:

. ' _,.., . -~
ments and bench marks, and shall have supervision and control of the time and extent of . the drawing of water from the reservoirs, and the power to compel the maintenance of all reservoirs established •••• "
"Section B. · This act is hereby declared to be a public act and for the accomplishment of public purposes, and shall be favorably construed to the accomplishment of said purposes."
"Section 9· The right 'is hereby reserved to the leg1,.sla.ture to repeal or amend this act at ap:y time • • ·• 11 ·
In Chippe:wa and Fl~beau Improvement Company v. Rail
road Oommi~eion;· 164 Wis. 105, it wa.a held that tl;le act w:aa
un~er the reserved powers in effect amended by the enactment of
the ge1;1eral water power act of 1915, and tp.at the dam was sub
ject t<;> the jurisdiction of the Commtssion und~r that law• The
following provisions of Chapter 380, ·Laws .of 19.:t.?, are still in
·>.: '.:.'\ .' :' . , .. e~ . .t:e.ct .... ~!3 , ~_ectio~;-J} .. ~02 ( 1.) ~91 .J2) of ~~-;J~~tute_a -. ~b,~oh .fo~-. : :, . .. ~ .. ... _-, :
low~
tt.( 1) T~~ ~·ommi;a~'i?n~ ~n the iri.tereat of public rights in navigable waters or to promote safety and pl','etect l~te, health an~ -i5r.opel'ty 1~ empcilwered . to ~egu+,ate and cont~ol. th~ 1,~·vel ru:td fl()w qf: water in . all nav~g~b!~ wateps ~.d>may er:ect1 .or m~y order · _and l,!equi:ra · p~~eh mal;1ks ta be · erected~ upon whieh ·sMli l?e de81,gn.at.ed 'the mai:imum level of water that ln~ be impounded and the lowest level o.f wate.r that may be maintained by any dam heretofore or hereafter con ... struoted and maintained in navigable waters; and shall establish and maintain gauging station~·ttpon the various navigable waters of the state .and-shall t8.ke other steps necessary todetermine and record the 9haracter-1stics of such waters.
u(2) The Colllllliaaion is vested with author ity and po»ar to inv8st!gate and determine all ra&sonable methods of construction, operation, maintenance; and equ._ipment for any dam so · as to conserve and protect all public rights in navigable waters snd so as to .protect life, health and property; and the construction, operation, ma..in'J:;enance and equipment, or any or all thereof, of dams in navigable waters shall be subject to the supervision of the commission and to the orders and regulations of the commission made
-7-

.,
. . :
or promulgated under the provisions of this chapter of the statutes,n ·
In the case just cited the improvement company attack ...
ed the · 1915 regul·a.tion of the Co:nnnisaion as depriving it of
property without due process of la~, In its decision the court
indicated but did not directly decide that while the primary ··
purpose of Chapter 64o, Laws of 1911, was certainly the crea
tion of reservoirs 11 for the purpose of accumulating grea~ stores
of water during wet periods and gradually letting it out during
dry periods,· so that there may· be as· nearly as pra,cticable a
uniform ,flow of the rivers, thus doing away with disastrous
floods ~d .. assuring to wate:r;;..power owners below a supply of
water durin.g the entire year" 1 there appeared to be "plain in
dications tbit the legislative thought indicated other public . . . . . ·. . : :. ' . ··,'. : . . ' . :. " . ' :. . . .. . . ,. . .. ' ' . -: . :~·.: ... \·, ·· ' ...
purposes than· the ·m~1:fe stol!age ·or: ilniriehse · qtt·tm.tities' of water· . :.
for the creation or power and that it was .apprecia.ted that the.re
might well arise a· conflict between the various purposes, in
which event all of the public interests were to be reeognized
and protected· aa ,,r~ . as. pr~oticab~G. tt', ( 164 Wia~ 105~ 116, 1.17)
On the other hand, in Flambeau River Lumbe!' Company
v. Rail!'oad Commission, 198 Wis. 134, it wa·s held that the leg-
islative purpose was to improve and not to destroy nav.igation
and especially was to tmprove the navigation of the Flambeau
for the d!'iving of logs. And in Flambeau River Lumber · Company
v •. Railroad Commission, 204 Wis • 524, in which the validity of
the Connnission t s order of March 3; 1928 authorizing the im.prove
ment company to retain all of the flow of the river expept ·150
cubic feet per second during the t inie when logs were befng
driven upon the river was assailed, the court said:
- Q

' . ... : . · /•··· .
"M~ifestly this power .must be exercis~d . to accomplish the declared purpose of the act, · (1st) to improve navigation for log-driving purposes, and (2d)
, to maintain as nearly as practicable a uniform flow of water. in acoordru:J,ge with. tht? provtsions of the act. If the order of :Maroh . .3,; l928, · accompl1shes one pur- · pose at the expense of the other, having due regard to the situation with W:lich the legislature was dealing, it must be apparent that the commission has not properly exercised its p,ower. · ":(:t is hot enough for the commission to prescribe a minimum flow in the river regardless of whether the .condition thereby cl'eated w 111 d~stroy the practical·, navigation of the stream. No. doubt ·the power w~s oonfeJ:ired upon the Railroad Connnission to re~htte t.he flow of the stream in . .o:rder that flexibie standal'ds might be erected and.' ltlairitained and' the r:itrerun made. useful for pl'acttcal purposes. The t~tal court found; and the . evidence sustains the findi-ng,. that if the dams be operated in ac~ordanoe with the order, not enough water will be e:vailabie du:d .. ng . the us1;tal 1md customary log":"'di.ivlng. "season to :inake ~he stl'erun practically navigabl~ to'r that purpose •.. ·It .. may well be that in
· the opinion. of the commission tP,~ .use. of .the water fol' eydra:.ulic · power purposes may be from a· public standpoint more important than the use of the watel'
.:fC?r . pur_~~~~~: .ot:.:~ :.n~:v~~a:t~otl1'f':, . )(f.PO~ :that ... Poix:tt ·the .. ·· .. termB of .the act fqreclose £he c~mmission. Its duty
· is to impr.ove navigation, not des·troy it or substantially impair :tt. It on,e purpose. may be sa.i¢11 under the terms . of the a~t, to be more important than another f. that place must .be accorded to navigation. If witb the passage of time na:viga.tion has been of decreasing importance, a new. situation has arisen which nn1at be de~lt with by" the legislature• The · Ee.il.zload Commission is limited in the exercise of ·ita authority· to the power .oonfe:rr ed upon 1 t by the aot.
"• •• The ordel' should be so framed as to tmprove navigation to the extent that navigation exists. The right of the navigator, on the other band, should be exercised reasonably and not so as to be unreasonably destructive of other public interests."
The court further said:
nit 18 nuggestod that ~ spirit of reasonable~ ness and cooperation would go far in solving the problema presented by the conditions which exist on ~any of the interior navigable water~ of the state, to the end that the natural resources of the state· shall be made · av&ilable to the highest extent reasonably possible for a.ll public purposes."
The court in this case rurthermore recognized that the
_ q_

-.
creation of hydraulic power when authori~ed by the legislature
is a public pul'pose, citing Wisconsin: Rival' Improvement Company
v. · J:>ier.1 137 Wis. 325
As we collate the.se cases B.nd the statutory provisions
which they construe we deem that it is within our power to make
reasonable regulations and requirements· ·wi'th. respect to the
maintenance and operation of the dam in- questi.on in order to
obtain 1t.s greatest possible u.sei'u.lness .for all public rights
and interests in the ·wa:te:rta af:t'Eicted. · This does not.·melini how-. . .
ever, in our opinion, that we can ~bs~ant1a1ly destroy the
usefu.liless of ·the drun for it;~ •:pecognized. prilnary purpose, that
is th~ evening out of the flow of water in the stream in order
to improve thE! generation of hydl'a.ulie ·power and t-o· p~trvent da.m-
'"'.e; .. •.:v·:· ·.·. __ .--J:§:~:·.·~!·_:{~?O~¥; /tp.r::,;:~~~.}~e.k-~. Of, .. P:~~e;_ ... ~~-pl~<? _;~~~-~,~~.~~·:. ·~~0~: - ~~-·-·.:_ . -~: :;.· ._ . . . . ·'~r · : recreationB!id fishing on the reser'Voi11 no· more than we could
destroy the USE!fulneas of the dam for ·log•d:riving in order to
promote the· generation of hydraulic po.wer. · To -do ei.ther would ' :
'be to defeat th~ exp,.eased purpose· of th~ legi.alature•
It ·is manifest that the ideal condition for the promo
tion of the public rights of fishing and recreation on the
reservoir would be the maintenance of a water level as nearly
uni'form 13.8 rainfall and runoff would permit, but to require the
dam to be so operated would be to destroy wholly its usefulness
f«:~r th'3 r:nupoa~ fo'!J which 1 t vrH8 oonst:J:ncte<'l SJ1c'l would Tflmove
all incentive of its owner for continued maintenance and opera
tion. Likewise, the narrower the permissible spread between
maximum and min~um levels the nearer the approach to the ideal
condition for fishing and recreation and the greater the impair-

.. ! ,..
• '
·~ : ;·
ment. of the usefulness of the dam for power generation and
flood control. If we were to determine that b~cause of charige
in conditions fiahir,tg and recreation ha:ve becom€l more important
public .rights than generation of pow_er and if we were to con
clude therefore that the dam should be 'hereafter operated to
serve only such more import~t public interests, we would be
not only oblivious of the limits .-of the reasonableness within
which our requirements must be kept but also of the express leg
'-slat1ve pll.rpo:ae 'i~ .the · a.utnQr1~at1o.l'l .. of .the dam .and the pur
poses which induced its construction. Just as it was held to
be beyond our powers to promu_lgate · a ·regul_ation designed to pro
mote power generation to the. e-',t~ent of de-stroying log-driving,
so wou.ld we be beyond our powers i .n· attempting · to promote fish-
ing at the . expense of ppwer _generat~o.n·. . . •': .. ' . ·.: .. . ·. : . . . ..... . ·. : : . . .. . .'·:,. : ·.~ . ;:~· ':: ' ' ·:: .. ~·{. ·· : ~ \
li-s we have alread~ .sa.i.d.~ howev~X', · we feel that we may
have . due regard for the public right of ;fis.h.ing and th.at we are
not w.it}1out power to regula.te reasonably l$.ving 1n view both of
these publi~ -pu.rpo~.a.s~. The .max~ ~net.i~ of :the drun fpr
power purposes would be t 'o pej.-m.tt the widest var_ie.tion 1n the
level p£ the water to be imp_ounded" Ip. 1915 the improvement
ec:>mpa.ny · sought the establishment o:f. .a n\..a.x!mu.m of 10' gauge
height with a minimun1 of 0 for the natural ·J..evel of the water.
We permitted only a maximum of 8t6" and a mininru:m of 5'0n during
the period of the yea~ when the reservoir was free of ice, and
.. !,,:·.:,. 4
a minimum of 2'6" when covered by ice~ This regulation was
prompted by -precisely the conside;ratio;us now ul'ged upon us by the
petitioners end was held to be valid. It involved a compromise
between the interests which were in conflict. By our order of

' • ·~
July 8, 1937, in response to the petitioners·• showing, we fu·rther
restricted · the operation of the idam so as to .provide a minimum
)leve·l of 5 '· during the entire· year and so as to regulate the
rate 'and perio'd of draw-off from the reservoir. We further re
quired a·work program to be carried on by the improvement com-
pany in order ·to minimize so far as seemed to us reasonably
praoticable the harmful effect on fish life. The present orde~
peT.mits only 65 percent of the previous capacity of the reser
voir to be m~de useful under ordinary -condit~ons.·
The position of . the petitioners .on rehearing, however,
is that the p~esent order d~El ~."P.ot go far enough and that. in • J I\ ., ;
order to g'-v~ substan~ta+. .. ~l,loteetion . to fish life it would be
necessary to establish a minimum ~f 6•6" . ~d a ·.mrud.mnllt of 8' o",
·~~.ch. le~~tf3..3 .. R.~~~,tl~~~;s .. ~?w :r_equ~st~ ~l:ds .. ·.,-'19.4~~~-~,~~. ~1:t,e , , .. ,. . ...... . ... ...... ;
reservoi-r to about 290,·000.,000 cubic feet o.f storage which i·s
but . 29 pe'l'oe:tit of its previous capacity.· Sl,lch a req-q.irement
would in our opinion go far beyond the limits of re&sonableness
and would in effect defeat t~ legislative purpose in e.u.~hC?riZ'
ing the dam to be cdlnstruoted.
The effect of the variation in levels upon the prop
erty of riparian proprietors has also been urged by petitioners.
These are private rights, and as between the riparian 9wners
and the improvement company they may have been acquired by the
imp:rovem€'mt nompany by p~eAcl'ipt.ionp s1ncEl the d9Jll }'1e.a be"'=n op
erated for more than 20 years in accordance with the water ·
levels authorized in the 1915 orde~. At any rate our conclu
sions make it unnecessary to determine the question.
It has also been urged that by the terms of the en-

:-. ·. · .
' . \ ... :. ' .
abling act itself the waters in the reserv9ir are to be given
preference over the waters below the dam. The_ act prov~des that
·"during· the times when it .may be found impracticable to m_a~ntain
at the same time such uniform flow of water throughout _the an-
tire length of aa-id rivers, the upper portions of said rivers
shali be given preference. tr This provision does not have :t;he .
meaning ascribed to it by .the petitioners. It does not refer
to the upper reaches of the river above the xeservoir ·because
the dam does not affect the flow in such _portions of the .river,
Nor _ does it mean the maintenance of a uniform level, quite dif
ferent from uniform flow, in the reservoir. In order to pro
duo.e a ·unifol'm flcryv of water the dam must be operated so as to
store water.· during seasons of plentiful supply and release it
during seasons of drought. Tbus, the uniform flow cap be ef-1. · : · .' . • . ,'
; ; ' ·,:~· : : .~' .. ' ~ , .. : . The upper portions of the .river ~e= ~ec~ed only below the drum.
ferred to in the act .are thos_e which are below and not above the
dam.
_We .fully appreciate the ~portanee _of _ -thia proceeding
not only to the petitioner:! bttt also to the public and the state. . . . ~ .
But as_ we have befor-e indica.te¢1 1 we have gon~ as far in our
judgment as we lawf'ully can in protecting the public interests
of _fish~g and recreation within the mandate laid upon us by the
legislature. In this connection it might .al_so be recalled that
the legislature to protect the interests of the state has pro-
vided for recapture of the dam, the dam site, and flowage rights
by paying compensation therefor to the improvement company.
Section 9 of the enabling act provides:
"The state. of Wisconsin shall have the right at any time~ whenever it may have the constitutional
- 13 ...

·· .. i
power,· to. take over to i'tJs.eU ap.d · becom~ .owner of all ·reservoirs and other works and property acquired bY the Chi-pp~wa and Fl11mbea.lf : Imp:t~ovement C.()mpAny;. pursu-. ant to thls act, by ·.paying therefor the· cash capita.l a.ctu.~lcy, paid on t .ba capital .stock . of:·.B:aid co:p1pa.ny · theretofore la'T(fully , iasued end outstanding 011 the
· actual value ·of . the · phys-ie.a.l 'pr.0pe.rt:tes . so taken over and without any allowance for franchises or good will of the business, such actual: value .to · be determined by the railroad conmdsaion of Wisconsin."
Findings of Fact
';rHE COMMI$SI ON FI.NDS: J ,,
1 . That the storage capaoity of the R~st Lak<'l
reservoir between gauge heights 8.'6" and 2'6n is l,cno,ooo,ooo
cubic feet.
2. That the capacity of the reservoir between , f ' I
gauge heights 5'0n and ·8t6" is 66o,'ooo,ooo cubic feet •
. '
.. · .. .... .. '
. ·3· That the · eapaeity :·.of t:b.e .. 'it&se'l'voir between ... ~,,;·;;;,, ..
gauge heights 8to" and 6t6tt (requested by petitioners) is
29o;ooo,oo6 cubic feet.
4. That the withdrawal of water to a minimum
level of 2 !·6a gauge height during the winte~ after the reservoir
was frozen over has resulted in the destl'uction of large numbers
of snmll fi~h ~hich were trapped ·in potholes ~ such withdrawal
9f water~
5· 'That t4e ~dden variations in the level of the
reservoir as permitted by the ·order of 1915 has . result'ed in the
de~truction of insect life forming .fish f'ood on the margins of
the reservoir and plant life furn ishing food , and cover for fish
and du.cks on such margins. ·
6. That such destruction off ish, insect, and
plant life has substantially impaired fishing during the last
-1"-

-;-~'(,t 'l
'·" ~
four or five years as compared with that which obtain~d prior
thereto.
7. That the maintenance and operation of the dam
has not been shown to have impaired fishing conditions as they
existed in the waters above the dam prior to 1915, or as these
conditions would have obtained had the waters affected remained
in their ~tural state.
8. That in the interests of recreation and fish
.ipg in the ·Eeat lake reservoir it is reasonable and necessary
to incr·ease the winter minimuln level of the water therein from
2'6" gauge height to 5'0" gauge he.ightJ to require the water to
be raised from the time of ·the sprtng break-up to April 15 of
each year to a minimum level of 7'3 11 gnuge height, rainfall and
runoff permitting, and to 8•6" .by July .1 of each year., rainfall. : =··· ·.·.·· · · · ,. ., t:.~ . - ~:· ~·;\ .:. ~ ;·:·,· . · · .~·-:~ .. - ~· · r . ":!,\ Jt:·· '. ··'~~ ··.·. :- · ·· · · · ·· ··· ·· .. • . ·' · ....
and run.o.t'.f"permittingj to permit the watar to be drawn off fl'bm
July 1 to. September 1 of eaeh y(mr to a m±n1lm:i.m level of 7'3 11 ,
and from September 1 to November 1 to a ·:min.tmum of' 5' on, but at ' ..
no \;im.e Jl.t· ,a ·~ate exceeding 2'11 pel' d:ayJ an~ .. to pe.rltlit no lowe:r-
mg of th.e level at.ter the· ice sheet forms 1n the early winter
until the ice breaks up during. the following spring.
9• That it is also reas<::mable and necessary in
the interests of fishing and recreation. to l.!equire the improve
ment company to .patrol the reservoir . during the -filiing and
draw.;.off periods recording the location and elevation e.t whlch
wat.er be.gins filling each of the potholes and the elevations at '
whieh the potholes are cut off fro~ the main reservoir when the
water level is lowered, and to require a five - year progl'am at a
rate of expenditure of at least $1,000 per ye.ar of dredging the
.. ,..
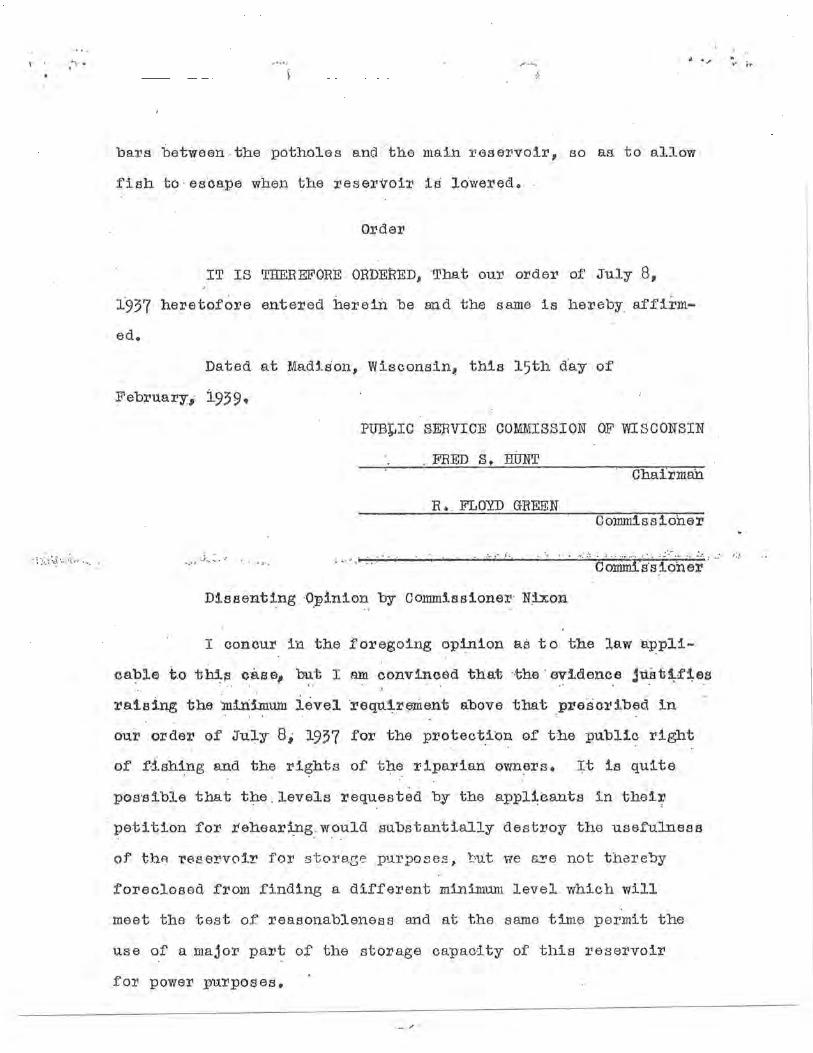
. . .,.
bars between the potholes and · the main reservoir, so as. to allow
fish to · escape when the reservoir is lowered. .
Order
IT IS TIIEREFORE ORDERED, "That our order of July 8,
1937 heretofore entered herein be snd the same is hereby_ affirm-
ed.
Dated at Madison, Wisconsin~ thla 15th d·a.y of
February, l939·
PUB~IC SEBVICE COMMISSION OF WISCONSIN
. FRED S, HUNT Chairman
B • . FLOYD GREEN Commissioner
Dissenting ·opinion_ by Commissioner· Nixon
I concur in the foregoing opinion as to the ];aw ·appli
cable b.o thl:-1'3 case; but I am convinced that ·the· evidence juat~~e.s
raising the ·miriimu.m ievel reqtt~r~ent above that _prescribed in
our order of July s, 1937 for the protect_ion of the public right
of f·.ishing and the ri~hts of the ripa.l:ian owners. J;:t is quite
pos·sible that t~e .levels :requested by the applicants in thai'?
petition for .rehear~g:. would substantially destJ:oy the usefulness
of thA 1'e.servo1r for store.[je purposes 1 but we B.!'e not thare"by
foreclosed from finding a diffel:ent minilmrn1 level which will
meet the test of reasonableness and at the same time permit the
use of a major part of the storage capac-ity of this reservoi!1
foT power pu~poses.
- /

' . . . ' .' \.r:r..;... "· .. -f.
~ . '/
Da~ed at Madison, Wisconsin, this 15th day. of
February, 1939.
ROBERT A NIXON Commissioner
• I
.:: .. ·· ·' ···

Appendix II - USGS Report
Prepared in cooperation with the Wisconsin Department of Natural Resources
Estimation of Natural Historical Flows for the Manitowish River near Manitowish Waters, Wisconsin
Scientific Investigations Report 2012-5135
U.S. Department of the Interior U.S. Geological Survey

Cover. Rest Lake Dam as viewed from Rest Lake, part of the Manitowish Chain of Lakes. (Photograph by James M. Klosiewski, Wisconsin Department of Natural Resources, September 22, 2002.)

Estimation of Natural Historical Flows for the Manitowish River near Manitowish Waters, Wisconsin
By Paul F. Juckem, Paul C. Reneau, and Dale M. Robertson
Prepared in cooperation with the Wisconsin Department of Natural Resources
Scientific Investigations Report 2012-5135
U.S. Department of the Interior U.S. Geological Survey

U.S. Department of the Interior KEN SALAZAR, Secretary
U.S. Geological Survey Marcia K. McNutt, Director
U.S. Geological Survey, Reston, Virginia: 2012
For more information on the USGS-the Federal source for science about the Earth, its natural and living resources, natural hazards, and the environment, visit http://www.usgs.gov or caii1-888-ASK-USGS.
For an overview of USGS information products, including maps, imagery, and publications, visit http://www.usgs.gov/pubprod
To order this and other USGS information products, visit http:/ /store.usgs.gov
Any use of trade, firm, or product names is for descriptive purposes only and does not imply endorsement by the U.S. Government.
Although this information product, for the most part, is in the public domain, it also may contain copyrighted materials as noted in the text. Permission to reproduce copyrighted items must be secured from the copyright owner.
Suggested citation: Juckem, P.F., Reneau, P.C., and Robertson, D.M., 2012, Estimation of natural historical flows for the Manitowish River near Manitowish Waters, Wisconsin: U.S. Geological Survey Scientific Investigations Report 2012-5135, 32 p., including appendix.

Acknowledgments
Local Project Coord inator
James Kreitlow, Water Resources Management Specialist, Wisconsin Department of Natural Resources, Rhinelander, Wis.
Field Support
Eric Dantoin, Hydrologic Technician, U.S. Geological Survey, Rhinelander, Wis.
Publishing Support
Laura Nelson, Office Assistant U.S. Geological Survey Wisconsin Water Science Center, Middleton, Wis.
Michelle Greenwood, Reports Specialist, U.S. Geological Survey Wisconsin Water Science Center, Middleton, Wis.
Bonnie Stich, Editor, U.S. Geological Survey Science Publishing Network, Louisville, Ky.
Technical Reviewers
Robert Waschbusch, Hydrologist, U.S. Geological Survey Wisconsin Water Science Center, Middleton, Wis.
Glenn Hodgkins, Hydrologist, U.S. Geological Survey Maine Water Science Center, Augusta, Maine.
Editorial Reviewer
Elizabeth Ciganovich, Technical Writer-Editor, U.S. Geological Survey Science Publishing Network, Madison, Wis.
Approving Official
Kevin Breen, Bureau Approving Official, U.S. Geological Survey Office of Science Quality and Integrity, New Cumberland, Pa.
iii

iv
Contents
Acknowledgments .... .. .. .... ............................ ........................................ ................. .. ................ ............. ........ iii
Abstract ................................ ..... .... ............ ... ...... ................... .............. ........... .. ................ .. ....... ...................... 1
I ntro d u cti on .......... ............................. ... ............. ................................. ...... ................ ..... ...................... .. ..... ..... 2
Purpose and Scope ................................................ ...... ..... .. ........................... ............ : ..... .................... 3
Physical Setting ................. .... ..................................... ...................... ..................................................... 3
Data Sources ............... ............ .. ....... ... .. ......... .......... ....... ..... .... ............. .................................... ..... .............. .. 3
Methods ...................................................... ............................... ................. ..... ....................... ..... .... .. .......... .... 3
Adjusted Drainage-Area Ratio Method ............. .......... ................... .. .......... ............................ .......... 6
Water-Budget Method ........................ ........................... ...................................... ........ .. ..... ............... 10
Natural Flows at the Rest Lake Dam .... ........ ........................ ............... ................ .......... ........................... 14
Natural Historical Flow Durations .. ... ... ... ............... .. ... ........ .............. ........ ... ..................................... ... ..... 18
Assumptions and Limitations ...... ..... :-: ...... ................... ... ........ .................................... ................................ 22
Summary and Conclusions .............................. ....................... ........... ....... ..... .... .. .. .............. .................. ..... 23
References Cited .............. ............................................................... .................... ..... ......... ......... ..... ............. 24
Appendix. Code for the Python-based Water-Budget Model ... .............. .............. ............................ 27
Figures
1. Map showing the Manitowish Chain of Lakes study area in north central Wisconsin and streamflow-gaging stations used during this study .... ................................ 4
2. Graph showing measured flows at Rice Creek (station 05357182) and Papoose Creek (station 05357299) during the 2-year study period ...... ................................ 5
3. Graph showing estimated flow withoutthe effects of upstream diversions and measured flow for the Trout River (station 05357259) .... ............................... .................. 6
4. Graphs showing flows measured by the Wisconsin Department of Natural Resources and U.S. Geological Survey at the Manitowish River (station 05357302) and dam outflows at the Rest Lake Dam outlet reported by the dam operator .... ........... ......... .. ............... ....................... .. .... .................... .................. ... ..... .7
5. Graph showing regression relation for total water yield for gaging stations upstream of the Manitowish Chain of Lakes and the total water yield for the Bear River (station 05357335) plus the Trout River (station 05357245) ......... ........................ 8
6. Graph showing measured total flow at gaging stations upstream of the Manitowish Chain of Lakes and computed flow into the Chain of Lakes using the adjusted drainage-area ratio and water-budget methods ..................... ...................... 15
7. Graph showing monthly error in estimated flow at the gaging stations upstream of the Manitowish Chain of Lakes for the adjusted drainage-area ratio and water-budget methods ................... ................................................ ........... .. .............. 16
8. Graph showing median daily flow at the Rest Lake Dam for each calendar day over the period of record available for each method ........... ........................................ .. ...... 17

9. Graph showing dam-operator reported stage and dam outflow for the Manitowish Chain of Lakes and computed natural flow at the Rest Lake Dam from the adjusted drainage-area ratio and water-budget methods, 1973-2011 .............. 19
10. Graph showing monthly flow-duration values for computed natural flow at the Rest Lake Dam based on the adjusted drainage-area ratio method for 1991-201 1 and the water-budget method for 1973-2011 ...................................................... 20
Tables
1. Generalized operation of the Rest Lake Dam ...... ... .. ............. ................ ...................... ............. 2
2. Monthly coefficients that were multiplied by total daily flow into the Chain of Lakes to compute daily values of natural flow at the Rest Lake Dam for the adjusted drainage-area ratio method .......................... ............. ................... ... ............ 10
3. Target f low-duration statistics fo r the upstream gaging stations for the 2-year study period, simulated equivalent values, residuals, and associated target weights from the water-budget model ..................... .................................... .......... ..... 12
4. Parameter names and descriptions, and calibrated values for the water-budget method .......................... ...... ................................................................. ................ ........... 13
5. Annual total measured dam outflow, total computed natural flow, and difference between measured dam outflows and computed natural flows from the water-budget and adjusted drainage-area ratio methods at the Rest Lake Dam ...................... ...... .............. .. ................................................ ......................... ...... .. 14
6. Monthly flow-duration values for computed natural flow at the Rest Lake Dam based on the adjusted drainage-area ratio and water-budget methods ................. ... ...... 21
v

vi
Conversion Factors and Datum Inch/Pound to Sl
inch (in.)
foot (ft)
mile (mi)
acre
Multiply
square mile (mF)
cubic foot (ft3)
cubic foot per second (ft3/s)
cubic foot per second per square mile [(ft3/s)/mF]
inch per year (in/yr)
By
Length
25.4
0.3048
1.609
Area
0.004047
2.590
Volume
0.02832
Flow rate
0.02832
0.01093
25.4
To obtain
millimeter (mm)
meter (m)
kilometer (krn)
square kilometer (krn2)
square kilometer (km2)
cubic meter (rn3)
cubic meter per second (m3/s)
cubic meter per second per square kilometer [(m3/s)/km2
)
millimeter per year (mm/yr)
Vertical coordinate information is referenced to the North American Vertical Datum of 1988 (NAVD 88).
Altitude, as used in this report, refers to distance above the vertical datum.

Estimation of Natural Historical Flows for the Manitowish River near Manitowish Waters, Wisconsin
By Paul F. Juckem, Paul C. Reneau, and Dale M. Robertson
Abstract
The Wisconsin Department of Natural Resources is charged with oversight of dam operations throughout Wisconsin and is considering modifications to the operating orders for the Rest Lake Dam in Vilas County, Wisconsin. State law requires that the operation orders be tied to natural low flows at the dam. Because the presence of the dam confounds measurement of natural flows, the U.S. Geological Survey, in cooperation with the Wisconsin Department of Natural Resources, installed streamflow-gaging stations and developed two statistical methods to improve estimates of natural flows at the Rest Lake Dam.
Two independent methods were used to estimate daily natural flow for the Manitowish River approximately 1 mile downstream of the Rest Lake Dam. The first method was an adjusted drainage-area ratio method, which used a regression analysis that related measured water yield (flow divided by watershed area) from short-term (2009-11) gaging stations upstream of the Manitowish Chain of Lakes to the water yield from two nearby long-term gaging stations in order to extend the flow record (1991-201 1). In this approach, the computed flows into the Chain of Lakes at the upstream gaging stations were multiplied by a coefficient to account for the monthly
./ hydrologic contributions (precipitation, evaporation, groundwater, and runoff) associated with the additional watershed area between the upstream gaging stations and the dam at the outlet of the Chain of Lakes (Rest Lake Dam). The second method used to estimate daily natural flow at the Rest Lake Dam was a water-budget approach, which used lake stage and dam outflow data provided by the dam operator. A water-budget model was constructed and then calibrated with an automated parameter-estimation program by matching simulated flow-duration statistics with measured flow-duration statistics at the upstream gaging stations. After calibration ofthe waterbudget model, the model was used to compute natural flow at the dam from 1973 to 2011.
Daily natural flows at the dam, as computed by the adjusted drainage-area ratio method and the water-budget method, were used to compute monthly flow-duration values for the period of historical data available for each method. Monthly flow-durations provide a means for evaluating the frequency and range in flows that have been observed for each month over the course of many years. Both methods described the pattern and timing of measured high-flow and low-flow events at the upstream gaging stations. The adjusted drainage-area ratio method generally had smaller residual errors across the full range of observed flows and had smaller monthly biases than the water-budget method. Although it is not possible to evaluate which method may be more "correct" for estimating monthly natural flows at the dan1, comparisons between the results of each method indicate that the adjusted drainage-area ratio method may be susceptible to biases at high flows due to isolated storms outside of the Manitowish River watershed. Conversely, it appears that the water-budget method may be susceptible to biases at low flows because of its sensitivity to the accuracy of reported lake stage and outflows, as well as effects of upstream diversions that could not be fully compensated for with this method.
Results from both methods are useful for understanding the natural flow patterns at the dam. Flows for both methods have similar patterns, with high median flows in spring and low median flows in late summer. Similarly, the range from monthly high-flow durations to low-flow durations increases during sprin~, decreases during summer, and increases again during fall . These seasonal patterns illustrate a challenge with interpreting a single value of natmallow flow. That is, a natural low flow computed for September is not representative of a natural low flow in April. Moreover, alteration of natural flows caused by storing water in the Chain of Lakes durino
"' spring and releasing it in fall causes a change in the timing of high and low flows compared with natural conditions. That is, the lowest reported dam outflows occurred in spring and highest reported outflows occurred in fall, which is opposite the natural patterns.
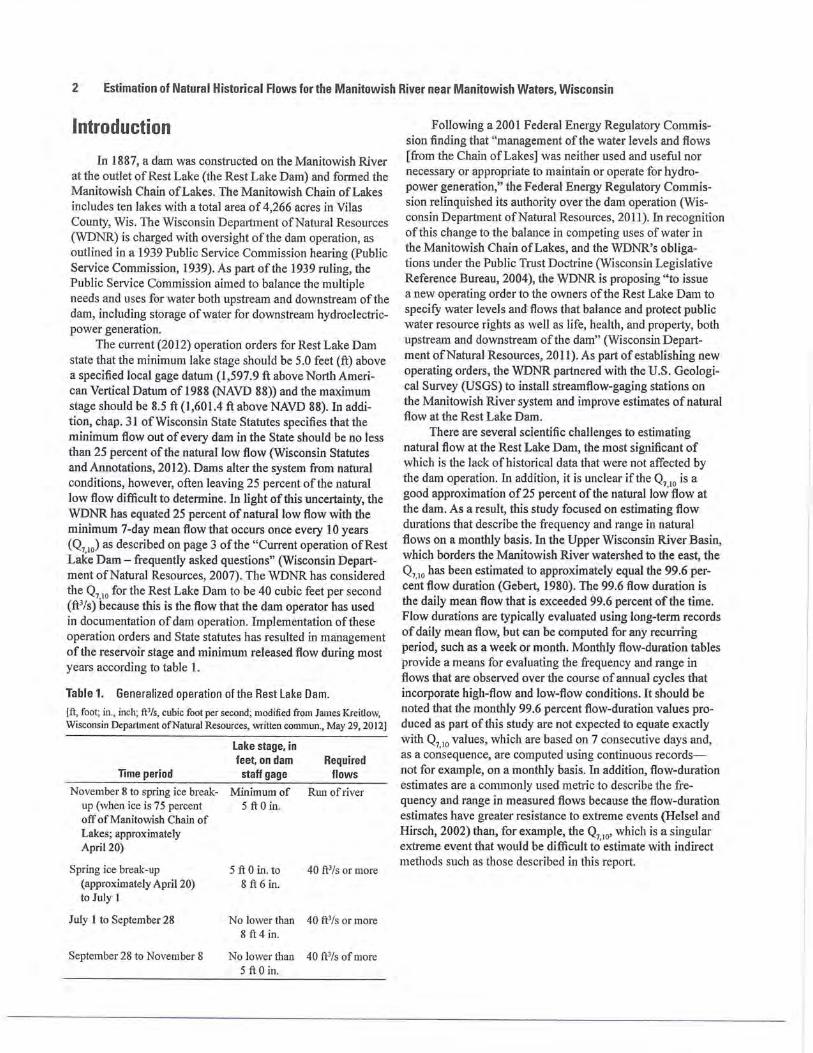
2 Estimation of Natural Historical Flows for the Manitowish River near Manitowish Waters, Wisconsin
Introduction
In 1887, a dam was constructed on the Manitowish River at the outlet of Rest Lake (the Rest Lake Dam) and formed the Manitowish Chain of Lakes. The Manitowish Chain of Lakes includes ten lakes with a total area of 4,266 acres in Vilas County, Wis. The Wisconsin Depmiment of Natural Resources (WDNR) is charged with oversight of the dam operation, as outlined in a I939 Public Service Commission hearing (Public Service Commission, 1939). As part of the 1939 ruling, the Public Service Commission aimed to balance the multiple needs and uses for water both upstream and downstream of the dam, including storage of water for downstream hydroelectricpower generation.
The current (2012) operation orders for Rest Lake Dam state that the minimum lake stage should be 5.0 feet (ft) above a specified local gage datum ( 1,597.9 ft above North American Vertical Datum of I988 (NAVD 88)) and the maximum stage should be 8.5 ft (1,601.4 ft above NAVD 88). In addition, chap. 31 of Wisconsin State Statutes specifies that the minimum flow out of every dam in the State shoufd be no less than 25 percent of the natural low flow (Wisconsin Statutes and Annotations, 20 I 2). Dams alter the system from natural conditions, howeve1; often leaving 25 percent of the natural low flow difficult to determine. In light of this uncertainty, the WDNR has equated 25 percent of natural low flow with the minimum 7-day mean flow that occurs once every 10 years (Q7,10) as described on page 3 of the "Current operation ofRest Lake Dam- frequently asked questions" (Wisconsin Department of Natural Resources, 2007). The WDNR has considered the Q7,10 for the Rest Lake Dam to be 40 cubic feet per second (ft3/s) because this is the flow that the dam operator has used in documentation of dam operation. Implementation of these operation orders and State statutes has resulted in management ofthe reservoir stage and minimum released flow durin<> most 0
years according to table I.
Table 1. Genera lized operation of the Rest Lake Dam. [ft, foot; in., inch; ft'/s, cubic foot per second; modified from James Kreitlow, Wisconsin Department of Natural Resources, written commun., May 29, 20 12)
Time period
November 8 to spring ice breakup (when ice is 75 percent off of Manitowish Chain of Lakes; approximately Apri120)
Spring ice break-up (approximately April 20) to July 1
July 1 to September 28
September 28 to November 8
Lake stage, in feet, on dam
staff gage
Minimum of 5 ft 0 in.
5 ft 0 in. to 8ft6in.
Required flows
Run of river
40 ft3/s or more
No lower than 40 ft3/s or more 8ft 4 in.
No lower than 40 ft3/s of more 5 ft 0 in.
Following a 2001 Federal Energy Regulatory Commission finding that "management of the water levels and flows [from the Chain ofLakes] was neither used and useful nor necessary or appropriate to maintain or operate for hydropower generation," the Federal Energy Regulatory Commission relinquished its authority over the dam operation (Wisconsin Department ofNatural Resources, 2011). In recognition of this change to the balance in competing uses of water in the Manitowish Chain of Lakes, and the WDNR's obliga-tions under the Public Trust Doctrine (Wisconsin Legislative Reference Bureau, 2004), the WDNR is proposing " to issue a new operating order to the owners of the Rest Lake Dam to specify water levels and flows that balance and protect public water resource rights as well as life, health, and property, both upstream and downstream of the dam" (Wisconsin Department of Natural Resources, 2011 ). As part of establishing new operating orders, the WDNR partnered with the U.S. Geological Survey (USGS) to install streamflow-gaging stations on the Manitowish River system and improve estimates of natural flow at the Rest Lake Dam.
There are several scientific challenges to estimating natural flow at the Rest Lake Dam, the most significm1t of which is the lack of historical data that were not affected by the dam operation. In addition, it is unclear if the Q is a good approximation of25 percent of the natural lo~
1
ftow at the dam. As a result, this study focused on estimating flow durations that describe the frequency and range in natural flows on a monthly basis. In the Upper Wisconsin River Basin, which borders the Manitowish River watershed to the east, the 0 7•10 has been estimated to approximately equal the 99.6 percent flow duration (Gebert, 1980). The 99.6 flow duration is the daily mean flow that is exceeded 99.6 percent of the time. Flow durations are typically evaluated using long-term records of daily mean flow, but can be computed for any recurring period, such as a week or month. Monthly flow-duration tables provide a means for evaluating the frequency and range in flows that are observed over the course of atmual cycles that incorporate high-flow and low-flow conditions. It should be noted that the monthly 99.6 percent flow-duration values produced as part of this study are not expected to equate exactly with Q7,10 values, which are based on 7 consecutive days and, as a consequence, are computed using continuous recordsnot for example, on a monthly basis. In addition, flow-duration estimates are a commonly used metric to describe the frequency and range in measured flows because the flow-duration estimates have greater resistance to extreme events (Helsel and Hirsch, 2002) than, for example, the Q
710, which is a singular
extreme event that would be difficult to' estimate with indirect methods such as those described in this report.

Purpose and Scope
The purpose of this repmt is to describe the natural historical flow in the Manitowish River at State Highway 51 near Manitowish Waters (station 05357302), as characterized by monthly flow-duration values. Because of a lack of direct flow measurements at the dam outlet, flow measured at State Highway 51 (05357302) was assumed to represent flow at the Rest Lake Dam, located approximately 1 mile (mi) upstream of State Highway 51. In addition, the methods used in this study involved computing historical average daily flows, but the scope of work is limited to describing the computed flow patterns as represented by monthly flow-duration tables. That is, every effort was made to compute accurate historical daily flows, but daily flows are not the focus of the study - the focus of the study is to produce summary statistics that describe broader historical flow pattems. Tltis distinction is made because individual daily flow estimates are expected to incorporate greater uncertainty than summary statistics that describe the distribution of hundreds of individual daily flow estimates.
Physical Setting
The Manitowish River watershed upstream of State Highway 51, which covers approximately 250 square miles (mF), is part of the Northern Lakes and Forests ecoregion (Omemik and others, 2000). This area has low-to-moderate relief and contains many wetlands and headwater lakes (fig. 1). The surficial geology of the watershed consists of glacial deposits, including pitted outwash and other ice-contact deposits composed of sand, gravel, and glacial till. The depth ofthe surficial materials may be up to 100 ft over igneous and metamorphic bedrock (Young and Hindall, 1972; Mudrey and others, 1982). The groundwater-flow system is dominated by permeable glacial deposits, and is generally in good communication with the surface-water system (Pint, 2002; Walker and others, 2012). Soils ofthe rolling-to-undulating uplands are primarily sandy loam, loamy sand, and sand, with permeabilities of2.5 to 5 influ· or more, and muck or peat soils in the wetlands (Hole and others, 1968; Oakes and Cotter, 1975). Flow into the Manitowish Chain of Lakes is primarily from four rivers: Manitowish River, Trout River, Rice Creek, .and Papoose Creek.
Methods 3
Data Sources
Four streamflow-gaging stations were installed in October 2009 and monitored through November 2011 to provide flow data (Rantz and others, 1982) for evaluating 2 years of flow into and out of the Chain of Lakes (fig. 1). These gag-ing stations were located at the Manitowish River at State Highway 51 near Manitowish Waters (station 05357302), the Trout River near Boulder Junction (station 05357259), the Manitowish River near County Highway H near Boulder Junction (station 05357157), and Rice Creek at County Highway K near Boulder Junction (station 05357182). In addition, lake stage was also measured at the Rest Lake Dam (station 460819089530500) using an automated digital recorder. Flow was measured intermittently at Papoose Creek at County Highway K near Manitowish Waters (station 05357299). All flow and lake-stage data coilected as part of this study are available online from the USGS: http://waterdata.usgs.gov/wil mvislsw.
Historical data for lake stage and flow over the Rest Lake Dam were provided by the dam operator. Historical flow data for the Bear River near Manitowish Waters (station ID 05357335) and the Trout River at Trout Lake near Boulder Junction (station ID 05357245), which were used for regression analyses, were from tl1e USGS National Water-Information system and are available online at http://waterdata.usgs. gov/wi/mvis/sw.
Methods
Two independent methods, the adjusted drainage-area ratio method and the water-budget method, were used to estimate historical natural flow at the Rest Lake Dam. Both methods used the two years of measured total flow into the Manitowish Chain of Lakes to calibrate equations or parameters specific to each method. Then, daily natural flows at the Rest Lake Dam were computed using historical flow data from nearby streams for the adjusted drainage-area ratio method, and historical dam outflow data from the dam operator for the water-budget method. Finally, flow-duration tables were generated from the computed daily natural flows at the Rest Lake Dam.

4 Estimation of Natural Historical Flows for the Manitowish River near Manitowish Waters, Wisconsin
Base map compiled and modified from digital data sources: U.S. Geological Survey, 1:24,000
EXPLANATION
Cranberry bogs
D Lakes and ponds • Streamflow-gaging
stations upstream of the Manitowish Chain of La kes
Cl 8 Lake stage gaging station Manitowish Chain of Lakes at the Rest Lake Dam and
~ Streamflow direction
State Highway 51
County and town roads
Rivers
streamflow-gaging station at State Highway 51, downstream of the Manitowish Chain of Lakes
EB Streamflow-gaging stations used as part of the adjusted drainage-area ratio method
I I I I
4 MILES I
4 KILOMETERS
Figure 1. The Manitowish Chain of Lakes study area in north central Wisconsin and streamflow-gaging stations used during this study.

The first step for both methods was to compute the total natural flow into the Manitowish Chain of Lakes, as measured at the four upstream gages on the major tributaries to the Chain ofLakes during the 2-year study (fig. 1). Given the relatively small flows in Papoose Creek (05357299) compared with the Manitowish River (05357157), Trout River (05357259), and Rice Creek (05357182), Papoose Creek was not continuously gaged. Instead, flow in Papoose Creek was measured 20 times during the study, and daily flows were estimated from daily flows measured in Rice Creek, using a regression relation developed between Papoose Creek and Rice Creek (fig. 2). In addition, measured daily flows for the Trout River near Boulder Junction (05357259) were adjusted to represent natural flow by removing the effects of diversions by cranbeny bog operations (fig. 3). This was done because of the interest in natural flows and was accomplished by identifying rapid changes in flows caused by pump activation, which were visible in unpublished gaging station data recorded at 15-minute intervals. Natural flows during times of these surface-water diversions were estimated by interpolating between prior and subsequent daily mean flows that appeared to be
-e c 0 (.J
C1l II) .... C1l c. ~ C1l -(.J
:0 ::l (.J
·= ..,z C1l C1l u C1l II)
0 0 c. <tl a..
·= :s: 0
:;>:: E <tl C1l .... t) -c ~
"' II)
<tl C1l
~
EXPLANATION
30 ~ Regression line
+ Measured streamflow
25
20
15
10
5 • • ••
0 0 5 10 15 20
Methods 5
unaffected by the diversions. Except for an unknown amount of water loss due to evaporation from diverted water stored in holding ponds and transpiration of diverted water used for irrigation, the remainder of the diverted water at the Trout River gage (05357259) is expected to return to the Chain of Lakes as groundwater discharge to the Chain of Lakes, and is incorporated into estimated flows at the Rest Lake Dam as described below in "adjusted drainage-area ratio method."
Total measured flow into the Manitowish Chain of Lakes (G Q cd) was computed on a daily basis by summing daily age measur
values of adjusted natural flow at the Trout River at Boulder Junction (05357259), measured flow at Manitowish River near County Highway H near Boulder Junction (05357157), measured flow at Rice Creek at County Highway K near Boulder Junction (05357182), and estimated flow at Papoose Creek at County Highway K near Manitowish Waters (05357299). Total measured flow into the Manitowish Chain of Lakes was then used to develop a relation with nearby long-tenn gaging stations (the adjusted drainage-area ratio method) and to calibrate a water-budget model that used long-term dam operation records.
•
•
• • •
25
•
30
• y=2.171 e 0.0573x
R2=0.75
•
35
• •
40
•
45
Measured streamflow in Rice Creek, in cubic feet per second
Figure 2. Measured flows at Rice Creek at County Highway K near Boulder Junction (station 05357182) and Papoose Creek at County Highway K near Manitowish Waters (station 05357299) during the 2-year study period.

6 Estimation of Natural Historical Flows for the Manitowish River near Manitowish Waters, Wisconsin
140
EXPLANATION "C 120 - Estimated natural streamflow "" 0 Measured daily streamflow u Ql
100 "' .... Ql a .....
80 Ql Ql .... u
:.0 60 ~ u c
::::· 40 0
::;::: E "' 20 ~ ~· ...,
Cl)
0
Date
Figure 3. Estimated flow without the effects of upstream diversions and measured flow for the Trout River near Boulder Junction (station 05357259). Negative flows were measured when lake water flowed into the stream channel.
Lake stage and dam outflow reported by the dam operator were used in both the adjusted drainage-area ratio method and the water-budget method. A few adjustments were needed to make the lake stage and flow data reported by the dam operator more useful for this study. First, flows for periods with missing data or very questionable data (for example, large changes in lake stage without a corresponding change in dam outflow) were estimated, typically by linear interpolation between the preceding and subsequent values. Second, flows reported by the dam operator were known to differ from flows measured by the WDNR and USGS between July 2002 and November 2011 at the downstream gage at State Highway 51 (05357302); therefore, the results of a regression equa-tion were used to adjust reported historical dam outflow data from 1973 to April28, 2009, to flows measured by the WDNR from July 2002 to April 28, 2009 (fig. 4A). A second equation was applied to the reported dam outflow data from April 29, 2009, to November 30, 2011, using daily gaging station data from December 1, 2009, to November 30, 2011 (fig. 4B). Two separate equations were needed because dam improvements performed on April29, 2009 (Dean Steines, written commun., May 26, 2009) changed the relation between estimated flows provided by the dam operator and flows measured by the WDNR and USGS (fig. 4).
Adjusted Drainage-Area Ratio Method
The adjusted drainage-area ratio method involved two steps to estimate natural historical flow at the Rest Lake Dam. The first step was to estimate total flow into the Manitowish Chain of Lakes from nearby long-term streamflow-gaging stations. The second step was to adjust this computed flow into the Chain of Lakes into natural flow at the downstream Rest Lake Dam.
Estimating total flow into the Manitowish Chain of Lakes was accomplished by relating measured flow divided by watershed area (water yield) at the up-stream gages for the monitoring period (December 2009 to December 2011) and total water yield for two nearby long-term gaging stations, the Bear River near Manitowish Waters (05357335) and Trout River at Trout Lake near Boulder Junction (05357245). Two different rivers were used instead of one river to better describe the overall patterns in runoff throughout the area. Yields were used for the regression equation rather than flows to ensure that differences in stream size were minimized so that both the Bear River and Trout River gages had equal influence on the relation with measured flow at the gages
(GageQ measured ).

400
"C <:: 350 0 tJ Q)
"' .... Q) 300 a. -Q) Q) -tJ 250 :.c :::1 tJ
<:: 200
~-0
:;:= E 150 "' e ..... "' "C 100 Q) .... :::>
"' "" Q)
2 50
0
600
"C <:: 0 tJ 500 Q)
"' .... Q) a. +-' Q) Q) 400 ..... tJ
:.0 ::1 tJ
-= 300 ~-
.E! E "' e 200 ..... Cl)
"C Q) .... :::J
"' "' 100 Q)
2
0
A
• • • • v= 1.0158x + 24.773 •
R2=0.87 • •
• •
• • ••• • • EXPLANATION • •
*• * •• ~ Regression line • t • Measured streamflow
• 0 50 100 150 200 250 300 350 400
Dam operator reported streamflow, in cubic feet per second
8
••• • • • • • • • y=0.9656x + 19.444
R2=0.97 •
•
EXPLANATION
~ Regression line
• Measured streamflow
0- 100 500 600
Dam operator reported streamflow, in cubic feet per second
Figure 4. Flows measured by the Wisconsin Department of Natural Resources and U.S. Geological Survey at the Manitowish River at State Highway 51 (station 05357302) and dam outflows at the Rest Lake Dam outlet reported by the dam operator. A, July 2002 to April28, 2009. 8, Dec. 1, 2009, to Nov. 30, 2011.
Methods 7

8 Estimation of Natural Historical Flows for the Manitowish River near Manitowish Waters, Wisconsin
One of two Line of Organic Correlation equations ( equations 1 and 2) were used to compute yield at the upstream gages, dependent upon on the measured lake stage:
Line of Organic Correlation equations (Helsel and Hirsch, 2002, p. 276-278) were used for the regression instead of more common regression methods, such as Ordinary Least Squares, to better maintain the distributional properties (standard deviation or percentiles) of the estimated yield for the
upstream gaging stations <cagc~ow_stage and Gageyhigh_stage ). That
where
Gage~ow_srage = 0 .3676(YBenr + YTrour ) + 0.2809 (1)
Gage~tigh_sroge = 0.3789(YBenr+ YTr01,) + 0.1662 (2)
YBear and Y :n-o, are the daily yields for the Bear River near Manitowish Waters (05357335) and the Trout River at Trout Lake near Boulder Junction (05357245), respectively, and
is, Ordinary Least Squares techniques, which are the default method for many common spreadsheet programs, slightly reduce the statistical variance (square of the standard deviation) of computed values, and therefore, their use would have slightly underestimated the predicted peak yields and overestimated the predicted minimum yields.
Two regression equations were used to compute yield at the upstream gaging stations because flow into the Chain of Lakes differs based upon the lake stage in the Chain (fig. 5).
Goge y/ow_stngc and Gage~•igh_stnge are the total COmputed yield
.,-Ql
-""
"' -' -0 <:: ·n;
.J: u .J:
"' ·;: "' .'!:: <:: ., :::::~ Ql .E £i ~ 0 ., E ::J
C"
"' "' ~ i;; "' c. c.., ::J <::
"' 0 c: <.> 0 .,
·..::: en "' ~ ~ Ql
"' c. "'-.~ Ql O>Ol .,-e><> ;;::g 0 <.>
;;::: <:: E ·-"' ., t; ~
.E "0 Qj ·;;:. ~
2l "' s: ] 0 1-
for all of the upstream gages at low and high lake stages, respectively .
2.0
y=0.3789x + 0.1662 R2=0.94
1.5
y=0.3676xt 0.2809 R2=0.96
1.0
0.5
0.0 0.0 1.0 2.0 3.0 4.0 5.0 6.0 7.0
Total water yield for the Bear and Trout Rivers, in cubic feet per second per square mile
Figure 5. Regression relation for total water yield for gaging stations upstream of the Manitowish Chain of Lakes and the total water yield for the Bear River near Manitowish Waters (station 05357335) plus the Trout River at Trout Lake near Boulder Junction (station 05357245). Both equations shown in the graph used data for which the combined yield for the Bear and Trout Rivers was more than 3.5 cubic feet per second per square mile.
EXPLANATION
- Regression line for yields at falling and low lake stage
- Regression line for yields at rising and high lake stage
• Water yield during falling and low lake stage
• Water yield during rising and high lake stage
0 Water yield used with both regressions

When the lake stage is high or rising, some flow is stored in the channels upstream of the gages, resulting in less actual flow at the upstream gaging stations. It is impmiant to note that acoustic velocity meters, which account for such "backwater" effects as part of the flow measurement, were used at the affected gages. Relatively low flows during high or rising lake stage suggest that this lake stage-dependent relation is associated with physical processes such as reduced groundwater discharge upstream of the gages and storage within the channels, and not measurement error or bias. To account for this lake stage-dependent relation with flow, equation I ( Y ) was used for estimating historical yield into the Goge lmv _stage
Chain of Lakes when the lake stage was below I,598 ft (5.1-ft gage height) or when the stage was falling between 1,600.5 ft (7.6-ft gage height) and 1,598 ft. Equation 2 (Gage~Jigh_stag.) was used for estimating historical yield into the Chain of Lakes when the lake stage was above 1,600.5 ft or rising between 1,598 and 1,600.5 ft . The 1,598 ft and 1,600.5 ft levels were used to transition between equations 1 and 2 because analyses demonstrated that when the lake stage is between these elevations, flows into the Chain of Lakes differ depending upon whether the lake stage is rising or falling. Flows into the Chain of Lakes are not affected by rising or falling lake stages when lake stages are below 1,598 ft or above I,600.5 ft. A 5-day moving average of Jake stage was used to select between equations I and 2 in order to dampen changes in lake stage that were reported only to the nearest inch by the dam operator. The 5-day moving average minimized short-term fluctuations in lake stage and yet captured the general trend. The effect of high or low lake stages on measured flow into the Chain of Lakes is small for very large flows . Thus, both regression equations used data for which the combined yield for the Bear and Trout Rivers was more than 3.5 cubic feet per second per square mile [(fP/s)/mF] (fig. 5).
Finally, computed yield into the Chain of Lakes was multiplied by the watershed area upstream of the gages (185 .6 mi2
) to compute the total daily flow into the Chain of Lakes ( 0 . ), following equation 3: ·
. Gage--m
is the total daily flow into the Manitowish Chain of Lakes at the upstream gaging stations,
is the computed daily yield at the upstream gages and represents either GagcY,ow_stagc
or Y. from equations I or 2, as
(3)
Gage /ugh stage
determinea from the daily measured lake stage, and
Methods 9
is the total watershed area that contributes to the upstream gaging stations (185.6 mF, or 5, 174,23I,OOO square feet (fl?)).
Equations I, 2, and 3 were calibrated with measured flows from Dec. 2009 to Nov. 20 II, and then applied to all historical flow data for the Bear and Trout Rivers to estimate historical natural flow into the Chain ofLakes from Dec. I99I to Nov. 20 II (the period of record for the Bear and Trout River gages).
The second step of the adjusted drainage-area ratio method was to use estimated natural flows upstream of the Chain of Lakes (GageQin) to compute natural flow at the d~wnstream dan1 ( Q ). The simplest application of the dramage-
nam nat • area ratio method is to use a single coefficient that IS equal to the area upstream of the dam divided by the monitored area ( A or the area upstream of the tributary gages, fig. I) to
Gage ' adjust upstream flows ( Ga
8,Q1.) to downstream flows at the
dam ( Q ). Such a constant coefficient approach assumes Dam nal •
that the hydrologic contributions (precipitatiOn, evapora-tion, groundwater, and runoff) associated with the additional watershed area are sin1ilar to those in the monitored area and are constant through time. In the adjusted drainage-area ratio method used in this study, however, the total natural flows at the gages ( Q ) were multiplied by a coefficient that dif-Gage m
fered for each month (table 2). Values for the monthly coef-ficients were computed using equation 4:
where
!lS
(4)
is the coefficient for a particular month of the year (i),
is the monthly average measured flow at State Highway 51 (05357302) over the 2-year study period and represents dam outflow,
is the monthly average computed flow into the Chain of Lakes at the upstream gaging stations over the 2-year study period, as computed from equation 3, and
is the monthly average change in water stored in the Chain of Lakes due to lake stage changes measured at station 460819089530500 over the 2-year study period.

10 Estimation of Natural Historical Flows for the Manitowish River near Manitowish Waters, Wisconsin
Table 2. Monthly coefficients (Kvalues) that were multiplied by total daily flow into the Chain of Lakes (6,g_D;) to compute daily values
of natural flow at the Rest Lake Dam (0.ma •• ,) for the adjusted drainage-area ratio method.
Month Jan. Feb. Mar. Apr. May
Coefficient 1.15 5 1.068 1.237 1.328 1.081 (K,)
This approach ensured that the monthly coefficients (K) were computed such that the product of each coefficient (K) and the monthly average computed flow into the Chain of Lakes (Ga•eQ111 ) minus the monthly average change in storage (~S) equaled the monthly average measured flows at State Highway 51 (DamQaut) for each month during the 2-year study period. That is, the approach ensured proper water balance on a monthly basis. Monthly coefficients were used, rather than a single constant coefficient, because monthly coefficients account for seasonal differences in precipitation, evaporation, runoff, and groundwater discharge to the Manitowish Chain of Lakes between the upstream gages <cageQ111 ) and the dam (DamQna,). Finally, the monthly coefficients were used to compute natural flow at the dant (DamQ,10,) according to equation 5:
where K
I
Q =K * Q Dam nnt I Gage in (5)
is the coefficient for a particular month of the year (i),
is the historical daily natural flow at the Rest Lake Dam, and
is the historical daily computed flow into the Chain of Lakes at the upstream gaging stations, as computed from equation 3.
Differences among the monthly K values are attributed to changes in precipitation, evaporation, near-shore runoff, and groundwater discharge over the calibration period of Dec. 2009 to Nov. 2011. All monthly values are greater than 1, indicating an increase in flow from the upstream gages to the downstream dam during ail months. Much of this annual increase between the upstream gages and downstream dam is expected to derive from groundwater discharge into the Chain of Lakes, particularly during the winter when precipitation, runoff, and evaporation are expected to be near zero. The K values increase during spring, likely reflecting increased precipitation, near-shore runoff and groundwater discharge due to spring recharge. The K value decreases in May, likely due to a rising lake stage relative to groundwater levels, which would reduce groundwater discharge into the Chain of Lakes, as well as due to an increased rate of evaporation. The K values gradually increase through summer, possibly indicating a gradual establishment of equilibrium between the lake stage and groundwater levels. The K values increase again in late fall, likely due to increased groundwater discharge due to lowering of the lake stage, as well as decreased evaporation. The K values steadily decrease again during the winter,
June July Aug. Sep. Oct. Nov. Dec.
1.113 1.130 1.185 1.276 1.289 1.420 1.356
likely as the lake stage and groundwater levels equilibrate and groundwater discharge becomes the primary source of water entering the Chain of Lakes between the upstream gages and the downstream dam.
As described earlier, natural flows in the Trout River were adjusted to account for diversion of water by cranberry operations near the Trout River near Boulder Junction gag-ing station (05357259), as shown in figure 3. Except for an unknown amount of water loss due to evaporation of diverted water stored in holding ponds and transpiration of diverted water used for irrigation, the remainder of the diverted water at the Trout River near Boulder Junction gage (05357259) is expected to return as groundwater discharge into the Chain of Lakes. This returned diversion water is accounted for by the monthly coefficients (K), in that the coefficient values were computed such that the total water into and out of the Chain of Lakes, as computed at the Rest Lake Dam, was balanced on a monthly basis. In other words, while the monthly coefficient (K) values do not identifY the individual sources of water entering the Chain of Lakes between the upstream gaging stations and the downstream dam, the coefficients do account for the total amount of water entering the Chain of Lakes between the gaging stations and the dam. That is, returned diversion water is incorporated into the monthly coefficients. Moreover, because no known cranberry operations exist in the Bear River (05357335) and the upstream Trout River at Trout Lake (05357245) watersheds, the adjusted drainage-area ratio method eliminates effects of diversions within the Chain of Lakes watershed on computed natural flow at the Rest Lake Dant (0 amQnnt). Nonetheless, possible diversions elsewhere in the system, such as near Alder Lake (fig. I), were not considered during this analysis due to a lack of data.
Water-Budget Method
The water-budget method also used two steps to estimate natural historical flow at the Rest Lake Dam. The first step was to calibrate the number of days (N-days) over which to average input data (lake stage, dam outflow, precipitation, and evaporation) and estimate groundwater discharge parameters by comparing computed flows with measured flows at the upstream gages for the 2-year study period. The second step was to average all historical lake stage and dam outflow data provided by the dam operator over the calibrated number of days (N-days) to compute historical natural flow at the downstream Rest Lake Dam.

The water budget for the Manitowish Chain of Lakes is described by equation 6:
where D.S
p
E GW
111
is change in storage of the Manitowish Chain of Lakes and is equal to the sum of water entering the Chain of Lakes minus the sum of water leaving the Chain of Lakes,
is precipitation on the lake surface, is evaporation from the lake surface, is the net groundwater discharge into the
Chain of Lakes, is the natural flow into the Chain of Lakes at
the upstream gaging stations, and is the dam outflow.
Realizing that the change in storage (D.S) accounts for all flows into and out of the Chain of Lakes, natural flow at the dam can be computed directly from lake stage and dam outflow data provided by the dam operator using equation 7:
where D.S
(7)
is change in storage of the Manitowish Chain of Lakes and is positive when flows entering the Chain of Lakes exceed flows leaving the Chain of Lakes (the lake stage rises); and is negative when flows leaving the Chain of Lakes exceed flows entering the Chain ofLakes (the lake stage falls),
is the dam outflow, and is natural flow at the Rest Lake Dam.
In comparing equations 6 and 7, it is apparent that natural flow at the Rest Lake Dan1 (Da
111Q,"',) represents all of the
natural sources and sinks of water (precipitation, evaporation, groundwater discharge, and flow at the upstream gages) to the Chain of Lakes. However, directly solving equation 7 with daily lake stage and dam outflow data results in spurious oscillations (unrealistically high and low flows) of the computed natural flow at the dam. That is, because of the large volume of the Chain of Lakes, small changes in lake stage represent a large amount of water added or removed from storage. For example, a l-inch decrease in lake stage releases 14,800,000 cubic feet (ft3) of water, or 171 ft3/s, out of the Chain of Lakes, which is substantial given that the average daily flow out of the Chain of Lakes during the 2-year study period was 165 ft3/s. To reduce the magnitude of computed oscillations, or "flashiness," daily lake stage and dam outflow data can be averaged over many days; however, the most appropriate number of days for averaging is not known in advance. Averaging too many days would eliminate natural
Methods 11
fluctuations, while averaging too few days would not adequately reduce spurious oscillations. For example, use of daily data (1-day averaging) does not reduce spurious oscillations, whereas averaging over 365 days eliminates natural seasonal fluctuations .
Instead of solving equation 7 directly, the water budget for the Chain ofLakes (equation 6) was rewritten into a computer model (see appendix) to solve for flow at the upstream gages (GageQin) to facilitate comparison with measured flow at the upstream gaging stations ( GageQmeasured), as shown in equation 8:
Q = -P + E- GW + 0 + D.S (8) Gage m m Dam---out
where the variables are the same as those defined for equation 6. Solving for flow at the upstream gages (GageQi,,) was necessary to "tune" or calibrate properties of the model (primarily the number of days over which lake stage, dam outflow, precipitation, and evaporation were averaged or smoothed) by comparing the computed flow at the upstream gages (GageQi) with measured flow ( Go Q d) from the 2-year study period. ge measure
Equation 8 was solved with the computer model using the adjusted lake stage and dam outflow reported by the dam operator, precipitation data from the nearby National Weather Service station at Rest Lake (Coop ID 477092), and biweekly evaporation rates averaged over a decade for nearby (6 mi southeast) Sparkling Lake (Lenters and others, 2005).
The model, as represented by equation 8, was calibrated with the automated calibration program, PEST (Doherty, 2011), by matching simulated flow-duration statistics with measured flow-duration statistics at the upstream gaging stations (0 0 d) for the 2-year study period (table 3). oqe-mearure Flow-duration statistics describe the percentage of time that a particular flow is equaled or exceeded (see Natural Historical Flow Durations, below, for additional descriptions), A detailed description of model parameter estimation and calibration is beyond the scope of this report; Aster and others (2005), Doherty and Hunt (2010), and Hill (1998) provide detailed descriptions of model calibration methods. More generally, calibration of the model results (simulated values) to match flow-duration statistics for measured flows (target values) was perfonned by adjusting the number of days (N-days) over which lake stage, dam outflow, precipitation, and evapora-tion were averaged (centered on the date being computed), in addition to estimating four groundwater discharge parameters. N-days was the primaty mechanism for matching the range in magnitude (minimum and maximutn flows) of simulated flows to the range in magnitude of measured flows from the 2-year study period. Inherently, the calibrated value for N-days incorporates some of the limitations of the method as well as the precision ofthe input data. Groundwater discharge to the Chain of Lakes was unknown and therefore estimated through the calibration process.

12 Estimation of Natural Historical Flows for the Manitowish River near Manitowish Waters, Wisconsin
Table 3. Target flow-duration statistic s for the upstream gaging stations (6,9•Qmeasuredl for the 2-year study
period, simulated equivalent values, residuals, and associated target weights from the water-budget model.
[ft' /s, cubic foot per second; sqrt, square root; FD, flow duration, is followed by a number indicating the percentage of time that the target value is equaled or exceeded]
Target value Simulated value Residual Weight (unitlessl Target description (ftl/sl (ftl/sl
Minimum flow 66.6 52.5
FD98 71.0 65.9
FD95 74.1 69.1
FD90 81.3 72.9
FD80 91.7 76.6
FD70 96.9 102.1
FD60 109 117
FD50 134 138
FD40 148 147
FD30 162 158
FD20 174 180
FDIO 195 213
FD5 219 232
FD2 234 243
Maximum flow 306 259
Groundwater discharge into the Chain of Lakes was expected to exceed the Joss of lake water into the groundwater system, because the region has high groundwater recharge (Gebert and others, 2009) and the K values for the Adjusted Drainage-Area Ratio method (table 2), particularly those during the winter, were all greater than 1, indicating a net gain of water from upstream to downstream that likely included a high percentage of groundwater discharge. Groundwater discharge was assumed to increase from relatively low to relatively high amounts across four conditions represented by (1) rising lake stage, (2) high lake stage, (3) low lake stage, and (4) falling lake stage. This pattern of groundwater discharge is conceptualized as being driven by relative changes in the hydraulic gradient between groundwater and the Chain of Lakes caused by operational changes in the lake stage. That is, relatively rapid increases in lake stage are expected to decrease the hydraulic gradient between groundwater and the Chain of Lakes, during which time groundwater discharge into the Chain of Lakes is at a minimum. Conversely, relatively rapid lowering oflake stage would increase the hydraulic gradient between groundwater and the Chain of Lakes, thus maximizing groundwater discharge. Periods of stable lake stage are expected to exhibit transitional hydraulic gradients, during which time inteimediate rates of groundwater discharge are expected.
Groundwater discharge into the Chain of Lakes was estimated as a residual term during the calibration process, and
(target- simulated, ftl/sl 1/sqrt (target value I 14.1 0.1225
5.1 .1187
5.0 .1162
8.4 .1109
15.1 .1044
-5.2 .1016
-8 .0957
-4 .0864
.0821
4 .0786
-6 .0758
-18 .0716
- 13 .0676
-9 .0654
47 .0572
was simulated using four adjustable parameters (table 4) based upon the measured lake stage: (1) GW _rising_lake_stage, (2) GW _high _stage _ratio, (3) GW _low _stage _ratio, and ( 4) GW _dropping_ stage _ratio. The parameter representing the period of minimum groundwater discharge, GW _rising_lake_stage, was estimated directly during calibration. The remaining parameters were computed as ratios tied to GW _rising_lake_stage and then summed in sequence to ensure that total groundwater discharge into the Chain of Lakes increased incrementally from periods of rising lake stage to periods of high lake stage, to periods of low Jake stage, and finally to periods of dropping lake stage (table 4). A minimum value was specified for each ratio as part of the calibration process to ensure that total groundwater discharge increased in the specified sequence. Although the calibrated values are reasonable based on prior groundwater studies in the area (Pint, 2002; Hunt and others, 2005; Hunt and others, 2008; Walker and others, 20 12), this relationship was not tested in a physical framework such as by an evaluation of field measurements or a model incorporating known governing laws for the physics of groundwater movement; thus, the groundwater discharge estimates should not be used beyond their application in this report. In addition, the groundwater parameters inherently account for any diverted water by cranberry operations that seeps into the ground and returns to the Chain of Lakes.

Methods 13
Table 4. Parameter names and descriptions, and calibrated values for the water-budget method.
[ft3/s, cubic foot per second;>, greater than; ft, foot; <=, less than or equal to]
Parameter name Parameter description Calibrated value
N-days Nwnber of days over which reported lake stage, dam outflow, precipitation, and evaporation were averaged
23 days
GW _rising_lake_stage Simulated net groundwater discharge to the Manitowish Chain of Lakes (between the upstream gages and the darn) when the lake stage was rising
24.7 ft3/s
G W _high_ stage _ratio A ratio multiplied by GW _rising_ lake _stage to simulate net groundwater discharge to the Chain of Lakes when the lake stage is high(> 1,599.5 ft)
1.0, translates to 24.7 ft3/s
at high stage
GW _low_stage_ratio A ratio multiplied by GW _rising_lake_stage and added to the discharge rep- 0.015, resented by GW _high_ stage _ratio (24.7 ft3/s) to simulate net groundwater discharge to the Chain of Lakes when the lake stage is low(<= 1,599.5 ft)
translates to 25.1 ft3/s at low stage
GW _dropping_stage_ratio A ratio multiplied by GW _rising_lake_stage and added to the discharge 0.62, represented by GW _low_stage_ratio (25.1 ft3/s) to simulate net groundwater discharge to the Chain of Lakes wheu the lake stage is dropping
trauslates to 40.4 fP/s during dropping stage
Foil owing estimation of values for theN-days and groundwater discharge parameters through calibration of the water-budget model (equation 8) using measured flow into the Chain of Lakes <aageQ"'""'""), equation 9 was used to compute
natural flow at the Rest Lake Dam <namQ,.,):
where
£law-stage
0 =P -E + GW + 0 (9) Dam--n(lf low-stage low-stage in Gage-in
is natural flow computed at the Rest Lake Dam,
is the volume of water that falls as precipitation onto the surface area of the lake at low stage (1,598 ft),
is the volume of water that evaporates from the surface area of the lake at low stage (1,598 ft),
is the estimated groundwater discharge into the Chain of Lakes, as represented by one of the four calibrated groundwater discharge values tied to the measured lake stage, and
is the computed natural flow into the Chain of Lakes at the upstream gaging stations, as estimated from equation 8.
Precipitation and evaporation were computed using the low lake-stage area because large operational increases in lake stage would not occur under natural flow conditions. Natural fluctuations of lake stage are not known and were not estimated.
Although the first step of the water-budget method (the calibration step) was limited to the 2-years for which flows at the upstream gages were measured (2009-11), the second step used all available historical lake stage and dam outflow data provided by the dam operator to compute natural flows at the
Rest Lake Dam. The procedure for computing daily natural historical flow at the dam <oamQno,) consisted of first solving for flow into the Chain of Lakes (GaaeQ1.) with equation 8 by averaging daily precipitation, evaporation, and the adjusted outflow and lake stage data provided by the dam operator over N-days (23 days). Then, the result of eq1,1ation 8 <aageQ
1,) was
combined with the appropriate stage-dependent groundwa-ter discharge parameter value (table 4) and N-day averaged precipitation and evaporation amounts computed with the low lake stage area to solve equation 9. This procedure, as implemented in the computer code provided in the appendix, was performed for each day that adjusted dam outflow and lake stage data were provided by the dam operator (Dec. 1973-Nov. 2011).
Some components of the water budget calculation (precipitation, evaporation, and groundwater) are of limited significance to the final calculation (DamQno,). This is because precipitation, evaporation, and groundwater were primarily used as a means to determine the number of days (N-days) over which to average input data provided by the dam operator, which acts as the primary mechanism for matching the range in computed and measured flows at the upstream gages. That is, although daily values of precipitation, evaporation, and groundwater discharge are important for computing natural flow at the upstream gages <aageQ1,) using equation 8, these components of the water budget are of the opposite sign in equation 9, and therefore are largely removed ("cancelled out") during the process of computing natural flow at the dam <namQ,.,). The only difference in the daily volume of precipitation and evaporation used in equations 8 and 9 is the difference in the lake surface area over which precipitation and evaporation occurs on the lake. The daily groundwater discharge values applied in equations 8 and 9 are identi-cal, thus effectively eliminating the calibrated groundwater

14 Estimation of Natural Historical Flows for the Manitowish River near Manitowish Waters, Wisconsin
parameter values from direct computation of natural flow at the dam (na
111Q,
101). In other words, only the low-stage lake area
used to compute precipitation and evaporation volumes and the number of days (23) used to average the input data directly affect the conversion of lake stage and dam outflow data provided by the dam operator into computed natural flow at the dam <namQ,za,).
Natural Flows at the Rest Lake Dam
Comparison of the measured (c Q d) and computed age measure
flow at the gages (GogeQin) for the 2-year study period helps in evaluating the relative accuracy of the adjusted drainagearea ratio method and the water-budget method (figs. 6 and 7). Both methods generally described the pattern and timing of high-flow and low-flow events at the upstream gages. The adjusted drainage-area ratio method, however, generally had smaller residual errors over the full range of observed flows and had smaller monthly biases than the water-budget method. Although a close fit with the measured flows at the upstrean1
gages is important, the focus of the study is to estimate natural flow at the dam <nrunQna,). Both methods produce similar total annual flows at the dam (table 5). Unfortunately, neither method can be directly evaluated against daily dam outflows, because dam operation alters the natural flow pattern.
Results from the two methods can be used to aid in understanding how current dam operations affect water levels in the Chain of Lakes and flows downstream of the dam. The median flow computed for each day of the year using all years with available data is shown for each method in figure 8. Alteration of dam outflows caused by storing water in the Chain of Lakes during spring and releasing water from the Chain of Lakes in fall is readily apparent, with reported dam outflows lowest in spring and highest in fall. The computed natural flow hydro graphs for both methods have peak flows in spring, minimal flows in late summer or early fall, and a gradual increase in flows during fall. Natural and observed flows for particular years vary and may not match this pattern exactly, but these typical patterns are useful for understanding the relationship between capturing and releasing water for storage in the Chain of Lakes and downstream flows.
Table 5. Annual total measured dam outflow, total computed natural flow, and difference between measured dam outflows and computed natural flows from the water-budget and adjusted drainage-area ratio methods at the Rest Lake Dam.
(ft', cubic foot]
Difference between Total computed Difference between measured dam
natural flow measured dam outflow and Total computed at the dam from outflow and computed natural
natural flow the adjusted computed flow from the Total measured at the dam from the drainage-area natural flow from the adjusted drainage-
dam outflow water-budget method ratio method water-budget method area ratio method Time period (ft3) (ftl) (ft3) (percent) (percent)
Dec. 2009-Nov. 2010 5,063,000,000 4,937,000,000 5,132,000,000 2.5 -1.3
Dec. 2010- Nov. 2011 5,324,000,000 5,450,000,000 5,275,000,000 -2.4 .9
Dec. 2009-Nov. 2011 10,387,000,000 10,387,000,000 10,407,000,000 .0 -.2

-c c: 0 0
"' .. Q; c. -"' ~ 0
:.0 :::J 0
.!: ~ 0
'g ., e
ci)
Natural Flows at the Rest Lake Dam 15
100
50
0 .____. _ _._ _ __,__...____,'----'---'----'--...__---''----'-......L.-....I.....--'----''----'---'----'--...__---''----'---'---'----' 1,590
~ ~ ~ ~ ~ ~ ~ ~ ~ ~ ~ ~ ~ ~ ~ ~ ~ ~ ~ ~ ~ ~ ~ ~ ~ ~ ~ ~ ~ ~ ~ ~ ~ ~ ~ ~ ~ ~ ~ ~ ~ ~ ~ ~
~ ~ ~ ~ ~ ~ ~ ~ ~ ~ ~ ~ ~ ~ ~ ~ ~ ~ ~ ~ ~ ~ Date
EXPLANATION
Measured total streamflow into the Manitowish Chain of lakes
Adjusted drainage-area ratio method computed streamflow into the Manitowish Chain of lakes
Water-budget method computed streamflow into the Manitowish Chain of lakes
U.S. Geological Survey measured la ke stage
Figure 6. Measured total flow at gaging stations upstream ofthe Manitowish Chain of Lakes and computed flow into the Chain of Lakes using the adjusted drainage-area ratio and water-budget methods.
co co en -0
E a ., Cl o; u •t: ~ c: ., u ·c Q)
E < "€ 0
2 Q)
> 0
..c ., -Q)
~
·= .,; C>
!9 en

16 Estimation of Natural Historical Flows for the Manitowish River near Manitowish Waters, Wisconsin
., c:., ., c: -co Q) u .... Q) ::I Cl) CL~ E ., a c. u .... Q) Q) c:n~ ~ .~ Ol..C >::I
"' u 2:-c ..c: ·-.... -c: Cl) 0 ;s: E.E! -="E Q) "'
~~ Q) Cl)
..C-o Q) Q) u ~ c ::I Q) Cl) ~ ., Q) Q)
:t:: E i5
Date
EXPLANATION
- Difference between monthly average water-budget method computed streamflow and measured streamflow at the upstream gages
- Difference between adjusted drainage-area ratio method computed streamflow and measured streamflow at the upstream gages
Figure 7. Monthly error in estimated flow at the gaging stations upstream of the Manitowish Chain of Lakes for the adjusted drainage-area ratio and water-budget methods.

400
"'0 350 c: 0 0 Q)
"' ~ 300 c. ...... Q) Q) -0 250
:.0 =:1 <J
·= 200 ~ 0 :g ctl 150 ~ ~ ~ 100 c: ctl :0 Q)
:2 50
Natural Flows at the Rest Lake Dam 17
Jan. Feb. Mar. Apr. May June July Aug. Sept. Oct. Nov.
EXPLANATION
Median reported dam outflow (adjusted) 1973--2011
Median computed streamflow from the water-budget 1973-2011
Median computed streamflow from the adjusted drainage-area ratio 1991-2011
Median reported dam outflow (adjusted) 1991-2011
Median computed streamflow from the water-budget 1991-2011
Median reported lake stage (adjusted) 1973--2011
Dec.
Figure 8. Median daily flow at the Rest Lake Dam for each calendar day over the period of record available for each method. (Dashed lines represent the median values for only 1991-2011 for the waterbudget method and reported dam outflows, and are included for direct comparison with the adjusted drainage-area ratio method.)
1,600
1,596
1,594
1,592
Q)CX) >IX) 0~ .o_ ctl 0
~ E Q) =:1 -c: ctl ·- 0 .u-Clctl ctl .!::! --e "' Q) ~> ctl c:
- ctl >u == "i:: ctl Q) -cE :';;<t ~"€ :2~

18 Estimation of Natural Historical Flows for the Manitowish River near Manitowish Waters, Wisconsin
One impetus for this study was to improve understanding of natural flow at the dam during extreme conditions, which cannot be evaluated using average annual values such as those in table 5. Instead, a comparison of the computed long-term natural flow at the dam for both methods (fig. 9) allows for qualitative evaluation of historical extreme flows. Although the comparison does not allow one to evaluate which method may be more accurate, it is useful for identifYing potentially problematic anomalies associated with each method. For example, the adjusted drainage-area ratio method indicated a large runoff event during the fall of 1994. Closer evaluation of this event, which was not computed by the water-budget method, indicated that the event was associated with high flows measured in the Bear River that were not however ~1easured in the Trout River. This indicates tha; the assu~ptlon that weather patterns driving flows in the Bear, Trout, and Manitowish Rivers are the same may not hold at all times. Violation of this assumption is expected to be more important for high flows than low flows, because droughts are typically regional, whereas summer storms are often local. Conversely, several negative and near-negative natural flows at the dam were computed with the water-budget method for Oct. 1974, Aug.-Sept. 1976, Aug.-Oct. 1989, July-Sept. 2005, and July 2006. Some of the near-negative natural flows that occurred in fall (for example, Oct. 1974) may be attributed to the precision of reported dan1 outflow data and the sensitivity of the method to large releases of water from the Chain ofLakes associated with lowering lake levels. That is, imprecision in the reported data can result in reported dam outflows during periods of falling stage that were small in comparison to the estimated ~mount of water released from the Chain of Lakes, resulting m a very low computed natural flow at the darn. Some nearnegative natural flows were also computed during summer for years with below average dam outflow (for example, Aug.Sept. 1976). During such instances, both the lake stage and reported dam outflow were declining, indicating that natural flow into the Chain of Lakes was likely affected by drought conditions. In addition, it is possible that diversions associated with cranberry operations in the Chain ofLakes Watershed could contribute to the near-negative computed flows for these periods (as evident in fig. 3). Natural flows at the dan1 calculated by the adjusted drainage-area ratio method are not ~xpected to be affected by diversions from cranberry operatiOns because no such operations are known to exist upstream of the Bear or Trout River gages. However, the water-budget method lacks adequate information to systematically remove possible effects from this type of diversion. This is because daily reported dam outflows inherently incorporate reductions in daily flow into the Chain of Lakes due to diversions which, because the diversions were not measured cannot be' systematically removed. Moreover, calibrating the waterbudget method with natural flow (fig. 3) into the Chain of Lakes (G:>g.Qin) only accounts for effects of diversions in tenns of the number of days (N-days) over which daily reported dam
outflow values are averaged and in terms of the groundwater discharge parameters, which as described earlier are effectively removed from direct computation of daily, natural flow at the Rest Lake Dam (0 am Qn.J As a result, to the extent that near-negative flows computed by the water-budget method are affected by diversions, the flows should not be considered natural.
Natural Historical Flow Durations
Daily natural flows at the dan1 ( Q ) computed by • Dam IJOI
equat1on 5 for the adjusted drainage-area ratio method and by the combination of equations 8 and 9, which used 23-day averaged values for the water-budget method (fig. 9), were used to compute monthly flow-duration values for the period of available historical data. Historical data for the Bear River near Manitowish Waters (05357335) and the Trout River at Trout Lake near Boulder Junction (05357245), which were used for the adjusted drainage-area ratio method, spanned from December 1, 1991, to November 30,2011. Historical lake stage and dan1 outflow reported by the dam operator, which were used for the water-budget method, spanned from December 1, 1913, to November 30, 2011. Monthly flow-duration statistics were computed as described by Helsel and Hirsch (2002) by ranking all computed DcnnQna, values within a given month for the duration of data available from each method (fig. 10, table 6).
A single flow-duration value, in cubic feet per second, represents the flow rate that is equaled or exceeded on the associated percentage of days over the period of calculation. For example, the Flow Duration 90 (FD90), or 90-percent flow duration, is the flow rate that is equaled or exceeded on 90 percent of the days being evaluated. For this study, flowduration values were computed on a monthly basis to evaluate seasonal changes in flow. Thus, a FD90 value of 116 fe/s for January, as computed with the adjusted drainage-area ratio method (table 6), means that 90 percent of all daily flows during January over the years 1992-2011 were equal to or greater than 116 ft3/s. Flow-duration values computed in this way are useful for describing natural flow patterns estimated using historical records, because flow-duration calculations are not overly influenced by extreme values, as opposed to an average value that may be strongly influenced by a single extreme runoff event. That is, flow-duration valHes, particularly the FD50 or median, are generally resistant to outliers or infrequent events and, therefore, are well suited for evaluating a range of typical conditions. Nonetheless, flow-duration values at the high and low range (FD2, 10, or FD 90, 98, 99.6) are more susceptible to extreme flows, because by definition these flows are observed infrequently (0.4 percent of days for the FD99.6). These characteristics for flow-duration values are evident in the results shown in table 6 and figure 10.

-g 900~Dl0~1'1l~i\f\1'1M~7----;:r----r-:-r---;---g BOO Q)
~ 700 ! 600 1,602 1,600
. 1,598
lH 1,596
Q)
~ 500 '-' :g 400 '-'
.!::: ~-0
'g co Q) c550m~~~~~ -100 "" ~ 0, ~ ~ "" !<> " a, 0, ~ ~ 1,590 ~ ~ ~ ~ ~ ~ ~ ~ ~ # ~ ~ ~ ~ $ ~ ~ ~ ~ ~ ~ ~ ~ ~ ~ ~ ~ ~ ~ ~ ~ ~ ~ ~ ~ ~ ~ ~ .(\) ''\) '.V '.V ''\) .(\) '.V '.V ''\) ''\) ''\) '.V '.V ''\) .(\) '.V '.V '.V .(\)
"C 900 1,602 c 0 '-' Q) (/)
~
Q)
0.. -ID
~ '-' :.c ::l '-' .!::: ~ 0
1,600
1,598
1,596
1,594
~ 'uu ...... • • ' ' ~ ~ ' 1..:1 1 592 ID '
c55 0 r---------------------------------------------------------------------~~---+----~----------------------~ -100 . 1,590
,'\.. ,, ~OS ~
~" ,tV."
EXPLANATION
-- Natural streamflow at the Rest lake Dam (DamOna~ tomputed by the adjusted drainage-area ratio method
-- Natural streamflow at the Rest lake Dam (DamOna~ computed by the water-budget method
-- Dam operator-reported lake stage
-- Dam operator-re)!lorted outflow at the Rest lake Dam
Figure 9. Dam-aperator reported stage ar:~d dam outflow fQr the Manitowish Chain of Lakes and camputed Aatural flow at the Rest lake Darn (0.mQn•t) tram the adjusted drainage-area ratio and water-budget methods, 1973-2011 .
co co en
b Q) E > ::l o.., .c co COCJ --ID CO ID '-' ~ ·-e ·- ID ai'> c:nc co co -'-' V) 'i:: Q) ID
"7ii E -'<X:
'€ 0 z
co 00 en .... 0
a> E > ::l o.., .c co COCJ --ID CO Q) '-'
~ ·-e ·- Q)
Q)- > c:nc co co - '-' tl) 'i:: Q) ID
"7ii E -'<X:
..c t: 0 z
2 Dl c: iil ::c iii' -Q
-::::! . n !2, :!! Q
:E c c iil -c;· = Ill
-~

20 Estimation of Natural Historical Flows for the Manitowish River near Manitowish Waters, Wisconsin
60Q.---.----,---.----.---,----.----.---.----,--~,---.-----,
A: I A
A
• • I • I
I X X I
0 i 0 i !
i - -
I!.
• • • X
X
0 0
A A
• • • x x
~ 0
A A
• •
x + X
0
0
A A
• • x+
o X - o
• • •
~ X - o
• . A A A
• • • X X X
8 .:!. o 0
0 - o
-lOQL---~--~----~--~--~----~--~----~--~----~--~--~
Jan. Feb. Mar. Apr. May June July Aug. Sept. Oct. Nov. Dec.
EXPLANATION
A Adjusted drainage-area ratio method FD2
Adjusted drainage-area ratio method FOlD
Adjusted drainage-area ratio method FD3D
+ Adjusted drainage-area ratio method FD5D
x Adjusted drainage-area ratio method FD70
o Adjusted drainage-area ratio method FD9D
- Adjusted drainage-area ratio method FD99.6
A Water-budget method FD2
• Water-budget method FOlD
• Water-budget method FD30
+ Water-budget method FD5D
x Water-budget method FD70
o Water-budget method FD9D
- Water-budget method FD99.6
Figure 10. Monthly flow-duration values for computed natural flow at the Rest Lake Dam based on the adjusted drainage-area ratio method for 1991-2011 and the water-budget method for 1973-201 1.

Table 6. Monthly flow-duration values for computed natwral flow atthe Rest lake Dam based on the adjusted draina§e-area ratio am! water-budget methods.
[FD, flow duration, is followed by a number indicating the percentage of time that the computed value is equaled or exc.eeded]
Flow duration
FD2
FD5
FD10
FD20
FD30
FD40
FD50
FD60
FD70
FD80
FD90
FD95
FD98
FD99.6
FD2
FD5
FDlO
FD20
FD30
FD40
FD50
FD60
FD70
FD80
FD~O
FD~5
FD98
FD99.6
Jan.
246
236
216
180
171
164
148
139
131
125
116
110
106
102
291
287
275
223
204
195
172
163
151
147
103
85.7
78.6
78.6
Feb.
217
208
201
168
157
145
138
133
125
118
111
108
107
105
291
287
231
213
201
194
168
159
150
134
100
85.7
78.6
78.6
Mar.
330
302 265
227
194
177
170
164
154
147
132
127
122
106
302
290
259
226
215
204
195
179
164
153
132
113
85.7
78.6
April
568
496 417
330
296
261
231
216
194
179
160
125
104
97.2
495
436
394
339
312
291
267
242
221
199
175 146
102
88.8
Row-duration value (cubic feet per second)
May June July Aug.
Adjusted drainage-area ratio method
423
354
315
258
236
214
1~8
168
154
129
112
94.6
87.3
81.2
488
451
379
313
273
248
226
203
177
149
126
108
89.7
55.9
302
272
246
213
189
176
164
151
142
127
106
~4.5
87.5
83.3
Water-budget method
326
306
277
245
213
189
173
155
137
122
95.7
70.9 49.1
35.6
267
245
227
203
179
170
157
138
125
96.5
83.9
70.8
64.5
61.7
288
265
232
194
174
148
129
115
102
77.3
44.4
35.2
28.6
13.6
330
251
219
183
166
155
142
107
91.0
82.6
71.4
63.0
56.4
51.3
305
232
201
163
132
121
106
90.6
79.7
65.0
43.4
23.5 16.0
3.6
Sepl
366
225
207
178
151
133
114
92.0
81.8
72.9
64.8
60.2
57.2
51.6
419
344
289
215
184
149
118
100
78.6
61.3
44.3
29.3
Hl.5
1.0
Del
328
299 270
222
178
157
140
118
109
103
94.2
80.7
71.1
64.0
488
431
345
271 242
213
185
163
138
111
79.9 54.8
14.0
-8.3
Nov.
349
308 275
243
218
193
172
148
136
125
116
110
107
96.5
357
322
2~7
260
221
206
193
184
162
144
109
89.2
76.6
_63.3
Dec.
347
309 280
224
209
197
190
164
145
128
118
Hl8
HIS
103
291
287
277
223
208
197
181
167
156 147
101
85.7 78.6
78.6
z I» 2" iil :c (ij' 8' .. (;' I» ..., g :E CJ .:::: .. ~ c;· = Ill
N -

22 Estimation of Natural Historical Flows for the Manitowish River near Manitowish Waters, Wisconsin
Results from both methods are useful for understanding the natural flow patterns at the dam. The monthly FDSO (median) values in figure 10 have similar patterns to the median daily flows shown in figure 8, with high flows in spring and low flows in late summer. This seasonal pattern is evident in both high (FDlO) and low flows (FD90) as well. For example, the FD 10 increases from about 200-230 ftNs in February (from the adjusted drainage-area ratio and water-budget methods, respectively) to about 420-390 fP/s in April, decreases to about 220-200 fV/s in August, and ends the year at about 280 ft3/s (both methods) in December (table 6, fig. 10). Similarly, the FD90 increases from about 110-100 ftl/s in February to about 160-180 ft3/s in April, decreases to about 70-40 ft3/s in August, and ends the year at about 120- 100 fP/s in December. Similarly, the range from high to low flows widens during spring, narrows during summer, and widens again during fall.
Differences among the results of each method demonstrate the difficulty in computing natural flows from surrogate records. For example, although the median values (FDSO) from each method tend to be relatively similar, values for the less freqmmt flows (for example, the FDIO and FD90) tend to be more variable, as would be expected given the greater uncertainty associated with estimating infrequent flows, regardless of the method.
Identification of a representative natural low flow at the dam, as required by Chapter 31 of the Wisconsin State Statutes (Wisconsin Statutes and Annotations, 20 12), is subject to interpretation. What is considered a low flow by one criterion may differ from what is considered a low flow by another criterion. For example, the effect of a particular low-flow value on the health of an aquatic organism can differ from the effect of that same flow on the utility of a water resource for economic or recreational gain. In addition, the results illustrate a chall<mge with interpreting a single value of natural low flow, because natural low flow varies on a seasonal basis. That is, a natural low flow computed for September is not representative of a natural low flow in April. The lowest natural flow computed by either method is -8.3 ft3/s for the FD99.6 during October based on the water-b11dget method (table 6), and that flow is physically impossible under natural conditions. This value is undoubtedly influenced by the sensitivity of the waterbudget method to small changes in lake stage, the precision of reported lake stage and dam outflow, and upstream diversions. As stated previously, natural flows computed by the adjusted drainage-area ratio method are expected to be less susceptible to biases at low flows than those computed by the water-budget method. The lowest natural flow computed by the adjusted drainage-area ratio method is 51.3 ft3/s for the FD99.6 during August. It is important to reiterate that a FD99.6 computed on a monthly basis is not equal to the FD99.6 computed on an annual basis, which Gebert (1980) equated with the Q
7.10
in the nearby Wisconsin River Basin. The FD99.6 computed on an annual basis for natural flows estimated by the adjusted drainage-area ratio and water-budget methods are 57 ft3/s and 10 ft3/s, respectively, with the water-budget method likely biased low.
Assumptions and Limitations
The methods used to estimate the monthly flow-duration values in table 6 for natural flow at the Rest Lake Dam incorporate many assumptions and limitations. It was assumed that the relation between reported dam outflow and measured flow by WDNR staff at State Highway 51 (05357302) prior to April28, 2009 (fig. 4A), was stationary over tin1e. That is, despite knowledge that the amount of leakage between stoplogs varied depending upon the stoplog conditions (use) and configuration (orientation and shape), no data were available for time-dependent adjustments to the reported dam outflows, and, therefore, the relation in figure 4A was assumed to be appropriate for all reported data from December 1973 to April 28, 2009. A second assumption was that the relation between the yield at the upstream gaging stations and the reference gaging stations on the Bear and Trout Rivers (stations 05357335 and 05357245, respectively) was stationary over time. A third assumption was that the estimated daily amount of water diverted by cranbeny operations that subsequently returns to the Chain of Lakes through the groundwater system was accounted for on a monthly basis through the coefficients (K) used in the adjusted drainage-area ratio method. A fourth assumption was that averaging reported lake stage and dam outflow over 23 days, as estimated during calibration of the water-budget method for the 2-year study period, was appropriate for the entire period of record.
Regardless of the assumptions, application of the results should recognize several limitations. First, although computed long-tem1 median natural flows at the dam tend to be relatively similar between the two methods, extreme values (for example, the FD2, 10, 90, and 99.6) deviate substantially between methods (fig. 10 and table 6). These large differences between methods illustrate the increased uncertainty associated with estimating extreme events using secondary data rather than directly measured natural flows at the dam. This higher level of uncertainty should be considered when using the results. Additional uncertainty is also incorporated into the water-budget method in the form of the precision with which reported lake stages and dam outflows were measured or estimated. Specifically, lake stage provided by the dam operator was reported to the nearest inch and measured at approximately noon each day. As stated previously, the water-budget method is highly sensitive to small changes in lake-stage

fluctuations--even when reporting to the hundredth of an inch-and low precision in the historical stage data. Rap-idly changing stages may confound this sensitivity, although averaging stages over 23 days is expected to reduce the effects of this limited precision. Conversely, averaging over 23 days limits the precision with which the timing of extreme flows can be estimated, thus potentially affecting the month during which an estimated extreme event occurs. Similarly, reported dam outflows were estimated from lake stage and an equation for flow over a weir. The extent to which the equation is affected by the configuration of the stoplogs, as described previously, is incorporated into the accuracy of the reported dam outflows. Finally, computed near-negative flows at the dan1 from the water-budget method may incorporate biases due to the reported data as described previously, as well as upstream diversions that were not accounted for using this method.
Summary and Conclusions
The Wisconsin Department of Natural Resources is charged with oversight of how the dam at the outlet of Rest Lake in Vilas County, Wis., is operated. Chapter 31 of the Wisconsin State Statutes specifies that the minimum flow out of every dam in the State should be no less than 25 percent ofthe natural low flow (Wisconsin Statutes and Annotations, 2012). Dams alter the system from natural conditions, however, often leaving 25 percent of the natural low flow difficult to determine. As part of establishing new operating orders for the dam, the Wisconsin Department of Natural Resources partnered with the U.S. Geological Survey to improve estimates of natural flow at the dam.
Two independent methods were used to estimate historical natural flow for the Manitowish River at State Highway 51 near Manitowish Waters (station 05357302), the site of a streamflow-gaging station located approximately 1 mile downstream of the Rest Lake Dam. Because of a lack of direct flow measurements at the dam outlet, flow measured at State Highway 51 (05357302) was assumed to represent flow at the Rest Lake Dan1. The first method, the adjusted drainage-area ratio method, related flow divided by watershed area (yield) for the total measured flow into the Manitowish Chain of Lakes at the upstream gages (GageQmeasu,.) with total yield for the Bear River near Manitowish Waters (station 05357335) and the Trout River at Trout Lake near Boulder Junction (station 05357245) to develop an equation for computing historical flows into the Chain of Lakes (G Q ) using all historical
age m data for the Bear and Trout River gages (1991-2011). To convert the computed total natural flow into the Chain of
Summary and Conclusions 23
Lakes at the upstream gages <aageQ1.) into natural flow at the downstream Rest Lake Dam ( Da
111Q
11), computed daily flows at
the upstream gages (GageQ1") were multiplied by a coefficient that varied by month. The second method, the water-budget method, used a computer model to compute natural flow at the dam using lake stage and dam outflow data provided by the dam operator. The water-budget model separated the computation into two equations. The first equation computed flows into the Chain of Lakes at the upstream gaging stations <aageQ1,),
and the second equation used those upstream flows to compute natural flows at the downstream Rest Lake Dam (DamQna,). Calculation of natural flows at the dam was separated into two equations so that the most appropriate number of days (23 days) over which to average input data (lake stage, dam outflow, precipitation, and evaporation) could be dete1mined by com paling measured flows at the upstream gages (GageQmea'"" ) for the 2-year study period with computed flows <aageQ1").
Averaging input data over 23 days was the primary mechanism for adjusting the "flashiness" of the computed flows. Following calibration of the water-budget model to determine the most appropriate number of days over which to average input data, the model was applied using all historical lake stage and dam outflow data from the dam operator (1973-2011) to compute historical natural flow at the Rest Lake Dam (DamQn)·
Daily natural flows at the dam (DamQna1), computed by
the adjusted drainage-area ratio and the water-budget methods, were used to compute monthly flow-duration values for the period of historical data available for each method (Dec. 1991 to Nov. 2011 for the adjusted drainage-area ratio method and Dec. 1973 to Nov. 2011 for the water-budget method). Monthly flow durations provide a means for evaluating the frequency and range in flows for specific months over many years, including the frequency with which certain high and low flows occur.
Results from both methods are useful for understanding the natural flow patterns at the dam. The monthly natural flows for both methods had similar patterns, with high median flows in spring and low median flows in late summer. Similarly, the range from high flows to low flows increased during spring, decreased during summer, and increased again during fall. These seasonal patterns illustrate a challenge with interpreting a single value of natural low flow. Moreover, alteration of natural flows caused by storing water in the Chain of Lakes during spring and releasing water from the Chain of Lakes in fall causes a change in the timing of high and low flows compared with flows under natural conditions. That is, the lowest reported outflows occurred in spring and highest reported outflows occurred in fall.

24 Estimation of Natural Historical Flows for the Manitowish River near Manitowish Waters, Wisconsin
Both methods captured the pattern and timing of measured high-flow and low-flow events at the upstream gaging stations. The adjusted drainage-area ratio method generally had smaller residual errors than the water-budget method over the full range in observed flows and had smaller monthly biases. Unfortunately, neither method could be directly compared against daily dam outflow, because dam operations altered the natural flow patterns. Both methods produced similar total annual flows at the dam, suggesting that the computed natural flows at the dam were correct on an annual basis for both methods. Although it was not possible to definitively determine which method was more accurate at estimating all monthly natural flows, particularly at very high or very fow flows, comparisons of the results of each method indicate that the adjusted drainage-area ratio method could be more susceptible to biases at high flows because of isolated storms outside of the Manitowish River watershed. Conversely, the water-budget method may be more susceptible to biases at low flows because ofthe sensitivity of the method to the accuracy of reported lake stages and dam outflows, as well as potential upstream diversions that could only partially be accounted for with this method (the adjusted drainage-area ratio method should not be affected by diversions by cranberry operations, because no such operations are known to be present in the Bear and Trout River watersheds that were used as part of this method).
References Cited
Aster, R.C., Borchers, B., and Thurber, C.H., 2005, Parameter estimation and inverse problems: Elsevier Academic Press, 301 p.
Doherty, J., 2011, PEST: Model-independent parameter estimation user manual (5th ed.), and addendum: Brisbane, Queensland, Australia, Watennark Numerical Computing.
Doherty, J.E., and Hunt, R.J., 2010, Approaches to highly · parameterized inversion-A guide to using PEST for groundwater-model calibration: U.S. Geological Survey Scientific Investigations Report 2010-5169, 59 p.
Gebert, W.A., 1980, Low-flow characteristics of streams in the Upper Wisconsin River Basin, Wisconsin: U.S. Geological Survey Water Resources Investigations Open-File Report 80-691, 60 p.
Gebert, W.A., Walker, J.F., and Hunt, R.J., 2011, Groundwater recharge in Wisconsin-Annual estimates for 1970-99 using streamflow data: U.S. Geological Smvey Fact Sheet 2009-3092, 4 p.
Helsel, D.R., and Hirsch, R.M., 2002, Statistical methods in water resources: U.S. Geological Survey Techniques of Water Resources Investigations, book 4, chap. A3, 522 p.
Hill, M.C., 1998, Methods and guidelines for effective model calibration: U.S. Geological Survey Water-Resources Investigations Report 98-4005, 90 p.
Hole, F.D., Beatty, M.T., Milfred, C.J., Lee, G.B., and Klingelhoets, A.J., 1968, Soils of Wisconsin: University of Wisconsin-Extension, Wisconsin Geological and Natural History Survey, 1 sheet, scale I :710,000.
Hunt, R.I., Feinstein, D.T., Pint, C.D., and Anderson, M.P., 2005, The importance of diverse data types to calibrate a watershed model of the Trout Lake Basin, northern Wisconsin: Journal ofHydrology, v. 321, p. 286-296.
Hunt, R.I., Prudic, D.E., Walker, J.F., and Anderson, M.P., 2008, Importance of unsaturated zone flow for simulating recharge in a humid climate: Ground Water, v. 46, no. 4, p. 551-560.
Lenters, J.D., Kratz, T.K., and Bowser, C.J., 2005, Effects of climate variability on lake evaporation: results from a longtelm energy budget study of Sparkling Lake, northern Wisconsin (USA): Journal ofHydrology, v. 308, p. 168-195.
Mudrey, M.G., Jr., Brown, B.A., and Greenberg, J.K., 1982, Bedrock geologic map of Wisconsin: University of Wisconsin-Extension, Wisconsin Geological and Natural History Survey, I sheet, scale 1:1,000,000.
Oakes, E.L., and Cotter, R.D. 1975, Water resources of Wisconsin-Upper Wisconsin River Basin: U.S. Geological Survey Hydrologic Investigations Atlas HA-536, 3 sheets, scale I: 1,000,000.
Omemik, J.M., Chapman, S.S., Lillie, R.A., and Dumke R.T., 2000, Ecoregions of Wisconsin: Transactions of the Wisconsin Academy of Science, Arts and Letters, v. 88, p. 77-:-103.
Pint, C.D., 2002, A groundwater flow model ofthe Trout Lake Basin, Wisconsin: Calibration and lake capture zone analysis: Madison, University of Wisconsin, M.S. thesis, 123 p.
Public Se1vice Commission ofWisconsin, February 15, 1939, Orderfor2-WP-295: 17 p., accessedAprill7, 2012, at http://dnr.wi.govlwater/basinlupwis/restlakedam/ documents/1937-and-1939-PSCOperatingOrder.pdf.
Rantz, S.E., and others, 1982, Measurement and computation of streamflow- Volume l, measurement of stage and discharge: U.S. Geological Survey Water Supply Paper 2175, 284 p.
Walker, J.F., Hunt, R.J., Hay, L.E., and Markstrom, S.L., 2012, Watershed scale response to climate change-Trout Lake Basin, Wisconsin: U.S. Geological Survey Fact Sheet 2011-3119, 6 p.
Wisconsin Department of Natural Resources, 2007, Current operation of Rest Lake-FAQ: 7 p., accessed April17, 2012, at http://dm:wi.gov!water/basin/upwislrestlakedam/ documents/FAQ-RestLakeDamOperation.pdj
Wisconsin Department of Natural Resources, 2011, Environmental overview of the Manitowish River system: 62 p., accessed Aprill7, 2012, at http://dnr.wi.gov/waterlbasinl llJllVis/restlakedam/documents/Environmenta/OverviewLinks.pdj
Wisconsin Legislative Reference Bureau, 2004, Wisconsin Constitution, art. IX, sec. 1, The public trust doctrine: accessed April 17, 2012, at: http://legis. wisconsin.gov/lrb/ pubs/consthi/04consthi!V 4. htm.
References Cited 25
Wisconsin Statutes and Annotations, 2012, chap. 31, Regulation of dams and bridges affecting navigable waters, of sec. 34, Flow of water regulated: accessed April18, 2012, at http:/ /docs. legis. wisconsin.gov/statutes/statutes/31/3 4.
Young, H.L., and Hindall, S.M., 1972, Water resources ofWisconsin--Chippewa River Basin: U.S. Geological Survey Hydrologic Investigations Atlas HA-386, 4 sheets.

Publishing support provided by the U.S. Geological Survey Science Publishing Network, Columbus Publishing Service Center
For more information concerning the research in this report, contact the
Director, Wisconsin Water Science Center
U.S. Geological Survey
8505 Research Way
Middleton, Wisconsin 53562
http://wi.water.usgs.gov/

Appendix 27
Appendix. Code for the Python-based Water-Budget Model
"Python" is a registered trademark of the Python Software Foundation.
Although this program has been used by the US Geological Survey (USGS), no warranty, expressed or implied, is made by the USGS or the US. Government as to the accuracy and functioning of the program and related program material nor shall the fact of distribution constitute any such warranty, and no responsibility is assumed by the USGS in connection therewith.
#This program computes Rest Lake natural flows at upstream gages and at the dam given lake stage, outflow, and climate #data.
import sys import math import numpy as np import matplotlib.pyplot as pit from datetime import datetime #pull the datetime module from datetime fi·om datetime import timedelta # grab the time differencing module
echo =False TARGDATES = [] DATES = [] NEWDATES = [] INFLOWS=[] OUTFLOWS = [] FLOWINS=[] FLO WINS_ CFS = [] OUTF =[) LLS = [] PPT= [] EVAP= [] LEVELS = [] SIMLEVELS=[] SIMOUTS = [] GWS=[] TF = '%m/%d/%Y' #time format used in the files
# ####################### # # Error Exception Classes # # ####################### # # -- cannot read/write/open/close file class FileFaii(Exception):
def _ init_ (self,filename,filetype): self.filename=filename self.ft = filetype
def _str _ (self): return('\n\nProblem with'+ self.ft +': '+ self.filename +' \n' +
"Either it can't be opened or closed, can't be read from or written to, or doesn't exist")
# -- wrong number of lines in cal file class Ca!Faii(Exception):
def _ init_(self,nlines,fn): self.nlines=nlines self.fn = fn
def _str _ (self): return('\n\nCal File: ' + self.fn + ' has wrong number of lines. \n' +

28 Estimation of Natural Historical Flows for the Manitowish River near Manitowish Waters, Wisconsin
'Read'+ str(self.nlines) +' lines in the file')
# -- Failure parsing the input data file class ParseFaii(Exception):
def _init_(self,offending_line): self.offending_line = offending_line
def_ str_(self): return('\n\nThere was a problem parsing a line in your data file. \n' +
'The offending line was:\n' + "" + self.offend·ing_line + "'') .
# start of code; read in the namefile from the command prompt. # the namefile points to the files with input data. try:
namfile = sys.argv[l] lines= open(namfile,'r').readlines() outfilename = lines(O].strip() obsfilename = lines[l].strip() datfilename = lines[2] .strip() calfilename = lines[3].strip() targfilename = lines[ 4].strip() outDAMfilename = lines(5].strip()
# Start and end days used for cropping filler values at the beginning and end of input files that were used to help with # averaging. STARTDAY = datetime.strptime(lines[6] .strip(),TF) ENDDAY = datetime.strptime(lines[7].strip(),TF)
except: raise(FileFail(namfile, 'name(* .NAM) file'))
# open output file for computed natural flow at the upstream gages try:
output_ file= open(outfilename,'w') except:
raise(FileFail( outfilename, 'output file'))
# open output file for computed natural flow results the dam try:
outDAM_file = open(outDAMfilename,'w') except:
raise(FileFail(outDAMfilename,'DAM output file'))
#open file where re-fom1atted measured flow at the upstream gages will be written for processing by TSPROC (Steve # Westenbroek, USGS, written commun., March, 2012), which is a time-series processing utility that is used to generate # flow-duration values for the measured and computed natural flows at the upstream gages that are used for calibration with #PEST. try:
obs_file = open(obsfilename,'w') except:
raise(FileFail( obsfilename,' obs file'))
# open file with measured flows at the upstream gage so this code can fonnat it for interpretation by TSPROC try:
target_ file= open(targfilename,'r').readlines() except:
raise(FileFail(targfilename, 'target file'))

for each_line in target_file[l:]: DATA_TARG = each_line.split(',') #split on commas DATE _TARG = DATA_TARG[O] RICE_CFS = ftoat(DATA_TARG[l]) MANITOWISH_CFS = ftoat(DATA_TARG[2]) TROUT_CFS = ftoat(DATA_TARG[3]) PAPOOSE= ftoat(DATA_TARG[4])
INFLOW TARG =RICE CFS +MANITOWISH CFS +TROUT CFS +PAPOOSE - - - -
Appendix 29
INFLOWS.append(INFLOW _TARG) #appends each INFLOW to the list INFLOWS (for plotting purposes)
try: MONTH, DAY, YEAR= DATE_ TARG.split("f')
except: raise(ParseF ail,each _line)
MM = MONTH.zfill(2) DD = DAY.zfill(2) OBS_outstring = ('obs_inftow ' + '{O}/{l}/{2}'.format(MM,DD,YEAR) +' 12:00:00' +
'{0:.2f}\n' .format(INFLOW _TARG))
if(echo): print OBS_outstring
obs _ file.write(OBS _ outstring)
# open file with calibration parameters try:
calib _file = open( calfilename, 'r').readlines() except:
raise(FileFail( cal filename, 'calibration parameter file'))
# make a list of just the numbers from the file lines=[] for each line in calib file: - -
line_stripped = each_Iine.strip() #removes leading and trailing whitespace line_split = line_stripped.split() #splits a string at whitespaces lines.append(line_split[O]) #appends each split character to the list: "lines"
if len(lines) != 6: raise(CaiFail(len(lines),calfilename)) #call an error if not 6lines in the calibration file.
#now pull out the calibration coeffs. GW _drop= ftoat(lines[O]) GW _low= ftoat(lines[l]) GW _rise= ftoat(lines[2]) GW _high = ftoat(lines[3]) FLOAT_ NSTAGE = ftoat(lines[ 4]) VOLDAMP = ftoat(lines[S])
# Pest needs to work with float numbers so that derivatives can be calculated. This code needs integer days. #Thus, theN-days over which to average all input values calibrated by PEST is rounded and then converted to an integer. NSTAGE = int(round(FLOAT_NSTAGE)) #round first (rounds 0.5 upwards), then convett to integer. ·
# open file with input data on lake stage, dam outflow, precip and evap. try:
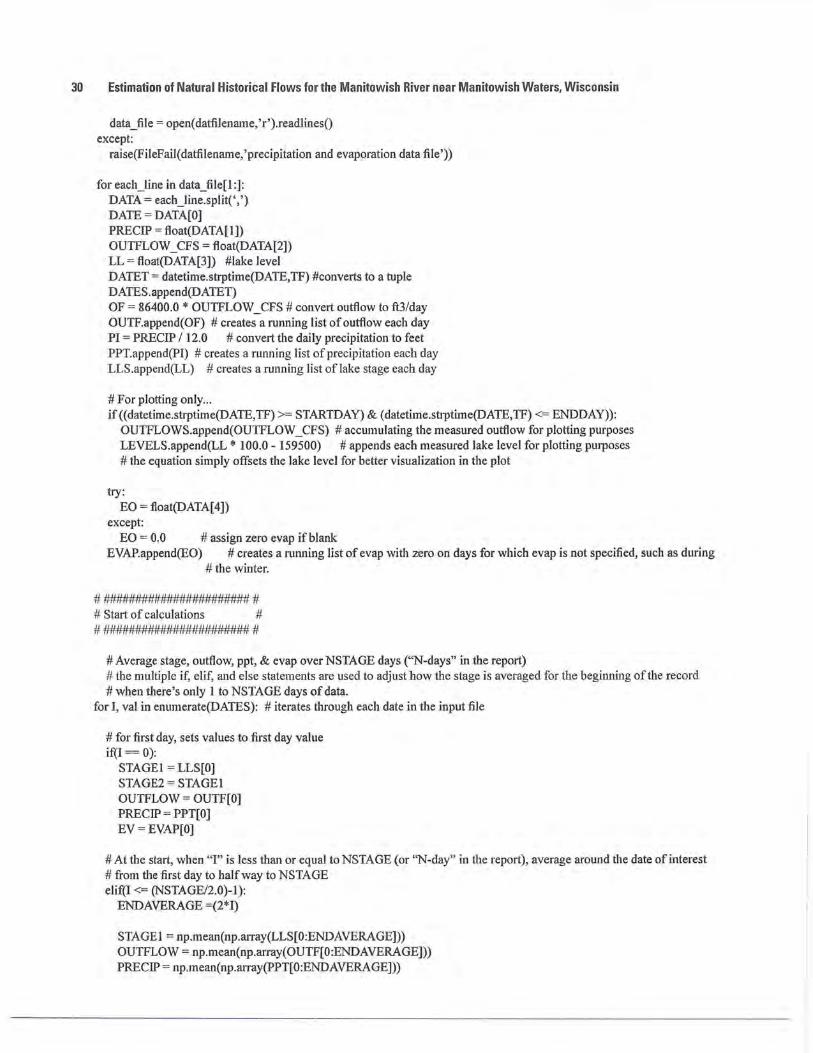
30 Estimation of Natural Historical Flows for the Manitowish River near Manitowish Waters, Wisconsin
data_ file= open( datfilename,'r').readlines() except:
raise(FileFail( datfilename, 'precipitation and evaporation data file'))
for each_line in data_file[l:]: DATA= each_line.split(' ,') DATE= DATA[O] PRECIP = float(DATA[l]) OUTFLOW_ CFS = float(DATA[2]) LL = float(DATA[3]) #lake level DATET = datetime.strptime(DATE, TF) #converts to a tuple DATES.append(DATET) OF= 86400.0 * OUTFLOW_ CFS #convert outflow to ft3/day OUTF.append(OF) #creates a running list of outflow each day PI= PRECIP I 12.0 #convert the daily precipitation to feet PPT.append(PI) # creates a running list of precipitation each day LLS.append(LL) #creates a running list oflake stage each day
#For plotting only ... if ((datetime.strptime(DATE, TF) >= STARTDAY) & ( datetime.strptime(DATE, TF) <= ENDDAY)):
OUTFLOWS.append(OUTFLOW _ CFS) #accumulating the measured outflow for plotting purposes LEVELS.append(LL * 100.0- 159500) #appends each measured lake level for plotting purposes # the equation simply offsets the lake level for better visualization in the plot
try: EO= float(DATA[4])
except: EO= 0.0 #assign zero evap if blank
EVAP.append(EO) #creates a running list of evap with zero on days for which evap is not specified, such as during # the winter.
# ####################### # # Start of calculations # # ####################### #
#Average stage, outflow, ppt, & evap over NSTAGE days ("N-days" in the report) #the multiple if, elif, and else statements are used to adjust how the stage is averaged for the beginning of the record #when there's only I to NSTAGE days of data.
for I, val in enumerate(DATES): #iterates through each date in the input file
# for first day, sets values to first day valm~ if(I = 0):
STAGE! = LLS(O] STAGE2 = STAGE! OUTFLOW= OUTF[O] PRECIP = PPT[O] EV=EVAP[OJ
#At the start, when "I" is less than or equal to NSTAGE (or ''N-day" in the report), average around the date of interest #from the first day to halfway to NSTAGE elif(l <= (NSTAGE/2.0)-1):
END AVERAGE =(2*1)
STAGE! = np.mean(np.anay(LLS[O:ENDAVERAGE])) OUTFLOW= np.mean(np.array(OUTF[O:ENDAVERAGE])) PRECIP = np.mean(np.array(PPT[O:ENDAVERAGE]))

EV = np.mean(np.array(EVAP[O:ENDAVERAGE]))
#average around the date of interest from 1/2 NSTAGE back to 1/2 NSTAGE fotward of the date else:
Appendix 31
STARTAVERAGE = int(math.floor(I-(NSTAGEI2.0-1))) #round first (math.floor rounds 0.9 down), then convert to #an integer
ENDAVERAGE = int(math.floor(I+NSTAGEI2.0)) #round first (math. floor rounds 0.9 down)
STAGE I= np.mean(np.array(LLS[STARTAVERAGE:ENDAVERAGE])) #averages lake stages around the current #date
OUTFLOW= np.mean(np.array(OUTF[STARTAVERAGE:ENDAVERAGE])) #averages outflow around the current #date
PRECIP = np.mean(np.array(PPT[STARTAVERAGE:ENDAVERAGE])) #averages precip around the current date EV = np.mean(np.array(EVAP[STARTAVERAGE:ENDAVERAGE])) #averages evap around the current date
# Calculate lake area in square feet AREA= (158065.01 * STAGE! * STAGE!)- (495798355.44 * STAGEl) + 388812322721.9 #area based on stage LOW AREA= (158065.01 * 1597.9 * 1597.9)- (495798355.44 * 1597.9) + 388812322721.9 #area based on normal low
#stage only #Determine which of the 4 groundwater parameters (calibrated with PEST) to apply to this date based on thestage and # change in stage if(STAGEl-STAGE2 > 0.015):
GW = GW rise * 86400.0 #convert to ft31d elif(STAGE1-STAGE2 < -0.02):
GW = GW _drop * 86400.0 elif(STAGEl > 1599.5):
GW = GW _high * 86400.0 else:
GW = GW _low * 86400.0
# Water balance and lake level calculations DSTAGE =STAGE I- STAGE2 #subtracts yesterday's lake stage (STAGE2) from the current lake stage STAGE I to
# compute change in stage DVOL = AREA* DSTAGE #compute change in lake storage due to change in lake stage FLOWIN = DVOL + OUTFLOW+ (EV * AREA) - (PRECIP *AREA) - GW #Compute natural flow into the chain of
# lakes at the gaging stations upstream of #the lake
FLO WIN CFS = FLOWIN I 86400.0 # convert to ft31s FLOWINDAM = FLOWIN + GW + (PRECIP * LOW AREA)- (EV * LOW AREA)# Compute natural flow at the dam.
# This includes inflow at the gages #plus groundwater and Precip-# Evap for lake area at low stage.
FLOWINDAM CFS = FLOWINDAM I 86400.0 # convert to ft31s STAG£2 =STAGE I #convert the cmrent date into "yesterday" for the next iteration of this loop #END OF WATER BUDGET CALCULATIONS
#remove the starting and ending values that were added to simplify date averaging, and limit results to the dates of #interest. if ((val>= STARTDAY) & (val<= ENDDAY)):
NEWDATES.append(val) #for plotting only FLOWINS.append(FLOWIN _ CFS) #for plotting only SIMLEVELS.append(STAGEl * 100.0- 159500) #shifts lake stage for plotting and appends each stage to the list
# SIMLEVELS for plotting SIMOUTS.append(OUTFLOW 186400.0) #for plotting only GWS.append(GWI86400.0) #for plotting only

32 Estimation of Natural Historical Flows for the Manitowish River near Manitowish Waters, Wisconsin
# format the output string for natural flow at the upstream gages and at the dam SIM_GS_outstring = 'SimGSin ' + DATES[I].strftime(TF) +' 12:00:00' + '{0:.2f}\n'.format(FLOWIN_CFS)
SIM_DAM_outstring = 'SimDAMin' + DATES[I].strftime(TF) +' 12:00:00' + '{0:.2f}\n' format(FLOWINDAM_CFS)
if(echo): print SIM_GS_outstring print SIM_))AM_outstring
output_ file.write(SIM _ GS _ outstring) #write to the output files outDAM_file.write(SIM:_DAM_outstring)
# close output file try:
output_ file.closeO except:
raise(FileFail(outfilename,'output file'))
#begin block of code to produce Matplotlib plot plt.figureO plt.plot(NEWDATES, LEVELS, 'y', NEWDATES, SIMLEVELS, 'c', NEWDATES, OUTFLOWS, 'g', NEWDATES, SIM:OUTS, 'm ', NEWDATES, INFLOWS, 'b', NEWDATES, FLO WINS, 'r', NEWDATES, GWS, '+',
label=['Levels', 'Sim _levels' ,'Outflow', 'Sim _Out', 'Measured', 'Python', 'GW']) plt.legend( ('Levels',' Sim _Levels', 'Outflow', 'Sim_ Out', 'Measured', 'Python', 'GW'), loc='upper left') plt.showO


Juckem and others~Estimation of Natural Historical Flows for the Manitowish River near Manitowish Waters, Wisconsin-Scientific Investigations Repert 2012-5135

Appendix Ill - Lake Maps


WISCONSIN CONSERVATION DEPARTMENT
I I Whitt and Rod Pint
I I I
_ _j _ _ I
DATE 4/17140 lt.ttrqi!IJ!( !LIJIO
COM~LEDIIY __ -k~----------------TitACEDIIY __ ~WL-----------------SOU!tCE 01' INI"'itMATION C C C CAMP loiEitC!£1t
SOUNDIN&S 500' 1niHral•
MAP REVISIO'"---------- --
LAKE SURVEY MAP
Whitt and Red Pine
TYPE LAKE IMPROVEMENT I!ECOIIO
DATE~ 6 BRUSH REFUGES 0 SAPLING TANGLES 0 SPAWN II& BOXES C MINNOW SPot.WNERS
&r GIIAVEL Mk MUCIC Sd SAND
___L_
_J_ ____._
Young 8rowth and
-""" l"lftt
LAIC! ALQfl ( MAIMTQWISH CHI•)
SECTIOH 2.D -11-H TOWNSHIP I 41 N RANK Ill! f: TOWN R!Df:lt LUI: COUNTY~
I I I I I I --------r-
Younv growltlSoalltrtll Pint
1
I I I I I
~ w I
AREA 214 krM TOTAL SHORELINE :!! 9 Mjlea MAX. DEPTHI_.otilc._' - - ------
SCALE:--limll:

Source: Wisconsin Department ofNatural Resources 608-266-2621 Alder Lake- Vilas County, Wisconsin DNR Lake Map Date - Jan 1960 - Historical Lake Map - Not for Navigation A Public Document - Please IdentifY the Source when using it.

STATE OF WISCONSIN
EPARTMENT OF NATURAL RESOURCES
J: li: ~
~ N
~ B.M. 'x' D.N.R. 1795 Brass cap set in a s" .concrete post. 54' S. of bqot romp and 61' W. of public boat landing on W. side of lake Assumed elevation 100.00' Wa!er level 94.94'
40'
sdiL---~~2~oo~o--~~40~o~o~~~.~o~oo~~--~eo~o~o~~~,~opoo ACRE FEET
----- - ---- - ------ - --- - --- -
NORTHERN HIGHLAND
STATE FOREST
EQUIPMENT_ RECORDING SONAR MAPPED ~~
TOPOGRAPHIC SYMBOLS LAKE BOTTOM SYMBOLS
P. Peat B Boulders Mk. Muck o8o Stumps 6. Snot;~s
~ Brush dlllll• Sleep slope pN) Partially wooded_ ...... ,_ Indefinite shoreline
2 II 12
@
\W) Wooded ?!:~~Marsh i) Cleared a..-- Spring
_C. Cloy :_t:; Rod. danger to naviga t ion
®·Pastured -~ ... Intermittent stream
@ ArJricultural ~ Permanent inlet
B.M. Bench Mark ~ Permanent outlet
• Dwelling ~ Dam ~ Resort D.N.A. Stole owned land @] Camp
M. Marl
Sd. Sand
St. Sill
Gr. Grovel
R. Rubblt> Br. Bedrock
T
1
Submerqent vegetation
Emergent vegetation
Flo olini'J verJelotion
-OJ- Brush shelters
LAKE SURVEY MAP '~
- ~ ~- ~-~~-~
NORTHERN HIGHLAND
STATE FOREST
;;:-=:::::::::::=-::::. ~ ~=~
/' / ' ' \
\ ' 'v/''
\-;: ::::::::0 r:;;.. ~ ® •
II
Fawn Lake 66 Acres 16 'Deep
~ ~
CLEAR LAKE
__ SEC. 1 . 2.6.12
Co:\ /-~-·, '\!:!) // __ ..:....__ ......... + . /-~-~=~~ ~· . ' 3 • I @
VILAS COUNTY
T.~N.R.~E.
@
@
@
----, / __ .,.
I ,_, '
,----- ....... _ ........ -------, ©-~--, \
' \ ,-, ( - ' \
Q: // -, ' '!!,) ' -
'"• ."1, ,__ ,', ; . f '·-··
@ I \ \..._ __
© ' ' \
- ---t>D, ~o---- --' /, ~-L: --...o:.:::::::,==--o:::-.:::::::,7/ ',,""C?I W/W j
' ' ~~~ .t NORTHERN HIGHLAND
STATE FOREST
2000'
L.M. Boss
'
WA TER AREA
UNDER 3FT.
554 7 ACRES
1...l...___%
OVER 20FT. .4]__% A< MAX. DEPTH ~~ FEET. --TOTAL ALK., ____ ~~----P.P.M.
<>Access -<>Access with Porkin9 + Boat Livery S.M.Boss VOLUME~
MAIN SHORELINE
__ ACRE FT.
~MI. Drown by: C Holt
Field work by: J. Smilh
POntish Trout
ISLAND SHORELINE .190 MI.

Source: Wisconsin Department ofNatural Resources 608-266-2621 Clear Lake- Vilas County, Wisconsin DNR Lake Map Date - Aug 1973 -Historical Lake Map -Not for Navigation A Public Document- Please Identify the Source when using it.

. STATE . OF WISCON,SIN DEPARTMENT OF NATURAL .RESOURCES
~ ~·
II \\ \\ '\ \ ~"" ""~
~ 1\ II
II I!
// ·
LAKE
NORTHERN HIGHLAND .
SLJR\iEY MAP I
0
FAWN .·
LAK.E __ SEC. 11;12
Cl~or Lake
554.7 Acr~s
VILAS COUNTY
T.____1L_N. R. __ 5_._ E.
d
-·-·-·-._- ----~-- ·. ~-//-'1---1 II 114 Line ____ _ -
5'·
~I ld
II . II
II If II II II II ·II . ~ \\ \\ .
~
15'~--'c--------~----~ \\ II II II
4
ACRE FEET IN H.UNDRE0S
. .
I I I i J
II II II
II II
II II
II II
II II
II II
'"'-. .... ~::::::-:::: (--~~~l ........ ,S ... "
ECUIP.MENT . REtaRDING ··:sONAR · MAPPED JULY ·19.73,.
T\JPO ~RAPHiC SY~aoi:~ > ·> . .
1-e·rush:_. :·. · <~I.WIIt ·s t~ep slo,pe ·
. _.P .. O_(··;·_i·?:_l)i ,.~oded ::~ ..... -.; :-:.:1~~ -e.·.-.! -~n. h·e shoi-ellne w_o·ode.d . G?l--~~--t"o ·rsh _ .
®·· ~~~~ti:~:~ .. · =~-{:;1 -~!_i;~~~-t- strea~ @ A9r.~t~!l~rol · ~:. P_e.r ~o:ne(lt i_nte·t
·a.M: ~-"nch-_.M ork ~ -~ermdnent" outlet .• oWein~-~ \...Lt Oor11 ~ ReSO/t · O.N.R·. Stote · owried land , @l Cam·p
.. · :.:- ·.~: ,,\·· :· :· : -.···· ·-·_,:·
~ YEJ\R .,.,·. LAKE·· BOTT'OM SYMBOLs ··
·· · so~-,~~ :e:~:~··. : .. P. : Peat . 'Mk. ·Muck"_ ..
c .. .Clay
M. Mi::l~l
sd. Sand St.' Sill Gc. Grovel·
R. Rubble ec. B~droc_k
~!o StumpS.· a-.:. snac;~s
::-f:: Roc"IO: .:d·a~Qr-r ·· ,·o novig~lion T Su~mer.lir-Or vr-gr-t~t ion 1 Emr-rge.nt , vr-qr-tillio n
...c.: Flootln!;! veoetotfon ~· Brush shr-lters
....
FOREST
,-- -- .... ' ' \ \ --~ t
I J , __ .....
0
--. . ---
· - ~~·~ (/)(/)
I 'l /=--=====-
~ ::=]""""'""=="::,,_ ._4-<7-:::--;:::...:
Slon• i..ake
138.8 Acres
43·' Onp
/
\.:.) -..;;;::=-::;:::;:;..-
""-~ ..
~~-===::::=
3aa· · o' 3oo' · sao' 9oo' 1200'
~'"'ALE
<>Access -c> AcCe.ss with. Porkin9 • . Boat. Livery Drown t;ty: G. Thu"esen ·
Fit'ld work by:J.Smilll R.Hert.z ISLAND SHORELINE__Qd

Source: Wisconsin Department ofNatural Resources 608-266-2621 Fawn Lake- Vilas County, Wisconsin DNR Lake Map Date - Jull973- Historical Lake Map- Not for Navigation A Public Document- Please IdentifY the Source when using it.

STATE EPARTMENT
d
5'
ld
IS ~
S zd 0
25~
3d
35' . '
OF
OF NATURAL
7 a 9.· --10 • II 12
\!!)
,, I'· \) · ,,.
, 4 5 6
\ ACRE FEET IN THOUSA.NDTHS J
~ @ \....-·
\ \ \ \
ol\\J. -- ./-"""~ ·~--,\\ ~~-- --~r
~ ~
1/ II
.p-·- II .h? ~
~,/ EOUIPMENT~RECOROING SONAR
-7' -:;:::.TOPOGR~PHIC SYMBOLS .
<BJ Brush 11111111 S tup slop!'
0 \ \~ ~<;! 'V\
\) -~·" '
\
'\,
' ~
~ ---+m ' LAKE BOTTOM SYMBOLS
P. Peat B Boulders Mk. Muc:k o•o Slumps & Sno\)s
@
........... t t'(c\1 .... '-;;..ll
Wood~cl '~~Marsh C. Cloy :;!-:: Rock clonQtr to noylqotion
t\KE/ SURVEY
B.M. Located on Rest Loke Oom {Part of Manitowish Chain) Water Goug:e Reading Assumed elevation":: 100.00' Water elevotion=91.50'
---
J --1 ' I I
I I
I / 1,_)
,_G , .......... ' \
\ ' \. -~AR VILAS
COUNTY
,0 T I I I' '' /,,'
Mk.
.. --~ ; (
\ \~ JL ,_,
/ ...... ...... ___ ...... ..... ....
' ' I '-\ '\
\ \ T. 42 N ' I \ -~ • R. 5 6 E
., ,e ' ~· ' \ I
II
'->, .: g. ,.
{?
@
'' @ ' -I'
\ .:::1 : \, Q.f /
,,--' -,_ kl / r:'::::U. -, .... _~ ......... , r I --1 I \ ,'
~~;- - -( I \ \ ,-c:r_JI.__, \ ----'~ ,, ,_ ·~· -- ' ·~ ' ~"" ~~~~~---.,..: ' " ' •''' ' /~ ..... ,} '\ • .• j p .. "' __ , •,o .. c!· • 0 ,, ___ / "> ?
q .. ,, ':-• r., - ·-"-·~ " - "·' ' '('~c.. "' ~~\&~· -; i '\, ~" ~ '-- >~~- ----\ --,~-:,-c-=/ ---~ ---,-- - -\ ., __ _JC--,0\ ' ,u. --; _.)f (.k-_:_-= -~2----~~==r~-La--, \,·---1
\\- ' ... ·' ,..L\ ' ~~~~~~;\:~_' . - . ~\J _L~~ - -" I l-· - i.
0
~ 0
-=-:.... --- - r
....... ,~L~/ ':::1
.......... -...... \ / 1
0
r-S:::Pc::-EC:-:l:cES::c,;-,O~F:-:::-Fl:::SCClH _./
____.-- \ / @ g c:. - WATER AREA I P22.5 ACRES
_...., . ........--- \ ( /~~=~ UNOER3FT. 17 •1. \ ~ _., I ~ ~ ~ ovER 20 FT.---Z.!J, .,.
700' 0' 700' ' I 400' X X
~~PW Partially woodtd _ ....... _ lndrtinitt shorrtint
Clrartd ~ Sprino
® Pasturtd -~~.lntfrmllttnt stream M. Marl \T Sobmorgent "gelot;on Sd. Sand · 1 Emtrqtnf vtqttotion @
MAX. DEPTH 3~· FEET,
37 P.P.M. @ AQriculfurol ~ Permanrnt inltt
B.M. Brnc:h Mark ~ Ptrmantnl oufltl
• OwellinQ \...l.J Oom [!] Rnorl O.N.R. Stol t o•ntd lond ~ como \\
St. Silt ..&:1.. flootinQ vfQtfatio~ Gr. Grovll -w- Brush shtlltn ~ R. Rubble A State camp site \ Manitowish Waters 5 M 1.
er. Bedrock ' \
TOTAL ALK.
~ VOLUME IZ ~!iii~ ACRE FT,
MAIN SHORELINE I~ J!'i MI. ISLAND SHORELINE _ _2~~ MI.

Source: Wisconsin Department ofNatural Resources 608-266-2621 Island Lake -Vilas County, Wisconsin DNR Lake Map Date - Aug 1973 - Historical Lake Map- Not for Navigation A Public Document - Please Identify the Source when using it.

STATE OF WISCONSIN
DEPARTMENT OF NATURAL RESOURCES
h j
II
J ;(/0"1'--._
5'
10'
15'
20'
25'
Sl :~: 0 40'
45'
so' 55'
60'
65'
7o'+--~-~-~-~-~-~-~~ 0 I 2 3 4 SE
ACRE FEET IN HUNDREDS
TOPOGRAPHIC SYMBOLS LAKE
~ Bmh oil IIIIo S '"' slop• P. Peal Partially wooded::-=-"'~ Indefinite s horelint Mk . Muck
Wooded ~~4i Morsh · c. Clo y Cleared -- Spring M. Marl
® Postu red --:-::":.-... Interm i ttent stream Sd . Sond
® AQricvllurCII ~ Permontnl in let 51. Si lt
8. M. Bench Mark ~ Permanen t oullet Gr. Grovel . Owellino \..LJ Oom . R_. Rubble l!l Resort O.N.R. Slate owned fond "' Bedrock I]] Camp
Boulde.rs -~- .. ~~ Stumps a Sn ag s.... ',,
=:t.: Rock don;er to na vigat ion ' Submtrqeont veoqtlolion
Emeroeon t veo qtlation Floa tin g vtqtt o1ion
-w. Br ush shellers 0 ', ',
',,.._
I I
', ', ' I
\ I
/
SURVEY® MAP
SCALE . .,. AcCess with POtkinQ
G.Thutsl!!n
work by:~
' LITTLE STAR VILAS LAKE COUNTY
___ SEC. 15.16.22 T.~N. R.~E. \ / ... , \ I ', I I \
!SPECIES OF ;t~H
~ g
~· ~~ <t u
Muskre X N. P1ke X Wolle t X L.M. oss X
+ Boat Livtry S.M.Boss X
c:===: ~' ~~~~\sn X I -...1k___ ', CISCO X ,__ ---.: "\
' -- ·'
'-·- _...- \,
0
I '
I I
I
/
,.,/" /
\ I
\ \
I
, I I I
' I , 1.
I I I
~ I I
I I
' /
I I
/
@
WATER AREA 245.1 ACRES
UNDER 3 FT.__bl Of.
OVIOR 20FT.~ %
MA X. DEPTH ______ 6_7 fEET. TOTAL A L K. P.P.M.,
VOLUME 7674.22 __ ACRE FT .
MAIN SHORELINE_ ~MI. ISLAND SHORELINE 0 .03 MI.

Source: Wisconsin Department ofNatural Resources 608-266-2621 Little Star Lake - Vilas County, Wisconsin DNR Lake Map Date- Jun 1975- Historical Lake Map- Not for Navigation A Public Document- Please Identify the Source when using it.

STATE OF WISCONSIN
DE~ARTMENT OF NATURAL RESOURCES
§ 'U
r 0
0 ::;: !: "' ., r
"' r
l> ;JJ ;::
"' "' l> ;JJ (J)
I
':;l\~ ~~~
I I I
I I I ' 15 I I;, i
i f_i]'i }I ! i 1,\ I
't~l~ll'1', . \,I_, 'l l, .ll~"l ~\> I
'
1 ~I 1 - i ' , , ___ '-":£ ______ -_,_.,..,
EQUIPMENT RECORDING SONAR MAPPED AUG 1977 MON'l'H"' ~
TOPOGRAPHIC SYMBOLS LAKE BOTTOM S YM BOLS
i Brush 11111111 Steep slope
Part ially wooded-':...'~ lndefini!e shoreline
Woodtd ~~-4iMorsh Clear·e·d ~ ·sprinQ
P. Peat B Boulders Mk . Muc k •'• Stumps 8 Snoo s
c. Cloy =:t:: Rock donoet to now-ioolion M. Mo rt T Submergent YtCjltfotion
® Pcs1urtd -~--lntrrmitl e nt stream Sd. Sand 1 Emergenl vegetation @ Agricultural ~ ·P t rn:tontn l inll!l St. Silt ..a... Floating v!ortot io n B.M. Bench Morll ======< Perman e nt oufjtt G,. Grovel .... Brush shelters
• Dwrlling \...l.J Dam· R. Rubble [!] Rt !.or t O.N.R . Stolt owned land B< Bedrock (2] Camp
' LAKE SURVEY MAP MANITOWISH L A KE
__ SEC. 14,22.23.2 4
. 0 E PTH m ~ ~ ~ ~ ~ ~ ~ ~ - N _ - _ ~- o_ c..n_ o. VI_ o_ CJI_ o_ 01. o. 01_ o_ 01_ o_
0-j-
"' !';"'
"' "' "' ., "' "'"' ... z'" .... g~ V> ,. .. z 0
"'"' 0
= ;;;
" C) ::;; .. "' ' li:: ~ ~ ~ :.... (l'j
~:b.;,;-ttl ~ .., " .. ~ ~ I"
" ,. ...
VILAS CO UNT!
T. - 42- N• R.~E.
(Sheet I of 2 I
~:Z:-<=====
400' CE
o' 400'
SCALE
eoo' 1200'
Sheet "1" She et "2" _
1600'
0 Acc e sS -c> Access with PorkinfiJ • Boat Livery
Drown by: ·G.Thuesen
_FiPid wo r k by: J Smith K Arnold
!SPECIES OF F ISH
!g g~
'!!~ Musk-ft X t'l~ X Wolle e X L.~.Boss X S.M.Bos.s X Panfish X Trout Cisco X
WA TER AREA 495.~ AC RES
UNDER 3FT. r.Qe % .
OVER 20FT. ~z ~:i ··t. MAX. DEPTH 61 FE ET.
TOT AL ALK. . 36 · P.P. M.
V OLUME 11351.34 A C RE FT.
MAIN SHORELINE 7.3 M I.
ISLAND SHORELINE 0.3 ML

STAT~ OF WISCONSIN
DEPARTMEtd OF' .NATURAL RESOURCES
c(0 EQUIPMENT RECORDING SONAR MAPPED ~ ---ffij
TOPOGRAPHIC SYMBOLS LAKE BOTTOM . SYMBOLS
m Brush 11111111 Slup slopr Porfiolly, wooded-"':..""- lndtfinile shoreline
Wood~d ~~~Marsh . Cleared _.._ Spring
® Postured -7.:'":.. ... \nltrm iltt nt stnom
P. Prot B Boulders M~- Muck .·. Slumps a Snoos
c. Cloy :;!-:: Rock danger to navigation M. Marl T S~bmerqenl veqelotion
Sd. Sand 1 Emergent 't'tqelolion
@ Agric.ulturol ~ Pt~'!'onent inlet St. - Silt ..a.. FlootinQ veqetolion
B.M. Bench Mark ~ Ptrn:'onent outlet G,. Grove l .. Brush shellers • Owrllinq '\....L1 Oom R. Rubble l!J Resort O.N.R. ' Stotl' owned land B< Bedrock JID Camp
LAKE SURVEY MAP
0 AcCfSS <> Access with P01kin9
Drown by: G .. Thutsen
fitld work by:J. Smith K,Ar"nold
MANITOWISH VI LAS LAKE COUNTY
__ SEC. 14,22,23,24 T. - 42- N. R.~E. + ( S h• • t 2 of 2 l
Sheet "1.1' V Sheet "2"
~2!--<==== 0
... ..,~ '..~ Ci:
"' :;:: "'.., ~ ~ I'
"' "' <1. "' ,..
~ "' "'
SPECIES OF FISH WATER AREA 495.5 ACRES
0 c E • UNDER 3FT. 7.QB .,. 8! OVER 20FT. 52.55 .%
Muslut X MAX. DEPTH 61 FEET. N, Pikt X Wol lt t X TOTAL ALK. P.P.M.
• Boat t.ivfry L.M.Boss X VOLUME 11351.34 ACRE FT. S . M.eoss X Ponfisl'l X MAIN SHORELINE 73 MI. Trout Cisco X ISLAND SHORELINE 0_.3 __ ._ MI.

Source: Wisconsin Department of Natural Resources 608-266-2621 Manitowish Lake- Vilas County, Wisconsin DNR Lake Map Date - Aug 1977 - Historical Lake Map - Not for Navigation A Public Document - Please IdentifY the Source when using it.


) WISCONSIN STATE OF
EPARTMENT/ 0 RESOURCES
I I
I I
\ )
~~~
1.
;;:: "'
0 EQUIPMENT RECORDING SONAR MAPPED AUGUST 1977
MONTH ----ym t..AKE BOTTO"-' SYMBOLS TOPOGRAPHIC SYMBOLS
i Brush · IIJII11c Steep slo p e
Partially woodtd --:...,;:- Indefinite shoreline
Wooded r.i..~-4t Norsh Cleared ~ Sprin9
P. Peat Mit. Muck .•. c. Cloy :.t:: Rod d0n9tr to noviQofion
"· Marl T Submergtnl Vt9tt0tion
® Postured -~-.lntermithnt stream Sd . Sand l Emergent veqetotion
® Aoriculfurol. ~ Permanent inlet B.M. Bench Mark -=====; Permanent outltl
St. Silt ~ FlootinQ v-egetation
G,. Gr ovel ... Brush sP'leiiHS
• Owellinq \...l..J Oom R. Rubblr [!] Rt$ort O.N.R. Stolt owntd land B'- Bedrock @] camp
SURVEY._ MAP REST LAKE
/ d~. I
__ SEC. 3 4 9 10
/
9 ~ Eill ~ THOUSAND
5oo· o' 5oo' 1,000' 1,5oo z,ooo
/
IRHRHH I SCALE I I I
0 Acctss <C> Access with Porkinr.~ • Boat Livery
Ora•n by: R Williams Fitld work b1; J. Smlth,K.ArnoM,K.Montreio
13 15
ISP~
~T ~~: Ao, ........
X X
X
VILAS COUNTY
T.-42- N. R .~E • .)(
®
WATER AREA 807 73 ACRES
UNDER 3FT. %
OVER 20FT. 45 "1.
MAX. DEPTH 53 FEET.
TOTAL ALK. P. P.M.
VOLUME 14.258.28 ACRE FT.
MAIN SHORELINE 6.ol8 MI.
ISLAND SHORELINE___l...Q2 ___ MI.

Source: Wisconsin Depaiiment of Natural Resources 608-266-2621 Rest Lake- Vilas County, Wisconsin DNR Lake Map Date - Aug 1977- Historical Lake Map- Not for Navigation A Public Document - Please Identify the Source when using it.

STATE OF WISCONSIN DEPARTMENT OF NATURAL RESOURCES
LAKE
~ SURVEY II
\\ \\
" II \\ \\
II \\ \\ II
SP IDER LAKE
__ SEC. 12.13,14
" ~ II ~ @~
~ ~ ~
VILAS COUNTY
T._4_2 __ N. R._s __ E.
N
~ II
(( ' ,-~-----\ \ ' I
~ \ \
40'
Slone Lake 138.8 Acres
43'0eep
1000 2000 3000 ACRE FEET
'!000 5000 6000
Note:
B.M. Located on Rest Lake
(Part of Manitowish Chain l
EQUIPMENT RECORDING SONAR
TOPOGRAPHIC SYMBOLS
~ ~
)) /J
;/ #
It
MAPPED JULY . 1973 \ ~ YEAR Manitowish Lake LAKE BDTfOM SYMBOLS 506 Acres
P. Peat 8 Boulders 58' Deep ~Brush .11111 11 Slti!P s lope
~ Porfiolly •ooded ;":."'::- Indefinite shoreline Mk. Muck .•. Stumps 8 Snoqs \
.....:r==-y -===
®
=======
jS PECJES or; f17H g g
~· 1: ~ C. Cia, ';t:: Rod daoger Ia n"lgatl" 14 /13 ~ ~ t.l. Marl T Submergent vegetation 23 24 Sd. Sand l Emergoot ,.,,,,,,.. I ~ 400' o' 400' rnJ' 1200 I txt---St. Sill ..a.. Floating vtgetotion I 8 A H R .. ,.... .. , ,... I
)E< Wooded (~~~Marsh ·_£.: Cleared ~ Spring
®Postured -~ ... Inte rmittent stream ® Agricultural ~ Permanent inle1
"'-' Muskir- X N.P1ke X
~ L.M.Boss
B.M. Bench Mark ~ Permanent outlet
• Dwelling -.....1J Com ~ Resort O.N.R. Sfote owned land @1 camp
Gr. Grovtl
R. RUbblt B[ Bedrock
~ Brush shellers 0 Accrss -4> Access with Porkin9
Drown b'f : ______c..t:Uill Fitl d wora by: R Hertz J. Smjtn
+ 8oo1 Livery S.M.Boss Pontisl'l Trout
• ~ ',, @ \
' ' ' ' ' '-- ......
!slood Lake 1032.5 Acres
35' Deep
@
WATER AREA ~CRES
UNDER 3 FT. ___ 5_ _% --OVER 20FT.~ _%
MAX. DEPTH ___ 4_3 FEET.
TOTAL ALK.__E P.P.M.
VOLUME 5 385 ACRE FT.
MAIN SHORELINE 5.92 MI.
'ISLAND SHORELINE MI.

Source: Wisconsin Department ofNatural Resources 608-266-2621 Spider Lake - Vilas County, Wisconsin DNR Lake Map Date- Jull973- Historical Lake Map- Not for Navigation A Public Document- Please Identify the Source when using it.

STATE OF WISCONSIN DE~ARTMENT OF NATURAL RESOURCES
\ """~ '\ """"~ '\ ~~ ~ ~ ~ ~ \\ ~ \\ \ \\ " 1\ ~ II \\
u ) ~ --~~ '\. ---"'~~,___
~=::;:;;-
\ '· '"' '··· 9
or-----_ 10'
r
~ 2d c
3d
4d
Stole Ccrnpsi te
100 300 500 700 900 100 13(X) 1500 1700 4CRE FEET
9
EQUIPMENT. ~~
9
TOPOGRAPHIC SYhiBOLS LAKE BOTTOM SYMBOLS
P. Peat 8 Bould ers Partially wooMd - -:."'::- Indefinite shorf'line Mk. Muck .•. Stumps a Snags
~ N
~
#"" .J!I
·-'
LAKE
II II II II
0 g
II #
II #
II '\,~=
@
« ,:?" -' _,
r : ( ~ II \ /) ~ """"""'~ )'(==-=-:::;;--
11
II II II i Brush dllllh St~•P slope
Wooded ~~Marsh C. Cloy ~t:: Rock danger to navigation II
Cleared o.--- Sprin9
® Postu red -~-Intermittent stream @ Aqricullurol =<_ Permanent inlet
B.N. ·aench Mork ~ Permanent outlet
• Dwel lin9 \...L! Oom ~ Resort O.N,R. Stole owned land ~ Camp
M. Marl
Sd. Sand
St. Sill Gr. Gro,e\
R. Rubble B[ Bedrock
T Submerqent veQetotion
1 Emergent vegetation Flootinq vegetation
~ Brush shellers
SURVEY MAP
®
0 Access
Drawn by: C. no •.
Spi<l<r Lake
272.3 Acr<s
43'0up
Fitl ld work b)': R Hgnz J.Smith
/ @
STONE LAKE
SEC. II 14
VILAS COUNTY
T.~N.R.~E.
=~ ,:Y
~=r=~~~/
;~====
. "' "i "'j J!
1200
=-====1 ·""'" ~
.,p.,p
~
FT.
MI.
MI.

Source: Wisconsin Department of Natural Resources 608-266-2621 Stone Lake- Vilas County, Wisconsin DNR Lake Map Date - Jul 1973 -Historical Lake Map -Not for Navigation A Public Document - Please Identify the Source when using it.
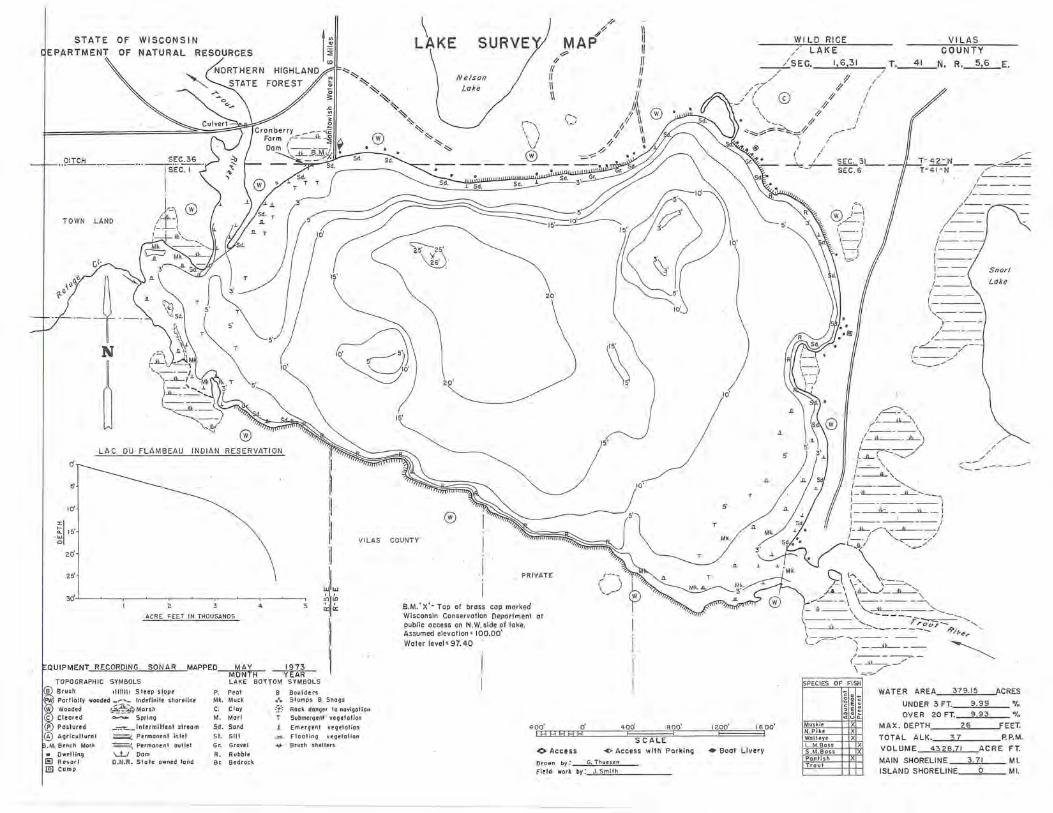
STATE OF WISCONSIN EPARTMENT OF NATURAL RESOURCES
TOWN L AND
N
~ LA C DU FLAMBEAU INDIAN RESER VATION
o'
10'
~115' • W
0
zd
II
li II
II
II
""' ""' ~ ~ ~ ~ ~ ~
,z:a 15'
L\KE
~
""' ""' ""'
co'
® VILAS COUNTY
SURVE
Nelson
Lake
r-, I \ 1 I I I \I
" ®
.# ?-
MAP \l II II ,::
// II II II II
zo'
,~, ,_,
-=---~
II II II
II /AI
If\\'
/1 II ;/ II ~ II
' ,15' '~~
Z5' ~~~ "'I"'
PR IVATE
30'-'-----~-i--~-~-~~-~-~-~~
.;,1 0: ACRE FEET IN THOUSANDS
OUIPMENT RECORDING SONAR MAPPED MAY 1973
II
il MONTH ---vE'AR
TOPOGRAPHIC SYMBOLS LAKE BOTTOM SYMBO LS
~Brush dllll \1 Slrep slope Part ially wooded ::-::.."".:: Indefinite shoreline Wooded (~~Marsh Cleared o.--- Spring
P. Peat 8 Boulders Mk. Muck ..• Stumps a Snags
c. Cloy ::f:: Rock danger to navigation
M. Marl T Submergenl ve gelollon ® Postured --:-:='!:... ... Intermittent stream Sd. Sand 1 Emergent veg etation
S.M.' x'- Top of brass cap marked Wisconsin Conservation Deportment at public access on N.W.side of lake. Assumed elevation= 100.00' Water level' 97.40
400' o' 400' 800'
{ 10
5'
1200'
WILD RICE VILAS / LAKE . COUNTY
__ ,_1 SEC. I 6 31 T. __ 4_1_N. R._2,_§_E.
/ I _,.,... ~ //
/,.-/_,; ~ I
~~I 0 # / - \ // I
\ // I
''-......... 4 ../ ~.:::::::.~~::::':::::==(4 / ... --
.n
.D.
T
!.§.00'
/ I ' .
I / I I
~-"7"-- ~ _.. ...... :-= /-----
~-----
1---1 --; ---
/- /---1---
j---, ___ _ I ~---- --:=--\ Snort 1---- Lake
I ~---,----,-- ---
' ·----/ ~----
/- ----r.::::..__ __ / ' / t ·---;.-/ _____ .....
/ ........ -_,, r;_~,
;'-----\ ; -"'-----""--' 1----;:=~_--/
/_ .JL_. ',// .,.. ., \ ,---' ,--tL\.
/-----'', :-.a.___-~ ...... --.... , ~--- .------I
I _ __L_ ----'L- I ' I ~--- ------ ,
1-..Jil_/-.... ,-~--/ I I ' /
":\ '',j
).:{ \-' , ~--_, .... /.:..&...- \ ,A__,_..I_~'\ _____ , \--------...
r- -a __ , '-, ___ -_---~--
c--/
,---- -'.............. -r-;-;;;;=;--:::::-- ........ , \~ ____ ..... _______ /f/J,.f!l,. .....
/
/ /
/
<__:/----~ _ _;_____ __
/----~-(- ...J1L__ _ .....
\.;::;._ __ /- ~ lriS-PE"'c"'IE::Sc-::0-:::~-F:::, 1""~HCII
WATER AREA 379.15 ACRES c e UNDER 3FT. 9.99 % E
9.93 .:; OVER 20FT . % Muskie X MAX. DEPTH 26 FEET.
@ Agricultural ==<. Permanent inl et St. Silt ...~::~- floating veget at ion 11--l"l--l"\-11-11-1 1----- N.P1ke X TOTAL ALK. 7 P.P.M.
I . M. Bench Mark ~Permanent ou tlet
• Dwelling \....!_! Dam ~ Resort D.N.R . State owned land @] Camp
G•. Grovel .... Brush she llers
R. Rubble
"' Bedrock
Wolle e X L.M.Boss X VOLUME 43 28 71 ACRE FT. S.M.Boss X Pontish MAIN SHORELINE 3. 71 MI. Trout
ISLAND SHORELINE 6 MI.
SCALE
0 Access "4>. Access with Porkino + Boat Livery Drown by: G. Thu~s~ n
Fi!ld work by :_;.J . ..;ScomlliL[IhL_ ____ _

Source: Wisconsin Depatiment of Natural Resources 608-266-2621 Wild Rice Lake- Vilas County, Wisconsin DNR Lake Map Date- May 1973 -Historical Lake Map -Not for Navigation A Public Document - Please Identify the Source when using it.