a longitudinal study in higher professional education Rutger ...
Upload
khangminh22Category
view
0download
0
Wisconsin Longitudinal StudyTracking the Life Course
Copyright © 2006 Wisconsin Longitudinal Study.
Handbook
Wisconsin Longitudinal Study handbook 2006
WLS Support
The Wisconsin Longitudinal Study is supported by the Behavioral and Social Research Program of
the National Institute on Aging, RO1 - AG09775, and PO1- AG21079.
Wisconsin Longitudinal Study handbook 2006
Organization of the WLS Handbook
The Wisconsin Longitudinal Study (WLS) Handbook is a useful resource for
researchers who want to use WLS data. The handbook is designed to direct readers to
appropriate sources of the WLS data, methodology, and documentation information.
Please note: key words and phrases often link to related sources on the WLS website
and within this document.
Chapter 1 Electronic Resources: Lists web resources and instructions on how to use
these resources, such as the WLS website and the secure data enclave, the
WLS listserv, archival listserv, and crosstabs. Also provides helpful con
tact information.........................................................................................p.5
Chapter 2 Overview and History of the WLS: Describes the purpose of the study,
demographics of the sample, and key information for each year of the
study (i.e. 1957, 1964, 1975-1977, 1992-1994, and 2002 2005)...........p.13
Chapter 3 Current Status and Direction: Contains descriptions of current projects,
research papers, and manuscripts using WLS data along with investiga
tors, key personnel, and research sites. Also includes WLS change
notices, and information about the most recent WLS data releases.......p.19
Chapter 4 About the WLS: Includes WLS support information, comparisons of the
WLS with other studies on aging, the historical relevance of the WLS,
prominent figures in the study, and influential works from the WLS. Also
provides information on other projects affiliated with the WLS and a link
to other studies on aging.........................................................................p.35
Chapter 5 Summaries: Describes the type of instrument used for each year of the
study as well as the particular sample of respondents associated with each
year of the study......................................................................................p.47
Chapter 6 How to Use the Data: This Chapter is currently under construction. It
includes Summary Measures, Best Measures, and Favorite Variables, and
will later include examples of how to use the WLS data........................73
Chapter 7 WLS Documentation: Offers links to and descriptions of documentation
for: variable creation; variable naming conventions; missing value codes;
codebooks; questionnaires; flowcharts for graduates, graduate spouses,
Wisconsin Longitudinal Study handbook 2006
siblings and widow(ers); error updates; cross-tabulations; citation and
sampling information. Also provides various links to reference documen-
tation and descriptions of items..............................................................p.81
Chapter 8 Flowcharts: Contains general overview flowcharts for the graduate, grad
uate spouse, graduate widow, and sibling telephone surveys. Includes
links to other flowcharts......................................................................p.105
Chapter 9 WLS Publication and Citation: Provides information on where to find the
WLS annotated bibliography, publications, and research summaries, as
well as instructions for how to cite theWLS data.................................p.111
Appendices:
Part 1: Documentation of Scales.......................................................................p.118
Part 2: A Descriptive Roadmap to the Data
Indicating Best Measures For Users.....................................................p.216
Part 3: A Guide to Comparable Measures
Among Major Life Course Studies of Aging
Chapter 1: Electronic Resources
Wisconsin Longitudinal Study handbook 2006
In this Chapter:
WLS Websites................................................................................................5
Data Distinctions............................................................................................5
Public Data Access.........................................................................................6
Private/Restricted Data Access.......................................................................7
Data Formats...................................................................................................8
WLS Utility Programs....................................................................................9
Listserves......................................................................................................10
WLS Websites
WLS Websites Respondent Website: http://wisls.org
WLS Public Webiste: http://www.ssc.wisc.edu/wlsresearch/
Public Data Users: http://dpls.dacc.wisc.edu/wls/index.html
Data Distinctions
WLS data are secure, well-maintained and available to external users to the
maximum possible extent. Original paper records are securely stored in the
Wisconsin State Archives and kept secure when in use. Four sets of electron-
ic records are maintained:
1. Public Data: These data were obtained from WLS respondents and do not
contain any data that could potentially allow an individual to be identified.
Exreme values are top and bottom coded, and months of events and exact
locations are not available. These data are available to the public through the
WLS website.
2. Private Data: These data were obtained from WLS respondents and con-
tain potentially identifying information. You must use the Secure Data
Enclave if your research requires these data.
3. Restricted Data: These data contain sensitive information, and were
obtained from souces other than a direct report by the respondent. You must
use the Secure Data Enclave if your research requires these data.
4. Identifier Data: No one has access to these data. Data that fall into this
category include names, addresses, phone numbers etc... These files are
accessible only to the project programmer and individuals under her direct
supervision.
5
PLEASENOTE
Data extractscontain datafrom the cur-rent round of
data collection,as well as
updates to theofficial release.
The currentround of datacollection is
still in its finalstages, so thisis a very pre-liminary ver-
sion of the pub-lic data.
Frequent updates will beavailable. Donot use thesedata in pub-lished worksuntil they are
part of the offi-cial release.
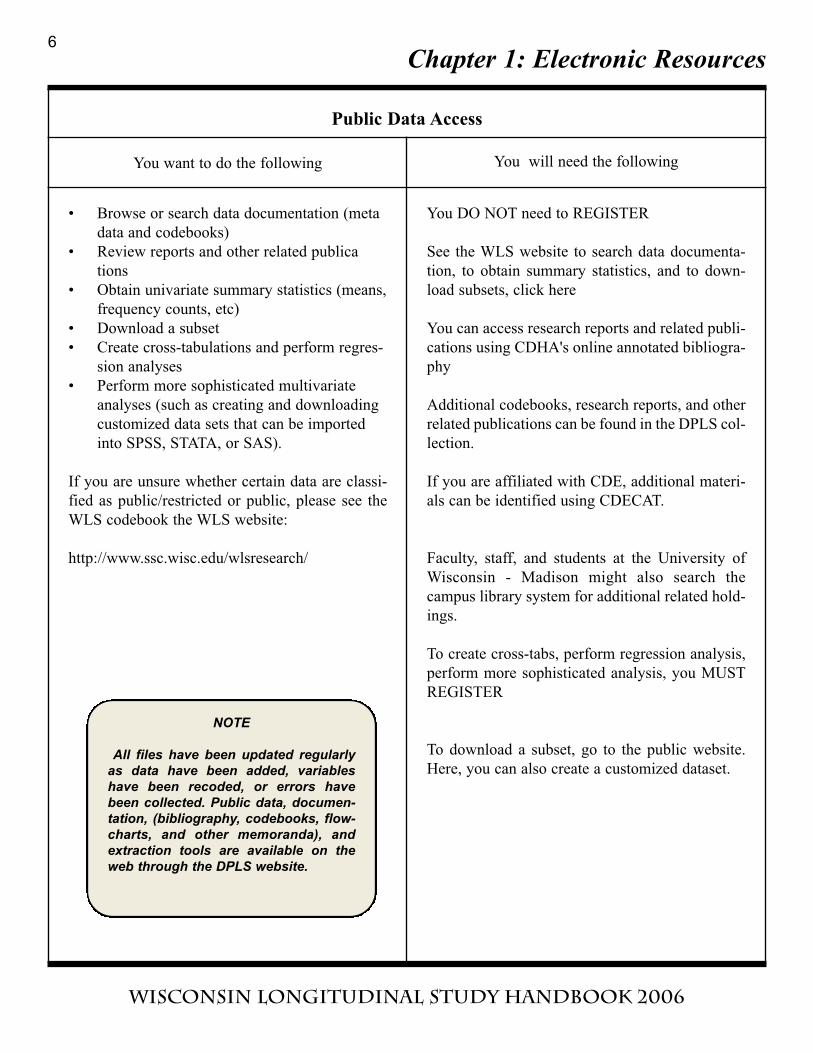
Public Data Access
You want to do the following You will need the following
• Browse or search data documentation (meta
data and codebooks)
• Review reports and other related publica
tions
• Obtain univariate summary statistics (means,
frequency counts, etc)
• Download a subset
• Create cross-tabulations and perform regres-
sion analyses
• Perform more sophisticated multivariate
analyses (such as creating and downloading
customized data sets that can be imported
into SPSS, STATA, or SAS).
If you are unsure whether certain data are classi-
fied as public/restricted or public, please see the
WLS codebook the WLS website:
http://www.ssc.wisc.edu/wlsresearch/
You DO NOT need to REGISTER
See the WLS website to search data documenta-
tion, to obtain summary statistics, and to down-
load subsets, click here
You can access research reports and related publi-
cations using CDHA's online annotated bibliogra-
phy
Additional codebooks, research reports, and other
related publications can be found in the DPLS col-
lection.
If you are affiliated with CDE, additional materi-
als can be identified using CDECAT.
Faculty, staff, and students at the University of
Wisconsin - Madison might also search the
campus library system for additional related hold-
ings.
To create cross-tabs, perform regression analysis,
perform more sophisticated analysis, you MUST
REGISTER
To download a subset, go to the public website.
Here, you can also create a customized dataset.
Chapter 1: Electronic Resources
Wisconsin Longitudinal Study handbook 2006
6
NOTE
All files have been updated regularlyas data have been added, variableshave been recoded, or errors havebeen collected. Public data, documen-tation, (bibliography, codebooks, flow-charts, and other memoranda), andextraction tools are available on theweb through the DPLS website.
Chapter 1: Electronic Resources
Wisconsin Longitudinal Study handbook 2006
7
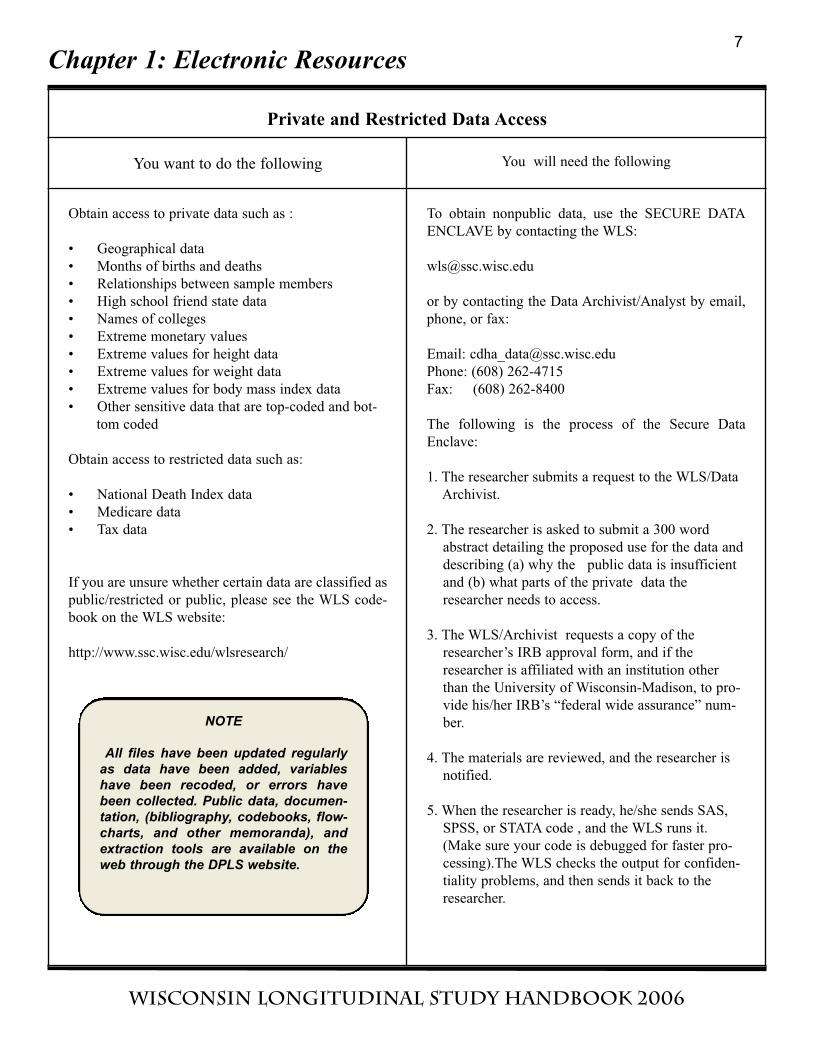
Private and Restricted Data Access
You want to do the following You will need the following
Obtain access to private data such as :
• Geographical data
• Months of births and deaths
• Relationships between sample members
• High school friend state data
• Names of colleges
• Extreme monetary values
• Extreme values for height data
• Extreme values for weight data
• Extreme values for body mass index data
• Other sensitive data that are top-coded and bot-
tom coded
Obtain access to restricted data such as:
• National Death Index data
• Medicare data
• Tax data
If you are unsure whether certain data are classified as
public/restricted or public, please see the WLS code-
book on the WLS website:
http://www.ssc.wisc.edu/wlsresearch/
To obtain nonpublic data, use the SECURE DATA
ENCLAVE by contacting the WLS:
or by contacting the Data Archivist/Analyst by email,
phone, or fax:
Email: [email protected]
Phone: (608) 262-4715
Fax: (608) 262-8400
The following is the process of the Secure Data
Enclave:
1. The researcher submits a request to the WLS/Data
Archivist.
2. The researcher is asked to submit a 300 word
abstract detailing the proposed use for the data and
describing (a) why the public data is insufficient
and (b) what parts of the private data the
researcher needs to access.
3. The WLS/Archivist requests a copy of the
researcher’s IRB approval form, and if the
researcher is affiliated with an institution other
than the University of Wisconsin-Madison, to pro-
vide his/her IRB’s “federal wide assurance” num-
ber.
4. The materials are reviewed, and the researcher is
notified.
5. When the researcher is ready, he/she sends SAS,
SPSS, or STATA code , and the WLS runs it.
(Make sure your code is debugged for faster pro-
cessing).The WLS checks the output for confiden-
tiality problems, and then sends it back to the
researcher.
NOTE
All files have been updated regularlyas data have been added, variableshave been recoded, or errors havebeen collected. Public data, documen-tation, (bibliography, codebooks, flow-charts, and other memoranda), andextraction tools are available on theweb through the DPLS website.
Chapter 1: Electronic Resources
Wisconsin Longitudinal Study handbook 2006
Data Formats
Two WLS data sets are available for users to download:
1. The first official release contains data from 1957-1994.
2. The new (unofficial) release contains data from 1957-2005. Please see
change notice # 23 for details on differences between 1957-1994 data in
this release and 1957-1994 data in the previous release. This change notice
can be found at: http://www.ssc.wisc.edu/wlsresearch/data/updates/.
Several formats of data are available: SAS, STATA, SPSS, and ASCII. By
browsing a variable list on the public site, users can also download extracts.
Sensitive data users can take advantage of the secure data enclave (see the
“Private data” chart immediately before this section for more information).
All of the downloadable data files are compressed in ZIP format. The order
of the variables in the data files is the same as the order of the variables in
the codebooks/documentation. If a variable is not available due to non-inter-
view, it will have the system missing value. For the SPSS file: variable and
value labels are declared. The SAS permanent data set has variable labels,
and a command file that allows the user to apply value labels with proc for-
mat. The STATA file contains variable and value labels. The variable names
are in lower case in Stata because Stata is case sensitive.
8
AdditionalMaterials
Additionalsource
materialsabout theWLS areavailablefrom the
Center forDemography
of Healthand Aging.Send email
to:
For addition-al informa-tion aboutthe WLS,
email:
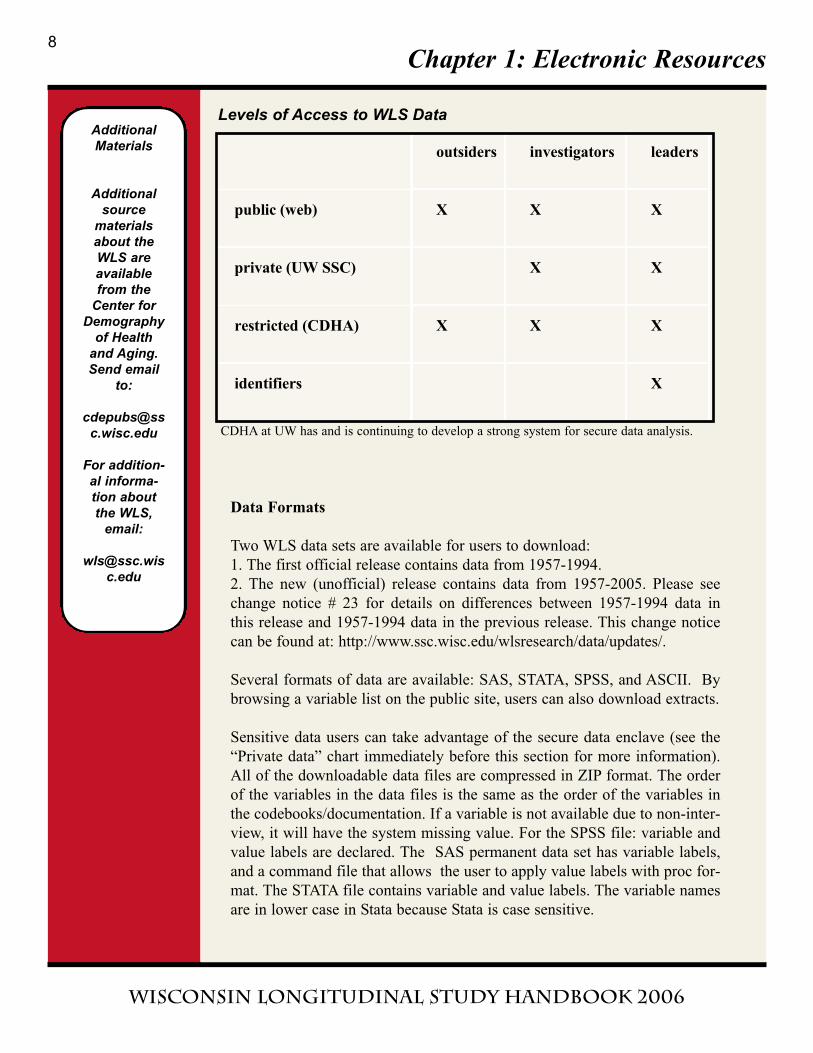
outsiders investigators leaders
public (web) X X X
private (UW SSC) X X
restricted (CDHA) X X X
identifiers X
Levels of Access to WLS Data
CDHA at UW has and is continuing to develop a strong system for secure data analysis.
Chapter 1: Electronic Resources
Wisconsin Longitudinal Study handbook 2006
WLS Utility Programs
Download the missing value converter for Stata. This converts WLS missing
value codes (-1, -2, etc.) into native Stata missing value codes. To do this,
click here.
The Wisconsin Longitudinal Study uses negative integers starting with -1 to
indicate missing values.
For all numeric variables in the WLS, the Stata program statawls will con-
vert these missing values to Stata missing values. It will also change the
value labels so that they remain correct. Additionally, the command can also
be used to change all variable names from uppercase to lowercase (or vice
versa).
After downloading the WLS dataset, you can run statawls once, save the
resulting dataset, and work from that for all your analyses.
If you know how to install and run Stata ado and help files, you can follow
the same practices to install and run statawls. Otherwise, statawls.ado is an
add-on Stata command, and like all add-on commands, it needs to be
installed in a location where Stata will find it. If you type -sysdir-, you can
see what directories Stata searches for .ado files. If you have write privileges
to the directory listed as PLUS or PERSONAL, we recommend installing it
there. Just copy the files into that directory and they should work.
Stata will also search the working directory for .ado files. You can see what
directory Stata has set as the working directory by typing "cd". If you type
"cd" and a path, you can change the working directory to whatever you want.
After statawls.ado has been put in the PLUS, PERSONAL, or working direc-
tory, all you need to do is type: statawls, lower
If you want statawls to change all the missing values and change variable
names from uppercase to lowercase. Leave off the ", lower" if you want to
leave variable names as is. If they are already lowercase and you want to
make them uppercase, you can specify ", upper" instead.
If the .hlp file is installed in either the PLUS, PERSONAL, or working direc-
tory, you can get more information on statawls by typing "help statawls".
9
Chapter 1: Electronic Resources
Wisconsin Longitudinal Study handbook 2006
Archive Listserve
The Data and Program Library Service (DPLS) announces additions to its
online archive via a listserver. To join the listserver send an email message
to: [email protected] containing the words: SUBSCRIBE
ARCHIVE in the message body. The listserver will respond with a mail
message indicating the success or failure of your attempt.
10
Chapter 1: Electronic Resources
Wisconsin Longitudinal Study handbook 2006
11
Chapter 1: Electronic Resources
Wisconsin Longitudinal Study handbook 2006
12
Chapter 2: Overview and History of the WLS
Wisconsin Longitudinal Study handbook 2006
In this Chapter
Study Purpose...............................................................................................13
StudyDescription ..........................................................................................13
Project History..............................................................................................15
Current Status and Directions......................................................................17
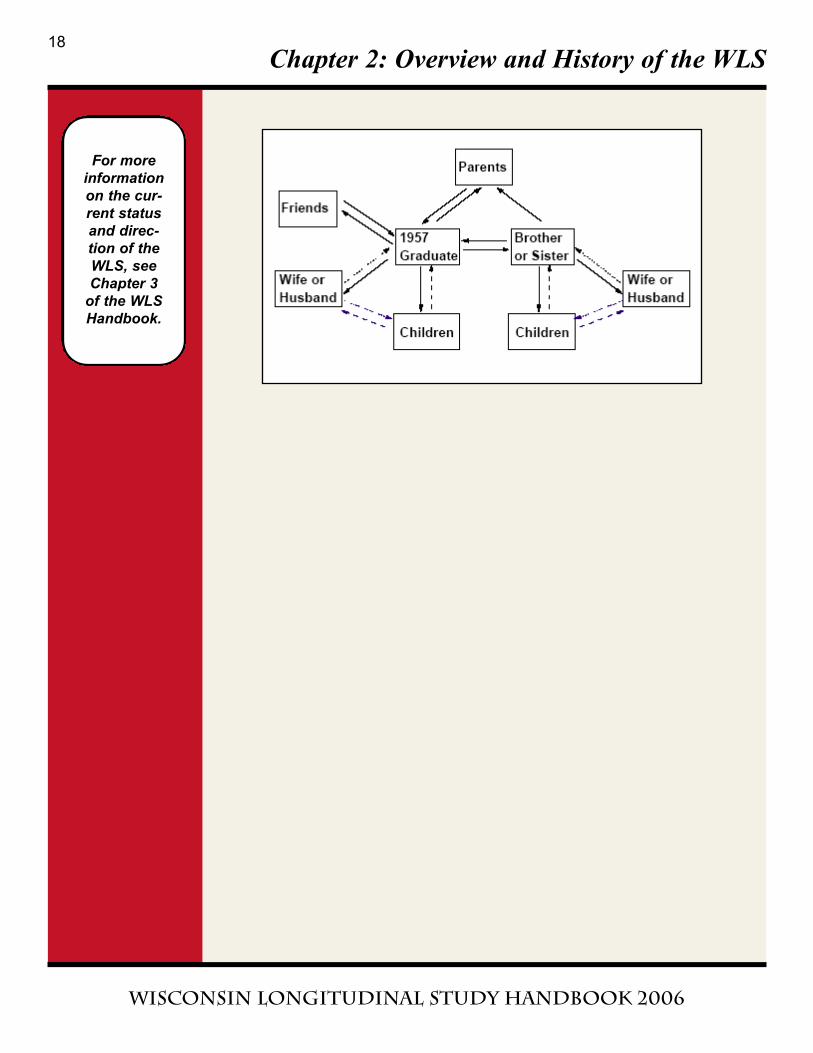
Relational Structure of WLS Data................................................................18
Purpose
The Wisconsin Longitudinal Study (WLS) cohort of men and women,
mainly born in 1939, precedes by about a decade the bulk of the baby boom
generation that continues to tax social institutions and resources at each stage
of life. For this reason, the study can provide early indications of trends and
problems that may become important as the larger group ages into its sixties.
This adds to the value of the study by obtaining basic information about the
life course as such, independent of the cohort's vanguard position with
respect to the baby boom. In addition, the WLS is also the first of the large,
longitudinal studies of American adolescents, and it thus provides the first
large-scale opportunity to study the life course from late adolescence through
the early/mid-60s in the context of a complete record of ability, aspiration,
and achievement.
WLS Study Description
The WLS is a long-term study of a random sample of 10,317 men and
women who graduated from Wisconsin high schools in 1957 and of their ran-
domly selected brothers and sisters. Survey data were collected from the
original respondents or their parents in 1957, 1964, 1975, and 1993, and from
a selected sibling in 1977 and 1994. These data provide a full record of social
background, youthful aspirations, schooling, military service, family forma-
tion, labor market experiences, and social participation of the original
respondents. The survey data from earlier years have been supplemented by
mental ability tests (of primary respondents and 2000 of their siblings), meas-
ures of school performance, and characteristics of communities of residence,
schools and colleges, employers, and industries. The WLS records for pri-
mary respondents are also linked to those of three same-sex high school
friends within the study population. In 1977 the study design was expanded
with the collection of parallel interview data for a highly stratified sub-sam-
ple of 2000 siblings of the primary respondents. In the 1992-93 round of the
WLS the sample was expanded to include a randomly selected sibling of
every respondent with at least one brother or sister, and the content was
extended to obtain detailed occupational histories and job characteristics;
13
Chapter 2: Overview and History of the WLS
Wisconsin Longitudinal Study handbook 2006
incomes, assets, and inter-household transfers; social and economic charac-
teristics of parents, siblings, and children and descriptions of the respon-
dents’ relationships with them; and extensive information about mental and
physical health and well-being.
The WLS sample is broadly representative of white, non-Hispanic American
men and women who have completed at least a high school education.
Among Americans aged 50 to 54 in 1990 and 1991, approximately 66 per-
cent were non-Hispanic white persons who completed at least 12 years of
schooling. Some strata of American society are not well represented. The
WLS sample is mainly of German, English, Irish, Scandinavian, Polish, or
Czech ancestry. It is estimated that about 75 percent of Wisconsin youth
graduated from high school in the late 1950s – everyone in the primary WLS
sample graduated from high school; about seven percent of their siblings did
not graduate from high school. Minorities are not well-represented: there are
only a handful of African American, Hispanic, or Asian persons in the sam-
ple, though a project is currently under way to find all African Americans
who graduated from Wisconsin high schools in 1957. About 19 percent of the
WLS sample is of farm origin, and that is consistent with national estimates
of persons of farm origin in cohorts born in the late 1930s. As in the later,
large, longitudinal studies of school-based samples, age variation occurs in
repeated observations rather than in cross-section. Also, siblings cover sev-
eral adjoining cohorts: they were born primarily between 1930 and 1948. In
1964, 1975, and again in 1992, about two-thirds of the sample lived in
Wisconsin, and about one-third lived elsewhere in the U.S. or abroad.
In 1992-93 a follow-up survey – of about 9,000 men and women who were
first interviewed as seniors in Wisconsin high schools in 1957 and have sub-
sequently been followed up in 1957, 1964, and 1975 – was completed. Most
respondents were 53 or 54 years old when interviewed. Other members of
the original sample who were not interviewed in 1975 (475 of 850 surviving
non-respondents) have also been interviewed. In all, 8493 of the 9741 sur-
viving members of the original sample have been interviewed. In 1993-94
randomly selected siblings of the high school graduates were interviewed.
Some 2000 siblings were previously interviewed in 1977, and they and
approximately 2800 additional siblings were interviewed in the 1993-94
round of the study. The surveys included a one-hour telephone interview fol-
lowed by a 20-page, self-administered questionnaire. Brief, close-out inter-
views were carried out with a relative of respondents who have died, and, in
cases in which the selected sibling has died, close-out data from the original
respondent were obtained.
14
Chapter 2: Overview and History of the WLS
Wisconsin Longitudinal Study handbook 2006
Project History
1957
The Wisconsin Longitudinal Study (WLS) began with a 1957 survey of the
educational plans of all high school seniors in the public, private, and
parochial schools of Wisconsin. A professor in the School of Education at the
University of Wisconsin, J. Kenneth Little, conducted the statewide survey
with the cooperation of the Wisconsin State Superintendent of Schools, and
it was used to plan the expansion and consolidation of public higher educa-
tion in the state.
1964
In 1962, William H. Sewell, one of the academic leaders who brought the
behavioral and social sciences into NIH, selected a random, one-third sample
of the graduates, consisting of 10,317 cases, for further study. Sewell had
long been interested in the formation and consequences of youthful aspira-
tions, but had lacked access to an appropriate population for study. Sewell
conducted a short mail survey of the selected students’ parents. He also
selected all students in the top tenth of academic ability, but this component
of the study was abandoned after the 1964 follow-up because of insufficient
funding. He then added information on the measured mental ability of each
student from files of the Wisconsin State Testing Service.
Instrument: Wisconsin Tax Department Data (Public Records)
Sample: 1/3 sample and Top 10% IQ
Father's 1957 occupation
Mother's 1957 occupation
Parental income 1957-1960
Male R's 1964 occupation
Male R's spouse's 1964 occupation
1975-1977
In 1975, the graduates were interviewed by telephone. The WLS also
obtained a roster of living siblings and chose a focal sibling at random for
each graduate, with the exception that all twins were included. In 1977, par-
allel interview data were obtained for a highly stratified sample of 2100 of
these randomly selected siblings.
Included in the 1975 Telephone Questionnaire: 1970 and 1975 residential
characteristics, head of household in 1957, parents' education, father's or
head's 1957 occupation, mother's 1957 occupation, parental income in 1957,
family of origin nationality and religion, religion and church attendance, sib-
15
Roadmap
For a list ofall data col-lection intru-ments from1957-1994,click here:
Chapter 2: Overview and History of the WLS
Wisconsin Longitudinal Study handbook 2006
ling data (age, sex, and education of all siblings), selected sibling (occupa-
tion, high school attended), educational and occupational aspirations, signif-
icant others'influence and friends names, graduate's education (college and
vocational), military experience, first full-time job after completing school,
job in 1970, job in 1974, labor force status, current or last job, job impor-
tance and satisfaction, attitudes toward work, occupational aspirations for
1985, marital history and spouse data, child roster, aspirations for randomly
selected child,work histories of ever married women, earnings of R and
spouse, social participation.
Included in the 1977 Sibling Survey: test scores from Wisconsin State
Testing Service, characteristics of town where sib attended high school, 1970
and 1977 residential characteristics, social background data, occupational
history, marital history and spouse data, child roster, work histories of ever
married women, earnings of sib and spouse, social participation.
Supplemental Data
Early survey data were supplemented by information on the earnings of par-
ents from state tax records, mental ability test scores and rank in high school
class, and characteristics of high schools and colleges, employers, indus-
tries, and communities of residence. State archival data on high school dis-
trict resources from 1954 to 1957 were added. WLS records for graduates are
also linked to those of three best same-sex high school friends. Data on the
occupational careers of male graduates are supplemented by Social Security
earnings histories from 1957 to 1971.
1992-1994
In 1992-94, the WLS collected new data from surviving members of the
original sample and their siblings. The graduates were 53 and 54 years old,
and four fifths of their siblings were 44 to 62 years old. At those ages, the
WLS graduates and their siblings were anticipating their own retirement and
aging as well as managing relationships with one another, their adult chil-
dren, and their elderly parents: (1) In 1993, 91 percent of graduates had at
least one
living sibling; (2) 90 percent of the graduates had at least one living child
aged 18 or older; and (3) 56 percent of graduates had a living mother, and 25
percent had a living father. Forty-five percent had no living parents, and 15
percent had two living parents. Thus, it was believed that the WLS gradu-
ates and their siblings were ideally suited for a study of aging and of
intergenerational relations among adults.
16
Chapter 2: Overview and History of the WLS
Wisconsin Longitudinal Study handbook 2006
In 1992-94, the WLS conducted four major surveys with NIA support: tele-
phone and mail surveys of graduates and nearly identical telephone and mail
surveys of an expanded random sample of focal siblings. The 1992/93 fol-
low-up survey consisted of about 9,000 men and women who were first inter-
viewed as seniors in Wisconsin high schools in 1957. Other members of the
original sample who were not interviewed in 1975 (475 of 850 surviving
non-respondents) were also interviewed. In all, 8493 of the 9741 surviving
members of the original sample were interviewed. In 1993/94, randomly
selected siblings of the high school graduates were interviewed. Some 2000
siblings were previously interviewed in 1977; they and approximately 2800
more siblings were interviewed in this round of the study. The surveys
included a 1-hour telephone interview, followed by a 20-page, self-adminis-
tered questionnaire. In our 1992-94 interviews, we updated measurements of
marital status, child-rearing, education, labor force participation, jobs and
occupations, social participation, and future aspirations and plans among the
graduates and their siblings. In addition, we expanded the content of the
study to cover psychological well-being, mental and physical health, wealth,
and social and exchange relationships with parents, siblings, and children.
In designing the new round of the study, the WLS tried to balance compara-
bility with our own previous concepts and methods, which were similar to
those used in the Current Population Survey and the 1973 Occupational
Changes in a Generation Survey, and comparability with other contemporary
projects, e.g., the Health and Retirement Survey, the National Survey of
Families and Households, NIH surveys of work and psychological function-
ing, the NORC General Social Survey, and the MacArthur Foundation's
Research Network on Successful Midlife Development.
Current Status and Direction
Most recently, survey data were collected from widow(er)s of the graduates
and siblings in 2005. The current round of data collection is reaching its final
stages, and a very preliminary version of the new data for the original respon-
dents is now available. Data for the original respondent’s spouse, the select-
ed sibling, and the selected sibling’s spouse will be available in the future.
Please join the WLS list serv by sending an email to:
[email protected] with a subject line of "Subscribe" and
visit this site frequently to insure you are aware of any updates.
17
Chapter 2: Overview and History of the WLS
Wisconsin Longitudinal Study handbook 2006
18
For more information on the cur-rent statusand direc-tion of theWLS, seeChapter 3
of the WLSHandbook.
Chapter 3: Current Status and Direction
Wisconsin Longitudinal Study handbook 2006
In this Chapter:
Most Recent WLS Data Release...................................................................19
WLS Data Updates ......................................................................................20
WLS “The Wisconsin Longitudinal Study: As We Age”...............................24
“Wisconsin Longitudinal Study: Tracking the Life Course”.......................25
“End-of-Life Planning and Well-Being in Late Life”..................................26
“Social and Behavioral Contexts of the Aging Mind” ...............................27
“Nonnormative Parenting Impacts in Midlife and Old Age”......................27
“Access to Care and Health Outcomes in the Near Elderly”.....................28
“Work Health and Well-Being” ..................................................................29
“Education in Careers, Health, and Retirement” .......................................30
“The Emotional Brain Accross the Life Course”........................................31
“Interaction and Cognition in Surveys of Older Adults”............................32
Most Recent WLS Data Release:
(November 17, 2005) Wisconsin Longitudinal Study Releases 2004
Graduate Data
The Wisconsin Longitudinal Study announces the public release of the 2004
WLS graduate data version 11.0. This is a preliminary release of the data
gathered from the telephone and mail interviews of the original graduate
respondents. The telephone interview was in the field from July of 2003
through June 2005. The mail survey is still in the field, but will soon be
complete. The current release includes 7,265 telephone participants and
6,279 mail participants in the current round of surveys.
These data will be updated with information from siblings, graduates’
spouses, siblings’ spouses, and surviving spouses of deceased graduates and
siblings in the months to come. This public-release WLS study is freely
available from the WLS website. Data files are downloadable in the
following formats: STATA, SAS, and SPSS. In addition to this new data
release, the past rounds (1957-1994) of WLS data have been updated. For
details about these changes click here.
To keep you informed of all further releases of the data we encourage
you to join one or both of our new list servers.
WLSannounce:
Individuals who subscribe to this list will receive occasional updates
19
PreliminaryRelease
WLS 11.00PreliminaryRelease odnow avail-able. This
datasetincludesnew datafrom thecurrent
round ofinterviews,as well asupdates tothe 1957-1994 data.
Please seeChange
Notice #23 for details
Chapter 3: Current Status and Direction
Wisconsin Longitudinal Study handbook 2006
20
from WLS staff regarding new releases, change notices, pilot grant
announcements, or other information of relevance to the WLS community.
If you subscribe to this list the only emails you will receive will be
from the WLS staff.
To subscribe to WLSannounce send an e-mail to
[email protected] with the subject line, "Subscribe."
WLSdiscuss:
This list will be open to posts from any list member who has a
question regarding the WLS. The purpose of this list is to facilitate
communication among researchers using the WLS data.
To subscribe to WLSdiscuss send an e-mail to
[email protected] with the subject line, "Subscribe."
WLS Data Updates
What follows are summaries of past data updates (change notices). For
complete WLS Data Updates, click here.
• A very preliminary release of the new data is now available. Version
11.00 includes new data from the current round of interviews, as well as
updates to the 1957-1994 data. Please read Change Notice #23 for complete
details.
• New editions of all three waves of data have been released. These new
releases (dated 04/2003) replace all previous editions. If you received data
and documentation before May 01, 2003, please read Change Notice #22. All
of the corresponding pages for these waves now reflect these new editions.
• Best measures of Father's Occupation were updated in the 12/6/00
release of Wave 1 data. See Change Notice #21.
• On December 6, 2000 a new version of the extract program, WLSGV,
was released. Files have been updated to reflect new and revised variables
and increase the size of arrays for expanded datasets. If you are downloading
any of the 12/00 updates, you should also download the 12/00 release of the
extract program. This release includes all updates made through December 6,
2000. SEE BELOW.
• A new edition (DPLS edition 4) of the third wave data (1993/94 Sibling
Chapter 3: Current Status and Direction
Wisconsin Longitudinal Study handbook 2006
Telephone and Mail surveys) has been released. This new release (dated
9/00) replaces all previous editions. If you received third wave data and doc-
umentation before December 6, 2000, please read Change Notice #21. All of
the pages for WLS: 1993/94 Sibling Telephone and Mail surveys now reflect
this new edition.
• A new edition (DPLS edition 8) of the second wave data (1992/93
Graduate Telephone and Mail Surveys) has been released. This new release
(dated 9/00) replaces all previous editions. If you received second wave data
and documentation before December 6, 2000, please read Change Notice
#21. All of the pages for WLS: 1992/93 Graduate Telephone and Mail
Surveys now reflect this new edition.
• A new edition (DPLS edition 9) of the first wave data (1957-1977
graduate and sibling surveys) has been released. This new release (dated
9/00) replaces all previous editions. If you received first wave data and doc-
umentation before December 6, 2000, please read Change Notice #21. All of
the pages for WLS: 1957-1977 graduate and sibling surveys now reflect this
new edition.
• On November 22, 1999 a new version of the extract program, WLSGV,
was released. Files have been updated to reflect new and revised variables
and increase the size of arrays for expanded datasets. If you are downloading
any of the 11/99 and 12/99 updates, you should also download the 11/99
release of the extract program. This release includes all updates made
through December 1, 1999. SEE BELOW.
• A new edition (DPLS edition 3) of the third wave data (1993/94 Sibling
Telephone and Mail surveys) has been released. This new release (dated
9/99) replaces all previous editions. If you received third wave data and doc-
umentation before December 1, 1999, please read Change Notice #20. All of
the pages for WLS: 1993/94 Sibling Telephone and Mail surveys now reflect
this new edition.
• A new edition (DPLS edition 7) of the second wave data (1992/93
Graduate Telephone and Mail Surveys) has been released. This new release
(dated 9/99) replaces all previous editions. If you received second wave data
and documentation before December 1, 1999, please read Change Notice
#19. All of the pages for WLS: 1992/93 Graduate Telephone and Mail
Surveys now reflect this new edition.
• A new edition (DPLS edition 8) of the first wave data (1957-1977
graduate and sibling surveys) has been released. This new release (dated
9/99) replaces all previous editions. If you received first wave data and doc-
21
Chapter 3: Current Status and Direction
Wisconsin Longitudinal Study handbook 2006
22
umentation before November 17, 1999, please read Change Notice #18. All
of the pages for WLS: 1957-1977 graduate and sibling surveys now reflect
this new edition.
• On 7/98 a new variable for type of illness (MX120RER) was added to
Wave 2 mail data (WLS23MU.DAT) in the 3/98 release. The codebooks
included this variable and did not need to be changed. If you received second
wave data before 7/98, please read Change Notice #17.
• A 5/98 revised version of the extract program, WLSGV, was released for
use with the 3/98 data releases of waves 1, 2, and 3. This corrected a problem
for Wave 1 - WLSCOMP and Wave 3 - XBEGV and WLS23SM. If you
received WLSGV before 5/98, please read Change Notice #16.
• On 5/98 revised version of Wave 1 (1957-1977 graduate and sibling
surveys) documentation was released. This corrected a problem for Wave 1
documentation in the company data module - WLSCOMP. Please read
Change Notice #15.
• On 5/98 a revised version of Wave 3 (1993/94 Sibling Telephone and
Mail surveys) documentation was released. This corrected a problem for
Wave 3 documentation - XBEGV and WLS23SM. Please read Change
Notice #14.
• On 3/98 an edition (DPLS edition 2) of the third wave data (1993/94
Sibling Telephone and Mail surveys) was released. This new release replaced
all previous editions. If you received third wave data before 3/98, please read
Change Notice #13.
• On 3/98 an edition (DPLS edition 6) of the second wave data (1992/93
Graduate Telephone and Mail Surveys) was released. This new release
replaced all previous editions. If you received second wave data before 3/98,
please read Change Notice #12.
• On 3/98 an edition (DPLS edition 7) of the first wave data (1957-1977
graduate and sibling surveys) was released. This new release replaced all
previous editions. If you received first wave data before 3/98, please read
Change Notice #11.
• On 12/97 a revised version of WLSGV was released. This corrected a
problem for Wave 3, mail data (1993/94 Sibling Mail Survey). If you
received WLSGV before 12/97, please read Change Notice #10.
• On 7/97 a revised release of first wave data (1957-1977 graduate and
Chapter 3: Current Status and Direction
Wisconsin Longitudinal Study handbook 2006
sibling surveys) to correct a minor error. If you received first wave data
before 7/97, please read Change Notice #9.
• On 4/24/97, twenty-one new variables on sexual harassment and job dis-
crimination were added to the first edition (DPLS edition 1) of the third wave
data (1993/94 Sibling Telephone and Mail Surveys) which was originally
released on March 26, 1997. Please read Change Notice #8. There was also
an updated version of the extract program - WLSGV - to be used with this
update.
• On 3/26/97 the first edition (DPLS edition 1) of the third wave data
(1993/94 Sibling Telephone and Mail Surveys) was released.
• On 3/26/97 a new edition (DPLS edition 5) of the second wave data
(1992/93 Graduate Telephone and Mail Surveys) was released. If you
received second wave data before 3/97, please read Change Notice #7.
• On 3/26/97 a new edition (DPLS edition 6) of the first wave data (1957-
1977 graduate and sibling surveys) was released. If you received first wave
data before 3/97, please read Change Notice #6.
• If you received second wave data (1992/93 Graduate Telephone
Surveys) depression and alcohol items in the HPER module, before 8/1/96
please read Change Notice #5. These changes appeared in the 3/26/97 release
of the second wave data.
• If you received first wave data (1957-1977 graduate and sibling surveys)
before May 31,1996, updates were made to the Wave 1 documentation and
the READMEs for the documentation and appendices. The codebook was
updated with complete descriptions of the codes for friends and additional
notes were added throughout.
• If you received second wave data (1992/93 Graduate Telephone and
Mail Surveys) before 5/31/96, please read this Change Notice #4. The errors
that existed in releases prior to the DPLS edition 4 of the second wave data
are described in detail in this report.
• If you received first wave data (1957-1977 graduate and sibling surveys)
before March 1996, please read this Change Notice #3. The errors that
existed in releases prior to the DPLS edition 5 of the first wave data are
described in detail in this report.
• If you received second wave data (1992/93 Graduate Telephone and
Mail Surveys) before January 19, 1996, please read this Change Notice
23
Chapter 3: Current Status and Direction
Wisconsin Longitudinal Study handbook 2006
24
#2.
• If you received first wave data (1957-1977 graduate and sibling
surveys) before June of 1995, please read this Change Notice #1.
• In March 1996 the following changes and/or additions were made to
the paper copies of the Wave 1 appendices:
• Appendix F - Remove the original COR #315. It never belonged with
that appendix and it has errors.
• Appendix P - Replace the complete original Appendix P with the new
Appendix P available in machine-readable form with this new release
of Wave 1 data.
• Appendix BB - Add COR #331 which describes the creation of the
work experience variables. This is available (at cost) from DPLS or
from ICPSR.
The Wisconsin Longitudinal Study: As We Age
We propose to continue the Wisconsin Longitudinal Study (WLS) with a
major round of data collection, 45 years after the high school graduation of
the original 10,317 participants. We want to exploit the unique scientific
value of the WLS to pursue a broad agenda of research on social and
economic factors in health and aging. We represent diverse scientific fields –
sociology, demography, epidemiology, economics, social and cognitive
psychology, industrial engineering, neuroscience, social work, psychiatry,
nursing, and medicine. Our plan for data collection – of which these
proposed surveys are only the first phase – will span many modes: telephone
and mail surveys, brain imaging, personal interview, anthropometric
measurement, bio-indicators, content analysis of recorded interviews, and
linked administrative records. We intend and expect that these new data,
along with the rich data presently available from the WLS, will resolve old
questions and open new areas of interdisciplinary inquiry about health,
aging, and the life course. All WLS data will be released to the research
community as soon as they have been collected, cleaned, and documented.
(a) We propose one-hour telephone and 48 page mail surveys in 2002-03 of
more than 9600 surviving American men and women who were first
interviewed as graduating seniors in high school in 1957 and were followed
up in 1964, 1975, and 1992; they will be 63-64 years old when they are
surveyed. (b) We propose parallel telephone and mail surveys of 7150
randomly selected siblings of the graduates; they vary widely in age and
most were first surveyed in 1994; about 2100 were first interviewed in 1977.
Chapter 3: Current Status and Direction
Wisconsin Longitudinal Study handbook 2006
(c) We propose shorter (30 minute) telephone interviews with spouses (N =
10,150) and widows of graduates and their siblings (N = 850). The WLS is
unique as a large scale longitudinal study of adults and their families that will
soon cover almost half a century. It is a valuable public resource for studies
of aging and the life course, inter-
generational transfers and relationships, family functioning, long-term
effects of education and of cognitive ability, occupational careers, physical
and mental well-being, and morbidity and mortality. Our goal is to extend
and enrich our observations of the WLS cohort since their adolescence in
ways that will answer important research questions in aging for decades to
come.
Wisconsin Longitudinal Study: Tracking the Life Course
We propose a collaborative, multidisciplinary program of projects on aging
and the life course that will both exploit and add to core resources of the
Wisconsin Longitudinal Study (WLS). The program will use existing longi-
tudinal data and new data, collected 45 years after the 1957 high school
graduation of the original 10,317 participants. We are more than 50 investi-
gators and colleagues at the University of Wisconsin and across the nation.
We want to exploit the unique scientific value of the WLS, along with other
relevant and comparable data on population aging, to pursue a broad agenda
of research on social and economic factors in health and aging. We represent
diverse scientific fields – sociology, demography, epidemiology, economics,
social and cognitive psychology, industrial engineering, neuroscience, social
work, psychiatry, nursing, and medicine. Our analytic work will reflect and,
we hope, intermingle the full range of theories, models, and methods of our
home disciplines. Regardless of our individual and collective plans, all WLS
data will be released to the research community as soon as they can be
collected, cleaned, and documented. We will recruit, encourage, and support
a cadre of researchers (and researchers-in-training) at the UW-Madison and
elsewhere who will fully exploit the unique resources of the Wisconsin
Longitudinal Study. We will supplement existing and new WLS data with
linked data from individual administrative records, organizational records,
and small area data. We will disseminate WLS data by several means,
including both public and secure access. We will sponsor and organize local
and extramural seminars and workshops to encourage use of WLS data and
to report research in progress, and we will organize a small project
competition and workshops to encourage innovative uses (and new users) of
WLS data. We will provide common resources and a venue for productive
scientific interaction for an initial set of eight major analytic research projects
that will use data from the WLS: Social and Behavioral Contexts of the
Aging Mind; End-of-Life Planning and Well-Being in Late Life;
Nonnormative Parenting Impacts in Midlife and Old Age; Access to Care and
25
Chapter 3: Current Status and Direction
Wisconsin Longitudinal Study handbook 2006
26
Health Outcomes in the Near Elderly; Family Relations, Labor Supply, and
Health in Later Life; Work, Health, and Well-Being; Education in Careers,
Health, and Retirement; and The Emotional Brain Across the Life Course.
End-of-Life Planning and Well Being in Late Life
The proposed research will investigate the impact of individual- and couple-
level end-of-life planning on the economic, psychological and physical well-
being of midlife men and women. End-of-life planning includes economic
preparations (e.g., preparation of wills, pension and investment strategies),
health-related preparations (e.g., advance directives, long-term care
insurance), and psychological preparations (e.g., in-depth discussions with
family members). The analyses will use data from the Wisconsin
Longitudinal Study, a sample survey of men and women who graduated
Wisconsin high schools in 1957, and who were reinterviewed in 1964, 1975,
and 1992-93. Our analyses will also use data obtained from the respondent,
a selected sibling, and spouse in the 2002 wave of the WLS. Retrospective
accounts of planning behavior will be obtained from widowed persons and
respondents who have recently lost a parent, in order to explore linkages
between past planning behavior and current well-being for persons who have
already experienced death of a close relative. Our research is guided by two
important themes: First, preparation for death and the consequences of death
for survivors are embedded in complex family relationships. Second, the
preparations and plans made for end-of-life are influenced both by contem-
poraneous economic and health conditions, and earlier life course
experiences, including economic, health and marital trajectories, and charac-
teristics of siblings and parents. We will address three broad objectives: (1)
to identify the contemporaneous and early life course characteristics that
influence the end-of-life planning strategies adopted by midlife adults; (2) to
investigate the effects of end-of-life planning on the psychological, physical
and economic well-being of midlife adults who have recently lost a spouse
or parent; and (3) to document the end-of-life planning strategies adopted by
midlife adults, and to prospectively explore the consequences of these
strategies for physical, emotional and economic well-being as the
respondents and spouses approach old age. These research goals are critically
important today, as public policies and medical technologies afford older
adults greater control over when, how and where they will die. We will use
multivariate techniques to test hypotheses derived from the specific aims.
Social and Behavioral Contexts of the Aging Mind
Principal Investigator: Robert M. Hauser
Investigators: Jeremy Freese, Dean Dennis Krahn, Molly Carnes, Deborah
Carr, Maryellen C. MacDonald, Kristen Lawton Barry, and Fred Blow
Chapter 3: Current Status and Direction
Wisconsin Longitudinal Study handbook 2006
This research will identify and estimate reciprocal relationships between
specific social and behavioral contexts and psychological functioning in an
aging population. Our interest in psychological functioning is not limited to
cognition, but also includes related aspects of individuals’ psychological
lives, especially symptoms of mental disorder and psychological well-being.
The research will encompass two general features of social context (everyday
social and intellectual engagement; the experience of stressors); one specific
behavioral context (alcohol use); and one specific technological context
(computer ownership and Internet use). In each of these four domains, we
seek to explicate how differences in psychological functioning may be both
a cause and consequence of differences in life contexts. The overarching goal
is to understand both how contextual factors affect psychological functioning
among older adults and how psychological factors contribute to differences
in the social, behavioral, and technological contexts of older adults’ lives.
Such reciprocal relationships can only be elaborated satisfactorily with lon-
gitudinal data. This project will exploit existing and new data collected in the
Wisconsin Longitudinal Study (WLS), which has followed a cohort of some
10,000 Wisconsin high school graduates—and more than 5000 of their sisters
and brothers—from 1957 to the present. The wealth of contextual
information already available in the WLS positions it to contribute
importantly and uniquely to the understanding of sources and patterns of
change in psychological functioning with age.
Nonnormative Parenting Impacts in Midlife and Old Age
Principal Investigator: Marsha Seltzer
Investigators: Jan Greenberg, Frank Floyd, Larry Bumpass, and Robert M.
Hauser
This research builds on the progress of a small grant (R03 AG15549) and
uses the Wisconsin Longitudinal Study (WLS) to investigate the long-range
effects of nonnormative parenting. Parents who have either a child with a
developmental disability (DD) or schizophrenia, or who have experienced
the death of a child, will be compared with unaffected parents with respect to
parental attainment and well-being as the parents transition from midlife to
the early
retirement years. Using a new set of screening measures, parents in these
groups will be identified in the WLS cohort. Affected WLS parents will be
compared with unaffected parents, controlling for differences among the
parent groups before the nonnormative parenting event occurred. The
analyses will include withingroup assessments of heterogeneity among WLS
parents who experienced a nonnormative parenting challenge, cross-
sectional group comparisons at various points in the life course, and longitu-
dinal analyses of the effects of nonnormative parenting experiences on the
life course trajectories and outcomes. The study has four specific aims: (1) to
27
Chapter 3: Current Status and Direction
Wisconsin Longitudinal Study handbook 2006
28
investigate how parents of children with DD or schizophrenia and parents
who have lost a child to death differ from parents of unaffected children in
midlife and in the transition to retirement; (2) to investigate the effect of the
timing of these nonnormative parenting events on parental life course trajec-
tories and well-being; (3) to examine the differential impact on mothers
versus fathers of having a child with a disability or experiencing the death of
a child; and (4) to replicate these analyses using data from the NSFH survey
in order to compare the WLS findings to those obtained in a national sample
with a broader age range. The proposed research integrates the life course
perspective with models of process and change from the stress and coping
framework to understand life-long patterns of adaptation associated with
nonnormative parenting experiences. The WLS provides an unprecedented
opportunity to study the effects of nonnormative parenting for a sample that
was recruited and assessed before the events occurred, and is thus less
vulnerable to the self-selection biases that constrained previous research.
Access to Care and Health Outcomes in the Near Elderly
Principal Investigator: Maureen Smith
Investigators: John Mullahy, Roberta Riportella-Muller, Stephanie Robert,
Molly Carnes, Karen Holden, Robert M. Hauser, and Richard Campbell
There are widespread concerns that near-elderly Americans (55-64 years old)
face increasing barriers to obtaining health care during a time of significant
life transitions and deteriorating health. The long-term objective of the
proposed research is to examine determinants of access to care, use of
services, and health-related outcomes in the near-elderly. The specific aims
are to determine the role of 1) significant recent life transitions such as
changes in health insurance, health, work, or income, 2) financial and non-
financial incentives in a person’s current health insurance plan, 3) the
healthcare environment (e.g., managed care market share, rural/urban), and
4) family history (e.g., parental health and early life experiences). Disparities
in access to care are examined for women and persons with low income or
poor health, as these vulnerable subgroups may have additional difficulties
overcoming barriers to care. This study builds on the strengths of the
Wisconsin Longitudinal Study (WLS). For 44 years, the WLS has followed
men and women who graduated from Wisconsin high schools in 1957
(N=10,317) and a randomly selected sibling (N=7,638). Data were collected
on mental and physical health, health insurance, socioeconomic status, and
occupational histories. WLS project leaders have proposed a new round of
telephone and mail surveys in 2002-03 of the surviving graduates and their
siblings. This proposal extends the WLS by 1) adding items on health
insurance, access to care, use of health services, and health outcomes to the
WLS telephone and mail surveys, 2) collecting detailed information on
health plan characteristics through a survey of health insurance companies,
Chapter 3: Current Status and Direction
Wisconsin Longitudinal Study handbook 2006
3) linking to environmental data from the Area Resource File and Interstudy,
and 4) linking eligible sibling records to Medicare enrollment and claims
data. Multilevel modeling will be used to separate the effects of individuals,
their health plans, their healthcare environment, and their family history in
explaining variation in access to care, use of services, and health outcomes.
The proposed research will provide valuable information to policymakers
and researchers interested in the health and healthcare experiences of the
near-elderly.
Work, Health, and Well-Being
Principal Investigator: John Robert Warren
Investigators: Pascale Carayon and Peter Hoonakker
This is a proposal to investigate the impact of the physical and psychosocial
characteristics of paid employment on a variety of physical and mental health
outcomes from midlife to ages 63-64 using data from the Wisconsin
Longitudinal Study (WLS). The WLS has followed a cohort of some 10,000
Wisconsin high school graduates since 1957. The goal of the project is to
explain the ways in which physical and psychosocial job characteristics
mediate relationship between socioeconomic status (SES) and health among
women and men. It will also explore the roles of job satisfaction, psycholog-
ical well-being, and other factors as mediators in the relationships between
job attributes and health. The proposed analyses will use data on detailed job
conditions and health from the 1975-77, 1992-93, and 2002 waves of the
WLS. Most health measures are self-reports of symptoms and diagnosed
medical conditions, but data from state workers’ compensation files will be
incorporated as well. The proposal addresses three analytic questions,
described in the specific aims: First, how do job characteristics affect health?
Specifically, how do the physical and psychosocial characteristics of jobs
influence general/overall health, depression, and cardiovascular, muscu-
loskeletal, and stress-related health problems and medical conditions?
Second, how do Quality of Working Life (QWL) factors mediate the relation-
ships between job characteristics and health? It is hypothesized that QWL
factors –including job satisfaction, psychological well being, and the rela-
tionship between work and family life – play an important role in mediating
the effects of job characteristics on health. Third, how are the cumulative
characteristics of jobs across the career related to health among the near
elderly? The first phase of the analysis will examine the impact of job char-
acteristics as measured in 1975, 1992, and 2002 on health as measured in
1992 and 2002, both in cross-section and longitudinally. However, the
analysis will also assess the cumulative health impact of job characteristics
(and changes in job characteristics) from 1975 through 2002. The analyses
will develop structural equation models that test hypotheses derived from
each of the specific aims.
29
Chapter 3: Current Status and Direction
Wisconsin Longitudinal Study handbook 2006
30
Education in Careers, Health, and Retirement
Principal Investigator: Robert M. Hauser
Investigators: Charles Halaby and Craig A. Olson
This is a proposal for research on the life-long effects of educational
attainment and academic performance on health, careers, and retirement,
based on data from the Wisconsin Longitudinal Study (WLS). Data from new
WLS surveys will be complemented by administrative record data (Core C
of this proposal). The WLS has followed a cohort of more than 10,000 youth
– and more than 5000 of their sisters or brothers – from high school
graduation to their deaths or to their early 60s. Thus, it provides unique
opportunities to study education, careers, and their consequences for health,
retirement, and mortality: baseline measurements of adolescent cognitive
functioning, educational performance, school resources and programs, and
ambition; detailed histories of education, family life, and careers; similar
data for randomly selected brothers or sisters of the Wisconsin graduates.
Familial patterns of resemblance or divergence in career lines and their con-
sequences may be traced, and self-reports of key variables are validated with
cross-sibling reports. Data have been obtained from the National Death
Index on mortality by cause through 1998 for graduates, siblings, and their
parents. We propose links to earnings and disability data from the Social
Security Administration. Other new data will be obtained through telephone
and mail surveys of graduates, siblings, spouses, and widows (proposed in a
complementary R01). Among other aims, we will extend a social-psycholog-
ical model of socioeconomic achievement from youth through maturity,
modifying it to add new explanatory variables and a richer set of health and
disability outcomes. We will assess the changing impacts of schooling –
including primary and secondary school resources – and of cognitive ability
on earnings and other career outcomes. We will compare similarities and
differences between women and men and among brothers and sisters in
selected outcomes, including prior health and behavioral factors that are
proximate to current outcomes. We will study differentials in retirement,
conceived as a process of changing commitment to the labor market vs. other
activities. We will also use new analytic methods to look at effects of major
contingent events, such as military service and type of college attended, on
economic, psychological, and health outcomes.
The Emotional Brain Across the Life Course
Group Leader: Richard J. Davidson
This project will use magnetic resonance imaging (MRI) to obtain high
resolution information about the morphometry of particular brain regions
implicated in emotion and emotion regulation and their levels of functional
activation in a biological subsample of WLS respondents. Respondents will
Chapter 3: Current Status and Direction
Wisconsin Longitudinal Study handbook 2006
undergo functional and structural MR imaging, along with brain electrical
activity measures. The circuitry that will be featured will include the
amygdala, hippocampus and different territories of the prefrontal cortex
(PFC). Each of these structures has been implicated in different aspects of
emotion and emotion regulation and is part of the central circuitry that is
likely crucial for understanding how cumulative psychosocial burden can
have deleterious effects upon health. For example, the hippocampus plays a
crucial role in the regulation of the hypothalamic-pituitary-adrenal axis and
high levels of glucocorticoids have been implicated in hippocampal atropy.
The failure to modulate emotion in a context-appropriate fashion is likely a
consequence of hippocampal dysfunction. In addition to the hippocampus,
the amygdala and prefrontal cortices are other key structures in the circuitry
of emotion regulation and also play an important role in regulating peripheral
biology that may be consequential for health. This project will utilize
functional and structural MRI along with high-density electrophysiological
measures to makes inferences about the structure and function of this
circuitry in a subsample of WLS respondents. These measures of brain
function and structure will be related to indices of advantage and adversity as
well as measures of affect, mental health and physical health. The data will
provide the most comprehensive examination to date of the relations between
the central circuitry of emotion in the aging brain and physical and mental
health.
Interaction and Cognition in Surveys of Older Adults
PI: Nora Cate Schaeffer
We propose new studies of respondent-interviewer interaction in telephone
interviews in the Wisconsin Longitudinal Study (WLS). High quality
recordings of almost all the WLS telephone interviews provide a data
resource about aging research participants that is unique in its size and
richness. This proposal focuses on a key set of participant-interviewer inter-
actions, namely, assessments of cognitive functioning. The project will
integrate existing as well as innovative research methodologies for the study
of interviewing, and it will improve methods for conducting interviews,
training interviewers, measuring cognition, and analyzing survey data. This
will be the 10th project in P01-AG21079. The P01 is a collaborative, multi-
disciplinary program of projects on aging and the life course that will both
exploit and add to core resources of the WLS. The larger project has engaged
more than 50 investigators and research colleagues at the UW and across the
nation. The program of projects complements the 5th major round of WLS
data collection, 46 years after the 1957 high school graduation of the original
10,317 participants,“The Wisconsin Longitudinal Study: As We Age” (R01-
AG09775). This new proposal embodies the sixth specific aim of the WLS
P01, to develop additional research activities using the WLS. This project
31
Chapter 3: Current Status and Direction
Wisconsin Longitudinal Study handbook 2006
32
will enrich and improve the research in other components of the WLS P01,
especially (but not only) in the case of Project 1 (The Aging Mind), which
focuses in part on the relationships between everyday social activities and
variations in cognitive functioning. While we anticipated a project of the
present kind in developing the current WLS R01 and P01 projects, neither of
those projects requested any support for the analysis of respondent-
interviewer interaction. Thus, this proposal does not alter any of the original
specific aims of the WLS program of projects, but rather has its own impetus
and trajectory that complements these current projects. The WLS focuses on
a set of processes – the cumulation of experiences and outcomes across the
life course during the last half of the 20th century and the beginning of the
21st century. The WLS began with a 1/3 random sample (N = 10,317) of
women and men who graduated from Wisconsin high schools in 1957. For a
complete review of previous research with the WLS, see Sewell et al. (2003).
The next two waves of survey data, collected from the graduates or their
parents in 1964 and 1975, contain social background, high school
curriculum, youthful aspirations and social influences, schooling, military
service, family formation, labor market experiences, and social participation.
Survey data were supplemented by earnings of parents from state tax records,
mental ability test scores and rank in high school class, and characteristics of
high schools and colleges, employers, industries, and communities of
residence, as well as state archival data on high school district resources from
1954 to 1957. Data on the occupational careers of male graduates are supple-
mented by Social Security earnings histories from 1957 to 1971. In 1992, the
1-hour telephone interview covered life history data, family rosters, and job
histories. The telephone survey collected selected items from key inventories
of personality, health (depression and alcohol use), and well-being of which
there are more detailed measures in the mail instrument. The mail instrument
adds measures of social contact, exchanges, and health, including an
extensive account of menopausal experience.
We expect to close out the graduate interviews for new data collection in
mid-summer 2004. The telephone recordings are delivered daily, as
interviews proceed, stored on a highly secure, dedicated (and massive) file
server, and backed up at another secure location. Because the recordings are
available immediately, a crew of trained coders is evaluating the cognitive
assessments on a flow basis. In addition, coded survey data should be
available in full by the fall. Important for the proposed project, continuous
recording means that early studies of the interaction are currently underway
and further activities proposed here can commence immediately.
Chapter 3: Current Status and Direction
Wisconsin Longitudinal Study handbook 2006
33
Chapter 3: Current Status and Direction
Wisconsin Longitudinal Study handbook 2006
34
Chapter 4: About the WLS
Wisconsin Longitudinal Study handbook 2006
In this Chapter
WLS Support.................................................................................................35Special Aspects of the WLS..........................................................................35Influential Works from the WLS....................................................................36Prominent Figures in the WLS.......................................................to be addedOther Projects Affilitated with the WLS.......................................................39WLS Pilot Grant Program............................................................................42
WLS Support
The Wisconsin Longitudinal Study is supported by the Behavioral and SocialResearch Program of the National Institute on Aging.
Special Aspects of the WLS
The Wisconsin study had been preceded by careful and insightful, but smalland selective longitudinal studies, which had long been in progress. Theseinclude the studies of exceptionally able youth initiated by Lewis Terman andthe two small studies of youth in California communities that were madefamous by Glen Elder and John Clausen. In addition, the WLS was soon fol-lowed by large, national longitudinal studies of youth, first among which wasthe ill-fated Project Talent of 1960. Three highly successful school-basednational longitudinal studies of youth have followed—the NationalLongitudinal Study of the High School Class of 1972, High School andBeyond (the class of 1982), and the National Educational Longitudinal Study(the class of 1992). However, none of these larger studies has continued morethan 15 years. The National Longitudinal Studies of Labor MarketExperience began with cohorts of 14 to 24 year-old women and men in thelate 1960s, but the male sample was soon abandoned because of high attri-tion rates. Only with the aging of the cohorts in the 1979 NationalLongitudinal Study of Youth—who are only 37 to 44 years old in 2002—isthere likely to be a national longitudinal study of women and men that com-pares favorably with the WLS both in size and coverage of the life course.
The WLS graduates and their siblings have lived through major socialchanges: rising affluence, suburban growth, the decline of old ethnic cleav-ages, the cold war, and changing gender roles. The WLS is unusually valu-able in its representation of women as well as men. Moreover, the WLScohort, born mainly in 1939, precedes by a few years the baby boom gener-ation that has taxed social institutions and resources at each stage of life, andthus the study can provide early indications of trends and problems that willbecome important as the larger group passes through its early 60s.
35
Chapter 4: About the WLS
Wisconsin Longitudinal Study handbook 2006
Prominent Figures in the WLS
J. Kenneth LittleWilliam H.SewellRobert M. Hauser
Influential Works from the WLS
The Following are influential WLS publications.
Alwin, Duane F. and Robert M. Hauser. 1975. "The Decomposition ofEffects in Path Analysis." American Sociological Review 40(1):37-47.
Hauser, Robert M. and William H. Sewell. 1986. "Family Effects in SimpleModels of Education, Occupational Status, and Earnings: Findings Fromthe Wisconsin and Kalamazoo Studies." Journal of LaborEconomics 4(3, Part 2):S83-S115.
Hauser, Robert M., Shu-Ling Tsai, and William H. Sewell. 1983. "A Modelof Stratification With Response Error in Social and PsychologicalVariables." Sociology of Education 56(1):20-46.
Hauser, Robert M. and Raymond S.-K. Wong. 1989. "Sibling Resemblance and Inter-Sibling Effects in Educational Attainment." Sociology ofEducation 62(3):149-71.
Sewell, William H. and Robert M. Hauser. 1972. "Causes andConsequences of Higher Education: Models of the Status AttainmentProcess." American Journal of Agricultural Economics 54(6):851-61.
Sewell, William H. and Robert M. Hauser. 1975. Education, Occupation,and Earnings: Achievement in the Early Career. New York: Academic Press.
36
Chapter 4: About the WLS
Wisconsin Longitudinal Study handbook 2006
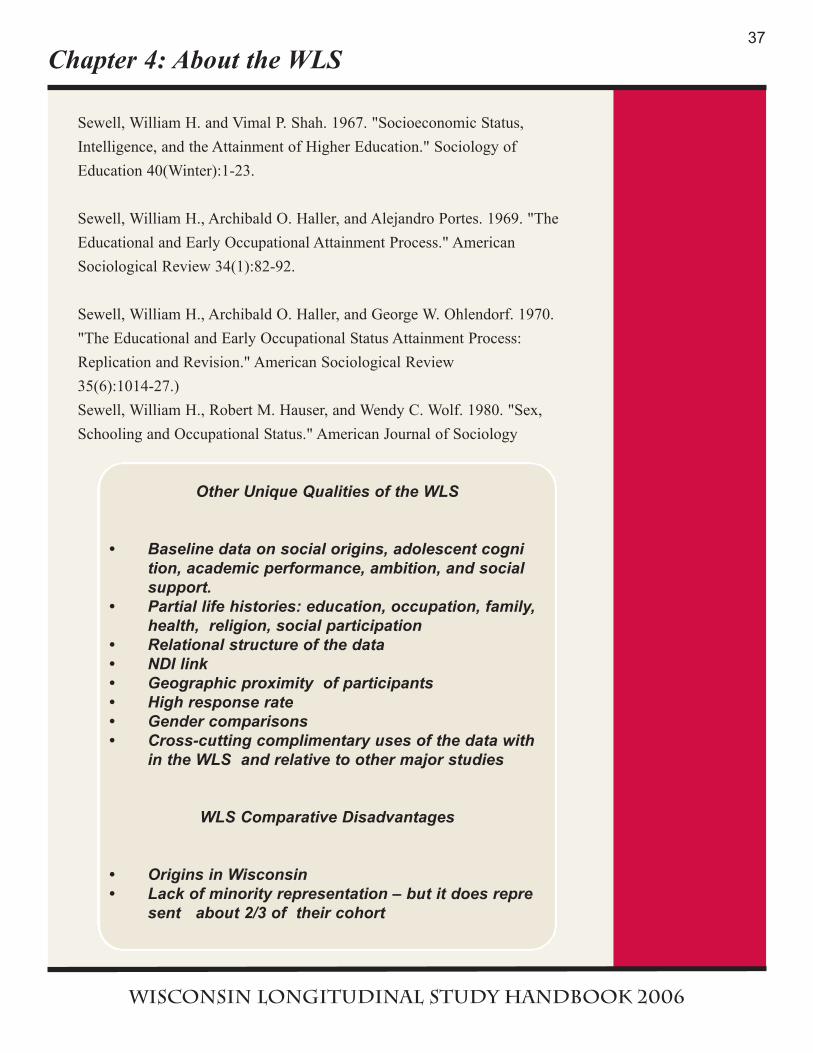
Sewell, William H. and Vimal P. Shah. 1967. "Socioeconomic Status, Intelligence, and the Attainment of Higher Education." Sociology of Education 40(Winter):1-23.
Sewell, William H., Archibald O. Haller, and Alejandro Portes. 1969. "The Educational and Early Occupational Attainment Process." American Sociological Review 34(1):82-92.
Sewell, William H., Archibald O. Haller, and George W. Ohlendorf. 1970."The Educational and Early Occupational Status Attainment Process:Replication and Revision." American Sociological Review 35(6):1014-27.) Sewell, William H., Robert M. Hauser, and Wendy C. Wolf. 1980. "Sex, Schooling and Occupational Status." American Journal of Sociology
37
Other Unique Qualities of the WLS
• Baseline data on social origins, adolescent cognition, academic performance, ambition, and social support.
• Partial life histories: education, occupation, family, health, religion, social participation
• Relational structure of the data• NDI link• Geographic proximity of participants • High response rate • Gender comparisons • Cross-cutting complimentary uses of the data with
in the WLS and relative to other major studies
WLS Comparative Disadvantages
• Origins in Wisconsin• Lack of minority representation – but it does repre
sent about 2/3 of their cohort
Chapter 4: About the WLS
Wisconsin Longitudinal Study handbook 2006
38
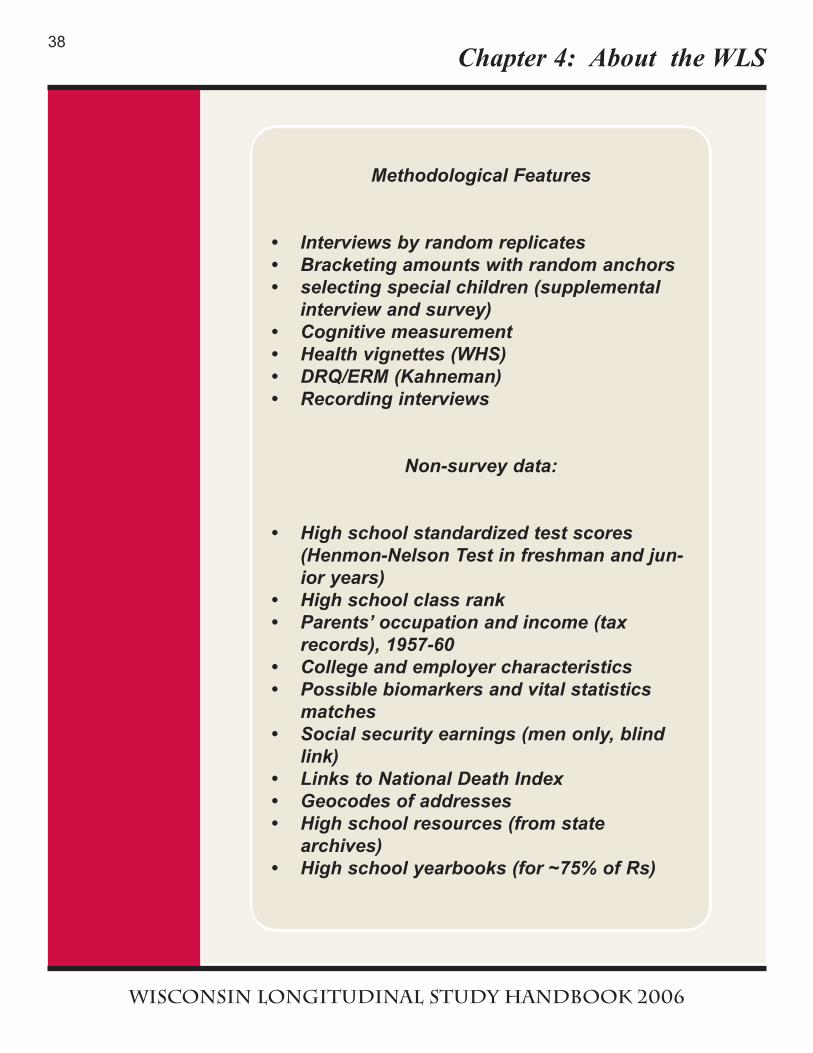
Methodological Features
• Interviews by random replicates• Bracketing amounts with random anchors• selecting special children (supplemental
interview and survey)• Cognitive measurement• Health vignettes (WHS)• DRQ/ERM (Kahneman)• Recording interviews
Non-survey data:
• High school standardized test scores (Henmon-Nelson Test in freshman and jun-ior years)
• High school class rank• Parents’ occupation and income (tax
records), 1957-60• College and employer characteristics• Possible biomarkers and vital statistics
matches• Social security earnings (men only, blind
link)• Links to National Death Index• Geocodes of addresses• High school resources (from state
archives)• High school yearbooks (for ~75% of Rs)
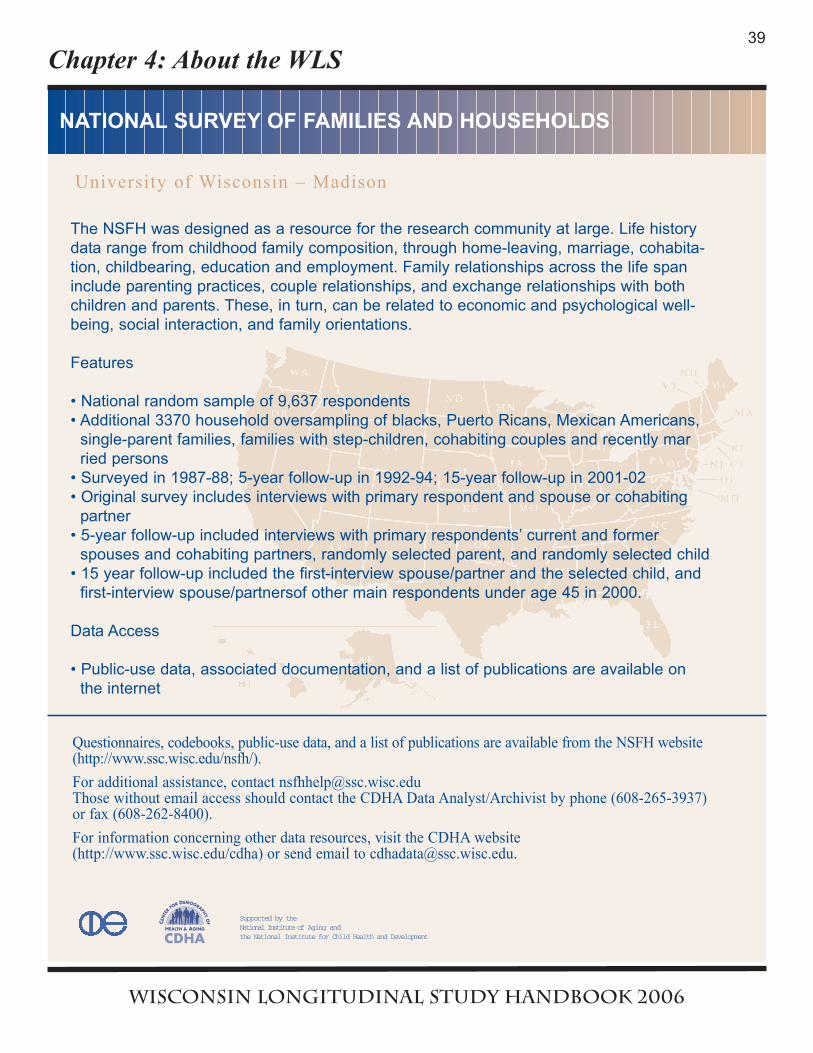
University of Wisconsin – Madison
Questionnaires, codebooks, public-use data, and a list of publications are available from the NSFH website(http://www.ssc.wisc.edu/nsfh/).For additional assistance, contact [email protected] without email access should contact the CDHA Data Analyst/Archivist by phone (608-265-3937)or fax (608-262-8400).For information concerning other data resources, visit the CDHA website(http://www.ssc.wisc.edu/cdha) or send email to [email protected].
NATIONAL SURVEY OF FAMILIES AND HOUSEHOLDSCE
NTE
R
FOR DEMOGRAPHY
OF
CDHAHEALTH & AGING
Supported by the National Institute of Aging and the National Institute for Child Health and Development
The NSFH was designed as a resource for the research community at large. Life historydata range from childhood family composition, through home-leaving, marriage, cohabita-tion, childbearing, education and employment. Family relationships across the life spaninclude parenting practices, couple relationships, and exchange relationships with bothchildren and parents. These, in turn, can be related to economic and psychological well-being, social interaction, and family orientations.
Features
• National random sample of 9,637 respondents • Additional 3370 household oversampling of blacks, Puerto Ricans, Mexican Americans,
single-parent families, families with step-children, cohabiting couples and recently married persons
• Surveyed in 1987-88; 5-year follow-up in 1992-94; 15-year follow-up in 2001-02• Original survey includes interviews with primary respondent and spouse or cohabiting
partner• 5-year follow-up included interviews with primary respondents’ current and former
spouses and cohabiting partners, randomly selected parent, and randomly selected child • 15 year follow-up included the first-interview spouse/partner and the selected child, and
first-interview spouse/partnersof other main respondents under age 45 in 2000.
Data Access
• Public-use data, associated documentation, and a list of publications are available on the internet
Chapter 4: About the WLS
Wisconsin Longitudinal Study handbook 2006
39
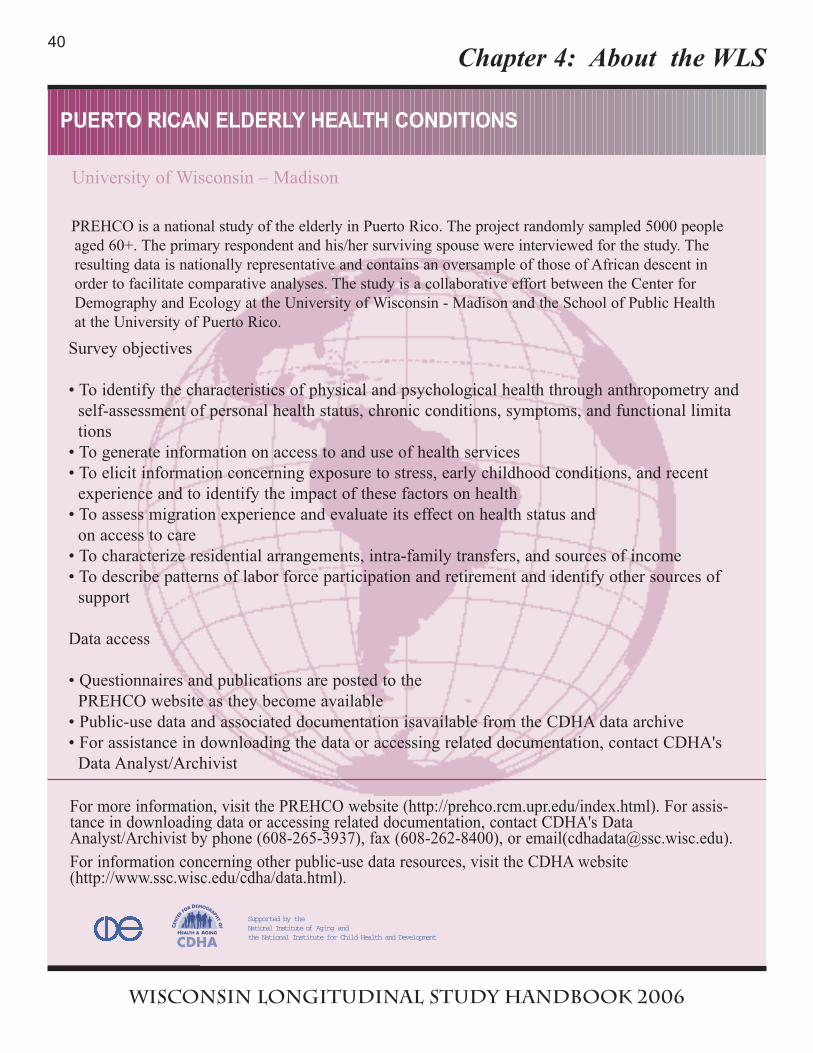
Chapter 4: About the WLS
Wisconsin Longitudinal Study handbook 2006
40
PUERTO RICAN ELDERLY HEALTH CONDITIONS
PREHCO is a national study of the elderly in Puerto Rico. The project randomly sampled 5000 peopleaged 60+. The primary respondent and his/her surviving spouse were interviewed for the study. Theresulting data is nationally representative and contains an oversample of those of African descent inorder to facilitate comparative analyses. The study is a collaborative effort between the Center forDemography and Ecology at the University of Wisconsin - Madison and the School of Public Healthat the University of Puerto Rico.
For more information, visit the PREHCO website (http://prehco.rcm.upr.edu/index.html). For assis-tance in downloading data or accessing related documentation, contact CDHA's DataAnalyst/Archivist by phone (608-265-3937), fax (608-262-8400), or email([email protected]). For information concerning other public-use data resources, visit the CDHA website(http://www.ssc.wisc.edu/cdha/data.html).
CEN
TER
FOR DEMOGRAPHY
OF
CDHAHEALTH & AGING
Supported by the National Institute of Aging and the National Institute for Child Health and Development
University of Wisconsin – Madison
Survey objectives
• To identify the characteristics of physical and psychological health through anthropometry and self-assessment of personal health status, chronic conditions, symptoms, and functional limita tions
• To generate information on access to and use of health services • To elicit information concerning exposure to stress, early childhood conditions, and recent
experience and to identify the impact of these factors on health• To assess migration experience and evaluate its effect on health status and
on access to care• To characterize residential arrangements, intra-family transfers, and sources of income• To describe patterns of labor force participation and retirement and identify other sources of
support
Data access
• Questionnaires and publications are posted to the PREHCO website as they become available
• Public-use data and associated documentation isavailable from the CDHA data archive• For assistance in downloading the data or accessing related documentation, contact CDHA's
Data Analyst/Archivist
Chapter 4: About the WLS
Wisconsin Longitudinal Study handbook 2006
41
University of Wisconsin – Madison
SABE is a cross-sectional survey on health and aging organized as a cooperative venture amongresearchers in Argentina, Barbados, Brazil, Chile, Cuba, Mexico and Uruguay.
CEN
TER
FOR DEMOGRAPHY
OF
CDHAHEALTH & AGING
Supported by the Pan American Health Organization
Salud, Bienestar, Y Envejecimiento en America Latina y ElCaribe
Participating Countries: Argentina, Barbados, Brazil, Chile, Cuba, Mexico and Uruguay. Questionnaires: http://www.ssc.wisc.edu/sabePublications: http://www.ssc.wisc.edu/sabePublic-use Data and Documentation: send email to [email protected] assistance, please contact CDHA's Data Analyst/Archivist by phone (608-265-3937),fax (608-262-8400), or email ([email protected]).
Survey Objectives
• Describe health conditions of elders (60+) including chronic and acute conditions, disability, and physical and mental impairment with special attention to those aged 80+
• Evaluate elder’s access to and use of traditional and formal health care services• Assess the relative contribution of family relations and networks, public assistance and pri
vate financial resources to health care utilization• Analyze differences in health, access, and utilization with respect to social class, gender, and
birth cohort• Evaluate the impact of health-related behaviors, occupational history, socioeconomic condi
tions, gender, and cohort on health• Perform comparative analysis across countries who share important characteristics
Data Access
• Public-use data and associated documentation are available from the CDHA data archive.• For assistance in downloading the data or accessing related documentation, contact the
CDHA Archivist.
Chapter 4: About the WLS
Wisconsin Longitudinal Study handbook 2006
42
WLS Pilot Grant Program
The Center for Demography of Health and Aging (CDHA) at the University of Wisconsin-Madison awarded three pilot grants to investigators using the Wisconsin Longitudinal Study(WLS) data for scholarly research. Selected recipients received $10,000 to support theirresearch, along with a residency at CDHA, where they received training and support in useof WLS data. The residency took place in January of 2006, and papers will be presented atCDHA during the summer of 2006. Authors are encouraged to publish their work in anyappropriate outlet.
Grant recipients have access to pre-release data from the 2003-2005 interviews. At this date,graduate interviews are complete, but collection of data from graduate spouses, siblings, andsibling spouses is still underway.
Applications for the next round of pilot grants are welcomed from investigators in suchdiverse fields as anthropology, demography, economics, epidemiology, family studies, genet-ics, gerontology, human development, medicine, nursing, psychology, public health, andsociology. Applicants must have a doctoral-level degree. We encourage applications fromjunior researchers (i.e., fewer than five years since completing their doctoral-level degree),and more experienced researchers who are new to the WLS data. Applicants must be affiliat-ed with either educational institutions or with 501(c) (3) nonprofit organizations. Expensesfor travel to Madison will be covered in addition to the $10,000 grant. Grant money may beused for investigators’ salary or research support.
The deadline for application is June 1, 2006. Recipients will be notified no later than July 1,2006. To apply submit a research proposal (5 page maximum) and a CV either electronically(preferred) or printed to:
Carol RoanCenter for Demography of Health and AgingUniversity of Wisconsin-Madison 1180 Observatory Drive, Room 4430 Madison, Wisconsin 53706 [email protected]
More information about the WLS and the pilot grant program including questionnaires, code-books and public data may be found at the WLS pilot grant website:http://www.ssc.wisc.edu/wlsresearch/pilot. Please contact Carol Roan by [email protected] or by telephone (608) 265-6196 if you have further questions.
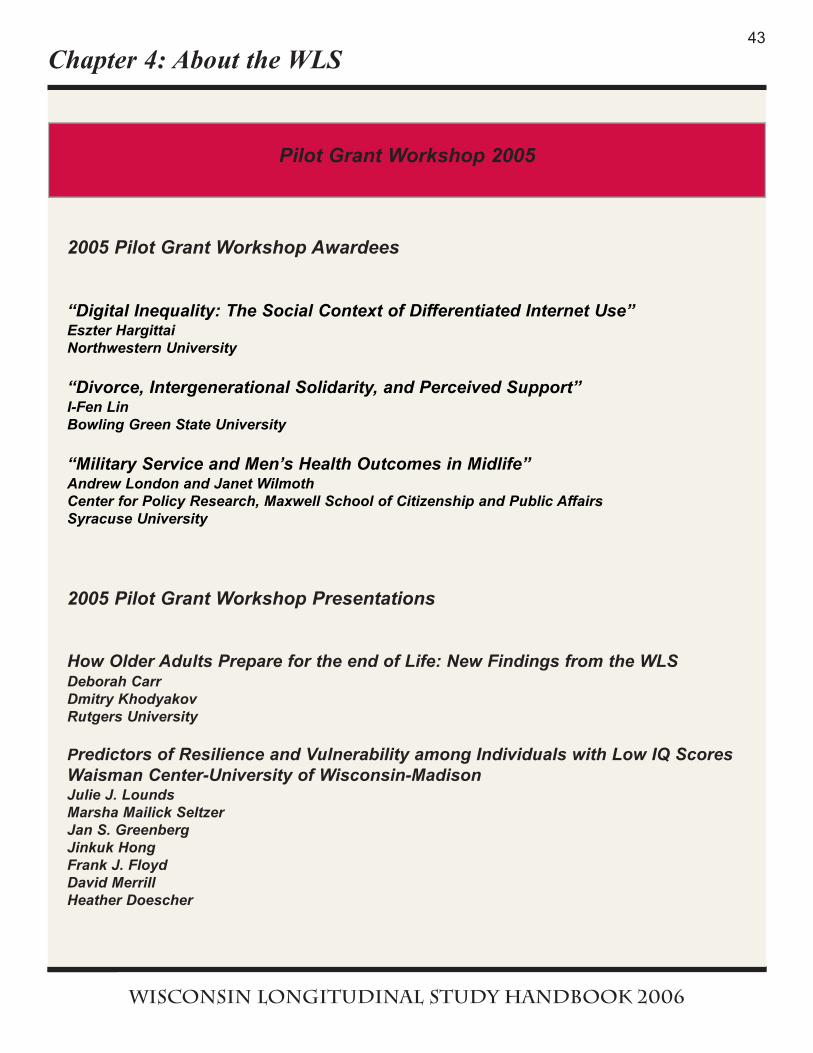
Chapter 4: About the WLS
Wisconsin Longitudinal Study handbook 2006
43
2005 Pilot Grant Workshop Awardees
“Digital Inequality: The Social Context of Differentiated Internet Use”Eszter Hargittai Northwestern University
“Divorce, Intergenerational Solidarity, and Perceived Support”I-Fen Lin Bowling Green State University
“Military Service and Men’s Health Outcomes in Midlife”Andrew London and Janet Wilmoth Center for Policy Research, Maxwell School of Citizenship and Public AffairsSyracuse University
2005 Pilot Grant Workshop Presentations
How Older Adults Prepare for the end of Life: New Findings from the WLS Deborah CarrDmitry KhodyakovRutgers University
Predictors of Resilience and Vulnerability among Individuals with Low IQ Scores Waisman Center-University of Wisconsin-MadisonJulie J. LoundsMarsha Mailick SeltzerJan S. GreenbergJinkuk HongFrank J. FloydDavid MerrillHeather Doescher
Pilot Grant Workshop 2005
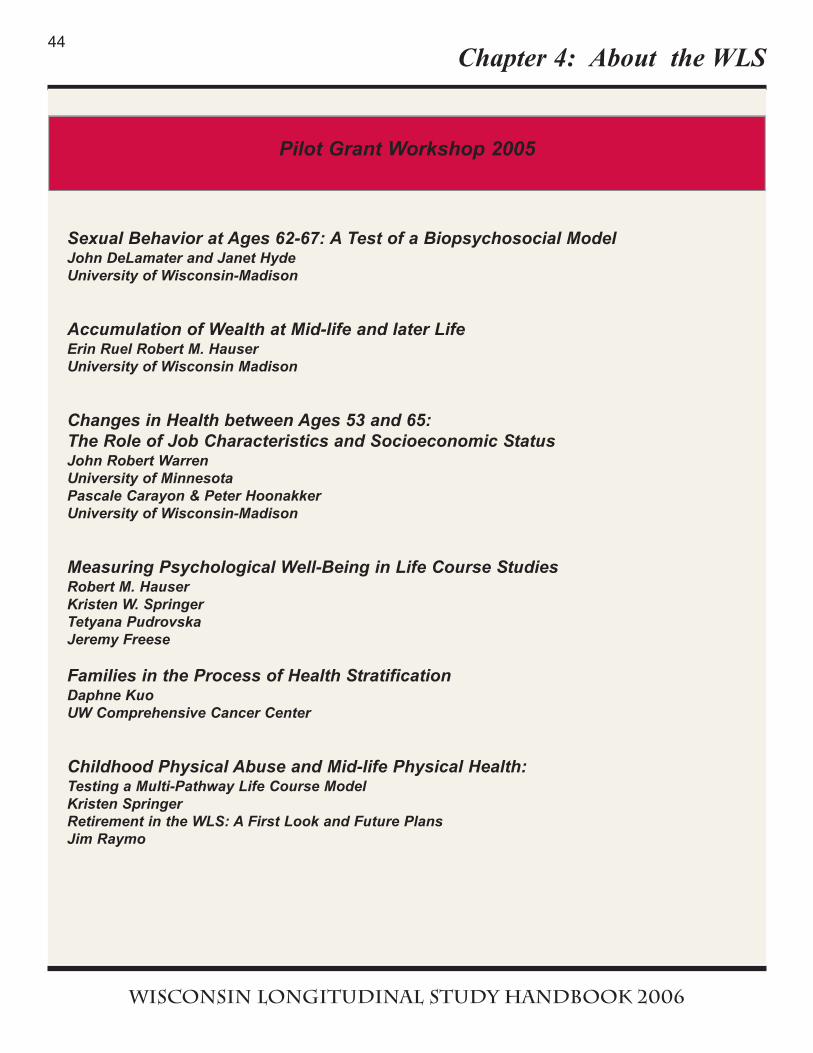
Chapter 4: About the WLS
Wisconsin Longitudinal Study handbook 2006
44
Sexual Behavior at Ages 62-67: A Test of a Biopsychosocial ModelJohn DeLamater and Janet HydeUniversity of Wisconsin-Madison
Accumulation of Wealth at Mid-life and later LifeErin Ruel Robert M. HauserUniversity of Wisconsin Madison
Changes in Health between Ages 53 and 65: The Role of Job Characteristics and Socioeconomic StatusJohn Robert WarrenUniversity of MinnesotaPascale Carayon & Peter HoonakkerUniversity of Wisconsin-Madison
Measuring Psychological Well-Being in Life Course StudiesRobert M. HauserKristen W. SpringerTetyana PudrovskaJeremy Freese
Families in the Process of Health StratificationDaphne KuoUW Comprehensive Cancer Center
Childhood Physical Abuse and Mid-life Physical Health: Testing a Multi-Pathway Life Course ModelKristen Springer Retirement in the WLS: A First Look and Future PlansJim Raymo
Pilot Grant Workshop 2005
A Typology of Patient Preferences for Participation in Decision MakingKathryn Flynn, PhDDuke UniversityCenter for Clinical and Genetic Economics Maureen Smith, MD PhD MPHDave Vanness, PhDUniversity of Wisconsin Medical SchoolDepartment of Population Health Sciences
Cognition, Personality, and Internet UseJeremy FreeseUniversity of Wisconsin-MadisonRWJ Scholars in Health Policy Research Program, Harvard UniversitySalvador RivasUniversity of Wisconsin-Madison
Conversation Analysis and Interaction Coding for Models of Interview Process and ProductDoug Maynard Nora Cate SchaefferJeremy Freese
Stability or Change: Personality in Late-MidlifeZhen Zeng Center for Demography of Health and AgingUniversity of Wisconsin-Madison
Chapter 4: About the WLS
Wisconsin Longitudinal Study handbook 2006
45
Pilot Grant Workshop 2005
Chapter 4: About the WLS
Wisconsin Longitudinal Study handbook 2006
2006 Pilot Grant Workshop Awardees
"Bad Jobs" and Health: Do Negative Work Exposures Work Together?Sarah Burgard University of Michigan
"Early-Life Environment and Cognitive Functioning in Late Midlife"Zhenmei Zhang Michigan State University
2006 Pilot Grant Workshop Presentations
“Digital Inequality: The Social Context of Differentiated Internet Use”Eszter Hargittai Discussant Sal Rivas
“Divorce, Intergenerational Solidarity, and Perceived Support”I-Fen Lin Discussant Jim Raymo
“Military Service and Men’s Health Outcomes in Midlife”Andrew London and Janet Wilmoth Discussant Bob Hauser
“Life Course Influences on End-of-Life Planning: Who Prepares for Late-LifeHealth Care Needs?”Debby Carr
"Nonnormative Parenting Impacts in Midlife and Later Life"Jan Greenberg
"Socioeconomic Status, Job Characteristics, and Health across the LifeCourse"Rob Warren
46
Pilot Grant Workshop 2006
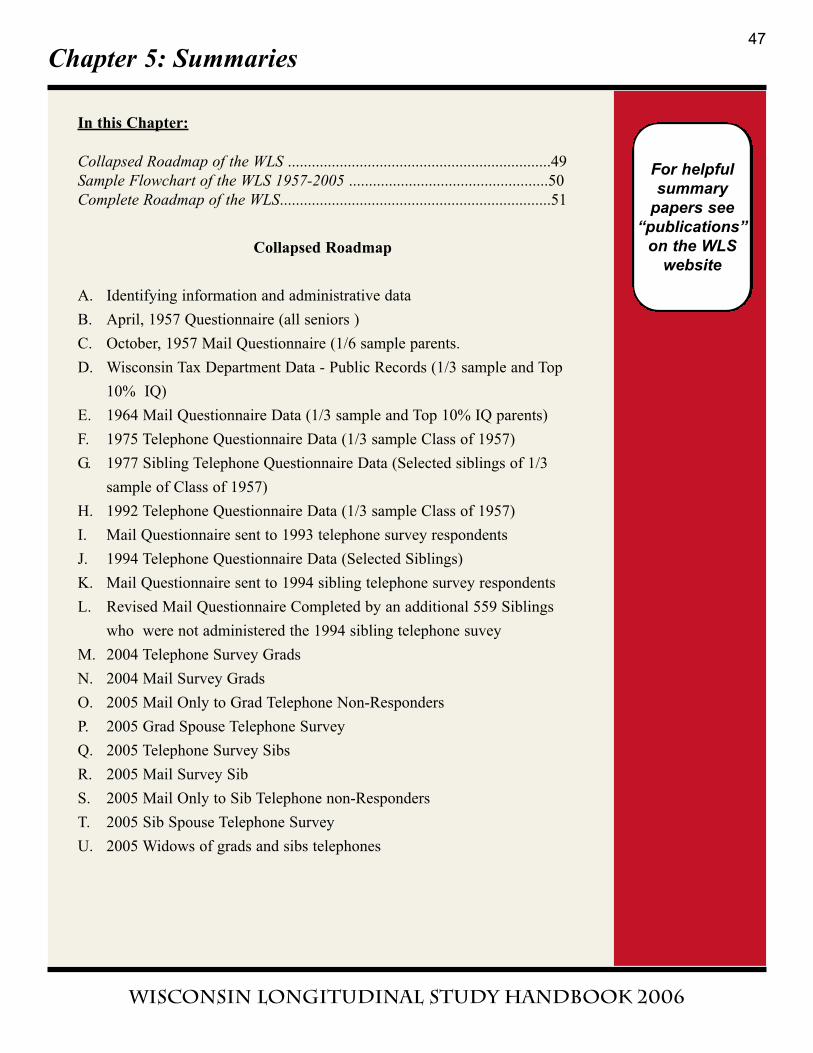
Chapter 5: Summaries
Wisconsin Longitudinal Study handbook 2006
In this Chapter:
Collapsed Roadmap of the WLS ..................................................................49
Sample Flowchart of the WLS 1957-2005 ..................................................50
Complete Roadmap of the WLS....................................................................51
Collapsed Roadmap
A. Identifying information and administrative data
B. April, 1957 Questionnaire (all seniors )
C. October, 1957 Mail Questionnaire (1/6 sample parents.
D. Wisconsin Tax Department Data - Public Records (1/3 sample and Top
10% IQ)
E. 1964 Mail Questionnaire Data (1/3 sample and Top 10% IQ parents)
F. 1975 Telephone Questionnaire Data (1/3 sample Class of 1957)
G. 1977 Sibling Telephone Questionnaire Data (Selected siblings of 1/3
sample of Class of 1957)
H. 1992 Telephone Questionnaire Data (1/3 sample Class of 1957)
I. Mail Questionnaire sent to 1993 telephone survey respondents
J. 1994 Telephone Questionnaire Data (Selected Siblings)
K. Mail Questionnaire sent to 1994 sibling telephone survey respondents
L. Revised Mail Questionnaire Completed by an additional 559 Siblings
who were not administered the 1994 sibling telephone suvey
M. 2004 Telephone Survey Grads
N. 2004 Mail Survey Grads
O. 2005 Mail Only to Grad Telephone Non-Responders
P. 2005 Grad Spouse Telephone Survey
Q. 2005 Telephone Survey Sibs
R. 2005 Mail Survey Sib
S. 2005 Mail Only to Sib Telephone non-Responders
T. 2005 Sib Spouse Telephone Survey
U. 2005 Widows of grads and sibs telephones
47
For helpfulsummary
papers see“publications”
on the WLSwebsite
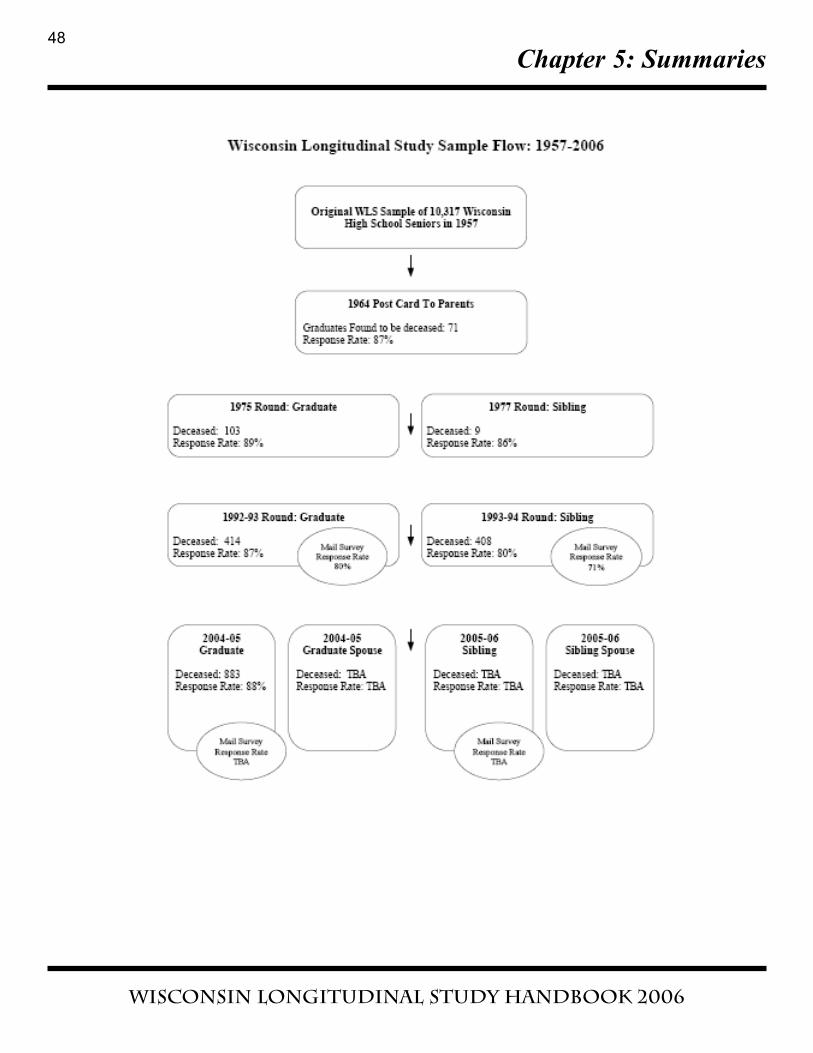
Chapter 5: Summaries
Wisconsin Longitudinal Study handbook 2006
48
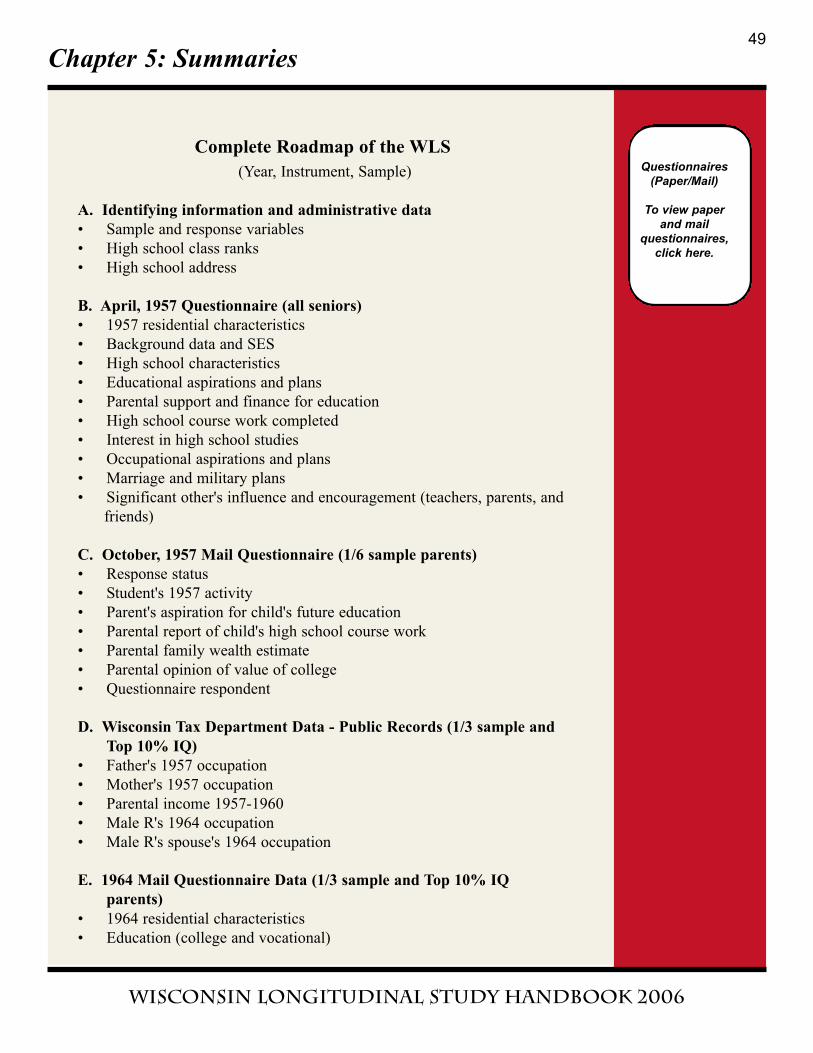
Chapter 5: Summaries
Wisconsin Longitudinal Study handbook 2006
Complete Roadmap of the WLS
(Year, Instrument, Sample)
A. Identifying information and administrative data
• Sample and response variables
• High school class ranks
• High school address
B. April, 1957 Questionnaire (all seniors)
• 1957 residential characteristics
• Background data and SES
• High school characteristics
• Educational aspirations and plans
• Parental support and finance for education
• High school course work completed
• Interest in high school studies
• Occupational aspirations and plans
• Marriage and military plans
• Significant other's influence and encouragement (teachers, parents, and
friends)
C. October, 1957 Mail Questionnaire (1/6 sample parents)
• Response status
• Student's 1957 activity
• Parent's aspiration for child's future education
• Parental report of child's high school course work
• Parental family wealth estimate
• Parental opinion of value of college
• Questionnaire respondent
D. Wisconsin Tax Department Data - Public Records (1/3 sample and
Top 10% IQ)
• Father's 1957 occupation
• Mother's 1957 occupation
• Parental income 1957-1960
• Male R's 1964 occupation
• Male R's spouse's 1964 occupation
E. 1964 Mail Questionnaire Data (1/3 sample and Top 10% IQ
parents)
• 1964 residential characteristics
• Education (college and vocational)
49
Questionnaires(Paper/Mail)
To view paperand mail
questionnaires, click here.
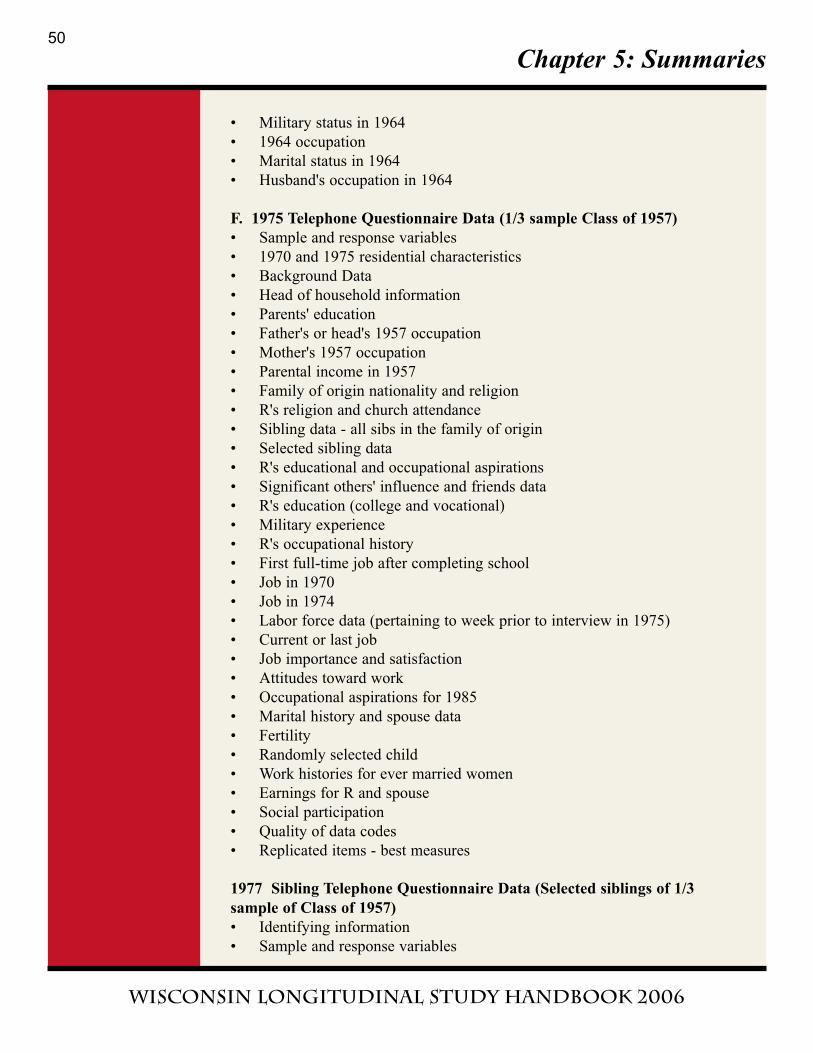
Chapter 5: Summaries
Wisconsin Longitudinal Study handbook 2006
• Military status in 1964
• 1964 occupation
• Marital status in 1964
• Husband's occupation in 1964
F. 1975 Telephone Questionnaire Data (1/3 sample Class of 1957)
• Sample and response variables
• 1970 and 1975 residential characteristics
• Background Data
• Head of household information
• Parents' education
• Father's or head's 1957 occupation
• Mother's 1957 occupation
• Parental income in 1957
• Family of origin nationality and religion
• R's religion and church attendance
• Sibling data - all sibs in the family of origin
• Selected sibling data
• R's educational and occupational aspirations
• Significant others' influence and friends data
• R's education (college and vocational)
• Military experience
• R's occupational history
• First full-time job after completing school
• Job in 1970
• Job in 1974
• Labor force data (pertaining to week prior to interview in 1975)
• Current or last job
• Job importance and satisfaction
• Attitudes toward work
• Occupational aspirations for 1985
• Marital history and spouse data
• Fertility
• Randomly selected child
• Work histories for ever married women
• Earnings for R and spouse
• Social participation
• Quality of data codes
• Replicated items - best measures
1977 Sibling Telephone Questionnaire Data (Selected siblings of 1/3
sample of Class of 1957)
• Identifying information
• Sample and response variables
50
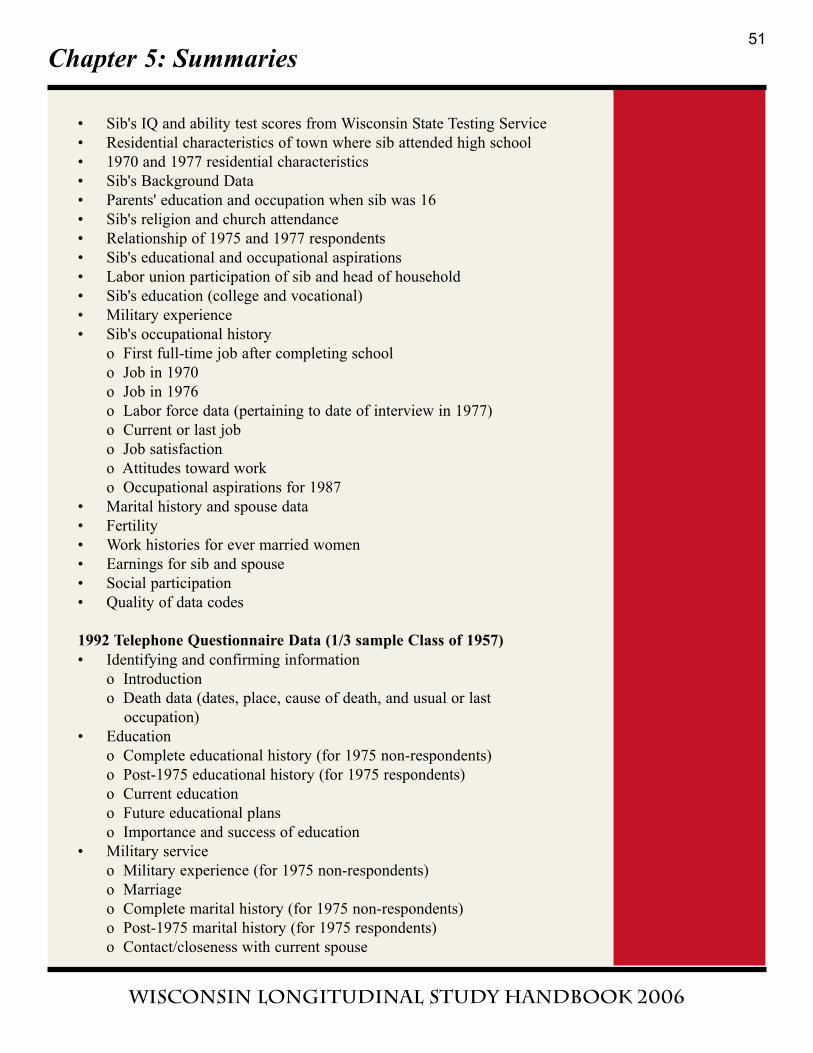
Chapter 5: Summaries
Wisconsin Longitudinal Study handbook 2006
• Sib's IQ and ability test scores from Wisconsin State Testing Service
• Residential characteristics of town where sib attended high school
• 1970 and 1977 residential characteristics
• Sib's Background Data
• Parents' education and occupation when sib was 16
• Sib's religion and church attendance
• Relationship of 1975 and 1977 respondents
• Sib's educational and occupational aspirations
• Labor union participation of sib and head of household
• Sib's education (college and vocational)
• Military experience
• Sib's occupational history
o First full-time job after completing school
o Job in 1970
o Job in 1976
o Labor force data (pertaining to date of interview in 1977)
o Current or last job
o Job satisfaction
o Attitudes toward work
o Occupational aspirations for 1987
• Marital history and spouse data
• Fertility
• Work histories for ever married women
• Earnings for sib and spouse
• Social participation
• Quality of data codes
1992 Telephone Questionnaire Data (1/3 sample Class of 1957)
• Identifying and confirming information
o Introduction
o Death data (dates, place, cause of death, and usual or last
occupation)
• Education
o Complete educational history (for 1975 non-respondents)
o Post-1975 educational history (for 1975 respondents)
o Current education
o Future educational plans
o Importance and success of education
• Military service
o Military experience (for 1975 non-respondents)
o Marriage
o Complete marital history (for 1975 non-respondents)
o Post-1975 marital history (for 1975 respondents)
o Contact/closeness with current spouse
51
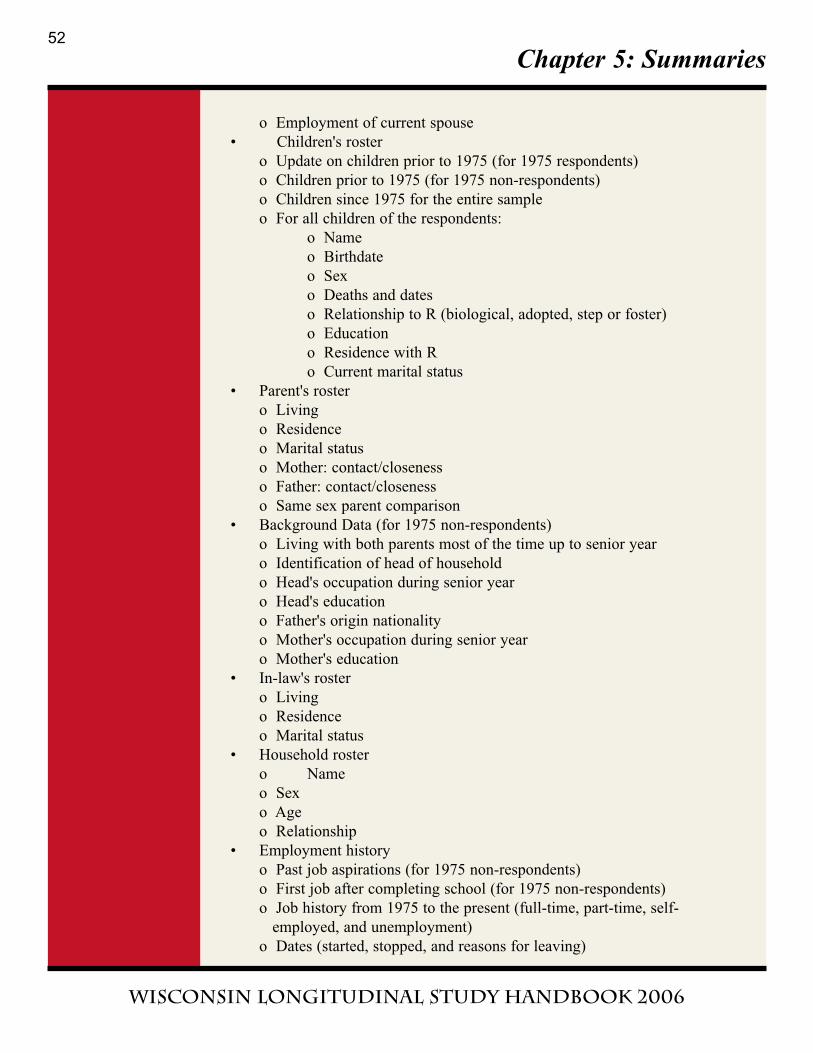
Chapter 5: Summaries
Wisconsin Longitudinal Study handbook 2006
o Employment of current spouse
• Children's roster
o Update on children prior to 1975 (for 1975 respondents)
o Children prior to 1975 (for 1975 non-respondents)
o Children since 1975 for the entire sample
o For all children of the respondents:
o Name
o Birthdate
o Sex
o Deaths and dates
o Relationship to R (biological, adopted, step or foster)
o Education
o Residence with R
o Current marital status
• Parent's roster
o Living
o Residence
o Marital status
o Mother: contact/closeness
o Father: contact/closeness
o Same sex parent comparison
• Background Data (for 1975 non-respondents)
o Living with both parents most of the time up to senior year
o Identification of head of household
o Head's occupation during senior year
o Head's education
o Father's origin nationality
o Mother's occupation during senior year
o Mother's education
• In-law's roster
o Living
o Residence
o Marital status
• Household roster
o Name
o Sex
o Age
o Relationship
• Employment history
o Past job aspirations (for 1975 non-respondents)
o First job after completing school (for 1975 non-respondents)
o Job history from 1975 to the present (full-time, part-time, self-
employed, and unemployment)
o Dates (started, stopped, and reasons for leaving)
52
Chapter 5: Summaries
Wisconsin Longitudinal Study handbook 2006
o Company name and place
o Industry
o Occupation
o Class of worker
o Labor union membership
o Benefits (Pension or retirement plans, health insurance,
educational training)
• Current/last job in 1992
o How they got job (if not self-employed)
o Wages
o Job characteristics
o Job supervision (respondents received either Wright's or Jenck's
supervision questions)
o Job satisfaction and conditions
o Job Importance
• Personality
o Big 5 personality items
• Cognition
o Eight items from the WAIS
• Selected child (same as 1975 if still living; else newly selected child)
o Complete name
o Spouse name
o Current address
o Current education
o Educational plans
o R's educational plans, aspirations, and expectation for selected child
o Military experience
o Current job
o Job help from R
o Contact and closeness between selected R and child
o Comparisons between R and child
• Sibling Roster (for 1975 non-respondents and those 1975 respondents
with deceased selected siblings)
o Number, sex, and sibling position of all siblings ever born
(including step and children adopted by your parents)
o Complete roster of all currently living biological and adopted
siblings
o Name
o Sex
o Relationship to R
o Age
o Education
• Selected sib (If selected sibling from 1975 survey is deceased, obtain
the following closeout)
53
Chapter 5: Summaries
Wisconsin Longitudinal Study handbook 2006
o Full name
o Relationship to R (biological, adopted, step or foster)
o Death date
o Place of death
o Cause of death
o Birthdate
o Last or usual job prior to death
• Selected sib (for 1975 non-respondents and those 1975 respondents
with deceased selected siblings)
o Full name
o Address
o Last high school attended
• Selected sib (same as 1975 if still living; else newly selected sibling)
Live in same household most of the time up to age 16
o Marital status
o Number of children
o Employment status
o Current or last job
o Job help from R
o Contact and closeness between R and selected sibling
o Comparisons between R and selected sibling
• Religion
o Family religious preference when you were in high school (for 1975
non-respondents)
o Current religious preference
o Attendance at religious services during the past year
o Current religious preference of spouse
o Religious preference of spouse at time of marriage
• Selected Friend (Asked of the 20.8% of the 1975 respondents who
named each other as best same-sex friends when they were seniors in
high school.)
o Current contact and closeness between R and friend
o Comparisons between R and friend
o If friend is deceased,
o Complete name of friend at time of death
o Date of death
o Place of death
• Psychological (administered to 80% of the respondents; same
individuals received Health questions)
Items for C. Ryff's Psychological Well-Being Scale
o Parent's income(administered to 50% of the respondents; for all
parents and in laws whether still married to original spouses or in
new marriages)
o Income from all sources during past 12 months
54
Chapter 5: Summaries
Wisconsin Longitudinal Study handbook 2006
o Total assets
o Debt
• Respondent's other income (for all members of the household, how
much and who received it?.)
o Amounts received during the past 12 months
o Wages, salaries, commissions, and tips before taxes
o Interest dividends or other investments
o Social security or supplemental security income
o Pensions, annuities, or survivor's benefits
o Public assistance
o Other government programs
o Receive child support
o Receive alimony
o Gifts, lump sum payments, and inheritances
o Other income - including lottery winnings, proceeds from
one-time asset sales, etc.
• Amounts paid out during the past 12 months
o Paid child support
o Paid alimony
• Intertransfers
o Receiving
o Inheritances
o Insurance settlements (amount and dates)
o Gifts (Amounts, sources, purposes of gifts (i.e., education,
downpayment, medical expenses)
• Giving
Charity contributions
• Transfers to children (transfers since 1975 amounts listed for each
child)
o $1,000 or more for downpayment on a house
o All education expenses including tuition payments
o Any other property, assets, or money
• Transfers to parents and in-laws (transfers since 1975 amounts listed
for each individual or couple)
o Money and purpose of transfer
o Any other property or assets
• Assets (current worth and debt)
o Home
o Other real estate
o Business or farm
o Vehicles
o Credit cards
o Loans (personal and student)
o Bills
55
Chapter 5: Summaries
Wisconsin Longitudinal Study handbook 2006
o Savings accounts
o Other investments (IRAs, Money market shares, CDs, stocks, bonds,
mutual funds, Tax Deferred Annuities)
• Health insurance
o Do you have health insurance?
o Through employer or private plans?
o Main reason for not having health insurance
• Pensions
o Employer pension plan (other than Social Security or Railroad
o Retirement benefits)
o Earliest age to receive benefits from this plan
o Individual IRA or Keogh Account
o Spouse retirement plans
• Health (administered to 80% of the respondents; same individuals
received Psychological questions)
o Depression history
o Alcohol use by respondent
o Feelings about respondent's own drinking
o Respondent's use of alcohol causing problems at home or work
• Problems with alcohol use within the family by respondent or other
family members
o Ever lived with a problem drinker
• Caregiving
o Receiving care: Long-term physical or mental condition, illness or
disability of respondent?
Limit to respondent's activities
Name of the illness
Type of care needed
o Giving care: Long-term physical or mental condition, illness or
disability of other household members?
Limit activities
Who has this limitation
Name of the illness
Type of care needed
o Future Plans
Plans for work in 10 years
Chances to do what you want
o Retirement
Respondent plans
Spouse plans
o Assessment of achievements
o Closeout items
Social Security Number
Confirmation of correct address
56
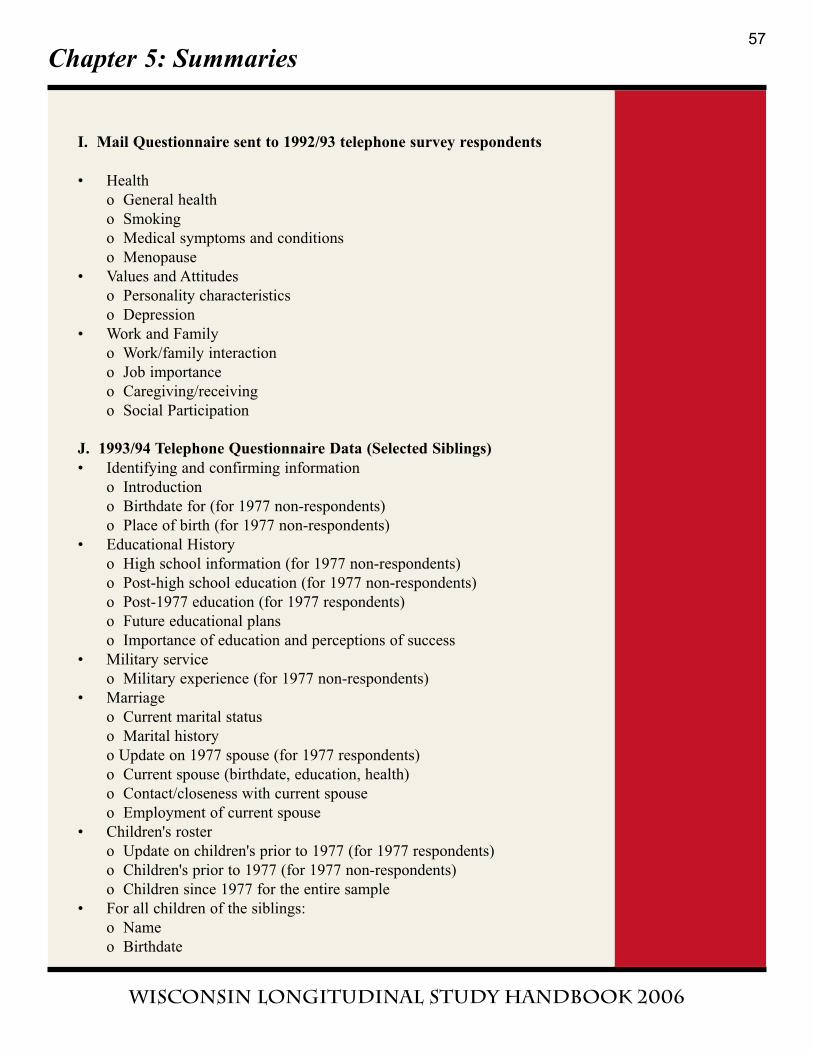
Chapter 5: Summaries
Wisconsin Longitudinal Study handbook 2006
I. Mail Questionnaire sent to 1992/93 telephone survey respondents
• Health
o General health
o Smoking
o Medical symptoms and conditions
o Menopause
• Values and Attitudes
o Personality characteristics
o Depression
• Work and Family
o Work/family interaction
o Job importance
o Caregiving/receiving
o Social Participation
J. 1993/94 Telephone Questionnaire Data (Selected Siblings)
• Identifying and confirming information
o Introduction
o Birthdate for (for 1977 non-respondents)
o Place of birth (for 1977 non-respondents)
• Educational History
o High school information (for 1977 non-respondents)
o Post-high school education (for 1977 non-respondents)
o Post-1977 education (for 1977 respondents)
o Future educational plans
o Importance of education and perceptions of success
• Military service
o Military experience (for 1977 non-respondents)
• Marriage
o Current marital status
o Marital history
o Update on 1977 spouse (for 1977 respondents)
o Current spouse (birthdate, education, health)
o Contact/closeness with current spouse
o Employment of current spouse
• Children's roster
o Update on children's prior to 1977 (for 1977 respondents)
o Children's prior to 1977 (for 1977 non-respondents)
o Children since 1977 for the entire sample
• For all children of the siblings:
o Name
o Birthdate
57
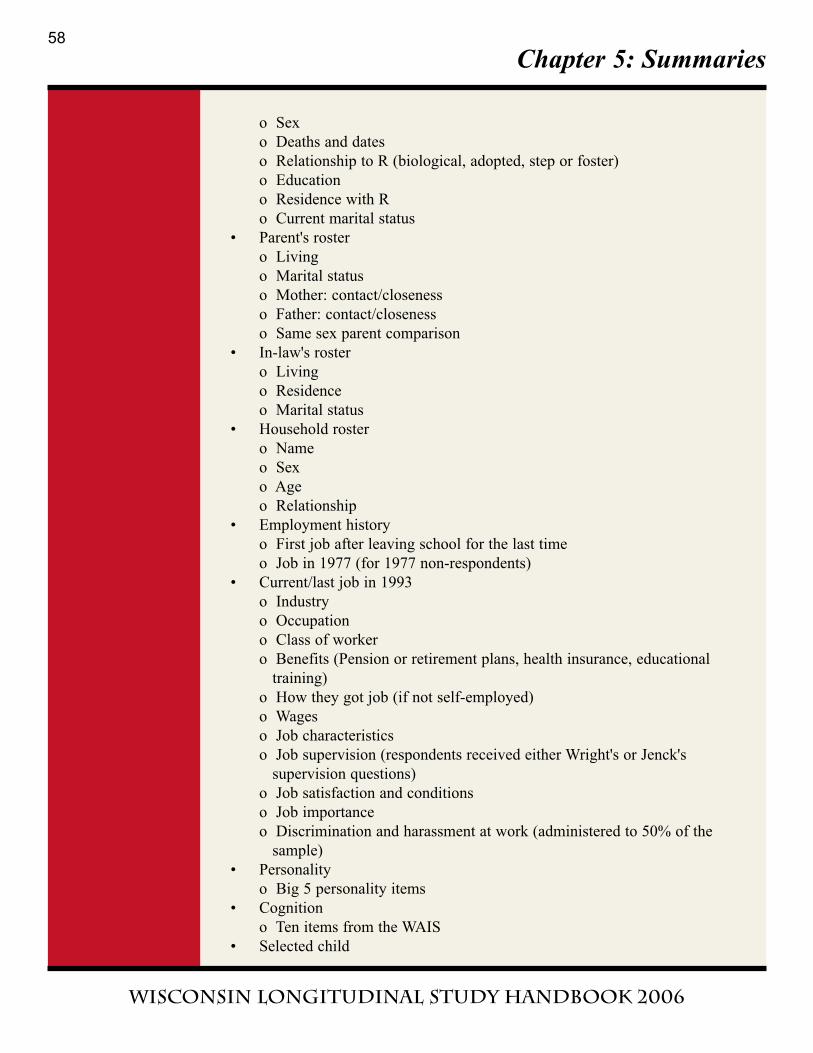
Chapter 5: Summaries
Wisconsin Longitudinal Study handbook 2006
o Sex
o Deaths and dates
o Relationship to R (biological, adopted, step or foster)
o Education
o Residence with R
o Current marital status
• Parent's roster
o Living
o Marital status
o Mother: contact/closeness
o Father: contact/closeness
o Same sex parent comparison
• In-law's roster
o Living
o Residence
o Marital status
• Household roster
o Name
o Sex
o Age
o Relationship
• Employment history
o First job after leaving school for the last time
o Job in 1977 (for 1977 non-respondents)
• Current/last job in 1993
o Industry
o Occupation
o Class of worker
o Benefits (Pension or retirement plans, health insurance, educational
training)
o How they got job (if not self-employed)
o Wages
o Job characteristics
o Job supervision (respondents received either Wright's or Jenck's
supervision questions)
o Job satisfaction and conditions
o Job importance
o Discrimination and harassment at work (administered to 50% of the
sample)
• Personality
o Big 5 personality items
• Cognition
o Ten items from the WAIS
• Selected child
58
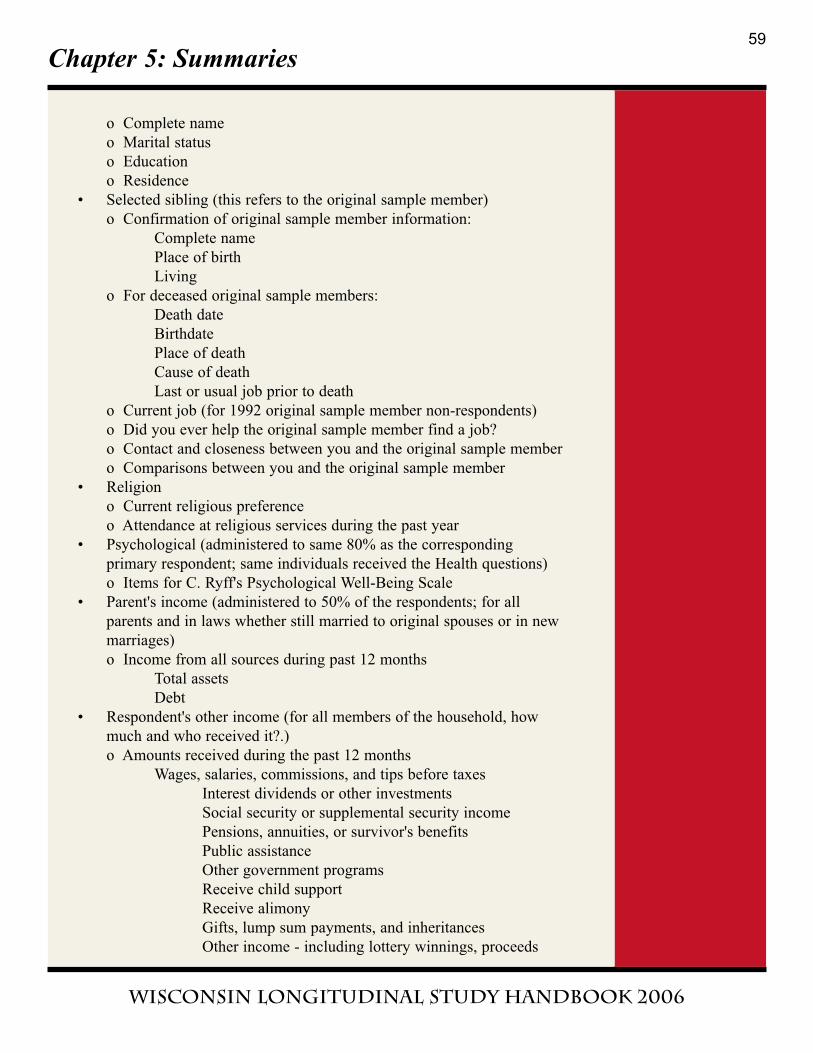
Chapter 5: Summaries
Wisconsin Longitudinal Study handbook 2006
o Complete name
o Marital status
o Education
o Residence
• Selected sibling (this refers to the original sample member)
o Confirmation of original sample member information:
Complete name
Place of birth
Living
o For deceased original sample members:
Death date
Birthdate
Place of death
Cause of death
Last or usual job prior to death
o Current job (for 1992 original sample member non-respondents)
o Did you ever help the original sample member find a job?
o Contact and closeness between you and the original sample member
o Comparisons between you and the original sample member
• Religion
o Current religious preference
o Attendance at religious services during the past year
• Psychological (administered to same 80% as the corresponding
primary respondent; same individuals received the Health questions)
o Items for C. Ryff's Psychological Well-Being Scale
• Parent's income (administered to 50% of the respondents; for all
parents and in laws whether still married to original spouses or in new
marriages)
o Income from all sources during past 12 months
Total assets
Debt
• Respondent's other income (for all members of the household, how
much and who received it?.)
o Amounts received during the past 12 months
Wages, salaries, commissions, and tips before taxes
Interest dividends or other investments
Social security or supplemental security income
Pensions, annuities, or survivor's benefits
Public assistance
Other government programs
Receive child support
Receive alimony
Gifts, lump sum payments, and inheritances
Other income - including lottery winnings, proceeds
59
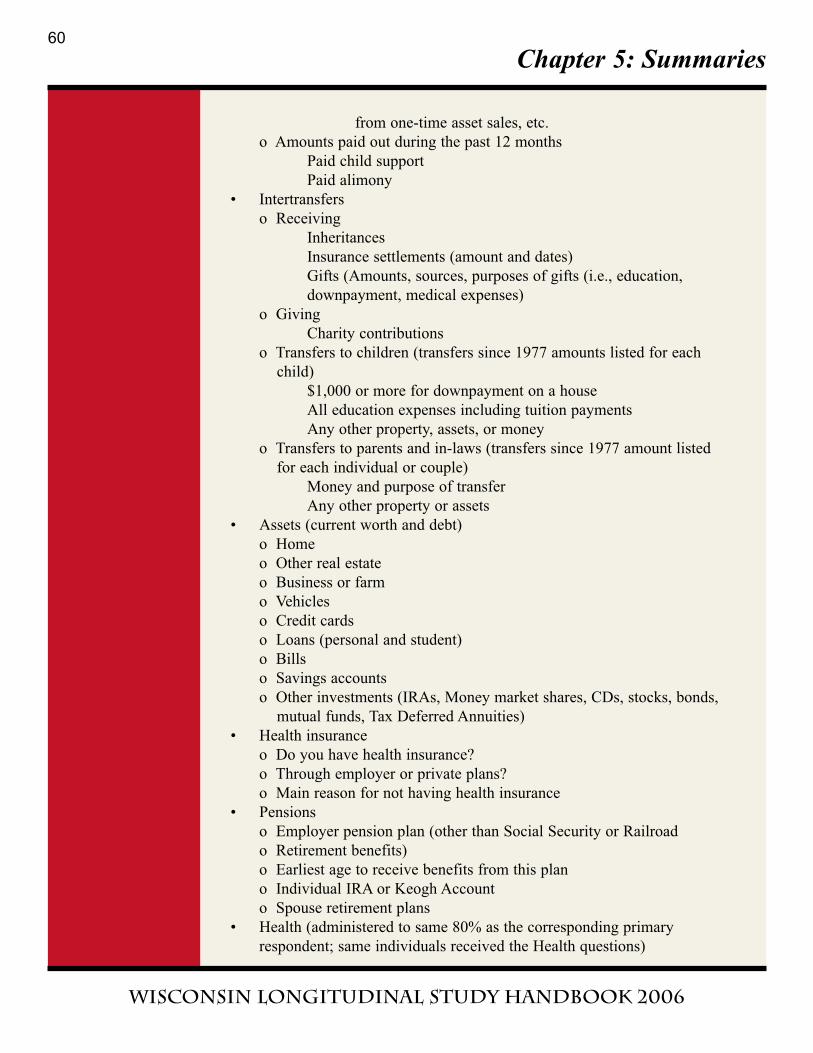
Chapter 5: Summaries
Wisconsin Longitudinal Study handbook 2006
from one-time asset sales, etc.
o Amounts paid out during the past 12 months
Paid child support
Paid alimony
• Intertransfers
o Receiving
Inheritances
Insurance settlements (amount and dates)
Gifts (Amounts, sources, purposes of gifts (i.e., education,
downpayment, medical expenses)
o Giving
Charity contributions
o Transfers to children (transfers since 1977 amounts listed for each
child)
$1,000 or more for downpayment on a house
All education expenses including tuition payments
Any other property, assets, or money
o Transfers to parents and in-laws (transfers since 1977 amount listed
for each individual or couple)
Money and purpose of transfer
Any other property or assets
• Assets (current worth and debt)
o Home
o Other real estate
o Business or farm
o Vehicles
o Credit cards
o Loans (personal and student)
o Bills
o Savings accounts
o Other investments (IRAs, Money market shares, CDs, stocks, bonds,
mutual funds, Tax Deferred Annuities)
• Health insurance
o Do you have health insurance?
o Through employer or private plans?
o Main reason for not having health insurance
• Pensions
o Employer pension plan (other than Social Security or Railroad
o Retirement benefits)
o Earliest age to receive benefits from this plan
o Individual IRA or Keogh Account
o Spouse retirement plans
• Health (administered to same 80% as the corresponding primary
respondent; same individuals received the Health questions)
60
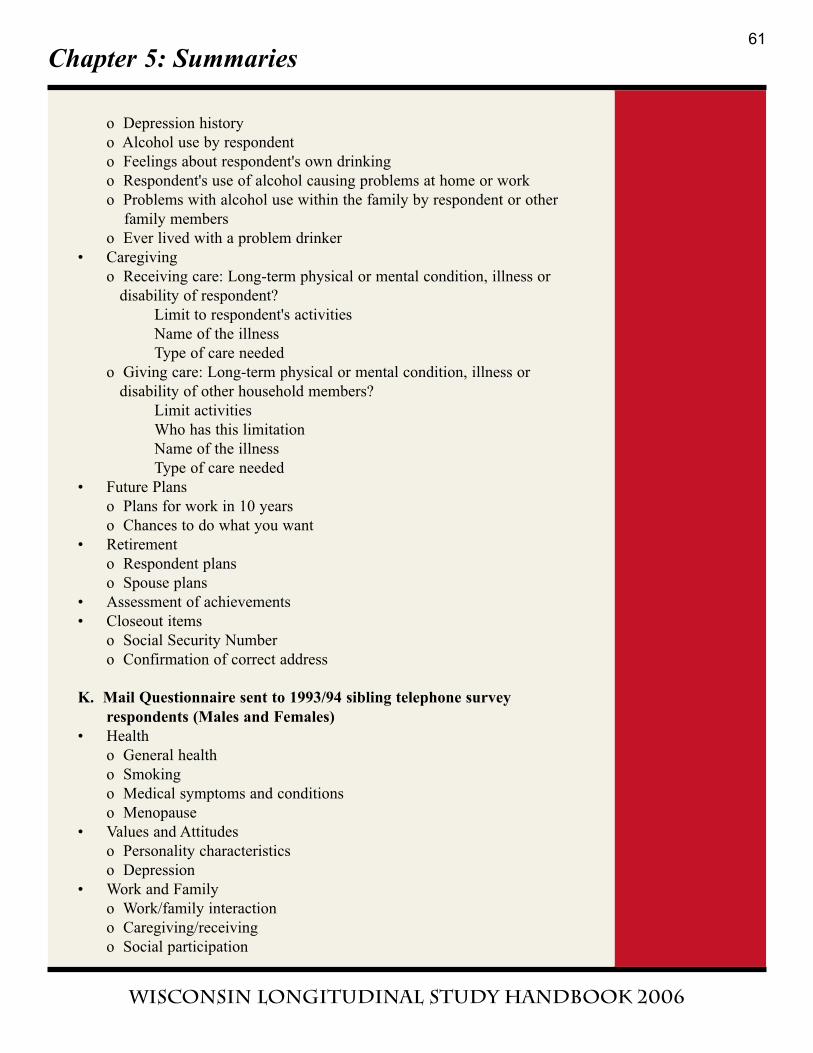
Chapter 5: Summaries
Wisconsin Longitudinal Study handbook 2006
o Depression history
o Alcohol use by respondent
o Feelings about respondent's own drinking
o Respondent's use of alcohol causing problems at home or work
o Problems with alcohol use within the family by respondent or other
family members
o Ever lived with a problem drinker
• Caregiving
o Receiving care: Long-term physical or mental condition, illness or
disability of respondent?
Limit to respondent's activities
Name of the illness
Type of care needed
o Giving care: Long-term physical or mental condition, illness or
disability of other household members?
Limit activities
Who has this limitation
Name of the illness
Type of care needed
• Future Plans
o Plans for work in 10 years
o Chances to do what you want
• Retirement
o Respondent plans
o Spouse plans
• Assessment of achievements
• Closeout items
o Social Security Number
o Confirmation of correct address
K. Mail Questionnaire sent to 1993/94 sibling telephone survey
respondents (Males and Females)
• Health
o General health
o Smoking
o Medical symptoms and conditions
o Menopause
• Values and Attitudes
o Personality characteristics
o Depression
• Work and Family
o Work/family interaction
o Caregiving/receiving
o Social participation
61
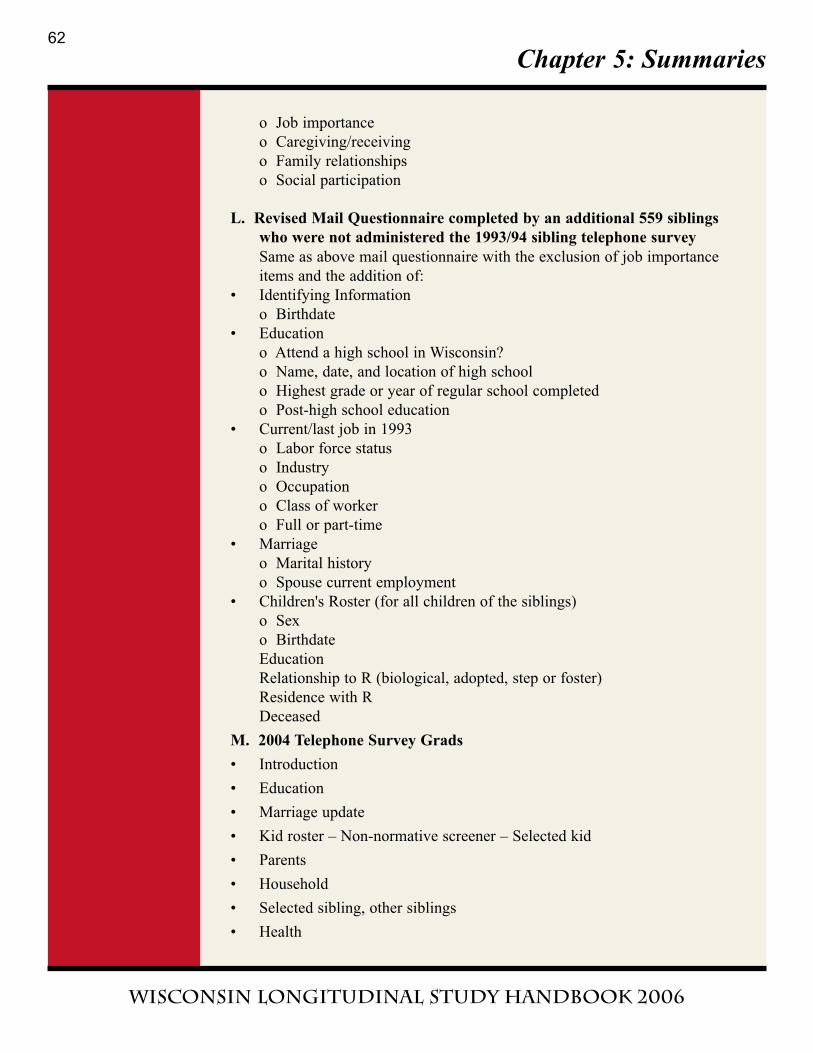
Chapter 5: Summaries
Wisconsin Longitudinal Study handbook 2006
o Job importance
o Caregiving/receiving
o Family relationships
o Social participation
L. Revised Mail Questionnaire completed by an additional 559 siblings
who were not administered the 1993/94 sibling telephone survey
Same as above mail questionnaire with the exclusion of job importance
items and the addition of:
• Identifying Information
o Birthdate
• Education
o Attend a high school in Wisconsin?
o Name, date, and location of high school
o Highest grade or year of regular school completed
o Post-high school education
• Current/last job in 1993
o Labor force status
o Industry
o Occupation
o Class of worker
o Full or part-time
• Marriage
o Marital history
o Spouse current employment
• Children's Roster (for all children of the siblings)
o Sex
o Birthdate
Education
Relationship to R (biological, adopted, step or foster)
Residence with R
Deceased
M. 2004 Telephone Survey Grads
• Introduction
• Education
• Marriage update
• Kid roster – Non-normative screener – Selected kid
• Parents
• Household
• Selected sibling, other siblings
• Health
62
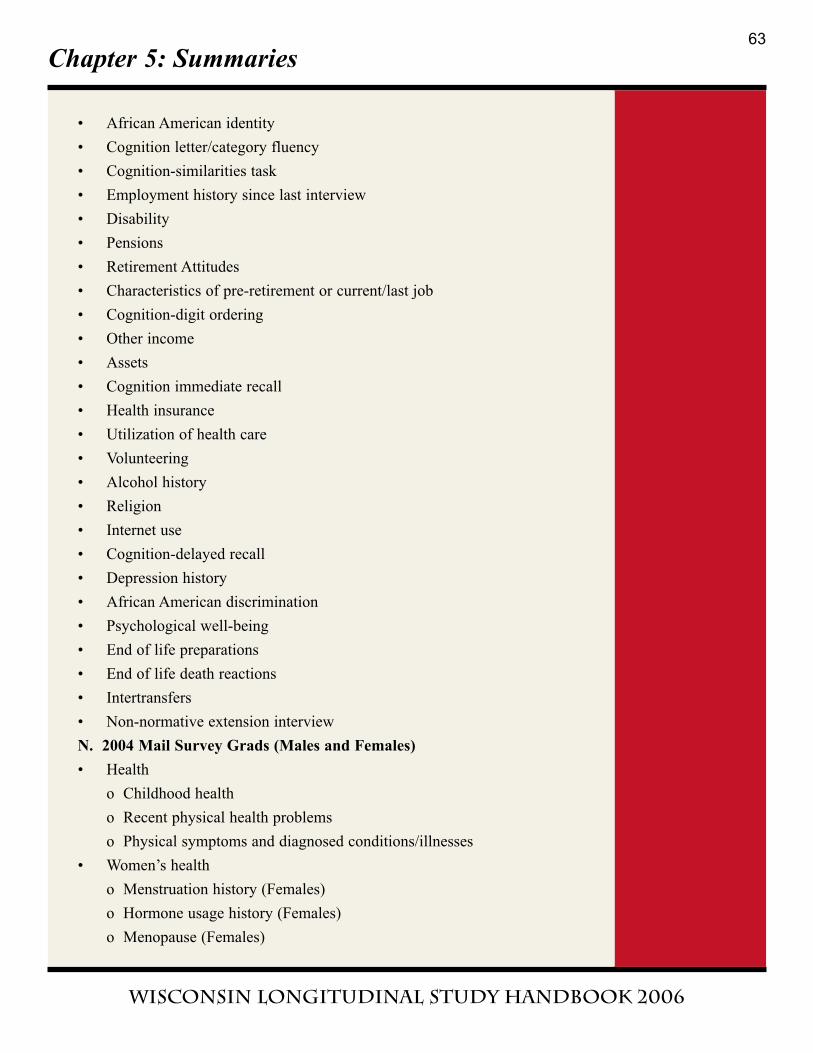
Chapter 5: Summaries
Wisconsin Longitudinal Study handbook 2006
• African American identity
• Cognition letter/category fluency
• Cognition-similarities task
• Employment history since last interview
• Disability
• Pensions
• Retirement Attitudes
• Characteristics of pre-retirement or current/last job
• Cognition-digit ordering
• Other income
• Assets
• Cognition immediate recall
• Health insurance
• Utilization of health care
• Volunteering
• Alcohol history
• Religion
• Internet use
• Cognition-delayed recall
• Depression history
• African American discrimination
• Psychological well-being
• End of life preparations
• End of life death reactions
• Intertransfers
• Non-normative extension interview
N. 2004 Mail Survey Grads (Males and Females)
• Health
o Childhood health
o Recent physical health problems
o Physical symptoms and diagnosed conditions/illnesses
• Women’s health
o Menstruation history (Females)
o Hormone usage history (Females)
o Menopause (Females)
63
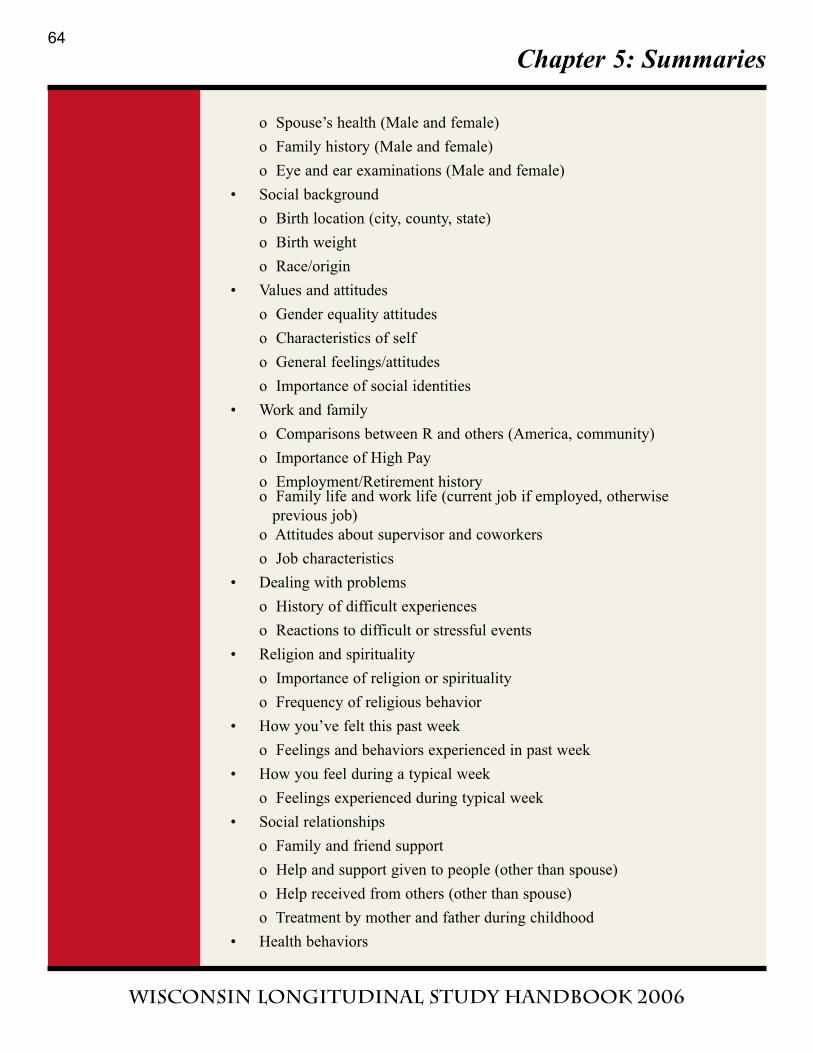
Chapter 5: Summaries
Wisconsin Longitudinal Study handbook 2006
o Spouse’s health (Male and female)
o Family history (Male and female)
o Eye and ear examinations (Male and female)
• Social background
o Birth location (city, county, state)
o Birth weight
o Race/origin
• Values and attitudes
o Gender equality attitudes
o Characteristics of self
o General feelings/attitudes
o Importance of social identities
• Work and family
o Comparisons between R and others (America, community)
o Importance of High Pay
o Employment/Retirement historyo Family life and work life (current job if employed, otherwise
previous job)
o Attitudes about supervisor and coworkers
o Job characteristics
• Dealing with problems
o History of difficult experiences
o Reactions to difficult or stressful events
• Religion and spirituality
o Importance of religion or spirituality
o Frequency of religious behavior
• How you’ve felt this past week
o Feelings and behaviors experienced in past week
• How you feel during a typical week
o Feelings experienced during typical week
• Social relationships
o Family and friend support
o Help and support given to people (other than spouse)
o Help received from others (other than spouse)
o Treatment by mother and father during childhood
• Health behaviors
64
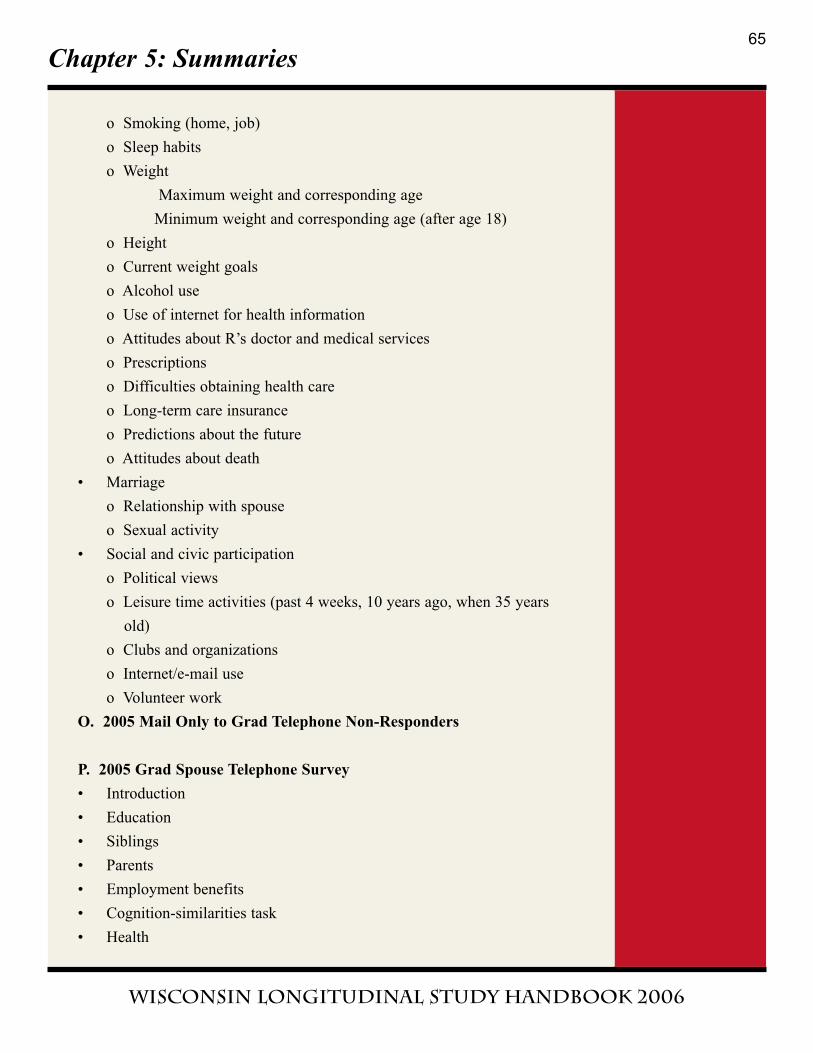
Chapter 5: Summaries
Wisconsin Longitudinal Study handbook 2006
o Smoking (home, job)
o Sleep habits
o Weight
Maximum weight and corresponding age
Minimum weight and corresponding age (after age 18)
o Height
o Current weight goals
o Alcohol use
o Use of internet for health information
o Attitudes about R’s doctor and medical services
o Prescriptions
o Difficulties obtaining health care
o Long-term care insurance
o Predictions about the future
o Attitudes about death
• Marriage
o Relationship with spouse
o Sexual activity
• Social and civic participation
o Political views
o Leisure time activities (past 4 weeks, 10 years ago, when 35 years
old)
o Clubs and organizations
o Internet/e-mail use
o Volunteer work
O. 2005 Mail Only to Grad Telephone Non-Responders
P. 2005 Grad Spouse Telephone Survey
• Introduction
• Education
• Siblings
• Parents
• Employment benefits
• Cognition-similarities task
• Health
65
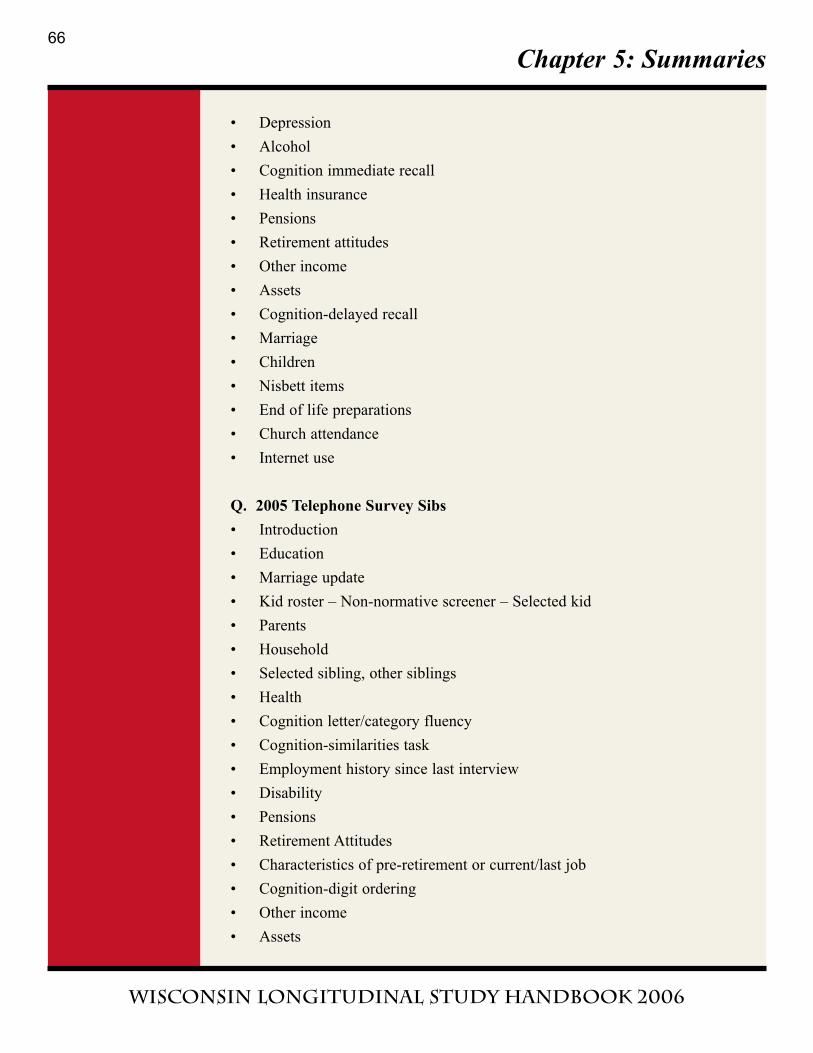
Chapter 5: Summaries
Wisconsin Longitudinal Study handbook 2006
• Depression
• Alcohol
• Cognition immediate recall
• Health insurance
• Pensions
• Retirement attitudes
• Other income
• Assets
• Cognition-delayed recall
• Marriage
• Children
• Nisbett items
• End of life preparations
• Church attendance
• Internet use
Q. 2005 Telephone Survey Sibs
• Introduction
• Education
• Marriage update
• Kid roster – Non-normative screener – Selected kid
• Parents
• Household
• Selected sibling, other siblings
• Health
• Cognition letter/category fluency
• Cognition-similarities task
• Employment history since last interview
• Disability
• Pensions
• Retirement Attitudes
• Characteristics of pre-retirement or current/last job
• Cognition-digit ordering
• Other income
• Assets
66
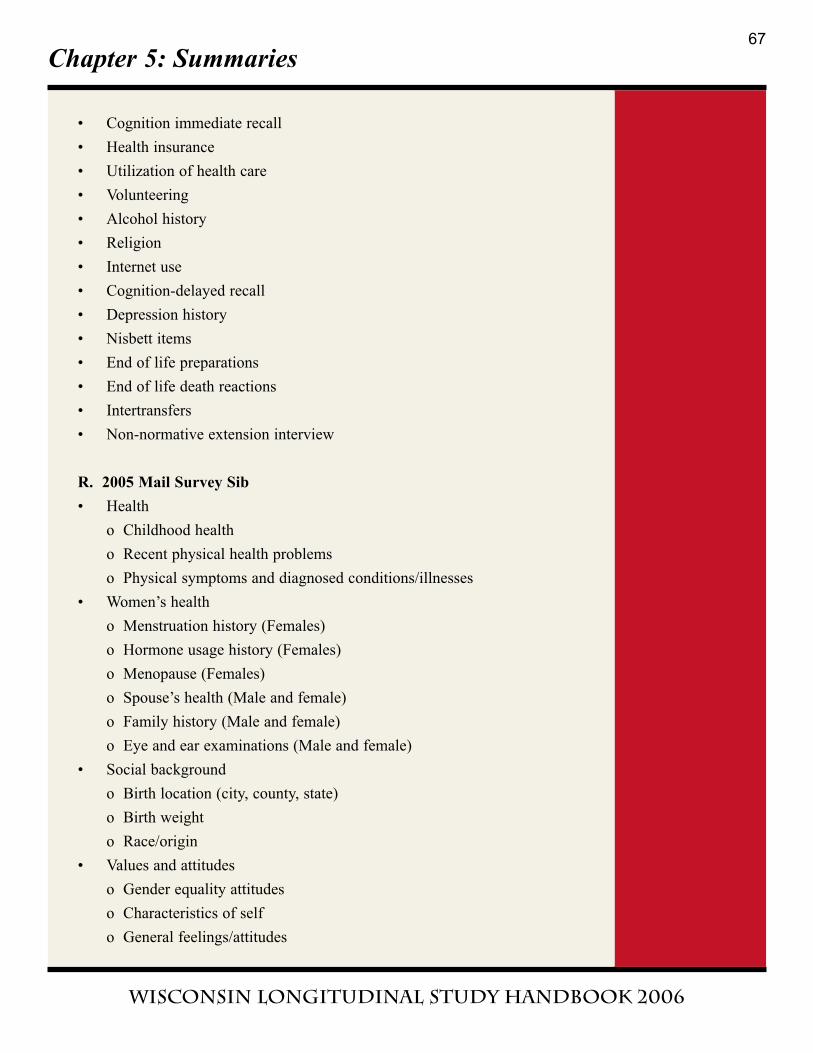
Chapter 5: Summaries
Wisconsin Longitudinal Study handbook 2006
• Cognition immediate recall
• Health insurance
• Utilization of health care
• Volunteering
• Alcohol history
• Religion
• Internet use
• Cognition-delayed recall
• Depression history
• Nisbett items
• End of life preparations
• End of life death reactions
• Intertransfers
• Non-normative extension interview
R. 2005 Mail Survey Sib
• Health
o Childhood health
o Recent physical health problems
o Physical symptoms and diagnosed conditions/illnesses
• Women’s health
o Menstruation history (Females)
o Hormone usage history (Females)
o Menopause (Females)
o Spouse’s health (Male and female)
o Family history (Male and female)
o Eye and ear examinations (Male and female)
• Social background
o Birth location (city, county, state)
o Birth weight
o Race/origin
• Values and attitudes
o Gender equality attitudes
o Characteristics of self
o General feelings/attitudes
67
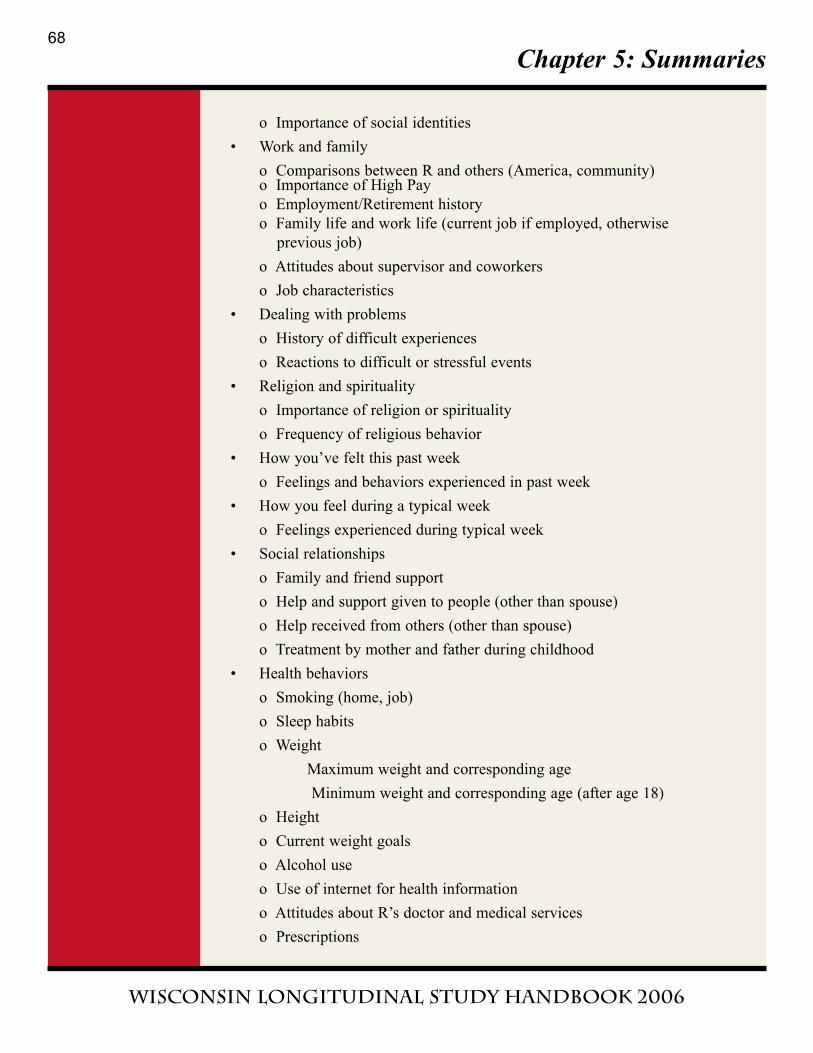
Chapter 5: Summaries
Wisconsin Longitudinal Study handbook 2006
o Importance of social identities
• Work and family
o Comparisons between R and others (America, community)o Importance of High Pay
o Employment/Retirement history
o Family life and work life (current job if employed, otherwise
previous job)
o Attitudes about supervisor and coworkers
o Job characteristics
• Dealing with problems
o History of difficult experiences
o Reactions to difficult or stressful events
• Religion and spirituality
o Importance of religion or spirituality
o Frequency of religious behavior
• How you’ve felt this past week
o Feelings and behaviors experienced in past week
• How you feel during a typical week
o Feelings experienced during typical week
• Social relationships
o Family and friend support
o Help and support given to people (other than spouse)
o Help received from others (other than spouse)
o Treatment by mother and father during childhood
• Health behaviors
o Smoking (home, job)
o Sleep habits
o Weight
Maximum weight and corresponding age
Minimum weight and corresponding age (after age 18)
o Height
o Current weight goals
o Alcohol use
o Use of internet for health information
o Attitudes about R’s doctor and medical services
o Prescriptions
68
Chapter 5: Summaries
Wisconsin Longitudinal Study handbook 2006
o Difficulties obtaining health care
o Long-term care insurance
o Predictions about the future
o Attitudes about death
• Marriage
o Relationship with spouse
o Sexual activity
• Social and civic participation
o Political views
o Leisure time activities (past 4 weeks, 10 years ago, when 35 years
old)
o Clubs and organizations
o Internet/e-mail use
o Volunteer work
S. 2005 Mail Only to Sib Telephone Non-Responders
T. 2005 Sib Spouse Telephone Survey
• Introduction
• Education
• Siblings
• Parents
• Employment benefits
• Cognition-similarities task
• Health
• Depression
• Alcohol
• Cognition immediate recall
• Health insurance
• Pensions
• Retirement attitudes
• Other income
• Assets
• Cognition-delayed recall
• Marriage
69
Chapter 5: Summaries
Wisconsin Longitudinal Study handbook 2006
• Children
• Nisbett items
• End of life preparations
• Church attendance
• Internet use
U. 2005 Widows of Grads and Sibs Telephones
• Introduction
• Graduate mortality close out
• Marriage update
• Education
High school, junior high, and elementary school names
• Kid roster – Non-normative screener – Selected kid
• Parents and parents-in-law
Grad parents’ mortality information
• Household
• Widow birth order/grad sub-ship and mortality
• Cognition-similarities task
• Health
• Current last job and benefits
• Pensions
• Retirement attitudes
• Other income
• Assets
• Cognition immediate recall
• Health insurance
• Alcohol history
• Religion
• Internet use
• Cognition-delayed recall
• Depression history
• End of life preparations
• End of life death reactions
• Intertransfers
• Non-normative extension interview
70
Chapter 5: Summaries
Wisconsin Longitudinal Study handbook 2006
71
Chapter 5: Summaries
Wisconsin Longitudinal Study handbook 2006
72
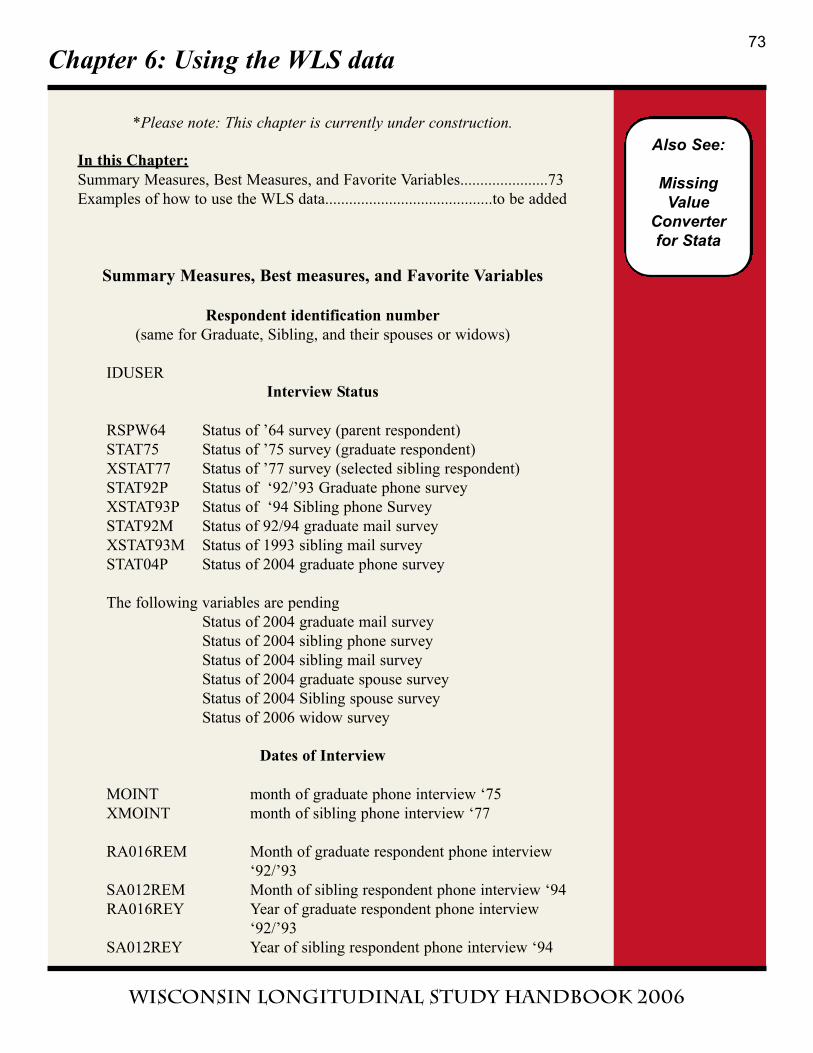
Chapter 6: Using the WLS data
Wisconsin Longitudinal Study handbook 2006
*Please note: This chapter is currently under construction.
In this Chapter:
Summary Measures, Best Measures, and Favorite Variables......................73
Examples of how to use the WLS data..........................................to be added
Summary Measures, Best measures, and Favorite Variables
Respondent identification number
(same for Graduate, Sibling, and their spouses or widows)
IDUSER
Interview Status
RSPW64 Status of ’64 survey (parent respondent)
STAT75 Status of ’75 survey (graduate respondent)
XSTAT77 Status of ’77 survey (selected sibling respondent)
STAT92P Status of ‘92/’93 Graduate phone survey
XSTAT93P Status of ‘94 Sibling phone Survey
STAT92M Status of 92/94 graduate mail survey
XSTAT93M Status of 1993 sibling mail survey
STAT04P Status of 2004 graduate phone survey
The following variables are pending
Status of 2004 graduate mail survey
Status of 2004 sibling phone survey
Status of 2004 sibling mail survey
Status of 2004 graduate spouse survey
Status of 2004 Sibling spouse survey
Status of 2006 widow survey
Dates of Interview
MOINT month of graduate phone interview ‘75
XMOINT month of sibling phone interview ‘77
RA016REM Month of graduate respondent phone interview
‘92/’93
SA012REM Month of sibling respondent phone interview ‘94
RA016REY Year of graduate respondent phone interview
‘92/’93
SA012REY Year of sibling respondent phone interview ‘94
73
Also See:
MissingValue
Converterfor Stata
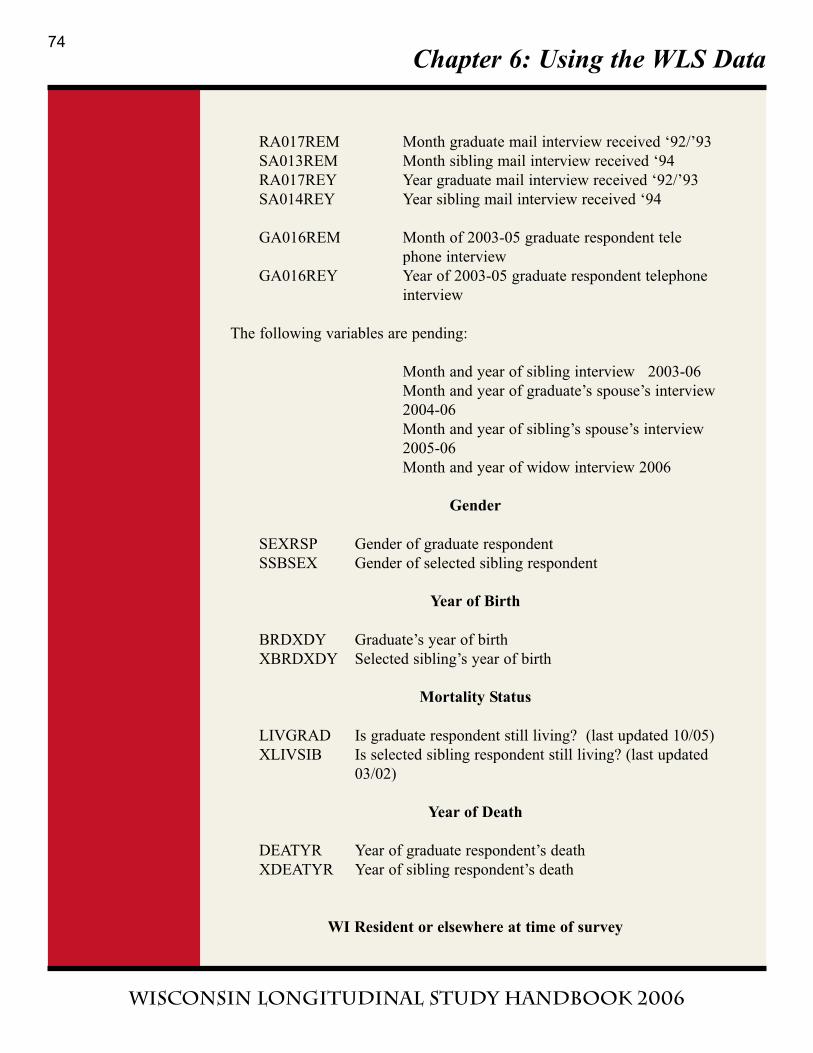
Chapter 6: Using the WLS Data
Wisconsin Longitudinal Study handbook 2006
RA017REM Month graduate mail interview received ‘92/’93
SA013REM Month sibling mail interview received ‘94
RA017REY Year graduate mail interview received ‘92/’93
SA014REY Year sibling mail interview received ‘94
GA016REM Month of 2003-05 graduate respondent tele
phone interview
GA016REY Year of 2003-05 graduate respondent telephone
interview
The following variables are pending:
Month and year of sibling interview 2003-06
Month and year of graduate’s spouse’s interview
2004-06
Month and year of sibling’s spouse’s interview
2005-06
Month and year of widow interview 2006
Gender
SEXRSP Gender of graduate respondent
SSBSEX Gender of selected sibling respondent
Year of Birth
BRDXDY Graduate’s year of birth
XBRDXDY Selected sibling’s year of birth
Mortality Status
LIVGRAD Is graduate respondent still living? (last updated 10/05)
XLIVSIB Is selected sibling respondent still living? (last updated
03/02)
Year of Death
DEATYR Year of graduate respondent’s death
XDEATYR Year of sibling respondent’s death
WI Resident or elsewhere at time of survey
74
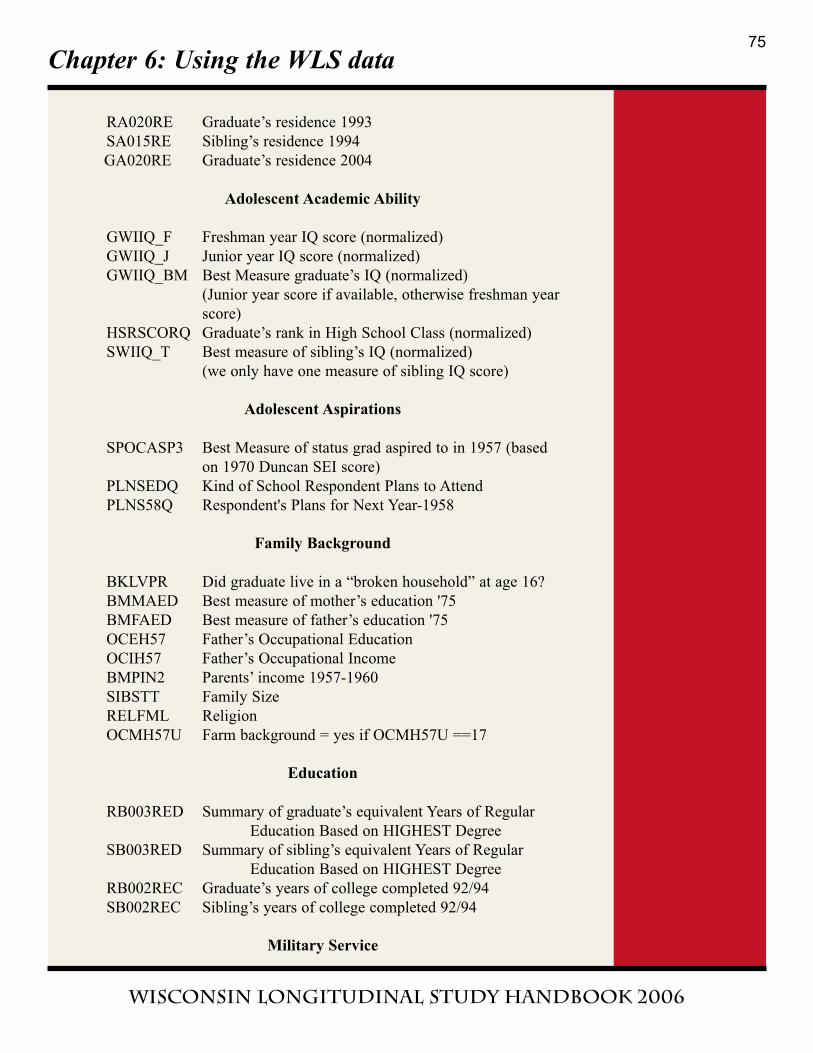
Chapter 6: Using the WLS data
Wisconsin Longitudinal Study handbook 2006
RA020RE Graduate’s residence 1993
SA015RE Sibling’s residence 1994
GA020RE Graduate’s residence 2004
Adolescent Academic Ability
GWIIQ_F Freshman year IQ score (normalized)
GWIIQ_J Junior year IQ score (normalized)
GWIIQ_BM Best Measure graduate’s IQ (normalized)
(Junior year score if available, otherwise freshman year
score)
HSRSCORQ Graduate’s rank in High School Class (normalized)
SWIIQ_T Best measure of sibling’s IQ (normalized)
(we only have one measure of sibling IQ score)
Adolescent Aspirations
SPOCASP3 Best Measure of status grad aspired to in 1957 (based
on 1970 Duncan SEI score)
PLNSEDQ Kind of School Respondent Plans to Attend
PLNS58Q Respondent's Plans for Next Year-1958
Family Background
BKLVPR Did graduate live in a “broken household” at age 16?
BMMAED Best measure of mother’s education '75
BMFAED Best measure of father’s education '75
OCEH57 Father’s Occupational Education
OCIH57 Father’s Occupational Income
BMPIN2 Parents’ income 1957-1960
SIBSTT Family Size
RELFML Religion
OCMH57U Farm background = yes if OCMH57U ==17
Education
RB003RED Summary of graduate’s equivalent Years of Regular
Education Based on HIGHEST Degree
SB003RED Summary of sibling’s equivalent Years of Regular
Education Based on HIGHEST Degree
RB002REC Graduate’s years of college completed 92/94
SB002REC Sibling’s years of college completed 92/94
Military Service
75
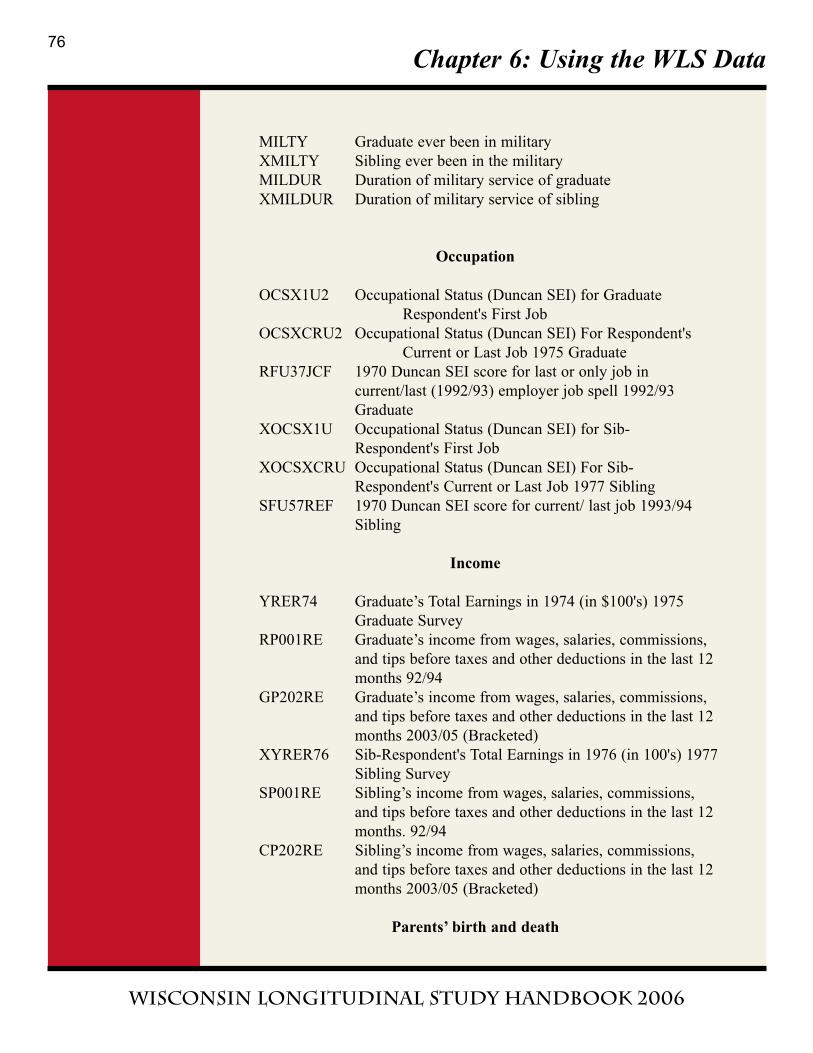
Chapter 6: Using the WLS Data
Wisconsin Longitudinal Study handbook 2006
MILTY Graduate ever been in military
XMILTY Sibling ever been in the military
MILDUR Duration of military service of graduate
XMILDUR Duration of military service of sibling
Occupation
OCSX1U2 Occupational Status (Duncan SEI) for Graduate
Respondent's First Job
OCSXCRU2 Occupational Status (Duncan SEI) For Respondent's
Current or Last Job 1975 Graduate
RFU37JCF 1970 Duncan SEI score for last or only job in
current/last (1992/93) employer job spell 1992/93
Graduate
XOCSX1U Occupational Status (Duncan SEI) for Sib-
Respondent's First Job
XOCSXCRU Occupational Status (Duncan SEI) For Sib-
Respondent's Current or Last Job 1977 Sibling
SFU57REF 1970 Duncan SEI score for current/ last job 1993/94
Sibling
Income
YRER74 Graduate’s Total Earnings in 1974 (in $100's) 1975
Graduate Survey
RP001RE Graduate’s income from wages, salaries, commissions,
and tips before taxes and other deductions in the last 12
months 92/94
GP202RE Graduate’s income from wages, salaries, commissions,
and tips before taxes and other deductions in the last 12
months 2003/05 (Bracketed)
XYRER76 Sib-Respondent's Total Earnings in 1976 (in 100's) 1977
Sibling Survey
SP001RE Sibling’s income from wages, salaries, commissions,
and tips before taxes and other deductions in the last 12
months. 92/94
CP202RE Sibling’s income from wages, salaries, commissions,
and tips before taxes and other deductions in the last 12
months 2003/05 (Bracketed)
Parents’ birth and death
76
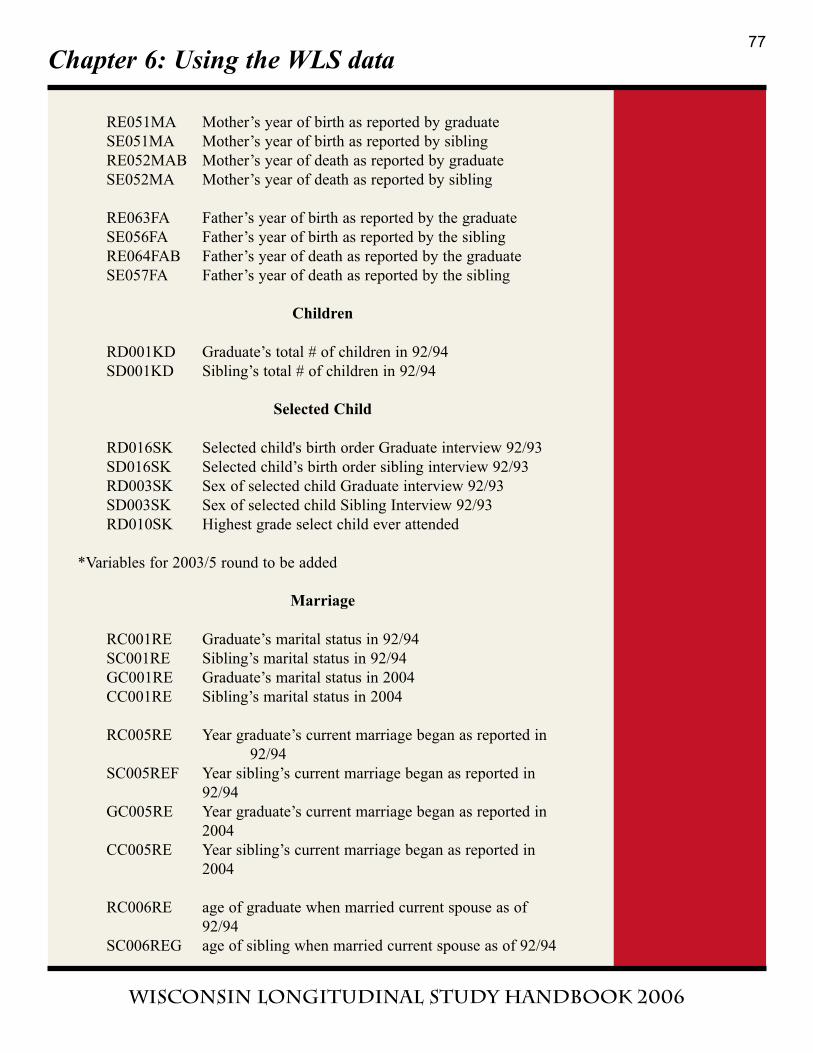
Chapter 6: Using the WLS data
Wisconsin Longitudinal Study handbook 2006
RE051MA Mother’s year of birth as reported by graduate
SE051MA Mother’s year of birth as reported by sibling
RE052MAB Mother’s year of death as reported by graduate
SE052MA Mother’s year of death as reported by sibling
RE063FA Father’s year of birth as reported by the graduate
SE056FA Father’s year of birth as reported by the sibling
RE064FAB Father’s year of death as reported by the graduate
SE057FA Father’s year of death as reported by the sibling
Children
RD001KD Graduate’s total # of children in 92/94
SD001KD Sibling’s total # of children in 92/94
Selected Child
RD016SK Selected child's birth order Graduate interview 92/93
SD016SK Selected child’s birth order sibling interview 92/93
RD003SK Sex of selected child Graduate interview 92/93
SD003SK Sex of selected child Sibling Interview 92/93
RD010SK Highest grade select child ever attended
*Variables for 2003/5 round to be added
Marriage
RC001RE Graduate’s marital status in 92/94
SC001RE Sibling’s marital status in 92/94
GC001RE Graduate’s marital status in 2004
CC001RE Sibling’s marital status in 2004
RC005RE Year graduate’s current marriage began as reported in
92/94
SC005REF Year sibling’s current marriage began as reported in
92/94
GC005RE Year graduate’s current marriage began as reported in
2004
CC005RE Year sibling’s current marriage began as reported in
2004
RC006RE age of graduate when married current spouse as of
92/94
SC006REG age of sibling when married current spouse as of 92/94
77
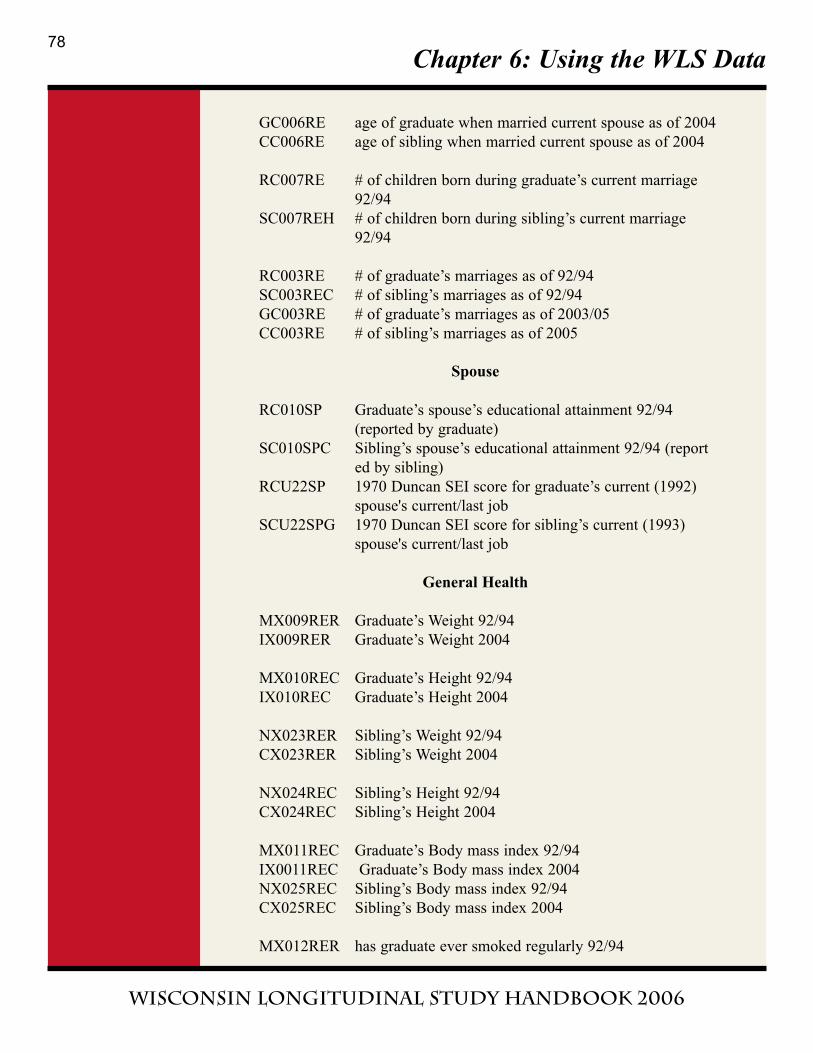
Chapter 6: Using the WLS Data
Wisconsin Longitudinal Study handbook 2006
GC006RE age of graduate when married current spouse as of 2004
CC006RE age of sibling when married current spouse as of 2004
RC007RE # of children born during graduate’s current marriage
92/94
SC007REH # of children born during sibling’s current marriage
92/94
RC003RE # of graduate’s marriages as of 92/94
SC003REC # of sibling’s marriages as of 92/94
GC003RE # of graduate’s marriages as of 2003/05
CC003RE # of sibling’s marriages as of 2005
Spouse
RC010SP Graduate’s spouse’s educational attainment 92/94
(reported by graduate)
SC010SPC Sibling’s spouse’s educational attainment 92/94 (report
ed by sibling)
RCU22SP 1970 Duncan SEI score for graduate’s current (1992)
spouse's current/last job
SCU22SPG 1970 Duncan SEI score for sibling’s current (1993)
spouse's current/last job
General Health
MX009RER Graduate’s Weight 92/94
IX009RER Graduate’s Weight 2004
MX010REC Graduate’s Height 92/94
IX010REC Graduate’s Height 2004
NX023RER Sibling’s Weight 92/94
CX023RER Sibling’s Weight 2004
NX024REC Sibling’s Height 92/94
CX024REC Sibling’s Height 2004
MX011REC Graduate’s Body mass index 92/94
IX0011REC Graduate’s Body mass index 2004
NX025REC Sibling’s Body mass index 92/94
CX025REC Sibling’s Body mass index 2004
MX012RER has graduate ever smoked regularly 92/94
78
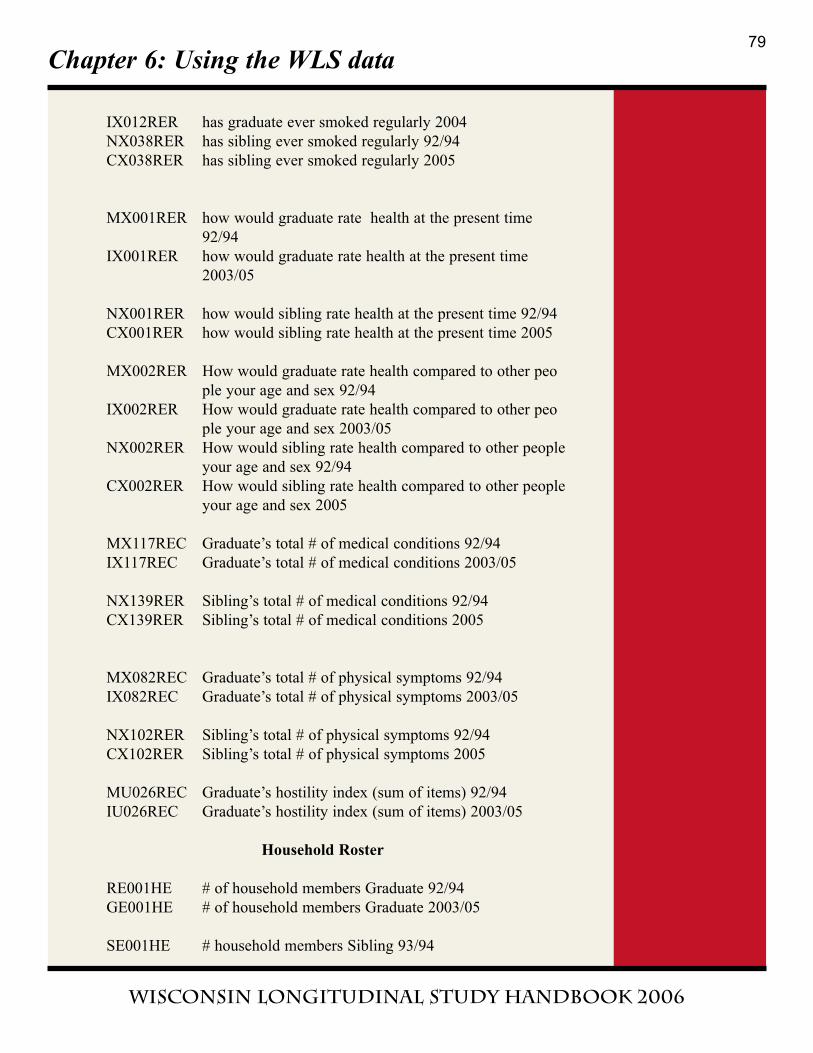
Chapter 6: Using the WLS data
Wisconsin Longitudinal Study handbook 2006
IX012RER has graduate ever smoked regularly 2004
NX038RER has sibling ever smoked regularly 92/94
CX038RER has sibling ever smoked regularly 2005
MX001RER how would graduate rate health at the present time
92/94
IX001RER how would graduate rate health at the present time
2003/05
NX001RER how would sibling rate health at the present time 92/94
CX001RER how would sibling rate health at the present time 2005
MX002RER How would graduate rate health compared to other peo
ple your age and sex 92/94
IX002RER How would graduate rate health compared to other peo
ple your age and sex 2003/05
NX002RER How would sibling rate health compared to other people
your age and sex 92/94
CX002RER How would sibling rate health compared to other people
your age and sex 2005
MX117REC Graduate’s total # of medical conditions 92/94
IX117REC Graduate’s total # of medical conditions 2003/05
NX139RER Sibling’s total # of medical conditions 92/94
CX139RER Sibling’s total # of medical conditions 2005
MX082REC Graduate’s total # of physical symptoms 92/94
IX082REC Graduate’s total # of physical symptoms 2003/05
NX102RER Sibling’s total # of physical symptoms 92/94
CX102RER Sibling’s total # of physical symptoms 2005
MU026REC Graduate’s hostility index (sum of items) 92/94
IU026REC Graduate’s hostility index (sum of items) 2003/05
Household Roster
RE001HE # of household members Graduate 92/94
GE001HE # of household members Graduate 2003/05
SE001HE # household members Sibling 93/94
79
Chapter 6: Using the WLS Data
Wisconsin Longitudinal Study handbook 2006
CE001HE # household members Sibling 2005
80
Chapter 7: Documentation
Wisconsin Longitudinal Study handbook 2006
In this Chapter
Documentation on the Web...........................................................................81
Appendices Descriptions .............................................................................82
Appendices Items..........................................................................................86
Variable Naming Conventions 1957-77.......................................................99
Data Conventions.......................................................................................101
What type of documentation do you need?
Depending on your needs, some sections of documentation may be more
helpful than others. For this reason, the documentation section of the hand-
book is organized in two ways.
1. Web Documentation
Click for links to:
Codebooks
Flowcharts
Appendices
Original Cross-Reference Tables
Change Notices
Questionaires
For web documentation, click here.
Click here to search for variables in the WLS DATA SET.
Click here for CHANGE NOTICES.
2. AppendicesThe appendices provide documentation for all modules of the study through
each wave of the study. Included in this section are:
1. Description of Appendices
2. Appendices Items
To VIEW APPENDICES ITEMS, click here.
81
Web
Documentation
Appendices
Codebooks
Flowcharts
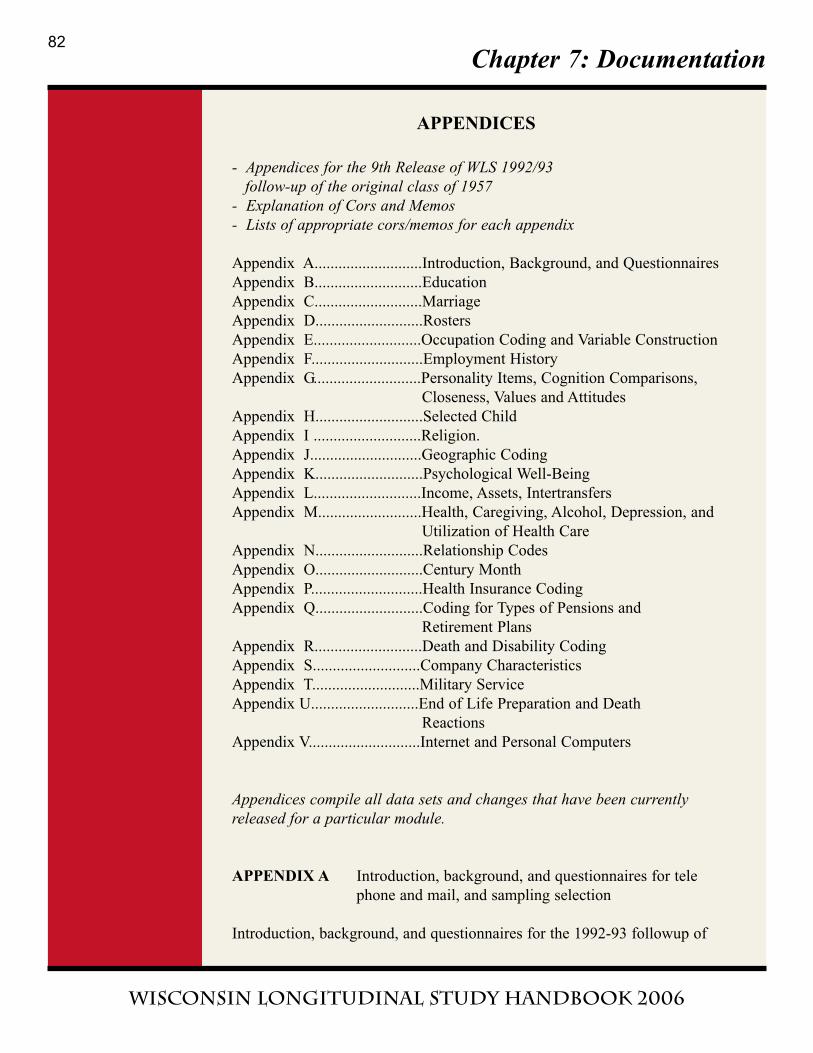
Chapter 7: Documentation
Wisconsin Longitudinal Study handbook 2006
APPENDICES
- Appendices for the 9th Release of WLS 1992/93 follow-up of the original class of 1957
- Explanation of Cors and Memos - Lists of appropriate cors/memos for each appendix
Appendix A...........................Introduction, Background, and Questionnaires
Appendix B...........................Education
Appendix C...........................Marriage
Appendix D...........................Rosters
Appendix E...........................Occupation Coding and Variable Construction
Appendix F............................Employment History
Appendix G...........................Personality Items, Cognition Comparisons,
Closeness, Values and Attitudes
Appendix H...........................Selected Child
Appendix I ...........................Religion.
Appendix J............................Geographic Coding
Appendix K...........................Psychological Well-Being
Appendix L...........................Income, Assets, Intertransfers
Appendix M..........................Health, Caregiving, Alcohol, Depression, and
Utilization of Health Care
Appendix N...........................Relationship Codes
Appendix O...........................Century Month
Appendix P............................Health Insurance Coding
Appendix Q...........................Coding for Types of Pensions and
Retirement Plans
Appendix R...........................Death and Disability Coding
Appendix S...........................Company Characteristics
Appendix T...........................Military Service
Appendix U...........................End of Life Preparation and Death
Reactions
Appendix V............................Internet and Personal Computers
Appendices compile all data sets and changes that have been currentlyreleased for a particular module.
APPENDIX A Introduction, background, and questionnaires for tele
phone and mail, and sampling selection
Introduction, background, and questionnaires for the 1992-93 followup of
82
Chapter 7: Documentation
Wisconsin Longitudinal Study handbook 2006
the 1957 high school students in the Wisconsin Longitudinal Study (WLS)
are here along with variable name mnemonics. This section also contains
summaries of the 1992/3 mail and telephone surveys, in both their original
version and with added questions about menopause. There are also files
use for the CASES CATI survey for both respondents and nonrespondents.
Included also are sibling data construction, background variables for grad-
uates and siblings, variable name mnemonics, coding of retrospective data,
and process used to identify sample members who are married to one
another. 1957-77 Background and questionnaires for 1957, 1964, 1975,
and 1977 rounds of the WLS along with interviewer instructions for 1975
graduates and 1977 siblings, recoding of questionnaires, and tracing proce-
dures are all detailed in this section of Appendix A. Included also are sib-
ling data construction, background variables for graduates and siblings,
variable name mnemonics, coding of retrospective data, and process used
to identify sample members who are married to one another.
APPENDIX B Education
Documents here detail the process of variable creation for education,
including codes for degree titles and levels of education, major fields of
study, and colleges. Not included on public release are Wisconsin high
school codes, school district variables, state, college, and vocational codes.
*** Not included on public release are: Wisconsin high school codes,
school district variables, state, college, and vocational codes.
APPENDIX C Marriage
This appendix contains information about the construction of variables for
marital history, number of children born into each marriage, couples within
our respondent pool, living arrangements of the current spouse and marital
and fertility coding.
APPENDIX D Family: household, children, parents, and siblings
Details on the creation of both the respondent’s household roster and chil-
dren’s roster are provided here.
APPENDIX E Occupation coding and variable construction
Included in occupation coding and variable construction are: coding infor-
mation on industry, class of worker, occupational aspirations, and taxes.
Other information proved here describes coding follow-ups, prestige and
status scores, hourly wage rate variable creation, index of job desirability,
SEI score information, job importance items, related mapping information
and a list of occupation for the 1992/93 round. Calculations of
83
Chapter 7: Documentation
Wisconsin Longitudinal Study handbook 2006
SEI/MSEI/TSEI/Occ.Ed./Occ.Inc. score to use when a weighted average
must be computed are also provided.
APPENDIX F Employment History, Detailed Job Change
Included are details on labor force and current occupation for 1975 and
1977, 1957 and 1977 surveys, work experience, and the creation of com-
plete job histories for women 1957-93. Also included are coding of experi-
ence and tenure for respondents not in the labor force at the time of the
interview and mapping of occupation categories.
APPENDIX G Personality items, cognition, comparisons, closeness,
values and attitudes
Covered here are references and variable creation for psychological, per-
sonality, health, work and family, organization, Tenacious Goal Pursuit
(TGP) and Flexible Goal Adjustment (FGA). Also included are details on
scoring of cognition items, and scales for personality items (including the 5
factor model of personality structure), the Weschler Adult Intelligence
Scale - WAIS), graduate IQ and high school rank data and construction of
"new" IQ variables.
APPENDIX H Selected child
This section details inconsistencies in the residence of selected child.
**NOTE:cor for Non-Normative is not yet available.
APPENDIX I Religion
Codes for religion are provided in this section.
APPENDIX J Geographic coding
Included are: selected addresses for 1957-1977 WLS follow-up studies,
variable creation for size of place of residence, and notes about size of
place of residence. Included in this section, also, are states and foreign
country codes, Geographic codes ( for County Codes- FIPS- and selected
addresses), Labor Market Areas (LMA), Metropolitan Statistical Areas
(MSA).and county populations. City codes are not available on public
release.
APPENDIX K Psychological well-being
84
Chapter 7: Documentation
Wisconsin Longitudinal Study handbook 2006
This section contains the creation of psychological well-being variables as
well as comparative survey measurement of health, psychological well-
being and social responsibility in the WLS, NSFH, and Whitehall Survey of
British Civil Servants.
APPENDIX L Income, assets, intertransfers
Included in this section are income, assets, intertransfers details, and proce-
dures in gathering tax data in June 1966. Processing of intertransfers to
children information, coding of transfers received, and a note on factor
weighted SES scores and construction of new best measures of 1957
parental income.
APPENDIX M Health, caregiving, alcohol, depression,
and utilization of health care
Covered here are references and variable creation for psychological, per-
sonality, health, work and family, organization, Tenacious Goal Pursuit
(TGP) and Flexible Goal Adjustment (FGA). Also included are details on
scoring of cognition items, and scales for personality items (including the 5
factor model of personality structure) and a list of health problems. Lastly
is the inclusion of comparative survey measurement of health, psychologi-
cal well-being and social responsibility in the WLS, NSFH, and the
Whitehall Survey of British Civil Servants.
APPENDIX N Relationship codes
Appendix N contains a list of relationship codes for both male and female
respondents.
APPENDIX O Century month
The file in this appendix provides century month allocations for cases when
only year or season was obtained. It also serves as a source of conversion
into century months for 1992/94 follow-up studies.
APPENDIX P Health insurance coding
Descriptions of health insurance codes for questions 826s: "Can you tell me
the main reason that you don't have any health insurance?" and 826n:
"Can you tell me more about that [health insurance]?" are detailed in this
section.
85
Chapter 7: Documentation
Wisconsin Longitudinal Study handbook 2006
APPENDIX Q Coding for types of pensions and retirement plans
This section provides a full description of coding for types of pensions and
retirement plans.
APPENDIX R Death and disability coding.
Included in this section are cause of death codes, friends death reports cod-
ing information, and disability codes.
APPENDIX S Company characteristics
In this section are: coding the name of employer for last or current job in
1975 and coding of company and industry data.
APPENDIX T Military service
This appendix contains details on the creation of military variables.
APPENDIX U End of Life Preparation and Death Reactions
Included in this new appendix, is information on variable creation, coding,
and description of problems/solutions for End of Life Preparation and
Death Reactions.
APPENDIX V Internet and Personal Computers
Included in this new appendix, is information on variable creation, coding,
and description of problems/solutions for internet and personal computers.
Appendices Items
The following lists contain references to specific appendices items. Most of
the references are “cors” or “memos” which are simply text documents
items created to describe changes/conventions in the study. The appendices
items are available on the public website.
Appendix A Introduction, Background, and Questionnaires.
Telephone, Mail, and Sampling Selection.
86
Chapter 7: Documentation
Wisconsin Longitudinal Study handbook 2006
wls70.asc 1957/77 data used for 1992 survey
cor446.asc Summary of 1992/93 telephone survey
rqfile.zip
nrqfile.zip Files used for the CASES CATI survey for 197 respon
dents. (Contains 25 files. )
mailq23r.wp5 Files used for the CASES CATI survey for 1975 non-
respondents (contains 25 files)
mqmenorg.wp5 Final version of 1992 mail survey with revised
menopause page (Word Perfect 5.1)
mailq.zip Original version of 1992 mail survey with original
menopause page (Word Perfect 5.1)
memo110c.asc Files used for data entry using the CASES software for
the 1992 mail surveys sent to all respondents of the
1992 telephone surveys(contains 5 files)
memo067.asc The Wisconsin Longitudinal Study: A Source of Public
Data on Aging in American Families
ques57.asc
ques64.asc A general selection of variables for WLS data
ques75.asc 1957 questionnaire
ques77.asc 1964 questionnaire
cor336at5.asc 1975 questionnaire
cor703.asc 1977 questionnaire
cor704.asc History of Interviews
cor000a.asc Interviewer instructions for 1975 graduate survey
cor000b.asc Interviewer instructions for 1977 sibling survey
Recoding of 1957 questionnaires - 8/18/62
cor336at3.asc Notes on coding of the 1964 follow-up study and
recoding of questionnaires - 8/17/62
memo130.asc Location of 1957 raw data: Status of variables and
Recommendations for 1983 recoding memo127a.asc
memo127a.asc Selection of Sample for Sibling Study and other notes
memo128.asc "Tracing Members of a Panel: a 17-year Follow-up"
cor607.asc Selection of Sample for Sibling Study and other notes
cor368a.asc 1977 Sibling Study Tracing Procedures
cor368.asc Conversion into century months
cor699.asc Sibling data construction in the 1975 survey
Clarification of the graduate's education variable in the
1975 sibling roster - selection of birth order and educa
tion variables
87
Chapter 7: Documentation
Wisconsin Longitudinal Study handbook 2006
cor700.asc Variables in the background section that presented spe
cial problems in cleaning and recoding
memo131.asc Variable name mnemonics
cor586.asc Background variables for the 1977 sibling study
cor583a.asc Variable name mnemonics
cor904.txt Variable Creation for Summary Module - Graduate
Spouse Instrument
Coding of retrospective data collected in 1992/93 for 1975
nonrespondents
cor857.txt Process used to identify sample members who are mar-
ried to one another
Variable Creation for summary varibles - gbeg 2004 graduate phone survey.
Appendix B Education
memo115a.asc Creation of education variables
cor554.asc Degree Titles and Levels of Education
cor555.asc Major Fields of Study
cor573.asc College Codes
cor275.asc Coding of 1964 educational variables
cor573.asc State and College Code Manual (not for public release)
cor705.asc Vocational School Code Manual (not for public release)
cor554.asc Degree titles
cor554.asc Major fields of study
memo005.asc Notes on the coding procedures used by WSRL in
coding the Wisconsin School Study – 1975
cor701.asc Special problems in the cleaning of graduate's educa
tion data in 1975
cor229a.asc Combining responses to vocational and technical ques
tions in 1975
cor256.asc Allocation of century months for regular education
variables in 1975 survey
memo044.asc Notes on cleaning education variables in 1977 sibling
study
cor588.asc Code numbers of wisconsin high schools
memo129.asc Creation of the Value of College Variable from 1957
data
cor872.txt Variable Creation for the Education Module - Graduate
Instrument
cor905.txt Variable Creation for Education Module - Graduate
Spouse Instrument
88
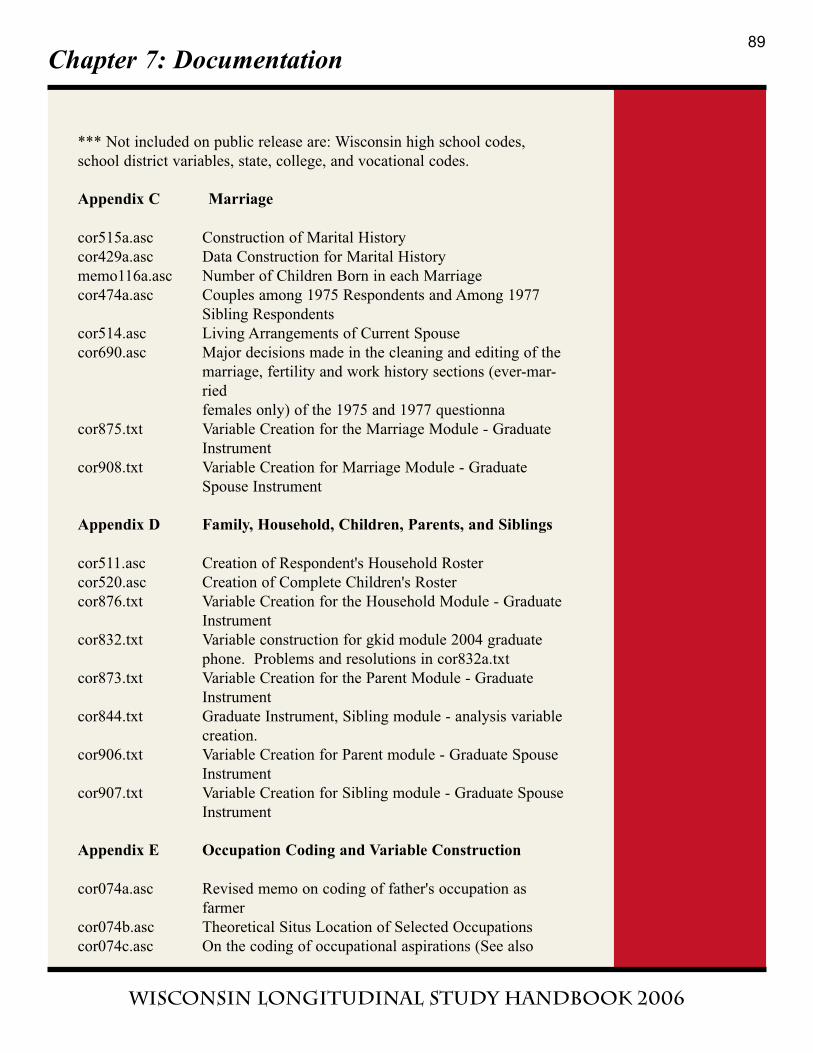
Chapter 7: Documentation
Wisconsin Longitudinal Study handbook 2006
*** Not included on public release are: Wisconsin high school codes,
school district variables, state, college, and vocational codes.
Appendix C Marriage
cor515a.asc Construction of Marital History
cor429a.asc Data Construction for Marital History
memo116a.asc Number of Children Born in each Marriage
cor474a.asc Couples among 1975 Respondents and Among 1977
Sibling Respondents
cor514.asc Living Arrangements of Current Spouse
cor690.asc Major decisions made in the cleaning and editing of the
marriage, fertility and work history sections (ever-mar-
ried
females only) of the 1975 and 1977 questionna
cor875.txt Variable Creation for the Marriage Module - Graduate
Instrument
cor908.txt Variable Creation for Marriage Module - Graduate
Spouse Instrument
Appendix D Family, Household, Children, Parents, and Siblings
cor511.asc Creation of Respondent's Household Roster
cor520.asc Creation of Complete Children's Roster
cor876.txt Variable Creation for the Household Module - Graduate
Instrument
cor832.txt Variable construction for gkid module 2004 graduate
phone. Problems and resolutions in cor832a.txt
cor873.txt Variable Creation for the Parent Module - Graduate
Instrument
cor844.txt Graduate Instrument, Sibling module - analysis variable
creation.
cor906.txt Variable Creation for Parent module - Graduate Spouse
Instrument
cor907.txt Variable Creation for Sibling module - Graduate Spouse
Instrument
Appendix E Occupation Coding and Variable Construction
cor074a.asc Revised memo on coding of father's occupation as
farmer
cor074b.asc Theoretical Situs Location of Selected Occupations
cor074c.asc On the coding of occupational aspirations (See also
89
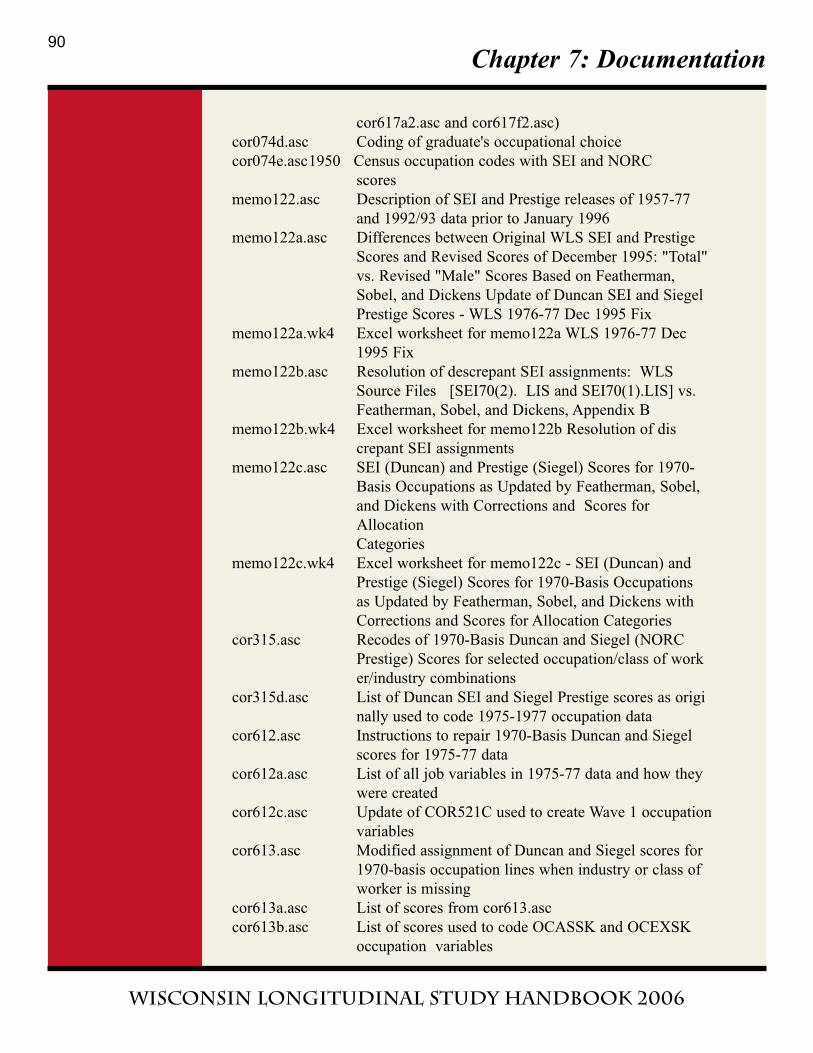
Chapter 7: Documentation
Wisconsin Longitudinal Study handbook 2006
cor617a2.asc and cor617f2.asc)
cor074d.asc Coding of graduate's occupational choice
cor074e.asc1950 Census occupation codes with SEI and NORC
scores
memo122.asc Description of SEI and Prestige releases of 1957-77
and 1992/93 data prior to January 1996
memo122a.asc Differences between Original WLS SEI and Prestige
Scores and Revised Scores of December 1995: "Total"
vs. Revised "Male" Scores Based on Featherman,
Sobel, and Dickens Update of Duncan SEI and Siegel
Prestige Scores - WLS 1976-77 Dec 1995 Fix
memo122a.wk4 Excel worksheet for memo122a WLS 1976-77 Dec
1995 Fix
memo122b.asc Resolution of descrepant SEI assignments: WLS
Source Files [SEI70(2). LIS and SEI70(1).LIS] vs.
Featherman, Sobel, and Dickens, Appendix B
memo122b.wk4 Excel worksheet for memo122b Resolution of dis
crepant SEI assignments
memo122c.asc SEI (Duncan) and Prestige (Siegel) Scores for 1970-
Basis Occupations as Updated by Featherman, Sobel,
and Dickens with Corrections and Scores for
Allocation
Categories
memo122c.wk4 Excel worksheet for memo122c - SEI (Duncan) and
Prestige (Siegel) Scores for 1970-Basis Occupations
as Updated by Featherman, Sobel, and Dickens with
Corrections and Scores for Allocation Categories
cor315.asc Recodes of 1970-Basis Duncan and Siegel (NORC
Prestige) Scores for selected occupation/class of work
er/industry combinations
cor315d.asc List of Duncan SEI and Siegel Prestige scores as origi
nally used to code 1975-1977 occupation data
cor612.asc Instructions to repair 1970-Basis Duncan and Siegel
scores for 1975-77 data
cor612a.asc List of all job variables in 1975-77 data and how they
were created
cor612c.asc Update of COR521C used to create Wave 1 occupation
variables
cor613.asc Modified assignment of Duncan and Siegel scores for
1970-basis occupation lines when industry or class of
worker is missing
cor613a.asc List of scores from cor613.asc
cor613b.asc List of scores used to code OCASSK and OCEXSK
occupation variables
90
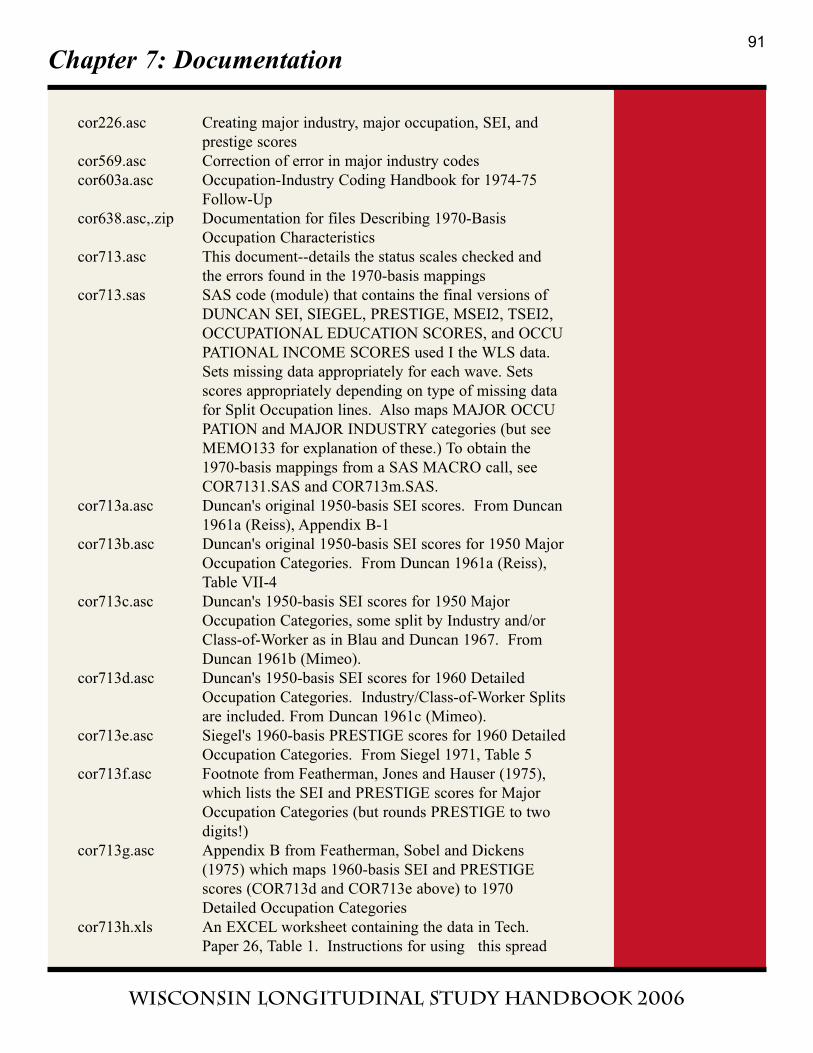
Chapter 7: Documentation
Wisconsin Longitudinal Study handbook 2006
cor226.asc Creating major industry, major occupation, SEI, and
prestige scores
cor569.asc Correction of error in major industry codes
cor603a.asc Occupation-Industry Coding Handbook for 1974-75
Follow-Up
cor638.asc,.zip Documentation for files Describing 1970-Basis
Occupation Characteristics
cor713.asc This document--details the status scales checked and
the errors found in the 1970-basis mappings
cor713.sas SAS code (module) that contains the final versions of
DUNCAN SEI, SIEGEL, PRESTIGE, MSEI2, TSEI2,
OCCUPATIONAL EDUCATION SCORES, and OCCU
PATIONAL INCOME SCORES used I the WLS data.
Sets missing data appropriately for each wave. Sets
scores appropriately depending on type of missing data
for Split Occupation lines. Also maps MAJOR OCCU
PATION and MAJOR INDUSTRY categories (but see
MEMO133 for explanation of these.) To obtain the
1970-basis mappings from a SAS MACRO call, see
COR7131.SAS and COR713m.SAS.
cor713a.asc Duncan's original 1950-basis SEI scores. From Duncan
1961a (Reiss), Appendix B-1
cor713b.asc Duncan's original 1950-basis SEI scores for 1950 Major
Occupation Categories. From Duncan 1961a (Reiss),
Table VII-4
cor713c.asc Duncan's 1950-basis SEI scores for 1950 Major
Occupation Categories, some split by Industry and/or
Class-of-Worker as in Blau and Duncan 1967. From
Duncan 1961b (Mimeo).
cor713d.asc Duncan's 1950-basis SEI scores for 1960 Detailed
Occupation Categories. Industry/Class-of-Worker Splits
are included. From Duncan 1961c (Mimeo).
cor713e.asc Siegel's 1960-basis PRESTIGE scores for 1960 Detailed
Occupation Categories. From Siegel 1971, Table 5
cor713f.asc Footnote from Featherman, Jones and Hauser (1975),
which lists the SEI and PRESTIGE scores for Major
Occupation Categories (but rounds PRESTIGE to two
digits!)
cor713g.asc Appendix B from Featherman, Sobel and Dickens
(1975) which maps 1960-basis SEI and PRESTIGE
scores (COR713d and COR713e above) to 1970
Detailed Occupation Categories
cor713h.xls An EXCEL worksheet containing the data in Tech.
Paper 26, Table 1. Instructions for using this spread
91
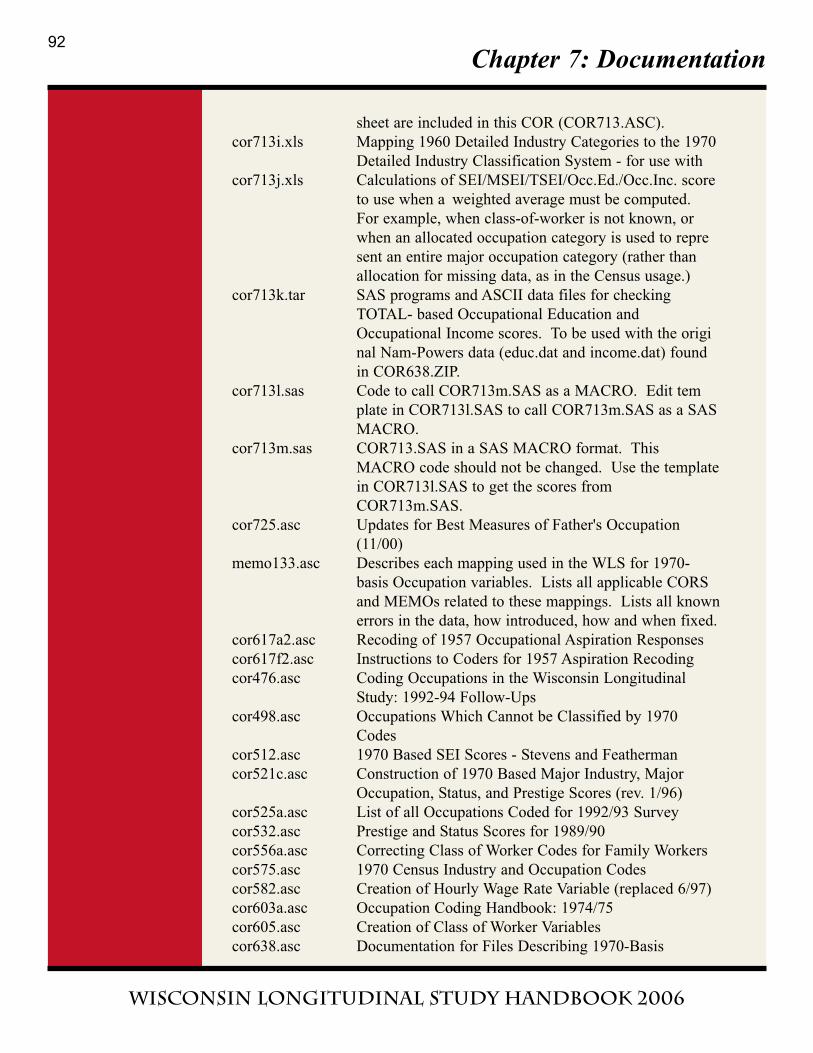
Chapter 7: Documentation
Wisconsin Longitudinal Study handbook 2006
sheet are included in this COR (COR713.ASC).
cor713i.xls Mapping 1960 Detailed Industry Categories to the 1970
Detailed Industry Classification System - for use with
cor713j.xls Calculations of SEI/MSEI/TSEI/Occ.Ed./Occ.Inc. score
to use when a weighted average must be computed.
For example, when class-of-worker is not known, or
when an allocated occupation category is used to repre
sent an entire major occupation category (rather than
allocation for missing data, as in the Census usage.)
cor713k.tar SAS programs and ASCII data files for checking
TOTAL- based Occupational Education and
Occupational Income scores. To be used with the origi
nal Nam-Powers data (educ.dat and income.dat) found
in COR638.ZIP.
cor713l.sas Code to call COR713m.SAS as a MACRO. Edit tem
plate in COR713l.SAS to call COR713m.SAS as a SAS
MACRO.
cor713m.sas COR713.SAS in a SAS MACRO format. This
MACRO code should not be changed. Use the template
in COR713l.SAS to get the scores from
COR713m.SAS.
cor725.asc Updates for Best Measures of Father's Occupation
(11/00)
memo133.asc Describes each mapping used in the WLS for 1970-
basis Occupation variables. Lists all applicable CORS
and MEMOs related to these mappings. Lists all known
errors in the data, how introduced, how and when fixed.
cor617a2.asc Recoding of 1957 Occupational Aspiration Responses
cor617f2.asc Instructions to Coders for 1957 Aspiration Recoding
cor476.asc Coding Occupations in the Wisconsin Longitudinal
Study: 1992-94 Follow-Ups
cor498.asc Occupations Which Cannot be Classified by 1970
Codes
cor512.asc 1970 Based SEI Scores - Stevens and Featherman
cor521c.asc Construction of 1970 Based Major Industry, Major
Occupation, Status, and Prestige Scores (rev. 1/96)
cor525a.asc List of all Occupations Coded for 1992/93 Survey
cor532.asc Prestige and Status Scores for 1989/90
cor556a.asc Correcting Class of Worker Codes for Family Workers
cor575.asc 1970 Census Industry and Occupation Codes
cor582.asc Creation of Hourly Wage Rate Variable (replaced 6/97)
cor603a.asc Occupation Coding Handbook: 1974/75
cor605.asc Creation of Class of Worker Variables
cor638.asc Documentation for Files Describing 1970-Basis
92
Chapter 7: Documentation
Wisconsin Longitudinal Study handbook 2006
cor638.zip Occupation Characteristics
cor639.asc Construction of 1990-basis Occupation Characteristics
and SEI Scores
cor681.asc Mapping 1990 Detailed Occupation and Industry Codes
to 1970 Major Occupation and Industry categories
cor683.asc Sas code to write 5% prestige scores given 1990 occ
codes.
cor684.asc Code to map 1970 Occ Codes to 1970 Occupational
Education and Income Characteristics (4-digits); Code
to map 1990 Occ Codes to 1990 Occupational
Education and Earnings Characteristics (4-digits).
memo072.asc Index of Job Desirability
memo120.asc Job Importance Items
Appendix F Employment History and Detailed Job Changes
cor553.asc The 1992 WLS Employment History Section:
Instrument and Codebook Design
cor522.asc Job History Summary Variables
cor691.asc Labor force and current occupation for the 1957 and
1977 surveys
memo043.asc The variables EXPER and TENURE - 11/81
cor331a.asc Coding of EXPER and TENURE for respondents not in
the labor force at the time of interview. 11/81
cor648.asc Mappings of 1960, 1980, and 1990 Census 3-digit occu-
pation categories to the 1970 3-digit categories.
cor648a.asc ASCII versions of Excel worksheets used in the map
pings of the occupation coding described in
cor648b.asc ASCII versions of Excel worksheets used in the map
pings of the occupation coding described in
cor648c.asc ASCII versions of Excel worksheets used in the map
pings of the occupation coding described in
cor648d.asc ASCII versions of Excel worksheets used in the map
pings of the occupation coding described in
cor648a.xls Excel worksheets used in the mappings of the occupa-
tion coding described in COR648.asc
cor648b.xls Excel worksheets used in the mappings of the occupa-
tion coding described in COR648.asc
cor648c.xls Excel worksheets used in the mappings of the occupa-
tion coding described in COR648.asc
cor648d.xls Excel worksheets used in the mappings of the occupa-
tion coding described in COR648.asc
cor851.txt Variable Creation for the Employment Module -
Graduate Instrument
93
Chapter 7: Documentation
Wisconsin Longitudinal Study handbook 2006
cor850.rtf Variable Creation for the Job Characteristics Module -
Graduate Instrument
cor850a.rtf Job Characteristics Module - Graduate Instrument-
describes the base hourly wage rate construction
cor850b.sas Job Characteristics Module - Graduate Instrument- con-
tains the code used to create the base hourly wage rate
cor851a.rtf Employment Module - Graduate Instrument-describes
retirement reasons codeset
cor851b.rtf Employment Module - Graduate Instrument-describes
reason laid off codeset
cor851c.rtf Employment Module - Graduate Instrument-describes
reason
cor863generic.sas SAS code used to create 1990 Major Industry, Major
Occupation, Nakao Treas Prestige Score, Occupational
Income, and Occupational Education Scores
cor889.rtf Variable Creation for the Graduate Spouse 2004
Employment Module
Appendix G Personality items, Cognition, Comparisons,
Closeness, Values and Attitudes, and Volunteering
cor571a.asc References and variable creation for psychologi
cal, personality, health, work and family, and organiza
tion items. Tenacious Goal Pursuit (TGP) and Flexible
Goal Adjustment (FGA) by Brandtstader and Renner.
(Complete Preliminary English Version)(rev.9/00)
cor458.asc Scoring for cognition items:primary sample 1992/93
follow-up.
cor572.asc Scoring for cognition items: sibling sample 1994
follow-up.
memo114.asc Scales for the personality items (5- factor model of
personality structure, cognition assessment, alcohol,
depression, self evaluation and social comparisons,
similarity, closeness, and contact)
structure,.txt - cognition assessment, alcohol, depression, self
evaluation and social comparisons, similarity, closeness,
and contact)"
memo091.asc Effect of instrument on distributions of
otherwise identical "Five-Factor Model of Personality"
items.
memo099.asc Examination of "Five-Factor Model of
Personality" mail items for unusual response patterns.
memo121.asc Using data on IQ and high school rank from the WLS
94
Chapter 7: Documentation
Wisconsin Longitudinal Study handbook 2006
(with additional notes on allocation flags and recoded
items from the 1957 Questionnaire)
memo124.asc Supporting figures for IQ updates and recommendations
memo124.pdf Supporting figures for IQ updates and recommendations
cor652.asc Construction of "new" IQ variables
cor860readme.txt Cognition-Fluency Coding files for 2003-2005 surveys.
cor860FluencyCodingToWLS.zip Cognition-Fluency Coding files
for 2003-2005 surveys.
cor860FluencyCodingSupervisorInstructions.doc Cognition-Fluency
Coding files for 2003-2005 surveys.
cor860FluencyCodingDecisions Cognition-Fluency Coding files
for 2003-2005 surveys.
cor862.txt Variable creation for the Cognition Digit Ordering
Module - Graduate Instrument
cor825.txt Variable creation for the Cognition Word Recall Module
- Immediate and Delayed, Graduate Instrument
cor841.txt Variable Creation For Volunteering
cor859similaritiesCodingFiles.Zip Cognition-Similarities Coding
files for 2003-2005 surveys.
cor859CognitionSimilarities GradPhone.doc Cognition-Similarities
Coding files for 2003-2005
surveys.
cor859readme.txt Cognition-Similarities Coding files for 2003-
2005 surveys.
cor871.txt Cognition Similarities open-ended coding
cor900.txt Variable Creation for the Cognition Word Recall module
- Immediate and Delayed, Graduate Spouse Instrument
cor911CognitionSimilarities GradSPOUSE.doc Variable Creation
for the 2003-2005 Cognition - Similarities
module, Graduate Spouse Instrument
95
Chapter 7: Documentation
Wisconsin Longitudinal Study handbook 2006
Appendix H Selected Child and Nonormative Children
cor576.asc Inconsistencies in Residence of Selected Child
**NOTE:cor for Non-Normative is not yet available.
Appendix I Religion
cor483r.asc Master List of Religion Codes (rev.5/96)
cor870.txt Variable creation for the Religion Module - Graduate
Instrument
cor909.txt Variable creation for Religion Module - Graduate
Spouse Instrument
Appendix J Geographic Coding
cor483s.asc States and Foreign Country Codes
cor606.asc Geographic Coding for County Codes (FIPS), Labor
Market
Areas (LMA),Metropolitan Statistical Areas (MSA), and
County Population.
cor685.asc City codes (not available on public release)
memo007.asc Geographic coding of selected addresses for 1957-1977
WLS
follow-up studies
cor337a.asc Creation of variables for size of place of residence in
hundreds
cor344a.asc Notes about size of place of residence in hundreds
Appendix K Psychological Well-Being
cor574a.asc Creation of Psychological Well-Being Variables
cor437.asc Comparative survey measurement of health, psychologi
cal well-being and social responsibility in the
WLS,NSFH, and Whitehall Survey of British Civil
Servants.
cor840.txt On variable creation for (and purpose of) the 2004
Psychological Well-Being graduate phone module.
Note that this is not the same as the PWB *mail* mod-
ule.
Appendix L Income, Assets, Intertransfers
cor702.asc Procedures in gathering tax data (June 1966)
96
*Note*
Not included onpublic releaseare: Wisconsin
high schoolcodes, school
district variables,state, college,
and vocational codes.
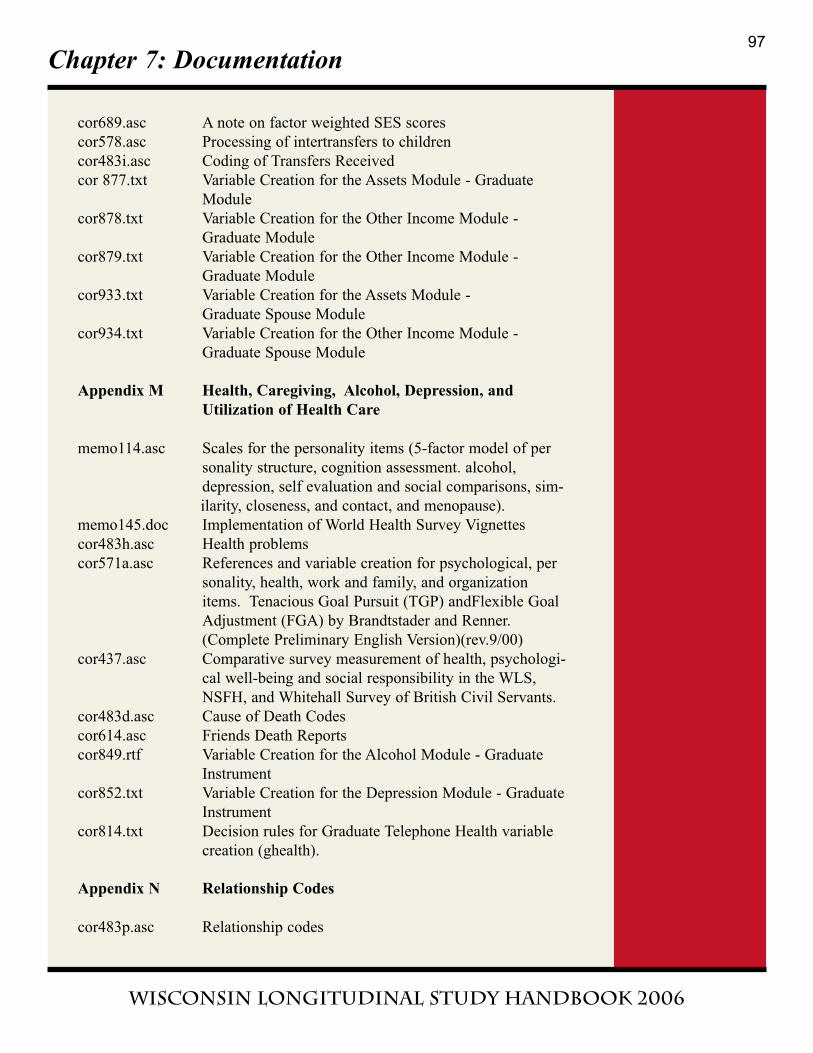
Chapter 7: Documentation
Wisconsin Longitudinal Study handbook 2006
cor689.asc A note on factor weighted SES scores
cor578.asc Processing of intertransfers to children
cor483i.asc Coding of Transfers Received
cor 877.txt Variable Creation for the Assets Module - Graduate
Module
cor878.txt Variable Creation for the Other Income Module -
Graduate Module
cor879.txt Variable Creation for the Other Income Module -
Graduate Module
cor933.txt Variable Creation for the Assets Module -
Graduate Spouse Module
cor934.txt Variable Creation for the Other Income Module -
Graduate Spouse Module
Appendix M Health, Caregiving, Alcohol, Depression, and
Utilization of Health Care
memo114.asc Scales for the personality items (5-factor model of per
sonality structure, cognition assessment. alcohol,
depression, self evaluation and social comparisons, sim-
ilarity, closeness, and contact, and menopause).
memo145.doc Implementation of World Health Survey Vignettes
cor483h.asc Health problems
cor571a.asc References and variable creation for psychological, per
sonality, health, work and family, and organization
items. Tenacious Goal Pursuit (TGP) andFlexible Goal
Adjustment (FGA) by Brandtstader and Renner.
(Complete Preliminary English Version)(rev.9/00)
cor437.asc Comparative survey measurement of health, psychologi-
cal well-being and social responsibility in the WLS,
NSFH, and Whitehall Survey of British Civil Servants.
cor483d.asc Cause of Death Codes
cor614.asc Friends Death Reports
cor849.rtf Variable Creation for the Alcohol Module - Graduate
Instrument
cor852.txt Variable Creation for the Depression Module - Graduate
Instrument
cor814.txt Decision rules for Graduate Telephone Health variable
creation (ghealth).
Appendix N Relationship Codes
cor483p.asc Relationship codes
97
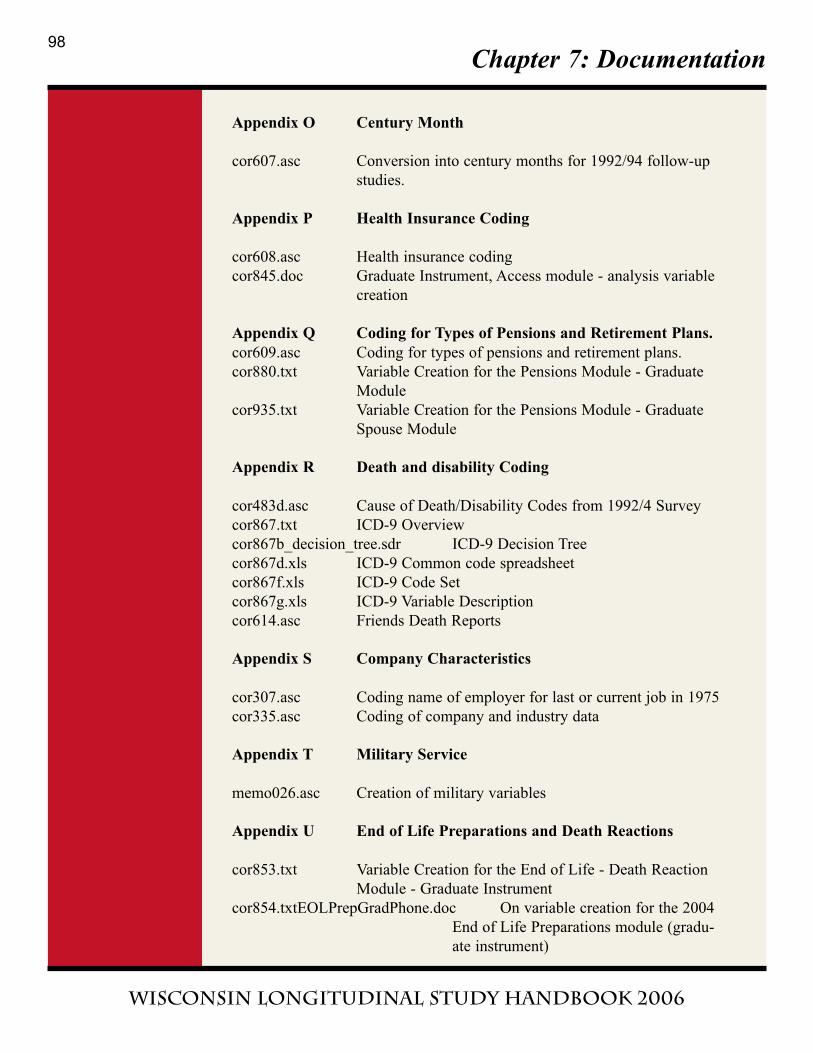
Chapter 7: Documentation
Wisconsin Longitudinal Study handbook 2006
Appendix O Century Month
cor607.asc Conversion into century months for 1992/94 follow-up
studies.
Appendix P Health Insurance Coding
cor608.asc Health insurance coding
cor845.doc Graduate Instrument, Access module - analysis variable
creation
Appendix Q Coding for Types of Pensions and Retirement Plans.
cor609.asc Coding for types of pensions and retirement plans.
cor880.txt Variable Creation for the Pensions Module - Graduate
Module
cor935.txt Variable Creation for the Pensions Module - Graduate
Spouse Module
Appendix R Death and disability Coding
cor483d.asc Cause of Death/Disability Codes from 1992/4 Survey
cor867.txt ICD-9 Overview
cor867b_decision_tree.sdr ICD-9 Decision Tree
cor867d.xls ICD-9 Common code spreadsheet
cor867f.xls ICD-9 Code Set
cor867g.xls ICD-9 Variable Description
cor614.asc Friends Death Reports
Appendix S Company Characteristics
cor307.asc Coding name of employer for last or current job in 1975
cor335.asc Coding of company and industry data
Appendix T Military Service
memo026.asc Creation of military variables
Appendix U End of Life Preparations and Death Reactions
cor853.txt Variable Creation for the End of Life - Death Reaction
Module - Graduate Instrument
cor854.txtEOLPrepGradPhone.doc On variable creation for the 2004
End of Life Preparations module (gradu-
ate instrument)
98
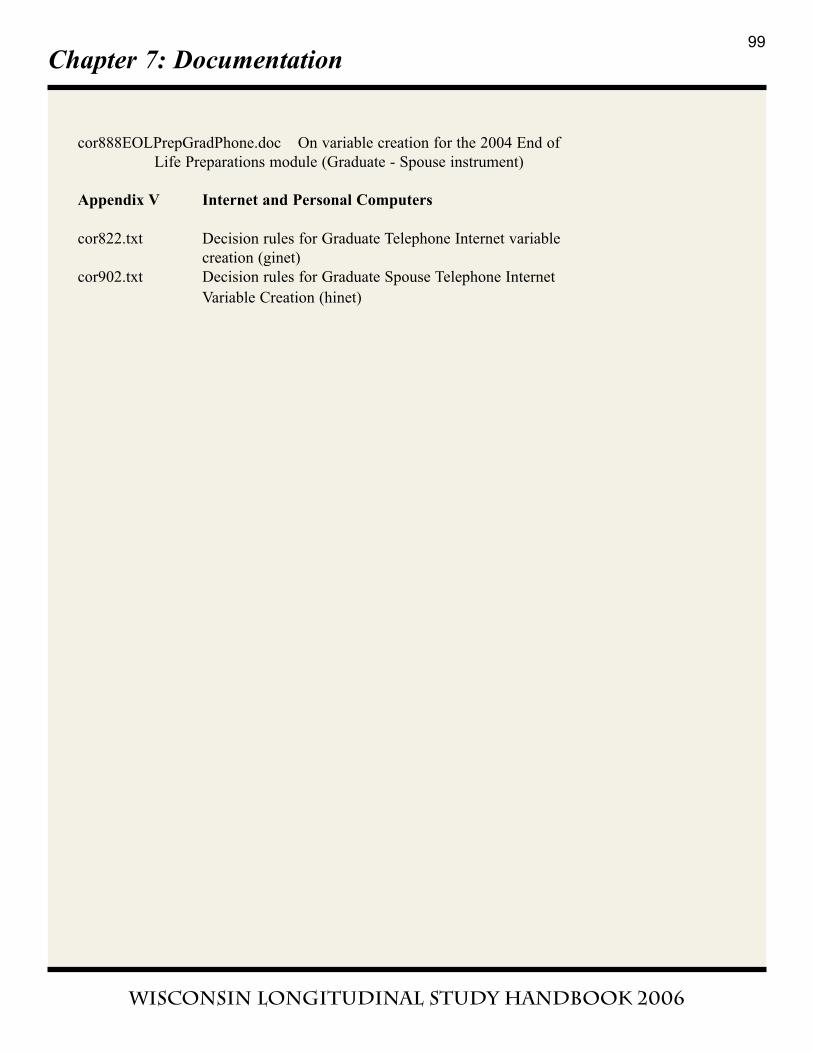
Chapter 7: Documentation
Wisconsin Longitudinal Study handbook 2006
cor888EOLPrepGradPhone.doc On variable creation for the 2004 End of
Life Preparations module (Graduate - Spouse instrument)
Appendix V Internet and Personal Computers
cor822.txt Decision rules for Graduate Telephone Internet variable
creation (ginet)
cor902.txt Decision rules for Graduate Spouse Telephone Internet
Variable Creation (hinet)
99
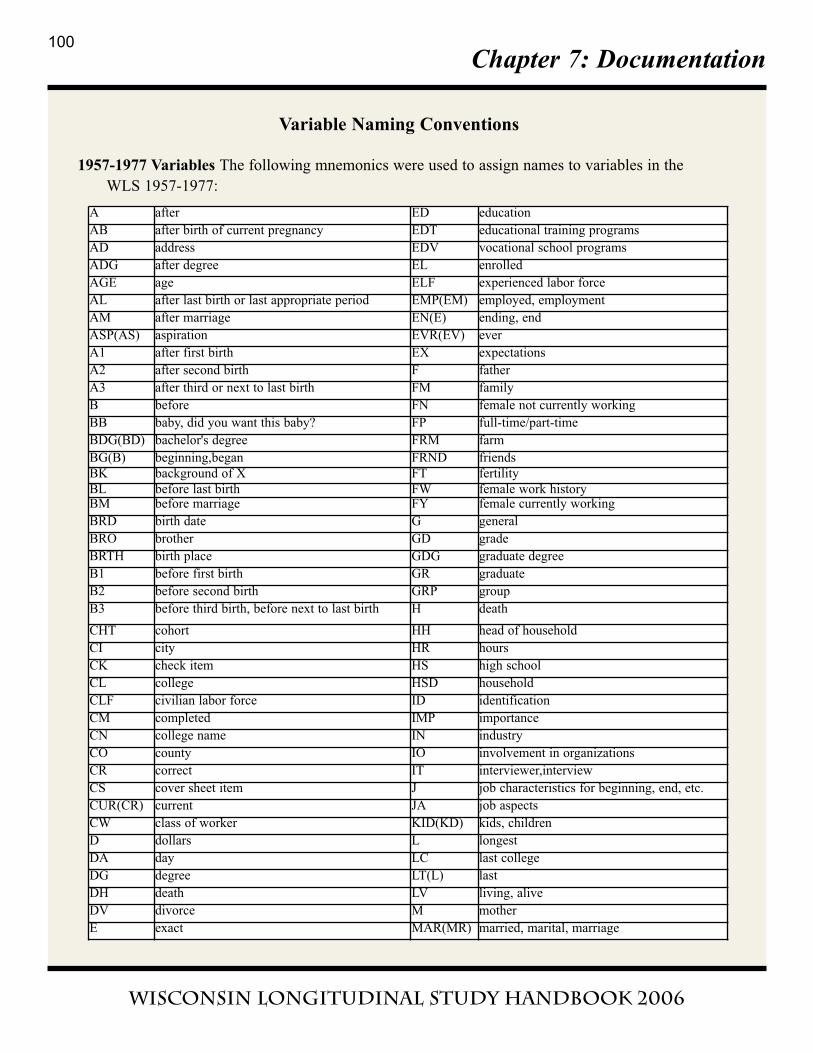
Chapter 7: Documentation
Wisconsin Longitudinal Study handbook 2006
Variable Naming Conventions
1957-1977 Variables The following mnemonics were used to assign names to variables in the
WLS 1957-1977:
100
A after ED education
AB after birth of current pregnancy EDT educational training programs
AD address EDV vocational school programs
ADG after degree EL enrolled
AGE age ELF experienced labor force
AL after last birth or last appropriate period EMP(EM) employed, employment
AM after marriage EN(E) ending, end
ASP(AS) aspiration EVR(EV) ever
A1 after first birth EX expectations
A2 after second birth F father
A3 after third or next to last birth FM family
B before FN female not currently working
BB baby, did you want this baby? FP full-time/part-time
BDG(BD) bachelor's degree FRM farm
BG(B) beginning,began FRND friends
BK background of X FT fertility
BL before last birth FW female work historyBM before marriage FY female currently working
BRD birth date G general
BRO brother GD grade
BRTH birth place GDG graduate degree
B1 before first birth GR graduate
B2 before second birth GRP group
B3 before third birth, before next to last birth H death
CHT cohort HH head of household
CI city HR hours
CK check item HS high school
CL college HSD household
CLF civilian labor force ID identification
CM completed IMP importance
CN college name IN industry
CO county IO involvement in organizations
CR correct IT interviewer,interview
CS cover sheet item J job characteristics for beginning, end, etc.
CUR(CR) current JA job aspects
CW class of worker KID(KD) kids, children
D dollars L longest
DA day LC last college
DG degree LT(L) last
DH death LV living, alive
DV divorce M mother
E exact MAR(MR) married, marital, marriage
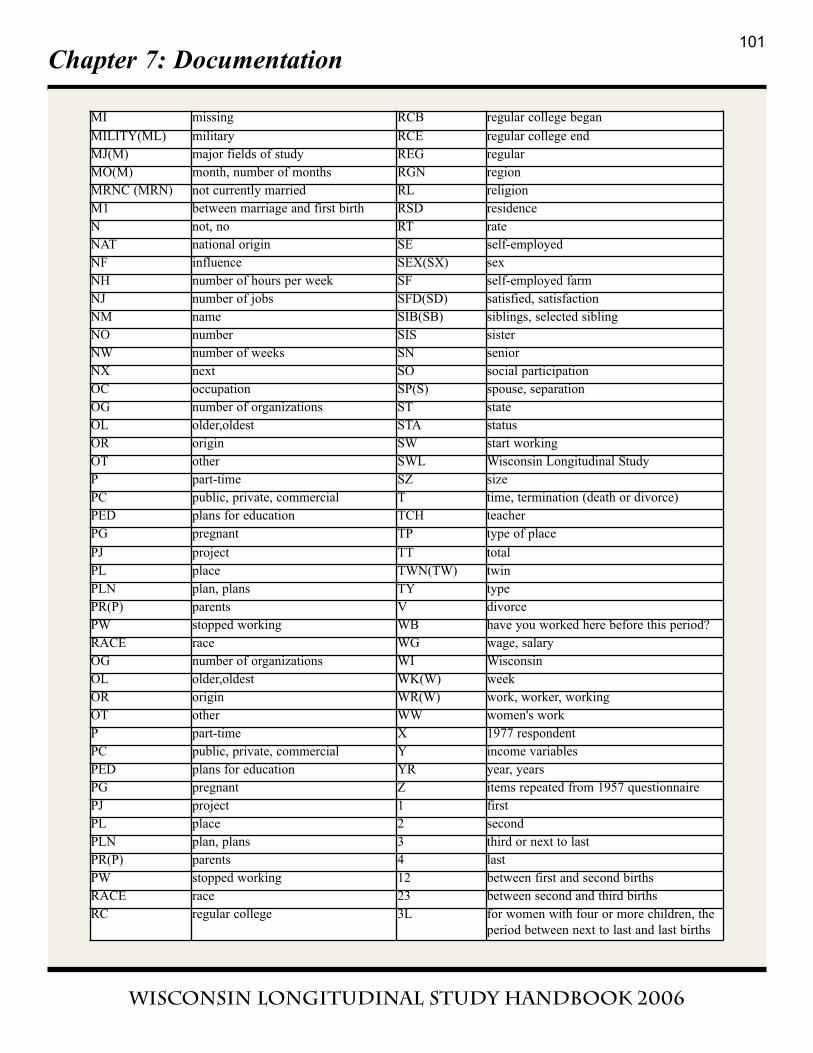
Chapter 7: Documentation
Wisconsin Longitudinal Study handbook 2006
101
MI missing RCB regular college began
MILITY(ML) military RCE regular college end
MJ(M) major fields of study REG regular
MO(M) month, number of months RGN region
MRNC (MRN) not currently married RL religion
M1 between marriage and first birth RSD residence
N not, no RT rate
NAT national origin SE self-employed
NF influence SEX(SX) sex
NH number of hours per week SF self-employed farm
NJ number of jobs SFD(SD) satisfied, satisfaction
NM name SIB(SB) siblings, selected sibling
NO number SIS sister
NW number of weeks SN senior
NX next SO social participation
OC occupation SP(S) spouse, separation
OG number of organizations ST state
OL older,oldest STA status
OR origin SW start working
OT other SWL Wisconsin Longitudinal Study
P part-time SZ size
PC public, private, commercial T time, termination (death or divorce)
PED plans for education TCH teacher
PG pregnant TP type of place
PJ project TT total
PL place TWN(TW) twin
PLN plan, plans TY type
PR(P) parents V divorce
PW stopped working WB have you worked here before this period?
RACE race WG wage, salary
OG number of organizations WI Wisconsin
OL older,oldest WK(W) week
OR origin WR(W) work, worker, working
OT other WW women's work
P part-time X 1977 respondent
PC public, private, commercial Y income variables
PED plans for education YR year, years
PG pregnant Z items repeated from 1957 questionnaire
PJ project 1 first
PL place 2 second
PLN plan, plans 3 third or next to last
PR(P) parents 4 last
PW stopped working 12 between first and second births
RACE race 23 between second and third births
RC regular college 3L for women with four or more children, the
period between next to last and last births
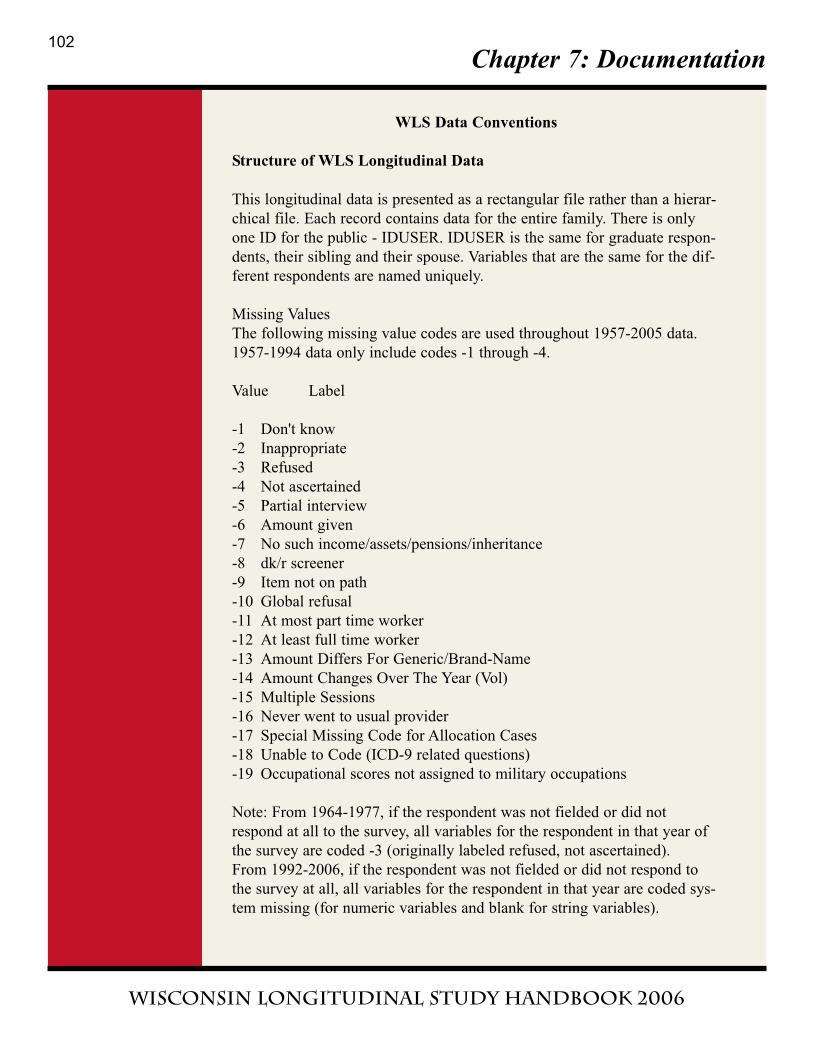
Chapter 7: Documentation
Wisconsin Longitudinal Study handbook 2006
WLS Data Conventions
Structure of WLS Longitudinal Data
This longitudinal data is presented as a rectangular file rather than a hierar-
chical file. Each record contains data for the entire family. There is only
one ID for the public - IDUSER. IDUSER is the same for graduate respon-
dents, their sibling and their spouse. Variables that are the same for the dif-
ferent respondents are named uniquely.
Missing Values
The following missing value codes are used throughout 1957-2005 data.
1957-1994 data only include codes -1 through -4.
Value Label
-1 Don't know
-2 Inappropriate
-3 Refused
-4 Not ascertained
-5 Partial interview
-6 Amount given
-7 No such income/assets/pensions/inheritance
-8 dk/r screener
-9 Item not on path
-10 Global refusal
-11 At most part time worker
-12 At least full time worker
-13 Amount Differs For Generic/Brand-Name
-14 Amount Changes Over The Year (Vol)
-15 Multiple Sessions
-16 Never went to usual provider
-17 Special Missing Code for Allocation Cases
-18 Unable to Code (ICD-9 related questions)
-19 Occupational scores not assigned to military occupations
Note: From 1964-1977, if the respondent was not fielded or did not
respond at all to the survey, all variables for the respondent in that year of
the survey are coded -3 (originally labeled refused, not ascertained).
From 1992-2006, if the respondent was not fielded or did not respond to
the survey at all, all variables for the respondent in that year are coded sys-
tem missing (for numeric variables and blank for string variables).
102
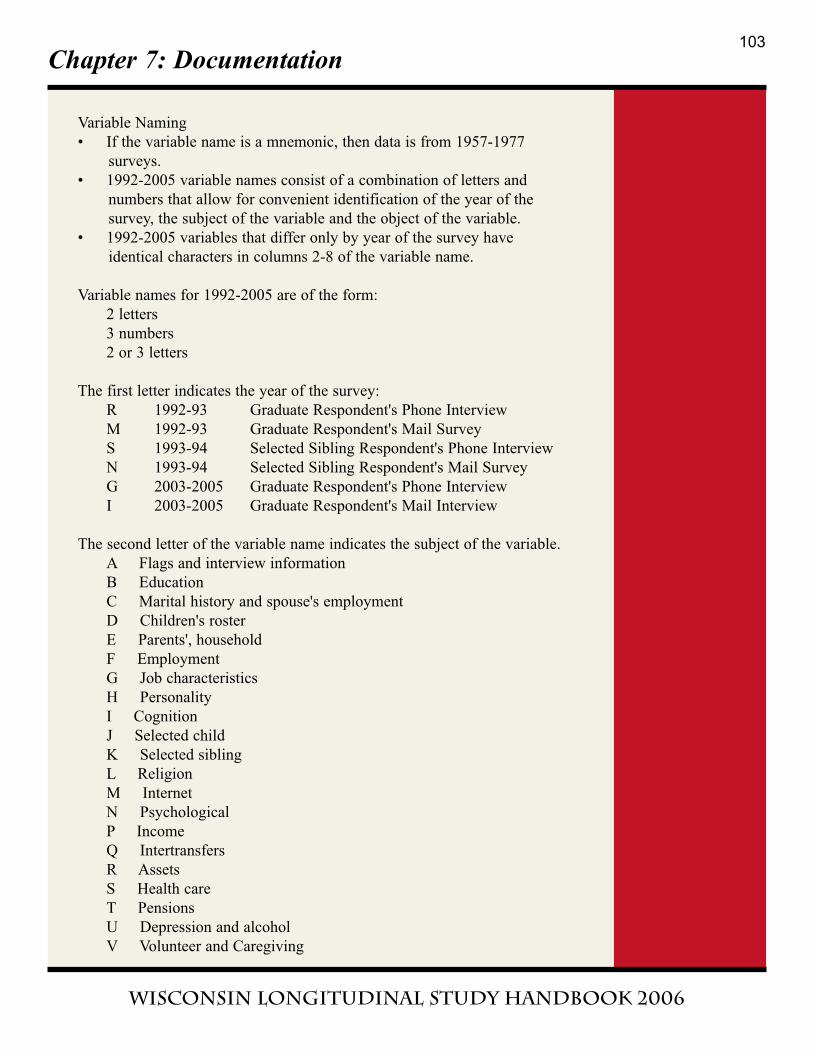
Chapter 7: Documentation
Wisconsin Longitudinal Study handbook 2006
Variable Naming
• If the variable name is a mnemonic, then data is from 1957-1977
surveys.
• 1992-2005 variable names consist of a combination of letters and
numbers that allow for convenient identification of the year of the
survey, the subject of the variable and the object of the variable.
• 1992-2005 variables that differ only by year of the survey have
identical characters in columns 2-8 of the variable name.
Variable names for 1992-2005 are of the form:
2 letters
3 numbers
2 or 3 letters
The first letter indicates the year of the survey:
R 1992-93 Graduate Respondent's Phone Interview
M 1992-93 Graduate Respondent's Mail Survey
S 1993-94 Selected Sibling Respondent's Phone Interview
N 1993-94 Selected Sibling Respondent's Mail Survey
G 2003-2005 Graduate Respondent's Phone Interview
I 2003-2005 Graduate Respondent's Mail Interview
The second letter of the variable name indicates the subject of the variable.
A Flags and interview information
B Education
C Marital history and spouse's employment
D Children's roster
E Parents', household
F Employment
G Job characteristics
H Personality
I Cognition
J Selected child
K Selected sibling
L Religion
M Internet
N Psychological
P Income
Q Intertransfers
R Assets
S Health care
T Pensions
U Depression and alcohol
V Volunteer and Caregiving
103
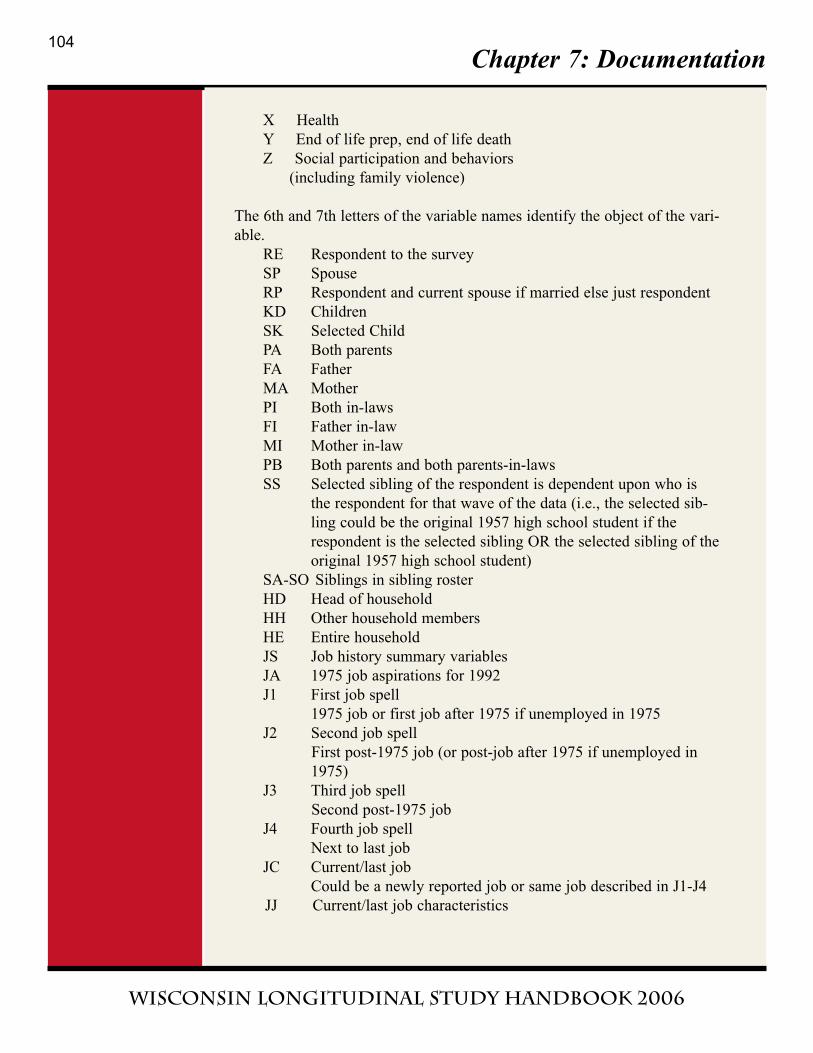
Chapter 7: Documentation
Wisconsin Longitudinal Study handbook 2006
X Health
Y End of life prep, end of life death
Z Social participation and behaviors
(including family violence)
The 6th and 7th letters of the variable names identify the object of the vari-
able.
RE Respondent to the survey
SP Spouse
RP Respondent and current spouse if married else just respondent
KD Children
SK Selected Child
PA Both parents
FA Father
MA Mother
PI Both in-laws
FI Father in-law
MI Mother in-law
PB Both parents and both parents-in-laws
SS Selected sibling of the respondent is dependent upon who is
the respondent for that wave of the data (i.e., the selected sib-
ling could be the original 1957 high school student if the
respondent is the selected sibling OR the selected sibling of the
original 1957 high school student)
SA-SO Siblings in sibling roster
HD Head of household
HH Other household members
HE Entire household
JS Job history summary variables
JA 1975 job aspirations for 1992
J1 First job spell
1975 job or first job after 1975 if unemployed in 1975
J2 Second job spell
First post-1975 job (or post-job after 1975 if unemployed in
1975)
J3 Third job spell
Second post-1975 job
J4 Fourth job spell
Next to last job
JC Current/last job
Could be a newly reported job or same job described in J1-J4
JJ Current/last job characteristics
104
Chapter 8: Flowcharts
Wisconsin Longitudinal Study handbook 2006
In this Chapter
2005 Flowcharts:
Graduate Flowchart...................................................................................106
Spouse Flowchart.................………………..............................................107
Sibling Flowchart…………………………………...................................108
Widow Flowchart…………………............................................................109
Nonormative Flowhcart.................................................................to be added
Letter Fluency Flowchart.............................................................to be added
Cognitive Similarities....................................................................to be added
Category Flowchart.......................................................................to be added
Pensions Flowcharts.....................................................................to be added
Retirement Flowchart...................................................................to be added
Assets Flowchart........…………………………………...............to be added
Intertransfers Flowchart..............................................................to be added
To find flowcharts that are not included here, see “documentation” on the
WLS public website.
The following flowcharts are included due to their popularity and/or
because they are new additions to the WLS.
105
Find otherDocumentation
on the Web
Appendices CodebooksFlowcharts
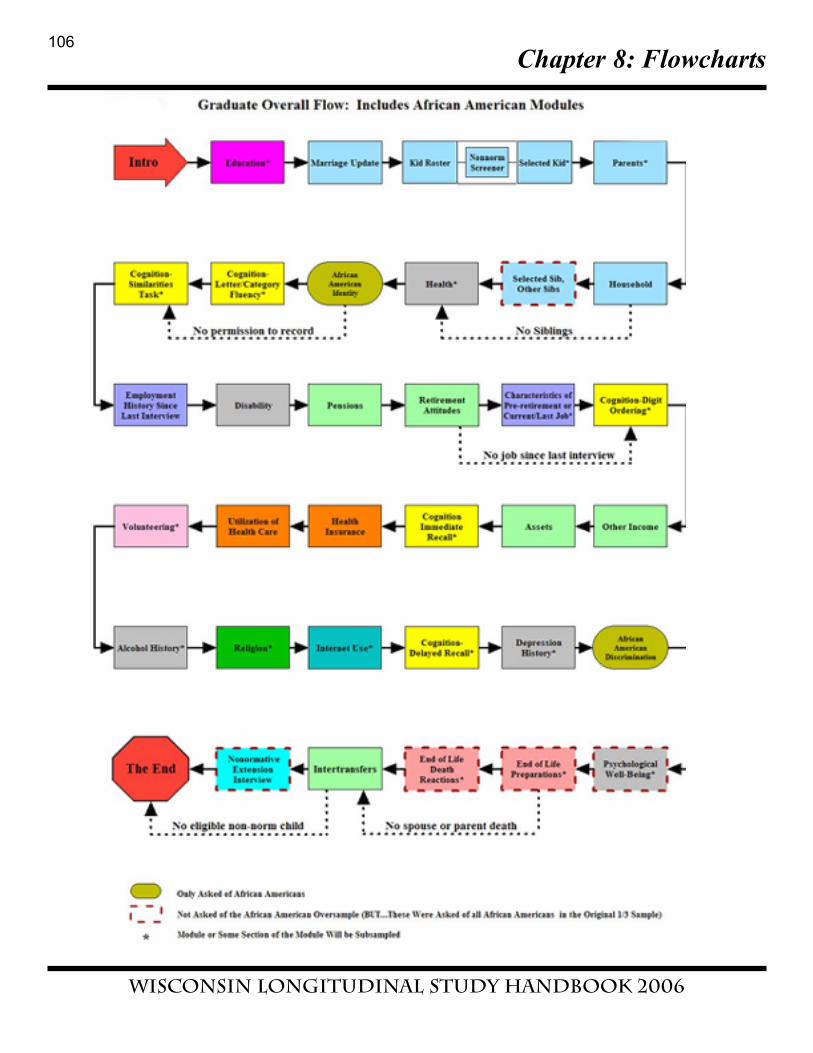
Chapter 8: Flowcharts
Wisconsin Longitudinal Study handbook 2006
106
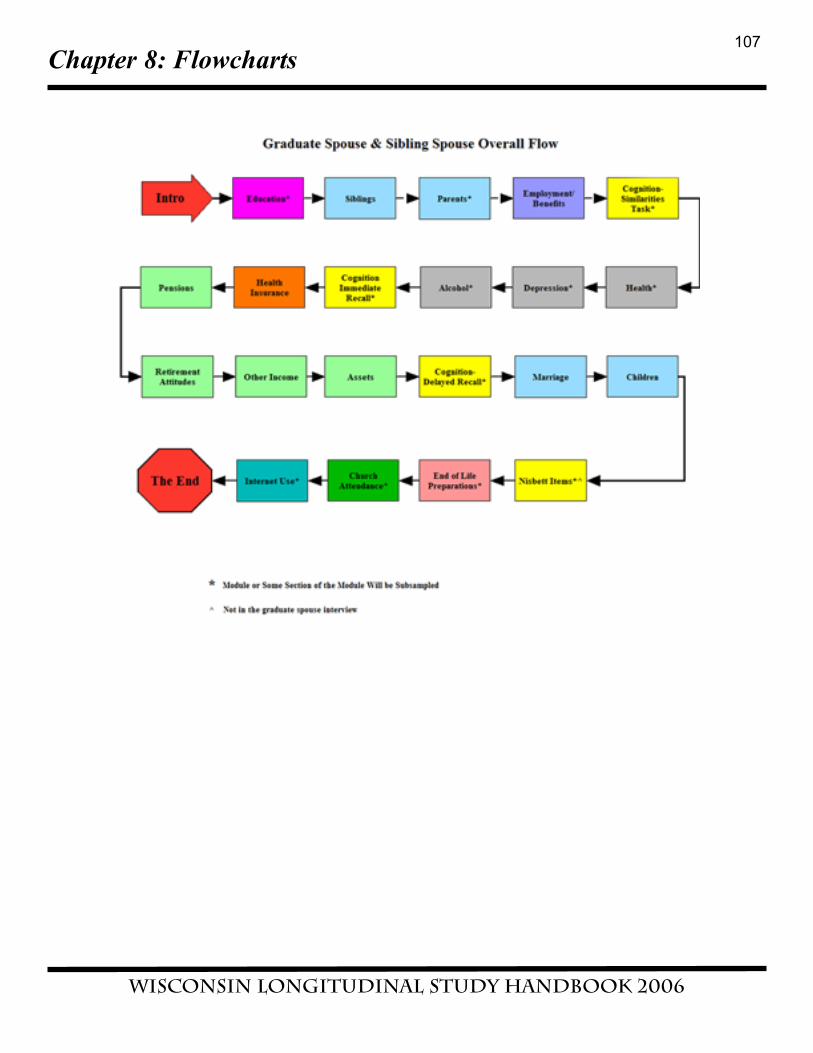
Chapter 8: Flowcharts
Wisconsin Longitudinal Study handbook 2006
107
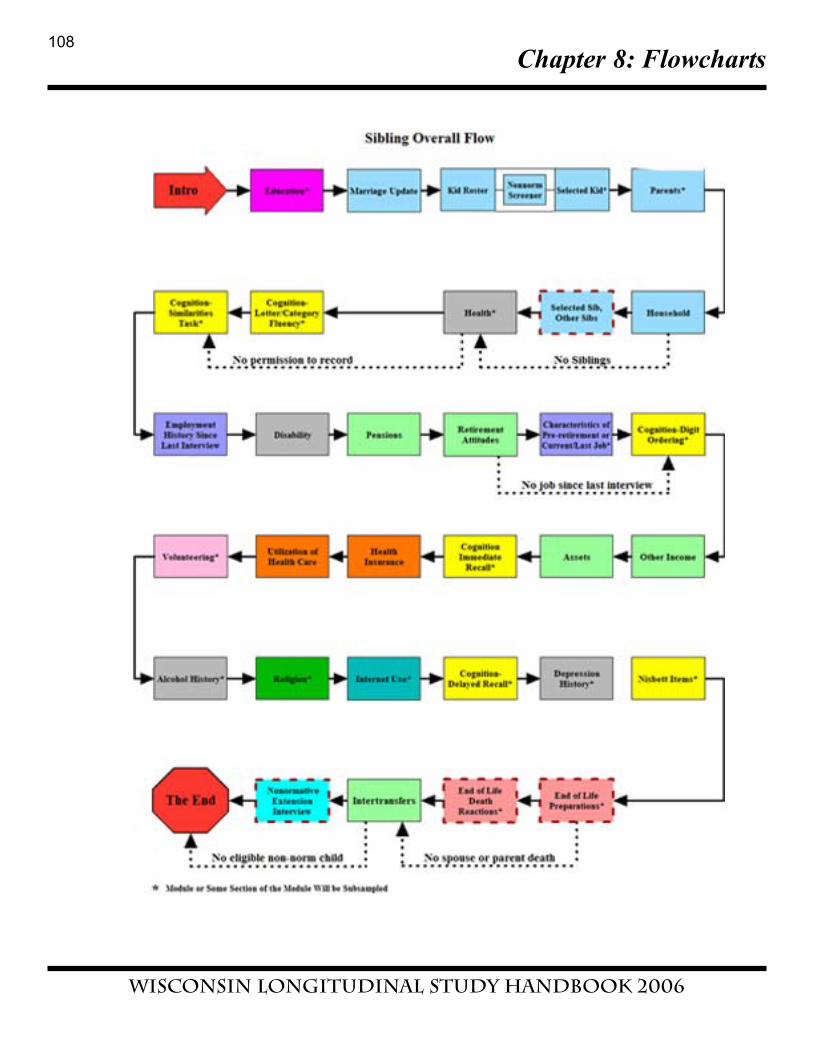
Chapter 8: Flowcharts
Wisconsin Longitudinal Study handbook 2006
108
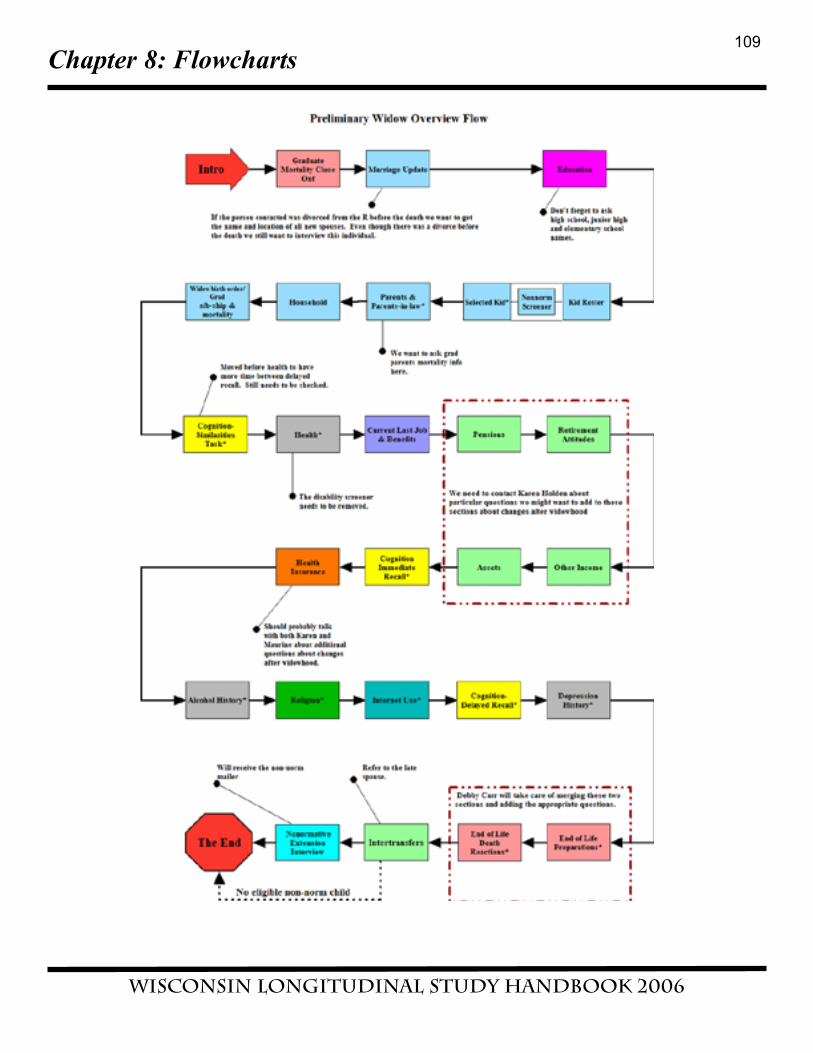
Chapter 8: Flowcharts
Wisconsin Longitudinal Study handbook 2006
109
Chapter 8: Flowcharts
Wisconsin Longitudinal Study handbook 2006
110
Chapter 9: Publications
Wisconsin Longitudinal Study handbook 2006
In This Chapter
Bibliography Information...........................................................................111
Recent Papers and Manuscripts.................................................................111
Recent Proposals .......................................................................................114
Citation Information...................................................................................114
Bibliography
Click here for an updated WLS bibliography.
Recent Papers and Manuscripts
Carr, Deborah. “‘My Daughter Has a Career - I Just Raised Babies’:
Women’s Intergenerational Social Comparisons.” Social Psychology
Quarterly (June 2004).
Carr, Deborah. “The Psychological Consequences of Midlife Men’s Social
Comparisons with their Young Adult Sons.” Journal of Marriage and
Family (forthcoming).
Hauser, Robert M., and Robert J. Willis, “Survey Design, Serendipity, and
the Growth of Knowledge.” Presented at the RANDSummer Institute, Santa
Monica, California, July 2003.
Hauser, Robert M., and Robert J. Willis, “Two Voyages Underway: Survey
Design and Methodology in the Health and Retirement Study and the
Wisconsin Longitudinal Study.” Population and Development Review
(forthcoming).
Hauser, Robert M., “Attrition in the Long Run: The Wisconsin
Longitudinal Study.” Field Methods (forthcoming). Same presented at NSF
Workshop on attrition in longitudinal studies, Cambridge, Massachusetts,
March 2003.
Hauser, Robert M., April, 2003. "Long-run effects of post-secondary educa-
tion in the Wisconsin Longitudinal Study."
Jackson, Daren C., Corrina J. Mueller, Isa Dolski, Kim M. Dalton, Jack B.
Nitschke, Heather L. Urry, Melissa A. Rosenkranz, Carol D. Ryff, Burton
111
Chapter 9: Publications
Wisconsin Longitudinal Study handbook 2006
H. Singer, and Richard J. Davidson, October, 2001. "Now You Feel It, Now
You Don’t: Frontal EEG Asymmetry and Individual Differences in
Emotion Regulation."
Krahn, Dean, Jeremy Freese, Robert Hauser, Kristen Barry, and Brian
Goodman, 2003. "Alcohol Use and Cognition at Mid-Life: The Importance
of Adjusting for Baseline Cognitive Ability and Educational Attainment."
Krahn, Dean, Robert M. Hauser, Jeremy Freese, Kristen Barry. "Alcohol
Use and Cognition at Midlife" Presented at the Meetings of the American
Sociological Association, Atlanta, August 2003.
Parish, S.L., Seltzer, M.M., Greenberg, J.S., & Floyd, F.J. “Economic
implications of caregiving at midlife: Comparing parents of children with
developmental disabilities to other parents.” Mental Retardation (in press).
Piliavin, J.A., forthcoming. "Feeling good by doing good." In Omoto, A.
M., Ed. Processes of community change and social action. Mahwah, NJ:
Lawrence Erlbaum Associates.
Piliavin, J.A., 2003. "Doing well by doing good: Benefits for the benefac-
tor." Pp. 227-247 in Keyes, Corey Lee M. and Haidt, Jon (Eds.).
Flourishing: The Positive Psychology and the Life Well Lived. Washington,
D.C.:APA.
Piliavin, J.A., “Health benefits of volunteering in the Wisconsin
Longitudinal Study.” manuscript prepared for presentation at the2004 meet-
ings of the American Sociological Association.
Piliavin, J.A., "I get more than I give: Volunteering, well-being, and
health." Presentation at the 2004 Eastern Sociological Society meetings,
February 21, 2004.
Rosenkrantz, M. A., Jackson, D. C., Dalton, K. M., Dolski, I., Ryff, C. D.,
Singer, B. H., Muller, D., Kalin, N. H., & Davidson, R. J.(2003).
“Affective style and in vivo immune response: Neurobehavioral mecha-
nisms.” Proceedings of the National Academy of Sciences, 100, 11148-
11152.
Seltzer, Marsha Mailick, Jan S. Greenberg, Frank J. Floyd, and Jinkuk
Hong, November, 2000. "Accommodative Coping and Well-Being of
Midlife Parents of Children with Mental Health Problems or
Developmental Disabilities." An earlier version of this paper was presented
at the 53rd Annual Scientific Meeting of the Gerontological Society of
112
Chapter 9: Publications
Wisconsin Longitudinal Study handbook 2006
American, Washington, DC.
Seltzer, M.M., Floyd, F.J., Greenberg, J.S., & Lounds, J. “Life course pat-
terns of attainment and well-being in individuals with borderline IQ scores:
Findings from a population-based study.” Paper to be presented at the 2004
Gatlinburg Conference on Research and Theory in MR/DD, San Diego,
CA.
Southworth Nigam, J.A., Hoonakker, P.L.T., Swanson, N.G. & Carayon, P.
(2003). Employment Status and Job Insecurity asPredictors of Depression.
Paper presented at the 5th Interdisciplinary Conference on Occupational
Stress and Health. March 20-22, 2003, Toronto, Canada.
Springer, Kristen W., Daphne Kuo, Jennifer Sheridan & Molly Carnes,
2005. “Decades Later: Long-Term Physical and Mental Health
Consequences of Childhood Physical Abuse." Revise and resubmit at Child
Abuse & Neglect: An International Journal.
Swanson, N.G., Hoonakker, P.L.T., Southworth, J. & Carayon, P. & Warren,
J.W. (2003). The relationship between job characteristics, psychological
variables and depression. Paper presented at the 5th Interdisciplinary
Conference on Occupational Stress and Health. March 20-22, 2003,
Toronto, Canada.
Springer, Kristen W., Jennifer Sheridan, Daphne Kuo, and Molly Carnes,
2003. "The Long-Term Health Outcomes of Childhood Abuse: An
Overview and a Call to Action."
Trentham-Dietz, Amy and Maureen Smith, 2003. Pilot Project: Linking the
WLS to the Wisconsin Cancer Reporting System
Urry, Heather L., Jack B. Nitschke, Isa Dolski, Daren C. Jackson, Kim M.
Dalton, Corrina J. Mueller, Melissa A. Rosenkranz, and Carol D. Ryff.
"Making a Life Worth Living: Neural Correlates of Well-Being." (forth-
coming). In Burton H. Singer and Richard J. Davidson (eds.) Neural
Correlates of Well-Being.
Urry, H.L., van Reekum, C.M., Johnstone, T., Thurow, M.E., Burghy, C.A.,
Mueller, C.J., Davidson, R.J. (2003). “Neural correlates of voluntarily regu-
lating negative affect.” Program No. 725.18. 2003 Abstract Viewer/Itinerary
Planner. Washington, DC: Society for Neuroscience, online.
Warren, John Robert, Robert M. Hauser, and Jennifer T. Sheridan, 2002.
"Occupational Stratification across the Life Course: Evidence from the
113
Chapter 9: Publications
Wisconsin Longitudinal Study handbook 2006
Wisconsin Longitudinal Study." American Sociological Review, Vol. 67
(June:432–455)
Warren, John Robert, Peter Hoonakker, Pascale Carayon, and Jennie Brand,
2003. "Job Characteristics as Mediators in SES-Health Relationships."
Warren, John Robert, Peter Hoonakker, and Pascale Carayon, October,
2002. "The Cumulative Impact of Job Characteristics on Health at Midlife"
Warren, John Robert, Jennie Brand, Peter Hoonakker, & Pascale Carayon.
“Sibling Models of the Role of Job Characteristics in Mediating SES-
Health Relationships.” Paper presented at the 2003 summer meetings of the
International Sociological Association’s Research Committee on
Stratification and Mobility.
Recent Proposals
Brandon, Peter D., June 2004 "Becoming My Brother or Sister's Keeper"
R03
Flynn, Kathryn E., June 2004. "AHRQ Grants for Health Services Research
Dissertation"
Scholz, John Karl and Meta Brown, March 2003. "The Determinants and
Consequences of Family Transfers." NIA R01 proposal.
Smith, Maureen, Pat Remington, and Amy Trentham-Dietz, 2003. "Patterns
of Care" in Integrating Aging and Cancer Research in NCI-Designated
Cancer Centers. Richard Weindruch PI. NIA-NCI Planning Grant Proposal.
Warren, John Robert, March, 2002. Proposal: Education, Job
Characteristics, and Health
How to Cite the WLS Data Properly
Acknowledgment Text for Use of WLS Data
This research uses data from the Wisconsin Longitudinal Study (WLS) of
the University of Wisconsin-Madison. Since 1991, the WLS has been
supported principally by the National Institute on Aging (AG-9775 and
AG-21079), with additional support from the Vilas Estate Trust, the
National Science Foundation, the Spencer Foundation, and the Graduate
114
Chapter 9: Publications
Wisconsin Longitudinal Study handbook 2006
School of the University of Wisconsin-Madison. A public use file of data
from the Wisconsin Longitudinal Study is available from the Wisconsin
Longitudinal Study, University of Wisconsin-Madison, 1180 Observatory
Drive, Madison, Wisconsin 53706 and at
http://www.ssc.wisc.edu/~wls/data/. The opinions expressed herein are
those of the authors.
Bibliographic Citations
Electronic resources are well established as a means of information dissem-
ination. The purpose of making a reference to an electronic resource is to
give enough information so that it can be located as well as acknowledge
those authors whose intellectual works are in electronic format.
Users of these data are requested to cite them properly. Below is an
example of proper citation for these works. You should consult a proper
style manual and modify the examples to maintain consistency in
punctuation and typeface.
Wisconsin Longitudinal Study (WLS) [graduates and siblings]: 1957-1977.
[machine-readable data file] / Hauser, Robert M. and Sewell, William H.
[principal investigator(s)]. Madison, WI: University of Wisconsin-Madison,
WLS. [distributor]; <http://www.ssc.wisc.edu/~wls/documentation/> ]
Wisconsin Longitudinal Study (WLS) [graduates]: 1992/93. [machine-
readable data file] / Hauser, Robert M.; Sewell, William H.; Hauser, Taissa
S. [principal investigator(s)]. Madison, WI: University of Wisconsin-
Madison, WLS. [distributor]; <http://www.ssc.wisc.edu/~wls/documenta-
tion/>
Wisconsin Longitudinal Study (WLS) [siblings]: 1993/94. [machine-
readable data file] / Hauser, Robert M; Sewell, William H; Hauser, Taissa
S. [principal investigator(s)]. Madison, WI: University of Wisconsin-
Madison, WLS. [distributor]; <http://www.ssc.wisc.edu/~wls/documenta-
tion/>
115
Chapter 9: Publications
Wisconsin Longitudinal Study handbook 2006
116
Appendices
Wisconsin Longitudinal Study handbook 2006
Appendices
PART 1: DOCUMENTATION OF SCALES.........................................118
PART 2: A DESCRIPTIVE ROADMAP TO THE DATA INDICATING
BEST MEASURES FOR USERS....................................................216
PART 3: A GUIDE TO COMPARABLE MEASURES AMONG
MAJOR LIFE COURSE STUDIES OF AGING
117
Appendices
Wisconsin Longitudinal Study handbook 2006
Part 1:
DOCUMENTATION OF SCALES
in
WISCONSIN LONGITUDINAL STUDY
1992-3 Respondent Mail Questionnaire & Telephone Interview
1993-4 Sibling Mail Questionnaire & Telephone Interview
University of Wisconsin Center for Demography of Health and Aging
January 11, 2006
118
Appendices
Wisconsin Longitudinal Study handbook 2006
Table of Contents
Introduction....................................................................................................7
1992-3 Respondent Mail Questionnaire...................................................... 8
Psychological Well-Being.......................................................................... .8
1. Autonomy........................................................................................ 8
2. Environmental Mastery.................................................................. 9
3. Personal Growth.............................................................................. 9
4. Positive Relation with Others........................................................ 10
5. Purpose in Life............................................................................... 11
6. Self-Acceptance.............................................................................. 12
Cross-Referencing................................................................................. 13
Source.................................................................................................... 14
Selected Studies Using Psychological Well-Being Scales.................... 14
Big Five Personality Items........................................................................ 15
1. Extraversion..................................................................................... 15
2. Agreeableness.............................................................................. 15
3. Conscientiousness....................................................................... 16
4. Neuroticism.............................................................................. 17
5. Openness.................................................................................. 17
Cross-Referencing................................................................................. 18
Source.................................................................................................. 19
Selected Studies Using Big Five Personality Items Scales................... 19
Depression (CESD)................................................................................... 20
Cross-Referencing................................................................................ 21
Source.................................................................................................. 21
Selected Studies Using CESD Scale.................................................... 21
Family-Work Spillover............................................................................ 23
1. Family Stress Spills Over to Work................................................. 23
2. Work Stress Spills Over Into Family Life.................................... 23
3. Family Enhancement Spills Over Into Work Life......................... 24
Cross-Referencing................................................................................. 25
Source................................................................................................... 25
Selected Studies Using Family-Work Spillover Scales........................ 25
Brandstadter Goal Attainment.................................................................. 26
119
Appendices
Wisconsin Longitudinal Study handbook 2006
1. Flexible Goal Adjustment (FGA)...................................... 26
2. Tenacious Goal Pursuit (TGP).......................................... 26
Cross-Referencing..................................................................... 27
(1992-3 Respondent Mail Questionnaire continued)
Source........................................................................................ 27
Selected Studies Using Brandstadter Goal Attainment Scales . 28
Hostility......................................................................................... 29
Cross-Referencing..................................................................... 29
Source........................................................................................ 29
Selected Studies Using Hostility Scale.................................. 30
Health Symptoms........................................................................ 31
Cross-Referencing................................................................... 32
Source....................................................................................... 32
Selected Studies Using Health Symptoms Scale...................... 32
Illness............................................................................................ 33
Cross-Referencing..................................................................... 34
Source........................................................................................ 34
Selected Studies Using Illness Scale........................................ 34
Body Mass Index (BMI).............................................................. 35
Cross-Referencing..................................................................... 35
Source....................................................................................... 35
Selected Studies Using BMI Scale........................................... 36
1992-3 Respondent Telephone Interview...................................... 37
Psychological Well-Being............................................................. 37
1. Autonomy........................................................................... 37
2. Environmental Mastery..................................................... 38
3. Personal Growth................................................................ 38
4. Positive Relations with Others.......................................... 39
5. Purpose in Life.................................................................. 40
6. Self-Acceptance................................................................ 40
7. Total Score for Psychological Well-Being........................ 41
Cross-Referencing..................................................................... 43
Source........................................................................................ 44
Selected Studies Using Psychological Well-Being Scales........ 44
120
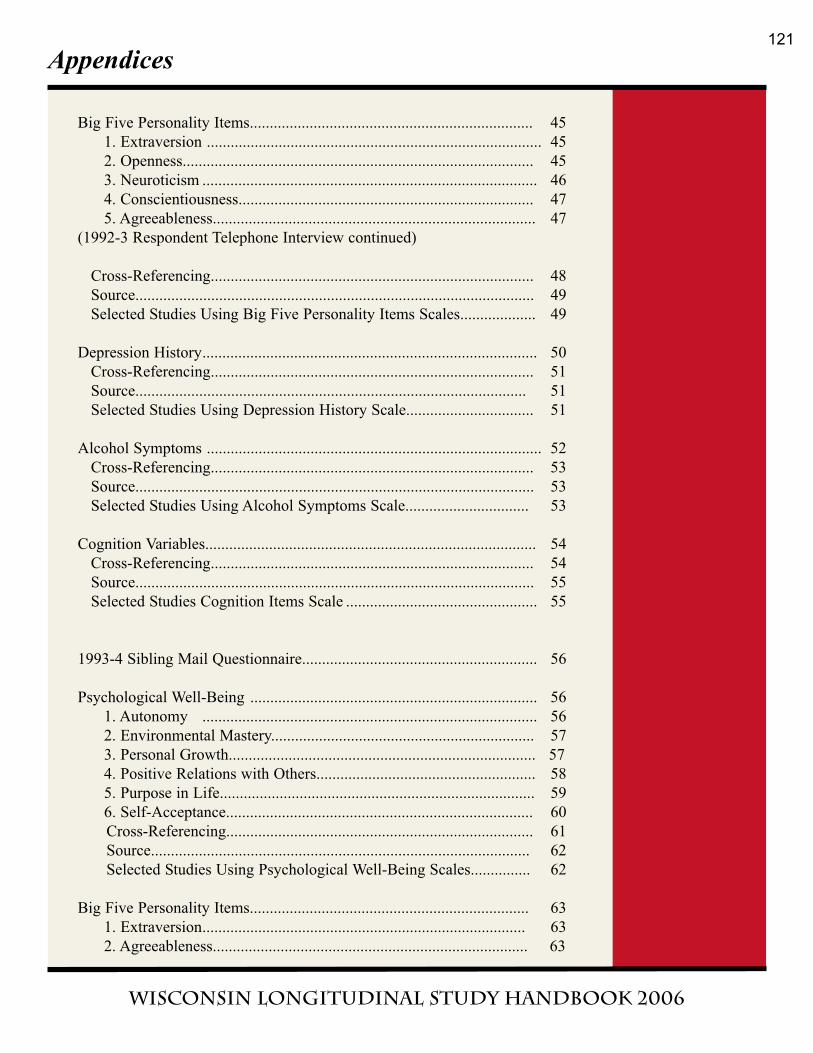
Appendices
Wisconsin Longitudinal Study handbook 2006
Big Five Personality Items....................................................................... 45
1. Extraversion .................................................................................... 45
2. Openness........................................................................................ 45
3. Neuroticism .................................................................................... 46
4. Conscientiousness.......................................................................... 47
5. Agreeableness................................................................................. 47
(1992-3 Respondent Telephone Interview continued)
Cross-Referencing................................................................................. 48
Source.................................................................................................... 49
Selected Studies Using Big Five Personality Items Scales................... 49
Depression History.................................................................................... 50
Cross-Referencing................................................................................. 51
Source.................................................................................................. 51
Selected Studies Using Depression History Scale................................ 51
Alcohol Symptoms .................................................................................... 52
Cross-Referencing................................................................................. 53
Source.................................................................................................... 53
Selected Studies Using Alcohol Symptoms Scale............................... 53
Cognition Variables................................................................................... 54
Cross-Referencing................................................................................. 54
Source.................................................................................................... 55
Selected Studies Cognition Items Scale ................................................ 55
1993-4 Sibling Mail Questionnaire........................................................... 56
Psychological Well-Being ........................................................................ 56
1. Autonomy .................................................................................... 56
2. Environmental Mastery.................................................................. 57
3. Personal Growth............................................................................. 57
4. Positive Relations with Others....................................................... 58
5. Purpose in Life............................................................................... 59
6. Self-Acceptance............................................................................. 60
Cross-Referencing............................................................................. 61
Source............................................................................................... 62
Selected Studies Using Psychological Well-Being Scales............... 62
Big Five Personality Items...................................................................... 63
1. Extraversion................................................................................. 63
2. Agreeableness............................................................................... 63
121
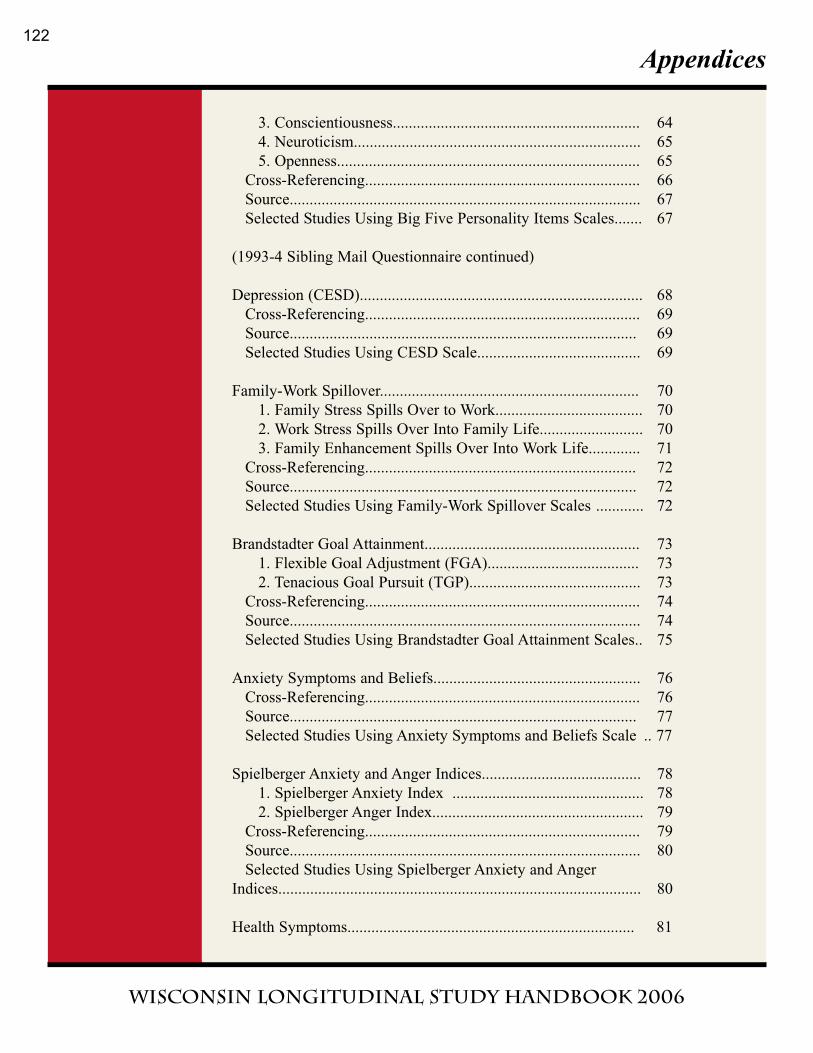
Appendices
Wisconsin Longitudinal Study handbook 2006
3. Conscientiousness.............................................................. 64
4. Neuroticism........................................................................ 65
5. Openness............................................................................ 65
Cross-Referencing..................................................................... 66
Source........................................................................................ 67
Selected Studies Using Big Five Personality Items Scales....... 67
(1993-4 Sibling Mail Questionnaire continued)
Depression (CESD)....................................................................... 68
Cross-Referencing..................................................................... 69
Source....................................................................................... 69
Selected Studies Using CESD Scale......................................... 69
Family-Work Spillover................................................................. 70
1. Family Stress Spills Over to Work..................................... 70
2. Work Stress Spills Over Into Family Life.......................... 70
3. Family Enhancement Spills Over Into Work Life............. 71
Cross-Referencing.................................................................... 72
Source....................................................................................... 72
Selected Studies Using Family-Work Spillover Scales ............ 72
Brandstadter Goal Attainment...................................................... 73
1. Flexible Goal Adjustment (FGA)...................................... 73
2. Tenacious Goal Pursuit (TGP)........................................... 73
Cross-Referencing..................................................................... 74
Source........................................................................................ 74
Selected Studies Using Brandstadter Goal Attainment Scales.. 75
Anxiety Symptoms and Beliefs.................................................... 76
Cross-Referencing..................................................................... 76
Source....................................................................................... 77
Selected Studies Using Anxiety Symptoms and Beliefs Scale .. 77
Spielberger Anxiety and Anger Indices........................................ 78
1. Spielberger Anxiety Index ................................................ 78
2. Spielberger Anger Index..................................................... 79
Cross-Referencing..................................................................... 79
Source........................................................................................ 80
Selected Studies Using Spielberger Anxiety and Anger
Indices........................................................................................... 80
Health Symptoms........................................................................ 81
122
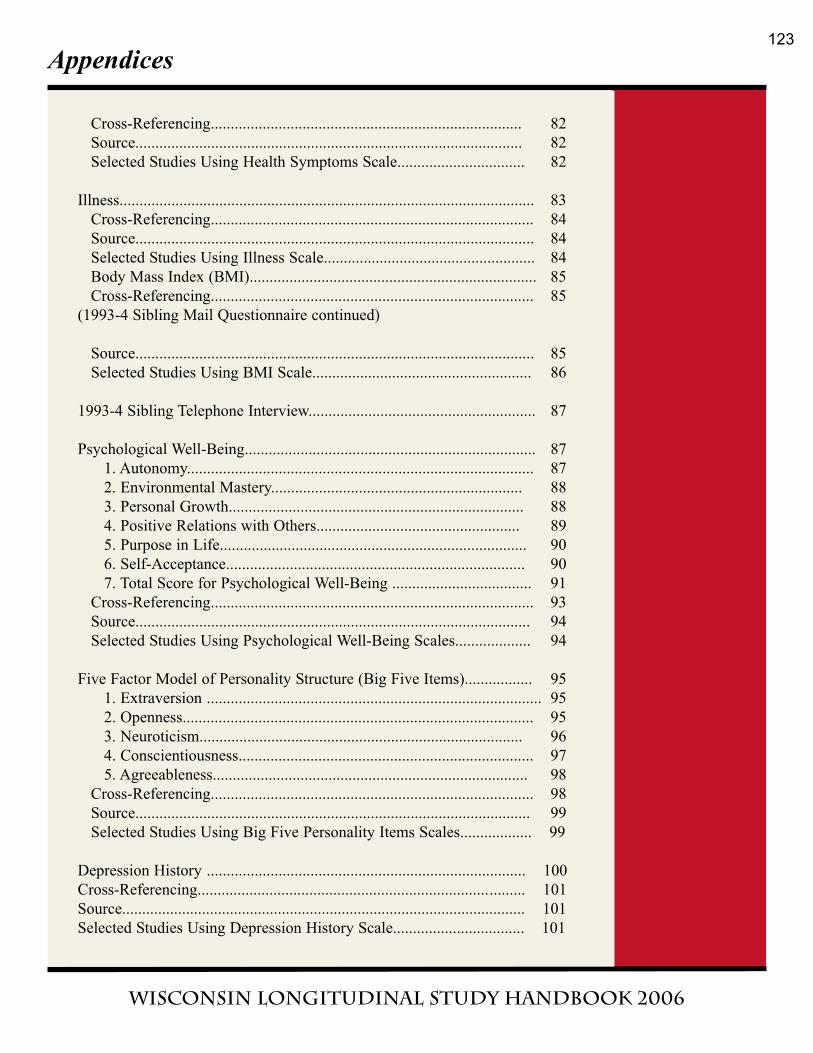
Appendices
Wisconsin Longitudinal Study handbook 2006
Cross-Referencing.............................................................................. 82
Source................................................................................................. 82
Selected Studies Using Health Symptoms Scale................................ 82
Illness........................................................................................................ 83
Cross-Referencing................................................................................. 84
Source.................................................................................................... 84
Selected Studies Using Illness Scale..................................................... 84
Body Mass Index (BMI)........................................................................ 85
Cross-Referencing................................................................................. 85
(1993-4 Sibling Mail Questionnaire continued)
Source.................................................................................................... 85
Selected Studies Using BMI Scale....................................................... 86
1993-4 Sibling Telephone Interview......................................................... 87
Psychological Well-Being......................................................................... 87
1. Autonomy....................................................................................... 87
2. Environmental Mastery............................................................... 88
3. Personal Growth.......................................................................... 88
4. Positive Relations with Others................................................... 89
5. Purpose in Life............................................................................. 90
6. Self-Acceptance........................................................................... 90
7. Total Score for Psychological Well-Being ................................... 91
Cross-Referencing................................................................................. 93
Source................................................................................................... 94
Selected Studies Using Psychological Well-Being Scales................... 94
Five Factor Model of Personality Structure (Big Five Items)................. 95
1. Extraversion .................................................................................... 95
2. Openness........................................................................................ 95
3. Neuroticism................................................................................. 96
4. Conscientiousness.......................................................................... 97
5. Agreeableness............................................................................... 98
Cross-Referencing................................................................................. 98
Source................................................................................................... 99
Selected Studies Using Big Five Personality Items Scales.................. 99
Depression History ................................................................................ 100
Cross-Referencing.................................................................................. 101
Source..................................................................................................... 101
Selected Studies Using Depression History Scale................................. 101
123
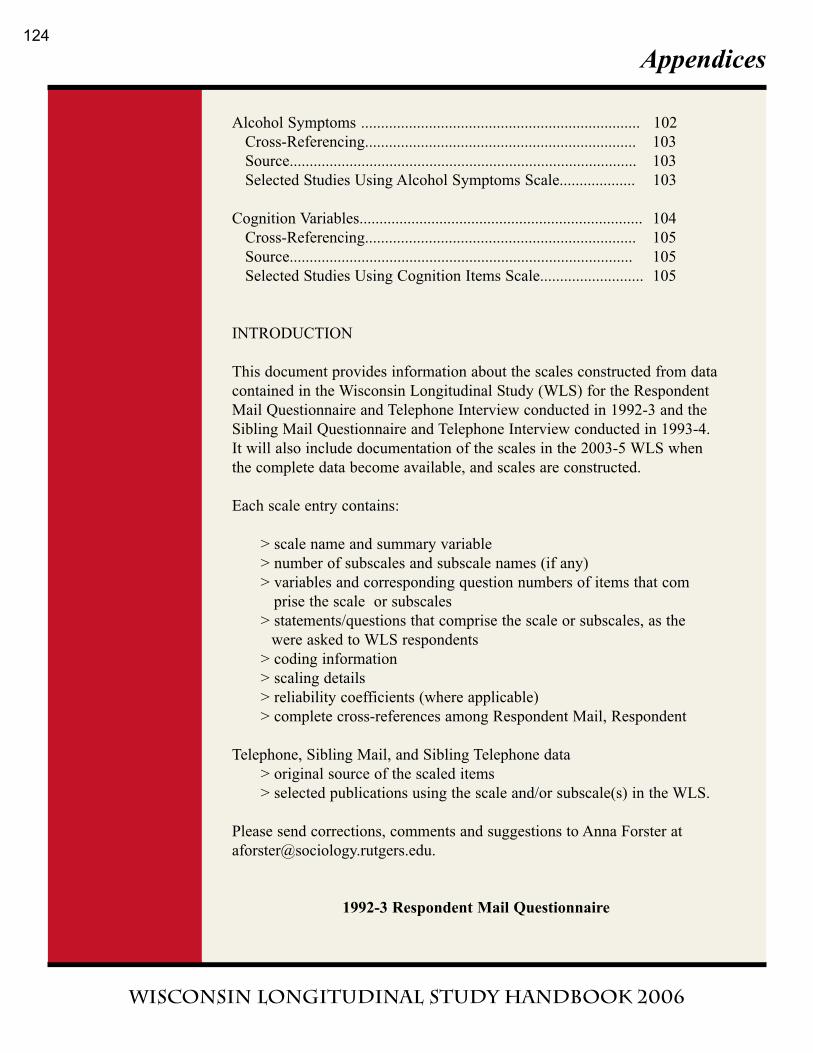
Appendices
Wisconsin Longitudinal Study handbook 2006
Alcohol Symptoms ...................................................................... 102
Cross-Referencing.................................................................... 103
Source....................................................................................... 103
Selected Studies Using Alcohol Symptoms Scale................... 103
Cognition Variables....................................................................... 104
Cross-Referencing.................................................................... 105
Source...................................................................................... 105
Selected Studies Using Cognition Items Scale.......................... 105
INTRODUCTION
This document provides information about the scales constructed from data
contained in the Wisconsin Longitudinal Study (WLS) for the Respondent
Mail Questionnaire and Telephone Interview conducted in 1992-3 and the
Sibling Mail Questionnaire and Telephone Interview conducted in 1993-4.
It will also include documentation of the scales in the 2003-5 WLS when
the complete data become available, and scales are constructed.
Each scale entry contains:
> scale name and summary variable
> number of subscales and subscale names (if any)
> variables and corresponding question numbers of items that com
prise the scale or subscales
> statements/questions that comprise the scale or subscales, as the
were asked to WLS respondents
> coding information
> scaling details
> reliability coefficients (where applicable)
> complete cross-references among Respondent Mail, Respondent
Telephone, Sibling Mail, and Sibling Telephone data
> original source of the scaled items
> selected publications using the scale and/or subscale(s) in the WLS.
Please send corrections, comments and suggestions to Anna Forster at
1992-3 Respondent Mail Questionnaire
124
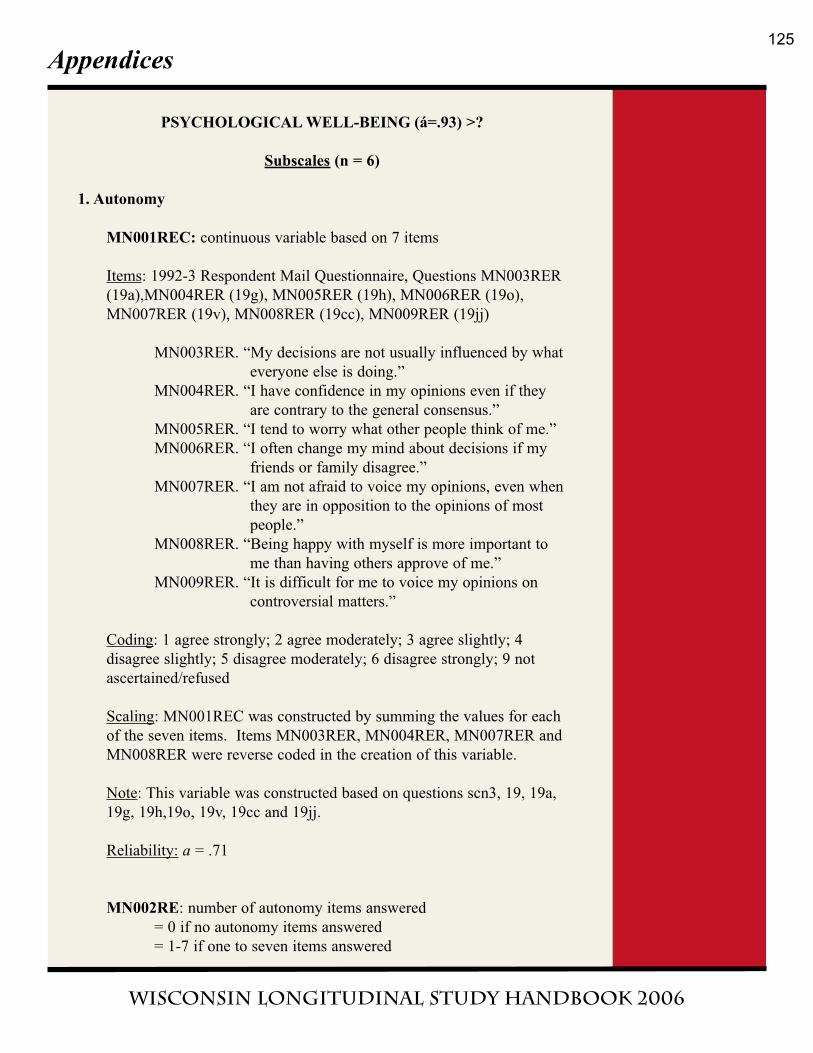
Appendices
Wisconsin Longitudinal Study handbook 2006
PSYCHOLOGICAL WELL-BEING (á=.93) >?
Subscales (n = 6)
1. Autonomy
MN001REC: continuous variable based on 7 items
Items: 1992-3 Respondent Mail Questionnaire, Questions MN003RER
(19a),MN004RER (19g), MN005RER (19h), MN006RER (19o),
MN007RER (19v), MN008RER (19cc), MN009RER (19jj)
MN003RER. “My decisions are not usually influenced by what
everyone else is doing.”
MN004RER. “I have confidence in my opinions even if they
are contrary to the general consensus.”
MN005RER. “I tend to worry what other people think of me.”
MN006RER. “I often change my mind about decisions if my
friends or family disagree.”
MN007RER. “I am not afraid to voice my opinions, even when
they are in opposition to the opinions of most
people.”
MN008RER. “Being happy with myself is more important to
me than having others approve of me.”
MN009RER. “It is difficult for me to voice my opinions on
controversial matters.”
Coding: 1 agree strongly; 2 agree moderately; 3 agree slightly; 4
disagree slightly; 5 disagree moderately; 6 disagree strongly; 9 not
ascertained/refused
Scaling: MN001REC was constructed by summing the values for each
of the seven items. Items MN003RER, MN004RER, MN007RER and
MN008RER were reverse coded in the creation of this variable.
Note: This variable was constructed based on questions scn3, 19, 19a,
19g, 19h,19o, 19v, 19cc and 19jj.
Reliability: a = .71
MN002RE: number of autonomy items answered
= 0 if no autonomy items answered
= 1-7 if one to seven items answered
125
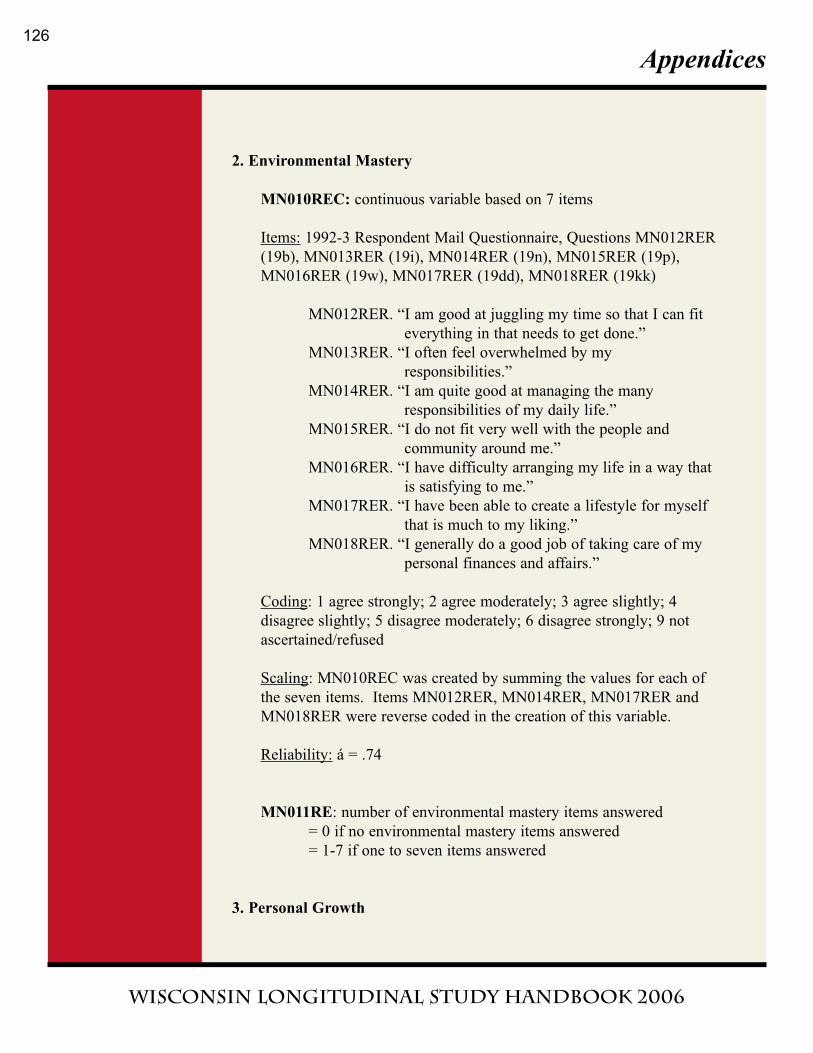
Appendices
Wisconsin Longitudinal Study handbook 2006
2. Environmental Mastery
MN010REC: continuous variable based on 7 items
Items: 1992-3 Respondent Mail Questionnaire, Questions MN012RER
(19b), MN013RER (19i), MN014RER (19n), MN015RER (19p),
MN016RER (19w), MN017RER (19dd), MN018RER (19kk)
MN012RER. “I am good at juggling my time so that I can fit
everything in that needs to get done.”
MN013RER. “I often feel overwhelmed by my
responsibilities.”
MN014RER. “I am quite good at managing the many
responsibilities of my daily life.”
MN015RER. “I do not fit very well with the people and
community around me.”
MN016RER. “I have difficulty arranging my life in a way that
is satisfying to me.”
MN017RER. “I have been able to create a lifestyle for myself
that is much to my liking.”
MN018RER. “I generally do a good job of taking care of my
personal finances and affairs.”
Coding: 1 agree strongly; 2 agree moderately; 3 agree slightly; 4
disagree slightly; 5 disagree moderately; 6 disagree strongly; 9 not
ascertained/refused
Scaling: MN010REC was created by summing the values for each of
the seven items. Items MN012RER, MN014RER, MN017RER and
MN018RER were reverse coded in the creation of this variable.
Reliability: á = .74
MN011RE: number of environmental mastery items answered
= 0 if no environmental mastery items answered
= 1-7 if one to seven items answered
3. Personal Growth
126
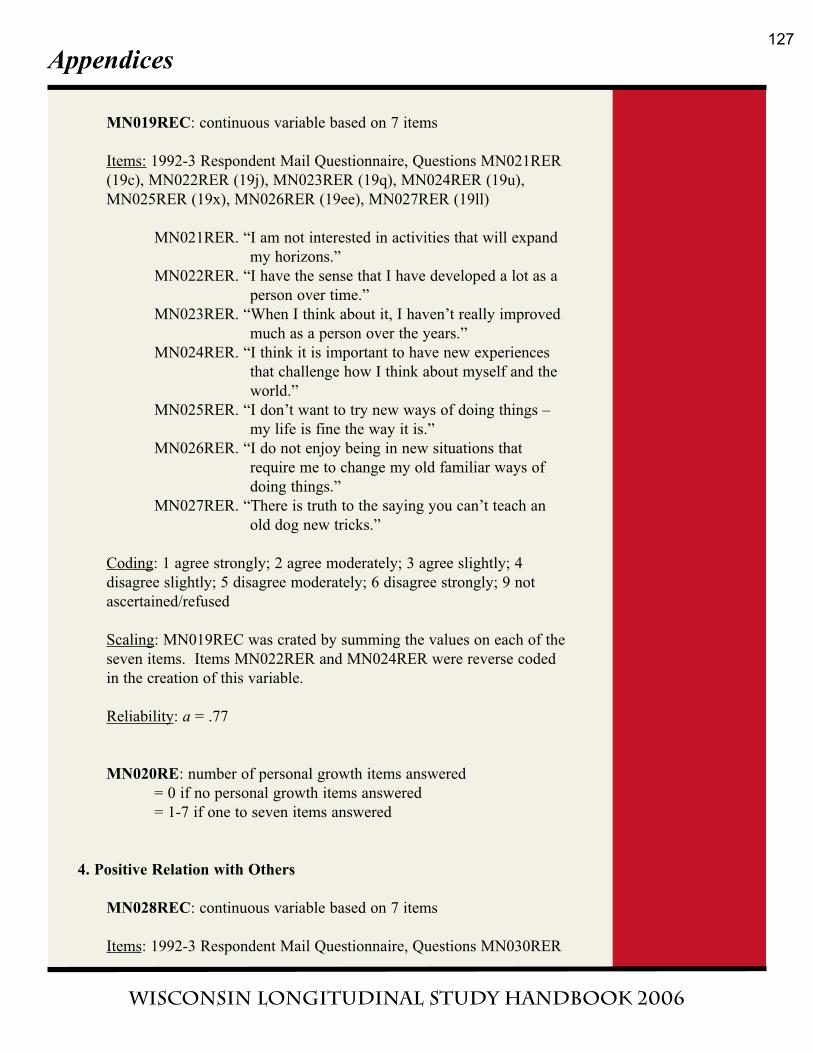
Appendices
Wisconsin Longitudinal Study handbook 2006
MN019REC: continuous variable based on 7 items
Items: 1992-3 Respondent Mail Questionnaire, Questions MN021RER
(19c), MN022RER (19j), MN023RER (19q), MN024RER (19u),
MN025RER (19x), MN026RER (19ee), MN027RER (19ll)
MN021RER. “I am not interested in activities that will expand
my horizons.”
MN022RER. “I have the sense that I have developed a lot as a
person over time.”
MN023RER. “When I think about it, I haven’t really improved
much as a person over the years.”
MN024RER. “I think it is important to have new experiences
that challenge how I think about myself and the
world.”
MN025RER. “I don’t want to try new ways of doing things –
my life is fine the way it is.”
MN026RER. “I do not enjoy being in new situations that
require me to change my old familiar ways of
doing things.”
MN027RER. “There is truth to the saying you can’t teach an
old dog new tricks.”
Coding: 1 agree strongly; 2 agree moderately; 3 agree slightly; 4
disagree slightly; 5 disagree moderately; 6 disagree strongly; 9 not
ascertained/refused
Scaling: MN019REC was crated by summing the values on each of the
seven items. Items MN022RER and MN024RER were reverse coded
in the creation of this variable.
Reliability: a = .77
MN020RE: number of personal growth items answered
= 0 if no personal growth items answered
= 1-7 if one to seven items answered
4. Positive Relation with Others
MN028REC: continuous variable based on 7 items
Items: 1992-3 Respondent Mail Questionnaire, Questions MN030RER
127
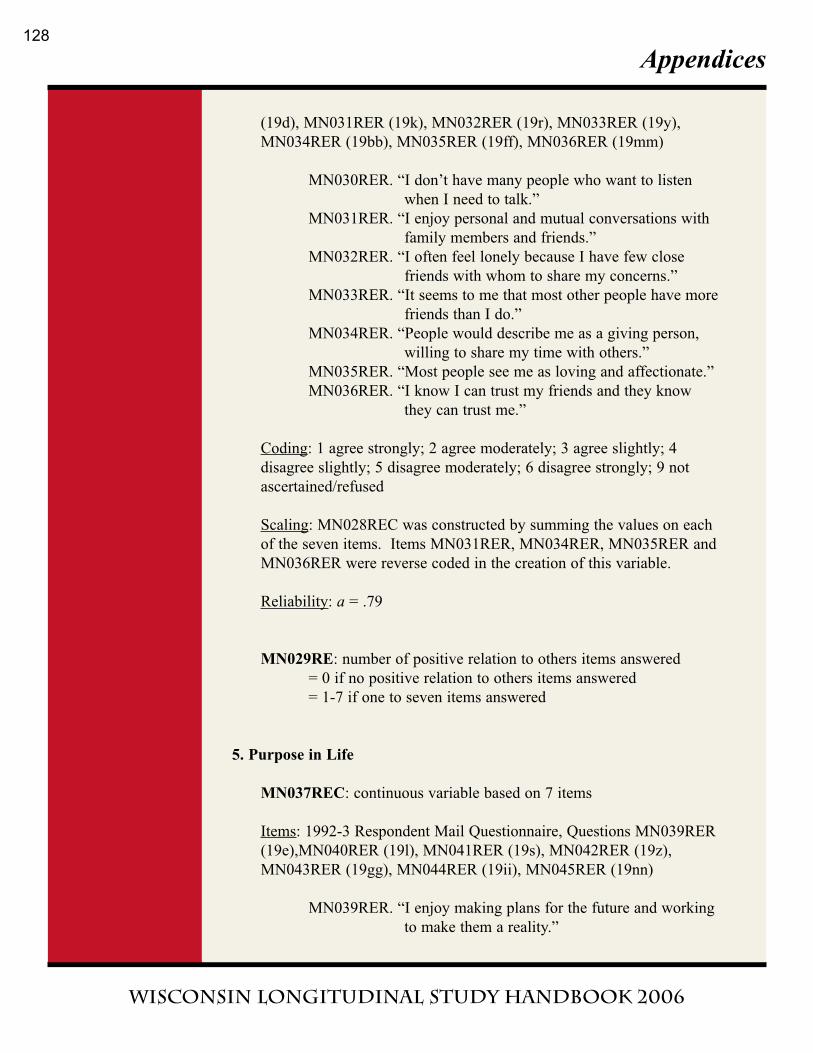
Appendices
Wisconsin Longitudinal Study handbook 2006
(19d), MN031RER (19k), MN032RER (19r), MN033RER (19y),
MN034RER (19bb), MN035RER (19ff), MN036RER (19mm)
MN030RER. “I don’t have many people who want to listen
when I need to talk.”
MN031RER. “I enjoy personal and mutual conversations with
family members and friends.”
MN032RER. “I often feel lonely because I have few close
friends with whom to share my concerns.”
MN033RER. “It seems to me that most other people have more
friends than I do.”
MN034RER. “People would describe me as a giving person,
willing to share my time with others.”
MN035RER. “Most people see me as loving and affectionate.”
MN036RER. “I know I can trust my friends and they know
they can trust me.”
Coding: 1 agree strongly; 2 agree moderately; 3 agree slightly; 4
disagree slightly; 5 disagree moderately; 6 disagree strongly; 9 not
ascertained/refused
Scaling: MN028REC was constructed by summing the values on each
of the seven items. Items MN031RER, MN034RER, MN035RER and
MN036RER were reverse coded in the creation of this variable.
Reliability: a = .79
MN029RE: number of positive relation to others items answered
= 0 if no positive relation to others items answered
= 1-7 if one to seven items answered
5. Purpose in Life
MN037REC: continuous variable based on 7 items
Items: 1992-3 Respondent Mail Questionnaire, Questions MN039RER
(19e),MN040RER (19l), MN041RER (19s), MN042RER (19z),
MN043RER (19gg), MN044RER (19ii), MN045RER (19nn)
MN039RER. “I enjoy making plans for the future and working
to make them a reality.”
128
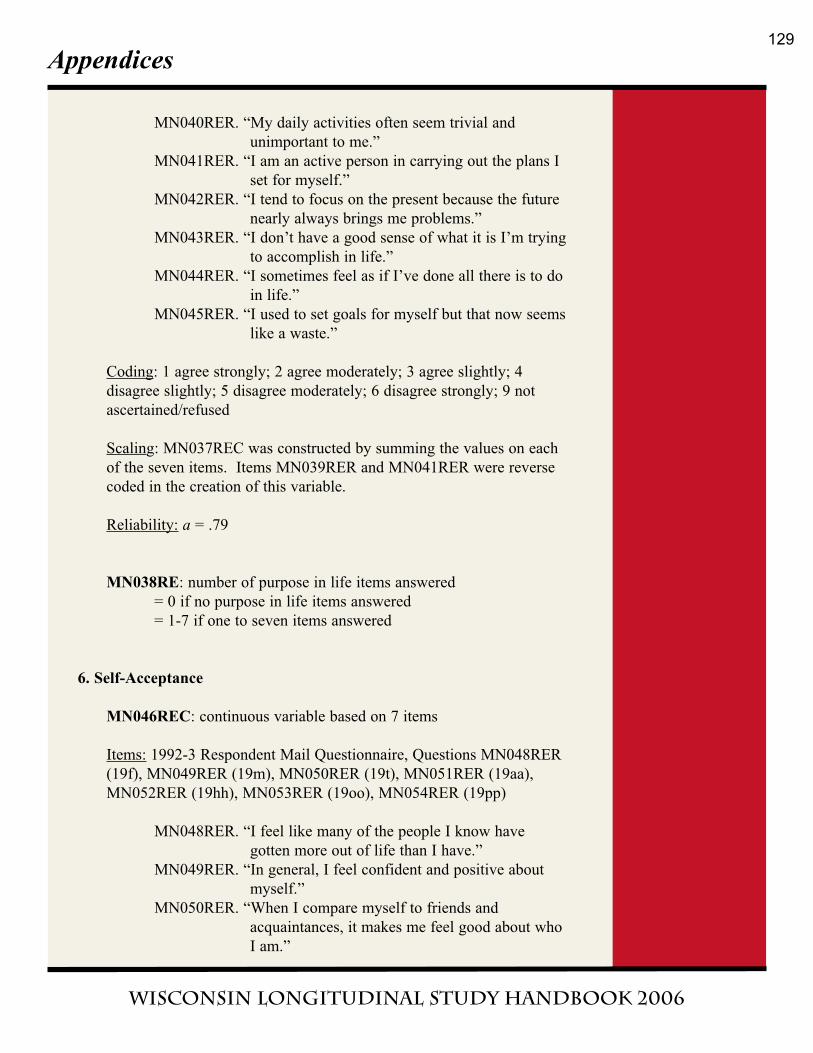
Appendices
Wisconsin Longitudinal Study handbook 2006
MN040RER. “My daily activities often seem trivial and
unimportant to me.”
MN041RER. “I am an active person in carrying out the plans I
set for myself.”
MN042RER. “I tend to focus on the present because the future
nearly always brings me problems.”
MN043RER. “I don’t have a good sense of what it is I’m trying
to accomplish in life.”
MN044RER. “I sometimes feel as if I’ve done all there is to do
in life.”
MN045RER. “I used to set goals for myself but that now seems
like a waste.”
Coding: 1 agree strongly; 2 agree moderately; 3 agree slightly; 4
disagree slightly; 5 disagree moderately; 6 disagree strongly; 9 not
ascertained/refused
Scaling: MN037REC was constructed by summing the values on each
of the seven items. Items MN039RER and MN041RER were reverse
coded in the creation of this variable.
Reliability: a = .79
MN038RE: number of purpose in life items answered
= 0 if no purpose in life items answered
= 1-7 if one to seven items answered
6. Self-Acceptance
MN046REC: continuous variable based on 7 items
Items: 1992-3 Respondent Mail Questionnaire, Questions MN048RER
(19f), MN049RER (19m), MN050RER (19t), MN051RER (19aa),
MN052RER (19hh), MN053RER (19oo), MN054RER (19pp)
MN048RER. “I feel like many of the people I know have
gotten more out of life than I have.”
MN049RER. “In general, I feel confident and positive about
myself.”
MN050RER. “When I compare myself to friends and
acquaintances, it makes me feel good about who
I am.”
129
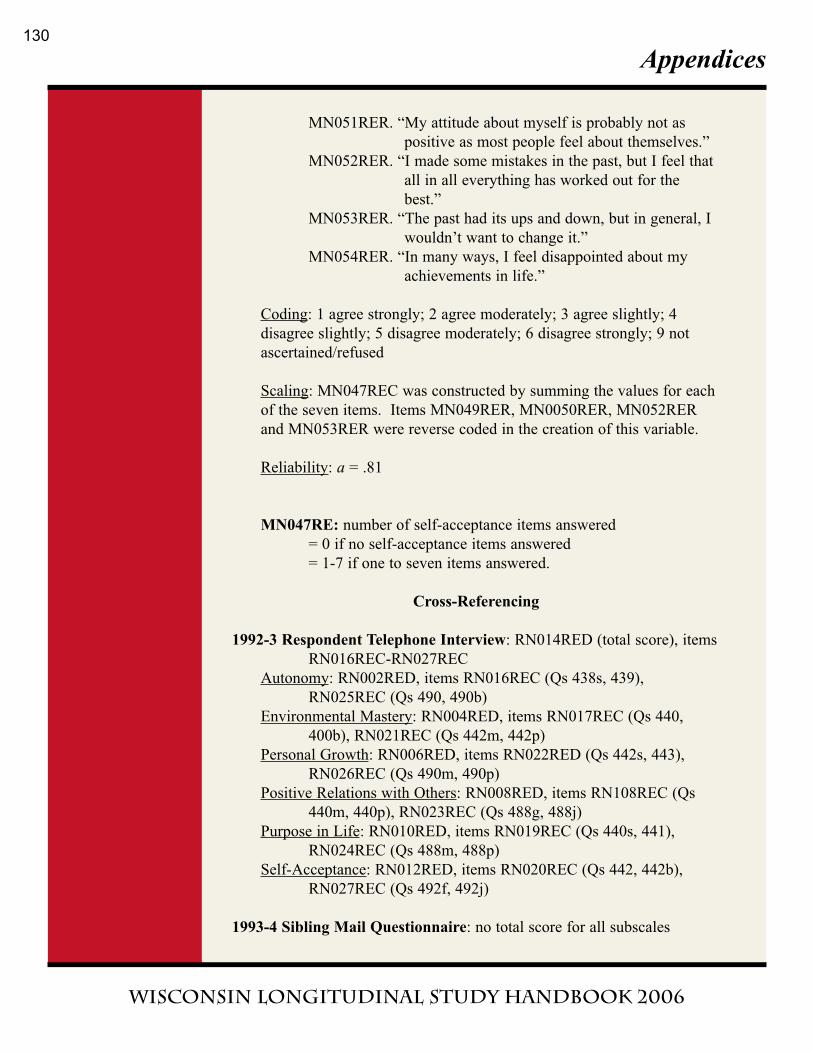
Appendices
Wisconsin Longitudinal Study handbook 2006
MN051RER. “My attitude about myself is probably not as
positive as most people feel about themselves.”
MN052RER. “I made some mistakes in the past, but I feel that
all in all everything has worked out for the
best.”
MN053RER. “The past had its ups and down, but in general, I
wouldn’t want to change it.”
MN054RER. “In many ways, I feel disappointed about my
achievements in life.”
Coding: 1 agree strongly; 2 agree moderately; 3 agree slightly; 4
disagree slightly; 5 disagree moderately; 6 disagree strongly; 9 not
ascertained/refused
Scaling: MN047REC was constructed by summing the values for each
of the seven items. Items MN049RER, MN0050RER, MN052RER
and MN053RER were reverse coded in the creation of this variable.
Reliability: a = .81
MN047RE: number of self-acceptance items answered
= 0 if no self-acceptance items answered
= 1-7 if one to seven items answered.
Cross-Referencing
1992-3 Respondent Telephone Interview: RN014RED (total score), items
RN016REC-RN027REC
Autonomy: RN002RED, items RN016REC (Qs 438s, 439),
RN025REC (Qs 490, 490b)
Environmental Mastery: RN004RED, items RN017REC (Qs 440,
400b), RN021REC (Qs 442m, 442p)
Personal Growth: RN006RED, items RN022RED (Qs 442s, 443),
RN026REC (Qs 490m, 490p)
Positive Relations with Others: RN008RED, items RN108REC (Qs
440m, 440p), RN023REC (Qs 488g, 488j)
Purpose in Life: RN010RED, items RN019REC (Qs 440s, 441),
RN024REC (Qs 488m, 488p)
Self-Acceptance: RN012RED, items RN020REC (Qs 442, 442b),
RN027REC (Qs 492f, 492j)
1993-4 Sibling Mail Questionnaire: no total score for all subscales
130
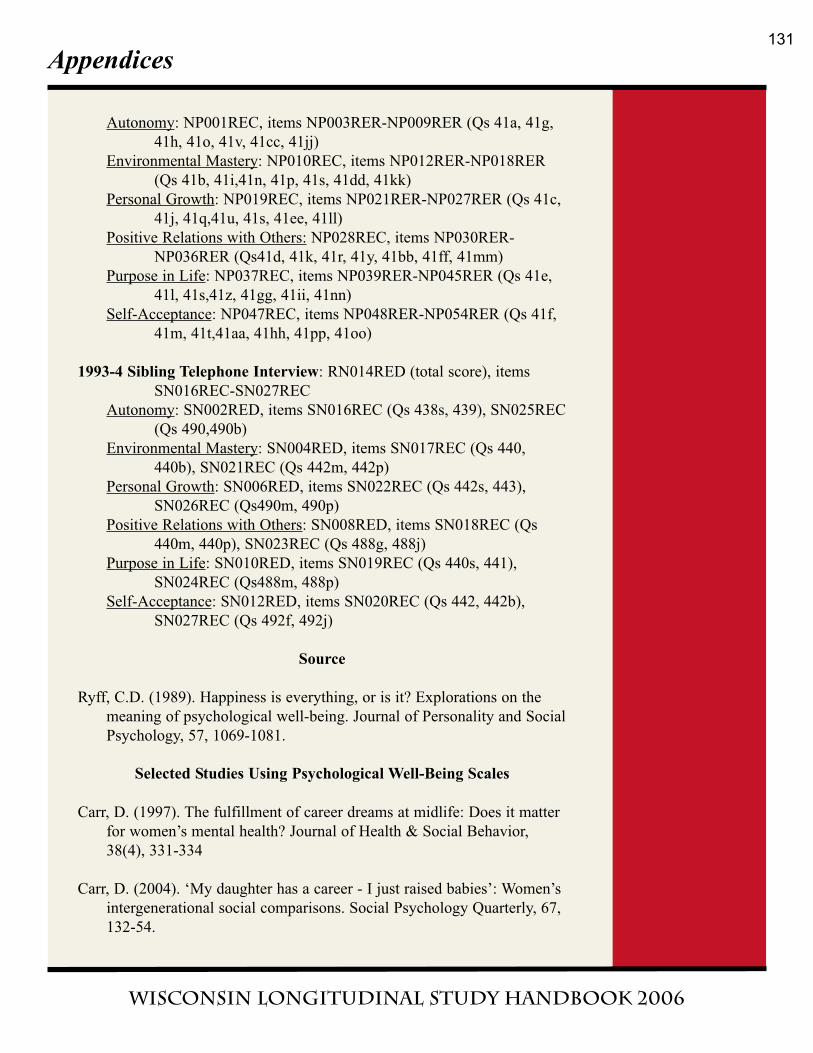
Appendices
Wisconsin Longitudinal Study handbook 2006
Autonomy: NP001REC, items NP003RER-NP009RER (Qs 41a, 41g,
41h, 41o, 41v, 41cc, 41jj)
Environmental Mastery: NP010REC, items NP012RER-NP018RER
(Qs 41b, 41i,41n, 41p, 41s, 41dd, 41kk)
Personal Growth: NP019REC, items NP021RER-NP027RER (Qs 41c,
41j, 41q,41u, 41s, 41ee, 41ll)
Positive Relations with Others: NP028REC, items NP030RER-
NP036RER (Qs41d, 41k, 41r, 41y, 41bb, 41ff, 41mm)
Purpose in Life: NP037REC, items NP039RER-NP045RER (Qs 41e,
41l, 41s,41z, 41gg, 41ii, 41nn)
Self-Acceptance: NP047REC, items NP048RER-NP054RER (Qs 41f,
41m, 41t,41aa, 41hh, 41pp, 41oo)
1993-4 Sibling Telephone Interview: RN014RED (total score), items
SN016REC-SN027REC
Autonomy: SN002RED, items SN016REC (Qs 438s, 439), SN025REC
(Qs 490,490b)
Environmental Mastery: SN004RED, items SN017REC (Qs 440,
440b), SN021REC (Qs 442m, 442p)
Personal Growth: SN006RED, items SN022REC (Qs 442s, 443),
SN026REC (Qs490m, 490p)
Positive Relations with Others: SN008RED, items SN018REC (Qs
440m, 440p), SN023REC (Qs 488g, 488j)
Purpose in Life: SN010RED, items SN019REC (Qs 440s, 441),
SN024REC (Qs488m, 488p)
Self-Acceptance: SN012RED, items SN020REC (Qs 442, 442b),
SN027REC (Qs 492f, 492j)
Source
Ryff, C.D. (1989). Happiness is everything, or is it? Explorations on the
meaning of psychological well-being. Journal of Personality and Social
Psychology, 57, 1069-1081.
Selected Studies Using Psychological Well-Being Scales
Carr, D. (1997). The fulfillment of career dreams at midlife: Does it matter
for women’s mental health? Journal of Health & Social Behavior,
38(4), 331-334
Carr, D. (2004). ‘My daughter has a career - I just raised babies’: Women’s
intergenerational social comparisons. Social Psychology Quarterly, 67,
132-54.
131
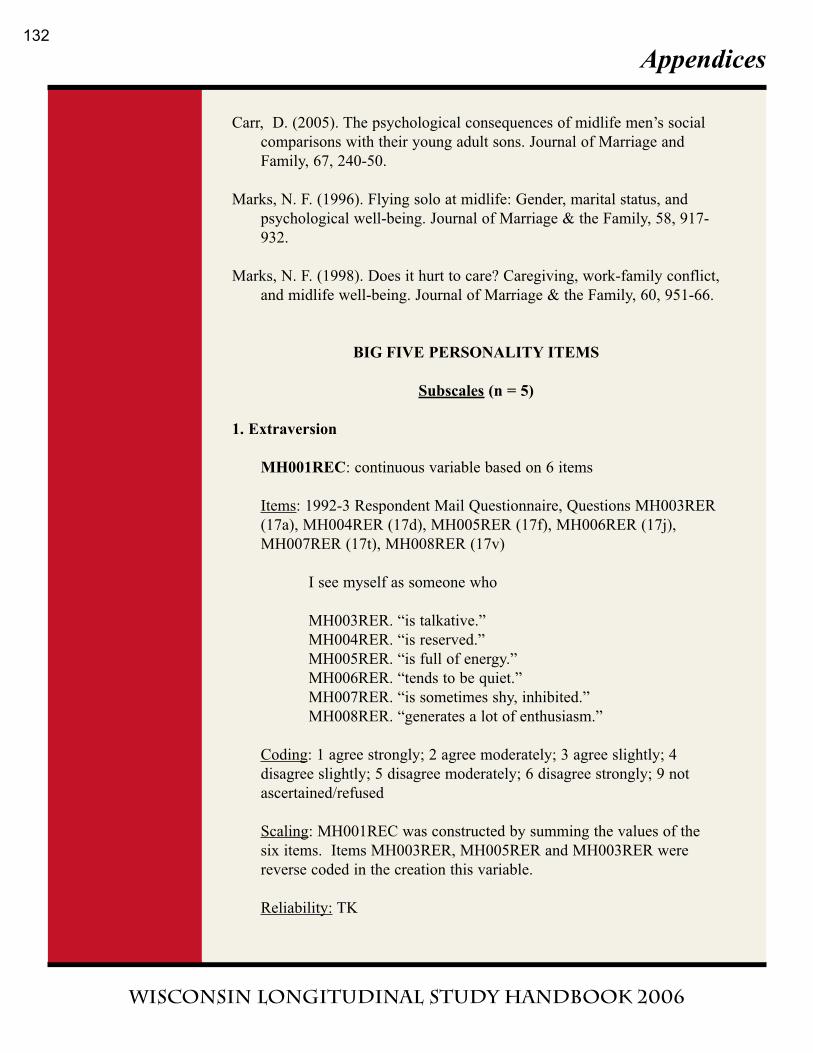
Appendices
Wisconsin Longitudinal Study handbook 2006
Carr, D. (2005). The psychological consequences of midlife men’s social
comparisons with their young adult sons. Journal of Marriage and
Family, 67, 240-50.
Marks, N. F. (1996). Flying solo at midlife: Gender, marital status, and
psychological well-being. Journal of Marriage & the Family, 58, 917-
932.
Marks, N. F. (1998). Does it hurt to care? Caregiving, work-family conflict,
and midlife well-being. Journal of Marriage & the Family, 60, 951-66.
BIG FIVE PERSONALITY ITEMS
Subscales (n = 5)
1. Extraversion
MH001REC: continuous variable based on 6 items
Items: 1992-3 Respondent Mail Questionnaire, Questions MH003RER
(17a), MH004RER (17d), MH005RER (17f), MH006RER (17j),
MH007RER (17t), MH008RER (17v)
I see myself as someone who
MH003RER. “is talkative.”
MH004RER. “is reserved.”
MH005RER. “is full of energy.”
MH006RER. “tends to be quiet.”
MH007RER. “is sometimes shy, inhibited.”
MH008RER. “generates a lot of enthusiasm.”
Coding: 1 agree strongly; 2 agree moderately; 3 agree slightly; 4
disagree slightly; 5 disagree moderately; 6 disagree strongly; 9 not
ascertained/refused
Scaling: MH001REC was constructed by summing the values of the
six items. Items MH003RER, MH005RER and MH003RER were
reverse coded in the creation this variable.
Reliability: TK
132
Appendices
Wisconsin Longitudinal Study handbook 2006
MH002RE: number of extraversion items answered
= 0 if no extraversion items answered
= 1-6 if one to six extraversion items answered
2. Agreeableness
MH009REC: continuous variable based on 6 items
Items: 1992-3 Respondent Mail Questionnaire, Questions MH011RER
(17b), MH012RER (17o), MH013RER (17p), MH014RER (17w),
MH015RER (17y), MH016RER (17bb)
I see myself as someone who
MH011RER. “tends to find fault with others.”
MH012RER. “is sometimes rude to others.”
MH013RER. “is generally trusting.”
MH014RER. “can be cold and aloof.”
MH015RER. “is considerate to almost everyone.”
MH016RER. “likes to cooperate with others.”
Coding: 1 agree strongly; 2 agree moderately; 3 agree slightly; 4
disagree slightly; 5 disagree moderately; 6 disagree strongly; 9 not
ascertained/refused
Scaling: MH009REC was constructed by summing the values of the
six items. Items MH013RER, MH015RER and MH016RER were
reverse coded in the creation of this variable.
Reliability: TK
MH010RE: numbers of agreeableness items answered
= 0 if no agreeableness items answered
= 1-6 if one to six items answered
3. Conscientiousness
MH017REC: continuous variable based on 6 items
Items: 1992-3 Respondent Mail Questionnaire, Questions MH019RER
(17c), MH020RER (17h), MH021RER (17l), MH022RER (17q),
MH023RER (17u), MH024RER (17cc)
133
Appendices
Wisconsin Longitudinal Study handbook 2006
I see myself as someone who
MH019RER. “does a thorough job.”
MH020RER. “is a reliable workers.”
MH021RER. “tends to be disorganized.”
MH022RER. “is lazy at times.”
MH023RER. “does things efficiently.”
MH024RER. “is easily distracted.”
Coding: 1 agree strongly; 2 agree moderately; 3 agree slightly; 4
disagree slightly; 5 disagree moderately; 6 disagree strongly; 9 not
ascertained/refused
Scaling: MH017REC was constructed by summing the values of the
six items. Items MH019RER, MH020RER and MH023RER were
reverse coded in the creation of this variable.
Reliability: TK
MH013RE: number of conscientiousness items answered
= 0 if no conscientiousness items answered
= 1-6 if one to six conscientiousness items answered
4. Neuroticism
MH025REC: continuous variable based on 5 items
Items: 1992-3 Respondent Mail Questionnaire, Questions MH027RER
(17i), MH028RER (17m), MH029RER (17r), MH030RER (17x),
MH031RER (17z)
I see myself as someone who
MH027RER. “can be tense.”
MH028RER. “is emotionally stable, not easily upset.”
MH029RER. “worries a lot.”
MH030RER. “remains calm in tense situations.”
MH031RER. “gets nervous easily.”
Coding: 1 agree strongly; 2 agree moderately; 3 agree slightly; 4
disagree slightly; 5 disagree moderately; 6 disagree strongly; 9 not
ascertained/refused
134
Appendices
Wisconsin Longitudinal Study handbook 2006
Scaling: MH025REC was constructed by summing the values of the
five items. Items MH027RER, MN029RER and MH031RER were
reverse coded in the creation of this variable.
Reliability: T
MH026RE: number of neuroticism items answered
= 0 if no neuroticism items answered
= 1-5 if one to five items answered
5. Openness
MH032REC: continuous variable based on 6 items
Items: 1992-3 Respondent Mail Questionnaire, Questions MH034RER
(17e), MH035RER (17g), MH036RER (17k), MH037RER (17n),
MH038RER (17s), MH039RER (17aa)
I see myself as someone who
MH034RER. “prefers the conventional, traditional.”
MH035RER. “prefers work that is routine and simple."
MH036RER. “values artistic, aesthetic experiences.”
MH037RER. “has an active imagination.”
MH038RER. “wants things to be simple and clear-cut.”
MH039RER. “is sophisticated in art, music, or literature.”
Coding: 1 agree strongly; 2 agree moderately; 3 agree slightly; 4
disagree slightly; 5 disagree moderately; 6 disagree strongly; 9 not
ascertained/refused
Scaling: MH032REC was constructed by summing the values of the
six items. Items MH036RER, MH037RER and MH039RER were
reverse coded in the creation of this variable.
Reliability: TK
MH033RE: number of openness items answered
= 0 if no openness items answered
= 1-6 if one to six items answered
Cross-Referencing
135
Appendices
Wisconsin Longitudinal Study handbook 2006
1992-3 Respondent Telephone Interview:
Extraversion: RH001REC, items RH011RE (Qs 308n, 309), RH016RE
(Qs 312f, 312j)
Agreeableness: RH009REC, items RH014RE (Qs 310m, 310p),
RH018RE (Qs 314, 314b)
Conscientiousness: RH007REC, items RH015RE (Qs 310s, 311),
RH019RE (Qs 314f, 314j)
Neuroticism: RH005REC, items RH013RE (Qs 310f, 310j), RH020RE
(Qs 314m, 314p)
Openness: RH003REC, items RH012RE (Qs 310, 310b), RH017RE
(Qs 312m, 312p)
1993-4 Sibling Mail Questionnaire:
Extraversion: NH001REC, items NH003RER-NH008RER (Qs 39a,
39d, 39f, 39j, 39t, 39v)
Agreeableness: NH009REC, items NH011RER-NH016RER (Qs 39b,
39o, 39p, 39w, 39y, 39bb)
Conscientiousness: NH017REC, items NH019RER-NH024RER (Qs
39c, 39h, 39l, 39q, 39u, 39cc)
Neuroticism: NH025REC, items NH027RER-NH031RER (Qs 39i,
39m, 39r, 39x, 39z)
Openness: NH032REC, items NH034RER-NH-039RER (Qs 39e, 39g,
39k, 39n. 39s, 39aa)
1993-4 Sibling Telephone Interview:
Extraversion: SH001REC, items SH011RE (Qs 308n, 309), SH016RE
(Qs 312f, 312j)
Agreeableness: SH009REC, items SH014RE (Qs 310m, 310p),
SH018RE (Qs 314, 314b)
Conscientiousness: SH007REC, items SH015RE (Qs 310s, 311),
SH019RE (Qs 314f, 314j)
Neuroticism: SH005REC, items SH013RE (Qs 310f, 310j), SH020RE
(Qs 314m, 314p)
Openness: SH003REC, items SH012RE (Qs 310, 310b), SH017RE
(Qs 312m, 312p)
Source
John, O. P., Donahue, E. M., & Kentle, R. L. (1991). The "Big Five"
inventory – version 4a and 5a. Berkely, CA: Institute of Personality
and Social Research, University of California, Berkeley.
136
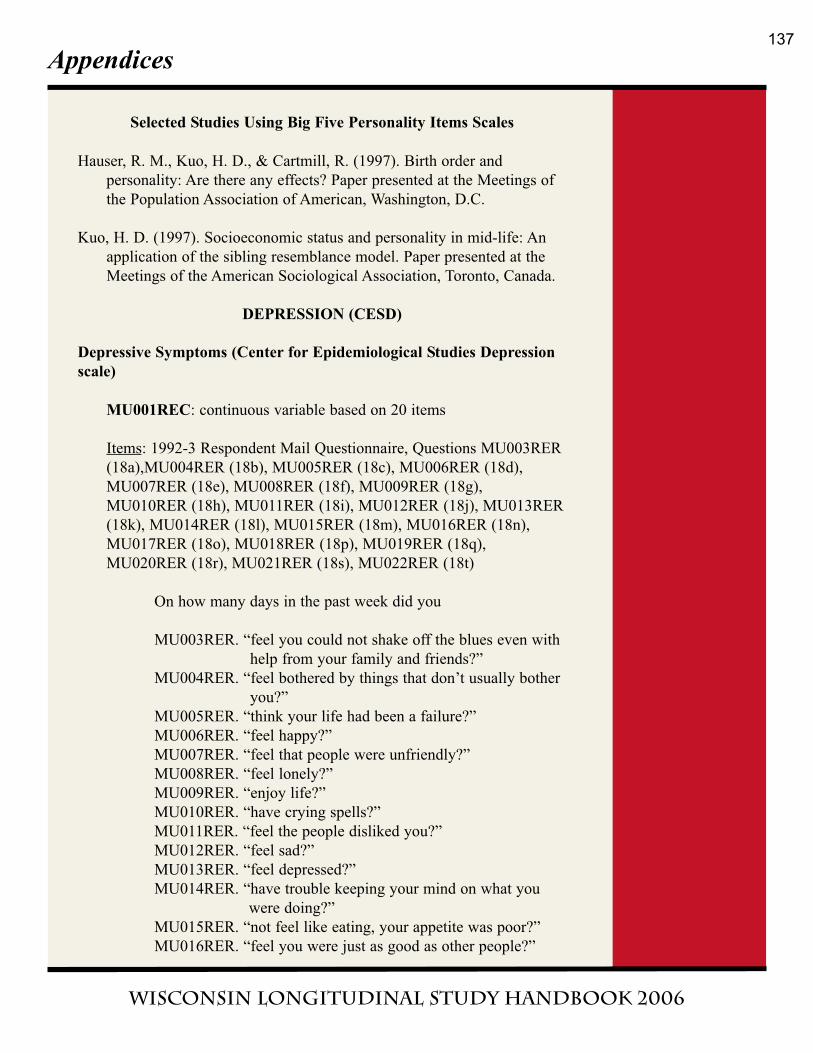
Appendices
Wisconsin Longitudinal Study handbook 2006
Selected Studies Using Big Five Personality Items Scales
Hauser, R. M., Kuo, H. D., & Cartmill, R. (1997). Birth order and
personality: Are there any effects? Paper presented at the Meetings of
the Population Association of American, Washington, D.C.
Kuo, H. D. (1997). Socioeconomic status and personality in mid-life: An
application of the sibling resemblance model. Paper presented at the
Meetings of the American Sociological Association, Toronto, Canada.
DEPRESSION (CESD)
Depressive Symptoms (Center for Epidemiological Studies Depression
scale)
MU001REC: continuous variable based on 20 items
Items: 1992-3 Respondent Mail Questionnaire, Questions MU003RER
(18a),MU004RER (18b), MU005RER (18c), MU006RER (18d),
MU007RER (18e), MU008RER (18f), MU009RER (18g),
MU010RER (18h), MU011RER (18i), MU012RER (18j), MU013RER
(18k), MU014RER (18l), MU015RER (18m), MU016RER (18n),
MU017RER (18o), MU018RER (18p), MU019RER (18q),
MU020RER (18r), MU021RER (18s), MU022RER (18t)
On how many days in the past week did you
MU003RER. “feel you could not shake off the blues even with
help from your family and friends?”
MU004RER. “feel bothered by things that don’t usually bother
you?”
MU005RER. “think your life had been a failure?”
MU006RER. “feel happy?”
MU007RER. “feel that people were unfriendly?”
MU008RER. “feel lonely?”
MU009RER. “enjoy life?”
MU010RER. “have crying spells?”
MU011RER. “feel the people disliked you?”
MU012RER. “feel sad?”
MU013RER. “feel depressed?”
MU014RER. “have trouble keeping your mind on what you
were doing?”
MU015RER. “not feel like eating, your appetite was poor?”
MU016RER. “feel you were just as good as other people?”
137
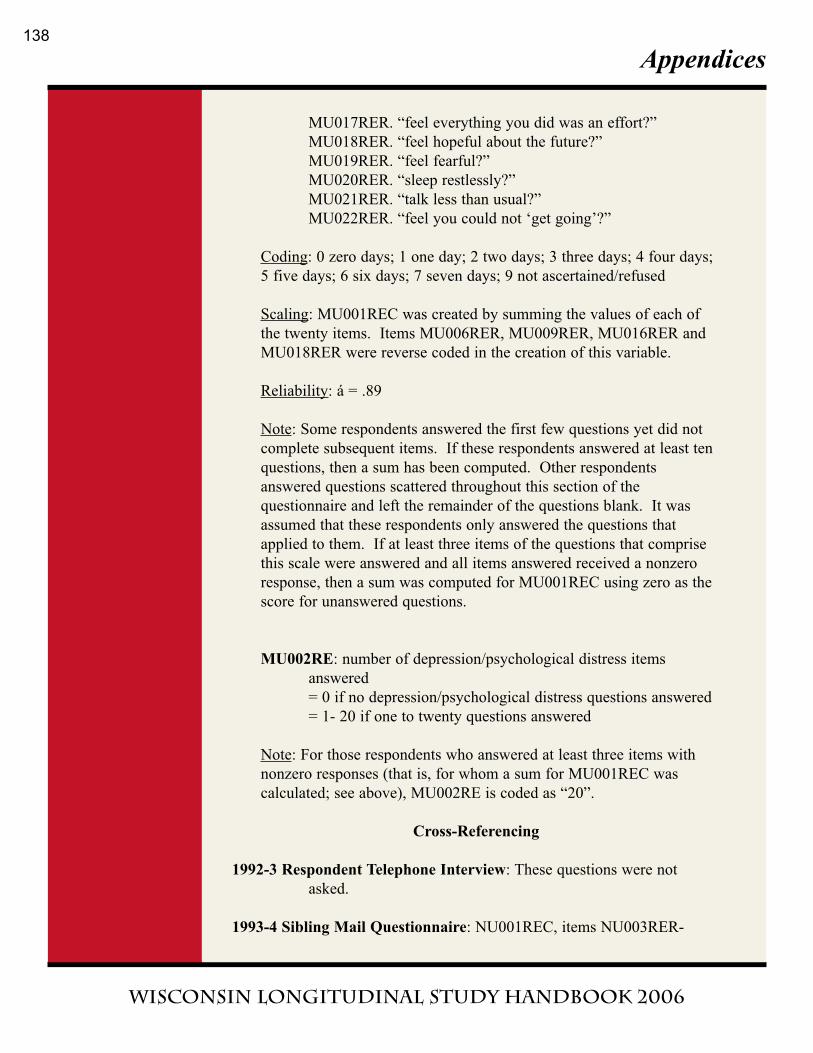
Appendices
Wisconsin Longitudinal Study handbook 2006
MU017RER. “feel everything you did was an effort?”
MU018RER. “feel hopeful about the future?”
MU019RER. “feel fearful?”
MU020RER. “sleep restlessly?”
MU021RER. “talk less than usual?”
MU022RER. “feel you could not ‘get going’?”
Coding: 0 zero days; 1 one day; 2 two days; 3 three days; 4 four days;
5 five days; 6 six days; 7 seven days; 9 not ascertained/refused
Scaling: MU001REC was created by summing the values of each of
the twenty items. Items MU006RER, MU009RER, MU016RER and
MU018RER were reverse coded in the creation of this variable.
Reliability: á = .89
Note: Some respondents answered the first few questions yet did not
complete subsequent items. If these respondents answered at least ten
questions, then a sum has been computed. Other respondents
answered questions scattered throughout this section of the
questionnaire and left the remainder of the questions blank. It was
assumed that these respondents only answered the questions that
applied to them. If at least three items of the questions that comprise
this scale were answered and all items answered received a nonzero
response, then a sum was computed for MU001REC using zero as the
score for unanswered questions.
MU002RE: number of depression/psychological distress items
answered
= 0 if no depression/psychological distress questions answered
= 1- 20 if one to twenty questions answered
Note: For those respondents who answered at least three items with
nonzero responses (that is, for whom a sum for MU001REC was
calculated; see above), MU002RE is coded as “20”.
Cross-Referencing
1992-3 Respondent Telephone Interview: These questions were not
asked.
1993-4 Sibling Mail Questionnaire: NU001REC, items NU003RER-
138
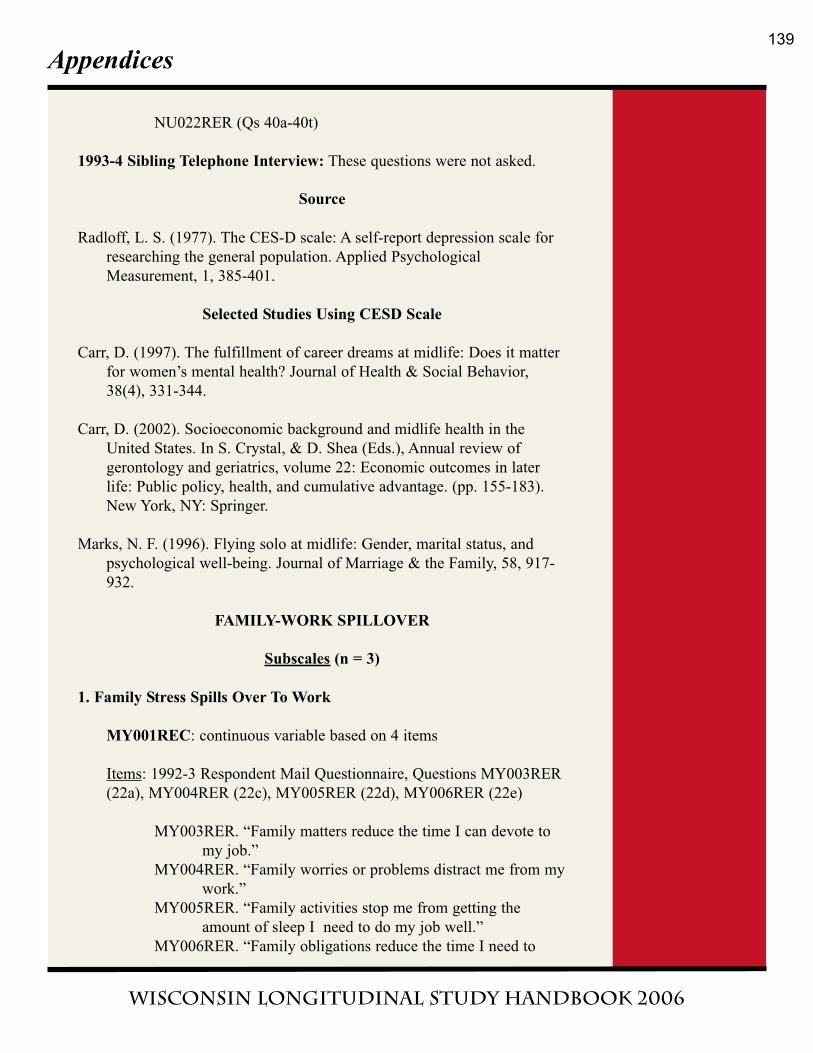
Appendices
Wisconsin Longitudinal Study handbook 2006
NU022RER (Qs 40a-40t)
1993-4 Sibling Telephone Interview: These questions were not asked.
Source
Radloff, L. S. (1977). The CES-D scale: A self-report depression scale for
researching the general population. Applied Psychological
Measurement, 1, 385-401.
Selected Studies Using CESD Scale
Carr, D. (1997). The fulfillment of career dreams at midlife: Does it matter
for women’s mental health? Journal of Health & Social Behavior,
38(4), 331-344.
Carr, D. (2002). Socioeconomic background and midlife health in the
United States. In S. Crystal, & D. Shea (Eds.), Annual review of
gerontology and geriatrics, volume 22: Economic outcomes in later
life: Public policy, health, and cumulative advantage. (pp. 155-183).
New York, NY: Springer.
Marks, N. F. (1996). Flying solo at midlife: Gender, marital status, and
psychological well-being. Journal of Marriage & the Family, 58, 917-
932.
FAMILY-WORK SPILLOVER
Subscales (n = 3)
1. Family Stress Spills Over To Work
MY001REC: continuous variable based on 4 items
Items: 1992-3 Respondent Mail Questionnaire, Questions MY003RER
(22a), MY004RER (22c), MY005RER (22d), MY006RER (22e)
MY003RER. “Family matters reduce the time I can devote to
my job.”
MY004RER. “Family worries or problems distract me from my
work.”
MY005RER. “Family activities stop me from getting the
amount of sleep I need to do my job well.”
MY006RER. “Family obligations reduce the time I need to
139
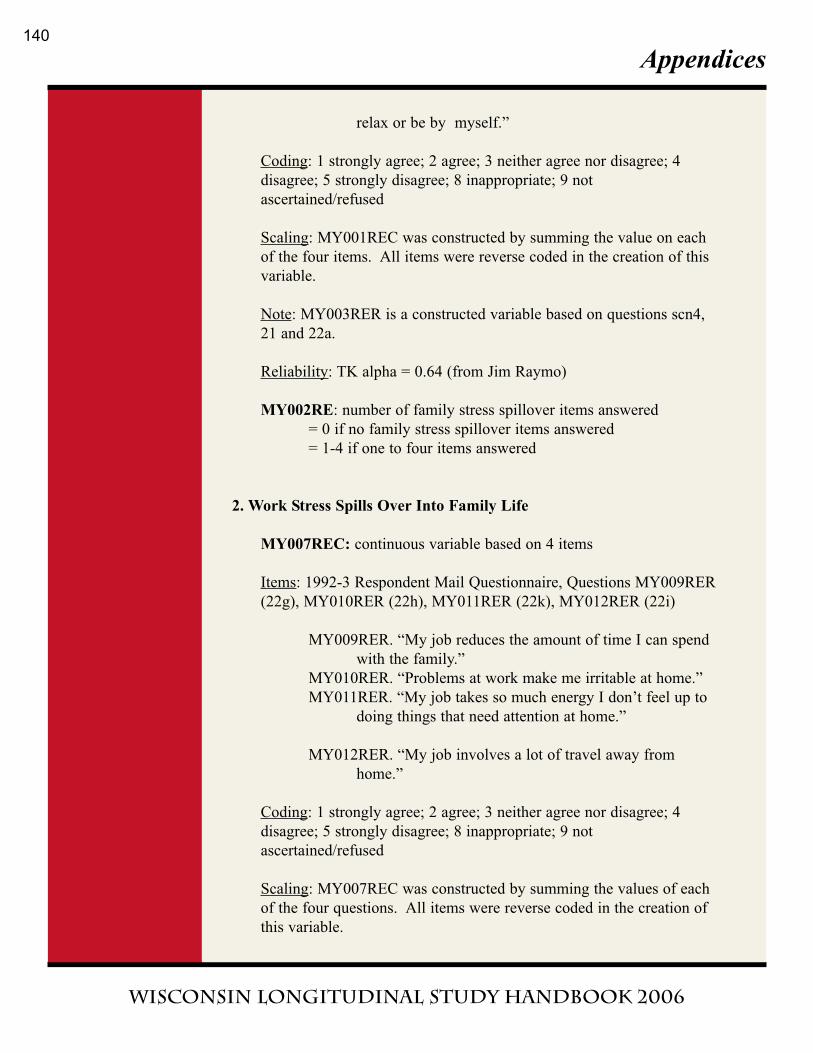
Appendices
Wisconsin Longitudinal Study handbook 2006
relax or be by myself.”
Coding: 1 strongly agree; 2 agree; 3 neither agree nor disagree; 4
disagree; 5 strongly disagree; 8 inappropriate; 9 not
ascertained/refused
Scaling: MY001REC was constructed by summing the value on each
of the four items. All items were reverse coded in the creation of this
variable.
Note: MY003RER is a constructed variable based on questions scn4,
21 and 22a.
Reliability: TK alpha = 0.64 (from Jim Raymo)
MY002RE: number of family stress spillover items answered
= 0 if no family stress spillover items answered
= 1-4 if one to four items answered
2. Work Stress Spills Over Into Family Life
MY007REC: continuous variable based on 4 items
Items: 1992-3 Respondent Mail Questionnaire, Questions MY009RER
(22g), MY010RER (22h), MY011RER (22k), MY012RER (22i)
MY009RER. “My job reduces the amount of time I can spend
with the family.”
MY010RER. “Problems at work make me irritable at home.”
MY011RER. “My job takes so much energy I don’t feel up to
doing things that need attention at home.”
MY012RER. “My job involves a lot of travel away from
home.”
Coding: 1 strongly agree; 2 agree; 3 neither agree nor disagree; 4
disagree; 5 strongly disagree; 8 inappropriate; 9 not
ascertained/refused
Scaling: MY007REC was constructed by summing the values of each
of the four questions. All items were reverse coded in the creation of
this variable.
140
Appendices
Wisconsin Longitudinal Study handbook 2006
Reliability: TK alpha = 0.57 (from Jim Raymo)
MY008RE: number of work stress spillover items answered
= 0 if no work stress spillover items answered
= 1-4 if one to four items answered
3. Family Enhancement Spills Over Into Work Life
MY013REC: continuous variable based on 3 items
Items: 1992-3 Respondent Mail Questionnaire, Questions MY015RER
(22b), MY016RER (22f), MY017RER (22j)
MY015RER. “I can do good work on the job because I am so
happy at home.”
MY016RER. “Family responsibilities make me work harder on
the job.”
MY017RER. “I can devote a lot of time to my job because of
the support I get on the home front.”
Coding:1 strongly agree; 2 agree; 3 neither agree nor disagree; 4
disagree; 5 strongly disagree; 8 inappropriate; 9 not ascertained/refused
Scaling: MY013REC was constructed by summing the values for each
of the three items. All items were reverse coded in the creation of this
variable.
Reliability: TK
MY014RE: number of family enhancing work items answered
= 0 if no family enhancing work items answered
= 1-3 if one to three items answered
Cross-Referencing
1992-3 Respondent Telephone Interview: These questions were not
asked.
1993-4 Sibling Mail Questionnaire:
Family Stress Spills Over to Work: NY001REC, items NY003RER-
NY006RER (Qs 45a, 45c, 45d, 45e)
141
Appendices
Wisconsin Longitudinal Study handbook 2006
Work Stress Spills Over into Family Life: NY007REC, items
NY009RER-NY012RER (Qs 45g, 45h, 45k, 45i)
Family Enhancement Spills Over into Work Life: NY013REC, items
NY015RER-NY017RER (Qs 45b, 45f, 45j)
1993-4 Sibling Telephone Interview: These questions were not asked.
Source
TK
Selected Studies Using Family-Work Spillover Scales
Marks, N. F. (1998). Does it hurt to care? Caregiving, work-family conflict,
and midlife well-being. Journal of Marriage & the Family, 60, 951-
966.
Raymo, J. M., & Sweeney, M. M. (2005). Work-family conflict and
retirement preferences. Unpublished manuscript.
BRANDSTADTER GOAL ATTAINMENT
Subscales (n = 2)
1. Flexible Goal Adjustment (FGA)
MN055REC: continuous variable based on 5 items
Items: 1992-3 Respondent Mail Questionnaire, Questions MN057RER
(20b), MN058RER (20c), MN059RER (20g), MN060RER (20i),
MN061RER (20j)
MN057RER. “If I don’t get something I want, I take it with
patience.”
MN058RER. “It is very difficult for me to accept a setback or
defeat.”
MN059RER. “I find it easy to see something positive even in a
serious mishap.”
MN060RER. “When everything seems to be going wrong, I
can usually find a bright side to a situation.”
MN061RER. “In general, I am not upset very long about an
opportunity passed up.”
142
Appendices
Wisconsin Longitudinal Study handbook 2006
Coding: 1 strongly agree; 2 agree; 3 neither agree nor disagree; 4
disagree; 5 strongly disagree; 9 not ascertained/refused
Scaling: MN055REC was constructed by summing the values on each
of the five items. Items MN057RER, MN059RER, MN060RER and
MN061RER were reverse coded in creating this variable.
Reliability: á = .67
MN056RE: number of FGA items answered
= 0 if no FGA items answered
= 1-5 if one to five items answered
2. Tenacious Goal Pursuit (TGP)
MN062REC: continuous variable based on 5 items
Items: 1992-3 Respondent Mail Questionnaire, Questions MN064RER
(20a), MN065RER (20d), MN066RER (20e), MN067RER (20f),
MN068RER (20h)
MN064RER. “Even when things seem hopeless, I keep on
fighting to reach my goals.”
MN065RER. “I stick to my goals and projects even in the face
of great adversity.”
MN066RER. “The harder a goal is to achieve, the more appeal
it has to me.”
MN067RER. “I can be very stubborn in pursuing my goals.”
MN068RER. “To avoid disappointment, I don’t set my goals
too high.”
Coding: 1 strongly agree; 2 agree; 3 neither agree nor disagree; 4
disagree; 5 strongly disagree; 9 not ascertained/refused
Scaling: MN062REC was constructed by summing the values on each
of the five questions. Items MN064RER, MN065RER, MN066RER
and MN067RER were reverse coded in creation of this variable.
Reliability: á = .67
MN063RE: number of TGP items answered
= 0 if no TGP items answered
= 1-5 if one to five items answered
143
Appendices
Wisconsin Longitudinal Study handbook 2006
Cross-Referencing
1992-3 Respondent Telephone Interview: These questions were not
asked.
1993-4 Sibling Mail Questionnaire:
Flexible Goal Adjustment: NP055REC, items NP057RER-NP061RER
(Qs 42b, 42c, 42g, 42i, 42j)
Tenacious Goal Pursuit: NP062REC, items NP064RER-NP068RER
(Qs 42a, 42d, 42e, 42f, 42h)
1993-4 Sibling Telephone Interview: These questions were not asked.
Source
Brandstadter, J. (1984). Personal and social control over development:
Some implications of an action perspective in life-span developmental
psychology. In P. B. Baltes, & O. G. Grim, Jr. (Eds.), Life-span
development and behavior (Volume 6). New York, NY: Academic
Press.
Brandstadter, J., & Renner, G. (1990). Tenacious goals pursuit and flexible
goal adjustment: Explication and age-related analysis of assimilative
and accommodative strategies of coping. Psychology & Aging, 5, 58-
67.
Selected Studies Using Brandstadter Goal Attainment Scales
Seltzer, M. M., Greenberg, J. S., & Floyd, F. (2000). Flexible goal
adjustment as a coping mechanism for midlife parents of children with
disabilities. Paper presented at the Meetings of the Gerontological
Society of American, Washington DC.
HOSTILITY
Hostility
MU026REC: continuous variable based on 3 items
Items: 1992-3 Respondent Mail Questionnaire, Questions MU023RER
(18u), MU024RER (18v), MU025RER (18w)
144
Appendices
Wisconsin Longitudinal Study handbook 2006
On how many days during the past week did you
MU023RER. “feel irritable, or likely to fight or argue?”
MU024RER. “feel like telling someone off?”
MU025RER. “feel angry or hostile for several hours at a
time?”
Coding: 0 zero days; 1 one day; 2 two days; 3 three days; 4 four days;
5 five days; 6 six days; 7 seven days; 9 not ascertained/refused
Scaling: MU025RER was constructed by summing the values on each
of the three items.
Reliability: TK
MU027RE: number of hostility items answered
= 0 if no hostility items answered
= 1-3 if one to three items answered
Cross-Referencing
1992-3 Respondent Telephone Interview: These questions were not
asked.
1993-4 Sibling Mail Questionnaire: These questions were not asked.
1993-4 Sibling Telephone Interview: These questions were not asked.
Source
TK
Selected Studies Using Hostility Scale
MacLean, A., & Hauser R. M. (2004). Socioeconomic status and
depression among adult siblings. Center for Demography and Ecology
(CDE) Working Paper 2000-04. University of Wisconsin-Madison.
Marks, N. F. (1996). Flying solo at midlife: Gender, marital status, and
psychological well-being. Journal of Marriage and the Family, 58, 917-
32.
Seltzer, M. M., Greenberg, J. S., Floyd, F. J., Pettee, Y., & Hong, J. (2001).
Life course impacts of parenting a child with a disability. American
145
Appendices
Wisconsin Longitudinal Study handbook 2006
Journal on Mental Retardation, 106(3), 256-286.
HEALTH SYMPTOMS
Total Number of Symptoms
MX082REC: continuous variable based on 22 items
Items: 1992-3 Respondent Mail Questionnaire, Questions MX016RER
(9Aa), MX019RER (9Ab), MX022RER (9Ac), MX025RER (9Ad),
MX028RER (9Ae), MX031RER (9Af), MX034RER (9Ag),
MX037RER (9Ah), MX040RER (9Ai), MX043RER (9Aj),
MX046RER (9Ak), MX049RER (9Al), MX052RER (9Am),
MX055RER (9An), MX058RER (9Ao), MX061RER (9Ap),
MX064RER (9Aq), MX067RER (9Ar), MX070RER (9As),
MX073RER (9At), MX076RER (9Au), MX079RER (9Av)
In the past six months have you
MX016RER. “felt a lack of energy.”
MX019RER. “had trouble sleeping.”
MX022RER. “had fatigue or exhaustion.”
MX025RER. “had headaches.”
MX028RER. “had visual problems.”
MX031RER. “felt dizziness or faintness.”
MX034RER. “felt numbness.”
MX037RER. “had ringing in the ears.”
MX040RER. “felt nausea.”
MX043RER. “vomited.”
MX046RER. “had upset stomach.”
MX049RER. “had constipation.”
MX052RER. “had diarrhea.”
MX055RER. “had urination problems.”
MX058RER. “had aching muscles.”
MX061RER. “had stiff/swollen joints.”
MX064RER. “had back pain or strain.”
MX067RER. “had chest pain.”
MX070RER. “felt shortness of breath.”
MX073RER. “had excess sweating.”
MX076RER. “had respiratory problems.”
MX079RER. “had skin problems.”
Coding: 1 has symptom; 2 does not have symptom
146
Appendices
Wisconsin Longitudinal Study handbook 2006
Scaling: MX082RE was constructed by summing the “has symptom”
responses for the 22 items.
Reliability: INAP
Cross-Referencing
1992-3 Respondent Telephone Interview: These questions were not
asked.
1993-4 Sibling Mail Questionnaire: NX102RER, items NX045RER-
NX099RER, every second item including NX045RER and
NX099RER (Qs 10Aa-10Az, 10A2, 10B3)
1993-4 Sibling Telephone Interview: These questions were not asked.
Source
TK
Selected Studies Using Health Symptoms Scale
Carr, D. (2002). Socioeconomic background and midlife health in the
United States. In S. Crystal, & D. Shea (Eds.), Annual review of
gerontology and geriatrics, volume 22: Economic outcomes in later
life: Public policy, health, and cumulative advantage. (pp. 155-183).
New York, NY: Springer.
Miech, R. A., & Hauser, R. M. (2001). Socioeconomic status (SES) and
health at midlife: A comparison of educational attainment with
occupa tion-based indicators. Annals of Epidemiology, 11(2), 75-84.
ILLNESS
Total Number of Illnesses
MX117RE: continuous variable based on 17 items
Items: 1992-3 Respondent Mail Questionnaire, Questions MX083RER
(10Aa),MX085RER (10Ab), MX087RER (10Ac), MX089RER
(10Ad), MX091RER (10Ae), MX093RER (10Af), MX095RER
(10Ag), MX097RER (10Ah), MX099RER (10Ai), MX101RER
(10Aj), MX103RER (10Ak), MX105RER (10Al), MX107RER
147
Appendices
Wisconsin Longitudinal Study handbook 2006
(10Am), MX109RER (10An), MX111RER (10Ao), MX113RER
(10Ap), MX115RER (10Aq)
A medical professional says you have
MX083RER. “anemia.”
MX085RER. “asthma.”
MX087RER. “arthritis or rheumatism.”
MX089RER. “bronchitis or emphysema.”
MX091RER. “cancer.”
MX093RER. “chronic liver trouble.”
MX095RER. “diabetes.”
MX097RER. “serious back trouble.”
MX099RER. “heart trouble.”
MX101RER. “high blood pressure.”
MX103RER. “circulation problems.”
MX105RER. “kidney or bladder problems.”
MX107RER. “ulcer.”
MX109RER. “allergies.”
MX111RER. “multiple sclerosis.”
MX113RER. “colitis.”
MX115RER. “some other illness or condition.”
Coding: 1 has symptom; 2 does not have symptom
Scaling: MX117RE was constructed by summing the “has symptom”
responses for the 17 items.
Reliability: INAP
Note: MX115RER is a constructed variable based on questions 10Aq
and IN75.
Cross-Referencing
1992-3 Respondent Telephone Interview: These questions were not
asked.
1993-4 Sibling Mail Questionnaire: NX139RER, items NX103RER-
NX137RER, every second item including NX103RER and
NX139RER (Qs 11Aa-11Ar, a11A4)
1993-4 Sibling Telephone Interview: These questions were not asked.
148
Appendices
Wisconsin Longitudinal Study handbook 2006
Source
Duke University Center for the Study of Aging and Human Development.
(1978). Multidimensional functional assessment: The OARS methodology. Durham, NC: Duke University.
Selected Studies Using Illness Scale
Miech, R. A., & Hauser, R. M. (2001). Socioeconomic status (SES) and
health at midlife: A comparison of educational attainment with
occupation-based indicators. Annals of Epidemiology, 11(2), 75-84.
BODY MASS INDEX (BMI)
Body Mass Index
MX011REC: continuous variable based on 2 items
Items: 1992-3 Mail Questionnaire, Questions MX009RER (6),
MX010REC (7a, 7b, 7c, 7d)
MX009RER. “How much do you weigh?”
MX010RER. “How tall are you?”
Coding: MX009RER is coded in pounds; 999 not ascertained/refused.
MX010RER is coded in inches; 9999 not ascertained/refused (two
decimal places are implied in the data file). MX011REC is one’s body
mass index, based on the formula BMI equals kilograms/meters
squared.
Scaling: MX011REC was constructed using the formula: BMI =
(weight in pounds * 703)/ height in inches squared, or MX011REC =
(MX009RER * 703)/MX010RER2.
Reliability: INAP
Notes: MX010RER is a constructed variable based on questions 7a,
7b, 7c and 7d. In the public data file, MX009RER is bottom-coded at
100 and top-coded at 300; MX010RER is bottom-coded at 5500 and
top-coded at 7700. In the public data file, MX011REC was created
using bottom- and top-coded values for MX009RER and MX010RER.
149
Appendices
Wisconsin Longitudinal Study handbook 2006
Cross-Referencing
1992-3 Respondent Telephone Interview: These questions were not
asked.
1993-4 Sibling Mail Questionnaire: NX025REC, items NX023RER (Q
6), NX024RER (Qs 7a-7d)
1993-4 Sibling Telephone Interview: These questions were not asked.
Source
National Heart, Lung, and Blood Institute [NHLBI]. 1998. Clinical Guidelines on the Identification, Evaluation, and Treatment of Overweight and Obesity in Adults. (National Institutes of Health
Publication, 98-4083). Bethesda, MD: National Institutes of Health.
Selected Studies Using BMI Scale
Carr, D. (2002). Socioeconomic background and midlife health in the
United States. In S. Crystal, & D. Shea (Eds.), Annual review of
gerontology and geriatrics, volume 22: Economic outcomes in later
life: Public policy, health, and cumulative advantage. (pp. 155-183).
New York, NY: Springer.
1992-3 Respondent Telephone Interview
PSCYHOLOGICAL WELL-BEING
An 80% random sample was selected to be asked psychological well-being
questions in the 1992-3 respondent telephone interviews. If RN001RE = 0,
the respondent was not in this 80% sample; if RN001RE = 1, the
respondent was in the 80% sample.
Subscales (n = 6)
1. Autonomy
RN002RED: continuous variable based on 2 items
Items: 1992-3 Respondent Telephone Interview, Questions RN016REC
150
Appendices
Wisconsin Longitudinal Study handbook 2006
(RE001RE, 438s, 439), RN025REC (RE001RE, 490, 490b)
RN016REC: “I tend to be influenced by people with strong
opinions.”
RN025REC: “I judge myself by what I think is important, not
by what others think is important.”
Coding: 01 agree strongly; 02 agree moderately; 03 agree slightly; 04
neither agree nor disagree; 05 disagree slightly; 06 disagree
moderately; 07 disagree strongly; 97 don’t know; 98 inappropriate
(RN001RE = 0); 99 refused/not ascertained
Scaling: RN002RED was constructed by summing the values for both
items. RN025REC was reverse coded in the creation of this variable.
Notes: RN016REC is a constructed variable based on questions
RE001RE, 438s and 439. RN025REC is a constructed variable based
on questions RE001RE, 490 and 490b.
Reliability: TK
RN003RED: number of autonomy items answered
= 0 if no autonomy items answered
= 1 if one autonomy item answered
= 2 if two autonomy items answered
= 8 if inappropriate (RN001RE = 0)
2. Environmental Mastery
RN004RED: continuous variable based on 2 items
Items: 1992-3 Respondent Telephone Interview, Questions RN017REC
(RE001RE, 440, 440b), RN021REC (RE001RE, 442m, 442p)
RN017REC. “In general, I feel I am in charge of the situation
in which I live.”
RN021REC. “The demands of everyday life often get me
down.”
Coding: 01 agree strongly; 02 agree moderately; 03 agree slightly; 04
neither agree nor disagree; 05 disagree slightly; 06 disagree
moderately; 07 disagree strongly; 97 don’t know; 98 inappropriate
(RN001RE = 0); 99 refused/not ascertained
151
Appendices
Wisconsin Longitudinal Study handbook 2006
Scaling: RN004RED was constructed by summing the values for both
items. RN017REC was reverse coded in the creation of this variable.
Notes: RN017REC is a constructed variable based on questions
RE001RE, 440 and 440b. RN021REC is a constructed variable based
on questions RE001RE, 442m and 442p.
Reliability: TK
RN005RED: number of environmental mastery items answered
= 0 if no environmental mastery items answered
= 1 if one environmental mastery item answered
= 2 if two environmental mastery items answered
= 8 if inappropriate (RN001RE = 0)
3. Personal Growth
RN006RED: continuous variable based on 2 items
Items: 1992-3 Respondent Telephone Interview, Questions RN022REC
(RE001RE, 442s, 443), RN026REC (RE001RE, 490m, 490p)
RN022REC. “For me, life has been a continuous process of
learning, changing, and growing.”
RN026REC. “I gave up trying to make big improvements or
changes in my life a long time ago.”
Coding: 01 agree strongly; 02 agree moderately; 03 agree slightly; 04
neither agree nor disagree; 05 disagree slightly; 06 disagree
moderately; 07 disagree strongly; 97 don’t know; 98
inappropriate (RN001RE = 0); 99 refused/not ascertained
Scaling: RN006RED was constructed by summing the values for both
items. RN026REC was reverse coded in the creation of this variable.
Notes: RN022REC is a constructed variable based on questions
RE001RE, 442s and 443. RN026REC is a constructed variable based
on questions RE001RE, 490m and 490p.
Reliability: TK
RN007RED: number of personal growth items answered
152
Appendices
Wisconsin Longitudinal Study handbook 2006
= 0 if no personal growth items answered
= 1 if one personal growth item answered
= 2 if two personal growth items answered
= 8 if inappropriate (RN001RE = 0)
4. Positive Relations with Others
RN008RED: continuous variable based on 2 items
Items: 1992-3 Respondent Telephone Interview, Questions RN018REC
(RE001RE, 440m, 440p), RN023REC (RE001RE, 488g, 488j)
RN018REC. “Maintaining close relationships has been difficult
and frustrating for me.”
RN023REC. “I have not experienced many warm and trusting
relationships with others.”
Coding: 01 agree strongly; 02 agree moderately; 03 agree slightly; 04
neither agree nor disagree; 05 disagree slightly; 06 disagree
moderately; 07 disagree strongly; 97 don’t know; 98 inappropriate
(RN001RE = 0); 99 refused/not ascertained
Scaling: RN008RED was constructed by summing the values for both
items.
Notes: RN018REC is a constructed variable based on questions
RE001RE, 440m and 440p. RN023REC is a constructed variable
based on questions RE001RE, 488g and 488j.
Reliability: TK
RN009RED: number of positive relations with others items answered
= 0 is no positive relations items answered
= 1 if one positive relations item answered
= 2 if two positive relations items answered
= 8 if inappropriate (RN001RE = 0)
5. Purpose in Life
RN010RED: continuous variable based on 2 items
Items: 1992-3 Respondent Telephone Interview, Questions RN019REC
(RE001RE, 440s, 441), RN024REC (RE001RE, 488m, 488p)
153
Appendices
Wisconsin Longitudinal Study handbook 2006
RN019REC. “Some people wander aimlessly through life but I am not
one of them.”
RN024REC. “I live life one day at a time and don’t really think about
the future.”
Coding: 01 agree strongly; 02 agree moderately; 03 agree slightly; 04
neither agree nor disagree; 05 disagree slightly; 06 disagree
moderately; 07 disagree strongly; 97 don’t know; 98 inappropriate
(RN001RE = 0); 99 refused/not ascertained
Scaling: RN010RED was constructed by summing the variables for
both items. RN019REC was reverse coded in the creation of this
variable.
Notes: RN019REC is a constructed variable based on questions
RE001RE, 440s and 441. RN024REC is a constructed variable based
on questions RE001RE, 488m and 488p.
Reliability: TK
RN011RED: number of purpose in life items answered
= 0 if no purpose in life items answered
= 1 if one purpose in life item answered
= 2 if two purpose in life items answered
= 8 if inappropriate (RN001RE = 0)
6. Self-Acceptance
RN012RED: continuous variable based on 2 items
Items: 1992-3 Respondent Telephone Interview, Questions RN020REC
(RN001RE, 442, 442b), RN027REC (RN001RE, 492f, 492j)
RN020REC. “When I look at the story of my life, I am pleased
with how things have turned out.”
RN027REC. “I like most aspects of my personality.”
Coding: 01 agree strongly; 02 agree moderately; 03 agree slightly; 04
neither agree nor disagree; 05 disagree slightly; 06 disagree
moderately; 07 disagree strongly; 97 don’t know; 98 inappropriate
(RN001RE = 0); 99 refused/not ascertained
154
Appendices
Wisconsin Longitudinal Study handbook 2006
Scaling: RN012RED was constructed by summing the values for both
items. Both items were reverse coded in the creation of this variable.
Notes: RN020REC is a constructed variable based on questions
RE001RE, 442 and 442b. RN027REC is a constructed variable based
on questions RE001RE, 492f and 492j.
Reliability: TK
RN013RED: number of self-acceptance items answered
= 0 if no self-acceptance items answered
= 1 if one self-acceptance item answered
= 2 if two self-acceptance items answered
= 8 if inappropriate (RN001RE = 0)
7. Total Score for Psychological Well-Being
RN014RED: continuous variable based on 12 items
Items: 1992-3 Respondent Telephone Interview, Questions RN016REC
(RE001RE, 438s, 439), RN017REC (RE001RE, 440, 440b),
RN018REC (RE001RE, 440m, 440p), RN019REC (RE001RE, 440s,
441), RN020REC (RE001RE, 442, 442b), RN021REC (RE001RE,
442m, 442p), RN022REC (RE001RE, 442s, 443), RN023REC
(RE001RE, 488g, 488j), RN024REC (RE001RE, 488m, 488p),
RN025REC (RE001RE, 490, 490b), RN026REC (RE001RE, 490m,
490p), RN027REC (RE001RE, 492f, 492j)
RN016REC. “I tend to be influenced by people with strong
opinions.”
RN017REC. “In general, I feel I am in charge of the situation
in which I live.
RN018REC. “Maintaining close relationships has been difficult
and frustrating for me.”
RN019REC. “Some people wander aimlessly through life but I
am not one of them.”
RN020REC. “When I look at the story of my life, I am pleased
with how things have turned out.”
RN021REC. “The demands of everyday life often get me
down.”
RN022REC. “For me, life has been a continuous process of
learning, changing, and growing.”
RN023REC. “I have not experienced many warm and trusting
155
Appendices
Wisconsin Longitudinal Study handbook 2006
relationships with others.”
RN204REC. “I live life one day at a time and don’t really think
about the future.”
RN025REC. “I judge myself by what I think is important, not
by what others think is important.”
RN026REC. “I gave up trying to make big improvements or
changes in my life a long time ago.”
RN027REC. “I like most aspects of my personality.”
Coding: 01 agree strongly; 02 agree moderately; 03 agree slightly; 04
neither agree nor disagree; 05 disagree slightly; 06 disagree
moderately; 07 disagree strongly; 97 don’t know; 98 inappropriate
(RN001RE = 0); 99 refused/not ascertained
Scaling: RN014RED was constructed by summing the values for each
of the twelve items. RN017REC, RN019REC, RN020REC,
RN022REC, RN025REC and RN027REC were reverse coded in the
creation of this variable.
Reliability: TK
Notes: RN016REC is a constructed variable based on questions
RE001RE, 438s and 439. RN017REC is a constructed variable based
on questions RE001RE, 440 and 440b. RN018REC is a constructed
variable based on questions RE001RE, 440m and 440p. RN019REC
is a constructed variable based on questions RE001RE, 440s and 441.
RN020REC is a constructed variable based on questions RE001RE,
442 and 442b. RN021REC is a constructed variable based on
questions RE001RE, 442m and 442p. RN022REC is a constructed
variable based on questions RE001RE, 442s and 443. RN023REC is a
constructed variable based on questions RE001RE, 488j and 488g.
RN024REC is a constructed variable based on questions RE001RE,
488m and 488p. RN025REC is a constructed variable based on
questions RE001RE, 490 and 490b. RN026REC is a constructed
variable based on questions RE001RE, 490m and 490p. RN027REC
is a constructed variable based on questions RE001RE, 492f and 492j.
RN015RED: total number of psychological well-being items answered
= 0 if no psychological well-being items answered
= 1-12 if one to twelve items answered
= 98 if inappropriate (RN001RE = 0)
156
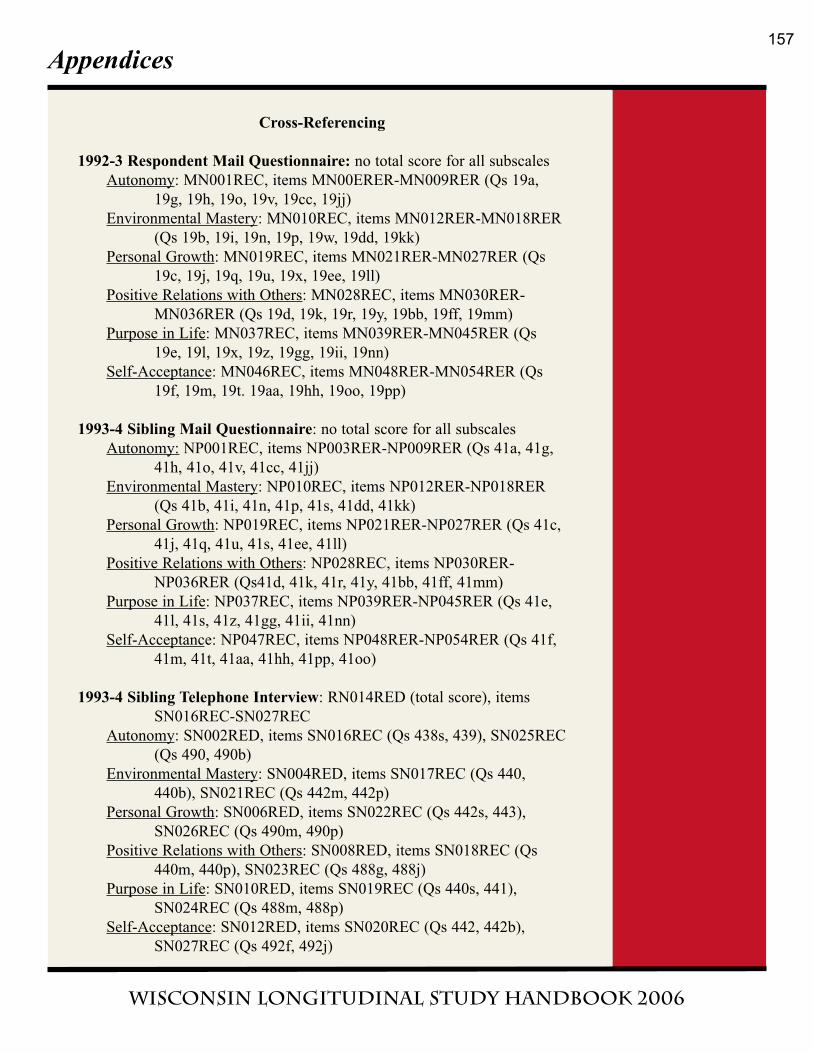
Appendices
Wisconsin Longitudinal Study handbook 2006
Cross-Referencing
1992-3 Respondent Mail Questionnaire: no total score for all subscales
Autonomy: MN001REC, items MN00ERER-MN009RER (Qs 19a,
19g, 19h, 19o, 19v, 19cc, 19jj)
Environmental Mastery: MN010REC, items MN012RER-MN018RER
(Qs 19b, 19i, 19n, 19p, 19w, 19dd, 19kk)
Personal Growth: MN019REC, items MN021RER-MN027RER (Qs
19c, 19j, 19q, 19u, 19x, 19ee, 19ll)
Positive Relations with Others: MN028REC, items MN030RER-
MN036RER (Qs 19d, 19k, 19r, 19y, 19bb, 19ff, 19mm)
Purpose in Life: MN037REC, items MN039RER-MN045RER (Qs
19e, 19l, 19x, 19z, 19gg, 19ii, 19nn)
Self-Acceptance: MN046REC, items MN048RER-MN054RER (Qs
19f, 19m, 19t. 19aa, 19hh, 19oo, 19pp)
1993-4 Sibling Mail Questionnaire: no total score for all subscales
Autonomy: NP001REC, items NP003RER-NP009RER (Qs 41a, 41g,
41h, 41o, 41v, 41cc, 41jj)
Environmental Mastery: NP010REC, items NP012RER-NP018RER
(Qs 41b, 41i, 41n, 41p, 41s, 41dd, 41kk)
Personal Growth: NP019REC, items NP021RER-NP027RER (Qs 41c,
41j, 41q, 41u, 41s, 41ee, 41ll)
Positive Relations with Others: NP028REC, items NP030RER-
NP036RER (Qs41d, 41k, 41r, 41y, 41bb, 41ff, 41mm)
Purpose in Life: NP037REC, items NP039RER-NP045RER (Qs 41e,
41l, 41s, 41z, 41gg, 41ii, 41nn)
Self-Acceptance: NP047REC, items NP048RER-NP054RER (Qs 41f,
41m, 41t, 41aa, 41hh, 41pp, 41oo)
1993-4 Sibling Telephone Interview: RN014RED (total score), items
SN016REC-SN027REC
Autonomy: SN002RED, items SN016REC (Qs 438s, 439), SN025REC
(Qs 490, 490b)
Environmental Mastery: SN004RED, items SN017REC (Qs 440,
440b), SN021REC (Qs 442m, 442p)
Personal Growth: SN006RED, items SN022REC (Qs 442s, 443),
SN026REC (Qs 490m, 490p)
Positive Relations with Others: SN008RED, items SN018REC (Qs
440m, 440p), SN023REC (Qs 488g, 488j)
Purpose in Life: SN010RED, items SN019REC (Qs 440s, 441),
SN024REC (Qs 488m, 488p)
Self-Acceptance: SN012RED, items SN020REC (Qs 442, 442b),
SN027REC (Qs 492f, 492j)
157
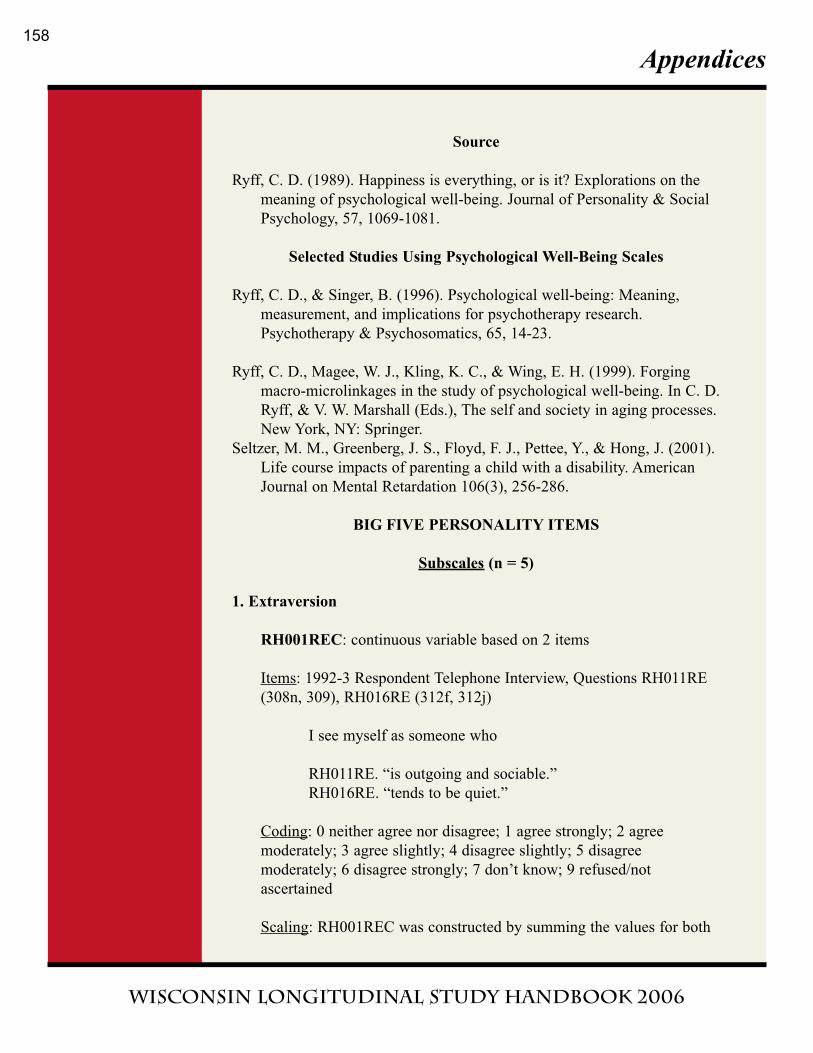
Appendices
Wisconsin Longitudinal Study handbook 2006
Source
Ryff, C. D. (1989). Happiness is everything, or is it? Explorations on the
meaning of psychological well-being. Journal of Personality & Social
Psychology, 57, 1069-1081.
Selected Studies Using Psychological Well-Being Scales
Ryff, C. D., & Singer, B. (1996). Psychological well-being: Meaning,
measurement, and implications for psychotherapy research.
Psychotherapy & Psychosomatics, 65, 14-23.
Ryff, C. D., Magee, W. J., Kling, K. C., & Wing, E. H. (1999). Forging
macro-microlinkages in the study of psychological well-being. In C. D.
Ryff, & V. W. Marshall (Eds.), The self and society in aging processes.
New York, NY: Springer.
Seltzer, M. M., Greenberg, J. S., Floyd, F. J., Pettee, Y., & Hong, J. (2001).
Life course impacts of parenting a child with a disability. American
Journal on Mental Retardation 106(3), 256-286.
BIG FIVE PERSONALITY ITEMS
Subscales (n = 5)
1. Extraversion
RH001REC: continuous variable based on 2 items
Items: 1992-3 Respondent Telephone Interview, Questions RH011RE
(308n, 309), RH016RE (312f, 312j)
I see myself as someone who
RH011RE. “is outgoing and sociable.”
RH016RE. “tends to be quiet.”
Coding: 0 neither agree nor disagree; 1 agree strongly; 2 agree
moderately; 3 agree slightly; 4 disagree slightly; 5 disagree
moderately; 6 disagree strongly; 7 don’t know; 9 refused/not
ascertained
Scaling: RH001REC was constructed by summing the values for both
158
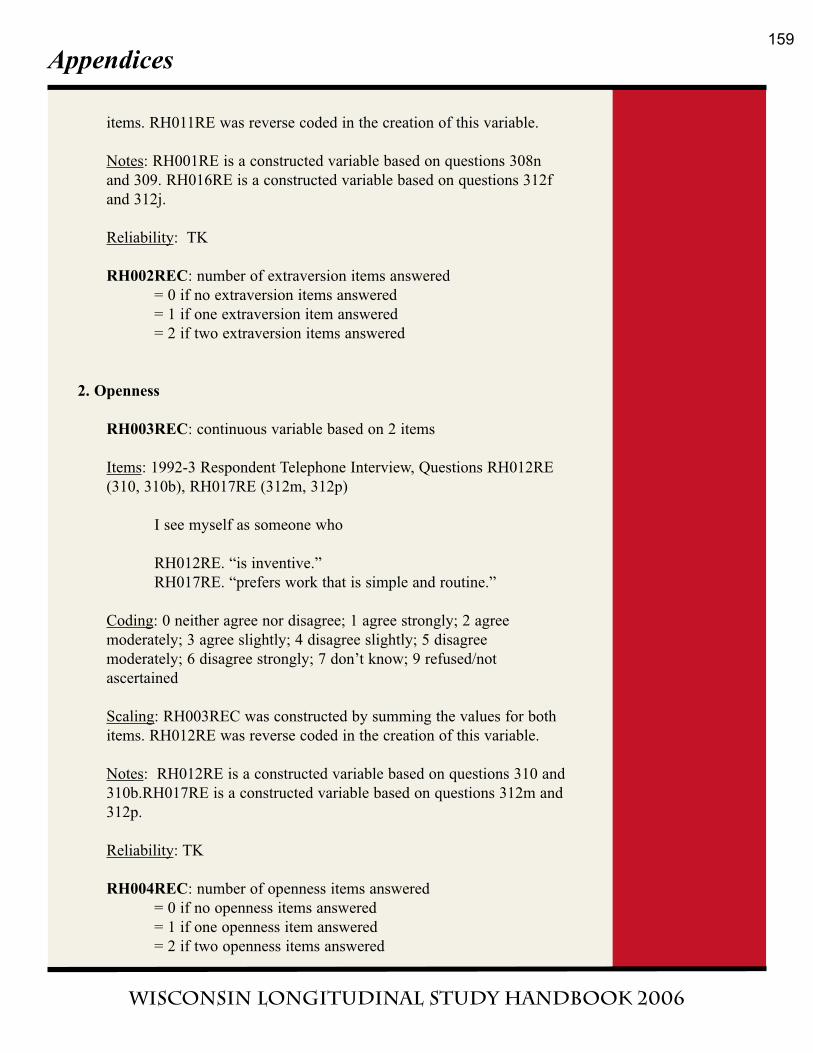
Appendices
Wisconsin Longitudinal Study handbook 2006
items. RH011RE was reverse coded in the creation of this variable.
Notes: RH001RE is a constructed variable based on questions 308n
and 309. RH016RE is a constructed variable based on questions 312f
and 312j.
Reliability: TK
RH002REC: number of extraversion items answered
= 0 if no extraversion items answered
= 1 if one extraversion item answered
= 2 if two extraversion items answered
2. Openness
RH003REC: continuous variable based on 2 items
Items: 1992-3 Respondent Telephone Interview, Questions RH012RE
(310, 310b), RH017RE (312m, 312p)
I see myself as someone who
RH012RE. “is inventive.”
RH017RE. “prefers work that is simple and routine.”
Coding: 0 neither agree nor disagree; 1 agree strongly; 2 agree
moderately; 3 agree slightly; 4 disagree slightly; 5 disagree
moderately; 6 disagree strongly; 7 don’t know; 9 refused/not
ascertained
Scaling: RH003REC was constructed by summing the values for both
items. RH012RE was reverse coded in the creation of this variable.
Notes: RH012RE is a constructed variable based on questions 310 and
310b.RH017RE is a constructed variable based on questions 312m and
312p.
Reliability: TK
RH004REC: number of openness items answered
= 0 if no openness items answered
= 1 if one openness item answered
= 2 if two openness items answered
159
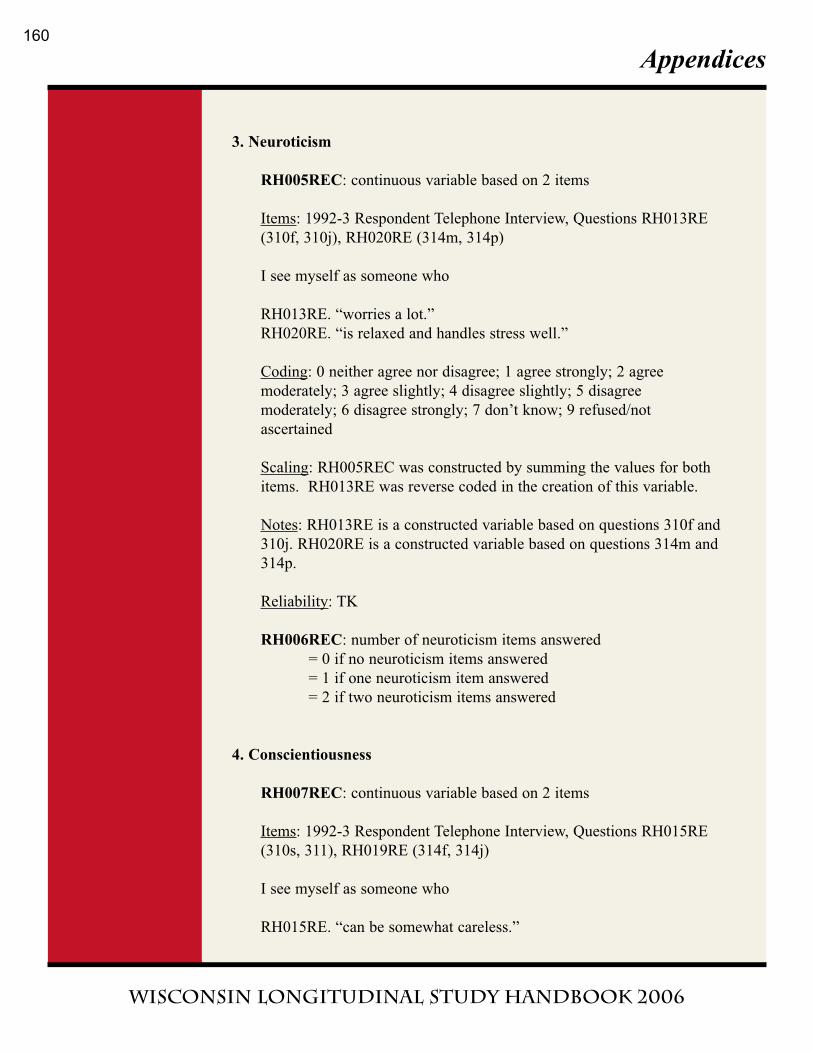
Appendices
Wisconsin Longitudinal Study handbook 2006
3. Neuroticism
RH005REC: continuous variable based on 2 items
Items: 1992-3 Respondent Telephone Interview, Questions RH013RE
(310f, 310j), RH020RE (314m, 314p)
I see myself as someone who
RH013RE. “worries a lot.”
RH020RE. “is relaxed and handles stress well.”
Coding: 0 neither agree nor disagree; 1 agree strongly; 2 agree
moderately; 3 agree slightly; 4 disagree slightly; 5 disagree
moderately; 6 disagree strongly; 7 don’t know; 9 refused/not
ascertained
Scaling: RH005REC was constructed by summing the values for both
items. RH013RE was reverse coded in the creation of this variable.
Notes: RH013RE is a constructed variable based on questions 310f and
310j. RH020RE is a constructed variable based on questions 314m and
314p.
Reliability: TK
RH006REC: number of neuroticism items answered
= 0 if no neuroticism items answered
= 1 if one neuroticism item answered
= 2 if two neuroticism items answered
4. Conscientiousness
RH007REC: continuous variable based on 2 items
Items: 1992-3 Respondent Telephone Interview, Questions RH015RE
(310s, 311), RH019RE (314f, 314j)
I see myself as someone who
RH015RE. “can be somewhat careless.”
160
Appendices
Wisconsin Longitudinal Study handbook 2006
RH019RE. “is easily distracted.”
Coding: 0 neither agree nor disagree; 1 agree strongly; 2 agree
moderately; 3 agree slightly; 4 disagree slightly; 5 disagree
moderately; 6 disagree strongly; 7 don’t know; 9 refused/not
ascertained
Scaling: RH007REC was constructed by summing the values for both
items.
Notes: RH015RE is a constructed variable based on questions 310s
and 311.RH019RE is a constructed variable based on questions 314f
and 314j.
Reliability: TK
RH008REC: number of conscientiousness items answered
= 0 if no conscientiousness items answered
= 1 if one conscientiousness item answered
= 2 if two conscientiousness items answered
5. Agreeableness
RH009REC: continuous variable based on 2 items
Items: 1992-3 Respondent Telephone Interview, Questions RH014RE
(310m, 310p), RH018RE (314, 314b)
I see myself as someone who
RH014RE. “has a forgiving nature.”
RH018RE. “tends to find fault with others.”
Coding: 0 neither agree nor disagree; 1 agree strongly; 2 agree
moderately; 3 agree slightly; 4 disagree slightly; 5 disagree
moderately; 6 disagree strongly; 7 don’t know; 9 refused/not
ascertained
Scaling: RH009REC was constructed by summing the values for both
items. RH014RE was reverse coded in the creation of this variable.
Notes: RH014RE is a constructed variable based on questions 310m
and 310p. RH018RE is a constructed variable based on questions 314
and 314b.
161
Appendices
Wisconsin Longitudinal Study handbook 2006
Reliability: TK
RH010REC: number of agreeableness items answered
= 0 if no agreeableness items answered
= 1 if one agreeableness item answered
= 2 if two agreeableness items answered
Cross-Referencing
1992-3 Respondent Mail Questionnaire:
Extraversion: MH001REC, items MH003RER-MH008RER (Qs 17a,
17d, 17f, 17j, 17t, 17v)
Agreeableness: MH009REC, items MH011RER-MH016RER (Qs 17b,
17o, 17p,17w, 17y, 17bb)
Conscientiousness: MH017REC, items MH019RER-MH024RER (Qs
17c, 17h,17l, 17g, 17u, 17cc)
Neuroticism: MH025REC, items MH027RER-MH031RER (Qs 17i,
17m, 17r,17x, 17z)
Openness: MH032REC, items MH034RER-MH039RER (Qs 17e, 17g,
17k, 17n, 17s, 17aa)
1993-4 Sibling Mail Questionnaire:
Extraversion: NH011REC, items NH003RER-NH008RER (Qs 39a,
39d, 39f, 39j, 39t, 39v)
Agreeableness: NH009REC, items NH011RER-NH016RER (Qs 39b,
39o, 39p, 39w, 39y, 39bb)
Conscientiousness: NH017REC, items NH019RER-NH024RER (Qs
39c, 39h, 39l, 39q, 39u, 39cc)
Neuroticism: NH025REC, items NH027RER-NH031RER (Qs 39i,
39m, 39r, 39x, 39z)
Openness: NH032REC, items NH034RER-NH039RER (Qs 39e, 39g,
39k, 39n, 39s, 39aa)
1993-4 Sibling Telephone Interview:
Extraversion: SH001REC, items SH011RE (Qs 308n, 309), SH016RE
(Qs 312f, 312j)
Agreeableness: SH009REC, items SH014RE (Qs 310m, 310p),
SH018RE (Qs 314, 314b)
Conscientiousness: SH007REC, items SH015RE (Qs 310s, 311),
SH019RE (Qs 314f, 314j)
Neuroticism: SH005REC, items SH013RE (Qs 310f, 310j), SH020RE
(Qs 314m, 314p)
162
Appendices
Wisconsin Longitudinal Study handbook 2006
Openness: SH003REC, items SH012RE (Qs 310, 310b), SH017RE
(Qs 312m, 312p)
Source
John, O. P., Donahue, E. M., & Kentle, R. L. (1991). The "Big Five"
inventory – version 4a and 5a. Berkely, CA: Institute of Personality
and Social Research, University of California, Berkeley.
Selected Studies Using Big Five Personality Items Scales
Hauser, R. M., Kuo, H. D., & Cartmill, R. (1997). Birth order and
personality: Are there any effects? Paper presented at the Meetings of
the Population Association of American, Washington, D.C.
Kuo, H. D. (1997). Socioeconomic status and personality in mid-life: An
application of the sibling resemblance model. Paper presented at the
Meetings of the American Sociological Association, Toronto, Canada.
DEPRESSION HISTORY
A 79% random sample was selected to be asked depression, depression
history and drinking problems/alcohol symptoms questions in the 1992-3
Respondent Telephone Interviews (RU001RE). If RU001RE = 0, the
respondent was not in this 79% sample; if RU001RE = 1, the respondent
was in the 79% sample. RU024RE includes only those respondents who
were selected to the 79% random sample.
The respondent was asked whether he/she had ever had a time in his/her
life lasting two weeks or more when nearly every day he/she felt depressed
(RU002RE). If RU002RE = 0, the respondent has never had an episode of
depression; if RU002RE = 1, the respondent has had at least one episode of
depression. RU024REC includes only those respondents for whom
RU002RE = 1.
The respondent was asked whether his/her experience with depression was
always caused by alcohol, drugs, medications or physical illness
(RU003RE). If RU003RE = 1, the respondent’s depression was always
caused by alcohol, drugs, medications or physical illness; if RU003RE = 2,
the respondent’s depression was sometimes caused by alcohol, drugs,
medications or physical illness; if RU003RE = 3, the respondent’s
depression was never caused by alcohol, drugs, medications or physical
illness. RU024REC includes only those respondents for whom RU003RE
163
Appendices
Wisconsin Longitudinal Study handbook 2006
= 2 or 3.
Depression Symptoms Count
RU024REC: continuous variable based on 7 items
Items: 1992-3 Respondent Telephone Interview, Questions RU006RE
(870a), RU007RE (870b), RU008RE (870c), RU009RE (870d),
RE010RE (870e), RU011RE (870f), RU012RE (870g)
RU006RE. “During this episode of depression, did the
respondent lose weight without trying to – as
much as 2 pounds a week for several week or as
much as 10 pounds altogether?”
RU007RE. “Did respondent have two weeks or more when
nearly every night (he/she) had trouble falling
asleep?”
RU008RE. “Did respondent have two weeks or more when
(he/she) lacked energy or felt tired all the time,
even when (he/she) had not been working very
hard?”
RU009RE. “Did respondent have two weeks or more when
(he/she) felt very bad when waking up, but felt
better later in the day?”
RU010RE. “Did respondent have two weeks or more when
(he/she) lost interest in most things like work,
hobbies, or things (he/she) usually liked to do
for fun?”
RU011RE. “Did respondent have two weeks or more when
nearly every day (he/she) had a lot more trouble
concentrating than normal?”
RU012RE. “Did respondent have two weeks or more when
(he/she) thought a lot about death – either
(his/her) own, someone else’s, or death in
general?”
Coding: 1 yes; 2 no; 7 don’t know; 8 inappropriate (RU001RE = 0 or
RU002RE = 1 or RU003RE = 1); 9 refused/not ascertained
Reliability: TK (INAP?)
Scaling: RU024REC was constructed by summing the “yes” responses
for the 7 items.
164
Appendices
Wisconsin Longitudinal Study handbook 2006
Cross-Referencing
1992-3 Respondent Mail Questionnaire: These questions were not asked.
1993-4 Sibling Mail Questionnaire: These questions were not asked.
1993-4 Sibling Telephone Interview: SU024REC, items SU006RE-
SU012RE (Qs870a-870g)
Source
TK
Selected Studies Using Depression History Scale
Carr, D. (1997). The fulfillment of career dreams at midlife: Does it matter
for women’s mental health? Journal of Health & Social Behaviour,
38(4), 331-344.
Singer, B. H., Ryff, C. D., Carr, D., & Magee, W. (1998). Linking life
histories and mental health: A person-centered strategy. Sociological
Methodology, 28, 1-51.
ALCOHOL SYMPTOMS
A 79% random sample was selected to be asked depression, depression
history and drinking problems/alcohol symptoms questions in the 1992-3
Respondent Telephone Interviews (RU001RE). If RU001RE = 0, the
respondent was not in this 79% sample; if RU001RE = 1, the respondent
was in the 79% sample. RU024RE includes only those respondents who
were selected to the 79% random sample.
Respondent was asked whether he/she has ever drunk alcoholic beverages
such as beer, wine, liquor or mixed alcoholic drinks. If RU025RE = 1, the
respondent answered “yes,” he/she has drunk alcoholic beverages; if
RU025RE = 2, the respondent answered “no,” he/she has never drunk
alcoholic beverages. RU034REC includes only those respondents for
whom RU025RE = 1.
Alcohol Symptoms Count
RU034REC: continuous variable based on 5 items
165
Appendices
Wisconsin Longitudinal Study handbook 2006
Items: 1992-3 Respondent Telephone Interview, Questions RU030RE
(876), RU031RE (876f), RU032RE (876m), RU033RE (876s),
RU035RE (878)
RU030RE. “Has respondent ever felt bad or guilty about
drinking?”
RU031RE. “Have people ever annoyed respondent by
criticizing respondent’s drinking?”
RU032RE. “Has respondent’s drinking ever caused a problem
at work?”
RU033RE. “Has respondent’s drinking ever created problems
between respondent and spouse, children,
parents, or other near relatives?”
RU035RE. “Has respondent ever gone to anyone for help about
drinking?”
Coding: 1 yes; 2 no; 7 don’t know; 8 inappropriate (RU001RE = 0,
RU025RE = 2); 9 refused/not ascertained
Scaling: RU034REC was constructed by summing the “yes” responses
for the five items.
Reliability: TK
Notes: RU034REC is a constructed variable based on questions 876,
876f, 876m, 876s, 878 and 878a.
Cross-Referencing
1992-3 Respondent Mail Questionnaire: These questions were not asked.
1993-4 Sibling Mail Questionnaire: These questions were not asked.
1993-4 Sibling Telephone Interview: SU034REC, items SU030RE-
SU033RE, SU035RE (Qs 876, 876f, 876m, 876s, 878)
Source
Seltzer M. L. (1971). The Michigan Alcoholism Screening Test: The quest
for a new diagnostic instrument. American Journal of Psychiatry,
127(12), 1653-1658.
166
Appendices
Wisconsin Longitudinal Study handbook 2006
Selected Studies Using Alcohol Symptoms Scale
Krahn, D., Freese, J., Hauser, R. M., Barry, K., & Goodman, B. (2003).
Alcohol use and cognition at mid-life: The importance of adjusting for
baseline cognitive ability and educational attainment. Alcoholism:
Clinical & Experimental Research, 27(7), 1162-66.
Seltzer, M. M., Greenberg, J. S., Floyd, F. J., Pettee, Y., & Hong, J. (2001).
Life course impacts of parenting a child with a disability. American
Journal on Mental Retardation, 106(3), 265-286.
COGNITION VARIABLES
Sum of Scores for Cognition Questions
RI001RE: continuous variable based on 8 items
Items: 1992-3 Respondent Telephone Interview, Questions RI002RE
(314t),RI003RE (316), RI004RE (316f), RI005RE (316m), RI006RE
(316s), RI007RE (318), RI008RE (318f), RI009RE (318m)
In what way are
RI002RE. “an orange and a banana alike?”
RI003RE. “a table and a chair alike?”
RI004RE. “an eye and an ear alike?”
RI005RE. “an egg and a seed alike?”
RI006RE. “air and water alike?”
RI007RE. “work and play alike?”
RI008RE. “a fly and a tree alike?”
RI009RE. “praise and punishment alike?”
Coding: A score of 0 (low), 1 or 2 (high) was assigned to each
response by a computer program. See COR548 and COR572 for
detailed information about the scoring of cognition items. Some
interviews did not include the cognition questions. If a question was
not asked, the code is 9. If at least one individual score is 9, then
RI001RE is 99.
Scaling: RI001RE way constructed by summing the values for each of
the eight items.
Reliability: TK
167
Appendices
Wisconsin Longitudinal Study handbook 2006
Note: Items RI002RE-RI009RE are 8 of the 14 items from the
Wechsler Adult Intelligence Scale (WAIS).
Cross-Referencing
1992-3 Respondent Mail Questionnaire: These questions were not asked.
1993-4 Sibling Mail Questionnaire: These questions were not asked.
1993-4 Sibling Telephone Interview: SI001RE, items SI002RE-SI011RE
(Qs 314t, 315, 316f, 315e, 316m, 316, 315g, 318, 318f, 318m)
Source
Wechsler, D. (1981). Wechsler Adult Intelligence Scale – Revised manual.
San Antonio, TX: The Psychological Corporation.
Selected Studies Using Cognition Items Scale
Hauser, R. M., Sheridan, J. T., & Warren, J. R. (1999). Socioeconomic
achievements of siblings in the life course: New findings from the
WLS. Research on Aging, 21(2), 338-378.
Krahn, D., Freese, J., Hauser, R. M., Barry, K., & Goodman, B. (2003).
Alcohol use and cognition at mid-life: The importance of adjusting for
baseline cognitive ability and educational attainment. Alcoholism:
Clinical & Experimental Research, 27(7), 1162-66.
1993-4 Sibling Mail Questionnaire
PSYCHOLOGICAL WELL-BEING
Subscales (n = 6)
1. Autonomy
NP001REC: continuous variable based on 7 items
Items: 1993-4 Sibling Mail Questionnaire, Questions NP003RER
(41a), NP004RER (41g), NP005RER (41h), NP006RER (41o),
NP007RER (41v), NP008RER (41cc), NP009RER (41jj)
NP003RER. “My decisions are not usually influenced by what
everyone else is doing.”
168
Appendices
Wisconsin Longitudinal Study handbook 2006
NP004RER. “I have confidence in my opinions even if they are
contrary to the general consensus.”
NP005RER. “I tend to worry about what other people think of
me.”
NP006RER. “I often change my mind about decisions if friends
or family disagree.”
NP007RER. “I am not afraid to voice my opinions, even when
they are in opposition to the opinions of most
people.”
NP008RER. “Being happy with myself is more important to
me than having others approve of me.”
NP009RER. “It’s difficult for me to voice my opinions on
controversial matters.”
Coding: 1 agree strongly; 2 agree moderately; 3 agree slightly; 4
disagree slightly; 5 disagree moderately; 6 disagree strongly; 9 not
ascertained/refused
Scaling: NP001REC was constructed by summing the values of the
seven items. NP003RER, NP004RER, NP007RER and NP008RER
were reverse coded in the creation of this variable.
Reliability: TK
NP002RE: number of autonomy items answered
= 0 if no autonomy items answered
= 1-7 if one to seven autonomy items answered
2. Environmental Mastery
NP010REC: continuous variable based on 7 items
Items: 1993-4 Sibling Mail Questionnaire, Questions NP012RER
(41b), NP013RER (41i), NP014RER (41n), NP015RER (41p),
NP016RER (41w), NP017RER (41dd), NP018RER (41kk)
NP012RER. “I am good at juggling my time so that I can fit
everything in that needs to get done.”
NP013RER. “I often feel overwhelmed by my responsibilities.”
NP014RER “I am quite good at managing the many
responsibilities of my daily life.”
NP015RER. “I do not fit very well with the people and
community around me.”
NP016RER. “I have difficulty arranging my life in a way that
169
Appendices
Wisconsin Longitudinal Study handbook 2006
is satisfying to me.”
NP017RER. “I have been able to create a lifestyle for myself
that is much to my liking.”
NP018RER. “I generally do a good job of taking care of my
personal finances and affairs.”
Coding: 1 agree strongly; 2 agree moderately; 3 agree slightly; 4
disagree slightly; 5 disagree moderately; 6 disagree strongly; 9 not
ascertained/refused
Scaling: NP010REC was constructed by summing the values of the
seven items. NP012RER, NP014RER, NP017RER and NP018RER
were reverse coded in the creation of this variable.
Reliability: TK
NP011RE: number of environmental mastery items answered
= 0 if no environmental mastery items answered
= 1-7 if one to seven items answered
3. Personal Growth
NP019REC: continuous variable based on 7 items
Items: 1993-4 Sibling Mail Questionnaire, Questions NP021RER
(41c), NP022RER (41j), NP023RER (41q), NP024RER (41u),
NP025RER (41x), NP026RER (41ee), NP027RER (41ll)
NP021RER. “I am not interested in activities that will expand
my horizons.”
NP022RER. “I have the sense that I have developed a lot as a
person over time.”
NP023RER. “When I think about it, I haven’t really improved
much as a person over the years.”
NP024RER. “I think it is important to have new experiences
that challenge how I think about myself and the
world.”
NP025RER. “I don’t want to try new ways of doing things –
my life is fine the way it is.”
NP026RER. “I do not enjoy being in new situations that
require me to change my old familiar ways of
doing things.”
NP027RER. “There is truth to the saying you can’t teach an old
170
Appendices
Wisconsin Longitudinal Study handbook 2006
dog new tricks.”
Coding: 1 agree strongly; 2 agree moderately; 3 agree slightly; 4
disagree slightly; 5 disagree moderately; 6 disagree strongly; 9 not
ascertained/refused
Scaling: NP019REC was constructed by summing the values of the
seven items. NP022RER and NP024RER were reverse coded in the
creation of this variable.
Reliability: TK
NP020RE: number of personal growth items answered
= 0 if no personal growth items answered
= 1-7 if one to seven items answered
4. Positive Relations with Others
NP028REC: continuous variable based on 7 items
Items: 1993-4 Sibling Mail Questionnaire, Questions NP030RER
(41d), NP031RER (41k), NP032RER (41r), NP033RER (41y),
NP034RER (41bb), NP035RER (41ff), NP036RER (41mm)
NP030RER. “I don’t have many people who want to listen
when I need to talk.”
NP031RER. “I enjoy personal and mutual conversations with
family members and friends.”
NP032RER. “I often feel lonely because I have few close
friends with whom to share my concerns.”
NP033RER. “It seems to me that most people have more
friends than I do.”
NP034RER. “People would describe me as a giving person,
willing to share my time with others.”
NP035RER. “Most people see me as loving and affectionate.”
NP036RER. “I know I can trust my friends and they know they
can trust me.”
Coding: 1 agree strongly; 2 agree moderately; 3 agree slightly; 4
disagree slightly; 5 disagree moderately; 6 disagree strongly; 9 not
ascertained/refused
Scaling: NP028REC was constructed by summing the values of the
seven items. NP031RER, NP034RER, NP035RER and NP036RER
171
Appendices
Wisconsin Longitudinal Study handbook 2006
were reverse coded in the creation of this variable.
Reliability: TK
NP029RE: number of positive relations to others items answered
= 0 if no positive relations to others items answered
= 1-7 if one to seven items answered
5. Purpose in Life
NP037REC: continuous variable based on 7 items
Items: 1993-4 Sibling Mail Questionnaire, Questions NP039RER
(41e), NP040RER (41l), NP041RER (41s), NP042RER (41z),
NP043RER (41gg), NP044RER (41ii), NP045RER (41nn)
NP039RER. “I enjoy making plans for the future and working
to make them a reality.”
NP040RER. “My daily activities often seem trivial and
unimportant to me.”
NP041RER. “I am an active person in carrying out the plans I
set for myself.”
NP042RER. “I tend to focus on the present because the future
nearly always brings me problems.”
NP043RER. “I don’t have a good sense of what I’m trying to
accomplish in life.”
NP044RER “I sometimes feel as if I’ve done all there is to do
in life.”
NP045RER. “I used to set goals for myself, but that now seems
like a waste of time.”
Coding: 1 agree strongly; 2 agree moderately; 3 agree slightly; 4
disagree slightly; 5 disagree moderately; 6 disagree strongly; 9 not
ascertained/refused
Scaling: NP037REC was constructed by summing the values of the
seven items. NP039RER and NP041RER were reverse coded in the
creation of this variable.
Reliability: TK
NP038RE: number of purpose in life items answered
= 0 if no purpose in life items answered
172
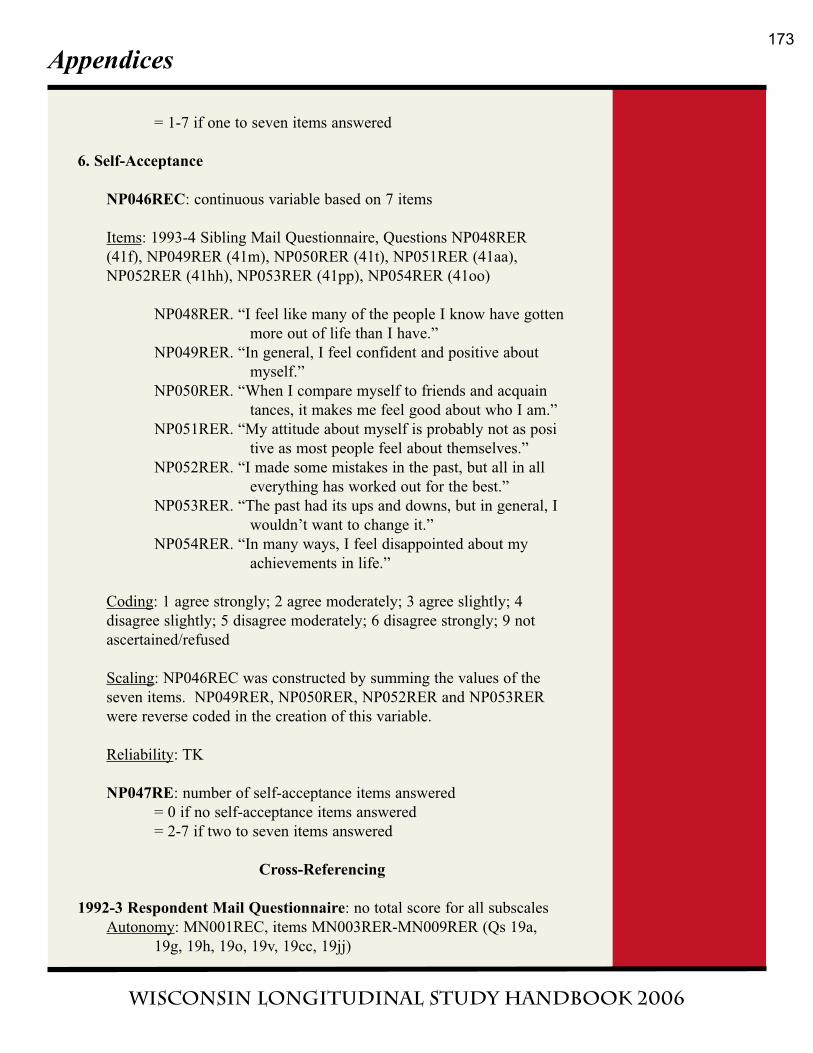
Appendices
Wisconsin Longitudinal Study handbook 2006
= 1-7 if one to seven items answered
6. Self-Acceptance
NP046REC: continuous variable based on 7 items
Items: 1993-4 Sibling Mail Questionnaire, Questions NP048RER
(41f), NP049RER (41m), NP050RER (41t), NP051RER (41aa),
NP052RER (41hh), NP053RER (41pp), NP054RER (41oo)
NP048RER. “I feel like many of the people I know have gotten
more out of life than I have.”
NP049RER. “In general, I feel confident and positive about
myself.”
NP050RER. “When I compare myself to friends and acquain
tances, it makes me feel good about who I am.”
NP051RER. “My attitude about myself is probably not as posi
tive as most people feel about themselves.”
NP052RER. “I made some mistakes in the past, but all in all
everything has worked out for the best.”
NP053RER. “The past had its ups and downs, but in general, I
wouldn’t want to change it.”
NP054RER. “In many ways, I feel disappointed about my
achievements in life.”
Coding: 1 agree strongly; 2 agree moderately; 3 agree slightly; 4
disagree slightly; 5 disagree moderately; 6 disagree strongly; 9 not
ascertained/refused
Scaling: NP046REC was constructed by summing the values of the
seven items. NP049RER, NP050RER, NP052RER and NP053RER
were reverse coded in the creation of this variable.
Reliability: TK
NP047RE: number of self-acceptance items answered
= 0 if no self-acceptance items answered
= 2-7 if two to seven items answered
Cross-Referencing
1992-3 Respondent Mail Questionnaire: no total score for all subscales
Autonomy: MN001REC, items MN003RER-MN009RER (Qs 19a,
19g, 19h, 19o, 19v, 19cc, 19jj)
173
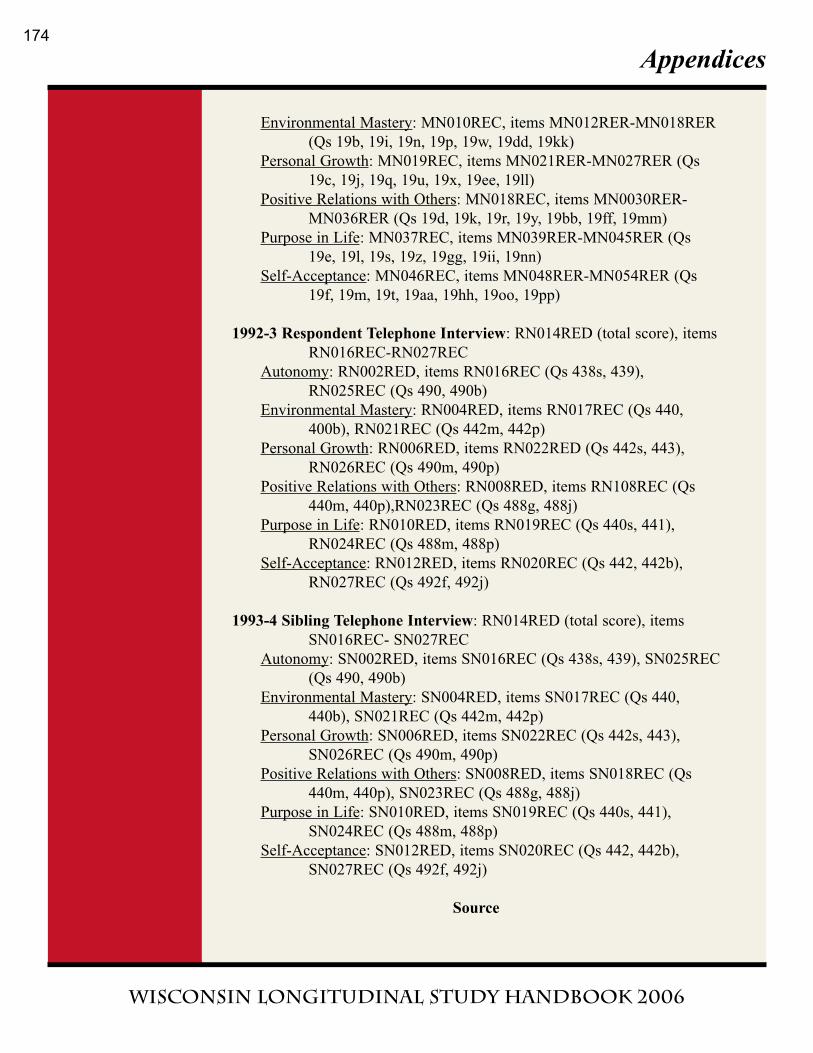
Appendices
Wisconsin Longitudinal Study handbook 2006
Environmental Mastery: MN010REC, items MN012RER-MN018RER
(Qs 19b, 19i, 19n, 19p, 19w, 19dd, 19kk)
Personal Growth: MN019REC, items MN021RER-MN027RER (Qs
19c, 19j, 19q, 19u, 19x, 19ee, 19ll)
Positive Relations with Others: MN018REC, items MN0030RER-
MN036RER (Qs 19d, 19k, 19r, 19y, 19bb, 19ff, 19mm)
Purpose in Life: MN037REC, items MN039RER-MN045RER (Qs
19e, 19l, 19s, 19z, 19gg, 19ii, 19nn)
Self-Acceptance: MN046REC, items MN048RER-MN054RER (Qs
19f, 19m, 19t, 19aa, 19hh, 19oo, 19pp)
1992-3 Respondent Telephone Interview: RN014RED (total score), items
RN016REC-RN027REC
Autonomy: RN002RED, items RN016REC (Qs 438s, 439),
RN025REC (Qs 490, 490b)
Environmental Mastery: RN004RED, items RN017REC (Qs 440,
400b), RN021REC (Qs 442m, 442p)
Personal Growth: RN006RED, items RN022RED (Qs 442s, 443),
RN026REC (Qs 490m, 490p)
Positive Relations with Others: RN008RED, items RN108REC (Qs
440m, 440p),RN023REC (Qs 488g, 488j)
Purpose in Life: RN010RED, items RN019REC (Qs 440s, 441),
RN024REC (Qs 488m, 488p)
Self-Acceptance: RN012RED, items RN020REC (Qs 442, 442b),
RN027REC (Qs 492f, 492j)
1993-4 Sibling Telephone Interview: RN014RED (total score), items
SN016REC- SN027REC
Autonomy: SN002RED, items SN016REC (Qs 438s, 439), SN025REC
(Qs 490, 490b)
Environmental Mastery: SN004RED, items SN017REC (Qs 440,
440b), SN021REC (Qs 442m, 442p)
Personal Growth: SN006RED, items SN022REC (Qs 442s, 443),
SN026REC (Qs 490m, 490p)
Positive Relations with Others: SN008RED, items SN018REC (Qs
440m, 440p), SN023REC (Qs 488g, 488j)
Purpose in Life: SN010RED, items SN019REC (Qs 440s, 441),
SN024REC (Qs 488m, 488p)
Self-Acceptance: SN012RED, items SN020REC (Qs 442, 442b),
SN027REC (Qs 492f, 492j)
Source
174
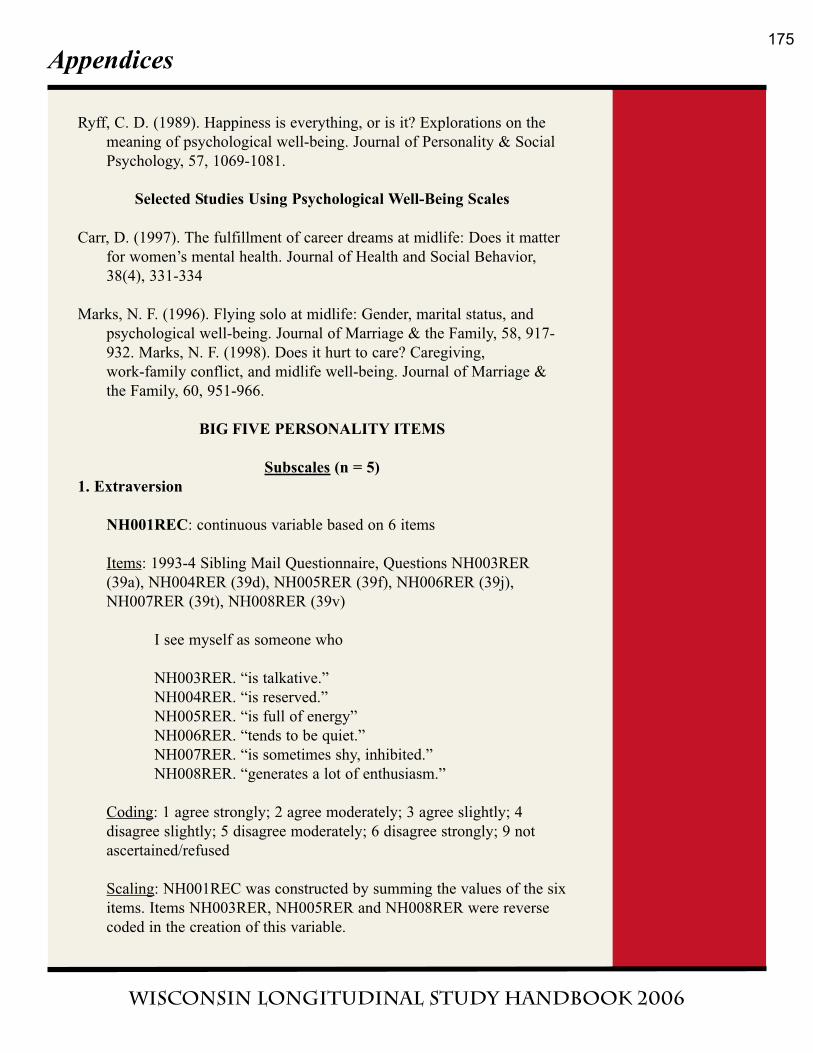
Appendices
Wisconsin Longitudinal Study handbook 2006
Ryff, C. D. (1989). Happiness is everything, or is it? Explorations on the
meaning of psychological well-being. Journal of Personality & Social
Psychology, 57, 1069-1081.
Selected Studies Using Psychological Well-Being Scales
Carr, D. (1997). The fulfillment of career dreams at midlife: Does it matter
for women’s mental health. Journal of Health and Social Behavior,
38(4), 331-334
Marks, N. F. (1996). Flying solo at midlife: Gender, marital status, and
psychological well-being. Journal of Marriage & the Family, 58, 917-
932. Marks, N. F. (1998). Does it hurt to care? Caregiving,
work-family conflict, and midlife well-being. Journal of Marriage &
the Family, 60, 951-966.
BIG FIVE PERSONALITY ITEMS
Subscales (n = 5)
1. Extraversion
NH001REC: continuous variable based on 6 items
Items: 1993-4 Sibling Mail Questionnaire, Questions NH003RER
(39a), NH004RER (39d), NH005RER (39f), NH006RER (39j),
NH007RER (39t), NH008RER (39v)
I see myself as someone who
NH003RER. “is talkative.”
NH004RER. “is reserved.”
NH005RER. “is full of energy”
NH006RER. “tends to be quiet.”
NH007RER. “is sometimes shy, inhibited.”
NH008RER. “generates a lot of enthusiasm.”
Coding: 1 agree strongly; 2 agree moderately; 3 agree slightly; 4
disagree slightly; 5 disagree moderately; 6 disagree strongly; 9 not
ascertained/refused
Scaling: NH001REC was constructed by summing the values of the six
items. Items NH003RER, NH005RER and NH008RER were reverse
coded in the creation of this variable.
175
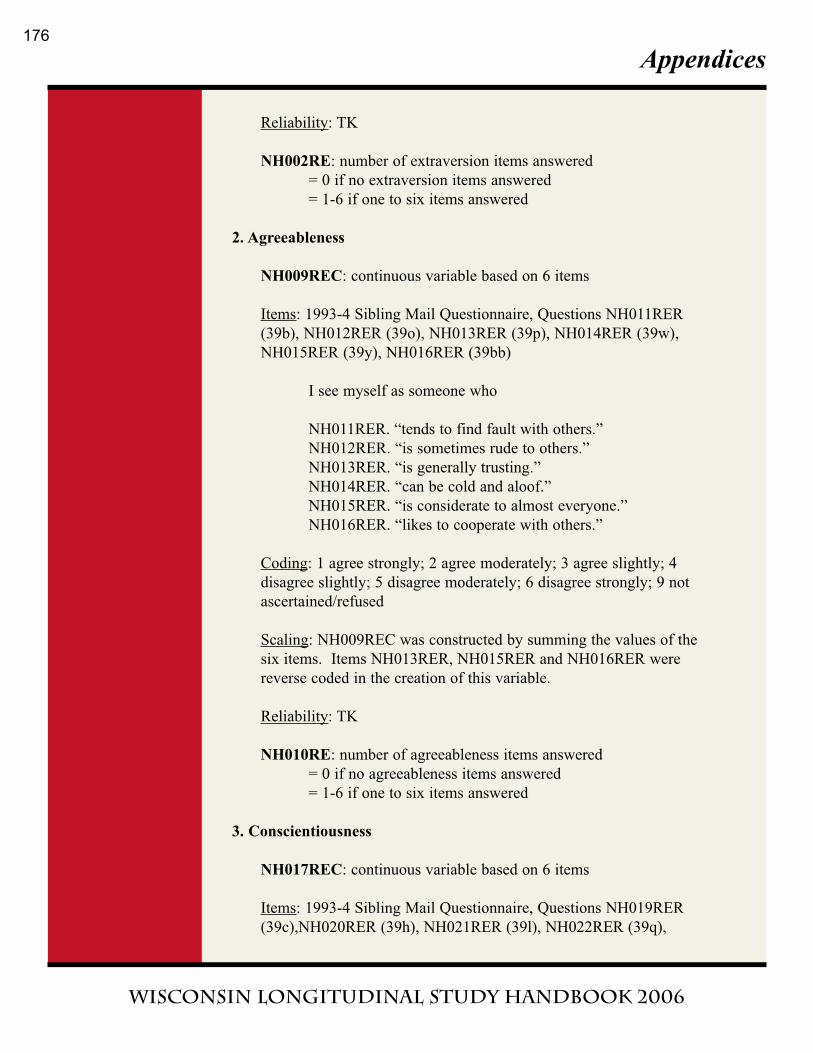
Appendices
Wisconsin Longitudinal Study handbook 2006
Reliability: TK
NH002RE: number of extraversion items answered
= 0 if no extraversion items answered
= 1-6 if one to six items answered
2. Agreeableness
NH009REC: continuous variable based on 6 items
Items: 1993-4 Sibling Mail Questionnaire, Questions NH011RER
(39b), NH012RER (39o), NH013RER (39p), NH014RER (39w),
NH015RER (39y), NH016RER (39bb)
I see myself as someone who
NH011RER. “tends to find fault with others.”
NH012RER. “is sometimes rude to others.”
NH013RER. “is generally trusting.”
NH014RER. “can be cold and aloof.”
NH015RER. “is considerate to almost everyone.”
NH016RER. “likes to cooperate with others.”
Coding: 1 agree strongly; 2 agree moderately; 3 agree slightly; 4
disagree slightly; 5 disagree moderately; 6 disagree strongly; 9 not
ascertained/refused
Scaling: NH009REC was constructed by summing the values of the
six items. Items NH013RER, NH015RER and NH016RER were
reverse coded in the creation of this variable.
Reliability: TK
NH010RE: number of agreeableness items answered
= 0 if no agreeableness items answered
= 1-6 if one to six items answered
3. Conscientiousness
NH017REC: continuous variable based on 6 items
Items: 1993-4 Sibling Mail Questionnaire, Questions NH019RER
(39c),NH020RER (39h), NH021RER (39l), NH022RER (39q),
176
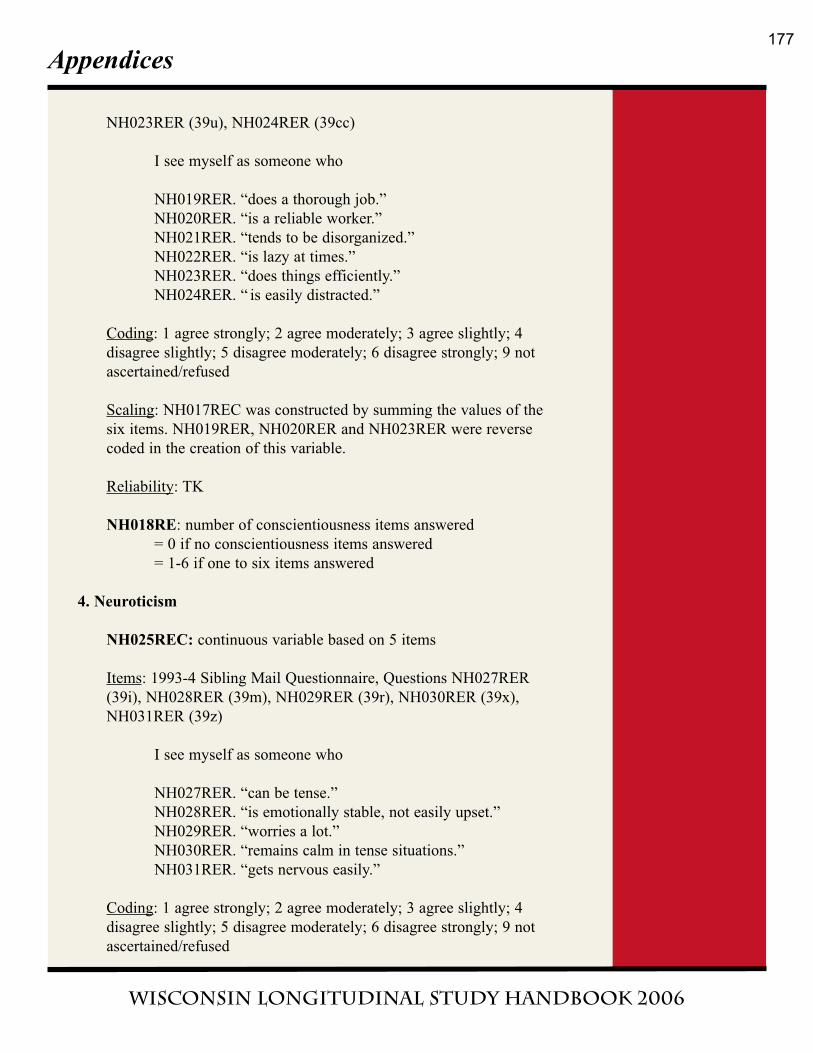
Appendices
Wisconsin Longitudinal Study handbook 2006
NH023RER (39u), NH024RER (39cc)
I see myself as someone who
NH019RER. “does a thorough job.”
NH020RER. “is a reliable worker.”
NH021RER. “tends to be disorganized.”
NH022RER. “is lazy at times.”
NH023RER. “does things efficiently.”
NH024RER. “ is easily distracted.”
Coding: 1 agree strongly; 2 agree moderately; 3 agree slightly; 4
disagree slightly; 5 disagree moderately; 6 disagree strongly; 9 not
ascertained/refused
Scaling: NH017REC was constructed by summing the values of the
six items. NH019RER, NH020RER and NH023RER were reverse
coded in the creation of this variable.
Reliability: TK
NH018RE: number of conscientiousness items answered
= 0 if no conscientiousness items answered
= 1-6 if one to six items answered
4. Neuroticism
NH025REC: continuous variable based on 5 items
Items: 1993-4 Sibling Mail Questionnaire, Questions NH027RER
(39i), NH028RER (39m), NH029RER (39r), NH030RER (39x),
NH031RER (39z)
I see myself as someone who
NH027RER. “can be tense.”
NH028RER. “is emotionally stable, not easily upset.”
NH029RER. “worries a lot.”
NH030RER. “remains calm in tense situations.”
NH031RER. “gets nervous easily.”
Coding: 1 agree strongly; 2 agree moderately; 3 agree slightly; 4
disagree slightly; 5 disagree moderately; 6 disagree strongly; 9 not
ascertained/refused
177
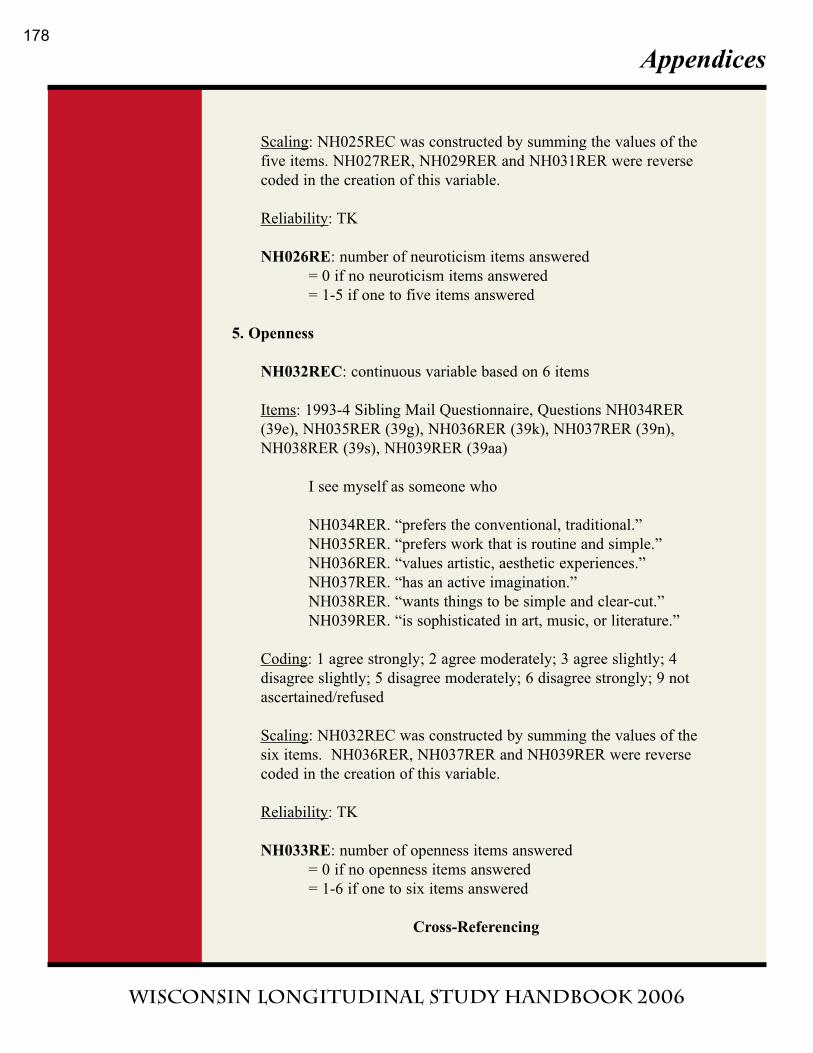
Appendices
Wisconsin Longitudinal Study handbook 2006
Scaling: NH025REC was constructed by summing the values of the
five items. NH027RER, NH029RER and NH031RER were reverse
coded in the creation of this variable.
Reliability: TK
NH026RE: number of neuroticism items answered
= 0 if no neuroticism items answered
= 1-5 if one to five items answered
5. Openness
NH032REC: continuous variable based on 6 items
Items: 1993-4 Sibling Mail Questionnaire, Questions NH034RER
(39e), NH035RER (39g), NH036RER (39k), NH037RER (39n),
NH038RER (39s), NH039RER (39aa)
I see myself as someone who
NH034RER. “prefers the conventional, traditional.”
NH035RER. “prefers work that is routine and simple.”
NH036RER. “values artistic, aesthetic experiences.”
NH037RER. “has an active imagination.”
NH038RER. “wants things to be simple and clear-cut.”
NH039RER. “is sophisticated in art, music, or literature.”
Coding: 1 agree strongly; 2 agree moderately; 3 agree slightly; 4
disagree slightly; 5 disagree moderately; 6 disagree strongly; 9 not
ascertained/refused
Scaling: NH032REC was constructed by summing the values of the
six items. NH036RER, NH037RER and NH039RER were reverse
coded in the creation of this variable.
Reliability: TK
NH033RE: number of openness items answered
= 0 if no openness items answered
= 1-6 if one to six items answered
Cross-Referencing
178
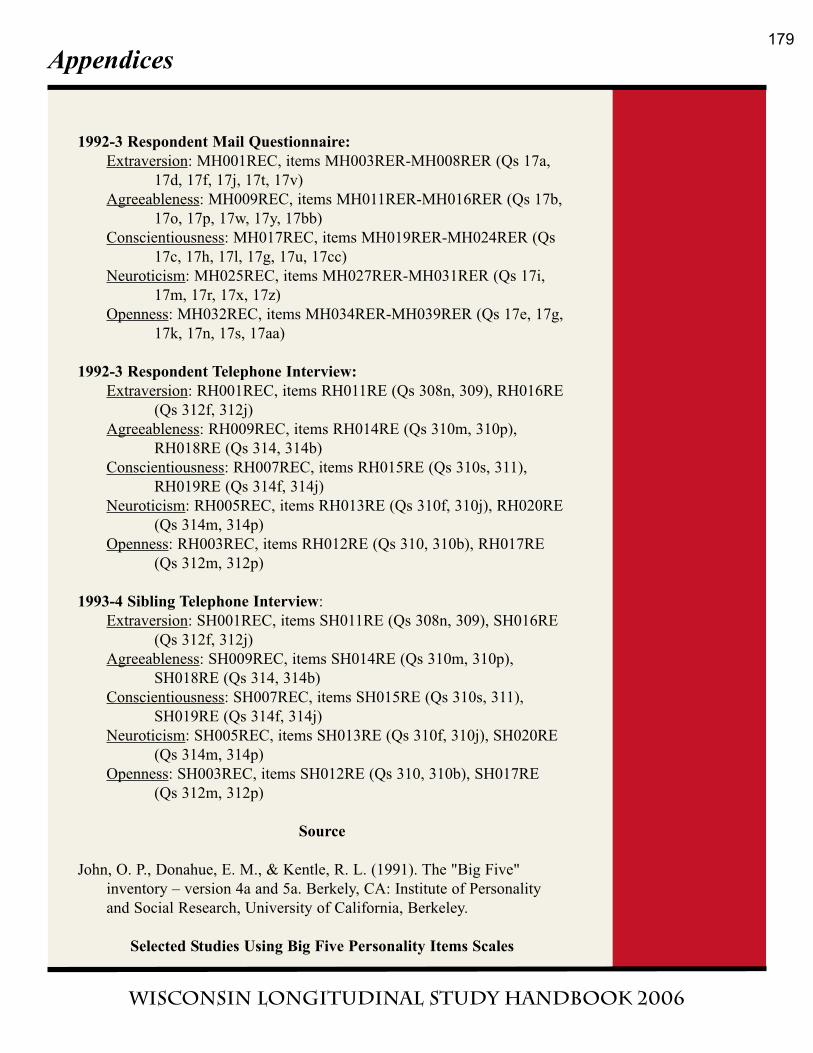
Appendices
Wisconsin Longitudinal Study handbook 2006
1992-3 Respondent Mail Questionnaire:
Extraversion: MH001REC, items MH003RER-MH008RER (Qs 17a,
17d, 17f, 17j, 17t, 17v)
Agreeableness: MH009REC, items MH011RER-MH016RER (Qs 17b,
17o, 17p, 17w, 17y, 17bb)
Conscientiousness: MH017REC, items MH019RER-MH024RER (Qs
17c, 17h, 17l, 17g, 17u, 17cc)
Neuroticism: MH025REC, items MH027RER-MH031RER (Qs 17i,
17m, 17r, 17x, 17z)
Openness: MH032REC, items MH034RER-MH039RER (Qs 17e, 17g,
17k, 17n, 17s, 17aa)
1992-3 Respondent Telephone Interview:
Extraversion: RH001REC, items RH011RE (Qs 308n, 309), RH016RE
(Qs 312f, 312j)
Agreeableness: RH009REC, items RH014RE (Qs 310m, 310p),
RH018RE (Qs 314, 314b)
Conscientiousness: RH007REC, items RH015RE (Qs 310s, 311),
RH019RE (Qs 314f, 314j)
Neuroticism: RH005REC, items RH013RE (Qs 310f, 310j), RH020RE
(Qs 314m, 314p)
Openness: RH003REC, items RH012RE (Qs 310, 310b), RH017RE
(Qs 312m, 312p)
1993-4 Sibling Telephone Interview:
Extraversion: SH001REC, items SH011RE (Qs 308n, 309), SH016RE
(Qs 312f, 312j)
Agreeableness: SH009REC, items SH014RE (Qs 310m, 310p),
SH018RE (Qs 314, 314b)
Conscientiousness: SH007REC, items SH015RE (Qs 310s, 311),
SH019RE (Qs 314f, 314j)
Neuroticism: SH005REC, items SH013RE (Qs 310f, 310j), SH020RE
(Qs 314m, 314p)
Openness: SH003REC, items SH012RE (Qs 310, 310b), SH017RE
(Qs 312m, 312p)
Source
John, O. P., Donahue, E. M., & Kentle, R. L. (1991). The "Big Five"
inventory – version 4a and 5a. Berkely, CA: Institute of Personality
and Social Research, University of California, Berkeley.
Selected Studies Using Big Five Personality Items Scales
179
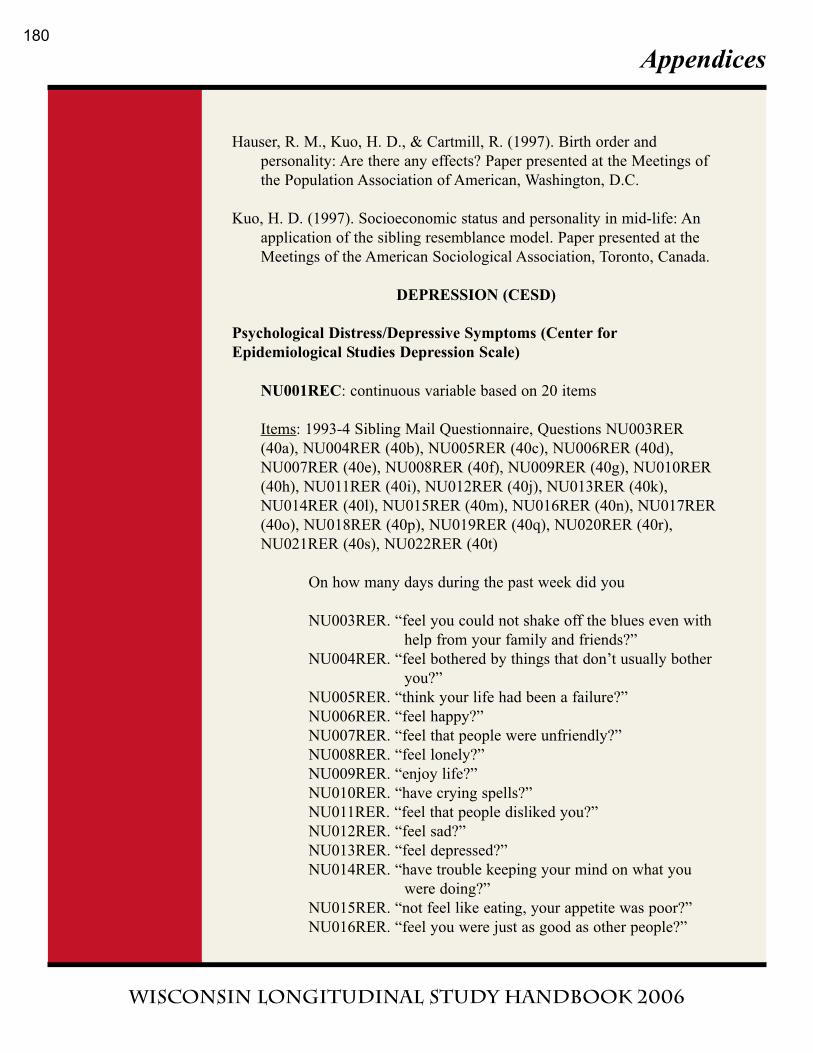
Appendices
Wisconsin Longitudinal Study handbook 2006
Hauser, R. M., Kuo, H. D., & Cartmill, R. (1997). Birth order and
personality: Are there any effects? Paper presented at the Meetings of
the Population Association of American, Washington, D.C.
Kuo, H. D. (1997). Socioeconomic status and personality in mid-life: An
application of the sibling resemblance model. Paper presented at the
Meetings of the American Sociological Association, Toronto, Canada.
DEPRESSION (CESD)
Psychological Distress/Depressive Symptoms (Center for
Epidemiological Studies Depression Scale)
NU001REC: continuous variable based on 20 items
Items: 1993-4 Sibling Mail Questionnaire, Questions NU003RER
(40a), NU004RER (40b), NU005RER (40c), NU006RER (40d),
NU007RER (40e), NU008RER (40f), NU009RER (40g), NU010RER
(40h), NU011RER (40i), NU012RER (40j), NU013RER (40k),
NU014RER (40l), NU015RER (40m), NU016RER (40n), NU017RER
(40o), NU018RER (40p), NU019RER (40q), NU020RER (40r),
NU021RER (40s), NU022RER (40t)
On how many days during the past week did you
NU003RER. “feel you could not shake off the blues even with
help from your family and friends?”
NU004RER. “feel bothered by things that don’t usually bother
you?”
NU005RER. “think your life had been a failure?”
NU006RER. “feel happy?”
NU007RER. “feel that people were unfriendly?”
NU008RER. “feel lonely?”
NU009RER. “enjoy life?”
NU010RER. “have crying spells?”
NU011RER. “feel that people disliked you?”
NU012RER. “feel sad?”
NU013RER. “feel depressed?”
NU014RER. “have trouble keeping your mind on what you
were doing?”
NU015RER. “not feel like eating, your appetite was poor?”
NU016RER. “feel you were just as good as other people?”
180
Appendices
Wisconsin Longitudinal Study handbook 2006
NU017RER. “feel everything you did was an effort?”
NU018RER. “feel hopeful about the future?”
NU019RER. “feel fearful?”
NU020RER. “sleep restlessly?”
NU021RER “talk less than usual?”
NU022RER. “feel you could not ‘get going’?”
Coding: 1 one day; 2 two days; 3 three days; 4 four days; 5 five days;
6 six days; 7 seven days; 9 not ascertained/refused
Scaling: NU001REC was constructed by summing the values of the
twenty items. NU006RER, NU009RER, NU016RER and NU018RER
were reverse coded in the creation of this variable.
Reliability: TK
Note: A sum was calculated if at least ten items of the scale were
answered.
NU002RE: number of depression/psychological distress items
answered
= 00 if no depression/psychological distress items answered
= 1-7 if one to seven items answered
= 10-20 if ten to twenty items answered
Cross-Referencing
1992-3 Respondent Mail Questionnaire: MU001REC, items
MU003RER-MU22RER (Qs 18a-18t)
1992-3 Respondent Telephone Interview: These questions were not
asked.
1993-4 Sibling Telephone Interview: These questions were not asked.
Source
Radloff, L. S. (1977). The CES-D scale: A self-report depression scale for
researching the general population. Applied Psychological
Measurement, 1, 385-401.
Selected Studies Using CESD Scale
181
Appendices
Wisconsin Longitudinal Study handbook 2006
Carr, D. (1997). The fulfillment of career dreams at midlife: Does it matter
for women’s mental health? Journal of Health & Social Behavior,
38(4), 331-344.
Carr, D. (2002). Socioeconomic background and midlife health in the
United States. In S.Crystal, & D. Shea (Eds.), Annual review of
gerontology and geriatrics, volume 22: Economic outcomes in later
life: Public policy, health, and cumulative advantage. (pp. 155-183).
New York, NY: Springer.
Marks, N. (1996). Flying solo at midlife: Gender, marital status, and
psychological well being. Journal of Marriage & the Family, 58, 917-
932.
FAMILY-WORK SPILLOVER
Subscales (n = 3)
1. Family Stress Spills Over Into Work
NY001REC: continuous variable based on 4 items
Items: 1993-4 Sibling Mail Questionnaire, Questions NY003RER
(45a), NY004RER (45c), NY005RER (45d), NY006RER (45e)
NY003RER. “Family matters reduce the time I can devote to
my job.”
NY004RER. “Family worries or problems distract me from my
work.”
NY005RER. “Family activities stop me from getting the
amount of sleep I need to do my job well.”
NY006RER. “Family obligations reduce the time I need to
relax or be by myself.”
Coding: 1 strongly agree; 2 agree; 3 neither agree nor disagree; 4
disagree; 5 strongly disagree; 8 inappropriate (not currently
employed); 9 not ascertained/refused
Scaling: NY001REC was constructed by summing the values of the
four items. All items were reverse coded in the creation of this
variable.
Reliability: TK
182
Appendices
Wisconsin Longitudinal Study handbook 2006
NY002RE: number of family stress spillover items answered
= 0 if no family stress spillover items answered
= 1-4 if one to four items answered
2. Work Stress Spills Over Into Family Life
NY007REC: continuous variable based on 4 items
Items: 1993-4 Sibling Mail Questionnaire, Questions NY009RER
(45g), NY010RER (45h), NY011RER (45k), NY012RER (45i)
NY009RER. “My job reduces the amount of time I can spend
with the family.”
NY010RER. “Problems at work make me irritable at home.”
NY011RER. “My job takes so much energy I don’t feel like
doing things that need attention at home.”
NY012RER. “My job involves a lot of travel away from
home.”
Coding: 1 strongly agree; 2 agree; 3 neither agree nor disagree; 4
disagree; 5 strongly disagree; 8 inappropriate (not currently employed);
9 not ascertained/refused
Scaling: NY007REC was constructed by summing the values of the
four items. All items were reverse coded in the creation of this
variable.
Reliability: TK
NY008RE: number of work spillover items answered
= 0 if no work spillover items answered
= 1-4 if one to four items answered
3. Family Enhancement Spills Over Into Work Life
NY013REC: continuous variable based on 3 items
Items: 1993-4 Sibling Mail Questionnaire, Questions NY015RER
(45b), NY016RER (45f), NY017RER (45j)
NY015RER. “I can do good work on the job because I am so
happy at home.”
NY016RER. “Family responsibilities make me work harder on
183
Appendices
Wisconsin Longitudinal Study handbook 2006
the job.”
NY017RER. “I can devote a lot of time to my job because of
the support I get on the home front.”
Coding: 1 strongly agree; 2 agree; 3 neither agree nor disagree; 4
disagree; 5 strongly disagree; 8 inappropriate (not currently
employed); 9 not ascertained/refused
Scaling: NY013REC was constructed by summing the values of the
three items. All items were reverse coded in the creation of this
variable.
Reliability: TK
NY014RE: number of family enhancement items answered
= 0 if no family enhancement items answered
= 1-3 if one to three items answered
Cross-Referencing
1992-3 Respondent Mail Questionnaire:
Family Stress Spills Over to Work: MY001REC, items MY003RER-
MY006RER (Qs 22a, 22c, 22d, 22e)
Work Stress Spills Over into Family Life: MY007REC, items
MY009RER- MY012RER (Qs 22g, 22h, 22k, 22i)
Family Enhancement Spills Over into Work Life: MY013REC, items
MY015RER-MY017RER (Qs 22b, 22f, 22j)
1992-3 Respondent Telephone Interview: These questions were not
asked.
1993-4 Sibling Telephone Interview: These questions were not asked.
Source
TK
Selected Studies Using Family-Work Spillover Scales
Marks, N. F. (1998). Does it hurt to care? Caregiving, work-family conflict,
184
Appendices
Wisconsin Longitudinal Study handbook 2006
and midlife well-being. Journal of Marriage & the Family, 60, 951-66.
BRANDSTADTER GOAL ATTAINMENT
Subscales (n = 2)
1. Flexible Goal Adjustment (FGA)
NP055REC: continuous variable based on 5 items
Items: 1993-4 Sibling Mail Questionnaire, Questions NP057RER
(42b), NP058RER (42c), NP059RER (42g), NP060RER (42i),
NP061RER (42j)
NP057RER. “If I don’t get something I want, I take it with
patience.”
NP058RER. “It is very difficult for me to accept a setback or
defeat.”
NP059RER. “I find it easy to see something positive even in a
serious mishap.”
NP060RER. “When everything seems to be going wrong, I can
usually find a bright side to the situation.”
NP061RER. “In general, I am not upset very long about an
opportunity passed up.”
Coding: 1 strongly agree; 2 agree; 3 neither agree nor disagree; 4
disagree; 5 strongly disagree; 9 not ascertained/refused
Scaling: NP055REC was constructed by summing the values of the
five items. NP057RER, NP059RER, NP060RER and NP061RER were
reverse coded in the creation of this variable.
Reliability: TK
NP056RE: number of flexible FGA items answered
= 0 if no FGA items answered
= 1-5 if one to five items answered
2. Tenacious Goal Pursuit (TGP)
NP062REC: continuous variable based on 5 items
Items: 1993-4 Sibling Mail Questionnaire, Questions NP064RER
(42a), NP065RER (42d), NP066RER (42e), NP067RER (41f),
185
Appendices
Wisconsin Longitudinal Study handbook 2006
NP068RER (41h)
NP064RER. “Even when things seem hopeless, I keep on fight
ing to reach my goals.”
NP065RER. “I stick to my goals and projects even in the face
of great difficulties.”
NP066RER. “The harder a goal is to achieve, the more appeal
it has to me.”
NP067RER. “I can be very stubborn in pursuing my goals.”
NP068RER. “To avoid disappointments, I don’t set my goals
too high.”
Coding: 1 strongly agree; 2 agree; 3 neither agree nor disagree; 4
disagree; 5 strongly disagree; 9 not ascertained/refused
Scaling: NP062REC was constructed by summing the values of the
five items. NP064RER, NP065RER, NP066RER and NP067 were
reverse coded in the creation of this variable.
Reliability: TK
NP063RE: number of TGP items answered
= 0 if no TGP items answered
= 1-5 if one to five items answered
Cross-Referencing
1992-3 Respondent Mail Questionnaire:
Flexible Goal Adjustment: MN055REC, items MN057RER-
MN061RER (Qs 20b, 20c, 20g, 20i, 20j)
Tenacious Goal Pursuit: MN062REC, items MN064RER-MN068RER
(Qs 20a, 20d, 20e, 20f, 20h)
1992-3 Respondent Telephone Interview: These questions were not
asked.
1993-4 Sibling Telephone Interview: These questions were not asked.
Source
Brandstadter, J. (1984). Personal and social control over development:
Some implications of an action perspective in life-span developmental
psychology. In P. B. Baltes, & O. G. Grim, Jr. (Eds.), Life-span
186
Appendices
Wisconsin Longitudinal Study handbook 2006
development and behavior (Volume 6). New York, NY:
Academic Press.
Brandstadter, J., & Renner, G. (1990). Tenacious goals pursuit and flexible
goal adjustment: Explication and age-related analysis of assimilative
and accommodative strategies of coping. Psychology & Aging, 5, 58-
67.
Selected Studies Using Brandstadter Goal Attainment Scales
Seltzer, M. M., Greenberg, J. S., & Floyd, F. (2000). Flexible goal
adjustment as a coping mechanism for midlife parents of children with
disabilities. Paper presented at the Meetings of the Gerontological
Society of American, Washington DC.
ANXIETY
Anxiety Symptoms and Beliefs
NU023REC: continuous variable based on 8 items
Items: 1993-4 Sibling Mail Questionnaire, Questions NU025RER
(40u), NU026RER (40v), NU027RER (40w), NU028RER (40x),
NU029RER (40y), NU030RER (40z), NU031RER (40aa), NU032RER
(40bb)
How many days during the past week did you
NU025RER. “feel you might collapse?”
NU026RER. “have difficulty swallowing?”
NU027RER. “feel you might die?”
NU028RER. “think you might be going crazy?”
NU029RER. “fear embarrassing yourself?”
NU030RER. “feel as though your surroundings were unreal?”
NU031RER. “feel that other people thought you were a fool?”
NU032RER. “have hot/cold flashes?”
Coding: 0 zero days; 1 one day; 2 two days; 3 three days; 4 four days;
5 five days; 6 six days; 7 seven days; 9 not ascertained/refused
(includes all 23 original sample members who are also siblings)
Scaling: NU023REC was constructed by summing the values of the
eight items.
187
Appendices
Wisconsin Longitudinal Study handbook 2006
Reliability: TK
Note: A sum was calculated if at least four items of the scale were
answered.
NU024RE: number of anxiety symptoms and beliefs items answered
= 0 if no anxiety symptoms and beliefs items answered
= 1-3 if one to three items answered
= 4-8 if four to eight items answered
= 09 if not ascertained (includes all 23 original sample mem
bers who are also siblings)
Cross-Referencing
1992-3 Respondent Mail Questionnaire: These questions were not asked.
1992-3 Respondent Telephone Interview: These questions were not
asked.
1993-4 Sibling Telephone Interview: These questions were not asked.
Source
TK
Selected Studies Using Anxiety Symptoms and Beliefs Scale
TK/none?
SPIELBERGER ANXIETY & ANGER INDICES
Subscales (n=2)
1. Spielberger Anxiety Index
NUA33REC: continuous variable based on 10 items
Items: 1993-4 Sibling Mail Questionnaire, Questions NU035RER
(43a), NU037RER (43c), NU039RER (43e), NU041RER (43g),
NU043RER (43i), NU045RER (43k), NU047RER (43m), NU049RER
(43o), NU051RER (43q), NU053RER (43s)
On how many days during the past week did you
188
Appendices
Wisconsin Longitudinal Study handbook 2006
NU035RER. “feel calm?”
NU037RER. “feel tense?”
NU039RER. “feel at ease?”
NU041RER. “worry over possible misfortune?”
NU043RER. “feel nervous?”
NU045RER. “feel jittery?”
NU047RER. “feel relaxed?”
NU049RER. “feel worried?”
NU051RER. “feel steady?”
NU053RER. “feel frightened?”
Coding: 0 zero days; 1 one day; 2 two days; 3 three days; 4 four days;
5 five days 6 six days; 7 seven days; 9 not ascertained/refused
(includes all 23 original sample members who are also siblings)
Scaling: NUA33REC was constructed by summing the values of the
ten items. NU035RER, NU039RER, NU047RER and NU051RER
were reverse coded in the creation of this variable.
Reliability: TK
Note: NU035RER is a constructed variable based on questions scn9
and 43a.
NUB33REC: number of Spielberger anxiety index items answered
= 0 if no Spielberger anxiety index items answered
= 1-4 if one to four items answered
= 4-10 if five to ten items answered
= 99 if not ascertained/refused (includes all 23 original sample
members who are also siblings)
2. Spielberger Anger Index
NUA34REC: continuous variable based on 10 items
Items: 1993-4 Sibling Mail Questionnaire, Questions NU036RER
(43b), NU038RER (43d), NU040RER (43f), NU042RER (43h),
NU044RER (43j), NU046RER (43l), NU048RER (43n), NU050RER
(43p), NU052RER (43r), NU054RER (43t)
On how many days during the past week did you
NU036RER. “feel furious?”
189
Appendices
Wisconsin Longitudinal Study handbook 2006
NU038RER. “feel like banging on the table?”
NU040RER. “feel angry?”
NU042RER. “feel like yelling at somebody?”
NU044RER. “feel like breaking things?”
NU046RER. “feel mad?”
NU048RER. “feel irritated?”
NU050RER. “feel like hitting someone?”
NU052RER. “feel burned up?”
NU054RER. “feel like swearing?”
Coding: 0 zero days; 1 one day; 2 two days; 3 three days; 4 four days;
5 five days; 6 six days; 7 seven days; 9 not ascertained/refused
(includes all 23 original sample members who are also siblings)
Scaling: NUA34REC was constructed by summing the values of the
ten items.
Reliability: TK
NUB34REC: number of Spielberger anger index items answered
= 00 if no Spielberger anger index items answered
= 1-4 if one to four items answered
= 5-10 if five to ten items answered
= 99 if not ascertained/refused (includes all 23 original sample
members who are also siblings)
Cross-Referencing
1992-3 Respondent Mail Questionnaire: These questions were not asked.
1992-3 Respondent Telephone Interview: These questions were not
asked.
1993-4 Sibling Telephone Interview: These questions were not asked.
Source
Anxiety Index
Spielberger, C. D., Gorsuch, R. L., & Lushene, R. E. (1970). STAI: Manual
for the State Trait Anxiety Inventory. Palo Alto, CA: Consulting
Psychologists Press.
190
Appendices
Wisconsin Longitudinal Study handbook 2006
Anger Index
Spielberger, C .D. (1980). Preliminary manual for the State-Trait Anger
Scale (STAS). Tampa, FL: University of South Florida Human
Resources Institute.
Selected Studies Using Spielberger Anxiety and Anger Indices
TK/none?
HEALTH SYMPTOMS
Total Number of Symptoms
NX102RER: continuous variable based on 28 items
Items: 1993-4 Sibling Mail Questionnaire, Questions NX045RER
(10Aa), NX047RER (10Ab), NX049RER (10Ac), NX051RER (10Ad),
NX053RER (10Ae), NX055RER (10Af), NX057RER (10Ag),
NX059RER (10Ah), NX061RER (10Ai), NX063RER (10Aj),
NX065RER (10Ak), NX067RER (10Al), NX069RER (10Am),
NX071RER (10An), NX073RER (10Ao), NX075RER (10Ap),
NX077RER (10Aq), NX079RER (10Ar), NX081RER (10As),
NX083RER (10At), NX085RER (10Au), NX087RER (10Av),
NX089RER (10Aw), NX091RER (10Ax), NX093RER (10Ay),
NX095RER (10Az), NX097RER (10A2), NX099RER (10B3)
How often in the past have you had
NX045RER. “a lack of energy in the past six months?”
NX047RER. “trouble sleeping in the past six months?”
NX049RER. “fatigue/exhaustion in the past six months?”
NX051RER. “headaches in the past six months?”
NX053RER. “visual problems in the past six months?”
NX055RER. “dizziness/faintness in the past six months?”
NX057RER. “numbness in the past six months?”
NX059RER. “ringing in ears in the past six months?”
NX061RER. “nausea in the past six months?”
NX063RER. “vomiting in the past six months?”
NX065RER. “upset stomach in the past six months?”
NX067RER. “constipation in the past six months?”
NX069RER. “diarrhea in the past six months?”
NX071RER. “urination problems in the past six months?”
NX073RER. “aching muscles in the past six months?”
191
Appendices
Wisconsin Longitudinal Study handbook 2006
NX075RER. “stiff/swollen joints in the past six months?”
NX077RER. “back pain/strain in the past six months?”
NX079RER. “chest pain in the past six months?”
NX081RER. “shortness of breath in the past six months?”
NX083RER. “excessive sweating in the past six months?”
NX085RER. “respiratory problems in the past six months?”
NX087RER. “skin problems in the past six months?”
NX089RER. “coughing/wheezing in the past six months?”
NX091RER. “bone pains in the past six months?”
NX093RER. “palpitations in the past six months?”
NX095RER. “painful sexual intercourse in the past six
months?”
NX097RER. “difficulties with sexual intercourse in the past six
months?”
NX099RER. “other symptoms.” [Listed; see Notes below.]
Coding: The variables that comprise this scale are coded: 0 have not
had; 1 monthly or less often; 2 about once a week; 3 daily or more
often; 9 not ascertained/refused (including all 23 original sample
members who are also siblings). NX102RER is not coded separately.
Scaling: NX109RER was constructed by… doesn’t say, but it looks
like by taking any 1, 2 or 3 answers as “has symptom” & summing to
get a score out of 28
Reliability: INAP
Notes: NX045RER is a constructed variable based on questions 10Aa
and scn2. A complete list of the “other symptoms” that make up
NX099RER is available in the 1993-4 Sibling Mail Questionnaire
codebook.
Cross-Referencing
1992-3 Respondent Mail Questionnaire: MX082REC, items
MX016RER-MX079RER, every third item including
MX016RER and MX079RER (Qs 9Aa-9Av)
1992-3 Respondent Telephone Interview: These questions were not
asked.
1993-4 Sibling Telephone Interview: These questions were not asked.
192
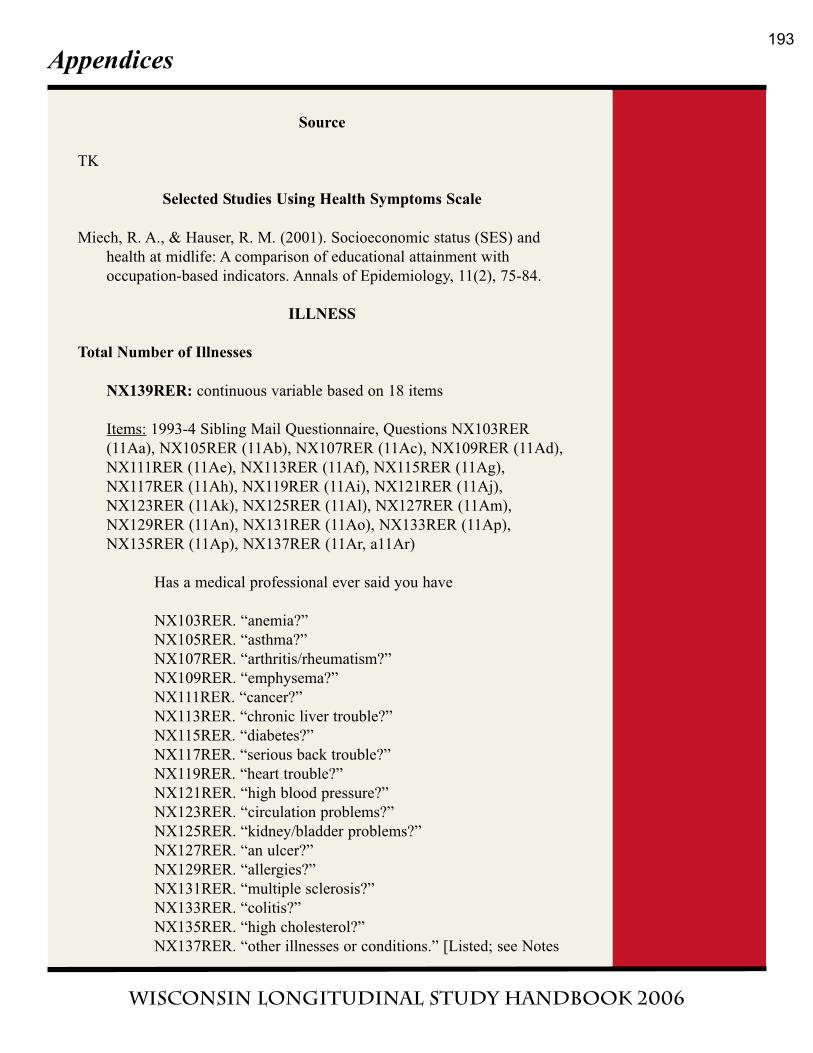
Appendices
Wisconsin Longitudinal Study handbook 2006
Source
TK
Selected Studies Using Health Symptoms Scale
Miech, R. A., & Hauser, R. M. (2001). Socioeconomic status (SES) and
health at midlife: A comparison of educational attainment with
occupation-based indicators. Annals of Epidemiology, 11(2), 75-84.
ILLNESS
Total Number of Illnesses
NX139RER: continuous variable based on 18 items
Items: 1993-4 Sibling Mail Questionnaire, Questions NX103RER
(11Aa), NX105RER (11Ab), NX107RER (11Ac), NX109RER (11Ad),
NX111RER (11Ae), NX113RER (11Af), NX115RER (11Ag),
NX117RER (11Ah), NX119RER (11Ai), NX121RER (11Aj),
NX123RER (11Ak), NX125RER (11Al), NX127RER (11Am),
NX129RER (11An), NX131RER (11Ao), NX133RER (11Ap),
NX135RER (11Ap), NX137RER (11Ar, a11Ar)
Has a medical professional ever said you have
NX103RER. “anemia?”
NX105RER. “asthma?”
NX107RER. “arthritis/rheumatism?”
NX109RER. “emphysema?”
NX111RER. “cancer?”
NX113RER. “chronic liver trouble?”
NX115RER. “diabetes?”
NX117RER. “serious back trouble?”
NX119RER. “heart trouble?”
NX121RER. “high blood pressure?”
NX123RER. “circulation problems?”
NX125RER. “kidney/bladder problems?”
NX127RER. “an ulcer?”
NX129RER. “allergies?”
NX131RER. “multiple sclerosis?”
NX133RER. “colitis?”
NX135RER. “high cholesterol?”
NX137RER. “other illnesses or conditions.” [Listed; see Notes
193
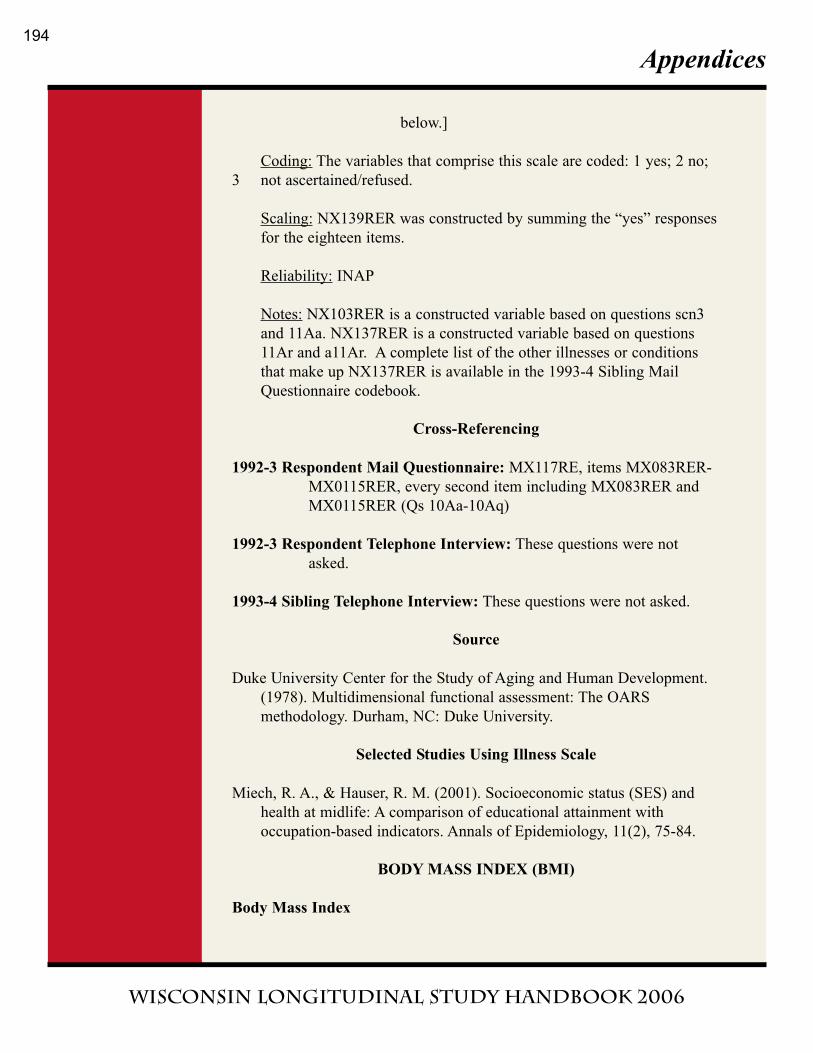
Appendices
Wisconsin Longitudinal Study handbook 2006
below.]
Coding: The variables that comprise this scale are coded: 1 yes; 2 no;
3 not ascertained/refused.
Scaling: NX139RER was constructed by summing the “yes” responses
for the eighteen items.
Reliability: INAP
Notes: NX103RER is a constructed variable based on questions scn3
and 11Aa. NX137RER is a constructed variable based on questions
11Ar and a11Ar. A complete list of the other illnesses or conditions
that make up NX137RER is available in the 1993-4 Sibling Mail
Questionnaire codebook.
Cross-Referencing
1992-3 Respondent Mail Questionnaire: MX117RE, items MX083RER-
MX0115RER, every second item including MX083RER and
MX0115RER (Qs 10Aa-10Aq)
1992-3 Respondent Telephone Interview: These questions were not
asked.
1993-4 Sibling Telephone Interview: These questions were not asked.
Source
Duke University Center for the Study of Aging and Human Development.
(1978). Multidimensional functional assessment: The OARS
methodology. Durham, NC: Duke University.
Selected Studies Using Illness Scale
Miech, R. A., & Hauser, R. M. (2001). Socioeconomic status (SES) and
health at midlife: A comparison of educational attainment with
occupation-based indicators. Annals of Epidemiology, 11(2), 75-84.
BODY MASS INDEX (BMI)
Body Mass Index
194
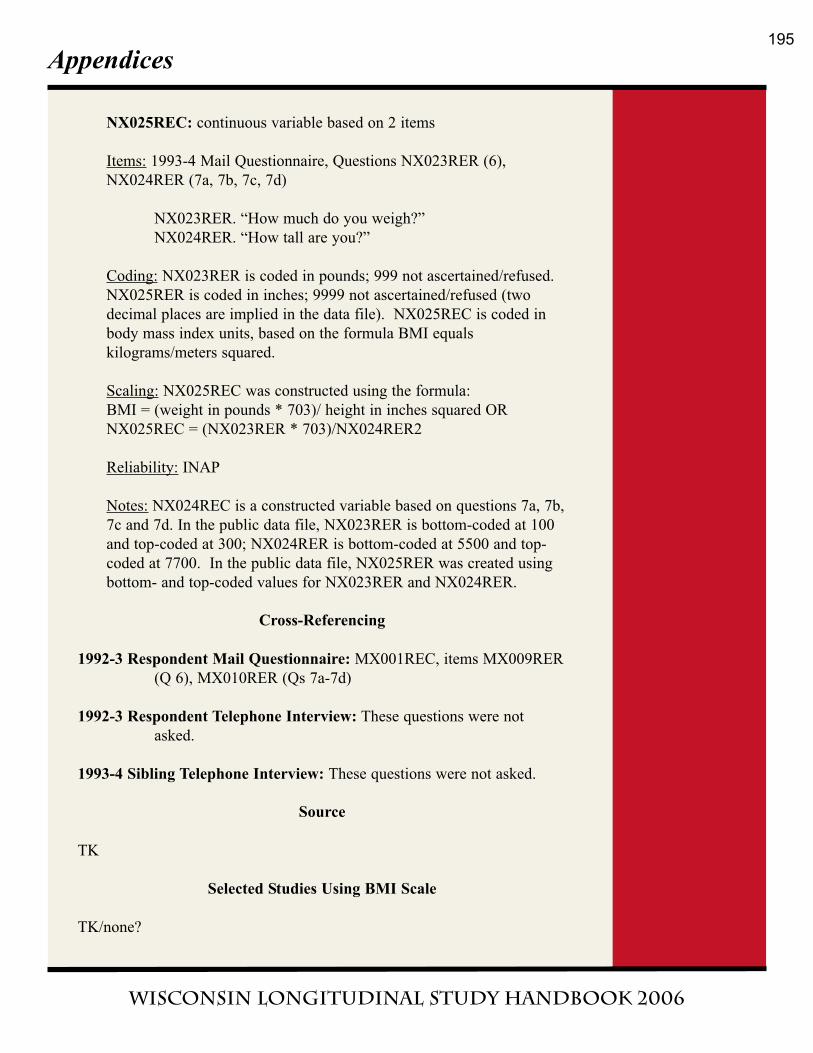
Appendices
Wisconsin Longitudinal Study handbook 2006
NX025REC: continuous variable based on 2 items
Items: 1993-4 Mail Questionnaire, Questions NX023RER (6),
NX024RER (7a, 7b, 7c, 7d)
NX023RER. “How much do you weigh?”
NX024RER. “How tall are you?”
Coding: NX023RER is coded in pounds; 999 not ascertained/refused.
NX025RER is coded in inches; 9999 not ascertained/refused (two
decimal places are implied in the data file). NX025REC is coded in
body mass index units, based on the formula BMI equals
kilograms/meters squared.
Scaling: NX025REC was constructed using the formula:
BMI = (weight in pounds * 703)/ height in inches squared OR
NX025REC = (NX023RER * 703)/NX024RER2
Reliability: INAP
Notes: NX024REC is a constructed variable based on questions 7a, 7b,
7c and 7d. In the public data file, NX023RER is bottom-coded at 100
and top-coded at 300; NX024RER is bottom-coded at 5500 and top-
coded at 7700. In the public data file, NX025RER was created using
bottom- and top-coded values for NX023RER and NX024RER.
Cross-Referencing
1992-3 Respondent Mail Questionnaire: MX001REC, items MX009RER
(Q 6), MX010RER (Qs 7a-7d)
1992-3 Respondent Telephone Interview: These questions were not
asked.
1993-4 Sibling Telephone Interview: These questions were not asked.
Source
TK
Selected Studies Using BMI Scale
TK/none?
195
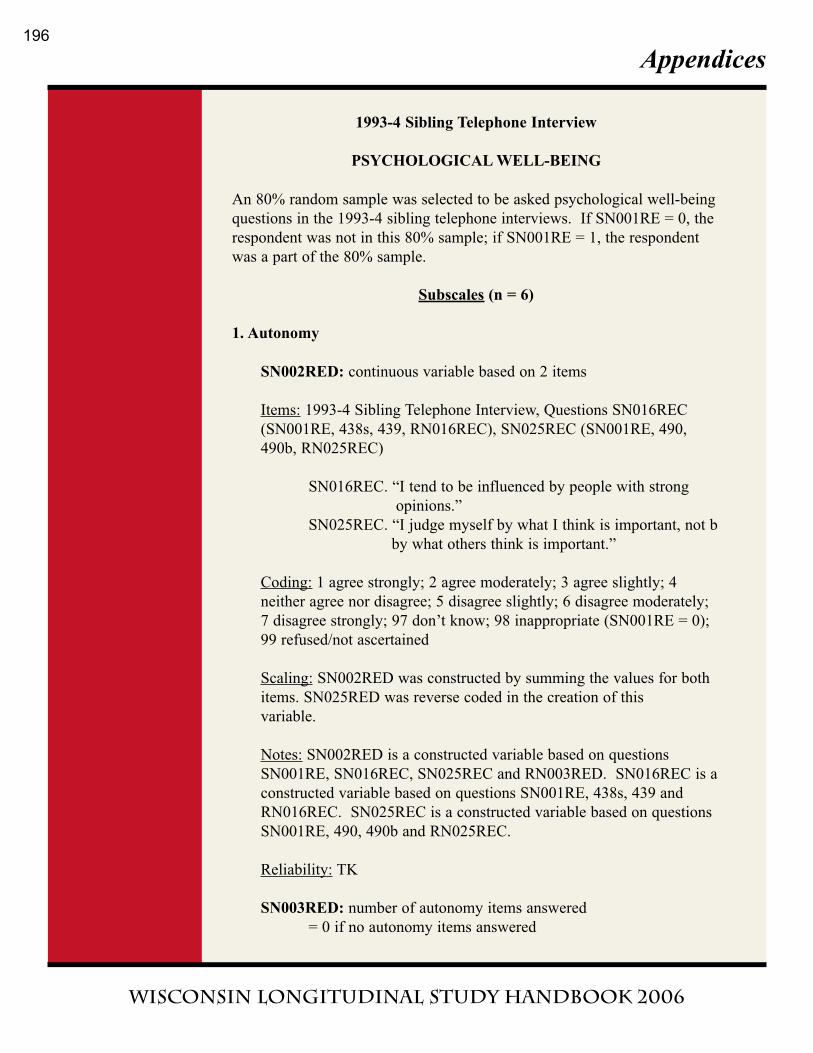
Appendices
Wisconsin Longitudinal Study handbook 2006
1993-4 Sibling Telephone Interview
PSYCHOLOGICAL WELL-BEING
An 80% random sample was selected to be asked psychological well-being
questions in the 1993-4 sibling telephone interviews. If SN001RE = 0, the
respondent was not in this 80% sample; if SN001RE = 1, the respondent
was a part of the 80% sample.
Subscales (n = 6)
1. Autonomy
SN002RED: continuous variable based on 2 items
Items: 1993-4 Sibling Telephone Interview, Questions SN016REC
(SN001RE, 438s, 439, RN016REC), SN025REC (SN001RE, 490,
490b, RN025REC)
SN016REC. “I tend to be influenced by people with strong
opinions.”
SN025REC. “I judge myself by what I think is important, not b
by what others think is important.”
Coding: 1 agree strongly; 2 agree moderately; 3 agree slightly; 4
neither agree nor disagree; 5 disagree slightly; 6 disagree moderately;
7 disagree strongly; 97 don’t know; 98 inappropriate (SN001RE = 0);
99 refused/not ascertained
Scaling: SN002RED was constructed by summing the values for both
items. SN025RED was reverse coded in the creation of this
variable.
Notes: SN002RED is a constructed variable based on questions
SN001RE, SN016REC, SN025REC and RN003RED. SN016REC is a
constructed variable based on questions SN001RE, 438s, 439 and
RN016REC. SN025REC is a constructed variable based on questions
SN001RE, 490, 490b and RN025REC.
Reliability: TK
SN003RED: number of autonomy items answered
= 0 if no autonomy items answered
196
Appendices
Wisconsin Longitudinal Study handbook 2006
= 1 if one autonomy item answered
= 2 if two autonomy items answered
= 8 if inappropriate (SN001RE = 0)
2. Environmental Mastery
SN004RED: continuous variable based on 2 items
Items: 1993-4 Sibling Telephone Interview, Questions SN017REC
(SN011RE, 440, 440b, RN017REC), SN021REC (SN001RE, 442m,
442p, RN021REC)
SN017REC. “In general, I feel I am in charge of the situation
in which I live.”
SN021REC. “The demands of everyday life often get me
down.”
Coding: 1 agree strongly; 2 agree moderately; 3 agree slightly; 4
neither agree nor disagree; 5 disagree slightly; 6 disagree moderately;
7 disagree strongly; 97 don’t know; 98 inappropriate (SN001RE = 0);
99 refused/not ascertained
Scaling: SN004RED was constructed by summing the values for both
items. SN017REC was reverse coded in the creation of this
variable.
Notes: SN004RED is a constructed variable based on questions
SN001RE, SN017REC, SN021REC and RN004RED. SN017REC is a
constructed variable based on questions RN001RE, 440, 440b and
RN017REC. SN021REC is a constructed variable based on questions
RN001RE, 442m, 442p and RN021REC.
Reliability: TK
SN005RED: number of environmental mastery items answered
= 0 if no environmental mastery items answered
= 1 if one environmental mastery item answered
= 2 if two environmental mastery items answered
= 8 if inappropriate (SN001RE = 0)
3. Personal Growth
SN006RED: continuous variable based on 2 items
197
Appendices
Wisconsin Longitudinal Study handbook 2006
Items: 1993-4 Sibling Telephone Interview, Questions SN022REC
(SN001RE, 442s, 443, RN022REC), SN026REC (SN001RE, 490m,
490p, RN026REC)
SN022REC. “For me, life has been a constant process of
learning, changing, and growing.”
SN026REC. “I gave up trying to make big improvements or
changes in my life a long time ago.”
Coding: 1 agree strongly; 2 agree moderately; 3 agree slightly; 4
neither agree nor disagree; 5 disagree slightly; 6 disagree moderately;
7 disagree strongly; 97 don’t know; 98 inappropriate (SN001RE = 0);
99 refused/not ascertained
Scaling: SN006RED was constructed by summing the values for both
items. SN022REC was reverse coded in the creation of this variable.
Notes: SN006RED is a constructed variable based on questions
SN001RE, SN022REC, SN026REC and RN006RED. SN022REC is a
constructed variable based on questions SN001RE, 442s, 443 and
RN022REC. SN026REC is a constructed variable based on questions
SN001RE, 490m, 490p and RN026REC.
Reliability: TK
SN007RED: number of personal growth items answered
= 0 if no personal growth items answered
= 1 if one personal growth item answered
= 2 if two personal growth items answered
= 8 if inappropriate (SN001RE = 0)
4. Positive Relations with Others
SN008RED: continuous variable based on 2 items
Items: 1993-4 Sibling Telephone Interview, Questions SN018REC
(SN001RE, 440m, 440p, RN018REC), SN023REC (SN001RE, 488g,
488j, RN023REC)
SN018REC. “Maintaining close relationships has been difficult
and frustrating for me.”
SN023REC. “I have not experienced many warm and trusting
relationships with others.”
198
Appendices
Wisconsin Longitudinal Study handbook 2006
Coding: 1 agree strongly; 2 agree moderately; 3 agree slightly; 4
neither agree nor disagree; 5 disagree slightly; 6 disagree moderately;
7 disagree strongly; 97 don’t know; 98 inappropriate (SN001RE = 0);
99 refused/not ascertained
Scaling: SN008RED was constructed by summing the values for both
items.
Notes: SN008RED is a constructed variable based on questions
SN001RE, SN018REC, SN023REC and RN008RED. SN018REC is a
constructed variable based on questions SN001RE, 440m, 440p and
RN018REC. SN023REC is a constructed variable based on questions
SN001RE, 488g, 488j and RN023REC.
Reliability: TK
SN009RED: number of positive relations with others items answered
= 0 if no positive relations items answered
= 1 if one positive relations item answered
= 2 if two positive relations items answered
= 8 if inappropriate (SN001RE = 0)
5. Purpose in Life
SN010RED: continuous variable based on 2 items
Items: 1993-4 Sibling Telephone Interview, Questions SN019REC
(SN001RE, 440s, 441, RN019REC), SN024REC (SN001RE,
488m, 488p, RN024REC)
SN019REC. “Some people wander aimlessly through life but I
am not one of them.”
SN024REC. “I live life one day at a time and don’t really think
about the future.”
Coding: 1 agree strongly; 2 agree moderately; 3 agree slightly; 4
neither agree nor disagree; 5 disagree slightly; 6 disagree moderately;
7 disagree strongly; 97 don’t know; 98 inappropriate (SN001RE = 0);
99 refused/not ascertained
Scaling: SN010RED was constructed by summing the values for both
items. SN019REC was reverse coded in the creation of this
variable.
199
Appendices
Wisconsin Longitudinal Study handbook 2006
Notes: SN010RED is a constructed variable based on questions
SN001RE, SN019REC, SN024REC and RN010RED. SN019REC is a
constructed variable based on questions SN001RE, 440s, 441 and
RN019REC. SN024REC is a constructed variable based on questions
RN001RE, 488m, 488p and RN024REC.
Reliability: TK
SN011RED: number of purpose in life items answered
= 0 if no purpose in life items answered
= 1 if one purpose in life item answered
= 2 if two purpose in life items answered
= 8 if inappropriate (SN001RE = 0)
6. Self-Acceptance
SN012RED: continuous variable based on 2 items
Items: 1993-4 Sibling Telephone Interview, Questions SN020REC
(RN001RE, 442, 442b, RN020REC), SN027REC (RN001RE, 492f,
492j, RN027REC)
SN020REC. “When I look at the story of my life, I am pleased
with how things have turned out.”
SN027REC. “I like most aspects of my personality.”
Coding: 1 agree strongly; 2 agree moderately; 3 agree slightly; 4
neither agree nor disagree; 5 disagree slightly; 6 disagree moderately;
7 disagree strongly; 97 don’t know; 98 inappropriate (SN001RE = 0);
99 refused/not ascertained
Scaling: SN012RED was constructed by summing the values for both
items. SN020REC and SN027REC were reverse coded in the creation
of this variable.
Notes: SN012RED is a constructed variable based on questions
SN001RE, SN020REC, SN027REC and RN012RED. SN020REC is a
constructed variable based on questions SN001RE, 442, 442b and
RN020REC. SN027REC is a constructed variable based on questions
SN001RE, 492f, 492j and RN027REC.
Reliability: TK
200
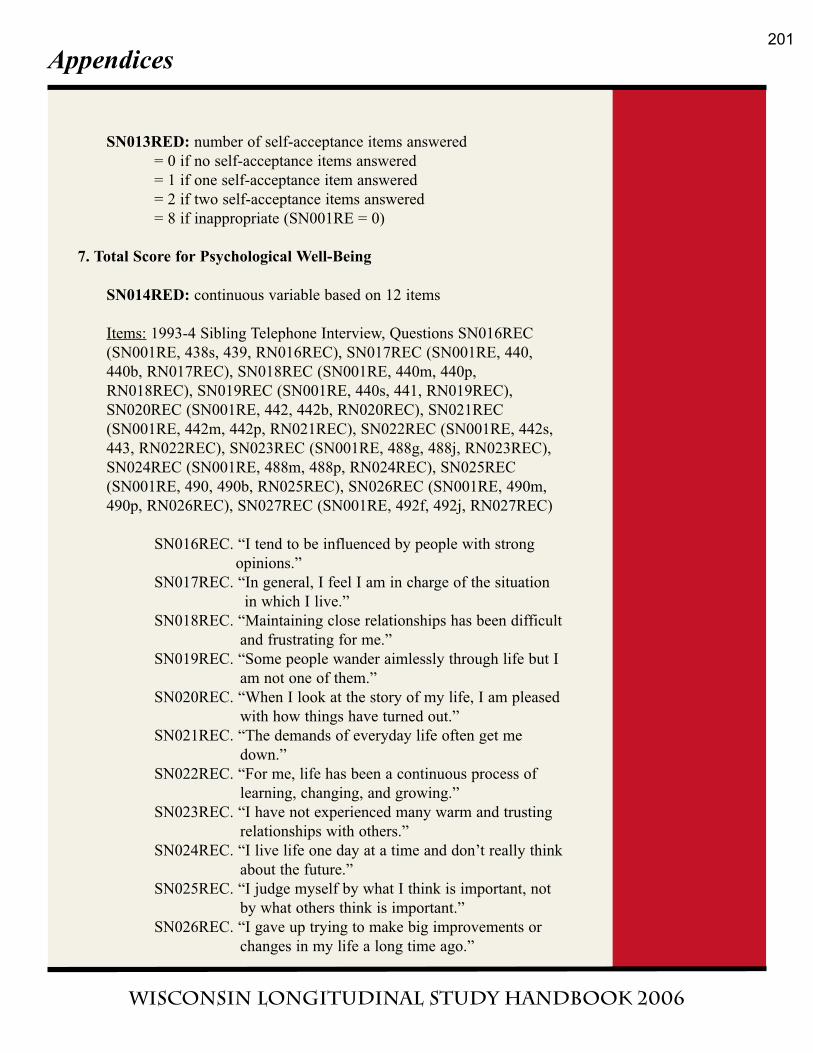
Appendices
Wisconsin Longitudinal Study handbook 2006
SN013RED: number of self-acceptance items answered
= 0 if no self-acceptance items answered
= 1 if one self-acceptance item answered
= 2 if two self-acceptance items answered
= 8 if inappropriate (SN001RE = 0)
7. Total Score for Psychological Well-Being
SN014RED: continuous variable based on 12 items
Items: 1993-4 Sibling Telephone Interview, Questions SN016REC
(SN001RE, 438s, 439, RN016REC), SN017REC (SN001RE, 440,
440b, RN017REC), SN018REC (SN001RE, 440m, 440p,
RN018REC), SN019REC (SN001RE, 440s, 441, RN019REC),
SN020REC (SN001RE, 442, 442b, RN020REC), SN021REC
(SN001RE, 442m, 442p, RN021REC), SN022REC (SN001RE, 442s,
443, RN022REC), SN023REC (SN001RE, 488g, 488j, RN023REC),
SN024REC (SN001RE, 488m, 488p, RN024REC), SN025REC
(SN001RE, 490, 490b, RN025REC), SN026REC (SN001RE, 490m,
490p, RN026REC), SN027REC (SN001RE, 492f, 492j, RN027REC)
SN016REC. “I tend to be influenced by people with strong
opinions.”
SN017REC. “In general, I feel I am in charge of the situation
in which I live.”
SN018REC. “Maintaining close relationships has been difficult
and frustrating for me.”
SN019REC. “Some people wander aimlessly through life but I
am not one of them.”
SN020REC. “When I look at the story of my life, I am pleased
with how things have turned out.”
SN021REC. “The demands of everyday life often get me
down.”
SN022REC. “For me, life has been a continuous process of
learning, changing, and growing.”
SN023REC. “I have not experienced many warm and trusting
relationships with others.”
SN024REC. “I live life one day at a time and don’t really think
about the future.”
SN025REC. “I judge myself by what I think is important, not
by what others think is important.”
SN026REC. “I gave up trying to make big improvements or
changes in my life a long time ago.”
201
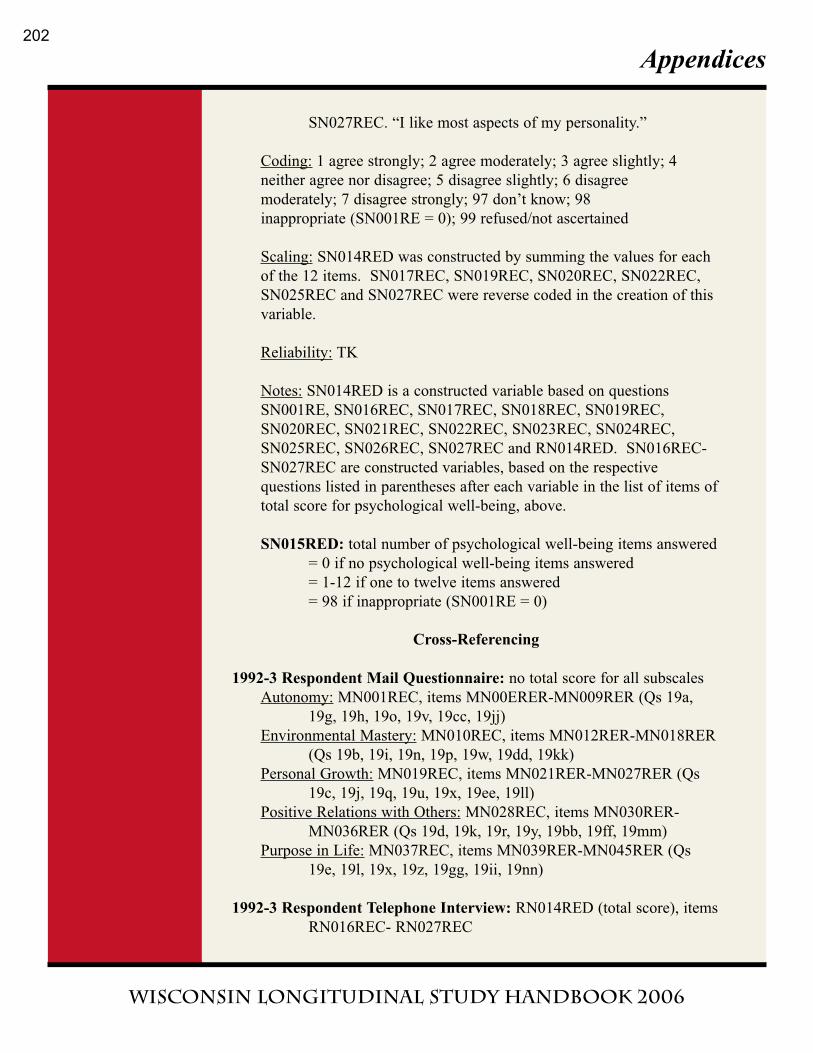
Appendices
Wisconsin Longitudinal Study handbook 2006
SN027REC. “I like most aspects of my personality.”
Coding: 1 agree strongly; 2 agree moderately; 3 agree slightly; 4
neither agree nor disagree; 5 disagree slightly; 6 disagree
moderately; 7 disagree strongly; 97 don’t know; 98
inappropriate (SN001RE = 0); 99 refused/not ascertained
Scaling: SN014RED was constructed by summing the values for each
of the 12 items. SN017REC, SN019REC, SN020REC, SN022REC,
SN025REC and SN027REC were reverse coded in the creation of this
variable.
Reliability: TK
Notes: SN014RED is a constructed variable based on questions
SN001RE, SN016REC, SN017REC, SN018REC, SN019REC,
SN020REC, SN021REC, SN022REC, SN023REC, SN024REC,
SN025REC, SN026REC, SN027REC and RN014RED. SN016REC-
SN027REC are constructed variables, based on the respective
questions listed in parentheses after each variable in the list of items of
total score for psychological well-being, above.
SN015RED: total number of psychological well-being items answered
= 0 if no psychological well-being items answered
= 1-12 if one to twelve items answered
= 98 if inappropriate (SN001RE = 0)
Cross-Referencing
1992-3 Respondent Mail Questionnaire: no total score for all subscales
Autonomy: MN001REC, items MN00ERER-MN009RER (Qs 19a,
19g, 19h, 19o, 19v, 19cc, 19jj)
Environmental Mastery: MN010REC, items MN012RER-MN018RER
(Qs 19b, 19i, 19n, 19p, 19w, 19dd, 19kk)
Personal Growth: MN019REC, items MN021RER-MN027RER (Qs
19c, 19j, 19q, 19u, 19x, 19ee, 19ll)
Positive Relations with Others: MN028REC, items MN030RER-
MN036RER (Qs 19d, 19k, 19r, 19y, 19bb, 19ff, 19mm)
Purpose in Life: MN037REC, items MN039RER-MN045RER (Qs
19e, 19l, 19x, 19z, 19gg, 19ii, 19nn)
1992-3 Respondent Telephone Interview: RN014RED (total score), items
RN016REC- RN027REC
202
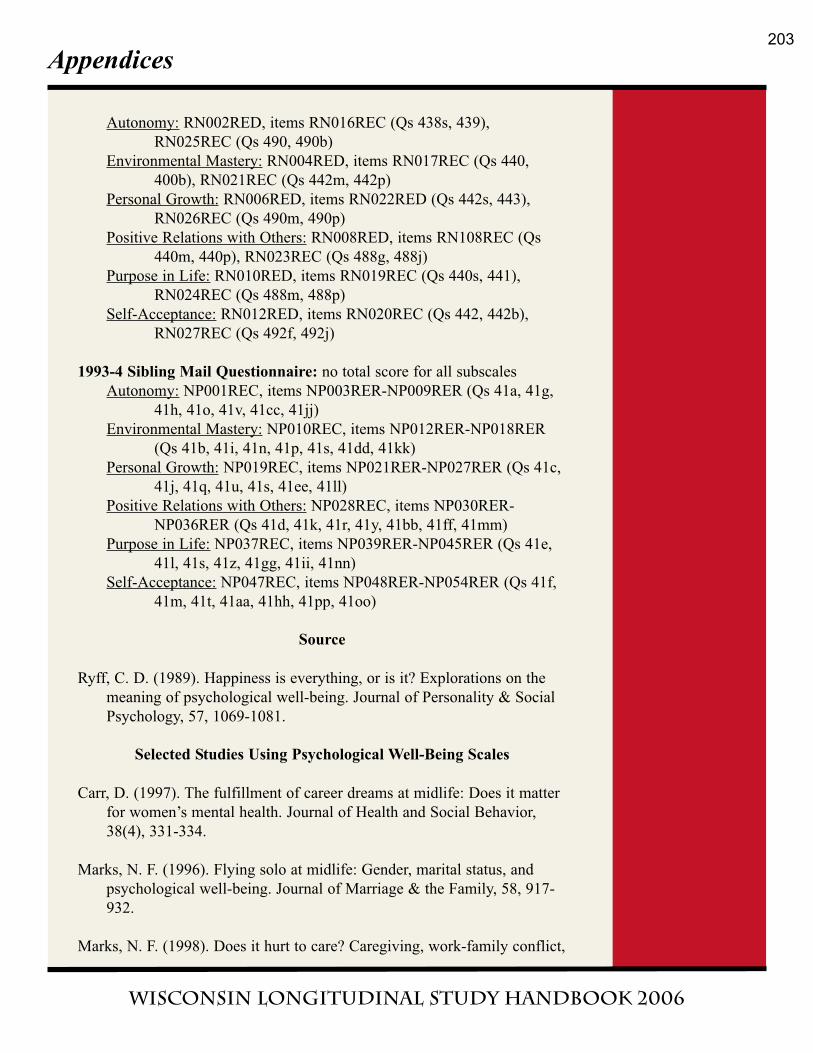
Appendices
Wisconsin Longitudinal Study handbook 2006
Autonomy: RN002RED, items RN016REC (Qs 438s, 439),
RN025REC (Qs 490, 490b)
Environmental Mastery: RN004RED, items RN017REC (Qs 440,
400b), RN021REC (Qs 442m, 442p)
Personal Growth: RN006RED, items RN022RED (Qs 442s, 443),
RN026REC (Qs 490m, 490p)
Positive Relations with Others: RN008RED, items RN108REC (Qs
440m, 440p), RN023REC (Qs 488g, 488j)
Purpose in Life: RN010RED, items RN019REC (Qs 440s, 441),
RN024REC (Qs 488m, 488p)
Self-Acceptance: RN012RED, items RN020REC (Qs 442, 442b),
RN027REC (Qs 492f, 492j)
1993-4 Sibling Mail Questionnaire: no total score for all subscales
Autonomy: NP001REC, items NP003RER-NP009RER (Qs 41a, 41g,
41h, 41o, 41v, 41cc, 41jj)
Environmental Mastery: NP010REC, items NP012RER-NP018RER
(Qs 41b, 41i, 41n, 41p, 41s, 41dd, 41kk)
Personal Growth: NP019REC, items NP021RER-NP027RER (Qs 41c,
41j, 41q, 41u, 41s, 41ee, 41ll)
Positive Relations with Others: NP028REC, items NP030RER-
NP036RER (Qs 41d, 41k, 41r, 41y, 41bb, 41ff, 41mm)
Purpose in Life: NP037REC, items NP039RER-NP045RER (Qs 41e,
41l, 41s, 41z, 41gg, 41ii, 41nn)
Self-Acceptance: NP047REC, items NP048RER-NP054RER (Qs 41f,
41m, 41t, 41aa, 41hh, 41pp, 41oo)
Source
Ryff, C. D. (1989). Happiness is everything, or is it? Explorations on the
meaning of psychological well-being. Journal of Personality & Social
Psychology, 57, 1069-1081.
Selected Studies Using Psychological Well-Being Scales
Carr, D. (1997). The fulfillment of career dreams at midlife: Does it matter
for women’s mental health. Journal of Health and Social Behavior,
38(4), 331-334.
Marks, N. F. (1996). Flying solo at midlife: Gender, marital status, and
psychological well-being. Journal of Marriage & the Family, 58, 917-
932.
Marks, N. F. (1998). Does it hurt to care? Caregiving, work-family conflict,
203
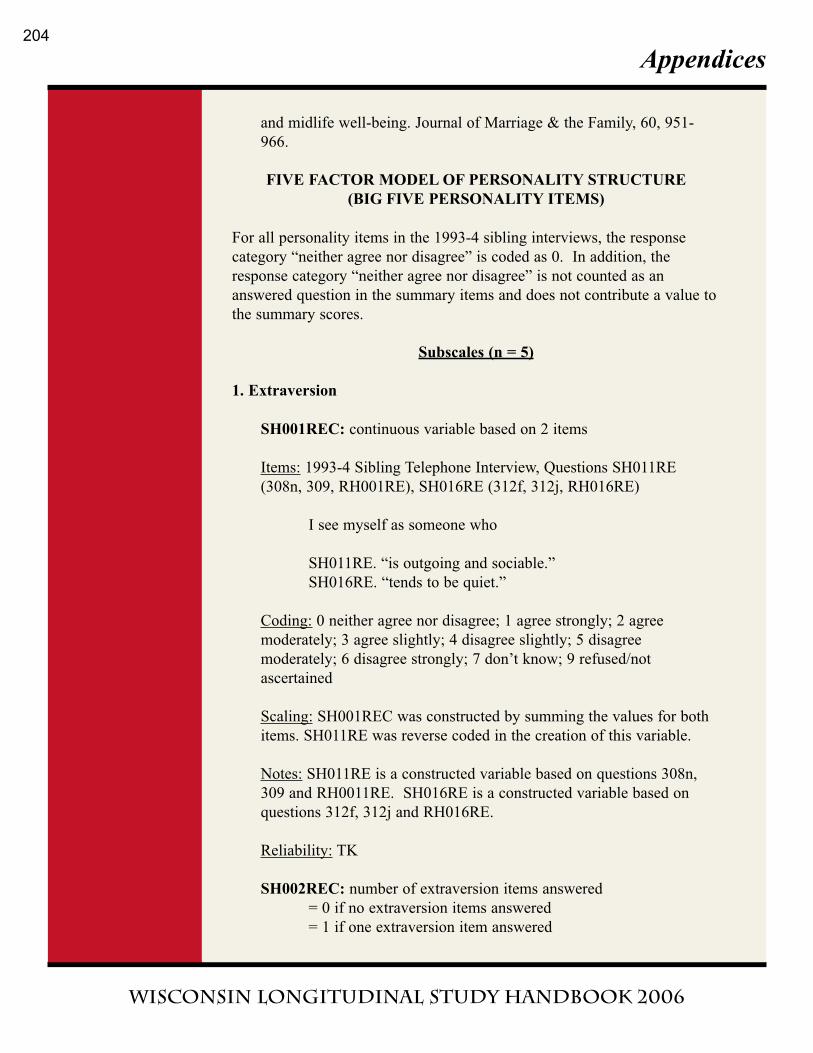
Appendices
Wisconsin Longitudinal Study handbook 2006
and midlife well-being. Journal of Marriage & the Family, 60, 951-
966.
FIVE FACTOR MODEL OF PERSONALITY STRUCTURE
(BIG FIVE PERSONALITY ITEMS)
For all personality items in the 1993-4 sibling interviews, the response
category “neither agree nor disagree” is coded as 0. In addition, the
response category “neither agree nor disagree” is not counted as an
answered question in the summary items and does not contribute a value to
the summary scores.
Subscales (n = 5)
1. Extraversion
SH001REC: continuous variable based on 2 items
Items: 1993-4 Sibling Telephone Interview, Questions SH011RE
(308n, 309, RH001RE), SH016RE (312f, 312j, RH016RE)
I see myself as someone who
SH011RE. “is outgoing and sociable.”
SH016RE. “tends to be quiet.”
Coding: 0 neither agree nor disagree; 1 agree strongly; 2 agree
moderately; 3 agree slightly; 4 disagree slightly; 5 disagree
moderately; 6 disagree strongly; 7 don’t know; 9 refused/not
ascertained
Scaling: SH001REC was constructed by summing the values for both
items. SH011RE was reverse coded in the creation of this variable.
Notes: SH011RE is a constructed variable based on questions 308n,
309 and RH0011RE. SH016RE is a constructed variable based on
questions 312f, 312j and RH016RE.
Reliability: TK
SH002REC: number of extraversion items answered
= 0 if no extraversion items answered
= 1 if one extraversion item answered
204
Appendices
Wisconsin Longitudinal Study handbook 2006
= 2 if two extraversion items answered
2. Openness
SH003REC: continuous variable based on 2 items
Items: 1993-4 Sibling Telephone Interview, Questions SH012RE (310,
310b, RH012RE), SH017RE (312m, 312p, RH017RE)
I see myself as someone who
SH012RE. “is inventive.”
SH017RE. “prefers work that is routine and simple.”
Coding: 0 neither agree nor disagree; 1 agree strongly; 2 agree
moderately; 3 agree slightly; 4 disagree slightly; 5 disagree
moderately; 6 disagree strongly; 7 don’t know; 9 refused/not
ascertained
Scaling: SH003REC was constructed by summing the values for both
items. SH012RE was reverse coded in the creation of this variable.
Notes: SH012RE is a constructed variable based on questions 310,
310b and RH012RE. SH017RE is a constructed variable based on
questions 312m, 312p and RH017RE.
Reliability: TK
SH004REC: number of openness questions answered
= 0 if no openness items answered
= 1 if one openness item answered
= 2 if two openness items answered
3. Neuroticism
SH005REC: continuous variable based on 2 items
Items: 1993-4 Sibling Telephone Interview, Questions SH013RE (310f,
310j, RH013RE), SH020RE (314m, 314p, RH020RE)
I see myself as someone who
SH013RE. “worries a lot.”
SH020RE. “is relaxed and handles stress well.”
205
Appendices
Wisconsin Longitudinal Study handbook 2006
Coding: 0 neither agree nor disagree; 1 agree strongly; 2 agree
moderately; 3 agree slightly; 4 disagree slightly; 5 disagree
moderately; 6 disagree strongly; 7 don’t know; 9 refused/not
ascertained
Scaling: SH005REC was constructed by summing the values for both
items. SH13RE was reverse coded in the creation of this variable.
Notes: SH013RE is a constructed variable based on questions 310f,
310j and RH013RE. SH020RE is a constructed variable based on
questions 314m, 314p and RH020RE.
Reliability: TK
SH006REC: number of neuroticism items answered
= 0 if no neuroticism items answered
= 1 if one neuroticism item answered
= 2 if two neuroticism items answered
4. Conscientiousness
SH007REC: continuous variable based on 2 items
Items: 1993-4 Sibling Telephone Interview, Questions SH015RE
(310s, 311, RH015RE), SH019RE (314f, 314j, RH019RE)
I see myself as someone who
SH015RE. “can be somewhat careless.”
SH019RE. “is easily distracted.”
Coding: 0 neither agree nor disagree; 1 agree strongly; 2 agree
moderately; 3 agree slightly; 4 disagree slightly; 5 disagree
moderately; 6 disagree strongly; 7 don’t know; 9 refused/not
ascertained
Scaling: SH007REC was constructed by summing the values for both
items.
Notes: SH015RE is a constructed variable based on questions 310s,
311 and RH015RE. SH019RE is a constructed variable based on
questions 314f, 314j and RH019RE.
206
Appendices
Wisconsin Longitudinal Study handbook 2006
Reliability: TK
SH008REC: number of conscientiousness items answered
= 0 if no conscientiousness items answered
= 1 if one conscientiousness item answered
= 2 if two conscientiousness items answered
5. Agreeableness
SH009REC: continuous variable based on 2 items
Items: 1993-4 Sibling Telephone Interview, Questions SH014RE
(310m, 310p, RH014RE), SH018RE (314, 314b, RH018RE)
I see myself as someone who
SH014RE. “has a forgiving nature.”
SH018RE. “tends to find fault with others.”
Coding: 0 neither agree nor disagree; 1 agree strongly; 2 agree
moderately; 3 agree slightly; 4 disagree slightly; 5 disagree
moderately; 6 disagree strongly; 7 don’t know; 9 refused/not
ascertained
Scaling: SH009REC was constructed by summing the values for both
items. SH014RE was reverse coded in the creation of this variable.
Notes: SH014RE is a constructed variable based on questions 310m,
310p and RH014RE. SH018RE is a constructed variable based on
questions 314, 314b and RH018RE.
Reliability: TK
SH010REC: number of agreeableness items answered
= 0 if no agreeableness items answered
= 1 if one agreeableness item answered
= 2 if two agreeableness items answered
Cross-Referencing
1992-3 Respondent Mail Questionnaire:
Extraversion: MH001REC, items MH003RER-MH008RER (Qs 17a,
17d, 17f, 17j, 17t, 17v)
207
Appendices
Wisconsin Longitudinal Study handbook 2006
Agreeableness: MH009REC, items MH011RER-MH016RER (Qs 17b,
17o, 17p, 17w, 17y, 17bb)
Conscientiousness: MH017REC, items MH019RER-MH024RER (Qs
17c, 17h, 17l, 17g, 17u, 17cc)
Neuroticism: MH025REC, items MH027RER-MH031RER (Qs 17i,
17m, 17r, 17x, 17z)
Openness: MH032REC, items MH034RER-MH039RER (Qs 17e, 17g,
17k, 17n, 17s, 17aa)
1992-3 Respondent Telephone Interview:
Extraversion: RH001REC, items RH011RE (Qs 308n, 309), RH016RE
(Qs 312f, 312j)
Agreeableness: RH009REC, items RH014RE (Qs 310m, 310p),
RH018RE (Qs 314, 314b)
Conscientiousness: RH007REC, items RH015RE (Qs 310s, 311),
RH019RE (Qs 314f, 314j)
Neuroticism: RH005REC, items RH013RE (Qs 310f, 310j), RH020RE
(Qs 314m, 314p)
Openness: RH003REC, items RH012RE (Qs 310, 310b), RH017RE
(Qs 312m, 312p)
1993-4 Sibling Mail Questionnaire:
Extraversion: NH001REC, items NH003RER-NH008RER (Qs 39a,
39d, 39f, 39j, 39t, 39v)
Agreeableness: NH009REC, items NH011RER-NH016RER (Qs 39b,
39o, 39p, 39w, 39y, 39bb)
Conscientiousness: NH017REC, items NH019RER-NH024RER (Qs
39c, 39h, 39l, 39q, 39u, 39cc)
Neuroticism: NH025REC, items NH027RER-NH031RER (Qs 39i,
39m, 39r, 39x, 39z)
Openness: NH032REC, items NH034RER-NH-039RER (Qs 39e, 39g,
39k, 39n. 39s, 39aa)
Source
John, O. P., Donahue, E. M., & Kentle, R. L. (1991). The "Big Five"
inventory – version 4a and 5a. Berkely, CA: Institute of Personality
and Social Research, University of California, Berkeley.
Selected Studies Using Big Five Personality Items Scales
Hauser, R. M., Kuo, H. D., & Cartmill, R. (1997). Birth order and
personality: Are there any effects? Paper Presented at the Meetings of
208
Appendices
Wisconsin Longitudinal Study handbook 2006
the Population Association of American, Washington, D.C.
Kuo, H. D. (1997). Socioeconomic status and personality in mid-life: An
application of the sibling resemblance model. Paper presented at the
Meetings of the American Sociological Association, Toronto, Canada.
DEPRESSION HISTORY
An 80% random sample was selected to be asked depression and alcohol
symptoms questions in the 1993-4 Sibling Telephone Interviews. If
SU001RE = 0, the respondent was not in this 80% sample; if SN001RE =
1, the respondent was a part of the 80% sample.
The respondent was asked whether he/she had ever had a time in his/her
life lasting two weeks or more when nearly every day he/she felt sad, blue,
depressed or when he/she lost interest in most things like work, hobbies or
things he/she usually liked to do for fun. If SU002RE = 1, the respondent
answered “yes,” that he/she has had an episode of depression; if SU002RE
= 2, the respondent answered “no,” that he/she has not had an episode of
depression. SU024REC includes only those respondents for whom
SU002RE = 1.
The respondent was asked if his/her experience with depression was always
caused by alcohol, drugs, medications or physical illness. If SU003RE = 1,
the respondent answered “yes”; if SU003RE = 2, the respondent answered
“sometimes”; if SU003RE = 3, the respondent answered “no.” SU024REC
includes only those respondents for whom SU003RE = 2 or 3.
Depression Symptoms Count
SU024REC: continuous variable based on 7 items
Items: 1993-4 Sibling Telephone Interview, Questions SU006RE
(870a, RU006RE), SU007RE (870b, RU007RE), SU008RE (870c,
RU008RE), SU009RE (870d, RU009RE), SU010RE (870e,
RU010RE), SU011RE (870f, RU011RE), SU012RE (870g, RU012RE)
SU006RE. “During this episode of depression, did the
respondent lose weight without trying to – as much
as 2 pounds a week for several weeks or as much
as 10 pounds altogether?”
SU007RE. “Did respondent have two weeks or more when
nearly every night (he/she) had trouble falling
asleep?”
209
Appendices
Wisconsin Longitudinal Study handbook 2006
SU008RE. “Did respondent have two weeks or more when
(he/she) lacked energy or felt tired all the time, even
when (he/she) had not been working very hard?”
SU009RE. “Did respondent have two weeks or more when
(he/she) felt very bad when waking up, but felt
better later in the day?”
SU010RE. “Did respondent have two weeks or more when
(he/she) lost interest in most things like work,
hobbies, or things (he/she) usually liked to do for
fun?”
SU011RE. “Did respondent have two weeks or more when
nearly every day (he/she) had a lot more trouble
concentrating than is normal?”
SU012RE. “Did respondent have two weeks or more when
(he/she) thought a lot about death – either (his/her)
own, someone else’s, or death in general?”
Coding: 1 yes; 2 no; 7 don’t know; 8 inappropriate (SU001RE = 0 or
SU002RE =1 or SU003RE = 1); 9 refused/not ascertained
Scaling: SU024REC was constructed by summing the “yes” responses
for the 7 items.
Reliability: TK/INAP?
Notes: SU024REC is a constructed variable based on questions
SU006RE, SU007RE, SU008RE, SU009RE, SU010RE, SU011RE,
SU012RE and RU024REC. SU006RE is a constructed variable based
on questions 870a and RU006RE. SU007RE is a constructed variable
based on questions 870b and RU007RE. SU008RE is a constructed
variable based on questions 870c and RU008RE. SU009RE is a
constructed variable based on questions 870d and RU009RE.
SU010RE is a constructed variable based on questions 870e and
RU010RE. SU011RE is a constructed variable based on questions
870f and RU011RE. SU012RE is a constructed variable based on
questions 870g and RU012RE.
Cross-Referencing
1992-3 Respondent Mail Questionnaire: These questions were not asked.
1992-3 Respondent Telephone Interview: RU024REC, items RU006RE-
RU012RE (Qs 870a-870g)
210
Appendices
Wisconsin Longitudinal Study handbook 2006
1993-4 Sibling Mail Questionnaire: These questions were not asked.
Source
TK
Selected Studies Using Depression Symptoms Scale
Carr, D. (1997). The fulfillment of career dreams at midlife: Does it matter
for women’s mental health. Journal of Health and Social Behaviour,
38(4), 331-344.
Singer, B. H., Ryff, C. D., Carr, D., & Magee, W. (1998). Linking life
histories and mental health: A person-centered strategy. Sociological
Methodology, 28, 1-51.
ALCOHOL SYMPTOMS
An 80% random sample was selected to be asked depression and alcohol
symptoms questions in the 1993-4 Sibling Telephone Interviews. If
SU001RE = 0, the respondent was not in this 80% sample; if SU001RE =
1, the respondent was a part of the 80% sample.
Respondent was asked whether he/she has ever drunk alcoholic beverages
such as beer, wine, liquor, or mixed alcoholic drinks. If SU025RE = 1, the
respondent answered “yes,” he/she has drunk alcoholic beverages; if
SU025RE = 2, the respondent answered “no,” he/she has never drunk
alcoholic beverages. SU034REC includes only those respondents for
whom SU025 = 1.
Alcohol Symptoms Count
SU034REC: continuous variable based on 5 items
Items: 1993-4 Sibling Telephone Interview, Questions SU030RE (876,
RU030RE), SU031RE (876f, RU031RE), SU032RE (876m,
RU032RE), SU033RE (876s, RU033RE), SU035RE (878, RU035RE)
SU030RE. “Has respondent ever felt bad or guilty about
drinking?”
SU031RE. “Have people ever annoyed respondent by
criticizing respondent’s drinking?”
SU032RE. “Has respondent’s drinking ever caused a problem
211
Appendices
Wisconsin Longitudinal Study handbook 2006
at work?”
SU033RE. “Has respondent’s drinking ever created problems
between respondent and spouse, children, parents,
or other near relatives?”
SU035RE. “Has respondent ever gone to anyone for help about
drinking?”
Coding: 1 yes; 2 no; 7 don’t know; 8 inappropriate (SU001RE = 1 or
SU025RE = 2); 9 refused/not ascertained
Scaling: SU034REC was constructed by summin the “yes” responses
for the five items.
Reliability: TK/INAP?
Notes: SU034REC is a constructed variable based on questions 876,
876f, 876m, 876s, 878, 878a, RU034REC. SU030RE is a constructed
variable based on questions 876 and RU030RE. SU031RE is a
constructed variable based on questions 876f and RU031RE.
SU032RE is a constructed variable based on questions 876m and
RU032RE. SU033RE is a constructed variable based on questions
876s and RU033RE. SU035RE is a constructed variable based on
questions 878 and RU035RE.
Cross-Referencing
1992-3 Respondent Mail Questionnaire: These questions were not asked.
1992-3 Respondent Telephone Interview: RU034REC, items RU030RE-
RU033RE, RU035RE (Qs 876, 876f, 876m, 876s, 878)
1993-4 Sibling Mail Questionnaire: These questions were not asked.
Source
Seltzer M. L. (1971). The Michigan Alcoholism Screening Test: The quest
for a new diagnostic instrument. American Journal of Psychiatry,
127(12), 1653-1658.
Selected Studies Using Alcohol Symptoms Scale
Krahn, D., Freese, J., Hauser, R. M., Barry, K., & Goodman, B. (2003).
Alcohol use and cognition at mid-life: The importance of adjusting for
212
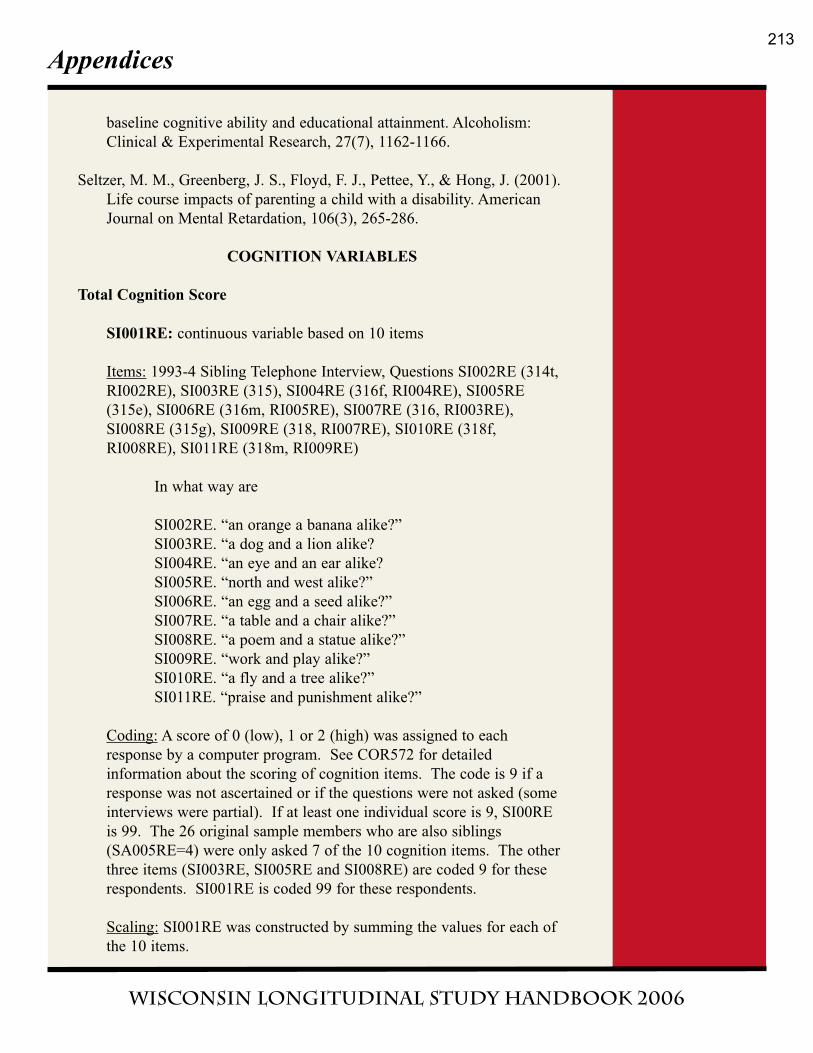
Appendices
Wisconsin Longitudinal Study handbook 2006
baseline cognitive ability and educational attainment. Alcoholism:
Clinical & Experimental Research, 27(7), 1162-1166.
Seltzer, M. M., Greenberg, J. S., Floyd, F. J., Pettee, Y., & Hong, J. (2001).
Life course impacts of parenting a child with a disability. American
Journal on Mental Retardation, 106(3), 265-286.
COGNITION VARIABLES
Total Cognition Score
SI001RE: continuous variable based on 10 items
Items: 1993-4 Sibling Telephone Interview, Questions SI002RE (314t,
RI002RE), SI003RE (315), SI004RE (316f, RI004RE), SI005RE
(315e), SI006RE (316m, RI005RE), SI007RE (316, RI003RE),
SI008RE (315g), SI009RE (318, RI007RE), SI010RE (318f,
RI008RE), SI011RE (318m, RI009RE)
In what way are
SI002RE. “an orange a banana alike?”
SI003RE. “a dog and a lion alike?
SI004RE. “an eye and an ear alike?
SI005RE. “north and west alike?”
SI006RE. “an egg and a seed alike?”
SI007RE. “a table and a chair alike?”
SI008RE. “a poem and a statue alike?”
SI009RE. “work and play alike?”
SI010RE. “a fly and a tree alike?”
SI011RE. “praise and punishment alike?”
Coding: A score of 0 (low), 1 or 2 (high) was assigned to each
response by a computer program. See COR572 for detailed
information about the scoring of cognition items. The code is 9 if a
response was not ascertained or if the questions were not asked (some
interviews were partial). If at least one individual score is 9, SI00RE
is 99. The 26 original sample members who are also siblings
(SA005RE=4) were only asked 7 of the 10 cognition items. The other
three items (SI003RE, SI005RE and SI008RE) are coded 9 for these
respondents. SI001RE is coded 99 for these respondents.
Scaling: SI001RE was constructed by summing the values for each of
the 10 items.
213
Appendices
Wisconsin Longitudinal Study handbook 2006
Reliability: TK/INAP?
Notes: Items SI002RE-SI011RE are ten of the fourteen items from the
Wechsler Adult Intelligence Scale (WAIS). SI009RE is a constructed
variable based on questions 314t and RI002RE. SI004RE is a
constructed variable based on questions 316f and RI004RE. SI006RE
is a constructed variable based on questions 316m and RI005RE.
SI007RE is a constructed variable based on questions 316 and
RI003RE. SI009RE is a constructed variable based on questions 318
and RI007RE. SI010RE is a constructed variable based on questions
318f and RI008RE. SI011RE is a constructed variable based on
questions 318m and RI009RE.
Cross-Referencing
1992-3 Respondent Mail Questionnaire:
1992-3 Respondent Telephone Interview: RI001RE, items RI002RE-
RI009RE (Qs 314t, 316, 316f, 316m, 316s, 318, 318f)
1993-4 Sibling Mail Questionnaire:
Source
Weschler, D. (1981). Wechsler Adult Intelligence Scale – Revised manual.
San Antonio, TX: The Psychological Corporation.
Selected Studies Using Cognition Items Scale
Hauser, R. M., Sheridan, J. T., & Warren, J. R. (1999). Socioeconomic
achievements of siblings in the life course: New findings from the
WLS. Research on Aging, 21(2), 338-378.
Krahn, D., Freese, J., Hauser, R. M., Barry, K., & Goodman, B. (2003).
Alcohol use and cognition at mid-life: The importance of adjusting for
baseline cognitive ability and educational attainment. Alcoholism:
Clinical & Experimental Research, 27(7), 1162-1166.
214
Appendices
Wisconsin Longitudinal Study handbook 2006
215
1
Part 2: A descriptive roadmap to the data indicating best measures for users.
THE CLASS OF 1957 IN THEIR MID-60S: A FIRST LOOK1
Robert M. Hauser and Carol L. Roan, Editors
Contributing Authors:
Megan Andrew, Shlomit Bornstein, Pascale Carayon, Deborah Carr, Heejeong Choi, John Delamater,
Heather Doescher, Kathryn Flynn, Carl Frederick, Dan Fischer, Jeremy Freese,
Hanna Grol-Prokopczyk, Robert M. Hauser, Taissa S. Hauser, Reiping Huang, Jeong Hwa Ho,
Peter Hoonakker, Dmitry Khodyakov, David Merrill, Luke Piefer, Jane Piliavin, Tetyana Pudrovska,
Elizabeth Rainwater, James Raymo, Carol Roan, Erin Ruel, Diane Shinberg, Kamil Sicinski,
Erica Siegl, Kristen Springer, John Robert Warren, Erin Wicke, Alexandra Wright, and James Yonker
1 This research uses data from the Wisconsin Longitudinal Study (WLS) of the University of Wisconsin-Madison. Since 1991, the WLS has been supported principally by the National Institute on Aging (AG-9775 and AG-21079), with additional support from the Vilas Estate Trust, the National Science Foundation, the Spencer Foundation, and the Graduate School of the University of Wisconsin-Madison. A public use file of data from the Wisconsin Longitudinal Study is available from the Wisconsin Longitudinal Study, University of Wisconsin-Madison, 1180 Observatory Drive, Madison, Wisconsin 53706 and at http://www.ssc.wisc.edu/~wls/data/. The opinions expressed herein are those of the authors. We thank Linda Jordan, Joe Savard, Jeremy Iverson, and Rachel Krause for research and technical support.
2
Preface
This paper presents the results from the latest round of data collection for the nearly 50 year-
old Wisconsin Longitudinal Study (WLS).2 The results primarily update the lives of the graduates
since our last interviews with them in 1993. Thus, those who are new to WLS should also read the
report on the overview and findings from our previous round of interviews and surveys.3 The
findings presented in this report are the results of a collaboration of a research team that over time has
involved many hundreds of researchers, students and interviewers. However, our most important
collaboration has been with our WLS participants. Over the years, we have not only maintained ties
with most of the surviving respondents of the original class of ’57 sample, we have also talked with
their siblings, their spouses and their sibling’s spouses. We are extremely grateful for their time,
energy, and continued enthusiasm for this project.
2 Wisconsin Longitudinal Study (WLS) [graduates] Version 11.0 Preliminary Release: 2004. [machine-readable data file] / Hauser, Robert M; Hauser, Taissa S. [principal investigators]. Madison, WI: University of Wisconsin-Madison, WLS. [distributor]; <http://www.ssc.wisc.edu/~wls/documentation/> 3 Hauser, Robert M., Carr, Deborah, Hauser, Taissa S., Hayes, Jeffrey , Krecker, Margaret, Kuo, Hsiang-Hui Daphne, Magee, William , Presti, John , Shinberg, Diane, Sweeney, Megan , Thompson-Colon, Theresa, Uhrig, S.C. Noah, Warren, John Robert. Revised April 1994. "The Class of 1957 after 35 Years: Overview and Preliminary Findings." Madison: University of Wisconsin-Madison. (http://www.ssc.wisc.edu/cde/cdewp/93-17.pdf)
3
Abstract
The Wisconsin Longitudinal Study (WLS) is a long-term study of more than 10,000 women
and men who graduated from Wisconsin high schools in 1957 and who now have been followed for 47
years, to ages 64-65. We briefly describe the contents of our 2003-2005 round of interviews and
surveys, the process of our data collection, and our research questions. Using preliminary data we
update the lives of the graduates and their families. We cover a broad array of topics with an
emphasis on family life, economic status, work, retirement, health care, mental and physical health and
well-being, social participation, and end of life plans.
4
THE CLASS OF 1957 IN THEIR MID-60S: A FIRST LOOK
Overview and History
The Wisconsin Longitudinal Study (WLS) is a long-term study of a random sample of men and
women who graduated from Wisconsin high schools in 1957. Begun as a study of graduates’ plans for
education after high school, the WLS has now been following the lives of its participants for nearly 5
decades. The questions asked of participants have shifted far away from post-high school plans to
include broad array of topics, but the study has maintained an interest in the life-long consequences of
social background and adolescent experiences. The first two rounds of longitudinal survey data were
collected from graduates and their parents in 1964 and 1975. Those data provide a full record of social
background, high school curriculum, youthful aspirations and social influences, schooling, military
service, family formation, labor market experiences, and social participation. These early survey data
were supplemented by earnings of parents from state tax records, academic ability test scores and rank
in high school class, and characteristics of high schools and colleges, employers, industries, and
communities of residence. In 1977, we surveyed a randomly selected sample of approximately 2000
of the graduates’ sisters and brothers. Asking the siblings the same questions we asked the graduates
allowed us to study how a common social background influences life events. In 1992-93 the WLS
returned to the field, adding a mail survey in addition to a new wave of telephone interviews. Along
with interviewing the original graduates we expanded the sibling sample. Nearly 5000 siblings
participated in telephone and mail surveys, carried out mainly in 1994. The 1992-94 round of
interviews updated our measures of marital status, child-rearing, education, labor force participation,
jobs and occupations, social participation, and future aspirations and plans among graduates and
5
siblings. Content was expanded to include psychological well-being, mental and physical health,
wealth, household economic transfers, and social comparisons and exchange relationships with parents,
siblings, and children.
In the 2004 wave of the WLS, items have been divided between telephone and mail surveys; as
in 1992-94, a few items appear in both instruments to check reliability or to experiment with
alternative item wording.4 The division of content between the telephone and mail instruments is based
on the complexity of branching structures, the need to bound queries with prior information, and
various aspects of item format. Telephone interviews used computer-assisted (CATI) technology.
Information essential to bounded segments of the telephone interview, such as name of the employer
at the last interview and rosters of children's and siblings' names, were transferred from files of the
1992-94 interviews and entered in the interview schedule database. Excepting this essential
information, in keeping with our established confidentiality policy, interviewers knew nothing about
respondents.
The content of the main graduate telephone survey for the 2004 wave covers:
• An update of education received from the previous wave;
• An update of marital history from the previous wave;
• An enumeration of children, and a screen for non-normative children;
• An update on the status of parents, questions on parents health and parent relationship;
• An update of household composition and member disability status; 4 A note about dates: The most recent round of the WLS graduate interviews was in the field from July of 2003 through June 2005. In order to avoid the cumbersome notation 2003-2005, this paper will refer to the year of this study as 2004. Similarly, the 1992-1994 wave of WLS will simply be referred to as 1993.
6
• A health section covering self-reported health, the Health Utilities Index, reports of specific
conditions, a disability screener and questions on care received;
• Detailed employment history since last interview, including information on current or last job
characteristics;
• Information on pensions;
• Retirement attitudes,
• Detailed information on income, assets and intergenerational transfers;
• Information on types of health insurance, characteristics of plans and changes to plans in the
past 12 months;
• Usual source of medical care (type and location of current and past providers);
• Volunteer activity;
• Alcohol history,
• Religious preference and attendance and spouses’ preference;
• Internet use;
• A lifetime history of significant depression; and symptoms of worst depressive episode and
duration between episodes;
• Psychological well-being (in a very small subsample);
• End of life preparations and reactions to loss of parent or spouse;
• At various points throughout the interview: a series of short cognitive exercises, assessing
letter/category fluency, similarities, immediate and delayed recall, and digit ordering.
The companion mail survey includes sections on:
7
• Physical and emotional health, symptoms, chronic conditions, activity, medical services
received, and family health history, smoking, sleep behavior, alcohol use;
• Social background
• Values & attitudes (masculinity scale, personality characteristics, optimism, mattering, social
identities, and psychological well-being)
• Work & family (subjective social standing, importance of job characteristics, conflict between
work and family, job conditions)
• Dealing with problems (dealing with family crises, aging parents, problems with the law,
handling stress, serious life events, and coping style
• Religion & spirituality
• Current psychological states {Depression/depressive symptoms, hostility, anger, anxiety,
current psychological well-being)
• Social relationships including care giving and receiving; parental treatment while growing up;
• Patient – physician relationship: communication, trust and decision-making;
• Health system perceptions & experience, difficulties and delays in obtaining health care;
• Use of health services –covered and not covered by insurance, and out of pocket prescription
and medical service costs;
• Use of long term care insurance;
• Perceptions about future health, disability and death;
• Marriage;
• Social and civic participation, volunteering and internet use.
8
As in the 1993 WLS surveys, the University of Wisconsin Survey Center (UWSC) carried out
survey operations and coding. Each phase of survey operations –from tracing through coding–was
carried out separately for 10 randomly selected replicate sub-samples within each major component of
the design (graduates, siblings, and their spouses). The replicate structure enabled the investigators to
monitor the success of field operations early in the data collection process and to smooth the balance
of easier and more difficult interviews across the field period. It also permitted them to vary survey
content over time among well-defined random subsamples of participants. Pretests of survey
procedures were conducted with individuals who are part of the population from which the WLS was
drawn, but not part of the WLS graduate sample. Using information from high school reunion booklets,
a sufficient number of non-sample individuals were located for early pretest activities.
Graduates received a letter describing the upcoming study and inviting their participation. They
were also directed to a public web-site describing the study. All instruments and operations were
cleared by the Institutional Review Board at the University of Wisconsin-Madison. Consent was
obtained by telephone at the start of the interview. Participants were assured of confidentiality and
informed that the study had obtained a certificate of confidentiality from the Federal Government. In
addition participants were asked if the interview could be recorded. Recordings are available for the
vast majority of telephone interviews, and they have been invaluable for quality assurance purposes.
Almost 85 percent of living graduates participated in the telephone phase of the 2004 surveys. After
successful completion of the telephone portion of the interview, participants were sent the 50-page
self-administered mail questionnaire with two crisp five-dollar bills clipped to the front page. Those
who did not return their questionnaire in a timely fashion received up to two more mailings and one,
final telephone contact to encourage them to mail back their questionnaires. Among these participants,
9
88 percent completed the mail instrument. At the end of the field period, some reluctant participants
were mailed copies of a compact disk, Billboard Magazine’s Greatest Hits of 1957, and that token gift
was successful in increasing the final response rate. Also, after all other field operations were
completed, mail questionnaires were sent to all individuals who had declined to participate in the
telephone interviews, and they were completed by almost 40 percent of the telephone non-participants.
Those instruments included updates of key demographic information.
Sample and Response Rates
The WLS sample is broadly representative of white, non-Hispanic American men and women
who have completed at least a high school education. Among Americans aged 65 in 2004,
approximately 66 percent were non-Hispanic white persons who completed at least 12 years of
schooling. Some strata of American society are not well represented. The WLS sample is mainly of
German, English, Irish, Scandinavian, Polish, or Czech ancestry. It is estimated that about 75 percent
of Wisconsin youth graduated from high school in the late 1950s – everyone in the primary WLS
sample graduated from high school. Minorities are not well-represented: there is only a handful of
African American, Hispanic, or Asian persons in the sample. About 19 percent of the WLS sample is
of farm origin, and that is consistent with national estimates of persons of farm origin in cohorts born
in the late 1930s.
10
Our survey instruments have been extremely well received by the graduates and their family
members. Figure 1shows the response rates for each round of the survey through the 2004 graduate
telephone survey.
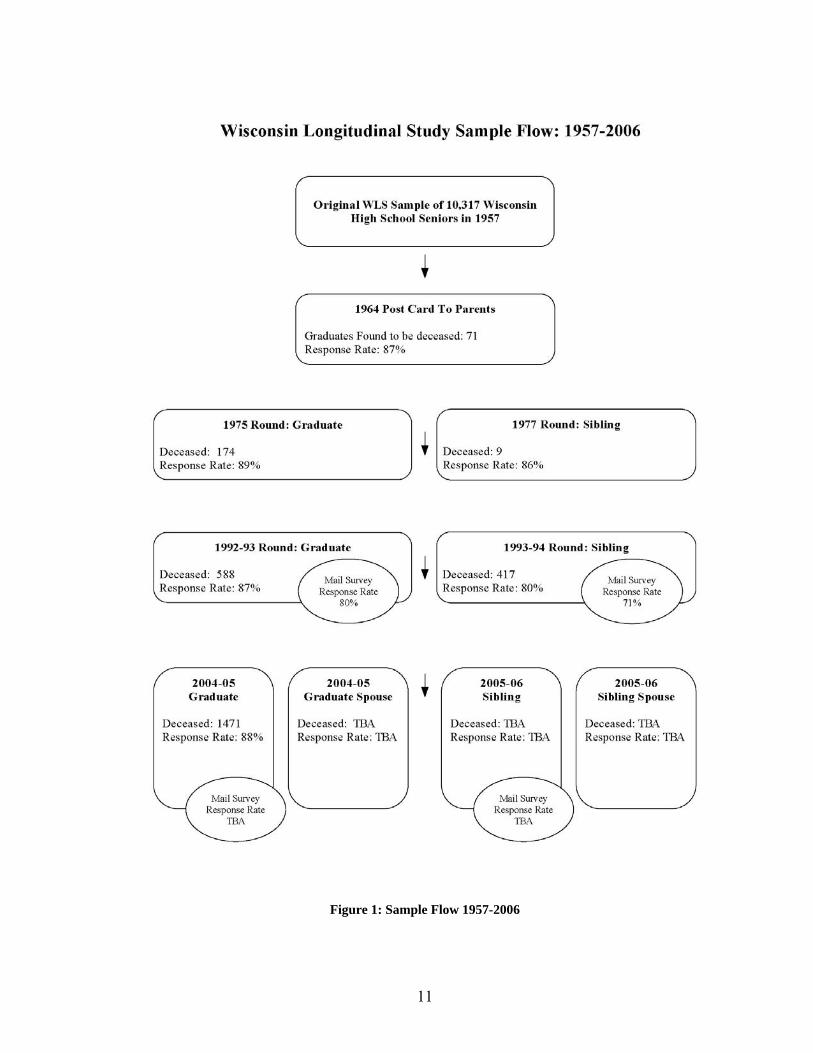
11
Figure 1: Sample Flow 1957-2006
12
Research Overview
Our research agenda focuses on a set of processes – the accumulation of experiences and
outcomes across the life course during the last half of the 20th century and the beginning of the 21st
century. It addresses a broad array of questions through a set of interrelated research projects about the
life course of WLS participants. The defining features of the enterprise are the facts that we have
already observed this cohort for almost half a century and that we can invest in additional observations
– social, economic, behavioral, and biomedical – for decades to come.
Our work seeks the answers to many questions. How will the large cohorts now reaching
midlife pass through the remaining decades of their lives? Which women and men will be “healthy,
wealthy, and wise,” and which will be less fortunate in their later years? What affects access to and
use of medical care among the near elderly? How does the quality of life among the elderly depend on
conditions and experiences in childhood, youth, and midlife? How do the effects of social origins and
academic success play out in later life? What are the cumulative effects of job characteristics and
working conditions? What vocational or social activities lead to better cognitive and psychological
functioning among the aging? How do life trajectories affect brain structure and activation? When and
how do the near elderly begin to prepare for their own deaths? How – and for how long – are the lives
of parents disrupted by disability or death among their own children? How do family structure and
history affect the transition to retirement?
We also use the WLS to investigate the process of collecting data. Most participants gave
permission to record their entire telephone interview while a smaller proportion agreed to record only
13
the questions on cognition. The audio files allow us to learn more about the interactions between
participants and interviewers. We may also use this information as an additional measure of cognitive
functioning. Because we collect information through telephone interviews and mail instruments we are
able to test for method effects on some of our measures, including psychological well-being and self-
rated general health. While the WLS is a study, and not primarily a data-collection service, data from
the WLS are thoroughly cleaned and documented, and – without violating the privacy and
confidentiality of research participants – they are available to qualified researchers beyond core project
investigators.
Graduate Mortality -- Elizabeth Rainwater
Death has claimed a modest fraction of the class of 1957 (12.6 percent) [livgrad], but most
members of the class are alive and well. Between 1957 and 2004, we know that 738 male and 465
female graduates have died. We were able to locate and obtain date of death for almost all of these
individuals and to learn cause of death for 294 men and 335 women in the National Death Index.5 The
major causes of death are cancers (41 percent of female death and 45 percent of male deaths), diseases
of the circulatory system, e.g., heart disease and stroke (33 percent of female deaths and 27 percent of
male deaths), and injuries (ten percent of male deaths, eight percent of female deaths).
Preliminary analyses have been performed on differential mortality of graduates. We have
educational attainment information from 1993, 1975, or 1964 for 1100 of the 1203 graduates who have
5 Special security procedures are in place to maintain the confidentiality of information about specific dates and causes of death.
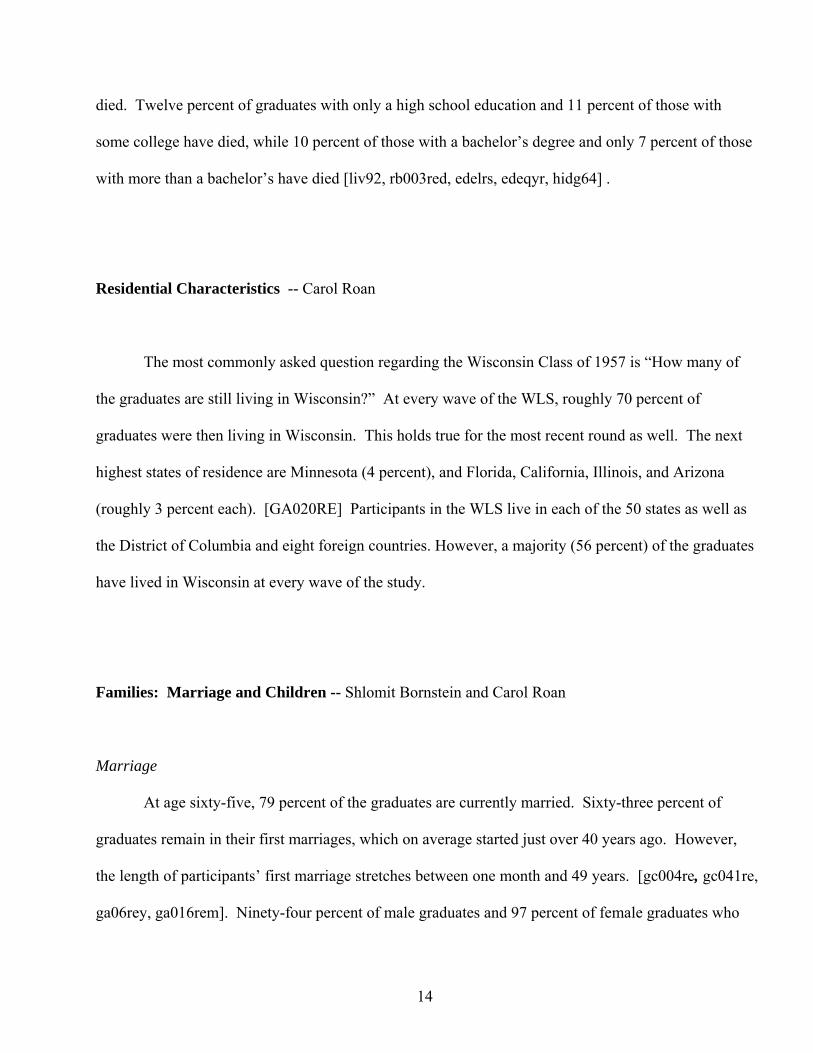
14
died. Twelve percent of graduates with only a high school education and 11 percent of those with
some college have died, while 10 percent of those with a bachelor’s degree and only 7 percent of those
with more than a bachelor’s have died [liv92, rb003red, edelrs, edeqyr, hidg64] .
Residential Characteristics -- Carol Roan
The most commonly asked question regarding the Wisconsin Class of 1957 is “How many of
the graduates are still living in Wisconsin?” At every wave of the WLS, roughly 70 percent of
graduates were then living in Wisconsin. This holds true for the most recent round as well. The next
highest states of residence are Minnesota (4 percent), and Florida, California, Illinois, and Arizona
(roughly 3 percent each). [GA020RE] Participants in the WLS live in each of the 50 states as well as
the District of Columbia and eight foreign countries. However, a majority (56 percent) of the graduates
have lived in Wisconsin at every wave of the study.
Families: Marriage and Children -- Shlomit Bornstein and Carol Roan
Marriage
At age sixty-five, 79 percent of the graduates are currently married. Sixty-three percent of
graduates remain in their first marriages, which on average started just over 40 years ago. However,
the length of participants’ first marriage stretches between one month and 49 years. [gc004re, gc041re,
ga06rey, ga016rem]. Ninety-four percent of male graduates and 97 percent of female graduates who
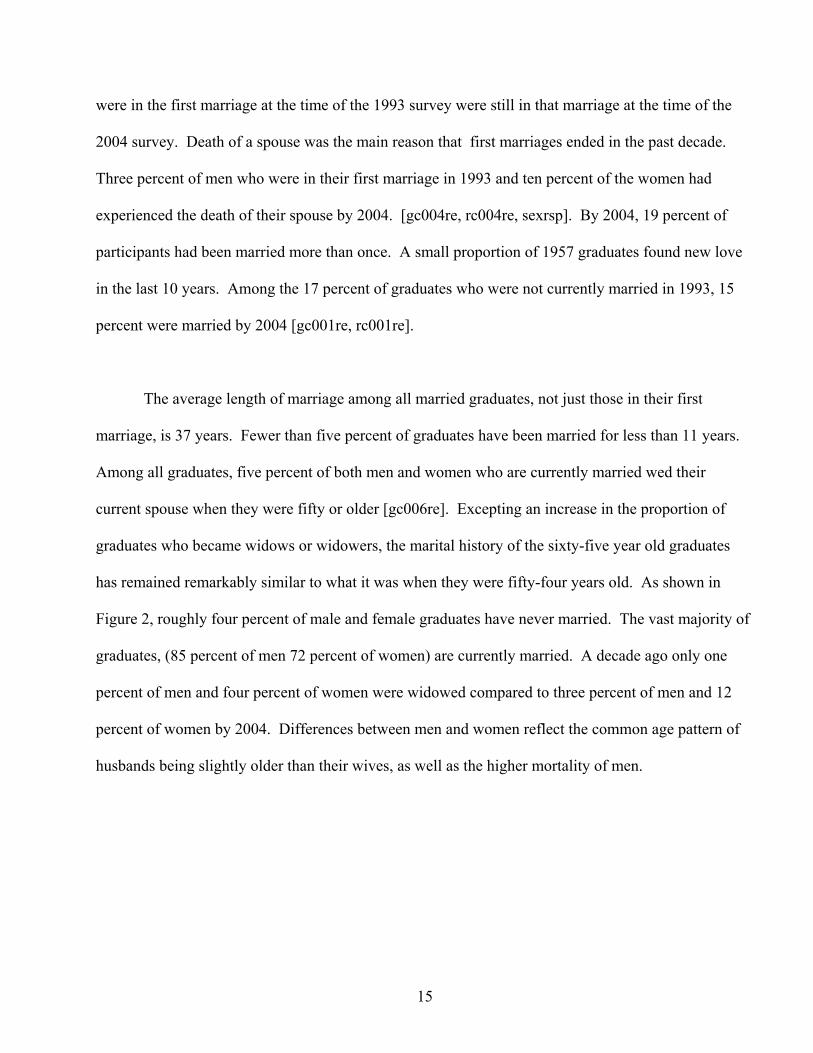
15
were in the first marriage at the time of the 1993 survey were still in that marriage at the time of the
2004 survey. Death of a spouse was the main reason that first marriages ended in the past decade.
Three percent of men who were in their first marriage in 1993 and ten percent of the women had
experienced the death of their spouse by 2004. [gc004re, rc004re, sexrsp]. By 2004, 19 percent of
participants had been married more than once. A small proportion of 1957 graduates found new love
in the last 10 years. Among the 17 percent of graduates who were not currently married in 1993, 15
percent were married by 2004 [gc001re, rc001re].
The average length of marriage among all married graduates, not just those in their first
marriage, is 37 years. Fewer than five percent of graduates have been married for less than 11 years.
Among all graduates, five percent of both men and women who are currently married wed their
current spouse when they were fifty or older [gc006re]. Excepting an increase in the proportion of
graduates who became widows or widowers, the marital history of the sixty-five year old graduates
has remained remarkably similar to what it was when they were fifty-four years old. As shown in
Figure 2, roughly four percent of male and female graduates have never married. The vast majority of
graduates, (85 percent of men 72 percent of women) are currently married. A decade ago only one
percent of men and four percent of women were widowed compared to three percent of men and 12
percent of women by 2004. Differences between men and women reflect the common age pattern of
husbands being slightly older than their wives, as well as the higher mortality of men.
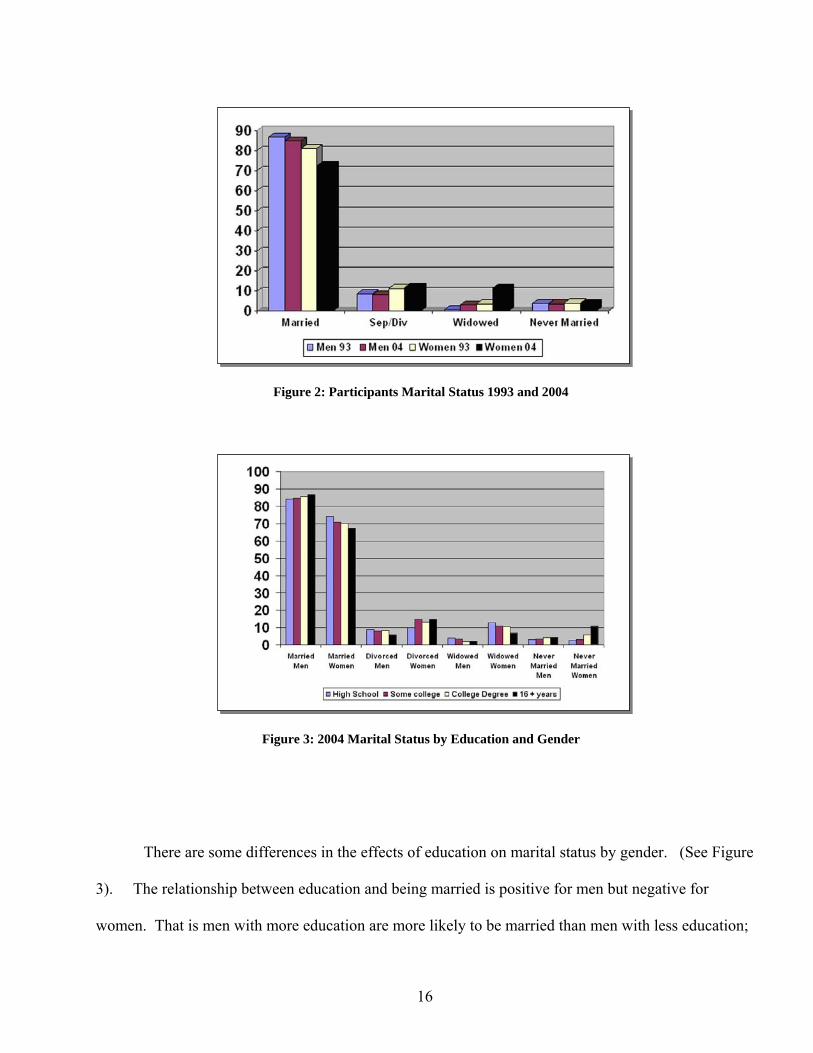
16
There are some differences in the effects of education on marital status by gender. (See Figure
3). The relationship between education and being married is positive for men but negative for
women. That is men with more education are more likely to be married than men with less education;
Figure 2: Participants Marital Status 1993 and 2004
Figure 3: 2004 Marital Status by Education and Gender
17
but women with more education are less likely to be married. The effect of having a post-graduate
degree on being never married for women is especially large among this cohort of women.
Keeping in mind that the majority of the graduates have been married for more than 40 years, it
is not surprising that almost all married participants (98 percent) say that they and their spouses share
“somewhat similar” (40 percent) or “very similar” (58 percent) views in terms of their outlook on life.
Unlike 1993 when women were slightly more likely than men to report sharing very similar views
with their spouse, no gender differences were found in 2004. Post-college educated men and women
are most likely to report sharing very similar views with their spouses (68 percent) while high school
educated men and women are least likely to do so (55 percent) [gc039re by gb103red, gc001re,
ga001re]. In terms of closeness to spouse, 83 percent reported being “very close,” and 15 percent
reported being “somewhat close” [gc040re]. The results were similar for men and women and across
education groups although post-graduate women report very similar views slightly more often (87
percent) than other women (83 percent) [gc040re by gb103red, gc001re, ga001re]. Because the
graduates’ spouses were also asked if they shared views when it comes to outlook on life and how
close they felt to their spouse, we can compare the spouses’ perceptions. Figure 4 shows that there is
high agreement between husbands and wives on whether or not they share similar views. Ninety-five
percent of couples report sharing “very similar” or “somewhat similar views.” Within the WLS
sample there are very few couples that “agree to disagree.” Only 11 couples report having views that
are either “not at all similar views” or “not very similar.”
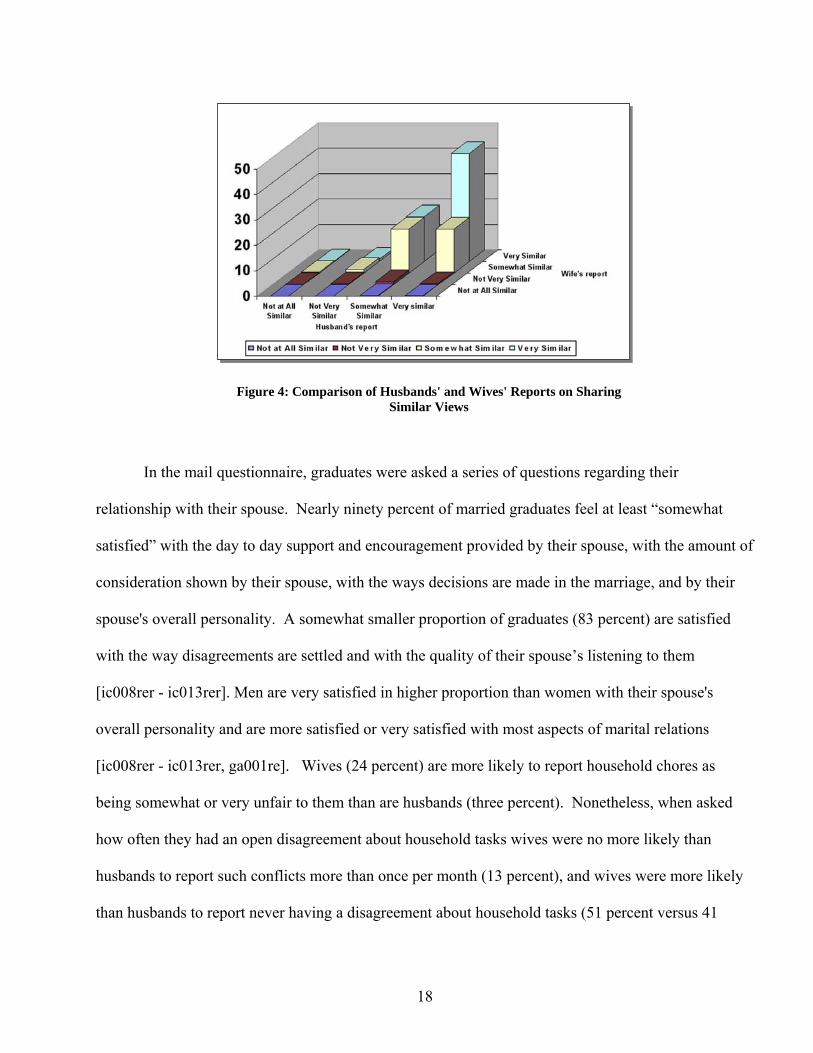
18
In the mail questionnaire, graduates were asked a series of questions regarding their
relationship with their spouse. Nearly ninety percent of married graduates feel at least “somewhat
satisfied” with the day to day support and encouragement provided by their spouse, with the amount of
consideration shown by their spouse, with the ways decisions are made in the marriage, and by their
spouse's overall personality. A somewhat smaller proportion of graduates (83 percent) are satisfied
with the way disagreements are settled and with the quality of their spouse’s listening to them
[ic008rer - ic013rer]. Men are very satisfied in higher proportion than women with their spouse's
overall personality and are more satisfied or very satisfied with most aspects of marital relations
[ic008rer - ic013rer, ga001re]. Wives (24 percent) are more likely to report household chores as
being somewhat or very unfair to them than are husbands (three percent). Nonetheless, when asked
how often they had an open disagreement about household tasks wives were no more likely than
husbands to report such conflicts more than once per month (13 percent), and wives were more likely
than husbands to report never having a disagreement about household tasks (51 percent versus 41
Figure 4: Comparison of Husbands' and Wives' Reports on Sharing Similar Views
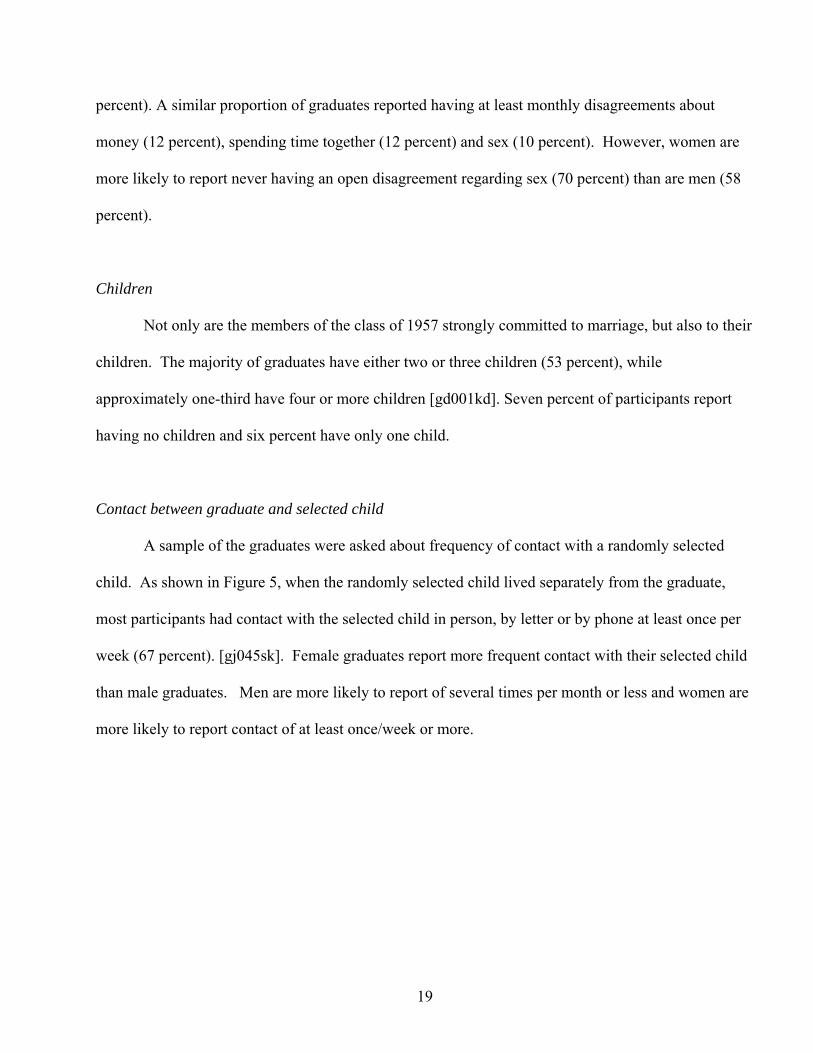
19
percent). A similar proportion of graduates reported having at least monthly disagreements about
money (12 percent), spending time together (12 percent) and sex (10 percent). However, women are
more likely to report never having an open disagreement regarding sex (70 percent) than are men (58
percent).
Children
Not only are the members of the class of 1957 strongly committed to marriage, but also to their
children. The majority of graduates have either two or three children (53 percent), while
approximately one-third have four or more children [gd001kd]. Seven percent of participants report
having no children and six percent have only one child.
Contact between graduate and selected child
A sample of the graduates were asked about frequency of contact with a randomly selected
child. As shown in Figure 5, when the randomly selected child lived separately from the graduate,
most participants had contact with the selected child in person, by letter or by phone at least once per
week (67 percent). [gj045sk]. Female graduates report more frequent contact with their selected child
than male graduates. Men are more likely to report of several times per month or less and women are
more likely to report contact of at least once/week or more.
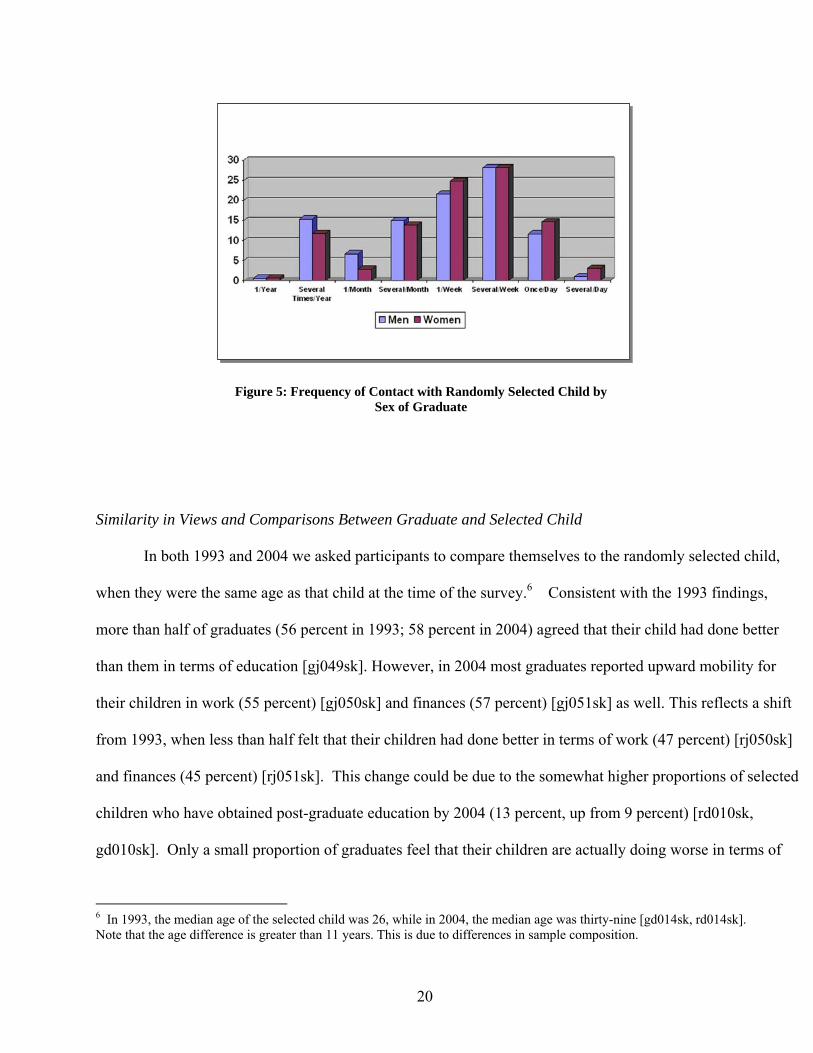
20
Similarity in Views and Comparisons Between Graduate and Selected Child
In both 1993 and 2004 we asked participants to compare themselves to the randomly selected child,
when they were the same age as that child at the time of the survey.6 Consistent with the 1993 findings,
more than half of graduates (56 percent in 1993; 58 percent in 2004) agreed that their child had done better
than them in terms of education [gj049sk]. However, in 2004 most graduates reported upward mobility for
their children in work (55 percent) [gj050sk] and finances (57 percent) [gj051sk] as well. This reflects a shift
from 1993, when less than half felt that their children had done better in terms of work (47 percent) [rj050sk]
and finances (45 percent) [rj051sk]. This change could be due to the somewhat higher proportions of selected
children who have obtained post-graduate education by 2004 (13 percent, up from 9 percent) [rd010sk,
gd010sk]. Only a small proportion of graduates feel that their children are actually doing worse in terms of
6 In 1993, the median age of the selected child was 26, while in 2004, the median age was thirty-nine [gd014sk, rd014sk]. Note that the age difference is greater than 11 years. This is due to differences in sample composition.
Figure 5: Frequency of Contact with Randomly Selected Child by Sex of Graduate
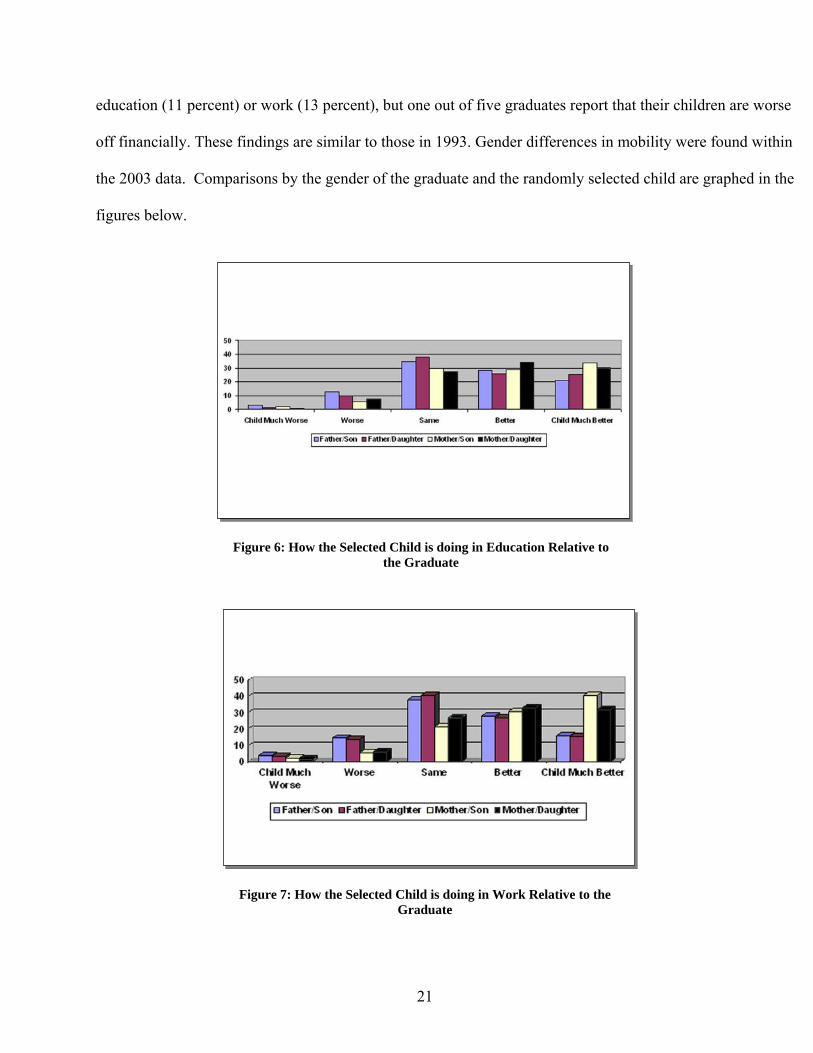
21
education (11 percent) or work (13 percent), but one out of five graduates report that their children are worse
off financially. These findings are similar to those in 1993. Gender differences in mobility were found within
the 2003 data. Comparisons by the gender of the graduate and the randomly selected child are graphed in the
figures below.
Figure 6: How the Selected Child is doing in Education Relative to the Graduate
Figure 7: How the Selected Child is doing in Work Relative to the Graduate
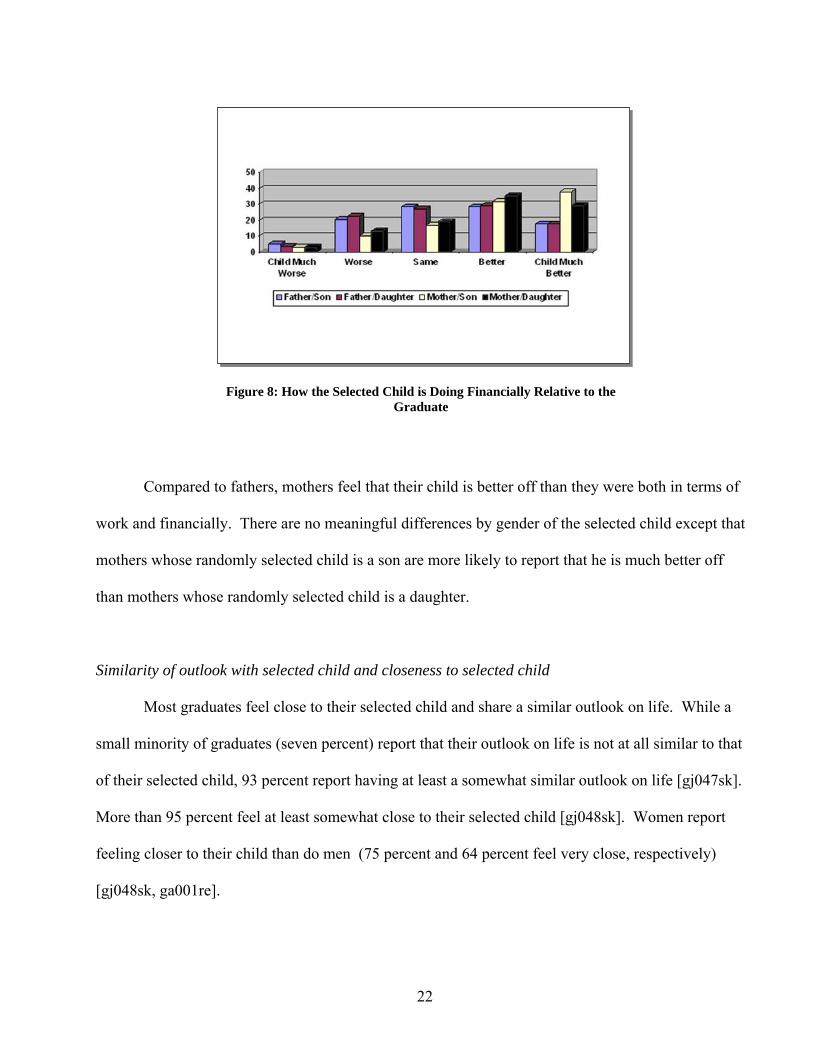
22
Compared to fathers, mothers feel that their child is better off than they were both in terms of
work and financially. There are no meaningful differences by gender of the selected child except that
mothers whose randomly selected child is a son are more likely to report that he is much better off
than mothers whose randomly selected child is a daughter.
Similarity of outlook with selected child and closeness to selected child
Most graduates feel close to their selected child and share a similar outlook on life. While a
small minority of graduates (seven percent) report that their outlook on life is not at all similar to that
of their selected child, 93 percent report having at least a somewhat similar outlook on life [gj047sk].
More than 95 percent feel at least somewhat close to their selected child [gj048sk]. Women report
feeling closer to their child than do men (75 percent and 64 percent feel very close, respectively)
[gj048sk, ga001re].
Figure 8: How the Selected Child is Doing Financially Relative to the Graduate
23
Non-normative Parenting – David Merrill, Heather Doescher
A number of questions were asked in the 2004 survey in an effort to identify parents who have
a child with either a developmental disability or a long-term serious mental illness. Most data on
parents with children with disabilities come from convenience or snowball samples. Thus, the WLS
provides a unique opportunity to examine the impact of raising a child with a disability on a group of
parents who are more representative of the general population.
Specifically, a participant experienced non-normative parenting if he or she had a child who
either had a developmental disability (such as autism, mental retardation, cerebral palsy, etc.) or a
long-term, serious mental illness (limited to bipolar disorder or schizophrenia). Once a participant was
identified as having a child with one of these two types of disabilities, he or she was asked to complete
an additional set of questions that asked about the experience of raising such a child.
We collected information about the participants' experiences raising their children from 239
parents [GD355 = 1] (three percent of all WLS participants) identified as having a child with a
disability. The actual number of WLS participants with such children was higher, but we restricted
our questions to parents who have had contact with their child at least one time in the last year.
Of these parents, 52 percent [use GD339_X to create new variable with count] had a child with
a mental illness and 48 percent had a child with a developmental disability. Fully 88 percent of these
children were biological children and 12 percent were adopted [based on d100s – only biological and
24
adopted children included in nonnorm sample]. For children without a developmental disability or
mental illness, 92 percent are biologically related to the participant. [GD004xx]
Among the parents who reported a child with a mental illness, 59 percent were women and the
remaining 41 percent were men [GA001RE]. However, among the parents who have a child with a
developmental disability, 53 percent of the participants were women and 47 percent were men. These
proportions may be compared to 46 percent men and 54 percent women among all participants in this
round of data collection. The gender disparity among participants reporting a child with a mental
illness is one of the many issues to investigate with these data; one possibility is that men were more
reluctant to report that their child had a serious mental illness.
Parents of nonnormative children do not differ from parents of normative children in terms of
marital history. Specifically these parents are no more likely to have been married more than once than
parents who have not experienced nonnormative parenting. [GC002RE] However, there are some
differences in current marital status among the different types of parents. Ten percent of parents who
have not raised a child with a developmental disability or a mental illness are currently divorced
compared to only five percent of parents who have a child with a developmental disability and 14
percent of those who have a child with a mental illness. Parents of nonnormative children have
slightly more children than parents without nonnormative children. Parents with a mentally ill child
had an average of 3.7 children and those with a developmentally disabled child had an average of 3.9
children compared to an average of 3.1 children for normative families [GD001KD]. One reason for
this difference is that, the more children there are in a family, the greater is the chance that at least one
of them will have a mental illness.
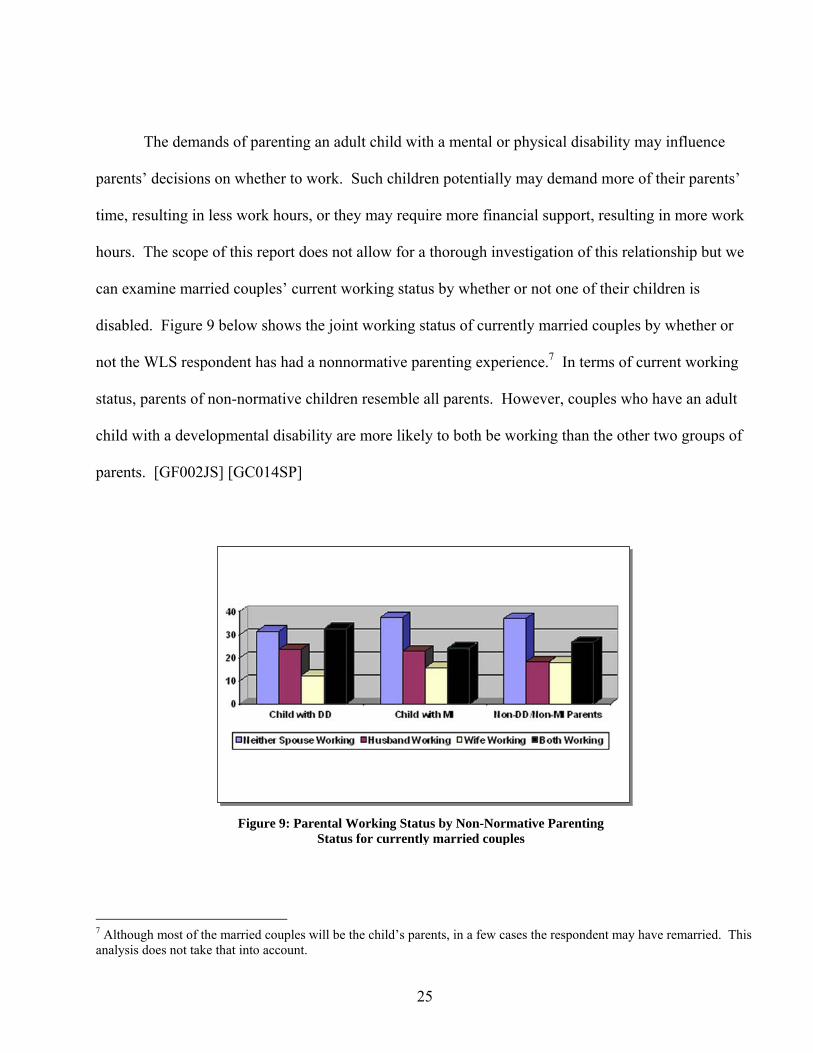
25
The demands of parenting an adult child with a mental or physical disability may influence
parents’ decisions on whether to work. Such children potentially may demand more of their parents’
time, resulting in less work hours, or they may require more financial support, resulting in more work
hours. The scope of this report does not allow for a thorough investigation of this relationship but we
can examine married couples’ current working status by whether or not one of their children is
disabled. Figure 9 below shows the joint working status of currently married couples by whether or
not the WLS respondent has had a nonnormative parenting experience.7 In terms of current working
status, parents of non-normative children resemble all parents. However, couples who have an adult
child with a developmental disability are more likely to both be working than the other two groups of
parents. [GF002JS] [GC014SP]
7 Although most of the married couples will be the child’s parents, in a few cases the respondent may have remarried. This analysis does not take that into account.
Figure 9: Parental Working Status by Non-Normative Parenting Status for currently married couples
26
Ninety-one percent of the children with a developmental disability have never been married,
compared to 56 percent of children with a mental illness [GD0090X]. When examining non-disabled
children of WLS participants, the picture is quite different. Only 18 percent of the children have never
been married. Among children with disabilities who have been married at least once, 67 percent are
currently married, 10 percent are currently divorced, and the remaining children are either separated or
widowed. [GD009xx]
The living situation of children with developmental disabilities or mental illness is varied.
Among children with developmental disabilities, 42 percent live with the participant or another family
member, 30 percent live independently, 25 percent live in a group home or institution, and 3 percent
live in some other situation. For children with a mental illness, 18 percent live with the participant or
another family member, 68 percent live independently, 3 percent live in a group home or institution,
and 8 percent live in some other situation [GH090].
Fully 88 percent of the children with a developmental disability need help with at least one
daily living activity, compared to 60 percent of the children with a mental illness [GH034, GH040,
GH046, GH052, GH058, GH064, GH070, GH076, GH082]. While 62 percent of the children with a
developmental disability and 42 percent of children with a mental illness currently work, only 40
percent of the children with a developmental disability and 36 percent of children with a mental illness
work at a job that does not have special support programs (such as a job coach). [GH015] In contrast,
90 percent of the non-disabled children are currently working. [GD016xx]
Only a small percentage of WLS graduates felt socially isolated as a result of their child's
27
behavior. The majority of parents of both types of children reported feeling not at all socially isolated
(79 percent of parents of children with mental illness and 73 percent of parents of children with
developmental disabilities) [GH115]. Only 11 percent of participants with a child with a
developmental disability and 10 percent of participants with a child with mental illness participated in
support groups [GH130].
Parents and Parents-in-Law - Megan Andrew and Elizabeth Rainwater
Mortality and Health of Parents
There are several sources of information about parental mortality, including the 1994 and 2004
sibling interviews, the 2004 graduate interview, and information from the National Death Index
(NDI).8 Based on the reports of the graduates, a significant minority, 25 percent, of participants have
at least one parent living at the time of the 2004 interview [ge050ma, ge062fa] compared to 64 percent
at the time of the 1993 interview. Five percent of the fathers and 22 percent of the mothers of the
1957 graduates were still alive [ge050ma ge062fa] as of the time of the 2004 interview. Only two
percent of graduates had two living parents, and 75 percent had lost both parents. Among fathers, the
median age at death was 76; for mothers it was 81 [ge063fa, ge064fab, ge051ma, ge052mab].
Forty-six percent of all maternal mortality and 22 percent of paternal mortality occurred after
the 1993 interview (ge52mab, ge064fab). If a parent was alive in 1993 (4696 mothers and 2134
fathers), the graduate was asked to assess their health (re050ma, re062fa). As you can see in the table
8 Footnote: The NDI information on parental death was not available at the time of this draft. Therefore, only information provided by graduates appears here.
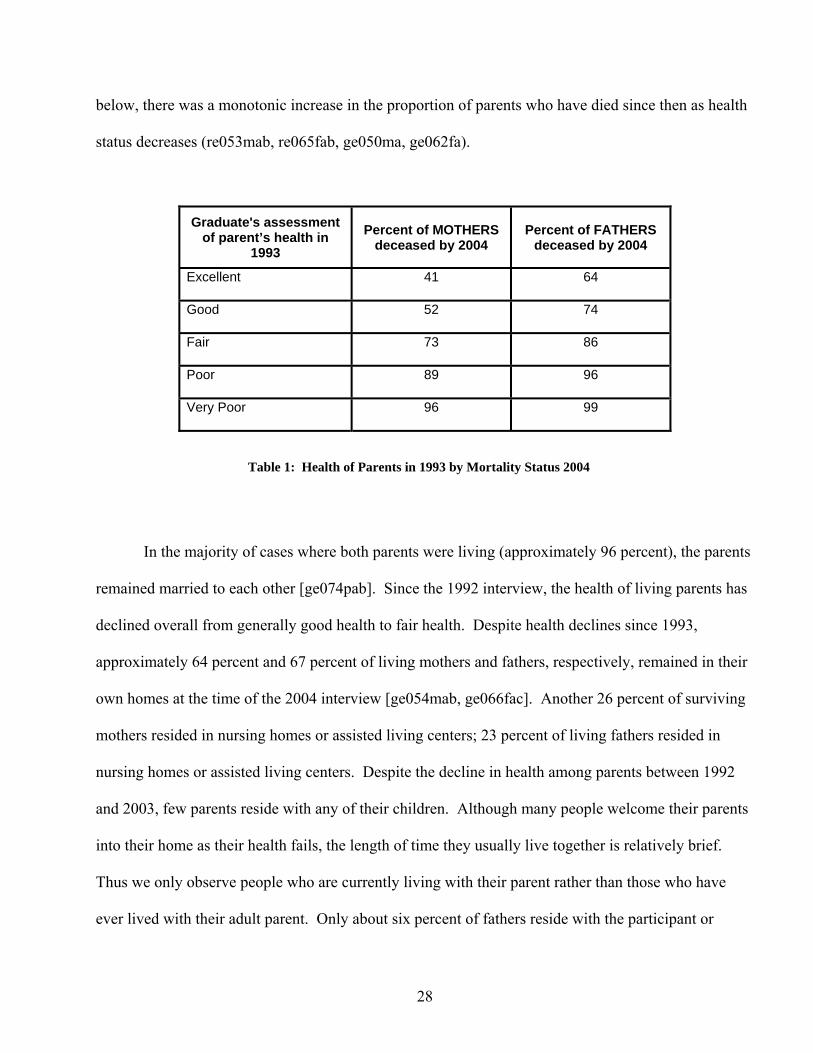
28
below, there was a monotonic increase in the proportion of parents who have died since then as health
status decreases (re053mab, re065fab, ge050ma, ge062fa).
Graduate's assessment of parent’s health in
1993 Percent of MOTHERS
deceased by 2004 Percent of FATHERS
deceased by 2004
Excellent 41 64
Good 52 74
Fair 73 86
Poor 89 96
Very Poor 96 99
In the majority of cases where both parents were living (approximately 96 percent), the parents
remained married to each other [ge074pab]. Since the 1992 interview, the health of living parents has
declined overall from generally good health to fair health. Despite health declines since 1993,
approximately 64 percent and 67 percent of living mothers and fathers, respectively, remained in their
own homes at the time of the 2004 interview [ge054mab, ge066fac]. Another 26 percent of surviving
mothers resided in nursing homes or assisted living centers; 23 percent of living fathers resided in
nursing homes or assisted living centers. Despite the decline in health among parents between 1992
and 2003, few parents reside with any of their children. Although many people welcome their parents
into their home as their health fails, the length of time they usually live together is relatively brief.
Thus we only observe people who are currently living with their parent rather than those who have
ever lived with their adult parent. Only about six percent of fathers reside with the participant or
Table 1: Health of Parents in 1993 by Mortality Status 2004
29
another child, and only seven percent of mothers reside with the participant or another child. Similar
to reports in 1993, female participants are more likely to live with a parent than male participants
[ga001ra, ge054mab, ge066fac]. However, the gender difference in the proportion of participants
living with a parent is small. There appears to be no relationship between the participant’s educational
level and whether a parent resides in a child’s home [gb103red, ge054mab, ge066fac]. Among
participants who do not live with their mother, the mean distance between the participant’s home and
that of his or her mother is approximately 369 miles and the median distance is 35 miles. For fathers
the average distance is 463 miles with a median of 50 miles. [ga001ra, ge055mac, ge067fad]. That is,
a few parents live at great distances from the graduates, while most live within 35 to 50 miles.
In 2004, the majority of participants feel at least somewhat close with their mothers, regardless
of gender or education [ge061mab, ga001re, gb103red]. About 60 percent of participants report they
are very close with their mothers; an additional 32 percent feel somewhat close with their mothers
[ge061mab]. This level of closeness is reflected in the similarity in outlook participants have with
their mothers. Approximately 25 percent of participants feel they have a very similar outlook with
their mothers and another 60 percent feel they have a somewhat similar outlook [ge060mab]. It
appears that participants maintain similarly close ties with their fathers: 55 percent report they are very
close with their father and another 31 percent report they are somewhat close with their father
[ge073fab]. Compared to reports in the 1993 survey, then, male participants in particular seem to have
developed closer relationships with aged parents, or else the parents of participants who had a closer
relationship were more likely to live longer. Like that of mothers’ outlook, the outlook of fathers
appears to be generally similar to that of participants. About 26 percent of participants feel they have

30
a very similar outlook with their father and another 53 percent report they have a somewhat similar
outlook [ge072fab].
Success in education, work, and finances provides an interesting point of comparison between
participants and their parents. If the parent lived to the current age of the graduate, the graduate was
asked to compare their success in education, work and finances with that of their same-age, same-
gender parent. Generally, participants feel they have done better or much better than their same-
gender parent at the same age. Participants who had a bachelor’s degree or higher, not surprisingly,
are more likely to report they have done much better than their parents in terms of education
[gb103red, ge077pad]. There was no apparent difference by gender. Similar to education, a large
majority reported they had done better or much better than their parents in terms of work (74 percent)
and finances (80 percent) when their parents were the same age as they are now, and participants with
a bachelor’s degree or higher were more likely to report they were much better off in terms of both
work and finances, though in this instance the mean difference was negligible [gb103red, ge079pad,
ge078pad]. Overall, participants appear to be doing better than their parents at the same age,
particularly those participants who have a bachelor’s degree or higher. Indeed, two percent or fewer
of participants felt they had done worse or much worse than their parents in education, work, or
finances [ge077pad, ge079pad, ge078pad]. These are similar to participant reports in the 1993 survey.
Mortality of Parents-In-Law
Information on death of the graduates’ parents-in-law comes from both the graduate interview
and the spouse interview. Among currently married participants, it appears that mortality for in-laws
31
is similar to that of parents. Because of the tendency of women to marry slightly older men, the
proportion of married participants who have a living parent-in-law differs markedly between men and
women. Thirty percent of male graduates have a living parent-in-law compared to 14 percent of
female graduates. [ge080mi, ge085fi] Moreover, married participants are more likely to have a
surviving mother-in-law (32 percent of men; 17 percent of women) than a surviving father-in-law (11
percent of men; four percent of women). Only one percent of females and six percent of males report
that both of their in-laws are alive. The median age at death for the married participants’ parents-in-
law is 80 years for mothers and 74 years for fathers (ae152mab; ae164mab)
Households - Megan Andrew
Not surprisingly, the number of household members has significantly decreased among
graduates from about 2.6 persons to 1.6 persons since 1993 [re001he, ge001he]. Approximately 11
percent of married graduates have more than the expected 2 persons in the household – the graduate
and the graduate’s spouse – while 24 percent of unmarried graduates have more than the expected 1
person per household [gc001re, ge001he]. Among married graduates with more than 2 persons in the
household, additional household members are typically sons (42 percent), and their average age is 32
years [gc001re, ge00403-ge00412, ge00503-ge00512]. Daughters accounted for another 23 percent of
all additional household members among married graduates, and their average age is 31 years
[gc001re, ge00403-ge00412, ge00503-ge00512]. The presence of adult children in the household
mirrors other research on the transition to adulthood, which cites the growing phenomenon of adult
children returning to the nest after having previously left for work or school. Grandchildren represent
32
another 15 percent of all additional household members of married graduates [gc001re, ge00403-
ge00412, ge00503-ge00512].
Among currently married participants, about 10 percent report a child is living with
them. Among unmarried participants, a similar portion report a child is living with them (~11
percent). Among currently married participants, about two percent have grandchildren living with
them. Among unmarried participants, about six percent have grandchildren living with them. Overall,
about three percent of participants report a grandchild is living with them. Unmarried participants are
much more likely to have grandchildren living with them than married participants.
Post-1993 Education - Megan Andrew
In terms of education, little has changed since 1993. Only about two percent of graduates were
enrolled in a regular school in 2004. Formal education ended for 98 percent of graduates before 2004
[gb103red]. Of the ninety-one graduates who attained additional education since 1993, 71 percent
were women. Women and men who had a college degree in 1993 were more likely to have continued
their education [rb003red, gb103red]. Women who remained in the same marriage since 1993 were
more likely to have attained additional education since 1993, though this pattern did not hold for men
[gc108re]. Among married men who attained additional education, 46 percent of spouses were
working. Among married women who attained additional education, approximately 25 percent of
spouses were working while 30 percent were retired [gc014sp, gc015sp].
33
The majority of men (69 percent) who attained additional education since 1993 had also retired
at least once between 1993 and 2004 and were either currently retired or retired but currently working.
For women, only about 54 percent who had attained additional education since 1993 had also retired at
least once since 1993. Among women, those who had never retired and were currently employed were
just as likely as women who had retired and were not currently employed to have attained additional
education [gf013jsc, gf014jsc].
The adolescent academic ability of both men and women exhibited a strong relationship with
educational attainment since 1993. Men who attained additional education since the last interview had
a significantly higher mean percentile test scores than men who did not (73 mean percentile score
versus 54 mean percentile score); similarly, women who attained additional education had an average
percentile score of 71 compared to 54 for women who did not. Thus, both men and women who had
higher test scores were more likely to obtain additional education since the last interview [iqhnq].
Past and Current Employment (Erin Ruel and Jeong Hwa Ho)
Some of the WLS graduates have spent the majority of their career working in the same job
while others have held multiple jobs between 1975 and 2004. Among those who have only worked
for one employer between 1975 and 2004 (29 percent of men and 25 percent of women) the mean
length of employment is 34 years for men and 26 years for women. That is, many individuals had
begun to work for that employer before 1975. As shown in Figure 10, it is more common for the
graduates to have had two to four employers (59 percent for both men and women). (jhh:tnes7505)
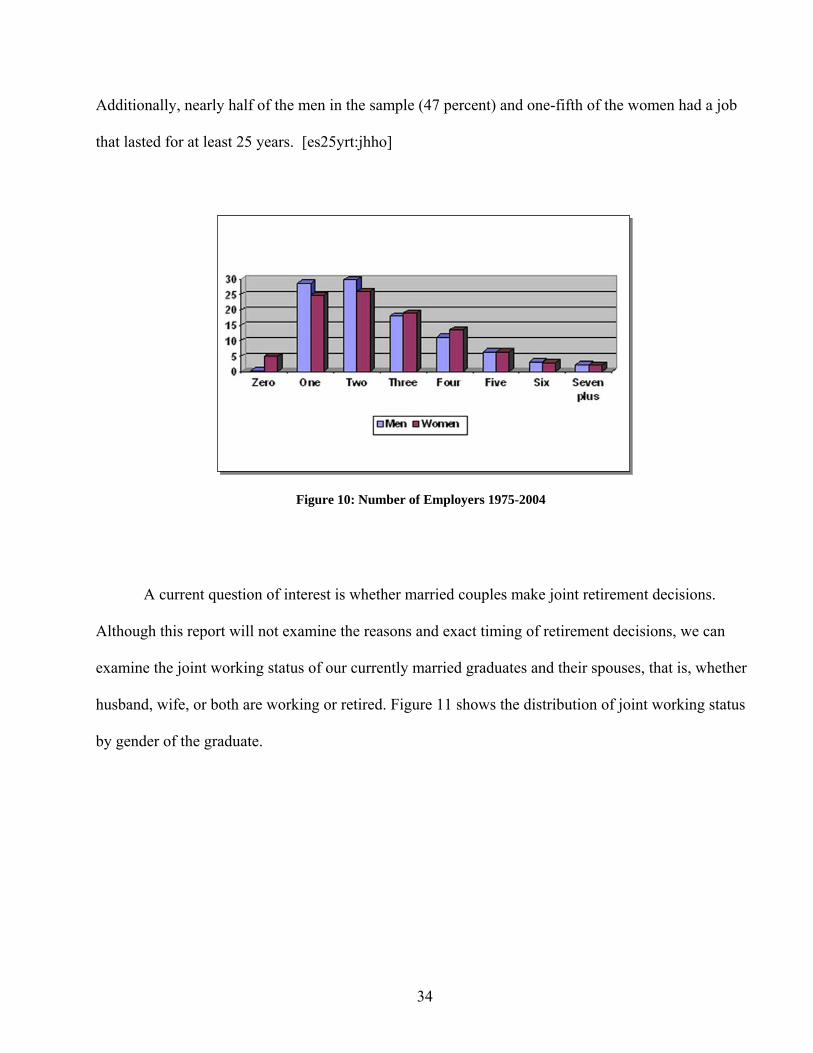
34
Additionally, nearly half of the men in the sample (47 percent) and one-fifth of the women had a job
that lasted for at least 25 years. [es25yrt:jhho]
A current question of interest is whether married couples make joint retirement decisions.
Although this report will not examine the reasons and exact timing of retirement decisions, we can
examine the joint working status of our currently married graduates and their spouses, that is, whether
husband, wife, or both are working or retired. Figure 11 shows the distribution of joint working status
by gender of the graduate.
Figure 10: Number of Employers 1975-2004
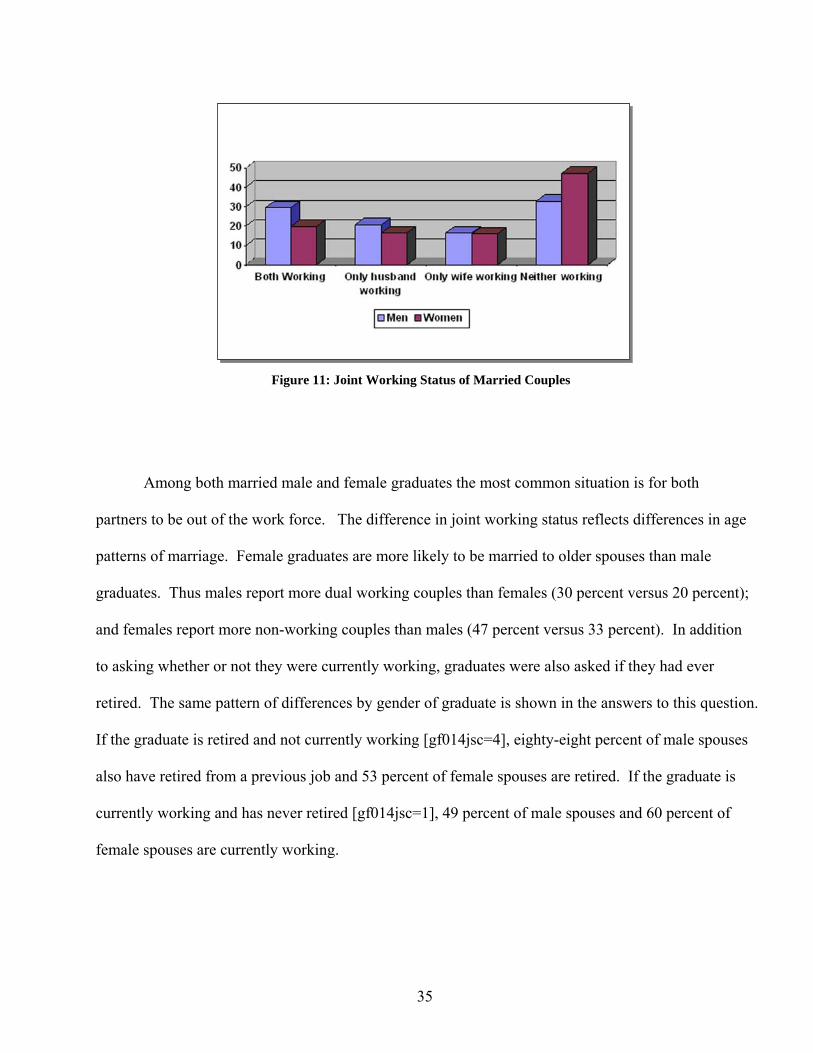
35
Among both married male and female graduates the most common situation is for both
partners to be out of the work force. The difference in joint working status reflects differences in age
patterns of marriage. Female graduates are more likely to be married to older spouses than male
graduates. Thus males report more dual working couples than females (30 percent versus 20 percent);
and females report more non-working couples than males (47 percent versus 33 percent). In addition
to asking whether or not they were currently working, graduates were also asked if they had ever
retired. The same pattern of differences by gender of graduate is shown in the answers to this question.
If the graduate is retired and not currently working [gf014jsc=4], eighty-eight percent of male spouses
also have retired from a previous job and 53 percent of female spouses are retired. If the graduate is
currently working and has never retired [gf014jsc=1], 49 percent of male spouses and 60 percent of
female spouses are currently working.
Figure 11: Joint Working Status of Married Couples
36
Retirement - Jim Raymo, Luke Piefer, Jeong Hwa Ho
In 1993, when the graduates were about age 54, it is not surprising that very few of them
defined themselves as retired (7 percent) or partly retired (5 percent) [rw022red]. More than ten years
later, the proportions of “completely” retired and partly retired graduates have increased to 50 percent
and 23 percent [gt112re], respectively. The proportion of non-retired men is the same as it is for
women – about 27 percent. However, 53 percent of women report being completely retired compared
to 47 percent of men, with the difference reflecting the higher prevalence of partial-retirement among
men.
The prevalence of partial retirement largely reflects the fact that 14 percent of graduates who
had worked since the 1993 interview reported that they had retired from a job during that time but
were nonetheless employed at the time of the 2004 interview. As noted above, men were more likely
to report this experience – about 18 percent of them, as compared to about 11 percent of the women.
About 44 percent of graduates were employed in 2004 [gf002js].
These results are remarkably consistent with responses in 1993, indicating that more than one-
third of the graduates (41 percent of men and 33 percent of women) expressed a desire to still be
working ten years after that interview, with about 23 percent hoping to work part-time [rw001re].
Interestingly, among those graduates who said they were absolutely certain they would be working
full-time after the age of 65 [rw029ref], 30 percent considered themselves completely retired in 2004,
and another 22 percent considered themselves partly retired [gt112re].
Naturally, similar trends in retirement were apparent among graduates’ spouses. Whereas only
seven percent were retired and four percent were partly retired in 1993 (with over 80 percent of these
37
being husbands, who are typically older than their wives) [rw024sp], a full 42 percent of spouses were
retired in 2004 [gc015sp]. Because only 42 percent were actually working at the time of the interview
[gc014sp], that number is probably a conservative estimate. Thirty-one percent of men reported that
their wives had retired, while 53 percent of women reported the same about their husbands.
When employed graduates were asked at what age they wish to stop working [gt113re], about
23 percent (28 percent of women and 19 percent of men) indicated that they wished to stop working
by age sixty-five or younger. Another 17 percent said they never wanted to stop working, with men
slightly more likely than women to report wanting to work indefinitely.
In 1993, more than 60 percent of men and women believed that their standard of living would
be about the same after retirement, and only about one in twenty thought that it would improve
[rw030ree]. However, 34 percent of graduates said that their standard of living would decrease either
somewhat or a lot. Non-retired women were somewhat less optimistic about their financial futures
than their male counterparts, with 36 percent of women and 32 percent of men expecting a decline in
standard of living. Although we had only a small pool of retired persons for comparison at the time of
the 1993 survey, their reports essentially mirrored those of their non-retired counterparts. Close to
two-thirds of graduates who were already retired and not working said that their standard of living had
remained about the same since they retired [rw032ree], with the remaining 39 percent evenly split
between those whose standard of living had improved and those for whom it had decreased.
However, it is very likely that the graduates who had already retired in 1993 were generally
those who could most easily afford to stop working – the 2004 data offer a much richer opportunity to
explore retirement experiences. Only 11 percent of graduates who were retired in 2004 reported a
decline in their standard of living, while 23 percent reported an improvement [gt120re]. College
38
graduates were the least likely to feel that their standard of living had declined after retirement. Many
of those who expected their standard of living to decline after retirement [rw030ree] did not find this
to be the case if they were retired in 2004, when 82 percent of retirees who had expected a decline
reported that their standard of living was the same as or better than it was before retiring. It should be
noted that those who had retired may still represent a biased sample of graduates; among non-retired,
married graduates whose spouses had also not yet retired, 32 percent expected their standard of living
to get worse after their eventual retirement, and almost all the rest (64 percent) thought it would stay
about the same [gt115re]. Differences by education are small, but graduates without a college degree
were somewhat more likely to expect a decline in their standard of living.
Finally, we found that just three percent of married graduates felt their relationship with their
spouse had gotten worse after retirement, whereas 33 percent reported an improvement in relations
with their spouse [gt121re]. It also appears that post-retirement changes in standard of living are
related to changes in the quality of marital relations. Among those who felt their standard of living
improved after retirement, 52 percent report a better relationship with their spouse whereas only about
30 percent of those whose standard of living stayed the same or got worse report better spousal
relations.
Job Characteristics, and Job Satisfaction – Erin Ruel, Carl Frederick, Rob Warren, Reiping Huang
A substantial body of research has documented the concentration of women into occupations
that offer fewer rewards, are less protective, and are located at lower levels of organizations. These
39
kinds of inequalities were present in both 1993 and 2004, and many of them persist even when we
limit our attention to women who work full-time and who hold nominally high-level positions. After
1993 the story became more complicated as many graduates retired; many of these retirees
subsequently returned to paid work. Whereas in 1993 it made sense to simply compare (1) all men to
all women and (2) men who worked full-time to women who worked full-time, in 2004 it became
possible to also compare (1) graduates who were employed in 2004 and who had never retired (33
percent of male graduates and 37 percent of female graduates), (2) graduates who retired since 1993
but were employed in 2004 (18 percent of male graduates and 12 percent of female graduates), and (3)
graduates who retired since 1993 but were not employed in 2004 (49 percent of male graduates and 51
percent of female graduates). Next we examine differences over time and by gender of several job
characteristics including private pension coverage, health insurance coverage, job authority and
organizational responsibility, working conditions, and finally job satisfaction for each of the three
groups above.
Full versus part-time work
In 1993 about 26 percent of women worked part-time on their current or most recent job
compared with only four percent of men [rf032jce]. In 2004, among graduates who were currently
employed and who had never retired, 45 percent of women worked part-time compared to 28 percent
of men [gf032jce, sort by sexrsp, where gf013jsc=0 and gf002js=1]. Not surprisingly, retirees who
return to the labor market are more likely to work part-time. Among graduates who retired between
1993 and 2004 but who were employed in 2004, 79 percent of women worked part-time compared to
72 percent of men [gf032jce, sort by sexrsp, where gf013jsc=1 and gf002js=1]. Among graduates who
40
retired between 1993 and 2004 and did not resume working, 11 percent of men and 34 percent of
women worked part-time at the jobs they held before retiring.
Pension and health insurance coverage
In 1993, men were more likely than women to be covered by a private pension plan through
their current or most recent employer (73 percent compared to 62 percent) [rf026jcd], and men were
also more likely than women to be covered by health insurance (83 percent versus 69 percent)
[rf027jcd]. In 2004, never-retired men and women were less likely to be covered by a private pension
plan or health insurance through their current employer than completely retired men and women were
through their last employer. Fifty-three percent of never-retired men were covered by a private pension
plan compared to 73 percent of completely retired men, and 57 percent of never-retired women were
covered by a private pension plan compared to 63 percent of completely retired women. Sixty-three
percent of never-retired men were covered by health insurance compared to 81 percent of completely
retired men, and 62 percent of never-retired women were covered by a private pension plan compared
to 71 percent of completely retired women [gf026jcd and gf027jcd, sort by sexrsp, where gf013jsc=0
and gf002js=1 or where gf013jsc=1 and gf002js=0]. As would be expected from the greater likelihood
of being a part time worker, of graduates who retired between 1993 and 2004 but were employed in
2004, 22 percent of the men and 24 percent of the women were covered by an employer sponsored
pension plan, and 27 percent of both men and women were covered by health insurance.
There appears to be little in the way of gender differences in pension and health coverage
between the currently working men and women who never retired. However, when we limit the
analysis to men and women who work full time and have never retired, only 62 percent of men have
41
pension coverage compared to 73 percent of women, and only 74 percent of men have health coverage
compared to 82 percent of women [gf032jce=1].
Size of employer
In 1993, women were somewhat more likely to be employed in smaller and less protective
firms, defined as one hundred employees or less (64 percent of women versus 58 percent of men). This
difference declined by 2004 for the never retired group (80 percent of women versus 76 percent of
men), but not for the completely retired (65 percent of women versus 50 percent of men) [select if
gf071jcd <4 or gf070jcd<=100,]. This gender difference is reversed in 2004 for the post-retirement
workers (77 percent of women versus 86 percent of men) and for the full-time never retired group (62
percent of women versus 72 percent of men).
The proportion of workers employed in smaller firms who lack pension or health insurance
coverage is substantial. The percentage of these workers who had private pension plans fell from 46
percent in 1993 [select if rg025jjc <4, [rf026jcd] to 42 percent in 2004 [select if gf071jcd <4 or
gf070jcd<=100, gf026jcd]. Likewise, the percentage of workers in smaller firms who had health
insurance coverage fell from 59 percent in 1993 [rf027jcd] to 51 percent in 2004 [select if gf071jcd <4
or gf070jcd<=100, gf027jcd]. By comparison, pension and health insurance benefits are more widely
available to employees in larger firms. The percentage of these workers who had private pension
plans fell from 94 percent in 1993 to 83 percent in 2004; the percentage of workers in larger firms who
had health insurance coverage fell from 91 percent in 1993 to 87 percent in 2004. There were no
substantial gender differences in pension and health coverage for employees of small or large firms;
however, there is a difference between currently working and retired graduates. Graduates who were
42
completely retired in 2004 had greater coverage in their last job than do the never retired graduates (68
percent for complete retirees versus 55 percent for never retired).
Gender differences in work authority
Gender differences emerge when we examine the authority and organizational responsibility
associated with either the graduates’ current job, most recent job, or the job that they first retired from.
Men consistently hold positions with more authority and this has persisted since 1993. In 2004, 36
percent of men had the authority to hire or fire others [gg028jjf] and 38 percent could set or influence
others’ rate of pay. [gg029jjf] In contrast, only 15 percent of women had these types of authority.
These percentages did not change when we limited our investigation to full-time workers [gf032jcf=1],
nor were there any substantial differences between the never retired, post retirement workers and
completely retired groups.
In 1993, 61 percent of all men and 43 percent of all women were in supervisory positions. In
2004, 56 percent of male and 33 percent of female graduates held supervisory positions, a decline of
five and ten percent respectively. This decline is located among the never retired men of whom, on
average, 48 percent hold supervisory positions compared to post retirement workers and complete
retirees of whom, on average, 60 percent held supervisory positions. For female graduates, the decline
is located among the never retired (31 percent) and complete retirees (33 percent) compared to the post
retirement workers (44 percent) [rg030jjf gg030jjf].
What happens when we turn the tables and look at which graduates have their work supervised
by someone else? In 1993, 72 percent of men and 80 percent of women were supervised at work. In
43
2004, the gender differences disappear for the post retirement workers and the completely retired: over
80 percent of all men and women were supervised on their current or most recent jobs in 2004.
[gg031jjf] Among never retired workers, however, more women (72 percent) than men (66 percent)
are supervised, although the never retired persons are less likely to be supervised than the other two
groups.
As in 1993, men are still more likely than women to have the ability to decide when to come to
work and when they can leave either officially or unofficially (62 percent versus 45 percent
respectively). This gender difference remains in 2004 in all employment status groups: for the never
retired; 70 percent of men versus 47 percent of women for the post retirement workers; 56 percent of
men versus 47 percent of women; for the completely retired; 51 percent of men versus 34 percent of
women had the ability to come and go to work on a flexible schedule [rg042jff gg042jff].
Working conditions
How have job content and working conditions changed for the graduates? The proportion of
graduates whose current or most recent job always or frequently required intense concentration
dropped from 89 percent in 1993 to 82 percent in 2004. [rg047jjc gg047jjc]. On average, slightly less
of the never retired group always or frequently required intense concentration on their current job (74
percent of men and 80 percent of women). In 1993, 73 percent of graduates always or frequently
worked under the pressure of time. In 2004, 46 percent of never retired men and 49 percent of never
retired women always or frequently worked under the pressure of time. These proportions are 20
percent higher among those graduates who have retired and gone back to work. [rg048jjc gg048jjc
sort by sexrsp, gf013jsc, and gf002js] In 2004, slightly more women than men reported that their job
44
always or frequently required lots of physical effort (31 percent versus 29 percent). There were no
significant differences among women, but 27 percent of never retired men, 28 percent of those who
returned to work and 31 percent of completely retired men have jobs that always or frequently
required lots of physical effort. These numbers are down slightly from roughly a third of all graduates
in 1993. [rg046jjc gg046jjc sort by sexrsp, gf013jsc, and gf002js]
Gender differences occur in other job characteristics as well. Men were still more likely than
women to get dirty while doing their jobs (51 versus 38 percent). These figures dropped since 1993
when the percentages were 53 and 47, respectively. [rg053jj gg053jj sort by sexrsp, gf013jsc, and
gf002js] In 2004 men were twice as likely as women to be exposed to hazardous conditions while at
work (46 versus 22 percent). Among men, 41 percent of never retired graduates were exposed to
hazardous conditions compared to 46 percent of retired graduates who went back to work and 53
percent of those who have completely retired. [gg054jj sort by sexrsp, gf013jsc, and gf002js]
Job satisfaction
One constant that has persisted over time, across levels of education, retirement status, and
between the genders is that about 90 percent of the graduates are satisfied with their jobs. In 1993, just
over half of the graduates were very satisfied with their jobs. In 2004, that figure rose to 58 percent
for women and 62 percent for men. Less than two percent of all graduates were very dissatisfied with
their jobs in either 1993 or 2004. [rg044jj gg044jj]
45
Pensions - Kamil Sicinski and Elizabeth Rainwater
Almost 55 percent of the WLS graduates are already completely retired [gf014jsc]. Among
those that are still in the labor force, 28 percent do not plan to retire at all. Of those planning
retirement, 58 percent prepare to stop working within 3 years and 74 percent within 5 years [gt113re].
While 80 percent of graduates report having retirement savings, either in the form of traditional
pensions or in plans such as 401(k)s or IRAs, men are significantly more likely to have them than
women (88 and 73 percent, respectively) [gt101re]. However, the difference disappears at the
household level, with 91 percent of households having some kind of private retirement savings
[gt101re, gt101sp]. Also, graduates having a college degree or above are more likely (88 percent) to
have a private retirement plan than those with a high school degree or some college (77 percent).
Among the graduates who have retirement plans, employer provided pensions are most
commonly reported (63 percent of men and 55 percent of women) [gt102re], followed by IRAs (44
percent of men and 48 percent of women) [gt103re] and 401(k)s (37 percent of men and 28 percent of
women) [gt104re]. Thirty percent of graduates reported having annuities or other retirement plans
[gt105re, gt106re]. While more than half of the graduates already started receiving retirement benefits
(63 percent of men and 48 percent of women), a sizable majority (66 percent) [gt107re,gt108re] has
kept at least some plans untouched. Thirty percent of graduates reported that they could start receiving
retirement benefits at any time [gt109re], and among those who provided a specific eligibility age, the
median age of eligibility was 62 years.
46
Some graduates were asked more specific questions about the way in which they elected to
receive benefits.9 Among them, 87 percent chose lifelong payments at a constant level and only 5
percent reported that all the benefits will end before death [gt122re]. Furthermore, most married
graduates reported that at least some of the benefits would continue after their death, though men (86
percent) were more likely to choose this option than women (62 percent) [gt123re]. In fact, the law
requires that unless you have a written waiver from your spouse or you have been married for less than
one year, pensions from private employers must be distributed such that a surviving spouse will
continue to receive benefits after the death of the employee.10 Given the greater likelihood that wives
will outlive their husbands, it makes sense that fewer wives than husbands chose to have their benefits
continue after their death. However, the 14 percent of married men who report not having this benefit
is somewhat surprising. They may be misreporting their actual coverage, a proportion of them may
fall under government pensions that are not subject to ERISA, or they may actually have a signed
waiver from their wife.
Access to Health Care - Kathryn Flynn and Alexandra Wright
Health insurance
When health insurance coverage from all sources is considered, we find that the vast majority
of graduates (94 percent) have access to health insurance, a proportion that has not changed
significantly from 1993 to 2004 [rs010re, rs011re, rs012re, rs013re, rs015re, gshhirec]. However, 40
percent of graduates are now covered by Medicare, the federal government’s health insurance program
9 These questions regarding benefits were only asked of a sample of our participants. 10 These laws are part of the Employee Retirement Income Security Act of 1974 (ERISA) and the Retirement Equity Act of 1984.
47
targeted primarily to people over the age of 65 (either alone or in combination with private/public
insurance) [gshhirec]. As a group, 13 percent of graduates either have no health insurance or rely on
public sources only (Medicare, Medicaid, or Military) [gspborec, gshhirec]. Both in 1993 and 2004,
approximately half of the women interviewed reported receiving health insurance through their own
employment; however, the proportion covered through their husbands’ insurance has declined from 68
percent to 31 percent [rs011re, gs011re]. This is very likely due to the increased number of husbands
who have reached the age of Medicare eligibility.
Changing health insurance plans is a common occurrence in the WLS. 64 percent of graduates
over the age of 65 (insured or uninsured) report changing health insurance in the last year [gsinsrec], a
finding not surprising given that 65 is the age most participants are first eligible for Medicare.
However, even among those under 65, 19 percent report a plan change within the past 12 months
[gsinsrec].
Health care providers
The majority of graduates (94 percent) report having one place that they usually go when they
are sick or need advice about their health [gsuscrec], and most (93 percent) also have one person they
consider their usual health care provider [gsu51rec]. During the last year, seven percent changed the
usual place they go to for health care [gsuplrec], while nearly ten percent changed their usual provider
in the last year [gsuprrec]. The major reasons cited for changing the usual place of care include the
participant moving (25 percent); the usual provider no longer being available (e.g. the usual provider
died or retired) (24 percent); or the participant changing insurance plans (18 percent). Quality of care
was cited by nine percent of participants making a change as being the primary reason for changing
48
their usual place of care. Consistent with this pattern, the major reasons participants gave for changing
their usual provider in the previous 12 months included the provider no longer being available (38
percent), the graduate moving (21 percent), or changing insurance plans (12 percent), while six percent
of participants cited the quality of care as their primary reason for changing providers [gsu29re,
gsu70re].
Experiences with health care
Over 90 percent of graduates visited a doctor or other health care provider in the last year
[ixhi01re]. Both in 1993 and 2004, approximately ten percent of sample members spent at least one
night in the hospital last year [mx008rer, ix008rer]. Additionally, 15 percent had at least one visit to
an emergency room [ixhi09re] and 16 percent had outpatient surgery (not including dental care)
[ixhi12re]. On the whole, sample members are satisfied with the health care they receive. Over 66
percent reported that the overall quality of the care and services they receive was either excellent or
very good [ixha30re].
Nearly 77 percent of men and 82 percent of women take at least one prescription drug every
day [ixhi20re], and more than 20 percent take 5 or more prescriptions each day. Though women are
more likely than men to be taking prescription drugs, the number of prescription drugs taken daily is
similar across genders. Five percent of men and 7 percent of women report taking less medication
than prescribed or having delayed filling a prescription because of the cost [ixhi18re]. In 1993, the
majority of both men (70 percent) and women (60 percent) spent no days in bed due to illness or injury
[mx007rer], Even though the cohort is a decade older, 76 percent of men and 69 percent of women
reported no days spent in bed due to illness or injury in 2004 [ix007rer]. This may in part be due to
49
how hard WLS graduates work to stay healthy; 77 percent of men and 87 percent of women agreed
that they work hard to stay healthy [ixha15re].
Work Family Balance, Values and Attitudes - Peter Hoonakker, Heejeong Choi, and Pascale
Carayon
Work family Balance
In 1993, men and women were equally distracted from their work by family problems. Fifteen
percent of never-retired graduates who are currently working reported family worries or problems that
distracted them from their work [my004rer]. In 2004, among WLS participants who were still working
and not retired, this percentage has decreased to 11 percent. Men are significantly more distracted by
family problems or worries than women (15 percent versus 8 percent) [iy004rer].
If family responsibilities consume most of women's time, then it appears that work takes up
most of men's time and energy. In 1993, 45 percent of men said that their jobs reduce the amount of
time they can spend with their families; however, only 33 percent of women agreed with that
statement [my009rer]. These numbers have increased by 2004 when 46 percent of the graduates
report that their jobs reduce the amount of time they can spend with the family [iy009rer]. As in 1993,
work takes up significantly more time of men’s time and energy (50 percent) than women’s (42
percent).
50
Men also are more likely than women to take the pressures of the "breadwinner" role to heart;
in 1993, 44 percent of never retired currently working men but only 26 percent of comparable women
agreed that family responsibilities make them work harder on the job [my016rer]. In 2004, these
percentages remain largely unchanged. Forty-five percent of the men and 26 percent of the women
agreed with this statement. [iy016rer].
Support from the family may alleviate some of men's job pressures; however, in 1993, 62
percent of men agreed that they can devote a lot of time to their job because of the support they get on
the home front, while only 52 percent of women expressed the same opinion [my017rer]. In 2004
support from the home front is equally or even more important: 50 percent of the women and 66
percent of the men agree that they can devote a lot of time to their job because of the support they get
on the home front [iy017rer].
Despite the fact that work responsibilities are often difficult to balance with family activities, in
1993, the majority of working men and women (69 percent) said that they would still work to make a
living even if they did not have to [my018rer]. In 2004, the percentage of graduates who said that they
would still work to make a living even if they didn't have to increased to 76 percent. However, in
2004 significantly more men (80 percent) than women (72 percent) say that they would continue
working if they did not have to work for a living [iy018rer]. This increase makes sense given that we
are comparing graduates who had continued to work between the two interviews, when many of them
were eligible to receive social security or other retirement benefits for the first time. Sixty-two percent
of graduates who in 1993 said they would not be working if they didn’t have to had completely retired
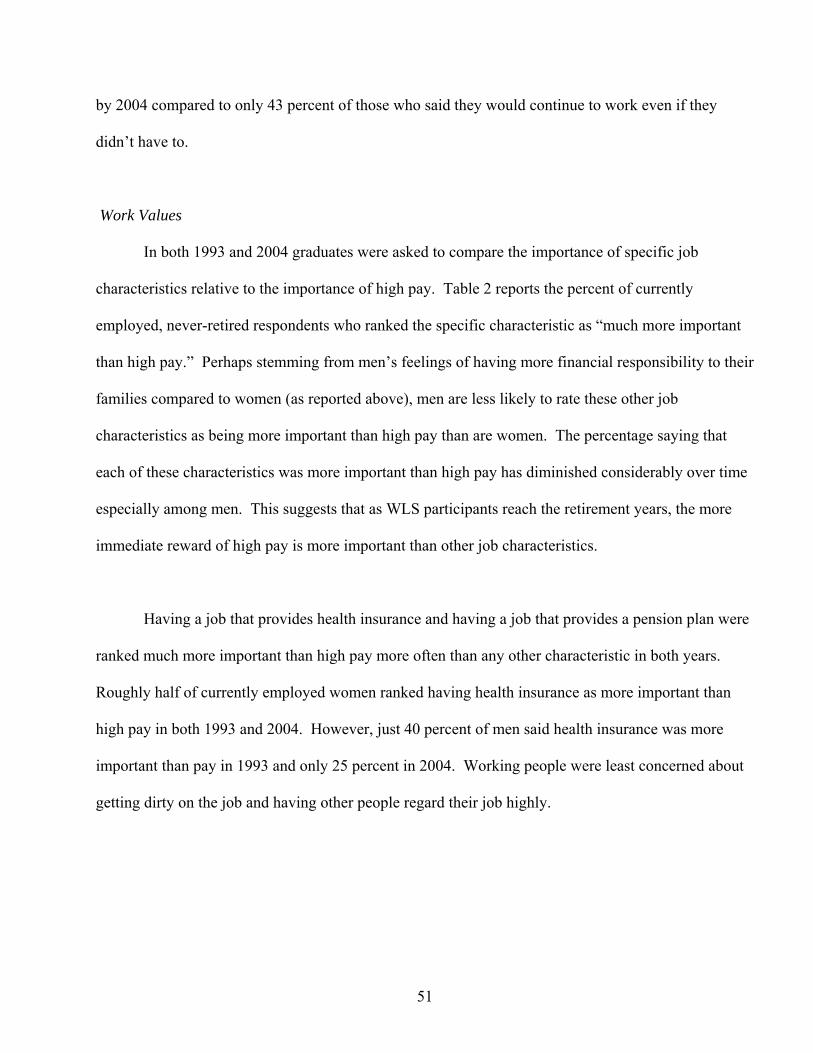
51
by 2004 compared to only 43 percent of those who said they would continue to work even if they
didn’t have to.
Work Values
In both 1993 and 2004 graduates were asked to compare the importance of specific job
characteristics relative to the importance of high pay. Table 2 reports the percent of currently
employed, never-retired respondents who ranked the specific characteristic as “much more important
than high pay.” Perhaps stemming from men’s feelings of having more financial responsibility to their
families compared to women (as reported above), men are less likely to rate these other job
characteristics as being more important than high pay than are women. The percentage saying that
each of these characteristics was more important than high pay has diminished considerably over time
especially among men. This suggests that as WLS participants reach the retirement years, the more
immediate reward of high pay is more important than other job characteristics.
Having a job that provides health insurance and having a job that provides a pension plan were
ranked much more important than high pay more often than any other characteristic in both years.
Roughly half of currently employed women ranked having health insurance as more important than
high pay in both 1993 and 2004. However, just 40 percent of men said health insurance was more
important than pay in 1993 and only 25 percent in 2004. Working people were least concerned about
getting dirty on the job and having other people regard their job highly.
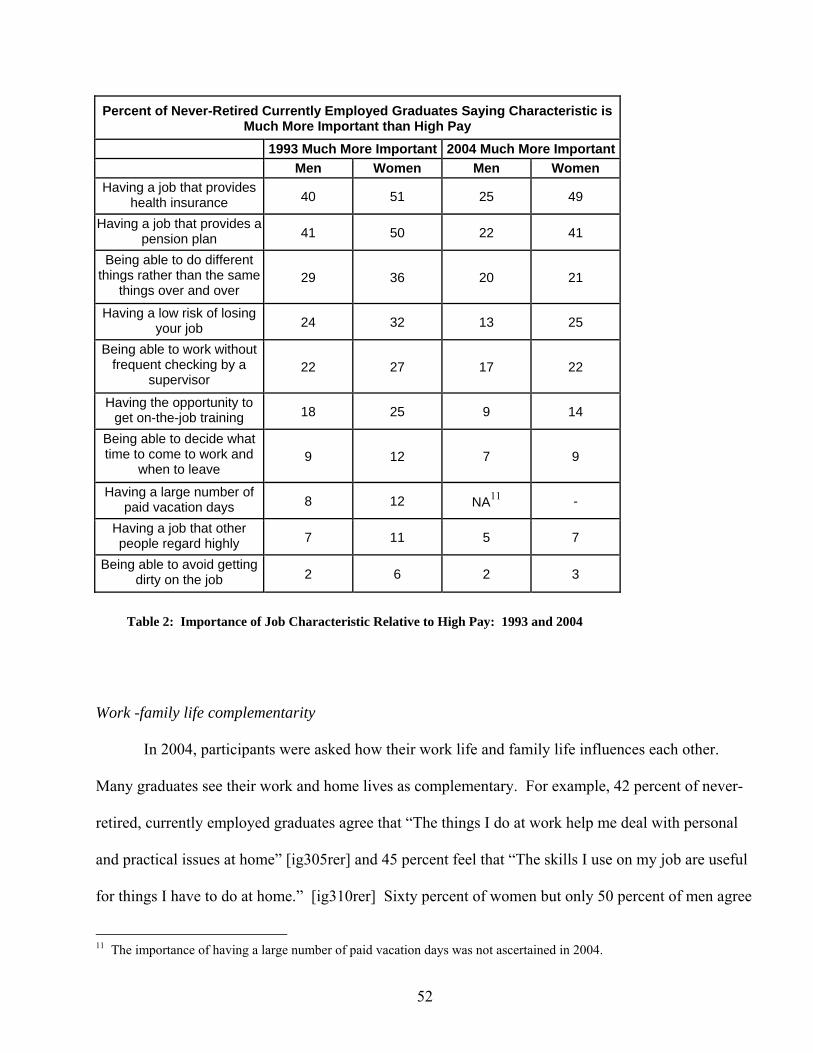
52
Percent of Never-Retired Currently Employed Graduates Saying Characteristic is Much More Important than High Pay
1993 Much More Important 2004 Much More Important Men Women Men Women
Having a job that provides health insurance 40 51 25 49
Having a job that provides a pension plan 41 50 22 41
Being able to do different things rather than the same
things over and over 29 36 20 21
Having a low risk of losing your job 24 32 13 25
Being able to work without frequent checking by a
supervisor 22 27 17 22
Having the opportunity to get on-the-job training 18 25 9 14
Being able to decide what time to come to work and
when to leave 9 12 7 9
Having a large number of paid vacation days 8 12 NA11 -
Having a job that other people regard highly 7 11 5 7
Being able to avoid getting dirty on the job 2 6 2 3
Work -family life complementarity
In 2004, participants were asked how their work life and family life influences each other.
Many graduates see their work and home lives as complementary. For example, 42 percent of never-
retired, currently employed graduates agree that “The things I do at work help me deal with personal
and practical issues at home” [ig305rer] and 45 percent feel that “The skills I use on my job are useful
for things I have to do at home.” [ig310rer] Sixty percent of women but only 50 percent of men agree
11 The importance of having a large number of paid vacation days was not ascertained in 2004.
Table 2: Importance of Job Characteristic Relative to High Pay: 1993 and 2004
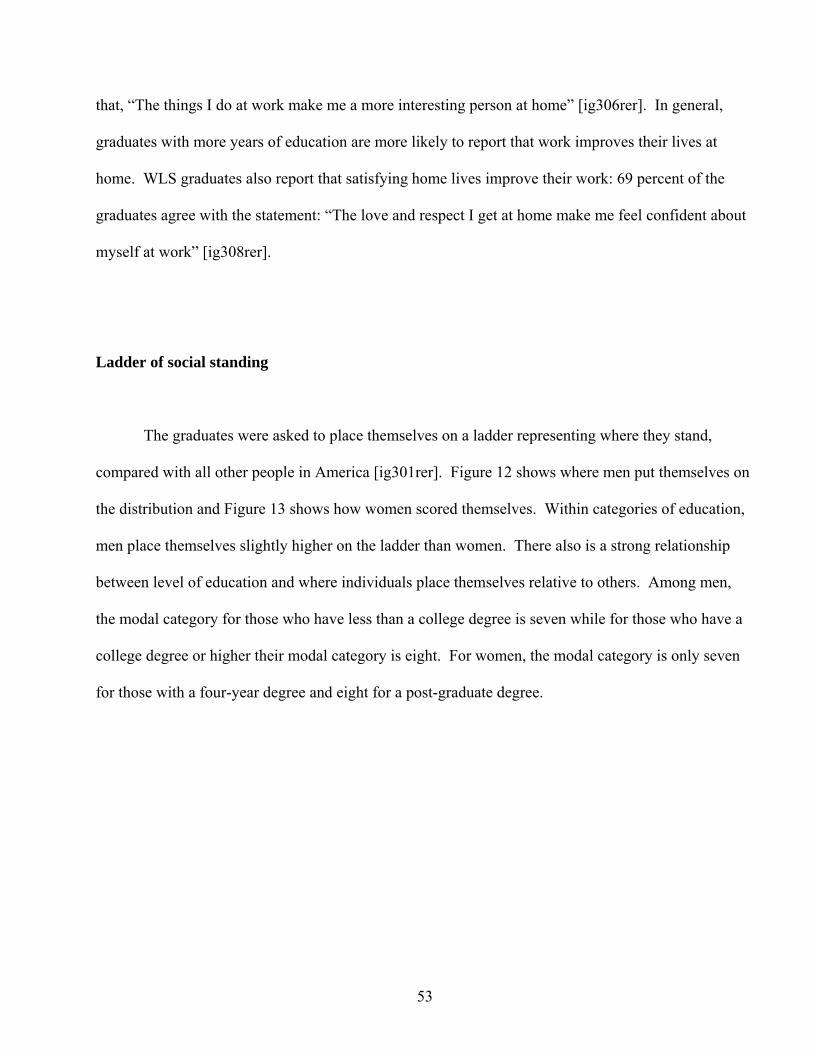
53
that, “The things I do at work make me a more interesting person at home” [ig306rer]. In general,
graduates with more years of education are more likely to report that work improves their lives at
home. WLS graduates also report that satisfying home lives improve their work: 69 percent of the
graduates agree with the statement: “The love and respect I get at home make me feel confident about
myself at work” [ig308rer].
Ladder of social standing
The graduates were asked to place themselves on a ladder representing where they stand,
compared with all other people in America [ig301rer]. Figure 12 shows where men put themselves on
the distribution and Figure 13 shows how women scored themselves. Within categories of education,
men place themselves slightly higher on the ladder than women. There also is a strong relationship
between level of education and where individuals place themselves relative to others. Among men,
the modal category for those who have less than a college degree is seven while for those who have a
college degree or higher their modal category is eight. For women, the modal category is only seven
for those with a four-year degree and eight for a post-graduate degree.
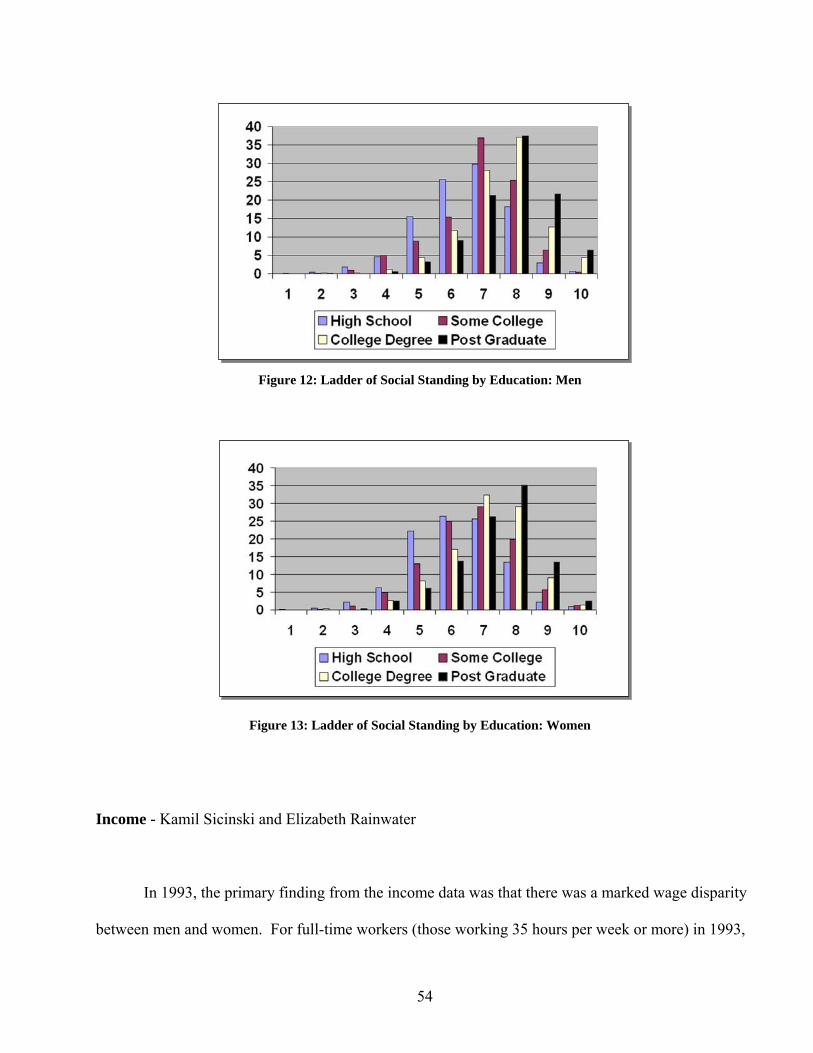
54
Income - Kamil Sicinski and Elizabeth Rainwater
In 1993, the primary finding from the income data was that there was a marked wage disparity
between men and women. For full-time workers (those working 35 hours per week or more) in 1993,
Figure 12: Ladder of Social Standing by Education: Men
Figure 13: Ladder of Social Standing by Education: Women
55
the real median annual wage and salary earnings for women were 53 percent of men’s earnings
($29,200 versus $54,900 in 2004 dollars) [rp001re, selected if rf032jce=1]. For full-time workers in
2004, the median annual wage and salary income is $48,000 for men and $30,000 for women [gp202re,
selected if gf032jce=1]. Thus, among graduates still in the labor force in 2004 the wage gap declined,
with women earning only 37 percent less than men. This effect is due to the decrease in real earnings
of men over the last decade, coupled with no change in the real earnings of women. Interestingly, this
picture does not change much if we limit the sample to people who have never retired from their
primary job – the median income of men in this group is $50,000, while for women it remains at
$30,000.
For part-time workers (those working less than 35 hours per week) in 1993, the real median
earnings of female graduates were less than half those of male graduates ($13,000 and $33,300,
respectively) [rp001re, selected if rf032jce=2]. For part-time workers in 2004, the median annual
wage and salary income is $10,000 for women and $13,000 for men [gp202re, selected if gf032jce=2].
Again, we see a sharp decline in the real earnings of men and relative stability of real earnings among
women. However, among these workers retirement status is important. Men who retired previously
and proceeded to pursue part-time employment earned $11,000 at the median compared to $23,000 for
those who have never retired. For women the difference is much less pronounced ($8,800 versus
$11,000).
There are indications that wages and salaries now account for a smaller proportion of a
graduate’s total personal income, even for full-time workers. In 1993, wage and salary income
accounted for approximately 90 percent of a graduate’s reported total personal income among full-
56
time workers and 78 percent of total income among part-time workers [rg019jjc, rp015ree, rf032jce].
In 2004, wages and salaries account for 77 percent of reported total personal income for full-time
workers and 46 percent of total income for part-time workers. The most common non-wage sources of
income were Social Security (with 77 percent of graduates reporting income from this source), interest
and dividends (62 percent reporting this type of income), and non-Social Security retirement plans (44
percent) [gp205re, gp209re, gp214rp]. Among those graduates receiving Social Security income, men
report a median annual income of $14,400 and women report a median annual income of $8,040
[gp205re, gp208rec]. Among graduates receiving non-Social Security retirement income, men report a
median annual income twice as large as the median reported by women ($24,000 and $12,000
respectively) [gp209re, gp211re]. Interest and dividend income is collected for the graduate and
spouse (if married) together. Although female graduates report less interest and dividend income than
male graduates ($2,000 versus $3,000), these differences are not significant once marital status is
taken into account [gp214rp, gp215rp, gc001re].
Full- or part-time status does not vary by educational attainment with roughly half of the
working graduates choosing part-time employment (gf032jc, gb103red). However, median annual
wages and salaries show significant differences by education. The median annual reported wage and
salary income for graduates with a high school diploma was $20,000. For those with some college,
the median was $24,000. The median for those with a bachelor’s was $35,000, compared to $40,000
for those with more than a bachelor’s (gp202re, gb103red). Predictably, this trend carries over into
Social Security income. The median annual Social Security income received by graduates with a high
school diploma was $10,392, compared to $11,460 for those with some college, $12,720 for those
with a bachelor’s degree, and $14,400 for those with more than a bachelor’s (gp208rec, gb103red). As
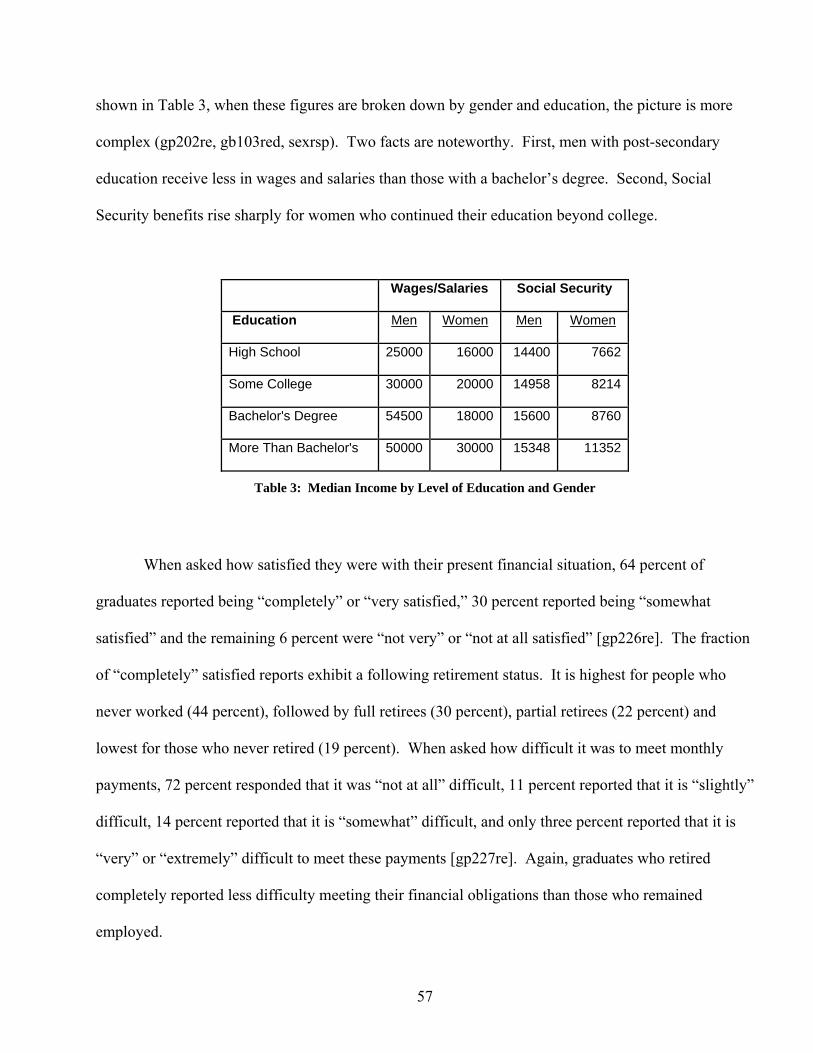
57
shown in Table 3, when these figures are broken down by gender and education, the picture is more
complex (gp202re, gb103red, sexrsp). Two facts are noteworthy. First, men with post-secondary
education receive less in wages and salaries than those with a bachelor’s degree. Second, Social
Security benefits rise sharply for women who continued their education beyond college.
Wages/Salaries Social Security
Education Men Women Men Women
High School 25000 16000 14400 7662
Some College 30000 20000 14958 8214
Bachelor's Degree 54500 18000 15600 8760
More Than Bachelor's 50000 30000 15348 11352
Table 3: Median Income by Level of Education and Gender
When asked how satisfied they were with their present financial situation, 64 percent of
graduates reported being “completely” or “very satisfied,” 30 percent reported being “somewhat
satisfied” and the remaining 6 percent were “not very” or “not at all satisfied” [gp226re]. The fraction
of “completely” satisfied reports exhibit a following retirement status. It is highest for people who
never worked (44 percent), followed by full retirees (30 percent), partial retirees (22 percent) and
lowest for those who never retired (19 percent). When asked how difficult it was to meet monthly
payments, 72 percent responded that it was “not at all” difficult, 11 percent reported that it is “slightly”
difficult, 14 percent reported that it is “somewhat” difficult, and only three percent reported that it is
“very” or “extremely” difficult to meet these payments [gp227re]. Again, graduates who retired
completely reported less difficulty meeting their financial obligations than those who remained
employed.
58
Assets - Kamil Sicinski and Elizabeth Rainwater
The vast majority of graduates (93 percent) own their own homes, while only six percent are
renting [gr020rp]. Homeowners report a median home value of $175,000 [gr021rp], up from
$118,000 in 1993. While there was almost no change in the home ownership rate in the sample over
the last decade, at present, 65 percent of houses do not carry mortgages [gr022rp], compared to only
40 percent in 1993. Almost five percent of graduates settled in a retirement community [gr051RP],
while only two percent report living in a mobile home.
Since 1993 the fraction of graduates reporting that they own a business or a farm declined from
23 to 18 percent [gr028rp]. The median selling price for businesses was $200,000, but almost 20
percent of owners stated that their business had no financial value [gr029rp]. Only 22 percent of
owners are still paying off business loans, down from 33 percent in 1993 [gr030rp]. About a third of
the graduates also reported owning some other real estate with a median value of $125,000 [gr024rp,
gr025rp].
Most of the financial investments in the sample are concentrated in retirement plans that
accumulate an account balance, such as IRAs, 401(k)s or profit sharing plans. Seventy-eight percent
of households have such savings with a median balance of $145,000 [gr060rp, gr061rp]. Additionally,
57 percent of graduates have stock market investments amounting to $80,000 at the median
[gr066rp,gr067rp]. About 40 percent also purchased certificates of deposit or saving bonds with a
median investment of $20,000 [gr064rp, gr065rp]. Almost everyone in the sample had a bank account
59
(checking, saving or money market fund) [gt062rp]. About nine percent of graduates maintained a
balance of less than $1,000 in these accounts; among those who had more the median balance was
$15,000 [gt063rp]. Only 16 percent of households had assets not covered by one of the above
categories.
Preliminary measures (based on direct reports only, with no imputations for missing
components) indicate that net worth of the median WLS household increased from $190,000 to
$327,000 in real terms over the last decade [gt100rpc]. This measure, while biased downward, is
already considerably higher than for a roughly comparable sample from the 2002 release of the Health
and Retirement Study ($274,000). The change in net worth was not uniform for all graduates. For
those in the first centile of the wealth distribution it grew 53 percent, for those at the median 79
percent and it more than doubled for households in the top 20 percent of the distribution. Putting it
differently, the wealthier one was in 1993, the more their wealth grew by 2004. It is also interesting to
note that the share of housing wealth in net worth fell from 46 percent to 40 percent since the 1993
round of interviews.
In addition to asking about assets, we also asked about life insurance coverage. Eighty-three
percent of men and 71 percent of women reported having life insurance policies [gr080re]. The
median face value is $50,000 for men and $20,000 for women [gr081re]. Graduates with large
policies (more than $50,000) were also asked whether their policy had an investment component. This
was the case for 64 percent of policies [gr084re] and the median cash value of these investments was
$26,000 [gr085re].
60
Finally, we asked married graduates who in the household knew most about assets, debts, and
retirement plans [gr086re]. There is a substantial disparity in the level of perceived financial
knowledge between husbands and wives. Among men, 56 percent named themselves as more
knowledgeable, 26 percent pointed to the spouse, and 18 percent reported equal knowledge with the
spouse. For women, the corresponding figures were 27, 53, and 19 percent. The high degree of
agreement between sexes suggests that there is no respondent bias in the assessment of financial
knowledge.
Intertransfers - Megan Andrew, Elizabeth Rainwater, and Kamil Sicinski
According to data from the 2004 survey, WLS families act as economic units to a large extent,
transferring resources across generations. Approximately 52 percent of male graduates and 53 percent
of female graduates had ever received an inheritance of at least $10,000 (gq100r1). These inheritances
generally came from parents or parents-in-law (78 percent) (gq103r1). The median inheritance for
both men and women in the WLS sample is approximately $40,000, and the median year of receipt is
1995 (gq101r1, gq102r1). In general then, WLS graduates receive a sizeable transfer of economic
resources in mid-life from their parents. Among WLS graduates with siblings, the parental estate was
divided equally among siblings in 90 percent of cases (gq104r1). Thirty-two percent of graduates with
one inheritance also received a second inheritance worth $10,000 or more with a median year of
receipt of 1993 (gq100r2). Among men, the median second inheritance was $35,000, and among
women, the median second inheritance was $30,000 (gq102r2, ga001re).
61
Aside from inheritances, WLS graduates also received economic gifts from living relatives,
mainly their parents. Approximately 67 percent of graduates reported a living parent (including in-
laws) in the 1993 interview. Among these graduates, 36 percent had received a gift from this parent(s)
since then (gq200r gq201r). Men and women are equally likely to have received a gift from a parent.
The main source of inter vivos gifts is the graduate’s mother (39 percent), mother-in-law (18 percent),
or the graduate’s parents jointly (15 percent) (gq202r1). The given reason for inter vivos gifts is either
to spend in any way or for “other” reasons, such as to reduce the size of the parental estate for tax
purposes (gq204r1). In 1993, men received a median $10,000 in inter vivos gifts over the past 10
years while women received slightly less, a median gift of $8,000 (rq007pb). By 2004, women had
reached parity with men and both groups report receiving $10,000 in inter vivos gifts since 1993
(gq203r1).
WLS graduates not only received economic resources but gave them as well. As their parents
had done for them, a significant portion of graduates with living children made downstream inter vivos
transfers to their children (41 percent) (gq401r1, gq400r, gd001kd). Forty-six percent of graduates
with more than one child distributed gifts equally among their children, in the remaining cases the
largest gift or loan was most commonly given to the oldest child (gq402r1, gq404r1). Reasons for
graduates’ gifts to their children differ slightly from the reasons for gifts from the graduates’ parents.
Approximately 36 percent of graduates gave their children gifts of $1000 or more to spend any way
they wanted (this includes wedding gifts), 16 percent gave their children a gift specifically for a down
payment on a home and 6 percent provided financial assistance (gq403r1). Following the typical
pattern of downstream transfer of economic resources from the parental generation to filial generations
(gq500r, gq400r, gq200r), in 2004 only four percent of WLS graduates with at least one living parent
62
reported having given them substantial gifts. Among those graduates giving to parents, the median
transfer was $5000 (gq502r1).
While families represent an important focus of economic transfers, WLS graduates also made
significant gifts to charitable organizations. About 67 percent of men and 60 percent of women in the
WLS sample reported giving more than $500 to charity in the last year (gq700r). Among graduates
who did make donations, men reported a median gift of $2000 while women reported a median gift of
$1500 (gq701r, ga001re).
Cognition – Carol Roan
Subjective Measures
In 2004 very few graduates reported being very forgetful or unable to remember anything at all.
The majority of graduates (78 percent) were able to remember “most things” over the past four weeks
and almost all the remaining graduates (21 percent), admitted to being “somewhat forgetful.”
[gx336re] Similarly, hardly any graduates were unable to, or had a great deal of difficulty thinking or
solving day-to-day problems. Nearly all (91 percent) said they were able to think clearly and solve
problems, seven percent said they had “a little” difficulty and two percent said they had “a great deal”
of difficulty. [gx337re] Although men and women did not differ significantly in their reports, those
who completed more education were somewhat less likely to report having difficulty with memory or
problem solving. Eighty-four percent of those with a college degree or higher were able to remember
most things and 94 percent are able to think clearly and solve problems. Among graduates who
stopped their formal education after completing high school, only 74 percent say they are able to
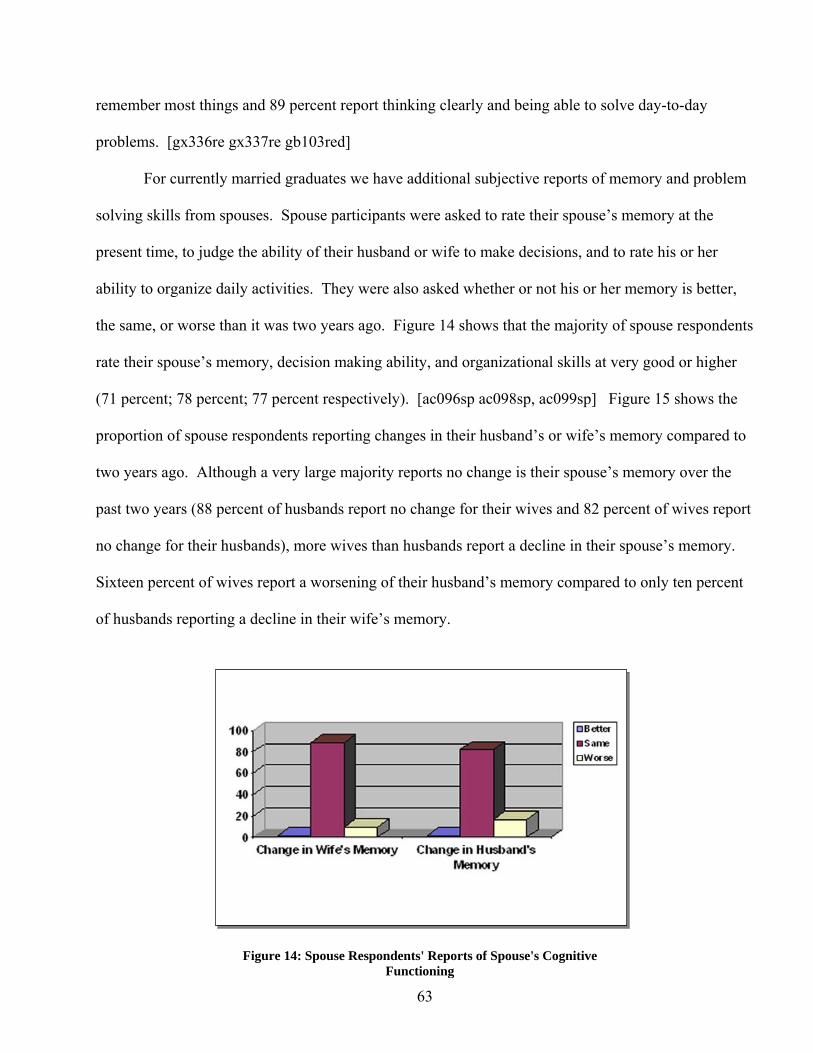
63
remember most things and 89 percent report thinking clearly and being able to solve day-to-day
problems. [gx336re gx337re gb103red]
For currently married graduates we have additional subjective reports of memory and problem
solving skills from spouses. Spouse participants were asked to rate their spouse’s memory at the
present time, to judge the ability of their husband or wife to make decisions, and to rate his or her
ability to organize daily activities. They were also asked whether or not his or her memory is better,
the same, or worse than it was two years ago. Figure 14 shows that the majority of spouse respondents
rate their spouse’s memory, decision making ability, and organizational skills at very good or higher
(71 percent; 78 percent; 77 percent respectively). [ac096sp ac098sp, ac099sp] Figure 15 shows the
proportion of spouse respondents reporting changes in their husband’s or wife’s memory compared to
two years ago. Although a very large majority reports no change is their spouse’s memory over the
past two years (88 percent of husbands report no change for their wives and 82 percent of wives report
no change for their husbands), more wives than husbands report a decline in their spouse’s memory.
Sixteen percent of wives report a worsening of their husband’s memory compared to only ten percent
of husbands reporting a decline in their wife’s memory.
Figure 14: Spouse Respondents' Reports of Spouse's Cognitive Functioning
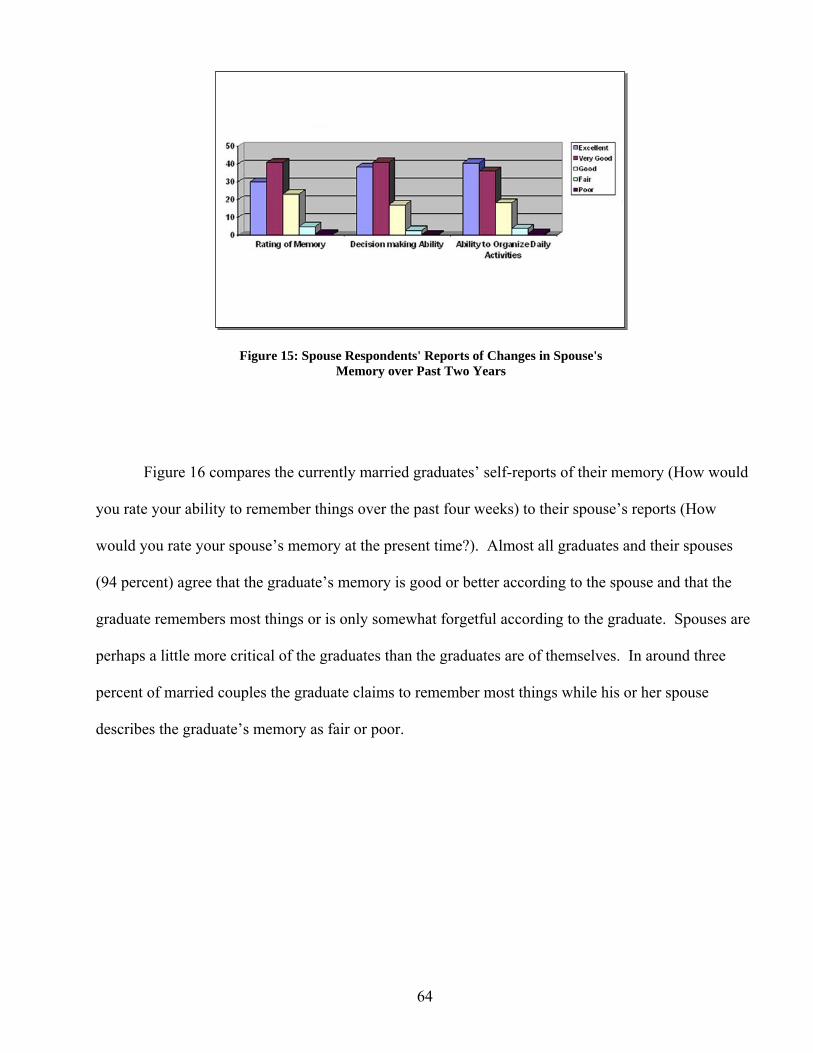
64
Figure 16 compares the currently married graduates’ self-reports of their memory (How would
you rate your ability to remember things over the past four weeks) to their spouse’s reports (How
would you rate your spouse’s memory at the present time?). Almost all graduates and their spouses
(94 percent) agree that the graduate’s memory is good or better according to the spouse and that the
graduate remembers most things or is only somewhat forgetful according to the graduate. Spouses are
perhaps a little more critical of the graduates than the graduates are of themselves. In around three
percent of married couples the graduate claims to remember most things while his or her spouse
describes the graduate’s memory as fair or poor.
Figure 15: Spouse Respondents' Reports of Changes in Spouse's Memory over Past Two Years
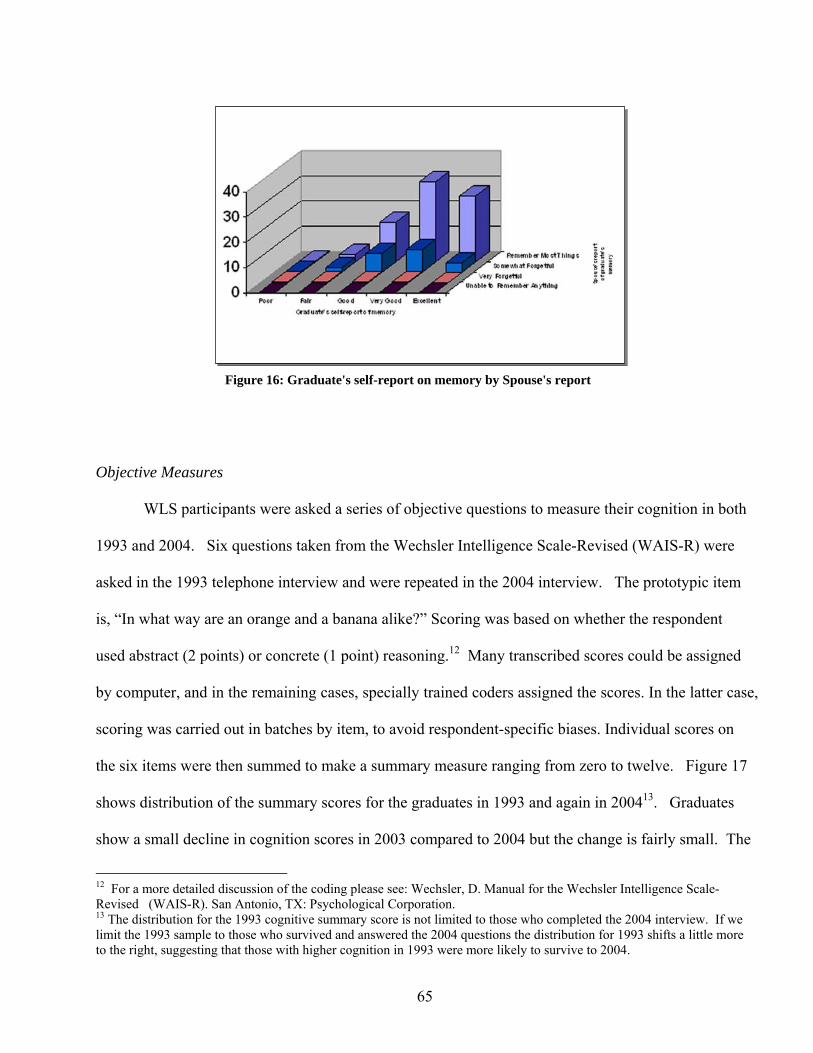
65
Objective Measures
WLS participants were asked a series of objective questions to measure their cognition in both
1993 and 2004. Six questions taken from the Wechsler Intelligence Scale-Revised (WAIS-R) were
asked in the 1993 telephone interview and were repeated in the 2004 interview. The prototypic item
is, “In what way are an orange and a banana alike?” Scoring was based on whether the respondent
used abstract (2 points) or concrete (1 point) reasoning.12 Many transcribed scores could be assigned
by computer, and in the remaining cases, specially trained coders assigned the scores. In the latter case,
scoring was carried out in batches by item, to avoid respondent-specific biases. Individual scores on
the six items were then summed to make a summary measure ranging from zero to twelve. Figure 17
shows distribution of the summary scores for the graduates in 1993 and again in 200413. Graduates
show a small decline in cognition scores in 2003 compared to 2004 but the change is fairly small. The
12 For a more detailed discussion of the coding please see: Wechsler, D. Manual for the Wechsler Intelligence Scale-Revised (WAIS-R). San Antonio, TX: Psychological Corporation. 13 The distribution for the 1993 cognitive summary score is not limited to those who completed the 2004 interview. If we limit the 1993 sample to those who survived and answered the 2004 questions the distribution for 1993 shifts a little more to the right, suggesting that those with higher cognition in 1993 were more likely to survive to 2004.
Figure 16: Graduate's self-report on memory by Spouse's report
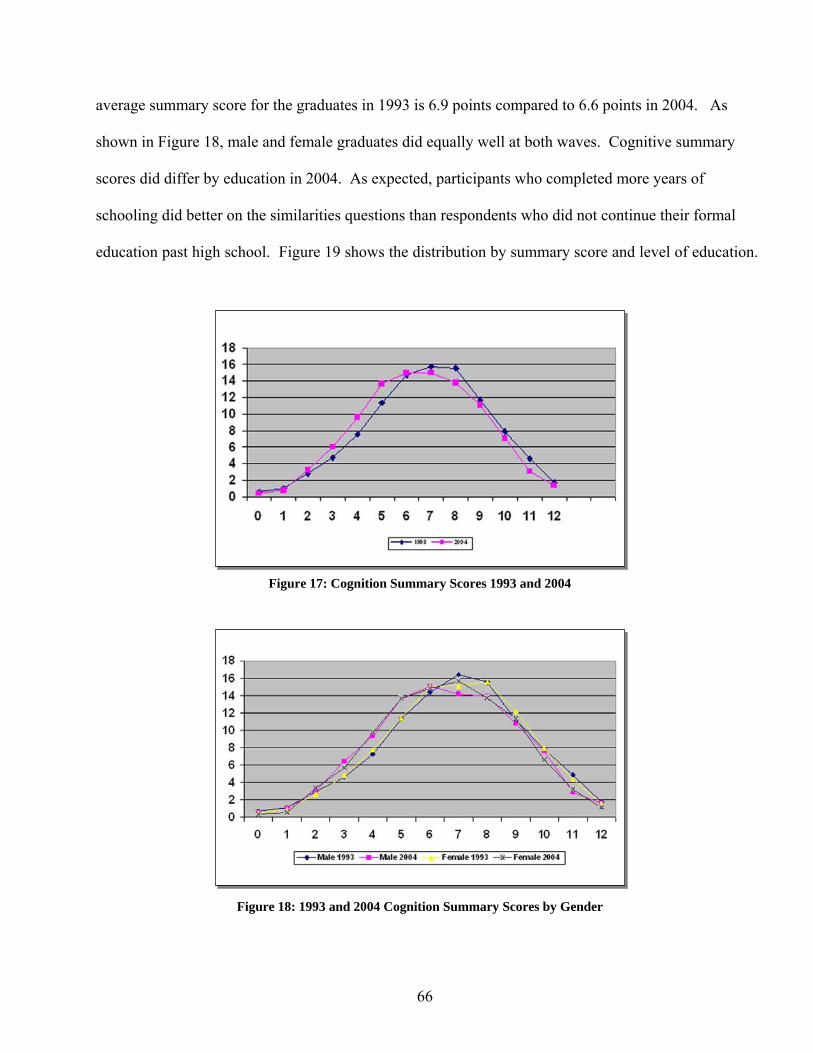
66
average summary score for the graduates in 1993 is 6.9 points compared to 6.6 points in 2004. As
shown in Figure 18, male and female graduates did equally well at both waves. Cognitive summary
scores did differ by education in 2004. As expected, participants who completed more years of
schooling did better on the similarities questions than respondents who did not continue their formal
education past high school. Figure 19 shows the distribution by summary score and level of education.
Figure 17: Cognition Summary Scores 1993 and 2004
Figure 18: 1993 and 2004 Cognition Summary Scores by Gender
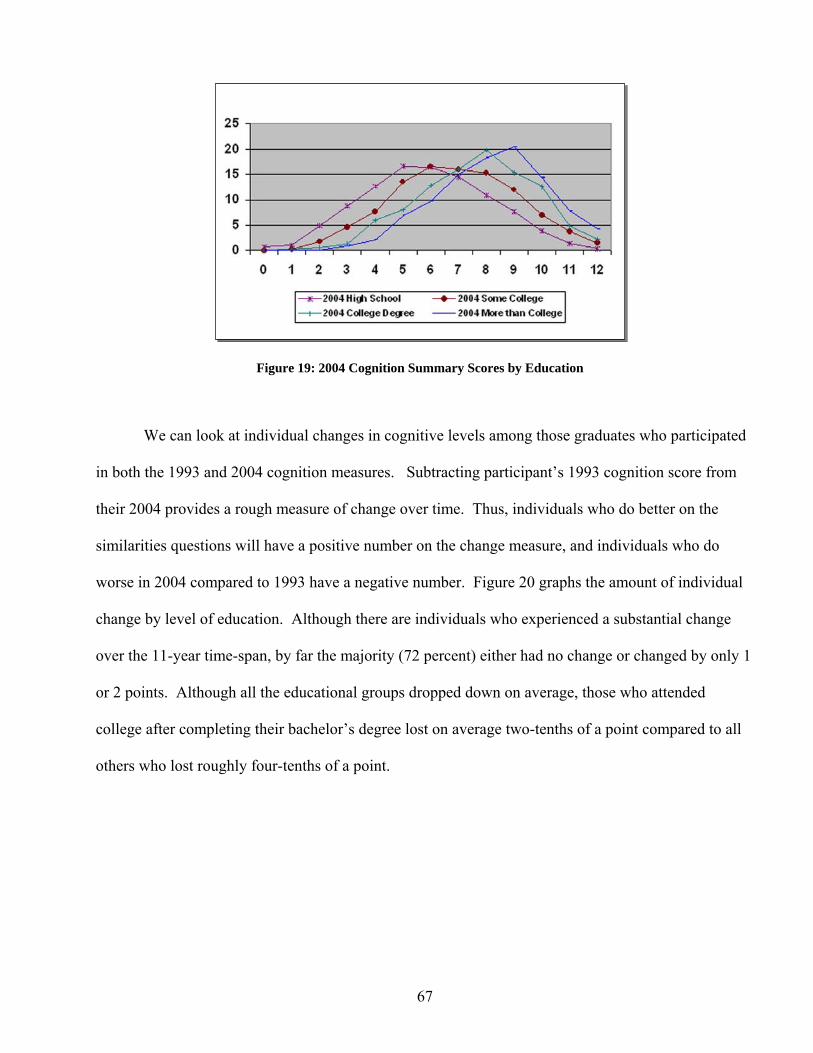
67
We can look at individual changes in cognitive levels among those graduates who participated
in both the 1993 and 2004 cognition measures. Subtracting participant’s 1993 cognition score from
their 2004 provides a rough measure of change over time. Thus, individuals who do better on the
similarities questions will have a positive number on the change measure, and individuals who do
worse in 2004 compared to 1993 have a negative number. Figure 20 graphs the amount of individual
change by level of education. Although there are individuals who experienced a substantial change
over the 11-year time-span, by far the majority (72 percent) either had no change or changed by only 1
or 2 points. Although all the educational groups dropped down on average, those who attended
college after completing their bachelor’s degree lost on average two-tenths of a point compared to all
others who lost roughly four-tenths of a point.
Figure 19: 2004 Cognition Summary Scores by Education
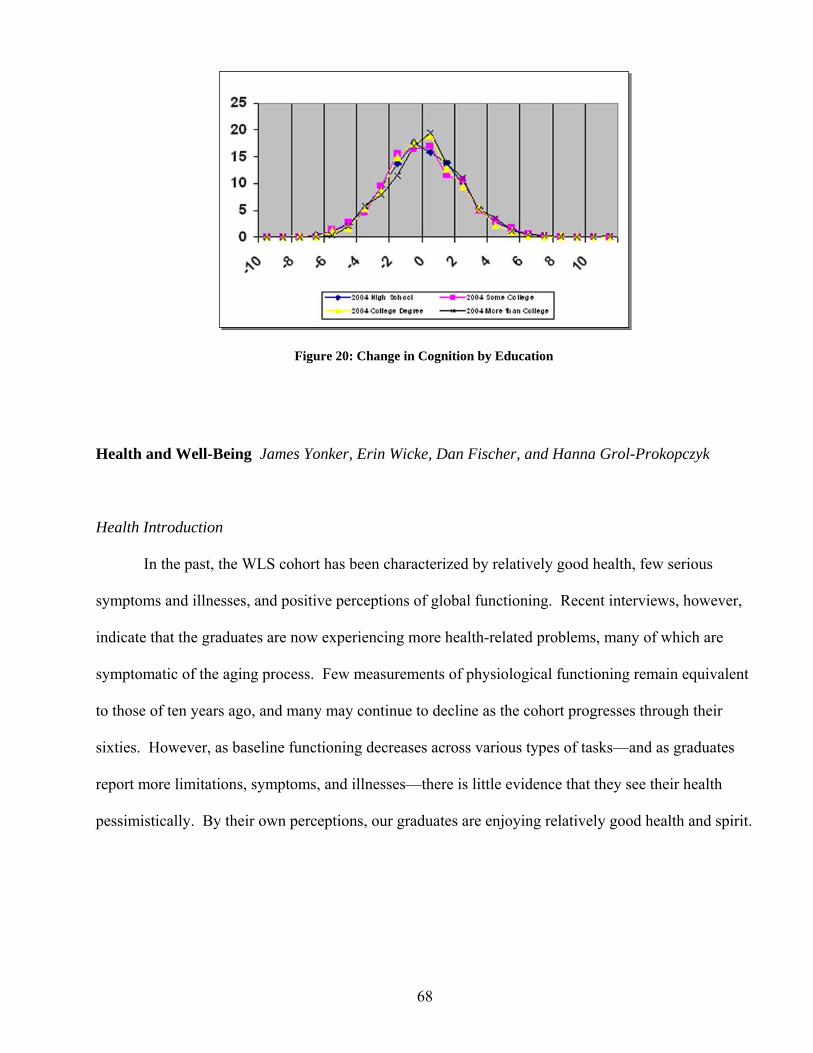
68
Health and Well-Being James Yonker, Erin Wicke, Dan Fischer, and Hanna Grol-Prokopczyk
Health Introduction
In the past, the WLS cohort has been characterized by relatively good health, few serious
symptoms and illnesses, and positive perceptions of global functioning. Recent interviews, however,
indicate that the graduates are now experiencing more health-related problems, many of which are
symptomatic of the aging process. Few measurements of physiological functioning remain equivalent
to those of ten years ago, and many may continue to decline as the cohort progresses through their
sixties. However, as baseline functioning decreases across various types of tasks—and as graduates
report more limitations, symptoms, and illnesses—there is little evidence that they see their health
pessimistically. By their own perceptions, our graduates are enjoying relatively good health and spirit.
Figure 20: Change in Cognition by Education
69
Height and Weight
Self-reports of height [ix010rec] and weight [ix009rer] show that the average woman in our
sample is 5'4 1/2" tall and weighs 160-165 pounds, while the average man is 5'10 1/2" and weighs
around 200 pounds. The typical graduate gained five and a half pounds since 1993 [mx009rer,
ix009rer]. A majority of both men (59 percent) and women (70 percent) consider themselves currently
overweight [ixw05rer]. According to current medical definitions of excess weight, based on the body
mass index (BMI), this perception is warranted. Among the men in our sample, only 18 percent are at
a healthy weight (18.5 ≤ BMI < 25), while 48 percent are overweight (25 ≤ BMI < 30) and 34 percent
obese (BMI ≥ 30) [ix011rec]. Among women, 32 percent fall into the healthy weight category, 37
percent are overweight, and 30 percent obese [ix011rec].
Thus, despite their perceptions, the women in our sample are less likely than men to be
clinically overweight. Nevertheless, a larger proportion of women than men are actively trying to lose
weight — 51 versus 39 percent [ixw06rer]. For both men and women, exercising [ixw08rer] and
cutting calories or fat [ixw07rer] are the preferred methods for weight loss or weight maintenance,
used in over 80 percent of cases. Very few graduates (two to three percent) use pills or laxatives as
part of their weight loss or weight maintenance plan [ixw09rer].
Exercise
Women report engaging in substantially more light physical activity than men—such as
walking, gardening, bowling, or housework (46 versus 29 hours per month) [ixe01rer]. On the other
hand, men engage in slightly more vigorous physical activity such as jogging, swimming, biking, or
playing team sports—eight and a half hours per month, compared to seven and a half for women
70
[ixe02rer]. Physical activity patterns also vary by educational background. Graduates with no more
than a high school diploma engage in more light physical activity (41 hours per month) and less
vigorous physical activity (7 hours per month) than their counterparts with college or post-collegiate
education. For example, those with post-collegiate education report 31 hours per month of light
activity, and over 11 hours per month of vigorous activity [ixe01rer, ixe02rer, gb103red]. These
educational differences in activity are evident for both men and women.
Global Functioning
In 1993, when graduates were in their mid-fifties, 90 percent [mx001rer] reported that their
current health was either excellent or good. Most graduates continue to rate their current health as
positive in general (85 percent) [ix001rer] and in comparison to others of the same age and sex (86
percent) [ix002rer]. A full 70 percent of graduates describe their current health as equal to or better
than 10 years ago [ix003rer], 77 percent report similarly about their appearance [ix004rer], and 84
percent report their childhood health as excellent or very good [ixc01rer]. Consistent with 1993, men
are still slightly more likely than women to report that their physical appearance is as good or better
than it was 10 years ago (79 versus 74 percent) [ix005rer].
As in 1993, graduates who pursued education after high school are more likely to report that
their current health is excellent or good (88 versus 82 percent) [ix001rer] and compared to others of
their same age and gender (89 versus 83 percent) [ix002rer]. However, also similar to 1993, graduates
with more than a high school education are slightly less likely to report that their appearance is
equivalent to or better than 10 years ago (73 versus 78 percent) [ix004rer].
71
Minor Health Limitations
Many common tasks are becoming harder for participants to perform without strain or
assistance, with clear disparities between women and men. While only 2 percent of men and 8 percent
of women report having difficulty carrying ten pounds — such as a bag of groceries [ixch03re], 10
percent of men and 39 percent of women have trouble carrying twenty-five pounds [ixch04re].
Additionally, 11 percent of men and 24 percent of women have difficulty pushing and pulling large
objects like a living room chair [ixch05re], and 21 percent of men and 29 percent of women report
being at least somewhat limited in moderate activities, such as moving a table, pushing a vacuum
cleaner, bowling, or playing golf [ixch01re]. A full 29 percent of men and 44 percent of women
indicate troubles with vigorous activities, like climbing several flights of stairs [ixch02re].
Graduates with an education beyond high school are less likely to have problems with any of
these tasks. While 29 percent of graduates with only a high school education report experiencing
difficulty with moderate tasks, only 21 percent of their more educated counterparts report the same
level of difficulty [ixch01re]. The same trend holds true for vigorous activities (42 versus 31 percent)
[ixch02re], lifting and carrying 25 pounds (29 versus 22 percent) [ixch04re], and pushing or pulling
large objects (20 versus 15) [ixch05re].
Some of these difficulties with moderate and routine activities may stem from limitations in
movement, pain, or fatigue. In general, more women report experiencing difficulty standing (22
versus 16 percent) [ixch06re] or sitting (seven versus four percent) [ixch07re] for an hour or more,
stooping, crouching or kneeling (45 versus 31 percent) [ixch08re], or reaching over their heads (nine
versus seven percent) [ixch09re].
72
Again controlling for gender, those with more than a high school education are less likely to
report difficulty with any of these tasks. While graduates with more than a high school education are
only slightly less likely to report difficulty standing (18 versus 20 percent) [ixch06re] or sitting (five
versus six percent) [ixch07re] for an hour or more, they were considerably less likely to report
difficulty stooping, crouching or kneeling (33 versus 43 percent) [ixch08re] or reaching over their
heads (six versus 10 percent) [ixch09re].
Furthermore, these limitations may hinder the amount and of type of activities graduates
participate in regularly. About 20 percent of graduates (18 percent of males, 22 percent of females)
report that in the past month they accomplished less that they would have liked to or were limited in
their activities or work because of their physical health [ix401rer,ix402rer]. Net of gender, graduates
with an education beyond high school are less likely to report these limitations than those with only a
high school education (18 versus 21 percent and 17 versus 21 percent, respectively) [ix401rer,
ix402rer]. Strikingly, 47 percent of men and 52 percent of women report that pain limited their normal
work at least a little bit in the past month [ix405rer] either inside or outside the home. High school
graduates express greater limitations from pain than those who pursued further education (54 percent
versus 44 percent), which parallels other trends in which more education is associated with fewer
health difficulties [ix405rer].
Vision & Hearing Impairments
Nearly all graduates—97 percent—use some form of vision correction regularly [ixhs05re].
Women are consistently more likely to use corrective lenses for their vision problems, including
prescription glasses (91 versus 87 percent) [ixhs02re] and contact lenses (seven versus three percent)
73
[ixhs03re]. However, male and female graduates use nonprescription magnifying glasses equally (12
percent) [ixhs04re]. Interestingly, female graduates are more likely to report increased problems
reading small print—such as on a medicine bottle—in the last year (45 versus 32 percent) [ixhs17re]
and last five years (58 versus 43 percent) [ixhs18re], while male graduates are slightly more likely to
report increased problems with understanding written instructions in the last year (four versus three
percent) [ixhs19re] and last five years (five versus three percent) [ixhs20re].
While graduates with only a high school education are more likely to wear glasses than those
with more education (92 versus 86 percent) [ixhs02re], the latter group is more likely to use contact
lenses (eight versus three percent) [ixhs03re] or nonprescription magnifying glasses (14 versus 10
percent) [ixhs04re]. Additionally, graduates with only a high school education are more likely to
report increased problems in the last year reading small print (42 versus 35 percent) [ixhs17re] and
understanding written instructions (four versus two percent) [ixhs19re] than their more educated
counterparts. They were also more likely to report increased problems understanding written
instructions in the last 5 years (five versus three percent) [ixhs20re].
While vision problems generally affect more women, men have more difficulties hearing.
Significantly more male graduates report having had their hearing checked in the last five years (49
versus 33 percent) [ixhs08re], which is likely the result of greater need. While 31 percent of male
graduates report that those living with or close to them think they should have their hearing checked,
only 10 percent of female graduates report the same [ixhs09re]. Male graduates are also more likely to
use hearing aids regularly (eight versus three percent) [ixhs10re].
74
Across the board, male graduates report greater increases in hearing-related problems. They
are more likely to report increased problems hearing conversations in person in the last year (19 versus
11 percent) [ixhs11re] and last five years (37 versus 21 percent) [ixhs12re], as well as over the phone
during the same time periods (13 versus 8 percent, and 21 versus 12 percent, respectively) [ixhs13re,
ixhs14re]. Not surprisingly, more males report difficulty understanding spoken instructions, such as
those from a doctor or employer, in the last year (seven versus three percent) [ixhs15re] and last five
years (eleven versus four percent) [ixhs16re].
Unlike vision problems, we see few differences in hearing problems across levels of
educational attainment, with or without controlling for gender. Graduates with only a high school
education were no more likely than others to have their hearing checked within the last five years
[ixhs08re] or regularly use hearing aids [ixhs10re]. They were also no more likely to report increased
problems understanding conversations in person [ixhs11re, ixhs12re] or over the phone [ixhs13re,
ixhs14re]. However, graduates with more than a high school education were considerably less likely
to report having someone they live with or close to them think they should have their hearing checked
(43 versus 57 percent) [ixhs09re].
Health Symptoms
The number of reported health symptoms has increased dramatically since 1993, with over 97
percent of graduates listing at least one of the 25 possible symptoms [ix082rec].14 Men tended to
report a full symptom less on average than women (7.9 versus 9.0) [ix082rec]. Looking specifically at
14 Symptoms: Aching muscles; Back pain/strain; Bone pains; Chest pain; Constipation; Coughing/wheezing; Diarrhea; Difficulties with or painful sexual intercourse; Dizziness/faintness; Excessive Sweating; Fatigue/exhaustion; Headache; Lack of energy; Neck and/or shoulder pain; Numbness; Pain in your hands/wrists; Pain in your ankles/knees; Palpitations (feeling your heart pound or race); Ringing in ears; Shortness of breath; Skin problems; Stiff/swollen joints; Trouble sleeping; Upset stomach; Urination problems.
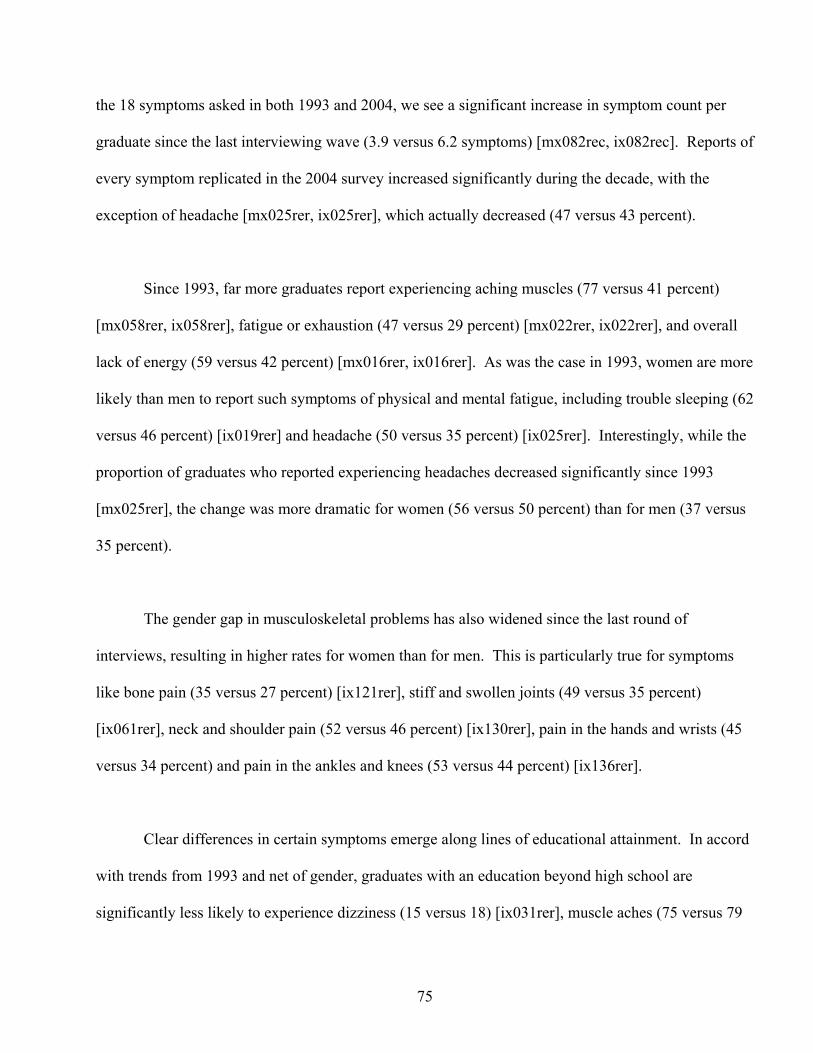
75
the 18 symptoms asked in both 1993 and 2004, we see a significant increase in symptom count per
graduate since the last interviewing wave (3.9 versus 6.2 symptoms) [mx082rec, ix082rec]. Reports of
every symptom replicated in the 2004 survey increased significantly during the decade, with the
exception of headache [mx025rer, ix025rer], which actually decreased (47 versus 43 percent).
Since 1993, far more graduates report experiencing aching muscles (77 versus 41 percent)
[mx058rer, ix058rer], fatigue or exhaustion (47 versus 29 percent) [mx022rer, ix022rer], and overall
lack of energy (59 versus 42 percent) [mx016rer, ix016rer]. As was the case in 1993, women are more
likely than men to report such symptoms of physical and mental fatigue, including trouble sleeping (62
versus 46 percent) [ix019rer] and headache (50 versus 35 percent) [ix025rer]. Interestingly, while the
proportion of graduates who reported experiencing headaches decreased significantly since 1993
[mx025rer], the change was more dramatic for women (56 versus 50 percent) than for men (37 versus
35 percent).
The gender gap in musculoskeletal problems has also widened since the last round of
interviews, resulting in higher rates for women than for men. This is particularly true for symptoms
like bone pain (35 versus 27 percent) [ix121rer], stiff and swollen joints (49 versus 35 percent)
[ix061rer], neck and shoulder pain (52 versus 46 percent) [ix130rer], pain in the hands and wrists (45
versus 34 percent) and pain in the ankles and knees (53 versus 44 percent) [ix136rer].
Clear differences in certain symptoms emerge along lines of educational attainment. In accord
with trends from 1993 and net of gender, graduates with an education beyond high school are
significantly less likely to experience dizziness (15 versus 18) [ix031rer], muscle aches (75 versus 79
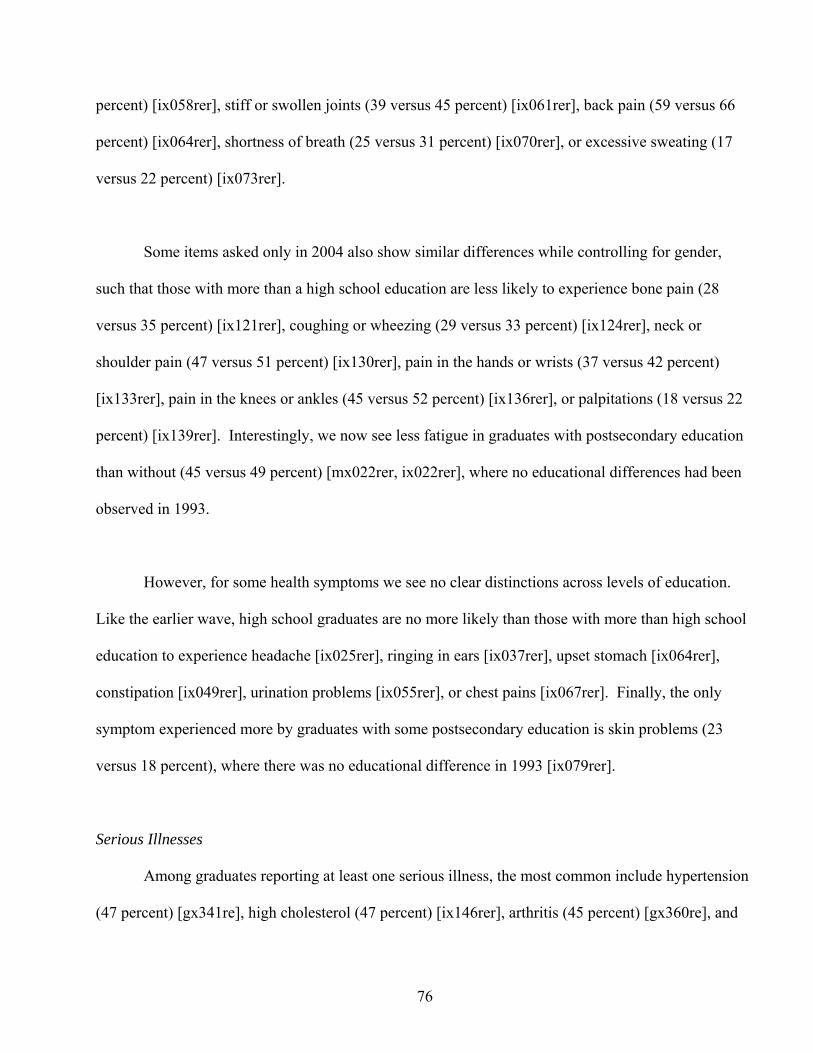
76
percent) [ix058rer], stiff or swollen joints (39 versus 45 percent) [ix061rer], back pain (59 versus 66
percent) [ix064rer], shortness of breath (25 versus 31 percent) [ix070rer], or excessive sweating (17
versus 22 percent) [ix073rer].
Some items asked only in 2004 also show similar differences while controlling for gender,
such that those with more than a high school education are less likely to experience bone pain (28
versus 35 percent) [ix121rer], coughing or wheezing (29 versus 33 percent) [ix124rer], neck or
shoulder pain (47 versus 51 percent) [ix130rer], pain in the hands or wrists (37 versus 42 percent)
[ix133rer], pain in the knees or ankles (45 versus 52 percent) [ix136rer], or palpitations (18 versus 22
percent) [ix139rer]. Interestingly, we now see less fatigue in graduates with postsecondary education
than without (45 versus 49 percent) [mx022rer, ix022rer], where no educational differences had been
observed in 1993.
However, for some health symptoms we see no clear distinctions across levels of education.
Like the earlier wave, high school graduates are no more likely than those with more than high school
education to experience headache [ix025rer], ringing in ears [ix037rer], upset stomach [ix064rer],
constipation [ix049rer], urination problems [ix055rer], or chest pains [ix067rer]. Finally, the only
symptom experienced more by graduates with some postsecondary education is skin problems (23
versus 18 percent), where there was no educational difference in 1993 [ix079rer].
Serious Illnesses
Among graduates reporting at least one serious illness, the most common include hypertension
(47 percent) [gx341re], high cholesterol (47 percent) [ix146rer], arthritis (45 percent) [gx360re], and
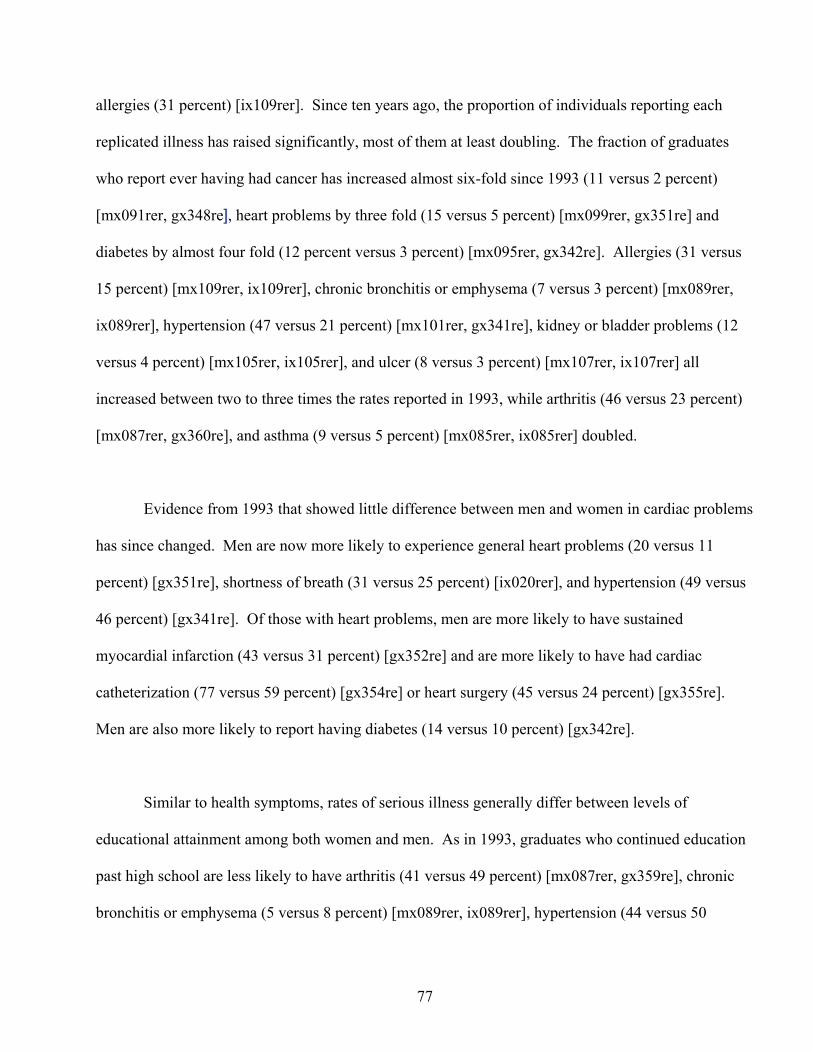
77
allergies (31 percent) [ix109rer]. Since ten years ago, the proportion of individuals reporting each
replicated illness has raised significantly, most of them at least doubling. The fraction of graduates
who report ever having had cancer has increased almost six-fold since 1993 (11 versus 2 percent)
[mx091rer, gx348re], heart problems by three fold (15 versus 5 percent) [mx099rer, gx351re] and
diabetes by almost four fold (12 percent versus 3 percent) [mx095rer, gx342re]. Allergies (31 versus
15 percent) [mx109rer, ix109rer], chronic bronchitis or emphysema (7 versus 3 percent) [mx089rer,
ix089rer], hypertension (47 versus 21 percent) [mx101rer, gx341re], kidney or bladder problems (12
versus 4 percent) [mx105rer, ix105rer], and ulcer (8 versus 3 percent) [mx107rer, ix107rer] all
increased between two to three times the rates reported in 1993, while arthritis (46 versus 23 percent)
[mx087rer, gx360re], and asthma (9 versus 5 percent) [mx085rer, ix085rer] doubled.
Evidence from 1993 that showed little difference between men and women in cardiac problems
has since changed. Men are now more likely to experience general heart problems (20 versus 11
percent) [gx351re], shortness of breath (31 versus 25 percent) [ix020rer], and hypertension (49 versus
46 percent) [gx341re]. Of those with heart problems, men are more likely to have sustained
myocardial infarction (43 versus 31 percent) [gx352re] and are more likely to have had cardiac
catheterization (77 versus 59 percent) [gx354re] or heart surgery (45 versus 24 percent) [gx355re].
Men are also more likely to report having diabetes (14 versus 10 percent) [gx342re].
Similar to health symptoms, rates of serious illness generally differ between levels of
educational attainment among both women and men. As in 1993, graduates who continued education
past high school are less likely to have arthritis (41 versus 49 percent) [mx087rer, gx359re], chronic
bronchitis or emphysema (5 versus 8 percent) [mx089rer, ix089rer], hypertension (44 versus 50
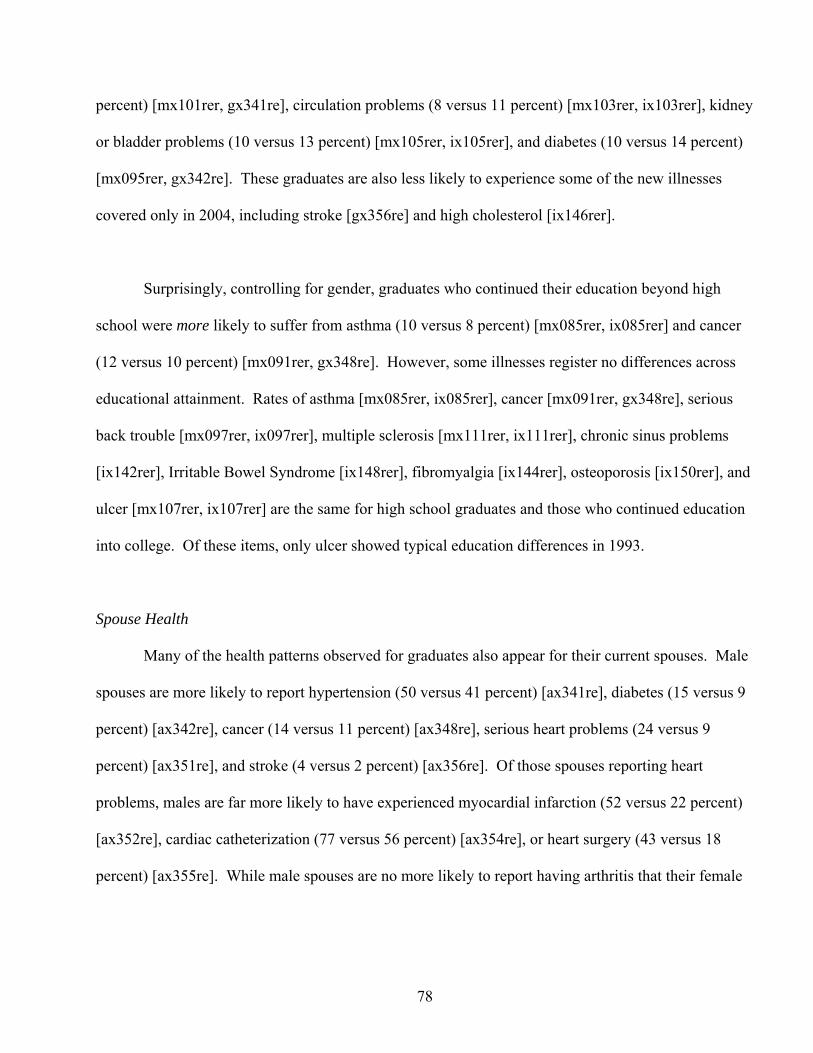
78
percent) [mx101rer, gx341re], circulation problems (8 versus 11 percent) [mx103rer, ix103rer], kidney
or bladder problems (10 versus 13 percent) [mx105rer, ix105rer], and diabetes (10 versus 14 percent)
[mx095rer, gx342re]. These graduates are also less likely to experience some of the new illnesses
covered only in 2004, including stroke [gx356re] and high cholesterol [ix146rer].
Surprisingly, controlling for gender, graduates who continued their education beyond high
school were more likely to suffer from asthma (10 versus 8 percent) [mx085rer, ix085rer] and cancer
(12 versus 10 percent) [mx091rer, gx348re]. However, some illnesses register no differences across
educational attainment. Rates of asthma [mx085rer, ix085rer], cancer [mx091rer, gx348re], serious
back trouble [mx097rer, ix097rer], multiple sclerosis [mx111rer, ix111rer], chronic sinus problems
[ix142rer], Irritable Bowel Syndrome [ix148rer], fibromyalgia [ix144rer], osteoporosis [ix150rer], and
ulcer [mx107rer, ix107rer] are the same for high school graduates and those who continued education
into college. Of these items, only ulcer showed typical education differences in 1993.
Spouse Health
Many of the health patterns observed for graduates also appear for their current spouses. Male
spouses are more likely to report hypertension (50 versus 41 percent) [ax341re], diabetes (15 versus 9
percent) [ax342re], cancer (14 versus 11 percent) [ax348re], serious heart problems (24 versus 9
percent) [ax351re], and stroke (4 versus 2 percent) [ax356re]. Of those spouses reporting heart
problems, males are far more likely to have experienced myocardial infarction (52 versus 22 percent)
[ax352re], cardiac catheterization (77 versus 56 percent) [ax354re], or heart surgery (43 versus 18
percent) [ax355re]. While male spouses are no more likely to report having arthritis that their female
79
counterparts (46 percent) [ax360re], they were much less likely to report pain, stiffness, or swelling in
their joints (53 versus 63 percent) [ax359re].
Age gaps between spouses may also play a role in spouse’s health. In this cohort, men were 2
to 3 years older than the women they married. Women were less likely than men to report that their
spouse is in good health (33 and 39 percent respectively) [gc038sp, ga001re]. Approximately one out
of four male or female spouses suffers from a health condition that limits his or her work or activities
[gc094sp, gv005re].
Graduates’ spouses present a mixed picture of their spouses’ health. Most of the graduates’
spouses (56 percent) report that the grads are in excellent or very good health [ac038sp if nwmrflag =
0], particularly the grad spouses who continued studying beyond high school [ac038sp, nwmrflag,
ab001re]. At the same time, many of the grads that are reported to be in good health (42 percent) are
also reported by their spouse to suffer from a condition or disability that limits their activities now or
is likely to do so in the future. Overall, one in three graduates is reported by his or her spouse to suffer
from a limiting health condition [av005sp, nwmrflag, ac038sp]. The graduates’ spouses who have
attended college are more likely than those who never attended college to report that their spouse has a
limiting condition for every grad health level except excellent [av005sp, nwmrflag, ac038sp, ab001re].
No gender differences were found.
Health of Biological Parents and Siblings
Almost all graduates report that a biological sibling or parent has had at least one serious
illness (94 percent) [ixa02rec-ixa12rec]. By disaggregating this number, we find that 57 percent of
80
graduates report at least one such relative who has had cancer [ixa12rec], 34 percent stroke [ixa04rec,
ixa05rec], 32 percent diabetes [ixa08rec], 9 percent asthma [ixa10rec], and 16 percent osteoporosis
[ixa11rec].15 As with cardiac illnesses, 56 percent of graduates have a biological sibling or parent who
sustained a heart attack [ixa06rec, ixa07rec], 59 percent have one with high blood pressure [ixa02rec],
and 35 percent have one with high cholesterol [ixa03rec].
Consistent with intuition and previous research, we see considerable evidence that graduates
experience illnesses similar to their parents and siblings. Graduates whose parents or siblings have
sustained a heart attack are more likely to have serious heart problems (18 versus 12 percent). Similar
patterns emerge for high blood pressure and cholesterol (56 versus 34 percent and 63 versus 38
percent, respectively), stroke (4 versus 2 percent), diabetes (21 versus 8 percent), asthma (23 versus 8
percent), osteoporosis (30 versus 8 percent), and cancer (12 versus 9 percent) [gx341re, gx352re,
ix146re, gx356re, ix085rer, gx342rec, ix150rer, gx348re, ixa02rec-ixa12rec].
Tobacco
Tobacco use behaviors have changed somewhat since the last round of interviewing. Whereas
in 1993 about 31 percent of graduates smoked cigarettes, the proportion fell to just 21 percent in 2004
[ix013rec]. Of the 31 percent of respondents who reported smoking in 1992, just under half (44
percent) have since quit. However, the average graduate who currently smokes cigarettes has done so
for over 45 years [ix014rer].
Of current cigarette smokers, men report having begun smoking regularly around age 17,
whereas the average woman began closer to age 19 [ixt06rer]. Men are far more likely to have ever 15 These categories are not mutually exclusive, so the percentages may add to more than 100 percent.
81
smoked cigarettes regularly (62 versus 49 percent) [ix012rer], or to have used other forms of tobacco
aside from cigarettes (52 versus 7 percent) [ixt01rer]. Consistent with 1993 findings, women are still
slightly more likely to currently smoke cigarettes (23 versus 20 percent) [ix013rer], but continue to
smoke just less than their male counterparts (slightly less than one pack per day versus slightly more
than one pack per day) [ix013rer, ix015rer].
Today, 12 percent of graduates live with someone who smokes (any form) inside the home
regularly [ixt12rer], and a full 74 percent report having grown up with a smoker—either a parent or
someone who smoked in the home [ixt02rer]. Fathers of graduates were far more likely to smoke than
their mothers (89 versus 33 percent) [ixt04rer, ixt03rer].
Alcohol use
Wisconsin is a state known for high levels of alcohol consumption, and so it is not surprising
that there appears to be a good deal of social drinking among WLS participants. Moreover, there is
little evidence that WLS participants decreased their alcohol consumption as they moved from their
fifties to their sixties. Seventy-two percent of participants report having alcohol in the previous month
in 2004, which is only about three percentage points less than the number who reported doing so in
1993 [gu026re, ru026re]. Indeed, the number of people reporting having had alcohol at least 20 days
in the previous month increased from 13 percent in 1993 to 18 percent in 2004 [gu026re, ru026re].
This increase in near-daily or daily drinking is possibly the result of publicity about the positive health
consequences of regular, moderate drinking; whatever its cause, it appears that participants with higher
levels of education were more likely to increase their drinking to more than 20 days a month. Among
men, the percentage of college graduates who drank more than 20 days in the past month increased
82
from 20 percent in 1993 to 29 percent in 2004, while, for those with only a high school degree, the
increase was only from fifteen percent to 19 percent [gu026re, ru026re].
As expected, we find that men drink more than women. While 32 percent of women reported
not drinking at all in the previous month, only about 23 percent of men reported similarly. Likewise,
twice as many men as women reported drinking at least 20 days in the past month (24 percent versus
12 percent) [gu026re, ru026re]. About 62 percent of women who drink report averaging only one
drink on a day that they have alcohol, compared to 37 percent of men [gu027re]. Of those who drank
alcohol on at least two occasions in the past month , only 8 percent of women report having had an
occasion where they had five ore more drinks, compared to 24 percent of men [gu029re].
Only about 3 percent of participants report having ever sought professional help for their
drinking [gu036re, ru036re]. There is good reason to think this underestimates the actual number of
WLS participants who have sought professional help for drinking, especially since some participants
who reported to us in 1993 that they had sought such help deny ever having sought help in the 2004
survey. Indeed, among those who participated in both the 1993 and 2004 surveys, slightly fewer
people reported having ever received professional help in 2004 than in 1993 (3.0 percent versus 3.2
percent). If one instead bases the estimate of how many participants have ever sought professional
help on the number who reported doing so in either 1993 or 2004, then 4.0 percent of participants have
sought professional help. Men are about three times more likely to have received such help than
women (6 percent versus 2 percent).
83
Of those graduates who indicated to us in 1993 that they had received professional help for
their drinking, about two-thirds reported in 1993 that they had not imbibed at all in the previous month
[ru036re, ru026re]. If this reflects a resolution to not drink at all, it appears that WLS participants are
good at sticking to it: over 80 percent of the people who had sought professional help and were not
drinking in 1993 were still reporting no alcohol consumption in the previous month in 2004 [gu026re].
Menopause/ Women's Health - Hanna Grol-Prokopczyk and Diane Shinberg
The 1993 wave of the WLS provided a uniquely detailed portrait of the timing and the side
effects (both medical and social) of menopause. In 2004, the WLS continues its commitment to
women’s health issues, focusing in more detail on women’s experiences with hormone replacement
therapy.
Menarche and menopause
On average, female graduates began menstruating at age twelve and a half, with a minimum
age of eight and a maximum age of 25 [in190rer]. A substantial minority of women (40 percent) in the
WLS sample have had either hysterectomies (surgical removal of the uterus) and/or oophorectomies
(surgical removal of the ovaries) [in122rer]. More specifically, 21 percent of women have had both
ovaries removed [in123are], 7 percent have had one ovary removed [in123bre], and 35 percent have
had their uterus removed [in123cre]. College graduates are less likely (32 percent) than women
without a college diploma (42 percent) to have had surgery to remove reproductive organs [in122rer
and gb103red]. The average age at which a woman underwent a hysterectomy was 43 [in124are].
Double oophorectomies were on averaged performed at age 46 [in124bre], and single ones at age 37
84
[in124cre]. Graduates had their last period at a median age of 50 (though this median age was 43 for
women who underwent hysterectomies or oophorectomies) [in120rer, in122rer].
Hormone replacement therapy
Sixty-two percent of women in the WLS have taken hormones for menopausal or aging
symptoms [in125rer], though of these, fewer than one in four are currently taking hormones [in203rer,
in200rer, in204rer, and in208rer]. The most popular hormone therapies have been estrogen and
progesterone together (taken by 73 percent of those who took hormones [in132rer]) and estrogen alone
(53 percent [in128rer]), while testosterone has been relatively rare (three percent [in205rer]).
Testosterone is also likely to be taken for a shorter period of time (2.7 years on average) than either
estrogen alone (11.3 years) or estrogen and progesterone (8.7 years) [in206rer, in207rer, in129rer,
in130rer, in133rer, and in134rer]. About two-thirds of women began taking hormones after they had
already stopped having periods [in209rer].
The reasons for which the graduates began taking hormones are many. Fifty-seven percent
considered their doctor’s recommendation to take hormones a “very important” reason [in220rer], and
health concerns such as preventing osteoporosis [in212rer] and heart disease [in214rer] were also very
important to many women (48 percent and 34 percent, respectively). Forty-five percent of women rate
relieving menopausal symptoms such as hot flashes and night sweats as a “very important” reason for
initiating hormone therapy [in211rer]. Slightly less often, women listed relieving mood swings,
depression, or anxiety as very important (21 percent [in213rer]). Very few women (fewer than seven
percent) considered regulating periods, improving sex life, or keeping youthful to be very important
reasons for taking hormones [in217rer, in218rer, and in219rer].
85
Despite the high hopes for good health evidenced in women's initial reasons for taking
hormone supplements, 78 percent of those who were once taking hormones have stopped doing so
[in222rer], and only nine percent of these have since resumed [in236rer]. Public controversy about the
benefits and safety of hormone replacement therapy clearly played a role in women's decisions to
discontinue hormones: 61 percent rated news stories on this topic as a "very important" reason for
their decision [in232rer]. Indeed, given that the most common age at which women stopped taking
hormones was 63 [in223rer], it appears likely that this decision was often made in the immediate wake
of the discontinuation (to much media fanfare) of the Women's Health Initiative post-menopausal
hormone therapy trial in mid-2002. Fear of possible long term effects (69 percent [in230rer]) and of
possible side effects (64 percent [in229rer]) were very important reasons to discontinue hormone
therapy for a majority of women, though fewer than 17 percent report actually experiencing
undesirable side effects first-hand [in233rer]. Nearly half (49 percent) reported that their doctor’s
advice to discontinue was very important [in231rer]. A minority of women reported that they stopped
hormone replacement therapy because they were feeling better [in224rer], because they felt that the
hormones did not help them [in225rer], or because they simply did not feel like taking them [in227rer].
Sexual Activity John Delamater
Men
In 2003-2004, the WLS for the first time included a series of questions about sexual activity,
administered in the mail questionnaire. Eighty-five percent of the men were married (ic001rer); an
additional five percent reported that they had a sexual partner (ic014rer). Asked how often they had
86
sex (ic017rer), 23 percent of the men reported once a week or more often, 21 percent said two or three
times per month, 19 percent said less than once a month, and 12 percent said they had not had sex in
the past year. (An additional 16 percent did not answer the question.) Participants who were married
or reported a partner were asked how physically pleasurable (ic015rer) and emotionally satisfying
(ic016rer) their sexual relationship was in the past year. Of men who answered these questions,
responses to the two questions were very similar, with 19 percent saying extremely to both, 44 percent
saying very, 22 percent saying moderately, seven percent slightly, and 7 percent not at all. Thus,
about two-thirds of the men find their sexual relationship pleasurable and satisfying. If a participant
reported that sexual activity had declined or ceased, he was asked a series of nine questions about
reasons for that change. Fifty-four percent reported a decline in sexual activity. They were most likely
to cite physical factors, including their own (40 percent; ic020rer) or their partner’s physical changes
(31 percent; ic021rer), or their own illness (27 percent; ic018rer). Thirty-four percent attributed the
decline to their partner losing interest (ic023rer).
Women
At the time they completed the questionnaire, 73 percent of the women were married
(ic001rer); an additional three percent reported that they had a sexual partner (ic014rer). Asked how
often they had sex (ic017rer), 16 percent of the women reported once a week or more often, 16 percent
said two or three times per month, 14 percent said less than once a month, and 13 percent said they
had not had sex in the past year. (An additional 19 percent did not answer the question.) Participants
who were married or reported a partner were asked how physically pleasurable (ic015rer) and
emotionally satisfying (ic016rer) their sexual relationship was in the past year. Of women who
answered these questions, responses to the two questions were very similar, with 15 percent saying
87
extremely to both, 37 percent saying very, 27 percent saying moderately, 9 percent slightly, and 12
percent not at all. Thus, one-half of the women find their sexual relationship pleasurable and satisfying,
compared to two-thirds of the men. Among women who reported a decline or end to sexual activity,
41 percent said the change was due to their own (27 percent; ic020rer) or their partner’s physical
changes (39 percent; ic021rer), or to their own illness (16 percent; ic018rer). Thirty-two percent
attributed the decline to their own loss of interest (ic022rer), and 25 percent to their partner losing
interest (ico23rer). Reported frequency of sexual activity, satisfaction with the sexual relationship, and
reasons why sexual activity declined or stopped were not related to years of education completed
(gb103red). Thus, both men and women attribute declining frequency to physical factors, although
men are much more likely to cite a partner’s loss of interest (35 percent) than women are (10 percent).
Frequency of sexual activity
Frequency of sexual activity is related to gender. Men are significantly more likely to report
frequent sexual activity than women. Frequency of sex is also positively related to physical health
(gx201re); men and women who report excellent or very good health report having sex more often.
On the other hand, participants who attain high scores on a measure of depression (q1fw: a-t) report
less frequent sexual activity. Finally, those who find their marriages satisfying (mean of relsat1 to
relsat6) have sex more often. Within the age range of WLS participants, 62 to 67, frequency of sex is
not related to age (RAGE), nor is it related to education (gb103red).
Disability Rob Warren and Reiping Huang
88
Early in the 2004 WLS graduate telephone interview participants were asked whether they had
any physical or mental illnesses or disabilities that limit what they are able to do either on or off the
job. At the end of the employment history module of that interview, participants who reported any
disability were then asked about the two most serious illnesses or disabilities that limit what they are
able to do. Finally, in the sub-module on disability benefits participants were asked about the most
serious illness or disability that caused them to receive disability benefits.
About one in four WLS graduates reported at least one physical or mental illness or disability
that limits what they are able to do either on or off the job; another one in ten reported a second
physical or mental illness or disability. Finally, one in five participants reported an illness or disability
for which they had received disability benefits.
The most commonly reported illnesses or disabilities were diseases of the musculoskeletal
system and connective tissues. Although participants reported a variety of such diseases, rheumatoid
arthritis was most frequently reported. The second most commonly reported class of illness or
disability consisted of diseases of the circulatory system—most frequently heart disease. For example,
almost one in ten participants reporting an illness or disability that caused them to receive disability
benefits listed heart disease as the most serious of their illnesses or disabilities. The third most
commonly reported class of illness or disability consisted of operations—particularly surgery on joint
structures.
89
Other frequently reported illnesses or diseases that limit what participants can do include:
diseases of the nervous system and sense organs (most commonly multiple sclerosis), neoplasms
(particularly malignant neoplasms), and injuries and poisonings (particularly back pains and strains).
Other frequently reported illnesses or diseases that led participants to receive disability benefits
included: diabetes, diseases of the nervous system and sense organs, and diseases of the respiratory
system (most commonly asthma).
Childhood Abuse Kristen Springer
Both men and women responded to questions about abuse experienced during childhood.
Childhood abuse was fairly common among graduates. Almost 30 percent of women and almost 35
percent of men reported experiencing at least “a little” verbal abuse from one or both of their parents
[iv208rer, iv211rer]. Men were also more likely to report having experienced at least “a little”
physical abuse by one or both parents — with 38 percent of men and 33 percent of women reporting
physical abuse [iv209rer, iv210rer, iv212rer, iv213rer]. Conversely, women graduates were more
likely than men to report being sexually abused as a child. Approximately nine percent of women
reported at least “a little” sexual abuse from anyone, compared to under three percent of men [iv214rer,
iv215rer, iv216rer, iv217rer, iv218rer, iv219rer]. Almost one-fourth of participants reported
experiencing more than one type of abuse, with more men reporting two or more types of abuse
[iv214rer, iv215rer, iv216rer, iv217rer, iv218rer, iv219rer iv209rer, iv210rer, iv212rer, iv213rer
iv208rer, iv211rer]. Three percent of women and one percent of men reported experiencing physical,
sexual, and emotional abuse as children [iv214rer, iv215rer, iv216rer, iv217rer, iv218rer, iv219rer
90
iv209rer, iv210rer, iv212rer, iv213rer iv208rer, iv211rer]. We also asked one question about
witnessing physical abuse and found that 14 percent of participants reported seeing a parent or sibling
being beaten at home [q7sr_b]. Slightly more men than women reported witnessing this family
violence [q7sr_b].
In general, we found that the graduate’s education was not related to the likelihood that they
were abused as children. However, there were two exceptions. Better educated men were less likely
to have experienced parental verbal abuse as children, [iv208rer, iv211rer] and better educated women
and men were less likely to have experienced parental physical abuse as children [iv209rer, iv210rer,
iv212rer, iv213rer].
Depression Shlomit Bornstein
Both men and women responded to a series of questions about their history of depression
symptoms (that lasted for two weeks or more) [GU002RE, GU001RE]. The same questions were
asked of the graduates and their spouses, and overall the answers were comparable. One out of five
graduates has experienced a period of depression, but for a quarter of these individuals the experience
was driven by external causes such as alcohol, drugs or illness [gu003re, GU001RE].
Women graduates have suffered from depression substantially more than men graduates have.
A much larger proportion of women (27 percent) than men (15 percent) reported a history of
depression symptoms, and yet women’s depression was less likely (27 percent) than men’s (37
91
percent) to be sometimes or always caused by external factors such as illness, alcohol, medications, or
drugs [gu003re, GU001RE, sexrsp].
Reported depression is clearly a mid-life phenomenon for the graduates. Of those who
reported ever being depressed, only one percent experienced their worst or most recent depression
period during their teen years, and exactly half of male and female graduates told us they have
experienced their worst or most recent period by age 51 [gu004re, GU001RE]. Both in 1993 and in
2004, roughly one-third of men and women graduates reported having their worst bout of depression
when they were age 30-45 [gu004re]. While half of men and women (55 percent and 49 percent
respectively) who were ever depressed said that they had just one such spell, an additional 41 percent
of women graduates and 34 percent of men reported two to five such experiences [gu013re].
Similarly to the graduates, a sizeable minority of grads’ spouses (17 percent) indicated that
they had experienced depression that was not related to drug or alcohol use [au001re, au003re]; that is,
they had a time in their lives lasting two weeks or longer when nearly every day they felt sad and lost
interest in their daily activities and hobbies. Like the graduates, a higher proportion of women (27
percent) than men (16 percent) reported ever having experienced these feelings. Unlike the graduates,
the proportions of men and women whose periods of depression were unrelated to external causes such
as alcohol or illness were the same (three out of four participants who reported periods of depression,
regardless of sex) [au003re, au001re, sexrsp]. Despite the older age of some of the spouses at the time
of interview, age 50 was the median age for graduate spouses’ worst or most recent periods of
depression, the same as among graduate participants [au004re, au001re].
Psychological Well-Being - Tetyana Pudrovska
92
Psychological well-being of the WLS graduates was assessed with the Ryff (1989) scale. In
1993, a series of 42 items measured individuals’ Autonomy (i.e. self-determination and independence)
[mn001rec, mn002re], Environmental Mastery (i.e. individuals’ ability to create environments suitable
to their personal preferences) [mn010rec, mn011re], Personal Growth (i.e. a continuous development
of one’s potential) [mn019rec, mn020re], Positive Relations with Others (i.e. warm, trusting
interpersonal bonds) [mn028rec, mn029re], Purpose in Life (i.e. a sense of directedness, intentionality,
and meaning to life) [mn037rec, mn038re], and Self-Acceptance (i.e. holding positive attitudes toward
oneself) [mn046rec, mn047re]. In 2004, the six dimensions of psychological well-being were
measured with a series of 31 items: 12 newly added items and 19 items repeated from the 1993
questionnaire.
Overall, both male and female graduates report high levels of psychological well-being. Yet,
gender differences are also evident. Consistent with the 1993 patterns, men in 2004 had significantly
greater average Autonomy [in001rec, in002re] scores than women. In contrast, women reported higher
levels of Environmental Mastery [in010rec, in011re], Personal Growth [in019rec, in020re], Positive
Relations [in028rec, in029re], and Purpose in Life [in037rec, in038re]. Self-Acceptance [in046rec,
in047re] did not show gender variation.
Additionally, psychological well-being tends to vary by education. While the levels of Positive
Relations with Others were similar across the four educational groups, men’s and women’s scores on
other dimensions revealed a tendency to grow as educational attainment increased, so that individuals
93
with 16 years of education or more reported the greatest levels of well-being. These trends were
evident both in 1993 and 2004.
A longitudinal comparison of the 19 repeated items indicates that both men and women
reported slightly lower levels of Autonomy, Personal Growth, Purpose in Life, and Self-Acceptance in
2003-05 when they were 64-65 years old relative to their self-reports in 1992-93 at ages 53-54.
Environmental Mastery has increased significantly for both male and female graduates, while the
Positive Relations score remained basically unchanged.
Caregiving - Erica Siegl and Jane Piliavin
Few aspects of the caregiving roles fulfilled by WLS graduates have changed since 1993. In
1993 and again in 2004, one-third of graduates said that they had ever provided care to a friend or
family member with a limiting condition [rv001re/ gv001re]. In contrast, the number of graduates
who reported providing care within the last 12 months nearly doubled from 13 percent in 1993
[rv017re] to 25 percent in 2004 [gv016res]. Also consistent with our findings in 1993 and with
traditional gender role socialization, we found that a majority, 70 percent, of caregivers were female
[sexrsp by gv001re]. In both 1993 and 2004 the most common recipient of care was the graduate’s
mother. For most graduates, their caregiving role ended with the death of the recipient.
94
Religion - Luke Piefer and Justin Resnick
The 2004 data show that graduates remain relatively stable in their religious preferences.
Although several dozen different religious preferences and specific denominations are represented in
our sample, a less superficial analysis reveals remarkable homogeneity. In 1975, 1993, and 2004,
approximately 40 percent of graduates were Catholics, about half identified themselves as Protestants,
and 1 percent were Jewish [relr75, rl001re, gl001re]. Throughout the years of the survey, about half of
all Protestants were Lutherans, who thus accounted for more than one-quarter of all graduates; the next
most common denomination was Methodist, accounting for another seven percent of the total sample.
In 2004, about two out of three graduates maintained the exact same religious preference that their
family had when they were in high school [relfml]; changes in specific denomination or specificity in
reporting account for most of the changes.
In 1993 and 2004, about 7 percent reported that they had no religious preference, down from
almost 10 percent in 1975, but still higher than the 2.5 percent who in 1975 reported having grown up
in a family without a religious preference. Male graduates have always been slightly more likely than
women to report having no religious preference; in 1993 and 2004, about nine percent of men and just
over five percent of women responded this way. The corresponding figures in the 1975 data are 13
percent and seven percent, respectively. Not surprisingly, a large majority of graduates (86 percent)
had the same religious preference as their spouses in 1993.
The graduates have also shown stability in their religious attendance through the years. In any
given wave, about 50 percent report attending religious services once a week or more in the past year,
95
which we term “regular” attendance. There was typically some change in which participants attended
regularly from one wave to the next – about 40 percent reported attending regularly both in 2004 and
1993, and 40 percent did so both in 1993 and 1975 [bkxrl3, rl004rec, gl004rec]. The other 10 percent
who attended regularly in each wave therefore must have not attended regularly at some point.
Similarly, 34 percent of participants reported regular attendance in all three waves. Again, the other
16 percent of regular attendees clearly changed their frequency of attendance across time.
In each wave, just under 45 percent of men reported regular church attendance, while the
percent of regular attendees among women ranged from 53 percent in 1993 to a high of 59 percent in
1975. The proportion of graduates not attending any religious services in the past year increased from
6 percent in 1975 to about 14 percent in 1993 and 2004. The proportion never attending is higher for
males than females in each wave. In 1975, eight percent of males never attended; in 1993, 16 percent
of males never attended; in 2004, 19 percent of males never attended. For females, five percent never
attended in 1975, 12 percent in 1993, and 11 percent in 2004. In other words, there has been a general
increase in participants who never attend services, but more of these people are male than female. In
addition, the proportion of males never attending increased monotonically from 1975 to 2004, while
the proportions for women stabilized between 1993 and 2004.
In 2004, graduates were given the opportunity to rank how strongly they hold certain values
regarding religion and spirituality [il001rer—il012rer], how often they seek comfort through certain
religious or spiritual channels [il013rer—il016rer], whether they agreed that the Bible was God’s word
exactly [il017rer], and whether it is the answer to all human problems [il018rer]. About 40 percent of
graduates agreed or strongly agreed with the two statements about the Bible, while 25 percent
96
disagreed or strongly disagreed, and the remaining graduates opted for neutrality. About 55 percent
reported that they often sought comfort through prayer [il013rer], while just eight percent often
consulted a religious or spiritual advisor [il016rer]. The frequency of meditation [il014rer] and
attending religious services often to seek comfort [il015rer] fell between these two extremes.
With regard to questions about religious values, graduates generally indicated that they were
grounded in religion and spirituality, but were unlikely to regard themselves as very religious. There
were a few exceptions; about 20 percent of graduates said religion [il003rer] and spirituality [il004rer]
were extremely important in their lives, and the same proportion indicated that obtaining religious
instruction for their children [il005rer] was extremely important. On the other hand, from 23 to 29
percent of graduates felt that it was not at all important to be with other people who hold the same
religion [il007rer], marry people who hold the same religion [il008rer], or stick to a particular faith
[il009rer].
Masculinity – Kristen Springer
A person’s idea about what makes someone “masculine” is one component of identity that may
impact various facets of a man’s adult life—including health. We measured several aspects of
masculinity ideals in one-half of the WLS sample. The areas of masculinity ideals we covered
included people’s perceptions of how men and women differ as well as how men “should” or “should
not” express their emotions. Male participants generally agreed that men and women should share
housework if both spouses work full-time. Specifically, 58 percent of men agreed that men should do
97
as much housework as their wives if their wives work full-time [ivm05rer]. However, men were split
about whether they agreed that it is much better for everyone if the man earns the main living and the
woman takes care of the family and home [ig307rer]. In response to this question, 35 percent of men
agreed men should earn the main living and 30 percent disagreed, with the rest neither agreeing nor
disagreeing. Over one-third of male respondents agreed that men have greater sexual needs than
women [ivm06rer], whereas only 27 percent of men agreed that being larger, stronger-looking, and
more muscular makes men more attractive to women [ivm09re].
Most WLS male participants did not believe in stereotypical masculine ideals about showing
emotions. For example, only 12 percent of men agreed that when a man is feeling pain, he should not
let it show [ivm07rer]. Over one quarter of WLS men agreed that in some kind of situations a man
should be ready to use his fists [ivm08rer].
WLS women were also asked the same questions about masculinity ideals. As a general
statement, WLS women were less likely than WLS men to agree with the statements about masculinity.
For example, only 20 percent of women agreed—compared to 50 percent who disagreed—that it is
much better for everyone if the man earns the main living and the woman takes care of the family and
home [ig307rer]. Only seven percent of WLS women agreed that when a man is feeling pain he
should not let it show [ivm07rer]. In addition, only seven percent of WLS women agree that in some
kind of situations a man should be ready to use his fists [ivm08rer]. WLS women were more likely
than WLS men to agree that men have greater sexual needs than women (41 percent of women
compared to 30 percent of men) [ivm06rer]. In terms of housework, approximately 58 percent of both
98
WLS men and women agreed that men should do as much housework if their wives work full-time
[ivm05rer]
The masculinity scale is related to education and self-reported health. Specifically, men with
higher levels of education were less likely to subscribe to an array of stereotypical masculinity ideals,
perhaps indicating a greater exposure to alternative masculinity standards through school [ivm02rer,
ivm03rer, ivm04rer, ivm05rer, ivm06rer, ivm07rer, ivm08rer, ivm09rer, ig307rer, gb103red] In
addition, analyses suggest stronger masculine attitudes among men are related to poorer general health
and a lower likelihood of accessing preventive health care, such as getting a prostate exam in the past
12 months [ivm02rer, ivm03rer, ivm04rer, ivm05rer, ivm06rer, ivm07rer, ivm08rer, ivm09rer,
ig307rer, ix001rer ix12m1re].
Social Participation - Erica Siegl and Jane Piliavin
We predicted in 1975 that participants were at the stage in their life-cycle when interest and
participation in community affairs was likely to be greatest. At this time most participants were ages
35-36, and many of them had school-aged children. In 1993 we noted that participants’ patterns of
social and community activities changed as they neared the end of their child-rearing years. We again
see that the trend towards declining participation continues with the 2004 surveys.
Involvement in youth oriented organizations declined significantly after 1975. Indicative of
this trend, participation in parent-teacher associations peaked in the 1975 survey when 40 percent of
99
graduates’ reported at least some involvement [sopar6]. Participation dropped to 14 percent in 1993
[mz008rer] and 3.5 percent in 2004 [iz008rer]. Similarly, participation in youth groups dropped by
half from 20 percent in 1975 [sopar11] to less than 10 percent in both 1993 and 2004 [mz0013rer,
iz013rer]. Involvement in other community, professional, and special interest organizations also
declined sharply between 1993 and 2004. Participation in sports teams dropped from 22 to 13 percent
[mz011rer, iz011rer] and hobby groups declined from 27 to 17 percent [mz018rer, iz018rer] between
1993 and 2004. Perhaps reflecting retirement trends, graduates reporting participation in business or
civic organizations decreased from 21 to 11 percent [mz007rer, iz007rer], and participation in
professional groups also dropped from 38 to 20 percent [mz014rer, iz014rer].
Exceptions to the trend of declining participation include three organizations where
participation increased from 1975 to 1993 and remained roughly stable or declined only slightly (less
than 2 percent) between 1993 and 2004. Included are charity organizations [sopr15, mz017rer,
iv017rer] with nearly 25 percent of graduates indicating at least some involvement in 1993 and 2004,
neighborhood improvement groups [sopr14, mz016rer, iz016rer] and veteran’s organizations [sopar3,
mz005rer, iz005rer] with approximately 10 percent participating. For a few other organizations,
participation levels remained fairly stable across time. Involvement in groups affiliated with religious
institutions [sopar1, mz002rer, iz002rer] hovered around one-third across all three waves, while
community centers [sopar7, mz009rer, iz009rer], country clubs [sopr10, mz012rer, iz012rer], and
political organizations [sopr13, mz015rer, iz015rer] maintained uniformly low rates of participation –
around seven percent. Finally, participation in religious institutions, such as a church or synagogue,
increased between 1993 and 2004 from 62 to 74 percent [mz003rer, iz003rer].
100
Participation varied between men and women in some fairly predictable ways. Men reported
greater participation in labor unions [sopar2, mz004rer, iz004rer], veterans’ organizations [sopar3,
mz005rer, iz005rer], sports teams [sopar9, mz011rer, iz011rer], business or civic [sopar5, mz007rer,
iz007rer] and professional organizations [sopr12, mz014rer, iz014rer] across all three waves. In
contrast, women reported significantly more involvement in hobby groups [mz018rer, iz018rer],
charity/welfare groups [sopr15, iz017rer, mz017rer] and religious affiliated organizations [sopar1,
mz001rer, iz001rer] across all three waves. In 1975, more women than men also reported involvement
in parent-teacher organizations [sopar6], although this gender difference disappears in 1993 and 2004
[mz008rer, iz008rer]. Nearly equal numbers of male and female graduates report being involved with
political groups [sopr13, mz015rer, iz015rer], neighborhood improvement organizations [sopr14,
mz016rer, iz016rer] and community centers [sopar7, mz009rer, iz009rer] in each year.
Participation varied among graduates according to their level of educational attainment.
Across all three survey years, education showed a strong positive relationship with participation in
organizations related to occupations such as professional [sopr12, mz014rer, iz014rer] and business or
civic organizations [sopar5, mz007rer, iz007rer]. But, in all three waves, high school graduates and
respondents with a professional or graduate degree reported greater involvement with labor unions
than respondents with either some college or a bachelor’s degree [sopar2, mz004rer, iz004rer].
Graduates with higher levels of education also tended to report greater involvement with political
groups [sopr13, mz015rer, iz015rer], charity/welfare [sopr15, iz017rer, mz017rer] and neighborhood
organizations [sopr14, mz016rer, iz016rer]. In 1993 and 2004, education appears to be positively
related to involvement with church affiliated organizations [sopar1, mz002rer, iz002rer]. Graduates’
educational attainments appeared unrelated to participation in parent-teacher organizations [sopar 6,
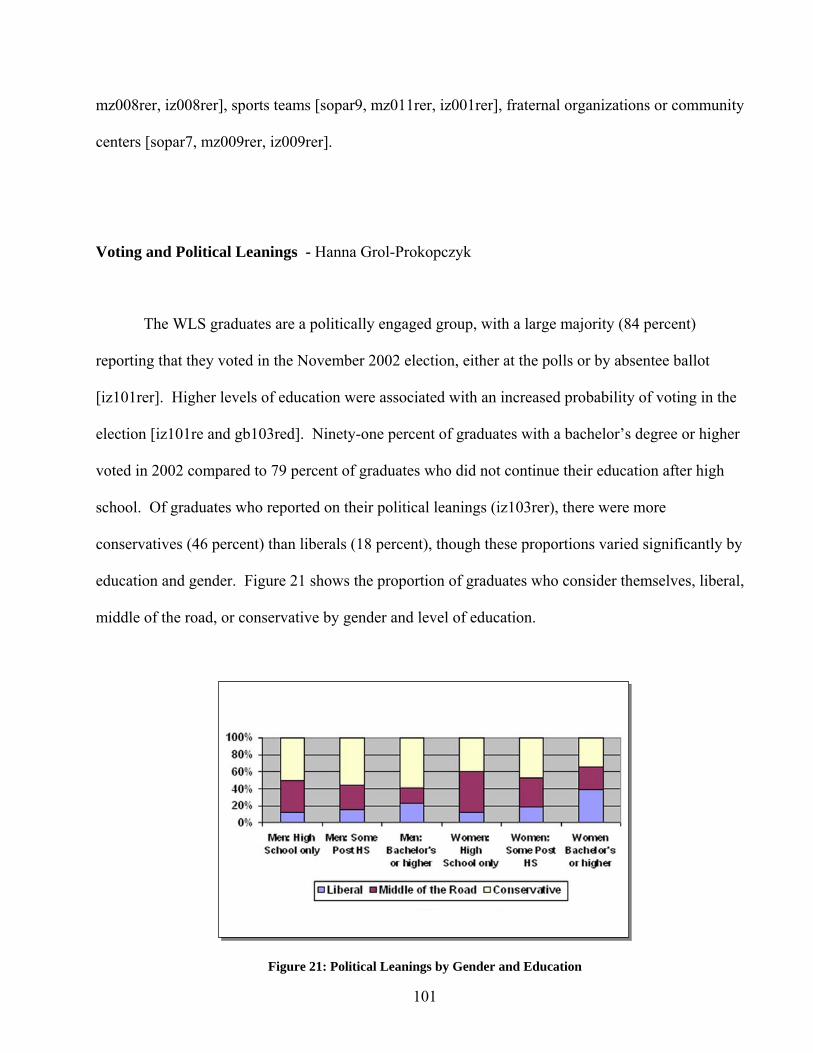
101
mz008rer, iz008rer], sports teams [sopar9, mz011rer, iz001rer], fraternal organizations or community
centers [sopar7, mz009rer, iz009rer].
Voting and Political Leanings - Hanna Grol-Prokopczyk
The WLS graduates are a politically engaged group, with a large majority (84 percent)
reporting that they voted in the November 2002 election, either at the polls or by absentee ballot
[iz101rer]. Higher levels of education were associated with an increased probability of voting in the
election [iz101re and gb103red]. Ninety-one percent of graduates with a bachelor’s degree or higher
voted in 2002 compared to 79 percent of graduates who did not continue their education after high
school. Of graduates who reported on their political leanings (iz103rer), there were more
conservatives (46 percent) than liberals (18 percent), though these proportions varied significantly by
education and gender. Figure 21 shows the proportion of graduates who consider themselves, liberal,
middle of the road, or conservative by gender and level of education.
Figure 21: Political Leanings by Gender and Education
102
Overall, men are more likely to label themselves as conservative (54 percent) than women (39
percent). This difference is largest among graduates who completed college. At the same time, women
are more likely than men to say they are liberal, and this difference, too, is largest among graduates
who completed college. Regardless of gender, graduates are less likely to report that they are “middle
of the road” as education increases. In fact, liberalism as well as conservatism increases with level of
completed education. Whereas 38 percent of women with at least a bachelor’s degree label themselves
as being liberal, only 12 percent of women with only a high school degree say they are liberal. Among
men, the difference between high school graduates and college graduates in labeling themselves as
liberal is smaller: 12 percent versus 23 percent (iz103rer and gb103red). As we might expect given
men’s greater political conservatism, more men (50 percent) than women (44 percent) identify as
Republican or Republican-leaning, and more women (40 percent) than men (33 percent) identify as
Democrats or Democrat-leaning [iz102rer].
Social Relationships - Erica Siegl and Jane Piliavin
The availability of social relationships for WLS graduates appears not to have changed
significantly since 1993. In both 1993 and 2004, approximately 85 percent of graduates report having
a family member – and nearly three-quarters report having a friend outside of their family – in whom
they can confide their personal feelings and share concerns. In 2004, women were again more likely
than men to report having either a family member or friend outside of their family in whom they can
confide (83 percent versus 61 percent) [iv054rer by sexresp]. The gap between men and women
increased slightly as the number of men who report having a friend outside the family declined slightly
103
(sixty-seven percent to 62 percent) between [mv054] to 2004 [iv054rer]. There were essentially no
educational differences in the share of graduates who reported having a family member in whom they
could confide.
Volunteering - Erica Siegl and Jane Piliavin
The Class of 1957 continues to give back to their communities. Over the last decade, 57
percent of graduates report spending some time volunteering [gv101re], and 15 percent volunteered
regularly across the whole time [gv102re]. Over one-third (34 percent) of graduates said they spent
time volunteering in the last 12 months [gv103re], and half of these volunteers said they gave an
average of 10 or more hours of their time each month [gv111re]. Volunteers most frequently said they
worked for a religious organization (sixty percent of volunteers [gv104re]), followed by national or
local organizations (47 percent [gv108re]), and education or school groups (29 percept [gv105re]).
More women than men report volunteering over the past 10 years (60 percent versus 52 percent),
although men and women volunteered in nearly equal numbers during the past 12 months [gv010re,
gv103re by sexresp]. Ninety percent of volunteers were either very or completely satisfied with the
results of their work [gv114re].
There is a positive relationship between education and volunteering during the past 10 years
(gv101re by gb103red). Around half of graduates with a high school degree and 56 percent of
graduates with some college report volunteering in the past 10 years compared to 72 percent of
graduates with a college degree and 76 percent of graduates with a graduate or professional degree.
Graduates with higher levels of education also report volunteering more regularly during this time
104
(gv102re by gb103red). In contrast, there was no difference by education level in volunteering over
the last 12 months (gv103re by gb103red ).
The reasons people volunteer are varied, and men and women differ in their reasons for
volunteering. Nearly three-quarters of WLS graduates agree that it is important to help others
[iz226rer]; around two-thirds named compassion for people in need [iz222rer]; and a little more than
half selected feeling better about themselves [iz2225] as important reasons for volunteering.
Significantly more women than men rated these reasons as being very important [iz226rer by sexrsp
and iz222rer by sexresp and iz225rer by sexresp]. In contrast, grads were less likely to endorse
learning to get along with a variety of people, working through personal problems, or having an escape
from personal troubles as important reasons for volunteering [IZ221rer, IZ228rer, IZ229rer]. Forty-
five percent of graduates did not see volunteering as at all important to helping them work through
personal problems [iz221rer] or as a good means of escaping from their own troubles [iz228rer].
Motivations for volunteering also vary by education. Graduates with a high school diploma or some
college are more likely to endorse escaping personal troubles as a reason for volunteering than
graduates with a college degree or more (iz228rer by gb103red), who in turn are more likely to support
the importance of helping others as a reason for volunteering (iz226rer by g103red).
The importance of volunteering for graduates’ self-identity also differs between women and
men. Overall, 23 percent of graduates strongly agree with the statement that “volunteering is an
important part of who I am” [iz323rer]. Twice as many women as men (8 percent versus 4.5 percent)
rated their identity as volunteer as very important to them [in504rer by sexresp].
105
Fewer graduates agree that the views of family and friends towards community service are
important reasons for volunteering. Fifty percent of graduates indicated that the value people close to
them place on community service is not important [iz220rer], and similarly 46 percent said the
importance of volunteering to the people they know best is not an important reason for volunteering
[iz227rer].
Blood Donations - Erica Siegl and Jane Piliavin
Nearly 50 percent of graduates have donated blood for use by others at least once in their
lifetime [gv116re], but only 17 percent donated blood for use by others in the past 12 months
[gv118re]. Twenty-six percent said they have given blood a total of five or more times [gv117re].
Significant gender differences in blood donation appear in the WLS sample. Across their lifetime,
more men than women said they have donated blood for use by themselves or others [gv115re and
gv116re by sexresp], and men also report donating more often—77 percent of male donors have given
5 or more times compared to 64 percent of women donors [gv117re by sexresp]. There were no
gender differences in blood donation during the past 12 months. There is a significant positive
relationship between education and donating blood for use by others (gv116re by gb103red), but not
with donating blood for use by oneself (gv115re).
106
Computer Ownership and Internet Use - Jeremy Freese
If one looks at larger trends in American society since 1993, few are dramatic as the spread of
Internet access into homes. Considering lingering stereotypes about Internet being mainly a younger
person’s technology, a large portion of WLS graduates are actively online. Less than a quarter of
WLS graduates have no personal computer in their homes [gm001he]. For those participants who do
have a personal computer in their homes, over 90 percent have household Internet access, and more
than five out of six WLS graduates who have household Internet access use the Internet at least
sometimes themselves [gm001he, gm016he, gm044re]. In all, almost 60 percent of WLS graduates
use the Internet from home, and over one-third of all participants use the Internet from home for at
least 2 hours per week [gm044re, gm046re, gm047re].
In the early days of home computing, it was primarily a male pastime, but the rise of the
Internet has coincided with a rise in women using computers. Among WLS graduates, the percentage
of men using the Internet is only slightly higher than the percentage of women who do so (60 percent
versus 57 percent) [gm044re]. For participants who do use the Internet, women and men are both
equally likely to use the Internet from home for more than two hours per week [gm046re, gm047re].
That said, the WLS does provide evidence that men and women do use the Internet differently. Men
spend more time using the web than women do (6.4 hours versus 4.4 hours), but women spend more
time than men doing e-mail (4.7 hours versus 4.2 hours) [iz214rer, iz217rer].
The chance that a WLS participant does have the Internet varies considerably by education.
Seventy-eight percent of WLS participants with college degrees have the Internet in their homes and
107
use it, compared to only 47 percent of participants who did not attend college [gm044re]. Partly this
difference may reflect differences in the probability of being exposed to the Internet at work, as twice
as many college graduates report using the Internet in their current or most recent job compared to
those who did not attend college (53 percent versus 24 percent) [gg203jj, gg205jj]. Interestingly,
while education is strongly associated with whether someone does or does not use the Internet at home,
education is not associated with the amount of time those who do use the Internet spend using it; in
other words, Internet users with only a high school education use the Internet for approximately the
same number of hours per week as those with college degrees [gm046re, gm047re].
Once people get the Internet in their home, they appear to keep using it. Only 3 percent of
WLS graduates with computers report having discontinued Internet access [gm016he, gm018he]. As
for the reasons why some households do not have computers and the Internet, graduates themselves
emphasize their choice in the matter more than either a lack of resources or skills. About a third of
participants say the reason for either not having a computer or not having the Internet is that they do
not think it would be useful, compared to 19 percent who say they would not know how to use the
computer or Internet and 12 percent who say they are too expensive.
End of Life Preparations - Dmitry Khodyakov and Deborah Carr
The majority (60.8 percent) of WLS graduates report that they have made some plans for the
types of medical treatments they want (or do not want) to receive if they become seriously ill
[gy004re/wpa1]. Although the majority of both men and women report that they have made plans, a
108
higher proportion of women than men did so (64 percent versus 57 percent, respectively). Nearly
three-quarters (74 percent) have discussed their health care plans with others [gy010re/wpa4], with
women slightly more likely than men to do so (77 percent and 70 percent, respectively).
Of those who have discussed their health care plans, roughly equal proportions did so with one
and two people (38 percent), while 24 percent discussed plans with three people [gy011rec]. A slightly
higher proportion of women than men had discussions with two people (41 percent and 34 percent,
respectively) and three people (30 percent and 17 percent, respectively). At the same time, a higher
proportion of men than women have discussed their plans with just one person (49 percent and 29
percent). Out of those people who had such discussions, 73 percent shared their plans with spouses
[gy012rec] and 62 percent with children [gy014rec]. Although a higher proportion of men than women
had discussions with spouses (83 percent and 65 percent), a higher proportion of women than men had
discussed their plans with children (72 percent and 48 percent). This gender gap reflects gender
differences in marital status, where men are much more likely than women to be still married in their
60s. Roughly 98 percent of participants reported that their loved ones (both spouses and children)
understand their plans either somewhat or extremely well [gy013rec and gy015rec]. Again, a slightly
higher proportion of men than women reported that their spouses understand their plans extremely
well (79 percent and 76 percent), while a slightly higher proportion of women than men think that
their children understand their medical plans extremely well (69 percent and 58 percent).
Slightly more than half (52 percent) of the graduates have appointed a durable power of
attorney for health care (DPAHC) [gy022re/wpb1]. A DPAHC is a person who is legally permitted to
make decisions about health care treatment for a patient, in the event the patient is incapacitated and
109
cannot make those decisions for himself or herself. Of those who named a DPAHC, 56 percent named
their spouse, while 35 percent gave this authority to their child, child-in-law, or grandchild. Roughly
equal proportions named other relatives (5 percent), or non-family members (4 percent). Less than 3
percent named siblings and some other relative. Similarly, less than 2 percent named their attorney or
a friend as DPAHC, while less than 1 percent appointed health care providers or clergy as their health
advocate [gy025re/wpb2]. A much higher proportion of men than women report that their spouses
have such authority (67 percent versus 47 percent), reflecting that fact that men are more likely than
women to be currently married at ages 64-65. In contrast, women are more likely than men to name
one of their children as DPAHC (43 percent versus 24 percent).
Graduates who had not appointed a DPAHC were asked to name the person they would pick, if
they were to appoint a health proxy. Graduates’ hypothetical choices closely mirror the actual choices
among those persons who did name DPAHC. Nearly 56 percent said they would pick their spouse, 36
percent would appoint their children, children-in-law, or grandchildren, 6 percent would name other
relatives, and 1 percent would choose their friends. Less than one percent of graduates say they would
select their healthcare professionals, attorneys, or religious advisers and clergy [gy026re/wpb3]. Again,
a higher percentage of men than women reported that they would pick their spouses (70 percent versus
43 percent), while a higher percentage of women than men would select their children (48 percent
versus 22 percent).
Graduates also were asked whether they have a living will. A living will is a formal document
that specifies the medical treatment a dying patient would like to receive in the event that he or she is
incapacitated. Slightly more than half (54 percent) of the graduates report that they have a living will
110
[gy030re/wpc1]. This is lower than the proportion of the participants who say that they have made
plans for their medical treatment (54 percent and 61 percent, respectively), suggesting that older adults
may formulate plans, but do not necessarily state them formally in a written document. Of those who
have a living will, 47 percent report that they have given these written instructions to spouses
[gy032rec] (with more men (57 percent) than women (38 percent) doing so) and 61 percent to children,
grandchildren, and children-in-law [gy033rec]16.
Quality of Spouse’s Death - Dmitry Khodyakov and Deborah Carr
Graduates who have experienced spousal bereavement in the ten years prior to interview were
asked to characterize the death of their husband or wife. A total of 409 graduates (6 percent) are recent
widows or widowers. Roughly one-third of them report that their spouse died suddenly. Of the two-
thirds (n=280 graduates) whose spouse died after some forewarning period, 45 percent report that their
spouse spent his or her final days at home, while 40 percent were in the hospital, 8 percent in a nursing
home, 5 percent in hospital hospice, and 1 percent were in the care of in-home hospice
[gy220sp/was4]. When asked about their deceased spouse’s death, 36 percent of bereaved graduates
say their spouse experienced no pain, 26 percent reported severe pain, 24 percent reported moderate
pain, and 15 percent said their spouse had slight pain during the last week of his/her life
[gy221sp/was5].
16 Percentages do not add up to 100 because participants can give instructions to several people. Also see the coding note for gy032rec and gy033rec.
111
The majority (59 percent) of recently widowed graduates report that their spouses had named a
DPHAC [gy225sp/wcs1]. Of those whose spouses had named a DPAHC, the vast majority (90
percent) said that they themselves were named. Only 6 percent said that their spouse had appointed a
child, less than 2 percent had appointed other family members, and less than 1 percent had appointed a
physician or attorney as their advocate [gy226sp/wcs2]. Of those whose spouse had appointed a
DPAHC, the majority (roughly 60 percent) believe that the DPAHC had no effect on their spouse’s
dying experience, 27 percent said that it helped a lot, and 10 percent said it helped a little. Only 3
percent said it caused problems, with nearly all saying the problems were minor. Less than 1 percent
of widowed graduates could not assess the role of the DPAHC in the last week of their spouse’s life
[gy227sp].
Slightly more than half of bereaved spouses (57 percent) said that their spouse had a living will
[gy228sp/wcs3]. When asked to evaluate how effective the living will was at the end of life, 53
percent felt that it had no effect, 32 percent believe that it helped a great deal, and 11 percent say it
helped a little. Only three percent believe it caused some problems; only a handful said it created
“major problems” in the last week of their spouse’s life [gy229sp/wcs4].
Nearly two-thirds (66 percent) of the bereaved spouses report that their spouses were able to
make medical decision during the last week of their lives [gy230sp/wcs5]. A similar proportion (63
percent) said that their spouses had specific wishes about their medical treatment [gy231sp/wsc6]. Of
those who said their spouse had specific preferences, the overwhelming majority (87 percent) report
that the doctor consulted with them to make sure that the medical care being offered matched with the
patient’s wishes [gy232sp/wcs7]. Nearly all recent widows and widowers whose spouse had a living
112
will (93 percent) report that their spouse received care that was consistent with his or her wishes
[gy233sp/wcs8]17.
Quality of Parent’s Death - Dmitry Khodyakov and Debby Carr
Graduates who have lost a parent in the ten years prior to interview were asked to describe the
situation surrounding the most recent parental death. Approximately 1,806 graduates (25 percent) were
asked about a parental death during that time period18. Roughly half (52 percent) of parentally
bereaved graduates report that their parent spent his or her last days at a nursing home, while 23
percent were in the hospital, 19 percent were at home, 4 percent spent their final days in hospital
hospice, 2 percent were receiving in-home hospice care, and less than 1 percent spent their final days
somewhere else [gy403pa/wap4].
Most graduates report that their parent was in at least some pain at the time of death. 36 percent
said their parent experienced no pain, 21 percent reported slight pain, 20 percent indicated moderate
pain, and 13 percent said their parent had severe pain during the last week of life. Ten percent did not
know the level of pain their parents had during the last week of life [gy404pa/wap5].
17 Widows and widowers did not differ significantly in their descriptions of the “quality of death” experienced by their spouses. 18 Due to sampling requirements all participants who experienced a father’s death in the past 10 years and half of the participants who experienced their mother’s death in the past 10 years were asked about death quality.
113
Most bereaved graduates (roughly 80 percent) report that their parent had appointed the
DPAHC [gy407pa/wcp1]. When the parent did have a DPAHC, roughly half (49 percent) named a
spouse and 46 percent named a child, grandchild, or child-in-law. Two percent named other relatives
and non-relatives, and 1.3 percent named both spouse and children [gy408pa/wcp1a].
The majority (52 percent) of graduates reported that the DPAHC had no effect on the quality of
care delivered to their parent, while 32 percent have said that it helped a lot, and 10 percent said it
helped a little. Only 3 percent said that the DPAHC caused problems during the last week of the
spouse’s life. Finally, 2 percent could not evaluate the role the DPAHC of a parent played in the last
week of his/her life [gy409pa/wcp2]. While a higher proportion of men than women report that the
DPAHC had no effect (56 percent versus 50 percent, respectively) and helped a little (11 percent
versus 9 percent), a higher proportion of women than men felt that the DPAHC helped a great deal (37
percent versus 26 percent, respectively).
Nearly 60 percent of those who lost a parent say that their parent had a living will
[gy410pa/wcp3]. A significantly higher proportion of women than men report that their parent had a
living will (63 percent versus 56 percent). Roughly half (52 percent) of these bereaved children say
that the living will had no effect on their parent’s end-of-life care, while one-third feel that it helped a
great deal, and 10 percent say that it helped a little. Two percent believe it caused some problems in
the last week of life, and two percent could not estimate the role of the living will [gy411pa/wcp4].
Although the majority of the bereaved children report that both the DPAHC and living will had no
effect on the parents’ last weeks of life, there is gender difference in opinions when it comes to the
role of DPAHC, but this gender difference disappears when we look at the role of the living will.
114
Half of the bereaved graduates report that their deceased parent was not able to make medical
decision during the last week of life [gy412pa/wcp5]. Half of the graduates also say that their parent
had specific wishes about their medical treatment, while ten percent reported that they did not know
about specific wishes of their deceased parent [gy413pa/wcp6]. Of those whose parents had clear
health care preferences, a full 92 percent believe that their parent received care that was consistent
with his or her wishes [gy414pa/wcp8].
Long Term Care Insurance – Dmitry Khodyakov and Deborah Carr
In the mail survey, WLS graduates were asked whether they currently have or ever have had
long-term care insurance. This is insurance that helps defray the costs for care in a nursing home or
long-term care facility. Roughly three-quarters (72 percent) report that they have never had long term
care insurance that specifically covers care at home and in nursing home [ixhi58re]. A slightly higher
percentage of women (73 percent) than men (70 percent) have never had such insurance.
When asked about the reasons for not having long term care insurance, half (47 percent)
indicated that the premiums were too high [ixhi59re], 35 percent reported that they did not think they
needed it [ixhi60re], 23 percent indicated that they thought it was not a good use of money [ixhi62re],
22 percent stated that they have never thought about it [ixhi61re], 6 percent reported that they were not
eligible for long term care insurance [ixhi63re], and 6 percent indicated some other reason for not
115
having such insurance [ixhi64re].19 A slightly higher proportion of women than men indicated that
premiums were too high (50 percent versus 44 percent), while a higher percentage of men state that
they have never thought about long term care insurance (42 percent versus 30 percent).
Attitudes and Expectations for Death –Dmitry Khodyakov and Deborah Carr
In the mail questionnaire, graduates were asked to indicate their level of agreement or
disagreement with several attitudes towards death and dying. In general, most graduates showed
higher levels of death “acceptance” rather than death “avoidance.” Graduates were first asked to
evaluate the statement “I avoid thinking about death all together” [ixha41re]. Roughly 60 percent
disagreed (strongly, moderately or slightly), whereas 40 percent agreed at least slightly. A higher
proportion of women than men (66 percent versus 59 percent) disagreed (strongly, moderately or
slightly) with this statement.
The majority (62 percent) of graduates “strongly agreed” with the statement: “death is simply a
part of the process of life,” while another 35 percent agreed either “moderately” or “slightly.” Less
than three percent disagreed with the statement [ixha42re]. Again, women showed a slightly greater
tendency toward “death acceptance” than did men. The majority of graduates also revealed beliefs
consistent with a “neutral acceptance” of death. More than 86 percent agreed with the statement: “I
neither fear death nor welcome it” [ixha43re]. Men were more slightly more likely than women to
19 Percentages do not add up to 100 because graduates could select more than one reason for not having insurance.
116
strongly endorse this view; a slightly higher percentage of men than women strongly agreed (33
percent versus 30 percent) with this statement.
Part 3:
A guide to comparable measures among major life course studies of aging.
Surveys of the Life Course and Aging: Some Comparisons1
Hsiang-Hui Daphne Kuo
Hyunjoon Park
Taissa S. Hauser
Robert M. Hauser
Nadine F. Marks
June 2001
Department of Sociology
Center for Demography of Health and Aging
University of Wisconsin-Madison
1
Surveys of the Life Course and Aging: Some Comparisons
Hsiang-Hui Daphne Kuo, Hyunjoon Park, Taissa S. Hauser,
Robert M. Hauser, Nadine F. Marks
Abstract
In this paper, we introduce, compare, and evaluate the design and content of five major
longitudinal studies of aging: the Wisconsin Longitudinal Study (WLS), Health and Retirement
Survey (HRS), National Survey of Families and Households (NSFH), Americans' Changing
Lives (ACL), and Midlife in the United States (MIDUS). We first compare population coverage,
sampling design, response rate, observational duration, sources of relational and multi-level data,
and links to public records. Overall, WLS, HRS, and NSFH excel in many respects. We also
evaluate questions and measures in each study. In topical coverage, WLS and NSFH are the
most complete. In question quality, WLS, HRS, and NSFH excel in several areas, while MIDUS
and ACL stand out mainly in life event inventories, psychological measures and some health
measures.
1
In several major reports, expert panels of the National Research Council (NRC) have offered
new, but convergent recommendations for future research on health and aging (National Research
Council 1997; 2000a; 2000b; 2000c; 2000d; 2001a; 2001b). Their common themes are (1) the
importance of social context for behavior; (2) interdisciplinary approaches to scientific and policy
issues; (3) the need for developmental or life-course perspectives; (4) recognition of multiple levels
of influence; (5) identification of mechanisms or pathways to health and illness; (6) development and
use of new methodologies; and (7) development of new institutional and training infrastructure to
support the new research agenda (Berkman 2001). These admirable goals require continued
development of major, public longitudinal data resources on population health and aging.
In a recent symposium at the National Academy of Sciences, Hauser (2001) outlined several
strengths of longitudinal population surveys: (1) Giving us “the big picture,” global descriptions of
variations in the life course in populations; (2) Making it possible to model dynamic processes over
long periods of time; (3) Providing data across time about role-relationships, e.g., parent-child, sister-
brother, wife-husband, as well as about persons; (4) Providing data at multiple levels of analysis,
e.g., the biological, neurological, psychological, and social, as well as varying levels of aggregation;
(5) Providing representative data about rare as well as common events and processes; (6) Leading to
serendipitous findings; and, taken together with other studies, (7) Permitting piecewise construction
of synthetic models of life-course processes.
We have assembled a tabular comparison among five major studies.2
1. Wisconsin Longitudinal Study (WLS) – http://dpls.dacc.wisc.edu/WLS/wlsarch.htm
2. Health and Retirement Survey (HRS) – http://www.umich.edu/~hrswww/
3. National Survey of Families and Households (NSFH) –
http://www.ssc.wisc.edu/nsfh/home.htm
2
4. Americans’ Changing Lives (ACL) – http://www.icpsr.umich.edu/
5. Midlife in the United States (MIDUS) – http://midmac.med.harvard.edu/
The last of these is not (yet) a longitudinal study, but a second wave has been proposed.
In our judgment, each of the five focal studies has made important contributions to our
knowledge of midlife development, health, and aging, and each is likely to make important
contributions in the future. Moreover, we believe that multiplicity, comparability, and partial
overlap in content are valuable features of the nation’s repertoire of longitudinal studies (Hauser
2001). Thus, we would not suggest that any one of them is a substitute for any of the others.
Among the major omissions from the comparison, the Panel Study of Income Dynamics
(PSID) is probably most important.3The PSID has followed the members of 5000 American
families – and the sample members who have left those families – since 1968. Its regular –
annual or biennial – coverage of income sources and amounts, employment, family composition
changes, and demographic events is unparalleled. The surveys often contain psychological
variables and health measures. Unfortunately, because of variations in the supplemental content
of the PSID – and in its sample design and coverage across time – we were unable to include it
in the comparison tables. We have also excluded other important studies of the elderly, either
because of short duration (the two Longitudinal Studies of Aging, LSOA), focus on institutional
populations (National Long-Term Care Survey, NLTCS)–or because they are no longer active–
the older cohorts of the National Longitudinal Survey of Labor Market Experience (NLS). The
Behavior and Social Research unit within the National Institute of Aging has prepared a very
useful summary of the design and content of its larger set of aging surveys and studies
(http://www.nih.gov/nia/research/extramural/behavior/data00.pdf).
3
A Description of the Wisconsin Longitudinal Study
The WLS began with a 1/3 random sample (N = 10,317) of women and men who graduated
from Wisconsin high schools in 1957.4 The original purpose of the study was to assess the demand
for higher education in Wisconsin. The next two waves of survey data were collected from the
graduates or their parents in 1964 and 1975. Those data provide a full record of social background,
high school curriculum, youthful aspirations and social influences, schooling, military service, family
formation, labor market experiences, and social participation. Early survey data were supplemented
by earnings of parents from state tax records, mental ability test scores and rank in high school class,
and characteristics of communities of residence, schools and colleges, employers, and industries.
Recently, the WLS added state archival data on high school district resources from 1954 to 1957
(Olson and Ackerman 2000a; 2000b). The WLS records for graduates are also linked to those of
three best same-sex high school friends; about half the graduates have a named peer in the sample.
Data on the occupational careers of male graduates are supplemented by Social Security earnings
histories from 1957 to 1971.
In 1975, the WLS obtained a roster of living siblings and chose a focal sibling at random for
each graduate (including all twins). Adolescent cognitive ability test scores have been located for
6619 siblings, 75 percent of the focal siblings of graduates. In 1977 parallel interviews were carried
out in a highly stratified sample of 2100 of these randomly selected siblings.
In 1992-94, the WLS conducted telephone and mail surveys of graduates and nearly identical
telephone and mail surveys of an expanded random sample of brothers and sisters of graduates.
These updated measurements of marital status, child-rearing, education, labor force participation,
jobs and occupations, social participation, and future aspirations and plans among graduates and
siblings. In addition, they expanded the content of earlier follow-ups to include psychological well-
4
being, mental and physical health, wealth, household economic transfers, and social comparison and
exchange relationships with parents, siblings, and children.
In 1975, measurement procedures resembled those of the Current Population Survey (CPS)
and the 1973 Occupational Changes in a Generation Survey (OCG). In 1992, the surveys balanced
continuity of these procedures with comparability to other well-designed surveys, e.g., Health and
Retirement Survey (HRS), National Survey of Families and Households (NSFH), NIH surveys of
work and psychological functioning, and the NORC General Social Survey (GSS). The survey
design was also coordinated with members of the MacArthur Foundation Research Network on
Successful Midlife Development, with the Whitehall II study (Marmot et al. 1991), and with
Wadsworth’s (1991) longitudinal cohort study of births in Great Britain in 1946.
In 1992, the 1-hour telephone interview covered life history data, family rosters, and job
histories, which have many skips or branches. For example, a job history protocol for CATI
(Computer-Assisted Telephone Interview), which covered 94% of jobs held since 1975 that lasted 6
months or longer. Because lower response rates were anticipated in the mail survey, the CATI
instrument contains selected items from key inventories of personality (The Big Five, John 1990;
1991), health (depression and alcohol use), and well-being (Ryff 1989; Ryff and Keyes 1995), of
which there are more detailed measures in the mail instrument. The mail instrument also added
measures of well-being, social contact, exchanges, and health, including an extensive account of
menopausal experience. The sibling mail survey was modified to obtain additional measures of
physical health and health-related behaviors, richer accounts of women's menopausal experiences,
and more information about relationships between the focal sibling and other family members–
including indicators of childhood abuse.
Recently, WLS graduates and siblings have been matched to the National Death Index-Plus
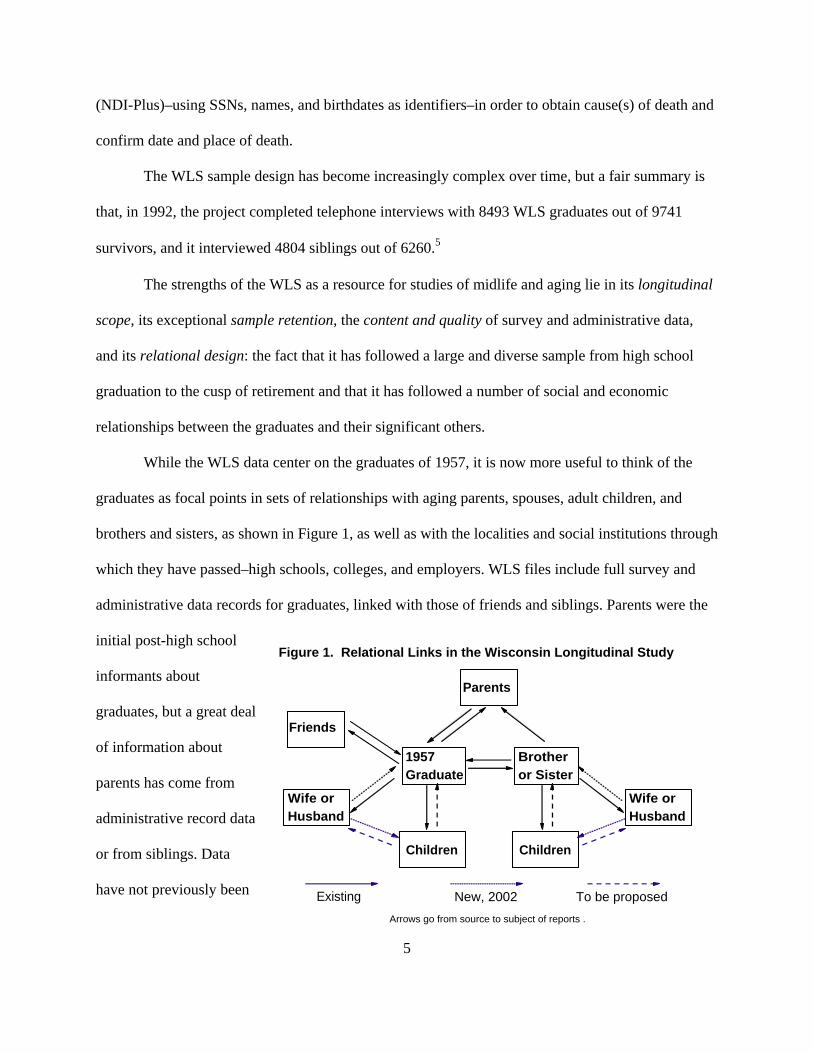
5
(NDI-Plus)–using SSNs, names, and birthdates as identifiers–in order to obtain cause(s) of death and
confirm date and place of death.
The WLS sample design has become increasingly complex over time, but a fair summary is
that, in 1992, the project completed telephone interviews with 8493 WLS graduates out of 9741
survivors, and it interviewed 4804 siblings out of 6260.5
The strengths of the WLS as a resource for studies of midlife and aging lie in its longitudinal
scope, its exceptional sample retention, the content and quality of survey and administrative data,
and its relational design: the fact that it has followed a large and diverse sample from high school
graduation to the cusp of retirement and that it has followed a number of social and economic
relationships between the graduates and their significant others.
While the WLS data center on the graduates of 1957, it is now more useful to think of the
graduates as focal points in sets of relationships with aging parents, spouses, adult children, and
brothers and sisters, as shown in Figure 1, as well as with the localities and social institutions through
which they have passed–high schools, colleges, and employers. WLS files include full survey and
administrative data records for graduates, linked with those of friends and siblings. Parents were the
initial post-high school
informants about
graduates, but a great deal
of information about
parents has come from
administrative record data
or from siblings. Data
have not previously been
Arrows go from source to subject of reports .
1957Graduate
Parents
Friends
Wife orHusband
Children
Figure 1. Relational Links in the Wisconsin Longitudinal Study
Wife orHusband
Brotheror Sister
Children
Existing New, 2002 To be proposed
6
obtained from spouses or children–except sometimes to help locate sample members.
The parallel data for siblings are a special strength of the WLS. Siblings provide unique data–
self-reporting variables that cannot be obtained from proxies, cross-validating information about
graduates and their families, and complementing accounts of inter-household (and intergenerational)
exchanges. Analytically, the sibling data permit construction of multi-level models of family and
individual effects on life course outcomes (Hauser and Sewell 1986; Hauser, Sheridan, and Warren
1999).
Among Americans aged 60 to 64 in March 2000, 66.7% are non-Hispanic white women and
men who completed at least 12 years of schooling (U.S. Bureau of the Census 2000: Table 1a) and
thus resemble the WLS cohort. The WLS is unusually valuable in its representation of women as
well as men. The WLS cohort, born mainly in 1939, precedes by a few years the baby boom
generation that has taxed social institutions and resources at each stage of life. The study can thus
provide early indications of trends and problems that will become important as the larger group
passes through its early 60s. Also, because the WLS is the first of the large, longitudinal studies of
American adolescents, it provides the first large-scale opportunity to study the life course from late
adolescence through the mid-60s in the context of a full record of ability, aspiration, and
achievement.6 The WLS graduates and their siblings have lived through major social changes: rising
affluence, suburban growth, the decline of old ethnic cleavages, the cold war, and changing gender
roles. The WLS overlaps the youngest cohorts that entered HRS in 1992, and this has provided
opportunities to check the scope of our findings. Unlike the WLS, the HRS is nationally
representative, but it does not cover the lives of respondents from adolescence to old age.
The WLS data also have obvious limitations. Some strata of American society are not
represented. Everyone in the graduate sample completed high school. (Sewell and Hauser 1975)
7
estimated that about 75% of Wisconsin youth graduated from high schools in the late 1950s; about
7% of siblings in the WLS did not graduate.7 There are only a handful of African American,
Hispanic, or Asian persons in the WLS. Given the minuscule share of minorities in Wisconsin when
the WLS began, there is no way to remedy this omission. About 19% of the WLS sample is of farm
origin; this is consistent with national estimates in cohorts of the late 1930s. In 1964, 1975, and 1992,
70% of the sample lived in Wisconsin, but 30% lived elsewhere in the U.S. or abroad. The WLS
graduates are homogeneous in age, but their siblings are not. Siblings range widely in age, mainly
from 8 to 10 years older to 8 to 10 years younger than the graduates.
National Studies of the Life Course and Aging
The HRS, MIDUS, NSFH, and ACL differ from the WLS in somewhat the same ways: All
attempt to cover the entire U.S. population; all are presently of relatively short duration. Except
HRS/AHEAD, they cover adults of all ages. Only NSFH provides rich (retrospective) data on early
life circumstances, but it lacks the psychological measures in the WLS. Beyond these features, each
study is unique in content and design, reflecting the interests of its leaders and research community.
Now that HRS has been combined with two older (AHEAD and CODA) cohorts, it provides
continuing, biennial coverage of the U.S. population over the age of 50 in a sample of about 20,000
individuals. It is surely the flagship among large, long-term studies of aging. It covers spouses of
married couples, and over-samples minorities and Floridians. HRS has also established links with
data from the SSA, NDI, HCFA (Medicare), and employers. Coverage was excellent in the initial
wave, and sample retention has been good across the first 8 years. Data cover cognition, self-reported
health–with different emphases than the WLS, and a variety of attitudes and preferences, but there is
far more emphasis on detailed economic data than in the WLS. Unlike the WLS, data on upbringing
and on events before the age of 50 are retrospective or thin in HRS. Spousal reports provide
8
important relational content, but there are no data from siblings or children. As with the WLS, bio-
indicators have been obtained only on a pilot basis.
NSFH began with 13,017 persons aged 19 or more in 1987-88.8
Wave 2 took place in 1992-93, and wave 3 is in the field. The response rate was 74% in the first
wave, and 83% of survivors responded in wave 2. The total sample is quite large, and the data
provide rich, self-reported accounts of relationships among spouses, children, and parents. NSFH
covers work experience, health, and well-being in less detail than the WLS. It provides similar data
on family histories, social support, inter-household exchanges, and current labor force involvement,
income sources, assets, and debt. However, there are few elders in NSFH–by comparison either to
HRS or WLS–and the NSFH does not provide cognitive measures or relational data for adult
siblings. The temporal window of observation in NSFH is wider than that of HRS–15 years vs. 9,
and there are no plans to obtain bio-indicators.
ACL, like NSFH and MIDUS, is a sample of the adult household population.9 The first
(1986) wave achieved a response rate of 68% (N = 3,617). Responses were obtained for 83% of first
wave participants in the second wave (1989) and for 83% of second wave participants in the third
wave (1994). A fourth wave has been funded. ACL focuses on “productive” social relationships–on
and off the job–and on cross-cultural variation in them. It has strong coverage of stressful events,
chronic strains, and their effects on health, personal functioning, and productive activity. It also has
excellent data on neighborhood contexts, spousal relationships, social support, and friendship.
However, ACL contains relatively little information about early life circumstances, schooling,
occupational histories, pensions, health, health insurance, or retirement.
MIDUS is a household-based, cross-sectional study of about 3500 adults in 1995 (over-
sampling those 45 and older), supplemented by 951 siblings (of 529 primary respondents), an
9
independent sample of 1000 twin-pairs, and small oversamples in several metropolitan areas. The
relational design is a great strength, but the first round response rate was unfortunately low (60.8% in
the main sample), and persons with low levels of schooling were substantially under-represented.
MIDUS has a very rich base of psychosocial assessments, focusing on midlife development and
health, but it is weak in measures of adolescent development, educational history, work history,
marital history, intergenerational relationships, and financial status. A second round has been
proposed to add a large array of bio-indicators and create a supplementary African-American sample
from Milwaukee.
Tabular Comparisons of Study Design and Content
We have constructed two tables that offer selected comparisons among WLS,10 MIDUS,
HRS, NSFH, and ACL.11 Table 1 is a summary of design and content, which reports our
assessments of study content – its quality and coverage – within several major areas. Table 2
provides supporting detail in each content area, and it is the major contribution of this paper. We
have constructed Table 2 by reviewing questionnaires and other documentation available at each
wave of each survey. Some surveys are covered in more detail than others in this edition of the
table. For example, we have not yet distinguished among waves in HRS or NSFH, where almost
all measures have been ascertained anew at each wave of the study. Also, we have not
distinguished sources of information in MIDUS,12 HRS, or NSFH, that is, whether data were
ascertained from primary respondents or from spouses, siblings, or children. The present
omission of these details implies that Table 2 understates the richness of relational data in those
surveys.
10
Reference List
Berkman, Lisa F. 2001. "Viewing the Contributions of the Behavioral and Social Sciences to
Health." The Barbara and Jerome Grossman Symposium: 2001. Washington, DC :
National Academy of Sciences.
Clausen, John A. 1993. American Lives: Looking Back at the Children of the Great Depression.
New York: The Free Press.
Elder, Glen H. Jr. 1974. Children of the Great Depression. Chicago: University of Chicago
Press.
Hauser, Robert M. 2001. "Longitudinal Population Surveys: Necessary, But No Panacea." The
Barbara and Jerome Grossman Symposium: 2001 . Washington, DC : National Academy
of Sciences.
Hauser, Robert M. and William H. Sewell. 1986. "Family Effects in Simple Models of
Education, Occupational Status, and Earnings: Findings From the Wisconsin and
Kalamazoo Studies." Journal of Labor Economics 4:S83-S115.
Hauser, Robert M., Jennifer T. Sheridan, and John R. Warren. 1999. "Socioeconomic
Achievements of Siblings in the Life Course: New Findings From the Wisconsin
Longitudinal Study." Research on Aging 21(2):338-78.
John, O. 1990. "Big Five Factor Taxonomy: Dimensions of Personality in the Natural Language
and Questionnaires." Handbook of Personality Theory and Research, Ed L. A. Pervin.
11
New York, NY: Guilford.
———. 1991. Big Five Inventory(BFI-54). University of California, Berkeley: Institute of
Personality Assessment and Research.
Marmot, Michael, George D. Smith, Stephen Stansfeld, Chandra Patel, Fiona North, Jenny Head,
Ian White, Eric Brunner, and Amanda Feeney. 1991. "Health Inequalities Among British
Civil Servants: The Whitehall II Study." The Lancet (337):1387-93.
National Research Council. 1997. Approaching Death: Improving Care at the End of Life.
Marilyn J. Field and Christine K. Cassel, Editors Committee on Care at the End of Life,
Institute of Medicine. Washington, DC: National Academy Press.
———. 2000a. Bridging Disciplines in the Brain, Behavioral, and Clinical Sciences. Terry C.
Pellmar and Leon Eisenberg, eds. Committee on Building Bridges in the Brain,
Behavioral, and Clinical Sciences. Division of Neuroscience and Behavioral Health.
Institute of Medicine. Washington, DC: National Academy Press.
———. 2000b. Promoting Health: Intervention Strategies From Social and Behavioral
Research. Brian D. Smedly and S. Leonard Syme, eds. Committee on Capitalizing on
Social Science and Behavioral Research to Improve the Public's Health, Division of
Health Promotion and Disease Prevention. Institute of Medicine. Washington, DC:
National Academy Press.
———. 2000c. The Aging Mind: Opportunities in Cognitive Research. Paul C. Stern and Laura
L. Carstensen, eds. Committee on Future Directions for Cognitive Research on Aging.
12
Board on Behavioral, Cognitive, and Sensory Sciences. Commission on Behavioral and
Social Sciences and Education. Washington, DC: National Academy Press.
———. 2000d. From Neurons to Neighborhoods: The Science of Early Childhood
Development. Jack P. Shonkoff and Deborah A. Phillips, eds. Committee on Integrating
the Science of Early Childhood Development. Board on Children, Youth, and Families.
Washington, DC: National Academy Press.
———. 2001a. Health and Behavior: The Interplay of Biological, Behavioral, and Societal
Influences . Committee on Health and Behavior: Research, Practice and Policy. Board on
Neuroscience and Behavioral Health. Institute of Medicine. Washington, DC: National
Academy Press.
———. 2001b. New Horizons in Health: An Integrative Approach. Burton H. Singer and Carol
D. Ryff, eds. Committee on Future Directions for Behavioral and Social Sciences
Research at the National Institutes of Health. Board on Behavioral, Cognitive, and
Sensory Sciences. Commission on Behavioral and Social Sciences and Education.
Washington, DC: National Academy Press.
Oden, Melita H. 1968. "The Fulfillment of Promise: 40-Year Follow-Up of the Terman Gifted
Group." Pp. 3-93 in , vol. 77.
Olson, Craig A. and Deena Ackerman. 2000a. High School Inputs and Labor Market Outcomes
for Male Workers in Their Mid-Thirties: New Data and New Estimates From Wisconsin.
IRP Discussion Paper 1205-00. Institute for Research on Poverty, University of
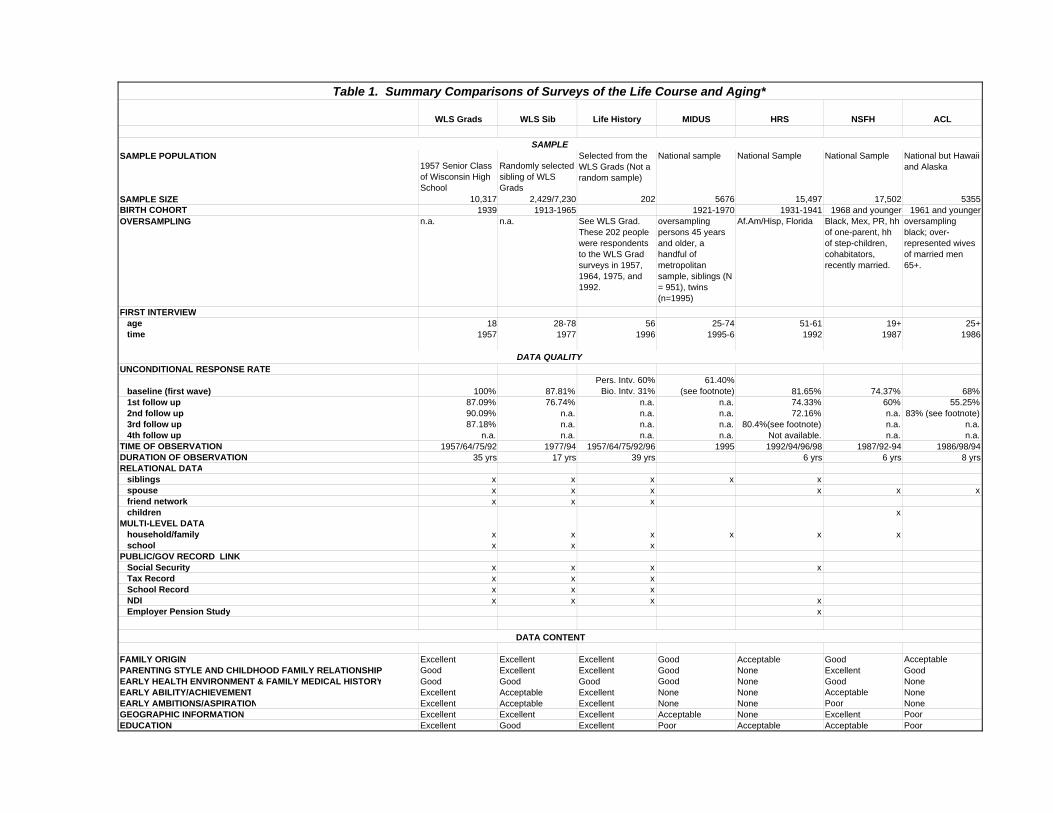
WLS Grads WLS Sib Life History MIDUS HRS NSFH ACL
SAMPLE POPULATION1957 Senior Class of Wisconsin High School
Randomly selected sibling of WLS Grads
Selected from the WLS Grads (Not a random sample)
National sample National Sample National Sample National but Hawaii and Alaska
SAMPLE SIZE 10,317 2,429/7,230 202 5676 15,497 17,502 5355BIRTH COHORT 1939 1913-1965 1921-1970 1931-1941 1968 and younger 1961 and youngerOVERSAMPLING n.a. n.a. See WLS Grad.
These 202 people were respondents to the WLS Grad surveys in 1957, 1964, 1975, and 1992.
oversampling persons 45 years and older, a handful of metropolitan sample, siblings (N = 951), twins (n=1995)
Af.Am/Hisp, Florida Black, Mex, PR, hh of one-parent, hh of step-children, cohabitators, recently married.
oversampling black; over-represented wives of married men 65+.
FIRST INTERVIEW age 18 28-78 56 25-74 51-61 19+ 25+ time 1957 1977 1996 1995-6 1992 1987 1986
UNCONDITIONAL RESPONSE RATE
baseline (first wave) 100% 87.81%Pers. Intv. 60%
Bio. Intv. 31%61.40%
(see footnote) 81.65% 74.37% 68% 1st follow up 87.09% 76.74% n.a. n.a. 74.33% 60% 55.25% 2nd follow up 90.09% n.a. n.a. n.a. 72.16% n.a. 83% (see footnote) 3rd follow up 87.18% n.a. n.a. n.a. 80.4%(see footnote) n.a. n.a. 4th follow up n.a. n.a. n.a. n.a. Not available. n.a. n.a.TIME OF OBSERVATION 1957/64/75/92 1977/94 1957/64/75/92/96 1995 1992/94/96/98 1987/92-94 1986/98/94DURATION OF OBSERVATION 35 yrs 17 yrs 39 yrs 6 yrs 6 yrs 8 yrsRELATIONAL DATA siblings x x x x x spouse x x x x x x friend network x x x children xMULTI-LEVEL DATA household/family x x x x x x school x x xPUBLIC/GOV RECORD LINK Social Security x x x x Tax Record x x x School Record x x x NDI x x x x Employer Pension Study x
FAMILY ORIGIN Excellent Excellent Excellent Good Acceptable Good AcceptablePARENTING STYLE AND CHILDHOOD FAMILY RELATIONSHIP Good Excellent Excellent Good None Excellent GoodEARLY HEALTH ENVIRONMENT & FAMILY MEDICAL HISTORY Good Good Good Good None Good NoneEARLY ABILITY/ACHIEVEMENT Excellent Acceptable Excellent None None Acceptable NoneEARLY AMBITIONS/ASPIRATION Excellent Acceptable Excellent None None Poor NoneGEOGRAPHIC INFORMATION Excellent Excellent Excellent Acceptable None Excellent PoorEDUCATION Excellent Good Excellent Poor Acceptable Acceptable Poor
Table 1. Summary Comparisons of Surveys of the Life Course and Aging*
SAMPLE
DATA CONTENT
DATA QUALITY
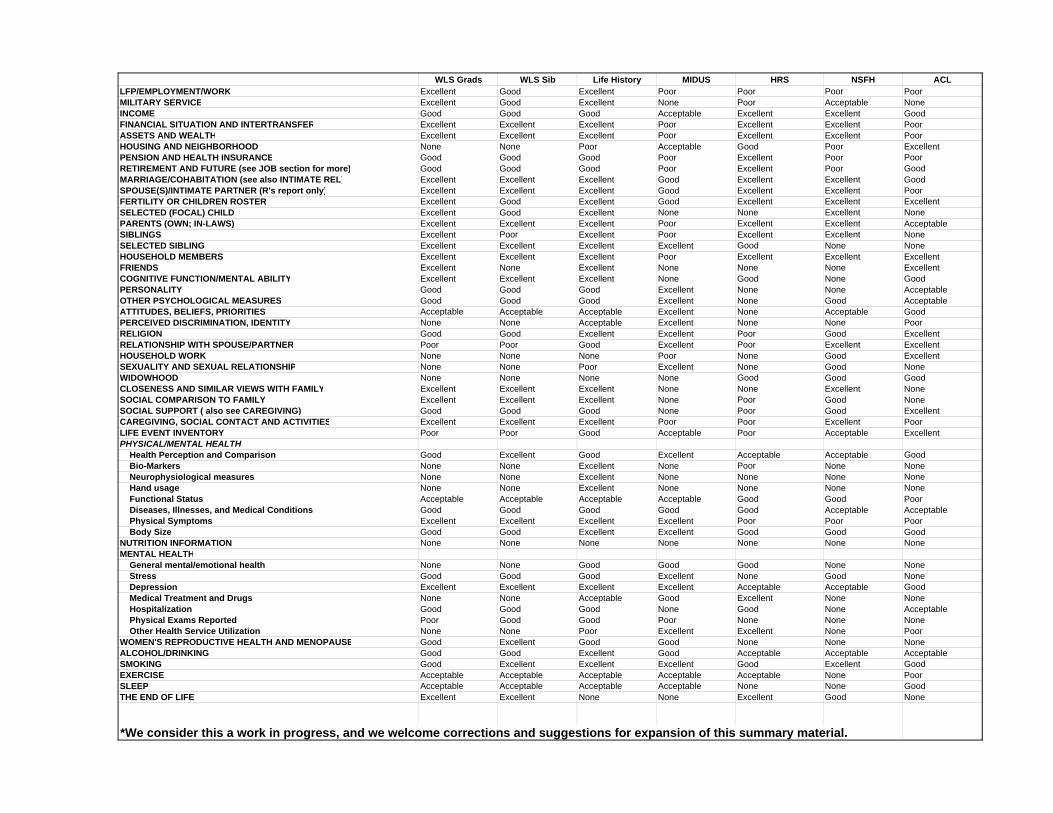
WLS Grads WLS Sib Life History MIDUS HRS NSFH ACLLFP/EMPLOYMENT/WORK Excellent Good Excellent Poor Poor Poor PoorMILITARY SERVICE Excellent Good Excellent None Poor Acceptable NoneINCOME Good Good Good Acceptable Excellent Excellent GoodFINANCIAL SITUATION AND INTERTRANSFER Excellent Excellent Excellent Poor Excellent Excellent PoorASSETS AND WEALTH Excellent Excellent Excellent Poor Excellent Excellent PoorHOUSING AND NEIGHBORHOOD None None Poor Acceptable Good Poor ExcellentPENSION AND HEALTH INSURANCE Good Good Good Poor Excellent Poor PoorRETIREMENT AND FUTURE (see JOB section for more) Good Good Good Poor Excellent Poor GoodMARRIAGE/COHABITATION (see also INTIMATE REL) Excellent Excellent Excellent Good Excellent Excellent GoodSPOUSE(S)/INTIMATE PARTNER (R's report only) Excellent Excellent Excellent Good Excellent Excellent PoorFERTILITY OR CHILDREN ROSTER Excellent Good Excellent Good Excellent Excellent ExcellentSELECTED (FOCAL) CHILD Excellent Good Excellent None None Excellent NonePARENTS (OWN; IN-LAWS) Excellent Excellent Excellent Poor Excellent Excellent AcceptableSIBLINGS Excellent Poor Excellent Poor Excellent Excellent NoneSELECTED SIBLING Excellent Excellent Excellent Excellent Good None NoneHOUSEHOLD MEMBERS Excellent Excellent Excellent Poor Excellent Excellent ExcellentFRIENDS Excellent None Excellent None None None ExcellentCOGNITIVE FUNCTION/MENTAL ABILITY Excellent Excellent Excellent None Good None GoodPERSONALITY Good Good Good Excellent None None AcceptableOTHER PSYCHOLOGICAL MEASURES Good Good Good Excellent None Good AcceptableATTITUDES, BELIEFS, PRIORITIES Acceptable Acceptable Acceptable Excellent None Acceptable GoodPERCEIVED DISCRIMINATION, IDENTITY None None Acceptable Excellent None None PoorRELIGION Good Good Excellent Excellent Poor Good ExcellentRELATIONSHIP WITH SPOUSE/PARTNER Poor Poor Good Excellent Poor Excellent ExcellentHOUSEHOLD WORK None None None Poor None Good ExcellentSEXUALITY AND SEXUAL RELATIONSHIP None None Poor Excellent None Good NoneWIDOWHOOD None None None None Good Good GoodCLOSENESS AND SIMILAR VIEWS WITH FAMILY Excellent Excellent Excellent None None Excellent NoneSOCIAL COMPARISON TO FAMILY Excellent Excellent Excellent None Poor Good NoneSOCIAL SUPPORT ( also see CAREGIVING) Good Good Good None Poor Good ExcellentCAREGIVING, SOCIAL CONTACT AND ACTIVITIES Excellent Excellent Excellent Poor Poor Excellent PoorLIFE EVENT INVENTORY Poor Poor Good Acceptable Poor Acceptable ExcellentPHYSICAL/MENTAL HEALTH Health Perception and Comparison Good Excellent Good Excellent Acceptable Acceptable Good Bio-Markers None None Excellent None Poor None None Neurophysiological measures None None Excellent None None None None Hand usage None None Excellent None None None None Functional Status Acceptable Acceptable Acceptable Acceptable Good Good Poor Diseases, Illnesses, and Medical Conditions Good Good Good Good Good Acceptable Acceptable Physical Symptoms Excellent Excellent Excellent Excellent Poor Poor Poor Body Size Good Good Excellent Excellent Good Good GoodNUTRITION INFORMATION None None None None None None NoneMENTAL HEALTH General mental/emotional health None None Good Good Good None None Stress Good Good Good Excellent None Good None Depression Excellent Excellent Excellent Excellent Acceptable Acceptable Good Medical Treatment and Drugs None None Acceptable Good Excellent None None Hospitalization Good Good Good None Good None Acceptable Physical Exams Reported Poor Good Good Poor None None None Other Health Service Utilization None None Poor Excellent Excellent None PoorWOMEN'S REPRODUCTIVE HEALTH AND MENOPAUSE Good Excellent Good Good None None NoneALCOHOL/DRINKING Good Good Excellent Good Acceptable Acceptable AcceptableSMOKING Good Excellent Excellent Excellent Good Excellent GoodEXERCISE Acceptable Acceptable Acceptable Acceptable Acceptable None PoorSLEEP Acceptable Acceptable Acceptable Acceptable None None GoodTHE END OF LIFE Excellent Excellent None None Excellent Good None
*We consider this a work in progress, and we welcome corrections and suggestions for expansion of this summary material.
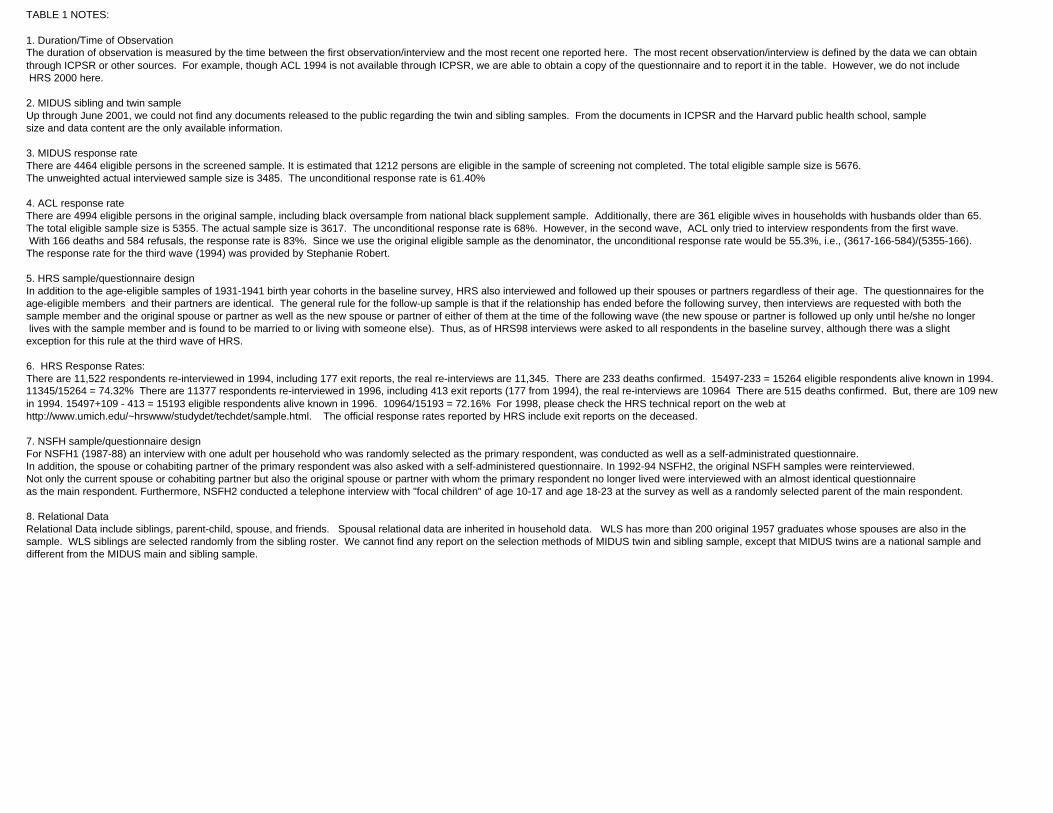
TABLE 1 NOTES:
1. Duration/Time of Observation
through ICPSR or other sources. For example, though ACL 1994 is not available through ICPSR, we are able to obtain a copy of the questionnaire and to report it in the table. However, we do not include HRS 2000 here.
2. MIDUS sibling and twin sampleUp through June 2001, we could not find any documents released to the public regarding the twin and sibling samples. From the documents in ICPSR and the Harvard public health school, sample size and data content are the only available information.
3. MIDUS response rateThere are 4464 eligible persons in the screened sample. It is estimated that 1212 persons are eligible in the sample of screening not completed. The total eligible sample size is 5676. The unweighted actual interviewed sample size is 3485. The unconditional response rate is 61.40%
4. ACL response rateThere are 4994 eligible persons in the original sample, including black oversample from national black supplement sample. Additionally, there are 361 eligible wives in households with husbands older than 65. The total eligible sample size is 5355. The actual sample size is 3617. The unconditional response rate is 68%. However, in the second wave, ACL only tried to interview respondents from the first wave. With 166 deaths and 584 refusals, the response rate is 83%. Since we use the original eligible sample as the denominator, the unconditional response rate would be 55.3%, i.e., (3617-166-584)/(5355-166). The response rate for the third wave (1994) was provided by Stephanie Robert.
5. HRS sample/questionnaire designIn addition to the age-eligible samples of 1931-1941 birth year cohorts in the baseline survey, HRS also interviewed and followed up their spouses or partners regardless of their age. The questionnaires for the age-eligible members and their partners are identical. The general rule for the follow-up sample is that if the relationship has ended before the following survey, then interviews are requested with both the sample member and the original spouse or partner as well as the new spouse or partner of either of them at the time of the following wave (the new spouse or partner is followed up only until he/she no longer lives with the sample member and is found to be married to or living with someone else). Thus, as of HRS98 interviews were asked to all respondents in the baseline survey, although there was a slight exception for this rule at the third wave of HRS.
6. HRS Response Rates: There are 11,522 respondents re-interviewed in 1994, including 177 exit reports, the real re-interviews are 11,345. There are 233 deaths confirmed. 15497-233 = 15264 eligible respondents alive known in 1994.
in 1994. 15497+109 - 413 = 15193 eligible respondents alive known in 1996. 10964/15193 = 72.16% For 1998, please check the HRS technical report on the web at http://www.umich.edu/~hrswww/studydet/techdet/sample.html. The official response rates reported by HRS include exit reports on the deceased.
7. NSFH sample/questionnaire designFor NSFH1 (1987-88) an interview with one adult per household who was randomly selected as the primary respondent, was conducted as well as a self-administrated questionnaire. In addition, the spouse or cohabiting partner of the primary respondent was also asked with a self-administered questionnaire. In 1992-94 NSFH2, the original NSFH samples were reinterviewed. Not only the current spouse or cohabiting partner but also the original spouse or partner with whom the primary respondent no longer lived were interviewed with an almost identical questionnaire as the main respondent. Furthermore, NSFH2 conducted a telephone interview with "focal children" of age 10-17 and age 18-23 at the survey as well as a randomly selected parent of the main respondent.
8. Relational DataRelational Data include siblings, parent-child, spouse, and friends. Spousal relational data are inherited in household data. WLS has more than 200 original 1957 graduates whose spouses are also in the sample. WLS siblings are selected randomly from the sibling roster. We cannot find any report on the selection methods of MIDUS twin and sibling sample, except that MIDUS twins are a national sample and different from the MIDUS main and sibling sample.
The duration of observation is measured by the time between the first observation/interview and the most recent one reported here. The most recent observation/interview is defined by the data we can obtain
11345/15264 = 74.32% There are 11377 respondents re-interviewed in 1996, including 413 exit reports (177 from 1994), the real re-interviews are 10964 There are 515 deaths confirmed. But, there are 109 new
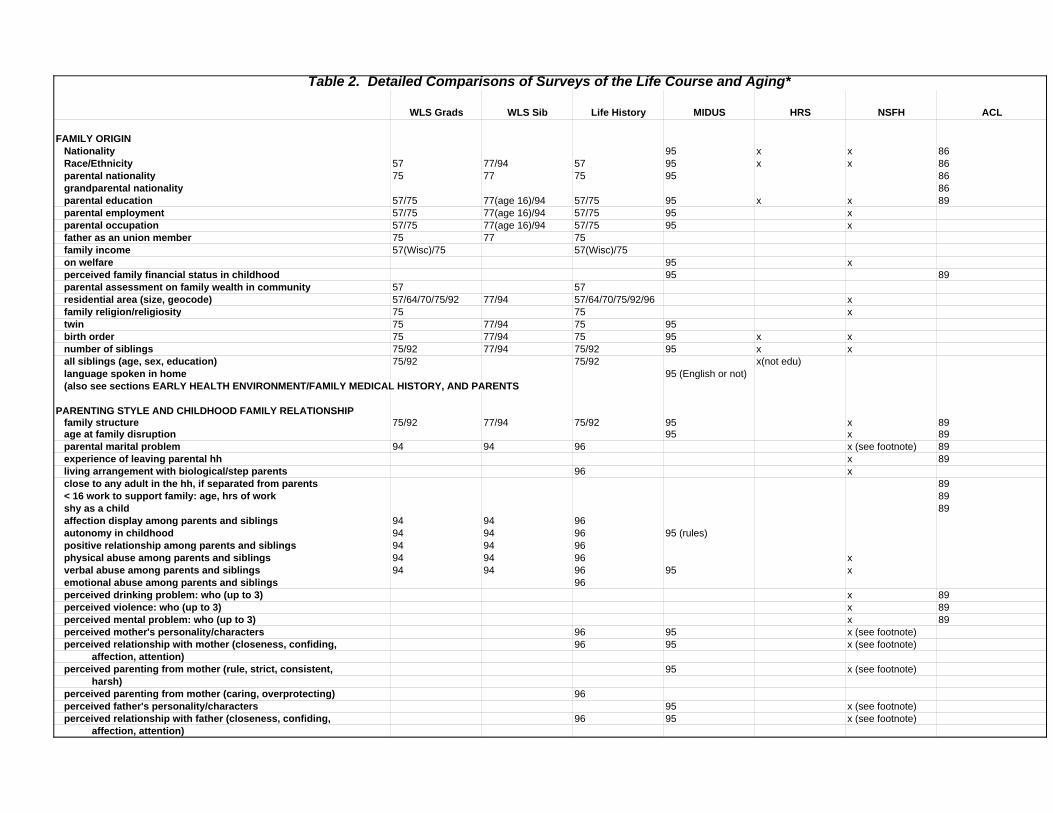
WLS Grads WLS Sib Life History MIDUS HRS NSFH ACL
FAMILY ORIGIN Nationality 95 x x 86 Race/Ethnicity 57 77/94 57 95 x x 86 parental nationality 75 77 75 95 86 grandparental nationality 86 parental education 57/75 77(age 16)/94 57/75 95 x x 89 parental employment 57/75 77(age 16)/94 57/75 95 x parental occupation 57/75 77(age 16)/94 57/75 95 x father as an union member 75 77 75 family income 57(Wisc)/75 57(Wisc)/75 on welfare 95 x perceived family financial status in childhood 95 89 parental assessment on family wealth in community 57 57 residential area (size, geocode) 57/64/70/75/92 77/94 57/64/70/75/92/96 x family religion/religiosity 75 75 x twin 75 77/94 75 95 birth order 75 77/94 75 95 x x number of siblings 75/92 77/94 75/92 95 x x all siblings (age, sex, education) 75/92 75/92 x(not edu) language spoken in home 95 (English or not) (also see sections EARLY HEALTH ENVIRONMENT/FAMILY MEDICAL HISTORY, AND PARENTS
PARENTING STYLE AND CHILDHOOD FAMILY RELATIONSHIP family structure 75/92 77/94 75/92 95 x 89 age at family disruption 95 x 89 parental marital problem 94 94 96 x (see footnote) 89 experience of leaving parental hh x 89 living arrangement with biological/step parents 96 x close to any adult in the hh, if separated from parents 89 < 16 work to support family: age, hrs of work 89 shy as a child 89 affection display among parents and siblings 94 94 96 autonomy in childhood 94 94 96 95 (rules) positive relationship among parents and siblings 94 94 96 physical abuse among parents and siblings 94 94 96 x verbal abuse among parents and siblings 94 94 96 95 x emotional abuse among parents and siblings 96 perceived drinking problem: who (up to 3) x 89 perceived violence: who (up to 3) x 89 perceived mental problem: who (up to 3) x 89 perceived mother's personality/characters 96 95 x (see footnote) perceived relationship with mother (closeness, confiding, 96 95 x (see footnote) affection, attention) perceived parenting from mother (rule, strict, consistent, 95 x (see footnote) harsh) perceived parenting from mother (caring, overprotecting) 96 perceived father's personality/characters 95 x (see footnote) perceived relationship with father (closeness, confiding, 96 95 x (see footnote) affection, attention)
Table 2. Detailed Comparisons of Surveys of the Life Course and Aging*
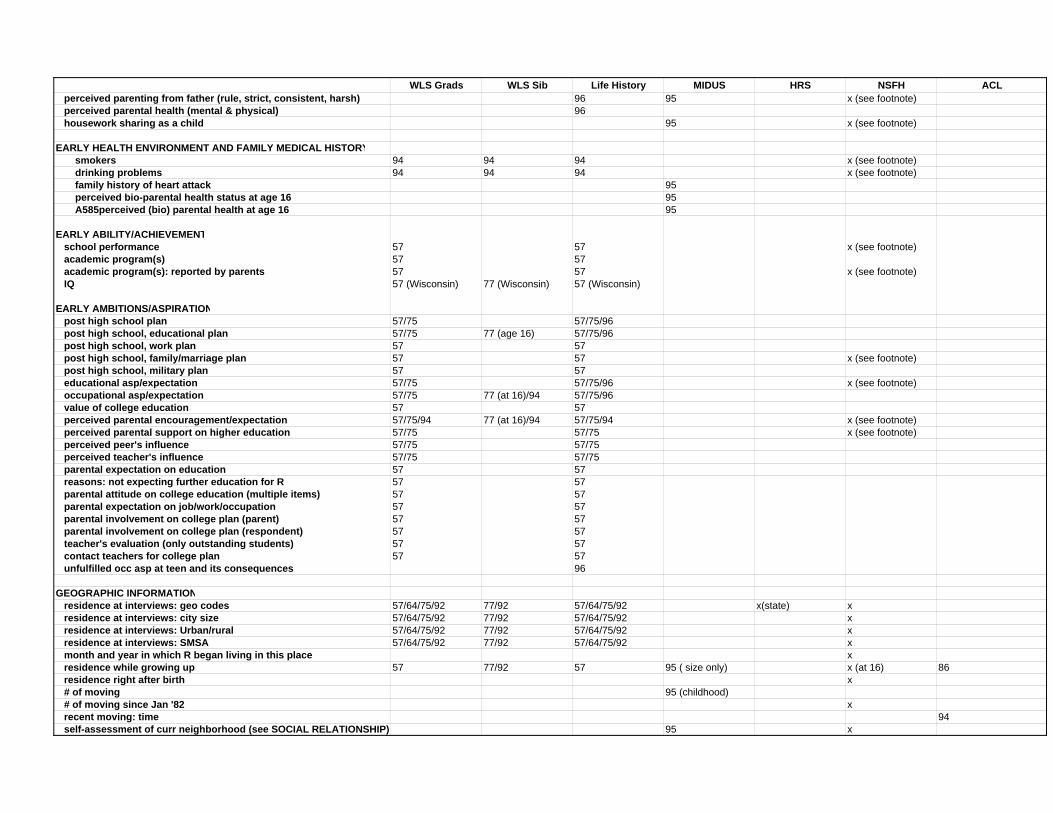
WLS Grads WLS Sib Life History MIDUS HRS NSFH ACL perceived parenting from father (rule, strict, consistent, harsh) 96 95 x (see footnote) perceived parental health (mental & physical) 96 housework sharing as a child 95 x (see footnote)
EARLY HEALTH ENVIRONMENT AND FAMILY MEDICAL HISTORY smokers 94 94 94 x (see footnote) drinking problems 94 94 94 x (see footnote) family history of heart attack 95 perceived bio-parental health status at age 16 95 A585perceived (bio) parental health at age 16 95
EARLY ABILITY/ACHIEVEMENT school performance 57 57 x (see footnote) academic program(s) 57 57 academic program(s): reported by parents 57 57 x (see footnote) IQ 57 (Wisconsin) 77 (Wisconsin) 57 (Wisconsin)
EARLY AMBITIONS/ASPIRATION post high school plan 57/75 57/75/96 post high school, educational plan 57/75 77 (age 16) 57/75/96 post high school, work plan 57 57 post high school, family/marriage plan 57 57 x (see footnote) post high school, military plan 57 57 educational asp/expectation 57/75 57/75/96 x (see footnote) occupational asp/expectation 57/75 77 (at 16)/94 57/75/96 value of college education 57 57 perceived parental encouragement/expectation 57/75/94 77 (at 16)/94 57/75/94 x (see footnote) perceived parental support on higher education 57/75 57/75 x (see footnote) perceived peer's influence 57/75 57/75 perceived teacher's influence 57/75 57/75 parental expectation on education 57 57 reasons: not expecting further education for R 57 57 parental attitude on college education (multiple items) 57 57 parental expectation on job/work/occupation 57 57 parental involvement on college plan (parent) 57 57 parental involvement on college plan (respondent) 57 57 teacher's evaluation (only outstanding students) 57 57 contact teachers for college plan 57 57 unfulfilled occ asp at teen and its consequences 96
GEOGRAPHIC INFORMATION residence at interviews: geo codes 57/64/75/92 77/92 57/64/75/92 x(state) x residence at interviews: city size 57/64/75/92 77/92 57/64/75/92 x residence at interviews: Urban/rural 57/64/75/92 77/92 57/64/75/92 x residence at interviews: SMSA 57/64/75/92 77/92 57/64/75/92 x month and year in which R began living in this place x residence while growing up 57 77/92 57 95 ( size only) x (at 16) 86 residence right after birth x # of moving 95 (childhood) # of moving since Jan '82 x recent moving: time 94 self-assessment of curr neighborhood (see SOCIAL RELATIONSHIP) 95 x
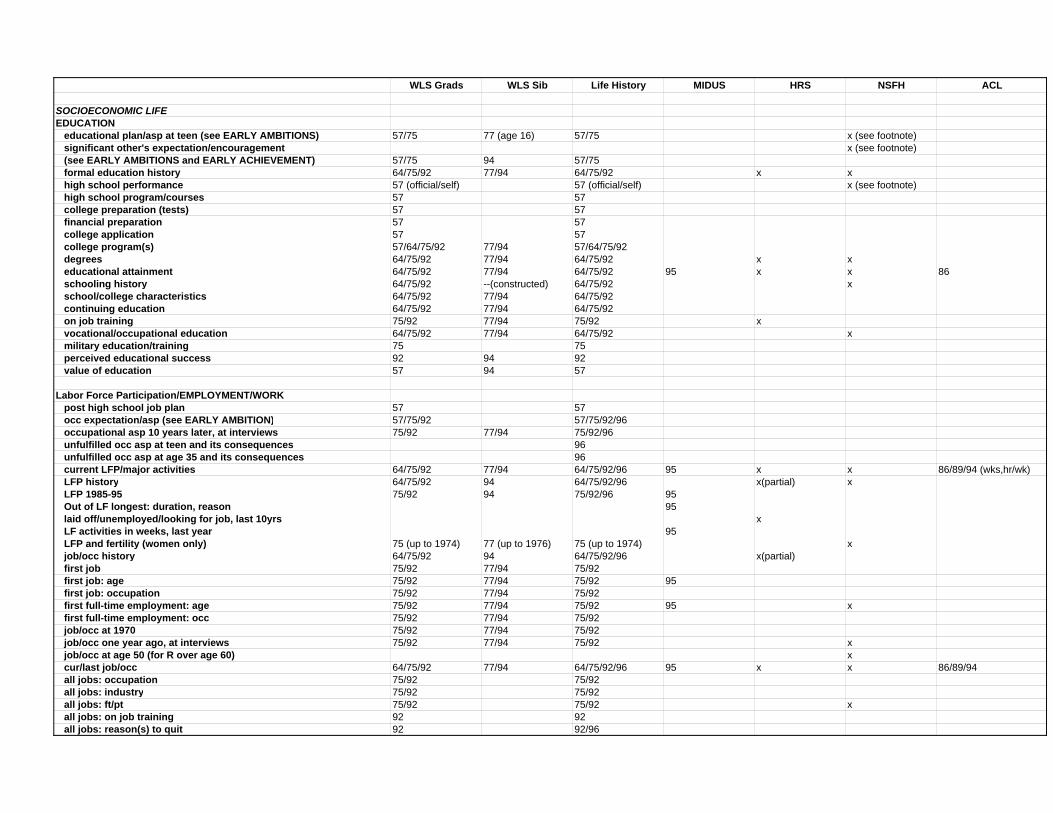
WLS Grads WLS Sib Life History MIDUS HRS NSFH ACL
SOCIOECONOMIC LIFEEDUCATION educational plan/asp at teen (see EARLY AMBITIONS) 57/75 77 (age 16) 57/75 x (see footnote) significant other's expectation/encouragement x (see footnote) (see EARLY AMBITIONS and EARLY ACHIEVEMENT) 57/75 94 57/75 formal education history 64/75/92 77/94 64/75/92 x x high school performance 57 (official/self) 57 (official/self) x (see footnote) high school program/courses 57 57 college preparation (tests) 57 57 financial preparation 57 57 college application 57 57 college program(s) 57/64/75/92 77/94 57/64/75/92 degrees 64/75/92 77/94 64/75/92 x x educational attainment 64/75/92 77/94 64/75/92 95 x x 86 schooling history 64/75/92 --(constructed) 64/75/92 x school/college characteristics 64/75/92 77/94 64/75/92 continuing education 64/75/92 77/94 64/75/92 on job training 75/92 77/94 75/92 x vocational/occupational education 64/75/92 77/94 64/75/92 x military education/training 75 75 perceived educational success 92 94 92 value of education 57 94 57
Labor Force Participation/EMPLOYMENT/WORK post high school job plan 57 57 occ expectation/asp (see EARLY AMBITION) 57/75/92 57/75/92/96 occupational asp 10 years later, at interviews 75/92 77/94 75/92/96 unfulfilled occ asp at teen and its consequences 96 unfulfilled occ asp at age 35 and its consequences 96 current LFP/major activities 64/75/92 77/94 64/75/92/96 95 x x 86/89/94 (wks,hr/wk) LFP history 64/75/92 94 64/75/92/96 x(partial) x LFP 1985-95 75/92 94 75/92/96 95 Out of LF longest: duration, reason 95 laid off/unemployed/looking for job, last 10yrs x LF activities in weeks, last year 95 LFP and fertility (women only) 75 (up to 1974) 77 (up to 1976) 75 (up to 1974) x job/occ history 64/75/92 94 64/75/92/96 x(partial) first job 75/92 77/94 75/92 first job: age 75/92 77/94 75/92 95 first job: occupation 75/92 77/94 75/92 first full-time employment: age 75/92 77/94 75/92 95 x first full-time employment: occ 75/92 77/94 75/92 job/occ at 1970 75/92 77/94 75/92 job/occ one year ago, at interviews 75/92 77/94 75/92 x job/occ at age 50 (for R over age 60) x cur/last job/occ 64/75/92 77/94 64/75/92/96 95 x x 86/89/94 all jobs: occupation 75/92 75/92 all jobs: industry 75/92 75/92 all jobs: ft/pt 75/92 75/92 x all jobs: on job training 92 92 all jobs: reason(s) to quit 92 92/96
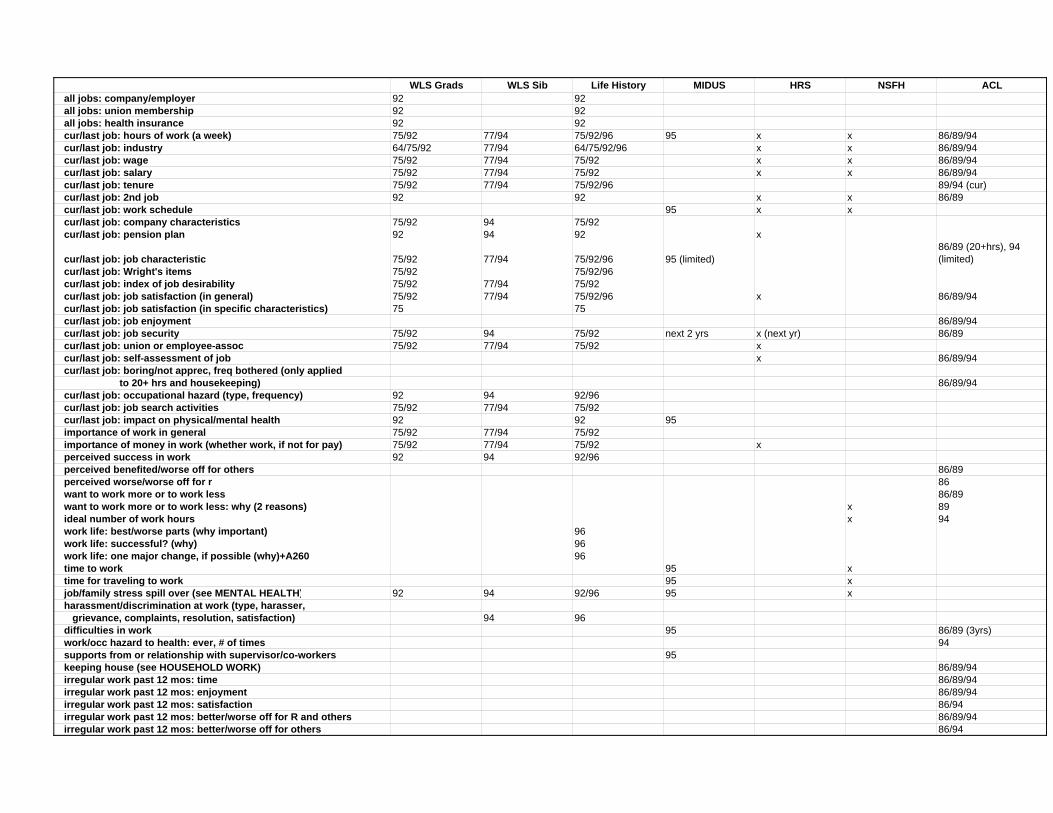
WLS Grads WLS Sib Life History MIDUS HRS NSFH ACL all jobs: company/employer 92 92 all jobs: union membership 92 92 all jobs: health insurance 92 92 cur/last job: hours of work (a week) 75/92 77/94 75/92/96 95 x x 86/89/94 cur/last job: industry 64/75/92 77/94 64/75/92/96 x x 86/89/94 cur/last job: wage 75/92 77/94 75/92 x x 86/89/94 cur/last job: salary 75/92 77/94 75/92 x x 86/89/94 cur/last job: tenure 75/92 77/94 75/92/96 89/94 (cur) cur/last job: 2nd job 92 92 x x 86/89 cur/last job: work schedule 95 x x cur/last job: company characteristics 75/92 94 75/92 cur/last job: pension plan 92 94 92 x
cur/last job: job characteristic 75/92 77/94 75/92/96 95 (limited)86/89 (20+hrs), 94 (limited)
cur/last job: Wright's items 75/92 75/92/96 cur/last job: index of job desirability 75/92 77/94 75/92 cur/last job: job satisfaction (in general) 75/92 77/94 75/92/96 x 86/89/94 cur/last job: job satisfaction (in specific characteristics) 75 75 cur/last job: job enjoyment 86/89/94 cur/last job: job security 75/92 94 75/92 next 2 yrs x (next yr) 86/89 cur/last job: union or employee-assoc 75/92 77/94 75/92 x cur/last job: self-assessment of job x 86/89/94 cur/last job: boring/not apprec, freq bothered (only applied to 20+ hrs and housekeeping) 86/89/94 cur/last job: occupational hazard (type, frequency) 92 94 92/96 cur/last job: job search activities 75/92 77/94 75/92 cur/last job: impact on physical/mental health 92 92 95 importance of work in general 75/92 77/94 75/92 importance of money in work (whether work, if not for pay) 75/92 77/94 75/92 x perceived success in work 92 94 92/96 perceived benefited/worse off for others 86/89 perceived worse/worse off for r 86 want to work more or to work less 86/89 want to work more or to work less: why (2 reasons) x 89 ideal number of work hours x 94 work life: best/worse parts (why important) 96 work life: successful? (why) 96 work life: one major change, if possible (why)+A260 96 time to work 95 x time for traveling to work 95 x job/family stress spill over (see MENTAL HEALTH) 92 94 92/96 95 x harassment/discrimination at work (type, harasser, grievance, complaints, resolution, satisfaction) 94 96 difficulties in work 95 86/89 (3yrs) work/occ hazard to health: ever, # of times 94 supports from or relationship with supervisor/co-workers 95 keeping house (see HOUSEHOLD WORK) 86/89/94 irregular work past 12 mos: time 86/89/94 irregular work past 12 mos: enjoyment 86/89/94 irregular work past 12 mos: satisfaction 86/94 irregular work past 12 mos: better/worse off for R and others 86/89/94 irregular work past 12 mos: better/worse off for others 86/94
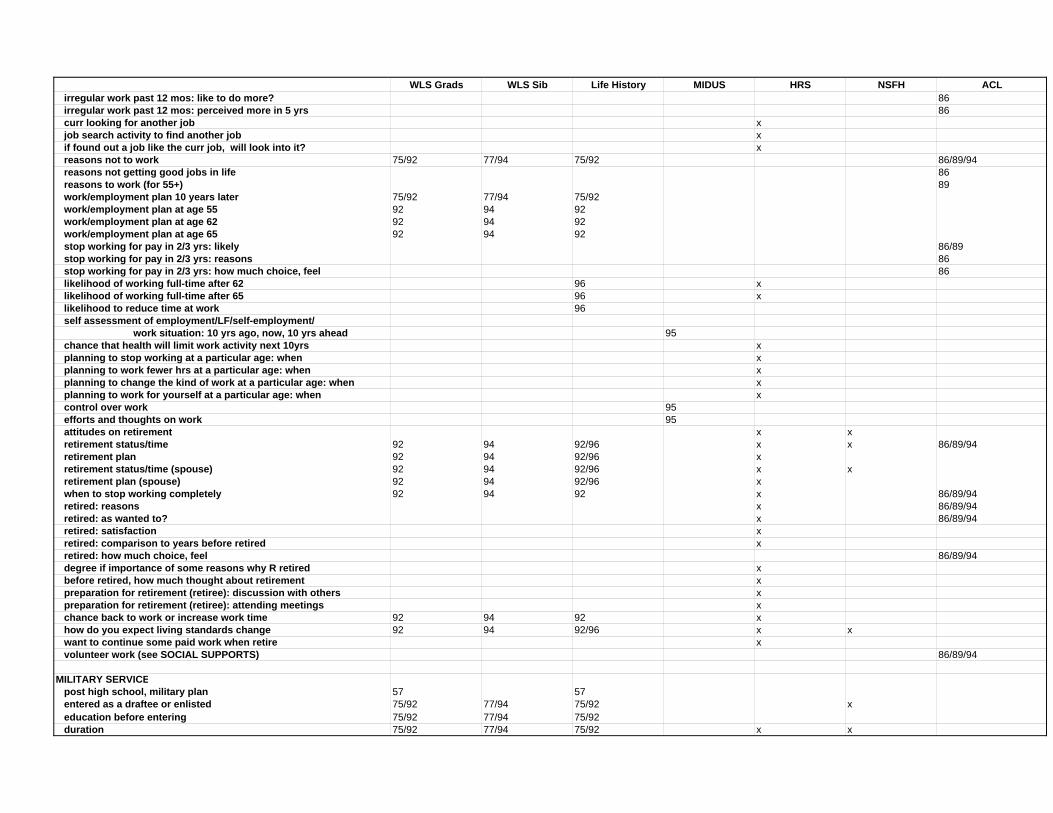
WLS Grads WLS Sib Life History MIDUS HRS NSFH ACL irregular work past 12 mos: like to do more? 86 irregular work past 12 mos: perceived more in 5 yrs 86 curr looking for another job x job search activity to find another job x if found out a job like the curr job, will look into it? x reasons not to work 75/92 77/94 75/92 86/89/94 reasons not getting good jobs in life 86 reasons to work (for 55+) 89 work/employment plan 10 years later 75/92 77/94 75/92 work/employment plan at age 55 92 94 92 work/employment plan at age 62 92 94 92 work/employment plan at age 65 92 94 92 stop working for pay in 2/3 yrs: likely 86/89 stop working for pay in 2/3 yrs: reasons 86 stop working for pay in 2/3 yrs: how much choice, feel 86 likelihood of working full-time after 62 96 x likelihood of working full-time after 65 96 x likelihood to reduce time at work 96 self assessment of employment/LF/self-employment/ work situation: 10 yrs ago, now, 10 yrs ahead 95 chance that health will limit work activity next 10yrs x planning to stop working at a particular age: when x planning to work fewer hrs at a particular age: when x planning to change the kind of work at a particular age: when x planning to work for yourself at a particular age: when x control over work 95 efforts and thoughts on work 95 attitudes on retirement x x retirement status/time 92 94 92/96 x x 86/89/94 retirement plan 92 94 92/96 x retirement status/time (spouse) 92 94 92/96 x x retirement plan (spouse) 92 94 92/96 x when to stop working completely 92 94 92 x 86/89/94 retired: reasons x 86/89/94 retired: as wanted to? x 86/89/94 retired: satisfaction x retired: comparison to years before retired x retired: how much choice, feel 86/89/94 degree if importance of some reasons why R retired x before retired, how much thought about retirement x preparation for retirement (retiree): discussion with others x preparation for retirement (retiree): attending meetings x chance back to work or increase work time 92 94 92 x how do you expect living standards change 92 94 92/96 x x want to continue some paid work when retire x volunteer work (see SOCIAL SUPPORTS) 86/89/94
MILITARY SERVICE post high school, military plan 57 57 entered as a draftee or enlisted 75/92 77/94 75/92 x education before entering 75/92 77/94 75/92 duration 75/92 77/94 75/92 x x
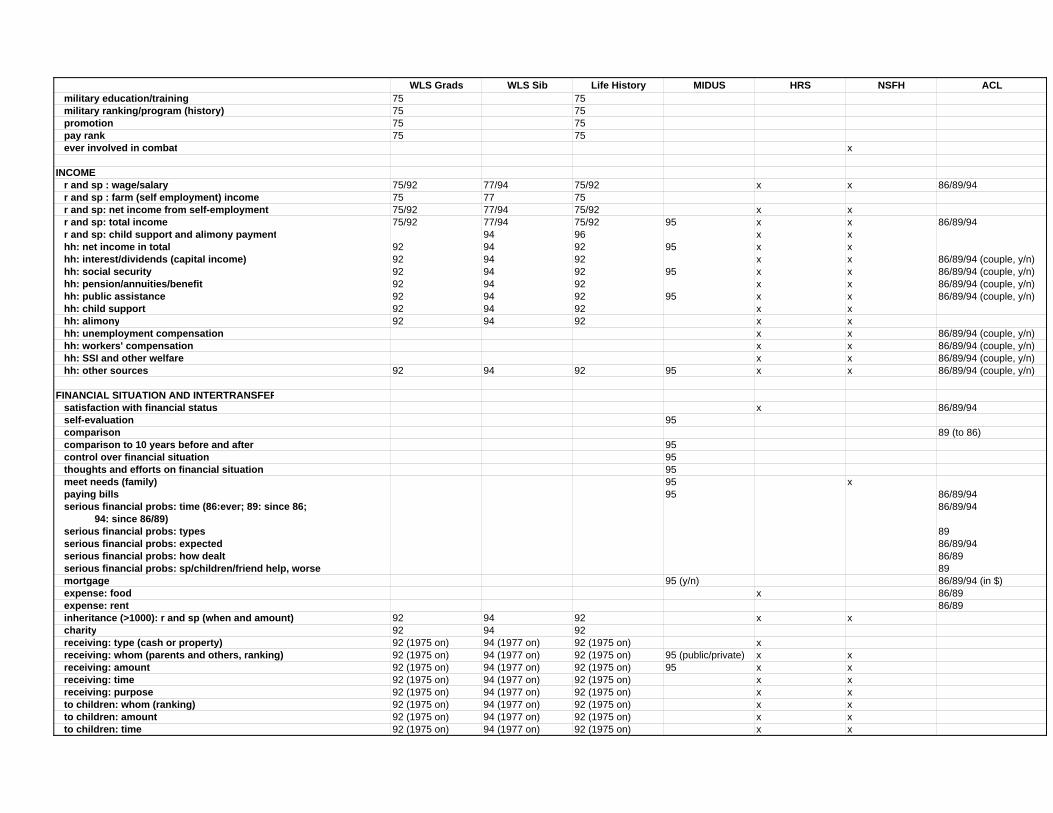
WLS Grads WLS Sib Life History MIDUS HRS NSFH ACL military education/training 75 75 military ranking/program (history) 75 75 promotion 75 75 pay rank 75 75 ever involved in combat x
INCOME r and sp : wage/salary 75/92 77/94 75/92 x x 86/89/94 r and sp : farm (self employment) income 75 77 75 r and sp: net income from self-employment 75/92 77/94 75/92 x x r and sp: total income 75/92 77/94 75/92 95 x x 86/89/94 r and sp: child support and alimony payment 94 96 x x hh: net income in total 92 94 92 95 x x hh: interest/dividends (capital income) 92 94 92 x x 86/89/94 (couple, y/n) hh: social security 92 94 92 95 x x 86/89/94 (couple, y/n) hh: pension/annuities/benefit 92 94 92 x x 86/89/94 (couple, y/n) hh: public assistance 92 94 92 95 x x 86/89/94 (couple, y/n) hh: child support 92 94 92 x x hh: alimony 92 94 92 x x hh: unemployment compensation x x 86/89/94 (couple, y/n) hh: workers' compensation x x 86/89/94 (couple, y/n) hh: SSI and other welfare x x 86/89/94 (couple, y/n) hh: other sources 92 94 92 95 x x 86/89/94 (couple, y/n)
FINANCIAL SITUATION AND INTERTRANSFER satisfaction with financial status x 86/89/94 self-evaluation 95 comparison 89 (to 86) comparison to 10 years before and after 95 control over financial situation 95 thoughts and efforts on financial situation 95 meet needs (family) 95 x paying bills 95 86/89/94 serious financial probs: time (86:ever; 89: since 86; 86/89/94 94: since 86/89) serious financial probs: types 89 serious financial probs: expected 86/89/94 serious financial probs: how dealt 86/89 serious financial probs: sp/children/friend help, worse 89 mortgage 95 (y/n) 86/89/94 (in $) expense: food x 86/89 expense: rent 86/89 inheritance (>1000): r and sp (when and amount) 92 94 92 x x charity 92 94 92 receiving: type (cash or property) 92 (1975 on) 94 (1977 on) 92 (1975 on) x receiving: whom (parents and others, ranking) 92 (1975 on) 94 (1977 on) 92 (1975 on) 95 (public/private) x x receiving: amount 92 (1975 on) 94 (1977 on) 92 (1975 on) 95 x x receiving: time 92 (1975 on) 94 (1977 on) 92 (1975 on) x x receiving: purpose 92 (1975 on) 94 (1977 on) 92 (1975 on) x x to children: whom (ranking) 92 (1975 on) 94 (1977 on) 92 (1975 on) x x to children: amount 92 (1975 on) 94 (1977 on) 92 (1975 on) x x to children: time 92 (1975 on) 94 (1977 on) 92 (1975 on) x x
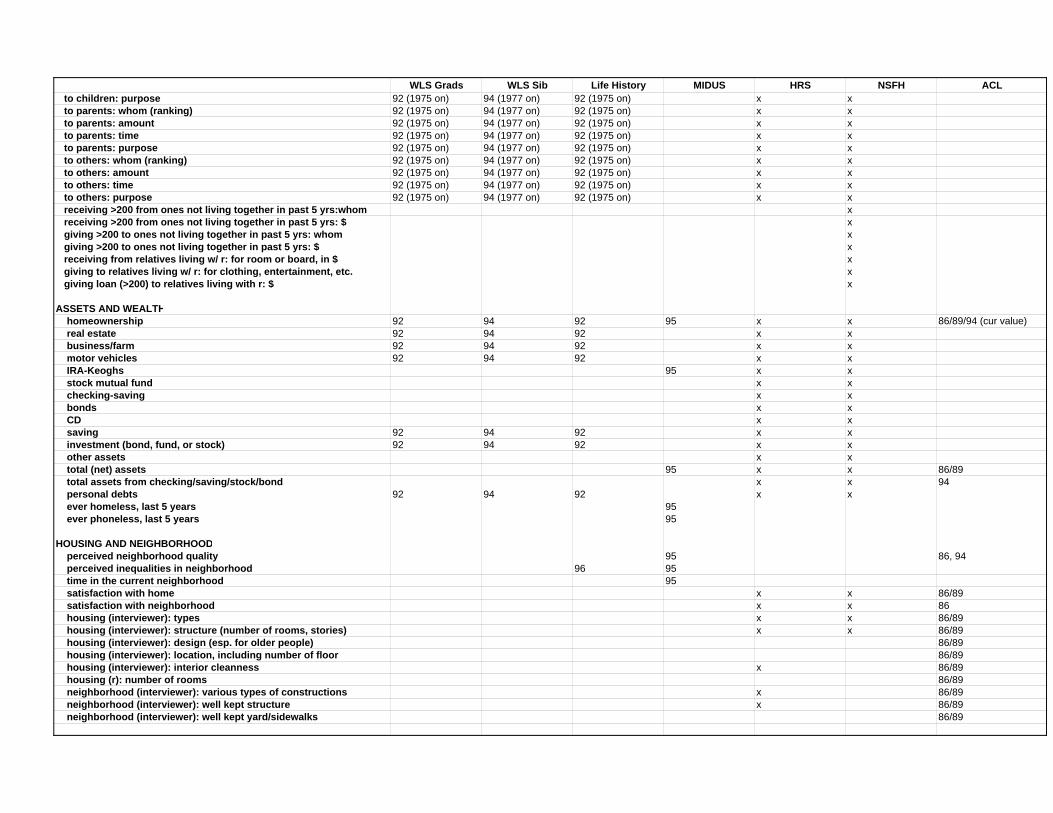
WLS Grads WLS Sib Life History MIDUS HRS NSFH ACL to children: purpose 92 (1975 on) 94 (1977 on) 92 (1975 on) x x to parents: whom (ranking) 92 (1975 on) 94 (1977 on) 92 (1975 on) x x to parents: amount 92 (1975 on) 94 (1977 on) 92 (1975 on) x x to parents: time 92 (1975 on) 94 (1977 on) 92 (1975 on) x x to parents: purpose 92 (1975 on) 94 (1977 on) 92 (1975 on) x x to others: whom (ranking) 92 (1975 on) 94 (1977 on) 92 (1975 on) x x to others: amount 92 (1975 on) 94 (1977 on) 92 (1975 on) x x to others: time 92 (1975 on) 94 (1977 on) 92 (1975 on) x x to others: purpose 92 (1975 on) 94 (1977 on) 92 (1975 on) x x receiving >200 from ones not living together in past 5 yrs:whom x receiving >200 from ones not living together in past 5 yrs: $ x giving >200 to ones not living together in past 5 yrs: whom x giving >200 to ones not living together in past 5 yrs: $ x receiving from relatives living w/ r: for room or board, in $ x giving to relatives living w/ r: for clothing, entertainment, etc. x giving loan (>200) to relatives living with r: $ x
ASSETS AND WEALTH homeownership 92 94 92 95 x x 86/89/94 (cur value) real estate 92 94 92 x x business/farm 92 94 92 x x motor vehicles 92 94 92 x x IRA-Keoghs 95 x x stock mutual fund x x checking-saving x x bonds x x CD x x saving 92 94 92 x x investment (bond, fund, or stock) 92 94 92 x x other assets x x total (net) assets 95 x x 86/89 total assets from checking/saving/stock/bond x x 94 personal debts 92 94 92 x x ever homeless, last 5 years 95 ever phoneless, last 5 years 95
HOUSING AND NEIGHBORHOOD perceived neighborhood quality 95 86, 94 perceived inequalities in neighborhood 96 95 time in the current neighborhood 95 satisfaction with home x x 86/89 satisfaction with neighborhood x x 86 housing (interviewer): types x x 86/89 housing (interviewer): structure (number of rooms, stories) x x 86/89 housing (interviewer): design (esp. for older people) 86/89 housing (interviewer): location, including number of floor 86/89 housing (interviewer): interior cleanness x 86/89 housing (r): number of rooms 86/89 neighborhood (interviewer): various types of constructions x 86/89 neighborhood (interviewer): well kept structure x 86/89 neighborhood (interviewer): well kept yard/sidewalks 86/89
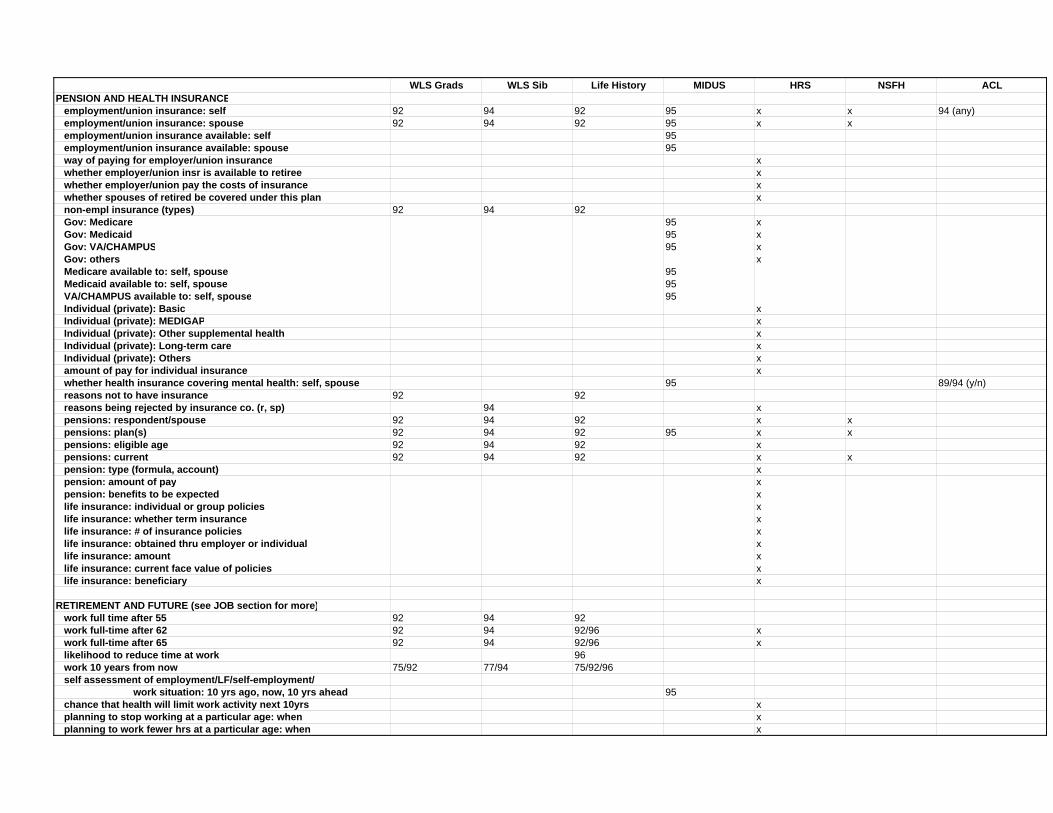
WLS Grads WLS Sib Life History MIDUS HRS NSFH ACLPENSION AND HEALTH INSURANCE employment/union insurance: self 92 94 92 95 x x 94 (any) employment/union insurance: spouse 92 94 92 95 x x employment/union insurance available: self 95 employment/union insurance available: spouse 95 way of paying for employer/union insurance x whether employer/union insr is available to retiree x whether employer/union pay the costs of insurance x whether spouses of retired be covered under this plan x non-empl insurance (types) 92 94 92 Gov: Medicare 95 x Gov: Medicaid 95 x Gov: VA/CHAMPUS 95 x Gov: others x Medicare available to: self, spouse 95 Medicaid available to: self, spouse 95 VA/CHAMPUS available to: self, spouse 95 Individual (private): Basic x Individual (private): MEDIGAP x Individual (private): Other supplemental health x Individual (private): Long-term care x Individual (private): Others x amount of pay for individual insurance x whether health insurance covering mental health: self, spouse 95 89/94 (y/n) reasons not to have insurance 92 92 reasons being rejected by insurance co. (r, sp) 94 x pensions: respondent/spouse 92 94 92 x x pensions: plan(s) 92 94 92 95 x x pensions: eligible age 92 94 92 x pensions: current 92 94 92 x x pension: type (formula, account) x pension: amount of pay x pension: benefits to be expected x life insurance: individual or group policies x life insurance: whether term insurance x life insurance: # of insurance policies x life insurance: obtained thru employer or individual x life insurance: amount x life insurance: current face value of policies x life insurance: beneficiary x
RETIREMENT AND FUTURE (see JOB section for more) work full time after 55 92 94 92 work full-time after 62 92 94 92/96 x work full-time after 65 92 94 92/96 x likelihood to reduce time at work 96 work 10 years from now 75/92 77/94 75/92/96 self assessment of employment/LF/self-employment/ work situation: 10 yrs ago, now, 10 yrs ahead 95 chance that health will limit work activity next 10yrs x planning to stop working at a particular age: when x planning to work fewer hrs at a particular age: when x
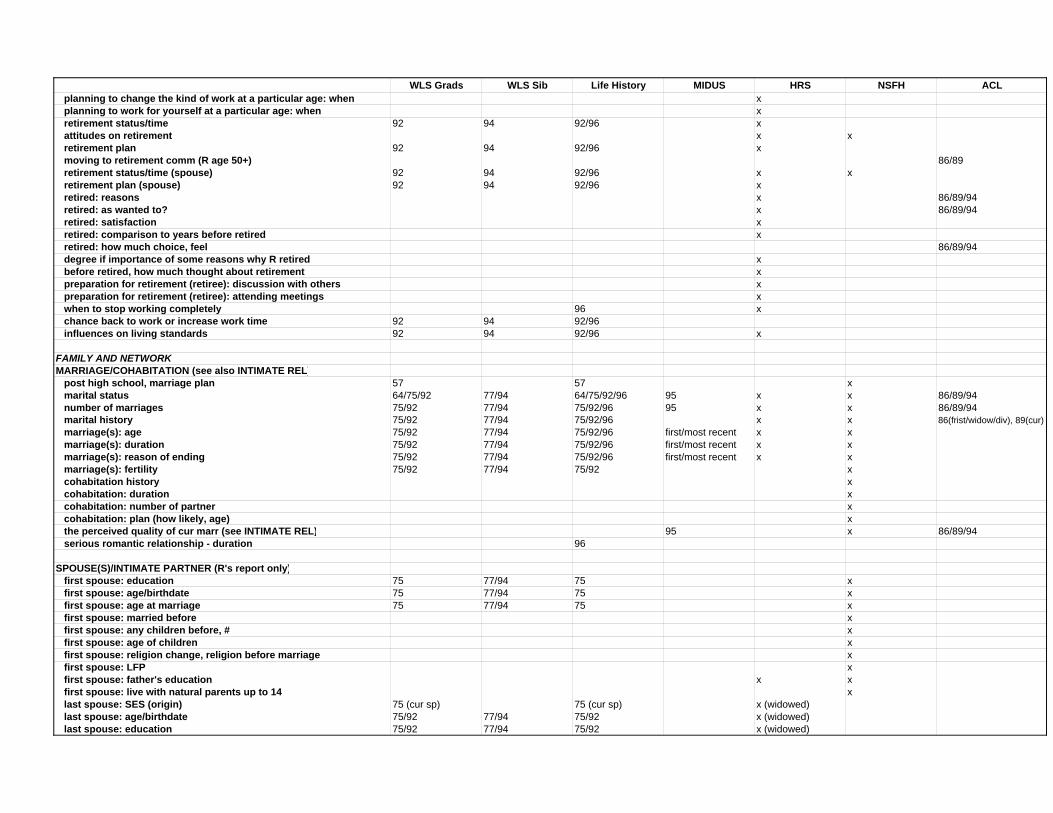
WLS Grads WLS Sib Life History MIDUS HRS NSFH ACL planning to change the kind of work at a particular age: when x planning to work for yourself at a particular age: when x retirement status/time 92 94 92/96 x attitudes on retirement x x retirement plan 92 94 92/96 x moving to retirement comm (R age 50+) 86/89 retirement status/time (spouse) 92 94 92/96 x x retirement plan (spouse) 92 94 92/96 x retired: reasons x 86/89/94 retired: as wanted to? x 86/89/94 retired: satisfaction x retired: comparison to years before retired x retired: how much choice, feel 86/89/94 degree if importance of some reasons why R retired x before retired, how much thought about retirement x preparation for retirement (retiree): discussion with others x preparation for retirement (retiree): attending meetings x when to stop working completely 96 x chance back to work or increase work time 92 94 92/96 influences on living standards 92 94 92/96 x
FAMILY AND NETWORKMARRIAGE/COHABITATION (see also INTIMATE REL) post high school, marriage plan 57 57 x marital status 64/75/92 77/94 64/75/92/96 95 x x 86/89/94 number of marriages 75/92 77/94 75/92/96 95 x x 86/89/94 marital history 75/92 77/94 75/92/96 x x 86(frist/widow/div), 89(cur) marriage(s): age 75/92 77/94 75/92/96 first/most recent x x marriage(s): duration 75/92 77/94 75/92/96 first/most recent x x marriage(s): reason of ending 75/92 77/94 75/92/96 first/most recent x x marriage(s): fertility 75/92 77/94 75/92 x cohabitation history x cohabitation: duration x cohabitation: number of partner x cohabitation: plan (how likely, age) x the perceived quality of cur marr (see INTIMATE REL) 95 x 86/89/94 serious romantic relationship - duration 96
SPOUSE(S)/INTIMATE PARTNER (R's report only) first spouse: education 75 77/94 75 x first spouse: age/birthdate 75 77/94 75 x first spouse: age at marriage 75 77/94 75 x first spouse: married before x first spouse: any children before, # x first spouse: age of children x first spouse: religion change, religion before marriage x first spouse: LFP x first spouse: father's education x x first spouse: live with natural parents up to 14 x last spouse: SES (origin) 75 (cur sp) 75 (cur sp) x (widowed) last spouse: age/birthdate 75/92 77/94 75/92 x (widowed) last spouse: education 75/92 77/94 75/92 x (widowed)
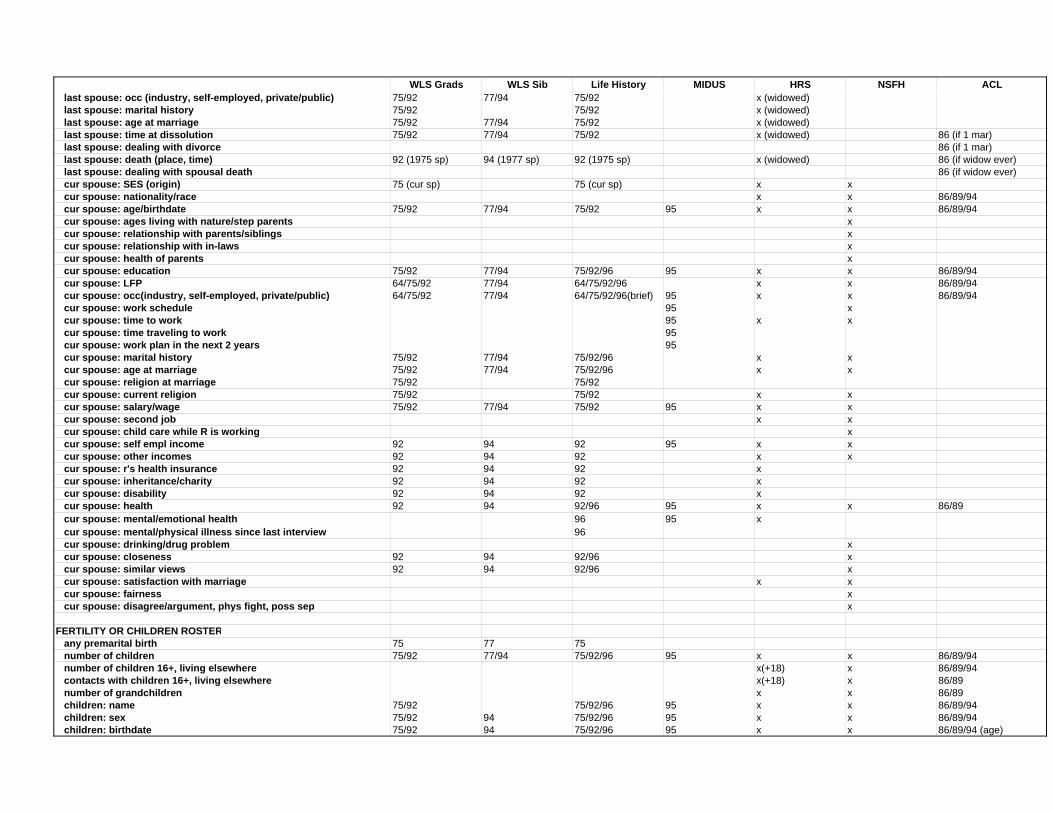
WLS Grads WLS Sib Life History MIDUS HRS NSFH ACL last spouse: occ (industry, self-employed, private/public) 75/92 77/94 75/92 x (widowed) last spouse: marital history 75/92 75/92 x (widowed) last spouse: age at marriage 75/92 77/94 75/92 x (widowed) last spouse: time at dissolution 75/92 77/94 75/92 x (widowed) 86 (if 1 mar) last spouse: dealing with divorce 86 (if 1 mar) last spouse: death (place, time) 92 (1975 sp) 94 (1977 sp) 92 (1975 sp) x (widowed) 86 (if widow ever) last spouse: dealing with spousal death 86 (if widow ever) cur spouse: SES (origin) 75 (cur sp) 75 (cur sp) x x cur spouse: nationality/race x x 86/89/94 cur spouse: age/birthdate 75/92 77/94 75/92 95 x x 86/89/94 cur spouse: ages living with nature/step parents x cur spouse: relationship with parents/siblings x cur spouse: relationship with in-laws x cur spouse: health of parents x cur spouse: education 75/92 77/94 75/92/96 95 x x 86/89/94 cur spouse: LFP 64/75/92 77/94 64/75/92/96 x x 86/89/94 cur spouse: occ(industry, self-employed, private/public) 64/75/92 77/94 64/75/92/96(brief) 95 x x 86/89/94 cur spouse: work schedule 95 x cur spouse: time to work 95 x x cur spouse: time traveling to work 95 cur spouse: work plan in the next 2 years 95 cur spouse: marital history 75/92 77/94 75/92/96 x x cur spouse: age at marriage 75/92 77/94 75/92/96 x x cur spouse: religion at marriage 75/92 75/92 cur spouse: current religion 75/92 75/92 x x cur spouse: salary/wage 75/92 77/94 75/92 95 x x cur spouse: second job x x cur spouse: child care while R is working x cur spouse: self empl income 92 94 92 95 x x cur spouse: other incomes 92 94 92 x x cur spouse: r's health insurance 92 94 92 x cur spouse: inheritance/charity 92 94 92 x cur spouse: disability 92 94 92 x cur spouse: health 92 94 92/96 95 x x 86/89 cur spouse: mental/emotional health 96 95 x cur spouse: mental/physical illness since last interview 96 cur spouse: drinking/drug problem x cur spouse: closeness 92 94 92/96 x cur spouse: similar views 92 94 92/96 x cur spouse: satisfaction with marriage x x cur spouse: fairness x cur spouse: disagree/argument, phys fight, poss sep x
FERTILITY OR CHILDREN ROSTER any premarital birth 75 77 75 number of children 75/92 77/94 75/92/96 95 x x 86/89/94 number of children 16+, living elsewhere x(+18) x 86/89/94 contacts with children 16+, living elsewhere x(+18) x 86/89 number of grandchildren x x 86/89 children: name 75/92 75/92/96 95 x x 86/89/94 children: sex 75/92 94 75/92/96 95 x x 86/89/94 children: birthdate 75/92 94 75/92/96 95 x x 86/89/94 (age)
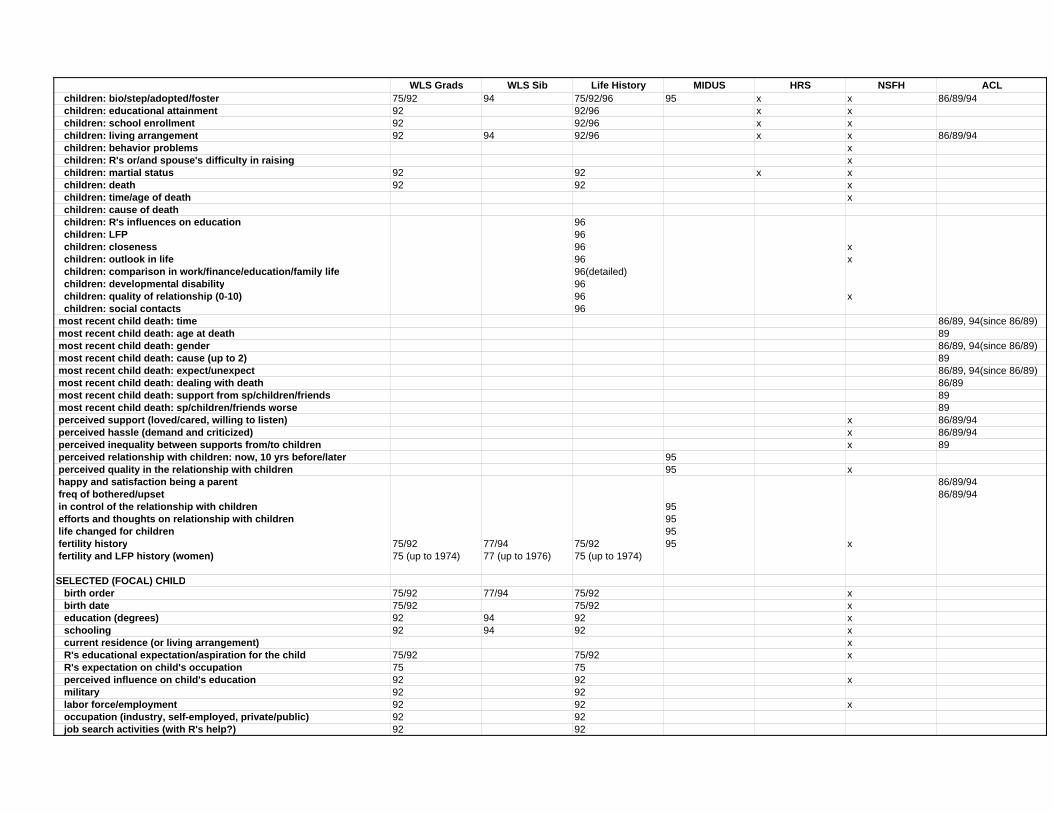
WLS Grads WLS Sib Life History MIDUS HRS NSFH ACL children: bio/step/adopted/foster 75/92 94 75/92/96 95 x x 86/89/94 children: educational attainment 92 92/96 x x children: school enrollment 92 92/96 x x children: living arrangement 92 94 92/96 x x 86/89/94 children: behavior problems x children: R's or/and spouse's difficulty in raising x children: martial status 92 92 x x children: death 92 92 x children: time/age of death x children: cause of death children: R's influences on education 96 children: LFP 96 children: closeness 96 x children: outlook in life 96 x children: comparison in work/finance/education/family life 96(detailed) children: developmental disability 96 children: quality of relationship (0-10) 96 x children: social contacts 96 most recent child death: time 86/89, 94(since 86/89) most recent child death: age at death 89 most recent child death: gender 86/89, 94(since 86/89) most recent child death: cause (up to 2) 89 most recent child death: expect/unexpect 86/89, 94(since 86/89) most recent child death: dealing with death 86/89 most recent child death: support from sp/children/friends 89 most recent child death: sp/children/friends worse 89 perceived support (loved/cared, willing to listen) x 86/89/94 perceived hassle (demand and criticized) x 86/89/94 perceived inequality between supports from/to children x 89 perceived relationship with children: now, 10 yrs before/later 95 perceived quality in the relationship with children 95 x happy and satisfaction being a parent 86/89/94 freq of bothered/upset 86/89/94 in control of the relationship with children 95 efforts and thoughts on relationship with children 95 life changed for children 95 fertility history 75/92 77/94 75/92 95 x fertility and LFP history (women) 75 (up to 1974) 77 (up to 1976) 75 (up to 1974) SELECTED (FOCAL) CHILD birth order 75/92 77/94 75/92 x birth date 75/92 75/92 x education (degrees) 92 94 92 x schooling 92 94 92 x current residence (or living arrangement) x R's educational expectation/aspiration for the child 75/92 75/92 x R's expectation on child's occupation 75 75 perceived influence on child's education 92 92 x military 92 92 labor force/employment 92 92 x occupation (industry, self-employed, private/public) 92 92 job search activities (with R's help?) 92 92
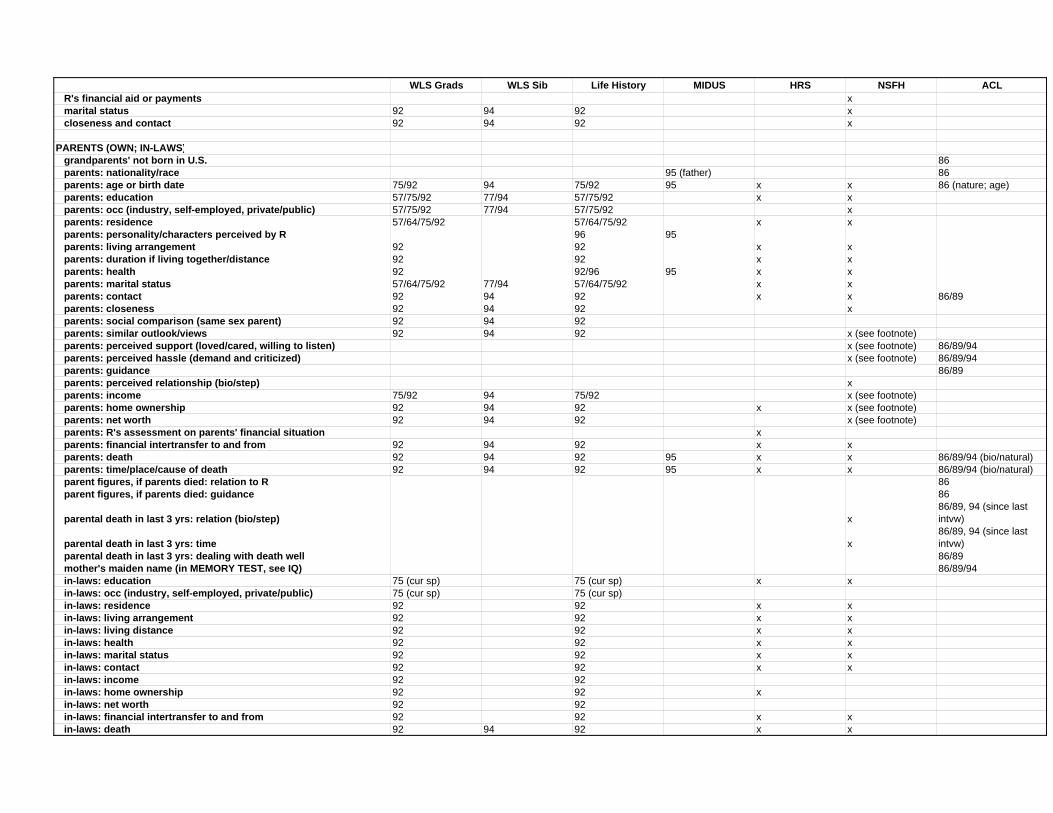
WLS Grads WLS Sib Life History MIDUS HRS NSFH ACL R's financial aid or payments x marital status 92 94 92 x closeness and contact 92 94 92 x
PARENTS (OWN; IN-LAWS) grandparents' not born in U.S. 86 parents: nationality/race 95 (father) 86 parents: age or birth date 75/92 94 75/92 95 x x 86 (nature; age) parents: education 57/75/92 77/94 57/75/92 x x parents: occ (industry, self-employed, private/public) 57/75/92 77/94 57/75/92 x parents: residence 57/64/75/92 57/64/75/92 x x parents: personality/characters perceived by R 96 95 parents: living arrangement 92 92 x x parents: duration if living together/distance 92 92 x x parents: health 92 92/96 95 x x parents: marital status 57/64/75/92 77/94 57/64/75/92 x x parents: contact 92 94 92 x x 86/89 parents: closeness 92 94 92 x parents: social comparison (same sex parent) 92 94 92 parents: similar outlook/views 92 94 92 x (see footnote) parents: perceived support (loved/cared, willing to listen) x (see footnote) 86/89/94 parents: perceived hassle (demand and criticized) x (see footnote) 86/89/94 parents: guidance 86/89 parents: perceived relationship (bio/step) x parents: income 75/92 94 75/92 x (see footnote) parents: home ownership 92 94 92 x x (see footnote) parents: net worth 92 94 92 x (see footnote) parents: R's assessment on parents' financial situation x parents: financial intertransfer to and from 92 94 92 x x parents: death 92 94 92 95 x x 86/89/94 (bio/natural) parents: time/place/cause of death 92 94 92 95 x x 86/89/94 (bio/natural) parent figures, if parents died: relation to R 86 parent figures, if parents died: guidance 86
parental death in last 3 yrs: relation (bio/step) x86/89, 94 (since last intvw)
parental death in last 3 yrs: time x86/89, 94 (since last intvw)
parental death in last 3 yrs: dealing with death well 86/89 mother's maiden name (in MEMORY TEST, see IQ) 86/89/94 in-laws: education 75 (cur sp) 75 (cur sp) x x in-laws: occ (industry, self-employed, private/public) 75 (cur sp) 75 (cur sp) in-laws: residence 92 92 x x in-laws: living arrangement 92 92 x x in-laws: living distance 92 92 x x in-laws: health 92 92 x x in-laws: marital status 92 92 x x in-laws: contact 92 92 x x in-laws: income 92 92 in-laws: home ownership 92 92 x in-laws: net worth 92 92 in-laws: financial intertransfer to and from 92 92 x x in-laws: death 92 94 92 x x
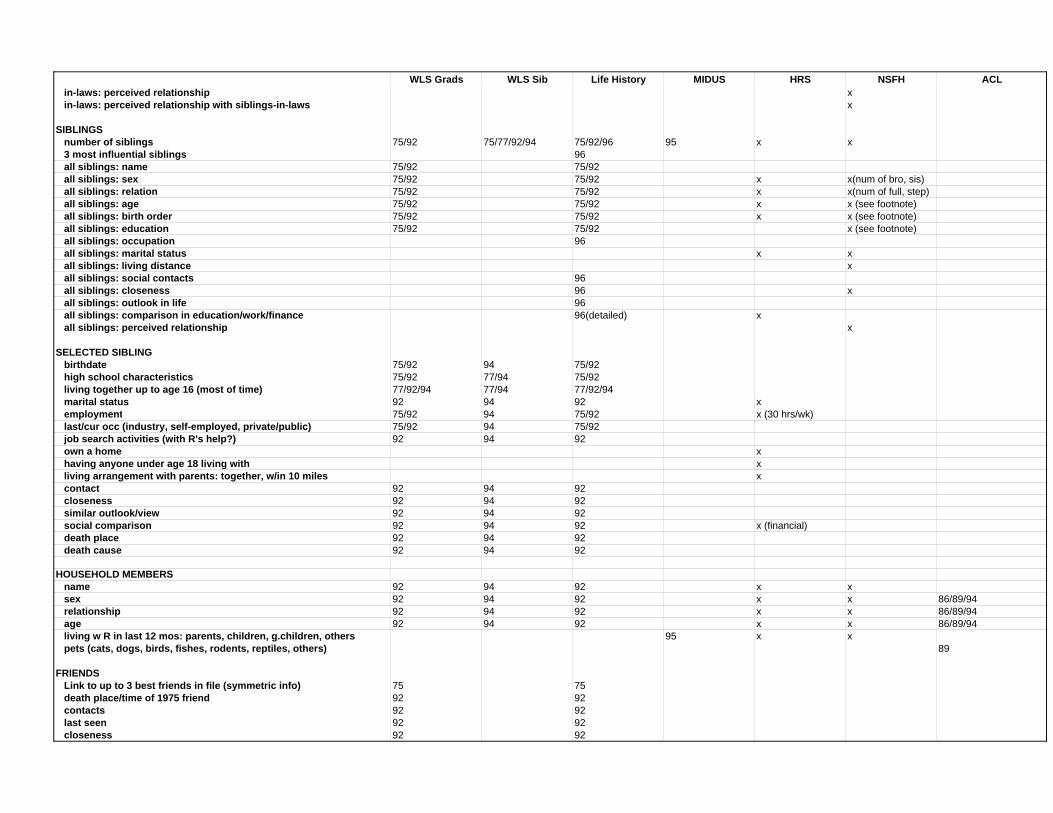
WLS Grads WLS Sib Life History MIDUS HRS NSFH ACL in-laws: perceived relationship x in-laws: perceived relationship with siblings-in-laws x SIBLINGS number of siblings 75/92 75/77/92/94 75/92/96 95 x x 3 most influential siblings 96 all siblings: name 75/92 75/92 all siblings: sex 75/92 75/92 x x(num of bro, sis) all siblings: relation 75/92 75/92 x x(num of full, step) all siblings: age 75/92 75/92 x x (see footnote) all siblings: birth order 75/92 75/92 x x (see footnote) all siblings: education 75/92 75/92 x (see footnote) all siblings: occupation 96 all siblings: marital status x x all siblings: living distance x all siblings: social contacts 96 all siblings: closeness 96 x all siblings: outlook in life 96 all siblings: comparison in education/work/finance 96(detailed) x all siblings: perceived relationship x
SELECTED SIBLING birthdate 75/92 94 75/92 high school characteristics 75/92 77/94 75/92 living together up to age 16 (most of time) 77/92/94 77/94 77/92/94 marital status 92 94 92 x employment 75/92 94 75/92 x (30 hrs/wk) last/cur occ (industry, self-employed, private/public) 75/92 94 75/92 job search activities (with R's help?) 92 94 92 own a home x having anyone under age 18 living with x living arrangement with parents: together, w/in 10 miles x contact 92 94 92 closeness 92 94 92 similar outlook/view 92 94 92 social comparison 92 94 92 x (financial) death place 92 94 92 death cause 92 94 92
HOUSEHOLD MEMBERS name 92 94 92 x x sex 92 94 92 x x 86/89/94 relationship 92 94 92 x x 86/89/94 age 92 94 92 x x 86/89/94 living w R in last 12 mos: parents, children, g.children, others 95 x x pets (cats, dogs, birds, fishes, rodents, reptiles, others) 89
FRIENDS Link to up to 3 best friends in file (symmetric info) 75 75 death place/time of 1975 friend 92 92 contacts 92 92 last seen 92 92 closeness 92 92
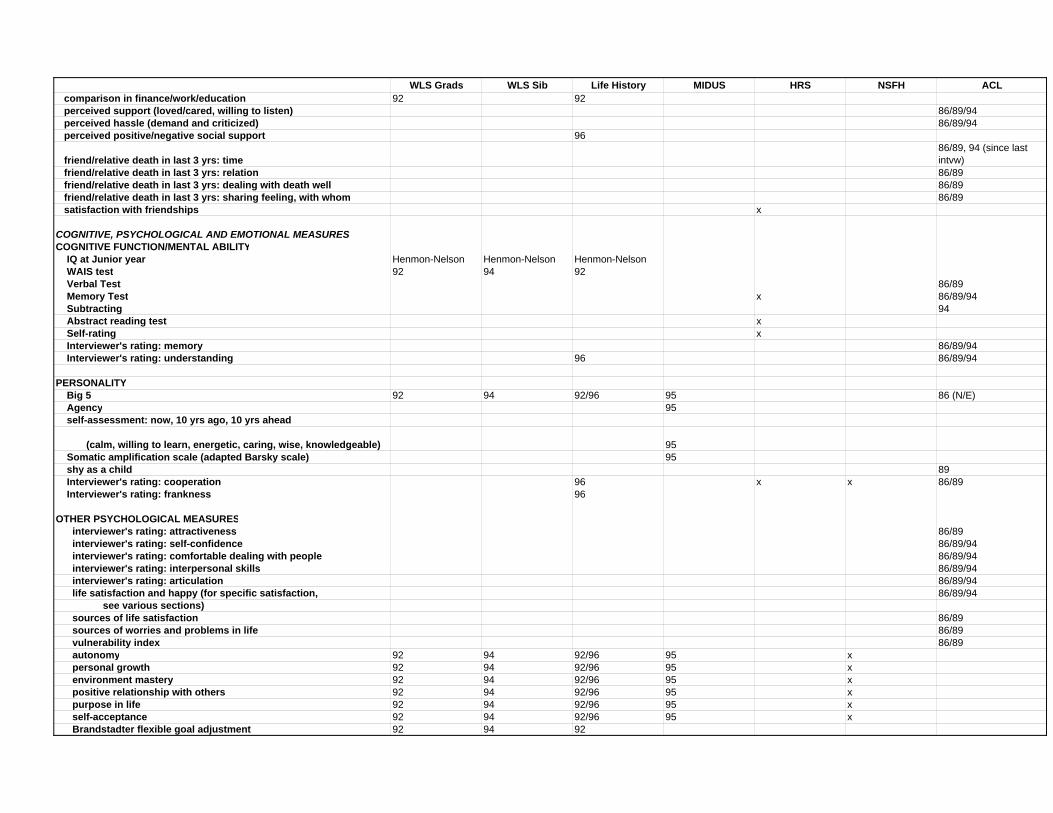
WLS Grads WLS Sib Life History MIDUS HRS NSFH ACL comparison in finance/work/education 92 92 perceived support (loved/cared, willing to listen) 86/89/94 perceived hassle (demand and criticized) 86/89/94 perceived positive/negative social support 96
friend/relative death in last 3 yrs: time86/89, 94 (since last intvw)
friend/relative death in last 3 yrs: relation 86/89 friend/relative death in last 3 yrs: dealing with death well 86/89 friend/relative death in last 3 yrs: sharing feeling, with whom 86/89 satisfaction with friendships x
COGNITIVE, PSYCHOLOGICAL AND EMOTIONAL MEASURESCOGNITIVE FUNCTION/MENTAL ABILITY IQ at Junior year Henmon-Nelson Henmon-Nelson Henmon-Nelson WAIS test 92 94 92 Verbal Test 86/89 Memory Test x 86/89/94 Subtracting 94 Abstract reading test x Self-rating x Interviewer's rating: memory 86/89/94 Interviewer's rating: understanding 96 86/89/94
PERSONALITY Big 5 92 94 92/96 95 86 (N/E) Agency 95 self-assessment: now, 10 yrs ago, 10 yrs ahead
(calm, willing to learn, energetic, caring, wise, knowledgeable) 95 Somatic amplification scale (adapted Barsky scale) 95 shy as a child 89 Interviewer's rating: cooperation 96 x x 86/89 Interviewer's rating: frankness 96
OTHER PSYCHOLOGICAL MEASURES interviewer's rating: attractiveness 86/89 interviewer's rating: self-confidence 86/89/94 interviewer's rating: comfortable dealing with people 86/89/94 interviewer's rating: interpersonal skills 86/89/94 interviewer's rating: articulation 86/89/94 life satisfaction and happy (for specific satisfaction, 86/89/94 see various sections) sources of life satisfaction 86/89 sources of worries and problems in life 86/89 vulnerability index 86/89 autonomy 92 94 92/96 95 x personal growth 92 94 92/96 95 x environment mastery 92 94 92/96 95 x positive relationship with others 92 94 92/96 95 x purpose in life 92 94 92/96 95 x self-acceptance 92 94 92/96 95 x Brandstadter flexible goal adjustment 92 94 92
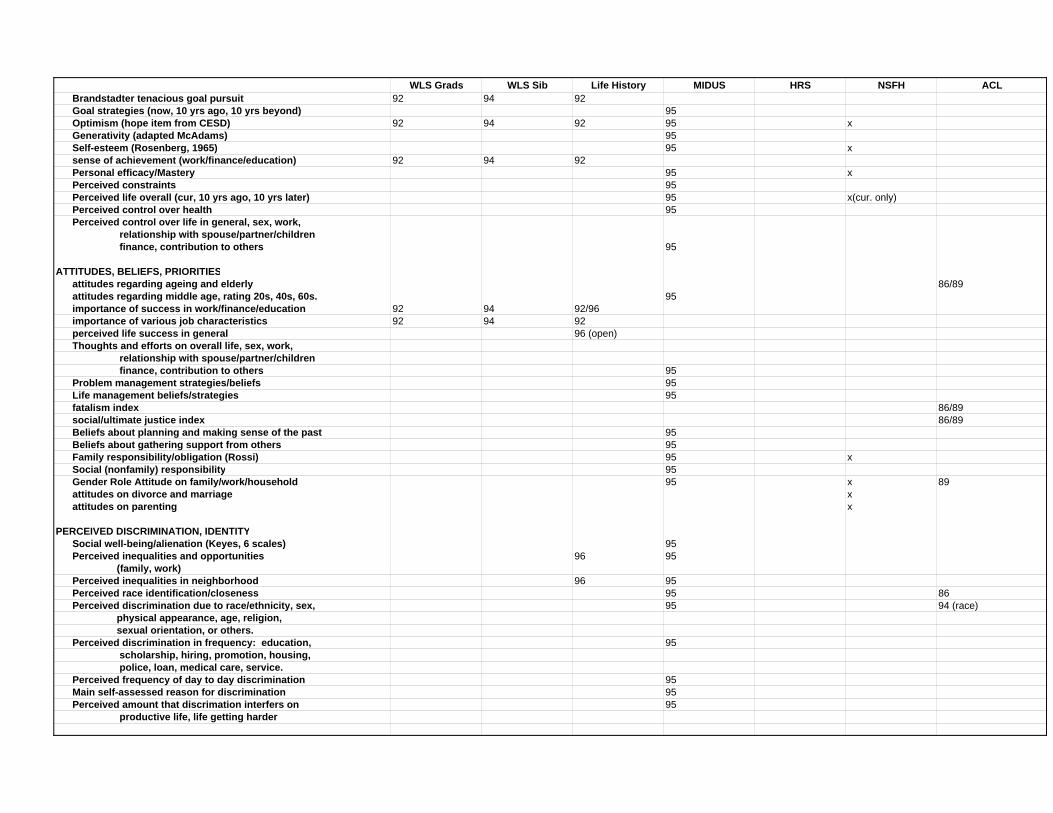
WLS Grads WLS Sib Life History MIDUS HRS NSFH ACL Brandstadter tenacious goal pursuit 92 94 92 Goal strategies (now, 10 yrs ago, 10 yrs beyond) 95 Optimism (hope item from CESD) 92 94 92 95 x Generativity (adapted McAdams) 95 Self-esteem (Rosenberg, 1965) 95 x sense of achievement (work/finance/education) 92 94 92 Personal efficacy/Mastery 95 x Perceived constraints 95 Perceived life overall (cur, 10 yrs ago, 10 yrs later) 95 x(cur. only) Perceived control over health 95 Perceived control over life in general, sex, work, relationship with spouse/partner/children finance, contribution to others 95
ATTITUDES, BELIEFS, PRIORITIES attitudes regarding ageing and elderly 86/89 attitudes regarding middle age, rating 20s, 40s, 60s. 95 importance of success in work/finance/education 92 94 92/96 importance of various job characteristics 92 94 92 perceived life success in general 96 (open) Thoughts and efforts on overall life, sex, work, relationship with spouse/partner/children finance, contribution to others 95 Problem management strategies/beliefs 95 Life management beliefs/strategies 95 fatalism index 86/89 social/ultimate justice index 86/89 Beliefs about planning and making sense of the past 95 Beliefs about gathering support from others 95 Family responsibility/obligation (Rossi) 95 x Social (nonfamily) responsibility 95 Gender Role Attitude on family/work/household 95 x 89 attitudes on divorce and marriage x attitudes on parenting x
PERCEIVED DISCRIMINATION, IDENTITY Social well-being/alienation (Keyes, 6 scales) 95 Perceived inequalities and opportunities 96 95 (family, work) Perceived inequalities in neighborhood 96 95 Perceived race identification/closeness 95 86 Perceived discrimination due to race/ethnicity, sex, 95 94 (race) physical appearance, age, religion, sexual orientation, or others. Perceived discrimination in frequency: education, 95 scholarship, hiring, promotion, housing, police, loan, medical care, service. Perceived frequency of day to day discrimination 95 Main self-assessed reason for discrimination 95 Perceived amount that discrimation interfers on 95 productive life, life getting harder
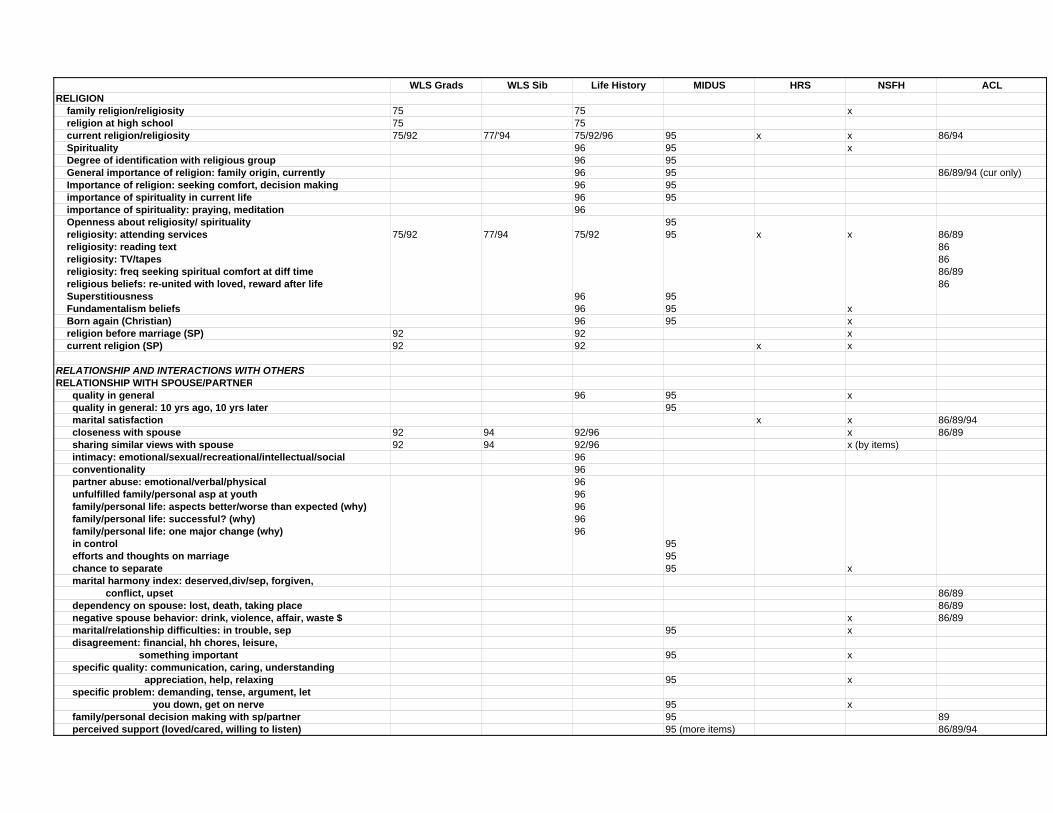
WLS Grads WLS Sib Life History MIDUS HRS NSFH ACLRELIGION family religion/religiosity 75 75 x religion at high school 75 75 current religion/religiosity 75/92 77/'94 75/92/96 95 x x 86/94 Spirituality 96 95 x Degree of identification with religious group 96 95 General importance of religion: family origin, currently 96 95 86/89/94 (cur only) Importance of religion: seeking comfort, decision making 96 95 importance of spirituality in current life 96 95 importance of spirituality: praying, meditation 96 Openness about religiosity/ spirituality 95 religiosity: attending services 75/92 77/94 75/92 95 x x 86/89 religiosity: reading text 86 religiosity: TV/tapes 86 religiosity: freq seeking spiritual comfort at diff time 86/89 religious beliefs: re-united with loved, reward after life 86 Superstitiousness 96 95 Fundamentalism beliefs 96 95 x Born again (Christian) 96 95 x religion before marriage (SP) 92 92 x current religion (SP) 92 92 x x
RELATIONSHIP AND INTERACTIONS WITH OTHERSRELATIONSHIP WITH SPOUSE/PARTNER quality in general 96 95 x quality in general: 10 yrs ago, 10 yrs later 95 marital satisfaction x x 86/89/94 closeness with spouse 92 94 92/96 x 86/89 sharing similar views with spouse 92 94 92/96 x (by items) intimacy: emotional/sexual/recreational/intellectual/social 96 conventionality 96 partner abuse: emotional/verbal/physical 96 unfulfilled family/personal asp at youth 96 family/personal life: aspects better/worse than expected (why) 96 family/personal life: successful? (why) 96 family/personal life: one major change (why) 96 in control 95 efforts and thoughts on marriage 95 chance to separate 95 x marital harmony index: deserved,div/sep, forgiven, conflict, upset 86/89 dependency on spouse: lost, death, taking place 86/89 negative spouse behavior: drink, violence, affair, waste $ x 86/89 marital/relationship difficulties: in trouble, sep 95 x disagreement: financial, hh chores, leisure, something important 95 x specific quality: communication, caring, understanding appreciation, help, relaxing 95 x specific problem: demanding, tense, argument, let you down, get on nerve 95 x family/personal decision making with sp/partner 95 89 perceived support (loved/cared, willing to listen) 95 (more items) 86/89/94
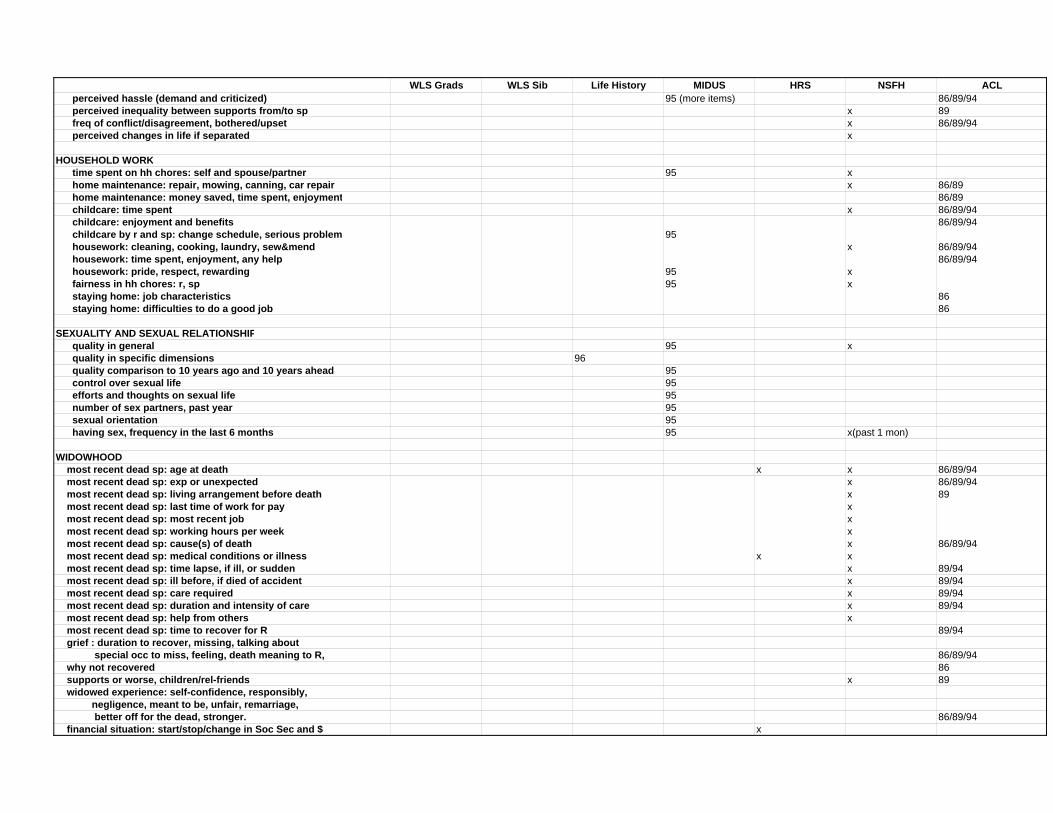
WLS Grads WLS Sib Life History MIDUS HRS NSFH ACL perceived hassle (demand and criticized) 95 (more items) 86/89/94 perceived inequality between supports from/to sp x 89 freq of conflict/disagreement, bothered/upset x 86/89/94 perceived changes in life if separated x
HOUSEHOLD WORK time spent on hh chores: self and spouse/partner 95 x home maintenance: repair, mowing, canning, car repair x 86/89 home maintenance: money saved, time spent, enjoyment 86/89 childcare: time spent x 86/89/94 childcare: enjoyment and benefits 86/89/94 childcare by r and sp: change schedule, serious problem 95 housework: cleaning, cooking, laundry, sew&mend x 86/89/94 housework: time spent, enjoyment, any help 86/89/94 housework: pride, respect, rewarding 95 x fairness in hh chores: r, sp 95 x staying home: job characteristics 86 staying home: difficulties to do a good job 86
SEXUALITY AND SEXUAL RELATIONSHIP quality in general 95 x quality in specific dimensions 96 quality comparison to 10 years ago and 10 years ahead 95 control over sexual life 95 efforts and thoughts on sexual life 95 number of sex partners, past year 95 sexual orientation 95 having sex, frequency in the last 6 months 95 x(past 1 mon)
WIDOWHOOD most recent dead sp: age at death x x 86/89/94 most recent dead sp: exp or unexpected x 86/89/94 most recent dead sp: living arrangement before death x 89 most recent dead sp: last time of work for pay x most recent dead sp: most recent job x most recent dead sp: working hours per week x most recent dead sp: cause(s) of death x 86/89/94 most recent dead sp: medical conditions or illness x x most recent dead sp: time lapse, if ill, or sudden x 89/94 most recent dead sp: ill before, if died of accident x 89/94 most recent dead sp: care required x 89/94 most recent dead sp: duration and intensity of care x 89/94 most recent dead sp: help from others x most recent dead sp: time to recover for R 89/94 grief : duration to recover, missing, talking about special occ to miss, feeling, death meaning to R, 86/89/94 why not recovered 86 supports or worse, children/rel-friends x 89 widowed experience: self-confidence, responsibly, negligence, meant to be, unfair, remarriage, better off for the dead, stronger. 86/89/94 financial situation: start/stop/change in Soc Sec and $ x
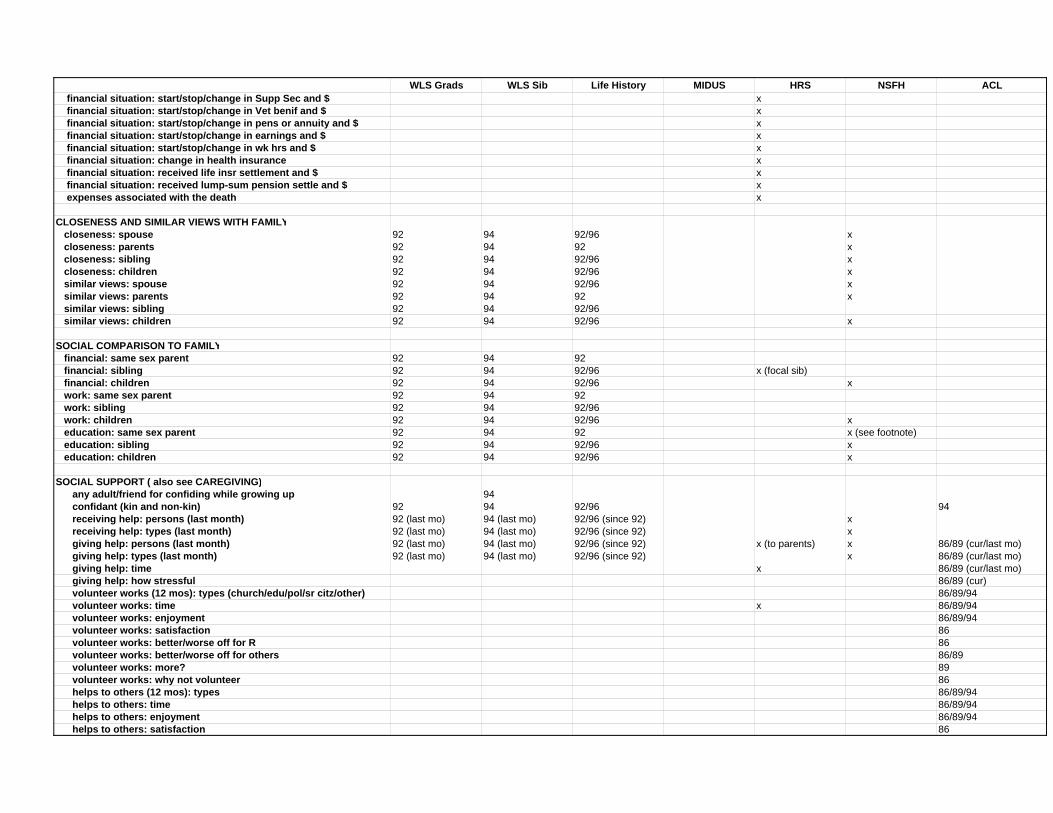
WLS Grads WLS Sib Life History MIDUS HRS NSFH ACL financial situation: start/stop/change in Supp Sec and $ x financial situation: start/stop/change in Vet benif and $ x financial situation: start/stop/change in pens or annuity and $ x financial situation: start/stop/change in earnings and $ x financial situation: start/stop/change in wk hrs and $ x financial situation: change in health insurance x financial situation: received life insr settlement and $ x financial situation: received lump-sum pension settle and $ x expenses associated with the death x
CLOSENESS AND SIMILAR VIEWS WITH FAMILY closeness: spouse 92 94 92/96 x closeness: parents 92 94 92 x closeness: sibling 92 94 92/96 x closeness: children 92 94 92/96 x similar views: spouse 92 94 92/96 x similar views: parents 92 94 92 x similar views: sibling 92 94 92/96 similar views: children 92 94 92/96 x
SOCIAL COMPARISON TO FAMILY financial: same sex parent 92 94 92 financial: sibling 92 94 92/96 x (focal sib) financial: children 92 94 92/96 x work: same sex parent 92 94 92 work: sibling 92 94 92/96 work: children 92 94 92/96 x education: same sex parent 92 94 92 x (see footnote) education: sibling 92 94 92/96 x education: children 92 94 92/96 x
SOCIAL SUPPORT ( also see CAREGIVING) any adult/friend for confiding while growing up 94 confidant (kin and non-kin) 92 94 92/96 94 receiving help: persons (last month) 92 (last mo) 94 (last mo) 92/96 (since 92) x receiving help: types (last month) 92 (last mo) 94 (last mo) 92/96 (since 92) x giving help: persons (last month) 92 (last mo) 94 (last mo) 92/96 (since 92) x (to parents) x 86/89 (cur/last mo) giving help: types (last month) 92 (last mo) 94 (last mo) 92/96 (since 92) x 86/89 (cur/last mo) giving help: time x 86/89 (cur/last mo) giving help: how stressful 86/89 (cur) volunteer works (12 mos): types (church/edu/pol/sr citz/other) 86/89/94 volunteer works: time x 86/89/94 volunteer works: enjoyment 86/89/94 volunteer works: satisfaction 86 volunteer works: better/worse off for R 86 volunteer works: better/worse off for others 86/89 volunteer works: more? 89 volunteer works: why not volunteer 86 helps to others (12 mos): types 86/89/94 helps to others: time 86/89/94 helps to others: enjoyment 86/89/94 helps to others: satisfaction 86
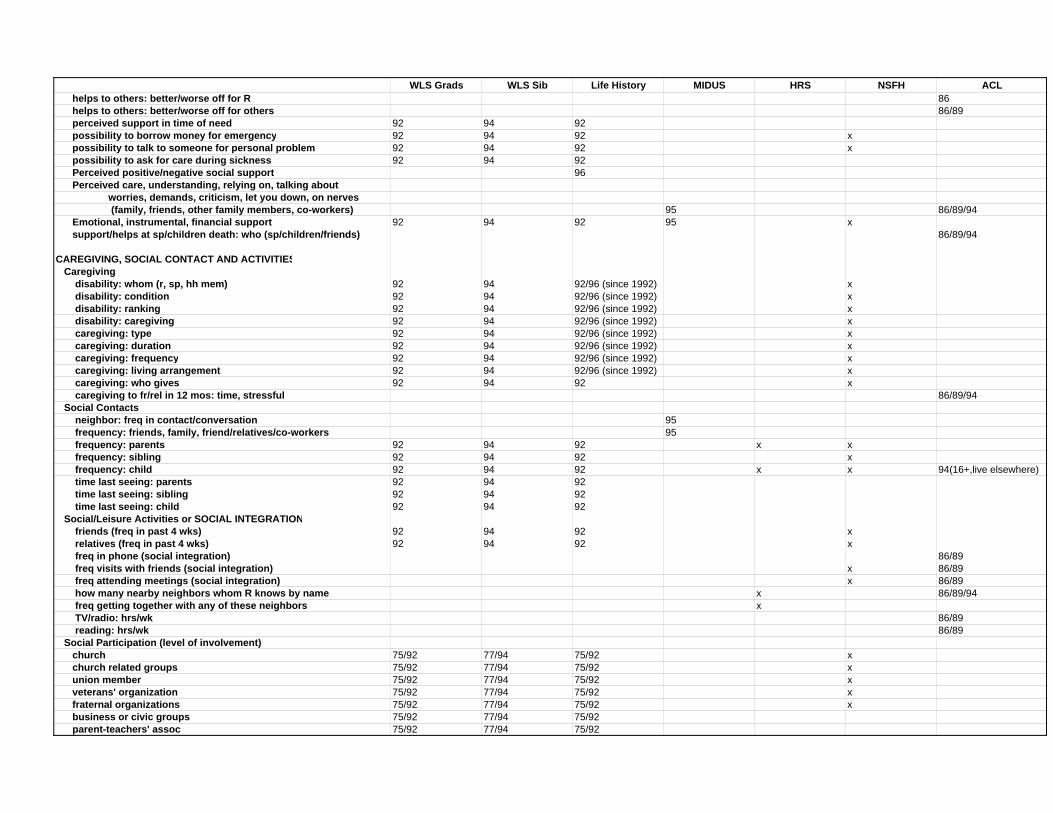
WLS Grads WLS Sib Life History MIDUS HRS NSFH ACL helps to others: better/worse off for R 86 helps to others: better/worse off for others 86/89 perceived support in time of need 92 94 92 possibility to borrow money for emergency 92 94 92 x possibility to talk to someone for personal problem 92 94 92 x possibility to ask for care during sickness 92 94 92 Perceived positive/negative social support 96 Perceived care, understanding, relying on, talking about worries, demands, criticism, let you down, on nerves (family, friends, other family members, co-workers) 95 86/89/94 Emotional, instrumental, financial support 92 94 92 95 x support/helps at sp/children death: who (sp/children/friends) 86/89/94 CAREGIVING, SOCIAL CONTACT AND ACTIVITIES Caregiving disability: whom (r, sp, hh mem) 92 94 92/96 (since 1992) x disability: condition 92 94 92/96 (since 1992) x disability: ranking 92 94 92/96 (since 1992) x disability: caregiving 92 94 92/96 (since 1992) x caregiving: type 92 94 92/96 (since 1992) x caregiving: duration 92 94 92/96 (since 1992) x caregiving: frequency 92 94 92/96 (since 1992) x caregiving: living arrangement 92 94 92/96 (since 1992) x caregiving: who gives 92 94 92 x caregiving to fr/rel in 12 mos: time, stressful 86/89/94 Social Contacts neighbor: freq in contact/conversation 95 frequency: friends, family, friend/relatives/co-workers 95 frequency: parents 92 94 92 x x frequency: sibling 92 94 92 x frequency: child 92 94 92 x x 94(16+,live elsewhere) time last seeing: parents 92 94 92 time last seeing: sibling 92 94 92 time last seeing: child 92 94 92 Social/Leisure Activities or SOCIAL INTEGRATION friends (freq in past 4 wks) 92 94 92 x relatives (freq in past 4 wks) 92 94 92 x freq in phone (social integration) 86/89 freq visits with friends (social integration) x 86/89 freq attending meetings (social integration) x 86/89 how many nearby neighbors whom R knows by name x 86/89/94 freq getting together with any of these neighbors x TV/radio: hrs/wk 86/89 reading: hrs/wk 86/89 Social Participation (level of involvement) church 75/92 77/94 75/92 x church related groups 75/92 77/94 75/92 x union member 75/92 77/94 75/92 x veterans' organization 75/92 77/94 75/92 x fraternal organizations 75/92 77/94 75/92 x business or civic groups 75/92 77/94 75/92 parent-teachers' assoc 75/92 77/94 75/92
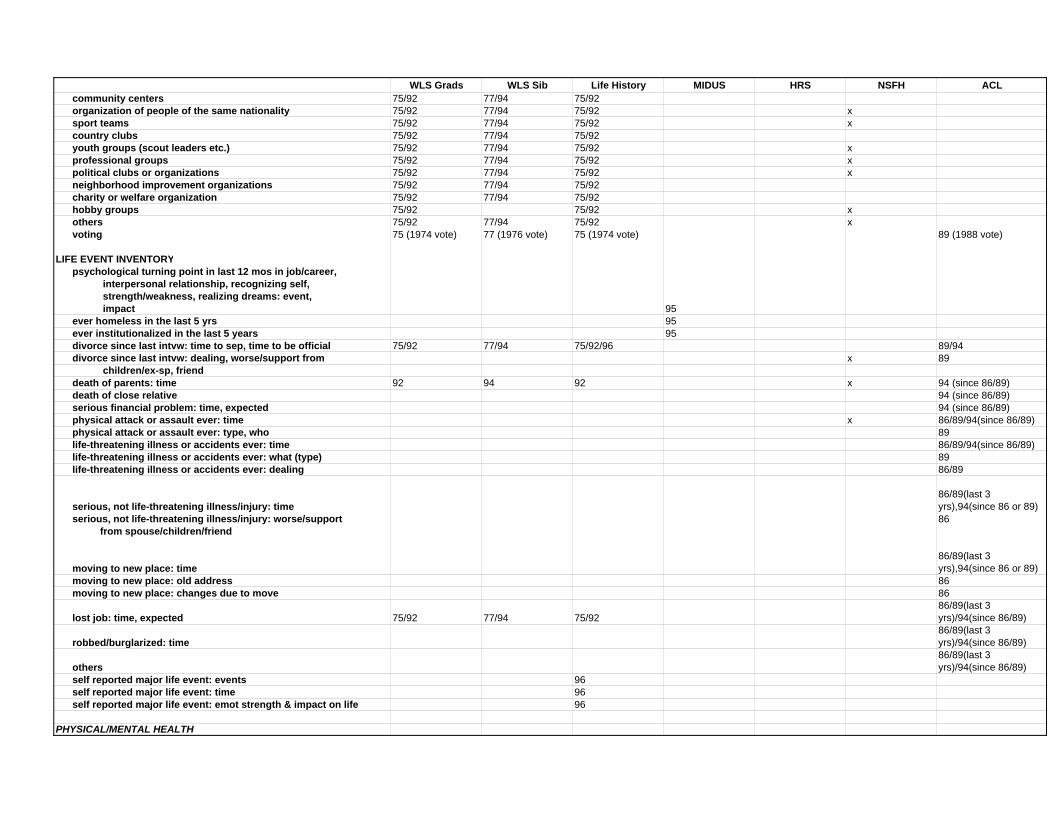
WLS Grads WLS Sib Life History MIDUS HRS NSFH ACL community centers 75/92 77/94 75/92 organization of people of the same nationality 75/92 77/94 75/92 x sport teams 75/92 77/94 75/92 x country clubs 75/92 77/94 75/92 youth groups (scout leaders etc.) 75/92 77/94 75/92 x professional groups 75/92 77/94 75/92 x political clubs or organizations 75/92 77/94 75/92 x neighborhood improvement organizations 75/92 77/94 75/92 charity or welfare organization 75/92 77/94 75/92 hobby groups 75/92 75/92 x others 75/92 77/94 75/92 x voting 75 (1974 vote) 77 (1976 vote) 75 (1974 vote) 89 (1988 vote)
LIFE EVENT INVENTORY psychological turning point in last 12 mos in job/career, interpersonal relationship, recognizing self, strength/weakness, realizing dreams: event, impact 95 ever homeless in the last 5 yrs 95 ever institutionalized in the last 5 years 95 divorce since last intvw: time to sep, time to be official 75/92 77/94 75/92/96 89/94 divorce since last intvw: dealing, worse/support from x 89 children/ex-sp, friend death of parents: time 92 94 92 x 94 (since 86/89) death of close relative 94 (since 86/89) serious financial problem: time, expected 94 (since 86/89) physical attack or assault ever: time x 86/89/94(since 86/89) physical attack or assault ever: type, who 89 life-threatening illness or accidents ever: time 86/89/94(since 86/89) life-threatening illness or accidents ever: what (type) 89 life-threatening illness or accidents ever: dealing 86/89
serious, not life-threatening illness/injury: time86/89(last 3 yrs),94(since 86 or 89)
serious, not life-threatening illness/injury: worse/support 86 from spouse/children/friend
moving to new place: time86/89(last 3 yrs),94(since 86 or 89)
moving to new place: old address 86 moving to new place: changes due to move 86
lost job: time, expected 75/92 77/94 75/9286/89(last 3 yrs)/94(since 86/89)
robbed/burglarized: time86/89(last 3 yrs)/94(since 86/89)
others86/89(last 3 yrs)/94(since 86/89)
self reported major life event: events 96 self reported major life event: time 96 self reported major life event: emot strength & impact on life 96
PHYSICAL/MENTAL HEALTH
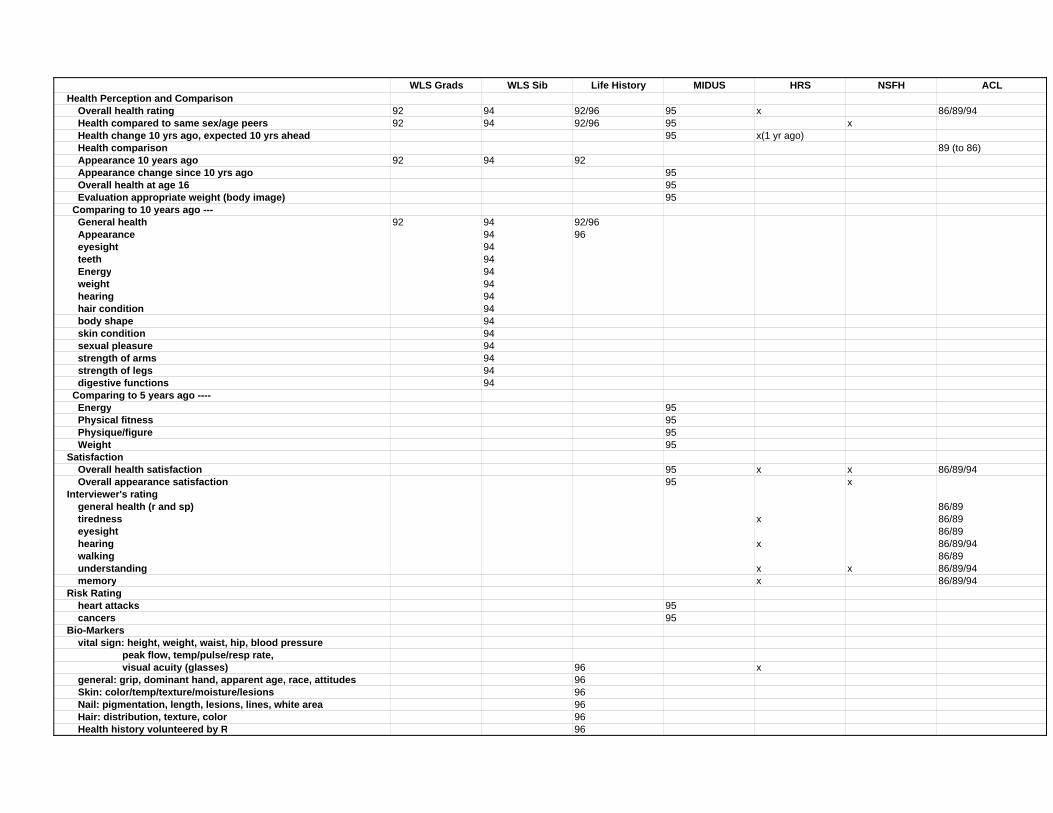
WLS Grads WLS Sib Life History MIDUS HRS NSFH ACL Health Perception and Comparison Overall health rating 92 94 92/96 95 x 86/89/94 Health compared to same sex/age peers 92 94 92/96 95 x Health change 10 yrs ago, expected 10 yrs ahead 95 x(1 yr ago) Health comparison 89 (to 86) Appearance 10 years ago 92 94 92 Appearance change since 10 yrs ago 95 Overall health at age 16 95 Evaluation appropriate weight (body image) 95 Comparing to 10 years ago --- General health 92 94 92/96 Appearance 94 96 eyesight 94 teeth 94 Energy 94 weight 94 hearing 94 hair condition 94 body shape 94 skin condition 94 sexual pleasure 94 strength of arms 94 strength of legs 94 digestive functions 94 Comparing to 5 years ago ---- Energy 95 Physical fitness 95 Physique/figure 95 Weight 95 Satisfaction Overall health satisfaction 95 x x 86/89/94 Overall appearance satisfaction 95 x Interviewer's rating general health (r and sp) 86/89 tiredness x 86/89 eyesight 86/89 hearing x 86/89/94 walking 86/89 understanding x x 86/89/94 memory x 86/89/94 Risk Rating heart attacks 95 cancers 95 Bio-Markers vital sign: height, weight, waist, hip, blood pressure peak flow, temp/pulse/resp rate, visual acuity (glasses) 96 x general: grip, dominant hand, apparent age, race, attitudes 96 Skin: color/temp/texture/moisture/lesions 96 Nail: pigmentation, length, lesions, lines, white area 96 Hair: distribution, texture, color 96 Health history volunteered by R 96
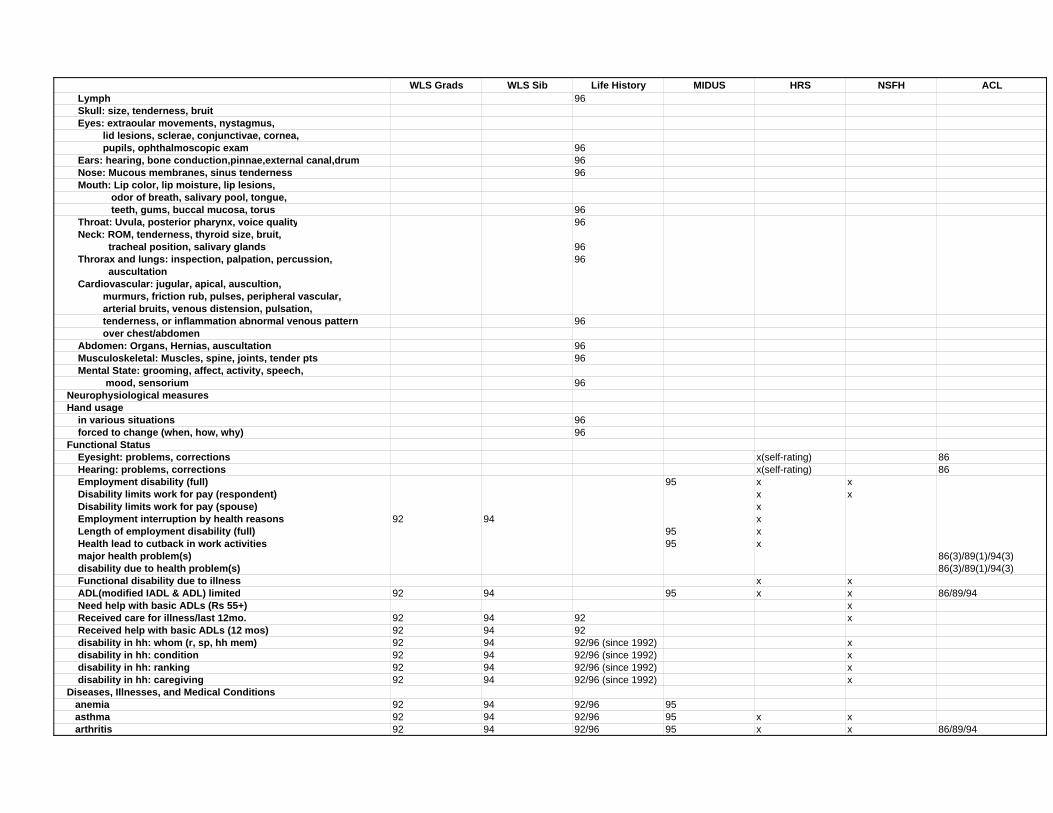
WLS Grads WLS Sib Life History MIDUS HRS NSFH ACL Lymph 96 Skull: size, tenderness, bruit Eyes: extraoular movements, nystagmus, lid lesions, sclerae, conjunctivae, cornea, pupils, ophthalmoscopic exam 96 Ears: hearing, bone conduction,pinnae,external canal,drum 96 Nose: Mucous membranes, sinus tenderness 96 Mouth: Lip color, lip moisture, lip lesions, odor of breath, salivary pool, tongue, teeth, gums, buccal mucosa, torus 96 Throat: Uvula, posterior pharynx, voice quality 96 Neck: ROM, tenderness, thyroid size, bruit, tracheal position, salivary glands 96 Throrax and lungs: inspection, palpation, percussion, 96 auscultation Cardiovascular: jugular, apical, auscultion, murmurs, friction rub, pulses, peripheral vascular, arterial bruits, venous distension, pulsation, tenderness, or inflammation abnormal venous pattern 96 over chest/abdomen Abdomen: Organs, Hernias, auscultation 96 Musculoskeletal: Muscles, spine, joints, tender pts 96 Mental State: grooming, affect, activity, speech, mood, sensorium 96 Neurophysiological measures Hand usage in various situations 96 forced to change (when, how, why) 96 Functional Status Eyesight: problems, corrections x(self-rating) 86 Hearing: problems, corrections x(self-rating) 86 Employment disability (full) 95 x x Disability limits work for pay (respondent) x x Disability limits work for pay (spouse) x Employment interruption by health reasons 92 94 x Length of employment disability (full) 95 x Health lead to cutback in work activities 95 x major health problem(s) 86(3)/89(1)/94(3) disability due to health problem(s) 86(3)/89(1)/94(3) Functional disability due to illness x x ADL(modified IADL & ADL) limited 92 94 95 x x 86/89/94 Need help with basic ADLs (Rs 55+) x Received care for illness/last 12mo. 92 94 92 x Received help with basic ADLs (12 mos) 92 94 92 disability in hh: whom (r, sp, hh mem) 92 94 92/96 (since 1992) x disability in hh: condition 92 94 92/96 (since 1992) x disability in hh: ranking 92 94 92/96 (since 1992) x disability in hh: caregiving 92 94 92/96 (since 1992) x Diseases, Illnesses, and Medical Conditions anemia 92 94 92/96 95 asthma 92 94 92/96 95 x x arthritis 92 94 92/96 95 x x 86/89/94
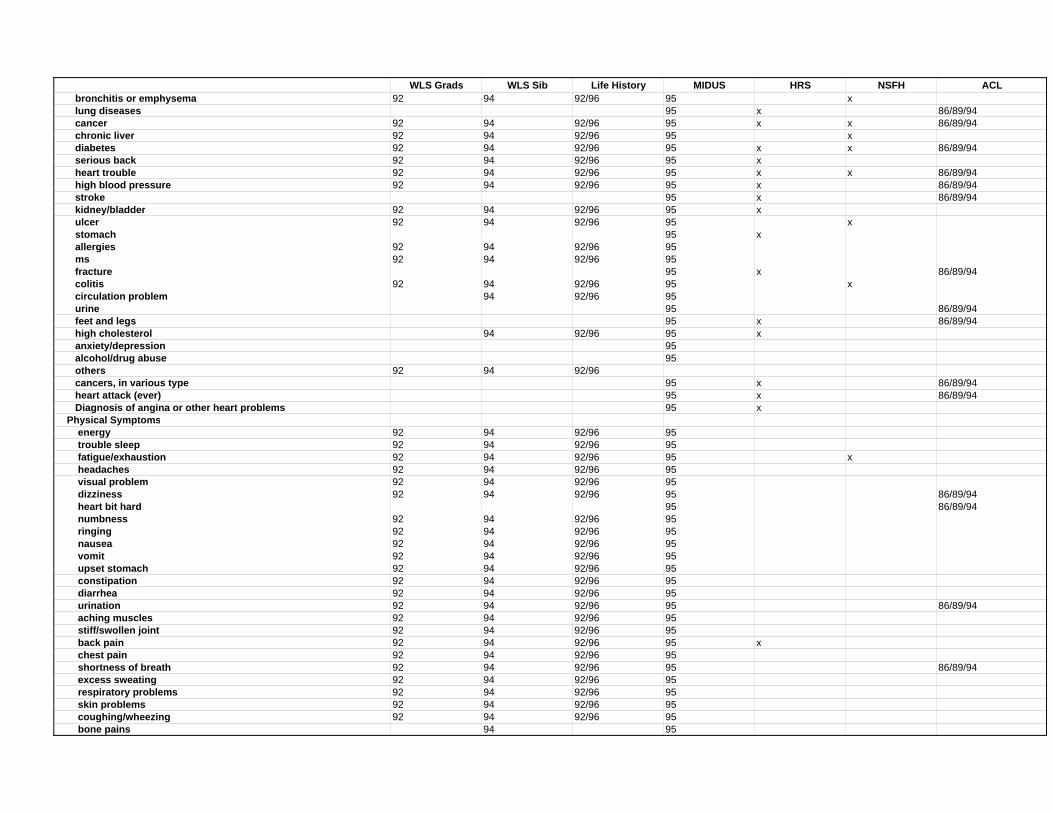
WLS Grads WLS Sib Life History MIDUS HRS NSFH ACL bronchitis or emphysema 92 94 92/96 95 x lung diseases 95 x 86/89/94 cancer 92 94 92/96 95 x x 86/89/94 chronic liver 92 94 92/96 95 x diabetes 92 94 92/96 95 x x 86/89/94 serious back 92 94 92/96 95 x heart trouble 92 94 92/96 95 x x 86/89/94 high blood pressure 92 94 92/96 95 x 86/89/94 stroke 95 x 86/89/94 kidney/bladder 92 94 92/96 95 x ulcer 92 94 92/96 95 x stomach 95 x allergies 92 94 92/96 95 ms 92 94 92/96 95 fracture 95 x 86/89/94 colitis 92 94 92/96 95 x circulation problem 94 92/96 95 urine 95 86/89/94 feet and legs 95 x 86/89/94 high cholesterol 94 92/96 95 x anxiety/depression 95 alcohol/drug abuse 95 others 92 94 92/96 cancers, in various type 95 x 86/89/94 heart attack (ever) 95 x 86/89/94 Diagnosis of angina or other heart problems 95 x Physical Symptoms energy 92 94 92/96 95 trouble sleep 92 94 92/96 95 fatigue/exhaustion 92 94 92/96 95 x headaches 92 94 92/96 95 visual problem 92 94 92/96 95 dizziness 92 94 92/96 95 86/89/94 heart bit hard 95 86/89/94 numbness 92 94 92/96 95 ringing 92 94 92/96 95 nausea 92 94 92/96 95 vomit 92 94 92/96 95 upset stomach 92 94 92/96 95 constipation 92 94 92/96 95 diarrhea 92 94 92/96 95 urination 92 94 92/96 95 86/89/94 aching muscles 92 94 92/96 95 stiff/swollen joint 92 94 92/96 95 back pain 92 94 92/96 95 x chest pain 92 94 92/96 95 shortness of breath 92 94 92/96 95 86/89/94 excess sweating 92 94 92/96 95 respiratory problems 92 94 92/96 95 skin problems 92 94 92/96 95 coughing/wheezing 92 94 92/96 95 bone pains 94 95
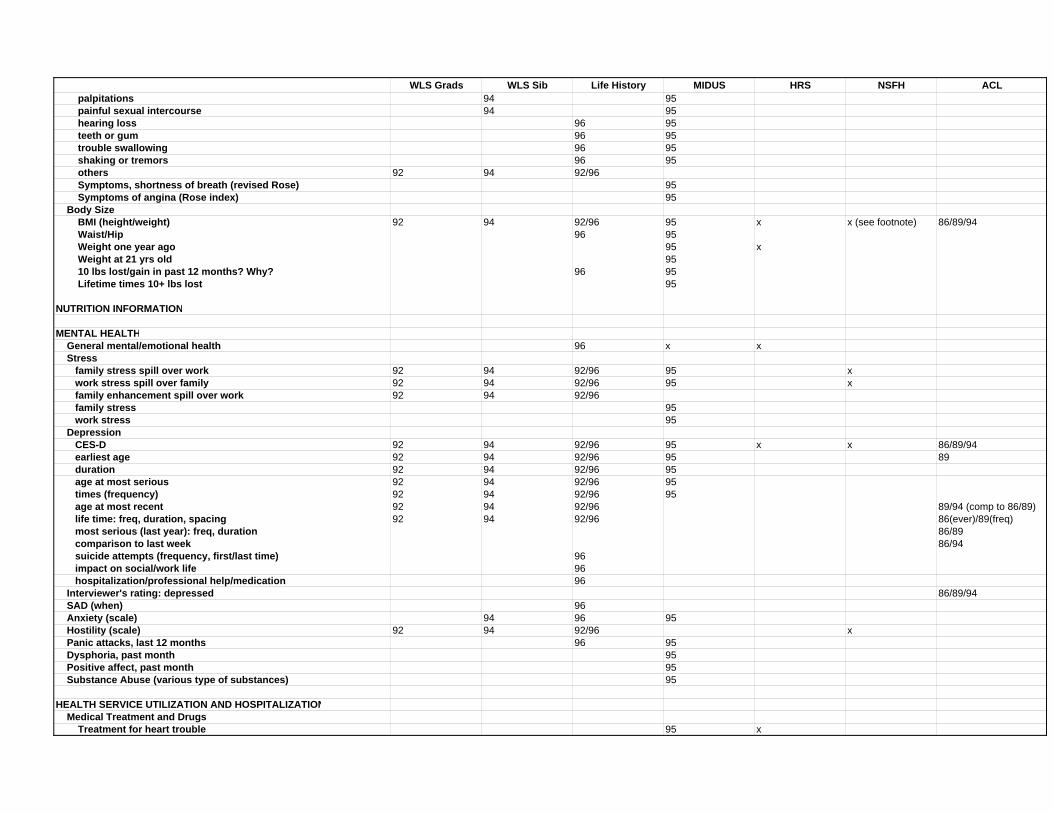
WLS Grads WLS Sib Life History MIDUS HRS NSFH ACL palpitations 94 95 painful sexual intercourse 94 95 hearing loss 96 95 teeth or gum 96 95 trouble swallowing 96 95 shaking or tremors 96 95 others 92 94 92/96 Symptoms, shortness of breath (revised Rose) 95 Symptoms of angina (Rose index) 95 Body Size BMI (height/weight) 92 94 92/96 95 x x (see footnote) 86/89/94 Waist/Hip 96 95 Weight one year ago 95 x Weight at 21 yrs old 95 10 lbs lost/gain in past 12 months? Why? 96 95 Lifetime times 10+ lbs lost 95
NUTRITION INFORMATION
MENTAL HEALTH General mental/emotional health 96 x x Stress family stress spill over work 92 94 92/96 95 x work stress spill over family 92 94 92/96 95 x family enhancement spill over work 92 94 92/96 family stress 95 work stress 95 Depression CES-D 92 94 92/96 95 x x 86/89/94 earliest age 92 94 92/96 95 89 duration 92 94 92/96 95 age at most serious 92 94 92/96 95 times (frequency) 92 94 92/96 95 age at most recent 92 94 92/96 89/94 (comp to 86/89) life time: freq, duration, spacing 92 94 92/96 86(ever)/89(freq) most serious (last year): freq, duration 86/89 comparison to last week 86/94 suicide attempts (frequency, first/last time) 96 impact on social/work life 96 hospitalization/professional help/medication 96 Interviewer's rating: depressed 86/89/94 SAD (when) 96 Anxiety (scale) 94 96 95 Hostility (scale) 92 94 92/96 x Panic attacks, last 12 months 96 95 Dysphoria, past month 95 Positive affect, past month 95 Substance Abuse (various type of substances) 95
HEALTH SERVICE UTILIZATION AND HOSPITALIZATION Medical Treatment and Drugs Treatment for heart trouble 95 x
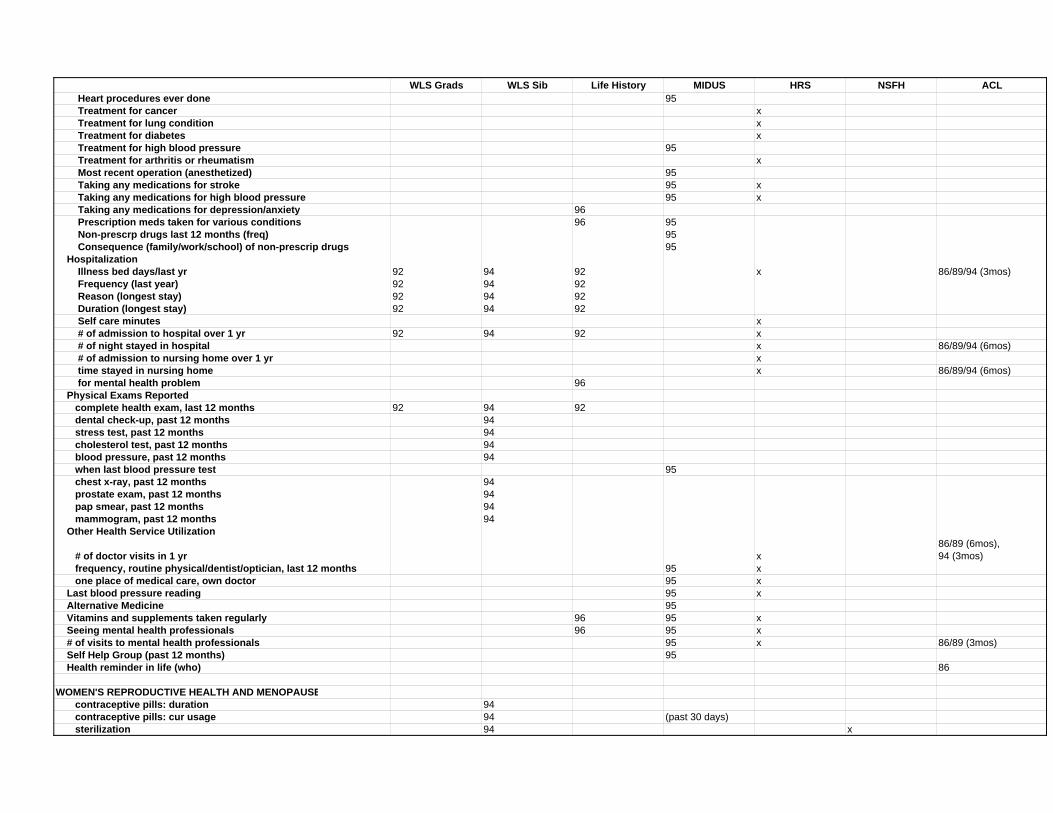
WLS Grads WLS Sib Life History MIDUS HRS NSFH ACL Heart procedures ever done 95 Treatment for cancer x Treatment for lung condition x Treatment for diabetes x Treatment for high blood pressure 95 Treatment for arthritis or rheumatism x Most recent operation (anesthetized) 95 Taking any medications for stroke 95 x Taking any medications for high blood pressure 95 x Taking any medications for depression/anxiety 96 Prescription meds taken for various conditions 96 95 Non-prescrp drugs last 12 months (freq) 95 Consequence (family/work/school) of non-prescrip drugs 95 Hospitalization Illness bed days/last yr 92 94 92 x 86/89/94 (3mos) Frequency (last year) 92 94 92 Reason (longest stay) 92 94 92 Duration (longest stay) 92 94 92 Self care minutes x # of admission to hospital over 1 yr 92 94 92 x # of night stayed in hospital x 86/89/94 (6mos) # of admission to nursing home over 1 yr x time stayed in nursing home x 86/89/94 (6mos) for mental health problem 96 Physical Exams Reported complete health exam, last 12 months 92 94 92 dental check-up, past 12 months 94 stress test, past 12 months 94 cholesterol test, past 12 months 94 blood pressure, past 12 months 94 when last blood pressure test 95 chest x-ray, past 12 months 94 prostate exam, past 12 months 94 pap smear, past 12 months 94 mammogram, past 12 months 94 Other Health Service Utilization
# of doctor visits in 1 yr x86/89 (6mos), 94 (3mos)
frequency, routine physical/dentist/optician, last 12 months 95 x one place of medical care, own doctor 95 x Last blood pressure reading 95 x Alternative Medicine 95 Vitamins and supplements taken regularly 96 95 x Seeing mental health professionals 96 95 x # of visits to mental health professionals 95 x 86/89 (3mos) Self Help Group (past 12 months) 95 Health reminder in life (who) 86
WOMEN'S REPRODUCTIVE HEALTH AND MENOPAUSE contraceptive pills: duration 94 contraceptive pills: cur usage 94 (past 30 days) sterilization 94 x
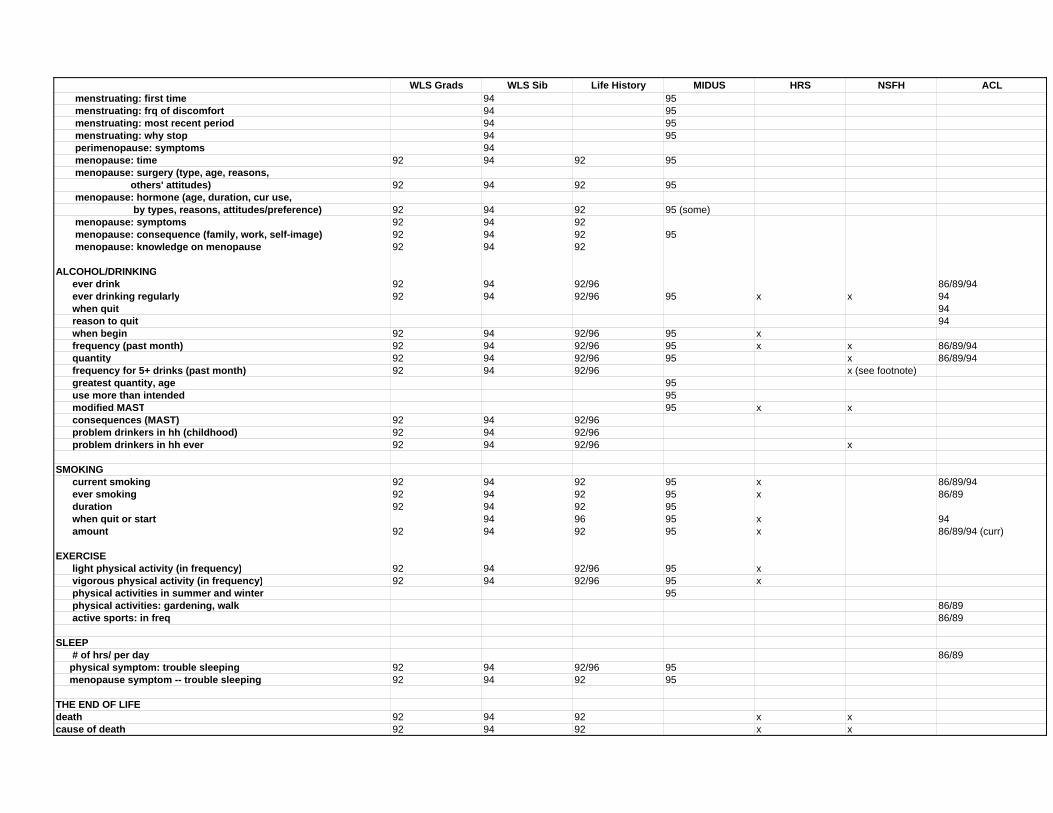
WLS Grads WLS Sib Life History MIDUS HRS NSFH ACL menstruating: first time 94 95 menstruating: frq of discomfort 94 95 menstruating: most recent period 94 95 menstruating: why stop 94 95 perimenopause: symptoms 94 menopause: time 92 94 92 95 menopause: surgery (type, age, reasons, others' attitudes) 92 94 92 95 menopause: hormone (age, duration, cur use, by types, reasons, attitudes/preference) 92 94 92 95 (some) menopause: symptoms 92 94 92 menopause: consequence (family, work, self-image) 92 94 92 95 menopause: knowledge on menopause 92 94 92
ALCOHOL/DRINKING ever drink 92 94 92/96 86/89/94 ever drinking regularly 92 94 92/96 95 x x 94 when quit 94 reason to quit 94 when begin 92 94 92/96 95 x frequency (past month) 92 94 92/96 95 x x 86/89/94 quantity 92 94 92/96 95 x 86/89/94 frequency for 5+ drinks (past month) 92 94 92/96 x (see footnote) greatest quantity, age 95 use more than intended 95 modified MAST 95 x x consequences (MAST) 92 94 92/96 problem drinkers in hh (childhood) 92 94 92/96 problem drinkers in hh ever 92 94 92/96 x
SMOKING current smoking 92 94 92 95 x 86/89/94 ever smoking 92 94 92 95 x 86/89 duration 92 94 92 95 when quit or start 94 96 95 x 94 amount 92 94 92 95 x 86/89/94 (curr)
EXERCISE light physical activity (in frequency) 92 94 92/96 95 x vigorous physical activity (in frequency) 92 94 92/96 95 x physical activities in summer and winter 95 physical activities: gardening, walk 86/89 active sports: in freq 86/89
SLEEP # of hrs/ per day 86/89 physical symptom: trouble sleeping 92 94 92/96 95 menopause symptom -- trouble sleeping 92 94 92 95
THE END OF LIFEdeath 92 94 92 x xcause of death 92 94 92 x x
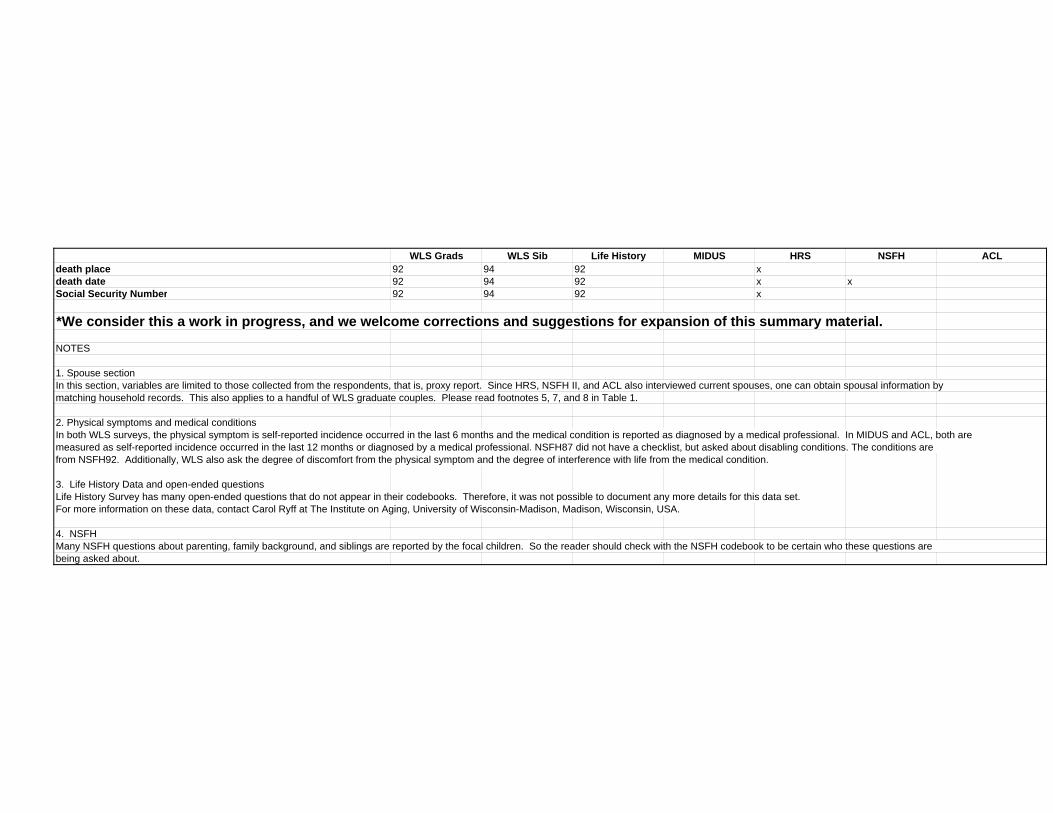
WLS Grads WLS Sib Life History MIDUS HRS NSFH ACLdeath place 92 94 92 xdeath date 92 94 92 x xSocial Security Number 92 94 92 x
*We consider this a work in progress, and we welcome corrections and suggestions for expansion of this summary material.
NOTES
1. Spouse sectionIn this section, variables are limited to those collected from the respondents, that is, proxy report. Since HRS, NSFH II, and ACL also interviewed current spouses, one can obtain spousal information by matching household records. This also applies to a handful of WLS graduate couples. Please read footnotes 5, 7, and 8 in Table 1.
2. Physical symptoms and medical conditionsIn both WLS surveys, the physical symptom is self-reported incidence occurred in the last 6 months and the medical condition is reported as diagnosed by a medical professional. In MIDUS and ACL, both are measured as self-reported incidence occurred in the last 12 months or diagnosed by a medical professional. NSFH87 did not have a checklist, but asked about disabling conditions. The conditions are from NSFH92. Additionally, WLS also ask the degree of discomfort from the physical symptom and the degree of interference with life from the medical condition.
3. Life History Data and open-ended questionsLife History Survey has many open-ended questions that do not appear in their codebooks. Therefore, it was not possible to document any more details for this data set.For more information on these data, contact Carol Ryff at The Institute on Aging, University of Wisconsin-Madison, Madison, Wisconsin, USA.
4. NSFHMany NSFH questions about parenting, family background, and siblings are reported by the focal children. So the reader should check with the NSFH codebook to be certain who these questions are being asked about.
Copyright © 2022 FDOKUMEN