National - Longitudinal Mortality Study - Census Bureau
392
National Jump to Index Longitudinal Mortality Study Extract and Analysis Files Reference Manual, Version 4.0 Mortality Follow-up 1979—2011 July 1, 2014
-
Upload
khangminh22 -
Category
Documents
-
view
0 -
download
0
Transcript of National - Longitudinal Mortality Study - Census Bureau

National Jump to Index Longitudinal Mortality Study
Extract and Analysis Files Reference Manual, Version 4.0 Mortality Follow-up 1979—2011 July 1, 2014

National Longitudinal Mortality Study - Table of Contents
1
TABLE OF CONTENTS
INTRODUCTION ..................................................................................................................... 2 NLMS INDEX AND RECORD FORMAT .................................................................................... 10 EXTRACT FILE ....................................................................................................................... 15 ANALYSIS FILE ................................................................................................................... 217 APPENDICES ...................................................................................................................... 315
A. September 1985 Health and Tobacco Use File
B. State Concatenated Codes
C. SMSA Rank
D. United Nations Codes for Countries and Areas
E. 1990 Industrial Classification System
F. 2007 Industrial Classification System
G. 1990 Occupational Classification System
H. 2000 Occupational Classification System
I. CDC 113 Causes of Death from ICD-10
National Longitudinal Mortality Study – Introduction
2
Variable Reference Manual for
National Longitudinal Mortality Study Extract and Analysis Files
Version 4.0 INTRODUCTION
Documentation Date: July 1, 2014 The National Longitudinal Mortality Study (NLMS) is a national, longitudinal, mortality study sponsored by the National Heart, Lung, and Blood Institute, the National Cancer Institute, the National Institute on Aging, the National Center for Health Statistics, and the U.S. Census Bureau for the purpose of studying the effects of differentials in demographic and socio-economic characteristics on mortality. The NLMS consists of a database developed for the purpose of studying the effects of demographic and socio-economic characteristics on differentials in U.S. mortality rates. The NLMS is a unique research database in that it is based on a complex, stratified sample of the non-institutionalized population of the United States. It consists of U.S. Census Bureau data from Current Population Surveys, Annual Social and Economic Supplements, and a subset of the 1980 Census combined with death certificate information to identify mortality status and cause of death. The study currently consists of approximately 3.8 million records with over 560,000 identified mortality cases. The content of the socio-economic variables available offers researchers the potential to answer questions on mortality differentials for a variety of important socio-economic and demographic subgroups not covered as extensively in other databases. This project has generated over 85 publications in various prominent scholarly, scientific, and public health related journals. The NLMS currently consists of Annual Social and Economic Supplements which cover the period from March 1973 to March 2011, Current Population Surveys for February 1978, April 1980, August 1980, December 1980, and September 1985, and one 1980 Census cohort, 39 cohorts in all. Mortality information is obtained from death certificates available for deceased persons through the National Center for Health Statistics. Important variables available for analyses are standard demographic and socio-economic variables such as education, income and employment as well as information collected from death certificates, including cause of death. This documentation identifies variables selected from National Longitudinal Mortality Study (NLMS) master files for use in study analysis files. The variables documented in this manual were selected by study sponsors to be of immediate interest as the primary focus of scientific and public health research and their importance in a wide variety of study publications.

National Longitudinal Mortality Study – Introduction
3
Description Of The NLMS File Structure The complete database of all NLMS variables available for analysis is stored on files called "Master Files," one file for each NLMS cohort. The data available in each cohort master file vary in content depending on the interests of the original sponsor of the file. Each master file has its own format and each contains both edited and unedited data. Because of the difficulty in using variable format files and because definitions of variables change over time, the NLMS has developed two other levels of files for analysis purposes, “Extract” and “Analysis” files. Extract Files are ASCII, fixed format files that contain a specifically defined, sponsor selected set of variables. These variables are taken, unaltered, directly from the source Master File. This Reference Manual documents NLMS Extract and Analysis variables. To accommodate analysis, SAS data files have been developed directly from the Extract files. These are called Analysis Files. During the development of Analysis Files, variable standardization across cohorts is implemented. Variable modifications are documented in the Analysis File section of this Reference Manual. Extract files are constructed by selecting the same subset of information from each NLMS Master File. Extract Files are organized to the same fixed format for all files. Each record consists of 117 variables in 339-character strings. Information relevant to death is left blank for all nondeceased persons. Extract files include fail-edit records and the set of selected variables as they are defined on the source NLMS Master File. A four-digit file description and an alphabetic letter code are the basic file identifiers associated with each cohort. In addition to an Extract File for each cohort, a special Extract File combining data across all cohorts has been created to include the same extract file information but only for deceased persons. The file, called the "Numerator File," has the same format, variable content, and variable location as the studies’ Extract Files. For the specific purpose of conducting matches to the National Death Index, a set of files called “Match Files” have been developed. These files consist of only those variables required for matching to the National Death Index. They also include identifiers necessary to link identified matches back to relevant NLMS records after a match. In a few instances, additional records are generated with pseudo birth dates to permit matches that would otherwise not be possible because the original file only collected quarter of birth and not month of birth. For the 2013 match to the NDI, specialized files were created containing all mortality information taken from death certificates and NLMS control numbers to permit the linking of these data to other NLMS analytical files. These files are called "Master Death Files. Characteristics of these files are not summarized in a tabular format. For persons not identified as deceased by NLMS processes, Master Death Files contain only the control number of the person and mortality outcome indicators: IND213, IND206, IND201, IND291, IND289, IND287, IND285, and IND185.

National Longitudinal Mortality Study – Introduction
4
Table 1 below lists, for each cohort, the letter code and the four-digit numerical code associated with each file, a description of the survey or Census from which the data were obtained, and the NLMS official date used as the start of follow-up for the cohort. The cohorts 8603, 8703, 8803, 8903, 9009, 9203, and 9303 have multiple start dates on the file. See the description of FACTOR for discussion of this feature and the alternative start dates that should be used. Table 1. Cohort Notation 01 Cohort A 7303 March 1973 CPS January 1, 1979 02 Cohort B 7802 February 1978 CPS January 1, 1979 03 Cohort C 7903 March 1979 CPS March 18, 1979 04 Cohort D 8014 April 1980 CPS April 13, 1980 05 Cohort E 8024 1980 Census E Sample January 1, 1981 06 Cohort F 8008 August 1980 CPS August 17, 1980 07 Cohort G 8012 December 1980 CPS December 14, 1980 08 Cohort H 8103 March 1981 CPS March 15, 1981 09 Cohort I 8203 March 1982 CPS March 14, 1982 10 Cohort J 8303 March 1983 CPS March 13, 1983 11 Cohort K 8403 March 1984 CPS March 18, 1984 12 Cohort L 8503 March 1985 CPS March 17, 1985 13 Cohort M 8509 September 1985 CPS September 21, 1985 14 Cohort N 8603 March 1986 CPS March 25, 1986 15 Cohort O 8703 March 1987 CPS March 24, 1987 16 Cohort P 8803 March 1988 CPS March 22, 1988 17 Cohort Q 8903 March 1989 CPS March 28, 1989 18 Cohort R 9003 March 1990 CPS March 27, 1990 19 Cohort S 9103 March 1991 CPS March 26, 1991 20 Cohort T 9203 March 1992 CPS March 24, 1992 21 Cohort U 9303 March 1993 CPS March 23, 1993 22 Cohort V 9413 March 1994 CPS March 22, 1994 23 Cohort W 9503 March 1995 CPS March 28, 1995 24 Cohort X 9603 March 1996 CPS March 26, 1996 25 Cohort Y 9703 March 1997 CPS March 25, 1997 26 Cohort Z 9803 March 1998 CPS March 24, 1998 27 Cohort AA 9903 March 1999 CPS March 23, 1999 28 Cohort BB 0003 March 2000 CPS March 28, 2000 29 Cohort CC 0103 March 2001 CPS March 27, 2001 30 Cohort DD 0203 March 2002 CPS March 26, 2002 31 Cohort EE 0303 March 2003 CPS March 25, 2003 32 Cohort FF 0403 March 2004 CPS March 23, 2004 33 Cohort GG 0503 March 2005 CPS March 22, 2005 34 Cohort HH 0603 March 2006 CPS March 28, 2006 35 Cohort II 0703 March 2007 CPS March 27, 2007 36 Cohort JJ 0803 March 2008 CPS March 25, 2008 37 Cohort KK 0903 March 2009 CPS March 24, 2009 38 Cohort LL 1003 March 2010 CPS March 23, 2010 39 Cohort MM 1103 March 2011 CPS March 22, 2011
Tables 2 and 3 list basic frequencies for each of the cohort extract files. Included in Table 2 are the number of records on the file and the number of fail-edits (i.e. records lacking sufficient

National Longitudinal Mortality Study – Introduction
5
information to match to the NDI). Table 3 shows the number of deaths in each file by the year of the identifying match. Table 2. File Specific Frequencies for the 2013 NDI Match Study Records Fail-Edits 01 7303 A 131,213 1,027 02 7802 B 94,662 1,900 03 7903 C 43,098 1,518 04 8014 D 184,871 1,891 05 8024 E 124,345 143 06 8008 F 182,373 1,052 07 8012 G 177,765 2,881 08 8103 H 61,804 1,707 09 8203 I 81,480 1,599 10 8303 J 81,281 2,070 11 8403 K 80,732 3,234 12 8503 L 80,071 3,368 13 8509 M 144,698 25 14 8603 N 46,022 7 15 8703 O 45,271 7 16 8803 P 45,479 6 17 8903 Q 41,925 7 18 9003 R 44,285 6 19 9103 S 49,037 9 20 9203 T 43,550 5 21 9303 U 62,899 2,304 22 9413 V 103,286 728 23 9503 W 75,485 579 24 9603 X 65,555 666 25 9703 Y 66,394 654 26 9803 Z 66,173 732 27 9903 AA 69,175 98 28 0003 BB 69,322 633 29 0103 CC 78,937 105 30 0203 DD 79,522 110 31 0303 EE 154,405 26,401 32 0403 FF 151,309 26,773 33 0503 GG 161,257 29,419 34 0603 HH 134,463 11,803 35 0703 II 133,742 12,129 36 0803 JJ 130,055 11,228 37 0903 KK 132,629 18,749 38 1003 LL 131,468 18,441 39 1103 MM 130,061 16,318 Total 3,780,099 200,332
NOTES: 1. "Records" gives the total number of all records on the NLMS cohort Master File. 2. "Fail-edits" are the number of records on the file that failed edit and are,
therefore, ineligible for a match to the NDI. These records are not considered to be part of the NLMS for analytical purposes since mortality cannot be determined.

National Longitudinal Mortality Study – Introduction
6
Table 3. Mortality by Year of Match Mortality by Year of Match
Study 83 85 87 89 91 01 06 13 01 7303 A 3,000 5,250 7,410 9,684 11,967 22,790 28,289 38,790
02 7802 B 2,540 4,468 6,397 8,406 10,379 20,020 24,815 34,398 03 7903 C 712 1,331 1,916 2,509 3,178 6,306 7,800 10,844 04 8014 D 2,102 4,756 7,647 10,607 13,733 28,336 35,266 49,503 05 8024 E 1,168 3,585 6,128 8,517 11,147 23,468 30,715 41,760
06 8008 F 1,653 4,276 7,165 10,036 12,926 27,225 33,559 47,165 07 8012 G 1,165 3,576 6,147 8,855 11,690 25,191 31,173 43,681 08 8103 H 297 1,166 2,048 2,915 3,853 8,553 10,821 15,520 09 8203 I 0 949 2,076 3,280 4,486 10,678 13,647 19,614
10 8303 J 0 357 1,464 2,566 3,749 9,579 12,394 18,230 11 8403 K 0 0 872 1,956 3,117 8,850 11,710 17,386 12 8503 L 0 0 378 1,459 2,529 8,131 10,974 16,613 13 8509 M 0 0 0 0 3,658 12,593 16,548 24,885
14 8603 N 0 0 0 0 0 6,411 8,676 13,746 15 8703 O 0 0 0 0 0 5,606 7,902 12,857 16 8803 P 0 0 0 0 0 5,246 7,569 12,721 17 8903 Q 0 0 0 0 0 4,305 6,408 10,997
18 9003 R 0 0 0 0 0 4,000 6,144 10,868 19 9103 S 0 0 0 0 0 3,355 5,896 11,072 20 9203 T 0 0 0 0 0 2,908 4,883 9,634 21 9303 U 0 0 0 0 0 2,765 5,192 10,249
22 9413 V 0 0 0 0 0 3,086 6,160 12,498 23 9503 W 0 0 0 0 0 1,827 4,142 8,892 24 9603 X 0 0 0 0 0 1,105 2,929 7,005 25 9703 Y 0 0 0 0 0 722 2,489 6,483
26 9803 Z 0 0 0 0 0 259 1,888 5,885 27 9903 AA 0 0 0 0 0 0 1,350 5,628 28 0003 BB 0 0 0 0 0 0 999 6,046 29 0103 CC 0 0 0 0 0 0 685 5,083
30 0203 DD 0 0 0 0 0 0 320 4,824 31 0303 EE 0 0 0 0 0 0 0 5,410 32 0403 FF 0 0 0 0 0 0 0 4,571 33 0503 GG 0 0 0 0 0 0 0 4,229
34 0603 HH 0 0 0 0 0 0 0 3,598 35 0703 II 0 0 0 0 0 0 0 2,969 36 0803 JJ 0 0 0 0 0 0 0 2,268 37 0903 KK 0 0 0 0 0 0 0 1,658
38 1003 LL 0 0 0 0 0 0 0 1,048 39 1103 MM 0 0 0 0 0 0 0 379
Total 12,637 29,714 49,648 70,790 96,412 253,315 341,343 559,007
NOTE: "Mortality by Year of Match" gives mortality count according to the relevant mortality indicator appropriate to the data complete through the indicated year. Frequencies are cumulative totals through the match year shown.

National Longitudinal Mortality Study – Introduction
7
Features of the Documentation The purpose of this Reference Manual is to document the NLMS and describe the variables available to researchers for immediate analysis. A brief description and a summary of useful information about the location of each variable on the Extract File serve as the index to this manual. The Index gives a variable description, the variable name in eight or fewer characters, page location in the Reference Manual of the full variable discussion in both the Extract and Analysis files, variable location on the Extract File, and variable edit status. The eight-digit label will be used in all NLMS software to refer to the variable and it will serve as the Analysis Files SAS dataset variable name. The location of each variable on the Extract File is identified in the index by its actual location in characters under the heading "LOCATION”. The size of the variable is the number of characters reserved on the record for the variable. Throughout the text there are links that point from the index to the Extract and Analysis versions of every variable and then back to the index. There are also links between the Extract and Analysis file versions of each variable. Running headers indicate the general category of variables as well as whether the reader is in the Extract or Analysis portion of the manual. The body of the Reference Manual contains a full description of each Extract file variable. The descriptive portion of the text is identified by the expression "DESCRIPTION." Possible codes and frequencies on relevant files are identified for each variable. Any restrictions or special conditions are also noted. When possible, an attempt has been made during the construction of Analysis Files to standardize the original master file codes so that variable values are consistent across cohorts. If not documented in the Analysis File section of the Reference Manual, no standardization has been made for the variable and Analysis File frequencies would be as indicated in the Extract File description portion of this manual. File-specific variable frequencies have been included in this Reference Manual along with the variable descriptions, for all variables for which the number of levels of the variable was small enough to construct a display table. Frequencies are shown for legitimate as well as illegitimate codes. Entries in this documentation are intended to reflect all entries on each file for all basic variables in the study. Comments on File Definition Not all records available in the respective CPS surveys or the Census sub-sample are part of the NLMS study because some records lack the required information to match to the National Death Index. These records are identified as failed edit records. For each match of NLMS records to the NDI, one or two indicator variables are created. These indicator variables are identified in the “Fail-Edit and Mortality Indicators” section of the Index (p10). A value of 0 or 1 for these indicator variables indicates a fail edit record for that match to the NDI. Fail-edit frequencies for each cohort for IND213 are shown in Table 2.

National Longitudinal Mortality Study – Introduction
8
For a small percentage of records in cohorts A, B, C, D, and F, a link could not be made between the data file record and the control file, the source of the NLMS Master File information. As a result, these records consist of control file information only and may not include desirable demographic or socio-economic information of interest to an analysis. The total number of records that did not link is also shown in Table 2. The frequency of "unknown" responses for variables described in this manual may include frequencies for records that did not link. Three Files with Special Restrictions Cohort A, based on the 1973 CPS survey, consists of persons identified as alive six years before the beginning of the National Death index in 1979. The NLMS is unable to determine which persons in this cohort died during the approximately six-year interim period between the end of interview in March 1973 and January 1, 1979, the starting date of the National Death Index. For most analyses, tables constructed using this file should not be included or should exclude persons older than 64 years of age in 1979. This would correspond to removing from analysis those persons whose actual age on the file is more than 58 years. By deleting persons 58 years of age or older, the persons having the greatest chance of dying during the 6 year period before the start of mortality follow-up would not be considered for analysis. A similar problem also applies to the February 1978 cohort, Cohort B. In this case the lack of follow-up potential is for the interim period from February 1978 to January 1979, a period of approximately 10 months. In 2008 a determination of mortality for records in the 7303 and 7802 cohorts was made by comparing these files to Social Security Administration NUMIDENT files to identify mortality prior to 1979. Mortality identified in this process is identified by an IND213 value of “5.” Records identified in this way should be considered as failed edits and dropped from analyses. Records in these cohorts not identified by fail edit status of 0, 1, or 5 would be eligible for analysis and follow-up beginning in 1979. Due to the lengthy follow-up period required to complete the 1980 Census, records for persons in the NLMS 1980 Census cohort, Cohort E who died in 1980 were considered to be invalid and the start of follow-up for this cohort was set to January 1, 1981. The September 1985 "Tobacco Use" File At the conclusion of the 1989 match to the NDI a new file, the September 1985 CPS file (cohort M), was added to the NLMS list of study cohorts. This file was constructed for the specific purpose of studying the tobacco use and health status variables obtained in the September 1985 CPS interview. The file consists of the full 155-character Extract File record, as for all other cohorts in the NLMS, with an appended section that contains the tobacco use and health status information, an additional 42 characters. Tallies and descriptions of variables occupying the first 155 characters have been incorporated into the main portion of the Reference Manual. The tobacco use and health status variables are documented in Appendix A as a

National Longitudinal Mortality Study – Introduction
9
regular continuation of this Reference Manual but with warnings that this information is only available on the 8509 file. Creation of the Analysis File SAS Datasets SAS datasets, derived from each of the NLMS Extract files described in Table 1, have been created for analysis purposes. These files are referred to as, “Analysis Files.” In the process of creating analysis files, a variety of edits were performed to both standardize variables and expedite analyses. The results of these edits are found in the Analysis File section of this documentation. Three basic types of edits may be performed on a variable: simple edits, are recoding of variables to a missing value code because of an inability to collect data; invalid entry edits, are recodings of obvious data keying errors to missing; recoding edits , edits made to standardize variable values across files. If the edits are simple or invalid entry, frequency counts are as shown in the body of the Reference Manual for the meaningful levels of the variables. For recoding edits, the final frequency distribution is given in the Analysis File. A set of columns in the Reference Manual index, labeled, “EDITS,” indicates any edits performed, and these indications are echoed in the Extract and Analysis File entries for each variable. Confidentiality of NLMS Data Title 13 of the United States Code (U.S.C.) provides the assurance of confidentiality of Census Bureau data. As such, NLMS operational procedures carefully follow well-defined practices designed to maintain the confidentiality of personal records as required by Title 13. These practices include the prevention of disclosure through the elimination of sparse cells in publications, the prohibited release of small-area geographical information on the NLMS public-use file, the use of an individually assigned NLMS control number to identify records instead of the use of personal identifiers for these purposes, and the restriction of persons having direct access to the NLMS database. A violation of Title 13 includes assessment of severe penalties including a prison term of up to 5 years and/or fines of up to $250,000, for any individual found guilty of releasing confidential information. In addition, any data acquired for NLMS purposes from an external agency is acquired under strict confidentiality protections and agreements that govern its use and subsequent release.

National Longitudinal Mortality Study – Index
10
NLMS Index and Record Format as of July 1, 2014 Return to TOC
PAGE NO. EXTRACT INFO EDITS
ITEM NO.
DESCRIPTION VARIABLE NAME EXTRACT ANALYSIS LOCATION SIZE SIMPLE INVALID
ENTRY RECODE
File and Survey
Variables
1 NDI/CPS Control No. CCNUM 15 NA 1 10
2 Code for Specific Master File FILE 17 NA 130 2
3 Exposure Factor in Years (X 100) FACTOR 18 NA 30 4
4 Serial # in CPS/ Control # in Census SERN 20 NA 180 2
5 Household ID No. HHID 21 NA 24 5 6 SSN Present or Absent
on NDI File SSNYN 22 NA 114 1 7 Validated SSN VALIDSSN 23 NA 239 1 8 Match Key/SSN
Collection Month MATCHKEY 25 NA 156 1 9 Start Date START 26 NA 157 10
Fail-Edit and Mortality
Indicators
10 Match Status in 1983 Match IND1 28 NA 69 1
11 Death Indicator in 1983 Match IND2 29 NA 70 1
12 Match Status in 1985 Match IND185 30 NA 129 1
13 Death Indicator in 1985 Match IND285 31 NA 134 1
14 Death Indicator in 1987 Match IND287 32 NA 139 1
15 Death Indicator in 1989 Match IND289 33 NA 140 1
16 Death Indicator in 1991 Match IND291 34 NA 141 1
17 Death Indicator in 2001 Match IND201 35 NA 142 1
18 Death Indicator in 2006 Match IND206 36 NA 261 1
19 Death Indicator in 2013 Match IND213 37 NA 300 1
20 Alive or Dead in the 2006 Match LIFE NA 223 NA NA
21 Valid for Analysis as of 2006 Match VALID NA 224 NA NA

National Longitudinal Mortality Study – Index
11
PAGE NO. EXTRACT INFO EDITS
ITEM NO. DESCRIPTION VARIABLE
NAME EXTRACT ANALYSIS LOCATION SIZE SIMPLE INVAID ENTRY RECODE
Geography
22 Census Geographical Division DIV 40 225 34 1 X
23 State within Division STATE 42 225 35 1 X
24 Division-State Concatenated STATER NA 226 NA NA X
25 FIPS State Code FIPSSTATE NA 231 NA NA
26 FIPS County Code COUNTY 44 NA 15 3
27 CPS PSU for Surveys/ "DO" for Census PSU 45 NA 171 5
28 PSU Type PSUTYPE 46 NA 240 1
29 CPS Segment for Surveys/"ED" for Census SEG 48 NA 176 4
30 Urban-Rural Status URB 49 237 11 1 X
31 SMSA Status SMSAST 51 237 12 1 X
32 SMSA Rank SMSAR 53 237 36 2 X
33 Urban/Rural Farm/Rural Nonfarm LAND 55 238 13 1 X
Age, Birth Information,
and Gender
34 Age in Years at Time of Survey AGE 57 239 50 2 X X
35 Century of Birth CENT 59 NA 52 1 36 Month of Birth MOB 60 249 112 2 X X 37 Year of Birth YOB 63 250 53 2 X 38 Final Sex from Multiple
Sources SEXF 65 251 185 1 X
39 Date of Birth — from SSA Numident DOBN 67 NA 272 10
40 Citizenship Group CITIZEN 68 251 323 1 X
41 Place of Birth POB 69 251 55 2 X
42 Place of Birth — Final POBF 71 NA 288 3 43 Three-Way
Classification of POBF POBFCAT3 73 NA 291 1
44 Four-Way Classification of POBF POBFCAT4 74 NA 292 1
45 Five-Way Classification of POBF POBFCAT5 75 NA 293 1
46 Region of Birth REGIONOB 76 NA 294 1 47 Region of Birth
Isolating the US REGIONOBG 77 NA 295 1
48 Region of Birth Isolating Mexico REGIONOBM 78 NA 296 2
49 Reg. Birth Iso. Mexico, Splits Europe REGIONOBE 79 NA 298 2

National Longitudinal Mortality Study – Index
12
PAGE NO. EXTRACT INFO EDITS
ITEM NO. DESCRIPTION VARIABLE
NAME EXTRACT ANALYSIS LOCATION SIZE SIMPLE INVAID ENTRY RECODE
Race and Ethnicity
50 Race RACE 80 NA 60 1
51 Race Recode — White/Black/Other RACER 83 254 61 1 X X X
52 Race Expanded w/ American Indian & Asian RACEX 86 256 132 1 X X X
53 Detailed Race 2000 CPS Redesign RACEPRDT 89 258 321 2 X
54 Asian or Pacific Islander, 10 categ. CATIAPI 91 NA 169 2
55 Hispanic Origin HISP 93 261 57 1 X X
56 Ethnic Origin or Descent ORIGIN 95 263 58 2 X
Marital Status/
Household Relationship
57 Marital Status MS 99 265 64 1 X
58 Relationship to Reference Person RELTRF 103 267 20 1 X
59 Relationship to Household Head RELTHD 105 269 21 1 X
Education
60 Education EDUC 108 270 66 2 X
Work Force Variables
61 Employment Status ESR 112 273 49 1 X X
62 Industry Using 1990 Codes IND1990 114 275 39 3 X X
63 Major industry Using 1990 Codes MAJIND90 116 276 42 2 X X
64 Industry Using 2007 Codes IND2007 119 279 324 4 X
65 Major Industry Using 2007 Codes MAJIND2007 121 280 328 2 X
66 Occupation Using 1990 Codes OCC1990 124 282 44 3 X X
67 Major Occupation Using 1990 Codes MAJOCC90 126 283 47 2 X X
68 Occupation Using 2000 Codes OCC2000 129 286 330 4 X X
69 Major Occupation Using 2000 Codes MAJOCC2000 131 287 334 2 X X
70 Class of Worker CLASSWKR 133 289 182 2 X X
71 Class of Worker, Recode RCOW1 137 292 184 1 X X

National Longitudinal Mortality Study – Index
13
PAGE NO. EXTRACT INFO EDITS
ITEM NO.
DESCRIPTION VARIABLE NAME EXTRACT ANALYSIS LOCATION SIZE SIMPLE INVAID
ENTRY RECODE
Other Demographics
72 Veterans Status VTSTAT 139 294 14 1 X X 73 Migration MIGRAT 141 296 167 2 X X
Family Income and
Poverty
74 Adjusted income FMINC80 146 299 29 1 X X
75 Family Income in Dollars FMINCOME 148 NA 104 8
76 Family Income Category FMINC90 149 301 143 2 X 77 Family Income Category FINC8090 151 302 145 1 X X
78 Adjusted Income in 1990 Dollars DOLINC90 153 NA 146 8
79 Percent of Poverty Level POVPCT90 154 304 154 2 X
Household
Characteristics
80 Number in Household HHNUM 158 305 22 2 X 81 Type of Living Quarters LIVTYP 162 306 18 2 X X
82 House Owned or Rented RENTER 165 308 241 1 X
Health Insurance and Health Status
83 Health Insurance Status HISTATUS 166 NA 186 1
84 Health Insurance Type HITYPE 168 NA 187 1
85 General Health HEALTH 170 NA 188 2
Tobacco-Use Variables
86 Smoked More Than 100 Cigarettes SMOK100 171 NA 242 1
87 Age Started Smoking AGESMK 172 NA 243 2
88 Smoking Frequency SMOKER 176 NA 245 2
89 Average Cigarettes Daily AVNMCIGS 177 NA 247 2
90 Smoking Follow-up Start (File) SMKFLSTR 180 NA 249 2
91 Smoking Follow-up Start Date SMKSTART 183 NA 251 10
92 Cigarette Smoking Status SMOKSTAT 185 311 336 2 X X
93 Rules for Smoking Cigarettes in the Home SMOKHOME 186 311 338 2 X X
94 Ever Use Smokeless Tobacco EVERUSE 187 NA 331 5
95 Current Use Smokeless Tobacco CURRUSE 190 NA 306 5

National Longitudinal Mortality Study – Index
14
PAGE NO. EXTRACT INFO EDITS
ITEM NO. DESCRIPTION VARIABLE
NAME EXTRACT ANALYSIS LOCATION SIZE SIMPLE INVAID ENTRY RECODE
Death Certificate
Information
96 Death Certificate Number DCNUM 193 NA 84 6
97 State of Death SOD 194 NA 81 3 98 Date of Death DOD 195 NA 71 6 99 ICD-9,ICD-10 Underlying
Cause of Death UCAUSE 203 312 77 4 X
100 First 3 Characters of Underlying Cause CAUSE3 NA 312 NA NA
101 113 Selected Causes of Death CAUSE113 NA 313 266 4
102 Hospital Type HOSP 206 NA 115 1 103 Did Death Occur in a
Hospital HOSPD 208 NA 116 1
104 Time from Onset to Cause of Death INTERV 210 NA 117 1
Case Weights
105 Weight — Race Variable Used WGT1 213 NA 191 12.5
106 Weight — Race Used, EOTF Included WGT2 214 NA 203 12.5
107 Weight — Race Not Used WGT3 215 NA 215 12.5 108 Weight — Race Not Used,
EOTF Included WGT4 216 NA 227 12.5

National Longitudinal Mortality Study – Extract File: File and Survey Variables
15
EXTRACT FILE Variable Description and Codes
July 1, 2014
FILE AND SURVEY VARIABLES
1. NDI/CPS Control Number CCNUM Return to Index EDITS: None DESCRIPTION: Unique NDI identification number. First four digits represent the file but are not necessarily a unique code for the file. The digits for each file and the total records counts for the file are: AVAILABLE FILES: All files 7303 March 1973 CPS file (131,213) 7802 February 1978 CPS file (94,662) 790_ March1 1979 CPS file (43,098) 8014 April 1980 CPS file (184,871) 8024 1980 Census E-sample file (124,345) 8008 August 1980 CPS file (182,373) 8012 December 1980 CPS file (177,765) 810_ March1 1981 CPS file (61,804) 820_ March1 1982 CPS file (81,480) 830_ March1 1983 CPS file (81,281) 840_ March1 1984 CPS file (80,732) 850_ March1 1985 CPS file (80,071) 8603 March 1986 CPS file (46,022) 8703 March 1987 CPS file (45,271) 8803 March 1988 CPS file (45,479) 8903 March 1989 CPS file (41,925) 9003 March 1990 CPS file (44,285) 9103 March 1991 CPS file (49,037) 9203 March 1992 CPS file (43,550) 9303 March 1993 CPS file (62,899) 9413 March 1994 CPS file (103,286) 9503 March 1995 CPS file (75,485) 9603 March 1996 CPS file (65,555) 9703 March 1997 CPS file (66,394) 9803 March 1998 CPS file (66,173) 9903 March 1999 CPS file (69,175) 0003 March 2000 CPS file (69,322) 0103 March 2001 CPS file (78,937) 0203 March 2002 CPS file (79,522) 0303 March 2003 CPS file (154,405) 0403 March 2004 CPS file (151,309) 0503 March 2005 CPS file (161,257) 0603 March 2006 CPS file (134,463) 0703 March 2007 CPS file (133,742) 0803 March 2008 CPS file (130,055) 0903 March 2009 CPS file (132,629) 1003 March 2010 CPS file (131,468) 1103 March 2011 CPS file (130,061)

National Longitudinal Mortality Study – Extract File: File and Survey Variables
16
1The four-digit code for these six cohorts is not unique within the cohort. Generally, throughout the documentation, the labels will refer to the year and month in the standard format for these files, i.e. 7903, 8103, 8203, 8303, 8403, and 8503 respectively.

National Longitudinal Mortality Study – Extract File: File and Survey Variables
17
2. Code for Specific Master File FILE Return to Index EDITS: None DESCRIPTION: A numerical code to identify the cohort. NOTE: Values assigned to the variable FILE identify the file and represent a chronological ordering of the files. AVAILABLE FILES: All files CODES for files: All files 01 — 7303 or 'A' cohort 02 — 7802 or 'B' cohort 03 — 7903 or 'C' cohort 04 — 8014 or 'D' cohort 05 — 8024 or 'E' cohort 06 — 8008 or 'F' cohort 07 — 8012 or 'G' cohort 08 — 8103 or 'H' cohort 09 — 8203 or 'I' cohort 10 — 8303 or 'J' cohort 11 — 8403 or 'K' cohort 12 — 8503 or 'L' cohort 13 — 8509 or 'M' cohort 14 — 8603 or 'N' cohort 15 — 8703 or 'O' cohort 16 — 8803 or 'P' cohort 17 — 8903 or 'Q' cohort 18 — 9003 or 'R' cohort 19 — 9103 or 'S' cohort 20 — 9203 or 'T' cohort 21 — 9303 or 'U' cohort 22 — 9413 or 'V' cohort 23 — 9503 or 'W' cohort 24 — 9603 or 'X' cohort 25 — 9703 or 'Y' cohort 26 — 9803 or 'Z' cohort 27 — 9903 or ‘AA’ cohort 28 — 0003 or ‘BB’ cohort 29 — 0103 or ‘CC’ cohort 30 — 0203 or ‘DD’ cohort 31 — 0303 or 'EE' cohort 32 — 0403 or 'FF' cohort 33 — 0503 or ‘GG’ cohort 34 — 0603 or ‘HH’ cohort 35 — 0703 or ‘II’ cohort 36 — 0803 or ‘JJ’ cohort 37 — 0903 or ‘KK’ cohort 38 — 1003 or ‘LL’ cohort 39 — 1103 or ‘MM’ cohort

National Longitudinal Mortality Study – Extract File: File and Survey Variables
18
3. Exposure Factor in Years (X 100) FACTOR Return to Index Return to Extract File Introduction EDITS: None DESCRIPTION: A constant determined for each file giving the follow-up time for the record, in years X 100, during the 1979–2011 follow-up period. NOTE: For some cohorts, subsets of records have different start times than the majority of records of the cohort. These alternate start times exist because Social Security Numbers were not collected during the standard March visit normally used by the NLMS. Instead, the Social Security Number was collected at a different household visit, usually a year later. In order to increase the number of records on follow-up in the NLMS, the Social Security Number was taken from the survey in which it was collected. The table below identifies these alternate factors and alternative start dates. These factors and associated start dates should be used as required for all analyses involving follow-up. Cohort Alternative Start Date 8603 March 24, 1987 8703 March 22, 1988 8803 March 28, 1989 8903 March 27, 1990 9003 March 26, 1991 9203 March 23, 1993 9303 January 25, 1994 9303 February 22, 1994 9303 March 22, 1994 AVAILABLE FILES: All files FREQUENCIES:
Cohort Start Date Factor Frequency Cohort Total
7303 01/01/79 3300 131,213 7802 01/01/79 3300 94,662 7903 03/18/79 3279 43,098 8014 04/13/80 3172 184,871 8024 01/01/81 -- 124,345 8008 08/17/80 3137 182,373 8012 12/14/80 3105 177,765 8103 03/15/81 3080 61,804 8203 03/14/82 2980 81,480 8303 03/13/83 2880 81,281 8403 03/18/84 2779 80,732 8503 03/17/85 2679 80,071 8509 09/21/85 2628 144,698
8603 03/25/86 2577 44,059 8603 03/24/87 2477 1,963 46,022
8703 03/24/87 2477 43,301 8703 03/22/88 2378 1,970 45,271

National Longitudinal Mortality Study – Extract File: File and Survey Variables
19
Cohort (cont.) Start Date Factor Frequency Cohort
Total 8803 03/22/88 2378 43,564 8803 03/28/89 2276 1,915 45,479 8903 03/28/89 2276 39,945 8903 03/27/90 2176 1,980 41,925
9003 03/27/90 2176 42,190 9003 03/26/91 2077 2,095 44,285
9103 03/26/91 2077 49,037
9203 03/24/92 1977 41,629 9203 03/23/93 1877 1,921 43,550
9303 03/23/93 1877 59,095 9303 01/25/94 1793 104 9303 02/22/94 1785 49 9303 03/22/94 1778 3,651 62,899
9413 03/22/94 1778 103,286 9503 03/28/95 1676 75,485 9603 03/26/96 1577 65,555 9703 03/25/97 1477 66,394 9803 03/24/98 1377 66,173 9903 03/23/99 1278 69,175 0003 03/28/00 1176 69,322 0103 03/27/01 1076 78,937 0203 03/26/02 977 79,522 0303 03/25/03 877 154,405 0403 03/23/04 777 151,309 0503 03/22/05 677 161,257 0603 03/28/06 576 134,463 0703 03/27/07 476 133,742 0803 03/25/08 377 130,055 0903 03/24/09 277 132,629 1003 03/23/10 177 131,468 1103 03/22/11 78 130,061

National Longitudinal Mortality Study – Extract File: File and Survey Variables
20
4. Serial # in CPS/Control # in Census SERN Return to Index EDITS: None DESCRIPTION: Identifies household serial number for all CPS records or the Census control number for all census records. There are no blank or unknown entries for the variable. AVAILABLE FILES: All files

National Longitudinal Mortality Study – Extract File: File and Survey Variables
21
5. Household Identification Number HHID Return to Index EDITS: None DESCRIPTION: The household identification number is a unique five-digit number assigned to every member of a household. This variable is used to link household information to the person records of persons in the household for cohorts 8603 chronologically up through 1103. NOTE: For files 7303, 7802, 8014, 8008, and 8012 HHID is computed using PSU, SEGMENT, and SERIAL NUMBER to identify households, see notes for variable 10, HHNUM. The identification number assigned is sequential starting with the first household on the file. For files 7903, 8103, 8203, 8303, 8404, and 8503 HHID is taken directly from the CPS record. For cohorts 8603 through 1103, HHID is the "household sequence number" on the ASCII Master Files, an 8-position number. Location varies from master file to master file. NOT AVAILABLE: 8024

National Longitudinal Mortality Study – Extract File: File and Survey Variables
22
6. SSN Present or Absent on NDI File SSNYN Return to Index EDITS: None DESCRIPTION: This variable indicates the presence or absence of a Social Security number on Census records in the matches to the NDI. For older cohorts, prior to 2006, the Social Security number was collected, voluntarily, from survey participants. For later files, the SSN was obtained through administrative record processing for survey records for which the interviewees did not opt out of the use of their information for administrative record research purposes. The value is '0' if SSN is blank, all zeroes, or bogus, e.g. 111-22-3333. AVAILABLE FILES: All files CODES for files: All files 0 — Social Security Number is missing 1 — Social Security Number is present FREQUENCIES: SSNYN\counts: 7303 7802 7903 8014 8024 8008 8012 8103 8203 8303 0 56,594 26,986 20,856 71,074 13,569 75,638 79,522 26,950 36,764 37,179 1 74,619 67,676 22,242 113,797 110,776 106,735 98,243 34,854 44,716 44,102 Total 131,213 94,662 43,098 184,871 124,345 182,373 177,765 61,804 81,480 81,281 SSNYN\counts: 8403 8503 8509 8603 8703 8803 8903 9003 9103 9203 0 36,966 36,317 144,695 5,524 5,377 5,623 5,023 5,160 5,818 5,230 1 43,766 43,754 3 40,498 39,894 39,856 36,902 39,125 43,219 38,320 Total 80,732 80,071 144,698 46,022 45,271 45,479 41,925 44,285 49,037 43,550 SSNYN\counts: 9303 9413 9503 9603 9703 9803 9903 0003 0103 0203 0 19,485 58,178 41,915 37,256 39,501 38,357 42,712 43,147 49,243 50,439 1 43,414 45,108 33,570 28,299 26,893 27,816 26,463 26,175 29,694 29,083 Total 62,899 103,286 75,485 65,555 66,394 66,173 69,175 69,322 78,937 79,522 SSNYN\counts: 0303 0403 0503 0603 0703 0803 0903 1003 1103 0 51,431 58,592 63,859 21,229 22,330 20,769 20,819 20,318 18,237 1 102,974 92,717 97,398 113,234 111,412 109,286 111,810 111,150 111,824 Total 154,405 151,309 161,257 134,463 133,742 130,055 132,629 131,468 130,061

National Longitudinal Mortality Study – Extract File: File and Survey Variables
23
7. Validated SSN VALIDSSN Return to Index EDITS: None DESCRIPTION: This variable indicates whether or not the Social Security number on the CPS or Census record has been validated against Social Security Administration files through the use of PVS in the Center for Administrative Records Research and Applications (CARRA), and determined to be the correct Social Security Number for the person. AVAILABLE FILES: All files CODES for files: 7303-0503 blank — Record not submitted for validation, not updated through PVS 0 — CPS SSN not validated through PVS 1 — CPS SSN validated through PVS FREQUENCIES: VALIDSSN\counts: 7303 7802 7903 8014 8024 8008 8012 8103 8203 8303 blank 45,443 13,901 17,636 55,283 226 60,751 66,051 22,131 30,574 31,279 0 2,071 7,691 1,624 8,037 7,658 9,489 10,426 3,347 3,887 4,286 1 83,699 73,070 23,838 121,551 116,461 112,133 101,288 36,326 47,019 45,716 Total 131,213 94,662 43,098 184,871 124,345 182,373 177,765 61,804 81,480 81,281 VALIDSSN\counts: 8403 8503 8509 8603 8703 8803 8903 9003 9103 9203 blank 31,113 30,433 . 194 71 51 71 74 3,391 106 0 4,823 4,836 20,640 939 342 366 309 422 30,526 835 1 44,796 44,802 124,058 44,889 44,858 45,062 41,545 43,789 15,120 42,609 Total 80,732 80,071 144,698 46,022 45,271 45,479 41,925 44,285 49,037 43,550 VALIDSSN\counts: 9303 9413 9503 9603 9703 9803 9903 0003 0103 0203 blank 14,223 39,592 37,510 33,450 35,886 34,639 32,093 31,416 16,573 18,304 0 3,667 17,504 2,674 1,863 1,909 1,982 976 5,272 906 934 1 45,009 46,190 35,301 30,242 28,599 29,552 36,106 32,634 61,458 60,284 Total 62,899 103,286 75,485 65,555 66,394 66,173 69,175 69,322 78,937 79,522 VALIDSSN\counts: 0303 0403 0503 blank 50,365 57,928 62,306 0 950 994 1,031 1 103,090 92,387 97,920 Total 154,405 151,309 161,257 NOTE: For these files, the assigned SSN was obtained originally only through the application of PVS. CODES for files: 0603–1103 blank — SSN not present on record 1 — SSN obtained for record and validated through PVS

National Longitudinal Mortality Study – Extract File: File and Survey Variables
24
FREQUENCIES: VALIDSSN\counts: 0603 0703 0803 0903 1003 1103 blank 20,048 21,016 20,769 20,819 20,318 18,237 1 114,415 112,726 109,286 111,810 111,150 111,824 Total 134,463 133,742 130,055 132,629 131,468 130,061
National Longitudinal Mortality Study – Extract File: File and Survey Variables
25
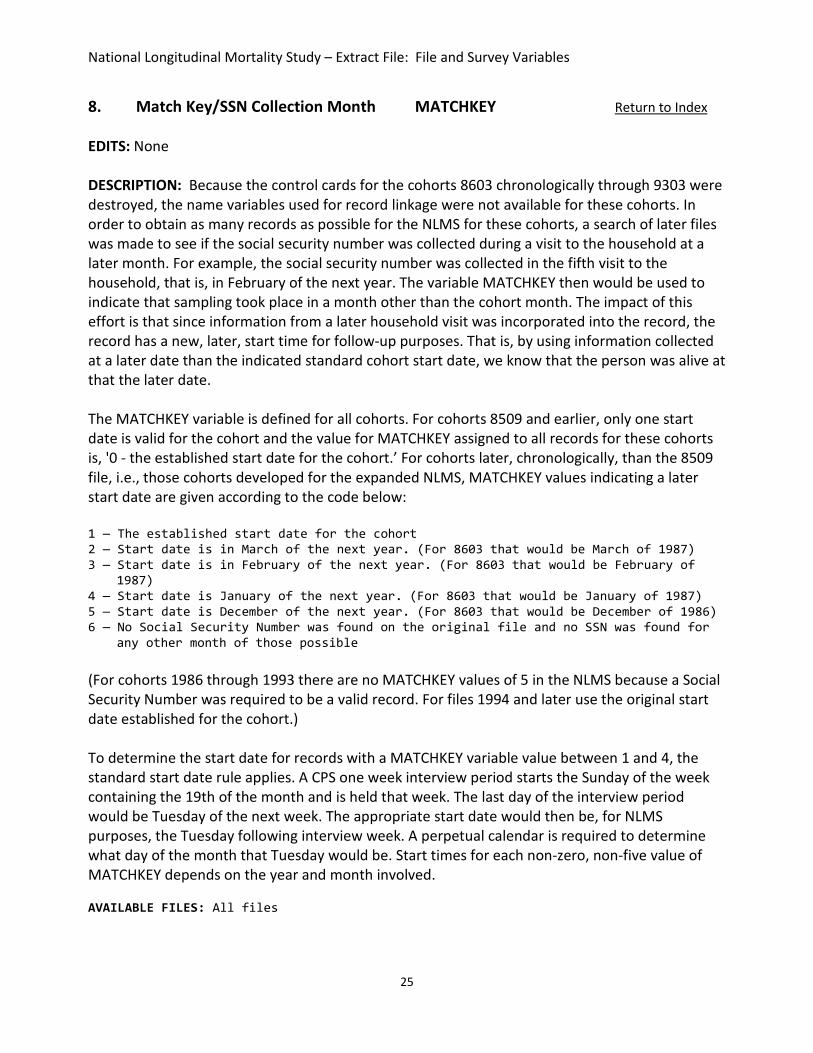
8. Match Key/SSN Collection Month MATCHKEY Return to Index EDITS: None DESCRIPTION: Because the control cards for the cohorts 8603 chronologically through 9303 were destroyed, the name variables used for record linkage were not available for these cohorts. In order to obtain as many records as possible for the NLMS for these cohorts, a search of later files was made to see if the social security number was collected during a visit to the household at a later month. For example, the social security number was collected in the fifth visit to the household, that is, in February of the next year. The variable MATCHKEY then would be used to indicate that sampling took place in a month other than the cohort month. The impact of this effort is that since information from a later household visit was incorporated into the record, the record has a new, later, start time for follow-up purposes. That is, by using information collected at a later date than the indicated standard cohort start date, we know that the person was alive at that the later date. The MATCHKEY variable is defined for all cohorts. For cohorts 8509 and earlier, only one start date is valid for the cohort and the value for MATCHKEY assigned to all records for these cohorts is, '0 - the established start date for the cohort.’ For cohorts later, chronologically, than the 8509 file, i.e., those cohorts developed for the expanded NLMS, MATCHKEY values indicating a later start date are given according to the code below: 1 — The established start date for the cohort 2 — Start date is in March of the next year. (For 8603 that would be March of 1987) 3 — Start date is in February of the next year. (For 8603 that would be February of
1987) 4 — Start date is January of the next year. (For 8603 that would be January of 1987) 5 — Start date is December of the next year. (For 8603 that would be December of 1986) 6 — No Social Security Number was found on the original file and no SSN was found for
any other month of those possible (For cohorts 1986 through 1993 there are no MATCHKEY values of 5 in the NLMS because a Social Security Number was required to be a valid record. For files 1994 and later use the original start date established for the cohort.) To determine the start date for records with a MATCHKEY variable value between 1 and 4, the standard start date rule applies. A CPS one week interview period starts the Sunday of the week containing the 19th of the month and is held that week. The last day of the interview period would be Tuesday of the next week. The appropriate start date would then be, for NLMS purposes, the Tuesday following interview week. A perpetual calendar is required to determine what day of the month that Tuesday would be. Start times for each non-zero, non-five value of MATCHKEY depends on the year and month involved. AVAILABLE FILES: All files
National Longitudinal Mortality Study – Extract File: File and Survey Variables
26
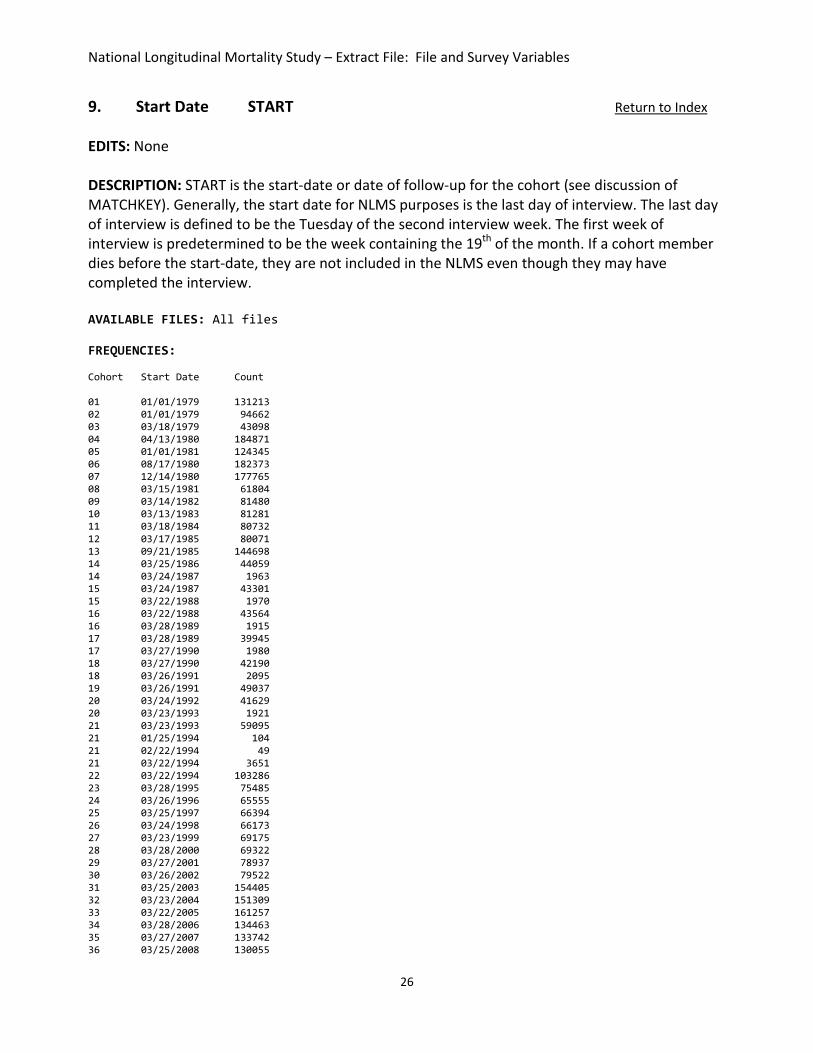
9. Start Date START Return to Index EDITS: None DESCRIPTION: START is the start-date or date of follow-up for the cohort (see discussion of MATCHKEY). Generally, the start date for NLMS purposes is the last day of interview. The last day of interview is defined to be the Tuesday of the second interview week. The first week of interview is predetermined to be the week containing the 19th of the month. If a cohort member dies before the start-date, they are not included in the NLMS even though they may have completed the interview. AVAILABLE FILES: All files FREQUENCIES: Cohort Start Date Count 01 01/01/1979 131213 02 01/01/1979 94662 03 03/18/1979 43098 04 04/13/1980 184871 05 01/01/1981 124345 06 08/17/1980 182373 07 12/14/1980 177765 08 03/15/1981 61804 09 03/14/1982 81480 10 03/13/1983 81281 11 03/18/1984 80732 12 03/17/1985 80071 13 09/21/1985 144698 14 03/25/1986 44059 14 03/24/1987 1963 15 03/24/1987 43301 15 03/22/1988 1970 16 03/22/1988 43564 16 03/28/1989 1915 17 03/28/1989 39945 17 03/27/1990 1980 18 03/27/1990 42190 18 03/26/1991 2095 19 03/26/1991 49037 20 03/24/1992 41629 20 03/23/1993 1921 21 03/23/1993 59095 21 01/25/1994 104 21 02/22/1994 49 21 03/22/1994 3651 22 03/22/1994 103286 23 03/28/1995 75485 24 03/26/1996 65555 25 03/25/1997 66394 26 03/24/1998 66173 27 03/23/1999 69175 28 03/28/2000 69322 29 03/27/2001 78937 30 03/26/2002 79522 31 03/25/2003 154405 32 03/23/2004 151309 33 03/22/2005 161257 34 03/28/2006 134463 35 03/27/2007 133742 36 03/25/2008 130055

National Longitudinal Mortality Study – Extract File: File and Survey Variables
27
37 03/24/2009 132629 38 03/23/2010 131468 39 03/22/2011 130061

National Longitudinal Mortality Study – Extract File: Fail-Edit and Mortality Indicator Variables
28
FAIL-EDIT AND MORTALITY INDICATOR VARIABLES
10. Match Status Indicator IND1 Return to Index EDITS: None DESCRIPTION: Variable indicating status of record when matched to the National Death Index in 1983. NOT AVAILABLE: 8203–1103 CODES for files: 7303–8103 0 — Record failed edit at Census in 1983 1 — Record failed edit at NCHS in 1983 2 — Record was not a hit in 1983 NDI match 3 — Record was a hit in 1983 NDI match FREQUENCIES: IND1\counts: 7303 7802 7903 8014 8024 8008 8012 8103 0 1,013 1,809 1,444 1,813 113 1,004 2,866 968 1 14 74 49 423 258 329 13 700 2 122,417 86,255 39,627 174,117 122,658 173,119 167,616 57,897 3 7,769 6,524 1,978 8,518 1,316 7,921 7,270 2,239 Total 131,213 94,662 43,098 184,871 124,345 182,373 177,765 61,804

National Longitudinal Mortality Study – Extract File: Fail-Edit and Mortality Indicator Variables
29
11. Observed Death Indicator IND2 Return to Index EDITS: None DESCRIPTION: Indicates whether a record was a death or not in 1983 match to the NDI. NOTE: Deaths occurring in 1980 are excluded from the 8024 file. NOT AVAILABLE: 8203–1103 CODES for files: 7303–8103 0 — Record failed edit at Census or NCHS 1 — Not a death (alive) in 1983 NDI match 2 — Death in 1979, 1980 or 1981 FREQUENCIES: IND2\counts: 7303 7802 7903 8014 8024 8008 8012 8103 0 1,027 1,883 1,493 2,236 371 1,333 2,879 1,668 1 127,186 90,239 40,893 180,533 122,806 179,387 173,721 59,839 2 3,000 2,540 712 2,102 1,168 1,653 1,165 297 Total 131,213 94,662 43,098 184,871 124,345 182,373 177,765 61,804

National Longitudinal Mortality Study – Extract File: Fail-Edit and Mortality Indicator Variables
30
12. Match Status Indicator (1985) IND185 Return to Index EDITS: None DESCRIPTION: Variable indicating status of record when matched to the National Death Index in 1985. NOT AVAILABLE: 8403–1103 CODES for files: 7303–8303 0 — Record failed edit at Census in 1985 1 — Record failed edit at NCHS in 1985 2 — Record was not a hit to the NDI in 1985 3 — Record was a hit to the NDI in 1985 FREQUENCIES: IND185\counts: 7303 7802 7903 8014 8024 8008 8012 8103 8203 8303 0 1,013 1,868 1,517 1,828 115 1,014 2,873 1,695 1,595 1,585 1 14 22 . 52 27 29 5 10 1 483 2 88,077 69,200 28,557 155,727 120,483 154,779 149,923 46,040 65,246 65,154 3 42,109 23,572 13,024 27,264 3,720 26,551 24,964 14,059 14,638 14,059 Total 131,213 94,662 43,098 184,871 124,345 182,373 177,765 61,804 81,480 81,281

National Longitudinal Mortality Study – Extract File: Fail-Edit and Mortality Indicator Variables
31
13. Observed Death Indicator (1985) IND285 Return to Index EDITS: None DESCRIPTION: Indicates whether the record was a death or not according to the 1985 match to the NDI. NOT AVAILABLE: 8403–1103 CODES for files: 7303–8303 0 — Record failed edit in the 1985 match to the NDI 1 — Death during 1979-1981 according to 1983 and 1985 matches 2 — Death during 1979-1981 according to 1983 match only 3 — Death during 1979-1981 according to 1985 match only 4 — Death during 1982-1983 according to 1985 match only 5 — Alive after 1985 match to the NDI 6 — Death, but record is the earlier or earliest of records in multiple files (count as
alive) FREQUENCIES: IND285\counts: 7303 7802 7903 8014 8024 8008 8012 8103 8203 8303 0 1,027 1,890 1,517 1,880 142 1,043 2,878 1,705 1,596 2,068 1 2,936 2,508 691 2,042 1,122 1,613 1,135 289 . . 2 64 31 21 60 46 39 30 8 . . 3 121 101 29 66 3 53 33 19 . . 4 2,129 1,828 590 2,588 2,414 2,571 2,378 850 949 357 5 124,926 88,294 40,247 178,227 120,600 177,049 171,310 58,933 78,935 78,856 6 10 10 3 8 18 5 1 . . . Total 131,213 94,662 43,098 184,871 124,345 182,373 177,765 61,804 81,480 81,281

National Longitudinal Mortality Study – Extract File: Fail-Edit and Mortality Indicator Variables
32
14. Observed Death Indicator (1987) IND287 Return to Index EDITS: None DESCRIPTION: Indicates whether the record was a death or not according to the 1987 match to the NDI. Includes earlier match results as well. NOT AVAILABLE: 8509–1103 CODES for files: 7303–8503 0 — Record failed edit in 1987 match to the NDI 1 — Death according to 1983, 1985 or 1987 matches to the NDI 2 — Alive after 1987 match to the NDI 3 — Death but record is the earlier or earliest of records in multiple files (count as
alive) FREQUENCIES: IND287\counts: 7303 7802 7903 8014 8024 8008 8012 8103 8203 8303 0 1,027 1,890 1,517 1,880 141 1,043 2,878 1,705 1,596 2,068 1 7,410 6,397 1,916 7,647 6,128 7,165 6,147 2,048 2,076 1,464 2 122,761 86,347 39,657 175,332 118,041 174,150 168,732 58,051 77,807 77,748 3 15 28 8 12 35 15 8 . 1 1 Total 131,213 94,662 43,098 184,871 124,345 182,373 177,765 61,804 81,480 81,281 IND287\counts: 8403 8503 0 3,234 3,367 1 872 378 2 76,626 76,326 3 . . Total 80,732 80,071
National Longitudinal Mortality Study – Extract File: Fail-Edit and Mortality Indicator Variables
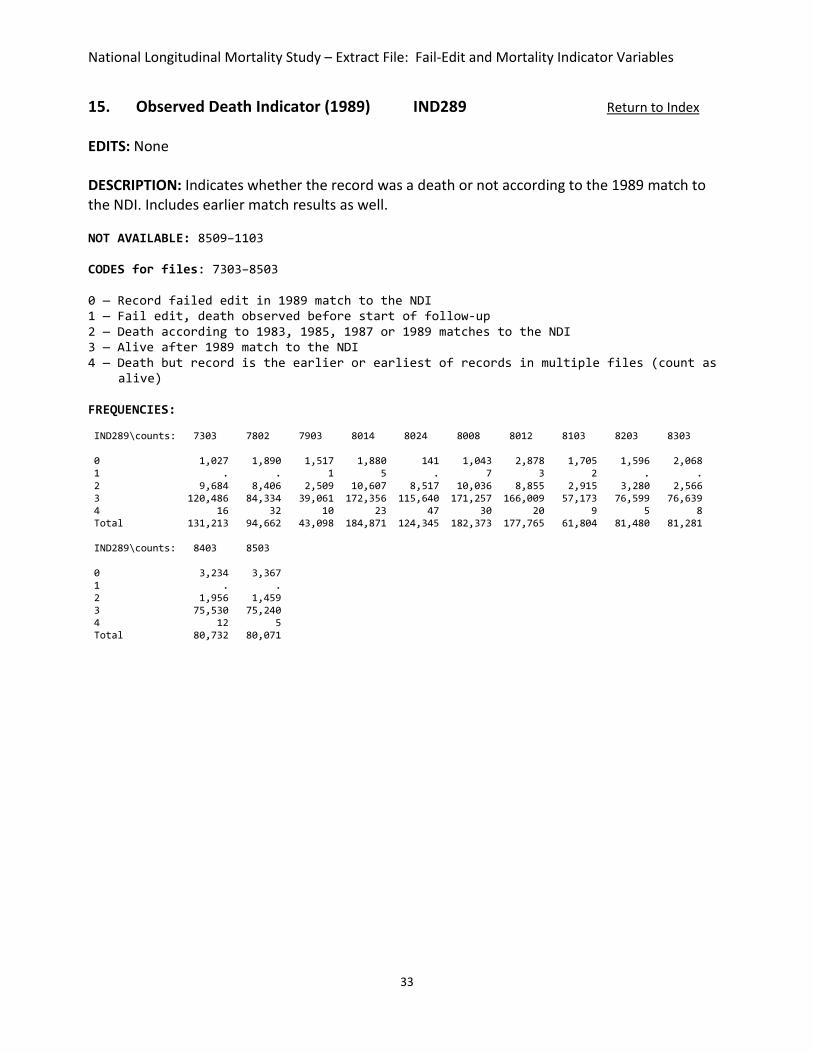
33
15. Observed Death Indicator (1989) IND289 Return to Index EDITS: None DESCRIPTION: Indicates whether the record was a death or not according to the 1989 match to the NDI. Includes earlier match results as well. NOT AVAILABLE: 8509–1103 CODES for files: 7303–8503 0 — Record failed edit in 1989 match to the NDI 1 — Fail edit, death observed before start of follow-up 2 — Death according to 1983, 1985, 1987 or 1989 matches to the NDI 3 — Alive after 1989 match to the NDI 4 — Death but record is the earlier or earliest of records in multiple files (count as
alive) FREQUENCIES: IND289\counts: 7303 7802 7903 8014 8024 8008 8012 8103 8203 8303 0 1,027 1,890 1,517 1,880 141 1,043 2,878 1,705 1,596 2,068 1 . . 1 5 . 7 3 2 . . 2 9,684 8,406 2,509 10,607 8,517 10,036 8,855 2,915 3,280 2,566 3 120,486 84,334 39,061 172,356 115,640 171,257 166,009 57,173 76,599 76,639 4 16 32 10 23 47 30 20 9 5 8 Total 131,213 94,662 43,098 184,871 124,345 182,373 177,765 61,804 81,480 81,281 IND289\counts: 8403 8503 0 3,234 3,367 1 . . 2 1,956 1,459 3 75,530 75,240 4 12 5 Total 80,732 80,071

National Longitudinal Mortality Study – Extract File: Fail-Edit and Mortality Indicator Variables
34
16. Observed Death Indicator (1991 match to NDI) IND291 Return to Index EDITS: None DESCRIPTION: Indicates whether the record was identified as a death or not according to the 1991 match to the NDI. NOT AVAILABLE: 8603—1103 CODES for files: 7303—8509 0 — Record failed edit in 1991 match to the NDI 1 — Fail edit, death observed before start of follow-up 2 — Death according to 1983, 1985, 1987, 1989 or 1991 matches to the NDI 3 — Alive after 1991 match to the NDI 4 — Death but record is the earlier or earliest of records in multiple files (count as
alive) FREQUENCIES: IND291\counts: 7303 7802 7903 8014 8024 8008 8012 8103 8203 8303 0 1,027 1,890 1,517 1,880 141 1,043 2,878 1,705 1,596 2,068 1 . . 1 5 . 7 3 2 2 2 2 11,967 10,379 3,178 13,733 11,147 12,926 11,690 3,853 4,486 3,749 3 118,195 82,344 38,387 169,220 112,986 168,359 163,165 56,235 75,391 75,453 4 24 49 15 33 71 38 29 9 5 9 Total 131,213 94,662 43,098 184,871 124,345 182,373 177,765 61,804 81,480 81,281 IND291\counts: 8403 8503 8509 0 3,234 3,367 . 1 . . 7 2 3,117 2,529 3,658 3 74,368 74,162 141,033 4 13 13 . Total 80,732 80,071 144,698

National Longitudinal Mortality Study – Extract File: Fail-Edit and Mortality Indicator Variables
35
17. Observed Death Indicator (2001 match to NDI) IND201 Return to Index EDITS: None DESCRIPTION: Indicates whether the record was identified as a death or not according to the 2001 match to the NDI. NOT AVAILABLE: 9903-1103 CODES for files: 7303-9803 0 — Record rejected by NDI in 2001 match 1 — Fail edit, death observed before start of follow—up 2 — Death according to 1983, 1985, 1987, 1989, 1991, or 2001 matches to the NDI 3 — Alive after 2001 match to the NDI 4 — Death but record is the earlier or earliest of records in multiple files (count as
alive) 5 — Special Fail Edit category for records from the 7303 and 7802 files for which
person was determined to have died prior to the start of the NDI. These deaths were determined from outside sources, most notably using the Social Security Administration file of deceased persons add to others.
6 — Record under review FREQUENCIES: IND201\counts: 7303 7802 7903 8014 8024 8008 8012 8103 8203 8303 0 1,027 1,900 1,517 1,883 143 1,043 2,878 1,705 1,596 2,068 1 . . 1 5 . 7 3 2 2 2 2 22,790 20,020 6,306 28,336 23,468 27,225 25,191 8,553 10,678 9,579 3 102,607 72,085 35,226 154,452 100,608 153,932 149,517 51,515 69,170 69,604 4 131 159 48 195 126 166 176 29 33 28 5 4,658 498 . . . . . . . . 6 . . . . . . . . 1 . Total 131,213 94,662 43,098 184,871 124,345 182,373 177,765 61,804 81,480 81,281 IND201\counts: 8403 8503 8509 8603 8703 8803 8903 9003 9103 9203 0 3,234 3,367 16 . . . . . . . 1 . . 7 4 4 5 6 4 5 4 2 8,850 8,131 12,593 6,411 5,606 5,246 4,305 4,000 3,355 2,908 3 68,622 68,431 131,987 39,599 39,651 40,216 37,604 40,269 45,672 40,632 4 26 142 95 8 10 12 10 12 5 6 5 . . . . . . . . . . 6 . . . . . . . . . . Total 80,732 80,071 144,698 46,022 45,271 45,479 41,925 44,285 49,037 43,550 IND201\counts: 9303 9413 9503 9603 9703 9803 0 2,288 687 534 625 605 686 1 6 10 6 4 5 4 2 2,765 3,086 1,827 1,105 722 259 3 57,740 99,456 73,117 63,821 65,062 65,224 4 100 47 1 . . . 5 . . . . . . 6 . . . . . . Total 62,899 103,286 75,485 65,555 66,394 66,173

National Longitudinal Mortality Study – Extract File: Fail-Edit and Mortality Indicator Variables
36
18. Observed Death Indicator (2006 match to NDI) IND206 Return to Index EDITS: None DESCRIPTION: Indicates whether the record was identified as a death or not according to the 2006 match to the NDI. NOT AVAILABLE: 0303-1103 CODES for files: 7303-0203 0 — Record rejected by NDI in 2006 match, or missing age or gender 1 — Fail edit, death observed before start of follow-up 2 — Death according to 1983, 1985, 1987, 1989, 1991, 2001 or 2006 matches to the NDI 3 — Alive after 2006 match to the NDI 4 — Death but record is the earlier or earliest of records in multiple files (count as
alive) 5 — Special Fail Edit category for records from the 7303 and 7802 files for which
person was determined to have died prior to the start of the NDI. These deaths were determined from outside sources, most notably using the Social Security Administration file of deceased persons add to others.
6 — Record under review FREQUENCIES: IND206\counts: 7303 7802 7903 8014 8024 8008 8012 8103 8203 8303 blank . . . . . . . . . . 0 1,027 1,900 1,517 1,883 143 1,043 2,878 1,705 1,596 2,068 1 . . 1 5 . 7 3 2 2 2 2 28,101 24,611 7,731 35,007 30,519 33,329 30,951 10,776 13,600 12,351 3 97,239 67,449 33,780 147,717 93,487 147,764 143,711 49,276 66,234 66,817 4 188 204 69 259 196 230 222 45 47 43 5 4,658 498 . . . . . . . . 6 . . . . . . . . 1 . Total 131,213 94,662 43,098 184,871 124,345 182,373 177,765 61,804 81,480 81,281 IND206\counts: 8403 8503 8509 8603 8703 8803 8903 9003 9103 9203 blank . . . . . . . . . . 0 3,234 3,367 16 . . . . . . . 1 . . 7 4 4 5 6 4 5 4 2 11,661 10,780 16,420 8,663 7,885 7,539 6,393 6,126 5,884 4,871 3 65,788 65,730 128,127 37,342 37,365 37,905 35,511 38,137 43,136 38,663 4 49 194 128 13 17 30 15 18 12 12 5 . . . . . . . . . . 6 . . . . . . . . . . Total 80,732 80,071 144,698 46,022 45,271 45,479 41,925 44,285 49,037 43,550 IND206\counts: 9303 9413 9503 9603 9703 9803 9903 0003 0103 0203 blank . . . . . . . . . . 0 2,287 687 534 625 605 686 . . . . 1 6 10 6 4 5 4 . . . . 2 4,990 6,050 4,138 2,925 2,488 1,885 1,326 983 678 320 3 55,414 96,429 70,803 61,997 63,295 63,595 67,825 68,323 78,252 79,202 4 202 110 4 4 1 3 24 16 7 . 5 . . . . . . . . . . 6 . . . . . . . . . . Total 62,899 103,286 75,485 65,555 66,394 66,173 69,175 69,322 78,937 79,522

National Longitudinal Mortality Study – Extract File: Fail-Edit and Mortality Indicator Variables
37
19. Observed Death Indicator (2013 match to NDI) IND213 Return to Index EDITS: None DESCRIPTION: Indicates whether the record was identified as a death or not according to the 2013 match to the NDI. An indication of “2” as a code identifies mortality for the record. Information on mortality for a record from previous matches to the NDI is perpetuated in this code AVAILABLE: All files CODES for files: All files 0 — Record rejected as failed edit by the NDI in the 2013 match, or missing age or
gender 1 — Fail edit, death observed before start of follow-up 2 — Death according to 1983, 1985, 1987, 1989, 1991, 2001, 2006, or 2013 matches to the
NDI 3 — Alive after 2013 match to the NDI 4 — Death but record is the earlier or earliest of records in multiple files (count as
alive) 5 — Special Fail Edit category for records from the 7303 and 7802 files for which
person was determined to have died prior to the start of the NDI. These deaths were determined from outside sources, most notably using the Social Security Administration file of deceased persons add to others.
FREQUENCIES: IND213\counts: 7303 7802 7903 8014 8024 8008 8012 8103 8203 8303 0 1,027 1,900 1,517 1,886 143 1,044 2,878 1,705 1,596 2,068 1 . . 1 5 . 8 3 2 3 2 2 38,499 34,040 10,743 49,053 41,384 46,758 43,305 15,429 19,509 18,138 3 86,738 57,866 30,736 133,477 82,442 134,156 131,203 44,577 60,267 60,981 4 291 358 101 450 376 407 376 91 105 92 5 4,658 498 . . . . . . . . Total 131,213 94,662 43,098 184,871 124,345 182,373 177,765 61,804 81,480 81,281 IND213\counts: 8403 8503 8509 8603 8703 8803 8903 9003 9103 9203 0 3,234 3,367 17 . . . . . . 1 1 . 1 8 7 7 6 7 6 9 4 2 17,288 16,285 24,669 13,695 12,798 12,644 10,951 10,820 11,028 9,592 3 60,112 60,090 119,788 32,269 32,407 32,752 30,921 33,411 37,956 33,911 4 98 328 216 51 59 77 46 48 44 42 5 . . . . . . . . . . Total 80,732 80,071 144,698 46,022 45,271 45,479 41,925 44,285 49,037 43,550 IND213\counts: 9303 9413 9503 9603 9703 9803 9903 0003 0103 0203 0 2,297 713 571 661 644 727 95 127 96 103 1 7 15 8 5 10 5 3 506 9 7 2 9,836 12,250 8,868 6,971 6,420 5,797 5,472 5,904 4,941 4,804 3 50,346 90,060 66,014 57,884 59,257 59,556 63,449 62,643 73,749 74,588 4 413 248 24 34 63 88 156 142 142 20 5 . . . . . . . . . . Total 62,899 103,286 75,485 65,555 66,394 66,173 69,175 69,322 78,937 79,522

National Longitudinal Mortality Study – Extract File: Fail-Edit and Mortality Indicator Variables
38
IND213\counts: 0303 0403 0503 0603 0703 0803 0903 1003 1103 0 594 633 594 577 733 871 582 473 529 1 25,807 26,140 28,825 11,226 11,396 10,357 18,167 17,968 15,789 2 5,393 4,531 4,211 3,577 2,955 2,256 1,652 1,045 379 3 122,594 119,965 127,609 119,062 118,644 116,559 112,222 111,979 113,364 4 17 40 18 21 14 12 6 3 . 5 . . . . . . . . . Total 154,405 151,309 161,257 134,463 133,742 130,055 132,629 131,468 130,061

National Longitudinal Mortality Study – Extract File: Fail-Edit and Mortality Indicator Variables
39
20. Alive or Dead in the 2013 Match LIFE Analysis File Return to Index EDITS: None DESCRIPTION: An indicator variable to show dead or alive. (Appears in Analysis file only) 21. Valid for Analysis as of 2013 Match VALID Analysis File Return to Index EDITS: None DESCRIPTION: An indicator variable to show which records are valid for analysis. (Appears in Analysis file only)

National Longitudinal Mortality Study – Extract File: Geographical Variables
40
GEOGRAPHICAL VARIABLES 22. Census Geographical Division DIV Analysis File Return to Index EDITS: Simple DESCRIPTION: The geographical division portion of the state code. The concatenation of variables DIV and STATE form a state code. This code has been used since 1960 as the U.S. Census Bureau’s state code. The states contained within each geographical division are shown in Appendix B. AVAILABLE FILES: All files CODES for files: All files blank — Non-interview household, missing 0 — Unknown 1 — New England 2 — Middle Atlantic 3 — East North Central 4 — West North Central 5 — South Atlantic 6 — East South Central 7 — West South Central 8 — Mountain 9 — Pacific FREQUENCIES: DIV\counts: 7303 7802 7903 8014 8024 8008 8012 8103 8203 8303 blank . . . . . . . . . . 0 1,032 1,927 . 1,892 63 1,129 218 . 1 . 1 8,124 5,657 2,853 14,151 10,795 13,958 14,285 5,042 5,959 6,226 2 22,452 16,071 6,247 21,135 15,077 21,436 19,725 7,375 10,450 10,325 3 25,783 17,482 6,255 28,006 19,838 27,381 24,906 8,790 11,432 11,210 4 10,338 7,059 3,580 21,782 13,645 21,700 22,218 6,793 8,388 8,200 5 19,657 14,661 5,927 26,111 19,748 26,031 26,816 8,933 11,800 12,004 6 8,322 6,103 2,284 10,938 7,529 11,039 9,272 4,040 4,755 4,682 7 13,013 9,569 4,432 16,056 10,793 15,667 14,379 5,541 7,848 7,906 8 5,688 3,993 4,643 21,430 12,439 21,152 21,768 7,233 8,657 8,945 9 16,804 12,140 6,877 23,370 14,418 22,880 24,178 8,057 12,190 11,783 Total 131,213 94,662 43,098 184,871 124,345 182,373 177,765 61,804 81,480 81,281 DIV\counts: 8403 8503 8509 8603 8703 8803 8903 9003 9103 9203 blank . . . . . . . . . . 0 . . . . . . . . . . 1 5,936 6,626 12,507 3,951 4,002 3,906 3,597 3,551 3,838 3,647 2 10,121 12,382 21,817 6,599 6,218 6,149 5,113 5,791 7,060 6,122 3 10,996 12,037 22,676 7,394 7,133 7,095 6,949 7,084 7,707 6,781 4 8,489 7,326 13,951 4,597 4,488 4,566 4,209 4,412 4,498 4,314 5 11,706 12,749 24,413 7,771 7,951 7,824 7,694 7,313 8,012 7,033 6 4,452 3,567 7,177 2,265 2,251 2,434 2,189 2,325 2,500 2,408 7 7,935 7,261 12,436 4,116 3,981 4,235 3,972 3,997 4,380 4,043 8 8,814 7,251 12,996 4,239 4,251 4,291 4,303 4,597 4,786 4,059 9 12,283 10,872 16,725 5,090 4,996 4,979 3,899 5,215 6,256 5,143 Total 80,732 80,071 144,698 46,022 45,271 45,479 41,925 44,285 49,037 43,550

National Longitudinal Mortality Study – Extract File: Geographical Variables
41
DIV\counts: 9303 9413 9503 9603 9703 9803 9903 0003 0103 0203 blank . . . . . . . . . . 0 . . . . . . . . . . 1 5,200 8,065 6,078 4,622 4,633 4,673 4,906 4,607 7,705 7,391 2 9,029 16,328 11,534 9,022 9,101 8,887 9,158 9,114 8,790 8,561 3 9,415 15,150 10,807 9,110 8,816 9,291 8,775 9,417 9,529 9,940 4 6,181 8,134 5,872 5,773 5,911 5,762 5,681 5,714 8,275 8,521 5 10,497 16,023 13,855 10,230 10,382 10,333 10,338 10,630 11,788 11,689 6 3,371 4,530 3,133 3,450 3,226 3,362 3,179 3,307 3,519 3,726 7 5,466 9,773 6,665 6,391 6,601 6,548 7,249 7,337 7,205 7,442 8 6,261 9,792 7,587 7,338 8,036 7,710 9,161 8,516 10,308 10,241 9 7,479 15,491 9,954 9,619 9,688 9,607 10,728 10,680 11,818 12,011 Total 62,899 103,286 75,485 65,555 66,394 66,173 69,175 69,322 78,937 79,522 DIV\counts: 0303 0403 0503 0603 0703 0803 0903 1003 1103 blank 22,184 22,047 23,959 6,620 6,764 5,485 5,525 5,539 6,047 0 . . . . . . . . . 1 12,723 13,159 13,029 13,045 12,742 12,473 12,921 12,557 12,350 2 14,524 13,698 12,452 11,481 11,424 12,060 11,732 11,467 11,251 3 16,883 16,759 16,941 14,638 14,528 14,154 14,500 14,178 13,777 4 14,697 14,436 16,131 14,262 14,280 13,543 14,397 14,412 14,191 5 21,176 20,544 23,547 22,890 22,721 22,400 22,528 22,370 22,153 6 6,522 6,486 7,291 6,100 6,037 5,829 5,824 6,080 5,781 7 11,034 10,884 12,504 10,947 11,197 11,283 11,636 11,424 11,610 8 16,104 15,516 15,201 14,259 14,383 13,132 13,569 13,513 13,383 9 18,558 17,780 20,202 20,221 19,666 19,696 19,997 19,928 19,518 Total 154,405 151,309 161,257 134,463 133,742 130,055 132,629 131,468 130,061

National Longitudinal Mortality Study – Extract File: Geographical Variables
42
23. State within Division STATE Analysis File Return to Index EDITS: Simple DESCRIPTION: The code for states within geographical divisions. The concatenation of variables DIV and STATE form a state code. This code has been used since 1960 as the U.S. Census Bureau’s code to identify each state. The full code for each state contained within a geographical division is shown in Appendix B. AVAILABLE FILES: All files CODES for files: All files 0 — Unknown or not matched to control card 1-9 — Possible STATE code values within divisions FREQUENCIES: STATE\counts: 7303 7802 7903 8014 8024 8008 8012 8103 8203 8303 blank . . . . . . . . . . 0 1,032 1,927 . 1,892 63 1,129 218 . 1 . 1-9 130,181 92,735 43,098 182,979 124,282 181,244 177,547 61,804 81,479 81,281 Total 131,213 94,662 43,098 184,871 124,345 182,373 177,765 61,804 81,480 81,281 STATE\counts: 8403 8503 8509 8603 8703 8803 8903 9003 9103 9203 blank . . . . . . . . . . 0 . . . . . . . . . . 1-9 80,732 80,071 144,698 46,022 45,271 45,479 41,925 44,285 49,037 43,550 Total 80,732 80,071 144,698 46,022 45,271 45,479 41,925 44,285 49,037 43,550 STATE\counts: 9303 9413 9503 9603 9703 9803 9903 0003 0103 0203 blank . . . . . . . . . . 0 . . . . . . . . . . 1-9 62,899 103,286 75,485 65,555 66,394 66,173 69,175 69,322 78,937 79,522 Total 62,899 103,286 75,485 65,555 66,394 66,173 69,175 69,322 78,937 79,522 STATE\counts: 0303 0403 0503 0603 0703 0803 0903 1003 1103 blank 22,184 22,047 23,959 6,620 6,764 5,485 5,525 5,539 6,047 0 . . . . . . . . . 1-9 132,221 129,262 137,298 127,843 126,978 124,570 127,104 125,929 124,014 Total 154,405 151,309 161,257 134,463 133,742 130,055 132,629 131,468 130,061
National Longitudinal Mortality Study – Extract File: Geographical Variables
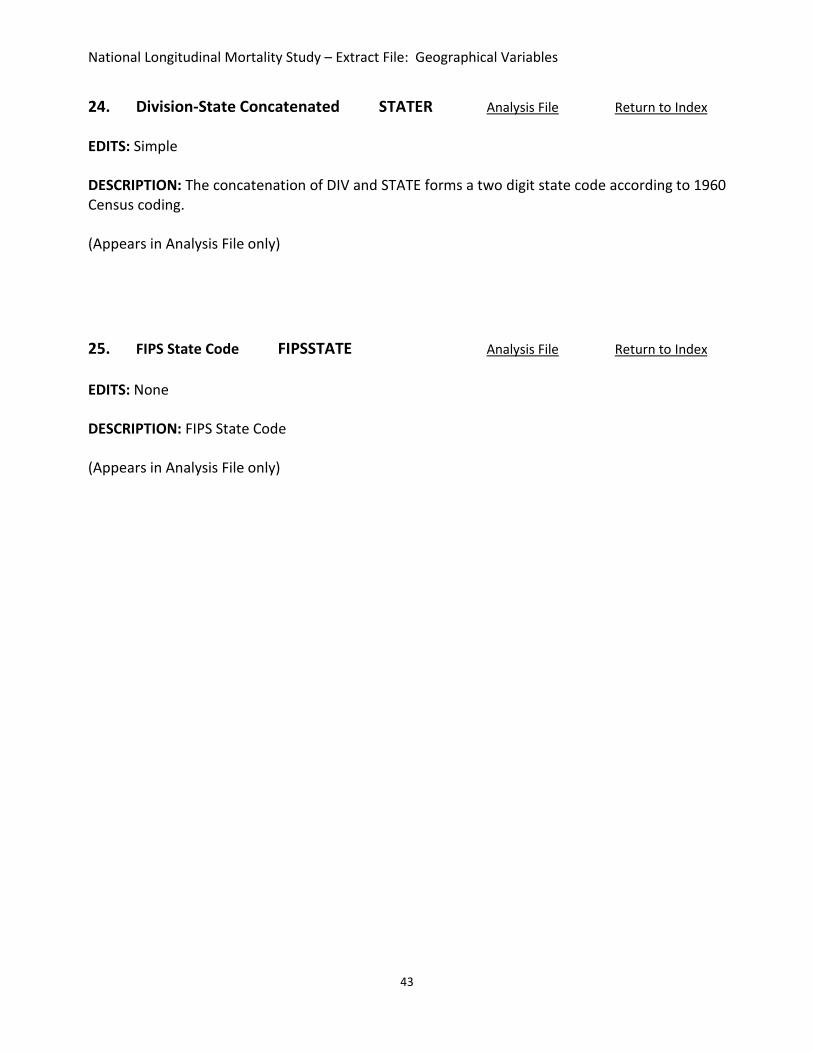
43
24. Division-State Concatenated STATER Analysis File Return to Index EDITS: Simple DESCRIPTION: The concatenation of DIV and STATE forms a two digit state code according to 1960 Census coding. (Appears in Analysis File only) 25. FIPS State Code FIPSSTATE Analysis File Return to Index EDITS: None DESCRIPTION: FIPS State Code (Appears in Analysis File only)

National Longitudinal Mortality Study – Extract File: Geographical Variables
44
26. FIPS County Code COUNTY Return to Index EDITS: None DESCRIPTION: County or independent city codes (1970). County codes are determined according to the Federal Information Processing Standards (FIPS) for counties. County codes were not collected directly for the 7303 and 8024 cohorts. Without extensive additional processing, county codes could not be obtained for these cohorts so they are left blank. The reference document to given county codes is FIPS PUB 6-2, 1973 September 15. NOT AVAILABLE: 7303, 8024 CODES for files: 7802-8014, 8008-1103 blank — Unknown 001-840 — FIPS codes 001-840 FREQUENCIES: COUNTY\counts: 7802 7903 8014 8008 8012 8103 8203 8303 8403 8503 blank 2,624 . 6,446 5,776 4,253 . 1 . . . 001-840 92,038 43,098 178,425 176,597 173,512 61,804 81,479 81,281 80,732 80,071 Total 94,662 43,098 184,871 182,373 177,765 61,804 81,480 81,281 80,732 80,071 COUNTY\counts: 8509 8603 8703 8803 8903 9003 9103 9203 9303 9413 blank . . . . . . . . . . 001-840 144,698 46,022 45,271 45,479 41,925 44,285 49,037 43,550 62,899 103,286 Total 144,698 46,022 45,271 45,479 41,925 44,285 49,037 43,550 62,899 103,286 COUNTY\counts: 9503 9603 9703 9803 9903 0003 0103 0203 0303 0403 blank . . . . . . . . 22,184 22,047 001-840 75,485 65,555 66,394 66,173 69,175 69,322 78,937 79,522 132,221 129,262 Total 75,485 65,555 66,394 66,173 69,175 69,322 78,937 79,522 154,405 151,309 COUNTY\counts: 0503 0603 0703 0803 0903 1003 1103 blank 23,959 6,620 6,764 5,485 5,525 5,539 6,047 001-840 137,298 127,843 126,978 124,570 127,104 125,929 124,014 Total 161,257 134,463 133,742 130,055 132,629 131,468 130,061

National Longitudinal Mortality Study – Extract File: Geographical Variables
45
27. CPS PSU, "DO" for Census PSU Return to Index EDITS: None DESCRIPTION: Identifies geographical coding of PSU for all CPS records, or DO for Census records. The actual PSU code is embedded in a 5-digit character field on both Extract and Analysis files. Prior to 1994 the length of the PSU code was 3 digits. Beginning in 1994, the standard PSU code was expanded to 5 digits with the first two digits being the FIPS state code and the last three a numerical character string between 001 and 999 identifying the PSU within the state. For the 1980 Census subsample file, 8024, the four-digit District Office code is placed in digits 2 through 5 of the PSU variable. There are no blank or unknown entries for this variable. AVAILABLE FILES: All files

National Longitudinal Mortality Study – Extract File: Geographical Variables
46
28. PSU Type PSUTYPE Return to Index EDITS: None DESCRIPTION: Variable describes whether a CPS PSU was sampled as self-representing or not. Self-representing PSUs are areas containing the largest population areas. These PSUs, designated (SR) PSUs, are in sample with certainty. The remaining areas, those not designated as self-representing, are called non self-representing PSUs, designated (NSR) PSUs. These PSUs are selected to sample with probability of selection proportional to the size of the population they contain. The values of the variable PSUTYPE are defined according to the sample design in effect at the time of the respective survey. Each decade, following the taking of a U.S. Census, current surveys are redesigned to reflect the most recent U.S. population count identified by the Census. A new design is typically implemented three to four years following the census. Since the NLMS cohorts cover the time period from 1973 to 2011, there are five different sampling designs represented within the various NLMS cohorts. The cohort, 8014, from April 1980, would have PSUTYPE values defined according to the 1970 current survey design. The cohort, 8503 has values of PSUTYPE derived from the 1980 design but the 8403 cohort has values derived from the 1970 design since the 1980 design, based on the 1980 Census, was implemented in April of 1984. The files 0303 through 1103, for the years 2003 through 2011, all follow the year 2000 design. NOT AVAILABLE: 8024 CODES for files: 7303-8014, 8008-1103 0 — Non-interview household 1 — Self-representing (SR) PSU 2 — Non self-representing (NSR) PSU FREQUENCIES: PSUTYPE\counts: 7303 7802 7903 8014 8008 8012 8103 8203 8303 8403 0 . . . . . . . . . . 1 84,032 59,919 25,629 120,285 118,059 115,065 34,577 46,682 45,945 56,930 2 47,181 34,743 17,469 64,586 64,314 62,700 27,227 34,798 35,336 23,802 Total 131,213 94,662 43,098 184,871 182,373 177,765 61,804 81,480 81,281 80,732 PSUTYPE\counts: 8503 8509 8603 8703 8803 8903 9003 9103 9203 9303 0 . . . . . . . . . . 1 60,132 106,457 33,532 33,069 32,796 29,649 31,656 35,653 31,447 45,451 2 19,939 38,241 12,490 12,202 12,683 12,276 12,629 13,384 12,103 17,448 Total 80,071 144,698 46,022 45,271 45,479 41,925 44,285 49,037 43,550 62,899 PSUTYPE\counts: 9413 9503 9603 9703 9803 9903 0003 0103 0203 0303 0 . . . . . . . . . 22,184 1 79,019 58,598 50,071 51,355 50,619 53,860 53,687 61,347 60,913 102,289 2 24,267 16,887 15,484 15,039 15,554 15,315 15,635 17,590 18,609 29,932 Total 103,286 75,485 65,555 66,394 66,173 69,175 69,322 78,937 79,522 154,405

National Longitudinal Mortality Study – Extract File: Geographical Variables
47
PSUTYPE\counts: 0403 0503 0603 0703 0803 0903 1003 1103 0 22,047 43,010 . . . . 5,539 . 1 99,742 98,250 105,350 98,184 96,660 98,652 98,300 102,815 2 29,520 19,997 29,113 35,558 33,395 33,977 27,629 27,246 Total 151,309 161,257 134,463 133,742 130,055 132,629 131,468 130,061

National Longitudinal Mortality Study – Extract File: Geographical Variables
48
29. CPS Segment, "ED" for Census SEG Return to Index EDITS: None DESCRIPTION: Identifies geographical coding of sampling segment for all CPS records or "ED" (Enumeration District) for Census records. For CPS records, the first digit of the SEG variable indicates the CPS rotation in which the record was sampled. There are no blanks or unknown entries for this variable. AVAILABLE FILES: All files

National Longitudinal Mortality Study – Extract File: Geographical Variables
49
30. Urban-Rural Status URB Analysis File Return to Index EDITS: Simple DESCRIPTION: Urban or rural status. The definition of urban and rural on files 7303 through 8503 follows from the 1970 Census. For cohorts 8509 through 9303, the definition follows from the 1980 Census land definition and for cohorts 9413 and later, the definition follows from the 1990 Census definition. An urban area consists of all persons living in urbanized areas and in places of 2,500 or more inhabitants outside urbanized areas. More specifically, the urban population consists of all persons living in
(1) places of 2,500 or more inhabitants incorporated as cities, villages, boroughs and towns, but excluding those persons living in the rural portions of extended cities; and (2) other territories, incorporated and unincorporated included in urbanized areas. The population not classified as urban constitutes the rural population.
AVAILABLE FILES: All files CODES for files: 7303-8014, 8008-1103 blank — Unknown 1 — Urban 2 — Rural FREQUENCIES: URB\counts: 7303 7802 7903 8014 8008 8012 8103 8203 8303 8403 blank 1,032 2,624 . 6,446 5,776 4,253 . 1 . . 1 92,406 63,952 29,789 117,674 115,662 113,175 40,500 54,092 53,532 53,601 2 37,775 28,086 13,309 60,751 60,935 60,337 21,304 27,387 27,749 27,131 Total 131,213 94,662 43,098 184,871 182,373 177,765 61,804 81,480 81,281 80,732 URB\counts: 8503 8509 8603 8703 8803 8903 9003 9103 9203 9303 blank . . . . . . . . . . 1 57,617 102,153 32,541 31,721 31,821 28,513 30,533 34,385 30,158 43,438 2 22,454 42,545 13,481 13,550 13,658 13,412 13,752 14,652 13,392 19,461 Total 80,071 144,698 46,022 45,271 45,479 41,925 44,285 49,037 43,550 62,899 URB\counts: 9413 9503 9603 9703 9803 9903 0003 0103 0203 0303 blank . . . . . . . . . 22,184 1 76,406 55,372 48,314 48,939 48,881 51,634 52,025 58,173 59,122 96,010 2 26,880 20,113 17,241 17,455 17,292 17,541 17,297 20,764 20,400 36,211 Total 103,286 75,485 65,555 66,394 66,173 69,175 69,322 78,937 79,522 154,405 URB\counts: 0403 0503 0603 0703 0803 0903 1003 1103 blank 22,047 23,959 6,620 6,764 5,485 5,525 5,539 6,047 1 93,959 94,931 98,425 98,203 96,802 98,896 98,082 97,218 2 35,303 42,367 29,418 28,775 27,768 28,208 27,847 26,796 Total 151,309 161,257 134,463 133,742 130,055 132,629 131,468 130,061

National Longitudinal Mortality Study – Extract File: Geographical Variables
50
CODES for files: 8024 0 — Urban 1 — Rural 2 — Part urban and part rural 3 — Unknown FREQUENCIES: URB\counts: 8024 0 87,343 1 31,647 3 5,355 Total 124,345
National Longitudinal Mortality Study – Extract File: Geographical Variables
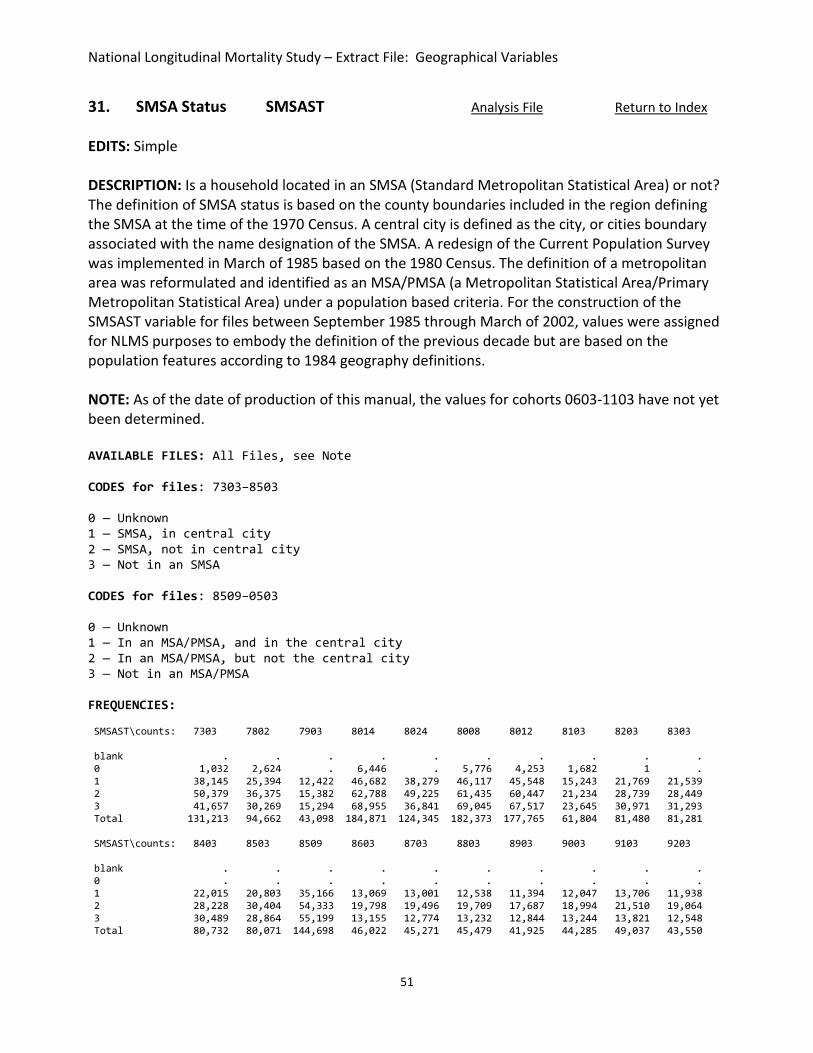
51
31. SMSA Status SMSAST Analysis File Return to Index EDITS: Simple DESCRIPTION: Is a household located in an SMSA (Standard Metropolitan Statistical Area) or not? The definition of SMSA status is based on the county boundaries included in the region defining the SMSA at the time of the 1970 Census. A central city is defined as the city, or cities boundary associated with the name designation of the SMSA. A redesign of the Current Population Survey was implemented in March of 1985 based on the 1980 Census. The definition of a metropolitan area was reformulated and identified as an MSA/PMSA (a Metropolitan Statistical Area/Primary Metropolitan Statistical Area) under a population based criteria. For the construction of the SMSAST variable for files between September 1985 through March of 2002, values were assigned for NLMS purposes to embody the definition of the previous decade but are based on the population features according to 1984 geography definitions. NOTE: As of the date of production of this manual, the values for cohorts 0603-1103 have not yet been determined. AVAILABLE FILES: All Files, see Note CODES for files: 7303–8503 0 — Unknown 1 — SMSA, in central city 2 — SMSA, not in central city 3 — Not in an SMSA CODES for files: 8509–0503 0 — Unknown 1 — In an MSA/PMSA, and in the central city 2 — In an MSA/PMSA, but not the central city 3 — Not in an MSA/PMSA FREQUENCIES: SMSAST\counts: 7303 7802 7903 8014 8024 8008 8012 8103 8203 8303 blank . . . . . . . . . . 0 1,032 2,624 . 6,446 . 5,776 4,253 1,682 1 . 1 38,145 25,394 12,422 46,682 38,279 46,117 45,548 15,243 21,769 21,539 2 50,379 36,375 15,382 62,788 49,225 61,435 60,447 21,234 28,739 28,449 3 41,657 30,269 15,294 68,955 36,841 69,045 67,517 23,645 30,971 31,293 Total 131,213 94,662 43,098 184,871 124,345 182,373 177,765 61,804 81,480 81,281 SMSAST\counts: 8403 8503 8509 8603 8703 8803 8903 9003 9103 9203 blank . . . . . . . . . . 0 . . . . . . . . . . 1 22,015 20,803 35,166 13,069 13,001 12,538 11,394 12,047 13,706 11,938 2 28,228 30,404 54,333 19,798 19,496 19,709 17,687 18,994 21,510 19,064 3 30,489 28,864 55,199 13,155 12,774 13,232 12,844 13,244 13,821 12,548 Total 80,732 80,071 144,698 46,022 45,271 45,479 41,925 44,285 49,037 43,550

National Longitudinal Mortality Study – Extract File: Geographical Variables
52
SMSAST\counts: 9303 9413 9503 9603 9703 9803 9903 0003 0103 0203 blank . . . . . . . . . . 0 . . . . . . . . . . 1 17,339 33,114 22,832 19,931 20,332 19,740 21,485 21,549 23,853 23,700 2 27,208 45,313 35,808 30,488 30,686 31,157 32,423 32,719 36,869 37,184 3 18,352 24,859 16,845 15,136 15,376 15,276 15,267 15,054 18,215 18,638 Total 62,899 103,286 75,485 65,555 66,394 66,173 69,175 69,322 78,937 79,522 SMSAST\counts: 0303 0403 0503 blank 22,184 22,047 23,959 0 . . . 1 38,133 36,938 36,738 2 63,117 61,909 62,020 3 30,971 30,415 38,540 Total 154,405 151,309 161,257

National Longitudinal Mortality Study – Extract File: Geographical Variables
53
32. SMSA Rank SMSAR Analysis File Return to Index EDITS: Invalid Entry DESCRIPTION: SMSAR is defined as the rank of the SMSA or Consolidated Metropolitan Statistical Area (CSMA) or Primary Metropolitan Statistical Area (PMSA), depending on the time period during which the cohort was sampled. In this discussion the description SMSA will be used as a general label for each of these terms. Ranks range from 1 to 98 (see Appendix C). All SMSAs of rank greater than 98 have an assigned rank of 99. All areas not defined as an SMSA will be assigned the value of 00. An MSA/CMSA/PMSA generally is an area consisting of a large population nucleus together with adjacent communities that have a high degree of social and eco-nomic integration with that nucleus. The term is basically a replacement for the previous term SMSA, Standard Metropolitan Statistical Area. The assigned ranks are given in Appendix C. There are five different rank-definition charts in this Appendix. The NLMS cohorts having the definition of rank in each chart are given at the top of each chart. NOTE 1: The definition of SMSA rank on the 9503 file was processed by NLMS staff to be consistent with the 1993 geographical rank definition. The original value of rank on the 9503 file was given in terms of two CPS design definitions, the 1980 design and the 1990 design. These definitions were given with no indication on the file of which design definition applied. In order to make the variable usable in analysis applications, all ranks were redefined according to the 1993 design geography. NOTE 2: For ranks less than 10, zeros are entered for blanks. For example, a rank of 9 is coded as 09. NOTE 3: As of the date of production of this manual, the values for cohorts 0603-1103 have not yet been determined. AVAILABLE FILES: All Files, see Note 3 CODES for files: 7303, 7802, 8014, 8008, 8012 0,00 — Not in an SMSA 01-98 — 1970 SMSA rank (see Appendix C, page 1) 99 — 1970 SMSA rank greater than 98 CODES for files: 7903, 8024, 8103, 8203, 8303, 8403, 8503 0,00 — Not in an SMSA 01-98 — 1973 SMSA rank (see Appendix C, page 2) 99 — 1973 SMSA rank greater than 98 CODES for files: 8603, 8703 0,00 — Not an MSA/CMS 01-98 — 1980 SMSA rank (see Appendix C, page 3)

National Longitudinal Mortality Study – Extract File: Geographical Variables
54
99 — 1980 SMSA rank greater than 98 CODES for files: 8509, 8803-9413 0,00 — Not an MSA/CMS 01-98 — 1983 MSA/CMSA rank (see Appendix C, page 4) 99 — 1983 MSA/CMSA greater than 98 CODES for files: 9503-0503 0,00 — Not an MSA/CMSA 01-98 — 1993 MSA/CMSA rank (see Appendix C, page 5) 99 — 1993 MSA/CMSA rank greater than 98 FREQUENCIES: SMSAR\counts: 7303 7802 7903 8014 8024 8008 8012 8103 8203 8303 0 42,687 . . . 36,841 74,821 . 1,682 1 . 00 . 32,893 15,294 75,401 . . 71,770 23,645 30,971 31,293 01-98 72,347 50,370 22,371 87,181 62,290 85,311 83,428 28,629 40,859 39,560 99 16,179 11,399 5,433 22,289 25,214 22,241 22,567 7,848 9,649 10,428 Total 131,213 94,662 43,098 184,871 124,345 182,373 177,765 61,804 81,480 81,281 SMSAR\counts: 8403 8503 8509 8603 8703 8803 8903 9003 9103 9203 0 . . . . . . . . . . 00 30,489 28,864 40,877 13,155 12,774 13,232 12,844 13,244 13,821 12,548 01-98 40,268 41,077 83,958 23,441 22,822 25,517 22,197 24,288 27,781 24,558 99 9,975 10,130 19,863 9,426 9,675 6,730 6,884 6,753 7,435 6,444 Total 80,732 80,071 144,698 46,022 45,271 45,479 41,925 44,285 49,037 43,550 SMSAR\counts: 9303 9413 9503 9603 9703 9803 9903 0003 0103 0203 0 . . . . . . . . . . 00 18,352 24,859 16,909 15,136 15,376 15,276 15,267 15,054 18,215 18,638 01-98 35,329 64,294 48,755 41,514 42,088 42,041 44,445 45,003 49,528 49,520 99 9,218 14,133 9,821 8,905 8,930 8,856 9,463 9,265 11,194 11,364 Total 62,899 103,286 75,485 65,555 66,394 66,173 69,175 69,322 78,937 79,522 SMSAR\counts: 0303 0403 0503 blank 22,184 22,047 62,499 0 . . . 00 30,971 30,415 . 01-98 82,804 80,680 79,968 99 18,446 18,167 18,790 Total 154,405 151,309 161,257

National Longitudinal Mortality Study – Extract File: Geographical Variables
55
33. Urban/Rural Farm/Rural Nonfarm LAND Analysis File Return to Index EDITS: Recode DESCRIPTION: Household location in terms of land use. The definition of "urban" and "rural" are the same as used in the definition of variable URB. The definition of a farm follows that used for the 1970 Census. A farm was a place that was rural, had agricultural sales of $1,000, or more, or a place of 10 acres or more and over $50 in farm sales. NOT AVAILABLE: 8024, 8503, 9303, 9413, 9503—1103 CODES for files: 7303, 7802, 8014, 8008, 8012 blank — Unknown 1 — Urban 2 — Rural farm 3 — Rural farm 4 — Rural nonfarm 5 — Rural nonfarm
NOTE: Agreement between "LAND" and "URB” is not exact for file 7303. FREQUENCIES: LAND\counts: 7303 7802 8014 8008 8012 blank 1,032 2,624 6,446 5,776 4,253 1 92,403 63,952 117,674 115,662 113,175 2 5,794 3,318 7,182 7,217 6,719 3 456 251 608 506 491 4 2,910 2,105 4,657 4,539 4,503 5 28,618 22,412 48,304 48,673 48,624 Total 131,213 94,662 184,871 182,373 177,765 CODES for files: 7903, 8103, 8203, 8303, 8403 1 — Urban area 2 — Farm, more than 10 acres or $1,000 or more in farm sales 3 — Nonfarm, more than 10 acres, $250-$999 in farm sales 4 — Nonfarm, more than 10 acres, $50-$249 in farm sales 5 — Nonfarm, more than 10 acres, less than $50 in farm sales 6 — Farm, less than 10 acres, $1,000 or more in farm sales 7 — Nonfarm, less than 10 acres, $250-$999 in farm sales 8 — Nonfarm, less than 10 acres, $50-$249 in farm sales 9 — Nonfarm, less than 10 acres, less than %50 in farm sales

National Longitudinal Mortality Study – Extract File: Geographical Variables
56
FREQUENCIES: LAND\counts: 7903 8103 8203 8303 8403 1 29,789 40,500 54,093 53,532 53,601 2 1,300 1,960 2,506 2,309 2,456 3 131 176 251 285 211 4 55 108 101 82 102 5 1,022 1,662 2,076 2,031 2,009 6 71 108 145 156 151 7 20 43 109 69 52 8 46 18 57 54 51 9 10,664 17,229 22,142 22,763 22,099 Total 43,098 61,804 81,480 81,281 80,732 CODES for file: 8509 1 — Urban 2 — Rural farm 3 — Rural nonfarm FREQUENCIES: LAND\counts: 8509 1 102,153 2 3,945 3 38,600 Total 144,698 CODES for files: 8603, 8703 1 — Urban 2 — Rural farm 4 — Rural nonfarm FREQUENCIES: LAND\counts: 8603 8703 1 32,560 31,763 2 1,356 1,277 4 12,106 12,231 Total 46,022 45,271 CODES for files: 8803–9203 1 — Urban 2 — Rural farm 3 — Rural nonfarm FREQUENCIES: LAND\counts: 8803 8903 9003 9103 9203 1 31,803 28,549 30,553 34,429 30,159 2 1,221 1,123 1,282 1,157 1,103 3 12,455 12,253 12,450 13,451 12,288 Total 45,479 41,925 44,285 49,037 43,550

National Longitudinal Mortality Study – Extract File: Age, Birth Information, and Gender Variables
57
AGE, BIRTH INFORMATION, AND GENDER VARIABLES 34. Age in Years at Time of Survey AGE Analysis File Return to Index EDITS: Simple, Recode DESCRIPTION: Age of person at the time of survey. 1 To obtain the information on age, the interviewer first asks the respondent for the person’s exact date of birth. If interviewer can’t get it, then the interviewer asks for an approximate date of birth. Finally, the interviewer asks for the person’s age. If the interviewer can’t get it, then a best estimate of age is sought. Back at the Regional Office, age, if given, is updated to account for aging. Thus, age is determined with varying degrees of certainty. There are no analyses which assess the validity of any version of the obtained response, nor are there indicators on files which show the interviewer confidence in either the date of birth or the age response obtained. If age was not available on CPS record, then age was taken from NDI control file data. If age did not exist for either of these two files and month and year of birth were available on the control file then age was computed using month and year of birth. Otherwise, age is missing. For years 7303-0203, the missing value code is 99. For years 0303-1103, the missing value code is ‘blank.’ For all files, ages 98 years and older have been recorded to age 98 years. NOTE: For the 7903 and 8103 files it was observed through past analysis that an unusually large number of persons were age 98. A special review of this problem was undertaken and a decision made to recompute a proper age based on year of birth. This action has been permanently implemented on these two files. AVAILABLE FILES: All Files CODES for files: 7303-0203 99 — missing CODES for files: 0303-1103 blank — missing CODES for files: 73031,2 78021,2 7903 80082 80122 80142 80243 Age range 0-98 14-98 0-98 0-98 0-98 0-98 0-98 CODES for files: 8103-8509 8603-8703 8803-9003 9103 9203 Age range 0-98 14-98 15-98 14-98 15-98 CODES for files: 9303-0103 0203 0303 0403-09034 1003 11034 Age range 0-98 0-80 0-98 0-80, 85 0-98 0-80, 85

National Longitudinal Mortality Study – Extract File: Age, Birth Information, and Gender Variables
58
1 Since mortality follow-up begins in 1979, add 6 to given age for 7303 file and add 1 to given age for 7802 file to obtain age at start of follow-up. 2 In these files, when the difference in age between the control file age and CPS age is greater than 10 years and neither entry is missing, then age is defined to be missing. 3 The start of follow-up for the 8024 file has been redefined to be January 1, 1981. For this reason, to obtain an approximately correct age for the 8024 file, add 1 to the given age on the file. 4 In these files, the value of age is as stated for ages less than or equal to 80. For ages greater than 80 the value of 85 is assigned. FREQUENCIES: AGE\counts: 7303 7802 7903 8014 8024 8008 8012 8103 8203 8303 00-98 130,564 94,293 43,055 184,562 123,352 181,997 176,903 61,754 81,479 81,281 99 649 369 43 309 993 376 862 50 1 . AGE\counts: 8403 8503 8509 8603 8703 8803 8903 9003 9103 9203 00-98 80,732 80,071 144,458 46,022 45,271 45,479 41,925 44,285 49,037 43,550 99 . . 240 . . . . . . . Total 80,732 80,071 144,698 46,022 45,271 45,479 41,925 44,285 49,037 43,550 AGE\counts: 9303 9413 9503 9603 9703 9803 9903 0003 0103 0203 00-98 62,899 103,286 75,485 65,555 66,394 66,173 69,172 69,304 78,922 79,522 99 . . . . . . 3 18 15 . Total 62,899 103,286 75,485 65,555 66,394 66,173 69,175 69,322 78,937 79,522 AGE\counts: 0303 0403 0503 0603 0703 0803 0903 1003 1103 blank 20,974 21,469 22,198 5,559 5,574 4,533 4,441 4,479 4,846 00-98 133,431 129,840 139,059 128,904 128,168 125,522 128,188 126,989 125,215 Total 154,405 151,309 161,257 134,463 133,742 130,055 132,629 131,468 130,061

National Longitudinal Mortality Study – Extract File: Age, Birth Information, and Gender Variables
59
35. Century of Birth CENT Return to Index EDITS: None DESCRIPTION: Century of date of birth. NOT AVAILABLE: 7303, 7903–8509, 9103, 9413, 9603, 9803, 9903 CODES for files: 7802, 8603–9003, 9203, 9303, 9503, 9703, 0003–1103 blank — Missing or not collected 0 — Born in the century of the 2000’s 8 — Born in the century of the 1800’s 9 — Born in the century of the 1900’s FREQUENCIES: CENT\counts: 7802 8603 8703 8803 8903 9003 9203 9303 9503 9703 blank 681 . . . . . . . . . 0 . . . . . . . . . . 8 2,838 274 227 159 115 68 48 37 36 14 9 91,143 45,748 45,044 45,320 41,810 44,217 43,502 62,862 75,449 66,380 Total 94,662 46,022 45,271 45,479 41,925 44,285 43,550 62,899 75,485 66,394 CENT\counts: 0003 0103 0203 0303 0403 0503 0603 0703 0803 0903 blank 27 35 26 19,064 19,498 20,654 6,045 5,765 5,682 5,440 0 188 1,361 2,494 7,319 9,390 12,293 13,306 15,454 16,902 19,535 8 12 6 1 1 . 1 2 . . . 9 69,095 77,535 77,001 128,021 122,421 128,309 115,110 112,523 107,471 107,654 Total 69,322 78,937 79,522 154,405 151,309 161,257 134,463 133,742 130,055 132,629 CENT\counts: 1003 1103 blank 5,614 5,948 0 21,271 22,761 8 . . 9 104,583 101,352 Total 131,468 130,061

National Longitudinal Mortality Study – Extract File: Age, Birth Information, and Gender Variables
60
36. Month of Birth MOB Analysis File Return to Index EDITS: Simple, Invalid Entry DESCRIPTION: This variable gives the month of birth of each person in numerical code. For cohorts 7303 - 8509, the response, taken from the control file, is the month of birth used in the matches to the National Death Index. For cohorts 8603-0203, the source is the NLMS master files because birth dates collected from CPS respondents are entered directly into the file that serves as the NLMS master file. NOT AVAILABLE: 8024, 9103 CODES for files: 7303-8014, 8008-9003, 9203-1103 Acceptable codes are months 01 to 12. All other codes are invalid. FREQUENCIES: MOB\counts: 7303 blank 858 0 2 01 10,973 02 10,262 03 11,135 04 10,305 05 10,514 06 10,534 07 11,182 08 11,374 09 11,326 10 11,170 11 10,633 12 10,877 13 2 14 2 15 1 16 2 17 2 18 3 21 5 22 5 23 2 30 1 31 1 32 1 33 2 36 1 37 1 41 1 42 2 44 1 50 1 52 1 53 1 55 2 61 1 62 2 63 1 66 2

National Longitudinal Mortality Study – Extract File: Age, Birth Information, and Gender Variables
61
MOB\counts: 7303 (cont.) 71 2 72 4 73 1 81 1 82 1 86 1 88 2 91 2 92 1 99 2 NA 5 Total 131,213 MOB\counts: 7802 7903 8014 8008 8012 8103 8203 8303 8403 8503 blank . 1,069 1,094 977 . 968 429 862 2,009 1,852 -- . . . . . . 1 . . . -0 . 2 . . . . . 1 . . -1 . . . . . . . . . . -2 . . . . . . . . . . -3 . . . . . . . . . . 0- . 415 . . . 638 920 883 1,068 1,266 00 869 . . . 2,496 . . . . . 01 8,073 3,566 15,308 15,059 14,593 5,036 6,717 6,772 6,486 6,472 02 7,358 3,247 14,258 14,117 13,428 4,815 6,399 6,055 6,150 5,906 03 7,784 3,462 15,725 15,598 14,766 5,220 6,830 6,751 6,620 6,543 04 7,505 3,321 14,645 14,195 13,915 4,712 6,257 6,252 6,097 6,005 05 7,561 3,436 14,983 14,946 14,197 4,968 6,384 6,316 6,206 6,315 06 7,415 3,354 14,727 14,762 14,440 4,743 6,471 6,540 6,274 6,207 07 7,977 3,541 15,882 15,704 15,026 5,214 6,965 6,889 6,645 6,679 08 8,299 3,682 16,241 16,089 15,366 5,351 7,051 6,960 6,889 6,927 09 8,430 3,645 16,180 15,782 15,344 5,299 6,959 6,968 6,797 6,648 0R . 1 . . . . . . . . 10 8,066 3,527 15,899 15,474 15,239 5,057 6,964 6,820 6,732 6,552 11 7,547 3,307 14,811 14,612 14,228 4,851 6,483 6,613 6,270 6,227 12 7,778 3,523 15,117 15,058 14,727 4,932 6,650 6,599 6,489 6,471 4 . . 1 . . . . . . . 5 . . . . . . . . . 1 Total 94,662 43,098 184,871 182,373 177,765 61,804 81,480 81,281 80,732 80,071 MOB\counts: 8509 8603 8703 8803 8903 9003 9203 9303 9413 9503 blank . . . . . . . 2,200 . . -- . . . . . . . . . . -0 . . . . . . . . . . -1 . . . . . . . . 11 9 -2 . . . . . . . . 1,583 650 -3 . . . . . . . . 1,238 610 0- . . . . . . . . . . 00 1 . . . . . . . . . 01 12,105 3,911 3,781 3,733 3,409 3,638 3,624 4,953 8,814 6,216 02 11,299 3,542 3,462 3,465 3,268 3,417 3,354 4,611 7,837 5,678 03 12,239 3,787 3,831 3,807 3,505 3,713 3,680 5,061 8,911 6,287 04 11,252 3,594 3,605 3,554 3,310 3,509 3,447 4,794 7,805 5,914 05 11,862 3,725 3,666 3,688 3,467 3,643 3,663 4,839 8,269 6,091 06 11,711 3,648 3,705 3,630 3,387 3,489 3,566 5,043 8,178 6,224 07 13,116 4,046 3,874 3,985 3,541 3,882 3,733 5,316 8,574 6,325 08 12,801 4,174 4,041 4,078 3,742 3,999 3,794 5,496 8,652 6,483 09 12,485 3,980 4,005 4,050 3,728 3,881 3,779 5,362 8,653 6,552 0R . . . . . . . . . . 10 12,359 4,050 3,893 3,914 3,728 3,728 3,797 5,281 8,474 6,328 11 11,509 3,621 3,694 3,757 3,373 3,662 3,458 4,921 8,063 5,967 12 11,959 3,944 3,714 3,818 3,467 3,724 3,655 5,022 8,224 6,151 4 . . . . . . . . . . 5 . . . . . . . . . . Total 144,698 46,022 45,271 45,479 41,925 44,285 43,550 62,899 103,286 75,485

National Longitudinal Mortality Study – Extract File: Age, Birth Information, and Gender Variables
62
MOB\counts: 9603 9703 9803 9903 0003 0103 0203 0303 0403 0503 blank . . . . . . . 21,089 21,440 22,665 -- . . . . . . . . . . -0 . . . . . . . . . . -1 3 7 5 . . . . . . . -2 553 671 467 21 40 49 27 . . . -3 695 903 789 . 7 5 10 . . . 0- . . . . . . . . . . 00 . . . . . . . . . . 01 5,497 5,742 5,794 6,080 6,078 6,914 6,949 11,740 11,460 12,465 02 4,846 4,983 5,035 5,367 5,280 5,992 6,189 10,266 10,070 10,664 03 5,497 5,468 5,454 5,975 5,933 6,796 6,700 11,099 11,023 11,470 04 5,085 5,087 5,147 5,516 5,367 6,212 6,187 10,542 10,291 11,103 05 5,179 5,372 5,251 5,635 5,711 6,475 6,520 11,034 10,702 11,518 06 5,293 5,343 5,183 5,601 5,550 6,392 6,423 10,908 10,789 11,171 07 5,628 5,589 5,541 5,944 5,905 6,726 6,810 11,499 11,050 11,933 08 5,693 5,717 5,659 6,001 6,164 6,754 6,929 11,668 11,288 11,943 09 5,493 5,556 5,690 5,811 5,834 6,869 6,824 11,582 11,326 11,949 0R . . . . . . . . . . 10 5,496 5,414 5,446 5,813 5,956 6,800 6,869 11,329 10,975 11,842 11 5,142 5,196 5,236 5,587 5,651 6,324 6,347 10,668 10,224 11,005 12 5,455 5,346 5,476 5,824 5,846 6,629 6,738 10,981 10,671 11,529 4 . . . . . . . . . . 5 . . . . . . . . . . Total 65,555 66,394 66,173 69,175 69,322 78,937 79,522 154,405 151,309 161,257 MOB\counts: 0603 0703 0803 0903 1003 1103 blank 8,481 9,513 11,162 11,729 11,440 12,840 -- . . . . . . -0 . . . . . . -1 . . . . . . -2 . . . . . . -3 . . . . . . 0- . . . . . . 00 . . . . . . 01 11,238 12,016 11,461 11,261 11,074 10,948 02 9,696 9,716 9,142 9,450 9,364 9,143 03 10,453 10,358 9,982 9,957 9,974 9,599 04 10,169 9,581 9,397 9,624 9,419 9,302 05 10,263 10,310 9,635 9,668 9,732 9,488 06 10,245 9,963 9,696 9,818 9,702 9,449 07 10,992 10,636 10,248 10,410 10,323 10,203 08 11,137 10,646 10,243 10,604 10,363 10,289 09 10,625 10,497 10,098 10,284 10,310 10,020 0R . . . . . . 10 10,783 10,557 10,034 10,178 10,139 9,818 11 9,960 9,678 9,382 9,606 9,599 9,208 12 10,421 10,271 9,575 10,040 10,029 9,754 4 . . . . . . 5 . . . . . . Total 134,463 133,742 130,055 132,629 131,468 130,061

National Longitudinal Mortality Study – Extract File: Age, Birth Information, and Gender Variables
63
37. Year of Birth YOB Analysis File Return to Index EDITS: Invalid Entry DESCRIPTION: Year of birth1. For cohorts 7303 - 8509, year of birth is not saved on CPS files. These data were collected from control card information for the file. When file originated from a source other than CPS, YOB was taken from that source. For cohorts 8603-0203, the source is the NLMS master files because birth dates collected from CPS respondents are entered directly into the file that serves as the NLMS master file. NOT AVAILABLE: 8024, 9103 1The century can be either 1800 or 1900 for the same two digit year-of-birth codes. CODES for files: 7303-8014, 8008-9003, 9203-1103 ( — Missing -1 — Missing -2 — Missing -3 — Missing 0 — Missing 0- — Missing 00-99 — Final two digits in year of birth 9> — Missing X — Missing XX — Missing FREQUENCIES: YOB\counts: 7303 7802 7903 8014 8008 8012 8103 8203 8303 8403 blank 789 2 1,072 527 449 2,142 968 429 858 2,016 ( 1 . . . . . . . . . -1 . . . . . . . . . . -2 . . . . . . . . . . -3 . . . . . . . . . . 0 5 672 . . . . . . . . 0- . . 393 . . . 551 835 757 953 00-99 130,417 93,887 41,633 184,344 181,924 175,623 60,285 80,216 79,666 77,763 9> 1 . . . . . . . . . X . 94 . . . . . . . . XX . 7 . . . . . . . . Total 131,213 94,662 43,098 184,871 182,373 177,765 61,804 81,480 81,281 80,732 YOB\counts: 8503 8509 8603 8703 8803 8903 9003 9203 9303 9413 blank 1,848 . . . . . . . . . ( . . . . . . . . . . -1 . . . . . . . . . 12 -2 . . . . . . . . . 914 -3 . . . . . . . . . 622 0 . . . . . . . . . . 0- 1,131 . . . . . . . . . 00-99 77,092 144,698 46,022 45,271 45,479 41,925 44,285 43,550 62,899 101,738 9> . . . . . . . . . . X . . . . . . . . . . XX . . . . . . . . . . Total 80,071 144,698 46,022 45,271 45,479 41,925 44,285 43,550 62,899 103,286

National Longitudinal Mortality Study – Extract File: Age, Birth Information, and Gender Variables
64
YOB\counts: 9503 9603 9703 9803 9903 0003 0103 0203 0303 0403 blank . . . . . . . . . . ( . . . . . . . . . . -1 12 8 6 7 . . . . 14,179 14,541 -2 355 283 326 221 18 23 33 18 1,818 1,734 -3 223 235 301 221 1 4 2 8 3,067 3,223 0 . . . 9 . . . . . . 0- . . . . . . . . . . 00-99 74,895 65,029 65,761 65,715 69,156 69,295 78,902 79,496 135,341 131,811 9> . . . . . . . . . . X . . . . . . . . . . XX . . . . . . . . . . Total 75,485 65,555 66,394 66,173 69,175 69,322 78,937 79,522 154,405 151,309 YOB\counts: 0503 0603 0703 0803 0903 1003 1103 blank . . . . . . . ( . . . . . . . -1 14,875 297 624 401 435 329 434 -2 2,184 2,156 1,768 1,247 1,134 1,256 1,132 -3 3,595 3,592 3,373 4,034 3,871 4,029 4,382 0 . . . . . . . 0- . . . . . . . 00-99 140,603 128,418 127,977 124,373 127,189 125,854 124,113 9> . . . . . . . X . . . . . . . XX . . . . . . . Total 161,257 134,463 133,742 130,055 132,629 131,468 130,061

National Longitudinal Mortality Study – Extract File: Age, Birth Information, and Gender Variables
65
38. Final Sex from Multiple Sources SEXF Analysis File Return to Index EDITS: Simple DESCRIPTION: This variable indicates the most complete information for gender available to the NLMS. The defining value assigned to this variable includes an attempt to identify missing values and settle inconsistencies among several sources by manual review. The defining value is determined by NLMS processing and may or may not be in agreement with the associated CPS or Census files. This multistep process was used to determine a valid SEXF entry for the following files: 7303, 7802, 8014, 8008, 8012, 8024, 8203, and 8509. The value of SEXF for all other NLMS files is the value of gender existing on the CPS or Census file, i.e. the value listed under the variable SEX. In some cases original values of gender are imputed for CPS purposes and were the values received by the NLMS from the CPS master file source. In addition, the following steps were followed to define the value of SEXF for the indicated files. If the value of SEX and SEXC are valid entries, i.e. a 1=male or 2=female, and SEX=SEXC, then SEXF is assigned the common value. If the value of SEX is a valid entry and SEXC is missing, the value of SEX is assigned to SEXF. If the value of SEX is missing and the value of SEXC is a valid entry, the value of SEXC is assigned to SEXF. If SEX and SEXC are valid but do not agree, then a manual review was conducted using as a first gender screen the uniquely male and uniquely female first names from the National Death Index. Cases not identified in this process were then listed within household for a manual, visual, review. Names that were not identifiable in this setting were assigned the value of variable SEX, the possibly imputed value of gender on the operational CPS file and the value of gender that is accepted as correct on the CPS master file. AVAILABLE FILES: All files CODES for files: All files blank — Missing 1 — Sex if male 2 — Sex if female 9 — Missing FREQUENCIES: SEXF\counts: 7303 7802 7903 8014 8024 8008 8012 8103 8203 8303 blank . . . . . . . . 1 . 1 63,470 44,717 20,720 89,398 57,969 88,170 85,878 29,884 39,398 39,144 2 67,743 49,943 22,378 95,473 66,375 94,203 91,886 31,920 42,081 42,137 9 . 2 . . 1 . 1 . . . Total 131,213 94,662 43,098 184,871 124,345 182,373 177,765 61,804 81,480 81,281 SEXF\counts: 8403 8503 8509 8603 8703 8803 8903 9003 9103 9203 blank . . . . . . . . . . 1 38,934 38,440 69,731 21,572 21,140 21,279 19,606 20,701 23,298 20,559 2 41,798 41,631 74,967 24,450 24,131 24,200 22,319 23,584 25,739 22,991 9 . . . . . . . . . . Total 80,732 80,071 144,698 46,022 45,271 45,479 41,925 44,285 49,037 43,550

National Longitudinal Mortality Study – Extract File: Age, Birth Information, and Gender Variables
66
SEXF\counts: 9303 9413 9503 9603 9703 9803 9903 0003 0103 0203 blank . . . . . . . . . . 1 29,966 49,598 36,212 31,336 32,041 31,905 33,345 33,708 38,297 38,650 2 32,933 53,688 39,273 34,219 34,353 34,268 35,830 35,614 40,640 40,872 9 . . . . . . . . . . Total 62,899 103,286 75,485 65,555 66,394 66,173 69,175 69,322 78,937 79,522 SEXF\counts: 0303 0403 0503 0603 0703 0803 0903 1003 1103 blank 22,184 22,047 23,959 6,620 6,764 5,485 5,525 5,539 6,047 1 64,546 62,613 66,656 62,206 61,874 60,343 61,746 61,191 60,074 2 67,675 66,649 70,642 65,637 65,104 64,227 65,358 64,738 63,940 9 . . . . . . . . . Total 154,405 151,309 161,257 134,463 133,742 130,055 132,629 131,468 130,061

National Longitudinal Mortality Study – Extract File: Age, Birth Information, and Gender Variables
67
39. Date of Birth—from SSA Numident DOBN Return to Index EDITS: None DESCRIPTION: AVAILABLE FILES: All files

National Longitudinal Mortality Study – Extract File: Age, Birth Information, and Gender Variables
68
40. Citizenship Group CITIZEN Analysis File Return to Index EDITS: Simple DESCRIPTION: Beginning with the 2000 redesign of the CPS, the variable PRCITSHP was collected and defined for CPS surveys. The NLMS version of this variable, CITIZEN, is a direct input of the variable PRCITSHP. NOT AVAILABLE: 7303-9303 CODES for files: 9413-0203 blank – blank, unknown, fail edit record 1 – Native, born in the U.S. 2 – Native, born in PR or U.S. outlying area 3 – Native, born abroad of U.S. parents 4 – Foreign born, U.S. citizenship by naturalization 5 – Foreign born, NOT a U.S. Citizen FREQUENCIES: CITIZEN\counts: 9413 9503 9603 9703 9803 9903 0003 0103 0203 blank 8,855 6,658 5,845 5,831 5,746 6,250 7,585 6,468 6,236 1 82,380 60,789 52,989 53,127 53,428 54,169 52,475 61,726 62,649 2 870 526 470 426 398 670 529 624 675 3 942 630 529 575 551 463 506 594 587 4 2,770 2,178 1,682 2,140 2,120 2,549 2,702 3,234 3,097 5 7,469 4,704 4,040 4,295 3,930 5,074 5,525 6,291 6,278 Total 103,286 75,485 65,555 66,394 66,173 69,175 69,322 78,937 79,522 CODES for files: 0303-1103 blank – blank, unknown, fail edit record 0 – unknown, fail edit record 1 – Native, born in the U.S. 2 – Native, born in PR or U.S. outlying area 3 – Native, born abroad of U.S. parents 4 – Foreign born, U.S. citizenship by naturalization 5 – Foreign born, NOT a U.S. Citizen FREQUENCIES: CITIZEN\counts: 0303 0403 0503 0603 0703 0803 0903 1003 1103 blank 7,704 6,708 6,296 4,805 4,043 3,201 2,770 1,755 687 0 20,616 21,105 21,827 5,082 5,009 4,421 4,342 4,387 4,734 1 110,358 107,611 116,179 107,775 107,482 105,590 108,528 107,724 106,847 2 695 768 731 750 741 737 707 732 789 3 1,013 1,119 1,073 1,020 985 982 973 993 977 4 4,905 4,968 5,294 5,323 5,728 5,781 6,182 6,409 6,861 5 9,114 9,030 9,857 9,708 9,754 9,343 9,127 9,468 9,166 Total 154,405 151,309 161,257 134,463 133,742 130,055 132,629 131,468 130,061

National Longitudinal Mortality Study – Extract File: Age, Birth Information, and Gender Variables
69
41. Place of Birth from Control File POB Analysis File Return to Index Return to POBF EDITS: Simple DESCRIPTION: Place of birth is collected from control card or from special sources when the control file was constructed by the original file sponsor. All file sources have been standardized into the National Death Index Geographical codes for states. NOT AVAILABLE: 7303, 7903, 8024, 8103–1103 CODES for files: 7802*, 8014, 8008, 8012 *Only available for small fraction of the 7802 file National Death Index Geographical Codes for State (or Foreign Country of Residence and Birth) Source: National Death Index User's Manual, October 1997. 01 Alabama 21 Maryland 41 South Carolina 02 Alaska 22 Massachusetts 42 South Dakota 03 Arizona 23 Michigan 43 Tennessee 04 Arkansas 24 Minnesota 44 Texas 05 California 25 Mississippi 45 Utah 06 Colorado 26 Missouri 46 Vermont 07 Connecticut 27 Montana 47 Virginia 08 Delaware 28 Nebraska 48 Washington 09 District of Columbia 29 Nevada 49 West Virginia 10 Florida 30 New Hampshire 50 Wisconsin 11 Georgia 31 New Jersey 51 Wyoming 12 Hawaii 32 New Mexico 52 Puerto Rico 13 Idaho 33 New York State 53 Virgin Islands 14 Illinois 34 North Carolina 54 Guam 15 Indiana 35 North Dakota 55 Canada 16 Iowa 36 Ohio 56 Cuba 17 Kansas 37 Oklahoma 57 Mexico 18 Kentucky 38 Oregon 59 Rest of world 19 Louisiana 39 Pennsylvania 99 Unknown 20 Maine 40 Rhode Island
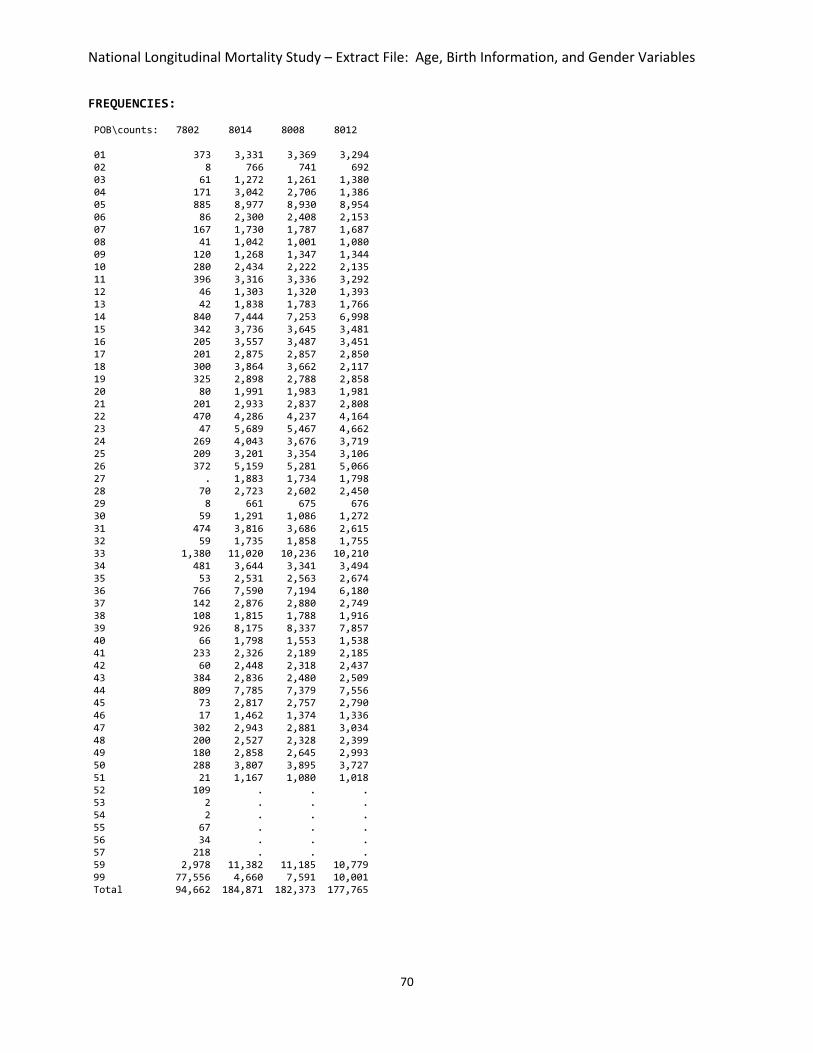
National Longitudinal Mortality Study – Extract File: Age, Birth Information, and Gender Variables
70
FREQUENCIES: POB\counts: 7802 8014 8008 8012 01 373 3,331 3,369 3,294 02 8 766 741 692 03 61 1,272 1,261 1,380 04 171 3,042 2,706 1,386 05 885 8,977 8,930 8,954 06 86 2,300 2,408 2,153 07 167 1,730 1,787 1,687 08 41 1,042 1,001 1,080 09 120 1,268 1,347 1,344 10 280 2,434 2,222 2,135 11 396 3,316 3,336 3,292 12 46 1,303 1,320 1,393 13 42 1,838 1,783 1,766 14 840 7,444 7,253 6,998 15 342 3,736 3,645 3,481 16 205 3,557 3,487 3,451 17 201 2,875 2,857 2,850 18 300 3,864 3,662 2,117 19 325 2,898 2,788 2,858 20 80 1,991 1,983 1,981 21 201 2,933 2,837 2,808 22 470 4,286 4,237 4,164 23 47 5,689 5,467 4,662 24 269 4,043 3,676 3,719 25 209 3,201 3,354 3,106 26 372 5,159 5,281 5,066 27 . 1,883 1,734 1,798 28 70 2,723 2,602 2,450 29 8 661 675 676 30 59 1,291 1,086 1,272 31 474 3,816 3,686 2,615 32 59 1,735 1,858 1,755 33 1,380 11,020 10,236 10,210 34 481 3,644 3,341 3,494 35 53 2,531 2,563 2,674 36 766 7,590 7,194 6,180 37 142 2,876 2,880 2,749 38 108 1,815 1,788 1,916 39 926 8,175 8,337 7,857 40 66 1,798 1,553 1,538 41 233 2,326 2,189 2,185 42 60 2,448 2,318 2,437 43 384 2,836 2,480 2,509 44 809 7,785 7,379 7,556 45 73 2,817 2,757 2,790 46 17 1,462 1,374 1,336 47 302 2,943 2,881 3,034 48 200 2,527 2,328 2,399 49 180 2,858 2,645 2,993 50 288 3,807 3,895 3,727 51 21 1,167 1,080 1,018 52 109 . . . 53 2 . . . 54 2 . . . 55 67 . . . 56 34 . . . 57 218 . . . 59 2,978 11,382 11,185 10,779 99 77,556 4,660 7,591 10,001 Total 94,662 184,871 182,373 177,765

National Longitudinal Mortality Study – Extract File: Age, Birth Information, and Gender Variables
71
42. Place of Birth—Final POBF Return to Index EDITS: None DESCRIPTION: Place of birth was collected at the time of survey for several of the early NLMS cohorts (see POB). The information for POB was obtained from control cards for information available at the time of survey. For the NLMS, the variable POB was collected mainly for the 1980 Census undercount files: 8014, 8008, and 8012. Through the use of administrative record linkage, other sources of place of birth have been used to create a more complete variable for place of birth, labeled POBF. This variable expands the original POB where it was available and creates new information otherwise. The main source of the additional information used to define POBF was the Social Security Administration NUMIDENT file. The code for the variable POBF was defined according to the ISO 3166-1 (International Organization for Standardization) format. The country names in this list are defined if the country is a part of one of two lists: The United Nations Terminology Bulletin, Country Names, or, Country and Region Codes for Statistical Use, of the UN Statistics Division. To be a country in one of these two lists, the country must satisfy at least one of the following: be a member of the United Nations, be a member of one of its specialized agencies, or be a party to the Statute of the International Court of Justice. Once a country name or territory name appears in either of these two sources, it is automatically added to the ISO list by default. The list of eligible names for NLMS purposes is the ISO 3166-1 list as defined in February of 2011; see Appendix D-1 (country name, alphabetical sort order) or D-2 (numerical value sort order). The definition of POBF includes over 600 country identifications. For this reason to provide ease of use, a variety of reclassifications of the variable have been developed. See POBFCAT3, POBFCAT4, POBFCAT5, REGIONOB, REGIONOBG, REGIONOBM, and REGIONOBE. POBF as defined in the NLMS covers not only foreign countries, but also includes the individual states of the United States. The coding of the NLMS variable POBF has been expanded from the ISO 3166-1 code to cover all possibilities in a single three-digit code as shown below. AVAILABLE FILES: All files CODES for files: All Files 001 – 899 Foreign country three digit ISO 3166-1 code, see Appendix D-1 or D-2 901 – 960 US state codes, the last two digits form the FIPS state code, see FIPSSTATE 970 – Other Asian country not specifically identified in ISO-3166-1 971 – Other areas in the Caribbean not specifically identified in ISO-3166-1 972 - Other areas on the African continent not specifically identified in ISO-3166-1 973 - Other areas of the Pacific Islands not specifically identified in ISO-3166-1 974 - Other areas in the Middle East not specifically identified in ISO-3166-1 975 – Yugoslavia 976 - Other areas in Europe not specifically identified in ISO-3166-1 977 - Other areas of North America not specifically identified in ISO-3166-1 978 - Other areas of Central America not specifically identified in ISO-3166-1 979 - Other areas of South America not specifically identified in ISO-3166-1

National Longitudinal Mortality Study – Extract File: Age, Birth Information, and Gender Variables
72
980 – Areas outside of the US not specifically identified, indication of foreign born. 981 – Areas inside the US not specifically identified, i.e., born in US 999 – Missing or unknown place of birth NOTE 1: The codes 970—981 were also assigned when the information available on place of birth indicated a place of birth in a general sense but not a specific country from the ISO 3166-1 list. That is, the information available was enough to assign one of the continents or generalized land areas indicated. NOTE 2: The determination of place of birth was dropped for files 0303-1103 from CPS, and the variable country of birth (PUNATVTY) was the only place of birth variable collected. The code (PUNATVTY = 057), born in the United States, identifies persons born in the U.S. All records so identified are assigned the POBF code of 981.

National Longitudinal Mortality Study – Extract File: Age, Birth Information, and Gender Variables
73
43. Three-Way Classification of POBF POBFCAT3 Return to Index EDITS: None DESCRIPTION: Place of birth was collected from control cards at the time of survey for several of the early NLMS cohorts. Through the use of administrative record linkage, other sources of place of birth have been used to create a more complete variable for place of birth, labeled POBF. The definition of POBF includes over 600 country identifications. For this reason to provide ease of use, a variety of reclassifications of the variable have been developed, including a three-way classification, POBFCAT3. Also see POBFCAT4, POBFCAT5, REGIONOB, REGIONOBG, REGIONOBM, and REGIONOBE. NOT AVAILABLE: 8024 CODES for files: 7303-8014, 8008-1103 0 – Missing POBF 1 – POBF is within the US, Puerto Rico, or within an outlying possession of the US 2 – POBF is NOT identified as part of the US as defined in category 1

National Longitudinal Mortality Study – Extract File: Age, Birth Information, and Gender Variables
74
44. Four-Way Classification of POBF POBFCAT4 Return to Index EDITS: None DESCRIPTION: Place of birth was collected from control cards at the time of survey for several of the early NLMS cohorts. Through the use of administrative record linkage, other sources of place of birth have been used to create a more complete variable for place of birth, labeled POBF. The definition of POBF includes over 600 country identifications. For this reason to provide ease of use, a variety of reclassifications of the variable have been developed, including a four-way classification, POBFCAT4. Also see POBFCAT3, POBFCAT5, REGIONOB, REGIONOBG, REGIONOBM, and REGIONOBE. NOT AVAILABLE: 8024 CODES for files: 7303-8014, 8008-1103 0 – Missing POBF 1 – POBF indicates born in the US 2 – POBF indicates born in Puerto Rico or within an outlying possession of the US 3 – POBF is NOT born in the US, i.e. POBF is not identified as either category 1 or 2
National Longitudinal Mortality Study – Extract File: Age, Birth Information, and Gender Variables
75
45. Five-Way Classification of POBF POBFCAT5 Return to Index EDITS: None DESCRIPTION: Place of birth was collected from control cards at the time of survey for several of the early NLMS cohorts. Through the use of administrative record linkage, other sources of place of birth have been used to create a more complete variable for place of birth, labeled POBF. The definition of POBF includes over 600 country identifications. For this reason to provide ease of use, a variety of reclassifications of the variable have been developed, including a five-way classification, POBFCAT5. Also see POBFCAT3, POBFCAT4, REGIONOB, REGIONOBG, REGIONOBM, and REGIONOBE. NOT AVAILABLE: 8024 CODES for files: 7303-8014, 8008-1103 0 – Missing POBF 1 – POBF indicates born in the US 2 – POBF indicates born in Puerto Rico or within an outlying possession of the US 3 – POBF indicates not born in the US, PR or outlying possession, categories 1 and 2, or in Mexico 4 – POBF indicates person was born in Mexico 5 – POBF indicates person born elsewhere but not in the US

National Longitudinal Mortality Study – Extract File: Age, Birth Information, and Gender Variables
76
46. Region of Birth REGIONOB Return to Index EDITS: None DESCRIPTION: Place of birth was collected from control cards at the time of survey for several of the early NLMS cohorts. Through the use of administrative record linkage, other sources of place of birth have been used to create a more complete variable for place of birth, labeled POBF. The definition of POBF includes over 600 country identifications. For this reason to provide ease of use, a variety of reclassifications of the variable have been developed, including POBF indicating region of birth, REGIONOB. Also see POBFCAT3, POBFCAT4, POBFCAT5, REGIONOBG, REGIONOBM, and REGIONOBE. NOT AVAILABLE: 8024 CODES for files: 7303-8014, 8008-1103 0 – Missing POBF 1 – POBF indicates a country on the African continent 2 – POBF indicates a country on the Asian continent 3 – POBF indicates a country on the European continent 4 – POBF indicates a country in Latin America 5 – POBF indicates a country on the North American continent, but not in the US 6 – POBF indicates a country not on a continent, but identified as an island off of an identifiable continent 7 – POBF indicates person born elsewhere but not in the US 8 – POBF indicates born in Puerto Rico or an outlying possession of the US 9 – POBF indicates born in the US

National Longitudinal Mortality Study – Extract File: Age, Birth Information, and Gender Variables
77
47. Region of Birth Isolating the US REGIONOBG Return to Index EDITS: None DESCRIPTION: Place of birth was collected from control cards at the time of survey for several of the early NLMS cohorts. Through the use of administrative record linkage, other sources of place of birth have been used to create a more complete variable for place of birth, labeled POBF. The definition of POBF includes over 600 country identifications. For this reason to provide ease of use, a variety of reclassifications of the variable have been developed, including POBF indicating region of birth and isolating the US, REGIONOBG. Also see POBFCAT3, POBFCAT4, POBFCAT5, REGIONOB, REGIONOBM, and REGIONOBE. NOT AVAILABLE: 8024 CODES for files: 7303-8014, 8008-1103 0 – Missing POBF 1 – POBF indicates a country on the African continent 2 – POBF indicates a country on the Asian continent 3 – POBF indicates a country on the European continent 4 – POBF indicates a country in Latin America 5 – POBF indicates the North American continent 6 – POBF indicates a country not on a continent, but identified as an island off of an identifiable continent 7 – POBF indicates person born elsewhere but not in the US 8 – POBF indicates born in the US, Puerto Rico, or an outlying possession of the US

National Longitudinal Mortality Study – Extract File: Age, Birth Information, and Gender Variables
78
48. Region of Birth Isolating Mexico REGIONOBM Return to Index EDITS: None DESCRIPTION: Place of birth was collected from control cards at the time of survey for several of the early NLMS cohorts. Through the use of administrative record linkage, other sources of place of birth have been used to create a more complete variable for place of birth, labeled POBF. The definition of POBF includes over 600 country identifications. For this reason to provide ease of use, a variety of reclassifications of the variable have been developed, including POBF indicating region of birth and isolating Mexico, REGIONOBM. Also see POBFCAT3, POBFCAT4, POBFCAT5, REGIONOB, REGIONOBG, and REGIONOBE. NOT AVAILABLE: 8024 CODES for files: 7303-8014, 8008-1103 00 – Missing POBF 01 – POBF indicates a country on the African continent 02 – POBF indicates a country on the Asian continent 03 – POBF indicates a country on the European continent 04 – POBF indicates a country in Latin America 05 – POBF indicates person was born in Mexico 06 – POBF indicates a country on the North American continent 07 – POBF indicates a country not on a continent, but identified as an island off of an
identifiable continent, not in the US 08 – POBF indicates person born elsewhere but not in the US 09 – POBF indicates born in Puerto Rico or an outlying possession of the US 10 – POBF indicates born in the US

National Longitudinal Mortality Study – Extract File: Age, Birth Information, and Gender Variables
79
49. Region of Birth Isolates Mexico, Splits Europe REGIONOBE Return to Index EDITS: None DESCRIPTION: Place of birth was collected from control cards at the time of survey for several of the early NLMS cohorts. Through the use of administrative record linkage, other sources of place of birth have been used to create a more complete variable for place of birth, labeled POBF. The definition of POBF includes over 600 country identifications. For this reason to provide ease of use, a variety of reclassifications of the variable have been developed, including POBF indicating region of birth and isolating Mexico while splitting Europe, REGIONOBE. Also see POBFCAT3, POBFCAT4, POBFCAT5, REGIONOB, REGIONOBG, and REGIONOBM. NOT AVAILABLE: 8024 CODES for files: 7303-8014, 8008-1103 00 – Missing POBF 01 – POBF indicates a country on the African continent 02 – POBF indicates a country on the Asian continent 03 – POBF indicates a country in Eastern Europe 04 – POBF indicates a country in Western Europe 05 – POBF indicates a country in North America but not the US or Mexico 06 – POBF indicates a country on the South American continent 07 – POBF indicates a country in Latin America 08 – POBF indicates person was born in Mexico 09 – POBF indicates a country not on a continent, but identified as an island off of an
identifiable continent, not in the US 10 – POBF indicates person born elsewhere but not in the US 11 – POBF indicates born in Puerto Rico or an outlying possession of the US 12 – POBF indicates born in the US

National Longitudinal Mortality Study – Extract File: Race and Ethnicity Variables
80
RACE AND ETHNICITY VARIABLES 50. Race RACE Return to Index EDITS: None DESCRIPTION: Codes for race are assigned with first priority being the CPS code. If there is no code on the CPS record, the second priority is the code on the control file. RACE can be difficult to use and interpret. For a simple race code, RACER is the recommended variable. To yield the maximum race group detail (which evolves over time with the availability of underlying data), RACEX is the recommended variable. There is no Analysis File version of RACE; use RACER or RACEX as appropriate. NOT AVAILABLE: 0303-1103 CODES for files: 7303-7903, 8012-8503 blank — Unknown 0 — Unknown 1 — White 2 — Black 3 — Other 7 — Other 9 — Unknown FREQUENCIES: RACE\counts: 7303 7802 7903 8012 8103 8203 8303 8403 8503 blank . 1 . 133 . 1 . . . 0 . 106 . 103 . . . . . 1 115,684 83,454 38,009 152,903 53,533 70,485 70,642 70,071 68,956 2 13,872 9,684 3,840 18,796 6,219 8,303 7,834 8,131 8,242 3 1,427 1,417 1,249 5,825 2,052 2,691 2,805 2,530 2,873 7 . . . 5 . . . . . 9 230 . . . . . . . . Total 131,213 94,662 43,098 177,765 61,804 81,480 81,281 80,732 80,071 CODES for files: 8014, 8008, 8509 - — Unknown 1 — White 2 — Black 3 — American Indian, Aleut, Eskimo 4 — Asian or Pacific islands 5 — Other

National Longitudinal Mortality Study – Extract File: Race and Ethnicity Variables
81
FREQUENCIES: RACE\counts: 8014 8008 8509 - . . 2 1 159,580 157,098 124,456 2 19,745 19,601 15,507 3 5,447 5,571 4,604 4 80 83 122 5 19 20 7 Total 184,871 182,373 144,698 CODES for files: 8024 9 — Unknown A — White I — Asian Indian B — Black J — Hawaiian C — Japanese K — Guamanian D — Chinese L — Samoan E — Filipino M — Eskimo F — Korean N — Aleutian G — Vietnamese O — Other H — American Indian FREQUENCIES: RACE\counts: 8024 9 1,051 A 100,254 B 16,463 C 541 D 362 E 479 F 118 G 122 H 991 I 138 J 160 K 26 L 13 M 53 N 36 O 3,538 Total 124,345 CODES for files: 8603, 8703 1 — White 2 — Black 3 — Other FREQUENCIES: RACE\counts: 8603 8703 1 40,881 40,200 2 3,831 3,771 3 1,310 1,300 Total 46,022 45,271

National Longitudinal Mortality Study – Extract File: Race and Ethnicity Variables
82
CODES for files: 8803–0203 1 — White 2 — Black 3 — American Indian, Aleut, Eskimo 4 — Asian or Pacific Islander 5 — Other FREQUENCIES: RACE\counts: 8803 8903 9003 9103 9203 9303 9413 9503 9603 9703 1 40,364 37,237 39,191 43,422 38,517 54,215 85,881 62,720 55,579 56,546 2 3,600 3,361 3,476 3,873 3,367 5,942 10,975 7,632 6,999 6,686 3 399 343 464 443 451 680 1,250 909 867 951 4 1,058 916 1,067 1,199 1,078 1,777 3,404 2,474 2,110 2,211 5 58 68 87 100 137 285 1,776 1,750 . . Total 45,479 41,925 44,285 49,037 43,550 62,899 103,286 75,485 65,555 66,394 RACE\counts: 9803 9903 0003 0103 0203 1 56,227 59,665 59,443 67,779 68,481 2 6,869 6,348 6,705 7,092 7,105 3 830 924 1,027 1,232 1,410 4 2,247 2,238 2,147 2,834 2,526 5 . . . . . Total 66,173 69,175 69,322 78,937 79,522

National Longitudinal Mortality Study – Extract File: Race and Ethnicity Variables
83
51. Race Recode—White/Black/Other RACER Analysis File Return to Index Return to RACE EDITS: Simple, Invalid Entry, Recode DESCRIPTION: Race is recoded so that all files have the same race coding. For files after 2003, the variable RACER is a recode taken from the NLMS variable #53, RACEPRDT, documented on page 89. The race variable, RACEPRDT, is a multi-category variable recording the respondent response to the survey request to identify a race category which best describes their race from the choices on a presented list. The multiple choices offer a variety of mixed race possibilities for the respondent to consider. The variable RACER for the indicated files is a recode of the variable, RACEPRDT, as determined by the CPS Branch of the Demographic Directorate. The NLMS variable is taken directly from the CPS variable, A_RACE, as given in NLMS master file according to the file documentation. The CPS Branch determined categorization translation of RACEPRDT to RACER is:
RACEPRDT = -1 – Missing ==> RACER = blank, Missing RACEPRDT = 01 – White Only ==> RACER = 1, White RACEPRDT = 02 – Black Only ==> RACER = 2, Black All categories of RACEPRDT below ==> RACER = 3, Other 03 -- American Indian, Alaskan Native Only 04 – Asian Only 05 – Hawaiian/Pacific Islander Only 06 – White and Black 07 – White and American Indian 08 – White and Asian 09 – White and Hawaiian 10 – Black and American Indian 11 – Black and Asian 12 – Black and Hawaiian, Other Pacific Islander 13 – Asian and American Indian 14 – American Indian and Hawaiian, Other Pacific Islander 15 – Asian and Hawaiian, Other Pacific Islander 16 – White, Black, and American Indian 17 – White, Black, and Asian 18 – White, Black, and Hawaiian, Other Pacific Islander 19 – White, Asian, and American Indian 20 – White, American Indian, and Hawaiian, Other Pacific Islander 21 – White, Asian, and Hawaiian, Other Pacific Islander 22 – Black, Asian and American Indian 23 – Black, American Indian, and Hawaiian, Other Pacific Islander 24 – Black, Asian, and Hawaiian, Other Pacific Islander 25 – Asian, American Indian, and Hawaiian, Other Pacific Islander 26 – White, Black, Asian, and American Indian 27 – White, Asian, American Indian, and Hawaiian, Other Pacific Islander 28 – White, Black, Asian, and Hawaiian, Other Pacific Islander 29 – White, Black, American Indian, and Hawaiian, Other Pacific Islander 30 – Black, Asian, American Indian, and Hawaiian, Other Pacific Islander 31 – White, Black, Asian, American Indian, and Hawaiian, Other Pacific Islander

National Longitudinal Mortality Study – Extract File: Race and Ethnicity Variables
84
AVAILABLE FILES: All files CODES for files: 7303-0203 blank — Blank - — Unknown 1 — White 2 — Black 3 — Other 4 — Other 5 — Other 9 — Unknown FREQUENCIES: RACER\counts: 7303 7802 7903 8014 8024 8008 8012 8103 8203 8303 blank . . . . . . . . 1 . - . . . . . . . . . . 1 115,684 83,454 38,009 159,580 100,254 157,098 152,903 53,533 70,485 70,642 2 13,872 9,684 3,840 19,745 16,463 19,601 18,796 6,219 8,303 7,834 3 1,427 1,417 1,249 5,546 6,577 5,674 5,830 2,052 2,691 2,805 4 . . . . . . . . . . 5 . . . . . . . . . . 9 230 107 . . 1,051 . 236 . . . Total 131,213 94,662 43,098 184,871 124,345 182,373 177,765 61,804 81,480 81,281 RACER\counts: 8403 8503 8509 8603 8703 8803 8903 9003 9103 9203 blank . . . . . . . . . . - . . 2 . . . . . . . 1 70,071 68,956 124,456 40,881 40,200 40,364 37,237 39,191 43,422 38,517 2 8,131 8,242 15,507 3,831 3,771 3,600 3,361 3,476 3,873 3,367 3 2,530 2,873 4,604 1,310 1,300 1,515 1,327 1,618 1,742 1,666 4 . . 122 . . . . . . . 5 . . 7 . . . . . . . 9 . . . . . . . . . . Total 80,732 80,071 144,698 46,022 45,271 45,479 41,925 44,285 49,037 43,550 RACER\counts: 9303 9413 9503 9603 9703 9803 9903 0003 0103 0203 blank . . . . . . . . . . - . . . . . . . . . . 1 54,215 85,881 62,720 55,579 56,546 56,227 59,665 59,443 67,779 68,481 2 5,942 10,975 7,632 6,999 6,686 6,869 6,348 6,705 7,092 7,105 3 2,742 6,430 5,133 2,977 3,162 3,077 3,162 3,174 4,066 3,936 4 . . . . . . . . . . 5 . . . . . . . . . . 9 . . . . . . . . . . Total 62,899 103,286 75,485 65,555 66,394 66,173 69,175 69,322 78,937 79,522 CODES for files: 0303-1103 blank — Missing 1 — White 2 — Black 3 — Other

National Longitudinal Mortality Study – Extract File: Race and Ethnicity Variables
85
FREQUENCIES: RACER\counts: 0303 0403 0503 0603 0703 0803 0903 1003 1103 blank 20,616 21,105 21,827 5,082 5,009 4,456 4,342 4,387 4,734 1 106,151 103,339 110,970 102,216 100,957 98,298 99,828 97,810 96,911 2 16,273 15,242 16,064 15,175 15,795 15,486 15,604 16,589 15,580 3 11,365 11,623 12,396 11,990 11,981 11,815 12,855 12,682 12,836 Total 154,405 151,309 161,257 134,463 133,742 130,055 132,629 131,468 130,061

National Longitudinal Mortality Study – Extract File: Race and Ethnicity Variables
86
52. Race Expanded w/ American Indian & Asian RACEX Analysis File Return to Index Return to RACE EDITS: Simple, Invalid Entry, Recode DESCRIPTION: An expanded version of RACE (variable #50) which separates the "American Indian, etc." and "Asian, etc." categories out of "Other" from the variable RACE. For files after 2003, the variable RACEX is a recode taken from the NLMS variable #53, RACEPRDT, documented on page 89. The race variable RACEPRDT is a multi-category variable recording the respondent response to the survey request to identify a race category which best describes their race from the choices on a presented list. The multiple choices offer a variety of mixed race possibilities for the respondent to consider. The variable RACEX for the indicated files is a recode of the variable, RACEPRDT, as determined by the CPS Branch of the Demographic Directorate. The NLMS variable is taken directly from the CPS variable, A_RACE, as given in NLMS master file according to the file documentation. The CPS Branch determined categorization translation of RACEPRDT to RACEX is:
RACEPRDT = -1 – Missing ==> RACEX = blank, Missing RACEPRDT = 01 – White Only ==> RACEX = 1, White RACEPRDT = 02 – Black Only ==> RACEX = 2, Black RACEPRDT = 03 – American Indian, Alaskan Native Only ==> RACEX = 3, American Indian or Eskimo RACEPRDT = 04 – Asian Only ==> RACEX = 4, Asian or Pacific Islander RACEPRDT = 05 – Hawaiian/Pacific Islander Only ==>
RACEX = 4, Asian or Pacific Islander RACEPRDT = 15 – Asian and Hawaiian, Other Pacific Islander ==>
RACEX = 4, Asian or Pacific Islander All categories of RACEPRDT below ==> RACEX = 5, Other Nonwhite
06 – White and Black 07 – White and American Indian 08 – White and Asian 09 – White and Hawaiian 10 – Black and American Indian 11 – Black and Asian 12 – Black and Hawaiian, Other Pacific Islander 13 – Asian and American Indian 14 – American Indian and Hawaiian, Other Pacific Islander 16 – White, Black, and American Indian 17 – White, Black, and Asian 18 – White, Black, and Hawaiian, Other Pacific Islander 19 – White, Asian, and American Indian 20 – White, American Indian, and Hawaiian, Other Pacific Islander 21 – White, Asian, and Hawaiian, Other Pacific Islander 22 – Black, Asian and American Indian 23 – Black, American Indian, and Hawaiian, Other Pacific Islander 24 – Black, Asian, and Hawaiian, Other Pacific Islander 25 – Asian, American Indian, and Hawaiian, Other Pacific Islander 26 – White, Black, Asian, and American Indian 27 – White, Asian, American Indian, and Hawaiian, Other Pacific Islander 28 – White, Black, Asian, and Hawaiian, Other Pacific Islander

National Longitudinal Mortality Study – Extract File: Race and Ethnicity Variables
87
29 – White, Black, American Indian, and Hawaiian, Other Pacific Islander 30 – Black, Asian, American Indian, and Hawaiian, Other Pacific Islander 31 – White, Black, Asian, American Indian, and Hawaiian, Other Pacific Islander
NOT AVAILABLE: 7303, 7802, 8603, 8703 CODES for files: 7903–8509 - — Unknown 1 — White 2 — Black 3 — American Indian or Eskimo 4 — Asian or Pacific Islander 5 — Other Nonwhite 9 — Unknown FREQUENCIES: RACEX\counts: 7903 8014 8024 8008 8012 8103 8203 8303 8403 8503 - . . . . . . . . . . 1 38,009 159,580 100,254 157,098 152,903 53,533 70,486 70,642 70,071 68,956 2 3,840 19,745 16,463 19,601 18,796 6,219 8,303 7,834 8,131 8,242 3 302 1,654 1,080 1,895 1,846 632 941 798 889 818 4 605 3,616 1,959 3,520 3,854 1,367 1,678 1,922 1,574 2,004 5 340 150 3,538 119 99 50 61 80 64 42 9 2 126 1,051 140 267 3 11 5 3 9 Total 43,098 184,871 124,345 182,373 177,765 61,804 81,480 81,281 80,732 80,071 RACEX\counts: 8509 - 225 1 124,197 2 15,451 3 1,337 4 3,318 5 170 9 . Total 144,698 CODES for files: 8803–0203 1 — White 2 — Black 3 — American Indian or Eskimo 4 — Asian or Pacific Islander 5 — Other Nonwhite

National Longitudinal Mortality Study – Extract File: Race and Ethnicity Variables
88
FREQUENCIES: RACEX\counts: 8803 8903 9003 9103 9203 9303 9413 9503 9603 9703 1 40,364 37,237 39,191 43,422 38,517 54,215 85,881 62,720 55,579 56,546 2 3,600 3,361 3,476 3,873 3,367 5,942 10,975 7,632 6,999 6,686 3 399 343 464 443 451 680 1,250 909 867 951 4 1,058 916 1,067 1,199 1,078 1,777 3,404 2,474 2,110 2,211 5 58 68 87 100 137 285 1,776 1,750 . . Total 45,479 41,925 44,285 49,037 43,550 62,899 103,286 75,485 65,555 66,394 RACEX\counts: 9803 9903 0003 0103 0203 1 56,227 59,665 59,443 67,779 68,481 2 6,869 6,348 6,705 7,092 7,105 3 830 924 1,027 1,232 1,410 4 2,247 2,238 2,147 2,834 2,526 5 . . . . . Total 66,173 69,175 69,322 78,937 79,522 CODES for files: 0303–1103 blank — Missing 1 — White 2 — Black 3 — American Indian or Eskimo 4 — Asian or Pacific Islander 5 — Other Nonwhite FREQUENCIES: RACEX\counts: 0303 0403 0503 0603 0703 0803 0903 1003 1103 blank 20,640 21,150 21,857 5,107 5,032 4,489 4,373 4,411 4,771 1 106,151 103,339 110,970 102,216 100,957 98,298 99,828 97,810 96,911 2 16,273 15,242 16,064 15,175 15,795 15,486 15,604 16,589 15,580 3 2,017 1,916 2,129 1,817 1,890 1,723 1,991 1,806 1,628 4 6,076 6,364 6,348 6,476 6,904 6,953 7,443 7,519 7,904 5 3,248 3,298 3,889 3,672 3,164 3,106 3,390 3,333 3,267 Total 154,405 151,309 161,257 134,463 133,742 130,055 132,629 131,468 130,061

National Longitudinal Mortality Study – Extract File: Race and Ethnicity Variables
89
53. Detailed Race 2000 CPS Redesign RACEPRDT Analysis File Return to Index Return to RACER EDITS: Simple Return to RACEX DESCRIPTION: Beginning with the 2000 redesign of the CPS, a detailed version of race was collected which presented the respondent with a wide variety of mixed race possibilities to describe his/her race. This variable was introduced to files in the NLMS in 2003. For files in the NLMS beginning with the 2003 file, other race variables such as RACER and RACEX are derived from the categories of RACEPRDT. NOT AVAILABLE: 7303-0203 CODES for files: 0303-1103 -1 — Missing
01 — White Only 02 — Black Only 03 — American Indian, Alaskan Native Only
04 — Asian Only 05 — Hawaiian/Pacific Islander Only 06 — White and Black 07 — White and American Indian 08 — White and Asian 09 — White and Hawaiian 10 — Black and American Indian 11 — Black and Asian 12 — Black and Hawaiian, Other Pacific Islander 13 — Asian and American Indian 14 — American Indian and Hawaiian, Other Pacific Islander 15 — Asian and Hawaiian, Other Pacific Islander 16 — White, Black, and American Indian 17 — White, Black, and Asian 18 — White, Black, and Hawaiian, Other Pacific Islander 19 — White, Asian, and American Indian 20 — White, American Indian, and Hawaiian, Other Pacific Islander 21 — White, Asian, and Hawaiian, Other Pacific Islander 22 — Black, Asian and American Indian 23 — Black, American Indian, and Hawaiian, Other Pacific Islander 24 — Black, Asian, and Hawaiian, Other Pacific Islander 25 — Asian, American Indian, and Hawaiian, Other Pacific Islander 26 — White, Black, Asian, and American Indian 27 — White, Asian, American Indian, and Hawaiian, Other Pacific Islander 28 — White, Black, Asian, and Hawaiian, Other Pacific Islander 29 — White, Black, American Indian, and Hawaiian, Other Pacific Islander 30 — Black, Asian, American Indian, and Hawaiian, Other Pacific Islander 31 — White, Black, Asian, American Indian, and Hawaiian, Other Pacific Islander

National Longitudinal Mortality Study – Extract File: Race and Ethnicity Variables
90
FREQUENCIES: RACEPRDT\counts: 0303 0403 0503 0603 0703 0803 0903 1003 1103 -1 20,616 21,105 21,827 5,082 5,009 4,456 4,342 4,387 4,734 01 106,151 103,339 110,970 102,216 100,957 98,298 99,828 97,810 96,911 02 16,273 15,242 16,064 15,175 15,795 15,486 15,604 16,589 15,580 03 2,017 1,916 2,129 1,817 1,890 1,723 1,991 1,806 1,628 04 5,393 5,773 5,735 5,763 6,182 6,219 6,603 6,776 7,156 05 598 456 486 562 586 586 724 597 625 06 632 628 709 701 666 662 819 905 884 07 1,561 1,578 1,810 1,619 1,327 1,210 1,339 1,199 1,151 08 414 463 536 569 572 563 563 545 585 09 170 176 214 204 152 161 143 139 144 10 159 110 197 163 127 148 113 122 124 11 54 33 39 22 29 41 53 49 47 12 15 6 21 19 12 7 13 6 21 13 13 15 9 6 12 10 3 15 8 14 2 6 21 16 2 1 5 10 10 15 85 135 127 151 136 148 116 146 123 16 84 59 94 113 84 118 107 102 76 17 25 7 14 6 5 3 8 4 5 18 5 6 3 7 4 2 13 5 4 19 2 25 18 19 26 11 32 21 16 20 14 10 6 12 9 9 11 24 8 21 98 176 198 196 137 160 168 187 184 22 3 9 2 2 6 3 . 2 4 23 1 . . 1 1 1 . . . 24 2 1 . . 2 1 1 3 2 25 2 2 1 1 2 1 . . . 26 1 1 5 3 4 4 9 3 5 27 10 20 13 12 4 8 14 14 11 28 . 7 8 1 . 5 4 2 1 29 2 . . 4 . 2 2 . 8 30 . 1 . . . . . . . 31 3 4 1 1 4 8 1 . 6 Total 154,405 151,309 161,257 134,463 133,742 130,055 132,629 131,468 130,061

National Longitudinal Mortality Study – Extract File: Race and Ethnicity Variables
91
54. Asian or Pacific Islanders, 10 Categories CATIAPI Return to Index EDITS: None DESCRIPTION: Detailed breakdown of ethnic origin for persons from selected locations on the Asian perimeter or the Pacific Ocean basin. This detailed information is available only since 1992. Variable CATIAPI generally agrees with NLMS expanded race variable, RACEX, level 4, described as Asian or Pacific Islanders. On the 9203 and 9303 master files, this variable was identified as API (Asian or Pacific Islander). During the first two years that it was collected, responses for this variable were obtained by both personal visit interviews and the use of CATI (Computer Assisted Telephone Interview). On the 9413 master file, and all later files, the variable was called CATIAPI since all information was collected using CATI interviews. NOT AVAILABLE: 7303–9103, 0303-1103 CODES for files: 9203–0203 00 — Not in universe (includes all groups not identified below) 01 — Chinese 02 — Filipino 03 — Japanese 04 — Asian Indian 05 — Korean 06 — Vietnamese 07 — Laotian, Cambodian, Hmong 08 — Other Asian (e.g. Thai, Pakistani, Srilankan, Burmese) 09 — Hawaiian 10 — Other Pacific Islander (e.g. Samoan, Guamanian, Tongan) FREQUENCIES: CATIAPI\counts: 9203 9303 9413 9503 9603 9703 9803 9903 0003 0103 00 42,503 61,415 99,987 73,071 63,572 64,315 64,068 67,133 67,345 76,332 01 187 317 630 430 375 490 376 370 370 413 02 217 299 643 532 358 372 426 457 394 555 03 209 254 392 331 235 252 274 288 207 331 04 85 117 252 138 142 158 186 129 211 235 05 84 102 392 249 181 217 170 153 163 223 06 60 96 232 216 166 172 241 169 199 252 07 28 69 131 97 115 86 102 90 62 114 08 78 92 285 181 120 122 104 172 142 162 09 62 103 183 123 174 106 97 127 123 134 10 37 35 159 117 117 104 129 87 106 186 Total 43,550 62,899 103,286 75,485 65,555 66,394 66,173 69,175 69,322 78,937

National Longitudinal Mortality Study – Extract File: Race and Ethnicity Variables
92
CATIAPI\counts: 0203 00 77,245 01 352 02 485 03 280 04 226 05 159 06 190 07 151 08 181 09 138 10 115 Total 79,522

National Longitudinal Mortality Study – Extract File: Race and Ethnicity Variables
93
55. Hispanic Origin HISP Analysis File Return to Index EDITS: Simple, Recode DESCRIPTION: Hispanic origin classifies all persons by Hispanic origin or other. The March 1973 (7303) and the E-sample (8024) files have been recoded to conform to the coding of the remaining files. Thus, the code for a Mexican person was defined as 3 for these two files. For 8024, Central and South Americans were coded as a 7, other Spanish. For files after 8509 up to 0203, the definition of HISP is derived from the CPS variable ORIGIN with all valid entries of ORIGIN not of interest for HISP being recoded to, “All Other.” For files after 2002, HISP is taken from the CPS variables PRDTHSP and PEHSPNON as follows:
If PEHSPNON = -1, HISP = Missing If PEHSPNON = 2, HISP = 8 If PEHSPNON = 1, HISP = PRDTHSP
AVAILABLE FILES: All files CODES for files: 7303-0203 0 — Unknown 1 — Mexican American 2 — Chicano 3 — Mexican (Mexicano) 4 — Puerto Rican 5 — Cuban 6 — Central and South American 7 — Other Spanish 8 — All other 9 — Don't know or not available FREQUENCIES: HISP\counts: 7303 7802 7903 8014 8024 8008 8012 8103 8203 8303 0 1,032 2,794 519 6,634 5,013 6,001 4,490 702 802 787 1 . 1,588 2,431 3,625 . 3,564 3,737 1,219 2,955 3,001 2 . 71 150 259 . 220 242 86 139 72 3 4,004 902 1,783 1,842 4,196 1,920 2,118 734 1,752 1,750 4 870 626 989 1,157 930 1,244 974 374 1,151 1,086 5 482 309 427 470 463 543 260 174 442 479 6 367 312 476 660 . 795 747 280 765 708 7 882 518 939 1,303 1,924 1,397 1,411 463 791 821 8 109,176 85,370 34,484 166,170 111,819 164,190 161,520 56,646 71,099 71,114 9 14,400 2,172 900 2,751 . 2,499 2,266 1,126 1,584 1,463 Total 131,213 94,662 43,098 184,871 124,345 182,373 177,765 61,804 81,480 81,281

National Longitudinal Mortality Study – Extract File: Race and Ethnicity Variables
94
HISP\counts: 8403 8503 8509 8603 8703 8803 8903 9003 9103 9203 0 775 655 775 . . 776 802 753 826 791 1 2,898 2,664 2,944 1,176 1,266 1,179 1,115 1,250 1,735 1,325 2 156 125 112 56 40 46 36 55 42 51 3 1,921 1,865 1,492 503 466 599 634 820 1,077 918 4 1,179 1,075 1,163 419 362 380 334 409 551 396 5 449 516 423 263 252 238 242 248 334 300 6 814 836 941 278 287 253 288 414 588 505 7 835 893 925 443 419 361 382 435 523 458 8 70,418 69,983 134,178 42,165 41,483 41,193 37,665 39,445 42,810 38,349 9 1,287 1,459 1,745 719 696 454 427 456 551 457 Total 80,732 80,071 144,698 46,022 45,271 45,479 41,925 44,285 49,037 43,550 HISP\counts: 9303 9413 9503 9603 9703 9803 9903 0003 0103 0203 0 951 1,291 1,107 1,072 1,141 1,146 1,128 1,341 1,531 1,879 1 1,990 5,162 3,047 2,647 2,885 2,755 4,263 4,514 4,724 4,721 2 79 185 122 105 186 162 255 290 255 216 3 1,294 4,574 2,963 2,904 3,294 3,115 4,977 5,629 6,004 6,432 4 609 2,142 1,316 1,200 1,032 1,194 1,483 1,578 1,667 1,702 5 351 693 465 395 423 427 693 662 639 707 6 720 2,548 1,565 1,437 1,550 1,551 2,230 2,473 2,569 2,554 7 591 1,510 975 807 1,030 752 1,311 1,329 1,523 1,478 8 55,565 84,024 63,665 54,631 54,335 54,501 52,507 51,039 59,235 58,991 9 749 1,157 260 357 518 570 328 467 790 842 Total 62,899 103,286 75,485 65,555 66,394 66,173 69,175 69,322 78,937 79,522 CODES for files: 0303-1103 blank — Unknown, missing 1 — Mexican 2 — Puerto Rican 3 — Cuban 4 — Central or South American 5 — Other Spanish 8 — All other FREQUENCIES: HISP\counts: 0303 0403 0503 0603 0703 0803 0903 1003 1103 blank 20,616 21,105 21,827 5,082 5,009 4,456 4,342 4,387 4,734 1 12,469 12,147 14,437 13,465 13,381 13,421 13,780 13,867 14,011 2 2,144 2,060 1,935 1,946 1,907 2,022 2,089 2,046 2,119 3 703 663 749 695 653 647 625 751 634 4 3,152 3,296 3,809 3,870 3,875 3,633 3,766 3,910 3,900 5 1,165 1,345 1,464 1,355 1,288 1,194 1,133 1,201 1,217 8 114,156 110,693 117,036 108,050 107,629 104,682 106,894 105,306 103,446 Total 154,405 151,309 161,257 134,463 133,742 130,055 132,629 131,468 130,061

National Longitudinal Mortality Study – Extract File: Race and Ethnicity Variables
95
56. Ethnic Origin ORIGIN Analysis File Return to Index EDITS: Recode DESCRIPTION: Ethnic origin taken from CPS Control Card. Because of the change in definition and category defined for race, ORIGIN was not created for the 2000 CPS redesign which was in place for the 2003 (0303) years and later. NOT AVAILABLE: 8014–8012, 0303-1103 CODES for file: 7303* *Ethnic origin for this file was recoded from original CPS file to conform as much as possible to the indicated codes. Original Code 00 — N/A 16 01 — German 01 02 — Italian 02 03 — Irish 03 04 — French 04 05 — Polish 05 06 — Russian 06 07 — English, Scot, Welsh 07 13 — Mexicano, Chicano 08 14 — Puerto Rican 09 15 — Cuban 10 16 — Central or South American 11 17 — Other Spanish 12 20 — Negro 13 30 — Other 14 39 — Don't know 15 CODES for files: 7802, 7903, 8103-8703 00 — NC, NIU 01 — German 02 — Italian 03 — Irish 04 — French 05 — Polish 06 — Russian 07 — English 08 — Scottish 09 — Welsh 10 — Mexican-American 11 — Chicano 12 — Mexican 13 — Mexicano 14 — Puerto Rican

National Longitudinal Mortality Study – Extract File: Race and Ethnicity Variables
96
15 — Cuban 16 — Central or South American 17 — Other Spanish 20 — Negro 21 — Black 30 — Another group not listed 39 — Don't Know 40 — Unknown FREQUENCIES: ORIGIN\counts: 7303 7802 7903 8103 8203 8303 8403 8503 8509 8603 00 7,081 364 10,382 197 1 . . . 267 . 01 13,166 7,673 2,364 4,929 6,019 5,659 5,785 6,102 11,188 4,206 02 4,452 3,460 1,049 1,658 2,022 2,109 1,933 2,405 4,430 1,467 03 7,765 4,359 1,371 2,609 3,075 2,995 3,073 2,988 5,864 2,226 04 2,521 1,543 502 1,067 1,217 1,328 1,139 1,187 2,290 855 05 2,334 1,889 418 820 1,054 1,033 1,070 1,122 2,218 843 06 1,094 741 235 355 419 422 413 429 829 313 07 16,674 4,774 1,474 3,364 4,039 3,849 3,756 3,927 7,394 2,571 08 . 762 260 532 554 532 548 601 1,148 438 09 . 226 78 128 173 150 129 161 295 112 10 . 1,636 1,689 1,319 3,122 3,300 3,213 2,884 2,949 1,176 11 . 73 95 94 142 88 169 121 112 56 12 . 797 1,041 648 1,651 1,538 1,668 1,652 1,493 501 13 4,004 160 87 7 5 2 2 3 . 2 14 870 652 629 351 1,109 1,069 1,161 1,095 1,170 419 15 482 318 346 170 422 467 438 485 424 263 16 367 323 344 275 778 687 789 804 940 278 17 882 560 726 465 845 823 833 889 929 443 18 . . . 1 . . . . . . 19 . . . 1 . . . . . . 20 12,897 3,274 1,760 5,818 7,677 7,226 7,549 7,500 14,258 3,515 21 . 6,108 810 13 . . . . . . 22 . . 3 5 . . . . . . 23 . 1 . . . . . . . . 24 . . 1 . . . . . . . 26 . . 1 1 . . . . . . 27 . . . 2 . . . . . . 30 48,273 52,744 16,869 35,976 45,584 46,539 45,758 44,230 84,524 25,619 31 . . 2 3 . . . . . . 32 . . 1 . . . . . . . 33 . . 1 2 . . . . . . 34 . . 2 1 . . . . . . 37 . . . 1 . . . . . . 39 8,351 2,225 558 992 1,333 1,235 1,061 1,218 1,976 632 40 . . . . 239 230 245 268 . 87 Total 131,213 94,662 43,098 61,804 81,480 81,281 80,732 80,071 144,698 46,022

National Longitudinal Mortality Study – Extract File: Race and Ethnicity Variables
97
ORIGIN\counts: 8703 00 . 01 4,144 02 1,464 03 2,242 04 897 05 735 06 261 07 2,597 08 400 09 122 10 1,266 11 40 12 466 13 . 14 362 15 252 16 287 17 419 18 . 19 . 20 3,449 21 . 22 . 23 . 24 . 26 . 27 . 30 25,172 31 . 32 . 33 . 34 . 37 . 39 630 40 66 Total 45,271 CODES for files: 8803–0203 01 — German 02 — Italian 03 — Irish 04 — French 05 — Polish 06 — Russian 07 — English 08 — Scottish 10 — Mexican American 11 — Chicano 12 — Mexican 14 — Puerto Rico 15 — Cuban 16 — Central or South American 17 — Other Hispanic 20 — Afro-American (Black Negro) 26 — Dutch 27 — Swedish 28 — Hungarian 30 — Other group

National Longitudinal Mortality Study – Extract File: Race and Ethnicity Variables
98
38 — Assigned NA 39 — Don’t know FREQUENCIES: ORIGIN\counts: 8803 8903 9003 9103 9203 9303 9413 9503 9603 9703 01 3,879 3,752 3,711 4,053 3,697 4,994 7,450 6,384 6,311 6,706 02 1,387 1,243 1,295 1,556 1,319 1,830 2,901 2,207 2,130 2,022 03 2,225 1,912 2,019 2,177 2,124 2,633 4,391 3,950 3,575 3,707 04 821 858 722 782 757 862 1,562 1,271 1,219 1,182 05 749 696 700 757 771 937 1,278 1,205 1,027 977 06 319 234 271 347 241 309 717 508 415 487 07 2,563 2,349 2,233 2,505 2,250 2,929 4,060 3,733 3,590 3,827 08 403 435 437 447 463 503 912 766 816 988 10 1,179 1,115 1,250 1,735 1,325 1,990 5,162 3,047 2,647 2,885 11 46 36 55 42 51 79 185 122 105 186 12 599 634 820 1,077 918 1,294 4,574 2,963 2,904 3,294 14 380 334 409 551 396 609 2,142 1,316 1,200 1,032 15 238 242 248 334 300 351 693 465 395 423 16 253 288 414 588 505 720 2,548 1,565 1,437 1,550 17 361 382 435 523 458 591 1,510 975 807 1,030 20 3,268 3,101 3,209 3,542 3,090 5,498 9,479 6,801 6,056 5,651 26 303 307 283 292 333 347 503 400 457 428 27 340 372 341 376 348 427 585 509 471 504 28 111 116 117 134 95 146 203 198 144 209 30 25,579 23,085 24,848 26,644 23,637 35,070 51,274 36,840 29,492 28,788 38 22 7 12 24 15 31 . . . . 39 454 427 456 551 457 749 1,157 260 357 518 Total 45,479 41,925 44,285 49,037 43,550 62,899 103,286 75,485 65,555 66,394 ORIGIN\counts: 9803 9903 0003 0103 0203 01 6,774 6,824 7,332 9,120 9,695 02 2,144 2,078 2,167 2,480 2,686 03 4,001 4,125 4,352 5,243 5,651 04 1,337 1,364 1,401 1,815 1,951 05 1,049 1,041 1,276 1,288 1,528 06 409 427 481 583 629 07 3,827 4,198 4,206 5,292 5,446 08 832 1,043 1,126 1,414 1,387 10 2,755 4,263 4,514 4,724 4,721 11 162 255 290 255 216 12 3,115 4,977 5,629 6,004 6,432 14 1,194 1,483 1,578 1,667 1,702 15 427 693 662 639 707 16 1,551 2,230 2,473 2,569 2,554 17 752 1,311 1,329 1,523 1,478 20 6,013 5,344 5,657 5,817 5,837 26 453 434 527 566 808 27 563 558 646 788 841 28 130 136 168 177 230 30 28,115 26,063 23,041 26,183 24,181 38 . . . . . 39 570 328 467 790 842 Total 66,173 69,175 69,322 78,937 79,522

National Longitudinal Mortality Study – Extract File: Marital Status/Household Relationship Variables
99
MARITAL STATUS/HOUSEHOLD RELATIONSHIP VARIABLES 57. Marital Status MS Analysis File Return to Index EDITS: Recode DESCRIPTION: Marital status AVAILABLE FILES: All files CODES for files: 7303 0 — Unknown, age < 13 years 1 — Single (never married) 2 — Married, spouse present 3 — Married, spouse absent: separated 4 — Married, spouse absent: husband in armed forces 5 — Married, spouse absent: other 6 — Widowed 7 — Divorced FREQUENCIES: MS\counts: 7303 0 33,906 1 24,191 2 59,786 3 1,931 4 110 5 706 6 7,349 7 3,234 Total 131,213 CODES for files: 7802 0 — Unknown 1 — Married, civilian spouse present 2 — Married armed forces spouse present 3 — Married spouse absent including separated 4 — Widowed or divorced 5 — Never married FREQUENCIES: MS\counts: 7802 0 2,624 1 53,840 2 414 3 2,397 4 11,073 5 24,314 Total 94,662

National Longitudinal Mortality Study – Extract File: Marital Status/Household Relationship Variables
100
CODES for files: 8014*, 8008*, 8012*, 8509 0 — Unknown 1 — Married, civilian spouse present 2 — Married, armed forces spouse present 3 — Married, spouse absent for other reasons 4 — Widowed 5 — Divorced 6 — Separated 7 — Never married NOTE: For persons 13 years of age and under in these files the entry given for marital status is incorrect, but is correct for persons ages 14+ FREQUENCIES: MS\counts: 8014 8008 8012 8509 0 43,303 42,438 40,359 30,498 1 81,039 80,299 78,811 64,485 2 710 639 629 543 3 667 635 680 601 4 10,282 9,906 9,567 8,150 5 7,978 8,061 8,000 7,418 6 2,891 3,018 2,951 2,448 7 38,001 37,377 36,768 30,555 Total 184,871 182,373 177,765 144,698 CODES for files: 7903, 8103–8503 0 — Unknown 1 — Married, civilian spouse present 2 — Married, armed forces spouse present 3 — Married, spouse absent in armed forces 4 — Married, spouse absent for other reasons 5 — Widowed 6 — Divorced 7 — Separated 8 — Never married (includes age <= 13) FREQUENCIES: MS\counts: 7903 8103 8203 8303 8403 8503 0 13 11 1 . . . 1 18,943 27,434 35,830 35,811 35,486 34,918 2 132 232 307 289 292 261 3 15 28 16 29 24 20 4 189 280 512 467 455 451 5 2,298 3,408 4,399 4,409 4,377 4,599 6 1,616 2,917 3,916 4,022 4,160 4,279 7 770 1,018 1,384 1,346 1,293 1,352 8 19,122 26,476 35,115 34,908 34,645 34,191 Total 43,098 61,804 81,480 81,281 80,732 80,071

National Longitudinal Mortality Study – Extract File: Marital Status/Household Relationship Variables
101
CODES for files: 8024 0 — Unknown 1 — Married 2 — Widowed 3 — Divorced 4 — Separated 5 — Never married FREQUENCIES: MS\counts: 8024 0 907 1 72,154 2 9,630 3 7,425 4 2,569 5 31,660 Total 124,345 CODES for files: 8603, 8703 1 — Married, civilian spouse present 2 — Married, armed forces spouse present 3 — Married, armed forces spouse absent 4 — Married, spouse absent 5 — Widowed 6 — Divorced 7 — Separated 8 — Never married FREQUENCIES: MS\counts: 8603 8703 1 26,929 26,639 2 251 219 3 13 12 4 274 304 5 3,252 3,140 6 3,357 3,300 7 947 1,028 8 10,999 10,629 Total 46,022 45,271

National Longitudinal Mortality Study – Extract File: Marital Status/Household Relationship Variables
102
CODES for files: 8803–1103 1 — Married, civilian spouse present 2 — Married, armed forces spouse present 3 — Married, spouse absent 4 — Widowed 5 — Divorced 6 — Separated 7 — Never married FREQUENCIES: MS\counts: 8803 8903 9003 9103 9203 9303 9413 9503 9603 9703 blank . . . . . . . . . . 1 26,658 24,695 25,781 28,518 25,168 30,096 40,865 31,840 27,122 27,617 2 270 206 246 231 214 225 400 270 206 213 3 231 207 262 355 295 363 871 578 505 556 4 3,294 3,042 3,055 3,262 3,046 3,660 5,049 3,901 3,456 3,444 5 3,338 3,178 3,488 3,854 3,582 4,245 6,753 4,929 4,504 4,597 6 937 837 939 1,051 933 1,100 1,902 1,321 1,201 1,151 7 10,751 9,760 10,514 11,766 10,312 23,210 47,446 32,646 28,561 28,816 Total 45,479 41,925 44,285 49,037 43,550 62,899 103,286 75,485 65,555 66,394 MS\counts: 9803 9903 0003 0103 0203 0303 0403 0503 0603 0703 blank . . . . . 22,184 22,047 23,959 6,620 6,764 1 27,485 28,908 28,838 32,672 33,010 51,763 50,566 53,881 49,479 49,667 2 193 188 184 237 214 421 440 461 415 357 3 604 627 682 776 784 1,329 1,252 1,465 1,440 1,286 4 3,192 3,276 3,266 3,709 3,629 4,789 4,694 5,084 4,618 4,498 5 4,646 4,791 4,880 5,706 5,764 9,016 8,750 9,415 8,820 8,779 6 1,065 1,135 1,077 1,223 1,229 2,074 1,923 2,112 2,053 2,034 7 28,988 30,250 30,395 34,614 34,892 62,829 61,637 64,880 61,018 60,357 Total 66,173 69,175 69,322 78,937 79,522 154,405 151,309 161,257 134,463 133,742 MS\counts: 0803 0903 1003 1103 blank 5,485 5,525 5,539 6,047 1 47,996 49,272 47,418 47,180 2 408 420 382 382 3 1,275 1,271 1,333 1,353 4 4,606 4,536 4,659 4,494 5 8,886 8,695 9,106 8,853 6 2,028 2,125 2,196 2,061 7 59,371 60,785 60,835 59,691 Total 130,055 132,629 131,468 130,061

National Longitudinal Mortality Study – Extract File: Marital Status/Household Relationship Variables
103
58. Relationship to Reference Person RELTRF Analysis File Return to Index EDITS: Simple DESCRIPTION: Relationship to reference person. NOTE 1: This variable is not defined for the 8603 and 8703 cohorts, but similar relationships to RELTRF are defined for the RELTHD variable, Item #9. In general, RELTRF variable is defined for the files chronologically up through 0203, whereas RELTHD is not defined for cohorts later than 8703. For certain types of analysis the responses found under the RELTHD variable may adequately serve as responses for the RELTRF variable for the 8603 and 8703 cohorts. For files 8803 and later, the variable RELTRF is a direct recode of the CPS variable a_exprrp. NOTE 2: For files 8008, 8014, and 8012 the relationship is INCORRECT for persons ages less than or equal to 13 years of age but is CORRECTLY coded for persons 14 and older in these cohorts. NOT AVAILABLE: 7303, 7802, 8024, 8603, 8703 CODES for files: 7903, 8014, 8008–8509, 8803-1103 blank — Unknown 0 — Unknown, fail edit record 1 — Reference person with other relative in household 2 — Reference person with no other relatives in household 3 — Husband 4 — Wife 5 — Own child 6 — Parent 7 — Brother/Sister 8 — Other relative of reference person (HHLDR-81), (Head-79) 9 — Non-relative of reference person with own relatives in household A — Non-relative of reference person, no own relatives in household FREQUENCIES: RELTRF\counts: 7903 8014 8008 8012 8103 8203 8303 8403 8503 8509 blank . 6,446 5,776 4,253 . 1 . . . . 0 178 128 200 120 67 169 620 164 170 . 1 11,357 83,050 82,480 80,919 16,593 21,841 21,699 21,789 21,667 39,420 2 3,631 17,101 16,799 16,675 6,069 7,718 7,596 7,764 7,938 15,134 3 250 3,320 3,418 3,608 533 711 814 893 1,016 1,861 4 9,099 39,462 38,872 37,899 13,025 17,027 16,871 16,689 16,255 30,102 5 15,844 26,748 26,346 25,673 21,556 28,509 28,155 27,893 27,528 48,906 6 236 862 907 936 301 422 374 354 483 724 7 378 1,318 1,284 1,266 455 598 580 591 627 1,034 8 1,122 2,416 2,397 2,424 1,604 2,382 2,283 2,350 2,109 3,665 9 232 717 767 751 296 470 598 564 536 691 A 771 3,303 3,127 3,241 1,305 1,632 1,691 1,681 1,742 3,161 Total 43,098 184,871 182,373 177,765 61,804 81,480 81,281 80,732 80,071 144,698

National Longitudinal Mortality Study – Extract File: Marital Status/Household Relationship Variables
104
RELTRF\counts: 8803 8903 9003 9103 9203 9303 9413 9503 9603 9703 blank . . . . 7 . . . . . 0 . . . . . . . . . . 1 16,521 15,192 16,090 17,924 16,013 19,018 26,163 20,131 17,513 17,712 2 6,557 6,150 6,499 7,109 6,533 7,528 11,469 8,507 7,453 7,594 3 651 670 788 922 848 1,195 2,776 2,601 2,504 2,897 4 12,624 11,644 12,003 13,017 11,500 13,636 17,498 13,091 10,869 10,739 5 6,564 5,871 6,224 6,913 5,839 17,396 34,597 24,344 21,227 21,303 6 235 196 207 266 234 356 706 602 592 613 7 317 270 325 398 327 373 975 646 570 571 8 661 593 636 740 648 1,410 4,177 2,512 2,167 2,230 9 123 131 137 187 146 309 1,067 666 557 534 A 1,226 1,208 1,376 1,561 1,455 1,678 3,858 2,385 2,103 2,201 Total 45,479 41,925 44,285 49,037 43,550 62,899 103,286 75,485 65,555 66,394 RELTRF\counts: 9803 9903 0003 0103 0203 0303 0403 0503 0603 0703 blank . . . . . 22,184 22,047 23,959 6,620 6,764 0 . . . . . . . . . . 1 17,650 18,700 18,482 21,110 21,322 34,507 33,693 35,892 33,280 33,196 2 7,639 7,604 7,587 9,171 9,294 12,523 12,218 13,186 12,441 12,483 3 3,189 3,601 4,107 4,970 5,295 8,699 8,897 9,772 9,175 9,282 4 10,384 10,569 10,006 11,054 10,906 16,788 15,958 16,751 15,146 14,965 5 21,225 22,410 22,176 24,913 25,044 46,385 45,305 47,613 44,118 43,653 6 577 649 749 914 902 1,470 1,508 1,531 1,538 1,620 7 591 674 758 841 873 1,346 1,350 1,352 1,430 1,389 8 2,138 2,239 2,531 2,682 2,641 4,570 4,578 5,087 4,657 4,607 9 533 500 529 537 475 1,079 947 1,055 964 1,052 A 2,247 2,229 2,397 2,745 2,770 4,854 4,808 5,059 5,094 4,731 Total 66,173 69,175 69,322 78,937 79,522 154,405 151,309 161,257 134,463 133,742 RELTRF\counts: 0803 0903 1003 1103 blank 5,485 5,525 5,539 6,047 0 . . . . 1 32,242 33,034 32,265 31,852 2 12,924 12,591 12,888 12,840 3 9,024 9,660 8,963 9,053 4 14,417 14,416 14,032 13,796 5 42,492 43,266 42,531 41,737 6 1,605 1,709 1,878 1,864 7 1,256 1,440 1,495 1,509 8 4,652 4,968 5,141 4,995 9 1,095 846 940 1,065 A 4,863 5,174 5,796 5,303 Total 130,055 132,629 131,468 130,061
National Longitudinal Mortality Study – Extract File: Marital Status/Household Relationship Variables
105
59. Relationship to Household Head RELTHD Analysis File Return to Index EDITS: Simple DESCRIPTION: Relationship to head of household. NOT AVAILABLE: 8803–1103 CODES for file: 8024 blank — Unknown 1 — Reference person 2 — Husband or wife of reference person 3 — Child of reference person 4 — Brother or sister of reference person 5 — Mother or father of reference person 6 — Other relative of reference person 7 — Nonrelative of reference person FREQUENCIES: RELTHD\counts: 8024 blank 2,560 1 60,266 2 35,167 3 19,444 4 1,085 5 806 6 2,007 7 3,010 Total 124,345 CODES for files: 7303, 8014, 8008, 8012, 8509 blank — Unknown (age less than or equal to 13 for file 7303) 1 — Head with other relatives (incl. wife) in household 2 — Head with no other relatives in household 3 — Wife of head 4 — Other relative of head 5 — Nonrelative of head with own relative (incl. wife) in household 6 — Nonrelative of head with no own relatives in household. NOTE: for file 7303, data only for civilians, ages 14+. FREQUENCIES: RELTHD\counts: 7303 8014 8008 8012 8509 blank 34,523 6,446 5,776 4,253 596 1 34,135 48,567 48,357 47,190 39,024 2 8,796 17,077 16,786 16,664 15,149 3 29,225 40,350 39,915 39,021 31,855 4 23,084 67,875 67,126 66,095 54,160 5 127 1,145 1,164 1,173 1,162 6 1,323 3,411 3,249 3,369 2,752 Total 131,213 184,871 182,373 177,765 144,698
National Longitudinal Mortality Study – Extract File: Marital Status/Household Relationship Variables
106
CODES for files: 7802 blank — Unknown or no CPS portion of record 1 — Male head with relatives in household 2 — Male head without relatives in household 3 — Male relative of head 4 — Male, nonrelative of head 5 — Female head with relatives in household 6 — Female head without relatives in household 7 — Wife of head of household 8 — Female relative of head of household 9 — Female nonrelative of head of household FREQUENCIES: RELTHD\counts: 7802 blank 2,624 1 27,523 2 4,064 3 10,717 4 933 5 4,464 6 6,090 7 26,656 8 10,563 9 1,028 Total 94,662 CODES for files: 7903 and March cohorts 8103–87031 blank — unknown 0 — Unknown 1 — Head (HHLDR—81) with other relatives 2 — Primary individual2 3 — Wife (Spouse-81) of head (HHLDR-81) 4 — Child of head (HHLDR-81) 5 — Other relative of head (HHLDR-81) 6 — Nonrelative of head (HHLDR-81) with own relatives in household 7 — Nonrelative of head (HHLDR-81) with no own relatives in household FREQUENCIES: RELTHD\counts: 7903 8103 8203 8303 8403 8503 8603 8703 blank . . 1 . . . . . 0 178 67 169 620 164 170 . . 1 11,360 16,593 21,841 21,699 21,789 21,667 16,606 16,429 2 3,631 6,069 7,718 7,596 7,764 7,938 6,412 6,248 3 9,339 13,558 17,738 17,685 17,582 17,271 13,425 13,264 4 15,845 21,556 28,509 28,155 27,893 27,528 6,900 6,787 5 1,742 2,360 3,402 3,237 3,295 3,219 1,336 1,181 6 232 296 470 598 564 536 159 174 7 771 1,305 1,632 1,691 1,681 1,742 1,184 1,188 Total 43,098 61,804 81,480 81,281 80,732 80,071 46,022 45,271 1The restriction that the head of household was to be the husband in a family was removed between 1979 and 1981. Thus, for the 1981 file and later, the head of household can be either male or female. The coding for the 1981 file for RELTHD, and all
National Longitudinal Mortality Study – Extract File: Marital Status/Household Relationship Variables
107
subsequent March files, remains the same except that a code of 3 means spouse of head rather than wife of head. 2Although everyone is, or has been part of a family, many people don't live as part of a family setting. In a single person household the individual is always coded as a primary individual (code = 2). A Primary individual for example is a person who lives alone or with non-relatives. For 1980 and beyond this person is referred to as a non-family householder.

National Longitudinal Mortality Study – Extract File: Education Variables
108
EDUCATION VARIABLES
60. Education EDUC Analysis File Return to Index Return to Analysis File Introduction EDITS: Recode DESCRIPTION: There are two different concepts the CPS has used to measure education: the years of school approach and the educational achievement approach. The first approach asked the highest grade level respondents had attended, and had a separate question to verify whether the respondent had actually completed that grade or not; the second concept enquired about educational achievement in terms of degrees attained such as a high school diploma, a B.A. or a Ph.D. or for lower education levels, it indicated the education level completed. CPS employed the years of school concept through 1991 (cohort 9103), and switched to the achievement concept starting with 1992 (9203). The NLMS variable, EDUC, contains education measured by both concepts combined into one variable. For the earlier cohorts, grade completed, is constructed using the indicator variable that indicates whether the grade was completed or not We have made this comparison and used the resulting education grade-level completed value as the response to the EDUC variable. The analysis file version of EDUC (see link above) combines these two somewhat disparate concepts of education into a single set of codes for all cohorts and, for the categories identified, represents grade completed. In short, the extract variable EDUC is the original education measure provided for each cohort. If indicated the resulting value of EDUC represents the grade completed. For later files the value of EDUC was originally collected as grade completed. NOT AVAILABLE: 8024 CODES for files: 7303–8014, 8008–8503, 8603, 8703 NOTE: In this coding El means elementary—first grade is highest grade attended, etc., H1 means high school first level is highest grade attended, 9th grade or freshman, etc., and Cl means college first level or freshman is highest grade attended, etc. 00 — Missing, invalid 01 — None 02 — E1 11 — H2 03 — E2 12 — H3 04 — E3 13 — H4 05 — E4 14 — C1 06 — E5 15 — C2 07 — E6 16 — C3 08 — E7 17 — C4 09 — E8 18 — C5 10 — H1 19 — C6+

National Longitudinal Mortality Study – Extract File: Education Variables
109
FREQUENCIES: EDUC\counts: 7303 7802 7903 8014 8008 8012 8103 8203 8303 8403 00 33,905 688 10,440 41,534 41,188 40,403 13,849 19,376 19,022 19,080 01 655 333 321 829 834 768 266 371 380 360 02 195 188 71 212 195 183 65 118 96 87 03 301 282 122 362 340 335 116 183 194 146 04 796 558 283 753 749 787 256 388 395 339 05 1,018 747 308 995 965 902 302 498 436 414 06 1,183 889 378 1,175 1,124 1,040 378 511 518 486 07 1,913 1,597 729 2,153 2,185 1,963 676 1,082 1,040 959 08 2,201 1,644 605 2,326 2,394 2,170 777 945 889 854 09 9,642 7,248 2,488 11,067 11,184 9,236 3,324 3,832 3,547 3,441 10 6,651 5,820 2,021 8,168 7,906 7,499 2,592 2,755 2,653 2,662 11 8,211 7,363 2,470 10,236 10,084 9,745 3,188 4,249 3,977 3,848 12 6,543 6,095 2,071 9,014 8,932 8,601 2,899 3,830 3,787 3,564 13 33,282 32,776 11,023 50,414 49,828 48,812 17,457 22,519 22,551 22,703 14 5,343 5,721 2,046 9,341 8,844 9,158 3,228 4,047 4,173 4,127 15 5,833 6,795 2,370 10,804 10,729 10,773 3,691 4,983 5,271 5,262 16 2,500 2,802 980 4,397 4,319 4,532 1,497 2,020 2,063 2,006 17 6,645 7,593 2,540 12,199 11,958 11,940 4,275 5,579 6,014 5,983 18 1,620 1,955 610 2,979 2,879 2,976 883 1,335 1,371 1,345 19 2,776 3,568 1,222 5,913 5,736 5,942 2,085 2,859 2,904 3,066 Total 131,213 94,662 43,098 184,871 182,373 177,765 61,804 81,480 81,281 80,732 EDUC\counts: 8503 8603 8703 00 18,369 744 531 01 363 154 160 02 88 46 42 03 151 96 73 04 323 179 166 05 421 232 213 06 465 281 280 07 940 583 543 08 777 554 542 09 3,311 2,281 2,220 10 2,615 1,621 1,597 11 3,915 2,664 2,480 12 3,493 2,423 2,359 13 22,463 17,034 16,618 14 4,304 3,245 3,105 15 5,382 4,130 4,296 16 2,045 1,568 1,590 17 6,268 4,746 4,904 18 1,358 1,000 1,019 19 3,020 2,441 2,533 Total 80,071 46,022 45,271 CODES for files: 8509, 8803–9103 00 — None 01 — E1 10 — H2 02 — E2 11 — H3 03 — E3 12 — H4 04 — E4 13 — C1 05 — E5 14 — C2 06 — E6 15 — C3 07 — E7 16 — C4 08 — E8 17 — C5 09 — H1 18 — C6+

National Longitudinal Mortality Study – Extract File: Education Variables
110
FREQUENCIES: EDUC\counts: 8509 8803 8903 9003 9103 00 30,990 630 638 596 536 01 112 41 40 38 28 02 203 105 98 91 107 03 493 173 209 167 210 04 585 198 208 216 244 05 700 257 236 235 243 06 1,443 525 507 545 599 07 1,591 504 441 444 476 08 6,821 2,086 1,870 1,820 1,796 09 5,655 1,655 1,481 1,526 1,505 10 6,973 2,512 2,311 2,396 2,532 11 6,325 2,401 2,100 2,231 2,336 12 41,453 16,950 15,213 16,210 18,261 13 7,619 3,171 3,071 3,234 3,602 14 9,953 4,042 3,830 4,304 4,928 15 3,880 1,608 1,534 1,599 1,842 16 11,734 4,883 4,748 4,974 5,782 17 2,529 987 936 1,014 1,052 18 5,639 2,751 2,454 2,645 2,958 Total 144,698 45,479 41,925 44,285 49,037 CODES for files: 9203–1103 00 — Children 31 — less than 1st grade 32 — 1st, 2nd, 3rd, or 4th grade 33 — 5th or 6th grade 34 — 7th and 8th grade 35 — 9th grade 36 — 10th grade 37 — 11th grade 38 — 12th grade no diploma 39 — HS graduate, high school diploma, or equivalent 40 — Some college but no degree 41 — Associate degree in occupational/voc program 42 — Associate degree in college: academic program 43 — Bachelor’s degree (e.g. BA, AB, BS) 44 — Master’s degree (e.g. MA, MS, MENG, MED, MSW, MBA) 45 — Professional school degree (MD, DDS, LLB, DVM etc.) 46 — Doctorate (e.g. PhD, EdD)

National Longitudinal Mortality Study – Extract File: Education Variables
111
FREQUENCIES: EDUC\counts: 9203 9303 9413 9503 9603 9703 9803 9903 0003 0103 blank . . . . . . . . . . 00 363 10,911 26,254 17,703 15,470 15,300 15,549 16,339 16,205 18,262 31 190 254 471 309 271 266 210 296 252 288 32 531 581 1,010 685 599 590 536 684 741 792 33 754 1,025 1,892 1,253 1,118 1,120 1,099 1,368 1,448 1,472 34 2,436 2,868 4,019 3,052 2,629 2,489 2,319 2,433 2,437 2,715 35 1,607 1,979 3,164 2,505 2,121 2,177 2,033 2,171 2,295 2,578 36 2,103 2,566 3,884 2,830 2,476 2,493 2,364 2,582 2,531 2,800 37 1,949 2,261 3,556 2,598 2,361 2,434 2,329 2,507 2,515 2,791 38 749 828 1,312 741 725 773 783 883 808 1,004 39 14,455 17,355 24,536 18,490 15,940 16,089 15,972 16,272 16,338 18,529 40 7,783 9,313 14,123 10,275 8,863 9,112 9,144 9,366 9,585 10,680 41 1,446 1,880 2,605 1,992 1,719 1,692 1,765 1,855 1,898 2,372 42 1,044 1,288 2,152 1,624 1,442 1,531 1,601 1,546 1,720 1,948 43 5,461 6,574 9,771 7,679 6,711 7,020 7,206 7,364 7,083 8,643 44 1,900 2,239 3,080 2,554 2,158 2,220 2,196 2,381 2,399 2,845 45 490 574 854 704 574 621 617 618 596 671 46 289 403 603 491 378 467 450 510 471 547 Total 43,550 62,899 103,286 75,485 65,555 66,394 66,173 69,175 69,322 78,937 EDUC\counts: 0203 0303 0403 0503 0603 0703 0803 0903 1003 1103 blank . 22,184 22,047 23,959 6,620 6,764 5,485 5,525 5,539 6,047 00 18,333 35,006 34,014 35,738 32,863 32,395 31,195 31,964 31,334 30,453 31 285 370 391 439 413 385 360 381 351 381 32 800 872 832 982 884 832 766 779 724 730 33 1,522 1,745 1,662 1,774 1,669 1,539 1,514 1,472 1,439 1,549 34 2,584 3,613 3,504 3,889 3,372 3,200 2,912 2,949 2,866 2,753 35 2,594 4,083 4,005 4,501 3,955 3,877 3,636 3,674 3,518 3,365 36 2,788 4,622 4,564 4,746 4,391 4,327 4,190 4,193 3,898 3,772 37 2,784 4,720 4,596 4,789 4,362 4,533 4,367 4,407 4,454 4,191 38 1,115 1,455 1,404 1,608 1,662 1,666 1,447 1,476 1,590 1,524 39 18,705 28,790 27,820 29,973 27,570 27,310 26,703 27,131 27,019 26,315 40 10,648 17,687 17,012 17,830 16,781 16,583 16,847 17,089 16,891 16,840 41 2,407 3,871 4,043 4,411 3,998 3,986 3,729 3,663 3,816 3,647 42 1,971 3,287 3,341 3,619 3,521 3,492 3,763 4,145 4,087 4,354 43 8,696 14,929 14,801 15,485 14,995 15,208 15,334 15,549 15,878 15,792 44 3,023 5,036 5,113 5,305 5,218 5,426 5,669 5,912 5,852 5,987 45 716 1,170 1,203 1,214 1,196 1,200 1,191 1,290 1,111 1,177 46 551 965 957 995 993 1,019 947 1,030 1,101 1,184 Total 79,522 154,405 151,309 161,257 134,463 133,742 130,055 132,629 131,468 130,061

National Longitudinal Mortality Study – Extract File: Work Force Variables
112
WORK FORCE VARIABLES
61. Employment Status ESR Analysis File Return to Index EDITS: Simple, Recode DESCRIPTION: The variable ESR was collected according to three different definitions depending on the date of interview for the cohort. The first definition applies to cohorts 7303 through 8703, the original 13 NLMS cohorts, plus the first two cohorts, chronologically, of the expanded NLMS. For these cohorts, ESR was defined exactly as answered on the survey and the responses were entered directly into the CPS record. The second definition used was collected beginning in March of 1988. For these cohorts, the variable ESR was dropped from collection on the CPS and replaced by two other variables: LFSR, labor force status recode, and MAJACT, “what was your major activity last week?” By combining responses of these two variables in the appropriate way, a set of categories were developed for the NLMS which are equivalent to the ESR definition used for the earlier CPS cohorts. This ESR definition remained valid as an approach to reconstructing the variable ESR until March of 1994. The values of ESR defined for these two sets of NLMS cohorts are defined below. For cohorts 9413 chronologically through 1103, the third definition of ESR used for the NLMS is taken directly from the CPS variable constructed for this type of information called, PEMLR, monthly labor force recode. Variables considered for the definition of ESR for files before 1994 are not valid after 1993 even though the variables may exist on NLMS master files. NOT AVAILABLE: 8024 CODES for files: 7303–8014, 8008–9303 0 — Not in the universe (e.g. age LE 13 years, no match to CPS) 1 — In the labor force, employed 2 — In the labor force, employed, not working 3 — In the labor force, unemployed but looking for work 4 — Not in the labor force, housekeeping 5 — Not in the labor force, at school 6 — Not in the labor force, unable to work 7 — Not in the labor force, other, retired

National Longitudinal Mortality Study – Extract File: Work Force Variables
113
FREQUENCIES: ESR\counts: 7303 7802 7903 8014 8008 8012 8103 8203 8303 8403 0 33,734 760 10,439 41,534 41,188 40,403 13,897 18,406 18,061 18,081 1 51,211 49,604 17,759 77,725 72,960 75,814 26,419 33,431 33,376 34,140 2 2,100 2,458 700 4,145 9,050 2,584 1,089 1,470 1,439 1,471 3 3,017 3,892 1,379 6,020 6,774 5,843 2,255 3,747 4,252 3,183 4 22,181 19,157 6,278 26,540 26,874 25,533 8,402 11,282 10,907 10,597 5 10,240 9,176 3,033 12,307 1,328 12,246 4,177 5,750 5,754 5,466 6 1,782 1,489 590 2,368 1,951 1,892 681 841 823 931 7 6,948 8,126 2,920 14,232 22,248 13,450 4,884 6,553 6,669 6,863 Total 131,213 94,662 43,098 184,871 182,373 177,765 61,804 81,480 81,281 80,732 ESR\counts: 8503 8509 8603 8703 8803 8903 9003 9103 9203 9303 0 17,324 31,073 238 11 441 483 408 583 386 11,041 1 34,532 63,854 26,028 26,127 26,522 24,677 26,123 29,020 25,198 29,901 2 1,440 2,947 1,107 1,142 1,114 1,100 1,145 1,191 1,111 1,321 3 3,044 4,671 2,132 1,968 1,691 1,441 1,622 2,199 2,202 2,403 4 10,092 18,297 7,487 7,047 6,851 6,139 6,315 6,567 5,711 6,686 5 5,492 9,028 2,793 2,844 2,378 2,093 2,270 2,513 2,231 3,006 6 819 1,404 649 586 669 688 743 797 710 1,036 7 7,328 13,424 5,588 5,546 5,813 5,304 5,659 6,167 6,001 7,505 Total 80,071 144,698 46,022 45,271 45,479 41,925 44,285 49,037 43,550 62,899 CODES for files: 9413–1103 0 — Children under 14 years, armed forces 1 — Employed, at work 2 — Employed, absent from work 3 — Unemployed, on layoff 4 — Unemployed, looking for work 5 — Not in the labor force, retired 6 — Not in the labor force, disabled 7 — Not in the labor force, other FREQUENCIES: ESR\counts: 9413 9503 9603 9703 9803 9903 0003 0103 0203 0303 0 26,710 18,011 15,706 15,553 15,775 16,636 16,558 18,621 18,705 56,404 1 44,458 33,931 29,455 30,319 30,578 31,919 32,363 36,982 36,659 59,916 2 1,667 1,421 1,112 1,095 1,132 1,160 1,270 1,391 1,330 2,062 3 529 359 300 342 309 319 237 411 408 682 4 3,154 1,814 1,649 1,550 1,415 1,386 1,372 1,604 2,056 3,635 5 10,652 8,768 7,579 7,901 7,693 7,744 7,541 8,839 8,791 11,116 6 2,753 2,202 1,870 1,974 1,930 2,089 2,024 2,401 2,495 3,940 7 13,363 8,979 7,884 7,660 7,341 7,922 7,957 8,688 9,078 16,650 Total 103,286 75,485 65,555 66,394 66,173 69,175 69,322 78,937 79,522 154,405 ESR\counts: 0403 0503 0603 0703 0803 0903 1003 1103 0 55,871 58,642 38,832 38,327 36,405 37,160 36,496 36,007 1 58,398 62,512 58,729 58,984 57,338 55,681 54,695 53,870 2 2,070 2,196 2,300 2,234 2,000 1,929 1,883 1,723 3 595 632 490 521 572 844 818 609 4 3,381 3,400 2,878 2,629 3,019 5,095 5,625 5,224 5 10,620 11,997 10,720 10,886 10,672 10,993 10,886 11,190 6 3,938 4,424 4,142 4,154 4,294 4,453 4,460 4,570 7 16,436 17,454 16,372 16,007 15,755 16,474 16,605 16,868 Total 151,309 161,257 134,463 133,742 130,055 132,629 131,468 130,061

National Longitudinal Mortality Study – Extract File: Work Force Variables
114
62. Industry Using 1990 Codes IND1990 Analysis File Return to Index Return to IND2007
EDITS: Simple, Invalid Entry DESCRIPTION: Job specific 1990 industrial classification codes.* Specific codes for industries are given in Appendix E. 1990 industry codes for NLMS cohorts March 1992 through March 1998 were taken directly from the Census Bureau’s Data Processing Center I&O coding found permanently on the NLMS master files for these cohorts. For cohorts collected prior to 1992, original coding in Jeffersonville was done according to the definitions used at the time. These codes were translated, for NLMS purposes, to a “best” choice 1990 code. Using documented Demographic Surveys Division(DSD) translations of 1970 industrial coding for the 1973 through 1982 NLMS cohorts, the 1970 industrial codes found on cohort master files were first converted to 1980 industrial codes. For 1970 industrial codes which translated into more than one 1980 code according to results on a DSD designed test sample, the 1980 industrial translation assigned, for NLMS purposes, was the most frequently corresponding 1980 code indicated on the DSD test file. A 1990 industrial code was then identified for these 1980 codes using DSD predetermined translations. The industrial classification codes contained on master file records for NLMS cohorts 1983 through 1991 used 1980 codes. These codes were converted to 1990 industrial codes using the same DSD documentation used to translate 1980 codes to 1990 codes for the 1973 through 1982 NLMS cohorts. NOTE 1: Errors will be generated by the strategy used to assign a 1970 industry to a particular 1980 industry for those 1970 industries for which there were multiple choices for a 1980 industry occur. The decision to assign the most frequently occurring translation according to the results of a test file from the 1980 Census was made to minimize the translation errors. NOTE 2: Industrial classifications change over the decades and the 1990 definition list has industries that were not classified in 1970 or in 1980. In particular, armed forces personnel were not classified until after 1991. Military classifications have been converted to missing for NLMS Industry classification purposes. Reference: 1990 Census of Population and Housing. Alphabetical Index of Industries and Occupations. 1990 CPH-R-3. NOT AVAILABLE: 8024 CODES for files: 7303-8014, 8008-1103 blank — Never worked, unknown, or age LE 13 years 0-1 — This code, literally the 3 characters “0-1”, is equiv to blank or 000 000 — Never worked, unknown, or age LE 13 years 001-932 — Valid industry 991 — Classified active military

National Longitudinal Mortality Study – Extract File: Work Force Variables
115
FREQUENCIES: IND1990\counts: 7303 7802 7903 8014 8008 8012 8103 8203 8303 8403 blank 71,613 36,632 21,419 92,648 89,958 89,529 32,178 41,091 40,744 40,477 0-1 . . . . . . . . . . 000 . . . . . . . . . . 001-932 59,600 58,030 21,679 92,223 92,415 88,236 29,626 40,389 40,503 40,221 991 . . . . . . . . 34 34 Total 131,213 94,662 43,098 184,871 182,373 177,765 61,804 81,480 81,281 80,732 IND1990\counts: 8503 8509 8603 8703 8803 8903 9003 9103 9203 9303 blank 39,705 70,568 14,664 13,992 15,044 13,612 14,390 15,462 . . 0-1 . . . . . . . . . . 000 . . . . . . . . 14,042 28,150 001-932 40,347 74,094 31,323 31,227 30,425 28,302 29,885 33,561 29,490 34,730 991 19 36 35 52 10 11 10 14 18 19 Total 80,071 144,698 46,022 45,271 45,479 41,925 44,285 49,037 43,550 62,899 IND1990\counts: 9413 9503 9603 9703 9803 9903 0003 0103 0203 0303 blank . . . . . . . . . . 0-1 . . . . . . . . 38,684 . 000 52,891 37,622 32,700 32,776 32,451 34,050 33,653 38,127 . 88,494 001-932 50,370 37,850 32,843 33,608 33,715 35,119 35,668 40,806 40,830 65,903 991 25 13 12 10 7 6 1 4 8 8 Total 103,286 75,485 65,555 66,394 66,173 69,175 69,322 78,937 79,522 154,405 IND1990\counts: 0403 0503 0603 0703 0803 0903 1003 1103 blank . . . . . . . 69,234 0-1 . . . . . . . . 000 86,935 93,167 70,382 69,812 67,302 69,381 68,886 . 001-932 64,360 68,076 64,068 63,922 62,739 63,232 62,565 60,810 991 14 14 13 8 14 16 17 17 Total 151,309 161,257 134,463 133,742 130,055 132,629 131,468 130,061

National Longitudinal Mortality Study – Extract File: Work Force Variables
116
63. Major Industry Using 1990 Codes MAJIND90 Analysis File Return to Index EDITS: Simple, Recode DESCRIPTION: Major industry classification recode for the specific 1990 industry classification. In the code list below, specific industry groupings are shown in parentheses. NOT AVAILABLE: 8024 CODES for files: 7303-8014, 8008-9803, 0303-1103 blank — Industry missing, not reported, unknown 00 — Missing 01 — Agriculture, forestry, and fisheries (010-032) 02 — Mining (040-050) 03 — Construction (060) 04 — Manufacturing, nondurable goods (100-222) 05 — Manufacturing, durable goods (230-392) 06 — Transportation, communications and
other public utilities (400-472) 07 — Wholesale trade, durable goods (500-532) 08 — Wholesale trade, nondurable goods (540-571) 09 — Retail trade (580-691) 10 — Finance, insurance, and real estate (700-712) 11 — Business and repair services (721-760) 12 — Personal services (761-791) 13 — Entertainment, recreational services (800-810) 14 — Professional and related services (812-893) 15 — Public administration (900-932) 17 — Active duty military (991) FREQUENCIES: MAJIND90\counts: 7303 7802 7903 8014 8008 8012 8103 8203 8303 8403 blank 71,613 36,632 21,419 92,648 89,958 89,529 32,178 41,091 40,744 40,477 00 . . . . . . . . . . 01 2,490 1,899 886 4,108 4,700 3,668 1,141 1,643 1,655 1,610 02 441 509 185 1,049 1,151 1,125 356 571 557 460 03 3,691 3,566 1,373 5,898 6,242 5,773 1,932 2,484 2,601 2,633 04 5,992 5,555 1,932 7,812 7,681 7,280 2,468 3,397 3,284 3,244 05 8,371 7,580 2,841 11,356 11,040 10,366 3,690 4,735 4,586 4,370 06 4,185 4,083 1,440 6,430 6,409 6,111 2,018 2,754 2,638 2,718 07 1,122 1,077 364 1,714 1,706 1,456 539 780 894 836 08 1,286 1,216 456 1,781 1,862 1,798 657 869 771 696 09 10,057 9,948 3,732 15,515 15,527 15,140 4,856 6,723 6,849 6,864 10 3,006 3,284 1,092 5,070 5,122 4,926 1,695 2,306 2,271 2,348 11 1,802 1,801 753 3,093 3,046 3,009 1,070 1,591 1,643 1,840 12 3,017 2,505 989 3,919 4,345 3,824 1,287 1,731 1,871 1,715 13 606 676 237 1,072 1,252 1,002 337 447 498 513 14 11,026 11,704 4,390 18,897 17,629 18,578 6,166 8,484 8,426 8,466 15 2,508 2,627 1,009 4,509 4,703 4,180 1,414 1,874 1,959 1,908 17 . . . . . . . . 34 34 Total 131,213 94,662 43,098 184,871 182,373 177,765 61,804 81,480 81,281 80,732

National Longitudinal Mortality Study – Extract File: Work Force Variables
117
MAJIND90\counts: 8503 8509 8603 8703 8803 8903 9003 9103 9203 9303 blank 39,705 70,568 14,664 13,992 15,044 13,612 14,390 15,462 . . 00 . . . . . . . . 14,042 28,150 01 1,381 2,662 1,181 1,227 958 973 1,010 1,068 890 1,101 02 415 702 335 254 244 201 242 257 229 255 03 2,608 5,046 2,054 2,021 1,899 1,823 1,859 2,084 1,859 2,055 04 3,246 5,670 2,460 2,238 2,334 2,167 2,181 2,505 2,210 2,417 05 4,563 8,071 3,390 3,228 3,235 2,935 3,164 3,379 2,881 3,247 06 2,762 5,023 2,002 2,060 2,070 1,924 1,954 2,268 1,905 2,406 07 809 1,519 587 618 590 564 587 713 617 669 08 725 1,304 592 558 569 500 497 596 554 599 09 6,905 12,856 5,332 5,422 5,082 4,710 5,053 5,585 4,992 6,101 10 2,528 4,560 1,769 1,926 2,047 1,826 1,886 2,149 1,821 2,093 11 1,878 3,644 1,460 1,561 1,555 1,507 1,607 1,804 1,487 1,892 12 1,744 3,181 1,281 1,204 1,118 1,120 1,177 1,177 1,107 1,298 13 493 1,038 448 433 366 312 351 446 438 569 14 8,492 15,435 6,860 6,998 6,879 6,398 6,867 7,951 7,120 8,369 15 1,798 3,383 1,572 1,479 1,479 1,342 1,450 1,579 1,380 1,659 17 19 36 35 52 10 11 10 14 18 19 Total 80,071 144,698 46,022 45,271 45,479 41,925 44,285 49,037 43,550 62,899 MAJIND90\counts: 9413 9503 9603 9703 9803 0303 0403 0503 0603 0703 blank . . . . . . . . . . 00 52,891 37,622 32,700 32,776 32,451 88,494 86,935 93,167 70,382 69,812 01 1,559 1,229 1,078 988 959 1,678 1,743 2,025 1,709 1,699 02 300 225 192 213 186 377 299 414 376 442 03 3,061 2,386 2,094 2,200 2,193 5,256 5,137 5,693 5,476 5,510 04 3,534 2,639 2,149 2,130 2,054 3,220 3,103 3,169 2,872 2,762 05 4,574 3,358 3,032 3,000 3,022 4,637 4,613 4,954 4,544 4,319 06 3,338 2,510 2,195 2,218 2,262 4,228 4,096 4,224 4,068 3,962 07 880 754 618 611 673 976 1,026 1,014 1,009 1,074 08 893 666 582 580 530 1,022 971 1,000 929 784 09 9,034 6,445 5,713 5,911 5,902 11,881 11,623 12,418 11,603 11,131 10 3,181 2,350 2,041 2,075 2,190 4,537 4,214 4,337 4,292 4,246 11 3,055 2,197 2,126 2,169 2,268 4,584 4,260 4,378 4,189 4,286 12 2,085 1,514 1,310 1,308 1,319 2,226 2,171 2,191 2,094 2,135 13 859 644 604 686 618 1,120 970 1,038 991 913 14 11,849 9,137 7,725 8,070 8,103 17,346 17,191 17,976 17,010 17,664 15 2,168 1,796 1,384 1,449 1,436 2,815 2,943 3,245 2,906 2,995 17 25 13 12 10 7 8 14 14 13 8 Total 103,286 75,485 65,555 66,394 66,173 154,405 151,309 161,257 134,463 133,742 MAJIND90\counts: 0803 0903 1003 1103 blank . . . 69,234 00 67,302 69,381 68,886 . 01 1,750 1,683 1,801 1,633 02 389 468 375 410 03 5,097 5,057 4,888 4,426 04 2,673 2,588 2,585 2,552 05 4,234 4,079 3,815 3,867 06 4,114 3,962 3,735 3,850 07 924 841 842 711 08 756 718 747 839 09 11,284 11,506 11,135 10,775 10 3,947 3,989 3,954 3,851 11 4,276 4,300 4,388 4,171 12 2,039 2,041 2,065 2,021 13 945 999 1,119 959 14 17,309 18,006 17,943 17,629 15 3,002 2,995 3,173 3,116 17 14 16 17 17 Total 130,055 132,629 131,468 130,061

National Longitudinal Mortality Study – Extract File: Work Force Variables
118
CODES for files: 9903-0203 00 — Missing 01 — Agriculture 02 — Mining 03 — Construction 04 — Manufacturing, durable goods 05 — Manufacturing, nondurable goods 06 — Transportation 07 — Communications 08 — Utilities and sanitary services 09 — Wholesale trade 10 — Retail trade 11 — Finance, insurance, and real estate 12 — Private households 13 — Business, auto and repair services 14 — Personal services, excluding private households 15 — Entertainment and recreation services 16 — Hospitals 17 — Medical services, excluding hospitals 18 — Educational services 19 — Social services 20 — Other professional services 21 — Forestry and fisheries 22 — Public administration 23 — Armed forces last job, currently unemployed FREQUENCIES: MAJIND90\counts: 9903 0003 0103 0203 00 35,714 35,368 40,143 40,805 01 1,037 1,022 1,121 1,058 02 215 174 233 192 03 2,351 2,465 2,881 2,990 04 3,091 3,085 3,390 3,250 05 2,056 2,243 2,425 2,227 06 1,573 1,667 1,767 1,812 07 427 465 561 574 08 392 374 411 446 09 1,352 1,427 1,575 1,513 10 6,039 6,040 6,851 7,150 11 2,217 2,177 2,527 2,485 12 300 310 326 274 13 2,270 2,437 2,841 2,721 14 1,065 1,097 1,339 1,234 15 663 651 791 811 16 1,270 1,224 1,478 1,542 18 2,979 2,932 3,430 3,441 19 935 935 1,093 1,192 20 1,581 1,585 1,886 1,965 21 64 65 64 75 22 1,578 1,578 1,800 1,757 23 6 1 4 8 Total 69,175 69,322 78,937 79,522

National Longitudinal Mortality Study – Extract File: Work Force Variables
119
64. Industry Using 2007 Codes IND2007 Analysis File Return to Index EDITS: Simple DESCRIPTION: Job specific codes using the Census 2007 industrial classification codes. Specific industrial codes are given in Appendix F. Year 2007 industrial codes for NLMS cohorts 2007 through 2011 were taken directly from the Census Bureau’s Data Processing Center ‘s I&O coding found permanently on the corresponding NLMS master file for the cohort. For cohorts collected between 2003 and 2006, the 2007 industrial coding was derived from the available Census 2000 code given on the corresponding NLMS master file. For NLMS cohorts prior to 2003 the translation to the 2007 code was based on the previously defined variable IND1990, see page 114. The translation of the codes for the cohorts prior to 2003, and those in the period 2003 to 2006, into the corresponding year 2007 code was done using crosswalks developed by the Industry and Industries Branch of the Census Bureau’s Population Division and made available on the Census Bureau’s website: www.census.gov/people/io. The assignment of a particular industrial code to a year 2007 code was based on the highest percentage association of the industry to a 2007 industry code determined from studies of the SF-3 and SF-4 Census Summary files as coded by the Census Bureau’s Industry and Industries Branch. These percentages are also found in documentation available on the previously reference website. In some cases there is a clear translation of the earlier code into the later code. That is, a high percentage of the earlier industrial code translated into one later code. In other cases, four or five possibilities might exist. In any case, the 2007 industrial code assigned is the code having the highest percentage of assignments for records for the given earlier industrial code. NOTE: The, “2007,” portion of the variable name indicates that the definition of industry follows the definition of industry codes developed for the 2000 Census with minor modifications made and followed in 2007. This definition of industry remained fixed in CPS surveys for the period from 2007 through to the year 2011, the latest CPS survey year incorporated into the NLMS. NOT AVAILABLE: 8024 FREQUENCIES: IND2007\counts: 7303 7802 7903 8014 8008 8012 8103 8203 8303 8403 blank 71,613 36,632 21,419 92,648 89,958 89,529 32,178 41,091 40,744 40,477 0000-9890 59,600 58,030 21,679 92,223 92,415 88,236 29,626 40,389 40,537 40,255 Total 131,213 94,662 43,098 184,871 182,373 177,765 61,804 81,480 81,281 80,732 IND2007\counts: 8503 8509 8603 8703 8803 8903 9003 9103 9203 9303 blank 39,705 70,568 14,664 13,992 15,044 13,612 14,390 15,462 14,042 28,150 0000-9890 40,366 74,130 31,358 31,279 30,435 28,313 29,895 33,575 29,508 34,749 Total 80,071 144,698 46,022 45,271 45,479 41,925 44,285 49,037 43,550 62,899

National Longitudinal Mortality Study – Extract File: Work Force Variables
120
IND2007\counts: 9413 9503 9603 9703 9803 9903 0003 0103 0203 0303 blank 52,891 37,622 32,700 32,776 32,451 34,050 33,653 38,127 38,684 . 0000-9890 50,395 37,863 32,855 33,618 33,722 35,125 35,669 40,810 40,838 154,405 Total 103,286 75,485 65,555 66,394 66,173 69,175 69,322 78,937 79,522 154,405 IND2007\counts: 0403 0503 0603 0703 0803 0903 1003 1103 blank . . . . . . . . 0000-9890 151,309 161,257 134,463 133,742 130,055 132,629 131,468 130,061 Total 151,309 161,257 134,463 133,742 130,055 132,629 131,468 130,061

National Longitudinal Mortality Study – Extract File: Work Force Variables
121
65. Major Industry Using 2007 Codes MAJIND2007 Analysis File Return to Index EDITS: Simple DESCRIPTION: Major industry classification recode for specific industry for Census 2007 industrial classification codes. Specific industrial groupings are shown below in parentheses. NOT AVAILABLE: 8024 CODES for files: 7303-8024, 8008-1103 blank — Industry missing, not reported, unknown 00 — Missing 01 — Agriculture, forestry, fishing, and hunting (0170-0290) 02 — Mining (0370-0490) 03 — Construction (0770) 04 — Manufacturing (1070-3990) 05 — Wholesale and retail trade (4070-5790) 06 — Transportation, warehousing and utilities (0570-0690, 6070-6390) 07 — Information (6470-6780) 08 — Financial, insurance, real estate, rental and leasing (6870-7190) 09 — Professional, scientific, management, administrative,
waste management services (7270-7790) 10 — Educational, health care, and social services (7860-8470) 11 — Arts, entertainment, recreation, leisure accommodation, and food (8560-8690) 12 — Other services except public administration (8770-9290) 13 — Public administration (9370-9590) 14 — Armed Forces (9670-9870) FREQUENCIES: MAJIND2007\counts: 7303 7802 7903 8014 8008 8012 8103 8203 8303 blank 71,613 36,632 21,419 92,648 89,958 89,529 32,178 41,091 40,744 00 . . . . . . . . . 01 2,496 1,886 880 4,009 4,566 3,648 1,124 1,638 1,619 02 441 509 185 1,049 1,151 1,125 356 571 557 03 3,691 3,566 1,373 5,898 6,242 5,773 1,932 2,484 2,601 04 13,962 12,757 4,648 18,503 18,102 17,023 5,938 7,830 7,575 05 9,983 9,558 3,403 14,339 14,371 13,930 4,633 6,177 6,354 06 3,163 3,081 1,055 4,774 4,823 4,575 1,496 2,002 1,923 07 1,423 1,474 541 2,395 2,247 2,136 781 1,030 1,038 08 3,036 3,307 1,106 5,118 5,177 4,972 1,713 2,329 2,301 09 2,480 2,779 1,053 4,681 4,708 4,586 1,606 2,367 2,295 10 9,167 9,526 3,598 15,343 14,161 15,089 4,943 6,764 6,818 11 3,320 3,586 1,574 6,466 6,917 6,214 1,984 2,940 3,091 12 3,930 3,374 1,254 5,139 5,247 4,985 1,706 2,383 2,372 13 2,508 2,627 1,009 4,509 4,703 4,180 1,414 1,874 1,959 14 . . . . . . . . 34 Total 131,213 94,662 43,098 184,871 182,373 177,765 61,804 81,480 81,281
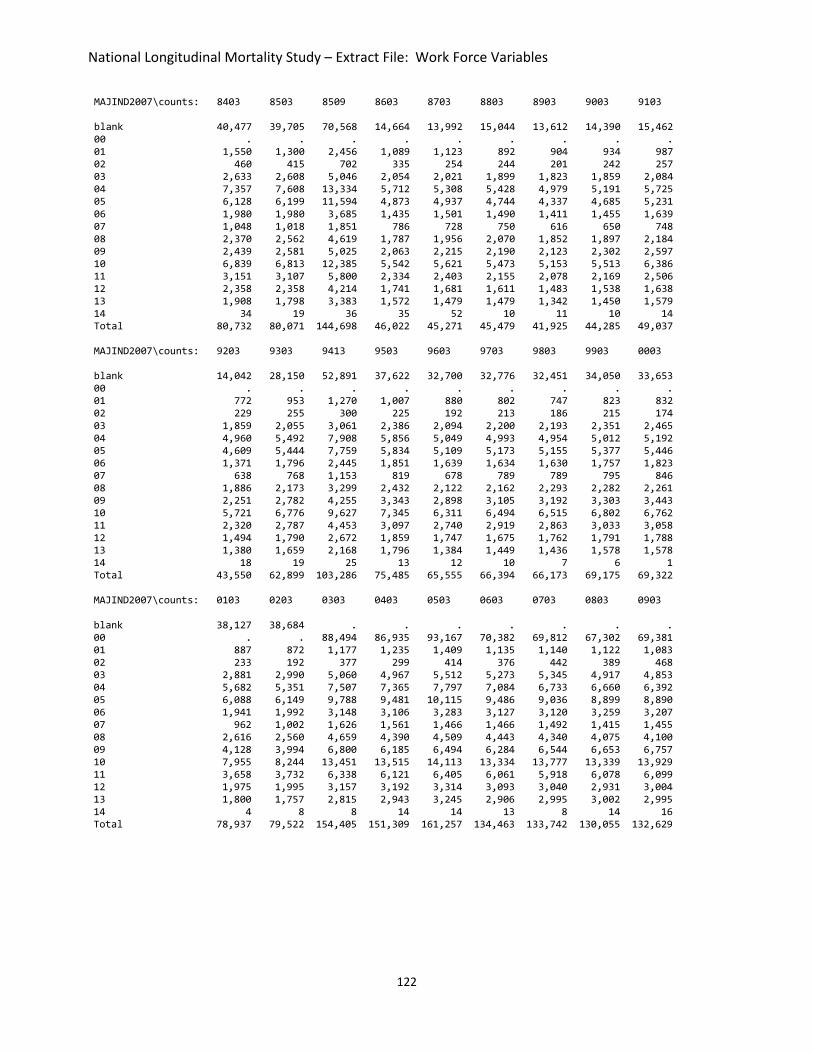
National Longitudinal Mortality Study – Extract File: Work Force Variables
122
MAJIND2007\counts: 8403 8503 8509 8603 8703 8803 8903 9003 9103 blank 40,477 39,705 70,568 14,664 13,992 15,044 13,612 14,390 15,462 00 . . . . . . . . . 01 1,550 1,300 2,456 1,089 1,123 892 904 934 987 02 460 415 702 335 254 244 201 242 257 03 2,633 2,608 5,046 2,054 2,021 1,899 1,823 1,859 2,084 04 7,357 7,608 13,334 5,712 5,308 5,428 4,979 5,191 5,725 05 6,128 6,199 11,594 4,873 4,937 4,744 4,337 4,685 5,231 06 1,980 1,980 3,685 1,435 1,501 1,490 1,411 1,455 1,639 07 1,048 1,018 1,851 786 728 750 616 650 748 08 2,370 2,562 4,619 1,787 1,956 2,070 1,852 1,897 2,184 09 2,439 2,581 5,025 2,063 2,215 2,190 2,123 2,302 2,597 10 6,839 6,813 12,385 5,542 5,621 5,473 5,153 5,513 6,386 11 3,151 3,107 5,800 2,334 2,403 2,155 2,078 2,169 2,506 12 2,358 2,358 4,214 1,741 1,681 1,611 1,483 1,538 1,638 13 1,908 1,798 3,383 1,572 1,479 1,479 1,342 1,450 1,579 14 34 19 36 35 52 10 11 10 14 Total 80,732 80,071 144,698 46,022 45,271 45,479 41,925 44,285 49,037 MAJIND2007\counts: 9203 9303 9413 9503 9603 9703 9803 9903 0003 blank 14,042 28,150 52,891 37,622 32,700 32,776 32,451 34,050 33,653 00 . . . . . . . . . 01 772 953 1,270 1,007 880 802 747 823 832 02 229 255 300 225 192 213 186 215 174 03 1,859 2,055 3,061 2,386 2,094 2,200 2,193 2,351 2,465 04 4,960 5,492 7,908 5,856 5,049 4,993 4,954 5,012 5,192 05 4,609 5,444 7,759 5,834 5,109 5,173 5,155 5,377 5,446 06 1,371 1,796 2,445 1,851 1,639 1,634 1,630 1,757 1,823 07 638 768 1,153 819 678 789 789 795 846 08 1,886 2,173 3,299 2,432 2,122 2,162 2,293 2,282 2,261 09 2,251 2,782 4,255 3,343 2,898 3,105 3,192 3,303 3,443 10 5,721 6,776 9,627 7,345 6,311 6,494 6,515 6,802 6,762 11 2,320 2,787 4,453 3,097 2,740 2,919 2,863 3,033 3,058 12 1,494 1,790 2,672 1,859 1,747 1,675 1,762 1,791 1,788 13 1,380 1,659 2,168 1,796 1,384 1,449 1,436 1,578 1,578 14 18 19 25 13 12 10 7 6 1 Total 43,550 62,899 103,286 75,485 65,555 66,394 66,173 69,175 69,322 MAJIND2007\counts: 0103 0203 0303 0403 0503 0603 0703 0803 0903 blank 38,127 38,684 . . . . . . . 00 . . 88,494 86,935 93,167 70,382 69,812 67,302 69,381 01 887 872 1,177 1,235 1,409 1,135 1,140 1,122 1,083 02 233 192 377 299 414 376 442 389 468 03 2,881 2,990 5,060 4,967 5,512 5,273 5,345 4,917 4,853 04 5,682 5,351 7,507 7,365 7,797 7,084 6,733 6,660 6,392 05 6,088 6,149 9,788 9,481 10,115 9,486 9,036 8,899 8,890 06 1,941 1,992 3,148 3,106 3,283 3,127 3,120 3,259 3,207 07 962 1,002 1,626 1,561 1,466 1,466 1,492 1,415 1,455 08 2,616 2,560 4,659 4,390 4,509 4,443 4,340 4,075 4,100 09 4,128 3,994 6,800 6,185 6,494 6,284 6,544 6,653 6,757 10 7,955 8,244 13,451 13,515 14,113 13,334 13,777 13,339 13,929 11 3,658 3,732 6,338 6,121 6,405 6,061 5,918 6,078 6,099 12 1,975 1,995 3,157 3,192 3,314 3,093 3,040 2,931 3,004 13 1,800 1,757 2,815 2,943 3,245 2,906 2,995 3,002 2,995 14 4 8 8 14 14 13 8 14 16 Total 78,937 79,522 154,405 151,309 161,257 134,463 133,742 130,055 132,629

National Longitudinal Mortality Study – Extract File: Work Force Variables
123
MAJIND2007\counts: 1003 1103 blank . . 00 68,886 69,234 01 1,169 1,107 02 375 410 03 4,676 4,180 04 6,162 6,161 05 8,736 8,383 06 3,087 2,931 07 1,364 1,327 08 4,065 3,908 09 6,776 6,627 10 14,073 13,834 11 6,006 5,933 12 2,903 2,893 13 3,173 3,116 14 17 17 Total 131,468 130,061

National Longitudinal Mortality Study – Extract File: Work Force Variables
124
66. Occupation Using 1990 Codes OCC1990 Analysis File Return to Index Return to OCC2000
EDITS: Simple, Invalid Entry DESCRIPTION: Job specific 1990 occupational classification codes. Specific 1990 occupation codes are given in Appendix G. 1990 occupation codes for NLMS cohorts 1992 through 1998 were taken directly from the Census Bureau’s Data Processing Center I&O coding found permanently on the NLMS master files for these cohorts. For cohorts collected prior to 1992, original coding in Jeffersonville was done according to the definitions used at the time. These codes were translated, for NLMS purposes, to a “best” choice 1990 code. Using documented Demographic Surveys Division (DSD) translations of 1970 occupational coding for the 1973 through 1982 NLMS cohorts, the 1970 occupational codes found on cohort master files were first converted to 1980 occupational codes. For 1970 occupational codes which translated into more than one 1980 code translation was made according to results from a DSD developed test sample, the 1980 occupational translation assigned, for NLMS purposes, was the most frequently corresponding 1980 code indicated on the test file. The 1990 occupational code was then identified for these 1980 codes using DSD predetermined translations. The occupational classification codes contained on master file records for NLMS cohorts 1983 through 1991 were 1980 codes. These codes were converted to 1990 occupational codes using the same DSD documentation used to translate 1980 codes to 1990 codes for the 1973 through 1982 NLMS cohorts. NOTE 1: Errors will be generated by the strategy used to assign a 1970 occupation to a particular 1980 occupation for those 1970 occupations for which there were multiple choices for a 1980 occupation. The decision to assign the most frequently occurring translation according to the results of a test file from the 1980 Census was made to minimize the translation errors. NOTE 2: Occupational classifications change over the decades and the 1990 definition list has occupations that were not classified in 1970 or in 1980. In particular, armed forces personnel were not classified until after 1991. Military classifications have been converted to missing for NLMS occupational classification purposes. Reference: 1990 Census of Population and Housing. Alphabetical Index of Industries and Occupations. 1990 CPH-R-3. NOT AVAILABLE: 8024 CODES for files: 7303-8014, 8008-1103 blank — Never worked, unknown, or age LE 13 years 0-1 — This code, literally the 3 characters “0-1”, is equiv to blank or 000 000 — Never worked, unknown, or age LE 13 years 003-889 — Valid occupation 905 — Classified active military

National Longitudinal Mortality Study – Extract File: Work Force Variables
125
FREQUENCIES: OCC1990\counts: 7303 7802 7903 8014 8008 8012 8103 8203 8303 8403 blank 71,520 36,577 21,393 92,480 89,880 89,480 32,109 41,025 40,774 40,497 0-1 . . . . . . . . . . 000 . . . . . . . . . . 003-889 59,693 58,085 21,705 92,390 92,493 88,285 29,694 40,455 40,473 40,201 905 . . . 1 . . 1 . 34 34 Total 131,213 94,662 43,098 184,871 182,373 177,765 61,804 81,480 81,281 80,732 OCC1990\counts: 8503 8509 8603 8703 8803 8903 9003 9103 9203 9303 blank 39,745 70,624 14,687 14,020 15,074 13,627 14,416 15,485 . . 0-1 . . . . . . . . . . 000 . . . . . . . . 14,042 28,150 003-889 40,307 74,038 31,300 31,199 30,395 28,287 29,859 33,538 29,490 34,730 905 19 36 35 52 10 11 10 14 18 19 Total 80,071 144,698 46,022 45,271 45,479 41,925 44,285 49,037 43,550 62,899 OCC1990\counts: 9413 9503 9603 9703 9803 9903 0003 0103 0203 0303 blank . . . . . . . . . . 0-1 . . . . . . . . 38,684 . 000 52,891 37,622 32,700 32,776 32,451 34,050 33,653 38,127 . 88,494 003-889 50,370 37,850 32,843 33,608 33,715 35,119 35,668 40,806 40,830 65,903 905 25 13 12 10 7 6 1 4 8 8 Total 103,286 75,485 65,555 66,394 66,173 69,175 69,322 78,937 79,522 154,405 OCC1990\counts: 0403 0503 0603 0703 0803 0903 1003 1103 blank . . . . . . . . 0-1 . . . . . . . . 000 86,935 93,167 70,382 69,812 67,302 69,381 68,886 69,234 003-889 64,360 68,076 64,068 63,922 62,739 63,232 62,565 60,810 905 14 14 13 8 14 16 17 17 Total 151,309 161,257 134,463 133,742 130,055 132,629 131,468 130,061

National Longitudinal Mortality Study – Extract File: Work Force Variables
126
67. Major Occupation Using 1990 Codes MAJOCC90 Analysis File Return to Index EDITS: Simple, Recode DESCRIPTION: Major occupation classification recode of 1990 specific occupation codes. In the table below, specific occupation groupings are shown in parentheses. NOT AVAILABLE: 8024 CODES for files: 7303-8014, 8008-9803, 0303-1103 blank — Occupation missing, unknown (files 7303-9103) Managerial & Professional Specialties 01 — Executive, administrative, managerial (003-037) 02 — Professional specialties (043-199) Technical, Sales & Administrative Support 03 — Technicians and related support (203-235) 04 — Sales (243-285) 05 — Administrative support including clerical (303-389) Service Occupations 06 — Private household (403-407) 07 — Protective services (413-427) 08 — Service excluding private and protective (433-469) Farming, Forestry & Fishing 09 — Farm operators & mangers (473-476) 10 — Other agricultural and related (477-499) Precision Production, Crafts & Repair 11 — Mechanics & repairers (503-549) 12 — Construction trades (553-599) 13 — Extractive (613-617) 14 — Precision production (628-699) Operators, Fabricators & Laborers 15 — Machine operators, assemblers & inspectors (703-799) 16 — Transportation & materials moving (803-859) 17 — Handlers, equipment cleaners, helpers & laborers (864-889) Military Occupations 18 — Military occupations (905) 19 — Occupation missing, unknown (files 9203-9803) (999) FREQUENCIES: MAJOCC90\counts: 8503 8509 8603 8703 8803 8903 9003 9103 9203 9303 blank 39,745 70,624 14,687 14,020 15,074 13,627 14,416 15,485 . . 00 . . . . . . . . . . 01 4,348 7,924 3,237 3,511 3,694 3,418 3,630 4,119 3,548 4,408 02 4,797 9,033 3,956 4,065 4,026 3,796 3,923 4,520 3,962 4,818 03 1,112 2,209 966 860 899 871 973 1,042 1,056 1,116 04 4,729 8,655 3,706 3,689 3,526 3,310 3,481 3,866 3,395 4,167 05 6,413 11,713 4,977 5,004 4,916 4,309 4,705 5,296 4,819 5,220 06 537 855 360 313 245 242 219 219 209 275 07 599 1,149 529 512 458 473 524 539 512 591 08 4,916 8,778 3,646 3,653 3,405 3,218 3,431 3,918 3,458 4,192 09 537 1,076 472 461 417 403 418 430 374 436 10 870 1,853 801 795 526 547 565 633 511 676

National Longitudinal Mortality Study – Extract File: Work Force Variables
127
MAJOCC90\counts: 8503 8509 8603 8703 8803 8903 9003 9103 9203 9303 (cont.) 11 1,598 2,878 1,257 1,177 1,206 1,085 1,076 1,244 1,069 1,141 12 1,714 3,341 1,361 1,290 1,275 1,143 1,250 1,422 1,216 1,370 13 117 143 77 52 57 44 41 54 55 56 14 1,405 2,625 1,149 1,078 1,038 941 1,003 1,046 922 1,075 15 3,114 5,359 2,206 2,071 2,219 2,089 2,070 2,377 1,964 2,305 16 1,699 3,104 1,267 1,320 1,253 1,206 1,227 1,427 1,180 1,478 17 1,802 3,343 1,333 1,348 1,235 1,192 1,323 1,386 1,240 1,406 18 19 36 35 52 10 11 10 14 18 19 19 . . . . . . . . 14,042 28,150 Total 80,071 144,698 46,022 45,271 45,479 41,925 44,285 49,037 43,550 62,899 MAJOCC90\counts: 9413 9503 9603 9703 9803 0303 0403 0503 0603 0703 blank . . . . . . . . . . 00 . . . . . 88,494 86,935 93,167 70,382 69,812 01 5,998 4,911 4,355 4,587 4,485 9,702 9,291 9,393 9,319 9,291 02 6,742 5,393 4,592 4,840 4,893 10,033 10,351 10,755 10,106 10,637 03 1,550 1,096 950 1,061 1,041 2,027 1,967 2,142 1,939 1,962 04 6,007 4,631 3,931 4,033 4,086 7,678 7,545 7,794 7,460 7,229 05 7,534 5,528 4,774 4,795 4,801 9,524 8,849 9,288 8,690 8,464 06 433 312 272 271 293 . . . . . 07 836 627 508 570 564 1,123 1,233 1,277 1,191 1,234 08 6,561 4,623 3,990 4,058 4,138 9,063 8,860 9,461 8,974 8,941 09 592 504 396 359 360 615 654 763 605 603 10 962 693 652 636 597 1,065 1,104 1,313 1,155 1,134 11 1,735 1,248 1,183 1,144 1,187 2,170 2,076 2,312 2,126 2,059 12 2,128 1,570 1,335 1,441 1,480 3,088 3,039 3,330 3,158 3,102 13 65 51 44 56 47 48 71 93 98 110 14 1,600 1,150 928 982 1,003 1,714 1,506 1,611 1,424 1,422 15 3,356 2,449 2,157 2,070 2,061 3,087 2,975 3,326 2,852 2,791 16 1,994 1,499 1,388 1,338 1,350 2,672 2,566 2,687 2,512 2,542 17 2,277 1,565 1,388 1,367 1,329 2,294 2,273 2,531 2,459 2,401 18 25 13 12 10 7 8 14 14 13 8 19 52,891 37,622 32,700 32,776 32,451 . . . . . Total 103,286 75,485 65,555 66,394 66,173 154,405 151,309 161,257 134,463 133,742 MAJOCC90\counts: 0803 0903 1003 1103 blank . . . . 00 67,302 69,381 68,886 69,234 01 9,203 9,629 9,229 8,743 02 10,498 10,895 10,859 11,120 03 1,967 1,973 2,057 2,128 04 7,096 7,047 6,865 6,590 05 8,295 8,205 8,012 7,819 06 . . . . 07 1,255 1,240 1,345 1,377 08 8,765 8,973 9,165 8,776 09 614 611 612 554 10 1,161 1,083 1,156 1,101 11 1,999 2,027 2,013 1,855 12 2,850 2,652 2,623 2,394 13 82 115 107 127 14 1,343 1,227 1,285 1,405 15 2,710 2,493 2,503 2,255 16 2,568 2,710 2,456 2,407 17 2,333 2,352 2,278 2,159 18 14 16 17 17 19 . . . . Total 130,055 132,629 131,468 130,061

National Longitudinal Mortality Study – Extract File: Work Force Variables
128
CODES for files: 9903-0203 00 — Missing 01 — Executive, administrative, and managerial 02 — Professional specialty 03 — Technicians and related support 04 — Sales 05 — Administrative support, including clerical 06 — Private household 07 — Protective service 08 — Service, excluding protective and household 09 — Precision production, craft, and repair 10 — Machine operators, assemblers, and inspectors 11 — Transportation and material moving 12 — Handlers, equip cleaners, helpers, laborers 13 — Farming, forestry, and fishing 14 — Armed forces FREQUENCIES: MAJOCC90\counts: 9903 0003 0103 0203 00 34,050 33,653 38,127 38,684 01 4,857 4,860 5,622 5,880 02 5,115 5,046 5,892 6,002 03 1,018 1,132 1,328 1,293 04 4,204 4,152 4,634 4,663 05 4,854 4,927 5,605 5,482 06 265 269 289 248 07 571 590 642 708 08 4,349 4,397 5,139 5,270 09 3,832 3,959 4,541 4,449 10 2,037 2,119 2,330 2,139 11 1,424 1,528 1,767 1,743 12 1,523 1,586 1,822 1,844 13 1,070 1,103 1,195 1,109 14 6 1 4 8 Total 69,175 69,322 78,937 79,522

National Longitudinal Mortality Study – Extract File: Work Force Variables
129
68. Occupation Using 2000 Codes OCC2000 Analysis File Return to Index EDITS: Simple, Recode DESCRIPTION: Job specific using Census Bureau 2000 occupational classification codes. Specific occupational codes are given in Appendix H. Census year 2000 occupational codes for NLMS cohorts 2003 through 2011 were taken directly from the Census Bureau’s Data Processing Center ‘s I&O coding found permanently on the corresponding NLMS master file for the cohort. For cohorts collected prior to 2003, the 2000 occupational coding was derived from the NLMS variable OCC1990, see page 124. The translation into the corresponding 2000 code was done using crosswalks developed by the Occupation and Industries Branch of the Census Bureau’s Population Division and made available on the Census Bureau’s website: www.census.gov/people/io. The assignment of a particular 1990 occupational code to a 2000 code was based on the highest percentage association of the 1990 occupation code to a 2000 occupation code determined from studies of the SF-3 and SF-4 Census Summary files as coded by the Census Bureau’s Occupations and Industries Branch. These percentages are also found in documents on the previously referenced website. In some cases, there is a clear translation of the 1990 code into the 2000 code. That is, a high percentage of the given 1990 occupational code translated into one 2000 code. In other cases, four or five possibilities might exist. In any case, the 2000 occupational code assigned is the code having the highest percentage of assignments for records with the given 1990 occupational code. NOTE: The, “2000,” portion of the variable name indicates that the definition of occupation follows the definition of occupation code developed for the 2000 Census. This definition of occupation remained fixed in CPS surveys for the entire period from 2003, the year of the CPS redesign to reflect the Census 2000 designed frame, through the year 2011, the latest CPS survey year incorporated into the NLMS. NOT AVAILABLE: 8024 FREQUENCIES: OCC2000\counts: 7303 7802 7903 8014 8008 8012 8103 8203 8303 8403 blank 71,520 36,577 21,393 92,480 89,880 89,480 32,109 41,025 40,774 40,497 0000-9840 59,693 58,085 21,705 92,391 92,493 88,285 29,695 40,455 40,507 40,235 Total 131,213 94,662 43,098 184,871 182,373 177,765 61,804 81,480 81,281 80,732 OCC2000\counts: 8503 8509 8603 8703 8803 8903 9003 9103 9203 9303 blank 39,745 70,624 14,687 14,020 15,074 13,627 14,416 15,485 14,042 28,150 0000-9840 40,326 74,074 31,335 31,251 30,405 28,298 29,869 33,552 29,508 34,749 Total 80,071 144,698 46,022 45,271 45,479 41,925 44,285 49,037 43,550 62,899 OCC2000\counts: 9413 9503 9603 9703 9803 9903 0003 0103 0203 0303 blank 52,891 37,622 32,700 32,776 32,451 34,050 33,653 38,127 38,684 . 0000-9840 50,395 37,863 32,855 33,618 33,722 35,125 35,669 40,810 40,838 154,405 Total 103,286 75,485 65,555 66,394 66,173 69,175 69,322 78,937 79,522 154,405

National Longitudinal Mortality Study – Extract File: Work Force Variables
130
OCC2000\counts: 0403 0503 0603 0703 0803 0903 1003 1103 blank . . . . . . . . 0000-9840 151,309 161,257 134,463 133,742 130,055 132,629 131,468 130,061 Total 151,309 161,257 134,463 133,742 130,055 132,629 131,468 130,061

National Longitudinal Mortality Study – Extract File: Work Force Variables
131
69. Major Occupation Using the Census 2000 Codes MAJOCC2000 Analysis File Return to Index
EDITS: Simple, Invalid Entry DESCRIPTION: Major occupation classification recode for specific occupation for Census 2000 occupational classification codes. Specific occupational groupings are shown in parentheses below. NOT AVAILABLE: 8024 Codes FOR FILES: 7303-8014, 8008-1103 blank — Industry missing, not reported, unknown 00 — Missing 01 — Management, business and financial occupations (0010-0950) 02 — Professional and related occupations (1000-3540) 03 — Service occupations (3600-4650) 04 — Sales and related occupations (4700-4965) 05 — Office and administrative support occupations (5000-5940) 06 — Farming, fishing and forestry occupations (6005-6130) 07 — Construction and extraction occupations (6200-6940) 08 — Installation, maintenance, and repair occupations (7000-7630) 09 — Productions occupations (7700-8965) 10 — Transportation and material moving occupations (9000-9750) 11 — Armed Forces (9800-9830) FREQUENCIES: MAJOCC2000\counts: 7303 7802 7903 8014 8008 8012 8103 8203 8303 blank 71,520 36,577 21,393 92,480 89,880 89,480 32,109 41,025 40,774 00 . . . . . . . . . 01 6,310 6,440 2,215 10,638 11,158 10,584 3,677 4,946 4,685 02 9,744 10,096 3,667 16,534 15,378 15,908 5,373 7,281 7,273 03 7,248 7,054 2,924 11,415 11,963 10,710 3,489 5,118 5,166 04 6,222 6,148 2,173 9,563 9,408 9,477 3,052 4,148 4,580 05 9,205 9,180 3,392 14,792 14,573 13,988 4,738 6,342 6,378 06 1,313 967 475 1,974 2,308 1,675 561 767 785 07 3,422 3,207 1,250 5,410 5,765 5,291 1,780 2,345 2,430 08 2,396 2,305 807 3,753 3,525 3,384 1,231 1,557 1,647 09 9,063 8,089 3,174 11,813 11,805 11,079 3,782 5,058 4,681 10 4,770 4,599 1,628 6,498 6,610 6,189 2,011 2,893 2,848 11 . . . 1 . . 1 . 34 Total 131,213 94,662 43,098 184,871 182,373 177,765 61,804 81,480 81,281

National Longitudinal Mortality Study – Extract File: Work Force Variables
132
MAJOCC2000\counts: 8403 8503 8509 8603 8703 8803 8903 9003 9103 blank 40,497 39,745 70,624 14,687 14,020 15,074 13,627 14,416 15,485 00 . . . . . . . . . 01 4,749 4,856 8,972 3,691 3,936 4,085 3,821 4,037 4,548 02 7,477 7,460 13,998 6,148 6,157 6,111 5,793 6,146 6,928 03 5,107 5,007 9,163 3,795 3,732 3,282 3,147 3,323 3,746 04 4,551 4,729 8,655 3,706 3,689 3,526 3,310 3,481 3,866 05 6,258 6,422 11,756 4,994 5,015 4,920 4,295 4,696 5,262 06 770 648 1,184 537 543 390 395 419 470 07 2,358 2,344 4,494 1,837 1,746 1,668 1,543 1,618 1,845 08 1,626 1,648 2,968 1,293 1,201 1,247 1,123 1,100 1,282 09 4,538 4,475 7,899 3,322 3,097 3,226 3,000 3,042 3,389 10 2,767 2,718 4,949 1,977 2,083 1,940 1,860 1,997 2,202 11 34 19 36 35 52 10 11 10 14 Total 80,732 80,071 144,698 46,022 45,271 45,479 41,925 44,285 49,037 MAJOCC2000\counts: 9203 9303 9413 9503 9603 9703 9803 9903 0003 blank 14,042 28,150 52,891 37,622 32,700 32,776 32,451 34,050 33,653 00 . . . . . . . . . 01 3,908 4,842 6,573 5,382 4,763 4,959 4,841 5,156 5,176 02 6,254 7,371 10,472 8,139 6,950 7,320 7,381 7,686 7,717 03 3,335 4,071 6,403 4,508 3,918 4,005 4,080 4,265 4,349 04 3,395 4,167 6,007 4,631 3,931 4,033 4,086 4,204 4,152 05 4,792 5,248 7,561 5,493 4,690 4,783 4,799 4,809 4,839 06 370 476 637 471 423 403 383 488 512 07 1,604 1,792 2,801 2,058 1,761 1,888 1,897 2,034 2,134 08 1,099 1,186 1,777 1,290 1,220 1,168 1,226 1,291 1,279 09 2,830 3,334 4,891 3,557 3,034 3,007 3,019 2,995 3,152 10 1,903 2,243 3,248 2,321 2,153 2,042 2,003 2,191 2,358 11 18 19 25 13 12 10 7 6 1 Total 43,550 62,899 103,286 75,485 65,555 66,394 66,173 69,175 69,322 MAJOCC2000\counts: 0103 0203 0303 0403 0503 0603 0703 0803 0903 blank 38,127 38,684 . . . . . . . 00 . . 88,494 86,935 93,167 70,382 69,812 67,302 69,381 01 6,006 6,290 9,282 8,917 9,204 8,934 8,951 8,910 9,268 02 9,023 9,212 12,391 12,621 13,198 12,345 12,938 12,754 13,224 03 5,026 4,961 11,394 11,331 12,077 11,440 11,378 11,248 11,444 04 4,634 4,663 7,555 7,390 7,634 7,275 7,076 6,900 6,888 05 5,495 5,396 9,447 8,854 9,216 8,645 8,415 8,306 8,126 06 483 467 550 572 670 578 581 551 510 07 2,538 2,554 4,292 4,064 4,576 4,457 4,436 4,085 3,904 08 1,428 1,429 2,355 2,234 2,486 2,268 2,208 2,120 2,186 09 3,422 3,172 4,655 4,421 4,871 4,219 4,141 3,983 3,664 10 2,751 2,686 3,982 3,956 4,144 3,907 3,798 3,882 4,018 11 4 8 8 14 14 13 8 14 16 Total 78,937 79,522 154,405 151,309 161,257 134,463 133,742 130,055 132,629 MAJOCC2000\counts: 1003 1103 blank . . 00 68,886 69,234 01 8,927 8,857 02 13,195 12,857 03 11,815 11,503 04 6,715 6,444 05 7,933 7,811 06 550 524 07 3,745 3,489 08 2,166 1,984 09 3,731 3,670 10 3,788 3,671 11 17 17 Total 131,468 130,061

National Longitudinal Mortality Study – Extract File: Work Force Variables
133
70. Class of Worker CLASSWKR Analysis File Return to Index EDITS: Simple, Recode DESCRIPTION: For files prior to 2003, detailed class of worker was derived from the type of work performed and the response to question 23E on the survey. This variable was coded differently during the different time periods of follow-up of the NLMS. The variable RCOW1 is a more direct response to question 23E. Beginning in 2003, the variable, CLASSWKR, loosely described as, class of worker, is taken from the CPS variable, PEIO1COW. This variable is a broad classification of the concept, What was your main job this month? NOT AVAILABLE: 8024 CODES for files: 7303, 7802, 8014, 8008, 8012 blank — Not in the universe -- — Missing value, unknown 00 — Not in the Labor Force 01 — Agriculture, Wage & Salary 02 — Agriculture, Self-Employed 03 — Agriculture, Unpaid Family 04 — Non-agriculture, Wage and Salary, private household 05 — Non-agriculture, Wage and Salary, government Non-agriculture, Wage and Salary, other private goods producing industries 06 — White collar occupations 07 — Blue collar occupations 08 — Service occupations Service producing industries 09 — White collar occupations 10 — Blue collar occupations 11 — Service occupations 12 — Non-agriculture, Wage and Salary, self-employed 13 — Non-agriculture, Wage and Salary, unpaid family 14 — No previous full time work experience ^^ — Missing value, unknown

National Longitudinal Mortality Study – Extract File: Work Force Variables
134
FREQUENCIES: CLASSWKR\counts: 7303 7802 8014 8008 8012 blank . 760 41,534 41,188 8,931 -- 33,734 . . . . 00 41,151 37,948 55,447 52,401 53,121 01 760 698 1,457 1,708 1,266 02 1,129 812 1,788 2,006 1,667 03 273 113 348 459 252 04 1,348 1,033 1,276 1,529 1,254 05 8,885 9,060 14,419 13,613 13,711 06 4,328 4,407 6,860 6,701 6,466 07 11,896 10,787 15,742 16,007 14,646 08 301 282 390 399 347 09 13,357 14,472 22,938 23,139 22,766 10 5,325 5,258 7,936 8,087 7,704 11 4,277 4,606 7,833 7,979 7,283 12 3,598 3,599 5,874 5,902 5,922 13 371 264 325 330 296 14 480 563 704 925 661 ^^ . . . . 31,472 Total 131,213 94,662 184,871 182,373 177,765 CODES for files: 7903, 8103–8703, 9413–0203 00 — Not in the labor force 01 — Private industry 02 — Federal government 03 — State government 04 — Local government 05 — Self employed, incorporated 06 — Self employed, not incorporated 07 — Without pay 08 — Never worked FREQUENCIES: CLASSWKR\counts: 7903 8103 8203 8303 8403 8503 8509 8603 8703 9413 00 21,258 31,925 40,854 40,320 40,070 39,315 69,870 14,664 13,992 52,659 01 15,669 21,283 28,983 29,103 29,126 29,692 54,375 22,977 22,841 37,403 02 724 985 1,346 1,306 1,401 1,242 2,292 1,030 1,015 1,445 03 788 1,183 1,516 1,607 1,605 1,572 2,733 1,222 1,280 2,054 04 2,049 2,528 3,436 3,421 3,372 3,236 6,036 2,785 2,733 3,724 05 387 651 879 1,023 946 1,010 1,868 733 769 1,572 06 1,687 2,630 3,526 3,610 3,544 3,405 6,409 2,456 2,513 4,116 07 241 322 431 379 262 209 487 155 128 81 08 295 297 509 512 406 390 628 . . 232 Total 43,098 61,804 81,480 81,281 80,732 80,071 144,698 46,022 45,271 103,286 CLASSWKR\counts: 9503 9603 9703 9803 9903 0003 0103 0203 00 37,429 32,550 32,613 32,307 33,932 33,550 38,009 38,524 01 27,642 24,411 24,972 25,288 26,428 26,882 31,105 30,920 02 1,140 898 874 859 881 912 1,030 1,045 03 1,708 1,357 1,416 1,399 1,427 1,484 1,726 1,681 04 2,965 2,438 2,484 2,469 2,701 2,642 2,978 3,026 05 1,238 904 1,074 1,051 1,016 1,148 1,127 1,335 06 3,115 2,792 2,765 2,618 2,638 2,569 2,795 2,793 07 55 55 33 38 34 32 49 38 08 193 150 163 144 118 103 118 160 Total 75,485 65,555 66,394 66,173 69,175 69,322 78,937 79,522
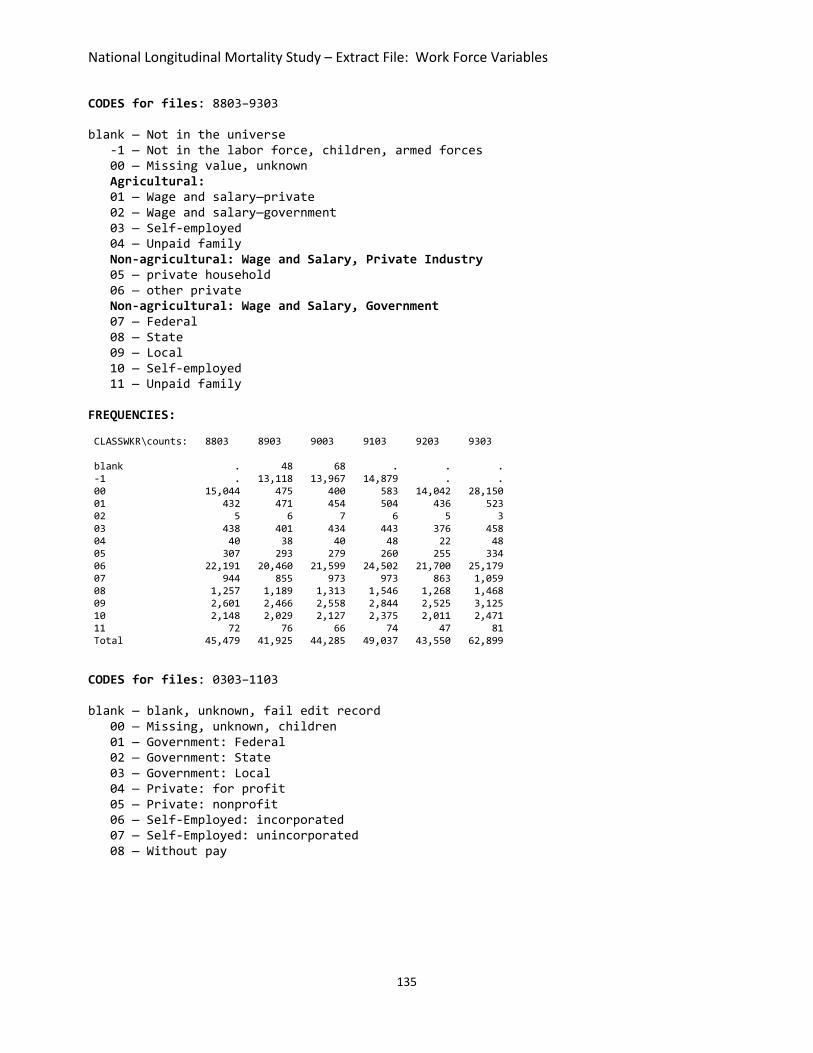
National Longitudinal Mortality Study – Extract File: Work Force Variables
135
CODES for files: 8803–9303 blank — Not in the universe -1 — Not in the labor force, children, armed forces 00 — Missing value, unknown Agricultural: 01 — Wage and salary—private 02 — Wage and salary—government 03 — Self-employed 04 — Unpaid family Non-agricultural: Wage and Salary, Private Industry 05 — private household 06 — other private Non-agricultural: Wage and Salary, Government 07 — Federal 08 — State 09 — Local 10 — Self-employed 11 — Unpaid family FREQUENCIES: CLASSWKR\counts: 8803 8903 9003 9103 9203 9303 blank . 48 68 . . . -1 . 13,118 13,967 14,879 . . 00 15,044 475 400 583 14,042 28,150 01 432 471 454 504 436 523 02 5 6 7 6 5 3 03 438 401 434 443 376 458 04 40 38 40 48 22 48 05 307 293 279 260 255 334 06 22,191 20,460 21,599 24,502 21,700 25,179 07 944 855 973 973 863 1,059 08 1,257 1,189 1,313 1,546 1,268 1,468 09 2,601 2,466 2,558 2,844 2,525 3,125 10 2,148 2,029 2,127 2,375 2,011 2,471 11 72 76 66 74 47 81 Total 45,479 41,925 44,285 49,037 43,550 62,899 CODES for files: 0303–1103 blank — blank, unknown, fail edit record 00 — Missing, unknown, children 01 — Government: Federal 02 — Government: State 03 — Government: Local 04 — Private: for profit 05 — Private: nonprofit 06 — Self-Employed: incorporated 07 — Self-Employed: unincorporated 08 — Without pay

National Longitudinal Mortality Study – Extract File: Work Force Variables
136
FREQUENCIES: CLASSWKR\counts: 0303 0403 0503 0603 0703 0803 0903 1003 1103 00 87,602 86,437 92,011 69,588 68,915 66,735 68,803 68,277 68,569 01 1,856 1,659 1,857 1,675 1,672 1,721 1,679 1,885 1,876 02 2,774 2,864 3,093 2,873 3,015 2,856 2,873 2,985 2,907 03 5,222 4,965 5,286 4,607 4,734 4,717 4,761 4,632 4,291 04 45,956 44,416 47,189 44,730 44,241 43,348 43,660 43,076 42,147 05 4,077 4,089 4,215 4,057 4,125 3,920 4,145 4,234 4,062 06 2,206 2,211 2,455 2,238 2,344 2,278 2,302 2,175 2,028 07 4,648 4,620 5,081 4,645 4,620 4,420 4,371 4,151 4,124 08 64 48 70 50 76 60 35 53 57 Total 154,405 151,309 161,257 134,463 133,742 130,055 132,629 131,468 130,061

National Longitudinal Mortality Study – Extract File: Work Force Variables
137
71. Class of Worker, Recode RCOW1 Analysis File Return to Index EDITS: Invalid Entry, Recode DESCRIPTION: Recode of detailed class of worker. NOT AVAILABLE: 8024 CODES for files: 7303 - — Unknown, not in universe 0 — Never worked Employed: 1 — Private 2 — Government 3 — Self-employed 4 — Unpaid family Unemployed: 5 — Private 6 — Government 7 — Self-employed 8 — Unpaid family FREQUENCIES: RCOW1\counts: 7303 - 33,734 0 41,631 1 39,308 2 8,683 3 4,683 4 637 5 2,272 6 214 7 44 8 7 Total 131,213 CODES for files: 7802-8014, 8008-0203 blank — Not in the universe, unknown - — Unknown 0 — Unknown, not in the universe 1 — Private industry 2 — Federal government 3 — State government 4 — Local government 5 — Self-employed, incorporated 6 — Self-employed, not incorporated 7 — Worked without pay 8 — Never worked ^ — Unknown

National Longitudinal Mortality Study – Extract File: Work Force Variables
138
FREQUENCIES: RCOW1\counts: 7802 7903 8014 8008 8012 8103 8203 8303 8403 8503 blank 760 . 41,534 41,188 8,931 . . . . . - 34,464 . 50,108 47,939 48,524 . . . . . 0 . 21,258 . . . 31,925 40,854 40,320 40,070 39,315 1 42,948 15,669 66,303 66,810 63,148 21,283 28,983 29,103 29,126 29,692 2 1,871 724 3,251 3,348 3,030 985 1,346 1,306 1,401 1,242 3 2,202 788 3,747 3,385 3,545 1,183 1,516 1,607 1,605 1,572 4 5,494 2,049 8,083 7,555 7,796 2,528 3,436 3,421 3,372 3,236 5 1,007 387 1,813 1,794 1,839 651 879 1,023 946 1,010 6 4,591 1,687 8,003 8,201 7,875 2,630 3,526 3,610 3,544 3,405 7 651 241 1,062 1,139 866 322 431 379 262 209 8 674 295 967 1,014 739 297 509 512 406 390 ^ . . . . 31,472 . . . . . Total 94,662 43,098 184,871 182,373 177,765 61,804 81,480 81,281 80,732 80,071 RCOW1\counts: 8509 8603 8703 8803 8903 9003 9103 9203 9303 9413 blank . . . 14,449 13,025 . 14,879 13,510 17,093 . - . . . . . 49 . . . . 0 69,870 14,664 13,992 435 475 14,356 583 386 11,249 52,659 1 54,375 22,977 22,841 22,114 20,424 21,494 24,401 21,628 24,873 37,403 2 2,292 1,030 1,015 944 855 972 974 863 1,060 1,445 3 2,733 1,222 1,280 1,260 1,193 1,314 1,548 1,271 1,458 2,054 4 6,036 2,785 2,733 2,603 2,468 2,549 2,847 2,527 3,109 3,724 5 1,868 733 769 799 800 741 865 759 1,007 1,572 6 6,409 2,456 2,513 2,586 2,430 2,560 2,818 2,387 2,920 4,116 7 487 155 128 112 114 106 122 69 129 81 8 628 . . 177 141 144 . 150 1 232 ^ . . . . . . . . . . Total 144,698 46,022 45,271 45,479 41,925 44,285 49,037 43,550 62,899 103,286 RCOW1\counts: 9503 9603 9703 9803 9903 0003 0103 0203 0303 0403 blank . . . . . . . . 87,602 86,437 - . . . . . . . . . . 0 37,429 32,550 32,613 32,307 33,932 33,550 38,009 38,524 . . 1 27,642 24,411 24,972 25,288 26,428 26,882 31,105 30,920 50,033 48,505 2 1,140 898 874 859 881 912 1,030 1,045 1,856 1,659 3 1,708 1,357 1,416 1,399 1,427 1,484 1,726 1,681 2,774 2,864 4 2,965 2,438 2,484 2,469 2,701 2,642 2,978 3,026 5,222 4,965 5 1,238 904 1,074 1,051 1,016 1,148 1,127 1,335 2,206 2,211 6 3,115 2,792 2,765 2,618 2,638 2,569 2,795 2,793 4,648 4,620 7 55 55 33 38 34 32 49 38 64 48 8 193 150 163 144 118 103 118 160 . . ^ . . . . . . . . . . Total 75,485 65,555 66,394 66,173 69,175 69,322 78,937 79,522 154,405 151,309 RCOW1\counts: 0503 0603 0703 0803 0903 1003 1103 blank 92,011 69,588 68,915 66,735 68,803 68,277 68,569 - . . . . . . . 0 . . . . . . . 1 51,404 48,787 48,366 47,268 47,805 47,310 46,209 2 1,857 1,675 1,672 1,721 1,679 1,885 1,876 3 3,093 2,873 3,015 2,856 2,873 2,985 2,907 4 5,286 4,607 4,734 4,717 4,761 4,632 4,291 5 2,455 2,238 2,344 2,278 2,302 2,175 2,028 6 5,081 4,645 4,620 4,420 4,371 4,151 4,124 7 70 50 76 60 35 53 57 8 . . . . . . . ^ . . . . . . . Total 161,257 134,463 133,742 130,055 132,629 131,468 130,061
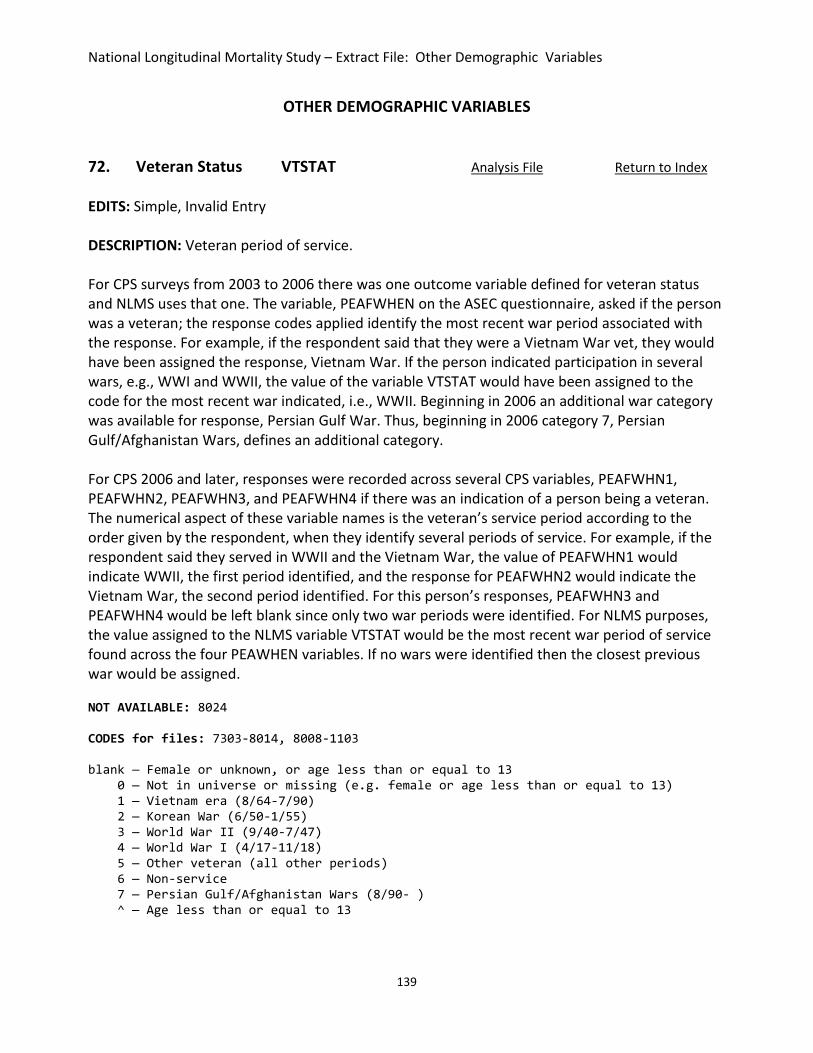
National Longitudinal Mortality Study – Extract File: Other Demographic Variables
139
OTHER DEMOGRAPHIC VARIABLES 72. Veteran Status VTSTAT Analysis File Return to Index EDITS: Simple, Invalid Entry DESCRIPTION: Veteran period of service. For CPS surveys from 2003 to 2006 there was one outcome variable defined for veteran status and NLMS uses that one. The variable, PEAFWHEN on the ASEC questionnaire, asked if the person was a veteran; the response codes applied identify the most recent war period associated with the response. For example, if the respondent said that they were a Vietnam War vet, they would have been assigned the response, Vietnam War. If the person indicated participation in several wars, e.g., WWI and WWII, the value of the variable VTSTAT would have been assigned to the code for the most recent war indicated, i.e., WWII. Beginning in 2006 an additional war category was available for response, Persian Gulf War. Thus, beginning in 2006 category 7, Persian Gulf/Afghanistan Wars, defines an additional category. For CPS 2006 and later, responses were recorded across several CPS variables, PEAFWHN1, PEAFWHN2, PEAFWHN3, and PEAFWHN4 if there was an indication of a person being a veteran. The numerical aspect of these variable names is the veteran’s service period according to the order given by the respondent, when they identify several periods of service. For example, if the respondent said they served in WWII and the Vietnam War, the value of PEAFWHN1 would indicate WWII, the first period identified, and the response for PEAFWHN2 would indicate the Vietnam War, the second period identified. For this person’s responses, PEAFWHN3 and PEAFWHN4 would be left blank since only two war periods were identified. For NLMS purposes, the value assigned to the NLMS variable VTSTAT would be the most recent war period of service found across the four PEAWHEN variables. If no wars were identified then the closest previous war would be assigned. NOT AVAILABLE: 8024 CODES for files: 7303-8014, 8008-1103 blank — Female or unknown, or age less than or equal to 13 0 — Not in universe or missing (e.g. female or age less than or equal to 13) 1 — Vietnam era (8/64-7/90) 2 — Korean War (6/50-1/55) 3 — World War II (9/40-7/47) 4 — World War I (4/17-11/18) 5 — Other veteran (all other periods) 6 — Non-service 7 — Persian Gulf/Afghanistan Wars (8/90- ) ^ — Age less than or equal to 13

National Longitudinal Mortality Study – Extract File: Other Demographic Variables
140
FREQUENCIES: VTSTAT\counts: 7303 7802 7903 8014 8008 8012 8103 8203 8303 8403 blank 84,967 51,365 . 117,992 116,029 81,428 . 1 . . 0 . . 27,784 . . . 39,163 51,693 51,380 51,266 1 3,983 4,209 1,433 6,511 6,205 6,330 2,131 2,701 2,734 2,709 2 3,151 2,615 833 3,754 3,750 3,605 1,306 1,582 1,521 1,555 3 7,542 6,154 1,916 8,670 8,492 8,234 2,816 3,534 3,333 3,246 4 727 302 91 411 323 304 129 116 110 58 5 2,450 2,398 826 3,777 3,822 3,851 1,340 1,772 1,830 1,768 6 28,393 27,619 10,215 43,756 43,752 42,541 14,919 20,081 20,373 20,130 7 . . . . . . . . . . ^ . . . . . 31,472 . . . . Total 131,213 94,662 43,098 184,871 182,373 177,765 61,804 81,480 81,281 80,732 VTSTAT\counts: 8503 8509 8603 8703 8803 8903 9003 9103 9203 9303 blank . 31,073 . . . . . . . . 0 50,382 . 24,842 24,417 441 483 408 583 386 11,041 1 2,711 4,999 2,102 2,038 1,948 1,790 1,926 2,090 1,859 2,157 2 1,503 2,754 1,140 1,131 1,155 1,044 1,102 1,207 995 1,164 3 3,051 5,954 2,378 2,292 2,202 1,991 1,994 2,023 1,762 1,966 4 63 115 35 29 18 13 11 8 9 5 5 1,832 3,675 1,473 1,473 1,557 1,483 1,554 1,698 1,609 1,762 6 20,529 96,128 14,052 13,891 38,158 35,121 37,290 41,428 36,930 44,804 7 . . . . . . . . . . ^ . . . . . . . . . . Total 80,071 144,698 46,022 45,271 45,479 41,925 44,285 49,037 43,550 62,899 VTSTAT\counts: 9413 9503 9603 9703 9803 9903 0003 0103 0203 0303 blank . . . . . . . . . . 0 26,690 18,011 15,706 15,553 15,775 16,548 16,429 18,542 18,592 59,140 1 2,765 2,229 1,777 1,880 1,899 1,918 1,810 2,136 2,216 2,900 2 1,311 1,055 937 913 828 867 856 931 915 977 3 2,289 1,936 1,557 1,509 1,360 1,304 1,185 1,239 1,158 1,213 4 9 4 1 2 . . . . . . 5 2,893 2,178 1,869 1,952 1,895 1,866 1,936 2,237 2,196 3,610 6 67,329 50,072 43,708 44,585 44,416 46,672 47,106 53,852 54,445 86,565 7 . . . . . . . . . . ^ . . . . . . . . . . Total 103,286 75,485 65,555 66,394 66,173 69,175 69,322 78,937 79,522 154,405 VTSTAT\counts: 0403 0503 0603 0703 0803 0903 1003 1103 blank . . 43,612 42,956 40,960 41,689 40,708 40,298 0 58,578 61,431 . . . . . . 1 2,798 2,834 3,924 3,929 3,720 3,763 3,459 3,493 2 929 1,037 1,612 1,532 1,394 1,448 1,292 1,299 3 1,050 1,166 929 813 703 653 572 480 4 . . 15 6 14 9 9 6 5 3,430 3,797 . . . . . . 6 84,524 90,992 82,784 82,786 81,573 83,405 83,603 82,596 7 . . 1,587 1,720 1,691 1,662 1,825 1,889 ^ . . . . . . . . Total 151,309 161,257 134,463 133,742 130,055 132,629 131,468 130,061

National Longitudinal Mortality Study – Extract File: Other Demographic Variables
141
73. Migration MIGRAT Analysis File Return to Index EDITS: Simple, Recode DESCRIPTION: Description of the move for persons who have moved recently. The determination of this variable is based on a composite of several CPS responses, one of which is the answer to "Were you living in this house on ?" For the March 1979 file this date was March 1, 1975, and for the March 1981 file the date was March 1, 1980. Thus, the time in residence for the March 1979 file was four years but for the March 1981 file the period was one year. During the era of the 1979 through 1985 surveys, the general strategy was to set the reference point for residence on the 1st day of the survey month for years divisible by 5. Thus, the reference year for the 1979 survey was 1975. For the 1981 through 1984 surveys the reference year was 1980, and for 1985 the reference year was 1985. NOT AVAILABLE: 7303, 7802, 8014-8012, 8509 CODES for files: 7903, 8103–8503 00 — Missing 01 — Nonmovers 02 — Moved within an SMSA 03 — Moved between SMSAs 04 — Moved from a SMSA to a non SMSA 05 — Moved from a non SMSA to an SMSA 06 — Moved from a non SMSA to a non SMSA 07 — Moved from abroad to an SMSA 08 — Moved from abroad to a non SMSA 09 — Not in survey, children LE (file specific age)1 1 Children less than or equal to 13 years of age are assigned the same moving status as their mother. However, children who were born after the specific survey reference point for moving and before the survey was taken are classified as 9, not in the survey scope for this variable. This would mean that the children so classified would have specific ages less than 4 years of age for the 1979 file and less than 1 year of age for the 1981 file. For March surveys after 1981 the reference point was set at 1 year unless the year of the interview was divisible by 5. In this case the reference period was 5 years prior on March 1. Thus, for files 8203, 8303, and 8403 the year’s reference point is March 1 of the previous year. For the 8503, the reference point is March 1, 1980, implying a 5 year interval.

National Longitudinal Mortality Study – Extract File: Other Demographic Variables
142
FREQUENCIES: MIGRAT\counts: 7903 8103 8203 8303 8403 8503 00 . . 1 . . . 01 23,076 50,038 66,797 66,704 65,972 42,880 02 7,449 4,309 5,500 5,468 5,722 12,383 03 2,317 1,253 1,624 1,552 1,620 4,468 04 1,438 756 1,013 880 863 2,502 05 892 665 741 696 777 1,946 06 4,340 3,446 4,116 4,341 4,048 8,327 07 645 274 290 242 291 1,123 08 61 64 87 121 96 220 09 2,880 999 1,311 1,277 1,343 6,222 Total 43,098 61,804 81,480 81,281 80,732 80,071
CODES for files: 8603, 8703 01 — Nonmover Within SMSA: 02 — Within central city 03 — Balance to balance 04 — Central city to balance 05 — Balance to central city Between SMSA: 06 — Central city to central city 07 — Balance to balance 08 — Central city to balance 09 — Balance to central city Other: 10 — Central city to non SMSA 11 — Balance to non SMSA 12 — Non SMSA to central city 13 — Non SMSA to balance 14 — Non SMSA to non SMSA 15 — Abroad to SMSA central city 16 — Abroad to balance SMSA 17 — Abroad to non SMSA FREQUENCIES: MIGRAT\counts: 8603 8703 01 38,358 37,739 02 1,429 1,359 03 1,356 1,433 04 558 523 05 336 324 06 326 313 07 500 488 08 346 309 09 226 272 10 186 161 11 231 180 12 203 235 13 235 287 14 1,590 1,526 15 63 72 16 66 38 17 13 12 Total 46,022 45,271

National Longitudinal Mortality Study – Extract File: Other Demographic Variables
143
CODES for files: 8803–9903,0103-1103 00 — Missing, unknown 01 — Nonmover Within MSA: 02 — Within same central city 03 — Between central cities 04 — Balance to balance 05 — Central city to balance 06 — Balance to central city Between MSAs (In 2005, area designation became CVSA): 07 — Central city to central city 08 — Balance to balance 09 — Central city to balance 10 — Balance to central city Other: 11 — Central city to outside MSAs 12 — Balance to outside MSA 13 — Outside MSAs to central cities 14 — Outside MSAs to balance of MSAs 15 — Outside MSAs at both dates 16 — Abroad to central cities 17 — Abroad to balance of MSAs 18 — Abroad to outside MSAs 19 — Not in universe (children under 1 yr old) FREQUENCIES: MIGRAT\counts: 8803 8903 9003 9103 9203 9303 9413 9503 9603 9703 00 . . . . . . . . . . 01 38,150 35,220 37,065 41,417 36,626 53,132 78,213 39,299 54,300 55,077 02 943 839 1,202 1,458 1,425 1,820 4,822 5,105 2,148 2,214 03 530 472 118 53 48 73 166 261 61 61 04 1,426 1,309 1,392 1,471 1,362 1,797 4,571 6,457 2,123 2,155 05 572 461 530 584 527 625 1,739 2,285 816 862 06 259 239 257 269 257 377 855 1,139 398 403 07 308 313 317 336 261 336 872 1,270 408 419 08 397 345 369 445 353 427 1,181 2,287 648 587 09 308 281 351 320 271 358 910 1,442 458 379 10 162 161 226 186 174 244 545 972 290 271 11 162 156 178 211 146 249 562 763 278 213 12 206 187 187 224 224 247 661 996 269 311 13 146 102 167 138 149 157 458 583 160 159 14 184 200 208 190 173 198 464 749 206 228 15 1,580 1,470 1,525 1,511 1,405 2,003 4,290 4,428 1,642 1,768 16 66 72 83 106 80 132 277 710 136 161 17 49 75 84 91 52 60 334 737 188 120 18 31 23 26 27 17 35 110 141 42 38 19 . . . . . 629 2,256 5,861 984 968 Total 45,479 41,925 44,285 49,037 43,550 62,899 103,286 75,485 65,555 66,394

National Longitudinal Mortality Study – Extract File: Other Demographic Variables
144
MIGRAT\counts: 9803 9903 0103 0203 0303 0403 0503 0603 0703 0803 00 . . . . 22,184 22,047 23,959 6,620 6,764 5,485 01 55,118 57,947 67,923 67,733 108,306 107,193 114,866 106,240 106,458 106,529 02 2,197 2,217 1,797 2,104 4,103 3,863 4,047 4,185 4,064 3,631 03 60 73 83 73 151 176 300 400 329 332 04 2,036 2,064 1,838 1,968 4,541 4,164 4,205 4,507 4,225 3,685 05 624 749 756 757 1,530 1,454 1,543 1,630 1,621 1,339 06 385 398 347 402 715 644 756 900 906 688 07 396 502 407 401 884 852 933 804 709 571 08 595 679 598 649 1,321 1,200 1,105 944 754 641 09 405 488 465 520 1,012 1,067 1,003 798 612 570 10 288 332 269 313 625 641 739 542 461 508 11 233 244 219 257 520 524 449 404 364 331 12 322 235 226 309 567 552 578 448 462 316 13 149 191 356 404 727 432 372 317 354 238 14 296 226 429 424 949 553 535 421 342 347 15 1,815 1,524 1,701 1,806 3,626 3,289 2,946 2,748 2,782 2,317 16 115 185 210 157 265 266 441 305 274 314 17 170 152 188 158 275 303 298 236 236 184 18 35 30 50 36 92 80 94 74 50 57 19 934 939 1,075 1,051 2,012 2,009 2,088 1,940 1,975 1,972 Total 66,173 69,175 78,937 79,522 154,405 151,309 161,257 134,463 133,742 130,055 MIGRAT\counts: 0903 1003 1103 00 5,525 5,539 6,047 01 108,322 106,701 106,413 02 3,889 4,202 3,742 03 274 359 374 04 4,215 4,258 3,661 05 1,320 1,507 1,224 06 783 724 753 07 656 586 651 08 618 593 572 09 605 552 616 10 388 419 347 11 323 292 257 12 323 289 342 13 263 268 251 14 300 375 277 15 2,301 2,463 2,320 16 307 197 286 17 183 225 180 18 46 27 28 19 1,988 1,892 1,720 Total 132,629 131,468 130,061 CODES for file: 0003 blank — Not in survey, children LE (file specific age) 1 — Nonmovers 2 — Moved within an SMSA 3 — Moved from a SMSA to a non SMSA 4 — Moved from a non SMSA to an SMSA 5 — Moved from a non SMSA to a non SMSA 6 — Moved from abroad to an SMSA 7 — Moved from abroad to a non SMSA 8 — Not in survey, children LE (file specific age) 9 — Not in survey, children LE (file specific age)

National Longitudinal Mortality Study – Extract File: Other Demographic Variables
145
FREQUENCIES: MIGRAT\counts: 0003 blank 3,399 1 55,511 2 6,728 3 517 4 372 5 1,438 6 389 7 39 8 854 9 75 Total 69,322

National Longitudinal Mortality Study – Extract File: Family Income and Poverty Variables
146
FAMILY INCOME AND POVERTY VARIABLES 74. Adjusted Income FMINC80 Analysis File Return to Index EDITS: Simple, Recode DESCRIPTION: For all March files, the value of FMINCOME, family income in unadjusted dollars, is inflated (deflated) to 1980 dollars and then each member of the family is assigned the appropriate category for the variable as indicated in the variable description below. For cohorts with categorical values of income (February 78; April, August, and December 1980; September 1985), included in the original set of NLMS cohorts, the value of fminc80 was set equal to the originally carried variable, previously called ADJINC. NOT AVAILABLE: 8024 CODES for files: 7303-8014, 8008-1103 blank — Unknown or missing income - — Negative income 1 — $ 0 – $ 4,999 2 — $ 5,000 – $ 9,999 3 — $10,000 – $14,999 4 — $15,000 – $19,999 5 — $20,000 – $24,999 6 — $25,000 – $49,999 7 — $50,000 plus 9 — Unknown or missing income FREQUENCIES: FMINC80\counts: 7303 7802 7903 8014 8008 8012 8103 8203 8303 8403 blank . . . . . . . . . . - 263 . . . . . . . . . 1 8,480 8,437 3,187 17,508 17,667 16,524 5,171 7,505 7,945 8,474 2 14,616 13,132 5,655 26,916 26,768 26,864 8,114 11,785 11,716 11,411 3 16,197 15,512 6,025 29,972 30,503 30,154 8,599 11,782 12,011 11,472 4 18,647 10,920 5,654 26,024 24,670 23,545 8,383 11,416 11,565 11,016 5 18,382 13,762 5,543 25,649 25,069 23,829 8,161 10,017 10,392 9,727 6 45,302 22,637 14,144 38,448 34,622 34,730 19,362 24,178 22,496 23,258 7 9,324 1,877 2,888 6,878 6,809 6,816 4,014 4,795 5,154 5,366 9 2 8,385 2 13,476 16,265 15,303 . 2 2 8 Total 131,213 94,662 43,098 184,871 182,373 177,765 61,804 81,480 81,281 80,732

National Longitudinal Mortality Study – Extract File: Family Income and Poverty Variables
147
FMINC80\counts: 8503 8509 8603 8703 8803 8903 9003 9103 9203 9303 blank . . . . . . . . . . - . . 139 121 62 88 45 69 53 92 1 7,268 19,826 4,295 4,114 3,994 3,745 3,878 4,198 4,077 6,477 2 10,738 17,621 6,270 5,859 5,674 5,593 5,839 6,476 6,065 8,551 3 10,561 24,056 6,198 5,817 6,215 5,543 5,741 6,522 6,171 8,439 4 10,367 14,788 5,918 5,601 5,840 5,184 5,550 6,212 5,729 7,611 5 9,346 25,097 5,506 5,270 5,233 4,839 5,097 5,622 4,777 7,022 6 25,145 31,362 14,084 14,311 14,326 12,897 13,843 15,165 12,909 19,053 7 6,641 4,636 3,611 4,169 4,129 4,029 4,288 4,768 3,764 5,623 9 5 7,312 1 9 6 7 4 5 5 31 Total 80,071 144,698 46,022 45,271 45,479 41,925 44,285 49,037 43,550 62,899 FMINC80\counts: 9413 9503 9603 9703 9803 9903 0003 0103 0203 0303 blank . . . . . . . . . 22,184 - 174 136 10 4 80 86 57 70 83 149 1 13,554 8,556 7,466 7,380 7,123 6,789 6,355 6,841 7,064 12,313 2 16,268 10,854 9,604 9,577 9,095 9,672 9,609 10,870 10,718 16,869 3 14,719 10,152 8,821 9,152 8,729 9,421 9,508 10,605 10,954 17,214 4 12,772 8,922 8,217 8,012 8,034 8,313 8,217 9,489 9,698 14,750 5 10,141 7,853 7,122 6,904 6,937 7,146 7,330 8,446 8,146 13,950 6 27,026 21,602 18,222 18,705 19,209 20,077 20,258 23,567 23,717 40,372 7 8,622 7,409 6,086 6,652 6,960 7,669 7,973 9,029 9,138 16,596 9 10 1 7 8 6 2 15 20 4 8 Total 103,286 75,485 65,555 66,394 66,173 69,175 69,322 78,937 79,522 154,405 FMINC80\counts: 0403 0503 0603 0703 0803 0903 1003 1103 blank 22,047 23,959 6,620 6,764 5,485 5,525 5,539 6,047 - 122 169 155 55 76 50 131 59 1 12,391 13,528 12,553 12,029 12,407 12,488 13,798 14,173 2 15,973 17,764 16,269 16,246 16,269 16,296 17,110 17,342 3 16,813 18,089 16,668 15,803 15,107 15,682 15,448 15,955 4 15,153 15,134 14,262 15,087 14,414 14,442 14,591 13,691 5 13,053 14,362 13,538 12,509 12,163 12,314 12,589 12,017 6 39,642 41,898 38,083 38,041 38,016 38,419 35,906 35,221 7 16,096 16,341 16,306 17,204 16,106 17,407 16,351 15,552 9 19 13 9 4 12 6 5 4 Total 151,309 161,257 134,463 133,742 130,055 132,629 131,468 130,061

National Longitudinal Mortality Study – Extract File: Family Income and Poverty Variables
148
75. Family Income in Dollars FMINCOME Return to Index EDITS: None DESCRIPTION: Family income as given on the file. This variable is a continuous measure of income for all March files. Every member of the family is assigned this value, one value for the family, for income. The variable is computed by adding together all the income for each member of the family using the variable, FTOTVAL, and then assigning to each member of the family, the total value determined for family income. For files that do not have a continuous income value (February 78; April, August, and December 1980; September 1985), each member of the family is assigned the median value of the income category identified for the family on the master file. For all March files, the income requested at the time of the survey is the income for the previous calendar year. For example, the income collected on the March 1988 Supplement, i.e. the 8803 cohort, is the income for the calendar year 1987. This income is collected according to categories of income such as, dividends, wages, etc. for each member of the family, and then these income categories are combined for all members of the family to determine the value for the CPS variable FTOTVAL. For non March files, including (February 78; April, August, and December 1980; September 1985), the income requested is the income for the family, according to the head of household, for the prior 4 months by rotation collected with this estimate expanded to give a full year value. This full year value is then categorized according to the income levels identified for the variable. Thus for the purposes of adjusting income for inflation, the assumption was made that the income for all March files was earned for the year prior to the given survey year. For the non-March files, the income is assumed to have been earned during the year of the survey.

National Longitudinal Mortality Study – Extract File: Family Income and Poverty Variables
149
76. Family Income Category FMINC90 Analysis File Return to Index EDITS: Simple DESCRIPTION: For all March files the value of DOLINC90 for the family, FMINCOME inflated to 1990 dollars is assigned a category as indicated below. The determined category is then assigned to each member of the family. For files with categorical values of income (February 78; April, August, and December 1980; September 1985), the median value of the category of income is inflated by the appropriate CPI value and then assigned to the appropriate category of FMINC90. NOT AVAILABLE: 8024 CODES for files: 7303-8014, 8008-1103 blank — Income missing or unknown -$ — Negative income 00 — Income missing or unknown 01 — $ 0 – $ 4,999 02 — $ 5,000 – $ 7,499 03 — $ 7,499 – $ 9,999 04 — $10,000 – $12,499 05 — $12,500 – $14,999 06 — $15,000 – $19,999 07 — $20,000 – $24,999 08 — $25,000 – $29,999 09 — $30,000 – $34,999 10 — $35,000 – $39,999 11 — $40,000 – $49,999 12 — $50,000 – $59,999 13 — $60,000 – $74,999 14 — $75,000 plus FREQUENCIES: FMINC90\counts: 7303 7802 7903 8014 8008 8012 8103 8203 8303 8403 blank . . . . . . . . . . -$ 263 . . . . . . . . . 00 10 8,385 . 13,476 16,265 15,303 2 23 50 16 01 3,830 4,858 1,462 6,745 6,998 6,447 2,434 3,265 3,821 3,942 02 3,972 3,579 1,450 10,763 10,669 10,077 2,383 3,664 3,504 3,638 03 4,412 3,563 1,662 5,876 6,088 5,766 2,572 3,399 3,643 3,800 04 4,366 3,939 1,831 8,460 8,311 8,535 2,470 3,538 3,608 3,308 05 4,674 5,630 1,830 12,580 12,369 12,563 2,630 4,077 3,935 3,816 06 10,123 7,987 3,633 12,112 12,279 12,137 5,712 7,380 7,302 7,312 07 10,934 7,525 3,921 17,860 18,224 18,017 5,187 7,510 7,571 7,272 08 11,016 10,920 3,338 26,024 24,670 23,545 5,227 6,852 7,608 6,687 09 12,576 . 3,854 . . . 5,307 6,936 6,708 6,781 10 10,997 13,762 3,251 25,649 25,069 23,829 5,150 6,202 6,219 5,920 11 19,097 10,884 5,827 . . . 7,937 9,895 9,558 9,379 12 12,788 . 3,999 38,448 34,622 34,730 5,375 7,065 6,481 6,608 13 10,889 11,753 3,527 . . . 4,620 5,854 5,292 5,883 14 11,266 1,877 3,513 6,878 6,809 6,816 4,798 5,820 5,981 6,370 Total 131,213 94,662 43,098 184,871 182,373 177,765 61,804 81,480 81,281 80,732

National Longitudinal Mortality Study – Extract File: Family Income and Poverty Variables
150
FMINC90\counts: 8503 8509 8603 8703 8803 8903 9003 9103 9203 9303 blank . . . . . . . . . . -$ . . 139 121 62 88 45 69 53 92 00 8 7,312 7 3 12 4 5 . 3 7 01 3,249 11,120 2,046 1,896 1,916 1,703 1,863 2,052 2,073 3,387 02 3,352 . 1,870 1,934 1,784 1,717 1,715 1,854 1,647 2,652 03 3,300 8,706 2,034 1,720 1,795 1,727 1,734 1,804 1,908 2,624 04 3,204 7,890 1,805 1,842 1,672 1,717 1,808 2,204 1,976 2,738 05 3,610 9,731 2,052 1,870 1,899 1,856 1,993 1,988 1,928 2,740 06 6,787 8,157 3,995 3,873 3,906 3,615 3,517 4,034 3,859 5,271 07 6,745 15,899 4,005 3,600 3,789 3,326 3,650 4,252 4,010 5,164 08 6,394 14,788 3,553 3,513 3,820 3,398 3,497 3,791 3,572 4,981 09 6,283 12,530 3,561 3,406 3,451 3,096 3,427 3,676 3,030 4,383 10 5,776 12,567 3,502 3,227 3,103 2,985 3,052 3,561 2,993 4,364 11 9,446 9,483 5,370 5,583 5,365 4,889 5,339 5,635 4,894 7,426 12 7,331 11,172 3,962 3,957 3,915 3,564 3,946 4,330 3,777 5,366 13 6,608 10,707 3,840 3,938 4,059 3,563 3,674 4,161 3,412 5,195 14 7,978 4,636 4,281 4,788 4,931 4,677 5,020 5,626 4,415 6,509 Total 80,071 144,698 46,022 45,271 45,479 41,925 44,285 49,037 43,550 62,899 FMINC90\counts: 9413 9503 9603 9703 9803 9903 0003 0103 0203 0303 blank . . . . . . . . . 22,184 -$ 174 136 10 4 80 86 57 70 83 149 00 17 13 9 25 11 10 18 32 4 8 01 7,597 4,779 4,175 4,173 3,999 3,645 3,464 3,616 3,723 7,256 02 5,166 3,281 2,838 2,781 2,692 2,529 2,287 2,811 2,880 4,227 03 5,346 3,454 2,933 2,971 2,907 3,049 3,059 3,158 3,000 5,122 04 4,856 3,432 3,000 3,156 2,950 3,072 2,943 3,353 3,629 5,226 05 5,150 3,528 3,148 2,969 2,785 2,971 3,097 3,726 3,495 5,791 06 9,691 6,406 5,722 5,748 5,564 6,106 6,104 6,700 6,629 10,703 07 8,582 6,176 5,447 5,724 5,387 5,719 5,742 6,289 6,847 10,723 08 8,363 5,536 5,085 5,044 5,038 5,281 5,285 6,369 6,288 9,462 09 6,958 5,245 4,772 4,571 4,797 4,701 5,023 5,412 5,347 8,493 10 6,229 4,989 4,352 4,112 4,089 4,526 4,238 5,237 5,189 8,722 11 10,526 8,122 7,190 7,134 7,219 7,371 7,467 8,672 8,272 14,160 12 7,692 6,125 5,242 5,548 5,415 5,715 5,624 6,804 6,898 11,707 13 7,071 5,886 4,700 4,879 5,275 5,597 5,638 6,341 6,851 11,664 14 9,868 8,377 6,932 7,555 7,965 8,797 9,276 10,347 10,387 18,808 Total 103,286 75,485 65,555 66,394 66,173 69,175 69,322 78,937 79,522 154,405 FMINC90\counts: 0403 0503 0603 0703 0803 0903 1003 1103 blank 22,047 23,959 6,620 6,764 5,485 5,525 5,539 6,047 -$ 122 169 155 55 76 50 131 59 00 10 9 7 3 3 14 24 12 01 7,379 7,943 7,383 6,868 7,121 7,161 7,939 8,471 02 4,205 4,920 4,209 4,105 4,424 4,544 4,947 4,765 03 4,891 5,086 5,146 4,991 4,834 4,691 4,909 5,473 04 5,230 5,571 5,040 4,511 5,152 5,312 5,657 5,442 05 5,070 5,968 5,468 5,342 4,626 4,766 5,803 5,591 06 10,461 10,738 10,620 10,806 10,559 10,456 10,201 9,993 07 10,518 11,488 9,745 9,601 9,806 10,119 9,654 9,785 08 9,495 9,567 9,390 9,441 8,069 8,175 9,095 8,916 09 8,974 9,720 8,439 8,827 8,491 8,603 8,003 8,362 10 7,556 8,251 8,251 7,623 7,656 7,799 7,728 6,740 11 14,499 15,169 13,790 13,211 13,667 13,318 12,665 12,786 12 10,776 11,774 10,553 10,491 9,989 10,818 9,831 10,010 13 11,777 12,293 11,234 11,480 11,773 11,606 10,716 10,022 14 18,299 18,632 18,413 19,623 18,324 19,672 18,626 17,587 Total 151,309 161,257 134,463 133,742 130,055 132,629 131,468 130,061

National Longitudinal Mortality Study – Extract File: Family Income and Poverty Variables
151
77. Family Income Category FINC8090 Analysis File Return to Index EDITS: Invalid Entry, Recode DESCRIPTION: The categories used historically for adjusted income by the NLMS based on 1980 dollars were inflated to 1990 dollars. Then, for all March files, the value of FMINCOME is inflated to 1990 dollars, DOLINC90. Each member of the family was then assigned to the appropriate category as identified for the inflated 1980 to 1990 categories. For files with categorical values of income (February 78; April, August, and December 1980; September 1985), the median value of the category determined at the time of the survey was inflated by the appropriate CPI value and then assigned to the resulting category of FMINC90. For files in the NLMS from the original study, cohorts 7303 chronologically through 8509, the FINC8090 category breakdown is the same as the original 1980-dollar assignment. NOT AVAILABLE: 8024 CODES for files: 7303-8014, 8008-1103 blank — Unknown or missing income – — Negative income 1 — $ 0 – $ 7,999 2 — $ 8,000 – $15,999 3 — $16,000 – $23,999 4 — $24,000 – $31,999 5 — $32,000 – $39,999 6 — $40,000 – $79,999 7 — $80,000 plus 9 — unknown or missing income FREQUENCIES: FINC8090\counts: 7303 7802 7903 8014 8008 8012 8103 8203 8303 8403 blank . . . . . . . . . . - 263 . . . . . . . . . 1 8,561 8,437 3,211 17,508 17,667 16,524 5,336 7,587 8,042 8,586 2 14,838 13,132 5,707 26,916 26,768 26,864 8,344 11,876 11,833 11,479 3 16,182 15,512 6,040 29,972 30,503 30,154 8,759 11,895 12,036 11,571 4 19,075 10,920 5,692 26,024 24,670 23,545 8,374 11,465 11,714 10,996 5 18,250 13,762 5,582 25,649 25,069 23,829 8,256 10,002 10,343 9,860 6 44,983 22,637 14,042 38,448 34,622 34,730 18,880 23,982 22,307 23,040 7 9,061 1,877 2,824 6,878 6,809 6,816 3,850 4,652 5,005 5,200 9 . 8,385 . 13,476 16,265 15,303 5 21 1 . Total 131,213 94,662 43,098 184,871 182,373 177,765 61,804 81,480 81,281 80,732
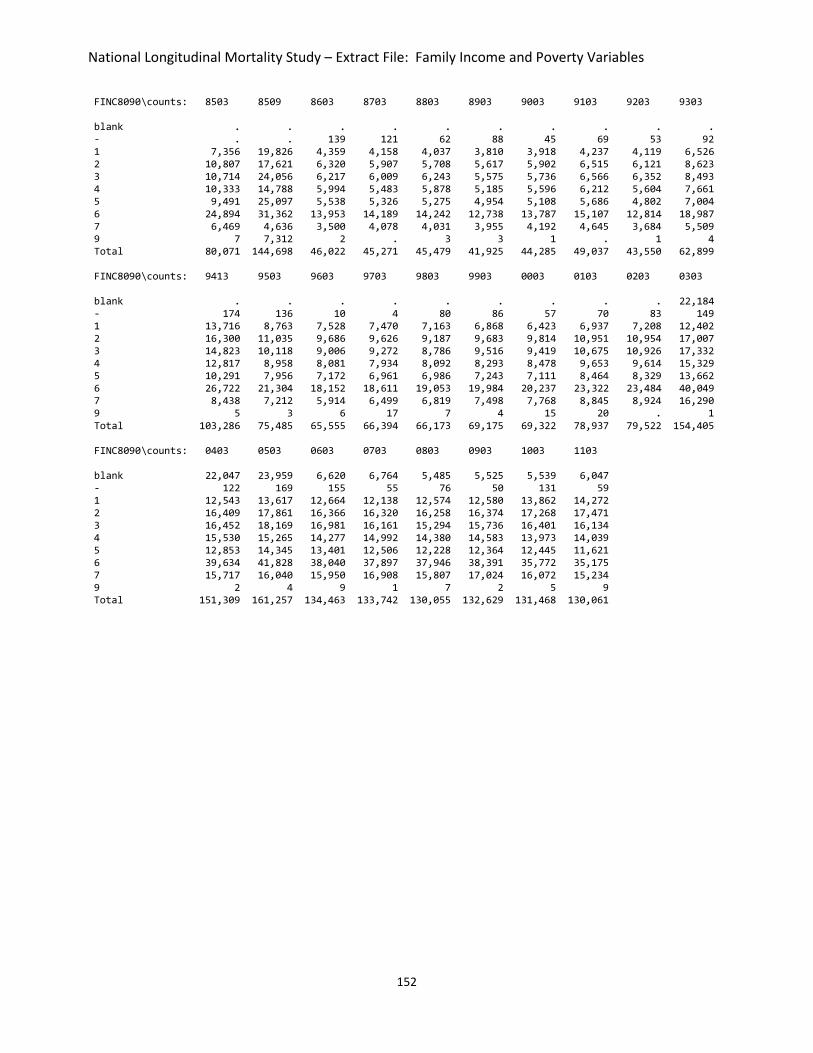
National Longitudinal Mortality Study – Extract File: Family Income and Poverty Variables
152
FINC8090\counts: 8503 8509 8603 8703 8803 8903 9003 9103 9203 9303 blank . . . . . . . . . . - . . 139 121 62 88 45 69 53 92 1 7,356 19,826 4,359 4,158 4,037 3,810 3,918 4,237 4,119 6,526 2 10,807 17,621 6,320 5,907 5,708 5,617 5,902 6,515 6,121 8,623 3 10,714 24,056 6,217 6,009 6,243 5,575 5,736 6,566 6,352 8,493 4 10,333 14,788 5,994 5,483 5,878 5,185 5,596 6,212 5,604 7,661 5 9,491 25,097 5,538 5,326 5,275 4,954 5,108 5,686 4,802 7,004 6 24,894 31,362 13,953 14,189 14,242 12,738 13,787 15,107 12,814 18,987 7 6,469 4,636 3,500 4,078 4,031 3,955 4,192 4,645 3,684 5,509 9 7 7,312 2 . 3 3 1 . 1 4 Total 80,071 144,698 46,022 45,271 45,479 41,925 44,285 49,037 43,550 62,899 FINC8090\counts: 9413 9503 9603 9703 9803 9903 0003 0103 0203 0303 blank . . . . . . . . . 22,184 - 174 136 10 4 80 86 57 70 83 149 1 13,716 8,763 7,528 7,470 7,163 6,868 6,423 6,937 7,208 12,402 2 16,300 11,035 9,686 9,626 9,187 9,683 9,814 10,951 10,954 17,007 3 14,823 10,118 9,006 9,272 8,786 9,516 9,419 10,675 10,926 17,332 4 12,817 8,958 8,081 7,934 8,092 8,293 8,478 9,653 9,614 15,329 5 10,291 7,956 7,172 6,961 6,986 7,243 7,111 8,464 8,329 13,662 6 26,722 21,304 18,152 18,611 19,053 19,984 20,237 23,322 23,484 40,049 7 8,438 7,212 5,914 6,499 6,819 7,498 7,768 8,845 8,924 16,290 9 5 3 6 17 7 4 15 20 . 1 Total 103,286 75,485 65,555 66,394 66,173 69,175 69,322 78,937 79,522 154,405 FINC8090\counts: 0403 0503 0603 0703 0803 0903 1003 1103 blank 22,047 23,959 6,620 6,764 5,485 5,525 5,539 6,047 - 122 169 155 55 76 50 131 59 1 12,543 13,617 12,664 12,138 12,574 12,580 13,862 14,272 2 16,409 17,861 16,366 16,320 16,258 16,374 17,268 17,471 3 16,452 18,169 16,981 16,161 15,294 15,736 16,401 16,134 4 15,530 15,265 14,277 14,992 14,380 14,583 13,973 14,039 5 12,853 14,345 13,401 12,506 12,228 12,364 12,445 11,621 6 39,634 41,828 38,040 37,897 37,946 38,391 35,772 35,175 7 15,717 16,040 15,950 16,908 15,807 17,024 16,072 15,234 9 2 4 9 1 7 2 5 9 Total 151,309 161,257 134,463 133,742 130,055 132,629 131,468 130,061
National Longitudinal Mortality Study – Extract File: Family Income and Poverty Variables
153
78. Adjusted Income in 1990 Dollars DOLINC90 Return to Index EDITS: None DESCRIPTION: Dollar amount of family income obtained from the master file variable FMINCOME is adjusted to 1990 dollars using the consumer price index. Every member of the family is assigned the same DOLINC90 value for income. The value is computed by adding together the income for each member of the family using the variable, FTOTVAL, adjusting this total dollar value for the family to a 1990 dollar value using the consumer price index*, then assigning this computed 1990 dollar value to each member of the family. For the February 78; April, August, and December 1980; and September 1985 files, which don't have an actual dollar value but consist of a categori-cal income indicator, each member of the family is assigned the CPI adjusted median value of the income category determined. NOTE: The CPI value used to adjust each FTOTVAL amount for inflation for a given cohort depends on the year for which the income for the cohort is determined. A complete description of the determination of the basis of the family income for each cohort is given in the documentation for the variable FMINCOME.

National Longitudinal Mortality Study – Extract File: Family Income and Poverty Variables
154
79. Percent of Poverty Level POVPCT90 Analysis File Return to Index EDITS: Simple DESCRIPTION: The variable POVPCT90 is defined by taking the DOLINC90 variable value and comparing it to the 1990 defined poverty level. A categorical variable value is assigned according to the category of percent of poverty level as indicated below. Family size and number of children in the family determine the poverty threshold level. NOTE: POVPCT90 is not determined for the 7802 and 8024 files. The 7802 file does not contain records for a full family. Children under 14 are not included on this file. Also, records do not contain a variable that in any way describes the number persons in the family. Therefore, for lack of information, the variable POVPCT90 can’t be calculated with any cer-tainty from these data and POVPCT90 is declared missing for all records of the file. POVPCT90 determination on non-March files: The core income variable on non-March files is generally a 14 level categorical variable. These files do not contain an exact dollar value for family income. Therefore, the calculation of POVPCT90 is made using the original categorical variable and assigning income according to the median value of each category. Since the category of highest income is a capped value at $75,000 the median value of $100,000 is arbitrarily assigned to families assigned the highest income category. Definition of the 1990 poverty threshold: The following table gives the threshold for the definition of poverty level for the year 1990. The threshold value depends on size of family unit and number of children less than 18 years of age under the care of the head of household. The determination of POVPCT90 is made by taking the variable DOLINC90 for each family member and comparing this value to the entry below for the number of persons in the family and the number of children in the family who are under 18 years of age. For files created before 1988, the number of children under 18 years of age in the family is determined directly from the file by examining the record of each family member and counting the number of children under 18 years of age with the required relationship to the survey reference person. For files 1988 and later, the master file variable, “fmrelu18,” giving the number of children under 18 in the family, was used. This variable was determined for the specific purpose of identifying the poverty threshold for the Income Poverty Branch (IPB) of HHES, the official U.S. Census Bureau group responsible for poverty determinations. Using this variable should lead to the exact threshold that would have been determined by the IPB for the cohort.

National Longitudinal Mortality Study – Extract File: Family Income and Poverty Variables
155
Poverty Thresholds for 1990 by Size of Family and Number of Related Children Under 18 Years (Dollars)
Size of Family Unit
Weighted Average Threshold
Related children under 18 years
None One Two Three Four Five Six Seven
Eight or
More One person (unrelated
individual) $ 6,652
Under 65 years 6,800 6,800
65 years and over 6,268 6,268
Two persons 8,509
Householder under 65 years 8,794 8,752 9,009
Householder 65 years and over 7,905 7,900 8,975
Three persons 10,419 10,223 10,520 10,530
Four persons 13,359 13,481 13,701 13,254 13,301
Five persons 15,792 16,257 16,494 15,989 15,598 15,359
Six persons 17,839 18,693 18,773 18,386 18,015 17,464 17,137
Seven persons 20,241 21,515 21,650 21,187 20,864 20,262 19,561 18,791 Eight persons 22,582 24,063 24,276 23,839 23,456 22,913 22,223 21,505 21,323 Nine persons or more 26,848 28,946 29,087 28,700 28,375 27,842 27,108 26,445 26,280 25,268
Source: U.S. Census Bureau NOT AVAILABLE: 7802, 8024 CODES for files: 7303, 7903, 8014, 8008-1103 blank — Missing value, no response 00 — Missing value, no response 01 — < - 50% of the poverty level 02 — > than 50% of the poverty level, but <= 75% of the poverty level 03 — > than 75% of the poverty level, but <= 100% of the poverty level 04 — > than 100% of the poverty level, but <= 125% of the poverty level 05 — > than 125% of the poverty level, but <= 150% of the poverty level 06 — > than 150% of the poverty level, but <= 175% of the poverty level 07 — > than 175% of the poverty level, but <= 200% of the poverty level 08 — > than 200% of the poverty level, but <= 225% of the poverty level 09 — > than 225% of the poverty level, but <= 250% of the poverty level 10 — > than 250% of the poverty level, but <= 275% of the poverty level 11 — > than 275% of the poverty level, but <= 300% of the poverty level 12 — > than 300% of the poverty level, but <= 325% of the poverty level 13 — > than 325% of the poverty level, but <= 350% of the poverty level 14 — > than 350% of the poverty level, but <= 375% of the poverty level 15 — > than 375% of the poverty level, but <= 400% of the poverty level 16 — > than 400% of the poverty level, but <= 450% of the poverty level 17 — > than 450% of the poverty level, but <= 500% of the poverty level 18 — > than 500% of the poverty level, but <= 550% of the poverty level 19 — > than 550% of the poverty level, but <= 600% of the poverty level 20 — > than 600% of the poverty level, but <= 700% of the poverty level 21 — > than 700% of the poverty level

National Longitudinal Mortality Study – Extract File: Family Income and Poverty Variables
156
FREQUENCIES: POVPCT90\counts: 7303 7903 8014 8008 8012 8103 8203 8303 8403 8503 00 . . . . . . . . . . 01 4,617 1,704 10,939 10,919 10,305 2,792 3,966 4,485 4,952 4,076 02 4,390 1,718 7,072 7,512 7,542 2,609 3,852 3,973 3,845 3,288 03 6,168 2,204 10,535 11,309 10,435 2,890 4,489 4,210 4,246 3,909 04 6,555 2,396 8,394 8,437 8,461 3,142 4,315 4,738 4,258 4,078 05 6,849 2,346 12,986 12,634 12,810 3,429 4,802 4,553 4,423 4,000 06 7,350 2,509 14,407 13,908 14,168 3,316 4,643 4,875 4,449 4,065 07 7,289 2,292 6,538 6,562 6,546 3,317 4,790 4,680 4,535 4,136 08 8,056 2,533 16,353 15,719 15,363 3,339 4,550 4,851 4,341 4,195 09 8,052 2,668 6,529 7,551 6,260 3,693 4,725 4,356 4,427 4,124 10 7,572 2,344 11,923 11,002 10,902 3,482 4,286 4,154 3,956 3,892 11 7,378 2,118 12,325 12,236 12,121 3,226 4,060 4,092 4,045 3,842 12 6,747 2,051 6,081 5,952 5,600 2,930 3,677 3,699 3,392 3,448 13 5,878 1,833 6,030 5,346 5,210 2,684 3,516 3,254 3,294 3,409 14 5,651 1,747 8,784 8,199 7,885 2,336 2,752 2,929 2,910 2,934 15 4,464 1,788 2,517 3,218 2,754 2,212 2,722 2,676 2,690 2,695 16 8,117 2,514 16,587 15,873 15,644 3,720 4,753 4,291 4,203 4,696 17 5,940 1,818 2,683 2,932 2,929 3,127 3,628 3,456 3,751 4,073 18 4,542 1,478 9,046 8,365 8,221 2,195 2,737 2,781 2,838 2,880 19 3,359 1,121 1,538 1,804 1,633 1,810 2,134 1,924 2,242 2,490 20 4,645 1,521 8,636 7,860 7,942 2,054 2,638 2,891 2,949 3,528 21 7,594 2,395 4,968 5,035 5,034 3,501 4,445 4,413 4,986 6,313 Total 131,213 43,098 184,871 182,373 177,765 61,804 81,480 81,281 80,732 80,071 POVPCT90\counts: 8509 8603 8703 8803 8903 9003 9103 9203 9303 9413 00 . . . . . . . . . . 01 11,927 1,846 1,831 1,921 1,743 1,920 2,127 1,894 3,664 8,736 02 4,403 1,550 1,330 1,307 1,229 1,220 1,416 1,358 2,170 5,213 03 5,950 1,945 1,855 1,629 1,607 1,696 1,871 1,680 2,593 5,265 04 6,651 1,973 1,917 1,920 1,791 1,752 1,913 1,844 3,014 5,613 05 11,060 2,064 1,888 1,876 1,832 1,895 2,043 1,991 2,877 5,128 06 10,569 2,145 1,989 1,910 1,800 2,053 2,235 2,122 2,783 5,446 07 5,010 2,304 2,124 2,087 2,031 1,992 2,310 2,144 3,073 5,163 08 11,995 2,347 2,106 2,273 1,962 2,095 2,313 2,146 3,126 5,045 09 6,859 2,285 2,186 2,073 1,945 2,073 2,355 2,073 2,979 4,972 10 7,582 2,315 2,031 2,234 1,895 2,007 2,191 2,076 2,922 4,592 11 8,059 2,163 2,171 2,074 1,846 1,961 2,299 2,096 2,909 4,233 12 5,636 2,071 1,971 2,007 1,830 2,039 2,053 1,910 2,797 3,952 13 5,857 1,870 1,859 2,031 1,757 1,842 2,025 1,775 2,494 3,891 14 6,496 1,790 1,839 1,794 1,566 1,801 1,861 1,798 2,430 3,521 15 1,618 1,665 1,630 1,642 1,606 1,608 1,853 1,491 2,288 3,093 16 11,041 3,075 3,005 3,086 2,769 2,811 3,215 2,890 4,012 5,659 17 3,076 2,544 2,517 2,452 2,363 2,346 2,662 2,256 3,165 4,052 18 7,811 1,850 2,095 1,982 1,890 2,016 2,258 1,875 2,601 3,703 19 1,459 1,669 1,655 1,758 1,514 1,721 1,857 1,477 2,016 2,822 20 5,898 2,220 2,510 2,496 2,235 2,482 2,591 2,116 3,073 4,239 21 5,741 4,331 4,762 4,927 4,714 4,955 5,589 4,538 5,913 8,948 Total 144,698 46,022 45,271 45,479 41,925 44,285 49,037 43,550 62,899 103,286

National Longitudinal Mortality Study – Extract File: Family Income and Poverty Variables
157
POVPCT90\counts: 9503 9603 9703 9803 9903 0003 0103 0203 0303 0403 00 . . . . . . . . 37,960 24,172 01 5,428 4,770 4,595 4,527 3,918 3,473 3,689 3,854 4,889 5,289 02 3,120 2,700 2,524 2,485 2,556 2,614 2,614 2,566 4,277 4,508 03 3,404 2,981 3,119 2,943 3,330 3,141 3,558 3,508 5,101 5,529 04 3,575 3,050 3,275 3,024 3,207 3,482 3,776 3,771 5,589 6,075 05 3,615 3,308 3,299 3,041 3,432 3,600 3,831 4,079 5,856 6,328 06 3,796 3,214 3,383 3,141 3,290 3,764 3,967 4,107 5,882 6,354 07 3,725 3,189 3,275 3,337 3,505 3,334 3,823 3,780 5,587 6,522 08 3,620 3,189 3,246 3,042 3,502 3,414 3,847 3,935 5,743 6,405 09 3,437 3,124 2,981 2,928 3,236 3,224 3,801 3,626 5,398 5,918 10 3,437 3,064 2,801 2,920 3,048 3,002 3,341 3,210 5,149 5,746 11 3,166 2,711 2,872 3,010 2,822 2,785 3,576 3,270 5,036 5,585 12 2,982 2,876 2,778 2,716 2,677 2,394 3,136 3,199 4,902 5,170 13 2,870 2,610 2,541 2,442 2,490 2,553 2,976 3,096 4,399 4,818 14 2,730 2,423 2,304 2,454 2,288 2,428 2,885 2,698 4,174 4,405 15 2,437 1,992 2,083 2,273 2,326 2,037 2,370 2,528 3,960 4,513 16 4,299 3,726 3,732 3,753 3,966 3,975 4,627 4,612 6,982 7,621 17 3,700 2,941 3,092 3,060 3,160 3,231 3,951 4,092 5,476 6,199 18 2,791 2,519 2,351 2,437 2,637 2,697 3,004 3,046 5,132 4,968 19 2,127 1,896 2,095 2,122 2,239 2,340 2,733 2,702 4,093 4,091 20 3,540 2,880 3,077 3,161 3,388 3,230 3,498 3,888 5,758 6,259 21 7,686 6,392 6,971 7,357 8,158 8,604 9,934 9,955 13,062 14,834 Total 75,485 65,555 66,394 66,173 69,175 69,322 78,937 79,522 154,405 151,309 POVPCT90\counts: 0503 0603 0703 0803 0903 1003 1103 00 26,396 9,000 21,619 19,746 7,857 8,244 8,662 01 5,676 5,191 4,501 4,613 5,020 5,744 6,130 02 5,027 4,491 4,050 3,974 4,437 4,838 5,315 03 6,086 5,511 4,787 5,123 5,479 5,991 5,970 04 6,250 6,219 5,257 5,338 5,951 5,695 6,155 05 6,871 6,243 5,314 5,519 6,118 6,432 6,086 06 6,987 6,128 5,644 5,135 6,118 6,160 5,856 07 6,787 6,339 5,495 5,306 5,743 6,276 6,320 08 6,464 6,275 5,590 5,123 5,616 5,706 6,072 09 6,524 5,903 5,410 4,809 5,835 5,859 5,448 10 6,578 5,644 4,559 5,134 5,505 5,226 5,189 11 5,677 5,494 5,037 4,757 5,376 5,156 5,069 12 5,728 5,043 4,593 4,373 5,172 4,832 4,630 13 5,212 4,727 4,012 4,346 4,638 4,560 4,322 14 4,690 4,612 4,122 4,018 4,345 4,035 4,157 15 4,549 3,960 3,584 3,667 4,012 4,053 3,913 16 7,888 7,505 6,528 6,548 7,351 6,767 6,709 17 6,719 6,172 5,584 5,416 6,172 6,073 5,632 18 5,400 5,049 4,659 4,513 5,180 4,916 4,640 19 4,419 4,003 3,798 3,737 4,474 4,034 3,945 20 6,491 6,181 5,576 5,497 6,488 6,037 5,730 21 14,838 14,773 14,023 13,363 15,742 14,834 14,111 Total 161,257 134,463 133,742 130,055 132,629 131,468 130,061

National Longitudinal Mortality Study – Extract File: Household Characteristic Variables
158
HOUSEHOLD CHARACTERISTICS VARIABLES
80. Number in Household HHNUM Analysis File Return to Index EDITS: Simple DESCRIPTION: Number of persons in the household. NOTE 1: For files 7303, 7802, 8014, 8008, and 8012, HHNUM is computed from within the NLMS file. It is defined to be the number of persons on the file having the same PSU, SEGMENT, and SERIAL NUMBER. For files 7903, 8024, and 8103- 8503, and 8024, household size is taken directly from the original CPS record. NOTE 2: Computations for 7802 file are based on the contents of the file which does not contain children. Therefore, number in household does not count the household size correctly for a majority of records on file. WARNING: DO NOT USE THE 7802 FILE for studies involving HHNUM. AVAILABLE FILES: All files CODES for files: 7303, 8014, 8008, 8012 01-24 — Number of persons FREQUENCIES: HHNUM\counts: 7303 8014 8008 8012 01 8,592 15,221 15,002 14,451 02 26,372 42,100 42,068 40,526 03 22,734 35,136 33,765 32,922 04 27,472 41,902 41,808 40,784 05 20,245 25,630 25,840 24,790 06 12,408 13,050 12,624 12,438 07 6,594 6,013 5,495 5,880 08 3,064 2,816 2,872 2,888 09 1,566 1,575 1,260 1,494 10 940 790 750 710 11 594 407 385 418 12 360 132 228 300 13 130 39 117 104 14 112 28 42 14 15 30 15 45 30 16 . . 48 16 17 . 17 . . 24 . . 24 . Total 131,213 184,871 182,373 177,765 CODES for file: 8024 00 — Group quarters 01-26 — Number of persons 29 — Group quarters 85 — Group quarters

National Longitudinal Mortality Study – Extract File: Household Characteristic Variables
159
FREQUENCIES: HHNUM\counts: 8024 00 4,685 01 12,918 02 33,631 03 23,153 04 22,879 05 13,630 06 6,944 07 3,651 08 1,283 09 750 10 375 11 219 12 123 13 37 14 56 15 6 29 2 85 3 Total 124,345 CODES for files: 7802, 7903, 8103-1103 00 — Unknown 1-26 — Number of persons FREQUENCIES: HHNUM\counts: 7802 7903 8103 8203 8303 8403 8503 8509 8603 8703 blank . . . . . . . . . . 00 . . . 1 . . . . . . 01 11,030 3,093 5,188 6,607 6,575 6,719 6,860 12,997 5,547 5,387 02 42,974 9,047 14,177 18,421 18,324 18,315 18,467 34,358 13,782 13,752 03 17,658 7,873 11,865 15,550 15,780 15,879 15,744 28,581 9,435 9,170 04 13,332 9,592 13,947 18,755 19,076 19,104 19,036 34,788 9,328 9,194 05 6,120 6,429 8,605 11,225 11,472 11,000 11,115 19,499 4,734 4,605 06 2,478 3,432 4,486 5,796 5,484 5,340 4,860 8,035 1,879 1,874 07 784 1,974 1,777 2,708 2,415 2,317 2,086 3,354 721 690 08 232 848 898 1,208 1,096 1,008 904 1,604 280 303 09 54 369 460 549 621 405 450 634 149 143 10 . 130 218 300 250 330 230 503 81 94 11 . 198 88 154 110 154 132 179 40 23 12 . 72 67 96 24 24 36 100 19 9 13 . 26 . 52 26 39 91 51 12 13 14 . . 28 42 28 28 14 . 6 11 15 . 15 . . . 30 30 15 . . 16 . . . 16 . 16 16 . 9 . 18 . . . . . . . . . . 19 . . . . . . . . . 3 24 . . . . . 24 . . . . 26 . . . . . . . . . . Total 94,662 43,098 61,804 81,480 81,281 80,732 80,071 144,698 46,022 45,271

National Longitudinal Mortality Study – Extract File: Household Characteristic Variables
160
HHNUM\counts: 8803 8903 9003 9103 9203 9303 9413 9503 9603 9703 blank . . . . . . . . . . 00 . . . . . . . . . . 01 5,616 5,267 5,512 6,071 5,482 6,364 9,249 7,021 6,203 6,290 02 14,143 12,991 13,735 14,982 13,794 16,474 23,924 18,306 15,996 16,222 03 9,307 8,628 8,720 9,912 8,699 12,558 20,419 14,562 12,621 12,816 04 9,146 8,582 8,984 9,931 8,692 14,777 23,877 17,856 15,204 15,368 05 4,386 4,077 4,284 4,754 4,208 7,634 14,555 9,785 8,675 8,825 06 1,701 1,486 1,688 1,914 1,488 2,930 5,841 4,302 3,726 3,828 07 643 472 737 743 669 1,108 2,681 1,890 1,610 1,519 08 239 190 281 387 267 474 1,204 920 792 784 09 150 133 142 169 131 260 660 531 306 315 10 55 47 79 97 72 131 395 130 230 190 11 39 26 62 50 21 93 259 77 77 66 12 18 10 36 13 8 53 92 36 12 72 13 18 . 16 7 6 13 113 26 39 39 14 . 5 3 7 9 21 14 28 . 14 15 8 3 6 . . . 3 15 . 30 16 . 8 . . . . . . 64 16 18 10 . . . 4 . . . . . 19 . . . . . . . . . . 24 . . . . . . . . . . 26 . . . . . 9 . . . . Total 45,479 41,925 44,285 49,037 43,550 62,899 103,286 75,485 65,555 66,394 HHNUM\counts: 9803 9903 0003 0103 0203 0303 0403 0503 0603 0703 blank . . . . . 22,184 22,047 23,959 6,620 6,764 00 . . . . . . . . . . 01 6,312 6,209 6,144 7,440 7,525 9,939 9,695 10,596 9,858 10,006 02 16,176 16,774 16,426 19,474 19,607 26,644 26,016 27,902 25,968 26,252 03 12,837 13,116 12,886 14,690 15,005 26,991 26,109 27,744 26,394 25,842 04 15,240 15,806 16,366 17,944 18,558 34,644 34,028 35,916 32,668 32,700 05 9,055 9,897 9,523 10,639 10,504 19,600 19,480 20,335 18,950 18,210 06 3,738 4,225 4,222 4,942 4,612 8,694 8,022 8,544 8,172 8,364 07 1,526 1,735 1,991 1,881 1,898 3,297 3,262 3,542 3,374 3,003 08 720 773 750 912 947 1,192 1,352 1,448 1,264 1,288 09 288 320 373 498 394 522 693 558 630 558 10 170 153 336 280 179 370 170 300 290 380 11 44 71 136 86 136 121 198 154 121 198 12 24 45 111 60 84 120 84 132 60 108 13 13 19 26 45 12 26 78 52 52 26 14 14 . . 28 14 14 28 28 42 28 15 . . . . 15 15 15 15 . 15 16 16 32 32 18 32 32 32 32 . . 18 . . . . . . . . . . 19 . . . . . . . . . . 24 . . . . . . . . . . 26 . . . . . . . . . . Total 66,173 69,175 69,322 78,937 79,522 154,405 151,309 161,257 134,463 133,742

National Longitudinal Mortality Study – Extract File: Household Characteristic Variables
161
HHNUM\counts: 0803 0903 1003 1103 blank 5,485 5,525 5,539 6,047 00 . . . . 01 10,301 10,024 10,082 10,159 02 25,722 26,346 25,758 25,678 03 25,146 25,368 24,996 24,450 04 31,680 32,160 31,952 30,684 05 18,320 18,770 17,995 18,245 06 8,064 8,316 8,364 8,388 07 2,968 3,332 3,731 3,220 08 1,176 1,384 1,520 1,792 09 594 702 756 720 10 370 350 390 300 11 154 154 242 209 12 60 120 60 72 13 . 78 26 52 14 . . 42 14 15 15 . 15 15 16 . . . 16 18 . . . . 19 . . . . 24 . . . . 26 . . . . Total 130,055 132,629 131,468 130,061

National Longitudinal Mortality Study – Extract File: Household Characteristic Variables
162
81. Type of Living Quarters LIVTYP Analysis File Return to Index EDITS: Invalid Entry, Recode DESCRIPTION: Type of living quarters for household. NOT AVAILABLE: 8024 CODES for file: 7303 blank — Unknown 01 — House, apartment, flat 02 — HU in non-transient hotel, etc. 03 — HU, permanent, intrans., hotel, motel, etc. 04 — HU in rooming house 05 — Trailer, permanent 06 — Trailer, mobile 07 — HU not specified above 17 — Other not HU FREQUENCIES: LIVTYP\counts: 7303 blank 1,032 01 125,642 02 96 03 85 04 123 05 3,901 06 47 07 168 17 119 Total 131,213 CODES for files: 7802–8014, 8008–8703 blank — Unknown 01 — House, apartment, flat 02 — HU in non-transient hotel, etc. 03 — HU, permanent in transient hotel, motel, etc. 04 — HU in rooming house 05 — Mobile home or trailer 06 — HU not specified above 07 — Quarters not HU in rooming or boarding house 08 — Unit not permanent in transient hotel, motel, etc. 09 — Tent or trailer site 10 — Other not HU ^- — Unknown

National Longitudinal Mortality Study – Extract File: Household Characteristic Variables
163
FREQUENCIES: LIVTYP\counts: 7802 7903 8014 8008 8012 8103 8203 8303 8403 8503 blank 2,624 . 6,446 5,776 4,253 . 1 . . . 01 88,134 41,364 169,292 167,810 163,962 58,673 77,145 76,654 76,571 75,399 02 66 39 124 109 95 58 42 64 36 28 03 39 29 66 73 70 23 28 34 47 15 04 50 29 49 74 87 29 55 31 48 24 05 3,572 1,603 8,599 8,324 9,009 2,929 4,106 4,362 3,937 4,452 06 29 10 60 68 50 10 32 20 28 36 07 23 2 46 35 19 6 3 14 12 24 08 6 . . . 9 . 1 4 8 1 09 1 . 2 2 6 . . 5 . . 10 118 22 187 102 205 76 67 93 45 92 ^- . . . . . . . . . . Total 94,662 43,098 184,871 182,373 177,765 61,804 81,480 81,281 80,732 80,071 LIVTYP\counts: 8509 8603 8703 blank . . . 01 136,238 43,602 42,553 02 98 10 23 03 36 11 11 04 51 26 9 05 8,054 2,282 2,570 06 24 6 26 07 30 36 34 08 12 3 . 09 7 . . 10 147 46 45 ^- 1 . . Total 144,698 46,022 45,271 CODES for files: 8803–1103 blank — Missing 01 — House, apartment, flat 02 — HU in non-transient hotel, etc. 03 — HU, permanent in transient hotel, motel, etc. 04 — HU in rooming house 05 — Mobile home or trailer with no permanent room added 06 — Mobile home or trailer with one or more permanent rooms added 07 — HU not specified above 08 — Quarters not HU in rooming or boarding house 09 — Unit not permanent in transient hotel, motel, etc. 10 — Tent or trailer site 11 — Student quarters in college dormitory 12 — Other not HU

National Longitudinal Mortality Study – Extract File: Household Characteristic Variables
164
FREQUENCIES: LIVTYP\counts: 8803 8903 9003 9103 9203 9303 9413 9503 9603 9703 blank . . . . . . . . . . 01 42,907 39,248 41,637 46,183 40,945 59,105 97,390 71,047 61,425 62,224 02 34 21 18 31 11 11 31 52 55 59 03 18 21 20 4 10 14 28 9 52 10 04 26 21 35 22 34 15 59 33 21 30 05 2,024 2,174 2,071 2,315 2,060 3,154 4,898 3,571 3,334 3,393 06 370 372 405 411 402 508 734 732 594 622 07 25 13 23 4 12 18 23 21 41 48 08 8 4 . 7 11 4 22 1 . . 09 . . 1 2 4 . 9 1 . . 10 1 2 1 . . 7 3 . . . 11 13 22 10 9 9 7 71 18 33 8 12 53 27 64 49 52 56 18 . . . Total 45,479 41,925 44,285 49,037 43,550 62,899 103,286 75,485 65,555 66,394 LIVTYP\counts: 9803 9903 0003 0103 0203 0303 0403 0503 0603 0703 blank . . . . . 22,184 22,047 23,959 6,620 6,764 01 62,201 65,232 65,319 74,718 74,981 125,369 122,661 130,063 121,275 120,304 02 56 47 43 51 35 110 80 93 94 47 03 5 6 8 6 11 22 9 16 23 25 04 25 22 32 27 25 13 43 29 18 31 05 3,237 3,118 3,380 3,432 3,736 5,658 5,411 6,217 5,691 5,676 06 610 674 503 646 655 973 866 750 645 749 07 18 48 9 21 22 28 95 60 39 47 08 2 6 6 . 5 . 2 6 . 5 09 . . . 2 . . 10 . . . 10 2 3 . . 2 . . . . 23 11 17 16 5 10 7 8 10 9 10 14 12 . 3 17 24 43 40 75 55 48 57 Total 66,173 69,175 69,322 78,937 79,522 154,405 151,309 161,257 134,463 133,742 LIVTYP\counts: 0703 0803 0903 1003 1103 blank 6,764 5,485 5,525 5,539 6,047 01 120,304 118,447 120,835 119,764 118,321 02 47 60 72 57 74 03 25 25 24 44 7 04 31 30 26 14 17 05 5,676 5,152 5,331 5,130 4,733 06 749 787 740 838 800 07 47 18 29 29 19 08 5 2 3 . 1 09 . . 3 4 1 10 23 2 . 1 5 11 14 21 13 6 10 12 57 26 28 42 26 Total 133,742 130,055 132,629 131,468 130,061

National Longitudinal Mortality Study – Extract File: Household Characteristic Variables
165
82. House Owned or Rented RENTER Analysis File Return to Index EDITS: Simple DESCRIPTION: Variable defines the type of ownership of the residence. NOT AVAILABLE: 8024 CODES for files: 7303-8014, 8008-1103 blank — Missing information 0 — Missing information 1 — residence is owned by householder 2 — Residence is rented by householder 3 — Residence is rented for non cash rent by householder FREQUENCIES: RENTER\counts: 7303 7802 7903 8014 8008 8012 8103 8203 8303 8403 blank . . . . . . . . . . 0 878 454 2,882 4,456 4,753 4,428 4,792 5,680 62 235 1 91,655 67,406 27,311 128,389 127,718 123,144 40,074 52,318 55,821 55,036 2 35,809 25,019 11,817 48,260 46,350 46,843 15,748 22,053 23,829 24,000 3 2,871 1,783 1,088 3,766 3,552 3,350 1,190 1,429 1,569 1,461 Total 131,213 94,662 43,098 184,871 182,373 177,765 61,804 81,480 81,281 80,732 RENTER\counts: 8503 8509 8603 8703 8803 8903 9003 9103 9203 9303 blank . . . . . . . . . . 0 108 983 . . . . . . . . 1 54,406 99,644 32,694 32,321 32,727 30,284 31,339 34,730 30,542 45,404 2 24,113 41,393 12,598 12,172 11,909 10,874 12,148 13,430 12,256 16,424 3 1,444 2,678 730 778 843 767 798 877 752 1,071 Total 80,071 144,698 46,022 45,271 45,479 41,925 44,285 49,037 43,550 62,899 RENTER\counts: 9413 9503 9603 9703 9803 9903 0003 0103 0203 0303 blank . . . . . . . . . . 0 . . . . . . . . . 22,184 1 63,645 50,797 43,777 44,924 45,297 47,105 47,246 54,488 55,462 91,687 2 37,811 23,341 20,557 20,317 19,646 20,965 20,949 23,209 22,745 38,619 3 1,830 1,347 1,221 1,153 1,230 1,105 1,127 1,240 1,315 1,915 Total 103,286 75,485 65,555 66,394 66,173 69,175 69,322 78,937 79,522 154,405 RENTER\counts: 0403 0503 0603 0703 0803 0903 1003 1103 blank . . . . . . 5,539 . 0 22,047 23,959 6,620 6,764 5,485 5,525 . 6,047 1 90,418 97,366 88,948 88,418 85,935 86,134 83,482 81,576 2 36,978 38,127 37,159 36,783 37,013 39,278 40,739 40,900 3 1,866 1,805 1,736 1,777 1,622 1,692 1,708 1,538 Total 151,309 161,257 134,463 133,742 130,055 132,629 131,468 130,061

National Longitudinal Mortality Study – Extract File: Health Insurance and Health Status Variables
166
HEALTH INSURANCE AND HEALTH STATUS VARIABLES
83. Health Insurance Status HISTATUS Return to Index EDITS: None DESCRIPTION: This indicator variable tells whether or not the person was covered by any health insurance plan in the previous calendar year. The variable, although derived specifically for NLMS files by NLMS staff, is based on the same criteria as used for the official U.S. government tabulation of Health Insurance statistics released by the U.S. Census Bureau. The variable definition is a yes/no response to the question of health insurance coverage by an employer (individual or group plan), private coverage, Medicare, Medicaid or government (ChampUS, ChampVA or Indian Health Service) and is given a “1' or ‘2' value, accordingly. NOTE: The format of the 1981 CPS questionnaire did not allow for the collection of information on private health insurance coverage. The result of this problem is that a larger than expected number of persons are identified as not covered by a health insurance program even though they, in fact, have a privately carried health coverage. The questionnaire was changed beginning in 1982 to allow for the collection of information concerning privately financed health insurance coverage. NOT AVAILABLE: 7303–8012, 8509 CODES for files: 8103–8503, 8603-1103 1 — Person is covered by health insurance from an employer, private purchase, Medicare,
Medicaid, or governmental health insurance plan 2 — Person is not covered by an acceptable health insurance plan FREQUENCIES: HISTATUS\counts: 8103 8203 8303 8403 8503 8603 8703 8803 8903 9003 1 46,335 66,935 66,128 64,892 64,148 40,229 39,576 40,565 36,953 38,969 2 15,469 14,545 15,153 15,840 15,923 5,793 5,695 4,914 4,972 5,316 Total 61,804 81,480 81,281 80,732 80,071 46,022 45,271 45,479 41,925 44,285 HISTATUS\counts: 9103 9203 9303 9413 9503 9603 9703 9803 9903 0003 1 42,794 38,004 54,483 85,940 63,945 55,509 55,942 55,525 57,086 57,520 2 6,243 5,546 8,416 17,346 11,540 10,046 10,452 10,648 12,089 11,802 Total 49,037 43,550 62,899 103,286 75,485 65,555 66,394 66,173 69,175 69,322 HISTATUS\counts: 0103 0203 0303 0403 0503 0603 0703 0803 0903 1003 1 67,081 67,559 112,330 109,546 117,274 108,645 107,511 105,912 108,254 105,472 2 11,856 11,963 42,075 41,763 43,983 25,818 26,231 24,143 24,375 25,996 Total 78,937 79,522 154,405 151,309 161,257 134,463 133,742 130,055 132,629 131,468

National Longitudinal Mortality Study – Extract File: Health Insurance and Health Status Variables
167
HISTATUS\counts: 1103 1 104,598 2 25,463 Total 130,061

National Longitudinal Mortality Study – Extract File: Health Insurance and Health Status Variables
168
84. Health Insurance Type HITYPE Return to Index EDITS: None DESCRIPTION: This variable summarizes, in broad categories, the type of health insurance coverage that the person had at any time in the previous calendar year. The variable is created using the following hierarchical generalized definition: If [X] is over 50, is [X] covered by Medicare? Yes=> HITYPE=1 STOP If No, is [X] covered by an employer health plan? Yes=> 4 STOP If No, is [X] covered by private health plan? Yes=> 5 STOP If No, is [X] covered by Medicare? Yes=> 1 STOP If No, is [X] covered by Medicaid? Yes=> 2 STOP If No, is [X] covered by ChampUS, ChampVA, or the Indian Health Services? Yes=> 3 STOP Else HITYPE = 0. (For this definition, if the response is, “Yes” at any step, the definition is complete at that point, indicated by the phrase, “STOP,” and all additional checks are not made.) NOTE: For files 8103 through 8503, a manual imputation was conducted by NLMS staff to generate, in case of missing values, a relative to head variable, RELTHD. This imputed value was not maintained as a permanent value on NLMS files. The imputation was conducted by examining the household structure, including input on age, sex, and full name. The RELTHD variable is of key importance in the determination of health insurance status and type because insurance policy holders may hold group coverage for other members of their family. NOT AVAILABLE: 7303-8012, 8509 CODES for files: 8103–8503, 9103–1103 0 — Missing, not in universe, unknown 1 — Medicare 2 — Medicaid 3 — ChampUS, ChampVA, VA Health Care, Military Health Care, Indian Health Care, other
Governmental Health Care 4 — Employer (as provider/as dependent), group coverage through an employer 5 — Private (as provider/as dependent), private coverage not through an employer FREQUENCIES: HITYPE\counts: 8103 8203 8303 8403 8503 8603 8703 8803 8903 9003 0 15,469 14,545 15,153 15,840 15,923 5,793 5,695 4,914 4,972 5,316 1 6,150 9,108 8,846 8,878 9,151 7,452 7,258 7,699 6,992 7,375 2 1,450 2,061 2,060 2,106 2,175 1,640 1,685 1,494 1,447 1,590 3 974 1,218 1,193 1,231 1,021 762 699 769 655 656 4 37,761 48,036 47,648 46,389 45,760 26,492 26,168 26,646 24,393 25,542 5 . 6,512 6,381 6,288 6,041 3,883 3,766 3,957 3,466 3,806 Total 61,804 81,480 81,281 80,732 80,071 46,022 45,271 45,479 41,925 44,285

National Longitudinal Mortality Study – Extract File: Health Insurance and Health Status Variables
169
HITYPE\counts: 9103 9203 9303 9413 9503 9603 9703 9803 9903 0003 0 6,243 5,546 8,416 17,346 11,540 10,046 10,452 10,484 12,089 11,802 1 7,861 7,561 9,215 11,791 9,607 8,392 8,552 8,325 8,674 6,456 2 1,929 1,910 3,884 10,284 6,242 5,896 5,622 5,109 5,034 5,305 3 842 618 875 1,379 1,305 914 827 1,062 753 713 4 28,174 24,509 34,857 51,890 42,755 36,819 37,448 37,909 39,427 40,669 5 3,988 3,406 5,652 10,596 4,036 3,488 3,493 3,284 3,198 4,377 Total 49,037 43,550 62,899 103,286 75,485 65,555 66,394 66,173 69,175 69,322 HITYPE\counts: 0103 0203 0303 0403 0503 0603 0703 0803 0903 1003 0 11,856 11,963 42,075 41,763 43,983 25,818 26,231 24,143 24,375 25,996 1 9,998 9,843 8,429 12,350 13,738 12,384 12,604 12,583 6,631 13,121 2 6,116 6,676 10,610 12,892 14,109 13,329 13,316 13,318 14,527 15,950 3 890 867 1,621 1,675 1,785 1,691 1,603 1,547 1,796 1,664 4 46,298 46,344 82,331 75,721 80,172 74,427 73,307 71,817 75,842 68,214 5 3,779 3,829 9,339 6,908 7,470 6,814 6,681 6,647 9,458 6,523 Total 78,937 79,522 154,405 151,309 161,257 134,463 133,742 130,055 132,629 131,468 HITYPE\counts: 1103 0 25,463 1 13,382 2 15,818 3 1,846 4 66,831 5 6,721 Total 130,061

National Longitudinal Mortality Study – Extract File: Health Insurance and Health Status Variables
170
85. General Health HEALTH Return to Index EDITS: None DESCRIPTION: This variable is the response to the question: “Would you say that [person]’s health in general is” NOT AVAILABLE: 7303–9303 CODES for files: 9413–1103 -1 — Missing -2 — Don’t know -3 — Refused 00 — Not in universe 01 — Excellent 02 — Very good 03 — Good 04 — Fair 05 — Poor FREQUENCIES: HEALTH\counts: 9413 9503 9603 9703 9803 9903 0003 0103 0203 0303 -1 5,424 1 20 311 396 6,305 5,385 6,449 6,450 12,754 -2 34 169 182 203 158 197 192 280 264 523 -3 141 869 821 784 684 659 661 792 939 2,158 00 77,174 9,592 6,929 6,037 5,009 . . . . 22,184 01 7,537 23,120 20,421 20,878 20,933 21,425 22,288 24,428 24,003 43,537 02 6,364 19,881 17,597 17,692 18,599 19,725 19,334 22,358 22,801 36,627 03 4,319 14,419 13,055 13,603 13,871 14,045 14,495 16,779 17,218 25,605 04 1,558 5,107 4,462 4,705 4,521 4,756 4,823 5,459 5,497 7,749 05 735 2,327 2,068 2,181 2,002 2,063 2,144 2,392 2,350 3,268 Total 103,286 75,485 65,555 66,394 66,173 69,175 69,322 78,937 79,522 154,405 HEALTH\counts: 0403 0503 0603 0703 0803 0903 1003 1103 -1 13,155 14,605 12,401 13,701 11,652 . . . -2 518 571 444 355 325 . . . -3 2,403 2,107 2,048 1,901 1,990 . . . 00 22,047 23,959 6,620 6,764 5,485 5,525 5,539 6,047 01 42,221 43,479 40,750 40,138 40,010 45,514 43,282 42,707 02 35,431 37,366 35,773 35,310 34,759 39,055 39,269 39,209 03 24,716 27,273 25,521 24,725 24,924 29,449 30,454 29,224 04 7,736 8,440 7,683 7,649 7,634 9,255 9,291 9,225 05 3,082 3,457 3,223 3,199 3,276 3,831 3,633 3,649 Total 151,309 161,257 134,463 133,742 130,055 132,629 131,468 130,061

National Longitudinal Mortality Study – Extract File: Tobacco Use Variables
171
TOBACCO USE VARIABLES The next section defines ten “smoking” variables that have been defined for use in the full NLMS. All are available for use in the SEER-NLMS analytical file. 86. Smoked More than 100 Cigarettes SMOK100 Return to Index EDITS: None DESCRIPTION: Response to question: Has (this person) smoked at least 100 cigarettes in his/her lifetime? NOT AVAILABLE: 7303-8503, 8603-9103, 9413, 9703 CODES for files: 8509, 9203, 9303, 9503, 9603, 9803-1103 blank — Missing 1 — Yes 2 — No FREQUENCIES: SMOK100\counts: 8509 9203 9303 9503 9603 9803 9903 0003 0103 0203 blank 42,434 19,714 28,290 44,835 28,574 33,048 27,251 28,662 42,856 46,859 1 49,644 11,129 15,981 13,211 16,303 13,770 16,660 16,766 14,549 13,553 2 52,620 12,707 18,628 17,439 20,678 19,355 25,264 23,894 21,532 19,110 Total 144,698 43,550 62,899 75,485 65,555 66,173 69,175 69,322 78,937 79,522 SMOK100\counts: 0303 0403 0503 0603 0703 0803 0903 1003 1103 blank 93,883 145,341 139,505 82,888 97,850 129,683 111,246 80,760 96,140 1 22,427 2,088 7,665 18,416 13,160 123 7,152 16,544 11,224 2 38,095 3,880 14,087 33,159 22,732 249 14,231 34,164 22,697 Total 154,405 151,309 161,257 134,463 133,742 130,055 132,629 131,468 130,061

National Longitudinal Mortality Study – Extract File: Tobacco Use Variables
172
87. Age Started Smoking AGESMK Return to Index EDITS: None DESCRIPTION: Response to question: How old was (this person) when he /she first started smoking cigarettes fairly regularly? NOT AVAILABLE: 7303-9103, 9413, 9703 CODES for files: 8509, 9203, 9303, 9503, 9603, 9803-1103 blank — Missing -1 — Not in the universe -2 — Respondent doesn’t know -3 — Refused to answer -5 — Never smoked regularly -9 — No response 01-99 — Valid age response FREQUENCIES: AGESMK\counts: 8509 9203 9303 9503 9603 9803 9903 0003 0103 0203 blank 100,975 19,714 28,290 44,835 28,574 26,003 20,086 23,761 35,810 41,857 -1 . 12,708 18,628 17,439 20,678 26,400 32,429 28,795 28,578 24,112 -2 . 406 535 588 593 639 718 742 650 558 -3 . . . 27 44 67 35 46 72 52 -5 . 303 432 359 430 377 447 434 351 313 -9 . 49 87 6 15 13 12 4 10 8 01 1 . 1 . 1 1 3 . . 2 02 8 . 1 . 1 . 1 2 . . 03 7 2 4 2 1 2 . . 1 . 04 28 5 8 4 1 2 2 . 3 . 05 53 23 31 8 8 4 7 15 12 9 06 108 19 26 16 13 9 18 21 8 13 07 124 25 45 20 28 18 27 22 24 25 08 167 33 68 53 56 40 44 63 40 29 09 169 48 69 50 83 58 72 77 50 64 10 345 95 132 105 133 114 166 137 115 130 11 234 74 109 90 117 108 134 139 102 114 12 1,002 291 456 343 437 394 465 486 396 411 13 1,311 347 556 479 617 562 690 652 554 592 14 2,382 609 922 731 966 796 1,044 1,005 873 828 15 4,134 1,014 1,540 1,264 1,612 1,353 1,679 1,733 1,391 1,402 16 6,816 1,511 2,186 1,839 2,304 1,892 2,321 2,406 2,089 1,928 17 4,634 1,053 1,493 1,253 1,555 1,292 1,588 1,684 1,400 1,333 18 7,398 1,758 2,390 1,962 2,430 2,052 2,440 2,512 2,203 1,992 19 2,812 691 919 849 989 768 943 910 857 787 20 4,102 958 1,338 1,082 1,324 1,088 1,305 1,299 1,201 1,024 21 2,005 456 721 548 650 561 676 615 556 531 22 1,123 286 434 298 377 344 396 362 350 302 23 655 151 219 155 218 179 190 193 171 147 24 464 112 141 110 147 144 133 123 126 106 25 1,167 275 389 332 395 303 351 374 327 277 26 233 60 85 64 70 66 78 75 57 60 27 197 29 71 65 72 57 67 68 49 54 28 230 50 91 69 82 62 71 68 51 55 29 82 17 30 24 34 26 37 25 26 27 30 607 121 173 158 206 148 184 185 180 138 31 55 8 17 16 19 9 19 15 15 12 32 92 46 28 32 23 36 34 39 29 26 33 52 10 19 14 18 13 11 29 18 15

National Longitudinal Mortality Study – Extract File: Tobacco Use Variables
173
AGESMK\counts: 8509 9203 9303 9503 9603 9803 9903 0003 0103 0203 (cont.) 34 36 2 11 7 18 12 14 17 13 8 35 266 51 66 55 77 53 70 57 46 51 36 27 13 10 12 9 9 20 15 12 7 37 35 5 9 7 9 3 13 9 9 7 38 43 11 10 12 20 13 8 13 12 15 39 23 11 3 4 5 5 9 3 7 7 40 178 46 37 33 35 23 51 39 44 39 41 11 1 5 1 3 4 6 4 3 3 42 21 6 12 5 9 8 5 . 5 10 43 16 3 2 4 5 . 5 4 2 5 44 11 3 3 1 4 2 5 2 . 2 45 64 11 18 15 9 19 8 12 9 10 46 2 1 1 . . 3 3 . 5 1 47 8 1 1 2 3 1 5 2 2 5 48 22 2 2 3 1 . 1 . 2 2 49 5 1 1 2 2 1 1 1 1 1 50 71 8 8 17 6 5 10 10 11 8 51 4 . 2 2 1 . . 2 1 1 52 5 2 2 3 . . 3 . 2 . 53 6 1 . . 1 2 2 1 1 . 54 5 . 1 . 1 . 2 . 1 2 55 14 4 1 2 2 3 2 2 1 1 56 6 . . . . 1 . . . 1 57 3 . 1 . 4 . 2 2 . 1 58 6 1 . . . . 1 1 . . 59 3 2 . 1 1 . . . . . 60 7 3 2 2 5 2 3 4 . . 61 2 . . . . . . 1 . . 62 2 . . . 1 . . . 1 1 63 1 . . . . 2 1 1 . . 64 3 1 1 . 1 . . . 1 . 65 7 1 1 3 . 2 . 2 1 1 66 2 . 1 . . . . . . . 67 2 . . . . . . . . . 68 2 . . . . . . . . . 69 1 . 1 1 . . . . . . 70 1 . 2 2 . . 2 . . . 71 . . . . . . . . . . 72 . 1 . . . . . . . . 73 . . . . . . . 1 . . 74 1 . . . . . . . . . 75 1 . . . 1 . . . . . 76 1 . . . . . . . . . 77 . . . . . . . 1 . . 78 . . 1 . . . . . . . 80 1 . . . 1 . . . . . 83 1 . . . . . . . . . 86 . 1 . . . . . . . . Total 144,698 43,550 62,899 75,485 65,555 66,173 69,175 69,322 78,937 79,522

National Longitudinal Mortality Study – Extract File: Tobacco Use Variables
174
AGESMK\counts: 0303 0403 0503 0603 0703 0803 0903 1003 1103 blank 80,843 144,459 133,632 70,859 91,591 129,570 106,672 69,041 88,730 -1 51,135 4,762 19,960 45,188 28,991 362 18,805 45,883 30,107 -2 1,012 107 349 936 594 3 360 836 531 -3 157 7 54 114 64 1 77 166 95 -5 606 40 218 484 317 4 151 371 256 -9 28 . 10 19 23 . 18 42 20 01 2 . 3 . 4 . . 2 2 02 1 . 1 3 1 . . . . 03 3 . . 2 . . . 1 . 04 4 1 1 2 1 . 2 1 6 05 9 1 2 11 2 . . 7 5 06 16 . 13 21 12 . 6 15 10 07 38 6 9 24 18 . 14 26 13 08 76 7 18 41 37 2 15 41 19 09 109 16 31 73 66 1 23 69 48 10 170 18 61 148 104 1 50 104 77 11 185 21 51 150 114 . 46 100 89 12 667 82 176 485 375 3 191 418 309 13 967 94 310 670 569 6 278 577 454 14 1,422 157 439 1,025 799 12 393 924 652 15 2,275 238 752 1,833 1,305 12 654 1,598 1,024 16 3,171 291 991 2,591 1,854 16 1,031 2,266 1,504 17 2,151 214 756 1,794 1,267 19 703 1,588 1,073 18 3,339 278 1,226 2,947 2,073 8 1,125 2,671 1,842 19 1,268 96 455 976 760 10 419 963 703 20 1,665 146 629 1,482 1,000 8 575 1,346 906 21 847 64 296 670 478 3 275 588 422 22 462 38 168 403 277 2 155 385 250 23 261 22 85 187 145 2 81 200 136 24 181 18 69 152 111 2 55 134 76 25 465 50 152 433 287 7 140 399 261 26 85 7 31 93 63 . 36 56 44 27 89 11 29 62 41 . 30 51 35 28 93 13 41 83 46 . 30 77 51 29 38 6 12 29 31 . 19 30 16 30 197 14 72 167 114 . 76 175 126 31 25 2 7 18 11 . 8 14 8 32 34 2 14 35 16 1 15 39 22 33 19 . 12 11 15 . 6 13 5 34 9 2 5 16 7 . 6 13 10 35 77 4 37 67 46 . 28 71 31 36 19 2 5 14 8 . 7 9 9 37 20 2 5 14 8 . 3 14 4 38 21 2 7 12 8 . 2 15 13 39 5 . 4 4 6 . 3 5 2 40 56 3 23 51 36 . 13 42 28 41 5 1 1 6 . . 3 6 3 42 6 . 5 7 7 . 6 8 6 43 4 1 2 7 3 . 4 4 3 44 4 1 1 4 2 . . 4 1 45 21 1 6 7 12 . 2 7 9 46 4 . 2 4 3 . 2 6 1 47 3 1 1 3 1 . . 7 4 48 7 . . 2 4 . 3 5 2 49 4 . 5 1 1 . . 2 . 50 13 1 6 11 5 . 6 15 2 51 . . . 2 . . 1 2 . 52 . . 2 1 . . . . . 53 . . . 1 1 . 1 4 1 54 2 . . . 1 . 1 1 1 55 1 . . 2 3 . . 4 1 56 2 . 2 1 1 . . . 1 57 . . 1 1 1 . . . 2 58 2 . . 1 1 . . . . 59 . . . . 1 . . 1 . 60 2 . . 2 . . 2 3 . 61 1 . . . . . . . .

National Longitudinal Mortality Study – Extract File: Tobacco Use Variables
175
AGESMK\counts: 0303 0403 0503 0603 0703 0803 0903 1003 1103 (cont.) 62 . . . . . . 1 1 . 63 . . . . . . . . . 64 . . 1 . . . 1 1 . 65 1 . . . . . . . . 66 . . . . . . . . . 67 . . . . . . . . . 68 . . . . . . . . . 69 . . . . . . . . . 70 1 . . . . . . . . 71 . . 1 1 . . . . . 72 . . . . . . . . . 73 . . . . . . . . . 74 . . . . . . . . . 75 . . . . . . . 1 . 76 . . . . . . . . . 77 . . . . . . . . . 78 . . . . . . . . . 80 . . . . . . . . . 83 . . . . . . . . . 86 . . . . . . . . . Total 154,405 151,309 161,257 134,463 133,742 130,055 132,629 131,468 130,061

National Longitudinal Mortality Study – Extract File: Tobacco Use Variables
176
88. Smoking Frequency SMOKER Return to Index EDITS: None DESCRIPTION: Response to question: Does (this person) smoke cigarettes every day, some days, or not all? NOT AVAILABLE: 7303-8503, 8603-9103, 9413, 9703 CODES for files: 8509, 9203, 9303, 9503, 9603, 9803-1103 blank — Missing -1 — Not in the universe -2 — Respondent doesn’t know -3 — Refused to answer -9 — No response 01 — Smokes every day 02 — Smokes some days 03 — Does not smoke at all FREQUENCIES: SMOKER\counts: 8509 9203 9303 9503 9603 9803 9903 0003 0103 0203 blank 42,434 19,714 28,290 44,835 28,574 26,003 20,086 23,761 35,810 41,857 -1 . 12,707 18,628 17,439 20,678 26,400 32,429 28,795 28,578 24,112 -2 . . . 14 10 16 16 17 8 12 -3 . . . 10 24 37 18 19 35 31 -9 . 38 44 8 20 16 17 7 15 12 01 49,644 4,288 6,510 5,255 6,714 5,322 6,411 6,388 5,259 5,092 02 . 881 1,376 1,085 1,376 1,174 1,665 1,725 1,282 1,275 03 52,620 5,922 8,051 6,839 8,159 7,205 8,533 8,610 7,950 7,131 Total 144,698 43,550 62,899 75,485 65,555 66,173 69,175 69,322 78,937 79,522 SMOKER\counts: 0303 0403 0503 0603 0703 0803 0903 1003 1103 blank 80,843 144,459 133,632 70,859 91,591 129,570 106,672 69,041 88,730 -1 51,135 4,762 19,960 45,188 28,991 362 18,805 45,883 30,107 -2 21 4 7 20 13 . 9 25 12 -3 50 2 30 39 22 . 34 60 36 -9 40 . 14 25 29 . 36 79 33 01 9,153 986 2,702 6,985 5,192 46 2,421 5,861 4,157 02 2,098 192 648 1,682 1,228 20 625 1,557 1,128 03 11,065 904 4,264 9,665 6,676 57 4,027 8,962 5,858 Total 154,405 151,309 161,257 134,463 133,742 130,055 132,629 131,468 130,061

National Longitudinal Mortality Study – Extract File: Tobacco Use Variables
177
89. Average Cigarettes Daily AVNMCIGS Return to Index
EDITS: None DESCRIPTION: Response to the question: On the average, how many cigarettes does (this person) now smoke a day? NOT AVAILABLE: 7303-9103, 9413, 9703, 0003 CODES for files: 9203, 9303, 9503, 9603, 9803-1103 blank — Missing -9 — No response -3 — Refused to answer -2 — Respondent doesn’t know -1 — Not in the universe 00-99 — Valid number of cigarettes smoked FREQUENCIES: AVNMCIGS\counts: 9203 9303 9503 9603 9803 9903 0003 0103 0203 0303 blank 19,714 28,290 44,835 28,574 26,003 20,086 69,322 35,810 41,857 80,843 -1 20,185 29,021 26,519 31,554 35,973 44,047 . 38,940 33,402 66,232 -2 18 17 28 35 31 33 . 35 32 61 -3 . . 20 26 40 26 . 41 40 54 -9 34 44 7 20 21 20 . 18 14 2 01 2 7 19 16 21 21 . 22 18 37 02 25 29 23 38 27 40 . 36 30 81 03 27 42 47 51 38 61 . 43 58 97 04 41 52 40 54 54 80 . 55 52 110 05 75 110 88 130 117 160 . 110 152 278 06 61 74 57 73 70 90 . 68 90 133 07 40 52 45 66 45 69 . 60 73 127 08 48 65 56 68 57 82 . 58 57 117 09 9 14 7 13 8 17 . 11 11 31 10 513 814 629 841 673 894 . 764 763 1,461 11 4 11 8 6 10 10 . 9 10 20 12 66 111 82 102 73 91 . 82 83 149 13 9 27 14 16 16 18 . 10 13 23 14 9 14 4 13 9 18 . 10 9 14 15 313 509 335 474 339 460 . 344 412 658 16 10 22 10 15 12 13 . 17 12 17 17 12 19 10 15 17 12 . 20 12 26 18 35 41 29 30 37 28 . 32 36 37 19 1 1 . 1 5 3 . 1 3 3 20 1,397 2,139 1,591 2,086 1,607 1,812 . 1,584 1,533 2,681 21 2 . 3 4 3 4 . 1 2 2 22 3 6 3 4 5 4 . 3 1 5 23 3 4 1 4 6 1 . 3 1 4 24 8 8 7 6 2 4 . . 4 6 25 83 162 111 114 91 107 . 103 84 160 26 . . 1 1 3 . . . . . 27 . 2 . . 1 1 . 1 1 2 28 2 3 . 2 . 2 . 1 4 . 29 . . 1 . 1 2 . 1 . . 30 370 575 414 550 397 452 . 340 337 504 31 . 1 . . . . . . 1 . 32 . . 1 1 1 1 . . 1 . 33 1 1 . . . . . . 1 . 34 1 . . . . . . . . . 35 32 48 33 26 28 24 . 14 14 25

National Longitudinal Mortality Study – Extract File: Tobacco Use Variables
178
AVNMCIGS\counts: 9203 9303 9503 9603 9803 9903 0003 0103 0203 0303 (cont.) 36 . . . . . . . 1 1 . 37 1 1 . . . . . 1 1 . 38 . 1 1 1 . 1 . . . 1 40 311 437 345 425 274 308 . 238 230 333 42 . 1 . . 1 . . . . . 43 . . . 1 . . . . . . 45 3 10 4 14 2 3 . 3 4 7 48 . . 1 . . . . 1 2 . 50 40 51 24 38 20 26 . 13 27 21 55 2 . . . . . . . 1 1 60 28 52 27 41 31 36 . 26 25 38 62 . . . . . . . 1 . . 65 2 1 . . . . . . . . 70 . 2 . 1 1 2 . 2 . . 75 . . 1 . . . . . . . 80 9 6 2 3 2 5 . 4 7 2 90 . 1 . 1 . 1 . . 1 1 99 1 1 2 1 1 . . . . 1 Total 43,550 62,899 75,485 65,555 66,173 69,175 69,322 78,937 79,522 154,405 AVNMCIGS\counts: 0403 0503 0603 0703 0803 0903 1003 1103 blank 144,459 133,632 70,859 91,591 129,570 106,672 69,041 88,730 -1 6,095 25,523 58,293 38,126 444 24,105 57,866 38,129 -2 3 15 42 35 . 20 40 38 -3 2 10 32 16 1 24 45 26 -9 1 4 10 11 . 3 4 4 01 4 13 33 23 1 15 21 11 02 8 13 51 40 1 19 57 42 03 9 26 101 64 2 25 105 81 04 8 38 94 78 1 45 96 60 05 31 84 194 166 4 90 231 179 06 21 47 111 90 . 43 125 105 07 18 36 101 73 2 36 104 86 08 12 30 106 75 1 42 102 94 09 3 7 19 13 . 15 19 18 10 166 415 1,131 894 9 437 1,078 820 11 2 5 15 13 . 5 9 3 12 12 60 130 85 1 39 123 73 13 2 5 20 15 . 5 36 12 14 1 4 11 8 . 7 9 10 15 76 212 532 374 7 190 414 276 16 . 5 18 14 . 3 18 10 17 5 6 17 11 . 10 13 12 18 5 10 37 20 . 6 24 15 19 1 . 5 4 . 2 1 2 20 267 758 1,767 1,348 7 591 1,455 955 21 . 1 1 4 . . 2 1 22 1 5 2 2 . 1 3 2 23 . 1 3 1 . . 2 3 24 . . 3 2 . 1 2 . 25 10 35 98 64 . 26 42 32 26 . . . . . . . . 27 . . . . . . 1 . 28 . 1 . 2 . 1 3 . 29 . 1 2 3 . . 2 . 30 51 121 337 252 3 97 206 126 31 . . . . . . . . 32 . 1 . . . . . . 33 . . 1 . . . 1 . 34 . . 1 . . . . 2 35 4 10 18 10 . 5 15 11 36 . . . . . . 1 1 37 . . . . . . 1 . 38 . 1 1 . . 1 . . 40 27 102 219 173 1 43 130 81 42 . . . . . . . .
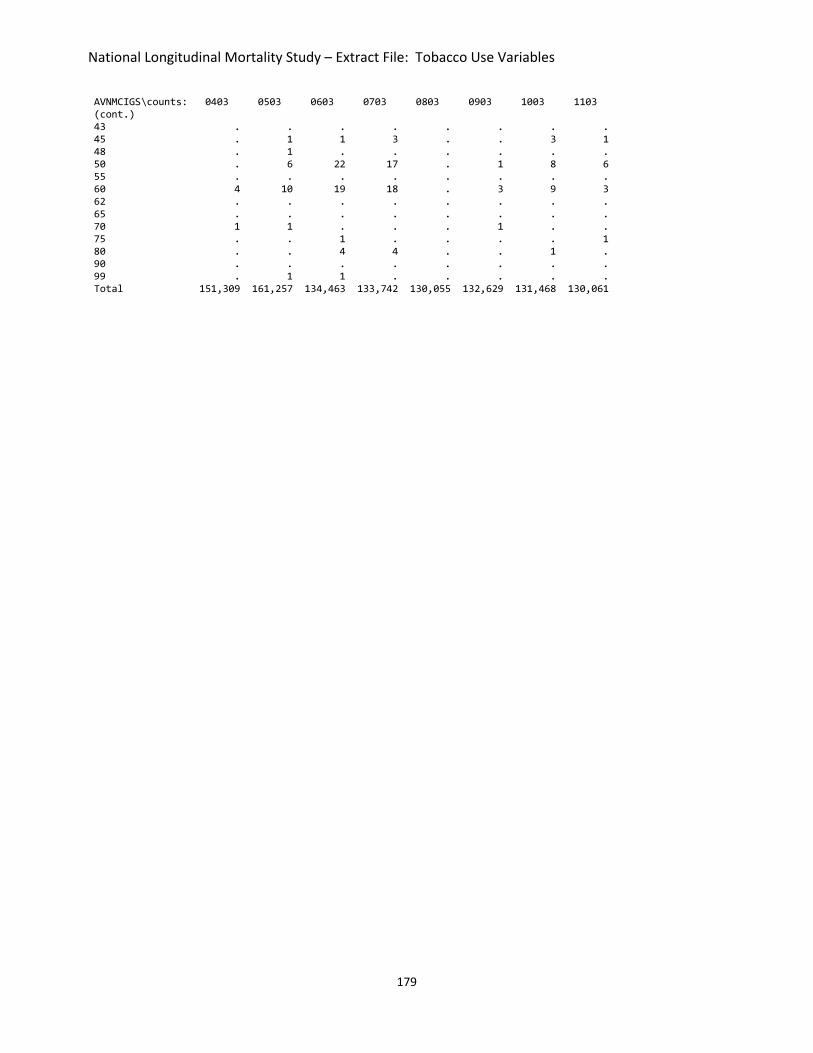
National Longitudinal Mortality Study – Extract File: Tobacco Use Variables
179
AVNMCIGS\counts: 0403 0503 0603 0703 0803 0903 1003 1103 (cont.) 43 . . . . . . . . 45 . 1 1 3 . . 3 1 48 . 1 . . . . . . 50 . 6 22 17 . 1 8 6 55 . . . . . . . . 60 4 10 19 18 . 3 9 3 62 . . . . . . . . 65 . . . . . . . . 70 1 1 . . . 1 . . 75 . . 1 . . . . 1 80 . . 4 4 . . 1 . 90 . . . . . . . . 99 . 1 1 . . . . . Total 151,309 161,257 134,463 133,742 130,055 132,629 131,468 130,061

National Longitudinal Mortality Study – Extract File: Tobacco Use Variables
180
90. Smoking Follow-up Start (File) SMKFLSTR Return to Index EDITS: None DESCRIPTION: This variable groups cigarette smokers into categories according to the survey for which the smoking information was collected. Except for the September 1985 cohort, smoking information available on NLMS records was not collected during the March interview as was the data used for the NLMS. Smoking data available was collected during other monthly household visits and attached to the March responses for NLMS purposes. These surveys are described in the codes of the SMKFLSTR variable below. Each SMKFLSTR value has associated with it an NLMS start of follow-up date which may or may not coincide with the standard start date for the file, in some cases the information on smoking is collected during a household visit prior to the date of the NLMS baseline survey, in other cases during a visit later than baseline. The correct start of follow-up date for all records in the smoking subset is given by the variable SMKSTART (see next page). In the code description below, the word “MIS” means “month in sample,” in the CPS rotation pattern. NOT AVAILABLE: 7303-8503, 8603-9103, 9413, 9703 CODES for files: 8509, 9203, 9303, 9503, 9603, 9803-1103 1 — 9203 NLMS(MIS: 1 & 2), smoking data collected in May 1993 CPS (MIS: 7 & 8) 2 — 9203 NLMS(MIS: 3 & 4), smoking data collected in January 1993 CPS (MIS: 5 & 6) 3 — 9303 NLMS(MIS: 3 & 4), smoking data collected in January 1993 CPS (MIS: 1 & 2) 4 — 9303 NLMS(MIS: 1 & 2), smoking data collected in May 1993 CPS (MIS: 3 & 4) 5 — 9503 NLMS(MIS: 3 & 4), smoking data collected in January 1996 CPS (MIS: 5 & 6) 6 — 9503 NLMS(MIS: 1 & 2), smoking data collected in May 1996 CPS (MIS: 7 & 8) 7 — 9603 NLMS(MIS: 3 & 4), smoking data collected in January 1996 CPS (MIS: 1 & 2) 8 — 9603 NLMS(MIS: 1 & 2), smoking data collected in May 1996 CPS (MIS: 3 & 4) 9 — 8509 NLMS(MIS: all), smoking data collected in September 1985 CPS (MIS: all) 11 – 9803 NLMS (MIS: 3 & 4), smoking data collected in January 1999 CPS (MIS: 5 & 6) 12 – 9903 NLMS (MIS: 3 & 4), smoking data collected in January 1999 CPS (MIS: 1 & 2) 13 – 9803 NLMS (MIS: 1 & 2), smoking data collected in May 1999 CPS (MIS: 7 & 8) 13 – 9903 NLMS (MIS: 3 & 4), smoking data collected in January 1999 CPS (MIS: 1 & 2) 16 – 0003 NLMS (MIS: 3 & 4), smoking data collected in January 2000 CPS (MIS: 1 & 2) 17 – 0003 NLMS (MIS: 1 & 2), smoking data collected in May 2000 CPS (MIS: 3 & 4) 20 – 0103 NLMS (MIS: 8 ), smoking data collected in June 1999 CPS (MIS: 4) 22 – 0103 NLMS (MIS: 2, 3 & 4), smoking data collected in February 2002 CPS (MIS: 5, 6 & 7) 23 – 0203 NLMS (MIS: 2, 3 & 4), smoking data collected in February 2002 CPS (MIS: 1, 2 & 3) 26 – 0303 NLMS (MIS: 2, 3 & 4), smoking data collected in February 2003 CPS (MIS: 1, 2 & 3) 27 – 0203 NLMS (MIS: 4), smoking data collected in June 2003 CPS(MIS: 8) 27 – 0303 NLMS (MIS: 1), smoking data collected in June 2003 CPS(MIS: 4) 28 – 0203 NLMS (Hispanic Supplement), smoking data collected in November 2003 CPS 29 – 0403 NLMS (Hispanic Supplement), smoking data collected in November 2003 CPS 30 – 0503 NLMS (MIS: 4), smoking data collected in August 2006 CPS (MIS: 5 )

National Longitudinal Mortality Study – Extract File: Tobacco Use Variables
181
30 – 0603 NLMS (MIS: 1 & 2), smoking data collected in May 2006 CPS (MIS: 3 & 4) 31 – 0603 NLMS (Hispanic Supplement), smoking data collected in August 2006 CPS(MIS: 5) 32 – 0603 NLMS (Hispanic Supplement), smoking data collected in January 2007 CPS(MIS: 5 & 6) 33 – 0703 NLMS (MIS: 3 & 4), smoking data collected in January 2007 CPS (MIS: 1 & 2) 34 – 0903 NLMS (Hispanic Supplement), smoking data collected in January 2007 CPS (MIS: 3 & 4) 35 – 0903 NLMS (MIS: 1 & 2), smoking data collected in May 2009 CPS (MIS: 7 & 8) 35 – 1003 NLMS (MIS: 1 & 2), smoking data collected in May 2009 CPS (MIS: 3 & 4) 36 – 1003 NLMS (MIS: 3 & 4), smoking data collected in January 2011 CPS(MIS: 5 & 6) 37 – 1003 NLMS (Hispanic Supplement), smoking data collected in August 2010 CPS(MIS: 5) 38 – 1103 NLMS (MIS: 3 & 4), smoking data collected in January 2011 CPS(MIS: 1 & 2) 38 – 1103 NLMS (Hispanic Supplement), smoking data collected in January 2011 FREQUENCIES: SMKFLSTR\counts: 8509 9203 9303 9503 9603 9803 9903 0003 0103 0203 blank . 19,714 28,290 44,835 28,574 26,003 20,086 23,761 35,810 32,057 01 . 11,346 . . . . . . . . 02 . 12,490 . . . . . . . . 03 . . 17,947 . . . . . . . 04 . . 16,662 . . . . . . . 05 . . . 15,391 . . . . . . 06 . . . 15,259 . . . . . . 07 . . . . 18,349 . . . . . 08 . . . . 18,632 . . . . . 09 144,698 . . . . . . . . . 11 . . . . . 20,399 . . . . 12 . . . . . . 28,450 . . . 13 . . . . . 19,771 20,639 . . . 16 . . . . . . . 24,986 . . 17 . . . . . . . 20,575 . . 20 . . . . . . . . 11,553 . 22 . . . . . . . . 31,574 . 23 . . . . . . . . . 37,665 26 . . . . . . . . . . 27 . . . . . . . . . 9,800 28 . . . . . . . . . . 29 . . . . . . . . . . 30 . . . . . . . . . . 31 . . . . . . . . . . 32 . . . . . . . . . . 33 . . . . . . . . . . 34 . . . . . . . . . . 35 . . . . . . . . . . 36 . . . . . . . . . . 37 . . . . . . . . . . 38 . . . . . . . . . . Total 144,698 43,550 62,899 75,485 65,555 66,173 69,175 69,322 78,937 79,522

National Longitudinal Mortality Study – Extract File: Tobacco Use Variables
182
SMKFLSTR\counts: 0303 0403 0503 0603 0703 0803 0903 1003 1103 blank 80,843 144,459 133,632 70,859 88,178 129,492 106,672 69,041 85,396 01 . . . . . . . . . 02 . . . . . . . . . 03 . . . . . . . . . 04 . . . . . . . . . 05 . . . . . . . . . 06 . . . . . . . . . 07 . . . . . . . . . 08 . . . . . . . . . 09 . . . . . . . . . 11 . . . . . . . . . 12 . . . . . . . . . 13 . . . . . . . . . 16 . . . . . . . . . 17 . . . . . . . . . 20 . . . . . . . . . 22 . . . . . . . . . 23 . . . . . . . . . 26 45,269 . . . . . . . . 27 23,278 . . . . . . . . 28 5,015 . . . . . . . . 29 . 6,850 . . . . . . . 30 . . 27,625 35,738 . . . . . 31 . . . 1,189 . . . . . 32 . . . 26,677 . . . . . 33 . . . . 45,564 . . . . 34 . . . . . 563 . . . 35 . . . . . . 25,957 33,288 . 36 . . . . . . . 1,147 . 37 . . . . . . . 27,992 . 38 . . . . . . . . 44,665 Total 154,405 151,309 161,257 134,463 133,742 130,055 132,629 131,468 130,061

National Longitudinal Mortality Study – Extract File: Tobacco Use Variables
183
91. Smoking Follow-up Start Date SMKSTART Return to Index EDITS: None DESCRIPTION:
This variable gives the start date for purposes of follow-up analysis of records involving smoking data according to the grouping of records by SMKFLSTR codes. In any analysis in which the smoking variables define the population under study, the start date given by this variable, SMKSTART, must be used in the analysis to properly reflect the correct follow-up time for these records. Start dates for SMKFLSTR: blank — Missing 05/26/1993, if SMKFLSTR = 1 01/27/1993, if SMKFLSTR = 2 03/23/1993, if SMKFLSTR = 3 05/26/1993, if SMKFLSTR = 4 01/24/1996, if SMKFLSTR = 5 05/29/1996, if SMKFLSTR = 6 03/26/1996, if SMKFLSTR = 7 05/29/1996, if SMKFLSTR = 8 09/21/1985, if SMKFLSTR = 9 01/27/1999, if SMKFLSTR = 11 03/21/1999, if SMKFLSTR = 12 05/26/1999, if SMKFLSTR = 13 03/29/2000, if SMKFLSTR = 16 05/24/2000, if SMKFLSTR = 17 06/27/2001, if SMKFLSTR = 20 02/27/2002, if SMKFLSTR = 22 03/27/2002, if SMKFLSTR = 23 03/26/2003, if SMKFLSTR = 26 06/25/2003, if SMKFLSTR = 27 11/26/2003, if SMKFLSTR = 28 03/24/2004, if SMKFLSTR = 29 05/24/2006, if SMKFLSTR = 30 08/24/2006, if SMKFLSTR = 31 01/24/2007, if SMKFLSTR = 32 03/26/2007, if SMKFLSTR = 33 03/26/2008, if SMKFLSTR = 34 05/26/2010, if SMKFLSTR = 35 08/25/2010, if SMKFLSTR = 36 01/26/2011, if SMKFLSTR = 37 03/27/2011, if SMKFLSTR = 38 NOT AVAILABLE: 7303-9103, 9413, 9703 AVAILABLE FILES: 9203, 9303, 9503, 9603, 9803-1103

National Longitudinal Mortality Study – Extract File: Tobacco Use Variables
184
FREQUENCIES: SMKSTART\counts: 9203 9303 9503 9603 9803 9903 0003 0103 0203 blank 19,714 28,290 44,835 28,574 26,003 20,086 23,761 35,810 32,057 01/24/1996 . . 15,391 . . . . . . 01/24/2007 . . . . . . . . . 01/26/2011 . . . . . . . . . 01/27/1993 12,490 . . . . . . . . 01/27/1999 . . . . 20,399 . . . . 02/27/2002 . . . . . . . 31,574 . 03/23/1993 . 17,947 . . . . . . . 03/24/1999 . . . . . 28,450 . . . 03/24/2004 . . . . . . . . . 03/26/1996 . . . 18,349 . . . . . 03/26/2003 . . . . . . . . . 03/26/2007 . . . . . . . . . 03/26/2008 . . . . . . . . . 03/27/2002 . . . . . . . . 37,665 03/27/2011 . . . . . . . . . 03/29/2000 . . . . . . 24,986 . . 05/24/2000 . . . . . . 20,575 . . 05/24/2006 . . . . . . . . . 05/26/1993 11,346 16,662 . . . . . . . 05/26/1999 . . . . 19,771 20,639 . . . 05/26/2010 . . . . . . . . . 05/29/1996 . . 15,259 18,632 . . . . . 06/25/2003 . . . . . . . . 9,800 06/27/2001 . . . . . . . 11,553 . 08/24/2006 . . . . . . . . . 08/25/2010 . . . . . . . . . 11/26/2003 . . . . . . . . . Total 43,550 62,899 75,485 65,555 66,173 69,175 69,322 78,937 79,522 SMKSTART\counts: 0303 0403 0503 0603 0703 0803 0903 1003 1103 blank 80,843 144,459 133,632 70,859 88,178 129,492 106,672 69,041 85,396 01/24/1996 . . . . . . . . . 01/24/2007 . . . 26,677 . . . . . 01/26/2011 . . . . . . . 27,992 . 01/27/1993 . . . . . . . . . 01/27/1999 . . . . . . . . . 02/27/2002 . . . . . . . . . 03/23/1993 . . . . . . . . . 03/24/1999 . . . . . . . . . 03/24/2004 . 6,850 . . . . . . . 03/26/1996 . . . . . . . . . 03/26/2003 45,269 . . . . . . . . 03/26/2007 . . . . 45,564 . . . . 03/26/2008 . . . . . 563 . . . 03/27/2002 . . . . . . . . . 03/27/2011 . . . . . . . . 44,665 03/29/2000 . . . . . . . . . 05/24/2000 . . . . . . . . . 05/24/2006 . . 27,625 35,738 . . . . . 05/26/1993 . . . . . . . . . 05/26/1999 . . . . . . . . . 05/26/2010 . . . . . . 25,957 33,288 . 05/29/1996 . . . . . . . . . 06/25/2003 23,278 . . . . . . . . 06/27/2001 . . . . . . . . . 08/24/2006 . . . 1,189 . . . . . 08/25/2010 . . . . . . . 1,147 . 11/26/2003 5,015 . . . . . . . . Total 154,405 151,309 161,257 134,463 133,742 130,055 132,629 131,468 130,061

National Longitudinal Mortality Study – Extract File: Tobacco Use Variables
185
92. Cigarette Smoking Status SMOKSTAT Analysis File Return to Index EDITS: Simple, Invalid Entry DESCRIPTION: Indicates the general quantity of cigarette smoking. This variable is a recode of several responses, so the variable is not a direct pickup of a response to a particular tobacco-use supplement item. NOT AVAILABLE: 7303-9103, 9413, 9703, 0003 CODES for files: 9203, 9303, 9503, 9603, 9803-9903, 0103-1103 blank — information missing or not provided -9 — No response provided -1 — Not in the universe 1 — Never smoked cigarettes. 2 — An everyday smoker of cigarettes. 3 — Is a smoker of cigarettes on some days 4 — Is a former smoker of cigarettes 9 — Smoking status is undetermined. FREQUENCIES: SMOKSTAT\counts: 9203 9303 9503 9603 9803 9903 0103 0203 0303 0403 blank 16,950 24,296 38,714 22,565 26,003 20,086 35,810 32,057 80,843 144,459 -1 2,650 3,786 6,012 5,894 6,912 6,988 6,904 6,610 12,778 864 -9 . . 141 169 202 228 200 206 373 24 1 12,820 18,828 17,439 20,678 19,355 25,264 21,532 24,204 38,095 3,880 2 4,288 6,510 5,255 6,714 5,322 6,411 5,259 6,121 9,153 986 3 881 1,376 1,085 1,376 1,174 1,665 1,282 1,525 2,098 192 4 5,922 8,051 6,839 8,159 7,205 8,533 7,950 8,799 11,065 904 9 39 52 . . . . . . . . Total 43,550 62,899 75,485 65,555 66,173 69,175 78,937 79,522 154,405 151,309 SMOKSTAT\counts: 0503 0603 0703 0803 0903 1003 1103 blank 133,632 70,859 91,591 129,570 106,672 69,041 88,730 -1 5,747 11,778 6,111 112 4,477 11,491 7,263 -9 177 335 212 1 176 392 228 1 14,087 33,159 22,732 249 14,231 34,164 22,697 2 2,702 6,985 5,192 46 2,421 5,861 4,157 3 648 1,682 1,228 20 625 1,557 1,128 4 4,264 9,665 6,676 57 4,027 8,962 5,858 9 . . . . . . . Total 161,257 134,463 133,742 130,055 132,629 131,468 130,061

National Longitudinal Mortality Study – Extract File: Tobacco Use Variables
186
93. Rules for Smoking Cigarettes in the Home SMOKHOME Analysis File Return to Index
EDITS: Simple, Invalid Entry DESCRIPTION: Is the response to the question, “Which statement best describes the rules about smoking in your home?” NOT AVAILABLE: 7303-9103, 9413, 9703, 0003 CODES for files: 9203, 9303, 9503, 9603, 9803-9903, 0103-1103 -9 — No response provided -3 — Refused to provide answer. -2 — Don’t know. -1 — Not in universe 0 — Missing 1 — No one is allowed to smoke anywhere in the house 2 — Smoking is allowed in some places or at some times. 3 — Smoking is permitted anywhere in the house at any time. FREQUENCIES: SMOKHOME\counts: 9203 9303 9503 9603 9803 9903 0103 0203 0303 0403 blank 16,950 24,296 38,714 22,565 26,003 20,086 35,810 41,857 80,843 144,459 -1 3,945 5,865 13,132 13,992 14,824 17,027 15,072 11,260 26,242 2,564 -2 . . 55 78 98 96 141 93 177 10 -3 . . 92 83 118 119 133 115 283 24 -9 . . 48 100 124 134 82 76 299 13 0 2,650 3,786 . . . . . . . . 1 8,538 12,263 12,623 15,172 15,300 19,826 18,727 17,731 34,184 3,169 2 5,190 7,540 5,299 6,628 4,870 6,137 4,834 4,415 6,129 534 3 6,156 8,947 5,522 6,937 4,836 5,750 4,138 3,975 6,248 536 9 121 202 . . . . . . . . Total 43,550 62,899 75,485 65,555 66,173 69,175 78,937 79,522 154,405 151,309 SMOKHOME\counts: 0503 0603 0703 0803 0903 1003 1103 blank 133,632 70,859 91,591 129,570 106,672 69,041 88,730 -1 11,842 25,850 15,192 194 9,975 24,981 16,237 -2 77 111 72 . 44 116 83 -3 119 254 145 3 180 333 214 -9 88 225 167 2 167 370 204 0 . . . . . . . 1 12,215 29,697 21,172 242 13,195 31,001 20,723 2 1,679 3,876 2,825 24 1,244 2,908 2,104 3 1,605 3,591 2,578 20 1,152 2,718 1,766 9 . . . . . . . Total 161,257 134,463 133,742 130,055 132,629 131,468 130,061

National Longitudinal Mortality Study – Extract File: Tobacco Use Variables
187
94. Ever Use Smokeless Tobacco EVERUSE Return to Index EDITS: None DESCRIPTION: This variable characterizes the information on CPS Tobacco-use Supplements for have you ever used tobacco other than the smoking of cigarettes. This variable is a companion variable to the variable defined as CURRUSE, which characterizes the concept of current use of tobacco products other than the smoking of cigarettes. The variable, EVERUSE, is a 5-digit character string in which each digit represents a have used response for the various types of other tobacco uses that were surveyed. Reading the digits from left to right, the individual digit components are:
1st digit, have ever used any other tobacco option other than cigarettes 2nd digit, have ever used pipes 3rd digit, have ever used cigars 4th digit, have ever used chewing tobacco 5th digit, have ever used snuff
For each digit the possible response values are:
1 – a yes response to, has … ever used this other tobacco-use option 2 – a no response to, has … ever used this other tobacco-use option 9 – response is not eligible, that is, other survey questions have ruled out the
possibility of a response to this item, or the response is missing for any reason.
An example of a possible response for the variable, EVERUSE, would be: for EVERUSE = ‘12122’ this person has at some time used other tobacco items, this person has been or is a cigar smoker, but this person has not at any time been a user of any of the other forms of other tobacco use. NOTE 1: This variable is generated by NLMS staff and is an attempt to characterize the ever use information available in the survey supplement. Information on other tobacco use was available for all CPS Tobacco-use supplements that are included in the NLMS. However, there was no attempt by supplement designers to maintain a consistency of the questions asked concerning the ever use of these other tobacco use options across the time period covered by the NLMS. Slight changes in the wording of the probing questions were made over time in an attempt to elicit better information on ever use or the concept of ever use was incorporated into the supplement. The development of the variable, EVERUSE, by the NLMS staff used the most relevant supplement responses to develop the EVERUSE variable digit by assuming that the supplement respondents were indicating an ever use habit. In some of the earlier supplements the ever use concept was not probed. See note below. Changes that occurred in the wording of the probe questions over the time in order to make precise the probe and elicit a more exact response have been interpreted by NLMS staff in order to create a one concept definition of ever use. Subtle variations in the wording have been generalized by NLMS staff to the concept of ever use defined for this variable.

National Longitudinal Mortality Study – Extract File: Tobacco Use Variables
188
NOTE 2: Over time, the different tobacco-use supplements addressed the issue of a current user versus someone who has ever used the product. Later surveys first probed if the person had ever used other tobacco options, if so, the ever use aspect was probed for the specific other-tobacco use options. If ever use was indicated then a probe of current use was made. For these later surveys, the determination of the CURRUSE and EVERUSE digit responses would be represented separately and appropriately by the two variables. For the earlier supplements, the probe generally sought just current use. For NLMS purposes, the determination of the digits for EVERUSE would be assigned the same response as those determined for the CURRUSE response. It is not clear in the earlier supplements if a former user was identified as a user or current user. NOT AVAILABLE: 7303-8503, 8603-9103, 9413, 9703 CODES for files: 8509, 9203, 9303, 9503, 9603, 9803–1103 11111 11112 11121 11122 11211 11212 11221 11222 12111 12112 12121 12122 12211 12212 12221 12222 22222 99999 FREQUENCIES: EVERUSE\counts: 8509 9203 9303 9503 9603 9803 9903 0003 0103 0203 blank . 16,950 24,296 23,303 8,243 26,003 48,536 23,755 35,810 32,057 11111 6 75 117 91 129 85 47 400 523 92 11112 8 81 85 85 83 81 70 215 293 65 11121 1 6 15 6 9 13 8 28 46 12 11122 138 311 418 297 395 317 384 840 952 175 11211 5 8 9 10 7 7 40 9 7 3 11212 40 39 57 43 57 45 354 65 83 18 11221 12 11 17 12 13 15 144 11 25 3 11222 901 680 843 625 709 494 277 787 876 192 12111 8 2 7 5 17 9 . 55 76 8 12112 45 40 38 47 60 48 . 202 288 63 12121 9 8 9 13 10 16 . 60 81 15 12122 761 361 532 419 493 538 . 1,614 1,893 415 12211 126 50 79 66 103 45 . 111 92 19 12212 1,847 519 824 581 761 633 . 955 956 192 12221 1,089 285 424 306 389 297 . 373 407 77 12222 59 . . . . . . . . . 22222 97,198 21,247 30,984 28,012 33,657 30,364 15,688 34,918 29,334 6,627 99999 42,445 2,877 4,145 21,564 20,420 7,163 3,627 4,924 7,195 39,489 Total 144,698 43,550 62,899 75,485 65,555 66,173 69,175 69,322 78,937 79,522

National Longitudinal Mortality Study – Extract File: Tobacco Use Variables
189
EVERUSE\counts: 0303 0403 0503 0603 0703 0803 0903 1003 1103 blank 80,843 144,459 133,632 70,859 88,178 129,492 106,672 69,041 85,396 11111 689 64 340 730 585 2 61 192 127 11112 410 32 194 532 431 2 57 142 107 11121 59 8 51 151 115 1 303 635 450 11122 1,208 81 817 1,811 1,280 10 547 1,071 626 11211 16 2 233 582 521 5 51 129 88 11212 151 11 269 721 540 6 81 257 202 11221 36 2 112 310 252 3 500 1,082 808 11222 1,203 87 1,867 4,701 3,629 36 1,487 3,570 2,358 12111 125 10 7 23 21 . 3 2 8 12112 497 46 11 32 26 . 10 20 12 12121 121 13 4 19 9 . 38 47 37 12122 2,965 268 204 474 250 . 144 351 192 12211 198 16 86 195 167 . 11 19 11 12212 1,562 156 221 470 372 1 83 211 161 12221 673 92 152 345 259 2 427 1,055 729 12222 . . . . . . . . . 22222 50,089 5,046 17,050 40,125 27,199 300 17,311 41,338 27,695 99999 13,560 916 6,007 12,383 9,908 195 4,843 12,306 11,054 Total 154,405 151,309 161,257 134,463 133,742 130,055 132,629 131,468 130,061

National Longitudinal Mortality Study – Extract File: Tobacco Use Variables
190
95. Currently Use Smokeless Tobacco CURRUSE Return to Index EDITS: None DESCRIPTION: This variable characterizes the information on CPS Tobacco-use Supplements for current, or currently using, use of tobacco other than the smoking of cigarettes. This variable is a companion variable to the variable defined as EVERUSE, which characterizes the concept of ever use of tobacco products other than the smoking of cigarettes. The variable, CURRUSE, is a 5-digit character string in which each digit represents the current use response for the various types of other tobacco uses that were surveyed. Reading the digits from left to right, the individual digit components are:
1st digit, current user of any other tobacco option other than cigarettes 2nd digit, current user of pipes 3rd digit, current user of cigars 4th digit, current user of chewing tobacco 5th digit, current user of snuff
For each digit the possible response values are: 1 – a yes response to, are you a current user of this other tobacco-use option 2 – a no response to, are you a current user of this other tobacco-use option 9 – response is not eligible, that is, other survey questions have ruled out the
possibility of a response to this item, or the response is missing for any reason.
An example of a possible response for the variable, CURRUSE, would be: for CURRUSE = ‘12122’ this person is a current user of other tobacco items, the person is currently a cigar smoker, but the person is not a user of any of the other forms of other tobacco use. NOTE 1: This variable is generated by NLMS staff and is an attempt to characterize the current use information available in the survey supplement. Information on other tobacco use was available for all CPS Tobacco-use Supplements that are included in the NLMS. However, there was no attempt by the supplement designers to maintain a consistency of the questions asked concerning the current use of these other tobacco use options across the time period covered by the NLMS. Slight changes in the wording of the probing questions were made over time in an attempt to elicit better information on current use. The development of the variable, CURRUSE, by the NLMS staff used the most relevant supplement responses to develop the CURRUSE variable digit by assuming that the supplement respondents were indicating a current use habit. For example, for some surveys the probe might be, ”does … use… ?”, for other surveys the probe might have been, “does … regularly use … ?” or, “does … currently use … ?” . For NLMS purposes, these responses would have resulted in the relevant digit being coded as a, “1”, in spite of the possibly subtle differences in the wording and therefore, the subtle differences in the respondent interpretation of the probing question. NOTE 2: Over time, the different tobacco-use supplements addressed the issue of a current user versus someone who has ever used the product. Later surveys first probed if the person had ever

National Longitudinal Mortality Study – Extract File: Tobacco Use Variables
191
used other tobacco options, if so, the ever use was probed for the specific other-tobacco use options. If ever use was indicated then a probe of current use was made. For these later surveys, the determination of the CURRUSE and EVERUSE digit responses would be represented separately by the two variables. For the earlier supplements, the probe generally sought current use. The determination of the digits for EVERUSE would be assigned the same response as those determined for the CURRUSE response. It is not clear in the earlier supplements if a former user was identified as a user or current user. NOT AVAILABLE: 7303-8503, 8603-9103, 9413, 9703 CODES for files: 8509, 9203, 9303, 9503, 9603, 9803–1103 11111 11112 11121 11122 11211 11212 11221 11222 12111 12112 12121 12122 12211 12212 12221 12222 22222 99999 FREQUENCIES: CURRUSE\counts: 8509 9203 9303 9503 9603 9803 9903 0003 0103 0203 blank . 16,950 24,296 23,303 8,243 26,003 48,536 23,755 35,810 32,057 11111 6 2 3 2 4 2 . 5 2 . 11112 8 4 3 4 4 4 1 9 9 1 11121 1 . 1 1 . . . 1 1 . 11122 138 25 36 29 30 46 29 83 40 9 11211 5 . . 1 . . . . . . 11212 40 4 7 4 5 4 4 6 7 1 11221 12 . 1 2 3 . . 2 2 1 11222 901 127 188 112 130 119 55 137 138 24 12111 8 . 1 3 3 1 3 11 6 1 12112 45 4 7 10 11 22 8 48 22 11 12121 9 . . 4 2 7 . 12 15 1 12122 761 146 206 208 264 369 159 892 713 152 12211 126 13 24 17 23 18 10 35 22 7 12212 1,847 316 466 312 446 361 183 465 399 79 12221 1,089 178 277 229 274 187 100 226 209 40 22222 97,257 22,904 33,238 29,680 35,693 31,867 16,460 38,711 34,347 7,649 99999 42,445 2,877 4,145 21,564 20,420 7,163 3,627 4,924 7,195 39,489 Total 144,698 43,550 62,899 75,485 65,555 66,173 69,175 69,322 78,937 79,522

National Longitudinal Mortality Study – Extract File: Tobacco Use Variables
192
CURRUSE\counts: 0303 0403 0503 0603 0703 0803 0903 1003 1103 blank 80,843 144,459 133,632 70,859 88,178 129,492 106,672 69,041 85,396 11111 3 1 2 9 7 . . 2 3 11112 8 . 2 10 7 . 5 2 2 11121 1 . 1 4 2 . 7 8 5 11122 77 10 26 81 66 1 22 40 40 11211 . 1 7 30 17 . 1 5 5 11212 5 1 25 50 50 . 2 17 10 11221 5 . 19 36 28 . 37 81 52 11222 167 10 516 1,395 1,085 13 334 859 542 12111 15 1 . 1 1 . . 1 . 12112 46 6 2 2 1 . 1 1 7 12121 17 3 . 1 3 . 1 6 4 12122 1,140 114 35 85 52 . 26 76 47 12211 45 5 43 90 94 . 2 2 1 12212 576 70 135 301 239 1 23 65 53 12221 332 48 151 376 287 . 326 707 525 22222 57,565 5,664 20,654 48,750 33,717 353 20,327 48,249 32,315 99999 13,560 916 6,007 12,383 9,908 195 4,843 12,306 11,054 Total 154,405 151,309 161,257 134,463 133,742 130,055 132,629 131,468 130,061

National Longitudinal Mortality Study – Extract File: Death Certificate Information Variables
193
DEATH CERTIFICATE INFORMATION VARIABLES 96. Death Certificate Number DCNUM Return to Index EDITS: None DESCRIPTION: The death certificate number for deaths is taken from the control file used for each match to the NDI. The death certificate number is unique only within a given year for the given state. Death certificate number is not available for deaths that occurred in New York, including both New York City and the rest of the state. NOTE: Blank for alive. AVAILABLE FILES: All files
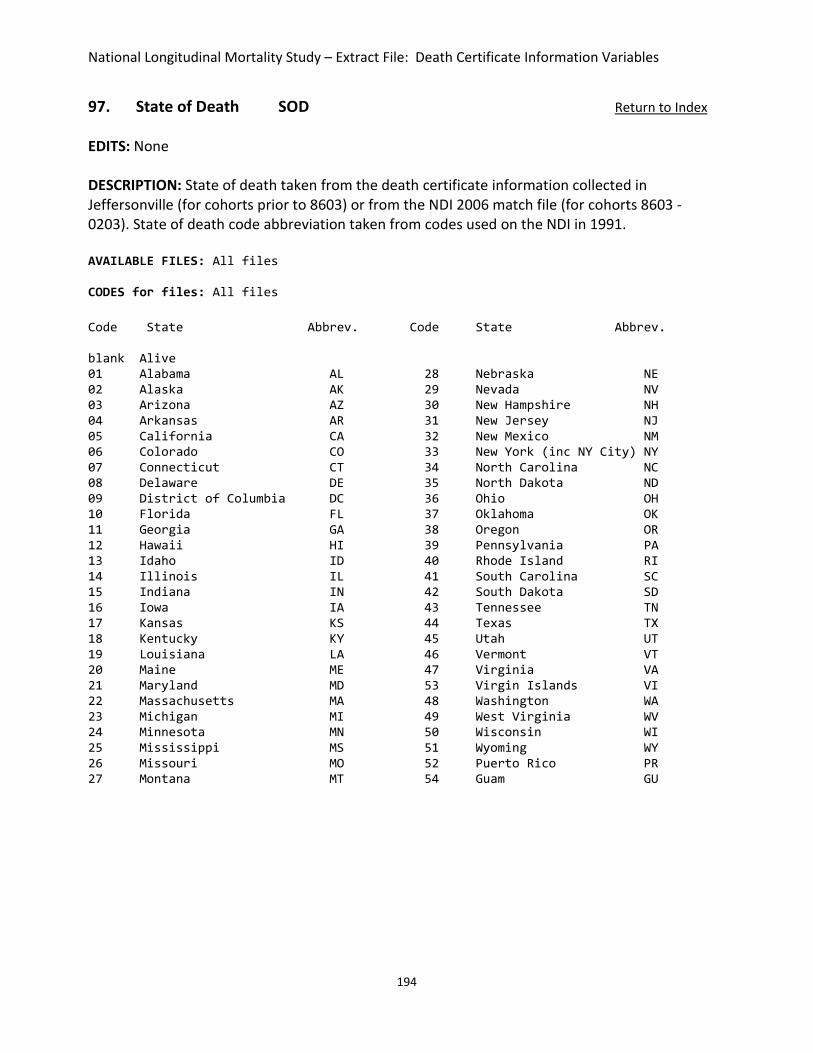
National Longitudinal Mortality Study – Extract File: Death Certificate Information Variables
194
97. State of Death SOD Return to Index EDITS: None DESCRIPTION: State of death taken from the death certificate information collected in Jeffersonville (for cohorts prior to 8603) or from the NDI 2006 match file (for cohorts 8603 - 0203). State of death code abbreviation taken from codes used on the NDI in 1991. AVAILABLE FILES: All files CODES for files: All files Code State Abbrev. Code State Abbrev. blank Alive 01 Alabama AL 28 Nebraska NE 02 Alaska AK 29 Nevada NV 03 Arizona AZ 30 New Hampshire NH 04 Arkansas AR 31 New Jersey NJ 05 California CA 32 New Mexico NM 06 Colorado CO 33 New York (inc NY City) NY 07 Connecticut CT 34 North Carolina NC 08 Delaware DE 35 North Dakota ND 09 District of Columbia DC 36 Ohio OH 10 Florida FL 37 Oklahoma OK 11 Georgia GA 38 Oregon OR 12 Hawaii HI 39 Pennsylvania PA 13 Idaho ID 40 Rhode Island RI 14 Illinois IL 41 South Carolina SC 15 Indiana IN 42 South Dakota SD 16 Iowa IA 43 Tennessee TN 17 Kansas KS 44 Texas TX 18 Kentucky KY 45 Utah UT 19 Louisiana LA 46 Vermont VT 20 Maine ME 47 Virginia VA 21 Maryland MD 53 Virgin Islands VI 22 Massachusetts MA 48 Washington WA 23 Michigan MI 49 West Virginia WV 24 Minnesota MN 50 Wisconsin WI 25 Mississippi MS 51 Wyoming WY 26 Missouri MO 52 Puerto Rico PR 27 Montana MT 54 Guam GU
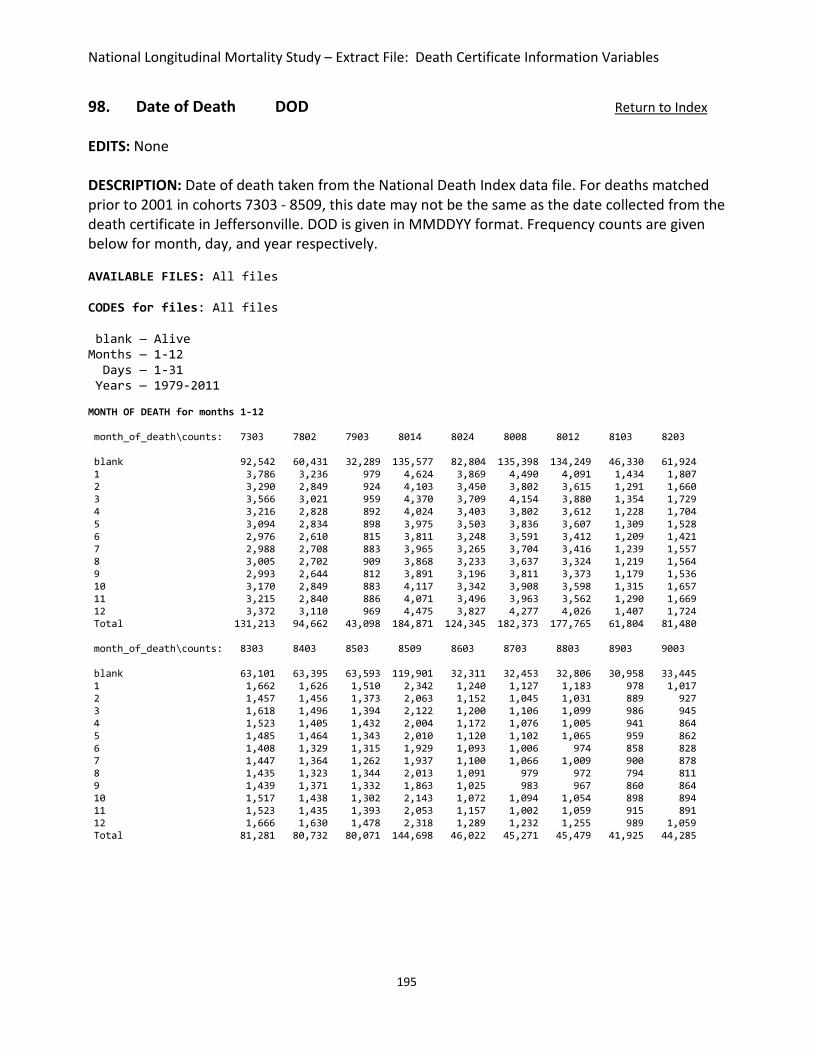
National Longitudinal Mortality Study – Extract File: Death Certificate Information Variables
195
98. Date of Death DOD Return to Index EDITS: None DESCRIPTION: Date of death taken from the National Death Index data file. For deaths matched prior to 2001 in cohorts 7303 - 8509, this date may not be the same as the date collected from the death certificate in Jeffersonville. DOD is given in MMDDYY format. Frequency counts are given below for month, day, and year respectively. AVAILABLE FILES: All files CODES for files: All files blank — Alive Months — 1-12 Days — 1-31 Years — 1979-2011 MONTH OF DEATH for months 1-12 month_of_death\counts: 7303 7802 7903 8014 8024 8008 8012 8103 8203 blank 92,542 60,431 32,289 135,577 82,804 135,398 134,249 46,330 61,924 1 3,786 3,236 979 4,624 3,869 4,490 4,091 1,434 1,807 2 3,290 2,849 924 4,103 3,450 3,802 3,615 1,291 1,660 3 3,566 3,021 959 4,370 3,709 4,154 3,880 1,354 1,729 4 3,216 2,828 892 4,024 3,403 3,802 3,612 1,228 1,704 5 3,094 2,834 898 3,975 3,503 3,836 3,607 1,309 1,528 6 2,976 2,610 815 3,811 3,248 3,591 3,412 1,209 1,421 7 2,988 2,708 883 3,965 3,265 3,704 3,416 1,239 1,557 8 3,005 2,702 909 3,868 3,233 3,637 3,324 1,219 1,564 9 2,993 2,644 812 3,891 3,196 3,811 3,373 1,179 1,536 10 3,170 2,849 883 4,117 3,342 3,908 3,598 1,315 1,657 11 3,215 2,840 886 4,071 3,496 3,963 3,562 1,290 1,669 12 3,372 3,110 969 4,475 3,827 4,277 4,026 1,407 1,724 Total 131,213 94,662 43,098 184,871 124,345 182,373 177,765 61,804 81,480 month_of_death\counts: 8303 8403 8503 8509 8603 8703 8803 8903 9003 blank 63,101 63,395 63,593 119,901 32,311 32,453 32,806 30,958 33,445 1 1,662 1,626 1,510 2,342 1,240 1,127 1,183 978 1,017 2 1,457 1,456 1,373 2,063 1,152 1,045 1,031 889 927 3 1,618 1,496 1,394 2,122 1,200 1,106 1,099 986 945 4 1,523 1,405 1,432 2,004 1,172 1,076 1,005 941 864 5 1,485 1,464 1,343 2,010 1,120 1,102 1,065 959 862 6 1,408 1,329 1,315 1,929 1,093 1,006 974 858 828 7 1,447 1,364 1,262 1,937 1,100 1,066 1,009 900 878 8 1,435 1,323 1,344 2,013 1,091 979 972 794 811 9 1,439 1,371 1,332 1,863 1,025 983 967 860 864 10 1,517 1,438 1,302 2,143 1,072 1,094 1,054 898 894 11 1,523 1,435 1,393 2,053 1,157 1,002 1,059 915 891 12 1,666 1,630 1,478 2,318 1,289 1,232 1,255 989 1,059 Total 81,281 80,732 80,071 144,698 46,022 45,271 45,479 41,925 44,285

National Longitudinal Mortality Study – Extract File: Death Certificate Information Variables
196
month_of_death\counts: 9103 9203 9303 9413 9503 9603 9703 9803 9903 blank 37,994 33,946 52,860 90,922 66,612 58,579 59,968 60,374 63,676 1 1,038 901 944 1,070 818 686 528 494 493 2 908 770 799 957 698 607 514 480 465 3 957 816 889 1,113 804 588 582 463 464 4 908 756 808 1,030 804 551 540 495 429 5 886 806 840 986 739 559 523 475 454 6 898 779 795 997 669 524 512 437 418 7 900 775 828 973 672 568 500 443 495 8 909 741 857 984 692 550 495 487 448 9 798 719 821 972 681 540 513 414 442 10 973 833 824 1,094 768 580 555 494 437 11 894 807 776 1,057 780 561 552 528 464 12 974 901 858 1,131 748 662 612 589 490 Total 49,037 43,550 62,899 103,286 75,485 65,555 66,394 66,173 69,175 month_of_death\counts: 0003 0103 0203 0303 0403 0503 0603 0703 0803 blank 62,898 73,980 74,711 149,012 146,778 157,046 130,886 130,787 127,799 1 580 404 458 447 374 340 293 220 150 2 517 368 355 428 354 305 250 209 157 3 518 444 409 466 386 327 300 231 173 4 581 411 430 462 375 347 286 261 207 5 529 451 386 415 391 353 330 254 193 6 537 384 345 445 379 334 267 257 168 7 489 410 398 456 376 336 292 265 192 8 497 393 388 415 354 343 268 244 187 9 446 401 367 440 366 362 285 245 199 10 587 397 441 451 402 371 333 233 198 11 553 431 420 489 374 369 343 270 204 12 590 463 414 479 400 424 330 266 228 Total 69,322 78,937 79,522 154,405 151,309 161,257 134,463 133,742 130,055 month_of_death\counts: 0903 1003 1103 blank 130,977 130,423 129,682 1 118 63 . 2 111 50 . 3 141 69 9 4 149 88 48 5 170 97 40 6 126 90 28 7 118 82 37 8 135 115 37 9 149 77 45 10 153 104 45 11 130 101 35 12 152 109 55 Total 132,629 131,468 130,061

National Longitudinal Mortality Study – Extract File: Death Certificate Information Variables
197
DAY OF DEATH for days 1-31 day_of_death\counts: 7303 7802 7903 8014 8024 8008 8012 8103 8203 blank 92,542 60,431 32,289 135,577 82,804 135,398 134,249 46,330 61,924 1 1,336 1,133 370 1,609 1,382 1,540 1,435 515 613 2 1,260 1,125 389 1,618 1,357 1,555 1,466 496 653 3 1,334 1,090 324 1,583 1,405 1,475 1,462 527 666 4 1,319 1,012 381 1,570 1,393 1,591 1,447 491 722 5 1,232 1,119 354 1,611 1,343 1,536 1,384 501 686 6 1,280 1,100 333 1,556 1,365 1,562 1,404 502 623 7 1,324 1,104 360 1,706 1,321 1,522 1,519 516 626 8 1,349 1,122 359 1,688 1,372 1,580 1,421 514 642 9 1,282 1,123 366 1,674 1,395 1,604 1,459 513 638 10 1,253 1,118 335 1,614 1,400 1,536 1,479 476 649 11 1,296 1,083 340 1,602 1,395 1,588 1,429 525 641 12 1,282 1,167 350 1,619 1,413 1,542 1,439 567 628 13 1,222 1,160 370 1,672 1,377 1,493 1,468 486 597 14 1,307 1,163 327 1,575 1,327 1,551 1,405 482 606 15 1,199 1,184 374 1,576 1,318 1,560 1,460 495 667 16 1,239 1,142 357 1,613 1,371 1,513 1,447 488 636 17 1,315 1,122 384 1,665 1,364 1,555 1,364 507 662 18 1,299 1,112 367 1,622 1,467 1,474 1,494 518 637 19 1,213 1,129 319 1,625 1,380 1,521 1,459 523 676 20 1,274 1,114 336 1,591 1,373 1,571 1,382 507 656 21 1,222 1,175 330 1,654 1,307 1,550 1,406 503 634 22 1,234 1,130 361 1,613 1,359 1,524 1,362 532 632 23 1,274 1,112 336 1,668 1,361 1,515 1,427 510 623 24 1,216 1,156 368 1,612 1,407 1,523 1,429 503 662 25 1,246 1,143 332 1,587 1,350 1,559 1,435 499 606 26 1,306 1,069 378 1,665 1,357 1,506 1,448 500 634 27 1,224 1,155 372 1,618 1,290 1,641 1,374 514 622 28 1,262 1,132 349 1,619 1,370 1,505 1,462 508 676 29 1,175 1,027 322 1,484 1,267 1,404 1,290 467 632 30 1,196 1,083 346 1,439 1,224 1,467 1,259 469 534 31 701 627 220 946 731 912 801 320 377 Total 131,213 94,662 43,098 184,871 124,345 182,373 177,765 61,804 81,480 day_of_death\counts: 8303 8403 8503 8509 8603 8703 8803 8903 9003 blank 63,101 63,395 63,593 119,901 32,311 32,453 32,806 30,958 33,445 1 604 553 550 806 459 424 410 395 332 2 588 540 524 790 469 407 398 376 366 3 610 568 541 779 470 397 423 364 348 4 571 585 524 865 462 430 436 393 334 5 602 588 527 857 474 424 448 326 366 6 583 519 577 814 431 413 417 359 352 7 568 542 517 845 466 423 429 365 322 8 604 565 537 822 466 415 454 340 356 9 648 573 573 801 486 422 382 321 365 10 579 609 553 809 444 412 439 342 372 11 580 529 525 829 417 462 400 352 371 12 595 582 559 823 448 433 409 390 383 13 568 549 542 859 479 424 458 349 359 14 595 559 551 803 457 418 416 349 366 15 647 563 543 872 470 416 371 353 361 16 535 597 546 828 441 426 442 367 380 17 591 585 548 784 434 425 407 384 349 18 565 552 506 782 464 438 396 357 348 19 587 592 543 868 451 433 424 341 348 20 634 591 518 814 411 429 384 342 375 21 581 579 514 803 439 401 431 377 333 22 625 576 535 813 435 412 407 348 362 23 593 545 569 760 448 410 416 377 310 24 608 572 583 824 423 462 406 361 345 25 612 593 553 814 431 415 456 388 356 26 632 573 536 764 463 418 418 327 360 27 633 586 521 807 430 398 432 389 365 28 572 587 532 803 478 403 396 354 367

National Longitudinal Mortality Study – Extract File: Death Certificate Information Variables
198
day_of_death\counts: 8303 8403 8503 8509 8603 8703 8803 8903 9003 (cont.) 29 556 562 507 719 394 416 393 323 326 30 572 466 493 729 399 386 339 353 345 31 342 357 331 511 272 226 236 205 218 Total 81,281 80,732 80,071 144,698 46,022 45,271 45,479 41,925 44,285 day_of_death\counts: 9103 9203 9303 9413 9503 9603 9703 9803 9903 blank 37,994 33,946 52,860 90,922 66,612 58,579 59,968 60,374 63,676 1 373 299 341 431 275 266 216 171 200 2 369 300 341 416 319 222 175 176 166 3 360 312 316 402 285 215 190 176 156 4 356 325 323 442 299 229 206 189 177 5 375 333 338 382 300 251 217 172 195 6 402 303 346 385 265 214 228 202 186 7 355 314 337 415 300 263 210 194 206 8 387 347 328 384 315 218 200 184 207 9 369 316 323 402 306 218 230 182 184 10 385 338 334 408 331 219 215 185 180 11 364 325 342 391 291 233 217 240 208 12 368 300 330 456 297 260 217 176 156 13 371 303 310 420 281 252 234 174 188 14 354 318 310 403 296 234 207 175 192 15 384 333 336 399 291 211 213 191 197 16 363 327 325 418 297 211 222 228 174 17 354 339 337 409 284 218 206 190 170 18 357 326 336 420 267 243 231 173 167 19 329 310 328 414 303 217 215 201 199 20 340 315 315 441 289 224 189 181 180 21 354 311 331 396 278 235 212 215 164 22 371 313 354 412 304 224 187 212 174 23 360 322 316 416 272 210 208 212 152 24 360 294 302 388 276 230 226 199 185 25 358 324 341 397 281 218 209 171 179 26 350 320 350 345 310 239 207 191 183 27 373 299 333 392 270 241 221 194 181 28 357 318 309 404 295 207 193 194 158 29 310 275 297 369 255 220 203 174 152 30 328 259 307 372 266 194 199 177 178 31 207 186 203 235 175 140 123 100 105 Total 49,037 43,550 62,899 103,286 75,485 65,555 66,394 66,173 69,175 day_of_death\counts: 0003 0103 0203 0303 0403 0503 0603 0703 0803 blank 62,898 73,980 74,711 149,012 146,778 157,046 130,886 130,787 127,799 1 191 153 157 184 148 122 122 88 80 2 218 137 147 195 150 124 114 107 70 3 194 174 168 173 149 139 124 101 81 4 215 155 154 171 147 135 127 107 76 5 219 157 155 177 129 153 134 99 76 6 210 175 148 165 147 162 126 86 56 7 204 156 136 189 154 147 133 90 68 8 215 156 181 187 131 120 123 90 86 9 244 174 160 167 174 153 125 101 80 10 226 182 139 193 154 133 99 89 71 11 218 182 158 200 148 142 122 105 82 12 212 159 184 186 158 140 106 87 71 13 199 156 139 168 130 133 100 91 71 14 201 148 153 195 162 131 110 82 67 15 214 161 157 173 150 126 112 104 72 16 199 160 162 164 179 140 133 95 77 17 218 159 162 188 155 136 128 95 73 18 224 138 149 168 134 137 113 109 67 19 211 180 154 176 138 131 110 98 77 20 219 167 163 159 148 141 125 96 74 21 191 154 187 177 150 119 95 84 64 22 200 165 149 180 151 134 125 89 76 23 209 157 165 166 163 129 104 87 67

National Longitudinal Mortality Study – Extract File: Death Certificate Information Variables
199
day_of_death\counts: 0003 0103 0203 0303 0403 0503 0603 0703 0803 (cont.) 24 244 172 145 161 161 138 108 101 91 25 198 159 165 171 129 145 110 127 82 26 201 176 170 172 143 144 128 96 67 27 226 153 148 166 143 157 123 95 82 28 206 167 151 178 136 141 115 112 70 29 167 172 147 168 134 151 109 97 63 30 197 150 161 174 138 135 122 91 73 31 134 103 97 102 98 73 52 56 46 Total 69,322 78,937 79,522 154,405 151,309 161,257 134,463 133,742 130,055 day_of_death\counts: 0903 1003 1103 blank 130,977 130,423 129,682 1 66 31 14 2 47 34 12 3 43 32 16 4 44 35 9 5 54 34 14 6 64 29 12 7 47 46 21 8 59 25 19 9 66 27 8 10 56 32 7 11 49 32 19 12 60 38 10 13 59 30 9 14 50 39 14 15 53 35 11 16 57 27 19 17 62 36 13 18 44 40 15 19 56 36 7 20 55 30 12 21 52 47 12 22 52 33 14 23 49 31 10 24 58 48 11 25 62 38 13 26 54 34 13 27 63 30 7 28 47 32 10 29 47 37 12 30 45 28 7 31 32 19 9 Total 132,629 131,468 130,061

National Longitudinal Mortality Study – Extract File: Death Certificate Information Variables
200
YEAR OF DEATH for years 1979-2011 year_of_death\counts: 7303 7802 7903 8014 8024 8008 8012 8103 8203 blank 92,542 60,431 32,289 135,577 82,804 135,398 134,249 46,330 61,924 1979 1,041 865 184 . . 1 . . . 1980 1,068 920 277 868 . 444 49 . . 1981 1,069 896 289 1,317 1,267 1,273 1,153 316 . 1982 1,058 959 267 1,259 1,320 1,263 1,159 436 405 1983 1,110 890 330 1,364 1,256 1,338 1,253 427 558 1984 1,090 975 317 1,466 1,338 1,401 1,266 443 545 1985 1,116 1,000 283 1,483 1,391 1,538 1,346 452 598 1986 1,175 1,012 286 1,516 1,261 1,466 1,359 447 585 1987 1,156 1,024 321 1,529 1,318 1,480 1,413 446 644 1988 1,138 964 344 1,594 1,378 1,509 1,443 458 622 1989 1,202 1,059 345 1,616 1,401 1,434 1,449 498 603 1990 1,163 1,020 332 1,567 1,364 1,559 1,453 532 633 1991 1,157 1,016 342 1,621 1,312 1,490 1,468 493 670 1992 1,203 1,029 362 1,650 1,385 1,500 1,440 500 684 1993 1,232 1,125 354 1,573 1,354 1,661 1,541 531 650 1994 1,234 1,072 346 1,681 1,422 1,579 1,566 503 719 1995 1,265 1,157 358 1,717 1,485 1,710 1,553 521 764 1996 1,293 1,114 347 1,739 1,509 1,687 1,547 563 719 1997 1,272 1,084 391 1,650 1,438 1,685 1,576 523 695 1998 1,235 1,209 349 1,703 1,465 1,669 1,626 596 749 1999 1,219 1,064 315 1,569 1,473 1,400 1,301 497 727 2000 1,237 1,147 351 1,548 1,551 1,527 1,374 535 667 2001 1,252 1,099 361 1,590 1,530 1,498 1,413 557 662 2002 1,285 1,096 343 1,615 1,456 1,426 1,398 545 746 2003 1,211 1,064 339 1,523 1,283 1,499 1,412 519 645 2004 1,137 998 325 1,579 1,207 1,461 1,340 503 681 2005 1,199 1,047 324 1,564 1,185 1,409 1,450 531 685 2006 1,149 1,019 355 1,509 1,223 1,481 1,361 536 624 2007 1,106 1,016 349 1,574 1,159 1,515 1,375 494 660 2008 1,118 1,123 359 1,618 1,225 1,529 1,415 526 653 2009 1,157 1,056 319 1,611 1,180 1,507 1,348 529 618 2010 1,190 1,015 331 1,531 1,177 1,505 1,355 519 668 2011 1,134 1,097 314 1,550 1,228 1,531 1,314 498 677 Total 131,213 94,662 43,098 184,871 124,345 182,373 177,765 61,804 81,480 year_of_death\counts: 8303 8403 8503 8509 8603 8703 8803 8903 9003 blank 63,101 63,395 63,593 119,901 32,311 32,453 32,806 30,958 33,445 1979 . . . . . . . . . 1980 . . . . . . . . . 1981 . . . 1 . . . . . 1982 . . . . . . . . 1 1983 362 . 1 . 2 1 . . . 1984 553 365 . . . . 1 . . 1985 566 522 385 217 . . . . . 1986 594 555 545 838 273 1 . 1 . 1987 539 567 567 849 427 279 . . . 1988 586 584 520 885 437 428 326 . . 1989 628 596 582 895 478 444 439 252 1 1990 624 563 598 983 504 469 426 343 253 1991 600 638 543 920 452 474 481 427 409 1992 624 616 595 977 531 456 497 412 404 1993 645 633 646 987 555 507 525 459 458 1994 610 677 679 1,036 567 498 492 465 487 1995 695 647 676 1,033 569 501 518 490 482 1996 733 695 701 1,078 555 528 505 510 516 1997 702 699 685 1,037 560 508 556 500 508 1998 661 641 661 1,009 558 565 529 481 517 1999 681 676 708 951 525 546 560 550 506 2000 643 640 622 928 524 559 597 475 517 2001 639 712 633 929 584 576 566 512 538 2002 706 679 623 984 574 564 550 531 547 2003 642 637 654 938 566 557 556 511 523 2004 624 561 622 878 539 537 560 494 511

National Longitudinal Mortality Study – Extract File: Death Certificate Information Variables
201
year_of_death\counts: 8303 8403 8503 8509 8603 8703 8803 8903 9003 (cont.) 2005 603 585 593 970 561 520 568 531 545 2006 670 664 612 921 570 537 566 518 486 2007 624 633 597 884 560 561 550 508 514 2008 698 638 639 919 554 529 565 465 546 2009 632 625 600 901 558 556 610 525 528 2010 603 658 600 898 557 552 569 501 535 2011 693 631 591 951 571 565 561 506 508 Total 81,281 80,732 80,071 144,698 46,022 45,271 45,479 41,925 44,285 year_of_death\counts: 9103 9203 9303 9413 9503 9603 9703 9803 9903 blank 37,994 33,946 52,860 90,922 66,612 58,579 59,968 60,374 63,676 1979 . . . 1 . . . . . 1980 . . . . . . . . . 1981 . . . . . . . . . 1982 . . . . . . . . . 1983 2 . . . . . . 1 . 1984 . . 1 . . . . . . 1985 . . . . . 1 1 . . 1986 . . . 1 2 . . . . 1987 . . . . . . 1 . . 1988 . . . . . . . . . 1989 1 . . 2 . . . . 1 1990 1 . . . . . 1 . . 1991 277 . . . . . . . . 1992 431 247 . . . . . . . 1993 479 413 266 . . . . . . 1994 514 387 456 489 . . 1 . . 1995 467 454 490 669 328 . . . . 1996 488 472 534 667 498 293 1 . . 1997 521 451 550 680 506 392 289 . . 1998 510 511 591 685 521 426 438 260 . 1999 499 514 560 734 534 414 433 367 300 2000 550 482 565 715 563 450 458 389 382 2001 590 468 553 731 571 478 423 425 433 2002 566 484 620 785 618 475 444 445 421 2003 546 540 556 695 546 387 462 415 427 2004 534 543 537 714 502 416 421 432 401 2005 573 524 518 679 541 493 430 428 398 2006 573 529 496 683 522 441 434 431 420 2007 602 474 574 645 464 444 420 436 479 2008 553 536 582 734 522 486 430 431 444 2009 559 511 516 707 519 461 425 458 456 2010 590 532 556 669 528 478 447 432 471 2011 617 532 518 679 588 441 467 449 466 Total 49,037 43,550 62,899 103,286 75,485 65,555 66,394 66,173 69,175 year_of_death\counts: 0003 0103 0203 0303 0403 0503 0603 0703 0803 blank 62,898 73,980 74,711 149,012 146,778 157,046 130,886 130,787 127,799 1979 . . . . . . . . . 1980 . . . . . . . . . 1981 . . . . . . . . . 1982 . . . . . . . . . 1983 . . . . . . . . . 1984 . . . . . . . . . 1985 . . . . . . . . . 1986 . . . . . . . . . 1987 . . . . . . . . . 1988 . . . . . . . . . 1989 . . . . . . . . . 1990 . . . . . . . . . 1991 . . . . . . . . . 1992 . . . . . . . . . 1993 . . . . . . . . . 1994 . . . . . . . . . 1995 . . . . . . . . .

National Longitudinal Mortality Study – Extract File: Death Certificate Information Variables
202
year_of_death\counts: 0003 0103 0203 0303 0403 0503 0603 0703 0803 (cont.) 1996 . . . . . . . . . 1997 . . . . . . . . . 1998 1 . . . . . . . . 1999 400 . . . . . . . . 2000 632 9 6 . . . . . . 2001 765 314 1 . . . . . . 2002 800 451 335 . . . . . . 2003 375 438 458 413 . . . . . 2004 381 434 458 543 372 . . . . 2005 416 484 514 575 518 427 . . . 2006 432 452 469 601 542 593 411 . . 2007 407 446 483 651 603 634 570 447 . 2008 459 510 514 647 661 620 621 613 393 2009 471 451 503 646 588 578 636 621 582 2010 399 495 510 647 592 666 669 610 657 2011 486 473 560 670 655 693 670 664 624 Total 69,322 78,937 79,522 154,405 151,309 161,257 134,463 133,742 130,055 year_of_death\counts: 0903 1003 1103 blank 130,977 130,423 129,682 1979 . . . 1980 . . . 1981 . . . 1982 . . . 1983 . . . 1984 . . . 1985 . . . 1986 . . . 1987 . . . 1988 . . . 1989 . . . 1990 . . . 1991 . . . 1992 . . . 1993 . . . 1994 . . . 1995 . . . 1996 . . . 1997 . . . 1998 . . . 1999 . . . 2000 . . . 2001 . . . 2002 . . . 2003 . . . 2004 . . . 2005 . . . 2006 . . . 2007 . . . 2008 . . . 2009 392 . . 2010 619 421 . 2011 641 624 379 Total 132,629 131,468 130,061

National Longitudinal Mortality Study – Extract File: Death Certificate Information Variables
203
99. ICD-9 & ICD-10 Underlying Cause of Death UCAUSE Analysis File Return to Index EDITS: Simple DESCRIPTION: The underlying cause of death taken from the death certificate information. Reference for coding is: International Classification of Diseases, published by the World Health Organization 1977, Volumes 1 and 2 (ICD-9), and 1992 (ICD-10). NOTE: There are 28 cases in the NLMS that have a value of IND201 of ‘2’ indicating the survey participant is deceased yet the underlying cause of death, UCAUSE, is unknown, ‘0000’ and all information about the death is missing. This missing information is under review and, hopefully, will be resolved following the next match of NLMS records to the NDI. An initial review of these 28 cases indicates that there are no biases evident in terms of occurrence in a particular file or a particular gender-race-Hispanic status classification. AVAILABLE FILES: All files CODES for files: All files blank — Person is alive or person is deceased, with cause yet to be determined 0001-9999 — Person is deceased, with cause of death determined by ICD-9 coding A000-Z999 — Person is deceased, with cause of death determined by ICD-10 coding FREQUENCIES: UCAUSE\counts: 7303 7802 7903 8014 8024 8008 8012 8103 8203 8303 blank 92,545 60,434 32,289 135,578 82,807 135,400 134,250 46,330 61,925 63,101 0001-9999 23,276 20,388 6,424 28,911 24,659 27,686 25,660 8,684 10,843 9,721 A000-Z999 15,392 13,840 4,385 20,382 16,879 19,287 17,855 6,790 8,712 8,459 Total 131,213 94,662 43,098 184,871 124,345 182,373 177,765 61,804 81,480 81,281 UCAUSE\counts: 8403 8503 8509 8603 8703 8803 8903 9003 9103 9203 blank 63,395 63,596 119,902 32,311 32,453 32,806 30,958 33,445 37,994 33,946 0001-9999 8,997 8,383 12,740 6,465 5,658 5,294 4,338 4,036 3,691 2,935 A000-Z999 8,340 8,092 12,056 7,246 7,160 7,379 6,629 6,804 7,352 6,669 Total 80,732 80,071 144,698 46,022 45,271 45,479 41,925 44,285 49,037 43,550 UCAUSE\counts: 9303 9413 9503 9603 9703 9803 9903 0003 0103 0203 blank 52,860 90,922 66,612 58,579 59,968 60,374 63,676 62,898 73,980 74,711 0001-9999 2,888 3,194 1,855 1,112 732 261 1 1 . . A000-Z999 7,151 9,170 7,018 5,864 5,694 5,538 5,498 6,423 4,957 4,811 Total 62,899 103,286 75,485 65,555 66,394 66,173 69,175 69,322 78,937 79,522 UCAUSE\counts: 0303 0403 0503 0603 0703 0803 0903 1003 1103 blank 149,012 146,778 157,046 130,886 130,787 127,799 130,977 130,423 129,682 0001-9999 . . . . . . . . . A000-Z999 5,393 4,531 4,211 3,577 2,955 2,256 1,652 1,045 379 Total 154,405 151,309 161,257 134,463 133,742 130,055 132,629 131,468 130,061

National Longitudinal Mortality Study – Extract File: Death Certificate Information Variables
204
100. First 3 Characters of Underlying Cause CAUSE3 Analysis File Return to Index EDITS: None DESCRIPTION: A three-character variable that is an extract of the first three characters of the variable UCAUSE. (Appears in Analysis file only)

National Longitudinal Mortality Study – Extract File: Death Certificate Information Variables
205
101. 113 Selected Causes of Death CAUSE113 Analysis File Return to Index EDITS: None DESCRIPTION: In 1992 the CDC’s National Center for Health Statistics (NCHS) published a standardized list of 113 selected causes of death, for the general analysis of mortality statistics and for ranking leading causes of death. For NLMS purposes, all causes of death, both ICD-9 and ICD-10, have been assigned to the NCHS 113 causes. This definition assigned causes based on the NCHS-identified value for mortality identified after the 2006 match. For mortality identified before the 2006 match, NLMS staff developed software to make the assignment from ICD-9 codes using an NCHS-developed algorithm. Thus, CAUSE113 is defined for all causes of death. (Appears in Analysis file only)

National Longitudinal Mortality Study – Extract File: Death Certificate Information Variables
206
102. Hospital Type HOSP Return to Index EDITS: None DESCRIPTION: Describes the place of death. NOT AVAILABLE: 9903–0203 CODES for files: 7303–9803, 0303-1103 blank — Alive 1 — Entry on death certificate includes hospital or medical center, or is a clinic
of a hospital 2 — Entry is a type of institution other than hospital or medical center, such as
nursing home, professional center, doctor's office, or clinic other than a hospital clinic
3 — Entry includes the word "clinic" but does not indicate whether or not it is of a hospital
4 — Entry is a street address (or home, or work, etc.) only 5 — Other entries which do not include the word "Hospital" or "Medical Center" 6 — Hospice 7 — Unknown 9 — Blank or illegible on the death certificate FREQUENCIES: HOSP\counts: 7303 7802 7903 8014 8024 8008 8012 8103 8203 8303 blank 92,710 60,612 32,351 135,939 83,120 135,734 134,567 46,449 62,049 63,274 1 20,693 18,149 5,810 25,919 21,601 24,580 22,468 7,973 10,057 9,223 2 7,586 6,625 2,053 9,660 8,566 9,212 8,648 3,043 3,774 3,572 3 64 51 17 95 72 81 75 33 45 33 4 8,424 7,634 2,358 10,872 8,963 10,532 9,753 3,446 4,500 4,141 5 1,232 1,090 366 1,716 1,473 1,583 1,579 611 731 735 6 292 266 89 374 279 357 349 133 172 164 7 194 217 40 253 238 254 290 109 138 133 9 18 18 14 43 33 40 36 7 14 6 Total 131,213 94,662 43,098 184,871 124,345 182,373 177,765 61,804 81,480 81,281 HOSP\counts: 8403 8503 8509 8603 8703 8803 8903 9003 9103 9203 blank 63,551 63,726 120,182 32,519 32,615 32,944 31,077 33,599 38,152 34,086 1 8,771 8,407 12,492 6,613 6,120 6,127 5,230 5,078 5,149 4,500 2 3,392 3,305 5,034 2,871 2,737 2,648 2,292 2,225 2,278 2,120 3 31 44 68 25 31 30 26 31 31 41 4 4,052 3,768 5,590 2,933 2,933 2,918 2,631 2,640 2,740 2,222 5 653 592 959 829 622 593 491 511 484 410 6 164 154 225 139 137 135 116 127 145 119 7 105 72 144 93 76 84 62 74 58 52 9 13 3 4 . . . . . . . Total 80,732 80,071 144,698 46,022 45,271 45,479 41,925 44,285 49,037 43,550
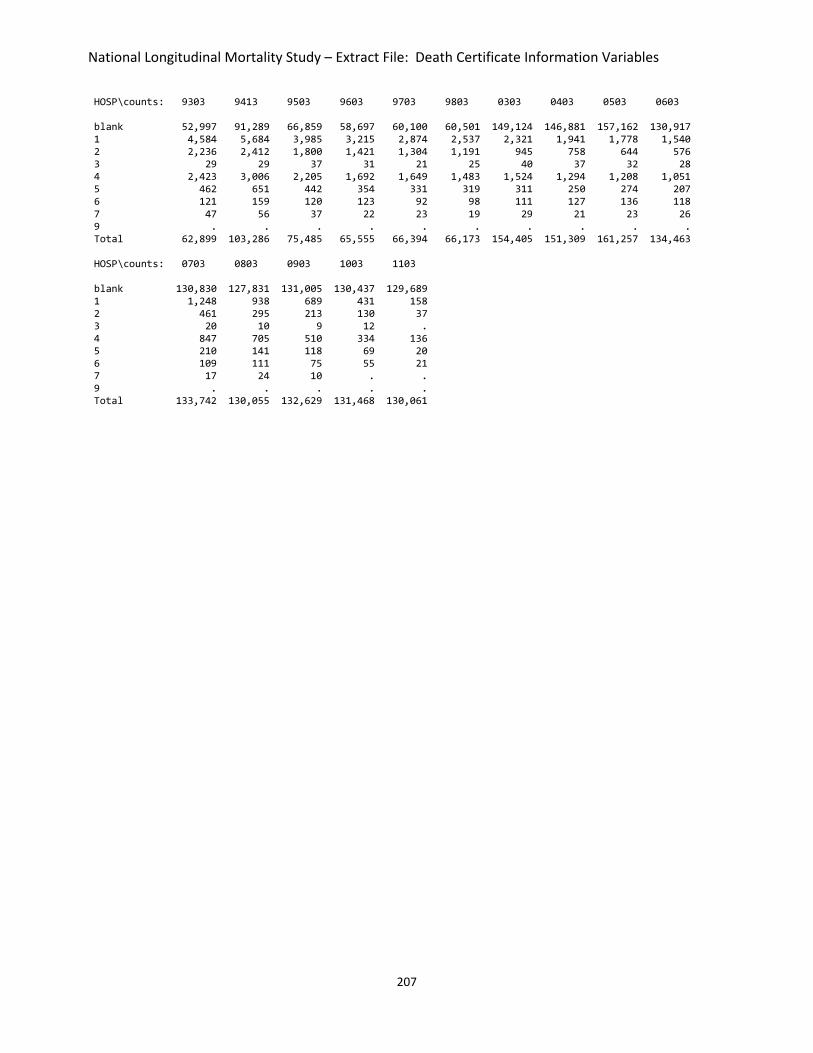
National Longitudinal Mortality Study – Extract File: Death Certificate Information Variables
207
HOSP\counts: 9303 9413 9503 9603 9703 9803 0303 0403 0503 0603 blank 52,997 91,289 66,859 58,697 60,100 60,501 149,124 146,881 157,162 130,917 1 4,584 5,684 3,985 3,215 2,874 2,537 2,321 1,941 1,778 1,540 2 2,236 2,412 1,800 1,421 1,304 1,191 945 758 644 576 3 29 29 37 31 21 25 40 37 32 28 4 2,423 3,006 2,205 1,692 1,649 1,483 1,524 1,294 1,208 1,051 5 462 651 442 354 331 319 311 250 274 207 6 121 159 120 123 92 98 111 127 136 118 7 47 56 37 22 23 19 29 21 23 26 9 . . . . . . . . . . Total 62,899 103,286 75,485 65,555 66,394 66,173 154,405 151,309 161,257 134,463 HOSP\counts: 0703 0803 0903 1003 1103 blank 130,830 127,831 131,005 130,437 129,689 1 1,248 938 689 431 158 2 461 295 213 130 37 3 20 10 9 12 . 4 847 705 510 334 136 5 210 141 118 69 20 6 109 111 75 55 21 7 17 24 10 . . 9 . . . . . Total 133,742 130,055 132,629 131,468 130,061

National Longitudinal Mortality Study – Extract File: Death Certificate Information Variables
208
103. Did Death Occur in a Hospital HOSPD Return to Index EDITS: None DESCRIPTION: Indicates the location of death relative to a hospital. Response is determined from the death certificate. Certain states do not have this item on their certificate. For these states a code 9 is assigned for this variable. Approximately 2.5% of the deaths observed occur in these states. NOT AVAILABLE: 9903–0203 CODES for files: 7303–9803, 0303-1103 blank — Alive 1 — DOA (a special box must be present and marked on the death certificate) 2 — Inpatient 3 — Outpatient/Emergency 4 — Other hospital visit 5 — Not in hospital 6 — Not on death certificate/unable to determine 9 — Blank on certificate or illegible FREQUENCIES: HOSPD\counts: 7303 7802 7903 8014 8024 8008 8012 8103 8203 8303 blank 92,711 60,612 32,351 135,939 83,120 135,734 134,567 46,449 62,049 63,274 1 1,014 983 238 1,236 1,042 1,136 1,065 387 436 348 2 15,306 13,500 4,311 19,594 16,409 18,576 16,961 5,999 7,675 7,174 3 5,230 4,686 1,536 6,933 5,557 6,705 6,162 2,285 2,849 2,708 4 4 4 . 2 4 7 6 2 3 1 5 13,890 12,354 3,858 17,982 15,602 17,179 16,161 5,749 7,346 6,809 6 2,654 2,164 693 2,618 2,164 2,489 2,342 775 919 765 9 404 359 111 567 447 547 501 158 203 202 Total 131,213 94,662 43,098 184,871 124,345 182,373 177,765 61,804 81,480 81,281 HOSPD\counts: 8403 8503 8509 8603 8703 8803 8903 9003 9103 9203 blank 63,551 63,726 120,182 32,519 32,615 32,944 31,077 33,599 38,152 34,086 1 341 325 487 249 241 242 172 169 171 137 2 6,853 6,638 9,847 5,441 5,044 5,009 4,264 4,204 4,188 3,692 3 2,603 2,631 4,007 2,255 2,177 2,236 2,008 1,946 2,128 2,003 4 2 2 . . . . . . . . 5 6,615 6,167 9,535 5,458 5,117 4,961 4,341 4,293 4,340 3,580 6 576 434 553 99 77 86 63 74 58 52 9 191 148 87 1 . 1 . . . . Total 80,732 80,071 144,698 46,022 45,271 45,479 41,925 44,285 49,037 43,550 HOSPD\counts: 9303 9413 9503 9603 9703 9803 0303 0403 0503 0603 blank 52,997 91,289 66,859 58,697 60,100 60,501 149,124 146,881 157,162 130,917 1 150 171 127 96 77 61 40 37 32 28 2 3,781 4,710 3,243 2,626 2,363 2,097 1,918 1,579 1,476 1,267 3 2,008 2,286 1,815 1,545 1,441 1,358 1,459 1,247 1,082 967 4 . . . . . . . . . . 5 3,916 4,774 3,404 2,569 2,390 2,137 1,835 1,544 1,482 1,258 6 47 56 37 22 23 19 29 21 23 26 9 . . . . . . . . . . Total 62,899 103,286 75,485 65,555 66,394 66,173 154,405 151,309 161,257 134,463
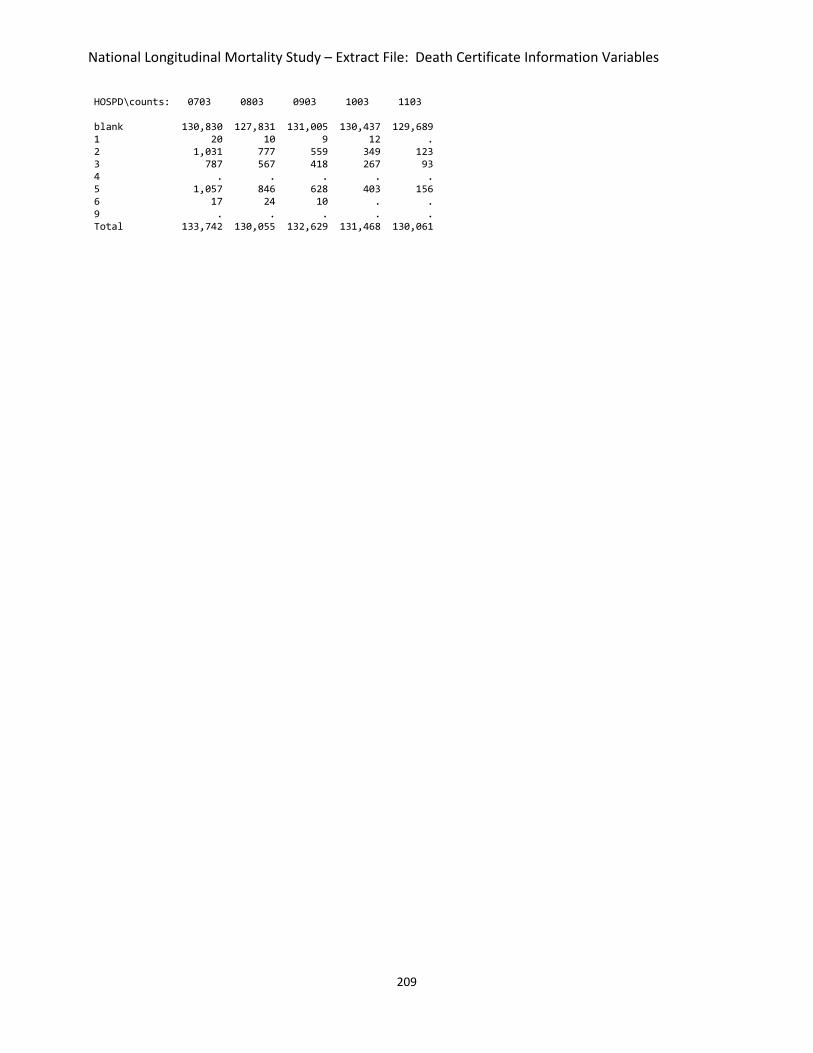
National Longitudinal Mortality Study – Extract File: Death Certificate Information Variables
209
HOSPD\counts: 0703 0803 0903 1003 1103 blank 130,830 127,831 131,005 130,437 129,689 1 20 10 9 12 . 2 1,031 777 559 349 123 3 787 567 418 267 93 4 . . . . . 5 1,057 846 628 403 156 6 17 24 10 . . 9 . . . . . Total 133,742 130,055 132,629 131,468 130,061

National Longitudinal Mortality Study – Extract File: Death Certificate Information Variables
210
104. Time from Onset to Cause of Death INTERV Return to Index EDITS: None DESCRIPTION: Identifies the interval of time between the immediate cause of death and the occurrence of death. NOT AVAILABLE: files 8603–1103, deaths occurring after 12/31/89 in files 7303–8509 CODES for files: 7303–8509, deaths occurring on or before 12/31/89 blank — Alive 0 — Less than 1 hour, minutes, sudden 1 — 1-23 hours or statement, 'hours' 2 — 1-6 days or statement, 'days' 3 — 7 or more days 4 — Unable to determine 9 — Blank or illegible FREQUENCIES: INTERV\counts: 7303 7802 7903 8014 8024 8008 8012 8103 8203 8303 blank 119,232 84,248 39,908 171,117 113,145 169,417 166,048 57,943 76,990 77,524 0 2,404 2,057 651 2,812 2,295 2,663 2,391 739 928 775 1 778 646 189 842 675 803 697 226 284 243 2 1,119 874 271 1,149 980 1,035 956 350 417 301 3 2,261 2,048 611 2,635 2,201 2,529 2,236 750 791 707 4 355 287 87 347 273 343 276 91 114 75 9 5,064 4,502 1,381 5,969 4,776 5,583 5,161 1,705 1,956 1,656 Total 131,213 94,662 43,098 184,871 124,345 182,373 177,765 61,804 81,480 81,281 INTERV\counts: 8403 8503 8509 blank 77,606 77,529 141,037 0 637 557 733 1 191 156 222 2 227 186 281 3 615 489 658 4 68 44 82 9 1,388 1,110 1,685 Total 80,732 80,071 144,698

National Longitudinal Mortality Study – Extract File: Case Weight Variables
211
CASE WEIGHT VARIABLES
There are four options of weights to use when analyzing CPS files. These weights were updated versions of the previously defined ADJWGT following the 2001 match to the NDI. This set of weights was created because no revision of the NLMS weights had taken place since creation of the original files, and because one file had errors in the original set of weights. These weights account for changes in the definition of key NLMS weighting variables, the reclassification of records as fail edit or not fail edit as determined by the most recent match to the NDI, including decisions to exclude or not records identified as the earlier of multiple files. Weighting of CPS records depends on 5 key variables: age, sex, race, state of residence, and Hispanic status. The key assumption in the determination of NLMS weights is that records missing age and sex will almost never be considered in any NLMS analyses. Records missing these key pieces of information will not be weighted. Also CPS or Census records in the NLMS which fail edit, that is, records which cannot match to the NDI according to the NDI matching criteria, identified by IND201 = 0 or 1, are not weighted. The 4 weighting options developed are based on whether or not the person is in the earlier of two or more files and whether or not race is identified. Files from 1986 or later are also weighted for Hispanic status. The approach used in determining weights for NLMS records is that weights will be determined within NLMS cohort to represent the fully eligible population at the time of survey. When cohorts are combined with other cohorts in an analysis, adjustments to the weights will have to be made to fairly weight the combined data to account for cohort differences in size and the population to be represented by the combined data. The reference population used for the derivation of the NLMS weights is the non-institutionalized population of the United States at the time of survey. The starting point of the weighting process is the original file weight developed by the Census Bureau at the time of the survey. For the March CPS files this variable is called, MARSUPWT. This original weight was assigned to all records on the master file using imputed values for cases missing the key weighting variables at the time the file was developed for the CPS Branch. The “official” U.S. non-institutionalized population totals by age, race, sex and state used for NLMS weight determination are the same official Census Bureau population totals used at the time of survey as appropriate population totals for determining the original survey record weights. Each of the 4 new NLMS weighting options are adjusted to the population figures originally used for the final survey weights but account for missing values or deleted records not in the NLMS. In order to minimize the number of records missing state of residence, the survey geography, PSU and Segment, on the cohort master file was used in an attempt to identify the state of residence. The state code derived in this manner is added to the NLMS Extract and Analyses files to replace the missing state value. The weighting process followed to weight the NLMS is based on the assumption that the established final CPS weight accounts for sampling disparities and the relationships between records on the file. The reweighting process implemented, therefore, adjusts for the fail-edit status of the NLMS records. The weighting process consists of ratio adjustments and raking across the indicated demographic variables and mimics the process used to determine the original CPS

National Longitudinal Mortality Study – Extract File: Case Weight Variables
212
weights on the file. First, a Hispanic status ratio adjustment is made to the files from 1986 and later by age and Hispanic status. Then the files are raked and ratio adjusted by age-sex-race and then by state of residence in four iterations to the converge to the corresponding non-institutionalized population. The four new weighting variables developed are missing for a record if the record is a fail edit, is missing age and gender or state of residence. The weights and their characteristics are by name:

National Longitudinal Mortality Study – Extract File: Case Weight Variables
213
105. Weight—Race Variable Used WGT1 Return to Index EDITS: None DESCRIPTION: This weight is to be used in analyses when combining multiple NLMS cohorts and the variable race is used in the analyses. Records having 0 WGT1 weight (records not for use in analyses): a. Records failing edit, i.e. IND213 = 0 or 1, b. Records for deceased which are the earlier of multiple files, IND213 = 4. c. Records missing race, gender or age, d. Records missing state of residence

National Longitudinal Mortality Study – Extract File: Case Weight Variables
214
106. Weight—Race Used, EOFT Included WGT2 Return to Index EDITS: None DESCRIPTION: This weight is based on the same exclusions as WGT1 except that records classified as the earlier of two files are included (NOT DELETED) for purposes of weighting determination. When using this weight the assumption would be that the file will be analyzed as a stand-alone file without other NLMS files in the analyses. Records having 0 WGT2 weight (records not for use in analyses): a. Records failing edit, i.e. IND213 = 0 or 1 b. Records missing race, gender or age c. Records missing state of residence

National Longitudinal Mortality Study – Extract File: Case Weight Variables
215
107. Weight—Race Not Used WGT3 Return to Index EDITS: None DESCRIPTION: This weight is derived ignoring the condition that the record is missing a value for race. When using this weight, the assumption would be that the file will be analyzed as part of a group of NLMS files and that a value of race is not required for the analyses involved. This weight is determined after deleting records which are the earlier of two files and is therefore, suitable for use when combining multiple files in analyses. Records having 0 WGT3 weight (records not for use in analyses): a. Records failing edit, i.e. IND213 = 0 or 1 b. Records for deceased which are the earlier of multiple files, IND213 = 4 c. Records missing either gender or age, or both d. Records missing state of residence

National Longitudinal Mortality Study – Extract File: Case Weight Variables
216
108. Weight—Race Not Used , EOTF Included WGT4 Return to Index EDITS: None DESCRIPTION: This weight is based on the same exclusions as WGT3 except that records classified as the earlier of two files are included (NOT DELETED) for purposes of weighting determination. When using these weights the assumption would be that the file is to be analyzed as a stand-alone file without other NLMS files in the analyses. This weight is derived ignoring the condition that the record is missing a value for race. Records having 0 WGT4 weight (records not for use in analyses): a. Records failing edit, i.e. IND213 = 0 or 1 b. Records missing either gender or age, or both c. Records missing state of residence

National Longitudinal Mortality Study – Analysis File
217
ANALYSIS FILE Variable Description and Codes
July 1,2014 Return to Index This Analysis File section documents the modifications made during the creation of SAS datasets, or “Analysis Files” from NLMS Extract Files. A major function in creating these SAS datasets is to standardize variables across all files in the study by recoding. This section last updated July 1, 2014. VARIABLE DELETIONS AND ADDITIONS IN ANALYSIS FILES There are six new variables, generated from extract file variables, which have been added to the analysis files by the recode program. These variables are: STATER, FIPSSTATE, CAUSE3, CAUSE113, VALID and LIFE. Two variables were dropped from this manual: EDUCC (grade completed), and EDUCCOMP (education incorporating EDUCC), because the recodes incorporate this information. See EDUC for details. SAS RECODES There are three types of modifications that may have been performed on any variable to create the Analysis files. They are: Simple Edit: occurs when coded levels of the variable indicate inability to collect an
informative variable response. All such levels are set to the appropriate SAS missing value code (blank for character variables and “.” for numerical variables). Simple edits would be made when the original variable levels indicate such information as; "unknown", "illegible", "blank", etc.
Invalid Entry Edit: occurs when invalid codes are found in the variable field. Invalid codes
include extraneous characters that obviously result from data keying errors or computer garbage.
Recoding Edit: occurs when valid codes of variables are recoded so that the variable has one
standardized set of entries across all cohorts. NOTE: When either the simple or invalid entry edits are identified, only the changes will be documented. All useful levels of the variable will remain as described in the Reference Manual Extract File documentation. For recoding edits a complete description, including listing of counts, will be shown.

National Longitudinal Mortality Study – Analysis File
218
EDITS TO VARIABLES
Below are shown the edited changes made to variables in creating the analysis files. Interpret the symbol "==>" to read "changed to.” Variables are numbered according to their number in the extract file. Within each group of variables, those without edits are listed first (i.e., variables may be out of numerical order). The type or types of edits applied to the variable are noted below the variable label.

National Longitudinal Mortality Study – Analysis File: File and Survey Variables
219
FILE AND SURVEY VARIABLES
1. NDI/CPS Control Number CCNUM Return to Index EDITS: None 2. Code for Specific Master File FILE EDITS: None 3. Exposure Factor in Years (X 100) FACTOR EDITS: None 4. Serial # in CPS/Control # in Census SERN EDITS: None 5. Household Identification Number HHID EDITS: None 6. SSN Present or Absent on NDI File SSNYN EDITS: None 7. Validated SSN VALIDSSN EDITS: None 8. Match Key/SSN Collection Month MATCHKEY EDITS: None

National Longitudinal Mortality Study – Analysis File: File and Survey Variables
220
9. Start Date START Return to Index EDITS: None

National Longitudinal Mortality Study – Analysis File: Fail-Edit and Mortality Indicator Variables
221
FAIL-EDIT AND MORTALITY INDICATOR VARIABLES
10. Match Status Indicator IND1 Return to Index EDITS: None 11. Observed Death Indicator IND2 EDITS: None 12. Match Status Indicator (1985) IND185 EDITS: None 13. Observed Death Indicator (1985) IND285 EDITS: None 14. Observed Death Indicator (1987) IND287 EDITS: None 15. Observed Death Indicator (1989) IND289 EDITS: None 16. Observed Death Indicator (1991 match to NDI) IND291 EDITS: None 17. Observed Death Indicator (2001 match to NDI) IND201 EDITS: None

National Longitudinal Mortality Study – Analysis File: Fail-Edit and Mortality Indicator Variables
222
18. Observed Death Indicator (2006 match to NDI) IND206 Return to Index EDITS: None 19. Observed Death Indicator (2013 match to NDI) IND213 EDITS: None

National Longitudinal Mortality Study – Analysis File: Fail-Edit and Mortality Indicator Variables
223
20. Alive or Dead in the 2013 Match LIFE Extract File Return to Index Return to Analysis File Introduction EDITS: Variable defined in Analysis File only. DESCRIPTION: An indicator variable to show dead or alive. A valid code of 0 or 1 means that record is eligible for analyses based on the IND213 indicator variable resulting from the 2013 match of NLMS records to the NDI. Below is the SAS code to compute the variable LIFE:
IF IND213 = '2' THEN LIFE = '1'; IF IND213 = '3' OR IND213 = '4' THEN LIFE = '0'; (These statements imply that fail-edit records are coded as missing.)
AVAILABLE FILES: All files CODES for files: All files blank — Unknown, fail edit 0 — Person identified as alive according to 2013 match 1 — Person identified as dead according to 2013 match FREQUENCIES: LIFE\counts: 7303 7802 7903 8014 8024 8008 8012 8103 8203 8303 blank 5,685 2,398 1,518 1,891 143 1,052 2,881 1,707 1,600 2,070 0 87,029 58,224 30,837 133,927 82,818 134,563 131,579 44,668 60,371 61,073 1 38,499 34,040 10,743 49,053 41,384 46,758 43,305 15,429 19,509 18,138 Total 131,213 94,662 43,098 184,871 124,345 182,373 177,765 61,804 81,480 81,281 LIFE\counts: 8403 8503 8509 8603 8703 8803 8903 9003 9103 9203 blank 3,234 3,368 25 7 7 6 7 6 9 5 0 60,210 60,418 120,004 32,320 32,466 32,829 30,967 33,459 38,000 33,953 1 17,288 16,285 24,669 13,695 12,798 12,644 10,951 10,820 11,028 9,592 Total 80,732 80,071 144,698 46,022 45,271 45,479 41,925 44,285 49,037 43,550 LIFE\counts: 9303 9413 9503 9603 9703 9803 9903 0003 0103 0203 blank 2,304 728 579 666 654 732 98 633 105 110 0 50,759 90,308 66,038 57,918 59,320 59,644 63,605 62,785 73,891 74,608 1 9,836 12,250 8,868 6,971 6,420 5,797 5,472 5,904 4,941 4,804 Total 62,899 103,286 75,485 65,555 66,394 66,173 69,175 69,322 78,937 79,522 LIFE\counts: 0303 0403 0503 0603 0703 0803 0903 1003 1103 blank 26,401 26,773 29,419 11,803 12,129 11,228 18,749 18,441 16,318 0 122,611 120,005 127,627 119,083 118,658 116,571 112,228 111,982 113,364 1 5,393 4,531 4,211 3,577 2,955 2,256 1,652 1,045 379 Total 154,405 151,309 161,257 134,463 133,742 130,055 132,629 131,468 130,061
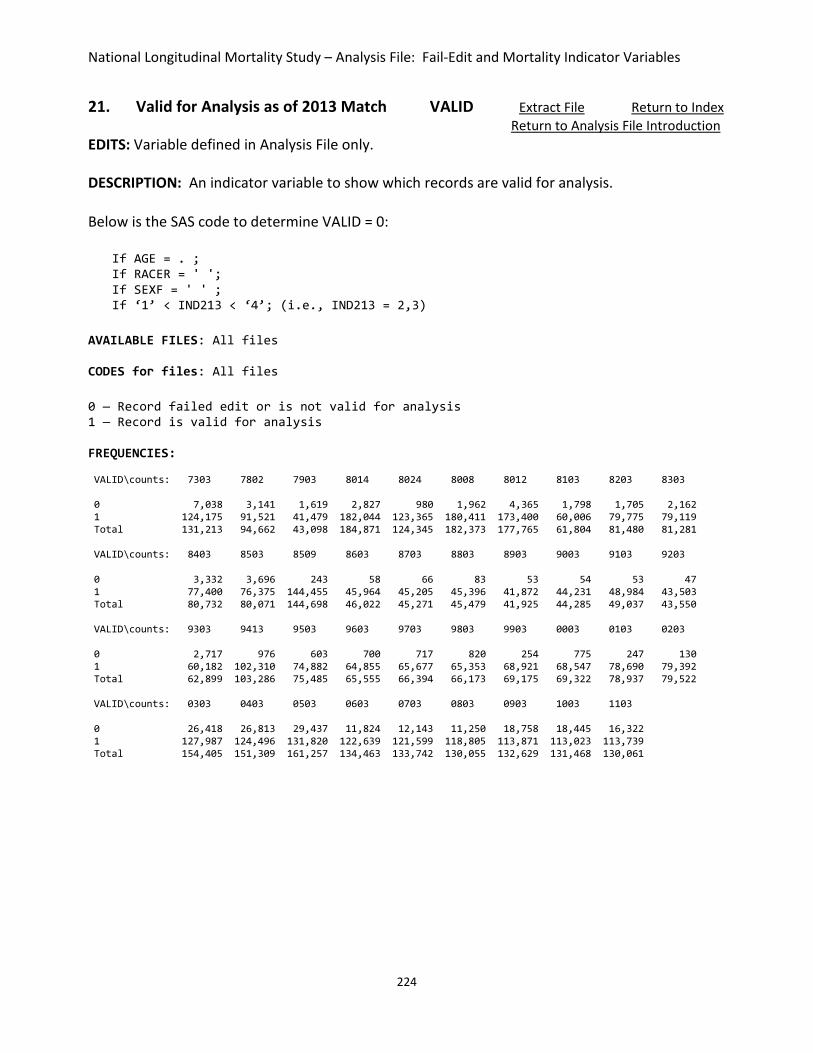
National Longitudinal Mortality Study – Analysis File: Fail-Edit and Mortality Indicator Variables
224
21. Valid for Analysis as of 2013 Match VALID Extract File Return to Index Return to Analysis File Introduction EDITS: Variable defined in Analysis File only. DESCRIPTION: An indicator variable to show which records are valid for analysis. Below is the SAS code to determine VALID = 0:
If AGE = . ; If RACER = ' '; If SEXF = ' ' ; If ‘1’ < IND213 < ‘4’; (i.e., IND213 = 2,3)
AVAILABLE FILES: All files CODES for files: All files 0 — Record failed edit or is not valid for analysis 1 — Record is valid for analysis FREQUENCIES: VALID\counts: 7303 7802 7903 8014 8024 8008 8012 8103 8203 8303 0 7,038 3,141 1,619 2,827 980 1,962 4,365 1,798 1,705 2,162 1 124,175 91,521 41,479 182,044 123,365 180,411 173,400 60,006 79,775 79,119 Total 131,213 94,662 43,098 184,871 124,345 182,373 177,765 61,804 81,480 81,281 VALID\counts: 8403 8503 8509 8603 8703 8803 8903 9003 9103 9203 0 3,332 3,696 243 58 66 83 53 54 53 47 1 77,400 76,375 144,455 45,964 45,205 45,396 41,872 44,231 48,984 43,503 Total 80,732 80,071 144,698 46,022 45,271 45,479 41,925 44,285 49,037 43,550 VALID\counts: 9303 9413 9503 9603 9703 9803 9903 0003 0103 0203 0 2,717 976 603 700 717 820 254 775 247 130 1 60,182 102,310 74,882 64,855 65,677 65,353 68,921 68,547 78,690 79,392 Total 62,899 103,286 75,485 65,555 66,394 66,173 69,175 69,322 78,937 79,522 VALID\counts: 0303 0403 0503 0603 0703 0803 0903 1003 1103 0 26,418 26,813 29,437 11,824 12,143 11,250 18,758 18,445 16,322 1 127,987 124,496 131,820 122,639 121,599 118,805 113,871 113,023 113,739 Total 154,405 151,309 161,257 134,463 133,742 130,055 132,629 131,468 130,061

National Longitudinal Mortality Study – Analysis File: Geographical Variables
225
GEOGRAPHICAL VARIABLES 22. Census Geographical Division DIV Extract File Return to Index EDITS: Simple For files: 7303, 7802, 8014–8012, 8203 0 ==> missing value code 23. State within Division STATE Extract File EDITS: Simple For files: 7303, 7802, 8014–8012, 8203 0 ==> missing value code

National Longitudinal Mortality Study – Analysis File: Geographical Variables
226
24. Division-State Concatenated STATER Extract File Return to Index Return to Analysis File Introduction EDITS: Simple DESCRIPTION: The concatenation of DIV and STATE forms a two digit state code according to 1960 Census coding. The first and second digits represent geographic division and state, respectively. Also see Appendix B. For files: 7303, 7802, 8014–8012, 8203 00 ==> missing value code AVAILABLE FILES: All files CODES for files: All files blank – Unknown, non-interview
household 11 – Maine 12 – New Hampshire 13 – Vermont 14 – Massachusetts 15 – Rhode Island 16 – Connecticut 21 – New York 22 – New Jersey 23 – Pennsylvania 31 – Ohio 32 – Indiana 33 – Illinois 34 – Michigan 35 – Wisconsin 41 – Minnesota 42 – Iowa 43 – Missouri 44 – North Dakota 45 – South Dakota 46 – Nebraska 47 – Kansas 51 – Delaware 52 – Maryland 53 – District of Columbia 54 – Virginia 55 – West Virginia 56 – North Carolina 57 – South Carolina 58 – Georgia 59 – Florida 61 – Kentucky 62 – Tennessee 63 – Alabama 64 – Mississippi
71 – Arkansas 72 – Louisiana 73 – Oklahoma 74 – Texas 81 – Montana 82 – Idaho 83 – Wyoming 84 – Colorado 85 – New Mexico 86 – Arizona 87 – Utah 88 – Nevada 91 – Washington 92 – Oregon 93 – California 94 – Alaska 95 – Hawaii

National Longitudinal Mortality Study – Analysis File: Geographical Variables
227
FREQUENCIES: STATER\counts: 7303 7802 7903 8014 8024 8008 8012 8103 8203 8303 blank 1,032 1,927 . 1,892 63 1,129 218 . 1 . 11 924 585 368 2,360 1,981 2,375 2,374 890 941 1,032 12 744 520 269 1,980 1,248 1,991 2,143 735 769 753 13 233 203 340 2,057 1,407 1,986 2,002 723 796 879 14 3,508 2,457 1,010 3,604 2,959 3,571 3,707 1,259 1,891 1,855 15 611 442 302 2,131 1,596 2,019 1,977 711 748 791 16 2,104 1,450 564 2,019 1,604 2,016 2,082 724 814 916 21 10,375 7,333 3,102 10,365 6,652 9,945 10,337 3,430 5,057 5,136 22 4,510 3,304 1,275 4,544 2,873 4,645 2,603 1,611 2,254 2,089 23 7,567 5,434 1,870 6,226 5,552 6,846 6,785 2,334 3,139 3,100 31 7,028 4,584 1,471 7,655 5,399 7,266 6,061 2,270 3,041 2,974 32 3,625 2,433 941 3,739 2,381 3,639 3,566 1,082 1,585 1,454 33 6,700 4,594 1,772 6,851 4,661 6,832 6,897 2,272 3,023 2,804 34 5,665 3,923 1,397 6,007 4,669 5,838 4,627 2,021 2,651 2,579 35 2,765 1,948 674 3,754 2,728 3,806 3,755 1,145 1,132 1,399 41 2,457 1,734 657 3,544 1,789 3,367 3,529 905 1,448 1,419 42 1,501 1,074 570 2,746 1,849 2,842 2,905 1,040 1,259 1,179 43 3,259 2,164 738 4,869 3,175 4,833 4,983 1,048 1,484 1,397 44 364 261 354 2,587 1,693 2,662 2,749 844 1,077 1,004 45 349 302 497 2,628 2,033 2,645 2,784 1,128 1,127 1,291 46 1,006 638 350 2,464 1,603 2,438 2,389 951 1,142 922 47 1,402 886 414 2,944 1,503 2,913 2,879 877 851 988 51 392 266 163 1,786 1,659 1,815 1,926 654 794 739 52 2,620 1,793 696 4,067 2,205 4,101 4,172 928 1,387 1,293 53 433 232 161 1,723 1,658 1,563 1,743 612 767 628 54 3,004 2,271 758 3,032 2,773 3,211 3,476 1,049 1,452 1,498 55 1,210 783 369 2,492 1,864 2,554 2,759 907 986 997 56 3,042 2,357 845 3,096 2,526 2,915 3,037 1,183 1,232 1,684 57 1,468 1,093 373 2,141 1,520 2,149 2,149 763 915 885 58 2,938 2,291 968 2,839 1,852 3,221 3,290 1,033 1,578 1,459 59 4,550 3,575 1,594 4,935 3,691 4,502 4,264 1,804 2,689 2,821 61 2,183 1,558 536 3,451 2,106 3,381 1,368 1,016 1,100 1,133 62 2,306 1,837 533 2,334 1,725 2,044 2,307 883 1,238 1,170 63 2,553 1,848 675 2,596 2,081 2,878 2,864 1,029 1,369 1,240 64 1,280 860 540 2,557 1,617 2,736 2,733 1,112 1,048 1,139 71 1,180 964 526 2,833 1,754 2,431 488 826 1,150 1,000 72 2,727 1,928 702 2,478 1,823 2,537 2,600 848 1,193 1,191 73 1,631 1,073 342 2,582 1,700 2,598 2,600 993 1,106 1,239 74 7,475 5,604 2,862 8,163 5,516 8,101 8,691 2,874 4,399 4,476 81 387 331 438 2,458 1,555 2,474 2,435 922 1,087 1,098 82 621 291 482 2,518 1,624 2,441 2,548 717 993 979 83 371 246 436 2,223 1,503 2,054 2,036 698 696 826 84 1,348 1,093 767 3,028 1,238 3,023 3,148 891 1,427 1,473 85 698 433 819 2,552 1,421 2,652 2,666 944 1,134 1,344 86 1,538 1,015 675 2,649 1,485 2,600 2,668 863 1,230 1,027 87 549 446 587 3,349 1,807 3,325 3,451 1,267 1,233 1,436 88 176 138 439 2,653 1,806 2,583 2,816 931 857 762 91 1,929 1,507 585 3,077 1,720 3,007 3,144 978 1,190 1,172 92 1,517 1,225 490 2,841 1,431 2,665 2,857 884 1,102 989 93 12,760 8,974 4,894 13,598 8,849 13,491 14,215 4,771 7,859 7,630 94 206 174 553 2,007 1,168 1,912 2,018 660 1,210 1,017 95 392 260 355 1,847 1,250 1,805 1,944 764 829 975 Total 131,213 94,662 43,098 184,871 124,345 182,373 177,765 61,804 81,480 81,281
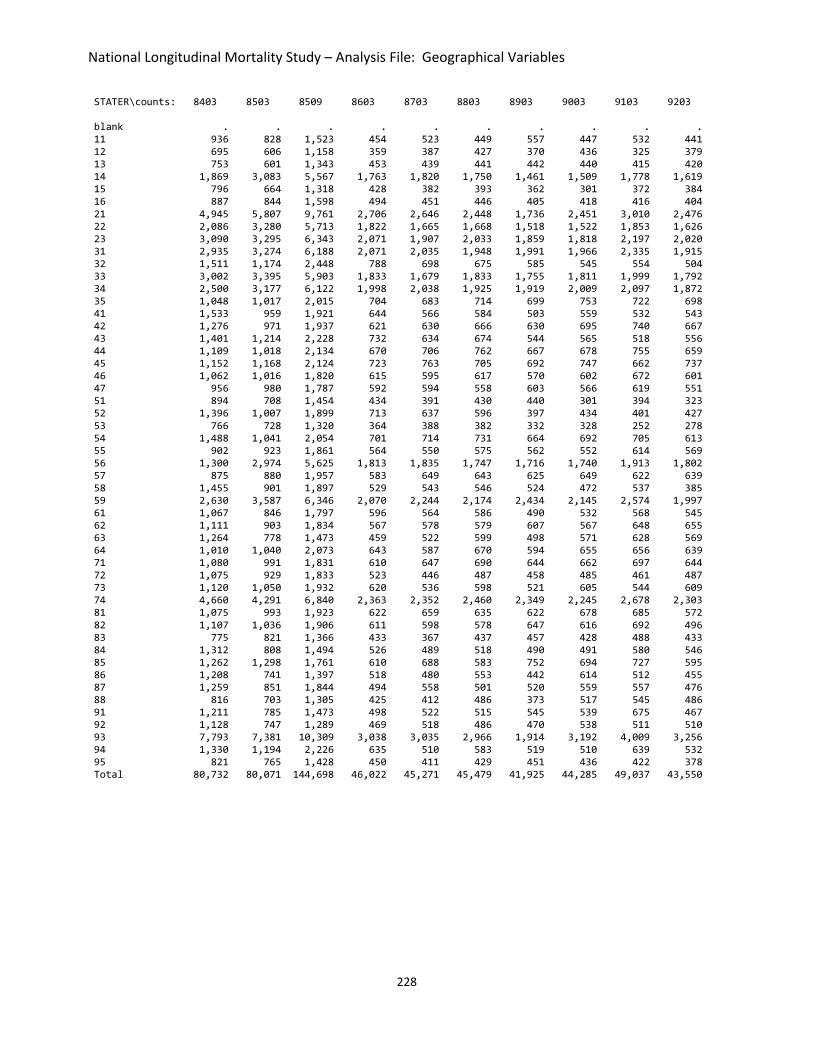
National Longitudinal Mortality Study – Analysis File: Geographical Variables
228
STATER\counts: 8403 8503 8509 8603 8703 8803 8903 9003 9103 9203 blank . . . . . . . . . . 11 936 828 1,523 454 523 449 557 447 532 441 12 695 606 1,158 359 387 427 370 436 325 379 13 753 601 1,343 453 439 441 442 440 415 420 14 1,869 3,083 5,567 1,763 1,820 1,750 1,461 1,509 1,778 1,619 15 796 664 1,318 428 382 393 362 301 372 384 16 887 844 1,598 494 451 446 405 418 416 404 21 4,945 5,807 9,761 2,706 2,646 2,448 1,736 2,451 3,010 2,476 22 2,086 3,280 5,713 1,822 1,665 1,668 1,518 1,522 1,853 1,626 23 3,090 3,295 6,343 2,071 1,907 2,033 1,859 1,818 2,197 2,020 31 2,935 3,274 6,188 2,071 2,035 1,948 1,991 1,966 2,335 1,915 32 1,511 1,174 2,448 788 698 675 585 545 554 504 33 3,002 3,395 5,903 1,833 1,679 1,833 1,755 1,811 1,999 1,792 34 2,500 3,177 6,122 1,998 2,038 1,925 1,919 2,009 2,097 1,872 35 1,048 1,017 2,015 704 683 714 699 753 722 698 41 1,533 959 1,921 644 566 584 503 559 532 543 42 1,276 971 1,937 621 630 666 630 695 740 667 43 1,401 1,214 2,228 732 634 674 544 565 518 556 44 1,109 1,018 2,134 670 706 762 667 678 755 659 45 1,152 1,168 2,124 723 763 705 692 747 662 737 46 1,062 1,016 1,820 615 595 617 570 602 672 601 47 956 980 1,787 592 594 558 603 566 619 551 51 894 708 1,454 434 391 430 440 301 394 323 52 1,396 1,007 1,899 713 637 596 397 434 401 427 53 766 728 1,320 364 388 382 332 328 252 278 54 1,488 1,041 2,054 701 714 731 664 692 705 613 55 902 923 1,861 564 550 575 562 552 614 569 56 1,300 2,974 5,625 1,813 1,835 1,747 1,716 1,740 1,913 1,802 57 875 880 1,957 583 649 643 625 649 622 639 58 1,455 901 1,897 529 543 546 524 472 537 385 59 2,630 3,587 6,346 2,070 2,244 2,174 2,434 2,145 2,574 1,997 61 1,067 846 1,797 596 564 586 490 532 568 545 62 1,111 903 1,834 567 578 579 607 567 648 655 63 1,264 778 1,473 459 522 599 498 571 628 569 64 1,010 1,040 2,073 643 587 670 594 655 656 639 71 1,080 991 1,831 610 647 690 644 662 697 644 72 1,075 929 1,833 523 446 487 458 485 461 487 73 1,120 1,050 1,932 620 536 598 521 605 544 609 74 4,660 4,291 6,840 2,363 2,352 2,460 2,349 2,245 2,678 2,303 81 1,075 993 1,923 622 659 635 622 678 685 572 82 1,107 1,036 1,906 611 598 578 647 616 692 496 83 775 821 1,366 433 367 437 457 428 488 433 84 1,312 808 1,494 526 489 518 490 491 580 546 85 1,262 1,298 1,761 610 688 583 752 694 727 595 86 1,208 741 1,397 518 480 553 442 614 512 455 87 1,259 851 1,844 494 558 501 520 559 557 476 88 816 703 1,305 425 412 486 373 517 545 486 91 1,211 785 1,473 498 522 515 545 539 675 467 92 1,128 747 1,289 469 518 486 470 538 511 510 93 7,793 7,381 10,309 3,038 3,035 2,966 1,914 3,192 4,009 3,256 94 1,330 1,194 2,226 635 510 583 519 510 639 532 95 821 765 1,428 450 411 429 451 436 422 378 Total 80,732 80,071 144,698 46,022 45,271 45,479 41,925 44,285 49,037 43,550

National Longitudinal Mortality Study – Analysis File: Geographical Variables
229
STATER\counts: 9303 9413 9503 9603 9703 9803 9903 0003 0103 0203 blank . . . . . . . . . . 11 730 918 657 605 646 642 720 610 1,243 1,096 12 548 706 640 587 631 625 705 588 1,175 1,048 13 458 745 654 629 640 600 588 575 1,152 1,014 14 2,300 3,930 2,916 1,451 1,479 1,460 1,515 1,391 1,475 1,493 15 551 882 576 698 577 656 657 664 1,271 1,394 16 613 884 635 652 660 690 721 779 1,389 1,346 21 3,575 7,914 5,274 4,443 4,404 4,284 4,389 4,571 4,133 3,988 22 2,483 4,519 3,006 1,956 2,010 2,030 2,094 2,046 2,051 2,031 23 2,971 3,895 3,254 2,623 2,687 2,573 2,675 2,497 2,606 2,542 31 2,941 4,115 3,001 2,388 2,247 2,504 2,143 2,372 2,145 2,271 32 752 1,123 822 789 845 854 819 877 1,217 1,331 33 2,061 4,643 3,006 2,765 2,660 2,817 2,793 2,978 2,849 2,754 34 2,655 4,065 3,106 2,208 2,203 2,197 2,142 2,249 1,892 2,010 35 1,006 1,204 872 960 861 919 878 941 1,426 1,574 41 784 975 856 936 874 948 858 870 1,337 1,396 42 895 1,147 875 824 857 792 784 832 1,277 1,299 43 757 1,017 726 749 798 739 740 741 1,164 998 44 899 1,233 785 760 772 810 751 706 1,023 1,011 45 995 1,466 936 836 938 774 812 791 1,138 1,199 46 955 1,197 864 832 865 882 904 866 1,204 1,227 47 896 1,099 830 836 807 817 832 908 1,132 1,391 51 587 757 602 631 700 674 649 698 853 908 52 618 920 763 741 746 721 697 635 1,138 1,095 53 393 864 601 612 585 611 526 612 727 655 54 961 1,307 2,120 953 915 978 904 964 1,266 1,134 55 794 1,069 867 887 788 839 744 804 1,060 918 56 2,634 3,546 2,729 1,519 1,617 1,583 1,510 1,666 1,443 1,539 57 880 1,167 681 669 708 704 646 592 823 746 58 675 1,223 2,217 1,019 1,133 1,098 1,007 931 880 967 59 2,955 5,170 3,275 3,199 3,190 3,125 3,655 3,728 3,598 3,727 61 759 1,117 754 869 774 909 781 829 966 1,047 62 823 1,115 752 880 776 881 802 814 798 936 63 768 1,201 846 837 836 812 806 909 1,052 1,004 64 1,021 1,097 781 864 840 760 790 755 703 739 71 863 1,185 900 870 957 800 886 803 898 794 72 623 1,017 780 895 796 891 853 854 700 828 73 825 1,398 894 987 913 974 896 905 990 1,033 74 3,155 6,173 4,091 3,639 3,935 3,883 4,614 4,775 4,617 4,787 81 891 1,238 891 875 914 906 955 791 778 816 82 974 1,347 914 935 950 996 1,157 927 1,048 1,088 83 629 829 855 815 884 846 848 840 1,047 961 84 751 1,217 944 872 978 925 1,038 1,092 1,711 1,784 85 850 1,551 1,175 1,107 1,336 1,116 1,616 1,418 1,488 1,363 86 662 1,258 1,106 984 1,238 1,145 1,423 1,423 1,446 1,337 87 830 1,153 880 1,043 911 989 972 942 1,084 1,264 88 674 1,199 822 707 825 787 1,152 1,083 1,706 1,628 91 680 1,058 830 838 782 939 803 786 1,233 1,353 92 669 1,089 803 803 757 828 736 803 1,120 1,238 93 4,722 10,987 6,842 6,418 6,758 6,546 7,770 7,632 7,569 7,324 94 826 1,418 769 871 747 703 750 820 992 1,227 95 582 939 710 689 644 591 669 639 904 869 Total 62,899 103,286 75,485 65,555 66,394 66,173 69,175 69,322 78,937 79,522

National Longitudinal Mortality Study – Analysis File: Geographical Variables
230
STATER\counts: 0303 0403 0503 0603 0703 0803 0903 1003 1103 blank 22,184 22,047 23,959 6,620 6,764 5,485 5,525 5,539 6,047 11 1,896 1,988 2,229 2,184 2,163 2,099 2,157 2,099 1,933 12 2,404 2,072 2,360 2,546 2,454 2,525 2,395 2,433 2,220 13 1,753 1,902 1,673 1,754 1,597 1,512 1,709 1,552 1,589 14 2,346 2,371 2,105 1,799 1,861 1,775 1,942 1,819 1,894 15 2,152 2,322 2,180 2,078 1,973 1,938 2,013 1,941 1,952 16 2,172 2,504 2,482 2,684 2,694 2,624 2,705 2,713 2,762 21 6,603 5,855 5,746 5,283 5,276 5,404 5,366 5,377 5,359 22 3,403 3,375 2,744 2,661 2,675 2,846 2,769 2,654 2,471 23 4,518 4,468 3,962 3,537 3,473 3,810 3,597 3,436 3,421 31 3,770 3,781 3,903 3,310 3,458 3,193 3,266 3,455 3,131 32 2,556 2,257 2,437 1,962 1,860 1,871 2,014 1,735 1,880 33 4,486 4,663 4,439 3,842 3,851 3,995 4,012 3,808 3,742 34 3,721 3,506 3,542 3,156 3,139 2,792 2,929 2,892 2,769 35 2,350 2,552 2,620 2,368 2,220 2,303 2,279 2,288 2,255 41 2,393 2,505 2,993 2,804 2,932 2,673 2,881 2,877 2,833 42 2,115 2,188 2,370 2,301 2,382 2,173 2,387 2,221 2,177 43 1,998 1,831 2,444 2,123 1,974 2,004 2,055 2,108 1,994 44 1,691 1,617 1,616 1,581 1,481 1,440 1,399 1,501 1,467 45 2,071 1,849 2,178 1,868 1,873 1,806 1,837 1,980 1,910 46 2,123 2,100 2,237 1,782 1,850 1,716 1,889 1,890 1,950 47 2,306 2,346 2,293 1,803 1,788 1,731 1,949 1,835 1,860 51 1,679 1,721 1,757 1,981 1,927 1,826 1,879 1,936 2,005 52 2,053 2,014 2,874 2,885 3,008 2,908 3,054 2,896 3,020 53 1,275 1,313 1,579 1,532 1,579 1,620 1,663 1,636 1,757 54 2,328 2,252 2,867 2,726 2,665 2,622 2,695 2,674 2,688 55 1,827 1,631 1,456 1,262 1,463 1,249 1,299 1,232 1,235 56 2,729 2,632 3,017 2,495 2,463 2,577 2,566 2,528 2,324 57 1,741 1,634 1,731 1,792 1,602 1,694 1,696 1,650 1,531 58 1,839 1,831 2,836 2,806 2,841 3,017 2,744 2,813 2,896 59 5,705 5,516 5,430 5,411 5,173 4,887 4,932 5,005 4,697 61 1,703 1,785 2,163 1,724 1,823 1,686 1,716 1,736 1,738 62 1,622 1,520 1,875 1,758 1,629 1,675 1,691 1,655 1,547 63 1,792 1,797 1,755 1,372 1,365 1,278 1,310 1,421 1,283 64 1,405 1,384 1,498 1,246 1,220 1,190 1,107 1,268 1,213 71 1,466 1,533 1,681 1,402 1,437 1,342 1,291 1,196 1,233 72 1,475 1,565 1,369 1,146 1,107 1,128 1,292 1,239 1,149 73 1,676 1,446 1,722 1,605 1,639 1,599 1,580 1,656 1,580 74 6,417 6,340 7,732 6,794 7,014 7,214 7,473 7,333 7,648 81 1,310 1,246 1,340 1,231 1,221 1,168 1,053 1,080 1,039 82 1,781 1,624 1,743 1,572 1,664 1,446 1,531 1,486 1,443 83 1,764 1,736 1,653 1,522 1,626 1,592 1,524 1,653 1,666 84 2,846 2,826 2,670 2,695 2,717 2,490 2,795 2,609 2,763 85 1,575 1,604 1,528 1,332 1,423 1,215 1,298 1,268 1,091 86 1,958 1,912 1,951 1,891 1,821 1,553 1,649 1,657 1,617 87 2,047 2,069 2,144 1,889 1,793 1,675 1,737 1,649 1,643 88 2,823 2,499 2,172 2,127 2,118 1,993 1,982 2,111 2,121 91 2,359 2,296 2,455 2,157 2,157 2,141 2,214 2,168 2,221 92 2,053 1,849 1,903 1,745 1,705 1,682 1,821 1,724 1,657 93 10,097 9,472 11,643 12,131 11,721 11,697 11,976 12,067 11,819 94 2,136 2,042 2,001 1,884 1,860 1,739 1,677 1,736 1,597 95 1,913 2,121 2,200 2,304 2,223 2,437 2,309 2,233 2,224 Total 154,405 151,309 161,257 134,463 133,742 130,055 132,629 131,468 130,061

National Longitudinal Mortality Study – Analysis File: Geographical Variables
231
25. FIPS State Code FIPSSTATE Extract File Return to Index Return to Analysis File Introduction Return to POBF EDITS: None AVAILABLE FILES: All files CODES for files: All files 00 – Unknown 01 – Alabama 02 – Alaska 04 – Arizona 05 – Arkansas 06 – California 08 – Colorado 09 – Connecticut 10 – Delaware 11 – District of Columbia 12 – Florida 13 – Georgia 15 – Hawaii 16 – Idaho 17 – Illinois 18 – Indiana 19 – Iowa 20 – Kansas 21 – Kentucky 22 – Louisiana 23 – Maine 24 – Maryland 25 – Massachusetts 26 – Michigan 27 – Minnesota 28 – Mississippi 29 – Missouri
30 – Montana 31 – Nebraska 32 – Nevada 33 – New Hampshire 34 – New Jersey 35 – New Mexico 36 – New York 37 – North Carolina 38 – North Dakota 39 – Ohio 40 – Oklahoma 41 – Oregon 42 – Pennsylvania 44 – Rhode Island 45 – South Carolina 46 – South Dakota 47 – Tennessee 48 – Texas 49 – Utah 50 – Vermont 51 – Virginia 53 – Washington 54 – West Virginia 55 – Wisconsin 56 – Wyoming

National Longitudinal Mortality Study – Analysis File: Geographical Variables
232
FREQUENCIES: FIPSSTATE\counts: 7303 7802 7903 8014 8024 8008 8012 8103 8203 8303 blank . . . . . . . . . . 00 1,032 1,927 . 1,892 63 1,129 218 . 1 . 01 2,553 1,848 675 2,596 2,081 2,878 2,864 1,029 1,369 1,240 02 206 174 553 2,007 1,168 1,912 2,018 660 1,210 1,017 04 1,538 1,015 675 2,649 1,485 2,600 2,668 863 1,230 1,027 05 1,180 964 526 2,833 1,754 2,431 488 826 1,150 1,000 06 12,760 8,974 4,894 13,598 8,849 13,491 14,215 4,771 7,859 7,630 08 1,348 1,093 767 3,028 1,238 3,023 3,148 891 1,427 1,473 09 2,104 1,450 564 2,019 1,604 2,016 2,082 724 814 916 10 392 266 163 1,786 1,659 1,815 1,926 654 794 739 11 433 232 161 1,723 1,658 1,563 1,743 612 767 628 12 4,550 3,575 1,594 4,935 3,691 4,502 4,264 1,804 2,689 2,821 13 2,938 2,291 968 2,839 1,852 3,221 3,290 1,033 1,578 1,459 15 392 260 355 1,847 1,250 1,805 1,944 764 829 975 16 621 291 482 2,518 1,624 2,441 2,548 717 993 979 17 6,700 4,594 1,772 6,851 4,661 6,832 6,897 2,272 3,023 2,804 18 3,625 2,433 941 3,739 2,381 3,639 3,566 1,082 1,585 1,454 19 1,501 1,074 570 2,746 1,849 2,842 2,905 1,040 1,259 1,179 20 1,402 886 414 2,944 1,503 2,913 2,879 877 851 988 21 2,183 1,558 536 3,451 2,106 3,381 1,368 1,016 1,100 1,133 22 2,727 1,928 702 2,478 1,823 2,537 2,600 848 1,193 1,191 23 924 585 368 2,360 1,981 2,375 2,374 890 941 1,032 24 2,620 1,793 696 4,067 2,205 4,101 4,172 928 1,387 1,293 25 3,508 2,457 1,010 3,604 2,959 3,571 3,707 1,259 1,891 1,855 26 5,665 3,923 1,397 6,007 4,669 5,838 4,627 2,021 2,651 2,579 27 2,457 1,734 657 3,544 1,789 3,367 3,529 905 1,448 1,419 28 1,280 860 540 2,557 1,617 2,736 2,733 1,112 1,048 1,139 29 3,259 2,164 738 4,869 3,175 4,833 4,983 1,048 1,484 1,397 30 387 331 438 2,458 1,555 2,474 2,435 922 1,087 1,098 31 1,006 638 350 2,464 1,603 2,438 2,389 951 1,142 922 32 176 138 439 2,653 1,806 2,583 2,816 931 857 762 33 744 520 269 1,980 1,248 1,991 2,143 735 769 753 34 4,510 3,304 1,275 4,544 2,873 4,645 2,603 1,611 2,254 2,089 35 698 433 819 2,552 1,421 2,652 2,666 944 1,134 1,344 36 10,375 7,333 3,102 10,365 6,652 9,945 10,337 3,430 5,057 5,136 37 3,042 2,357 845 3,096 2,526 2,915 3,037 1,183 1,232 1,684 38 364 261 354 2,587 1,693 2,662 2,749 844 1,077 1,004 39 7,028 4,584 1,471 7,655 5,399 7,266 6,061 2,270 3,041 2,974 40 1,631 1,073 342 2,582 1,700 2,598 2,600 993 1,106 1,239 41 1,517 1,225 490 2,841 1,431 2,665 2,857 884 1,102 989 42 7,567 5,434 1,870 6,226 5,552 6,846 6,785 2,334 3,139 3,100 44 611 442 302 2,131 1,596 2,019 1,977 711 748 791 45 1,468 1,093 373 2,141 1,520 2,149 2,149 763 915 885 46 349 302 497 2,628 2,033 2,645 2,784 1,128 1,127 1,291 47 2,306 1,837 533 2,334 1,725 2,044 2,307 883 1,238 1,170 48 7,475 5,604 2,862 8,163 5,516 8,101 8,691 2,874 4,399 4,476 49 549 446 587 3,349 1,807 3,325 3,451 1,267 1,233 1,436 50 233 203 340 2,057 1,407 1,986 2,002 723 796 879 51 3,004 2,271 758 3,032 2,773 3,211 3,476 1,049 1,452 1,498 53 1,929 1,507 585 3,077 1,720 3,007 3,144 978 1,190 1,172 54 1,210 783 369 2,492 1,864 2,554 2,759 907 986 997 55 2,765 1,948 674 3,754 2,728 3,806 3,755 1,145 1,132 1,399 56 371 246 436 2,223 1,503 2,054 2,036 698 696 826 Total 131,213 94,662 43,098 184,871 124,345 182,373 177,765 61,804 81,480 81,281
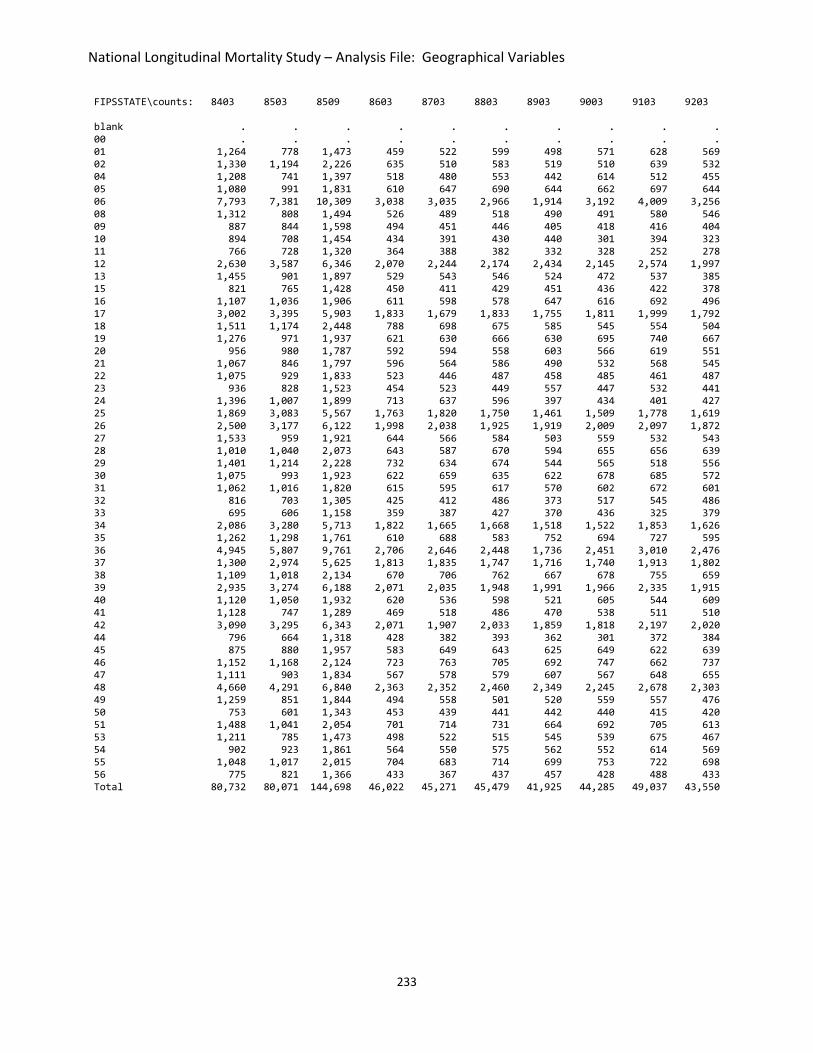
National Longitudinal Mortality Study – Analysis File: Geographical Variables
233
FIPSSTATE\counts: 8403 8503 8509 8603 8703 8803 8903 9003 9103 9203 blank . . . . . . . . . . 00 . . . . . . . . . . 01 1,264 778 1,473 459 522 599 498 571 628 569 02 1,330 1,194 2,226 635 510 583 519 510 639 532 04 1,208 741 1,397 518 480 553 442 614 512 455 05 1,080 991 1,831 610 647 690 644 662 697 644 06 7,793 7,381 10,309 3,038 3,035 2,966 1,914 3,192 4,009 3,256 08 1,312 808 1,494 526 489 518 490 491 580 546 09 887 844 1,598 494 451 446 405 418 416 404 10 894 708 1,454 434 391 430 440 301 394 323 11 766 728 1,320 364 388 382 332 328 252 278 12 2,630 3,587 6,346 2,070 2,244 2,174 2,434 2,145 2,574 1,997 13 1,455 901 1,897 529 543 546 524 472 537 385 15 821 765 1,428 450 411 429 451 436 422 378 16 1,107 1,036 1,906 611 598 578 647 616 692 496 17 3,002 3,395 5,903 1,833 1,679 1,833 1,755 1,811 1,999 1,792 18 1,511 1,174 2,448 788 698 675 585 545 554 504 19 1,276 971 1,937 621 630 666 630 695 740 667 20 956 980 1,787 592 594 558 603 566 619 551 21 1,067 846 1,797 596 564 586 490 532 568 545 22 1,075 929 1,833 523 446 487 458 485 461 487 23 936 828 1,523 454 523 449 557 447 532 441 24 1,396 1,007 1,899 713 637 596 397 434 401 427 25 1,869 3,083 5,567 1,763 1,820 1,750 1,461 1,509 1,778 1,619 26 2,500 3,177 6,122 1,998 2,038 1,925 1,919 2,009 2,097 1,872 27 1,533 959 1,921 644 566 584 503 559 532 543 28 1,010 1,040 2,073 643 587 670 594 655 656 639 29 1,401 1,214 2,228 732 634 674 544 565 518 556 30 1,075 993 1,923 622 659 635 622 678 685 572 31 1,062 1,016 1,820 615 595 617 570 602 672 601 32 816 703 1,305 425 412 486 373 517 545 486 33 695 606 1,158 359 387 427 370 436 325 379 34 2,086 3,280 5,713 1,822 1,665 1,668 1,518 1,522 1,853 1,626 35 1,262 1,298 1,761 610 688 583 752 694 727 595 36 4,945 5,807 9,761 2,706 2,646 2,448 1,736 2,451 3,010 2,476 37 1,300 2,974 5,625 1,813 1,835 1,747 1,716 1,740 1,913 1,802 38 1,109 1,018 2,134 670 706 762 667 678 755 659 39 2,935 3,274 6,188 2,071 2,035 1,948 1,991 1,966 2,335 1,915 40 1,120 1,050 1,932 620 536 598 521 605 544 609 41 1,128 747 1,289 469 518 486 470 538 511 510 42 3,090 3,295 6,343 2,071 1,907 2,033 1,859 1,818 2,197 2,020 44 796 664 1,318 428 382 393 362 301 372 384 45 875 880 1,957 583 649 643 625 649 622 639 46 1,152 1,168 2,124 723 763 705 692 747 662 737 47 1,111 903 1,834 567 578 579 607 567 648 655 48 4,660 4,291 6,840 2,363 2,352 2,460 2,349 2,245 2,678 2,303 49 1,259 851 1,844 494 558 501 520 559 557 476 50 753 601 1,343 453 439 441 442 440 415 420 51 1,488 1,041 2,054 701 714 731 664 692 705 613 53 1,211 785 1,473 498 522 515 545 539 675 467 54 902 923 1,861 564 550 575 562 552 614 569 55 1,048 1,017 2,015 704 683 714 699 753 722 698 56 775 821 1,366 433 367 437 457 428 488 433 Total 80,732 80,071 144,698 46,022 45,271 45,479 41,925 44,285 49,037 43,550

National Longitudinal Mortality Study – Analysis File: Geographical Variables
234
FIPSSTATE\counts: 9303 9413 9503 9603 9703 9803 9903 0003 0103 0203 blank . . . . . . . . . . 00 . . . . . . . . . . 01 768 1,201 846 837 836 812 806 909 1,052 1,004 02 826 1,418 769 871 747 703 750 820 992 1,227 04 662 1,258 1,106 984 1,238 1,145 1,423 1,423 1,446 1,337 05 863 1,185 900 870 957 800 886 803 898 794 06 4,722 10,987 6,842 6,418 6,758 6,546 7,770 7,632 7,569 7,324 08 751 1,217 944 872 978 925 1,038 1,092 1,711 1,784 09 613 884 635 652 660 690 721 779 1,389 1,346 10 587 757 602 631 700 674 649 698 853 908 11 393 864 601 612 585 611 526 612 727 655 12 2,955 5,170 3,275 3,199 3,190 3,125 3,655 3,728 3,598 3,727 13 675 1,223 2,217 1,019 1,133 1,098 1,007 931 880 967 15 582 939 710 689 644 591 669 639 904 869 16 974 1,347 914 935 950 996 1,157 927 1,048 1,088 17 2,061 4,643 3,006 2,765 2,660 2,817 2,793 2,978 2,849 2,754 18 752 1,123 822 789 845 854 819 877 1,217 1,331 19 895 1,147 875 824 857 792 784 832 1,277 1,299 20 896 1,099 830 836 807 817 832 908 1,132 1,391 21 759 1,117 754 869 774 909 781 829 966 1,047 22 623 1,017 780 895 796 891 853 854 700 828 23 730 918 657 605 646 642 720 610 1,243 1,096 24 618 920 763 741 746 721 697 635 1,138 1,095 25 2,300 3,930 2,916 1,451 1,479 1,460 1,515 1,391 1,475 1,493 26 2,655 4,065 3,106 2,208 2,203 2,197 2,142 2,249 1,892 2,010 27 784 975 856 936 874 948 858 870 1,337 1,396 28 1,021 1,097 781 864 840 760 790 755 703 739 29 757 1,017 726 749 798 739 740 741 1,164 998 30 891 1,238 891 875 914 906 955 791 778 816 31 955 1,197 864 832 865 882 904 866 1,204 1,227 32 674 1,199 822 707 825 787 1,152 1,083 1,706 1,628 33 548 706 640 587 631 625 705 588 1,175 1,048 34 2,483 4,519 3,006 1,956 2,010 2,030 2,094 2,046 2,051 2,031 35 850 1,551 1,175 1,107 1,336 1,116 1,616 1,418 1,488 1,363 36 3,575 7,914 5,274 4,443 4,404 4,284 4,389 4,571 4,133 3,988 37 2,634 3,546 2,729 1,519 1,617 1,583 1,510 1,666 1,443 1,539 38 899 1,233 785 760 772 810 751 706 1,023 1,011 39 2,941 4,115 3,001 2,388 2,247 2,504 2,143 2,372 2,145 2,271 40 825 1,398 894 987 913 974 896 905 990 1,033 41 669 1,089 803 803 757 828 736 803 1,120 1,238 42 2,971 3,895 3,254 2,623 2,687 2,573 2,675 2,497 2,606 2,542 44 551 882 576 698 577 656 657 664 1,271 1,394 45 880 1,167 681 669 708 704 646 592 823 746 46 995 1,466 936 836 938 774 812 791 1,138 1,199 47 823 1,115 752 880 776 881 802 814 798 936 48 3,155 6,173 4,091 3,639 3,935 3,883 4,614 4,775 4,617 4,787 49 830 1,153 880 1,043 911 989 972 942 1,084 1,264 50 458 745 654 629 640 600 588 575 1,152 1,014 51 961 1,307 2,120 953 915 978 904 964 1,266 1,134 53 680 1,058 830 838 782 939 803 786 1,233 1,353 54 794 1,069 867 887 788 839 744 804 1,060 918 55 1,006 1,204 872 960 861 919 878 941 1,426 1,574 56 629 829 855 815 884 846 848 840 1,047 961 Total 62,899 103,286 75,485 65,555 66,394 66,173 69,175 69,322 78,937 79,522

National Longitudinal Mortality Study – Analysis File: Geographical Variables
235
FIPSSTATE\counts: 0303 0403 0503 0603 0703 0803 0903 1003 1103 blank 22,184 22,047 23,959 6,620 6,764 5,485 5,525 5,539 6,047 00 . . . . . . . . . 01 1,792 1,797 1,755 1,372 1,365 1,278 1,310 1,421 1,283 02 2,136 2,042 2,001 1,884 1,860 1,739 1,677 1,736 1,597 04 1,958 1,912 1,951 1,891 1,821 1,553 1,649 1,657 1,617 05 1,466 1,533 1,681 1,402 1,437 1,342 1,291 1,196 1,233 06 10,097 9,472 11,643 12,131 11,721 11,697 11,976 12,067 11,819 08 2,846 2,826 2,670 2,695 2,717 2,490 2,795 2,609 2,763 09 2,172 2,504 2,482 2,684 2,694 2,624 2,705 2,713 2,762 10 1,679 1,721 1,757 1,981 1,927 1,826 1,879 1,936 2,005 11 1,275 1,313 1,579 1,532 1,579 1,620 1,663 1,636 1,757 12 5,705 5,516 5,430 5,411 5,173 4,887 4,932 5,005 4,697 13 1,839 1,831 2,836 2,806 2,841 3,017 2,744 2,813 2,896 15 1,913 2,121 2,200 2,304 2,223 2,437 2,309 2,233 2,224 16 1,781 1,624 1,743 1,572 1,664 1,446 1,531 1,486 1,443 17 4,486 4,663 4,439 3,842 3,851 3,995 4,012 3,808 3,742 18 2,556 2,257 2,437 1,962 1,860 1,871 2,014 1,735 1,880 19 2,115 2,188 2,370 2,301 2,382 2,173 2,387 2,221 2,177 20 2,306 2,346 2,293 1,803 1,788 1,731 1,949 1,835 1,860 21 1,703 1,785 2,163 1,724 1,823 1,686 1,716 1,736 1,738 22 1,475 1,565 1,369 1,146 1,107 1,128 1,292 1,239 1,149 23 1,896 1,988 2,229 2,184 2,163 2,099 2,157 2,099 1,933 24 2,053 2,014 2,874 2,885 3,008 2,908 3,054 2,896 3,020 25 2,346 2,371 2,105 1,799 1,861 1,775 1,942 1,819 1,894 26 3,721 3,506 3,542 3,156 3,139 2,792 2,929 2,892 2,769 27 2,393 2,505 2,993 2,804 2,932 2,673 2,881 2,877 2,833 28 1,405 1,384 1,498 1,246 1,220 1,190 1,107 1,268 1,213 29 1,998 1,831 2,444 2,123 1,974 2,004 2,055 2,108 1,994 30 1,310 1,246 1,340 1,231 1,221 1,168 1,053 1,080 1,039 31 2,123 2,100 2,237 1,782 1,850 1,716 1,889 1,890 1,950 32 2,823 2,499 2,172 2,127 2,118 1,993 1,982 2,111 2,121 33 2,404 2,072 2,360 2,546 2,454 2,525 2,395 2,433 2,220 34 3,403 3,375 2,744 2,661 2,675 2,846 2,769 2,654 2,471 35 1,575 1,604 1,528 1,332 1,423 1,215 1,298 1,268 1,091 36 6,603 5,855 5,746 5,283 5,276 5,404 5,366 5,377 5,359 37 2,729 2,632 3,017 2,495 2,463 2,577 2,566 2,528 2,324 38 1,691 1,617 1,616 1,581 1,481 1,440 1,399 1,501 1,467 39 3,770 3,781 3,903 3,310 3,458 3,193 3,266 3,455 3,131 40 1,676 1,446 1,722 1,605 1,639 1,599 1,580 1,656 1,580 41 2,053 1,849 1,903 1,745 1,705 1,682 1,821 1,724 1,657 42 4,518 4,468 3,962 3,537 3,473 3,810 3,597 3,436 3,421 44 2,152 2,322 2,180 2,078 1,973 1,938 2,013 1,941 1,952 45 1,741 1,634 1,731 1,792 1,602 1,694 1,696 1,650 1,531 46 2,071 1,849 2,178 1,868 1,873 1,806 1,837 1,980 1,910 47 1,622 1,520 1,875 1,758 1,629 1,675 1,691 1,655 1,547 48 6,417 6,340 7,732 6,794 7,014 7,214 7,473 7,333 7,648 49 2,047 2,069 2,144 1,889 1,793 1,675 1,737 1,649 1,643 50 1,753 1,902 1,673 1,754 1,597 1,512 1,709 1,552 1,589 51 2,328 2,252 2,867 2,726 2,665 2,622 2,695 2,674 2,688 53 2,359 2,296 2,455 2,157 2,157 2,141 2,214 2,168 2,221 54 1,827 1,631 1,456 1,262 1,463 1,249 1,299 1,232 1,235 55 2,350 2,552 2,620 2,368 2,220 2,303 2,279 2,288 2,255 56 1,764 1,736 1,653 1,522 1,626 1,592 1,524 1,653 1,666 Total 154,405 151,309 161,257 134,463 133,742 130,055 132,629 131,468 130,061

National Longitudinal Mortality Study – Analysis File: Geographical Variables
236
26. FIPS County Code COUNTY Return to Index EDITS: None 27. CPS PSU, "DO" for Census PSU EDITS: None 28. PSU Type PSUTYPE EDITS: None 29. CPS Segment, "ED" for Census SEG EDITS: None

National Longitudinal Mortality Study – Analysis File: Geographical Variables
237
30. Urban-Rural Status URB Extract File Return to Index EDITS: Simple For file: 8024 3 ==> missing value code 31. SMSA Status SMSAST Extract File EDITS: Simple For files: 7303, 7802, 8014–8103, 8203 0 ==> missing value code 32. SMSA Rank SMSAR Extract File EDITS: Invalid Entry For files: 7303, 8024, 8008, 8103, 8203 0_ ==> 00

National Longitudinal Mortality Study – Analysis File: Geographical Variables
238
33. Urban/Rural Farm/Rural Nonfarm LAND Extract File Return to Index EDITS: Recode For files: 7303, 7802, 8014, 8008, 8012 1 ==> 1 2, 3 ==> 2 4, 5 ==> 3 For files: 7903, 8103, 8203, 8303, 8403 1 ==> 1 2, 6 ==> 2 3, 4, 5, 7, 8, 9 ==> 3 For files: 8603, 8703 1 ==> 1 2 ==> 2 4 ==> 3 NOT AVAILABLE: 8024, 8503, 9303-1103 CODES for files: 7303-8014, 8008-8403, 8509-9203 blank — Missing 1 — Non-rural 2 — Rural, farm 3 — Rural, nonfarm FREQUENCIES: LAND\counts: 7303 7802 7903 8014 8008 8012 8103 8203 8303 8403 blank 1,032 2,624 . 6,446 5,776 4,253 . . . . 1 92,403 63,952 29,789 117,674 115,662 113,175 40,500 54,093 53,532 53,601 2 6,250 3,569 1,371 7,790 7,723 7,210 2,068 2,651 2,465 2,607 3 31,528 24,517 11,938 52,961 53,212 53,127 19,236 24,736 25,284 24,524 Total 131,213 94,662 43,098 184,871 182,373 177,765 61,804 81,480 81,281 80,732 LAND\counts: 8509 8603 8703 8803 8903 9003 9103 9203 blank . . . . . . . . 1 102,153 32,560 31,763 31,803 28,549 30,553 34,429 30,159 2 3,945 1,356 1,277 1,221 1,123 1,282 1,157 1,103 3 38,600 12,106 12,231 12,455 12,253 12,450 13,451 12,288 Total 144,698 46,022 45,271 45,479 41,925 44,285 49,037 43,550

National Longitudinal Mortality Study – Analysis File: Age, Birth Information, and Gender Variables
239
AGE, BIRTH INFORMATION, AND GENDER VARIABLES 34. Age in Years at Time of Survey AGE Extract File Return to Index EDITS: Simple, Recode For files: 7303–0203 99 ==> missing value code AVAILABLE FILES: All files CODES for files: 73031,2 78021,2 7903 80082 80122 80142 80243 Age range 0-98 14-98 0-98 0-98 0-98 0-98 0-98 CODES for files: 8103-8509 8603-8703 8803-9003 9103 9203 Age range 0-98 14-98 15-98 14-98 15-98 CODES for files: 9303-0103 0203 0303 0403-09034 1003 11034 Age range 0-98 0-80 0-98 0-80, 85 0-98 0-80, 85 1 Since mortality follow-up begins in 1979, add 6 to given age for 7303 file and add 1 to given age for 7802 file to obtain age at start of follow-up. 2 In these files, when the difference in age between the control file age and CPS age is greater than 10 years and neither entry is missing, then age is defined to be missing. 3 The start of follow-up for the 8024 file has been redefined to be January 1, 1981. For this reason, to obtain an approximately correct age for the 8024 file, add 1 to the given age on the file. 4 In these files, the value of age is as stated for ages less than or equal to 80. For ages greater than 80 the value of 85 is assigned.

National Longitudinal Mortality Study – Analysis File: Age, Birth Information, and Gender Variables
240
FREQUENCIES: AGE\counts: 7303 7802 7903 8014 8024 8008 8012 8103 8203 8303 missing 649 369 43 309 993 376 862 50 1 . 0 1,894 . 737 2,850 110 2,824 2,713 998 1,311 1,277 1 2,040 . 742 2,891 195 2,837 2,862 1,022 1,325 1,244 2 2,343 . 711 2,853 183 2,717 2,788 946 1,295 1,383 3 2,205 . 689 2,780 198 2,873 2,723 1,016 1,316 1,292 4 2,185 . 669 2,642 215 2,696 2,594 905 1,195 1,261 5 2,101 . 652 2,688 223 2,620 2,644 958 1,213 1,240 6 2,160 . 693 2,712 244 2,643 2,574 904 1,221 1,183 7 2,378 . 733 2,769 256 2,789 2,621 913 1,173 1,207 8 2,454 . 801 2,907 287 2,871 2,734 946 1,206 1,180 9 2,599 . 777 3,242 321 3,051 3,015 947 1,197 1,169 10 2,658 . 755 3,048 352 3,146 3,115 1,056 1,363 1,266 11 2,586 . 757 3,082 420 3,010 2,932 1,013 1,406 1,321 12 2,702 . 741 2,957 462 2,955 2,865 1,007 1,386 1,387 13 2,598 . 809 3,124 608 2,906 2,753 958 1,402 1,274 14 2,741 2,348 845 3,195 875 3,085 2,986 1,015 1,366 1,338 15 2,773 2,411 818 3,327 1,957 3,341 3,096 1,045 1,397 1,312 16 2,680 2,432 848 3,541 2,275 3,326 3,233 1,123 1,426 1,375 17 2,607 2,408 893 3,502 2,345 3,455 3,311 1,135 1,494 1,426 18 2,429 2,263 782 3,425 2,497 3,286 3,220 1,155 1,432 1,388 19 2,265 2,140 802 3,340 2,651 3,254 3,148 1,075 1,420 1,380 20 2,225 2,239 745 3,326 2,478 3,321 3,115 1,108 1,385 1,402 21 2,081 2,035 757 3,154 2,524 3,100 3,065 1,133 1,435 1,396 22 2,127 2,095 803 3,420 2,535 3,114 3,059 1,097 1,374 1,403 23 1,900 2,142 782 3,402 2,535 3,249 3,154 1,163 1,343 1,430 24 2,100 2,082 751 3,186 2,487 3,197 3,156 1,093 1,411 1,471 25 2,117 2,034 769 3,202 2,676 3,263 3,062 1,123 1,473 1,483 26 2,076 2,117 721 3,237 2,680 3,249 3,104 1,119 1,426 1,528 27 1,669 1,955 725 3,050 2,634 3,044 3,050 1,071 1,397 1,424 28 1,682 1,967 745 3,027 2,590 3,054 3,044 1,063 1,385 1,423 29 1,843 1,900 694 3,102 2,445 3,000 2,913 1,049 1,358 1,390 30 1,824 2,076 714 3,124 2,601 3,028 2,982 1,009 1,330 1,366 31 1,623 1,916 701 2,916 2,564 2,937 2,821 1,037 1,300 1,373 32 1,593 1,518 654 2,949 2,702 2,857 2,885 951 1,260 1,307 33 1,419 1,586 541 3,006 2,693 2,979 2,997 973 1,293 1,327 34 1,447 1,657 574 2,407 2,033 2,429 2,578 988 1,363 1,256 35 1,352 1,683 533 2,259 2,094 2,269 2,223 773 1,295 1,290 36 1,393 1,459 609 2,405 2,119 2,301 2,238 804 1,019 1,247 37 1,359 1,393 463 2,481 2,134 2,456 2,345 780 1,045 925 38 1,399 1,376 517 2,190 1,897 2,110 2,305 748 1,078 1,053 39 1,353 1,360 435 2,095 1,786 2,007 1,996 709 1,017 1,061 40 1,455 1,352 467 1,973 1,796 1,978 2,031 666 954 1,093 41 1,392 1,229 453 1,897 1,604 1,889 1,811 646 951 972 42 1,581 1,278 428 1,846 1,715 1,885 1,799 646 873 876 43 1,503 1,225 398 1,759 1,522 1,923 1,802 612 847 811 44 1,490 1,129 437 1,948 1,615 1,820 1,732 606 860 810 45 1,548 1,255 402 1,905 1,624 1,864 1,746 633 854 831 46 1,528 1,169 408 1,617 1,588 1,738 1,736 594 825 794 47 1,477 1,265 402 1,850 1,568 1,796 1,678 573 749 790 48 1,595 1,311 463 1,826 1,572 1,692 1,677 611 793 818 49 1,442 1,297 412 1,837 1,675 1,801 1,672 615 714 764 50 1,593 1,361 451 1,919 1,658 1,968 1,895 674 830 785 51 1,476 1,286 458 1,872 1,606 1,804 1,729 614 788 805 52 1,514 1,320 412 1,913 1,694 1,878 1,831 637 813 814 53 1,377 1,321 378 1,833 1,686 1,923 1,846 647 761 756 54 1,417 1,351 440 1,903 1,654 1,854 1,772 614 846 815 55 1,370 1,359 454 2,027 1,718 1,862 1,804 683 829 819 56 1,320 1,366 429 1,906 1,605 1,897 1,799 590 787 779 57 1,257 1,279 423 1,835 1,691 1,901 1,827 602 797 836 58 1,247 1,156 417 1,900 1,716 1,839 1,763 661 804 758 59 1,216 1,157 417 1,830 1,609 1,815 1,731 599 819 734 60 1,191 1,161 391 1,762 1,574 1,803 1,773 589 826 762 61 1,138 1,097 364 1,698 1,480 1,634 1,542 573 729 714 62 1,135 1,114 338 1,660 1,560 1,643 1,580 546 725 723

National Longitudinal Mortality Study – Analysis File: Age, Birth Information, and Gender Variables
241
AGE\counts: 7303 7802 7903 8014 8024 8008 8012 8103 8203 8303 (cont.) 63 1,107 1,067 337 1,579 1,384 1,585 1,551 495 655 697 64 1,031 1,090 340 1,555 1,445 1,513 1,409 480 663 675 65 978 1,035 325 1,614 1,331 1,626 1,527 503 714 649 66 943 984 324 1,465 1,259 1,560 1,451 471 622 590 67 920 964 276 1,406 1,236 1,441 1,337 490 592 613 68 833 877 304 1,284 1,214 1,347 1,356 449 611 597 69 758 819 279 1,340 1,159 1,233 1,174 408 587 532 70 809 765 288 1,228 1,102 1,189 1,270 423 518 576 71 679 770 245 1,156 996 1,078 1,129 356 529 522 72 831 704 195 1,143 988 1,118 1,096 379 519 500 73 1,239 618 217 1,011 940 1,009 976 370 441 419 74 581 598 186 966 879 911 954 311 383 418 75 567 609 217 941 828 903 844 311 416 392 76 548 492 179 821 694 853 815 238 347 343 77 500 534 154 713 677 798 734 254 328 332 78 455 407 165 613 590 695 651 221 322 305 79 404 382 120 691 610 662 568 180 297 277 80 351 326 120 562 534 620 612 217 251 286 81 292 279 105 524 444 465 474 153 224 209 82 298 290 86 430 390 429 438 162 226 229 83 244 234 101 391 351 374 344 126 174 159 84 225 206 73 352 357 346 318 121 140 149 85 157 176 63 293 297 290 270 104 124 158 86 134 147 54 257 228 238 207 78 100 98 87 114 128 41 221 213 175 198 72 74 88 88 89 104 39 166 163 164 137 50 81 74 89 71 65 21 133 161 144 128 46 64 64 90 46 54 23 123 119 105 86 40 36 62 91 43 37 12 83 104 76 73 21 39 37 92 15 29 14 53 65 58 52 21 34 31 93 18 21 8 34 57 44 32 15 22 34 94 14 18 5 30 47 27 32 7 16 17 95 11 6 6 20 31 21 24 9 10 10 96 8 9 . 11 15 21 17 4 4 11 97 5 5 3 9 14 4 9 4 4 5 98 4 14 1 15 19 19 15 6 7 6 99 . . . . . . . . . . Total 131,213 94,662 43,098 184,871 124,345 182,373 177,765 61,804 81,480 81,281

National Longitudinal Mortality Study – Analysis File: Age, Birth Information, and Gender Variables
242
AGE\counts: 8403 8503 8509 8603 8703 8803 8903 9003 9103 9203 missing . . 240 . . . . . . . 0 1,343 1,211 2,157 . . . . . . . 1 1,296 1,202 2,208 . . . . . . . 2 1,315 1,297 2,266 . . . . . . . 3 1,421 1,267 2,308 . . . . . . . 4 1,328 1,245 2,260 . . . . . . . 5 1,261 1,234 2,301 . . . . . . . 6 1,196 1,178 2,216 . . . . . . . 7 1,142 1,199 2,050 . . . . . . . 8 1,190 1,202 2,145 . . . . . . . 9 1,247 1,132 2,002 . . . . . . . 10 1,135 1,201 2,072 . . . . . . . 11 1,222 1,167 2,028 . . . . . . . 12 1,251 1,168 2,055 . . . . . . . 13 1,353 1,282 2,232 . . . . . . . 14 1,380 1,384 2,281 449 406 . . . 331 . 15 1,311 1,336 2,436 776 687 1,061 1,035 1,034 597 926 16 1,227 1,328 2,316 732 735 794 675 678 731 653 17 1,336 1,265 2,122 833 829 792 719 658 788 637 18 1,328 1,255 2,170 805 772 772 743 743 738 642 19 1,280 1,248 2,093 784 767 736 668 722 813 636 20 1,338 1,270 2,220 757 772 734 666 709 844 623 21 1,351 1,295 2,358 853 771 740 595 671 850 716 22 1,420 1,346 2,383 928 812 724 695 757 888 748 23 1,406 1,363 2,377 953 870 826 736 799 828 745 24 1,380 1,403 2,430 1,024 925 868 798 774 870 732 25 1,464 1,426 2,544 1,014 996 960 828 838 957 750 26 1,455 1,392 2,542 1,036 980 959 822 893 1,013 822 27 1,435 1,437 2,455 1,003 1,021 1,001 925 942 1,022 893 28 1,375 1,326 2,529 1,038 991 1,000 943 936 1,100 968 29 1,390 1,412 2,522 1,079 1,011 1,057 932 992 1,131 1,051 30 1,362 1,418 2,483 1,074 1,079 1,109 968 945 1,107 1,019 31 1,375 1,305 2,531 1,091 995 1,102 951 1,001 1,157 953 32 1,348 1,403 2,474 1,092 1,009 1,019 1,005 1,012 1,119 1,016 33 1,264 1,307 2,376 1,012 1,043 995 951 1,026 1,138 954 34 1,303 1,268 2,329 1,013 1,002 996 947 963 1,174 954 35 1,339 1,327 2,281 942 909 1,014 947 1,071 1,076 1,001 36 1,292 1,210 2,181 918 934 968 946 955 1,117 972 37 1,216 1,249 2,248 928 900 936 863 972 1,035 998 38 942 1,271 2,344 979 952 906 832 933 993 903 39 970 966 1,831 943 965 881 847 963 1,011 958 40 1,046 960 1,782 754 949 964 811 870 1,032 880 41 1,021 990 1,792 703 724 897 832 888 978 846 42 863 1,053 1,793 756 749 732 819 904 930 821 43 856 862 1,704 725 739 715 708 834 1,031 795 44 814 860 1,602 667 717 656 645 672 930 842 45 830 783 1,492 643 648 718 652 681 786 809 46 737 791 1,402 577 580 645 670 717 757 687 47 795 775 1,331 602 620 591 601 678 760 620 48 758 736 1,377 561 576 575 501 596 760 645 49 795 755 1,400 540 569 536 548 573 657 679 50 774 786 1,345 567 579 603 513 577 640 592 51 722 747 1,283 552 563 543 507 587 581 564 52 754 785 1,287 509 548 557 473 517 634 514 53 793 715 1,368 564 516 492 482 517 577 563 54 824 750 1,305 503 522 516 516 515 617 513 55 798 777 1,392 558 533 510 446 511 531 467 56 802 810 1,411 578 572 571 519 486 559 499 57 756 742 1,406 547 532 541 476 518 507 503 58 768 742 1,399 604 586 573 459 494 577 434 59 749 681 1,451 614 582 557 518 527 521 488 60 770 795 1,423 546 539 562 531 530 515 517 61 752 701 1,384 565 521 507 498 504 594 454 62 762 776 1,333 562 597 523 528 527 547 467 63 734 697 1,265 543 561 568 487 501 562 481 64 652 675 1,316 512 552 500 495 516 528 440 65 683 755 1,392 554 589 557 502 533 546 475

National Longitudinal Mortality Study – Analysis File: Age, Birth Information, and Gender Variables
243
AGE\counts: 8403 8503 8509 8603 8703 8803 8903 9003 9103 9203 (cont.) 66 620 633 1,144 502 550 529 438 513 551 478 67 625 588 1,199 470 463 518 454 473 512 460 68 548 612 1,115 434 443 520 481 501 502 452 69 586 575 1,015 466 453 510 434 453 500 454 70 562 575 1,059 417 412 442 421 441 467 457 71 514 486 967 457 412 450 384 414 434 420 72 453 523 953 437 398 420 364 378 425 390 73 456 452 861 384 359 399 309 362 391 404 74 416 441 866 377 329 353 320 344 364 333 75 427 435 807 329 314 345 300 285 330 294 76 340 381 735 292 297 317 268 325 329 310 77 324 328 737 278 267 294 249 272 273 278 78 294 300 595 222 212 263 279 230 252 257 79 297 288 531 249 229 224 245 236 241 247 80 270 293 501 178 174 199 193 238 237 235 81 251 225 417 165 164 176 167 161 158 218 82 184 189 413 143 163 153 179 180 172 186 83 190 188 357 154 133 128 96 146 157 158 84 137 163 290 124 115 131 120 132 103 134 85 139 135 268 106 97 93 100 103 115 107 86 112 100 209 93 101 78 83 86 76 95 87 88 113 195 58 61 68 54 71 76 86 88 66 64 147 61 50 50 60 52 62 60 89 53 86 120 39 34 47 38 38 48 38 90 57 48 100 34 34 32 26 23 46 27 91 33 40 81 25 34 17 19 21 30 33 92 30 40 61 19 23 23 20 16 31 25 93 20 21 45 21 16 14 13 6 18 8 94 15 19 21 8 15 11 16 9 10 11 95 10 12 23 5 5 8 5 5 13 7 96 12 10 13 4 10 4 7 5 11 3 97 3 5 12 5 3 2 3 1 7 8 98 5 9 10 4 5 2 6 5 11 12 99 . . . . . . . . . . Total 80,732 80,071 144,698 46,022 45,271 45,479 41,925 44,285 49,037 43,550

National Longitudinal Mortality Study – Analysis File: Age, Birth Information, and Gender Variables
244
AGE\counts: 9303 9413 9503 9603 9703 9803 9903 0003 0103 0203 missing . . . . . . . . . . 0 601 2,256 1,035 984 968 934 939 984 1,075 1,058 1 660 1,837 1,120 994 1,023 974 1,011 1,014 1,165 1,172 2 722 1,784 1,239 1,040 1,016 937 1,012 1,060 1,172 1,185 3 705 1,907 1,221 1,044 956 1,038 1,077 1,012 1,113 1,177 4 757 1,822 1,246 1,015 1,038 1,001 1,099 1,039 1,205 1,157 5 641 1,783 1,262 1,123 1,061 1,098 1,115 1,074 1,205 1,209 6 741 1,720 1,190 1,142 1,090 1,082 1,158 1,091 1,204 1,220 7 782 1,705 1,208 997 1,103 1,157 1,155 1,138 1,285 1,253 8 675 1,668 1,174 1,071 1,027 1,075 1,179 1,157 1,339 1,250 9 748 1,671 1,187 1,002 997 1,070 1,157 1,183 1,285 1,314 10 736 1,662 1,137 1,007 980 1,072 1,087 1,186 1,323 1,248 11 755 1,631 1,172 1,014 1,004 1,016 1,116 1,081 1,256 1,303 12 781 1,566 1,176 989 1,045 1,050 1,105 1,054 1,230 1,305 13 802 1,664 1,201 1,054 944 1,061 1,075 1,099 1,199 1,245 14 428 1,578 1,135 995 1,048 984 1,054 1,033 1,206 1,237 15 1,213 1,511 1,152 1,004 1,009 1,030 1,035 1,066 1,208 1,218 16 886 1,432 1,102 977 1,024 1,000 1,015 1,027 1,194 1,222 17 839 1,410 1,079 951 1,011 980 1,037 1,099 1,213 1,161 18 826 1,278 1,007 881 912 889 1,015 959 1,072 1,113 19 745 1,316 913 864 900 828 932 952 1,026 1,046 20 821 1,368 913 863 774 821 810 872 1,002 1,030 21 861 1,410 913 795 842 810 868 909 1,039 1,003 22 858 1,538 958 788 779 736 843 855 930 984 23 817 1,734 1,018 837 808 800 861 875 1,020 1,026 24 836 1,626 1,104 894 865 833 876 857 1,014 1,002 25 878 1,695 1,025 983 900 826 788 883 994 1,001 26 893 1,626 1,022 896 950 898 873 891 971 999 27 950 1,647 1,033 890 901 991 974 935 1,004 982 28 1,026 1,773 1,096 923 921 912 1,047 949 1,017 961 29 1,070 1,676 1,121 939 979 959 994 1,024 1,075 1,056 30 1,116 1,812 1,158 981 1,008 1,020 1,063 995 1,202 1,174 31 1,072 1,739 1,224 1,045 969 936 1,027 1,032 1,155 1,246 32 1,184 1,770 1,175 1,029 1,036 951 977 1,007 1,114 1,189 33 1,176 1,810 1,272 1,024 1,008 1,040 1,113 1,012 1,013 1,128 34 1,116 1,778 1,376 1,070 1,079 1,126 1,111 997 1,137 1,186 35 1,161 1,762 1,296 1,159 1,072 1,107 1,119 1,104 1,226 1,122 36 1,154 1,722 1,200 1,130 1,127 1,113 1,071 1,120 1,290 1,160 37 1,166 1,682 1,254 1,104 1,071 1,102 1,112 1,105 1,305 1,253 38 1,122 1,628 1,220 1,105 1,102 1,107 1,173 1,049 1,269 1,293 39 1,065 1,520 1,241 1,062 1,110 1,133 1,053 1,119 1,334 1,291 40 1,163 1,552 1,226 1,137 1,127 1,066 1,135 1,160 1,276 1,292 41 1,096 1,537 1,148 1,019 1,122 993 1,125 1,107 1,263 1,249 42 1,085 1,432 1,132 995 992 1,088 1,056 1,143 1,308 1,247 43 1,049 1,368 1,110 970 1,045 1,022 1,102 1,141 1,319 1,334 44 997 1,326 1,092 955 967 1,017 1,073 1,101 1,263 1,236 45 992 1,370 1,105 917 931 984 1,052 1,114 1,214 1,217 46 975 1,411 1,047 890 907 960 1,024 983 1,200 1,198 47 812 1,275 1,084 846 895 865 948 1,001 1,116 1,186 48 749 1,036 1,058 925 887 896 932 973 1,091 1,177 49 820 1,064 779 874 905 828 963 876 1,091 1,139 50 842 1,082 853 655 948 978 917 929 1,040 1,095 51 663 1,049 814 611 712 836 973 922 984 1,016 52 682 938 874 730 721 667 885 923 989 964 53 626 871 737 695 683 644 648 835 1,005 978 54 613 788 736 595 710 739 693 690 986 955 55 587 828 708 606 661 711 704 677 760 976 56 585 809 666 520 608 607 690 666 779 815 57 578 753 664 550 543 552 561 646 807 741 58 587 801 591 518 572 509 557 600 716 729 59 556 734 603 526 526 540 531 565 632 766 60 547 721 588 507 512 530 547 591 609 718 61 575 724 510 510 535 524 527 533 620 622 62 579 685 598 532 515 509 515 548 580 641 63 551 710 548 475 497 499 484 450 583 597 64 561 741 571 475 469 430 460 446 559 548 65 560 727 581 515 482 490 437 525 580 572
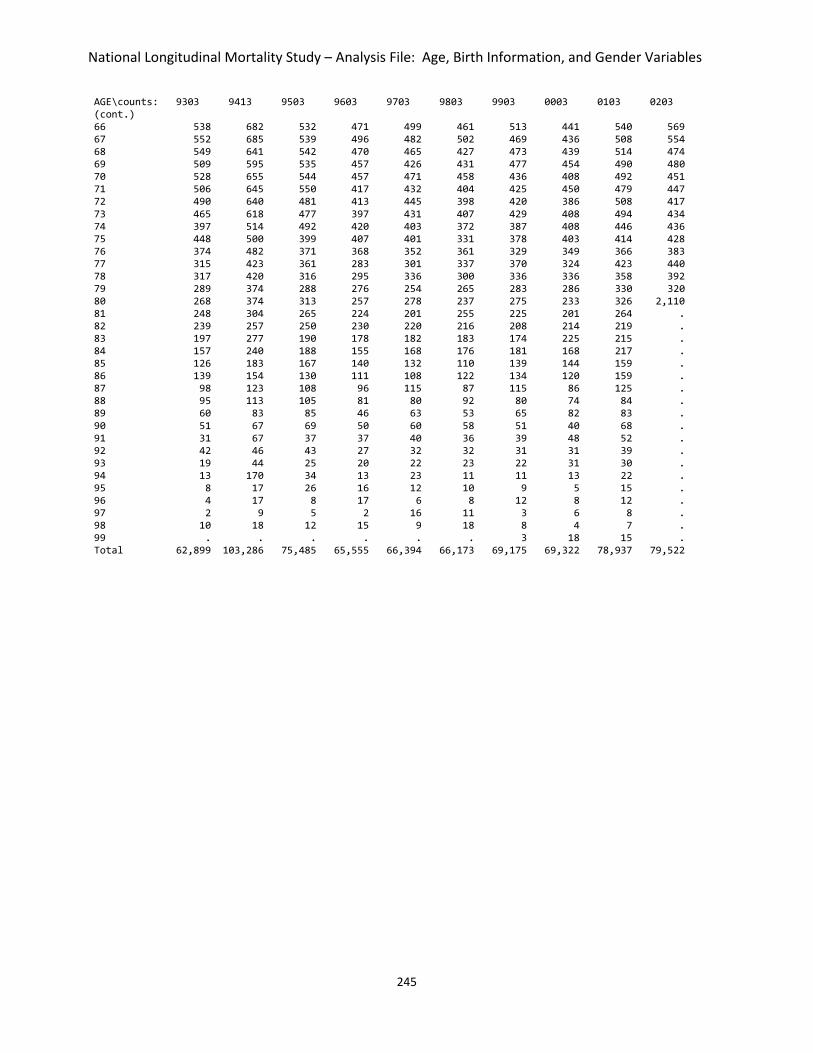
National Longitudinal Mortality Study – Analysis File: Age, Birth Information, and Gender Variables
245
AGE\counts: 9303 9413 9503 9603 9703 9803 9903 0003 0103 0203 (cont.) 66 538 682 532 471 499 461 513 441 540 569 67 552 685 539 496 482 502 469 436 508 554 68 549 641 542 470 465 427 473 439 514 474 69 509 595 535 457 426 431 477 454 490 480 70 528 655 544 457 471 458 436 408 492 451 71 506 645 550 417 432 404 425 450 479 447 72 490 640 481 413 445 398 420 386 508 417 73 465 618 477 397 431 407 429 408 494 434 74 397 514 492 420 403 372 387 408 446 436 75 448 500 399 407 401 331 378 403 414 428 76 374 482 371 368 352 361 329 349 366 383 77 315 423 361 283 301 337 370 324 423 440 78 317 420 316 295 336 300 336 336 358 392 79 289 374 288 276 254 265 283 286 330 320 80 268 374 313 257 278 237 275 233 326 2,110 81 248 304 265 224 201 255 225 201 264 . 82 239 257 250 230 220 216 208 214 219 . 83 197 277 190 178 182 183 174 225 215 . 84 157 240 188 155 168 176 181 168 217 . 85 126 183 167 140 132 110 139 144 159 . 86 139 154 130 111 108 122 134 120 159 . 87 98 123 108 96 115 87 115 86 125 . 88 95 113 105 81 80 92 80 74 84 . 89 60 83 85 46 63 53 65 82 83 . 90 51 67 69 50 60 58 51 40 68 . 91 31 67 37 37 40 36 39 48 52 . 92 42 46 43 27 32 32 31 31 39 . 93 19 44 25 20 22 23 22 31 30 . 94 13 170 34 13 23 11 11 13 22 . 95 8 17 26 16 12 10 9 5 15 . 96 4 17 8 17 6 8 12 8 12 . 97 2 9 5 2 16 11 3 6 8 . 98 10 18 12 15 9 18 8 4 7 . 99 . . . . . . 3 18 15 . Total 62,899 103,286 75,485 65,555 66,394 66,173 69,175 69,322 78,937 79,522

National Longitudinal Mortality Study – Analysis File: Age, Birth Information, and Gender Variables
246
AGE\counts: 0303 0403 0503 0603 0703 0803 0903 1003 1103 0 2,021 2,018 2,133 1,967 2,006 1,997 2,018 1,921 1,754 1 2,170 2,096 2,310 2,161 2,092 2,008 2,049 2,065 1,889 2 2,379 2,207 2,257 2,181 2,099 2,117 2,141 2,117 2,027 3 2,313 2,314 2,386 2,140 2,255 2,071 2,121 2,215 2,259 4 2,356 2,204 2,409 2,129 2,174 2,116 2,194 2,146 2,103 5 2,323 2,249 2,351 2,230 2,171 2,131 2,148 2,062 2,052 6 2,279 2,228 2,435 2,203 2,215 1,949 2,153 2,120 2,048 7 2,377 2,233 2,358 2,177 2,157 2,168 2,168 2,183 2,126 8 2,272 2,207 2,369 2,197 2,198 2,179 2,262 2,092 2,046 9 2,410 2,292 2,453 2,244 2,190 2,108 2,196 2,084 1,992 10 2,428 2,297 2,420 2,237 2,182 2,117 2,194 2,172 2,144 11 2,478 2,422 2,427 2,200 2,292 2,076 2,098 2,140 2,143 12 2,531 2,498 2,650 2,313 2,250 2,106 2,200 2,105 2,025 13 2,449 2,375 2,656 2,419 2,193 2,199 2,195 2,164 2,065 14 2,399 2,502 2,527 2,332 2,242 2,089 2,146 2,015 2,104 15 2,378 2,379 2,633 2,347 2,251 2,258 2,114 2,104 2,067 16 2,370 2,398 2,458 2,418 2,357 2,298 2,413 2,104 2,097 17 2,376 2,306 2,449 2,246 2,319 2,288 2,281 2,217 2,127 18 2,105 2,153 2,208 2,081 2,068 2,053 2,135 2,080 2,065 19 1,715 1,623 1,790 1,678 1,677 1,557 1,691 1,657 1,589 20 1,709 1,682 1,758 1,647 1,551 1,568 1,604 1,680 1,587 21 1,627 1,636 1,656 1,626 1,610 1,567 1,544 1,646 1,637 22 1,672 1,653 1,704 1,652 1,544 1,656 1,608 1,588 1,538 23 1,635 1,630 1,734 1,743 1,474 1,617 1,515 1,545 1,588 24 1,684 1,633 1,786 1,744 1,660 1,566 1,626 1,680 1,546 25 1,654 1,628 1,820 1,795 1,693 1,640 1,690 1,774 1,630 26 1,682 1,609 1,670 1,737 1,733 1,625 1,674 1,584 1,762 27 1,706 1,594 1,714 1,622 1,697 1,709 1,646 1,661 1,612 28 1,751 1,622 1,763 1,696 1,623 1,669 1,744 1,784 1,701 29 1,740 1,640 1,808 1,676 1,651 1,664 1,755 1,887 1,744 30 1,847 1,850 1,859 1,736 1,823 1,763 1,785 1,822 1,841 31 1,931 1,789 1,796 1,681 1,755 1,620 1,715 1,846 1,790 32 2,035 1,884 1,922 1,626 1,730 1,619 1,755 1,722 1,798 33 2,078 2,026 2,082 1,795 1,653 1,786 1,708 1,774 1,689 34 1,920 1,967 2,182 1,825 1,723 1,625 1,721 1,752 1,710 35 1,996 2,038 2,224 2,147 1,933 1,787 1,705 1,823 1,694 36 2,026 1,828 2,055 1,928 2,085 1,894 1,765 1,776 1,682 37 2,074 1,968 2,056 1,891 1,978 1,938 1,832 1,780 1,709 38 2,194 1,979 2,168 1,907 1,921 1,902 1,972 1,907 1,766 39 2,252 2,109 2,202 1,916 1,877 1,843 1,978 1,932 1,750 40 2,430 2,287 2,438 2,138 2,044 1,894 2,096 2,064 2,066 41 2,218 2,181 2,209 1,995 1,979 1,791 1,852 1,842 1,926 42 2,343 2,111 2,315 2,114 2,039 1,874 1,819 1,740 1,847 43 2,261 2,202 2,204 2,135 2,030 2,055 1,973 1,808 1,698 44 2,237 2,122 2,234 2,028 2,055 2,011 1,982 1,781 1,676 45 2,256 2,159 2,264 2,108 2,032 2,000 1,990 1,989 1,740 46 2,117 2,047 2,056 1,989 2,044 1,945 1,918 1,916 1,840 47 1,968 1,940 2,108 1,950 1,914 1,931 1,897 1,874 1,862 48 1,917 1,873 2,007 1,955 1,835 1,852 1,912 1,909 1,781 49 1,795 1,841 1,904 1,762 1,796 1,816 1,828 1,796 1,796 50 1,793 1,779 1,936 1,783 1,805 1,834 1,803 1,800 1,816 51 1,490 1,628 1,729 1,710 1,709 1,672 1,725 1,709 1,652 52 1,534 1,488 1,678 1,589 1,568 1,549 1,671 1,627 1,598 53 1,482 1,435 1,478 1,455 1,481 1,582 1,638 1,519 1,562 54 1,403 1,331 1,562 1,413 1,464 1,397 1,555 1,589 1,552 55 1,370 1,328 1,421 1,313 1,390 1,374 1,438 1,497 1,502 56 1,322 1,284 1,327 1,272 1,405 1,257 1,370 1,332 1,418 57 993 1,173 1,389 1,223 1,287 1,281 1,354 1,284 1,356 58 1,008 1,012 1,264 1,265 1,203 1,263 1,244 1,198 1,300 59 927 896 987 1,147 1,194 1,158 1,137 1,197 1,199 60 1,005 923 1,037 879 1,129 1,218 1,217 1,117 1,235 61 798 961 969 866 882 1,092 1,100 1,098 1,192 62 875 778 967 860 861 883 1,051 1,059 1,095 63 787 778 872 885 810 803 808 1,032 1,105 64 743 701 825 795 867 866 818 794 1,018 65 721 795 859 794 809 879 907 867 796 66 663 714 743 722 731 747 842 756 806

National Longitudinal Mortality Study – Analysis File: Age, Birth Information, and Gender Variables
247
AGE\counts: 0303 0403 0503 0603 0703 0803 0903 1003 1103 (cont.) 67 620 583 678 567 686 687 769 765 757 68 627 624 694 651 654 629 690 649 761 69 566 567 666 577 624 630 639 688 704 70 577 555 610 602 574 588 619 642 644 71 560 578 601 511 548 542 569 586 578 72 572 509 599 542 532 536 565 557 542 73 524 559 563 479 495 482 513 520 519 74 522 491 583 468 493 431 497 485 496 75 561 496 553 532 506 464 479 463 521 76 485 467 547 491 460 419 489 454 450 77 472 504 575 470 491 447 481 422 387 78 448 436 488 464 469 460 448 391 425 79 410 351 412 401 336 343 340 405 377 80 403 1,549 1,730 1,589 1,615 1,620 1,639 406 1,645 81 337 . . . . . . 342 . 82 311 . . . . . . 333 . 83 271 . . . . . . 327 . 84 233 . . . . . . 281 . 85 220 1,038 1,340 1,125 1,220 1,277 1,247 257 1,479 86 175 . . . . . . 225 . 87 158 . . . . . . 168 . 88 110 . . . . . . 159 . 89 98 . . . . . . 130 . 90 106 . . . . . . 106 . 91 64 . . . . . . 76 . 92 51 . . . . . . 63 . 93 54 . . . . . . 49 . 94 37 . . . . . . 29 . 95 20 . . . . . . 30 . 96 11 . . . . . . 15 . 97 6 . . . . . . 21 . 98 24 . . . . . . 25 . 99 20,974 21,469 22,198 5,559 5,574 4,533 4,441 4,479 4,846 Total 154,405 151,309 161,257 134,463 133,742 130,055 132,629 131,468 130,061

National Longitudinal Mortality Study – Analysis File: Age, Birth Information, and Gender Variables
248
35. Century of Birth CENT Return to Index EDITS: None
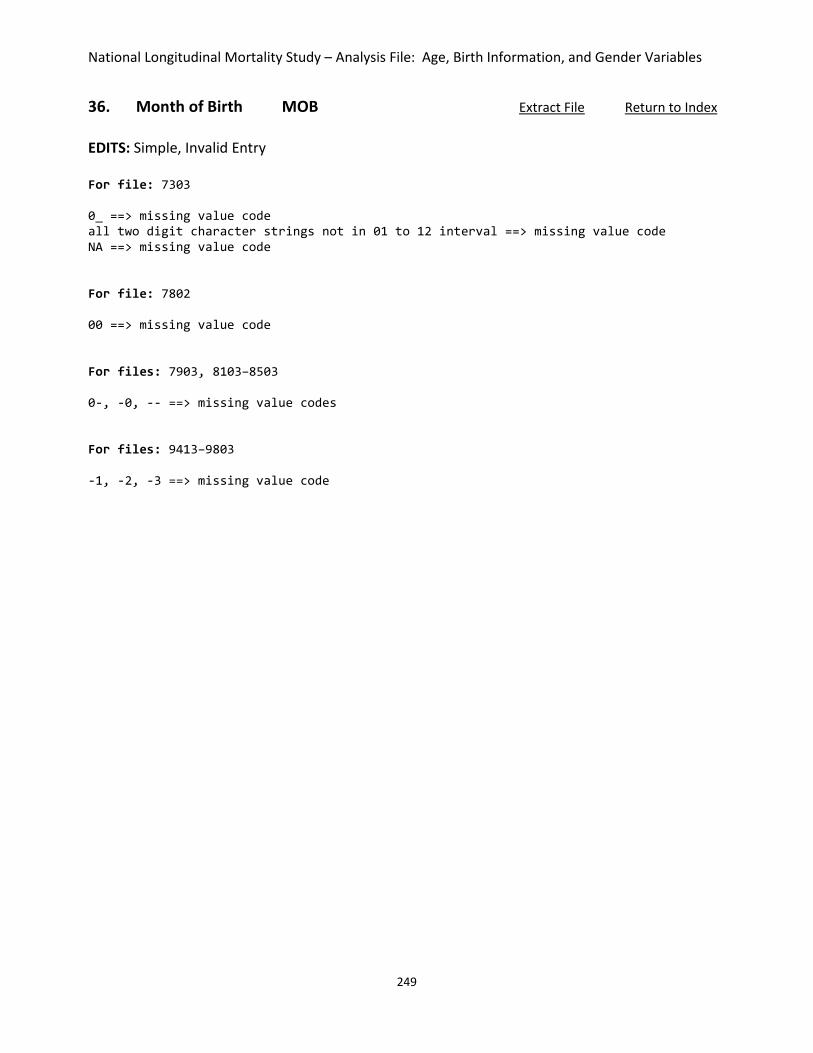
National Longitudinal Mortality Study – Analysis File: Age, Birth Information, and Gender Variables
249
36. Month of Birth MOB Extract File Return to Index EDITS: Simple, Invalid Entry For file: 7303 0_ ==> missing value code all two digit character strings not in 01 to 12 interval ==> missing value code NA ==> missing value code For file: 7802 00 ==> missing value code For files: 7903, 8103–8503 0-, -0, -- ==> missing value codes For files: 9413–9803 -1, -2, -3 ==> missing value code

National Longitudinal Mortality Study – Analysis File: Age, Birth Information, and Gender Variables
250
37. Year of Birth YOB Extract File Return to Index EDITS: Invalid Entry For files: 7903, 8103–8503 0- ==> missing value code For file: 7303 (_ , 0_ , 9> ==> missing value code For file: 7802 0_, X_ , XX ==> missing value code For files: 9413–9703 -1 , -2 , -3 ==> missing value code For file: 9803 _, -1, -2, -3 ==> missing value code

National Longitudinal Mortality Study – Analysis File: Age, Birth Information, and Gender Variables
251
38. Final Sex from Multiple Sources SEXF Extract File Return to Index EDITS: Simple For files: 7802, 8024, 8012 9 ==> missing value code 39. Date of Birth—from SSA Numident DOBN EDITS: None 40. Citizenship Group CITIZEN Extract File EDITS: Simple For files: 9413-1103 0 ==> missing value code 41. Place of Birth POB Extract File EDITS: Simple For files: 8014, 8024, 8008, 8012 99 ==> missing value code
42. Place of Birth—Final POBF EDITS: None 43. Three-Way Classification of POBF POBFCAT3 EDITS: None 44. Four-Way Classification of POBF POBFCAT4 EDITS: None

National Longitudinal Mortality Study – Analysis File: Age, Birth Information, and Gender Variables
252
45. Five-Way Classification of POBF POBFCAT5 Return to Index EDITS: None 46. Region of Birth REGIONOB EDITS: None 47. Region of Birth Isolating the US REGIONOBG EDITS: None 48. Region of Birth Isolating Mexico REGIONOBM EDITS: None 49. Region of Birth Isolates Mexico, Splits Europe REGIONOBE EDITS: None

National Longitudinal Mortality Study – Analysis File: Race and Ethnicity Variables
253
RACE AND ETHNICITY VARIABLES
50. Race RACE Return to Index EDITS: None

National Longitudinal Mortality Study – Analysis File: Race and Ethnicity Variables
254
51. Race Recode—White/Black/Other RACER Extract File Return to Index EDITS: Simple, Invalid Entry, Recode For files: 7303, 7802, 8024, 8012 9 ==> missing value code For file: 8509 if RACER = '-' then RACER = ' '; else if RACER = '5' & RACEX = '5' then RACER = '3'; else if RACER = '1' & RACEX = '4' then RACER = '3'; else if RACER = '4' & RACEX = '4' then RACER = '3'; else if RACER = '1' & RACEX = '3' then RACER = '3'; else if RACER = '4' & RACEX = '3' then RACER = '3'; else if RACER = '5' & RACEX = '1' then RACER = '1'; AVAILABLE FILES: All files CODES for files: All files blank — Unknown 1 — White 2 — Black 3 — Other FREQUENCIES: RACER\counts: 7303 7802 7903 8014 8024 8008 8012 8103 8203 8303 blank 230 107 . . 1,051 . 236 . 1 . 1 115,684 83,454 38,009 159,580 100,254 157,098 152,903 53,533 70,485 70,642 2 13,872 9,684 3,840 19,745 16,463 19,601 18,796 6,219 8,303 7,834 3 1,427 1,417 1,249 5,546 6,577 5,674 5,830 2,052 2,691 2,805 Total 131,213 94,662 43,098 184,871 124,345 182,373 177,765 61,804 81,480 81,281 RACER\counts: 8403 8503 8509 8603 8703 8803 8903 9003 9103 9203 blank . . 2 . . . . . . . 1 70,071 68,956 124,455 40,881 40,200 40,364 37,237 39,191 43,422 38,517 2 8,131 8,242 15,507 3,831 3,771 3,600 3,361 3,476 3,873 3,367 3 2,530 2,873 4,734 1,310 1,300 1,515 1,327 1,618 1,742 1,666 Total 80,732 80,071 144,698 46,022 45,271 45,479 41,925 44,285 49,037 43,550 RACER\counts: 9303 9413 9503 9603 9703 9803 9903 0003 0103 0203 blank . . . . . . . . . . 1 54,215 85,881 62,720 55,579 56,546 56,227 59,665 59,443 67,779 68,481 2 5,942 10,975 7,632 6,999 6,686 6,869 6,348 6,705 7,092 7,105 3 2,742 6,430 5,133 2,977 3,162 3,077 3,162 3,174 4,066 3,936 Total 62,899 103,286 75,485 65,555 66,394 66,173 69,175 69,322 78,937 79,522

National Longitudinal Mortality Study – Analysis File: Race and Ethnicity Variables
255
RACER\counts: 0303 0403 0503 0603 0703 0803 0903 1003 1103 blank 20,616 21,105 21,827 5,082 5,009 4,456 4,342 4,387 4,734 1 106,151 103,339 110,970 102,216 100,957 98,298 99,828 97,810 96,911 2 16,273 15,242 16,064 15,175 15,795 15,486 15,604 16,589 15,580 3 11,365 11,623 12,396 11,990 11,981 11,815 12,855 12,682 12,836 Total 154,405 151,309 161,257 134,463 133,742 130,055 132,629 131,468 130,061

National Longitudinal Mortality Study – Analysis File: Race and Ethnicity Variables
256
52. Race Expanded w/ American Indian & Asian RACEX Extract File Return to Index EDITS: Simple, Invalid Entry, Recode NOTE: If RACEX is missing on the 8509 file, then RACER information is used to provide race information. For files: 7903–8503 9 ==> missing value code For file: 8509 if RACEX = '-' & RACER = '1' then RACEX = '1'; else if RACEX = '-' & RACER = '2' then RACEX = '2'; else if RACEX = '-' & RACER = '3' then RACEX = ' '; else if RACEX = '-' then RACEX = ''; NOT AVAILABLE: 7303, 7802, 8603, 8703 CODES for files: 7903–8509, 8803-0203 blank — Unknown 1 — White 2 — Black 3 — American Indian or Eskimo 4 — Asian or Pacific Islander 5 — Other Nonwhite FREQUENCIES: RACEX\counts: 7903 8014 8024 8008 8012 8103 8203 8303 8403 8503 blank 2 126 1,051 140 267 3 11 5 3 9 1 38,009 159,580 100,254 157,098 152,903 53,533 70,486 70,642 70,071 68,956 2 3,840 19,745 16,463 19,601 18,796 6,219 8,303 7,834 8,131 8,242 3 302 1,654 1,080 1,895 1,846 632 941 798 889 818 4 605 3,616 1,959 3,520 3,854 1,367 1,678 1,922 1,574 2,004 5 340 150 3,538 119 99 50 61 80 64 42 Total 43,098 184,871 124,345 182,373 177,765 61,804 81,480 81,281 80,732 80,071 RACEX\counts: 8509 8803 8903 9003 9103 9203 9303 9413 9503 9603 blank 3 . . . . . . . . . 1 124,386 40,364 37,237 39,191 43,422 38,517 54,215 85,881 62,720 55,579 2 15,484 3,600 3,361 3,476 3,873 3,367 5,942 10,975 7,632 6,999 3 1,337 399 343 464 443 451 680 1,250 909 867 4 3,318 1,058 916 1,067 1,199 1,078 1,777 3,404 2,474 2,110 5 170 58 68 87 100 137 285 1,776 1,750 . Total 144,698 45,479 41,925 44,285 49,037 43,550 62,899 103,286 75,485 65,555

National Longitudinal Mortality Study – Analysis File: Race and Ethnicity Variables
257
RACEX\counts: 9703 9803 9903 0003 0103 0203 blank . . . . . . 1 56,546 56,227 59,665 59,443 67,779 68,481 2 6,686 6,869 6,348 6,705 7,092 7,105 3 951 830 924 1,027 1,232 1,410 4 2,211 2,247 2,238 2,147 2,834 2,526 5 . . . . . . Total 66,394 66,173 69,175 69,322 78,937 79,522 CODES for files: 0303-1103 blank — Unknown 1 — White 2 — Black 3 — American Indian or Eskimo 4 — Asian or Pacific Islander 5 — More than one race, other non-white FREQUENCIES: RACEX\counts: 0303 0403 0503 0603 0703 0803 0903 1003 1103 blank 20,640 21,150 21,857 5,107 5,032 4,489 4,373 4,411 4,771 1 106,151 103,339 110,970 102,216 100,957 98,298 99,828 97,810 96,911 2 16,273 15,242 16,064 15,175 15,795 15,486 15,604 16,589 15,580 3 2,017 1,916 2,129 1,817 1,890 1,723 1,991 1,806 1,628 4 6,076 6,364 6,348 6,476 6,904 6,953 7,443 7,519 7,904 5 3,248 3,298 3,889 3,672 3,164 3,106 3,390 3,333 3,267 Total 154,405 151,309 161,257 134,463 133,742 130,055 132,629 131,468 130,061

National Longitudinal Mortality Study – Analysis File: Race and Ethnicity Variables
258
53. Detailed Race 2000 CPS Redesign RACEPRDT Extract File Return to Index EDITS: Simple For files: 0303-1103 -1 ==> missing value code CODES for files: 0303-1103 blank — Blank, unknown, fail edit record
01 — White Only 02 — Black Only 03 — American Indian, Alaskan Native Only
04 — Asian Only 05 — Hawaiian/Pacific Islander Only 06 — White and Black 07 — White and American Indian 08 — White and Asian 09 — White and Hawaiian 10 — Black and American Indian 11 — Black and Asian 12 — Black and Hawaiian, Other Pacific Islander 13 — Asian and American Indian 14 — American Indian and Hawaiian, Other Pacific Islander 15 — Asian and Hawaiian, Other Pacific Islander 16 — White, Black, and American Indian 17 — White, Black, and Asian 18 — White, Black, and Hawaiian, Other Pacific Islander 19 — White, Asian, and American Indian 20 — White, American Indian, and Hawaiian, Other Pacific Islander 21 — White, Asian, and Hawaiian, Other Pacific Islander 22 — Black, Asian and American Indian 23 — Black, American Indian, and Hawaiian, Other Pacific Islander 24 — Black, Asian, and Hawaiian, Other Pacific Islander 25 — Asian, American Indian, and Hawaiian, Other Pacific Islander 26 — White, Black, Asian, and American Indian 27 — White, Asian, American Indian, and Hawaiian, Other Pacific Islander 28 — White, Black, Asian, and Hawaiian, Other Pacific Islander 29 — White, Black, American Indian, and Hawaiian, Other Pacific Islander 30 — Black, Asian, American Indian, and Hawaiian, Other Pacific Islander 31 — White, Black, Asian, American Indian, and Hawaiian, Other Pacific Islander

National Longitudinal Mortality Study – Analysis File: Race and Ethnicity Variables
259
FREQUENCIES: RACEPRDT\counts: 0303 0403 0503 0603 0703 0803 0903 1003 1103 blank 20,616 21,105 21,827 5,082 5,009 4,456 4,342 4,387 4,734 01 106,151 103,339 110,970 102,216 100,957 98,298 99,828 97,810 96,911 02 16,273 15,242 16,064 15,175 15,795 15,486 15,604 16,589 15,580 03 2,017 1,916 2,129 1,817 1,890 1,723 1,991 1,806 1,628 04 5,393 5,773 5,735 5,763 6,182 6,219 6,603 6,776 7,156 05 598 456 486 562 586 586 724 597 625 06 632 628 709 701 666 662 819 905 884 07 1,561 1,578 1,810 1,619 1,327 1,210 1,339 1,199 1,151 08 414 463 536 569 572 563 563 545 585 09 170 176 214 204 152 161 143 139 144 10 159 110 197 163 127 148 113 122 124 11 54 33 39 22 29 41 53 49 47 12 15 6 21 19 12 7 13 6 21 13 13 15 9 6 12 10 3 15 8 14 2 6 21 16 2 1 5 10 10 15 85 135 127 151 136 148 116 146 123 16 84 59 94 113 84 118 107 102 76 17 25 7 14 6 5 3 8 4 5 18 5 6 3 7 4 2 13 5 4 19 2 25 18 19 26 11 32 21 16 20 14 10 6 12 9 9 11 24 8 21 98 176 198 196 137 160 168 187 184 22 3 9 2 2 6 3 . 2 4 23 1 . . 1 1 1 . . . 24 2 1 . . 2 1 1 3 2 25 2 2 1 1 2 1 . . . 26 1 1 5 3 4 4 9 3 5 27 10 20 13 12 4 8 14 14 11 28 . 7 8 1 . 5 4 2 1 29 2 . . 4 . 2 2 . 8 30 . 1 . . . . . . . 31 3 4 1 1 4 8 1 . 6 Total 154,405 151,309 161,257 134,463 133,742 130,055 132,629 131,468 130,061
National Longitudinal Mortality Study – Analysis File: Race and Ethnicity Variables
260
54. Asian or Pacific Islanders, 10 Categories CATIAPI Return to Index EDITS: None

National Longitudinal Mortality Study – Analysis File: Race and Ethnicity Variables
261
55. Hispanic Origin HISP Extract File Return to Index EDITS: Simple, Recode For files: 7303–1103 0, 9 ==> missing value code For files: 0303–1103 0, 9 ==> missing value code 1 ==> 3 2 ==> 4 3 ==> 5 4 ==> 6 5 ==> 7 CODES for files: All files blank — Missing 01 — Mexican American 02 — Chicano 03 — Mexican (Mexicano) 04 — Puerto Rican 05 — Cuban 06 — Central or South American 07 — Other Spanish 08 — All Other FREQUENCIES: HISP\counts: 7303 7802 7903 8014 8024 8008 8012 8103 8203 8303 blank 15,432 4,966 1,419 9,385 5,013 8,500 6,756 1,828 2,386 2,250 1 . 1,588 2,431 3,625 . 3,564 3,737 1,219 2,955 3,001 2 . 71 150 259 . 220 242 86 139 72 3 4,004 902 1,783 1,842 4,196 1,920 2,118 734 1,752 1,750 4 870 626 989 1,157 930 1,244 974 374 1,151 1,086 5 482 309 427 470 463 543 260 174 442 479 6 367 312 476 660 . 795 747 280 765 708 7 882 518 939 1,303 1,924 1,397 1,411 463 791 821 8 109,176 85,370 34,484 166,170 111,819 164,190 161,520 56,646 71,099 71,114 Total 131,213 94,662 43,098 184,871 124,345 182,373 177,765 61,804 81,480 81,281 HISP\counts: 8403 8509 8603 8703 8803 8903 9003 9103 9203 9303 blank 2,062 2,520 719 696 1,230 1,229 1,209 1,377 1,248 1,700 1 2,898 2,944 1,176 1,266 1,179 1,115 1,250 1,735 1,325 1,990 2 156 112 56 40 46 36 55 42 51 79 3 1,921 1,492 503 466 599 634 820 1,077 918 1,294 4 1,179 1,163 419 362 380 334 409 551 396 609 5 449 423 263 252 238 242 248 334 300 351 6 814 941 278 287 253 288 414 588 505 720 7 835 925 443 419 361 382 435 523 458 591 8 70,418 134,178 42,165 41,483 41,193 37,665 39,445 42,810 38,349 55,565 Total 80,732 144,698 46,022 45,271 45,479 41,925 44,285 49,037 43,550 62,899

National Longitudinal Mortality Study – Analysis File: Race and Ethnicity Variables
262
HISP\counts: 9413 9503 9603 9703 9803 9903 0003 0103 0203 0303 blank 2,448 1,367 1,429 1,659 1,716 1,456 1,808 2,321 2,721 20,616 1 5,162 3,047 2,647 2,885 2,755 4,263 4,514 4,724 4,721 . 2 185 122 105 186 162 255 290 255 216 . 3 4,574 2,963 2,904 3,294 3,115 4,977 5,629 6,004 6,432 12,469 4 2,142 1,316 1,200 1,032 1,194 1,483 1,578 1,667 1,702 2,144 5 693 465 395 423 427 693 662 639 707 703 6 2,548 1,565 1,437 1,550 1,551 2,230 2,473 2,569 2,554 3,152 7 1,510 975 807 1,030 752 1,311 1,329 1,523 1,478 1,165 8 84,024 63,665 54,631 54,335 54,501 52,507 51,039 59,235 58,991 114,156 Total 103,286 75,485 65,555 66,394 66,173 69,175 69,322 78,937 79,522 154,405 HISP\counts: 0403 0503 0603 0703 0803 0903 1003 1103 blank 21,105 21,827 5,082 5,009 4,456 4,342 4,387 4,734 1 . . . . . . . . 2 . . . . . . . . 3 12,147 14,437 13,465 13,381 13,421 13,780 13,867 14,011 4 2,060 1,935 1,946 1,907 2,022 2,089 2,046 2,119 5 663 749 695 653 647 625 751 634 6 3,296 3,809 3,870 3,875 3,633 3,766 3,910 3,900 7 1,345 1,464 1,355 1,288 1,194 1,133 1,201 1,217 8 110,693 117,036 108,050 107,629 104,682 106,894 105,306 103,446 Total 151,309 161,257 134,463 133,742 130,055 132,629 131,468 130,061

National Longitudinal Mortality Study – Analysis File: Race and Ethnicity Variables
263
56. Ethnic Origin ORIGIN Extract File Return to Index EDITS: Recode For file: 7303 00, 39 ==> blank For files: 7802,7903,8103-8703 00, 39, 40 ==> blank 08, 09 ==> 07 10, 11, 12 ==> 13 21 ==> 20 For files: 8803-0203 08 ==> 07 10, 11, 12 ==> 13 26, 27, 28 ==> 30 38, 39 ==> blank NOT AVAILABLE: 8014–8012 CODES for files: 7303–7903, 8103–0203 blank — Missing 01 — German 02 — Italian 03 — Irish 04 — French 05 — Polish 06 — Russian 07 — English, Scottish, Welsh 13 — Mexicano, Mexican, Chicano, Mexican-American 14 — Puerto Rican 15 — Cuban 16 — Central or South American 17 — Other Hispanic 20 — Afro-American (Black, Negro) 30 — Other Group

National Longitudinal Mortality Study – Analysis File: Race and Ethnicity Variables
264
FREQUENCIES: ORIGIN\counts: 7303 7802 7903 8103 8203 8303 8403 8503 8509 8603 blank 15,432 2,590 10,951 1,206 1,573 1,465 1,306 1,486 2,243 719 01 13,166 7,673 2,364 4,929 6,019 5,659 5,785 6,102 11,188 4,206 02 4,452 3,460 1,049 1,658 2,022 2,109 1,933 2,405 4,430 1,467 03 7,765 4,359 1,371 2,609 3,075 2,995 3,073 2,988 5,864 2,226 04 2,521 1,543 502 1,067 1,217 1,328 1,139 1,187 2,290 855 05 2,334 1,889 418 820 1,054 1,033 1,070 1,122 2,218 843 06 1,094 741 235 355 419 422 413 429 829 313 07 16,674 5,762 1,812 4,024 4,766 4,531 4,433 4,689 8,837 3,121 13 4,004 2,666 2,912 2,068 4,920 4,928 5,052 4,660 4,554 1,735 14 870 652 629 351 1,109 1,069 1,161 1,095 1,170 419 15 482 318 346 170 422 467 438 485 424 263 16 367 323 344 275 778 687 789 804 940 278 17 882 560 726 465 845 823 833 889 929 443 20 12,897 9,382 2,570 5,831 7,677 7,226 7,549 7,500 14,258 3,515 30 48,273 52,744 16,869 35,976 45,584 46,539 45,758 44,230 84,524 25,619 Total 131,213 94,662 43,098 61,804 81,480 81,281 80,732 80,071 144,698 46,022 ORIGIN\counts: 8703 8803 8903 9003 9103 9203 9303 9413 9503 9603 blank 696 476 434 468 575 472 780 1,157 260 357 01 4,144 3,879 3,752 3,711 4,053 3,697 4,994 7,450 6,384 6,311 02 1,464 1,387 1,243 1,295 1,556 1,319 1,830 2,901 2,207 2,130 03 2,242 2,225 1,912 2,019 2,177 2,124 2,633 4,391 3,950 3,575 04 897 821 858 722 782 757 862 1,562 1,271 1,219 05 735 749 696 700 757 771 937 1,278 1,205 1,027 06 261 319 234 271 347 241 309 717 508 415 07 3,119 2,966 2,784 2,670 2,952 2,713 3,432 4,972 4,499 4,406 13 1,772 1,824 1,785 2,125 2,854 2,294 3,363 9,921 6,132 5,656 14 362 380 334 409 551 396 609 2,142 1,316 1,200 15 252 238 242 248 334 300 351 693 465 395 16 287 253 288 414 588 505 720 2,548 1,565 1,437 17 419 361 382 435 523 458 591 1,510 975 807 20 3,449 3,268 3,101 3,209 3,542 3,090 5,498 9,479 6,801 6,056 30 25,172 26,333 23,880 25,589 27,446 24,413 35,990 52,565 37,947 30,564 Total 45,271 45,479 41,925 44,285 49,037 43,550 62,899 103,286 75,485 65,555 ORIGIN\counts: 9703 9803 9903 0003 0103 0203 blank 518 570 328 467 790 842 01 6,706 6,774 6,824 7,332 9,120 9,695 02 2,022 2,144 2,078 2,167 2,480 2,686 03 3,707 4,001 4,125 4,352 5,243 5,651 04 1,182 1,337 1,364 1,401 1,815 1,951 05 977 1,049 1,041 1,276 1,288 1,528 06 487 409 427 481 583 629 07 4,815 4,659 5,241 5,332 6,706 6,833 13 6,365 6,032 9,495 10,433 10,983 11,369 14 1,032 1,194 1,483 1,578 1,667 1,702 15 423 427 693 662 639 707 16 1,550 1,551 2,230 2,473 2,569 2,554 17 1,030 752 1,311 1,329 1,523 1,478 20 5,651 6,013 5,344 5,657 5,817 5,837 30 29,929 29,261 27,191 24,382 27,714 26,060 Total 66,394 66,173 69,175 69,322 78,937 79,522
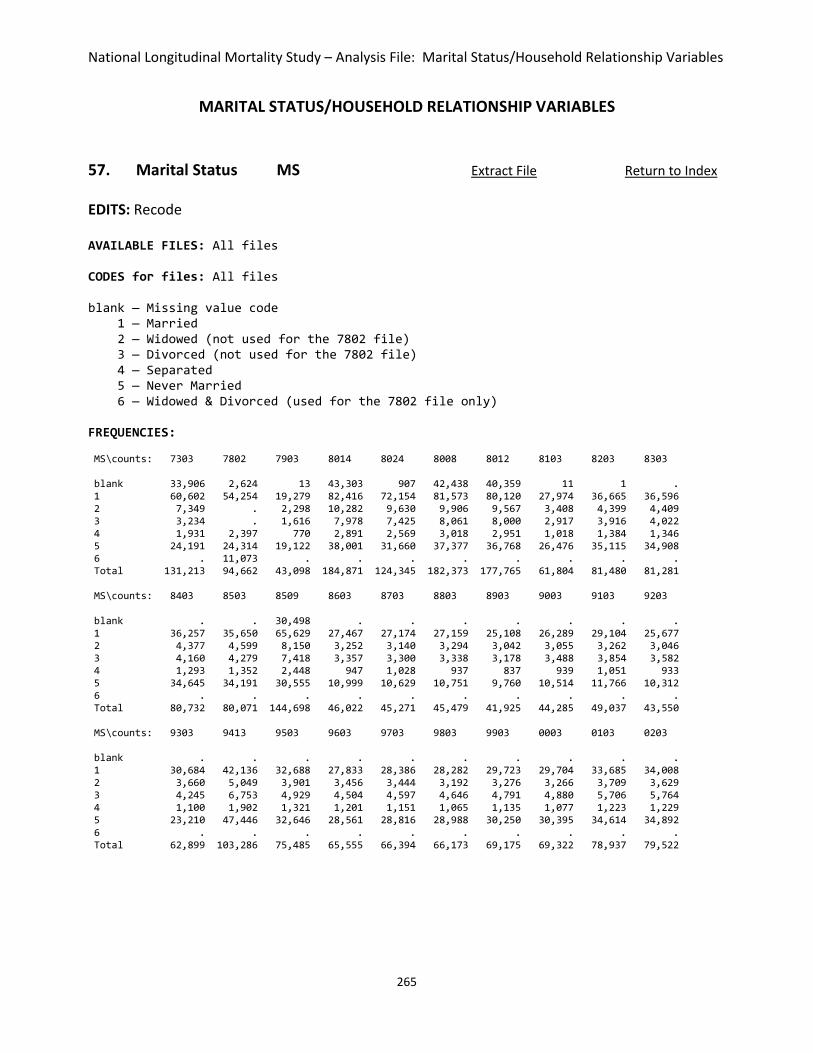
National Longitudinal Mortality Study – Analysis File: Marital Status/Household Relationship Variables
265
MARITAL STATUS/HOUSEHOLD RELATIONSHIP VARIABLES 57. Marital Status MS Extract File Return to Index
EDITS: Recode AVAILABLE FILES: All files CODES for files: All files blank — Missing value code 1 — Married 2 — Widowed (not used for the 7802 file) 3 — Divorced (not used for the 7802 file) 4 — Separated 5 — Never Married 6 — Widowed & Divorced (used for the 7802 file only) FREQUENCIES: MS\counts: 7303 7802 7903 8014 8024 8008 8012 8103 8203 8303 blank 33,906 2,624 13 43,303 907 42,438 40,359 11 1 . 1 60,602 54,254 19,279 82,416 72,154 81,573 80,120 27,974 36,665 36,596 2 7,349 . 2,298 10,282 9,630 9,906 9,567 3,408 4,399 4,409 3 3,234 . 1,616 7,978 7,425 8,061 8,000 2,917 3,916 4,022 4 1,931 2,397 770 2,891 2,569 3,018 2,951 1,018 1,384 1,346 5 24,191 24,314 19,122 38,001 31,660 37,377 36,768 26,476 35,115 34,908 6 . 11,073 . . . . . . . . Total 131,213 94,662 43,098 184,871 124,345 182,373 177,765 61,804 81,480 81,281 MS\counts: 8403 8503 8509 8603 8703 8803 8903 9003 9103 9203 blank . . 30,498 . . . . . . . 1 36,257 35,650 65,629 27,467 27,174 27,159 25,108 26,289 29,104 25,677 2 4,377 4,599 8,150 3,252 3,140 3,294 3,042 3,055 3,262 3,046 3 4,160 4,279 7,418 3,357 3,300 3,338 3,178 3,488 3,854 3,582 4 1,293 1,352 2,448 947 1,028 937 837 939 1,051 933 5 34,645 34,191 30,555 10,999 10,629 10,751 9,760 10,514 11,766 10,312 6 . . . . . . . . . . Total 80,732 80,071 144,698 46,022 45,271 45,479 41,925 44,285 49,037 43,550 MS\counts: 9303 9413 9503 9603 9703 9803 9903 0003 0103 0203 blank . . . . . . . . . . 1 30,684 42,136 32,688 27,833 28,386 28,282 29,723 29,704 33,685 34,008 2 3,660 5,049 3,901 3,456 3,444 3,192 3,276 3,266 3,709 3,629 3 4,245 6,753 4,929 4,504 4,597 4,646 4,791 4,880 5,706 5,764 4 1,100 1,902 1,321 1,201 1,151 1,065 1,135 1,077 1,223 1,229 5 23,210 47,446 32,646 28,561 28,816 28,988 30,250 30,395 34,614 34,892 6 . . . . . . . . . . Total 62,899 103,286 75,485 65,555 66,394 66,173 69,175 69,322 78,937 79,522

National Longitudinal Mortality Study – Analysis File: Marital Status/Household Relationship Variables
266
MS\counts: 0303 0403 0503 0603 0703 0803 0903 1003 1103 blank 22,184 22,047 23,959 6,620 6,764 5,485 5,525 5,539 6,047 1 53,513 52,258 55,807 51,334 51,310 49,679 50,963 49,133 48,915 2 4,789 4,694 5,084 4,618 4,498 4,606 4,536 4,659 4,494 3 9,016 8,750 9,415 8,820 8,779 8,886 8,695 9,106 8,853 4 2,074 1,923 2,112 2,053 2,034 2,028 2,125 2,196 2,061 5 62,829 61,637 64,880 61,018 60,357 59,371 60,785 60,835 59,691 6 . . . . . . . . . Total 154,405 151,309 161,257 134,463 133,742 130,055 132,629 131,468 130,061

National Longitudinal Mortality Study – Analysis File: Marital Status/Household Relationship Variables
267
58. Relationship to Reference Person RELTRF Extract File Return to Index EDITS: Simple For files: 7903, 8103–8503 0 ==> missing value code For files: 8014, 8008, 8012 - ==> missing value code AVAILABLE FILES: All files CODES for files: All files blank — Unknown 1 — Reference person with other relative in household 2 — Reference person with no other relatives in household 3 — Husband 4 — Wife 5 — Own child 6 — Parent 7 — Brother/Sister 8 — Other relative of reference person (HHLDR-81), (Head-79) 9 — Non-relative of reference person with own relatives in household A — Non-relative of reference person, no own relatives in household FREQUENCIES: RELTRF\counts: 7903 8014 8008 8012 8103 8203 8303 8403 8503 8509 blank 178 6,574 5,976 4,373 67 170 620 164 170 . 1 11,357 83,050 82,480 80,919 16,593 21,841 21,699 21,789 21,667 39,420 2 3,631 17,101 16,799 16,675 6,069 7,718 7,596 7,764 7,938 15,134 3 250 3,320 3,418 3,608 533 711 814 893 1,016 1,861 4 9,099 39,462 38,872 37,899 13,025 17,027 16,871 16,689 16,255 30,102 5 15,844 26,748 26,346 25,673 21,556 28,509 28,155 27,893 27,528 48,906 6 236 862 907 936 301 422 374 354 483 724 7 378 1,318 1,284 1,266 455 598 580 591 627 1,034 8 1,122 2,416 2,397 2,424 1,604 2,382 2,283 2,350 2,109 3,665 9 232 717 767 751 296 470 598 564 536 691 A 771 3,303 3,127 3,241 1,305 1,632 1,691 1,681 1,742 3,161 Total 43,098 184,871 182,373 177,765 61,804 81,480 81,281 80,732 80,071 144,698

National Longitudinal Mortality Study – Analysis File: Marital Status/Household Relationship Variables
268
RELTRF\counts: 8803 8903 9003 9103 9203 9303 9413 9503 9603 9703 blank . . . . 7 . . . . . 1 16,521 15,192 16,090 17,924 16,013 19,018 26,163 20,131 17,513 17,712 2 6,557 6,150 6,499 7,109 6,533 7,528 11,469 8,507 7,453 7,594 3 651 670 788 922 848 1,195 2,776 2,601 2,504 2,897 4 12,624 11,644 12,003 13,017 11,500 13,636 17,498 13,091 10,869 10,739 5 6,564 5,871 6,224 6,913 5,839 17,396 34,597 24,344 21,227 21,303 6 235 196 207 266 234 356 706 602 592 613 7 317 270 325 398 327 373 975 646 570 571 8 661 593 636 740 648 1,410 4,177 2,512 2,167 2,230 9 123 131 137 187 146 309 1,067 666 557 534 A 1,226 1,208 1,376 1,561 1,455 1,678 3,858 2,385 2,103 2,201 Total 45,479 41,925 44,285 49,037 43,550 62,899 103,286 75,485 65,555 66,394 RELTRF\counts: 9803 9903 0003 0103 0203 0303 0403 0503 0603 0703 blank . . . . . 22,184 22,047 23,959 6,620 6,764 1 17,650 18,700 18,482 21,110 21,322 34,507 33,693 35,892 33,280 33,196 2 7,639 7,604 7,587 9,171 9,294 12,523 12,218 13,186 12,441 12,483 3 3,189 3,601 4,107 4,970 5,295 8,699 8,897 9,772 9,175 9,282 4 10,384 10,569 10,006 11,054 10,906 16,788 15,958 16,751 15,146 14,965 5 21,225 22,410 22,176 24,913 25,044 46,385 45,305 47,613 44,118 43,653 6 577 649 749 914 902 1,470 1,508 1,531 1,538 1,620 7 591 674 758 841 873 1,346 1,350 1,352 1,430 1,389 8 2,138 2,239 2,531 2,682 2,641 4,570 4,578 5,087 4,657 4,607 9 533 500 529 537 475 1,079 947 1,055 964 1,052 A 2,247 2,229 2,397 2,745 2,770 4,854 4,808 5,059 5,094 4,731 Total 66,173 69,175 69,322 78,937 79,522 154,405 151,309 161,257 134,463 133,742 RELTRF\counts: 0803 0903 1003 1103 blank 5,485 5,525 5,539 6,047 1 32,242 33,034 32,265 31,852 2 12,924 12,591 12,888 12,840 3 9,024 9,660 8,963 9,053 4 14,417 14,416 14,032 13,796 5 42,492 43,266 42,531 41,737 6 1,605 1,709 1,878 1,864 7 1,256 1,440 1,495 1,509 8 4,652 4,968 5,141 4,995 9 1,095 846 940 1,065 A 4,863 5,174 5,796 5,303 Total 130,055 132,629 131,468 130,061

National Longitudinal Mortality Study – Analysis File: Marital Status/Household Relationship Variables
269
59. Relationship to Household Head RELTHD Extract File Return to Index EDITS: Simple NOTE: Variable not standardized across files For files: 7903, 8103–8503, 8603, 8703 0 ==> missing value code

National Longitudinal Mortality Study – Analysis File: Education Variables
270
EDUCATION VARIABLES 60. Education EDUC Extract File Return to Index EDITS: Recode Education recode variable that merges the concepts of years of school completed (7303–9103) with educational achievement (9203 and later cohorts) and reduces them to one set of codes for all cohorts. The final assignment to categories represents grade completed. NOT AVAILABLE: 8024 For files: 7303–8014, 8008–8503, 8603, 8703 01 ==> 01 02, 03, 04, 05 ==> 02 06, 07 ==> 03 08, 09 ==> 04 10 ==> 05 11 ==> 06 12 ==> 07 13 ==> 08 14 ==> 09 15 ==> 10 16 ==> 11 17 ==> 12 18 ==> 13 19 ==> 14 For files: 8509, 8803–9103 00 ==> 01 01, 02, 03, 04 ==> 02 05, 06 ==> 03 07, 08 ==> 04 09 ==> 05 10 ==> 06 11 ==> 07 12 ==> 08 13 ==> 09 14 ==> 10 15 ==> 11 16 ==> 12 17 ==> 13 18 ==> 14

National Longitudinal Mortality Study – Analysis File: Education Variables
271
For files: 9203–1103 00 ==> 00 31 ==> 01 32 ==> 02 33 ==> 03 34 ==> 04 35 ==> 05 36 ==> 06 37, 38 ==> 07 39 ==> 08 40, 41, 42 ==> 11 43 ==> 12 44, 45, 46 ==> 14 CODES for files: 7303–8014, 8008–1103 00 — Missing, children 01 — None, LT E1 02 — Completed El, E2, E3, E4 03 — Completed E5, E6 04 — Completed E7, E8 05 — Completed H1 06 — completed H2 07 — Completed H3 08 — Completed H4 09 — completed C1 10 — Completed C2 11 — completed C3 12 — Completed C4 13 — Completed C5 14 — Completed C6+ FREQUENCIES: EDUC\counts: 7303 7802 7903 8014 8008 8012 8103 8203 8303 8403 00 33,905 438 10,431 41,534 41,188 40,403 13,843 19,376 19,022 19,080 01 763 706 369 946 956 875 314 435 431 405 02 2,505 1,898 840 2,571 2,391 2,418 799 1,274 1,213 1,069 03 3,508 2,848 1,217 3,822 3,646 3,421 1,246 1,713 1,703 1,580 04 15,262 12,007 4,176 17,691 15,251 15,241 5,351 5,942 5,519 5,444 05 6,968 6,208 2,099 8,721 8,485 8,255 2,887 3,646 3,523 3,370 06 7,736 7,075 2,362 10,048 10,144 9,747 3,115 4,219 4,052 3,891 07 5,963 5,598 1,940 8,291 8,411 7,883 2,670 3,526 3,428 3,341 08 32,743 32,467 10,944 50,237 50,587 48,704 17,559 22,615 22,719 22,808 09 4,696 5,175 1,848 8,438 8,308 8,433 2,879 3,662 3,840 3,863 10 5,042 5,849 2,035 9,363 9,653 9,352 3,185 4,335 4,578 4,548 11 2,095 2,391 839 3,862 3,953 3,859 1,265 1,732 1,759 1,741 12 6,302 7,248 2,410 11,518 11,656 11,377 4,052 5,291 5,730 5,638 13 1,319 1,671 508 2,607 2,535 2,524 792 1,192 1,185 1,189 14 2,406 3,083 1,080 5,222 5,209 5,273 1,847 2,522 2,579 2,765 Total 131,213 94,662 43,098 184,871 182,373 177,765 61,804 81,480 81,281 80,732

National Longitudinal Mortality Study – Analysis File: Education Variables
272
EDUC\counts: 8503 8509 8603 8703 8803 8903 9003 9103 9203 9303 00 18,369 . 744 531 . . . . 363 10,911 01 408 31,052 182 186 650 663 617 546 190 254 02 1,065 1,514 598 550 559 605 550 642 531 581 03 1,529 2,426 955 907 888 807 849 929 754 1,025 04 5,224 10,239 3,478 3,396 3,275 2,944 2,924 2,893 2,436 2,868 05 3,388 6,058 2,202 2,100 2,137 1,982 1,996 2,066 1,607 1,979 06 3,886 7,039 2,694 2,572 2,613 2,248 2,399 2,544 2,103 2,566 07 3,262 5,822 2,236 2,221 2,236 2,055 2,177 2,286 2,698 3,089 08 22,616 42,270 17,312 16,829 17,189 15,510 16,522 18,650 14,455 17,355 09 4,035 7,202 3,134 2,947 2,905 2,818 3,093 3,472 . . 10 4,683 8,906 3,440 3,757 3,593 3,382 3,709 4,322 . . 11 1,792 3,535 1,434 1,390 1,369 1,359 1,407 1,609 10,273 12,481 12 5,962 11,304 4,513 4,680 4,678 4,515 4,792 5,429 5,461 6,574 13 1,159 2,184 925 931 899 850 843 990 . . 14 2,693 5,147 2,175 2,274 2,488 2,187 2,407 2,659 2,679 3,216 Total 80,071 144,698 46,022 45,271 45,479 41,925 44,285 49,037 43,550 62,899 EDUC\counts: 9413 9503 9603 9703 9803 9903 0003 0103 0203 0303 00 26,254 17,703 15,470 15,300 15,549 16,339 16,205 18,262 18,333 57,190 01 471 309 271 266 210 296 252 288 285 370 02 1,010 685 599 590 536 684 741 792 800 872 03 1,892 1,253 1,118 1,120 1,099 1,368 1,448 1,472 1,522 1,745 04 4,019 3,052 2,629 2,489 2,319 2,433 2,437 2,715 2,584 3,613 05 3,164 2,505 2,121 2,177 2,033 2,171 2,295 2,578 2,594 4,083 06 3,884 2,830 2,476 2,493 2,364 2,582 2,531 2,800 2,788 4,622 07 4,868 3,339 3,086 3,207 3,112 3,390 3,323 3,795 3,899 6,175 08 24,536 18,490 15,940 16,089 15,972 16,272 16,338 18,529 18,705 28,790 09 . . . . . . . . . . 10 . . . . . . . . . . 11 18,880 13,891 12,024 12,335 12,510 12,767 13,203 15,000 15,026 24,845 12 9,771 7,679 6,711 7,020 7,206 7,364 7,083 8,643 8,696 14,929 13 . . . . . . . . . . 14 4,537 3,749 3,110 3,308 3,263 3,509 3,466 4,063 4,290 7,171 Total 103,286 75,485 65,555 66,394 66,173 69,175 69,322 78,937 79,522 154,405 EDUC\counts: 0403 0503 0603 0703 0803 0903 1003 1103 00 56,061 59,697 39,483 39,159 36,680 37,489 36,873 36,500 01 391 439 413 385 360 381 351 381 02 832 982 884 832 766 779 724 730 03 1,662 1,774 1,669 1,539 1,514 1,472 1,439 1,549 04 3,504 3,889 3,372 3,200 2,912 2,949 2,866 2,753 05 4,005 4,501 3,955 3,877 3,636 3,674 3,518 3,365 06 4,564 4,746 4,391 4,327 4,190 4,193 3,898 3,772 07 6,000 6,397 6,024 6,199 5,814 5,883 6,044 5,715 08 27,820 29,973 27,570 27,310 26,703 27,131 27,019 26,315 09 . . . . . . . . 10 . . . . . . . . 11 24,396 25,860 24,300 24,061 24,339 24,897 24,794 24,841 12 14,801 15,485 14,995 15,208 15,334 15,549 15,878 15,792 13 . . . . . . . . 14 7,273 7,514 7,407 7,645 7,807 8,232 8,064 8,348 Total 151,309 161,257 134,463 133,742 130,055 132,629 131,468 130,061

National Longitudinal Mortality Study – Analysis File: Work Force Variables
273
WORK FORCE VARIABLES 61. Employment Status ESR Extract File Return to Index EDITS: Simple, Recode The variable ESR has been recoded for the analysis files because the change of definition occurring in 1994 resulted in two definitions that were not directly compatible. NOT AVAILABLE: 8024 For files: 7303–8014, 8008–9303 1 ==> 1 2 ==> 2 3 ==> 3 4 ==> 5 5 ==> 5 6 ==> 4 7 ==> 4 For files: 9413–1103 1 ==> 1 2 ==> 2 3 ==> 2 4 ==> 3 5 ==> 5 6 ==> 4 7 ==> 5 CODES for files: 7303–8014, 8008–1103 0 — Children <= 13, Armed Forces, missing 1 — In the labor force, employed 2 — In the labor force, absent from work 3 — In the labor force, unemployed, looking for work 4 — Not in the labor force, disabled, unable to work 5 — Not in the labor force, retired, other (housekeeping, student, etc.) NOTE: Age of person may be used to separate students from retired-other persons in category 5.

National Longitudinal Mortality Study – Analysis File: Work Force Variables
274
FREQUENCIES: ESR\counts: 7303 7802 7903 8014 8008 8012 8103 8203 8303 8403 0 33,734 760 10,439 41,534 41,188 40,403 13,897 18,406 18,061 18,081 1 51,211 49,604 17,759 77,725 72,960 75,814 26,419 33,431 33,376 34,140 2 2,100 2,458 700 4,145 9,050 2,584 1,089 1,470 1,439 1,471 3 3,017 3,892 1,379 6,020 6,774 5,843 2,255 3,747 4,252 3,183 4 1,782 1,489 590 2,368 1,951 1,892 681 841 823 931 5 39,369 36,459 12,231 53,079 50,450 51,229 17,463 23,585 23,330 22,926 Total 131,213 94,662 43,098 184,871 182,373 177,765 61,804 81,480 81,281 80,732 ESR\counts: 8503 8509 8603 8703 8803 8903 9003 9103 9203 9303 0 17,324 31,073 238 11 441 483 408 583 386 11,041 1 34,532 63,854 26,028 26,127 26,522 24,677 26,123 29,020 25,198 29,901 2 1,440 2,947 1,107 1,142 1,114 1,100 1,145 1,191 1,111 1,321 3 3,044 4,671 2,132 1,968 1,691 1,441 1,622 2,199 2,202 2,403 4 819 1,404 649 586 669 688 743 797 710 1,036 5 22,912 40,749 15,868 15,437 15,042 13,536 14,244 15,247 13,943 17,197 Total 80,071 144,698 46,022 45,271 45,479 41,925 44,285 49,037 43,550 62,899 ESR\counts: 9413 9503 9603 9703 9803 9903 0003 0103 0203 0303 0 26,710 18,011 15,706 15,553 15,775 16,636 16,558 18,621 18,705 56,404 1 44,458 33,931 29,455 30,319 30,578 31,919 32,363 36,982 36,659 59,916 2 2,196 1,780 1,412 1,437 1,441 1,479 1,507 1,802 1,738 2,744 3 3,154 1,814 1,649 1,550 1,415 1,386 1,372 1,604 2,056 3,635 4 2,753 2,202 1,870 1,974 1,930 2,089 2,024 2,401 2,495 3,940 5 24,015 17,747 15,463 15,561 15,034 15,666 15,498 17,527 17,869 27,766 Total 103,286 75,485 65,555 66,394 66,173 69,175 69,322 78,937 79,522 154,405 ESR\counts: 0403 0503 0603 0703 0803 0903 1003 1103 0 55,871 58,642 38,832 38,327 36,405 37,160 36,496 36,007 1 58,398 62,512 58,729 58,984 57,338 55,681 54,695 53,870 2 2,665 2,828 2,790 2,755 2,572 2,773 2,701 2,332 3 3,381 3,400 2,878 2,629 3,019 5,095 5,625 5,224 4 3,938 4,424 4,142 4,154 4,294 4,453 4,460 4,570 5 27,056 29,451 27,092 26,893 26,427 27,467 27,491 28,058 Total 151,309 161,257 134,463 133,742 130,055 132,629 131,468 130,061

National Longitudinal Mortality Study – Analysis File: Work Force Variables
275
62. Industry Using 1990 Codes IND1990 Extract File Return to Index EDITS: Simple, Invalid Entry For files: 9203–9803 000 ==> missing value code For files: 7303–8014, 8008–8509 Blanks to left of valid digits 0 filled.

National Longitudinal Mortality Study – Analysis File: Work Force Variables
276
63. Major Industry Using 1990 Codes MAJIND90 Extract File Return to Index EDITS: Simple, Recode For files: 9203-1103 00 ==> missing value code For files: 9903-0203 old_majind90 = majind90; select (old_majind90); when ('04') majind90 = '05'; when ('05') majind90 = '04'; when ('07','08') majind90 = '06'; /*when ('09') majind90 = '07'; see below, depends on ind1990 */ when ('10') majind90 = '09'; when ('11') majind90 = '10'; when ('12') majind90 = '12'; when ('13') majind90 = '11'; when ('14') majind90 = '12'; when ('15') majind90 = '13'; when ('16','17','18','19','20') majind90 = '14'; when ('21') majind90 = '01'; when ('22') majind90 = '15'; when ('23') majind90 = '17'; otherwise majind90 = old_majind90; end; if '500' <= ind1990 <= '532' then MAJIND90 = '07'; else if '540' <= ind1990 <= '571' then MAJIND90 = '08'; NOT AVAILABLE: 8024 CODES for files: 7303-8014, 8008-1103 (specific 1990 industry groupings are shown in parentheses) blank — Industry missing, not reported, unknown 01 — Agriculture, Forestry, & Fisheries (010-032) 02 — Mining (040-050) 03 — Construction (060) 04 — Manufacturing (Nondurable Goods) (100-222) 05 — Manufacturing (Durable Goods) (230-392) 06 — Transportation, Communications &
Other Public Utilities (400-472) 07 — Wholesale Trade (Durable Goods) (500-532) 08 — Wholesale Trade (Nondurable Goods) (540-571) 09 — Retail Trade (580-691) 10 — Finance, Insurance & Real Estate (700-712) 11 — Business & Repair Services (721-760) 12 — Personal Services (761-791) 13 — Entertainment, Recreational Services (800-810) 14 — Professional and Related Services (812-893) 15 — Public Administration (900-932) 17 — Active Duty Military (991)

National Longitudinal Mortality Study – Analysis File: Work Force Variables
277
FREQUENCIES: MAJIND90\counts: 7303 7802 7903 8014 8008 8012 8103 8203 8303 8403 blank 71,613 36,632 21,419 92,648 89,958 89,529 32,178 41,091 40,744 40,477 00 . . . . . . . . . . 01 2,490 1,899 886 4,108 4,700 3,668 1,141 1,643 1,655 1,610 02 441 509 185 1,049 1,151 1,125 356 571 557 460 03 3,691 3,566 1,373 5,898 6,242 5,773 1,932 2,484 2,601 2,633 04 5,992 5,555 1,932 7,812 7,681 7,280 2,468 3,397 3,284 3,244 05 8,371 7,580 2,841 11,356 11,040 10,366 3,690 4,735 4,586 4,370 06 4,185 4,083 1,440 6,430 6,409 6,111 2,018 2,754 2,638 2,718 07 1,122 1,077 364 1,714 1,706 1,456 539 780 894 836 08 1,286 1,216 456 1,781 1,862 1,798 657 869 771 696 09 10,057 9,948 3,732 15,515 15,527 15,140 4,856 6,723 6,849 6,864 10 3,006 3,284 1,092 5,070 5,122 4,926 1,695 2,306 2,271 2,348 11 1,802 1,801 753 3,093 3,046 3,009 1,070 1,591 1,643 1,840 12 3,017 2,505 989 3,919 4,345 3,824 1,287 1,731 1,871 1,715 13 606 676 237 1,072 1,252 1,002 337 447 498 513 14 11,026 11,704 4,390 18,897 17,629 18,578 6,166 8,484 8,426 8,466 15 2,508 2,627 1,009 4,509 4,703 4,180 1,414 1,874 1,959 1,908 17 . . . . . . . . 34 34 Total 131,213 94,662 43,098 184,871 182,373 177,765 61,804 81,480 81,281 80,732 MAJIND90\counts: 8503 8509 8603 8703 8803 8903 9003 9103 9203 9303 blank 39,705 70,568 14,664 13,992 15,044 13,612 14,390 15,462 . . 00 . . . . . . . . 14,042 28,150 01 1,381 2,662 1,181 1,227 958 973 1,010 1,068 890 1,101 02 415 702 335 254 244 201 242 257 229 255 03 2,608 5,046 2,054 2,021 1,899 1,823 1,859 2,084 1,859 2,055 04 3,246 5,670 2,460 2,238 2,334 2,167 2,181 2,505 2,210 2,417 05 4,563 8,071 3,390 3,228 3,235 2,935 3,164 3,379 2,881 3,247 06 2,762 5,023 2,002 2,060 2,070 1,924 1,954 2,268 1,905 2,406 07 809 1,519 587 618 590 564 587 713 617 669 08 725 1,304 592 558 569 500 497 596 554 599 09 6,905 12,856 5,332 5,422 5,082 4,710 5,053 5,585 4,992 6,101 10 2,528 4,560 1,769 1,926 2,047 1,826 1,886 2,149 1,821 2,093 11 1,878 3,644 1,460 1,561 1,555 1,507 1,607 1,804 1,487 1,892 12 1,744 3,181 1,281 1,204 1,118 1,120 1,177 1,177 1,107 1,298 13 493 1,038 448 433 366 312 351 446 438 569 14 8,492 15,435 6,860 6,998 6,879 6,398 6,867 7,951 7,120 8,369 15 1,798 3,383 1,572 1,479 1,479 1,342 1,450 1,579 1,380 1,659 17 19 36 35 52 10 11 10 14 18 19 Total 80,071 144,698 46,022 45,271 45,479 41,925 44,285 49,037 43,550 62,899 MAJIND90\counts: 9413 9503 9603 9703 9803 9903 0003 0103 0203 0303 blank . . . . . . . . . . 00 52,891 37,622 32,700 32,776 32,451 35,714 35,368 40,143 40,805 88,494 01 1,559 1,229 1,078 988 959 1,101 1,087 1,185 1,133 1,678 02 300 225 192 213 186 215 174 233 192 377 03 3,061 2,386 2,094 2,200 2,193 2,351 2,465 2,881 2,990 5,256 04 3,534 2,639 2,149 2,130 2,054 3,091 3,085 3,390 3,250 3,220 05 4,574 3,358 3,032 3,000 3,022 2,056 2,243 2,425 2,227 4,637 06 3,338 2,510 2,195 2,218 2,262 2,392 2,506 2,739 2,832 4,228 07 880 754 618 611 673 697 800 827 760 976 08 893 666 582 580 530 655 627 748 753 1,022 09 9,034 6,445 5,713 5,911 5,902 6,039 6,040 6,851 7,150 11,881 10 3,181 2,350 2,041 2,075 2,190 2,217 2,177 2,527 2,485 4,537 11 3,055 2,197 2,126 2,169 2,268 2,270 2,437 2,841 2,721 4,584 12 2,085 1,514 1,310 1,308 1,319 1,365 1,407 1,665 1,508 2,226 13 859 644 604 686 618 663 651 791 811 1,120 14 11,849 9,137 7,725 8,070 8,103 6,765 6,676 7,887 8,140 17,346 15 2,168 1,796 1,384 1,449 1,436 1,578 1,578 1,800 1,757 2,815 17 25 13 12 10 7 6 1 4 8 8 Total 103,286 75,485 65,555 66,394 66,173 69,175 69,322 78,937 79,522 154,405

National Longitudinal Mortality Study – Analysis File: Work Force Variables
278
MAJIND90\counts: 0403 0503 0603 0703 0803 0903 1003 1103 blank . . . . . . . 69,234 00 86,935 93,167 70,382 69,812 67,302 69,381 68,886 . 01 1,743 2,025 1,709 1,699 1,750 1,683 1,801 1,633 02 299 414 376 442 389 468 375 410 03 5,137 5,693 5,476 5,510 5,097 5,057 4,888 4,426 04 3,103 3,169 2,872 2,762 2,673 2,588 2,585 2,552 05 4,613 4,954 4,544 4,319 4,234 4,079 3,815 3,867 06 4,096 4,224 4,068 3,962 4,114 3,962 3,735 3,850 07 1,026 1,014 1,009 1,074 924 841 842 711 08 971 1,000 929 784 756 718 747 839 09 11,623 12,418 11,603 11,131 11,284 11,506 11,135 10,775 10 4,214 4,337 4,292 4,246 3,947 3,989 3,954 3,851 11 4,260 4,378 4,189 4,286 4,276 4,300 4,388 4,171 12 2,171 2,191 2,094 2,135 2,039 2,041 2,065 2,021 13 970 1,038 991 913 945 999 1,119 959 14 17,191 17,976 17,010 17,664 17,309 18,006 17,943 17,629 15 2,943 3,245 2,906 2,995 3,002 2,995 3,173 3,116 17 14 14 13 8 14 16 17 17 Total 151,309 161,257 134,463 133,742 130,055 132,629 131,468 130,061

National Longitudinal Mortality Study – Analysis File: Work Force Variables
279
64. Industry Using 2007 Codes IND2007 Extract File Return to Index EDITS: Simple For files: 0303-1103 0000 ==> missing value code

National Longitudinal Mortality Study – Analysis File: Work Force Variables
280
65. Major Industry Using 2007 Codes MAJIND2007 Extract File Return to Index EDITS: Simple For files: 0303-1103 00 ==> missing value code CODES for files: 7303-8024, 8008-1103 blank — Industry missing, not reported, unknown 01 — Agriculture, forestry, fishing, and hunting (0170-0290) 02 — Mining (0370-0490) 03 — Construction (0770) 04 — Manufacturing (1070-3990) 05 — Wholesale and retail trade (4070-5790) 06 — Transportation, warehousing and utilities (0570-0690, 6070-6390) 07 — Information (6470-6780) 08 — Financial, insurance, real estate, rental and leasing (6870-7190) 09 — Professional, scientific, management, administrative,
waste management services (7270-7790) 10 — Educational, health care, and social services (7860-8470) 11 — Arts, entertainment, recreation, leisure accommodation, and food (8560-8690) 12 — Other services except public administration (8770-9290) 13 — Public administration (9370-9590) 14 — Armed Forces (9670-9870) FREQUENCIES: MAJIND2007\counts: 7303 7802 7903 8014 8008 8012 8103 8203 8303 blank 71,613 36,632 21,419 92,648 89,958 89,529 32,178 41,091 40,744 01 2,496 1,886 880 4,009 4,566 3,648 1,124 1,638 1,619 02 441 509 185 1,049 1,151 1,125 356 571 557 03 3,691 3,566 1,373 5,898 6,242 5,773 1,932 2,484 2,601 04 13,962 12,757 4,648 18,503 18,102 17,023 5,938 7,830 7,575 05 9,983 9,558 3,403 14,339 14,371 13,930 4,633 6,177 6,354 06 3,163 3,081 1,055 4,774 4,823 4,575 1,496 2,002 1,923 07 1,423 1,474 541 2,395 2,247 2,136 781 1,030 1,038 08 3,036 3,307 1,106 5,118 5,177 4,972 1,713 2,329 2,301 09 2,480 2,779 1,053 4,681 4,708 4,586 1,606 2,367 2,295 10 9,167 9,526 3,598 15,343 14,161 15,089 4,943 6,764 6,818 11 3,320 3,586 1,574 6,466 6,917 6,214 1,984 2,940 3,091 12 3,930 3,374 1,254 5,139 5,247 4,985 1,706 2,383 2,372 13 2,508 2,627 1,009 4,509 4,703 4,180 1,414 1,874 1,959 14 . . . . . . . . 34 Total 131,213 94,662 43,098 184,871 182,373 177,765 61,804 81,480 81,281 MAJIND2007\counts: 8403 8503 8509 8603 8703 8803 8903 9003 9103 blank 40,477 39,705 70,568 14,664 13,992 15,044 13,612 14,390 15,462 01 1,550 1,300 2,456 1,089 1,123 892 904 934 987 02 460 415 702 335 254 244 201 242 257 03 2,633 2,608 5,046 2,054 2,021 1,899 1,823 1,859 2,084 04 7,357 7,608 13,334 5,712 5,308 5,428 4,979 5,191 5,725 05 6,128 6,199 11,594 4,873 4,937 4,744 4,337 4,685 5,231 06 1,980 1,980 3,685 1,435 1,501 1,490 1,411 1,455 1,639 07 1,048 1,018 1,851 786 728 750 616 650 748 08 2,370 2,562 4,619 1,787 1,956 2,070 1,852 1,897 2,184 09 2,439 2,581 5,025 2,063 2,215 2,190 2,123 2,302 2,597

National Longitudinal Mortality Study – Analysis File: Work Force Variables
281
MAJIND2007\counts: 8403 8503 8509 8603 8703 8803 8903 9003 9103 (cont.) 10 6,839 6,813 12,385 5,542 5,621 5,473 5,153 5,513 6,386 11 3,151 3,107 5,800 2,334 2,403 2,155 2,078 2,169 2,506 12 2,358 2,358 4,214 1,741 1,681 1,611 1,483 1,538 1,638 13 1,908 1,798 3,383 1,572 1,479 1,479 1,342 1,450 1,579 14 34 19 36 35 52 10 11 10 14 Total 80,732 80,071 144,698 46,022 45,271 45,479 41,925 44,285 49,037 MAJIND2007\counts: 9203 9303 9413 9503 9603 9703 9803 9903 0003 blank 14,042 28,150 52,891 37,622 32,700 32,776 32,451 34,050 33,653 01 772 953 1,270 1,007 880 802 747 823 832 02 229 255 300 225 192 213 186 215 174 03 1,859 2,055 3,061 2,386 2,094 2,200 2,193 2,351 2,465 04 4,960 5,492 7,908 5,856 5,049 4,993 4,954 5,012 5,192 05 4,609 5,444 7,759 5,834 5,109 5,173 5,155 5,377 5,446 06 1,371 1,796 2,445 1,851 1,639 1,634 1,630 1,757 1,823 07 638 768 1,153 819 678 789 789 795 846 08 1,886 2,173 3,299 2,432 2,122 2,162 2,293 2,282 2,261 09 2,251 2,782 4,255 3,343 2,898 3,105 3,192 3,303 3,443 10 5,721 6,776 9,627 7,345 6,311 6,494 6,515 6,802 6,762 11 2,320 2,787 4,453 3,097 2,740 2,919 2,863 3,033 3,058 12 1,494 1,790 2,672 1,859 1,747 1,675 1,762 1,791 1,788 13 1,380 1,659 2,168 1,796 1,384 1,449 1,436 1,578 1,578 14 18 19 25 13 12 10 7 6 1 Total 43,550 62,899 103,286 75,485 65,555 66,394 66,173 69,175 69,322 MAJIND2007\counts: 0103 0203 0303 0403 0503 0603 0703 0803 0903 blank 38,127 38,684 88,494 86,935 93,167 70,382 69,812 67,302 69,381 01 887 872 1,177 1,235 1,409 1,135 1,140 1,122 1,083 02 233 192 377 299 414 376 442 389 468 03 2,881 2,990 5,060 4,967 5,512 5,273 5,345 4,917 4,853 04 5,682 5,351 7,507 7,365 7,797 7,084 6,733 6,660 6,392 05 6,088 6,149 9,788 9,481 10,115 9,486 9,036 8,899 8,890 06 1,941 1,992 3,148 3,106 3,283 3,127 3,120 3,259 3,207 07 962 1,002 1,626 1,561 1,466 1,466 1,492 1,415 1,455 08 2,616 2,560 4,659 4,390 4,509 4,443 4,340 4,075 4,100 09 4,128 3,994 6,800 6,185 6,494 6,284 6,544 6,653 6,757 10 7,955 8,244 13,451 13,515 14,113 13,334 13,777 13,339 13,929 11 3,658 3,732 6,338 6,121 6,405 6,061 5,918 6,078 6,099 12 1,975 1,995 3,157 3,192 3,314 3,093 3,040 2,931 3,004 13 1,800 1,757 2,815 2,943 3,245 2,906 2,995 3,002 2,995 14 4 8 8 14 14 13 8 14 16 Total 78,937 79,522 154,405 151,309 161,257 134,463 133,742 130,055 132,629 MAJIND2007\counts: 1003 1103 blank 68,886 69,234 01 1,169 1,107 02 375 410 03 4,676 4,180 04 6,162 6,161 05 8,736 8,383 06 3,087 2,931 07 1,364 1,327 08 4,065 3,908 09 6,776 6,627 10 14,073 13,834 11 6,006 5,933 12 2,903 2,893 13 3,173 3,116 14 17 17 Total 131,468 130,061

National Longitudinal Mortality Study – Analysis File: Work Force Variables
282
66. Occupation Using 1990 Codes OCC1990 Extract File Return to Index EDITS: Simple, Invalid Entry For files: 9203–9803, 0303-1103 000 ==> missing value code For files: 0203 0-1 ==> missing value code

National Longitudinal Mortality Study – Analysis File: Work Force Variables
283
67. Major Occupation Using 1990 Codes MAJOCC90 Extract File Return to Index EDITS: Simple, Recode For files: 9903-1103 00 ==> missing value code For files: 9203–9803 19 ==> missing value code For files: 9903-0203 old_majocc90 = majocc90; select (old_majocc90); when ('10') majocc90 = '15'; when ('11') majocc90 = '16'; when ('12') majocc90 = '17'; when ('14') majocc90 = '18'; when ('15','-1') majocc90 = '00'; otherwise majocc90 = old_majocc90; end; NOT AVAILABLE: 8024 CODES for files: 7303-8014, 8008-1103 (specific 1990 occupation groupings are shown in parentheses) blank — Occupation missing, unknown Managerial & Professional Specialties 01 — Executive, administrative, managerial (003-037) 02 — Professional specialties (043-199) Technical, Sales & Administrative Support 03 — Technicians and related support (203-235) 04 — Sales (243-285) 05 — Administrative support including clerical (303-389) Service Occupations 06 — Private household (403-407) 07 — Protective services (413-427) 08 — Service excluding private and protective (433-469) Farming, Forestry & Fishing 09 — Farm operators & mangers (473-476) 10 — Other agricultural and related (477-499) Precision Production, Crafts & Repair 11 — Mechanics & repairers (503-549) 12 — Construction trades (553-599) 13 — Extractive (613-617) 14 — Precision production (628-699) Operators, Fabricators & Laborers 15 — Machine operators, assemblers & inspectors (703-799) 16 — Transportation & materials moving (803-859)

National Longitudinal Mortality Study – Analysis File: Work Force Variables
284
17 — Handlers, equipment cleaners, helpers & laborers (864-889) Military Occupations 18 — Military occupations (905)
NOTE: Military codes for 9903-0203 are under review. FREQUENCIES: MAJOCC90\counts: 7303 7802 7903 8014 8008 8012 8103 8203 8303 8403 blank 71,520 36,577 21,393 92,480 89,880 89,480 32,109 41,025 40,774 40,497 01 5,197 5,628 1,910 8,878 9,285 8,905 3,161 4,219 4,052 4,120 02 6,288 6,541 2,371 10,619 9,837 10,356 3,479 4,691 4,716 4,876 03 1,312 1,390 471 2,424 2,253 2,305 789 1,038 1,050 1,143 04 6,222 6,148 2,173 9,563 9,408 9,477 3,052 4,148 4,580 4,551 05 9,188 9,168 3,372 14,815 14,579 13,965 4,702 6,411 6,332 6,210 06 1,333 1,030 350 1,290 1,366 1,275 429 606 571 521 07 801 799 286 1,251 1,177 1,171 421 550 607 567 08 6,422 6,579 2,748 10,891 10,914 10,219 3,364 4,881 4,957 5,012 09 1,111 781 309 1,725 1,887 1,629 508 692 647 669 10 1,658 1,253 633 2,588 3,329 2,185 697 1,033 1,064 973 11 2,322 2,247 791 3,651 3,419 3,286 1,197 1,511 1,594 1,582 12 2,308 2,270 822 3,632 3,888 3,494 1,236 1,582 1,734 1,729 13 107 118 51 269 296 315 105 154 146 97 14 2,434 2,284 860 3,529 3,496 3,332 1,183 1,493 1,421 1,434 15 6,794 5,926 2,366 8,525 8,490 7,980 2,684 3,652 3,333 3,163 16 2,724 2,613 929 3,987 4,085 3,837 1,265 1,705 1,761 1,771 17 3,472 3,310 1,263 4,753 4,784 4,554 1,422 2,089 1,908 1,783 18 . . . 1 . . 1 . 34 34 Total 131,213 94,662 43,098 184,871 182,373 177,765 61,804 81,480 81,281 80,732 MAJOCC90\counts: 8503 8509 8603 8703 8803 8903 9003 9103 9203 9303 blank 39,745 70,624 14,687 14,020 15,074 13,627 14,416 15,485 14,042 28,150 01 4,348 7,924 3,237 3,511 3,694 3,418 3,630 4,119 3,548 4,408 02 4,797 9,033 3,956 4,065 4,026 3,796 3,923 4,520 3,962 4,818 03 1,112 2,209 966 860 899 871 973 1,042 1,056 1,116 04 4,729 8,655 3,706 3,689 3,526 3,310 3,481 3,866 3,395 4,167 05 6,413 11,713 4,977 5,004 4,916 4,309 4,705 5,296 4,819 5,220 06 537 855 360 313 245 242 219 219 209 275 07 599 1,149 529 512 458 473 524 539 512 591 08 4,916 8,778 3,646 3,653 3,405 3,218 3,431 3,918 3,458 4,192 09 537 1,076 472 461 417 403 418 430 374 436 10 870 1,853 801 795 526 547 565 633 511 676 11 1,598 2,878 1,257 1,177 1,206 1,085 1,076 1,244 1,069 1,141 12 1,714 3,341 1,361 1,290 1,275 1,143 1,250 1,422 1,216 1,370 13 117 143 77 52 57 44 41 54 55 56 14 1,405 2,625 1,149 1,078 1,038 941 1,003 1,046 922 1,075 15 3,114 5,359 2,206 2,071 2,219 2,089 2,070 2,377 1,964 2,305 16 1,699 3,104 1,267 1,320 1,253 1,206 1,227 1,427 1,180 1,478 17 1,802 3,343 1,333 1,348 1,235 1,192 1,323 1,386 1,240 1,406 18 19 36 35 52 10 11 10 14 18 19 Total 80,071 144,698 46,022 45,271 45,479 41,925 44,285 49,037 43,550 62,899

National Longitudinal Mortality Study – Analysis File: Work Force Variables
285
MAJOCC90\counts: 9413 9503 9603 9703 9803 9903 0003 0103 0203 0303 blank 52,891 37,622 32,700 32,776 32,451 34,050 33,653 38,127 38,684 88,494 01 5,998 4,911 4,355 4,587 4,485 4,857 4,860 5,622 5,880 9,702 02 6,742 5,393 4,592 4,840 4,893 5,115 5,046 5,892 6,002 10,033 03 1,550 1,096 950 1,061 1,041 1,018 1,132 1,328 1,293 2,027 04 6,007 4,631 3,931 4,033 4,086 4,204 4,152 4,634 4,663 7,678 05 7,534 5,528 4,774 4,795 4,801 4,854 4,927 5,605 5,482 9,524 06 433 312 272 271 293 265 269 289 248 . 07 836 627 508 570 564 571 590 642 708 1,123 08 6,561 4,623 3,990 4,058 4,138 4,349 4,397 5,139 5,270 9,063 09 592 504 396 359 360 329 321 368 400 615 10 962 693 652 636 597 741 782 827 709 1,065 11 1,735 1,248 1,183 1,144 1,187 1,244 1,230 1,389 1,379 2,170 12 2,128 1,570 1,335 1,441 1,480 1,539 1,633 1,954 1,942 3,088 13 65 51 44 56 47 51 38 62 45 48 14 1,600 1,150 928 982 1,003 998 1,058 1,136 1,083 1,714 15 3,356 2,449 2,157 2,070 2,061 2,037 2,119 2,330 2,139 3,087 16 1,994 1,499 1,388 1,338 1,350 1,424 1,528 1,767 1,743 2,672 17 2,277 1,565 1,388 1,367 1,329 1,523 1,586 1,822 1,844 2,294 18 25 13 12 10 7 6 1 4 8 8 Total 103,286 75,485 65,555 66,394 66,173 69,175 69,322 78,937 79,522 154,405 MAJOCC90\counts: 0403 0503 0603 0703 0803 0903 1003 1103 blank 86,935 93,167 70,382 69,812 67,302 69,381 68,886 69,234 01 9,291 9,393 9,319 9,291 9,203 9,629 9,229 8,743 02 10,351 10,755 10,106 10,637 10,498 10,895 10,859 11,120 03 1,967 2,142 1,939 1,962 1,967 1,973 2,057 2,128 04 7,545 7,794 7,460 7,229 7,096 7,047 6,865 6,590 05 8,849 9,288 8,690 8,464 8,295 8,205 8,012 7,819 06 . . . . . . . . 07 1,233 1,277 1,191 1,234 1,255 1,240 1,345 1,377 08 8,860 9,461 8,974 8,941 8,765 8,973 9,165 8,776 09 654 763 605 603 614 611 612 554 10 1,104 1,313 1,155 1,134 1,161 1,083 1,156 1,101 11 2,076 2,312 2,126 2,059 1,999 2,027 2,013 1,855 12 3,039 3,330 3,158 3,102 2,850 2,652 2,623 2,394 13 71 93 98 110 82 115 107 127 14 1,506 1,611 1,424 1,422 1,343 1,227 1,285 1,405 15 2,975 3,326 2,852 2,791 2,710 2,493 2,503 2,255 16 2,566 2,687 2,512 2,542 2,568 2,710 2,456 2,407 17 2,273 2,531 2,459 2,401 2,333 2,352 2,278 2,159 18 14 14 13 8 14 16 17 17 Total 151,309 161,257 134,463 133,742 130,055 132,629 131,468 130,061

National Longitudinal Mortality Study – Analysis File: Work Force Variables
286
68. Occupation Using 2000 Codes OCC2000 Extract File Return to Index EDITS: Simple, Recode For files: 8014, 8103, 8303-0203 9830 ==> 9840 For files: 0303-1103 0000 ==> missing value code

National Longitudinal Mortality Study – Analysis File: Work Force Variables
287
69. Major Occupation Using the Census 2000 Codes MAJOCC2000 Extract File Return to Index
EDITS: Simple, Invalid Entry For files: 7303-8014, 8008-1103 00 ==> missing value code FREQUENCIES: MAJOCC2000\counts: 7303 7802 7903 8014 8008 8012 8103 8203 8303 blank 71,520 36,577 21,393 92,480 89,880 89,480 32,109 41,025 40,774 01 6,310 6,440 2,215 10,638 11,158 10,584 3,677 4,946 4,685 02 9,744 10,096 3,667 16,534 15,378 15,908 5,373 7,281 7,273 03 7,248 7,054 2,924 11,415 11,963 10,710 3,489 5,118 5,166 04 6,222 6,148 2,173 9,563 9,408 9,477 3,052 4,148 4,580 05 9,205 9,180 3,392 14,792 14,573 13,988 4,738 6,342 6,378 06 1,313 967 475 1,974 2,308 1,675 561 767 785 07 3,422 3,207 1,250 5,410 5,765 5,291 1,780 2,345 2,430 08 2,396 2,305 807 3,753 3,525 3,384 1,231 1,557 1,647 09 9,063 8,089 3,174 11,813 11,805 11,079 3,782 5,058 4,681 10 4,770 4,599 1,628 6,498 6,610 6,189 2,011 2,893 2,848 11 . . . 1 . . 1 . 34 Total 131,213 94,662 43,098 184,871 182,373 177,765 61,804 81,480 81,281 MAJOCC2000\counts: 8403 8503 8509 8603 8703 8803 8903 9003 9103 blank 40,497 39,745 70,624 14,687 14,020 15,074 13,627 14,416 15,485 01 4,749 4,856 8,972 3,691 3,936 4,085 3,821 4,037 4,548 02 7,477 7,460 13,998 6,148 6,157 6,111 5,793 6,146 6,928 03 5,107 5,007 9,163 3,795 3,732 3,282 3,147 3,323 3,746 04 4,551 4,729 8,655 3,706 3,689 3,526 3,310 3,481 3,866 05 6,258 6,422 11,756 4,994 5,015 4,920 4,295 4,696 5,262 06 770 648 1,184 537 543 390 395 419 470 07 2,358 2,344 4,494 1,837 1,746 1,668 1,543 1,618 1,845 08 1,626 1,648 2,968 1,293 1,201 1,247 1,123 1,100 1,282 09 4,538 4,475 7,899 3,322 3,097 3,226 3,000 3,042 3,389 10 2,767 2,718 4,949 1,977 2,083 1,940 1,860 1,997 2,202 11 34 19 36 35 52 10 11 10 14 Total 80,732 80,071 144,698 46,022 45,271 45,479 41,925 44,285 49,037 MAJOCC2000\counts: 9203 9303 9413 9503 9603 9703 9803 9903 0003 blank 14,042 28,150 52,891 37,622 32,700 32,776 32,451 34,050 33,653 01 3,908 4,842 6,573 5,382 4,763 4,959 4,841 5,156 5,176 02 6,254 7,371 10,472 8,139 6,950 7,320 7,381 7,686 7,717 03 3,335 4,071 6,403 4,508 3,918 4,005 4,080 4,265 4,349 04 3,395 4,167 6,007 4,631 3,931 4,033 4,086 4,204 4,152 05 4,792 5,248 7,561 5,493 4,690 4,783 4,799 4,809 4,839 06 370 476 637 471 423 403 383 488 512 07 1,604 1,792 2,801 2,058 1,761 1,888 1,897 2,034 2,134 08 1,099 1,186 1,777 1,290 1,220 1,168 1,226 1,291 1,279 09 2,830 3,334 4,891 3,557 3,034 3,007 3,019 2,995 3,152 10 1,903 2,243 3,248 2,321 2,153 2,042 2,003 2,191 2,358 11 18 19 25 13 12 10 7 6 1 Total 43,550 62,899 103,286 75,485 65,555 66,394 66,173 69,175 69,322

National Longitudinal Mortality Study – Analysis File: Work Force Variables
288
MAJOCC2000\counts: 0103 0203 0303 0403 0503 0603 0703 0803 0903 blank 38,127 38,684 88,494 86,935 93,167 70,382 69,812 67,302 69,381 01 6,006 6,290 9,282 8,917 9,204 8,934 8,951 8,910 9,268 02 9,023 9,212 12,391 12,621 13,198 12,345 12,938 12,754 13,224 03 5,026 4,961 11,394 11,331 12,077 11,440 11,378 11,248 11,444 04 4,634 4,663 7,555 7,390 7,634 7,275 7,076 6,900 6,888 05 5,495 5,396 9,447 8,854 9,216 8,645 8,415 8,306 8,126 06 483 467 550 572 670 578 581 551 510 07 2,538 2,554 4,292 4,064 4,576 4,457 4,436 4,085 3,904 08 1,428 1,429 2,355 2,234 2,486 2,268 2,208 2,120 2,186 09 3,422 3,172 4,655 4,421 4,871 4,219 4,141 3,983 3,664 10 2,751 2,686 3,982 3,956 4,144 3,907 3,798 3,882 4,018 11 4 8 8 14 14 13 8 14 16 Total 78,937 79,522 154,405 151,309 161,257 134,463 133,742 130,055 132,629 MAJOCC2000\counts: 1003 1103 blank 68,886 69,234 01 8,927 8,857 02 13,195 12,857 03 11,815 11,503 04 6,715 6,444 05 7,933 7,811 06 550 524 07 3,745 3,489 08 2,166 1,984 09 3,731 3,670 10 3,788 3,671 11 17 17 Total 131,468 130,061

National Longitudinal Mortality Study – Analysis File: Work Force Variables
289
70. Class of Worker CLASSWKR Extract File Return to Index EDITS: Simple, Recode For file: 7303 -- ==> missing value code For files: 8903–9103 -1 ==> missing value code For file: 8012 ^^ ==> missing value code For files: 0303–1103 01 ==> 05 02 ==> 05 03 ==> 05 04 ==> 04 05 ==> 04 06 ==> 12 07 ==> 12 08 ==> 14 NOT AVAILABLE: 8024 CODES for files: 7303-8014, 8008-1103 blank — Not in the universe, unknown 00 — Not in the labor force 01 — Agriculture, wage & salary 02 — Agriculture, self-employed 03 — Agriculture, unpaid family 04 — Non-agriculture, wage and salary, private household 05 — Non-agriculture, wage and salary, government Non-agriculture, Wage and Salary, Other Private Goods Producing Industries 06 — White collar occupations 07 — Blue collar occupations 08 — Service occupations Service Producing Industries 09 — White collar occupations 10 — Blue collar occupations 11 — Service occupations 12 — Non-agriculture, wage and salary, self-employed 13 — Non-agriculture, wage and salary, unpaid family 14 — No previous full time work experience, no pay

National Longitudinal Mortality Study – Analysis File: Work Force Variables
290
FREQUENCIES: CLASSWKR\counts: 7303 7802 7903 8014 8008 8012 8103 8203 8303 8403 blank 33,734 760 . 41,534 41,188 40,403 . . . . 00 41,151 37,948 21,258 55,447 52,401 53,121 31,925 40,854 40,320 40,070 01 760 698 15,669 1,457 1,708 1,266 21,283 28,983 29,103 29,126 02 1,129 812 724 1,788 2,006 1,667 985 1,346 1,306 1,401 03 273 113 788 348 459 252 1,183 1,516 1,607 1,605 04 1,348 1,033 2,049 1,276 1,529 1,254 2,528 3,436 3,421 3,372 05 8,885 9,060 387 14,419 13,613 13,711 651 879 1,023 946 06 4,328 4,407 1,687 6,860 6,701 6,466 2,630 3,526 3,610 3,544 07 11,896 10,787 241 15,742 16,007 14,646 322 431 379 262 08 301 282 295 390 399 347 297 509 512 406 09 13,357 14,472 . 22,938 23,139 22,766 . . . . 10 5,325 5,258 . 7,936 8,087 7,704 . . . . 11 4,277 4,606 . 7,833 7,979 7,283 . . . . 12 3,598 3,599 . 5,874 5,902 5,922 . . . . 13 371 264 . 325 330 296 . . . . 14 480 563 . 704 925 661 . . . . Total 131,213 94,662 43,098 184,871 182,373 177,765 61,804 81,480 81,281 80,732 CLASSWKR\counts: 8503 8509 8603 8703 8803 8903 9003 9103 9203 9303 blank . . . . . 13,166 14,035 14,879 . . 00 39,315 69,870 14,664 13,992 15,044 475 400 583 14,042 28,150 01 29,692 54,375 22,977 22,841 432 471 454 504 436 523 02 1,242 2,292 1,030 1,015 5 6 7 6 5 3 03 1,572 2,733 1,222 1,280 438 401 434 443 376 458 04 3,236 6,036 2,785 2,733 40 38 40 48 22 48 05 1,010 1,868 733 769 307 293 279 260 255 334 06 3,405 6,409 2,456 2,513 22,191 20,460 21,599 24,502 21,700 25,179 07 209 487 155 128 944 855 973 973 863 1,059 08 390 628 . . 1,257 1,189 1,313 1,546 1,268 1,468 09 . . . . 2,601 2,466 2,558 2,844 2,525 3,125 10 . . . . 2,148 2,029 2,127 2,375 2,011 2,471 11 . . . . 72 76 66 74 47 81 12 . . . . . . . . . . 13 . . . . . . . . . . 14 . . . . . . . . . . Total 80,071 144,698 46,022 45,271 45,479 41,925 44,285 49,037 43,550 62,899 CLASSWKR\counts: 9413 9503 9603 9703 9803 9903 0003 0103 0203 0303 blank . . . . . . . . . . 00 52,659 37,429 32,550 32,613 32,307 33,932 33,550 38,009 38,524 87,602 01 37,403 27,642 24,411 24,972 25,288 26,428 26,882 31,105 30,920 1,856 02 1,445 1,140 898 874 859 881 912 1,030 1,045 2,774 03 2,054 1,708 1,357 1,416 1,399 1,427 1,484 1,726 1,681 5,222 04 3,724 2,965 2,438 2,484 2,469 2,701 2,642 2,978 3,026 45,956 05 1,572 1,238 904 1,074 1,051 1,016 1,148 1,127 1,335 4,077 06 4,116 3,115 2,792 2,765 2,618 2,638 2,569 2,795 2,793 2,206 07 81 55 55 33 38 34 32 49 38 4,648 08 232 193 150 163 144 118 103 118 160 64 09 . . . . . . . . . . 10 . . . . . . . . . . 11 . . . . . . . . . . 12 . . . . . . . . . . 13 . . . . . . . . . . 14 . . . . . . . . . . Total 103,286 75,485 65,555 66,394 66,173 69,175 69,322 78,937 79,522 154,405

National Longitudinal Mortality Study – Analysis File: Work Force Variables
291
CLASSWKR\counts: 0403 0503 0603 0703 0803 0903 1003 1103 blank . . . . . . . . 00 86,437 92,011 69,588 68,915 66,735 68,803 68,277 68,569 01 1,659 1,857 1,675 1,672 1,721 1,679 1,885 1,876 02 2,864 3,093 2,873 3,015 2,856 2,873 2,985 2,907 03 4,965 5,286 4,607 4,734 4,717 4,761 4,632 4,291 04 44,416 47,189 44,730 44,241 43,348 43,660 43,076 42,147 05 4,089 4,215 4,057 4,125 3,920 4,145 4,234 4,062 06 2,211 2,455 2,238 2,344 2,278 2,302 2,175 2,028 07 4,620 5,081 4,645 4,620 4,420 4,371 4,151 4,124 08 48 70 50 76 60 35 53 57 09 . . . . . . . . 10 . . . . . . . . 11 . . . . . . . . 12 . . . . . . . . 13 . . . . . . . . 14 . . . . . . . . Total 151,309 161,257 134,463 133,742 130,055 132,629 131,468 130,061

National Longitudinal Mortality Study – Analysis File: Work Force Variables
292
71. Class of worker, Recode RCOW1 Extract File Return to Index EDITS: Invalid Entry, Recode For files: 7303, 7802, 8014, 8008, 8012 - ==> missing value code For files: 7303–0203 0 ==> missing value code For file: 8012 ^ ==> missing value code For file: 7303 1, 5 ==> 1 2, 6 ==> 2 3, 7 ==> 3 4, 8 ==> 4 For files: 7802–8014, 8008–1103 3, 4 ==> 2 5, 6 ==> 3 7 ==> 4 8 ==> 5
NOT AVAILABLE: 8024 CODES for files: 7303–8014, 8008–1103 blank — Not in universe, unknown 1 — Private industry 2 — Government 3 — Self-employed 4 — Worked without pay 5 — Never worked

National Longitudinal Mortality Study – Analysis File: Work Force Variables
293
FREQUENCIES: RCOW1\counts: 7303 7802 7903 8014 8008 8012 8103 8203 8303 8403 blank 75,365 35,224 21,258 91,642 89,127 88,927 31,925 40,854 40,320 40,070 1 41,580 42,948 15,669 66,303 66,810 63,148 21,283 28,983 29,103 29,126 2 8,897 9,567 3,561 15,081 14,288 14,371 4,696 6,298 6,334 6,378 3 4,727 5,598 2,074 9,816 9,995 9,714 3,281 4,405 4,633 4,490 4 644 651 241 1,062 1,139 866 322 431 379 262 5 . 674 295 967 1,014 739 297 509 512 406 Total 131,213 94,662 43,098 184,871 182,373 177,765 61,804 81,480 81,281 80,732 RCOW1\counts: 8503 8509 8603 8703 8803 8903 9003 9103 9203 9303 blank 39,315 69,870 14,664 13,992 14,884 13,500 14,405 15,462 13,896 28,342 1 29,692 54,375 22,977 22,841 22,114 20,424 21,494 24,401 21,628 24,873 2 6,050 11,061 5,037 5,028 4,807 4,516 4,835 5,369 4,661 5,627 3 4,415 8,277 3,189 3,282 3,385 3,230 3,301 3,683 3,146 3,927 4 209 487 155 128 112 114 106 122 69 129 5 390 628 . . 177 141 144 . 150 1 Total 80,071 144,698 46,022 45,271 45,479 41,925 44,285 49,037 43,550 62,899 RCOW1\counts: 9413 9503 9603 9703 9803 9903 0003 0103 0203 0303 blank 52,659 37,429 32,550 32,613 32,307 33,932 33,550 38,009 38,524 87,602 1 37,403 27,642 24,411 24,972 25,288 26,428 26,882 31,105 30,920 50,033 2 7,223 5,813 4,693 4,774 4,727 5,009 5,038 5,734 5,752 9,852 3 5,688 4,353 3,696 3,839 3,669 3,654 3,717 3,922 4,128 6,854 4 81 55 55 33 38 34 32 49 38 64 5 232 193 150 163 144 118 103 118 160 . Total 103,286 75,485 65,555 66,394 66,173 69,175 69,322 78,937 79,522 154,405 RCOW1\counts: 0403 0503 0603 0703 0803 0903 1003 1103 blank 86,437 92,011 69,588 68,915 66,735 68,803 68,277 68,569 1 48,505 51,404 48,787 48,366 47,268 47,805 47,310 46,209 2 9,488 10,236 9,155 9,421 9,294 9,313 9,502 9,074 3 6,831 7,536 6,883 6,964 6,698 6,673 6,326 6,152 4 48 70 50 76 60 35 53 57 5 . . . . . . . . Total 151,309 161,257 134,463 133,742 130,055 132,629 131,468 130,061

National Longitudinal Mortality Study – Analysis File: Other Demographic Variables
294
OTHER DEMOGRAPHIC VARIABLES
72. Veteran Status VTSTAT Extract File Return to Index EDITS: Simple, Invalid Entry For files: 7303–0203 0 ==> missing value code For files: 8012 ^ ==> missing value code NOT AVAILABLE: 8024 CODES for files: 7303–8014, 8008–1103 blank — Female or unknown, or age less than or equal to 13 1 — Vietnam era 2 — Korean War 3 — World War II 4 — World War I 5 — Other veteran 6 — Non-service 7 — Persian Gulf/Afghanistan Wars FREQUENCIES: VTSTAT\counts: 7303 7802 7903 8014 8008 8012 8103 8203 8303 8403 blank 84,967 51,365 27,784 117,992 116,029 112,900 39,163 51,694 51,380 51,266 1 3,983 4,209 1,433 6,511 6,205 6,330 2,131 2,701 2,734 2,709 2 3,151 2,615 833 3,754 3,750 3,605 1,306 1,582 1,521 1,555 3 7,542 6,154 1,916 8,670 8,492 8,234 2,816 3,534 3,333 3,246 4 727 302 91 411 323 304 129 116 110 58 5 2,450 2,398 826 3,777 3,822 3,851 1,340 1,772 1,830 1,768 6 28,393 27,619 10,215 43,756 43,752 42,541 14,919 20,081 20,373 20,130 7 . . . . . . . . . . Total 131,213 94,662 43,098 184,871 182,373 177,765 61,804 81,480 81,281 80,732 VTSTAT\counts: 8503 8509 8603 8703 8803 8903 9003 9103 9203 9303 blank 50,382 31,073 24,842 24,417 441 483 408 583 386 11,041 1 2,711 4,999 2,102 2,038 1,948 1,790 1,926 2,090 1,859 2,157 2 1,503 2,754 1,140 1,131 1,155 1,044 1,102 1,207 995 1,164 3 3,051 5,954 2,378 2,292 2,202 1,991 1,994 2,023 1,762 1,966 4 63 115 35 29 18 13 11 8 9 5 5 1,832 3,675 1,473 1,473 1,557 1,483 1,554 1,698 1,609 1,762 6 20,529 96,128 14,052 13,891 38,158 35,121 37,290 41,428 36,930 44,804 7 . . . . . . . . . . Total 80,071 144,698 46,022 45,271 45,479 41,925 44,285 49,037 43,550 62,899

National Longitudinal Mortality Study – Analysis File: Other Demographic Variables
295
VTSTAT\counts: 9413 9503 9603 9703 9803 9903 0003 0103 0203 0303 blank 26,690 18,011 15,706 15,553 15,775 16,548 16,429 18,542 18,592 59,140 1 2,765 2,229 1,777 1,880 1,899 1,918 1,810 2,136 2,216 2,900 2 1,311 1,055 937 913 828 867 856 931 915 977 3 2,289 1,936 1,557 1,509 1,360 1,304 1,185 1,239 1,158 1,213 4 9 4 1 2 . . . . . . 5 2,893 2,178 1,869 1,952 1,895 1,866 1,936 2,237 2,196 3,610 6 67,329 50,072 43,708 44,585 44,416 46,672 47,106 53,852 54,445 86,565 7 . . . . . . . . . . Total 103,286 75,485 65,555 66,394 66,173 69,175 69,322 78,937 79,522 154,405 VTSTAT\counts: 0403 0503 0603 0703 0803 0903 1003 1103 blank 58,578 61,431 43,612 42,956 40,960 41,689 40,708 40,298 1 2,798 2,834 3,924 3,929 3,720 3,763 3,459 3,493 2 929 1,037 1,612 1,532 1,394 1,448 1,292 1,299 3 1,050 1,166 929 813 703 653 572 480 4 . . 15 6 14 9 9 6 5 3,430 3,797 . . . . . . 6 84,524 90,992 82,784 82,786 81,573 83,405 83,603 82,596 7 . . 1,587 1,720 1,691 1,662 1,825 1,889 Total 151,309 161,257 134,463 133,742 130,055 132,629 131,468 130,061
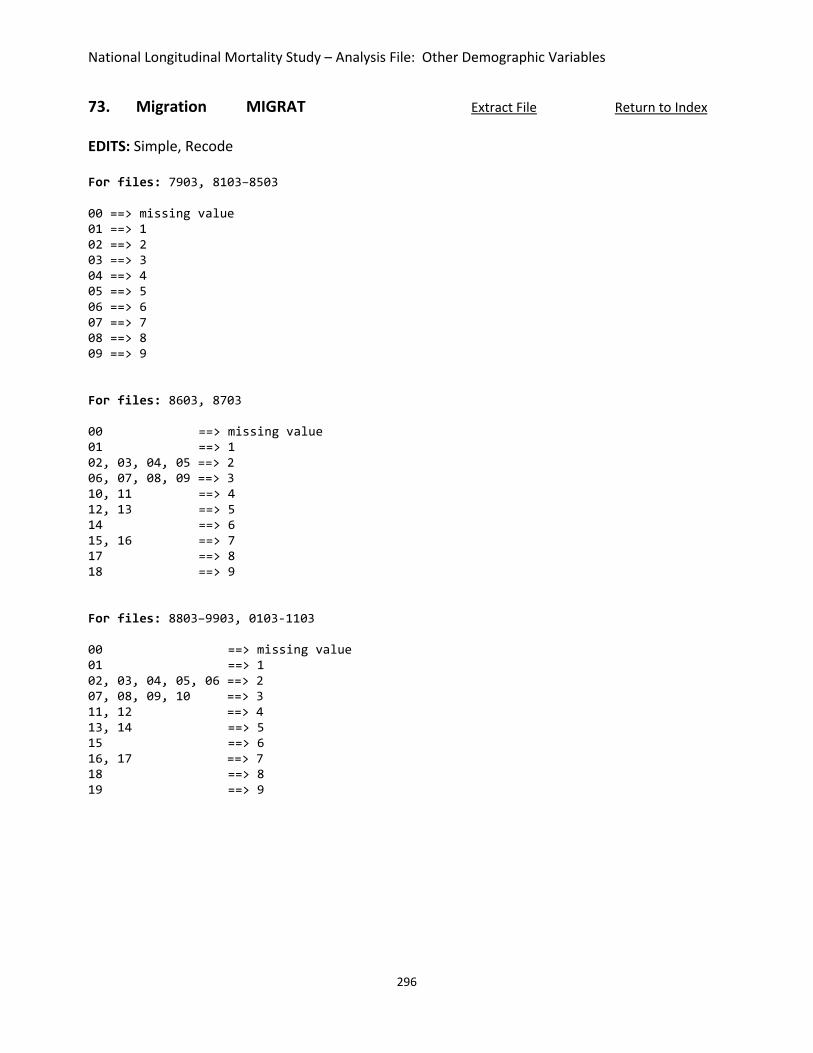
National Longitudinal Mortality Study – Analysis File: Other Demographic Variables
296
73. Migration MIGRAT Extract File Return to Index EDITS: Simple, Recode For files: 7903, 8103–8503 00 ==> missing value 01 ==> 1 02 ==> 2 03 ==> 3 04 ==> 4 05 ==> 5 06 ==> 6 07 ==> 7 08 ==> 8 09 ==> 9
For files: 8603, 8703 00 ==> missing value 01 ==> 1 02, 03, 04, 05 ==> 2 06, 07, 08, 09 ==> 3 10, 11 ==> 4 12, 13 ==> 5 14 ==> 6 15, 16 ==> 7 17 ==> 8 18 ==> 9 For files: 8803–9903, 0103-1103 00 ==> missing value 01 ==> 1 02, 03, 04, 05, 06 ==> 2 07, 08, 09, 10 ==> 3 11, 12 ==> 4 13, 14 ==> 5 15 ==> 6 16, 17 ==> 7 18 ==> 8 19 ==> 9

National Longitudinal Mortality Study – Analysis File: Other Demographic Variables
297
For file: 0003 0 ==> missing value 1 ==> 1 2 ==> 2 3 ==> 4 4 ==> 5 5 ==> 6 6 ==> 7 7 ==> 8 8, 9 ==> 9 blank ==> 9 NOT AVAILABLE: 7303, 7802, 8014-8012, 8509 CODES for files: 7903, 8103-8503, 8603-1103 blank — Missing 1 — Nonmovers 2 — Moved within an SMSA 3 — Moved between SMSAs 4 — Moved from a SMSA to a non SMSA 5 — Moved from a non SMSA to an SMSA 6 — Moved from a non SMSA to a non SMSA 7 — Moved from abroad to an SMSA 8 — Moved from abroad to a non SMSA 9 — Not in survey, children LE (file specific age) FREQUENCIES: MIGRAT\counts: 7903 8103 8203 8303 8403 8503 8603 8703 8803 8903 blank . . 1 . . . . . . . 1 23,076 50,038 66,797 66,704 65,972 42,880 38,358 37,739 38,150 35,220 2 7,449 4,309 5,500 5,468 5,722 12,383 3,679 3,639 3,730 3,320 3 2,317 1,253 1,624 1,552 1,620 4,468 1,398 1,382 1,175 1,100 4 1,438 756 1,013 880 863 2,502 417 341 368 343 5 892 665 741 696 777 1,946 438 522 330 302 6 4,340 3,446 4,116 4,341 4,048 8,327 1,590 1,526 1,580 1,470 7 645 274 290 242 291 1,123 129 110 115 147 8 61 64 87 121 96 220 13 12 31 23 9 2,880 999 1,311 1,277 1,343 6,222 . . . . Total 43,098 61,804 81,480 81,281 80,732 80,071 46,022 45,271 45,479 41,925 MIGRAT\counts: 9003 9103 9203 9303 9413 9503 9603 9703 9803 9903 blank . . . . . . . . . . 1 37,065 41,417 36,626 53,132 78,213 39,299 54,300 55,077 55,118 57,947 2 3,499 3,835 3,619 4,692 12,153 15,247 5,546 5,695 5,302 5,501 3 1,263 1,287 1,059 1,365 3,508 5,971 1,804 1,656 1,684 2,001 4 365 435 370 496 1,223 1,759 547 524 555 479 5 375 328 322 355 922 1,332 366 387 445 417 6 1,525 1,511 1,405 2,003 4,290 4,428 1,642 1,768 1,815 1,524 7 167 197 132 192 611 1,447 324 281 285 337 8 26 27 17 35 110 141 42 38 35 30 9 . . . 629 2,256 5,861 984 968 934 939 Total 44,285 49,037 43,550 62,899 103,286 75,485 65,555 66,394 66,173 69,175

National Longitudinal Mortality Study – Analysis File: Other Demographic Variables
298
MIGRAT\counts: 0003 0103 0203 0303 0403 0503 0603 0703 0803 0903 blank . . . 22,184 22,047 23,959 6,620 6,764 5,485 5,525 1 55,511 67,923 67,733 108,306 107,193 114,866 106,240 106,458 106,529 108,322 2 6,728 4,821 5,304 11,040 10,301 10,851 11,622 11,145 9,675 10,481 3 . 1,739 1,883 3,842 3,760 3,780 3,088 2,536 2,290 2,267 4 517 445 566 1,087 1,076 1,027 852 826 647 646 5 372 785 828 1,676 985 907 738 696 585 563 6 1,438 1,701 1,806 3,626 3,289 2,946 2,748 2,782 2,317 2,301 7 389 398 315 540 569 739 541 510 498 490 8 39 50 36 92 80 94 74 50 57 46 9 4,328 1,075 1,051 2,012 2,009 2,088 1,940 1,975 1,972 1,988 Total 69,322 78,937 79,522 154,405 151,309 161,257 134,463 133,742 130,055 132,629 MIGRAT\counts: 1003 1103 blank 5,539 6,047 1 106,701 106,413 2 11,050 9,754 3 2,150 2,186 4 581 599 5 643 528 6 2,463 2,320 7 422 466 8 27 28 9 1,892 1,720 Total 131,468 130,061

National Longitudinal Mortality Study – Analysis File: Family Income and Poverty Variables
299
FAMILY INCOME AND POVERTY VARIABLES
74. Adjusted Income FMINC80 Extract File Return to Index EDITS: Simple, Recode For files: 7303–0203 - ==> 0, negative income level 9 ==> missing value code NOT AVAILABLE: 8024 CODES for files: 7303–8014, 8008–1103 blank — Unknown or missing income 0 — Negative income 1 — $ 0 – $ 4,999 2 — $ 5,000 – $ 9,999 3 — $10,000 – $14,999 4 — $15,000 – $19,999 5 — $20,000 – $24,999 6 — $25,000 – $49,999 7 — $50,000 plus FREQUENCIES: FMINC80\counts: 7303 7802 7903 8014 8008 8012 8103 8203 8303 8403 blank 2 8,385 2 13,476 16,265 15,303 . 2 2 8 0 263 . . . . . . . . . 1 8,480 8,437 3,187 17,508 17,667 16,524 5,171 7,505 7,945 8,474 2 14,616 13,132 5,655 26,916 26,768 26,864 8,114 11,785 11,716 11,411 3 16,197 15,512 6,025 29,972 30,503 30,154 8,599 11,782 12,011 11,472 4 18,647 10,920 5,654 26,024 24,670 23,545 8,383 11,416 11,565 11,016 5 18,382 13,762 5,543 25,649 25,069 23,829 8,161 10,017 10,392 9,727 6 45,302 22,637 14,144 38,448 34,622 34,730 19,362 24,178 22,496 23,258 7 9,324 1,877 2,888 6,878 6,809 6,816 4,014 4,795 5,154 5,366 Total 131,213 94,662 43,098 184,871 182,373 177,765 61,804 81,480 81,281 80,732 FMINC80\counts: 8503 8509 8603 8703 8803 8903 9003 9103 9203 9303 blank 5 7,312 1 9 6 7 4 5 5 31 0 . . 139 121 62 88 45 69 53 92 1 7,268 19,826 4,295 4,114 3,994 3,745 3,878 4,198 4,077 6,477 2 10,738 17,621 6,270 5,859 5,674 5,593 5,839 6,476 6,065 8,551 3 10,561 24,056 6,198 5,817 6,215 5,543 5,741 6,522 6,171 8,439 4 10,367 14,788 5,918 5,601 5,840 5,184 5,550 6,212 5,729 7,611 5 9,346 25,097 5,506 5,270 5,233 4,839 5,097 5,622 4,777 7,022 6 25,145 31,362 14,084 14,311 14,326 12,897 13,843 15,165 12,909 19,053 7 6,641 4,636 3,611 4,169 4,129 4,029 4,288 4,768 3,764 5,623 Total 80,071 144,698 46,022 45,271 45,479 41,925 44,285 49,037 43,550 62,899
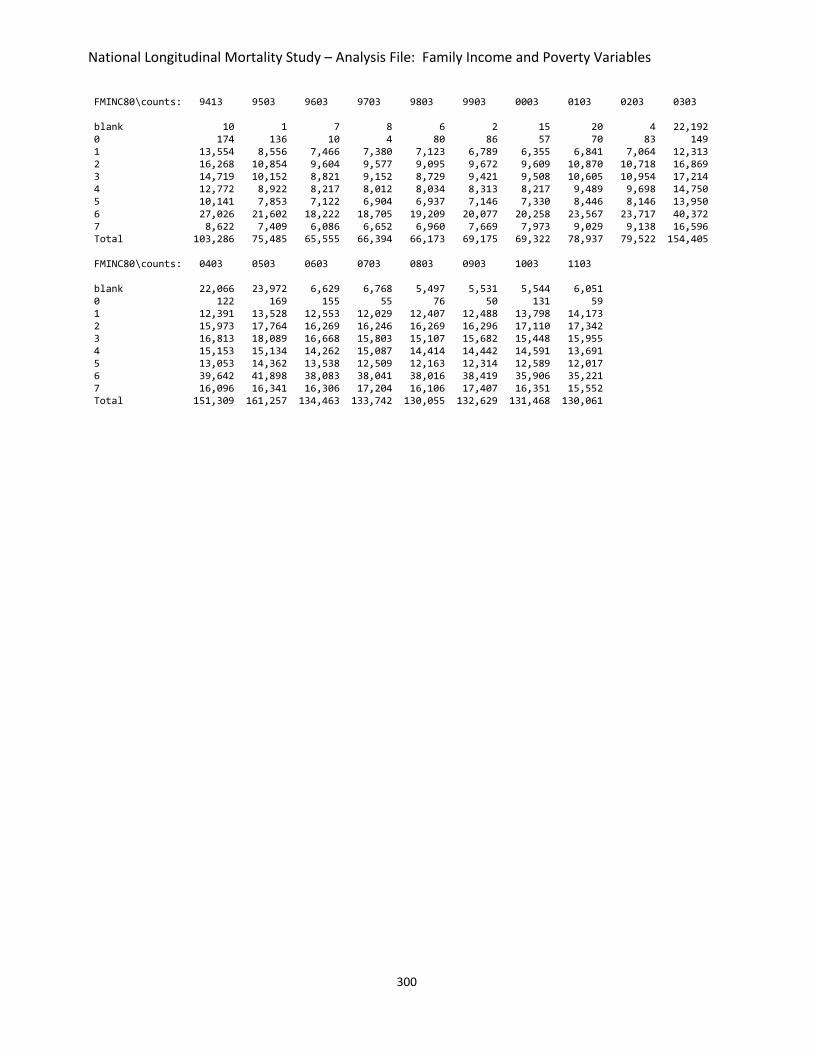
National Longitudinal Mortality Study – Analysis File: Family Income and Poverty Variables
300
FMINC80\counts: 9413 9503 9603 9703 9803 9903 0003 0103 0203 0303 blank 10 1 7 8 6 2 15 20 4 22,192 0 174 136 10 4 80 86 57 70 83 149 1 13,554 8,556 7,466 7,380 7,123 6,789 6,355 6,841 7,064 12,313 2 16,268 10,854 9,604 9,577 9,095 9,672 9,609 10,870 10,718 16,869 3 14,719 10,152 8,821 9,152 8,729 9,421 9,508 10,605 10,954 17,214 4 12,772 8,922 8,217 8,012 8,034 8,313 8,217 9,489 9,698 14,750 5 10,141 7,853 7,122 6,904 6,937 7,146 7,330 8,446 8,146 13,950 6 27,026 21,602 18,222 18,705 19,209 20,077 20,258 23,567 23,717 40,372 7 8,622 7,409 6,086 6,652 6,960 7,669 7,973 9,029 9,138 16,596 Total 103,286 75,485 65,555 66,394 66,173 69,175 69,322 78,937 79,522 154,405 FMINC80\counts: 0403 0503 0603 0703 0803 0903 1003 1103 blank 22,066 23,972 6,629 6,768 5,497 5,531 5,544 6,051 0 122 169 155 55 76 50 131 59 1 12,391 13,528 12,553 12,029 12,407 12,488 13,798 14,173 2 15,973 17,764 16,269 16,246 16,269 16,296 17,110 17,342 3 16,813 18,089 16,668 15,803 15,107 15,682 15,448 15,955 4 15,153 15,134 14,262 15,087 14,414 14,442 14,591 13,691 5 13,053 14,362 13,538 12,509 12,163 12,314 12,589 12,017 6 39,642 41,898 38,083 38,041 38,016 38,419 35,906 35,221 7 16,096 16,341 16,306 17,204 16,106 17,407 16,351 15,552 Total 151,309 161,257 134,463 133,742 130,055 132,629 131,468 130,061

National Longitudinal Mortality Study – Analysis File: Family Income and Poverty Variables
301
75. Family Income in Dollars FMINCOME Return to Index EDITS: None 76. Family Income Category FMINC90 Extract File EDITS: Simple For files: 7303–0203 00 ==> missing value code

National Longitudinal Mortality Study – Analysis File: Family Income and Poverty Variables
302
77. Family Income Category FINC8090 Extract File Return to Index EDITS: Invalid Entry, Recode For files: 7303–0203 - ==> 0 negative income value code 9 ==> missing value code NOT AVAILABLE: 8024 CODES for files: 7303-8014, 8008-1103 blank — Unknown or missing income 0 — Negative Income 1 — $ 0 – $ 7,999 2 — $ 8,000 – $15,999 3 — $16,000 – $23,999 4 — $24,000 – $31,999 5 — $32,000 – $39,999 6 — $40,000 – $79,999 7 — $80,000 plus FREQUENCIES: FINC8090\counts: 7303 7802 7903 8014 8008 8012 8103 8203 8303 8403 blank . 8,385 . 13,476 16,265 15,303 5 21 1 . 0 263 . . . . . . . . . 1 8,561 8,437 3,211 17,508 17,667 16,524 5,336 7,587 8,042 8,586 2 14,838 13,132 5,707 26,916 26,768 26,864 8,344 11,876 11,833 11,479 3 16,182 15,512 6,040 29,972 30,503 30,154 8,759 11,895 12,036 11,571 4 19,075 10,920 5,692 26,024 24,670 23,545 8,374 11,465 11,714 10,996 5 18,250 13,762 5,582 25,649 25,069 23,829 8,256 10,002 10,343 9,860 6 44,983 22,637 14,042 38,448 34,622 34,730 18,880 23,982 22,307 23,040 7 9,061 1,877 2,824 6,878 6,809 6,816 3,850 4,652 5,005 5,200 Total 131,213 94,662 43,098 184,871 182,373 177,765 61,804 81,480 81,281 80,732 FINC8090\counts: 8503 8509 8603 8703 8803 8903 9003 9103 9203 9303 blank 7 7,312 2 . 3 3 1 . 1 4 0 . . 139 121 62 88 45 69 53 92 1 7,356 19,826 4,359 4,158 4,037 3,810 3,918 4,237 4,119 6,526 2 10,807 17,621 6,320 5,907 5,708 5,617 5,902 6,515 6,121 8,623 3 10,714 24,056 6,217 6,009 6,243 5,575 5,736 6,566 6,352 8,493 4 10,333 14,788 5,994 5,483 5,878 5,185 5,596 6,212 5,604 7,661 5 9,491 25,097 5,538 5,326 5,275 4,954 5,108 5,686 4,802 7,004 6 24,894 31,362 13,953 14,189 14,242 12,738 13,787 15,107 12,814 18,987 7 6,469 4,636 3,500 4,078 4,031 3,955 4,192 4,645 3,684 5,509 Total 80,071 144,698 46,022 45,271 45,479 41,925 44,285 49,037 43,550 62,899

National Longitudinal Mortality Study – Analysis File: Family Income and Poverty Variables
303
FINC8090\counts: 9413 9503 9603 9703 9803 9903 0003 0103 0203 0303 blank 5 3 6 17 7 4 15 20 . 22,185 0 174 136 10 4 80 86 57 70 83 149 1 13,716 8,763 7,528 7,470 7,163 6,868 6,423 6,937 7,208 12,402 2 16,300 11,035 9,686 9,626 9,187 9,683 9,814 10,951 10,954 17,007 3 14,823 10,118 9,006 9,272 8,786 9,516 9,419 10,675 10,926 17,332 4 12,817 8,958 8,081 7,934 8,092 8,293 8,478 9,653 9,614 15,329 5 10,291 7,956 7,172 6,961 6,986 7,243 7,111 8,464 8,329 13,662 6 26,722 21,304 18,152 18,611 19,053 19,984 20,237 23,322 23,484 40,049 7 8,438 7,212 5,914 6,499 6,819 7,498 7,768 8,845 8,924 16,290 Total 103,286 75,485 65,555 66,394 66,173 69,175 69,322 78,937 79,522 154,405 FINC8090\counts: 0403 0503 0603 0703 0803 0903 1003 1103 blank 22,049 23,963 6,629 6,765 5,492 5,527 5,544 6,056 0 122 169 155 55 76 50 131 59 1 12,543 13,617 12,664 12,138 12,574 12,580 13,862 14,272 2 16,409 17,861 16,366 16,320 16,258 16,374 17,268 17,471 3 16,452 18,169 16,981 16,161 15,294 15,736 16,401 16,134 4 15,530 15,265 14,277 14,992 14,380 14,583 13,973 14,039 5 12,853 14,345 13,401 12,506 12,228 12,364 12,445 11,621 6 39,634 41,828 38,040 37,897 37,946 38,391 35,772 35,175 7 15,717 16,040 15,950 16,908 15,807 17,024 16,072 15,234 Total 151,309 161,257 134,463 133,742 130,055 132,629 131,468 130,061

National Longitudinal Mortality Study – Analysis File: Family Income and Poverty Variables
304
78. Adjusted Income in 1990 Dollars DOLINC90 Return to Index EDITS: None 79. Percent of Poverty Level POVPCT90 Extract File EDITS: Simple For files: 7303–0203 00 ==> missing value code

National Longitudinal Mortality Study – Analysis File: Household Characteristics Variables
305
HOUSEHOLD CHARACTERISTIC VARIABLES 80. Number in Household HHNUM Extract File Return to Index EDITS: Simple For files: 7303, 8014, 8008, 8012 Single digit household sizes 10's digit zero-filled. For files: 8024, 8203 00 ==> missing value code

National Longitudinal Mortality Study – Analysis File: Household Characteristics Variables
306
81. Type of Living Quarters LIVTYP Extract File Return to Index EDITS: Invalid Entry, Recode For file: 8509 ^- ==> missing value code For file: 7303 05, 06 ==> 05 07 ==> 06 17 ==> 10 For files: 8803-0203 05, 06 ==> 05 07 ==> 06 08 ==> 07 09 ==> 08 10 ==> 09 11, 12 ==> 10 NOT AVAILABLE: 8024 CODES for files: 7303–8014, 8008–1103 blank — Unknown 01 — House, apartment, flat 02 — HU in non-transient hotel, etc. 03 — HU, permanent in transient hotel, motel, etc. 04 — HU in rooming house 05 — Mobile home or trailer 06 — HU not specified above 07 — Quarters not HU in rooming or boarding house 08 — Unit not permanent in transient hotel, motel, etc. 09 — Tent or trailer site 10 — Other not HU FREQUENCIES: LIVTYP\counts: 7303 7802 7903 8014 8008 8012 8103 8203 8303 8403 blank 1,032 2,624 . 6,446 5,776 4,253 . 1 . . 01 125,642 88,134 41,364 169,292 167,810 163,962 58,673 77,145 76,654 76,571 02 96 66 39 124 109 95 58 42 64 36 03 85 39 29 66 73 70 23 28 34 47 04 123 50 29 49 74 87 29 55 31 48 05 3,948 3,572 1,603 8,599 8,324 9,009 2,929 4,106 4,362 3,937 06 168 29 10 60 68 50 10 32 20 28 07 . 23 2 46 35 19 6 3 14 12 08 . 6 . . . 9 . 1 4 8 09 . 1 . 2 2 6 . . 5 . 10 119 118 22 187 102 205 76 67 93 45 Total 131,213 94,662 43,098 184,871 182,373 177,765 61,804 81,480 81,281 80,732

National Longitudinal Mortality Study – Analysis File: Household Characteristics Variables
307
LIVTYP\counts: 8503 8509 8603 8703 8803 8903 9003 9103 9203 9303 blank . 1 . . . . . . . . 01 75,399 136,238 43,602 42,553 42,907 39,248 41,637 46,183 40,945 59,105 02 28 98 10 23 34 21 18 31 11 11 03 15 36 11 11 18 21 20 4 10 14 04 24 51 26 9 26 21 35 22 34 15 05 4,452 8,054 2,282 2,570 2,394 2,546 2,476 2,726 2,462 3,662 06 36 24 6 26 25 13 23 4 12 18 07 24 30 36 34 8 4 . 7 11 4 08 1 12 3 . . . 1 2 4 . 09 . 7 . . 1 2 1 . . 7 10 92 147 46 45 66 49 74 58 61 63 Total 80,071 144,698 46,022 45,271 45,479 41,925 44,285 49,037 43,550 62,899 LIVTYP\counts: 9413 9503 9603 9703 9803 9903 0003 0103 0203 0303 blank . . . . . . . . . 22,184 01 97,390 71,047 61,425 62,224 62,201 65,232 65,319 74,718 74,981 125,369 02 31 52 55 59 56 47 43 51 35 110 03 28 9 52 10 5 6 8 6 11 22 04 59 33 21 30 25 22 32 27 25 13 05 5,632 4,303 3,928 4,015 3,847 3,792 3,883 4,078 4,391 6,631 06 23 21 41 48 18 48 9 21 22 28 07 22 1 . . 2 6 6 . 5 . 08 9 1 . . . . . 2 . . 09 3 . . . 2 3 . . 2 . 10 89 18 33 8 17 19 22 34 50 48 Total 103,286 75,485 65,555 66,394 66,173 69,175 69,322 78,937 79,522 154,405 LIVTYP\counts: 0403 0503 0603 0703 0803 0903 1003 1103 blank 22,047 23,959 6,620 6,764 5,485 5,525 5,539 6,047 01 122,661 130,063 121,275 120,304 118,447 120,835 119,764 118,321 02 80 93 94 47 60 72 57 74 03 9 16 23 25 25 24 44 7 04 43 29 18 31 30 26 14 17 05 6,277 6,967 6,336 6,425 5,939 6,071 5,968 5,533 06 95 60 39 47 18 29 29 19 07 2 6 . 5 2 3 . 1 08 10 . . . . 3 4 1 09 . . . 23 2 . 1 5 10 85 64 58 71 47 41 48 36 Total 151,309 161,257 134,463 133,742 130,055 132,629 131,468 130,061

National Longitudinal Mortality Study – Analysis File: Household Characteristics Variables
308
82. House Owned or Rented RENTER Extract File Return to Index EDITS: Simple For files: 7303-8014, 8008-8509 0 ==> missing value code

National Longitudinal Mortality Study – Analysis File: Health Insurance and Health Status Variables
309
HEALTH INSURANCE AND HEALTH STATUS VARIABLES
83. Health Insurance Status HISTATUS Return to Index EDITS: None 84. Health Insurance Type HITYPE EDITS: None 85. General Health HEALTH EDITS: None

National Longitudinal Mortality Study – Analysis File: Tobacco Use Variables
310
TOBACCO USE VARIABLES 86. Smoked More than 100 Cigarettes SMOK100 Return to Index EDITS: None 87. Age Started Smoking AGESMK EDITS: None 88. Smoking Frequency SMOKER EDITS: None 89. Average Cigarettes Daily AVNMCIGS EDITS: None 90. Smoking Follow-up Start (File) SMKFLSTR EDITS: None 91. Smoking Follow-up Start Date SMKSTART EDITS: None

National Longitudinal Mortality Study – Analysis File: Tobacco Use Variables
311
92. Cigarette Smoking Status SMOKSTAT Extract File Return to Index EDITS: Simple, Invalid Entry For files: 9203, 9303, 9503, 9603, 9803-1103 -9, -1, 9 ==> missing value code 93. Rules for Smoking Cigarettes in the Home SMOKHOME Extract File
EDITS: Simple, Invalid Entry For files: 9203, 9303, 9503, 9603, 9803-1103 blank, -9, -3, -2, -1, 0, 9 ==> missing value code 94. Ever Used Tobacco EVERUSE EDITS: None 95. Currently Use Tobacco CURRUSE EDITS: None

National Longitudinal Mortality Study – Analysis File: Death Certificate Information Variables
312
DEATH CERTIFICATE INFORMATION VARIABLES 96. Death Certificate Number DCNUM Return to Index EDITS: None 97. State of Death SOD EDITS: None 98. Date of Death DOD EDITS: None 99. ICD-9 & ICD-10 Underlying Cause of Death UCAUSE Extract File EDITS: Simple For persons alive the blank or missing code has been recoded to '0000' to accommodate the LPS system. AVAILABLE FILES: 7303–1103 CODES: Blank ==> '0000' 100. First 3 Characters of Underlying Cause CAUSE3 Extract File Return to Analysis File Introduction EDITS: None DESCRIPTION: A three-character variable that is an extract of the first three characters of the variable UCAUSE. NOTE: In order to agree with developed software, persons alive have CAUSE3 = '000'.

National Longitudinal Mortality Study – Analysis File: Death Certificate Information Variables
313
101. 113 Selected Causes of Death CAUSE113 Extract File Return to Index Return to Analysis File Introduction EDITS: None DESCRIPTION: In 1992 the CDC’s National Center for Health Statistics published a standardized list of 113 selected causes of death, for the general analysis of mortality statistics and for ranking leading causes of death. For NLMS purposes, both ICD-9 and ICD-10 underlying cause codes have been assigned to the CAUSE113 coding. See Appendix I. 102. Hospital Type HOSP EDITS: None 103. Did Death Occur in a Hospital HOSPD EDITS: None 104. Time from Onset to Cause of Death INTERV EDITS: None

National Longitudinal Mortality Study – Analysis File: Case Weight Variables
314
CASE WEIGHT VARIABLESS
105. Weight—Race Variable Used WGT1 Return to Index EDITS: None 106. Weight—Race Used, EOFT Included WGT2 EDITS: None 107. Weight—Race Not Used WGT3 EDITS: None 108. Weight—Race Not Used, EOTF Included WGT4 EDITS: None

National Longitudinal Mortality Study – Appendices
315
APPENDICES Return to Main TOC
A. September 1985 Health and Tobacco Use File
B. State Concatenated Codes
C. SMSA Rank
D. United Nations Codes for Countries and Areas
E. 1990 Industrial Classification System
F. 2007 Industrial Classification System
G. 1990 Occupational Classification System
H. 2000 Occupational Classification System
I. CDC 113 Causes of Death from ICD-10

National Longitudinal Mortality Study – Appendix A: Sept 1985 Health and Tobacco Use File
316
Appendix A September 1985 Health and Tobacco Use File
Return to Appendix TOC Return to Main TOC Return to Introduction
September 1985 Health and Tobacco Use Variables DESCRIPTION VARIABLE NAME
Diabetes DIABET
Chronic Kidney Disease KIDNEY
Asthma/Bronchitis ASTHMA
Chronic Heart Disease HRTCND
Influenza Vaccine INFVAC
Pneumonia Vaccine PNUVAC
Pneumonia Vaccine in Past 12 Months PNU12
Polio Vaccine by Mouth POLVAC
Times Polio Vaccine taken by Mouth NPLVAC Times Polio Vaccine taken by Mouth in Past 12 Months NPOL12
DPT Shots DPTSHT
Number of DPT Shots NDPSHT
Red Measles in Past 12 Months RME12
Red Measles Shots RMESHT
Red Measles Shots in Past 12 Months RMES12
Three Day Measles in Past 12 Months ME312
Three Day Measles Shots ME3SHT
Three Day Measles Shots in Past 12 Months ME3S12
Chicken Pox in Past 12 Months CPX12
Mumps Shots MUMSHT
Mumps Shots in Past 12 Months MUMS12
Age Check Item For Children AGECK0
Day Care DAYCAR
Age Check Item For Adults AGECK1
Smoked at least 100 Cigarettes SMK10085
Age First Smoked AGESMK85
Never Smoked Regularly SMKCAT
Smoke Cigarettes Now SMKNOW
Use Other Forms of Tobacco OTHTOB
Used Snuff SNUFF
Used Chewing Tobacco CHEWTB
Smoke Cigars CIGARS
Smoke Pipe PIPETB
Use Other Forms of Tobacco OTHFRM
Who Gives Information INTVCK
Age Check for Persons 0-19 AGECK2
Immunization Record IMMREC
Who Answered Supplement SUPRES

National Longitudinal Mortality Study – Appendix A: Sept 1985 Health and Tobacco Use File
317
NOTE: The variables listed below are for the September 1985 (8509) cohort ONLY. Diabetes DIABET DESCRIPTION: For persons 14+, is the response to the question, "Does ... have diabetes?" Codes/Counts: 8509 1 - Yes 3,296 2 - No 104,870 3 - Don't know 113 9 - Not answered 5,683 blank - Missing, children < 13 30,736
Chronic Kidney Disease KIDNEY DESCRIPTION: For persons 14+, is the response to the question, "Does ... have chronic kidney disease?" Codes/Counts: 8509 1 - Yes 899 2 - No 106,768 3 - Don't know 118 9 - Not answered 6,177 blank - Missing, children < 13 30,736
Asthma/Bronchitis ASTHMA DESCRIPTION: For persons 14+, is the response to the question, "Does ... have asthma, emphysema, tuberculosis or chronic bronchitis?" Codes/Counts: 8509 1 - Yes 5,604 2 - No 102,388 3 - Don't know 120 9, - Not answered 5,850 blank - Missing, children < 13 30,736
Chronic Heart Condition HRTCND DESCRIPTION: For persons 14+, is the-response to the question, "Has...ever been told by a doctor that he/she had a chronic heart condition such as a heart attack, a rheumatic heart condition, high blood pressure or hardening of the arteries?" Codes/Counts: 8509 1 - Yes 16,186 2 - No 91,823 3 - Don't know 164 9 - Not answered 5,789 blank - Missing, children < 13 30,736

National Longitudinal Mortality Study – Appendix A: Sept 1985 Health and Tobacco Use File
318
Had Influenza Vaccine INFVAC DESCRIPTION: For all persons in sample, is the response to the question, "Has ... had influenza vaccine in period from September 1, 1984 to August 31, 1985?" Codes/Counts: 8509 1 - Yes 9,399 2 - No 126,210 3 - Don't know 1,794 9 - Not answered 7,295
Pneumonia Vaccine PNUVAC DESCRIPTION: For all persons in the sample, is the response to the question, "Has ... received pneumonia vaccine?" Codes/Counts: 8509 1 - Yes 5,370 2 - No 127,713 3 - Don't know 3,790 9 - Not answered 7,465
Pneumonia Vaccine Latest 12 Months PNU12 DESCRIPTION: For all persons who responded with "yes" to question 73, is the response to the question, "Did ... receive the pneumonia vaccine between September 1, 1984 and August 31, 1985?" Codes/Counts: 8509 1 - Yes 1,476 2 - No 3,492 3 - Don't know 110 9 - Not answered 8,117 bl- Missing, adults ages 20+ 131,503 Did not answer "yes" to question 73
Polio Vaccine by Mouth POLVAC DESCRIPTION: For all children and for adults ages 14-19, is the response to the question, "Has ... ever taken polio vaccine by mouth?" Codes/Counts: 8509 1 - Yes 38,005 2 - No 2,724 3 - Don't know 1,063 9 - Not answered 2,392

National Longitudinal Mortality Study – Appendix A: Sept 1985 Health and Tobacco Use File
319
Times Polio Vaccine by Mouth NPLVAC DESCRIPTION: For all children and for adults ages 14-19 who answered "yes" to question 75, is the response to the question, "How many times has… taken Polio vaccine by mouth?" Codes/Counts: 8509 1 - One time 2,227 2 - Two times 3,671 3 - Three times 8,593 4 - Four or more times 19,134 5 - Don't know 4,181 9 - Not answered 199 bl- Missing, adults ages 20+ 106,693 Did not answer "yes" to question 75
Times Polio Vaccine Past 12 Months NPOL12 DESCRIPTION: For all children and for adults ages 14-19 who answered "yes" to question 75, is the response to the question, "How many times has ... taken Polio vaccine by mouth in the past 12 months?" Codes/Counts: 8509 1 - None 28,985 2 - one time 5,559 3 - Two times 1,307 4 - Three times 630 5 - Four or more times 142 6 - Don't know 1,180 9 - Not answered 202 bl- missing, adults ages 20+ 106,693 Did not answer "yes" to question 75
DTP Shots DTPSHT DESCRIPTION: For all children and for adults ages 14-19, is the response to the question, "Has ... ever had any shots against diphtheria, tetanus and whooping cough, that is DTP?" Codes/Counts: 8509 1 - Yes 39,882 2 - No 1,331 3 - Don't know 525 9 - Not answered 2,446 bl- missing, adults ages 20+ 100,514

National Longitudinal Mortality Study – Appendix A: Sept 1985 Health and Tobacco Use File
320
Number of DTP Shots NDPSHT DESCRIPTION: For all children and for adults ages 14-19 who answered "yes" to question 78, is the response to the question, "How many DTP shots has ... ever had?" Codes/Counts: 8509 1-one shot 1,603 2-Two shots 2,461 3-Three shots 6,673 4-Four shots 10,154 5-Five or more shots 13,527 6-Don't know 5,286 9-Not answered 178 bl- Missing, adults ages 20+ 104,816 Did not answer "yes" to question 78
Red Measles RME12 DESCRIPTION: For all children and adults ages 14-19, is the response to the question, "Has ... had the Red Measles, also known as the eight day measles, in the past 12 months?" Codes/Counts: 8509 1 - Yes 1,014 2 - No 40,305 3 - Don't know 406 9 - Not answered 2,459 bl- missing, adults ages 20+ 100,514
Red Measles Shots RMESHT DESCRIPTION: For all children and adults ages 14-19, is the response to the question, "Has ... ever had an injection or shot against the Red Measles?" Codes/Counts: 8509 1 - Yes 28,047 2 - No 9,996 3 - Don't know 3,682 9 - Not answered 2,459 bl- missing, adults ages 20+ 100,514
Red Measles Shots in Past 12 Months RMES12 DESCRIPTION: For all children and for adults ages 14-19 who answered "yes" to question 81, is the response to the question, "Has ... had Red Measles shots in the past 12 months?" Codes/Counts: 8509 1 - Yes 3,137 2 - No 24,307 3 - Don't know 407 9 - Not answered 196 bl- missing, adults ages 20+ 116,651 Did not answer "yes" to question 81

National Longitudinal Mortality Study – Appendix A: Sept 1985 Health and Tobacco Use File
321
Three-day Measles Past 12 Months ME312 DESCRIPTION: For all children and for adults ages 14-19 is the response to the question, "Has ... had the Three-day Measles, also known as Rubella or German measles, in the past 12 months?" Codes/Counts: 8509 1 - Yes 1,517 2 - No 39,692 3 - Don't know 492 9 - Not answered 2,483 bl- missing, adults ages 20+ 100,514
Three-day Measles Shots ME3SHT DESCRIPTION: For all children and for all adults ages 14-19, is the response to the question, "Has ... had Three-day Measles shots?" Codes/Counts: 8509 1 Yes 23,271 2 No 9,630 3 Don't know 3,790 9 Not answered 2,493 bl- missing, adults ages 20+ 100,514
Three-day Measles Shots Past 12 Months ME3S12 DESCRIPTION: For all children and for adults ages 14-19 who answered "yes" to question 84, is the response to the question, "Has ... had Three-day Measles shots in the past 12 months?" Codes/Counts: 8509 1 - Yes 3,097 2 - No 24,587 3 - Don't know 398 9 - Not answered 189 bl- missing, adults ages 20+ 116,427 Did not answer "yes" to question 84
Chicken Pox Past 12 Months CPX12 DESCRIPTION: For all children and for adults ages 14-19, is the response to the question, "Has ... had Chicken Pox in the past 12 months, the period from September 1, 1984 to August 31, 1985?" Codes/Counts: 8509 1 - Yes 2,797 2 - No 38,652 3 - Don't know 201 9 - Not answered 2,534 bl- missing, adults ages 20+ 100,514

National Longitudinal Mortality Study – Appendix A: Sept 1985 Health and Tobacco Use File
322
Mumps Shots MUMSHT DESCRIPTION: For all children and for adults ages 14-19, is the response to the question, "Has ... had an injection or shots against the Mumps?" Codes/Counts: 8509 1 - Yes 27,988 2 - No 10,230 3 - Don't know 3,450 9 - Not answered 2,516 bl- missing, adults ages 20+ 100,514
Mumps Shot Past 12 Months MUMS12 DESCRIPTION: For all children and for adults ages 14-19 who answered "yes" to question 87, is the response to the question, "Has ... had Mumps shots in the past 12 months?" Codes/Counts: 8509 1 - Yes 3,071 2 - No 24,314 3 - Don't know 383 9 - Not answered 220 bl- missing, adults ages 20+ 116,710
Age Check Item for Children AGECKO DESCRIPTION: For all children ages 0-13, is an indicator of one of two age groups. Codes/Counts: 8509 1 - Ages 0 - 5 13,861 2 - Ages 6 - 13 16,875 bl- missing, ages 14+ 113,962
Day Care DAYCAR DESCRIPTION: For all children ages 0-13, is the response to the question, "Was ... enrolled in a licensed day care program from September 1, 1984 to August 31, 1985?" Codes/Counts: 8509 1 - Yes 2,859 2 - No 10,186 3 - Don't know 15 9 - Not answered 801 bl- missing, ages 14+ 130,837

National Longitudinal Mortality Study – Appendix A: Sept 1985 Health and Tobacco Use File
323
Age Check Item for Adults AGECK1 DESCRIPTION: For all adults ages 14+, is an indicator of persons ages 16+. Codes/Counts: 8509 1 - Ages 16+ 108,911 2 - All other persons 35,191 bl- Missing 596
Smoked at Least 100 Cigarettes—8509 File SMK10085 DESCRIPTION: For all adults ages 16+, is the response to the question, "Has ... smoked at least 100 cigarettes in his or her entire life?" Codes/Counts: 8509 1 - Yes 49,644 2 - No 52,620 3 - Don't know 580 9 - Not answered 6,067 bl- Missing, ages 0-15 35,787
Age First Smoked—8509 File AGESMK85 DESCRIPTION: For all persons 16+ for whom the response to question 92 was either "yes" or "Not answered", is the response to the question, "What was the age at which... first started smoking cigarettes fairly regularly?" Codes/Counts: 8509 1-83 - Ages 1-83 43,723 blank - Missing, don't know, 100,975 ages 0-15
Never Smoked Regularly SMKCAT DESCRIPTION: For all persons 16+ for whom the response to question 92 was either "Yes" or "Not answered", is the negative categorical response to, "Has ... smoked more than 100 cigarettes?" Codes/Counts: 8509 1 - Never regularly 1,620 2 - Don't know 4,115 9 - Not applicable 6,233 bl- Missing, not "Yes" or 132,730 "Not answered" for question 92

National Longitudinal Mortality Study – Appendix A: Sept 1985 Health and Tobacco Use File
324
Smoke Cigarettes Now SMKNOW DESCRIPTION: For all persons ages 16+ who responded with an answer of other than "Don't know" for question 94 is the response to the question, "Does...smoke cigarettes now?" Codes/Counts: 8509 1 - Yes 23,300 2 - No 19,522 3 - Don't know 27 9 - Not answered 6,242 bl- Missing, ages 0-15, 90,607 response "Don't know" to question 94
Smoke Other Tobacco OTHTOB DESCRIPTION: For all persons ages 16+, is the response to the question, "Does ... use other forms of tobacco such as snuff or chewing tobacco?" Codes/Counts: 8509 1 - Yes 5,055 2 - No 97,198 3 - Don't know 136 9 - Not answered 6,522 bl- Missing, ages 0-15 35,787
Used Snuff SNUFF DESCRIPTION: For all persons ages 16+ for whom the response to question 96 was either "Yes" or "Nor- applicable", is the response to the question, "What other forms of tobacco did... use?" for inhaling snuff. Codes/Counts: 8509 - - Unknown 3,758 1 - Snuff 1,256 9 - Not answered 6,563 bl- Missing, ages 0-15, did 133,121 not respond "Yes" or "Not answered" to question 96

National Longitudinal Mortality Study – Appendix A: Sept 1985 Health and Tobacco Use File
325
Used Chewing Tobacco CHEWTB DESCRIPTION: For all persons ages 16+ for whom the response to question 96 was either "Yes" or "Not answered", is the response to the question, "What other forms of tobacco did... use?" for chewing tobacco. Codes/Counts: 8509 - - Unknown 2,929 1 - Chewing Tobacco 2,085 9 - Not answered 6,563 bl- Missing, ages 0-15, did 133,121 not respond "Yes" or "Not answered" to question 96
Smoked Cigars CIGARS DESCRIPTION: For all persons ages 16+ for whom the response to question 96 was either "Yes" or "Not answered", is the response to the question, "What other forms of tobacco did... use?" for smoking cigars. Codes/Counts: 8509 - - Unknown 4,038 1 - Cigars 976 9 - Not answered 6,563 bl- Missing, ages 0-15, did 133,121 not respond "Yes" or "Not answered" to question 96
Smoked Pipe Tobacco PIPETB DESCRIPTION: For all persons ages 16+ for whom the response to question 96 was either "Yes" or "Not answered", is the response to the question, "What other forms of tobacco did... use?" for pipe tobacco. Codes/Counts: 8509 - - Unknown 3,903 1 - Smoked pipe tobacco 1,111 9 - Not answered 6,563 bl- Missing, ages 0-15, did 133,121 not respond "Yes" or "Not answered" to question 96

National Longitudinal Mortality Study – Appendix A: Sept 1985 Health and Tobacco Use File
326
Other Form of Tobacco OTHFRM DESCRIPTION: For all persons ages 16+ for whom the response to question 96 was either "Yes" or "Not answered", is the response to the question, "What other forms of tobacco did... use?" for other not specified possibilities. Codes/Counts: 8509 - - Unknown 4,993 1 - Other form of tobacco 21 9 - Not answered 6,563 bl- Missing, ages 0-15, did 133,121 not respond "Yes" or "Not answered" to question 96
Interviewer Check Item INTVCK DESCRIPTION: For all persons, is the response to the interviewer's assessment about who is giving the information. Codes/Counts: 8509 1 - Him/herself 56,882 2 - All other persons 50,137 9 - Not answered, children 37,083 bl- Missing, unknown 596
Age Check for Persons 0-19 AGECK2 DESCRIPTION: At completion of interview interviewer is asked to assess whether any persons are ages 0-19. This variable summarizes that information. Codes/Counts: 8509 1 - Person in household ages 0-19 88,738 2 - All other persons 35,364 bl- Missing 596
Check Immunization Record IMMREC DESCRIPTION: For persons 0-19 in the household, is the response to the question, "Did... refer to an immunization record, for example a private physicians record, health department record... to answer any of the immunization questions for children 0-19 years of age?" Codes/Counts: 8509 1 - Yes 20,942 2 - No 62,049 9 - Not answered 5,747 bl- Missing, persons ages 20+ 55,960 with no persons ages 0-19 in household

National Longitudinal Mortality Study – Appendix A: Sept 1985 Health and Tobacco Use File
327
Responding to Supplement Items SUPRES DESCRIPTION: For all persons in households with persons ages 0-19, interviewer is asked to identify who answered to questions on immunization and smoking. Codes/Count: 8509 1 - Parent 75,318 2 - Self 1,864 3 - Other relative 4,797 4 - Nonrelative 451 9 - Not answered 6,308 bl- Missing, persons ages 20+ 55,960 with no person ages 0-19 in the household

National Longitudinal Mortality Study – Appendix B: State Concatenated Codes
328
Appendix B STATE CONCATENATED CODES
Return to Appendix TOC Return to Main TOC Return to STATE Return to DIV Return to STATER
New-England Division
Middle Atlantic Division
East North Central Division
Maine 11 New York 21 Ohio 31 New Hampshire 12 New Jersey 22 Indiana 32 Vermont 13 Pennsylvania 23 Illinois 33 Massachusetts 14
Michigan 34
Rhode Island 15
Wisconsin 35 Connecticut 16
West North Central
Division
South Atlantic Division
East South Central Division
Minnesota 41 Delaware 51 Kentucky 61 Iowa 42 Maryland 52 Tennessee 62 Missouri 43 District of Columbia 53 Alabama 63 North Dakota 44 Virginia 54 Mississippi 64 South Dakota 45 West Virginia 55
Nebraska 46 North Carolina 56 Kansas 47 South Carolina 57
Georgia 58
Florida 59
West South Central Division
Mountain Division
Pacific Division
Arkansas 71 Montana 81 Washington 91 Louisiana 72 Idaho 82 Oregon 92 Oklahoma 73 Wyoming 83 California 93 Texas 74 Colorado 84 Alaska 94
New Mexico 85 Hawaii 95
Arizona 86
Utah 87
Nevada 88

National Longitudinal Mortality Study – Appendix C: SMSA Ranking
329
Appendix C SMSA Ranking: 1970 SMSA Ranks
CODES for files 7303, 7802, 8014, 8008, 8012 Return to Appendix TOC Return to Main TOC Return to SMSAR
Not an SMSA 00 New York, NY 01 Portland, OR-WA 34 Wilmington, DL-NJ-MD 67 Los Angeles-Long Beach, CA
02 Phoenix, AZ 35 Flint, MI 68
Chicago, IL 03 Columbus, OH 36 Tulsa, OK 69 Philadelphia, PA 04 Providence-Pawtucket-
Warwick, RI-MA 37 Orlando, FL 70
Detroit, MI 05 Rochester, NY 38 Fresno, CA 71 San Francisco-Oakland, CA 06 San Antonio, TX 39 Tacoma, WA 72 Washington, DC-MD-VA 07 Dayton, OH 40 Harrisburg, PA 73 Boston, MA 08 Louisville, KY-ID 41 Charlotte, NC 74 Nassau-Suffolk, NY 09 Sacramento, CA 42 Knoxville, TN 75 Pittsburgh, PA 10 Memphis, TN-AR-MS 43 Wichita, KS 76 St. Louis, MO-IL 11 Ft. Worth, TX 44 Bridgeport, CE 77 Baltimore, MD 12 Birmingham, AL 45 Lansing, MI 78 Cleveland, OH 13 Albany-Schenectady-Troy, NY 46 Mobile, AL 79 Houston, TX 14 Toledo, OH-MI 47 Oxnard-Ventura, CA 80 Newark, NJ 15 Norfolk-Portsmouth, VA 48 Canton, OH 81 Minneapolis-St. Paul, MN 16 Akron, OH 49 Davenport- Rock Island-
Moline, IA-IL 82
Dallas, TX 17 Hartford, CT 50 El Paso, TX 83 Seattle-Everett, WA 18 Oklahoma City, OK 51 New Haven, CT 84 Anaheim-Santa Ana- Garden Grove, CA
19
Syracuse, NY 52 Tucson, AZ 85
Milwaukee, WI 20 Gary-Hammond-East Chicago, IN
53 West Palm Beach, FL 86
Atlanta, GA 21 Honolulu, HI 54 Worchester, MA 87 Cincinnati, OH 22 Ft. Lauderdale-
Hollywood, FL 55
Wilkes-Barre-Hazelton, PA 88
Paterson-Clifton- Passaic, NJ
23
Jersey City, NJ 56 Peoria, IL 89
San Diego, CA 24 Greensboro-Winston- Salem-High Point, NC
57
Utica-Rome, NY
90
Buffalo, NY 25 Salt Lake City, UT 58 York, PA 91 Miami, FL 26 Allentown-Bethlehem-
Easton, PA-NJ 59
Bakersfield, CA 92
Kansas City, MO-KS 27 Omaha, NE-IA 60 Little Rock- North Little Rock, AK
93
Denver, CO 28 Nashville, TN 61 Columbia, SC 94 San Bernardino- Riverside-Ontario CA
29 Grand Rapids, MI 62 Lancaster, PA 95
Indianapolis, IN 30 Youngstown-Warren, OH 63 Beaumont-Port Arthur - Orange, TX
96
San Jose, CA 31 Springfield-Chicopee- Holyoke, MA
64 Albuquerque, NM 97
New Orleans, LA 32 Jacksonville, FL 65 Chattanooga, TN-GA 98 Tampa-St. Petersburg, FL 33 Richmond, VA 66 All Smaller SMSA's 99

National Longitudinal Mortality Study – Appendix C: SMSA Ranking
330
1973 SMSA Ranks
CODES for files: 7903, 8024, 8103, 8203, 8303, 8403, 8503 Return to SMSAR Not an SMSA 00 New York, NY 01 Portland, OR-WA 33 Wilmington, DL-NJ-MD 66 Los Angeles-Long Beach, CA
02 Phoenix, AZ 34 Flint, MI 67
Chicago, IL 03 Columbus, OH 35 Tulsa, OK 68 Philadelphia, PA 04 Providence-Pawtucket-
Warwick, RI-MA 36 Orlando, FL 69
Detroit, MI 05 Rochester, NY 37 Fresno, CA 70 San Francisco-Oakland, CA 06 San Antonio, TX 38 Tacoma, WA 71 Washington, DC-MD-VA 07 Dayton, OH 39 Harrisburg, PA 72 Boston, MA 08 Louisville, KY-IN 40 Charlotte, NC 73 Sacramento, CA 41 Knoxville, TN 74 Pittsburgh, PA 09 Memphis, TN-AR-MS 42 Wichita, KA 75 St. Louis, MO-IL 10 Ft. Worth, TX 43 Bridgeport, CT 76 Baltimore, MD 11 Birmingham, AL 44 Lansing, MI 77 Cleveland, OH 12 Albany-Schenectady-
Troy, NY 45 Mobile, AL 78
Houston, TX 13 Toledo, OH-MI 46 Oxnard-Ventura, CA 79 Newark, NJ 14 Norfolk-Portsmouth, VA 47 Canton, OH 80 Minneapolis-St. Paul, MN 15 Akron, OH 48 Davenport-Rock Island
Moline, IA-IL 81
Dallas, TX 16 Hartford, CT 49 El Paso, TX 82 Seattle-Everett, WA 17 Oklahoma City, OK 50 New Haven, CT 83 Anaheim-Santa Ana- Garden Grove, CA
18
Syracuse, NY 51 Tucson, AZ 84
Milwaukee, WI 19 Gary-Hammond- East Chicago, IN
52 West Palm Beach, FL 85
Atlanta, GA 20 Honolulu, HI 53 Worchester, MA 86 Cincinnati, OH 21 Ft. Lauderdale-
Hollywood, FL 54
Wilkes-Barre-Hazelton, PA 87
Paterson-Clifton- Passaic, NJ
22
Jersey City, NJ 55 Peoria, IL 88
San Diego, CA 23 Greensboro-Winston- Salem-High Point, NC
56
Utica-Rome, NY
89
Buffalo, NY 24 Salt Lake City, UT 57 York, PA 90 Miami, FL 25 Allentown-Bethlehem-
Easton, PA-NJ 58
Bakersfield, CA 91
Kansas City, MO-KS 26 Omaha, NE-IA 59 Little Rock- North Little Rock, AK
92
Denver, CO 27 Nashville, TN 60 Columbia, SC 93 San Bernardino- Riverside-Ontario, CA
28 Grand Rapids, MI 61 Lancaster, PA 94
Indianapolis, IN 29 Youngstown-Warren, OH 62 Beaumont-Port Arthur - Orange, TX
95
San Jose, CA 30 Springfield-Chicopee- Holyoke, MA
63 Albuquerque, NM 96
New Orleans, LA 31 Jacksonville, FL 64 Chattanooga, TN-GA 97 Tampa-St. Petersburg, FL 32 Richmond, VA 65 Trenton, NJ 98 All smaller SMSA's 99

National Longitudinal Mortality Study – Appendix C: SMSA Ranking
331
1980 SMSA Rank
CODES for files: 8603, 8703 Return to SMSAR Not an SMSA 00 New York, NY 01 Columbus, OH 34 Austin, TX 67 Los Angeles- Long Beach, CA
02
Norfolk-Portsmouth, VA 35 Gary-Hammond-East Chicago, IN
68
Chicago, IL 03 Sacramento, CA 36 Providence-Pawtucket- Warwick, RI-MA
69
Philadelphia, PA 04 Indianapolis, IN 37 Grand Rapids, MI 70 Detroit, MI 05 San Antonio, TX 38 Toledo, OH-MI 71 Washington, DC-MD-VA 06 Ft. Worth, TX 39 Raleigh-Durham, NC 72 Houston, TX 07 Portland, OR-WA 40 Omaha, NE-IA 73 Boston, MA 08 Ft. Lauderdale-
Hollywood, FL 41 Tucson, AZ 74
Nassau-Suffolk, NY 09 Charlotte, NC 42 Greenville-Spartanburg, SC 75 St. Louis, MO-IL 10 Salt Lake City, UT 43 Knoxville, TN 76 Atlanta, GA 11 Rochester, NY 44 Oxnard-Ventura, CA 77 Baltimore, MD 12 Buffalo, NY 45 Harrisburg, PA 78 Minneapolis-St. Paul, MI-WI
13 Louisville, KY-IN 46 Fresno, CA 79
Dallas, TX 14 Oklahoma City, OK 47 Jersey City, NJ 80 Pittsburgh, PA 15 Memphis, TN-AR 48 Wilmington, DE-NJ-MD 81 Anaheim-Santa Ana- Garden Grove, CA
16
Dayton-Springfield, OH 49 Baton Rouge, LA 82
San Diego, CA 17 Middlesex-Somerset- Hunterdon, NJ
50 Las Vegas, NV 83
Newark, NJ 18 Monmouth-Ocean, NJ 51 El Paso, TX 84 Oakland, Calif. 19 Birmingham, AL 52 Youngstown-Warren, OH 85 Cleveland, OH 20 Nashville, TN 53 Springfield-Chicopee-
Holyoke, MA 86
Tampa-St. Petersburg, FL 21 Greensboro-Winston-Salem- High Point, NC
54 Tacoma, WA 87
San Bernardino- Riverside-Ontario CA
22 Albany-Schenectady-Troy, NY 55 New Haven-Meriden, CT 88
Phoenix, AZ 23 Orlando, FL 56 Little Rock- North Little Rock, AK
89
Miami, Hialeah, FL 24 Honolulu, HI 57 Charleston, SC 90 Seattle-Everett, WA 25 Richmond, VA 58 Mobile, AL 91 Denver, CO 26 Jacksonville, FL 59 Bakersfield, CA 92 Kansas City, MO-KS 27 Hartford, CT 60 Chicago (Lake County), IL 93 Denver, CO 28 Scranton-Wilkes-Barre, PA 61 Albuquerque, NM 94 Cincinnati, OH 29 Tulsa, OK 62 Johnson City-Kingsport-
Bristol, TN 95
Milwaukee, WI 30 West Palm Beach, FL 63 New Haven, CT 96 San Jose, CA 31 Syracuse, NY 64 Flint, MI 97 New Orleans, LA 32 Akron, OH 65 Columbia, SC 98 Bergen-Passaic, NJ 33 Allentown-Bethlehem-
Easton, PA-NJ 66 All smaller SMSA's 99
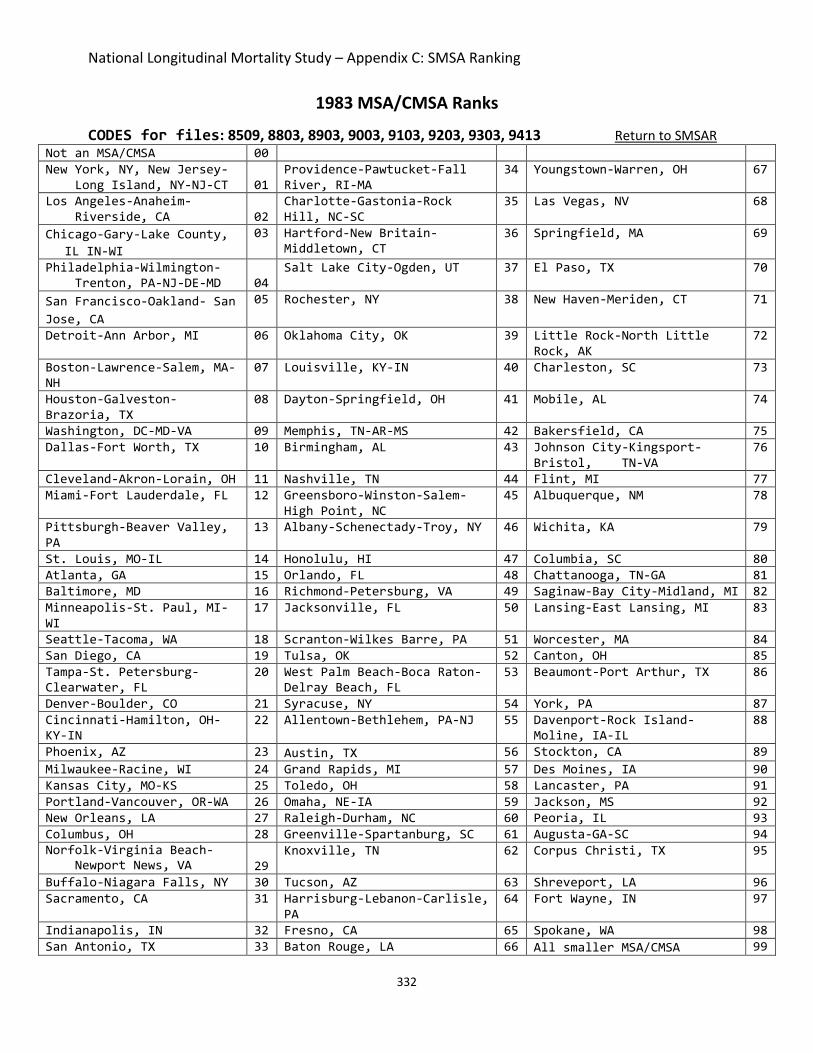
National Longitudinal Mortality Study – Appendix C: SMSA Ranking
332
1983 MSA/CMSA Ranks
CODES for files: 8509, 8803, 8903, 9003, 9103, 9203, 9303, 9413 Return to SMSAR Not an MSA/CMSA 00 New York, NY, New Jersey- Long Island, NY-NJ-CT
01
Providence-Pawtucket-Fall River, RI-MA
34 Youngstown-Warren, OH 67
Los Angeles-Anaheim- Riverside, CA
02
Charlotte-Gastonia-Rock Hill, NC-SC
35 Las Vegas, NV 68
Chicago-Gary-Lake County, IL IN-WI
03 Hartford-New Britain-Middletown, CT
36 Springfield, MA 69
Philadelphia-Wilmington- Trenton, PA-NJ-DE-MD
04
Salt Lake City-Ogden, UT 37 El Paso, TX 70
San Francisco-Oakland- San Jose, CA
05 Rochester, NY 38 New Haven-Meriden, CT 71
Detroit-Ann Arbor, MI 06 Oklahoma City, OK 39 Little Rock-North Little Rock, AK
72
Boston-Lawrence-Salem, MA-NH
07 Louisville, KY-IN 40 Charleston, SC 73
Houston-Galveston-Brazoria, TX
08 Dayton-Springfield, OH 41 Mobile, AL 74
Washington, DC-MD-VA 09 Memphis, TN-AR-MS 42 Bakersfield, CA 75 Dallas-Fort Worth, TX 10 Birmingham, AL 43 Johnson City-Kingsport-
Bristol, TN-VA 76
Cleveland-Akron-Lorain, OH 11 Nashville, TN 44 Flint, MI 77 Miami-Fort Lauderdale, FL 12 Greensboro-Winston-Salem-
High Point, NC 45 Albuquerque, NM 78
Pittsburgh-Beaver Valley, PA
13 Albany-Schenectady-Troy, NY 46 Wichita, KA 79
St. Louis, MO-IL 14 Honolulu, HI 47 Columbia, SC 80 Atlanta, GA 15 Orlando, FL 48 Chattanooga, TN-GA 81 Baltimore, MD 16 Richmond-Petersburg, VA 49 Saginaw-Bay City-Midland, MI 82 Minneapolis-St. Paul, MI-WI
17 Jacksonville, FL 50 Lansing-East Lansing, MI 83
Seattle-Tacoma, WA 18 Scranton-Wilkes Barre, PA 51 Worcester, MA 84 San Diego, CA 19 Tulsa, OK 52 Canton, OH 85 Tampa-St. Petersburg-Clearwater, FL
20 West Palm Beach-Boca Raton-Delray Beach, FL
53 Beaumont-Port Arthur, TX 86
Denver-Boulder, CO 21 Syracuse, NY 54 York, PA 87 Cincinnati-Hamilton, OH-KY-IN
22 Allentown-Bethlehem, PA-NJ 55 Davenport-Rock Island- Moline, IA-IL
88
Phoenix, AZ 23 Austin, TX 56 Stockton, CA 89 Milwaukee-Racine, WI 24 Grand Rapids, MI 57 Des Moines, IA 90 Kansas City, MO-KS 25 Toledo, OH 58 Lancaster, PA 91 Portland-Vancouver, OR-WA 26 Omaha, NE-IA 59 Jackson, MS 92 New Orleans, LA 27 Raleigh-Durham, NC 60 Peoria, IL 93 Columbus, OH 28 Greenville-Spartanburg, SC 61 Augusta-GA-SC 94 Norfolk-Virginia Beach- Newport News, VA
29
Knoxville, TN 62 Corpus Christi, TX 95
Buffalo-Niagara Falls, NY 30 Tucson, AZ 63 Shreveport, LA 96 Sacramento, CA 31 Harrisburg-Lebanon-Carlisle,
PA 64 Fort Wayne, IN 97
Indianapolis, IN 32 Fresno, CA 65 Spokane, WA 98 San Antonio, TX 33 Baton Rouge, LA 66 All smaller MSA/CMSA 99

National Longitudinal Mortality Study – Appendix C: SMSA Ranking
333
1993 MSA/CMSA Ranks
CODES for files: 9503, 9603, 9703, 9803, 9903, 0003, 0103, 0203 Return to SMSAR Not an MSA/CMSA 00 New York, NY, New Jersey- Long Island, NY-NJ-CT
01
Charlotte-Gastonia-Rock Hill, NC-SC
34 Harrisburg-Lebanon-Carlisle, PA
67
Los Angeles-Anaheim- Riverside, CA
02
Hartford-New Britain-Middletown, CT
35 Springfield, MA 68
Chicago-Gary, IL-IN 03 Providence-Fall River, Warwick, RI-MA
36 Knoxville, TN 69
Washington Baltimore Hagerstown DC-MD-VA-WV
04
Salt Lake City-Ogden, UT 37 Bakersfield, CA 70
San Francisco-Oakland-San Jose, CA
05 Rochester, NY 38 Little Rock-North Little Rock, AR
71
Philadelphia-Wilmington- Trenton, PA-NJ-DE-MD
06
Greensboro-Winston-Salem- High Point, NC
39
Charleston-North Charleston, SC
72
Boston-Manchester, MA-NH-ME
07 Memphis, TN-AR-MS 40 Sarasota-Bradenton, FL 73
Detroit-Ann Arbor-Flint, MI
08 Nashville, TN 41 Wichita, KS 74
Dallas-Fort Worth, TX 09 Oklahoma City, OK 42 Stockton-Lodi, CA 75 Houston-Galveston-Brazoria, TX
10 Dayton-Springfield, OH 43 Mobile, AL 76
Miami-Fort Lauderdale, FL
11 Louisville, KY-IN 44 Baton Rouge, LA 77
Seattle-Tacoma, Bremerton, WA
12 Grand Rapids, MI 45 Fort Wayne, IN 78
Atlanta, GA 13 Jacksonville, FL 46 Columbia, SC 79 Cleveland-Akron, OH 14 Richmond-Petersburg, VA 47 Johnson City-Kingsport-
Bristol, IN-VA 80
Minneapolis-St. Paul, MI-WI
15 West Palm Beach-Boca Raton, FL
48 Lansing-East Lansing, MI 81
San Diego, CA 16 Albany-Schenectady-Troy, NY 49 Kalamazoo-Battle Creek, MI 82 St. Louis, MO-IL 17 Raleigh-Durham, NC 50 Lancaster, PA 83 Pittsburgh, PA 18 Las Vegas, NV 51 Lexington, KY 84 Phoenix, AZ 19 Austin-San Marcos, TX 52 Lakeland-Winter Haven, FL 85 Tampa-St. Petersburg-Clearwater, FL
20 Birmingham, AL 53 Chattanooga, TN-GA 86
Denver-Boulder-Greeley, CO
21 Honolulu, HI 54 Daytona Beach, FL 87
Cincinnati-Hamilton, OH-KY-IN
22 Greenville-Spartanburg-Anderson, SC
55 Saginaw-Bay City-Midland, MI
88
Portland-Vancouver, OR-WA
23 Fresno, CA 56 Melbourne-Titusville-Palm Bay, FL
89
Milwaukee-Racine, WI 24 Syracuse, NY 57 Colorado Springs, CO 90 Kansas City, MO-KS 25 Tulsa, OK 58 Jackson, MS 91 Sacramento-Yolo, CA 26 Tucson, AZ 59 Augusta-Aiken, GA-SC 92 Norfolk-Virginia Beach- Newport News, VA-NC
27
Omaha, NE-IA 60 Canton-Massillon, OH 93
Indianapolis, IN 28 Scranton-Wilkes Barre- 61 Des Moines, IA 94

National Longitudinal Mortality Study – Appendix C: SMSA Ranking
334
Hazleton, PA Columbus, OH 29 Toledo, OH 62 McAllen-Edinburg-Mission,
TX 95
San Antonio, TX 30 Youngstown-Warren, OH 63 Shreveport-Bossier City, LA 96 New Orleans, LA 31 Allentown-Bethlehem-Easton,
PA 64 Modesto, CA 97
Orlando, FL 32 El Paso, TX 65 Santa Barbara-Santa Maria-Lompoc, CA
98
Buffalo-Niagara Falls, NY
33 Albuquerque, NM 66 All smaller SMSA's 99

National Longitudinal Mortality Study – Appendix D-1: UN Codes for Countries and Areas, Alphabetic Sort
335
United Nations Department of Economic and Social Affairs Codes for Countries or Area: Alphabetic Sort
Return to Appendix TOC Return to Main TOC Return to POBF
004 Afghanistan 184 Cook Islands 360 Indonesia 248 Åland Islands 188 Costa Rica 364 Iran (Islamic Republic of) 008 Albania 384 Côte d’Ivoire 368 Iraq 012 Algeria 191 Croatia 372 Ireland 016 American Samoa 192 Cuba 833 Isle of Man 020 Andorra 531 Curaçao 376 Israel 024 Angola 196 Cyprus 380 Italy 660 Anguilla 203 Czech Republic 388 Jamaica 028 Antigua and Barbuda 408 Democratic People’s Rep of Korea 392 Japan 032 Argentina 180 Democratic Republic of the Congo 832 Jersey 051 Armenia 208 Denmark 400 Jordan 533 Aruba 262 Djibouti 398 Kazakhstan 036 Australia 212 Dominica 404 Kenya 040 Austria 214 Dominican Republic 296 Kiribati 031 Azerbaijan 218 Ecuador 414 Kuwait 044 Bahamas 818 Egypt 417 Kyrgyzstan 048 Bahrain 222 El Salvador 418 Lao Peoples Democratic Republic 050 Bangladesh 226 Equatorial Guinea 428 Latvia 052 Barbados 232 Eritrea 422 Lebanon 112 Belarus 233 Estonia 426 Lesotho 056 Belgium 231 Ethiopia 430 Liberia 084 Belize 234 Faeroe Islands 434 Libya 204 Benin 238 Falkland Islands (Malvinas) 438 Liechtenstein 060 Bermuda 242 Fiji 440 Lithuania 064 Bhutan 246 Finland 442 Luxembourg 068 Bolivia (Plurinational State of) 250 France 450 Madagascar 535 Bonaire, Saint Eustatius and Saba 254 French Guiana 454 Malawi 070 Bosnia and Herzegovina 258 French Polynesia 458 Malaysia 072 Botswana 266 Gabon 462 Maldives 076 Brazil 270 Gambia 466 Mali 092 British Virgin Islands 268 Georgia 470 Malta 096 Brunei Darussalam 276 Germany 584 Marshall Islands 100 Bulgaria 288 Ghana 474 Martinique 854 Burkina Faso 292 Gibraltar 478 Mauritania 108 Burundi 300 Greece 480 Mauritius 116 Cambodia 304 Greenland 175 Mayotte 120 Cameroon 308 Grenada 484 Mexico 124 Canada 312 Guadeloupe 583 Micronesia (Federated States of) 132 Cape Verde 316 Guam 492 Monaco 136 Cayman Islands 320 Guatemala 496 Mongolia 140 Central African Republic 831 Guernsey 499 Montenegro 148 Chad 324 Guinea 500 Montserrat 830 Channel Islands 624 Guinea-Bissau 504 Morocco 052 Chile 328 Guyana 508 Mozambique 156 China 332 Haiti 104 Myanmar 344 China, Hong Kong Special Admin. Reg. 336 Holy See 516 Namibia 446 China, Macao Special Admin. Region 340 Honduras 520 Nauru 170 Colombia 348 Hungary 524 Nepal 174 Comoros 352 Iceland 528 Netherlands 178 Congo 356 India 540 New Caledonia

National Longitudinal Mortality Study – Appendix D-1: UN Codes for Countries and Areas, Alphabetic Sort
336
554 New Zealand 710 South Africa 558 Nicaragua 728 South Sudan 562 Niger 724 Spain 566 Nigeria 144 Sri Lanka 570 Niue 729 Sudan 574 Norfolk Island 740 Suriname 580 Northern Mariana Islands 744 Svalbard and Jan Mayen Islands 578 Norway 748 Swaziland 275 Occupied Palestinian Territory 752 Sweden 512 Oman 756 Switzerland 586 Pakistan 760 Syrian Arab Republic 585 Palau 762 Tajikistan 591 Panama 764 Thailand 598 Papua New Guinea 807 The former Yugoslav Rep of Macedonia 600 Paraguay 626 Timor-Leste 604 Peru 768 Togo 608 Philippines 772 Tokelau 612 Pitcairn 776 Tonga 616 Poland 780 Trinidad and Tobago 620 Portugal 788 Tunisia 630 Puerto Rico 792 Turkey 634 Qatar 795 Turkmenistan 410 Republic of Korea 796 Turks and Caicos Islands 498 Republic of Moldova 798 Tuvalu 638 Réunion 800 Uganda 642 Romania 804 Ukraine 643 Russian Federation 784 United Arab Emirates 646 Rwanda 826 UK--Great Britain & Northern Ireland 652 Saint-Barthélemy 834 United Republic of Tanzania 654 Saint Helena 840 United States of America 659 Saint Kitts and Nevis 850 United States Virgin Islands 662 Saint Lucia 858 Uruguay 663 Saint-Martin (French part) 860 Uzbekistan 666 Saint Pierre and Miquelon 548 Vanuatu 670 Saint Vincent and the Grenadines 862 Venezuela (Bolivarian Republic of) 882 Samoa 704 Viet Nam 674 San Marino 876 Wallis and Futuna Islands 678 Sao Tome and Principe 732 Western Sahara 680 Sark 887 Yemen 682 Saudi Arabia 894 Zambia 686 Senegal 716 Zimbabwe 688 Serbia 690 Seychelles 694 Sierra Leone 702 Singapore 534 Saint Maarten (Dutch part) 703 Sloovakia 705 Slovenia 90 Solomon Islands 706 Somalia
Source: United Nations Department of Economic and Social Affairs, Economic and Social Development website http://unstats.un.org/unsd/methods/m49/m49alpha.htm, accessed on 12/5/12.

National Longitudinal Mortality Study – Appendix D-2: UN Codes for Countries and Areas, Numeric Sort
337
United Nations Department of Economic and Social Affairs Codes for Countries or Areas: Numeric Sort
Return to Appendix TOC Return to Main TOC Return to POBF
004 Afghanistan 196 Cyprus 384 Côte d’Ivoire 008 Albania 203 Czech Republic 388 Jamaica 012 Algeria 204 Benin 392 Japan 016 American Samoa 208 Denmark 398 Kazakhstan 020 Andorra 212 Dominica 400 Jordan 024 Angola 214 Dominican Republic 404 Kenya 028 Antigua and Barbuda 218 Ecuador 408 Democratic People’s Republic of Korea 031 Azerbaijan 222 El Salvador 410 Republic of Korea 032 Argentina 226 Equatorial Guinea 414 Kuwait 036 Australia 231 Ethiopia 417 Kyrgyzstan 040 Austria 232 Eritrea 418 Lao Peoples Democratic Republic 044 Bahamas 233 Estonia 422 Lebanon 048 Bahrain 234 Faeroe Islands 426 Lesotho 050 Bangladesh 238 Falkland Islands (Malvinas) 428 Latvia 051 Armenia 242 Fiji 430 Liberia 052 Barbados 246 Finland 434 Libya 052 Chile 248 Åland Islands 438 Liechtenstein 056 Belgium 250 France 440 Lithuania 060 Bermuda 254 French Guiana 442 Luxembourg 064 Bhutan 258 French Polynesia 446 China, Macao Special Admin. Region 068 Bolivia (Plurinational State of) 262 Djibouti 450 Madagascar 070 Bosnia and Herzegovina 266 Gabon 454 Malawi 072 Botswana 268 Georgia 458 Malaysia 076 Brazil 270 Gambia 462 Maldives 084 Belize 275 Occupied Palestinian Territory 466 Mali 090 Solomon Islands 276 Germany 470 Malta 092 British Virgin Islands 288 Ghana 474 Martinique 096 Brunei Darussalam 292 Gibraltar 478 Mauritania 100 Bulgaria 296 Kiribati 480 Mauritius 104 Myanmar 300 Greece 484 Mexico 108 Burundi 304 Greenland 492 Monaco 112 Belarus 308 Grenada 496 Mongolia 116 Cambodia 312 Guadeloupe 498 Republic of Moldova 120 Cameroon 316 Guam 499 Montenegro 124 Canada 320 Guatemala 500 Montserrat 132 Cape Verde 324 Guinea 504 Morocco 136 Cayman Islands 328 Guyana 508 Mozambique 140 Central African Republic 332 Haiti 512 Oman 144 Sri Lanka 336 Holy See 516 Namibia 148 Chad 340 Honduras 520 Nauru 156 China 344 China, Hong Kong Special Admin.
Region 524 Nepal
170 Colombia 348 Hungary 528 Netherlands 174 Comoros 352 Iceland 531 Curaçao 175 Mayotte 356 India 533 Aruba 178 Congo 360 Indonesia 534 Saint Maarten (Dutch part) 180 Democratic Republic of the Congo 364 Iran (Islamic Republic of) 535 Bonaire, Saint Eustatius and Saba 184 Cook Islands 368 Iraq 540 New Caledonia 188 Costa Rica 372 Ireland 548 Vanuatu 191 Croatia 376 Israel 554 New Zealand 192 Cuba 380 Italy 558 Nicaragua

National Longitudinal Mortality Study – Appendix D-2: UN Codes for Countries and Areas, Numeric Sort
338
562 Niger 728 South Sudan 566 Nigeria 729 Sudan 570 Niue 732 Western Sahara 574 Norfolk Island 740 Suriname 578 Norway 744 Svalbard and Jan Mayen Islands 580 Northern Mariana Islands 748 Swaziland 583 Micronesia (Federated States of) 752 Sweden 584 Marshall Islands 756 Switzerland 585 Palau 760 Syrian Arab Republic 586 Pakistan 762 Tajikistan 591 Panama 764 Thailand 598 Papua New Guinea 768 Togo 600 Paraguay 772 Tokelau 604 Peru 776 Tonga 608 Philippines 780 Trinidad and Tobago 612 Pitcairn 784 United Arab Emirates 616 Poland 788 Tunisia 620 Portugal 792 Turkey 624 Guinea-Bissau 795 Turkmenistan 626 Timor-Leste 796 Turks and Caicos Islands 630 Puerto Rico 798 Tuvalu 634 Qatar 800 Uganda 638 Réunion 804 Ukraine 642 Romania 807 The former Yugoslav Rep of Macedonia 643 Russian Federation 818 Egypt 646 Rwanda 826 UK--Great Britain & Northern Ireland 652 Saint-Barthélemy 830 Channel Islands 654 Saint Helena 831 Guernsey 659 Saint Kitts and Nevis 832 Jersey 660 Anguilla 833 Isle of Man 662 Saint Lucia 834 United Republic of Tanzania 663 Saint-Martin (French part) 840 United States of America 666 Saint Pierre and Miquelon 850 United States Virgin Islands 670 Saint Vincent and the Grenadines 854 Burkina Faso 674 San Marino 858 Uruguay 678 Sao Tome and Principe 860 Uzbekistan 680 Sark 862 Venezuela (Bolivarian Republic of) 682 Saudi Arabia 876 Wallis and Futuna Islands 686 Senegal 882 Samoa 688 Serbia 887 Yemen 690 Seychelles 894 Zambia 694 Sierra Leone 702 Singapore 703 Sloovakia 704 Viet Nam 705 Slovenia 706 Somalia 710 South Africa 716 Zimbabwe 724 Spain
Source: United Nations Department of Economic and Social Affairs, Economic and Social Development website http://unstats.un.org/unsd/methods/m49/m49alpha.htm, accessed on 12/5/12.

National Longitudinal Mortality Study – Appendix E: 1990 Industrial Classification System
339
Appendix E 1990 INDUSTRIAL CLASSIFICATION SYSTEM
Return to Appendix TOC Return to Main TOC Return to IND1990 Numbers in parentheses following the industry categories are the 1987 SIC definitions. The abbreviation "pt" means "part" and "n.e.c." means "not elsewhere classified."
1990
Industry Code
Industry Category
AGRICULTURE
010 Agricultural production, crops (01) 011 Agricultural production, livestock (02) 012 Veterinary services (074) 020 Landscape and horticultural services (078) 030 Agricultural services, n.e.c. (071, 072, 075, 076)
FORESTRY AND FISHERIES 031 Forestry 032 Fishing, hunting, and trapping (09)
MINING 040 Metal mining (10) 041 Coal mining (12) 042 Oil and gas extraction (13) 050 Nonmetallic mining and quarrying, except fuel (14)
060 CONSTRUCTION (15, 16, 17)
MANUFACTURING
Nondurable Goods 100 Meat products (201) 101 Dairy products (202) 102 Canned, frozen and preserved fruits and vegetables (203) 110 Grain mill products (204) 111 Bakery products (205) 112 Sugar and confectionery products (206) 120 Beverage industries (208) 121 Miscellaneous food preparations and kindred products (207, 209) 122 Not specified food industries 130 Tobacco manufactures (21) 132 Knitting mills (225) 140 Dyeing and finishing textiles, except wool and knit goods (226) 141 Carpets and rugs (227) 142 Yarn, thread, and fabric mills (221-224, 228)

National Longitudinal Mortality Study – Appendix E: 1990 Industrial Classification System
340
1990 Industry
Code Industry Category
MANUFACTURING, Nondurable Goods, cont. 150 Miscellaneous textile mill products (229) 151 Apparel and accessories, except knit (231-238) 152 Miscellaneous fabricated textile products (239) 160 Pulp, paper, and paperboard mills (261-263) 161 Miscellaneous paper and pulp products (267) 162 Paperboard containers and boxes (265) 171 Newspaper publishing and printing (271) 172 Printing, publishing, and allied industries, except newspapers (272-279) 180 Plastics, synthetics, and resins (282) 181 Drugs (283) 182 Soaps and cosmetics (284) 190 Paints, varnishes, and related products (285) 191 Agricultural chemicals (287) 192 Industrial and miscellaneous chemicals (281,286, 289) 200 Petroleum refining (291) 201 Miscellaneous petroleum and coal products (295, 299) 210 Tires and inner tubes (301) 211 Other rubber products, and plastics footwear and belting (302-306) 212 Miscellaneous plastics products (308) 220 Leather tanning and finishing (311) 221 Footwear, except rubber and plastic (313, 314) 222 Leather products, except footwear (315-317, 319)
Durable Goods 230 Logging (241) 231 Sawmills, planing mills, and millwork (242, 243) 232 Wood buildings and mobile homes (245) 241 Miscellaneous wood products (244, 249) 242 Furniture and fixtures (25) 250 Glass and glass products (321-323) 251 Cement, concrete, gypsum, and plaster products (324, 327) 252 Structural clay products (325) 261 Pottery and related products (326) 262 Miscellaneous nonmetallic mineral and stone products (328, 329) 270 Blast furnaces, steelworks, rolling and finishing mills (331) 271 Iron and steel foundries (332) 272 Primary aluminum industries (3334, part 334, 3353-3355, 3363, 3365) 280 Other primary metal industries (3331, 3339, part 334, 3351, 3356, 3357, 3364, 3366,
3369, 339) 281 Cutlery, handtools, and general hardware (342) 282 Fabricated structural metal products (344)

National Longitudinal Mortality Study – Appendix E: 1990 Industrial Classification System
341
1990 Industry
Code Industry Category
MANUFACTURING, Durable Goods, cont. 290 Screw machine products (345) 291 Metal forgings and stampings (346) 292 Ordnance (348) 300 Miscellaneous fabricated metal products (341, 343, 347, 349) 301 Not specified metal industries 310 Engines and turbines (351) 311 Farm machinery and equipment (352) 312 Construction and material handling machines (353) 320 Metalworking machinery (354) 321 Office and accounting machines (3578, 3579) 322 Computers and related equipment (3571-3577) 331 Machinery, except electrical, n.e.c. (355, 356, 358, 359) 332 Not specified machinery 340 Household appliances (363) 341 Radio, TV, and communication equipment (365, 366) 342 Electrical machinery, equipment, and supplies, n.e.c. (361, 362, 364, 367, 369) 350 Not specified electrical machinery, equipment, and supplies 351 Motor vehicles and motor vehicle equipment (371) 352 Aircraft and parts (372) 360 Ship and boat building and repairing (373) 361 Railroad locomotives and equipment (374) 362 Guided missiles, space vehicles, and parts (376) 370 Cycles and miscellaneous transportation equipment (375, 379) 371 Scientific and controlling instruments (381, 382 except 3827) 372 Medical, dental, and optical instruments and supplies (3827, 384, 385) 380 Photographic equipment and supplies (386) 381 Watches, clocks, and clockwork operated devices (387) 382 Not specified professional equipment (manufacturing) 390 Toys, amusement, and sporting goods (394) 391 Miscellaneous manufacturing industries (39 except 394) 392 Not specified manufacturing industries
TRANSPORTATION, COMMUNICATIONS, AND OTHER PUBLIC UTILITIES 400 Railroads (40) 401 Bus service and urban transit (41, except 412) 402 Taxicab service (412) 410 Trucking service (421, 423) 411 Warehousing and storage (422) 412 US Postal Service (43) 420 Water transportation (44)

National Longitudinal Mortality Study – Appendix E: 1990 Industrial Classification System
342
1990 Industry
Code Industry Category
TRANSPORTATION, COMMUNICATIONS, AND OTHER PUBLIC UTILITIES, cont. 421 Air transportation (45) 422 Pipe lines, except natural gas (46) 432 Services incidental to transportation (47) 440 Radio and television broadcasting and cable (483, 484) 441 Telephone communications (481) 442 Telegraph and miscellaneous communications services (482, 489) 450 Electric light and power (491) 451 Gas and steam supply systems (492, 496) 452 Electric and gas, and other combinations (493) 470 Water supply and irrigation (494, 497) 471 Sanitary services (495) 472 Not specified utilities
WHOLESALE TRADE
Durable Goods 500 Motor vehicles and equipment (501) 501 Furniture and home furnishings (502) 502 Lumber and construction materials (503) 510 Professional and commercial equipment and supplies (504) 511 Metals and minerals, except petroleum (505) 512 Electrical goods (506) 521 Hardware, plumbing and heating supplies (507) 522 Not specified electrical and hardware (wholesale trade) 530 Machinery, equipment, and supplies (508) 531 Scrap and waste materials (5093) 532 Miscellaneous wholesale, durable goods (509 except 5093)
Nondurable Goods 540 Paper and paper products (511) 541 Drugs, chemicals and allied products (512, 516) 542 Apparel, fabrics, and notions (513) 550 Groceries and related products (514) 551 Farm-product raw materials (515) 552 Petroleum products (517) 560 Alcoholic beverages (518) 561 Farm supplies (5191) 562 Miscellaneous wholesale, nondurable goods (5192-5199) 571 Not specified wholesale trade
RETAIL TRADE 580 Lumber and building material retailing (521, 523) 581 Hardware stores (525)

National Longitudinal Mortality Study – Appendix E: 1990 Industrial Classification System
343
1990 Industry
Code Industry Category
RETAIL TRADE, cont. 582 Retail nurseries and garden stores (526) 590 Mobile home dealers (527) 591 Department stores (531) 592 Variety stores (533) 600 Miscellaneous general merchandise stores (539) 601 Grocery stores (541) 602 Dairy products stores (545) 610 Retail bakeries (546) 611 Food stores, n.e.c. (542, 543, 544, 549) 612 Motor vehicle dealers (551, 552) 620 Auto and home supply stores (553) 621 Gasoline service stations (554) 622 Miscellaneous vehicle dealers (555, 556, 557, 559) 623 Apparel and accessory stores, except shoe (56, except 566) 630 Shoe stores (566) 631 Furniture and home furnishings stores (571) 632 Household appliance stores (572) 633 Radio, TV, and computer stores (5731, 5734) 640 Music stores (5735, 5736) 641 Eating and drinking places (58) 642 Drug stores (591) 650 Liquor stores (592) 651 Sporting goods, bicycles, and hobby stores (5941, 5945, 5946) 652 Book and stationery stores (5942, 5943) 660 Jewelry stores (5944) 661 Gift, novelty, and souvenir shops (5947) 662 Sewing, needlework and piece goods stores (5949) 663 Catalog and mail order houses (5961) 670 Vending machine operators (5962) 671 Direct selling establishments (5963) 672 Fuel dealers (598) 681 Retail florists (5992) 682 Miscellaneous retail stores (593, 5948, 5993-5995, 5999) 691 Not specified retail trade
FINANCE, INSURANCE, AND REAL ESTATE 700 Banking (60 except 603 and 606) 701 Savings institutions, including credit unions (603, 606) 702 Credit agencies, n.e.c. (61) 710 Security, commodity brokerage, and investment companies (62, 67)

National Longitudinal Mortality Study – Appendix E: 1990 Industrial Classification System
344
1990 Industry
Code Industry Category
FINANCE, INSURANCE, AND REAL ESTATE, cont. 711 Insurance (63, 64) 712 Real estate, including real estate-insurance offices (65)
BUSINESS AND REPAIR SERVICES 721 Advertising (731) 722 Services to dwellings and other buildings (734) 731 Personnel supply services (736) 732 Computer and data processing services (737) 740 Detective and protective services (7381, 7382) 741 Business services, n.e.c. (732, 733, 735, 7383-7389) 742 Automotive rental and leasing, without drivers (751) 750 Automotive parking and carwashes (752, 7542) 751 Automotive repair and related services (753, 7549) 752 Electrical repair shops (762, 7694) 760 Miscellaneous repair services (763, 764, 7692, 7699)
PERSONAL SERVICES 761 Private Households (88) 762 Hotels and motels (701) 770 Lodging places, except hotels and motels (702, 703, 704) 771 Laundry, cleaning, and garment services (721 except part 7219) 772 Beauty shops (723) 780 Barber shops (724) 781 Funeral service and crematories (726) 782 Shoe repair shops (725) 790 Dressmaking shops (part 7219) 791 Miscellaneous personal services (722, 729)
ENTERTAINMENT AND RECREATION SERVICES 800 Theaters and motion pictures (781-783, 792) 801 Video tape rental (784) 802 Bowling centers (793) 810 Miscellaneous entertainment and recreation services (791, 794, 799)
PROFESSIONAL AND RELATED SERVICES 812 Offices and clinics of physicians (801, 803) 820 Offices and clinics of dentists (802) 821 Offices and clinics of chiropractors (8041) 822 Offices and clinics of optometrists (8042) 830 Offices and clinics of health practitioners, n.e.c. (8043, 8049) 831 HOSPITALS (806) 832 Nursing and personal care facilities (805) 840 Health services, n.e.c. (807, 808, 809)

National Longitudinal Mortality Study – Appendix E: 1990 Industrial Classification System
345
1990 Industry
Code Industry Category
PROFESSIONAL AND RELATED SERVICES, cont. 841 Legal services (81) 842 Elementary and secondary schools (821) 850 Colleges and universities (822) 851 Vocational schools (824) 852 Libraries (823) 860 Educational services, n.e.c. (829) 861 Job training and vocational rehabilitation services (833) 862 Child day care services (part 835) 863 Family child care homes (part 835) 870 Residential care facilities, without nursing (836) 871 Social services, n.e.c. (832, 839) 872 Museums, art galleries, and zoos (84) 873 Labor unions (863) 880 Religious organizations (866) 881 Membership organizations, n.e.c. (861, 862, 864, 865, 869) 882 Engineering, architectural, and surveying services (871) 890 Accounting, auditing, and bookkeeping services (872) 891 Research, development, and testing services (873) 892 Management and public relations services (874) 893 Miscellaneous professional and related services (899)
PUBLIC ADMINISTRATION 900 Executive and legislative offices (911-913) 901 General government, n.e.c. (919) 910 Justice, public order, and safety (92) 921 Public finance, taxation, and monetary policy (93) 922 Administration of human resources programs (94) 930 Administration of environmental quality and housing programs (95) 931 Administration of economic programs (96) 932 National security and international affairs (97)
ACTIVE DUTY MILITARY 991 Assigned to persons whose labor force status is unemployed and whose last job was
Armed Forces

National Longitudinal Mortality Study – Appendix F: 2007 Industrial Classification System
346
Appendix F
2007 INDUSTRIAL CLASSIFICATION SYSTEM Return to Appendix TOC Return to Main TOC Return to IND INDUSTRY CODE CROSSWALK
U.S. Census Bureau
1990 Census, NAICS 2007, Census 2007 codes
Sorted by Census 2000 Codes
Key: New = Census 2000 category without a 1990 equivalent New7 = Census 2007 category without a 2002, 2000, or 1990 equivalent Old = 1990 Census category without a 2000 equivalent (deleted or merged with another
category) p = part of a 1990 category (1990 category split into 2 or more major parts) - (minus) = component moved from 1990 industry to different 2000 category + (plus) = component added to 1990 industry to make new 2000 category * = 1990 major group change to a different NAICS/2000 sector *****= 2007 new code added or change to existing code for 2007 **** = new title added for 2007 1990 Census
1997 NAICS Census 2000
Census 2000 Category Title
010 111 017 Crop production
011 112 018 Animal production
31 1131, 1132 019 Forestry except logging
230* 1133 027 Logging
032 114 028 Fishing, hunting, and trapping 030 115 029 Support activities for agriculture and
forestry 042 211 037 Oil and gas extraction
041 2121 038 Coal mining
040 2122 039 Metal ore mining
050 2123 047 Nonmetallic mineral mining and quarrying
New Part of 21 048 Not specified type of mining New 213 049 Support activities for mining
450 2211 057 Electric power generation, transmission and distribution
451- 2212 058 Natural gas distribution

National Longitudinal Mortality Study – Appendix F: 2007 Industrial Classification System
347
452 Pts. 2211, 2212 059 Electric and gas and other combinations
470+ 22131, 22133 067 Water, steam, air-conditioning, and irrigation systems
471p 22132 068 Sewage treatment facilities
472 Part of 22 069 Not specified utilities
060+ 23 077 Construction
110 3111, 3112 107 Animal food, grain, and oilseed milling
112 3113 108 Sugar and confectionery products
102 3114 109 Fruit and vegetable preserving and specialty food manufacturing
101 3115 117 Dairy product manufacturing 100 3116 118 Animal slaughtering and processing
610* 311811 119 Retail bakeries
111 3118 exc. 311811 127 Bakeries except retail
121 3117, 3119 128 Seafood and other miscellaneous foods n.e.c.
122 Part of 311 129 Not specified food industries 120 3121 137 Beverage manufacturing 130 3122 139 Tobacco manufacturing 142p 3131 147 Fiber, yarn, and thread mills
142p 3132 exc. 31324 148 Fabric mills, except knitting
140 3133 149 Textile and fabric finishing and coating mills
141 31411 157 Carpets and rugs manufacturing 150 314 exc. 31411 159 Textile product mills except carpets and
rugs
132 31324, 3151 167 Knitting mills
151 3152 168 Cut and sew apparel manufacturing 152 3159 169 Apparel accessories and other apparel
manufacturing
221+ 3162 177 Footwear manufacturing 222 3161, 3169 179 Leather tanning and products, except
footwear manufacturing
220 31611 Old (now part of 179) 160 3221 187 Pulp, paper, and paperboard mills

National Longitudinal Mortality Study – Appendix F: 2007 Industrial Classification System
348
162 32221 188 Paperboard containers and boxes
161 32222, 32223,32229
189 Miscellaneous paper and pulp products
172p 3231 199 Printing and related support activities
200 32411 207 Petroleum refining
201 32412, 32419 209 Miscellaneous petroleum and coal products
180 3252 217 Resin, synthetic rubber and fibers, and filaments manufacturing
191 3253 218 Agricultural chemical manufacturing
181 3254 219 Pharmaceutical and medicine manufacturing
190 3255 227 Paint, coating, and adhesives manufacturing
182 3256 228 Soap, cleaning compound, and cosmetic manufacturing
192 3251, 3259 229 Industrial and miscellaneous chemicals
212 3261 237 Plastics product manufacturing
210 32621 238 Tire manufacturing
211- 32622, 32629 239 Rubber products, except tires, manufacturing
261 32711 247 Pottery, ceramics, and related products manufacturing
252 32712 248 Structural clay product manufacturing
250 3272 249 Glass and glass product manufacturing
251 3273, 3274 257 Cement, concrete, lime, and gypsum product manufacturing
262 3279 259 Miscellaneous nonmetallic mineral product manufacturing
270 3311, 3312 267 Iron and steel mills and steel product manufacturing
272+/- 3313 268 Aluminum production and processing
280- 3314 269 Nonferrous metal, except aluminum, production and processing
271+ 3315 277 Foundries
291 3321 278 Metal forgings and stampings
281 3322 279 Cutlery and hand tool manufacturing
282 3323, 3324 287 Structural metals and tank and shipping container manufacturing
290 3327 288 Machine shops; turned product; screw nut and bolt activities

National Longitudinal Mortality Study – Appendix F: 2007 Industrial Classification System
349
300p 3328 289 Coating, engraving, heat treating and allied activities
292 332992-332995 297 Ordnance
300p 3325, 3326, 3329 exc. 332992, 332993, 332994, 332995
298 Miscellaneous fabricated metal products manufacturing
301 Part of 331 and 332
299 Not specified metal industries
311 33311 307 Agricultural implement manufacturing
312 33312, 33313 308 Construction, mining and oil field manufacturing
321 3333 309 Commercial and service industry machinery manufacturing
380 333315 Old (now part of 309) 320 3335 317 Metalworking machinery manufacturing 310 3336 318 Engines, turbines, and power
transmission equipment manufacturing
331+ 3332, 3334,3339 319 Machinery manufacturing, n.e.c.
332 Part of 333 329 Not specified machinery manufacturing
322 3341 336 Computer and peripheral equipment manufacturing
341 3342, 3343 337 Communications, audio, and video equipment manufacturing
371 3345 338 Navigational, measuring, electromedical, and control instruments manufacturing
381 334518 Old (now part of 338) 342p 3344, 3346 339 Electronic component and product
manufacturing, n.e.c.
340 3352 347 Household appliance manufacturing
342p+ 3351, 3353, 3359
349 Electrical machinery, equipment, and and supplies manufacturing, n.e.c.
350 Part of 335 Old (now part of 349)

National Longitudinal Mortality Study – Appendix F: 2007 Industrial Classification System
350
351+ 3361, 3362, 3363 357 Motor vehicles and motor vehicle equipment manufacturing
352 336411-336413 358 Aircrafts and parts manufacturing
362 336414, 336415, 336419
359 Aerospace products and parts manufacturing
361 3365 367 Railroad rolling stock manufacturing 360 3366 368 Ship and boat building
370- 3369 369 Other transportation equipment manufacturing
231p 3211 377 Sawmills and wood preservation
231p 3212 378 Veneer, plywood, and engineered wood product manufacturing
232 321991, 321992 379 Prefabricated wood buildings and mobile homes manufacturing
241 3219 exc. 321991,321992
387 Miscellaneous wood product manufacturing
242 337 389 Furniture and fixtures
372+ 3391 396 Medical equipment and supplies manufacturing
390 33992, 33993 397 Toys, amusement and sporting goods manufacturing
391 3399 exc. 33992, 33993
398 Miscellaneous manufacturing, n.e.c.
392 Part of 31-33 399 Not specified manufacturing
500 4211 407 Motor vehicles, parts and supplies wholesalers
501 4212 408 Furniture and home furnishing wholesalers
502 4213 409 Lumber and other construction materials wholesalers
510 4214 417 Professional and commercial equipment and supplies wholesalers
511 4215 418 Metals and minerals, except petroleum wholesalers

National Longitudinal Mortality Study – Appendix F: 2007 Industrial Classification System
351
512 4216 419 Electrical goods wholesalers
521 4217 426 Hardware, plumbing and heating equipment, and supplies wholesalers
530 4218 427 Machinery, equipment, and supplies wholesalers
531 42193 428 Recyclable material wholesalers
532 4219 exc. 42193 429 Misc durable goods wholesalers
540 4221 437 Paper and paper product wholesalers
541 4222, 4226 438 Drugs, sundries, and chemical and allied product wholesalers
542 4223 439 Apparel, fabrics, and notions wholesalers
550 4224 447 Groceries and related product wholesalers
551 4225 448 Farm product raw material wholesalers
552 4227 449 Petroleum and petroleum product wholesalers
560 4228 456 Alcoholic beverage wholesalers
561 42291 457 Farm supplies wholesalers
562 4229 exc. 42291 458 Misc. nondurable goods wholesalers
571 Part of 42 459 Not specified wholesale trade 612 4411 467 Automobile dealers
622 4412 468 Other motor vehicle dealers
620 4413 469 Auto parts, accessories, and tire stores
631 442 477 Furniture and home furnishings stores
632 443111 478 Household appliance stores
633+ 443112, 44312 479 Radio, TV, and computer stores
580 4441 exc. 44413 487 Building material and supplies dealers
581 44413 488 Hardware stores
582 4442 489 Lawn and garden equipment and supplies stores
601 4451 497 Grocery stores
611 4452 498 Specialty food stores 602 445299 Old (now part of 498)

National Longitudinal Mortality Study – Appendix F: 2007 Industrial Classification System
352
650 4453 499 Beer, wine, and liquor stores
642 44611 507 Pharmacies and drug stores
682p- 446 exc. 44611 508 Health and personal care, except drug, stores
621 447 509 Gasoline stations
623 448 exc. 44821 and 4483
517 Clothing and accessories, except shoe, stores
630 44821 518 Shoe stores
660+ 4483 519 Jewelry, luggage, and leather goods stores
651 44313, 45111, 45112
527 Sporting goods, camera, and hobby and toy stores
662 45113 528 Sewing, needlework and piece goods stores
640 45114, 45122 529 Music stores
652p+ 45121 537 Book stores and news dealers
591 45211 538 Department stores
600+ 4529 539 Miscellaneous general merchandise stores
592 45299 Old (now part of 539) 681 4531 547 Retail florists 652p 45321 548 Office supplies and stationary stores 682p- 4533 549 Used merchandise stores
661 45322 557 Gift, novelty, and souvenir shops
682p- 4539 558 Miscellaneous retail stores
590 45393 Old (now part of 558) 663+ 45411 559 Electronic shopping and mail-order
houses 670 45421 567 Vending machine operators
672 45431 568 Fuel dealers
671- 45439 569 Other direct selling establishments 691 Part of 44-45 579 Not specified retail trade
421 481 607 Air transportation
400 482 608 Rail transportation
420 483 609 Water transportation
410p 484 617 Truck transportation
401p- 4851, 4852, 4854, 4855, 4859
618 Bus service and urban transit
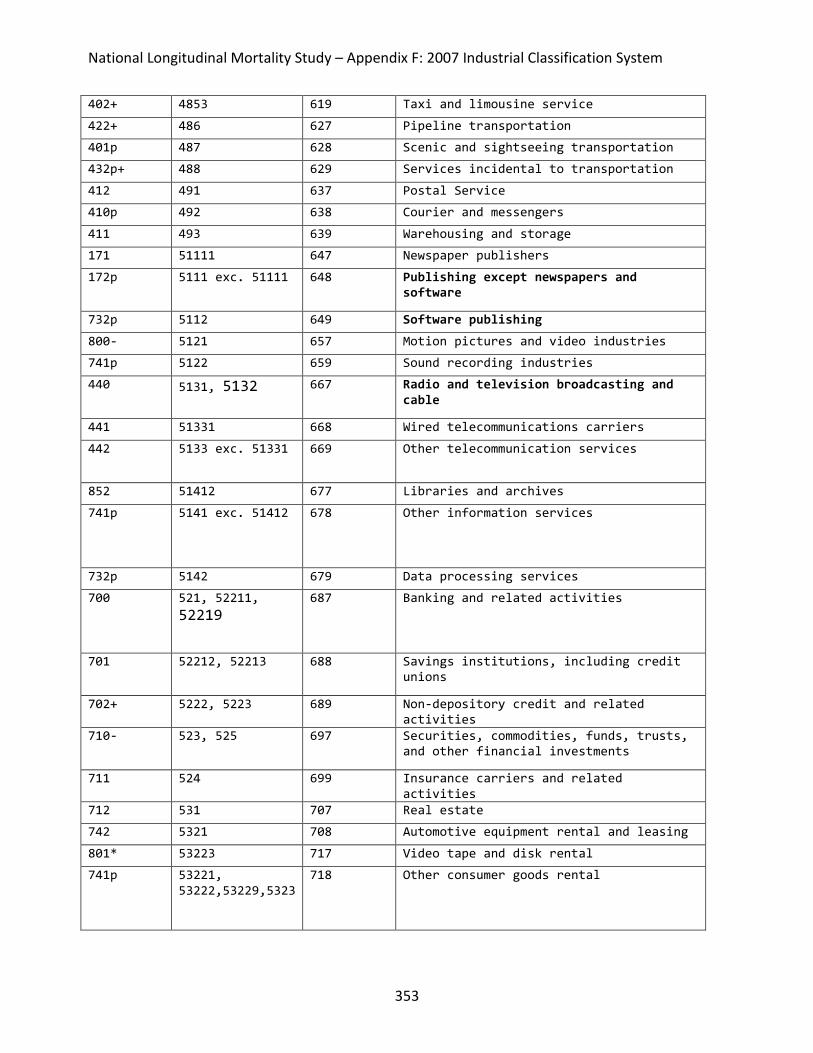
National Longitudinal Mortality Study – Appendix F: 2007 Industrial Classification System
353
402+ 4853 619 Taxi and limousine service
422+ 486 627 Pipeline transportation
401p 487 628 Scenic and sightseeing transportation
432p+ 488 629 Services incidental to transportation
412 491 637 Postal Service
410p 492 638 Courier and messengers
411 493 639 Warehousing and storage
171 51111 647 Newspaper publishers 172p 5111 exc. 51111 648 Publishing except newspapers and
software
732p 5112 649 Software publishing
800- 5121 657 Motion pictures and video industries 741p 5122 659 Sound recording industries 440 5131, 5132 667 Radio and television broadcasting and
cable
441 51331 668 Wired telecommunications carriers
442 5133 exc. 51331 669 Other telecommunication services
852 51412 677 Libraries and archives 741p 5141 exc. 51412 678 Other information services
732p 5142 679 Data processing services
700 521, 52211, 52219
687 Banking and related activities
701 52212, 52213 688 Savings institutions, including credit unions
702+ 5222, 5223 689 Non-depository credit and related activities
710- 523, 525 697 Securities, commodities, funds, trusts, and other financial investments
711 524 699 Insurance carriers and related activities
712 531 707 Real estate
742 5321 708 Automotive equipment rental and leasing
801* 53223 717 Video tape and disk rental
741p 53221, 53222,53229,5323
718 Other consumer goods rental

National Longitudinal Mortality Study – Appendix F: 2007 Industrial Classification System
354
741p 5324, 533 719 Commercial, industrial, and other intangible assets rental and leasing
841+ 5411 727 Legal services
890 5412 728 Accounting, tax preparation, bookkeeping and payroll services
882 5413 729 Architectural, engineering, and related services
741p 5414 737 Specialized design services
732p 5415 738 Computer systems design and related services
892 5416 739 Management, scientific and technical consulting services
891 5417 746 Scientific research and development services
721 5418 747 Advertising and related services
012* 54194 748 Veterinary services
893p 5419 exc. 54194 749 Other professional, scientific and technical services
New 551 757 Management of companies and enterprises
731 5613 758 Employment services
741p 5614 759 Business support services
432p 5615 767 Travel arrangement and reservation services
740 5616 768 Investigation and security services
722 5617 exc. 56173 769 Services to buildings and dwellings
020* 56173 777 Landscaping services 741p 5611, 5612, 5619 778 Other administrative and other support
services
471p 562 779 Waste management and remediation services
842 6111 786 Elementary and secondary schools
850 6112, 6113 787 Colleges and universities, including junior colleges
851 6114, 6115 788 Business, technical, and trade schools and training
860 6116, 6117 789 Other schools, instruction, and educational services
812p 6211 797 Offices of physicians
820 6212 798 Offices of dentists
821 62131 799 Office of chiropractors

National Longitudinal Mortality Study – Appendix F: 2007 Industrial Classification System
355
822 62132 807 Offices of optometrists
830 6213 exc. 62131, 62132
808 Offices of other health practitioners
812p 6214 809 Outpatient care centers
840p 6216 817 Home health care services
840p+ 6215, 6219 818 Other health care services
831 622 819 Hospitals
832 6231 827 Nursing care facilities
870 6232, 6233, 6239 829 Residential care facilities, without nursing
871p 6241 837 Individual and family services
871p 6242 838 Community food and housing, and emergency services
861 6243 839 Vocational rehabilitation services
862 6244 847 Child day care services
863 Part of 6244 Old (now part of 847) 810p+ 711 856 Independent artists, performing arts,
spectator sports, and related industries
872* 712 857 Museums, art galleries, historical sites, and similar institutions
802 71395 858 Bowling centers
810p 713 exc. 71395 859 Other amusement, gambling, and recreation industries
762 7211 866 Traveler accommodation
770 7212, 7213 867 Recreational vehicle parks and camps, and rooming and boarding houses
641p+ 722 exc. 7224 868 Restaurants and other food services
641p 7224 869 Drinking places, alcoholic beverages
751 8111 exc. 811192 877 Automotive repair and maintenance
750- 811192 878 Car washes
752 8112 879 Electronic and precision equipment repair and maintenance
760p 8113 887 Commercial and industrial machinery and equipment repair and maintenance
760p 8114 exc. 81143 888 Personal and household goods repair and maintenance
790 81149 Old (now part of 888)

National Longitudinal Mortality Study – Appendix F: 2007 Industrial Classification System
356
782 81143 889 Footwear and leather goods repair
780 812111 897 Barber shops
772p 812112 898 Beauty salons
772p 812113, 81219 899 Nail salons and other personal care services
771 8123 907 Drycleaning and laundry services
781+ 8122 908 Funeral homes, cemeteries and crematories
791+ 8129 909 Other personal services
880 8131 916 Religious organizations
881p+ 8132, 8133, 8134
917 Civic, social, advocacy organizations, and grantmaking and giving services
873+ 81393 918 Labor unions 881p+ 8139 exc. 81393 919 Business, professional, political, and
similar organizations
761 814 929 Private households
900 92111, 92112, 92114, pt. 92115
937 Executive offices and legislative bodies
921 92113 938 Public finance activities
901 92119 939 Other general government and support
910+ 922, pt. 92115 947 Justice, public order, and safety activities
922 923 948 Administration of human resource programs
930 924, 925 949 Administration of environmental quality and housing programs
931 926, 927 957 Administration of economic programs and space research
932 928 959 National security and international affairs
940 Part of 928 967 U.S. Army
941 Part of 928 968 U. S. Air Force 942 Part of 928 969 U. S. Navy 950 Part of 928 977 U. S. Marines 951 Part of 928 978 U. S. Coast Guard 952 Part of 928 979 U. S. Armed Forces, branch not
specified 960 Part of 928 987 Military Reserves or National Guard

National Longitudinal Mortality Study – Appendix F: 2007 Industrial Classification System
357
992 992 Unemployed, no work experience since 1994

National Longitudinal Mortality Study – Appendix G: 1990 Occupational Classification System
358
Appendix G 1990 OCCUPATIONAL CLASSIFICATION SYSTEM
Return to Appendix TOC Return to Main TOC Return to OCC1990 Numbers in parentheses following the occupation categories are the 1980 Standard Occupational Classification code equivalents. The abbreviation "pt" means "part" and "n.e.c." means "not elsewhere classified."
1990 Occupation
Code Occupation Category
MANAGERIAL AND PROFESSIONAL SPECIALTY OCCUPATIONS
EXECUTIVE, ADMINISTRATIVE, AND MANAGERIAL OCCUPATIONS 003 Legislators (111) 004 Chief executives and general administrators, public administration
(112) 005 Administrators and officials, public administration (1132-1139) 006 Administrators, protective services (1131) 007 Financial managers (122) 008 Personnel and labor relations managers (123) 009 Purchasing managers (124) 013 Managers, marketing, advertising, and public relations (125) 014 Administrators, education and related fields (128) 015 Managers, medicine and health (131) 016 Postmasters and mail superintendents (1344) 017 Managers, food serving and lodging establishments (1351) 018 Managers, properties and real estate (1353) 019 Funeral directors (part 1359) 021 Managers, service organizations, n.e.c. (127, 1352, 1354, part 1359) 022 Managers and administrators, n.e.c. (121, 126, 132-1343, 136-139)
Management Related Occupations 023 Accountants and auditors (1412) 024 Underwriters (1414) 025 Other financial officers (1415, 1419) 026 Management analysts (142) 027 Personnel, training, and labor relations specialists (143) 029 Purchasing agents and buyers, farm products (1443) 029 Buyers, wholesale and retail trade except farm products (1442) 033 Purchasing agents and buyers, n.e.c. (1449) 034 Business and promotion agents (145) 035 Construction inspectors (1472) 036 Inspectors and compliance officers, except construction (1473) 037 Management related occupations, n.e.c. (149)

National Longitudinal Mortality Study – Appendix G: 1990 Occupational Classification System
359
1990 Occupation
Code Occupation Category
PROFESSIONAL SPECIALTY OCCUPATIONS
Engineers, Architects, and Surveyors 043 Architects (161)
Engineers 044 Aerospace (1622) 045 Metallurgical and materials (1623) 046 Mining (1624) 047 Petroleum (1625) 048 Chemical (1626) 049 Nuclear (1627) 053 Civil (1628) 054 Agricultural (1632) 055 Electrical and electronic (1633, 1636) 056 Industrial (1634) 057 Mechanical (1635) 058 Marine and naval architects (1637) 059 Engineers, n.e.c. (1639) 063 Surveyors and mapping scientists (164)
Mathematical and Computer Scientists 064 Computer systems analysts and scientists (171) 065 Operations and systems researchers and analysts (172) 066 Actuaries (1732) 067 Statisticians (1733) 068 Mathematical scientists, n.e.c. (1739)
Natural Scientists 069 Physicists and astronomers (1842, 1843) 073 Chemists, except biochemists (1845) 074 Atmospheric and space scientists (1846) 075 Geologists and geodesists (1847) 076 Physical scientists, n.e.c. (1849) 077 Agricultural and food scientists (1853) 078 Biological and life scientists (1854) 079 Forestry and conservation scientists (1852) 083 Medical scientists (1855)
Health Diagnosing Occupations 084 Physicians (261) 085 Dentists (262) 086 Veterinarians (27) 087 Optometrists (281) 088 Podiatrists (283)

National Longitudinal Mortality Study – Appendix G: 1990 Occupational Classification System
360
1990 Occupation
Code Occupation Category
PROFESSIONAL SPECIALTY OCCUPATIONS, Health Diagnosing Occupations, cont.
089 Health diagnosing practitioners, n.e.c. (289)
Health Assessment and Treating Occupations 095 Registered nurses (29) 096 Pharmacists (301) 097 Dietitians (302)
Therapists 098 Respiratory therapists (3031) 099 Occupational therapists (3032) 103 Physical therapists (3033) 104 Speech therapists (3034) 105 Therapists, n.e.c. (3039) 106 Physicians' assistants (304)
Teachers, Postsecondary 113 Earth, environmental, and marine science teachers (2212) 114 Biological science teachers (2213) 115 Chemistry teachers (2214) 116 Physics teachers (2215) 117 Natural science teachers, n.e.c. (2216) 118 Psychology teachers (2217) 119 Economics teachers (2218) 123 History teachers (2222) 124 Political science teachers (2223) 125 Sociology teachers (2224) 126 Social science teachers, n.e.c. (2225) 127 Engineering teachers (2226) 128 Mathematical science teachers (2227) 129 Computer science teachers (2228) 133 Medical science teachers (2231) 134 Health specialties teachers (2232) 135 Business, commerce, and marketing teachers (2233) 136 Agriculture and forestry teachers (2234) 137 Art, drama, and music teachers (2235) 138 Physical education teachers (2236) 139 Education teachers (2237) 143 English teachers (2238) 144 Foreign language teachers (2242) 145 Law teachers (2243) 146 Social work teachers (2244) 147 Theology teachers (2245)

National Longitudinal Mortality Study – Appendix G: 1990 Occupational Classification System
361
1990 Occupation
Code Occupation Category
PROFESSIONAL SPECIALTY OCCUPATIONS, Teachers, Postsecondary, cont. 148 Trade and industrial teachers (2246) 149 Home economics teachers (2247) 153 Teachers, postsecondary, n.e.c. (2249) 154 Postsecondary teachers, subject not specified
Teachers, Except Postsecondary 155 Teachers, prekindergarten and kindergarten (231) 156 Teachers, elementary school (232) 157 Teachers, secondary school (233) 158 Teachers, special education (235) 159 Teachers, n.e.c. (236, 239) 163 Counselors, Educational and Vocational (24)
Librarians, Archivists, and Curators 164 Librarians (251) 165 Archivists and curators (252)
Social Scientists and Urban Planners 166 Economists (1912) 167 Psychologists (1915) 168 Sociologists (1916) 169 Social scientists, n.e.c. (1913, 1914, 1919) 173 Urban planners (192)
Social, Recreation, and Religious Workers 174 Social workers (2032) 175 Recreation workers (2033) 176 Clergy (2042) 177 Religious workers, n.e.c. (2049)
Lawyers and Judges (211-212) 178 Lawyers (211) 179 Judges
Writers, Artists, Entertainers, and Athletes 183 Authors (321) 184 Technical writers (398) 185 Designers (322) 186 Musicians and composers (323) 187 Actors and directors (324) 188 Painters, sculptors, craft-artists, and artist printmakers (325) 189 Photographers (326) 193 Dancers (327) 194 Artists, performers, and related workers, n.e.c. (328, 329) 195 Editors and reporters (331)

National Longitudinal Mortality Study – Appendix G: 1990 Occupational Classification System
362
1990 Occupation
Code Occupation Category
PROFESSIONAL SPECIALTY OCCUPATIONS, Writers, Artists, Entertainers, and Athletes, cont.
197 Public relations specialists (332) 198 Announcers (333) 199 Athletes (34)
TECHNICAL, SALES, AND ADMINISTRATIVE SUPPORT OCCUPATIONS
TECHNICIANS AND RELATED SUPPORT OCCUPATIONS
Health Technologists and Technicians 203 Clinical laboratory technologists and technicians (362) 204 Dental hygienists (363) 205 Health record technologists and technicians (364) 206 Radiologic technicians (365) 207 Licensed practical nurses (366) 208 Health technologists and technicians, n.e.c. (369)
Technologists and Technicians, Except Health
Engineering and Related Technologists and Technicians 213 Electrical and electronic technicians (3711) 214 Industrial engineering technicians (3712) 215 Mechanical engineering technicians (3713) 216 Engineering technicians, n.e.c. (3719) 217 Drafting occupations (372) 218 Surveying and mapping technicians (373)
Science Technicians 223 Biological technicians (382) 224 Chemical technicians (3831) 225 Science technicians, n.e.c. (3832, 3833, 384, 389)
Technicians, Except Health, Engineering, and Science 226 Airplane pilots and navigators (825) 227 Air traffic controllers (392) 228 Broadcast equipment operators (393) 229 Computer programmers (3971, 3972) 233 Tool programmers, numerical control (3974) 234 Legal assistants (396) 235 Technicians, n.e.c. (399)
SALES OCCUPATIONS 243 Supervisors and Proprietors, Sales Occupations (40)
Sales Representatives, Finance and Business Services 253 Insurance sales occupations (4122) 254 Real estate sales occupations (4123) 255 Securities and financial services sales occupations (4124) 256 Advertising and related sales occupations (4153)

National Longitudinal Mortality Study – Appendix G: 1990 Occupational Classification System
363
1990 Occupation
Code Occupation Category
SALES OCCUPATIONS, Sales Representatives, Finance and Business Services, cont.
257 Sales occupations, other business services (4152)
Sales Representatives, Commodities, Except Retail 258 Sales engineers (421) 259 Sales representatives, mining, manufacturing, and wholesale (423,
424)
Sales Workers, Retail and Personal Services 263 Sales workers, motor vehicles and boats (4342, 4344) 264 Sales workers, apparel (4346) 265 Sales workers, shoes (4351) 266 Sales workers, furniture and home furnishings (4348) 267 Sales workers, radio, TV, hi-fi, and appliances (4343, 4352) 268 Sales workers, hardware and building supplies (4353) 269 Sales workers, parts (4367) 274 Sales workers, other commodities (4345, 4347, 4354, 4356, 4359, 4362,
4369) 275 Sales counter clerks (4363) 276 Cashiers (4364) 277 Street and door-to-door sales workers (4366) 278 News vendors (4365)
Sales Related Occupations 283 Demonstrators, promoters and models, sales (445) 284 Auctioneers (447) 285 Sales support occupations, n.e.c. (444, 446, 449)
ADMINISTRATIVE SUPPORT OCCUPATIONS, INCLUDING CLERICAL
Supervisors, Administrative Support Occupations 303 Supervisors, general office (4511, 4513, 4514, 4516, 4519, 4529) 304 Supervisors, computer equipment operators (4512) 305 Supervisors, financial records processing (4521) 306 Chief communications operators (4523) 307 Supervisors, distribution, scheduling, and adjusting clerks (4522,
4524-4528)
Computer Equipment Operators 308 Computer operators (4612) 309 Peripheral equipment operators (4613)
Secretaries, Stenographers, and Typists 313 Secretaries (4622) 314 Stenographers (4623) 315 Typists (4624)
Information Clerks 316 Interviewers (4642)

National Longitudinal Mortality Study – Appendix G: 1990 Occupational Classification System
364
1990 Occupation
Code Occupation Category
ADMINISTRATIVE SUPPORT OCCUPATIONS, INCLUDING CLERICAL, Information Clerks, cont.
318 Transportation ticket and reservation agents (4644) 319 Receptionists (4645) 323 Information clerks, n.e.c. (4649)
Records Processing Occupations, Except Financial 325 Classified-ad clerks (4662) 326 Correspondence clerks (4663) 327 Order clerks (4664) 328 Personnel clerks, except payroll and timekeeping (4692) 329 Library clerks (4694) 335 File clerks (4696) 336 Records clerks (4699)
Financial Records Processing Occupations 337 Bookkeepers, accounting, and auditing clerks (4712) 338 Payroll and timekeeping clerks (4713) 339 Billing clerks (4715) 343 Cost and rate clerks (4716) 344 Billing, posting, and calculating machine operators (4718)
Duplicating, Mail and Other Office Machine Operators 345 Duplicating machine operators (4722) 346 Mail preparing and paper handling machine operators (4723) 347 Office machine operators, n.e.c. (4729)
Communications Equipment Operators 348 Telephone operators (4732) 353 Communications equipment operators, n.e.c. (4733, 4739)
Mail and Message Distributing Occupations 354 Postal clerks, except mail carriers (4742) 355 Mail carriers, postal service (4743) 356 Mail clerks, except postal service (4744) 357 Messengers (4745)
Material Recording, Scheduling, and Distributing Clerks 359 Dispatchers (4751) 363 Production coordinators (4752) 364 Traffic, shipping, and receiving clerks (4753) 365 Stock and inventory clerks (4754) 366 Meter readers (4755) 368 Weighers, measurers, checkers, and samplers (4756, 4757) 373 Expediters (4758) 374 Material recording, scheduling, and distributing clerks, n.e.c.
(4759)

National Longitudinal Mortality Study – Appendix G: 1990 Occupational Classification System
365
1990 Occupation
Code Occupation Category
ADMINISTRATIVE SUPPORT OCCUPATIONS, INCLUDING CLERICAL, cont.
Adjusters and Investigators 375 Insurance adjusters, examiners, and investigators (4782) 376 Investigators and adjusters, except insurance (4783) 377 Eligibility clerks, social welfare (4784) 378 Bill and account collectors (4786)
Miscellaneous Administrative Support Occupations 379 General office clerks (463) 383 Bank tellers (4791) 384 Proofreaders (4792) 385 Data-entry keyers (4793) 386 Statistical clerks (4794) 387 Teachers' aides (4795) 389 Administrative support occupations, n.e.c. (4787, 4799)
SERVICE OCCUPATIONS
PRIVATE HOUSEHOLD OCCUPATIONS 403 Launderers and ironers (503) 404 Cooks, private household (504) 405 Housekeepers and butlers (505) 406 Child care workers, private household (506) 407 Private household cleaners and servants (502, 507, 509)
PROTECTIVE SERVICE OCCUPATIONS
Supervisors, Protective Service Occupations 413 Supervisors, firefighting and fire prevention occupations (5111) 414 Supervisors, police and detectives (5112) 415 Supervisors, guards (5113)
Firefighting and Fire Prevention Occupations 416 Fire inspection and fire prevention occupations (5122) 417 Firefighting occupations (5123)
Police and Detectives 418 Police and detectives, public service (5132) 423 Sheriffs, bailiffs, and other law enforcement officers (5134) 424 Correctional institution officers (5133)
Guards 425 Crossing guards (5142) 426 Guards and police, except public service (5144) 427 Protective service occupations, n.e.c. (5149)
SERVICE OCCUPATIONS, EXCEPT PROTECTIVE AND HOUSEHOLD
Food Preparation and Service Occupations 433 Supervisors, food preparation and service occupations (5211)

National Longitudinal Mortality Study – Appendix G: 1990 Occupational Classification System
366
1990 Occupation
Code Occupation Category
SERVICE OCCUPATIONS, EXCEPT PROTECTIVE AND HOUSEHOLD, Food Preparation and Service Occupations, cont.
434 Bartenders (5212) 435 Waiters and waitresses (5213) 436 Cooks (5214, 5215) 438 Food counter, fountain and related occupations (5216) 439 Kitchen workers, food preparation (5217) 443 Waiters'/waitresses' assistants (5218) 444 Miscellaneous food preparation occupations (5219)
Health Service Occupations 445 Dental assistants (5232) 446 Health aides, except nursing (5233) 447 Nursing aides, orderlies, and attendants (5236)
Cleaning and Building Service Occupations, Except Household 448 Supervisors, cleaning and building service workers (5241) 449 Maids and housemen (5242, 5249) 453 Janitors and cleaners (5244) 454 Elevator operators (5245) 455 Pest control occupations (5246)
Personal Service Occupations 456 Supervisors, personal service occupations (5251) 457 Barbers (5252) 458 Hairdressers and cosmetologists (5253) 459 Attendants, amusement and recreation facilities (5254) 461 Guides (5255) 462 Ushers (5256) 463 Public transportation attendants (5257) 464 Baggage porters and bellhops (5262) 465 Welfare service aides (5263) 466 Family child care providers (part 5264) 467 Early childhood teacher's assistants (part 5264) 468 Child care workers, n.e.c. (part 5264) 469 Personal service occupations, n.e.c. (5258, 5269)
FARMING, FORESTRY, AND FISHING OCCUPATIONS
Farm Operators and Managers 473 Farmers, except horticultural (5512-5514) 474 Horticultural specialty farmers (5515) 475 Managers, farms, except horticultural (5522-5524) 476 Managers, horticultural specialty farms (5525)

National Longitudinal Mortality Study – Appendix G: 1990 Occupational Classification System
367
1990 Occupation
Code Occupation Category
FARMING, FORESTRY, AND FISHING OCCUPATIONS, cont.
Other Agricultural and Related Occupations
Farm Occupations, Except Managerial 477 Supervisors, farm workers (5611) 479 Farm workers (5612-5617) 483 Marine life cultivation workers (5618) 484 Nursery workers (5619)
Related Agricultural Occupations 485 Supervisors, related agricultural occupations (5621) 486 Groundskeepers and gardeners, except farm (5622) 487 Animal caretakers, except farm (5624) 488 Graders and sorters, agricultural products (5625) 489 Inspectors, agricultural products (5627)
Forestry and Logging Occupations 494 Supervisors, forestry and logging workers (571) 495 Forestry workers, except logging (572) 496 Timber cutting and logging occupations (573, 579)
Fishers, Hunters, and Trappers 497 Captains and other officers, fishing vessels (part 8241) 498 Fishers (583) 499 Hunters and trappers (584)
PRECISION PRODUCTION, CRAFT, AND REPAIR OCCUPATIONS
Mechanics and Repairers 503 Supervisors, mechanics and repairers (60)
Mechanics and Repairers, Except Supervisors
Vehicle and Mobile Equipment Mechanics and Repairers 505 Automobile mechanics (part 6111) 506 Automobile mechanic apprentices (part 6111) 507 Bus, truck, and stationary engine mechanics (6112) 508 Aircraft engine mechanics (6113) 509 Small engine repairers (6114) 514 Automobile body and related repairers (6115) 515 Aircraft mechanics, except engine (6116) 516 Heavy equipment mechanics (6117) 517 Farm equipment mechanics (6118) 518 Industrial machinery repairers (613) 519 Machinery maintenance occupations (614)
Electrical and Electronic Equipment Repairers 523 Electronic repairers, communications and industrial equipment (6151,
6153, 6155) 525 Data processing equipment repairers (6154)

National Longitudinal Mortality Study – Appendix G: 1990 Occupational Classification System
368
1990 Occupation
Code Occupation Category
PRECISION PRODUCTION, CRAFT, AND REPAIR OCCUPATIONS, Electrical and Electronic Equipment Repairers, cont.
527 Telephone line installers and repairers (6157) 529 Telephone installers and repairers (6158) 533 Miscellaneous electrical and electronic equipment repairers (6152,
6159) 534 Heating, air conditioning, and refrigeration mechanics (616)
Miscellaneous Mechanics and Repairers 535 Camera, watch, and musical instrument repairers (6171, 6172) 536 Locksmiths and safe repairers (6173) 538 Office machine repairers (6174) 539 Mechanical controls and valve repairers (6175) 543 Elevator installers and repairers (6176) 544 Millwrights (6178) 547 Specified mechanics and repairers, n.e.c. (6177, 6179) 549 Not specified mechanics and repairers
Construction Trades
Supervisors, Construction Occupations 553 Supervisors, brickmasons, stonemasons, and tile setters (6312) 554 Supervisors, carpenters and related workers (6313) 555 Supervisors, electricians and power transmission installers (6314) 556 Supervisors, painters, paperhangers, and plasterers (6315) 557 Supervisors, plumbers, pipefitters, and steamfitters (6316) 558 Supervisors, construction, n.e.c. (6311, 6318)
Construction Trades, Except Supervisors 563 Brickmasons and stonemasons (part 6412, part 6413) 564 Brickmason and stonemason apprentices (part 6412, part 6413) 565 Tile setters, hard and soft (part 6414, part 6462) 566 Carpet installers (part 6462) 567 Carpenters (part 6422) 569 Carpenter apprentices (part 6422) 573 Drywall installers (6424) 575 Electricians (part 6432) 576 Electrician apprentices (part 6432) 577 Electrical power installers and repairers (6433) 579 Painters, construction and maintenance (6442) 583 Paperhangers (6443) 584 Plasterers (6444) 585 Plumbers, pipefitters, and steamfitters (part 645) 587 Plumber, pipefitter, and steamfitter apprentices (part 645) 588 Concrete and terrazzo finishers (6463)
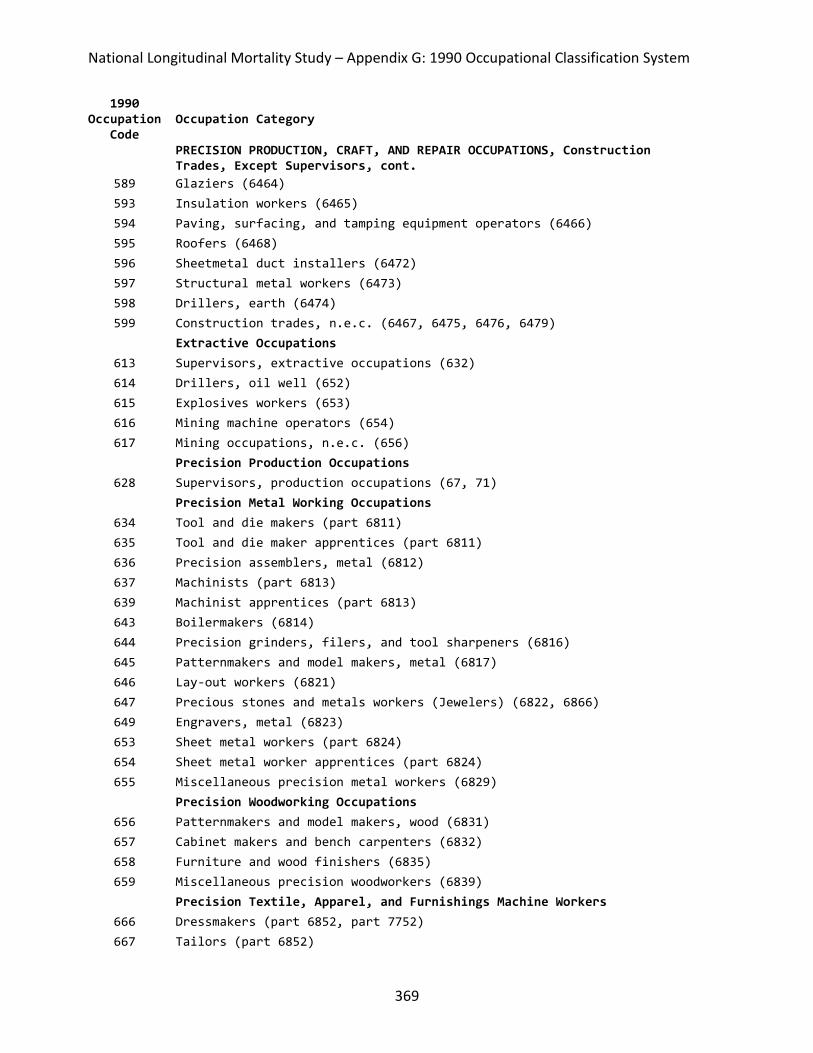
National Longitudinal Mortality Study – Appendix G: 1990 Occupational Classification System
369
1990 Occupation
Code Occupation Category
PRECISION PRODUCTION, CRAFT, AND REPAIR OCCUPATIONS, Construction Trades, Except Supervisors, cont.
589 Glaziers (6464) 593 Insulation workers (6465) 594 Paving, surfacing, and tamping equipment operators (6466) 595 Roofers (6468) 596 Sheetmetal duct installers (6472) 597 Structural metal workers (6473) 598 Drillers, earth (6474) 599 Construction trades, n.e.c. (6467, 6475, 6476, 6479)
Extractive Occupations 613 Supervisors, extractive occupations (632) 614 Drillers, oil well (652) 615 Explosives workers (653) 616 Mining machine operators (654) 617 Mining occupations, n.e.c. (656)
Precision Production Occupations 628 Supervisors, production occupations (67, 71)
Precision Metal Working Occupations 634 Tool and die makers (part 6811) 635 Tool and die maker apprentices (part 6811) 636 Precision assemblers, metal (6812) 637 Machinists (part 6813) 639 Machinist apprentices (part 6813) 643 Boilermakers (6814) 644 Precision grinders, filers, and tool sharpeners (6816) 645 Patternmakers and model makers, metal (6817) 646 Lay-out workers (6821) 647 Precious stones and metals workers (Jewelers) (6822, 6866) 649 Engravers, metal (6823) 653 Sheet metal workers (part 6824) 654 Sheet metal worker apprentices (part 6824) 655 Miscellaneous precision metal workers (6829)
Precision Woodworking Occupations 656 Patternmakers and model makers, wood (6831) 657 Cabinet makers and bench carpenters (6832) 658 Furniture and wood finishers (6835) 659 Miscellaneous precision woodworkers (6839)
Precision Textile, Apparel, and Furnishings Machine Workers 666 Dressmakers (part 6852, part 7752) 667 Tailors (part 6852)

National Longitudinal Mortality Study – Appendix G: 1990 Occupational Classification System
370
1990 Occupation
Code Occupation Category
PRECISION PRODUCTION, CRAFT, AND REPAIR OCCUPATIONS, Precision Textile, Apparel, and Furnishings Machine Workers, cont.
668 Upholsterers (6853) 669 Shoe repairers (6854) 674 Miscellaneous precision apparel and fabric workers (6856, 6859, part
7752)
Precision Workers, Assorted Materials 675 Hand molders and shapers, except jewelers (6861) 676 Patternmakers, lay-out workers, and cutters (6862) 677 Optical goods workers (6864, part 7477, part 7677) 678 Dental laboratory and medical appliance technicians (6865) 679 Bookbinders (6844) 683 Electrical and electronic equipment assemblers (6867) 684 Miscellaneous precision workers, n.e.c. (6869)
Precision Food Production Occupations 686 Butchers and meat cutters (6871) 687 Bakers (6872) 688 Food batchmakers (6873, 6879)
Precision Inspectors, Testers, and Related Workers 689 Inspectors, testers, and graders (6881, 828) 693 Adjusters and calibrators (6882)
Plant and System Operators 694 Water and sewage treatment plant operators (691) 695 Power plant operators (part 693) 696 Stationary engineers (part 693, 7668) 699 Miscellaneous plant and system operators (692, 694, 695, 696)
OPERATORS, FABRICATORS, AND LABORERS
MACHINE OPERATORS, ASSEMBLERS, AND INSPECTORS
Machine Operators and Tenders, Except Precision
Metal Working and Plastic Working Machine Operators 703 Lathe and turning machine set-up operators (7312) 704 Lathe and turning machine operators (7512) 705 Milling and planing machine operators (7313, 7513) 706 Punching and stamping press machine operators (7314, 7317, 7514,
7517) 707 Rolling machine operators (7316, 7516) 708 Drilling and boring machine operators (7318, 7518) 709 Grinding, abrading, buffing, and polishing machine operators (7322,
7324, 7522) 713 Forging machine operators (7319, 7519) 714 Numerical control machine operators (7326) 715 Miscellaneous metal, plastic, stone, and glass working machine
operators (7329, 7529)

National Longitudinal Mortality Study – Appendix G: 1990 Occupational Classification System
371
1990 Occupation
Code Occupation Category
MACHINE OPERATORS, ASSEMBLERS, AND INSPECTORS, Metal Working and Plastic Working Machine Operators, cont.
717 Fabricating machine operators, n.e.c. (7339, 7539)
Metal and Plastic Processing Machine Operators 719 Molding and casting machine operators (7315, 7342, 7515, 7542) 723 Metal plating machine operators (7343, 7543) 724 Heat treating equipment operators (7344, 7544)
725 Miscellaneous metal and plastic processing machine operators (7349, 7549)
Woodworking Machine Operators 726 Wood lathe, routing, and planing machine operators (7431, 7432, 7631,
7632) 727 Sawing machine operators (7433, 7633) 728 Shaping and joining machine operators (7435, 7635) 729 Nailing and tacking machine operators (7636) 733 Miscellaneous woodworking machine operators (7434, 7439, 7634, 7639)
Printing Machine Operators 734 Printing press operators (7443, 7643) 735 Photoengravers and lithographers (6842, 7444, 7644) 736 Typesetters and compositors (6841, 7642) 737 Miscellaneous printing machine operators (6849, 7449, 7649)
Textile, Apparel, and Furnishings Machine Operators 738 Winding and twisting machine operators (7451, 7651) 739 Knitting, looping, taping, and weaving machine operators (7452, 7652) 743 Textile cutting machine operators (7654) 744 Textile sewing machine operators (7655) 745 Shoe machine operators (7656) 747 Pressing machine operators (7657) 748 Laundering and dry cleaning machine operators (6855, 7658) 749 Miscellaneous textile machine operators (7459, 7659)
Machine Operators, Assorted Materials 753 Cementing and gluing machine operators (7661) 754 Packaging and filling machine operators (7462, 7662) 755 Extruding and forming machine operators (7463, 7663) 756 Mixing and blending machine operators (7664) 757 Separating, filtering, and clarifying machine operators (7476, 7666,
7676) 758 Compressing and compacting machine operators (7467, 7667) 759 Painting and paint spraying machine operators (7669) 763 Roasting and baking machine operators, food (7472, 7672) 764 Washing, cleaning, and pickling machine operators (7673) 765 Folding machine operators (7474, 7674)

National Longitudinal Mortality Study – Appendix G: 1990 Occupational Classification System
372
1990 Occupation
Code Occupation Category
MACHINE OPERATORS, ASSEMBLERS, AND INSPECTORS, Machine Operators, Assorted Materials, cont.
766 Furnace, kiln, and oven operators, except food (7675) 768 Crushing and grinding machine operators (part 7477, part 7677) 769 Slicing and cutting machine operators (7478, 7678) 773 Motion picture projectionists (part 7479) 774 Photographic process machine operators (6863, 6868, 7671) 777 Miscellaneous machine operators, n.e.c. (part 7479, 7665, 7679) 779 Machine operators, not specified
Fabricators, Assemblers, and Hand Working Occupations 783 Welders and cutters (7332, 7532, 7714) 784 Solderers and brazers (7333, 7533, 7717) 785 Assemblers (772, 774) 786 Hand cutting and trimming occupations (7753) 787 Hand molding, casting, and forming occupations (7754, 7755) 789 Hand painting, coating, and decorating occupations (7756) 793 Hand engraving and printing occupations (7757) 795 Miscellaneous hand working occupations (7758, 7759)
Production Inspectors, Testers, Samplers, and Weighers 796 Production inspectors, checkers, and examiners (782, 787) 797 Production testers (783) 798 Production samplers and weighers (784) 799 Graders and sorters, except agricultural (785)
TRANSPORTATION AND MATERIAL MOVING OCCUPATIONS
Motor Vehicle Operators 803 Supervisors, motor vehicle operators (8111) 804 Truck drivers (8212-8214) 806 Driver-sales workers (8218) 808 Bus drivers (8215) 809 Taxicab drivers and chauffeurs (8216) 813 Parking lot attendants (874) 814 Motor transportation occupations, n.e.c. (8219)
Transportation Occupations, Except Motor Vehicles
Rail Transportation Occupations 823 Railroad conductors and yardmasters (8113) 824 Locomotive operating occupations (8232) 825 Railroad brake, signal, and switch operators (8233) 826 Rail vehicle operators, n.e.c. (8239)
Water Transportation Occupations 828 Ship captains and mates, except fishing boats (part 8241, 8242) 829 Sailors and deckhands (8243)

National Longitudinal Mortality Study – Appendix G: 1990 Occupational Classification System
373
1990 Occupation
Code Occupation Category
TRANSPORTATION AND MATERIAL MOVING OCCUPATIONS, Water Transportation Occupations, cont.
833 Marine engineers (8244) 834 Bridge, lock, and lighthouse tenders (8245)
Material Moving Equipment Operators 843 Supervisors, material moving equipment operators (812) 844 Operating engineers (8312) 845 Longshore equipment operators (8313) 848 Hoist and winch operators (8314) 849 Crane and tower operators (8315) 853 Excavating and loading machine operators (8316) 855 Grader, dozer, and scraper operators (8317) 856 Industrial truck and tractor equipment operators (8318) 859 Miscellaneous material moving equipment operators (8319)
HANDLERS, EQUIPMENT CLEANERS, HELPERS, AND LABORERS 864 Supervisors, handlers, equipment cleaners, and laborers, n.e.c. (85) 865 Helpers, mechanics, and repairers (863)
Helpers, Construction, and Extractive Occupations 866 Helpers, construction trades (8641-8645, 8648) 867 Helpers, surveyor (8646) 868 Helpers, extractive occupations (865) 869 Construction laborers (871) 874 Production helpers (861, 862)
Freight, Stock, and Material Handlers 875 Garbage collectors (8722) 876 Stevedores (8723) 877 Stock handlers and baggers (8724) 878 Machine feeders and offbearers (8725) 883 Freight, stock, and material handlers, n.e.c. (8726) 885 Garage and service station related occupations (873) 887 Vehicle washers and equipment cleaners (875) 888 Hand packers and packagers (8761) 889 Laborers, except construction (8769)
905 Assigned to persons whose current labor force status is unemployed and whose last job was Armed Forces

National Mortality Longitudinal Study – Appendix H: 2000 Occupational Classification System
374
Appendix H 2000 OCCUPATIONAL CLASSIFICATION SYSTEM
Return to Appendix TOC Return to Main TOC Return to OCC2000
2000 Occupation
Code Occupation Category
0010 Chief Executives
0020 General and Operations Managers
0030 Legislators
0040 Advertising and Promotions Managers
0050 Marketing and Sales Managers
0060 Public Relations Managers
0010 Administrative Services Managers
0110 Computer and Information Systems Managers
0210 Financial Managers
0310 Human Resources Managers
0410 Industrial Production Managers
0510 Purchasing Managers
0610 Transportation, Storage, and Distribution Managers
0200 Farm, Ranch, and Other Agricultural Managers
0210 Farmers and Ranchers
0220 Construction Managers
0230 Education Administrators
0300 Engineering Managers
0310 Food Service Managers
0320 Funeral Directors
0330 Gaming Managers
0340 Lodging Managers
0350 Medical and Health Services Managers
0360 Natural Sciences Managers
0400 Postmasters and Mail Superintendents
0410 Property, Real Estate, and Community Association Managers
0420 Social and Community Service Managers
0430 Managers, All Other
0500 Agents and Business Managers of Artists, Performers, and Athletes
0510 Purchasing Agents and Buyers, Farm Products
0520 Wholesale and Retail Buyers, Except Farm Products

National Mortality Longitudinal Study – Appendix H: 2000 Occupational Classification System
375
2000 Occupation
Code Occupation Category
0530 Purchasing Agents, Except Wholesale, Retail, and Farm Products
0540 Claims Adjusters, Appraisers, Examiners, and Investigators
0560 Compliance Officers, Except Agriculture, Construction, Health and Safety, and Transportation
0600 Cost Estimators
0620 Human Resources, Training, and Labor Relations Specialists
0700 Logisticians
0710 Management Analysts
0720 Meeting and Convention Planners
0730 Other Business Operations Specialists
0800 Accountants and Auditors
0810 Appraisers and Assessors of Real Estate
0820 Budget Analysts
0830 Credit Analysts
0840 Financial Analysts
0850 Personal Financial Advisors
0860 Insurance Underwriters
0900 Financial Examiners
0910 Loan Counselors and Officers
0930 Tax Examiners, Collectors, and Revenue Agents
0940 Tax Preparers
0950 Financial Specialists, All Other
1000 Computer Scientists and Systems Analysts
1010 Computer Programmers
1020 Computer Software Engineers
1040 Computer Support Specialists
1060 Database Administrators
1100 Network and Computer Systems Administrators
1110 Network Systems and Data Communications Analysts
1200 Actuaries
1210 Mathematicians
1220 Operations Research Analysts
1230 Statisticians
1240 Miscellaneous Mathematical Occupations
1300 Architects, Except Naval
1310 Surveyors, Cartographers, and Photogrammetrists

National Mortality Longitudinal Study – Appendix H: 2000 Occupational Classification System
376
2000 Occupation
Code Occupation Category
1320 Aerospace Engineers
1330 Agricultural Engineers
1340 Biomedical Engineers
1350 Chemical Engineers
1360 Civil Engineers
1400 Computer Hardware Engineers
1410 Electrical and Electronics Engineers
1420 Environmental Engineers
1430 Industrial Engineers, Including Health and Safety
1440 Marine Engineers and Naval Architects
1450 Materials Engineers
1460 Mechanical Engineers
1500 Mining and Geological Engineers, Including Mining Safety Engineers
1510 Nuclear Engineers
1520 Petroleum Engineers
1530 Engineers, All Other
1540 Drafters
1550 Engineering Technicians, Except Drafters
1560 Surveying and Mapping Technicians
1600 Agricultural and Food Scientists
1610 Biological Scientists
1640 Conservation Scientists and Foresters
1650 Medical Scientists
1700 Astronomers and Physicists
1710 Atmospheric and Space Scientists
1720 Chemists and Materials Scientists
1740 Environmental Scientists and Geoscientists
1760 Physical Scientists, All Other
1800 Economists
1810 Market and Survey Researchers
1820 Psychologists
1830 Sociologists
1840 Urban and Regional Planners
1860 Miscellaneous Social Scientists and Related Workers
1900 Agricultural and Food Science Technicians

National Mortality Longitudinal Study – Appendix H: 2000 Occupational Classification System
377
2000 Occupation
Code Occupation Category
1910 Biological Technicians
1920 Chemical Technicians
1930 Geological and Petroleum Technicians
1940 Nuclear Technicians
1960 Other Life, Physical, and Social Science Technicians
2000 Counselors
2010 Social Workers
2020 Miscellaneous Community and Social Service Specialists
2040 Clergy
2050 Directors, Religious Activities and Education
2060 Religious Workers, All Other
2100 Lawyers
2110 Judges, Magistrates, and Other Judicial Workers
2140 Paralegals and Legal Assistants
2150 Miscellaneous Legal Support Workers
2200 Postsecondary Teachers
2300 Preschool and Kindergarten Teachers
2310 Elementary and Middle School Teachers
2320 Secondary School Teachers
2330 Special Education Teachers
2340 Other Teachers and Instructors
2400 Archivists, Curators, and Museum Technicians
2430 Librarians
2440 Library Technicians
2540 Teacher Assistants
2550 Other Education, Training, and Library Workers
2600 Artists and Related Workers
2630 Designers
2700 Actors
2710 Producers and Directors
2720 Athletes, Coaches, Umpires, and Related Workers
2740 Dancers and Choreographers
2750 Musicians, Singers, and Related Workers
2760 Entertainers and Performers, Sports and Related Workers, All Other
2800 Announcers

National Mortality Longitudinal Study – Appendix H: 2000 Occupational Classification System
378
2000 Occupation
Code Occupation Category
2810 News Analysts, Reporters and Correspondents
2820 Public Relations Specialists
2830 Editors
2840 Technical Writers
2850 Writers and Authors
2860 Miscellaneous Media and Communication Workers
2900 Broadcast and Sound Engineering Technicians and Radio Operators
2910 Photographers
2920 Television, Video, and Motion Picture Camera Operators and Editors
2960 Media and Communication Equipment Workers, All Other
3000 Chiropractors
3010 Dentists
3030 Dietitians and Nutritionists
3040 Optometrists
3050 Pharmacists
3060 Physicians and Surgeons
3110 Physician Assistants
3120 Podiatrists
3130 Registered Nurses
3140 Audiologists
3150 Occupational Therapists
3160 Physical Therapists
3200 Radiation Therapists
3210 Recreational Therapists
3220 Respiratory Therapists
3230 Speech-Language Pathologists
3240 Therapists, All Other
3250 Veterinarians
3260 Health Diagnosing and Treating Practitioners, All Other
3300 Clinical Laboratory Technologists and Technicians
3310 Dental Hygienists
3320 Diagnostic Related Technologists and Technicians
3400 Emergency Medical Technicians and Paramedics
3410 Health Diagnosing and Treating Practitioner Support Technicians
3500 Licensed Practical and Licensed Vocational Nurses

National Mortality Longitudinal Study – Appendix H: 2000 Occupational Classification System
379
2000 Occupation
Code Occupation Category
3510 Medical Records and Health Information Technicians
3520 Opticians, Dispensing
3530 Miscellaneous Health Technologists and Technicians
3540 Other Healthcare Practitioners and Technical Occupations
3600 Nursing, Psychiatric, and Home Health Aides
3610 Occupational Therapist Assistants and Aides
3620 Physical Therapist Assistants and Aides
3630 Massage Therapists
3640 Dental Assistants
3650 Medical Assistants and Other Healthcare Support Occupations
3700 First-Line Supervisors/Managers of Correctional Officers
3710 First-Line Supervisors/Managers of Police and Detectives
3720 First-Line Supervisors/Managers of Fire Fighting and Prevention Workers
3730 Supervisors, Protective Service Workers, All Other
3740 Fire Fighters
3750 Fire Inspectors
3800 Bailiffs, Correctional Officers, and Jailers
3820 Detectives and Criminal Investigators
3830 Fish and Game Wardens
3840 Parking Enforcement Workers
3850 Police and Sheriff's Patrol Officers
3860 Transit and Railroad Police
3900 Animal Control Workers
3910 Private Detectives and Investigators
3920 Security Guards and Gaming Surveillance Officers
3940 Crossing Guards
3950 Lifeguards and Other Protective Service Workers
4000 Chefs and Head Cooks
4010 First-Line Supervisors/Managers of Food Preparation and Serving Workers
4020 Cooks
4030 Food Preparation Workers
4040 Bartenders
4050 Combined Food Preparation and Serving Workers, Including Fast Food
4060 Counter Attendants, Cafeteria, Food Concession, and Coffee Shop
4110 Waiters and Waitresses

National Mortality Longitudinal Study – Appendix H: 2000 Occupational Classification System
380
2000 Occupation
Code Occupation Category
4120 Food Servers, Nonrestaurant
4130 Dining Room and Cafeteria Attendants and Bartender Helpers
4140 Dishwashers
4150 Hosts and Hostesses, Restaurant, Lounge, and Coffee Shop
4160 Food Preparation and Serving Related Workers, All Other
4200 First-Line Supervisors/Managers of Housekeeping and Janitorial Workers
4210 First-Line Supervisors/Managers of Landscaping, Lawn Service, and Groundskeeping Workers
4220 Janitors and Building Cleaners
4230 Maids and Housekeeping Cleaners
4240 Pest Control Workers
4250 Grounds Maintenance Workers
4300 First-Line Supervisors/Managers of Gaming Workers
4320 First-Line Supervisors/Managers of Personal Service Workers
4340 Animal Trainers
4350 Nonfarm Animal Caretakers
4400 Gaming Services Workers
4410 Motion Picture Projectionists
4420 Ushers, Lobby Attendants, and Ticket Takers
4430 Miscellaneous Entertainment Attendants and Related Workers
4460 Funeral Service Workers
4500 Barbers
4510 Hairdressers, Hairstylists, and Cosmetologists
4520 Miscellaneous Personal Appearance Workers
4530 Baggage Porters, Bellhops, and Concierges
4540 Tour and Travel Guides
4550 Transportation Attendants
4600 Child Care Workers
4610 Personal and Home Care Aides
4620 Recreation and Fitness Workers
4640 Residential Advisors
4650 Personal Care and Service Workers, All Other
4700 First-Line Supervisors/Managers of Retail Sales Workers
4710 First-Line Supervisors/Managers of Non-Retail Sales Workers
4720 Cashiers
4740 Counter and Rental Clerks

National Mortality Longitudinal Study – Appendix H: 2000 Occupational Classification System
381
2000 Occupation
Code Occupation Category
4750 Parts Salespersons
4760 Retail Salespersons
4800 Advertising Sales Agents
4810 Insurance Sales Agents
4820 Securities, Commodities, and Financial Services Sales Agents
4830 Travel Agents
4840 Sales Representatives, Services, All Other
4850 Sales Representatives, Wholesale and Manufacturing
4900 Models, Demonstrators, and Product Promoters
4920 Real Estate Brokers and Sales Agents
4930 Sales Engineers
4940 Telemarketers
4950 Door-To-Door Sales Workers, News and Street Vendors, and Related Workers
4960 Sales and Related Workers, All Other
5000 First-Line Supervisors/Managers of Office and Administrative Support Workers
5010 Switchboard Operators, Including Answering Service
5020 Telephone Operators
5030 Communications Equipment Operators, All Other
5100 Bill and Account Collectors
5110 Billing and Posting Clerks and Machine Operators
5120 Bookkeeping, Accounting, and Auditing Clerks
5130 Gaming Cage Workers
5140 Payroll and Timekeeping Clerks
5150 Procurement Clerks
5160 Tellers
5200 Brokerage Clerks
5210 Correspondence Clerks
5220 Court, Municipal, and License Clerks
5230 Credit Authorizers, Checkers, and Clerks
5240 Customer Service Representatives
5250 Eligibility Interviewers, Government Programs
5260 File Clerks
5300 Hotel, Motel, and Resort Desk Clerks
5310 Interviewers, Except Eligibility and Loan
5320 Library Assistants, Clerical

National Mortality Longitudinal Study – Appendix H: 2000 Occupational Classification System
382
2000 Occupation
Code Occupation Category
5330 Loan Interviewers and Clerks
5340 New Accounts Clerks
5350 Order Clerks
5360 Human Resources Assistants, Except Payroll and Timekeeping
5400 Receptionists and Information Clerks
5410 Reservation and Transportation Ticket Agents and Travel Clerks
5420 Information and Record Clerks, All Other
5500 Cargo and Freight Agents
5510 Couriers and Messengers
5520 Dispatchers
5530 Meter Readers, Utilities
5540 Postal Service Clerks
5550 Postal Service Mail Carriers
5560 Postal Service Mail Sorters, Processors, and Processing Machine Operators
5600 Production, Planning, and Expediting Clerks
5610 Shipping, Receiving, and Traffic Clerks
5620 Stock Clerks and Order Fillers
5630 Weighers, Measurers, Checkers, and Samplers, Recordkeeping
5700 Secretaries and Administrative Assistants
5800 Computer Operators
5810 Data Entry Keyers
5820 Word Processors and Typists
5830 Desktop Publishers
5840 Insurance Claims and Policy Processing Clerks
5850 Mail Clerks and Mail Machine Operators, Except Postal Service
5860 Office Clerks, General
5900 Office Machine Operators, Except Computer
5910 Proofreaders and Copy Markers
5920 Statistical Assistants
5930 Office and Administrative Support Workers, All Other
6000 First-Line Supervisors/Managers/Contractors of Farming, Fishing, and Forestry Workers
6010 Agricultural Inspectors
6020 Animal Breeders
6040 Graders and Sorters, Agricultural Products
6050 Other Agricultural Workers

National Mortality Longitudinal Study – Appendix H: 2000 Occupational Classification System
383
2000 Occupation
Code Occupation Category
6100 Fishers and Related Fishing Workers
6110 Hunters and Trappers
6120 Forest and Conservation Workers
6130 Logging Workers
6200 First-Line Supervisors/Managers of Construction Trades and Extraction Workers
6210 Boilermakers
6220 Brickmasons, Blockmasons, and Stonemasons
6230 Carpenters
6240 Carpet, Floor, and Tile Installers and Finishers
6250 Cement Masons, Concrete Finishers, and Terrazzo Workers
6260 Construction Laborers
6300 Paving, Surfacing, and Tamping Equipment Operators
6310 Pile-Driver Operators
6320 Operating Engineers and Other Construction Equipment Operators
6330 Drywall Installers, Ceiling Tile Installers, and Tapers
6350 Electricians
6360 Glaziers
6400 Insulation Workers
6420 Painters, Construction and Maintenance
6430 Paperhangers
6440 Pipelayers, Plumbers, Pipefitters, and Steamfitters
6460 Plasterers and Stucco Masons
6500 Reinforcing Iron and Rebar Workers
6510 Roofers
6520 Sheet Metal Workers
6530 Structural Iron and Steel Workers
6600 Helpers, Construction Trades
6660 Construction and Building Inspectors
6700 Elevator Installers and Repairers
6710 Fence Erectors
6720 Hazardous Materials Removal Workers
6730 Highway Maintenance Workers
6740 Rail-Track Laying and Maintenance Equipment Operators
6750 Septic Tank Servicers and Sewer Pipe Cleaners
6760 Miscellaneous Construction and Related Workers

National Mortality Longitudinal Study – Appendix H: 2000 Occupational Classification System
384
2000 Occupation
Code Occupation Category
6800 Derrick, Rotary Drill, and Service Unit Operators, Oil, Gas, and Mining
6820 Earth Drillers, Except Oil and Gas
6830 Explosives Workers, Ordnance Handling Experts, and Blasters
6840 Mining Machine Operators
6910 Roof Bolters, Mining
6920 Roustabouts, Oil and Gas
6930 Helpers--Extraction Workers
6940 Other Extraction Workers
7000 First-Line Supervisors/Managers of Mechanics, Installers, and Repairers
7010 Computer, Automated Teller, and Office Machine Repairers
7020 Radio and Telecommunications Equipment Installers and Repairers
7030 Avionics Technicians
7040 Electric Motor, Power Tool, and Related Repairers
7050 Electrical and Electronics Installers and Repairers, Transportation Equipment
7100 Electrical and Electronics Repairers, Industrial and Utility
7110 Electronic Equipment Installers and Repairers, Motor Vehicles
7120 Electronic Home Entertainment Equipment Installers and Repairers
7130 Security and Fire Alarm Systems Installers
7140 Aircraft Mechanics and Service Technicians
7150 Automotive Body and Related Repairers
7160 Automotive Glass Installers and Repairers
7200 Automotive Service Technicians and Mechanics
7210 Bus and Truck Mechanics and Diesel Engine Specialists
7220 Heavy Vehicle and Mobile Equipment Service Technicians and Mechanics
7240 Small Engine Mechanics
7260 Miscellaneous Vehicle and Mobile Equipment Mechanics, Installers, and Repairers
7300 Control and Valve Installers and Repairers
7310 Heating, Air Conditioning, and Refrigeration Mechanics and Installers
7320 Home Appliance Repairers
7330 Industrial and Refractory Machinery Mechanics
7340 Maintenance and Repair Workers, General
7350 Maintenance Workers, Machinery
7360 Millwrights
7410 Electrical Power-Line Installers and Repairers
7420 Telecommunications Line Installers and Repairers

National Mortality Longitudinal Study – Appendix H: 2000 Occupational Classification System
385
2000 Occupation
Code Occupation Category
7430 Precision Instrument and Equipment Repairers
7510 Coin, Vending, and Amusement Machine Servicers and Repairers
7520 Commercial Divers
7540 Locksmiths and Safe Repairers
7550 Manufactured Building and Mobile Home Installers
7560 Riggers
7600 Signal and Track Switch Repairers
7610 Helpers--Installation, Maintenance, and Repair Workers
7620 Other Installation, Maintenance, and Repair Workers
7700 First-Line Supervisors/Managers of Production and Operating Workers
7710 Aircraft Structure, Surfaces, Rigging, and Systems Assemblers
7720 Electrical, Electronics, and Electromechanical Assemblers
7730 Engine and Other Machine Assemblers
7740 Structural Metal Fabricators and Fitters
7750 Miscellaneous Assemblers and Fabricators
7800 Bakers
7810 Butchers and Other Meat, Poultry, and Fish Processing Workers
7830 Food and Tobacco Roasting, Baking, and Drying Machine Operators and Tenders
7840 Food Batchmakers
7850 Food Cooking Machine Operators and Tenders
7900 Computer Control Programmers and Operators
7920 Extruding and Drawing Machine Setters, Operators, and Tenders, Metal and Plastic
7930 Forging Machine Setters, Operators, and Tenders, Metal and Plastic
7940 Rolling Machine Setters, Operators, and Tenders, Metal and Plastic
7950 Cutting, Punching, and Press Machine Setters, Operators, and Tenders, Metal and Plastic
7960 Drilling and Boring Machine Tool Setters, Operators, and Tenders, Metal and Plastic
8000 Grinding, Lapping, Polishing, and Buffing Machine Tool Setters, Operators, and Tenders, Metal and Plastic
8010 Lathe and Turning Machine Tool Setters, Operators, and Tenders, Metal and Plastic
8020 Milling and Planing Machine Setters, Operators, and Tenders, Metal and Plastic
8030 Machinists
8040 Metal Furnace and Kiln Operators and Tenders
8060 Model Makers and Patternmakers, Metal and Plastic
2000 Occupation Category

National Mortality Longitudinal Study – Appendix H: 2000 Occupational Classification System
386
Occupation Code
8100 Molders and Molding Machine Setters, Operators, and Tenders, Metal and Plastic
8120 Multiple Machine Tool Setters, Operators, and Tenders, Metal and Plastic
8130 Tool and Die Makers
8140 Welding, Soldering, and Brazing Workers
8150 Heat Treating Equipment Setters, Operators, and Tenders, Metal and Plastic
8160 Lay-Out Workers, Metal and Plastic
8200 Plating and Coating Machine Setters, Operators, and Tenders, Metal and Plastic
8210 Tool Grinders, Filers, and Sharpeners
8220 Metalworkers and Plastic Workers, All Other
8230 Bookbinders and Bindery Workers
8240 Job Printers
8250 Prepress Technicians and Workers
8260 Printing Machine Operators
8300 Laundry and Dry-Cleaning Workers
8310 Pressers, Textile, Garment, and Related Materials
8320 Sewing Machine Operators
8330 Shoe and Leather Workers and Repairers
8340 Shoe Machine Operators and Tenders
8350 Tailors, Dressmakers, and Sewers
8360 Textile Bleaching and Dyeing Machine Operators and Tenders
8400 Textile Cutting Machine Setters, Operators, and Tenders
8410 Textile Knitting and Weaving Machine Setters, Operators, and Tenders
8420 Textile Winding, Twisting, and Drawing Out Machine Setters, Operators, and Tenders
8430 Extruding and Forming Machine Setters, Operators, and Tenders, Synthetic and Glass Fibers
8440 Fabric and Apparel Patternmakers
8450 Upholsterers
8460 Textile, Apparel, and Furnishings Workers, All Other
8500 Cabinetmakers and Bench Carpenters
8510 Furniture Finishers
8520 Model Makers and Patternmakers, Wood
8530 Sawing Machine Setters, Operators, and Tenders, Wood
8540 Woodworking Machine Setters, Operators, and Tenders, Except Sawing
8550 Woodworkers, All Other 2000
Occupation Occupation Category

National Mortality Longitudinal Study – Appendix H: 2000 Occupational Classification System
387
Code
8600 Power Plant Operators, Distributors, and Dispatchers
8610 Stationary Engineers and Boiler Operators
8620 Water and Liquid Waste Treatment Plant and System Operators
8630 Miscellaneous Plant and System Operators
8640 Chemical Processing Machine Setters, Operators, and Tenders
8650 Crushing, Grinding, Polishing, Mixing, and Blending Workers
8710 Cutting Workers
8720 Extruding, Forming, Pressing, and Compacting Machine Setters, Operators, and Tenders
8730 Furnace, Kiln, Oven, Drier, and Kettle Operators and Tenders
8740 Inspectors, Testers, Sorters, Samplers, and Weighers
8750 Jewelers and Precious Stone and Metal Workers
8760 Medical, Dental, and Ophthalmic Laboratory Technicians
8800 Packaging and Filling Machine Operators and Tenders
8810 Painting Workers
8830 Photographic Process Workers and Processing Machine Operators
8840 Semiconductor Processors
8850 Cementing and Gluing Machine Operators and Tenders
8860 Cleaning, Washing, and Metal Pickling Equipment Operators and Tenders
8900 Cooling and Freezing Equipment Operators and Tenders
8910 Etchers and Engravers
8920 Molders, Shapers, and Casters, Except Metal and Plastic
8930 Paper Goods Machine Setters, Operators, and Tenders
8940 Tire Builders
8950 Helpers--Production Workers
8960 Production Workers, All Other
9000 Supervisors, Transportation and Material Moving Workers
9030 Aircraft Pilots and Flight Engineers
9040 Air Traffic Controllers and Airfield Operations Specialists
9110 Ambulance Drivers and Attendants, Except Emergency Medical Technicians
9120 Bus Drivers
9130 Driver/Sales Workers and Truck Drivers
9140 Taxi Drivers and Chauffeurs
9150 Motor Vehicle Operators, All Other
9200 Locomotive Engineers and Operators
9230 Railroad Brake, Signal, and Switch Operators 2000
Occupation Occupation Category

National Mortality Longitudinal Study – Appendix H: 2000 Occupational Classification System
388
Code
9240 Railroad Conductors and Yardmasters
9260 Subway, Streetcar, and Other Rail Transportation Workers
9300 Sailors and Marine Oilers
9310 Ship and Boat Captains and Operators
9330 Ship Engineers
9340 Bridge and Lock Tenders
9350 Parking Lot Attendants
9360 Service Station Attendants
9410 Transportation Inspectors
9420 Other Transportation Workers
9500 Conveyor Operators and Tenders
9510 Crane and Tower Operators
9520 Dredge, Excavating, and Loading Machine Operators
9560 Hoist and Winch Operators
9600 Industrial Truck and Tractor Operators
9610 Cleaners of Vehicles and Equipment
9620 Laborers and Freight, Stock, and Material Movers, Hand
9630 Machine Feeders and Offbearers
9640 Packers and Packagers, Hand
9650 Pumping Station Operators
9720 Refuse and Recyclable Material Collectors
9730 Shuttle Car Operators
9740 Tank Car, Truck, and Ship Loaders
9750 Material Moving Workers, All Other
9800 Military Officer Special and Tactical Operations Leaders/Managers
9810 First-Line Enlisted Military Supervisors/Managers
9820 Military Enlisted Tactical Operations and Air/Weapons Specialists and Crew Members
9830 Military, Rank Not Specified

National Mortality Longitudinal Study – Appendix I: NCHS 113 Causes of Death from ICD-10
389
Appendix I NCHS 113 Causes of Death for ICD-9 & ICD-10
Return to Appendix TOC Return to Main TOC Return to CAUSE113
In 1992 the CDC’s National Center for Health Statistics published a standardized list of 113 selected causes of death, for the general analysis of ICD–10 mortality statistics and for ranking leading causes of death. Source: www.cdc.gov/nchs/data/nvsr/nvsr49/nvsr49_11.pdf
1 Salmonella infections 2 Shigellosis and amebiasis 3 Certain other intestinal infections 4 Respiratory tuberculosis 5 Other tuberculosis 6 Whooping cough 7 Scarlet fever and erysipelas 8 Meningococcal infection 9 Septicemia
10 Syphilis 11 Acute poliomyelitis 12 Arthropod-borne viral encephalitis 13 Measles 14 Viral hepatitis 15 Human immunodeficiency virus (HIV) disease 16 Malaria 17 Other and unspecified infectious and parasitic diseases and their sequelae 18 Malignant neoplasms of lip, oral cavity and pharynx 19 Malignant neoplasm of esophagus 20 Malignant neoplasm of stomach 21 Malignant neoplasms of colon, rectum and anus 22 Malignant neoplasms of liver and intrahepatic bile ducts 23 Malignant neoplasm of pancreas 24 Malignant neoplasm of larynx 25 Malignant neoplasms of trachea, bronchus and lung 26 Malignant melanoma of skin 27 Malignant neoplasm of breast 28 Malignant neoplasm of cervix uteri 29 Malignant neoplasms of corpus uteri and uterus, part unspecified 30 Malignant neoplasm of ovary 31 Malignant neoplasm of prostate 32 Malignant neoplasms of kidney and renal pelvis 33 Malignant neoplasm of bladder 34 Malignant neoplasms of meninges, brain and other parts of central nervous system

National Mortality Longitudinal Study – Appendix I: NCHS 113 Causes of Death from ICD-10
390
35 Hodgkin's disease 36 Non-Hodgkin's lymphoma 37 Leukemia 38 Multiple myeloma and immunoproliferative neoplasms 39 Other and unspecified malignant neoplasms of lymphoid, hematopoietic and related tissue 40 All other and unspecified malignant neoplasms 41 In situ neoplasms, benign neoplasms and neoplasms of uncertain or unknown behavior 42 Anemias 43 Diabetes mellitus 44 Malnutrition 45 Other nutritional deficiencies 46 Meningitis 47 Parkinson's disease 48 Alzheimer's disease 49 Acute rheumatic fever and chronic rheumatic heart diseases 50 Hypertensive heart disease 51 Hypertensive heart and renal disease 52 Acute myocardial infarction 53 Other acute ischemic heart diseases 54 Atherosclerotic cardiovascular disease, so described 55 All other forms of chronic ischemic heart disease 56 Acute and subacute endocarditis 57 Diseases of pericardium and acute myocarditis 58 Heart failure 59 All other forms of heart disease 60 Essential (primary) hypertension and hypertensive renal disease 61 Cerebrovascular diseases 62 Atherosclerosis 63 Aortic aneurysm and dissection 64 Other diseases of arteries, arterioles and capillaries 65 Other disorders of circulatory system 66 Influenza 67 Pneumonia 68 Acute bronchitis and bronchiolitis 69 Unspecified acute lower respiratory infection 70 Bronchitis, chronic and unspecified 71 Emphysema 72 Asthma 73 Other chronic lower respiratory diseases 74 Pneumoconioses and chemical effects

National Mortality Longitudinal Study – Appendix I: NCHS 113 Causes of Death from ICD-10
391
75 Pneumonitis due to solids and liquids 76 Other diseases of respiratory system 77 Peptic ulcer 78 Diseases of appendix 79 Hernia 80 Alcoholic liver disease 81 Other chronic liver disease and cirrhosis 82 Cholelithiasis and other disorders of gallbladder 83 Acute and rapidly progressive nephritic and nephrotic syndrome 84 Chronic glomerulonephritis, nephritis and nephritis not specified as acute or chronic, and
renal sclerosis unspecified 85 Renal failure 86 Other disorders of kidney 87 Infections of kidney 88 Hyperplasia of prostate 89 Inflammatory diseases of female pelvic organs 90 Pregnancy with abortive outcome 91 Other complications of pregnancy, childbirth and the puerperium 92 Certain conditions originating in the perinatal period 93 Congenital malformations, deformations and chromosomal abnormalities 94 Symptoms, signs and abnormal clinical and laboratory findings, not elsewhere classified 95 All other diseases (Residual) 96 Motor vehicle crash 97 Unintentional injury: Other land transport 98 Unintentional injury: Water, air and space, and other transport 99 Falls
100 Accidental discharge of firearms 101 Accidental drowning and submersion 102 Accidental exposure to smoke, fire and flames 103 Accidental poisoning and exposure to noxious substances 104 Other and unspecified nontransport accidents and their sequelae 105 Intentional self-harm (suicide) by discharge of firearms 106 Intentional self-harm (suicide) by other and unspecified means and their sequelae 107 Assault (homicide) by discharge of firearms 108 Assault (homicide) by other and unspecified means and their sequelae 109 Legal intervention 110 Discharge of firearms, undetermined intent 111 Other and unspecified events of undetermined intent and their sequelae 112 Operations of war and their sequelae 113 Complications of medical and surgical care