Value of Product Shipments: 2003 - Census Bureau
93
-
Upload
khangminh22 -
Category
Documents
-
view
2 -
download
0
Transcript of Value of Product Shipments: 2003 - Census Bureau

������������ �
� �������
������������� �������� ��������
����������������������������� ���������� �� ����� � ���� ���������!����"�#���
������������� ����� ������

This report was prepared in the Manufacturing and Construction Division under the direction of Judy M.Dodds, Assistant Division Chief for Census and Related Programs who was responsible for the overallplanning, management, and coordination. Mendel D. Gayle, Chief, Census and Related ProgramsSupport Branch, assisted by Arminta Quash, Section Chief, Robert Reinard, Chief, Consumer GoodsIndustries Branch, assisted by Suzanne Conard, Susan DiCola, and James Hinckley, Section Chiefs,Kenneth Hansen, Chief, Investment Goods Industries Branch, assisted by Chris Blackburn, MikeBrown, and Jazmin Rose, Section Chiefs, Nathaniel Shelton, Chief, Primary Goods Industries Branch,assisted by Walter Hunter, Jr., Joanna Nguyen, and Athanasios Theodoropoulos, Section Chiefs,and Raphael Corrado, Tom Flood, Robert Miller, and Robert Rosati , Special Assistants, performedthe planning and implementation. Bill Baldwin, Luis Blanco, Larry Blumberg, Phillip Brown,Brenda Campbell, Catherine Cooper, Paul Corey, Mary Kim Corley , Theresa Crowley, ChrisCunningham, Vance Davis, Jesse Dawson, Kellie Friedrich, Dennis Gosier, Vera Harris-Bourne,Karen Harshbarger, Nancy Higgins, Steven Hood, Rachael Horwitz, Tom Ickes, Evelyn Jordan,Daphne Kelly, Cathy Knudsen, Kristen Lauziere, Mai Ngan Le, Jennifer Lee, Robert Lee,Jennifer Leotta, John Linehan, Keith McKenzie, Blynda Metcalf, Stanley Montgomery, PhilippeMorris, Madelyn Nieves, Betty Pannell, Bridgett Parker-Bell, Dorothy Parsons, Gloria Peebles-Butler, Michael Perkinson, Deanna Pickerall, Dana Sklut, LaTanya Steele, Susan Sundermann,Myss Sykes-Stephens, Betty Sutter, Dora Thomas, Ronanne Vinson, Keeley Voor, DennethWallace, Hilda Ward, Edward Watkins III, Tempie Whittington, Ernest Wilson Jr., BarbaraWongus, and Kevin Younes, provided primary staff assistance. Mendel D. Gayle, Chief, Census andRelated Programs Support Branch, assisted by Arlinda Allen, Kimberly DePhillip, and Baruti Taylor,Section Chiefs, performed overall coordination of the publication process. Patrick Duck, MichaelFlaherty, Taylor C. Murph, Wanda Sledd, and Veronica White provided primary staff assistance.Mathematical and statistical techniques, as well as the coverage operations, were provided by PaulHsen, Assistant Division Chief for Research and Methodology Programs, assisted by Stacey Cole, Chief,Manufacturing Methodology Branch, and Robert Struble, Section Chief. Jeffrey Dalzell and CathyGregor provided primary staff assistance.Eddie J. Salyers, Assistant Division Chief of Economic Planning and Coordination Division, wasresponsible for overseeing the editing and tabulation procedures and the interactive analytical software.Dennis Shoemaker and Kim Wortman, Special Assistants, John D. Ward, Chief, Analytical Branch,and Brandy L. Yarbrough, Chief, Edit Branch, were responsible for developing the systems andprocedures for data collection, editing, review, and correction. Donna L. Hambric, Chief of theEconomic Planning Staff, was responsible for overseeing the systems and information for dissemination.Douglas J. Miller, Chief, Tables and Dissemination Branch, assisted by Lisa Aispuro, Jamie Fleming,Keith Fuller, Andrew W. Hait, and Kathy G. Padgett were responsible for developing the datadissemination systems and procedures.The Geography Division staff, Robert LaMacchia, Chief, developed geographic coding procedures andassociated computer programs.The Economic Statistical Methods and Programming Division, Howard R. Hogan, Chief, developed andcoordinated the computer processing systems. Barry F. Sessamen, Assistant Division Chief for PostCollection, was responsible for design and implementation of the processing system and computerprograms. Gary T. Sheridan, Chief, Macro Analytical Branch, assisted by Apparao V. Katikineni andEdward F. Johnson provided computer programming and implementation.The Systems Support Division provided the table composition system. Robert Joseph Brown, TableImage Processing System (TIPS) Senior Software Engineer, was responsible for the design anddevelopment of the TIPS, under the supervision of Robert J. Bateman, Assistant Division Chief,Information Systems.The staff of the National Processing Center performed mailout preparation and receipt operations,clerical and analytical review activities, and data entry.Margaret A. Smith, Bernadette J. Beasley, Michael T. Browne, and Alan R. Plisch of theAdministrative and Customer Services Division, Walter C. Odom, Chief, provided publication andprinting management, graphics design and composition, and editorial review for print and electronicmedia. General direction and production management were provided by James R. Clark, AssistantDivision Chief, and Susan L. Rappa, Chief, Publications Services Branch.
Special acknowledgment is also due the many businesses whose cooperation contributed to thepublication of these data.
ACKNOWLEDGMENTS

������������ �
� �������
������������� ����� ������
������������� �������� ��������
��������������� �������������������������
�����$
���������� �����!��������$������$
"�������������������������������������� ������#��������
����������$��������� ����� �
������"$����#�%"���������&����� ���������
� ���

Frederick T. Knickerbocker,Associate Directorfor Economic Programs
Thomas L. Mesenbourg,Assistant Directorfor Economic Programs
William G. Bostic, Jr.,Chief, Manufacturingand Construction Division
ECONOMICS
AND STATISTICS
ADMINISTRATION
Economicsand StatisticsAdministration
Kathleen B. Cooper,Under Secretaryfor Economic Affairs
U.S. CENSUS BUREAU
Charles Louis Kincannon,Director
Hermann Habermann,Deputy Director andChief Operating Officer

CONTENTS
Introduction v���������������������������������������������������
Tables
1. Value of Shipments for Product Classes: 2003 and 2002 1������
Appendixes
A. Explanation of Terms A–1�������������������������������������
B. NAICS Codes, Titles, and Descriptions ������������������������
C. Methodology C–1���������������������������������������������
D. Geographic Notes ������������������������������������������
E. Metropolitan and Micropolitan Statistical Areas �����������������
F. Current Industrial Reports by Product Class Codes F–1�����������
G. Product Classes Primary to More Than One Industry G–1����������
�� Not applicable for this report.
Annual Survey of Manufactures Contents iiiU.S. Census Bureau, 2002 Economic Census

Annual Survey of Manufactures
SCOPE
The Annual Survey of Manufactures (ASM) provides sample estimates of statistics for all manufac-turing establishments with one or more paid employees. The Manufacturing sector (sector 31-33)comprises establishments engaged in the mechanical, physical, or chemical transformation ofmaterials, substances, or components into new products. The assembling of component parts ofmanufactured products is considered manufacturing, except in cases where the activity is appro-priately classified in Sector 23, Construction. This report presents manufacturing establishmentstatistics from the 2003 ASM.
Establishments in the manufacturing sector are often described as plants, factories, or mills andcharacteristically use power-driven machines and materials-handling equipment. However, estab-lishments that transform materials or substances into new products by hand or in the worker’shome and those engaged in selling to the general public products made on the same premisesfrom which they are sold, such as bakeries, candy stores, and custom tailors, may also beincluded in this sector. Manufacturing establishments may process materials or may contract withother establishments to process their materials for them. Both of these types of establishmentsare included in manufacturing.
The materials, substances, or components transformed by manufacturing establishments are rawmaterials that are products of agriculture, forestry, fishing, mining, or quarrying, as well as prod-ucts of other manufacturing establishments. The materials used may be purchased directly fromproducers, obtained through customary trade channels, or secured without recourse to the marketby transferring the product from one establishment to another, under the same ownership. Thenew product of a manufacturing establishment may be finished in the sense that it is ready forutilization or consumption, or it may be semifinished to become an input for an establishmentengaged in further manufacturing. For example, the product of the alumina refinery is the inputused in the primary production of aluminum; primary aluminum is the input to an aluminum wiredrawing plant; and aluminum wire is the input for a fabricated wire product manufacturing estab-lishment.
The subsectors in the manufacturing sector generally reflect distinct production processes relatedto material inputs, production equipment, and employee skills. In the machinery area, whereassembling is a key activity, parts and accessories for manufactured products are classified in theindustry of the finished manufactured item when they are made for separate sale. For example, areplacement refrigerator door would be classified with refrigerators and an attachment for a pieceof metal working machinery would be classified with metal working machinery. However, compo-nents, input from other manufacturing establishments, are classified based on the productionfunction of the component manufacturer. For example, electronic components are classified inSubsector 334, Computer and Electronic Product Manufacturing; and stampings are classified inSubsector 332, Fabricated Metal Product Manufacturing.
Manufacturing establishments often perform one or more activities that are classified outside themanufacturing sector of North American Industry Classification System (NAICS). For instance,almost all manufacturing has some captive research and development or administrative opera-tions, such as accounting, payroll, or management. These captive services are treated the same ascaptive manufacturing activities. When the services are provided by separate establishments, theyare classified to the NAICS sector where such services are primary, not in manufacturing.
The boundaries of manufacturing and the other sectors within the North American Industry Classi-fication System (NAICS) can be somewhat blurry. The establishments in the manufacturing sectorare engaged in the transformation of materials into new products. Their output is a new product.
Annual Survey of Manufactures v2002 Economic Census
U.S. Census Bureau, 2002 Economic Census

However, the definition of what constitutes a new product can be somewhat subjective. For clarifi-cation purposes, the following activities are considered manufacturing in NAICS: milk bottling andpasteurizing; water bottling and processing; fresh fish packaging (oyster shucking, fish filleting,and etc.); apparel jobbing (assigning of materials to contract factories or shops for fabrication orother contract operations, as well as contracting on materials owned by others); printing andrelated activities; ready-mixed concrete production; leather converting; grinding of lenses to pre-scription; wood preserving; electroplating, plating, metal heat treating, and polishing for thetrade; lapidary work for the trade; fabricating signs and advertising displays; rebuilding orremanufacturing machinery (i.e., automotive parts); ship repair and renovation; machine shops;and tire retreading.
Exclusions. There are activities that are sometimes considered manufacturing, but for the NorthAmerican Industry Classification System (NAICS) are classified in another sector. These activitiesinclude logging, classified in Sector 11, Agriculture, Forestry, Fishing and Hunting, which is con-sidered a harvesting operation; the beneficiating of ores and other minerals, classified in Sector21, Mining, is considered part of the activity of mining; the construction of structures and fabri-cating operations performed at the site of construction by contractors, is classified in Sector 23,Construction; establishments engaged in breaking of bulk and redistribution in smaller lots,including packaging, repackaging, or bottling products, such as liquors or chemicals; the custom-ized assembly of computers; sorting of scrap; mixing paints to customer order; and cutting met-als to customer order, are classified in Sector 42, Wholesale Trade or Sector 44-45, Retail Trade,produce a modified version of the same product, not a new product; and publishing and the com-bined activity of publishing and printing, classified in Sector 51, Information, perform the trans-formation of information into a product where as the value of the product to the consumer lies inthe information content, not in the format in which it is distributed (i.e., the book or software dis-kette).
The tabulations for the manufacturing sector do not include central administrative offices, ware-houses, or other establishments that serve manufacturing establishments within the same organi-zation. Data for such establishments are classified according to the nature of the service they pro-vide. For example, separate headquarter establishments are reported in NAICS Sector 55,Management of Companies and Enterprises.
The reports described below exclude establishments of firms with no paid employees. These“nonemployers,” typically self-employed individuals or partnerships operating businesses thatthey have not chosen to incorporate, are reported separately in Nonemployer Statistics. The con-tribution of nonemployers, relatively small for this sector, may be examined atwww.census.gov/nonemployerimpact.
Definitions. Terms are defined in Appendix A, Explanation of Terms.
REPORTS
The Annual Survey of Manufactures (ASM) consists of manufacturing establishment statistics fromthe 2003 ASM and revised 2002 Economic Census — Manufacturing data. Three reports are issuedfrom this survey. Each of the following ASM reports provide sample estimates of statistics on allmanufacturing establishments with one or more paid employees.
AS-1 — Statistics for Industry Groups and Industries. This report presents manufacturingestablishment statistics for industry groups and industries from the Annual Survey of Manufac-tures (ASM). This ASM report presents 2002 and 2003 data at the three-, four-, and five-digit NorthAmerican Industry Classification System (NAICS) levels, and additional detail corresponding toindividual six-digit NAICS industries or groups of six-digit NAICS industries. The 2002 data arefrom the 2002 Economic Census — Manufacturing and include revisions made to the data since itsinitial release. This report also includes a historic table with data for the all-manufacturing levelback to 1977. This report includes such statistics as number of establishments, employment, pay-roll, value added by manufacture, cost of materials consumed, detailed capital expenditures,supplemental labor costs, fuels and electric energy used, inventories by stage of fabrication, valueof shipments, detailed miscellaneous receipts, and interplant transfers.
vi Annual Survey of Manufactures 2002 Economic Census
U.S. Census Bureau, 2002 Economic Census

AS-2 — Value of Product Shipments. This report presents value of product shipments from theAnnual Survey of Manufactures (ASM). This ASM report presents 2002 and 2003 shipments datafor the 473 six-digit North American Industry Classification System (NAICS) product groups, 1,450seven-digit NAICS product classes, and products primary to more than one industry.
AS-3 — Geographic Area Statistics. This report presents similar statistics at the “all manufac-turing” level for the United States, each state, and the District of Columbia. This Annual Survey ofManufactures (ASM) report presents 2002 and 2003 data at the three- and four-digit North Ameri-can Industry Classification System (NAICS) levels for employment, payroll, value added by manu-facture, cost of materials consumed, value of shipments, and total capital expenditures. Data fordetailed capital expenditures, supplemental labor costs, fuels and electric energy used, and inven-tories by stage of fabrication are also presented at the US and state levels.
Other reports. Data for this sector are also included in the 2002 Economic Census — Manufac-turing and reports with multisector coverage, including Nonemployer Statistics, Comparative Sta-tistics, Bridge Between 2002 NAICS and 1997 NAICS, Business Expenses, and the Survey of Busi-ness Owners reports.
GEOGRAPHIC AREAS COVERED
1. The United States as a whole.
2. States and the District of Columbia.
DOLLAR VALUES
All dollar values presented are expressed in current dollars; i.e., 2003 data are expressed in 2003dollars, and 2002 data in 2002 dollars. Consequently, when making comparisons with prior years,users of the data should consider the changes in prices that have occurred.
All dollar values are shown in thousands of dollars.
COMPARABILITY OF THE 2003 AND PRIOR YEARS ANNUAL SURVEY OF MANUFAC-TURES
The 2003 Annual Survey of Manufactures (ASM) and prior years present data based on the NorthAmerican Industry Classification System (NAICS). While there were NAICS revisions to selectedindustries for the 2002 Economic Census, this sector was not affected by those revisions.
However, for the historical data, the adoption of the North American Industry Classification Sys-tem (NAICS) in the 1997 Economic Census — Manufacturing has had a major impact on the com-parability of current and historic data. Approximately half of the industries in the manufacturingsector of NAICS do not have comparable industries in the Standard Industrial Classification (SIC)system that was used prior to 1997.
While most of the changes affecting the manufacturing sector were changes within the sector,some industries left manufacturing and others came into manufacturing. Prominent among thoseindustries that left manufacturing are logging and portions of publishing. Prominent among theindustries that came into the manufacturing sector are bakeries, candy stores where candy ismade on the premises, custom tailors, makers of custom draperies, and tire retreading. The neteffect of the classification changes are such that if the 1997 value of shipments data for all manu-facturers were tabulated on an Standard Industrial Classification (SIC) basis, it would be approxi-mately 3 percent higher.
Another change resulting from the conversion to the North American Industry Classification Sys-tem (NAICS) is that data for auxiliaries and central administrative offices (CAOs) associated withmanufacturers are not presented with the manufacturing data.
It should also be noted that while the Census Bureau published “new capital expenditures” in thepast, starting with the 1997 Economic Census — Manufacturing, the Census Bureau began pub-lishing “total capital expenditures.” The historic data presented in this report have been adjustedto be consistent with the new policy.
Annual Survey of Manufactures vii2002 Economic Census
U.S. Census Bureau, 2002 Economic Census

For 2003, there have been several additional data tables added which did not exist in prior AnnualSurvey of Manufactures (ASM) publications. These tables for 2003 include value of shipments forindustry groups and industries and products primary to more than one industry. Also for the AS-1,tables 2 through 7, a new industry grouping (North American Industry Classification System(NAICS) five-digit) will be published for certain industries. These groupings correspond to two ormore individual six-digit NAICS industries within that five-digit NAICS Classification. The ASMindustry groupings descriptions can be found in Appendix B, NAICS Codes, Titles, and Descrip-tions. The comparability tables can be found in Appendix F, Comparability of NAICS Codes andNAICS based Codes: 2002 to 2003.
RELIABILITY OF DATA
All data compiled for the manufacturing sector are subject to sampling errors as well as nonsam-pling errors. Nonsampling errors can be attributed to many sources: inability to identify all casesin the actual universe; definition and classification difficulties; differences in the interpretation ofquestions; errors in recording or coding the data obtained; and other errors of collection,response, coverage, processing, and estimation for missing or misreported data.
No direct measurement of these effects has been obtained except for estimation for missing ormisreported data shown as percentages in the tables. Precautionary steps were taken in all phasesof the collection, processing, and tabulation of the data in an effort to minimize the effects of non-sampling errors. More information on the reliability of the data is included in Appendix C, Method-ology.
DISCLOSURE
In accordance with federal law governing census reports (Title 13 of the United States Code), nodata are published that would disclose the operations of an individual establishment or company.However, the number of establishments in a specific industry or geographic area is not considereda disclosure; therefore, this information may be released even though other information is with-held. Techniques employed to limit disclosure are discussed atwww.census.gov/epcd/ec02/disclosure.htm.
The disclosure analysis for “industry statistics” files is based on the total value of shipments.When the total value of shipments cannot be shown without disclosing information for individualcompanies, the complete line is suppressed except for capital expenditures. Nonetheless, the sup-pressed data are included in higher-level totals. A separate disclosure analysis is performed forcapital expenditures, which can be suppressed even though value of shipments data are pub-lished and vice versa.
AVAILABILITY OF MORE FREQUENT ECONOMIC DATA
The Census Bureau conducts the Annual Survey of Manufactures (ASM) in each of the 4 yearsbetween the Economic Censuses, which is collected for years ending in 2 and 7. The ASM is aprobability-based sample of approximately 55,000 establishments and collects many of the sameindustry statistics (including employment, payroll, value of shipments, etc.) as the Economic Cen-sus — Manufacturing. However, there are selected statistics not included in the ASM. Among theseare the number of companies and establishments, detailed product and materials data, and sub-state geographic data. In addition to the Economic Census — Manufacturing, the Census Bureauconducts the Current Industrial Reports (CIR) program. The CIR program publishes selecteddetailed product statistics for selected manufacturing industries at the U.S. level annually and, insome cases, monthly and/or quarterly. The Census Bureau also conducts the monthly Manufactur-ers’ Shipments, Inventories, and Orders (M3) Program, which publishes detailed inventory statis-tics for manufacturing industries at the U.S. level.
In addition, the County Business Patterns (CBP) program offers annual statistics on the number ofestablishments, employment, and payroll classified by industry within each county, and Statisticsof U.S. Businesses provides annual statistics classified by the employment size of the enterprise,further classified by industry for the United States, and by broader categories for states and met-ropolitan areas.
viii Annual Survey of Manufactures 2002 Economic Census
U.S. Census Bureau, 2002 Economic Census

CONTACTS FOR DATA USERS
Questions about these data may be directed to the U.S. Census Bureau, Manufacturing and Con-struction Division, Information Services Center, 301-763-4673 or ask.census.gov.
ABBREVIATIONS AND SYMBOLS
The following abbreviations and symbols are used with these data:
A Standard error of 100 percent or moreD Withheld to avoid disclosing data of individual companies; data are included in higher level totalsN Not available or not comparableS Withheld because estimates did not meet publication standardsX Not applicabler Revisednsk Not specified by kind– Represents zero (page image/print only)
Annual Survey of Manufactures ix2002 Economic Census
U.S. Census Bureau, 2002 Economic Census

Table 1. Value of Shipments for Product Classes: 2003 and 2002[Includes value of product shipments produced by (1) establishments classified in their primary industry and (2) establishments classified in other industries (secondary). Transfers of products from oneestablishment of a company to another establishment of the same company (interplant transfers) are also included. Data based on the 2003 Annual Survey of Manufactures (ASM). For information onconfidentiality protection, sampling error, nonsampling error, and explanation of terms, see note 2 at end of table. For meaning of abbreviations and symbols, see introductory text]
Productclass code Product Value of
product shipments($1,000)
Relativestandard error
of estimate1
(percent)
311111 Dog and cat food manufacturing 2003��������������������������������������������������������� 10 707 651 32002�� 9 784 304 X
3111111 Dog food 2003��������������������������������������������������������������������������� 7 144 701 42002�� 5 975 051 X
3111114 Cat food 2003���������������������������������������������������������������������������� 3 291 685 22002�� 3 541 476 X
311111W Dog and cat food manufacturing, nsk, total 2003���������������������������������������������� 271 265 72002�� 267 777 X
311119 Other animal food manufacturing 2003�������������������������������������������������������� 15 995 531 32002�� 15 845 289 X
3111191 Chicken and turkey feed, supplements, concentrates, and premixes 2003������������������������ 5 945 886 22002�� 5 325 527 X
3111194 Dairy cattle feed, complete 2003������������������������������������������������������������ 1 741 259 52002�� 1 621 456 X
3111197 Dairy cattle feed supplements, concentrates, and premixes 2003������������������������������� 985 803 122002�� 973 643 X
311119A Swine feed, complete 2003���������������������������������������������������������������� 1 003 785 82002�� 533 191 X
311119D Swine feed supplements, concentrates, and premixes 2003������������������������������������ 703 194 52002�� 571 830 X
311119G Beef cattle feed, complete 2003������������������������������������������������������������ 570 548 352002�� 617 001 X
311119J Beef cattle feed supplements, concentrates, and premixes 2003�������������������������������� 574 308 272002�� 636 915 X
311119M Other poultry and livestock feed 2003������������������������������������������������������� 737 951 272002�� 810 973 X
311119P Other prepared animal feeds, including feeding materials and adjuncts 2003��������������������� 852 048 62002�� 659 443 X
311119R Specialty feeds 2003���������������������������������������������������������������������� 1 493 664 72002�� 1 037 081 X
311119W Other animal food manufacturing, nsk, total 2003��������������������������������������������� 1 387 084 182002�� 3 058 229 X
311211 Flour milling 2003��������������������������������������������������������������������������� 7 258 504 12002�� 6 736 639 X
3112111 Wheat flour (except flour mixes), made in flour mills 2003�������������������������������������� 4 604 077 12002�� 4 324 988 X
3112114 Wheat mill products, except flour 2003������������������������������������������������������ 527 236 42002�� 495 977 X
3112117 Corn mill products 2003������������������������������������������������������������������� 1 047 223 42002�� 940 807 X
311211A Prepared flour mixes, including refrigerated and frozen doughs and batters, made inflour mills2 2003������������������������������������������������������������������������� 555 522 1
2002�� 565 584 X
311211B Other grain mill products 2003�������������������������������������������������������������� 283 477 12002�� 238 252 X
311211W Flour milling, nsk, total 2003���������������������������������������������������������������� 240 969 12002�� 171 031 X
311212 Rice milling 2003��������������������������������������������������������������������������� 1 615 159 22002�� 1 664 652 X
3112120 Rice milling 2003������������������������������������������������������������������������� 1 615 159 22002�� 1 664 652 X
311213 Malt manufacturing 2003�������������������������������������������������������������������� 528 613 12002�� 494 011 X
3112130 Malt 2003�������������������������������������������������������������������������������� 528 613 12002�� 494 011 X
311221 Wet corn milling 2003����������������������������������������������������������������������� 6 952 595 22002�� 6 857 302 X
3112211 Corn sweeteners 2003�������������������������������������������������������������������� 3 279 712 32002�� 3 106 601 X
3112214 Manufactured starch 2003����������������������������������������������������������������� 1 393 391 12002�� 1 696 085 X
3112218 Corn oil3 2003���������������������������������������������������������������������������� 542 219 12002�� 347 827 X
311221A Wet process corn byproducts 2003���������������������������������������������������������� 1 270 201 42002�� 1 246 354 X
311221W Wet corn milling, nsk, total 2003������������������������������������������������������������ 467 073 12002�� 460 435 X
311222 Soybean processing 2003������������������������������������������������������������������� 13 650 762 12002�� 10 833 935 X
3112221 Soybean oil3 2003������������������������������������������������������������������������ 4 010 801 12002�� 2 745 728 X
3112224 Soybean cake, meal, and other byproducts3 2003��������������������������������������������� 9 431 447 22002�� 7 955 369 X
311222W Soybean processing, nsk, total 2003�������������������������������������������������������� 208 515 12002�� 132 838 X
See footnotes at end of table.
Value of Product Shipments Annual Survey of Manufactures 1U.S. Census Bureau, 2002 Economic Census

Table 1. Value of Shipments for Product Classes: 2003 and 2002�Con.[Includes value of product shipments produced by (1) establishments classified in their primary industry and (2) establishments classified in other industries (secondary). Transfers of products from oneestablishment of a company to another establishment of the same company (interplant transfers) are also included. Data based on the 2003 Annual Survey of Manufactures (ASM). For information onconfidentiality protection, sampling error, nonsampling error, and explanation of terms, see note 2 at end of table. For meaning of abbreviations and symbols, see introductory text]
Productclass code Product Value of
product shipments($1,000)
Relativestandard error
of estimate1
(percent)
311223 Other oilseed processing 2003��������������������������������������������������������������� 1 389 164 32002�� 1 309 321 X
3112231 Crude cottonseed oil3 2003���������������������������������������������������������������� 71 529 302002�� 104 458 X
3112234 Cottonseed oil, once�refined (after alkali or caustic wash but before deodorizing or usein end products)3 2003������������������������������������������������������������������� 176 973 15
2002�� 165 746 X
3112237 Cotton linters3 2003����������������������������������������������������������������������� 47 253 92002�� 62 138 X
311223A Cottonseed cake and meal and other byproducts3 2003���������������������������������������� 281 061 42002�� 286 330 X
311223D Linseed oil3 2003������������������������������������������������������������������������� 37 540 12002�� D X
311223G Other vegetable oils3 2003����������������������������������������������������������������� 630 119 32002�� 514 009 X
311223J Other vegetable oil mill products3 2003������������������������������������������������������ 142 683 12002�� D X
311223W Other oilseed processing, nsk, total 2003���������������������������������������������������� 2 007 42002�� 2 619 X
311225 Fats and oils refining and blending 2003������������������������������������������������������� 8 645 601 22002�� 8 437 004 X
3112252 Shortening and cooking oils3 2003���������������������������������������������������������� 7 065 562 22002�� 6 681 530 X
3112254 Margarine, butter blends, and butter substitutes3 2003����������������������������������������� 1 205 638 42002�� 1 321 386 X
311225W Fats and oils refining and blending, nsk, total 2003�������������������������������������������� 374 402 112002�� 434 088 X
311230 Breakfast cereal manufacturing 2003���������������������������������������������������������� 8 583 015 12002�� 7 832 992 X
3112301 Ready�to�serve breakfast cereal foods (except infant cereals) 2003����������������������������� 7 345 740 12002�� 7 102 823 X
3112304 Other breakfast cereal foods 2003���������������������������������������������������������� 928 980 62002�� 621 930 X
311230W Breakfast cereal manufacturing, nsk, total 2003����������������������������������������������� 308 295 12002�� 108 239 X
311311 Sugarcane mills 2003����������������������������������������������������������������������� 1 843 563 12002�� 1 663 551 X
3113110 Raw cane sugar 2003��������������������������������������������������������������������� 1 843 563 12002�� 1 663 551 X
311312 Cane sugar refining 2003�������������������������������������������������������������������� 2 816 842 12002�� 2 656 775 X
3113120 Refined granulated cane sugar and by�products 2003����������������������������������������� 2 816 842 12002�� 2 656 775 X
311313 Beet sugar manufacturing 2003��������������������������������������������������������������� 2 729 114 162002�� 2 206 922 X
3113130 Beet sugar 2003�������������������������������������������������������������������������� 2 729 114 162002�� 2 206 922 X
311320 Chocolate and confectionery manufacturing from cacao beans 2003������������������������������ 3 854 134 32002�� 4 005 215 X
3113201 Chocolate coatings, made from cacao beans3 2003������������������������������������������� 811 097 12002�� 711 658 X
3113204 Chocolate and chocolate�type confectionery products, made from cacao beans4 2003������������� 1 674 214 12002�� 2 028 528 X
3113207 Other chocolate and cocoa products, made from cacao beans3 2003���������������������������� 1 259 400 82002�� 1 161 045 X
311320W Chocolate and confectionery manufacturing from cacao beans, nsk, total 2003������������������� 109 424 12002�� 103 984 X
311330 Confectionery manufacturing from purchased chocolate 2003������������������������������������ 8 228 775 12002�� 7 633 688 X
3113301 Chocolate and chocolate�type confectionery products, made from purchased chocolatenot retailed at manufacturing establishment4 2003������������������������������������������� 7 315 301 1
2002�� 6 896 304 X
3113302 Chocolate and chocolate�type confectionery products, made from purchased chocolateretailed at manufacturing establishment2 2003����������������������������������������������� 281 805 2
2002�� 225 335 X
311330W Confectionery manufacturing from purchased chocolate, nsk, total 2003������������������������� 631 669 42002�� 512 049 X
311340 Nonchocolate confectionery manufacturing 2003������������������������������������������������ 6 770 949 12002�� 6 615 124 X
3113401 Nonchocolate�type confectionery products, made and packaged for shipment notretailed at manufacturing establishment3 2003����������������������������������������������� 4 461 762 1
2002�� 4 308 464 X
3113402 Nonchocolate�type confectionery products made from purchased chocolate retailed atmanufacturing establishment 2003��������������������������������������������������������� 92 658 4
2002�� 99 448 X
3113404 Chewing gum, bubble gum, and chewing gum base3 2003������������������������������������� 1 747 491 12002�� 1 738 964 X
See footnotes at end of table.
2 Annual Survey of Manufactures Value of Product ShipmentsU.S. Census Bureau, 2002 Economic Census
Table 1. Value of Shipments for Product Classes: 2003 and 2002�Con.[Includes value of product shipments produced by (1) establishments classified in their primary industry and (2) establishments classified in other industries (secondary). Transfers of products from oneestablishment of a company to another establishment of the same company (interplant transfers) are also included. Data based on the 2003 Annual Survey of Manufactures (ASM). For information onconfidentiality protection, sampling error, nonsampling error, and explanation of terms, see note 2 at end of table. For meaning of abbreviations and symbols, see introductory text]
Productclass code Product Value of
product shipments($1,000)
Relativestandard error
of estimate1
(percent)
311340 Nonchocolate confectionery manufacturing�Con.3113407 Other confectionery�type products 2003����������������������������������������������������� 214 835 3
2002�� 239 914 X
311340W Nonchocolate confectionery manufacturing, nsk, total 2003������������������������������������ 254 203 42002�� 228 334 X
311411 Frozen fruit, juice, and vegetable manufacturing 2003������������������������������������������� 8 901 377 12002�� 8 679 817 X
3114111 Frozen fruits, juices, ades, drinks, and cocktails 2003������������������������������������������ 2 271 291 12002�� 2 446 828 X
3114114 Frozen vegetables 2003������������������������������������������������������������������� 6 307 207 12002�� 5 803 345 X
311411W Frozen fruit, juice, and vegetable manufacturing, nsk, total 2003�������������������������������� 322 879 212002�� 429 644 X
311412 Frozen specialty food manufacturing 2003����������������������������������������������������� 12 827 012 12002�� 12 351 134 X
3114121 Frozen dinners (beef, pork, and poultry pies) and nationality foods 2003������������������������� 8 527 416 12002�� 8 362 236 X
3114124 Other frozen specialties 2003�������������������������������������������������������������� 3 264 614 22002�� 2 940 795 X
311412W Frozen specialty food manufacturing, nsk, total 2003������������������������������������������ 1 034 982 22002�� 1 048 103 X
311421 Fruit and vegetable canning 2003������������������������������������������������������������� 17 910 582 32002�� 18 767 941 X
3114211 Canned fruits, except baby foods 2003������������������������������������������������������ 2 401 270 12002�� 2 127 937 X
3114214 Canned vegetables, except hominy and mushrooms 2003������������������������������������� 1 844 875 122002�� 2 775 443 X
3114217 Canned hominy and mushrooms 2003������������������������������������������������������� 151 629 12002�� 142 115 X
311421A Canned vegetable juices 2003�������������������������������������������������������������� 578 294 12002�� 601 700 X
311421D Canned catsup and other tomato based sauces 2003����������������������������������������� 3 984 957 22002�� 4 273 116 X
311421G Canned jams, jellies, and preserves 2003���������������������������������������������������� 1 087 099 12002�� 1 170 649 X
311421J Canned fruit juices, nectars, and concentrates 2003������������������������������������������� 3 640 880 22002�� 3 283 334 X
311421M Fresh fruit juices and nectars 2003���������������������������������������������������������� 1 815 239 72002�� 1 729 920 X
311421P Pickles and other pickled products 2003����������������������������������������������������� 1 071 022 492002�� 1 475 140 X
311421W Fruit and vegetable canning, nsk, total 2003�������������������������������������������������� 1 335 318 92002�� 1 188 587 X
311422 Specialty canning 2003���������������������������������������������������������������������� 6 989 748 32002�� 6 593 010 X
3114221 Canned baby foods, except cereal and biscuits 2003������������������������������������������ D S2002�� 810 251 X
3114224 Canned soups and stews, except frozen and seafood 2003������������������������������������ 3 504 034 12002�� 3 316 050 X
3114227 Canned dry beans 2003������������������������������������������������������������������� 1 137 969 S2002�� 976 059 X
311422B Other canned specialties and nationality foods 2003������������������������������������������� D S2002�� 776 119 X
311422W Specialty canning, nsk, total 2003����������������������������������������������������������� 391 790 162002�� 714 531 X
311423 Dried and dehydrated food manufacturing 2003������������������������������������������������� 4 295 282 82002�� 4 546 457 X
3114231 Soup mixes (including oriental, dried and dehydrated, and freeze�dried) and bouillon 2003��������� 948 586 22002�� 1 077 242 X
3114235 Dried and dehydrated fruits and vegetables, including freeze�dried 2003������������������������� 2 700 236 112002�� 2 504 614 X
3114237 Macaroni and noodle products, purchased, packaged with other ingredients mitse,except canned or frozen 2003������������������������������������������������������������� 117 270 1
2002�� 129 457 X
3114238 Other purchased products packaged with dried and dehydrated ingredients mitse 2003������������ 388 183 42002�� 394 989 X
311423W Dried and dehydrated food manufacturing, nsk, total 2003������������������������������������� S S2002�� 440 155 X
311511 Fluid milk manufacturing 2003���������������������������������������������������������������� 22 224 537 12002�� 21 644 978 X
3115111 Fluid milk and cream, bulk sales 2003������������������������������������������������������� 3 507 166 22002�� 3 715 643 X
3115115 Fluid milk and related products, packaged (including cartons, bottles, cans, anddispenser cans), except U.H.T. 2003������������������������������������������������������� 12 583 866 1
2002�� 12 164 224 X
3115117 Cottage cheese (including bakers’, pot, and farmers’ cheese) 2003������������������������������ 691 365 72002�� 770 882 X
See footnotes at end of table.
Value of Product Shipments Annual Survey of Manufactures 3U.S. Census Bureau, 2002 Economic Census

Table 1. Value of Shipments for Product Classes: 2003 and 2002�Con.[Includes value of product shipments produced by (1) establishments classified in their primary industry and (2) establishments classified in other industries (secondary). Transfers of products from oneestablishment of a company to another establishment of the same company (interplant transfers) are also included. Data based on the 2003 Annual Survey of Manufactures (ASM). For information onconfidentiality protection, sampling error, nonsampling error, and explanation of terms, see note 2 at end of table. For meaning of abbreviations and symbols, see introductory text]
Productclass code Product Value of
product shipments($1,000)
Relativestandard error
of estimate1
(percent)
311511 Fluid milk manufacturing�Con.311511A Yogurt, except frozen 2003���������������������������������������������������������������� 2 395 580 3
2002�� 2 162 718 X
311511D Perishable dairy product substitutes 2003���������������������������������������������������� 772 201 112002�� 766 216 X
311511G Other packaged milk products 2003��������������������������������������������������������� 1 582 508 42002�� 1 467 567 X
311511W Fluid milk manufacturing, nsk, total 2003����������������������������������������������������� 691 850 82002�� 597 728 X
311512 Creamery butter manufacturing 2003���������������������������������������������������������� 1 873 218 52002�� 1 996 863 X
3115120 Creamery butter manufacturing 2003�������������������������������������������������������� 1 873 218 52002�� 1 996 863 X
311513 Cheese manufacturing 2003����������������������������������������������������������������� 21 053 898 12002�� 20 042 934 X
3115131 Natural cheese (cheddar, Swiss, Italian, brick, cream, grated, dried, etc.), exceptcottage cheese 2003��������������������������������������������������������������������� 14 690 046 2
2002�� 13 719 763 X
3115134 Process cheese and related products 2003�������������������������������������������������� 5 209 051 32002�� 5 160 468 X
3115137 Cheese substitutes and imitations 2003������������������������������������������������������ 463 996 22002�� 489 267 X
311513A Raw liquid whey 2003��������������������������������������������������������������������� 113 892 62002�� 118 285 X
311513W Cheese manufacturing, nsk, total 2003������������������������������������������������������ 576 914 82002�� 555 151 X
311514 Dry, condensed, and evaporated dairy product manufacturing 2003������������������������������� 9 735 003 12002�� 9 750 215 X
3115141 Dry milk products and mixtures 2003�������������������������������������������������������� 4 277 154 12002�� 4 191 750 X
3115145 Milk products, shipped in consumer�type cans, except substitutes 2003�������������������������� 2 143 730 12002�� 2 117 680 X
3115147 Concentrated milk products, shipped in bulk (barrels, drums, and tanks) 2003�������������������� 559 933 162002�� 558 277 X
311514A Ice cream mixes and related products 2003�������������������������������������������������� 866 860 62002�� 871 351 X
311514D Dairy product substitutes 2003������������������������������������������������������������� 1 730 745 12002�� 1 890 117 X
311514W Dry, condensed, and evaporated dairy product manufacturing, nsk, total 2003�������������������� 156 581 122002�� 121 040 X
311520 Ice cream and frozen dessert manufacturing 2003���������������������������������������������� 7 201 847 32002�� 7 784 683 X
3115200 Ice cream and frozen dessert manufacturing 2003�������������������������������������������� 7 201 847 32002�� 7 784 683 X
311611 Animal (except poultry) slaughtering 2003������������������������������������������������������ 60 810 116 12002�� 54 001 300 X
3116111 Beef, not canned or made into sausage, made in slaughtering plants 2003����������������������� 37 438 885 12002�� 32 145 346 X
3116114 Veal, not canned or made into sausage, made in slaughtering plants 2003����������������������� 489 347 12002�� 476 889 X
3116117 Lamb and mutton, not canned or made into sausage, made in slaughtering plants 2003������������ 296 440 32002�� 281 392 X
311611A Pork, not canned or made into sausage, made in slaughtering plants 2003����������������������� 12 630 715 12002�� 12 140 264 X
311611D Lard, made in slaughtering plants 2003������������������������������������������������������ 67 519 12002�� 43 679 X
311611G Pork, processed or cured, not canned or made into sausage, made in slaughteringplants2 2003���������������������������������������������������������������������������� 2 217 026 5
2002�� 2 273 712 X
311611J Sausage and similar products, except canned, made in slaughtering plants2 2003����������������� 2 295 302 42002�� 2 006 968 X
311611M Canned meats (except dog, cat, and baby food), made in slaughtering plants2 2003��������������� 195 077 82002�� 169 049 X
311611P Hides, skins, and pelts, made in slaughtering plants 2003�������������������������������������� 2 200 527 22002�� 1 950 652 X
311611R Miscellaneous byproducts of slaughtering plants 2003����������������������������������������� 1 311 077 22002�� 957 648 X
311611W Animal (except poultry) slaughtering, nsk, total 2003������������������������������������������ 1 668 201 32002�� 1 555 701 X
See footnotes at end of table.
4 Annual Survey of Manufactures Value of Product ShipmentsU.S. Census Bureau, 2002 Economic Census

Table 1. Value of Shipments for Product Classes: 2003 and 2002�Con.[Includes value of product shipments produced by (1) establishments classified in their primary industry and (2) establishments classified in other industries (secondary). Transfers of products from oneestablishment of a company to another establishment of the same company (interplant transfers) are also included. Data based on the 2003 Annual Survey of Manufactures (ASM). For information onconfidentiality protection, sampling error, nonsampling error, and explanation of terms, see note 2 at end of table. For meaning of abbreviations and symbols, see introductory text]
Productclass code Product Value of
product shipments($1,000)
Relativestandard error
of estimate1
(percent)
311612 Meat processed from carcasses 2003��������������������������������������������������������� 26 710 335 12002�� 24 114 584 X
3116121 Pork, processed or cured, not canned or made into sausage, made from purchasedcarcasses2 2003������������������������������������������������������������������������� 6 099 242 3
2002�� 5 228 805 X
3116124 Sausage and similar products, except canned, made from purchased carcasses2 2003������������ 6 995 433 12002�� 6 453 289 X
3116127 Canned meats (except dog, cat, and baby food), made from purchased carcasses2 2003���������� 1 355 789 32002�� 1 148 081 X
311612A Other processed, frozen, or cooked meats, made from purchased carcasses 2003���������������� 11 259 407 12002�� 10 368 329 X
311612W Meat processed from carcasses, nsk, total 2003���������������������������������������������� 1 000 464 22002�� 916 080 X
311613 Rendering and meat byproduct processing 2003������������������������������������������������ 3 200 201 32002�� 2 793 258 X
3116131 Lard and other greases, except wool grease3 2003�������������������������������������������� 1 227 089 52002�� 878 762 X
3116135 Animal and marine feed and fertilizer byproducts3 2003���������������������������������������� 1 913 876 42002�� 1 863 465 X
311613W Rendering and meat byproduct processing, nsk, total 2003������������������������������������� 59 236 122002�� 51 031 X
311615 Poultry processing 2003��������������������������������������������������������������������� 38 795 258 12002�� 37 104 826 X
3116151 Young chickens (usually under 20 weeks of age), including bulk, chilled, frozen, whole,and parts 2003�������������������������������������������������������������������������� 24 837 914 1
2002�� 24 024 163 X
3116154 Hens and fowl, including frozen, whole, and parts 2003���������������������������������������� 407 036 102002�� 281 293 X
3116157 Turkeys, including frozen, whole, and parts 2003��������������������������������������������� 4 055 524 22002�� 3 619 753 X
311615A Other poultry and small game, including frozen, whole, and parts 2003�������������������������� 305 203 82002�� 226 549 X
311615D Processed poultry and small game (except soups), containing 20 percent or morepoultry or meat 2003��������������������������������������������������������������������� 8 953 829 1
2002�� 8 735 931 X
311615W Poultry processing, nsk, total 2003���������������������������������������������������������� 235 753 32002�� 217 137 X
311711 Seafood canning 2003����������������������������������������������������������������������� 1 219 560 82002�� 1 367 617 X
3117110 Seafood canning 2003��������������������������������������������������������������������� 1 219 560 82002�� 1 367 617 X
311712 Fresh and frozen seafood processing 2003���������������������������������������������������� 7 180 971 32002�� 6 932 783 X
3117121 Prepared fresh fish and other fresh seafood 2003��������������������������������������������� 1 645 403 102002�� 1 246 176 X
3117122 Prepared frozen fish 2003����������������������������������������������������������������� 2 446 737 22002�� 2 512 965 X
3117123 Prepared frozen shellfish 2003������������������������������������������������������������� 1 409 730 82002�� 1 679 782 X
3117124 Other prepared fresh and frozen seafood 2003����������������������������������������������� 1 020 148 62002�� 879 583 X
311712W Fresh and frozen seafood processing, nsk, total 2003����������������������������������������� 658 953 102002�� 614 277 X
311811 Retail bakeries 2003������������������������������������������������������������������������ 2 575 946 42002�� 2 382 994 X
3118110 Retail bakery products 2003���������������������������������������������������������������� 2 575 946 42002�� 2 382 994 X
311812 Commercial bakeries 2003������������������������������������������������������������������� 20 111 245 22002�� 21 410 804 X
3118121 Bread (white, wheat, rye, etc.), including frozen 2003������������������������������������������ 7 578 763 42002�� 7 978 287 X
3118125 Rolls (bread�type), muffins, bagels, and croissants 2003��������������������������������������� 5 176 959 22002�� 5 805 145 X
3118127 Soft cakes, except frozen 2003������������������������������������������������������������� 2 531 953 92002�� 2 375 948 X
311812A Pies (fruit, cream, and custard), except frozen 2003������������������������������������������� 408 612 32002�� 462 402 X
311812D Other sweet goods, except frozen 2003������������������������������������������������������ 2 002 154 62002�� 2 269 524 X
311812W Commercial bakeries, nsk, total 2003�������������������������������������������������������� 2 412 805 52002�� 2 519 498 X
311813 Frozen cakes, pies, and other pastries manufacturing 2003�������������������������������������� 3 788 302 52002�� 3 859 917 X
3118130 Frozen bakery product manufacturing 2003�������������������������������������������������� 3 788 302 52002�� 3 859 917 X
See footnotes at end of table.
Value of Product Shipments Annual Survey of Manufactures 5U.S. Census Bureau, 2002 Economic Census

Table 1. Value of Shipments for Product Classes: 2003 and 2002�Con.[Includes value of product shipments produced by (1) establishments classified in their primary industry and (2) establishments classified in other industries (secondary). Transfers of products from oneestablishment of a company to another establishment of the same company (interplant transfers) are also included. Data based on the 2003 Annual Survey of Manufactures (ASM). For information onconfidentiality protection, sampling error, nonsampling error, and explanation of terms, see note 2 at end of table. For meaning of abbreviations and symbols, see introductory text]
Productclass code Product Value of
product shipments($1,000)
Relativestandard error
of estimate1
(percent)
311821 Cookie and cracker manufacturing 2003������������������������������������������������������� 9 698 212 32002�� 9 375 485 X
3118212 Crackers, biscuits, and related products 2003������������������������������������������������ 4 321 275 42002�� 3 767 729 X
3118214 Cookies, wafers, and ice cream cones and cups (except frozen) 2003��������������������������� 5 031 439 52002�� 4 971 593 X
311821W Cookie and cracker manufacturing, nsk, total 2003�������������������������������������������� 345 499 332002�� 636 163 X
311822 Flour mixes and dough manufacturing from purchased flour 2003��������������������������������� 5 030 682 12002�� 4 543 605 X
3118220 Prepared flour mixes (including refrigerated and frozen doughs and batters), madefrom purchased flour2 2003��������������������������������������������������������������� 5 030 682 1
2002�� 4 543 605 X
311823 Dry pasta manufacturing 2003���������������������������������������������������������������� 2 037 014 12002�� 1 634 801 X
3118230 Dry macaroni, spaghetti and egg noodle products, mitse (except canned or frozen) 2003����������� 2 037 014 12002�� 1 634 801 X
311830 Tortilla manufacturing 2003������������������������������������������������������������������ 1 453 885 42002�� 1 373 649 X
3118300 Tortillas sold in bulk or packages, not frozen or canned 2003����������������������������������� 1 453 885 42002�� 1 373 649 X
311911 Roasted nuts and peanut butter manufacturing 2003�������������������������������������������� 5 098 552 22002�� 4 936 707 X
3119111 Nuts and seeds (salted, roasted, cooked, or blanched) 2003����������������������������������� 3 790 437 32002�� 3 766 266 X
3119114 Peanut butter 2003����������������������������������������������������������������������� 1 151 780 12002�� 992 486 X
311911W Roasted nuts and peanut butter manufacturing, nsk, total 2003��������������������������������� 156 335 42002�� 177 955 X
311919 Other snack food manufacturing 2003��������������������������������������������������������� 12 800 323 12002�� 12 444 086 X
3119191 Potato chips and sticks, plain and flavored 2003���������������������������������������������� 4 909 119 22002�� 4 876 975 X
3119194 Corn chips and related products 2003������������������������������������������������������� 5 442 829 12002�� 5 616 568 X
3119197 Other chips, sticks (hard pretzels, bacon rinds, popcorn (except candied), etc.),excluding crackers, soft pretzels, and nuts 2003��������������������������������������������� 1 855 128 1
2002�� 1 748 765 X
311919W Other snack food manufacturing, nsk, total 2003���������������������������������������������� 593 247 12002�� 201 778 X
311920 Coffee and tea manufacturing 2003����������������������������������������������������������� 5 452 230 12002�� 5 179 716 X
3119201 Roasted coffee 2003���������������������������������������������������������������������� 3 788 869 22002�� 3 592 114 X
3119205 Coffee, concentrated (freeze�dried, spray�dried, frozen, or liquid concentrated,mixtures, etc.), and coffee substitutes 2003������������������������������������������������� 709 583 1
2002�� 590 034 X
3119207 Tea in consumer packages 2003������������������������������������������������������������ 823 723 22002�� 853 994 X
311920W Coffee and tea manufacturing, nsk, total 2003������������������������������������������������ 130 055 82002�� 143 574 X
311930 Flavoring syrup and concentrate manufacturing 2003�������������������������������������������� 9 713 742 22002�� 9 526 060 X
3119301 Liquid beverage bases not for use by soft drink bottlers 2003����������������������������������� 767 311 102002�� 521 673 X
3119304 Liquid beverage bases, concentrates and syrups, for sale by soft drink bottlers, totrade or nonbottler distributors 2003�������������������������������������������������������� 3 873 750 1
2002�� 3 943 655 X
3119305 Soft drink flavoring syrup sold in bulk 2003��������������������������������������������������� 928 502 72002�� 938 358 X
3119308 Other flavoring agents (except chocolate syrups) 2003���������������������������������������� 4 004 859 12002�� 3 773 890 X
311930W Flavoring syrup and concentrate manufacturing, nsk, total 2003��������������������������������� 139 320 712002�� 348 484 X
311941 Mayonnaise, dressing, and other prepared sauce manufacturing 2003����������������������������� 5 196 034 12002�� 5 055 678 X
3119411 Vinegar and cider 2003�������������������������������������������������������������������� 347 857 42002�� 336 645 X
3119414 Prepared sauces, except tomato 2003������������������������������������������������������� 1 829 357 22002�� 1 707 194 X
3119417 Mayonnaise, salad dressings, and sandwich spreads 2003������������������������������������� 2 762 493 12002�� 2 755 487 X
311941W Mayonnaise, dressing, and other prepared sauce manufacturing, nsk, total 2003������������������ 256 327 22002�� 256 352 X
See footnotes at end of table.
6 Annual Survey of Manufactures Value of Product ShipmentsU.S. Census Bureau, 2002 Economic Census

Table 1. Value of Shipments for Product Classes: 2003 and 2002�Con.[Includes value of product shipments produced by (1) establishments classified in their primary industry and (2) establishments classified in other industries (secondary). Transfers of products from oneestablishment of a company to another establishment of the same company (interplant transfers) are also included. Data based on the 2003 Annual Survey of Manufactures (ASM). For information onconfidentiality protection, sampling error, nonsampling error, and explanation of terms, see note 2 at end of table. For meaning of abbreviations and symbols, see introductory text]
Productclass code Product Value of
product shipments($1,000)
Relativestandard error
of estimate1
(percent)
311942 Spice and extract manufacturing 2003��������������������������������������������������������� 5 666 165 22002�� 5 375 228 X
3119421 Table salt (evaporated), pepper (white and black), and other spices 2003������������������������ 2 188 987 32002�� 2 045 193 X
3119425 Flavoring extracts, emulsions, and other liquid flavors and food colorings (exceptsynthetic) 2003�������������������������������������������������������������������������� 1 820 906 2
2002�� 1 471 322 X
3119427 Dry mix food preparations 2003������������������������������������������������������������� 1 593 273 32002�� 1 635 202 X
311942W Spice and extract manufacturing, nsk, total 2003���������������������������������������������� 62 999 822002�� 223 511 X
311991 Perishable prepared food manufacturing 2003�������������������������������������������������� 5 311 698 42002�� 5 273 253 X
3119910 Perishable prepared food manufacturing 2003������������������������������������������������ 5 311 698 42002�� 5 273 253 X
311999 All other miscellaneous food manufacturing 2003����������������������������������������������� 13 210 840 32002�� 10 883 412 X
3119991 Desserts (ready�to�mix) 2003��������������������������������������������������������������� 560 127 22002�� 630 306 X
3119994 Sweetening syrups and molasses 2003������������������������������������������������������ 476 013 22002�� 513 167 X
3119997 Baking powder and yeast 2003������������������������������������������������������������� 322 225 132002�� 363 344 X
311999B Packaging purchased macaroni and noodle products with other purchasedingredients 2003������������������������������������������������������������������������� 1 465 603 14
2002�� 1 210 708 X
311999G Egg processing 2003���������������������������������������������������������������������� 1 586 958 22002�� 1 441 539 X
311999J Flavoring powders, tablets, and paste (including dry mix cocktails) 2003������������������������� 1 686 660 12002�� 1 807 350 X
311999P Other food preparations 2003�������������������������������������������������������������� 2 527 304 32002�� 2 104 481 X
311999W All other miscellaneous food manufacturing, nsk, total 2003������������������������������������ 4 585 952 52002�� 2 812 517 X
312111 Soft drink manufacturing 2003���������������������������������������������������������������� 29 881 076 32002�� 29 142 222 X
3121111 Bottled carbonated soft drinks 2003��������������������������������������������������������� 9 879 810 62002�� 10 592 948 X
3121114 Canned carbonated soft drinks 2003�������������������������������������������������������� 8 951 946 32002�� 8 878 383 X
312111A Non�carbonated soft drinks 2003������������������������������������������������������������ 7 472 002 12002�� 6 196 738 X
312111W Soft drink manufacturing, nsk, total 2003����������������������������������������������������� 3 577 318 122002�� 3 474 153 X
312112 Bottled water manufacturing 2003������������������������������������������������������������� 3 300 572 42002�� 2 577 270 X
3121120 Bottled water manufacturing 2003����������������������������������������������������������� 3 300 572 42002�� 2 577 270 X
312113 Ice manufacturing 2003���������������������������������������������������������������������� 677 500 62002�� 590 048 X
3121130 Ice manufacturing 2003�������������������������������������������������������������������� 677 500 62002�� 590 048 X
312120 Breweries 2003����������������������������������������������������������������������������� 19 185 129 12002�� 17 789 150 X
3121201 Canned beer and ale case goods 2003������������������������������������������������������ 9 418 268 12002�� 9 221 705 X
3121204 Bottled beer and ale case goods 2003������������������������������������������������������� 7 055 346 12002�� 6 737 874 X
3121207 Beer and ale in barrels and kegs 2003������������������������������������������������������� 1 111 057 12002�� 1 084 752 X
3121209 All other malt beverages and brewing products 2003������������������������������������������ 1 127 811 22002�� 321 335 X
312120W Breweries, nsk, total 2003����������������������������������������������������������������� 472 648 22002�� 423 484 X
312130 Wineries 2003������������������������������������������������������������������������������ 8 693 758 22002�� 9 023 449 X
3121300 Wine, brandy, and brandy spirits 2003������������������������������������������������������� 8 693 758 22002�� 9 023 449 X
312140 Distilleries 2003���������������������������������������������������������������������������� 4 029 457 12002�� 4 212 052 X
3121402 Distilled liquor, except brandy 2003��������������������������������������������������������� 1 056 892 52002�� 968 543 X
3121404 Bottled liquor, except brandy 2003���������������������������������������������������������� 2 798 675 12002�� 3 088 267 X
312140W Distilleries, nsk, total 2003����������������������������������������������������������������� 173 890 102002�� 155 242 X
See footnotes at end of table.
Value of Product Shipments Annual Survey of Manufactures 7U.S. Census Bureau, 2002 Economic Census

Table 1. Value of Shipments for Product Classes: 2003 and 2002�Con.[Includes value of product shipments produced by (1) establishments classified in their primary industry and (2) establishments classified in other industries (secondary). Transfers of products from oneestablishment of a company to another establishment of the same company (interplant transfers) are also included. Data based on the 2003 Annual Survey of Manufactures (ASM). For information onconfidentiality protection, sampling error, nonsampling error, and explanation of terms, see note 2 at end of table. For meaning of abbreviations and symbols, see introductory text]
Productclass code Product Value of
product shipments($1,000)
Relativestandard error
of estimate1
(percent)
312210 Tobacco stemming and redrying 2003��������������������������������������������������������� 912 785 12002�� 1 051 107 X
3122101 Unstemmed leaf tobacco, redried before packing 2003���������������������������������������� 124 402 12002�� 123 230 X
3122104 Tobacco, stemmed 2003������������������������������������������������������������������ 497 794 12002�� 639 289 X
312210W Tobacco stemming and redrying, nsk, total 2003���������������������������������������������� 290 589 12002�� 288 588 X
312221 Cigarette manufacturing 2003���������������������������������������������������������������� 33 312 835 12002�� 33 723 543 X
3122210 Cigarettes, including nontobacco cigarettes 2003��������������������������������������������� 33 312 835 12002�� 33 723 543 X
312229 Other tobacco product manufacturing 2003���������������������������������������������������� 4 247 851 12002�� 4 099 864 X
3122291 Cigars 2003������������������������������������������������������������������������������ D S2002�� D X
3122294 Chewing and smoking tobacco 2003�������������������������������������������������������� 2 555 750 12002�� 2 462 929 X
3122297 Reconstituted tobacco (processed sheet and homogenized) 2003������������������������������� D S2002�� D X
312229W Other tobacco product manufacturing, nsk, total 2003����������������������������������������� 228 202 12002�� 234 032 X
313111 Yarn spinning mills 2003��������������������������������������������������������������������� 5 911 042 32002�� 6 333 548 X
3131111 Carded cotton yarns3 2003����������������������������������������������������������������� 2 309 538 22002�� 2 266 596 X
3131113 Combed cotton yarns3 2003���������������������������������������������������������������� 608 969 142002�� 627 203 X
3131115 Rayon, acetate, and/or lyocell spun yarns3 2003���������������������������������������������� 160 242 22002�� 173 759 X
3131116 Spun noncellulosic fiber and other natural fiber yarns3 2003������������������������������������ 2 613 861 42002�� 2 876 562 X
3131119 Wool yarns, including new, reused, and reprocessed wool3 2003�������������������������������� 139 090 12002�� 159 454 X
313111C Scouring and combing mill products 2003���������������������������������������������������� 31 602 12002�� 131 019 X
313111W Yarn spinning mills, nsk, total 2003���������������������������������������������������������� 47 740 702002�� 98 955 X
313112 Yarn texturizing, throwing, and twisting mills 2003����������������������������������������������� 4 408 897 32002�� 4 297 525 X
3131121 Novelty and plied yarns, other than wool (not spun or thrown at the sameestablishment) 2003���������������������������������������������������������������������� 176 199 4
2002�� 146 416 X
3131123 Thrown filament yarns, except textured 2003������������������������������������������������� 1 146 153 32002�� 1 133 746 X
3131125 Textured, crimped, and bulked filament yarns, including stretch yarn, made frompurchased filament yarn4 2003������������������������������������������������������������ 2 929 151 5
2002�� 2 816 781 X
3131128 Commission receipts for throwing, texturing, or winding filament yarns 2003���������������������� 139 577 72002�� 127 764 X
313112W Yarn texturizing, throwing, and twisting mills, nsk, total 2003������������������������������������ 17 817 72002�� 72 818 X
313113 Thread mills 2003��������������������������������������������������������������������������� 301 192 42002�� 307 118 X
3131130 Thread mills 2003������������������������������������������������������������������������� 301 192 42002�� 307 118 X
313210 Broadwoven fabric mills 2003���������������������������������������������������������������� 9 954 639 12002�� 10 805 716 X
3132101 Cotton broadwoven plain weave fabrics (excluding pile) (gray goods)3 2003���������������������� 800 986 12002�� 959 518 X
3132103 Cotton broadwoven twill weave fabrics (excluding pile) (gray goods)3 2003����������������������� 692 052 32002�� 822 951 X
3132105 Cotton broadwoven fabrics, weaves other than plain, twill, or pile (gray goods)3 2003�������������� 171 169 32002�� 193 768 X
3132107 Cotton broadwoven pile fabrics (gray goods)3 2003������������������������������������������� D S2002�� D X
3132109 Finished cotton broadwoven fabrics, finished in weaving mills2 2003����������������������������� 476 890 12002�� 538 804 X
313210D Fabricated textile products, made in weaving mills4 2003��������������������������������������� 1 200 272 12002�� 1 362 943 X
313210E Manmade fiber broadwoven fabrics of 85 percent or more filament yarns, chiefly rayon,acetate, and/or lyocell (gray goods)3 2003�������������������������������������������������� 488 618 2
2002�� 532 258 X
313210G Manmade fiber broadwoven fabrics of 85 percent or more filament yarns (excludingrayon, acetate, and/or lyocell) (gray goods)3 2003�������������������������������������������� 1 341 089 1
2002�� 1 361 408 X
See footnotes at end of table.
8 Annual Survey of Manufactures Value of Product ShipmentsU.S. Census Bureau, 2002 Economic Census

Table 1. Value of Shipments for Product Classes: 2003 and 2002�Con.[Includes value of product shipments produced by (1) establishments classified in their primary industry and (2) establishments classified in other industries (secondary). Transfers of products from oneestablishment of a company to another establishment of the same company (interplant transfers) are also included. Data based on the 2003 Annual Survey of Manufactures (ASM). For information onconfidentiality protection, sampling error, nonsampling error, and explanation of terms, see note 2 at end of table. For meaning of abbreviations and symbols, see introductory text]
Productclass code Product Value of
product shipments($1,000)
Relativestandard error
of estimate1
(percent)
313210 Broadwoven fabric mills�Con.313210H Manmade fiber broadwoven plain weave fabrics, of 85 percent or more spun yarns
(excluding pile), excluding wool blends (gray goods)3 2003������������������������������������ 907 697 22002�� 1 029 502 X
313210J Manmade fiber broadwoven twill weave fabrics, of 85 percent or more spun yarns(excluding pile), excluding wool blends (gray goods)3 2003������������������������������������ 173 419 2
2002�� 176 684 X
313210L Manmade fiber broadwoven fabrics, of weaves other than plain, twill, and pile, of 85percent or more spun yarn, excluding wool blends (gray goods)3 2003�������������������������� 333 739 1
2002�� 345 813 X
313210M Manmade fiber broadwoven fabrics, combinations of spun and filament yarns(excluding wool blends), each less than 85 percent of total fiber content (gray goods)3 2003���������������������������������������������������������������������������������� 529 869 1
2002�� 595 922 X
313210N Other broadwoven fabrics of manmade fibers including pile; and broadwoven fabrics ofsilk and natural fibers (excluding cotton) (gray goods)3 2003����������������������������������� 321 300 1
2002�� 284 805 X
313210P Finished manmade fiber and silk broadwoven fabrics, finished in weaving mills2 2003�������������� 1 308 477 12002�� 1 394 156 X
313210T Wool broadwoven fabrics (gray goods)3 2003������������������������������������������������ 67 579 12002�� D X
313210U Finished broadwoven wool fabrics and felts (finished in weaving mills) 2003���������������������� D S2002�� D X
313210W Broadwoven fabric mills, nsk, total 2003����������������������������������������������������� 556 763 22002�� 567 181 X
313221 Narrow fabric mills 2003��������������������������������������������������������������������� 1 070 938 12002�� 1 117 825 X
3132211 Woven narrow fabrics (12 inches or less in width) 2003���������������������������������������� 769 253 22002�� 808 078 X
3132213 Braided narrow fabrics (12 inches or less in width) 2003��������������������������������������� 174 034 12002�� 183 418 X
3132215 Covered rubber thread, made in narrow fabric mills 2003�������������������������������������� 78 601 12002�� 82 254 X
313221W Narrow fabric mills, nsk, total 2003���������������������������������������������������������� 49 050 42002�� 44 075 X
313222 Schiffli machine embroidery 2003������������������������������������������������������������� 103 526 162002�� 137 130 X
3132220 Schiffli machine embroideries 2003��������������������������������������������������������� 103 526 162002�� 137 130 X
313230 Nonwoven fabric mills 2003������������������������������������������������������������������ 4 797 541 22002�� 4 892 049 X
3132301 Nonwoven fabrics 2003�������������������������������������������������������������������� 2 983 697 32002�� 3 225 481 X
3132303 Fabricated nonwoven products 2003�������������������������������������������������������� 949 908 22002�� 844 667 X
3132305 Pressed, punched, or needled felts (except hats) 2003���������������������������������������� 751 377 52002�� 695 574 X
313230W Nonwoven fabric mills, nsk, total 2003������������������������������������������������������� 112 560 92002�� 126 327 X
313241 Weft knit fabric mills 2003�������������������������������������������������������������������� 1 703 561 92002�� 1 787 492 X
3132411 Weft (circular) knit fabrics greige goods (excluding hosiery)3 2003������������������������������� 543 040 182002�� 646 667 X
3132413 Finished weft (circular) knit fabrics, excluding hosiery 2003������������������������������������� 999 019 112002�� 956 750 X
3132416 Nonapparel articles of weft knit fabrics and commission receipts for knitting only orknitting and finishing weft knit fabrics (excluding hosiery) 2003��������������������������������� 106 317 15
2002�� 118 166 X
313241W Weft knit fabric mills, nsk, total 2003��������������������������������������������������������� 55 185 62002�� 65 909 X
313249 Other knit fabric and lace mills 2003����������������������������������������������������������� 1 401 726 22002�� 1 553 820 X
3132491 Warp knit fabrics greige goods3 2003�������������������������������������������������������� 353 488 42002�� 380 644 X
3132493 Finished warp knit fabrics 2003������������������������������������������������������������� 855 472 32002�� 949 560 X
3132495 Lace and net goods, all leavers and nottingham lace machine products, includingbobbinets and barmen laces 2003��������������������������������������������������������� 41 459 1
2002�� 42 178 X
3132497 Contract and commission receipts for knitting only or knitting and finishing of warp knitfabrics, lace, or net goods 2003������������������������������������������������������������ 75 002 18
2002�� 71 784 X
313249A Other nonapparel warp knit end products (including knitted towels and washcloths),excluding fabrics, lace, and net goods 2003������������������������������������������������� 24 463 1
2002�� 26 039 X
313249W Other knit fabric and lace mills, nsk, total 2003������������������������������������������������ 51 841 232002�� 83 615 X
See footnotes at end of table.
Value of Product Shipments Annual Survey of Manufactures 9U.S. Census Bureau, 2002 Economic Census

Table 1. Value of Shipments for Product Classes: 2003 and 2002�Con.[Includes value of product shipments produced by (1) establishments classified in their primary industry and (2) establishments classified in other industries (secondary). Transfers of products from oneestablishment of a company to another establishment of the same company (interplant transfers) are also included. Data based on the 2003 Annual Survey of Manufactures (ASM). For information onconfidentiality protection, sampling error, nonsampling error, and explanation of terms, see note 2 at end of table. For meaning of abbreviations and symbols, see introductory text]
Productclass code Product Value of
product shipments($1,000)
Relativestandard error
of estimate1
(percent)
313311 Broadwoven fabric finishing mills 2003��������������������������������������������������������� 6 130 252 22002�� 6 628 902 X
3133111 Finished cotton broadwoven fabrics, finished in finishing mills2 2003����������������������������� 1 650 276 32002�� 1 757 451 X
3133113 Job or commission finishing of cotton broadwoven fabrics 2003��������������������������������� 793 902 92002�� 954 650 X
3133115 Finished manmade fiber and silk broadwoven fabrics, finished in finishing mills2 2003�������������� 2 075 992 42002�� 2 200 012 X
3133117 Job or commission finishing of manmade fiber and silk broadwoven fabrics 2003������������������ D S2002�� D X
3133119 Finished broadwoven wool fabrics and felts (not finished in weaving mill) 2003�������������������� D S2002�� D X
313311W Broadwoven fabric finishing mills, nsk, total 2003��������������������������������������������� 852 827 32002�� 946 065 X
313312 Textile and fabric finishing (except broadwoven fabric) mills 2003��������������������������������� 2 889 748 22002�� 3 397 784 X
3133120 Finished fabrics (excluding broadwoven) and other finished textiles 2003������������������������� 2 889 748 22002�� 3 397 784 X
313320 Fabric coating mills 2003�������������������������������������������������������������������� 2 252 719 22002�� 2 143 076 X
3133201 Vinyl coated fabrics, including expanded vinyl coated 2003������������������������������������� 716 769 32002�� 672 753 X
3133204 Rubber coating of fabrics and garments 2003������������������������������������������������ 224 027 72002�� 204 208 X
3133205 Other coated or laminated fabrics and coated yarns 2003�������������������������������������� 1 159 029 32002�� 1 039 459 X
313320W Fabric coating mills, nsk, total 2003��������������������������������������������������������� 152 894 122002�� 226 656 X
314110 Carpet and rug mills 2003�������������������������������������������������������������������� 12 906 723 12002�� 13 064 449 X
3141101 Woven carpet and rugs3 2003�������������������������������������������������������������� 871 204 22002�� 769 819 X
3141103 Tufted carpet and rugs3 2003��������������������������������������������������������������� 11 128 411 12002�� 11 396 407 X
3141105 Other carpet, rugs, and mats3 2003��������������������������������������������������������� 468 986 92002�� 417 693 X
314110W Carpet and rug mills, nsk, total 2003�������������������������������������������������������� 438 121 122002�� 480 530 X
314121 Curtain and drapery mills 2003��������������������������������������������������������������� 1 332 611 42002�� 1 470 829 X
3141210 Curtains and draperies 2003��������������������������������������������������������������� 1 332 611 42002�� 1 470 829 X
314129 Other household textile product mills 2003����������������������������������������������������� 5 615 140 12002�� 6 077 546 X
3141291 Bedspreads, made from purchased materials4 2003������������������������������������������� 173 188 32002�� 185 292 X
3141293 Sheets and pillowcases, made from purchased materials4 2003��������������������������������� 1 131 577 12002�� 1 346 720 X
3141295 Towels and washcloths, made from purchased materials4 2003��������������������������������� 597 115 12002�� 587 024 X
3141296 Other household furnishings, made from purchased materials4 2003���������������������������� 3 325 893 12002�� 3 530 606 X
314129W Other household textile product mills, nsk, total 2003������������������������������������������ 387 367 42002�� 427 904 X
314911 Textile bag mills 2003����������������������������������������������������������������������� 644 919 62002�� 656 905 X
3149110 Textile bags 2003������������������������������������������������������������������������� 644 919 62002�� 656 905 X
314912 Canvas and related product mills 2003�������������������������������������������������������� 1 784 053 42002�� 1 705 033 X
3149120 Canvas and related products 2003���������������������������������������������������������� 1 784 053 42002�� 1 705 033 X
314991 Rope, cordage, and twine mills 2003���������������������������������������������������������� 551 356 32002�� 604 135 X
3149911 Cordage and twine, hard fiber 2003��������������������������������������������������������� 82 376 92002�� 74 320 X
3149913 Cordage and twine, soft fiber (except cotton) 2003�������������������������������������������� 359 670 42002�� 412 234 X
3149915 Cotton cordage and twine 2003������������������������������������������������������������� 46 201 72002�� 51 400 X
314991W Rope, cordage, and twine mills, nsk, total 2003����������������������������������������������� 63 109 62002�� 66 181 X
314992 Tire cord and tire fabric mills 2003������������������������������������������������������������ 1 218 271 12002�� 1 222 681 X
3149920 Tire cord and tire fabrics3 2003������������������������������������������������������������� 1 218 271 12002�� 1 222 681 X
See footnotes at end of table.
10 Annual Survey of Manufactures Value of Product ShipmentsU.S. Census Bureau, 2002 Economic Census

Table 1. Value of Shipments for Product Classes: 2003 and 2002�Con.[Includes value of product shipments produced by (1) establishments classified in their primary industry and (2) establishments classified in other industries (secondary). Transfers of products from oneestablishment of a company to another establishment of the same company (interplant transfers) are also included. Data based on the 2003 Annual Survey of Manufactures (ASM). For information onconfidentiality protection, sampling error, nonsampling error, and explanation of terms, see note 2 at end of table. For meaning of abbreviations and symbols, see introductory text]
Productclass code Product Value of
product shipments($1,000)
Relativestandard error
of estimate1
(percent)
314999 All other miscellaneous textile product mills 2003����������������������������������������������� 4 813 279 32002�� 4 973 480 X
3149991 Recovered fibers, processed mill waste and related products 2003������������������������������ 175 481 72002�� 187 128 X
3149993 Paddings and upholstery filling, batting, and wadding (excluding foam rubber andplastics) 2003��������������������������������������������������������������������������� 483 949 8
2002�� 508 604 X
3149995 Embroideries (excluding Schiffli machine products) 2003��������������������������������������� 637 556 72002�� 560 996 X
3149997 Other trimmings and findings 2003���������������������������������������������������������� 221 890 112002�� 242 972 X
3149998 All other miscellaneous fabricated textile products 2003���������������������������������������� 2 280 589 42002�� 2 375 251 X
314999W All other miscellaneous textile product mills, nsk, total 2003������������������������������������ 1 013 814 72002�� 1 098 529 X
315111 Sheer hosiery mills 2003��������������������������������������������������������������������� 810 771 32002�� 886 348 X
3151111 Women’s, misses’, and girls’ sheer finished hosiery, full�length, knee�length, and belowthe knee 2003��������������������������������������������������������������������������� 217 031 7
2002�� 229 248 X
3151113 Women’s, misses’, and girls’ sheer finished pantyhose, including tights, all needle 2003������������ 498 905 32002�� 517 180 X
3151115 Women’s, misses’, and girls’ sheer hosiery shipped in the greige (except socks) 2003������������� 67 732 142002�� 109 237 X
315111W Sheer hosiery mills, nsk, total 2003��������������������������������������������������������� 27 104 142002�� 30 683 X
315119 Other hosiery and sock mills 2003������������������������������������������������������������ 2 138 323 42002�� 2 336 824 X
3151191 Men’s finished seamless hosiery and socks, (sizes 10 and up) 2003����������������������������� 997 476 62002�� 1 265 617 X
3151193 All other finished hosiery, other than sheer 2003���������������������������������������������� 908 904 72002�� 847 727 X
3151195 Seamless hosiery (except sheer), shipped in the greige 2003����������������������������������� 141 595 152002�� 127 230 X
315119W Other hosiery and sock mills, nsk, total 2003������������������������������������������������� 90 348 32002�� 96 250 X
315191 Outerwear knitting mills 2003����������������������������������������������������������������� 1 345 157 22002�� 1 654 422 X
3151912 Men’s and boys’ sweaters, made in knitting mills3 2003���������������������������������������� 36 847 42002�� 59 532 X
3151914 Women’s, girls’, and infants’ sweaters, made in knitting mills3 2003������������������������������ 199 639 32002�� 303 584 X
3151917 Men’s and boys’ knit dress and sport shirts (including polo, tank tops, sweat and t�shirts), made in knitting mills4 2003��������������������������������������������������������� 402 179 2
2002�� 476 486 X
315191B Women’s, girls’, and infants’ knit shirts and blouses (including polo, tank tops, sweatand t�shirts), made in knitting mills3 2003��������������������������������������������������� 177 219 10
2002�� 222 998 X
315191D Knit outerwear, except sweaters and shirts, made in knitting mills 2003�������������������������� 105 411 22002�� 133 739 X
315191E Contract receipts for knitting only or knitting and finishing knitting mill products, exceptunderwear and nightwear 2003������������������������������������������������������������ 73 444 15
2002�� 80 472 X
315191G Gloves and mittens, made in knitting mills4 2003���������������������������������������������� 47 957 42002�� 54 562 X
315191H Hats, mufflers, scarves, and other knitting mill apparel products, excluding outerwear,gloves and mittens, underwear, and nightwear 2003������������������������������������������ 51 930 14
2002�� 39 204 X
315191W Outerwear knitting mills, nsk, total 2003������������������������������������������������������ 250 532 92002�� 283 845 X
315192 Underwear and nightwear knitting mills 2003��������������������������������������������������� 414 321 42002�� 813 592 X
3151921 Men’s and boys’ knit underwear, nightwear, and robes, made in knitting mills4 2003��������������� D S2002�� 368 232 X
3151924 Women’s, girls’, and infants’ knit underwear and nightwear, made in knitting mills4 2003����������� 215 899 42002�� 434 039 X
315192E Contract receipts for knitting only or knitting and finishing underwear and nightwear 2003���������� D S2002�� – X
315192W Underwear and nightwear knitting mills, nsk, total 2003���������������������������������������� 11 362 12002�� 11 321 X
See footnotes at end of table.
Value of Product Shipments Annual Survey of Manufactures 11U.S. Census Bureau, 2002 Economic Census
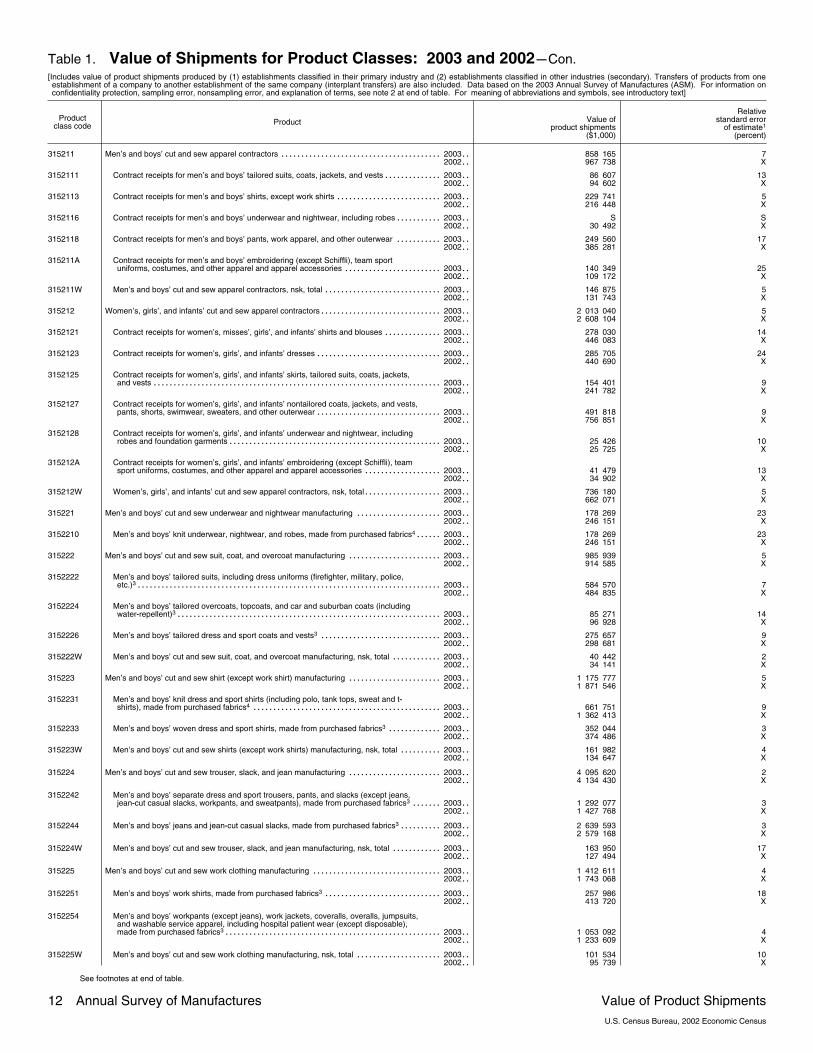
Table 1. Value of Shipments for Product Classes: 2003 and 2002�Con.[Includes value of product shipments produced by (1) establishments classified in their primary industry and (2) establishments classified in other industries (secondary). Transfers of products from oneestablishment of a company to another establishment of the same company (interplant transfers) are also included. Data based on the 2003 Annual Survey of Manufactures (ASM). For information onconfidentiality protection, sampling error, nonsampling error, and explanation of terms, see note 2 at end of table. For meaning of abbreviations and symbols, see introductory text]
Productclass code Product Value of
product shipments($1,000)
Relativestandard error
of estimate1
(percent)
315211 Men’s and boys’ cut and sew apparel contractors 2003������������������������������������������ 858 165 72002�� 967 738 X
3152111 Contract receipts for men’s and boys’ tailored suits, coats, jackets, and vests 2003���������������� 86 607 132002�� 94 602 X
3152113 Contract receipts for men’s and boys’ shirts, except work shirts 2003���������������������������� 229 741 52002�� 216 448 X
3152116 Contract receipts for men’s and boys’ underwear and nightwear, including robes 2003������������� S S2002�� 30 492 X
3152118 Contract receipts for men’s and boys’ pants, work apparel, and other outerwear 2003������������� 249 560 172002�� 385 281 X
315211A Contract receipts for men’s and boys’ embroidering (except Schiffli), team sportuniforms, costumes, and other apparel and apparel accessories 2003�������������������������� 140 349 25
2002�� 109 172 X
315211W Men’s and boys’ cut and sew apparel contractors, nsk, total 2003������������������������������� 146 875 52002�� 131 743 X
315212 Women’s, girls’, and infants’ cut and sew apparel contractors 2003�������������������������������� 2 013 040 52002�� 2 608 104 X
3152121 Contract receipts for women’s, misses’, girls’, and infants’ shirts and blouses 2003���������������� 278 030 142002�� 446 083 X
3152123 Contract receipts for women’s, girls’, and infants’ dresses 2003��������������������������������� 285 705 242002�� 440 690 X
3152125 Contract receipts for women’s, girls’, and infants’ skirts, tailored suits, coats, jackets,and vests 2003�������������������������������������������������������������������������� 154 401 9
2002�� 241 782 X
3152127 Contract receipts for women’s, girls’, and infants’ nontailored coats, jackets, and vests,pants, shorts, swimwear, sweaters, and other outerwear 2003��������������������������������� 491 818 9
2002�� 756 851 X
3152128 Contract receipts for women’s, girls’, and infants’ underwear and nightwear, includingrobes and foundation garments 2003������������������������������������������������������� 25 426 10
2002�� 25 725 X
315212A Contract receipts for women’s, girls’, and infants’ embroidering (except Schiffli), teamsport uniforms, costumes, and other apparel and apparel accessories 2003��������������������� 41 479 13
2002�� 34 902 X
315212W Women’s, girls’, and infants’ cut and sew apparel contractors, nsk, total 2003��������������������� 736 180 52002�� 662 071 X
315221 Men’s and boys’ cut and sew underwear and nightwear manufacturing 2003����������������������� 178 269 232002�� 246 151 X
3152210 Men’s and boys’ knit underwear, nightwear, and robes, made from purchased fabrics4 2003�������� 178 269 232002�� 246 151 X
315222 Men’s and boys’ cut and sew suit, coat, and overcoat manufacturing 2003������������������������� 985 939 52002�� 914 585 X
3152222 Men’s and boys’ tailored suits, including dress uniforms (firefighter, military, police,etc.)3 2003������������������������������������������������������������������������������ 584 570 7
2002�� 484 835 X
3152224 Men’s and boys’ tailored overcoats, topcoats, and car and suburban coats (includingwater�repellent)3 2003�������������������������������������������������������������������� 85 271 14
2002�� 96 928 X
3152226 Men’s and boys’ tailored dress and sport coats and vests3 2003�������������������������������� 275 657 92002�� 298 681 X
315222W Men’s and boys’ cut and sew suit, coat, and overcoat manufacturing, nsk, total 2003�������������� 40 442 22002�� 34 141 X
315223 Men’s and boys’ cut and sew shirt (except work shirt) manufacturing 2003������������������������� 1 175 777 52002�� 1 871 546 X
3152231 Men’s and boys’ knit dress and sport shirts (including polo, tank tops, sweat and t�shirts), made from purchased fabrics4 2003������������������������������������������������� 661 751 9
2002�� 1 362 413 X
3152233 Men’s and boys’ woven dress and sport shirts, made from purchased fabrics3 2003��������������� 352 044 32002�� 374 486 X
315223W Men’s and boys’ cut and sew shirts (except work shirts) manufacturing, nsk, total 2003������������ 161 982 42002�� 134 647 X
315224 Men’s and boys’ cut and sew trouser, slack, and jean manufacturing 2003������������������������� 4 095 620 22002�� 4 134 430 X
3152242 Men’s and boys’ separate dress and sport trousers, pants, and slacks (except jeans,jean�cut casual slacks, workpants, and sweatpants), made from purchased fabrics3 2003��������� 1 292 077 3
2002�� 1 427 768 X
3152244 Men’s and boys’ jeans and jean�cut casual slacks, made from purchased fabrics3 2003������������ 2 639 593 32002�� 2 579 168 X
315224W Men’s and boys’ cut and sew trouser, slack, and jean manufacturing, nsk, total 2003�������������� 163 950 172002�� 127 494 X
315225 Men’s and boys’ cut and sew work clothing manufacturing 2003���������������������������������� 1 412 611 42002�� 1 743 068 X
3152251 Men’s and boys’ work shirts, made from purchased fabrics3 2003������������������������������� 257 986 182002�� 413 720 X
3152254 Men’s and boys’ workpants (except jeans), work jackets, coveralls, overalls, jumpsuits,and washable service apparel, including hospital patient wear (except disposable),made from purchased fabrics3 2003�������������������������������������������������������� 1 053 092 4
2002�� 1 233 609 X
315225W Men’s and boys’ cut and sew work clothing manufacturing, nsk, total 2003����������������������� 101 534 102002�� 95 739 X
See footnotes at end of table.
12 Annual Survey of Manufactures Value of Product ShipmentsU.S. Census Bureau, 2002 Economic Census

Table 1. Value of Shipments for Product Classes: 2003 and 2002�Con.[Includes value of product shipments produced by (1) establishments classified in their primary industry and (2) establishments classified in other industries (secondary). Transfers of products from oneestablishment of a company to another establishment of the same company (interplant transfers) are also included. Data based on the 2003 Annual Survey of Manufactures (ASM). For information onconfidentiality protection, sampling error, nonsampling error, and explanation of terms, see note 2 at end of table. For meaning of abbreviations and symbols, see introductory text]
Productclass code Product Value of
product shipments($1,000)
Relativestandard error
of estimate1
(percent)
315228 Men’s and boys’ cut and sew other outerwear manufacturing 2003�������������������������������� 1 184 124 92002�� 1 172 879 X
3152282 Men’s and boys’ nontailored coats, jackets, and vests, including down� and feather�filled (except ski apparel and work jackets), made from purchased fabrics3 2003����������������� 347 366 5
2002�� 395 066 X
3152284 Men’s and boys’ shorts (including dress and athletic) and swimwear, made frompurchased fabrics3 2003������������������������������������������������������������������ 496 939 19
2002�� 460 755 X
3152286 Men’s and boys’ sweaters, sweatpants, jogging and warm�up suits, playsuits,beachwear (except swimsuits), and ski apparel, made from purchased fabrics3 2003������������� 225 642 6
2002�� 205 188 X
315228W Men’s and boys’ cut and sew other outerwear manufacturing, nsk, total 2003��������������������� 114 176 162002�� 111 870 X
315231 Women’s and girls’ cut and sew lingerie, loungewear, and nightwear manufacturing 2003������������ 2 120 079 12002�� 2 330 692 X
3152311 Women’s and girls’ underwear, except foundation garments, made from purchasedfabrics4 2003���������������������������������������������������������������������������� 326 012 9
2002�� 482 037 X
3152313 Women’s and girls’ nightwear, except robes, made from purchased fabrics4 2003����������������� 234 959 32002�� 256 728 X
3152315 Women’s and girls’ brassieres, bra�lettes, and bandeaux, made from purchasedfabrics4 2003���������������������������������������������������������������������������� 1 371 558 1
2002�� 1 364 077 X
3152318 Women’s and girls’ corsets (except surgical), girdles, and combinations, made frompurchased fabrics4 2003������������������������������������������������������������������ 57 068 1
2002�� 56 282 X
3152319 Women’s and girls’ robes and dressing gowns, made from purchased fabrics4 2003��������������� 60 634 42002�� 66 783 X
315231W Women’s and girls’ cut and sew lingerie, loungewear and nightwear manufacturing,nsk, total 2003�������������������������������������������������������������������������� 69 848 6
2002�� 104 785 X
315232 Women’s and girls’ cut and sew blouse and shirt manufacturing 2003����������������������������� 2 749 025 32002�� 3 110 947 X
3152321 Women’s and girls’ knit shirts and blouses (including polo, tank tops, sweat and t�shirts), made from purchased fabrics3 2003������������������������������������������������� 1 530 430 4
2002�� 1 605 180 X
3152323 Women’s and girls’ woven shirts and blouses, made from purchased fabrics3 2003���������������� 977 111 52002�� 1 237 803 X
315232W Women’s and girls’ cut and sew blouse and shirt manufacturing, nsk, total 2003������������������ 241 485 32002�� 267 964 X
315233 Women’s and girls’ cut and sew dress manufacturing 2003��������������������������������������� 2 719 539 32002�� 3 042 071 X
3152330 Women’s and girls’ dresses, made from purchased fabrics3 2003������������������������������� 2 719 539 32002�� 3 042 071 X
315234 Women’s and girls’ cut and sew suit, coat, tailored jacket, and skirt manufacturing 2003������������� 1 238 599 32002�� 1 492 436 X
3152342 Women’s and girls’ tailored coats and capes, including water�repellent (except fur,leather, down� and feather�filled)3 2003����������������������������������������������������� 205 085 12
2002�� 235 830 X
3152344 Women’s and girls’ tailored suits and pantsuits, including dress uniforms (firefighter,military, police, etc)3 2003����������������������������������������������������������������� 93 008 4
2002�� 96 269 X
3152346 Women’s and girls’ skirts, made from purchased fabrics3 2003���������������������������������� 554 068 52002�� 716 960 X
3152348 Women’s and girls’ tailored jackets and vests, except fur and leather3 2003���������������������� 264 176 42002�� 314 741 X
315234W Women’s and girls’ cut and sew suit, coat, tailored jacket, and skirt manufacturing, nsk,total 2003������������������������������������������������������������������������������� 122 261 6
2002�� 128 636 X
315239 Women’s and girls’ cut and sew other outerwear manufacturing 2003������������������������������ 4 160 132 32002�� 5 019 443 X
3152392 Women’s and girls’ sweaters, including sweater vests, made from purchased fabrics3 2003�������� 220 538 32002�� 231 306 X
3152394 Women’s and girls’ shorts, including tennis skirts, made from purchased fabrics3 2003������������� 389 456 22002�� 565 360 X
3152396 Women’s and girls’ slacks, jeans, and jean�cut casual slacks (except sweatpants),made from purchased fabrics3 2003�������������������������������������������������������� 2 004 411 3
2002�� 2 455 997 X
3152398 Women’s and girls’ sweatpants, bodysuits and bodyshirts, jogging and warm�up suits,playsuits, rompers, and beachwear (except swimwear), made from purchasedfabrics3 2003���������������������������������������������������������������������������� 130 762 17
2002�� 208 345 X
315239A Women’s and girls’ swimwear, made from purchased fabrics3 2003����������������������������� 584 903 52002�� 640 317 X
315239C Women’s and girls’ nontailored coats, jackets, and vests (including water�repellent,down� and feather�filled, and ski apparel), made from purchased fabrics3 2003������������������� 180 989 10
2002�� 167 380 X
315239E Women’s and girls’ washable service apparel, including hospital patient wear (exceptdisposable), coveralls, overalls, and jumpsuits, made from purchased fabrics3 2003�������������� 331 181 4
2002�� 413 504 X
See footnotes at end of table.
Value of Product Shipments Annual Survey of Manufactures 13U.S. Census Bureau, 2002 Economic Census
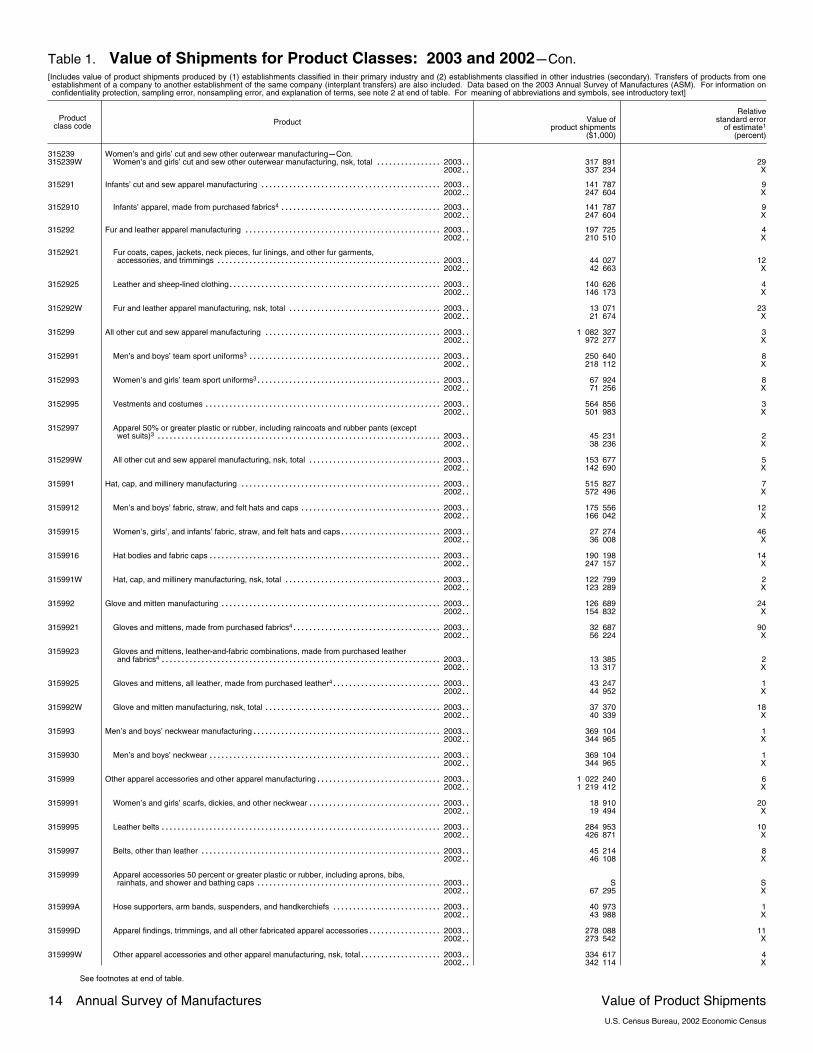
Table 1. Value of Shipments for Product Classes: 2003 and 2002�Con.[Includes value of product shipments produced by (1) establishments classified in their primary industry and (2) establishments classified in other industries (secondary). Transfers of products from oneestablishment of a company to another establishment of the same company (interplant transfers) are also included. Data based on the 2003 Annual Survey of Manufactures (ASM). For information onconfidentiality protection, sampling error, nonsampling error, and explanation of terms, see note 2 at end of table. For meaning of abbreviations and symbols, see introductory text]
Productclass code Product Value of
product shipments($1,000)
Relativestandard error
of estimate1
(percent)
315239 Women’s and girls’ cut and sew other outerwear manufacturing�Con.315239W Women’s and girls’ cut and sew other outerwear manufacturing, nsk, total 2003������������������ 317 891 29
2002�� 337 234 X
315291 Infants’ cut and sew apparel manufacturing 2003����������������������������������������������� 141 787 92002�� 247 604 X
3152910 Infants’ apparel, made from purchased fabrics4 2003������������������������������������������ 141 787 92002�� 247 604 X
315292 Fur and leather apparel manufacturing 2003��������������������������������������������������� 197 725 42002�� 210 510 X
3152921 Fur coats, capes, jackets, neck pieces, fur linings, and other fur garments,accessories, and trimmings 2003���������������������������������������������������������� 44 027 12
2002�� 42 663 X
3152925 Leather and sheep�lined clothing 2003������������������������������������������������������� 140 626 42002�� 146 173 X
315292W Fur and leather apparel manufacturing, nsk, total 2003���������������������������������������� 13 071 232002�� 21 674 X
315299 All other cut and sew apparel manufacturing 2003���������������������������������������������� 1 082 327 32002�� 972 277 X
3152991 Men’s and boys’ team sport uniforms3 2003�������������������������������������������������� 250 640 82002�� 218 112 X
3152993 Women’s and girls’ team sport uniforms3 2003������������������������������������������������ 67 924 82002�� 71 256 X
3152995 Vestments and costumes 2003������������������������������������������������������������� 564 856 32002�� 501 983 X
3152997 Apparel 50% or greater plastic or rubber, including raincoats and rubber pants (exceptwet suits)3 2003������������������������������������������������������������������������� 45 231 2
2002�� 38 236 X
315299W All other cut and sew apparel manufacturing, nsk, total 2003����������������������������������� 153 677 52002�� 142 690 X
315991 Hat, cap, and millinery manufacturing 2003���������������������������������������������������� 515 827 72002�� 572 496 X
3159912 Men’s and boys’ fabric, straw, and felt hats and caps 2003������������������������������������� 175 556 122002�� 166 042 X
3159915 Women’s, girls’, and infants’ fabric, straw, and felt hats and caps 2003��������������������������� 27 274 462002�� 36 008 X
3159916 Hat bodies and fabric caps 2003������������������������������������������������������������ 190 198 142002�� 247 157 X
315991W Hat, cap, and millinery manufacturing, nsk, total 2003����������������������������������������� 122 799 22002�� 123 289 X
315992 Glove and mitten manufacturing 2003��������������������������������������������������������� 126 689 242002�� 154 832 X
3159921 Gloves and mittens, made from purchased fabrics4 2003��������������������������������������� 32 687 902002�� 56 224 X
3159923 Gloves and mittens, leather�and�fabric combinations, made from purchased leatherand fabrics4 2003������������������������������������������������������������������������ 13 385 2
2002�� 13 317 X
3159925 Gloves and mittens, all leather, made from purchased leather4 2003����������������������������� 43 247 12002�� 44 952 X
315992W Glove and mitten manufacturing, nsk, total 2003���������������������������������������������� 37 370 182002�� 40 339 X
315993 Men’s and boys’ neckwear manufacturing 2003������������������������������������������������� 369 104 12002�� 344 965 X
3159930 Men’s and boys’ neckwear 2003������������������������������������������������������������ 369 104 12002�� 344 965 X
315999 Other apparel accessories and other apparel manufacturing 2003��������������������������������� 1 022 240 62002�� 1 219 412 X
3159991 Women’s and girls’ scarfs, dickies, and other neckwear 2003����������������������������������� 18 910 202002�� 19 494 X
3159995 Leather belts 2003������������������������������������������������������������������������ 284 953 102002�� 426 871 X
3159997 Belts, other than leather 2003�������������������������������������������������������������� 45 214 82002�� 46 108 X
3159999 Apparel accessories 50 percent or greater plastic or rubber, including aprons, bibs,rainhats, and shower and bathing caps 2003������������������������������������������������ S S
2002�� 67 295 X
315999A Hose supporters, arm bands, suspenders, and handkerchiefs 2003����������������������������� 40 973 12002�� 43 988 X
315999D Apparel findings, trimmings, and all other fabricated apparel accessories 2003�������������������� 278 088 112002�� 273 542 X
315999W Other apparel accessories and other apparel manufacturing, nsk, total 2003���������������������� 334 617 42002�� 342 114 X
See footnotes at end of table.
14 Annual Survey of Manufactures Value of Product ShipmentsU.S. Census Bureau, 2002 Economic Census

Table 1. Value of Shipments for Product Classes: 2003 and 2002�Con.[Includes value of product shipments produced by (1) establishments classified in their primary industry and (2) establishments classified in other industries (secondary). Transfers of products from oneestablishment of a company to another establishment of the same company (interplant transfers) are also included. Data based on the 2003 Annual Survey of Manufactures (ASM). For information onconfidentiality protection, sampling error, nonsampling error, and explanation of terms, see note 2 at end of table. For meaning of abbreviations and symbols, see introductory text]
Productclass code Product Value of
product shipments($1,000)
Relativestandard error
of estimate1
(percent)
316110 Leather and hide tanning and finishing 2003���������������������������������������������������� 2 305 206 22002�� 2 430 448 X
3161101 Finished and unfinished leather 2003�������������������������������������������������������� 2 106 453 32002�� 2 219 132 X
3161104 Contract and commission receipts for tanning or finishing leather owned by others 2003����������� 99 078 72002�� 119 329 X
3161107 Furs, dressed and dyed or bleached 2003��������������������������������������������������� 15 342 12002�� 11 487 X
316110W Leather and hide tanning and finishing, nsk, total 2003���������������������������������������� 84 333 12002�� 80 500 X
316211 Rubber and plastics footwear manufacturing 2003���������������������������������������������� 474 062 42002�� 469 398 X
3162111 Protective footwear3 2003������������������������������������������������������������������ 108 192 172002�� 109 021 X
3162114 Shoes with soles vulcanized, molded, or cemented to fabric uppers, excluding sandalsand slippers3 2003����������������������������������������������������������������������� 352 071 3
2002�� 348 657 X
316211W Rubber and plastics footwear manufacturing, nsk, total 2003����������������������������������� 13 799 22002�� 11 720 X
316212 House slipper manufacturing 2003������������������������������������������������������������ 13 918 12002�� 84 618 X
3162120 House slippers3 2003��������������������������������������������������������������������� 13 918 12002�� 84 618 X
316213 Men’s footwear (except athletic) manufacturing 2003�������������������������������������������� 961 555 72002�� 956 807 X
3162130 Men’s footwear, except athletic3 2003������������������������������������������������������� 961 555 72002�� 956 807 X
316214 Women’s footwear (except athletic) manufacturing 2003����������������������������������������� 258 094 32002�� 263 398 X
3162140 Women’s footwear, except athletic3 2003���������������������������������������������������� 258 094 32002�� 263 398 X
316219 Other footwear manufacturing 2003����������������������������������������������������������� 116 915 52002�� 122 613 X
3162190 All other footwear, except rubber3 2003������������������������������������������������������ 116 915 52002�� 122 613 X
316991 Luggage manufacturing 2003����������������������������������������������������������������� 522 690 62002�� 563 259 X
3169910 Luggage 2003���������������������������������������������������������������������������� 522 690 62002�� 563 259 X
316992 Women’s handbag and purse manufacturing 2003���������������������������������������������� 202 310 32002�� 193 113 X
3169920 Women’s and children’s handbags and purses 2003������������������������������������������� 202 310 32002�� 193 113 X
316993 Personal leather good (except women’s handbag and purse) manufacturing 2003������������������� 309 631 32002�� 290 620 X
3169930 All other personal leather goods 2003������������������������������������������������������� 309 631 32002�� 290 620 X
316999 All other leather good manufacturing 2003����������������������������������������������������� 607 334 22002�� 666 614 X
3169991 Boot and shoe cut stock and findings 2003��������������������������������������������������� 64 626 142002�� 78 345 X
3169994 All other miscellaneous leather goods 2003�������������������������������������������������� 468 665 22002�� 502 995 X
316999W All other leather good manufacturing, nsk, total 2003������������������������������������������ 74 043 52002�� 85 274 X
321113 Sawmills 2003������������������������������������������������������������������������������ 20 912 328 22002�� 20 225 357 X
3211131 Hardwood lumber, made in sawmills2 2003��������������������������������������������������� 4 229 559 22002�� 3 772 464 X
3211133 Softwood lumber, made in sawmills2 2003��������������������������������������������������� 11 460 717 12002�� 11 120 320 X
3211135 Wood chips, except field chips 2003��������������������������������������������������������� 1 765 816 112002�� 1 765 507 X
3211137 Wood ties, siding, shingles, and shakes and contract sawing of logs owned by others 2003�������� 274 948 42002�� 252 102 X
321113W Sawmills, nsk, total 2003������������������������������������������������������������������� 3 181 288 72002�� 3 314 964 X
321114 Wood preservation 2003��������������������������������������������������������������������� 4 419 115 22002�� 4 185 415 X
3211141 Wood poles, piles, and posts owned and treated by the same establishment 2003���������������� 1 008 178 42002�� 926 370 X
3211145 Other wood products owned and treated by the same establishment 2003����������������������� 2 873 034 22002�� 2 823 627 X
3211149 Contract wood preservation 2003����������������������������������������������������������� 160 986 52002�� 165 571 X
321114W Wood preservation, nsk, total 2003���������������������������������������������������������� 376 918 102002�� 269 847 X
See footnotes at end of table.
Value of Product Shipments Annual Survey of Manufactures 15U.S. Census Bureau, 2002 Economic Census

Table 1. Value of Shipments for Product Classes: 2003 and 2002�Con.[Includes value of product shipments produced by (1) establishments classified in their primary industry and (2) establishments classified in other industries (secondary). Transfers of products from oneestablishment of a company to another establishment of the same company (interplant transfers) are also included. Data based on the 2003 Annual Survey of Manufactures (ASM). For information onconfidentiality protection, sampling error, nonsampling error, and explanation of terms, see note 2 at end of table. For meaning of abbreviations and symbols, see introductory text]
Productclass code Product Value of
product shipments($1,000)
Relativestandard error
of estimate1
(percent)
321211 Hardwood veneer and plywood manufacturing 2003��������������������������������������������� 2 905 579 22002�� 2 985 822 X
3212111 Hardwood veneer, including veneer backed with paper, cloth, or other flexiblematerial 2003��������������������������������������������������������������������������� 1 081 138 3
2002�� 1 121 230 X
3212113 Hardwood plywood, except prefinished hardwood plywood made from purchasedhardwood plywood 2003������������������������������������������������������������������ 1 054 980 2
2002�� 1 043 725 X
3212115 Prefinished hardwood plywood made from purchased hardwood plywood 2003������������������� 112 184 202002�� 131 971 X
3212117 Hardwood plywood type products 2003������������������������������������������������������ 431 695 72002�� 481 891 X
321211W Hardwood veneer and plywood manufacturing, nsk, total 2003���������������������������������� 225 581 132002�� 207 005 X
321212 Softwood veneer and plywood manufacturing 2003���������������������������������������������� 4 611 424 12002�� 4 473 591 X
3212121 Softwood veneer, including veneer backed with paper, cloth, or other flexible material 2003�������� 882 069 22002�� 867 204 X
3212123 Softwood plywood, rough, including touch sanded, interior and exterior 2003��������������������� 2 347 196 12002�� 2 308 338 X
3212125 Softwood plywood, sanded, interior and exterior 2003����������������������������������������� 612 545 72002�� 647 967 X
3212128 Softwood plywood specialties 2003��������������������������������������������������������� 679 017 12002�� 624 683 X
321212W Softwood veneer and plywood manufacturing, nsk, total 2003���������������������������������� 90 597 102002�� 25 399 X
321213 Engineered wood member (except truss) manufacturing 2003������������������������������������ 2 211 239 22002�� 2 044 706 X
3212130 Engineered wood members (except trusses) 2003�������������������������������������������� 2 211 239 22002�� 2 044 706 X
321214 Truss manufacturing 2003������������������������������������������������������������������� 4 576 390 32002�� 4 208 143 X
3212140 Wood trusses 2003����������������������������������������������������������������������� 4 576 390 32002�� 4 208 143 X
321219 Reconstituted wood product manufacturing 2003����������������������������������������������� 6 601 004 12002�� 5 670 063 X
3212191 Particleboard made from particleboard produced at the same location 2003���������������������� 1 016 717 32002�� 1 203 134 X
3212192 Waferboard and oriented strandboard 2003�������������������������������������������������� 2 855 349 22002�� 1 933 582 X
3212193 Medium density fiberboard (MDF) made from MDF produced at the same location 2003����������� 675 625 22002�� 657 842 X
3212194 Hardboard made from hardboard produced at the same location 2003��������������������������� 622 670 12002�� 475 013 X
3212195 Cellulosic fiberboard (insulating board) 2003������������������������������������������������� 156 614 192002�� 117 793 X
3212197 Hardboard made from purchased hardboard 2003�������������������������������������������� 376 136 62002�� 319 961 X
3212198 Prefinished particleboard and medium density fiberboard (MDF) made from purchasedparticleboard and MDF 2003�������������������������������������������������������������� 704 760 3
2002�� 753 549 X
321219W Reconstituted wood product manufacturing, nsk, total 2003������������������������������������ 193 133 62002�� 209 189 X
321911 Wood window and door manufacturing 2003��������������������������������������������������� 10 559 836 32002�� 10 106 072 X
3219111 Wood window units 2003������������������������������������������������������������������ 3 280 810 32002�� 2 998 536 X
3219113 Wood sash, excluding sash shipped in window units 2003�������������������������������������� 90 416 42002�� 81 040 X
3219115 Wood window and door frames, including door frames shipped in door units, excludingwindow frames shipped in window units 2003������������������������������������������������ 564 010 4
2002�� 542 436 X
3219117 Wood panel, flush, and molded face doors, interior and exterior, including doors withglazed sections 2003��������������������������������������������������������������������� 3 327 245 3
2002�� 3 335 347 X
3219119 Other wood doors, including garage, patio, bifold, cabinet, screen, storm, and louver 2003��������� 1 731 419 22002�� 1 594 661 X
321911W Wood window and door manufacturing, nsk, total 2003���������������������������������������� 1 565 937 152002�� 1 554 052 X
321912 Cut stock, resawing lumber, and planing 2003�������������������������������������������������� 5 512 354 42002�� 5 355 632 X
3219121 Hardwood lumber, made from purchased lumber2 2003���������������������������������������� 1 347 997 152002�� 1 084 139 X
3219123 Softwood lumber, made from purchased lumber2 2003���������������������������������������� 1 761 159 12002�� 1 691 623 X
3219126 Hardwood cut stock and dimension 2003���������������������������������������������������� 959 047 42002�� 959 772 X
See footnotes at end of table.
16 Annual Survey of Manufactures Value of Product ShipmentsU.S. Census Bureau, 2002 Economic Census

Table 1. Value of Shipments for Product Classes: 2003 and 2002�Con.[Includes value of product shipments produced by (1) establishments classified in their primary industry and (2) establishments classified in other industries (secondary). Transfers of products from oneestablishment of a company to another establishment of the same company (interplant transfers) are also included. Data based on the 2003 Annual Survey of Manufactures (ASM). For information onconfidentiality protection, sampling error, nonsampling error, and explanation of terms, see note 2 at end of table. For meaning of abbreviations and symbols, see introductory text]
Productclass code Product Value of
product shipments($1,000)
Relativestandard error
of estimate1
(percent)
321912 Cut stock, resawing lumber, and planing�Con.3219128 Softwood cut stock and dimension 2003����������������������������������������������������� 579 341 1
2002�� 641 738 X
3219129 Sawn wood fence stock, wood lath, and contract resawing and planing 2003��������������������� 153 973 172002�� 123 170 X
321912W Cut stock, resawn lumber, and planing, nsk, total 2003���������������������������������������� 710 837 102002�� 855 190 X
321918 Other millwork (including flooring) 2003�������������������������������������������������������� 5 934 429 22002�� 5 631 916 X
3219181 Wood moldings, except prefinished moldings made from purchased moldings,including moldings covered with metal, plastics, etc. 2003������������������������������������� 2 112 064 5
2002�� 2 030 037 X
3219183 Prefinished wood moldings made from purchased moldings, including wood moldingscovered with metal and plastics 2003������������������������������������������������������� 97 337 2
2002�� 92 608 X
3219185 Other wood millwork products, including stairwork, exterior millwork, and softwoodflooring 2003���������������������������������������������������������������������������� 1 572 465 5
2002�� 1 497 489 X
3219187 Hardwood flooring 2003������������������������������������������������������������������� 1 577 848 22002�� 1 551 839 X
321918W Other millwork (including flooring), nsk, total 2003��������������������������������������������� 574 716 52002�� 459 943 X
321920 Wood container and pallet manufacturing 2003������������������������������������������������� 4 694 868 22002�� 4 817 428 X
3219201 Nailed and lock�corner wood boxes 2003���������������������������������������������������� 372 844 162002�� 331 735 X
3219203 Wood box and crate shook 2003������������������������������������������������������������ 128 832 162002�� 144 949 X
3219205 Wood pallets and pallet containers, wood and metal combination 2003�������������������������� 2 944 025 22002�� 3 028 039 X
3219207 Other wood container parts and wood containers 2003���������������������������������������� 576 132 52002�� 625 774 X
321920W Wood container and pallet manufacturing, nsk, total 2003�������������������������������������� 673 034 62002�� 686 931 X
321991 Manufactured home (mobile home) manufacturing 2003����������������������������������������� 5 873 054 12002�� 6 631 875 X
3219911 Manufactured homes (mobile homes) 2003�������������������������������������������������� 5 341 003 12002�� 6 122 376 X
3219915 Nonresidential mobile buildings 2003�������������������������������������������������������� 338 532 22002�� 348 551 X
321991W Manufactured home (mobile home) manufacturing, nsk, total 2003������������������������������ 193 519 12002�� 160 948 X
321992 Prefabricated wood building manufacturing 2003������������������������������������������������ 3 584 294 52002�� 3 569 872 X
3219921 Components for prefabricated stationary wood buildings (not sold as complete units) 2003��������� 581 255 162002�� 423 675 X
3219923 Precut packages for prefabricated stationary wood buildings (complete units) 2003���������������� 614 493 92002�� 668 504 X
3219925 Prefabricated stationary wood buildings shipped in panel form (complete units) 2003�������������� 827 005 42002�� 718 548 X
3219927 Prefabricated stationary wood buildings shipped in three�dimensional assemblies 2003������������ 1 065 536 132002�� 1 292 257 X
321992W Prefabricated wood building manufacturing, nsk, total 2003������������������������������������ 496 005 72002�� 466 888 X
321999 All other miscellaneous wood product manufacturing 2003��������������������������������������� 4 277 458 22002�� 4 213 754 X
3219990 All other miscellaneous wood product manufacturing 2003������������������������������������� 4 277 458 22002�� 4 213 754 X
322110 Pulp mills 2003����������������������������������������������������������������������������� 5 239 788 12002�� 5 247 195 X
3221101 Special alpha and dissolving woodpulp (sulfite and sulfate for chemical conversion,papermaking, and other uses) 2003�������������������������������������������������������� 924 180 1
2002�� 895 538 X
3221103 Sulfate woodpulp, including soda 2003������������������������������������������������������ 3 611 424 12002�� 3 687 222 X
3221105 Sulfite and other woodpulp 2003������������������������������������������������������������ 179 964 12002�� 169 371 X
3221107 All other miscellaneous pulp, other than wood, and pulp mill byproducts 2003��������������������� 514 694 62002�� 485 588 X
322110W Pulp mills, nsk, total 2003������������������������������������������������������������������ 9 527 112002�� 9 476 X
See footnotes at end of table.
Value of Product Shipments Annual Survey of Manufactures 17U.S. Census Bureau, 2002 Economic Census

Table 1. Value of Shipments for Product Classes: 2003 and 2002�Con.[Includes value of product shipments produced by (1) establishments classified in their primary industry and (2) establishments classified in other industries (secondary). Transfers of products from oneestablishment of a company to another establishment of the same company (interplant transfers) are also included. Data based on the 2003 Annual Survey of Manufactures (ASM). For information onconfidentiality protection, sampling error, nonsampling error, and explanation of terms, see note 2 at end of table. For meaning of abbreviations and symbols, see introductory text]
Productclass code Product Value of
product shipments($1,000)
Relativestandard error
of estimate1
(percent)
322121 Paper (except newsprint) mills 2003����������������������������������������������������������� 38 482 976 12002�� 40 783 284 X
3221211 Clay�coated printing and converting paper 2003���������������������������������������������� 7 265 231 12002�� 7 693 273 X
3221213 Uncoated freesheet paper (containing not more than 10 percent mechanical fiber) 2003����������� 9 456 711 12002�� 10 178 840 X
3221215 Bleached bristols (weight more than 150 g per sq meter), excluding cotton fiber indexand bogus 2003������������������������������������������������������������������������� 1 295 106 1
2002�� 1 226 783 X
3221217 Cotton fiber paper (containing 25 percent or more cotton or similar fibers) and thinpaper 2003����������������������������������������������������������������������������� D S
2002�� D X
3221219 Unbleached kraft (not less than 80 percent) packaging and industrial converting paper 2003�������� 855 115 12002�� 954 175 X
322121A Packaging and industrial converting paper, except unbleached kraft 2003������������������������ 773 416 52002�� 876 648 X
322121C Special industrial paper, except specialty packaging, including absorbent, batteryseparator, electrical papers, etc. 2003������������������������������������������������������ 1 628 764 4
2002�� 1 685 363 X
322121E Construction paper 2003������������������������������������������������������������������� 256 637 62002�� 241 521 X
322121G Tissue paper and other machine�creped paper 2003������������������������������������������ 2 313 423 42002�� 2 060 339 X
322121K Disposable diapers and similar disposable products, made in paper mills2 2003������������������� D S2002�� D X
322121N Sanitary tissue paper products, made in paper mills2 2003������������������������������������� 11 217 142 12002�� 12 557 480 X
322121W Paper (except newsprint) mills, nsk, total 2003������������������������������������������������ 38 118 652002�� 39 133 X
322122 Newsprint mills 2003������������������������������������������������������������������������ 3 023 481 12002�� 3 419 363 X
3221221 Newsprint 2003��������������������������������������������������������������������������� 1 991 305 12002�� 2 533 179 X
3221223 Uncoated ground�wood paper (containing more than 10 percent mechanical fiber) 2003����������� 1 030 848 12002�� 886 184 X
322122W Newsprint mills, nsk, total 2003������������������������������������������������������������� 1 328 12002�� – X
322130 Paperboard mills 2003����������������������������������������������������������������������� 19 332 087 12002�� 19 649 670 X
3221301 Unbleached kraft packaging and industrial converting paperboard (80 percent or morevirgin woodpulp) 2003�������������������������������������������������������������������� 7 797 324 2
2002�� 8 075 890 X
3221303 Bleached packaging and industrial converting paperboard (80 percent or more virginbleached woodpulp) 2003����������������������������������������������������������������� 3 989 490 1
2002�� 4 046 941 X
3221305 Semichemical paperboard, including corrugating medium (75 percent or more virginwoodpulp) 2003������������������������������������������������������������������������� 1 170 123 1
2002�� 1 049 286 X
3221307 Recycled paperboard 2003����������������������������������������������������������������� 6 329 580 12002�� 6 416 857 X
3221309 Wet machine board, including binders’ board and shoe board 2003������������������������������ 38 865 192002�� 48 486 X
322130W Paperboard mills, nsk, total 2003����������������������������������������������������������� 6 706 182002�� 12 210 X
322211 Corrugated and solid fiber box manufacturing 2003��������������������������������������������� 27 646 308 22002�� 27 926 685 X
3222110 Corrugated and solid fiber boxes, including pallets 2003��������������������������������������� 27 646 308 22002�� 27 926 685 X
322212 Folding paperboard box manufacturing 2003��������������������������������������������������� 7 993 034 12002�� 8 142 622 X
3222120 Folding paperboard boxes, packaging, and packaging components 2003������������������������� 7 993 034 12002�� 8 142 622 X
322213 Setup paperboard box manufacturing 2003���������������������������������������������������� 616 821 72002�� 760 519 X
3222130 Setup (rigid) paperboard boxes 2003�������������������������������������������������������� 616 821 72002�� 760 519 X
322214 Fiber can, tube, drum, and similar products manufacturing 2003���������������������������������� 2 129 896 52002�� 1 883 080 X
3222141 Paperboard fiber drums with ends of any material 2003���������������������������������������� 302 878 92002�� 292 641 X
3222143 Fiber cans, tubes, and similar fiber products 2003��������������������������������������������� 1 711 630 52002�� 1 529 199 X
322214W Fiber can, tube, drum, and similar products manufacturing, nsk, total 2003����������������������� 115 388 32002�� 61 240 X
See footnotes at end of table.
18 Annual Survey of Manufactures Value of Product ShipmentsU.S. Census Bureau, 2002 Economic Census
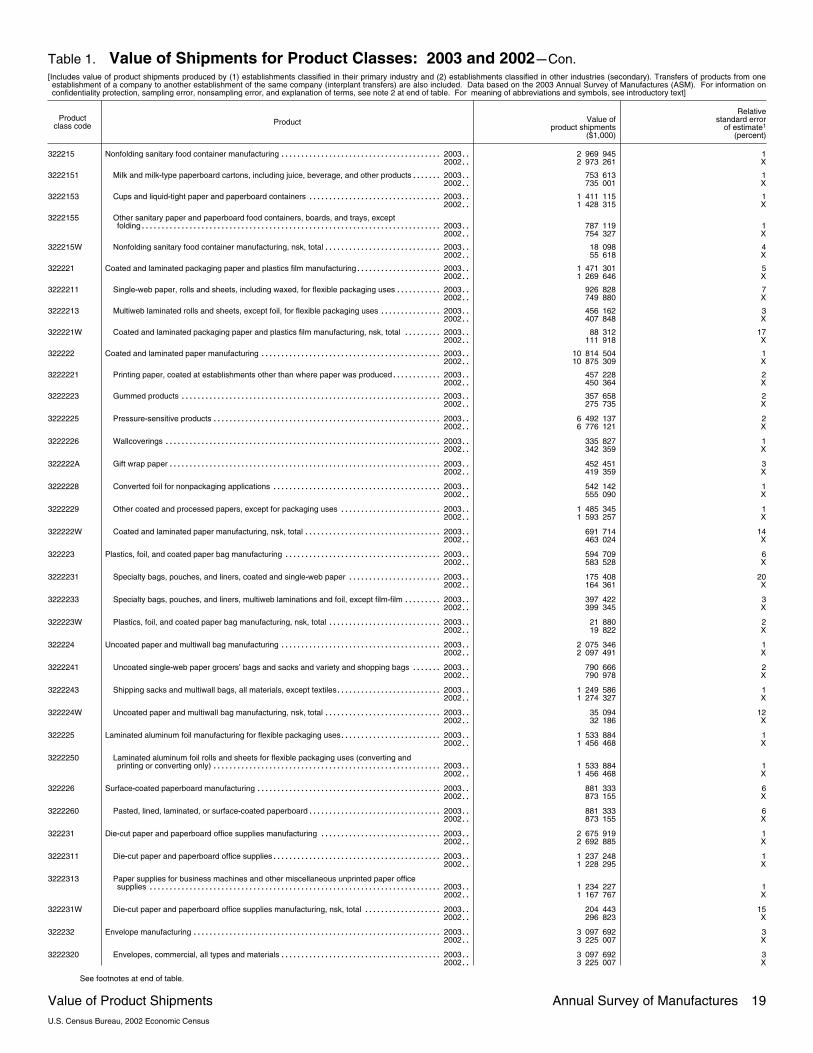
Table 1. Value of Shipments for Product Classes: 2003 and 2002�Con.[Includes value of product shipments produced by (1) establishments classified in their primary industry and (2) establishments classified in other industries (secondary). Transfers of products from oneestablishment of a company to another establishment of the same company (interplant transfers) are also included. Data based on the 2003 Annual Survey of Manufactures (ASM). For information onconfidentiality protection, sampling error, nonsampling error, and explanation of terms, see note 2 at end of table. For meaning of abbreviations and symbols, see introductory text]
Productclass code Product Value of
product shipments($1,000)
Relativestandard error
of estimate1
(percent)
322215 Nonfolding sanitary food container manufacturing 2003������������������������������������������ 2 969 945 12002�� 2 973 261 X
3222151 Milk and milk�type paperboard cartons, including juice, beverage, and other products 2003��������� 753 613 12002�� 735 001 X
3222153 Cups and liquid�tight paper and paperboard containers 2003����������������������������������� 1 411 115 12002�� 1 428 315 X
3222155 Other sanitary paper and paperboard food containers, boards, and trays, exceptfolding 2003����������������������������������������������������������������������������� 787 119 1
2002�� 754 327 X
322215W Nonfolding sanitary food container manufacturing, nsk, total 2003������������������������������� 18 098 42002�� 55 618 X
322221 Coated and laminated packaging paper and plastics film manufacturing 2003����������������������� 1 471 301 52002�� 1 269 646 X
3222211 Single�web paper, rolls and sheets, including waxed, for flexible packaging uses 2003������������� 926 828 72002�� 749 880 X
3222213 Multiweb laminated rolls and sheets, except foil, for flexible packaging uses 2003����������������� 456 162 32002�� 407 848 X
322221W Coated and laminated packaging paper and plastics film manufacturing, nsk, total 2003����������� 88 312 172002�� 111 918 X
322222 Coated and laminated paper manufacturing 2003����������������������������������������������� 10 814 504 12002�� 10 875 309 X
3222221 Printing paper, coated at establishments other than where paper was produced 2003�������������� 457 228 22002�� 450 364 X
3222223 Gummed products 2003������������������������������������������������������������������� 357 658 22002�� 275 735 X
3222225 Pressure�sensitive products 2003����������������������������������������������������������� 6 492 137 22002�� 6 776 121 X
3222226 Wallcoverings 2003����������������������������������������������������������������������� 335 827 12002�� 342 359 X
322222A Gift wrap paper 2003���������������������������������������������������������������������� 452 451 32002�� 419 359 X
3222228 Converted foil for nonpackaging applications 2003�������������������������������������������� 542 142 12002�� 555 090 X
3222229 Other coated and processed papers, except for packaging uses 2003��������������������������� 1 485 345 12002�� 1 593 257 X
322222W Coated and laminated paper manufacturing, nsk, total 2003������������������������������������ 691 714 142002�� 463 024 X
322223 Plastics, foil, and coated paper bag manufacturing 2003����������������������������������������� 594 709 62002�� 583 528 X
3222231 Specialty bags, pouches, and liners, coated and single�web paper 2003������������������������� 175 408 202002�� 164 361 X
3222233 Specialty bags, pouches, and liners, multiweb laminations and foil, except film�film 2003����������� 397 422 32002�� 399 345 X
322223W Plastics, foil, and coated paper bag manufacturing, nsk, total 2003������������������������������ 21 880 22002�� 19 822 X
322224 Uncoated paper and multiwall bag manufacturing 2003������������������������������������������ 2 075 346 12002�� 2 097 491 X
3222241 Uncoated single�web paper grocers’ bags and sacks and variety and shopping bags 2003��������� 790 666 22002�� 790 978 X
3222243 Shipping sacks and multiwall bags, all materials, except textiles 2003���������������������������� 1 249 586 12002�� 1 274 327 X
322224W Uncoated paper and multiwall bag manufacturing, nsk, total 2003������������������������������� 35 094 122002�� 32 186 X
322225 Laminated aluminum foil manufacturing for flexible packaging uses 2003��������������������������� 1 533 884 12002�� 1 456 468 X
3222250 Laminated aluminum foil rolls and sheets for flexible packaging uses (converting andprinting or converting only) 2003����������������������������������������������������������� 1 533 884 1
2002�� 1 456 468 X
322226 Surface�coated paperboard manufacturing 2003������������������������������������������������ 881 333 62002�� 873 155 X
3222260 Pasted, lined, laminated, or surface�coated paperboard 2003����������������������������������� 881 333 62002�� 873 155 X
322231 Die�cut paper and paperboard office supplies manufacturing 2003�������������������������������� 2 675 919 12002�� 2 692 885 X
3222311 Die�cut paper and paperboard office supplies 2003�������������������������������������������� 1 237 248 12002�� 1 228 295 X
3222313 Paper supplies for business machines and other miscellaneous unprinted paper officesupplies 2003��������������������������������������������������������������������������� 1 234 227 1
2002�� 1 167 767 X
322231W Die�cut paper and paperboard office supplies manufacturing, nsk, total 2003��������������������� 204 443 152002�� 296 823 X
322232 Envelope manufacturing 2003���������������������������������������������������������������� 3 097 692 32002�� 3 225 007 X
3222320 Envelopes, commercial, all types and materials 2003������������������������������������������ 3 097 692 32002�� 3 225 007 X
See footnotes at end of table.
Value of Product Shipments Annual Survey of Manufactures 19U.S. Census Bureau, 2002 Economic Census

Table 1. Value of Shipments for Product Classes: 2003 and 2002�Con.[Includes value of product shipments produced by (1) establishments classified in their primary industry and (2) establishments classified in other industries (secondary). Transfers of products from oneestablishment of a company to another establishment of the same company (interplant transfers) are also included. Data based on the 2003 Annual Survey of Manufactures (ASM). For information onconfidentiality protection, sampling error, nonsampling error, and explanation of terms, see note 2 at end of table. For meaning of abbreviations and symbols, see introductory text]
Productclass code Product Value of
product shipments($1,000)
Relativestandard error
of estimate1
(percent)
322233 Stationery, tablet, and related product manufacturing 2003��������������������������������������� 1 201 689 62002�� 1 510 584 X
3222331 Stationery 2003��������������������������������������������������������������������������� 373 604 122002�� 359 300 X
3222333 Tablets, pads, and related products 2003���������������������������������������������������� 705 628 72002�� 1 030 707 X
322233W Stationery, tablet, and related product manufacturing, nsk, total 2003���������������������������� 122 457 92002�� 120 577 X
322291 Sanitary paper product manufacturing 2003���������������������������������������������������� 8 348 687 12002�� 8 848 033 X
3222912 Disposable diapers and similar disposable products, made from purchased sanitarypaper stock or wadding2 2003������������������������������������������������������������� 4 618 841 1
2002�� 4 843 482 X
3222915 Sanitary tissue paper products, made from purchased sanitary paper stock orwadding2 2003�������������������������������������������������������������������������� 3 567 385 1
2002�� 3 850 388 X
322291W Sanitary paper product manufacturing, nsk, total 2003����������������������������������������� 162 461 12002�� 154 163 X
322299 All other converted paper product manufacturing 2003������������������������������������������� 3 966 750 22002�� 4 217 043 X
3222991 Molded pulp goods, including egg cartons, florist pots, food trays, etc. 2003���������������������� 378 430 22002�� 390 854 X
3222993 Miscellaneous converted paper and paperboard products 2003��������������������������������� 3 233 415 32002�� 3 358 723 X
322299W All other converted paper product manufacturing, nsk, total 2003�������������������������������� 354 906 112002�� 467 466 X
323110 Commercial lithographic printing 2003��������������������������������������������������������� 44 492 543 12002�� 46 085 206 X
3231101 Magazine and periodical printing (lithographic), including magazine and comicsupplements for Sunday newspapers (excluding printing of newspaper advertisinginserts) 2003���������������������������������������������������������������������������� 6 020 161 2
2002�� 6 411 888 X
3231103 Label and wrapper printing (lithographic) 2003������������������������������������������������ 1 875 634 82002�� 2 176 513 X
3231105 Catalog and directory printing (lithographic) 2003��������������������������������������������� 4 282 886 12002�� 4 451 240 X
3231107 Financial and legal printing (lithographic) 2003������������������������������������������������ 1 966 541 212002�� 2 386 659 X
3231109 Advertising printing (lithographic) 2003������������������������������������������������������ 12 857 849 12002�� 13 328 892 X
323110B Other commercial and general job printing (lithographic) 2003���������������������������������� 8 508 103 22002�� 8 132 559 X
323110W Commercial lithographic printing, nsk, total 2003���������������������������������������������� 8 981 369 32002�� 9 197 455 X
323111 Commercial gravure printing 2003������������������������������������������������������������ 3 298 383 12002�� 3 339 550 X
3231111 Magazine and periodical printing (gravure), including magazine and comicsupplements for Sunday newspapers (excluding printing of newspaper advertisinginserts) 2003���������������������������������������������������������������������������� 518 736 1
2002�� 614 236 X
3231113 Label and wrapper printing (gravure) 2003��������������������������������������������������� 654 392 32002�� 661 524 X
3231115 Catalog and directory printing (gravure) 2003������������������������������������������������� 755 368 12002�� 732 353 X
3231117 Advertising printing (gravure) 2003���������������������������������������������������������� 1 032 671 12002�� 956 410 X
3231119 Other commercial and general job printing (gravure) 2003�������������������������������������� 149 643 102002�� 186 683 X
323111W Commercial gravure printing, nsk, total 2003������������������������������������������������� 187 573 22002�� 188 344 X
323112 Commercial flexographic printing 2003�������������������������������������������������������� 5 218 912 12002�� 5 188 625 X
3231121 Label and wrapper printing (flexographic) 2003����������������������������������������������� 4 127 000 22002�� 4 106 492 X
3231123 Other commercial and general job printing (flexographic) 2003���������������������������������� 670 423 52002�� 640 939 X
323112W Commercial flexographic printing, nsk, total 2003��������������������������������������������� 421 489 72002�� 441 194 X
323113 Commercial screen printing 2003������������������������������������������������������������� 6 488 639 22002�� 6 504 902 X
3231132 Screen printed labels 2003����������������������������������������������������������������� 827 592 32002�� 788 560 X
3231134 Screen printing on garments, apparel accessories, and other fabric articles, exceptlabels 2003����������������������������������������������������������������������������� 2 044 793 3
2002�� 2 085 462 X
3231136 Screen printing (except on textiles, apparel, apparel accessories, and labels) 2003���������������� 2 195 123 32002�� 2 258 981 X
323113W Commercial screen printing, nsk, total 2003�������������������������������������������������� 1 421 130 62002�� 1 371 899 X
See footnotes at end of table.
20 Annual Survey of Manufactures Value of Product ShipmentsU.S. Census Bureau, 2002 Economic Census

Table 1. Value of Shipments for Product Classes: 2003 and 2002�Con.[Includes value of product shipments produced by (1) establishments classified in their primary industry and (2) establishments classified in other industries (secondary). Transfers of products from oneestablishment of a company to another establishment of the same company (interplant transfers) are also included. Data based on the 2003 Annual Survey of Manufactures (ASM). For information onconfidentiality protection, sampling error, nonsampling error, and explanation of terms, see note 2 at end of table. For meaning of abbreviations and symbols, see introductory text]
Productclass code Product Value of
product shipments($1,000)
Relativestandard error
of estimate1
(percent)
323114 Quick printing 2003������������������������������������������������������������������������� 3 817 157 52002�� 3 750 701 X
3231140 Quick printing 2003����������������������������������������������������������������������� 3 817 157 52002�� 3 750 701 X
323115 Digital printing 2003������������������������������������������������������������������������� 3 010 900 22002�� 2 898 668 X
3231150 Digital printing 2003����������������������������������������������������������������������� 3 010 900 22002�� 2 898 668 X
323116 Manifold business forms printing 2003��������������������������������������������������������� 6 138 798 22002�� 6 682 316 X
3231161 Unit set business forms, loose or bound 2003������������������������������������������������ 1 184 248 32002�� 1 214 353 X
3231163 Manifold books and pegboard accounting systems 2003��������������������������������������� 80 347 42002�� 94 848 X
3231165 Custom continuous business forms 2003���������������������������������������������������� 1 679 246 32002�� 1 845 865 X
3231167 Stock continuous business forms 2003������������������������������������������������������ 624 456 42002�� 682 384 X
3231169 Checkbooks (including inserts and refills, but excluding those in continuous form anddie�cut) 2003���������������������������������������������������������������������������� 1 383 490 6
2002�� 1 591 788 X
323116W Manifold business forms printing, nsk, total 2003���������������������������������������������� 1 187 010 62002�� 1 253 078 X
323117 Books printing 2003������������������������������������������������������������������������� 4 683 765 12002�� 4 779 947 X
3231171 Textbook printing and binding 2003��������������������������������������������������������� 1 154 413 12002�� 1 152 697 X
3231173 Technical, scientific, and professional book printing and binding 2003���������������������������� 535 471 52002�� 552 876 X
3231175 Religious book printing and binding 2003���������������������������������������������������� 330 202 32002�� 327 086 X
3231177 General book (trade, etc.) printing and binding 2003������������������������������������������� 1 215 921 12002�� 1 237 756 X
3231179 Other book printing and binding 2003�������������������������������������������������������� 800 920 22002�� 859 517 X
323117A Books, printing only, not bound 2003�������������������������������������������������������� 44 672 72002�� 62 643 X
323117C Pamphlets, printing only or printing and binding (excluding advertising pamphlets) 2003������������ 108 252 142002�� 103 659 X
323117W Books printing, nsk, total 2003�������������������������������������������������������������� 493 915 32002�� 483 713 X
323118 Blankbook, looseleaf binders, and devices manufacturing 2003����������������������������������� 1 474 650 42002�� 1 505 329 X
3231181 Blankbook making, except checkbooks 2003������������������������������������������������� 388 009 112002�� 380 592 X
3231183 Looseleaf binders, devices, and forms 2003�������������������������������������������������� 942 027 22002�� 937 615 X
323118W Blankbook, looseleaf binders and devices manufacturing, nsk, total 2003������������������������ 144 614 242002�� 187 122 X
323119 Other commercial printing 2003��������������������������������������������������������������� 2 655 370 82002�� 2 581 775 X
3231193 Label and wrapper printing (letterpress) 2003������������������������������������������������� 325 893 22002�� 343 919 X
3231199 Advertising printing (letterpress) 2003������������������������������������������������������� 367 707 32002�� 351 239 X
323119C Other commercial and general job printing (letterpress) 2003����������������������������������� 630 071 102002�� 554 311 X
323119E Engraving (printing) 2003������������������������������������������������������������������ 163 213 22002�� 143 749 X
323119J All other commercial and general job printing (excluding lithographic (offset), gravure,flexographic, screen, quick, digital, letterpress, and engraving printing) 2003�������������������� 106 702 3
2002�� 101 394 X
323119W Other commercial printing, nsk, total 2003��������������������������������������������������� 1 061 784 192002�� 1 087 163 X
323121 Tradebinding and related work 2003����������������������������������������������������������� 2 301 368 32002�� 2 329 213 X
3231211 Edition, library, and other hardcover binding of books (printed elsewhere) 2003������������������� 348 600 32002�� 343 172 X
3231215 Softcover, pamphlet, sample book, and other binding of books and materials printedelsewhere 2003������������������������������������������������������������������������� 639 147 4
2002�� 673 910 X
3231217 Miscellaneous binding and postpress work, including collating, perforating, folding,gluing, die�cutting, gold or foil stamping, etc. 2003�������������������������������������������� 918 728 4
2002�� 919 899 X
323121W Tradebinding and related work, nsk, total 2003����������������������������������������������� 394 892 82002�� 392 232 X
See footnotes at end of table.
Value of Product Shipments Annual Survey of Manufactures 21U.S. Census Bureau, 2002 Economic Census
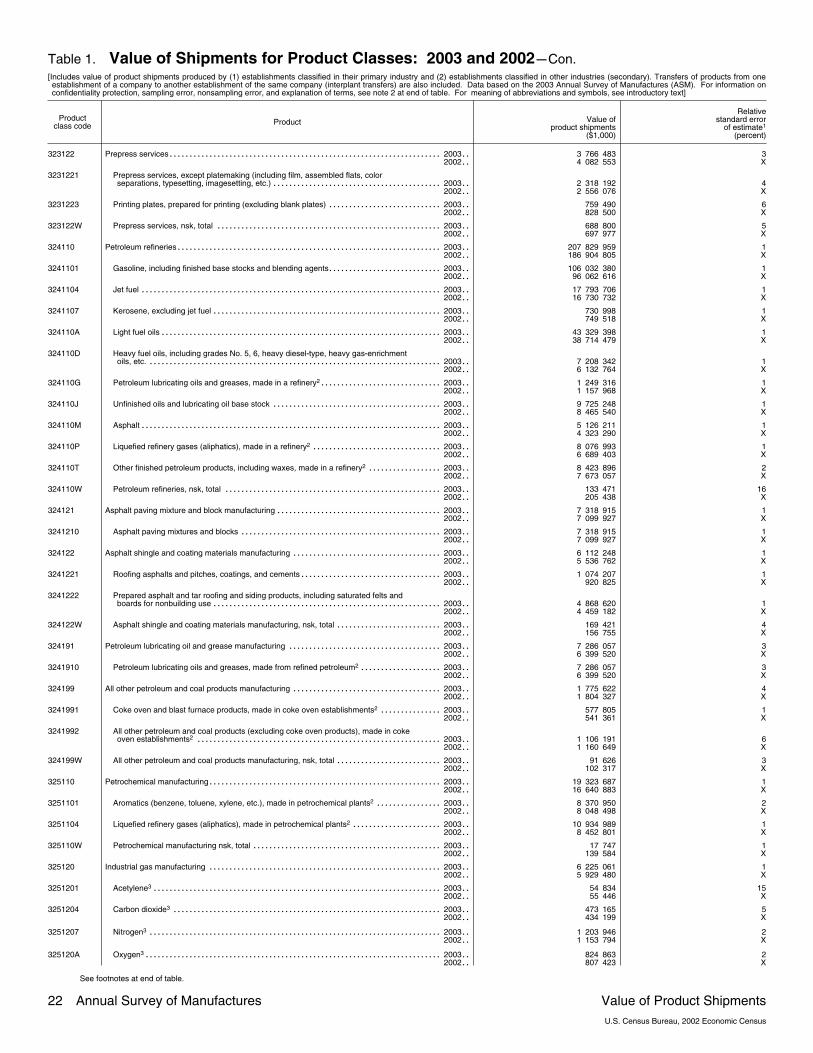
Table 1. Value of Shipments for Product Classes: 2003 and 2002�Con.[Includes value of product shipments produced by (1) establishments classified in their primary industry and (2) establishments classified in other industries (secondary). Transfers of products from oneestablishment of a company to another establishment of the same company (interplant transfers) are also included. Data based on the 2003 Annual Survey of Manufactures (ASM). For information onconfidentiality protection, sampling error, nonsampling error, and explanation of terms, see note 2 at end of table. For meaning of abbreviations and symbols, see introductory text]
Productclass code Product Value of
product shipments($1,000)
Relativestandard error
of estimate1
(percent)
323122 Prepress services 2003���������������������������������������������������������������������� 3 766 483 32002�� 4 082 553 X
3231221 Prepress services, except platemaking (including film, assembled flats, colorseparations, typesetting, imagesetting, etc.) 2003�������������������������������������������� 2 318 192 4
2002�� 2 556 076 X
3231223 Printing plates, prepared for printing (excluding blank plates) 2003������������������������������ 759 490 62002�� 828 500 X
323122W Prepress services, nsk, total 2003���������������������������������������������������������� 688 800 52002�� 697 977 X
324110 Petroleum refineries 2003�������������������������������������������������������������������� 207 829 959 12002�� 186 904 805 X
3241101 Gasoline, including finished base stocks and blending agents 2003������������������������������ 106 032 380 12002�� 96 062 616 X
3241104 Jet fuel 2003����������������������������������������������������������������������������� 17 793 706 12002�� 16 730 732 X
3241107 Kerosene, excluding jet fuel 2003����������������������������������������������������������� 730 998 12002�� 749 518 X
324110A Light fuel oils 2003������������������������������������������������������������������������ 43 329 398 12002�� 38 714 479 X
324110D Heavy fuel oils, including grades No. 5, 6, heavy diesel�type, heavy gas�enrichmentoils, etc. 2003��������������������������������������������������������������������������� 7 208 342 1
2002�� 6 132 764 X
324110G Petroleum lubricating oils and greases, made in a refinery2 2003�������������������������������� 1 249 316 12002�� 1 157 968 X
324110J Unfinished oils and lubricating oil base stock 2003�������������������������������������������� 9 725 248 12002�� 8 465 540 X
324110M Asphalt 2003����������������������������������������������������������������������������� 5 126 211 12002�� 4 323 290 X
324110P Liquefied refinery gases (aliphatics), made in a refinery2 2003���������������������������������� 8 076 993 12002�� 6 689 403 X
324110T Other finished petroleum products, including waxes, made in a refinery2 2003�������������������� 8 423 896 22002�� 7 673 057 X
324110W Petroleum refineries, nsk, total 2003�������������������������������������������������������� 133 471 162002�� 205 438 X
324121 Asphalt paving mixture and block manufacturing 2003������������������������������������������� 7 318 915 12002�� 7 099 927 X
3241210 Asphalt paving mixtures and blocks 2003���������������������������������������������������� 7 318 915 12002�� 7 099 927 X
324122 Asphalt shingle and coating materials manufacturing 2003��������������������������������������� 6 112 248 12002�� 5 536 762 X
3241221 Roofing asphalts and pitches, coatings, and cements 2003������������������������������������� 1 074 207 12002�� 920 825 X
3241222 Prepared asphalt and tar roofing and siding products, including saturated felts andboards for nonbuilding use 2003����������������������������������������������������������� 4 868 620 1
2002�� 4 459 182 X
324122W Asphalt shingle and coating materials manufacturing, nsk, total 2003���������������������������� 169 421 42002�� 156 755 X
324191 Petroleum lubricating oil and grease manufacturing 2003���������������������������������������� 7 286 057 32002�� 6 399 520 X
3241910 Petroleum lubricating oils and greases, made from refined petroleum2 2003���������������������� 7 286 057 32002�� 6 399 520 X
324199 All other petroleum and coal products manufacturing 2003��������������������������������������� 1 775 622 42002�� 1 804 327 X
3241991 Coke oven and blast furnace products, made in coke oven establishments2 2003����������������� 577 805 12002�� 541 361 X
3241992 All other petroleum and coal products (excluding coke oven products), made in cokeoven establishments2 2003��������������������������������������������������������������� 1 106 191 6
2002�� 1 160 649 X
324199W All other petroleum and coal products manufacturing, nsk, total 2003���������������������������� 91 626 32002�� 102 317 X
325110 Petrochemical manufacturing 2003������������������������������������������������������������ 19 323 687 12002�� 16 640 883 X
3251101 Aromatics (benzene, toluene, xylene, etc.), made in petrochemical plants2 2003������������������ 8 370 950 22002�� 8 048 498 X
3251104 Liquefied refinery gases (aliphatics), made in petrochemical plants2 2003������������������������ 10 934 989 12002�� 8 452 801 X
325110W Petrochemical manufacturing nsk, total 2003������������������������������������������������� 17 747 12002�� 139 584 X
325120 Industrial gas manufacturing 2003������������������������������������������������������������ 6 225 061 12002�� 5 929 480 X
3251201 Acetylene3 2003�������������������������������������������������������������������������� 54 834 152002�� 55 446 X
3251204 Carbon dioxide3 2003��������������������������������������������������������������������� 473 165 52002�� 434 199 X
3251207 Nitrogen3 2003��������������������������������������������������������������������������� 1 203 946 22002�� 1 153 794 X
325120A Oxygen3 2003���������������������������������������������������������������������������� 824 863 22002�� 807 423 X
See footnotes at end of table.
22 Annual Survey of Manufactures Value of Product ShipmentsU.S. Census Bureau, 2002 Economic Census

Table 1. Value of Shipments for Product Classes: 2003 and 2002�Con.[Includes value of product shipments produced by (1) establishments classified in their primary industry and (2) establishments classified in other industries (secondary). Transfers of products from oneestablishment of a company to another establishment of the same company (interplant transfers) are also included. Data based on the 2003 Annual Survey of Manufactures (ASM). For information onconfidentiality protection, sampling error, nonsampling error, and explanation of terms, see note 2 at end of table. For meaning of abbreviations and symbols, see introductory text]
Productclass code Product Value of
product shipments($1,000)
Relativestandard error
of estimate1
(percent)
325120 Industrial gas manufacturing�Con.325120C Argon and hydrogen3 2003����������������������������������������������������������������� 1 814 196 1
2002�� 1 741 796 X
325120G Fluorocarbon gases 2003������������������������������������������������������������������ 740 019 12002�� 694 756 X
325120U Other industrial gases 2003���������������������������������������������������������������� 676 024 92002�� 654 892 X
325120W Industrial gas manufacturing, nsk, total 2003������������������������������������������������� 438 014 32002�� 387 174 X
325131 Inorganic dye and pigment manufacturing 2003������������������������������������������������� 4 217 175 12002�� 3 749 115 X
3251311 Titanium dioxide, composite and pure3 2003������������������������������������������������� 2 997 808 12002�� 2 551 674 X
3251314 Other white opaque pigments 2003��������������������������������������������������������� 178 576 152002�� 185 383 X
3251317 Chrome colors and other inorganic pigments 2003�������������������������������������������� 980 294 22002�� 943 481 X
325131W Inorganic dye and pigment manufacturing, nsk, total 2003�������������������������������������� 60 498 62002�� 68 577 X
325132 Synthetic organic dye and pigment manufacturing 2003������������������������������������������ 2 307 866 22002�� 2 514 132 X
3251321 Synthetic organic dyes 2003��������������������������������������������������������������� 901 062 22002�� 991 929 X
3251324 Synthetic organic pigments, lakes, and toners 2003������������������������������������������� 1 346 091 32002�� 1 447 870 X
325132W Synthetic organic dye and pigment manufacturing, nsk, total 2003������������������������������ 60 712 502002�� 74 333 X
325181 Alkalies and chlorine manufacturing 2003������������������������������������������������������ 3 744 208 12002�� 2 941 680 X
3251811 Chlorine, compressed or liquefied3 2003����������������������������������������������������� 1 429 177 12002�� 979 384 X
3251814 Sodium hydroxide (caustic soda)3 2003������������������������������������������������������ 1 715 060 12002�� 1 396 397 X
3251817 Other alkalies 2003����������������������������������������������������������������������� 562 840 12002�� 539 751 X
325181W Alkalies and chlorine manufacturing, nsk, total 2003������������������������������������������� 37 131 12002�� 26 148 X
325182 Carbon black manufacturing 2003������������������������������������������������������������� 1 143 731 12002�� 1 046 719 X
3251820 Carbon black, all processes 2003����������������������������������������������������������� 1 143 731 12002�� 1 046 719 X
325188 All other basic inorganic chemical manufacturing 2003������������������������������������������� 13 149 905 12002�� 13 571 474 X
3251881 Sulfuric acid3 2003������������������������������������������������������������������������ 641 758 42002�� 672 824 X
3251884 Inorganic acids, excluding nitric, sulfuric and phosphoric3 2003��������������������������������� 528 712 132002�� 578 182 X
3251887 Other inorganic aluminum compounds3 2003������������������������������������������������� 1 222 436 12002�� 1 320 173 X
325188A Potassium and sodium compounds, excluding bleaches, alkalies, and alum3 2003���������������� 1 899 456 32002�� 2 018 667 X
325188D Chemical catalytic preparations, excluding silica gel catalyst 2003������������������������������� 2 383 291 12002�� 2 188 749 X
325188H All other inorganic chemicals 2003���������������������������������������������������������� 5 698 577 32002�� 5 934 914 X
325188W All other basic inorganic chemical manufacturing, nsk, total 2003������������������������������� 775 676 52002�� 857 965 X
325191 Gum and wood chemical manufacturing 2003�������������������������������������������������� 1 065 877 22002�� 1 024 694 X
3251910 Gum and wood chemicals, including wood distillation products 2003����������������������������� 1 065 877 22002�� 1 024 694 X
325192 Cyclic crude and intermediate manufacturing 2003���������������������������������������������� 6 496 342 32002�� 6 794 763 X
3251921 Cyclic (coal tar) intermediates 2003��������������������������������������������������������� 6 044 150 32002�� 6 142 483 X
3251924 Tar, tar crudes, and tar pitches 2003�������������������������������������������������������� 443 023 12002�� 634 072 X
325192W Cyclic crude and intermediate manufacturing, nsk, total 2003����������������������������������� 9 169 12002�� 18 208 X
325193 Ethyl alcohol manufacturing 2003������������������������������������������������������������� 3 421 580 62002�� 3 009 125 X
3251930 Ethyl alcohol 2003������������������������������������������������������������������������ 3 421 580 62002�� 3 009 125 X
See footnotes at end of table.
Value of Product Shipments Annual Survey of Manufactures 23U.S. Census Bureau, 2002 Economic Census

Table 1. Value of Shipments for Product Classes: 2003 and 2002�Con.[Includes value of product shipments produced by (1) establishments classified in their primary industry and (2) establishments classified in other industries (secondary). Transfers of products from oneestablishment of a company to another establishment of the same company (interplant transfers) are also included. Data based on the 2003 Annual Survey of Manufactures (ASM). For information onconfidentiality protection, sampling error, nonsampling error, and explanation of terms, see note 2 at end of table. For meaning of abbreviations and symbols, see introductory text]
Productclass code Product Value of
product shipments($1,000)
Relativestandard error
of estimate1
(percent)
325199 All other basic organic chemical manufacturing 2003�������������������������������������������� 48 626 694 22002�� 45 678 922 X
3251991 Fatty acids 2003�������������������������������������������������������������������������� 1 613 780 22002�� 1 574 666 X
3251994 Bulk pesticides and other bulk synthetic organic agricultural chemicals, excludingpreparations 2003����������������������������������������������������������������������� 1 488 827 2
2002�� 1 198 701 X
3251997 Industrial organic flavor oil mixtures and blends 2003������������������������������������������ 449 360 32002�� 464 090 X
325199A Reagent and high�purity grades of organic chemicals refined from purchased technicalgrades 2003���������������������������������������������������������������������������� 598 075 3
2002�� 552 346 X
325199E Natural organic chemicals 2003������������������������������������������������������������� 1 465 207 72002�� 1 429 633 X
325199G Synthetic organic alcohols, unmixed 2003���������������������������������������������������� 1 947 933 32002�� 1 816 454 X
325199H Synthetic organic chemicals for use as flavor and perfume materials 2003����������������������� 1 137 209 22002�� 1 246 888 X
325199K Synthetic organic rubber�processing chemicals 2003������������������������������������������ 382 066 22002�� 401 508 X
325199N Synthetic organic plasticizers 2003���������������������������������������������������������� 587 848 22002�� 589 162 X
325199R Other synthetic organic chemicals 2003����������������������������������������������������� 7 812 375 112002�� 6 976 838 X
325199T Miscellaneous end use chemicals and chemical products, excluding urea 2003������������������� 14 999 329 12002�� 14 203 603 X
325199V Miscellaneous cyclic and acyclic chemicals and chemical products, excluding fatty acidesters 2003����������������������������������������������������������������������������� 15 346 343 1
2002�� 14 182 208 X
325199W All other basic organic chemical manufacturing, nsk, total 2003��������������������������������� 798 343 162002�� 1 042 825 X
325211 Plastics material and resin manufacturing 2003������������������������������������������������� 49 248 367 12002�� 46 136 949 X
3252111 Thermoplastic resins and plastics materials 2003��������������������������������������������� 40 420 345 12002�� 37 633 647 X
3252114 Thermosetting resins and plastics materials 2003��������������������������������������������� 7 891 564 22002�� 7 904 972 X
325211W Plastics material and resin manufacturing, nsk, total 2003�������������������������������������� 936 459 32002�� 598 330 X
325212 Synthetic rubber manufacturing 2003���������������������������������������������������������� 6 291 377 12002�� 5 778 261 X
3252120 Synthetic rubber (vulcanizable elastomers) 2003���������������������������������������������� 6 291 377 12002�� 5 778 261 X
325221 Cellulosic organic fiber manufacturing 2003���������������������������������������������������� 1 009 212 12002�� 971 021 X
3252210 Rayon, acetate, and lyocell manufactured fibers2 2003���������������������������������������� 1 009 212 12002�� 971 021 X
325222 Noncellulosic organic fiber manufacturing 2003������������������������������������������������� 7 424 775 12002�� 7 346 676 X
3252221 Nylon and other polyamide manufactured fibers2 2003����������������������������������������� 2 827 371 12002�� 2 644 689 X
3252224 Polyolefin manufactured fibers2 2003�������������������������������������������������������� 426 685 32002�� 420 089 X
3252227 Polyester manufactured fibers2 2003�������������������������������������������������������� 1 839 283 12002�� 1 877 248 X
325222A Other manufactured noncellulosic fibers (excluding glass, carbon, and graphite)2 2003������������ 867 431 12002�� 865 283 X
325222D Producer�textured manufactured noncellulosic fibers 2003������������������������������������� 1 422 504 12002�� 1 492 871 X
325222W Noncellulosic organic fiber manufacturing, nsk, total 2003�������������������������������������� 41 501 12002�� 46 496 X
325311 Nitrogenous fertilizer manufacturing 2003������������������������������������������������������ 4 297 722 12002�� 3 562 905 X
3253111 Synthetic ammonia, nitric acid, and ammonium compounds3 2003������������������������������ 3 381 862 12002�� 2 629 945 X
3253114 Urea3 2003������������������������������������������������������������������������������ 682 604 42002�� 739 533 X
3253117 Fertilizer materials of organic origin, including activated sewage sludge, processedtankage, and other natural fertilizer materials 2003������������������������������������������� 60 050 10
2002�� 61 357 X
325311W Nitrogenous fertilizer manufacturing, nsk, total 2003������������������������������������������� 173 206 102002�� 132 070 X
See footnotes at end of table.
24 Annual Survey of Manufactures Value of Product ShipmentsU.S. Census Bureau, 2002 Economic Census
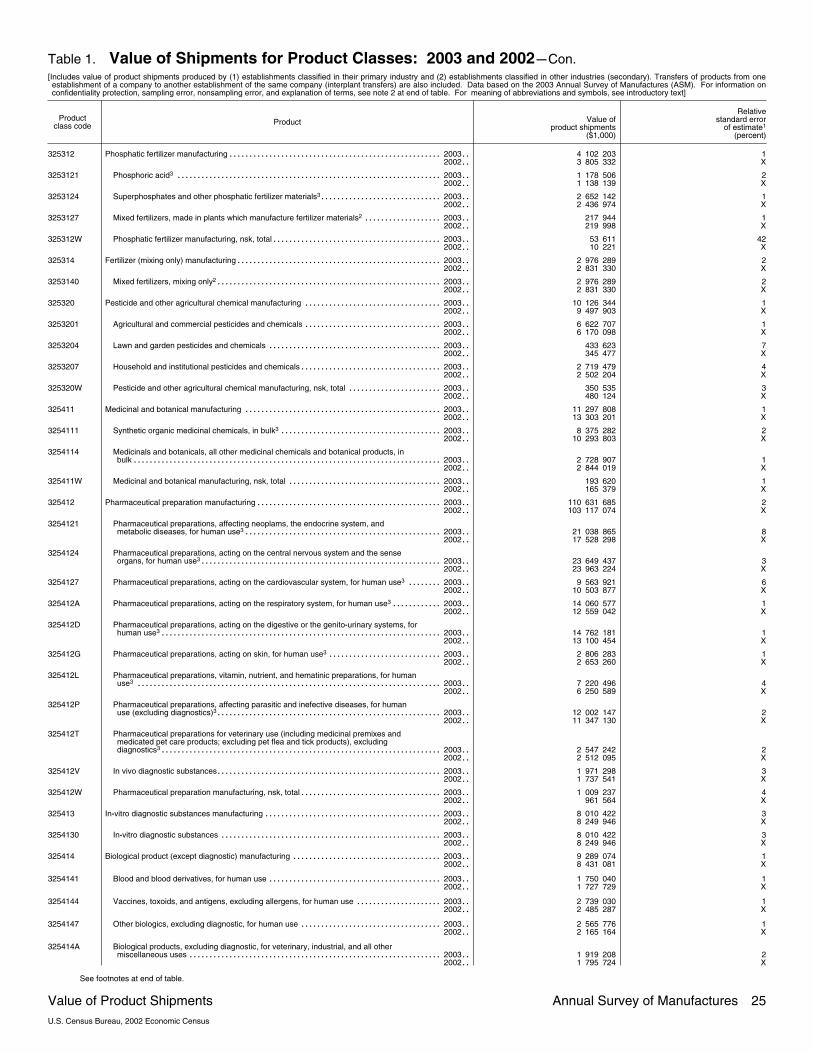
Table 1. Value of Shipments for Product Classes: 2003 and 2002�Con.[Includes value of product shipments produced by (1) establishments classified in their primary industry and (2) establishments classified in other industries (secondary). Transfers of products from oneestablishment of a company to another establishment of the same company (interplant transfers) are also included. Data based on the 2003 Annual Survey of Manufactures (ASM). For information onconfidentiality protection, sampling error, nonsampling error, and explanation of terms, see note 2 at end of table. For meaning of abbreviations and symbols, see introductory text]
Productclass code Product Value of
product shipments($1,000)
Relativestandard error
of estimate1
(percent)
325312 Phosphatic fertilizer manufacturing 2003������������������������������������������������������� 4 102 203 12002�� 3 805 332 X
3253121 Phosphoric acid3 2003�������������������������������������������������������������������� 1 178 506 22002�� 1 138 139 X
3253124 Superphosphates and other phosphatic fertilizer materials3 2003�������������������������������� 2 652 142 12002�� 2 436 974 X
3253127 Mixed fertilizers, made in plants which manufacture fertilizer materials2 2003��������������������� 217 944 12002�� 219 998 X
325312W Phosphatic fertilizer manufacturing, nsk, total 2003�������������������������������������������� 53 611 422002�� 10 221 X
325314 Fertilizer (mixing only) manufacturing 2003����������������������������������������������������� 2 976 289 22002�� 2 831 330 X
3253140 Mixed fertilizers, mixing only2 2003���������������������������������������������������������� 2 976 289 22002�� 2 831 330 X
325320 Pesticide and other agricultural chemical manufacturing 2003������������������������������������ 10 126 344 12002�� 9 497 903 X
3253201 Agricultural and commercial pesticides and chemicals 2003������������������������������������ 6 622 707 12002�� 6 170 098 X
3253204 Lawn and garden pesticides and chemicals 2003��������������������������������������������� 433 623 72002�� 345 477 X
3253207 Household and institutional pesticides and chemicals 2003������������������������������������� 2 719 479 42002�� 2 502 204 X
325320W Pesticide and other agricultural chemical manufacturing, nsk, total 2003������������������������� 350 535 32002�� 480 124 X
325411 Medicinal and botanical manufacturing 2003��������������������������������������������������� 11 297 808 12002�� 13 303 201 X
3254111 Synthetic organic medicinal chemicals, in bulk3 2003������������������������������������������ 8 375 282 22002�� 10 293 803 X
3254114 Medicinals and botanicals, all other medicinal chemicals and botanical products, inbulk 2003������������������������������������������������������������������������������� 2 728 907 1
2002�� 2 844 019 X
325411W Medicinal and botanical manufacturing, nsk, total 2003���������������������������������������� 193 620 12002�� 165 379 X
325412 Pharmaceutical preparation manufacturing 2003������������������������������������������������ 110 631 685 22002�� 103 117 074 X
3254121 Pharmaceutical preparations, affecting neoplams, the endocrine system, andmetabolic diseases, for human use3 2003��������������������������������������������������� 21 038 865 8
2002�� 17 528 298 X
3254124 Pharmaceutical preparations, acting on the central nervous system and the senseorgans, for human use3 2003�������������������������������������������������������������� 23 649 437 3
2002�� 23 963 224 X
3254127 Pharmaceutical preparations, acting on the cardiovascular system, for human use3 2003���������� 9 563 921 62002�� 10 503 877 X
325412A Pharmaceutical preparations, acting on the respiratory system, for human use3 2003�������������� 14 060 577 12002�� 12 559 042 X
325412D Pharmaceutical preparations, acting on the digestive or the genito�urinary systems, forhuman use3 2003������������������������������������������������������������������������ 14 762 181 1
2002�� 13 100 454 X
325412G Pharmaceutical preparations, acting on skin, for human use3 2003������������������������������ 2 806 283 12002�� 2 653 260 X
325412L Pharmaceutical preparations, vitamin, nutrient, and hematinic preparations, for humanuse3 2003������������������������������������������������������������������������������ 7 220 496 4
2002�� 6 250 589 X
325412P Pharmaceutical preparations, affecting parasitic and inefective diseases, for humanuse (excluding diagnostics)3 2003���������������������������������������������������������� 12 002 147 2
2002�� 11 347 130 X
325412T Pharmaceutical preparations for veterinary use (including medicinal premixes andmedicated pet care products; excluding pet flea and tick products), excludingdiagnostics3 2003������������������������������������������������������������������������ 2 547 242 2
2002�� 2 512 095 X
325412V In vivo diagnostic substances 2003���������������������������������������������������������� 1 971 298 32002�� 1 737 541 X
325412W Pharmaceutical preparation manufacturing, nsk, total 2003������������������������������������� 1 009 237 42002�� 961 564 X
325413 In�vitro diagnostic substances manufacturing 2003���������������������������������������������� 8 010 422 32002�� 8 249 946 X
3254130 In�vitro diagnostic substances 2003��������������������������������������������������������� 8 010 422 32002�� 8 249 946 X
325414 Biological product (except diagnostic) manufacturing 2003��������������������������������������� 9 289 074 12002�� 8 431 081 X
3254141 Blood and blood derivatives, for human use 2003��������������������������������������������� 1 750 040 12002�� 1 727 729 X
3254144 Vaccines, toxoids, and antigens, excluding allergens, for human use 2003����������������������� 2 739 030 12002�� 2 485 287 X
3254147 Other biologics, excluding diagnostic, for human use 2003������������������������������������� 2 565 776 12002�� 2 165 164 X
325414A Biological products, excluding diagnostic, for veterinary, industrial, and all othermiscellaneous uses 2003����������������������������������������������������������������� 1 919 208 2
2002�� 1 795 724 X
See footnotes at end of table.
Value of Product Shipments Annual Survey of Manufactures 25U.S. Census Bureau, 2002 Economic Census

Table 1. Value of Shipments for Product Classes: 2003 and 2002�Con.[Includes value of product shipments produced by (1) establishments classified in their primary industry and (2) establishments classified in other industries (secondary). Transfers of products from oneestablishment of a company to another establishment of the same company (interplant transfers) are also included. Data based on the 2003 Annual Survey of Manufactures (ASM). For information onconfidentiality protection, sampling error, nonsampling error, and explanation of terms, see note 2 at end of table. For meaning of abbreviations and symbols, see introductory text]
Productclass code Product Value of
product shipments($1,000)
Relativestandard error
of estimate1
(percent)
325414 Biological product (except diagnostic) manufacturing�Con.325414W Biological product (except diagnostic) manufacturing, nsk, total 2003���������������������������� 315 020 11
2002�� 257 177 X
325510 Paint and coating manufacturing 2003��������������������������������������������������������� 19 057 614 12002�� 19 316 504 X
3255101 Architectural coatings3 2003���������������������������������������������������������������� 7 591 864 12002�� 7 763 279 X
3255104 Product finishes for original equipment manufacturers (OEM), excluding marinecoatings.3 2003�������������������������������������������������������������������������� 5 230 830 2
2002�� 5 295 393 X
3255107 Special�purpose coatings including all marine coatings, industrial, construction andmaintenance coatings, traffic marking paints, etc.3 2003�������������������������������������� 3 588 177 2
2002�� 3 289 244 X
325510B Miscellaneous allied paint products, including paint and varnish removers, thinners,pigment dispersions, glazing compounds, etc.3 2003����������������������������������������� 1 321 474 4
2002�� 1 354 955 X
325510W Paint and coating manufacturing, nsk, total 2003���������������������������������������������� 1 325 269 72002�� 1 613 633 X
325520 Adhesive manufacturing 2003���������������������������������������������������������������� 7 616 616 32002�� 7 387 049 X
3255201 Natural base glues and adhesives 2003����������������������������������������������������� 338 850 52002�� 250 525 X
3255204 Synthetic resin and rubber adhesives, including all types of bonding and laminatingadhesives 2003�������������������������������������������������������������������������� 4 906 987 5
2002�� 4 416 684 X
3255207 Structural sealants (load�bearing) 2003������������������������������������������������������ 563 425 102002�� 734 810 X
325520A Nonstructural caulking compounds and sealants 2003����������������������������������������� 1 489 721 22002�� 1 482 516 X
325520W Adhesive manufacturing, nsk, total 2003����������������������������������������������������� 317 633 322002�� 502 514 X
325611 Soap and other detergent manufacturing 2003�������������������������������������������������� 15 792 185 22002�� 16 213 496 X
3256111 Soaps and detergents, commercial, industrial, and institutional 2003���������������������������� 6 833 222 32002�� 6 947 259 X
3256114 Household detergents 2003���������������������������������������������������������������� 3 523 626 32002�� 3 852 011 X
3256117 Soaps, excluding specialty cleaners, household 2003������������������������������������������ 2 493 182 12002�� D X
325611A Glycerin, natural 2003��������������������������������������������������������������������� 18 029 12002�� D X
325611D Toothpaste, including gels and toothpowder 2003��������������������������������������������� 1 369 413 12002�� 1 557 067 X
325611W Soap and other detergent manufacturing, nsk, total 2003�������������������������������������� 1 554 714 42002�� 1 355 806 X
325612 Polish and other sanitation good manufacturing 2003�������������������������������������������� 8 695 563 32002�� 8 112 961 X
3256121 Household bleaches (chlorine and nonchlorine)3 2003����������������������������������������� 1 095 704 82002�� 963 590 X
3256125 Specialty cleaning and sanitation products 2003���������������������������������������������� 5 244 828 42002�� 4 859 590 X
3256127 Polishing preparations and related products 2003��������������������������������������������� 1 676 692 62002�� 1 684 683 X
325612W Polish and other sanitation good manufacturing, nsk, total 2003��������������������������������� 678 339 72002�� 605 098 X
325613 Surface active agent manufacturing 2003������������������������������������������������������ 5 670 277 12002�� 6 204 036 X
3256130 Surfactants, finishing agents, and assistants 2003�������������������������������������������� 5 670 277 12002�� 6 204 036 X
325620 Toilet preparation manufacturing 2003��������������������������������������������������������� 27 052 972 12002�� 30 430 169 X
3256201 Shaving preparations 2003����������������������������������������������������������������� 677 357 12002�� 622 630 X
3256204 Perfumes, toilet waters, and colognes 2003�������������������������������������������������� 2 819 058 12002�� 2 997 336 X
3256207 Hair preparations (including shampoos) 2003������������������������������������������������� 5 937 646 22002�� 7 993 433 X
325620A Dentifrices, mouthwashes, gargles, and rinses 2003������������������������������������������� 1 003 717 22002�� 1 240 606 X
325620D Creams, lotions and oils, excluding shaving, hair, and deodorant 2003��������������������������� 5 520 665 12002�� 6 134 297 X
325620G Other cosmetics and toilet preparations 2003������������������������������������������������� 9 028 075 12002�� 9 335 438 X
325620W Toilet preparation manufacturing, nsk, total 2003���������������������������������������������� 2 066 453 22002�� 2 106 429 X
See footnotes at end of table.
26 Annual Survey of Manufactures Value of Product ShipmentsU.S. Census Bureau, 2002 Economic Census

Table 1. Value of Shipments for Product Classes: 2003 and 2002�Con.[Includes value of product shipments produced by (1) establishments classified in their primary industry and (2) establishments classified in other industries (secondary). Transfers of products from oneestablishment of a company to another establishment of the same company (interplant transfers) are also included. Data based on the 2003 Annual Survey of Manufactures (ASM). For information onconfidentiality protection, sampling error, nonsampling error, and explanation of terms, see note 2 at end of table. For meaning of abbreviations and symbols, see introductory text]
Productclass code Product Value of
product shipments($1,000)
Relativestandard error
of estimate1
(percent)
325910 Printing ink manufacturing 2003�������������������������������������������������������������� 3 884 591 22002�� 4 018 353 X
3259101 Letterpress printing inks 2003�������������������������������������������������������������� 112 447 22002�� 118 266 X
3259104 Lithographic and offset inks 2003����������������������������������������������������������� 1 493 102 52002�� 1 636 129 X
3259107 Gravure printing inks 2003����������������������������������������������������������������� 430 728 72002�� 487 558 X
325910A Flexographic printing inks 2003������������������������������������������������������������� 806 234 72002�� 798 837 X
325910E Nonimpact/digital inks 2003���������������������������������������������������������������� 254 935 32002�� 239 120 X
325910H All other printing inks 2003����������������������������������������������������������������� 295 210 32002�� 312 060 X
325910W Printing ink manufacturing, nsk, total 2003��������������������������������������������������� 491 935 32002�� 426 383 X
325920 Explosives manufacturing 2003��������������������������������������������������������������� 808 619 52002�� 901 131 X
3259200 Explosives 2003�������������������������������������������������������������������������� 808 619 52002�� 901 131 X
325991 Custom compounding of purchased resins 2003������������������������������������������������ 7 344 122 12002�� 7 102 410 X
3259911 Custom compounding of purchased resins and color concentrates 2003������������������������� 5 339 112 22002�� 5 729 573 X
3259912 Resins in the form of pellets from spent or post consumer plastics 2003�������������������������� 550 925 52002�� 519 828 X
325991W Custom compounding of purchased resins, nsk, total 2003������������������������������������� 1 454 086 22002�� 853 009 X
325992 Photographic film, paper, plate, and chemical manufacturing 2003�������������������������������� 7 387 533 12002�� 9 208 293 X
3259921 Photographic sensitized film, plates, paper, and cloth, silver halide type (excluding X�ray) 2003������������������������������������������������������������������������������� 3 531 664 1
2002�� 5 039 491 X
3259923 Sensitized photographic film, plates, paper, and cloth, other than silver halide type(including X�ray) 2003�������������������������������������������������������������������� 1 884 508 1
2002�� 1 858 098 X
3259925 Prepared photographic chemicals 2003������������������������������������������������������ 1 724 311 22002�� 1 890 761 X
325992W Photographic film, paper, plate, and chemical manufacturing, nsk, total 2003��������������������� 247 050 42002�� 419 943 X
325998 All other miscellaneous chemical product and preparation manufacturing 2003���������������������� 12 520 846 12002�� 12 390 709 X
3259981 Evaporated salt (bulk, pressed blocks, and packaged), excluding table salt 2003������������������ 653 174 42002�� 613 466 X
3259984 Matches 2003���������������������������������������������������������������������������� 48 086 32002�� 49 997 X
3259987 Gelatin, excluding ready�to�eat desserts 2003������������������������������������������������ 491 470 12002�� 521 432 X
325998A Water treating compounds 2003������������������������������������������������������������ 2 580 977 12002�� 2 530 799 X
325998E Automotive chemicals 2003���������������������������������������������������������������� 1 070 514 32002�� 1 037 626 X
325998J All other chemical preparations, including essential oils and water�treatingcompounds3 2003����������������������������������������������������������������������� 6 173 495 1
2002�� 6 280 475 X
325998W All other miscellaneous chemical product and preparation manufacturing, nsk, total 2003���������� 1 503 130 22002�� 1 356 914 X
326111 Plastics bag manufacturing 2003�������������������������������������������������������������� 7 638 259 22002�� 7 424 341 X
3261111 Single�web film specialty bags, pouches, and liners 2003�������������������������������������� 6 528 365 22002�� 6 477 347 X
3261113 Multiweb film/film combination specialty bags, pouches, and liners 2003������������������������� 672 460 42002�� 687 190 X
326111W Plastics bag manufacturing, nsk, total 2003�������������������������������������������������� 437 435 42002�� 259 804 X
326112 Plastics packaging film and sheet (including laminated) manufacturing 2003������������������������ 7 774 263 12002�� 7 146 036 X
3261121 Single�web film, rolls, and sheets, including coextruded, for flexible packaging uses 2003���������� 4 892 980 22002�� 4 363 831 X
3261123 Film/film multiweb laminated rolls and sheets, except foil, for flexible packaging uses 2003��������� 2 709 319 22002�� 2 687 640 X
326112W Plastics packaging film and sheet (including laminated) manufacturing, nsk, total 2003������������� 171 965 62002�� 94 565 X
326113 Unlaminated plastics film and sheet (except packaging) manufacturing 2003����������������������� 13 346 724 32002�� 13 786 078 X
3261130 Unlaminated plastics film and sheet, excluding packaging 2003��������������������������������� 13 346 724 32002�� 13 786 078 X
See footnotes at end of table.
Value of Product Shipments Annual Survey of Manufactures 27U.S. Census Bureau, 2002 Economic Census

Table 1. Value of Shipments for Product Classes: 2003 and 2002�Con.[Includes value of product shipments produced by (1) establishments classified in their primary industry and (2) establishments classified in other industries (secondary). Transfers of products from oneestablishment of a company to another establishment of the same company (interplant transfers) are also included. Data based on the 2003 Annual Survey of Manufactures (ASM). For information onconfidentiality protection, sampling error, nonsampling error, and explanation of terms, see note 2 at end of table. For meaning of abbreviations and symbols, see introductory text]
Productclass code Product Value of
product shipments($1,000)
Relativestandard error
of estimate1
(percent)
326121 Unlaminated plastics profile shape manufacturing 2003������������������������������������������ 5 473 505 22002�� 5 310 883 X
3261210 Unlaminated plastics profile shapes 2003���������������������������������������������������� 5 473 505 22002�� 5 310 883 X
326122 Plastics pipe and pipe fitting manufacturing 2003������������������������������������������������ 5 451 887 12002�� 5 367 809 X
3261221 Plastics pipe 2003������������������������������������������������������������������������ 4 582 717 12002�� 4 521 427 X
3261223 Plastics pipe fittings and unions 2003�������������������������������������������������������� 626 820 72002�� 572 172 X
326122W Plastics pipe and pipe fitting manufacturing, total 2003����������������������������������������� 242 350 102002�� 274 210 X
326130 Laminated plastics plate, sheet (except packaging), and shape manufacturing 2003����������������� 2 277 435 22002�� 2 267 581 X
3261300 Thermosetting plastics laminates (excluding flexible packaging) 2003���������������������������� 2 277 435 22002�� 2 267 581 X
326140 Polystyrene foam product manufacturing 2003�������������������������������������������������� 5 699 052 42002�� 6 048 541 X
3261401 Transportation polystyrene foam products (including seating, dash, and other interior�exterior components) 2003���������������������������������������������������������������� 480 168 4
2002�� 460 295 X
3261402 Packaging, polystyrene foam products 2003�������������������������������������������������� 1 647 872 62002�� 1 780 397 X
3261403 Building and construction polystyrene foam products 2003������������������������������������� 1 023 206 52002�� 1 041 660 X
3261404 Furniture and furnishings polystyrene foam products 2003������������������������������������� 41 737 12002�� 33 313 X
3261405 Consumer and institutional polystyrene foam products 2003������������������������������������ 1 982 611 102002�� 2 151 620 X
3261406 Miscellaneous polystyrene foam products 2003����������������������������������������������� 277 922 82002�� 295 385 X
326140W Polystyrene foam product manufacturing, nsk, total 2003�������������������������������������� 245 536 82002�� 285 871 X
326150 Urethane and other foam product (except polystyrene) manufacturing 2003������������������������ 7 169 594 62002�� 6 694 217 X
3261501 Transportation polyurethane foam products 2003��������������������������������������������� 1 669 629 112002�� 1 551 815 X
3261502 Packaging polyurethane foam products 2003������������������������������������������������� 341 679 82002�� 365 549 X
3261503 Building and construction polyurethane foam 2003�������������������������������������������� 491 998 12002�� 479 721 X
3261504 Furniture and furnishings polyurethane foam products 2003������������������������������������ 2 836 881 52002�� 2 550 631 X
3261505 Consumer and institutional polyurethane foam products 2003���������������������������������� 286 834 42002�� 262 723 X
3261506 All other miscellaneous polyurethane foam products 2003�������������������������������������� 443 485 122002�� 392 442 X
3261509 Products made of foam other than polystyrene or polyurethane including phenolics,vinyl and cellulose acetate, etc. 2003������������������������������������������������������� 827 945 38
2002�� 811 476 X
326150W Urethane and other foam product (except polystyrene) manufacturing, nsk, total 2003������������� 271 144 42002�� 279 860 X
326160 Plastics bottle manufacturing 2003������������������������������������������������������������ 8 275 097 22002�� 7 955 610 X
3261600 Plastics bottles 2003���������������������������������������������������������������������� 8 275 097 22002�� 7 955 610 X
326191 Plastics plumbing fixture manufacturing 2003��������������������������������������������������� 3 251 825 62002�� 3 123 128 X
3261910 Plastics plumbing fixtures 2003������������������������������������������������������������� 3 251 825 62002�� 3 123 128 X
326192 Resilient floor covering manufacturing 2003���������������������������������������������������� 1 699 801 12002�� 1 584 637 X
3261920 Resilient floor coverings 2003�������������������������������������������������������������� 1 699 801 12002�� 1 584 637 X
326199 All other plastics product manufacturing 2003�������������������������������������������������� 71 003 933 12002�� 69 849 885 X
3261991 Transportation fabricated plastics products (excluding foam and reinforced plastics) 2003���������� 15 525 537 32002�� 14 669 472 X
3261992 Electrical and electronic fabricated plastics (excluding foam and reinforced plastics) 2003���������� 4 679 275 102002�� 4 545 106 X
3261993 Industrial machinery plastics products, excluding foam (including gears, bearings,bushings, cams, and other components) 2003����������������������������������������������� 1 311 958 3
2002�� 1 378 351 X
3261994 Plastics packaging (excluding film and sheet, foam, and bottles) 2003��������������������������� 9 092 723 22002�� 8 943 964 X
3261995 Plastics dinnerware, tableware, kitchenware, and oven�microwave ware (excludingfoam and cups) 2003��������������������������������������������������������������������� 2 214 863 2
2002�� 2 162 649 X
See footnotes at end of table.
28 Annual Survey of Manufactures Value of Product ShipmentsU.S. Census Bureau, 2002 Economic Census
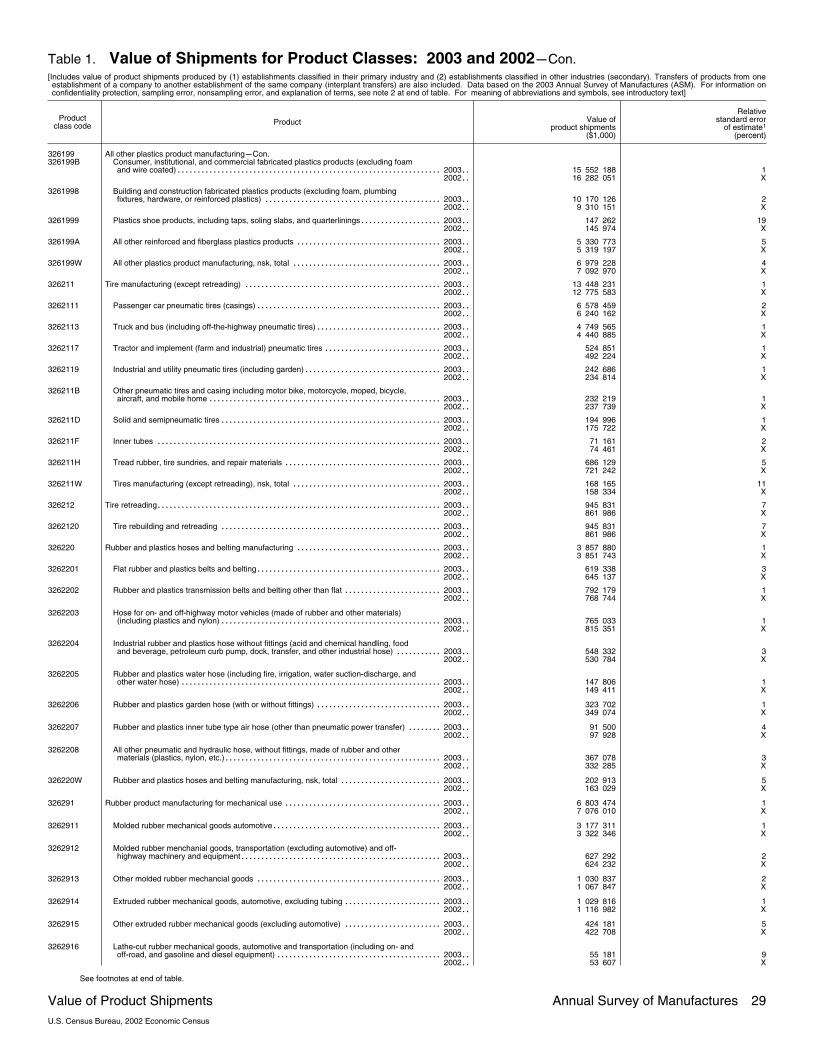
Table 1. Value of Shipments for Product Classes: 2003 and 2002�Con.[Includes value of product shipments produced by (1) establishments classified in their primary industry and (2) establishments classified in other industries (secondary). Transfers of products from oneestablishment of a company to another establishment of the same company (interplant transfers) are also included. Data based on the 2003 Annual Survey of Manufactures (ASM). For information onconfidentiality protection, sampling error, nonsampling error, and explanation of terms, see note 2 at end of table. For meaning of abbreviations and symbols, see introductory text]
Productclass code Product Value of
product shipments($1,000)
Relativestandard error
of estimate1
(percent)
326199 All other plastics product manufacturing�Con.326199B Consumer, institutional, and commercial fabricated plastics products (excluding foam
and wire coated) 2003�������������������������������������������������������������������� 15 552 188 12002�� 16 282 051 X
3261998 Building and construction fabricated plastics products (excluding foam, plumbingfixtures, hardware, or reinforced plastics) 2003���������������������������������������������� 10 170 126 2
2002�� 9 310 151 X
3261999 Plastics shoe products, including taps, soling slabs, and quarterlinings 2003���������������������� 147 262 192002�� 145 974 X
326199A All other reinforced and fiberglass plastics products 2003�������������������������������������� 5 330 773 52002�� 5 319 197 X
326199W All other plastics product manufacturing, nsk, total 2003��������������������������������������� 6 979 228 42002�� 7 092 970 X
326211 Tire manufacturing (except retreading) 2003��������������������������������������������������� 13 448 231 12002�� 12 775 583 X
3262111 Passenger car pneumatic tires (casings) 2003������������������������������������������������ 6 578 459 22002�� 6 240 162 X
3262113 Truck and bus (including off�the�highway pneumatic tires) 2003��������������������������������� 4 749 565 12002�� 4 440 885 X
3262117 Tractor and implement (farm and industrial) pneumatic tires 2003������������������������������� 524 851 12002�� 492 224 X
3262119 Industrial and utility pneumatic tires (including garden) 2003������������������������������������ 242 686 12002�� 234 814 X
326211B Other pneumatic tires and casing including motor bike, motorcycle, moped, bicycle,aircraft, and mobile home 2003������������������������������������������������������������ 232 219 1
2002�� 237 739 X
326211D Solid and semipneumatic tires 2003��������������������������������������������������������� 194 996 12002�� 175 722 X
326211F Inner tubes 2003������������������������������������������������������������������������� 71 161 22002�� 74 461 X
326211H Tread rubber, tire sundries, and repair materials 2003����������������������������������������� 686 129 52002�� 721 242 X
326211W Tires manufacturing (except retreading), nsk, total 2003��������������������������������������� 168 165 112002�� 158 334 X
326212 Tire retreading 2003������������������������������������������������������������������������� 945 831 72002�� 861 986 X
3262120 Tire rebuilding and retreading 2003��������������������������������������������������������� 945 831 72002�� 861 986 X
326220 Rubber and plastics hoses and belting manufacturing 2003�������������������������������������� 3 857 880 12002�� 3 851 743 X
3262201 Flat rubber and plastics belts and belting 2003������������������������������������������������ 619 338 32002�� 645 137 X
3262202 Rubber and plastics transmission belts and belting other than flat 2003�������������������������� 792 179 12002�� 768 744 X
3262203 Hose for on� and off�highway motor vehicles (made of rubber and other materials)(including plastics and nylon) 2003��������������������������������������������������������� 765 033 1
2002�� 815 351 X
3262204 Industrial rubber and plastics hose without fittings (acid and chemical handling, foodand beverage, petroleum curb pump, dock, transfer, and other industrial hose) 2003������������� 548 332 3
2002�� 530 784 X
3262205 Rubber and plastics water hose (including fire, irrigation, water suction�discharge, andother water hose) 2003������������������������������������������������������������������� 147 806 1
2002�� 149 411 X
3262206 Rubber and plastics garden hose (with or without fittings) 2003��������������������������������� 323 702 12002�� 349 074 X
3262207 Rubber and plastics inner tube type air hose (other than pneumatic power transfer) 2003���������� 91 500 42002�� 97 928 X
3262208 All other pneumatic and hydraulic hose, without fittings, made of rubber and othermaterials (plastics, nylon, etc.) 2003�������������������������������������������������������� 367 078 3
2002�� 332 285 X
326220W Rubber and plastics hoses and belting manufacturing, nsk, total 2003��������������������������� 202 913 52002�� 163 029 X
326291 Rubber product manufacturing for mechanical use 2003����������������������������������������� 6 803 474 12002�� 7 076 010 X
3262911 Molded rubber mechanical goods automotive 2003�������������������������������������������� 3 177 311 12002�� 3 322 346 X
3262912 Molded rubber menchanial goods, transportation (excluding automotive) and off�highway machinery and equipment 2003���������������������������������������������������� 627 292 2
2002�� 624 232 X
3262913 Other molded rubber mechancial goods 2003������������������������������������������������ 1 030 837 22002�� 1 067 847 X
3262914 Extruded rubber mechanical goods, automotive, excluding tubing 2003�������������������������� 1 029 816 12002�� 1 116 982 X
3262915 Other extruded rubber mechanical goods (excluding automotive) 2003�������������������������� 424 181 52002�� 422 708 X
3262916 Lathe�cut rubber mechanical goods, automotive and transportation (including on� andoff�road, and gasoline and diesel equipment) 2003������������������������������������������� 55 181 9
2002�� 53 607 X
See footnotes at end of table.
Value of Product Shipments Annual Survey of Manufactures 29U.S. Census Bureau, 2002 Economic Census

Table 1. Value of Shipments for Product Classes: 2003 and 2002�Con.[Includes value of product shipments produced by (1) establishments classified in their primary industry and (2) establishments classified in other industries (secondary). Transfers of products from oneestablishment of a company to another establishment of the same company (interplant transfers) are also included. Data based on the 2003 Annual Survey of Manufactures (ASM). For information onconfidentiality protection, sampling error, nonsampling error, and explanation of terms, see note 2 at end of table. For meaning of abbreviations and symbols, see introductory text]
Productclass code Product Value of
product shipments($1,000)
Relativestandard error
of estimate1
(percent)
326291 Rubber product manufacturing for mechanical use�Con.3262917 Other lathe�cut rubber mechanical goods (excluding automotive and transportation) 2003���������� 77 440 5
2002�� 84 208 X
326291W Rubber product manufacturing for mechanical use, nsk, total 2003������������������������������ 381 415 82002�� 384 080 X
326299 All other rubber product manufacturing 2003��������������������������������������������������� 6 638 389 22002�� 6 368 884 X
3262991 Rubber sponge, expanded and foam rubber products 2003������������������������������������ 756 781 42002�� 802 162 X
3262993 Rubber floor and wall coverings 2003�������������������������������������������������������� 721 589 22002�� 714 747 X
3262994 Shoe products, rubber, elastomer resin 2003������������������������������������������������� 71 467 52002�� 75 309 X
326299A Rubber druggist and medical sundries, excluding household gloves 2003������������������������ 426 974 52002�� 468 672 X
3262996 Rubber compounds or mixtures for sale or interplant transfer 2003������������������������������ 1 912 907 12002�� 1 766 649 X
3262997 All other industrial rubber products 2003����������������������������������������������������� 1 384 700 62002�� 1 308 403 X
326299B All other miscellaneous rubber goods 2003��������������������������������������������������� 609 127 42002�� 622 848 X
326299W All other rubber product manufacturing, nsk, total 2003���������������������������������������� 754 843 42002�� 610 094 X
327111 Vitreous china plumbing fixture and china and earthenware bathroom accessoriesmanufacturing 2003������������������������������������������������������������������������ 905 055 1
2002�� 979 448 X
3271110 Vitreous plumbing fixtures 2003������������������������������������������������������������� 905 055 12002�� 979 448 X
327112 Vitreous china, fine earthenware, and other pottery product manufacturing 2003�������������������� 917 477 32002�� 928 607 X
3271121 Vitreous china, porcelain, and earthenware (semivitreous) table and kitchenware(including household, hotel, or commercial uses) (including bone and feldspar) 2003������������� 322 617 3
2002�� 327 599 X
3271125 All other pottery products (including china decorated for the trade) 2003������������������������� 538 301 42002�� 529 438 X
327112W Vitreous china, fine earthenware, and other pottery product manufacturing, nsk, total 2003��������� 56 559 272002�� 71 570 X
327113 Porcelain electrical supply manufacturing 2003������������������������������������������������� 965 153 32002�� 1 023 124 X
3271130 Porcelain, steatite, and other ceramic electrical products 2003���������������������������������� 965 153 32002�� 1 023 124 X
327121 Brick and structural clay tile manufacturing 2003������������������������������������������������ 1 839 026 22002�� 1 767 367 X
3271210 Brick and structural clay tile3 2003���������������������������������������������������������� 1 839 026 22002�� 1 767 367 X
327122 Ceramic wall and floor tile manufacturing 2003������������������������������������������������� 877 056 12002�� 905 503 X
3271220 Clay floor and wall tile, glazed and unglazed (including quarry tile and ceramic mosaictile)3 2003������������������������������������������������������������������������������ 877 056 1
2002�� 905 503 X
327123 Other structural clay product manufacturing 2003����������������������������������������������� 192 853 22002�� 191 380 X
3271231 Vitrified clay sewer pipe and fittings3 2003��������������������������������������������������� 52 104 12002�� 50 407 X
3271234 All other structural clay products (architectural terra cotta, drain tile, flue tile, roofingtile, conduit, etc.), except clay refractories3 2003��������������������������������������������� 135 692 3
2002�� 136 443 X
327123W Other structural clay product manufacturing, nsk, total 2003������������������������������������ 5 057 12002�� 4 530 X
327124 Clay refractory manufacturing 2003����������������������������������������������������������� 858 944 42002�� 844 122 X
3271240 Clay refractories3 2003�������������������������������������������������������������������� 858 944 42002�� 844 122 X
327125 Nonclay refractory manufacturing 2003�������������������������������������������������������� 1 015 558 62002�� 995 497 X
3271250 Nonclay refractories (except dead�burned magnesia)3 2003������������������������������������ 1 015 558 62002�� 995 497 X
327211 Flat glass manufacturing 2003���������������������������������������������������������������� 2 802 964 12002�� 2 690 928 X
3272111 Flat glass (float, sheet, and plate process), made by flat glass producers3 2003������������������� 2 106 389 12002�� 2 006 371 X
3272114 Other glass products, made by flat glass producers2 2003�������������������������������������� 694 902 12002�� 682 630 X
327211W Flat glass manufacturing, nsk, total 2003����������������������������������������������������� 1 673 32002�� 1 927 X
See footnotes at end of table.
30 Annual Survey of Manufactures Value of Product ShipmentsU.S. Census Bureau, 2002 Economic Census

Table 1. Value of Shipments for Product Classes: 2003 and 2002�Con.[Includes value of product shipments produced by (1) establishments classified in their primary industry and (2) establishments classified in other industries (secondary). Transfers of products from oneestablishment of a company to another establishment of the same company (interplant transfers) are also included. Data based on the 2003 Annual Survey of Manufactures (ASM). For information onconfidentiality protection, sampling error, nonsampling error, and explanation of terms, see note 2 at end of table. For meaning of abbreviations and symbols, see introductory text]
Productclass code Product Value of
product shipments($1,000)
Relativestandard error
of estimate1
(percent)
327212 Other pressed and blown glass and glassware manufacturing 2003������������������������������� 4 153 572 12002�� 4 708 157 X
3272121 Glass fiber mat, textile�type, made by establishments producing glass3 2003��������������������� 1 418 671 12002�� 1 489 084 X
3272123 Machine�made pressed and blown table, kitchen, art, and novelty glassware, made byglass producers4 2003�������������������������������������������������������������������� 946 340 1
2002�� 970 555 X
3272125 Machine�made pressed and blown lighting, automotive, and electronic glassware,made by glass producers4 2003����������������������������������������������������������� 865 633 1
2002�� 1 280 417 X
3272127 All other machine�made pressed and blown glassware (including technical andscientific glassware, glass blocks, and lens blanks), made by glass producers4 2003������������� 614 912 1
2002�� 629 964 X
3272129 Handmade pressed and blown glassware, made by glass producers2 2003����������������������� 98 840 92002�� 118 784 X
327212W Other pressed and blown glass and glassware manufacturing, nsk, total 2003�������������������� 209 177 32002�� 219 353 X
327213 Glass container manufacturing 2003���������������������������������������������������������� 4 342 878 12002�� 4 344 817 X
3272130 Glass containers3 2003�������������������������������������������������������������������� 4 342 878 12002�� 4 344 817 X
327215 Glass product manufacturing made of purchased glass 2003������������������������������������� 10 498 069 22002�� 10 409 562 X
3272151 Machine�made pressed and blown table, kitchen, art, and novelty glassware, madefrom purchased glass4 2003��������������������������������������������������������������� 635 487 3
2002�� 654 251 X
3272153 All other machine�made pressed and blown glassware (including lighting, automotive,electronic, scientific, laboratory, industrial, and technical), made from purchasedglass4 2003����������������������������������������������������������������������������� 846 846 3
2002�� 854 671 X
3272155 Handmade pressed and blown glassware, made from purchased glass4 2003�������������������� 128 425 12002�� 134 678 X
3272159 Mirrors (decorated and undecorated), made from purchased glass3 2003������������������������ 1 771 647 72002�� 1 483 181 X
327215B Other glass products, made from purchased glass4 2003�������������������������������������� 6 432 591 22002�� 6 478 890 X
327215W Glass product manufacturing made of purchased glass, nsk, total 2003�������������������������� 683 072 232002�� 803 891 X
327310 Cement manufacturing 2003����������������������������������������������������������������� 7 213 450 12002�� 7 206 346 X
3273100 Cement, hydraulic (including cost of shipping containers) 2003��������������������������������� 7 213 450 12002�� 7 206 346 X
327320 Ready�mix concrete manufacturing 2003������������������������������������������������������� 21 201 985 22002�� 20 387 302 X
3273200 Ready�mix concrete 2003������������������������������������������������������������������ 21 201 985 22002�� 20 387 302 X
327331 Concrete block and brick manufacturing 2003�������������������������������������������������� 3 547 279 42002�� 3 425 723 X
3273310 Concrete block and brick 2003�������������������������������������������������������������� 3 547 279 42002�� 3 425 723 X
327332 Concrete pipe manufacturing 2003������������������������������������������������������������ 2 441 338 52002�� 2 352 738 X
3273320 Concrete pipe 2003����������������������������������������������������������������������� 2 441 338 52002�� 2 352 738 X
327390 Other concrete product manufacturing 2003���������������������������������������������������� 7 994 402 22002�� 8 394 908 X
3273901 Precast concrete products 2003������������������������������������������������������������ 5 424 935 22002�� 5 528 029 X
3273904 Prestressed concrete products 2003�������������������������������������������������������� 1 341 073 32002�� 1 532 841 X
327390W Other concrete product manufacturing, nsk, total 2003����������������������������������������� 1 228 394 72002�� 1 334 038 X
327410 Lime manufacturing 2003�������������������������������������������������������������������� 986 174 32002�� 977 101 X
3274100 Lime 2003������������������������������������������������������������������������������� 986 174 32002�� 977 101 X
327420 Gypsum product manufacturing 2003���������������������������������������������������������� 4 365 227 22002�� 3 914 118 X
3274201 Gypsum building materials 2003������������������������������������������������������������ 3 534 040 22002�� 2 946 471 X
3274205 Other gypsum products 2003��������������������������������������������������������������� 598 508 102002�� 777 541 X
327420W Gypsum product manufacturing, nsk, total 2003���������������������������������������������� 232 680 12002�� 190 106 X
See footnotes at end of table.
Value of Product Shipments Annual Survey of Manufactures 31U.S. Census Bureau, 2002 Economic Census

Table 1. Value of Shipments for Product Classes: 2003 and 2002�Con.[Includes value of product shipments produced by (1) establishments classified in their primary industry and (2) establishments classified in other industries (secondary). Transfers of products from oneestablishment of a company to another establishment of the same company (interplant transfers) are also included. Data based on the 2003 Annual Survey of Manufactures (ASM). For information onconfidentiality protection, sampling error, nonsampling error, and explanation of terms, see note 2 at end of table. For meaning of abbreviations and symbols, see introductory text]
Productclass code Product Value of
product shipments($1,000)
Relativestandard error
of estimate1
(percent)
327910 Abrasive product manufacturing 2003��������������������������������������������������������� 3 462 330 12002�� 3 367 704 X
3279101 Nonmetallic sized grains, powders, and flour abrasives (including graded productsonly) 2003������������������������������������������������������������������������������ 711 121 3
2002�� 586 700 X
3279104 Nonmetallic abrasive products (including diamond abrasives) 2003������������������������������ 937 258 32002�� 944 382 X
3279107 Nonmetallic coated abrasive products and buffing wheels, polishing wheels, and laps 2003��������� 1 469 771 22002�� 1 522 272 X
327910A Metal abrasives including steel and iron grid, shot, and sand, and other metalabrasives 2003�������������������������������������������������������������������������� 184 905 3
2002�� 130 499 X
327910W Abrasive product manufacturing, nsk, total 2003���������������������������������������������� 159 275 102002�� 183 851 X
327991 Cut stone and stone product manufacturing 2003����������������������������������������������� 2 339 282 32002�� 2 199 091 X
3279911 Dressed dimension granite (including gneiss, syenite, diorite, and cut granite) 2003��������������� 1 006 874 62002�� 886 880 X
3279914 Dressed dimension limestone (including dolomite, travertine, calcareous, tufa, and cutlimestone) 2003������������������������������������������������������������������������� 303 775 3
2002�� 267 530 X
3279917 Dressed dimension marble and other stone 2003��������������������������������������������� 422 627 82002�� 403 837 X
327991W Cut stone and stone product manufacturing, nsk, total 2003������������������������������������ 606 006 72002�� 640 844 X
327992 Ground or treated mineral and earth manufacturing 2003���������������������������������������� 2 200 534 42002�� 1 983 653 X
3279920 Treated minerals and earths3 2003���������������������������������������������������������� 2 200 534 42002�� 1 983 653 X
327993 Mineral wool manufacturing 2003������������������������������������������������������������� 4 546 591 22002�� 4 727 995 X
3279931 Mineral wool for thermal and acoustical envelope insulation (for homes andcommercial, and industrial buildings) 2003�������������������������������������������������� 2 970 814 1
2002�� 2 919 906 X
3279934 Mineral wool for industrial, equipment, and appliance insulation 2003���������������������������� 1 306 634 52002�� 1 392 508 X
327993W Mineral wool manufacturing, nsk, total 2003�������������������������������������������������� 269 143 142002�� 415 581 X
327999 All other nonmetallic mineral product manufacturing 2003���������������������������������������� 1 993 158 32002�� 1 830 646 X
3279990 All other nonmetallic mineral products 2003�������������������������������������������������� 1 993 158 32002�� 1 830 646 X
331111 Iron and steel mills 2003��������������������������������������������������������������������� 43 640 423 12002�� 43 925 719 X
3311111 Coke oven and blast furnace products, made in steel mills2 2003������������������������������� 1 187 379 22002�� 947 986 X
3311113 Steel ingots and semifinished shapes and forms, made in steel mills3 2003����������������������� 2 819 588 12002�� 3 521 492 X
3311115 Hot rolled steel sheet and strip (including tin mill products, tinplate, blackplate,terneplate, and tin�free steel), made in steel mills3 2003��������������������������������������� 15 302 778 1
2002�� 15 774 610 X
3311117 Hot rolled steel bars and bar shapes, plates, structural shapes, and piling (includingconcrete reinforcing and tool steel bars), made in steel mills3 2003����������������������������� 10 818 739 1
2002�� 10 769 497 X
3311119 Steel wire, including galvanized and other coated wire, made in steel mills producingwire rods or hot rolled bars4 2003���������������������������������������������������������� 349 725 4
2002�� 360 762 X
331111B Steel pipes and tubes, made in steel mills producing semifinished shapes or plate4 2003����������� 1 465 583 42002�� 1 794 054 X
331111D Cold rolled steel sheet and strip, made in steel mills producing hot rolled sheet orstrip4 2003������������������������������������������������������������������������������ 9 689 095 1
2002�� 9 173 225 X
331111F Cold finished steel bars and bar shapes, made in steel mills producing hot rolled barsand bar shapes4 2003�������������������������������������������������������������������� 782 912 1
2002�� 644 345 X
331111H Seamless rolled ring forgings, ferrous, made in steel mills2 2003�������������������������������� 83 639 192002�� 75 703 X
331111J Open die and smith forgings (hammer and press), ferrous, made in steel mills2 2003�������������� 214 579 42002�� 187 842 X
331111L Other steel mill products, including steel rails, except wire products3 2003������������������������ 618 553 92002�� 552 733 X
331111W Iron and steel mills, nsk, total 2003���������������������������������������������������������� 307 853 62002�� 123 470 X
See footnotes at end of table.
32 Annual Survey of Manufactures Value of Product ShipmentsU.S. Census Bureau, 2002 Economic Census

Table 1. Value of Shipments for Product Classes: 2003 and 2002�Con.[Includes value of product shipments produced by (1) establishments classified in their primary industry and (2) establishments classified in other industries (secondary). Transfers of products from oneestablishment of a company to another establishment of the same company (interplant transfers) are also included. Data based on the 2003 Annual Survey of Manufactures (ASM). For information onconfidentiality protection, sampling error, nonsampling error, and explanation of terms, see note 2 at end of table. For meaning of abbreviations and symbols, see introductory text]
Productclass code Product Value of
product shipments($1,000)
Relativestandard error
of estimate1
(percent)
331112 Electrometallurgical ferroalloy product manufacturing 2003��������������������������������������� 757 122 12002�� 814 749 X
3311121 Ferrochromium, including briquettes, ferrochromium silicon, exothermic chromiumadditives, and other chromium alloys 2003�������������������������������������������������� – 1
2002�� – X
3311123 Ferrosilicon, including briquettes, and other silicon alloys 2003���������������������������������� 80 025 12002�� 163 491 X
3311125 Other ferroalloys 2003��������������������������������������������������������������������� 677 097 12002�� 651 258 X
331112W Electrometallurgical ferroalloy product manufacturing, nsk, total 2003���������������������������� – 12002�� – X
331210 Iron and steel pipe and tube manufacturing from purchased steel 2003���������������������������� 6 413 480 22002�� 6 654 913 X
3312100 Iron and steel pipes and tubes, made from purchased iron and steel4 2003����������������������� 6 413 480 22002�� 6 654 913 X
331221 Rolled steel shape manufacturing 2003�������������������������������������������������������� 5 693 467 22002�� 5 839 875 X
3312211 Cold rolled steel sheet and strip, made from purchased steel4 2003����������������������������� 4 166 395 22002�� 4 287 446 X
3312213 Cold finished steel bars and bar shapes, made from purchased steel4 2003���������������������� 1 050 475 32002�� 1 103 739 X
3312215 Iron and steel powders, paste, and flakes, made from purchased steel 2003���������������������� 397 232 82002�� 396 588 X
331221W Rolled steel shape manufacturing, nsk, total 2003��������������������������������������������� 79 366 182002�� 52 102 X
331222 Steel wire drawing 2003��������������������������������������������������������������������� 3 770 272 22002�� 4 015 083 X
3312221 Noninsulated ferrous wire rope, cable, and fabricated wire rope assemblies (includinglifting slings), made in plants that draw wire4 2003�������������������������������������������� 819 768 2
2002�� 868 100 X
3312223 Steel nails, staples, tacks, spikes, and brads, made in plants that draw wire4 2003���������������� 298 283 92002�� 297 119 X
3312225 Steel wire, including galvanized and other coated wire, made in plants that draw wire4 2003�������� 1 498 540 22002�� 1 654 791 X
3312227 Steel fencing and fence gates, made in plants that draw wire4 2003����������������������������� 300 022 62002�� 292 751 X
3312229 Ferrous wire cloth and other ferrous woven wire products, made in plants that drawwire4 2003������������������������������������������������������������������������������ 60 616 1
2002�� 62 598 X
331222B Other ferrous wire products (excluding springs), made in plants that draw wire4 2003�������������� 619 395 52002�� 680 911 X
331222W Steel wire drawing, nsk, total 2003���������������������������������������������������������� 173 646 52002�� 158 813 X
331311 Alumina refining 2003����������������������������������������������������������������������� 631 636 12002�� 558 081 X
3313110 Aluminum oxide, except natural alumina3 2003����������������������������������������������� 631 636 12002�� 558 081 X
331312 Primary aluminum production 2003������������������������������������������������������������ 4 495 786 12002�� 4 914 793 X
3313120 Aluminum ingot, including billet, made in primary aluminum reduction plants2 2003���������������� 4 495 786 12002�� 4 914 793 X
331314 Secondary smelting and alloying of aluminum 2003��������������������������������������������� 3 543 875 12002�� 3 486 388 X
3313142 Aluminum ingot, including billet, made by secondary smelters2 2003����������������������������� 2 965 823 12002�� 2 952 464 X
3313145 Aluminum and aluminum�base alloy powders, paste, and flakes from purchasedaluminum 2003�������������������������������������������������������������������������� 404 628 1
2002�� 368 141 X
331314W Secondary smelting and alloying of aluminum, nsk, total 2003���������������������������������� 173 425 62002�� 165 783 X
331315 Aluminum sheet, plate, and foil manufacturing 2003��������������������������������������������� 10 982 934 12002�� 10 755 580 X
3313151 Aluminum plate (thickness of 0.25 in. or more), including continuous cast 2003������������������� 584 858 12002�� 589 429 X
3313153 Aluminum sheet and strip, including continuous cast 2003�������������������������������������� 9 404 393 12002�� 9 190 350 X
3313155 Plain aluminum foil (less than .006 in. thick) 2003��������������������������������������������� 794 500 12002�� 792 980 X
3313157 Aluminum welded tube 2003��������������������������������������������������������������� 96 839 82002�� 105 930 X
331315W Aluminum sheet, plate, and foil manufacturing, nsk, total 2003���������������������������������� 102 344 12002�� 76 891 X
See footnotes at end of table.
Value of Product Shipments Annual Survey of Manufactures 33U.S. Census Bureau, 2002 Economic Census

Table 1. Value of Shipments for Product Classes: 2003 and 2002�Con.[Includes value of product shipments produced by (1) establishments classified in their primary industry and (2) establishments classified in other industries (secondary). Transfers of products from oneestablishment of a company to another establishment of the same company (interplant transfers) are also included. Data based on the 2003 Annual Survey of Manufactures (ASM). For information onconfidentiality protection, sampling error, nonsampling error, and explanation of terms, see note 2 at end of table. For meaning of abbreviations and symbols, see introductory text]
Productclass code Product Value of
product shipments($1,000)
Relativestandard error
of estimate1
(percent)
331316 Aluminum extruded product manufacturing 2003������������������������������������������������ 5 211 838 22002�� 5 391 686 X
3313161 Extruded aluminum rod, bar, and other extruded shapes 2003���������������������������������� 4 506 352 22002�� 4 677 193 X
3313163 Extruded and drawn aluminum tube 2003���������������������������������������������������� 650 500 92002�� 649 974 X
331316W Aluminum extruded product manufacturing, nsk, total 2003������������������������������������� 54 986 62002�� 64 519 X
331319 Other aluminum rolling and drawing 2003������������������������������������������������������ 1 533 013 12002�� 1 441 186 X
3313192 Aluminum and aluminum�base alloy wire and cable (except covered or insulated),including ACSR, made in aluminum rolling mills and plants that draw wire frompurchased or recovered aluminum 2003���������������������������������������������������� 378 830 1
2002�� 379 475 X
3313193 Rolled aluminum rod and bar (including continuous cast), made in aluminum rollingmills and plants that draw wire from purchased or recovered aluminum 2003�������������������� 281 746 1
2002�� 172 004 X
331319D Aluminum ingot, including billet, made in aluminum rolling mills and plants that drawwire from purchased or recovered aluminum2 2003������������������������������������������� 228 516 1
2002�� 304 344 X
331319E Aluminum insulated wire and cable2 2003���������������������������������������������������� 551 744 12002�� 476 064 X
331319W Other aluminum rolling and drawing, nsk, total 2003������������������������������������������� 92 177 42002�� 109 299 X
331411 Primary smelting and refining of copper 2003��������������������������������������������������� 2 039 703 12002�� 2 212 133 X
3314110 Primary smelting and refining of copper2 2003������������������������������������������������ 2 039 703 12002�� 2 212 133 X
331419 Primary smelting and refining of nonferrous metal (except copper and aluminum) 2003�������������� 2 436 785 22002�� 2 501 791 X
3314193 Primary smelting and refining of zinc2 2003�������������������������������������������������� 262 095 52002�� 245 001 X
3314197 Primary precious metals and precious metal alloys2 2003�������������������������������������� 516 875 42002�� 646 552 X
331419A All other miscellaneous primary nonferrous metals2 2003�������������������������������������� 1 532 798 22002�� 1 506 253 X
331419W Primary smelting and refining of nonferrous metal (except copper and aluminum), nsk,total 2003������������������������������������������������������������������������������� 125 017 1
2002�� 103 985 X
331421 Copper rolling, drawing, and extruding 2003���������������������������������������������������� 6 236 000 12002�� 5 868 034 X
3314211 Copper wire, bare and tinned (nonelectrical), made in rolling mills 2003�������������������������� 288 261 12002�� 306 884 X
3314213 Copper and copper�base alloy rod, bar, and shapes 2003�������������������������������������� 2 796 267 12002�� 2 656 801 X
3314217 Copper and copper�base alloy sheet, strip, and plate 2003������������������������������������� 1 208 361 12002�� 1 083 062 X
3314219 Copper and copper�base alloy pipe and tube 2003�������������������������������������������� 1 871 936 12002�� 1 779 723 X
331421W Copper rolling, drawing, and extruding, nsk, total 2003����������������������������������������� 71 175 292002�� 41 564 X
331422 Copper wire (except mechanical) drawing 2003������������������������������������������������� 2 499 136 12002�� 2 663 475 X
3314222 Copper and copper�base alloy wire, strand, and cable, made in plants that draw wire 2003��������� 716 832 22002�� 711 260 X
3314224 Copper wire and cable, including apparatus wire, cord, and flexible cord sets, made incopper wire drawing plants2 2003���������������������������������������������������������� 1 021 052 2
2002�� 1 143 374 X
3314225 Copper magnet wire (except fiber optic), made in plants that draw wire3 2003��������������������� 697 923 12002�� 769 401 X
331422W Copper wire (except mechanical) drawing, nsk, total 2003�������������������������������������� 63 329 252002�� 39 440 X
331423 Secondary smelting, refining, and alloying of copper 2003���������������������������������������� 703 151 92002�� 625 812 X
3314230 Secondary smelting, refining, and alloying of copper2 2003������������������������������������� 703 151 92002�� 625 812 X
331491 Nonferrous metal (except copper and aluminum) rolling, drawing, and extruding 2003��������������� 4 115 702 22002�� 4 396 353 X
3314912 Nickel and nickel�base alloy mill shapes 2003������������������������������������������������ 1 027 641 22002�� 1 106 797 X
3314913 Titanium and titanium�base alloy mill shapes 2003�������������������������������������������� 868 691 32002�� 838 664 X
331491A Precious metal mill shapes 2003������������������������������������������������������������ 547 532 112002�� 703 478 X
331491D All other nonferrous metal mill shapes 2003�������������������������������������������������� 1 290 573 32002�� 1 360 525 X
331491F Apparatus wire and cord and flexible cord sets (except aluminum, copper, wiringharnesses and fiber optic), made in plants that draw wire4 2003�������������������������������� 61 752 1
2002�� 61 740 X
See footnotes at end of table.
34 Annual Survey of Manufactures Value of Product ShipmentsU.S. Census Bureau, 2002 Economic Census

Table 1. Value of Shipments for Product Classes: 2003 and 2002�Con.[Includes value of product shipments produced by (1) establishments classified in their primary industry and (2) establishments classified in other industries (secondary). Transfers of products from oneestablishment of a company to another establishment of the same company (interplant transfers) are also included. Data based on the 2003 Annual Survey of Manufactures (ASM). For information onconfidentiality protection, sampling error, nonsampling error, and explanation of terms, see note 2 at end of table. For meaning of abbreviations and symbols, see introductory text]
Productclass code Product Value of
product shipments($1,000)
Relativestandard error
of estimate1
(percent)
331491 Nonferrous metal (except copper and aluminum) rolling, drawing, and extruding�Con.331491H Magnet wire, (except aluminum and copper), made in plants that draw wire3 2003����������������� 16 206 1
2002�� 14 693 X
331491W Nonferrous metal (except copper and aluminum) rolling, drawing, and extruding, nsk,total 2003������������������������������������������������������������������������������� 303 308 10
2002�� 310 456 X
331492 Secondary smelting, refining, and alloying of nonferrous metal (except copper andaluminum) 2003��������������������������������������������������������������������������� 2 746 919 3
2002�� 2 451 163 X
3314921 Other nonferrous metal powders, paste, and flakes 2003��������������������������������������� 1 174 776 72002�� 1 001 430 X
3314927 Secondary smelting, refining, and alloying of zinc2 2003��������������������������������������� 160 178 22002�� 169 477 X
3314929 Secondary precious metals and precious metal alloys2 2003����������������������������������� 386 922 72002�� 332 934 X
331492B All other miscellaneous secondary nonferrous metals2 2003������������������������������������ 786 129 22002�� 800 094 X
331492W Secondary smelting, refining, and alloying of nonferrous metal (except copper andaluminum), nsk, total 2003���������������������������������������������������������������� 238 914 1
2002�� 147 228 X
331511 Iron foundries 2003������������������������������������������������������������������������� 9 575 739 12002�� 9 794 555 X
3315111 Ductile iron pressure pipe and fittings3 2003�������������������������������������������������� 1 662 299 12002�� 1 549 981 X
3315113 Other ductile iron castings3 2003������������������������������������������������������������ 2 773 120 12002�� 2 980 628 X
3315115 Cast iron pressure pipe and fittings3 2003���������������������������������������������������� 33 255 72002�� 35 398 X
3315117 Cast iron soil pipe and fittings, all sizes3 2003������������������������������������������������ 299 969 12002�� 309 976 X
3315119 Other gray iron castings3 2003������������������������������������������������������������� 4 380 897 12002�� 4 476 228 X
331511A Standard malleable iron castings3 2003������������������������������������������������������ 88 088 52002�� 92 887 X
331511C Pearlitic malleable iron castings3 2003������������������������������������������������������� 118 923 12002�� 130 962 X
331511E Molds and stools for heavy steel ingots3 2003������������������������������������������������ 42 757 42002�� 42 664 X
331511W Iron foundries, nsk, total 2003�������������������������������������������������������������� 176 431 42002�� 175 831 X
331512 Steel investment foundries 2003�������������������������������������������������������������� 1 861 792 22002�� 2 128 652 X
3315120 Steel investment castings3 2003������������������������������������������������������������ 1 861 792 22002�� 2 128 652 X
331513 Steel foundries (except investment) 2003������������������������������������������������������ 2 589 435 32002�� 2 433 573 X
3315131 Other carbon steel castings, except investment3 2003����������������������������������������� 1 243 055 42002�� 1 152 828 X
3315133 High alloy steel castings, except investment3 2003�������������������������������������������� 639 098 42002�� 608 266 X
3315135 Other alloy steel castings, except investment3 2003������������������������������������������� 595 721 112002�� 554 591 X
331513W Steel foundries (except investment), nsk, total 2003������������������������������������������� 111 560 42002�� 117 888 X
331521 Aluminum die�casting foundries 2003���������������������������������������������������������� 3 970 102 52002�� 4 318 278 X
3315210 Aluminum die�castings3 2003��������������������������������������������������������������� 3 970 102 52002�� 4 318 278 X
331522 Nonferrous (except aluminum) die�casting foundries 2003���������������������������������������� 1 789 071 32002�� 1 813 240 X
3315220 Nonferrous (except aluminum) die�castings3 2003��������������������������������������������� 1 789 071 32002�� 1 813 240 X
331524 Aluminum foundries (except die�casting) 2003�������������������������������������������������� 3 364 180 32002�� 3 494 517 X
3315240 Aluminum foundries3 2003����������������������������������������������������������������� 3 364 180 32002�� 3 494 517 X
331525 Copper foundries (except die�casting) 2003���������������������������������������������������� 748 945 42002�� 747 645 X
3315250 Copper foundries3 2003������������������������������������������������������������������� 748 945 42002�� 747 645 X
331528 Other nonferrous foundries (except die�casting) 2003�������������������������������������������� 797 837 42002�� 749 678 X
3315280 Other nonferrous foundries3 2003����������������������������������������������������������� 797 837 42002�� 749 678 X
See footnotes at end of table.
Value of Product Shipments Annual Survey of Manufactures 35U.S. Census Bureau, 2002 Economic Census

Table 1. Value of Shipments for Product Classes: 2003 and 2002�Con.[Includes value of product shipments produced by (1) establishments classified in their primary industry and (2) establishments classified in other industries (secondary). Transfers of products from oneestablishment of a company to another establishment of the same company (interplant transfers) are also included. Data based on the 2003 Annual Survey of Manufactures (ASM). For information onconfidentiality protection, sampling error, nonsampling error, and explanation of terms, see note 2 at end of table. For meaning of abbreviations and symbols, see introductory text]
Productclass code Product Value of
product shipments($1,000)
Relativestandard error
of estimate1
(percent)
332111 Iron and steel forging 2003������������������������������������������������������������������� 3 816 033 32002�� 3 988 037 X
3321111 Hot impression die impact, press, and upset steel forgings 2003�������������������������������� 2 565 967 32002�� 2 517 824 X
3321113 Cold impression die impact, press, and upset steel forgings 2003������������������������������� 392 681 72002�� 422 452 X
3321115 Seamless rolled ring forgings, ferrous, made from purchased iron and steel2 2003���������������� 274 040 42002�� 297 526 X
3321117 Open die and smith forgings (hammer and press), ferrous, made from purchased ironand steel2 2003�������������������������������������������������������������������������� 385 353 4
2002�� 470 840 X
332111W Iron and steel forging, nsk, total 2003�������������������������������������������������������� 197 992 402002�� 279 395 X
332112 Nonferrous forging 2003��������������������������������������������������������������������� 1 782 072 32002�� 1 861 605 X
3321121 Hot impression die impact, press, and upset nonferrous forgings 2003��������������������������� 1 306 360 42002�� 1 381 988 X
3321122 Other nonferrous forgings 2003������������������������������������������������������������� 437 551 12002�� 440 291 X
332112W Nonferrous forging, nsk, total 2003���������������������������������������������������������� 38 161 32002�� 39 326 X
332114 Custom roll forming 2003�������������������������������������������������������������������� 4 410 806 32002�� 4 007 080 X
3321140 Custom roll form products 2003������������������������������������������������������������� 4 410 806 32002�� 4 007 080 X
332115 Crown and closure manufacturing 2003�������������������������������������������������������� 867 980 12002�� 900 861 X
3321150 Crowns and closures 2003����������������������������������������������������������������� 867 980 12002�� 900 861 X
332116 Metal stamping 2003������������������������������������������������������������������������ 9 030 251 32002�� 8 830 659 X
3321161 Job stampings, except automotive 2003����������������������������������������������������� 6 183 807 42002�� 5 952 758 X
3321163 Metal spinning products, excluding cooking and kitchen utensils 2003��������������������������� 160 316 122002�� 149 363 X
3321166 Stamped and pressed metal end products, including vitreous (porcelain) enameledproducts 2003��������������������������������������������������������������������������� 1 668 262 8
2002�� 1 668 171 X
332116W Metal stamping, nsk, total 2003������������������������������������������������������������� 1 017 867 52002�� 1 060 367 X
332117 Powder metallurgy part manufacturing 2003���������������������������������������������������� 1 342 509 82002�� 1 293 105 X
3321170 Powder metallurgy parts 2003�������������������������������������������������������������� 1 342 509 82002�� 1 293 105 X
332211 Cutlery and flatware (except precious) manufacturing 2003��������������������������������������� 1 853 015 32002�� 1 814 120 X
3322112 Cutlery, scissors, shears, trimmers, and snips 2003������������������������������������������� 614 139 92002�� 648 485 X
3322113 Razor blades and razors, except electric 2003������������������������������������������������ 1 190 560 12002�� 1 118 872 X
332211W Cutlery and flatware (except precious) manufacturing, nsk, total 2003��������������������������� 48 315 22002�� 46 763 X
332212 Hand and edge tool manufacturing 2003������������������������������������������������������� 5 252 970 22002�� 5 677 742 X
3322122 Mechanics’ hand service tools 2003��������������������������������������������������������� 1 687 400 22002�� 2 035 341 X
3322123 Edge tools, hand�operated 2003������������������������������������������������������������ 469 507 102002�� 501 847 X
3322125 Dies and interchangeable cutting tools, for machines and power�driven handtools 2003������������ 837 955 22002�� 798 978 X
3322128 All other miscellaneous handtools 2003������������������������������������������������������ 1 094 921 32002�� 1 177 616 X
3322129 Precision measuring tools (inspection, quality control, tool room, and machinists’) 2003������������ 724 040 32002�� 713 047 X
332212W Hand and edge tool manufacturing, nsk, total 2003�������������������������������������������� 439 147 52002�� 450 913 X
332213 Saw blade and handsaw manufacturing 2003��������������������������������������������������� 1 083 063 32002�� 1 188 013 X
3322130 Saw blades and handsaws 2003������������������������������������������������������������ 1 083 063 32002�� 1 188 013 X
See footnotes at end of table.
36 Annual Survey of Manufactures Value of Product ShipmentsU.S. Census Bureau, 2002 Economic Census

Table 1. Value of Shipments for Product Classes: 2003 and 2002�Con.[Includes value of product shipments produced by (1) establishments classified in their primary industry and (2) establishments classified in other industries (secondary). Transfers of products from oneestablishment of a company to another establishment of the same company (interplant transfers) are also included. Data based on the 2003 Annual Survey of Manufactures (ASM). For information onconfidentiality protection, sampling error, nonsampling error, and explanation of terms, see note 2 at end of table. For meaning of abbreviations and symbols, see introductory text]
Productclass code Product Value of
product shipments($1,000)
Relativestandard error
of estimate1
(percent)
332214 Kitchen utensil, pot, and pan manufacturing 2003����������������������������������������������� 1 246 893 72002�� 1 247 603 X
3322141 Stamped and spun utensils, cooking and kitchen, aluminum 2003������������������������������� 787 520 112002�� 825 053 X
3322143 Stamped and spun utensils, cooking and kitchen, except aluminum 2003������������������������ 450 460 32002�� 413 254 X
332214W Kitchen utensil, pot, and pan manufacturing, nsk, total 2003������������������������������������ 8 913 12002�� 9 296 X
332311 Prefabricated metal building and component manufacturing 2003��������������������������������� 4 597 034 22002�� 4 744 875 X
3323111 Prefabricated metal building and component systems (excluding farm servicebuildings, residential buildings, and parts) 2003���������������������������������������������� 2 860 940 2
2002�� 2 985 957 X
3323113 Other prefabricated and portable metal buildings and parts 2003�������������������������������� 1 143 804 42002�� 1 203 628 X
332311W Prefabricated metal building and component manufacturing, nsk, total 2003���������������������� 592 290 52002�� 555 290 X
332312 Fabricated structural metal manufacturing 2003������������������������������������������������� 17 342 782 32002�� 17 432 760 X
3323121 Fabricated structural metal bar joists and concrete reinforcing bars 2003������������������������� 9 006 103 42002�� 9 474 726 X
3323123 Fabricated structural metal for bridges 2003�������������������������������������������������� 1 074 290 82002�� 1 024 854 X
3323125 Other fabricated structural metal 2003������������������������������������������������������� 4 392 240 42002�� 3 976 557 X
332312W Fabricated structural metal manufacturing, nsk, total 2003������������������������������������� 2 870 149 72002�� 2 956 623 X
332313 Plate work manufacturing 2003��������������������������������������������������������������� 2 954 736 62002�� 3 206 237 X
3323130 Fabricated plate work (stacks and weldments) 2003������������������������������������������� 2 954 736 62002�� 3 206 237 X
332321 Metal window and door manufacturing 2003���������������������������������������������������� 10 486 527 12002�� 10 355 512 X
3323211 Metal doors (except storm doors) 2003������������������������������������������������������ 5 569 300 12002�� 5 372 931 X
3323213 Metal windows (except storm sash) 2003���������������������������������������������������� 2 295 328 22002�� 2 224 168 X
3323215 Metal molding and trim and store fronts 2003������������������������������������������������� 851 046 32002�� 988 156 X
3323217 Metal combination screen, storm sash, and storm doors 2003���������������������������������� 555 991 22002�� 544 830 X
3323219 Metal window and door screens (except combination) and metal weather strip 2003��������������� 345 071 42002�� 340 780 X
332321W Metal window and door manufacturing, nsk, total 2003����������������������������������������� 869 791 72002�� 884 647 X
332322 Sheet metal work manufacturing 2003��������������������������������������������������������� 14 962 501 32002�� 14 643 650 X
3323221 Sheet metal air�conditioning ducts and stove pipe 2003���������������������������������������� 2 178 655 72002�� 1 946 826 X
3323223 Sheet metal culverts, flumes, irrigation pipes, etc. 2003���������������������������������������� 499 860 132002�� 557 674 X
3323227 Sheet metal roofing and roof drainage equipment 2003���������������������������������������� 1 591 252 122002�� 1 417 019 X
3323229 Sheet metal flooring and siding 2003�������������������������������������������������������� 901 645 132002�� 921 549 X
332322A Sheet metal awnings, canopies, cornices, and soffits 2003������������������������������������� 640 113 82002�� 684 375 X
332322C Sheet metal electronic enclosures 2003������������������������������������������������������ 2 446 508 52002�� 2 340 049 X
332322G Other sheet metal work 2003��������������������������������������������������������������� 4 138 976 42002�� 3 616 545 X
332322F Metal studs, nonload and load�bearing (iron, steel, and aluminum) 2003������������������������� 467 787 22002�� 333 965 X
332322W Sheet metal work manufacturing, nsk, total 2003���������������������������������������������� 2 097 707 132002�� 2 825 648 X
332323 Ornamental and architectural metal work manufacturing 2003������������������������������������ 5 149 951 32002�� 5 201 688 X
3323231 Metal grilles, registers, and air diffusers 2003������������������������������������������������� 561 094 32002�� 575 893 X
3323233 Ornamental and architectural metal work 2003����������������������������������������������� 1 716 599 42002�� 1 605 588 X
3323236 Open metal flooring, grating, and studs 2003������������������������������������������������� 358 116 82002�� 364 762 X
3323237 Metal scaffolding and shoring and forming for concrete work 2003������������������������������ 609 100 32002�� 567 481 X
3323239 Other architectural and ornamental work 2003������������������������������������������������ 1 155 077 82002�� 1 219 720 X
See footnotes at end of table.
Value of Product Shipments Annual Survey of Manufactures 37U.S. Census Bureau, 2002 Economic Census

Table 1. Value of Shipments for Product Classes: 2003 and 2002�Con.[Includes value of product shipments produced by (1) establishments classified in their primary industry and (2) establishments classified in other industries (secondary). Transfers of products from oneestablishment of a company to another establishment of the same company (interplant transfers) are also included. Data based on the 2003 Annual Survey of Manufactures (ASM). For information onconfidentiality protection, sampling error, nonsampling error, and explanation of terms, see note 2 at end of table. For meaning of abbreviations and symbols, see introductory text]
Productclass code Product Value of
product shipments($1,000)
Relativestandard error
of estimate1
(percent)
332323 Ornamental and architectural metal work manufacturing�Con.332323W Ornamental and architectural metal work manufacturing, nsk, total 2003������������������������� 749 966 7
2002�� 868 244 X
332410 Power boiler and heat exchanger manufacturing 2003������������������������������������������� 2 978 825 112002�� 3 316 556 X
3324101 Fabricated heat exchangers and steam condensers (except nuclear applications) 2003������������ 1 617 620 112002�� 1 443 108 X
3324105 Steel power boilers (stationary and marine), parts and attachments (except nuclearapplications) 2003����������������������������������������������������������������������� 579 117 45
2002�� 956 644 X
3324107 Nuclear reactor steam supply systems, heat exchangers and condensers,pressurizers, components, and auxiliary equipment 2003������������������������������������� 263 835 9
2002�� 204 298 X
332410W Power boiler and heat exchanger manufacturing, nsk, total 2003�������������������������������� 518 254 132002�� 712 506 X
332420 Metal tank (heavy gauge) manufacturing 2003�������������������������������������������������� 4 546 358 32002�� 4 450 329 X
3324207 Gas cylinders 2003����������������������������������������������������������������������� 483 657 62002�� 506 386 X
3324209 Metal tanks, complete at factory (standard line pressure) 2003���������������������������������� 647 508 62002�� 568 981 X
332420C Metal tanks, complete at factory (standard line nonpressure) 2003������������������������������ 639 979 102002�� 503 947 X
332420E Metal tanks and vessels, custom fabricated at the factory and field erected 2003������������������ 1 307 191 52002�� 1 222 557 X
332420G Metal tanks and vessels, custom fabricated and field erected 2003������������������������������ 1 100 724 32002�� 1 137 825 X
332420W Metal tank (heavy gauge) manufacturing, nsk, total 2003��������������������������������������� 367 298 92002�� 510 633 X
332431 Metal can manufacturing 2003���������������������������������������������������������������� 10 894 791 12002�� 11 016 574 X
3324311 Steel cans and tinware products 2003������������������������������������������������������� 4 210 573 12002�� 4 077 534 X
3324313 Aluminum (including lids, ends, and parts shipped separately) 2003����������������������������� 6 592 921 12002�� 6 863 690 X
332431W Metal can manufacturing, nsk, total 2003���������������������������������������������������� 91 297 12002�� 75 350 X
332439 Other metal container manufacturing 2003����������������������������������������������������� 3 134 962 52002�� 2 825 151 X
3324391 Steel pails (1 to 12 gallon capacity) and fabricated steel boxes 2003����������������������������� 854 899 142002�� 741 462 X
3324393 Steel shipping barrels and drums (excluding beer barrels) (more than 12 galloncapacity) 2003��������������������������������������������������������������������������� 596 071 4
2002�� 630 194 X
3324396 All other metal container manufacturing 2003������������������������������������������������� 1 208 603 62002�� 1 111 692 X
332439W Other metal container manufacturing, nsk, total 2003������������������������������������������ 475 388 52002�� 341 803 X
332510 Hardware manufacturing 2003���������������������������������������������������������������� 9 453 550 12002�� 9 736 503 X
3325102 Furniture hardware (excluding cabinet hardware) 2003���������������������������������������� 710 752 32002�� 749 412 X
3325104 Builders’ hardware 2003������������������������������������������������������������������� 4 602 378 12002�� 4 773 366 X
3325106 Motor vehicle hardware (lock units, door and window handles, window regulators,hinges, license plate brackets, etc.) 2003��������������������������������������������������� 2 489 679 2
2002�� 2 628 099 X
3325107 Other transportation equipment hardware (except motor vehicle hardware) 2003������������������ 381 932 112002�� 359 113 X
332510A All other miscellaneous hardware 2003������������������������������������������������������ 639 917 82002�� 568 383 X
332510W Hardware manufacturing, nsk, total 2003���������������������������������������������������� 628 892 122002�� 658 130 X
332611 Spring (heavy gauge) manufacturing 2003����������������������������������������������������� 751 821 42002�� 678 760 X
3326111 Hot formed steel springs, except wire 2003��������������������������������������������������� 380 335 52002�� 314 092 X
3326113 Cold formed steel springs, except wire 2003�������������������������������������������������� 324 814 82002�� 335 293 X
332611W Spring (heavy gauge) manufacturing, nsk, total 2003������������������������������������������ 46 672 72002�� 29 375 X
See footnotes at end of table.
38 Annual Survey of Manufactures Value of Product ShipmentsU.S. Census Bureau, 2002 Economic Census

Table 1. Value of Shipments for Product Classes: 2003 and 2002�Con.[Includes value of product shipments produced by (1) establishments classified in their primary industry and (2) establishments classified in other industries (secondary). Transfers of products from oneestablishment of a company to another establishment of the same company (interplant transfers) are also included. Data based on the 2003 Annual Survey of Manufactures (ASM). For information onconfidentiality protection, sampling error, nonsampling error, and explanation of terms, see note 2 at end of table. For meaning of abbreviations and symbols, see introductory text]
Productclass code Product Value of
product shipments($1,000)
Relativestandard error
of estimate1
(percent)
332612 Spring (light gauge) manufacturing 2003������������������������������������������������������� 2 149 404 52002�� 2 179 274 X
3326122 Precision mechanical wire springs 2003����������������������������������������������������� 770 643 52002�� 832 425 X
3326124 Other wire springs 2003������������������������������������������������������������������� 1 300 290 82002�� 1 272 361 X
332612W Spring (light gauge) manufacturing, nsk, total 2003�������������������������������������������� 78 471 192002�� 74 488 X
332618 Other fabricated wire product manufacturing 2003���������������������������������������������� 5 598 632 22002�� 5 548 101 X
3326181 Noninsulated ferrous wire rope, cable, forms, and strand, made from purchased wire2 2003�������� 670 012 32002�� 634 072 X
3326182 Other fabricated wire products, made from purchased wire 2003�������������������������������� 252 236 92002�� 218 248 X
3326183 Ferrous wire cloth and other ferrous woven wire products, made from purchasedwire2 2003������������������������������������������������������������������������������ 144 040 17
2002�� 154 823 X
3326185 Nonferrous wire cloth and other nonferrous woven wire products, made frompurchased wire 2003��������������������������������������������������������������������� 76 484 15
2002�� 64 554 X
3326187 Steel fencing and fence gates, made from purchased wire2 2003�������������������������������� 248 264 82002�� 253 748 X
3326189 Steel nails, staples, tacks, spikes, and brads, made from purchased wire2 2003������������������� 355 293 12002�� 374 374 X
332618B Other ferrous wire products (excluding springs), made from purchased wire2 2003���������������� 2 601 661 32002�� 2 716 622 X
332618W Other fabricated wire product manufacturing, nsk, total 2003����������������������������������� 1 250 642 72002�� 1 131 660 X
332710 Machine shops 2003������������������������������������������������������������������������ 24 284 407 22002�� 24 643 978 X
3327100 Receipts for machine shop job work and job order repairs 2003��������������������������������� 24 284 407 22002�� 24 643 978 X
332721 Precision turned product manufacturing 2003��������������������������������������������������� 8 344 935 32002�� 8 445 941 X
3327211 Precision turned products, automotive 2003�������������������������������������������������� 2 267 474 32002�� 2 126 078 X
3327215 Precision turned products (made on CNC equipment or screw machines), exceptautomotive 2003������������������������������������������������������������������������� 5 039 956 3
2002�� 4 313 768 X
332721W Precision turned product manufacturing, nsk, total 2003��������������������������������������� 1 037 504 152002�� 2 006 095 X
332722 Bolt, nut, screw, rivet, and washer manufacturing 2003������������������������������������������ 6 914 208 22002�� 7 178 202 X
3327221 Aircraft fasteners, except plastics (including aerospace) (meet specifications for flyingvehicles) 2003��������������������������������������������������������������������������� 1 088 453 7
2002�� 1 180 488 X
3327223 Externally threaded metal fasteners (except aircraft types) 2003�������������������������������� 2 653 680 22002�� 2 830 694 X
3327225 Internally threaded metal fasteners (except aircraft types) 2003��������������������������������� 618 039 82002�� 631 713 X
3327227 Nonthreaded metal fasteners (except aircraft types) 2003�������������������������������������� 1 115 614 42002�� 956 861 X
332722A Products (except fasteners), made by cold�heading (or warm� or hot�heading)processes 2003������������������������������������������������������������������������� 912 761 3
2002�� 1 013 797 X
332722W Bolt, nut, screw, rivet, and washer manufacturing, nsk, total 2003������������������������������� 525 662 72002�� 564 649 X
332811 Metal heat treating 2003��������������������������������������������������������������������� 3 247 748 72002�� 3 439 795 X
3328110 Heat treating of metal for the trade (heat treating, pickling, annealing, brazing, shotpeening, tempering, etc.) 2003������������������������������������������������������������ 3 247 748 7
2002�� 3 439 795 X
332812 Metal coating, engraving (except jewelry and silverware), and allied services tomanufacturers 2003������������������������������������������������������������������������ 9 311 741 1
2002�� 9 600 630 X
3328120 Metal coating, engraving, and allied services 2003�������������������������������������������� 9 311 741 12002�� 9 600 630 X
332813 Electroplating, plating, polishing, anodizing, and coloring 2003������������������������������������ 5 581 058 22002�� 5 715 929 X
3328130 Electroplating, plating, polishing, anodizing, and coloring 2003���������������������������������� 5 581 058 22002�� 5 715 929 X
See footnotes at end of table.
Value of Product Shipments Annual Survey of Manufactures 39U.S. Census Bureau, 2002 Economic Census

Table 1. Value of Shipments for Product Classes: 2003 and 2002�Con.[Includes value of product shipments produced by (1) establishments classified in their primary industry and (2) establishments classified in other industries (secondary). Transfers of products from oneestablishment of a company to another establishment of the same company (interplant transfers) are also included. Data based on the 2003 Annual Survey of Manufactures (ASM). For information onconfidentiality protection, sampling error, nonsampling error, and explanation of terms, see note 2 at end of table. For meaning of abbreviations and symbols, see introductory text]
Productclass code Product Value of
product shipments($1,000)
Relativestandard error
of estimate1
(percent)
332911 Industrial valve manufacturing 2003����������������������������������������������������������� 7 687 407 12002�� 8 045 502 X
3329111 Gates, globes, angles, straightway (Y�type) check, stop and check, cross, 3� and 4�way, and other industrial valves 2003������������������������������������������������������� 1 280 395 3
2002�� 1 409 810 X
3329113 Industrial valves for water works and municipal equipment (IBBM, AWWA, and UL) 2003���������� 1 091 932 12002�� 966 765 X
3329115 Industrial ball valves (all metals, pressures, and types), including manual and power�operated, on�off valves 2003�������������������������������������������������������������� 1 152 384 1
2002�� 1 087 458 X
3329117 Industrial butterfly valves (all metals, pressures, and types), including manual andpower�operated, on�off valves 2003�������������������������������������������������������� 484 189 3
2002�� 544 040 X
3329119 Industrial plug valves (all metals, pressures, and types), including lubricated, cylindricaleccentric, and sleeve�lined 2003����������������������������������������������������������� 231 833 1
2002�� 275 503 X
332911B All other miscellaneous industrial valves 2003������������������������������������������������ 927 425 62002�� 990 832 X
332911D Nuclear valves (N�stamp only) 2003��������������������������������������������������������� 108 683 12002�� 72 502 X
332911F Automatic regulating and control valves and parts (except nuclear), power�operated,designed for modulating (throttling) service3 2003�������������������������������������������� 1 827 160 2
2002�� 1 991 063 X
332911H Solenoid�operated valves and parts, except nuclear and fluid power transfer3 2003���������������� 331 259 32002�� 377 718 X
332911W Industrial valve manufacturing, nsk, total 2003������������������������������������������������ 252 148 32002�� 329 811 X
332912 Fluid power valve and hose fitting manufacturing 2003������������������������������������������� 5 846 366 12002�� 5 676 990 X
3329121 Aerospace type hydraulic fluid power valves3 2003�������������������������������������������� 694 629 32002�� 717 176 X
3329123 Aerospace type pneumatic fluid power valves3 2003������������������������������������������� 395 223 22002�� 400 619 X
3329125 Nonaerospace type hydraulic directional control valves3 2003���������������������������������� 461 154 72002�� 419 135 X
3329127 Nonaerospace type hydraulic valves, except directional control3 2003��������������������������� 587 615 22002�� 563 123 X
3329129 Nonaerospace type pneumatic directional control valves3 2003��������������������������������� 451 939 42002�� 492 388 X
332912B Nonaerospace type pneumatic valves, except directional control3 2003�������������������������� 181 864 22002�� 142 130 X
332912D Parts for fluid power valves3 2003����������������������������������������������������������� 235 484 112002�� 184 326 X
332912F Aerospace type hydraulic and pneumatic fluid power hose or tube end fittings andassemblies3 2003������������������������������������������������������������������������ 600 818 3
2002�� 638 325 X
332912H Nonaerospace type flared (metal) fittings, couplings, and assemblies of tubing used influid power transfer systems3 2003��������������������������������������������������������� 423 998 4
2002�� 391 254 X
332912J Nonaerospace type flareless fittings and couplings, including nonmetal fittings, used influid power transfer systems3 2003��������������������������������������������������������� 580 608 1
2002�� 536 414 X
332912L Nonaerospace type hydraulic and pneumatic fittings and couplings for hose3 2003���������������� 651 631 22002�� 706 617 X
332912N Nonaerospace type hydraulic and pneumatic assemblies of hose3 2003������������������������� 302 769 12002�� 274 125 X
332912W Fluid power valve and hose fitting manufacturing, nsk, total 2003������������������������������� 278 634 42002�� 211 358 X
332913 Plumbing fixture fitting and trim manufacturing 2003��������������������������������������������� 3 019 561 22002�� 3 138 725 X
3329131 Single lever plumbing fixture controls, two and three handle bath and shower fittings,and antiscald bath or shower valves (brass goods) 2003�������������������������������������� 1 151 735 1
2002�� 1 144 127 X
3329133 Lavatory and sink fittings (except single control), including drains and overflows (brassgoods) 2003���������������������������������������������������������������������������� 569 150 3
2002�� 544 718 X
3329138 Miscellaneous plumbing fixtures, fittings, and trim (brass goods) 2003��������������������������� 1 087 268 52002�� 1 178 598 X
332913W Plumbing fixture fitting and trim manufacturing, nsk, total 2003���������������������������������� 211 408 202002�� 271 282 X
332919 Other metal valve and pipe fitting manufacturing 2003������������������������������������������� 2 733 936 32002�� 2 701 665 X
3329191 Plumbing and heating valves and specialties, except plumbers’ brass goods 2003����������������� 585 331 32002�� 553 253 X
3329194 Metal fittings, flanges, and unions for piping systems 2003������������������������������������� 1 843 842 42002�� 1 791 819 X
332919W Other metal valve and pipe fitting manufacturing, nsk, total 2003�������������������������������� 304 763 82002�� 356 593 X
See footnotes at end of table.
40 Annual Survey of Manufactures Value of Product ShipmentsU.S. Census Bureau, 2002 Economic Census

Table 1. Value of Shipments for Product Classes: 2003 and 2002�Con.[Includes value of product shipments produced by (1) establishments classified in their primary industry and (2) establishments classified in other industries (secondary). Transfers of products from oneestablishment of a company to another establishment of the same company (interplant transfers) are also included. Data based on the 2003 Annual Survey of Manufactures (ASM). For information onconfidentiality protection, sampling error, nonsampling error, and explanation of terms, see note 2 at end of table. For meaning of abbreviations and symbols, see introductory text]
Productclass code Product Value of
product shipments($1,000)
Relativestandard error
of estimate1
(percent)
332991 Ball and roller bearing manufacturing 2003����������������������������������������������������� 5 524 793 12002�� 5 547 655 X
3329911 Ball bearings, complete, unmounted3 2003��������������������������������������������������� 1 829 257 32002�� 1 874 355 X
3329913 Tapered roller bearings (including cups and cones), unmounted3 2003��������������������������� 1 512 678 12002�� 1 465 005 X
3329915 Other roller bearings, unmounted3 2003����������������������������������������������������� 1 033 887 12002�� 1 043 692 X
3329917 Mounted bearings (except plain)3 2003������������������������������������������������������ 510 639 32002�� 469 668 X
3329919 Parts and components for ball and roller bearings (including balls and rollers), soldseparately (excluding cups and cones)3 2003������������������������������������������������ 581 110 1
2002�� 624 222 X
332991W Ball and roller bearing manufacturing, nsk, total 2003������������������������������������������ 57 221 12002�� 70 713 X
332992 Small arms ammunition manufacturing 2003��������������������������������������������������� 911 193 12002�� 889 841 X
3329920 Small arms ammunition 2003��������������������������������������������������������������� 911 193 12002�� 889 841 X
332993 Ammunition (except small arms) manufacturing 2003�������������������������������������������� 990 439 22002�� 809 147 X
3329931 Artillery ammunition (more than 30 mm, more than 1.18 in.) 2003������������������������������� 531 341 32002�� 460 976 X
3329933 All other miscellaneous ammunition (except for small arms) 2003������������������������������� 454 757 12002�� 342 820 X
332993W Ammunition (except small arms) manufacturing, nsk, total 2003��������������������������������� 4 342 12002�� 5 351 X
332994 Small arms manufacturing 2003�������������������������������������������������������������� 1 579 540 22002�� 1 528 027 X
3329941 Machine guns (30 mm or less, 1.18 in. or less) 2003������������������������������������������ D S2002�� D X
3329944 Small arms (30 mm or less, 1.18 in. or less) 2003��������������������������������������������� D S2002�� D X
332994W Small arms manufacturing, nsk, total 2003��������������������������������������������������� 56 423 182002�� 66 961 X
332995 Other ordnance and accessories manufacturing 2003������������������������������������������� 1 420 060 12002�� 1 335 825 X
3329951 Guns, howitzers, mortars, turrets, parts, and other related equipment (more than 30mm (1.18 in.)) 2003���������������������������������������������������������������������� 859 203 2
2002�� 739 881 X
3329952 All other miscellaneous ordnance and accessories, including rocket projectors, linethrowing guns, flame throwers, torpedo tubes, etc. (including parts) 2003����������������������� 540 957 1
2002�� 573 228 X
332995W Other ordnance and accessories manufacturing, nsk, total 2003�������������������������������� 19 901 22002�� 22 716 X
332996 Fabricated pipe and pipe fitting manufacturing 2003��������������������������������������������� 3 402 397 52002�� 3 605 906 X
3329960 Fabricated pipe and pipe fittings made from purchased pipe 2003������������������������������� 3 402 397 52002�� 3 605 906 X
332997 Industrial pattern manufacturing 2003��������������������������������������������������������� 585 631 52002�� 617 342 X
3329970 Industrial patterns 2003�������������������������������������������������������������������� 585 631 52002�� 617 342 X
332998 Enameled iron and metal sanitary ware manufacturing 2003�������������������������������������� 1 175 594 32002�� 1 229 839 X
3329980 Enameled iron and metal sanitary ware 2003������������������������������������������������� 1 175 594 32002�� 1 229 839 X
332999 All other miscellaneous fabricated metal product manufacturing 2003������������������������������ 11 691 750 22002�� 11 755 386 X
3329992 Converted unmounted aluminum foil packaging products 2003���������������������������������� 718 173 22002�� 778 831 X
3329995 Miscellaneous machinery products 2003����������������������������������������������������� 1 401 275 52002�� 1 327 423 X
3329997 Fabricated metal collapsible tubes 2003����������������������������������������������������� 71 973 112002�� 74 277 X
3329999 Flat metal strapping 2003������������������������������������������������������������������ 377 579 12002�� 395 967 X
332999B Metal ladders 2003������������������������������������������������������������������������ 333 422 12002�� 342 391 X
332999H All other miscellaneous fabricated metal products 2003���������������������������������������� 5 499 729 32002�� 5 553 752 X
332999W All other miscellaneous fabricated metal product manufacturing, nsk, total 2003������������������� 3 289 601 32002�� 3 282 745 X
See footnotes at end of table.
Value of Product Shipments Annual Survey of Manufactures 41U.S. Census Bureau, 2002 Economic Census

Table 1. Value of Shipments for Product Classes: 2003 and 2002�Con.[Includes value of product shipments produced by (1) establishments classified in their primary industry and (2) establishments classified in other industries (secondary). Transfers of products from oneestablishment of a company to another establishment of the same company (interplant transfers) are also included. Data based on the 2003 Annual Survey of Manufactures (ASM). For information onconfidentiality protection, sampling error, nonsampling error, and explanation of terms, see note 2 at end of table. For meaning of abbreviations and symbols, see introductory text]
Productclass code Product Value of
product shipments($1,000)
Relativestandard error
of estimate1
(percent)
333111 Farm machinery and equipment manufacturing 2003�������������������������������������������� 14 441 499 22002�� 13 537 170 X
3331111 Farm�type (power take�off hp) wheel tractors (2� and 4�wheel drive) (sold with orwithout attachments)3 2003��������������������������������������������������������������� 3 311 656 2
2002�� 3 325 218 X
3331114 Farm dairy equipment, sprayers and dusters (except aerial types), farm blowers, andattachments3 2003����������������������������������������������������������������������� 793 833 12
2002�� 650 877 X
3331117 Planting, seeding, and fertilizing machinery and attachments, excluding turfmachinery3 2003������������������������������������������������������������������������ 981 367 4
2002�� 825 062 X
3331119 Harvesting machinery (except hay and straw) and attachments3 2003��������������������������� 2 203 228 42002�� 2 001 231 X
333111A Haying machinery and attachments3 2003��������������������������������������������������� 1 035 651 12002�� 767 915 X
333111C Parts for farm machinery, for sale separately3 2003������������������������������������������� 1 307 732 92002�� 1 270 884 X
333111E Farm plows (including plowshares, primary tillage), harrows, rollers, pulverizers, andcultivators and weeders, and attachments3 2003��������������������������������������������� 257 058 16
2002�� 342 737 X
333111G All other farm machinery and equipment (excluding parts), including attachments3 2003����������� 1 969 152 62002�� 1 946 235 X
333111J Commercial turf and grounds care equipment, including parts and attachments3 2003������������� 1 915 507 42002�� 1 855 679 X
333111W Farm machinery and equipment manufacturing, nsk, total 2003��������������������������������� 666 315 32002�� 551 332 X
333112 Lawn and garden tractor and home lawn and garden equipment manufacturing 2003���������������� 7 569 495 12002�� 6 355 028 X
3331121 Consumer nonriding lawn, garden, and snow equipment3 2003��������������������������������� 3 375 730 12002�� 2 712 635 X
3331123 Consumer riding lawn, garden, and snow equipment3 2003������������������������������������ 3 276 194 32002�� 2 801 385 X
3331127 Parts and attachments for consumer lawn, garden, and snow equipment3 2003������������������� 826 454 12002�� 751 300 X
333112W Lawn and garden tractor and home lawn and garden equipment manufacturing, nsk,total 2003������������������������������������������������������������������������������� 91 116 10
2002�� 89 708 X
333120 Construction machinery manufacturing 2003��������������������������������������������������� 17 872 846 12002�� 16 694 677 X
3331201 Power cranes, excavation loaders, dozers, construction tractors, off�highway trucksand trailers, mixers, pavers, backhoes, and related equipment3 2003��������������������������� 13 037 911 1
2002�� 11 971 192 X
3331208 Other construction machinery and equipment (excluding parts) 2003���������������������������� 1 658 447 42002�� 1 879 437 X
3331209 Parts for construction machinery and equipment, sold separately 2003�������������������������� 2 600 133 22002�� 2 276 126 X
333120W Construction machinery manufacturing, nsk, total 2003���������������������������������������� 576 356 162002�� 567 922 X
333131 Mining machinery and equipment manufacturing 2003������������������������������������������� 2 047 782 12002�� 1 949 863 X
3331311 Underground mining machinery (except parts sold separately)3 2003���������������������������� 442 369 22002�� 476 036 X
3331313 Mineral processing and beneficiation machinery (except parts sold separately) 2003�������������� D S2002�� D X
3331315 Crushing, pulverizing, and screening machinery (except parts sold separately andportable crushing, screening, washing and combination plants)3 2003�������������������������� 278 314 2
2002�� 243 675 X
3331317 Drills and other mining machinery (except parts sold separately)3 2003�������������������������� D S2002�� D X
3331319 Parts and attachments for mining machinery and equipment (sold separately) 2003��������������� 731 603 22002�� 619 835 X
333131W Mining machinery and equipment manufacturing, nsk, total 2003�������������������������������� 169 622 52002�� 176 678 X
333132 Oil and gas field machinery and equipment manufacturing 2003���������������������������������� 5 116 755 22002�� 4 958 938 X
3331321 Rotary oil and gas field drilling machinery and equipment 2003��������������������������������� 1 407 432 32002�� 1 380 119 X
3331323 Other oil and gas field drilling machinery and equipment 2003���������������������������������� 719 452 102002�� 790 394 X
3331325 Oil and gas field production machinery and equipment (except pumps) 2003��������������������� 2 015 434 42002�� 1 872 598 X
3331327 Portable drilling rigs and parts (above ground)3 2003������������������������������������������ 442 544 72002�� 381 313 X
3331329 Oil and gas field derricks and well surveying machinery 2003����������������������������������� 101 442 52002�� 103 898 X
333132W Oil and gas field machinery and equipment manufacturing, nsk, total 2003����������������������� 430 451 62002�� 430 616 X
See footnotes at end of table.
42 Annual Survey of Manufactures Value of Product ShipmentsU.S. Census Bureau, 2002 Economic Census

Table 1. Value of Shipments for Product Classes: 2003 and 2002�Con.[Includes value of product shipments produced by (1) establishments classified in their primary industry and (2) establishments classified in other industries (secondary). Transfers of products from oneestablishment of a company to another establishment of the same company (interplant transfers) are also included. Data based on the 2003 Annual Survey of Manufactures (ASM). For information onconfidentiality protection, sampling error, nonsampling error, and explanation of terms, see note 2 at end of table. For meaning of abbreviations and symbols, see introductory text]
Productclass code Product Value of
product shipments($1,000)
Relativestandard error
of estimate1
(percent)
333210 Sawmill and woodworking machinery manufacturing 2003���������������������������������������� 888 778 32002�� 887 722 X
3332103 Woodworking machinery, including parts, attachments, and accessories 2003�������������������� 739 103 42002�� 735 769 X
3332105 Woodworking machinery for home workshops, garages, and service shops (excludingchainsaws and other power�driven handtools) 2003������������������������������������������ 88 967 2
2002�� 85 265 X
333210W Sawmill and woodworking machinery manufacturing, nsk, total 2003���������������������������� 60 708 82002�� 66 688 X
333220 Plastics and rubber industry machinery manufacturing 2003�������������������������������������� 2 524 821 22002�� 2 686 233 X
3332201 Plastics�working machinery and equipment, excluding patterns and molds 2003������������������ 2 269 664 22002�� 2 379 486 X
3332203 Rubber�working machinery and equipment, excluding tire molds 2003��������������������������� 198 382 52002�� 217 921 X
333220W Plastics and rubber industry machinery manufacturing, nsk, total 2003��������������������������� 56 775 362002�� 88 826 X
333291 Paper industry machinery manufacturing 2003�������������������������������������������������� 1 770 863 42002�� 1 580 434 X
3332911 Paper industry machinery 2003������������������������������������������������������������� 943 930 42002�� 814 596 X
3332913 Parts and attachments for paper industry machinery (sold separately) 2003���������������������� 657 856 92002�� 584 007 X
333291W Paper industry machinery manufacturing, nsk, total 2003�������������������������������������� 169 078 62002�� 181 831 X
333292 Textile machinery manufacturing 2003��������������������������������������������������������� 785 127 52002�� 808 864 X
3332921 Textile machinery (except parts, attachments, and accessories) 2003��������������������������� 462 313 72002�� 503 491 X
3332923 Parts and attachments for textile machinery 2003��������������������������������������������� 288 149 62002�� 269 175 X
333292W Textile machinery manufacturing, nsk, total 2003��������������������������������������������� 34 665 132002�� 36 198 X
333293 Printing machinery and equipment manufacturing 2003������������������������������������������ 2 498 247 32002�� 2 724 212 X
3332931 Printing presses, offset lithographic 2003���������������������������������������������������� 401 064 42002�� 372 574 X
3332933 Printing presses, other than lithographic 2003������������������������������������������������ 272 474 82002�� 335 057 X
3332935 Typesetting machinery, excluding justifying typewriters 2003����������������������������������� D S2002�� D X
3332937 Binding machinery and equipment (including paper cutting, collating, and gatheringmachines) 2003������������������������������������������������������������������������� D S
2002�� D X
3332939 All other miscellaneous printing trades machinery 2003���������������������������������������� 1 289 954 42002�� 1 440 115 X
333293W Printing machinery and equipment manufacturing, nsk, total 2003������������������������������� 248 722 172002�� 318 909 X
333294 Food product machinery manufacturing 2003��������������������������������������������������� 2 619 319 22002�� 2 549 270 X
3332941 Dairy and milk products plant machinery and equipment (except bottling andpackaging) 2003������������������������������������������������������������������������� 277 225 7
2002�� 292 876 X
3332943 Commercial food products machinery (except packaging machinery and food cookingand warming equipment) 2003������������������������������������������������������������� 1 057 338 3
2002�� 992 111 X
3332945 Industrial machinery and equipment for manufacturing or processing foods, beverages,and animal and fowl feed 2003������������������������������������������������������������ 987 769 3
2002�� 997 722 X
333294W Food product machinery manufacturing, nsk, total 2003���������������������������������������� 296 987 82002�� 266 561 X
333295 Semiconductor machinery manufacturing 2003������������������������������������������������� 8 078 572 12002�� 8 788 193 X
3332950 Semiconductor manufacturing equipment (except furnaces and ovens, instruments,and photographics) 2003����������������������������������������������������������������� 8 078 572 1
2002�� 8 788 193 X
333298 All other industrial machinery manufacturing 2003����������������������������������������������� 6 646 861 22002�� 7 029 144 X
3332981 Chemical manufacturing machinery, equipment, and parts 2003�������������������������������� 1 214 828 52002�� 1 312 363 X
3332983 Foundry machinery and equipment, excluding patterns and molds 2003������������������������� 371 432 122002�� 403 390 X
3332985 Printed circuit board manufacturing machinery, except testing 2003����������������������������� 694 503 22002�� 977 625 X
3332987 All other miscellaneous special industry machinery and equipment3 2003������������������������ 3 778 595 32002�� 3 718 304 X
333298W All other industrial machinery manufacturing, nsk, total 2003����������������������������������� 587 504 72002�� 617 462 X
See footnotes at end of table.
Value of Product Shipments Annual Survey of Manufactures 43U.S. Census Bureau, 2002 Economic Census

Table 1. Value of Shipments for Product Classes: 2003 and 2002�Con.[Includes value of product shipments produced by (1) establishments classified in their primary industry and (2) establishments classified in other industries (secondary). Transfers of products from oneestablishment of a company to another establishment of the same company (interplant transfers) are also included. Data based on the 2003 Annual Survey of Manufactures (ASM). For information onconfidentiality protection, sampling error, nonsampling error, and explanation of terms, see note 2 at end of table. For meaning of abbreviations and symbols, see introductory text]
Productclass code Product Value of
product shipments($1,000)
Relativestandard error
of estimate1
(percent)
333311 Automatic vending machine manufacturing 2003������������������������������������������������ 1 120 906 32002�� 1 310 196 X
3333111 Automatic merchandising machines, coin�operated (vending) (excluding moneychanging machines and coin�operated mechanisms) 2003������������������������������������ 801 263 2
2002�� 824 047 X
3333113 Automatic merchandising machines, coin�operated mechanisms, including timeswitches 2003��������������������������������������������������������������������������� 95 289 9
2002�� 124 903 X
3333114 Currency handling machines, including money changing and dispensing machines 2003����������� 174 292 142002�� 317 889 X
333311W Automatic vending machine manufacturing, nsk, total 2003������������������������������������� 50 062 12002�� 43 357 X
333312 Commercial laundry, drycleaning, and pressing machine manufacturing 2003����������������������� 596 038 12002�� 580 454 X
3333120 Commercial laundry, drycleaning, and pressing machines 2003��������������������������������� 596 038 12002�� 580 454 X
333313 Office machinery manufacturing 2003��������������������������������������������������������� 1 838 051 32002�� 2 520 519 X
3333131 Automatic typing and word processing machines, including parts and attachments3 2003���������� D S2002�� D X
3333137 Duplicating machines, except parts and attachments3 2003������������������������������������ D S2002�� D X
333313A Mailing, letter handling, and addressing machines, except parts and attachments3 2003����������� 1 158 975 32002�� 2 044 821 X
333313E Other electric office machines, including electric pencil sharpeners and electricstaplers3 2003��������������������������������������������������������������������������� 117 731 1
2002�� 77 721 X
333313H Other office machinery manufacturing 2003�������������������������������������������������� 176 546 172002�� 85 316 X
333313J All other miscellaneous parts and attachments for office machines3 2003������������������������ 253 819 92002�� 166 326 X
333313W Office machinery manufacturing, nsk, total 2003���������������������������������������������� 61 043 142002�� 64 086 X
333314 Optical instrument and lens manufacturing 2003������������������������������������������������ 3 285 887 22002�� 3 116 993 X
3333141 Sighting, tracking, and fire�control equipment, optical�type3 2003�������������������������������� 809 310 62002�� 711 521 X
3333143 All other miscellaneous optical instruments and lenses3 2003����������������������������������� 2 199 102 22002�� 2 185 350 X
333314W Optical instrument and lens manufacturing, nsk, total 2003������������������������������������� 277 476 32002�� 220 122 X
333315 Photographic and photocopying equipment manufacturing 2003���������������������������������� 2 437 702 42002�� 2 133 928 X
3333151 Still picture photographic equipment 2003���������������������������������������������������� 878 592 22002�� 835 081 X
3333153 Photocopying equipment, including diffusion transfer, dye transfer, electrostatic, lightand heat sensitive types, etc. 2003��������������������������������������������������������� 811 389 11
2002�� 611 861 X
3333155 Microfilming, blueprinting, and whiteprinting equipment 2003����������������������������������� 22 830 22002�� 20 710 X
3333157 Motion picture equipment 2003������������������������������������������������������������� 420 401 22002�� 386 057 X
333315W Photographic and photocopying equipment manufacturing, nsk, total 2003����������������������� 304 492 42002�� 280 219 X
333319 Other commercial and service industry machinery manufacturing 2003���������������������������� 10 264 355 12002�� 10 431 536 X
3333191 Commercial cooking and food�warming equipment 2003��������������������������������������� 2 030 056 12002�� 2 149 572 X
3333193 Commercial and industrial vacuum cleaners, including parts and attachments 2003��������������� 380 904 162002�� 466 881 X
3333195 Automotive maintenance equipment, except handtools 2003����������������������������������� 591 395 82002�� 613 888 X
3333197 Electronic teaching machines, teaching aids, trainers, and simulators, including kits3 2003��������� 1 193 021 42002�� 1 197 876 X
333319A Miscellaneous machinery products (including flexible metal hose and tubing, metalbellows, etc.), except electrical 2003������������������������������������������������������� 5 474 827 2
2002�� 5 481 154 X
333319W Other commercial and service industry machinery manufacturing, nsk, total 2003����������������� 594 151 82002�� 522 165 X
333411 Air purification equipment manufacturing 2003�������������������������������������������������� 2 097 153 32002�� 2 060 301 X
3334111 Dust collection and other air purification equipment for industrial gas cleaningsystems 2003��������������������������������������������������������������������������� 631 083 6
2002�� 643 040 X
3334113 Dust collection and other air purification equipment for cleaning incoming air 2003���������������� 1 413 992 32002�� 1 355 570 X
333411W Air purification equipment manufacturing, nsk, total 2003��������������������������������������� 52 078 382002�� 61 691 X
See footnotes at end of table.
44 Annual Survey of Manufactures Value of Product ShipmentsU.S. Census Bureau, 2002 Economic Census

Table 1. Value of Shipments for Product Classes: 2003 and 2002�Con.[Includes value of product shipments produced by (1) establishments classified in their primary industry and (2) establishments classified in other industries (secondary). Transfers of products from oneestablishment of a company to another establishment of the same company (interplant transfers) are also included. Data based on the 2003 Annual Survey of Manufactures (ASM). For information onconfidentiality protection, sampling error, nonsampling error, and explanation of terms, see note 2 at end of table. For meaning of abbreviations and symbols, see introductory text]
Productclass code Product Value of
product shipments($1,000)
Relativestandard error
of estimate1
(percent)
333412 Industrial and commercial fan and blower manufacturing 2003������������������������������������ 1 588 568 62002�� 1 691 684 X
3334120 Industrial and commercial fans and blowers 2003��������������������������������������������� 1 588 568 62002�� 1 691 684 X
333414 Heating equipment (except warm air furnaces) manufacturing 2003������������������������������� 3 952 758 32002�� 3 867 484 X
3334141 Cast iron heating boilers, radiators, and convectors (except parts) 2003�������������������������� 696 717 12002�� 689 301 X
3334143 Domestic heating stoves (except electric and parts) 2003�������������������������������������� 926 209 42002�� 840 520 X
3334145 Steel heating boilers (15 p.s.i. or less), and all other hot water heating boilers (exceptparts) 2003����������������������������������������������������������������������������� 237 503 5
2002�� 242 621 X
3334147 Floor and wall furnaces, unit heaters, gas�fired infrared heaters, and mechanicalstokers 2003���������������������������������������������������������������������������� 389 952 8
2002�� 448 576 X
333414A Other heating equipment, except electric (including parts for nonelectric heatingequipment and oil burners)3 2003���������������������������������������������������������� 1 590 033 5
2002�� 1 396 381 X
333414W Heating equipment (except warm air furnaces) manufacturing, nsk, total 2003�������������������� 112 345 472002�� 250 085 X
333415 Air�conditioning and warm air heating equipment and commercial and industrialrefrigeration equipment manufacturing 2003��������������������������������������������������� 23 013 015 1
2002�� 23 091 638 X
3334152 Heat transfer equipment (except electrically operated dehumidifiers), mechanicallyrefrigerated, self�contained, except motor vehicle mechanical air�conditioningsystems3 2003�������������������������������������������������������������������������� 4 722 918 3
2002�� 4 790 113 X
3334153 Commercial refrigerators and related equipment3 2003���������������������������������������� 2 450 703 22002�� 2 830 298 X
3334155 Refrigeration condensing units, all refrigerants, except ammonia (complete)3 2003���������������� 382 236 12002�� 348 518 X
3334156 Room air�conditioners and dehumidifiers, except portable dehumidifiers3 2003�������������������� 782 830 12002�� 872 033 X
3334159 All other miscellaneous refrigeration and air�conditioning equipment 2003������������������������ 1 035 140 22002�� 928 383 X
333415A Compressors and compressor units, all refrigerants, except automotives3 2003������������������� 2 649 615 12002�� 2 329 264 X
333415C Warm air furnaces, including duct furnaces and humidifiers, and electric comfortheating3 2003��������������������������������������������������������������������������� 2 094 093 2
2002�� 1 975 140 X
333415D Parts and accessories for air�conditioning and heat transfer equipment 2003��������������������� 1 567 415 42002�� 1 640 381 X
333415E Unitary air�conditioners, except air source heat pumps3 2003����������������������������������� 5 493 142 12002�� 5 414 379 X
333415F Air source heat pumps, except room air�conditioners3 2003������������������������������������ 1 007 581 22002�� 979 256 X
333415G Ground and ground water source heat pumps3 2003������������������������������������������ 109 397 332002�� 130 140 X
333415W Air�conditioning and warm air heating equipment and commercial and industrialrefrigeration equipment manufacturing, nsk, total 2003���������������������������������������� 717 946 7
2002�� 853 733 X
333511 Industrial mold manufacturing 2003����������������������������������������������������������� 5 521 888 22002�� 5 830 395 X
3335110 Industrial molds and mold boxes 2003������������������������������������������������������� 5 521 888 22002�� 5 830 395 X
333512 Machine tool (metal cutting types) manufacturing 2003������������������������������������������ 2 578 513 32002�� 2 636 611 X
3335121 Metal gear cutting machines3 2003���������������������������������������������������������� 109 099 32002�� 80 556 X
3335122 Metal grinding, polishing, buffing, honing, and lapping machines, except gear�toothgrinding, lapping, polishing, and buffing machines3 2003�������������������������������������� 253 828 8
2002�� 312 516 X
3335123 Metal lathes (turning machines) numerically and nonnumerically controlled3 2003����������������� 238 257 222002�� 182 798 X
3335124 Metal milling machines (excluding machining centers)3 2003����������������������������������� 84 627 42002�� 51 269 X
3335125 Machine tools for home workshops, laboratories, garages, etc. (metalworking andprimarily metalworking only) 2003���������������������������������������������������������� 83 409 3
2002�� 73 881 X
3335126 Parts for metal cutting�type machine tools (sold separately), including rebuilt andremanufactured metal cutting machine tools3 2003������������������������������������������� 481 210 4
2002�� 599 039 X
3335127 Metal machining centers (multifunction numerically controlled machines)3 2003������������������� 430 703 52002�� 385 065 X
3335128 Metal station type machines3 2003���������������������������������������������������������� 136 703 102002�� 138 461 X
3335129 Other metal cutting machine tools (except those designed primarily for homeworkshops, laboratories, garages, etc.)3 2003����������������������������������������������� 468 438 6
2002�� 506 790 X
See footnotes at end of table.
Value of Product Shipments Annual Survey of Manufactures 45U.S. Census Bureau, 2002 Economic Census

Table 1. Value of Shipments for Product Classes: 2003 and 2002�Con.[Includes value of product shipments produced by (1) establishments classified in their primary industry and (2) establishments classified in other industries (secondary). Transfers of products from oneestablishment of a company to another establishment of the same company (interplant transfers) are also included. Data based on the 2003 Annual Survey of Manufactures (ASM). For information onconfidentiality protection, sampling error, nonsampling error, and explanation of terms, see note 2 at end of table. For meaning of abbreviations and symbols, see introductory text]
Productclass code Product Value of
product shipments($1,000)
Relativestandard error
of estimate1
(percent)
333512 Machine tool (metal cutting types) manufacturing�Con.333512A Metal boring machines and drilling machines (excluding machining centers)3 2003���������������� 110 162 7
2002�� 118 549 X
333512W Machine tool (metal cutting types) manufacturing, nsk, total 2003������������������������������� 182 076 162002�� 187 687 X
333513 Machine tool (metal forming types) manufacturing 2003������������������������������������������ 1 145 161 32002�� 1 136 340 X
3335131 Metal punching and shearing machines (including power and manual) and bending andforming machines (power only)3 2003������������������������������������������������������ 300 924 6
2002�� 351 668 X
3335133 Metalworking presses (except forging and die�stamping presses)3 2003������������������������� 205 034 92002�� 204 742 X
3335135 Other metal forming machine tools, including forging and die�stamping machines(except metalworking presses)3 2003������������������������������������������������������� 217 173 10
2002�� 201 819 X
3335137 Parts for metal forming machine tools (sold separately), including rebuilt andremanufactured metal forming machine tools3 2003������������������������������������������ 288 223 5
2002�� 242 298 X
333513W Machine tool (metal forming types) manufacturing, nsk, total 2003������������������������������ 133 807 82002�� 135 813 X
333514 Special die and tool, die set, jig, and fixture manufacturing 2003���������������������������������� 7 411 386 22002�� 7 587 179 X
3335140 Special dies, tools, jigs, and fixtures 2003���������������������������������������������������� 7 411 386 22002�� 7 587 179 X
333515 Cutting tool and machine tool accessory manufacturing 2003������������������������������������� 4 238 486 22002�� 4 607 772 X
3335151 Small cutting tools for machine tools and metalworking machinery 2003������������������������� 2 699 634 12002�� 2 977 175 X
3335153 Other attachments and accessories for machine tools and metalworking machinery 2003���������� 923 536 52002�� 991 184 X
333515W Cutting tool and machine tool accessory manufacturing, nsk, total 2003�������������������������� 615 316 72002�� 639 413 X
333516 Rolling mill machinery and equipment manufacturing 2003��������������������������������������� 477 781 32002�� 499 761 X
3335161 Hot rolling mill machinery (including combination hot and cold) (except tube rolling) 2003����������� 118 333 12002�� 127 880 X
3335163 Cold rolling mill machinery 2003������������������������������������������������������������ 75 586 132002�� 71 715 X
3335165 Other rolling mill machinery (including tube mill machinery) and parts for all rolling millmachinery 2003������������������������������������������������������������������������� 268 124 3
2002�� 271 603 X
333516W Rolling mill machinery and equipment manufacturing, nsk, total 2003���������������������������� 15 739 32002�� 28 563 X
333518 Other metalworking machinery manufacturing 2003��������������������������������������������� 2 214 327 22002�� 2 646 570 X
3335181 Assembly machines 2003������������������������������������������������������������������ 1 492 784 32002�� 1 845 844 X
3335183 Other metalworking machinery (except handheld and ultrasonic) 2003��������������������������� 618 280 42002�� 692 300 X
333518W Other metalworking machinery manufacturing, nsk, total 2003���������������������������������� 103 263 52002�� 108 426 X
333611 Turbine and turbine generator set units manufacturing 2003�������������������������������������� 13 521 677 12002�� 13 732 728 X
3336110 Turbines, turbine generators, and turbine generator sets (including parts) 2003������������������� 13 521 677 12002�� 13 732 728 X
333612 Speed changer, industrial high�speed drive, and gear manufacturing 2003������������������������� 1 885 372 42002�� 1 948 447 X
3336123 Gears 2003������������������������������������������������������������������������������ 587 076 42002�� 585 119 X
3336127 Speed changers and industrial high�speed drives 2003���������������������������������������� 1 223 978 62002�� 1 286 565 X
333612W Speed changer, industrial high�speed drive, and gear manufacturing, nsk, total 2003�������������� 74 318 82002�� 76 763 X
333613 Mechanical power transmission equipment manufacturing 2003����������������������������������� 2 485 333 22002�� 2 691 514 X
3336131 Plain bearings and bushings 2003���������������������������������������������������������� 521 584 12002�� 587 979 X
3336133 Mechanical power transmission equipment, except speed changers, drives, andgears 2003������������������������������������������������������������������������������ 1 956 956 2
2002�� 2 098 340 X
333613W Mechanical power transmission equipment manufacturing, nsk, total 2003����������������������� 6 793 12002�� 5 195 X
See footnotes at end of table.
46 Annual Survey of Manufactures Value of Product ShipmentsU.S. Census Bureau, 2002 Economic Census

Table 1. Value of Shipments for Product Classes: 2003 and 2002�Con.[Includes value of product shipments produced by (1) establishments classified in their primary industry and (2) establishments classified in other industries (secondary). Transfers of products from oneestablishment of a company to another establishment of the same company (interplant transfers) are also included. Data based on the 2003 Annual Survey of Manufactures (ASM). For information onconfidentiality protection, sampling error, nonsampling error, and explanation of terms, see note 2 at end of table. For meaning of abbreviations and symbols, see introductory text]
Productclass code Product Value of
product shipments($1,000)
Relativestandard error
of estimate1
(percent)
333618 Other engine equipment manufacturing 2003��������������������������������������������������� 19 370 161 12002�� 18 453 070 X
3336181 Gasoline and gas�gasoline engines (except aircraft, automobile, highway truck, bus,tank, and outboard marine)3 2003���������������������������������������������������������� 2 929 731 2
2002�� 2 281 230 X
3336183 Diesel, semidiesel, and dual�fuel engines (except automobile, highway truck, bus, andtank)3 2003����������������������������������������������������������������������������� 2 326 281 1
2002�� 2 769 467 X
3336185 Diesel, semidiesel, and dual�fuel engines for automobiles, highway trucks, and buses3 2003�������� 7 305 442 12002�� 6 516 158 X
3336189 Piston�type natural gas engines, including LPG (liquified petroleum gas) engines(excluding gas turbines) 2003������������������������������������������������������������� 326 874 17
2002�� 283 130 X
333618B All other miscellaneous engine equipment 2003����������������������������������������������� 1 026 768 92002�� 1 025 206 X
333618F Parts and accessories for internal combustion engines, except aircraft and gasautomotive engines and turbines 2003������������������������������������������������������ 5 190 917 2
2002�� 5 391 081 X
333618W Other engine equipment manufacturing, nsk, total 2003���������������������������������������� 264 149 172002�� 186 798 X
333911 Pump and pumping equipment manufacturing 2003��������������������������������������������� 7 450 036 12002�� 6 472 825 X
3339111 Pump and pumping equipment3 2003������������������������������������������������������� 5 829 720 22002�� 5 031 569 X
3339115 Parts and attachments for pumps and pumping equipment (except hydraulic fluidpower, and air and gas compressors), including locomotive and packaged pumps3 2003���������� 1 291 909 2
2002�� 1 140 191 X
333911W Pump and pumping equipment manufacturing, nsk, total 2003���������������������������������� 328 407 102002�� 301 065 X
333912 Air and gas compressor manufacturing 2003��������������������������������������������������� 4 239 536 62002�� 4 175 335 X
3339121 Air and gas compressors and vacuum pumps3 2003������������������������������������������� 2 566 898 82002�� 2 581 987 X
3339125 Parts and attachments for air and gas compressors (except refrigeration, ice making,and air�conditioning equipment), including packaged compressors3 2003������������������������ 708 779 12
2002�� 592 670 X
3339127 Industrial spraying equipment 2003��������������������������������������������������������� 795 916 82002�� 818 318 X
333912W Air and gas compressor manufacturing, nsk, total 2003���������������������������������������� 167 943 292002�� 182 360 X
333913 Measuring and dispensing pump manufacturing 2003������������������������������������������� 904 473 12002�� 867 814 X
3339130 Measuring and dispensing pumps 2003������������������������������������������������������ 904 473 12002�� 867 814 X
333921 Elevator and moving stairway manufacturing 2003���������������������������������������������� 1 922 497 32002�� 1 870 525 X
3339211 Elevators and moving stairways 2003������������������������������������������������������� 1 404 805 32002�� 1 444 609 X
3339213 Parts and attachments for elevators and moving stairways (sold separately) 2003����������������� 434 801 82002�� 346 247 X
333921W Elevator and moving stairway manufacturing, nsk, total 2003����������������������������������� 82 892 82002�� 79 669 X
333922 Conveyor and conveying equipment manufacturing 2003���������������������������������������� 4 726 207 22002�� 5 025 780 X
3339221 Unit handling conveyors and conveying systems, except hoists and farm elevators 2003����������� 2 198 628 42002�� 2 216 749 X
3339223 Parts, attachments, and accessories for unit handling conveyors and conveyingsystems (sold separately) 2003������������������������������������������������������������ 242 325 8
2002�� 235 014 X
3339228 Bulk material handling conveyors and conveying systems, except hoists and farmelevators3 2003�������������������������������������������������������������������������� 1 421 702 3
2002�� 1 582 924 X
3339229 Parts, attachments, and accessories for bulk material handling conveyors andconveying systems (sold separately) 2003�������������������������������������������������� 503 433 6
2002�� 571 327 X
333922W Conveyor and conveying equipment manufacturing, nsk, total 2003����������������������������� 360 120 92002�� 419 766 X
333923 Overhead traveling crane, hoist, and monorail system manufacturing 2003������������������������� 2 856 260 22002�� 3 009 506 X
3339231 Hoists 2003������������������������������������������������������������������������������ 398 522 42002�� 455 161 X
3339233 Overhead traveling cranes and monorail systems 2003���������������������������������������� 467 411 72002�� 467 964 X
3339237 Winches, aerial work platforms, and automotive wrecker hoists3 2003��������������������������� 1 781 660 22002�� 1 951 812 X
333923W Overhead traveling crane, hoist, and monorail system manufacturing, nsk, total 2003�������������� 208 668 42002�� 134 569 X
See footnotes at end of table.
Value of Product Shipments Annual Survey of Manufactures 47U.S. Census Bureau, 2002 Economic Census

Table 1. Value of Shipments for Product Classes: 2003 and 2002�Con.[Includes value of product shipments produced by (1) establishments classified in their primary industry and (2) establishments classified in other industries (secondary). Transfers of products from oneestablishment of a company to another establishment of the same company (interplant transfers) are also included. Data based on the 2003 Annual Survey of Manufactures (ASM). For information onconfidentiality protection, sampling error, nonsampling error, and explanation of terms, see note 2 at end of table. For meaning of abbreviations and symbols, see introductory text]
Productclass code Product Value of
product shipments($1,000)
Relativestandard error
of estimate1
(percent)
333924 Industrial truck, tractor, trailer, and stacker machinery manufacturing 2003������������������������� 4 825 603 22002�� 4 619 917 X
3339242 Industrial trucks, tractors, mobile straddle carriers and cranes, and automatic stackingmachines 2003�������������������������������������������������������������������������� 3 791 458 2
2002�� 3 433 169 X
3339243 Parts and attachments for industrial trucks and tractors (sold separately) 2003�������������������� 867 435 32002�� 1 048 230 X
333924W Industrial truck, tractor, trailer, and stacker machinery manufacturing, nsk, total 2003�������������� 166 711 72002�� 138 518 X
333991 Power�driven handtool manufacturing 2003���������������������������������������������������� 2 880 709 32002�� 3 395 494 X
3339911 Power�driven handtools, pneumatic, hydraulic, and power�actuated 2003������������������������ 1 024 422 32002�� 1 085 869 X
3339913 Power�driven handtools, internal combustion engine driven (including parts) 2003����������������� 298 350 12002�� 241 686 X
3339917 Power�driven handtools, battery�powered (cordless), including parts 2003������������������������ 316 189 12002�� 589 603 X
3339919 Power�driven handtools, electric (except battery�powered), including parts 2003������������������ 1 142 954 22002�� 1 329 811 X
333991W Power�driven handtool manufacturing, nsk, total 2003����������������������������������������� 98 794 862002�� 148 525 X
333992 Welding and soldering equipment manufacturing 2003������������������������������������������� 3 217 412 22002�� 3 524 679 X
3339921 Arc welding machines, components, and accessories (except electrodes), except studwelding equipment 2003������������������������������������������������������������������ 1 019 114 1
2002�� 1 261 711 X
3339923 Arc welding electrodes, metal 2003��������������������������������������������������������� 595 313 12002�� 682 211 X
3339927 Resistance welders, components, accessories, and electrodes 2003���������������������������� 573 070 62002�� 565 879 X
3339929 Gas welding and cutting equipment, parts, attachments, and accessories 2003������������������� 338 464 92002�� 311 733 X
333992A Other welding equipment, components, and accessories (except arc, resistance, andgas welding equipment) 2003������������������������������������������������������������� 571 772 3
2002�� 601 846 X
333992W Welding and soldering equipment manufacturing, nsk, total 2003������������������������������� 119 680 142002�� 101 299 X
333993 Packaging machinery manufacturing 2003����������������������������������������������������� 3 879 124 32002�� 3 758 142 X
3339931 Packing, packaging, and bottling machinery (except parts) 2003�������������������������������� 3 034 913 42002�� 3 007 006 X
3339935 Parts for packing, packaging, and bottling machinery 2003������������������������������������� 715 253 42002�� 653 729 X
333993W Packaging machinery manufacturing, nsk, total 2003������������������������������������������ 128 959 172002�� 97 407 X
333994 Industrial process furnace and oven manufacturing 2003����������������������������������������� 1 501 114 62002�� 1 513 619 X
3339940 Industrial furnaces and ovens, and electric industrial heating equipment 2003�������������������� 1 501 114 62002�� 1 513 619 X
333995 Fluid power cylinder and actuator manufacturing 2003������������������������������������������� 3 144 360 22002�� 3 117 147 X
3339951 Nonaerospace type hydraulic fluid power cylinders and actuators, linear and rotary3 2003���������� 918 971 32002�� 982 271 X
3339953 Nonaerospace type pneumatic fluid power cylinders and actuators, linear and rotary3 2003��������� 595 912 52002�� 545 716 X
3339955 Parts for nonaerospace type hydraulic and pneumatic fluid power cylinders andactuators, including accumulators, cushions, etc.3 2003��������������������������������������� 436 105 3
2002�� 401 633 X
3339957 Aerospace type fluid power cylinders and actuators, hydraulic and pneumatic3 2003��������������� 1 054 087 32002�� 987 725 X
333995W Fluid power cylinder and actuator manufacturing, nsk, total 2003�������������������������������� 139 285 252002�� 199 802 X
333996 Fluid power pump and motor manufacturing 2003����������������������������������������������� 2 502 865 22002�� 2 390 501 X
3339961 Nonaerospace type reciprocating fluid power pumps3 2003������������������������������������� 523 659 12002�� 547 848 X
3339963 Nonaerospace type rotary and other fluid power pumps3 2003���������������������������������� 477 256 12002�� 483 946 X
3339965 Nonaerospace type fluid power motors3 2003������������������������������������������������ 470 362 12002�� 443 550 X
3339967 Aerospace type fluid power pumps and motors3 2003����������������������������������������� 293 638 122002�� 252 051 X
3339969 Parts for fluid power pumps, motors, and hydrostatic transmissions3 2003������������������������ 658 660 32002�� 591 596 X
333996W Fluid power pump and motor manufacturing, nsk, total 2003������������������������������������ 79 290 32002�� 71 510 X
See footnotes at end of table.
48 Annual Survey of Manufactures Value of Product ShipmentsU.S. Census Bureau, 2002 Economic Census

Table 1. Value of Shipments for Product Classes: 2003 and 2002�Con.[Includes value of product shipments produced by (1) establishments classified in their primary industry and (2) establishments classified in other industries (secondary). Transfers of products from oneestablishment of a company to another establishment of the same company (interplant transfers) are also included. Data based on the 2003 Annual Survey of Manufactures (ASM). For information onconfidentiality protection, sampling error, nonsampling error, and explanation of terms, see note 2 at end of table. For meaning of abbreviations and symbols, see introductory text]
Productclass code Product Value of
product shipments($1,000)
Relativestandard error
of estimate1
(percent)
333997 Scale and balance (except laboratory) manufacturing 2003��������������������������������������� 661 129 42002�� 622 423 X
3339971 Vehicle and industrial scales 2003���������������������������������������������������������� 302 285 52002�� 316 506 X
3339973 Retail, commercial, household, and mailing scales 2003��������������������������������������� 213 745 72002�� 195 336 X
3339975 Parts, attachments, and accessories for scales and balances, except laboratory 2003������������� 112 001 22002�� 98 878 X
333997W Scale and balance (except laboratory) manufacturing, nsk, total 2003��������������������������� 33 097 462002�� 11 703 X
333999 All other miscellaneous general purpose machinery manufacturing 2003��������������������������� 8 724 232 32002�� 8 775 754 X
3339991 Filters and strainers, except fluid power 2003������������������������������������������������� 2 309 677 32002�� 2 398 768 X
3339993 Filters for hydraulic fluid power systems, nonaerospace3 2003���������������������������������� 508 916 22002�� 295 554 X
3339994 Filters for pneumatic fluid power systems, nonaerospace3 2003��������������������������������� 120 019 12002�� 110 818 X
3339996 Filters for hydraulic and pneumatic fluid power systems, aerospace3 2003������������������������ 197 400 212002�� 85 214 X
3339997 All other miscellaneous general industrial machinery3 2003������������������������������������� 3 275 674 42002�� 3 220 804 X
333999A All other miscellaneous machinery products, except electrical 2003������������������������������ 479 755 112002�� 914 515 X
333999W All other miscellaneous general purpose machinery manufacturing, nsk, total 2003���������������� 1 832 791 92002�� 1 750 081 X
334111 Electronic computer manufacturing 2003������������������������������������������������������� 39 164 084 12002�� 41 180 600 X
3341111 Host computers, multiusers (mainframes, super computers, medium scale systems,UNIX servers, PC servers)3 2003���������������������������������������������������������� 12 168 701 1
2002�� 12 967 418 X
3341117 Single user computers, microprocessor�based, capable of supporting attachedperipherals (personal computers, workstations, portable computers)3 2003���������������������� 25 151 292 1
2002�� 26 559 313 X
334111D Other computers (array, analog, hybrid, and special�use computers)3 2003����������������������� 852 778 32002�� 807 690 X
334111W Electronic computer manufacturing, nsk, total 2003������������������������������������������� 991 313 22002�� 846 179 X
334112 Computer storage device manufacturing 2003�������������������������������������������������� 7 326 738 22002�� 7 628 413 X
3341121 Computer storage devices (except parts, attachments, and accessories)3 2003������������������� 5 360 979 12002�� 5 461 472 X
3341124 Parts, attachments, and accessories for computer storage devices3 2003������������������������ 1 193 412 12002�� 1 686 810 X
334112W Computer storage device manufacturing, nsk, total 2003��������������������������������������� 772 348 212002�� 480 131 X
334113 Computer terminal manufacturing 2003�������������������������������������������������������� 436 042 22002�� 391 322 X
3341131 Computer terminals (except point�of�sale and funds�transfer devices, parts,attachments, and accessories)3 2003������������������������������������������������������� 310 843 1
2002�� 274 862 X
3341134 Parts, attachments, and accessories for computer terminals (except point�of�sale andfunds�transfer devices)3 2003������������������������������������������������������������� 22 290 8
2002�� 54 843 X
334113W Computer terminal manufacturing, nsk, total 2003��������������������������������������������� 102 908 52002�� 61 617 X
334119 Other computer peripheral equipment manufacturing 2003��������������������������������������� 14 228 699 22002�� 15 316 906 X
3341191 All other miscellaneous computer peripheral (input/output) equipment (except parts,attachments, and accessories)3 2003������������������������������������������������������� 9 494 657 2
2002�� 10 419 354 X
3341194 Parts, subassemblies, and accessories for computer peripheral equipment3 2003����������������� 1 959 394 122002�� 2 260 946 X
3341197 Point of sale terminals and fund�transfer devices.3 2003��������������������������������������� 730 574 152002�� 728 555 X
334119D Parts and attachments for point of sale terminals and fund�transfer devices3 2003����������������� 83 466 22002�� 81 089 X
334119W Other computer peripheral equipment manufacturing, nsk, total 2003���������������������������� 1 960 609 82002�� 1 826 962 X
334210 Telephone apparatus manufacturing 2003����������������������������������������������������� 20 707 962 12002�� 26 009 324 X
3342101 Telephone switching and switchboard equipment3 2003���������������������������������������� 4 329 196 22002�� 7 090 986 X
3342104 Telephone and telegraph (wire) apparatus, carrier line equipment (office and linerepeaters and line terminating carrier equipment) and nonconsumer modems,including auxiliary sets3 2003�������������������������������������������������������������� 2 974 755 1
2002�� 4 161 386 X
See footnotes at end of table.
Value of Product Shipments Annual Survey of Manufactures 49U.S. Census Bureau, 2002 Economic Census

Table 1. Value of Shipments for Product Classes: 2003 and 2002�Con.[Includes value of product shipments produced by (1) establishments classified in their primary industry and (2) establishments classified in other industries (secondary). Transfers of products from oneestablishment of a company to another establishment of the same company (interplant transfers) are also included. Data based on the 2003 Annual Survey of Manufactures (ASM). For information onconfidentiality protection, sampling error, nonsampling error, and explanation of terms, see note 2 at end of table. For meaning of abbreviations and symbols, see introductory text]
Productclass code Product Value of
product shipments($1,000)
Relativestandard error
of estimate1
(percent)
334210 Telephone apparatus manufacturing�Con.3342107 Other telephone and telegraph (wire) apparatus, including telephone sets, telephone
answering, and fax machines3 2003�������������������������������������������������������� 12 030 798 12002�� 12 874 890 X
334210W Telephone apparatus manufacturing, nsk, total 2003������������������������������������������ 1 373 213 172002�� 1 882 062 X
334220 Radio and television broadcasting and wireless communications equipmentmanufacturing 2003������������������������������������������������������������������������ 31 398 116 3
2002�� 30 133 460 X
3342201 Communication systems and equipment, including microwave equipment, and spacesatellites (except broadcast)3 2003��������������������������������������������������������� 26 015 534 3
2002�� 24 643 353 X
3342202 Broadcast, studio, and related electronic equipment3 2003������������������������������������� 2 789 789 52002�� 3 192 407 X
334220W Radio and television broadcasting and wireless communications equipmentmanufacturing, nsk, total 2003������������������������������������������������������������� 2 592 792 3
2002�� 2 297 700 X
334290 Other communications equipment manufacturing 2003������������������������������������������ 4 579 887 22002�� 4 886 125 X
3342901 Alarm systems, including electric sirens and horns3 2003�������������������������������������� 2 347 706 12002�� 3 014 393 X
3342902 Vehicular and pedestrian traffic control equipment, including electric railway signalsand attachments3 2003������������������������������������������������������������������� 998 077 5
2002�� 895 932 X
3342903 Intercommunications systems, including inductive paging systems (selective paging),except telephone and telegraph3 2003������������������������������������������������������ 425 113 5
2002�� 302 998 X
334290W Other communications equipment manufacturing, nsk, total 2003������������������������������� 808 991 62002�� 672 802 X
334310 Audio and video equipment manufacturing 2003������������������������������������������������ 10 084 577 22002�� 9 729 306 X
3343101 Home, portable, and automobile radios and radio�phonograph�tape recorder�compactdisc combinations3 2003������������������������������������������������������������������ 2 591 325 1
2002�� 2 460 917 X
3343102 Television receivers, including combination models3 2003�������������������������������������� 3 500 208 52002�� 3 391 132 X
3343104 Speakers, including loudspeaker systems and loudspeakers sold separately, andcommercial sound equipment3 2003�������������������������������������������������������� 1 865 830 3
2002�� 1 761 507 X
3343105 Other consumer audio and video equipment, including audio and video recorders andplayers (camcorders)3 2003��������������������������������������������������������������� 1 563 246 6
2002�� 1 719 063 X
334310W Audio and video equipment manufacturing, nsk, total 2003������������������������������������� 563 967 42002�� 396 687 X
334411 Electron tube manufacturing 2003������������������������������������������������������������ 2 313 171 12002�� 3 250 227 X
3344111 Transmittal, industrial, and special�purpose electron tubes (except X�ray)3 2003������������������ 635 468 12002�� 586 614 X
3344114 Receiving�type electron tubes, including cathode ray (new and rebuilt)3 2003��������������������� 1 527 805 12002�� 2 515 608 X
3344117 Electron tube parts3 2003������������������������������������������������������������������ 76 274 52002�� 85 705 X
334411W Electron tube manufacturing, nsk, total 2003������������������������������������������������� 73 624 12002�� 62 300 X
334412 Bare printed circuit board manufacturing 2003�������������������������������������������������� 5 882 413 42002�� 6 615 714 X
3344120 Bare printed circuit boards3 2003����������������������������������������������������������� 5 882 413 42002�� 6 615 714 X
334413 Semiconductor and related device manufacturing 2003������������������������������������������ 65 357 805 12002�� 59 683 691 X
3344131 Integrated microcircuits, including semiconductor networks, microprocessors, andMOS memories3 2003�������������������������������������������������������������������� 54 456 895 1
2002�� 49 383 542 X
3344134 Transistors3 2003������������������������������������������������������������������������� 646 499 32002�� 869 836 X
3344137 Diodes and rectifiers3 2003���������������������������������������������������������������� 363 092 72002�� 427 238 X
334413A Other semiconductor devices, including semiconductor parts such as chips, wafers,and heat sinks3 2003��������������������������������������������������������������������� 7 439 357 2
2002�� 6 964 875 X
334413W Semiconductor and related device manufacturing, nsk, total 2003������������������������������� 2 451 962 12002�� 2 038 200 X
334414 Electronic capacitor manufacturing 2003������������������������������������������������������� 1 241 285 42002�� 1 365 970 X
3344140 Capacitors for electronic circuitry3 2003������������������������������������������������������ 1 241 285 42002�� 1 365 970 X
334415 Electronic resistor manufacturing 2003�������������������������������������������������������� 684 198 22002�� 682 755 X
3344150 Resistors for electronic circuitry3 2003������������������������������������������������������� 684 198 22002�� 682 755 X
See footnotes at end of table.
50 Annual Survey of Manufactures Value of Product ShipmentsU.S. Census Bureau, 2002 Economic Census

Table 1. Value of Shipments for Product Classes: 2003 and 2002�Con.[Includes value of product shipments produced by (1) establishments classified in their primary industry and (2) establishments classified in other industries (secondary). Transfers of products from oneestablishment of a company to another establishment of the same company (interplant transfers) are also included. Data based on the 2003 Annual Survey of Manufactures (ASM). For information onconfidentiality protection, sampling error, nonsampling error, and explanation of terms, see note 2 at end of table. For meaning of abbreviations and symbols, see introductory text]
Productclass code Product Value of
product shipments($1,000)
Relativestandard error
of estimate1
(percent)
334416 Electronic coil, transformer, and other inductor manufacturing 2003������������������������������� 1 231 159 32002�� 1 210 430 X
3344160 Electronic coils, transformers, and other inductors3 2003��������������������������������������� 1 231 159 32002�� 1 210 430 X
334417 Electronic connector manufacturing 2003������������������������������������������������������ 3 972 629 22002�� 3 885 478 X
3344171 Coaxial (RF) connectors for electronic circuitry3 2003������������������������������������������ 450 882 22002�� 488 622 X
3344174 Cylindrical connectors for electronic circuitry3 2003�������������������������������������������� 574 441 22002�� 530 666 X
3344177 Rack and panel (rectangular) connectors for electronic circuitry3 2003��������������������������� 310 321 92002�� 283 749 X
334417A Printed circuit connectors for electronic circuitry3 2003����������������������������������������� 849 507 32002�� 788 366 X
334417D Other connectors for electronic circuitry, including parts3 2003���������������������������������� 1 570 769 32002�� 1 576 019 X
334417W Electronic connector manufacturing, nsk, total 2003������������������������������������������� 216 709 42002�� 218 056 X
334418 Printed circuit assembly (electronic assembly) manufacturing 2003�������������������������������� 22 743 599 32002�� 22 782 118 X
3344184 External modems, consumer3 2003��������������������������������������������������������� 751 876 402002�� 429 309 X
334418B Printed circuit assemblies, loaded boards and modules (printed circuit boards withinserted electronic components)3 2003����������������������������������������������������� 20 621 970 2
2002�� 21 079 096 X
334418W Printed circuit assembly (electronic assembly) manufacturing, nsk, total 2003��������������������� 1 369 753 62002�� 1 273 713 X
334419 Other electronic component manufacturing 2003������������������������������������������������ 9 306 217 22002�� 10 199 377 X
3344191 Crystals, filters, piezoelectric, and other related electronic devices (except microwavefilters)3 2003���������������������������������������������������������������������������� 688 836 9
2002�� 762 418 X
3344194 All other miscellaneous transducers, including electrical�electronic input/outputtransducers3 2003����������������������������������������������������������������������� 1 218 416 3
2002�� 1 236 819 X
3344197 Switches, mechanical, for electronic circuitry3 2003������������������������������������������� 784 590 22002�� 834 836 X
334419A Microwave components and devices, except antennae, tubes, and semiconductors3 2003���������� 1 484 648 22002�� 1 570 942 X
334419E All other miscellaneous electronic components3 2003������������������������������������������ 4 036 927 32002�� 4 447 903 X
334419W Other electronic component manufacturing, nsk, total 2003������������������������������������� 1 092 801 72002�� 1 346 459 X
334510 Electromedical and electrotherapeutic apparatus manufacturing 2003����������������������������� 16 279 325 12002�� 15 219 239 X
3345101 Electromedical equipment, including diagnostic, therapeutic, and patient monitoringequipment (excluding ionizing radiation equipment)3 2003������������������������������������� 14 755 621 1
2002�� 13 769 610 X
3345103 Electronic hearing aids, complete units3 2003������������������������������������������������ 1 148 888 112002�� 833 167 X
334510W Electromedical and electrotherapeutic apparatus manufacturing, nsk, total 2003������������������ 374 815 272002�� 616 462 X
334511 Search, detection, navigation, guidance, aeronautical, and nautical system andinstrument manufacturing 2003�������������������������������������������������������������� 32 442 254 1
2002�� 30 212 793 X
3345111 Aeronautical, nautical, and navigational instruments, not sending or receiving radiosignals (except engine instruments)3 2003�������������������������������������������������� 2 150 132 4
2002�� 2 684 264 X
3345113 Search, detection, navigation, and guidance systems and equipment3 2003���������������������� 28 904 048 12002�� 26 681 159 X
334511W Search, detection, nagivation, guidance, aeronautical, and nautical system andinstrument manufacturing, nsk, total 2003��������������������������������������������������� 1 388 074 9
2002�� 847 370 X
334512 Automatic environmental control manufacturing for residential, commercial, andappliance use 2003������������������������������������������������������������������������ 2 784 368 2
2002�� 2 768 050 X
3345120 Automatic environmental controls for monitoring residential, commercial, and applianceuse3 2003������������������������������������������������������������������������������ 2 784 368 2
2002�� 2 768 050 X
334513 Instruments and related products manufacturing for measuring, displaying, andcontrolling industrial process variables 2003��������������������������������������������������� 6 335 987 2
2002�� 6 769 461 X
3345130 Process control instruments3 2003���������������������������������������������������������� 6 335 987 22002�� 6 769 461 X
See footnotes at end of table.
Value of Product Shipments Annual Survey of Manufactures 51U.S. Census Bureau, 2002 Economic Census

Table 1. Value of Shipments for Product Classes: 2003 and 2002�Con.[Includes value of product shipments produced by (1) establishments classified in their primary industry and (2) establishments classified in other industries (secondary). Transfers of products from oneestablishment of a company to another establishment of the same company (interplant transfers) are also included. Data based on the 2003 Annual Survey of Manufactures (ASM). For information onconfidentiality protection, sampling error, nonsampling error, and explanation of terms, see note 2 at end of table. For meaning of abbreviations and symbols, see introductory text]
Productclass code Product Value of
product shipments($1,000)
Relativestandard error
of estimate1
(percent)
334514 Totalizing fluid meter and counting device manufacturing 2003������������������������������������ 4 917 988 12002�� 5 059 577 X
3345141 Integrating and totalizing meters for gas and liquids3 2003������������������������������������� 1 512 615 12002�� 1 421 203 X
3345143 Counting devices, excluding motor vehicle instruments3 2003���������������������������������� 433 075 22002�� 466 615 X
3345145 Motor vehicle instruments3 2003������������������������������������������������������������ 2 743 176 12002�� 2 928 428 X
334514W Totalizing fluid meter and counting device manufacturing, nsk, total 2003������������������������ 229 122 52002�� 243 331 X
334515 Instrument manufacturing for measuring and testing electricity and electrical signals 2003������������ 9 740 181 12002�� 9 841 766 X
3345151 Electrical integrating instruments3 2003������������������������������������������������������ 728 967 22002�� 699 737 X
3345153 Test equipment for testing electrical, radio, and communication circuits, and motors(except portable instrument transformers)3 2003��������������������������������������������� 8 044 697 2
2002�� 8 158 961 X
3345155 Other instruments to measure electricity3 2003����������������������������������������������� 268 859 232002�� 318 039 X
334515W Instrument manufacturing for measuring and testing electricity and electrical signals,nsk, total 2003�������������������������������������������������������������������������� 697 658 5
2002�� 665 029 X
334516 Analytical laboratory instrument manufacturing 2003�������������������������������������������� 7 738 369 22002�� 7 130 994 X
3345160 Analytical and scientific instruments, except optical3 2003�������������������������������������� 7 738 369 22002�� 7 130 994 X
334517 Irradiation apparatus manufacturing 2003������������������������������������������������������ 4 136 759 22002�� 4 512 657 X
3345170 Irradiation (ionizing radiation) equipment3 2003����������������������������������������������� 4 136 759 22002�� 4 512 657 X
334518 Watch, clock, and part manufacturing 2003���������������������������������������������������� 573 286 42002�� 637 761 X
3345182 Watches, watchcases, movements, and modules (including watch parts) 2003�������������������� 106 315 42002�� 113 590 X
3345184 Clocks, timing mechanisms, time recording and time stamp devices, time switches,clock movements, and clock cases (including parts) 2003������������������������������������� 455 108 5
2002�� 507 482 X
334518W Watch, clock, and part manufacturing, nsk, total 2003����������������������������������������� 11 862 102002�� 16 689 X
334519 Other measuring and controlling device manufacturing 2003������������������������������������� 5 248 628 22002�� 5 384 595 X
3345192 Aircraft engine instruments, except flight3 2003����������������������������������������������� 841 796 12002�� 840 400 X
3345194 Physical properties testing and inspection equipment and kinematic testing andmeasuring equipment3 2003�������������������������������������������������������������� 1 864 870 3
2002�� 1 893 668 X
3345195 Nuclear radiation detection and monitoring instruments3 2003���������������������������������� 506 117 82002�� 520 592 X
3345197 Commercial, geophysical, meteorological, and general�purpose instruments andequipment, except medical thermometers3 2003��������������������������������������������� 1 322 887 5
2002�� 1 437 786 X
3345199 Survey and drafting instruments and apparatus, including photogrammetricequipment3 2003������������������������������������������������������������������������ 263 936 2
2002�� 266 411 X
334519W Other measuring and controlling device manufacturing, nsk, total 2003�������������������������� 449 021 22002�� 425 738 X
334611 Software reproducing 2003������������������������������������������������������������������� 650 042 112002�� 617 290 X
3346110 Software reproducing 2003����������������������������������������������������������������� 650 042 112002�� 617 290 X
334612 Prerecorded compact disc (except software), tape, and record reproducing 2003�������������������� 3 818 483 32002�� 4 270 831 X
3346120 Reproduction of recording media 2003������������������������������������������������������� 3 818 483 32002�� 4 270 831 X
334613 Magnetic and optical recording media manufacturing 2003��������������������������������������� 2 366 353 12002�� 2 564 267 X
3346130 Magnetic and optical recording media3 2003������������������������������������������������� 2 366 353 12002�� 2 564 267 X
335110 Electric lamp bulb and part manufacturing 2003������������������������������������������������� 2 489 980 12002�� 2 472 636 X
3351101 Electric lamp bulbs and tubes (including sealed beam lamp bulbs) 2003������������������������� 2 176 403 12002�� 2 155 760 X
3351103 Electric lamp (bulbs and tubes) components (including bases, supports, lead�ins,filaments, etc.), except lamp bulb blanks 2003����������������������������������������������� 302 476 9
2002�� 308 091 X
335110W Electric lamp bulb and part manufacturing, nsk, total 2003������������������������������������� 11 101 12002�� 8 785 X
See footnotes at end of table.
52 Annual Survey of Manufactures Value of Product ShipmentsU.S. Census Bureau, 2002 Economic Census

Table 1. Value of Shipments for Product Classes: 2003 and 2002�Con.[Includes value of product shipments produced by (1) establishments classified in their primary industry and (2) establishments classified in other industries (secondary). Transfers of products from oneestablishment of a company to another establishment of the same company (interplant transfers) are also included. Data based on the 2003 Annual Survey of Manufactures (ASM). For information onconfidentiality protection, sampling error, nonsampling error, and explanation of terms, see note 2 at end of table. For meaning of abbreviations and symbols, see introductory text]
Productclass code Product Value of
product shipments($1,000)
Relativestandard error
of estimate1
(percent)
335121 Residential electric lighting fixture manufacturing 2003������������������������������������������� 1 930 696 42002�� 1 965 398 X
3351211 Residential�type electric lighting fixtures (except portable), including parts andaccessories 2003������������������������������������������������������������������������ 1 293 607 4
2002�� 1 263 226 X
3351214 Residential�type portable lighting fixtures, including parts and accessories 2003������������������� 561 259 72002�� 631 036 X
335121W Residential electric lighting fixture manufacturing, nsk, total 2003������������������������������� 75 830 62002�� 71 136 X
335122 Commercial, industrial, and institutional electric lighting fixture manufacturing 2003������������������ 3 575 665 22002�� 3 906 236 X
3351221 Commercial and institutional�type electric lighting fixtures, including parts andaccessories 2003������������������������������������������������������������������������ 2 574 549 2
2002�� 2 651 594 X
3351222 Industrial�type electric lighting fixtures, including parts and accessories 2003��������������������� 877 446 42002�� 1 132 034 X
335122W Commercial, industrial, and institutional electric lighting fixture manufacturing, nsk,total 2003������������������������������������������������������������������������������� 123 669 13
2002�� 122 608 X
335129 Other lighting equipment manufacturing 2003�������������������������������������������������� 3 356 961 42002�� 3 486 761 X
3351291 Outdoor lighting equipment (including parts and accessories) 2003������������������������������ 1 719 238 32002�� 1 885 794 X
3351294 All other miscellaneous electric and nonelectric lighting equipment, including handportable, parts and accessories 2003������������������������������������������������������� 1 538 252 8
2002�� 1 530 285 X
335129W Other lighting equipment manufacturing, nsk, total 2003��������������������������������������� 99 470 12002�� 70 682 X
335211 Electric housewares and household fan manufacturing 2003������������������������������������� 2 011 828 12002�� 2 010 095 X
3352111 Electric fans, except industrial type3 2003���������������������������������������������������� 587 407 22002�� 613 916 X
3352114 Small electric household appliances, except fans and wall and baseboard heating unitsfor permanent installation 2003������������������������������������������������������������ 1 231 402 2
2002�� 1 221 884 X
3352115 Parts and attachments for small household electric appliances3 2003���������������������������� 63 064 12002�� 65 352 X
335211W Electric housewares and household fan manufacturing, nsk, total 2003�������������������������� 129 955 12002�� 108 943 X
335212 Household vacuum cleaner manufacturing 2003������������������������������������������������ 1 905 114 12002�� 2 267 849 X
3352121 Household vacuum cleaners, upright�stick type, including parts 2003���������������������������� D S2002�� D X
3352122 Floor waxing and floor polishing machines and parts3 2003������������������������������������� D S2002�� D X
335212W Household vacuum cleaner manufacturing, nsk, total 2003������������������������������������� 42 880 12002�� 100 538 X
335221 Household cooking appliance manufacturing 2003���������������������������������������������� 4 333 846 12002�� 4 030 283 X
3352211 Electric (including microwave) household ranges, ovens, surface cooking units, andequipment3 2003������������������������������������������������������������������������ 2 257 803 1
2002�� 1 905 685 X
3352213 Gas household ranges, ovens, surface cooking units, and equipment (including partsand accessories)3 2003������������������������������������������������������������������� 989 588 2
2002�� 929 545 X
3352215 Other household ranges and cooking equipment3 2003���������������������������������������� 1 041 852 32002�� 1 164 764 X
335221W Household cooking appliance manufacturing, nsk, total 2003����������������������������������� 44 603 12002�� 30 289 X
335222 Household refrigerator and home freezer manufacturing 2003������������������������������������ 5 828 542 12002�� 5 354 277 X
3352221 Household refrigerators, including combination refrigerator�freezers3 2003����������������������� 5 205 170 12002�� 4 768 642 X
3352222 Household food freezers, complete units3 2003����������������������������������������������� D S2002�� D X
3352223 Parts and attachments for household refrigerators and freezers3 2003��������������������������� D S2002�� D X
335222W Household refrigerator and home freezer manufacturing, nsk, total 2003������������������������� 3 167 12002�� 275 X
335224 Household laundry equipment manufacturing 2003���������������������������������������������� 4 785 307 12002�� 4 486 624 X
3352240 Household laundry equipment3 2003�������������������������������������������������������� 4 785 307 12002�� 4 486 624 X
See footnotes at end of table.
Value of Product Shipments Annual Survey of Manufactures 53U.S. Census Bureau, 2002 Economic Census

Table 1. Value of Shipments for Product Classes: 2003 and 2002�Con.[Includes value of product shipments produced by (1) establishments classified in their primary industry and (2) establishments classified in other industries (secondary). Transfers of products from oneestablishment of a company to another establishment of the same company (interplant transfers) are also included. Data based on the 2003 Annual Survey of Manufactures (ASM). For information onconfidentiality protection, sampling error, nonsampling error, and explanation of terms, see note 2 at end of table. For meaning of abbreviations and symbols, see introductory text]
Productclass code Product Value of
product shipments($1,000)
Relativestandard error
of estimate1
(percent)
335228 Other major household appliance manufacturing 2003������������������������������������������� 3 612 610 22002�� 3 304 592 X
3352281 Household water heaters, electric, for permanent installation3 2003����������������������������� 613 383 52002�� 627 636 X
3352283 Household water heaters, except electric3 2003����������������������������������������������� 1 047 654 52002�� 835 806 X
3352285 All other miscellaneous household appliances3 2003������������������������������������������ 1 949 147 22002�� 1 839 948 X
335228W Other major household appliance manufacturing, nsk, total 2003�������������������������������� 2 426 442002�� 1 202 X
335311 Power, distribution, and specialty transformer manufacturing 2003�������������������������������� 4 125 904 12002�� 4 332 416 X
3353111 Power and distribution transformers, except parts 2003���������������������������������������� 2 182 497 12002�� 2 276 686 X
3353113 Specialty transformers, except fluorescent lamp ballast 2003����������������������������������� 377 251 22002�� 355 093 X
3353115 Fluorescent lamp ballasts3 2003������������������������������������������������������������ 660 082 12002�� 630 265 X
3353117 Commercial, institutional, and industrial general�purpose transformers, all voltages 2003����������� 270 887 62002�� 263 434 X
3353119 Power regulators, boosters, and other transformers and parts for all transformers 2003������������ 422 288 122002�� 547 747 X
335311W Power, distribution, and specialty transformer manufacturing, nsk, total 2003��������������������� 212 898 42002�� 259 191 X
335312 Motor and generator manufacturing 2003������������������������������������������������������ 9 261 661 12002�� 8 944 301 X
3353121 Fractional horsepower motors (rated at less than 746 watts) (except hermetics)3 2003������������� 3 107 128 12002�� 2 990 132 X
3353123 Integral horsepower motors and generators other than for land transportationequipment (rated at 746 watts or more) (except hemetics)3 2003������������������������������� 1 586 812 1
2002�� 1 639 960 X
3353125 Land transportation motors, generators, and control equipment (except parts)3 2003�������������� 226 012 12002�� 196 625 X
3353127 Prime mover generator sets, except steam and hydraulic turbine3 2003�������������������������� 1 366 535 22002�� 1 378 351 X
3353129 Fractional motor generator sets and other rotating equipment (including hermetics)3 2003���������� 861 762 22002�� 861 411 X
335312A Integral motor generator sets and other rotating equipment (including hermetics)3 2003������������ 646 730 22002�� 535 500 X
335312C Parts and supplies for motors, generators, generator sets, and other rotatingequipment, excluding motors for built�in jobs3 2003������������������������������������������� 807 006 3
2002�� 728 297 X
335312E Armature rewinding on a factory basis 2003�������������������������������������������������� 64 533 92002�� 68 409 X
335312W Motor and generator manufacturing, nsk, total 2003������������������������������������������� 595 142 42002�� 545 616 X
335313 Switchgear and switchboard apparatus manufacturing 2003�������������������������������������� 7 481 590 12002�� 7 534 822 X
3353131 Power circuit breakers, all voltages3 2003���������������������������������������������������� 620 912 32002�� 696 689 X
3353133 Low voltage panelboards and distribution boards and other switching and interruptingdevices, 1000 volts or less3 2003���������������������������������������������������������� 2 182 504 3
2002�� 2 060 891 X
3353135 Fuses and fuse equipment less than 2300 volts (except power distribution cut�outs)3 2003��������� 394 810 32002�� 481 439 X
3353137 Molded case circuit breakers, 1000 volts or less3 2003����������������������������������������� 1 271 760 12002�� 1 322 557 X
3353139 Duct, including plug�in units and accessories, 1000 volts or less3 2003��������������������������� 193 700 12002�� 210 402 X
335313A Switchgear, except ducts and relays3 2003��������������������������������������������������� 2 240 690 12002�� 2 257 982 X
335313W Switchgear and switchboard apparatus manufacturing, nsk, total 2003��������������������������� 577 214 162002�� 504 862 X
335314 Relay and industrial control manufacturing 2003������������������������������������������������ 8 401 309 12002�� 8 819 927 X
3353141 Relays for electronic circuitry, industrial control overload, and switchgear type3 2003�������������� 683 877 82002�� 694 720 X
3353143 Specific�purpose industrial controls3 2003���������������������������������������������������� 2 977 008 22002�� 2 871 023 X
3353146 General�purpose industrial controls 2003���������������������������������������������������� 3 546 893 12002�� 3 795 228 X
3353147 Parts for industrial controls and motor�control accessories3 2003�������������������������������� 510 370 52002�� 510 820 X
335314W Relay and industrial control manufacturing, nsk, total 2003������������������������������������� 683 162 32002�� 948 136 X
See footnotes at end of table.
54 Annual Survey of Manufactures Value of Product ShipmentsU.S. Census Bureau, 2002 Economic Census
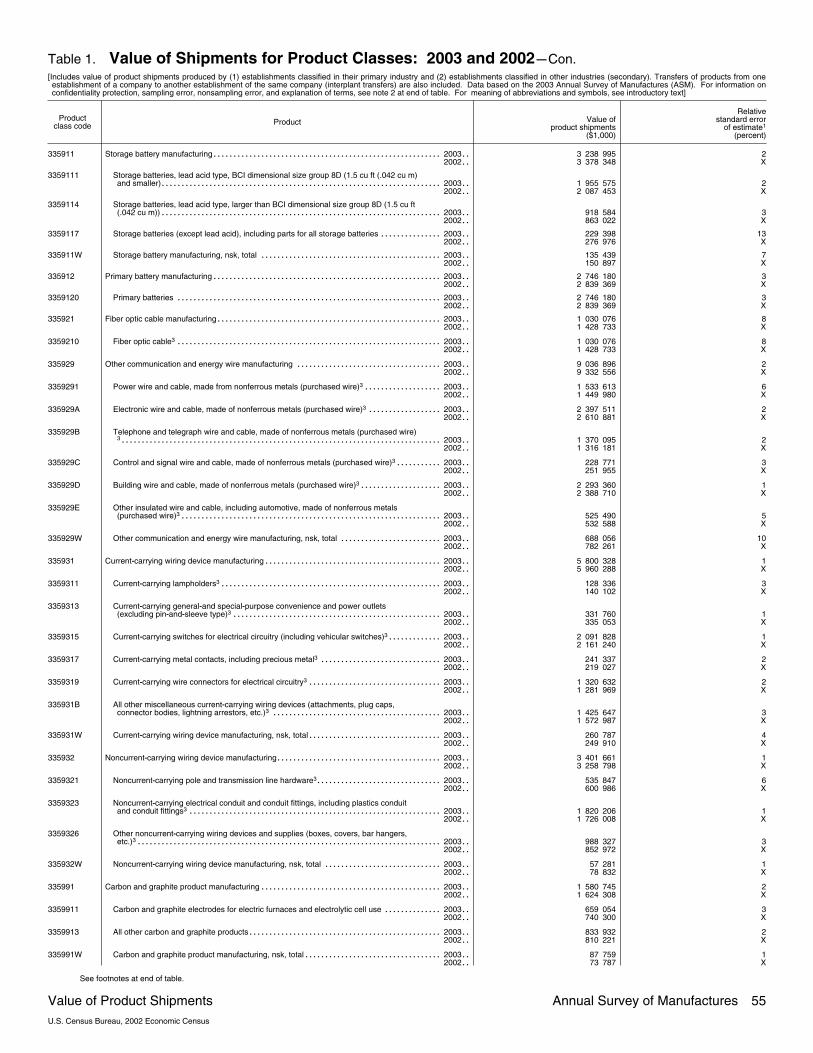
Table 1. Value of Shipments for Product Classes: 2003 and 2002�Con.[Includes value of product shipments produced by (1) establishments classified in their primary industry and (2) establishments classified in other industries (secondary). Transfers of products from oneestablishment of a company to another establishment of the same company (interplant transfers) are also included. Data based on the 2003 Annual Survey of Manufactures (ASM). For information onconfidentiality protection, sampling error, nonsampling error, and explanation of terms, see note 2 at end of table. For meaning of abbreviations and symbols, see introductory text]
Productclass code Product Value of
product shipments($1,000)
Relativestandard error
of estimate1
(percent)
335911 Storage battery manufacturing 2003����������������������������������������������������������� 3 238 995 22002�� 3 378 348 X
3359111 Storage batteries, lead acid type, BCI dimensional size group 8D (1.5 cu ft (.042 cu m)and smaller) 2003������������������������������������������������������������������������ 1 955 575 2
2002�� 2 087 453 X
3359114 Storage batteries, lead acid type, larger than BCI dimensional size group 8D (1.5 cu ft(.042 cu m)) 2003������������������������������������������������������������������������ 918 584 3
2002�� 863 022 X
3359117 Storage batteries (except lead acid), including parts for all storage batteries 2003����������������� 229 398 132002�� 276 976 X
335911W Storage battery manufacturing, nsk, total 2003����������������������������������������������� 135 439 72002�� 150 897 X
335912 Primary battery manufacturing 2003����������������������������������������������������������� 2 746 180 32002�� 2 839 369 X
3359120 Primary batteries 2003�������������������������������������������������������������������� 2 746 180 32002�� 2 839 369 X
335921 Fiber optic cable manufacturing 2003���������������������������������������������������������� 1 030 076 82002�� 1 428 733 X
3359210 Fiber optic cable3 2003�������������������������������������������������������������������� 1 030 076 82002�� 1 428 733 X
335929 Other communication and energy wire manufacturing 2003�������������������������������������� 9 036 896 22002�� 9 332 556 X
3359291 Power wire and cable, made from nonferrous metals (purchased wire)3 2003��������������������� 1 533 613 62002�� 1 449 980 X
335929A Electronic wire and cable, made of nonferrous metals (purchased wire)3 2003�������������������� 2 397 511 22002�� 2 610 881 X
335929B Telephone and telegraph wire and cable, made of nonferrous metals (purchased wire)3 2003���������������������������������������������������������������������������������� 1 370 095 2
2002�� 1 316 181 X
335929C Control and signal wire and cable, made of nonferrous metals (purchased wire)3 2003������������� 228 771 32002�� 251 955 X
335929D Building wire and cable, made of nonferrous metals (purchased wire)3 2003���������������������� 2 293 360 12002�� 2 388 710 X
335929E Other insulated wire and cable, including automotive, made of nonferrous metals(purchased wire)3 2003������������������������������������������������������������������� 525 490 5
2002�� 532 588 X
335929W Other communication and energy wire manufacturing, nsk, total 2003��������������������������� 688 056 102002�� 782 261 X
335931 Current�carrying wiring device manufacturing 2003���������������������������������������������� 5 800 328 12002�� 5 960 288 X
3359311 Current�carrying lampholders3 2003��������������������������������������������������������� 128 336 32002�� 140 102 X
3359313 Current�carrying general�and special�purpose convenience and power outlets(excluding pin�and�sleeve type)3 2003������������������������������������������������������ 331 760 1
2002�� 335 053 X
3359315 Current�carrying switches for electrical circuitry (including vehicular switches)3 2003��������������� 2 091 828 12002�� 2 161 240 X
3359317 Current�carrying metal contacts, including precious metal3 2003�������������������������������� 241 337 22002�� 219 027 X
3359319 Current�carrying wire connectors for electrical circuitry3 2003����������������������������������� 1 320 632 22002�� 1 281 969 X
335931B All other miscellaneous current�carrying wiring devices (attachments, plug caps,connector bodies, lightning arrestors, etc.)3 2003�������������������������������������������� 1 425 647 3
2002�� 1 572 987 X
335931W Current�carrying wiring device manufacturing, nsk, total 2003����������������������������������� 260 787 42002�� 249 910 X
335932 Noncurrent�carrying wiring device manufacturing 2003������������������������������������������� 3 401 661 12002�� 3 258 798 X
3359321 Noncurrent�carrying pole and transmission line hardware3 2003��������������������������������� 535 847 62002�� 600 986 X
3359323 Noncurrent�carrying electrical conduit and conduit fittings, including plastics conduitand conduit fittings3 2003����������������������������������������������������������������� 1 820 206 1
2002�� 1 726 008 X
3359326 Other noncurrent�carrying wiring devices and supplies (boxes, covers, bar hangers,etc.)3 2003������������������������������������������������������������������������������ 988 327 3
2002�� 852 972 X
335932W Noncurrent�carrying wiring device manufacturing, nsk, total 2003������������������������������� 57 281 12002�� 78 832 X
335991 Carbon and graphite product manufacturing 2003����������������������������������������������� 1 580 745 22002�� 1 624 308 X
3359911 Carbon and graphite electrodes for electric furnaces and electrolytic cell use 2003���������������� 659 054 32002�� 740 300 X
3359913 All other carbon and graphite products 2003�������������������������������������������������� 833 932 22002�� 810 221 X
335991W Carbon and graphite product manufacturing, nsk, total 2003������������������������������������ 87 759 12002�� 73 787 X
See footnotes at end of table.
Value of Product Shipments Annual Survey of Manufactures 55U.S. Census Bureau, 2002 Economic Census
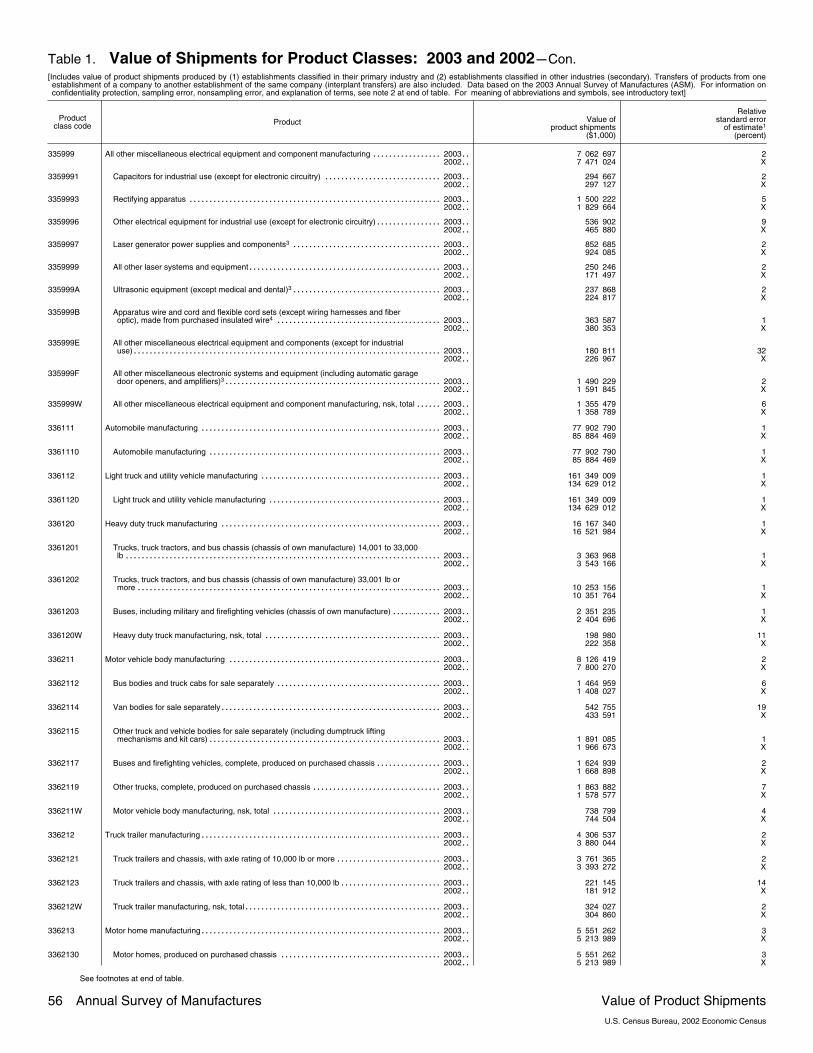
Table 1. Value of Shipments for Product Classes: 2003 and 2002�Con.[Includes value of product shipments produced by (1) establishments classified in their primary industry and (2) establishments classified in other industries (secondary). Transfers of products from oneestablishment of a company to another establishment of the same company (interplant transfers) are also included. Data based on the 2003 Annual Survey of Manufactures (ASM). For information onconfidentiality protection, sampling error, nonsampling error, and explanation of terms, see note 2 at end of table. For meaning of abbreviations and symbols, see introductory text]
Productclass code Product Value of
product shipments($1,000)
Relativestandard error
of estimate1
(percent)
335999 All other miscellaneous electrical equipment and component manufacturing 2003������������������� 7 062 697 22002�� 7 471 024 X
3359991 Capacitors for industrial use (except for electronic circuitry) 2003������������������������������� 294 667 22002�� 297 127 X
3359993 Rectifying apparatus 2003����������������������������������������������������������������� 1 500 222 52002�� 1 829 664 X
3359996 Other electrical equipment for industrial use (except for electronic circuitry) 2003������������������ 536 902 92002�� 465 880 X
3359997 Laser generator power supplies and components3 2003��������������������������������������� 852 685 22002�� 924 085 X
3359999 All other laser systems and equipment 2003�������������������������������������������������� 250 246 22002�� 171 497 X
335999A Ultrasonic equipment (except medical and dental)3 2003��������������������������������������� 237 868 22002�� 224 817 X
335999B Apparatus wire and cord and flexible cord sets (except wiring harnesses and fiberoptic), made from purchased insulated wire4 2003������������������������������������������� 363 587 1
2002�� 380 353 X
335999E All other miscellaneous electrical equipment and components (except for industrialuse) 2003������������������������������������������������������������������������������� 180 811 32
2002�� 226 967 X
335999F All other miscellaneous electronic systems and equipment (including automatic garagedoor openers, and amplifiers)3 2003�������������������������������������������������������� 1 490 229 2
2002�� 1 591 845 X
335999W All other miscellaneous electrical equipment and component manufacturing, nsk, total 2003�������� 1 355 479 62002�� 1 358 789 X
336111 Automobile manufacturing 2003�������������������������������������������������������������� 77 902 790 12002�� 85 884 469 X
3361110 Automobile manufacturing 2003������������������������������������������������������������ 77 902 790 12002�� 85 884 469 X
336112 Light truck and utility vehicle manufacturing 2003����������������������������������������������� 161 349 009 12002�� 134 629 012 X
3361120 Light truck and utility vehicle manufacturing 2003��������������������������������������������� 161 349 009 12002�� 134 629 012 X
336120 Heavy duty truck manufacturing 2003��������������������������������������������������������� 16 167 340 12002�� 16 521 984 X
3361201 Trucks, truck tractors, and bus chassis (chassis of own manufacture) 14,001 to 33,000lb 2003��������������������������������������������������������������������������������� 3 363 968 1
2002�� 3 543 166 X
3361202 Trucks, truck tractors, and bus chassis (chassis of own manufacture) 33,001 lb ormore 2003������������������������������������������������������������������������������ 10 253 156 1
2002�� 10 351 764 X
3361203 Buses, including military and firefighting vehicles (chassis of own manufacture) 2003�������������� 2 351 235 12002�� 2 404 696 X
336120W Heavy duty truck manufacturing, nsk, total 2003���������������������������������������������� 198 980 112002�� 222 358 X
336211 Motor vehicle body manufacturing 2003������������������������������������������������������� 8 126 419 22002�� 7 800 270 X
3362112 Bus bodies and truck cabs for sale separately 2003������������������������������������������� 1 464 959 62002�� 1 408 027 X
3362114 Van bodies for sale separately 2003��������������������������������������������������������� 542 755 192002�� 433 591 X
3362115 Other truck and vehicle bodies for sale separately (including dumptruck liftingmechanisms and kit cars) 2003������������������������������������������������������������ 1 891 085 1
2002�� 1 966 673 X
3362117 Buses and firefighting vehicles, complete, produced on purchased chassis 2003������������������ 1 624 939 22002�� 1 668 898 X
3362119 Other trucks, complete, produced on purchased chassis 2003���������������������������������� 1 863 882 72002�� 1 578 577 X
336211W Motor vehicle body manufacturing, nsk, total 2003�������������������������������������������� 738 799 42002�� 744 504 X
336212 Truck trailer manufacturing 2003�������������������������������������������������������������� 4 306 537 22002�� 3 880 044 X
3362121 Truck trailers and chassis, with axle rating of 10,000 lb or more 2003���������������������������� 3 761 365 22002�� 3 393 272 X
3362123 Truck trailers and chassis, with axle rating of less than 10,000 lb 2003��������������������������� 221 145 142002�� 181 912 X
336212W Truck trailer manufacturing, nsk, total 2003��������������������������������������������������� 324 027 22002�� 304 860 X
336213 Motor home manufacturing 2003�������������������������������������������������������������� 5 551 262 32002�� 5 213 989 X
3362130 Motor homes, produced on purchased chassis 2003������������������������������������������ 5 551 262 32002�� 5 213 989 X
See footnotes at end of table.
56 Annual Survey of Manufactures Value of Product ShipmentsU.S. Census Bureau, 2002 Economic Census

Table 1. Value of Shipments for Product Classes: 2003 and 2002�Con.[Includes value of product shipments produced by (1) establishments classified in their primary industry and (2) establishments classified in other industries (secondary). Transfers of products from oneestablishment of a company to another establishment of the same company (interplant transfers) are also included. Data based on the 2003 Annual Survey of Manufactures (ASM). For information onconfidentiality protection, sampling error, nonsampling error, and explanation of terms, see note 2 at end of table. For meaning of abbreviations and symbols, see introductory text]
Productclass code Product Value of
product shipments($1,000)
Relativestandard error
of estimate1
(percent)
336214 Travel trailer and camper manufacturing 2003�������������������������������������������������� 6 951 990 22002�� 6 776 926 X
3362141 Travel trailers 2003����������������������������������������������������������������������� 3 674 119 12002�� 3 432 267 X
3362143 Automobile and light truck trailers 2003������������������������������������������������������ 1 788 326 72002�� 1 769 468 X
3362145 Camping trailers, campers, pickup covers, and parts 2003������������������������������������� 1 009 912 32002�� 993 860 X
336214W Travel trailer and camper manufacturing, nsk, total 2003��������������������������������������� 479 633 82002�� 581 331 X
336311 Carburetor, piston, piston ring, and valve manufacturing 2003������������������������������������ 2 521 107 22002�� 2 323 886 X
3363111 Carburetors, new and rebuilt (all types) 2003������������������������������������������������� 362 975 12002�� 391 091 X
3363113 Pistons, piston rings, and piston pins (engine) 2003������������������������������������������� 1 577 536 12002�� 1 436 813 X
3363115 Valves (engine intake and exhaust) 2003���������������������������������������������������� 449 398 62002�� 416 684 X
336311W Carburetor, piston, piston ring, and valve manufacturing, nsk, total 2003������������������������� 131 199 222002�� 79 298 X
336312 Gasoline engine and engine parts manufacturing 2003������������������������������������������ 30 825 700 12002�� 31 272 414 X
3363121 Gasoline engines and gasoline engine parts for motor vehicles, new 2003������������������������ 29 541 551 12002�� 29 779 550 X
3363123 Gasoline engines and engine parts for motor vehicles, rebuilt 2003������������������������������ 439 273 272002�� 593 058 X
336312W Gasoline engine and engine parts manufacturing, nsk, total 2003������������������������������� 844 876 32002�� 899 806 X
336321 Vehicular lighting equipment manufacturing 2003����������������������������������������������� 2 668 728 12002�� 2 584 543 X
3363210 Vehicular lighting equipment 2003���������������������������������������������������������� 2 668 728 12002�� 2 584 543 X
336322 Other motor vehicle electrical and electronic equipment manufacturing 2003����������������������� 17 520 873 22002�� 17 725 566 X
3363221 Ignition harness and cable sets 2003�������������������������������������������������������� 1 150 805 12002�� 1 202 339 X
3363223 Battery charging alternators, generators, and regulators 2003���������������������������������� 1 551 034 22002�� 1 613 089 X
3363225 Cranking motors (starters) 2003������������������������������������������������������������ 2 075 282 12002�� 2 064 157 X
3363227 Spark plugs (all types) 2003���������������������������������������������������������������� 410 720 12002�� 507 283 X
3363229 All other miscellaneous complete engine electrical equipment 2003����������������������������� 4 267 496 12002�� 4 425 745 X
336322A Parts for engine electrical and electronic equipment 2003�������������������������������������� 704 128 12002�� 675 241 X
336322D Motor vehicle electrical and electronic equipment3 2003��������������������������������������� 6 330 035 62002�� 6 180 746 X
336322W Other motor vehicle electrical and electronic equipment manufacturing, nsk, total 2003������������ 1 031 373 132002�� 1 056 966 X
336330 Motor vehicle steering and suspension component (except spring) manufacturing 2003�������������� 10 595 196 12002�� 10 688 279 X
3363301 Motor vehicle steering and suspension components, new 2003��������������������������������� 10 237 867 12002�� 10 351 686 X
3363303 Motor vehicle steering and suspension components, rebuilt 2003������������������������������� 194 867 12002�� 182 073 X
336330W Motor vehicle steering and suspension component (except spring) manufacturing, nsk,total 2003������������������������������������������������������������������������������� 162 461 3
2002�� 154 520 X
336340 Motor vehicle brake system manufacturing 2003������������������������������������������������ 11 850 518 12002�� 12 261 956 X
3363401 Motor vehicle brake parts and assemblies, new 2003������������������������������������������ 11 302 832 12002�� 11 672 431 X
3363403 Motor vehicle brake parts and assemblies, rebuilt 2003���������������������������������������� 370 505 52002�� 407 363 X
336340W Motor vehicle brake system manufacturing, nsk, total 2003������������������������������������� 177 181 32002�� 182 162 X
336350 Motor vehicle transmission and power train parts manufacturing 2003����������������������������� 34 029 003 32002�� 35 839 495 X
3363501 Motor vehicle drive train components, new 2003���������������������������������������������� 32 521 410 32002�� 34 498 469 X
3363503 Motor vehicle drive train components, rebuilt 2003�������������������������������������������� 1 073 293 92002�� 945 328 X
336350W Motor vehicle transmission and power train parts manufacturing, nsk, total 2003������������������ 434 301 52002�� 395 698 X
See footnotes at end of table.
Value of Product Shipments Annual Survey of Manufactures 57U.S. Census Bureau, 2002 Economic Census
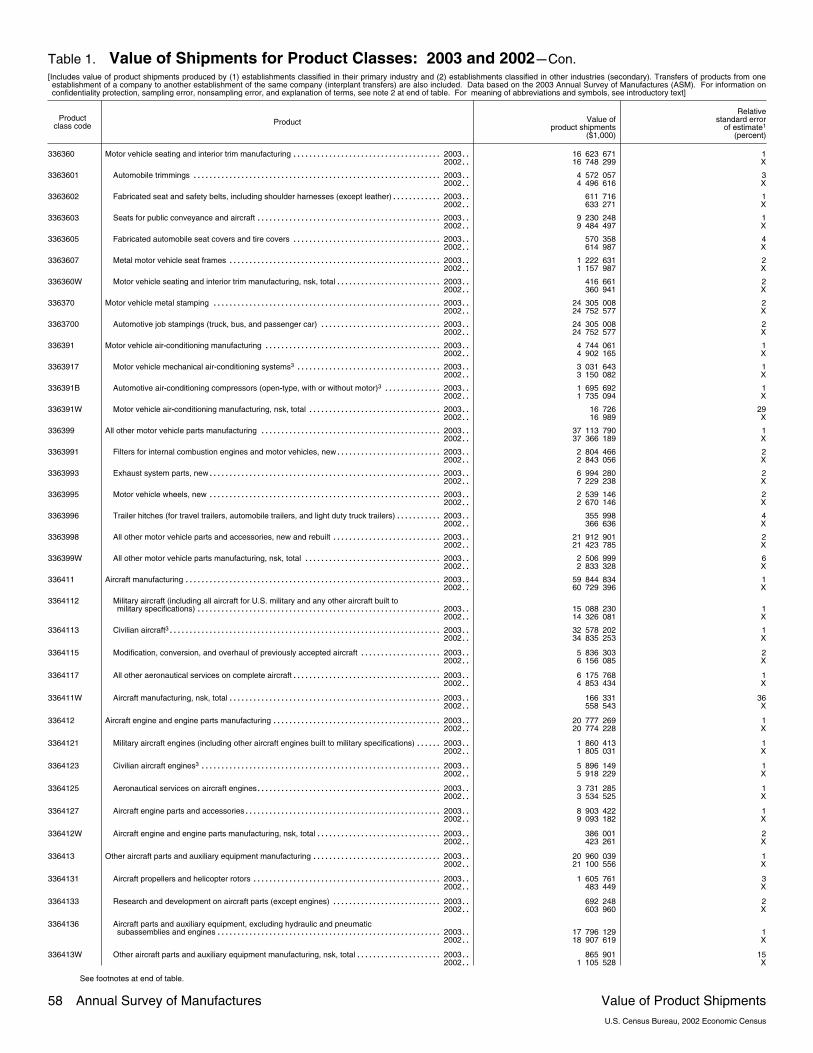
Table 1. Value of Shipments for Product Classes: 2003 and 2002�Con.[Includes value of product shipments produced by (1) establishments classified in their primary industry and (2) establishments classified in other industries (secondary). Transfers of products from oneestablishment of a company to another establishment of the same company (interplant transfers) are also included. Data based on the 2003 Annual Survey of Manufactures (ASM). For information onconfidentiality protection, sampling error, nonsampling error, and explanation of terms, see note 2 at end of table. For meaning of abbreviations and symbols, see introductory text]
Productclass code Product Value of
product shipments($1,000)
Relativestandard error
of estimate1
(percent)
336360 Motor vehicle seating and interior trim manufacturing 2003��������������������������������������� 16 623 671 12002�� 16 748 299 X
3363601 Automobile trimmings 2003���������������������������������������������������������������� 4 572 057 32002�� 4 496 616 X
3363602 Fabricated seat and safety belts, including shoulder harnesses (except leather) 2003�������������� 611 716 12002�� 633 271 X
3363603 Seats for public conveyance and aircraft 2003������������������������������������������������ 9 230 248 12002�� 9 484 497 X
3363605 Fabricated automobile seat covers and tire covers 2003��������������������������������������� 570 358 42002�� 614 987 X
3363607 Metal motor vehicle seat frames 2003������������������������������������������������������� 1 222 631 22002�� 1 157 987 X
336360W Motor vehicle seating and interior trim manufacturing, nsk, total 2003���������������������������� 416 661 22002�� 360 941 X
336370 Motor vehicle metal stamping 2003����������������������������������������������������������� 24 305 008 22002�� 24 752 577 X
3363700 Automotive job stampings (truck, bus, and passenger car) 2003�������������������������������� 24 305 008 22002�� 24 752 577 X
336391 Motor vehicle air�conditioning manufacturing 2003���������������������������������������������� 4 744 061 12002�� 4 902 165 X
3363917 Motor vehicle mechanical air�conditioning systems3 2003�������������������������������������� 3 031 643 12002�� 3 150 082 X
336391B Automotive air�conditioning compressors (open�type, with or without motor)3 2003���������������� 1 695 692 12002�� 1 735 094 X
336391W Motor vehicle air�conditioning manufacturing, nsk, total 2003����������������������������������� 16 726 292002�� 16 989 X
336399 All other motor vehicle parts manufacturing 2003����������������������������������������������� 37 113 790 12002�� 37 366 189 X
3363991 Filters for internal combustion engines and motor vehicles, new 2003���������������������������� 2 804 466 22002�� 2 843 056 X
3363993 Exhaust system parts, new 2003������������������������������������������������������������ 6 994 280 22002�� 7 229 238 X
3363995 Motor vehicle wheels, new 2003������������������������������������������������������������ 2 539 146 22002�� 2 670 146 X
3363996 Trailer hitches (for travel trailers, automobile trailers, and light duty truck trailers) 2003������������� 355 998 42002�� 366 636 X
3363998 All other motor vehicle parts and accessories, new and rebuilt 2003����������������������������� 21 912 901 22002�� 21 423 785 X
336399W All other motor vehicle parts manufacturing, nsk, total 2003������������������������������������ 2 506 999 62002�� 2 833 328 X
336411 Aircraft manufacturing 2003������������������������������������������������������������������ 59 844 834 12002�� 60 729 396 X
3364112 Military aircraft (including all aircraft for U.S. military and any other aircraft built tomilitary specifications) 2003��������������������������������������������������������������� 15 088 230 1
2002�� 14 326 081 X
3364113 Civilian aircraft3 2003���������������������������������������������������������������������� 32 578 202 12002�� 34 835 253 X
3364115 Modification, conversion, and overhaul of previously accepted aircraft 2003���������������������� 5 836 303 22002�� 6 156 085 X
3364117 All other aeronautical services on complete aircraft 2003��������������������������������������� 6 175 768 12002�� 4 853 434 X
336411W Aircraft manufacturing, nsk, total 2003������������������������������������������������������� 166 331 362002�� 558 543 X
336412 Aircraft engine and engine parts manufacturing 2003�������������������������������������������� 20 777 269 12002�� 20 774 228 X
3364121 Military aircraft engines (including other aircraft engines built to military specifications) 2003�������� 1 860 413 12002�� 1 805 031 X
3364123 Civilian aircraft engines3 2003�������������������������������������������������������������� 5 896 149 12002�� 5 918 229 X
3364125 Aeronautical services on aircraft engines 2003������������������������������������������������ 3 731 285 12002�� 3 534 525 X
3364127 Aircraft engine parts and accessories 2003��������������������������������������������������� 8 903 422 12002�� 9 093 182 X
336412W Aircraft engine and engine parts manufacturing, nsk, total 2003��������������������������������� 386 001 22002�� 423 261 X
336413 Other aircraft parts and auxiliary equipment manufacturing 2003���������������������������������� 20 960 039 12002�� 21 100 556 X
3364131 Aircraft propellers and helicopter rotors 2003������������������������������������������������� 1 605 761 32002�� 483 449 X
3364133 Research and development on aircraft parts (except engines) 2003����������������������������� 692 248 22002�� 603 960 X
3364136 Aircraft parts and auxiliary equipment, excluding hydraulic and pneumaticsubassemblies and engines 2003���������������������������������������������������������� 17 796 129 1
2002�� 18 907 619 X
336413W Other aircraft parts and auxiliary equipment manufacturing, nsk, total 2003����������������������� 865 901 152002�� 1 105 528 X
See footnotes at end of table.
58 Annual Survey of Manufactures Value of Product ShipmentsU.S. Census Bureau, 2002 Economic Census

Table 1. Value of Shipments for Product Classes: 2003 and 2002�Con.[Includes value of product shipments produced by (1) establishments classified in their primary industry and (2) establishments classified in other industries (secondary). Transfers of products from oneestablishment of a company to another establishment of the same company (interplant transfers) are also included. Data based on the 2003 Annual Survey of Manufactures (ASM). For information onconfidentiality protection, sampling error, nonsampling error, and explanation of terms, see note 2 at end of table. For meaning of abbreviations and symbols, see introductory text]
Productclass code Product Value of
product shipments($1,000)
Relativestandard error
of estimate1
(percent)
336414 Guided missile and space vehicle manufacturing 2003������������������������������������������� 11 118 202 32002�� 10 345 901 X
3364141 Complete guided missiles 2003������������������������������������������������������������� 4 266 875 12002�� 3 796 806 X
3364143 Research and development on complete guided missiles 2003��������������������������������� 1 059 305 12002�� 785 535 X
3364145 Other services on complete guided missiles 2003��������������������������������������������� 42 636 12002�� 55 445 X
3364147 Complete space vehicles (excluding propulsion systems) 2003��������������������������������� 4 623 758 42002�� 4 473 244 X
3364149 Research and development on complete space vehicles 2003���������������������������������� D S2002�� D X
336414A All other services on complete space vehicles 2003������������������������������������������� D S2002�� D X
336414W Guided missile and space vehicle manufacturing, nsk, total 2003������������������������������� 2 133 12002�� 1 534 X
336415 Guided missile and space vehicle propulsion unit and propulsion unit partsmanufacturing 2003������������������������������������������������������������������������ 3 642 799 1
2002�� 3 139 844 X
3364151 Complete missiles, space vehicle engines, and propulsion units 2003���������������������������� 2 288 811 12002�� 2 041 604 X
3364153 Research and development on complete missiles, space vehicle engines, andpropulsion units 2003��������������������������������������������������������������������� 807 423 1
2002�� 583 875 X
3364155 Other services on complete missiles, space vehicle engines, and propulsion units 2003������������ 288 871 12002�� 286 978 X
3364157 Missile and space vehicle engine and propulsion parts and accessories 2003��������������������� 251 202 12002�� 221 516 X
336415W Guided missile and space vehicle propulsion unit and propulsion unit partsmanufacturing, nsk, total 2003������������������������������������������������������������� 6 492 9
2002�� 5 871 X
336419 Other guided missile and space vehicle parts and auxiliary equipment manufacturing 2003����������� 2 867 720 32002�� 2 864 675 X
3364191 Missile and space vehicle components, parts, and subassemblies 2003�������������������������� 2 324 390 42002�� 2 607 751 X
3364193 Research and development on missile and space vehicle parts and components 2003������������� 492 784 12002�� 205 509 X
336419W Other guided missile and space vehicle parts and auxiliary equipment manufacturing,nsk, total 2003�������������������������������������������������������������������������� 50 546 1
2002�� 51 415 X
336510 Railroad rolling stock manufacturing 2003������������������������������������������������������ 6 029 038 22002�� 6 414 562 X
3365101 Locomotives, new and rebuilt (including parts) 2003������������������������������������������� 2 450 556 12002�� 2 610 323 X
3365103 Freight train and passenger train cars, new (excluding parts) 2003������������������������������ 1 059 617 12002�� 1 111 439 X
3365105 Street, subway, trolley, and rapid transit cars, rebuilt (including parts) 2003����������������������� 2 280 004 42002�� 2 466 118 X
336510W Railroad rolling stock manufacturing, nsk, total 2003������������������������������������������� 238 862 52002�� 226 682 X
336611 Ship building and repairing 2003�������������������������������������������������������������� 13 069 264 12002�� 12 303 669 X
3366111 Nonpropelled ships, new construction 2003�������������������������������������������������� 726 901 42002�� 755 895 X
3366113 Military self�propelled ships (including combat ships, troop transport vessels, fleetauxiliaries, and service craft), new construction 2003����������������������������������������� D S
2002�� D X
3366116 Nonmillitary self�propelled ships, new construction 2003��������������������������������������� 1 449 390 32002�� 1 514 878 X
3366118 Ship repair, military 2003������������������������������������������������������������������ D S2002�� D X
336611A Ship repair, nonmilitary 2003��������������������������������������������������������������� 669 433 72002�� 613 872 X
336611W Ship building and repairing, nsk, total 2003��������������������������������������������������� 564 142 52002�� 558 118 X
336612 Boat building 2003�������������������������������������������������������������������������� 7 987 642 22002�� 7 844 696 X
3366121 Outboard motorboats, including commercial and military (except sailboats andlifeboats) 2003�������������������������������������������������������������������������� 2 399 967 5
2002�� 2 604 144 X
3366123 Inboard motorboats, including commercial and military (except sailboats andlifeboats) 2003�������������������������������������������������������������������������� 2 510 782 4
2002�� 2 366 467 X
3366125 Inboard�outdrive boats, including commercial and military (except sailboats andlifeboats) 2003�������������������������������������������������������������������������� 1 770 667 3
2002�� 1 587 322 X
3366128 All other boats (excluding military and commercial) 2003��������������������������������������� 518 617 32002�� 504 368 X
See footnotes at end of table.
Value of Product Shipments Annual Survey of Manufactures 59U.S. Census Bureau, 2002 Economic Census

Table 1. Value of Shipments for Product Classes: 2003 and 2002�Con.[Includes value of product shipments produced by (1) establishments classified in their primary industry and (2) establishments classified in other industries (secondary). Transfers of products from oneestablishment of a company to another establishment of the same company (interplant transfers) are also included. Data based on the 2003 Annual Survey of Manufactures (ASM). For information onconfidentiality protection, sampling error, nonsampling error, and explanation of terms, see note 2 at end of table. For meaning of abbreviations and symbols, see introductory text]
Productclass code Product Value of
product shipments($1,000)
Relativestandard error
of estimate1
(percent)
336612 Boat building�Con.336612W Boat building, nsk, total 2003��������������������������������������������������������������� 787 610 5
2002�� 782 395 X
336991 Motorcycle, bicycle, and parts manufacturing 2003���������������������������������������������� 4 565 061 22002�� 4 217 540 X
3369912 Bicycles and parts (excluding children’s two�wheel sidewalk cycles with solid orsemipneumatic tires) 2003���������������������������������������������������������������� 820 353 5
2002�� 842 776 X
3369913 Motorcycles, including three�wheel, motorbikes, motor scooters, mopeds, and parts(including sidecars) 2003����������������������������������������������������������������� 3 556 113 1
2002�� 3 162 206 X
336991W Motorcycle, bicycle, and parts manufacturing, nsk, total 2003����������������������������������� 188 595 192002�� 212 558 X
336992 Military armored vehicle, tank, and tank component manufacturing 2003��������������������������� 1 817 563 12002�� 1 795 202 X
3369920 Military armored vehicles, tanks, and tank components 2003����������������������������������� 1 817 563 12002�� 1 795 202 X
336999 All other transportation equipment manufacturing 2003������������������������������������������ 7 013 981 32002�� 6 962 213 X
3369991 Self�propelled golf carts and industrial in�plant personnel carriers (including parts) 2003������������ 906 871 122002�� 968 608 X
3369995 All other miscellaneous transportation equipment, including all�terrain vehicles 2003��������������� 5 892 909 32002�� 5 742 513 X
336999W All other transportation equipment manufacturing, nsk, total 2003������������������������������� 214 201 102002�� 251 092 X
337110 Wood kitchen cabinet and countertop manufacturing 2003��������������������������������������� 14 616 442 12002�� 13 792 701 X
337110H Wood custom kitchen cabinets, bathroom vanities, and related cabinetwork forpermanent installation sold directly to the customer at retail 2003������������������������������ 3 195 030 2
2002�� 2 953 381 X
3371101 Wood stock line kitchen cabinets and related cabinetwork for permanent installation 2003���������� 5 149 886 12002�� 4 738 908 X
3371104 Other wood custom kitchen cabinets and related cabinetwork for permanentinstallation, excluding kitchen cabinets and related cabinetwork sold directly to thecustomer at retail 2003������������������������������������������������������������������� 1 540 213 3
2002�� 1 437 063 X
3371107 Bathroom vanities and related cabinetwork for permanent installation, excluding woodcustom bathroom vanities and related cabinetwork sold directly to the customer atretail 2003������������������������������������������������������������������������������ 1 187 052 2
2002�� 958 265 X
337110B Wood and plastics laminated wood kitchen cabinet tops 2003���������������������������������� 667 332 72002�� 707 847 X
337110F Wood and plastics laminated wood bathroom vanity tops 2003��������������������������������� 167 547 102002�� 239 314 X
337110W Wood kitchen cabinet and countertop manufacturing, nsk, total 2003���������������������������� 2 709 382 22002�� 2 757 923 X
337121 Upholstered household furniture manufacturing 2003�������������������������������������������� 10 201 395 12002�� 10 371 697 X
3371211 Upholstered wood household furniture, excluding stock line dual�purpose sleepfurniture 2003��������������������������������������������������������������������������� 8 591 111 1
2002�� 8 827 141 X
3371213 Upholstered household furniture (except wood) 2003������������������������������������������ 131 385 62002�� 107 838 X
3371214 Dual�purpose sleep furniture, including convertible sofas, jackknife sofa beds and chairbeds, studio couches, and futons shipped with frames (except custom sold directly tothe customer at retail) 2003��������������������������������������������������������������� 555 332 3
2002�� 507 863 X
337121W Upholstered household furniture manufacturing, nsk, total 2003��������������������������������� 923 567 22002�� 928 855 X
337122 Nonupholstered wood household furniture manufacturing 2003����������������������������������� 10 353 218 12002�� 11 439 140 X
3371221 Wood household den, family room, library, and living room furniture (except customsold directly to the customer at retail) 2003�������������������������������������������������� 3 238 075 3
2002�� 3 476 737 X
3371224 Wood dining room and kitchen furniture (except custom sold directly to the customer atretail), excluding kitchen cabinets 2003����������������������������������������������������� 1 266 395 3
2002�� 1 597 278 X
3371228 Wood bedroom furniture (except custom sold directly to the customer at retail) 2003��������������� 2 510 152 12002�� 2 873 538 X
337122A Infants’ and children’s wood furniture (except custom sold directly to the customer atretail) 2003������������������������������������������������������������������������������ 385 168 2
2002�� 462 951 X
337122E Wood outdoor furniture, unpainted wood furniture, and ready�to�assemble woodfurniture (except custom sold directly to the customer at retail) 2003���������������������������� 1 625 788 4
2002�� 1 853 364 X
337122H Custom nonupholstered wood household furniture sold directly to the customer at retail(except kitchen cabinets, bathroom vanities, and related cabinetwork) 2003��������������������� 101 379 8
2002�� 109 840 X
337122W Nonupholstered wood household furniture manufacturing, nsk, total 2003������������������������ 1 226 261 42002�� 1 065 432 X
See footnotes at end of table.
60 Annual Survey of Manufactures Value of Product ShipmentsU.S. Census Bureau, 2002 Economic Census

Table 1. Value of Shipments for Product Classes: 2003 and 2002�Con.[Includes value of product shipments produced by (1) establishments classified in their primary industry and (2) establishments classified in other industries (secondary). Transfers of products from oneestablishment of a company to another establishment of the same company (interplant transfers) are also included. Data based on the 2003 Annual Survey of Manufactures (ASM). For information onconfidentiality protection, sampling error, nonsampling error, and explanation of terms, see note 2 at end of table. For meaning of abbreviations and symbols, see introductory text]
Productclass code Product Value of
product shipments($1,000)
Relativestandard error
of estimate1
(percent)
337124 Metal household furniture manufacturing 2003�������������������������������������������������� 1 617 607 32002�� 1 921 910 X
3371241 Metal dining room and kitchen furniture, including padded and plain chairs and stools 2003��������� 198 341 92002�� 222 032 X
3371244 Metal outdoor and casual furniture, including beach, lawn, garden, and porch furniture 2003�������� 544 970 72002�� 701 217 X
3371248 Other nonupholstered metal household furniture 2003����������������������������������������� 611 366 22002�� 669 725 X
337124W Metal household furniture manufacturing, nsk, total 2003��������������������������������������� 262 930 122002�� 328 936 X
337125 Household furniture (except wood and metal) manufacturing 2003�������������������������������� 793 664 82002�� 786 211 X
3371250 Nonupholstered household furniture (except wood and metal) 2003����������������������������� 793 664 82002�� 786 211 X
337127 Institutional furniture manufacturing 2003������������������������������������������������������ 4 139 549 22002�� 4 145 834 X
3371271 School furniture (except stone and concrete), excluding library furniture 2003��������������������� 842 267 42002�� 785 517 X
3371274 Public building and related furniture, excluding bar, bowling center, cafeteria,restaurant, and school furniture 2003������������������������������������������������������� 1 249 521 3
2002�� 1 279 487 X
3371278 Bar, bowling center, cafeteria, and restaurant furniture 2003������������������������������������ 854 862 52002�� 907 472 X
337127A Other furniture 2003����������������������������������������������������������������������� 710 327 42002�� 693 327 X
337127W Institutional furniture manufacturing, nsk, total 2003������������������������������������������� 482 572 32002�� 480 031 X
337129 Wood television, radio, and sewing machine cabinet manufacturing 2003�������������������������� 351 075 22002�� 394 453 X
3371290 Wood television, radio, and sewing machine cabinets used as housings 2003�������������������� 351 075 22002�� 394 453 X
337211 Wood office furniture manufacturing 2003������������������������������������������������������ 3 029 900 12002�� 2 948 717 X
3372111 Wood office seating, including upholstered seating 2003��������������������������������������� 570 853 22002�� 578 286 X
3372114 Wood office desks and extensions 2003����������������������������������������������������� 606 698 22002�� 639 436 X
3372117 Wood office files, storage units, and tables 2003���������������������������������������������� 673 270 32002�� 660 374 X
337211A Wood office furniture panel systems, desking systems, and other wood office furniture 2003�������� 921 081 22002�� 803 578 X
337211W Wood office furniture manufacturing, nsk, total 2003������������������������������������������� 257 998 22002�� 267 043 X
337212 Custom architectural woodwork and millwork manufacturing 2003��������������������������������� 3 452 405 32002�� 3 667 292 X
3372120 Custom architectural woodwork, millwork, and fixtures 2003������������������������������������ 3 452 405 32002�� 3 667 292 X
337214 Office furniture (except wood) manufacturing 2003���������������������������������������������� 7 511 050 12002�� 7 225 013 X
3372141 Nonwood office seating, including upholstered seating 2003������������������������������������ 2 620 068 12002�� 2 162 886 X
3372144 Nonwood office desks and extensions 2003�������������������������������������������������� 230 766 132002�� 284 236 X
3372147 Nonwood office files, storage units, and tables 2003������������������������������������������� 2 370 263 12002�� 2 329 188 X
337214A Nonwood office furniture panel systems, desking systems, and other nonwood officefurniture 2003��������������������������������������������������������������������������� 2 081 335 4
2002�� 2 179 009 X
337214W Office furniture (except wood) manufacturing, nsk, total 2003����������������������������������� 208 619 282002�� 269 694 X
337215 Showcase, partition, shelving, and locker manufacturing 2003������������������������������������ 7 792 400 22002�� 8 140 023 X
3372151 Wood lockers, partitions, and shelving (except custom) 2003����������������������������������� 181 559 42002�� 184 536 X
3372155 Wood bank, office, store, and related fixtures (except custom) 2003����������������������������� 1 550 552 52002�� 1 544 639 X
3372157 Nonwood partitions, prefabricated, assembled and knock�down 2003���������������������������� 237 893 62002�� 257 969 X
337215A Nonwood shelving and lockers 2003�������������������������������������������������������� 1 090 025 32002�� 1 080 868 X
337215E Nonwood storage racks and accessories 2003������������������������������������������������ 946 814 32002�� 917 152 X
337215G Nonwood bank, office, store, and related fixtures 2003����������������������������������������� 1 304 044 62002�� 1 369 771 X
337215J Wood furniture frames 2003���������������������������������������������������������������� 246 496 72002�� 292 951 X
See footnotes at end of table.
Value of Product Shipments Annual Survey of Manufactures 61U.S. Census Bureau, 2002 Economic Census

Table 1. Value of Shipments for Product Classes: 2003 and 2002�Con.[Includes value of product shipments produced by (1) establishments classified in their primary industry and (2) establishments classified in other industries (secondary). Transfers of products from oneestablishment of a company to another establishment of the same company (interplant transfers) are also included. Data based on the 2003 Annual Survey of Manufactures (ASM). For information onconfidentiality protection, sampling error, nonsampling error, and explanation of terms, see note 2 at end of table. For meaning of abbreviations and symbols, see introductory text]
Productclass code Product Value of
product shipments($1,000)
Relativestandard error
of estimate1
(percent)
337215 Showcase, partition, shelving, and locker manufacturing�Con.337215L Hardwood and softwood furniture dimension fully machined ready for assembly 2003�������������� 1 042 313 3
2002�� 910 106 X
337215W Showcase, partition, shelving, and locker manufacturing, nsk, total 2003������������������������� 1 192 705 102002�� 1 582 031 X
337910 Mattress manufacturing 2003����������������������������������������������������������������� 5 112 516 32002�� 4 912 961 X
3379101 Innerspring mattresses (including innerspring mattresses made with polyurethane andrubber topper pads and sold as part of Hollywood beds), excluding innerspring crib�size mattresses 2003��������������������������������������������������������������������� 3 048 580 4
2002�� 2 806 730 X
3379104 Other mattresses 2003�������������������������������������������������������������������� 505 468 62002�� 481 999 X
3379107 Foundations, excluding innerspring units and foundations incorporated into hybrid�typeflotation sleep ensembles and electric adjustable sleep ensembles 2003������������������������ 1 200 459 7
2002�� 1 234 994 X
337910A Sleep system ensembles and mattresses, excluding conventional waterbeds 2003���������������� 122 181 52002�� 97 632 X
337910W Mattress manufacturing, nsk, total 2003����������������������������������������������������� 235 827 162002�� 291 606 X
337920 Blind and shade manufacturing 2003���������������������������������������������������������� 2 369 060 22002�� 2 534 474 X
3379202 Window shades and window shade accessories and rollers 2003������������������������������� 625 877 42002�� 609 578 X
3379204 Venetian blinds, including components and parts 2003����������������������������������������� 834 178 32002�� 931 029 X
3379208 Other blinds and shades, including curtain and drapery fixtures, poles, and rods 2003������������� 761 056 42002�� 810 757 X
337920W Blind and shade manufacturing, nsk, total 2003����������������������������������������������� 147 949 162002�� 183 110 X
339111 Laboratory apparatus and furniture manufacturing 2003����������������������������������������� 4 405 312 12002�� 4 277 473 X
3391114 Hospital beds 2003����������������������������������������������������������������������� 660 287 12002�� 765 798 X
3391116 Hospital furniture 2003�������������������������������������������������������������������� 905 436 12002�� 882 281 X
3391118 Laboratory apparatus and furniture3 2003���������������������������������������������������� 2 622 379 12002�� 2 457 468 X
339111W Laboratory apparatus and furniture manufacturing, nsk, total 2003������������������������������ 217 210 72002�� 171 926 X
339112 Surgical and medical instrument manufacturing 2003�������������������������������������������� 21 598 262 32002�� 20 515 808 X
3391120 Surgical and medical instruments 2003������������������������������������������������������ 21 598 262 32002�� 20 515 808 X
339113 Surgical appliance and supplies manufacturing 2003�������������������������������������������� 25 754 220 12002�� 23 272 314 X
3391132 Medical and surgical appliances and supplies, including orthopedic, prosthetic, andtherapeutic appliances and supplies 2003��������������������������������������������������� 21 252 502 1
2002�� 19 211 483 X
3391136 Personal industrial and nonindustrial safety equipment and clothing 2003������������������������ 3 145 303 42002�� 2 791 800 X
339113W Surgical appliance and supplies manufacturing, nsk, total 2003��������������������������������� 1 356 416 52002�� 1 269 031 X
339114 Dental equipment and supplies manufacturing 2003��������������������������������������������� 3 109 462 12002�� 3 013 943 X
3391141 Dental professional equipment and supplies 2003��������������������������������������������� 1 965 130 12002�� 2 005 945 X
3391143 Dental laboratory equipment and supplies 2003����������������������������������������������� 801 692 32002�� 732 675 X
339114W Dental equipment and supplies manufacturing, nsk, total 2003���������������������������������� 342 640 52002�� 275 323 X
339115 Ophthalmic goods manufacturing 2003�������������������������������������������������������� 4 138 649 52002�� 3 976 330 X
3391151 Ophthalmic fronts and temples 2003�������������������������������������������������������� 64 842 12002�� 67 644 X
3391153 Ophthalmic glass focal lenses 2003��������������������������������������������������������� 36 257 12002�� 42 783 X
3391155 Ophthalmic plastics focal lenses 2003������������������������������������������������������� 594 263 112002�� 585 625 X
3391157 Contact lenses 2003���������������������������������������������������������������������� 1 931 245 92002�� 1 852 962 X
339115B Other ophthalmic goods and prescription ground eyeglass lenses 2003�������������������������� 1 068 768 22002�� 1 058 991 X
339115W Ophthalmic goods manufacturing, nsk, total 2003��������������������������������������������� 443 275 232002�� 368 325 X
See footnotes at end of table.
62 Annual Survey of Manufactures Value of Product ShipmentsU.S. Census Bureau, 2002 Economic Census

Table 1. Value of Shipments for Product Classes: 2003 and 2002�Con.[Includes value of product shipments produced by (1) establishments classified in their primary industry and (2) establishments classified in other industries (secondary). Transfers of products from oneestablishment of a company to another establishment of the same company (interplant transfers) are also included. Data based on the 2003 Annual Survey of Manufactures (ASM). For information onconfidentiality protection, sampling error, nonsampling error, and explanation of terms, see note 2 at end of table. For meaning of abbreviations and symbols, see introductory text]
Productclass code Product Value of
product shipments($1,000)
Relativestandard error
of estimate1
(percent)
339116 Dental laboratories 2003��������������������������������������������������������������������� 3 446 262 42002�� 3 111 473 X
3391160 Dental laboratories 2003������������������������������������������������������������������� 3 446 262 42002�� 3 111 473 X
339911 Jewelry (except costume) manufacturing 2003�������������������������������������������������� 5 573 463 12002�� 5 536 108 X
3399111 Jewelry made of gold and platinum, excluding jewelry made of gold and platinum clador plated to silver and nonprecious metal 2003���������������������������������������������� 3 437 700 1
2002�� 3 499 728 X
3399113 Jewelry made of silver (including jewelry made of gold and platinum clad or plated tosilver), excluding jewelry made of silver clad or plated to nonprecious metal 2003���������������� 832 820 3
2002�� 761 343 X
3399115 Other jewelry, except costume 2003��������������������������������������������������������� 653 675 22002�� 636 033 X
3399117 Stamped metal coins, including stamped metal tokens 2003������������������������������������ 32 913 92002�� 35 048 X
339911W Jewelry (except costume) manufacturing, nsk, total 2003�������������������������������������� 616 355 72002�� 603 956 X
339912 Silverware and hollowware manufacturing 2003������������������������������������������������� 345 669 42002�� 422 351 X
3399122 Precious metal and pewter hollowware, including baby goods, ecclesiastical ware,novelties, toiletware, and trophies 2003����������������������������������������������������� 142 768 11
2002�� 119 777 X
3399125 Precious metal and pewter flatware and cutlery, including all knives, forks, spoons, andcarving sets made wholly of metal 2003���������������������������������������������������� 163 116 1
2002�� 266 453 X
339912W Silverware and hollowware manufacturing, nsk, total 2003������������������������������������� 39 786 82002�� 36 121 X
339913 Jewelers’ material and lapidary work manufacturing 2003���������������������������������������� 1 077 348 12002�� 1 051 634 X
3399132 Lapidary work, including cutting, engraving, and polishing precious stones,semiprecious stones, natural or cultured pearls, and diamonds for jewelry andindustrial purposes (except for watch jewels) 2003������������������������������������������� 373 688 1
2002�� 346 217 X
3399133 Jewelers’ findings and materials made of precious metal, excluding jewelers’ findingsand materials made of gold, platinum, and silver plated to nonprecious metal 2003��������������� 563 791 1
2002�� 581 336 X
3399135 Other jewelers’ findings and materials, including jewelers’ findings and materials madeof gold, platinum, and silver plated to nonprecious metal 2003��������������������������������� 55 711 9
2002�� 45 480 X
339913W Jewelers’ material and lapidary work manufacturing, nsk, total 2003����������������������������� 84 158 92002�� 78 601 X
339914 Costume jewelry and novelty manufacturing 2003����������������������������������������������� 758 998 72002�� 777 839 X
3399140 Costume jewelry and novelties 2003�������������������������������������������������������� 758 998 72002�� 777 839 X
339920 Sporting and athletic goods manufacturing 2003������������������������������������������������ 11 014 984 22002�� 10 826 265 X
3399201 Fishing tackle and equipment 2003���������������������������������������������������������� 655 174 42002�� 666 967 X
3399203 Golf equipment, excluding apparel and shoes 2003������������������������������������������� 2 976 276 12002�� 2 813 177 X
3399205 Playground equipment 2003���������������������������������������������������������������� 834 951 22002�� 864 976 X
3399207 Gymnasium and exercise equipment 2003��������������������������������������������������� 2 541 359 62002�� 2 267 051 X
339920A Other sporting and athletic goods 2003������������������������������������������������������ 3 110 714 32002�� 3 401 117 X
339920W Sporting and athletic goods manufacturing, nsk, total 2003������������������������������������� 896 510 42002�� 812 977 X
339931 Doll and stuffed toy manufacturing 2003������������������������������������������������������� 205 956 92002�� 276 191 X
3399310 Dolls, toy animals, action figures, and stuffed toys (including parts and accessories) 2003���������� 205 956 92002�� 276 191 X
339932 Game, toy, and children’s vehicle manufacturing 2003������������������������������������������� 3 265 020 12002�� 3 419 367 X
3399322 Baby carriages and children’s vehicles (including parts for children’s vehicles soldseparately), excluding bicycles with pneumatic tires 2003������������������������������������� 174 580 2
2002�� 170 332 X
3399327 Nonelectronic games and puzzles, including parts 2003���������������������������������������� 487 545 32002�� 471 374 X
3399326 Models (operating and static), craft kits and supplies, natural science kits and sets, andcollectors’ miniatures 2003���������������������������������������������������������������� 476 531 2
2002�� 488 112 X
3399329 Other electronic toys and games, including home video games (excluding cartridges,disks, and tapes) 2003������������������������������������������������������������������� 842 207 1
2002�� 817 071 X
3399328 Other nonelectronic toys, including parts 2003������������������������������������������������ 1 016 887 22002�� 1 220 515 X
See footnotes at end of table.
Value of Product Shipments Annual Survey of Manufactures 63U.S. Census Bureau, 2002 Economic Census
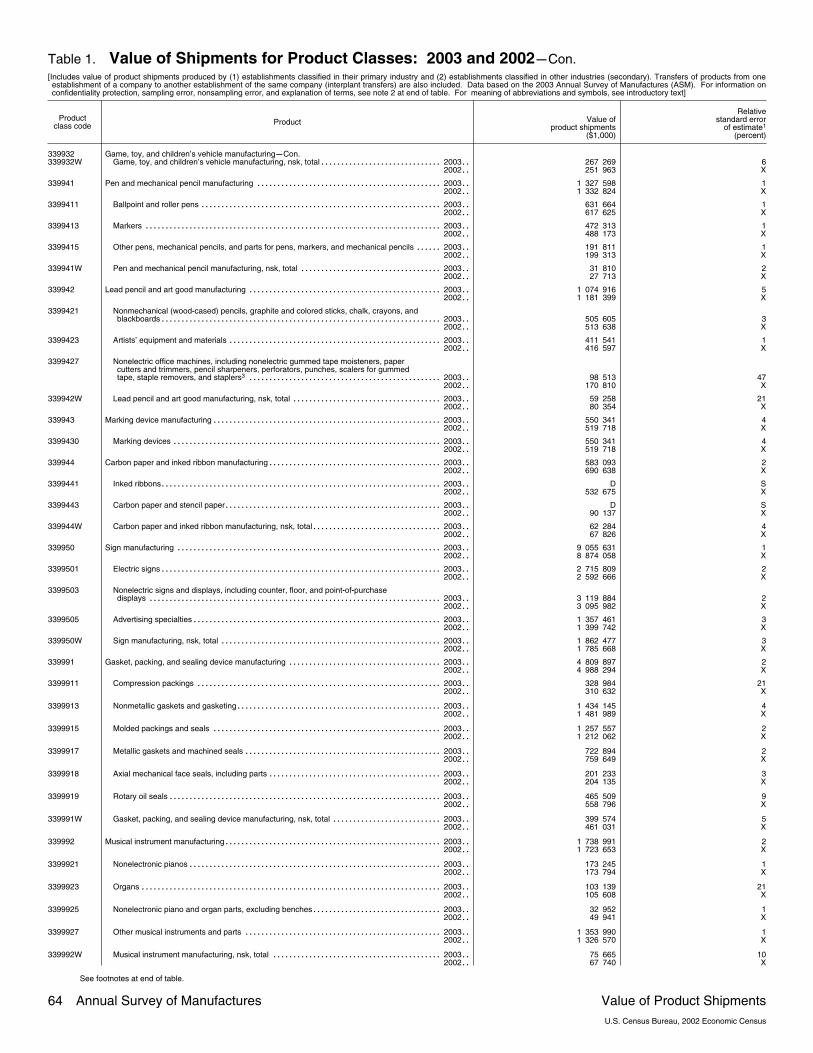
Table 1. Value of Shipments for Product Classes: 2003 and 2002�Con.[Includes value of product shipments produced by (1) establishments classified in their primary industry and (2) establishments classified in other industries (secondary). Transfers of products from oneestablishment of a company to another establishment of the same company (interplant transfers) are also included. Data based on the 2003 Annual Survey of Manufactures (ASM). For information onconfidentiality protection, sampling error, nonsampling error, and explanation of terms, see note 2 at end of table. For meaning of abbreviations and symbols, see introductory text]
Productclass code Product Value of
product shipments($1,000)
Relativestandard error
of estimate1
(percent)
339932 Game, toy, and children’s vehicle manufacturing�Con.339932W Game, toy, and children’s vehicle manufacturing, nsk, total 2003�������������������������������� 267 269 6
2002�� 251 963 X
339941 Pen and mechanical pencil manufacturing 2003������������������������������������������������ 1 327 598 12002�� 1 332 824 X
3399411 Ballpoint and roller pens 2003�������������������������������������������������������������� 631 664 12002�� 617 625 X
3399413 Markers 2003���������������������������������������������������������������������������� 472 313 12002�� 488 173 X
3399415 Other pens, mechanical pencils, and parts for pens, markers, and mechanical pencils 2003�������� 191 811 12002�� 199 313 X
339941W Pen and mechanical pencil manufacturing, nsk, total 2003������������������������������������� 31 810 22002�� 27 713 X
339942 Lead pencil and art good manufacturing 2003�������������������������������������������������� 1 074 916 52002�� 1 181 399 X
3399421 Nonmechanical (wood�cased) pencils, graphite and colored sticks, chalk, crayons, andblackboards 2003������������������������������������������������������������������������ 505 605 3
2002�� 513 638 X
3399423 Artists’ equipment and materials 2003������������������������������������������������������� 411 541 12002�� 416 597 X
3399427 Nonelectric office machines, including nonelectric gummed tape moisteners, papercutters and trimmers, pencil sharpeners, perforators, punches, scalers for gummedtape, staple removers, and staplers3 2003�������������������������������������������������� 98 513 47
2002�� 170 810 X
339942W Lead pencil and art good manufacturing, nsk, total 2003��������������������������������������� 59 258 212002�� 80 354 X
339943 Marking device manufacturing 2003����������������������������������������������������������� 550 341 42002�� 519 718 X
3399430 Marking devices 2003��������������������������������������������������������������������� 550 341 42002�� 519 718 X
339944 Carbon paper and inked ribbon manufacturing 2003��������������������������������������������� 583 093 22002�� 690 638 X
3399441 Inked ribbons 2003������������������������������������������������������������������������ D S2002�� 532 675 X
3399443 Carbon paper and stencil paper 2003�������������������������������������������������������� D S2002�� 90 137 X
339944W Carbon paper and inked ribbon manufacturing, nsk, total 2003���������������������������������� 62 284 42002�� 67 826 X
339950 Sign manufacturing 2003�������������������������������������������������������������������� 9 055 631 12002�� 8 874 058 X
3399501 Electric signs 2003������������������������������������������������������������������������ 2 715 809 22002�� 2 592 666 X
3399503 Nonelectric signs and displays, including counter, floor, and point�of�purchasedisplays 2003��������������������������������������������������������������������������� 3 119 884 2
2002�� 3 095 982 X
3399505 Advertising specialties 2003���������������������������������������������������������������� 1 357 461 32002�� 1 399 742 X
339950W Sign manufacturing, nsk, total 2003��������������������������������������������������������� 1 862 477 32002�� 1 785 668 X
339991 Gasket, packing, and sealing device manufacturing 2003���������������������������������������� 4 809 897 22002�� 4 988 294 X
3399911 Compression packings 2003��������������������������������������������������������������� 328 984 212002�� 310 632 X
3399913 Nonmetallic gaskets and gasketing 2003����������������������������������������������������� 1 434 145 42002�� 1 481 989 X
3399915 Molded packings and seals 2003����������������������������������������������������������� 1 257 557 22002�� 1 212 062 X
3399917 Metallic gaskets and machined seals 2003��������������������������������������������������� 722 894 22002�� 759 649 X
3399918 Axial mechanical face seals, including parts 2003��������������������������������������������� 201 233 32002�� 204 135 X
3399919 Rotary oil seals 2003���������������������������������������������������������������������� 465 509 92002�� 558 796 X
339991W Gasket, packing, and sealing device manufacturing, nsk, total 2003����������������������������� 399 574 52002�� 461 031 X
339992 Musical instrument manufacturing 2003�������������������������������������������������������� 1 738 991 22002�� 1 723 653 X
3399921 Nonelectronic pianos 2003����������������������������������������������������������������� 173 245 12002�� 173 794 X
3399923 Organs 2003����������������������������������������������������������������������������� 103 139 212002�� 105 608 X
3399925 Nonelectronic piano and organ parts, excluding benches 2003���������������������������������� 32 952 12002�� 49 941 X
3399927 Other musical instruments and parts 2003��������������������������������������������������� 1 353 990 12002�� 1 326 570 X
339992W Musical instrument manufacturing, nsk, total 2003�������������������������������������������� 75 665 102002�� 67 740 X
See footnotes at end of table.
64 Annual Survey of Manufactures Value of Product ShipmentsU.S. Census Bureau, 2002 Economic Census

Table 1. Value of Shipments for Product Classes: 2003 and 2002�Con.[Includes value of product shipments produced by (1) establishments classified in their primary industry and (2) establishments classified in other industries (secondary). Transfers of products from oneestablishment of a company to another establishment of the same company (interplant transfers) are also included. Data based on the 2003 Annual Survey of Manufactures (ASM). For information onconfidentiality protection, sampling error, nonsampling error, and explanation of terms, see note 2 at end of table. For meaning of abbreviations and symbols, see introductory text]
Productclass code Product Value of
product shipments($1,000)
Relativestandard error
of estimate1
(percent)
339993 Fastener, button, needle, and pin manufacturing 2003������������������������������������������� 615 851 32002�� 629 636 X
3399931 Buttons and button parts, including button backs, blanks, and molds (excluding buttonsand button parts made of precious metals and precious and semiprecious stones) 2003���������� 207 126 6
2002�� 203 639 X
3399933 Zippers and slide fasteners, excluding zippers and slide fasteners made of preciousmetals and precious and semiprecious stones 2003������������������������������������������ 125 153 2
2002�� 133 255 X
3399935 Buckles, fasteners (except slide fasteners), needles, and pins, excluding those madeof precious metals and precious and semiprecious stones 2003�������������������������������� 214 812 5
2002�� 222 580 X
339993W Fastener, button, needle, and pin manufacturing, nsk, total 2003�������������������������������� 68 760 12002�� 70 162 X
339994 Broom, brush, and mop manufacturing 2003��������������������������������������������������� 1 968 365 42002�� 2 079 334 X
3399941 Brooms, mops, and dusters 2003����������������������������������������������������������� 448 034 192002�� 544 278 X
3399943 Paint and varnish brushes and paint holders, pads, roller frames, and rollers, includingreplacement rollers 2003������������������������������������������������������������������ 475 402 1
2002�� 490 584 X
3399945 Other brushes 2003����������������������������������������������������������������������� 911 345 32002�� 894 159 X
339994W Broom, brush, and mop manufacturing, nsk, total 2003���������������������������������������� 133 584 32002�� 150 313 X
339995 Burial casket manufacturing 2003������������������������������������������������������������� 963 364 22002�� 1 188 319 X
3399951 Metal burial caskets and coffins, completely lined and trimmed, adult sizes only 2003�������������� 525 602 22002�� 778 673 X
3399953 Wood burial caskets and coffins, completely lined and trimmed, adult sizes only 2003������������� 291 967 52002�� 273 709 X
3399955 Other burial caskets and coffins, including burial boxes and vaults (except concreteand stone), casket shells, casket shipping cases and containers, and children’scaskets and coffins 2003����������������������������������������������������������������� 90 681 4
2002�� 81 462 X
339995W Burial casket manufacturing, nsk, total 2003�������������������������������������������������� 55 114 22002�� 54 475 X
339999 All other miscellaneous manufacturing 2003���������������������������������������������������� 13 389 350 12002�� 12 640 805 X
3399991 Hand�portable and fixed�system (except water sprinkler system) fire extinguishingequipment, parts and attachments 2003���������������������������������������������������� 663 904 3
2002�� 626 171 X
3399993 Coin�operated amusement machines, excluding jukeboxes 2003�������������������������������� 1 478 371 12002�� 1 211 214 X
3399995 Candles, including tapers 2003������������������������������������������������������������� 1 313 137 22002�� 1 236 983 X
3399997 Umbrellas and parasols, including parts for umbrellas and parasols 2003������������������������ 68 252 32002�� 70 201 X
3399999 Artificial trees, flowers, fruits, and wreaths, including feathers and plumes 2003������������������� 274 594 32002�� 260 711 X
339999E Mirror and picture frames and framed pictures 2003������������������������������������������� 1 170 232 42002�� 1 413 742 X
339999K All other miscellaneous fabricated products 2003��������������������������������������������� 5 598 790 12002�� 5 281 252 X
339999W All other miscellaneous manufacturing, nsk, total 2003����������������������������������������� 2 822 070 32002�� 2 540 531 X
1Description of relative standard error of estimate is given in Appendix C. Percentage standard errors shown are approximate relative standard errors of estimates of level.2This product class is primary to more than one industry. See Appendix G for products primary relationships.3Additional data are available for this product class in the Current Industrial Report (CIR) series. See Appendix F for CIR survey number and title.4Additional data are available for this product class in the Current Industrial Report (CIR) series. Also, this product class is primary to more than one industry. See Appendix F for CIR survey
number and title and Appendix G for products primary relationships.
Note 1: Previous years’ data may differ from that published in the 2002 Economic Census because of changes encountered in subsequent review of the 2003 Annual Survey of Manufactures(ASM).
Note 2: The data in this table are based on the 2003 Annual Survey of Manufactures (ASM). To maintain confidentiality, the Census Bureau suppresses data to protect the identity of anybusiness or individual. The data in this table contain sampling errors and nonsampling errors. For explanation of terms, see Appendix A. For full technical documentation, see Appendix C.
Value of Product Shipments Annual Survey of Manufactures 65U.S. Census Bureau, 2002 Economic Census

Appendix A.Explanation of Terms
PRODUCT CODES AND CLASSES OF PRODUCTS
NAICS United States industries are identified by a six-digit code. The longer code accommodatesthe large number of sectors and allows more flexibility in designing subsectors. Each product orservice is assigned a ten-digit code. The product coding structure represents an extension by theCensus Bureau of the six-digit industry classifications of the manufacturing and mining sectors.The classification system operates so that the industrial coverage is progressively narrower withthe successive addition of digits.
As in previous censuses, data were collected for most industries on the quantity and value of indi-vidual products shipped. Since the 1997 census programs, information is collected on the outputof almost 10,000 individual product items.
In the manufacturing sector for 2002, there are 21 subsectors (three-digit NAICS), 86 industrygroups (four-digit NAICS), 184 NAICS industries (five-digit NAICS) that are comparable with Cana-dian and Mexican classification, and 473 U.S. industries (six-digit NAICS). Product classes andproducts of the manufacturing industries have been assigned codes based on the industry fromwhich they originate. There are 1,450 product classes (seven-digit codes), 5,674 census products,and an additional 3,746 ten-digit product codes. The ten-digit products are considered the pri-mary products of the industry with the same first six digits.
The list of products for which separate information was collected was prepared after consultationwith industry and government representatives.
Comparability with previous figures was given considerable weight in the selection of product cat-egories, so that comparable 1992 information is presented for most products.
Typically, both quantity and value of shipments information were collected. However, if quantitywas not significant or could not be reported by manufacturers, only value of shipments was col-lected.
Shipments include both commercial shipments and transfers of products to other plants of thesame company. For industries in which a considerable portion of the total shipments is trans-ferred to other plants of the same company, separate information on interplant transfers also wascollected. Moreover, for products that are used to a large degree within the same establishment asmaterials or components in the fabrication of other products, total production and often con-sumption of the item within the plant (quantity produced and consumed) was collected. Typically,the information on production also was collected for products for which there are significant dif-ferences between total production and shipments in a given year because of wide fluctuations infinished goods inventories. Other measures of output of products with long production cycleswere used as appropriate and feasible.
TOTAL VALUE OF SHIPMENTS
Includes the received or receivable net selling values, “Free on Board” (FOB) plant (exclusive offreight and taxes), of all products shipped, both primary and secondary, as well as all miscella-neous receipts, such as receipts for contract work performed for others, installation and repair,sales of scrap, and sales of products bought and sold without further processing. Included are allitems made by or for the establishments from material owned by it, whether sold, transferred toother plants of the same company, or shipped on consignment. The net selling value of productsmade in one plant on a contract basis from materials owned by another was reported by the plantproviding the materials.
Appendix A A–1
U.S. Census Bureau, 2002 Economic Census

In the case of multiunit companies, the manufacturer was requested to report the value of prod-ucts transferred to other establishments of the same company at full economic or commercialvalue, including not only the direct cost of production but also a reasonable proportion of “allother costs” (including company overhead) and profit.
In addition to the value for NAICS defined products, aggregates of the following categories of mis-cellaneous receipts are reported as part of a total establishment’s value of product shipments:
1. Reported contract work — receipts for work or services that a plant performed for others ontheir materials.
2. Value of resales — sales of products bought and sold without further manufacture, process-ing, or assembly.
3. Other miscellaneous receipts — includes repair work, installation, sales of scrap, etc.
Industry primary product value of shipments represents one of three components of value of ship-ments. These components are:
1. Primary product value of shipments.
2. Secondary product value of shipments.
3. Total miscellaneous receipts.
Primary product shipments is used in the calculations of industry specialization ratio and industrycoverage ratio.
Duplication in cost of materials and value of shipment
The aggregate of the cost of materials and value of shipments figures for industry groups and forall manufacturing industries includes large amounts of duplication, since the products of someindustries are used as materials by others. This duplication results, in part, from the addition ofrelated industries representing successive stages in the production of a finished manufacturedproduct. Examples are the addition of flour mills to bakeries in the food group and the addition ofpulp mills to paper mills in the paper and allied products group of industries.
Estimates of the overall extent of this duplication indicate that the value of manufactured prod-ucts exclusive of such duplication (the value of finished manufactures) tends to approximate two-thirds of the total value of products reported in the annual survey.
Duplication of products within individual industries is significant within a number of industrygroups, e.g., machinery and transportation industries. These industries frequently include com-plete machinery and their parts. In this case, the parts made for original equipment are materialsconsumed for assembly plants in the same industry.
Even when no significant amount of duplication is involved, value of shipments figures are defi-cient as measures of the relative economic importance of individual manufacturing industries orgeographic areas because of the wide variation in ratio of materials, labor, and other processingcosts of value of shipments, both among industries and within the same industry.
Before 1962, cost of materials and value of shipments were not published for some industries thatincluded considerable duplication. Since then, these data have been published for all industries atthe U.S. level and beginning in 1964, for all geographic levels.
Specialization and coverage ratio
An establishment is classified in a particular industry, if its shipments of primary products of thatindustry exceed in value its shipments of the products of any other single industry.
An establishment’s shipments include those products assigned to an industry (primary products),those considered primary to other industries (secondary products), and receipts for miscellaneousactivities (merchandising, contract work, resales, etc.).
A–2 Appendix A
U.S. Census Bureau, 2002 Economic Census

Specialization and coverage ratio have been developed to measure the relationship of primaryproduct shipments to the data on shipments for a particular industry.
Specialization ratio represents the ratio of primary product shipments to total product shipments(primary and secondary, excluding miscellaneous receipts) for the establishments classified in theindustry.
Coverage ratio represents the ratio of primary products shipped by the establishments classifiedin the industry to the total shipments of such products that are shipped by all manufacturingestablishments wherever classified.
Appendix A A–3
U.S. Census Bureau, 2002 Economic Census

Appendix B.NAICS Codes, Titles, and Descriptions
Not applicable for this report.
Appendix B B–1Annual Survey of Manufactures
U.S. Census Bureau, Annual Survey of Manufactures

Appendix C.Methodology
SOURCES OF THE DATA
The Annual Survey of Manufactures (ASM) is a sample survey of approximately 57,000 establish-ments. A new sample is selected at 5-year intervals beginning the second survey year subsequentto the Economic Census — Manufacturing. The current sample was selected from the 1997 Eco-nomic Census — Manufacturing and has been used as the ASM sample since 1999. A new ASMsample will be introduced for the 2004-2008 surveys based on the 2002 Economic Census —Manufacturing.
In 1997, there were approximately 366,000 individual manufacturing establishments. For sampleefficiency and cost considerations, the 1997 manufacturing population was divided into thosesent report forms and those not sent report forms. The coverage of and the method of obtainingthe Annual Survey of Manufactures (ASM) sample information from each are described below:
1. Establishments sent a report form:
Mail stratum. The mail stratum of the survey is comprised of larger single-location manufac-turing companies and all manufacturing establishments of multiunit companies (companiesthat operate at more than one physical location). Approximately 200,000 of the 366,000establishments in the 1997 Economic Census — Manufacturing were assigned to the mail stra-tum. On an annual basis, the mail stratum is supplemented with larger, newly active single-location companies identified from a list provided by the Internal Revenue Service (IRS) andnew manufacturing locations of multiunit companies identified from the Census Bureau’sCompany Organization Survey (COS).
The 1999-2003 ASM sample design is similar to the one used since 1984. Companies in the1997 Economic Census — Manufacturing with manufacturing shipments of at least $1 billionwere defined as company certainties. For these large companies, each manufacturing estab-lishment is included in the mail sample. For the 1999-2003 sample, there are approximately500 certainty companies collectively accounting for over 14,000 establishments.
For the remaining portion of the mail component of the survey, the establishment was definedas the sample unit. All establishments with 500 employees or more were defined as employ-ment certainties. In addition, all establishments producing electronic computers were definedas certainties. A final certainty category, small industry certainties, was added for the 1999sample. This category assured that all establishments of small industries (20 establishmentsor less) were included in the sample. Across these four arbitrary certainty classes, there wereapproximately 16,600 establishments included in the sample with certainty. Collectively,these certainty establishments accounted for approximately 62 percent of the total value ofshipments in the 1997 Economic Census — Manufacturing.
Smaller establishments in the remaining portion of the mail stratum were sampled with prob-abilities ranging from .02 to 1.00. The initial probabilities of selection assigned to theseestablishments were proportionate to a measure-of-size determined for each establishment.The measure-of-size was a function of the establishment’s 1997 industry classification and its1997 product class data. For each product class and six-digit industry, a desired reliabilityconstraint was specified. The product class constraints were based on product class size(1997 shipments) while the industry constraints were a function of both current size (1997shipments) and change in size since 1992. Using a technique developed by Dr. James R.Chromy of the Research Triangle Institute, the initial establishment probabilities were opti-mized such that the expected sample satisfied all industry and product class reliability con-straints, while the sample size was minimized. This technique reduces the likelihood of select-ing nonrepresentative samples for individual product classes or industries.
Appendix C C–1
U.S. Census Bureau, 2002 Economic Census

This method of assigning probabilities based on product class shipments is motivated by theCensus Bureau’s primary desire to produce reliable estimates of both product class and indus-try shipments. The high correlation between shipments and employment, value-added, andother general statistics assures that these variables will also be well represented by thesample. The actual sample selection procedure uses an independent chance of selectionmethod (Poisson sampling).
2. Establishments not sent a report form:
a. Nonmail stratum. The nonmail component of the Annual Survey of Manufactures (ASM) tra-ditionally consists of small, single-establishment companies from the Economic Census —Manufacturing. For the 1999 sample, this component also included approximately 3,600single-establishment companies that were rotated from the mail stratum to the nonmailstratum in order to prevent their selection in consecutive sample panels. The combined ini-tial nonmail component of the 1999 sample contained approximately 166,000 single-establishment companies from the 1997 Economic Census — Manufacturing. The nonmailstratum is also supplemented annually using the list of newly active single-location compa-nies provided by the Internal Revenue Service (IRS) and payroll cutoffs. Companies withpayroll below the payroll cutoff are added to the nonmail stratum. For this portion of thepopulation, sampling is not used. The data for these companies are estimated based onselected information obtained annually from the administrative records of the IRS andSocial Security Administration (SSA). This administrative information, which includes pay-roll, total employment, industry classification, and physical location, is obtained under con-ditions which safeguard the confidentiality of both tax and census records.
b. All nonemployers, i.e., all firms subject to federal income tax, with no paid employees, dur-ing 2003 are excluded as in previous Annual Survey of Manufactures (ASM). Data for non-employers are not included in this report, but are released in the annual Nonemployer Sta-tistics series.
The report forms, frequently asked questions, and instructions used to collect information fromestablishments in the Annual Survey of Manufactures (ASM) are available athttp://help.econ.census.gov/BHS/ASM/index.html.
The Annual Survey of Manufactures (ASM) reports to review online are available athttp://www.census.gov/mcd/asmhome.html.
ESTABLISHMENT BASIS OF REPORTING
The Annual Survey of Manufactures (ASM) is conducted on an establishment basis. Reports arefiled for those establishments selected in the sample. Companies engaged in distinctly differentlines of activity at one location are requested to submit separate reports, if the plant records per-mit such a separation and if the activities are substantial in size. Estimates are based on thereports from a representative sample of manufacturing establishments. These estimates representthe portion of the manufacturing population accounted for by establishments with paid employ-ees. Nonemployers are defined as out-of-scope of the ASM. The tables provide estimates foremployment, plant hours, payrolls, value added by manufacture, capital expenditures, cost ofmaterials, inventories, value of industry shipments, and fuels and electric energy consumed formost manufacturing industries.
The Annual Survey of Manufactures (ASM) excludes data for central administrative offices (CAOs).These would include separately operated administrative offices, warehouses, garages, and otherauxiliary units that service manufacturing establishments of the same company. These data arepublished in a separate report series.
RELIABILITY OF DATA
All data compiled in the Annual Survey of Manufactures (ASM) are subject to nonsampling errors.Nonsampling errors can be attributed to many sources during the development or execution ofthe ASM. The following are two ways that further explain this method:
C–2 Appendix C
U.S. Census Bureau, 2002 Economic Census

1. Estimating Procedure. Most of the Annual Survey of Manufactures (ASM) estimates derived forthe mail stratum are computed using a difference estimator. At the establishment level, thereis a strong correlation between the current-year data values and the corresponding historicaldata values. Therefore, within the mailed stratum, for each item at each level of aggregation,an estimate of the “difference” between the current year and a base year is computed fromsample cases and added to the corresponding base-year values. For the 1998-2001 ASM esti-mates, the 1997 Economic Census — Manufacturing values serve as the base year. For the2003 ASM, the base has been updated to the 2002 Economic Census — Manufacturing.
Due to the positive year-to-year correlation, estimates derived using this methodology aregenerally more reliable than comparable estimates developed from the current sample dataalone. Estimates for the capital expenditures variables are not generated using the differenceestimator because the year-to-year correlations are considerably weaker. The standard linearestimator is used for these variables.
For the nonmail stratum, estimates for payroll are directly tabulated from the administrative-record data provided by the Internal Revenue Service (IRS) and the Social Security Administra-tion (SSA). Estimates of the other data variables are developed from industry averages.Although the nonmail stratum contained approximately 156,000 individual establishments in2003, it accounted for less than 3 percent of the estimate for total value of shipments at thetotal manufacturing level.
Corresponding estimates for the mail and nonmail components are combined to produce theestimates included in this publication.
2. Data Qualifications. The estimates developed from the sample are apt to differ somewhatfrom the results of a survey covering all companies in the sample lists, but otherwise con-ducted under essentially the same conditions as the actual sample survey. The estimates ofthe magnitude of the sampling errors (the difference between the estimates obtained and theresults theoretically obtained from a comparable, complete-coverage survey) are provided bythe standard errors of estimates.
The particular sample selected for the Annual Survey of Manufactures (ASM) is one of manysimilar probability samples that, by chance, might have been selected under the same specifi-cations. Each of the possible samples would yield somewhat different sets of results, and thestandard errors are measures of the variation of all the possible sample estimates around thetheoretically comparable, complete-coverage values.
Estimates of the standard errors have been computed from the sample data for selectedAnnual Survey of Manufactures (ASM) statistics in this report. They are represented in theform of relative standard errors (the standard errors divided by the estimated values to whichthey refer).
In conjunction with its associated estimate, the relative standard error may be used to defineconfidence intervals (ranges that would include the comparable, complete-coverage value forspecified percentages of all the possible samples).
The complete-coverage value would be included in the range:
• From one standard error below to one standard error above the derived estimate for abouttwo-thirds of all possible samples.
• From two standard errors below to two standard errors above the derived estimate forabout 19 out of 20 of all possible samples.
• From three standard errors below to three standard errors above the derived estimate fornearly all samples.
An inference that the comparable, complete-survey result would be within the indicated rangeswould be correct in approximately the relative frequencies shown. Those proportions, there-fore, may be interpreted as defining the confidence that the estimates from a particular samplewould differ from complete-coverage results by as much as one, two, or three standard errors,respectively.
Appendix C C–3
U.S. Census Bureau, 2002 Economic Census

For example, suppose an estimated total is shown at 50,000 with an associated relative stan-dard error of 2 percent, that is, a standard error of 1,000 (2 percent of 50,000). There isapproximately 67 percent confidence that the interval 49,000 to 51,000 includes the complete-coverage total, about 95 percent confidence that the interval 48,000 to 52,000 includes thecomplete-coverage total, and almost certain confidence that the interval 47,000 to 53,000includes the complete-coverage total.
In addition to the sample errors, the estimates are subject to various response and operationalerrors: errors of collection, reporting, coding, transcription, imputation for nonresponse, etc.These operational errors also would occur if a complete canvass were to be conducted underthe same conditions as the survey. Explicit measures of their effects generally are not available.However, it is believed that most of the important operational errors were detected and cor-rected during the Census Bureau’s review of the data for reasonableness and consistency. Thesmall operational errors usually remain. To some extent, they are compensating in the aggre-gated totals shown. When important operational errors were detected too late to correct theestimates, the data were suppressed or were specifically qualified in the tables.
As derived, the estimated standard errors included part of the effect of the operational errors.The total errors, which depend upon the joint effect of the sampling and operational errors, areusually of the order of size indicated by the standard error, or moderately higher. However, forparticular estimates, the total error may considerably exceed the standard errors shown. Anyfigures shown in the tables in this publication having an associated standard error exceeding15 percent may be combined with higher level totals, creating a broader aggregate, which thenmay be of acceptable reliability.
DUPLICATION IN COST OF MATERIALS AND VALUE OF SHIPMENTS
Data for cost of materials and value of shipments include varying amounts of duplication, espe-cially at higher levels of aggregation. This is because the products of one establishment may bethe materials of another. The value added statistics avoid this duplication and are, for most pur-poses, the best measure for comparing the relative economic importance of industries and geo-graphic areas.
VALUE OF INDUSTRY SHIPMENTS COMPARED WITH VALUE OF PRODUCT SHIPMENTS
The Annual Survey of Manufactures (ASM) shows value of shipments data for industries and prod-ucts. In the industry statistics tables and files, these data represent the total value of shipments ofall establishments classified in a particular industry. The data include the shipments of the prod-ucts classified in the industry (primary to the industry), products classified in other industries(secondary to the industry), and miscellaneous receipts (resales, contract receipts, repair work,etc.). Value of product shipments shown in the products statistics tables and files represent thetotal value of all products shipped that are classified as primary to an industry regardless of theclassification of the producing establishment.
DISCLOSURE
In accordance with federal law governing census reports (Title 13 of the United States Code), nodata are published that would disclose the operations of an individual establishment or company.However, the number of establishments in a specific industry or geographic area is not considereda disclosure; therefore, this information may be released even though other information is with-held. Techniques employed to limit disclosure are discussed atwww.census.gov/epcd/ec02/disclosure.htm.
The disclosure analysis for the industry statistics files is based on the total value of shipments.When the total value of shipments cannot be shown without disclosing information for individualcompanies, the complete line is suppressed except for capital expenditures. Nonetheless, the sup-pressed data are included in higher-level totals. A separate disclosure analysis is performed forcapital expenditures, which can be suppressed even though value of shipments data are pub-lished.
C–4 Appendix C
U.S. Census Bureau, 2002 Economic Census

Appendix D.Geographic Notes
Not applicable for this report.
Appendix D D–1Annual Survey of Manufactures
U.S. Census Bureau, Annual Survey of Manufactures

Appendix E.Metropolitan and Micropolitan Statistical Areas
Not applicable for this report.
Appendix E E–1Annual Survey of Manufactures
U.S. Census Bureau, Annual Survey of Manufactures

Appendix F.Current Industrial Reports by Product Class Codes
Product class code CIR survey CIR description
3112218 M311K��������������������������������������������������� Fats and Oils: Production, Consumption, and Stocks���������������������������������������������������
3112221 M311K��������������������������������������������������� Fats and Oils: Production, Consumption, and Stocks���������������������������������������������������
3112224 M311J��������������������������������������������������� Fats and Oils: Oilseed Crushings����������������������������������������������������
3112231 M311J��������������������������������������������������� Fats and Oils: Oilseed Crushings����������������������������������������������������
3112234 M311K��������������������������������������������������� Fats and Oils: Production, Consumption, and Stocks���������������������������������������������������
3112237 M311J��������������������������������������������������� Fats and Oils: Oilseed Crushings����������������������������������������������������
311223A M311J��������������������������������������������������� Fats and Oils: Oilseed Crushings����������������������������������������������������
311223D M311K�������������������������������������������������� Fats and Oils: Production, Consumption, and Stocks���������������������������������������������������
311223G M311K�������������������������������������������������� Fats and Oils: Production, Consumption, and Stocks���������������������������������������������������
311223J M311J��������������������������������������������������� Fats and Oils: Oilseed Crushings����������������������������������������������������
3112252 M311K��������������������������������������������������� Fats and Oils: Production, Consumption, and Stocks���������������������������������������������������
3112254 M311K��������������������������������������������������� Fats and Oils: Production, Consumption, and Stocks���������������������������������������������������
3113201 MA311D��������������������������������������������������� Confectionery��������������������������������������������������
3113204 MA311D��������������������������������������������������� Confectionery��������������������������������������������������
3113207 MA311D��������������������������������������������������� Confectionery��������������������������������������������������
3113301 MA311D��������������������������������������������������� Confectionery��������������������������������������������������
3113401 MA311D��������������������������������������������������� Confectionery��������������������������������������������������
3113404 MA311D��������������������������������������������������� Confectionery��������������������������������������������������
3116131 M311K��������������������������������������������������� Fats and Oils: Production, Consumption, and Stocks���������������������������������������������������
3116135 M311K��������������������������������������������������� Fats and Oils: Production, Consumption, and Stocks���������������������������������������������������
3131111 MA313F��������������������������������������������������� Yarn Production��������������������������������������������������
3131113 MA313F��������������������������������������������������� Yarn Production��������������������������������������������������
3131115 MA313F��������������������������������������������������� Yarn Production��������������������������������������������������
3131116 MA313F��������������������������������������������������� Yarn Production��������������������������������������������������
3131119 MA313F��������������������������������������������������� Yarn Production��������������������������������������������������
3131125 MA313F��������������������������������������������������� Yarn Production��������������������������������������������������
3132101 MQ313T��������������������������������������������������� Broadwoven Fabrics��������������������������������������������������
3132103 MQ313T��������������������������������������������������� Broadwoven Fabrics��������������������������������������������������
3132105 MQ313T��������������������������������������������������� Broadwoven Fabrics��������������������������������������������������
3132107 MQ313T��������������������������������������������������� Broadwoven Fabrics��������������������������������������������������
313210D MQ314X�������������������������������������������������� Bed and Bath Furnishings��������������������������������������������������
313210E MQ313T��������������������������������������������������� Broadwoven Fabrics��������������������������������������������������
313210G MQ313T�������������������������������������������������� Broadwoven Fabrics��������������������������������������������������
313210H MQ313T�������������������������������������������������� Broadwoven Fabrics��������������������������������������������������
313210J MQ313T��������������������������������������������������� Broadwoven Fabrics��������������������������������������������������
313210L MQ313T��������������������������������������������������� Broadwoven Fabrics��������������������������������������������������
313210M MQ313T�������������������������������������������������� Broadwoven Fabrics��������������������������������������������������
313210N MQ313T�������������������������������������������������� Broadwoven Fabrics��������������������������������������������������
313210T MQ313T��������������������������������������������������� Broadwoven Fabrics��������������������������������������������������
3132411 MA313K��������������������������������������������������� Knit Fabric Production��������������������������������������������������
3132491 MA313K��������������������������������������������������� Knit Fabric Production��������������������������������������������������
3141101 MA314Q��������������������������������������������������� Carpets and Rugs��������������������������������������������������
3141103 MA314Q��������������������������������������������������� Carpets and Rugs��������������������������������������������������
3141105 MA314Q��������������������������������������������������� Carpets and Rugs��������������������������������������������������
3141291 MQ314X��������������������������������������������������� Bed and Bath Furnishings��������������������������������������������������
3141293 MQ314X��������������������������������������������������� Bed and Bath Furnishings��������������������������������������������������
3141295 MQ314X��������������������������������������������������� Bed and Bath Furnishings��������������������������������������������������
3141296 MQ314X��������������������������������������������������� Bed and Bath Furnishings��������������������������������������������������
3149920 MQ313T��������������������������������������������������� Broadwoven Fabrics��������������������������������������������������
3151912 MQ315A��������������������������������������������������� Apparel��������������������������������������������������
3151914 MQ315A��������������������������������������������������� Apparel��������������������������������������������������
3151917 MQ315A��������������������������������������������������� Apparel��������������������������������������������������
315191B MQ315A��������������������������������������������������� Apparel��������������������������������������������������
315191G MA315D�������������������������������������������������� Gloves and Mittens��������������������������������������������������
3151921 MQ315A��������������������������������������������������� Apparel��������������������������������������������������
3151924 MQ315A��������������������������������������������������� Apparel��������������������������������������������������
3152210 MQ315A��������������������������������������������������� Apparel��������������������������������������������������
3152222 MQ315A��������������������������������������������������� Apparel��������������������������������������������������
3152224 MQ315A��������������������������������������������������� Apparel��������������������������������������������������
3152226 MQ315A��������������������������������������������������� Apparel��������������������������������������������������
3152231 MQ315A��������������������������������������������������� Apparel��������������������������������������������������
3152233 MQ315A��������������������������������������������������� Apparel��������������������������������������������������
3152242 MQ315A��������������������������������������������������� Apparel��������������������������������������������������
3152244 MQ315A��������������������������������������������������� Apparel��������������������������������������������������
3152251 MQ315A��������������������������������������������������� Apparel��������������������������������������������������
3152254 MQ315A��������������������������������������������������� Apparel��������������������������������������������������
3152282 MQ315A��������������������������������������������������� Apparel��������������������������������������������������
3152284 MQ315A��������������������������������������������������� Apparel��������������������������������������������������
3152286 MQ315A��������������������������������������������������� Apparel��������������������������������������������������
3152311 MQ315A��������������������������������������������������� Apparel��������������������������������������������������
3152313 MQ315A��������������������������������������������������� Apparel��������������������������������������������������
3152315 MQ315A��������������������������������������������������� Apparel��������������������������������������������������
3152318 MQ315A��������������������������������������������������� Apparel��������������������������������������������������
3152319 MQ315A��������������������������������������������������� Apparel��������������������������������������������������
3152321 MQ315A��������������������������������������������������� Apparel��������������������������������������������������
3152323 MQ315A��������������������������������������������������� Apparel��������������������������������������������������
3152330 MQ315A��������������������������������������������������� Apparel��������������������������������������������������
3152342 MQ315A��������������������������������������������������� Apparel��������������������������������������������������
3152344 MQ315A��������������������������������������������������� Apparel��������������������������������������������������
3152346 MQ315A��������������������������������������������������� Apparel��������������������������������������������������
3152348 MQ315A��������������������������������������������������� Apparel��������������������������������������������������
3152392 MQ315A��������������������������������������������������� Apparel��������������������������������������������������
3152394 MQ315A��������������������������������������������������� Apparel��������������������������������������������������
3152396 MQ315A��������������������������������������������������� Apparel��������������������������������������������������
3152398 MQ315A��������������������������������������������������� Apparel��������������������������������������������������
315239A MQ315A��������������������������������������������������� Apparel��������������������������������������������������
315239C MQ315A�������������������������������������������������� Apparel��������������������������������������������������
315239E MQ315A��������������������������������������������������� Apparel��������������������������������������������������
3152910 MQ315A��������������������������������������������������� Apparel��������������������������������������������������
Annual Survey of Manufactures Appendix F F–1U.S. Census Bureau, 2002 Economic Census Dec. 1, 2004
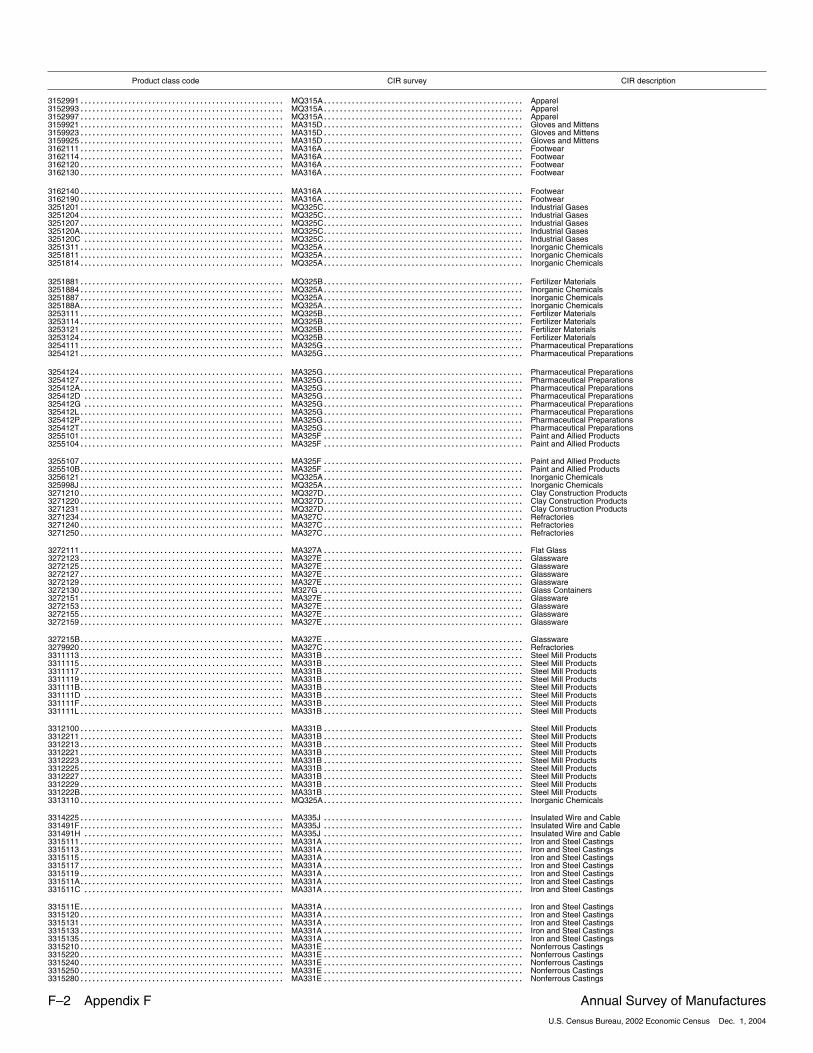
Product class code CIR survey CIR description
3152991 MQ315A��������������������������������������������������� Apparel��������������������������������������������������
3152993 MQ315A��������������������������������������������������� Apparel��������������������������������������������������
3152997 MQ315A��������������������������������������������������� Apparel��������������������������������������������������
3159921 MA315D��������������������������������������������������� Gloves and Mittens��������������������������������������������������
3159923 MA315D��������������������������������������������������� Gloves and Mittens��������������������������������������������������
3159925 MA315D��������������������������������������������������� Gloves and Mittens��������������������������������������������������
3162111 MA316A��������������������������������������������������� Footwear��������������������������������������������������
3162114 MA316A��������������������������������������������������� Footwear��������������������������������������������������
3162120 MA316A��������������������������������������������������� Footwear��������������������������������������������������
3162130 MA316A��������������������������������������������������� Footwear��������������������������������������������������
3162140 MA316A��������������������������������������������������� Footwear��������������������������������������������������
3162190 MA316A��������������������������������������������������� Footwear��������������������������������������������������
3251201 MQ325C��������������������������������������������������� Industrial Gases��������������������������������������������������
3251204 MQ325C��������������������������������������������������� Industrial Gases��������������������������������������������������
3251207 MQ325C��������������������������������������������������� Industrial Gases��������������������������������������������������
325120A MQ325C��������������������������������������������������� Industrial Gases��������������������������������������������������
325120C MQ325C�������������������������������������������������� Industrial Gases��������������������������������������������������
3251311 MQ325A��������������������������������������������������� Inorganic Chemicals��������������������������������������������������
3251811 MQ325A��������������������������������������������������� Inorganic Chemicals��������������������������������������������������
3251814 MQ325A��������������������������������������������������� Inorganic Chemicals��������������������������������������������������
3251881 MQ325B��������������������������������������������������� Fertilizer Materials��������������������������������������������������
3251884 MQ325A��������������������������������������������������� Inorganic Chemicals��������������������������������������������������
3251887 MQ325A��������������������������������������������������� Inorganic Chemicals��������������������������������������������������
325188A MQ325A��������������������������������������������������� Inorganic Chemicals��������������������������������������������������
3253111 MQ325B��������������������������������������������������� Fertilizer Materials��������������������������������������������������
3253114 MQ325B��������������������������������������������������� Fertilizer Materials��������������������������������������������������
3253121 MQ325B��������������������������������������������������� Fertilizer Materials��������������������������������������������������
3253124 MQ325B��������������������������������������������������� Fertilizer Materials��������������������������������������������������
3254111 MA325G��������������������������������������������������� Pharmaceutical Preparations��������������������������������������������������
3254121 MA325G��������������������������������������������������� Pharmaceutical Preparations��������������������������������������������������
3254124 MA325G��������������������������������������������������� Pharmaceutical Preparations��������������������������������������������������
3254127 MA325G��������������������������������������������������� Pharmaceutical Preparations��������������������������������������������������
325412A MA325G��������������������������������������������������� Pharmaceutical Preparations��������������������������������������������������
325412D MA325G�������������������������������������������������� Pharmaceutical Preparations��������������������������������������������������
325412G MA325G�������������������������������������������������� Pharmaceutical Preparations��������������������������������������������������
325412L MA325G��������������������������������������������������� Pharmaceutical Preparations��������������������������������������������������
325412P MA325G��������������������������������������������������� Pharmaceutical Preparations��������������������������������������������������
325412T MA325G��������������������������������������������������� Pharmaceutical Preparations��������������������������������������������������
3255101 MA325F��������������������������������������������������� Paint and Allied Products��������������������������������������������������
3255104 MA325F��������������������������������������������������� Paint and Allied Products��������������������������������������������������
3255107 MA325F��������������������������������������������������� Paint and Allied Products��������������������������������������������������
325510B MA325F��������������������������������������������������� Paint and Allied Products��������������������������������������������������
3256121 MQ325A��������������������������������������������������� Inorganic Chemicals��������������������������������������������������
325998J MQ325A��������������������������������������������������� Inorganic Chemicals��������������������������������������������������
3271210 MQ327D��������������������������������������������������� Clay Construction Products��������������������������������������������������
3271220 MQ327D��������������������������������������������������� Clay Construction Products��������������������������������������������������
3271231 MQ327D��������������������������������������������������� Clay Construction Products��������������������������������������������������
3271234 MA327C��������������������������������������������������� Refractories��������������������������������������������������
3271240 MA327C��������������������������������������������������� Refractories��������������������������������������������������
3271250 MA327C��������������������������������������������������� Refractories��������������������������������������������������
3272111 MA327A��������������������������������������������������� Flat Glass��������������������������������������������������
3272123 MA327E��������������������������������������������������� Glassware��������������������������������������������������
3272125 MA327E��������������������������������������������������� Glassware��������������������������������������������������
3272127 MA327E��������������������������������������������������� Glassware��������������������������������������������������
3272129 MA327E��������������������������������������������������� Glassware��������������������������������������������������
3272130 M327G��������������������������������������������������� Glass Containers���������������������������������������������������
3272151 MA327E��������������������������������������������������� Glassware��������������������������������������������������
3272153 MA327E��������������������������������������������������� Glassware��������������������������������������������������
3272155 MA327E��������������������������������������������������� Glassware��������������������������������������������������
3272159 MA327E��������������������������������������������������� Glassware��������������������������������������������������
327215B MA327E��������������������������������������������������� Glassware��������������������������������������������������
3279920 MA327C��������������������������������������������������� Refractories��������������������������������������������������
3311113 MA331B��������������������������������������������������� Steel Mill Products��������������������������������������������������
3311115 MA331B��������������������������������������������������� Steel Mill Products��������������������������������������������������
3311117 MA331B��������������������������������������������������� Steel Mill Products��������������������������������������������������
3311119 MA331B��������������������������������������������������� Steel Mill Products��������������������������������������������������
331111B MA331B��������������������������������������������������� Steel Mill Products��������������������������������������������������
331111D MA331B�������������������������������������������������� Steel Mill Products��������������������������������������������������
331111F MA331B��������������������������������������������������� Steel Mill Products��������������������������������������������������
331111L MA331B��������������������������������������������������� Steel Mill Products��������������������������������������������������
3312100 MA331B��������������������������������������������������� Steel Mill Products��������������������������������������������������
3312211 MA331B��������������������������������������������������� Steel Mill Products��������������������������������������������������
3312213 MA331B��������������������������������������������������� Steel Mill Products��������������������������������������������������
3312221 MA331B��������������������������������������������������� Steel Mill Products��������������������������������������������������
3312223 MA331B��������������������������������������������������� Steel Mill Products��������������������������������������������������
3312225 MA331B��������������������������������������������������� Steel Mill Products��������������������������������������������������
3312227 MA331B��������������������������������������������������� Steel Mill Products��������������������������������������������������
3312229 MA331B��������������������������������������������������� Steel Mill Products��������������������������������������������������
331222B MA331B��������������������������������������������������� Steel Mill Products��������������������������������������������������
3313110 MQ325A��������������������������������������������������� Inorganic Chemicals��������������������������������������������������
3314225 MA335J��������������������������������������������������� Insulated Wire and Cable��������������������������������������������������
331491F MA335J��������������������������������������������������� Insulated Wire and Cable��������������������������������������������������
331491H MA335J�������������������������������������������������� Insulated Wire and Cable��������������������������������������������������
3315111 MA331A��������������������������������������������������� Iron and Steel Castings��������������������������������������������������
3315113 MA331A��������������������������������������������������� Iron and Steel Castings��������������������������������������������������
3315115 MA331A��������������������������������������������������� Iron and Steel Castings��������������������������������������������������
3315117 MA331A��������������������������������������������������� Iron and Steel Castings��������������������������������������������������
3315119 MA331A��������������������������������������������������� Iron and Steel Castings��������������������������������������������������
331511A MA331A��������������������������������������������������� Iron and Steel Castings��������������������������������������������������
331511C MA331A�������������������������������������������������� Iron and Steel Castings��������������������������������������������������
331511E MA331A��������������������������������������������������� Iron and Steel Castings��������������������������������������������������
3315120 MA331A��������������������������������������������������� Iron and Steel Castings��������������������������������������������������
3315131 MA331A��������������������������������������������������� Iron and Steel Castings��������������������������������������������������
3315133 MA331A��������������������������������������������������� Iron and Steel Castings��������������������������������������������������
3315135 MA331A��������������������������������������������������� Iron and Steel Castings��������������������������������������������������
3315210 MA331E��������������������������������������������������� Nonferrous Castings��������������������������������������������������
3315220 MA331E��������������������������������������������������� Nonferrous Castings��������������������������������������������������
3315240 MA331E��������������������������������������������������� Nonferrous Castings��������������������������������������������������
3315250 MA331E��������������������������������������������������� Nonferrous Castings��������������������������������������������������
3315280 MA331E��������������������������������������������������� Nonferrous Castings��������������������������������������������������
F–2 Appendix F Annual Survey of ManufacturesU.S. Census Bureau, 2002 Economic Census Dec. 1, 2004

Product class code CIR survey CIR description
332911F MA334B��������������������������������������������������� Measurement Instruments and Related Products��������������������������������������������������
332911H MA334B�������������������������������������������������� Measurement Instruments and Related Products��������������������������������������������������
3329121 MA333N��������������������������������������������������� Fluid Power Products��������������������������������������������������
3329123 MA333N��������������������������������������������������� Fluid Power Products��������������������������������������������������
3329125 MA333N��������������������������������������������������� Fluid Power Products��������������������������������������������������
3329127 MA333N��������������������������������������������������� Fluid Power Products��������������������������������������������������
3329129 MA333N��������������������������������������������������� Fluid Power Products��������������������������������������������������
332912B MA333N��������������������������������������������������� Fluid Power Products��������������������������������������������������
332912D MA333N�������������������������������������������������� Fluid Power Products��������������������������������������������������
332912F MA333N��������������������������������������������������� Fluid Power Products��������������������������������������������������
332912H MA333N�������������������������������������������������� Fluid Power Products��������������������������������������������������
332912J MA333N��������������������������������������������������� Fluid Power Products��������������������������������������������������
332912L MA333N��������������������������������������������������� Fluid Power Products��������������������������������������������������
332912N MA333N�������������������������������������������������� Fluid Power Products��������������������������������������������������
3329911 MA332Q��������������������������������������������������� Antifriction Bearings��������������������������������������������������
3329913 MA332Q��������������������������������������������������� Antifriction Bearings��������������������������������������������������
3329915 MA332Q��������������������������������������������������� Antifriction Bearings��������������������������������������������������
3329917 MA332Q��������������������������������������������������� Antifriction Bearings��������������������������������������������������
3329919 MA332Q��������������������������������������������������� Antifriction Bearings��������������������������������������������������
3331111 MA333A��������������������������������������������������� Farm Machinery and Lawn and Garden Equipment��������������������������������������������������
3331114 MA333A��������������������������������������������������� Farm Machinery and Lawn and Garden Equipment��������������������������������������������������
3331117 MA333A��������������������������������������������������� Farm Machinery and Lawn and Garden Equipment��������������������������������������������������
3331119 MA333A��������������������������������������������������� Farm Machinery and Lawn and Garden Equipment��������������������������������������������������
333111A MA333A��������������������������������������������������� Farm Machinery and Lawn and Garden Equipment��������������������������������������������������
333111C MA333A�������������������������������������������������� Farm Machinery and Lawn and Garden Equipment��������������������������������������������������
333111E MA333A��������������������������������������������������� Farm Machinery and Lawn and Garden Equipment��������������������������������������������������
333111G MA333A�������������������������������������������������� Farm Machinery and Lawn and Garden Equipment��������������������������������������������������
333111J MA333A��������������������������������������������������� Farm Machinery and Lawn and Garden Equipment��������������������������������������������������
3331121 MA333A��������������������������������������������������� Farm Machinery and Lawn and Garden Equipment��������������������������������������������������
3331123 MA333A��������������������������������������������������� Farm Machinery and Lawn and Garden Equipment��������������������������������������������������
3331127 MA333A��������������������������������������������������� Farm Machinery and Lawn and Garden Equipment��������������������������������������������������
3331201 MA333D��������������������������������������������������� Construction Machinery��������������������������������������������������
3331311 MA333F��������������������������������������������������� Mining Machinery��������������������������������������������������
3331315 MA333F��������������������������������������������������� Mining Machinery��������������������������������������������������
3331317 MA333F��������������������������������������������������� Mining Machinery��������������������������������������������������
3331327 MA333F��������������������������������������������������� Mining Machinery��������������������������������������������������
3332987 MA333A��������������������������������������������������� Farm Machinery and Lawn and Garden Equipment��������������������������������������������������
3333131 MA334R��������������������������������������������������� Computers and Office Machines��������������������������������������������������
3333137 MA334R��������������������������������������������������� Computers and Office Machines��������������������������������������������������
333313A MA334R��������������������������������������������������� Computers and Office Machines��������������������������������������������������
333313E MA334R��������������������������������������������������� Computers and Office Machines��������������������������������������������������
333313J MA334R��������������������������������������������������� Computers and Office Machines��������������������������������������������������
3333141 MA334B��������������������������������������������������� Measurement Instruments and Related Products��������������������������������������������������
3333143 MA334B��������������������������������������������������� Measurement Instruments and Related Products��������������������������������������������������
3333197 MA334P��������������������������������������������������� Communication and Other Electronic Equipment��������������������������������������������������
333414A MA335E��������������������������������������������������� Electric Housewares and Fans��������������������������������������������������
3334152 MA333M��������������������������������������������������� Refrigeration, Air Conditioning, and Warm Air Heating Equipment��������������������������������������������������
3334153 MA333M��������������������������������������������������� Refrigeration, Air Conditioning, and Warm Air Heating Equipment��������������������������������������������������
3334155 MA333M��������������������������������������������������� Refrigeration, Air Conditioning, and Warm Air Heating Equipment��������������������������������������������������
3334156 MA333M��������������������������������������������������� Refrigeration, Air Conditioning, and Warm Air Heating Equipment��������������������������������������������������
333415A MA333M��������������������������������������������������� Refrigeration, Air Conditioning, and Warm Air Heating Equipment��������������������������������������������������
333415C MA333M�������������������������������������������������� Refrigeration, Air Conditioning, and Warm Air Heating Equipment��������������������������������������������������
333415E MA333M��������������������������������������������������� Refrigeration, Air Conditioning, and Warm Air Heating Equipment��������������������������������������������������
333415F MA333M��������������������������������������������������� Refrigeration, Air Conditioning, and Warm Air Heating Equipment��������������������������������������������������
333415G MA333M�������������������������������������������������� Refrigeration, Air Conditioning, and Warm Air Heating Equipment��������������������������������������������������
3335121 MQ333W��������������������������������������������������� Metalworking Machinery�������������������������������������������������
3335122 MQ333W��������������������������������������������������� Metalworking Machinery�������������������������������������������������
3335123 MQ333W��������������������������������������������������� Metalworking Machinery�������������������������������������������������
3335124 MQ333W��������������������������������������������������� Metalworking Machinery�������������������������������������������������
3335126 MQ333W��������������������������������������������������� Metalworking Machinery�������������������������������������������������
3335127 MQ333W��������������������������������������������������� Metalworking Machinery�������������������������������������������������
3335128 MQ333W��������������������������������������������������� Metalworking Machinery�������������������������������������������������
3335129 MQ333W��������������������������������������������������� Metalworking Machinery�������������������������������������������������
333512A MQ333W��������������������������������������������������� Metalworking Machinery�������������������������������������������������
3335131 MQ333W��������������������������������������������������� Metalworking Machinery�������������������������������������������������
3335133 MQ333W��������������������������������������������������� Metalworking Machinery�������������������������������������������������
3335135 MQ333W��������������������������������������������������� Metalworking Machinery�������������������������������������������������
3335137 MQ333W��������������������������������������������������� Metalworking Machinery�������������������������������������������������
3336181 MA333L��������������������������������������������������� Internal Combustion Engines��������������������������������������������������
3336183 MA333L��������������������������������������������������� Internal Combustion Engines��������������������������������������������������
3336185 MA333L��������������������������������������������������� Internal Combustion Engines��������������������������������������������������
3339111 MA333P��������������������������������������������������� Pumps and Compressors��������������������������������������������������
3339115 MA333P��������������������������������������������������� Pumps and Compressors��������������������������������������������������
3339121 MA333P��������������������������������������������������� Pumps and Compressors��������������������������������������������������
3339125 MA333P��������������������������������������������������� Pumps and Compressors��������������������������������������������������
3339228 MA333A��������������������������������������������������� Farm Machinery and Lawn and Garden Equipment��������������������������������������������������
3339237 MA333D��������������������������������������������������� Construction Machinery��������������������������������������������������
3339951 MA333N��������������������������������������������������� Fluid Power Products��������������������������������������������������
3339953 MA333N��������������������������������������������������� Fluid Power Products��������������������������������������������������
3339955 MA333N��������������������������������������������������� Fluid Power Products��������������������������������������������������
3339957 MA333N��������������������������������������������������� Fluid Power Products��������������������������������������������������
3339961 MA333N��������������������������������������������������� Fluid Power Products��������������������������������������������������
3339963 MA333N��������������������������������������������������� Fluid Power Products��������������������������������������������������
3339965 MA333N��������������������������������������������������� Fluid Power Products��������������������������������������������������
3339967 MA333N��������������������������������������������������� Fluid Power Products��������������������������������������������������
3339969 MA333N��������������������������������������������������� Fluid Power Products��������������������������������������������������
3339993 MA333N��������������������������������������������������� Fluid Power Products��������������������������������������������������
3339994 MA333N��������������������������������������������������� Fluid Power Products��������������������������������������������������
3339996 MA333N��������������������������������������������������� Fluid Power Products��������������������������������������������������
3339997 MA333N��������������������������������������������������� Fluid Power Products��������������������������������������������������
3341111 MA334R��������������������������������������������������� Computers and Office Machines��������������������������������������������������
3341117 MA334R��������������������������������������������������� Computers and Office Machines��������������������������������������������������
334111D MA334R�������������������������������������������������� Computers and Office Machines��������������������������������������������������
3341121 MA334R��������������������������������������������������� Computers and Office Machines��������������������������������������������������
3341124 MA334R��������������������������������������������������� Computers and Office Machines��������������������������������������������������
3341131 MA334R��������������������������������������������������� Computers and Office Machines��������������������������������������������������
3341134 MA334R��������������������������������������������������� Computers and Office Machines��������������������������������������������������
3341191 MA334R��������������������������������������������������� Computers and Office Machines��������������������������������������������������
3341194 MA334R��������������������������������������������������� Computers and Office Machines��������������������������������������������������
3341197 MA334R��������������������������������������������������� Computers and Office Machines��������������������������������������������������
Annual Survey of Manufactures Appendix F F–3U.S. Census Bureau, 2002 Economic Census Dec. 1, 2004
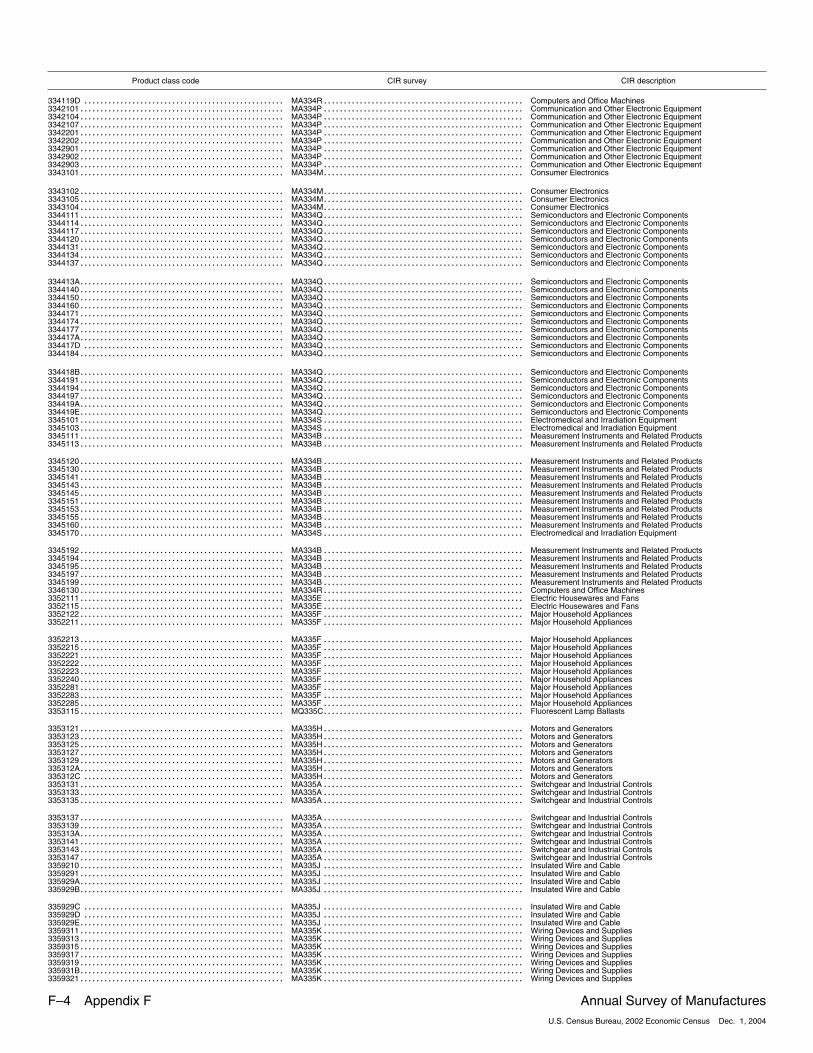
Product class code CIR survey CIR description
334119D MA334R�������������������������������������������������� Computers and Office Machines��������������������������������������������������
3342101 MA334P��������������������������������������������������� Communication and Other Electronic Equipment��������������������������������������������������
3342104 MA334P��������������������������������������������������� Communication and Other Electronic Equipment��������������������������������������������������
3342107 MA334P��������������������������������������������������� Communication and Other Electronic Equipment��������������������������������������������������
3342201 MA334P��������������������������������������������������� Communication and Other Electronic Equipment��������������������������������������������������
3342202 MA334P��������������������������������������������������� Communication and Other Electronic Equipment��������������������������������������������������
3342901 MA334P��������������������������������������������������� Communication and Other Electronic Equipment��������������������������������������������������
3342902 MA334P��������������������������������������������������� Communication and Other Electronic Equipment��������������������������������������������������
3342903 MA334P��������������������������������������������������� Communication and Other Electronic Equipment��������������������������������������������������
3343101 MA334M��������������������������������������������������� Consumer Electronics��������������������������������������������������
3343102 MA334M��������������������������������������������������� Consumer Electronics��������������������������������������������������
3343105 MA334M��������������������������������������������������� Consumer Electronics��������������������������������������������������
3343104 MA334M��������������������������������������������������� Consumer Electronics��������������������������������������������������
3344111 MA334Q��������������������������������������������������� Semiconductors and Electronic Components��������������������������������������������������
3344114 MA334Q��������������������������������������������������� Semiconductors and Electronic Components��������������������������������������������������
3344117 MA334Q��������������������������������������������������� Semiconductors and Electronic Components��������������������������������������������������
3344120 MA334Q��������������������������������������������������� Semiconductors and Electronic Components��������������������������������������������������
3344131 MA334Q��������������������������������������������������� Semiconductors and Electronic Components��������������������������������������������������
3344134 MA334Q��������������������������������������������������� Semiconductors and Electronic Components��������������������������������������������������
3344137 MA334Q��������������������������������������������������� Semiconductors and Electronic Components��������������������������������������������������
334413A MA334Q��������������������������������������������������� Semiconductors and Electronic Components��������������������������������������������������
3344140 MA334Q��������������������������������������������������� Semiconductors and Electronic Components��������������������������������������������������
3344150 MA334Q��������������������������������������������������� Semiconductors and Electronic Components��������������������������������������������������
3344160 MA334Q��������������������������������������������������� Semiconductors and Electronic Components��������������������������������������������������
3344171 MA334Q��������������������������������������������������� Semiconductors and Electronic Components��������������������������������������������������
3344174 MA334Q��������������������������������������������������� Semiconductors and Electronic Components��������������������������������������������������
3344177 MA334Q��������������������������������������������������� Semiconductors and Electronic Components��������������������������������������������������
334417A MA334Q��������������������������������������������������� Semiconductors and Electronic Components��������������������������������������������������
334417D MA334Q�������������������������������������������������� Semiconductors and Electronic Components��������������������������������������������������
3344184 MA334Q��������������������������������������������������� Semiconductors and Electronic Components��������������������������������������������������
334418B MA334Q��������������������������������������������������� Semiconductors and Electronic Components��������������������������������������������������
3344191 MA334Q��������������������������������������������������� Semiconductors and Electronic Components��������������������������������������������������
3344194 MA334Q��������������������������������������������������� Semiconductors and Electronic Components��������������������������������������������������
3344197 MA334Q��������������������������������������������������� Semiconductors and Electronic Components��������������������������������������������������
334419A MA334Q��������������������������������������������������� Semiconductors and Electronic Components��������������������������������������������������
334419E MA334Q��������������������������������������������������� Semiconductors and Electronic Components��������������������������������������������������
3345101 MA334S��������������������������������������������������� Electromedical and Irradiation Equipment��������������������������������������������������
3345103 MA334S��������������������������������������������������� Electromedical and Irradiation Equipment��������������������������������������������������
3345111 MA334B��������������������������������������������������� Measurement Instruments and Related Products��������������������������������������������������
3345113 MA334B��������������������������������������������������� Measurement Instruments and Related Products��������������������������������������������������
3345120 MA334B��������������������������������������������������� Measurement Instruments and Related Products��������������������������������������������������
3345130 MA334B��������������������������������������������������� Measurement Instruments and Related Products��������������������������������������������������
3345141 MA334B��������������������������������������������������� Measurement Instruments and Related Products��������������������������������������������������
3345143 MA334B��������������������������������������������������� Measurement Instruments and Related Products��������������������������������������������������
3345145 MA334B��������������������������������������������������� Measurement Instruments and Related Products��������������������������������������������������
3345151 MA334B��������������������������������������������������� Measurement Instruments and Related Products��������������������������������������������������
3345153 MA334B��������������������������������������������������� Measurement Instruments and Related Products��������������������������������������������������
3345155 MA334B��������������������������������������������������� Measurement Instruments and Related Products��������������������������������������������������
3345160 MA334B��������������������������������������������������� Measurement Instruments and Related Products��������������������������������������������������
3345170 MA334S��������������������������������������������������� Electromedical and Irradiation Equipment��������������������������������������������������
3345192 MA334B��������������������������������������������������� Measurement Instruments and Related Products��������������������������������������������������
3345194 MA334B��������������������������������������������������� Measurement Instruments and Related Products��������������������������������������������������
3345195 MA334B��������������������������������������������������� Measurement Instruments and Related Products��������������������������������������������������
3345197 MA334B��������������������������������������������������� Measurement Instruments and Related Products��������������������������������������������������
3345199 MA334B��������������������������������������������������� Measurement Instruments and Related Products��������������������������������������������������
3346130 MA334R��������������������������������������������������� Computers and Office Machines��������������������������������������������������
3352111 MA335E��������������������������������������������������� Electric Housewares and Fans��������������������������������������������������
3352115 MA335E��������������������������������������������������� Electric Housewares and Fans��������������������������������������������������
3352122 MA335F��������������������������������������������������� Major Household Appliances��������������������������������������������������
3352211 MA335F��������������������������������������������������� Major Household Appliances��������������������������������������������������
3352213 MA335F��������������������������������������������������� Major Household Appliances��������������������������������������������������
3352215 MA335F��������������������������������������������������� Major Household Appliances��������������������������������������������������
3352221 MA335F��������������������������������������������������� Major Household Appliances��������������������������������������������������
3352222 MA335F��������������������������������������������������� Major Household Appliances��������������������������������������������������
3352223 MA335F��������������������������������������������������� Major Household Appliances��������������������������������������������������
3352240 MA335F��������������������������������������������������� Major Household Appliances��������������������������������������������������
3352281 MA335F��������������������������������������������������� Major Household Appliances��������������������������������������������������
3352283 MA335F��������������������������������������������������� Major Household Appliances��������������������������������������������������
3352285 MA335F��������������������������������������������������� Major Household Appliances��������������������������������������������������
3353115 MQ335C��������������������������������������������������� Fluorescent Lamp Ballasts��������������������������������������������������
3353121 MA335H��������������������������������������������������� Motors and Generators��������������������������������������������������
3353123 MA335H��������������������������������������������������� Motors and Generators��������������������������������������������������
3353125 MA335H��������������������������������������������������� Motors and Generators��������������������������������������������������
3353127 MA335H��������������������������������������������������� Motors and Generators��������������������������������������������������
3353129 MA335H��������������������������������������������������� Motors and Generators��������������������������������������������������
335312A MA335H��������������������������������������������������� Motors and Generators��������������������������������������������������
335312C MA335H�������������������������������������������������� Motors and Generators��������������������������������������������������
3353131 MA335A��������������������������������������������������� Switchgear and Industrial Controls��������������������������������������������������
3353133 MA335A��������������������������������������������������� Switchgear and Industrial Controls��������������������������������������������������
3353135 MA335A��������������������������������������������������� Switchgear and Industrial Controls��������������������������������������������������
3353137 MA335A��������������������������������������������������� Switchgear and Industrial Controls��������������������������������������������������
3353139 MA335A��������������������������������������������������� Switchgear and Industrial Controls��������������������������������������������������
335313A MA335A��������������������������������������������������� Switchgear and Industrial Controls��������������������������������������������������
3353141 MA335A��������������������������������������������������� Switchgear and Industrial Controls��������������������������������������������������
3353143 MA335A��������������������������������������������������� Switchgear and Industrial Controls��������������������������������������������������
3353147 MA335A��������������������������������������������������� Switchgear and Industrial Controls��������������������������������������������������
3359210 MA335J��������������������������������������������������� Insulated Wire and Cable��������������������������������������������������
3359291 MA335J��������������������������������������������������� Insulated Wire and Cable��������������������������������������������������
335929A MA335J��������������������������������������������������� Insulated Wire and Cable��������������������������������������������������
335929B MA335J��������������������������������������������������� Insulated Wire and Cable��������������������������������������������������
335929C MA335J�������������������������������������������������� Insulated Wire and Cable��������������������������������������������������
335929D MA335J�������������������������������������������������� Insulated Wire and Cable��������������������������������������������������
335929E MA335J��������������������������������������������������� Insulated Wire and Cable��������������������������������������������������
3359311 MA335K��������������������������������������������������� Wiring Devices and Supplies��������������������������������������������������
3359313 MA335K��������������������������������������������������� Wiring Devices and Supplies��������������������������������������������������
3359315 MA335K��������������������������������������������������� Wiring Devices and Supplies��������������������������������������������������
3359317 MA335K��������������������������������������������������� Wiring Devices and Supplies��������������������������������������������������
3359319 MA335K��������������������������������������������������� Wiring Devices and Supplies��������������������������������������������������
335931B MA335K��������������������������������������������������� Wiring Devices and Supplies��������������������������������������������������
3359321 MA335K��������������������������������������������������� Wiring Devices and Supplies��������������������������������������������������
F–4 Appendix F Annual Survey of ManufacturesU.S. Census Bureau, 2002 Economic Census Dec. 1, 2004

Product class code CIR survey CIR description
3359323 MA335K��������������������������������������������������� Wiring Devices and Supplies��������������������������������������������������
3359326 MA335K��������������������������������������������������� Wiring Devices and Supplies��������������������������������������������������
3359997 MA334P��������������������������������������������������� Communication and Other Electronic Equipment��������������������������������������������������
335999A MA334P��������������������������������������������������� Communication and Other Electronic Equipment��������������������������������������������������
335999B MA334P��������������������������������������������������� Communication and Other Electronic Equipment��������������������������������������������������
335999F MA334P��������������������������������������������������� Communication and Other Electronic Equipment��������������������������������������������������
336322D MA334Q�������������������������������������������������� Semiconductors and Electronic Components��������������������������������������������������
3363917 MA333M��������������������������������������������������� Refrigeration, Air Conditioning, and Warm Air Heating Equipment��������������������������������������������������
336391B MA333M��������������������������������������������������� Refrigeration, Air Conditioning, and Warm Air Heating Equipment��������������������������������������������������
3364113 M336G��������������������������������������������������� Civil Aircraft and Aircraft Engines���������������������������������������������������
3364123 M336G��������������������������������������������������� Civil Aircraft and Aircraft Engines���������������������������������������������������
3391118 MA334B��������������������������������������������������� Measurement Instruments and Related Products��������������������������������������������������
3399427 MA334R��������������������������������������������������� Computers and Office Machines��������������������������������������������������
Annual Survey of Manufactures Appendix F F–5U.S. Census Bureau, 2002 Economic Census Dec. 1, 2004

Appendix G.Product Classes Primary to More Than One Industry
Productclass code Product class description
Pork, processed or cured, not canned or made into sausage311611G Pork, processed or cured, not canned or made into sausage, made in slaughtering plants3116121 Pork, processed or cured, not canned or made into sausage, made from purchased carcasses
Sausage and similar products, except canned311611J Sausage and similar products, except canned, made in slaughtering plants3116124 Sausage and similar products, except canned, made from purchased carcasses
Canned meats (except dog, cat, and baby food)311611M Canned meats (except dog, cat, and baby food), made in slaughtering plants3116127 Canned meats (except dog, cat, and baby food), made from purchased carcasses
Prepared flour mixes (including refrigerated and frozen doughs and batters)311211A Prepared flour mixes (including refrigerated and frozen doughs and batters), made in flour mills3118220 Prepared flour mixes (including refrigerated and frozen doughs and batters), made from purchased flour
Chocolate and chocolate�type confectionery products3113204 Chocolate and chocolate�type confectionery products, made from cacao beans3113301 Chocolate and chocolate�type confectionery products, made from purchased chocolate, not retailed at manufacturing establishment3113302 Chocolate and chocolate�type confectionery products, made from purchased chocolate, retailed at manufacturing establishment
Textured, crimped, and bulked filament yarns3131125 Textured, crimped, and bulked filament yarns, including stretch yarn, made from purchased filament yarn3252210 Rayon, acetate, and lyocell manufactured fibers3252221 Nylon and other polyamide manufactured fibers3252224 Polyolefin manufactured fibers3252227 Polyester manufactured fibers325222A Other manufactured noncellulosic fibers (excluding glass, carbon, and graphite)
Finished cotton broadwoven fabrics3132109 Finished cotton broadwoven fabrics, finished in weaving mills3133111 Finished cotton broadwoven fabrics, finished in finishing mills
Fabricated textile products313210D Fabricated textile products, made in weaving mills3141293 Sheets and pillowcases, made from purchased materials3141291 Bedspreads, made from purchased materials3141295 Towels and washcloths, made from purchased materials3141296 Other household furnishings, made from purchased materials
Finished manmade fiber and silk broadwoven fabrics313210P Finished manmade fiber and silk broadwoven fabrics, finished in weaving mills3133115 Finished manmade fiber and silk broadwoven fabrics, finished in finishing mills
Men’s and boys’ knit dress and sport shirts (including polo, tank tops, sweat and t�shirts)3151917 Men’s and boys’ knit dress and sport shirts (including polo, tank tops, sweat and t�shirts), made in knitting mills3152231 Men’s and boys’ knit dress and sport shirts (including polo, tank tops, sweat and t�shirts), made from purchased fabrics
Men’s and boys’ knit underwear, nightwear, and robes (including thermal, undershirts, undershorts and briefs, and woven boxer shorts)3151921 Men’s and boys’ knit underwear, nightwear, and robes (including thermal, undershirts, undershorts and briefs, and woven boxer shorts), made in knitting mills3152210 Men’s and boys’ knit underwear, nightwear, and robes (including thermal, undershirts, undershorts and briefs, and woven boxer shorts), made from purchased fabrics
Women’s, girls’, and infants’ knit underwear and nightwear3151924 Women’s, girls’, and infants’ knit underwear and nightwear, made in knitting mills3152311 Women’s and girls’ underwear, except foundation garments, made from purchased fabrics3152313 Women’s and girls’ nightwear, except robes, made from purchased fabrics3152315 Women’s and girls’ brassieres, bra�lettes, and bandeaux, made from purchased fabrics3152318 Women’s and girls’ corsets (except surgical), girdles, and combinations, made from purchased fabrics3152319 Women’s and girls’ robes and dressing gowns, made from purchased fabrics3152910 Infants’ apparel, made from purchased fabrics
Gloves and mittens315191G Gloves and mittens, made in knitting mills3159921 Gloves and mittens, made from purchased fabrics3159923 Gloves and mittens, leather�and�fabric combinations, made from purchased leather and fabrics3159925 Gloves and mittens, all leather, made from purchased leather
Hardwood lumber3211131 Hardwood lumber, made in sawmills3219121 Hardwood lumber, made from purchased lumber
Softwood lumber3211133 Softwood lumber, made in sawmills3219123 Softwood lumber, made from purchased lumber
Disposable diapers and similar disposable products322121K Disposable diapers and similar disposable products, made in paper mills3222912 Disposable diapers and similar disposable products, made from purchased sanitary paper stock or wadding
Sanitary tissue paper products322121N Sanitary tissue paper products, made in paper mills3222915 Sanitary tissue paper products, made from purchased sanitary paper stock or wadding
Petroleum lubricating oils and greases324110G Petroleum lubricating oils and greases, made in a refinery3241910 Petroleum lubricating oils and greases, made from refined petroleum
Liquefied refinery gases (aliphatics)324110P Liquefied refinery gases (aliphatics), made in a refinery3251104 Liquefied refinery gases (aliphatics), made in petrochemical plants
Aromatics (benzene, toluene, xylene, etc.)324110T Aromatics (benzene, toluene, xylene, etc.), made in a refinery3251101 Aromatics (benzene, toluene, xylene, etc.), made in petrochemical plants
Other finished petroleum products, including waxes324110T Other finished petroleum products, including waxes, made in a refinery3241992 All other petroleum and coal products, excluding coke oven products, made from refined petroleum
Annual Survey of Manufactures Appendix G G–1U.S. Census Bureau, 2002 Economic Census Mar. 11, 2005

Productclass code Product class description
Mixed fertilizers3253127 Mixed fertilizers, made in plants which manufacture fertilizer materials3253140 Mixed fertilizers, mixing only
Other glass products3272114 Other glass products, made by flat glass producers327215B Other glass products, made from purchased glass
Machine�made pressed and blown table, kitchen, art, and novelty glassware3272123 Machine�made pressed and blown table, kitchen, art, and novelty glassware, made by glass producers3272151 Machine�made pressed and blown table, kitchen, art, and novelty glassware, made from purchased glass
Machine�made pressed and blown glassware (excluding table, kitchen, art, and novelty)3272125 Machine�made pressed and blown lighting, automotive, and electronic glassware, made by glass producers3272127 All other machine�made pressed and blown glassware (including technical and scientific glassware, glass blocks, and lens blanks), made by glass producers3272153 All other machine�made pressed and blown glassware (including lighting, automotive, electronic, scientific, laboratory, industrial, and technical), made from purchased glass
Handmade pressed and blown glassware3272129 Handmade pressed and blown glassware, made by glass producers3272155 Handmade pressed and blown glassware, made from purchased glass3311111 Coke oven and blast furnace products, made in steel mills3241991 Coke oven and blast furnace products, made in coke oven establishments
Steel wire, including galvanized and other coated wire3311119 Steel wire, including galvanized and other coated wire, made in steel mills producing wire rods or hot rolled bars3312225 Steel wire, including galvanized and other coated wire, made in plants that draw wire
Steel pipes and tubes331111B Steel pipes and tubes, made in steel mills producing semifinished shapes or plate3312100 Iron and steel pipes and tubes, made from purchased iron and steel
Cold rolled steel sheet and strip331111D Cold rolled steel sheet and strip, made in steel mills producing hot rolled sheet or strip3312211 Cold rolled steel sheet and strip, made from purchased steel
Cold finished steel bars and bar shapes331111F Cold finished steel bars and bar shapes, made in steel mills producing hot rolled bars and bar shapes3312213 Cold finished steel bars and bar shapes, made from purchased steel
Seamless rolled ring forgings, ferrous331111H Seamless rolled ring forgings, ferrous, made in steel mills3321115 Seamless rolled ring forgings, ferrous, made from purchased iron and steel
Open die and smith forgings (hammer and press), ferrous331111J Open die and smith forgings (hammer and press), ferrous, made in steel mills3321117 Open die and smith forgings (hammer and press), ferrous, made from purchased iron and steel
Noninsulated ferrous wire rope, cable, forms, and strand3312221 Noninsulated ferrous wire rope, cable, forms, and strand, made in plants that draw wire3326181 Noninsulated ferrous wire rope, cable, forms, and strand, made from purchased wire
Steel nails, staples, tacks, spikes, and brads3312223 Steel nails, staples, tacks, spikes, and brads, made in plants that draw wire3326189 Steel nails, staples, tacks, spikes, and brads, made from purchased wire
Steel fencing and fence gates3312227 Steel fencing and fence gates, made in plants that draw wire3326187 Steel fencing and fence gates, made from purchased wire
Ferrous wire cloth and other ferrous woven wire products3312229 Ferrous wire cloth and other ferrous woven wire products, made in plants that draw wire3326183 Ferrous wire cloth and other ferrous woven wire products, made from purchased wire
Other ferrous wire products (excluding springs)331222B Other ferrous wire products (excluding springs), made in plants that draw wire332618B Other ferrous wire products (excluding springs), made from purchased wire
Aluminum ingot, including billet3313120 Aluminum ingot, including billet, made in primary aluminum reduction plants3313142 Aluminum ingot, including billet, made by secondary smelters331319D Aluminum ingot, including billet, made in aluminum rolling mills and plants that draw wire from purchased or recovered aluminum
Apparatus wire and cord and flexible cord sets (except wiring harnesses and fiber optic)331319E Aluminum insulated wire and cable, made in aluminum rolling and drawing plants3314224 Copper wire and cable, including apparatus wire, cord, and flexible cord sets, made in plants that draw wire331491F Apparatus wire and cord and flexible cord sets (except aluminum, copper, wiring harnesses and fiber optic), made in plants that draw wire335999B Apparatus wire and cord and flexible cord sets (except wiring harnesses and fiber optic), made from purchased insulated wire
Smelting and refining of copper3314110 Primary smelting and refining of copper3314230 Secondary smelting, refining, and alloying of copper
Smelting and refining of zinc3314193 Primary smelting and refining of zinc3314927 Secondary smelting, refining, and alloying of zinc
Precious metals and precious metal alloys3314197 Primary precious metals and precious metal alloys3314929 Secondary precious metals and precious metal alloys
All other miscellaneous nonferrous metals331419A All other miscellaneous primary nonferrous metals331492B All other miscellaneous secondary nonferrous metals
G–2 Appendix G Annual Survey of ManufacturesU.S. Census Bureau, 2002 Economic Census Mar. 11, 2005

��
��
����
������
��
� �����
���
�������
��
������
����
�����
���� �
���
��
������