The impact of "3C" factors on making pricing
17
Polytechnic Journal of Humanities and Social Sciences 112 Polytechnic Journal of Humanities and Social Sciences Volume 3 No. 1 (2022); pages; DOI: 10.25156/ptjhss.v3n1y2022.pp112-128 Received 15 March 2022; Accepted 4 April 2022; Regular research paper: Published 21 May 2022 Corresponding author’s e-mail: Hazim.mohammed@su,edu.krd Copyright © 2022 Hazim, Zhelan. This is an open access article distributed under the Creative Commons Attribution License (CC BY-NC-ND 4.0) Abstract—(3C) factors are cost, customer and competition that have an effect on company's objective through making pricing decision. The goal of this research is to highlight the estimation of the different causes that has an influence on pricing decision and how well a company can handle these factors effectively to achieve goals of the company. The main research problem is represented; “Does the "3C" factors have an impact on making pricing decision to achieve of company’s objectives?” The researchers used the analytical approach methods (SPSS and Easy Fit) to analyze the questionnaire form through distributing (148) questionnaires to industrial companies (managers, Vic managers and division managers) and academics (economic & administrative collage) in Erbil city. Following the analysis, the researchers came to the conclusion that the (3C) explain 69.1% (coefficient of determination) of the changes in making pricing decisions and explains 60.4% of the changes in making pricing decisions in order to achieve the study's objectives and test its hypotheses. (Coefficient of determination) of the changes in company’s objective, (that mean (3C) have a significant effect on making pricing decision to achieve company's objectives. The most important result of the research is the “3C” factors have great influences on making pricing decision to achieve goals of company" Keywords—(3C), Making pricing decision, company’s objectives. First axis (part): The general framework of the study: 1-1 INTRODUCTION There are some factors that characterize and represent the current age such as fast changes in the modern manufacturing environment, the emergence of developing technologies, the decrease of the role of the human element, shortage of talent and resources, the appearance of global trade companies, and the power of competition in the presence of open markets for products and services. (Mohammed, 2020). Every business today faces the challenge of maximizing shareholder returns while remaining competitive and relevant in a volatile and unstable market. Managers face a slew of responsibilities as a result of the profit maximization motive and the need to stay in the market. One of these massive tasks is deciding on a price. The major target of any pricing decision is to achieve the company's objectives. The objectives of a company may differ based on the nature of the business. So every pricing decision need to take into account many factors in order to reach the company's goals, either directly or indirectly (Monroe, 2003), especially when markets are totally in a competitive state. Company's objectives can be achieved through various methods. Companies can concentrate on some ways like: cost decrease, increase in market share, preserving customers and bringing new customers, setting of high price, etc. for upgrading profit level as target of any business company. a company's business stage strategy might be cost leadership or product differentiation aimed at achieving the company's set objectives based on the strategic management school of thought. The cost leadership strategy achieves success by lowering costs rather than competing, whereas the product differentiation strategy focuses on producing high- quality products. It has been argued in economic theory that regardless of the type of business level strategy adopted by a company, the consumer for the similar product varies (Olawale & Joel, 2017). Every business entity, without care of their business line or objectives, must take cost minimization and profit maximization into consideration. There will always The impact of "3C" factors on making pricing decision to achieve company’s objectives: A study of the opinions of a sample of industrial companies' managers and specialized academics/Erbil Assist. Prof. Dr. Hazim H. Mohammed 1 , Zhelan A. Sadeq 2 1 Department of Accounting, Erbil Salahaddin University, Erbil, Kurdistan Region – Iraq 2 MSc. Student at Department of Accounting, Salahaddin University, Erbil, Kurdistan Region – Iraq
-
Upload
khangminh22 -
Category
Documents
-
view
5 -
download
0
Transcript of The impact of "3C" factors on making pricing

Polytechnic Journal of Humanities and Social Sciences 112
Polytechnic Journal of Humanities and Social Sciences
Volume 3 No. 1 (2022); pages; DOI: 10.25156/ptjhss.v3n1y2022.pp112-128
Received 15 March 2022; Accepted 4 April 2022; Regular research paper: Published 21 May 2022
Corresponding author’s e-mail: Hazim.mohammed@su,edu.krd
Copyright © 2022 Hazim, Zhelan. This is an open access article distributed under the Creative Commons Attribution License (CC BY-NC-ND
4.0)
Abstract—(3C) factors are cost, customer and competition that
have an effect on company's objective through making pricing
decision. The goal of this research is to highlight the estimation of
the different causes that has an influence on pricing decision and
how well a company can handle these factors effectively to
achieve goals of the company. The main research problem is
represented; “Does the "3C" factors have an impact on making
pricing decision to achieve of company’s objectives?” The
researchers used the analytical approach methods (SPSS and
Easy Fit) to analyze the questionnaire form through distributing
(148) questionnaires to industrial companies (managers, Vic
managers and division managers) and academics (economic &
administrative collage) in Erbil city. Following the analysis, the
researchers came to the conclusion that the (3C) explain 69.1%
(coefficient of determination) of the changes in making pricing
decisions and explains 60.4% of the changes in making pricing
decisions in order to achieve the study's objectives and test its
hypotheses. (Coefficient of determination) of the changes in
company’s objective, (that mean (3C) have a significant effect on
making pricing decision to achieve company's objectives. The
most important result of the research is the “3C” factors have
great influences on making pricing decision to achieve goals of
company"
Keywords—(3C), Making pricing decision, company’s
objectives.
First axis (part): The general framework of the study:
1-1 INTRODUCTION
There are some factors that characterize and represent the
current age such as fast changes in the modern manufacturing
environment, the emergence of developing technologies, the
decrease of the role of the human element, shortage of talent
and resources, the appearance of global trade companies, and
the power of competition in the presence of open markets for
products and services. (Mohammed, 2020). Every business
today faces the challenge of maximizing shareholder returns
while remaining competitive and relevant in a volatile and
unstable market. Managers face a slew of responsibilities as a
result of the profit maximization motive and the need to stay
in the market. One of these massive tasks is deciding on a
price. The major target of any pricing decision is to achieve
the company's objectives. The objectives of a company may
differ based on the nature of the business. So every pricing
decision need to take into account many factors in order to
reach the company's goals, either directly or indirectly
(Monroe, 2003), especially when markets are totally in a
competitive state. Company's objectives can be achieved
through various methods. Companies can concentrate on some
ways like: cost decrease, increase in market share, preserving
customers and bringing new customers, setting of high price,
etc. for upgrading profit level as target of any business
company. a company's business stage strategy might be cost
leadership or product differentiation aimed at achieving the
company's set objectives based on the strategic management
school of thought. The cost leadership strategy achieves
success by lowering costs rather than competing, whereas the
product differentiation strategy focuses on producing high-
quality products. It has been argued in economic theory that
regardless of the type of business level strategy adopted by a
company, the consumer for the similar product varies
(Olawale & Joel, 2017). Every business entity, without care of
their business line or objectives, must take cost minimization
and profit maximization into consideration. There will always
The impact of "3C" factors on making pricing
decision to achieve company’s objectives: A
study of the opinions of a sample of industrial
companies' managers and specialized
academics/Erbil
Assist. Prof. Dr. Hazim H. Mohammed1
, Zhelan A. Sadeq
2
1Department of Accounting, Erbil Salahaddin University, Erbil, Kurdistan Region – Iraq
2 MSc. Student at Department of Accounting, Salahaddin University, Erbil, Kurdistan Region – Iraq

Polytechnic Journal of Humanities and Social Sciences
113
DOI: 10.25156/ptjhss.v3n1y2022.pp112-128
be a need to reduce costs and expand products. Every single
business is established and supposed to offer competitive price
regardless they are small or large private or public private
(Ayozie, 2008). According to Hilton (2005), the most
important and difficult dicision a manager from a company
make is to set price for company’s products and services,
because of many reasons that need to considered, Customers,
cost, competition, political, environmental, legal, and image-
related issues are some of the factors that impact pricing
decisions. The researchers will be selecting the first three
factors as an independent variable in order to reach the
hypothesis and research objectives.
Methodological framework: This thesis is about a
description of the study methodology for identifying and
treating the problem in order to meet the study's objective. By
defining the research problem, its significance, aims,
hypotheses, and limitations, as well as the model. Based on the
foregoing, the study methodology can be presented, as the
following;
Research problems: Making a decision entails selecting a
process from among the alternatives, knowing all of the
information regarding the different alternatives available, and
selecting the one with the lowest cost or highest profit. Pricing
is a decision that should be made with great care because of
the nature of the decision and its impact on the company's
total goals and objectives, which are primarily upgrade profit,
market expansion, customer maintenance, and customer
attraction, all of which are influenced by a variety of factors
such as competition, customers, and costs. So according to
above, the research problem could be presented, via the
following: The main research problem is represented; “Does
the "3C" factors have an impact on making pricing decision to
achieve the company’s objectives?”
The following main questions can help to clarify the research
problem:
1. Does the customer factor have an impact on making
pricing decisions to achieve company’s objectives?
2. Does the competition factor have an impact on making
pricing decisions to achieve company’s objectives?
3. Does the cost factor have an impact on making pricing
decisions to achieve company’s objective?
Research objectives: This research aims to highlight the
revelation of the various causes that effecting pricing
decisions and how well a company candela with these factors
correctly to obtain the company's objectives. The research
focuses on the pricing policy decision and the role of the
company's objectives in the pricing decision process. "Pricing
will be examined from the perspective of research sample,
who will examine how a relationship between price and the
various factors that affect it can be established." It evaluates
the role of the price of similar products on the achievement of
the company's objectives in Erbil / Iraq.
Research importance: It deals with the importance of the
research that pricing decisions is one of the most effective and
essential traditional technique in managerial accounting in
light of the increasing competition, technical and
administrative development, whether at the local or
international level in how effect each of cost, customer and
competition factor in making pricing decisions of products and
services in industrial companies in order to achieve their
objectives of expanding the market base, maintaining existing
customers, attracting new customers and maximizing
profitability in light of the marginal manufacturing
environment and changing markets.
Research hypothesis: The following hypothesis can be
developed based on the research problem and objectives: "The
general hypothesis of the research is that the “3C” factors have
great influences on making pricing decision to achieve goals
of company”. The hypothesis can be divided into the
following:
1: Hypothesis of impact:
First main hypothesis: There is impact of the three factors on
making pricing decision
The following three sub-hypotheses are derived from the first
main hypothesis:
- There is impact of the cost factor on making pricing
decision
- There is impact of the customer factor on making pricing
decision
- There is impact of the competition factor on making
pricing decision
Second main hypothesis: There is impact of the making
pricing decision on company’s objective
2: Hypotheses of impact difference:
First main hypothesis: There is difference in the independent
variable (three factors together) impact on the making
pricing decision according to profession
The following three sub-hypotheses are derived from the first
main hypothesis:
- There is difference in the cost factor impact on the
making pricing decision according to career position.
- There is difference in the customer factor impact on the
making pricing decision according to career position.
- There is difference in the competition factor impact on
the making pricing decision according to career position.
Second main hypothesis: There is difference in impact of the
making pricing decision on the company’s objective
according to career position
Research limits: The researcher chose the opinions of the
managers and vice managers in a group of industrial

114 Polytechnic Journal of Humanities and Social Sciences
DOI: 10.25156/ptjhss.v3n1y2022.pp112-128
companies in the Erbil governorate, and a sample was studied
to reach the goal and prove the hypothesis.
Research Methodology: To complete this research, the
researcher uses the scientific method, which consists of a set
of methods, to attain the research's aims and hypotheses, are:
The inductive approach is to determine the study problem and
test hypotheses. The deductive method is to determine the
study axes and hypotheses development. The historical
approach is to review previous studies, review books,
scientific references and periodicals related to the research
subject, and the descriptive analytical approach uses the
sample on industrial companies operating in the local
environment and the use of statistical methods (SPSS and
Easy Fit) to analyze the questionnaire form.
Conceptual framework of the research: The independent,
mediating, and dependent variables can be shown as follows
based on the research problem:
1. Independent variables: “3C” factors: These are those
factors that have an effect on making pricing decision to
achieve company’s objective, and it consists of (1st C, cost,
2nd
C, competition and 3rd
C, customers).
2. Mediating variable: making pricing decision: It is an
intermediate variable that leads to the achievement of the
company's goal due to the "3C" factors.
3. The dependent variable: company objective: These are
those objectives or goals that are affected by “3 C” factors,
and they consist of "profitability goal, expanding market
basic, maintaining customers and attracting new
customers.
The study was divided into four parts in an effort to attain the
overall objective of the study, which is as follows: The first
part dealt with the methodological framework of the study and
some of the literature review. The second part presented the
theoretical framework of the study. The third part was devoted
to the aspect Applied by analyzing the questionnaire list in a
sample of industrial companies in Erbil governorate using the
statistical method used to show the effect of “3C” factors on
making pricing decisions in order to reach the achievement of
the company’s goals. The fourth part deals with the most
important conclusions and recommendations reached by the
researcher from Theoretical and practical side.
1-2 Previous studies and what distinguishes them from the
current study: According to Yaskal & Melnyk (2013) to
deals with the methodological and theoretical interpretation of
the economic core of the two types of “competition” and
competitiveness, and revealed the results of the study in
theory, illustrating the local scientific achievement where, they
provide a broad analysis of the conceptual form of the
fundamental theoretical issues of competitiveness with
analysis of method and synthesis as well as A source to
improve competitiveness between companies. In terms of
according to Schiefer (2013) aims to analyze how competitor
intelligence affects strategic purchasing decisions on the
allocation of supplier resources and leads to a competitive
advantage, and the results show that the relationship between
buyer and supplier slightly affected by competitor intelligence;
The assumption that competitor information bring about a
better allocation of resources and eventually positively affects
a company's competitive advantage is widely accepted by
partakers in competitive markets. But According to Coller &
Collini (2014) focuses on analyzing the value of accuracy in
the context of full cost pricing procedure. Despite economic
theory, argues that price determination in profit maximization
should be independent of how a firm allocates fixed overhead
costs to products; fixed cost allocation has been shown to be
commonly used in practice. Vulnerabilities of systems in
companies in the long run A lower level of accuracy may
increase company profits, in addition to the role that accuracy
plays, depends largely on the characteristics of the decision
context in which the cost data is operating (i.e., the full cost
pricing decision) and on the existence of differences in the
characteristics of Products Market. Ndyamukama and
Machibya (2015) conducted research to discover the
relationship between pricing strategies and customer retention.
This resulted from a long-term observation of customers who
used to switch from Airtel (T) Ltd to other mobile industry
competitors, and the most important finding of this study was
that there is a great relationship between customer retention
and pricing strategies, and thus in attempt to maintain as many
customers as possible. Customers demanded that Airtel devise
better pricing strategies in order to attract as many customers
as possible. Whereas, according to Kim et al. (2018) focused
on verifying and evaluating the factors (capacity, varying
expenses, level of influence in determining selling price, cost
of information and market share) that affect cost-based pricing
method for feed, mills in Vietnam, the study results indicated
that cost-based pricing method of enterprises is greatly
affected by the cost information; The least influential factors
are selling price and market share. Wilson & Christella (2019)
mention to analyze the effect of website design,
trustworthiness, time saved, product diversity, and delivery
efficiency towards customer content. In the Indonesian e-
commerce industry. According to the findings of this study all
these factors, reliability, time saved, product variation, and
delivery well-functioning all have a positive and great effect
on customer satisfaction, but product variation has the
strongest influence among the other variables. This study,
however, discovered that there is no positive and important
relationship between customer content and website design.
According to Cantet al. (2016) the primary goal of this study
was to inquire into the causes (Consumer, Cost, Demand
curve, Competitors, and so on) considered by small business
enterprises (SME's) when upgrading their pricing strategies.
The study discovered that SME's totally recognize that

Polytechnic Journal of Humanities and Social Sciences
115
DOI: 10.25156/ptjhss.v3n1y2022.pp112-128
competitor knowledge affect price setting as well as macro
environmental factors such as fuel prices and inflation. As for
The study (Amaral & Guerreiro, 2019) focus to identify the
factors that explain price determination, as the additional cost
formula is not only the pricing method but more importantly
the core of pricing. Factors (two barriers to deploying value-
based pricing, forced similarity, and full-cost use), but
negatively correlated with five (firm size, competitors' ability
to copy, standard similarity, and experience). According to
Fareed et al (2016), the study investigates the effect of key
determinants of ability sector profitability in Pakistan such as
firm size, firm age, firm development, productivity,
competition, and cost discussed in the broader
multidisciplinary literature. The study's findings show that
firm productivity, firm size, and competition are among the
most powerful factors determining profitability in Pakistan's
power and energy sectors. Finally, Toni et al. (2017)
conducted a study focused on proposing and testing a
theoretical model that shows the effects of pricing policy on
company profitability, and the majority of the results show
that the value-based value has a positive effect on the
profitability of the companies studied. Low price levels have a
negative impact on pricing strategy and high price levels,
indicating that pricing policies affect organizational
profitability; thus, a more strategic view of the pricing process
may be one aspect that managers cannot overlook.
Following the presentation of some previous studies belonging
to the topic of the research, the researchers found out that
there is a poor relationship between the previous studies and
the title of the research. Previous research examined the
impact of cost on pricing decisions for a company's products
and services, while others examined customers' attitudes
toward products and services in terms of price, quality, and
delivery speed. The remaining studies concentrated on the
impact of competition and competitors on product and service
pricing. However, the current study is an extension of previous
research on the effect of (3C) factors on pricing decisions to
achieve corporate goals. This research is noteworthy. The
current study aimed to demonstrate the impact of each factor
(cost, customer, and competition) on pricing decisions in order
to meet the company's goals separately, which was not
addressed in previous studies. This study differs from previous
studies through attempting to show the extent to which each
factor (cost, customer and competition) alone and together
influences on making pricing decisions to achieve the
company's goals (which is the strategy of expanding the
market base, maintaining existing customers, acquiring new
customers and maximizing profitability) together, which was
not addressed by previous studies. To the best of our
knowledge, this is the first study at the Iraqi and Kurdistan
Region levels.
Second axis: The theoretical side of the study:
2-1: Concept of “3C” and its important: In this section, the
researchers will focus on the three factors of cost, customer
and competition in some detail:
2-1-1: A brief overview of 1st factor (Cost): Cost is a term
that is frequently used in all types of industrial, non-industrial,
commercial, service, and retail establishments. The process
encompasses management functions such as planning, control,
decision making, and coordination, as well as the provision of
cost data that is useful and appropriate for making managerial
decisions such as pricing decisions. The cost of a good or
service is a monetary measure of the resources sacrificed to
achieve that goal. The cost of an object is a monetary measure
of the amount of resources used to create it (Mohammed,
2021). Cost is defined by Datar and Rajan as a resource that is
sacrificed or foregone in order to achieve a specific goal. A
cost is typically defined as the monetary amount required to
obtain goods or services for example, the cost of labor or
advertising (Datar & Rajan, 2018), and CIMA Londan defines
as "the amount of expenditure (actual or national) incurred on,
or attributable to a specified things or activity" (Institute of
Co. Secreraties, 2013). It is great to distinguish among assets,
costs, expenses and losses, First the assets will be cost when
exchanged for other assets, affected financial statement
through the inventory and other assets on balance sheet.
Second, the cost will be expenses when exchanged for
revenue, impacts financial statement through cost of goods
sold or some other expenses on the income statement. Final
the cost will be losses when exchanged nothing in return,
impacts financial statement through Separate non-operating
item on income statement (Rajan & Cholasseri, 2019). A cost
objective is an activity that necessitates separate cost
measurements. As an example, suppose a manufacturer has
three product lines, and management needs costing
information for each of the three product lines separately. In
this case, each individual product line is a cost objective, cost
objectives are also known as cost centers (Hefer, 2013).
According to Ignou (2020), the following are the main cost
characteristics: 1) if the term "cost is not completely identified
with its nature and type, it is insufficient. 2) Costs depict not
always exact similar content 3cost is unstable concept, there
will never be a cost is correct, exact, or precise; it does not
stay the same thing; 4) anybody can calculate cost in their own
way 5) costs differ with passage of time, volume, firm,
approach, or purpose. Cost analysis and cost classification
entail categorizing costs into various logical groups based on
some suitable basis. Cost analysis and classification are
required for cost control and managerial decision making;
therefore, there are various methods of cost classification, with
the method chosen based on the purpose for which it is
required. According to Lanen et al. ( 2021): (1) according to

116 Polytechnic Journal of Humanities and Social Sciences
DOI: 10.25156/ptjhss.v3n1y2022.pp112-128
nature (material, labor and expenses), (2) according to
functions to which they relate (manufacturing cost, marketing
cost, administration cost, distribution cost and research &
developing cost), (3) according to their identifiability with
jobs, products, or services (direct cost and indirect cost), (4) in
accordance with their variability with changes in output
(variable cost, fixed cost and semi-varible cost), (5) according
to their product or period (product cost and period cost), (5)
according to their controllability (controllable cost and non-
controllable cost), and (6) according to their relevance to
decision making (opportunity, differential, avoidable &
unavoidable and sunk), relationship with accounting period
(capital and revenue).
2-1-2: A brief overview of 2nd
factor (Customer):
Customers are an important factor among (3C), and they are
not too stupid to buy a product without first researching it.
Actually, consumers are price sensitive because they want to
maximize the value of their money and time at a competitive
price. Customers are very intelligent and aware when they
decide what they get in exchange for the money they pay for a
product or service. (Al-Mamun & Rahman, 2014). The
customer factor identifies and describes the market and
customer in which the economic unit will compete. As well as
the method by which value is created for customers, because
of affecting on activity result of economic unit through price
of their products and services, the revenue component of
financial objectives is derived from the customer factor;
revenue will not be generated if the appropriate products and
services are not provided to the target customers. Once the
definition of customers and markets, core objectives and
measures are developed. The core objectives and measures are
those that all economic units share. Increase market share,
increase customer retention, increase customer acquisition,
increase customer satisfaction, and increase customer
profitability are the five main core objectives (Hansen &
Mowen, 2006). A customer is defined as a person or economic
unit who purchases goods and services. He is the most
valuable asset in any economic unit (Rahman & Safeena, 2016).
Customers are very important to a company; they add value to
a company; they spend money on company’s products. They
suggest, inform friends, and they provide information, so they
must be satisfied through a set of measures, which are as
follows (Datar & Rajan, 2018): "Data from market research on
customer choice and satisfaction with certain product features,
market share, percentage of customer content, number of
defective units sent to customers as a percentage of total units
shipped, number of customer criticism, percentage of products
that delivered to customers but failed, average products
delivery delays, and on-time delivery rate", as a result of
increased customer maintenance, honesty, and positive word-
of-mouth advertising, higher customer satisfaction should
result in lower external failure costs, lower quality costs, and
higher future revenues. Lower customer satisfaction indicates
higher external failure and quality costs in the future.
2-1-3: A brief overview of 3rd
factor (Competition):
Competition is a powerful tool and an essential component of
economic life. It came from the word "compete," which means
"to seek together," and as a result, it increases human wish,
allowing you to achieve the best results while also driving
technological innovation and productivity growth (Zelga,
2017), and is the best and significant method for manage
market processes, providing economic freedom to enterprises
and encouraging them to raise their competitiveness (Melnyk
& Yaskal, 2013). Because competition is inherently a
dynamic and complex phenomenon, factor market competition
has far-reaching implications for a company's profitability and
total market power. As a result, a focal company is very likely
to try to gain a competitive advantage in purchasing activities
(Schiefer, 2013). Competition and competitiveness are terms
that are frequently used in business and public debate about
economic units, their environments, and their ability to
perform in accordance with strategic or policy goals derived
from business, economic, or social objectives (Listra, 2015).
We can define competition as a contest between two parties or
more pursuing specific goal that cannot be splited, only one
can win and gain (an example of which is a zero-sum game)
(Smith, et al., 2001) or competition is an activity in which
individuals try to gain the advantage that others seek in the
meanwhile and under the same circumstance; its essence
depends on the removal of rivals in the same industry and the
acquisition of their consumers. We have four kind of market
competition: pure monopoly, perfect competition,
monopolistic competition, and monopolistic competition
(Zelga, 2017). As for the goal of competition, we have to
remember three important points when we focus on the
objectives of competition (Listra, 2015): (1) highlighting
changeable of competition (quantity, price, quality etc.), (2)
targeted stage of achievement; and (3) the strategic objectives
of agents determine the competitive process.
2-2: Concept of making pricing decision and its calculation
methods: The process of making a decision entails evaluating
and ranking potential courses of action. Pricing managerial
decision making is concerned with pricing decisions such as
price setting or price changes. Price positioning and product
decisions that introduce new pricing points of products or
service mix, as well as price management decision-making
problems that affect the entire organization, fall under this
category. Pricing decisions in a business are based on the
overall marketing strategy because they affect the company's
relationship with customers (Remenova & Kintler, 2020). On
the other hand, one of the most important marketing mix
decisions that an economic unit must make. When financial
data, whether cost or price, is required, the accountant is

Polytechnic Journal of Humanities and Social Sciences
117
DOI: 10.25156/ptjhss.v3n1y2022.pp112-128
frequently the first point of contact for the economic unit. As a
result, accountants need to have knowledge about revenue data
sources as well as the economic and marketing concepts
required to interpret that data (Hansen & Mowen, 2006).
Pricing decisions, according to modern marketing theory
should be made in the context of the firm's entire marketing
mix (Foxall, 2008). Pricing decisions are defined as the
process by which firm management determines the price at
which services or products must be sold in completely
competitive markets. The main pricing decision objectives are
profit maximization, price stability and prevention of
competition, Maximum return on investment, obtain target
market share, reducing sales turnover, Penetration in market,
Introduction in new markets, Stable product price, etc. By
using available data such as transaction data and sales data,
these strategies can be carried out successfully. Pricing with
analytics helps leverage data to increase profits (Rajendra &
Sinha, 2020). Customers usually like products with high
quality and low cost. Although customer require is analyzed
well in marketing classes, accountants should be careful about
it, especially when it interacts with supply (Hansen & Mowen,
2006). As a result, the way managers price a service or a
product eventually depends on supply and demand, and three
factors influence pricing decisions based on supply and
demand: competitors, customers, and costs (Datar & Rajan,
2018). Pricing a product, on the other hand, is influenced by a
variety of factors because price involves a large number of
variables. Factors are divided into two types: internal factors
that influence pricing based on cost, and external factors that
impact pricing according to customers and competition
(Remenova & Kintler, 2020). As for alternative long-run
pricing approaches, there are two kind of approaches for
pricing decisions according to Datar & Rajan (2018); (1)
Market-based approach, (2) Cost-based approach, the market-
based approach to pricing starts by asking, “What is the
customers demand, and how is competitor’s reaction to our
action, what price should we charge?” Based on this price,
managers can control costs to earn a target return on
investment, and there are four types of market –based
approach: perfect competition, monopolistic competition),
oligopoly, and monopoly. The cost-based approach to pricing
starts by asking, “Given what is the cost to make this product,
what price should we charge that will cover our costs and earn
a target return on investment?”, they calculate the cost of the
product and add the preferred profit. The procedure of this
method is simple. There is a cost base and a markup. The
markup is amount added to the base cost that includes the
preferred profit as well as any costs that are not included in the
base cost (Hansen & Mowen, 2006). It can be calculated price
of products according to cost-based approach, as follows:
"Price = Cost + Markup". The different cost bases and
markup percentages give four aspect selling prices that are
close to each other, according to Datar & Rajan (2018):
(Variable manufacturing cost, Variable cost of the product,
Manufacturing cost and full cost of the product). And there is
another approach to determine price of products is target cost,
is considered one of the most important and the best modern
cost management systems, because it is supposed to work on
reducing costs and developing products without compromising
the quality of the products. The system also focuses on
satisfying the customers' desires continuously to achieve the
highest percentage of sales and profits. It is one of the cost
management tools that cost to produce (Alzlzly, 2019).
The researcher noticed and according with Datar & Rajan
(2018), that there are three markets when industrial companies'
managers weigh customers, competitors, and costs differently
when making pricing decisions, as follows: (a) In a fully
competitive market: companies operating in a perfectly
competitive market sell very similar commodity products for
example food companies; managers at these companies have
no control over setting prices and must accept the price
determined by a market with many participants, cost
information assists managers in determining the amount of
output to produce in order to maximize operating income. (b)
In a semi-competitive markets, all three factors affect prices:
the value customers place on a product and the prices charged
for competing products affect demand, and the costs of
producing and delivering the product affect supply, for
example, companies that produce technology products (c) In
less competitive market, the key factor influencing pricing
decisions is the customer's willingness to pay based on the
value that customers place on the product or service, not costs
or competitors, an example of this type of market is computer
software companies
2-3: An Overview of company’s goals: Company's
objectives in this research are included in three aspects:
2-3-1: Concept and important of profitability: Profitability
refers to the extent to which the value of a manufacturing
production exceeds the cost of the resources used to produce
it. Profitability is measured in absolute terms by net income
(Edwards & Duffy, 2014), and in a competitive marketplace,
the owners of business should try to know how to gain a
reasonable profitability level. Profitability is a ratio used to
assess a company's performance. It is a critical component of a
company's financial reporting. A company's profitability
shows its power to produce earnings over a particular period
of time at a given rate of sales, assets, and capital stock. The
comprehension determinants of profitability are a great factor
for helping managers in developing an effective profitability
policy for their company. The company's essential objective is
to enlarge profitability. No company can attract external
resources without profitability and cannot survive eventually.

118 Polytechnic Journal of Humanities and Social Sciences
DOI: 10.25156/ptjhss.v3n1y2022.pp112-128
Knowing company profitability will give feedback to the
company. The company can find a strategy that must be
carried out to find a solution for the problem and reduce the
negative impact of business survival (Margaretha & Supartika,
2016). In general, we can define profitability as a company’s
earnings after cutting all the costs for a given period of time. It
is the significant sign of management success, shareholder
satisfaction, investor attraction, and the company's long-term
viability (Jayathilaka, 2020). There are many indicators to
evaluate the profitability of companies and the most indicator
used, are ROA (Return on Assets) and ROE (Return on
Equity).
2-3-2: Concept and important of Strategy of expanding market
basic: Market expansion is a very important option in
improving economies. It is the activity of making a product
available on a larger level in an existing or new market. Its
strategy starts with a study of existing and potential
distribution channels and concludes with the applying of
measures to increase reach and sales in the markets of interest
(Bang & Joshi, 2008). Expansion strategies are then strategies
used by the organization to achieve its long-term expansion
goals (Onyonkam 2013). Many studies on market expansion
strategy focused more on evaluating the 'fit' between the
organization and outside causes like market attractiveness,
competitive benefit, and risk, with little attention paid to
internal factors like organizational structure, management
systems, and corporate culture. A market expansion policy is a
growing strategy that entails selling available products in a
new market when growth in the company's existing sales
channels peaks (Robinson & Lundstrom, 2003). Moreover,
market expanding Strategies are the strategies targeted at
gaining larger market share, even for a short period of time
earnings. Three broad growth strategies are Market leader
strategy, Market challenger strategy and Market niche strategy
Boone (Tangus & Omar, 2017). According to Yifan & Xirui
there are four principles of market expansion should adhere to
market-oriented principle, According to Yifan & Xirui (2020): resource-based, product-based, quality-critical, and efficiency-
centric. Three element of market expansion strategy
determined (Bang & Joshi, 2008): (1) a definition of market
scope in terms of customers and competitors, (2) the creation
of willingness and ability among target customers, and (3) the
fulfillment of demand in a sustainable manner.
2-3-3: Concept and important of retention of current
customers (loyal customers) and attracting new customers: Nowadays, we cannot deny the importance of the customer in
any economic unit, and the customer is the most important
source of added value in the company, and the customer is
someone or a party who receives or consumes products that
can choose which product to be chosen among many different
products and suppliers." Customers might be both individuals
and businesses who purchase products and services from
businesses that satisfied their needs (Torkinlampi, 2018). So in
a competitive market, attracting and retaining customers is
critical. Identifying the effective factors influencing customer
loyalty can assist managers in making decisions regarding the
retention and creation of loyal customers. (Mizani et al. 2018).
2-3-3-1: A brief concept of retention of current customers
(loyal customers): Customer loyalty prefers the products or
the services of company over competitors on a consistent
basis. Customers who have a strong loyalty to a particular
company cannot be influenced easily by price or availability.
They are willing pay extra to ensure the exact same quality
product and service that they have come to expect (Chambers,
2020). Customer retention is the procedure that businesses and
organizations take on in order to retain the customer not to
change their mind about their products. Customer retention
programs facilitate businesses in retaining their customers,
most often through customer loyalty and brand loyalty
initiatives. Furthermore, customer retention contributes to the
profitability of your small business. There are some factors
can be implemented for making Long-term customer
relationships like: providing personalized quality service,
advertising well, awarding loyal customers, and offering
inventive products and services. (www.ngdate.com, 2016).
2-3-3-2: A brief concept of attracting new customers: Value
creation and customer satisfaction are critical factors in
attracting customers to successful companies in a global
market (Mizani et al. 2018), and that is, by researching them.
Research is the process of gathering information in order to
increase or revise current knowledge by discovering new facts
in a specific field. In the case of attracting new customers,
research is required to obtain more information on how to
attract them, by using what theory and how to apply this
theory correctly, so that it benefits the company (Petrovskaya,
2014).
Third (part): Analytical aspect for research: The
researchers have uploaded and analyzed all of the
questionnaire through the statistical Program SPSS and Easy
Fit to test the following hypotheses:
3-1: Study sample description: The questionnaire was
distributed in three different categories (general managers and
their assistants, division managers in industrial companies,
and academics), and (148) forms were valid for analysis for a
sample of (170) researches in the Kurdistan Region.
3-1-1: Statistical description of general information: The
general information of the researches is summarized in Tables
(1-6).
Table (1): Statistical description of career position
Class Frequency Percent Cumulative Percent
Co. manager 34 22.97 22.97
Vice Co. manager 16 10.81 33.78
Division manager 22 14.86 48.64
Academics 76 51.36 100.0

Polytechnic Journal of Humanities and Social Sciences
119
DOI: 10.25156/ptjhss.v3n1y2022.pp112-128
Total 148 100.0
Table (1) shows that the study sample that included the career
position was 22.97% Co. manager, 10.81% Vice Co. manager,
14.86% Division manager, and 51.36% academics.
Table (2): Statistical description of Academic qualification Class Frequency Percent Cumulative Percent
Less than a Bachelor's 8 5.41 5.41
Bachelor's degree 54 36.49 41.9
MSc. degree 56 37.84 79.74
PhD. Degree 30 20.26 100.0
Total 148 100.0
Table (2) shows that 5.41% of the study sample had less than a
bachelor's degree, 36.49% had a bachelor's degree, 37.84%
had a MSc. degree, and 20.26% were PhD. degree.
Table (3): Statistical description of Specialization Class Frequency Percent Cumulative Percent
Accounting 54 36.49 36.49
Management 50 33.78 70.27
Banking sciences 4 2.70 72.97
Others 40 27.03 100.0
Total 148 100.0
According to Table (3), the specialization was represented by
36.49% accounting, 33.78% management, 2.7% banking
sciences, and 27.03% others in the study sample.
Table (4): Statistical description of Experience years Class Frequency Percent Cumulative Percent
Less than 5 years 18 12.16 12.16
From 5-15 years 60 40.54 52.70
From 15 years and over 70 47.30 100.0
Total 148 100.0
Table (4) shows the experience years that 12.16% of the study
sample had less than 5 years of experience, 40.54% had 5-15
years of experience, and 47.3% had 15 years or more of
experience.
Table (5): Statistical description of Age Class Frequency Percent Cumulative Percent
Less than 30 years 10 6.76 6.76
From 30-45 years 76 51.35 58.11
More than 45 years 62 41.89 100.0
Total 148 100.0
According to Table (5), the age distribution in the study
sample was 6.76% less than 30 years, 51.35% from 30-45
years, and 41.89% more than 45 years.
Table (6): Statistical description of Gender Class Frequency Percent Cumulative Percent
Male 130 87.84 87.84
Female 18 12.16 100.0
Total 148 100.0
Table (6) shows that the study sample that included the Age
was 87.84% Male, 12.16% Female.
3-1-2: Description and diagnosis of study variables: The
mean, standard deviation, and degree of agreement for study
variables, which included (36) items segmented into three
variables, are calculated in this analysis. The arithmetic means
for each questionnaire item evaluated using a Likert scale
(Totally not agree = 1, Not agree = 2, Not sure = 3, Agreed =
4, and totally agree = 5) are summarized in the tables below:
Independent variable: it includes three factors on making
pricing decisions to achieve company’s objective, which are
the cost, the customer, and the competition factor.
Table (7) shows that the average of the independent variable is
equal to (4.049) which is greater than the average of the
hypothetical agreement (3), degree of agreement is 80.98%
with standard deviation (0.869), indicates that the research
sample does not have divergent opinions about the variable
items.
The cost factor average was (4.1318), which is greater than the
average of the hypothetical agreement (3), degree of
agreement is 82.63% with standard deviation (0.8653),
indicates that the research sample does not have divergent
opinions about the factor items. The first item (Cost is one of
the most important factors whose trends must be determined,
studied, analyzed and carefully controlled when making a
pricing decision for products and services) got the highest
average agreement (in this factor), which reached (4.2838)
with degree of agreement is 85.68% with standard deviation
(0.98313).
Table (7): Descriptive Statistics for independent variable Factor Mean Std. Deviation Degree of agreement
A1 4.2838 .98313 85.68
A3 4.2297 .88136 84.59
A7 4.1622 .88874 83.24
A6 4.1622 .85757 83.24
A5 4.1351 .84635 82.70
A4 4.0811 .86907 81.62
A8 4.0135 .74675 80.27
A2 3.9865 .84906 79.73
Average of Factor 1 4.1318 0.8653 82.63
B2 4.2027 .77336 84.05
B3 4.2027 .73734 84.05
B6 4.1892 .86780 83.78
B1 4.0811 .97250 81.62
B5 4.0541 .82300 81.08
B7 4.0270 .85671 80.54
B4 3.9595 .92493 79.19
B8 3.9324 1.02128 78.65
Average of Factor 2 4.0811 0.8721 81.62
C7 4.1216 .67919 82.43
C2 4.0676 .74379 81.35
C8 3.9730 .93274 79.46
C4 3.9189 .82076 78.38
C5 3.8919 .94138 77.84
C3 3.8784 .93245 77.57
C1 3.8243 1.03488 76.49
C6 3.7973 .87256 75.95
Average of Factor 3 3.9341
0.8697 78.68
Average of independent
variable 4.0490 0.8690 80.98
The customer factor average was (4.0811), which is greater
than the average of the hypothetical agreement (3), degree of
agreement is 81.62% with standard deviation (0.8721),
indicates that the research sample does not have divergent

120 Polytechnic Journal of Humanities and Social Sciences
DOI: 10.25156/ptjhss.v3n1y2022.pp112-128
opinions about the factor items. The second item is the
company's hearing of its customers' complaints and trying to
solve their problems will preserve its existing customers and
provide the opportunity to attract new customers. The third
item is , studying the behavior and attitude of customers in the
markets about the company's preferred products and services
and using its results (price and specifications) will help the
company's management to take the appropriate decision to
price its products and services) got the highest average
agreement (in this factor), which reached (4.2027) with degree
of agreement is 84.05% with standard deviation (0.77336) and
(0.73734) respectively.
The competition factor average was (3.9341), which is greater
than the average of the hypothetical agreement (3), degree of
agreement is 78.68% with standard deviation (0.8697),
indicates that the research sample does not have divergent
opinions about the factor items. The seven item (The
competition factor helps the company's management to
continue the process of analyzing and studying the
competitive market to identify changes that may occur on
competing products and the entry of new competitors, and this
affects pricing decisions) got the highest average agreement
(in this factor), which reached (4.1216) with degree of
agreement is 82.43% with standard deviation (0.67919).
Mediating variable: making pricing decisions, which
included (6) items.
Table (8): Descriptive Statistics for mediating variable
Item Mean
Std.
Deviation
Degree of
agreement
D6 4.0811 .76943 81.62
D1 4.0676 .86238 81.35
D2 4.0541 .83937 81.08
D3 3.9730 .85671 79.46
D4 3.9054 .92094 78.11
D5 3.6486 .86398 72.97
Average of mediating variable 3.9550 0.8521 79.098
Table (8) shows that the average of the mediating variable is
(3.955), which is greater than the average of the hypothetical
agreement (3), that the degree of agreement is 79.098 percent
with a standard deviation of (0.8521), and that the research
sample does not have divergent opinions about the variable
items. The six item (Choosing the appropriate method for
pricing the company's products and services comes from
monitoring and analyzing the prices, costs and quality of
competitors' offers) got the highest average agreement (in this
variable), which reached (4.0811) with degree of agreement is
81.62% with standard deviation (0.76943).
Dependent variable: company’s objective, which included
(6) items.
Table (9): Descriptive Statistics for dependent variable
Item Mean
Std. Deviation Degree of
agreement
E6 4.3243 .70195 86.49
E3 4.2432 .77038 84.86
E4 4.1892 .65311 83.78
E5 4.0811 .75154 81.62
E2 4.0541 .85543 81.08
E1 3.5811 1.01695 71.62
Average of dependent
variable 4.0788 0.7916 81.58
Table (9) shows that the average of the dependent variable is
equal to (4.0788) which is greater than the average of the
hypothetical agreement (3), degree of agreement is 81.58%
with standard deviation (0.7916), indicates that the research
sample does not have divergent opinions about the variable
items. The six item (Retaining current customers and
attracting new customers comes through consolidating good
connections with them by offering relevant product
information and prompt responses to their requests, as well as
after-sales services) got the highest average agreement (in this
variable), which reached (4.3243) with degree of agreement is
86.49% with standard deviation (0.70195).
3-2: Test reliability coefficient and Validity of the
questionnaire (consistency): Reliability Simply put, a
reliable measuring instrument is one that produces consistent
results when measuring the same objects or events over and
over. It's also worth noting that researchers have no idea how
reliable an instrument (a test) is because they don't have
information of the real scores. The researchers, on the other
hand, can estimate reliability. Cronbach's alpha is a measure
of internal consistency, or how closely related a set of items is
to one another. It is considered scale reliability metric. A
measure with a "high" alpha value does not necessarily
indicate that it is one-dimensional. Additional analyses can be
performed if you want to provide proof that the scale in
question is unidimensional in addition to measuring internal
consistency. Exploratory factor analysis is a way for
determining dimensionality. Cronbach's alpha is not a
statistical test; rather, it is a coefficient of reliability (or
consistency). Cronbach's alpha coefficient will be used on this
basis.
In contrast, content validity assumes that we are able to
describe the entire population of behavior (or other things) that
an operationalization is supposed to capture. Think of our
operationalization as a subset of that population. Our
operationalization will have content validity to the point that
the sample is symbolic of the population. To assess content
validity, we can describe the population of interest as
accurately as possible and ask specialists (people who have
knowledge about interest construct) to evaluate how
representative our sample is of that population. To assess the
consistency with sincerity (which represents the root of the
reliability coefficient), a questionnaire was administered and
the results were summarized in a table (10).
Table (10) displays the reliability statistics for Cronbach alpha
values, are (0.424, 0.158, 0.183, 0.792, 0.711, 0.746 and

Polytechnic Journal of Humanities and Social Sciences
121
DOI: 10.25156/ptjhss.v3n1y2022.pp112-128
0.945) and the validity vales are (0.9612, 0.9225, 0.9017,
0.8899, 0.8432, 0.8637 and 0.9721), and they are all greater
than 0.60 and 0.80, indicating the measuring instrument's high
reliability. Furthermore, it shows a high stage of internal
consistency in relation to the specified sample.
Table (10): Reliability Statistics
Variables Cronbach's Alpha Validity N of Items
Independent 0.924 0.9612 24
Cost factor 0.851 .92250 8
Customer factor 0.813 .90170 8
Competition factor 0.792 .88990 8
Mediating 0.711 .84320 6
Dependent 0.746 .86370 6
All variables 0.945 .97210 36
3-3: Test data distribution: The researchers will test whether
or not the questionnaire variables and means have a normal
distribution using a non-parametric test (Kolmogorov-
Smirnov) and a parametric test2 (using the Easy Fit
program), which determines the tool and the appropriate test
to test the study hypotheses, test the following hypotheses:
:0H The means of the questionnaire variables have normal
distribution.
:1H The means of the questionnaire variables have non-
normal distribution.
The test results are summarized under the significance level
(0.05) by the following table:
Table (11): Test of Normality Result Chi-Squared K.S.
Variables Critical
Value
p
Value
Statistic Critical
Value
p
Value
Statistic
Normal 14.067 0.000 61.035 0.1116 0.058 0.1081 Independent
Normal 14.067 0.083 12.570 0.1116 0.004 0.1423 Cost
Normal 14.067 0.009 18.498 0.1116 0.159 0.0912 Customer
Non Normal
14.067 0.000 26.452 0.1116 0.017 0.1261 Competition
Non
Normal 14.067 0.000 55.110 0.1116 0.015 0.1276 Mediating
Non
Normal 14.067 0.000 31.306 0.1116 0.000 0.1838 Dependent
Table (11) shows by using (K.S.), test that means of the
independent variable and customer factor have normal
distributions because the p-values are equal to (0.1081, and
0.0912), respectively, and are greater than the significance
level (0.05), and Statistic are less than (0.1116), whereas the
rest of the variables do not. Using the (Chi-Squared) test, the
means of the cost factor have a normal distribution because
the p-values are equal to (0.083), which is greater than the
significance level (0.05), and the statistic is less than (14.067),
whereas the rest of the variables do not. Finally, independent,
cost, and customer variables have normal distribution while
the competition, mediating, and dependent variables do not
have a normal distribution.
3-4: Study hypotheses test: The study covered the testing of
three basic hypotheses, the first related to the importance and
agreement, the second to effect, and impact difference.
3-4-1: Hypothesis of impact: The simple linear regression
model was estimated and the coefficient of determination was
calculated to test the impact hypothesis significantly, and the
following hypotheses were tested:
First main hypothesis:
0H : There is no impact of the three factors on making pricing
decision
1H : There is impact of the three factors on making pricing
decision
The three factors together represent the independent variable
and the mediating variable (making pricing decision)
represents the dependent variable. On this basis, the simple
linear regression model will be estimated and the first main
hypothesis tested, which is summarized in the following table.
Table (12): The impact of the three factors on making pricing
decision
Model Coefficientsa T Sig. F
Sig.
R
Square
(Constant) 0.470 2.411 0.017
325.825 0.000 0.691 Three factor 0.861 18.051 0.000
According to Table (12), the three factors explain 69.1%
(coefficient of determination) of the changes in pricing
decisions. Linear regression is the best model for this data
because the F-statistic is equal to (325.825), which is the
highest of the tabulated values under the (0.05) significance
level, and the degrees of freedom (1 and 146) are equal to
(3.91), which is confirmed by the p-value, which is equal to
zero and less than the significance level (0.05). Since t-statistic
equal to (18.051) for the coefficient of independent variable
(three factor), and it's the largest of tabulated value under the
(0.05) significantly level and degrees of freedom (147) which
is equal to (1.96), (the p-value is (0.000), which less than the
significantly level (0.05), its therefore significant and
contribute to the interpretation of the model (making pricing
decision), and finally, the null hypothesis is rejected in favor
of the alternative hypothesis, which states that "the three
factors have an impact on pricing decisions".
The following three sub-hypotheses are derived from the first
main hypothesis:
First sub-hypothesis:
0H : There is no impact of the cost factor on making pricing
decision
1H : There is impact of the cost factor on making pricing
decision

122 Polytechnic Journal of Humanities and Social Sciences
DOI: 10.25156/ptjhss.v3n1y2022.pp112-128
The cost factor represents the independent variable and the
mediating variable (making pricing decision) represents the
dependent variable. On this basis, the simple linear regression
model will be estimated and the first sub-hypothesis tested,
which is summarized in the following table.
Table (13): The impact of the cost factor on making pricing
decision
Model Coefficientsa T Sig. F
Sig. R
Square
(Constant) 1.200 5.748 0.000
177.904 0.000 0.549 Three factor 0.667 13.338 0.000
According to Table (13), the cost factor explains 54.9%
(coefficient of determination) of the changes in pricing
decisions. Linear regression is the best model for this data
because the F-statistic is equal to (177.904), which is the
highest of the tabulated values under the (0.05) significance
level, and degrees of freedom (1 and 146) are equal to (3.91),
which is confirmed by the p-value, which is equal to zero and
less than the significance level (0.05). Since t-statistic equal to
(13.338) for the coefficient of independent variable (cost
factor), and it's the largest of tabulated value under the (0.05)
significantly level and degrees of freedom (147) which is
equal to (1.96), (the p-value is (0.000), which less than the
significantly level (0.05)), its therefore significant and
contribute to the interpretation of the model (making pricing
decision), and finaly, the null hypothesis is rejected and accept
the alternative hypothesis which states that “There is impact of
the cost factor on making pricing decision”.
Second sub-hypothesis:
0H : There is no impact of the customer factor on making
pricing decision
1H : There is impact of the customer factor on making pricing
decision
The customer factor represents the independent variable and
the mediating variable (making pricing decision) represents
the dependent variable. On this basis, the simple linear
regression model will be estimated and the second sub-
hypothesis tested, which is summarized in the following table.
Table (14): The impact of the customer factor on making
pricing decision
Model Coefficientsa T Sig. F
Sig.
R
Square
(Constant) 0.923 4.614 0.000
234.341 0.000 0.616 Three factor 0.743 15.308 0.000
According to Table (14), the customer factor explains 61.6%
(coefficient of determination) of the changes in pricing
decisions. Linear regression is the best model for this data
because the F-statistic is equal to (234.341), which is the
largest of the tabulated values under the (0.05) significance
level, and degrees of freedom (1 and 146) are equal to (3.91),
which is confirmed by the p-value, which is equal to zero and
less than the significance level (0.05). Since t-statistic equal to
(15.308) for the coefficient of independent variable (customer
factor), and it's the largest of tabulated value under the (0.05)
significantly level and degrees of freedom (147) which is
equal to (1.96), (the p-value is (0.000), which less than the
significantly level (0.05)), its therefore significant and
contribute to the interpretation of the model (making pricing
decision), and finally, the null hypothesis is rejected and
accept the alternative hypothesis which states that “There is
impact of the customer factor on making pricing decision”.
Third sub-hypothesis:
0H : There is no impact of the competition factor on making
pricing decision
1H : There is impact of the competition factor on making
pricing decision
The competition factor represents the independent variable
and the mediating variable (making pricing decision)
represents the dependent variable. On this basis, the simple
linear regression model will be estimated and the third sub-
hypothesis tested, which is summarized in the following table.
Table (15): The impact of the competition factor on making
pricing decision
Model Coefficientsa T Sig. F
Sig.
R
Square
(Constant) 1.128 5.189 0.000 172.475 0.000 0.542
Three factor 0.719 13.133 0.000
According to Table (15), the competition factor explains
54.2% (coefficient of determination) of the changes in pricing
decisions. Linear regression is the best model for this data
because the F-statistic is equal to (172.475), which is the
highest of the tabulated values under the (0.05) significance
level, and the degrees of freedom (1 and 146) are equal to
(3.91), which is confirmed by the p-value, which is equal to
zero and less than the significance level (0.05). Since t-statistic
equal to (13.133) for the coefficient of independent variable
(competition factor), and it's the largest of tabulated value
under the (0.05) significantly level and degrees of freedom
(147) which is equal to (1.96), (the p-value is (0.000), which
less than the significantly level (0.05)), its therefore significant
and contribute to the interpretation of the model (making
pricing decision), and finally, the null hypothesis is rejected
and accept the alternative hypothesis which states that “There
is impact of the competition factor on making pricing
decision”.
Second main hypothesis:
0H : There is no impact of the making pricing decision on
company’s objective

Polytechnic Journal of Humanities and Social Sciences
123
DOI: 10.25156/ptjhss.v3n1y2022.pp112-128
1H : There is impact of the making pricing decision on
company’s objective
The making pricing decision represent the independent
variable and the company’s objective represent the dependent
variable. On this basis, the simple linear regression model will
be estimated and the second main hypothesis tested, which is
summarized in the following table.
Table (16): The impact of the making pricing decision on
company’s objective
Model Coefficientsa T Sig. F
Sig.
R
Square
(Constant) 1.087 5.379 0.000
223.041 0.000 0.604 Three factor 0.756 14.935 0.000
According to Table (16), pricing decisions explain 60.4%
(coefficient of determination) of changes in the company's
objective. Linear regression is the best model for this data
because the F-statistic is equal to (223.041), which is the
highest of the tabulated values under the (0.05) significance
level, and the degrees of freedom (1 and 146) are equal to
(3.91), which is confirmed by the p-value, which is equal to
zero and less than the significance level (0.05). Since t-statistic
equal to (14.935) for the coefficient of independent variable
(making pricing decision), and it's the largest of tabulated
value under the (0.05) significantly level and degrees of
freedom (147) which is equal to (1.96), (the p-value is (0.000),
which less than the significantly level (0.05)), its therefore
significant and contribute to the interpretation of the model
(company’s objective), and finally, the null hypothesis is
rejected and accept the alternative hypothesis which states that
“There is impact of the making pricing decision on company’s
objective”.
3-4-2: Hypotheses of impact difference: Here, the difference
in the independent variable impact on the dependent variable
according to career position (academic and professional), will
be tested, and the following hypotheses test:
First main hypothesis:
0H : There is no difference in the independent variable (three
factors together) impact on the making pricing decision
according to career position.
1H : There is difference in the independent variable (three
factors together) impact on the making pricing decision
according to profession.
The three factors together represent the independent variable
and the mediating variable (making pricing decision)
represents the dependent variable for both academic and
professional. On this basis, the simple linear regression model
will be estimated for both academic (76 searched) and
professional (72 searched), and the first main hypothesis
tested, which is summarized in the following table.
Table (17): The impact difference of the three factors on
making pricing decision according to career position
Model Coefficientsa t Sig. F
Sig. R
Square
Academic (Constant) 0.483 2.126 0.037
219.1
4
0.00
0 0.748
Three factor 0.867 (0.059) 14.80 0.000
professional (Constant) 0.091 0.229 0.820 101.6
3
0.00
0 0.592
Three factor 0.941(0.093) 10.08 0.000
impact difference test 0.672 0.503
Table (17) shows that the three factors explain 74.8% of the
changes in pricing decisions for academics. Linear regression
is the best model for this data because the F-statistic is equal
to (219.14), it is the largest of the tabulated values under the
(0.05) significance level, and the degrees of freedom (1 and
74) are equal to (3.96), as confirmed by the p-value, which is
equal to zero and less than the significance level (0.05). Since
t-statistic equal to (14.80) for the coefficient of independent
variable (three factor), and it's the largest of tabulated value
under the (0.05) significantly level and degrees of freedom
(75) which is equal to (1.99), (the p-value is (0.000), which
less than the significantly level (0.05)), its therefore significant
and contribute to the interpretation of the model (making
pricing decision) for academic.
For professional, the three factors, explains 59.2% of the
changes in making pricing decision. Linear regression
appropriate model for this data because F-statistic equal to
(101.63), it's the largest of tabulated value under the (0.05)
significantly level and degrees of freedom (1 and 70) which is
equal to (3.97), this is confirmed by the p-value, which is
equal to zero and is less than the significance level (0.05).
Since t-statistic equal to (10.08) for the coefficient of
independent variable (three factor), and it's the largest of
tabulated value under the (0.05) significantly level and degrees
of freedom (71) which is equal to (1.995), (the p-value is
(0.000), which less than the significantly level (0.05)), its
therefore significant and contribute to the interpretation of the
model (making pricing decision) for professional.
Finally, impact difference test, since t-statistic equal to (0.672)
and its less than the tabulated value under the (0.05)
significantly level and degrees of freedom (144) which is
equal to (1.96), (the p-value is (0.503), which greater than the
significantly level (0.05)), its therefore non-significant and the
null hypothesis is accepted which states that “There is no
difference in the independent variable (three factors together)
impact on the making pricing decision according to career
position”.
The following three sub-hypotheses are derived from the first
main hypothesis:

124 Polytechnic Journal of Humanities and Social Sciences
DOI: 10.25156/ptjhss.v3n1y2022.pp112-128
First sub-hypothesis:
0H : There is no difference in the cost factor impact on the
making pricing decision according to career position.
1H : There is difference in the cost factor impact on the
making pricing decision according to career position.
The cost factor represents the independent variable and the
mediating variable (making pricing decision) represents the
dependent variable for both academic and professional. On
this basis, the simple linear regression model will be estimated
for both academic (76 searched) and professional (72
searched), and the first sub-hypothesis tested, which is
summarized in the following table.
Table (18): The impact difference of the cost factor on making
pricing decision according to career position
Model Coefficientsa T Sig. F
Sig.
R
Square
Academic (Constant) 0.784 3.803 0.000
221.1
9
0.00
0 0.749
Cost factor 0.775(0.052) 14.87 0.000
Professional (Constant) 1.784 4.063 0.000 28.26
5
0.00
0 0.288
Cost factor 0.531(0.1) 5.316 0.000
impact difference test 2.165 0.032
According to Table (18), the cost factor explains 74.9% of the
changes in pricing decisions for academic institutions. Linear
regression is the best model for this data because the F-
statistic is equal to (221.19), which is the largest of the
tabulated values under the (0.05) significance level, and the
degrees of freedom (1 and 74) are equal to (3.96), which is
confirmed by the p-value, which is equal to zero and less than
the significance level (0.05). Since t-statistic equal to (14.87)
for the coefficient of independent variable (cost factor), and
it's the largest of tabulated value under the (0.05) significantly
level and degrees of freedom (75) which is equal to (1.99),
(the p-value is (0.000), which less than the significantly level
(0.05)), its therefore significant and contribute to the
interpretation of the model (making pricing decision) for
academic.
For professional, the cost factor, explains 28.8% of the
changes in making pricing decision. Linear regression
appropriate model for this data because F-statistic equal to
(28.265), it's the largest of tabulated value under the (0.05)
significantly level and degrees of freedom (1 and 70) which is
equal to (3.97), this is confirmed by the p-value, which is
equal to zero and is less than the significance level (0.05).
Since t-statistic equal to (5.316) for the coefficient of
independent variable (cost factor), and it's the largest of
tabulated value under the (0.05) significantly level and degrees
of freedom (71) which is equal to (1.995), (the p-value is
(0.000), which less than the significantly level (0.05)), its
therefore significant and contribute to the interpretation of the
model (making pricing decision) for professional.
Finally, the impact difference test is significant because the t-
statistic equals (2.135) and is greater than the tabulated value
under the (0.05) significantly level and degrees of freedom
(144) equals (1.96), (the p-value is (0.032), which is less than
the significantly level (0.05)), the null hypothesis is rejected,
and the alternative hypothesis is accepted, which states that
"There is difference in the cost factor impact on the making
pricing decision according to career position”.
Second sub-hypothesis:
0H : There is no difference in the customer factor impact on
the making pricing decision according to career
position.
1H : There is difference in the customer factor impact on the
making pricing decision according to career position.
The customer factor represents the independent variable and
the mediating variable (making pricing decision) represents
the dependent variable for both academic and professional. On
this basis, the simple linear regression model will be estimated
for both academic (76 searched) and professional (72
searched), and the second sub-hypothesis tested, which is
summarized in the following table.
Table (19): The impact difference of the customer factor on
making pricing decision according to career position
Model Coefficientsa T Sig. F
Sig.
R
Square
Academic (Constant) 0.917 3.965 0.000 160.74 0.000 0.685
Customer factor 0.751(0.059) 12.68 0.000
professional (Constant) 0.695 1.648 0.104 65.982 0.000 0.485
Customer factor 0.789(0.097) 8.123 0.000
impact difference test 0.335 0.738
According to Table (19), the customer factor explains 68.5%
of the changes in pricing decisions for academic. Linear
regression is the best model for this data because the F-
statistic is equal to (160.74), which is the highest of the
tabulated values under the (0.05) significance level, and the
degrees of freedom (1 and 74) are equal to (3.96), which is
confirmed by the p-value, which is equal to zero and less than
the significance level (0.05). Since t-statistic equal to (12.68)
for the coefficient of independent variable (customer factor),
and it's the largest of tabulated value under the (0.05)
significantly level and degrees of freedom (75) which is equal
to (1.99), (the p-value is (0.000), which less than the
significance level (0.05)), its therefore significant and
contribute to the interpretation of the model (making pricing
decision) for academic.
For professional, the customer factor, explains 48.5% of the
changes in making pricing decision. Linear regression
appropriate model for this data because F-statistic equal to
(65.982), it's the largest of tabulated value under the (0.05)

Polytechnic Journal of Humanities and Social Sciences
125
DOI: 10.25156/ptjhss.v3n1y2022.pp112-128
significantly level and degrees of freedom (1 and 70) which is
equal to (3.97), this is confirmed by the p-value, which is
equal to zero and is less than the significance level (0.05).
Since t-statistic equal to (8.123) for the coefficient of
independent variable (customer factor), and it's the largest of
tabulated value under the (0.05) significantly level and degrees
of freedom (71) which is equal to (1.995), (the p-value is
(0.000), which less than the significantly level (0.05)), its
therefore significant and contribute to the interpretation of the
model (making pricing decision) for professional.
Finally, the impact difference test is non-significant because
the t-statistic is (0.335), which is less than the tabulated value
under the (0.05) significance level, and degrees of freedom
(144), which is equal to (1.96), (the p-value is (0.738), which
is greater than the significance level (0.05)), and the null
hypothesis is accepted, which states that "There is no
difference in the customer factor impact on the making pricing
decision according to career position."
Third sub-hypothesis:
0H : There is no difference in the competition factor impact
on the making pricing decision according to career
position.
1H : There is difference in the competition factor impact on
the making pricing decision according to career
position.
The competition factor represents the independent variable
and the mediating variable (making pricing decision)
represents the dependent variable for both academic and
professional. On this basis, the simple linear regression model
will be estimated for both academic (76 searched) and
professional (72 searched), and the third sub-hypothesis
tested, which is summarized in the following table.
Table (20): The impact difference of the competition factor on
making pricing decision according to career position
Model Coefficientsa t Sig. F
Sig.
R
Square
Academic (Constant) 1.509 4.877 0.000
56.856
0.00
0
0.434
Competition factor 0.612(0.081) 7.540 0.000
Professional (Constant) 0.606 1.851 0.068
115.54
0.00
0
0.623
Competition factor 0.850(0.079) 10.75 0.000
impact difference test 2.103 0.037
According to Table (20), the competition factor explains
43.4% of the changes in pricing decisions for academic
institutions. Linear regression is the best model for this data
because the F-statistic is equal to (56.856), which is the
highest of the tabulated values under the (0.05) significance
level, and the degrees of freedom (1 and 74) are equal to
(3.96), which is confirmed by the p-value, which is equal to
zero and less than the significance level (0.05). Since t-statistic
equal to (7.54) for the coefficient of independent variable
(competition factor), and it's the largest of tabulated value
under the (0.05) significant level and degrees of freedom (75)
which is equal to (1.99), (the p-value is (0.000), which less
than the significant level (0.05)), its therefore significant and
contribute to the interpretation of the model (making pricing
decision) for academic.
For professional, the competition factor, explains 62.3% of the
changes in making pricing decision. Linear regression
appropriate model for this data because F-statistic equal to
(115.54), it's the largest of tabulated value under the (0.05)
significance level and degrees of freedom (1 and 70) which is
equal to (3.97), this is confirmed by the p-value, which is
equal to zero and is less than the significance level (0.05).
Since t-statistic equal to (10.75) for the coefficient of
independent variable (competition factor), and it's the largest
of tabulated value under the (0.05) significantly level and
degrees of freedom (71) which is equal to (1.995), (the p-value
is (0.000), which is less than the significance level (0.05)), its
therefore significant and contribute to the interpretation of the
model (making pricing decision) for professional.
Finally, impact difference test, since t-statistic equal to (2.103)
and its greater than tabulated value under the (0.05)
significantly level and degrees of freedom (144) which is
equal to (1.96), (the p-value is (0.037), which is less than the
significantly level (0.05)), its therefore significant and the null
hypothesis is rejected and accept the alternative hypothesis
which states that “There is difference in the competition factor
impact on the making pricing decision according to career
position”.
Second main hypothesis:
0H : There is no difference in impact of the making pricing
decision on the company’s objective according to
career position.
1H : There is difference in impact of the making pricing
decision on the company’s objective according to
career position.
Making pricing decision represents the independent variable
and the company’s objective represents the dependent variable
for both academic and professional. On this basis, the simple
linear regression model will be estimated for both academic
(76 searched) and professional (72 searched), and the second
main hypothesis tested, which is summarized in the following
table.
Table (21): The impact difference of making pricing decision
on company’s objective according to career position
Model Coefficientsa t Sig.
F
Sig. R Square
Academic (Constant) 0.367 1.704 0.093
270.46 0.000 0.785
making pricing decision 0.919(0.056) 16.45 0.000
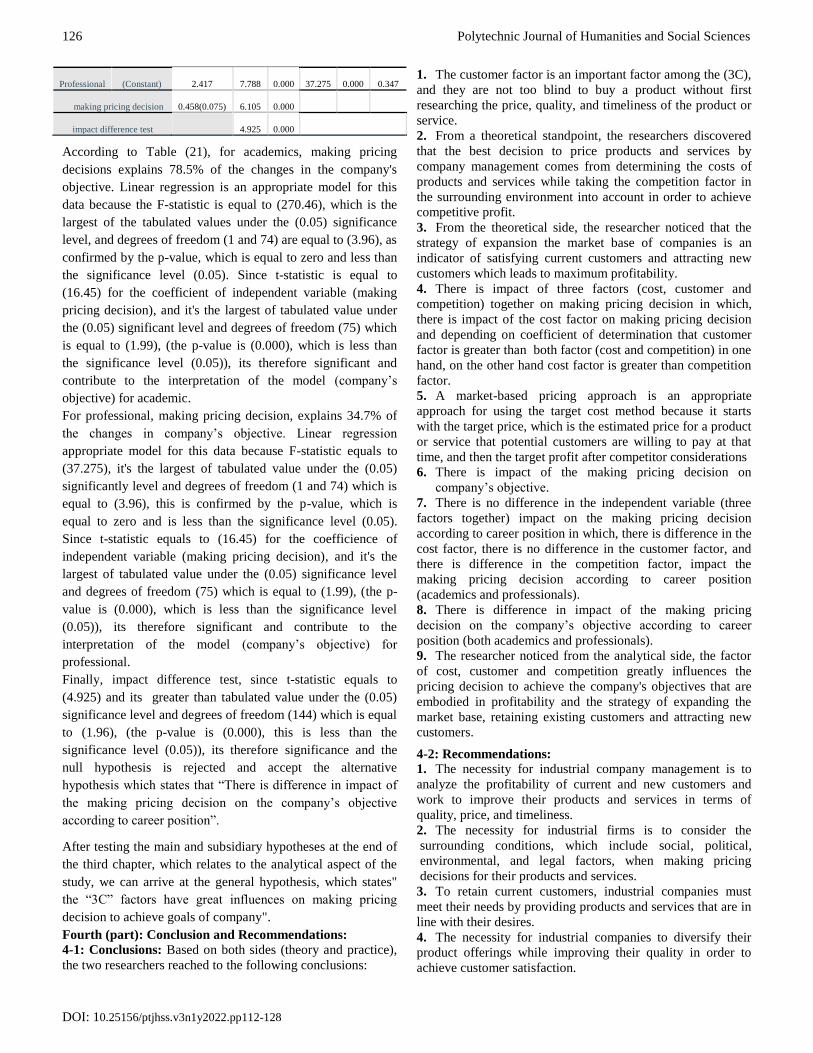
126 Polytechnic Journal of Humanities and Social Sciences
DOI: 10.25156/ptjhss.v3n1y2022.pp112-128
Professional (Constant) 2.417 7.788 0.000 37.275 0.000 0.347
making pricing decision 0.458(0.075) 6.105 0.000
impact difference test 4.925 0.000
According to Table (21), for academics, making pricing
decisions explains 78.5% of the changes in the company's
objective. Linear regression is an appropriate model for this
data because the F-statistic is equal to (270.46), which is the
largest of the tabulated values under the (0.05) significance
level, and degrees of freedom (1 and 74) are equal to (3.96), as
confirmed by the p-value, which is equal to zero and less than
the significance level (0.05). Since t-statistic is equal to
(16.45) for the coefficient of independent variable (making
pricing decision), and it's the largest of tabulated value under
the (0.05) significant level and degrees of freedom (75) which
is equal to (1.99), (the p-value is (0.000), which is less than
the significance level (0.05)), its therefore significant and
contribute to the interpretation of the model (company’s
objective) for academic.
For professional, making pricing decision, explains 34.7% of
the changes in company’s objective. Linear regression
appropriate model for this data because F-statistic equals to
(37.275), it's the largest of tabulated value under the (0.05)
significantly level and degrees of freedom (1 and 74) which is
equal to (3.96), this is confirmed by the p-value, which is
equal to zero and is less than the significance level (0.05).
Since t-statistic equals to (16.45) for the coefficience of
independent variable (making pricing decision), and it's the
largest of tabulated value under the (0.05) significance level
and degrees of freedom (75) which is equal to (1.99), (the p-
value is (0.000), which is less than the significance level
(0.05)), its therefore significant and contribute to the
interpretation of the model (company’s objective) for
professional.
Finally, impact difference test, since t-statistic equals to
(4.925) and its greater than tabulated value under the (0.05)
significance level and degrees of freedom (144) which is equal
to (1.96), (the p-value is (0.000), this is less than the
significance level (0.05)), its therefore significance and the
null hypothesis is rejected and accept the alternative
hypothesis which states that “There is difference in impact of
the making pricing decision on the company’s objective
according to career position”.
After testing the main and subsidiary hypotheses at the end of
the third chapter, which relates to the analytical aspect of the
study, we can arrive at the general hypothesis, which states"
the “3C” factors have great influences on making pricing
decision to achieve goals of company".
Fourth (part): Conclusion and Recommendations:
4-1: Conclusions: Based on both sides (theory and practice),
the two researchers reached to the following conclusions:
1. The customer factor is an important factor among the (3C),
and they are not too blind to buy a product without first
researching the price, quality, and timeliness of the product or
service.
2. From a theoretical standpoint, the researchers discovered
that the best decision to price products and services by
company management comes from determining the costs of
products and services while taking the competition factor in
the surrounding environment into account in order to achieve
competitive profit.
3. From the theoretical side, the researcher noticed that the
strategy of expansion the market base of companies is an
indicator of satisfying current customers and attracting new
customers which leads to maximum profitability.
4. There is impact of three factors (cost, customer and
competition) together on making pricing decision in which,
there is impact of the cost factor on making pricing decision
and depending on coefficient of determination that customer
factor is greater than both factor (cost and competition) in one
hand, on the other hand cost factor is greater than competition
factor.
5. A market-based pricing approach is an appropriate
approach for using the target cost method because it starts
with the target price, which is the estimated price for a product
or service that potential customers are willing to pay at that
time, and then the target profit after competitor considerations
6. There is impact of the making pricing decision on
company’s objective.
7. There is no difference in the independent variable (three
factors together) impact on the making pricing decision
according to career position in which, there is difference in the
cost factor, there is no difference in the customer factor, and
there is difference in the competition factor, impact the
making pricing decision according to career position
(academics and professionals).
8. There is difference in impact of the making pricing
decision on the company’s objective according to career
position (both academics and professionals).
9. The researcher noticed from the analytical side, the factor
of cost, customer and competition greatly influences the
pricing decision to achieve the company's objectives that are
embodied in profitability and the strategy of expanding the
market base, retaining existing customers and attracting new
customers.
4-2: Recommendations:
1. The necessity for industrial company management is to
analyze the profitability of current and new customers and
work to improve their products and services in terms of
quality, price, and timeliness.
2. The necessity for industrial firms is to consider the
surrounding conditions, which include social, political,
environmental, and legal factors, when making pricing
decisions for their products and services.
3. To retain current customers, industrial companies must
meet their needs by providing products and services that are in
line with their desires.
4. The necessity for industrial companies to diversify their
product offerings while improving their quality in order to
achieve customer satisfaction.

Polytechnic Journal of Humanities and Social Sciences
127
DOI: 10.25156/ptjhss.v3n1y2022.pp112-128
5. The necessity for industrial companies to use the target
cost technique when making pricing decisions in the face of
intense competition between companies.
6. The necessity for customers to participate in the process of
product improvement and development because it plays a role
in the markets, as evidenced by field studies, market studies,
and specialized research in that area.
References:
7. Al-Mamun, A. & Rahman, M., (2014), " A Critical Review
of Consumers’ Sensitivity to Price: Managerial & Theoretical
Issues", Journal of International Business & Economics, 2(2),
pp.1-9.
8. Alzlzly, K., (2019), "Target Cost and its Role in Cost
Reduction and Product Development (And Applied in
Engineering Industrial Companies)", Jour of Adv Research in
Dynamical & Control Systems, 11 (Special Issue), pp.287-
297.
9. Amaral, J. & Guerreiro, R. (2019), "Factors explaining a
cost-based pricing essence", Journal of Business & Industrial
Marketing, Vol. 34 No. 8, pp. 1850-1865.
10. Ayozie, D.O. (2008), “The Role of Small Scale Industry in
National Development in Nigeria”, ICAN Students’ Journal,
Jan/March, 12(1), pp.10-17.
11. Cant, M., Wiid, J. & Sephapo, C., (2016), " Key factors
influencing pricing strategies for small business enterprises
(SMEs): Are the important?", Journal of Applied Business
Research, 32(6), pp.
12. Coller, G. & Collini, P., (2014), “The value of cost
accuracy in full-cost pricing decisions”, Conference Paper,
available at:
https://www.researchgate.net/publication/282858709.
13. Datar, S. & Rajan, M., (2018), " Horngren’s Cost
Accounting: A Managerial emphasis", 16th edition, Pearson
Education, Inc, USA.
14. Edwards, W. & Duffym P., (2014), "Encyclopedia of
Agriculture and Food Systems", Academic Press, pp. 100-112.
15. Fareed, Z., Ali, Z., Shahzad, F., Nazir, M. & Ullah, H.,
(2016), "Determinants of profitability: evidence from power
and energy sector", STUDIA UBB OECONOMICA, 61(3),
pp.59-78.
16. Foxall, G., (2008), "The Logic of Price Decision-Making",
Management Decision, 18(5), pp.235-245.
17. Hansen, D. & Mowen, M., (2006), "Cost Management:
Accounting and Control"m 5th Edition, Thomson South-
Western, Canada.
18. Hefer, J., (2013), "Priniple of cost accounting", Oxford
University Press Southern Africa.
19. Hilton, R.W. (2005), “Managerial Accounting: Creating
Value in a Dynamic Business Environment”, McGraw Hill
New York.
20. Ignou, (2020), "Cost Accounting", Indira Gandhi National
Open University, New Dilhi.
21. Kim, A., Khanh, H. & Van, H., (2018), “Factors
influencing the cost-based pricing method: the empirical study
of Vietnamese feed mills”, Article in Economic Annals-XXl
171 (5-6), pp.29-37.
22. Lanen, W., Anderson, S. & Maher, M., (2021),
"Fundamentals of Cost Accounting", 10th edution, McGraw-
Hill Irwin Education, USA.
23. Listra, E., (2015), "The concept of competition and the
objectives of competitors", Social and Behavioral Sciences
213, pp.25–30.
24. Margaretham F. & Supartika, N., (2016), "Factors
Affecting Profitability of Small Medium Enterprises (SMEs)
Firm Listed in Indonesia Stock Exchange", Journal of
Economics, Business and Management, 4 (2), pp.132-137.
25. Mohammed, H. (2021), "The role of using strategic
profitability analysis in maximizing shareholders value in
economic units", Palarch’s Journal of Archaeology of
Egypt/Egyptology 18(4), pp. 5122-5140.
26. Mohammed, H., 2020, "Integration between indicators of
throughput accounting and balanced scorecard in enhancing
the competitive advantage in economic units", PhD.
dissertation unpublication, Economic & Administration
Collage, Salahaddin University.
27. Monroe, K.B. (2003), “Pricing- Making Profitable
Decisions”, 3rd Edition McGraw Hill/ Irwin, New York.
28. Ndyamukama, G. & Machibya, M., (2015), “Pricing
strategies and customer Retention”, master thesis unpublished
in International Business, Tampere University of Applied
Sciences.
29. Olawale, L., & Joel, O., (2017), “Factors Influencing
Pricing Decision: Evidence from Non-Financial Firms in
Nigeria”, Acta Universitatis Danubius. Economica, 13(1),
pp.157-172.
30. Rahman, R. & Safeena, P., (2016), "Customer Needs and
Customer Satisfaction", Training manual on theeranaipunya-
equipping fisherwomen youth for future.
31. Rajan, S. & Cholasseri, A., (2019), "Strategic cost
accounting", School of Distance Education, University of
Calicut.
32. Rajendra, G. & Sinha, M., (2020), "Impact of Analytics on
Pricing Decisions", Psychology & Education, 57(9), pp.4260-
4268.
33. Remenova, K. & Kintler, J., (2020), "How a pricing
decisions are decided and executed", SHS Web of
Conferences 83(5), pp.1-6.
34. Schiefer, C., (2013), “Role of competitive intelligence in
strategic purchasing decisions and its influence on suppliers’
resource allocation”, master thesis unpublished, University of
Twente, Nürtingen.
35. Smith, G., Ferrier, J. & Ndofor, H., (2001), "Competitive
dynamics research: Critique and future directions", Handbook
of strategic management, pp.315-36
(https://en.wikipedia.org/wiki/Competition).
36. The inistitue of Company Seccretaries, (2013), "Cost &
Management Accounting", module1, part1, Indiea.
37. Toni, D., Milan, G., Saciloto, E. & Larentis, F., (2017),
"Pricing strategies and levels and their impact on corporate
profitability", Revista de Administração, 52(2017), pp.120-
133.
38. Wilson, N. & Christella, R., (2019), " An Empirical
Research of Factors Affecting Customer Satisfaction: A Case
of the Indonesian E-Commerce Industry", DeReMa Jurnal
Manajemen, 14(1), pp.21-40.
39. Yaskal, I. & Melnyk, O., (2013), "Theoretical approaches
to concepts of “competition” and “competitiveness”",
E.coforum, 2(2), pp.8-12.

128 Polytechnic Journal of Humanities and Social Sciences
DOI: 10.25156/ptjhss.v3n1y2022.pp112-128
40. Zelga, K., (2017), "The importance of competition and
enterprise competitiveness", World Scientific News 72,
pp.301-306.
41. Jayathilaka, A., (2020), "Operating Profit and Net Profit:
Measurements of Profitability", University of Sri
Jayewardenepuna, Gangodawila, Nugegoda, Sri Lank, 7
(e7011), pp1-11.
42. Bang, V. & Joshi, S., (2008), "Conceptualization of
Market Expansion Strategies in Developing Economies",
Academy of Marketing Science Review, 12(4), pp.1-26.
43. Yifan, R. & Xirui, H., (2020), "Research on the Market
Expansion Strategy of Tourism Enterprises under the
Background of Big Data", Advances in Economics, Business
and Management Research, 155, pp.258-261.
44. Tangus, D. & Omar, N., (2017), "Effects of Market
Expansion Strategies on Performance of Commercial Banks in
Mombasa Country", International Journal of Economics,
Business and Management Research, 1(02), pp. 39-50.
45. Robinson, G. & Lundstrom, W., (2003), "Market
expansion strategy: development of a conceptual market
expansion decision scorecard", Briefings in Enterpreneurial
Finance, 12(5), pp. 259-272.
46. Onyonkam, L., (2013), "Expansion Strategies and
Performance of Commercial Banks in Kenya", Unpublished
thesis, MSc. in Administration, School of Busniess, University
of Nairobi.
47. Mizani, N., Sheikh, R., Gholami, A. & Sana, S., (2018),
"Attracting and Retaining Customers by AxiomaticDesign and
Incomplete Rough-Set Theory", Int. J. Appl. Comput. Math,
pp.2-17.
48. Chambers, S., (2020), "The Importance of Customers
Loyality", www.nicereply.com/blog/the-importance-of-
customer-loyalty.
49. Torkinlampi, E., (2018), "Customer Loyality in Business",
Thesis in Business Management, Centria University of
Applied Sciences.
50. Petrovskaya, D., (2014), "How to Attract New Customers.
Case: La Fiaba", Thesis degree Programme in International
Business, Faculty of Business Administration, Lappeenrant.
51. (www.ngdate.com, 2016).
I.